UNITED STATES
SECURITIES AND EXCHANGE COMMISSION
Washington, D.C. 20549
FORM N-CSR
CERTIFIED SHAREHOLDER REPORT OF REGISTERED MANAGEMENT
INVESTMENT COMPANIES
| Investment Company Act file number | 811-04813 |
Dreyfus Investment Funds
(Exact name of Registrant as specified in charter)
c/o The Dreyfus Corporation
200 Park Avenue
New York, New York 10166
(Address of principal executive offices) (Zip code)
Michael A. Rosenberg, Esq.
200 Park Avenue
New York, New York 10166
(Name and address of agent for service)
| Registrant's telephone number, including area code: | (212) 922-6000 | |
| Date of fiscal year end: | 12/31 | |
| Date of reporting period: | 12/31/2009 | |
The following N-CSR relates only to the Registrant’s series listed below and does not affect the other series of the Registrant, which have a different fiscal year end and, therefore, different N-CSR reporting requirements. Separate N-CSR Forms will be filed for those series, as appropriate.
Dreyfus/Standish Fixed Income Fund
Dreyfus/Standish Global Fixed Income Fund
Dreyfus/Standish International Fixed Income Fund
FORM N-CSR
| Item 1. | Reports to Stockholders. |
The views expressed in this report reflect those of the portfolio manager only through the end of the period covered and do not necessarily represent the views of Dreyfus or any other person in the Dreyfus organization. Any such views are subject to change at any time based upon market or other conditions and Dreyfus disclaims any responsibility to update such views.These views may not be relied on as investment advice and, because investment decisions for a Dreyfus fund are based on numerous factors, may not be relied on as an indication of trading intent on behalf of any Dreyfus fund.
Not FDIC-Insured • Not Bank-Guaranteed • May Lose Value
Contents | |
THE FUND | |
| 2 | A Letter from the Chairman and CEO |
| 3 | Discussion of Fund Performance |
| 6 | Fund Performance |
| 7 | Understanding Your Fund’s Expenses |
| 7 | Comparing Your Fund’s Expenses With Those of Other Funds |
| 8 | Statement of Investments |
| 26 | Statement of Financial Futures |
| 27 | Statement of Options Written |
| 28 | Statement of Assets and Liabilities |
| 29 | Statement of Operations |
| 30 | Statement of Changes in Net Assets |
| 31 | Financial Highlights |
| 32 | Notes to Financial Statements |
| 52 | Report of Independent Registered Public Accounting Firm |
| 53 | Important Tax Information |
| 54 | Board Members Information |
| 56 | Officers of the Fund |
FOR MORE INFORMATION | |
Back Cover |
Dreyfus/Standish
Fixed Income Fund
The Fund

A LETTER FROM THE CHAIRMAN AND CEO
Dear Shareholder:
We are pleased to present to you this annual report for Dreyfus/Standish Fixed Income Fund, covering the 12-month period from January 1, 2009, through December 31, 2009.
The U.S. and global bond markets ended 2009 with healthy annual gains among higher yielding market sectors, but U.S.Treasury securities and other sovereign bonds from developed nations gave back a portion of their previous gains.The bond market’s advance was driven partly by government intervention and partly by improving investor sentiment as the global economy staged a gradual, but sustained, recovery from a severe recession and banking crisis. After four consecutive quarters of contraction, the U.S. economy returned to growth during the third quarter of 2009, buoyed by greater manufacturing activity to replenish depleted inventories and satisfy export demand.The slumping housing market also showed signs of renewed life later in the year when home sales and prices rebounded modestly. However, economic headwinds remain, including a high unemployment rate and the prospect of anemic consumer spending.
As 2010 begins, our Chief Economist, as well as many securities analysts and portfolio managers have continued to find opportunities and survey potential challenges across the various fixed-income markets, both domestic and international. While no one can predict the future, we believe that the 2010 investment environment will likely require a broader range of investment considerations relative to last year.As always, your financial adviser can help you determine the mix of investments that may be best suited to helping you achieve your goals at a level of risk that is comfortable for you.
For information about how the fund performed during the reporting period, as well as market perspectives, we have provided a Discussion of Fund Performance.
Thank you for your continued confidence and support.
Jonathan R. Baum
Chairman and Chief Executive Officer
The Dreyfus Corporation
2
January 15, 2010

DISCUSSION OF FUND PERFORMANCE
For the period of January 1, 2009, through December 31, 2009, as provided by David Bowser, CFA, and Peter Vaream, Portfolio Managers
Fund and Market Performance Overview
For the 12-month period ended December 31, 2009, Dreyfus/Standish Fixed Income Fund’s Class I shares achieved a total return of 18.32%.1 In comparison, the Barclays Capital U.S. Aggregate Bond Index (the “Index”), the fund’s benchmark, achieved a total return of 5.93% for the same period.2
After bottoming early in the year,higher yielding sectors of the U.S.bond market rallied during 2009 as credit markets thawed and investors began to anticipate an economic recovery. Conversely, U.S.Treasury securities gave back some of the gains achieved during a “flight to quality” in late 2008.The fund produced a higher return than its benchmark over the reporting period, primarily due to strong results from investment-grade corporate bonds, high yield bonds and commercial mortgages.
The Fund’s Investment Approach
The fund seeks to achieve a high level of current income, consistent with conserving principal and liquidity, and secondarily seeks capital appreciation. To achieve this, the fund invests, under normal circumstances, at least 80% of net assets in fixed-income securities issued by U.S. and foreign governments and companies.
The fund invests primarily in investment-grade securities,but may invest up to 15% of assets in below investment-grade securities, sometimes referred to as junk bonds. The fund will not invest in securities rated lower than B at the time of purchase. In this instance, we will attempt to select fixed-income securities that have the potential to be upgraded.
Sustained Market Rally Erased Earlier Losses
2009 began in the midst of a global banking crisis and deep recession that produced steep declines among higher yielding bonds, including mortgage-backed, asset-backed and corporate securities. In contrast, U.S.Treasury securities had rallied amid a “flight to quality.”
The Fund 3
DISCUSSION OF FUND PERFORMANCE (continued)
The Federal Reserve Board (the “Fed”) and U.S. government responded aggressively to the downturn. In early 2009, government officials rescued struggling automakers, and Congress passed the $787 billion American Recovery and Reinvestment Act of 2009.The Fed continued to inject massive amounts of liquidity into the banking system, and it purchased mortgage- and asset-backed debt through new programs such as the Term Asset-Backed Securities Loan Facility (TALF). In addition, the Fed maintained its target for the overnight federal funds rate at an all-time low range of between 0% and 0.25%.
Investor sentiment began to improve as it became clearer in March 2009 that these remedial measures had helped to avert a collapse of the U.S. banking system. Investors capitalized on attractive valuations among higher yielding fixed-income securities, sparking sustained rallies that were particularly impressive for high yield bonds, investment-grade corporate bonds, emerging market debt securities and certain commercial mortgage-backed securities. Residential mortgage-backed securities also rebounded, in part due to massive purchases by the Fed. Conversely, U.S.Treasury securities gave back some of their earlier gains.
Sector Allocation Strategy Produced Strong Results
The fund began the reporting period with underweighted exposure to U.S.Treasury securities and overweighted positions in investment-grade corporate bonds, high yield bonds and commercial mortgage-backed securities. These higher yielding market sectors led the 2009 rebound. The fund’s holdings in the investment-grade corporate sector were broadly diversified across industry groups, and we maintained a relatively conservative security selection strategy to mitigate some of the risk inherent in overweighted exposure to the sector.The fund’s holdings of lower-rated high yield bonds emphasized issuers that we believed had sound underlying assets, including a number of opportunities in the health care and utilities industry groups. The fund’s positions in commercial mortgages focused on AAA-rated, seasoned securities with average maturity in the five- to six-year range. The fund also benefited from its holdings of high-quality asset-backed securities and emerging market debt.
4
In order to focus on adding value through our sector allocation and security selection strategies, we generally maintained the fund’s interest-rate strategies—including its average duration and yield-curve positioning—in a range that was roughly in line with the benchmark Although a modestly longer-than-average effective duration early in the year was a mild drag on performance, any resulting shortfall was offset by income produced from the sale of options designed to capture differences between implied and actual price volatility.
Maintaining a Disciplined Approach to Security Selection
As of the reporting period’s end, we have maintained the fund’s sector allocation strategy, as we believe that higher yielding bonds have room for further gains while a subpar U.S. economic recovery continues to gain traction. However, we are aware that the bulk of the bond market rally probably is behind us, and we expect the Fed to pare back some of its remedial programs in 2010. Therefore, we believe that security selection will become a more critical determinant of fund performance over the foreseeable future, an environment to which our research-intensive approach may be particularly well suited.
| January 15, 2010 | |
| The fund may, but is not required to, use derivative instruments, such as options, futures and | |
| options on futures, forward contracts, swaps (including credit default swaps on corporate bonds and | |
| asset-backed securities), options on swaps, and other credit derivatives. A small investment in | |
| derivatives could have a potentially large impact on the fund’s performance.The use of derivatives | |
| involves risks different from, or possibly greater than, the risks associated with investing directly in | |
| the underlying assets. | |
| Effective September 1, 2009, the single class shares of Dreyfus/Standish Fixed Income Fund | |
| were re-designated as Class I shares. | |
| 1 | Total return includes reinvestment of dividends and any capital gains paid. Past performance is no |
| guarantee of future results. Share price, yield and investment return fluctuate such that upon | |
| redemption, fund shares may be worth more or less than their original cost. Return figure provided | |
| reflects the absorption of certain fund expenses by The Dreyfus Corporation pursuant to a | |
| voluntary undertaking in effect, which may be extended, terminated or modified at any time. Had | |
| these expenses not been absorbed, the fund’s return would have been lower. | |
| 2 | SOURCE: LIPPER INC. — Reflects reinvestment of dividends and, where applicable, capital |
| gain distributions.The Barclays Capital U.S.Aggregate Bond (Hedged) Index is a widely accepted, | |
| unmanaged total return index of corporate, U.S. government and U.S. government agency debt | |
| instruments, mortgage-backed securities and asset-backed securities with an average maturity of 1- | |
| 10 years.The Index does not include fees and expenses to which the fund is subject. | |
The Fund 5
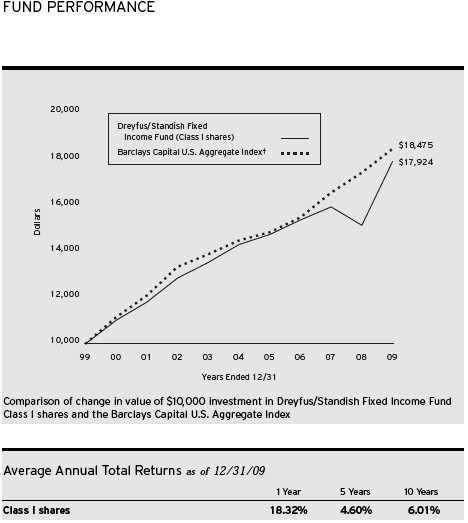
† Source: Lipper Inc.
Past performance is not predictive of future performance.The fund’s performance shown in the graph and table does not reflect the deduction of taxes that a shareholder would pay on fund distributions or the redemption of fund shares.
The above graph compares a $10,000 investment made in Class I shares of Dreyfus/Standish Fixed Income Fund on 12/31/99 to a $10,000 investment made in the Barclays Capital U.S. Aggregate Index (the “Index”) on that date. All dividends and capital gain distributions are reinvested.
Effective September 1, 2009, the single class shares of Dreyfus/Standish Fixed Income Fund were re-designated as Class I shares.
The fund’s performance shown in the line graph takes into account all applicable fees and expenses.The Index is a widely accepted, unmanaged total return index of corporate, U.S. government and U.S. government agency debt instruments, mortgage-backed securities and asset-backed securities with an average of maturity of 1-10 years. Unlike a mutual fund, the Index is not subject to charges, fees and other expenses. Investors cannot invest directly in any index. These factors can contribute to the Index potentially outperforming the fund. Further information relating to fund performance, including expense reimbursements, if applicable, is contained in the Financial Highlights section of the prospectus and elsewhere in this report.
6
UNDERSTANDING YOUR FUND’S EXPENSES (Unaudited)
As a mutual fund investor, you pay ongoing expenses, such as management fees and other expenses. Using the information below, you can estimate how these expenses affect your investment and compare them with the expenses of other funds.You also may pay one-time transaction expenses, including sales charges (loads) and redemption fees, which are not shown in this section and would have resulted in higher total expenses. For more information, see your fund’s prospectus or talk to your financial adviser.
Review your fund’s expenses
The table below shows the expenses you would have paid on a $1,000 investment in Dreyfus/Standish Fixed Income Fund from July 1, 2009 to December 31, 2009. It also shows how much a $1,000 investment would be worth at the close of the period, assuming actual returns and expenses.
| Expenses and Value of a $1,000 Investment | |
| assuming actual returns for the six months ended December 31, 2009† | |
| Expenses paid per $1,000†† | $ 2.70 |
| Ending value (after expenses) | $1,098.40 |
| COMPARING YOUR FUND’S EXPENSES |
| WITH THOSE OF OTHER FUNDS (Unaudited) |
Using the SEC’s method to compare expenses
The Securities and Exchange Commission (SEC) has established guidelines to help investors assess fund expenses. Per these guidelines, the table below shows your fund’s expenses based on a $1,000 investment, assuming a hypothetical 5% annualized return. You can use this information to compare the ongoing expenses (but not transaction expenses or total cost) of investing in the fund with those of other funds.All mutual fund shareholder reports will provide this information to help you make this comparison. Please note that you cannot use this information to estimate your actual ending account balance and expenses paid during the period.
| Expenses and Value of a $1,000 Investment | |
| assuming a hypothetical 5% annualized return for the six months ended December 31, 2009† | |
| Expenses paid per $1,000†† | $ 2.60 |
| Ending value (after expenses) | $1,022.63 |
† Effective September 1, 2009, the fund’s shares were redesignated as Class I shares.
Expenses are equal to the fund’s annualized expense ratio of .51% for Class I, multiplied by the average account value over the period, multiplied by 184/365 (to reflect the one-half year period).
The Fund 7
STATEMENT OF INVESTMENTS
December 31, 2009
| Coupon | Maturity | Principal | |||
| Bonds and Notes—110.3% | Rate (%) | Date | Amount ($) | Value ($) | |
| Advertising—.2% | |||||
| Lamar Media, | |||||
| Gtd. Notes | 6.63 | 8/15/15 | 408,000 | 397,800 | |
| Aerospace & Defense—.1% | |||||
| L-3 Communications, | |||||
| Gtd. Notes, Ser. B | 6.38 | 10/15/15 | 300,000 | 302,625 | |
| Agriculture—.9% | |||||
| Altria Group, | |||||
| Gtd. Notes | 9.70 | 11/10/18 | 945,000 | 1,170,003 | |
| Philip Morris International, | |||||
| Sr. Unscd. Notes | 5.65 | 5/16/18 | 890,000 | 937,466 | |
| 2,107,469 | |||||
| Asset-Backed Ctfs./ | |||||
| Auto Receivables—3.6% | |||||
| Americredit Automobile Receivables | |||||
| Trust, Ser. 2008-AF, Cl. A2A | 4.47 | 1/12/12 | 452,978 | a | 455,936 |
| Americredit Prime Automobile | |||||
| Receivables, Ser. 2007-2M, Cl. A3 | 5.22 | 6/8/12 | 1,251,979 | 1,271,068 | |
| Americredit Prime Automobile | |||||
| Receivables, Ser. 2007-1, Cl. E | 6.96 | 3/8/16 | 894,110 | b | 744,931 |
| Capital Auto Receivables Asset | |||||
| Trust, Ser. 2007-SN2, Cl. A4 | 1.26 | 5/16/11 | 1,210,000 | b,c | 1,212,415 |
| Capital One Auto Finance Trust, | |||||
| Ser. 2007-C, Cl. A3A | 5.13 | 4/16/12 | 1,279,518 | 1,304,420 | |
| Ford Credit Auto Owner Trust, | |||||
| Ser. 2006-C, Cl. C | 5.47 | 9/15/12 | 490,000 | 514,731 | |
| Ford Credit Auto Owner Trust, | |||||
| Ser. 2007-A, Cl. D | 7.05 | 12/15/13 | 600,000 | b | 628,292 |
| Hyundai Auto Receivables Trust, | |||||
| Ser. 2006-B, Cl. D | 5.41 | 5/15/13 | 82,915 | 82,374 | |
| JPMorgan Auto Receivables Trust, | |||||
| Ser. 2008-A, Cl. D | 5.22 | 1/15/11 | 666,396 | b | 660,874 |
| Wachovia Auto Loan Owner Trust, | |||||
| Ser. 2007-1, Cl. C | 5.45 | 10/22/12 | 300,000 | 306,209 | |
| Wachovia Auto Loan Owner Trust, | |||||
| Ser. 2007-1, Cl. D | 5.65 | 2/20/13 | 1,725,000 | 1,744,366 | |
| 8,925,616 |
8
| Coupon | Maturity | Principal | |||
| Bonds and Notes (continued) | Rate (%) | Date | Amount ($) | Value ($) | |
| Asset-Backed Ctfs./ | |||||
| Credit Cards—1.0% | |||||
| Bank of America Credit Card Trust, | |||||
| Ser. 2007-B4, Cl. B4 | 0.32 | 9/15/12 | 1,000,000 | c | 995,836 |
| Citibank Credit Card Issuance | |||||
| Trust, Ser. 2006-C4, Cl. C4 | 0.45 | 1/9/12 | 600,000 | a,c | 599,854 |
| Washington Mutual Master Note | |||||
| Trust, Ser. 2007-B1, Cl. B1 | 4.95 | 3/17/14 | 785,000 | b | 791,794 |
| 2,387,484 | |||||
| Asset-Backed Ctfs./ | |||||
| Home Equity Loans—1.7% | |||||
| Bayview Financial Acquisition | |||||
| Trust, Ser. 2005-B, Cl. 1A6 | 5.21 | 4/28/39 | 148,607 | c | 139,273 |
| Carrington Mortgage Loan Trust, | |||||
| Ser. 2005-NC5, Cl. A2 | 0.55 | 10/25/35 | 553,797 | c | 509,560 |
| Citigroup Mortgage Loan Trust, | |||||
| Ser. 2005-HE1, Cl. M1 | 0.66 | 5/25/35 | 281,685 | a,c | 274,875 |
| Citigroup Mortgage Loan Trust, | |||||
| Ser. 2005-WF1, Cl. A5 | 5.01 | 2/25/35 | 131,560 | c | 111,479 |
| Citigroup Mortgage Loan Trust, | |||||
| Ser. 2005-WF2, Cl. AF7 | 5.25 | 8/25/35 | 1,668,209 | c | 1,256,842 |
| First Franklin Mortgage Loan Asset | |||||
| Backed Certificates, | |||||
| Ser. 2005-FF2, Cl. M1 | 0.63 | 3/25/35 | 487,857 | c | 468,470 |
| Home Equity Asset Trust, | |||||
| Ser. 2005-2, Cl. M1 | 0.68 | 7/25/35 | 221,641 | c | 214,663 |
| Mastr Asset Backed Securities | |||||
| Trust, Ser. 2006-AM1, Cl. A2 | 0.36 | 1/25/36 | 188,039 | a,c | 181,070 |
| Morgan Stanley Capital, | |||||
| Ser. 2004-NC1, Cl. M2 | 1.78 | 12/27/33 | 336,620 | c | 258,265 |
| Option One Mortgage Loan Trust, | |||||
| Ser. 2004-2, Cl. M2 | 1.28 | 5/25/34 | 188,065 | c | 144,739 |
| Securitized Asset Backed | |||||
| Receivables, Ser. 2004-OP2, Cl. M2 | 1.28 | 8/25/34 | 817,246 | c | 564,377 |
| Terwin Mortgage Trust, | |||||
| Ser. 2006-9HGA, Cl. A1 | 0.31 | 10/25/37 | 46,698 | a,b,c | 46,721 |
| 4,170,334 |
The Fund 9
STATEMENT OF INVESTMENTS (continued)
| Coupon | Maturity | Principal | |||
| Bonds and Notes (continued) | Rate (%) | Date | Amount ($) | Value ($) | |
| Asset-Backed Ctfs./ | |||||
| Manufactured Housing—.4% | |||||
| Green Tree Financial, | |||||
| Ser. 1994-7, Cl. M1 | 9.25 | 3/15/20 | 122,499 | a | 122,767 |
| Vanderbilt Mortgage Finance, | |||||
| Ser. 1999-A, Cl. 1A6 | 6.75 | 3/7/29 | 1,030,000 | c | 964,724 |
| 1,087,491 | |||||
| Auto Parts & Equipment—.3% | |||||
| Goodyear Tire & Rubber, | |||||
| Gtd. Notes | 8.63 | 12/1/11 | 720,000 | d | 750,600 |
| Banks—6.4% | |||||
| American Express, | |||||
| Sr. Unscd. Notes | 7.25 | 5/20/14 | 1,090,000 | 1,231,090 | |
| American Express Credit, | |||||
| Sr. Unscd. Notes | 5.13 | 8/25/14 | 220,000 | 232,060 | |
| American Express Credit, | |||||
| Sr. Unscd. Notes, Ser. C | 7.30 | 8/20/13 | 260,000 | 292,444 | |
| Barclays Bank, | |||||
| Sr. Unscd. Notes, Ser. 1 | 5.00 | 9/22/16 | 160,000 | 163,722 | |
| Barclays Bank, | |||||
| Sub. Notes | 10.18 | 6/12/21 | 500,000 | b | 646,518 |
| Capital One Bank USA, | |||||
| Sub. Notes | 8.80 | 7/15/19 | 450,000 | 532,640 | |
| Citigroup, | |||||
| Sr. Unscd. Notes | 5.50 | 4/11/13 | 1,655,000 | 1,717,124 | |
| Citigroup, | |||||
| Unscd. Notes | 8.50 | 5/22/19 | 650,000 | 751,839 | |
| Countrywide Home Loans, | |||||
| Gtd. Notes, Ser. L | 4.00 | 3/22/11 | 590,000 | 602,740 | |
| Goldman Sachs Group, | |||||
| Sub. Notes | 5.63 | 1/15/17 | 390,000 | 398,904 | |
| Goldman Sachs Group, | |||||
| Sub. Notes | 6.75 | 10/1/37 | 860,000 | 886,788 | |
| JPMorgan Chase & Co., | |||||
| Sr. Unscd. Notes | 6.00 | 1/15/18 | 945,000 | 1,017,496 | |
| Manufacturers & | |||||
| Traders Trust, | |||||
| Sub. Notes | 5.59 | 12/28/20 | 625,000 | c | 545,793 |
| MBNA, | |||||
| Sr. Unscd. Notes | 6.13 | 3/1/13 | 435,000 | 461,821 |
10
| Coupon | Maturity | Principal | |||
| Bonds and Notes (continued) | Rate (%) | Date | Amount ($) | Value ($) | |
| Banks (continued) | |||||
| Merrill Lynch & Co., | |||||
| Sub. Notes | 5.70 | 5/2/17 | 1,970,000 | 1,933,787 | |
| Morgan Stanley, | |||||
| Sr. Unscd. Notes | 6.60 | 4/1/12 | 805,000 | 876,295 | |
| NB Capital Trust IV, | |||||
| Bank Gtd. Cap. Secs. | 8.25 | 4/15/27 | 265,000 | 264,338 | |
| PNC Funding, | |||||
| Bank Gtd. Notes | 6.70 | 6/10/19 | 620,000 | 694,998 | |
| Sovereign Bancorp, | |||||
| Sr. Unscd. Notes | 4.80 | 9/1/10 | 577,000 | a | 589,228 |
| Wells Fargo Capital XIII, | |||||
| Gtd. Bonds | 7.70 | 12/29/49 | 2,005,000 | c | 1,954,875 |
| 15,794,500 | |||||
| Beverages—1.1% | |||||
| Anheuser-Busch InBev Worldwide, | |||||
| Gtd. Notes | 8.20 | 1/15/39 | 1,385,000 | b | 1,756,921 |
| Diageo Capital, | |||||
| Gtd. Notes | 7.38 | 1/15/14 | 710,000 | 822,064 | |
| 2,578,985 | |||||
| Chemicals—.5% | |||||
| Dow Chemical, | |||||
| Sr. Unscd. Notes | 8.55 | 5/15/19 | 595,000 | 711,110 | |
| Lubrizol, | |||||
| Sr. Unscd. Notes | 8.88 | 2/1/19 | 485,000 | 603,980 | |
| 1,315,090 | |||||
| Commercial & Professional | |||||
| Services—1.1% | |||||
| Aramark, | |||||
| Gtd. Notes | 8.50 | 2/1/15 | 712,000 | 736,920 | |
| ERAC USA Finance, | |||||
| Gtd. Notes | 6.38 | 10/15/17 | 1,425,000 | b | 1,441,533 |
| Iron Mountain, | |||||
| Sr. Sub. Notes | 8.38 | 8/15/21 | 600,000 | 622,500 | |
| 2,800,953 | |||||
| Commercial Mortgage | |||||
| Pass-Through Ctfs.—11.3% | |||||
| Bayview Commercial Asset Trust, | |||||
| Ser. 2006-SP1, Cl. A1 | 0.50 | 4/25/36 | 128,477 | b,c | 111,509 |
The Fund 11
STATEMENT OF INVESTMENTS (continued)
| Coupon | Maturity | Principal | |||
| Bonds and Notes (continued) | Rate (%) | Date | Amount ($) | Value ($) | |
| Commercial Mortgage | |||||
| Pass-Through Ctfs. (continued) | |||||
| Bayview Commercial Asset Trust, | |||||
| Ser. 2006-SP2, Cl. A | 0.51 | 1/25/37 | 948,604 | b,c | 506,972 |
| Bayview Commercial Asset Trust, | |||||
| Ser. 2004-1, Cl. A | 0.59 | 4/25/34 | 250,872 | b,c | 181,750 |
| Bayview Commercial Asset Trust, | |||||
| Ser. 2005-3A, Cl. B1 | 1.33 | 11/25/35 | 105,421 | b,c | 37,196 |
| Bayview Commercial Asset Trust, | |||||
| Ser. 2006-2A, Cl. B2 | 1.70 | 7/25/36 | 313,839 | b,c | 108,686 |
| Bayview Commercial Asset Trust, | |||||
| Ser. 2006-1A, Cl. B2 | 1.93 | 4/25/36 | 159,812 | b,c | 56,646 |
| Bayview Commercial Asset Trust, | |||||
| Ser. 2005-3A, Cl. B3 | 3.23 | 11/25/35 | 210,903 | b,c | 68,998 |
| Bayview Commercial Asset Trust, | |||||
| Ser. 2005-4A, Cl. B3 | 3.73 | 1/25/36 | 70,818 | b,c | 16,362 |
| Bear Stearns Commercial Mortgage | |||||
| Securities, Ser. 2003-T12, Cl. A3 | 4.24 | 8/13/39 | 1,771,107 | a,c | 1,775,907 |
| Bear Stearns Commercial Mortgage | |||||
| Securities, Ser. 2007-T26, Cl. A4 | 5.47 | 1/12/45 | 1,015,000 | c | 962,581 |
| Bear Stearns Commercial Mortgage | |||||
| Securities, Ser. 2006-PW12, | |||||
| Cl. AAB | 5.69 | 9/11/38 | 875,000 | c | 897,983 |
| Bear Stearns Commercial Mortgage | |||||
| Securities, Ser. 2007-T28, Cl. A4 | 5.74 | 9/11/42 | 1,275,000 | c | 1,230,490 |
| Bear Stearns Commercial Mortgage | |||||
| Securities, Ser. 1998-C1, Cl. A2 | 6.44 | 6/16/30 | 891 | a | 890 |
| Credit Suisse/Morgan Stanley | |||||
| Commercial Mortgage Certificates, | |||||
| Ser. 2006-HC1A, Cl. A1 | 0.42 | 5/15/23 | 955,393 | a,b,c | 841,200 |
| Crown Castle Towers, | |||||
| Ser. 2006-1A, Cl. AFX | 5.24 | 11/15/36 | 2,725,000 | a,b | 2,806,750 |
| Crown Castle Towers, | |||||
| Ser. 2006-1A, Cl. B | 5.36 | 11/15/36 | 620,000 | a,b | 635,500 |
| Crown Castle Towers, | |||||
| Ser. 2006-1A, Cl. C | 5.47 | 11/15/36 | 1,555,000 | a,b | 1,589,988 |
| Crown Castle Towers, | |||||
| Ser. 2005-1A, Cl. D | 5.61 | 6/15/35 | 610,000 | b | 616,100 |
| Crown Castle Towers, | |||||
| Ser. 2006-1A, Cl. D | 5.77 | 11/15/36 | 950,000 | b | 971,375 |
12
| Coupon | Maturity | Principal | |||
| Bonds and Notes (continued) | Rate (%) | Date | Amount ($) | Value ($) | |
| Commercial Mortgage | |||||
| Pass-Through Ctfs. (continued) | |||||
| CS First Boston Mortgage | |||||
| Securities, Ser. 2004-C3, Cl. A3 | 4.30 | 7/15/36 | 228,264 | 228,741 | |
| CS First Boston Mortgage | |||||
| Securities, Ser. 2005-C4, Cl. AAB | 5.07 | 8/15/38 | 1,050,000 | c | 1,065,596 |
| First Union National Bank | |||||
| Commercial Mortgage, | |||||
| Ser. 2001-C2, Cl. A2 | 6.66 | 1/12/43 | 494,390 | a | 512,541 |
| Goldman Sachs Mortgage Securities | |||||
| Corporation II, Ser. 2007-EOP, Cl. B | 0.48 | 3/6/20 | 2,965,000 | a,b,c | 2,593,610 |
| Goldman Sachs Mortgage Securities | |||||
| Corporation II, Ser. 2007-EOP, Cl. E | 0.67 | 3/6/20 | 1,120,000 | a,b,c | 956,653 |
| Goldman Sachs Mortgage Securities | |||||
| Corporation II, Ser. 2007-EOP, Cl. K | 1.28 | 3/6/20 | 650,000 | b,c | 529,134 |
| JP Morgan Chase Commercial | |||||
| Mortgage Securities, | |||||
| Ser. 2003-CB7, Cl. A3 | 4.45 | 1/12/38 | 750,000 | 755,334 | |
| JP Morgan Chase Commercial | |||||
| Mortgage Securities, | |||||
| Ser. 2005-LDP5, Cl. A2 | 5.20 | 12/15/44 | 1,485,000 | a | 1,496,530 |
| JPMorgan Chase Commercial | |||||
| Mortgage Securities, | |||||
| Ser. 2009-IWST, Cl. B | 7.15 | 12/5/27 | 225,000 | b | 220,326 |
| JPMorgan Chase Commercial | |||||
| Mortgage Securities, | |||||
| Ser. 2009-IWST, Cl. C | 7.44 | 12/5/27 | 825,000 | b,c | 798,210 |
| LB-UBS Commercial Mortgage Trust, | |||||
| Ser. 2004-C7, Cl. A2 | 3.99 | 10/15/29 | 175,749 | 175,749 | |
| Merrill Lynch Mortgage Trust, | |||||
| Ser. 2005-LC1, Cl. A2 | 5.20 | 1/12/44 | 675,892 | c | 688,542 |
| Merrill Lynch Mortgage Trust, | |||||
| Ser. 2005-CKI1, Cl. A2 | 5.38 | 11/12/37 | 350,000 | a,c | 353,252 |
| Merrill Lynch/Countrywide | |||||
| Commercial Mortgage Trust, | |||||
| Ser. 2006-2, Cl. A4 | 6.10 | 6/12/46 | 1,110,000 | c | 1,091,804 |
| Morgan Stanley Capital I, | |||||
| Ser. 2005-HQ5, Cl. A2 | 4.81 | 1/14/42 | 174,557 | a | 174,503 |
| Morgan Stanley Capital I, | |||||
| Ser. 2007-T27, Cl. A4 | 5.80 | 6/11/42 | 760,000 | c | 735,249 |
The Fund 13
STATEMENT OF INVESTMENTS (continued)
| Coupon | Maturity | Principal | |||
| Bonds and Notes (continued) | Rate (%) | Date | Amount ($) | Value ($) | |
| Commercial Mortgage | |||||
| Pass-Through Ctfs. (continued) | |||||
| Morgan Stanley Dean Witter Capital | |||||
| I, Ser. 2001-PPM, Cl. A2 | 6.40 | 2/15/31 | 7,637 | a | 7,863 |
| Morgan Stanley Dean Witter Capital | |||||
| I, Ser. 2001-PPM, Cl. A3 | 6.54 | 2/15/31 | 9,328 | a | 9,639 |
| SBA CMBS Trust, | |||||
| Ser. 2006-1A, Cl. D | 5.85 | 11/15/36 | 375,000 | b | 382,500 |
| TIAA Seasoned Commercial | |||||
| Mortgage Trust, | |||||
| Ser. 2007-C4, Cl. A3 | 6.07 | 8/15/39 | 940,000 | c | 975,845 |
| Wachovia Bank Commercial Mortgage | |||||
| Trust, Ser. 2005-C16, Cl. A2 | 4.38 | 10/15/41 | 309,806 | a | 312,697 |
| 27,481,201 | |||||
| Diversified Financial Services—5.7% | |||||
| Ameriprise Financial, | |||||
| Jr. Sub. Notes | 7.52 | 6/1/66 | 610,000 | c,d | 541,375 |
| BSKYB Finance UK, | |||||
| Gtd. Notes | 6.50 | 10/15/35 | 825,000 | b | 844,092 |
| Caterpillar Financial Services, | |||||
| Sr. Unscd. Notes | 7.15 | 2/15/19 | 855,000 | 990,406 | |
| Discover Financial Services, | |||||
| Sr. Unscd. Notes | 10.25 | 7/15/19 | 1,050,000 | 1,229,778 | |
| Ford Motor Credit, | |||||
| Sr. Unscd. Notes | 8.00 | 12/15/16 | 1,195,000 | 1,198,160 | |
| Fresenius US Finance II, | |||||
| Gtd. Notes | 9.00 | 7/15/15 | 775,000 | b | 856,375 |
| General Electric Capital, | |||||
| Sr. Unscd. Notes | 0.38 | 10/21/10 | 825,000 | a,c,d | 825,780 |
| General Electric Capital, | |||||
| Sr. Unscd. Notes | 4.38 | 9/21/15 | 850,000 | 861,650 | |
| Harley-Davidson Funding, | |||||
| Gtd. Notes | 5.75 | 12/15/14 | 1,145,000 | b | 1,163,722 |
| Hutchison Whampoa International, | |||||
| Gtd. Notes | 5.75 | 9/11/19 | 695,000 | b | 707,167 |
| Hutchison Whampoa International, | |||||
| Gtd. Notes | 7.63 | 4/9/19 | 305,000 | b | 351,662 |
| Invesco, | |||||
| Gtd. Notes | 5.38 | 2/27/13 | 595,000 | 605,970 |
14
| Coupon | Maturity | Principal | |||
| Bonds and Notes (continued) | Rate (%) | Date | Amount ($) | Value ($) | |
| Diversified Financial | |||||
| Services (continued) | |||||
| Jefferies Group, | |||||
| Sr. Unscd. Notes | 7.75 | 3/15/12 | 633,000 | 685,011 | |
| Leucadia National, | |||||
| Sr. Unscd. Notes | 7.00 | 8/15/13 | 420,000 | 423,675 | |
| Leucadia National, | |||||
| Sr. Unscd. Notes | 7.13 | 3/15/17 | 950,000 | 902,500 | |
| Pearson Dollar Finance Two, | |||||
| Gtd. Notes | 6.25 | 5/6/18 | 1,240,000 | b | 1,304,096 |
| Reynolds Group Escrow, | |||||
| Sr. Scd. Notes | 7.75 | 10/15/16 | 520,000 | b | 534,300 |
| 14,025,719 | |||||
| Electric Utilities—2.7% | |||||
| AES, | |||||
| Sr. Unscd. Notes | 7.75 | 10/15/15 | 1,215,000 | 1,239,300 | |
| AES, | |||||
| Sr. Unscd. Notes | 8.00 | 10/15/17 | 70,000 | 72,188 | |
| Consumers Energy, | |||||
| First Mortgage Bonds, Ser. B | 5.38 | 4/15/13 | 465,000 | 499,663 | |
| Enel Finance International, | |||||
| Gtd. Notes | 5.70 | 1/15/13 | 550,000 | b | 593,990 |
| Enel Finance International, | |||||
| Gtd. Bonds | 6.25 | 9/15/17 | 1,295,000 | b | 1,426,014 |
| FirstEnergy, | |||||
| Sr. Unscd. Notes, Ser. B | 6.45 | 11/15/11 | 49,000 | 52,564 | |
| National Grid, | |||||
| Sr. Unscd. Notes | 6.30 | 8/1/16 | 548,000 | 596,785 | |
| Nevada Power, | |||||
| Mortgage Notes | 6.50 | 8/1/18 | 775,000 | 831,842 | |
| NiSource Finance, | |||||
| Gtd. Notes | 5.25 | 9/15/17 | 760,000 | d | 748,686 |
| NRG Energy, | |||||
| Gtd. Notes | 7.38 | 1/15/17 | 650,000 | 653,250 | |
| 6,714,282 | |||||
| Environmental Control—1.1% | |||||
| Allied Waste North America, | |||||
| Gtd. Notes, Ser. B | 7.13 | 5/15/16 | 250,000 | 266,591 |
The Fund 15
STATEMENT OF INVESTMENTS (continued)
| Coupon | Maturity | Principal | |||
| Bonds and Notes (continued) | Rate (%) | Date | Amount ($) | Value ($) | |
| Environmental Control (continued) | |||||
| Allied Waste North America, | |||||
| Gtd. Notes | 7.25 | 3/15/15 | 360,000 | 376,605 | |
| Republic Services, | |||||
| Gtd. Notes | 5.50 | 9/15/19 | 515,000 | b | 523,935 |
| Veolia Environnement, | |||||
| Sr. Unscd. Notes | 5.25 | 6/3/13 | 620,000 | 656,219 | |
| Waste Management, | |||||
| Sr. Unscd. Notes | 7.00 | 7/15/28 | 596,000 | 643,606 | |
| Waste Management, | |||||
| Sr. Unscd. Notes | 7.38 | 8/1/10 | 260,000 | a | 269,363 |
| 2,736,319 | |||||
| Food & Beverages—.9% | |||||
| Kraft Foods, | |||||
| Sr. Unscd. Notes | 6.88 | 2/1/38 | 635,000 | 668,478 | |
| Stater Brothers Holdings, | |||||
| Gtd. Notes | 7.75 | 4/15/15 | 595,000 | d | 606,900 |
| Stater Brothers Holdings, | |||||
| Gtd. Notes | 8.13 | 6/15/12 | 670,000 | 680,050 | |
| SUPERVALU, | |||||
| Sr. Unscd. Bonds | 7.50 | 11/15/14 | 75,000 | 76,313 | |
| SUPERVALU, | |||||
| Sr. Unscd. Notes | 8.00 | 5/1/16 | 195,000 | 198,900 | |
| 2,230,641 | |||||
| Foreign/Governmental—1.5% | |||||
| Federal Republic of Brazil, | |||||
| Sr. Unscd. Bonds | 6.00 | 1/17/17 | 1,160,000 | 1,258,600 | |
| Province of Quebec Canada, | |||||
| Unscd. Notes | 4.60 | 5/26/15 | 585,000 | d | 619,933 |
| Republic of Italy, | |||||
| Sr. Unscd. Notes | 5.38 | 6/12/17 | 595,000 | 636,325 | |
| State of Qatar, | |||||
| Sr. Notes | 4.00 | 1/20/15 | 515,000 | b | 518,863 |
| United Mexican States, | |||||
| Sr. Unscd. Notes | 5.63 | 1/15/17 | 744,000 | 779,340 | |
| 3,813,061 | |||||
| Forest Products & Paper—.3% | |||||
| Georgia-Pacific, | |||||
| Gtd. Notes | 7.00 | 1/15/15 | 315,000 | b | 320,513 |
| Georgia-Pacific, | |||||
| Gtd. Notes | 8.25 | 5/1/16 | 485,000 | b | 516,525 |
| 837,038 |
16
| Coupon | Maturity | Principal | |||
| Bonds and Notes (continued) | Rate (%) | Date | Amount ($) | Value ($) | |
| Health Care—1.5% | |||||
| Boston Scientific, | |||||
| Sr. Notes | 6.00 | 1/15/20 | 503,000 | 514,918 | |
| Boston Scientific, | |||||
| Sr. Notes | 6.25 | 11/15/15 | 785,000 | 847,800 | |
| Boston Scientific, | |||||
| Sr. Notes | 7.38 | 1/15/40 | 180,000 | 193,995 | |
| Community | |||||
| Health Systems, | |||||
| Gtd. Notes | 8.88 | 7/15/15 | 715,000 | 741,812 | |
| Davita, | |||||
| Gtd. Notes | 6.63 | 3/15/13 | 727,000 | d | 732,452 |
| Quest Diagnostic, | |||||
| Sr. Notes | 5.75 | 1/30/40 | 600,000 | 584,330 | |
| 3,615,307 | |||||
| Insurance—2.9% | |||||
| ACE INA Holdings, | |||||
| Gtd. Notes | 5.80 | 3/15/18 | 745,000 | 794,020 | |
| Cincinnati Financial, | |||||
| Sr. Notes | 6.13 | 11/1/34 | 49,000 | 43,387 | |
| Jackson National Life | |||||
| Global Funding, | |||||
| Sr. Scd. Notes | 5.38 | 5/8/13 | 785,000 | b | 797,788 |
| Lincoln National, | |||||
| Sr. Unscd. Notes | 0.33 | 3/12/10 | 1,285,000 | a,c | 1,282,981 |
| MetLife, | |||||
| Sr. Unscd. Notes | 5.00 | 6/15/15 | 1,098,000 | 1,156,228 | |
| Nippon Life Insurance, | |||||
| Sub. Notes | 4.88 | 8/9/10 | 1,000,000 | b | 1,003,953 |
| Prudential Financial, | |||||
| Sr. Unscd. Notes | 4.75 | 9/17/15 | 970,000 | 984,814 | |
| Prudential Financial, | |||||
| Sr. Unscd. Notes | 6.63 | 12/1/37 | 175,000 | 179,962 | |
| Willis North America, | |||||
| Gtd. Notes | 6.20 | 3/28/17 | 440,000 | 436,810 | |
| Willis North America, | |||||
| Gtd. Notes | 7.00 | 9/29/19 | 390,000 | 397,816 | |
| 7,077,759 | |||||
| Manufacturing—.3% | |||||
| Bombardier, | |||||
| Sr. Unscd. Notes | 8.00 | 11/15/14 | 750,000 | b | 782,813 |
The Fund 17
STATEMENT OF INVESTMENTS (continued)
| Coupon | Maturity | Principal | |||
| Bonds and Notes (continued) | Rate (%) | Date | Amount ($) | Value ($) | |
| Media—5.2% | |||||
| Cablevision Systems, | |||||
| Sr. Unscd. Notes, Ser. B | 8.00 | 4/15/12 | 100,000 | 106,250 | |
| Clear Channel Worldwide, | |||||
| Sr. Notes | 9.25 | 12/15/17 | 15,000 | b | 15,375 |
| Clear Channel Worldwide, | |||||
| Sr. Notes | 9.25 | 12/15/17 | 470,000 | b | 486,450 |
| Cox Communications, | |||||
| Sr. Unscd. Notes | 6.25 | 6/1/18 | 575,000 | b | 613,026 |
| CSC Holdings, | |||||
| Sr. Unscd. Notes | 8.50 | 4/15/14 | 560,000 | b,d | 599,200 |
| CSC Holdings, | |||||
| Sr. Unscd. Notes | 8.63 | 2/15/19 | 430,000 | b | 464,938 |
| DirecTV Holdings, | |||||
| Gtd. Notes | 5.88 | 10/1/19 | 220,000 | b | 224,174 |
| DirecTV Holdings, | |||||
| Gtd. Notes | 7.63 | 5/15/16 | 610,000 | 667,276 | |
| Discovery Communications, | |||||
| Gtd. Notes | 5.63 | 8/15/19 | 255,000 | 263,782 | |
| Dish DBS, | |||||
| Gtd. Notes | 7.75 | 5/31/15 | 900,000 | 947,250 | |
| News America, | |||||
| Gtd. Notes | 6.15 | 3/1/37 | 720,000 | 718,669 | |
| News America, | |||||
| Gtd. Notes | 6.65 | 11/15/37 | 515,000 | 545,770 | |
| News America Holdings, | |||||
| Gtd. Debs | 7.70 | 10/30/25 | 945,000 | 989,282 | |
| Reed Elsevier Capital, | |||||
| Gtd. Notes | 4.63 | 6/15/12 | 1,070,000 | 1,112,879 | |
| TCI Communications, | |||||
| Sr. Unscd. Bonds | 7.88 | 2/15/26 | 765,000 | 859,554 | |
| Time Warner, | |||||
| Gtd. Notes | 5.88 | 11/15/16 | 1,960,000 | 2,118,834 | |
| Time Warner Cable, | |||||
| Gtd. Notes | 5.85 | 5/1/17 | 955,000 | 1,004,886 | |
| Time Warner Cable, | |||||
| Gtd. Notes | 6.75 | 7/1/18 | 865,000 | 951,809 | |
| 12,689,404 |
18
| Coupon | Maturity | Principal | ||
| Bonds and Notes (continued) | Rate (%) | Date | Amount ($) | Value ($) |
| Mining—1.2% | ||||
| BHP Billiton Finance USA, | ||||
| Gtd. Notes | 6.50 | 4/1/19 | 335,000 | 384,946 |
| Freeport-McMoRan Copper & Gold, | ||||
| Sr. Unscd. Notes | 8.38 | 4/1/17 | 590,000 | 646,936 |
| Rio Tinto Finance USA, | ||||
| Gtd. Notes | 5.88 | 7/15/13 | 645,000 | 696,535 |
| Teck Resources, | ||||
| Sr. Scd. Notes | 10.25 | 5/15/16 | 505,000 | 590,850 |
| Teck Resources, | ||||
| Sr. Scd. Notes | 10.75 | 5/15/19 | 495,000 | 594,000 |
| 2,913,267 | ||||
| Office And Business Equipment—.2% | ||||
| Xerox, | ||||
| Sr. Unscd. Notes | 5.50 | 5/15/12 | 235,000 | 248,491 |
| Xerox, | ||||
| Sr. Unscd. Notes | 5.65 | 5/15/13 | 335,000 | 349,323 |
| 597,814 | ||||
| Oil & Gas—3.1% | ||||
| Anadarko Petroleum, | ||||
| Sr. Unscd. Notes | 8.70 | 3/15/19 | 565,000 | 703,982 |
| Chesapeake Energy, | ||||
| Gtd. Notes | 7.50 | 6/15/14 | 255,000 | 261,375 |
| Chesapeake Energy, | ||||
| Gtd. Notes | 9.50 | 2/15/15 | 1,565,000 | 1,725,413 |
| EQT, | ||||
| Sr. Unscd. Notes | 8.13 | 6/1/19 | 240,000 | 277,758 |
| Husky Energy, | ||||
| Sr. Unscd. Notes | 7.25 | 12/15/19 | 585,000 | 677,256 |
| Marathon Oil, | ||||
| Sr. Unscd. Notes | 7.50 | 2/15/19 | 370,000 | 427,746 |
| Newfield Exploration, | ||||
| Sr. Sub. Notes | 7.13 | 5/15/18 | 165,000 | 167,475 |
| Petro-Canada, | ||||
| Sr. Unscd. Notes | 6.80 | 5/15/38 | 680,000 | 752,046 |
| Petrohawk Energy, | ||||
| Gtd. Notes | 7.88 | 6/1/15 | 80,000 | 81,200 |
The Fund 19
STATEMENT OF INVESTMENTS (continued)
| Coupon | Maturity | Principal | |||
| Bonds and Notes (continued) | Rate (%) | Date | Amount ($) | Value ($) | |
| Oil & Gas (continued) | |||||
| Petrohawk Energy, | |||||
| Gtd. Notes | 9.13 | 7/15/13 | 80,000 | 84,000 | |
| Petrohawk Energy, | |||||
| Gtd. Notes | 10.50 | 8/1/14 | 385,000 | 422,538 | |
| Range Resouces, | |||||
| Gtd. Notes | 8.00 | 5/15/19 | 895,000 | 962,125 | |
| Sempra Energy, | |||||
| Sr. Unscd. Notes | 6.50 | 6/1/16 | 565,000 | 613,554 | |
| Valero Energy, | |||||
| Gtd. Notes | 9.38 | 3/15/19 | 320,000 | 381,218 | |
| 7,537,686 | |||||
| Packaging & Containers—.4% | |||||
| Crown Americas, | |||||
| Gtd. Notes | 7.63 | 11/15/13 | 288,000 | d | 298,800 |
| Owens-Brockway Glass Container, | |||||
| Gtd. Notes | 6.75 | 12/1/14 | 650,000 | 667,875 | |
| Owens-Brockway Glass Container, | |||||
| Gtd. Notes | 7.38 | 5/15/16 | 100,000 | d | 103,750 |
| 1,070,425 | |||||
| Pipelines—1.2% | |||||
| ANR Pipeline, | |||||
| Sr. Unscd. Notes | 7.00 | 6/1/25 | 10,000 | 10,565 | |
| El Paso, | |||||
| Sr. Unscd. Notes | 7.00 | 6/15/17 | 400,000 | 398,717 | |
| El Paso, | |||||
| Sr. Unscd. Notes | 8.25 | 2/15/16 | 760,000 | 815,100 | |
| Kinder Morgan | |||||
| Energy Partners, | |||||
| Sr. Unscd. Notes | 6.85 | 2/15/20 | 895,000 | 994,643 | |
| Plains All American Pipeline, | |||||
| Gtd. Notes | 5.75 | 1/15/20 | 610,000 | 611,607 | |
| 2,830,632 | |||||
| Racetracks—.2% | |||||
| Penn National Gaming, | |||||
| Sr. Sub. Notes | 8.75 | 8/15/19 | 575,000 | b | 590,813 |
| Real Estate—3.2% | |||||
| Boston Properties, | |||||
| Sr. Unscd. Notes | 5.63 | 4/15/15 | 645,000 | 664,693 | |
| Federal Realty Investment Trust, | |||||
| Sr. Unscd. Bonds | 5.65 | 6/1/16 | 375,000 | 361,935 |
20
| Coupon | Maturity | Principal | |||
| Bonds and Notes (continued) | Rate (%) | Date | Amount ($) | Value ($) | |
| Real Estate (continued) | |||||
| Federal Realty Investment Trust, | |||||
| Sr. Unscd. Notes | 6.00 | 7/15/12 | 380,000 | 396,741 | |
| Healthcare Realty Trust, | |||||
| Sr. Unscd. Notes | 5.13 | 4/1/14 | 230,000 | 222,131 | |
| Healthcare Realty Trust, | |||||
| Sr. Unscd. Notes | 8.13 | 5/1/11 | 575,000 | 604,244 | |
| HRPT Properties Trust, | |||||
| Sr. Unscd. Notes | 0.85 | 3/16/11 | 541,000 | a,c | 502,591 |
| Liberty Property, | |||||
| Sr. Unscd. Notes | 5.50 | 12/15/16 | 290,000 | 268,091 | |
| Mack-Cali Realty, | |||||
| Sr. Unscd. Notes | 5.05 | 4/15/10 | 485,000 | a | 487,945 |
| Mack-Cali Realty, | |||||
| Sr. Unscd. Notes | 5.13 | 1/15/15 | 196,000 | 187,536 | |
| Mack-Cali Realty, | |||||
| Sr. Unscd. Notes | 5.25 | 1/15/12 | 340,000 | 348,168 | |
| National Retail Properties, | |||||
| Sr. Unscd. Notes | 6.15 | 12/15/15 | 565,000 | 554,818 | |
| Prologis, | |||||
| Sr. Unscd. Notes | 6.63 | 5/15/18 | 560,000 | 531,921 | |
| Regency Centers, | |||||
| Gtd. Notes | 5.25 | 8/1/15 | 187,000 | 179,258 | |
| Regency Centers, | |||||
| Gtd. Notes | 5.88 | 6/15/17 | 330,000 | 305,829 | |
| Simon Property Group, | |||||
| Sr. Unscd. Notes | 5.00 | 3/1/12 | 742,000 | 767,331 | |
| Simon Property Group, | |||||
| Sr. Unscd. Notes | 5.75 | 5/1/12 | 236,000 | 248,052 | |
| WEA Finance, | |||||
| Sr. Notes | 7.13 | 4/15/18 | 895,000 | b | 980,082 |
| WEA Finance, | |||||
| Gtd. Notes | 7.50 | 6/2/14 | 245,000 | b | 275,959 |
| 7,887,325 | |||||
| Residential Mortgage | |||||
| Pass-Through Ctfs.—.2% | |||||
| Impac Secured Assets CMN Owner | |||||
| Trust, Ser. 2006-1, Cl. 2A1 | 0.58 | 5/25/36 | 552,361 | a,c | 424,071 |
| Structured Asset Mortgage | |||||
| Investments, Ser. 1998-2, Cl. B | 5.48 | 4/30/30 | 24,668 | a,c | 17,017 |
| 441,088 |
The Fund 21
STATEMENT OF INVESTMENTS (continued)
| Coupon | Maturity | Principal | |||
| Bonds and Notes (continued) | Rate (%) | Date | Amount ($) | Value ($) | |
| Retail—.9% | |||||
| Autozone, | |||||
| Sr. Unscd. Notes | 5.75 | 1/15/15 | 560,000 | 607,984 | |
| CVS Pass-Through Trust, | |||||
| Pass Thru Certificates | 8.35 | 7/10/31 | 486,668 | b | 536,853 |
| Home Depot, | |||||
| Sr. Unscd. Notes | 5.88 | 12/16/36 | 499,000 | 483,258 | |
| Staples, | |||||
| Gtd. Notes | 9.75 | 1/15/14 | 570,000 | 695,112 | |
| 2,323,207 | |||||
| State/Territory | |||||
| General Obligations—2.3% | |||||
| Erie Tobacco Asset | |||||
| Securitization Corporation, | |||||
| Tobacco Settlement | |||||
| Asset-Backed Bonds | 6.00 | 6/1/28 | 835,000 | 692,908 | |
| Michigan Tobacco Settlement | |||||
| Finance Authority, | |||||
| Tobacco Settlement | |||||
| Asset-Backed Bonds | 7.31 | 6/1/34 | 1,690,000 | 1,352,456 | |
| State of California | |||||
| Build America Taxable | |||||
| Various Purpose, Bonds | 7.55 | 4/1/39 | 1,205,000 | 1,168,934 | |
| Tobacco Settlement Authority of | |||||
| Iowa, Tobacco Settlement | |||||
| Asset-Backed Bonds | 6.50 | 6/1/23 | 2,753,000 | 2,321,880 | |
| 5,536,178 | |||||
| Steel—.3% | |||||
| Arcelormittal, | |||||
| Sr. Unscd. Notes | 9.85 | 6/1/19 | 585,000 | 757,882 | |
| Telecommunications—2.6% | |||||
| AT & T, | |||||
| Sr. Unscd. Notes | 5.60 | 5/15/18 | 1,465,000 | 1,537,822 | |
| CC Holdings, | |||||
| Sr. Scd. Notes | 7.75 | 5/1/17 | 1,180,000 | b | 1,262,600 |
| Cellco Partnership, | |||||
| Sr. Unscd. Notes | 5.55 | 2/1/14 | 1,420,000 | 1,542,503 | |
| Telecom Italia Capital, | |||||
| Gtd. Notes | 5.25 | 11/15/13 | 630,000 | 663,206 | |
| Telecom Italia Capital, | |||||
| Gtd. Notes | 7.72 | 6/4/38 | 305,000 | 352,253 |
22
| Coupon | Maturity | Principal | |||
| Bonds and Notes (continued) | Rate (%) | Date | Amount ($) | Value ($) | |
| Telecommunications (continued) | |||||
| Verizon Communications, | |||||
| Sr. Unscd. Notes | 7.35 | 4/1/39 | 605,000 | 704,164 | |
| Wind Acquisition Finance, | |||||
| Sr. Notes | 11.75 | 7/15/17 | 370,000 | b | 406,075 |
| 6,468,623 | |||||
| Textiles—.4% | |||||
| Mohawk Industries, | |||||
| Sr. Unscd. Notes | 6.25 | 1/15/11 | 970,000 | 999,100 | |
| Transportation—.1% | |||||
| Norfolk Southern, | |||||
| Sr. Unscd. Notes | 5.75 | 4/1/18 | 145,000 | 153,636 | |
| U.S. Government Agencies—.4% | |||||
| Federal National Mortgage | |||||
| Association, Bonds, Ser. 1 | 4.75 | 11/19/12 | 853,000 | d,e | 924,077 |
| U.S. Government Agencies/ | |||||
| Mortgage-Backed—32.8% | |||||
| Federal Home Loan Mortgage Corp.: | |||||
| 3.50%, 9/1/10 | 168,254 e | 169,485 | |||
| 4.50%, 4/1/10 | 13,522 e | 13,650 | |||
| 5.50%, 1/1/34—7/1/38 | 1,078,152 e | 1,132,945 | |||
| 6.00%, 6/1/22—11/1/37 | 310,154 e | 330,306 | |||
| 7.00%, 11/1/31 | 169,480 e | 186,642 | |||
| Federal National Mortgage Association: | |||||
| 4.50% | 6,650,000 e,f | 6,639,613 | |||
| 5.00% | 24,820,000 e,f | 25,510,188 | |||
| 5.50% | 19,110,000 e,f | 20,100,384 | |||
| 6.00% | 8,930,000 e,f | 9,499,594 | |||
| 3.53%, 7/1/10 | 1,191,815 e | 1,202,574 | |||
| 4.00%, 5/1/10 | 534,323 e | 539,145 | |||
| 4.06%, 6/1/13 | 48,000 e | 49,684 | |||
| 4.50%, 11/1/14 | 9,611 e | 9,925 | |||
| 4.90%, 1/1/14 | 392,024 e | 414,860 | |||
| 5.00%, 10/1/11—1/1/36 | 2,914,686 e | 3,002,865 | |||
| 5.50%, 11/1/24—9/1/34 | 2,815,840 e | 2,965,968 | |||
| 6.00%, 7/1/17—1/1/38 | 4,481,099 e | 4,754,200 | |||
| 6.50%, 12/1/15 | 3,090 e | 3,327 | |||
| 7.00%, 11/1/31—6/1/32 | 33,717 e | 37,229 | |||
| 7.50%, 2/1/29—11/1/29 | 4,838 e | 5,443 | |||
| 8.50%, 6/1/12 | 1,097 e | 1,157 | |||
| Ser. 2002-T11, Cl. A, 4.77%, 4/25/12 | 11,925 a,e | 12,187 | |||
| Ser. 2002-T3, Cl. A, 5.14%, 12/25/11 | 338,370 a,e | 338,566 | |||
The Fund 23
STATEMENT OF INVESTMENTS (continued)
| Principal | ||
| Bonds and Notes (continued) | Amount ($) | Value ($) |
| U.S. Government Agencies/ | ||
| Mortgage-Backed (continued) | ||
| Government National Mortgage Association I: | ||
| 6.00%, 1/15/32 | 2,030 | 2,169 |
| 6.50%, 7/15/32 | 4,806 | 5,178 |
| 8.00%, 8/15/25—11/15/26 | 26,160 | 30,002 |
| 9.00%, 2/15/21 | 11,071 | 12,657 |
| Ser. 2004-57, Cl. A, 3.02%, 1/16/19 | 429,212 a | 432,336 |
| Ser. 2004-77, Cl. A, 3.40%, 3/16/20 | 173,432 a | 174,250 |
| Ser. 2005-9, Cl. A, 4.03%, 5/16/22 | 814,490 a | 829,116 |
| Ser. 2006-9, Cl. A, 4.20%, 8/16/26 | 1,724,190 a | 1,767,239 |
| 80,172,884 | ||
| U.S. Government Securities—10.1% | ||
| U.S. Treasury Bonds; | ||
| 4.25%, 5/15/39 | 3,190,000 | 2,993,617 |
| U.S. Treasury Notes: | ||
| 0.88%, 4/30/11 | 5,370,000 a | 5,378,812 |
| 1.00%, 8/31/11 | 7,500,000 | 7,506,157 |
| 2.50%, 3/31/13 | 1,155,000 | 1,181,619 |
| 3.50%, 2/15/18 | 2,283,000 | 2,264,987 |
| 3.88%, 10/31/12 | 4,860,000 a,d | 5,172,867 |
| 24,498,059 | ||
| Total Bonds and Notes | ||
| (cost $265,801,143) | 270,325,187 | |
| Short-Term Investments—12.4% | ||
| U.S. Government Agency—11.6% | ||
| Federal Home Loan Bank | ||
| 0.02%, 1/25/10 | 28,500,000 a | 28,499,829 |
| U.S. Treasury Bills—.8% | ||
| 0.02%, 1/14/10 | 1,950,000 a | 1,949,988 |
| Total Short-Term Investments | ||
| (cost $30,449,621) | 30,449,817 | |
| Other Investment—2.2% | Shares | Value ($) |
| Registered Investment Company; | ||
| Dreyfus Institutional Preferred | ||
| Plus Money Market Fund | ||
| (cost $5,473,984) | 5,473,984 g | 5,473,984 |
24
| Investment of Cash Collateral | ||
| for Securities Loaned—4.7% | Shares | Value ($) |
| Registered Investment Company; | ||
| Dreyfus Institutional Cash Advantage Fund | ||
| (cost $11,417,823) | 11,417,823 g | 11,417,823 |
| Total Investments (cost $313,142,571) | 129.6% | 317,666,811 |
| Liabilities, Less Cash and Receivables | (29.6%) | (72,497,780) |
| Net Assets | 100.0% | 245,169,031 |
| a Held by broker as collateral for open financial futures and options positions. |
| b Securities exempt from registration under Rule 144A of the Securities Act of 1933.These securities may be resold in |
| transactions exempt from registration, normally to qualified institutional buyers. At December 31, 2009, these |
| securities had a total market value of $40,660,817 or 16.6% of net assets. |
| c Variable rate security—interest rate subject to periodic change. |
| d Security, or portion thereof, on loan. At December 31, 2009, the total market value of the fund’s securities on loan is |
| $11,069,633 and the total market value of the collateral held by the fund is $11,417,823. |
| e On September 7, 2008, the Federal Housing Finance Agency (FHFA) placed Federal National Mortgage |
| Association and Federal Home Loan Mortgage Corporation into conservatorship with FHFA as the conservator. As |
| such, the FHFA will oversee the continuing affairs of these companies. |
| f Purchased on a forward commitment basis. |
| g Investment in affiliated money market mutual fund. |
| Portfolio Summary (Unaudited)† | |||
| Value (%) | Value (%) | ||
| Corporate Bonds | 45.0 | Asset/Mortgage-Backed | 18.2 |
| U.S. Government & Agencies | 43.3 | Municipals | 2.3 |
| Short-Term/ | Foreign/Governmental | 1.5 | |
| Money Market Investments | 19.3 | 129.6 | |
| † Based on net assets. | |||
| See notes to financial statements. | |||
The Fund 25
STATEMENT OF FINANCIAL FUTURES
December 31, 2009
| Unrealized | ||||
| Market Value | Appreciation | |||
| Covered by | (Depreciation) | |||
| Contracts | Contracts ($) | Expiration | at 12/31/2009 ($) | |
| Financial Futures Long | ||||
| U.S. Treasury 5 Year Notes | 54 | 6,176,672 | March 2010 | (99,576) |
| U.S. Long Bond | 76 | 8,768,500 | March 2010 | (351,039) |
| Financial Futures Short | ||||
| U.S. Treasury 2 Year Notes | 1 | (216,266) | March 2010 | 1,545 |
| U.S. Treasury 10 Year Notes | 109 | (12,584,391) | March 2010 | 398,201 |
| Gross Unrealized Appreciation | 399,746 | |||
| Gross Unrealized Depreciation | (450,615) | |||
| See notes to financial statements. | ||||
26
| STATEMENT OF OPTIONS WRITTEN | ||
| December 31, 2009 | ||
| Face Amount | ||
| Covered by | ||
| Contracts ($) | Value ($) | |
| Call Options: | ||
| 10-Year USD LIBOR-BBA, | ||
| September 2012 @ 4.50 | 12,000,000 a | (522,091) |
| 5-Year USD LIBOR-BBA, | ||
| January 2010 @ 2.73 | 4,865,000 a | (2,457) |
| 10-Year USD LIBOR-BBA, | ||
| December 2010 @ 3.545 | 2,440,000 a | (31,168) |
| 10-Year USD LIBOR-BBA, | ||
| November 2012 @ 4.76 | 12,000,000 a | (630,112) |
| Put Options: | ||
| 10-Year USD LIBOR-BBA, | ||
| September 2012 @ 4.50 | 12,000,000 a | (1,018,895) |
| 5-Year USD LIBOR-BBA, | ||
| January 2010 @ 2.73 | 4,865,000 a | (68,481) |
| 10-Year USD LIBOR-BBA, | ||
| December 2010 @ 5.045 | 2,440,000 a | (64,983) |
| 10-Year USD LIBOR-BBA, | ||
| November 2012 @ 4.76 | 12,000,000 a | (916,984) |
| (Premiums received $3,332,537) | (3,255,171) | |
| BBA—British Bankers Association | ||
| LIBOR—London Interbank Offered Rate | ||
| USD—US Dollar | ||
| a Non-income producing security. | ||
| See notes to financial statements. | ||
The Fund 27
STATEMENT OF ASSETS AND LIABILITIES
December 31, 2009
| Cost | Value | |
| Assets ($): | ||
| Investments in securities—See Statement of Investments (including | ||
| securities on loan, valued at $11,069,633)—Note 1(c): | ||
| Unaffiliated issuers | 296,250,764 | 300,775,004 |
| Affiliated issuers | 16,891,807 | 16,891,807 |
| Cash | 2,356,842 | |
| Dividends and interest receivable | 2,289,140 | |
| Unrealized appreciation on forward foreign | ||
| currency exchange contracts—Note 4 | 56,694 | |
| Receivable for shares of Beneficial Interest subscribed | 38,940 | |
| 322,408,427 | ||
| Liabilities ($): | ||
| Due to The Dreyfus Corporation and affiliates—Note 3(b) | 138,722 | |
| Payable for investment securities purchased | 62,221,138 | |
| Liability for securities on loan—Note 1(c) | 11,417,823 | |
| Outstanding options written, at value (premiums received | ||
| $3,332,537)—See Statement of Options Written—Note 4 | 3,255,171 | |
| Unrealized depreciation on forward foreign | ||
| currency exchange contracts—Note 4 | 81,279 | |
| Payable for shares of Beneficial Interest redeemed | 51,841 | |
| Payable for futures variation margin—Note 4 | 10,844 | |
| Accrued expenses | 62,578 | |
| 77,239,396 | ||
| Net Assets ($) | 245,169,031 | |
| Composition of Net Assets ($): | ||
| Paid-in capital | 268,413,751 | |
| Accumulated undistributed investment income—net | 1,575,433 | |
| Accumulated net realized gain (loss) on investments | (29,346,305) | |
| Accumulated net unrealized appreciation (depreciation) | ||
| on investments, options transactions, financial futures and | ||
| foreign currency transactions [including ($50,869) | ||
| net unrealized (depreciation) on financial futures] | 4,526,152 | |
| Net Assets ($) | 245,169,031 | |
| Class I Shares Outstandinga | ||
| (unlimited number of $.001 par value shares of Beneficial Interest authorized) | 12,387,336 | |
| Net Asset Value, offering and redemption price per share ($) | 19.79 | |
| a Effective September 1, 2009, the fund’s shares were redesignated as Class I shares. | ||
| See notes to financial statements. | ||
28
STATEMENT OF OPERATIONS
Year Ended December 31, 2009
| Investment Income ($): | |
| Income: | |
| Interest | 12,700,151 |
| Income from securities lending—Note 1(c) | 63,414 |
| Dividends | 13,726 |
| Total Income | 12,777,291 |
| Expenses: | |
| Investment advisory fee—Note 3(a) | 982,635 |
| Administrative service fees—Note 3(b) | 79,628 |
| Professional fees | 106,146 |
| Custodian fees—Note 3(c) | 94,550 |
| Accounting and administration fees—Note 3(a) | 45,000 |
| Registration fees | 33,871 |
| Prospectus and shareholders’ reports | 31,214 |
| Trustees’ fees and expenses—Note 3(d) | 28,097 |
| Shareholder servicing costs—Note 3(c) | 19,535 |
| Loan commitment fees—Note 2 | 11,394 |
| Interest expense—Note 2 | 21 |
| Miscellaneous | 61,430 |
| Total Expenses | 1,493,521 |
| Less—reduction in investment advisory fee due to undertaking—Note 3(a) | (234,830) |
| Less—reduction in fees due to earnings credits—Note 1(c) | (445) |
| Net Expenses | 1,258,246 |
| Investment Income—Net | 11,519,045 |
| Realized and Unrealized Gain (Loss) on Investments—Note 4 ($): | |
| Net realized gain (loss) on investments and foreign currency transactions | (15,478,516) |
| Net realized gain (loss) on options transactions | 1,257,883 |
| Net realized gain (loss) on financial futures | 1,615,256 |
| Net realized gain (loss) on swap transactions | 228,800 |
| Net realized gain (loss) on forward foreign currency exchange contracts | 466,038 |
| Net Realized Gain (Loss) | (11,910,539) |
| Net unrealized appreciation (depreciation) on investments, options transactions, | |
| financial futures, swap transactions and foreign currency transactions [including | |
| ($2,754,042) net unrealized (depreciation) on financial futures, $107,126 | |
| net unrealized appreciation on options transactions, ($241,234) net unrealized | |
| (depreciation) on swap transactions and ($118,126) net unrealized | |
| (depreciation) on forward foreign currency exchange contracts] | 39,698,782 |
| Net Realized and Unrealized Gain (Loss) on Investments | 27,788,243 |
| Net Increase in Net Assets Resulting from Operations | 39,307,288 |
| See notes to financial statements. | |
The Fund 29
STATEMENT OF CHANGES IN NET ASSETS
| Year Ended December 31, | ||
| 2009a | 2008 | |
| Operations ($): | ||
| Investment income—net | 11,519,045 | 21,904,971 |
| Net realized gain (loss) on investments | (11,910,539) | (11,302,018) |
| Net unrealized appreciation | ||
| (depreciation) on investments | 39,698,782 | (29,080,065) |
| Net Increase (Decrease) in Net Assets | ||
| Resulting from Operations | 39,307,288 | (18,477,112) |
| Dividends to Shareholders from ($): | ||
| Investment income—net | (11,179,541) | (19,851,849) |
| Beneficial Interest Transactions ($): | ||
| Net proceeds from shares sold | 42,041,649 | 23,413,889 |
| Dividends reinvested | 8,767,115 | 13,684,047 |
| Cost of shares redeemed | (144,509,127) | (253,599,379)b |
| Increase (Decrease) in Net Assets | ||
| from Beneficial Interest Transactions | (93,700,363) | (216,501,443) |
| Total Increase (Decrease) in Net Assets | (65,572,616) | (254,830,404) |
| Net Assets ($): | ||
| Beginning of Period | 310,741,647 | 565,572,051 |
| End of Period | 245,169,031 | 310,741,647 |
| Undistributed investment income—net | 1,575,433 | 1,061,417 |
| Capital Share Transactions (Shares): | ||
| Shares sold | 2,231,266 | 1,228,451 |
| Shares issued for dividends reinvested | 470,198 | 735,348 |
| Shares redeemed | (8,047,865) | (13,516,112) |
| Net Increase (Decrease) in Shares Outstanding | (5,346,401) | (11,552,313) |
| a | Effective September 1, 2009, the fund’s shares were redesignated as Class I shares. |
| b | Includes redemption-in-kind amounting to $26,531,547. |
| See notes to financial statements. | |
30
FINANCIAL HIGHLIGHTS
The following table describes the performance for the fiscal periods indicated. Total return shows how much your investment in the fund would have increased (or decreased) during each period, assuming you had reinvested all dividends and distributions.These figures have been derived from the fund’s financial statements.
| Year Ended December 31, | |||||
| 2009a | 2008 | 2007 | 2006 | 2005 | |
| Per Share Data ($): | |||||
| Net asset value, beginning of period | 17.52 | 19.31 | 19.61 | 19.66 | 20.08 |
| Investment Operations: | |||||
| Investment income—netb | .85 | .88 | .96 | .93 | .82 |
| Net realized and unrealized | |||||
| gain (loss) on investments | 2.29 | (1.81) | (.26) | (.10) | (.23) |
| Total from Investment Operations | 3.14 | (.93) | .70 | .83 | .59 |
| Distributions: | |||||
| Dividends from investment income—net | (.87) | (.86) | (1.00) | (.88) | (1.01) |
| Net asset value, end of period | 19.79 | 17.52 | 19.31 | 19.61 | 19.66 |
| Total Return (%) | 18.32 | (5.00) | 3.64 | 4.38 | 2.96 |
| Ratios/Supplemental Data (%): | |||||
| Ratio of total expenses | |||||
| to average net assets | .60 | .52 | .51c | .50c | .49c |
| Ratio of net expenses | |||||
| to average net assets | .50 | .50 | .50 | .50 | .49 |
| Ratio of net investment income | |||||
| to average net assets | 4.62 | 4.72 | 4.93 | 4.75 | 4.09 |
| Portfolio Turnover Rated | 361.73 | 443 | 430e | 382e | 380e |
| Net Assets, end of period ($ x 1,000) | 245,169 | 310,742 | 565,572 | 559,572 | 455,891 |
| a | Effective September 1, 2009, the fund’s shares were redesignated as Class I shares. |
| b | Based on average shares outstanding at each month end. |
| c | Includes the fund’s share of The Standish Mellon Fixed Income Portfolio’s (the “Portfolio”) allocated expenses. |
| d | The portfolio turnover rates excluding mortgage dollar roll transactions for the periods ended December 31, 2009, |
| 2008, 2007, 2006 and 2005 were 93.83%, 72%, 166%, 139% and 106%, respectively. | |
| e | On October 25, 2007, the fund, which owned 100% of the Portfolio on such date, withdrew entirely from the |
| Portfolio and received the Portfolio’s securties and cash in exchange for its interest in the Portfolio. Effective October 26, | |
| 2007, the fund began investing directly in the securities in which the Portfolio had invested. Portfolio turnover | |
| represents activity of both the fund and the Portfolio for 2007. The amounts shown for 2005-2006 are rates | |
| for the Portfolio. | |
| See notes to financial statements. | |
The Fund 31
NOTES TO FINANCIAL STATEMENTS
NOTE 1—Significant Accounting Policies:
Dreyfus/Standish Fixed Income Fund (the “fund”) is a separate diversified series of Dreyfus Investment Funds (the “Trust”), which is registered under the Investment Company Act of 1940, as amended (the “Act”), as an open-end management investment company and operates as a series company offering twelve series, including the fund. The fund’s investment objective is to achieve a high level of current income while preserving principal and maintaining liquidity. The Dreyfus Corporation (the “Manager” or “Dreyfus”), a wholly-owned subsidiary of The Bank of New York Mellon Corporation (“BNY Mellon”), serves as the fund’s investment adviser. MBSC Securities Corporation (the “Distributor”), a wholly-owned subsidiary of the Manager, is the distributor of the fund’s shares.
The Board ofTrustees approved, effective September 1, 2009, the redesignation of the fund’s shares as Class I shares. Class I shares are sold primarily to bank trust departments and other financial service providers, including The Bank of New York Mellon, a subsidiary of BNY Mellon and an affiliate of Dreyfus, acting on behalf of customers having a qualified trust or investment account or relationship at such institution and bear no distribution or service fees. Class I shares are offered without a front end sales charge or contingent deferred sales charge.
The Trust accounts separately for the assets, liabilities and operations of each series. Expenses directly attributable to each series are charged to that series’ operations; expenses which are applicable to all series are allocated among them on a pro rata basis.
The Financial Accounting Standards Board (“FASB”) Accounting Standards Codification (“ASC”) has become the exclusive reference of authoritative U.S. generally accepted accounting principles (“GAAP”) recognized by the FASB to be applied by nongovernmental entities. Rules and interpretive releases of the Securities and Exchange Commission (“SEC”) under authority of federal laws are also sources of authoritative GAAP for SEC registrants. The ASC has superseded all existing non-SEC accounting and reporting standards. The fund’s
32
financial statements are prepared in accordance with GAAP, which may require the use of management estimates and assumptions.Actual results could differ from those estimates.
(a) Portfolio valuation: Investments in securities excluding short-term investments (other than U.S.Treasury Bills), financial futures, options, swaps and forward foreign currency exchange contracts (“forward contracts”) are valued each business day by an independent pricing service (the “Service”) approved by the Board of Trustees. Investments for which quoted bid prices are readily available and are representative of the bid side of the market in the judgment of the Service are valued at the mean between the quoted bid prices (as obtained by the Service from dealers in such securities) and asked prices (as calculated by the Service based upon its evaluation of the market for such securities). Other investments (which constitute a majority of the portfolio securities) are valued as determined by the Service, based on methods which include consideration of: yields or prices of securities of comparable quality, coupon, maturity and type; indications as to values from dealers; and general market conditions. Restricted securities, as well as securities or other assets for which recent market quotations are not readily available and are not valued by a pricing service approved by the Board of Trustees, or are determined by the fund not to reflect accurately fair value, are valued at fair value as determined in good faith under the direction of the Board of Trustees.The factors that may be considered when fair valuing a security include fundamental analytical data, the nature and duration of restrictions on disposition, an evaluation of the forces that influence the market in which the securities are purchased and sold and public trading in similar securities of the issuer or comparable issuers. Short-term investments, excluding U.S. Treasury Bills, are carried at amortized cost, which approximates value. Registered investment companies tha t are not traded on an exchange are valued at their net asset value. Financial futures and options that are traded on an exchange are valued at the last sales price on the securities exchange on which such securities are primarily traded or at the last sales price on the national securities market on each
The Fund 33
NOTES TO FINANCIAL STATEMENTS (continued)
business day. Options traded over-the-counter are valued at the mean between the bid and the asked price. Investments in swap transactions are valued each business day by a pricing service approved by the Board of Trustees. Swaps are valued by the service by using a swap pricing model which incorporates among other factors, default probabilities, recovery rates, credit curves of the underlying issuer and swap spreads on interest rates. Investments denominated in foreign currencies are translated to U.S. dollars at the prevailing rates of exchange. Forward contracts are valued at the forward rate.
The fair value of a financial instrument is the amount that would be received to sell an asset or paid to transfer a liability in an orderly transaction between market participants at the measurement date (i.e. the exit price). GAAP establishes a fair value hierarchy that prioritizes the inputs of valuation techniques used to measure fair value.This hierarchy gives the highest priority to unadjusted quoted prices in active markets for identical assets or liabilities (Level 1 measurements) and the lowest priority to unobservable inputs (Level 3 measurements).
Additionally, GAAP provides guidance on determining whether the volume and activity in a market has decreased significantly and whether such a decrease in activity results in transactions that are not orderly. GAAP requires enhanced disclosures around valuation inputs and techniques used during annual and interim periods.
Various inputs are used in determining the value of the fund’s investments relating to fair value measurements.These inputs are summarized in the three broad levels listed below:
Level 1—unadjusted quoted prices in active markets for identical investments.
Level 2—other significant observable inputs (including quoted prices for similar investments, interest rates, prepayment speeds, credit risk, etc.).
Level 3—significant unobservable inputs (including the fund’s own assumptions in determining the fair value of investments).
The inputs or methodology used for valuing securities are not necessarily an indication of the risk associated with investing in those securities.
34
The following is a summary of the inputs used as of December 31, 2009 in valuing the fund’s investments:
| Level 2—Other | Level 3— | |||
| Level 1— | Significant | Significant | ||
| Unadjusted | Observable | Unobservable | ||
| Quoted Prices | Inputs | Inputs | Total | |
| Assets ($) | ||||
| Investments in Securities: | ||||
| Corporate Bonds | — | 110,887,714 | — | 110,887,714 |
| U.S. Government | ||||
| Agencies/Mortgage | ||||
| Backed | — | 109,596,790 | — | 109,596,790 |
| Asset-Backed | — | 16,570,925 | — | 16,570,925 |
| Commercial Mortgage— | ||||
| Backed | — | 27,481,201 | — | 27,481,201 |
| Municipal Bonds | — | 5,536,178 | — | 5,536,178 |
| Foreign Government | — | 3,813,061 | — | 3,813,061 |
| U.S. Treasury | — | 26,448,047 | — | 26,448,047 |
| Residential | ||||
| Mortgage—Backed | — | 441,088 | — | 441,088 |
| Mutual Funds | 16,891,807 | — | — | 16,891,807 |
| Other Financial | ||||
| Instruments† | 399,746 | 56,694 | — | 456,440 |
| Liabilities ($) | ||||
| Other Financial | ||||
| Instruments† | (450,615) | (3,336,450) | — | (3,787,065) |
| † Other financial instruments include derivative instruments, such as futures, forward foreign currency | ||||
| exchange contracts, swap contracts and options contracts. Amounts shown represent unrealized | ||||
| appreciation (depreciation), or in the case of options, market value at period end. | ||||
The following is a reconciliation of the change in the value of Level 3 assets for which significant unobservable inputs were used to determine fair value:
| Investments | Investments in | |
| in Private | Asset-Backed | |
| Investment Fund ($)†† | Security ($) | |
| Balance as of 12/31/2008 | 1,983,334 | 526,725 |
| Realized gain (loss) | — | — |
| Change in unrealized | ||
| appreciation (depreciation) | — | (82,376) |
| Net purchases (sales) | (1,983,334) | — |
| Transfers in and/or out of Level 3 | — | (444,349) |
| Balance as of 12/31/2009 | — | — |
| †† Investment in BlackRock Cash Strategies Fund LLC. See Note 1(c). | ||
The Fund 35
NOTES TO FINANCIAL STATEMENTS (continued)
(b) Foreign currency transactions: The fund does not isolate that portion of the results of operations resulting from changes in foreign exchange rates on investments from the fluctuations arising from changes in market prices of securities held. Such fluctuations are included with the net realized and unrealized gain or loss on investments.
Net realized foreign exchange gains or losses arise from sales of foreign currencies, currency gains or losses realized on securities transactions between trade and settlement date, and the difference between the amounts of dividends, interest and foreign withholding taxes recorded on the fund’s books and the U.S. dollar equivalent of the amounts actually received or paid. Net unrealized foreign exchange gains and losses arise from changes in the value of assets and liabilities other than investments resulting from changes in exchange rates. Foreign currency gains and losses on investments are included with net realized and unrealized gain or loss on investments.
(c) Securities transactions and investment income: Securities transactions are recorded on a trade date basis. Realized gains and losses from securities transactions are recorded on the identified cost basis. Dividend income is recognized on the ex-dividend date and interest income, including, where applicable, accretion of discount and amortization of premium on investments, is recognized on the accrual basis.
The fund has arrangements with the custodian and cash management bank whereby the fund may receive earnings credits when positive cash balances are maintained, which are used to offset custody and cash management fees. For financial reporting purposes, the fund includes net earnings credits as an expense offset in the Statement of Operations.
Investing in foreign markets may involve special risks and considerations not typically associated with investing in the U.S. These risks include revaluation of currencies, high rates of inflation, repatriation restrictions on income and capital, and adverse political and economic developments. Moreover, securities issued in these markets may be less liquid, subject to government ownership controls and delayed settlements, and their prices may be more volatile than those of comparable securities in the U.S.
36
Pursuant to a securities lending agreement with The Bank of New York Mellon, a subsidiary of BNY Mellon and an affiliate of Dreyfus, the fund may lend securities to qualified institutions. It is the fund’s policy that, at origination, all loans are secured by collateral of at least 102% of the value of U.S. securities loaned and 105% of the value of foreign securities loaned. Collateral equivalent to at least 100% of the market value of securities on loan is maintained at all times. Collateral is either in the form of cash, which can be invested in certain money market mutual funds managed by the Manager, U.S. Government and Agency securities or letters of credit.The fund is entitled to receive all income on securities loaned, in addition to income earned as a result of the lending transaction. Although each security loaned is fully collateralized, the fund bears the risk of delay in recovery of, or loss of rights in, the securities loaned should a borrower fail to return the securities in a timely manner. During the period ended December 31, 2009, The Bank of New York Mellon earned $34,146 from lending portfolio securities, pursuant to the securities lending agreement.
Until December 10, 2007, all cash collateral received by the fund and other series of the Trust in connection with the securities lending program was invested in the BlackRock Cash Strategies Fund LLC (the “BlackRock Fund”), a private investment fund not affiliated with the Trust or its investment adviser. On December 10, 2007, the BlackRock Fund announced that it was suspending investor withdrawal privileges due to conditions related to the credit markets and the adverse affect of such conditions on the liquidity of the BlackRock Fund’s portfolio holdings. Commencing on December 11, 2007, all new cash collateral received in connection with the securities lending activity of the fund and other series of the Trust was invested by the securities lending agent in the Dreyfus Institutional Cash Advantage Fund (the “Dreyfus Fund”), an affiliated money market fund registered as an investment company under the Investment Company Act of 1940, as amended.To the extent that the BlackRock Fund agreed to permit withdrawals during the period December 11, 2007 through January 22, 2009, the securities lending agent effected such with-
The Fund 37
NOTES TO FINANCIAL STATEMENTS (continued)
drawals and the cash proceeds from such withdrawals by the fund were reinvested in the shares of the Dreyfus Fund. As of January 22, 2009, the final withdrawal was reinvested in the Dreyfus Fund. Repayments of cash collateral during the period were made from the proceeds of redemptions of shares of the Dreyfus Fund.
(d) Affiliated issuers: Investments in other investment companies advised by the Manager are defined as “affiliated” in the Act.
(e) Concentration of Risk: The fund invests primarily in debt securities. Failure of an issuer of the debt securities to make timely interest or principal payments, or a decline or the perception of a decline in the credit quality of a debt security, can cause the debt security’s price to fall, potentially lowering the fund’s share price. In addition, the value of debt securities may decline due to general market conditions that are not specifically related to a particular company, such as real or perceived adverse economic conditions, changes in outlook for corporate earnings, changes in interest or currency rates or adverse investor sentiment. They may also decline because of factors that affect a particular industry.
(f) Dividends to shareholders: Dividends are recorded on the ex-dividend date. Dividends from investment income-net are declared and paid quarterly. Dividends from net realized capital gains, if any, are normally declared and paid annually, but the fund may make distributions on a more frequent basis to comply with the distribution requirements of the Internal Revenue Code of 1986, as amended (the “Code”).To the extent that net realized capital gains can be offset by capital loss carryovers, it is the policy of the fund not to distribute such gains. Income and capital gain distributions are determined in accordance with income tax regulations, which may differ from GAAP.
(g) Federal income taxes: It is the policy of the fund to continue to qualify as a regulated investment company, if such qualification is in the best interests of its shareholders, by complying with the applicable provisions of the Code, and to make distributions of taxable income sufficient to relieve it from substantially all federal income and excise taxes.
38
As of and during the period ended December 31, 2009, the fund did not have any liabilities for any uncertain tax positions.The fund recognizes interest and penalties, if any, related to uncertain tax positions as income tax expense in the Statement of Operations. During the period, the fund did not incur any interest or penalties.
Each of the tax years in the four-year period ended December 31, 2009 remains subject to examination by the Internal Revenue Service and state taxing authorities.
At December 31, 2009, the components of accumulated earnings on a tax basis were as follows: undistributed ordinary income $1,543,750, accumulated capital losses $29,254,068 and unrealized appreciation $4,500,367. In addition, the fund had $34,769 of capital losses realized after October 31, 2009, which were deferred for tax purposes to the first day of the following fiscal year.
The accumulated capital loss carryover is available for federal income tax purposes to be applied against future net securities profits, if any realized subsequent to December 31, 2009. If not applied, $963,957 of the carryover expires in fiscal 2014, $3,009,464 expires in fiscal 2015, $10,847,262 expires in fiscal 2016 and $14,433,385 expires in fiscal 2017. It’s uncertain whether the fund will be able to realize the benefits of the remaining capital loss carryovers before they expire.
The tax character of distributions paid to shareholders during the fiscal periods ended December 31, 2009 and December 31, 2008 were as follows: ordinary income $11,179,541 and $19,851,849, respectively.
During the period ended December 31, 2009, as a result of permanent book to tax differences, primarily due to the tax treatment for paydown gains and losses on mortgage-backed securities, foreign currency transactions and expirations of capital loss carryovers, the fund increased accumulated undistributed investment income-net by $174,512, increased accumulated net realized gain (loss) on investments by $35,810,510 and decreased paid-in capital by $35,985,022. Net assets and net asset value per share were not affected by this reclassification.
The Fund 39
NOTES TO FINANCIAL STATEMENTS (continued)
NOTE 2—Bank Lines of Credit:
The fund participates with other Dreyfus-managed funds in a $225 million unsecured credit facility led by Citibank, N.A. and a $300 million unsecured credit facility provided by The Bank of New York Mellon (each, a “Facility”), each to be utilized primarily for temporary or emergency purposes, including the financing of redemptions. In connection therewith, the fund has agreed to pay its pro rata portion of commitment fees for each Facility. Interest is charged to the fund based on rates determined pursuant to the terms of the respective Facility at the time of borrowing. Prior to September 24, 2009, the Trust had entered into two separate agreements with The Bank of New York Mellon that enabled the fund, and other funds in the Trust, to borrow, in the aggregate, (i) up to $35 million under a committed line of credit and (ii) up to $15 million under an uncommitted line of credit.
The average amount of borrowings outstanding under the Facilities and lines of credit during the period ended December 31, 2009, was approximately $1,600 with a related weighted average annualized interest rate of 1.30%.
NOTE 3—Investment Advisory Fee and Other Transactions With Affiliates:
(a) Pursuant to an investment advisory agreement with the Manager, the investment advisory fee is based on the value of the fund’s average net assets and is computed at the following annual rates: .40% of the first $250 million; .35% of the next $250 million and .30% in excess of $500 million. The Manager had undertaken from January 1, 2009 through December 31, 2009, to reduce the investment advisory fee paid by the fund, to the extent that the fund’s aggregate annual expenses, exclusive of taxes, brokerage fees, interest on borrowings, commitment fees and extraordinary expenses, do not exceed an annual rate of .50% of the value of the fund’s average daily net assets. The reduction in investment advisory fee, pursuant to the undertaking, amounted to $234,830 during the period ended December 31, 2009.
40
The Trust entered into an agreement with The Bank of New York Mellon, pursuant to which The Bank of New York Mellon provides administration and fund accounting services for the fund. For these services, the fund pays The Bank of NewYork Mellon a fixed fee plus asset and transaction based fees, as well as out-of-pocket expenses. During the period ended December 31, 2009, the fund was charged $45,000 for administration and fund accounting services pursuant to the agreement.
(b) The fund may pay administrative service fees.These fees are paid to affiliated or unaffiliated retirement plans, omnibus accounts and platform administrators and other entities (“Plan Administrators”) that provide record keeping and/or other administrative support services to accounts, retirement plans and their participants. As compensation for such services, the fund may pay each Plan Administrator an administrative service fee in an amount of up to .15% (on an annualized basis) of the fund’s average daily net assets attributable to fund shares that are held in accounts serviced by such Plan Administrator. During the period ended December 31, 2009, the fund was charged $79,628.The fund’s adviser or its affiliates may pay additional compensation from their own resources to Plan Administrators and other entities for administrati ve services, as well as in consideration of marketing or other distribution-related services. These payments may provide an incentive for these entities to actively promote the fund or cooperate with the distributor’s promotional efforts.
(c) The fund compensates Dreyfus Transfer, Inc., a wholly-owned subsidiary of the Manager under a transfer agency agreement for providing personnel and facilities to perform transfer agency services for the fund. During the period ended December 31, 2009, the fund was charged $14,118 pursuant to the transfer agency agreement, which is included in Shareholder servicing costs in the Statement of Operations.
The fund compensates The Bank of New York Mellon under cash management agreements for performing cash management services related to fund subscriptions and redemptions. During the period
The Fund 41
NOTES TO FINANCIAL STATEMENTS (continued)
ended December 31, 2009, the fund was charged $445 pursuant to the cash management agreements, which is included in Shareholder servicing costs in the Statement of Operations.These fees were offset by earnings credits pursuant to the cash management agreements.
The fund also compensates The Bank of New York Mellon under a custody agreement for providing custodial services for the fund. During the period ended December 31, 2009, the fund was charged $94,550 pursuant to the custody agreement.
During the period ended December 31, 2009, the fund was charged $6,681 for services performed by the Chief Compliance Officer.
The components of “Due to The Dreyfus Corporation and affiliates” in the Statement of Assets and Liabilities consist of: investment advisory fees $108,230, custodian fees $25,291, chief compliance officer fees $5,011 and transfer agency per account fees $190.
(d) Prior to January 1, 2010, each Trustee received $45,000 per year, plus $6,000 for each joint Board meeting of the Trust, The Dreyfus/Laurel Funds, Inc., The Dreyfus/Laurel Funds Trust, The Dreyfus/Laurel Tax-Free Municipal Funds and Dreyfus Funds, Inc. (collectively, the “Board Group Open-end Funds”) attended, $2,000 for separate in-person committee meetings attended which were not held in conjunction with a regularly scheduled Board meeting and $1,500 for Board meetings and separate committee meetings attended that were conducted by telephone. Effective January 1, 2010, the Board Group Open-end Funds will pay eachTrustee who is not an“interested person”of theTrust (as defined in the 1940 Act) $60,000 per annum, plus $7,000 per joint Board Group Open-end Funds Board meeting attended, $2,500 for separate in-person committee meeti ngs attended which are not held in conjunction with a regularly scheduled Board meeting and $2,000 for Board meetings and separate committee meetings attended that are conducted by telephone. The Board Group Open-end Funds also reimburse each Trustee who is not an “interested person” of the Trust (as defined in the 1940 Act) for
42
travel and out-of-pocket expenses.With respect to Board meetings, the Chairman of the Board receives an additional 25% of such compensation (with the exception of reimbursable amounts).With respect to compensation committee meetings prior to January 1, 2010, the Chair of the compensation committee received $900 per compensation committee meeting, and, effective January 1, 2010, the Chair of each of the Board’s committees, unless the Chair also serves as Chair of the Board, will receive $1,350 per applicable committee meeting. In the event that there is an in-person joint committee meeting or a joint telephone meeting of the Board Group Open-end Funds and Dreyfus High Yield Strategies Fund, the $2,000 or $1,500 fee (prior to January 1, 2010) or the $2,500 or $2,000 fee (effective January 1, 2010), as applicable, is allocated between the Board Group Open-end Funds and Dreyfus High Yield Strategies Fund. The Trust’s port ion of these fees and expenses are charged and allocated to each series based on net assets. Amounts required to be paid by the Trust directly to the non-interested Trustees, that would be applied to offset a portion of the management fee payable by certain other series of the Trust to the Manager, are in fact paid directly by the Manager to the non-interested Trustees.
NOTE 4—Securities Transactions:
The aggregate amount of purchases and sales (including paydowns) of investment securities, excluding short-term securities, financial futures, forward contracts, options transactions and swap transactions, during the period ended December 31, 2009, amounted to $1,060,996,076 and $1,201,235,381, respectively, of which $785,772,593 in purchases and $788,361,157 in sales were from mortgage dollar roll transactions.
The fund adopted the provisions of ASC Topic 815 “Derivatives and Hedging” which requires qualitative disclosures about objectives and strategies for using derivatives, quantitative disclosures about fair value amounts of gains and losses on derivative instruments and disclosures
The Fund 43
NOTES TO FINANCIAL STATEMENTS (continued)
about credit-risk-related contingent features in derivative agreements. The disclosure requirements distinguish between derivatives, which are accounted for as “hedges” and those that do not qualify for hedge accounting. Because investment companies value their derivatives at fair value and recognize changes in fair value through the Statement of Operations, they do not qualify for such accounting. Accordingly, even though a fund’s investments in derivatives may represent economic hedges, they are considered to be non-hedge transactions for purposes of this disclosure.The following tables show the fund’s exposure to different types of market risk as it relates to the Statement of Assets and Liabilities and the Statement of Operations, respectively.
Fair value of derivative instruments as of December 31, 2009 is shown below:
| Derivative | Derivative | ||
| Assets ($) | Liabilities ($) | ||
| Interest rate risk1 | 399,746 | Interest rate risk1,2 | (3,705,786) |
| Foreign currency risk3 | 56,694 | Foreign currency risk4 | (81,279) |
| Gross fair value of | |||
| derivatives contracts | 456,440 | (3,787,065) |
| Statement of Assets and Liabilities location: | |
| 1 | Includes cumulative appreciation (depreciation) on futures contracts as reported in the Statement |
| of Financial Futures, but only the unpaid variation margin is reported in the Statement of Assets | |
| and Liabilities. | |
| 2 | Outstanding options written, at value. |
| 3 | Unrealized appreciation on forward foreign currency exchange contracts. |
| 4 | Unrealized depreciation on forward foreign currency exchange contracts. |
The effect of derivative instruments in the Statement of Operations during the period ended December 31, 2009 is shown below:
| Amount of realized gain or (loss) on derivatives recognized in income ($) | |||||
| Forward | |||||
| Underlying risk | Futures5 | Options6 | Contracts7 | Swaps8 | Total |
| Interest rate | 1,615,256 | 1,257,883 | — | — | 2,873,139 |
| Foreign exchange | — | — | 466,038 | — | 466,038 |
| Credit | — | — | — | 228,800 | 228,800 |
| Total | 1,615,256 | 1,257,883 | 466,038 | 228,800 | 3,567,977 |
44
| Change in unrealized appreciation or (depreciation) on derivatives recognized in income ($)9 | |||||
| Forward | |||||
| Underlying risk | Futures | Options | Contracts | Swaps | Total |
| Interest rate | (2,754,042) | 107,126 | — | — | (2,646,916) |
| Foreign exchange | — | — | (118,126) | — | (118,126) |
| Credit | — | — | — | (241,234) | (241,234) |
| Total | (2,754,042) | 107,126 | (118,126) | (241,234) (3,006,276) | |
| Statement of Operations location: | |
| 5 | Net realized gain (loss) on financial futures. |
| 6 | Net realized gain (loss) on options transactions. |
| 7 | Net realized gain (loss) on forward foreign currency exchange contracts. |
| 8 | Net realized gain (loss) on swap transactions. |
| 9 | Net unrealized appreciation (depreciation) on investments, financial futures, options transactions, |
| forward foreign currency contracts and swap transactions. | |
During the period ended December 31, 2009, the average market value of interest rate futures contracts was $46,991,247, which represented 18.84% of average net assets.The average market value of options contracts was $1,087,168, which represented 0.44% of average net assets. The average market value of forward contracts was $7,224,704, which represented 2.90% of average net assets.The average notional value of credit default swap contracts was $482,308, which represented 0.19% of average net assets.
Mortgage Dollar Rolls: A mortgage dollar roll transaction involves a sale by the fund of mortgage related securities that it holds with an agreement by the fund to repurchase similar securities at an agreed upon price and date.The securities purchased will bear the same interest rate as those sold, but generally will be collateralized by pools of mortgages with different prepayment histories than those securities sold.
Futures Contracts: In the normal course of pursuing its investment objective, the fund is exposed to market risk, including interest rate risk, as a result of changes in value of underlying financial instruments.The fund invests in financial futures contracts in order to manage its exposure to or protect against changes in the market. A futures contract represents a commitment for the future purchase or a sale of an asset at
The Fund 45
NOTES TO FINANCIAL STATEMENTS (continued)
a specified date. Upon entering into such contracts, these investments require initial margin deposits with a broker, which consist of cash or cash equivalents. The amount of these deposits is determined by the exchange or Board of Trade on which the contract is traded and is subject to change. Accordingly, variation margin payments are received or made to reflect daily unrealized gains or losses which are recorded in the Statement of Operations. Futures contracts are valued daily at the last sales price established by the Board of Trade or exchange upon which they are traded. When the contracts are closed, the fund recognizes a realized gain or loss. There is minimal counterparty credit risk to the fund with futures, since futures are exchange traded and the exchange’s clearinghouse, as counterparty to all exchange traded futures, guarantees the futures against default. Contracts open at December 31, 2009 are set forth in the Statement of Financial Futures.
Options: A call option gives the purchaser of the option the right (but not the obligation) to buy, and obligates the writer to sell, the underlying security or securities at the exercise price at any time during the option period, or at a specified date. Conversely, a put option gives the purchaser of the option the right (but not the obligation) to sell, and obligates the writer to buy the underlying security or securities at the exercise price at any time during the option period, or at a specified date. The fund writes (sells) put and call options primarily to hedge against changes in security prices, or securities that the fund intends to purchase, or against fluctuations in value caused by changes in prevailing market interest rates or other market conditions.
As a writer of call options, the fund receives a premium at the outset and then bears the market risk of unfavorable changes in the price of the financial instrument underlying the option. Generally, the fund realizes a gain, to the extent of the premium, if the price of the underlying financial instrument decreases between the date the option is written and the date on which the option is terminated. Generally, the fund incurs a loss, if the price of the financial instrument increases between those dates. As a writer of put options, the fund receives a premium at the outset and then bears the market risk of unfavorable
46
changes in the price of the financial instrument underlying the option. Generally, the fund realizes a gain, to the extent of the premium, if the price of the underlying financial instrument increases between the date the option is written and the date on which the option is terminated. Generally, the fund incurs a loss, if the price of the financial instrument decreases between those dates.
As a writer of put options, the fund receives a premium at the outset and then bears the market risk of unfavorable changes in the price of the financial instrument underlying the option. Generally, the fund would realize a gain, to the extent of the premium, if the price of the underlying financial instrument increases between the date the option is written and the date on which the option is terminated. Generally, the fund would incur a loss, if the price of the financial instrument decreases between those dates. As a writer of an option, the fund may have no control over whether the underlying securities may be sold (call) or purchased (put) and as a result bears the market risk of an unfavorable change in the price of the security underlying the written option. One risk of holding a put or a call option is that if the option is not sold or exercised prior to its expiration, it becomes worthless. However, this risk is limite d to the premium paid by the fund.Upon the expiration or closing of the option transaction, a gain or loss is reported in the Statement of Operations. The following summarizes the fund’s call/put options written for the period ended December 31, 2009:
| Face Amount | Options Terminated | |||
| Covered by | Premiums | Net Realized | ||
| Options Written: | Contracts ($) | Received ($) | Cost ($) Gain (Loss) ($) | |
| Contracts outstanding | ||||
| December 31, 2008 | 164,000 | 237,699 | — | — |
| Contracts written | 345,172,000 | 6,692,153 | — | — |
| Contracts terminated: | ||||
| Contracts closed | 156,910,000 | 2,198,136 | 2,218,090 | (19,954) |
| Contracts expired | 125,816,000 | 1,399,179 | — | 1,399,179 |
| Total contracts | ||||
| terminated | 282,726,000 | 3,597,315 | 2,218,090 | 1,379,225 |
| Contracts Outstanding | ||||
| December 31, 2009 | 62,610,000 | 3,332,537 | — | — |
The Fund 47
NOTES TO FINANCIAL STATEMENTS (continued)
Forward Foreign Currency Exchange Contracts: The fund enters into forward contracts in order to hedge its exposure to changes in foreign currency exchange rates on its foreign fund holdings, to settle foreign currency transactions or as a part of its investment strategy. When executing forward contracts, the fund is obligated to buy or sell a foreign currency at a specified rate on a certain date in the future. With respect to sales of forward contracts, the fund incurs a loss if the value of the contract increases between the date the forward contract is opened and the date the forward contract is closed.The fund realizes a gain if the value of the contract decreases between those dates. With respect to purchases of forward contracts, the fund incurs a loss if the value of the contract decreases between the date the forward contract is opened and the date the forward contract is closed. The fund realizes a gain if the value of the contract increases between those dates. The fund is exposed to foreign currency risk as a result of changes in value of underlying financial instruments.The fund is also exposed to credit risk associated with counterparty nonperformance on these forward contracts, which is typically limited to the unrealized gain on each open contract.The following summarizes open forward contracts at December 31, 2009:
| Foreign | Unrealized | |||
| Forward Foreign Currency | Currency | Appreciation | ||
| Exchange Contracts | Amounts | Cost ($) | Value ($) (Depreciation) ($) | |
| Purchases: | ||||
| Argentine Peso, | ||||
| Expiring 1/8/2010 | 4,670,000 | 1,217,573 | 1,225,213 | 7,640 |
| Brazilian Real, | ||||
| Expiring 1/8/2010 | 2,150,000 | 1,238,479 | 1,231,216 | (7,263) |
| British Pound, | ||||
| Expiring 1/29/2010 | 710,000 | 1,155,284 | 1,146,351 | (8,933) |
| Indonesian Rupiah, | ||||
| Expiring 1/8/2010 11,586,320,000 | 1,228,275 | 1,231,286 | 3,011 | |
| Malaysian Ringgit, | ||||
| Expiring 1/29/2010 | 2,050,000 | 601,508 | 597,954 | (3,554) |
| Mexican New Peso, | ||||
| Expiring 1/8/2010 | 15,870,000 | 1,229,232 | 1,214,705 | (14,527) |
| Russian Ruble, | ||||
| Expiring 1/12/2010 | 35,870,000 | 1,226,744 | 1,181,143 | (45,601) |
| South Korean Won, | ||||
| Expiring 2/26/2010 | 698,135,000 | 599,901 | 598,500 | (1,401) |
48
| Foreign | Unrealized | |||
| Forward Foreign Currency | Currency | Appreciation | ||
| Exchange Contracts | Amounts | Proceeds ($) | Value ($) (Depreciation) ($) | |
| Sales: | ||||
| Euro, | ||||
| Expiring 1/29/2010 | 400,000 | 581,300 | 573,881 | 7,419 |
| Euro, | ||||
| Expiring 1/29/2010 | 2,105,000 | 3,058,670 | 3,020,046 | 38,624 |
| Gross Unrealized | ||||
| Appreciation | 56,694 | |||
| Gross Unrealized | ||||
| Depreciation | (81,279) | |||
Swaps: The fund enters into swap agreements to exchange the interest rate on, or return generated by, one nominal instrument for the return generated by another nominal instrument. The fund enters into these agreements to provide a substitute for purchasing or selling particular securities or to increase potential returns.
The fund accrues for the interim payments on swap contracts on a daily basis, with the net amount recorded within unrealized appreciation (depreciation) on swap contracts in the Statement of Assets and Liabilities. Once the interim payments are settled in cash, the net amount is recorded as realized gain (loss) on swaps, in addition to realized gain (loss) recorded upon the termination of swap contracts in the Statement of Operations. Upfront payments made and/or received by the fund, are recorded as an asset and/or liability in the Statement of Assets and Liabilities and are recorded as a realized gain or loss ratably over the contract’s term/event with the exception of forward started interest rate swaps which are recorded as realized gains or losses on the termination date. Fluctuations in the value of swap contracts are recorded for financial statement purposes as unrealized appreciation or depreciation on swap transac tions.
Credit Default Swaps: Credit default swaps involve commitments to pay a fixed interest rate in exchange for payment if a credit event affecting a third party (the referenced company, obligation or index) occurs. Credit events may include a failure to pay interest or principal,
The Fund 49
NOTES TO FINANCIAL STATEMENTS (continued)
bankruptcy, or restructuring.The fund enters into these agreements to manage its exposure to the market or certain sectors of the market, to reduce its risk exposure to defaults of corporate and sovereign issuers, or to create exposure to corporate or sovereign issuers to which it is not otherwise exposed. For those credit default swaps in which the fund is paying a fixed rate, the fund is buying credit protection on the instrument. In the event of a credit event, the fund would receive the full notional amount for the reference obligation. For those credit default swaps in which the fund is receiving a fixed rate, the fund is selling credit protection on the underlying instrument.The maximum payouts for these contracts are limited to the notional amount of each swap. Credit default swaps may involve greater risks than if the fund had invested in the reference obligation directly and are subject to general market risk, liquidit y risk, counterparty risk and credit risk.At December 31, 2009, the fund held no open credit default swaps.
At December 31, 2009, the cost of investments for federal income tax purposes was $313,250,907; accordingly, accumulated net unrealized appreciation on investments was $4,415,904, consisting of $9,518,805 gross unrealized appreciation and $5,102,901 gross unrealized depreciation.
NOTE 5—Change in Independent Registered Public Accounting Firm:
PricewaterhouseCoopers LLP (“PWC”), 300 Madison Avenue, New York, New York 10017, an independent registered public accounting firm, was the independent registered public accounting firm for the fund for the fiscal year ended December 31, 2008. At the meetings held on February 9-10, 2009, the Audit Committee and the Board of Trustees of the Trust engaged KPMG LLP to replace PWC as the independent registered public accounting firm for the Trust, effective upon the conclusion of the audit of the December 31, 2008 financial statements of the Trust.
During the funds’ two fiscal years ended December 31, 2008 and the subsequent interim period through the effective date of PWC’s
50
replacement: (i) no report on the funds’ financial statements contained an adverse opinion or a disclaimer of opinion, or was qualified or modified as to uncertainty, audit scope, or accounting principles; and (ii) there were no “disagreements” (as such term is used in Item 304 of Regulation S-K) with PWC on any matter of accounting principles or practices, financial statement disclosure, or auditing scope or procedure, which disagreement(s), if not resolved to the satisfaction of PWC, would have caused it to make reference to the subject matter of the disagreement(s) in connection with its report.
NOTE 6—New Accounting Pronouncement:
In January 2010, FASB issued Accounting Standards Update (“ASU”) No. 2010-06 “Improving Disclosures about Fair Value Measurements”. ASU 2010-06 will require reporting entities to make new disclosures about amounts and reasons for significant transfers in and out of Level 1 and Level 2 fair value measurements as well as inputs and valuation techniques used to measure fair value for both recurring and nonrecur-ring fair value measurements that fall in either Level 2 or Level 3, and information on purchases, sales, issuances and settlements on a gross basis in the reconciliation of activity in Level 3 fair value measurements.The new and revised disclosures are required to be implemented for fiscal years beginning after December 15, 2009 except for the disclosures surrounding purchases, sales, issuances and settlements on a gross basis in the reconciliation of Level 3 fair value measurements, which are effective for fiscal years beginning after December 15, 2010. Management is currently evaluating the impact the adoption of ASU No. 2010-06 may have on the fund’s financial statement disclosures.
NOTE 7—Subsequent Events Evaluation:
Dreyfus has evaluated the need for disclosures and/or adjustments resulting from subsequent events through February 26, 2010, the date the financial statements were issued. This evaluation did not result in any subsequent events that necessitated disclosures and/or adjustments.
The Fund 51
REPORT OF INDEPENDENT REGISTERED
PUBLIC ACCOUNTING FIRM
The Board of Trustees and Shareholders of
Dreyfus/Standish Fixed Income Fund
We have audited the accompanying statement of assets and liabilities of Dreyfus/Standish Fixed Income Fund (the “Fund”), a series of Dreyfus Investment Funds, including the statements of investments, financial futures and options written, as of December 31, 2009, and the related statement of operations, the statement of changes in net assets and financial highlights for the year then ended.These financial statements and financial highlights are the responsibility of the Fund’s management. Our responsibility is to express an opinion on these financial statements and financial highlights based on our audit.The statement of changes in net assets for the year ended December 31, 2008 and the financial highlights for each of the years in the four-year period ended December 31, 2008 were audited by other independent registered public accountants whose report thereon, dated February 27, 2009 expressed an unqualified opin ion on that statement of changes in net assets and those financial highlights.
We conducted our audit in accordance with the standards of the Public Company Accounting Oversight Board (United States).Those standards require that we plan and perform the audit to obtain reasonable assurance about whether the financial statements and financial highlights are free of material misstatement.An audit also includes examining, on a test basis, evidence supporting the amounts and disclosures in the financial statements. Our procedures included confirmation of securities owned as of December 31, 2009 by correspondence with the custodian and brokers or by other appropriate auditing procedures where replies from brokers were not received.An audit also includes assessing the accounting principles used and significant estimates made by management, as well as evaluating the overall financial statement presentation.We believe that our audit provides a reasonable basis for our opinion.
In our opinion, the financial statements and financial highlights referred to above present fairly, in all material respects, the financial position of Dreyfus/Standish Fixed Income Fund as of December 31, 2009, and the results of its operations, the changes in its net assets, and the financial highlights for the year then ended, in conformity with U.S. generally accepted accounting principles.

New York, New York
February 26, 2010
52
IMPORTANT TAX INFORMATION (Unaudited)
For federal tax purposes the fund hereby designates 94.31% of ordinary income dividends paid during the fiscal year ended December 31, 2009 as qualifying “interest related dividends”.
The Fund 53
OFFICERS OF THE FUND (Unaudited)
BRADLEY J. SKAPYAK, President since January 2010.
Chief Operating Officer and a director of the Manager since June 2009. From April 2003 to June 2009, Mr. Skapyak was the head of the Investment Accounting and Support Department of the Manager. He is an officer of 76 investment companies (comprised of 171 portfolios) managed by the Manager. He is 51 years old and has been an employee of the Manager since February 1988.
PHILLIP N. MAISANO, Executive Vice President since December 2008.
Chief Investment Officer,Vice Chair and a director of the Manager, and an officer of 76 investment companies (comprised of 171 portfolios) managed by the Manager. Mr. Maisano also is an officer and/or Board member of certain other investment management subsidiaries of The Bank of New York Mellon Corporation, each of which is an affiliate of the Manager. He is 62 years old and has been an employee of the Manager since November 2006. Prior to joining the Manager, Mr. Maisano served as Chairman and Chief Executive Officer of EACM Advisors, an affiliate of the Manager, since August 2004.
J. DAVID OFFICER, Vice President since January 2010.
Director of Mellon United National Bank, an affiliate of the Manager, and an officer of 77 investment companies (comprised of 194 portfolios) managed by the Manager. Prior to June 2009, Mr. Officer was Chief Operating Officer,Vice Chairman and a director of the Manager, where he had been employed since April 1998. He is 61 years old.
MICHAEL A. ROSENBERG, Vice President and Secretary since December 2008.
Assistant General Counsel of BNY Mellon, and an officer of 77 investment companies (comprised of 194 portfolios) managed by the Manager. He is 49 years old and has been an employee of the Manager since October 1991.
KIESHA ASTWOOD, Vice President and Assistant Secretary since January 2010.
Counsel of BNY Mellon, and an officer of 77 investment companies (comprised of 194 portfolios) managed by the Manager. She is 36 years old and has been an employee of the Manager since July 1995.
JAMES BITETTO, Vice President and Assistant Secretary since December 2008.
Senior Counsel of BNY Mellon and Secretary of the Manager, and an officer of 77 investment companies (comprised of 194 portfolios) managed by the Manager. He is 43 years old and has been an employee of the Manager since December 1996.
JONI LACKS CHARATAN, Vice President and Assistant Secretary since December 2008.
Senior Counsel of BNY Mellon, and an officer of 77 investment companies (comprised of 194 portfolios) managed by the Manager. She is 54 years old and has been an employee of the Manager since October 1988.
JOSEPH M. CHIOFFI, Vice President and Assistant Secretary since December 2008.
Senior Counsel of BNY Mellon, and an officer of 77 investment companies (comprised of 194 portfolios) managed by the Manager. He is 48 years old and has been an employee of the Manager since June 2000.
KATHLEEN DENICHOLAS, Vice President and Assistant Secretary since January 2010.
Senior Counsel of BNY Mellon, and an officer of 77 investment companies (comprised of 194 portfolios) managed by the Manager. She is 35 years old and has been an employee of the Manager since February 2001.
56
JANETTE E. FARRAGHER, Vice President and Assistant Secretary since December 2008.
Assistant General Counsel of BNY Mellon, and an officer of 77 investment companies (comprised of 194 portfolios) managed by the Manager. She is 47 years old and has been an employee of the Manager since February 1984.
JOHN B. HAMMALIAN, Vice President and Assistant Secretary since December 2008.
Managing Counsel of BNY Mellon, and an officer of 77 investment companies (comprised of 194 portfolios) managed by the Manager. He is 46 years old and has been an employee of the Manager since February 1991.
M. CRISTINA MEISER, Vice President and Assistant Secretary since January 2010.
Senior Counsel of BNY Mellon, and an officer of 77 investment companies (comprised of 194 portfolios) managed by the Manager. She is 39 years old and has been an employee of the Manager since August 2001.
ROBERT R. MULLERY, Vice President and Assistant Secretary since December 2008.
Managing Counsel of BNY Mellon, and an officer of 77 investment companies (comprised of 194 portfolios) managed by the Manager. He is 57 years old and has been an employee of the Manager since May 1986.
JEFF PRUSNOFSKY, Vice President and Assistant Secretary since December 2008.
Managing Counsel of BNY Mellon, and an officer of 77 investment companies (comprised of 194 portfolios) managed by the Manager. He is 44 years old and has been an employee of the Manager since October 1990.
JAMES WINDELS, Treasurer since December 2008.
Director – Mutual Fund Accounting of the Manager, and an officer of 77 investment companies (comprised of 194 portfolios) managed by the Manager. He is 51 years old and has been an employee of the Manager since April 1985.
RICHARD CASSARO, Assistant Treasurer since December 2008.
Senior Accounting Manager – Money Market and Municipal Bond Funds of the Manager, and an officer of 77 investment companies (comprised of 194 portfolios) managed by the Manager. He is 50 years old and has been an employee of the Manager since September 1982.
GAVIN C. REILLY, Assistant Treasurer since December 2008.
Tax Manager of the Investment Accounting and Support Department of the Manager, and an officer of 77 investment companies (comprised of 194 portfolios) managed by the Manager. He is 41 years old and has been an employee of the Manager since April 1991.
ROBERT ROBOL, Assistant Treasurer since December 2008.
Senior Accounting Manager – Fixed Income Funds of the Manager, and an officer of 77 investment companies (comprised of 194 portfolios) managed by the Manager. He is 45 years old and has been an employee of the Manager since October 1988.
ROBERT SALVIOLO, Assistant Treasurer since December 2008.
Senior Accounting Manager – Equity Funds of the Manager, and an officer of 77 investment companies (comprised of 194 portfolios) managed by the Manager. He is 42 years old and has been an employee of the Manager since June 1989.
The Fund 57
OFFICERS OF THE FUND (Unaudited) (continued)
ROBERT SVAGNA, Assistant Treasurer since December 2008.
Senior Accounting Manager – Equity Funds of the Manager, and an officer of 77 investment companies (comprised of 194 portfolios) managed by the Manager. He is 42 years old and has been an employee of the Manager since November 1990.
JOSEPH W. CONNOLLY, Chief Compliance Officer since December 2008.
Chief Compliance Officer of the Manager and The Dreyfus Family of Funds (77 investment companies, comprised of 194 portfolios). From November 2001 through March 2004, Mr. Connolly was first Vice-President, Mutual Fund Servicing for Mellon Global Securities Services. In that capacity, Mr. Connolly was responsible for managing Mellon’s Custody, Fund Accounting and Fund Administration services to third-party mutual fund clients. He is 52 years old and has served in various capacities with the Manager since 1980, including manager of the firm’s Fund Accounting Department from 1997 through October 2001.
WILLIAM GERMENIS, Anti-Money Laundering Compliance Officer since December 2008.
Vice President and Anti-Money Laundering Compliance Officer of the Distributor, and the Anti-Money Laundering Compliance Officer of 73 investment companies (comprised of 190 portfolios) managed by the Manager. He is 39 years old and has been an employee of the Distributor since October 1998.
58
NOTES
The views expressed in this report reflect those of the portfolio manager only through the end of the period covered and do not necessarily represent the views of Dreyfus or any other person in the Dreyfus organization. Any such views are subject to change at any time based upon market or other conditions and Dreyfus disclaims any responsibility to update such views.These views may not be relied on as investment advice and, because investment decisions for a Dreyfus fund are based on numerous factors, may not be relied on as an indication of trading intent on behalf of any Dreyfus fund.
Not FDIC-Insured • Not Bank-Guaranteed • May Lose Value
Contents | |
THE FUND | |
| 2 | A Letter from the Chairman and CEO |
| 3 | Discussion of Fund Performance |
| 6 | Fund Performance |
| 8 | Understanding Your Fund’s Expenses |
| 8 | Comparing Your Fund’s Expenses With Those of Other Funds |
| 9 | Statement of Investments |
| 25 | Statement of Financial Futures |
| 25 | Statement of Options Written |
| 26 | Statement of Assets and Liabilities |
| 27 | Statement of Operations |
| 28 | Statement of Changes in Net Assets |
| 30 | Financial Highlights |
| 32 | Notes to Financial Statements |
| 56 | Report of Independent Registered Public Accounting Firm |
| 57 | Important Tax Information |
| 58 | Board Members Information |
| 60 | Officers of the Fund |
FOR MORE INFORMATION | |
Back Cover |
Dreyfus/Standish
Global Fixed
Income Fund
The Fund

A LETTER FROM THE CHAIRMAN AND CEO
Dear Shareholder:
We are pleased to present this annual report for Dreyfus/Standish Global Fixed Income Fund, covering the 12-month period from January 1, 2009, through December 31, 2009.
The U.S. and global bond markets ended 2009 with healthy annual gains among higher yielding market sectors, but U.S.Treasury securities and other sovereign bonds from developed nations gave back a portion of their previous gains.The bond market’s advance was driven partly by government intervention and partly by improving investor sentiment as the global economy staged a gradual, but sustained, recovery from a severe recession and banking crisis. After four consecutive quarters of contraction, the U.S. economy returned to growth during the third quarter of 2009, buoyed by greater manufacturing activity to replenish depleted inventories and satisfy export demand.The slumping housing market also showed signs of renewed life later in the year when home sales and prices rebounded modestly. However, economic headwinds remain, including a high unemployment rate and the prospect of anemic consumer spending.
As 2010 begins, our Chief Economist, as well as many securities analysts and portfolio managers have continued to find opportunities and survey potential challenges across the various fixed-income markets, both domestic and international. While no one can predict the future, we believe that the 2010 investment environment will likely require a broader range of investment considerations relative to last year.As always, your financial adviser can help you determine the mix of investments that may be best suited to helping you achieve your goals at a level of risk that is comfortable for you.
For information about how the fund performed during the reporting period, as well as market perspectives, we have provided a Discussion of Fund Performance.
Thank you for your continued confidence and support.
Jonathan R. Baum
Chairman and Chief Executive Officer
The Dreyfus Corporation
January 15, 2010
2

DISCUSSION OF FUND PERFORMANCE
For the period of January 1, 2009, through December 31, 2009, as provided by David Leduc, CFA, and Thomas Fahey, Co-Portfolio Managers
Fund and Market Performance Overview
For the 12-month period ended December 31, 2009, Dreyfus/Standish Global Fixed Income Fund’s Class I shares achieved a total return of 15.48%.1 In comparison, the Barclays Capital Global Aggregate (Hedged) Index (the “Index”), the fund’s benchmark, achieved a total return of 5.09% for the same period.2 On December 2, 2009, the fund introduced Class A shares and Class C shares, which produced total returns of 0.03% and –0.03%, respectively, through December 31, 2009.1 Higher yielding sectors of the global bond markets rallied during much of 2009 when signs of economic recovery boosted investor sentiment. Conversely, sovereign bonds of developed nations gave back some of the gains achieved in 2008 during a “flight to quality.”The fund’s Class I shares produced a higher return than its benchmark, primarily due to strong results from its sector allocation strategy and favorable security selections among corporate bonds and emerging market securities.
The Fund’s Investment Approach
The fund seeks to maximize total return while realizing a market level of income, consistent with preserving principal and liquidity, by normally investing at least 80% of its assets in U.S. dollar and non-U.S. dollar-denominated fixed-income securities of governments and companies located in various countries, including emerging markets. These may include high-grade and medium-grade government, corporate, mortgage-backed, asset-backed, high yield and emerging market debt securities.To protect the U.S. dollar value of the fund’s assets, we hedge most, but not necessarily all, of the portfolio’s foreign currency exposure.
The fund emphasizes rotation among undervalued countries, sectors, securities and currencies. In particular, we focus on securities with the most potential for added value, i.e., those involving potential for credit upgrades and unique structural characteristics.To identify these securities, we use macroeconomic research and quantitative analysis to allocate assets among countries and currencies based on a comparative evaluation of interest and inflation rate trends, government fiscal/monetary policy and credit quality of government debt.
The Fund 3
DISCUSSION OF FUND PERFORMANCE (continued)
Sustained Market Rally Erased Earlier Losses
2009 began in the midst of a global banking crisis and recession that produced steep declines among mortgage-backed, asset-backed, corporate-backed and emerging-market securities. In contrast, sovereign bonds of some developed nations, most notably U.S. Treasuries, had rallied during a “flight to quality.” The world’s central banks and government officials responded aggressively to the downturn by rescuing struggling corporations and enacting massive economic stimulus programs. Monetary authorities injected massive amounts of liquidity into the international banking system, and they maintained historically low short-term interest rates. In the United States, the overnight federal funds rate stood at an all-time low range of between 0% and 0.25% throughout the year.
Investor sentiment began to improve in March 2009 as it became clearer that these remedial measures were gaining traction, sparking sustained rallies that were particularly impressive for high yield bonds, investment-grade corporate bonds and emerging market securities. Conversely, U.S.Treasuries and sovereign bonds of other industrialized countries gave back some of their previous gains.
Sector Allocation Strategy Produced Strong Results
The fund began the year with underweighted exposure to sovereign debt and overweighted positions in investment-grade corporate bonds, high yield bonds and emerging market securities. The fund received particularly strong results from the emerging markets, where bonds in Brazil and Mexico gained value as interest rates declined.The fund also benefited from positions in emerging market currencies, which gained value relative to the U.S. dollar, euro, British pound and Japanese yen.
The fund’s holdings in the investment-grade corporate sector were focused primarily in the United States,Europe and the United Kingdom, including issuers in traditionally defensive industry groups, such as utilities and the senior debt of multinational banks. High yield positions included a diverse array of U.S. issuers with credit ratings toward the upper end of the below-investment-grade spectrum. Although the fund maintained underweighted exposure to sovereign bonds in developed markets, it held especially light positions in Greece, Ireland, Spain and other “peripheral” European nations due to heightened fiscal and competitive pressures.The fund began 2009 with modest exposure to mortgage-backed securities, but we gradually reduced that position after the sector had rallied amid massive levels of government support.
4
The fund’s interest rate strategies detracted mildly from relative performance, but it was not enough to offset strength in other areas.We generally set the fund’s average duration in a range that was slightly longer than industry averages, and we tended to focus on bonds with maturities of five years and 10 years.
Maintaining a Research-Intensive Process
As of the reporting period’s end, we have maintained the fund’s sector allocation strategy, as we believe that the emerging markets and corporate-backed bonds have room for further gains. However, we expect governments and central banks to pare back some of their remedial programs in 2010. Therefore, security selection may become a more critical determinant of fund performance, an environment to which our research-intensive approach may be particularly well suited.
| January 15, 2010 | |
| Foreign bonds are subject to special risks including exposure to currency fluctuations, | |
| changing political and economic conditions, and potentially less liquidity. The fixed income | |
| securities of issuers located in emerging markets can be more volatile and less liquid than | |
| those of issuers in more mature economies. | |
| Investments in foreign currencies are subject to the risk that those currencies will decline in | |
| value relative to the U.S. dollar, or, in the case of hedged positions, that the U.S. dollar will | |
| decline relative to the currency being hedged. Currency rates in foreign countries may | |
| fluctuate significantly over short periods of time. A decline in the value of foreign currencies | |
| relative to the U.S. dollar will reduce the value of securities held by the fund and | |
| denominated in those currencies. | |
| The fund may, but is not required to, use derivative instruments, such as options, futures and | |
| options on futures, forward contracts, swaps (including credit default swaps on corporate bonds and | |
| asset-backed securities), options on swaps, and other credit derivatives.A small investment in | |
| derivatives could have a potentially large impact on the fund’s performance.The use of derivatives | |
| involves risks different from, or possibly greater than, the risks associated with investing directly in | |
| the underlying assets. Credit default swaps and similar instruments involve greater risks than if the | |
| fund had invested in the reference obligation directly, since, in addition to general market risks, they | |
| are subject to illiquidity risk, counterparty risk and credit risks. | |
| Effective September 1, 2009, the single class shares of Dreyfus/Standish Global Fixed Income | |
| Fund were re-designated as Class I shares. | |
| 1 | Total return includes reinvestment of dividends and any capital gains paid. Past performance is no |
| guarantee of future results. Share price and investment return fluctuate such that upon redemption, | |
| fund shares may be worth more or less than their original cost. Return figure provided reflects the | |
| absorption of certain fund expenses by The Dreyfus Corporation pursuant to an undertaking in | |
| effect that may be extended, terminated or modified at any time. Had these expenses not been | |
| absorbed, the fund’s return would have been lower. | |
| 2 | SOURCE: Barclays Capital Inc. — Reflects reinvestment of dividends and, where applicable, |
| capital gain distributions.The Barclays Capital Global Aggregate (Hedged) Index provides a | |
| broad-based measure of the global investment-grade fixed income markets.The three major | |
| components of this index are the U.S.Aggregate, the Pan-European Aggregate, and the Asian- | |
| Pacific Aggregate Indices.The index also includes Eurodollar and Euro-Yen corporate bonds, | |
| Canadian Government securities, and USD investment-grade 144A securities. Index returns do | |
| not reflect fees and expenses associated with operating a mutual fund. | |
The Fund 5
FUND PERFORMANCE
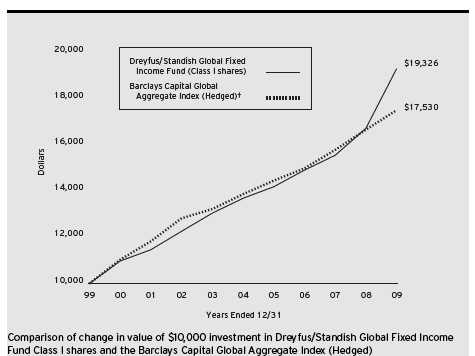
| † Source: Barclays Capital Inc. |
| Past performance is not predictive of future performance. |
| The above graph compares a $10,000 investment made in Class I shares of Dreyfus/Standish Global Fixed Income |
| Fund on 12/31/99 to a $10,000 investment made in the Barclays Capital Global Aggregate Index (Hedged) (the |
| “Index”) on that date.All dividends and capital gain distributions are reinvested. |
| Effective on September 1, 2009, the single class shares of Dreyfus/Standish Global Fixed Income Fund were re- |
| designated as Class I shares. Effective December 2, 2009, the fund implemented a multi-class structure and Class A |
| shares and Class C shares were adopted. |
| The fund’s performance shown in the line graph takes into account all applicable fees and expenses for Class I shares. |
| Performance for Class A and Class C shares will vary from the performance of Class I shares shown above due to |
| differences in charges and expenses.The Index provides a broad-based measure of the global investment-grade fixed |
| income markets.The three major components of this index are the U.S.Aggregate, the Pan-European Aggregate, and the |
| Asian-Pacific Aggregate Indices.The Index also includes Eurodollar and Euro-Yen corporate bonds, Canadian government |
| securities, and USD investment grade 144A securities. Unlike a mutual fund, the Index is not subject to charges, fees |
| and other expenses. Investors cannot invest directly in any index.These factors can contribute to the Index potentially |
| outperforming the fund. Further information relating to fund performance, including expense reimbursements, if applicable, |
| is contained in the Financial Highlights section of the prospectus and elsewhere in this report. |
6
| Average Annual Total Returns as of 12/31/09 | ||||
| Inception | ||||
| Date | 1 Year | 5 Years | 10 Years | |
| Class A shares | ||||
| with maximum sales charge (4.5%) | 12/2/09 | 10.34%†† | 6.14%†† | 6.33%†† |
| without sales charge | 12/2/09 | 15.52%†† | 7.12%†† | 6.81%†† |
| Class C shares | ||||
| with applicable redemption charge † | 12/2/09 | 14.45%†† | 7.11%†† | 6.81%†† |
| without redemption | 12/2/09 | 15.45%†† | 7.11%†† | 6.81%†† |
| Class I shares | 1/1/94 | 15.48% | 7.12% | 6.81% |
| Past performance is not predictive of future performance.The fund’s performance shown in the graph and table does not | |
| reflect the deduction of taxes that a shareholder would pay on fund distributions or the redemption of fund shares. | |
| † | The maximum contingent deferred sales charge for Class C shares is 1% for shares redeemed within one year of the |
| date of purchase. | |
| †† | The total return performance figures presented for Class A and Class C shares of the fund reflect the performance of |
| the fund’s Class I shares for periods prior to 12/2/09 (the inception date for Class A and Class C shares), adjusted | |
| to reflect the applicable sales load for that class. | |
The Fund 7
UNDERSTANDING YOUR FUND’S EXPENSES (Unaudited)
As a mutual fund investor, you pay ongoing expenses, such as management fees and other expenses. Using the information below, you can estimate how these expenses affect your investment and compare them with the expenses of the funds.You also may pay one-time transaction expenses, including sales charges (loads) and redemption fees, which are not shown in this section and would have resulted in higher total expenses. For more information, see your fund’s prospectus or talk to your financial advisor.
Review your fund’s expenses
The table below shows the expenses you would have paid on a $1,000 investment in Dreyfus/Standish Global Fixed Income Fund from July 1, 2009 to December 31, 2009. It also shows how much a $1,000 investment would be worth at the close of the period, assuming actual returns and expenses.
| Expenses and Value of a $1,000 Investment | |||
| assuming actual returns for the six months ended December 31, 2009† | |||
| Class A | Class C | Class I | |
| Expenses paid per $1,000†† | $ .74 | $ 1.36 | $ 3.42 |
| Ending value (after expenses) | $1,000.30 | $999.70 | $1,090.20 |
| COMPARING YOUR FUND’S EXPENSES |
| WITH THOSE OF OTHER FUNDS (Unaudited) |
Using the SEC’s method to compare expenses
The Securities and Exchange Commission (SEC) has established guidelines to help investors assess fund expenses. Per these guidelines, the table below shows your fund’s expenses based on a $1,000 investment, assuming a hypothetical 5% annualized return. You can use this information to compare the ongoing expenses (but not transaction expenses or total cost) of investing in the fund with those of other funds.All mutual fund shareholder reports will provide this information to help you make this comparison. Please note that you cannot use this information to estimate your actual ending account balance and expenses paid during the period.
| Expenses and Value of a $1,000 Investment | |||
| assuming a hypothetical 5% annualized return for the six months ended December 31, 2009††† | |||
| Class A | Class C | Class I | |
| Expenses paid per $1,000†††† | $ 4.58 | $ 8.39 | $ 3.31 |
| Ending value (after expenses) | $1,020.67 | $1,016.89 | $1,021.93 |
| † | From December 2, 2009 (commencement of initial offering) to December 31, 2009 for Class A and Class C shares. |
| †† | Expenses are equal to the fund’s annualized expense ratio of .90% for Class A and 1.65% for Class C, |
| multiplied by the average account value over the period, multiplied by 30/365 (to reflect the actual days in the | |
| period). Expenses are equal to the fund’s annualized expense ratio of .65% for Class I, multiplied by the average | |
| account value over the period, multiplied by 184/365 (to reflect the one-half year period). | |
| ††† | Please note that while Class A and Class C shares commenced operations on December 2, 2009, the Hypothetical |
| expenses paid during the period reflect projected activity for the full six month period for purposes of comparability.This | |
| projection assumes that annualized expense ratios were in effect during the period July 1, 2009 to December 31, 2009. | |
| †††† | Expenses are equal to the fund’s annualized expense ratio of .90% for Class A, 1.65% for Class C and |
| .65% for Class I, multiplied by the average account value over the period, multiplied by 184/365 (to reflect | |
| the one-half year period). |
8
| STATEMENT OF INVESTMENTS |
| December 31, 2009 |
| Coupon | Maturity | Principal | ||||
| Bonds and Notes—94.5% | Rate (%) | Date | Amount ($) | Value ($) | ||
| Australia—.5% | ||||||
| Rio Tinto Finance USA, | ||||||
| Gtd. Notes | 5.88 | 7/15/13 | 190,000 | 205,181 | ||
| Saint George Bank, | ||||||
| Sr. Unscd. Notes | EUR | 6.50 | 6/24/13 | 100,000 | a | 159,664 |
| 364,845 | ||||||
| Belgium—.4% | ||||||
| Belgium Kingdom, | ||||||
| Bonds, Ser. 44 | EUR | 5.00 | 3/28/34 | 210,000 | a | 323,673 |
| Bermuda—.1% | ||||||
| Holcim Capital, | ||||||
| Gtd. Notes | 6.88 | 9/29/39 | 100,000 | b,c | 105,358 | |
| Brazil—2.4% | ||||||
| Brazilian Government, | ||||||
| Unsub. Bonds | BRL | 12.50 | 1/5/16 | 2,675,000 | a | 1,743,897 |
| Canada—2.9% | ||||||
| Barrick Gold, | ||||||
| Sr. Unscd. Notes | 6.95 | 4/1/19 | 170,000 | 191,743 | ||
| Canadian National Railway, | ||||||
| Sr. Unscd. Notes | 5.55 | 3/1/19 | 225,000 | 240,841 | ||
| Husky Energy, | ||||||
| Sr. Unscd. Notes | 7.25 | 12/15/19 | 80,000 | 92,616 | ||
| Province of Ontario Canada, | ||||||
| Notes | CAD | 4.50 | 12/2/12 | 825,000 | a | 838,599 |
| Rogers Wireless, | ||||||
| Gtd. Notes | 7.50 | 3/15/15 | 45,000 | 52,617 | ||
| Teck Resources, | ||||||
| Sr. Scd. Notes | 10.25 | 5/15/16 | 60,000 | 70,200 | ||
| Teck Resources, | ||||||
| Sr. Scd. Notes | 10.75 | 5/15/19 | 370,000 | 444,000 | ||
| Trans-Canada Pipelines, | ||||||
| Sr. Unscd. Notes | 7.63 | 1/15/39 | 145,000 | 179,171 | ||
| 2,109,787 | ||||||
| Cayman Islands—.9% | ||||||
| Hutchison Whampoa International, | ||||||
| Gtd. Notes | 4.63 | 9/11/15 | 320,000 | c | 323,678 | |
| Petrobras International Finance, | ||||||
| Gtd. Notes | 5.75 | 1/20/20 | 170,000 | 173,789 | ||
| Vale Overseas, | ||||||
| Gtd. Notes | 6.88 | 11/10/39 | 170,000 | 171,993 | ||
| 669,460 | ||||||
The Fund 9
STATEMENT OF INVESTMENTS (continued)
| Coupon | Maturity | Principal | ||||
| Bonds and Notes (continued) | Rate (%) | Date | Amount ($) | Value ($) | ||
| Denmark—.8% | ||||||
| NYKREDIT, | ||||||
| Sub. Notes | EUR | 4.90 | 9/22/49 | 475,000 | a,d | 602,628 |
| France—4.6% | ||||||
| BNP Paribas, | ||||||
| Sr. Unscd. Notes | EUR | 3.25 | 3/27/12 | 100,000 | a | 146,450 |
| Carrefour, | ||||||
| Sr. Unscd. Notes | EUR | 5.13 | 10/10/14 | 50,000 | a | 77,580 |
| France Telecom, | ||||||
| Sr. Unscd. Notes | 5.38 | 7/8/19 | 170,000 | 179,543 | ||
| GDF Suez, | ||||||
| Sr. Unscd. Notes | EUR | 6.25 | 1/24/14 | 75,000 | a | 120,942 |
| Government of France, | ||||||
| Bonds | EUR | 4.00 | 10/25/14 | 750,000 | a | 1,142,651 |
| Government of France, | ||||||
| Bonds | EUR | 4.75 | 4/25/35 | 210,000 | a | 324,249 |
| Lafarge, | ||||||
| Notes | EUR | 5.50 | 12/16/19 | 75,000 | a | 106,735 |
| PPR, | ||||||
| Sr. Unscd. Notes | EUR | 8.63 | 4/3/14 | 205,000 | a | 347,091 |
| Societe Generale, | ||||||
| Sr. Unscd. Notes | EUR | 5.25 | 3/28/13 | 100,000 | a | 154,256 |
| Societe Generale, | ||||||
| Sub. Notes | EUR | 6.13 | 8/20/18 | 100,000 | a | 161,366 |
| Societe Generale, | ||||||
| Sub. Notes | EUR | 7.76 | 5/22/49 | 50,000 | a,d | 67,377 |
| Veolia Environnement, | ||||||
| Sr. Unscd. Notes | EUR | 4.88 | 5/28/13 | 65,000 | a | 98,375 |
| Veolia Environnement, | ||||||
| Sr. Unscd. Notes | EUR | 6.75 | 4/24/19 | 150,000 | a | 252,002 |
| Veolia Environnement, | ||||||
| Sr. Unscd. Notes | EUR | 6.13 | 11/25/33 | 130,000 | a | 202,838 |
| 3,381,455 | ||||||
| Germany—4.1% | ||||||
| Bayer, | ||||||
| Jr. Sub. Bonds | EUR | 5.00 | 7/29/05 | 105,000 | a,d | 139,384 |
| Bundesrepublik Deutschland, | ||||||
| Bonds, Ser. 03 | EUR | 4.50 | 1/4/13 | 205,000 | a | 316,650 |
| Bundesrepublik Deutschland, | ||||||
| Bonds, Ser. 05 | EUR | 4.00 | 1/4/37 | 390,000 | a | 544,943 |
10
| Coupon | Maturity | Principal | ||||
| Bonds and Notes (continued) | Rate (%) | Date | Amount ($) | Value ($) | ||
| Germany (continued) | ||||||
| Bundesrepublik Deutschland, | ||||||
| Bonds, Ser. 08 | EUR | 4.25 | 7/4/18 | 215,000 | a | 331,815 |
| Deutsche Bank, | ||||||
| Sr. Unscd. Notes | EUR | 5.13 | 8/31/17 | 200,000 | a | 309,181 |
| Eurohypo, | ||||||
| Bonds, Ser. 2212 | EUR | 4.50 | 1/21/13 | 370,000 | a,c | 563,021 |
| Heidelbergcement, | ||||||
| Sr. Unscd. Notes | EUR | 8.50 | 10/31/19 | 345,000 | a | 525,475 |
| Henkel & Co., | ||||||
| Sub. Bonds | EUR | 5.38 | 11/25/04 | 125,000 | a,d | 161,879 |
| KFW, | ||||||
| Gtd. Notes | 3.50 | 3/10/14 | 125,000 | 128,583 | ||
| 3,020,931 | ||||||
| Hong Kong—.5% | ||||||
| Hutchison Whampoa International, | ||||||
| Gtd. Notes | 7.63 | 4/9/19 | 285,000 | c | 328,602 | |
| Hungary—1.7% | ||||||
| Hungary Government, | ||||||
| Bonds, Ser. 17/B | HUF | 6.75 | 2/24/17 | 130,000,000 | a | 641,510 |
| Hungary Government, | ||||||
| Bonds, Ser. 19/A | HUF | 6.50 | 6/24/19 | 127,000,000 | a | 610,538 |
| 1,252,048 | ||||||
| Indonesia—.8% | ||||||
| Indonesia Government, | ||||||
| Notes | IDR | 11.50 | 9/15/19 | 5,000,000,000 | a | 586,262 |
| Ireland—.3% | ||||||
| Principal Financial | ||||||
| Global Funding II, | ||||||
| Sr. Scd. Notes | EUR | 4.50 | 1/26/17 | 200,000 | a | 254,546 |
| Italy—2.8% | ||||||
| Atlantia, | ||||||
| Gtd. Notes | EUR | 1.17 | 6/9/11 | 300,000 | a,d | 430,016 |
| Atlantia, | ||||||
| Gtd. Notes | EUR | 5.63 | 5/6/16 | 210,000 | a | 328,813 |
| Enel-Societa Per Azioni, | ||||||
| Notes | EUR | 5.63 | 6/21/27 | 120,000 | a | 183,169 |
| Finmeccanica, | ||||||
| Sr. Notes | EUR | 4.88 | 3/24/25 | 80,000 | a | 112,143 |
The Fund 11
STATEMENT OF INVESTMENTS (continued)
| Coupon | Maturity | Principal | ||||
| Bonds and Notes (continued) | Rate (%) | Date | Amount ($) | Value ($) | ||
| Italy (continued) | ||||||
| Telecom Italia, | ||||||
| Sr. Unscd. Notes | EUR | 5.25 | 3/17/55 | 200,000 | a | 239,997 |
| Telecom Italia, | ||||||
| Sr. Unscd. Notes | GBP | 5.63 | 12/29/15 | 300,000 | a | 493,674 |
| Telecom Italia, | ||||||
| Sr. Unscd. Notes | EUR | 8.25 | 3/21/16 | 135,000 | a | 237,307 |
| 2,025,119 | ||||||
| Japan—4.9% | ||||||
| Development Bank of Japan, | ||||||
| Gov’t Gtd. Notes | JPY | 1.05 | 6/20/23 | 27,000,000 | a | 263,452 |
| Japan Government, | ||||||
| Bonds, Ser. 8 | JPY | 1.00 | 6/10/16 | 130,000,000 | a | 1,346,471 |
| Japan Government, | ||||||
| Bonds, Ser. 11 | JPY | 1.70 | 6/20/33 | 195,100,000 | a | 1,894,174 |
| 3,504,097 | ||||||
| Luxembourg—2.2% | ||||||
| Enel Finance International, | ||||||
| Gtd. Notes | 5.70 | 1/15/13 | 295,000 | c | 318,595 | |
| Finmeccanica, | ||||||
| Gtd. Bonds | EUR | 5.25 | 1/21/22 | 225,000 | a | 329,695 |
| Holcim US Finance, | ||||||
| Notes | 6.00 | 12/30/19 | 140,000 | c | 145,999 | |
| Telecom Italia Financial, | ||||||
| Gtd. Notes | EUR | 7.50 | 4/20/11 | 60,000 | a | 92,194 |
| Tyco International Finance, | ||||||
| Gtd. Notes | 4.13 | 10/15/14 | 65,000 | 66,516 | ||
| Wind Acquisition Finance, | ||||||
| Sr. Notes | 11.75 | 7/15/17 | 300,000 | c | 329,250 | |
| Wind Acquisition Finance, | ||||||
| Sr. Notes | EUR | 11.75 | 7/15/17 | 220,000 | a,c | 344,553 |
| 1,626,802 | ||||||
| Mexico—1.9% | ||||||
| Mexican Bonos, | ||||||
| Bonds, Ser. M 10 | MXN | 7.75 | 12/14/17 | 17,900,000 | a | 1,362,819 |
| Netherlands—6.2% | ||||||
| Daimler | ||||||
| International Finance, | ||||||
| Gtd. Notes | EUR | 6.88 | 6/10/11 | 195,000 | a | 297,510 |
12
| Coupon | Maturity | Principal | ||||
| Bonds and Notes (continued) | Rate (%) | Date | Amount ($) | Value ($) | ||
| Netherlands (continued) | ||||||
| Deutsche Telekom | ||||||
| International Finance, | ||||||
| Gtd. Notes | EUR | 5.75 | 4/14/15 | 180,000 | a | 285,296 |
| Diageo Capital, | ||||||
| Gtd. Notes | EUR | 5.50 | 7/1/13 | 195,000 | a | 303,739 |
| E.ON International Finance, | ||||||
| Gtd. Notes | EUR | 4.88 | 1/28/14 | 100,000 | a | 154,353 |
| E.ON International Finance, | ||||||
| Gtd. Notes | EUR | 5.50 | 10/2/17 | 130,000 | a | 205,717 |
| Elsevier Finance, | ||||||
| Gtd. Notes | EUR | 6.50 | 4/2/13 | 100,000 | a | 158,698 |
| ING Bank, | ||||||
| Sub. Notes | EUR | 5.50 | 1/4/12 | 110,000 | a | 163,226 |
| Koninklijke KPN, | ||||||
| Sr. Unscd. Notes | EUR | 4.75 | 1/17/17 | 75,000 | a | 111,015 |
| Koninklijke KPN, | ||||||
| Sr. Unscd. Bonds | EUR | 6.50 | 1/15/16 | 100,000 | a | 162,049 |
| Koninklijke KPN, | ||||||
| Sr. Unscd. Bonds | 8.00 | 10/1/10 | 180,000 | 189,034 | ||
| Netherlands Government, | ||||||
| Bonds | EUR | 4.00 | 7/15/18 | 825,000 | a | 1,232,673 |
| Netherlands Government, | ||||||
| Bonds | EUR | 4.00 | 1/15/37 | 320,000 | a | 442,440 |
| Repsol International Finance, | ||||||
| Gtd. Notes | EUR | 4.63 | 10/8/14 | 100,000 | a | 151,829 |
| RWE Finance, | ||||||
| Sr. Unscd. Notes | EUR | 6.63 | 1/31/19 | 200,000 | a | 343,295 |
| Shell International Finance, | ||||||
| Gtd. Notes | 6.38 | 12/15/38 | 135,000 | 152,730 | ||
| Telefonica Europe BV, | ||||||
| Gtd. Notes | EUR | 5.13 | 2/14/13 | 55,000 | a | 84,479 |
| 4,438,083 | ||||||
| Norway—.6% | ||||||
| DNB Nor Bank, | ||||||
| Sub. Notes | EUR | 0.92 | 5/30/17 | 100,000 | a,d | 134,590 |
| Yara International ASA, | ||||||
| Notes | 7.88 | 6/11/19 | 270,000 | c | 308,804 | |
| 443,394 | ||||||
The Fund 13
STATEMENT OF INVESTMENTS (continued)
| Coupon | Maturity | Principal | ||||
| Bonds and Notes (continued) | Rate (%) | Date | Amount ($) | Value ($) | ||
| Poland—.4% | ||||||
| Poland Government, | ||||||
| Bonds, Ser. 0413 | PLN | 5.25 | 4/25/13 | 925,000 | a | 322,659 |
| Qatar—.8% | ||||||
| State of Qatar, | ||||||
| Sr. Notes | 4.00 | 1/20/15 | 450,000 | c | 453,375 | |
| State of Qatar, | ||||||
| Sr. Notes | 5.15 | 4/9/14 | 150,000 | c | 158,625 | |
| 612,000 | ||||||
| Russia—.8% | ||||||
| Russian Federation, | ||||||
| Sr. Unscd. Bonds | 7.50 | 3/31/30 | 493,500 | d | 561,973 | |
| South Korea—.2% | ||||||
| Export-Import Bank of Korea, | ||||||
| Sr. Unscd. Notes | EUR | 5.75 | 5/22/13 | 110,000 | a | 167,680 |
| Spain—1.4% | ||||||
| Santander International, | ||||||
| Bank Gtd. Notes | EUR | 5.63 | 2/14/12 | 100,000 | a | 153,064 |
| Spanish Government, | ||||||
| Sr. Unsub. Bonds | EUR | 4.10 | 7/30/18 | 300,000 | a | 439,812 |
| Telefonica Emisiones, | ||||||
| Gtd. Notes | EUR | 4.69 | 11/11/19 | 250,000 | a | 361,840 |
| Telefonica Emisiones, | ||||||
| Gtd. Notes | EUR | 5.50 | 4/1/16 | 50,000 | a | 77,858 |
| 1,032,574 | ||||||
| Supranational—.3% | ||||||
| Eurasian Development Bank, | ||||||
| Sr. Unscd. Notes | 7.38 | 9/29/14 | 190,000 | c | 198,313 | |
| Sweden—2.5% | ||||||
| Svenska Handelsbanken, | ||||||
| Sub. Notes | 0.40 | 3/15/16 | 175,000 | d | 170,333 | |
| Svenska Handelsbanken, | ||||||
| Sub. Notes | EUR | 4.19 | 12/16/49 | 370,000 | a,d | 470,741 |
| Swedish Government, | ||||||
| Bonds | SEK | 4.25 | 3/12/19 | 8,080,000 | a | 1,214,213 |
| 1,855,287 | ||||||
| Switzerland—1.5% | ||||||
| Credit Suisse Capital, | ||||||
| Bank Gtd. Notes | EUR | 6.91 | 11/7/49 | 200,000 | a,d | 285,993 |
14
| Coupon | Maturity | Principal | ||||
| Bonds and Notes (continued) | Rate (%) | Date | Amount ($) | Value ($) | ||
| Switzerland (continued) | ||||||
| Credit Suisse Capital, | ||||||
| Bank Gtd. Notes | EUR | 7.97 | 12/29/49 | 125,000 | a,d | 179,641 |
| Credit Suisse London, | ||||||
| Sr. Unscd. Notes | EUR | 6.13 | 5/16/14 | 105,000 | a | 167,126 |
| Credit Suisse New York, | ||||||
| Sr. Unscd. Notes | 5.50 | 5/1/14 | 190,000 | 206,387 | ||
| Credit Suisse New York, | ||||||
| Sr. Unscd. Notes | 5.30 | 8/13/19 | 250,000 | 257,225 | ||
| 1,096,372 | ||||||
| United Kingdom—8.5% | ||||||
| ASIF III Jersey, | ||||||
| Sr. Scd. Notes | EUR | 5.50 | 3/7/11 | 225,000 | a | 318,131 |
| Barclays Bank, | ||||||
| Sr. Unscd. Notes | 5.20 | 7/10/14 | 270,000 | 286,490 | ||
| Barclays Bank, | ||||||
| Sr. Unscd. Notes | 6.75 | 5/22/19 | 250,000 | 279,351 | ||
| Barclays Bank, | ||||||
| Sub. Notes | EUR | 4.88 | 12/15/49 | 170,000 | a,d | 155,970 |
| Barclays Bank, | ||||||
| Sub. Notes | EUR | 6.00 | 1/23/18 | 215,000 | a | 326,769 |
| BAT International Finance, | ||||||
| Gtd. Notes | EUR | 5.38 | 6/29/17 | 110,000 | a | 169,551 |
| BAT International Finance, | ||||||
| Gtd. Notes | GBP | 6.38 | 12/12/19 | 190,000 | a | 324,839 |
| Diageo Capital, | ||||||
| Gtd. Notes | 7.38 | 1/15/14 | 135,000 | 156,308 | ||
| FCE Bank, | ||||||
| Sr. Unscd. Notes | EUR | 7.13 | 1/16/12 | 450,000 | a | 635,420 |
| HSBC Holdings, | ||||||
| Sub. Notes | EUR | 6.25 | 3/19/18 | 100,000 | a | 159,779 |
| National Grid, | ||||||
| Sr. Unscd. Notes | 6.30 | 8/1/16 | 75,000 | 81,677 | ||
| National Grid, | ||||||
| Sr. Unscd. Notes | EUR | 5.00 | 7/2/18 | 110,000 | a | 165,076 |
| National Grid Gas, | ||||||
| Gtd. Notes | GBP | 7.00 | 12/16/24 | 70,000 | a | 126,442 |
| Reed Elsevier Investment, | ||||||
| Gtd. Notes | GBP | 7.00 | 12/11/17 | 100,000 | a | 177,796 |
The Fund 15
STATEMENT OF INVESTMENTS (continued)
| Coupon | Maturity | Principal | ||||
| Bonds and Notes (continued) | Rate (%) | Date | Amount ($) | Value ($) | ||
| United Kingdom (continued) | ||||||
| Royal Bank of Scotland, | ||||||
| Sr. Unscd. Notes | EUR | 5.75 | 5/21/14 | 215,000 | a | 324,914 |
| United Kingdom Gilt, | ||||||
| Bonds | GBP | 2.25 | 3/7/14 | 350,000 | a | 555,553 |
| United Kingdom Gilt, | ||||||
| Bonds | GBP | 4.25 | 3/7/36 | 820,000 | a | 1,281,548 |
| United Kingdom Gilt, | ||||||
| Bonds | GBP | 5.00 | 3/7/12 | 205,000 | a | 355,363 |
| Vodafone Group, | ||||||
| Notes | GBP | 8.13 | 11/26/18 | 140,000 | a | 271,491 |
| 6,152,468 | ||||||
| United States—39.5% | ||||||
| AES, | ||||||
| Sr. Unscd. Notes | 7.75 | 10/15/15 | 165,000 | 168,300 | ||
| American Express, | ||||||
| Sr. Unscd. Notes | 7.25 | 5/20/14 | 460,000 | 519,542 | ||
| Anadarko Petroleum, | ||||||
| Sr. Unscd. Notes | 8.70 | 3/15/19 | 140,000 | 174,438 | ||
| Anheuser-Busch | ||||||
| InBev Worldwide, | ||||||
| Gtd. Notes | 8.20 | 1/15/39 | 215,000 | c | 272,735 | |
| Aramark, | ||||||
| Gtd. Notes | 8.50 | 2/1/15 | 275,000 | 284,625 | ||
| AT&T, | ||||||
| Sr. Unscd. Notes | 5.80 | 2/15/19 | 250,000 | 266,964 | ||
| AT&T, | ||||||
| Sr. Unscd. Notes | 6.40 | 5/15/38 | 120,000 | 123,729 | ||
| AT&T, | ||||||
| Sr. Unscd. Notes | EUR | 6.13 | 4/2/15 | 100,000 | a | 160,723 |
| Autozone, | ||||||
| Sr. Unscd. Notes | 5.75 | 1/15/15 | 305,000 | 331,134 | ||
| Baker Hughes, | ||||||
| Sr. Unscd. Notes | 7.50 | 11/15/18 | 135,000 | 161,417 | ||
| Ball, | ||||||
| Gtd. Notes | 7.38 | 9/1/19 | 295,000 | 304,588 | ||
| Bank of America, | ||||||
| Sr. Notes | 6.50 | 8/1/16 | 220,000 | 236,888 | ||
| Bank of America, | ||||||
| Sr. Unscd. Notes | 4.90 | 5/1/13 | 225,000 | 233,438 | ||
16
| Coupon | Maturity | Principal | ||||
| Bonds and Notes (continued) | Rate (%) | Date | Amount ($) | Value ($) | ||
| United States (continued) | ||||||
| Bank of America, | ||||||
| Sr. Unscd. Notes | 7.38 | 5/15/14 | 195,000 | 221,478 | ||
| Bank of America, | ||||||
| Sub. Notes | EUR | 4.00 | 3/28/18 | 200,000 | a,d | 259,853 |
| Baxter International, | ||||||
| Sr. Unscd. Notes | 4.00 | 3/1/14 | 135,000 | 139,350 | ||
| Bear Stearns Commercial | ||||||
| Mortgage Securities, | ||||||
| Ser. 2007-T26, Cl. A4 | 5.47 | 1/12/45 | 150,000 | d | 142,253 | |
| Bear Stearns Commercial | ||||||
| Mortgage Securities, | ||||||
| Ser. 2007-T28, Cl. A4 | 5.74 | 9/11/42 | 85,000 | d | 82,033 | |
| BMW US Capital, | ||||||
| Gtd. Notes | EUR | 5.00 | 5/28/15 | 200,000 | a | 305,387 |
| BNP Paribas, | ||||||
| Sub. Bonds | EUR | 5.87 | 10/16/49 | 195,000 | a,d | 251,588 |
| Bombardier, | ||||||
| Sr. Unscd. Notes | 6.30 | 5/1/14 | 100,000 | c | 99,500 | |
| Capital One Bank USA, | ||||||
| Sub. Notes | 8.80 | 7/15/19 | 250,000 | 295,911 | ||
| Capital One Capital VI, | ||||||
| Gtd. Notes | 8.88 | 5/15/40 | 150,000 | 160,875 | ||
| Cargill, | ||||||
| Sr. Unscd. Notes | EUR | 4.38 | 4/29/13 | 200,000 | a | 297,846 |
| CC Holdings, | ||||||
| Sr. Scd. Notes | 7.75 | 5/1/17 | 310,000 | c | 331,700 | |
| CenturyTel, | ||||||
| Sr. Notes, Ser. Q | 6.15 | 9/15/19 | 120,000 | 122,907 | ||
| Chesapeake Energy, | ||||||
| Gtd. Notes | 7.50 | 9/15/13 | 220,000 | b | 224,950 | |
| Chesapeake Energy, | ||||||
| Gtd. Notes | EUR | 6.25 | 1/15/17 | 495,000 | a | 649,290 |
| Citigroup, | ||||||
| Sr. Unscd. Notes | 6.13 | 5/15/18 | 695,000 | 699,891 | ||
| Citigroup Commercial | ||||||
| Mortgage Trust, | ||||||
| Ser. 2007-C6, Cl. A4 | 5.70 | 12/10/49 | 255,000 | d | 228,078 | |
| Clear Channel Worldwide, | ||||||
| Sr. Notes | 9.25 | 12/15/17 | 20,000 | c | 20,500 | |
The Fund 17
STATEMENT OF INVESTMENTS (continued)
| Coupon | Maturity | Principal | |||
| Bonds and Notes (continued) | Rate (%) | Date | Amount ($) | Value ($) | |
| United States (continued) | |||||
| Clear Channel Worldwide, | |||||
| Sr. Notes | 9.25 | 12/15/17 | 265,000 | c | 274,275 |
| Columbus Southern Power, | |||||
| Sr. Unscd. Notes | 6.05 | 5/1/18 | 70,000 | 73,884 | |
| Consumers Energy, | |||||
| First Mortgage Bonds | 6.70 | 9/15/19 | 115,000 | b | 129,880 |
| Consumers Energy, | |||||
| First Mortgage Bonds, Ser. D | 5.38 | 4/15/13 | 140,000 | 150,436 | |
| Consumers Energy, | |||||
| First Mortgage Bonds, Ser. P | 5.50 | 8/15/16 | 45,000 | 47,325 | |
| CSC Holdings, | |||||
| Sr. Unscd. Notes | 8.50 | 4/15/14 | 305,000 | c | 326,350 |
| Delhaize Group, | |||||
| Gtd. Notes | 6.50 | 6/15/17 | 300,000 | 326,293 | |
| DirecTV Holdings, | |||||
| Gtd. Notes | 5.88 | 10/1/19 | 145,000 | c | 147,751 |
| Discover Financial Services, | |||||
| Sr. Unscd. Notes | 10.25 | 7/15/19 | 180,000 | 210,819 | |
| Discovery Communications, | |||||
| Gtd. Notes | 5.63 | 8/15/19 | 190,000 | 196,544 | |
| Dish DBS, | |||||
| Gtd. Notes | 7.75 | 5/31/15 | 320,000 | 336,800 | |
| Dow Chemical, | |||||
| Sr. Unscd. Notes | 8.55 | 5/15/19 | 265,000 | 316,713 | |
| Echostar DBS, | |||||
| Gtd. Notes | 7.13 | 2/1/16 | 105,000 | 107,756 | |
| El Paso, | |||||
| Sr. Unscd. Notes | 7.00 | 6/15/17 | 335,000 | 333,925 | |
| Energy Transfer Partners, | |||||
| Sr. Unscd. Notes | 8.50 | 4/15/14 | 175,000 | 202,186 | |
| Enterprise Products Operations, | |||||
| Notes | 6.13 | 10/15/39 | 325,000 | 315,025 | |
| EQT, | |||||
| Sr. Unscd. Notes | 8.13 | 6/1/19 | 135,000 | 156,239 | |
| First Energy Solutions, | |||||
| Gtd. Notes | 4.80 | 2/15/15 | 205,000 | b | 209,478 |
| Freeport-McMoRan Copper & Gold, | |||||
| Sr. Unscd. Notes | 8.38 | 4/1/17 | 489,000 | 536,189 |
18
| Coupon | Maturity | Principal | ||||
| Bonds and Notes (continued) | Rate (%) | Date | Amount ($) | Value ($) | ||
| United States (continued) | ||||||
| General Electric Capital, | ||||||
| Sr. Unscd. Notes | 5.88 | 1/14/38 | 285,000 | 264,744 | ||
| General Electric Capital, | ||||||
| Sub. Bonds | EUR | 4.63 | 9/15/66 | 175,000 | a,d | 190,662 |
| Georgia-Pacific, | ||||||
| Gtd. Notes | 7.00 | 1/15/15 | 120,000 | c | 122,100 | |
| Georgia-Pacific, | ||||||
| Gtd. Notes | 7.13 | 1/15/17 | 206,000 | c | 209,605 | |
| GMAC Commercial | ||||||
| Mortgage Securities, | ||||||
| Ser. 2003-C3, Cl. A2 | 4.22 | 4/10/40 | 71,787 | 72,329 | ||
| GMAC Commercial | ||||||
| Mortgage Securities, | ||||||
| Ser. 2002-C2, Cl. A2 | 5.39 | 10/15/38 | 144,702 | 148,659 | ||
| Goldman Sachs Group, | ||||||
| Sr. Unscd. Notes | 7.50 | 2/15/19 | 420,000 | 490,468 | ||
| Goodyear Tire & Rubber, | ||||||
| Sr. Unscd. Notes | 10.50 | 5/15/16 | 150,000 | 166,500 | ||
| Harley-Davidson Funding, | ||||||
| Gtd. Notes | 5.75 | 12/15/14 | 325,000 | c | 330,314 | |
| HCA, | ||||||
| Sr. Scd. Notes | 7.88 | 2/15/20 | 640,000 | c | 668,000 | |
| HSBC Capital Funding, | ||||||
| Gtd. Bonds | EUR | 5.37 | 3/24/49 | 370,000 | a,d | 449,525 |
| IBM, | ||||||
| Sr. Unscd. Notes | 5.60 | 11/30/39 | 110,000 | 111,033 | ||
| IBM, | ||||||
| Sr. Unscd. Notes | EUR | 6.63 | 1/30/14 | 100,000 | a | 163,206 |
| Ipalco Enterprises, | ||||||
| Sr. Scd. Notes | 7.25 | 4/1/16 | 270,000 | c | 272,025 | |
| Iron Mountain, | ||||||
| Sr. Sub. Notes | 8.38 | 8/15/21 | 295,000 | 306,063 | ||
| JPMorgan Chase & Co., | ||||||
| Sr. Unscd. Notes | 4.75 | 5/1/13 | 225,000 | 237,675 | ||
| JPMorgan Chase & Co., | ||||||
| Sr. Unscd. Notes | EUR | 5.25 | 5/8/13 | 150,000 | a | 231,331 |
| JPMorgan Chase & Co., | ||||||
| Sr. Unscd. Notes | 6.30 | 4/23/19 | 400,000 | 440,814 | ||
The Fund 19
STATEMENT OF INVESTMENTS (continued)
| Coupon | Maturity | Principal | ||||
| Bonds and Notes (continued) | Rate (%) | Date | Amount ($) | Value ($) | ||
| United States (continued) | ||||||
| JPMorgan Chase Commercial | ||||||
| Mortgage Securities, | ||||||
| Ser. 2009-IWST, Cl. A2 | 5.63 | 12/5/27 | 680,000 | c | 674,961 | |
| Kinder Morgan Energy Partners, | ||||||
| Sr. Unscd. Notes | 5.80 | 3/1/21 | 25,000 | b | 25,839 | |
| Kinder Morgan | ||||||
| Energy Partners, | ||||||
| Sr. Unscd. Notes | 6.85 | 2/15/20 | 265,000 | 294,503 | ||
| Kraft Foods, | ||||||
| Sr. Unscd. Notes | 6.88 | 2/1/38 | 115,000 | 121,063 | ||
| Kraft Foods, | ||||||
| Sr. Unscd. Notes | EUR | 6.25 | 3/20/15 | 150,000 | a | 236,099 |
| Lamar Media, | ||||||
| Gtd. Notes | 6.63 | 8/15/15 | 302,000 | 294,450 | ||
| Levi Strauss & Co., | ||||||
| Sr. Unscd. Notes | EUR | 8.63 | 4/1/13 | 100,000 | a | 144,788 |
| Marathon Oil, | ||||||
| Sr. Unscd. Notes | 7.50 | 2/15/19 | 100,000 | 115,607 | ||
| Meccanica Holdings USA, | ||||||
| Gtd. Notes | 7.38 | 7/15/39 | 125,000 | c | 140,785 | |
| Merrill Lynch Mortgage Trust, | ||||||
| Ser. 2005-CIP1, Cl. A2 | 4.96 | 8/12/10 | 115,000 | 115,373 | ||
| Merrill Lynch/Countrywide | ||||||
| Commercial Mortgage Trust, | ||||||
| Ser. 2006-2, Cl. A4 | 6.10 | 6/12/46 | 155,000 | d | 152,459 | |
| Metropolitan Life | ||||||
| Global Funding I, | ||||||
| Sr. Scd. Notes | 5.13 | 4/10/13 | 300,000 | c | 318,056 | |
| Metropolitan Life | ||||||
| Global Funding I, | ||||||
| Sr. Scd. Notes | 5.13 | 6/10/14 | 535,000 | c | 566,750 | |
| MGM Mirage, | ||||||
| Sr. Scd. Notes | 11.13 | 11/15/17 | 315,000 | c | 350,438 | |
| Morgan Stanley, | ||||||
| Sr. Unscd. Notes | EUR | 5.50 | 10/2/17 | 115,000 | a | 168,784 |
| Morgan Stanley, | ||||||
| Sr. Unscd. Notes | 7.30 | 5/13/19 | 305,000 | 343,085 | ||
20
| Coupon | Maturity | Principal | |||
| Bonds and Notes (continued) | Rate (%) | Date | Amount ($) | Value ($) | |
| United States (continued) | |||||
| Morgan Stanley Capital I, | |||||
| Ser. 2007-T27, Cl. A4 | 5.80 | 6/11/42 | 35,000 | d | 33,860 |
| Morgan Stanley Capital I, | |||||
| Ser. 2006-IQ12, Cl. A1 | 5.26 | 12/15/43 | 76,834 | 78,546 | |
| Mosaic, | |||||
| Sr. Unscd. Notes | 7.38 | 12/1/14 | 130,000 | c | 139,203 |
| Newfield Exploration, | |||||
| Sr. Sub. Notes | 7.13 | 5/15/18 | 25,000 | 25,375 | |
| News America, | |||||
| Gtd. Notes | 6.15 | 3/1/37 | 210,000 | 209,612 | |
| News America, | |||||
| Sr. Gtd. Unscd. Notes | 6.90 | 3/1/19 | 155,000 | 174,951 | |
| Nordic Telephone Holdings, | |||||
| Sr. Scd. Bonds | 8.88 | 5/1/16 | 90,000 | c | 95,625 |
| Norfolk Southern, | |||||
| Sr. Unscd. Notes | 5.75 | 1/15/16 | 135,000 | 143,805 | |
| NRG Energy, | |||||
| Gtd. Notes | 7.38 | 1/15/17 | 325,000 | 326,625 | |
| Pacific Gas & Electric, | |||||
| Sr. Unscd. Notes | 8.25 | 10/15/18 | 90,000 | 110,073 | |
| Peabody Energy, | |||||
| Gtd. Notes | 7.38 | 11/1/16 | 210,000 | 217,613 | |
| Peabody Energy, | |||||
| Gtd. Notes, Ser. B | 6.88 | 3/15/13 | 95,000 | 96,544 | |
| Penn National Gaming, | |||||
| Sr. Sub. Notes | 8.75 | 8/15/19 | 315,000 | c | 323,663 |
| Pepsico, | |||||
| Sr. Unscd. Notes | 7.90 | 11/1/18 | 125,000 | 153,661 | |
| Petrohawk Energy, | |||||
| Gtd. Notes | 7.88 | 6/1/15 | 55,000 | 55,825 | |
| PetroHawk Energy, | |||||
| Gtd. Notes | 9.13 | 7/15/13 | 45,000 | 47,250 | |
| Petrohawk Energy, | |||||
| Gtd. Notes | 10.50 | 8/1/14 | 195,000 | 214,013 | |
| PFIZER, | |||||
| Sr. Unscd. Notes | 5.35 | 3/15/15 | 215,000 | 235,243 |
The Fund 21
STATEMENT OF INVESTMENTS (continued)
| Coupon | Maturity | Principal | ||||
| Bonds and Notes (continued) | Rate (%) | Date | Amount ($) | Value ($) | ||
| United States (continued) | ||||||
| Philip Morris International, | ||||||
| Sr. Unscd. Notes | 5.65 | 5/16/18 | 125,000 | 131,667 | ||
| Philip Morris International, | ||||||
| Sr. Unscd. Notes | 6.88 | 3/17/14 | 135,000 | 153,112 | ||
| Plains All American Pipeline, | ||||||
| Gtd. Notes | 8.75 | 5/1/19 | 65,000 | 76,768 | ||
| Plains All | ||||||
| American Pipeline, | ||||||
| Sr. Unscd. Notes | 4.25 | 9/1/12 | 300,000 | 309,789 | ||
| Procter & Gamble, | ||||||
| Sr. Unscd. Notes | EUR | 5.13 | 10/24/17 | 105,000 | a | 164,870 |
| Prudential Financial, | ||||||
| Sr. Unscd. Notes | 4.75 | 9/17/15 | 322,000 | 326,918 | ||
| Reed Elsevier Capital, | ||||||
| Gtd. Notes | 4.63 | 6/15/12 | 320,000 | 332,824 | ||
| Reed Elsevier Capital, | ||||||
| Gtd. Notes | 8.63 | 1/15/19 | 110,000 | 134,064 | ||
| Reynolds Group Escrow, | ||||||
| Sr. Scd. Notes | EUR | 7.75 | 10/15/16 | 235,000 | a,c | 343,621 |
| Schering-Plough, | ||||||
| Sr. Unscd. Notes | EUR | 5.00 | 10/1/10 | 50,000 | a | 73,621 |
| Schering-Pough, | ||||||
| Sr. Unscd. Notes | EUR | 5.38 | 10/1/14 | 140,000 | a | 219,641 |
| Simon Property Group, | ||||||
| Sr. Unscd. Notes | 6.75 | 5/15/14 | 265,000 | 282,672 | ||
| Staples, | ||||||
| Gtd. Notes | 9.75 | 1/15/14 | 270,000 | b | 329,263 | |
| Sungard Data Systems, | ||||||
| Gtd. Notes | 10.63 | 5/15/15 | 45,000 | b | 49,781 | |
| SUPERVALU, | ||||||
| Sr. Unscd. Notes | 8.00 | 5/1/16 | 125,000 | 127,500 | ||
| Time Warner Cable, | ||||||
| Gtd. Debs | 6.75 | 6/15/39 | 280,000 | 294,206 | ||
22
| Coupon | Maturity | Principal | |||
| Bonds and Notes (continued) | Rate (%) | Date | Amount ($) | Value ($) | |
| United States (continued) | |||||
| Time Warner Cable, | |||||
| Gtd. Notes | 8.75 | 2/14/19 | 140,000 | 170,908 | |
| Verizon Communications, | |||||
| Sr. Unscd. Notes | 6.10 | 4/15/18 | 245,000 | 266,729 | |
| Verizon Communications, | |||||
| Sr. Unscd. Notes | 7.35 | 4/1/39 | 115,000 | 133,849 | |
| Wachovia Bank Commercial | |||||
| Mortgage Trust, | |||||
| Ser. 2005-C16, Cl. A2 | 4.38 | 10/15/41 | 66,560 | 67,181 | |
| Wachovia Bank Commercial | |||||
| Mortgage Trust, | |||||
| Ser. 2007-C34, Cl. A3 | 5.68 | 5/15/46 | 100,000 | 88,273 | |
| Waste Management, | |||||
| Gtd. Notes | 7.38 | 3/11/19 | 280,000 | 323,650 | |
| Wells Fargo, | |||||
| Sr. Unscd. Notes | 4.38 | 1/31/13 | 225,000 | 233,870 | |
| WM Covered Bond Program, | |||||
| Notes | EUR | 4.00 | 9/27/16 | 235,000 a | 331,216 |
| 28,755,352 | |||||
| Total Bonds and Notes | |||||
| (cost $64,206,225) | 68,898,484 | ||||
| Short-Term Investments—.5% | |||||
| U.S. Treasury Bills; | |||||
| 0.06%, 1/14/10 | |||||
| (cost $359,991) | 360,000 e | 359,992 | |||
| Other Investment—2.4% | Shares | Value ($) | |||
| Registered Investment Company; | |||||
| Dreyfus Institutional Preferred | |||||
| Plus Money Market Fund | |||||
| (cost $1,767,084) | 1,767,084 f | 1,767,084 | |||
The Fund 23
STATEMENT OF INVESTMENTS (continued)
| Investment of Cash Collateral | ||
| for Securities Loaned—1.0% | Shares | Value ($) |
| Registered Investment Company; | ||
| Dreyfus Institutional Cash Advantage Fund | ||
| (cost $714,299) | 714,299 f | 714,299 |
| Total Investments (cost $67,047,599) | 98.4% | 71,739,859 |
| Cash and Receivables (Net) | 1.6% | 1,189,875 |
| Net Assets | 100.0% | 72,929,734 |
| a Principal amount stated in U.S. Dollars unless otherwise noted. |
| BRL—Brazilian Real |
| CAD—Canadian Dollar |
| EUR—Euro |
| GBP—British Pound |
| HUF—Hungary Forint |
| IDR—Indonesian Rupiah |
| JPY—JapaneseYen |
| MXN—Mexican New Peso |
| PLN— Polish Zloty |
| SEK—Swedish Krona |
| b Security, or portion thereof, on loan.At December 31, 2009, the total market value of the fund’s securities on loan is |
| $682,937 and the total market value of the collateral held by the fund is $714,299. |
| c Securities exempt from registration under Rule 144A of the Securities Act of 1933.These securities may be resold in |
| transactions exempt from registration, normally to qualified institutional buyers.At December 31, 2009, these |
| securities had a total market value of $9,606,130 or 13.2% of net assets. |
| d Variable rate security—interest rate subject to periodic change. |
| e Held by broker at collateral for open financial futures and options positions. |
| f Investment in affiliated money market mutual fund. |
| Portfolio Summary (Unaudited)† | |||
| Value (%) | Value (%) | ||
| Corporate Bonds | 64.5 | Commercial Mortgage-Backed | 2.6 |
| Foreign/Governmental | 27.4 | ||
| Short-Term/Money Market Investments | 3.9 | 98.4 | |
| † Based on net assets. | |||
| See notes to financial statements. | |||
24
| STATEMENT OF FINANCIAL FUTURES |
| December 31, 2009 |
| Unrealized | ||||
| Market Value | Appreciation | |||
| Covered by | (Depreciation) | |||
| Contracts | Contracts ($) | Expiration | at 12/31/2009 ($) | |
| Financial Futures Short | ||||
| 10 Year Long Glit | 2 | (369,718) | March 2010 | 3,471 |
| U.S. Treasury 10 Year Notes | 108 | (12,468,937) | March 2010 | 312,183 |
| U.S. Treasury Long Bond | 7 | (807,625) | March 2010 | 50,192 |
| Financial Futures Long | ||||
| EURO—Bobl | 7 | 1,160,629 | March 2010 | (7,575) |
| EURO—Bund | 4 | 694,927 | March 2010 | (7,178) |
| Japanese Yen 10 Year Bond | 3 | 4,499,919 | March 2010 | (4,327) |
| U.S. Treasury 2 Year Notes | 7 | 1,513,859 | March 2010 | (8,215) |
| U.S. Treasury 5 Year Notes | 3 | 343,148 | March 2010 | (6,032) |
| Gross Unrealized Appreciation | 365,846 | |||
| Gross Unrealized Depreciation | (33,327) | |||
| See notes to financial statements. | ||||
| STATEMENT OF OPTIONS WRITTEN |
| December 31, 2009 |
| Face Amount | ||
| Covered by | ||
| Contracts ($) | Value ($) | |
| Call Options: | ||
| 10-Year USD LIBOR-BBA, | ||
| September 2012 @ 4.47 | 1,619,000 a | (68,817) |
| 10-Year USD LIBOR-BBA, | ||
| November 2012 @ 4.76 | 1,365,000 a | (71,675) |
| Put Options: | ||
| 10-Year USD LIBOR-BBA, | ||
| September 2012 @ 4.47 | 1,619,000 a | (139,444) |
| 10-Year USD LIBOR-BBA, | ||
| November 2012 @ 4.76 | 1,365,000 a | (104,306) |
| (Premiums received $394,125) | (384,242) |
| BBA—British Bankers Association |
| LIBOR—London Interbank Offered Rate |
| USD—US Dollar |
| a Non-income producing security. |
| See notes to financial statements. |
The Fund 25
| STATEMENT OF ASSETS AND LIABILITIES |
| December 31, 2009 |
| Cost | Value | ||
| Assets ($): | |||
| Investments in securities—See Statement of Investments (including | |||
| securities on loan, valued at $682,937)—Note 1(c): | |||
| Unaffiliated issuers | 64,566,216 | 69,258,476 | |
| Affiliated issuers | 2,481,383 | 2,481,383 | |
| Cash | 128,651 | ||
| Cash denominated in foreign currencies | 156,269 | 155,079 | |
| Dividends and interest receivable | 1,454,555 | ||
| Unrealized appreciation on forward foreign | |||
| currency exchange contracts—Note 4 | 591,023 | ||
| Unrealized appreciation on swap contracts—Note 4 | 174,087 | ||
| Receivable for shares of Beneficial Interest subscribed | 65,007 | ||
| Receivable for futures variation margin—Note 4 | 41,790 | ||
| Receivable for investment securities sold | 5,334 | ||
| Prepaid expenses | 31,046 | ||
| 74,386,431 | |||
| Liabilities ($): | |||
| Due to The Dreyfus Corporation and affiliates—Note 3(c) | 43,726 | ||
| Liability for securities on loan—Note 1(c) | 714,299 | ||
| Outstanding options written, at value (premiums received | |||
| $394,125)—See Statement of Options Written—Note 4 | 384,242 | ||
| Swaps premium received—Note 4 | 88,359 | ||
| Unrealized depreciation on forward foreign | |||
| currency exchange contracts—Note 4 | 74,723 | ||
| Unrealized depreciation on swap contracts—Note 4 | 61,526 | ||
| Payable for shares of Beneficial Interest redeemed | 57,621 | ||
| Payable for investment securities purchased | 7,551 | ||
| Accrued expenses | 24,650 | ||
| 1,456,697 | |||
| Net Assets ($) | 72,929,734 | ||
| Composition of Net Assets ($): | |||
| Paid-in capital | 70,375,575 | ||
| Accumulated undistributed investment income—net | 355,787 | ||
| Accumulated net realized gain (loss) on investments | (3,460,238) | ||
| Accumulated net unrealized appreciation (depreciation) on investments, | |||
| options transactions, swap transactions and foreign currency transactions | |||
| (including $332,519 net unrealized appreciation on financial futures) | 5,658,610 | ||
| Net Assets ($) | 72,929,734 | ||
| Net Asset Value Per Share | |||
| Class A | Class C | Class I | |
| Net Assets ($) | 9,910 | 9,910 | 72,909,914 |
| Shares Outstanding | 478 | 478 | 3,518,015 |
| Net Asset Value Per Share ($) | 20.73 | 20.73 | 20.72 |
| See notes to financial statements. | |||
26
| STATEMENT OF OPERATIONS |
| Year Ended December 31, 2009 |
| Investment Income ($): | |
| Income: | |
| Interest | 2,977,646 |
| Income from securities lending—Note 1(c) | 6,826 |
| Dividends: | |
| Affiliated issuers | 1,788 |
| Total Income | 2,986,260 |
| Expenses: | |
| Investment advisory fee—Note 3(a) | 225,877 |
| Auditing fees | 61,740 |
| Accounting and administration fee—Note 3(a) | 60,000 |
| Custodian fees—Note 3(d) | 46,331 |
| Registration fees | 27,832 |
| Legal fees | 16,349 |
| Prospectus and shareholders’ reports | 15,541 |
| Shareholder servicing costs—Note 3(d) | 9,849 |
| Trustees’ fees and expenses—Note 3(e) | 7,481 |
| Administrative service fees—Note 3(b) | 2,071 |
| Loan commitment fees—Note 2 | 1,198 |
| Interest expense—Note 2 | 68 |
| Distribution fees—Note 3(c) | 6 |
| Miscellaneous | 48,671 |
| Total Expenses | 523,014 |
| Less—reduction in investment advisory fee due to undertaking—Note 3(a) | (153,467) |
| Less—reduction in fees due to earnings credits—Note 1(c) | (1,199) |
| Net Expenses | 368,348 |
| Investment Income—Net | 2,617,912 |
| Realized and Unrealized Gain (Loss) on Investments—Note 4 ($): | |
| Net realized gain (loss) on investments and foreign currency transactions | 653,858 |
| Net realized gain (loss) on financial futures | (212,575) |
| Net realized gain (loss) on options transactions | (720) |
| Net realized gain (loss) on swap transactions | 556,086 |
| Net realized gain (loss) on forward foreign currency exchange contracts | (1,747,762) |
| Net Realized Gain (Loss) | (751,113) |
| Net unrealized appreciation (depreciation) on investments, foreign currency | |
| transactions, financial futures, options transactions, swap transactions and | |
| forward foreign currency exchange contracts (including $637,581 net | |
| unrealized appreciation on financial futures, $9,883 net unrealized | |
| appreciation on options transactions, ($396,268) net unrealized | |
| (depreciation) on swap transactions and $699,000 net unrealized | |
| appreciation on forward foreign currency exchange contracts) | 6,469,557 |
| Net Realized and Unrealized Gain (Loss) on Investments | 5,718,444 |
| Net Increase in Net Assets Resulting from Operations | 8,336,356 |
| See notes to financial statements. | |
The Fund 27
STATEMENT OF CHANGES IN NET ASSETS
| Year Ended December 31, | ||
| 2009a | 2008 | |
| Operations ($): | ||
| Investment income—net | 2,617,912 | 1,897,177 |
| Net realized gain (loss) on investments | (751,113) | 2,891,008 |
| Net unrealized appreciation | ||
| (depreciation) on investments | 6,469,557 | (1,768,884) |
| Net Increase (Decrease) in Net Assets | ||
| Resulting from Operations | 8,336,356 | 3,019,301 |
| Dividends to Shareholders from ($): | ||
| Investment income—net: | ||
| Class A shares | (94) | — |
| Class C Shares | (88) | — |
| Class I Shares | (1,670,497) | (3,514,522) |
| Total Dividends | (1,670,679) | (3,514,522) |
| Beneficial Interest Transactions ($): | ||
| Net proceeds from shares sold: | ||
| Class A shares | 10,000 | — |
| Class C Shares | 10,000 | — |
| Class I Shares | 27,004,753 | 1,999,500 |
| Dividends reinvested: | ||
| Class I Shares | 1,513,437 | 3,006,638 |
| Cost of shares redeemed: | ||
| Class I Shares | (5,683,103) | (1,934,700) |
| Increase (Decrease) in Net Assets from | ||
| Beneficial Interest Transactions | 22,855,087 | 3,071,438 |
| Total Increase (Decrease) in Net Assets | 29,520,764 | 2,576,517 |
| Net Assets ($): | ||
| Beginning of Period | 43,408,970 | 40,832,753 |
| End of Period | 72,929,734 | 43,408,970 |
| Undistributed investment income—net | 355,787 | 1,144,083 |
28
| Year Ended December 31, | ||
| 2009a | 2008 | |
| Capital Share Transactions: | ||
| Class A | ||
| Shares sold | 478 | — |
| Class C | ||
| Shares sold | 478 | — |
| Class I | ||
| Shares sold | 1,382,640 | 104,148 |
| Shares issued for dividends reinvested | 78,752 | 161,964 |
| Shares redeemed | (286,414) | (102,881) |
| Net Increase (Decrease) in Shares Outstanding | 1,174,978 | 163,231 |
| a | The fund commenced offering three classes of shares. Effective September 1, 2009, the existing shares were |
| redesignated Class I and effective December 2, 2009, the fund added Class A and Class C shares. | |
| See notes to financial statements. | |
The Fund 29
FINANCIAL HIGHLIGHTS
The following tables describe the performance for each share class for the fiscal periods indicated. All information (except portfolio turnover rate) reflects financial results for a single fund share.Total return shows how much your investment in the fund would have increased (or decreased) during each period, assuming you had reinvested all dividends and distributions.These figures have been derived from the fund’s financial statements.
| Year Ended December 31, 2009a | ||
| Class A | Class C | |
| Shares | Shares | |
| Per Share Data ($): | ||
| Net asset value, beginning of period | 20.92 | 20.92 |
| Investment Operations: | ||
| Investment income—netb | .08 | .06 |
| Net realized and unrealized | ||
| gain (loss) on investments | (.07) | (.07) |
| Total from Investment Operations | .01 | (.01) |
| Distributions: | ||
| Dividends from investment income—net | (.20) | (.18) |
| Net asset value, end of period | 20.73 | 20.73 |
| Total Return (%)c,d | .03 | (.03) |
| Ratios/Supplemental Data (%): | ||
| Ratio of total expenses to average net assetse | .98 | 1.73 |
| Ratio of net expenses to average net assetse | .90 | 1.65 |
| Ratio of net investment income to average net assetse | 4.40 | 3.65 |
| Portfolio Turnover Rated,f | 131.97 | 131.97 |
| Net Assets, end of period ($ x 1,000) | 10 | 10 |
| a | From December 2, 2009 (commencement of initial offering) to December 31, 2009. |
| b | Based on average shares outstanding at each month end. |
| c | Exclusive of sales charge. |
| d | Not annualized. |
| e | Annualized. |
| f | The portfolio turnover rates excluding mortgage dollar roll transactions for the period ended December 31, 2009 |
| was 111.36%. | |
| See notes to financial statements. | |
30
| Year Ended December 31, | |||||
| Class I Shares | 2009a | 2008 | 2007 | 2006 | 2005 |
| Per Share Data ($): | |||||
| Net asset value, beginning of period | 18.53 | 18.73 | 18.60 | 18.28 | 19.64 |
| Investment Operations: | |||||
| Investment income—netb | .91 | .86 | .85 | .70 | .75 |
| Net realized and unrealized | |||||
| gain (loss) on investments | 1.90 | .53 | (.06)c | .22 | (.04) |
| Total from Investment Operations | 2.81 | 1.39 | .79 | .92 | .71 |
| Distributions: | |||||
| Dividends from investment income—net | (.62) | (1.59) | (.66) | (.60) | (2.07) |
| Net asset value, end of period | 20.72 | 18.53 | 18.73 | 18.60 | 18.28 |
| Total Return (%) | 15.48 | 7.50 | 4.30 | 5.09 | 3.64 |
| Ratios/Supplemental Data (%): | |||||
| Ratio of total expenses | |||||
| to average net assets | .92 | 1.02 | .91 | .81 | .77 |
| Ratio of net expenses | |||||
| to average net assets | .65 | .65 | .65d | .65d | .65d |
| Ratio of net investment income | |||||
| to average net assets | 4.62 | 4.52 | 4.54 | 3.79 | 3.75 |
| Portfolio Turnover Ratee | 131.97 | 190 | 274f | 152f | 181f |
| Net Assets, end of period ($ x 1,000) | 72,910 | 43,409 | 40,833 | 41,660 | 70,168 |
| a | The fund commenced offering three classes of shares on December 2, 2009. Effective September 1, 2009, the existing |
| shares were redesignated as Class I shares. | |
| b | Based on average shares outstanding at each month end. |
| c | Amounts include litigation proceeds received by the fund of $.01 for the year ended December 31, 2007. |
| d | Includes the fund’s share of the The Standish Mellon Global Fixed Income Portfolio’s (the “Portfolio”) |
| allocated expenses. | |
| e | The portfolio turnover rates excluding mortgage dollar roll transactions for the periods ended December 31, 2009, |
| 2008 , 2007, 2006 and 2005 were 111.36%, 116%, 128%, 122% and 167%, respectively. | |
| f | On October 25, 2007, the fund, which owned 100% of the Portfolio on such date, withdrew entirely from the |
| Portfolio and received the Portfolio’s securties and cash in exchange for its interests in the Portfolio. Effective | |
| October 26, 2007, the fund began investing directly in the securities in which the Portfolio had invested. Portfolio | |
| turnover represents activity of both the fund and the Portfolio for 2007. The amounts shown for 2005-2006 are | |
| rates for the Portfolio. | |
| See notes to financial statements. | |
The Fund 31
NOTES TO FINANCIAL STATEMENTS
NOTE 1—Significant Accounting Policies:
Dreyfus/Standish Global Fixed Income Fund (the “fund”) is a separate diversified series of Dreyfus Investment Funds (the “Trust”), which is registered under the Investment Company Act of 1940, as amended (the “Act”), as an open-end management investment company and operates as a series company offering twelve series, including the fund. The fund’s investment objective is to seek to maximize total return while realizing a market level of income, consistent with the preservation of capital and the maintenance of liquidity. The Dreyfus Corporation (the “Manager” or “Dreyfus”), a wholly-owned subsidiary of The Bank of New York Mellon Corporation (“BNY Mellon”), serves as the fund’s investment adviser.
The Board of Trustees approved, effective September 1, 2009, the fund’s shares were redesignated as Class I shares.
At the Board meeting held on October 29, 2009, the Board of trustees approved, effective December 2, 2009, the implementation of a multiple class structure and the fund added Class A and Class C shares.
MBSC Securities Corporation (the “Distributor”), a wholly-owned subsidiary of the Manager, is the distributor of the fund’s shares. The fund is authorized to issue an unlimited number of $.001 par value shares of Beneficial Interest in each of the following classes of shares: Class A, Class C and Class I. Class A shares are subject to a sale charge imposed at the time of purchase. Class C shares are subject to a contingent deferred sales charge (“CDSC”) imposed on Class C shares redeemed within one year of purchase. Class I shares are sold primarily to bank trust departments and other financial service providers (including The Bank of NewYork Mellon, a subsidiary of BNY Mellon and an affiliate of Dreyfus), acting on behalf of customers having a qualified trust or an investment account or relationship at such institution, and bear no distribution or shareholder services fees.Class I shares are offered wi thout a front-end sales charge or CDSC. Other differences between the classes include the services offered to, the expenses borne by each class, the allocation of certain transfer agency costs and certain voting rights. Income, expenses (other than expenses attributable to a specific
32
class), and realized and unrealized gains or losses on investments are allocated to each class of shares based on its relative net assets.
As of December 31, 2009, MBC Investments Corp., an indirect subsidiary of BNY Mellon, held 478 Class A and Class C shares of the fund.
The Trust accounts separately for the assets, liabilities and operations of each series. Expenses directly attributable to each series are charged to that series’ operations; expenses which are applicable to all series are allocated among them on a pro rata basis.
The Financial Accounting Standards Board (“FASB”) Accounting Standards Codification (“ASC”) has become the exclusive reference of authoritative U.S. generally accepted accounting principles (“GAAP”) recognized by the FASB to be applied by nongovernmental entities. Rules and interpretive releases of the Securities and Exchange Commission (“SEC”) under authority of federal laws are also sources of authoritative GAAP for SEC registrants. The ASC has superseded all existing non-SEC accounting and reporting standards. The fund’s financial statements are prepared in accordance with GAAP, which may require the use of management estimates and assumptions.Actual results could differ from those estimates.
(a) Portfolio valuation: Investments in securities excluding short-term investments (other than U.S. Treasury Bills), financial futures, options, swaps and forward foreign currency exchange contracts (“forward contracts”) are valued each business day by an independent pricing service (the “Service”) approved by the Board of Trustees. Investments for which quoted bid prices are readily available and are representative of the bid side of the market in the judgment of the Service are valued at the mean between the quoted bid prices (as obtained by the Service from dealers in such securities) and asked prices (as calculated by the Service based upon its evaluation of the market for such securities). Other investments (which constitute a majority of the portfolio securities) are valued as determined by the Service, based on methods which include consideration of: yields or prices of securities of comparable quality, coupon, maturity and type; indications as to values from dealers; and general market conditions. Restricted securities, as well as
The Fund 33
NOTES TO FINANCIAL STATEMENTS (continued)
securities or other assets for which recent market quotations are not readily available and are not valued by a pricing service approved by the Board of Trustees, or are determined by the fund not to reflect accurately fair value, are valued at fair value as determined in good faith under the direction of the Board of Trustees.The factors that may be considered when fair valuing a security include fundamental analytical data, the nature and duration of restrictions on disposition, an evaluation of the forces that influence the market in which the securities are purchased and sold and public trading in similar securities of the issuer or comparable issuers. Short-term investments, excluding U.S. Treasury Bills, are carried at amortized cost, which approximates value. Registered investment companies that are not traded on an exchange are valued at their net asset value. Financial futures and options, which are traded on an exchan ge, are valued at the last sales price on the securities exchange on which such securities are primarily traded or at the last sales price on the national securities market on each business day. Options traded over-the-counter are valued at the mean between the bid and the asked price. Investments in swap transactions are valued each business day by a pricing service approved by the Board of Trustees. Swaps are valued by the service by using a swap pricing model which incorporates among other factors, default probabilities, recovery rates, credit curves of the underlying issuer and swap spreads on interest rates. Investments denominated in foreign currencies are translated to U.S. dollars at the prevailing rates of exchange. Forward contracts are valued at the forward rate.
The fair value of a financial instrument is the amount that would be received to sell an asset or paid to transfer a liability in an orderly transaction between market participants at the measurement date (i.e. the exit price). GAAP establishes a fair value hierarchy that prioritizes the inputs of valuation techniques used to measure fair value.This hierarchy gives the highest priority to unadjusted quoted prices in active markets for identical assets or liabilities (Level 1 measurements) and the lowest priority to unobservable inputs (Level 3 measurements).
Additionally, GAAP provides guidance on determining whether the volume and activity in a market has decreased significantly and
34
whether such a decrease in activity results in transactions that are not orderly. GAAP requires enhanced disclosures around valuation inputs and techniques used during annual and interim periods.
Various inputs are used in determining the value of the fund’s investments relating to fair value measurements.These inputs are summarized in the three broad levels listed below:
Level 1—unadjusted quoted prices in active markets for identical investments.
Level 2—other significant observable inputs (including quoted prices for similar investments, interest rates, prepayment speeds, credit risk, etc.).
Level 3—significant unobservable inputs (including the fund’s own assumptions in determining the fair value of investments).
The inputs or methodology used for valuing securities are not necessarily an indication of the risk associated with investing in those securities.
The following is a summary of the inputs used as of December 31, 2009 in valuing the fund’s investments:
| Level 2—Other | Level 3— | |||
| Level 1— | Significant | Significant | ||
| Unadjusted | Observable | Unobservable | ||
| Quoted Prices | Inputs | Inputs | Total | |
| Assets ($) | ||||
| Investments in Securities: | ||||
| U.S. Treasury | — | 359,992 | — | 359,992 |
| Corporate Bonds | — | 47,724,542 | — | 47,724,542 |
| Foreign Government | — | 19,289,937 | — | 19,289,937 |
| Commercial | ||||
| Mortgage—Backed | — | 1,884,005 | — | 1,884,005 |
| Mutual Funds | 2,481,383 | — | — | 2,481,383 |
| Other Financial | ||||
| Instruments† | 365,846 | 765,110 | — | 1,130,956 |
| Liabilities ($) | ||||
| Other Financial | ||||
| Instruments† | (33,327) | (520,491) | — | (553,818) |
| † Other financial instruments include derivative instruments, such as futures, forward foreign currency | ||||
| exchange contracts, swap contracts and options contracts.Amounts shown represent unrealized | ||||
| appreciation (depreciation), or in the case of options, market value at period end. | ||||
The Fund 35
NOTES TO FINANCIAL STATEMENTS (continued)
The following is a reconciliation of Level 3 assets for which significant unobservable inputs were used to determine fair value:
| Investments in Private | |
| Investment Fund ($)†† | |
| Balance as of 12/31/2008 | 146,140 |
| Realized gain (loss) | — |
| Change in unrealized appreciation (depreciation) | — |
| Net purchases (sales) | (146,140) |
| Transfers in and/or out of Level 3 | — |
| Balance as of 12/31/2009 | — |
| †† Investment in BlackRock Cash Strategies Fund LLC. See Note 1(c). |
(b) Foreign currency transactions: The fund does not isolate that portion of the results of operations resulting from changes in foreign exchange rates on investments from the fluctuations arising from changes in market prices of securities held. Such fluctuations are included with the net realized and unrealized gain or loss on investments.
Net realized foreign exchange gains or losses arise from sales of foreign currencies, currency gains or losses realized on securities transactions between trade and settlement date, and the difference between the amounts of dividends, interest and foreign withholding taxes recorded on the fund’s books and the U.S. dollar equivalent of the amounts actually received or paid. Net unrealized foreign exchange gains and losses arise from changes in the value of assets and liabilities other than investments resulting from changes in exchange rates. Foreign currency gains and losses on investments are included with net realized and unrealized gain or loss on investments.
(c) Securities transactions and investment income: Securities transactions are recorded on a trade date basis. Realized gains and losses from securities transactions are recorded on the identified cost basis. Dividend income is recognized on the ex-dividend date and interest income, including, where applicable, accretion of discount and amortization of premium on investments, is recognized on the accrual basis.
The fund has arrangements with the custodian and cash management bank whereby the fund may receive earnings credits when positive cash
36
balances are maintained, which are used to offset custody and cash management fees. For financial reporting purposes, the fund includes net earnings credits as an expense offset in the Statement of Operations.
Pursuant to a securities lending agreement with The Bank of New York Mellon, the fund may lend securities to qualified institutions. It is the fund’s policy that, at origination, all loans are secured by collateral of at least 102% of the value of U.S. securities loaned and 105% of the value of foreign securities loaned. Collateral equivalent to at least 100% of the market value of securities on loan is maintained at all times. Collateral is either in the form of cash, which can be invested in certain money market mutual funds managed by the Manager, U.S. Government and Agency securities or letters of credit. The fund is entitled to receive all income on securities loaned, in addition to income earned as a result of the lending transaction. Although each security loaned is fully collateralized, the fund bears the risk of delay in recovery of, or loss of rights in, the securities loaned should a borrower fail to return the securities in a timely manner. During the period ended December 31, 2009, The Bank of New York Mellon earned $3,676 from lending portfolio securities, pursuant to the securities lending agreement.
Until December 10, 2007, all cash collateral received by the fund and other series of the Trust in connection with the securities lending program was invested in the BlackRock Cash Strategies Fund LLC (the “BlackRock Fund”), a private investment fund not affiliated with the Trust or its investment adviser. On December 10, 2007, the BlackRock Fund announced that it was suspending investor withdrawal privileges due to conditions related to the credit markets and the adverse affect of such conditions on the liquidity of the BlackRock Fund’s portfolio holdings. Commencing on December 11, 2007, all new cash collateral received in connection with the securities lending activity of the fund and other series of the Trust was invested by the securities lending agent in the Dreyfus Institutional Cash Advantage Fund (the “Dreyfus Fund”), an affiliated money market fund registered as an investment company under the Investment Company Act of
The Fund 37
NOTES TO FINANCIAL STATEMENTS (continued)
1940, as amended.To the extent that the BlackRock Fund agreed to permit withdrawals during the period December 11, 2007 through January 22, 2009, the securities lending agent effected such withdrawals and the cash proceeds from such withdrawals by the fund were reinvested in the shares of the Dreyfus Fund. As of January 22, 2009, the final withdrawal was reinvested in the Dreyfus Fund. Repayments of cash collateral during the period were made from the proceeds of redemptions of shares of the Dreyfus Fund.
(d) Affiliated issuers: Investments in other investment companies advised by the Manager are defined as “affiliated” in the Act.
(e) Concentration of Risk: The fund invests primarily in debt securities. Failure of an issuer of the debt securities to make timely interest or principal payments, or a decline or the perception of a decline in the credit quality of a debt security, can cause the debt security’s price to fall, potentially lowering the fund’s share price. In addition, the value of debt securities may decline due to general market conditions that are not specifically related to a particular company, such as real or perceived adverse economic conditions, changes in outlook for corporate earnings, changes in interest or currency rates or adverse investor sentiment. They may also decline because of factors that affect a particular industry.
(f) Dividends to shareholders: Dividends are recorded on the ex-dividend date. Dividends from investment income-net are declared and paid quarterly. Dividends from net realized capital gains, if any, are normally declared and paid annually, but the fund may make distributions on a more frequent basis to comply with the distribution requirements of the Internal Revenue Code of 1986, as amended (the “Code”).To the extent that net realized capital gains can be offset by capital loss carryovers, it is the policy of the fund not to distribute such gains. Income and capital gain distributions are determined in accordance with income tax regulations, which may differ from GAAP.
(g) Federal income taxes: It is the policy of the fund to continue to qualify as a regulated investment company, if such qualification is in the
38
best interests of its shareholders, by complying with the applicable provisions of the Code, and to make distributions of taxable income sufficient to relieve it from substantially all federal income and excise taxes.
As of and during the period ended December 31, 2009, the fund did not have any liabilities for any uncertain tax positions.The fund recognizes interest and penalties, if any, related to uncertain tax positions as income tax expense in the Statement of Operations. During the period, the fund did not incur any interest or penalties.
Each of the tax years in the four-year period ended December 31, 2009 remains subject to examination by the Internal Revenue Service and state taxing authorities.
At December 31, 2009, the components of accumulated earnings on a tax basis were as follows: undistributed ordinary income $1,554,377, accumulated capital losses $3,030,893 and unrealized appreciation $4,030,675.
The accumulated capital loss carryover is available for federal income tax purposes to be applied against future net securities profits, if any, realized subsequent to December 31, 2009. If not applied, $2,830,391 of the carryover expires in fiscal 2010 and $200,502 expires in fiscal 2014.
The tax character of distributions paid to shareholders during the fiscal periods ended December 31, 2009 and December 31, 2008 were as follows: ordinary income $1,670,679 and $3,514,522, respectively.
During the period ended December 31, 2009, as a result of permanent book to tax differences, primarily due to the tax treatment for paydowns gains and losses on mortgage-backed securities, foreign currency transactions, amortization of premiums and swap periodic payments, the fund decreased accumulated undistributed investment income-net by $1,735,529, increased accumulated net realized gain (loss) on investments by $1,718,843 and increased paid-in capital by $16,686. Net assets and net asset value per share were not affected by this reclassification.
The Fund 39
NOTES TO FINANCIAL STATEMENTS (continued)
NOTE 2—Bank Lines of Credit:
The fund participates with other Dreyfus-managed funds in a $225 million unsecured credit facility led by Citibank, N.A. and a $300 million unsecured credit facility provided by The Bank of New York Mellon (each, a “Facility”), each to be utilized primarily for temporary or emergency purposes, including the financing of redemptions. In connection therewith, the fund has agreed to pay its pro rata portion of commitment fees for each Facility. Interest is charged to the fund based on rates determined pursuant to the terms of the respective Facility at the time of borrowing. Prior to September 24, 2009, the Trust had entered into two separate agreements with The Bank of New York Mellon that enabled the fund, and other funds in the Trust, to borrow, in the aggregate, (i) up to $35 million under a committed line of credit and (ii) up to $15 million under an uncommitted line of credit.
The average amount of borrowings outstanding under the Facilities and lines of credit during the period ended December 31, 2009, was approximately $7,700 with a related weighted average annualized interest rate of .85%.
NOTE 3—Investment Advisory Fee and Other Transactions With Affiliates:
(a) Pursuant to an investment advisory agreement with the Manager, the investment advisory fee is computed at the annual rate of .40% of the value of the fund’s average daily net assets and is payable monthly. The Manager had undertaken from January 1, 2009 through December 31, 2009 to reduce the investment advisory fee paid by the fund, to the extent that the fund’s aggregate annual expenses, exclusive of taxes, brokerage fees, Rule 12b-1 distribution plan fees, shareholder services plan fees, interest on borrowings, commitment fees and extraordinary expenses, do not exceed an annual rate of .65% of the value of the fund’s average daily net assets.The reduction in investment advisory fee, pursuant to the undertaking, amounted to $153,467 during the year ended December 31, 2009.
40
The Trust entered into an agreement with The Bank of New York Mellon, pursuant to which The Bank of New York Mellon provides administration and fund accounting services for the fund. For these services the fund pays The Bank of NewYork Mellon a fixed fee plus asset and transaction based fees, as well as out-of-pocket expenses. During the period ended December 31, 2009, the fund was charged $60,000 for administration and fund accounting services pursuant to the agreement.
(b)The fund pays administrative service fees for Class I shares.These fees are paid to affiliated or unaffiliated retirement plans, omnibus accounts and platform administrators and other entities (“Plan Administrators”) that provide record keeping and/or other administrative support services to accounts, retirement plans and their participants.As compensation for such services, Class I shares pay each Plan Administrator an administrative service fee in an amount of up to .15% (on an annualized basis) of their average daily net assets attributable to Class I shares that are held in accounts serviced by such Plan Administrator. During the period ended December 31, 2009, Class I shares was charged $2,071. The fund’s adviser or its affiliates may pay additional compensation from their own resources to Plan Administrators and other entities f or administrative services, as well as in consideration of marketing or other distribution-related services. These payments may provide an incentive for these entities to actively promote the fund or cooperate with the distributor’s promotional efforts.
(c) Under the Distribution Plan (the “Plan”) adopted pursuant to Rule 12b-1 under the Act, Class C shares pay the Distributor for distributing their shares at an annual rate of .75% of the value of the average daily net assets. During the period ended December 31, 2009, Class C shares were charged $6 pursuant to the Plan.
(d) Under the Shareholder Services Plan, Class A and Class C shares pay the Distributor at an annual rate of .25% of the value of their average daily net assets for the provision of certain services.The services provided
The Fund 41
NOTES TO FINANCIAL STATEMENTS (continued)
may include personal services relating to shareholder accounts, such as answering shareholder inquiries regarding the fund and providing reports and other information, and services related to the maintenance of shareholder accounts.The Distributor may make payments to Service Agents (a securities dealer, financial institution or other industry professional) in respect of these services.The Distributor determines the amounts to be paid to Service Agents. During the period ended December 31, 2009, Class A and Class C shares were charged $2 and $2, respectively, pursuant to the Shareholder Services Plan.
Under its terms, the Plan and Shareholder Services Plan shall remain in effect from year to year, provided such continuance is approved annually by a vote of a majority of those Trustees who are not “interested persons” of theTrust and who have no direct or indirect financial interest in the operation of or in any agreement related to the Plan or Shareholder Services Plan.
The fund compensates Dreyfus Transfer, Inc., a wholly-owned subsidiary of the Manager, under a transfer agency agreement for providing personnel and facilities to perform transfer agency services for the fund. During the period ended December 31, 2009, the fund was charged $7,220 pursuant to the transfer agency agreement, which is included in Shareholder servicing costs in the Statement of Operations.
The fund compensates The Bank of New York Mellon under cash management agreements for performing cash management services related to fund subscriptions and redemptions. During the period ended December 31, 2009, the fund was charged $1,199 pursuant to the cash management agreements, which is included in Shareholder servicing costs in the Statement of Operations.These fees were offset by earnings credits pursuant to the cash management agreements.
The fund also compensates The Bank of New York Mellon under a custody agreement for providing custodial services for the fund. During the period ended December 31, 2009, the fund was charged $46,331 pursuant to the custody agreement.
42
During the period ended December 31, 2009, the fund was charged $6,681 for services performed by the Chief Compliance Officer.
The components of “Due to The Dreyfus Corporation and affiliates” in the Statement of Assets and Liabilities consist of: investment advisory fees $23,790, Rule 12b-1 distribution plan fees $6, shareholder services plan fees $4, custodian fees $17,251, chief compliance officer fees $5,011 and transfer agency per account fees $750, which are offset against an expense reimbursement currently in effect in the amount of $3,086.
(e) Prior to January 1, 2010, each Trustee received $45,000 per year, plus $6,000 for each joint Board meeting of the Trust, The Dreyfus/Laurel Funds, Inc., The Dreyfus/Laurel Funds Trust, The Dreyfus/Laurel Tax-Free Municipal Funds and Dreyfus Funds, Inc. (collectively, the “Board Group Open-End Funds”) attended, $2,000 for separate in-person committee meetings attended which were not held in conjunction with a regularly scheduled Board meeting and $1,500 for Board meetings and separate committee meetings attended that were conducted by telephone. Effective January 1, 2010, the Board Group Open-End Funds will pay eachTrustee who is not an“interested person”of theTrust (as defined in the 1940 Act) $60,000 per annum, plus $7,000 per joint Board Group Open-End Funds Board meeting attended, $2,500 for separate in-person committee meeti ngs attended which are not held in conjunction with a regularly scheduled Board meeting and $2,000 for Board meetings and separate committee meetings attended that are conducted by telephone. The Board Group Open-End Funds also reimburse each Trustee who is not an “interested person” of the Trust (as defined in the 1940 Act) for travel and out-of-pocket expenses.With respect to Board meetings, the Chairman of the Board receives an additional 25% of such compensation (with the exception of reimbursable amounts).With respect to compensation committee meetings prior to January 1, 2010, the Chair of the compensation committee received $900 per compensation committee meeting, and, effective January 1, 2010, the Chair of each of the Board’s
The Fund 43
NOTES TO FINANCIAL STATEMENTS (continued)
committees, unless the Chair also serves as Chair of the Board, will receive $1,350 per applicable committee meeting. In the event that there is an in-person joint committee meeting or a joint telephone meeting of the Board Group Open-End Funds and Dreyfus HighYield Strategies Fund, the $2,000 or $1,500 fee (prior to January 1, 2010) or the $2,500 or $2,000 fee (effective January 1, 2010), as applicable, is allocated between the Board Group Open-End Funds and Dreyfus High Yield Strategies Fund. The Trust’s portion of these fees and expenses are charged and allocated to each series based on net assets. Amounts required to be paid by the Trust directly to the non-interested Trustees, that would be applied to offset a portion of the management fee payable to the Manager,are in fact paid directly by the Manager to the non-interested Trustees.
NOTE 4—Securities Transactions:
The aggregate amount of purchases and sales (including paydowns) of investment securities, excluding short-term securities, financial futures, options transactions, forward contracts and swap transactions, during the period ended December 31,2009, amounted to $93,433,973 and $71,903,375, respectively, of which $11,195,231 in purchases and $11,231,831 in sales were from mortgage dollar roll transactions.
The fund adopted the provisions of ASC Topic 815 “Derivatives and Hedging” which requires qualitative disclosures about objectives and strategies for using derivatives, quantitative disclosures about fair value amounts of gains and losses on derivative instruments and disclosures about credit-risk-related contingent features in derivative agreements. The disclosure requirements distinguish between derivatives, which are accounted for as “hedges” and those that do not qualify for hedge accounting. Because investment companies value their derivatives at fair value and recognize changes in fair value through the Statement of Operations, they do not qualify for such accounting.Accordingly, even though a fund’s investments in derivatives may represent economic hedges, they are considered to be non-hedge transactions for purposes of this disclosure.The following tables show the fund’s exposure to differe nt types of market risk as it relates to the Statement of Assets and Liabilities and the Statement of Operations, respectively.
44
Fair value of derivative instruments as of December 31, 2009 is shown below:
| Derivative | Derivative | ||
| Assets ($) | Liabilities ($) | ||
| Interest rate risk1,2 | 457,939 | Interest rate risk1,3,4 | (479,095) |
| Foreign exchange risk5 | 591,023 | Foreign exchange risk6 | (74,723) |
| Credit risk2 | 81,994 | Credit risk | — |
| Gross fair value of | |||
| derivatives contracts | 1,130,956 | (553,818) |
| Statement of Assets and Liabilities location: | |
| 1 | Includes cumulative appreciation/depreciation on futures contracts as reported in the Statement of |
| Financial Futures, but only the unpaid variation margin is reported in the Statement of Assets | |
| and Liabilities. | |
| 2 | Unrealized appreciation on swap contracts. |
| 3 | Unrealized depreciation on swap contracts. |
| 4 | Outstanding options written, at value. |
| 5 | Unrealized appreciation on forward foreign currency exchange contracts. |
| 6 | Unrealized depreciation on forward foreign currency exchange contracts. |
The effect of derivative instruments on the Statement of Operations during the period ended December 31, 2009 is shown below:
| Amount of realized gain or (loss) on derivatives recognized in income ($) | |||||
| Forward | |||||
| Underlying risk | Futures7 | Options8 | Contracts9 | Swaps10 | Total |
| Interest rate | (212,575) | (720) | — | 444,988 | 231,693 |
| Foreign exchange | — | — | (1,747,762) | — | (1,747,762) |
| Credit | — | — | — | 111,098 | 111,098 |
| Total | (212,575) | (720) | (1,747,762) | 556,086 | (1,404,971) |
| Change in unrealized appreciation or (depreciation) on derivatives recognized in income ($)11 | |||||
| Forward | |||||
| Underlying risk | Futures | Options | Contracts | Swaps | Total |
| Interest rate | 637,581 | 9,883 | — | (466,121) | 181,343 |
| Foreign exchange | — | — | 699,000 | — | 699,000 |
| Credit | — | — | — | 69,853 | 69,853 |
| Total | 637,581 | 9,883 | 699,000 | (396,268) | 950,196 |
| Statement of Operations location: | |
| 7 | Net realized gain (loss) on financial futures. |
| 8 | Net realized gain (loss) on options transactions. |
| 9 | Net realized gain (loss) on forward foreign currency exchange contracts. |
| 10 | Net realized gain (loss) on swap transactions. |
| 11 | Net unrealized appreciation (depreciation) on investments, financial futures, options transactions, |
| forward foreign currency exchange contracts and swap transactions. | |
The Fund 45
NOTES TO FINANCIAL STATEMENTS (continued)
During the period ended December 31, 2009, the average market value of interest rate futures contracts was $18,882,845, which represented 14.80% of average net assets. The average market value of interest rate options contracts was $99,585, which represented .08% of average net assets. The average market value of forward contracts was $29,615,325, which represented 23.21% of average net assets.The average notional value of interest rate swap contracts was $8,687,020, which represented 6.81% of average net assets. The average notional value of credit default swap contracts was $649,700, which represented .51% of average net assets.
Mortgage Dollar Rolls: A mortgage dollar roll transaction involves a sale by the fund of mortgage related securities that it holds with an agreement by the fund to repurchase similar securities at an agreed upon price and date.The securities purchased will bear the same interest rate as those sold, but generally will be collateralized by pools of mortgages with different prepayment histories than those securities sold.
Futures Contracts: In the normal course of pursuing its investment objective, the fund is exposed to market risk and including interest rate risk, as a result of changes in value of underlying financial instruments. The fund invests in financial futures contracts in order to manage its exposure to or protect against changes in the market.A futures contract represents a commitment for the future purchase or a sale of an asset at a specified date. Upon entering into such contracts, these investments require initial margin deposits with a broker, which consist of cash or cash equivalents. The amount of these deposits is determined by the exchange or Board of Trade on which the contract is traded and is subject to change. Accordingly, variation margin payments are received or made to reflect daily unrealized gains or losses which are recorded in the Statem ent of Operations. Futures contracts are valued daily at the last sales price established by the Board of Trade or exchange upon which they are traded. When the contracts are closed, the fund recognizes a realized gain or loss. There is minimal counterparty credit risk to the fund with futures, since futures are exchange traded and the exchange’s clearinghouse, as counterparty to all exchange traded futures, guarantees
46
the futures against default. Contracts open at December 31, 2009 are set forth in the Statement of Financial Futures.
Options: A call option gives the purchaser of the option the right (but not the obligation) to buy, and obligates the writer to sell, the underlying security or securities at the exercise price at any time during the option period, or at a specified date. Conversely, a put option gives the purchaser of the option the right (but not the obligation) to sell, and obligates the writer to buy the underlying security or securities at the exercise price at any time during the option period, or at a specified date. The fund writes (sells) put and call options primarily to hedge against changes in security prices, or securities that the fund intends to purchase, or against fluctuations in value caused by changes in prevailing market interest rates or other market conditions.
As a writer of call options, the fund receives a premium at the outset and then bears the market risk of unfavorable changes in the price of the financial instrument underlying the option. Generally, the fund realizes a gain, to the extent of the premium, if the price of the underlying financial instrument decreases between the date the option is written and the date on which the option is terminated. Generally, the fund incurs a loss, if the price of the financial instrument increases between those dates.
As a writer of put options, the fund receives a premium at the outset and then bears the market risk of unfavorable changes in the price of the financial instrument underlying the option. Generally, the fund realizes a gain, to the extent of the premium, if the price of the underlying financial instrument increases between the date the option is written and the date on which the option is terminated. Generally, the fund incurs a loss, if the price of the financial instrument decreases between those dates. As a writer of an option, the fund may have no control over whether the underlying securities may be sold (call) or purchased (put) and as a result bears the market risk of an unfavorable change in the price of the security underlying the written option. One risk of holding a put or a call option is that if the option is not sold or
The Fund 47
NOTES TO FINANCIAL STATEMENTS (continued)
exercised prior to its expiration, it becomes worthless. However, this risk is limited to the premium paid by the fund. Upon the expiration or closing of the option transaction, a gain or loss is reported in the Statement of Operations.
The following summarizes the fund’s call/put options written for the period ended December 31, 2009:
| Face Amount | Options Terminated | |||
| Covered by | Premiums | Net Realized | ||
| Options Written: | Contracts ($) | Received ($) | Cost ($) Gain (Loss) ($) | |
| Contracts outstanding | ||||
| December 31, 2008 | — | — | ||
| Contracts written | 10,568,000 | 443,996 | ||
| Contracts terminated: | ||||
| Contracts closed | 3,400,000 | 33,371 | 50,591 | (17,220) |
| Contracts expired | 1,200,000 | 16,500 | — | 16,500 |
| Total contracts terminated | 4,600,000 | 49,871 | 50,591 | (720) |
| Contracts Outstanding | ||||
| December 31, 2009 | 5,968,000 | 394,125 | ||
Forward Foreign Currency Exchange Contracts: The fund enters into forward contracts in order to hedge its exposure to changes in foreign currency exchange rates on its foreign portfolio holdings, to settle foreign currency transactions or as a part of its investment strategy.When executing forward contracts, the fund is obligated to buy or sell a foreign currency at a specified rate on a certain date in the future. With respect to sales of forward contracts, the fund incurs a loss if the value of the contract increases between the date the forward contract is opened and the date the forward contract is closed.The fund realizes a gain if the value of the contract decreases between those dates.With respect to purchases of forward contracts, the fund incurs a loss if the value of the contract decreases between the date the forward contract is opened and t he date the forward contract is closed. The fund realizes a gain if the value of the contract increases between those dates.The fund is exposed to foreign currency risk as a result of changes in value of underlying financial instruments.The fund is also exposed to credit risk associated with counterparty nonperformance on these forward contracts, which is
48
typically limited to the unrealized gain on each open contract.The following summarizes open forward contracts at December 31, 2009:
| Foreign | Unrealized | ||||
| Forward Foreign Currency | Currency | Appreciation | |||
| Exchange Contracts | Amounts | Cost ($) | Value ($) (Depreciation) ($) | ||
| Purchases: | |||||
| Argentine Peso, | |||||
| Expiring 1/8/2010 | 2,690,000 | 701,343 | 706,114 | 4,771 | |
| Brazilian Real, | |||||
| Expiring 1/8/2010 | 1,240,000 | 714,286 | 710,993 | (3,293) | |
| Indonesian Rupiah, | |||||
| Expiring | |||||
| 1/8/2010 | 6,667,010,000 | 706,775 | 708,507 | 1,732 | |
| Malaysian Ringgit, | |||||
| Expiring 1/29/2010 | 2,205,000 | 646,988 | 643,166 | (3,822) | |
| Mexican New Peso, | |||||
| Expiring 1/8/2010 | 9,130,000 | 707,176 | 697,407 | (9,769) | |
| Norwegian Krone, | |||||
| Expiring 1/29/2010 | 3,800,000 | 652,495 | 655,476 | 2,981 | |
| Russian Ruble, | |||||
| Expiring, 1/12/2010 | 20,640,000 | 705,882 | 679,643 | (26,239) | |
| South Korean Won, | |||||
| Expiring 2/26/2010 | 773,680,000 | 664,103 | 663,263 | (840) | |
| Sales: | Proceeds ($) | ||||
| Brazilian Real, | |||||
| Expiring 1/29/2010 | 2,990,000 | 1,700,313 | 1,706,369 | (6,056) | |
| British Pound, | |||||
| Expiring 1/29/2010 | 1,910,000 | 3,107,875 | 3,084,495 | 23,380 | |
| Canadian Dollar, | |||||
| Expiring 1/29/2010 | 880,000 | 828,984 | 841,443 | (12,459) | |
| Euro, | |||||
| Expiring 1/29/2010 | 560,000 | 813,781 | 802,765 | 11,016 | |
| Euro, | |||||
| Expiring 1/29/2010 | 10,278,000 14,936,503 14,733,601 | 202,902 | |||
| Euro, | |||||
| Expiring 1/29/2010 | 560,000 | 813,870 | 802,764 | 11,106 | |
| Euro, | |||||
| Expiring 1/29/2010 | 5,480,000 | 7,964,687 | 7,855,627 | 109,060 | |
| Euro, | |||||
| Expiring 1/29/2010 | 1,450,000 | 2,106,918 | 2,078,587 | 28,331 | |
| Euro, | |||||
| Expiring 1/29/2010 | 30,000 | 43,646 | 43,005 | 641 | |
| Euro, | |||||
| Expiring 1/29/2010 | 130,000 | 185,843 | 186,356 | (513) | |
The Fund 49
NOTES TO FINANCIAL STATEMENTS (continued)
| Foreign | Unrealized | |||
| Forward Foreign Currency | Currency | Appreciation | ||
| Exchange Contracts | Amounts | Proceeds ($) | Value ($) (Depreciation) ($) | |
| Sales (continued): | ||||
| Hungary Forint, | ||||
| Expiring 1/29/2010 | 241,730,000 | 1,283,204 | 1,281,090 | 2,114 |
| Japanese Yen, | ||||
| Expiring 1/29/2010 | 30,660,000 | 342,191 | 329,251 | 12,940 |
| Japanese Yen, | ||||
| Expiring 1/29/2010 | 95,770,000 | 1,068,527 | 1,028,452 | 40,075 |
| Japanese Yen, | ||||
| Expiring 1/29/2010 | 60,520,000 | 675,499 | 649,910 | 25,589 |
| Japanese Yen, | ||||
| Expiring 1/29/2010 | 19,490,000 | 217,459 | 209,298 | 8,161 |
| Japanese Yen, | ||||
| Expiring | ||||
| 1/29/2010 | 103,790,000 | 1,158,862 | 1,114,577 | 44,285 |
| Japanese Yen, | ||||
| Expiring 1/29/2010 | 15,930,000 | 176,888 | 171,069 | 5,819 |
| Japanese Yen, | ||||
| Expiring 1/29/2010 | 128,963,000 | 1,404,802 | 1,384,904 | 19,898 |
| Mexican New Peso, | ||||
| Expiring 1/29/2010 | 18,070,000 | 1,409,593 | 1,376,547 | 33,046 |
| New Zealand Dollar, | ||||
| Expiring 1/29/2010 | 10,000 | 7,249 | 7,245 | 4 |
| New Zealand Dollar, | ||||
| Expiring 1/29/2010 | 240,000 | 172,800 | 173,872 | (1,072) |
| Polish Zloty, | ||||
| Expiring 1/29/2010 | 910,000 | 320,345 | 317,173 | 3,172 |
| Swedish Krona, | ||||
| Expiring 1/29/2010 | 4,550,000 | 625,394 | 636,054 | (10,660) |
| Gross Unrealized | ||||
| Appreciation | 591,023 | |||
| Gross Unrealized | ||||
| Depreciation | (74,723) | |||
Swaps: The fund enters into swap agreements to exchange the interest rate on, or return generated by, one nominal instrument for the return generated by another nominal instrument. The fund enters into these agreements to hedge certain market or interest rate risks, to manage the interest rate sensitivity (sometimes called duration) of fixed income securities, to provide a substitute for purchasing or selling particular securities or to increase potential returns.
The fund accrues for the interim payments on swap contracts on a daily basis, with the net amount recorded within unrealized apprecia-
50
tion (depreciation) on swap contracts in the Statement of Assets and Liabilities. Once the interim payments are settled in cash, the net amount is recorded as realized gain (loss) on swaps, in addition to realized gain (loss) recorded upon the termination of swaps contracts in the Statement of Operations. Upfront payments made and/or received by the fund, are recorded as an asset and/or liability in the Statement of Assets and Liabilities and are recorded as a realized gain or loss ratably over the contract’s term/event with the exception of forward starting interest rate swaps which are recorded as realized gains or losses on the termination date. Fluctuations in the value of swap contracts are recorded for financial statement purposes as unrealized appreciation or depreciation on swap transactions.
Interest Rate Swaps: Interest rate swaps involve the exchange of commitments to pay and receive interest based on a notional principal amount.The fund enters into these agreements for a variety of reasons, including to hedge certain market or interest rate risks, to manage the interest rate sensitivity (sometimes called duration) of fixed income securities, to provide a substitute for purchasing or selling particular securities or to increase potential returns.The fund may elect to pay a fixed rate and receive a floating rate, or receive a fixed rate and pay a floating rate on a notional principal amount.The net interest received or paid on interest rate swap agreements is included within unrealized appreciation (depreciation) on swap contracts in the Statement of Assets and Liabilities. Interest rate swaps are valued daily and the change, if any, is r ecorded as an unrealized gain or loss in the Statement of Operations. When a swap contract is terminated early, the fund records a realized gain or loss equal to the difference between the current realized value and the expected cash flows.
The fund’s maximum risk of loss from counterparty credit risk is the discounted net value of the cash flows to be received from the coun-terparty over the contract’s remaining life, to the extent that the amount is positive. This risk is mitigated by having a master netting arrangement between the fund and the counterparty and by the post-
The Fund 51
NOTES TO FINANCIAL STATEMENTS (continued)
ing of collateral by the counterparty to the fund to cover the fund’s exposure to the counterparty.The following summarizes open interest rate swaps entered into by the fund at December 31, 2009:
| Unrealized | |||||
| Notional | Reference | (Pay)/Receive | Appreciation | ||
| Amount ($) | Entity/Currency | Counterparty | Fixed Rate (%) Expiration (Depreciation) ($) | ||
| 1,570,000 | USD—3 Month | ||||
| Libor | JP Morgan | 3.29 | 11/24/2018 | (61,526) | |
| 360,000 | GBP—6 Month | ||||
| Libor | JP Morgan | 6.30 | 6/18/2011 | 41,134 | |
| 219,000,000 | JPY—6 Month | ||||
| Yenibor | JP Morgan | 1.36 | 1/19/2012 | 50,959 | |
| Gross Unrealized | |||||
| Appreciation | 92,093 | ||||
| Gross Unrealized | |||||
| Depreciation | (61,526) | ||||
Credit Default Swaps: Credit default swaps involve commitments to pay a fixed interest rate in exchange for payment if a credit event affecting a third party (the referenced company, obligation or index) occurs. Credit events may include a failure to pay interest or principal, bankruptcy, or restructuring.The fund enters into these agreements to manage its exposure to the market or certain sectors of the market, to reduce its risk exposure to defaults of corporate and sovereign issuers, or to create exposure to corporate or sovereign issuers to which it is not otherwise exposed. For those credit default swaps in which the fund is paying a fixed rate, the fund is buying credit protection on the instrument. In the event of a credit event, the fund would receive the full notional amount for the reference obligation. For those credit default swaps in which the fund is receiving a fixed rate, the fund is selling credit protection on the underlying instrument.The maximum payouts for these contracts are limited to the notional amount of each swap. Credit default swaps may involve greater risks than if the fund had invested in the reference obligation directly and are subject to general market risk, liquidity risk, counterparty risk and credit risk.
The maximum potential amount of future payments (undiscounted) that a fund as a seller of protection could be required to make under a credit default swap agreement would be an amount equal to the notional amount of the agreement which may exceed the amount of unrealized appreciation or depreciation reflected on the Statement of
52
Assets and Liabilities. Notional amounts of all credit default swap agreements are disclosed in the following chart, which summarizes open credit default swaps on index issues entered into by the fund. These potential amounts would be partially offset by any recovery values of the respective referenced obligations, underlying securities comprising the referenced index, upfront payments received upon entering into the agreement, or net amounts received from the settlement of buy protection credit default swap agreements entered into by the fund for the same referenced entity or entities. The following summarizes open credit default swaps entered into by the fund at December 31, 2009:
| (Pay) | Upfront | |||||
| Receive | Implied | Premiums | ||||
| Reference | Notional | Fixed | Credit | Market | Receivable | Unrealized |
| Obligation | Amount ($)2 | Rate (%) | Spread (%)3 | Value ($) | (Payable) ($) | Appreciation ($) |
| Sale Contracts:1 | ||||||
| Dow Jones | ||||||
| CDX.NA.HY.13 | ||||||
| Index | ||||||
| 12/20/2014† | 59,400a | 5.00 | 5.16 | (274) | 3,814 | 3,540 |
| Dow Jones | ||||||
| CDX.NA.HY.13 | ||||||
| Index | ||||||
| 12/20/2014† | 1,316,700b | 5.00 | 5.16 | (6,091) | 84,545 | 78,454 |
| Grosss Unrealized | ||||||
| Appreciation | 81,994 | |||||
| † Expiration Date | ||||||
| Counterparty: | ||||||
| a | Barclays |
| b | Goldman, Sachs & Co. |
| 1 | If the fund is a seller of protection and a credit event occurs, as defined under the terms of the swap |
| agreement, the fund will either (i) pay to the buyer of protection an amount equal to the notional | |
| amount of the swap and take delivery of the reference obligation or (ii) pay a net settlement | |
| amount in the form of cash or securities equal to the notional amount of the swap less the recovery | |
| value of the reference obligation. | |
| 2 | The maximum potential amount the fund could be required to pay as a seller of credit protection |
| or receive as a buyer of credit protection if a credit event occurs as defined under the terms of the | |
| swap agreement. | |
| 3 | Implied credit spreads, represented in absolute terms, utilized in determining the market value as of |
| the period end serve as an indicator of the current status of the payment/performance risk and | |
| represent the likelihood of risk of default for the credit derivative.The credit spread of a particular | |
| referenced entity reflects the cost of buying/selling protection and may include upfront payments | |
| required to be made to enter into the agreement.Wider credit spreads represent a deterioration of | |
| the referenced entity's credit soundness and a greater likelihood of risk of default or other credit | |
| event occurring as defined under the terms of the agreement.A credit spread identified as | |
| Defaulted indicates a credit event has occurred for the referenced entity. |
The Fund 53
NOTES TO FINANCIAL STATEMENTS (continued)
GAAP includes required disclosure for (i) the nature and terms of the credit derivative, reasons for entering into the credit derivative, the events or circumstances that would require the seller to perform under the credit derivative, and the current status of the payment/performance risk of the credit derivative, (ii) the maximum potential amount of future payments (undiscounted) the seller could be required to make under the credit derivative, (iii) the fair value of the credit derivative, and (iv) the nature of any recourse provisions and assets held either as collateral or by third parties. There are amendments, which require additional disclosures about the current status of the payment/performance risk of a guarantee.All changes to accounting policies have been made in accordance with these amendments and are incorporated within current period as part of the Notes to the Statement of Investments and disclosures within th is Note.
At December 31, 2009, the cost of investments for federal income tax purposes was $67,113,006; accordingly, accumulated net unrealized appreciation on investments was $4,626,853, consisting of $5,245,959 gross unrealized appreciation and $619,106 gross unrealized depreciation.
NOTE 5—Change in Independent Registered Public Accounting Firm:
PricewaterhouseCoopers LLP (“PWC”), 300 Madison Avenue, New York, New York 10017, an independent registered public accounting firm, was the independent registered public accounting firm for the fund for the fiscal year ended December 31, 2008. At the meetings held on February 9-10, 2009, the Audit Committee and the Board of Trustees of the Trust engaged KPMG LLP to replace PWC as the independent registered public accounting firm for the Trust, effective upon the conclusion of the audit of the December 31, 2008 financial statements of the Trust.
During the funds’ two fiscal years ended December 31, 2008 and the subsequent interim period through the effective date of PWC’s replacement: (i) no report on the funds’ financial statements contained an
54
adverse opinion or a disclaimer of opinion, or was qualified or modified as to uncertainty, audit scope, or accounting principles; and (ii) there were no “disagreements” (as such term is used in Item 304 of Regulation S-K) with PWC on any matter of accounting principles or practices, financial statement disclosure, or auditing scope or procedure, which disagreement(s), if not resolved to the satisfaction of PWC, would have caused it to make reference to the subject matter of the disagree-ment(s) in connection with its report.
NOTE 6—New Accounting Pronouncement:
In January 2010, FASB issued Accounting Standards Update (“ASU”) No. 2010-06 “Improving Disclosures about Fair Value Measurements”. ASU 2010-06 will require reporting entities to make new disclosures about amounts and reasons for significant transfers in and out of Level 1 and Level 2 fair value measurements as well as inputs and valuation techniques used to measure fair value for both recurring and nonrecur-ring fair value measurements that fall in either Level 2 or Level 3, and information on purchases, sales, issuances and settlements on a gross basis in the reconciliation of activity in Level 3 fair value measurements.The new and revised disclosures are required to be implemented for fiscal years beginning after December 15, 2009 except for the disclosures surrounding purchases, sales, issuances and settlements on a gross basis in the reconciliation of Level 3 fair value measurements, which are effective for fiscal years beginning after December 15, 2010. Management is currently evaluating the impact the adoption of ASU No. 2010-06 may have on the fund’s financial statement disclosures.
NOTE 7—Subsequent Events Evaluation:
Dreyfus has evaluated the need for disclosures and/or adjustments resulting from subsequent events through February 26, 2010, the date the financial statements were issued. This evaluation did not result in any subsequent events that necessitated disclosures and/or adjustments.
The Fund 55
| REPORT OF INDEPENDENT REGISTERED |
| PUBLIC ACCOUNTING FIRM |
| The Board of Trustees and Shareholders of |
| Dreyfus/Standish Global Fixed income Fund |
We have audited the accompanying statement of assets and liabilities of Dreyfus/Standish Global Fixed Income Fund (the “Fund”), a series of Dreyfus Investment Funds, including the statements of investments, financial futures and options written, as of December 31, 2009, and the related statement of operations, the statement of changes in net assets and financial highlights for the year then ended. These financial statements and financial highlights are the responsibility of the Fund’s management. Our responsibility is to express an opinion on these financial statements and financial highlights based on our audit.The statement of changes in net assets for the year ended December 31, 2008 and the financial highlights for each of the years in the four-year period ended December 31, 2008 were audited by other independent registered public accountants whose report thereon, dated February 27, 2009, expressed an unquali fied opinion on that statement of changes in net assets and those financial highlights.
We conducted our audit in accordance with the standards of the Public Company Accounting Oversight Board (United States).Those standards require that we plan and perform the audit to obtain reasonable assurance about whether the financial statements and financial highlights are free of material misstatement.An audit also includes examining, on a test basis, evidence supporting the amounts and disclosures in the financial statements. Our procedures included confirmation of securities owned as of December 31, 2009 by correspondence with the custodian and brokers or by other appropriate auditing procedures where replies from brokers were not received.An audit also includes assessing the accounting principles used and significant estimates made by management, as well as evaluating the overall financial statement presentation.We believe that our audit provides a reasonable basis for our opinion.
In our opinion, the financial statements and financial highlights referred to above present fairly, in all material respects, the financial position of Dreyfus/Standish Global Fixed Income Fund as of December 31, 2009, and the results of its operations,the changes in its net assets,and the financial highlights for the year then ended, in conformity with U.S. generally accepted accounting principles.

New York, New York
February 26, 2010
56
IMPORTANT TAX INFORMATION (Unaudited)
For federal tax purposes the fund hereby designates 57.44% of ordinary income dividends paid during the fiscal year ended December 31, 2009 as qualifying “interest related dividends”.
In accordance with federal tax law, the fund elects to provide each shareholder with their portion of the fund's income sourced from foreign countries.Accordingly, the fund hereby makes the following designation regarding its fiscal year ended December 31, 2009:
—the total amount of income sourced from foreign countries was $1,543,303
Where required by federal tax law rules, shareholders will receive notification of their proportionate share of foreign sourced income for the 2009 calendar year with Form 1099-DIV which will be mailed by early 2010.
The Fund 57
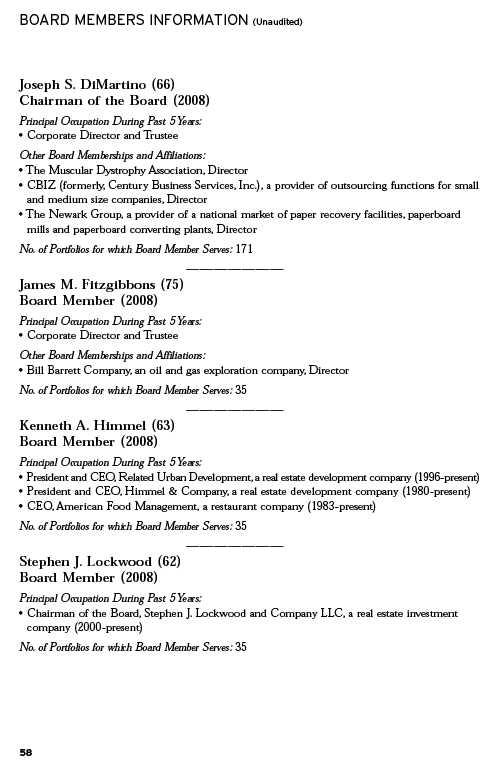
OFFICERS OF THE FUND (Unaudited)
BRADLEY J. SKAPYAK, President since January 2010.
Chief Operating Officer and a director of the Manager since June 2009. From April 2003 to June 2009, Mr. Skapyak was the head of the Investment Accounting and Support Department of the Manager. He is an officer of 76 investment companies (comprised of 171 portfolios) managed by the Manager. He is 51 years old and has been an employee of the Manager since February 1988.
PHILLIP N. MAISANO, Executive Vice President since December 2008.
Chief Investment Officer,Vice Chair and a director of the Manager, and an officer of 76 investment companies (comprised of 171 portfolios) managed by the Manager. Mr. Maisano also is an officer and/or Board member of certain other investment management subsidiaries of The Bank of New York Mellon Corporation, each of which is an affiliate of the Manager. He is 62 years old and has been an employee of the Manager since November 2006. Prior to joining the Manager, Mr. Maisano served as Chairman and Chief Executive Officer of EACM Advisors, an affiliate of the Manager, since August 2004.
J. DAVID OFFICER, Vice President since January 2010.
Director of Mellon United National Bank, an affiliate of the Manager, and an officer of 77 investment companies (comprised of 194 portfolios) managed by the Manager. Prior to June 2009, Mr. Officer was Chief Operating Officer,Vice Chairman and a director of the Manager, where he had been employed since April 1998. He is 61 years old.
MICHAEL A. ROSENBERG, Vice President and Secretary since December 2008.
Assistant General Counsel of BNY Mellon, and an officer of 77 investment companies (comprised of 194 portfolios) managed by the Manager. He is 49 years old and has been an employee of the Manager since October 1991.
KIESHA ASTWOOD, Vice President and Assistant Secretary since January 2010.
Counsel of BNY Mellon, and an officer of 77 investment companies (comprised of 194 portfolios) managed by the Manager. She is 36 years old and has been an employee of the Manager since July 1995.
JAMES BITETTO, Vice President and Assistant Secretary since December 2008.
Senior Counsel of BNY Mellon and Secretary of the Manager, and an officer of 77 investment companies (comprised of 194 portfolios) managed by the Manager. He is 43 years old and has been an employee of the Manager since December 1996.
JONI LACKS CHARATAN, Vice President and Assistant Secretary since December 2008.
Senior Counsel of BNY Mellon, and an officer of 77 investment companies (comprised of 194 portfolios) managed by the Manager. She is 54 years old and has been an employee of the Manager since October 1988.
JOSEPH M. CHIOFFI, Vice President and Assistant Secretary since December 2008.
Senior Counsel of BNY Mellon, and an officer of 77 investment companies (comprised of 194 portfolios) managed by the Manager. He is 48 years old and has been an employee of the Manager since June 2000.
KATHLEEN DENICHOLAS, Vice President and Assistant Secretary since January 2010.
Senior Counsel of BNY Mellon, and an officer of 77 investment companies (comprised of 194 portfolios) managed by the Manager. She is 35 years old and has been an employee of the Manager since February 2001.
60
JANETTE E. FARRAGHER, Vice President and Assistant Secretary since December 2008.
Assistant General Counsel of BNY Mellon, and an officer of 77 investment companies (comprised of 194 portfolios) managed by the Manager. She is 47 years old and has been an employee of the Manager since February 1984.
JOHN B. HAMMALIAN, Vice President and Assistant Secretary since December 2008.
Managing Counsel of BNY Mellon, and an officer of 77 investment companies (comprised of 194 portfolios) managed by the Manager. He is 46 years old and has been an employee of the Manager since February 1991.
M. CRISTINA MEISER, Vice President and Assistant Secretary since January 2010.
Senior Counsel of BNY Mellon, and an officer of 77 investment companies (comprised of 194 portfolios) managed by the Manager. She is 39 years old and has been an employee of the Manager since August 2001.
ROBERT R. MULLERY, Vice President and Assistant Secretary since December 2008.
Managing Counsel of BNY Mellon, and an officer of 77 investment companies (comprised of 194 portfolios) managed by the Manager. He is 57 years old and has been an employee of the Manager since May 1986.
JEFF PRUSNOFSKY, Vice President and Assistant Secretary since December 2008.
Managing Counsel of BNY Mellon, and an officer of 77 investment companies (comprised of 194 portfolios) managed by the Manager. He is 44 years old and has been an employee of the Manager since October 1990.
JAMES WINDELS, Treasurer since December 2008.
Director – Mutual Fund Accounting of the Manager, and an officer of 77 investment companies (comprised of 194 portfolios) managed by the Manager. He is 51 years old and has been an employee of the Manager since April 1985.
RICHARD CASSARO, Assistant Treasurer since December 2008.
Senior Accounting Manager – Money Market and Municipal Bond Funds of the Manager, and an officer of 77 investment companies (comprised of 194 portfolios) managed by the Manager. He is 50 years old and has been an employee of the Manager since September 1982.
GAVIN C. REILLY, Assistant Treasurer since December 2008.
Tax Manager of the Investment Accounting and Support Department of the Manager, and an officer of 77 investment companies (comprised of 194 portfolios) managed by the Manager. He is 41 years old and has been an employee of the Manager since April 1991.
ROBERT ROBOL, Assistant Treasurer since December 2008.
Senior Accounting Manager – Fixed Income Funds of the Manager, and an officer of 77 investment companies (comprised of 194 portfolios) managed by the Manager. He is 45 years old and has been an employee of the Manager since October 1988.
ROBERT SALVIOLO, Assistant Treasurer since December 2008.
Senior Accounting Manager – Equity Funds of the Manager, and an officer of 77 investment companies (comprised of 194 portfolios) managed by the Manager. He is 42 years old and has been an employee of the Manager since June 1989.
The Fund 61
OFFICERS OF THE FUND (Unaudited) (continued)
ROBERT SVAGNA, Assistant Treasurer since December 2008.
Senior Accounting Manager – Equity Funds of the Manager, and an officer of 77 investment companies (comprised of 194 portfolios) managed by the Manager. He is 42 years old and has been an employee of the Manager since November 1990.
JOSEPH W. CONNOLLY, Chief Compliance Officer since December 2008.
Chief Compliance Officer of the Manager and The Dreyfus Family of Funds (77 investment companies, comprised of 194 portfolios). From November 2001 through March 2004, Mr. Connolly was first Vice-President, Mutual Fund Servicing for Mellon Global Securities Services. In that capacity, Mr. Connolly was responsible for managing Mellon’s Custody, Fund Accounting and Fund Administration services to third-party mutual fund clients. He is 52 years old and has served in various capacities with the Manager since 1980, including manager of the firm’s Fund Accounting Department from 1997 through October 2001.
WILLIAM GERMENIS, Anti-Money Laundering Compliance Officer since December 2008.
Vice President and Anti-Money Laundering Compliance Officer of the Distributor, and the Anti-Money Laundering Compliance Officer of 73 investment companies (comprised of 190 portfolios) managed by the Manager. He is 39 years old and has been an employee of the Distributor since October 1998.
62
NOTES
The views expressed in this report reflect those of the portfolio manager only through the end of the period covered and do not necessarily represent the views of Dreyfus or any other person in the Dreyfus organization. Any such views are subject to change at any time based upon market or other conditions and Dreyfus disclaims any responsibility to update such views.These views may not be relied on as investment advice and, because investment decisions for a Dreyfus fund are based on numerous factors, may not be relied on as an indication of trading intent on behalf of any Dreyfus fund.
Not FDIC-Insured • Not Bank-Guaranteed • May Lose Value
Contents | |
THE FUND | |
| 2 | A Letter from the Chairman and CEO |
| 3 | Discussion of Fund Performance |
| 6 | Fund Performance |
| 7 | Understanding Your Fund’s Expenses |
| 7 | Comparing Your Fund’s Expenses With Those of Other Funds |
| 8 | Statement of Investments |
| 21 | Statement of Financial Futures |
| 21 | Statement of Options Written |
| 22 | Statement of Assets and Liabilities |
| 23 | Statement of Operations |
| 24 | Statement of Changes in Net Assets |
| 25 | Financial Highlights |
| 26 | Notes to Financial Statements |
| 50 | Report of Independent Registered Public Accounting Firm |
| 51 | Important Tax Information |
| 52 | Board Members Information |
| 54 | Officers of the Fund |
FOR MORE INFORMATION | |
Back Cover |
Dreyfus/Standish
International Fixed
Income Fund
The Fund

A LETTER FROM THE CHAIRMAN AND CEO
Dear Shareholder:
We are pleased to present this annual report for Dreyfus/Standish International Fixed Income Fund, covering the 12-month period from January 1, 2009, through December 31, 2009.
The U.S. and global bond markets ended 2009 with healthy annual gains among higher yielding market sectors, but U.S.Treasury securities and other sovereign bonds from developed nations gave back a portion of their previous gains.The bond market’s advance was driven partly by government intervention and partly by improving investor sentiment as the global economy staged a gradual, but sustained, recovery from a severe recession and banking crisis. After four consecutive quarters of contraction, the U.S. economy returned to growth during the third quarter of 2009, buoyed by greater manufacturing activity to replenish depleted inventories and satisfy export demand.The slumping housing market also showed signs of renewed life later in the year when home sales and prices rebounded modestly. However, economic headwinds remain, including a high unemployment rate and the prospect of anemic consumer spending.
As 2010 begins, our Chief Economist, as well as many securities analysts and portfolio managers have continued to find opportunities and survey potential challenges across the various fixed-income markets, both domestic and international. While no one can predict the future, we believe that the 2010 investment environment will likely require a broader range of investment considerations relative to last year.As always, your financial adviser can help you determine the mix of investments that may be best suited to helping you achieve your goals at a level of risk that is comfortable for you.
For information about how the fund performed during the reporting period, as well as market perspectives, we have provided a Discussion of Fund Performance.
Thank you for your continued confidence and support.

Jonathan R. Baum
Chairman and Chief Executive Officer
The Dreyfus Corporation
2
January 15, 2010

DISCUSSION OF FUND PERFORMANCE
For the period of January 1, 2009, through December 31, 2009, as provided by David Leduc, CFA, and Thomas Fahey, Co-Portfolio Managers
Fund and Market Performance Overview
For the 12-month period ended December 31, 2009, Dreyfus/Standish International Fixed Income Fund’s Class I shares achieved a total return of 13.86%.1 In comparison, the Barclays Capital Global Aggregate ex-U.S. Index (Hedged) (the “Index”), the fund’s benchmark, achieved a total return of 4.43% for the same period.2 Higher yielding sectors of the international bond markets rallied during much of 2009 when signs of economic recovery boosted investor sentiment. Conversely, the traditionally defensive sovereign bonds of developed nations gave back some of the gains they achieved during a “flight to quality” in 2008.The fund produced a high er return than that of its benchmark, primarily due to strong results from our sector allocation strategy and favorable security selections among corporate bonds and emerging market securities.
The Fund’s Investment Approach
The fund seeks to maximize total return while realizing a market level of income, consistent with preserving principal and liquidity, by normally investing at least 80% of its assets in fixed income securities.The fund also normally invests at least 65% of its assets in non-U.S. dollar-denominated fixed-income securities of foreign governments and companies located in various countries, including emerging markets. The fund’s investments may include non-U.S. high-grade and medium-grade government, corporate, mortgage-backed, asset-backed, high yield and emerging market debt securities. To protect the U.S. dollar value of the fund’s assets, we hedge most, but not necessarily all, of the portfolio’s foreign currency exposure.
The fund emphasizes rotation among undervalued countries, sectors, securities and currencies. In particular, we focus on securities with the most potential for added value, i.e., those involving potential for credit upgrades and unique structural characteristics.To identify these securities, we use macroeconomic research and quantitative analysis to allocate assets among countries and currencies based on a comparative evaluation of interest and inflation rate trends, government fiscal/monetary policy and credit quality of government debt.
The Fund 3
DISCUSSION OF FUND PERFORMANCE (continued)
Sustained Market Rally Erased Earlier Losses
2009 began in the midst of a global banking crisis and recession that produced steep declines among mortgage-backed, asset-backed, corporate-backed bonds and emerging-market securities. In contrast, sovereign bonds of some developed nations had rallied during a “flight to quality.” The world’s central banks and government officials responded aggressively to the downturn by rescuing struggling corporations and enacting massive economic stimulus programs. Monetary authorities injected massive amounts of liquidity into the international banking system, and they maintained historically low short-term interest rates.
Investor sentiment began to improve in March 2009 as it became clearer that these remedial measures were gaining traction, sparking sustained rallies that were particularly impressive for high yield bonds, investment-grade corporate bonds and emerging market securities. Conversely, sovereign bonds of industrialized countries in Europe gave back some of their earlier gains.
Sector Allocation Strategy Produced Strong Results
The fund began the year with underweighted exposure to sovereign debt and overweighted positions in investment-grade corporate bonds, high yield bonds and emerging market securities. The fund received particularly strong results from the emerging markets, where bonds in Brazil and Mexico gained value as interest rates declined.The fund also benefited from positions in emerging market currencies, which appreciated relative to the euro, British pound and Japanese yen.
The fund’s holdings in the investment-grade corporate sector were focused primarily in Europe and the United Kingdom, including issuers in traditionally defensive industry groups, such as utilities and the senior debt of multinational banks. The fund also allocated assets to corporate bonds in the United States, where risk premiums were especially attractive early in the year. As those premiums normalized, we shifted the fund’s focus to corporate securities in Europe. High yield positions included a diverse array of issuers with credit ratings toward the upper end of the below-investment-grade spectrum.
Although the fund maintained underweighted exposure to sovereign bonds in developed markets, it held especially light positions in Greece, Ireland, Spain and other “peripheral” European nations due to heightened fiscal and competitive pressures.The fund began 2009 with modest exposure to mortgage-backed securities, but we gradually
4
reduced that position after the sector had rallied amid massive levels of government support.
The fund’s interest rate strategies detracted mildly from relative performance, but it was not enough to offset strength in other areas.We generally set the fund’s average duration in a range that was slightly longer than industry averages, and we tended to focus on bonds with maturities of five years and 10 years.
Maintaining a Research-Intensive Process
As of the reporting period’s end, we have maintained the fund’s sector allocation strategy, as we believe that the emerging markets and corporate-backed bonds have room for further gains. However, we expect governments and central banks to pare back some of their remedial programs in 2010. Therefore, security selection may become a more critical determinant of fund performance, an environment to which our research-intensive approach may be particularly well suited.
| January 15, 2010 | |
| Foreign bonds are subject to special risks including exposure to currency fluctuations, | |
| changing political and economic conditions, and potentially less liquidity. The fixed income | |
| securities of issuers located in emerging markets can be more volatile and less liquid than | |
| those of issuers in more mature economies. | |
| Investments in foreign currencies are subject to the risk that those currencies will decline in | |
| value relative to the U.S. dollar, or, in the case of hedged positions, that the U.S. dollar will | |
| decline relative to the currency being hedged. Currency rates in foreign countries may | |
| fluctuate significantly over short periods of time. A decline in the value of foreign currencies | |
| relative to the U.S. dollar will reduce the value of securities held by the fund and | |
| denominated in those currencies. | |
| The fund may, but is not required to, use derivative instruments, such as options, futures and | |
| options on futures, forward contracts, swaps (including credit default swaps on corporate bonds and | |
| asset-backed securities), options on swaps, and other credit derivatives.A small investment in | |
| derivatives could have a potentially large impact on the fund’s performance.The use of derivatives | |
| involves risks different from, or possibly greater than, the risks associated with investing directly in | |
| the underlying assets. Credit default swaps and similar instruments involve greater risks than if the | |
| fund had invested in the reference obligation directly, since, in addition to general market risks, they | |
| are subject to illiquidity risk, counterparty risk and credit risks. | |
| Effective September 1, 2009, the single class shares of Dreyfus/Standish International Fixed | |
| Income Fund were re-designated as Class I shares. | |
| 1 | Total return includes reinvestment of dividends and any capital gains paid. Past performance is no |
| guarantee of future results. Share price and investment return fluctuate such that upon redemption, | |
| fund shares may be worth more or less than their original cost. Return figure provided reflects the | |
| absorption of certain fund expenses by The Dreyfus Corporation pursuant to an undertaking in | |
| effect that may be extended, terminated or modified at any time. Had these expenses not been | |
| absorbed, the fund’s return would have been lower. | |
| 2 | SOURCE: LIPPER. — Reflects reinvestment of dividends and, where applicable, capital gain |
| distributions.The Barclays Capital Global Aggregate ex-U.S. Index (Hedged) is designed to | |
| measure the performance of global investment-grade, fixed-rate debt markets, excluding the United | |
| States, hedged into U.S. dollars. Investors cannot invest directly in any index. | |
The Fund 5
| FUND PERFORMANCE |
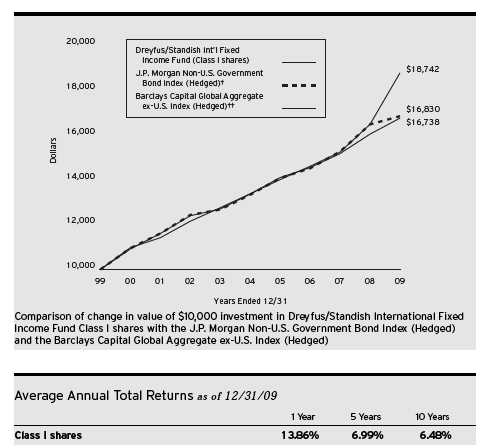
| † | Source: Bloomberg L.P. |
| †† | Source: Barclays Capital Inc. |
| Past performance is not predictive of future performance.The fund’s performance shown in the graph and table does not | |
| reflect the deduction of taxes that a shareholder would pay on fund distributions or the redemption of fund shares. | |
| The above graph compares a $10,000 investment made in Class I shares of Dreyfus/Standish International Fixed | |
| Income Fund on 12/31/99 to a $10,000 investment made in the J.P. Morgan Non-U.S. Government Bond Index | |
| (Hedged) (the “J.P. Morgan Index”) and the Barclays Capital Global Aggregate ex-U.S. Index (Hedged) (the “Barclays | |
| Capital Index”) on that date.All dividends and capital gain distributions are reinvested. | |
| Effective February 10, 2009, Dreyfus/Standish International Fixed Income Fund changed its benchmark from the | |
| J.P. Morgan Index to the Barclays Capital Index. In future reports, the fund’s performance will no longer be compared to | |
| the J.P. Morgan Index because the Barclays Capital Index is more reflective of the fund’s portfolio investment profile. | |
| Effective on September 1, 2009, the single class shares of Dreyfus/Standish International Fixed Income Fund were | |
| re-designated as Class I shares. | |
| The fund’s performance shown in the line graph takes into account all applicable fees and expenses.The J.P. Morgan Index | |
| is an unmanaged broad based index of non-U.S. government bonds with maturities of one year or more that are currency- | |
| hedged into U.S. dollars.The Barclays Capital Index is designed to measure the performance of global investment-grade, | |
| fixed-rate debt markets, excluding the United States, hedged into U.S. dollars.These factors can contribute to the Index | |
| potentially outperforming the fund. Unlike a mutual fund, the indices are not subject to charges, fees and other expenses. | |
| Investors cannot invest directly in any index. Further information relating to fund performance, including expense | |
| reimbursements, if applicable, is contained in the Financial Highlights section of the prospectus and elsewhere in this report. | |
6
UNDERSTANDING YOUR FUND’S EXPENSES (Unaudited)
As a mutual fund investor, you pay ongoing expenses, such as management fees and other expenses. Using the information below, you can estimate how these expenses affect your investment and compare them with the expenses of other funds.You also may pay one-time transaction expenses, including sales charges (loads) and redemption fees, which are not shown in this section and would have resulted in higher total expenses. For more information, see your fund’s prospectus or talk to your financial adviser.
Review your fund’s expenses
The table below shows the expenses you would have paid on a $1,000 investment in Dreyfus/Standish International Fixed Income Fund from July 1, 2009 to December 31, 2009. It also shows how much a $1,000 investment would be worth at the close of the period, assuming actual returns and expenses.
| Expenses and Value of a $1,000 Investment | |
| assuming actual returns for the six months ended December 31, 2009† | |
| Expenses paid per $1,000†† | $ 4.19 |
| Ending value (after expenses) | $1,079.80 |
| COMPARING YOUR FUND’S EXPENSES |
| WITH THOSE OF OTHER FUNDS (Unaudited) |
Using the SEC’s method to compare expenses
The Securities and Exchange Commission (SEC) has established guidelines to help investors assess fund expenses. Per these guidelines, the table below shows your fund’s expenses based on a $1,000 investment, assuming a hypothetical 5% annualized return. You can use this information to compare the ongoing expenses (but not transaction expenses or total cost) of investing in the fund with those of other funds.All mutual fund shareholder reports will provide this information to help you make this comparison. Please note that you cannot use this information to estimate your actual ending account balance and expenses paid during the period.
| Expenses and Value of a $1,000 Investment | |
| assuming a hypothetical 5% annualized return for the six months ended December 31, 2009† | |
| Expenses paid per $1,000†† | $ 4.08 |
| Ending value (after expenses) | $1,021.17 |
† Effective September 1, 2009, the fund’s shares were redesignated as Class I shares.
Expenses are equal to the fund's annualized expense ratio of .80% for Class I, multiplied by the average account value over the period, multiplied by 184/365 (to reflect the one-half year period).
The Fund 7
| STATEMENT OF INVESTMENTS |
| December 31, 2009 |
| Coupon | Maturity | Principal | ||||
| Bonds and Notes��92.8% | Rate (%) | Date | Amount ($) | Value ($) | ||
| Australia—1.4% | ||||||
| Queensland Treasury, | ||||||
| Gtd. Notes | AUD | 6.00 | 8/14/13 | 910,000 | a | 834,441 |
| Rio Tinto Finance USA, | ||||||
| Gtd. Notes | 5.88 | 7/15/13 | 225,000 | 242,977 | ||
| Saint George Bank, | ||||||
| Sr. Unscd. Notes | EUR | 6.50 | 6/24/13 | 150,000 | a | 239,496 |
| 1,316,914 | ||||||
| Belgium—1.5% | ||||||
| Anheuser-Busch InBev, | ||||||
| Gtd. Notes | GBP | 9.75 | 7/30/24 | 130,000 | a | 288,372 |
| Belgium Kingdom, | ||||||
| Bonds, Ser. 44 | EUR | 5.00 | 3/28/34 | 700,000 | a | 1,078,909 |
| 1,367,281 | ||||||
| Bermuda—.1% | ||||||
| Holcim Capital, | ||||||
| Gtd. Notes | 6.88 | 9/29/39 | 120,000 | b | 126,430 | |
| Brazil—2.2% | ||||||
| Brazilian Government, | ||||||
| Unsub. Bonds | BRL | 12.50 | 1/5/16 | 3,050,000 | a | 1,988,369 |
| Canada—3.2% | ||||||
| Barrick Gold, | ||||||
| Sr. Unscd. Notes | 6.95 | 4/1/19 | 235,000 | 265,056 | ||
| Canadian Government, | ||||||
| Bonds, Ser. VW17 | CAD | 8.00 | 6/1/27 | 310,000 | a | 435,826 |
| Province of Ontario Canada, | ||||||
| Notes | CAD | 4.50 | 12/2/12 | 1,670,000 | a | 1,697,529 |
| Teck Resources, | ||||||
| Sr. Scd. Notes | 10.75 | 5/15/19 | 215,000 | 258,000 | ||
| Trans-Canada Pipelines, | ||||||
| Sr. Unscd. Notes | 7.63 | 1/15/39 | 205,000 | 253,311 | ||
| 2,909,722 | ||||||
| Cayman Islands—.5% | ||||||
| Petrobras | ||||||
| International Finance, | ||||||
| Gtd. Notes | 5.75 | 1/20/20 | 215,000 | 219,792 | ||
| Vale Overseas, | ||||||
| Gtd. Notes | 6.88 | 11/10/39 | 215,000 | 217,521 | ||
| 437,313 |
8
| Coupon | Maturity | Principal | ||||
| Bonds and Notes (continued) | Rate (%) | Date | Amount ($) | Value ($) | ||
| Denmark—.8% | ||||||
| NYKREDIT, | ||||||
| Sub. Notes | EUR | 4.90 | 9/22/49 | 600,000 | a,c | 761,214 |
| Finland—.7% | ||||||
| Aktia Real Estate, | ||||||
| Bonds | EUR | 4.13 | 6/11/14 | 450,000 | a | 663,399 |
| France—6.0% | ||||||
| BNP Paribas, | ||||||
| Sr. Unscd. Notes | EUR | 3.25 | 3/27/12 | 135,000 | a | 197,708 |
| Electricite of France, | ||||||
| Sr. Unscd. Notes | EUR | 5.00 | 5/30/14 | 150,000 | a | 232,589 |
| GDF Suez, | ||||||
| Sr. Unscd. Notes | EUR | 6.25 | 1/24/14 | 95,000 | a | 153,194 |
| Government of France, | ||||||
| Bonds | EUR | 4.25 | 10/25/18 | 2,120,000 | a | 3,216,020 |
| Lafarge, | ||||||
| Notes | EUR | 5.50 | 12/16/19 | 95,000 | a | 135,198 |
| PPR, | ||||||
| Sr. Unscd. Notes | EUR | 8.63 | 4/3/14 | 245,000 | a | 414,817 |
| Societe Generale, | ||||||
| Sr. Unscd. Notes | EUR | 5.25 | 3/28/13 | 250,000 | a | 385,641 |
| Societe Generale, | ||||||
| Sub. Notes | EUR | 6.13 | 8/20/18 | 150,000 | a | 242,049 |
| Societe Generale, | ||||||
| Sub. Notes | EUR | 7.76 | 5/22/49 | 50,000 | a,c | 67,377 |
| Veolia Environnement, | ||||||
| Sr. Unscd. Notes | EUR | 6.13 | 11/25/33 | 170,000 | a | 265,250 |
| Veolia Environnement, | ||||||
| Sr. Unscd. Notes | EUR | 6.75 | 4/24/19 | 150,000 | a | 252,002 |
| 5,561,845 | ||||||
| Germany—9.6% | ||||||
| Bayer, | ||||||
| Jr. Sub. Bonds | EUR | 5.00 | 7/29/05 | 125,000 | a,c | 165,933 |
| Bundesrepublik Deutschland, | ||||||
| Bonds, Ser. 01 | EUR | 5.00 | 7/4/11 | 1,745,000 | a | 2,646,075 |
| Bundesrepublik Deutschland, | ||||||
| Bonds, Ser. 03 | EUR | 4.25 | 1/4/14 | 535,000 | a | 825,181 |
| Bundesrepublik Deutschland, | ||||||
| Bonds, Ser. 08 | EUR | 4.25 | 7/4/18 | 2,130,000 | a | 3,287,282 |
The Fund 9
STATEMENT OF INVESTMENTS (continued)
| Coupon | Maturity | Principal | ||||
| Bonds and Notes (continued) | Rate (%) | Date | Amount ($) | Value ($) | ||
| Germany (continued) | ||||||
| Deutsche Bank, | ||||||
| Sr. Unscd. Notes | EUR | 5.13 | 8/31/17 | 250,000 | a | 386,476 |
| Eurohypo, | ||||||
| Bonds, Ser. 2212 | EUR | 4.50 | 1/21/13 | 430,000 | a,b | 654,322 |
| Heidelbergcement, | ||||||
| Gtd. Notes | EUR | 8.50 | 10/31/19 | 435,000 | a | 662,555 |
| Henkel & Co., | ||||||
| Sub. Bonds | EUR | 5.38 | 11/25/04 | 155,000 | a,c | 200,731 |
| 8,828,555 | ||||||
| Hungary—1.6% | ||||||
| Hungary Government, | ||||||
| Bonds, Ser. 17/B | HUF | 6.75 | 2/24/17 | 150,000,000 | a | 740,203 |
| Hungary Government, | ||||||
| Bonds, Ser. 19/A | HUF | 6.50 | 6/24/19 | 162,000,000 | a | 778,797 |
| 1,519,000 | ||||||
| Indonesia—.8% | ||||||
| Indonesia Government, | ||||||
| Notes | IDR | 11.50 | 9/15/19 | 6,000,000,000 | a | 703,515 |
| Ireland—.3% | ||||||
| Principal Financial | ||||||
| Global Funding II, | ||||||
| Sr. Scd. Notes | EUR | 4.50 | 1/26/17 | 250,000 | a | 318,182 |
| Italy—2.1% | ||||||
| Atlantia, | ||||||
| Gtd. Notes | EUR | 5.63 | 5/6/16 | 395,000 | a | 618,482 |
| Enel-Societa Per Azioni, | ||||||
| Notes | EUR | 5.63 | 6/21/27 | 165,000 | a | 251,858 |
| Telecom Italia, | ||||||
| Sr. Unscd. Notes | EUR | 5.25 | 3/17/55 | 200,000 | a | 239,997 |
| Telecom Italia, | ||||||
| Sr. Unscd. Notes | EUR | 8.25 | 3/21/16 | 165,000 | a | 290,042 |
| Telecom Italia, | ||||||
| Sr. Unscd. Notes | GBP | 5.63 | 12/29/15 | 350,000 | a | 575,953 |
| 1,976,332 | ||||||
| Japan—7.6% | ||||||
| Development Bank of Japan, | ||||||
| Gov’t Gtd. Notes | JPY | 1.05 | 6/20/23 | 11,000,000 | a | 107,332 |
| Development Bank of Japan, | ||||||
| Gov’t Gtd. Notes | JPY | 1.70 | 9/20/22 | 263,000,000 | a | 2,812,924 |
10
| Coupon | Maturity | Principal | ||||
| Bonds and Notes (continued) | Rate (%) | Date | Amount ($) | Value ($) | ||
| Japan (continued) | ||||||
| Japan Government, | ||||||
| Bonds, Ser. 8 | JPY | 1.00 | 6/10/16 | 180,000,000 | a | 1,864,345 |
| Japan Government, | ||||||
| Bonds, Ser. 11 | JPY | 1.70 | 6/20/33 | 160,850,000 | a | 1,561,650 |
| Japan Government, | ||||||
| Bonds, Ser. 288 | JPY | 1.70 | 9/20/17 | 54,100,000 | a | 614,986 |
| 6,961,237 | ||||||
| Luxembourg—1.3% | ||||||
| Finmeccanica, | ||||||
| Gtd. Bonds | EUR | 5.25 | 1/21/22 | 280,000 | a | 410,287 |
| Holcim US Finance, | ||||||
| Gtd. Notes | 6.00 | 12/30/19 | 170,000 | b | 177,284 | |
| Telecom Italia Financial, | ||||||
| Gtd. Notes | EUR | 7.50 | 4/20/11 | 105,000 | a | 161,340 |
| Wind Acquisition Finance, | ||||||
| Gtd. Notes | EUR | 11.75 | 7/15/17 | 260,000 | a,b | 407,199 |
| 1,156,110 | ||||||
| Mexico—1.5% | ||||||
| Mexican Bonos, | ||||||
| Bonds, Ser. M 10 | MXN | 7.75 | 12/14/17 | 18,235,000 | a | 1,388,324 |
| Netherlands—8.4% | ||||||
| Daimler | ||||||
| International Finance, | ||||||
| Gtd. Notes | EUR | 6.88 | 6/10/11 | 240,000 | a | 366,166 |
| Deutsche Telekom | ||||||
| International Finance, | ||||||
| Gtd. Notes | EUR | 5.75 | 4/14/15 | 205,000 | a | 324,920 |
| Diageo Capital, | ||||||
| Gtd. Notes | EUR | 5.50 | 7/1/13 | 240,000 | a | 373,833 |
| E.ON International Finance, | ||||||
| Gtd. Notes | EUR | 4.88 | 1/28/14 | 140,000 | a | 216,094 |
| E.ON International Finance, | ||||||
| Gtd. Notes | EUR | 5.50 | 10/2/17 | 175,000 | a | 276,927 |
| Elsevier Finance, | ||||||
| Gtd. Notes | EUR | 6.50 | 4/2/13 | 150,000 | a | 238,048 |
| ING Bank, | ||||||
| Sub. Notes | EUR | 5.50 | 1/4/12 | 150,000 | a | 222,580 |
| Netherlands Government, | ||||||
| Bonds | EUR | 4.00 | 7/15/18 | 1,030,000 | a | 1,538,974 |
The Fund 11
STATEMENT OF INVESTMENTS (continued)
| Coupon | Maturity | Principal | ||||
| Bonds and Notes (continued) | Rate (%) | Date | Amount ($) | Value ($) | ||
| Netherlands (continued) | ||||||
| Netherlands Government, | ||||||
| Bonds | EUR | 4.00 | 1/15/37 | 2,190,000 | a | 3,027,946 |
| Repsol International Finance, | ||||||
| Gtd. Notes | EUR | 4.63 | 10/8/14 | 275,000 | a | 417,529 |
| RWE Finance, | ||||||
| Gtd. Notes | EUR | 6.63 | 1/31/19 | 250,000 | a | 429,118 |
| Telefonica Europe BV, | ||||||
| Gtd. Notes | EUR | 5.13 | 2/14/13 | 75,000 | a | 115,199 |
| Volkswagen International | ||||||
| Finance NV, | ||||||
| Gtd. Bonds | EUR | 4.88 | 5/22/13 | 140,000 | a | 212,158 |
| 7,759,492 | ||||||
| Norway—.2% | ||||||
| DNB Nor Bank, | ||||||
| Sub. Notes | EUR | 0.92 | 5/30/17 | 150,000 | a,c | 201,885 |
| Poland—.5% | ||||||
| Poland Government, | ||||||
| Bonds, Ser. 0413 | PLN | 5.25 | 4/25/13 | 1,125,000 | a | 392,423 |
| Republic of Poland, | ||||||
| Sr. Unscd. Bonds | 6.38 | 7/15/19 | 90,000 | 98,341 | ||
| 490,764 | ||||||
| Qatar—.8% | ||||||
| State of Qatar, | ||||||
| Sr. Notes | 4.00 | 1/20/15 | 565,000 | b | 569,238 | |
| State of Qatar, | ||||||
| Sr. Notes | 5.15 | 4/9/14 | 190,000 | b | 200,925 | |
| 770,163 | ||||||
| Russia—.4% | ||||||
| Russian Federation, | ||||||
| Sr. Unscd. Bonds | 7.50 | 3/31/30 | 329,000 | c | 374,649 | |
| South Korea—.3% | ||||||
| Export-Import Bank of Korea, | ||||||
| Sr. Unscd. Notes | EUR | 5.75 | 5/22/13 | 155,000 | a | 236,276 |
| Spain—.7% | ||||||
| Santander International, | ||||||
| Bank Gtd. Notes | EUR | 5.63 | 2/14/12 | 100,000 | a | 153,064 |
| Telefonica Emisiones, | ||||||
| Gtd. Notes | EUR | 4.69 | 11/11/19 | 100,000 | a | 144,736 |
12
| Coupon | Maturity | Principal | ||||
| Bonds and Notes (continued) | Rate (%) | Date | Amount ($) | Value ($) | ||
| Spain (continued) | ||||||
| Telefonica Emisiones, | ||||||
| Gtd. Notes | EUR | 5.50 | 4/1/16 | 250,000 | a | 389,291 |
| 687,091 | ||||||
| Supranational—.9% | ||||||
| Eurasian Development Bank, | ||||||
| Sr. Unscd. Notes | 7.38 | 9/29/14 | 230,000 | b | 240,062 | |
| European Investment Bank, | ||||||
| Sr. Unscd. Notes | JPY | 1.90 | 1/26/26 | 58,000,000 | a | 603,776 |
| 843,838 | ||||||
| Sweden—4.6% | ||||||
| Svenska Handelsbanken, | ||||||
| Jr. Sub. Notes | EUR | 4.19 | 12/16/49 | 625,000 | a,c | 795,171 |
| Swedish Government, | ||||||
| Bonds, Ser. 1045 | SEK | 5.25 | 3/15/11 | 10,385,000 | a | 1,535,357 |
| Swedish Government, | ||||||
| Bonds, Ser. 1050 | SEK | 3.00 | 7/12/16 | 5,500,000 | a | 769,996 |
| Swedish Government, | ||||||
| Bonds, Ser. 1052 | SEK | 4.25 | 3/12/19 | 7,700,000 | a | 1,157,109 |
| 4,257,633 | ||||||
| Switzerland—.9% | ||||||
| Credit Suisse Capital, | ||||||
| Bank Gtd. Notes | EUR | 6.91 | 11/7/49 | 245,000 | a,c | 350,341 |
| Credit Suisse Capital, | ||||||
| Bank Gtd. Notes | EUR | 7.97 | 12/29/49 | 160,000 | a,c | 229,941 |
| Credit Suisse London, | ||||||
| Sr. Unscd. Notes | EUR | 6.13 | 5/16/14 | 130,000 | a | 206,918 |
| 787,200 | ||||||
| United Kingdom—9.0% | ||||||
| ASIF III Jersey, | ||||||
| Sr. Scd. Notes | EUR | 5.50 | 3/7/11 | 275,000 | a | 388,827 |
| Barclays Bank, | ||||||
| Sr. Unscd. Notes | 6.75 | 5/22/19 | 290,000 | 324,047 | ||
| Barclays Bank, | ||||||
| Sub. Notes | EUR | 4.88 | 12/15/49 | 210,000 | a,c | 192,669 |
| Barclays Bank, | ||||||
| Sub. Notes | EUR | 6.00 | 1/23/18 | 270,000 | a | 410,361 |
| BAT International Finance, | ||||||
| Gtd. Notes | EUR | 5.38 | 6/29/17 | 140,000 | a | 215,792 |
The Fund 13
STATEMENT OF INVESTMENTS (continued)
| Coupon | Maturity | Principal | ||||
| Bonds and Notes (continued) | Rate (%) | Date | Amount ($) | Value ($) | ||
| United Kingdom (continued) | ||||||
| BAT International Finance, | ||||||
| Gtd. Notes | GBP | 6.38 | 12/12/19 | 240,000 | a | 410,322 |
| FCE Bank, | ||||||
| Sr. Unscd. Notes | EUR | 7.13 | 1/16/12 | 600,000 | a | 847,227 |
| HSBC Holdings, | ||||||
| Sub. Notes | EUR | 6.25 | 3/19/18 | 150,000 | a | 239,668 |
| National Grid, | ||||||
| Sr. Unscd. Notes | 6.30 | 8/1/16 | 105,000 | 114,347 | ||
| National Grid, | ||||||
| Sr. Unscd. Notes | EUR | 5.00 | 7/2/18 | 275,000 | a | 412,691 |
| National Grid Gas PLC, | ||||||
| Gtd. Notes | GBP | 7.00 | 12/16/24 | 135,000 | a | 243,852 |
| Reed Elsevier Investment, | ||||||
| Gtd. Notes | GBP | 7.00 | 12/11/17 | 150,000 | a | 266,695 |
| Royal Bank of Scotland, | ||||||
| Sr. Unscd. Notes | EUR | 5.75 | 5/21/14 | 395,000 | a | 596,935 |
| United Kingdom Gilt, | ||||||
| Bonds | GBP | 4.25 | 3/7/36 | 1,585,000 | a | 2,477,139 |
| United Kingdom Gilt, | ||||||
| Bonds | GBP | 4.50 | 3/7/19 | 545,000 | a | 909,320 |
| Vodafone Group, | ||||||
| Sr. Uncd. Notes | GBP | 8.13 | 11/26/18 | 150,000 | a | 290,883 |
| 8,340,775 | ||||||
| United States—24.9% | ||||||
| AES, | ||||||
| Sr. Unscd. Notes | 7.75 | 10/15/15 | 190,000 | 193,800 | ||
| American Express, | ||||||
| Sr. Unscd. Notes | 7.25 | 5/20/14 | 385,000 | 434,834 | ||
| Anadarko Petroleum, | ||||||
| Sr. Unscd. Notes | 8.70 | 3/15/19 | 175,000 | 218,047 | ||
| Aramark, | ||||||
| Gtd. Notes | 8.50 | 2/1/15 | 320,000 | d | 331,200 | |
| AT&T, | ||||||
| Sr. Unscd. Notes | EUR | 6.13 | 4/2/15 | 100,000 | a | 160,723 |
| Autozone, | ||||||
| Sr. Unscd. Notes | 5.75 | 1/15/15 | 380,000 | 412,561 | ||
| Ball, | ||||||
| Gtd. Notes | 7.38 | 9/1/19 | 365,000 | 376,862 | ||
14
| Coupon | Maturity | Principal | ||||
| Bonds and Notes (continued) | Rate (%) | Date | Amount ($) | Value ($) | ||
| United States (continued) | ||||||
| Bank of America, | ||||||
| Sr. Unscd. Notes | 7.38 | 5/15/14 | 390,000 | 442,956 | ||
| Bear Stearns Commercial | ||||||
| Mortgage Securities, | ||||||
| Ser. 2007-T26, Cl. A4 | 5.47 | 1/12/45 | 55,000 | c | 52,160 | |
| Bear Stearns Commercial | ||||||
| Mortgage Securities, | ||||||
| Ser. 2007-T28, Cl. A4 | 5.74 | 9/11/42 | 50,000 | c | 48,255 | |
| BMW US Capital, | ||||||
| Gtd. Notes | EUR | 5.00 | 5/28/15 | 245,000 | a | 374,099 |
| BNP Paribas, | ||||||
| Sub. Bonds | EUR | 5.87 | 10/16/49 | 250,000 | a,c | 322,548 |
| Bombardier, | ||||||
| Sr. Unscd. Notes | 6.30 | 5/1/14 | 200,000 | b | 199,000 | |
| Capital One Capital VI, | ||||||
| Gtd. Notes | 8.88 | 5/15/40 | 115,000 | 123,337 | ||
| Cargill, | ||||||
| Sr. Unscd. Notes | EUR | 4.38 | 4/29/13 | 200,000 | a | 297,846 |
| Cargill, Inc. | ||||||
| Sr. Unscd. Notes | EUR | 6.25 | 7/24/15 | 250,000 | a | 402,824 |
| CC Holdings, | ||||||
| Sr. Scd. Notes | 7.75 | 5/1/17 | 380,000 | b | 406,600 | |
| CenturyTel, | ||||||
| Sr. Notes, Ser. Q | 6.15 | 9/15/19 | 145,000 | 148,513 | ||
| Chesapeake Energy, | ||||||
| Gtd. Notes | 7.50 | 9/15/13 | 230,000 | 235,175 | ||
| Chesapeake Energy, | ||||||
| Gtd. Notes | EUR | 6.25 | 1/15/17 | 150,000 | a | 196,754 |
| Citigroup, | ||||||
| Sr. Unscd. Notes | 6.13 | 5/15/18 | 360,000 | 362,533 | ||
| Citigroup | ||||||
| Commercial Mortgage | ||||||
| Trust, Ser. 2007-C6, | ||||||
| Cl. A4 | 5.70 | 12/10/49 | 325,000 | c | 290,687 | |
| CSC Holdings, | ||||||
| Sr. Unscd. Notes | 8.50 | 4/15/14 | 375,000 | b | 401,250 | |
| Delhaize Group, | ||||||
| Gtd. Notes | 6.50 | 6/15/17 | 198,000 | 215,354 | ||
The Fund 15
STATEMENT OF INVESTMENTS (continued)
| Coupon | Maturity | Principal | ||||
| Bonds and Notes (continued) | Rate (%) | Date | Amount ($) | Value ($) | ||
| United States (continued) | ||||||
| Discover Financial Services, | ||||||
| Sr. Unscd. Notes | 10.25 | 7/15/19 | 220,000 | 257,668 | ||
| Discovery Communications, | ||||||
| Gtd. Notes | 5.63 | 8/15/19 | 230,000 | 237,921 | ||
| Dish DBS, | ||||||
| Gtd. Notes | 7.75 | 5/31/15 | 395,000 | 415,737 | ||
| Dow Chemical, | ||||||
| Sr. Unscd. Notes | 8.55 | 5/15/19 | 315,000 | 376,470 | ||
| Echostar DBS, | ||||||
| Gtd. Notes | 7.13 | 2/1/16 | 135,000 | 138,544 | ||
| El Paso, | ||||||
| Sr. Unscd. Notes | 7.00 | 6/15/17 | 410,000 | 408,685 | ||
| Energy Transfer Partners, | ||||||
| Sr. Unscd. Notes | 8.50 | 4/15/14 | 220,000 | 254,176 | ||
| Enterprise Products Operations, | ||||||
| Gtd. Notes | 6.13 | 10/15/39 | 390,000 | 378,030 | ||
| EQT, | ||||||
| Sr. Unscd. Notes | 8.13 | 6/1/19 | 155,000 | 179,386 | ||
| First Energy Solutions, | ||||||
| Gtd. Notes, Series WI | 4.80 | 2/15/15 | 245,000 | 250,351 | ||
| Freeport-McMoRan | ||||||
| Copper & Gold, | ||||||
| Sr. Unscd. Notes | 8.38 | 4/1/17 | 260,000 | 285,090 | ||
| General Electric Capital, | ||||||
| Sub. Bonds | EUR | 4.63 | 9/15/66 | 215,000 | a,c | 234,242 |
| Georgia-Pacific, | ||||||
| Gtd. Notes | 7.00 | 1/15/15 | 145,000 | b | 147,538 | |
| GMAC Commercial | ||||||
| Mortgage Securities, | ||||||
| Ser. 2002-C2, Cl. A2 | 5.39 | 10/15/38 | 180,878 | 185,824 | ||
| GMAC Commercial | ||||||
| Mortgage Securities, | ||||||
| Ser. 2003-C3, Cl. A2 | 4.22 | 4/10/40 | 90,588 | 91,272 | ||
| Goldman Sachs Group, | ||||||
| Sr. Unscd. Notes | 7.50 | 2/15/19 | 520,000 | 607,246 | ||
| Goodyear Tire & Rubber, | ||||||
| Sr. Unscd. Notes | 10.50 | 5/15/16 | 150,000 | 166,500 | ||
16
| Coupon | Maturity | Principal | ||||
| Bonds and Notes (continued) | Rate (%) | Date | Amount ($) | Value ($) | ||
| United States (continued) | ||||||
| Harley-Davidson Funding, | ||||||
| Gtd. Notes | 5.75 | 12/15/14 | 405,000 | b | 411,622 | |
| HCA, | ||||||
| Sr. Scd. Notes | 7.88 | 2/15/20 | 190,000 | b | 198,313 | |
| Ipalco Enterprises, | ||||||
| Sr. Scd. Notes | 7.25 | 4/1/16 | 330,000 | b | 332,475 | |
| Iron Mountain, | ||||||
| Sr. Sub. Notes | 8.38 | 8/15/21 | 370,000 | 383,875 | ||
| JPMorgan Chase & Co., | ||||||
| Sr. Unscd. Notes | 6.30 | 4/23/19 | 195,000 | 214,897 | ||
| JPMorgan Chase & Co., | ||||||
| Sr. Unscd. Notes | 4.75 | 5/1/13 | 280,000 | 295,773 | ||
| JPMorgan Chase Commercial | ||||||
| Mortgage Securities, | ||||||
| Ser. 2009-IWST, Cl. A2 | 5.63 | 12/5/27 | 850,000 | b | 843,702 | |
| Kinder Morgan Energy Partners, | ||||||
| Sr. Unscd. Notes | 5.80 | 3/1/21 | 40,000 | 41,342 | ||
| Kinder Morgan Energy Partners, | ||||||
| Sr. Unscd. Notes | 6.85 | 2/15/20 | 315,000 | 350,070 | ||
| Kraft Foods, | ||||||
| Sr. Unscd. Notes | EUR | 6.25 | 3/20/15 | 255,000 | a | 401,368 |
| Lamar Media, | ||||||
| Gtd. Notes | 6.63 | 8/15/15 | 360,000 | 351,000 | ||
| Levi Strauss & Co., | ||||||
| Sr. Unscd. Notes | EUR | 8.63 | 4/1/13 | 150,000 | a | 217,183 |
| Merrill Lynch Mortgage Trust, | ||||||
| Ser. 2005-CIP1, Cl. A2 | 4.96 | 8/12/10 | 150,000 | 150,486 | ||
| Merrill Lynch/Countrywide | ||||||
| Commercial Mortgage Trust, | ||||||
| Ser. 2006-2, Cl. A4 | 6.10 | 6/12/46 | 185,000 | c | 181,967 | |
| Metropolitan Life Global Funding I, | ||||||
| Sr. Scd. Notes | 5.13 | 4/10/13 | 200,000 | b | 212,037 | |
| Metropolitan Life | ||||||
| Global Funding I, | ||||||
| Sr. Scd. Notes | 5.13 | 6/10/14 | 235,000 | b | 248,946 | |
| MGM Mirage, | ||||||
| Sr. Scd. Notes | 11.13 | 11/15/17 | 400,000 | b | 445,000 | |
The Fund 17
STATEMENT OF INVESTMENTS (continued)
| Coupon | Maturity | Principal | ||||
| Bonds and Notes (continued) | Rate (%) | Date | Amount ($) | Value ($) | ||
| United States (continued) | ||||||
| Morgan Stanley, | ||||||
| Sr. Unscd. Notes | 7.30 | 5/13/19 | 355,000 | 399,329 | ||
| Morgan Stanley, | ||||||
| Sr. Unscd. Notes | EUR | 5.50 | 10/2/17 | 145,000 | a | 212,814 |
| Morgan Stanley Capital I, | ||||||
| Ser. 2006-IQ12, Cl. A1 | 5.26 | 12/15/43 | 82,133 | 83,963 | ||
| Mosaic, | ||||||
| Sr. Unscd. Notes | 7.38 | 12/1/14 | 160,000 | b | 171,327 | |
| Newfield Exploration, | ||||||
| Sr. Sub. Notes | 7.13 | 5/15/18 | 25,000 | 25,375 | ||
| News America, | ||||||
| Gtd. Notes | 6.15 | 3/1/37 | 140,000 | 139,741 | ||
| News America, | ||||||
| Gtd. Notes | 6.90 | 3/1/19 | 220,000 | 248,317 | ||
| Nordic Telephone Holdings, | ||||||
| Sr. Scd. Bonds | 8.88 | 5/1/16 | 135,000 | b | 143,438 | |
| NRG Energy, | ||||||
| Gtd. Notes | 7.38 | 1/15/17 | 400,000 | 402,000 | ||
| Peabody Energy, | ||||||
| Gtd. Notes | 7.38 | 11/1/16 | 255,000 | 264,244 | ||
| Peabody Energy, | ||||||
| Gtd. Notes, Ser. B | 6.88 | 3/15/13 | 120,000 | 121,950 | ||
| Penn National Gaming, | ||||||
| Sr. Sub. Notes | 8.75 | 8/15/19 | 385,000 | b | 395,588 | |
| Plains All American Pipeline, | ||||||
| Gtd. Notes | 4.25 | 9/1/12 | 375,000 | 387,236 | ||
| Procter & Gamble, | ||||||
| Sr. Unscd. Notes | EUR | 5.13 | 10/24/17 | 135,000 | a | 211,976 |
| Prudential Financial, | ||||||
| Sr. Unscd. Notes | 4.75 | 9/17/15 | 394,000 | 400,017 | ||
| Reynolds Group Escrow, | ||||||
| Sr. Scd. Notes | EUR | 7.75 | 10/15/16 | 305,000 | a,b | 445,977 |
| Roche, | ||||||
| Gtd. Notes | EUR | 5.63 | 3/4/16 | 130,000 | a | 208,235 |
18
| Coupon | Maturity | Principal | ||||
| Bonds and Notes (continued) | Rate (%) | Date | Amount ($) | Value ($) | ||
| United States (continued) | ||||||
| Schering-Plough, | ||||||
| Gtd. Notes | EUR | 5.00 | 10/1/10 | 85,000 | a | 125,155 |
| Schering-Plough, | ||||||
| Gtd. Notes | EUR | 5.38 | 10/1/14 | 200,000 | a | 313,772 |
| Simon Property Group, | ||||||
| Sr. Unscd. Notes | 6.75 | 5/15/14 | 315,000 | 336,006 | ||
| Staples, | ||||||
| Gtd. Notes | 9.75 | 1/15/14 | 340,000 | 414,628 | ||
| Wachovia Bank Commercial | ||||||
| Mortgage Trust, | ||||||
| Ser. 2005-C16, Cl. A2 | 4.38 | 10/15/41 | 82,292 | 83,060 | ||
| Wachovia Bank | ||||||
| Commercial Mortgage | ||||||
| Trust, Ser. 2007-C34, | ||||||
| Cl. A3 | 5.68 | 5/15/46 | 130,000 | 114,755 | ||
| Windstream, | ||||||
| Gtd. Notes | 7.88 | 11/1/17 | 305,000 | b | 302,713 | |
| WM Covered Bond Program, | ||||||
| Notes | EUR | 4.00 | 9/27/16 | 285,000 | a | 401,688 |
| 22,895,958 | ||||||
| Total Bonds and Notes | ||||||
| (cost $81,340,772) | 85,629,466 | |||||
| Short-Term Investment—1.8% | ||||||
| U.S. Treasury Bills; | ||||||
| 0.03%, 1/14/10 | ||||||
| (cost $1,659,980) | 1,660,000 d,e | 1,659,980 | ||||
| Other Investment—1.8% | Shares | Value ($) | ||||
| Registered Investment Company; | ||||||
| Dreyfus Institutional Preferred | ||||||
| Plus Money Market Fund | ||||||
| (cost $1,631,828) | 1,631,828 f | 1,631,828 | ||||
The Fund 19
STATEMENT OF INVESTMENTS (continued)
| Investment of Cash Collateral | ||
| for Securities Loaned—1.0% | Shares | Value ($) |
| Registered Investment Company; | ||
| Dreyfus Institutional Cash Advantage Fund | ||
| (cost $885,292) | 885,292 f | 885,292 |
| Total Investments (cost $85,517,872) | 97.4% | 89,806,566 |
| Cash and Receivables (Net) | 2.6% | 2,363,996 |
| Net Assets | 100.0% | 92,170,562 |
| a Principal amount stated in U.S. Dollars unless otherwise noted: |
| AUD—Australian Dollar |
| BRL—Brazilian Real |
| CAD—Canadian Dollar |
| EUR—Euro |
| GBP—British Pound |
| HUF—Hungary Forint |
| IDR—Indonesian Rupiah |
| JPY—JapaneseYen |
| MXN—Mexican New Peso |
| PLN— Polish Zloty |
| SEK—Swedish Krona |
| b Securities exempt from registration under Rule 144A of the Securities Act of 1933.These securities may be resold in |
| transactions exempt from registration, normally to qualified institutional buyers.At December 31, 2009, these |
| securities had a total market value of $7,680,986 or 8.3% of net assets. |
| c Variable rate security—interest rate subject to periodic change. |
| d Security, or portion thereof, on loan.At December 31, 2009, the total market value of the fund’s securities on loan is |
| $861,754 and the total market value of the collateral held by the fund is $885,292. |
| e Held by broker as collateral for open financial futures and options positions. |
| f Investment in affiliated money market mutual fund. |
| Portfolio Summary (Unaudited)† | |||
| Value (%) | Value (%) | ||
| Corporate Bonds | 47.6 | Commercial Mortgage-Backed | 2.3 |
| Foreign/Governmental | 42.9 | ||
| Short-Term/Money Market Investments | 4.6 | 97.4 | |
20
| STATEMENT OF FINANCIAL FUTURES |
| December 31, 2009 |
| Unrealized | ||||
| Market Value | Appreciation | |||
| Covered by | (Depreciation) | |||
| Contracts | Contracts ($) | Expiration | at 12/31/2009 ($) | |
| Financial Futures Long | ||||
| Euro—Bobl | 46 | 7,626,991 | March 2010 | (35,441) |
| Euro—Bund | 2 | 347,463 | March 2010 | (3,589) |
| Euro—Schatz | 13 | 2,011,956 | March 2010 | 1,643 |
| Japanese 10 Year Bond | 3 | 4,499,919 | March 2010 | (2,931) |
| U.S. Treasury 5 Year Notes | 5 | 571,914 | March 2010 | (8,219) |
| Financial Futures Short | ||||
| U.S. Treasury 10 Year Notes | 146 | (16,856,156) | March 2010 | 457,655 |
| U.S. Long Bond | 21 | (2,422,875) | March 2010 | 150,575 |
| Gross Unrealized Appreciation | 609,873 | |||
| Gross Unrealized Depreciation | (50,180) | |||
| See notes to financial statements. | ||||
| STATEMENT OF OPTIONS WRITTEN |
| December 31, 2009 |
| Face Amount | ||
| Covered by | ||
| Contracts ($) | Value ($) | |
| Call Options: | ||
| 10-Year USD LIBOR-BBA, | ||
| September 2012 @ 4.47 | 1,963,000 a | (83,439) |
| 10-Year USD LIBOR-BBA, | ||
| November 2012 @ 4.76 | 1,730,000 a | (90,841) |
| Put Options: | ||
| 10-Year USD LIBOR-BBA, | ||
| September 2012 @ 4.47 | 1,963,000 a | (169,072) |
| 10-Year USD LIBOR-BBA, | ||
| November 2012 @ 4.76 | 1,730,000 a | (132,199) |
| (Premiums received $487,669) | (475,551) |
| BBA—British Bankers Association |
| LIBOR—London Interbank Offered Rate |
| USD—US Dollar |
| a Non-income producing security. |
| See notes to financial statements. |
The Fund 21
STATEMENT OF ASSETS AND LIABILITIES
December 31, 2009
| Cost | Value | |
| Assets ($): | ||
| Investments in securities—See Statement of Investments (including | ||
| securities on loan, valued at $861,754)—Note 1(c): | ||
| Unaffiliated issuers | 83,000,752 | 87,289,446 |
| Affiliated issuers | 2,517,120 | 2,517,120 |
| Cash | 47,002 | |
| Cash denominated in foreign currencies | 202,562 | 201,370 |
| Dividends and interest receivable | 1,842,097 | |
| Unrealized appreciation on forward foreign | ||
| currency exchange contracts—Note 4 | 1,006,060 | |
| Unrealized appreciation on swap contracts—Note 4 | 629,089 | |
| Receivable for shares of Beneficial Interest subscribed | 616,170 | |
| Receivable for futures variation margin—Note 4 | 65,841 | |
| Receivable for investment securities sold | 11,443 | |
| Prepaid expenses | 11,735 | |
| 94,237,373 | ||
| Liabilities ($): | ||
| Due to The Dreyfus Corporation and affiliates—Note 3(b) | 48,885 | |
| Liability for securities on loan—Note 1(c) | 885,292 | |
| Outstanding options written, at value (premiums received | ||
| $487,669)—See Statement of Options Written—Note 4 | 475,551 | |
| Payable for investment securities purchased | 181,278 | |
| Payable for shares of Beneficial Interest redeemed | 170,939 | |
| Unrealized depreciation on forward foreign | ||
| currency exchange contracts—Note 4 | 121,489 | |
| Swaps premiums received—Note 4 | 109,655 | |
| Unrealized depreciation on swap contracts—Note 4 | 31,077 | |
| Accrued expenses | 42,645 | |
| 2,066,811 | ||
| Net Assets ($) | 92,170,562 | |
| Composition of Net Assets ($): | ||
| Paid-in capital | 87,291,978 | |
| Accumulated undistributed investment income—net | 1,507,813 | |
| Accumulated net realized gain (loss) on investments | (2,964,771) | |
| Accumulated net unrealized appreciation (depreciation) on investments, options | ||
| transactions, swap transactions and foreign currency transactions (including | ||
| $559,693 net unrealized appreciation on financial futures) | 6,335,542 | |
| Net Assets ($) | 92,170,562 | |
| Class I Shares Outstandinga | ||
| (unlimited number of $.001 par value shares of Beneficial Interest authorized) | 4,622,426 | |
| Net Asset Value, offering and redemption price per share ($) | 19.94 | |
| a Effective September 1, 2009, the fund’s shares were redesignated as Class I shares. | ||
| See notes to financial statements. | ||
22
| STATEMENT OF OPERATIONS | |
| Year Ended December 31, 2009 | |
| Investment Income ($): | |
| Income: | |
| Interest | 3,340,255 |
| Dividends; | |
| Affiliated issuers | 1,964 |
| Income from securities lending—Note 1(c) | 2,729 |
| Total Income | 3,344,948 |
| Expenses: | |
| Investment advisory fee—Note 3(a) | 285,900 |
| Accounting and administration fee—Note 3(a) | 60,000 |
| Shareholder servicing costs—Note 3(c) | 62,295 |
| Auditing fees | 54,994 |
| Custodian fees—Note 3(c) | 51,880 |
| Registration fees | 28,327 |
| Prospectus and shareholders’ reports | 16,571 |
| Legal fees | 15,905 |
| Trustees’ fees and expenses—Note 3(d) | 3,645 |
| Interest expense—Note 2 | 227 |
| Administrative service fee—Note 3(b) | 100 |
| Loan commitment fees—Note 2 | 38 |
| Miscellaneous | 40,315 |
| Total Expenses | 620,197 |
| Less—reduction in advisory fee due to undertaking—Note 3(a) | (41,251) |
| Less—reduction in fees due to earnings credits—Note 1(c) | (6,880) |
| Net Expenses | 572,066 |
| Investment Income—Net | 2,772,882 |
| Realized and Unrealized Gain (Loss) on Investments—Note 4 ($): | |
| Net realized gain (loss) on investments and foreign currency transactions | 3,783,414 |
| Net realized gain (loss) on options transactions | (1,014) |
| Net realized gain (loss) on financial futures | (270,137) |
| Net realized gain (loss) on swap transactions | 1,474,446 |
| Net realized gain (loss) on forward foreign currency exchange contracts | (3,728,761) |
| Net Realized Gain (Loss) | 1,257,948 |
| Net unrealized appreciation (depreciation) on investments, foreign currecncy | |
| transactions, options transactions, financial futures, swap transactions and | |
| forward foreign currency exchange contracts [including $12,118 net unrealized | |
| appreciation on options transactions, $1,051,203 net unrealized appreciation | |
| on financial futures transactions, ($872,814) net unrealized (depreciation) on | |
| swap transactions and $2,172,582 net unrealized appreciation on forward | |
| foreign currency exchange contracts] | 5,099,961 |
| Net Realized and Unrealized Gain (Loss) on Investments | 6,357,909 |
| Net Increase in Net Assets Resulting from Operations | 9,130,791 |
| See notes to financial statements. | |
The Fund 23
STATEMENT OF CHANGES IN NET ASSETS
| Year Ended December 31, | ||
| 2009a | 2008 | |
| Operations ($): | ||
| Investment income—net | 2,772,882 | 3,412,090 |
| Net realized gain (loss) on investments | 1,257,948 | 7,229,876 |
| Net unrealized appreciation | ||
| (depreciation) on investments | 5,099,961 | (3,632,115) |
| Net Increase (Decrease) in Net Assets | ||
| Resulting from Operations | 9,130,791 | 7,009,851 |
| Dividends to Shareholders from ($): | ||
| Investment income—net | (4,926,356) | (4,312,893) |
| Beneficial Interest Transactions ($): | ||
| Net proceeds from shares sold | 51,586,255 | 29,147,476 |
| Dividends reinvested | 4,351,063 | 3,819,217 |
| Cost of shares redeemed | (28,915,816) | (74,595,538)b |
| Increase (Decrease) in Net Assets | ||
| from Beneficial Interest Transactions | 27,021,502 | (41,628,845) |
| Total Increase (Decrease) in Net Assets | 31,225,937 | (38,931,887) |
| Net Assets ($): | ||
| Beginning of Period | 60,944,625 | 99,876,512 |
| End of Period | 92,170,562 | 60,944,625 |
| Accumulated investment income—net | 1,507,813 | 5,018,818 |
| Capital Share Transactions (Shares): | ||
| Shares sold | 2,702,732 | 1,538,887 |
| Shares issued for dividends reinvested | 238,553 | 203,271 |
| Shares redeemed | (1,535,214) | (3,905,356) |
| Net Increase (Decrease) in Shares Outstanding | 1,406,071 | (2,163,198) |
| a | Effective September 1, 2009, the fund’s shares were redesignated as Class I shares. |
| b | Includes redemption-in-kind amounting to $25,283,970. |
| See notes to financial statements. | |
24
FINANCIAL HIGHLIGHTS
The following table describes the performance for the fiscal periods indicated. Total return shows how much your investment in the fund would have increased (or decreased) during each period, assuming you had reinvested all dividends and distributions.These figures have been derived from the fund’s financial statements.
| Year Ended December 31, | |||||
| Class I Shares | 2009a | 2008 | 2007 | 2006 | 2005 |
| Per Share Data ($): | |||||
| Net asset value, beginning of period | 18.95 | 18.57 | 18.14 | 17.55 | 21.35 |
| Investment Operations: | |||||
| Investment income—netb | .74 | .72 | .69 | .53 | .75 |
| Net realized and unrealized | |||||
| gain (loss) on investments | 1.72 | .75 | .10 | .21 | .23 |
| Total from Investment Operations | 2.46 | 1.47 | .79 | .74 | .98 |
| Distributions: | |||||
| Dividends from investment income—net | (1.47) | (1.09) | (.36) | (.15) | (4.78) |
| Net asset value, end of period | 19.94 | 18.95 | 18.57 | 18.14 | 17.55 |
| Total Return (%) | 13.86 | 8.08 | 4.35 | 4.27 | 4.72 |
| Ratios/Supplemental Data (%): | |||||
| Ratio of total expenses | |||||
| to average net assets | .87 | .80 | .70 | .68 | .58 |
| Ratio of net expenses | |||||
| to average net assets | .80 | .78 | .70 | .68 | .58 |
| Ratio of net investment income | |||||
| to average net assets | 3.88 | 3.84 | 3.73 | 3.01 | 3.49 |
| Portfolio Turnover Rate | 120.50 | 158c | 168c | 89 | 168 |
| Net Assets, end of period ($ x 1,000) | 92,171 | 60,945 | 99,877 | 93,344 | 122,721 |
| a | Effective September 1, 2009, the fund’s shares were redesignated as Class I shares. |
| b | Based on average shares outstanding at each month end. |
| c | The portfolio turnover rates excluding mortgage dollar roll transactions for the periods ended December 31, 2008 and |
| 2007 were 144% and 140%, respectively. | |
| See notes to financial statements. | |
The Fund 25
NOTES TO FINANCIAL STATEMENTS
NOTE 1—Significant Accounting Policies:
Dreyfus/Standish International Fixed Income Fund (the “fund”) is a separate diversified series of Dreyfus Investment Funds (the “Trust”), which is registered under the Investment Company Act of 1940, as amended (the “Act”), as an open-end management investment company and operates as a series company offering twelve series, including the fund. The fund’s investment objective is to seek to maximize total return while realizing a market level of income, consistent with the preservation of capital and the maintenance of liquidity. The Dreyfus Corporation (the “Manager” or “Dreyfus”), a wholly-owned subsidiary of The Bank of New York Mellon Corporation (“BNY Mellon”), serves as the fund’s investment adviser. MBSC Securities Corporation (the “Distributor”), a wholly-owned subsidiary of the Manager, is the distributor of the fund’s shares.
The Board of Trustees approved, effective September 1, 2009, the fund’s shares were redesignated as Class I shares. Class I shares are sold primarily to bank trust departments and other financial service providers, (including The Bank of NewYork Mellon, a subsidiary of BNY Mellon and an affiliate of Dreyfus), acting on behalf of customers having a qualified trust or an investment account or relationship at such institution and bear no distribution or service fees. Class I shares are offered without a front end sales charge or contingent deferred sales charge.
The Trust accounts separately for the assets, liabilities and operations of each series. Expenses directly attributable to each series are charged to that series’ operations; expenses which are applicable to all series are allocated among them on a pro rata basis.
The Financial Accounting Standards Board (“FASB”) Accounting Standards Codification (“ASC”) has become the exclusive reference of authoritative U.S. generally accepted accounting principles (“GAAP”) recognized by the FASB to be applied by nongovernmental entities. Rules and interpretive releases of the Securities and Exchange Commission (“SEC”) under authority of federal laws are also sources of authoritative GAAP for SEC registrants. The ASC has superseded
26
all existing non-SEC accounting and reporting standards. The fund’s financial statements are prepared in accordance with GAAP, which may require the use of management estimates and assumptions.Actual results could differ from those estimates.
(a) Portfolio valuation: Investments in securities excluding short-term investments (other than U.S. Treasury Bills), financial futures, options, swap transactions and forward foreign currency exchange contracts (“forward contracts”) are valued each business day by an independent pricing service (the “Service”) approved by the Board of Trustees. Investments for which quoted bid prices are readily available and are representative of the bid side of the market in the judgment of the Service are valued at the mean between the quoted bid prices (as obtained by the Service from dealers in such securities) and asked prices (as calculated by the Service based upon its evaluation of the market for such securities). Other investments (which constitute a majority of the portfolio securities) are valued as determined by the Service, based on m ethods which include consideration of: yields or prices of securities of comparable quality, coupon, maturity and type; indications as to values from dealers; and general market conditions. Restricted securities, as well as securities or other assets for which recent market quotations are not readily available, that are not valued by a pricing service approved by the Board of Trustees, or are determined by the fund not to reflect accurately fair value, are valued at fair value as determined in good faith under the direction of the Board of Trustees.The factors that may be considered when fair valuing a security include fundamental analytical data, the nature and duration of restrictions on disposition, an evaluation of the forces that influence the market in which the securities are purchased and sold and public trading in similar securities of the issuer or comparable issuers. Short-term investments are carried at amortized cost, which approximates value. Registered investment companies that are not traded on an exchange are valued at their net asset value. Financial futures and options that are traded on an exchange, are valued at the last sales price
The Fund 27
NOTES TO FINANCIAL STATEMENTS (continued)
on the exchange on which such contracts are primarily traded or at the last sales price on the national securities market on each business day. Options traded over-the-counter are valued at the mean between the bid and the asked price. Investments denominated in foreign currencies are translated to U.S. dollars at the prevailing rates of exchange on the valuation date. Forward contracts are valued at the forward rate. Investments in swap transactions are valued each business day by an independent pricing service approved by the Board of Trustees. Swaps are valued by the service by using a swap pricing model which incorporates among other factors, default probabilities, recovery rates, credit curves of the underlying issuer and swap spreads an interest rates.
The fair value of a financial instrument is the amount that would be received to sell an asset or paid to transfer a liability in an orderly transaction between market participants at the measurement date (i.e. the exit price). GAAP establishes a fair value hierarchy that prioritizes the inputs of valuation techniques used to measure fair value.This hierarchy gives the highest priority to unadjusted quoted prices in active markets for identical assets or liabilities (Level 1 measurements) and the lowest priority to unobservable inputs (Level 3 measurements).
Additionally, GAAP provides guidance on determining whether the volume and activity in a market has decreased significantly and whether such a decrease in activity results in transactions that are not orderly. GAAP requires enhanced disclosures around valuation inputs and techniques used during annual and interim periods.
Various inputs are used in determining the value of the fund’s investments relating to fair value measurements. These inputs are summarized in the three broad levels listed below:
Level 1—unadjusted quoted prices in active markets for identical investments.
Level 2—other significant observable inputs (including quoted prices for similar investments, interest rates, prepayment speeds, credit risk, etc.).
Level 3—significant unobservable inputs (including the fund’s own assumptions in determining the fair value of investments).
28
The inputs or methodology used for valuing securities are not necessarily an indication of the risk associated with investing in those securities.
The following is a summary of the inputs used as of December 31, 2009 in valuing the fund’s investments:
| Level 2—Other | Level 3— | |||
| Level 1— | Significant | Significant | ||
| Unadjusted | Observable | Unobservable | ||
| Quoted Prices | Inputs | Inputs | Total | |
| Assets ($) | ||||
| Investments in Securities: | ||||
| Commercial | ||||
| Mortgage-Backed | — | 2,126,131 | — | 2,126,131 |
| Corporate Bonds | — | 43,870,210 | — | 43,870,210 |
| Foreign Government | — | 39,633,125 | — | 39,633,125 |
| Mutual Funds | 2,517,120 | — | — | 2,517,120 |
| U.S. Treasury | — | 1,659,980 | — | 1,659,980 |
| Other Financial | ||||
| Instruments† | 609,873 | 1,635,149 | — | 2,245,022 |
| Liabilities ($) | ||||
| Other Financial | ||||
| Instruments† | (50,180) | (628,117) | — | (678,297) |
| † Other financial instruments include derivative instruments such as futures, forward foreign currency | ||||
| exchange contracts, swap contracts and options contracts.Amounts shown represent unrealized | ||||
| appreciation (depreciation), or in the case of options, market value at period end. | ||||
The following is a reconciliation of Level 3 assets for which significant unobservable inputs were used to determine fair value:
| Investments in | |
| Private Investment Fund ($)†† | |
| Balance as of 12/31/2008 | 64,706 |
| Realized gain (loss) | — |
| Change in unrealized appreciation (depreciation) | — |
| Net purchases (sales) | (64,706) |
| Transfers in and/or out of Level 3 | — |
| Balance as of 12/31/2009 | — |
| †† Investment in BlackRock Cash Strategies Fund LLC. See Note 1(c). | |
| (b) Foreign currency transactions: The fund does not isolate that por- | |
| tion of the results of operations resulting from changes in foreign | |
The Fund 29
NOTES TO FINANCIAL STATEMENTS (continued)
exchange rates on investments from the fluctuations arising from changes in the market prices of securities held. Such fluctuations are included with the net realized and unrealized gain or loss on investments.
Net realized foreign exchange gains or losses arise from sales of foreign currencies, currency gains or losses realized on securities transactions between trade and settlement date, and the difference between the amounts of dividends, interest and foreign withholding taxes recorded on the fund’s books and the U.S. dollar equivalent of the amounts actually received or paid. Net unrealized foreign exchange gains and losses arise from changes in the value of assets and liabilities other than investments resulting from changes in exchange rates. Foreign currency gains and losses on investments are included with net realized and unrealized gain or loss on investments.
(c) Securities transactions and investment income: Securities transactions are recorded on a trade date basis. Realized gains and losses from securities transactions are recorded on the identified cost basis. Dividend income is recognized on the ex-dividend date and interest income, including, where applicable, accretion of discount and amortization of premium on investments, is recognized on the accrual basis.
The fund has arrangements with the custodian and cash management bank whereby the fund may receive earnings credits when positive cash balances are maintained, which are used to offset custody and cash management fees. For financial reporting purposes, the fund includes net earnings credits as an expense offset in the Statement of Operations.
Pursuant to a securities lending agreement with The Bank of New York Mellon, the fund may lend securities to qualified institutions. It is the fund’s policy that, at origination, all loans are secured by collateral of at least 102% of the value of U.S. securities loaned and 105% of the value of foreign securities loaned and that collateral equivalent to at least 100% of the market value of securities on loan is maintained at all times. Collateral is either in the form of cash, which can be invested
30
in certain money market mutual funds managed by the Manager, U.S. Government and Agency securities or letters of credit. The fund is entitled to receive all income on securities loaned, in addition to income earned as a result of the lending transaction. Although each security loaned is fully collateralized, the fund bears the risk of delay in recovery of, or loss of rights in, the securities loaned should a borrower fail to return the securities in a timely manner. During the period ended December 31, 2009, The Bank of New York Mellon earned $1,469 from lending portfolio securities, pursuant to the securities lending agreement.
Until December 10, 2007, all cash collateral received by the fund and other series of the Trust in connection with the securities lending program was invested in the BlackRock Cash Strategies Fund LLC (the “BlackRock Fund”), a private investment fund not affiliated with the Trust or its investment adviser. On December 10, 2007, the BlackRock Fund announced that it was suspending investor withdrawal privileges due to conditions related to the credit markets and the adverse affect of such conditions on the liquidity of the BlackRock Fund’s portfolio holdings. Commencing on December 11, 2007, all new cash collateral received in connection with the securities lending activity of the fund and other series of the Trust was invested by the securities lending agent in the Dreyfus Institutional Cash Advantage Fund (the “Dreyfus Fund”), an affiliated money market fund registered as an investment company under the Investment Company Act of 1940, as amended.To the extent that the BlackRock Fund agreed to permit withdrawals during the period December 11, 2007 through December 31, 2008, the securities lending agent effected such withdrawals and the cash proceeds from such withdrawals by the fund were reinvested in the shares of the Dreyfus Fund. As of January 22, 2009, the final withdrawal was reinvested in the shares of the Dreyfus Fund. Repayments of cash collateral during the period were made from the proceeds of redemptions of shares of the Dreyfus Fund.
The Fund 31
NOTES TO FINANCIAL STATEMENTS (continued)
(d) Affiliated issuers: Investments in other investment companies advised by the Manager are defined as “affiliated” in the Act.
(e) Concentration of Risk: The fund invests primarily in debt securities. Failure of an issuer of the debt securities to make timely interest or principal payments, or a decline or the perception of a decline in the credit quality of a debt security, can cause the debt security’s price to fall, potentially lowering the fund’s share price. In addition, the value of debt securities may decline due to general market conditions that are not specifically related to a particular company, such as real or perceived adverse economic conditions, changes in outlook for corporate earnings, changes in interest or currency rates or adverse investor sentiment.They may also decline because of factors that affect a particular industry.
(f) Dividends to shareholders: Dividends are recorded on the ex-dividend date. Dividends from investment income-net are declared and paid quarterly. Dividends from net realized capital gains, if any, are normally declared and paid annually, but the fund may make distributions on a more frequent basis to comply with the distribution requirements of the Internal Revenue Code of 1986, as amended (the “Code”).To the extent that net realized capital gains can be offset by capital loss carryovers, it is the policy of the fund not to distribute such gains. Income and capital gain distributions are determined in accordance with income tax regulations, which may differ from GAAP.
(g) Federal income taxes: It is the policy of the fund to continue to qualify as a regulated investment company, if such qualification is in the best interests of its shareholders, by complying with the applicable provisions of the Code, and to make distributions of taxable income sufficient to relieve it from substantially all federal income and excise taxes.
As of and during the period ended December 31, 2009, the fund did not have any liabilities for any uncertain tax positions.The fund rec-
32
ognizes interest and penalties, if any, related to uncertain tax positions as income tax expense in the Statement of Operations. During the period, the fund did not incur any interest or penalties.
Each of the tax years in the four-year period ended December 31, 2009 remains subject to examination by the Internal Revenue Service and state taxing authorities.
At December 31, 2009, the components of accumulated earnings on a tax basis were as follows: undistributed ordinary income $3,696,092, accumulated capital losses $1,891,140 and unrealized appreciation $3,073,632.
The accumulated capital loss carryover is available for federal income tax purposes to be applied against future net securities profits, if any, realized subsequent to December 31, 2009. If not applied, the carryover expires in fiscal 2010. Its uncertain whether the fund will be able to realize the benefits of the remaining capital loss carryovers before they expire and the remaining capital loss carryover could be subject to future limitations imposed by the internal revenue code related to share ownership activity.
The tax character of distributions paid to shareholders during the fiscal periods ended December 31, 2009 and December 31, 2008 were as follows: ordinary income $4,926,356 and $4,312,893, respectively.
During the period ended December 31, 2009, as a result of permanent book to tax differences, primarily due to the tax treatment for pay down gains and loses on mortgage-backed securities, foreign currency transactions, amortization of premiums and swap periodic payments, the fund decreased accumulated undistributed investment income-net by $1,357,531, increased accumulated net realized gain (loss) on investment by $1,334,472 and increased paid-in capital by $23,059. Net assets and net asset value per share were not affected by this reclassification.
The Fund 33
NOTES TO FINANCIAL STATEMENTS (continued)
NOTE 2—Bank Lines of Credit:
The fund participates with other Dreyfus-managed funds in a $225 million unsecured credit facility led by Citibank, N.A. and a $300 million unsecured credit facility provided by The Bank of New York Mellon (each, a “Facility”), each to be utilized primarily for temporary or emergency purposes, including the financing of redemptions. In connection therewith, the fund has agreed to pay its pro rata portion of commitment fees for each Facility. Interest is charged to the fund based on rates determined pursuant to the terms of the respective Facility at the time of borrowing. Prior to September 24, 2009, the Trust had entered into two separate agreements with The Bank of New York Mellon that enabled the fund, and other funds in the Trust, to borrow, in the aggregate, (i) up to $35 million under a committed line of credit and (ii) up to $15 million under an uncommitted line of credit.
The average amount of borrowings outstanding under the Facilities and Lines of Credit during the period ended December 31, 2009, was approximately $16,300 with a related weighted average annualized interest rate of 1.39%.
NOTE 3—Investment Advisory Fee and Other Transactions With Affiliates:
(a) Pursuant to an investment advisory agreement with the Manager, the investment advisory fee is computed at the annual rate of .40% of the value of the fund’s average daily net assets and is payable monthly. The Manager had undertaken from January 1, 2009 through December 31, 2009 to reduce the investment advisory fee paid by the fund, to the extent that the fund’s aggregate annual expenses, exclusive of taxes, brokerage fees, interest on borrowings, commitment fees and extraordinary expenses, do not exceed an annual rate of .80% of the value of the fund’s average daily net assets.The reduction in investment advisory fee, pursuant to the undertaking, amounted to $41,251 during the period ended December 31, 2009.
34
The Trust entered into an agreement with The Bank of New York Mellon, pursuant to which The Bank of New York Mellon provides administration and fund accounting services for the fund. For these services the fund pays The Bank of NewYork Mellon a fixed fee plus asset and transaction based fees, as well as out-of-pocket expenses. During the period ended December 31, 2009, the fund was charged $60,000 for administration and fund accounting services pursuant to the agreement.
(b) The fund may pay administrative service fees.These fees are paid to affiliated or unaffiliated retirement plans, omnibus accounts and platform administrators and other entities (“Plan Administrators”) that provide record keeping and/or other administrative support services to accounts, retirement plans and their participants. As compensation for such services, the fund may pay each Plan Administrator an administrative service fee in an amount of up to .15% (on an annualized basis) of the fund’s average daily net assets attributable to fund shares that are held in accounts serviced by such Plan Administrator. For the period ended December 31, 2009, the fund was charged $100. The fund’s adviser or its affiliates may pay additional compensation from their own resources to Plan Administrators and other entities for administrative se rvices, as well as in consideration of marketing or other distribution-related services. These payments may provide an incentive for these entities to actively promote the fund or cooperate with the distributor’s promotional efforts.
(c) The fund compensates Dreyfus Transfer, Inc., a wholly-owned subsidiary of the Manager, under a transfer agency agreement for providing personnel and facilities to perform transfer agency services for the fund. During the period ended December 31, 2009 the fund was charged $25,186 pursuant to the transfer agency agreement, which is included in Shareholder servicing costs in the Statement of Operations.
The fund compensates The Bank of New York Mellon under cash management agreements for performing cash management services
The Fund 35
NOTES TO FINANCIAL STATEMENTS (continued)
related to fund subscriptions and redemptions. During the period ended December 31, 2009, the fund was charged $6,880 pursuant to the cash management agreements, which is included in Shareholder servicing costs in the Statement of Operations.These fees were offset by earnings credits pursuant to the cash management agreements.
The fund also compensates The Bank of New York Mellon under a custody agreement for providing custodial services for the fund. During the period ended December 31, 2009, the fund was charged $51,880 pursuant to the custody agreement.
During the period ended December 31, 2009, the fund was charged $6,681 for services performed by the Chief Compliance Officer.
The components of “Due to The Dreyfus Corporation and affiliates” in the Statement of Assets and Liabilities consist of:investment advisory fees $31,078, custodian fees $16,749, chief compliance officer fees $5,011 and transfer agency per account fees $3,000, which are offset against an expense reimbursement currently in effect in the amount of $6,953.
(d) Prior to January1, 2010, eachTrustee received $45,000 per year, plus $6,000 for each joint Board meeting of the Trust,The Dreyfus/Laurel Funds, Inc.,The Dreyfus/Laurel Funds Trust,The Dreyfus/Laurel Tax-Free Municipal Funds and Dreyfus Funds, Inc. (collectively, the “Board Group Open-end Funds”) attended, $2,000 for separate in-person committee meetings attended which were not held in conjunction with a regularly scheduled Board meeting and $1,500 for Board meetings and separate committee meetings attended that were conducted by telephone. Effective January 1, 2010, the Board Group Open-end Funds will pay each Trustee who is not an “interested person” of the Trust (as defined in the 1940 Act) $60,000 per annum, plus $7,000 per joint Board Group Open-end Funds Board meeting attended, $2,500 for separate in-person committee meetin gs attended which are not held in conjunction with a regularly scheduled Board meeting and $2,000 for Board meetings and separate committee meetings attended that are conducted by telephone.The Board Group Open-end Funds also reimburse each Trustee who is not an “interested person” of the
36
Trust (as defined in the 1940 Act) for travel and out-of-pocket expenses.With respect to Board meetings, the Chairman of the Board receives an additional 25% of such compensation (with the exception of reimbursable amounts). With respect to compensation committee meetings prior to January 1, 2010, the Chair of the compensation committee received $900 per compensation committee meeting, and, effective January 1, 2010, the Chair of each of the Board’s committees, unless the Chair also serves as Chair of the Board, will receive $1,350 per applicable committee meeting. In the event that there is an in-person joint committee meeting or a joint telephone meeting of the Board Group Open-end Funds and Dreyfus High Yield Strategies Fund, the $2,000 or $1,500 fee (prior to January 1, 2010) or the $2,500 or $2,000 fee (effective January 1, 2010), as applicable, is allocated between the Board Group Open-end Funds and Dreyfus High Yiel d Strategies Fund. The Trust’s portion of these fees and expenses are charged and allocated to each series based on net assets.Amounts required to be paid by the Trust directly to the non-interested Trustees, that would be applied to offset a portion of the management fee payable by certain other series of the Trust to the Manager, are in fact paid directly by the Manager to the non-interested Trustees.
NOTE 4—Securities Transactions:
The aggregate amount of purchases and sales (including paydowns) of investment securities, excluding short-term securities, option transactions, financial futures, forward contracts and swap transactions, during the period ended December 31, 2009, amounted to $108,507,055 and $80,829,360, respectively.
The fund adopted the provisions of ASC Topic 815 “Derivatives and Hedging” which requires qualitative disclosures about objectives and strategies for using derivatives, quantitative disclosures about fair value amounts of gains and losses on derivative instruments and disclosures about credit-risk-related contingent features in derivative agreements. The disclosure requirements distinguish between derivatives, which
The Fund 37
NOTES TO FINANCIAL STATEMENTS (continued)
are accounted for as “hedges” and those that do not qualify for hedge accounting. Because investment companies value their derivatives at fair value and recognize changes in fair value through the Statement of Operations, they do not qualify for such accounting. Accordingly, even though a fund’s investments in derivatives may represent economic hedges, they are considered to be non-hedge transactions for purposes of this disclosure.The following tables show the fund’s exposure to different types of market risk as it relates to the Statement of Assets and Liabilities and the Statement of Operations, respectively.
Fair value of derivative instruments as of December 31, 2009 is shown below:
| Derivative | Derivative | ||
| Assets ($) | Liabilities ($) | ||
| Interest rate risk1,2 | 1,137,206 | Interest rate risk1,3,4 | (556,808) |
| Foreign exchange risk5 | 1,006,060 | Foreign exchange risk6 | (121,489) |
| Credit risk2 | 101,756 | — | |
| Gross fair value of | |||
| derivatives contracts | 2,245,022 | (678,297) |
| Statement of Assets and Liabilities location: | |
| 1 | Includes cumulative appreciation/depreciation of futures contracts as reported on the Statement of |
| Financial Futures, but only the unpaid variation margin is reported in the Statement of Asset | |
| and Liabilities. | |
| 2 | Unrealized appreciation on swap contracts. |
| 3 | Unrealized depreciation on swap contracts. |
| 4 | Outstanding options written, at value. |
| 5 | Unrealized appreciation on forward foreign currency exchange contracts. |
| 6 | Unrealized depreciation on forward foreign currency exchange contracts. |
The effect of derivative instruments on the Statement of Operations for the period ended December 31, 2009 is shown below:
| Amount of realized gain or (loss) on derivatives recognized in income ($) | |||||
| Forward | |||||
| Underlying risk | Futures7 | Options8 | Contracts9 | Swaps10 | Total |
| Interest rate | (270,137) | (1,014) | — | 1,286,664 | 1,015,513 |
| Foreign exchange | — | — | (3,728,761) | — | (3,728,761) |
| Credit | — | — | — | 187,782 | 187,782 |
| Total | (270,137) | (1,014) | (3,728,761) | 1,474,446 | (2,525,466) |
38
| Change in unrealized appreciation or (depreciation) on derivatives recognized in income ($)11 | ||||||
| Forward | ||||||
| Underlying risk | Futures | Options | Contracts | Swaps | Total | |
| Interest rate | 1,051,203 | 12,118 | — | (946,837) | 116,484 | |
| Foreign exchange | — | — | 2,172,582 | - | 2,172,582 | |
| Credit | — | — | — | 74,023 | 74,023 | |
| Total | 1,051,203 | 12,118 | 2,172,582 | (872,814) | 2,363,089 | |
| Statement of Operations location: | ||||||
| 7 | Net realized gain (loss) on financial futures. | |||||
| 8 | Net realized gain (loss) on options transactions. | |||||
| 9 | Net realized gain (loss) on forward foreign currency exchange contracts. | |||||
| 10 | Net realized gain (loss) on swap transactions. | |||||
| 11 | Net unrealized appreciation (depreciation) on investments, financial futures, options transactions, | |||||
| forward foreign currency contracts and swap transactions. | ||||||
During the period ended December 31, 2009, the average market value of interest rate futures contracts was $29,375,231, which represented 41.10% of average net assets.The average market value of options contracts was $122,529, which represented .17% of average net assets.The average market value of forward contracts was $52,962,733, which represented 74.10% of average net assets. The average notional value of interest rate swap contracts was $21,461,735, which represented 30.03% of average net assets.The average notional value of credit default swap contracts was $900,212, which represented 1.26% of average net assets.
Futures Contracts: In the normal course of pursuing its investment objective, the fund is exposed to market risk, including interest rate risk, as a result of changes in value of underlying financial instruments. The fund invests in financial futures contracts in order to manage its exposure to or protect against changes in the market.A futures contract represents a commitment for the future purchase or a sale of an asset at a specified date. Upon entering into such contracts, these investments require initial margin deposits with a broker, which consist of cash or cash equivalents. The amount of these deposits is determined by the exchange or Board of Trade on which the contract is traded and is subject to change. Accordingly, variation margin payments are received or made to reflect
The Fund 39
NOTES TO FINANCIAL STATEMENTS (continued)
daily unrealized gains or losses which are recorded in the Statement of Operations. Futures contracts are valued daily at the last sales price established by the Board of Trade or exchange upon which they are traded. When the contracts are closed, the fund recognizes a realized gain or loss.There is minimal counterparty credit risk to the fund with futures, since futures are exchange traded and the exchange’s clearinghouse, as counterparty to all exchange traded futures, guarantees the futures against default. Contracts open at December 31, 2009 are set forth in the Statement of Financial Futures.
Options: A call option gives the purchaser of the option the right (but not the obligation) to buy, and obligates the writer to sell, the underlying security or securities at the exercise price at any time during the option period, or at a specified date. Conversely, a put option gives the purchaser of the option the right (but not the obligation) to sell, and obligates the writer to buy the underlying security or securities at the exercise price at any time during the option period, or at a specified date. The fund writes (sells) put and call options primarily to hedge against changes in security prices, or securities that the fund intends to purchase, or against fluctuations in value caused by changes in prevailing market interest rates or other market conditions.
As a writer of call options, the fund receives a premium at the outset and then bears the market risk of unfavorable changes in the price of the financial instrument underlying the option. Generally, the fund realizes a gain, to the extent of the premium, if the price of the underlying financial instrument decreases between the date the option is written and the date on which the option is terminated. Generally, the fund incurs a loss, if the price of the financial instrument increases between those dates.
As a writer of put options, the fund receives a premium at the outset and then bears the market risk of unfavorable changes in the price of the financial instrument underlying the option. Generally, the fund realizes a gain, to the extent of the premium, if the price of the under-
40
lying financial instrument increases between the date the option is written and the date on which the option is terminated. Generally, the fund incurs a loss, if the price of the financial instrument decreases between those dates. As a writer of an option, the fund may have no control over whether the underlying securities may be sold (call) or purchased (put) and as a result bears the market risk of an unfavorable change in the price of the security underlying the written option. One risk of holding a put or a call option is that if the option is not sold or exercised prior to its expiration, it becomes worthless. However, this risk is limited to the premium paid by the fund. Upon the expiration or closing of the option transaction, a gain or loss is reported in the Statement of Operations.
The following summarizes the fund’s call/put options written for the period ended December 31, 2009:
| Face Amount | Options Terminated | |||
| Covered by | Premiums | Net Realized | ||
| Options Written: | Contracts ($) | Received ($) | Cost ($) Gain (Loss) ($) | |
| Contracts outstanding | ||||
| December 31, 2008 | — | — | — | — |
| Contracts written | 13,186,000 | 550,366 | — | — |
| Contracts terminated: | ||||
| Contracts closed | 4,300,000 | 42,072 | 63,711 | (21,639) |
| Contracts expired | 1,500,000 | 20,625 | — | 20,625 |
| Total Contracts terminated: | 5,800,000 | 62,697 | 63,711 | (1,014) |
| Contracts outstanding | ||||
| December 31, 2009 | 7,386,000 | 487,669 | — | — |
Forward Foreign Currency Exchange Contracts: The fund enters into forward contracts in order to hedge its exposure to changes in foreign currency exchange rates on its foreign portfolio holdings, to settle foreign currency transactions or as a part of its investment strat-egy.When executing forward contracts, the fund is obligated to buy or sell a foreign currency at a specified rate on a certain date in the future. With respect to sales of forward contracts, the fund incurs a loss if the value of the contract increases between the date the forward contract
The Fund 41
NOTES TO FINANCIAL STATEMENTS (continued)
is opened and the date the forward contract is closed.The fund realizes a gain if the value of the contract decreases between those dates. With respect to purchases of forward contracts, the fund incurs a loss if the value of the contract decreases between the date the forward contract is opened and the date the forward contract is closed. The fund realizes a gain if the value of the contract increases between those dates. The fund is exposed to foreign currency risk as a result of changes in value of underlying financial instruments.The fund is also exposed to credit risk associated with counterparty nonperformance on these forward contracts, which is typically limited to the unrealized gain on each open contract.The following summarizes open forward contracts at December 31, 2009:
| Foreign | Unrealized | |||
| Forward Foreign Currency | Currency | Appreciation | ||
| Exchange Contracts | Amounts | Cost ($) | Value ($) (Depreciation) ($) | |
| Purchases: | ||||
| Argentine Peso, | ||||
| Expiring 1/8/2010 | 3,370,000 | 878,634 | 884,611 | 5,977 |
| Brazilian Real, | ||||
| Expiring 1/8/2010 | 1,550,000 | 892,857 | 888,740 | (4,117) |
| Indonesian Rupiah, | ||||
| Expiring 1/8/2010 | 8,365,870,000 | 886,873 | 889,047 | 2,174 |
| Japanese Yen, | ||||
| Expiring 1/5/2010 | 16,848,231 | 181,848 | 180,901 | (947) |
| Malaysian Ringgit, | ||||
| Expiring 1/29/2010 | 2,685,000 | 787,829 | 783,175 | (4,654) |
| Mexican New Peso, | ||||
| Expiring 1/8/2010 | 11,460,000 | 887,650 | 875,388 | (12,262) |
| Norwegian Krone, | ||||
| Expiring 1/29/2010 | 4,600,000 | 789,862 | 793,471 | 3,609 |
| Russian Ruble, | ||||
| Expiring 1/12/2010 | 25,900,000 | 885,773 | 852,847 | (32,926) |
| South Korean Won, | ||||
| Expiring 2/26/2010 | 942,620,000 | 809,116 | 808,093 | (1,023) |
| Sales: | Proceeds ($) | |||
| Australian Dollar, | ||||
| Expiring 1/29/2010 | 935,000 | 844,436 | 837,332 | 7,104 |
| Brazilian Real, | ||||
| Expiring 1/29/2010 | 3,385,000 | 1,924,936 | 1,931,792 | (6,856) |
| British Pound, | ||||
| Expiring 1/29/2010 | 150,000 | 243,593 | 242,238 | 1,355 |
42
| Foreign | Unrealized | |||
| Forward Foreign Currency | Currency | Appreciation | ||
| Exchange Contracts | Amounts | Proceeds ($) | Value ($) (Depreciation) ($) | |
| Sales (continued): | ||||
| British Pound, | ||||
| Expiring 1/29/2010 | 2,935,000 | 4,775,714 | 4,739,787 | 35,927 |
| Canadian Dollar, | ||||
| Expiring 1/29/2010 | 2,260,000 | 2,128,982 | 2,160,980 | (31,998) |
| Euro, | ||||
| Expiring 1/29/2010 | 20,260,000 | 29,442,845 | 29,042,884 | 399,961 |
| Euro, | ||||
| Expiring 1/29/2010 | 150,000 | 218,001 | 215,026 | 2,975 |
| Euro, | ||||
| Expiring 1/29/2010 | 5,985,000 | 8,698,659 | 8,579,549 | 119,110 |
| Euro, | ||||
| Expiring 1/29/2010 | 1,060,000 | 1,540,371 | 1,519,519 | 20,852 |
| Euro, | ||||
| Expiring 1/29/2010 | 1,835,000 | 2,666,341 | 2,630,488 | 35,853 |
| Euro, | ||||
| Expiring 1/29/2010 | 380,000 | 552,858 | 544,733 | 8,125 |
| Euro, | ||||
| Expiring 1/29/2010 | 280,000 | 401,120 | 401,383 | (263) |
| Euro, | ||||
| Expiring 1/29/2010 | 180,000 | 258,362 | 258,032 | 330 |
| Hungary Forint, | ||||
| Expiring 1/29/2010 | 292,580,000 | 1,553,137 | 1,550,579 | 2,558 |
| Japanese Yen, | ||||
| Expiring 1/29/2010 | 30,510,000 | 340,517 | 327,640 | 12,877 |
| Japanese Yen, | ||||
| Expiring 1/29/2010 | 369,640,000 | 4,124,157 | 3,969,480 | 154,677 |
| Japanese Yen, | ||||
| Expiring 1/29/2010 | 67,730,000 | 755,974 | 727,337 | 28,637 |
| Japanese Yen, | ||||
| Expiring 1/29/2010 | 16,170,000 | 180,427 | 173,646 | 6,781 |
| Japanese Yen, | ||||
| Expiring 1/29/2010 | 72,050,000 | 803,896 | 773,728 | 30,168 |
| Japanese Yen, | ||||
| Expiring 1/29/2010 | 128,455,000 | 1,434,258 | 1,379,449 | 54,809 |
| Japanese Yen, | ||||
| Expiring 1/29/2010 | 24,300,000 | 269,829 | 260,953 | 8,876 |
| Japanese Yen, | ||||
| Expiring 1/29/2010 | 162,935,000 | 1,774,862 | 1,749,722 | 25,140 |
| Japanese Yen, | ||||
| Expiring 1/29/2010 | 16,850,000 | 181,887 | 180,949 | 938 |
The Fund 43
NOTES TO FINANCIAL STATEMENTS (continued)
| Foreign | Unrealized | |||
| Forward Foreign Currency | Currency | Appreciation | ||
| Exchange Contracts | Amounts | Proceeds ($) | Value ($) (Depreciation) ($) | |
| Sales (continued): | ||||
| Mexican New Peso, | ||||
| Expiring 1/29/2010 | 18,290,000 | 1,426,755 | 1,393,306 | 33,449 |
| New Zealand Dollar, | ||||
| Expiring 1/29/2010 | 330,000 | 237,600 | 239,075 | (1,475) |
| Polish Zloty, | ||||
| Expiring 1/29/2010 | 1,090,000 | 383,708 | 379,910 | 3,798 |
| Swedish Krona, | ||||
| Expiring 1/29/2010 | 6,410,000 | 891,293 | 896,068 | (4,775) |
| Swedish Krona, | ||||
| Expiring 1/29/2010 | 8,620,000 | 1,184,815 | 1,205,008 | (20,193) |
| Gross Unrealized | ||||
| Appreciation | 1,006,060 | |||
| Gross Unrealized | ||||
| Depreciation | (121,489) | |||
Swaps: The fund enters into swap agreements to exchange the interest rate on, or return generated by, one nominal instrument for the return generated by another nominal instrument. The fund enters into these agreements to hedge certain market or interest rate risks, to manage the interest rate sensitivity (sometimes called duration) of fixed income securities, to provide a substitute for purchasing or selling particular securities or to increase potential returns.
The fund accrues for the interim payments on swap contracts on a daily basis, with the net amount recorded within unrealized appreciation (depreciation) on swap contracts in the Statement of Assets and Liabilities. Once the interim payments are settled in cash, the net amount is recorded as realized gain (loss) on swaps, in addition to realized gain (loss) recorded upon the termination of swaps contracts in the Statement of Operations. Upfront payments made and/or received by the fund, are recorded as an asset and/or liability in the Statement of Assets and Liabilities and are recorded as a realized gain or loss ratably over the contract’s term/event with the exception of forward started interest rate swaps which are recorded as realized gains or losses on the termination date. Fluctuations in the value of swap contracts are recorded for financial statement purposes as unrealized appreciation or depreciation on swap transa ctions.
44
Interest Rate Swaps: Interest rate swaps involve the exchange of commitments to pay and receive interest based on a notional principal amount.The fund enters into these agreements for a variety of reasons, including to hedge certain market or interest rate risks, to manage the interest rate sensitivity (sometimes called duration) of fixed income securities, to provide a substitute for purchasing or selling particular securities or to increase potential returns.The fund may elect to pay a fixed rate and receive a floating rate, or receive a fixed rate and pay a floating rate on a notional principal amount.The net interest received or paid on interest rate swap agreements is included within unrealized appreciation (depreciation) on swap contracts in the Statement of Assets and Liabilities. Interest rate swaps are valued daily and the change, if any, is r ecorded as an unrealized gain or loss in the Statement of Operations. When a swap contract is terminated early, the fund records a realized gain or loss equal to the difference between the current realized value and the expected cash flows.
The fund’s maximum risk of loss from counterparty credit risk is the discounted net value of the cash flows to be received from the coun-terparty over the contract’s remaining life, to the extent that the amount is positive. This risk is mitigated by having a master netting arrangement between the fund and the counterparty and by the posting of collateral by the counterparty to the fund to cover the fund’s exposure to the counterparty.The following summarizes open interest rate swaps entered into by the fund at December 31, 2009:
| Unrealized | |||||
| Notional | Reference | (Pay)/Receive | Appreciation | ||
| Amount ($) | Entity/Currency | Counterparty | Fixed Rate (%) Expiration (Depreciation) ($) | ||
| 1,080,000 | GBP—6 Month | ||||
| Libor | JP Morgan | 6.30 | 6/18/2011 | 123,403 | |
| 595,000,000 | JPY—6 Month | ||||
| Yenibor | JP Morgan | 1.36 | 1/19/2012 | 138,449 | |
| 240,000,000 | JPY—6 Month | ||||
| Yenibor | JP Morgan | 1.13 | 2/16/2019 | (31,077) | |
| 304,000,000 | JPY—6 Month | ||||
| Yenibor | JP Morgan | 2.08 | 7/28/2016 | 265,481 | |
| Gross Unrealized | |||||
| Appreciation | 527,333 | ||||
| Gross Unrealized | |||||
| Depreciation | (31,077) | ||||
The Fund 45
NOTES TO FINANCIAL STATEMENTS (continued)
Credit Default Swaps: Credit default swaps involve commitments to pay a fixed interest rate in exchange for payment if a credit event affecting a third party (the referenced company, obligation or index) occurs. Credit events may include a failure to pay interest or principal, bankruptcy, or restructuring.The fund enters into these agreements to manage its exposure to the market or certain sectors of the market, to reduce its risk exposure to defaults of corporate and sovereign issuers, or to create exposure to corporate or sovereign issuers to which it is not otherwise exposed. For those credit default swaps in which the fund is paying a fixed rate, the fund is buying credit protection on the instrument. In the event of a credit event, the fund would receive the full notional amount for the reference obligation. For those credit default swaps in which the fund is receiving a fixed rate, the fund is selling credit protection on the underlying instrument.The maximum payouts for these contracts are limited to the notional amount of each swap. Credit default swaps may involve greater risks than if the fund had invested in the reference obligation directly and are subject to general market risk, liquidity risk, counterparty risk and credit risk.
The maximum potential amount of future payments (undiscounted) that a fund as a seller of protection could be required to make under a credit default swap agreement would be an amount equal to the notional amount of the agreement which may exceed the amount of unrealized appreciation or depreciation reflected on the Statement of Assets and Liabilities. Notional amounts of all credit default swap agreements are disclosed in the following chart, which summarizes open credit default swaps on index issues entered into by the fund. These potential amounts would be partially offset by any recovery values of the respective referenced obligations, underlying securities comprising the referenced index, upfront payments received upon entering into the agreement, or net amounts received from the settlement of buy protection credit default swap agreements entered into by the fund for the
46
same referenced entity or entities.The following summarizes open credit default swaps entered into by the fund at December 31, 2009:
| (Pay) | Upfront | |||||
| Receive | Implied | Premiums | ||||
| Reference | Notional | Fixed | Credit | Market | Receivable | Unrealized |
| Obligation | Amount ($)2 | Rate (%) | Spread (%)3 | Value ($) | (Payable) ($) | Appreciation ($) |
| Sale Contracts:1 | ||||||
| Dow Jones | ||||||
| CDX.NA.HY.13 | ||||||
| Index | ||||||
| 12/20/2014† | 1,707,750a | 5.00 | 5.16 | (7,899) | 109,655 | 101,756 |
| Gross Unrealized | ||||||
| Appreciation | 101,756 | |||||
| † | Expiration Date |
| Counterparty: | |
| a | Goldman, Sachs & Co. |
| 1 | If the fund is a seller of protection and a credit event occurs, as defined under the terms of the swap |
| agreement, the fund will either (i) pay to the buyer of protection an amount equal to the notional | |
| amount of the swap and take delivery of the reference obligation or (ii) pay a net settlement | |
| amount in the form of cash or securities equal to the notional amount of the swap less the recovery | |
| value of the reference obligation. | |
| 2 | The maximum potential amount the fund could be required to pay as a seller of credit protection |
| or receive as a buyer of credit protection if a credit event occurs as defined under the terms of the | |
| swap agreement. | |
| 3 | Implied credit spreads, represented in absolute terms, utilized in determining the market value as of |
| the period end serve as an indicator of the current status of the payment/performance risk and | |
| represent the likelihood of risk of default for the credit derivative.The credit spread of a particular | |
| referenced entity reflects the cost of buying/selling protection and may include upfront payments | |
| required to be made to enter into the agreement.Wider credit spreads represent a deterioration of | |
| the referenced entity’s credit soundness and a greater likelihood of risk of default or other credit | |
| event occurring as defined under the terms of the agreement.A credit spread identified as | |
| “Defaulted” indicates a credit event has occurred for the referenced entity. | |
GAAP includes required disclosure for (i) the nature and terms of the credit derivative, reasons for entering into the credit derivative, the events or circumstances that would require the seller to perform under the credit derivative, and the current status of the payment/performance risk of the credit derivative, (ii) the maximum potential amount of future payments (undiscounted) the seller could be required to make under the credit derivative, (iii) the fair value of the credit deriv-
The Fund 47
NOTES TO FINANCIAL STATEMENTS (continued)
ative, and (iv) the nature of any recourse provisions and assets held either as collateral or by third parties. There are amendments, which require additional disclosures about the current status of the payment/performance risk of a guarantee.All changes to accounting policies have been made in accordance with these amendments and are incorporated within current period as part of the Notes to the Statement of Investments and disclosures within this Note.
At December 31, 2009, the cost of investments for federal income tax purposes was $85,939,661; accordingly, accumulated net unrealized appreciation on investments was $3,866,905, consisting of $5,320,696 gross unrealized appreciation and $1,453,791 gross unrealized depreciation.
NOTE 5—Change in Independent Registered Public Accounting Firm:
PricewaterhouseCoopers LLP (“PWC”), 300 Madison Avenue, New York, New York 10017, an independent registered public accounting firm, were the independent registered public accounting firm for the fund for the fiscal year ended December 31, 2008. At the meetings held on February 9-10, 2009, the Audit Committee and the Board of Trustees of the Trust engaged KPMG LLP to replace PWC as the independent registered public accounting firm for the Trust, effective upon the conclusion of the audit of the December 31, 2008 financial statements of the Trust.
During the funds’ two fiscal years ended December 31, 2008 and the subsequent interim period through the effective date of PWC’s replacement: (i) no report on the funds’ financial statements contained an adverse opinion or a disclaimer of opinion, or was qualified or modified as to uncertainty, audit scope, or accounting principles; and (ii) there were no “disagreements” (as such term is used in Item 304 of
48
Regulation S-K) with PWC on any matter of accounting principles or practices, financial statement disclosure, or auditing scope or procedure, which disagreement(s), if not resolved to the satisfaction of PWC, would have caused it to make reference to the subject matter of the disagreement(s) in connection with its report.
NOTE 6—New Accounting Pronouncement:
In January 2010, FASB issued Accounting Standards Update (“ASU”) No. 2010-06 “Improving Disclosures about Fair Value Measurements”. ASU 2010-06 will require reporting entities to make new disclosures about amounts and reasons for significant transfers in and out of Level 1 and Level 2 fair value measurements as well as inputs and valuation techniques used to measure fair value for both recurring and nonrecur-ring fair value measurements that fall in either Level 2 or Level 3, and information on purchases, sales, issuances and settlements on a gross basis in the reconciliation of activity in Level 3 fair value measurements.The new and revised disclosures are required to be implemented for fiscal years beginning after December 15, 2009 except for the disclosures surrounding purchases, sales, issuances and settlements on a gross basis in the reconciliation of Level 3 fair value measurements,which are effective for fiscal years beginning after December 15, 2010. Management is currently evaluating the impact the adoption of ASU No. 2010-06 may have on the fund’s financial statement disclosures.
NOTE 7—Subsequent Events Evaluation:
Dreyfus has evaluated the need for disclosures and/or adjustments resulting from subsequent events through February 26, 2010, the date the financial statements were issued. This evaluation did not result in any subsequent events that necessitated disclosures and/or adjustments.
The Fund 49
| REPORT OF INDEPENDENT REGISTERED |
| PUBLIC ACCOUNTING FIRM |
The Board of Trustees and Shareholders of Dreyfus/Standish International Fixed Income Fund
We have audited the accompanying statement of assets and liabilities of Dreyfus/Standish International Fixed Income Fund (the “Fund”), a series of Dreyfus Investment Funds, including the statements of investments, financial futures and options written, as of December 31, 2009, and the related statement of operations, the statement of changes in net assets and financial highlights for the year then ended.These financial statements and financial highlights are the responsibility of the Fund’s management. Our responsibility is to express an opinion on these financial statements and financial highlights based on our audit. The statement of changes in net assets for the year ended December 31, 2008 and the financial highlights for each of the years in the four-year period ended December 31, 2008 were audited by other independent registered public accountants whose report thereon, dated February 27, 2009, expressed an unqualified opinion on that statement of changes in net assets and those financial highlights.
We conducted our audit in accordance with the standards of the Public Company Accounting Oversight Board (United States).Those standards require that we plan and perform the audit to obtain reasonable assurance about whether the financial statements and financial highlights are free of material misstatement.An audit also includes examining, on a test basis, evidence supporting the amounts and disclosures in the financial statements. Our procedures included confirmation of securities owned as of December 31, 2009 by correspondence with the custodian and brokers or by other appropriate auditing procedures where replies from brokers were not received.An audit also includes assessing the accounting principles used and significant estimates made by management, as well as evaluating the overall financial statement presentation.We believe that our audit provides a reasonable basis for our opinion.
In our opinion, the financial statements and financial highlights referred to above present fairly, in all material respects, the financial position of Dreyfus/Standish International Fixed Income Fund as of December 31, 2009, and the results of its operations, the changes in its net assets, and the financial highlights for the year then ended, in conformity with U.S. generally accepted accounting principles.

New York, New York
February 26, 2010
50
IMPORTANT TAX INFORMATION (Unaudited)
For federal tax purposes the fund hereby designates 37.22% of ordinary income dividends paid during the fiscal year ended December 31, 2009 as qualifying “interest related dividends”.
In accordance with federal tax law, the fund elects to provide each shareholder with their portion of the fund’s income sourced from foreign countries.Accordingly, the fund hereby makes the following designation regarding its fiscal year ended December 31, 2009:
—the total amount of income sourced from foreign countries was $2,629,330
Where required by federal tax law rules, shareholders will receive notification of their proportionate share of foreign sourced income for the 2009 calendar year with Form 1099-DIV which will be mailed by early 2010.
The Fund 51
OFFICERS OF THE FUND (Unaudited)
BRADLEY J. SKAPYAK, President since January 2010.
Chief Operating Officer and a director of the Manager since June 2009. From April 2003 to June 2009, Mr. Skapyak was the head of the Investment Accounting and Support Department of the Manager. He is an officer of 76 investment companies (comprised of 171 portfolios) managed by the Manager. He is 51 years old and has been an employee of the Manager since February 1988.
PHILLIP N. MAISANO, Executive Vice President since December 2008.
Chief Investment Officer,Vice Chair and a director of the Manager, and an officer of 76 investment companies (comprised of 171 portfolios) managed by the Manager. Mr. Maisano also is an officer and/or Board member of certain other investment management subsidiaries of The Bank of New York Mellon Corporation, each of which is an affiliate of the Manager. He is 62 years old and has been an employee of the Manager since November 2006. Prior to joining the Manager, Mr. Maisano served as Chairman and Chief Executive Officer of EACM Advisors, an affiliate of the Manager, since August 2004.
J. DAVID OFFICER, Vice President since January 2010.
Director of Mellon United National Bank, an affiliate of the Manager, and an officer of 77 investment companies (comprised of 194 portfolios) managed by the Manager. Prior to June 2009, Mr. Officer was Chief Operating Officer,Vice Chairman and a director of the Manager, where he had been employed since April 1998. He is 61 years old.
MICHAEL A. ROSENBERG, Vice President and Secretary since December 2008.
Assistant General Counsel of BNY Mellon, and an officer of 77 investment companies (comprised of 194 portfolios) managed by the Manager. He is 49 years old and has been an employee of the Manager since October 1991.
KIESHA ASTWOOD, Vice President and Assistant Secretary since January 2010.
Counsel of BNY Mellon, and an officer of 77 investment companies (comprised of 194 portfolios) managed by the Manager. She is 36 years old and has been an employee of the Manager since July 1995.
JAMES BITETTO, Vice President and Assistant Secretary since December 2008.
Senior Counsel of BNY Mellon and Secretary of the Manager, and an officer of 77 investment companies (comprised of 194 portfolios) managed by the Manager. He is 43 years old and has been an employee of the Manager since December 1996.
JONI LACKS CHARATAN, Vice President and Assistant Secretary since December 2008.
Senior Counsel of BNY Mellon, and an officer of 77 investment companies (comprised of 194 portfolios) managed by the Manager. She is 54 years old and has been an employee of the Manager since October 1988.
JOSEPH M. CHIOFFI, Vice President and Assistant Secretary since December 2008.
Senior Counsel of BNY Mellon, and an officer of 77 investment companies (comprised of 194 portfolios) managed by the Manager. He is 48 years old and has been an employee of the Manager since June 2000.
KATHLEEN DENICHOLAS, Vice President and Assistant Secretary since January 2010.
Senior Counsel of BNY Mellon, and an officer of 77 investment companies (comprised of 194 portfolios) managed by the Manager. She is 35 years old and has been an employee of the Manager since February 2001.
54
JANETTE E. FARRAGHER, Vice President and Assistant Secretary since December 2008.
Assistant General Counsel of BNY Mellon, and an officer of 77 investment companies (comprised of 194 portfolios) managed by the Manager. She is 47 years old and has been an employee of the Manager since February 1984.
JOHN B. HAMMALIAN, Vice President and Assistant Secretary since December 2008.
Managing Counsel of BNY Mellon, and an officer of 77 investment companies (comprised of 194 portfolios) managed by the Manager. He is 46 years old and has been an employee of the Manager since February 1991.
M. CRISTINA MEISER, Vice President and Assistant Secretary since January 2010.
Senior Counsel of BNY Mellon, and an officer of 77 investment companies (comprised of 194 portfolios) managed by the Manager. She is 39 years old and has been an employee of the Manager since August 2001.
ROBERT R. MULLERY, Vice President and Assistant Secretary since December 2008.
Managing Counsel of BNY Mellon, and an officer of 77 investment companies (comprised of 194 portfolios) managed by the Manager. He is 57 years old and has been an employee of the Manager since May 1986.
JEFF PRUSNOFSKY, Vice President and Assistant Secretary since December 2008.
Managing Counsel of BNY Mellon, and an officer of 77 investment companies (comprised of 194 portfolios) managed by the Manager. He is 44 years old and has been an employee of the Manager since October 1990.
JAMES WINDELS, Treasurer since December 2008.
Director – Mutual Fund Accounting of the Manager, and an officer of 77 investment companies (comprised of 194 portfolios) managed by the Manager. He is 51 years old and has been an employee of the Manager since April 1985.
RICHARD CASSARO, Assistant Treasurer since December 2008.
Senior Accounting Manager – Money Market and Municipal Bond Funds of the Manager, and an officer of 77 investment companies (comprised of 194 portfolios) managed by the Manager. He is 50 years old and has been an employee of the Manager since September 1982.
GAVIN C. REILLY, Assistant Treasurer since December 2008.
Tax Manager of the Investment Accounting and Support Department of the Manager, and an officer of 77 investment companies (comprised of 194 portfolios) managed by the Manager. He is 41 years old and has been an employee of the Manager since April 1991.
ROBERT ROBOL, Assistant Treasurer since December 2008.
Senior Accounting Manager – Fixed Income Funds of the Manager, and an officer of 77 investment companies (comprised of 194 portfolios) managed by the Manager. He is 45 years old and has been an employee of the Manager since October 1988.
ROBERT SALVIOLO, Assistant Treasurer since December 2008.
Senior Accounting Manager – Equity Funds of the Manager, and an officer of 77 investment companies (comprised of 194 portfolios) managed by the Manager. He is 42 years old and has been an employee of the Manager since June 1989.
The Fund 55
OFFICERS OF THE FUND (Unaudited) (continued)
ROBERT SVAGNA, Assistant Treasurer since December 2008.
Senior Accounting Manager – Equity Funds of the Manager, and an officer of 77 investment companies (comprised of 194 portfolios) managed by the Manager. He is 42 years old and has been an employee of the Manager since November 1990.
JOSEPH W. CONNOLLY, Chief Compliance Officer since December 2008.
Chief Compliance Officer of the Manager and The Dreyfus Family of Funds (77 investment companies, comprised of 194 portfolios). From November 2001 through March 2004, Mr. Connolly was first Vice-President, Mutual Fund Servicing for Mellon Global Securities Services. In that capacity, Mr. Connolly was responsible for managing Mellon’s Custody, Fund Accounting and Fund Administration services to third-party mutual fund clients. He is 52 years old and has served in various capacities with the Manager since 1980, including manager of the firm’s Fund Accounting Department from 1997 through October 2001.
WILLIAM GERMENIS, Anti-Money Laundering Compliance Officer since December 2008.
Vice President and Anti-Money Laundering Compliance Officer of the Distributor, and the Anti-Money Laundering Compliance Officer of 73 investment companies (comprised of 190 portfolios) managed by the Manager. He is 39 years old and has been an employee of the Distributor since October 1998.
56
| Item 2. | Code of Ethics. |
The Registrant has adopted a code of ethics that applies to the Registrant's principal executive officer, principal financial officer, principal accounting officer or controller, or persons performing similar functions. There have been no amendments to, or waivers in connection with, the Code of Ethics during the period covered by this Report.
| Item 3. | Audit Committee Financial Expert. |
The Registrant's Board has determined that Joseph S. DiMartino, a member of the Audit Committee of the Board, is an audit committee financial expert as defined by the Securities and Exchange Commission (the "SEC"). Joseph S. DiMartino is "independent" as defined by the SEC for purposes of audit committee
| Item 4. | Principal Accountant Fees and Services. |
(a) Audit Fees. The aggregate fees billed for each of the last two fiscal years (the "Reporting Periods") for professional services rendered by the Registrant's principal accountant (the "Auditor") for the audit of the Registrant's annual financial statements, or services that are normally provided by the Auditor in connection with the statutory and regulatory filings or engagements for the Reporting Periods, were $171,042 in 2008 and $101,100 in 2009.
(b) Audit-Related Fees. The aggregate fees billed in the Reporting Periods for assurance and related services by the Auditor that are reasonably related to the performance of the audit of the Registrant's financial statements and are not reported under paragraph (a) of this Item 4 were $9,855 in 2008 and $12,900 in 2009. These services consisted of security counts required by Rule 17f-2 under the Investment Company Act of 1940, as amended.
The aggregate fees billed in the Reporting Periods for non-audit assurance and related services by the Auditor to the Registrant's investment adviser (not including any sub-investment adviser whose role is primarily portfolio management and is subcontracted with or overseen by another investment adviser), and any entity controlling, controlled by or under common control with the investment adviser that provides ongoing services to the Registrant ("Service Affiliates"), that were reasonably related to the performance of the annual audit of the Service Affiliate, which required pre-approval by the Audit Committee were $0 in 2008 and $0 in 2009.
(c) Tax Fees. The aggregate fees billed in the Reporting Periods for professional services rendered by the Auditor for tax compliance, tax advice and tax planning ("Tax Services") were $23,470 in 2008 and $7,500 in 2009. These services consisted of (i) review or preparation of U.S. federal, state, local and excise tax returns; (ii) U.S. federal, state and local tax planning, advice and assistance regarding statutory, regulatory or administrative developments, (iii) tax advice regarding tax qualification matters and/or treatment of various financial instruments held or proposed to be acquired or held, and (iv) determination of Passive Foreign Investment Companies.
The aggregate fees billed in the Reporting Periods for Tax Services by the Auditor to Service Affiliates which required pre-approval by the Audit Committee were $0 in 2008 and $0 in 2009.
(d) All Other Fees. The aggregate fees billed in the Reporting Periods for products and services provided by the Auditor, other than the services reported in paragraphs (a) through (c) of this Item, were $0 in 2008 and $0 in 2009.
The aggregate fees billed in the Reporting Periods for Non-Audit Services by the Auditor to Service Affiliates, other than the services reported in paragraphs (b) through (c) of this Item, which required pre-approval by the Audit Committee were $0 in 2008 and $0 in 2009.
Note: None of the services described in paragraphs (b) through (d) of this Item 4 were approved by the Audit Committee pursuant to paragraph (c)(7)(i)(C) of Rule 2-01 of Regulation S-X.
Audit Committee Pre-Approval Policies and Procedures. The Registrant's Audit Committee has established policies and procedures (the "Policy") for pre-approval (within specified fee limits) of the Auditor's engagements for non-audit services to the Registrant and Service Affiliates without specific case-by-case consideration. Pre-approval considerations include whether the proposed services are compatible with maintaining the Auditor's independence. Pre-approvals pursuant to the Policy are considered annually.
Non-Audit Fees. The aggregate non-audit fees billed by the Auditor for services rendered to the Registrant, and rendered to Service Affiliates, for the Reporting Periods were $100,000 in 2008 and $4,021,870 in 2009.
Auditor Independence. The Registrant's Audit Committee has considered whether the provision of non-audit services that were rendered to Service Affiliates which were not pre-approved (not requiring pre-approval) is compatible with maintaining the Auditor's independence.
| Item 5. | Audit Committee of Listed Registrants. |
| Not applicable. | |
| Item 6. | Schedule of Investments. |
| (a) | Not applicable. |
| Item 7. | Disclosure of Proxy Voting Policies and Procedures for Closed-End Management |
| Investment Companies. | |
| Not applicable. | |
| Item 8. | Portfolio Managers of Closed-End Management Investment Companies. |
| Not applicable | |
| Item 9. | Purchases of Equity Securities by Closed-End Management Investment Companies and |
| Affiliated Purchasers. | |
| Not applicable. | |
| Item 10. | Submission of Matters to a Vote of Security Holders. |
| There have been no material changes to the procedures applicable to Item 10. | |
| Item 11. | Controls and Procedures. |
(a) The Registrant's principal executive and principal financial officers have concluded, based on their evaluation of the Registrant's disclosure controls and procedures as of a date within 90 days of the filing date of this report, that the Registrant's disclosure controls and procedures are reasonably designed to ensure that information required to be disclosed by the Registrant on Form N-CSR is recorded, processed, summarized and reported within the required time periods and that information required to be disclosed by the Registrant in the reports that it files or submits on Form N-CSR is accumulated and communicated to the Registrant's management, including its principal executive and principal financial officers, as appropriate to allow timely decisions regarding required disclosure.
(b) There were no changes to the Registrant's internal control over financial reporting that occurred during the second fiscal quarter of the period covered by this report that have materially affected, or are reasonably likely to materially affect, the Registrant's internal control over financial reporting.
| Item 12. | Exhibits. |
(a)(1) Code of ethics referred to in Item 2.
(a)(2) Certifications of principal executive and principal financial officers as required by Rule 30a-2(a) under the Investment Company Act of 1940.
(a)(3) Not applicable.
(b) Certification of principal executive and principal financial officers as required by Rule 30a-2(b) under the Investment Company Act of 1940.
SIGNATURES
Pursuant to the requirements of the Securities Exchange Act of 1934 and the Investment Company Act of 1940, the Registrant has duly caused this Report to be signed on its behalf by the undersigned, thereunto duly authorized.
Dreyfus Investment Funds
| By: | /s/ Bradley J. Skapyak |
| Bradley J. Skapyak, | |
| President | |
| Date: | February 19, 2010 |
Pursuant to the requirements of the Securities Exchange Act of 1934 and the Investment Company Act of 1940, this Report has been signed below by the following persons on behalf of the Registrant and in the capacities and on the dates indicated.
| By: | /s/ Bradley J. Skapyak |
| Bradley J. Skapyak, | |
| President | |
| Date: | February 19, 2010 |
| By: | /s/ James Windels |
| James Windels, | |
| Treasurer | |
| Date: | February 19, 2010 |
EXHIBIT INDEX
(a)(1) Code of ethics referred to in Item 2.
(a)(2) Certifications of principal executive and principal financial officers as required by Rule 30a 2(a) under the Investment Company Act of 1940. (EX-99.CERT)
(b) Certification of principal executive and principal financial officers as required by Rule 30a-2(b) under the Investment Company Act of 1940. (EX-99.906CERT)