| UNITED STATES SECURITIES AND EXCHANGE COMMISSION Washington, D.C. 20549 |
| FORM N-CSR/A |
| CERTIFIED SHAREHOLDER REPORT OF REGISTERED MANAGEMENT INVESTMENT COMPANIES |
Investment Company Act file number 811-04813
| Dreyfus Investment Funds (Exact name of Registrant as specified in charter) |
| c/o The Dreyfus Corporation 200 Park Avenue New York, New York 10166 (Address of principal executive offices) (Zip code) |
| Michael A. Rosenberg, Esq. 200 Park Avenue New York, New York 10166 (Name and address of agent for service) |
| Registrant's telephone number, including area code: | (212) 922-6000 | |||
| Date of fiscal year end: | 9/30 | |||
| Date of reporting period: | 9/30/2009 | |||
The following N-CSR/A relates only to Dreyfus/The Boston Company Small/Mid Cap Growth Fund, a series of the Registrant with a fiscal year of 9/30. The Shareholders’ reports for the Registrant’s series listed below are incorporated by reference to the Form N-CSR, filed with the Securities and Exchange Commission on November 30, 2009 under the submission number 0001423799-09-000015. The Form N-CSR/A does not affect the other series of the Registrant, which have a different fiscal year end and, therefore, different N-CSR reporting requirements. Separate N-CSR Forms will be filed for those series, as appropriate.
| Dreyfus/The Boston Company Emerging Markets Core Equity Fund |
| Dreyfus/The Boston Company International Core Equity Fund |
| Dreyfus/The Boston Company Large Cap Core Fund |
| Dreyfus/The Boston Company Small Cap Growth Fund |
| Dreyfus/The Boston Company Small Cap Tax-Sensitive Equity Fund |
| Dreyfus/The Boston Company Small Cap Value Fund |
| Dreyfus/Standish Intermediate Tax Exempt Bond Fund |
| Dreyfus/Newton International Equity Fund |
| FORM N-CSR/A |
Item 1. Reports to Stockholders.
Save time. Save paper. View your next shareholder report online as soon as it’s available. Log into www.dreyfus.com and sign up for Dreyfus eCommunications. It’s simple and only takes a few minutes.
The views expressed in this report reflect those of the portfolio manager only through the end of the period covered and do not necessarily represent the views of Dreyfus or any other person in the Dreyfus organization. Any such views are subject to change at any time based upon market or other conditions and Dreyfus disclaims any responsibility to update such views.These views may not be relied on as investment advice and, because investment decisions for a Dreyfus fund are based on numerous factors, may not be relied on as an indication of trading intent on behalf of any Dreyfus fund.
Not FDIC-Insured • Not Bank-Guaranteed • May Lose Value
Contents
THE FUND
2 A Letter from the Chairman and CEO
3 Discussion of Fund Performance
6 Fund Performance
8 Understanding Your Fund’s Expenses
8 Comparing Your Fund’s Expenses With Those of Other Funds
9 Statement of Investments
14 Statement of Assets and Liabilities
15 Statement of Operations
16 Statement of Changes in Net Assets
18 Financial Highlights
20 Notes to Financial Statements
33 Report of Independent Registered Public Accounting Firm
34 Board Members Information
36 Officers of the Fund
FOR MORE INFORMATION
Back Cover
| Dreyfus/The Boston |
| Company Small/Mid Cap |
| Growth Fund |
| The Fund |

A LETTER FROM THE CHAIRMAN AND CEO
Dear Shareholder:
We present this annual report for Dreyfus/The Boston Company Small/Mid Cap Growth Fund, covering the 12-month period from October 1, 2008, through September 30, 2009.
While the end of the recession will not be officially declared over for months, evidence suggests that the economy has turned a corner, including inventory rebuilding among manufacturers and improvements in home sales and prices.These indicators continue to help fuel a sustained rally among domestic and international stocks, many of which hit 52-week lows back in March. Since then, the best returns were generated by the most beaten-down securities and by smaller-cap securities. Momentum may keep these stocks rallying for a time, but the fundamental case for future gains seems to depend on an actual acceleration of economic activity.
Currently, in our judgment, the financial markets appear poised to enter into a new phase in which underlying fundamentals of individual companies and industry groups, not bargain hunting, are likely to drive investment returns. Of course, the best strategy for your portfolio depends not only on your view of the economy’s direction, but on your current financial needs, future goals and attitudes toward risk. Your financial advisor can help you decide which investments have the potential to benefit from a recovery while guarding against unexpected economic developments.
For information about how the fund performed during the reporting period, as well as market perspectives, we have provided a Discussion of Fund Performance.
Thank you for your continued confidence and support.

| Jonathan R. Baum Chairman and Chief Executive Officer The Dreyfus Corporation October 15, 2009 |
| 2 |

DISCUSSION OF FUND PERFORMANCE
For the period of October 1, 2008, through September 30, 2009, as provided by Todd Wakefield and B. Randall Watts, Jr., Portfolio Managers
Fund and Market Performance Overview
For the 12-month period ended September 30, 2009, Dreyfus/The Boston Company Small/Mid Cap Growth Fund’s Class I shares produced a total return of –7.27%.1 Between their inception on March 31, 2009, and September 30, 2009, the fund’s Class A and Class C shares returned 31.99% and 31.39%, respectively.1 In comparison, the fund’s benchmark, the Russell 2500 Growth Index (the “Index”), produced a total return of –3.08% for the 12-month period and 42.70% for the six-month period.2
After suffering steep declines stemming from a global financial crisis and recession, small- and midcap stocks reversed course in mid-March, as renewed economic optimism fueled a market rally through the reporting period’s end. The fund produced lower returns than its benchmark, mainly due to its bias toward higher-quality companies at a time when lower-quality stocks led the market.
The Fund’s Investment Approach
The fund seeks long-term growth of capital.To pursue its goal, the fund normally invests at least 80% of its assets in equity securities of small-cap and midcap U.S. companies with market capitalizations, at the time of purchase, equal to or less than the total market capitalization of the largest company in the Index.When choosing stocks, we seek to identify high-quality small-cap and midcap companies with rapid current or expected earnings or revenue growth. We employ fundamental research to identify companies with attractive characteristics, such as strong business and competitive positions, solid cash flows and balance sheets, high-quality management and high sustainable growth.We also may invest in companies that our research indicates will experience accelerating revenues and expanding operating margins.
Stocks Rallied in 2009 from Multi-Year Lows
The reporting period opened in the midst of a severe recession characterized by rising unemployment, plummeting housing values and depressed consumer sentiment.The economic downturn was intensi-
The Fund 3
DISCUSSION OF FUND PERFORMANCE (continued)
fied by a financial crisis that nearly led to the collapse of the global banking system. Consequently, investors favored the stocks of traditionally defensive market sectors and companies during the worst of the downturn. However, in early March, evidence of stabilization in the credit markets and economy buoyed investor sentiment. Bargain-hunting investors quickly regained their appetites for risk, and they began to flock toward the lower-quality, beaten-down stocks they previously had avoided.
Quality Bias Undermined Performance
Although the fund held up relatively well compared to its benchmark during the worst of the downturn, we remained resolute in our focus on higher-quality companies with positive cash flows, healthy balance sheets and solid business franchises. Because many of the benchmark’s stronger performers during the 2009 rally did not meet our investment criteria, the fund’s returns, trailed its benchmark for the reporting period overall.
In addition, the traditionally defensive health care sector suffered due to uncertainty surrounding government health care reform legislation, and cash-strapped consumers found ways to reduce health care costs, including postponing elective procedures. In light of these headwinds, the fund’s health care holdings weighed on its performance. Biotechnology firms Myriad Genetics, Onyx Pharmaceuticals, OSI Pharmaceuticals and BioMarin Pharmaceutical detracted from returns during the volatile reporting period, as did equipment suppliers Conmed, Haemonetics, IMMUNOCORP and Wright Medical. Negative industry trends also punished the stocks of lifesciences tools companies Covance,PAREXEL International and Thermo Fisher Scientific.
Within the volatile financials sector, overweighted exposure to insurance companies RLI Corp. and Tower Group detracted from performance when investors questioned the firms’ investment portfolios. An increase in the fund’s exposure to the stronger-performing information technology sector proved too late to fully capture the segment’s advance.The fund also encountered disappointments in software developers Concur Technologies, which underperformed when it missed earnings targets, and Sybase, whose stock climbed less robustly than sector averages. Semiconductor makers ON Semiconductor Corp., FormFactor and Microsemi also disappointed amid sluggish consumer and business spending.
4
The fund achieved better relative results through an overweighted position in the energy sector. In addition, strong stock selections included exploration-and-production firms CNX Gas Corp., Continental Resources and Plains Exploration & Production. Rising oil prices in 2009 also benefited equipment provider Dril-Quip, while timely sales in FMC Technologies, and Natco Group limited declines helping to outperform the segment overall. In the telecommunications services sector, an underweighted position and strong stock selections boosted the fund’s performance. Successes included fiber optics network provider Abovenet, which reported strong quarterly financial results.
Focusing on High-Quality Growth Stocks
We have continued to favor information technology companies due to their economic sensitivity and the prospect of robust demand from companies that have postponed upgrades to their systems.We continue to watch the growth potential of certain insurers in the financials sector. Conversely, the fund has maintained underweighted exposure to the industrials sector, which may have rallied too strongly, and the consumer discretionary sector, where we have not yet seen signs of stabilization in consumer spending. Regardless of the market’s direction, we intend to remain steadfast in our investment approach, focusing on higher-quality companies with strong growth prospects and attractive valuations.
October 15, 2009
| Effective 3/31/2009, the fund adopted a multiple class structure.The fund’s existing shares were | ||
| reclassified as Class I shares and Class A and Class C have been added. | ||
| 1 | Total return includes reinvestment of dividends and any capital gains paid, and does not take into | |
| consideration the maximum initial sales charge in the case of Class A shares, or the applicable | ||
| contingent deferred sales charge imposed on redemptions in the case of Class C shares. Had these | ||
| charges been reflected, returns would have been lower. Past performance is no guarantee of future | ||
| results. Share price and investment return fluctuate such that upon redemption, fund shares may be | ||
| worth more or less than their original cost. Return figure for Class C shares provided reflects the | ||
| absorption of certain fund expenses by The Dreyfus Corporation. Had these expenses not been | ||
| absorbed, the fund’s Class C return would have been lower.This waiver is voluntary and may be | ||
| terminated or changed at any time. | ||
| 2 | SOURCE: LIPPER INC. — The Russell 2500 Growth Index is an unmanaged index that | |
| measures the performance of those Russell 2500 companies (the 2,500 smallest companies in the | ||
| Russell 3000 Index, which is comprised of the 3,000 largest U.S. companies based on total | ||
| market capitalization) with higher price-to-book ratios and higher forecasted growth values.The | ||
| total return figure cited for this index assumes change in security prices and reinvestment of | ||
| dividends, but does not reflect the costs of managing a mutual fund. |
The Fund 5
FUND PERFORMANCE
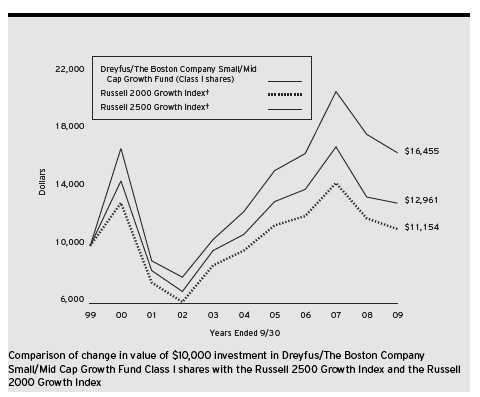
| † Source: Lipper Inc. |
| Past performance is not predictive of future performance. |
| The above graph compares a $10,000 investment made in Class I shares of Dreyfus/The Boston Company Small/Mid |
| Cap Growth Fund on 9/30/99 to a $10,000 investment made in the Russell 2500 Growth Index and the Russell |
| 2000 Growth Index on that date. All dividends and capital gain distributions are reinvested. |
| Effective on December 1, 2008,The Dreyfus Corporation became the fund’s investment adviser and the fund’s name |
| changed from The Boston Company Small/Mid Cap Growth Fund to Dreyfus/The Boston Company Small/Mid |
| Cap Growth Fund.The fund is a series of Dreyfus Investment Funds (prior to December 1, 2008, Mellon Institutional |
| Funds Investment Trust). |
| Effective on March 31, 2009, Dreyfus/The Boston Company Small/Mid Cap Growth Fund implemented a multi- |
| class structure. Existing shares were re-designated as Class I shares and Class A and Class C shares were adopted. |
| The fund’s performance shown in the line graph takes into account all applicable fees and expenses for Class I shares. |
| Performance for Class A and Class C shares will vary from the performance of Class I shares shown above due to |
| differences in charges and expenses.The Russell 2500 Growth Index is an unmanaged index that measures the |
| performance of those Russell 2500 companies in the Russell 3000 Index with higher price-to-book ratios and higher |
| forecasted growth values.The Russell 2000 Growth Index is an unmanaged index that measures the performance of |
| those Russell 2000 companies with higher price-to-book ratios and higher forecasted growth values. Unlike a mutual |
| fund, the indices are not subject to charges, fees and other expenses. Investors cannot invest directly in any index.These |
| factors can contribute to the indices potentially outperforming the fund. Further information relating to fund performance, |
| including expense reimbursements, if applicable, is contained in the Financial Highlights section of the prospectus and |
| elsewhere in this report. |
6
| Average Annual Total Returns as of 9/30/09 | ||||||||
| Inception | ||||||||
| Date | 1 Year | 5 Years | 10 Years | |||||
| Class A shares | ||||||||
| with maximum sales charge (5.75%) | 3/31/09 | –12.60%†† | 4.62%†† | 4.49%†† | ||||
| without sales charge | 3/31/09 | –7.27%†† | 5.87%†† | 5.11%†† | ||||
| Class C shares | ||||||||
| with applicable redemption charge † | 3/31/09 | –8.61%†† | 5.77%†† | 5.06%†† | ||||
| without redemption | 3/31/09 | –7.69%†† | 5.77%†† | 5.06%†† | ||||
| Class I shares | 1/1/88 | –7.27% | 5.87% | 5.11% | ||||
| Past performance is not predictive of future performance.The fund’s performance shown in the graph and table does not | ||
| reflect the deduction of taxes that a shareholder would pay on fund distributions or the redemption of fund shares. | ||
| † | The maximum contingent deferred sales charge for Class C shares is 1% for shares redeemed within one year of the | |
| date of purchase. | ||
| †† | The total return performance figures presented for Class A and Class C shares of the fund reflect the performance of | |
| the fund’s Class I shares for periods prior to 3/31/09 (the inception date for Class A and Class C shares), adjusted | ||
| to reflect the applicable sales load for that class. | ||
The Fund 7
UNDERSTANDING YOUR FUND’S EXPENSES (Unaudited)
As a mutual fund investor, you pay ongoing expenses, such as management fees and other expenses. Using the information below, you can estimate how these expenses affect your investment and compare them with the expenses of other funds.You also may pay one-time transaction expenses, including sales charges (loads) and redemption fees, which are not shown in this section and would have resulted in higher total expenses. For more information, see your fund’s prospectus or talk to your financial adviser.
Review your fund’s expenses
The table below shows the expenses you would have paid on a $1,000 investment in Dreyfus/The Boston Company Small/Mid Cap Growth Fund from April 1, 2009 to September 30, 2009. It also shows how much a $1,000 investment would be worth at the close of the period, assuming actual returns and expenses.
| Expenses and Value of a $1,000 Investment | ||||||
| assuming actual returns for the six months ended September 30, 2009 | ||||||
| Class A | Class C | Class I | ||||
| Expenses paid per $1,000† | $ 7.27 | $ 11.63 | $ 5.18 | |||
| Ending value (after expenses) | $1,319.90 | $1,313.90 | $1,319.90 | |||
| COMPARING YOUR | FUND’S EXPENSES | |
| WITH THOSE OF | OTHER FUNDS ( U n a u d i t e d ) |
Using the SEC’s method to compare expenses
The Securities and Exchange Commission (SEC) has established guidelines to help investors assess fund expenses. Per these guidelines, the table below shows your fund’s expenses based on a $1,000 investment, assuming a hypothetical 5% annualized return. You can use this information to compare the ongoing expenses (but not transaction expenses or total cost) of investing in the fund with those of other funds.All mutual fund shareholder reports will provide this information to help you make this comparison. Please note that you cannot use this information to estimate your actual ending account balance and expenses paid during the period.
| Expenses and Value of a $1,000 Investment | ||||||
| assuming a hypothetical 5% annualized return for the six months ended September 30, 2009 | ||||||
| Class A | Class C | Class I | ||||
| Expenses paid per $1,000† | $ 6.33 | $ 10.10 | $ 4.51 | |||
| Ending value (after expenses) | $1,018.80 | $1,015.04 | $1,020.61 | |||
| † Expenses are equal to the fund’s annualized expense ratio of 1.25% for Class A, 2.00% for Class C and .89% |
| for Class I , multiplied by the average account value over the period, multiplied by 183/365 (to reflect the one-half |
| year period). |
8
| STATEMENT OF | INVESTMENTS | |
| S e p t e m b e r 3 0 , 2 0 0 9 |
| Common Stocks—97.5% | Shares | Value ($) | ||
| Consumer Discretionary—15.2% | ||||
| Bed Bath & Beyond | 22,260 a,b | 835,640 | ||
| Carter’s | 61,500 b | 1,642,050 | ||
| Cato, Cl. A | 38,950 | 790,296 | ||
| Children’s Place Retail Stores | 57,260 b | 1,715,510 | ||
| Choice Hotels International | 28,280 a | 878,377 | ||
| Columbia Sportswear | 40,130 a | 1,651,751 | ||
| GameStop, Cl. A | 65,590 b | 1,736,167 | ||
| Gentex | 60,580 | 857,207 | ||
| Interactive Data | 51,880 | 1,359,775 | ||
| International Game Technology | 59,830 a | 1,285,148 | ||
| ITT Educational Services | 15,250 a,b | 1,683,753 | ||
| Jarden | 38,590 | 1,083,221 | ||
| Lions Gate Entertainment | 244,788 a,b | 1,507,894 | ||
| Panera Bread, Cl. A | 30,190 a,b | 1,660,450 | ||
| Papa John’s International | 87,678 b | 2,154,248 | ||
| Pool | 48,180 a | 1,070,560 | ||
| Urban Outfitters | 27,410 a,b | 826,960 | ||
| WMS Industries | 28,990 a,b | 1,291,794 | ||
| Wolverine World Wide | 66,120 | 1,642,421 | ||
| 25,673,222 | ||||
| Consumer Staples—4.3% | ||||
| Alberto-Culver | 46,150 | 1,277,432 | ||
| Casey’s General Stores | 27,020 | 847,888 | ||
| Estee Lauder, Cl. A | 56,060 | 2,078,705 | ||
| Hain Celestial Group | 39,720 a,b | 761,432 | ||
| Whole Foods Market | 73,930 a,b | 2,254,126 | ||
| 7,219,583 | ||||
| Energy—7.0% | ||||
| Arena Resources | 35,200 b | 1,249,600 | ||
| CNX Gas | 55,502 a,b | 1,703,911 | ||
| Concho Resources | 51,120 b | 1,856,678 | ||
| Dril-Quip | 32,930 b | 1,634,645 | ||
| Lufkin Industries | 16,840 | 895,551 | ||
| Plains Exploration & Production | 85,100 b | 2,353,866 | ||
| Tidewater | 46,440 | 2,186,860 | ||
| 11,881,111 |
The Fund 9
STATEMENT OF INVESTMENTS (continued)
| Common Stocks (continued) | Shares | Value ($) | ||
| Exchange Traded Funds—3.1% | ||||
| iShares Russell 2000 Growth Index Fund | 78,720 a | 5,149,862 | ||
| Financial—9.5% | ||||
| Arch Capital Group | 21,970 b | 1,483,854 | ||
| Jefferies Group | 61,740 a,b | 1,681,180 | ||
| Knight Capital Group, Cl. A | 119,080 b | 2,589,990 | ||
| MFA Financial | 208,240 d | 1,657,590 | ||
| Plum Creek Timber | 43,550 a,d | 1,334,372 | ||
| RLI | 7,220 a | 381,072 | ||
| Tower Group | 61,970 | 1,511,448 | ||
| Validus Holdings | 63,290 | 1,632,882 | ||
| Westamerica Bancorporation | 39,340 a | 2,045,680 | ||
| Willis Group Holdings | 59,800 | 1,687,556 | ||
| 16,005,624 | ||||
| Health Care—22.2% | ||||
| Alexion Pharmaceuticals | 27,370 a,b | 1,219,060 | ||
| Allscripts-Misys Healthcare Solutions | 104,480 a,b | 2,117,810 | ||
| Alnylam Pharmaceuticals | 34,693 a,b | 786,837 | ||
| AmerisourceBergen | 74,550 | 1,668,429 | ||
| Beckman Coulter | 28,980 | 1,997,881 | ||
| Bio-Rad Laboratories, Cl. A | 14,980 b | 1,376,362 | ||
| Centene | 45,210 b | 856,277 | ||
| Charles River Laboratories International | 32,830 a,b | 1,214,053 | ||
| Chemed | 18,240 | 800,554 | ||
| Eclipsys | 84,970 b | 1,639,921 | ||
| Emergency Medical Services, Cl. A | 30,299 b | 1,408,903 | ||
| ev3 | 67,187 b | 827,072 | ||
| Exelixis | 133,740 b | 853,261 | ||
| Haemonetics | 19,340 b | 1,085,361 | ||
| Human Genome Sciences | 83,570 a,b | 1,572,787 | ||
| MEDNAX | 33,220 b | 1,824,442 | ||
| Nektar Therapeutics | 84,530 b | 823,322 | ||
| NuVasive | 36,980 a,b | 1,544,285 | ||
| Owens & Minor | 20,070 | 908,168 | ||
| PerkinElmer | 66,810 | 1,285,424 | ||
| PharMerica | 31,562 a,b | 586,106 | ||
| PSS World Medical | 63,450 a,b | 1,385,114 |
10
| Common Stocks (continued) | Shares | Value ($) | ||
| Health Care (continued) | ||||
| Resmed | 26,210 a,b | 1,184,692 | ||
| SXC Health Solutions | 33,990 b | 1,590,392 | ||
| Thermo Fisher Scientific | 26,780 b | 1,169,483 | ||
| Thoratec | 21,390 a,b | 647,475 | ||
| United Therapeutics | 16,400 a,b | 803,436 | ||
| Universal Health Services, Cl. B | 27,960 | 1,731,563 | ||
| Vertex Pharmaceuticals | 30,880 b | 1,170,352 | ||
| Volcano | 80,243 b | 1,349,687 | ||
| 37,428,509 | ||||
| Industrial—10.6% | ||||
| Applied Industrial Technologies | 39,450 | 834,762 | ||
| Barnes Group | 81,490 | 1,392,664 | ||
| Crane | 33,090 | 854,053 | ||
| EnerSys | 71,850 b | 1,589,322 | ||
| Flowserve | 14,380 | 1,417,005 | ||
| GrafTech International | 118,540 b | 1,742,538 | ||
| IDEX | 45,380 a | 1,268,371 | ||
| Landstar System | 88,700 | 3,375,922 | ||
| MSC Industrial Direct, Cl. A | 19,230 a | 838,043 | ||
| Mueller Industries | 67,350 | 1,607,645 | ||
| Old Dominion Freight Line | 6,240 a,b | 189,883 | ||
| Pentair | 55,150 a | 1,628,028 | ||
| Robert Half International | 46,380 | 1,160,428 | ||
| 17,898,664 | ||||
| Materials—1.6% | ||||
| Aurizon Mines | 153,350 b | 668,606 | ||
| H.B. Fuller | 62,710 | 1,310,639 | ||
| Packaging Corp. of America | 38,810 | 791,724 | ||
| 2,770,969 | ||||
| Technology—23.7% | ||||
| ADTRAN | 35,700 | 876,435 | ||
| Atheros Communications | 24,810 a,b | 658,209 | ||
| BMC Software | 18,780 b | 704,813 | ||
| CACI International, Cl. A | 33,440 b | 1,580,709 | ||
| Celestica | 91,980 b | 871,970 | ||
| Citrix Systems | 23,270 a,b | 912,882 |
The Fund 11
STATEMENT OF INVESTMENTS (continued)
| Common Stocks (continued) | Shares | Value ($) | ||
| Technology (continued) | ||||
| Cogent | 58,140 b | 587,214 | ||
| Coherent | 53,580 a,b | 1,249,486 | ||
| CyberSource | 44,850 b | 747,649 | ||
| F5 Networks | 22,260 b | 882,164 | ||
| FEI | 39,910 b | 983,782 | ||
| Genpact | 186,380 b | 2,292,474 | ||
| International Rectifier | 66,130 b | 1,288,874 | ||
| j2 Global Communications | 41,670 a,b | 958,827 | ||
| Jabil Circuit | 99,760 | 1,337,782 | ||
| Lawson Software | 192,500 b | 1,201,200 | ||
| LSI | 366,920 b | 2,014,391 | ||
| Mentor Graphics | 130,950 b | 1,219,145 | ||
| Metavante Technologies | 37,484 b | 1,292,448 | ||
| MKS Instruments | 107,590 b | 2,075,411 | ||
| Novatel Wireless | 64,560 a,b | 733,402 | ||
| Novellus Systems | 40,370 b | 846,963 | ||
| ON Semiconductor | 147,680 b | 1,218,360 | ||
| PMC-Sierra | 268,440 b | 2,566,286 | ||
| Polycom | 96,230 b | 2,574,153 | ||
| Quality Systems | 13,640 a | 839,815 | ||
| Quest Software | 138,340 b | 2,331,029 | ||
| Rofin-Sinar Technologies | 51,440 b | 1,181,062 | ||
| SkillSoft, ADR | 95,740 b | 919,104 | ||
| Verigy | 129,140 a,b | 1,500,607 | ||
| Vishay Intertechnology | 196,390 b | 1,551,481 | ||
| 39,998,127 | ||||
| Telecommunications—.3% | ||||
| Above Net | 11,350 a,b | 553,426 | ||
| Total Common Stocks | ||||
| (cost $141,304,963) | 164,579,097 |
12
| Other Investment—2.8% | Shares | Value ($) | ||
| Registered Investment Company; | ||||
| Dreyfus Institutional Preferred | ||||
| Plus Money Market Fund | ||||
| (cost $4,807,629) | 4,807,629 c | 4,807,629 | ||
| Investment of Cash Collateral | ||||
| for Securities Loaned—20.2% | ||||
| Registered Investment Company; | ||||
| Dreyfus Institutional Cash | ||||
| Advantage Fund | ||||
| (cost $34,033,874) | 34,033,874 c | 34,033,874 | ||
| Total Investments (cost $180,146,466) | 120.5% | 203,420,600 | ||
| Liabilities, Less Cash and Receivables | (20.5%) | (34,590,004) | ||
| Net Assets | 100.0% | 168,830,596 | ||
| ADR—American Depository Receipts |
| a All or a portion of these securities are on loan. At September 30, 2009, the total market value of the fund’s securities |
| on loan is $32,814,561 and the total market value of the collateral held by the fund is $34,033,874. |
| b Non-income producing security. |
| c Investment in affiliated money market mutual fund. |
| d Investment in Real Estate Investment Trust. |
| Portfolio Summary (Unaudited)† | ||||||
| Value (%) | Value (%) | |||||
| Technology | 23.7 | Energy | 7.0 | |||
| Money Market Investments | 23.0 | Consumer Staples | 4.3 | |||
| Health Care | 22.2 | Exchange Traded Funds | 3.1 | |||
| Consumer Discretionary | 15.2 | Materials | 1.6 | |||
| Industrial | 10.6 | Telecommunications | .3 | |||
| Financial | 9.5 | 120.5 | ||||
| † Based on net assets. |
| See notes to financial statements. |
The Fund 13
| STATEMENT OF | ASSETS | AND | LIABILITIES | |||
| S e p t e m b e r 3 0 , 2 0 0 9 |
| Cost | Value | |||||
| Assets ($): | ||||||
| Investments in securities—See Statement of Investments (including | ||||||
| securities on loan, valued at $32,814,561)—Note 1(b): | ||||||
| Unaffiliated issuers | 141,304,963 | 164,579,097 | ||||
| Affiliated issuers | 38,841,503 | 38,841,503 | ||||
| Cash | 144,446 | |||||
| Receivable for investment securities sold | 4,202,071 | |||||
| Receivable for shares of Beneficial Interest subscribed | 482,726 | |||||
| Dividends and interest receivable | 55,841 | |||||
| Prepaid expenses | 4,515 | |||||
| 208,310,199 | ||||||
| Liabilities ($): | ||||||
| Due to The Dreyfus Corporation and affiliates—Note 3(d) | 116,949 | |||||
| Liability for securities on loan—Note 1(b) | 34,033,874 | |||||
| Payable for investment securities purchased | 5,234,588 | |||||
| Payable for shares of Beneficial Interest redeemed | 43,947 | |||||
| Accrued expenses | 50,245 | |||||
| 39,479,603 | ||||||
| Net Assets ($) | 168,830,596 | |||||
| Composition of Net Assets ($): | ||||||
| Paid-in capital | 171,029,793 | |||||
| Accumulated net realized gain (loss) on investments | (25,473,331) | |||||
| Accumulated net unrealized appreciation | ||||||
| (depreciation) on investments | 23,274,134 | |||||
| Net Assets ($) | 168,830,596 | |||||
| Net Asset Value Per Share | ||||||
| Class A | Class C | Class I | ||||
| Net Assets ($) | 186,012 | 13,212 | 168,631,372 | |||
| Shares Outstanding | 16,751 | 1,196 | 15,185,328 | |||
| Net Asset Value Per Share ($) | 11.10 | 11.05 | 11.10 | |||
See notes to financial statements.
| STATEMENT OF OPERATIONS |
| Ye a r E n d e d S e p t e m b e r 3 0 , 2 0 0 9 |
| Investment Income ($): | ||
| Income: | ||
| Cash dividends: | ||
| Unaffiliated issuers | 874,293 | |
| Affiliated issuers | 11,467 | |
| Income from securities lending—Note 1(b) | 99,702 | |
| Total Income | 985,462 | |
| Expenses: | ||
| Investment advisory fee—Note 3(a) | 642,089 | |
| Custodian fees—Note 3(d) | 75,301 | |
| Registration fees | 62,124 | |
| Prospectus and shareholders’ reports | 61,604 | |
| Professional fees | 60,189 | |
| Accounting and administration fees—Note 3(a) | 33,000 | |
| Shareholder servicing costs—Note 3(c,d) | 28,063 | |
| Trustees’ fees and expenses—Note 3(e) | 9,628 | |
| Loan commitment fees—Note 2 | 1,479 | |
| Distribution fees—Note 3(b) | 44 | |
| Miscellaneous | 22,227 | |
| Total Expenses | 995,748 | |
| Less—reduction in expenses | ||
| due to undertaking—Note 3(a) | (13) | |
| Less—reduction in fees due to | ||
| earnings credits—Note 1(b) | (569) | |
| Net Expenses | 995,166 | |
| Investment (Loss)—Net | (9,704) | |
| Realized and Unrealized Gain (Loss) on Investments—Note 4 ($): | ||
| Net realized gain (loss) on investments | (20,317,790) | |
| Net realized gain (loss) on financial futures | 336,533 | |
| Net Realized Gain (Loss) | (19,981,257) | |
| Net unrealized appreciation (depreciation) on investments | 27,751,645 | |
| Net Realized and Unrealized Gain (Loss) on Investments | 7,770,388 | |
| Net Increase in Net Assets Resulting from Operations | 7,760,684 |
| See notes to financial statements. |
The Fund 15
STATEMENT OF CHANGES IN NET ASSETS
| Year Ended September 30, | ||||
| 2009a | 2008 | |||
| Operations ($): | ||||
| Investment (loss)—net | (9,704) | (77,773) | ||
| Net realized gain (loss) on investments | (19,981,257) | (3,875,369) | ||
| Net unrealized appreciation | ||||
| (depreciation) on investments | 27,751,645 | (7,270,337) | ||
| Net Increase (Decrease) in Net Assets | ||||
| Resulting from Operations | 7,760,684 | (11,223,479) | ||
| Dividends to Shareholders from ($): | ||||
| Investment income—net | ||||
| Class I Shares | — | (17,315) | ||
| Net realized gain on investments: | ||||
| Class I Shares | — | (5,326,461) | ||
| Total Dividend | — | (5,343,776) | ||
| Beneficial Interest Transactions ($): | ||||
| Net proceeds from shares sold: | ||||
| Class A Shares | 157,650 | 94,722,212 | ||
| Class C Shares | 10,000 | — | ||
| Class I Shares | 97,319,239 | — | ||
| Dividends Reinvested: | ||||
| Class I Shares | — | 5,250,865 | ||
| Cost of shares redeemed: | ||||
| Class I Shares | (26,684,215) | (15,570,888) | ||
| Increase (Decrease) in Net Assets from | ||||
| Beneficial Interest Transactions | 70,802,674 | 84,402,189 | ||
| Total Increase (Decrease) in Net Assets | 78,563,358 | 67,834,934 | ||
| Net Assets ($): | ||||
| Beginning of Period | 90,267,238 | 22,432,304 | ||
| End of Period | 168,830,596 | 90,267,238 | ||
16
| Year Ended September 30, | ||||
| 2009a | 2008 | |||
| Capital Share Transactions: | ||||
| Class A | ||||
| Shares sold | 16,751 | — | ||
| Class C | ||||
| Shares sold | 1,196 | — | ||
| Class I | ||||
| Shares sold | 10,482,193 | 7,051,939 | ||
| Shares issued for dividends reinvested | — | 371,086 | ||
| Shares redeemed | (2,840,128) | (1,150,203) | ||
| Net Increase (Decrease) in Shares Outstanding | 7,642,065 | 6,272,822 | ||
| a | The fund changed to a multiple class fund on March 31, 2009.The existing shares were redesignated as Class I and | |
| the fund commenced offering Class A and Class C shares. | ||
| See notes to financial statements. | ||
The Fund 17
FINANCIAL HIGHLIGHTS
The following tables describe the performance for each share class for the fiscal periods indicated.All information (except portfolio turnover rate) reflects financial results for a single fund share.Total return shows how much your investment in the fund would have increased (or decreased) during each period, assuming you had reinvested all dividends and distributions.These figures have been derived from the fund’s financial statements.
| Year Ended September 30, 2009a | ||||
| Class A Shares | Class C Shares | |||
| Per Share Data ($): | ||||
| Net asset value, beginning of period | 8.36 | 8.36 | ||
| Investment Operations: | ||||
| Investment (loss)—netb | (.02) | (.06) | ||
| Net realized and unrealized | ||||
| gain (loss) on investments | 2.76 | 2.75 | ||
| Total from Investment Operations | 2.74 | 2.69 | ||
| Net asset value, end of period | 11.10 | 11.05 | ||
| Total Return (%)c,d | 32.78 | 32.18 | ||
| Ratios/Supplemental Data (%): | ||||
| Ratio of total expenses to average net assetse | 1.26 | 2.16 | ||
| Ratio of net expenses to average net assetse | 1.25 | 2.00 | ||
| Ratio of net investment (loss) | ||||
| to average net assetse | (.37) | (1.20) | ||
| Portfolio Turnover Ratef | 278.73 | 278.73 | ||
| Net Assets, end of period ($ x 1,000) | 186 | 13 | ||
| a | From March 31, 2009 (commencement of initial offering) to September 30, 2009. | |
| b | Based on average shares outstanding at each month end. | |
| c | Exclusive of sales charge. | |
| d | Not annualized. | |
| e | Annualized. | |
| f | Represents portfolio turnover for the fund for the year. | |
| See notes to financial statements. | ||
18
| Year Ended September 30, | ||||||||||
| Class I Shares | 2009a | 2008 | 2007 | 2006 | 2005 | |||||
| Per Share Data ($): | ||||||||||
| Net asset value, beginning of period | 11.97 | 17.66 | 14.92 | 13.84 | 11.26 | |||||
| Investment Operations: | ||||||||||
| Investment income (loss)—netb | (.00)c | (.02) | .01 | (.02) | (.04) | |||||
| Net realized and unrealized | ||||||||||
| gain (loss) on investments | (.87) | (1.93)d | 3.74d | 1.10 | 2.62 | |||||
| Total from Investment Operations | (.87) | (1.95) | 3.75 | 1.08 | 2.58 | |||||
| Distributions: | ||||||||||
| Dividends from investment income—net | — | (.01) | — | — | — | |||||
| Dividends from net realized gain on investments — | (3.73) | (1.01) | — | — | ||||||
| Total Distributions | — | (3.74) | (1.01) | — | — | |||||
| Net asset value, end of period | 11.10 | 11.97 | 17.66 | 14.92 | 13.84 | |||||
| Total Return (%) | (7.27) | (14.32) | 26.31 | 7.80e | 22.91 | |||||
| Ratios/Supplemental Data (%): | ||||||||||
| Ratio of total expenses | ||||||||||
| to average net assets | .93 | 1.11 | 1.23 | 1.29 | 1.38 | |||||
| Ratio of net expenses | ||||||||||
| to average net assets | .93f | 1.00 | 1.00 | 1.00 | 1.00 | |||||
| Ratio of net investment income | ||||||||||
| (loss) to average net assets | (.01) | (.15) | .07 | (.16) | (.32) | |||||
| Portfolio Turnover Rate | 278.73 | 201 | 180 | 161 | 167 | |||||
| Net Assets, end of period ($ x 1,000) | 168,631 | 90,267 | 22,432 | 20,389 | 19,709 | |||||
| a | The fund changed to a multiple class fund on March 31, 2009.The existing shares were redesignated as Class I shares. | |
| b | Based on average shares outstanding at each month end. | |
| c | Amount represents less than $.01 per share. | |
| d | Amounts include litigation proceeds received by the fund of $.01 for the year ended September 30, 2008 and $.19 | |
| for the year ended September 30, 2007. | ||
| e | For the year ended September 30, 2006, .03% of the fund’s return consisted of a payment by the advisor to | |
| compensate the fund for a trading error. Excluding this payment, total return was 7.77%. | ||
| f | Expense waivers and/or reimbursements amounted to less than .01%. | |
| See notes to financial statements. | ||
The Fund 19
NOTES TO FINANCIAL STATEMENTS
NOTE 1—Significant Accounting Policies:
Dreyfus/The Boston Company Small/Mid Cap Growth Fund (the “fund”) is a separate diversified series of Dreyfus Investment Funds (the “Trust”), which is registered under the Investment Company Act of 1940, as amended (the “Act”), as an open-end management investment company and operates as a series company currently offering twelve series, including the fund.The fund’s investment objective is to achieve long-term growth of capital. Prior to December 1, 2008,The Boston Company Asset Management, LLC (“TBCAM”), a wholly-owned subsidiary of The Bank of New York Mellon Corporation (“BNY Mellon”), served as the fund’s investment adviser. Effective December 1, 2008, The Dreyfus Corporation (the “Manager” or “Dreyfus”), a wholly-owned subsidiary of BNY Mellon, serves as the fund’s investment adviser.
At a meeting of the Board of Trustees held on August 27, 2008, the Board approved, effective December 1, 2008, a proposal to change the names of the Trust and the fund from “Mellon Institutional Funds Investment Trust” and “The Boston Company Small/Mid Cap Growth Fund” to “Dreyfus Investment Funds” and “Dreyfus/The Boston Company Small/Mid Cap Growth Fund,” respectively.
The Board of Trustees approved, effective March 31, 2009, the implementation of a multiple class structure for the fund. On March 31, 2009, existing shares were redesignated as Class I shares and the fund added Class A and Class C shares.
MBSC Securities Corporation (the “Distributor”), a wholly-owned subsidiary of the Manager, is the distributor of the fund’s shares. The fund is authorized to issue an unlimited number of $.001 par value shares of Beneficial Interest in each of the following classes of shares: Class A, Class C and Class I shares. Class A shares are subject to a sales charge imposed at the time of purchase. Class C shares are subject to a contingent deferred sales charge (“CDSC”) imposed on Class C shares
20
redeemed within one year of purchase and Class I shares are sold at net asset value per share only to institutional investors. Other differences between the classes include the services offered to and the expenses borne by each class, the allocation of certain transfer agency costs and certain voting rights. Income, expenses (other than expenses attributable to a specific class), and realized and unrealized gains or losses on investments are allocated to each class of shares based on its relative net assets.
As of September 30, 2009, MBC Investments Corp., an indirect subsidiary of BNY Mellon, held 1,196 Class A and Class C shares of the fund.
The Trust accounts separately for the assets, liabilities and operations of each series. Expenses directly attributable to each series are charged to that series’ operations; expenses which are applicable to all series are allocated among them on a pro rata basis.
The Financial Accounting Standards Board (“FASB”) Accounting Standards Codification (“ASC”) has become the exclusive reference of authoritative U.S. generally accepted accounting principles (“GAAP”) recognized by the FASB to be applied by nongovernmental entities. Rules and interpretive releases of the Securities and Exchange Commission (“SEC”) under authority of federal laws are also sources of authoritative GAAP for SEC registrants. The Codification has superseded all existing non-SEC accounting and reporting standards. The fund’s financial statements are prepared in accordance with GAAP, which may require the use of management estimates and assumptions. Actual results could differ from those estimates.
(a) Portfolio valuation: Investments in securities are valued at the last sales price on the securities exchange or national securities market on which such securities are primarily traded. Securities listed on the National Market System for which market quotations are available are valued at the official closing price or, if there is no official closing price
The Fund 21
NOTES TO FINANCIAL STATEMENTS (continued)
that day, at the last sales price. Securities not listed on an exchange or the national securities market, or securities for which there were no transactions, are valued at the average of the most recent bid and asked prices, except for open short positions, where the asked price is used for valuation purposes. Bid price is used when no asked price is available. Registered investment companies that are not traded on an exchange are valued at their net asset value. When market quotations or official closing prices are not readily available, or are determined not to reflect accurately fair value, such as when the value of a security has been significantly affected by events after the close of the exchange or market on which the security is principally traded (for example, a foreign exchange or market),but before the fund calculates its net asset value,the fund may value these investments at fair value as determined in accordance with the proce dures approved by the Board of Trustees. Fair valuing of securities may be determined with the assistance of a pricing service using calculations based on indices of domestic securities and other appropriate indicators, such as prices of relevant ADRs and futures contracts. For other securities that are fair valued by the Board of Trustees, certain factors may be considered such as: fundamental analytical data, the nature and duration of restrictions on disposition, an evaluation of the forces that influence the market in which the securities are purchased and sold and public trading in similar securities of the issuer or comparable issuers. Financial futures are valued at the last sales price.
The fair value of a financial instrument is the amount that would be received to sell an asset or paid to transfer a liability in an orderly transaction between market participants at the measurement date (i.e. the exit price). GAAP establishes a fair value hierarchy that prioritizes the inputs of valuation techniques used to measure fair value.This hierarchy gives the highest priority to unadjusted quoted prices in active markets for identical assets or liabilities (Level 1 measurements) and the lowest priority to unobservable inputs (Level 3 measurements).
Additionally, GAAP provides guidance on determining whether the volume and activity in a market has decreased significantly and whether such a decrease in activity results in transactions that are not orderly.
22
GAAP requires enhanced disclosures around valuation inputs and techniques used during annual and interim periods.
These inputs are summarized in the three broad levels listed below:
| Level 1—unadjusted quoted prices in active markets for |
| identical investments. |
| Level 2—other significant observable inputs (including quoted |
| prices for similar investments, interest rates, prepayment speeds, |
| credit risk, etc.). |
| Level 3—significant unobservable inputs (including the fund’s own |
| assumptions in determining the fair value of investments). |
The inputs or methodology used for valuing securities are not necessarily an indication of the risk associated with investing in those securities.
The following is a summary of the inputs used as of September 30, 2009 in valuing the fund’s investments:
| Level 2—Other | Level 3— | |||||||||
| Level 1— | Significant | Significant | ||||||||
| Unadjusted | Observable | Unobservable | ||||||||
| Quoted Prices | Inputs | Inputs | Total | |||||||
| Assets ($) | ||||||||||
| Investments in Securities: | ||||||||||
| Equity Securities— | ||||||||||
| Domestic† | 156,388,052 | — | — | 156,388,052 | ||||||
| Equity Securities— | ||||||||||
| Foreign† | 3,041,183 | — | — | 3,041,183 | ||||||
| Mutual Funds/ | ||||||||||
| Exchange | ||||||||||
| Traded Funds | 43,991,365 | — | — | 43,991,365 | ||||||
| Other Financial | ||||||||||
| Instruments†† | — | — | — | — | ||||||
| Liabilities ($) | ||||||||||
| Other Financial | ||||||||||
| Instruments†† | — | — | — | — | ||||||
| † | See Statement of Investments for industry classification. | |||||||||
| †† | Other financial instruments include derivative instruments, such as futures, forward foreign currency | |||||||||
| exchange contracts, swap contracts and options contracts. Amounts shown represent unrealized | ||||||||||
| appreciation (depreciation), or in the case of options, market value at period end. | ||||||||||
The Fund 23
NOTES TO FINANCIAL STATEMENTS (continued)
The following is a reconciliation of the change in value of Level 3 assets for which significant unobservable inputs were used to determine fair value:
| Investments in | ||
| Private Investment | ||
| Fund ($)††† | ||
| Balance as of 9/30/2008 | 243,478 | |
| Realized gain (loss) | — | |
| Change in unrealized appreciation (depreciation) | — | |
| Net purchases (sales) | (243,478) | |
| Transfers in and/or out of Level 3 | — | |
| Balance as of 9/30/2009 | — | |
| ††† Investment in BlackRock Cash Strategies Fund LLC. See Note 1(b). |
(b) Securities transactions and investment income: Securities transactions are recorded on a trade date basis. Realized gains and losses from securities transactions are recorded on the identified cost basis. Dividend income is recognized on the ex-dividend date and interest income, including, where applicable, accretion of discount and amortization of premium on investments, is recognized on the accrual basis.
The fund has arrangements with the custodian and cash management bank whereby the fund may receive earnings credits when positive cash balances are maintained, which are used to offset custody and cash management fees. For financial reporting purposes, the fund includes net earnings credits as an expense offset in the Statement of Operations.
Pursuant to a securities lending agreement with The Bank of New York Mellon, a subsidiary of BNY Mellon and an affiliate of Dreyfus, the fund may lend securities to qualified institutions. It is the fund’s policy that, at origination, all loans are secured by collateral of at least 102% of the value of U.S. securities loaned and 105% of the value of foreign securities loaned. Collateral equivalent to at least 100% of the market value of securities on loan is maintained at all times. Collateral is either in the form of cash, which can be invested in certain money market mutual funds managed by the Manager, U.S. Government and Agency securities or letters of credit.The fund is entitled to receive all income on securities loaned, in addition to income earned as a result
24
of the lending transaction. Although each security loaned is fully collateralized, the fund bears the risk of delay in recovery of, or loss of rights in, the securities loaned should a borrower fail to return the securities in a timely manner. During the period ended September 30, 2009, The Bank of New York Mellon earned $33,234 from lending fund portfolio securities, pursuant to the securities lending agreement.
Until December 10, 2007, all cash collateral received by the fund and other series of the Trust in connection with the securities lending program was invested in the BlackRock Cash Strategies Fund LLC (the “BlackRock Fund”), a private investment fund not affiliated with the Trust or its investment adviser. On December 10, 2007, the BlackRock Fund announced that it was suspending investor withdrawal privileges due to conditions related to the credit markets and the adverse affect of such conditions on the liquidity of the BlackRock Fund’s portfolio holdings. Commencing on December 11, 2007, all new cash collateral received in connection with the securities lending activity of the fund and other series of the Trust was invested by the securities lending agent in the Dreyfus Institutional Cash Advantage Fund (the “Dreyfus Fund”), an affiliated money market fund registered as an investment company under the Act. To th e extent that the BlackRock Fund agreed to permit withdrawals during the period December 11, 2007 through January 22, 2009, the securities lending agent effected such withdrawals and the cash proceeds from such withdrawals by the fund were reinvested in the shares of the Dreyfus Fund. As of January 22, 2009, the final withdrawal was reinvested in the Dreyfus Fund. Repayments of cash collateral during the period were made from the proceeds of redemptions of shares of the Dreyfus Fund.
(c) Affiliated issuers: Investments in other investment companies advised by the Manager are defined as “affiliated” in the Act.
(d) Dividends to shareholders: Dividends are recorded on the ex-dividend date. Dividends from investment income-net and dividends from net realized capital gains, if any, are normally declared and paid semian-nually and annually, respectively, but the fund may make distributions on a more frequent basis to comply with the distribution requirements
The Fund 25
NOTES TO FINANCIAL STATEMENTS (continued)
of the Internal Revenue Code of 1986, as amended (the “Code”).The Board of Trustees approved, effective on or about January 1, 2010, the fund to pay dividends from investment income-net annually. To the extent that net realized capital gains can be offset by capital loss carryovers, it is the policy of the fund not to distribute such gains. Income and capital gain distributions are determined in accordance with income tax regulations, which may differ from GAAP.
(e) Federal income taxes: It is the policy of the fund to continue to qualify as a regulated investment company, if such qualification is in the best interests of its shareholders, by complying with the applicable provisions of the Code, and to make distributions of taxable income sufficient to relieve it from substantially all federal income and excise taxes.
As of and during the period ended September 30, 2009, the fund did not have any liabilities for any uncertain tax positions.The fund recognizes interest and penalties, if any, related to uncertain tax positions as income tax expense in the Statement of Operations. During the period, the fund did not incur any interest or penalties.
Each of the tax years in the four-year period ended September 30, 2009 remains subject to examination by the Internal Revenue Service and state taxing authorities.
At September 30, 2009, the components of accumulated earnings on a tax basis were as follows: accumulated capital losses $9,601,514 and unrealized appreciation $19,865,524. In addition, the fund had $12,463,207 of capital losses realized after October 31, 2008, which were deferred for tax purposes to the first day of the following fiscal year.
The accumulated capital loss carryover is available for federal income tax purposes to be applied against future net securities profits, if any, realized subsequent to September 30, 2009. If not applied the carryover expires in fiscal 2017.
The tax character of distributions paid to shareholders during the fiscal periods ended September 30, 2009 and September 30, 2008 were as follows: ordinary income $0 and $3,337,115 and long-term capital gains $0 and $2,006,661, respectively.
26
During the period ended September 30, 2009, as a result of permanent book to tax differences, primarily due to the tax treatment for real estate investment trusts and net operating losses, the fund increased accumulated undistributed investment income-net by $9,704, increased accumulated net realized gain (loss) on investments by $42,685 and decreased paid-in capital by $52,389. Net assets and net asset value per share were not affected by this reclassification.
NOTE 2—Bank Lines of Credit:
Prior to September 24, 2009, the Trust had entered into two separate agreements withThe Bank of NewYork Mellon, that enabled the fund, and other funds in the Trust, to borrow, in the aggregate, (i) up to $35 million under a committed line of credit and (ii) up to $15 million under an uncommitted line of credit (collectively, the “Prior Facilities”). Effective September 24, 2009, the fund began participating, with other Dreyfus-managed funds, in a $145 million unsecured credit facility led by Citibank, N.A. and a $300 million unsecured credit facility provided by The Bank of NewYork Mellon (each, a “Facility” and, collectively, the “Current Facilities”), each to be utilized primarily for temporary or emergency purposes, including the financing of redemptions. Effective October 14, 2009, the amount of the Citibank, N.A. Facility changed from $145 million to $215 million. The fund has agr eed to pay its pro rata portion of facility fees for each Facility. Interest is charged to the fund based on rates determined pursuant to the terms of the respective Facility at the time of borrowing. During the period ended September 30, 2009, the fund did not borrow under the Prior Facilities or the Current Facilities.
NOTE 3—Investment Advisory Fee and Other Transactions With Affiliates:
(a) Pursuant to an investment advisory agreement (“Agreement”) with the Manager, the investment advisory fee is computed at the annual rate of .60% of the value of the fund’s average daily net assets and is payable monthly.
The Fund 27
NOTES TO FINANCIAL STATEMENTS (continued)
The Manager currently is limiting the fund’s operating expenses or assuming all or part of the expenses of the fund so that such expenses (excluding Rule 12b-1 fees, shareholder services fees, taxes, interest, brokerage commissions, commitment fees, acquired fund fees and extraordinary expenses) do not exceed 1.00% of the value of the fund’s average daily net assets.The expense limitation and waiver are volun tary, not contractual, and may be terminated at any time.The reduc tion in expenses, pursuant to the undertaking, amounted to $13 during the period ended September 30, 2009.
The Trust entered into an agreement with The Bank of New York Mellon, pursuant to which The Bank of New York Mellon provides administration and fund accounting services for the fund. For these services, the fund pays The Bank of NewYork Mellon a fixed fee plus asset and transaction based fees, as well as out-of-pocket expenses Pursuant to this agreement, the fund was charged $33,000 for the period ended September 30, 2009 for administration and fund accounting services.
(b) Under the Distribution Plan (the “Plan”) adopted pursuant to Rule 12b-1 under the Act, Class C shares pay the Distributor for distribut ing their shares at an annual rate of .75% of the value of the average daily net assets of Class C shares. During the period ended September 30, 2009, Class C shares were charged $44 pursuant to the Plan.
(c) Under the Shareholder Services Plan, Class A and Class C shares pay the Distributor at an annual rate of .25% of their average daily net assets for the provision of certain services.The services provided may include personal services relating to shareholder accounts, such as answering shareholder inquiries regarding the fund and providing reports and other information, and services related to the maintenance of share holder accounts.The Distributor may make payments to Service Agents (a securities dealer, financial institution or other industry professional) in respect of these services.The Distributor determines the amounts to be paid to Service Agents. During the period ended September 30, 2009, Class A and Class C shares were charged $140 and $14, respec tively, pursuant to the Shareholder Services Plan.
28
(d) The fund compensates Dreyfus Transfer, Inc., a wholly-owned subsidiary of the Manager, under a transfer agency agreement for providing personnel and facilities to perform transfer agency services for the fund. During the period ended September 30, 2009 the fund was charged $7,408 pursuant to the transfer agency agreement.
The fund compensates The Bank of New York Mellon under cash management agreements for performing cash management services related to fund subscriptions and redemptions. During the period ended September 30, 2009, the fund was charged $569 pursuant to the cash management agreements.These fees were offset by earnings credits pursuant to the cash management agreements.
The fund also compensates The Bank of New York Mellon under a custody agreement for providing custodial services for the fund. During the period ended September 30, 2009, the fund was charged $75,301 pursuant to the custody agreement.
During the period ended September 30, 2009, the fund was charged $6,254 for services performed by the Chief Compliance Officer.
The components of “Due to The Dreyfus Corporation and affiliates” in the Statement of Assets and Liabilities consist of: investment advisory fees $81,911, Rule 12b-1 distribution plan fees $8, shareholders service fees $40, custodian fees $30,872, chief compliance officer fees $3,341 and transfer agency per account fees $777.
(e) Effective December 1, 2008, each Trustee receives $45,000 per year, plus $6,000 for each joint Board meeting ofThe Dreyfus/Laurel Funds, Inc.,The Dreyfus/Laurel Funds Trust and The Dreyfus/Laurel Tax-Free Municipal Funds, (collectively, the “Dreyfus/Laurel Funds”), Dreyfus Funds, Inc. and the Trust attended, $2,000 for separate in-person committee meetings attended which are not held in conjunction with a regularly scheduled Board meeting and $1,500 for Board meetings and separate committee meetings attended that are conducted by telephone and is reimbursed for travel and out-of-pocket expenses.With respect to Board meetings, the Chairman of the Board receives an additional
The Fund 29
NOTES TO FINANCIAL STATEMENTS (continued)
25% of such compensation (with the exception of reimbursable amounts).With respect to compensation committee meetings, the Chair of the compensation committee receives $900 per meeting. In the event that there is an in-person joint committee meeting of the Dreyfus/Laurel Funds, Dreyfus Funds, Inc., the Trust and Dreyfus High Yield Strategies Fund, the $2,000 or $1,500 fee, as applicable, will be allocated between the Dreyfus/Laurel Funds,The Dreyfus Funds, Inc., the Trust and Dreyfus High Yield Strategies Fund. These fees and expenses are charged and allocated to each series based on net assets.
(g) Prior to December 1, 2008, at which time the fee was eliminated, a 2% redemption fee was charged and retained by the fund on certain shares redeemed within thirty days following the date of issuance, subject to exceptions, including redemptions made through the use of the fund’s exchange privilege. From October 1, 2008 to November 30, 2008, there were no redemption fees charged and retained by the fund. The fund reserves the right to reimpose a redemption fee in the future.
NOTE 4—Securities Transactions:
The aggregate amount of purchases and sales of investment securities, excluding short-term securities and financial futures, during the period ended September 30, 2009, amounted to $363,276,378 and $293,668,339, respectively.
The fund adopted the provisions of ASC 815 Derivatives and Hedging which requires qualitative disclosures about objectives and strategies for using derivatives, quantitative disclosures about fair value amounts of gains and losses on derivative instruments and disclosures about credit-risk-related contingent features in derivative agreements. The disclosure requirements distinguish between derivatives, which are accounted for as “hedges” and those that do not qualify for hedge accounting. Because investment companies value their derivatives at fair value and recognize changes in fair value through the Statement of Operations, they do not qualify for such accounting. Accordingly, even though a fund’s investments in derivatives may represent economic hedges, they are considered to be non-hedge transactions for purposes of this disclosure.
30
Futures Contracts: In the normal course of pursuing its investment objectives, the fund is exposed to market risk, including equity price risk, as a result of changes in value of underlying financial instruments. The fund may invest in financial futures contracts in order to manage its exposure to or protect against changes in the market.A futures contract represents a commitment for the future purchase or a sale of an asset at a specified date. Upon entering into such contracts, these investments require initial margin deposits with a broker, which consist of cash or cash equivalents.The amount of these deposits is determined by the exchange or Board of Trade on which the contract is traded and is subject to change.Accordingly, variation margin payments are received or made to reflect daily unrealized gains or losses which are recorded in the Statement of Operat ions. Futures contracts are valued daily at the last sales price established by the Board of Trade or exchange upon which they are traded.When the contracts are closed, the fund recognizes a realized gain or loss.There is minimal counterparty credit risk to the fund with futures, since futures are exchange traded and the exchange’s clearinghouse, as counterparty to all exchange traded futures, guarantees the futures against default. At September 30, 2009, there were no open financial futures contracts outstanding.
At September 30, 2009, the cost of investments for federal income tax purposes was $183,555,076; accordingly, accumulated net unrealized appreciation on investments was $19,865,524, consisting of $24,459,388 gross unrealized appreciation and $4,593,864, gross unrealized depreciation.
NOTE 5—Change in Independent Registered Public Accounting Firm:
PricewaterhouseCoopers LLP (“PWC”), 300 Madison Avenue, New York, New York 10017, an independent registered public accounting firm, was the independent registered public accounting firm for the fund for the fiscal year ended September 30, 2008. At the meetings held on February 9-10, 2009, the Audit Committee and the Board of Trustees of the Trust engaged KPMG LLP to replace PWC as the independent registered public accounting firm for the Trust, effective
The Fund 31
NOTES TO FINANCIAL STATEMENTS (continued)
upon the conclusion of the audit of the December 31, 2008 financial statements of other series of the Trust.
During the fund’s past two fiscal years and any subsequent interim period: (i) no report on the fund’s financial statements contained an adverse opinion or a disclaimer of opinion, or was qualified or modified as to uncertainty, audit scope, or accounting principles; and (ii) there were no “disagreements” (as such term is used in Item 304 of Regulation S-K) with PWC on any matter of accounting principles or practices, financial statement disclosure, or auditing scope or procedure, which disagreement(s), if not resolved to the satisfaction of PWC, would have caused it to make reference to the subject matter of the disagreement(s) in connection with its report.
NOTE 6—Subsequent Events Evaluation:
Dreyfus has evaluated the need for disclosures and/or adjustments resulting from subsequent events through November 24, 2009, the date the financial statements were issued. This evaluation did not result in any subsequent events that necessitated disclosures and/or adjustments other than the following.
At a meeting held on October 28-29, 2009, the Board of Trustees of Dreyfus Investment Funds, on behalf of Dreyfus/The Boston Company Small/Mid Cap Growth Fund (the “Acquiring Fund”), and the Board of Directors of Dreyfus Funds, Inc., on behalf of Dreyfus Discovery Fund (the “Fund”), each approved an Agreement and Plan of Reorganization pursuant to which, subject to approval by Fund shareholders, the Fund will transfer all of its assets, subject to its liabilities, to the Acquiring Fund, in exchange for a number of shares of the Acquiring Fund equal in value to the assets less liabilities of the Fund (the “Exchange”).The Acquiring Fund shares will then be distributed to the Fund’s shareholders on a pro rata basis in liquidation of the Fund. Fund shareholders will receive shares of the corresponding class of the Acquiring Fund in the Exchange, with holders of Class B and F shares of the Fund receiving Clas s A shares of the Acquiring Fund.
32
| REPORT OF INDEPENDENT REGISTERED |
| PUBLIC ACCOUNTING FIRM |
| To the Board of Trustees and Shareholders of |
| Dreyfus/The Boston Company Small/Mid Cap Growth Fund |
We have audited the accompanying statement of assets and liabilities of Dreyfus/The Boston Company Small/Mid Cap Growth Fund (the “Fund”) (formerly The Boston Company Small/Mid Cap Growth Fund), a series of Dreyfus Investment Funds (formerly Mellon Institutional Funds), including the statement of investments as of September 30, 2009, and the related statement of operations, the statement of changes in net assets and financial highlights for the year then ended.These financial statements and financial highlights are the responsibility of the Fund’s management. Our responsibility is to express an opinion on these financial statements and financial highlights based on our audit. The statement of changes in net assets for the year ended September 30, 2008 and the financial highlights for each of the years in the four-year period ended September 30, 2008 were audited by other independent registered public accountants whose report t hereon, dated November 28, 2008, expressed an unqualified opinion on that statement of changes in net assets and those financial highlights.
We conducted our audit in accordance with the standards of the Public Company Accounting Oversight Board (United States).Those standards require that we plan and perform the audit to obtain reasonable assurance about whether the financial statements and financial highlights are free of material misstatement. An audit also includes examining, on a test basis, evidence supporting the amounts and disclosures in the financial statements. Our procedures included confirmation of securities owned as of September 30, 2009 by correspondence with the custodian and brokers or by other appropriate auditing procedures where replies from brokers were not received. An audit also includes assessing the accounting principles used and significant estimates made by management,as well as evaluating the overall financial statement presentation. We believe that our audit provides a reasonable basis for our opinion.
In our opinion, the financial statements and financial highlights referred to above present fairly, in all material respects, the financial position of Dreyfus/The Boston Company Small/Mid Cap Growth Fund as of September 30, 2009, and the results of its operations, the changes in its net assets, and the financial highlights for the year then ended, in conformity with U.S. generally accepted accounting principles.

| New York, New York |
| November 24, 2009 |
The Fund 33
OFFICERS OF THE FUND (Unaudited)
J. DAVID OFFICER, President since October 2007.
Chairman, President and Chief Executive Officer of Founders Asset Management LLC, an affiliate of the Manager, and an officer of 76 investment companies (comprised of 173 portfolios) managed by the Manager. Prior to June 2009, Mr. Officer was Chief Operating Officer,Vice Chairman and a director of the Manager, where he had been employed since April 1998. He is 61 years old.
PHILLIP N. MAISANO, Executive Vice President since December 2008.
Chief Investment Officer,Vice Chair and a director of the Manager, and an officer of 76 investment companies (comprised of 173 portfolios) managed by the Manager. Mr. Maisano also is an officer and/or Board member of certain other investment management subsidiaries of The Bank of New York Mellon Corporation, each of which is an affiliate of the Manager. He is 62 years old and has been an employee of the Manager since November 2006. Prior to joining the Manager, Mr. Maisano served as Chairman and Chief Executive Officer of EACM Advisors, an affiliate of the Manager, since August 2004, and served as Chief Executive Officer of Evaluation Associates, a leading institutional investment consulting firm, from 1988 until 2004.
MICHAEL A. ROSENBERG, Vice President and Secretary since December 2008.
Assistant General Counsel of BNY Mellon, and an officer of 77 investment companies (comprised of 196 portfolios) managed by the Manager. He is 49 years old and has been an employee of the Manager since October 1991.
JAMES BITETTO, Vice President and Assistant Secretary since December 2008.
Senior Counsel of BNY Mellon and Secretary of the Manager, and an officer of 77 investment companies (comprised of 196 portfolios) managed by the Manager. He is 43 years old and has been an employee of the Manager since December 1996.
JONI LACKS CHARATAN, Vice President and Assistant Secretary since December 2008.
Senior Counsel of BNY Mellon, and an officer of 77 investment companies (comprised of 196 portfolios) managed by the Manager. She is 53 years old and has been an employee of the Manager since October 1988.
JOSEPH M. CHIOFFI, Vice President and Assistant Secretary since December 2008.
Senior Counsel of BNY Mellon, and an officer of 77 investment companies (comprised of 196 portfolios) managed by the Manager. He is 47 years old and has been an employee of the Manager since June 2000.
JANETTE E. FARRAGHER, Vice President and Assistant Secretary since December 2008.
Assistant General Counsel of BNY Mellon, and an officer of 77 investment companies (comprised of 196 portfolios) managed by the Manager. She is 46 years old and has been an employee of the Manager since February 1984.
JOHN B. HAMMALIAN, Vice President and Assistant Secretary since December 2008.
Managing Counsel of BNY Mellon, and an officer of 77 investment companies (comprised of 196 portfolios) managed by the Manager. He is 46 years old and has been an employee of the Manager since February 1991.
ROBERT R. MULLERY, Vice President and Assistant Secretary since December 2008.
Managing Counsel of BNY Mellon, and an officer of 77 investment companies (comprised of 196 portfolios) managed by the Manager. He is 57 years old and has been an employee of the Manager since May 1986.
JEFF PRUSNOFSKY, Vice President and Assistant Secretary since December 2008.
Managing Counsel of BNY Mellon, and an officer of 77 investment companies (comprised of 196 portfolios) managed by the Manager. He is 44 years old and has been an employee of the Manager since October 1990.
36
JAMES WINDELS, Treasurer since December 2008.
Director – Mutual Fund Accounting of the Manager, and an officer of 77 investment companies (comprised of 196 portfolios) managed by the Manager. He is 51 years old and has been an employee of the Manager since April 1985.
RICHARD CASSARO, Assistant Treasurer since December 2008.
Senior Accounting Manager – Money Market and Municipal Bond Funds of the Manager, and an officer of 77 investment companies (comprised of 196 portfolios) managed by the Manager. He is 50 years old and has been an employee of the Manager since September 1982.
GAVIN C. REILLY, Assistant Treasurer since December 2008.
Tax Manager of the Investment Accounting and Support Department of the Manager, and an officer of 77 investment companies (comprised of 196 portfolios) managed by the Manager. He is 41 years old and has been an employee of the Manager since April 1991.
ROBERT ROBOL, Assistant Treasurer since December 2008.
Senior Accounting Manager – Fixed Income Funds of the Manager, and an officer of 77 investment companies (comprised of 196 portfolios) managed by the Manager. He is 45 years old and has been an employee of the Manager since October 1988.
ROBERT SALVIOLO, Assistant Treasurer since December 2008.
Senior Accounting Manager – Equity Funds of the Manager, and an officer of 77 investment companies (comprised of 196 portfolios) managed by the Manager. He is 42 years old and has been an employee of the Manager since June 1989.
ROBERT SVAGNA, Assistant Treasurer since December 2008.
Senior Accounting Manager – Equity Funds of the Manager, and an officer of 77 investment companies (comprised of 196 portfolios) managed by the Manager. He is 42 years old and has been an employee of the Manager since November 1990.
JOSEPH W. CONNOLLY, Chief Compliance Officer since December 2008.
Chief Compliance Officer of the Manager and The Dreyfus Family of Funds (77 investment companies, comprised of 196 portfolios). From November 2001 through March 2004, Mr. Connolly was first Vice-President, Mutual Fund Servicing for Mellon Global Securities Services. In that capacity, Mr. Connolly was responsible for managing Mellon’s Custody, Fund Accounting and Fund Administration services to third-party mutual fund clients. He is 52 years old and has served in various capacities with the Manager since 1980, including manager of the firm’s Fund Accounting Department from 1997 through October 2001.
WILLIAM GERMENIS, Anti-Money Laundering Compliance Officer since December 2008.
Vice President and Anti-Money Laundering Compliance Officer of the Distributor, and the Anti-Money Laundering Compliance Officer of 73 investment companies (comprised of 192 portfolios) managed by the Manager. He is 39 years old and has been an employee of the Distributor since October 1998.
The Fund 37
Item 2. Code of Ethics.
The Registrant has adopted a code of ethics that applies to the Registrant's principal executive officer, principal financial officer, principal accounting officer or controller, or persons performing similar functions. There have been no amendments to, or waivers in connection with, the Code of Ethics during the period covered by this Report.
Item 3. Audit Committee Financial Expert.
The Registrant's Board has determined that Joseph S. DiMartino, a member of the Audit Committee of the Board, is an audit committee financial expert as defined by the Securities and Exchange Commission (the "SEC"). Joseph S. DiMartino is "independent" as defined by the SEC for purposes of audit committee financial expert determinations.
Item 4. Principal Accountant Fees and Services.
(a) Audit Fees. The aggregate fees billed for each of the last two fiscal years (the "Reporting Periods") for professional services rendered by the Registrant's principal accountant (the "Auditor") for the audit of the Registrant's annual financial statements, or services that are normally provided by the Auditor in connection with the statutory and regulatory filings or engagements for the Reporting Periods, were $337,011 in 2008 and $226,300 in 2009.
(b) Audit-Related Fees. The aggregate fees billed in the Reporting Periods for assurance and related services by the Auditor that are reasonably related to the performance of the audit of the Registrant's financial statements and are not reported under paragraph (a) of this Item 4 were $51,500 in 2008 and $47,300 in 2009. These services consisted of security counts required by Rule 17f-2 under the Investment Company Act of 1940, as amended.
The aggregate fees billed in the Reporting Periods for non-audit assurance and related services by the Auditor to the Registrant's investment adviser (not including any sub-investment adviser whose role is primarily portfolio management and is subcontracted with or overseen by another investment adviser), and any entity controlling, controlled by or under common control with the investment adviser that provides ongoing services to the Registrant ("Service Affiliates"), that were reasonably related to the performance of the annual audit of the Service Affiliate, which required pre-approval by the Audit Committee were $0 in 2008 and $0 in 2009.
(c) Tax Fees. The aggregate fees billed in the Reporting Periods for professional services rendered by the Auditor for tax compliance, tax advice and tax planning ("Tax Services") were $97,829 in 2008 and $22,500 in 2008. These services consisted of (i) review or preparation of U.S. federal, state, local and excise tax returns; (ii) U.S. federal, state and local tax planning, advice and assistance regarding statutory, regulatory or administrative developments, (iii) tax advice regarding tax qualification matters and/or treatment of various financial instruments held or proposed to be acquired or held, and (iv) determination of Passive Foreign Investment Companies.
The aggregate fees billed in the Reporting Periods for Tax Services by the Auditor to Service Affiliates which required pre-approval by the Audit Committee were $0 in 2008 and $0 in 2009.
(d) All Other Fees. The aggregate fees billed in the Reporting Periods for products and services provided by the Auditor, other than the services reported in paragraphs (a) through (c) of this Item, were $0 in 2008 and $0 in 2009.
The aggregate fees billed in the Reporting Periods for Non-Audit Services by the Auditor to Service Affiliates, other than the services reported in paragraphs (b) through (c) of this Item, which required pre-approval by the Audit Committee were $0 in 2008 and $0 in 2009.
Audit Committee Pre-Approval Policies and Procedures. The Registrant's Audit Committee has established policies and procedures (the "Policy") for pre-approval (within specified fee limits) of the Auditor's engagements for non-audit services to the Registrant and Service Affiliates without specific case-by-case consideration. Pre-approval considerations include whether the proposed services are compatible with maintaining the Auditor's independence. Pre-approvals pursuant to the Policy are considered annually.
Non-Audit Fees. The aggregate non-audit fees billed by the Auditor for services rendered to the Registrant, and rendered to Service Affiliates, for the Reporting Periods were $95,500 in 2008 and $5,463,990 in 2009.
Auditor Independence. The Registrant's Audit Committee has considered whether the provision of non-audit services that were rendered to Service Affiliates which were not pre-approved (not requiring pre-approval) is compatible with maintaining the Auditor's independence.
Item 5. Audit Committee of Listed Registrants.
Not applicable.
Item 6. Schedule of Investments.
(a) Not applicable.
Item 7. Disclosure of Proxy Voting Policies and Procedures for Closed-End Management Investment Companies.
Not applicable.
Item 8. Portfolio Managers of Closed-End Management Investment Companies.
Not applicable
Item 9. Purchases of Equity Securities by Closed-End Management Investment Companies and Affiliated Purchasers.
Not applicable.
Item 10. Submission of Matters to a Vote of Security Holders.
There have been no material changes to the procedures applicable to Item 10.
Item 11. Controls and Procedures.
(a) The Registrant's principal executive and principal financial officers have concluded, based on their evaluation of the Registrant's disclosure controls and procedures as of a date within 90 days of the filing date of this report, that the Registrant's disclosure controls and procedures are reasonably designed to ensure that information required to be disclosed by the Registrant on Form N-CSR is recorded, processed, summarized and reported within the required time periods and that information required to be disclosed by the Registrant in the reports that it files or submits on Form N-CSR is accumulated and communicated to the Registrant's management, including its principal executive and principal financial officers, as appropriate to allow timely decisions regarding required disclosure.
(b) There were no changes to the Registrant's internal control over financial reporting that occurred during the second fiscal quarter of the period covered by this report that have materially affected, or are reasonably likely to materially affect, the Registrant's internal control over financial reporting.
Item 12. Exhibits.
(a)(1) Code of ethics referred to in Item 2.
(a)(2) Certifications of principal executive and principal financial officers as required by Rule 30a-2(a) under the Investment Company Act of 1940.
(a)(3) Not applicable.
(b) Certification of principal executive and principal financial officers as required by Rule 30a-2(b) under the Investment Company Act of 1940.
| SIGNATURES |
Pursuant to the requirements of the Securities Exchange Act of 1934 and the Investment Company Act of 1940, the Registrant has duly caused this Report to be signed on its behalf by the undersigned, thereunto duly authorized.
Dreyfus Investment Funds
| By: | /s/ J. David Officer | |
| J. David Officer | ||
| President | ||
| Date: | December 3, 2009 | |
Pursuant to the requirements of the Securities Exchange Act of 1934 and the Investment Company Act of 1940, this Report has been signed below by the following persons on behalf of the Registrant and in the capacities and on the dates indicated.
| By: | /s/ J. David Officer | |
| J. David Officer | ||
| President | ||
| Date: | December 3, 2009 | |
| By: | /s/ James Windels | |
| James Windels | ||
| Treasurer | ||
| Date: | December 3, 2009 | |
EXHIBIT INDEX
(a)(1) Code of ethics referred to in Item 2.
(a)(2) Certifications of principal executive and principal financial officers as required by Rule 30a-2(a) under the Investment Company Act of 1940. (EX-99.CERT)
(b) Certification of principal executive and principal financial officers as required by Rule 30a-2(b) under the Investment Company Act of 1940. (EX-99.906CERT)