UNITED STATES
SECURITIES AND EXCHANGE COMMISSION
Washington, D.C. 20549
FORM N-CSR
CERTIFIED SHAREHOLDER REPORT OF REGISTERED MANAGEMENT
INVESTMENT COMPANIES
Investment Company Act file number | 811-04813 |
| |
| Dreyfus Investment Funds | |
| (Exact name of Registrant as specified in charter) | |
| | |
| c/o The Dreyfus Corporation 200 Park Avenue New York, New York 10166 | |
| (Address of principal executive offices) (Zip code) | |
| | |
| Bennett A. MacDougall, Esq. 200 Park Avenue New York, New York 10166 | |
| (Name and address of agent for service) | |
|
Registrant's telephone number, including area code: | (212) 922-6400 |
| |
Date of fiscal year end: | 09/30 | |
Date of reporting period: | 09/30/2017 | |
| | | | | | | |
The following N-CSR relates only to the Registrant's series listed below and does not relate to any series of the Registrant with a different fiscal year end and, therefore, different N-CSR reporting requirements. A separate N-CSR will be filed for any series with a different fiscal year end, as appropriate.
Dreyfus Diversified Emerging Markets Fund
Dreyfus/Newton International Equity Fund
Dreyfus Tax Sensitive Total Return Bond Fund
Dreyfus/The Boston Company Small/Mid Cap Growth Fund
Dreyfus/The Boston Company Small Cap Growth Fund
Dreyfus/The Boston Company Small Cap Value Fund
FORM N-CSR
Item 1. Reports to Stockholders.
Dreyfus Diversified Emerging Markets Fund
| | | |

| | ANNUAL REPORT September 30, 2017 |
| |
Save time. Save paper. View your next shareholder report online as soon as it’s available. Log into www.dreyfus.com and sign up for Dreyfus eCommunications. It’s simple and only takes a few minutes. |
| |
The views expressed in this report reflect those of the portfolio manager(s) only through the end of the period covered and do not necessarily represent the views of Dreyfus or any other person in the Dreyfus organization. Any such views are subject to change at any time based upon market or other conditions and Dreyfus disclaims any responsibility to update such views. These views may not be relied on as investment advice and, because investment decisions for a Dreyfus fund are based on numerous factors, may not be relied on as an indication of trading intent on behalf of any Dreyfus fund. |
| |
Not FDIC-Insured • Not Bank-Guaranteed • May Lose Value |
Contents
T H E F U N D
F O R M O R E I N F O R M AT I O N
Back Cover
| | | | |
| |
Dreyfus Diversified Emerging Markets Fund
| | The Fund |
A LETTER FROM THE CEO OF DREYFUS
Dear Shareholder:
We are pleased to present this annual report for Dreyfus Diversified Emerging Markets Fund, covering the 12-month period from October 1, 2016 through September 30, 2017. For information about how the fund performed during the reporting period, as well as general market perspectives, we provide a Discussion of Fund Performance on the pages that follow.
Stocks set a series of new record highs and bonds produced mixed results over the past year in response to changing economic and political conditions. Financial markets during the final months of 2016 were dominated by the election of a new U.S. presidential administration. Equities and corporate-backed bonds surged higher in anticipation of more business-friendly regulatory, tax, and fiscal policies, but high-quality bonds generally lost value due to expectations of rising interest rates and accelerating inflation in a stronger economy. Despite a series of short-term interest rate hikes, bonds recovered most or all of their previous losses over the first nine months of 2017 when it became clearer that pro-growth legislation would take time and political capital to enact. U.S. and international stocks continued to rally as corporate earnings grew and global economic conditions improved.
The markets’ recent strong performance has been supported by solid underlying fundamentals. While we currently expect these favorable conditions to persist, we remain watchful for economic and political developments that could derail the rallies. As always, we encourage you to discuss the risks and opportunities of today’s investment environment with your financial advisor.
Thank you for your continued confidence and support.
Sincerely,

Mark D. Santero
Chief Executive Officer
The Dreyfus Corporation
October 16, 2017
2
DISCUSSION OF FUND PERFORMANCE
For the period from October 1, 2016 through September 30, 2017, as provided by portfolio managers Elizabeth Slover, Michelle Y. Chan, CFA, and Julianne McHugh of The Boston Company, Sub-Investment Adviser; C. Wesley Boggs, William S. Cazalet, CAIA, Ronald P. Gala, CFA, Peter D. Goslin, CFA, and Syed A. Zamil, CFA, of Mellon Capital Management Corporation, Sub-Investment Adviser
Market and Fund Performance Overview
For the 12-month period ended September 30, 2017, Dreyfus Diversified Emerging Markets Fund’s Class A shares produced a total return of 21.48%, Class C shares returned 20.39%, Class I shares returned 22.05%, and Class Y shares returned 22.06%.1 In comparison, the fund’s benchmark, the MSCI Emerging Markets Index (the “Index”), produced a total return of 22.46% for the same period.2
Emerging market equities rose sharply during the reporting period, largely in response to improving commodity prices, favorable currency movements, and accelerating corporate earnings growth. The fund mildly lagged the Index, mainly due to sector allocation shortfalls in one of its underlying funds, Dreyfus Global Emerging Markets Fund.
The Fund’s Investment Approach
The fund seeks long-term capital growth. To pursue its goal, the fund invests at least 80% of its assets in equity securities (or other instruments with similar economic characteristics) of companies located, organized, or with a majority of assets or business in countries considered to be emerging markets, including other investment companies that invest in such securities.
The fund uses a “manager-of-managers” approach by selecting one or more experienced investment managers to serve as subadvisers to the fund. The fund also uses a “fund-of-funds” approach by investing in one or more underlying funds. The fund currently allocates its assets among emerging market equity strategies of The Boston Company Asset Management, LLC (the TBCAM Strategy) and Mellon Capital Management Corporation (the Mellon Capital Strategy), each an affiliate of Dreyfus, and two affiliated underlying funds, Dreyfus Global Emerging Markets Fund, which is sub-advised by Newton Investment Management (North America) Limited (the Newton Fund) and Dreyfus Strategic Beta Emerging Markets Equity Fund, which is sub-advised by Mellon Capital Management Corporation (the Mellon Capital Fund). Dreyfus determines the investment strategies and sets the target allocations.
Emerging Markets Rebounded in 2017
The reporting period began with lackluster market performance due to uncertainties regarding the impact of the upcoming U.S. presidential election on global trade and currency exchange rates. However, after the U.S. presidential election in November, many emerging markets responded positively to rebounding energy and commodity prices. While stocks in Mexico and China initially lagged market averages amid concerns regarding possible detrimental U.S. trade policy shifts, they recovered when those worries waned.
3
DISCUSSION OF FUND PERFORMANCE (continued)
The remainder of the reporting period saw significant gains for most emerging market equities, which were supported by corporate earnings growth, a weakening U.S. dollar, and improving global and local economic conditions. China experienced explosive growth in the value of Internet-related stocks, while India, which briefly suffered in response to an unexpected demonetization in November 2016, rebounded sharply in the ensuing months. Consequently, after lagging their developed market counterparts early in the reporting period, emerging markets significantly outpaced developed market averages for the reporting period overall.
Three of Four Strategies Outperformed the Index
Although the fund participated substantially in the Index’s gains, relative performance was dampened by the Newton Fund. Most notably, the Newton Fund struggled with overweighted exposure to the Philippines and underweighted positions in China and South Africa. The Newton Fund’s security selection strategy generally produced better results in South Korea, India, and Chile due to strong stock picks. From an industry group perspective, sector allocation shortfalls in the health care and industrials sectors offset favorable security selection results in the consumer discretionary, information technology, and materials sectors.
The fund achieved better relative results through the TBCAM Strategy, which achieved strong security selections in China, including high-flying Internet-related companies Alibaba Group Holding and Tencent Holdings. Investments in India and Brazil also supported the strategy’s returns. These winners more than offset relatively disappointing results in the Philippines and South Korea.
The fund’s quantitative investment strategies also fared relatively well. The Mellon Capital Strategy, which employs a composite alpha-ranking process, outperformed the Index due to strong results in India and South Korea. From an industry group perspective, the strategy fared especially well in the consumer discretionary, health care, financials, and materials sectors. The Mellon Capital Fund, which uses a strategic beta stock-ranking methodology, achieved especially strong results through favorable stock selections in Brazil, Russia, and South Korea, which more than made up for the adverse effects of underweighted exposure to China. Overweighted positions in the energy and materials sectors also added value, as did a focus on Chinese real estate developers.
Finding Ample Investment Opportunities
Despite the recent gains posted by emerging-market stocks, market valuations across the region have remained attractive compared to developed markets, particularly in light of forecasts of stronger economic growth. While each of the fund’s four underlying strategies employs its own distinctive approach to investing in emerging-market equities, all report that
4
they have continued to find opportunities that meet their investment criteria across a wide variety of markets and industry groups.
October 16, 2017
1 Total return includes reinvestment of dividends and any capital gains paid, and does not take into consideration the maximum initial sales charge in the case of Class A shares, or the applicable contingent deferred sales charge imposed on redemptions in the case of Class C shares. Had these charges been reflected, returns would have been lower. Past performance is no guarantee of future results. Share price and investment return fluctuate such that upon redemption, fund shares may be worth more or less than their original cost. The fund’s returns reflect the absorption of certain fund expenses by The Dreyfus Corporation pursuant to an agreement in effect through February 1, 2019, at which time it may be extended, terminated, or modified. Had these expenses not been absorbed, the fund’s returns would have been lower.
2 Source: Lipper Inc. — Reflects reinvestment of net dividends and, where applicable, capital gain distributions. The MSCI Emerging Markets Index is a free float-adjusted market capitalization-weighted index that is designed to measure equity market performance of emerging markets. Investors cannot invest directly in any index.
The fund’s performance will be influenced by political, social, and economic factors affecting investments in foreign companies. These special risks include exposure to currency fluctuations, less liquidity, less developed or less efficient trading markets, lack of comprehensive company information, political instability, and differing auditing and legal standards. Investments in foreign currencies are subject to the risk that those currencies will decline in value relative to the U.S. dollar, or, in the case of hedged positions, that the U.S. dollar will decline relative to the currency being hedged.
Emerging markets tend to be more volatile than the markets of more mature economies and generally have less diverse and less mature economic structures and less stable political systems than those of developed countries. The securities of companies located in emerging markets are often subject to rapid and large changes in price. An investment in this fund should be considered only as a supplement to a complete investment program for those investors willing to accept the greater risks associated with investing in emerging market countries.
The ability of the fund to achieve its investment goal depends, in part, on the ability of Dreyfus to allocate effectively the fund’s assets among investment strategies, subadvisers, and underlying funds. There can be no assurance that the actual allocations will be effective in achieving the fund’s investment goal or that an investment strategy, subadviser or underlying fund will achieve its particular investment objective.
Each subadviser makes investment decisions independently, and it is possible that the investment styles of the subadvisers may not complement one another. As a result, the fund’s exposure to a given stock, industry, sector, market capitalization, geographic area, or investment style could unintentionally be greater or smaller than it would have been if the fund had a single adviser or investment strategy.
The risks of investing in other investment companies, including ETFs, typically reflect the risks associated with the types of instruments in which the investment companies and ETFs invest. When the fund or an underlying fund invests in another investment company or ETF, shareholders of the fund will bear indirectly their proportionate share of the expenses of the other investment company or ETF (including management fees) in addition to the expenses of the fund. ETFs are exchange-traded investment companies that are, in many cases, designed to provide investment results corresponding to an index. The value of the underlying securities can fluctuate in response to activities of individual companies or in response to general market and/or economic conditions.
5
FUND PERFORMANCE
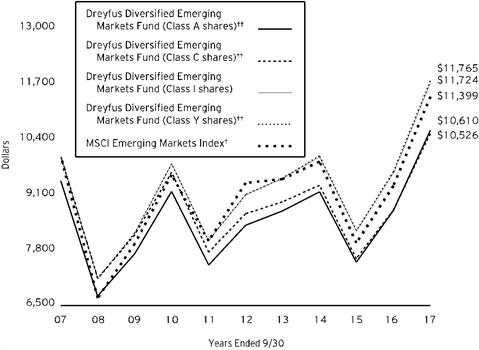
Comparison of change in value of $10,000 investment in Dreyfus Diversified Emerging Markets Fund Class A shares, Class C shares, Class I shares and Class Y shares and the MSCI Emerging Markets Index (the “Index”)
† Source: Lipper Inc.
†† The total return figures presented for Class A and Class C shares of the fund reflect the performance of the fund’s Class I shares for the period prior to 3/31/09 (the inception date for Class A and Class C shares), adjusted to reflect the applicable sales load for Class A shares.
The total return figures presented for Class Y shares of the fund reflect the performance of the fund’s Class I shares for the period prior to 1/31/14 (the inception date for Class Y shares).
Past performance is not predictive of future performance.
The above graph compares a $10,000 investment made in each of the Class A, Class C, Class I and Class Y shares of Dreyfus Diversified Emerging Markets Fund on 9/30/07 to a $10,000 investment made in the Index on that date. All dividends and capital gain distributions are reinvested.
The fund’s performance shown in the line graph above takes into account the maximum initial sales charge on Class A shares and all other applicable fees and expenses on all classes. The Index is a free float-adjusted market capitalization-weighted index that is designed to measure equity market performance of emerging markets. Unlike a mutual fund, the Index is not subject to charges, fees and other expenses. Investors cannot invest directly in any index. These factors can contribute to the Index potentially outperforming the fund. Further information relating to fund performance, including expense reimbursements, if applicable, is contained in the Financial Highlights section of the prospectus and elsewhere in this report.
6
| | | | | |
Average Annual Total Returns as of 9/30/17 | | |
| Inception | 1 Year | 5 Years | 10 Years |
Date |
Class A shares | | | | |
with maximum sales charge (5.75%) | 3/31/09 | 14.47% | 3.59% | 0.59%†† |
without sales charge | 3/31/09 | 21.48% | 4.83% | 1.19%†† |
Class C shares | | | | |
with applicable redemption charge † | 3/31/09 | 19.39% | 3.99% | 0.51%†† |
without redemption | 3/31/09 | 20.39% | 3.99% | 0.51%†† |
Class I shares | 7/10/06 | 22.05% | 5.20% | 1.60% |
Class Y shares | 1/31/14 | 22.06% | 5.27%†† | 1.64%†† |
MSCI Emerging Markets Index | | 22.46% | 3.99% | 1.32% |
† The maximum contingent deferred sales charge for Class C shares is 1% for shares redeemed within one year of the date of purchase.
†† The total return performance figures presented for Class A and Class C shares of the fund reflect the performance of the fund’s Class I shares for the period prior to 3/31/09 (the inception date for Class A and Class C shares), adjusted to reflect the applicable sales load for Class A shares.
The total return performance figures presented for Class Y shares of the fund reflect the performance of the fund’s Class I shares for the period prior to 1/31/14 (the inception date for Class Y shares).
The performance data quoted represents past performance, which is no guarantee of future results. Share price and investment return fluctuate and an investor’s shares may be worth more or less than original cost upon redemption. Current performance may be lower or higher than the performance quoted. Go to Dreyfus.com for the fund’s most recent month-end returns.
The fund’s performance shown in the graph and table does not reflect the deduction of taxes that a shareholder would pay on fund distributions or the redemption of fund shares. In addition to the performance of Class A shares shown with and without a maximum sales charge, the fund’s performance shown in the table takes into account all other applicable fees and expenses on all classes.
7
UNDERSTANDING YOUR FUND’S EXPENSES (Unaudited)
As a mutual fund investor, you pay ongoing expenses, such as management fees and other expenses. Using the information below, you can estimate how these expenses affect your investment and compare them with the expenses of other funds. You also may pay one-time transaction expenses, including sales charges (loads) and redemption fees, which are not shown in this section and would have resulted in higher total expenses. For more information, see your fund’s prospectus or talk to your financial adviser.
Review your fund’s expenses
The table below shows the expenses you would have paid on a $1,000 investment in Dreyfus Diversified Emerging Markets Fund from April 1, 2017 to September 30, 2017. It also shows how much a $1,000 investment would be worth at the close of the period, assuming actual returns and expenses.
| | | | | | | | | | | | | |
Expenses and Value of a $1,000 Investment | | |
assuming actual returns for the six months ended September 30, 2017 |
| | | | | | | | |
| | | | Class A | Class C | Class I | Class Y |
Expenses paid per $1,000† | | $7.19 | | $12.40 | | $5.20 | | $4.71 |
Ending value (after expenses) | | $1,156.40 | | $1,151.10 | | $1,159.50 | | $1,159.30 |
COMPARING YOUR FUND’S EXPENSES
WITH THOSE OF OTHER FUNDS (Unaudited)
Using the SEC’s method to compare expenses
The Securities and Exchange Commission (“SEC”) has established guidelines to help investors assess fund expenses. Per these guidelines, the table below shows your fund’s expenses based on a $1,000 investment, assuming a hypothetical 5% annualized return. You can use this information to compare the ongoing expenses (but not transaction expenses or total cost) of investing in the fund with those of other funds. All mutual fund shareholder reports will provide this information to help you make this comparison. Please note that you cannot use this information to estimate your actual ending account balance and expenses paid during the period.
| | | | | | | | | | | | |
Expenses and Value of a $1,000 Investment | | |
assuming a hypothetical 5% annualized return for the six months ended September 30, 2017 |
| | | | | | | | |
| | | | Class A | Class C | Class I | Class Y |
Expenses paid per $1,000† | | $6.73 | | $11.61 | | $4.86 | | $4.41 |
Ending value (after expenses) | | $1,018.40 | | $1,013.54 | | $1,020.26 | | $1,020.71 |
† Expenses are equal to the fund’s annualized expense ratio of 1.33% for Class A, 2.30% for Class C, .96% for Class I and .87% for Class Y, multiplied by the average account value over the period, multiplied by 183/365 (to reflect the one-half year period).
8
STATEMENT OF INVESTMENTS
September 30, 2017
| | | | | | | | |
| |
Description | | | | Shares | | Value ($) | |
Common Stocks - 53.0% | | | | | |
Brazil - 3.5% | | | | | |
Banco Bradesco | | | | 7,250 | | 76,457 | |
Banco BTG Pactual | | | | 88,200 | | 524,942 | |
Banco do Brasil | | | | 67,500 | | 743,808 | |
BR Malls Participacoes | | | | 4,335 | | 19,258 | |
CCR | | | | 42,600 | | 238,210 | |
Cia de Saneamento Basico do Estado de Sao Paulo | | | | 89,900 | | 944,657 | |
EcoRodovias Infraestrutura e Logistica | | | | 202,500 | | 729,528 | |
EDP - Energias do Brasil | | | | 126,500 | | 604,711 | |
Hypermarcas | | | | 58,200 | | 591,712 | |
Petroleo Brasileiro, ADR | | | | 91,941 | a | 888,150 | |
Petroleo Brasileiro, ADR | | | | 19,009 | a | 190,850 | |
Qualicorp | | | | 97,600 | | 1,167,940 | |
Vale | | | | 87,441 | | 879,890 | |
| | | | | 7,600,113 | |
Canada - .1% | | | | | |
Gran Tierra Energy | | | | 121,722 | a,b | 277,526 | |
Chile - .7% | | | | | |
Aguas Andinas, Cl. A | | | | 164,900 | | 104,343 | |
Empresa Nacional de Telecomunicaciones | | | | 40,673 | | 421,562 | |
Enel Generacion Chile | | | | 568,400 | | 497,222 | |
Itau CorpBanca | | | | 61,140,090 | | 575,914 | |
| | | | | 1,599,041 | |
China - 16.4% | | | | | |
Air China, Cl. H | | | | 326,000 | | 270,846 | |
Alibaba Group Holding, ADR | | | | 34,698 | a | 5,992,692 | |
Anhui Conch Cement, Cl. H | | | | 266,000 | | 1,060,717 | |
ANTA Sports Products | | | | 114,000 | | 479,402 | |
Baidu, ADR | | | | 950 | a | 235,305 | |
Bank of China, Cl. H | | | | 2,534,000 | | 1,248,899 | |
Beijing Capital International Airport, Cl. H | | | | 317,956 | | 473,784 | |
BYD, Cl. H | | | | 52,500 | | 486,920 | |
China Communications Services, Cl. H | | | | 766,000 | | 394,198 | |
China Construction Bank, Cl. H | | | | 2,730,000 | | 2,264,632 | |
China Evergrande Group | | | | 44,000 | a | 153,490 | |
China Huarong Asset Management, Cl. H | | | | 877,000 | c | 391,819 | |
China Life Insurance, Cl. H | | | | 235,000 | | 699,441 | |
China Lodging Group, ADR | | | | 7,666 | a | 910,874 | |
China Medical System Holdings | | | | 101,000 | | 176,358 | |
9
STATEMENT OF INVESTMENTS (continued)
| | | | | | | | |
| |
Description | | | | Shares | | Value ($) | |
Common Stocks - 53.0% (continued) | | | | | |
China - 16.4% (continued) | | | | | |
China Petroleum & Chemical, Cl. H | | | | 142,000 | | 106,342 | |
China Shenhua Energy, Cl. H | | | | 235,000 | | 552,332 | |
China Southern Airlines, Cl. H | | | | 136,000 | | 93,666 | |
China Telecom, Cl. H | | | | 1,080,000 | | 553,024 | |
China Vanke, Cl. H | | | | 11,700 | | 38,493 | |
Chongqing Rural Commercial Bank, Cl. H | | | | 1,471,000 | | 932,133 | |
CNOOC | | | | 601,000 | | 775,524 | |
Country Garden Holdings | | | | 30,000 | | 47,698 | |
Geely Automobile Holdings | | | | 240,000 | | 675,918 | |
Guangzhou Automobile Group, Cl. H | | | | 182,000 | | 421,240 | |
Huaneng Renewables, Cl. H | | | | 832,000 | | 274,791 | |
Industrial & Commercial Bank of China, Cl. H | | | | 833,000 | | 618,490 | |
Jiangsu Expressway, Cl. H | | | | 216,000 | | 330,708 | |
Longfor Properties | | | | 7,500 | | 18,914 | |
New Oriental Education & Technology Group, ADR | | | | 7,633 | | 673,689 | |
People's Insurance Company Group of China, Cl. H | | | | 812,000 | | 362,778 | |
PICC Property & Casualty, Cl. H | | | | 206,000 | | 363,393 | |
Ping An Insurance Group Company of China, Cl. H | | | | 208,000 | | 1,596,293 | |
Shanghai Pharmaceuticals Holding, Cl. H | | | | 273,900 | | 669,007 | |
Sino-Ocean Group Holding | | | | 23,500 | | 15,673 | |
Sinopec Shanghai Petrochemical, Cl. H | | | | 266,000 | | 158,341 | |
Sinopharm Group, Cl. H | | | | 73,600 | | 324,113 | |
Sunny Optical Technology Group | | | | 68,000 | | 1,081,161 | |
Tencent Holdings | | | | 185,200 | | 7,970,741 | |
Zhejiang Expressway, Cl. H | | | | 720,000 | | 894,977 | |
ZTE, Cl. H | | | | 288,600 | a | 943,946 | |
| | | | | 35,732,762 | |
Colombia - .1% | | | | | |
Ecopetrol | | | | 335,100 | | 159,755 | |
Interconexion Electrica | | | | 27,800 | | 129,504 | |
| | | | | 289,259 | |
Hong Kong - 1.0% | | | | | |
China Everbright International | | | | 479,000 | | 600,927 | |
China Overseas Land & Investment | | | | 30,000 | | 97,547 | |
China Resources Land | | | | 20,000 | | 61,191 | |
China Unicom Hong Kong | | | | 346,000 | a | 481,023 | |
Haier Electronics Group | | | | 181,000 | a | 441,170 | |
Shanghai Industrial Holdings | | | | 161,000 | | 487,435 | |
Shimao Property Holdings | | | | 10,500 | | 22,770 | |
| | | | | 2,192,063 | |
10
| | | | | | | | |
| |
Description | | | | Shares | | Value ($) | |
Common Stocks - 53.0% (continued) | | | | | |
Hungary - .5% | | | | | |
OTP Bank | | | | 7,500 | | 281,398 | |
Richter Gedeon | | | | 32,716 | | 812,541 | |
| | | | | 1,093,939 | |
India - 3.4% | | | | | |
Aurobindo Pharma | | | | 37,184 | | 393,728 | |
Axis Bank | | | | 75,240 | | 582,414 | |
Bajaj Finance | | | | 14,800 | | 416,460 | |
Bharat Petroleum | | | | 29,808 | | 215,072 | |
Bharti Infratel | | | | 62,400 | | 370,835 | |
Hero MotoCorp | | | | 6,800 | | 392,942 | |
Hindustan Petroleum | | | | 76,350 | | 483,144 | |
ICICI Bank | | | | 118,282 | | 500,849 | |
Indiabulls Housing Finance | | | | 31,259 | | 577,492 | |
Indian Oil | | | | 67,316 | | 412,738 | |
Infosys | | | | 8,020 | | 110,490 | |
ITC | | | | 122,048 | | 482,624 | |
Mahindra & Mahindra | | | | 17,368 | | 333,494 | |
NTPC | | | | 157,311 | | 403,272 | |
Power Finance | | | | 136,686 | | 255,083 | |
Tata Consultancy Services | | | | 2,375 | | 88,524 | |
Tata Power | | | | 198,400 | | 236,306 | |
UPL | | | | 60,374 | | 719,552 | |
Vedanta | | | | 101,250 | | 484,389 | |
| | | | | 7,459,408 | |
Indonesia - 1.4% | | | | | |
Bank Mandiri | | | | 1,459,800 | | 728,870 | |
Bank Negara Indonesia | | | | 597,600 | | 328,327 | |
Bank Rakyat Indonesia | | | | 353,100 | | 400,446 | |
Bumi Serpong Damai | | | | 3,317,700 | | 435,988 | |
Indofood Sukses Makmur | | | | 641,700 | | 401,390 | |
Telekomunikasi Indonesia | | | | 911,100 | | 316,575 | |
United Tractors | | | | 174,600 | | 414,819 | |
| | | | | 3,026,415 | |
Malaysia - .4% | | | | | |
AirAsia | | | | 337,600 | | 275,837 | |
Genting | | | | 189,600 | | 428,817 | |
Public Bank | | | | 37,200 | | 180,075 | |
| | | | | 884,729 | |
Mexico - 1.1% | | | | | |
Arca Continental | | | | 100,700 | | 687,425 | |
Coca-Cola Femsa, Ser. L | | | | 15,100 | | 116,612 | |
El Puerto de Liverpool, Ser. C1 | | | | 50,000 | | 403,817 | |
Fibra Uno Administracion | | | | 13,100 | | 22,100 | |
11
STATEMENT OF INVESTMENTS (continued)
| | | | | | | | |
| |
Description | | | | Shares | | Value ($) | |
Common Stocks - 53.0% (continued) | | | | | |
Mexico - 1.1% (continued) | | | | | |
Fomento Economico Mexicano | | | | 62,600 | | 597,742 | |
Grupo Aeroportuario del Sureste, Cl. B | | | | 12,900 | | 246,028 | |
Grupo Bimbo, Ser. A | | | | 52,000 | | 125,845 | |
Wal-Mart de Mexico | | | | 70,800 | | 162,129 | |
| | | | | 2,361,698 | |
Panama - .4% | | | | | |
Copa Holdings, Cl. A | | | | 5,983 | | 745,063 | |
Philippines - .5% | | | | | |
Ayala Land | | | | 43,100 | | 36,907 | |
DMCI Holdings | | | | 1,605,100 | | 492,910 | |
Globe Telecom | | | | 2,295 | | 92,614 | |
Metropolitan Bank & Trust | | | | 231,160 | | 393,613 | |
SM Prime Holdings | | | | 46,300 | | 31,399 | |
| | | | | 1,047,443 | |
Poland - .8% | | | | | |
KGHM Polska Miedz | | | | 9,625 | | 309,667 | |
Polskie Gornictwo Naftowe i Gazownictwo | | | | 151,686 | | 282,255 | |
Powszechna Kasa Oszczednosci Bank Polski | | | | 43,646 | a | 422,585 | |
Powszechny Zaklad Ubezpieczen | | | | 51,780 | | 652,749 | |
| | | | | 1,667,256 | |
Qatar - .0% | | | | | |
Qatar National Bank | | | | 814 | | 27,305 | |
Russia - 1.4% | | | | | |
Gazprom, ADR | | | | 46,113 | | 193,213 | |
Lukoil, ADR | | | | 4,647 | | 245,966 | |
MMC Norilsk Nickel, ADR | | | | 4,700 | | 80,911 | |
Rosneft Oil Co., GDR | | | | 88,349 | | 490,779 | |
Sberbank of Russia, ADR | | | | 120,083 | | 1,709,382 | |
Sistema, GDR | | | | 6,159 | | 29,563 | |
Surgutneftegas, ADR | | | | 12,760 | | 64,566 | |
Tatneft, ADR | | | | 7,450 | | 318,115 | |
| | | | | 3,132,495 | |
South Africa - 1.6% | | | | | |
Barclays Africa Group | | | | 25,800 | | 264,884 | |
Clicks Group | | | | 50,893 | | 594,044 | |
FirstRand | | | | 157,407 | | 604,922 | |
Growthpoint Properties | | | | 17,287 | | 31,028 | |
Investec | | | | 12,200 | | 88,309 | |
Mondi | | | | 5,400 | | 144,178 | |
Naspers, Cl. N | | | | 3,400 | | 733,303 | |
Redefine Properties | | | | 20,861 | | 16,472 | |
12
| | | | | | | | |
| |
Description | | | | Shares | | Value ($) | |
Common Stocks - 53.0% (continued) | | | | | |
South Africa - 1.6% (continued) | | | | | |
Resilient REIT | | | | 2,384 | | 23,434 | |
Sappi | | | | 64,800 | | 440,623 | |
Standard Bank Group | | | | 14,200 | | 165,518 | |
Telkom | | | | 80,873 | | 354,166 | |
| | | | | 3,460,881 | |
South Korea - 8.6% | | | | | |
Coway | | | | 5,134 | | 421,352 | |
Dongbu Insurance | | | | 4,900 | | 312,306 | |
E-MART | | | | 2,333 | | 424,700 | |
GS Holdings | | | | 5,100 | | 292,103 | |
Hana Financial Group | | | | 17,918 | | 740,749 | |
Hanwha | | | | 7,400 | | 284,280 | |
Hanwha Life Insurance | | | | 54,500 | | 325,948 | |
Hyosung | | | | 933 | | 118,524 | |
Hyundai Marine & Fire Insurance | | | | 7,100 | | 280,814 | |
Hyundai Mobis | | | | 2,142 | | 448,841 | |
ING Life Insurance Korea | | | | 11,109 | c | 460,228 | |
KB Financial Group | | | | 3,220 | | 157,718 | |
KIWOOM Securities | | | | 6,243 | | 394,633 | |
KT | | | | 6,996 | | 178,053 | |
KT&G | | | | 5,172 | | 476,401 | |
LG | | | | 1,300 | | 91,483 | |
LG Chem | | | | 2,348 | | 803,611 | |
LG Electronics | | | | 5,600 | | 402,881 | |
LG Innotek | | | | 3,986 | | 535,944 | |
Lotte Chemical | | | | 1,006 | | 332,010 | |
NH Investment & Securities | | | | 6,900 | | 81,931 | |
POSCO | | | | 4,507 | | 1,247,408 | |
Samsung Electronics | | | | 2,968 | | 6,644,215 | |
Samsung SDI | | | | 5,262 | | 911,954 | |
Shinhan Financial Group | | | | 12,129 | | 532,666 | |
SK Holdings | | | | 890 | | 223,792 | |
SK Hynix | | | | 8,400 | | 607,989 | |
SK Telecom | | | | 1,840 | | 409,656 | |
Woori Bank | | | | 30,800 | | 480,010 | |
| | | | | 18,622,200 | |
Taiwan - 5.1% | | | | | |
Airtac International Group | | | | 51,189 | | 705,613 | |
Cathay Financial Holding | | | | 370,000 | | 588,115 | |
Chailease Holding | | | | 96,000 | | 231,421 | |
First Financial Holding | | | | 500,723 | | 321,167 | |
Formosa Chemicals & Fibre | | | | 188,000 | | 571,613 | |
Fubon Financial Holding | | | | 418,000 | | 652,005 | |
13
STATEMENT OF INVESTMENTS (continued)
| | | | | | | | |
| |
Description | | | | Shares | | Value ($) | |
Common Stocks - 53.0% (continued) | | | | | |
Taiwan - 5.1% (continued) | | | | | |
Hon Hai Precision Industry | | | | 192,250 | | 665,686 | |
Innolux | | | | 343,000 | | 160,053 | |
Lite-On Technology | | | | 265,000 | | 378,397 | |
Micro-Star International | | | | 136,000 | | 292,415 | |
Phison Electronics | | | | 39,000 | | 463,000 | |
Powertech Technology | | | | 286,659 | | 826,210 | |
Taiwan Semiconductor Manufacturing | | | | 639,600 | | 4,566,462 | |
Uni-President Enterprises | | | | 98,000 | | 205,217 | |
Wistron | | | | 587,586 | | 469,891 | |
| | | | | 11,097,265 | |
Thailand - 1.1% | | | | | |
Glow Energy | | | | 75,900 | | 203,121 | |
Indorama Ventures | | | | 219,100 | | 277,570 | |
PTT | | | | 43,300 | | 529,727 | |
PTT, NVDR | | | | 7,800 | | 95,424 | |
Siam Cement | | | | 17,850 | | 268,687 | |
Thai Beverage | | | | 851,100 | | 564,702 | |
Thai Oil | | | | 178,700 | | 495,645 | |
| | | | | 2,434,876 | |
Turkey - 1.3% | | | | | |
Akbank | | | | 82,700 | | 218,184 | |
Arcelik | | | | 49,230 | | 313,927 | |
Emlak Konut Gayrimenkul Yatirim Ortakligi | | | | 14,944 | a | 11,241 | |
Enka Insaat ve Sanayi | | | | 1 | | 1 | |
Ford Otomotiv Sanayi | | | | 30,300 | | 387,791 | |
KOC Holding | | | | 78,400 | | 359,769 | |
Tupras Turkiye Petrol Rafinerileri | | | | 15,282 | | 521,560 | |
Turkiye Garanti Bankasi | | | | 289,290 | | 785,957 | |
Turkiye Is Bankasi, Cl. C | | | | 54,100 | | 102,948 | |
Turkiye Vakiflar Bankasi, Cl. D | | | | 109,300 | | 192,344 | |
| | | | | 2,893,722 | |
United Arab Emirates - .5% | | | | | |
Dubai Islamic Bank | | | | 203,647 | | 336,306 | |
Emaar Properties | | | | 304,181 | | 703,179 | |
| | | | | 1,039,485 | |
United States - 3.1% | | | | | |
iShares MSCI All Peru Capped ETF | | | | 35,040 | b | 1,359,202 | |
iShares MSCI Emerging Markets ETF | | | | 56,526 | b | 2,532,930 | |
iShares MSCI Philippines ETF | | | | 28,257 | b | 1,044,661 | |
iShares MSCI South Korea Capped ETF | | | | 25,564 | | 1,765,450 | |
14
| | | | | | | | |
| |
Description | | | | Shares | | Value ($) | |
Common Stocks - 53.0% (continued) | | | | | |
United States - 3.1% (continued) | | | | | |
Vanguard FTSE Emerging Markets ETF | | | | 100 | | 4,357 | |
| | | | | 6,706,600 | |
Total Common Stocks (cost $90,792,988) | | | | 115,391,544 | |
| | | Preferred Dividend Yield % | | | | | |
Preferred Stocks - 1.9% | | | | | |
Brazil - 1.5% | | | | | |
Banco Bradesco | | 2.03 | | 45,283 | | 501,135 | |
Banco do Estado do Rio Grande do Sul, Cl. B | | 5.35 | | 114,400 | | 637,171 | |
Cia Energetica de Minas Gerais | | 7.89 | | 228,600 | | 575,984 | |
Cia Paranaense de Energia | | 8.35 | | 28,400 | | 253,140 | |
Itau Unibanco Holding | | 4.39 | | 59,729 | | 817,534 | |
Suzano Papel e Celulose, Cl. A | | 1.66 | | 88,000 | | 508,748 | |
| | | | | 3,293,712 | |
Colombia - .1% | | | | | |
Grupo Aval Acciones y Valores | | 4.67 | | 130,123 | | 58,933 | |
South Korea - .3% | | | | | |
Samsung Electronics | | 1.26 | | 369 | | 664,319 | |
Taiwan - .0% | | | | | |
Cathay Financial Holding | | 0.24 | | 23,923 | | 48,834 | |
Total Preferred Stocks (cost $3,082,764) | | | | 4,065,798 | |
| | | | | | | | |
Registered Investment Companies - 43.0% | | | | | |
United States - 43.0% | | | | | |
Dreyfus Global Emerging Markets Fund, Cl. Y | | | | 4,341,049 | d,e | 76,142,000 | |
Dreyfus Strategic Beta Emerging Markets Equity Fund, Cl. Y | | | | 1,310,281 | e | 17,636,388 | |
Total Registered Investment Companies (cost $71,842,857) | | | | 93,778,388 | |
15
STATEMENT OF INVESTMENTS (continued)
| | | | | | | | |
| |
Description | | | | Shares | | Value ($) | |
Investment of Cash Collateral for Securities Loaned - 1.3% | | | | | |
Registered Investment Company; | | | | | |
Dreyfus Institutional Preferred Government Money Market Fund, Institutional Shares
(cost $2,813,104) | | | | 2,813,104 | f | 2,813,104 | |
Total Investments (cost $168,531,713) | | 99.2% | | 216,048,834 | |
Cash and Receivables (Net) | | .8% | | 1,827,131 | |
Net Assets | | 100.0% | | 217,875,965 | |
ADR—American Depository Receipt
ETF—Exchange-Traded Fund
GDR—Global Depository Receipt
NVDR—Non-Voting Depository Receipt
REIT—Real Estate Investment Trust
aNon-income producing security.
b Security, or portion thereof, on loan. At September 30, 2017, the value of the fund’s securities on loan was $2,776,002 and the value of the collateral held by the fund was $2,813,104.
c Security exempt from registration pursuant to Rule 144A under the Securities Act of 1933. These securities may be resold in transactions exempt from registration, normally to qualified institutional buyers. At September 30, 2017, these securities were valued at $852,047 or .39% of net assets.
d The fund’s investment in the Dreyfus Global Emerging Markets Fund, Cl. Y represents 34.9% of the fund’s net assets. The Dreyfus Global Emerging Markets Fund, Cl. Y seeks to provide long-term capital appreciation.
e Investment in affiliated mutual fund.
fInvestment in affiliated money market mutual fund.
| | |
Portfolio Summary (Unaudited) † | Value (%) |
Mutual Fund: Foreign | 43.0 |
Information Technology | 15.4 |
Financials | 13.0 |
Consumer Discretionary | 3.9 |
Materials | 3.9 |
Energy | 3.7 |
Industrials | 3.4 |
Exchange-Traded Funds | 3.1 |
Consumer Staples | 2.2 |
Utilities | 1.9 |
Health Care | 1.9 |
Telecommunications | 1.7 |
Money Market Investment | 1.3 |
Real Estate | .8 |
| | 99.2 |
† Based on net assets.
See notes to financial statements.
16
STATEMENT OF INVESTMENTS IN AFFILIATED ISSUERS
| | | | | | |
Registered Investment Companies | | Value
9/30/2016 ($) | Purchases ($)† | Sales ($) | Net Realized
Gain (Loss) ($) |
Dreyfus Global Emerging Markets Fund, Cl. Y | | 54,484,482 | 14,326,630 | 3,994,767 | (86,501) |
Dreyfus Institutional Preferred Government Money Market Fund, Institutional Shares | | — | 22,241,957 | 19,428,853 | — |
Dreyfus Strategic Beta Emerging Markets Equity Fund, Cl. Y | | 12,259,823 | 3,826,096 | 998,692 | 36,108 |
Total | | 66,744,305 | 40,394,683 | 24,422,312 | (50,393) |
| | | | | | |
Registered Investment Companies | | Change in Net
Unrealized
Appreciation
(Depreciation) ($) | Value
9/30/2017 ($) | Net
Assets (%) | Dividends/
Distributions ($) |
Dreyfus Global Emerging Markets Fund, Cl. Y | | 11,412,156 | 76,142,000 | 34.9 | 17,516 |
Dreyfus Institutional Preferred Government Money Market Fund, Institutional Shares | | — | 2,813,104 | 1.3 | — |
Dreyfus Strategic Beta Emerging Markets Equity Fund, Cl. Y | | 2,513,053 | 17,636,388 | 8.1 | 248,819 |
Total | | 13,925,209 | 96,591,492 | 44.3 | 266,335 |
† Includes reinvested dividends/distributions.
See notes to financial statements.
17
STATEMENT OF ASSETS AND LIABILITIES
September 30, 2017
| | | | | | | |
| | | | | | |
| | | Cost | | Value | |
Assets ($): | | | | |
Investments in securities—See Statement of Investments
(including securities on loan, valued at $2,776,002)—Note 1(c): | | | |
Unaffiliated issuers | | 93,875,752 | | 119,457,342 | |
Affiliated issuers | | 74,655,961 | | 96,591,492 | |
Cash | | | | | 3,395,315 | |
Cash denominated in foreign currency | | | 1,390,455 | | 1,381,337 | |
Receivable for shares of Beneficial Interest subscribed | | | | | 144,500 | |
Dividends and securities lending income receivable | | | | | 139,405 | |
Receivable for investment securities sold | | | | | 28,228 | |
Prepaid expenses | | | | | 27,230 | |
| | | | | 221,164,849 | |
Liabilities ($): | | | | |
Due to The Dreyfus Corporation and affiliates—Note 3(c) | | | | | 171,385 | |
Liability for securities on loan—Note 1(c) | | | | | 2,813,104 | |
Payable for shares of Beneficial Interest redeemed | | | | | 244,096 | |
Accrued expenses | | | | | 60,299 | |
| | | | | 3,288,884 | |
Net Assets ($) | | | 217,875,965 | |
Composition of Net Assets ($): | | | | |
Paid-in capital | | | | | 195,226,204 | |
Accumulated undistributed investment income—net | | | | | 595,545 | |
Accumulated net realized gain (loss) on investments | | | | | (25,454,317) | |
Accumulated net unrealized appreciation (depreciation)
on investments and foreign currency transactions | | | | 47,508,533 | |
Net Assets ($) | | | 217,875,965 | |
| | | | | | |
Net Asset Value Per Share | Class A | Class C | Class I | Class Y | |
Net Assets ($) | 900,787 | 27,963 | 3,550,081 | 213,397,134 | |
Shares Outstanding | 37,247 | 1,224 | 147,153 | 8,832,995 | |
Net Asset Value Per Share ($) | 24.18 | 22.85 | 24.13 | 24.16 | |
| | | | | | |
See notes to financial statements. | | | | | |
18
STATEMENT OF OPERATIONS
Year Ended September 30, 2017
| | | | | | | |
| | | | | | |
| | | | | | |
Investment Income ($): | | | | |
Income: | | | | |
Cash dividends (net of $292,712 foreign taxes withheld at source): | |
Unaffiliated issuers | | | 2,205,261 | |
Affiliated issuers | | | 266,335 | |
Income from securities lending—Note 1(c) | | | 7,982 | |
Total Income | | | 2,479,578 | |
Expenses: | | | | |
Investment advisory fee—Note 3(a) | | | 1,011,998 | |
Professional fees | | | 98,021 | |
Administration fee—Note 3(a) | | | 92,007 | |
Custodian fees—Note 3(c) | | | 91,129 | |
Registration fees | | | 66,262 | |
Trustees’ fees and expenses—Note 3(d) | | | 12,057 | |
Prospectus and shareholders’ reports | | | 11,319 | |
Shareholder servicing costs—Note 3(c) | | | 6,826 | |
Loan commitment fees—Note 2 | | | 4,076 | |
Distribution fees—Note 3(b) | | | 355 | |
Miscellaneous | | | 67,290 | |
Total Expenses | | | 1,461,340 | |
Less—reduction in expenses due to undertaking—Note 3(a) | | | (28) | |
Less—reduction in fees due to earnings credits—Note 3(c) | | | (9,436) | |
Net Expenses | | | 1,451,876 | |
Investment Income—Net | | | 1,027,702 | |
Realized and Unrealized Gain (Loss) on Investments—Note 4 ($): | | |
Net realized gain (loss) on investments and foreign currency transactions: | | |
Unaffiliated issuers | | | | 4,836,079 | |
Affiliated issuers | | | | (50,393) | |
Net realized gain (loss) on forward foreign currency exchange contracts | (47,765) | |
Net Realized Gain (Loss) | | | 4,737,921 | |
Net unrealized appreciation (depreciation) on investments
and foreign currency transactions: | | | | |
Unaffiliated issuers | | | | 15,432,906 | |
Affiliated issuers | | | | 13,925,209 | |
Net Unrealized Appreciation (Depreciation) | | | 29,358,115 | |
Net Realized and Unrealized Gain (Loss) on Investments | | | 34,096,036 | |
Net Increase in Net Assets Resulting from Operations | | 35,123,738 | |
| | | | | | | |
See notes to financial statements. | | | | | |
19
STATEMENT OF CHANGES IN NET ASSETS
| | | | | | | | | | |
| | | | Year Ended September 30, |
| | | | 2017 | | 2016 | |
Operations ($): | | | | | | | | |
Investment income—net | | | 1,027,702 | | | | 612,182 | |
Net realized gain (loss) on investments | | 4,737,921 | | | | (18,430,537) | |
Net unrealized appreciation (depreciation)
on investments | | 29,358,115 | | | | 39,348,620 | |
Net Increase (Decrease) in Net Assets
Resulting from Operations | 35,123,738 | | | | 21,530,265 | |
Distributions to Shareholders from ($): | |
Investment income—net: | | | | | | | | |
Class A | | | (706) | | | | (5,152) | |
Class I | | | (6,480) | | | | (5,449) | |
Class Y | | | (714,061) | | | | (1,057,347) | |
Total Distributions | | | (721,247) | | | | (1,067,948) | |
Beneficial Interest Transactions ($): | |
Net proceeds from shares sold: | | | | | | | | |
Class A | | | 537,581 | | | | 319,297 | |
Class C | | | - | | | | 23,636 | |
Class I | | | 4,376,821 | | | | 1,075,725 | |
Class Y | | | 60,760,200 | | | | 65,099,939 | |
Distributions reinvested: | | | | | | | | |
Class A | | | 706 | | | | 5,152 | |
Class I | | | 5,849 | | | | 4,990 | |
Class Y | | | 112,993 | | | | 170,335 | |
Cost of shares redeemed: | | | | | | | | |
Class A | | | (747,230) | | | | (676,922) | |
Class C | | | (44,160) | | | | (274,249) | |
Class I | | | (2,523,767) | | | | (2,949,941) | |
Class Y | | | (29,151,205) | | | | (121,057,786) | |
Increase (Decrease) in Net Assets
from Beneficial Interest Transactions | 33,327,788 | | | | (58,259,824) | |
Total Increase (Decrease) in Net Assets | 67,730,279 | | | | (37,797,507) | |
Net Assets ($): | |
Beginning of Period | | | 150,145,686 | | | | 187,943,193 | |
End of Period | | | 217,875,965 | | | | 150,145,686 | |
Undistributed investment income—net | 595,545 | | | | 477,060 | |
20
| | | | | | | | | | |
| | | | Year Ended September 30, |
| | | | 2017 | | 2016 | |
Capital Share Transactions (Shares): | |
Class A | | | | | | | | |
Shares sold | | | 24,924 | | | | 18,059 | |
Shares issued for distributions reinvested | | | 38 | | | | 296 | |
Shares redeemed | | | (35,348) | | | | (37,669) | |
Net Increase (Decrease) in Shares Outstanding | (10,386) | | | | (19,314) | |
Class C | | | | | | | | |
Shares sold | | | - | | | | 1,450 | |
Shares redeemed | | | (2,173) | | | | (15,716) | |
Net Increase (Decrease) in Shares Outstanding | (2,173) | | | | (14,266) | |
Class Ia | | | | | | | | |
Shares sold | | | 208,888 | | | | 59,285 | |
Shares issued for distributions reinvested | | | 317 | | | | 289 | |
Shares redeemed | | | (122,804) | | | | (164,331) | |
Net Increase (Decrease) in Shares Outstanding | 86,401 | | | | (104,757) | |
Class Ya | | | | | | | | |
Shares sold | | | 2,831,224 | | | | 3,702,351 | |
Shares issued for distributions reinvested | | | 6,111 | | | | 9,840 | |
Shares redeemed | | | (1,438,486) | | | | (6,966,813) | |
Net Increase (Decrease) in Shares Outstanding | 1,398,849 | | | | (3,254,622) | |
| | | | | | | | | | |
aDuring the period ended September 30, 2017, 150,737 Class Y shares representing $3,124,374 were exchanged for 150,938 Class I shares and during the period ended September 30, 2016, 51,105 Class Y shares representing $928,807 were exchanged for 51,169 Class I shares. | |
See notes to financial statements. | | | | | | | | |
21
FINANCIAL HIGHLIGHTS
The following tables describe the performance for each share class for the fiscal periods indicated. All information (except portfolio turnover rate) reflects financial results for a single fund share. Total return shows how much your investment in the fund would have increased (or decreased) during each period, assuming you had reinvested all dividends and distributions. These figures have been derived from the fund’s financial statements.
| | | | | | | | | |
| | | | |
| | | |
| | | Year Ended September 30, |
Class A Shares | | 2017 | 2016 | 2015 | 2014 | 2013 |
Per Share Data ($): | | | | | | |
Net asset value, beginning of period | | 19.92 | 17.23 | 21.34 | 20.58 | 19.78 |
Investment Operations: | | | | | | |
Investment income—neta | | .02 | .02 | .09 | .05 | .23 |
Net realized and unrealized
gain (loss) on investments | | 4.26 | 2.72 | (3.88) | .98 | .57 |
Total from Investment Operations | | 4.28 | 2.74 | (3.79) | 1.03 | .80 |
Distributions: | | | | | | |
Dividends from investment
income—net | | (.02) | (.08) | (.13) | (.28) | – |
Dividends from net realized gain
on investments | | — | — | (.20) | — | — |
Total Distributions | | (.02) | (.08) | (.33) | (.28) | — |
Proceeds from redemption
fees—Note 3(e) | | .00b | .03 | .01 | .01 | — |
Net asset value, end of period | | 24.18 | 19.92 | 17.23 | 21.34 | 20.58 |
Total Return (%)c | | 21.48 | 16.20 | (18.00) | 5.14 | 3.99 |
Ratios/Supplemental Data (%): | | | | | | |
Ratio of total expenses
to average net assets | | 1.28d | 1.39d | 1.42d | 4.80d | 6.20 |
Ratio of net expenses
to average net assets | | 1.27d | 1.39d | 1.42d | 1.60d | 1.60 |
Ratio of net investment income
to average net assets | | .08d | .10d | .47d | .22d | 1.10 |
Portfolio Turnover Rate | | 50.35 | 62.91 | 78.32 | 128.76 | 67.74 |
Net Assets, end of period ($ x 1,000) | | 901 | 949 | 1,153 | 209 | 130 |
a Based on average shares outstanding.
b Amount represents less than $.01 per share.
c Exclusive of sales charge.
d Amount does not include the expenses of the underlying funds.
See notes to financial statements.
22
| | | | | | | | |
| | | | |
| | | |
| | | Year Ended September 30, |
Class C Shares | | 2017 | 2016 | 2015 | 2014 | 2013 |
Per Share Data ($): | | | | | | |
Net asset value, beginning of period | | 18.98 | 16.50 | 20.44 | 19.60 | 18.98 |
Investment Operations: | | | | | | |
Investment income (loss)—neta | | (.16) | (.13) | .04 | (.16) | .04 |
Net realized and unrealized
gain (loss) on investments | | 4.03 | 2.58 | (3.79) | .99 | .58 |
Total from Investment Operations | | 3.87 | 2.45 | (3.75) | .83 | .62 |
Distributions: | | | | | | |
Dividends from net realized gain
on investments | | — | — | (.20) | — | — |
Proceeds from redemption
fees—Note 3(e) | | .00b | .03 | .01 | .01 | — |
Net asset value, end of period | | 22.85 | 18.98 | 16.50 | 20.44 | 19.60 |
Total Return (%)c | | 20.39 | 15.03 | (18.44) | 4.34 | 3.21 |
Ratios/Supplemental Data (%): | | | | | | |
Ratio of total expenses
to average net assets | | 2.32d | 2.23d | 2.08d | 6.10d | 6.62 |
Ratio of net expenses
to average net assets | | 2.25d | 2.23d | 2.08d | 2.35d | 2.35 |
Ratio of net investment income (loss)
to average net assets | | (.83)d | (.74)d | .22d | (.77)d | .22 |
Portfolio Turnover Rate | | 50.35 | 62.91 | 78.32 | 128.76 | 67.74 |
Net Assets, end of period ($ x 1,000) | | 28 | 64 | 291 | 69 | 76 |
a Based on average shares outstanding.
b Amount represents less than $.01 per share.
c Exclusive of sales charge.
d Amount does not include the expenses of the underlying funds.
See notes to financial statements.
23
FINANCIAL HIGHLIGHTS (continued)
| | | | | | | | |
| | | |
| | | |
| | | Year Ended September 30, |
Class I Shares | | 2017 | 2016 | 2015 | 2014 | 2013 |
Per Share Data ($): | | | | | | |
Net asset value, beginning of period | | 19.86 | 17.16 | 21.16 | 20.45 | 19.60 |
Investment Operations: | | | | | | |
Investment income (loss)—neta | | .13 | .02 | .16 | (.30) | .26 |
Net realized and unrealized
gain (loss) on investments | | 4.22 | 2.75 | (3.79) | 1.34 | .59 |
Total from Investment Operations | | 4.35 | 2.77 | (3.63) | 1.04 | .85 |
Distributions: | | | | | | |
Dividends from investment
income—net | | (.08) | (.10) | (.18) | (.34) | — |
Dividends from net realized gain
on investments | | — | — | (.20) | — | — |
Total Distributions | | (.08) | (.10) | (.38) | (.34) | — |
Proceeds from redemption
fees—Note 3(e) | | .00b | .03 | .01 | .01 | — |
Net asset value, end of period | | 24.13 | 19.86 | 17.16 | 21.16 | 20.45 |
Total Return (%) | | 22.05 | 16.45 | (17.44) | 5.32 | 4.23 |
Ratios/Supplemental Data (%): | | | | | | |
Ratio of total expenses
to average net assets | | .95c | 1.11c | .99c | 3.57c | 5.39 |
Ratio of net expenses
to average net assets | | .94c | 1.11c | .99c | 1.35c | 1.35 |
Ratio of net investment income (loss)
to average net assets | | .57c | .12c | .83c | (.63)c | 1.27 |
Portfolio Turnover Rate | | 50.35 | 62.91 | 78.32 | 128.76 | 67.74 |
Net Assets, end of period ($ x 1,000) | | 3,550 | 1,207 | 2,840 | 748 | 3,359 |
a Based on average shares outstanding.
b Amount represents less than $.01 per share.
c Amount does not include the expenses of the underlying funds.
See notes to financial statements.
24
| | | | | | | | | | |
| | | |
| | | | | | |
| | | | Year Ended September 30, |
Class Y Shares | | | 2017 | 2016 | 2015 | 2014a |
Per Share Data ($): | | | | | | |
Net asset value, beginning of period | | | 19.90 | 17.18 | 21.20 | 19.03 |
Investment Operations: | | | | | | |
Investment income—netb | | | .13 | .07 | .17 | .14 |
Net realized and unrealized gain (loss)
on investments | | | 4.23 | 2.74 | (3.82) | 2.02 |
Total from Investment Operations | | | 4.36 | 2.81 | (3.65) | 2.16 |
Distributions: | | | | | | |
Dividends from investment income—net | | | (.10) | (.12) | (.18) | — |
Dividends from net realized gain
on investments | | | — | — | (.20) | — |
Total Distributions | | | (.10) | (.12) | (.38) | — |
Proceeds from redemption fees—Note 3(e) | | | .00c | .03 | .01 | .01 |
Net asset value, end of period | | | 24.16 | 19.90 | 17.18 | 21.20 |
Total Return (%) | | | 22.06 | 16.64 | (17.44) | 11.40d |
Ratios/Supplemental Data (%): | | | | | | |
Ratio of total expenses to average net assetse | | | .86 | 1.01 | .93 | 1.29f |
Ratio of net expenses to average net assetse | | | .85 | 1.01 | .93 | 1.29f |
Ratio of net investment income
to average net assetse | | | .61 | .42 | .84 | 1.03f |
Portfolio Turnover Rate | | | 50.35 | 62.91 | 78.32 | 128.76 |
Net Assets, end of period ($ x 1,000) | | | 213,397 | 147,926 | 183,659 | 187,879 |
a From the close of business on January 31, 2014 (commencement of initial offering) to September 30, 2014.
b Based on average shares outstanding.
c Amount represents less than $.01 per share.
d Not annualized.
e Amount does not include the expenses of the underlying funds.
f Annualized.
See notes to financial statements.
25
NOTES TO FINANCIAL STATEMENTS
NOTE 1—Significant Accounting Policies:
Dreyfus Diversified Emerging Markets Fund (the “fund”) is a separate diversified series of Dreyfus Investment Funds (the “Trust”), which is registered under the Investment Company Act of 1940, as amended (the “Act”), as an open-end management investment company and operates as a series company currently offering seven series, including the fund. The fund’s investment objective is to seek long-term growth of capital. The Dreyfus Corporation (the “Manager” or “Dreyfus”), a wholly-owned subsidiary of The Bank of New York Mellon Corporation (“BNY Mellon”), serves as the fund’s investment adviser. Mellon Capital Management Corporation (“Mellon Capital”) and The Boston Company Asset Management, LLC (“TBCAM”), each a wholly-owned subsidiary of BNY Mellon and an affiliate of Dreyfus, serve as the fund’s sub-investment advisers.
Effective March 31, 2017, the fund authorized the issuance of Class T shares, but, as of the date of this report, the fund did not offer Class T shares for purchase.
MBSC Securities Corporation (the “Distributor”), a wholly-owned subsidiary of Dreyfus, is the distributor of the fund’s shares. The fund is authorized to issue an unlimited number of $.001 par value shares of Beneficial Interest in each of the following classes of shares: Class A, Class C, Class I, Class T and Class Y. Class A, Class C and Class T shares are sold primarily to retail investors through financial intermediaries and bear Distribution and/or Shareholder Services Plan fees. Class A and Class T shares generally are subject to a sales charge imposed at the time of purchase. Class C shares are subject to a contingent deferred sales charge (“CDSC”) imposed on Class C shares redeemed within one year of purchase. Class I shares are sold primarily to bank trust departments and other financial service providers (including The Bank of New York Mellon, a subsidiary of BNY Mellon and an affiliate of Dreyfus, and its affiliates), acting on behalf of customers having a qualified trust or an investment account or relationship at such institution, and bear no Distribution or Shareholder Services Plan fees. Class Y shares are sold at net asset value per share generally to institutional investors, and bear no Distribution or Shareholder Services Plan fees. Class I and Class Y shares are offered without a front-end sales charge or CDSC. Other differences between the classes include the services offered to and the expenses borne by each class, the allocation of certain transfer agency costs, and certain voting rights. Income, expenses (other than expenses attributable to a specific
26
class), and realized and unrealized gains or losses on investments are allocated to each class of shares based on its relative net assets.
The Trust accounts separately for the assets, liabilities and operations of each series. Expenses directly attributable to each series are charged to that series’ operations; expenses which are applicable to all series are allocated among them on a pro rata basis.
The Financial Accounting Standards Board (“FASB”) Accounting Standards Codification is the exclusive reference of authoritative U.S. generally accepted accounting principles (“GAAP”) recognized by the FASB to be applied by nongovernmental entities. Rules and interpretive releases of the Securities and Exchange Commission (“SEC”) under authority of federal laws are also sources of authoritative GAAP for SEC registrants. The fund’s financial statements are prepared in accordance with GAAP, which may require the use of management estimates and assumptions. Actual results could differ from those estimates.
(a) Portfolio valuation: The fair value of a financial instrument is the amount that would be received to sell an asset or paid to transfer a liability in an orderly transaction between market participants at the measurement date (i.e., the exit price). GAAP establishes a fair value hierarchy that prioritizes the inputs of valuation techniques used to measure fair value. This hierarchy gives the highest priority to unadjusted quoted prices in active markets for identical assets or liabilities (Level 1 measurements) and the lowest priority to unobservable inputs (Level 3 measurements).
Additionally, GAAP provides guidance on determining whether the volume and activity in a market has decreased significantly and whether such a decrease in activity results in transactions that are not orderly. GAAP requires enhanced disclosures around valuation inputs and techniques used during annual and interim periods.
Various inputs are used in determining the value of the fund’s investments relating to fair value measurements. These inputs are summarized in the three broad levels listed below:
Level 1—unadjusted quoted prices in active markets for identical investments.
Level 2—other significant observable inputs (including quoted prices for similar investments, interest rates, prepayment speeds, credit risk, etc.).
Level 3—significant unobservable inputs (including the fund’s own assumptions in determining the fair value of investments).
27
NOTES TO FINANCIAL STATEMENTS (continued)
The inputs or methodology used for valuing securities are not necessarily an indication of the risk associated with investing in those securities.
Changes in valuation techniques may result in transfers in or out of an assigned level within the disclosure hierarchy. Valuation techniques used to value the fund’s investments are as follows:
Investments in securities are valued at the last sales price on the securities exchange or national securities market on which such securities are primarily traded. Securities listed on the National Market System for which market quotations are available are valued at the official closing price or, if there is no official closing price that day, at the last sales price. For open short positions, asked prices are used for valuation purposes. Bid price is used when no asked price is available. Registered investment companies that are not traded on an exchange are valued at their net asset value. All of the preceding securities are generally categorized within Level 1 of the fair value hierarchy.
Securities not listed on an exchange or the national securities market, or securities for which there were no transactions, are valued at the average of the most recent bid and asked prices. These securities are generally categorized within Level 2 of the fair value hierarchy.
Fair valuing of securities may be determined with the assistance of a pricing service using calculations based on indices of domestic securities and other appropriate indicators, such as prices of relevant ADRs and futures. Utilizing these techniques may result in transfers between Level 1 and Level 2 of the fair value hierarchy.
When market quotations or official closing prices are not readily available, or are determined not to reflect accurately fair value, such as when the value of a security has been significantly affected by events after the close of the exchange or market on which the security is principally traded (for example, a foreign exchange or market), but before the fund calculates its net asset value, the fund may value these investments at fair value as determined in accordance with the procedures approved by the Trust’s Board of Trustees (the “Board”). Certain factors may be considered when fair valuing investments such as: fundamental analytical data, the nature and duration of restrictions on disposition, an evaluation of the forces that influence the market in which the securities are purchased and sold, and public trading in similar securities of the issuer or comparable issuers. These securities are either categorized within Level 2 or 3 of the fair value hierarchy depending on the relevant inputs used.
28
For restricted securities where observable inputs are limited, assumptions about market activity and risk are used and are generally categorized within Level 3 of the fair value hierarchy.
Investments denominated in foreign currencies are translated to U.S. dollars at the prevailing rates of exchange.
Forward foreign currency exchange contracts (“forward contracts”) are valued at the forward rate and are generally categorized within Level 2 of the fair value hierarchy.
The following is a summary of the inputs used as of September 30, 2017 in valuing the fund’s investments:
| | | | | | |
| | Level 1 - Unadjusted Quoted Prices | Level 2 - Other Significant Observable Inputs | | Level 3 - Significant Unobservable Inputs | Total |
Assets ($) | | | |
Investments in Securities: | | | |
Equity Securities – Foreign
Common Stocks† | 107,796,794 | — | | — | 107,796,794 |
Equity Securities - Foreign
Preferred Stocks† | 4,953,948 | — | | — | 4,953,948 |
Exchange-Traded Funds | 6,706,600 | — | | — | 6,706,600 |
Registered Investment Companies | 96,591,492 | — | | — | 96,591,492 |
† See Statement of Investments for additional detailed categorizations.
At September 30, 2016, $74,667,823 of exchange traded foreign equity securities were classified within Level 2 of the fair value hierarchy pursuant to the fund’s fair valuation procedures. It is the fund’s policy to recognize transfers between levels at the end of the reporting period.
(b) Foreign currency transactions: The fund does not isolate that portion of the results of operations resulting from changes in foreign exchange rates on investments from the fluctuations arising from changes in the market prices of securities held. Such fluctuations are included with the net realized and unrealized gain or loss on investments.
Net realized foreign exchange gains or losses arise from sales of foreign currencies, currency gains or losses realized on securities transactions between trade and settlement date, and the difference between the amounts of dividends, interest and foreign withholding taxes recorded on the fund’s books and the U.S. dollar equivalent of the amounts actually received or paid. Net unrealized foreign exchange gains and losses arise from changes in the value of assets and liabilities other than investments
29
NOTES TO FINANCIAL STATEMENTS (continued)
resulting from changes in exchange rates. Foreign currency gains and losses on foreign currency transactions are also included with net realized and unrealized gain or loss on investments.
(c) Securities transactions and investment income: Securities transactions are recorded on a trade date basis. Realized gains and losses from securities transactions are recorded on the identified cost basis. Dividend income is recognized on the ex-dividend date and interest income, including, where applicable, accretion of discount and amortization of premium on investments, is recognized on the accrual basis.
Pursuant to a securities lending agreement with The Bank of New York Mellon, the fund may lend securities to qualified institutions. It is the fund’s policy that, at origination, all loans are secured by collateral of at least 102% of the value of U.S. securities loaned and 105% of the value of foreign securities loaned. Collateral equivalent to at least 100% of the market value of securities on loan is maintained at all times. Collateral is either in the form of cash, which can be invested in certain money market mutual funds managed by Dreyfus, or U.S. Government and Agency securities. The fund is entitled to receive all dividends, interest and distributions on securities loaned, in addition to income earned as a result of the lending transaction. Should a borrower fail to return the securities in a timely manner, The Bank of New York Mellon is required to replace the securities for the benefit of the fund or credit the fund with the market value of the unreturned securities and is subrogated to the fund’s rights against the borrower and the collateral. Additionally, the contractual maturity of security lending transactions are on an overnight and continuous basis. During the period ended September 30, 2017, The Bank of New York Mellon earned $1,269 from lending portfolio securities, pursuant to the securities lending agreement.
(d) Affiliated issuers: Investments in other investment companies advised by Dreyfus are defined as “affiliated” under the Act.
(e) Risk: Investing in foreign markets may involve special risks and considerations not typically associated with investing in the U.S. These risks include revaluation of currencies, high rates of inflation, repatriation restrictions on income and capital, and adverse political and economic developments. Moreover, securities issued in these markets may be less liquid, subject to government ownership controls and delayed settlements, and their prices may be more volatile than those of comparable securities in the U.S.
30
(f) Dividends and distributions to shareholders: Dividends and distributions are recorded on the ex-dividend date. Dividends from investment income-net and dividends from net realized capital gains, if any, are normally declared and paid annually, but the fund may make distributions on a more frequent basis to comply with the distribution requirements of the Internal Revenue Code of 1986, as amended (the “Code”). To the extent that net realized capital gains can be offset by capital loss carryovers, it is the policy of the fund not to distribute such gains. Income and capital gain distributions are determined in accordance with income tax regulations, which may differ from GAAP.
(g) Federal income taxes: It is the policy of the fund to continue to qualify as a regulated investment company, if such qualification is in the best interests of its shareholders, by complying with the applicable provisions of the Code, and to make distributions of taxable income sufficient to relieve it from substantially all federal income and excise taxes.
As of and during the period ended September 30, 2017, the fund did not have any liabilities for any uncertain tax positions. The fund recognizes interest and penalties, if any, related to uncertain tax positions as income tax expense in the Statement of Operations. During the period ended September 30, 2017, the fund did not incur any interest or penalties.
Each tax year in the four-year period ended September 30, 2017 remains subject to examination by the Internal Revenue Service and state taxing authorities.
At September 30, 2017, the components of accumulated earnings on a tax basis were as follows: undistributed ordinary income $940,040, accumulated capital losses $23,427,564 and unrealized appreciation $45,137,285.
Under the Regulated Investment Company Modernization Act of 2010, the fund is permitted to carry forward capital losses for an unlimited period. Furthermore, capital loss carryovers retain their character as either short-term or long-term capital losses.
The accumulated capital loss carryover is available for federal income tax purposes to be applied against future net realized capital gains, if any, realized subsequent to September 30, 2017. The fund has $11,640,865 of short-term capital losses and $11,786,699 of long-term capital losses which can be carried forward for an unlimited period.
The tax character of distributions paid to shareholders during the fiscal periods ended September 30, 2017 and September 30, 2016 were as follows: ordinary income $721,247 and $1,067,948, respectively.
31
NOTES TO FINANCIAL STATEMENTS (continued)
During the period ended September 30, 2017, as a result of permanent book to tax differences, primarily due to the tax treatment for foreign currency gains and losses, foreign capital gains taxes and passive foreign investment companies, the fund decreased accumulated undistributed investment income-net by $187,970 and increased accumulated net realized gain (loss) on investments by the same amount. Net assets and net asset value per share were not affected by this reclassification.
NOTE 2—Bank Lines of Credit:
The fund participates with other Dreyfus-managed funds in an $810 million unsecured credit facility led by Citibank, N.A. and a $300 million unsecured credit facility provided by The Bank of New York Mellon (each, a “Facility”), each to be utilized primarily for temporary or emergency purposes, including the financing of redemptions. Prior to October 5, 2016, the unsecured credit facility with Citibank, N.A. was $555 million. In connection therewith, the fund has agreed to pay its pro rata portion of commitment fees for each Facility. Interest is charged to the fund based on rates determined pursuant to the terms of the respective Facility at the time of borrowing. During the period ended September 30, 2017, the fund did not borrow under the Facilities.
NOTE 3—Investment Advisory Fee, Sub-Investment Advisory Fee, Administration Fee and Other Transactions with Affiliates:
(a) Pursuant to an investment advisory agreement with Dreyfus, the fund has agreed to pay an investment advisory fee at the annual rate of 1.10% of the value of the fund’s average daily net assets other than assets allocated to investments in other investment companies (other underlying funds, which may consist of affiliated funds, mutual funds and exchange traded funds) and is payable monthly. Therefore the fund’s investment advisory fee will fluctuate based on the fund’s allocation between underlying and direct investments. Dreyfus had contractually agreed, from October 1, 2016 through February 1, 2017, to waive receipt of its fees and/or assume the direct expenses of the fund, so that the expenses of Class A, C, I and Y shares (excluding Rule 12b-1 Distribution Plan fees, Shareholder Services Plan fees, taxes, interest expense, brokerage commissions, commitment fees on borrowings, acquired fund fees and expenses of the underlying fund and extraordinary expenses) did not exceed 1.35%, 1.35%, 1.35% and 1.30% of the value of the respective class’ average daily net assets. Dreyfus has also contractually agreed, from February 2, 2017 through February 1, 2019, to waive receipt of its fees and/or assume the expenses of the fund, so that the expenses of Class A, Class C, Class I and Class Y shares (excluding certain expenses as described above) do not exceed 1.30% of the value of the fund’s average daily net assets. The reduction in expenses,
32
pursuant to the undertaking, amounted to $28 during the period ended September 30, 2017.
Pursuant to separate sub-investment advisory agreements between Dreyfus, TBCAM and Mellon Capital, each serves as the fund’s sub-investment adviser responsible for the day-to-day management of a portion of the fund’s portfolio. Dreyfus pays each sub-investment adviser a monthly fee at an annual percentage of the value of the fund’s average daily net assets. Dreyfus has obtained an exemptive order from the SEC (the “Order”), upon which the fund may rely, to use a manager of managers approach that permits Dreyfus, subject to certain conditions and approval by the Board, to enter into and materially amend sub-investment advisory agreements with one or more sub-investment advisers who are either unaffiliated with Dreyfus or are wholly-owned subsidiaries (as defined under the Act) of Dreyfus’ ultimate parent company, BNY Mellon, without obtaining shareholder approval. The Order also allows the fund to disclose the sub-investment advisory fee paid by Dreyfus to any unaffiliated sub-investment adviser in the aggregate with other unaffiliated sub-investment advisers in documents filed with the SEC and provided to shareholders. In addition, pursuant to the Order, it is not necessary to disclose the sub-investment advisory fee payable by Dreyfus separately to a sub-investment adviser that is a wholly-owned subsidiary of BNY Mellon in documents filed with the SEC and provided to shareholders; such fees are to be aggregated with fees payable to Dreyfus. Dreyfus has ultimate responsibility (subject to oversight by the Board) to supervise any sub-investment adviser and recommend the hiring, termination, and replacement of any sub-investment adviser to the Board.
The fund has a Fund Accounting and Administrative Services Agreement (the “Administration Agreement”) with Dreyfus, whereby Dreyfus performs administrative, accounting and recordkeeping services for the fund. The fund has agreed to compensate Dreyfus for providing accounting and recordkeeping services, administration, compliance monitoring, regulatory and shareholder reporting, as well as related facilities, equipment and clerical help. The fee is based on the fund’s average daily net assets and computed at the following annual rates: .10% of the first $500 million, .065% of the next $500 million and .02% in excess of $1 billion.
In addition, after applying any expense limitations or fee waivers that reduce the fees paid to Dreyfus for this service, Dreyfus has contractually agreed in writing to waive any remaining fees for this service to the extent that they exceed both Dreyfus’ costs in providing these services and a reasonable allocation of the costs incurred by Dreyfus and its affiliates
33
NOTES TO FINANCIAL STATEMENTS (continued)
related to the support and oversight of these services. The fund also reimburses Dreyfus for the out-of-pocket expenses incurred in performing this service for the fund. Pursuant to the Administration Agreement, the fund was charged $92,007 during the period ended September 30, 2017.
During the period ended September 30, 2017, the Distributor retained $966 from commissions earned on sales of the fund’s Class A shares.
(b) Under the Distribution Plan adopted pursuant to Rule 12b-1 under the Act, Class C shares pay the Distributor for distributing its shares at an annual rate of .75% of the value of its average daily net assets. During the period ended September 30, 2017, Class C shares were charged $355 pursuant to the Distribution Plan.
(c) Under the Shareholder Services Plan, Class A and Class C shares pay the Distributor at an annual rate of .25% of the value of their average daily net assets for the provision of certain services. The services provided may include personal services relating to shareholder accounts, such as answering shareholder inquiries regarding the fund and providing reports and other information, and services related to the maintenance of shareholder accounts. The Distributor may make payments to Service Agents (securities dealers, financial institutions or other industry professionals) with respect to these services. The Distributor determines the amounts to be paid to Service Agents. During the period ended September 30, 2017, Class A and Class C shares were charged $2,129 and $118, respectively, pursuant to the Shareholder Services Plan.
Under its terms, the Distribution Plan and Shareholder Services Plan shall remain in effect from year to year, provided such continuance is approved annually by a vote of a majority of those Trustees who are not “interested persons” of the Trust and who have no direct or indirect financial interest in the operation of or in any agreement related to the Distribution Plan or Shareholder Services Plan.
The fund has arrangements with the transfer agent and the custodian whereby the fund may receive earnings credits when positive cash balances are maintained, which are used to offset transfer agency and custody fees. For financial reporting purposes, the fund includes net earnings credits as an expense offset in the Statement of Operations.
The fund compensates Dreyfus Transfer, Inc., a wholly-owned subsidiary of Dreyfus, under a transfer agency agreement for providing transfer agency and cash management services for the fund. The majority of transfer agency fees are comprised of amounts paid on a per account basis, while cash management fees are related to fund subscriptions and redemptions. During the period ended September 30, 2017, the fund was
34
charged $2,365 for transfer agency services and $103 for cash management services. These fees are included in Shareholder servicing costs in the Statement of Operations. Cash management fees were offset by earnings credits of $103.
The fund compensates The Bank of New York Mellon under a custody agreement for providing custodial services for the fund. These fees are determined based on net assets, geographic region and transaction activity. During the period ended September 30, 2017, the fund was charged $91,129 pursuant to the custody agreement. These fees were offset by earnings credits of $9,332.
During the period ended September 30, 2017, the fund was charged $11,281 for services performed by the Chief Compliance Officer and his staff.
The components of “Due to The Dreyfus Corporation and affiliates” in the Statement of Assets and Liabilities consist of: investment advisory fees $106,437, administration fees $9,676, Distribution Plan fees $18, Shareholder Services Plan fees $194, custodian fees $48,836, Chief Compliance Officer fees $5,604 and transfer agency fees $629, which are offset again an expense reimbursement currently in effect in the amount of $9.
(d) Each Board member also serves as a Board member of other funds within the Dreyfus complex. Annual retainer fees and attendance fees are allocated to each fund based on net assets.
(e) A 2% redemption fee is charged and retained by the fund on certain shares redeemed within sixty days following the date of issuance subject to certain exceptions, including redemptions made through use of the fund’s exchange privilege. During the period ended September 30, 2017, redemption fees charged and retained by the fund amounted to $37,812.
NOTE 4—Securities Transactions:
The aggregate amount of purchases and sales of investment securities, excluding short-term securities and forward contracts, during the period ended September 30, 2017, amounted to $114,814,135 and $84,504,662, respectively.
Derivatives: A derivative is a financial instrument whose performance is derived from the performance of another asset. The fund enters into International Swaps and Derivatives Association, Inc. Master Agreements or similar agreements (collectively, “Master Agreements”) with its over-the-counter (“OTC”) derivative contract counterparties in order to, among other things, reduce its credit risk to counterparties. Master Agreements
35
NOTES TO FINANCIAL STATEMENTS (continued)
include provisions for general obligations, representations, collateral and events of default or termination. Under a Master Agreement, the fund may offset with the counterparty certain derivative financial instrument’s payables and/or receivables with collateral held and/or posted and create one single net payment in the event of default or termination.
Each type of derivative instrument that was held by the fund during the period ended September 30, 2017 is discussed below.
Forward Foreign Currency Exchange Contracts: The fund enters into forward contracts in order to hedge its exposure to changes in foreign currency exchange rates on its foreign portfolio holdings, to settle foreign currency transactions or as a part of its investment strategy. When executing forward contracts, the fund is obligated to buy or sell a foreign currency at a specified rate on a certain date in the future. With respect to sales of forward contracts, the fund incurs a loss if the value of the contract increases between the date the forward contract is opened and the date the forward contract is closed. The fund realizes a gain if the value of the contract decreases between those dates. With respect to purchases of forward contracts, the fund incurs a loss if the value of the contract decreases between the date the forward contract is opened and the date the forward contract is closed. The fund realizes a gain if the value of the contract increases between those dates. Any realized or unrealized gains or losses which occurred during the period are reflected in the Statement of Operations. The fund is exposed to foreign currency risk as a result of changes in value of underlying financial instruments. The fund is also exposed to credit risk associated with counterparty nonperformance on these forward contracts, which is generally limited to the unrealized gain on each open contract. This risk may be mitigated by Master Agreements, if any, between the fund and the counterparty and the posting of collateral, if any, by the counterparty to the fund to cover the fund’s exposure to the counterparty. At September 30, 2017, there were no forward contracts outstanding.
The following summarizes the average market value of derivatives outstanding during the period ended September 30, 2017:
| | | |
| | Average Market Value ($) |
Forward contracts | | 113,757 |
| | | |
At September 30, 2017, the cost of investments for federal income tax purposes was $170,902,961; accordingly, accumulated net unrealized appreciation on investments was $45,145,873, consisting of $49,057,954 gross unrealized appreciation and $3,912,081 gross unrealized depreciation.
36
REPORT OF INDEPENDENT REGISTERED
PUBLIC ACCOUNTING FIRM
The Board of Trustees and Shareholders of
Dreyfus Investment Funds
We have audited the accompanying statement of assets and liabilities of Dreyfus Diversified Emerging Markets Fund (the “Fund”), a series of Dreyfus Investment Funds, including the statements of investments and investments in affiliated issuers, as of September 30, 2017, and the related statement of operations for the year then ended, the statements of changes in net assets for each of the years in the two-year period then ended, and the financial highlights for each of the years or periods in the five-year period then ended. These financial statements and financial highlights are the responsibility of the Fund’s management. Our responsibility is to express an opinion on these financial statements and financial highlights based on our audits.
We conducted our audits in accordance with the standards of the Public Company Accounting Oversight Board (United States). Those standards require that we plan and perform the audit to obtain reasonable assurance about whether the financial statements and financial highlights are free of material misstatement. An audit includes examining, on a test basis, evidence supporting the amounts and disclosures in the financial statements. Our procedures included confirmation of securities owned as of September 30, 2017, by correspondence with the custodian and brokers or by other appropriate auditing procedures. An audit also includes assessing the accounting principles used and significant estimates made by management, as well as evaluating the overall financial statement presentation. We believe that our audits provide a reasonable basis for our opinion.
In our opinion, the financial statements and financial highlights referred to above present fairly, in all material respects, the financial position of Dreyfus Diversified Emerging Markets Fund as of September 30, 2017, the results of its operations for the year then ended, the changes in its net assets for each of the years in the two-year period then ended, and the financial highlights for each of the years or periods in the five-year period then ended, in conformity with U.S. generally accepted accounting principles.

New York, New York
November 22, 2017
37
IMPORTANT TAX INFORMATION (Unaudited)
For federal tax purposes, the fund elects to provide each shareholder with their portion of the fund’s income sourced from foreign countries and taxes paid from foreign countries. The fund reports the maximum amount allowable but not less than $2,449,316 as income sourced from foreign countries for the fiscal year ended September 30, 2017 in accordance with Section 853(c)(2) of the Internal Revenue Code and also the fund reports the maximum amount allowable but not less than $422,829 as taxes paid from foreign countries for the fiscal year ended September 30, 2017 in accordance with Section 853(a) of the Internal Revenue Code. Where required by federal tax rules, shareholders will receive notification of their proportionate share of foreign sourced income and foreign taxes paid for the 2017 calendar year with Form 1099-DIV which will be mailed in early 2018. Also, the fund reports the maximum amount allowable, but not less than $721,247 as ordinary income dividends paid during the fiscal year ended September 30, 2017 as qualified dividend income in accordance with Section 854(b)(1)(B) Section 852(b)(3)(C) of the Internal Revenue Code.
38
BOARD MEMBERS INFORMATION (Unaudited)
INDEPENDENT BOARD MEMBERS
Joseph S. DiMartino (73)
Chairman of the Board (2008)
Principal Occupation During Past 5 Years:
· Corporate Director and Trustee (1995-present)
Other Public Company Board Memberships During Past 5 Years:
· CBIZ (formerly, Century Business Services, Inc.), a provider of outsourcing functions for small and medium size companies, Director (1997-present)
No. of Portfolios for which Board Member Serves: 127
———————
Francine J. Bovich (66)
Board Member (2011)
Principal Occupation During Past 5 Years:
· Trustee, The Bradley Trusts, private trust funds (2011-present)
Other Public Company Board Memberships During Past 5 Years:
· Annaly Capital Management, Inc., Board Member (May 2014-present)
No. of Portfolios for which Board Member Serves: 75
———————
Kenneth A. Himmel (71)
Board Member (2008)
Principal Occupation During Past 5 Years:
· Managing Partner, Gulf Related, an international real estate development company (2010-present)
· President and CEO, Related Urban Development, a real estate development company (1996-present)
· President and CEO, Himmel & Company, a real estate development company (1980-present)
· CEO, American Food Management, a restaurant company (1983-present)
No. of Portfolios for which Board Member Serves: 28
———————
39
BOARD MEMBERS INFORMATION (Unaudited) (continued)
INDEPENDENT BOARD MEMBERS (continued)
Stephen J. Lockwood (70)
Board Member (2008)
Principal Occupation During Past 5 Years:
· Chairman of the Board, Stephen J. Lockwood and Company LLC, a real estate investment company (2000-present)
No. of Portfolios for which Board Member Serves: 28
———————
Roslyn M. Watson (67)
Board Member (2008)
Principal Occupation During Past 5 Years:
· Principal, Watson Ventures, Inc., a real estate investment company (1993-present)
No. of Portfolios for which Board Member Serves: 61
———————
Benaree Pratt Wiley (71)
Board Member (2008)
Principal Occupation During Past 5 Years:
· Principal, The Wiley Group, a firm specializing in strategy and business development (2005-present)
Other Public Company Board Memberships During Past 5 Years:
· CBIZ (formerly, Century Business Services, Inc.), a provider of outsourcing functions for small and medium size companies, Director (2008-present)
No. of Portfolios for which Board Member Serves: 82
———————
Once elected all Board Members serve for an indefinite term, but achieve Emeritus status upon reaching age 80. The address of the Board Members and Officers is c/o The Dreyfus Corporation, 200 Park Avenue, New York, New York 10166. Additional information about the Board Members is available in the fund’s Statement of Additional Information which can be obtained from Dreyfus free of charge by calling this toll free number: 1-800-DREYFUS.
James M. Fitzgibbons, Emeritus Board Member
40
OFFICERS OF THE FUND (Unaudited)
BRADLEY J. SKAPYAK, President since January 2010.
Chief Operating Officer and a director of the Manager since June 2009, Chairman of Dreyfus Transfer, Inc., an affiliate of the Manager and the transfer agent of the funds, since May 2011 and Chief Executive Officer of MBSC Securities Corporation since August 2016. He is an officer of 61 investment companies (comprised of 127 portfolios) managed by the Manager. He is 58 years old and has been an employee of the Manager since February 1988.
BENNETT A. MACDOUGALL, Chief Legal Officer since October 2015.
Chief Legal Officer of the Manager and Associate General Counsel and Managing Director of BNY Mellon since June 2015; from June 2005 to June 2015, he served in various capacities with Deutsche Bank – Asset & Wealth Management Division, including as Director and Associate General Counsel, and Chief Legal Officer of Deutsche Investment Management Americas Inc. from June 2012 to May 2015. He is an officer of 62 investment companies (comprised of 152 portfolios) managed by the Manager. He is 46 years old and has been an employee of the Manager since June 2015.
JANETTE E. FARRAGHER, Vice President and Secretary since December 2011.
Associate General Counsel of BNY Mellon, and an officer of 62 investment companies (comprised of 152 portfolios) managed by the Manager. She is 54 years old and has been an employee of the Manager since February 1984.
JAMES BITETTO, Vice President and Assistant Secretary since December 2008.
Managing Counsel of BNY Mellon and Secretary of the Manager, and an officer of 62 investment companies (comprised of 152 portfolios) managed by the Manager. He is 51 years old and has been an employee of the Manager since December 1996.
JOSEPH M. CHIOFFI, Vice President and Assistant Secretary since December 2008.
Managing Counsel of BNY Mellon, and an officer of 62 investment companies (comprised of 152 portfolios) managed by the Manager. He is 55 years old and has been an employee of the Manager since June 2000.
MAUREEN E. KANE, Vice President and Assistant Secretary since April 2015.
Managing Counsel of BNY Mellon since July 2014; from October 2004 until July 2014, General Counsel, and from May 2009 until July 2014, Chief Compliance Officer of Century Capital Management. She is an officer of 62 investment companies (comprised of 152 portfolios) managed by the Manager. She is 55 years old and has been an employee of the Manager since July 2014.
SARAH S. KELLEHER, Vice President and Assistant Secretary since April 2014.
Senior Counsel of BNY Mellon since March 2013, from August 2005 to March 2013, Associate General Counsel of Third Avenue Management. She is an officer of 62 investment companies (comprised of 152 portfolios) managed by the Manager. She is 42 years old and has been an employee of the Manager since March 2013.
JEFF PRUSNOFSKY, Vice President and Assistant Secretary since December 2008.
Senior Managing Counsel of BNY Mellon, and an officer of 62 investment companies (comprised of 152 portfolios) managed by the Manager. He is 52 years old and has been an employee of the Manager since October 1990.
NATALYA ZELENSKY, Vice President and Assistant Secretary since March 2017.
Counsel and Vice President of BNY Mellon since May 2016; Attorney at Wildermuth Endowment Strategy Fund/Wildermuth Advisory, LLC from November 2015 until May 2016; Assistant General Counsel at RCS Advisory Services from July 2014 until November 2015; Associate at Sutherland, Asbill & Brennan from January 2013 until January 2014; Associate at K&L Gates from October 2011 until January 2013. She is an officer of 62 investment companies (comprised of 152 portfolios) managed by Dreyfus. She is 32 years old and has been an employee of the Manager since May 2016.
JAMES WINDELS, Treasurer since December 2008.
Director – Mutual Fund Accounting of the Manager, and an officer of 62 investment companies (comprised of 152 portfolios) managed by the Manager. He is 59 years old and has been an employee of the Manager since April 1985.
41
OFFICERS OF THE FUND (Unaudited) (continued)
RICHARD CASSARO, Assistant Treasurer since December 2008.
Senior Accounting Manager – Money Market and Municipal Bond Funds of the Manager, and an officer of 62 investment companies (comprised of 152 portfolios) managed by the Manager. He is 58 years old and has been an employee of the Manager since September 1982.
GAVIN C. REILLY, Assistant Treasurer since December 2005.
Tax Manager of the Investment Accounting and Support Department of the Manager, and an officer of 62 investment companies (comprised of 152 portfolios) managed by the Manager. He is 49 years old and has been an employee of the Manager since April 1991.
ROBERT S. ROBOL, Assistant Treasurer since December 2008.
Senior Accounting Manager – Dreyfus Financial Reporting of the Manager, and an officer of 62 investment companies (comprised of 152 portfolios) managed by the Manager. He is 53 years old and has been an employee of the Manager since October 1988.
ROBERT SALVIOLO, Assistant Treasurer since December 2008.
Senior Accounting Manager – Equity Funds of the Manager, and an officer of 62 investment companies (comprised of 152 portfolios) managed by the Manager. He is 50 years old and has been an employee of the Manager since June 1989.
ROBERT SVAGNA, Assistant Treasurer since December 2008.
Senior Accounting Manager – Fixed Income and Equity Funds of the Manager, and an officer of 62 investment companies (comprised of 152 portfolios) managed by the Manager. He is 50 years old and has been an employee of the Manager since November 1990.
JOSEPH W. CONNOLLY, Chief Compliance Officer since December 2008.
Chief Compliance Officer of the Manager and The Dreyfus Family of Funds (62 investment companies, comprised of 152 portfolios). He is 60 years old and has served in various capacities with the Manager since 1980, including manager of the firm’s Fund Accounting Department from 1997 through October 2001.
CARIDAD M. CAROSELLA, Anti-Money Laundering Compliance Officer since January 2016.
Anti-Money Laundering Compliance Officer of the Dreyfus Family of Funds and BNY Mellon Funds Trust since January 2016; from May 2015 to December 2015, Interim Anti-Money Laundering Compliance Officer of the Dreyfus Family of Funds and BNY Mellon Funds Trust and the Distributor; from January 2012 to May 2015, AML Surveillance Officer of the Distributor and from 2007 to December 2011, Financial Processing Manager of the Distributor. She is an officer of 57 investment companies (comprised of 147 portfolios) managed by the Manager. She is 49 years old and has been an employee of the Distributor since 1997.
42
NOTES
43
NOTES
44
NOTES
45
Dreyfus Diversified Emerging Markets Fund
200 Park Avenue
New York, NY 10166
Manager
The Dreyfus Corporation
200 Park Avenue
New York, NY 10166
Sub-Investment Adviser
Mellon Capital Management Corporation
50 Fremont Street, Suite 3900
San Francisco, CA 94105
The Boston Company Asset Management, LLC
BNY Mellon Center One Boston Place
Boston, MA 02108
Custodian
The Bank of New York Mellon
225 Liberty Street
New York, NY 10286
Transfer Agent &
Dividend Disbursing Agent
Dreyfus Transfer, Inc.
200 Park Avenue
New York, NY 10166
Distributor
MBSC Securities Corporation
200 Park Avenue
New York, NY 10166
| | |
Ticker Symbols: | Class A: DBEAX Class C: DBECX Class I: SBCEX Class Y: SBYEX |
Telephone Call your financial representative or 1-800-DREYFUS
Mail The Dreyfus Family of Funds, 144 Glenn Curtiss Boulevard, Uniondale, NY 11556-0144
E-mail Send your request to info@dreyfus.com
Internet Information can be viewed online or downloaded at www.dreyfus.com
The fund files its complete schedule of portfolio holdings with the Securities and Exchange Commission (“SEC”) for the first and third quarters of each fiscal year on Form N-Q. The fund’s Forms N-Q are available on the SEC’s website at www.sec.gov and may be reviewed and copied at the SEC’s Public Reference Room in Washington, D.C. (phone 1-800-SEC-0330 for information).
A description of the policies and procedures that the fund uses to determine how to vote proxies relating to portfolio securities and information regarding how the fund voted these proxies for the most recent 12-month period ended June 30 is available at www.dreyfus.com and on the SEC’s website at www.sec.gov and without charge, upon request, by calling 1-800-DREYFUS.
| | |
© 2017 MBSC Securities Corporation
6919AR0917 | 
|
Dreyfus/Newton International Equity Fund
| | | |

| | ANNUAL REPORT September 30, 2017 |
| |
Save time. Save paper. View your next shareholder report online as soon as it’s available. Log into www.dreyfus.com and sign up for Dreyfus eCommunications. It’s simple and only takes a few minutes. |
| |
The views expressed in this report reflect those of the portfolio manager(s) only through the end of the period covered and do not necessarily represent the views of Dreyfus or any other person in the Dreyfus organization. Any such views are subject to change at any time based upon market or other conditions and Dreyfus disclaims any responsibility to update such views. These views may not be relied on as investment advice and, because investment decisions for a Dreyfus fund are based on numerous factors, may not be relied on as an indication of trading intent on behalf of any Dreyfus fund. |
| |
Not FDIC-Insured • Not Bank-Guaranteed • May Lose Value |
Contents
T H E F U N D
F O R M O R E I N F O R M AT I O N
Back Cover
| | | | |
| |
Dreyfus/Newton International Equity Fund
| | The Fund |
A LETTER FROM THE CEO OF DREYFUS
Dear Shareholder:
We are pleased to present this annual report for Dreyfus/Newton International Equity Fund, covering the 12-month period from October 1, 2016 through September 30, 2017. For information about how the fund performed during the reporting period, as well as general market perspectives, we provide a Discussion of Fund Performance on the pages that follow.
Stocks set a series of new record highs and bonds produced mixed results over the past year in response to changing economic and political conditions. Financial markets during the final months of 2016 were dominated by the election of a new U.S. presidential administration. Equities and corporate-backed bonds surged higher in anticipation of more business-friendly regulatory, tax, and fiscal policies, but high-quality bonds generally lost value due to expectations of rising interest rates and accelerating inflation in a stronger economy. Despite a series of short-term interest rate hikes, bonds recovered most or all of their previous losses over the first nine months of 2017 when it became clearer that pro-growth legislation would take time and political capital to enact. U.S. and international stocks continued to rally as corporate earnings grew and global economic conditions improved.
The markets’ recent strong performance has been supported by solid underlying fundamentals. While we currently expect these favorable conditions to persist, we remain watchful for economic and political developments that could derail the rallies. As always, we encourage you to discuss the risks and opportunities of today’s investment environment with your financial advisor.
Thank you for your continued confidence and support.
Sincerely,

Mark D. Santero
Chief Executive Officer
The Dreyfus Corporation
October 16, 2017
2
DISCUSSION OF FUND PERFORMANCE
For the period from October 1, 2016 through September 30, 2017, as provided by portfolio managers Paul Markham and Jeff Munroe, of Newton Investment Management (North America) Limited, Sub-Investment Adviser
Market and Fund Performance Overview
For the 12-month period ended September 30, 2017, Dreyfus/Newton International Equity Fund’s Class A shares produced a total return of 14.76%, Class C shares returned 13.83%, Class I shares returned 15.02%, and Class Y shares returned 15.11%.1,2 In comparison, the fund’s benchmark, the MSCI EAFE Index (the “Index”), produced a total return of 19.10% for the same period.3
International equities gained ground over the reporting period amid improving economic data and rising corporate earnings. The fund lagged its benchmark, largely due to sector allocation shortfalls in the financials sector and overweighted exposure in the consumer staples sector.
The Fund’s Investment Approach
The fund seeks long-term growth of capital. To pursue its goal, the fund normally invests at least 80% of its net assets, plus any borrowings for investment purposes, in common stocks or securities convertible into common stocks of foreign companies and depositary receipts evidencing ownership in such securities.
The core of the investment philosophy of Newton Investment Management (North America) Limited (“Newton”), the fund’s sub-investment adviser, is the belief that no company, market or economy can be considered in isolation; each must be understood within a global context. Newton believes that a global comparison of companies is the most effective method of stock analysis, and Newton’s global analysts research investment opportunities by global sector rather than by region.
The process begins by identifying a core list of investment themes that Newton believes will positively or negatively affect certain sectors or industries and cause stocks within these sectors or industries to outperform or underperform others. Newton then identifies specific companies using these investment themes to help focus on areas where thematic and strategic research indicates superior returns are likely to be achieved. Sell decisions for individual stocks will typically be a result of one or more of the following: a change in investment theme or strategy, profit-taking, a significant change in the prospects of a company, price movement and market activity have created an extreme valuation, and the valuation of a company has become expensive against its peers.
Political Stability and Economic Growth Buoyed Markets
The Index began the reporting period with mild declines over the final months of 2016 when investors responded cautiously to political uncertainty in the United States, which culminated in the unexpected election of a new presidential administration. However, evidence of greater global economic growth in early 2017 sparked sustained rallies in international markets. Eurozone stocks were bolstered by an improving regional economy, better-than-expected corporate earnings, and encouraging statements from the European Central Bank. At the same time, Dutch and French election results reaffirmed regional unity by rejecting nationalist candidates. The United Kingdom participated in the market’s rise but lagged its neighbors as the country began the process of exiting the European Union. In Japan, solid corporate financial results and a more positive economic outlook bolstered returns. However, Japanese equities rose at a more modest pace than in Europe when a weakening yen threatened to dampen export activity.
Financial Stocks Led Global Markets Higher
The fund’s performance compared to the Index was undermined during the reporting period by its sector allocation strategy, particularly a relatively low allocation to the financials sector, which led the market’s advance, and overweighted exposure to the consumer staples sector. From a security selection perspective, favorable stock picks in the telecommunication services, financials, and information
3
DISCUSSION OF FUND PERFORMANCE (continued)
technology sectors were largely offset by disappointments in the health care, consumer discretionary, real estate, and materials sectors.
In the consumer staples sector, Japan Tobacco lost value due to concerns about the company’s ability to compete in “next-generation” products in its home market. Among health care companies, Teva Pharmaceutical Industries in Israel has struggled with competitive and pricing pressures, and China Biologic Products was hurt by weaker short-term dynamics in the Chinese plasma market. Other significant individual detractors from relative performance included Dutch corporate services provider Intertrust, German real estate company LEG Immobilien, and Japanese pharmacy operator Sugi Holdings.
On a more positive note, the Royal Bank of Scotland Group delivered strong operating performance towards the end of the reporting period as expectations for a U.K. interest-rate hike grew. Germany-based Infineon Technologies benefited from a number of secular trends, including electric vehicle adoption, automation, alternative energy, and regulatory pressures to reduce automobiles’ carbon dioxide emissions.
At times, the fund used futures contracts to manage its currency exposures.
Assessing the Trade-Off Between Risk and Reward
Momentum in the global economy currently appears to be slowing. With central banks bent on tightening their monetary policies, a spike in borrowing costs could spark instability in the financial markets. We believe that such a setting calls for a discriminating and company-specific assessment of potential risks and rewards. In this environment, we have identified ample opportunities meeting our investment criteria in the information technology sector, but relatively few in the materials and financials sectors.
October 16, 2017
1 The Dreyfus Corporation (Dreyfus) serves as the investment adviser for the fund. Newton Investment Management North America Limited (Newton) is the fund’s sub-investment adviser. Newton’s comments are provided as a general market overview and should not be considered investment advice or predictive of any future market performance. Newton’s views are current as of the date of this communication and are subject to change rapidly as economic and market conditions dictate.
2 Total return includes reinvestment of dividends and any capital gains paid, and does not take into consideration the maximum initial sales charge in the case of Class A shares, or the applicable contingent deferred sales charge imposed on redemptions in the case of Class C shares. Had these charges been reflected, returns would have been lower. Past performance is no guarantee of future results. Share price, yield, and investment return fluctuate such that upon redemption, fund shares may be worth more or less than their original cost. The fund’s return reflects the absorption of certain fund expenses by The Dreyfus Corporation pursuant to an agreement in effect through February 1, 2019, at which time it may be extended, modified, or terminated. Had these expenses not been absorbed, returns would have been lower.
3 Source: Lipper Inc. — Reflects reinvestment of net dividends and, where applicable, capital gain distributions. The MSCI EAFE Index (Europe, Australasia, Far East) is a free float-adjusted market capitalization-weighted index that is designed to measure the equity market performance of developed markets, excluding the U.S. and Canada. Investors cannot invest directly in any index.
Please note: the position in any security highlighted with italicized typeface was sold during the reporting period.
Equities are subject generally to market, market sector, market liquidity, issuer, and investment style risks, among other factors, to varying degrees, all of which are more fully described in the fund’s prospectus.
Investing internationally involves special risks, including changes in currency exchange rates, political, economic and social instability, a lack of comprehensive company information, differing auditing and legal standards, and less market liquidity. The use of derivatives involves risks different from, or possibly greater than, the risks associated with investing directly in the underlying assets. Derivatives can be highly volatile, illiquid, difficult to value, and there is the risk that changes in the value of a derivative held by the fund will not correlate with the underlying instruments or the fund’s other investments.
4
FUND PERFORMANCE
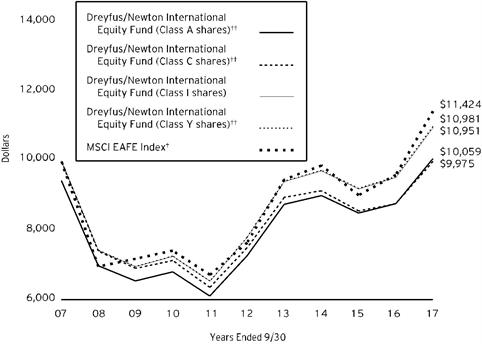
Comparison of change in value of $10,000 investment in Dreyfus/Newton International Equity Fund Class A shares, Class C shares, Class I shares and Class Y shares and the MSCI EAFE Index (the “Index”)
† Source: Lipper Inc.
†† The total return figures presented for Class A and Class C shares of the fund reflect the performance of the fund’s Class I shares for the period prior to 3/31/08 (the inception date for Class A and Class C shares), adjusted to reflect the applicable sales load for Class A shares.
The total return figures presented for Class Y shares of the fund reflect the performance of the fund’s Class I shares for the period prior to 7/1/13 (the inception date for Class Y shares).
Past performance is not predictive of future performance.
The above graph compares a $10,000 investment made in each of the Class A, Class C, Class I and Class Y shares of Dreyfus/Newton International Equity Fund on 9/30/07 to a $10,000 investment made in the Index on that date. All dividends and capital gain distributions are reinvested.
The fund’s performance shown in the line graph above takes into account the maximum initial sales charge on Class A shares and all other applicable fees and expenses on all classes. The Index (Europe, Australasia, Far East) is a free float-adjusted market capitalization-weighted index that is designed to measure the equity market performance of developed markets, excluding the U.S. and Canada. Unlike a mutual fund, the Index is not subject to charges, fees and other expenses. Investors cannot invest directly in any index. These factors can contribute to the Index potentially outperforming the fund. Further information relating to fund performance, including expense reimbursements, if applicable, is contained in the Financial Highlights section of the prospectus and elsewhere in this report.
5
FUND PERFORMANCE (continued)
| | | | | |
Average Annual Total Returns as of 9/30/17 |
| | Inception | | | |
| Date | 1 Year | 5 Years | 10 Years |
Class A shares | | | | |
with maximum sales charge (5.75%) | 3/31/08 | 8.15% | 5.47% | 0.06%†† |
without sales charge | 3/31/08 | 14.76% | 6.72% | 0.65%†† |
Class C shares | | | | |
with applicable redemption charge† | 3/31/08 | 12.83% | 5.89% | -0.03%†† |
without redemption | 3/31/08 | 13.83% | 5.89% | -0.03%†† |
Class I shares | 12/21/05 | 15.02% | 7.04% | 0.91% |
Class Y shares | 7/1/13 | 15.11% | 7.10%†† | 0.94%†† |
MSCI EAFE Index | | 19.10% | 8.38% | 1.34% |
† The maximum contingent deferred sales charge for Class C shares is 1% for shares redeemed within one year of the date of purchase.
†† The total return performance figures presented for Class A and Class C shares of the fund reflect the performance of the fund’s Class I shares for the period prior to 3/31/08 (the inception date for Class A and Class C shares), adjusted to reflect the applicable sales load for Class A shares.
The total return performance figures presented for Class Y shares of the fund reflect the performance of the fund’s Class I shares for the period prior to 7/1/13 (the inception date for Class Y shares).
The performance data quoted represents past performance, which is no guarantee of future results. Share price and investment return fluctuate and an investor’s shares may be worth more or less than original cost upon redemption. Current performance may be lower or higher than the performance quoted. Go to Dreyfus.com for the fund’s most recent month-end returns.
The fund’s performance shown in the graph and table does not reflect the deduction of taxes that a shareholder would pay on fund distributions or the redemption of fund shares. In addition to the performance of Class A shares shown with and without a maximum sales charge, the fund’s performance shown in the table takes into account all other applicable fees and expenses on all classes.
6
UNDERSTANDING YOUR FUND’S EXPENSES (Unaudited)
As a mutual fund investor, you pay ongoing expenses, such as management fees and other expenses. Using the information below, you can estimate how these expenses affect your investment and compare them with the expenses of other funds. You also may pay one-time transaction expenses, including sales charges (loads) and redemption fees, which are not shown in this section and would have resulted in higher total expenses. For more information, see your fund’s prospectus or talk to your financial adviser.
Review your fund’s expenses
The table below shows the expenses you would have paid on a $1,000 investment in Dreyfus/Newton International Equity Fund from April 1, 2017 to September 30, 2017. It also shows how much a $1,000 investment would be worth at the close of the period, assuming actual returns and expenses.
| | | | | | | | | | | |
Expenses and Value of a $1,000 Investment | | |
assuming actual returns for the six months ended September 30, 2017 |
| | | Class A | | Class C | | Class I | | Class Y |
Expenses paid per $1,000† | | $5.74 | | $9.82 | | $4.42 | | $4.42 |
Ending value (after expenses) | | $1,121.20 | | $1,116.80 | | $1,122.30 | | $1,122.90 |
COMPARING YOUR FUND’S EXPENSES
WITH THOSE OF OTHER FUNDS (Unaudited)
Using the SEC’s method to compare expenses
The Securities and Exchange Commission (“SEC”) has established guidelines to help investors assess fund expenses. Per these guidelines, the table below shows your fund’s expenses based on a $1,000 investment, assuming a hypothetical 5% annualized return. You can use this information to compare the ongoing expenses (but not transaction expenses or total cost) of investing in the fund with those of other funds. All mutual fund shareholder reports will provide this information to help you make this comparison. Please note that you cannot use this information to estimate your actual ending account balance and expenses paid during the period.
| | | | | | | | | |
Expenses and Value of a $1,000 Investment |
assuming a hypothetical 5% annualized return for the six months ended September 30, 2017 |
| | | Class A | | Class C | | Class I | | Class Y |
Expenses paid per $1,000† | | $5.47 | | $9.35 | | $4.20 | | $4.20 |
Ending value (after expenses) | | $1,019.65 | | $1,015.79 | | $1,020.91 | | $1,020.91 |
† Expenses are equal to the fund's annualized expense ratio of 1.08% for Class A, 1.85% for Class C, .83% for Class I and .83% for Class Y, multiplied by the average account value over the period, multiplied by 183/365 (to reflect the one-half year period).
7
STATEMENT OF INVESTMENTS
September 30, 2017
| | | | | | | | |
| |
Description | | | | Shares | | Value ($) | |
Common Stocks - 95.7% | | | | | |
Australia - 1.0% | | | | | |
Dexus | | | | 1,497,437 | a | 11,158,599 | |
China - 3.4% | | | | | |
Baidu, ADR | | | | 86,491 | b | 21,422,956 | |
China Biologic Products Holdings | | | | 185,189 | b | 17,087,389 | |
| | | | | 38,510,345 | |
France - 6.9% | | | | | |
BNP Paribas | | | | 307,858 | | 24,833,127 | |
L'Oreal | | | | 75,558 | | 16,065,340 | |
Total | | | | 378,812 | | 20,346,426 | |
Vivendi | | | | 691,830 | | 17,514,477 | |
| | | | | 78,759,370 | |
Georgia - 1.1% | | | | | |
TBC Bank Group | | | | 552,582 | | 12,291,612 | |
Germany - 13.1% | | | | | |
Bayer | | | | 108,762 | | 14,821,249 | |
Deutsche Post | | | | 333,779 | | 14,858,511 | |
Deutsche Wohnen | | | | 270,992 | | 11,504,589 | |
Hella KGaA Hueck & Co. | | | | 333,979 | | 19,687,038 | |
Infineon Technologies | | | | 1,499,733 | | 37,701,597 | |
LEG Immobilien | | | | 167,652 | | 16,959,384 | |
SAP | | | | 171,653 | | 18,804,534 | |
Telefonica Deutschland Holding | | | | 2,780,501 | | 15,603,142 | |
| | | | | 149,940,044 | |
Hong Kong - 3.6% | | | | | |
AIA Group | | | | 3,398,912 | | 25,062,386 | |
Man Wah Holdings | | | | 17,904,800 | | 16,044,549 | |
| | | | | 41,106,935 | |
India - 3.1% | | | | | |
Indiabulls Housing Finance | | | | 1,182,241 | | 21,502,542 | |
Vakrangee | | | | 1,958,152 | | 14,133,698 | |
| | | | | 35,636,240 | |
Ireland - 3.7% | | | | | |
Allied Irish Banks | | | | 3,061,014 | | 18,396,473 | |
CRH | | | | 647,513 | | 24,615,680 | |
| | | | | 43,012,153 | |
Japan - 25.7% | | | | | |
Don Quijote Holdings | | | | 722,600 | | 27,003,182 | |
Ebara | | | | 653,900 | | 21,704,657 | |
FANUC | | | | 65,800 | | 13,326,656 | |
Invincible Investment | | | | 29,308 | a | 12,098,259 | |
Japan Airlines | | | | 492,386 | | 16,663,016 | |
8
| | | | | | | | |
| |
Description | | | | Shares | | Value ($) | |
Common Stocks - 95.7% (continued) | | | | | |
Japan - 25.7% (continued) | | | | | |
Japan Tobacco | | | | 836,800 | | 27,426,069 | |
LIXIL VIVA | | | | 466,200 | | 7,764,131 | |
M3 | | | | 384,600 | | 10,954,392 | |
Recruit Holdings | | | | 655,213 | | 14,190,216 | |
Seven & i Holdings | | | | 256,900 | | 9,919,844 | |
Skylark | | | | 710,000 | | 10,493,046 | |
SoftBank Group | | | | 198,500 | | 16,024,652 | |
Sony | | | | 633,000 | | 23,547,994 | |
Sugi Holdings | | | | 383,700 | | 20,391,255 | |
Suntory Beverage & Food | | | | 364,400 | | 16,224,341 | |
TechnoPro Holdings | | | | 661,900 | | 31,352,384 | |
Topcon | | | | 886,800 | | 15,619,974 | |
| | | | | 294,704,068 | |
Netherlands - 6.2% | | | | | |
RELX | | | | 751,957 | | 16,006,081 | |
Unilever | | | | 310,014 | | 18,334,831 | |
Wolters Kluwer | | | | 794,601 | | 36,715,431 | |
| | | | | 71,056,343 | |
Norway - 1.3% | | | | | |
DNB | | | | 731,424 | | 14,739,601 | |
Portugal - 1.1% | | | | | |
Galp Energia | | | | 723,758 | | 12,826,795 | |
South Korea - 1.4% | | | | | |
Samsung SDI | | | | 94,679 | | 16,408,767 | |
Switzerland - 6.2% | | | | | |
Credit Suisse Group | | | | 1,264,600 | b | 20,019,949 | |
Novartis | | | | 306,508 | | 26,240,010 | |
Roche Holding | | | | 95,160 | | 24,292,407 | |
| | | | | 70,552,366 | |
United Kingdom - 17.9% | | | | | |
Associated British Foods | | | | 220,050 | | 9,415,086 | |
Barclays | | | | 7,754,045 | | 20,089,841 | |
British American Tobacco | | | | 283,013 | | 17,717,940 | |
Centrica | | | | 2,944,494 | | 7,378,300 | |
Diageo | | | | 350,338 | | 11,515,659 | |
Ferguson | | | | 320,168 | | 21,005,032 | |
GlaxoSmithKline | | | | 690,987 | | 13,782,333 | |
Prudential | | | | 551,537 | | 13,203,276 | |
Royal Bank of Scotland Group | | | | 10,985,415 | b | 39,494,912 | |
Royal Dutch Shell, Cl. B | | | | 922,960 | | 28,377,554 | |
Vodafone Group | | | | 8,388,066 | | 23,469,095 | |
| | | | | 205,449,028 | |
Total Common Stocks (cost $848,347,955) | | | | 1,096,152,266 | |
9
STATEMENT OF INVESTMENTS (continued)
| | | | | | | | |
| |
Description | | Preferred
Dividend
Yield(%) | | Shares | | Value ($) | |
Preferred Stocks - 1.3% | | | | | |
Germany - 1.3% | | | | | |
Volkswagen
(cost $13,850,495) | | 1.34 | | 94,295 | | 15,379,636 | |
| | | | | | | | |
Other Investment - 2.5% | | | | | |
Registered Investment Company; | | | | | |
Dreyfus Institutional Preferred Government Plus Money Market Fund
(cost $28,985,984) | | | | 28,985,984 | c | 28,985,984 | |
Total Investments (cost $891,184,434) | | 99.5% | | 1,140,517,886 | |
Cash and Receivables (Net) | | .5% | | 5,391,028 | |
Net Assets | | 100.0% | | 1,145,908,914 | |
ADR—American Depository Receipt
a Investment in real estate investment trust.
b Non-income producing security.
c Investment in affiliated money market mutual fund.
| | |
Portfolio Summary (Unaudited) † | Value (%) |
Financials | 18.3 |
Industrials | 15.2 |
Consumer Staples | 12.8 |
Information Technology | 12.2 |
Health Care | 10.7 |
Consumer Discretionary | 10.3 |
Energy | 5.4 |
Telecommunication Services | 4.8 |
Real Estate | 4.5 |
Money Market Investment | 2.5 |
Materials | 2.2 |
Utilities | .6 |
| | 99.5 |
† Based on net assets.
See notes to financial statements.
10
STATEMENT OF INVESTMENTS IN AFFILIATED ISSUERS
| | | | | | | |
Registered Investment Company | Value
9/30/2016 ($) | Purchases ($) | Sales ($) | Value
9/30/2017 ($) | Net
Assets (%) | Dividends/
Distributions ($) |
Dreyfus Institutional Preferred Government Plus Money Market Fund | 2,777,060 | 341,706,079 | 315,497,155 | 28,985,984 | 2.5 | 160,126 |
See notes to financial statements.
11
STATEMENT OF FORWARD FOREIGN CURRENCY EXCHANGE CONTRACTS September 30, 2017
| | | | | | |
Counterparty/ Purchased
Currency | Purchased Currency
Amounts | Currency
Sold | Sold
Currency
Amounts | Settlement Date | Unrealized Appreciation (Depreciation)($) |
Citigroup | | | |
Euro | 35,886,484 | United States Dollar | 43,133,830 | 12/15/17 | (532,099) |
Japanese Yen | 3,640,649,131 | United States Dollar | 32,279,551 | 10/13/17 | 97,013 |
United States Dollar | 32,279,550 | Australian Dollar | 41,104,024 | 10/13/17 | 42,738 |
United States Dollar | 43,133,831 | British Pound | 32,920,000 | 12/15/17 | (1,086,431) |
United States Dollar | 33,840,191 | Japanese Yen | 3,806,277,000 | 12/15/17 | (118,130) |
JP Morgan Chase Bank | | | |
British Pound | 1,572,137 | United States Dollar | 2,111,412 | 10/2/17 | (4,752) |
United States Dollar | 2,618,313 | Euro | 2,221,847 | 10/2/17 | (7,673) |
State Street Bank and Trust Co | | | |
United States Dollar | 33,887,026 | British Pound | 25,613,000 | 12/15/17 | (518,003) |
United States Dollar | 3,962,225 | Japanese Yen | 446,966,046 | 10/3/17 | (9,924) |
United States Dollar | 104,861 | Japanese Yen | 11,794,249 | 10/4/17 | 46 |
UBS | | | |
Australian Dollar | 41,104,024 | United States Dollar | 32,477,050 | 10/13/17 | (240,237) |
Euro | 1,296,561 | United States Dollar | 1,529,872 | 10/2/17 | 2,525 |
British Pound | 32,920,000 | United States Dollar | 43,098,344 | 12/15/17 | 1,121,918 |
United States Dollar | 43,098,344 | Euro | 36,059,522 | 12/15/17 | 291,195 |
United States Dollar | 32,477,049 | Japanese Yen | 3,631,746,000 | 10/13/17 | 179,662 |
Gross Unrealized Appreciation | | | 1,735,097 |
Gross Unrealized Depreciation | | | (2,517,249) |
See notes to financial statements.
12
STATEMENT OF ASSETS AND LIABILITIES
September 30, 2017
| | | | | | | |
| | | | | | |
| | | Cost | | Value | |
Assets ($): | | | | |
Investments in securities—See Statement of Investments: | | | |
Unaffiliated issuers | | 862,198,450 | | 1,111,531,902 | |
Affiliated issuers | | 28,985,984 | | 28,985,984 | |
Cash | | | | | 729,115 | |
Cash denominated in foreign currency | | | 1,003,455 | | 1,002,094 | |
Receivable for investment securities sold | | | | | 6,382,252 | |
Dividends receivable | | | | | 4,823,690 | |
Cash collateral held by broker—Note 4 | | | | | 2,210,000 | |
Unrealized appreciation on forward foreign
currency exchange contracts—See Statement of
Forward Foreign Currency Exchange Contracts—Note 4 | | | | | 1,735,097 | |
Receivable for shares of Beneficial Interest subscribed | | | | | 601,671 | |
Prepaid expenses | | | | | 30,562 | |
| | | | | 1,158,032,367 | |
Liabilities ($): | | | | |
Due to The Dreyfus Corporation and affiliates—Note 3(c) | | | | | 852,165 | |
Payable for investment securities purchased | | | | | 8,428,586 | |
Unrealized depreciation on forward foreign
currency exchange contracts—See Statement of
Forward Foreign Currency Exchange Contracts—Note 4 | | | | | 2,517,249 | |
Payable for shares of Beneficial Interest redeemed | | | | | 250,536 | |
Accrued expenses | | | | | 74,917 | |
| | | | | 12,123,453 | |
Net Assets ($) | | | 1,145,908,914 | |
Composition of Net Assets ($): | | | | |
Paid-in capital | | | | | 962,275,376 | |
Accumulated undistributed investment income—net | | | | | 12,267,406 | |
Accumulated net realized gain (loss) on investments | | | | | (77,252,416) | |
Accumulated net unrealized appreciation (depreciation)
on investments and foreign currency transactions | | | | 248,618,548 | |
Net Assets ($) | | | 1,145,908,914 | |
| | | | | | |
Net Asset Value Per Share | Class A | Class C | Class I | Class Y | |
Net Assets ($) | 3,845,310 | 1,783,921 | 112,714,299 | 1,027,565,384 | |
Shares Outstanding | 178,467 | 84,782 | 5,272,198 | 48,275,024 | |
Net Asset Value Per Share ($) | 21.55 | 21.04 | 21.38 | 21.29 | |
| | | | | | |
See notes to financial statements. | | | | | |
13
STATEMENT OF OPERATIONS
Year Ended September 30, 2017
| | | | | | | |
| | | | | | |
| | | | | | |
Investment Income ($): | | | | |
Income: | | | | |
Cash dividends (net of $1,935,360 foreign taxes withheld at source): | |
Unaffiliated issuers | | | 23,805,130 | |
Affiliated issuers | | | 160,126 | |
Total Income | | | 23,965,256 | |
Expenses: | | | | |
Investment advisory fee—Note 3(a) | | | 8,154,506 | |
Custodian fees—Note 3(c) | | | 365,316 | |
Administration fee—Note 3(a) | | | 115,951 | |
Professional fees | | | 99,003 | |
Shareholder servicing costs—Note 3(c) | | | 83,984 | |
Trustees’ fees and expenses—Note 3(d) | | | 83,550 | |
Registration fees | | | 75,451 | |
Loan commitment fees—Note 2 | | | 28,299 | |
Prospectus and shareholders’ reports | | | 15,609 | |
Interest expense—Note 2 | | | 13,022 | |
Distribution fees—Note 3(b) | | | 10,386 | |
Miscellaneous | | | 64,411 | |
Total Expenses | | | 9,109,488 | |
Less—reduction in expenses due to undertaking—Note 3(a) | | | (37,370) | |
Less—reduction in fees due to earnings credits—Note 3(c) | | | (760) | |
Net Expenses | | | 9,071,358 | |
Investment Income—Net | | | 14,893,898 | |
Realized and Unrealized Gain (Loss) on Investments—Note 4 ($): | | |
Net realized gain (loss) on investments and foreign currency transactions | 9,524,893 | |
Net realized gain (loss) on forward foreign currency exchange contracts | 1,718,020 | |
Net Realized Gain (Loss) | | | 11,242,913 | |
Net unrealized appreciation (depreciation) on investments
and foreign currency transactions | | | 115,325,832 | |
Net unrealized appreciation (depreciation) on
forward foreign currency exchange contracts | | | (698,427) | |
Net Unrealized Appreciation (Depreciation) | | | 114,627,405 | |
Net Realized and Unrealized Gain (Loss) on Investments | | | 125,870,318 | |
Net Increase in Net Assets Resulting from Operations | | 140,764,216 | |
| | | | | | | |
See notes to financial statements. | | | | | |
14
STATEMENT OF CHANGES IN NET ASSETS
| | | | | | | | | | |
| | | | Year Ended September 30, |
| | | | 2017 | | 2016 | |
Operations ($): | | | | | | | | |
Investment income—net | | | 14,893,898 | | | | 15,982,929 | |
Net realized gain (loss) on investments | | 11,242,913 | | | | (57,486,854) | |
Net unrealized appreciation (depreciation)
on investments | | 114,627,405 | | | | 81,361,795 | |
Net Increase (Decrease) in Net Assets
Resulting from Operations | 140,764,216 | | | | 39,857,870 | |
Distributions to Shareholders from ($): | |
Investment income—net: | | | | | | | | |
Class A | | | (52,660) | | | | (66,686) | |
Class C | | | (1,025) | | | | (4,742) | |
Class I | | | (1,085,404) | | | | (610,971) | |
Class Y | | | (13,469,323) | | | | (11,120,282) | |
Total Distributions | | | (14,608,412) | | | | (11,802,681) | |
Beneficial Interest Transactions ($): | |
Net proceeds from shares sold: | | | | | | | | |
Class A | | | 1,874,121 | | | | 2,976,546 | |
Class C | | | 548,147 | | | | 530,889 | |
Class I | | | 59,544,633 | | | | 61,333,937 | |
Class Y | | | 145,132,706 | | | | 328,405,779 | |
Distributions reinvested: | | | | | | | | |
Class A | | | 51,532 | | | | 65,675 | |
Class C | | | 1,025 | | | | 4,742 | |
Class I | | | 1,013,638 | | | | 569,133 | |
Class Y | | | 5,361,493 | | | | 4,475,809 | |
Cost of shares redeemed: | | | | | | | | |
Class A | | | (4,267,744) | | | | (4,321,694) | |
Class C | | | (402,915) | | | | (508,161) | |
Class I | | | (40,209,660) | | | | (26,725,447) | |
Class Y | | | (279,856,496) | | | | (210,851,108) | |
Increase (Decrease) in Net Assets
from Beneficial Interest Transactions | (111,209,520) | | | | 155,956,100 | |
Total Increase (Decrease) in Net Assets | 14,946,284 | | | | 184,011,289 | |
Net Assets ($): | |
Beginning of Period | | | 1,130,962,630 | | | | 946,951,341 | |
End of Period | | | 1,145,908,914 | | | | 1,130,962,630 | |
Undistributed investment income—net | 12,267,406 | | | | 10,851,977 | |
15
STATEMENT OF CHANGES IN NET ASSETS (continued)
| | | | | | | | | | |
| | | | Year Ended September 30, |
| | | | 2017 | | 2016 | |
Capital Share Transactions (Shares): | |
Class A | | | | | | | | |
Shares sold | | | 98,116 | | | | 162,010 | |
Shares issued for distributions reinvested | | | 2,905 | | | | 3,418 | |
Shares redeemed | | | (230,289) | | | | (233,471) | |
Net Increase (Decrease) in Shares Outstanding | (129,268) | | | | (68,043) | |
Class C | | | | | | | | |
Shares sold | | | 27,612 | | | | 28,824 | |
Shares issued for distributions reinvested | | | 59 | | | | 252 | |
Shares redeemed | | | (22,348) | | | | (27,912) | |
Net Increase (Decrease) in Shares Outstanding | 5,323 | | | | 1,164 | |
Class Ia | | | | | | | | |
Shares sold | | | 3,091,507 | | | | 3,324,543 | |
Shares issued for distributions reinvested | | | 57,724 | | | | 29,892 | |
Shares redeemed | | | (2,145,893) | | | | (1,452,541) | |
Net Increase (Decrease) in Shares Outstanding | 1,003,338 | | | | 1,901,894 | |
Class Ya | | | | | | | | |
Shares sold | | | 7,626,774 | | | | 17,940,974 | |
Shares issued for distributions reinvested | | | 306,722 | | | | 236,191 | |
Shares redeemed | | | (15,232,881) | | | | (11,482,175) | |
Net Increase (Decrease) in Shares Outstanding | (7,299,385) | | | | 6,694,990 | |
| | | | | | | | | | |
aDuring the period ended September 30, 2017, 518,868 Class Y shares representing $10,043,102 were exchanged for 516,624 Class I shares and during the period ended September 30, 2016, 442,280 Class Y shares representing $8,075,787 were exchanged for 440,353 Class I shares. | |
See notes to financial statements. | | | | | | | | |
16
FINANCIAL HIGHLIGHTS
The following tables describe the performance for each share class for the fiscal periods indicated. All information (except portfolio turnover rate) reflects financial results for a single fund share. Total return shows how much your investment in the fund would have increased (or decreased) during each period, assuming you had reinvested all dividends and distributions. These figures have been derived from the fund’s financial statements.
| | | | | | | |
| | | |
| | | Year Ended September 30, |
Class A Shares | | 2017 | 2016 | 2015 | 2014 | 2013 |
Per Share Data ($): | | | | | | |
Net asset value, beginning of period | | 18.97 | 18.54 | 20.41 | 20.15 | 16.96 |
Investment Operations: | | | | | | |
Investment income—neta | | .19 | .22 | .19 | .47 | .21 |
Net realized and unrealized
gain (loss) on investments | | 2.57 | .39 | (1.33) | .10 | 3.19 |
Total from Investment Operations | | 2.76 | .61 | (1.14) | .57 | 3.40 |
Distributions: | | | | | | |
Dividends from
investment income—net | | (.18) | (.18) | (.38) | (.31) | (.21) |
Dividends from net realized
gain on investments | | – | – | (.35) | – | – |
Total Distributions | | (.18) | (.18) | (.73) | (.31) | (.21) |
Net asset value, end of period | | 21.55 | 18.97 | 18.54 | 20.41 | 20.15 |
Total Return (%)b | | 14.76 | 3.27 | (5.58) | 2.88 | 20.24 |
Ratios/Supplemental Data (%): | | | | | | |
Ratio of total expenses
to average net assets | | 1.23 | 1.23 | 1.19 | 1.30 | 1.34 |
Ratio of net expenses
to average net assets | | 1.18 | 1.23 | 1.19 | 1.30 | 1.34 |
Ratio of net investment income
to average net assets | | .99 | 1.16 | .97 | 2.22 | 1.11 |
Portfolio Turnover Rate | | 37.78 | 34.87 | 36.37 | 39.45 | 55.27 |
Net Assets,
end of period ($ x 1,000) | | 3,845 | 5,839 | 6,965 | 2,324 | 9,404 |
a Based on average shares outstanding.
b Exclusive of sales charge.
See notes to financial statements.
17
FINANCIAL HIGHLIGHTS (continued)
| | | | | | | |
| | | |
| | | Year Ended September 30, |
Class C Shares | | 2017 | 2016 | 2015 | 2014 | 2013 |
Per Share Data ($): | | | | | | |
Net asset value, beginning of period | | 18.50 | 18.10 | 20.10 | 19.90 | 16.70 |
Investment Operations: | | | | | | |
Investment income—neta | | .06 | .07 | .02 | .29 | .05 |
Net realized and unrealized
gain (loss) on investments | | 2.50 | .38 | (1.30) | .14 | 3.17 |
Total from Investment Operations | | 2.56 | .45 | (1.28) | .43 | 3.22 |
Distributions: | | | | | | |
Dividends from
investment income—net | | (.02) | (.05) | (.37) | (.23) | (.02) |
Dividends from net realized
gain on investments | | – | – | (.35) | – | – |
Total Distributions | | (.02) | (.05) | (.72) | (.23) | (.02) |
Net asset value, end of period | | 21.04 | 18.50 | 18.10 | 20.10 | 19.90 |
Total Return (%)b | | 13.83 | 2.50 | (6.39) | 2.18 | 19.31 |
Ratios/Supplemental Data (%): | | | | | | |
Ratio of total expenses
to average net assets | | 1.99 | 2.02 | 2.01 | 2.04 | 2.13 |
Ratio of net expenses
to average net assets | | 1.95 | 2.02 | 2.01 | 2.04 | 2.13 |
Ratio of net investment income
to average net assets | | .32 | .37 | .10 | 1.43 | .28 |
Portfolio Turnover Rate | | 37.78 | 34.87 | 36.37 | 39.45 | 55.27 |
Net Assets,
end of period ($ x 1,000) | | 1,784 | 1,470 | 1,417 | 1,256 | 979 |
a Based on average shares outstanding.
b Exclusive of sales charge.
See notes to financial statements.
18
| | | | | | | |
| | | |
| | | Year Ended September 30, |
Class I Shares | | 2017 | 2016 | 2015 | 2014 | 2013 |
Per Share Data ($): | | | | | | |
Net asset value, beginning of period | | 18.85 | 18.39 | 20.37 | 20.10 | 16.92 |
Investment Operations: | | | | | | |
Investment income—neta | | .27 | .27 | .26 | .61 | .26 |
Net realized and unrealized
gain (loss) on investments | | 2.51 | .41 | (1.35) | .03 | 3.18 |
Total from Investment Operations | | 2.78 | .68 | (1.09) | .64 | 3.44 |
Distributions: | | | | | | |
Dividends from
investment income—net | | (.25) | (.22) | (.54) | (.37) | (.26) |
Dividends from net realized
gain on investments | | – | – | (.35) | – | – |
Total Distributions | | (.25) | (.22) | (.89) | (.37) | (.26) |
Net asset value, end of period | | 21.38 | 18.85 | 18.39 | 20.37 | 20.10 |
Total Return (%) | | 15.02 | 3.66 | (5.37) | 3.25 | 20.62 |
Ratios/Supplemental Data (%): | | | | | | |
Ratio of total expenses
to average net assets | | .93 | .94 | .90 | .96 | 1.01 |
Ratio of net expenses
to average net assets | | .89 | .94 | .90 | .96 | 1.01 |
Ratio of net investment income
to average net assets | | 1.42 | 1.44 | 1.32 | 2.95 | 1.42 |
Portfolio Turnover Rate | | 37.78 | 34.87 | 36.37 | 39.45 | 55.27 |
Net Assets,
end of period ($ x 1,000) | | 112,714 | 80,458 | 43,538 | 29,479 | 535,265 |
a Based on average shares outstanding.
See notes to financial statements.
19
FINANCIAL HIGHLIGHTS (continued)
| | | | | | |
| | | | | | |
| | | Year Ended September 30, |
Class Y Shares | 2017 | 2016 | 2015 | 2014 | 2013a |
Per Share Data ($): | | | | | |
Net asset value, beginning of period | 18.77 | 18.31 | 20.38 | 20.11 | 18.74 |
Investment Operations: | | | | | |
Investment income—netb | .27 | .28 | .26 | .22 | .06 |
Net realized and unrealized
gain (loss) on investments | 2.51 | .40 | (1.34) | .43 | 1.31 |
Total from Investment Operations | 2.78 | .68 | (1.08) | .65 | 1.37 |
Distributions: | | | | | |
Dividends from
investment income—net | (.26) | (.22) | (.64) | (.38) | – |
Dividends from net realized
gain on investments | – | – | (.35) | – | – |
Total Distributions | (.26) | (.22) | (.99) | (.38) | – |
Net asset value, end of period | 21.29 | 18.77 | 18.31 | 20.38 | 20.11 |
Total Return (%) | 15.11 | 3.68 | (5.32) | 3.33 | 6.29c |
Ratios/Supplemental Data (%): | | | | | |
Ratio of total expenses
to average net assets | .86 | .88 | .89 | .91 | .94d |
Ratio of net expenses
to average net assets | .86 | .88 | .89 | .91 | .94d |
Ratio of net investment income
to average net assets | 1.42 | 1.49 | 1.32 | 1.10 | 1.19d |
Portfolio Turnover Rate | 37.78 | 34.87 | 36.37 | 39.45 | 55.27 |
Net Assets,
end of period ($ x 1,000) | 1,027,565 | 1,043,195 | 895,031 | 763,426 | 1 |
a From July 1, 2013, (commencement of initial offering) to September 30, 2013.
b Based on average shares outstanding.
c Not annualized.
d Annualized.
See notes to financial statements.
20
NOTES TO FINANCIAL STATEMENTS
NOTE 1—Significant Accounting Policies:
Dreyfus/Newton International Equity Fund (the “fund”) is a separate diversified series of Dreyfus Investment Funds (the “Trust”), which is registered under the Investment Company Act of 1940, as amended (the “Act”), as an open-end management investment company and operates as a series company currently offering seven series, including the fund. The fund’s investment objective is to seek long-term growth of capital. The Dreyfus Corporation (the “Manager” or “Dreyfus”), a wholly-owned subsidiary of The Bank of New York Mellon Corporation (“BNY Mellon”), serves as the fund’s investment adviser. Newton Investment Management (North America) Limited (“Newton”), a wholly-owned subsidiary of BNY Mellon and an affiliate of Dreyfus, serves as the fund’s sub-investment adviser.
Effective March 31, 2017, the fund authorized the issuance of Class T shares, but, as of the date of this report, the fund did not offer Class T shares for purchase.
MBSC Securities Corporation (the “Distributor”), a wholly-owned subsidiary of Dreyfus, is the distributor of the fund’s shares. The fund is authorized to issue an unlimited number of $.001 par value shares of Beneficial Interest in each of the following classes of shares: Class A, Class C, Class I, Class T and Class Y. Class A, Class C and Class T shares are sold primarily to retail investors through financial intermediaries and bear Distribution and/or Shareholder Services Plan fees. Class A and Class T shares generally are subject to a sales charge imposed at the time of purchase. Class C shares are subject to a contingent deferred sales charge (“CDSC”) imposed on Class C shares redeemed within one year of purchase. Class I shares are sold primarily to bank trust departments and other financial service providers (including The Bank of New York Mellon, a subsidiary of BNY Mellon and an affiliate of Dreyfus, and its affiliates), acting on behalf of customers having a qualified trust or an investment account or relationship at such institution, and bear no Distribution or Shareholder Services Plan fees. Class Y shares are sold at net asset value per share generally to institutional investors, and bear no Distribution or Shareholder Services Plan fees. Class I and Class Y shares are offered without a front-end sales charge or CDSC. Other differences between the classes include the services offered to and the expenses borne by each class, the allocation of certain transfer agency costs, and certain voting rights. Income, expenses (other than expenses attributable to a specific
21
NOTES TO FINANCIAL STATEMENTS (continued)
class), and realized and unrealized gains or losses on investments are allocated to each class of shares based on its relative net assets.
The Trust accounts separately for the assets, liabilities and operations of each series. Expenses directly attributable to each series are charged to that series’ operations; expenses which are applicable to all series are allocated among them on a pro rata basis.
The Financial Accounting Standards Board (“FASB”) Accounting Standards Codification (“ASC”) is the exclusive reference of authoritative U.S. generally accepted accounting principles (“GAAP”) recognized by the FASB to be applied by nongovernmental entities. Rules and interpretive releases of the Securities and Exchange Commission (“SEC”) under authority of federal laws are also sources of authoritative GAAP for SEC registrants. The fund’s financial statements are prepared in accordance with GAAP, which may require the use of management estimates and assumptions. Actual results could differ from those estimates.
(a) Portfolio valuation: The fair value of a financial instrument is the amount that would be received to sell an asset or paid to transfer a liability in an orderly transaction between market participants at the measurement date (i.e., the exit price). GAAP establishes a fair value hierarchy that prioritizes the inputs of valuation techniques used to measure fair value. This hierarchy gives the highest priority to unadjusted quoted prices in active markets for identical assets or liabilities (Level 1 measurements) and the lowest priority to unobservable inputs (Level 3 measurements).
Additionally, GAAP provides guidance on determining whether the volume and activity in a market has decreased significantly and whether such a decrease in activity results in transactions that are not orderly. GAAP requires enhanced disclosures around valuation inputs and techniques used during annual and interim periods.
Various inputs are used in determining the value of the fund’s investments relating to fair value measurements. These inputs are summarized in the three broad levels listed below:
Level 1—unadjusted quoted prices in active markets for identical investments.
Level 2—other significant observable inputs (including quoted prices for similar investments, interest rates, prepayment speeds, credit risk, etc.).
Level 3—significant unobservable inputs (including the fund’s own assumptions in determining the fair value of investments).
22
The inputs or methodology used for valuing securities are not necessarily an indication of the risk associated with investing in those securities.
Changes in valuation techniques may result in transfers in or out of an assigned level within the disclosure hierarchy. Valuation techniques used to value the fund’s investments are as follows:
Investments in securities are valued at the last sales price on the securities exchange or national securities market on which such securities are primarily traded. Securities listed on the National Market System for which market quotations are available are valued at the official closing price or, if there is no official closing price that day, at the last sales price. For open short positions, asked prices are used for valuation purposes. Bid price is used when no asked price is available. Registered investment companies that are not traded on an exchange are valued at their net asset value. All of the preceding securities are generally categorized within Level 1 of the fair value hierarchy.
Securities not listed on an exchange or the national securities market, or securities for which there were no transactions, are valued at the average of the most recent bid and asked prices. These securities are generally categorized within Level 2 of the fair value hierarchy.
Fair valuing of securities may be determined with the assistance of a pricing service using calculations based on indices of domestic securities and other appropriate indicators, such as prices of relevant ADRs and futures. Utilizing these techniques may result in transfers between Level 1 and Level 2 of the fair value hierarchy.
When market quotations or official closing prices are not readily available, or are determined not to reflect accurately fair value, such as when the value of a security has been significantly affected by events after the close of the exchange or market on which the security is principally traded (for example, a foreign exchange or market), but before the fund calculates its net asset value, the fund may value these investments at fair value as determined in accordance with the procedures approved by the Trust's Board of Trustees (the “Board”). Certain factors may be considered when fair valuing investments such as: fundamental analytical data, the nature and duration of restrictions on disposition, an evaluation of the forces that influence the market in which the securities are purchased and sold, and public trading in similar securities of the issuer or comparable issuers. These securities are either categorized within Level 2 or 3 of the fair value hierarchy depending on the relevant inputs used.
23
NOTES TO FINANCIAL STATEMENTS (continued)
For restricted securities where observable inputs are limited, assumptions about market activity and risk are used and are generally categorized within Level 3 of the fair value hierarchy.
Investments denominated in foreign currencies are translated to U.S. dollars at the prevailing rates of exchange.
Forward foreign currency exchange contracts (“forward contracts”) are valued at the forward rate and are generally categorized within Level 2 of the fair value hierarchy.
The following is a summary of the inputs used as of September 30, 2017 in valuing the fund’s investments:
| | | | | |
| | Level 1 –
Unadjusted Quoted
Prices | Level 2 –
Other
Significant
Observable
Inputs | Level 3 –
Significant
Unobservable
Inputs | Total |
Assets ($) | | | |
Investments in Securities: | | | |
Equity Securities - Foreign Common Stocks† | 1,096,152,266 | – | – | 1,096,152,266 |
Equity Securities - Foreign Preferred Stocks† | 15,379,636 | – | – | 15,379,636 |
Registered Investment Company | 28,985,984 | – | – | 28,985,984 |
Other Financial Instruments: | | | | |
Forward Foreign Currency Exchange Contracts†† | – | 1,735,097 | – | 1,735,097 |
Liabilities ($) | | | | |
Other Financial Instruments: | | | | |
Forward Foreign Currency Exchange Contracts†† | – | (2,517,249) | – | (2,517,249) |
† See Statement of Investments for additional detailed categorizations.
†† Amount shown represents unrealized appreciation (depreciation) at period end.
At September 30, 2016, $1,049,046,518 of exchange traded foreign equity securities were classified within Level 2 of the fair value hierarchy pursuant to the fund’s fair valuation procedures. It is the fund’s policy to recognize transfers between levels at the end of the reporting period.
(b) Foreign currency transactions: The fund does not isolate that portion of the results of operations resulting from changes in foreign exchange rates on investments from the fluctuations arising from changes in the market prices of securities held. Such fluctuations are included with the net realized and unrealized gain or loss on investments.
24
Net realized foreign exchange gains or losses arise from sales of foreign currencies, currency gains or losses realized on securities transactions between trade and settlement date, and the difference between the amounts of dividends, interest and foreign withholding taxes recorded on the fund’s books and the U.S. dollar equivalent of the amounts actually received or paid. Net unrealized foreign exchange gains and losses arise from changes in the value of assets and liabilities other than investments resulting from changes in exchange rates. Foreign currency gains and losses on foreign currency transactions are also included with net realized and unrealized gain or loss on investments.
(c) Securities transactions and investment income: Securities transactions are recorded on a trade date basis. Realized gains and losses from securities transactions are recorded on the identified cost basis. Dividend income is recognized on the ex-dividend date and interest income, including, where applicable, accretion of discount and amortization of premium on investments, is recognized on the accrual basis.
(d) Affiliated issuers: Investments in other investment companies advised by Dreyfus are defined as “affiliated” under the Act.
(e) Risk: Investing in foreign markets may involve special risks and considerations not typically associated with investing in the U.S. These risks include revaluation of currencies, high rates of inflation, repatriation restrictions on income and capital, and adverse political and economic developments. Moreover, securities issued in these markets may be less liquid, subject to government ownership controls and delayed settlements, and their prices may be more volatile than those of comparable securities in the U.S.
(f) Dividends and distributions to shareholders: Dividends and distributions are recorded on the ex-dividend date. Dividends from investment income-net and dividends from net realized capital gains, if any, are normally declared and paid annually, but the fund may make distributions on a more frequent basis to comply with the distribution requirements of the Internal Revenue Code of 1986, as amended (the “Code”). To the extent that net realized capital gains can be offset by capital loss carryovers, it is the policy of the fund not to distribute such gains. Income and capital gain distributions are determined in accordance with income tax regulations, which may differ from GAAP.
(g) Federal income taxes: It is the policy of the fund to continue to qualify as a regulated investment company, if such qualification is in the best interests of its shareholders, by complying with the applicable
25
NOTES TO FINANCIAL STATEMENTS (continued)
provisions of the Code, and to make distributions of taxable income sufficient to relieve it from substantially all federal income and excise taxes.
As of and during the period ended September 30, 2017, the fund did not have any liabilities for any uncertain tax positions. The fund recognizes interest and penalties, if any, related to uncertain tax positions as income tax expense in the Statement of Operations. During the period ended September 30, 2017, the fund did not incur any interest or penalties.
Each tax year in the four-year period ended September 30, 2017 remains subject to examination by the Internal Revenue Service and state taxing authorities.
At September 30, 2017, the components of accumulated earnings on a tax basis were as follows: undistributed ordinary income $13,272,557, accumulated capital losses $69,775,708 and unrealized appreciation $240,136,689.
Under the Regulated Investment Company Modernization Act of 2010, the fund is permitted to carry forward capital losses for an unlimited period. Furthermore, capital loss carryovers retain their character as either short-term or long-term capital losses.
The accumulated capital loss carryover is available for federal income tax purposes to be applied against future net realized capital gains, if any, realized subsequent to September 30, 2017. The fund has $37,187,365 of short-term capital losses and $32,588,343 of long-term capital losses which can be carried forward for an unlimited period.
The tax character of distributions paid to shareholders during the fiscal periods ended September 30, 2017 and September 30, 2016 were as follows: ordinary income $14,608,412 and $11,802,681.
During the period ended September 30, 2017, as a result of permanent book to tax differences, primarily due to the tax treatment for foreign currency gains and losses and passive foreign investment companies, the fund increased accumulated undistributed investment income-net by $1,129,943 and decreased accumulated net realized gain (loss) on investments by the same amount. Net assets and net asset value per share were not affected by this reclassification.
NOTE 2—Bank Lines of Credit:
The fund participates with other Dreyfus-managed funds in an $810 million unsecured credit facility led by Citibank, N.A. and a $300 million unsecured credit facility provided by The Bank of New York Mellon (each, a “Facility”), each to be utilized primarily for temporary or emergency
26
purposes, including the financing of redemptions. Prior to October 5, 2016, the unsecured credit facility with Citibank, N.A. was $555 million. In connection therewith, the fund has agreed to pay its pro rata portion of commitment fees for each Facility. Interest is charged to the fund based on rates determined pursuant to the terms of the respective Facility at the time of borrowing.
The average amount of borrowings outstanding under the Facilities during the period ended September 30, 2017, was approximately $808,800 with a related weighted average annualized interest rate of 1.61%.
NOTE 3—Investment Advisory Fee, Sub-Investment Advisory Fee, Administration Fee and Other Transactions with Affiliates:
(a) Pursuant to an investment advisory agreement with Dreyfus, the investment advisory fee was computed at the annual rate of .80% of the value of the fund’s average daily net assets and is payable monthly. Effective May 1, 2017, pursuant to a revised investment advisory agreement with Dreyfus, the fund has agreed to pay an investment advisory fee at the annual rate of .75% of the value of the fund’s average daily net assets. Dreyfus has contractually agreed, from May 1, 2017 through February 1, 2018, to waive receipt of its fees and/or assume the expenses of the fund so that the total annual fund operating expenses of Class A, C, I and Y shares (excluding Rule 12b-1 Distribution Plan fees, Shareholder Services Plan fees, taxes, interest expense, brokerage commissions, commitment fees on borrowings and extraordinary expenses) do not exceed .82% of the value of the fund’s average daily net assets. The reduction in expenses, pursuant to the undertaking, amounted to $37,370 during the period ended September 30, 2017.
Pursuant to a sub-investment advisory agreement between Dreyfus and Newton, Dreyfus pays Newton a monthly fee at an annual percentage rate of the value of the fund’s average daily net assets.
The fund had a Fund Accounting and Administrative Services Agreement (the “Administration Agreement”) with Dreyfus, whereby Dreyfus performs administrative, accounting and recordkeeping services for the fund. The fund had agreed to compensate Dreyfus for providing accounting and recordkeeping services, administration, compliance monitoring, regulatory and shareholder reporting, as well as related facilities, equipment and clerical help. The fee is based on the fund’s average daily net assets and computed at the following annual rates: .10% of the first $500 million, .065% of the next $500 million and .02% in excess of $1 billion.
27
NOTES TO FINANCIAL STATEMENTS (continued)
In addition, after applying any expense limitations or fee waivers that reduce the fees paid to Dreyfus for this service, Dreyfus had contractually agreed in writing to waive any remaining fees for this service to the extent that they exceed both Dreyfus’ costs in providing these services and a reasonable allocation of the costs incurred by Dreyfus and its affiliates related to the support and oversight of these services. The fund also had reimbursed Dreyfus for the out-of-pocket expenses incurred in performing this service for the fund. Pursuant to the Administration Agreement, the fund was charged $115,951 during the period ended September 30, 2017. Effective May 1, 2017, the Administration Agreement with Dreyfus was terminated.
During the period ended September 30, 2017, the Distributor retained $699 from commissions earned on sales of the fund's Class A shares.
(b) Under the Distribution Plan adopted pursuant to Rule 12b-1 under the Act, Class C shares pay the Distributor for distributing its shares at an annual rate of .75% of the value of its average daily net assets. During the period ended September 30, 2017, Class C shares were charged $10,386 pursuant to the Distribution Plan.
(c) Under the Shareholder Services Plan, Class A and Class C shares pay the Distributor at an annual rate of .25% of the value of their average daily net assets for the provision of certain services. The services provided may include personal services relating to shareholder accounts, such as answering shareholder inquiries regarding the fund and providing reports and other information, and services related to the maintenance of shareholder accounts. The Distributor may make payments to Service Agents (securities dealers, financial institutions or other industry professionals) with respect to these services. The Distributor determines the amounts to be paid to Service Agents. During the period ended September 30, 2017, Class A and Class C shares were charged $10,339 and $3,462, respectively, pursuant to the Shareholder Services Plan.
Under its terms, the Distribution Plan and Shareholder Services Plan shall remain in effect from year to year, provided such continuance is approved annually by a vote of a majority of those Trustees who are not “interested persons” of the Trust and who have no direct or indirect financial interest in the operation of or in any agreement related to the Distribution Plan or Shareholder Services Plan.
The fund has arrangements with the transfer agent and the custodian whereby the fund may receive earnings credits when positive cash balances are maintained, which are used to offset transfer agency and custody fees.
28
For financial reporting purposes, the fund includes net earnings credits as an expense offset in the Statement of Operations.
The fund compensates Dreyfus Transfer, Inc., a wholly-owned subsidiary of Dreyfus, under a transfer agency agreement for providing transfer agency and cash management services for the fund. The majority of transfer agency fees are comprised of amounts paid on a per account basis, while cash management fees are related to fund subscriptions and redemptions. During the period ended September 30, 2017, the fund was charged $4,701 for transfer agency services and $180 for cash management services. These fees are included in Shareholder servicing costs in the Statement of Operations. Cash management fees were offset by earnings credits of $180.
The fund compensates The Bank of New York Mellon under a custody agreement for providing custodial services for the fund. These fees are determined based on net assets, geographic region and transaction activity. During the period ended September 30, 2017, the fund was charged $365,316 pursuant to the custody agreement. These fees were partially offset by earnings credits of $580.
During the period ended September 30, 2017, the fund was charged $11,281 for services performed by the Chief Compliance Officer and his staff.
The components of “Due to The Dreyfus Corporation and affiliates” in the Statement of Assets and Liabilities consist of: investment advisory fees $699,076, Distribution Plan fees $1,061, Shareholder Services Plan fees $1,144, custodian fees $142,398, Chief Compliance Officer fees $5,604 and transfer agency fees $8,533, which are offset against an expense reimbursement currently in effect in the amount of $5,651.
(d) Each Board member also serves as a Board member of other funds within the Dreyfus complex. Annual retainer fees and attendance fees are allocated to each fund based on net assets.
NOTE 4—Securities Transactions:
The aggregate amount of purchases and sales of investment securities, excluding short-term securities and forward contracts, during the period ended September 30, 2017, amounted to $388,797,893 and $527,641,678, respectively.
Derivatives: A derivative is a financial instrument whose performance is derived from the performance of another asset. The fund enters into International Swaps and Derivatives Association, Inc. Master Agreements or similar agreements (collectively, “Master Agreements”) with its over-
29
NOTES TO FINANCIAL STATEMENTS (continued)
the-counter (“OTC”) derivative contract counterparties in order to, among other things, reduce its credit risk to counterparties. Master Agreements include provisions for general obligations, representations, collateral and events of default or termination. Under a Master Agreement, the fund may offset with the counterparty certain derivative financial instrument’s payables and/or receivables with collateral held and/or posted and create one single net payment in the event of default or termination.
Each type of derivative instrument that was held by the fund during the period ended September 30, 2017 is discussed below.
Forward Foreign Currency Exchange Contracts: The fund enters into forward contracts in order to hedge its exposure to changes in foreign currency exchange rates on its foreign portfolio holdings, to settle foreign currency transactions or as a part of its investment strategy. When executing forward contracts, the fund is obligated to buy or sell a foreign currency at a specified rate on a certain date in the future. With respect to sales of forward contracts, the fund incurs a loss if the value of the contract increases between the date the forward contract is opened and the date the forward contract is closed. The fund realizes a gain if the value of the contract decreases between those dates. With respect to purchases of forward contracts, the fund incurs a loss if the value of the contract decreases between the date the forward contract is opened and the date the forward contract is closed. The fund realizes a gain if the value of the contract increases between those dates. Any realized or unrealized gains or losses which occurred during the period are reflected in the Statement of Operations. The fund is exposed to foreign currency risk as a result of changes in value of underlying financial instruments. The fund is also exposed to credit risk associated with counterparty nonperformance on these forward contracts, which is generally limited to the unrealized gain on each open contract. This risk may be mitigated by Master Agreements, if any, between the fund and the counterparty and the posting of collateral, if any, by the counterparty to the fund to cover the fund’s exposure to the counterparty. Forward contracts open at September 30, 2017 are set forth in the Statement of Forward Foreign Currency Exchange Contracts.
The provisions of ASC Topic 210 “Disclosures about Offsetting Assets and Liabilities” require disclosure on the offsetting of financial assets and liabilities. These disclosures are required for certain investments, including derivative financial instruments subject to Master Agreements which are eligible for offsetting in the Statement of Assets and Liabilities and require the fund to disclose both gross and net information with respect to such investments. For financial reporting purposes, the fund does not offset
30
derivative assets and derivative liabilities that are subject to Master Agreements in the Statement of Assets and Liabilities.
At September 30, 2017, derivative assets and liabilities (by type) on a gross basis are as follows:
| | | | | | |
Derivative Financial Instruments: | | Assets ($) | | Liabilities ($) | |
Forward contracts | | 1,735,097 | | (2,517,249) | |
Total gross amount of derivative | | | | | |
assets and liabilities in the | | | | | |
Statement of Assets and Liabilities | | 1,735,097 | | (2,517,249) | |
Derivatives not subject to | | | | | |
Master Agreements | | - | | - | |
Total gross amount of assets | | | | | |
and liabilities subject to | | | | | |
Master Agreements | | 1,735,097 | | (2,517,249) | |
The following tables present derivative assets and liabilities net of amounts available for offsetting under Master Agreements and net of related collateral received or pledged, if any, as of September 30, 2017:
| | | | | | | |
| | | | Financial | | | |
| | | | Instruments | | | |
| | | | and Derivatives | | | |
| | Gross Amount of | | Available | Collateral | | Net Amount of |
Counterparty | Assets ($) | 1 | for Offset ($) | Received ($) | 2 | Assets ($) |
Citigroup | 139,751 | | (139,751) | - | | - |
State Street Bank
and Trust Company | 46 | | (46) | - | | - |
UBS | 1,595,300 | | (240,237) | - | | 1,355,063 |
Total | 1,735,097 | | (380,034) | - | | 1,355,063 |
| | | | | | | |
| | | | Financial | | | |
| | | | Instruments | | | |
| | | | and Derivatives | | | |
| | Gross Amount of | | Available | Collateral | | Net Amount of |
Counterparty | Liabilities ($) | 1 | for Offset ($) | Pledged ($) | 2 | Liabilities ($) |
Citigroup | (1,736,660) | | 139,751 | 1,596,909 | | - |
JP Morgan
Chase Bank | (12,425) | | - | - | | (12,425) |
State Street Bank
and Trust Company | (527,927) | | 46 | 490,000 | | (37,881) |
UBS | (240,237) | | 240,237 | - | | - |
Total | (2,517,249) | | 380,034 | 2,086,909 | | (50,306) |
| | | | | | | |
1 Absent a default event or early termination, OTC derivative assets and liabilities are presented at gross amounts and are not offset in the Statement of Assets and Liabilities. |
2 In some instances, the actual collateral received and/or pledged may be more than the amount shown due to over collateralization. |
31
NOTES TO FINANCIAL STATEMENTS (continued)
The following summarizes the average market value of derivatives outstanding during the period ended September 30, 2017:
| | | |
| | Average Market Value ($) |
Forward contracts | | 44,194,507 |
| | | |
At September 30, 2017, the cost of investments inclusive of derivative contracts for federal income tax purposes was $900,438,546; accordingly, accumulated net unrealized appreciation on investments inclusive of derivative contracts was $239,297,188, consisting of $266,747,616 gross unrealized appreciation and $27,450,428 gross unrealized depreciation.
32
REPORT OF INDEPENDENT REGISTERED
PUBLIC ACCOUNTING FIRM
The Board of Trustees and Shareholders of
Dreyfus Investment Funds
We have audited the accompanying statement of assets and liabilities of Dreyfus/Newton International Equity Fund (the “Fund”), a series of Dreyfus Investment Funds, including the statements of investments, investments in affiliated issuers, and forward foreign currency exchange contracts, as of September 30, 2017, and the related statement of operations for the year then ended, the statements of changes in net assets for each of the years in the two-year period then ended, and the financial highlights for each of the years or periods in the five-year period then ended. These financial statements and financial highlights are the responsibility of the Fund’s management. Our responsibility is to express an opinion on these financial statements and financial highlights based on our audits.
We conducted our audits in accordance with the standards of the Public Company Accounting Oversight Board (United States). Those standards require that we plan and perform the audit to obtain reasonable assurance about whether the financial statements and financial highlights are free of material misstatement. An audit includes examining, on a test basis, evidence supporting the amounts and disclosures in the financial statements. Our procedures included confirmation of securities owned as of September 30, 2017, by correspondence with the custodian and brokers or by other appropriate auditing procedures. An audit also includes assessing the accounting principles used and significant estimates made by management, as well as evaluating the overall financial statement presentation. We believe that our audits provide a reasonable basis for our opinion.
In our opinion, the financial statements and financial highlights referred to above present fairly, in all material respects, the financial position of Dreyfus/Newton International Equity Fund as of September 30, 2017, the results of its operations for the year then ended, the changes in its net assets for each of the years in the two-year period then ended, and the financial highlights for each of the years or periods in the five-year period then ended, in conformity with U.S. generally accepted accounting principles.

New York, New York
November 22, 2017
33
IMPORTANT TAX INFORMATION (Unaudited)
For federal tax purposes, the fund elects to provide each shareholder with their portion of the fund’s income sourced from foreign countries and taxes paid from foreign countries. The fund reports the maximum amount allowable but not less than $25,797,088 as income sourced from foreign countries for the fiscal year ended September 30, 2017 in accordance with Section 853(c)(2) of the Internal Revenue Code and also the fund reports the maximum amount allowable but not less than $1,853,015 as taxes paid from foreign countries for the fiscal year ended September 30, 2017 in accordance with Section 853(a) of the Internal Revenue Code. Where required by federal tax rules, shareholders will receive notification of their proportionate share of foreign sourced income and foreign taxes paid for the 2017 calendar year with Form 1099-DIV which will be mailed in early 2018. Also the fund reports the maximum amount allowable, but not less than $14,608,412 as ordinary income dividends paid during the fiscal year ended September 30, 2017 as qualified dividend income in accordance with Section 854(b)(1)(B) Section 852(b)(3)(C) of the Internal Revenue Code.
34
BOARD MEMBERS INFORMATION (Unaudited)
INDEPENDENT BOARD MEMBERS
Joseph S. DiMartino (73)
Chairman of the Board (2008)
Principal Occupation During Past 5 Years:
· Corporate Director and Trustee (1995-present)
Other Public Company Board Memberships During Past 5 Years:
· CBIZ (formerly, Century Business Services, Inc.), a provider of outsourcing functions for small and medium size companies, Director (1997-present)
No. of Portfolios for which Board Member Serves: 127
———————
Francine J. Bovich (66)
Board Member (2011)
Principal Occupation During Past 5 Years:
· Trustee, The Bradley Trusts, private trust funds (2011-present)
Other Public Company Board Memberships During Past 5 Years:
· Annaly Capital Management, Inc., Board Member (May 2014-present)
No. of Portfolios for which Board Member Serves: 75
———————
Kenneth A. Himmel (71)
Board Member (2008)
Principal Occupation During Past 5 Years:
· Managing Partner, Gulf Related, an international real estate development company (2010-present)
· President and CEO, Related Urban Development, a real estate development company (1996-present)
· President and CEO, Himmel & Company, a real estate development company (1980-present)
· CEO, American Food Management, a restaurant company (1983-present)
No. of Portfolios for which Board Member Serves: 28
———————
35
BOARD MEMBERS INFORMATION (Unaudited) (continued)
INDEPENDENT BOARD MEMBERS (continued)
Stephen J. Lockwood (70)
Board Member (2008)
Principal Occupation During Past 5 Years:
· Chairman of the Board, Stephen J. Lockwood and Company LLC, a real estate investment company (2000-present)
No. of Portfolios for which Board Member Serves: 28
———————
Roslyn M. Watson (67)
Board Member (2008)
Principal Occupation During Past 5 Years:
· Principal, Watson Ventures, Inc., a real estate investment company (1993-present)
No. of Portfolios for which Board Member Serves: 61
———————
Benaree Pratt Wiley (71)
Board Member (2008)
Principal Occupation During Past 5 Years:
· Principal, The Wiley Group, a firm specializing in strategy and business development (2005-present)
Other Public Company Board Memberships During Past 5 Years:
· CBIZ (formerly, Century Business Services, Inc.), a provider of outsourcing functions for small and medium size companies, Director (2008-present)
No. of Portfolios for which Board Member Serves: 82
———————
Once elected all Board Members serve for an indefinite term, but achieve Emeritus status upon reaching age 80. The address of the Board Members and Officers is c/o The Dreyfus Corporation, 200 Park Avenue, New York, New York 10166. Additional information about the Board Members is available in the fund’s Statement of Additional Information which can be obtained from Dreyfus free of charge by calling this toll free number: 1-800-DREYFUS.
James M. Fitzgibbons, Emeritus Board Member
36
OFFICERS OF THE FUND (Unaudited)
BRADLEY J. SKAPYAK, President since January 2010.
Chief Operating Officer and a director of the Manager since June 2009, Chairman of Dreyfus Transfer, Inc., an affiliate of the Manager and the transfer agent of the funds, since May 2011 and Chief Executive Officer of MBSC Securities Corporation since August 2016. He is an officer of 61 investment companies (comprised of 127 portfolios) managed by the Manager. He is 58 years old and has been an employee of the Manager since February 1988.
BENNETT A. MACDOUGALL, Chief Legal Officer since October 2015.
Chief Legal Officer of the Manager and Associate General Counsel and Managing Director of BNY Mellon since June 2015; from June 2005 to June 2015, he served in various capacities with Deutsche Bank – Asset & Wealth Management Division, including as Director and Associate General Counsel, and Chief Legal Officer of Deutsche Investment Management Americas Inc. from June 2012 to May 2015. He is an officer of 62 investment companies (comprised of 152 portfolios) managed by the Manager. He is 46 years old and has been an employee of the Manager since June 2015.
JANETTE E. FARRAGHER, Vice President and Secretary since December 2011.
Associate General Counsel of BNY Mellon, and an officer of 62 investment companies (comprised of 152 portfolios) managed by the Manager. She is 54 years old and has been an employee of the Manager since February 1984.
JAMES BITETTO, Vice President and Assistant Secretary since December 2008.
Managing Counsel of BNY Mellon and Secretary of the Manager, and an officer of 62 investment companies (comprised of 152 portfolios) managed by the Manager. He is 51 years old and has been an employee of the Manager since December 1996.
JOSEPH M. CHIOFFI, Vice President and Assistant Secretary since December 2008.
Managing Counsel of BNY Mellon, and an officer of 62 investment companies (comprised of 152 portfolios) managed by the Manager. He is 55 years old and has been an employee of the Manager since June 2000.
MAUREEN E. KANE, Vice President and Assistant Secretary since April 2015.
Managing Counsel of BNY Mellon since July 2014; from October 2004 until July 2014, General Counsel, and from May 2009 until July 2014, Chief Compliance Officer of Century Capital Management. She is an officer of 62 investment companies (comprised of 152 portfolios) managed by the Manager. She is 55 years old and has been an employee of the Manager since July 2014.
SARAH S. KELLEHER, Vice President and Assistant Secretary since April 2014.
Senior Counsel of BNY Mellon since March 2013, from August 2005 to March 2013, Associate General Counsel of Third Avenue Management. She is an officer of 62 investment companies (comprised of 152 portfolios) managed by the Manager. She is 42 years old and has been an employee of the Manager since March 2013.
JEFF PRUSNOFSKY, Vice President and Assistant Secretary since December 2008.
Senior Managing Counsel of BNY Mellon, and an officer of 62 investment companies (comprised of 152 portfolios) managed by the Manager. He is 52 years old and has been an employee of the Manager since October 1990.
NATALYA ZELENSKY, Vice President and Assistant Secretary since March 2017.
Counsel and Vice President of BNY Mellon since May 2016; Attorney at Wildermuth Endowment Strategy Fund/Wildermuth Advisory, LLC from November 2015 until May 2016; Assistant General Counsel at RCS Advisory Services from July 2014 until November 2015; Associate at Sutherland, Asbill & Brennan from January 2013 until January 2014; Associate at K&L Gates from October 2011 until January 2013. She is an officer of 62 investment companies (comprised of 152 portfolios) managed by Dreyfus. She is 32 years old and has been an employee of the Manager since May 2016.
JAMES WINDELS, Treasurer since December 2008.
Director – Mutual Fund Accounting of the Manager, and an officer of 62 investment companies (comprised of 152 portfolios) managed by the Manager. He is 59 years old and has been an employee of the Manager since April 1985.
37
OFFICERS OF THE FUND (Unaudited) (continued)
RICHARD CASSARO, Assistant Treasurer since December 2008.
Senior Accounting Manager – Money Market and Municipal Bond Funds of the Manager, and an officer of 62 investment companies (comprised of 152 portfolios) managed by the Manager. He is 58 years old and has been an employee of the Manager since September 1982.
GAVIN C. REILLY, Assistant Treasurer since December 2008.
Tax Manager of the Investment Accounting and Support Department of the Manager, and an officer of 62 investment companies (comprised of 152 portfolios) managed by the Manager. He is 49 years old and has been an employee of the Manager since April 1991.
ROBERT S. ROBOL, Assistant Treasurer since December 2008.
Senior Accounting Manager – Dreyfus Financial Reporting of the Manager, and an officer of 62 investment companies (comprised of 152 portfolios) managed by the Manager. He is 53 years old and has been an employee of the Manager since October 1988.
ROBERT SALVIOLO, Assistant Treasurer since December 2008.
Senior Accounting Manager – Equity Funds of the Manager, and an officer of 62 investment companies (comprised of 152 portfolios) managed by the Manager. He is 50 years old and has been an employee of the Manager since June 1989.
ROBERT SVAGNA, Assistant Treasurer since December 2008.
Senior Accounting Manager – Fixed Income and Equity Funds of the Manager, and an officer of 62 investment companies (comprised of 152 portfolios) managed by the Manager. He is 50 years old and has been an employee of the Manager since November 1990.
JOSEPH W. CONNOLLY, Chief Compliance Officer since December 2008.
Chief Compliance Officer of the Manager and The Dreyfus Family of Funds (62 investment companies, comprised of 152 portfolios). He is 60 years old and has served in various capacities with the Manager since 1980, including manager of the firm’s Fund Accounting Department from 1997 through October 2001.
CARIDAD M. CAROSELLA, Anti-Money Laundering Compliance Officer since January 2016.
Anti-Money Laundering Compliance Officer of the Dreyfus Family of Funds and BNY Mellon Funds Trust since January 2016; from May 2015 to December 2015, Interim Anti-Money Laundering Compliance Officer of the Dreyfus Family of Funds and BNY Mellon Funds Trust and the Distributor; from January 2012 to May 2015, AML Surveillance Officer of the Distributor and from 2007 to December 2011, Financial Processing Manager of the Distributor. She is an officer of 57 investment companies (comprised of 147 portfolios) managed by the Manager. She is 49 years old and has been an employee of the Distributor since 1997.
38
NOTES
39
NOTES
40
NOTES
41
Dreyfus/Newton International Equity Fund
200 Park Avenue
New York, NY 10166
Manager
The Dreyfus Corporation
200 Park Avenue
New York, NY 10166
Sub-Investment Adviser
Newton Investment Management
(North America) Limited
160 Queen Victoria Street
London, EC4V, 4LA, UK
Custodian
The Bank of New York Mellon
225 Liberty Street
New York, NY 10286
Transfer Agent &
Dividend Disbursing Agent
Dreyfus Transfer, Inc.
200 Park Avenue
New York, NY 10166
Distributor
MBSC Securities Corporation
200 Park Avenue
New York, NY 10166
| | |
Ticker Symbols: | Class A: NIEAX Class C: NIECX Class I: SNIEX Class Y: NIEYX |
Telephone Call your financial representative or 1-800-DREYFUS
Mail The Dreyfus Family of Funds, 144 Glenn Curtiss Boulevard, Uniondale, NY 11556-0144
E-mail Send your request to info@dreyfus.com
Internet Information can be viewed online or downloaded at www.dreyfus.com
The fund files its complete schedule of portfolio holdings with the Securities and Exchange Commission (“SEC”) for the first and third quarters of each fiscal year on Form N-Q. The fund’s Forms N-Q are available on the SEC’s website at www.sec.gov and may be reviewed and copied at the SEC’s Public Reference Room in Washington, D.C. (phone 1-800-SEC-0330 for information).
A description of the policies and procedures that the fund uses to determine how to vote proxies relating to portfolio securities and information regarding how the fund voted these proxies for the most recent 12-month period ended June 30 is available at www.dreyfus.com and on the SEC’s website at www.sec.gov and without charge, upon request, by calling 1-800-DREYFUS.
| | |
© 2017 MBSC Securities Corporation
6916AR0917 | 
|
Dreyfus Tax Sensitive Total Return Bond Fund
| | | |

| | ANNUAL REPORT September 30, 2017 |
| |
Save time. Save paper. View your next shareholder report online as soon as it’s available. Log into www.dreyfus.com and sign up for Dreyfus eCommunications. It’s simple and only takes a few minutes. |
| |
The views expressed in this report reflect those of the portfolio manager(s) only through the end of the period covered and do not necessarily represent the views of Dreyfus or any other person in the Dreyfus organization. Any such views are subject to change at any time based upon market or other conditions and Dreyfus disclaims any responsibility to update such views. These views may not be relied on as investment advice and, because investment decisions for a Dreyfus fund are based on numerous factors, may not be relied on as an indication of trading intent on behalf of any Dreyfus fund. |
| |
Not FDIC-Insured • Not Bank-Guaranteed • May Lose Value |
Contents
T H E F U N D
F O R M O R E I N F O R M AT I O N
Back Cover
| | | | |
| |
Dreyfus Tax Sensitive Total Return Bond Fund
| | The Fund |
A LETTER FROM THE CEO OF DREYFUS
Dear Shareholder:
We are pleased to present this annual report for Dreyfus Tax Sensitive Total Return Bond Fund, covering the 12-month period from October 1, 2016 through September 30, 2017. For information about how the fund performed during the reporting period, as well as general market perspectives, we provide a Discussion of Fund Performance on the pages that follow.
Stocks set a series of new record highs and bonds produced mixed results over the past year in response to changing economic and political conditions. Financial markets during the final months of 2016 were dominated by the election of a new U.S. presidential administration. Equities and corporate-backed bonds surged higher in anticipation of more business-friendly regulatory, tax, and fiscal policies, but high-quality bonds generally lost value due to expectations of rising interest rates and accelerating inflation in a stronger economy. Despite a series of short-term interest rate hikes, bonds recovered most or all of their previous losses over the first nine months of 2017 when it became clearer that pro-growth legislation would take time and political capital to enact. U.S. and international stocks continued to rally as corporate earnings grew and global economic conditions improved.
The markets’ recent strong performance has been supported by solid underlying fundamentals. While we currently expect these favorable conditions to persist, we remain watchful for economic and political developments that could derail the rallies. As always, we encourage you to discuss the risks and opportunities of today’s investment environment with your financial advisor.
Thank you for your continued confidence and support.
Sincerely,

Mark D. Santero
Chief Executive Officer
The Dreyfus Corporation
October 16, 2017
2
DISCUSSION OF FUND PERFORMANCE
For the period from October 1, 2016 through September 30, 2017, as provided by portfolio managers Thomas Casey, Daniel Rabasco, and Jeffrey Burger, of Standish Mellon Asset Management Company, LLC, Sub-Investment Adviser
Market and Fund Performance Overview
For the 12-month period ended September 30, 2017, Dreyfus Tax Sensitive Total Return Bond Fund’s Class A shares produced a total return of 0.59%, Class C shares returned -0.11%, Class I shares returned 0.84%, and Class Y shares returned 0.88%.1 In comparison, the fund’s benchmark, the Bloomberg Barclays 3-, 5-, 7-, 10-Year U.S. Municipal Bond Index (the “Index”), provided a total return of 1.01% for the same period.2
Municipal bonds produced modestly positive returns over the reporting period when moderating long-term interest rates and improving supply-and-demand dynamics offset earlier market weakness in the wake of the 2016 presidential election. The fund underperformed its benchmark, mainly due to a modestly long average duration early in the reporting period.
The Fund’s Investment Approach
The fund seeks high after-tax total return. To pursue its goal, the fund normally invests at least 80% of its net assets, plus any borrowings for investment purposes, in bonds. The fund normally invests at least 65% of its net assets in municipal bonds that provide income exempt from federal personal income tax. The fund may invest up to 35% of its net assets in taxable bonds. The fund invests principally in bonds rated investment grade at the time of purchase or, if unrated, determined to be of comparable quality.3 The fund may invest up to 25% of its assets in bonds rated below investment grade.
We seek relative value opportunities among municipal bonds and invest selectively in taxable securities with the potential to enhance after-tax total return and/or reduce volatility. We use a combination of fundamental credit analysis and macroeconomic and quantitative inputs to identify undervalued sectors and securities, and we select municipal bonds using fundamental credit analysis to estimate the relative value and attractiveness of various sectors and securities and to exploit pricing inefficiencies.
Supply-and-Demand Dynamics Buoyed Municipal Bonds
The reporting period began in the midst of heightened market volatility stemming from a flood of new securities as issuers sought to lock in low financing rates in advance of short-term interest-rate hikes from the Federal Reserve Board. In addition, the unexpected outcome of the presidential election sparked uncertainty regarding potential changes in tax policy.
These negative trends reversed immediately after the election in November, and municipal bonds rebounded steadily from low valuations as the supply of newly issued securities moderated, demand increased, and investors realized that tax reform legislation was not imminent. However, a tax reform proposal in September rekindled investors’ concerns, and municipal bonds gave back a portion of their previous gains.
Although growth in tax revenues has slowed and several states are facing pressure from underfunded pension systems, credit conditions have remained stable for most municipal issuers. Solid credit fundamentals helped lower-rated municipal bonds outperform their higher-quality counterparts over the reporting period.
Long Average Duration Dampened Relative Results
Although the fund performed well in the rising market environment that prevailed over most of the first nine months of 2017, its interest-rate strategies made it more sensitive to the damaging effects of rising bond yields in the immediate wake of the 2016 presidential election. The fund maintained a
3
DISCUSSION OF FUND PERFORMANCE (continued)
relatively long average duration and a focus on bonds with maturities in the 10- to 20-year range. Consequently, the fund mildly trailed the Index for the reporting period overall.
In contrast, the fund’s focus on intermediate-term securities helped it benefit from declining interest rates over the reporting period’s second half. In addition, the fund’s emphasis on higher-yielding revenue-backed bonds—and a correspondingly underweighted position in lower-yielding general obligation bonds—enabled the fund to maintain a yield advantage over the Index. The fund achieved particularly favorable contributions from revenue bonds backed by education facilities, hospitals, special-tax districts, and water-and-sewer infrastructure. The fund also benefited from general obligation bonds from California and appropriation bonds from New Jersey. Among taxable securities, asset-backed securities and taxable municipal bonds added value over the reporting period.
A More Cautious Investment Posture
In the wake of the municipal bond market’s recent rally, yield differences have narrowed along the market’s credit-quality spectrum, and tax reform has become a more prominent part of the national debate. In addition, short- and long-term interest rates are expected to rise in a growing economy. The municipal bond market may also face seasonal supply-and-demand pressures over the next few months.
Therefore, we have reduced the fund’s average duration to a more moderately long position, and we have maintained a bias toward higher-quality securities. On the other hand, we have retained the fund’s emphasis on revenue-backed bonds, and we remain watchful for trading opportunities to boost the fund’s total return potential as interest rates rise.
October 16, 2017
1 Total return includes reinvestment of dividends and any capital gains paid, and does not take into consideration the maximum initial sales charge in the case of Class A shares or the applicable contingent deferred sales charge imposed on redemptions in the case of Class C shares. Share price, yield, and investment return fluctuate such that upon redemption, fund shares may be worth more or less than their original cost. Dividends paid by the fund will be exempt from federal income tax to the extent such dividends are derived from interest paid on principal obligations. The fund also may invest a portion of its assets in securities that generate income that is not exempt from federal or state income tax. Income may be subject to state and local taxes, and some income may be subject to the federal alternative minimum tax (AMT) for certain investors. Capital gains, if any, are taxable. Return figures provided reflect the absorption of certain fund expenses by The Dreyfus Corporation, pursuant to an agreement in effect through February 1, 2019, at which time it may be extended, modified, or terminated. Had these expenses not been absorbed, the fund’s returns would have been lower. Past performance is no guarantee of future results.
2 Source: Lipper Inc. — The Bloomberg Barclays 3-, 5-, 7-, 10-Year U.S. Municipal Bond Index is composed of an equal-weighted composite of the 3-Year, 5-Year, 7-Year, and 10-Year Bloomberg Barclays U.S. Municipal Bond indices, reflects investments of dividends and, where applicable, capital gain distributions. Investors cannot invest directly in any index.
3 The fund may continue to own investment-grade bonds (at the time of purchase), which are subsequently downgraded to below investment grade.
Bonds are subject generally to interest-rate, credit, liquidity, and market risks, to varying degrees, all of which are more fully described in the fund’s prospectus. Generally, all other factors being equal, bond prices are inversely related to interest-rate changes, and rate increases can cause price declines.
The use of derivatives involves risks different from, or possibly greater than, the risks associated with investing directly in the underlying assets. Derivatives can be highly volatile, illiquid, difficult to value, and there is the risk that changes in the value of a derivative held by the fund will not correlate with the underlying instruments or the fund’s other investments.
4
FUND PERFORMANCE
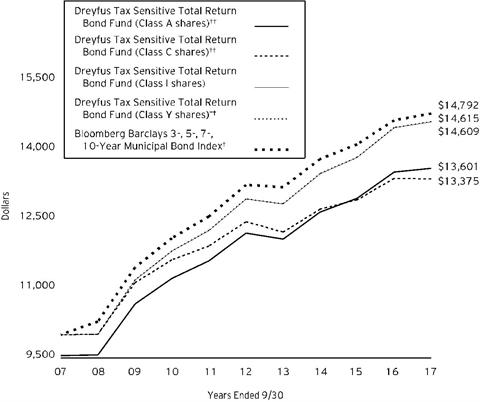
Comparison of change in value of $10,000 investment in Dreyfus Tax Sensitive Total Return Bond Fund Class A shares, Class C shares, Class I shares and Class Y shares and the Bloomberg Barclays 3-, 5-, 7-, 10-Year Municipal Bond Index (the “Index”)
† Source: Lipper Inc.
†† The total return figures presented for Class A and Class C shares of the fund reflect the performance of the fund’s Class I shares for the period prior to 3/31/09 (the inception date for Class A and Class C shares), adjusted to reflect the applicable sales load for Class A shares. The total return figures presented for Class Y shares of the fund reflect the performance of the fund’s Class I shares for the period prior to 7/1/13 (the inception date for Class Y shares).
Past performance is not predictive of future performance.
The above graph compares a $10,000 investment made in each of the Class A, Class C, Class I and Class Y shares of Dreyfus Tax Sensitive Total Return Bond Fund on 9/30/07 to a $10,000 investment made in the Index on that date. All dividends and capital gain distributions are reinvested.
The fund’s performance shown in the line graph above takes into account the maximum initial sales charge on Class A shares and all other applicable fees and expenses on all classes. The Index is composed of an equal-weighted composite of the 3-Year, 5-Year, 7-Year, and 10- Year Bloomberg Barclays U.S. Municipal Bond indices. Reflects investments of dividends and, where applicable, capital gain distributions. Unlike a mutual fund, the Index is not subject to charges, fees and other expenses. Investors cannot invest directly in any index. These factors can contribute to the Index potentially outperforming the fund. Further information relating to fund performance, including expense reimbursements, if applicable, is contained in the Financial Highlights section of the prospectus and elsewhere in this report.
5
FUND PERFORMANCE (continued)
| | | | | |
Average Annual Total Returns as of 9/30/17 |
| Inception | 1 Year | 5 Years | 10 Years |
Date |
Class A shares | | | | |
with maximum sales charge (4.5%) | 3/31/09 | -3.92% | 1.26% | 3.12%†† |
without sales charge | 3/31/09 | 0.59% | 2.20% | 3.60%†† |
Class C shares | | | | |
with applicable redemption charge † | 3/31/09 | -1.10% | 1.45% | 2.95%†† |
without redemption | 3/31/09 | -0.11% | 1.45% | 2.95%†† |
Class I shares | 11/2/92 | 0.84% | 2.45% | 3.86% |
Class Y shares | 7/1/13 | 0.88% | 2.46%†† | 3.87%†† |
Bloomberg Barclays 3-, 5-, 7-, 10-Year | | | | |
Municipal Bond Index | | 1.01% | 2.23% | 3.99% |
† The maximum contingent deferred sales charge for Class C shares is 1% for shares redeemed within one year of the date of purchase.
†† The total return performance figures presented for Class A and Class C shares of the fund reflect the performance of the fund’s Class I shares for the period prior to 3/31/09 (the inception date for Class A and Class C shares), adjusted to reflect the applicable sales load for Class A shares. The total return performance figures presented for Class Y shares of the fund reflect the performance of the fund’s Class I shares for the period prior to 7/1/13 (the inception date for Class Y shares).
The performance data quoted represents past performance, which is no guarantee of future results. Share price and investment return fluctuate and an investor’s shares may be worth more or less than original cost upon redemption. Current performance may be lower or higher than the performance quoted. Go to Dreyfus.com for the fund’s most recent month-end returns.
The fund’s performance shown in the graph and table does not reflect the deduction of taxes that a shareholder would pay on fund distributions or the redemption of fund shares. In addition to the performance of Class A shares shown with and without a maximum sales charge, the fund’s performance shown in the table takes into account all other applicable fees and expenses on all classes.
6
UNDERSTANDING YOUR FUND’S EXPENSES (Unaudited)
As a mutual fund investor, you pay ongoing expenses, such as management fees and other expenses. Using the information below, you can estimate how these expenses affect your investment and compare them with the expenses of other funds. You also may pay one-time transaction expenses, including sales charges (loads) and redemption fees, which are not shown in this section and would have resulted in higher total expenses. For more information, see your fund’s prospectus or talk to your financial adviser.
Review your fund’s expenses
The table below shows the expenses you would have paid on a $1,000 investment in Dreyfus Tax Sensitive Total Return Bond Fund from April 1, 2017 to September 30, 2017. It also shows how much a $1,000 investment would be worth at the close of the period, assuming actual returns and expenses.
| | | | | | | | | | | | |
Expenses and Value of a $1,000 Investment | | |
assuming actual returns for the six months ended September 30, 2017 |
| | | | | | | | |
| | | | Class A | Class C | Class I | Class Y |
Expenses paid per $1,000† | | $3.56 | | $7.36 | | $2.29 | | $2.29 |
Ending value (after expenses) | | $1,029.30 | | $1,025.40 | | $1,030.50 | | $1,030.60 |
COMPARING YOUR FUND’S EXPENSES
WITH THOSE OF OTHER FUNDS (Unaudited)
Using the SEC’s method to compare expenses
The Securities and Exchange Commission (“SEC”) has established guidelines to help investors assess fund expenses. Per these guidelines, the table below shows your fund’s expenses based on a $1,000 investment, assuming a hypothetical 5% annualized return. You can use this information to compare the ongoing expenses (but not transaction expenses or total cost) of investing in the fund with those of other funds. All mutual fund shareholder reports will provide this information to help you make this comparison. Please note that you cannot use this information to estimate your actual ending account balance and expenses paid during the period.
| | | | | | | | | | | | |
Expenses and Value of a $1,000 Investment | | |
assuming a hypothetical 5% annualized return for the six months ended September 30, 2017 |
| | | | | | | | |
| | | | Class A | Class C | Class I | Class Y |
Expenses paid per $1,000† | | $3.55 | | $7.33 | | $2.28 | | $2.28 |
Ending value (after expenses) | | $1,021.56 | | $1,017.80 | | $1,022.81 | | $1,022.81 |
† Expenses are equal to the fund’s annualized expense ratio of .70% for Class A, 1.45% for Class C, .45% for Class I and .45% for Class Y, multiplied by the average account value over the period, multiplied by 183/365 (to reflect the one-half year period).
7
STATEMENT OF INVESTMENTS
September 30, 2017
| | | | | | | | | | |
| |
Description | Coupon
Rate (%) | | Maturity
Date | | Principal
Amount ($) | | Value ($) | |
Bonds and Notes - 2.2% | | | | | |
Asset-Backed Certificates - .5% | | | | | |
Carrington Mortgage Loan Trust,
Ser. 2006-NC5, Cl. A2, 1 Month LIBOR+.11% | | 1.34 | | 1/25/37 | | 370,998 | a | 325,720 | |
OneMain Financial Issuance Trust,
Ser. 2014-1A, Cl. B | | 3.24 | | 6/18/24 | | 1,180,000 | b | 1,180,813 | |
| | 1,506,533 | |
Asset-Backed Ctfs./Auto Receivables - 1.4% | | | | | |
Capital Auto Receivables Asset Trust,
Ser. 2014-2, Cl. D | | 2.81 | | 8/20/19 | | 240,000 | | 240,965 | |
DT Auto Owner Trust,
Ser. 2014-2A, Cl. D | | 3.68 | | 4/15/21 | | 1,097,624 | b | 1,105,317 | |
DT Auto Owner Trust,
Ser. 2014-3A, Cl. D | | 4.47 | | 11/15/21 | | 2,345,000 | b | 2,389,358 | |
| | 3,735,640 | |
Health Care - .3% | | | | | |
Dignity Health,
Scd. Bonds | | 2.64 | | 11/1/19 | | 760,000 | | 766,929 | |
Total Bonds and Notes
(cost $5,943,809) | | 6,009,102 | |
| | | | | | | | | |
Long-Term Municipal Investments - 93.6% | | | | | |
Alabama - 1.0% | | | | | |
Alabama Federal Aid Highway Finance Authority,
Special Obligation Revenue | | 5.00 | | 9/1/29 | | 1,000,000 | | 1,231,630 | |
Alabama Public School and College Authority,
Capital Improvement Revenue | | 5.00 | | 1/1/26 | | 1,250,000 | | 1,505,975 | |
| | 2,737,605 | |
Arizona - .7% | | | | | |
Phoenix Civic Improvement Corporation,
Junior Lien Water System Revenue | | 5.00 | | 7/1/26 | | 1,180,000 | | 1,458,763 | |
Phoenix Industrial Development Authority,
Education Facility Revenue (Legacy Traditional Schools Projects) | | 3.00 | | 7/1/20 | | 360,000 | b | 359,676 | |
| | 1,818,439 | |
Arkansas - .8% | | | | | |
Arkansas Development Finance Authority,
HR (Washington Regional Medical Center) | | 5.00 | | 2/1/25 | | 1,835,000 | | 2,162,070 | |
8
| | | | | | | | | | |
| |
Description | Coupon
Rate (%) | | Maturity Date | | Principal Amount ($) | | Value ($) | |
Long-Term Municipal Investments - 93.6% (continued) | | | | | |
California - 8.3% | | | | | |
California,
GO (Various Purpose) | | 5.00 | | 8/1/28 | | 1,500,000 | | 1,835,535 | |
California,
GO (Various Purpose) | | 5.00 | | 8/1/29 | | 1,500,000 | | 1,822,890 | |
California,
GO (Various Purpose) | | 5.00 | | 8/1/36 | | 1,400,000 | | 1,648,038 | |
California,
GO (Various Purpose) (Build America Bonds) | | 6.65 | | 3/1/22 | | 2,290,000 | | 2,657,866 | |
California,
GO, Refunding (Various Purpose) | | 5.00 | | 11/1/32 | | 1,000,000 | | 1,213,730 | |
California State Public Works Board,
LR (Judicial Council of California) (New Stockton Courthouse) | | 5.00 | | 10/1/26 | | 1,000,000 | | 1,197,000 | |
California State University Trustees,
Systemwide Revenue | | 5.00 | | 11/1/22 | | 1,000,000 | | 1,148,070 | |
California Statewide Communities Development Authority,
Revenue (Loma Linda University Medical Center) | | 5.00 | | 12/1/31 | | 525,000 | b | 590,966 | |
Golden State Tobacco Securitization Corporation,
Enhanced Tobacco Settlement Asset-Backed Bonds (Insured; AMBAC) | | 4.60 | | 6/1/23 | | 750,000 | | 767,415 | |
Golden State Tobacco Securitization Corporation,
Revenue (Tobacco Settlement) | | 5.00 | | 6/1/23 | | 1,000,000 | | 1,161,510 | |
Golden State Tobacco Securitization Corporation,
Revenue (Tobacco Settlement) | | 5.00 | | 6/1/26 | | 1,000,000 | | 1,191,950 | |
Jurupa Public Financing Authority,
Special Tax Revenue | | 5.00 | | 9/1/29 | | 1,060,000 | | 1,231,847 | |
Los Angeles Community Facilities District Number 4,
Special Tax Revenue (Playa Vista-Phase 1) | | 5.00 | | 9/1/28 | | 1,000,000 | | 1,143,400 | |
Los Angeles Department of Airports,
Subordinate Revenue (Los Angeles International Airport) | | 5.00 | | 5/15/27 | | 1,000,000 | | 1,209,900 | |
Los Angeles Harbor Department,
Revenue (Green Bonds) | | 5.00 | | 8/1/21 | | 1,355,000 | | 1,541,922 | |
Sacramento County,
Airport System Senior Revenue | | 5.00 | | 7/1/22 | | 1,275,000 | | 1,312,727 | |
Southern California Public Power Authority,
Revenue (Windy Point/Windy Flats Project) | | 5.00 | | 7/1/23 | | 1,000,000 | | 1,104,980 | |
| | 22,779,746 | |
9
STATEMENT OF INVESTMENTS (continued)
| | | | | | | | | | |
| |
Description | Coupon
Rate (%) | | Maturity Date | | Principal Amount ($) | | Value ($) | |
Long-Term Municipal Investments - 93.6% (continued) | | | | | |
Colorado - 1.4% | | | | | |
City and County of Denver,
Airport System Subordinate Revenue | | 5.00 | | 11/15/22 | | 720,000 | | 833,710 | |
Colorado Health Facilities Authority,
HR (Adventist Health System/Sunbelt Obligated Group) | | 5.00 | | 11/15/26 | | 1,000,000 | | 1,213,120 | |
Denver Convention Center Hotel Authority,
Convention Center Hotel Senior Revenue | | 5.00 | | 12/1/31 | | 1,490,000 | | 1,733,838 | |
| | 3,780,668 | |
Connecticut - 1.2% | | | | | |
Connecticut,
Special Tax Obligation Revenue (Transportation Infrastructure Purposes) | | 5.00 | | 8/1/26 | | 1,840,000 | | 2,187,190 | |
Connecticut,
Special Tax Obligation Revenue (Transportation Infrastructure Purposes) | | 5.00 | | 9/1/33 | | 1,000,000 | | 1,132,170 | |
| | 3,319,360 | |
District of Columbia - 2.4% | | | | | |
District of Columbia,
Revenue (Ingleside Rock Creek Project) | | 3.88 | | 7/1/24 | | 1,750,000 | | 1,750,315 | |
District of Columbia,
University Revenue (Georgetown University Issue) | | 5.00 | | 4/1/24 | | 2,015,000 | | 2,415,340 | |
District of Columbia,
University Revenue (Georgetown University Issue) | | 5.00 | | 4/1/32 | | 1,000,000 | | 1,195,400 | |
Metropolitan Washington Airports Authority,
Airport System Revenue | | 5.00 | | 10/1/24 | | 1,000,000 | | 1,175,770 | |
| | 6,536,825 | |
Florida - 7.6% | | | | | |
Citizens Property Insurance Corporation,
Personal Lines Account/Commercial Lines Account Senior Secured Revenue | | 5.00 | | 6/1/20 | | 1,500,000 | | 1,646,865 | |
Citizens Property Insurance Corporation,
Personal Lines Account/Commercial Lines Account Senior Secured Revenue | | 5.00 | | 6/1/21 | | 3,000,000 | | 3,384,060 | |
Florida Department of Transportation,
Turnpike Revenue | | 5.00 | | 7/1/25 | | 1,000,000 | | 1,184,710 | |
Florida Higher Educational Facilities Financing Authority,
Educational Facilities Revenue (Nova Southeastern University Project) | | 5.00 | | 4/1/26 | | 1,500,000 | | 1,786,065 | |
Jacksonville,
Special Revenue | | 5.00 | | 10/1/27 | | 1,000,000 | | 1,180,510 | |
10
| | | | | | | | | | |
| |
Description | Coupon
Rate (%) | | Maturity Date | | Principal Amount ($) | | Value ($) | |
Long-Term Municipal Investments - 93.6% (continued) | | | | | |
Florida - 7.6% (continued) | | | | | |
Lee County,
Transportation Facilities Revenue (Insured; Assured Guaranty Municipal Corp.) | | 5.00 | | 10/1/25 | | 1,000,000 | | 1,187,110 | |
Miami Beach Redevelopment Agency,
Tax Increment Revenue (City Center/Historic Convention Village) | | 5.00 | | 2/1/33 | | 1,500,000 | | 1,720,410 | |
Miami-Dade County,
Aviation Revenue (Miami International Airport) | | 5.25 | | 10/1/23 | | 1,000,000 | | 1,114,720 | |
Miami-Dade County,
Seaport Revenue | | 5.00 | | 10/1/22 | | 2,000,000 | | 2,290,600 | |
Miami-Dade County School Board,
COP | | 5.00 | | 5/1/26 | | 1,500,000 | | 1,794,795 | |
Orange County,
Tourist Development Tax Revenue | | 5.00 | | 10/1/30 | | 750,000 | | 895,853 | |
South Miami Health Facilities Authority,
HR (Baptist Health South Florida Obligated Group) | | 5.00 | | 8/15/18 | | 750,000 | | 752,520 | |
Tampa,
Capital Improvement Cigarette Tax Allocation Revenue (H. Lee Moffitt Cancer Center Project) | | 5.00 | | 9/1/23 | | 500,000 | | 573,510 | |
Village Community Development District Number 7,
Special Assessment Revenue | | 3.00 | | 5/1/19 | | 625,000 | | 638,975 | |
Village Community Development District Number 7,
Special Assessment Revenue | | 3.00 | | 5/1/20 | | 595,000 | | 613,558 | |
| | 20,764,261 | |
Georgia - 2.9% | | | | | |
Atlanta,
Airport General Revenue | | 5.00 | | 1/1/22 | | 1,000,000 | | 1,111,790 | |
Atlanta Development Authority,
Senior Lien Revenue (New Downtown Atlanta Stadium Project) | | 5.00 | | 7/1/29 | | 1,000,000 | | 1,183,350 | |
Fulton County Development Authority,
Hospital Revenue (Wellstar Health Systems) | | 5.00 | | 4/1/36 | | 1,775,000 | | 2,025,701 | |
Fulton County Development Authority,
Revenue (Piedmont Healthcare, Inc. Project) | | 5.00 | | 7/1/25 | | 1,000,000 | | 1,204,970 | |
Main Street Natural Gas, Inc.,
Gas Project Revenue (Guaranty Agreement; Merrill Lynch and Co., Inc.) | | 5.50 | | 9/15/28 | | 1,100,000 | | 1,341,450 | |
Municipal Electric Authority of Georgia,
Project One Subordinated Bonds | | 5.00 | | 1/1/21 | | 1,000,000 | | 1,110,440 | |
| | 7,977,701 | |
11
STATEMENT OF INVESTMENTS (continued)
| | | | | | | | | | |
| |
Description | Coupon
Rate (%) | | Maturity Date | | Principal Amount ($) | | Value ($) | |
Long-Term Municipal Investments - 93.6% (continued) | | | | | |
Hawaii - .4% | | | | | |
Hawaii Department of Budget and Finance,
Special Purpose Revenue (Hawaiian Electric Company) | | 4.00 | | 3/1/37 | | 1,090,000 | | 1,135,355 | |
Illinois - 7.9% | | | | | |
Chicago,
Customer Facility Charge Senior Lien Revenue (Chicago O'Hare International Airport) | | 5.25 | | 1/1/24 | | 1,500,000 | | 1,738,755 | |
Chicago,
General Airport Senior Lien Revenue (Chicago O'Hare International Airport) | | 5.00 | | 1/1/35 | | 750,000 | | 863,670 | |
Chicago,
General Airport Third Lien Revenue (Chicago O'Hare International Airport) (Insured; Assured Guaranty Municipal Corp.) (Prerefunded) | | 5.00 | | 1/1/18 | | 1,000,000 | c | 1,010,500 | |
Chicago,
Second Lien Water Revenue | | 5.00 | | 11/1/26 | | 1,000,000 | | 1,144,330 | |
Chicago Park District,
Limited Tax GO | | 5.00 | | 1/1/28 | | 2,500,000 | | 2,811,975 | |
Cook County,
Sales Tax Revenue, Refunding | | 5.00 | | 11/15/35 | | 1,000,000 | | 1,164,980 | |
Greater Chicago Metropolitan Water Reclamation District,
Unlimited Tax GO | | 5.00 | | 12/1/31 | | 1,000,000 | | 1,169,780 | |
Illinois Finance Authority,
Revenue (Edward-Elmhurst Healthcare) | | 5.00 | | 1/1/36 | | 1,500,000 | | 1,652,805 | |
Illinois Finance Authority,
Revenue (Rush University Medical Center Obligated Group) | | 5.00 | | 11/15/26 | | 1,000,000 | | 1,171,950 | |
Illinois Finance Authority,
Revenue, Refunding (Rosalind Franklin University of Medicine & Science) | | 5.00 | | 8/1/35 | | 1,100,000 | | 1,199,913 | |
Illinois Toll Highway Authority,
Toll Highway Senior Revenue | | 5.00 | | 1/1/27 | | 1,000,000 | | 1,196,940 | |
Illinois Toll Highway Authority,
Toll Highway Senior Revenue | | 5.00 | | 1/1/31 | | 1,000,000 | | 1,166,730 | |
Metropolitan Pier and Exposition Authority,
Revenue (McCormick Place Expansion Project) | | 5.00 | | 12/15/28 | | 2,035,000 | | 2,179,200 | |
Metropolitan Water Reclamation District of Greater Chicago,
GO | | 5.00 | | 12/1/27 | | 1,000,000 | | 1,205,260 | |
12
| | | | | | | | | | |
| |
Description | Coupon
Rate (%) | | Maturity Date | | Principal Amount ($) | | Value ($) | |
Long-Term Municipal Investments - 93.6% (continued) | | | | | |
Illinois - 7.9% (continued) | | | | | |
South Western Development Authority,
Health Facility Revenue (Memorial Group) (Prerefunded) | | 7.13 | | 11/1/23 | | 1,500,000 | c | 1,981,665 | |
| | 21,658,453 | |
Indiana - .9% | | | | | |
Indiana Finance Authority,
Highway Revenue, Refunding | | 5.00 | | 6/1/36 | | 2,065,000 | | 2,468,687 | |
Kansas - .5% | | | | | |
Kansas Development Finance Authority,
Revolving Funds Revenue (Kansas Department of Health and Environment) | | 5.00 | | 3/1/21 | | 1,150,000 | | 1,257,399 | |
Kentucky - .4% | | | | | |
Louisville and Jefferson County Metropolitan Sewer District,
Sewer and Drainage System Revenue | | 5.00 | | 5/15/23 | | 1,000,000 | | 1,144,640 | |
Louisiana - .8% | | | | | |
Louisiana,
State Highway Improvement Revenue | | 5.00 | | 6/15/25 | | 1,000,000 | | 1,195,200 | |
Tobacco Settlement Financing Corporation of Louisiana,
Tobacco Settlement Asset-Backed Bonds | | 5.00 | | 5/15/20 | | 1,000,000 | | 1,085,510 | |
| | 2,280,710 | |
Maryland - 1.5% | | | | | |
Baltimore,
Covention Center Hotel Revenue (Convention Center Hotel Project) | | 5.00 | | 9/1/36 | | 1,000,000 | | 1,145,560 | |
Maryland Economic Development Corporation,
EDR (Transportation Facilities Project) | | 5.13 | | 6/1/20 | | 1,000,000 | | 1,056,110 | |
Maryland Health and Higher Educational Facilities Authority,
Revenue (University of Maryland Medical System Issue) | | 5.00 | | 7/1/32 | | 1,500,000 | | 1,747,890 | |
| | 3,949,560 | |
Massachusetts - 1.2% | | | | | |
Massachusetts Development Finance Agency,
Revenue (Suffolk University) | | 5.00 | | 7/1/28 | | 1,335,000 | | 1,580,413 | |
Massachusetts Port Authority,
Revenue, Refunding | | 5.00 | | 7/1/28 | | 1,500,000 | | 1,821,375 | |
| | 3,401,788 | |
13
STATEMENT OF INVESTMENTS (continued)
| | | | | | | | | | |
| |
Description | Coupon
Rate (%) | | Maturity Date | | Principal Amount ($) | | Value ($) | |
Long-Term Municipal Investments - 93.6% (continued) | | | | | |
Michigan - 2.2% | | | | | |
Detroit,
Sewage Disposal System Senior Lien Revenue (Insured; Assured Guaranty Municipal Corp.) | | 5.25 | | 7/1/19 | | 1,000,000 | | 1,070,130 | |
Great Lakes Water Authority,
Water Supply System Second Lien Revenue | | 5.00 | | 7/1/25 | | 1,105,000 | | 1,298,662 | |
Michigan Finance Authority,
HR (Beaumont Health Credit Group) | | 5.00 | | 8/1/25 | | 1,000,000 | | 1,180,220 | |
Michigan Finance Authority,
Local Government Loan Program Revenue (Detroit Water and Sewerage Department, Sewage Disposal System Revenue Senior Lien Local Project Bonds) (Insured; Assured Guaranty Municipal Corp.) | | 5.00 | | 7/1/30 | | 1,000,000 | | 1,144,120 | |
Michigan Finance Authority,
Local Government Loan Program Revenue (School District of the City of Detroit State Qualified Unlimited Tax GO Local Project Bonds) | | 5.00 | | 5/1/20 | | 1,125,000 | | 1,225,508 | |
Michigan Finance Authority,
Unemployment Obligation Assessment Revenue | | 5.00 | | 7/1/21 | | 145,000 | | 149,486 | |
| | 6,068,126 | |
Minnesota - .9% | | | | | |
Saint Paul Housing and Redevelopment Authority,
Hospital Facility Revenue (HealthEast Care System Project) (Escrowed to Maturity) | | 5.00 | | 11/15/21 | | 1,000,000 | | 1,147,350 | |
Western Minnesota Municipal Power Agency,
Power Supply Revenue | | 5.00 | | 1/1/29 | | 1,120,000 | | 1,310,870 | |
| | 2,458,220 | |
Missouri - 2.6% | | | | | |
Missouri Development Finance Board,
Infrastructure Facilities Revenue (Branson Landing Project) | | 5.00 | | 6/1/23 | | 1,000,000 | | 1,165,010 | |
Missouri Development Finance Board,
Infrastructure Facilities Revenue (Branson Landing Project) | | 5.00 | | 6/1/28 | | 1,000,000 | | 1,125,820 | |
Missouri Health and Educational Facilities Authority,
Health Facilities Revenue (Saint Luke's Health System, Inc.) | | 5.00 | | 11/15/27 | | 1,000,000 | | 1,192,280 | |
14
| | | | | | | | | | |
| |
Description | Coupon
Rate (%) | | Maturity Date | | Principal Amount ($) | | Value ($) | |
Long-Term Municipal Investments - 93.6% (continued) | | | | | |
Missouri - 2.6% (continued) | | | | | |
Missouri Joint Municipal Electric Utility Commission,
Power Project Revenue (Prairie State Project) | | 5.00 | | 12/1/29 | | 3,120,000 | | 3,653,052 | |
| | 7,136,162 | |
Nebraska - .4% | | | | | |
Nebraska Public Power District,
General Revenue | | 5.00 | | 1/1/30 | | 1,000,000 | | 1,172,880 | |
New Jersey - 4.8% | | | | | |
New Jersey Economic Development Authority,
Cigarette Tax Revenue | | 5.00 | | 6/15/18 | | 1,250,000 | | 1,277,963 | |
New Jersey Economic Development Authority,
Revenue | | 5.00 | | 6/15/21 | | 2,000,000 | | 2,195,240 | |
New Jersey Economic Development Authority,
School Facilities Construction Revenue | | 5.00 | | 6/15/26 | | 1,845,000 | | 2,066,990 | |
New Jersey Economic Development Authority,
Water Facilities Revenue (New Jersey - American Water Company, Inc. Project) | | 5.10 | | 6/1/23 | | 1,000,000 | | 1,083,240 | |
New Jersey Health Care Facilities Financing Authority,
Revenue (Inspira Health Obligated Group) | | 5.00 | | 7/1/35 | | 1,850,000 | | 2,135,455 | |
New Jersey Health Care Facilities Financing Authority,
Revenue (Virtua Health Issue) | | 5.00 | | 7/1/25 | | 1,000,000 | | 1,169,810 | |
New Jersey Higher Education Student Assistance Authority,
Senior Student Loan Revenue | | 5.00 | | 12/1/18 | | 1,000,000 | | 1,039,380 | |
New Jersey Higher Education Student Assistance Authority,
Senior Student Loan Revenue | | 5.00 | | 12/1/24 | | 1,000,000 | | 1,151,180 | |
Tobacco Settlement Financing Corporation of New Jersey,
Tobacco Settlement Asset-Backed Bonds | | 4.50 | | 6/1/23 | | 910,000 | | 910,865 | |
| | 13,030,123 | |
New Mexico - 1.5% | | | | | |
Albuquerque,
GO (General Purpose Bonds) | | 5.00 | | 7/1/20 | | 2,000,000 | | 2,210,520 | |
New Mexico Municipal Energy Acquisition Authority,
Gas Supply Revenue (SBPA; Royal Bank of Canada), 1 Month LIBOR+.65% | | 1.48 | | 2/1/19 | | 1,000,000 | a | 998,130 | |
15
STATEMENT OF INVESTMENTS (continued)
| | | | | | | | | | |
| |
Description | Coupon
Rate (%) | | Maturity Date | | Principal Amount ($) | | Value ($) | |
Long-Term Municipal Investments - 93.6% (continued) | | | | | |
New Mexico - 1.5% (continued) | | | | | |
New Mexico Municipal Energy Acquisition Authority,
Gas Supply Revenue, 1 Month LIBOR+.75% | | 1.58 | | 8/1/19 | | 1,000,000 | a | 999,050 | |
| | 4,207,700 | |
New York - 13.5% | | | | | |
Metropolitan Transportation Authority,
Dedicated Tax Fund Revenue | | 5.00 | | 11/15/24 | | 2,000,000 | | 2,389,920 | |
Metropolitan Transportation Authority,
Transportation Revenue | | 5.00 | | 11/15/26 | | 1,205,000 | | 1,429,359 | |
Metropolitan Transportation Authority,
Transportation Revenue | | 5.00 | | 11/15/27 | | 2,380,000 | | 2,911,264 | |
Nassau County,
GO (General Improvement) | | 5.00 | | 10/1/21 | | 2,000,000 | | 2,284,960 | |
New York City,
GO | | 5.00 | | 8/1/21 | | 2,000,000 | | 2,144,200 | |
New York City,
GO | | 5.00 | | 3/1/25 | | 1,000,000 | | 1,199,780 | |
New York City Health and Hospitals Corporation,
Health System Revenue | | 5.00 | | 2/15/19 | | 1,000,000 | | 1,053,980 | |
New York City Transitional Finance Authority,
Revenue | | 2.63 | | 2/1/23 | | 2,500,000 | | 2,508,950 | |
New York State Dormitory Authority,
Revenue (Orange Regional Medical Center Obligated Group) | | 5.00 | | 12/1/27 | | 800,000 | b | 918,816 | |
New York State Urban Development Corporation,
Personal Income Tax Revenue | | 5.00 | | 3/15/31 | | 1,000,000 | | 1,162,330 | |
New York State Urban Development Corporation,
Revenue | | 2.67 | | 3/15/23 | | 2,500,000 | | 2,505,800 | |
New York Transportation Development Corporation,
Special Facility Revenue (American Airlines, Inc. John F. Kennedy International Airport Project) | | 5.00 | | 8/1/21 | | 1,350,000 | | 1,475,766 | |
New York Transportation Development Corporation,
Special Facility Revenue (Terminal One Group Association, L.P. Project) | | 5.00 | | 1/1/19 | | 2,500,000 | | 2,617,675 | |
Onondaga Civic Development Corporation,
Revenue (Saint Joseph's Hospital Health Center Project) (Prerefunded) | | 5.00 | | 7/1/19 | | 1,000,000 | c | 1,068,330 | |
16
| | | | | | | | | | |
| |
Description | Coupon
Rate (%) | | Maturity Date | | Principal Amount ($) | | Value ($) | |
Long-Term Municipal Investments - 93.6% (continued) | | | | | |
New York - 13.5% (continued) | | | | | |
Port Authority of New York and New Jersey,
(Consolidated Bonds, 185th Series) | | 5.00 | | 9/1/30 | | 1,000,000 | | 1,157,520 | |
Triborough Bridge and Tunnel Authority,
General Revenue (MTA Bridges and Tunnels) | | 5.00 | | 11/15/24 | | 2,150,000 | | 2,525,562 | |
Triborough Bridge and Tunnel Authority,
General Revenue (MTA Bridges and Tunnels), 1 Month LIBOR+.35% | | 1.18 | | 12/3/19 | | 3,500,000 | a | 3,485,300 | |
TSASC,
Revenue | | 5.00 | | 6/1/32 | | 2,000,000 | | 2,305,440 | |
TSASC, Inc. of New York,
Subordinate Tobacco Settlement Bonds | | 5.00 | | 6/1/22 | | 1,500,000 | | 1,644,900 | |
| | 36,789,852 | |
North Carolina - .7% | | | | | |
North Carolina Medical Care Commission,
Health Care Facilities First Mortgage Revenue (Pennybryn at Maryfield) | | 5.00 | | 10/1/19 | | 1,875,000 | | 1,971,487 | |
Ohio - 1.0% | | | | | |
Ohio Higher Educational Facility Commission,
Higher Educational Facility Revenue (Case Western Reserve University Project) | | 5.00 | | 12/1/23 | | 1,500,000 | | 1,775,325 | |
Southeastern Ohio Port Authority,
Hospital Facilities Improvement Revenue (Memorial Health System Obligated Group Project) | | 5.50 | | 12/1/29 | | 820,000 | | 888,060 | |
| | 2,663,385 | |
Pennsylvania - 2.5% | | | | | |
Montgomery County Industrial Development Authority,
Retirement Community Revenue (Adult Communities Total Services, Inc. Retirement - Life Communities, Inc. Obligated Group) | | 5.00 | | 11/15/36 | | 2,570,000 | | 2,885,981 | |
Pennsylvania Turnpike Commission,
Turnpike Revenue | | 5.00 | | 12/1/29 | | 1,000,000 | | 1,190,570 | |
Philadelphia,
Gas Works Revenue | | 5.00 | | 8/1/21 | | 1,000,000 | | 1,135,210 | |
Philadelphia School District,
GO | | 5.00 | | 9/1/21 | | 1,500,000 | | 1,622,040 | |
| | 6,833,801 | |
Rhode Island - 1.1% | | | | | |
Rhode Island Health and Educational Building Corporation,
Higher Education Facilities Revenue (Brown University Issue) | | 5.00 | | 9/1/21 | | 700,000 | | 801,024 | |
17
STATEMENT OF INVESTMENTS (continued)
| | | | | | | | | | |
| |
Description | Coupon
Rate (%) | | Maturity Date | | Principal Amount ($) | | Value ($) | |
Long-Term Municipal Investments - 93.6% (continued) | | | | | |
Rhode Island - 1.1% (continued) | | | | | |
Tobacco Settlement Financing Corporation of Rhode Island,
Tobacco Settlement Asset-Backed Bonds | | 5.00 | | 6/1/26 | | 1,000,000 | | 1,139,560 | |
Tobacco Settlement Financing Corporation of Rhode Island,
Tobacco Settlement Asset-Backed Bonds | | 5.00 | | 6/1/35 | | 1,000,000 | | 1,086,790 | |
| | 3,027,374 | |
South Carolina - .4% | | | | | |
South Carolina Public Service Authority,
Revenue Obligations (Santee Cooper) | | 5.00 | | 12/1/21 | | 1,000,000 | | 1,131,980 | |
Tennessee - 1.3% | | | | | |
Memphis,
GO (General Improvement) | | 5.00 | | 4/1/26 | | 1,840,000 | | 2,227,265 | |
Tennessee Energy Acquisition Corporation,
Gas Project Revenue | | 5.25 | | 9/1/26 | | 1,120,000 | | 1,351,986 | |
| | 3,579,251 | |
Texas - 13.8% | | | | | |
Arlington,
Special Tax Revenue Sr. Lien (Insured; Assured Guaranty Municipal Corp.) | | 5.00 | | 2/15/29 | | 1,350,000 | | 1,592,257 | |
Arlington Independent School District,
Unlimited Tax School Building Bonds (Permanent School Fund Guarantee Program) | | 5.00 | | 2/15/27 | | 1,400,000 | | 1,638,518 | |
Central Texas Regional Mobility Authority,
Senior Lien Revenue | | 5.00 | | 1/1/27 | | 1,250,000 | | 1,486,888 | |
Central Texas Regional Mobility Authority,
Senior Lien Revenue | | 5.00 | | 1/1/31 | | 1,175,000 | | 1,352,272 | |
Corpus Christi,
Utility System Junior Lien Revenue (Insured; Assured Guaranty Municipal Corp.) | | 5.00 | | 7/15/23 | | 1,725,000 | | 1,999,758 | |
Denton,
Utility System Revenue | | 5.00 | | 12/1/27 | | 2,000,000 | | 2,428,960 | |
Harris County,
Tax Road GO | | 5.00 | | 10/1/27 | | 1,500,000 | | 1,825,170 | |
Harris County-Houston Sports Authority,
Senior Lien Revenue | | 5.00 | | 11/15/29 | | 750,000 | | 867,863 | |
Houston,
Airport System Special Facilities Revenue (United Airlines, Inc. Terminal E Project) | | 4.75 | | 7/1/24 | | 1,000,000 | | 1,093,710 | |
18
| | | | | | | | | | |
| |
Description | Coupon
Rate (%) | | Maturity Date | | Principal Amount ($) | | Value ($) | |
Long-Term Municipal Investments - 93.6% (continued) | | | | | |
Texas - 13.8% (continued) | | | | | |
Houston,
Airport System Subordinate Lien Revenue (Insured; XLCA) | | 2.47 | | 7/1/32 | | 2,675,000 | d | 2,487,750 | |
Houston,
Combined Utility System First Lien Revenue, MUNIPSA+.90% | | 1.84 | | 5/1/20 | | 2,500,000 | a | 2,520,850 | |
Houston,
GO (Public Improvement) | | 5.00 | | 3/1/24 | | 2,000,000 | | 2,388,540 | |
Love Field Airport Modernization Corporation,
General Airport Revenue | | 5.00 | | 11/1/26 | | 1,000,000 | | 1,199,990 | |
Love Field Airport Modernization Corporation,
General Airport Revenue | | 5.00 | | 11/1/27 | | 1,850,000 | | 2,187,736 | |
North Texas Tollway Authority,
First Tier System Revenue | | 5.00 | | 1/1/22 | | 1,000,000 | | 1,147,310 | |
North Texas Tollway Authority,
Second Tier System Revenue | | 5.00 | | 1/1/21 | | 2,000,000 | | 2,231,020 | |
Plano Independent School District,
Unlimited Tax Bonds (Permanent School Fund Guarantee Program) | | 5.00 | | 2/15/26 | | 1,500,000 | | 1,853,985 | |
Sam Rayburn Municipal Power Agency,
Power Supply System Revenue | | 5.00 | | 10/1/20 | | 1,210,000 | | 1,332,500 | |
Texas,
GO (College Student Loan Bonds) | | 5.00 | | 8/1/22 | | 1,500,000 | | 1,740,840 | |
Texas,
GO (College Student Loan Bonds) | | 5.50 | | 8/1/25 | | 2,400,000 | | 2,994,432 | |
West Travis County Public Utility Agency,
Revenue | | 5.00 | | 8/15/23 | | 1,140,000 | | 1,289,876 | |
| | 37,660,225 | |
Utah - .6% | | | | | |
Utah Transit Authority,
Subordinated Sales Tax Revenue | | 5.00 | | 6/15/35 | | 1,500,000 | | 1,733,010 | |
Virginia - 1.6% | | | | | |
Virginia College Building Authority,
Educational Facilities Revenue (Marymount University Project) | | 5.00 | | 7/1/19 | | 425,000 | b | 445,294 | |
Virginia Public School Authority,
School Financing Bonds | | 5.00 | | 8/1/24 | | 2,000,000 | | 2,328,220 | |
Virginia Small Business Financing Authority,
Revenue | | 5.00 | | 7/1/34 | | 1,400,000 | | 1,517,432 | |
| | 4,290,946 | |
Washington - 3.2% | | | | | |
King County Public Hospital District Number 1,
Limited Tax GO (Valley Medical Center) | | 5.00 | | 12/1/25 | | 2,500,000 | | 2,967,725 | |
19
STATEMENT OF INVESTMENTS (continued)
| | | | | | | | | | |
| |
Description | Coupon
Rate (%) | | Maturity Date | | Principal Amount ($) | | Value ($) | |
Long-Term Municipal Investments - 93.6% (continued) | | | | | |
Washington - 3.2% (continued) | | | | | |
Port of Seattle,
Intermediate Lien Revenue | | 5.00 | | 4/1/25 | | 3,340,000 | | 3,962,075 | |
Washington,
GO (Various Purpose) | | 5.00 | | 7/1/27 | | 1,500,000 | | 1,823,040 | |
| | 8,752,840 | |
Wisconsin - .9% | | | | | |
Wisconsin Health and Educational Facilities Authority,
Health Facilities Revenue (UnityPoint Health) | | 5.00 | | 12/1/23 | | 1,000,000 | | 1,187,930 | |
Wisconsin Health and Educational Facilities Authority,
Revenue (ProHealth Care, Inc. Obligated Group) | | 5.00 | | 8/15/33 | | 1,000,000 | | 1,126,740 | |
| | 2,314,670 | |
U.S. Related - .7% | | | | | |
Puerto Rico Highways & Transportation Authority,
Highway Revenue (Insured; FSA) | | 5.25 | | 7/1/36 | | 1,600,000 | | 1,852,320 | |
Total Long-Term Municipal Investments
(cost $247,928,745) | | 255,847,619 | |
Total Investments (cost $253,872,554) | | 95.8% | 261,856,721 | |
Cash and Receivables (Net) | | 4.2% | 11,395,316 | |
Net Assets | | 100.0% | 273,252,037 | |
LIBOR—London Interbank Offered Rate
MUNIPSA—SIFMA Municipal Swap Index Yield
a Variable rate security—rate shown is the interest rate in effect at period end.
b Security exempt from registration pursuant to Rule 144A under the Securities Act of 1933. These securities may be resold in transactions exempt from registration, normally to qualified institutional buyers. At September 30, 2017, these securities were valued at $6,990,240 or 2.56% of net assets.
c These securities are prerefunded; the date shown represents the prerefunded date. Bonds which are prerefunded are collateralized by U.S. Government securities which are held in escrow and are used to pay principal and interest on the municipal issue and to retire the bonds in full at the earliest refunding date.
d Auction Rate Security—interest rate is reset periodically under an auction process that is conducted by an auction agent. Rate shown is the interest rate in effect at period end.
20
| | |
Portfolio Summary (Unaudited) † | Value (%) |
Transportation Services | 23.7 |
Health Care | 10.4 |
Special Tax | 8.9 |
Utility-Electric | 7.3 |
Education | 7.2 |
City | 5.7 |
Utility-Water and Sewer | 5.1 |
State/Territory | 4.8 |
County | 2.6 |
Prerefunded | 1.9 |
Asset-Backed Ctfs./Auto Receivables | 1.4 |
Asset-Backed/Municipal | 1.1 |
Asset-Backed Certificates/Corporate | .6 |
Housing | .5 |
Lease | .4 |
Other | 14.2 |
| | 95.8 |
† Based on net assets.
See notes to financial statements.
21
| | | | |
| |
Summary of Abbreviations (Unaudited) |
| |
ABAG | Association of Bay Area
Governments | ACA | American Capital Access |
AGC | ACE Guaranty Corporation | AGIC | Asset Guaranty Insurance Company |
AMBAC | American Municipal Bond
Assurance Corporation | ARRN | Adjustable Rate
Receipt Notes |
BAN | Bond Anticipation Notes | BPA | Bond Purchase Agreement |
CIFG | CDC Ixis Financial Guaranty | COP | Certificate of Participation |
CP | Commercial Paper | DRIVERS | Derivative Inverse
Tax-Exempt Receipts |
EDR | Economic Development
Revenue | EIR | Environmental Improvement
Revenue |
FGIC | Financial Guaranty
Insurance Company | FHA | Federal Housing Administration |
FHLB | Federal Home
Loan Bank | FHLMC | Federal Home Loan Mortgage
Corporation |
FNMA | Federal National
Mortgage Association | GAN | Grant Anticipation Notes |
GIC | Guaranteed Investment
Contract | GNMA | Government National Mortgage
Association |
GO | General Obligation | HR | Hospital Revenue |
IDB | Industrial Development Board | IDC | Industrial Development Corporation |
IDR | Industrial Development
Revenue | LIFERS | Long Inverse Floating
Exempt Receipts |
LOC | Letter of Credit | LOR | Limited Obligation Revenue |
LR | Lease Revenue | MERLOTS | Municipal Exempt Receipts
Liquidity Option Tender |
MFHR | Multi-Family Housing Revenue | MFMR | Multi-Family Mortgage Revenue |
PCR | Pollution Control Revenue | PILOT | Payment in Lieu of Taxes |
P-FLOATS | Puttable Floating Option
Tax-Exempt Receipts | PUTTERS | Puttable Tax-Exempt Receipts |
RAC | Revenue Anticipation Certificates | RAN | Revenue Anticipation Notes |
RAW | Revenue Anticipation Warrants | RIB | Residual Interest Bonds |
ROCS | Reset Options Certificates | RRR | Resources Recovery Revenue |
SAAN | State Aid Anticipation Notes | SBPA | Standby Bond Purchase Agreement |
SFHR | Single Family Housing Revenue | SFMR | Single Family Mortgage Revenue |
SONYMA | State of New York
Mortgage Agency | SPEARS | Short Puttable Exempt
Adjustable Receipts |
SWDR | Solid Waste Disposal Revenue | TAN | Tax Anticipation Notes |
TAW | Tax Anticipation Warrants | TRAN | Tax and Revenue Anticipation Notes |
XLCA | XL Capital Assurance | | |
See notes to financial statements.
22
STATEMENT OF ASSETS AND LIABILITIES
September 30, 2017
| | | | | | | |
| | | | | | |
| | | Cost | | Value | |
Assets ($): | | | | |
Investments in securities—See Statement of Investments | | 253,872,554 | | 261,856,721 | |
Cash | | | | | 8,845,431 | |
Interest receivable | | | | | 2,935,986 | |
Receivable for shares of Beneficial Interest subscribed | | | | | 8,242 | |
Prepaid expenses | | | | | 29,959 | |
| | | | | 273,676,339 | |
Liabilities ($): | | | | |
Due to The Dreyfus Corporation and affiliates—Note 3(c) | | | | | 86,924 | |
Payable for shares of Beneficial Interest redeemed | | | | | 280,181 | |
Accrued expenses | | | | | 57,197 | |
| | | | | 424,302 | |
Net Assets ($) | | | 273,252,037 | |
Composition of Net Assets ($): | | | | |
Paid-in capital | | | | | 264,887,913 | |
Accumulated undistributed investment income—net | | | | | 10,948 | |
Accumulated net realized gain (loss) on investments | | | | | 369,009 | |
Accumulated net unrealized appreciation (depreciation)
on investments | | | | 7,984,167 | |
Net Assets ($) | | | 273,252,037 | |
| | | | | | |
Net Asset Value Per Share | Class A | Class C | Class I | Class Y | |
Net Assets ($) | 16,713,664 | 584,817 | 248,973,166 | 6,980,390 | |
Shares Outstanding | 725,019 | 25,360 | 10,794,081 | 302,666 | |
Net Asset Value Per Share ($) | 23.05 | 23.06 | 23.07 | 23.06 | |
| | | | | | |
See notes to financial statements. | | | | | |
23
STATEMENT OF OPERATIONS
Year Ended September 30, 2017
| | | | | | | |
| | | | | | |
| | | | | | |
Investment Income ($): | | | | |
Interest Income | | | 6,747,076 | |
Expenses: | | | | |
Investment advisory fee—Note 3(a) | | | 971,662 | |
Administration fee—Note 3(a) | | | 145,749 | |
Registration fees | | | 66,150 | |
Shareholder servicing costs—Note 3(c) | | | 54,343 | |
Professional fees | | | 53,657 | |
Trustees’ fees and expenses—Note 3(d) | | | 19,803 | |
Custodian fees—Note 3(c) | | | 16,284 | |
Prospectus and shareholders’ reports | | | 7,862 | |
Loan commitment fees—Note 2 | | | 5,981 | |
Distribution fees—Note 3(b) | | | 4,873 | |
Miscellaneous | | | 55,634 | |
Total Expenses | | | 1,401,998 | |
Less—reduction in expenses due to undertaking—Note 3(a) | | | (261,796) | |
Less—reduction in fees due to earnings credits—Note 3(c) | | | (12,012) | |
Net Expenses | | | 1,128,190 | |
Investment Income—Net | | | 5,618,886 | |
Realized and Unrealized Gain (Loss) on Investments—Note 4 ($): | | |
Net realized gain (loss) on investments | 477,865 | |
Net unrealized appreciation (depreciation) on investments | | | (2,798,780) | |
Net Realized and Unrealized Gain (Loss) on Investments | | | (2,320,915) | |
Net Increase in Net Assets Resulting from Operations | | 3,297,971 | |
| | | | | | | |
See notes to financial statements. | | | | | |
24
STATEMENT OF CHANGES IN NET ASSETS
| | | | | | | | | | |
| | | | Year Ended September 30, |
| | | | 2017 | | | | 2016 | |
Operations ($): | | | | | | | | |
Investment income—net | | | 5,618,886 | | | | 5,126,750 | |
Net realized gain (loss) on investments | | 477,865 | | | | 192,403 | |
Net unrealized appreciation (depreciation)
on investments | | (2,798,780) | | | | 4,875,739 | |
Net Increase (Decrease) in Net Assets
Resulting from Operations | 3,297,971 | | | | 10,194,892 | |
Distributions to Shareholders from ($): | | | | | | | | |
Investment income—net: | | | | | | | | |
Class A | | | (281,439) | | | | (125,997) | |
Class C | | | (8,600) | | | | (10,129) | |
Class I | | | (5,151,638) | | | | (4,914,574) | |
Class Y | | | (128,528) | | | | (22,793) | |
Net realized gain on investments: | | | | | | | | |
Class A | | | (22,649) | | | | (26,351) | |
Class C | | | (1,024) | | | | (2,978) | |
Class I | | | (330,275) | | | | (866,904) | |
Class Y | | | (10,438) | | | | (3,954) | |
Total Distributions | | | (5,934,591) | | | | (5,973,680) | |
Beneficial Interest Transactions ($): | | | | | | | | |
Net proceeds from shares sold: | | | | | | | | |
Class A | | | 13,251,556 | | | | 1,300,371 | |
Class C | | | - | | | | 191,447 | |
Class I | | | 104,596,037 | | | | 59,884,638 | |
Class Y | | | 6,260,000 | | | | - | |
Distributions reinvested: | | | | | | | | |
Class A | | | 298,642 | | | | 144,389 | |
Class C | | | 9,624 | | | | 13,077 | |
Class I | | | 4,928,332 | | | | 4,829,541 | |
Class Y | | | 138,941 | | | | 26,719 | |
Cost of shares redeemed: | | | | | | | | |
Class A | | | (2,588,091) | | | | (2,326,072) | |
Class C | | | (163,910) | | | | (209,142) | |
Class I | | | (75,194,981) | | | | (42,730,113) | |
Class Y | | | (564,439) | | | | (20,000) | |
Increase (Decrease) in Net Assets
from Beneficial Interest Transactions | 50,971,711 | | | | 21,104,855 | |
Total Increase (Decrease) in Net Assets | 48,335,091 | | | | 25,326,067 | |
Net Assets ($): | | | | | | | | |
Beginning of Period | | | 224,916,946 | | | | 199,590,879 | |
End of Period | | | 273,252,037 | | | | 224,916,946 | |
Undistributed investment income—net | 10,948 | | | | 19 | |
25
STATEMENT OF CHANGES IN NET ASSETS (continued)
| | | | | | | | | | |
| | | | Year Ended September 30, |
| | | | 2017 | | | | 2016 | |
Capital Share Transactions (Shares): | | | | | | | | |
Class A | | | | | | | | |
Shares sold | | | 588,876 | | | | 55,987 | |
Shares issued for distributions reinvested | | | 13,087 | | | | 6,219 | |
Shares redeemed | | | (113,870) | | | | (100,057) | |
Net Increase (Decrease) in Shares Outstanding | 488,093 | | | | (37,851) | |
Class C | | | | | | | | |
Shares sold | | | - | | | | 8,238 | |
Shares issued for distributions reinvested | | | 422 | | | | 563 | |
Shares redeemed | | | (7,232) | | | | (8,978) | |
Net Increase (Decrease) in Shares Outstanding | (6,810) | | | | (177) | |
Class I | | | | | | | | |
Shares sold | | | 4,598,052 | | | | 2,584,140 | |
Shares issued for distributions reinvested | | | 216,002 | | | | 207,707 | |
Shares redeemed | | | (3,304,942) | | | | (1,833,669) | |
Net Increase (Decrease) in Shares Outstanding | 1,509,112 | | | | 958,178 | |
Class Y | | | | | | | | |
Shares sold | | | 279,162 | | | | - | |
Shares issued for distributions reinvested | | | 6,084 | | | | 1,150 | |
Shares redeemed | | | (25,041) | | | | (849) | |
Net Increase (Decrease) in Shares Outstanding | 260,205 | | | | 301 | |
| | | | | | | | | | |
See notes to financial statements. | | | | | | | | |
26
FINANCIAL HIGHLIGHTS
The following tables describe the performance for each share class for the fiscal periods indicated. All information (except portfolio turnover rate) reflects financial results for a single fund share. Total return shows how much your investment in the fund would have increased (or decreased) during each period, assuming you had reinvested all dividends and distributions. These figures have been derived from the fund’s financial statements.
| | | | | | | | | | |
| | | | | |
| | | |
| | | Year Ended September 30, |
Class A Shares | | 2017 | 2016 | 2015 | 2014 | 2013 |
Per Share Data ($): | | | | | | |
Net asset value, beginning of period | | 23.43 | 23.00 | 23.15 | 22.56 | 23.44 |
Investment Operations: | | | | | | |
Investment income—neta | | .48 | .49 | .52 | .49 | .51 |
Net realized and unrealized
gain (loss) on investments | | (.35) | .51 | .02 | .59 | (.76) |
Total from Investment Operations | | .13 | 1.00 | .54 | 1.08 | (.25) |
Distributions: | | | | | | |
Dividends from Investment
income—net | | (.47) | (.48) | (.51) | (.49) | (.51) |
Dividends from net realized gain
on investments | | (.04) | (.09) | (.18) | — | (.12) |
Total Distributions | | (.51) | (.57) | (.69) | (.49) | (.63) |
Net asset value, end of period | | 23.05 | 23.43 | 23.00 | 23.15 | 22.56 |
Total Return (%)b | | .59 | 4.40 | 2.38 | 4.84 | (1.10) |
Ratios/Supplemental Data (%): | | | | | | |
Ratio of total expenses
to average net assets | | .85 | .88 | .89 | .95 | .89 |
Ratio of net expenses
to average net assets | | .70 | .70 | .70 | .70 | .70 |
Ratio of net investment income
to average net assets | | 2.08 | 2.07 | 2.24 | 2.15 | 2.20 |
Portfolio Turnover Rate | | 20.30 | 29.16 | 29.93 | 26.01 | 35.03 |
Net Assets, end of period ($ x 1,000) | | 16,714 | 5,551 | 6,319 | 6,173 | 6,908 |
a Based on average shares outstanding.
b Exclusive of sales charge.
See notes to financial statements.
27
FINANCIAL HIGHLIGHTS (continued)
| | | | | | | | | |
| | | | | |
| | | |
| | | Year Ended September 30, |
Class C Shares | | 2017 | 2016 | 2015 | 2014 | 2013 |
Per Share Data ($): | | | | | | |
Net asset value, beginning of period | | 23.43 | 23.00 | 23.16 | 22.57 | 23.45 |
Investment Operations: | | | | | | |
Investment income—neta | | .30 | .31 | .35 | .32 | .33 |
Net realized and unrealized
gain (loss) on investments | | (.33) | .51 | .01 | .59 | (.75) |
Total from Investment Operations | | (.03) | .82 | .36 | .91 | (.42) |
Distributions: | | | | | | |
Dividends from investment
income—net | | (.30) | (.30) | (.34) | (.32) | (.34) |
Dividends from net realized gain
on investments | | (.04) | (.09) | (.18) | — | (.12) |
Total Distributions | | (.34) | (.39) | (.52) | (.32) | (.46) |
Net asset value, end of period | | 23.06 | 23.43 | 23.00 | 23.16 | 22.57 |
Total Return (%)b | | (.11) | 3.62 | 1.58 | 4.07 | (1.80) |
Ratios/Supplemental Data (%): | | | | | | |
Ratio of total expenses
to average net assets | | 1.64 | 1.70 | 1.69 | 1.75 | 1.65 |
Ratio of net expenses
to average net assets | | 1.45 | 1.45 | 1.45 | 1.45 | 1.45 |
Ratio of net investment income
to average net assets | | 1.34 | 1.32 | 1.49 | 1.40 | 1.45 |
Portfolio Turnover Rate | | 20.30 | 29.16 | 29.93 | 26.01 | 35.03 |
Net Assets, end of period ($ x 1,000) | | 585 | 754 | 744 | 1,001 | 1,831 |
a Based on average shares outstanding.
b Exclusive of sales charge.
See notes to financial statements.
28
| | | | | | | |
| | |
| | | |
| | | Year Ended September 30, |
Class I Shares | | 2017 | 2016 | 2015 | 2014 | 2013 |
Per Share Data ($): | | | | | | |
Net asset value, beginning of period | | 23.44 | 23.01 | 23.16 | 22.57 | 23.45 |
Investment Operations: | | | | | | |
Investment income—neta | | .53 | .54 | .57 | .55 | .57 |
Net realized and unrealized
gain (loss) on investments | | (.33) | .51 | .03 | .59 | (.76) |
Total from Investment Operations | | .20 | 1.05 | .60 | 1.14 | (.19) |
Distributions: | | | | | | |
Dividends from Investment
income—net | | (.53) | (.53) | (.57) | (.55) | (.57) |
Dividends from net realized gain
on investments | | (.04) | (.09) | (.18) | — | (.12) |
Total Distributions | | (.57) | (.62) | (.75) | (.55) | (.69) |
Net asset value, end of period | | 23.07 | 23.44 | 23.01 | 23.16 | 22.57 |
Total Return (%) | | .84 | 4.65 | 2.63 | 5.11 | (.85) |
Ratios/Supplemental Data (%): | | | | | | |
Ratio of total expenses
to average net assets | | .56 | .57 | .58 | .68 | .61 |
Ratio of net expenses
to average net assets | | .45 | .45 | .45 | .45 | .45 |
Ratio of net investment income
toaverage net assets | | 2.33 | 2.32 | 2.48 | 2.40 | 2.45 |
Portfolio Turnover Rate | | 20.30 | 29.16 | 29.93 | 26.01 | 35.03 |
Net Assets, end of period ($ x 1,000) | | 248,973 | 217,617 | 191,558 | 145,493 | 123,524 |
a Based on average shares outstanding.
See notes to financial statements.
29
FINANCIAL HIGHLIGHTS (continued)
| | | | | | | | |
| | | |
| | | | | |
| | | Year Ended September 30, |
Class Y Shares | | 2017 | 2016 | 2015 | 2014 | 2013a |
Per Share Data ($): | | | | | | |
Net asset value, beginning of period | | 23.43 | 23.00 | 23.16 | 22.57 | 22.60 |
Investment Operations: | | | | | | |
Investment income—netb | | .54 | .54 | .57 | .47 | .14 |
Net realized and unrealized
gain (loss) on investments | | (.34) | .51 | .02 | .68 | (.03) |
Total from Investment Operations | | .20 | 1.05 | .59 | 1.15 | .11 |
Distributions: | | | | | | |
Dividends from Investment
income—net | | (.53) | (.53) | (.57) | (.56) | (.14) |
Dividends from net realized gain
on investments | | (.04) | (.09) | (.18) | — | — |
Total Distributions | | (.57) | (.62) | (.75) | (.56) | (.14) |
Net asset value, end of period | | 23.06 | 23.43 | 23.00 | 23.16 | 22.57 |
Total Return (%) | | .88 | 4.66 | 2.59 | 5.13 | .50c |
Ratios/Supplemental Data (%): | | | | | | |
Ratio of total expenses
to average net assets | | .55 | .57 | .59 | .66 | .58d |
Ratio of net expenses
to average net assets | | .45 | .45 | .45 | .45 | .45d |
Ratio of net investment income
to average net assets | | 2.33 | 2.32 | 2.48 | 2.40 | 2.57d |
Portfolio Turnover Rate | | 20.30 | 29.16 | 29.93 | 26.01 | 35.03 |
Net Assets, end of period ($ x 1,000) | | 6,980 | 995 | 970 | 1,026 | 1 |
a From July 1, 2013 (commencement of initial offering) to September 30, 2013.
b Based on average shares outstanding.
c Not annualized.
d Annualized.
See notes to financial statements.
30
NOTES TO FINANCIAL STATEMENTS
NOTE 1—Significant Accounting Policies:
Dreyfus Tax Sensitive Total Return Bond Fund (the “fund”) is a separate non-diversified series of Dreyfus Investment Funds (the “Trust”), which is registered under the Investment Company Act of 1940, as amended (the “Act”), as an open-end management investment company and operates as a series company currently offering seven series, including the fund. The fund’s investment objective is to seek a high after-tax total return. The Dreyfus Corporation (the “Manager” or “Dreyfus”), a wholly-owned subsidiary of The Bank of New York Mellon Corporation (“BNY Mellon”), serves as the fund’s investment adviser. Standish Mellon Asset Management Company LLC (“Standish”), a wholly-owned subsidiary of BNY Mellon and an affiliate of Dreyfus, serves as the fund’s sub-investment adviser.
Effective March 31, 2017, the fund authorized the issuance of Class T shares, but, as of the date of this report, the fund did not offer Class T shares for purchase.
MBSC Securities Corporation (the “Distributor”), a wholly-owned subsidiary of Dreyfus, is the distributor of the fund’s shares. The fund is authorized to issue an unlimited number of $.001 par value shares of Beneficial Interest in each of the following classes of shares: Class A, Class C, Class I, Class T and Class Y. Class A, Class C and Class T shares are sold primarily to retail investors through financial intermediaries and bear Distribution and/or Shareholder Services Plan fees. Class A and Class T shares generally are subject to a sales charge imposed at the time of purchase. Class C shares are subject to a contingent deferred sales charge (“CDSC”) imposed on Class C shares redeemed within one year of purchase. Class I shares are sold primarily to bank trust departments and other financial service providers (including The Bank of New York Mellon, a subsidiary of BNY Mellon and an affiliate of Dreyfus, and its affiliates), acting on behalf of customers having a qualified trust or an investment account or relationship at such institution, and bear no Distribution or Shareholder Services Plan fees. Class Y shares are sold at net asset value per share generally to institutional investors, and bear no Distribution or Shareholder Services Plan fees. Class I and Class Y shares are offered without a front-end sales charge or CDSC. Other differences between the classes include the services offered to and the expenses borne by each class, the allocation of certain transfer agency costs, and certain voting rights. Income, expenses (other than expenses attributable to a specific
31
NOTES TO FINANCIAL STATEMENTS (continued)
class), and realized and unrealized gains or losses on investments are allocated to each class of shares based on its relative net assets.
The Trust accounts separately for the assets, liabilities and operations of each series. Expenses directly attributable to each series are charged to that series’ operations; expenses which are applicable to all series are allocated among them on a pro rata basis.
The Financial Accounting Standards Board (“FASB”) Accounting Standards Codification is the exclusive reference of authoritative U.S. generally accepted accounting principles (“GAAP”) recognized by the FASB to be applied by nongovernmental entities. Rules and interpretive releases of the Securities and Exchange Commission (“SEC”) under authority of federal laws are also sources of authoritative GAAP for SEC registrants. The fund’s financial statements are prepared in accordance with GAAP, which may require the use of management estimates and assumptions. Actual results could differ from those estimates.
(a) Portfolio valuation: The fair value of a financial instrument is the amount that would be received to sell an asset or paid to transfer a liability in an orderly transaction between market participants at the measurement date (i.e., the exit price). GAAP establishes a fair value hierarchy that prioritizes the inputs of valuation techniques used to measure fair value. This hierarchy gives the highest priority to unadjusted quoted prices in active markets for identical assets or liabilities (Level 1 measurements) and the lowest priority to unobservable inputs (Level 3 measurements).
Additionally, GAAP provides guidance on determining whether the volume and activity in a market has decreased significantly and whether such a decrease in activity results in transactions that are not orderly. GAAP requires enhanced disclosures around valuation inputs and techniques used during annual and interim periods.
Various inputs are used in determining the value of the fund’s investments relating to fair value measurements. These inputs are summarized in the three broad levels listed below:
Level 1—unadjusted quoted prices in active markets for identical investments.
Level 2—other significant observable inputs (including quoted prices for similar investments, interest rates, prepayment speeds, credit risk, etc.).
Level 3—significant unobservable inputs (including the fund’s own assumptions in determining the fair value of investments).
32
The inputs or methodology used for valuing securities are not necessarily an indication of the risk associated with investing in those securities.
Changes in valuation techniques may result in transfers in or out of an assigned level within the disclosure hierarchy. Valuation techniques used to value the fund’s investments are as follows:
Registered investment companies that are not traded on an exchange are valued at their net asset value and are generally categorized within Level 1 of the fair value hierarchy.
Investments in securities, excluding short-term investments (other than U.S. Treasury Bills), are valued each business day by an independent pricing service (the “Service”) approved by the Trust’s Board of Trustees (the “Board”). Investments for which quoted bid prices are readily available and are representative of the bid side of the market in the judgment of the Service are valued at the mean between the quoted bid prices (as obtained by the Service from dealers in such securities) and asked prices (as calculated by the Service based upon its evaluation of the market for such securities). Other investments (which constitute a majority of the portfolio securities) are valued as determined by the Service, based on methods which include consideration of the following: yields or prices of securities of comparable quality, coupon, maturity and type; indications as to values from dealers; and general market conditions. These securities are generally categorized within Level 2 of the fair value hierarchy.
The Service is engaged under the general supervision of the Board.
When market quotations or official closing prices are not readily available, or are determined not to reflect accurately fair value, such as when the value of a security has been significantly affected by events after the close of the exchange or market on which the security is principally traded (for example, a foreign exchange or market), but before the fund calculates its net asset value, the fund may value these investments at fair value as determined in accordance with the procedures approved by the Board. Certain factors may be considered when fair valuing investments such as: fundamental analytical data, the nature and duration of restrictions on disposition, an evaluation of the forces that influence the market in which the securities are purchased and sold, and public trading in similar securities of the issuer or comparable issuers. These securities are either categorized within Level 2 or 3 of the fair value hierarchy depending on the relevant inputs used.
For restricted securities where observable inputs are limited, assumptions about market activity and risk are used and are generally categorized within Level 3 of the fair value hierarchy.
33
NOTES TO FINANCIAL STATEMENTS (continued)
The following is a summary of the inputs used as of September 30, 2017 in valuing the fund’s investments:
| | | | | |
| | Level 1 -
Unadjusted
Quoted Prices | Level 2 – Other
Significant
Observable
Inputs | Level 3 -
Significant
Unobservable
Inputs | Total |
Assets ($) |
Investments in Securities: |
Asset-Backed | — | 5,242,173 | — | 5,242,173 |
Corporate Bonds† | — | 766,929 | — | 766,929 |
Municipal Bonds† | — | 255,847,619 | — | 255,847,619 |
† See Statement of Investments for additional detailed categorizations.
At September 30, 2017, there were no transfers between levels of the fair value hierarchy. It is the fund’s policy to recognize transfers between levels at the end of the reporting period.
(b) Securities transactions and investment income: Securities transactions are recorded on a trade date basis. Realized gains and losses from securities transactions are recorded on the identified cost basis. Interest income, adjusted for accretion of discount and amortization of premium on investments, is earned from settlement date and recognized on the accrual basis. Securities purchased or sold on a when issued or delayed delivery basis may be settled a month or more after the trade date.
(c) Risk: The fund invests primarily in debt securities. Failure of an issuer of the debt securities to make timely interest or principal payments, or a decline or the perception of a decline in the credit quality of a debt security, can cause the debt security’s price to fall, potentially lowering the fund’s share price. In addition, the value of debt securities may decline due to general market conditions that are not specifically related to a particular issuer, such as real or perceived adverse economic conditions, changes in outlook for corporate earnings, changes in interest or currency rates or adverse investor sentiment. Such values may also decline because of factors that affect a particular industry.
(d) Dividends and distributions to shareholders: It is the policy of the fund to declare dividends daily from investment income-net. Such dividends are paid monthly. Dividends from net realized capital gains, if any, are normally declared and paid annually, but the fund may make distributions on a more frequent basis to comply with the distribution requirements of the Internal Revenue Code of 1986, as amended (the “Code”). To the extent that net realized capital gains can be offset by capital loss carryovers, it is the policy of the fund not to distribute such
34
gains. Income and capital gain distributions are determined in accordance with income tax regulations, which may differ from GAAP.
(e) Federal income taxes: It is the policy of the fund to continue to qualify as a regulated investment company, which can distribute tax-exempt dividends, by complying with the applicable provisions of the Code, and to make distributions of income and net realized capital gain sufficient to relieve it from substantially all federal income and excise taxes.
As of and during the period ended September 30, 2017, the fund did not have any liabilities for any uncertain tax positions. The fund recognizes interest and penalties, if any, related to uncertain tax positions as income tax expense in the Statement of Operations. During the period ended September 30, 2017, the fund did not incur any interest or penalties.
Each tax year in the four-year period ended September 30, 2017 remains subject to examination by the Internal Revenue Service and state taxing authorities.
At September 30, 2017, the components of accumulated earnings on a tax basis were as follows: undistributed tax-exempt income $21,741, undistributed ordinary income $45,412, undistributed capital gains $310,131 and unrealized appreciation $7,997,633.
The tax character of distributions paid to shareholders during the fiscal periods ended September 30, 2017 and September 30, 2016 were as follows: tax-exempt income $5,341,468 and $4,559,794, ordinary income $252,344 and $1,042,824, and long-term capital gains $340,779 and $371,062, respectively.
During the period ended September 30, 2017, as a result of permanent book to tax differences, primarily due to the tax treatment for amortization adjustments and paydown gains and losses, the fund decreased accumulated undistributed investment income-net by $37,752, increased accumulated net realized gain (loss) on investments by $36,025 and increased paid-in capital by $1,727. Net assets and net asset value per share were not affected by this reclassification.
NOTE 2—Bank Lines of Credit:
The fund participates with other Dreyfus-managed funds in an $810 million unsecured credit facility led by Citibank, N.A. and a $300 million unsecured credit facility provided by The Bank of New York Mellon (each, a “Facility”), each to be utilized primarily for temporary or emergency purposes, including the financing of redemptions. Prior to October 5, 2016, the unsecured credit facility with Citibank, N.A. was $555 million. In connection therewith, the fund has agreed to pay its pro rata portion of
35
NOTES TO FINANCIAL STATEMENTS (continued)
commitment fees for each Facility. Interest is charged to the fund based on rates determined pursuant to the terms of the respective Facility at the time of borrowing. During the period ended September 30, 2017, the fund did not borrow under the Facilities.
NOTE 3—Investment Advisory Fee, Sub-Investment Advisory Fee, Administration Fee and Other Transactions with Affiliates:
(a) Pursuant to an investment advisory agreement with Dreyfus, the fund has agreed to pay an investment advisory fee at the annual rate of .40% of the value of the fund’s average daily net assets and is payable monthly. Dreyfus has contractually agreed, from October 1, 2016 through February 1, 2019, to waive receipt of its fees and/or assume the expenses of the fund so that the direct expenses of the classes (excluding Rule 12b-1 Distribution Plan fees, Shareholder Services Plan fees, taxes, interest expense, brokerage commissions, commitment fees on borrowings and extraordinary expenses) do not exceed .45% of the value of the fund’s average daily net assets. The reduction in expenses, pursuant to the undertaking, amounted to $261,796 during the year ended September 30, 2017.
Pursuant to a sub-investment advisory agreement between Dreyfus and Standish, Standish serves as the fund’s sub-investment adviser responsible for the day-to-day management of the fund’s portfolio. Dreyfus pays the sub-investment adviser a monthly fee at an annual percentage of the value of the fund’s average daily net asset. Dreyfus has obtained an exemptive order from the SEC (the “Order”), upon which the fund may rely, to use a manager of managers approach that permits Dreyfus, subject to certain conditions and approval by the Board, to enter into and materially amend sub-investment advisory agreements with one or more sub-investment advisers who are either unaffiliated with Dreyfus or are wholly-owned subsidiaries (as defined under the Act) of Dreyfus’ ultimate parent company, BNY Mellon, without obtaining shareholder approval. The Order also allows the fund to disclose the sub-investment advisory fee paid by Dreyfus to any unaffiliated sub-investment adviser in the aggregate with other unaffiliated sub-investment advisers in documents filed with the SEC and provided to shareholders. In addition, pursuant to the Order, it is not necessary to disclose the sub-investment advisory fee payable by Dreyfus separately to a sub-investment adviser that is a wholly-owned subsidiary of BNY Mellon in documents filed with the SEC and provided to shareholders; such fees are to be aggregated with fees payable to Dreyfus. Dreyfus has ultimate responsibility (subject to oversight by the Board) to supervise any sub-investment adviser and recommend the hiring, termination, and replacement of any sub-investment adviser to the Board.
36
The fund has a Fund Accounting and Administrative Services Agreement (the “Administration Agreement”) with Dreyfus, whereby Dreyfus performs administrative, accounting and recordkeeping services for the fund. The fund has agreed to compensate Dreyfus for providing accounting and recordkeeping services, administration, compliance monitoring, regulatory and shareholder reporting, as well as related facilities, equipment and clerical help. The fee is based on the fund’s average daily net assets and computed at the following annual rates: .06% of the first $500 million, .04% of the next $500 million and .02% in excess of $1 billion.
In addition, after applying any expense limitations or fee waivers that reduce the fees paid to Dreyfus for this service, Dreyfus has contractually agreed in writing to waive any remaining fees for this service to the extent that they exceed both Dreyfus’ costs in providing these services and a reasonable allocation of the costs incurred by Dreyfus and its affiliates related to the support and oversight of these services. The fund also reimburses Dreyfus for the out-of-pocket expenses incurred in performing this service for the fund. Pursuant to the Administration Agreement, the fund was charged $145,749 during the period ended September 30, 2017.
(b) Under the Distribution Plan adopted pursuant to Rule 12b-1 under the Act, Class C shares pay the Distributor for distributing its shares at an annual rate of .75% of the value of its average daily net assets. During the period ended September 30, 2017, Class C shares were charged $4,873 pursuant to the Distribution Plan.
(c) Under the Shareholder Services Plan, Class A and Class C shares pay the Distributor at an annual rate of .25% of the value of their average daily net assets for the provision of certain services. The services provided may include personal services relating to shareholder accounts, such as answering shareholder inquiries regarding the fund and providing reports and other information, and services related to the maintenance of shareholder accounts. The Distributor may make payments to Service Agents (securities dealers, financial institutions or other industry professionals) with respect to these services. The Distributor determines the amounts to be paid to Service Agents. During the period ended September 30, 2017, Class A and Class C shares were charged $34,125 and $1,624, respectively, pursuant to the Shareholder Services Plan.
Under its terms, the Distribution Plan and Shareholder Services Plan shall remain in effect from year to year, provided such continuance is approved annually by a vote of a majority of those Trustees who are not “interested persons” of the Trust and who have no direct or indirect financial interest
37
NOTES TO FINANCIAL STATEMENTS (continued)
in the operation of or in any agreement related to the Distribution Plan or Shareholder Services Plan.
The fund has arrangements with the transfer agent and the custodian whereby the fund may receive earnings credits when positive cash balances are maintained, which are used to offset transfer agency and custody fees. For financial reporting purposes, the fund includes net earnings credits as an expense offset in the Statement of Operations.
The fund compensates Dreyfus Transfer, Inc., a wholly-owned subsidiary of Dreyfus, under a transfer agency agreement for providing transfer agency and cash management services for the fund. The majority of transfer agency fees are comprised of amounts paid on a per account basis, while cash management fees are related to fund subscriptions and redemptions. During the period ended September 30, 2017, the fund was charged $7,547 for transfer agency services and $426 for cash management services. These fees are included in Shareholder servicing costs in the Statement of Operations. Cash management fees were offset by earnings credits of $426.
The fund compensates The Bank of New York Mellon under a custody agreement for providing custodial services for the fund. These fees are determined based on net assets, geographic region and transaction activity. During the period ended September 30, 2017, the fund was charged $16,284 pursuant to the custody agreement. These fees were partially offset by earnings credits of $11,586.
During the period ended September 30, 2017, the fund was charged $11,281 for services performed by the Chief Compliance Officer and his staff.
The components of “Due to The Dreyfus Corporation and affiliates” in the Statement of Assets and Liabilities consist of: investment advisory fees $87,788, administration fees $13,168, Distribution Plan fees $362, Shareholder Services Plan fees $3,565, custodian fees $4,891, Chief Compliance Officer fees $5,604 and transfer agency fees $1,565, which are offset against an expense reimbursement currently in effect in the amount of $30,019.
(d) Each Board member also serves as a Board member of other funds within the Dreyfus complex. Annual retainer fees and attendance fees are allocated to each fund based on net assets.
NOTE 4—Securities Transactions:
The aggregate amount of purchases and sales (including paydowns) of investment securities, excluding short-term securities, during the period
38
ended September 30, 2017, amounted to $93,910,484 and $48,233,331, respectively.
At September 30, 2017, the cost of investments for federal income tax purposes was $253,859,088; accordingly, accumulated net unrealized appreciation on investments was $7,997,633 consisting of $8,355,626 gross unrealized appreciation and $357,993 gross unrealized depreciation.
39
REPORT OF INDEPENDENT REGISTERED
PUBLIC ACCOUNTING FIRM
The Board of Trustees and Shareholders of
Dreyfus Investment Funds
We have audited the accompanying statement of assets and liabilities of Dreyfus Tax Sensitive Total Return Bond Fund (the “Fund”), a series of Dreyfus Investment Funds, including the statement of investments, as of September 30, 2017, and the related statement of operations for the year then ended, the statements of changes in net assets for each of the years in the two-year period then ended, and the financial highlights for each of the years or periods in the five-year period then ended. These financial statements and financial highlights are the responsibility of the Fund’s management. Our responsibility is to express an opinion on these financial statements and financial highlights based on our audits.
We conducted our audits in accordance with the standards of the Public Company Accounting Oversight Board (United States). Those standards require that we plan and perform the audit to obtain reasonable assurance about whether the financial statements and financial highlights are free of material misstatement. An audit includes examining, on a test basis, evidence supporting the amounts and disclosures in the financial statements. Our procedures included confirmation of securities owned as of September 30, 2017, by correspondence with the custodian and brokers or by other appropriate auditing procedures. An audit also includes assessing the accounting principles used and significant estimates made by management, as well as evaluating the overall financial statement presentation. We believe that our audits provide a reasonable basis for our opinion.
In our opinion, the financial statements and financial highlights referred to above present fairly, in all material respects, the financial position of Dreyfus Tax Sensitive Total Return Bond Fund as of September 30, 2017, the results of its operations for the year then ended, the changes in its net assets for each of the years in the two-year period then ended, and the financial highlights for each of the years or periods in the five-year period then ended, in conformity with U.S. generally accepted accounting principles.

New York, New York
November 22, 2017
40
IMPORTANT TAX INFORMATION (Unaudited)
In accordance with federal tax law, the fund hereby reports all the dividends paid from investment income-net during its fiscal year ended September 30, 2017 as “exempt-interest dividends” (not generally subject to regular federal income tax), except $228,737 that is being reported as an ordinary income distribution for reporting purposes. Where required by federal tax law rules, shareholders will receive notification of their portion of the fund’s taxable ordinary dividends (if any), capital gains distributions (if any) and tax-exempt dividends paid for the 2017 calendar year on Form 1099-DIV, which will be mailed in early 2018. The fund reports the maximum amount allowable but not less than $.0332 per share as a capital gain dividend in accordance with Section 852(b)(3)(C) of the Internal Revenue Code. Also, the fund reports the maximum amount allowable but not less than $.0023 as a short-term capital gain dividend paid on December 29, 2016 in accordance with Sections 871(k)(2) and 881(e) of the Internal Revenue Code.
41
BOARD MEMBERS INFORMATION (Unaudited)
INDEPENDENT BOARD MEMBERS
Joseph S. DiMartino (73)
Chairman of the Board (2008)
Principal Occupation During Past 5 Years:
· Corporate Director and Trustee (1995-present)
Other Public Company Board Memberships During Past 5 Years:
· CBIZ (formerly, Century Business Services, Inc.), a provider of outsourcing functions for small and medium size companies, Director (1997-present)
No. of Portfolios for which Board Member Serves: 127
———————
Francine J. Bovich (66)
Board Member (2011)
Principal Occupation During Past 5 Years:
· Trustee, The Bradley Trusts, private trust funds (2011-present)
Other Public Company Board Memberships During Past 5 Years:
· Annaly Capital Management, Inc., Board Member (May 2014-present)
No. of Portfolios for which Board Member Serves: 75
———————
Kenneth A. Himmel (71)
Board Member (2008)
Principal Occupation During Past 5 Years:
· Managing Partner, Gulf Related, an international real estate development company (2010-present)
· President and CEO, Related Urban Development, a real estate development company (1996-present)
· President and CEO, Himmel & Company, a real estate development company (1980-present)
· CEO, American Food Management, a restaurant company (1983-present)
No. of Portfolios for which Board Member Serves: 28
———————
42
Stephen J. Lockwood (70)
Board Member (2008)
Principal Occupation During Past 5 Years:
· Chairman of the Board, Stephen J. Lockwood and Company LLC, a real estate investment company (2000-present)
No. of Portfolios for which Board Member Serves: 28
———————
Roslyn M. Watson (67)
Board Member (2008)
Principal Occupation During Past 5 Years:
· Principal, Watson Ventures, Inc., a real estate investment company (1993-present)
No. of Portfolios for which Board Member Serves: 61
———————
Benaree Pratt Wiley (71)
Board Member (2008)
Principal Occupation During Past 5 Years:
· Principal, The Wiley Group, a firm specializing in strategy and business development (2005-present)
Other Public Company Board Memberships During Past 5 Years:
· CBIZ (formerly, Century Business Services, Inc.), a provider of outsourcing functions for small and medium size companies, Director (2008-present)
No. of Portfolios for which Board Member Serves: 82
———————
Once elected all Board Members serve for an indefinite term, but achieve Emeritus status upon reaching age 80. The address of the Board Members and Officers is c/o The Dreyfus Corporation, 200 Park Avenue, New York, New York 10166. Additional information about the Board Members is available in the fund’s Statement of Additional Information which can be obtained from Dreyfus free of charge by calling this toll free number: 1-800-DREYFUS.
James M. Fitzgibbons, Emeritus Board Member
43
OFFICERS OF THE FUND (Unaudited)
BRADLEY J. SKAPYAK, President since January 2010.
Chief Operating Officer and a director of the Manager since June 2009, Chairman of Dreyfus Transfer, Inc., an affiliate of the Manager and the transfer agent of the funds, since May 2011 and Chief Executive Officer of MBSC Securities Corporation since August 2016. He is an officer of 61 investment companies (comprised of 127 portfolios) managed by the Manager. He is 58 years old and has been an employee of the Manager since February 1988.
BENNETT A. MACDOUGALL, Chief Legal Officer since October 2015.
Chief Legal Officer of the Manager and Associate General Counsel and Managing Director of BNY Mellon since June 2015; from June 2005 to June 2015, he served in various capacities with Deutsche Bank – Asset & Wealth Management Division, including as Director and Associate General Counsel, and Chief Legal Officer of Deutsche Investment Management Americas Inc. from June 2012 to May 2015. He is an officer of 62 investment companies (comprised of 152 portfolios) managed by the Manager. He is 46 years old and has been an employee of the Manager since June 2015.
JANETTE E. FARRAGHER, Vice President and Secretary since December 2011.
Associate General Counsel of BNY Mellon, and an officer of 62 investment companies (comprised of 152 portfolios) managed by the Manager. She is 54 years old and has been an employee of the Manager since February 1984.
JAMES BITETTO, Vice President and Assistant Secretary since December 2008.
Managing Counsel of BNY Mellon and Secretary of the Manager, and an officer of 62 investment companies (comprised of 152 portfolios) managed by the Manager. He is 51 years old and has been an employee of the Manager since December 1996.
JOSEPH M. CHIOFFI, Vice President and Assistant Secretary since December 2008.
Managing Counsel of BNY Mellon, and an officer of 62 investment companies (comprised of 152 portfolios) managed by the Manager. He is 55 years old and has been an employee of the Manager since June 2000.
MAUREEN E. KANE, Vice President and Assistant Secretary since April 2015.
Managing Counsel of BNY Mellon since July 2014; from October 2004 until July 2014, General Counsel, and from May 2009 until July 2014, Chief Compliance Officer of Century Capital Management. She is an officer of 62 investment companies (comprised of 152 portfolios) managed by the Manager. She is 55 years old and has been an employee of the Manager since July 2014.
SARAH S. KELLEHER, Vice President and Assistant Secretary since April 2014.
Senior Counsel of BNY Mellon since March 2013, from August 2005 to March 2013, Associate General Counsel of Third Avenue Management. She is an officer of 62 investment companies (comprised of 152 portfolios) managed by the Manager. She is 42 years old and has been an employee of the Manager since March 2013.
JEFF PRUSNOFSKY, Vice President and Assistant Secretary since December 2008.
Senior Managing Counsel of BNY Mellon, and an officer of 62 investment companies (comprised of 152 portfolios) managed by the Manager. He is 52 years old and has been an employee of the Manager since October 1990.
NATALYA ZELENSKY, Vice President and Assistant Secretary since March 2017.
Counsel and Vice President of BNY Mellon since May 2016; Attorney at Wildermuth Endowment Strategy Fund/Wildermuth Advisory, LLC from November 2015 until May 2016; Assistant General Counsel at RCS Advisory Services from July 2014 until November 2015; Associate at Sutherland, Asbill & Brennan from January 2013 until January 2014; Associate at K&L Gates from October 2011 until January 2013. She is an officer of 62 investment companies (comprised of 152 portfolios) managed by Dreyfus. She is 32 years old and has been an employee of the Manager since May 2016.
JAMES WINDELS, Treasurer since December 2008.
Director – Mutual Fund Accounting of the Manager, and an officer of 62 investment companies (comprised of 152 portfolios) managed by the Manager. He is 59 years old and has been an employee of the Manager since April 1985.
44
RICHARD CASSARO, Assistant Treasurer since December 2008.
Senior Accounting Manager – Money Market and Municipal Bond Funds of the Manager, and an officer of 62 investment companies (comprised of 152 portfolios) managed by the Manager. He is 58 years old and has been an employee of the Manager since September 1982.
GAVIN C. REILLY, Assistant Treasurer since December 2008.
Tax Manager of the Investment Accounting and Support Department of the Manager, and an officer of 62 investment companies (comprised of 152 portfolios) managed by the Manager. He is 49 years old and has been an employee of the Manager since April 1991.
ROBERT S. ROBOL, Assistant Treasurer since December 2008.
Senior Accounting Manager – Dreyfus Financial Reporting of the Manager, and an officer of 62 investment companies (comprised of 152 portfolios) managed by the Manager. He is 53 years old and has been an employee of the Manager since October 1988.
ROBERT SALVIOLO, Assistant Treasurer since December 2008.
Senior Accounting Manager – Equity Funds of the Manager, and an officer of 62 investment companies (comprised of 152 portfolios) managed by the Manager. He is 50 years old and has been an employee of the Manager since June 1989.
ROBERT SVAGNA, Assistant Treasurer since December 2008.
Senior Accounting Manager – Fixed Income and Equity Funds of the Manager, and an officer of 62 investment companies (comprised of 152 portfolios) managed by the Manager. He is 50 years old and has been an employee of the Manager since November 1990.
JOSEPH W. CONNOLLY, Chief Compliance Officer since December 2008.
Chief Compliance Officer of the Manager and The Dreyfus Family of Funds (62 investment companies, comprised of 152 portfolios). He is 60 years old and has served in various capacities with the Manager since 1980, including manager of the firm’s Fund Accounting Department from 1997 through October 2001.
CARIDAD M. CAROSELLA, Anti-Money Laundering Compliance Officer since January 2016.
Anti-Money Laundering Compliance Officer of the Dreyfus Family of Funds and BNY Mellon Funds Trust since January 2016; from May 2015 to December 2015, Interim Anti-Money Laundering Compliance Officer of the Dreyfus Family of Funds and BNY Mellon Funds Trust and the Distributor; from January 2012 to May 2015, AML Surveillance Officer of the Distributor and from 2007 to December 2011, Financial Processing Manager of the Distributor. She is an officer of 57 investment companies (comprised of 147 portfolios) managed by the Manager. She is 49 years old and has been an employee of the Distributor since 1997.
45
Dreyfus Tax Sensitive Total Return Bond Fund
200 Park Avenue
New York, NY 10166
Manager
The Dreyfus Corporation
200 Park Avenue
New York, NY 10166
Sub-Investment Adviser
Standish Mellon Asset Management
Company LLC
BNY Mellon Center
201 Washington Street
Suite 2900
Boston, MA 02108-4408
Custodian
The Bank of New York Mellon
225 Liberty Street
New York, NY 10286
Transfer Agent &
Dividend Disbursing Agent
Dreyfus Transfer, Inc.
200 Park Avenue
New York, NY 10166
Distributor
MBSC Securities Corporation
200 Park Avenue
New York, NY 10166
| | |
Ticker Symbols: | Class A: DSDAX Class C: DSDCX Class I: SDITX Class Y: SDYTX |
Telephone Call your financial representative or 1-800-DREYFUS
Mail The Dreyfus Family of Funds, 144 Glenn Curtiss Boulevard, Uniondale, NY 11556-0144
E-mail Send your request to info@dreyfus.com
Internet Information can be viewed online or downloaded at www.dreyfus.com
The fund files its complete schedule of portfolio holdings with the Securities and Exchange Commission (“SEC”) for the first and third quarters of each fiscal year on Form N-Q. The fund’s Forms N-Q are available on the SEC’s website at www.sec.gov and may be reviewed and copied at the SEC’s Public Reference Room in Washington, D.C. (phone 1-800-SEC-0330 for information).
A description of the policies and procedures that the fund uses to determine how to vote proxies relating to portfolio securities and information regarding how the fund voted these proxies for the most recent 12-month period ended June 30 is available at www.dreyfus.com and on the SEC’s website at www.sec.gov and without charge, upon request, by calling 1-800-DREYFUS.
| | |
© 2017 MBSC Securities Corporation
6935AR0917 | 
|
Dreyfus/The Boston Company Small/Mid Cap Growth Fund
| | | |

| | ANNUAL REPORT September 30, 2017 |
| |
Save time. Save paper. View your next shareholder report online as soon as it’s available. Log into www.dreyfus.com and sign up for Dreyfus eCommunications. It’s simple and only takes a few minutes. |
| |
The views expressed in this report reflect those of the portfolio manager(s) only through the end of the period covered and do not necessarily represent the views of Dreyfus or any other person in the Dreyfus organization. Any such views are subject to change at any time based upon market or other conditions and Dreyfus disclaims any responsibility to update such views. These views may not be relied on as investment advice and, because investment decisions for a Dreyfus fund are based on numerous factors, may not be relied on as an indication of trading intent on behalf of any Dreyfus fund. |
| |
Not FDIC-Insured • Not Bank-Guaranteed • May Lose Value |
Contents
T H E F U N D
F O R M O R E I N F O R M AT I O N
Back Cover
| | | | |
| |
Dreyfus/The Boston Company Small/Mid Cap Growth Fund
| | The Fund |
A LETTER FROM THE CEO OF DREYFUS
Dear Shareholder:
We are pleased to present this annual report for Dreyfus/The Boston Company Small/Mid Cap Growth Fund, covering the 12-month period from October 1, 2016 through September 30, 2017. For information about how the fund performed during the reporting period, as well as general market perspectives, we provide a Discussion of Fund Performance on the pages that follow.
Stocks set a series of new record highs and bonds produced mixed results over the past year in response to changing economic and political conditions. Financial markets during the final months of 2016 were dominated by the election of a new U.S. presidential administration. Equities and corporate-backed bonds surged higher in anticipation of more business-friendly regulatory, tax, and fiscal policies, but high-quality bonds generally lost value due to expectations of rising interest rates and accelerating inflation in a stronger economy. Despite a series of short-term interest rate hikes, bonds recovered most or all of their previous losses over the first nine months of 2017 when it became clearer that pro-growth legislation would take time and political capital to enact. U.S. and international stocks continued to rally as corporate earnings grew and global economic conditions improved.
The markets’ recent strong performance has been supported by solid underlying fundamentals. While we currently expect these favorable conditions to persist, we remain watchful for economic and political developments that could derail the rallies. As always, we encourage you to discuss the risks and opportunities of today’s investment environment with your financial advisor.
Thank you for your continued confidence and support.
Sincerely,

Mark D. Santero
Chief Executive Officer
The Dreyfus Corporation
October 16, 2017
2
DISCUSSION OF FUND PERFORMANCE
For the period from October 1, 2016 through September 30, 2017, as provided by John R. Porter, Todd W. Wakefield, CFA, and Robert C. Zeuthen, CFA, of The Boston Company Asset Management, LLC, Sub-Investment Adviser
Market and Fund Performance Overview
For the 12-month period ended September 30, 2017, Dreyfus/The Boston Company Small/Mid Cap Growth Fund’s Class A shares achieved a total return of 21.95%, Class C shares returned 21.00%, Class I shares returned 22.34%, and Class Y shares returned 22.44%.1 In comparison, the fund’s benchmark, the Russell 2500™ Growth Index (the “Index”), produced a total return of 20.07% for the same period.2
Small- and mid-cap stocks gained considerable ground amid better-than-expected corporate earnings, improving global economic prospects, and the potential for more business-friendly policies from a new U.S. presidential administration. The fund outperformed its benchmark, mainly due to strong stock selections in the information technology, materials, and industrials sectors.
The Fund’s Investment Approach
The fund seeks long-term growth of capital. To pursue its goal, the fund normally invests at least 80% of its net assets in equity securities of small-cap and mid-cap U.S. companies with market capitalizations equal to or less than the total market capitalization of the largest company in the Index. When choosing stocks, we seek to identify high-quality small-cap and mid-cap companies with rapid current or expected earnings or revenue growth.
We employ a growth-oriented investment style in managing the fund’s portfolio, which means we seek to identify those small-cap and mid-cap companies which are experiencing or are expected to experience rapid earnings or revenue growth. We focus on high-quality companies and individual stock selection, instead of trying to predict which industries or sectors will perform best and select stocks by:
· Using fundamental research to identify and follow companies considered to have attractive characteristics; and
· Investing in a company when the research indicates that the company will experience accelerating revenues and expanding operating margins.
The fund’s investment strategy may lead it to emphasize certain industries, such as technology, health care, business services and communications.
Rising Corporate Earnings Drove Markets Higher
While political uncertainties caused U.S. stocks to dip in the weeks before the 2016 presidential election, equity markets were reenergized in November and December when investors began to anticipate lower corporate taxes, reduced regulatory constraints on business, and increased infrastructure spending from a new presidential administration.
Small- and mid-cap stocks in 2017 generally continued to build on gains achieved during the final months of 2016. Consecutive quarters of better-than-expected corporate earnings and encouraging global economic developments drove the Index to a series of new highs in February and early March. While concerns about the new U.S. administration’s ability to implement its pro-growth policy proposals slowed the pace of the market’s advance in the spring, most broad measures of stock market performance quickly erased those losses and reached new all-time highs over the summer. However, market leadership shifted from value-oriented stocks to more growth-oriented companies. All three major capitalization ranges produced double-digit returns in this environment, but small- and mid-cap growth stocks generally lagged their large-cap counterparts for the reporting period overall.
3
DISCUSSION OF FUND PERFORMANCE (continued)
Security Selection Strategy Enhanced Relative Results
The fund’s strong performance compared to the Index was driven in part by successful stock selections in the information technology sector. Internet software and services stocks fared especially well. Analytic software developer New Relic reported robust growth stemming from rising demand for data management services. Cloud-based marketing-and-sales software platform HubSpot launched a new product that was well received by small and midsized businesses. Payments processor Square achieved better-than-expected sales and earnings over three consecutive quarters.
In the materials sector, building materials provider Headwaters gained value after an acquisition offer from a large Australian construction materials firm in an environment of robust demand from residential and commercial builders. Consumer lawn and garden products maker Scotts Miracle-Gro exhibited solid earnings growth and effective cost management. Among industrial companies, aerospace-and-defense company Mercury Systems advanced as geopolitical tensions intensified, and nuclear power components producer BWX Technologies reported revenues and earnings that surpassed analysts’ expectations.
Disappointments during the reporting period were concentrated primarily in the energy sector. While the fund’s stock selection strategy worked relatively well in the sector, overweighted exposure to the struggling industry group weighed on relative performance overall. Most significantly, expectations of lower normalized oil prices hurt results from oil services provider Oil States International, exploration-and-production company Diamondback Energy, and commercial sand producer U.S. Silica Holdings. In the consumer discretionary sector, household products company Newell Brands faced concerns over access to raw materials due to a major hurricane later in the reporting period, and entertainment company IMAX lost value when relatively few movie theaters upgraded their technology. Finally, among health care stocks, Brookdale Senior Living contended with industry data showing increased supply and higher labor costs, as well as hurricane-related disruptions.
A Constructive Investment Posture
Although stocks have rallied strongly, we believe that market fundamentals remain constructive for small- and mid-cap stocks in an environment of strong corporate earnings, muted inflation, and accelerating global economic growth. As of the reporting period’s end, we have maintained overweighted exposure to the information technology sector and, to a lesser extent, the health care sector. In contrast, we have found fewer growth opportunities in the materials, industrials, financials, and consumer discretionary sectors.
October 16, 2017
1 Total return includes reinvestment of dividends and any capital gains paid, and does not take into consideration the maximum initial sales charge in the case of Class A shares, or the applicable contingent deferred sales charge imposed on redemptions in the case of Class C shares. Had these charges been reflected, returns would have been lower. Past performance is no guarantee of future results. Share price and investment return fluctuate such that upon redemption, fund shares may be worth more or less than their original cost.
2 Source: Lipper Inc. — The Russell 2500™ Growth Index measures the performance of the small- to mid-cap growth segment of the U.S. equity universe. It includes those Russell 2500 companies with higher growth earning potential as defined by Russell’s leading style methodology. The Russell 2500™ Growth Index is constructed to provide a comprehensive and unbiased barometer of the small- to mid-cap growth market. The index is completely reconstituted annually to ensure larger stocks do not distort the performance and characteristics of the true small- to mid-cap opportunity set and that the represented companies continue to reflect growth characteristics. Investors cannot invest directly in any index.
Please note: the position in any security highlighted with italicized typeface was sold during the reporting period.
Equities are subject generally to market, market sector, market liquidity, issuer, and investment style risks, among other factors, to varying degrees, all of which are more fully described in the fund’s prospectus.
Small and midsized companies carry additional risks because their earnings and revenues tend to be less predictable, and their share prices more volatile, than those of larger, more established companies.
4
FUND PERFORMANCE
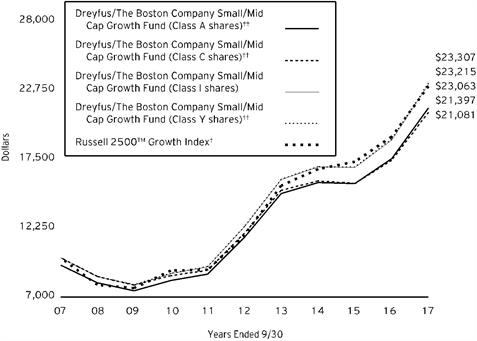
Comparison of change in value of $10,000 investment in Dreyfus/The Boston Company Small/Mid Cap Growth Fund Class A shares, Class C shares, Class I shares and Class Y shares and the Russell 2500™ Growth Index (the “Index”)
† Source: Lipper Inc.
†† The total return figures presented for Class A and Class C shares of the fund reflect the performance of the fund’s Class I shares for the period prior to 3/31/09 (the inception date for Class A and Class C shares), adjusted to reflect the applicable sales load for Class A shares.
The total return figures presented for Class Y shares of the fund reflect the performance of the fund’s Class I shares for the period prior to 7/1/13 (the inception date for Class Y shares).
Past performance is not predictive of future performance.
The above graph compares a $10,000 investment made in each of the Class A, Class C, Class I and Class Y shares of Dreyfus/The Boston Company Small/Mid Cap Growth Fund on 9/30/07 to a $10,000 investment made in the Index on that date. All dividends and capital gain distributions are reinvested.
The fund’s performance shown in the line graph above takes into account the maximum initial sales charge on Class A shares and all other applicable fees and expenses on all classes. The Index measures the performance of the small- to mid-cap growth segment of the U.S. equity universe. It includes those Russell 2500 companies with higher growth earning potential as defined by Russell’s leading style methodology. The Index is constructed to provide a comprehensive and unbiased barometer of the small- to mid-cap growth market. The Index is completely reconstituted annually to ensure larger stocks do not distort the performance and characteristics of the true small- to mid-cap opportunity set and that the represented companies continue to reflect growth characteristics. Unlike a mutual fund, the Index is not subject to charges, fees and other expenses. Investors cannot invest directly in any index. These factors can contribute to the Index potentially outperforming the fund. Further information relating to fund performance, including expense reimbursements, if applicable, is contained in the Financial Highlights section of the prospectus and elsewhere in this report.
5
FUND PERFORMANCE (continued)
| | | | | |
Average Annual Total Returns as of 9/30/17 |
| | Inception
Date | 1 Year | 5 Years | 10 Years |
Class A shares | | | | |
with maximum sales charge (5.75%) | 3/31/09 | 14.91% | 11.76% | 7.90%†† |
without sales charge | 3/31/09 | 21.95% | 13.10% | 8.55%†† |
Class C shares | | | | |
with applicable redemption charge† | 3/31/09 | 20.00% | 12.19% | 7.74%†† |
without redemption | 3/31/09 | 21.00% | 12.19% | 7.74%†† |
Class I shares | 1/1/88 | 22.34% | 13.39% | 8.79% |
Class Y shares | 7/1/13 | 22.44% | 13.48%†† | 8.83%†† |
Russell 2500™ Growth Index | | 20.07% | 14.46% | 8.72% |
† The maximum contingent deferred sales charge for Class C shares is 1% for shares redeemed within one year of the date of purchase.
†† The total return performance figures presented for Class A and Class C shares of the fund reflect the performance of the fund’s Class I shares for the period prior to 3/31/09 (the inception date for Class A and Class C shares), adjusted to reflect the applicable sales load for Class A shares.
The total return performance figures presented for Class Y shares of the fund reflect the performance of the fund’s Class I shares for the period prior to 7/1/13 (the inception date for Class Y shares).
The performance data quoted represents past performance, which is no guarantee of future results. Share price and investment return fluctuate and an investor’s shares may be worth more or less than original cost upon redemption. Current performance may be lower or higher than the performance quoted. Go to Dreyfus.com for the fund’s most recent month-end returns.
The fund’s performance shown in the graph and table does not reflect the deduction of taxes that a shareholder would pay on fund distributions or the redemption of fund shares. In addition to the performance of Class A shares shown with and without a maximum sales charge, the fund’s performance shown in the table takes into account all other applicable fees and expenses on all classes.
6
UNDERSTANDING YOUR FUND’S EXPENSES (Unaudited)
As a mutual fund investor, you pay ongoing expenses, such as management fees and other expenses. Using the information below, you can estimate how these expenses affect your investment and compare them with the expenses of other funds. You also may pay one-time transaction expenses, including sales charges (loads) and redemption fees, which are not shown in this section and would have resulted in higher total expenses. For more information, see your fund’s prospectus or talk to your financial adviser.
Review your fund’s expenses
The table below shows the expenses you would have paid on a $1,000 investment in Dreyfus/The Boston Company Small/Mid Cap Growth Fund from April 1, 2017 to September 30, 2017. It also shows how much a $1,000 investment would be worth at the close of the period, assuming actual returns and expenses.
| | | | | | | | | | | |
Expenses and Value of a $1,000 Investment | | |
assuming actual returns for the six months ended September 30, 2017 |
| | | Class A | | Class C | | Class I | | Class Y |
Expenses paid per $1,000† | | $5.51 | | $9.47 | | $3.87 | | $3.61 |
Ending value (after expenses) | | $1,115.00 | | $1,110.70 | | $1,116.80 | | $1,116.90 |
COMPARING YOUR FUND’S EXPENSES
WITH THOSE OF OTHER FUNDS (Unaudited)
Using the SEC’s method to compare expenses
The Securities and Exchange Commission (“SEC”) has established guidelines to help investors assess fund expenses. Per these guidelines, the table below shows your fund’s expenses based on a $1,000 investment, assuming a hypothetical 5% annualized return. You can use this information to compare the ongoing expenses (but not transaction expenses or total cost) of investing in the fund with those of other funds. All mutual fund shareholder reports will provide this information to help you make this comparison. Please note that you cannot use this information to estimate your actual ending account balance and expenses paid during the period.
| | | | | | | | | |
Expenses and Value of a $1,000 Investment |
assuming a hypothetical 5% annualized return for the six months ended September 30, 2017 |
| | | Class A | | Class C | | Class I | | Class Y |
Expenses paid per $1,000† | | $5.27 | | $9.05 | | $3.70 | | $3.45 |
Ending value (after expenses) | | $1,019.85 | | $1,016.09 | | $1,021.41 | | $1,021.66 |
† Expenses are equal to the fund’s annualized expense ratio of 1.04% for Class A, 1.79% for Class C, .73% for Class I and .68% for Class Y, multiplied by the average account value over the period, multiplied by 183/365 (to reflect the one-half year period).
7
STATEMENT OF INVESTMENTS
September 30, 2017
| | | | | | | | |
| |
Description | | | | Shares | | Value ($) | |
Common Stocks - 99.1% | | | | | |
Banks - 2.3% | | | | | |
First Republic Bank | | | | 147,505 | | 15,408,372 | |
SVB Financial Group | | | | 59,715 | a | 11,172,079 | |
| | | | | 26,580,451 | |
Capital Goods - 13.8% | | | | | |
Allegion | | | | 141,530 | | 12,238,099 | |
Beacon Roofing Supply | | | | 391,489 | a | 20,063,811 | |
BMC Stock Holdings | | | | 495,711 | a,b | 10,583,430 | |
BWX Technologies | | | | 302,224 | | 16,930,588 | |
Curtiss-Wright | | | | 91,732 | | 9,589,663 | |
Graco | | | | 95,410 | | 11,801,263 | |
Mercury Systems | | | | 351,396 | a,b | 18,230,425 | |
Proto Labs | | | | 122,007 | a | 9,797,162 | |
Quanta Services | | | | 436,164 | a | 16,299,449 | |
Snap-on | | | | 47,070 | | 7,013,901 | |
Watsco | | | | 45,135 | | 7,269,894 | |
Woodward | | | | 79,936 | | 6,203,833 | |
Xylem | | | | 270,082 | | 16,915,236 | |
| | | | | 162,936,754 | |
Commercial & Professional Services - 1.0% | | | | | |
Copart | | | | 353,820 | a,b | 12,160,793 | |
Consumer Durables & Apparel - 2.4% | | | | | |
Lululemon Athletica | | | | 300,571 | a | 18,710,545 | |
Newell Brands | | | | 229,808 | | 9,805,907 | |
| | | | | 28,516,452 | |
Consumer Services - 6.0% | | | | | |
Bright Horizons Family Solutions | | | | 73,502 | a | 6,336,607 | |
Buffalo Wild Wings | | | | 69,602 | a,b | 7,356,931 | |
Planet Fitness, Cl. A | | | | 1,148,008 | | 30,973,256 | |
Twilio, Cl. A | | | | 886,632 | a,b | 26,465,965 | |
| | | | | 71,132,759 | |
Diversified Financials - 1.0% | | | | | |
CBOE Holdings | | | | 114,347 | | 12,307,168 | |
Energy - 1.4% | | | | | |
Diamondback Energy | | | | 172,474 | a,b | 16,895,553 | |
Food & Staples Retailing - .5% | | | | | |
Sprouts Farmers Market | | | | 334,198 | a | 6,272,896 | |
Food, Beverage & Tobacco - .6% | | | | | |
TreeHouse Foods | | | | 107,300 | a,b | 7,267,429 | |
Health Care Equipment & Services - 9.7% | | | | | |
ABIOMED | | | | 84,990 | a | 14,329,314 | |
Acadia Healthcare | | | | 313,239 | a,b | 14,960,294 | |
8
| | | | | | | | |
| |
Description | | | | Shares | | Value ($) | |
Common Stocks - 99.1% (continued) | | | | | |
Health Care Equipment & Services - 9.7% (continued) | | | | | |
Align Technology | | | | 123,399 | a | 22,985,532 | |
athenahealth | | | | 79,616 | a | 9,901,046 | |
Brookdale Senior Living | | | | 713,739 | a | 7,565,633 | |
Centene | | | | 102,663 | a | 9,934,699 | |
Dentsply Sirona | | | | 146,613 | | 8,768,924 | |
DexCom | | | | 290,914 | a,b | 14,232,967 | |
Nevro | | | | 130,445 | a,b | 11,854,842 | |
| | | | | 114,533,251 | |
Materials - 4.6% | | | | | |
Carpenter Technology | | | | 288,436 | | 13,853,581 | |
Eagle Materials | | | | 179,749 | | 19,179,218 | |
Packaging Corporation of America | | | | 182,835 | | 20,967,518 | |
| | | | | 54,000,317 | |
Media - 1.9% | | | | | |
IMAX | | | | 568,615 | a,b | 12,879,130 | |
Liberty Media, Cl. C | | | | 235,322 | a,b | 8,963,415 | |
| | | | | 21,842,545 | |
Pharmaceuticals, Biotechnology & Life Sciences - 13.1% | | | | | |
Aerie Pharmaceuticals | | | | 149,025 | a,b | 7,242,615 | |
Alkermes | | | | 356,743 | a | 18,136,814 | |
Cambrex | | | | 163,241 | a,b | 8,978,255 | |
Flexion Therapeutics | | | | 396,238 | a,b | 9,581,035 | |
Halozyme Therapeutics | | | | 857,510 | a,b | 14,894,949 | |
ICON | | | | 121,268 | a | 13,810,000 | |
Jazz Pharmaceuticals | | | | 123,608 | a | 18,077,670 | |
Ligand Pharmaceuticals | | | | 113,244 | a,b | 15,418,171 | |
Neurocrine Biosciences | | | | 341,425 | a,b | 20,922,524 | |
Radius Health | | | | 181,679 | a,b | 7,003,726 | |
Sage Therapeutics | | | | 103,592 | a,b | 6,453,782 | |
TESARO | | | | 105,448 | a,b | 13,613,337 | |
| | | | | 154,132,878 | |
Real Estate - 1.0% | | | | | |
Digital Realty Trust | | | | 96,495 | c | 11,418,253 | |
Retailing - 3.7% | | | | | |
Carvana | | | | 393,327 | b | 5,774,040 | |
Core-Mark Holding | | | | 141,224 | b | 4,538,939 | |
LKQ | | | | 351,229 | a | 12,640,732 | |
Ollie's Bargain Outlet Holdings | | | | 201,955 | a,b | 9,370,712 | |
Ulta Beauty | | | | 50,649 | a | 11,449,713 | |
| | | | | 43,774,136 | |
Semiconductors & Semiconductor Equipment - 7.0% | | | | | |
Cavium | | | | 219,077 | a | 14,445,937 | |
Impinj | | | | 351,549 | a,b | 14,627,954 | |
9
STATEMENT OF INVESTMENTS (continued)
| | | | | | | | |
| |
Description | | | | Shares | | Value ($) | |
Common Stocks - 99.1% (continued) | | | | | |
Semiconductors & Semiconductor Equipment - 7.0% (continued) | | | | | |
Inphi | | | | 242,898 | a,b | 9,640,622 | |
Mellanox Technologies | | | | 123,899 | a,b | 5,841,838 | |
Power Integrations | | | | 411,835 | | 30,146,322 | |
Semtech | | | | 214,406 | a | 8,050,945 | |
| | | | | 82,753,618 | |
Software & Services - 24.3% | | | | | |
2U | | | | 191,444 | a,b | 10,728,522 | |
Black Knight Financial Services, Cl. A | | | | 330,465 | a,b | 14,226,518 | |
Booz Allen Hamilton Holdings | | | | 328,518 | | 12,283,288 | |
CACI International, Cl. A | | | | 95,491 | a | 13,306,671 | |
CommVault Systems | | | | 341,940 | a | 20,789,952 | |
CoStar Group | | | | 72,990 | a | 19,579,568 | |
HubSpot | | | | 405,820 | a | 34,109,171 | |
LogMeIn | | | | 176,847 | | 19,462,012 | |
New Relic | | | | 452,839 | a | 22,551,382 | |
Proofpoint | | | | 236,579 | a,b | 20,634,420 | |
Shopify, Cl. A | | | | 245,975 | a | 28,653,628 | |
Splunk | | | | 239,542 | a,b | 15,912,775 | |
Square, Cl. A | | | | 1,232,386 | a | 35,505,041 | |
SS&C Technologies Holdings | | | | 485,449 | | 19,490,777 | |
| | | | | 287,233,725 | |
Technology Hardware & Equipment - 3.4% | | | | | |
FLIR Systems | | | | 178,275 | | 6,936,680 | |
Lumentum Holdings | | | | 329,850 | a,b | 17,927,348 | |
NETGEAR | | | | 203,753 | a,b | 9,698,643 | |
Trimble | | | | 149,721 | a | 5,876,549 | |
| | | | | 40,439,220 | |
Transportation - 1.4% | | | | | |
J.B. Hunt Transport Services | | | | 146,488 | | 16,271,887 | |
Total Common Stocks (cost $905,238,637) | | | | 1,170,470,085 | |
| | | | | | | | |
Other Investment - 1.4% | | | | | |
Registered Investment Company; | | | | | |
Dreyfus Institutional Preferred Government Plus Money Market Fund
(cost $16,523,985) | | | | 16,523,985 | d | 16,523,985 | |
10
| | | | | | | | |
| |
Description | | | | Shares | | Value ($) | |
Investment of Cash Collateral for Securities Loaned - 13.3% | | | | | |
Registered Investment Company; | | | | | |
Dreyfus Institutional Preferred Government Money Market Fund, Institutional Shares
(cost $156,633,716) | | | | 156,633,716 | d | 156,633,716 | |
Total Investments (cost $1,078,396,338) | | 113.8% | | 1,343,627,786 | |
Liabilities, Less Cash and Receivables | | (13.8%) | | (162,544,790) | |
Net Assets | | 100.0% | | 1,181,082,996 | |
a Non-income producing security.
b Security, or portion thereof, on loan. At September 30, 2017, the value of the fund’s securities on loan was $288,648,725 and the value of the collateral held by the fund was $294,551,265, consisting of cash collateral of $156,633,716 and U.S. Government & Agency securities valued at $137,917,549.
c Investment in real estate investment trust.
d Investment in affiliated money market mutual fund.
| | |
Portfolio Summary (Unaudited) † | Value (%) |
Software & Services | 24.3 |
Money Market Investments | 14.7 |
Capital Goods | 13.8 |
Pharmaceuticals, Biotechnology & Life Sciences | 13.1 |
Health Care Equipment & Services | 9.7 |
Semiconductors & Semiconductor Equipment | 7.0 |
Consumer Services | 6.0 |
Materials | 4.6 |
Retailing | 3.7 |
Technology Hardware & Equipment | 3.4 |
Consumer Durables & Apparel | 2.4 |
Banks | 2.3 |
Media | 1.9 |
Energy | 1.4 |
Transportation | 1.4 |
Diversified Financials | 1.0 |
Commercial & Professional Services | 1.0 |
Real Estate | 1.0 |
Food, Beverage & Tobacco | .6 |
Food & Staples Retailing | .5 |
| | 113.8 |
† Based on net assets.
See notes to financial statements.
11
STATEMENT OF INVESTMENTS IN AFFILIATED ISSUERS
| | | | | | | |
Registered Investment Companies | Value
9/30/2016 ($) | Purchases ($) | Sales ($) | Value
9/30/2017 ($) | Net
Assets (%) | Dividends/
Distributions ($) |
Dreyfus Institutional Cash Advantage Fund, Institutional Shares | 61,352,680 | – | 61,352,680 | – | – | – |
Dreyfus Institutional Preferred Government Plus Money Market Fund | 21,320,462 | 488,304,556 | 493,101,033 | 16,523,985 | 1.4 | 106,100 |
Dreyfus Institutional Preferred Government Money Market Fund, Institutional Shares | – | 796,430,604 | 639,796,888 | 156,633,716 | 13.3 | – |
Total | 82,673,142 | 1,284,735,160 | 1,194,250,601 | 173,157,701 | 14.7 | 106,100 |
See notes to financial statements.
12
STATEMENT OF ASSETS AND LIABILITIES
September 30, 2017
| | | | | | | |
| | | | | | |
| | | Cost | | Value | |
Assets ($): | | | | |
Investments in securities—See Statement of Investments
(including securities on loan, valued at $288,648,725)—Note 1(b): | | | |
Unaffiliated issuers | | 905,238,637 | | 1,170,470,085 | |
Affiliated issuers | | 173,157,701 | | 173,157,701 | |
Cash | | | | | 1,380,130 | |
Dividends and securities lending income receivable | | | | | 483,916 | |
Receivable for shares of Beneficial Interest subscribed | | | | | 233,657 | |
Prepaid expenses | | | | | 111,806 | |
| | | | | 1,345,837,295 | |
Liabilities ($): | | | | |
Due to The Dreyfus Corporation and affiliates—Note 3(c) | | | | | 710,537 | |
Liability for securities on loan—Note 1(b) | | | | | 156,633,716 | |
Payable for investment securities purchased | | | | | 6,199,387 | |
Payable for shares of Beneficial Interest redeemed | | | | | 1,047,442 | |
Accrued expenses | | | | | 163,217 | |
| | | | | 164,754,299 | |
Net Assets ($) | | | 1,181,082,996 | |
Composition of Net Assets ($): | | | | |
Paid-in capital | | | | | 835,818,661 | |
Accumulated undistributed investment income—net | | 148,313 | |
Accumulated net realized gain (loss) on investments | | | | | 79,884,574 | |
Accumulated net unrealized appreciation (depreciation)
on investments | | | | 265,231,448 | |
Net Assets ($) | | | 1,181,082,996 | |
| | | | | | |
Net Asset Value Per Share | Class A | Class C | Class I | Class Y | |
Net Assets ($) | 225,373,953 | 37,725,108 | 497,603,523 | 420,380,412 | |
Shares Outstanding | 11,343,327 | 2,100,494 | 24,323,781 | 20,455,874 | |
Net Asset Value Per Share ($) | 19.87 | 17.96 | 20.46 | 20.55 | |
| | | | | | |
See notes to financial statements. | | | | | |
13
STATEMENT OF OPERATIONS
Year Ended September 30, 2017
| | | | | | | |
| | | | | | |
| | | | | | |
Investment Income ($): | | | | |
Income: | | | | |
Cash dividends: | |
Unaffiliated issuers | | | 5,853,699 | |
Affiliated issuers | | | 106,100 | |
Income from securities lending—Note 1(b) | | | 2,348,820 | |
Interest | | | 1,252 | |
Total Income | | | 8,309,871 | |
Expenses: | | | | |
Investment advisory fee—Note 3(a) | | | 6,203,061 | |
Shareholder servicing costs—Note 3(c) | | | 1,329,534 | |
Distribution fees—Note 3(b) | | | 268,892 | |
Registration fees | | | 219,434 | |
Administration fee—Note 3(a) | | | 160,913 | |
Professional fees | | | 85,410 | |
Custodian fees—Note 3(c) | | | 69,490 | |
Trustees’ fees and expenses—Note 3(d) | | | 65,809 | |
Prospectus and shareholders’ reports | | | 53,476 | |
Loan commitment fees—Note 2 | | | 24,716 | |
Interest expense—Note 2 | | | 286 | |
Miscellaneous | | | 30,841 | |
Total Expenses | | | 8,511,862 | |
Less—reduction in fees due to earnings credits—Note 3(c) | | | (8,624) | |
Net Expenses | | | 8,503,238 | |
Investment (Loss)—Net | | | (193,367) | |
Realized and Unrealized Gain (Loss) on Investments—Note 4 ($): | | |
Net realized gain (loss) on investments | 84,344,443 | |
Net unrealized appreciation (depreciation) on investments | | | 126,103,544 | |
Net Realized and Unrealized Gain (Loss) on Investments | | | 210,447,987 | |
Net Increase in Net Assets Resulting from Operations | | 210,254,620 | |
| | | | | | | |
See notes to financial statements. | | | | | |
14
STATEMENT OF CHANGES IN NET ASSETS
| | | | | | | | | | |
| | | | Year Ended September 30, |
| | | | 2017 | | 2016 | |
Operations ($): | | | | | | | | |
Investment (loss)—net | | | (193,367) | | | | (2,132,511) | |
Net realized gain (loss) on investments | | 84,344,443 | | | | 27,648,284 | |
Net unrealized appreciation (depreciation)
on investments | | 126,103,544 | | | | 79,181,821 | |
Net Increase (Decrease) in Net Assets
Resulting from Operations | 210,254,620 | | | | 104,697,594 | |
Distributions to Shareholders from ($): | |
Net realized gain on investments: | | | | | | | | |
Class A | | | (4,997,899) | | | | (14,162,754) | |
Class C | | | (837,455) | | | | (2,369,599) | |
Class I | | | (11,207,680) | | | | (32,102,467) | |
Class Y | | | (2,582,326) | | | | (6,629,336) | |
Total Distributions | | | (19,625,360) | | | | (55,264,156) | |
Beneficial Interest Transactions ($): | |
Net proceeds from shares sold: | | | | | | | | |
Class A | | | 29,521,100 | | | | 27,869,952 | |
Class C | | | 8,581,799 | | | | 5,717,983 | |
Class I | | | 118,039,101 | | | | 90,844,531 | |
Class Y | | | 277,256,945 | | | | 78,013,436 | |
Distributions reinvested: | | | | | | | | |
Class A | | | 4,713,908 | | | | 13,597,132 | |
Class C | | | 834,810 | | | | 2,351,988 | |
Class I | | | 11,079,966 | | | | 31,581,829 | |
Class Y | | | 2,582,326 | | | | 6,629,336 | |
Cost of shares redeemed: | | | | | | | | |
Class A | | | (70,237,478) | | | | (48,373,129) | |
Class C | | | (11,517,257) | | | | (10,052,551) | |
Class I | | | (229,273,713) | | | | (150,361,398) | |
Class Y | | | (37,606,231) | | | | (82,304,295) | |
Increase (Decrease) in Net Assets
from Beneficial Interest Transactions | 103,975,276 | | | | (34,485,186) | |
Total Increase (Decrease) in Net Assets | 294,604,536 | | | | 14,948,252 | |
Net Assets ($): | |
Beginning of Period | | | 886,478,460 | | | | 871,530,208 | |
End of Period | | | 1,181,082,996 | | | | 886,478,460 | |
Undistributed investment income (loss)—net | 148,313 | | | | (1,422,440) | |
15
STATEMENT OF CHANGES IN NET ASSETS (continued)
| | | | | | | | | | |
| | | | Year Ended September 30, |
| | | | 2017 | | 2016 | |
Capital Share Transactions (Shares): | |
Class Aa | | | | | | | | |
Shares sold | | | 1,680,997 | | | | 1,784,531 | |
Shares issued for distributions reinvested | | | 281,595 | | | | 861,123 | |
Shares redeemed | | | (4,005,912) | | | | (3,105,350) | |
Net Increase (Decrease) in Shares Outstanding | (2,043,320) | | | | (459,696) | |
Class Ca | | | | | | | | |
Shares sold | | | 533,474 | | | | 399,641 | |
Shares issued for distributions reinvested | | | 54,849 | | | | 162,206 | |
Shares redeemed | | | (709,377) | | | | (700,043) | |
Net Increase (Decrease) in Shares Outstanding | (121,054) | | | | (138,196) | |
Class Ia | | | | | | | | |
Shares sold | | | 6,473,849 | | | | 5,699,323 | |
Shares issued for distributions reinvested | | | 644,559 | | | | 1,953,113 | |
Shares redeemed | | | (12,739,528) | | | | (9,406,753) | |
Net Increase (Decrease) in Shares Outstanding | (5,621,120) | | | | (1,754,317) | |
Class Ya | | | | | | | | |
Shares sold | | | 15,447,057 | | | | 5,017,728 | |
Shares issued for distributions reinvested | | | 149,613 | | | | 408,966 | |
Shares redeemed | | | (2,016,919) | | | | (5,024,552) | |
Net Increase (Decrease) in Shares Outstanding | 13,579,751 | | | | 402,142 | |
| | | | | | | | | | |
aDuring the period ended September 30, 2017, 303 Class A shares representing $5,098 were exchanged for 295 Class I shares, 1,105 Class C shares representing $17,825 were exchanged for 977 Class I shares and 5,834,952 Class I shares representing $103,337,008 were exchanged for 5,808,713 Class Y shares and during the period ended September 30, 2016, 343 Class A shares representing $5,687 were exchanged for 335 Class I shares and 537,037 Class I shares representing $8,775,190 were exchanged for 535,073 Class Y shares. | |
See notes to financial statements. | | | | | | | | |
16
FINANCIAL HIGHLIGHTS
The following tables describe the performance for each share class for the fiscal periods indicated. All information (except portfolio turnover rate) reflects financial results for a single fund share. Total return shows how much your investment in the fund would have increased (or decreased) during each period, assuming you had reinvested all dividends and distributions. These figures have been derived from the fund’s financial statements.
| | | | | | | | |
| | |
| | | |
| | | Year Ended September 30, |
Class A Shares | | 2017 | 2016 | 2015 | 2014 | 2013 |
Per Share Data ($): | | | | | | |
Net asset value, beginning of period | | 16.66 | 15.83 | 17.65 | 18.76 | 15.82 |
Investment Operations: | | | | | | |
Investment (loss)—neta | | (.04) | (.06) | (.07) | (.09) | (.06) |
Net realized and unrealized
gain (loss) on investments | | 3.63 | 1.92 | .06 | 1.08 | 4.20 |
Total from Investment Operations | | 3.59 | 1.86 | (.01) | .99 | 4.14 |
Distributions: | | | | | | |
Dividends from net realized
gain on investments | | (.38) | (1.03) | (1.81) | (2.10) | (1.20) |
Net asset value, end of period | | 19.87 | 16.66 | 15.83 | 17.65 | 18.76 |
Total Return (%)b | | 21.95 | 12.11 | (.42) | 5.59 | 28.73 |
Ratios/Supplemental Data (%): | | | | | | |
Ratio of total expenses
to average net assets | | 1.04 | 1.04 | 1.03 | 1.04 | 1.02 |
Ratio of net expenses
to average net assets | | 1.03 | 1.04 | 1.03 | 1.04 | 1.02 |
Ratio of net investment (loss)
to average net assets | | (.20) | (.41) | (.42) | (.48) | (.34) |
Portfolio Turnover Rate | | 67.52 | 120.54 | 144.39 | 139.37 | 124.25 |
Net Assets, end of period ($ x 1,000) | | 225,374 | 222,978 | 219,185 | 225,427 | 193,470 |
a Based on average shares outstanding.
b Exclusive of sales charge.
See notes to financial statements.
17
FINANCIAL HIGHLIGHTS (continued)
| | | | | | | |
| | |
| | | |
| | | Year Ended September 30, |
Class C Shares | | 2017 | 2016 | 2015 | 2014 | 2013 |
Per Share Data ($): | | | | | | |
Net asset value, beginning of period | | 15.20 | 14.64 | 16.58 | 17.87 | 15.26 |
Investment Operations: | | | | | | |
Investment (loss)—neta | | (.16) | (.17) | (.20) | (.22) | (.20) |
Net realized and unrealized
gain (loss) on investments | | 3.30 | 1.76 | .07 | 1.03 | 4.01 |
Total from Investment Operations | | 3.14 | 1.59 | (.13) | .81 | 3.81 |
Distributions: | | | | | | |
Dividends from net realized
gain on investments | | (.38) | (1.03) | (1.81) | (2.10) | (1.20) |
Net asset value, end of period | | 17.96 | 15.20 | 14.64 | 16.58 | 17.87 |
Total Return (%)b | | 21.00 | 11.28 | (1.18) | 4.72 | 27.54 |
Ratios/Supplemental Data (%): | | | | | | |
Ratio of total expenses
to average net assets | | 1.79 | 1.83 | 1.81 | 1.83 | 1.92 |
Ratio of net expenses
to average net assets | | 1.79 | 1.83 | 1.81 | 1.83 | 1.92 |
Ratio of net investment (loss)
to average net assets | | (.97) | (1.19) | (1.21) | (1.26) | (1.29) |
Portfolio Turnover Rate | | 67.52 | 120.54 | 144.39 | 139.37 | 124.25 |
Net Assets, end of period ($ x 1,000) | | 37,725 | 33,779 | 34,554 | 31,329 | 6,991 |
a Based on average shares outstanding.
b Exclusive of sales charge.
See notes to financial statements.
18
| | | | | | | | | |
| | |
| | | |
| | | Year Ended September 30, |
Class I Shares | | 2017 | 2016 | 2015 | 2014 | 2013 |
Per Share Data ($): | | | | | | |
Net asset value, beginning of period | | 17.09 | 16.18 | 17.96 | 19.01 | 15.98 |
Investment Operations: | | | | | | |
Investment income (loss)—neta | | .02 | (.03) | (.03) | (.04) | (.01) |
Net realized and unrealized
gain (loss) on investments | | 3.73 | 1.97 | .06 | 1.09 | 4.24 |
Total from Investment Operations | | 3.75 | 1.94 | .03 | 1.05 | 4.23 |
Distributions: | | | | | | |
Dividends from net realized
gain on investments | | (.38) | (1.03) | (1.81) | (2.10) | (1.20) |
Net asset value, end of period | | 20.46 | 17.09 | 16.18 | 17.96 | 19.01 |
Total Return (%) | | 22.34 | 12.36 | (.17) | 5.85 | 29.03 |
Ratios/Supplemental Data (%): | | | | | | |
Ratio of total expenses
to average net assets | | .75 | .79 | .79 | .80 | .75 |
Ratio of net expenses
to average net assets | | .75 | .79 | .79 | .80 | .75 |
Ratio of net investment income
(loss) to average net assets | | .10 | (.16) | (.19) | (.24) | (.06) |
Portfolio Turnover Rate | | 67.52 | 120.54 | 144.39 | 139.37 | 124.25 |
Net Assets, end of period ($ x 1,000) | | 497,604 | 511,768 | 512,830 | 605,932 | 605,704 |
a Based on average shares outstanding.
See notes to financial statements.
19
FINANCIAL HIGHLIGHTS (continued)
| | | | | | | |
| | |
| | | | |
| | | Year Ended September 30, |
Class Y Shares | | 2017 | 2016 | 2015 | 2014 | 2013a |
Per Share Data ($): | | | | | | |
Net asset value, beginning of period | | 17.15 | 16.21 | 17.97 | 19.01 | 17.16 |
Investment Operations: | | | | | | |
Investment income (loss)—netb | | .01 | (.00)c | (.01) | (.03) | (.01) |
Net realized and unrealized
gain (loss) on investments | | 3.77 | 1.97 | .06 | 1.09 | 1.86 |
Total from Investment Operations | | 3.78 | 1.97 | .05 | 1.06 | 1.85 |
Distributions: | | | | | | |
Dividends from net realized
gain on investments | | (.38) | (1.03) | (1.81) | (2.10) | - |
Net asset value, end of period | | 20.55 | 17.15 | 16.21 | 17.97 | 19.01 |
Total Return (%) | | 22.44 | 12.53 | (.05) | 5.90 | 10.78d |
Ratios/Supplemental Data (%): | | | | | | |
Ratio of total expenses
to average net assets | | .68 | .68 | .68 | .72 | .72e |
Ratio of net expenses
to average net assets | | .68 | .68 | .68 | .72 | .72e |
Ratio of net investment income
(loss)to average net assets | | .05 | (.03) | (.07) | (.15) | (.26)e |
Portfolio Turnover Rate | | 67.52 | 120.54 | 144.39 | 139.37 | 124.25 |
Net Assets, end of period ($ x 1,000) | | 420,380 | 117,953 | 104,961 | 100,902 | 1 |
a From July 1, 2013, (commencement of initial offering) to September 30, 2013.
b Based on average shares outstanding.
c Amount represents less than $.01 per share.
d Not annualized.
e Annualized.
See notes to financial statements.
20
NOTES TO FINANCIAL STATEMENTS
NOTE 1—Significant Accounting Policies:
Dreyfus/The Boston Company Small/Mid Cap Growth Fund (the “fund”) is a separate non-diversified series of Dreyfus Investment Funds (the “Trust”), which is registered under the Investment Company Act of 1940, as amended (the “Act”), as an open-end management investment company and operates as a series company currently offering seven series, including the fund. The fund’s investment objective is to seek long-term growth of capital. The Dreyfus Corporation (the “Manager” or “Dreyfus”), a wholly-owned subsidiary of The Bank of New York Mellon Corporation (“BNY Mellon”), serves as the fund’s investment adviser. The Boston Company Asset Management, LLC (“TBCAM”), a wholly-owned subsidiary of BNY Mellon and an affiliate of Dreyfus, serves as the fund’s sub-investment adviser. Effective August 31, 2017, the fund is closed to new investors.
Effective March 31, 2017, the fund authorized the issuance of Class T shares, but, as of the date of this report, the fund did not offer Class T shares for purchase.
MBSC Securities Corporation (the “Distributor”), a wholly-owned subsidiary of Dreyfus, is the distributor of the fund’s shares. The fund is authorized to issue an unlimited number of $.001 par value shares of Beneficial Interest in each of the following classes of shares: Class A, Class C, Class I, Class T and Class Y. Class A, Class C and Class T shares are sold primarily to retail investors through financial intermediaries and bear Distribution and/or Shareholder Services Plan fees. Class A and Class T shares generally are subject to a sales charge imposed at the time of purchase. Class C shares are subject to a contingent deferred sales charge (“CDSC”) imposed on Class C shares redeemed within one year of purchase. Class I shares are sold primarily to bank trust departments and other financial service providers (including The Bank of New York Mellon, a subsidiary of BNY Mellon and an affiliate of Dreyfus, and its affiliates), acting on behalf of customers having a qualified trust or an investment account or relationship at such institution, and bear no Distribution or Shareholder Services Plan fees. Class Y shares are sold at net asset value per share generally to institutional investors, and bear no Distribution or Shareholder Services Plan fees. Class I and Class Y shares are offered without a front-end sales charge or CDSC. Other differences between the classes include the services offered to and the expenses borne by each class, the allocation of certain transfer agency costs, and certain voting rights. Income, expenses (other than expenses attributable to a specific class), and realized and unrealized gains or losses on investments are allocated to each class of shares based on its relative net assets.
21
NOTES TO FINANCIAL STATEMENTS (continued)
The Trust accounts separately for the assets, liabilities and operations of each series. Expenses directly attributable to each series are charged to that series’ operations; expenses which are applicable to all series are allocated among them on a pro rata basis.
The Financial Accounting Standards Board (“FASB”) Accounting Standards Codification is the exclusive reference of authoritative U.S. generally accepted accounting principles (“GAAP”) recognized by the FASB to be applied by nongovernmental entities. Rules and interpretive releases of the Securities and Exchange Commission (“SEC”) under authority of federal laws are also sources of authoritative GAAP for SEC registrants. The fund’s financial statements are prepared in accordance with GAAP, which may require the use of management estimates and assumptions. Actual results could differ from those estimates.
(a) Portfolio valuation: The fair value of a financial instrument is the amount that would be received to sell an asset or paid to transfer a liability in an orderly transaction between market participants at the measurement date (i.e., the exit price). GAAP establishes a fair value hierarchy that prioritizes the inputs of valuation techniques used to measure fair value. This hierarchy gives the highest priority to unadjusted quoted prices in active markets for identical assets or liabilities (Level 1 measurements) and the lowest priority to unobservable inputs (Level 3 measurements).
Additionally, GAAP provides guidance on determining whether the volume and activity in a market has decreased significantly and whether such a decrease in activity results in transactions that are not orderly. GAAP requires enhanced disclosures around valuation inputs and techniques used during annual and interim periods.
Various inputs are used in determining the value of the fund’s investments relating to fair value measurements. These inputs are summarized in the three broad levels listed below:
Level 1—unadjusted quoted prices in active markets for identical investments.
Level 2—other significant observable inputs (including quoted prices for similar investments, interest rates, prepayment speeds, credit risk, etc.).
Level 3—significant unobservable inputs (including the fund’s own assumptions in determining the fair value of investments).
The inputs or methodology used for valuing securities are not necessarily an indication of the risk associated with investing in those securities.
22
Changes in valuation techniques may result in transfers in or out of an assigned level within the disclosure hierarchy. Valuation techniques used to value the fund’s investments are as follows:
Investments in securities are valued at the last sales price on the securities exchange or national securities market on which such securities are primarily traded. Securities listed on the National Market System for which market quotations are available are valued at the official closing price or, if there is no official closing price that day, at the last sales price. For open short positions, asked prices are used for valuation purposes. Bid price is used when no asked price is available. Registered investment companies that are not traded on an exchange are valued at their net asset value. All of the preceding securities are generally categorized within Level 1 of the fair value hierarchy.
Securities not listed on an exchange or the national securities market, or securities for which there were no transactions, are valued at the average of the most recent bid and asked prices. These securities are generally categorized within Level 2 of the fair value hierarchy.
Fair valuing of securities may be determined with the assistance of a pricing service using calculations based on indices of domestic securities and other appropriate indicators, such as prices of relevant American Depository Receipts and futures. Utilizing these techniques may result in transfers between Level 1 and Level 2 of the fair value hierarchy.
When market quotations or official closing prices are not readily available, or are determined not to reflect accurately fair value, such as when the value of a security has been significantly affected by events after the close of the exchange or market on which the security is principally traded (for example, a foreign exchange or market), but before the fund calculates its net asset value, the fund may value these investments at fair value as determined in accordance with the procedures approved by the Trust’s Board of Trustees (the “Board”). Certain factors may be considered when fair valuing investments such as: fundamental analytical data, the nature and duration of restrictions on disposition, an evaluation of the forces that influence the market in which the securities are purchased and sold, and public trading in similar securities of the issuer or comparable issuers. These securities are either categorized within Level 2 or 3 of the fair value hierarchy depending on the relevant inputs used.
For restricted securities where observable inputs are limited, assumptions about market activity and risk are used and are generally categorized within Level 3 of the fair value hierarchy.
23
NOTES TO FINANCIAL STATEMENTS (continued)
The following is a summary of the inputs used as of September 30, 2017 in valuing the fund’s investments:
| | | | | |
| | Level 1 – Unadjusted
Quoted Prices | Level 2 –Other Significant Observable
Inputs | Level 3 –Significant Unobservable Inputs | Total |
Assets ($) | | | |
Investments in Securities: | | | |
Equity Securities - Domestic Common Stocks† | 1,096,416,783 | – | – | 1,096,416,783 |
Equity Securities - Foreign Common Stocks† | 74,053,302 | – | – | 74,053,302 |
Registered Investment Companies | 173,157,701 | – | – | 173,157,701 |
† See Statement of Investments for additional detailed categorizations.
At September 30, 2017, there were no transfers between levels of the fair value hierarchy. It is the fund’s policy to recognize transfers between levels at the end of the reporting period.
(b) Securities transactions and investment income: Securities transactions are recorded on a trade date basis. Realized gains and losses from securities transactions are recorded on the identified cost basis. Dividend income is recognized on the ex-dividend date and interest income, including, where applicable, accretion of discount and amortization of premium on investments, is recognized on the accrual basis.
Pursuant to a securities lending agreement with The Bank of New York Mellon, the fund may lend securities to qualified institutions. It is the fund’s policy that, at origination, all loans are secured by collateral of at least 102% of the value of U.S. securities loaned and 105% of the value of foreign securities loaned. Collateral equivalent to at least 100% of the market value of securities on loan is maintained at all times. Collateral is either in the form of cash, which can be invested in certain money market mutual funds managed by Dreyfus, or U.S. Government and Agency securities. The fund is entitled to receive all dividends, interest and distributions on securities loaned, in addition to income earned as a result of the lending transaction. Should a borrower fail to return the securities in a timely manner, The Bank of New York Mellon is required to replace the securities for the benefit of the fund or credit the fund with the market value of the unreturned securities and is subrogated to the fund’s rights
24
against the borrower and the collateral. Additionally, the contractual maturity of security lending transactions are on an overnight and continuous basis. During the period ended September 30, 2017, The Bank of New York Mellon earned $431,782 from lending portfolio securities, pursuant to the securities lending agreement.
(c) Affiliated issuers: Investments in other investment companies advised by Dreyfus are defined as “affiliated” under the Act.
(d) Dividends and distributions to shareholders: Dividends and distributions are recorded on the ex-dividend date. Dividends from investment income-net and dividends from net realized capital gains, if any, are normally declared and paid annually, but the fund may make distributions on a more frequent basis to comply with the distribution requirements of the Internal Revenue Code of 1986, as amended (the “Code”). To the extent that net realized capital gains can be offset by capital loss carryovers, it is the policy of the fund not to distribute such gains. Income and capital gain distributions are determined in accordance with income tax regulations, which may differ from GAAP.
(e) Federal income taxes: It is the policy of the fund to continue to qualify as a regulated investment company, if such qualification is in the best interests of its shareholders, by complying with the applicable provisions of the Code, and to make distributions of taxable income sufficient to relieve it from substantially all federal income and excise taxes.
As of and during the period ended September 30, 2017, the fund did not have any liabilities for any uncertain tax positions. The fund recognizes interest and penalties, if any, related to uncertain tax positions as income tax expense in the Statement of Operations. During the period ended September 30, 2017, the fund did not incur any interest or penalties.
Each tax year in the four-year period ended September 30, 2017 remains subject to examination by the Internal Revenue Service and state taxing authorities.
At September 30, 2017, the components of accumulated earnings on a tax basis were as follows: undistributed ordinary income $8,297,806, undistributed capital gains $72,593,053 and unrealized appreciation $264,373,476.
The tax character of distributions paid to shareholders during the fiscal periods ended September 30, 2017 and September 30, 2016 were as follows: long-term capital gains $19,625,360 and $55,264,156, respectively.
During the period ended September 30, 2017, as a result of permanent book to tax differences, primarily due to the tax treatment for net
25
NOTES TO FINANCIAL STATEMENTS (continued)
operating losses and real estate investment trusts, the fund increased accumulated undistributed investment income-net by $1,764,120 and decreased accumulated net realized gain (loss) on investment by the same amount. Net assets and net asset value per share were not affected by this reclassification.
NOTE 2—Bank Lines of Credit:
The fund participates with other Dreyfus-managed funds in an $810 million unsecured credit facility led by Citibank, N.A. and a $300 million unsecured credit facility provided by The Bank of New York Mellon (each, a “Facility”), each to be utilized primarily for temporary or emergency purposes, including the financing of redemptions. Prior to October 5, 2016, the unsecured credit facility with Citibank, N.A. was $555 million. In connection therewith, the fund has agreed to pay its pro rata portion of commitment fees for each Facility. Interest is charged to the fund based on rates determined pursuant to the terms of the respective Facility at the time of borrowing.
The average amount of borrowings outstanding under the Facilities during the period ended September 30, 2017 was approximately $17,500 with a related weighted average annualized interest rate of 1.63%.
NOTE 3—Investment Advisory Fee, Sub-Investment Advisory Fee, Administration Fee and Other Transactions with Affiliates:
(a) Pursuant to an investment advisory agreement with Dreyfus, the investment advisory fee is computed at the annual rate of .60% of the value of the fund’s average daily net assets and is payable monthly.
Pursuant to a sub-investment advisory agreement between Dreyfus and TBCAM, TBCAM serves as the fund’s sub-investment adviser responsible for the day-to-day management of the fund’s portfolio. Dreyfus pays TBCAM a monthly fee at an annual percentage of the value of the fund’s average daily net assets. Dreyfus has obtained an exemptive order from the SEC (the “Order”), upon which the fund may rely, to use a manager of managers approach that permits Dreyfus, subject to certain conditions and approval by the Board, to enter into and materially amend sub-investment advisory agreements with one or more sub-investment advisers who are either unaffiliated with Dreyfus or are wholly-owned subsidiaries (as defined under the Act) of Dreyfus’ ultimate parent company, BNY Mellon, without obtaining shareholder approval. The Order also allows the fund to disclose the sub-investment advisory fee paid by Dreyfus to any unaffiliated sub-investment adviser in the aggregate with other unaffiliated sub-investment advisers in documents filed with the SEC and provided to shareholders. In addition, pursuant to the Order, it is not necessary to
26
disclose the sub-investment advisory fee payable by Dreyfus separately to a sub-investment adviser that is a wholly-owned subsidiary of BNY Mellon in documents filed with the SEC and provided to shareholders; such fees are to be aggregated with fees payable to Dreyfus. Dreyfus has ultimate responsibility (subject to oversight by the Board) to supervise any sub-investment adviser and recommend the hiring, termination, and replacement of any sub-investment adviser to the Board.
The fund has a Fund Accounting and Administrative Services Agreement (the “Administration Agreement”) with Dreyfus, whereby Dreyfus performs administrative, accounting and recordkeeping services for the fund. The fund has agreed to compensate Dreyfus for providing accounting and recordkeeping services, administration, compliance monitoring, regulatory and shareholder reporting, as well as related facilities, equipment and clerical help. The fee is based on the fund’s average daily net assets and computed at the following annual rates: .06% of the first $500 million, .04% of the next $500 million and .02% in excess of $1 billion.
In addition, after applying any expense limitations or fee waivers that reduce the fees paid to Dreyfus for this service, Dreyfus has contractually agreed in writing to waive any remaining fees for this service to the extent that they exceed both Dreyfus’ costs in providing these services and a reasonable allocation of the costs incurred by Dreyfus and its affiliates related to the support and oversight of these services. The fund also reimburses Dreyfus for the out-of-pocket expenses incurred in performing this service for the fund. Pursuant to the Administration Agreement, the fund was charged $160,913 during the period ended September 30, 2017.
During the period ended September 30, 2017, the Distributor retained $10,593 from commissions earned on sales of the fund’s Class A shares and $2,987 from CDSCs on redemptions of the fund’s Class C shares.
(b) Under the Distribution Plan adopted pursuant to Rule 12b-1 under the Act, Class C shares pay the Distributor for distributing its shares at an annual rate of .75% of the value of its average daily net assets. During the period ended September 30, 2017, Class C shares were charged $268,892 pursuant to the Distribution Plan.
(c) Under the Shareholder Services Plan, Class A and Class C shares pay the Distributor at an annual rate of .25% of the value of their average daily net assets for the provision of certain services. The services provided may include personal services relating to shareholder accounts, such as answering shareholder inquiries regarding the fund and providing reports and other information, and services related to the maintenance of
27
NOTES TO FINANCIAL STATEMENTS (continued)
shareholder accounts. The Distributor may make payments to Service Agents (securities dealers, financial institutions or other industry professionals) with respect to these services. The Distributor determines the amounts to be paid to Service Agents. During the period ended September 30, 2017, Class A and Class C shares were charged $542,543 and $89,631, respectively, pursuant to the Shareholder Services Plan.
Under its terms, the Distribution Plan and Shareholder Services Plan shall remain in effect from year to year, provided such continuance is approved annually by a vote of a majority of those Trustees who are not “interested persons” of the Trust and who have no direct or indirect financial interest in the operation of or in any agreement related to the Distribution Plan or Shareholder Services Plan.
The fund has arrangements with the transfer agent and the custodian whereby the fund may receive earnings credits when positive cash balances are maintained, which are used to offset transfer agency and custody fees. For financial reporting purposes, the fund includes net earnings credits as an expense offset in the Statement of Operations.
The fund compensates Dreyfus Transfer, Inc., a wholly-owned subsidiary of Dreyfus, under a transfer agency agreement for providing transfer agency and cash management services for the fund. The majority of transfer agency fees are comprised of amounts paid on a per account basis, while cash management fees are related to fund subscriptions and redemptions. During the period ended September 30, 2017, the fund was charged $85,089 for transfer agency services and $7,259 for cash management services. These fees are included in Shareholder servicing costs in the Statement of Operations. Cash management fees were partially offset by earnings credits of $7,259.
The fund compensates The Bank of New York Mellon under a custody agreement for providing custodial services for the fund. These fees are determined based on net assets, geographic region and transaction activity. During the period ended September 30, 2017, the fund was charged $69,490 pursuant to the custody agreement. These fees were partially offset by earnings credit of $1,365.
During the period ended September 30, 2017, the fund was charged $11,281 for services performed by the Chief Compliance Officer and his staff.
The components of “Due to The Dreyfus Corporation and affiliates” in the Statement of Assets and Liabilities consist of: investment advisory fees $571,420, administration fees $13,410, Distribution Plan fees $23,081,
28
Shareholder Services Plan fees $53,267, custodian fees $23,786, Chief Compliance Officer fees $5,604 and transfer agency fees $19,969.
(d) Each Board member also serves as a Board member of other funds within the Dreyfus complex. Annual retainer fees and attendance fees are allocated to each fund based on net assets.
NOTE 4—Securities Transactions:
The aggregate amount of purchases and sales of investment securities, excluding short-term securities, during the period ended September 30, 2017, amounted to $783,211,932 and $687,603,812, respectively.
At September 30, 2017, the cost of investments for federal income tax purposes was $1,079,254,310; accordingly, accumulated net unrealized appreciation on investments was $264,373,476, consisting of $292,583,329 gross unrealized appreciation and $28,209,853 gross unrealized depreciation.
NOTE 5—Plan of Reorganization:
The Board has approved, an Agreement and Plan of Reorganization between the fund and Dreyfus Mid-Cap Growth Fund (the “Acquired Fund”), providing for the Acquired Fund to merge into the fund as part of a tax-free reorganization. The merger was approved by Acquired Fund’s shareholders on November 16, 2017. The merger is anticipated to occur on or about January 19, 2018. On that date, the Acquired Fund will transfer all of its assets at net asset value, subject to its liabilities, for an equivalent value of such shares of the fund. Such shares will be distributed pro rata to shareholders of the Acquired Fund so that each shareholder will receive a number of shares of the fund equal to the aggregate net asset value of the shareholder’s Acquired Fund shares.
29
REPORT OF INDEPENDENT REGISTERED
PUBLIC ACCOUNTING FIRM
The Board of Trustees and Shareholders of
Dreyfus Investment Funds
We have audited the accompanying statement of assets and liabilities of Dreyfus/The Boston Company Small/Mid Cap Growth Fund (the “Fund”), a series of Dreyfus Investment Funds, including the statements of investments and investments in affiliated issuers, as of September 30, 2017, and the related statement of operations for the year then ended, the statements of changes in net assets for each of the years in the two-year period then ended, and the financial highlights for each of the years or periods in the five-year period then ended. These financial statements and financial highlights are the responsibility of the Fund’s management. Our responsibility is to express an opinion on these financial statements and financial highlights based on our audits.
We conducted our audits in accordance with the standards of the Public Company Accounting Oversight Board (United States). Those standards require that we plan and perform the audit to obtain reasonable assurance about whether the financial statements and financial highlights are free of material misstatement. An audit includes examining, on a test basis, evidence supporting the amounts and disclosures in the financial statements. Our procedures included confirmation of securities owned as of September 30, 2017, by correspondence with the custodian and brokers or by other appropriate auditing procedures. An audit also includes assessing the accounting principles used and significant estimates made by management, as well as evaluating the overall financial statement presentation. We believe that our audits provide a reasonable basis for our opinion.
In our opinion, the financial statements and financial highlights referred to above present fairly, in all material respects, the financial position of Dreyfus/The Boston Company Small/Mid Cap Growth Fund as of September 30, 2017, the results of its operations for the year then ended, the changes in its net assets for each of the years in the two-year period then ended, and the financial highlights for each of the years or periods in the five-year period then ended, in conformity with U.S. generally accepted accounting principles.
As discussed in Note 5 to the financial statements, the Fund’s Board of Trustees has approved an agreement and plan of reorganization between the Fund and the Dreyfus Mid-Cap Growth Fund. Our opinion is not modified with respect to this matter.

New York, New York
November 22, 2017
30
IMPORTANT TAX INFORMATION (Unaudited)
For federal tax purposes, the fund reports the maximum amount allowable but not less than $.3764 per share as a capital gain dividend in accordance with Section 852(b)(3)(C) of the Internal Revenue Code.
31
BOARD MEMBERS INFORMATION (Unaudited)
INDEPENDENT BOARD MEMBERS
Joseph S. DiMartino (73)
Chairman of the Board (2008)
Principal Occupation During Past 5 Years:
· Corporate Director and Trustee (1995-present)
Other Public Company Board Memberships During Past 5 Years:
· CBIZ (formerly, Century Business Services, Inc.), a provider of outsourcing functions for small and medium size companies, Director (1997-present)
No. of Portfolios for which Board Member Serves: 127
———————
Francine J. Bovich (66)
Board Member (2011)
Principal Occupation During Past 5 Years:
· Trustee, The Bradley Trusts, private trust funds (2011-present)
Other Public Company Board Memberships During Past 5 Years:
· Annaly Capital Management, Inc., Board Member (May 2014-present)
No. of Portfolios for which Board Member Serves: 75
———————
Kenneth A. Himmel (71)
Board Member (2008)
Principal Occupation During Past 5 Years:
· Managing Partner, Gulf Related, an international real estate development company (2010-present)
· President and CEO, Related Urban Development, a real estate development company (1996-present)
· President and CEO, Himmel & Company, a real estate development company (1980-present)
· CEO, American Food Management, a restaurant company (1983-present)
No. of Portfolios for which Board Member Serves: 28
———————
32
Stephen J. Lockwood (70)
Board Member (2008)
Principal Occupation During Past 5 Years:
· Chairman of the Board, Stephen J. Lockwood and Company LLC, a real estate investment company (2000-present)
No. of Portfolios for which Board Member Serves: 28
———————
Roslyn M. Watson (67)
Board Member (2008)
Principal Occupation During Past 5 Years:
· Principal, Watson Ventures, Inc., a real estate investment company (1993-present)
No. of Portfolios for which Board Member Serves: 61
———————
Benaree Pratt Wiley (71)
Board Member (2008)
Principal Occupation During Past 5 Years:
· Principal, The Wiley Group, a firm specializing in strategy and business development (2005-present)
Other Public Company Board Memberships During Past 5 Years:
· CBIZ (formerly, Century Business Services, Inc.), a provider of outsourcing functions for small and medium size companies, Director (2008-present)
No. of Portfolios for which Board Member Serves: 82
———————
Once elected all Board Members serve for an indefinite term, but achieve Emeritus status upon reaching age 80. The address of the Board Members and Officers is c/o The Dreyfus Corporation, 200 Park Avenue, New York, New York 10166. Additional information about the Board Members is available in the fund’s Statement of Additional Information which can be obtained from Dreyfus free of charge by calling this toll free number: 1-800-DREYFUS.
James M. Fitzgibbons, Emeritus Board Member
33
OFFICERS OF THE FUND (Unaudited)
BRADLEY J. SKAPYAK, President since January 2010.
Chief Operating Officer and a director of the Manager since June 2009, Chairman of Dreyfus Transfer, Inc., an affiliate of the Manager and the transfer agent of the funds, since May 2011 and Chief Executive Officer of MBSC Securities Corporation since August 2016. He is an officer of 61 investment companies (comprised of 127 portfolios) managed by the Manager. He is 58 years old and has been an employee of the Manager since February 1988.
BENNETT A. MACDOUGALL, Chief Legal Officer since October 2015.
Chief Legal Officer of the Manager and Associate General Counsel and Managing Director of BNY Mellon since June 2015; from June 2005 to June 2015, he served in various capacities with Deutsche Bank – Asset & Wealth Management Division, including as Director and Associate General Counsel, and Chief Legal Officer of Deutsche Investment Management Americas Inc. from June 2012 to May 2015. He is an officer of 62 investment companies (comprised of 152 portfolios) managed by the Manager. He is 46 years old and has been an employee of the Manager since June 2015.
JANETTE E. FARRAGHER, Vice President and Secretary since December 2011.
Associate General Counsel of BNY Mellon, and an officer of 62 investment companies (comprised of 152 portfolios) managed by the Manager. She is 54 years old and has been an employee of the Manager since February 1984.
JAMES BITETTO, Vice President and Assistant Secretary since December 2008.
Managing Counsel of BNY Mellon and Secretary of the Manager, and an officer of 62 investment companies (comprised of 152 portfolios) managed by the Manager. He is 51 years old and has been an employee of the Manager since December 1996.
JOSEPH M. CHIOFFI, Vice President and Assistant Secretary since December 2008.
Managing Counsel of BNY Mellon, and an officer of 62 investment companies (comprised of 152 portfolios) managed by the Manager. He is 55 years old and has been an employee of the Manager since June 2000.
MAUREEN E. KANE, Vice President and Assistant Secretary since April 2015.
Managing Counsel of BNY Mellon since July 2014; from October 2004 until July 2014, General Counsel, and from May 2009 until July 2014, Chief Compliance Officer of Century Capital Management. She is an officer of 62 investment companies (comprised of 152 portfolios) managed by the Manager. She is 55 years old and has been an employee of the Manager since July 2014.
SARAH S. KELLEHER, Vice President and Assistant Secretary since April 2014.
Senior Counsel of BNY Mellon since March 2013, from August 2005 to March 2013, Associate General Counsel of Third Avenue Management. She is an officer of 62 investment companies (comprised of 152 portfolios) managed by the Manager. She is 42 years old and has been an employee of the Manager since March 2013.
JEFF PRUSNOFSKY, Vice President and Assistant Secretary since December 2008.
Senior Managing Counsel of BNY Mellon, and an officer of 62 investment companies (comprised of 152 portfolios) managed by the Manager. He is 52 years old and has been an employee of the Manager since October 1990.
NATALYA ZELENSKY, Vice President and Assistant Secretary since March 2017.
Counsel and Vice President of BNY Mellon since May 2016; Attorney at Wildermuth Endowment Strategy Fund/Wildermuth Advisory, LLC from November 2015 until May 2016; Assistant General Counsel at RCS Advisory Services from July 2014 until November 2015; Associate at Sutherland, Asbill & Brennan from January 2013 until January 2014; Associate at K&L Gates from October 2011 until January 2013. She is an officer of 62 investment companies (comprised of 152 portfolios) managed by Dreyfus. She is 32 years old and has been an employee of the Manager since May 2016.
JAMES WINDELS, Treasurer since December 2008.
Director – Mutual Fund Accounting of the Manager, and an officer of 62 investment companies (comprised of 152 portfolios) managed by the Manager. He is 59 years old and has been an employee of the Manager since April 1985.
34
RICHARD CASSARO, Assistant Treasurer since December 2008.
Senior Accounting Manager – Money Market and Municipal Bond Funds of the Manager, and an officer of 62 investment companies (comprised of 152 portfolios) managed by the Manager. He is 58 years old and has been an employee of the Manager since September 1982.
GAVIN C. REILLY, Assistant Treasurer since December 2008.
Tax Manager of the Investment Accounting and Support Department of the Manager, and an officer of 62 investment companies (comprised of 152 portfolios) managed by the Manager. He is 49 years old and has been an employee of the Manager since April 1991.
ROBERT S. ROBOL, Assistant Treasurer since December 2008.
Senior Accounting Manager – Dreyfus Financial Reporting of the Manager, and an officer of 62 investment companies (comprised of 152 portfolios) managed by the Manager. He is 53 years old and has been an employee of the Manager since October 1988.
ROBERT SALVIOLO, Assistant Treasurer since December 2008.
Senior Accounting Manager – Equity Funds of the Manager, and an officer of 62 investment companies (comprised of 152 portfolios) managed by the Manager. He is 50 years old and has been an employee of the Manager since June 1989.
ROBERT SVAGNA, Assistant Treasurer since December 2008.
Senior Accounting Manager – Fixed Income and Equity Funds of the Manager, and an officer of 62 investment companies (comprised of 152 portfolios) managed by the Manager. He is 50 years old and has been an employee of the Manager since November 1990.
JOSEPH W. CONNOLLY, Chief Compliance Officer since December 2008.
Chief Compliance Officer of the Manager and The Dreyfus Family of Funds (62 investment companies, comprised of 152 portfolios). He is 60 years old and has served in various capacities with the Manager since 1980, including manager of the firm’s Fund Accounting Department from 1997 through October 2001.
CARIDAD M. CAROSELLA, Anti-Money Laundering Compliance Officer since January 2016.
Anti-Money Laundering Compliance Officer of the Dreyfus Family of Funds and BNY Mellon Funds Trust since January 2016; from May 2015 to December 2015, Interim Anti-Money Laundering Compliance Officer of the Dreyfus Family of Funds and BNY Mellon Funds Trust and the Distributor; from January 2012 to May 2015, AML Surveillance Officer of the Distributor and from 2007 to December 2011, Financial Processing Manager of the Distributor. She is an officer of 57 investment companies (comprised of 147 portfolios) managed by the Manager. She is 49 years old and has been an employee of the Distributor since 1997.
35
NOTES
36
NOTES
37
Dreyfus/The Boston Company Small/Mid Cap Growth Fund
200 Park Avenue
New York, NY 10166
Manager
The Dreyfus Corporation
200 Park Avenue
New York, NY 10166
Sub-Investment Adviser
The Boston Company Asset
Management LLC
BNY Mellon Center
One Boston Place
Boston, MA 02108
Custodian
The Bank of New York Mellon
225 Liberty Street
New York, NY 10286
Transfer Agent &
Dividend Disbursing Agent
Dreyfus Transfer, Inc.
200 Park Avenue
New York, NY 10166
Distributor
MBSC Securities Corporation
200 Park Avenue
New York, NY 10166
| | |
Ticker Symbols: | Class A: DBMAX Class C: DBMCX Class I: SDSCX Class Y: DBMYX |
Telephone Call your financial representative or 1-800-DREYFUS
Mail The Dreyfus Family of Funds, 144 Glenn Curtiss Boulevard, Uniondale, NY 11556-0144
E-mail Send your request to info@dreyfus.com
Internet Information can be viewed online or downloaded at www.dreyfus.com
The fund files its complete schedule of portfolio holdings with the Securities and Exchange Commission (“SEC”) for the first and third quarters of each fiscal year on Form N-Q. The fund’s Forms N-Q are available on the SEC’s website at www.sec.gov and may be reviewed and copied at the SEC’s Public Reference Room in Washington, D.C. (phone 1-800-SEC-0330 for information).
A description of the policies and procedures that the fund uses to determine how to vote proxies relating to portfolio securities and information regarding how the fund voted these proxies for the most recent 12-month period ended June 30 is available at www.dreyfus.com and on the SEC’s website at www.sec.gov and without charge, upon request, by calling 1-800-DREYFUS.
| | |
© 2017 MBSC Securities Corporation
6921AR0917 | 
|
Dreyfus/The Boston Company Small Cap Growth Fund
| | | |

| | ANNUAL REPORT September 30, 2017 |
| |
Save time. Save paper. View your next shareholder report online as soon as it’s available. Log into www.dreyfus.com and sign up for Dreyfus eCommunications. It’s simple and only takes a few minutes. |
| |
The views expressed in this report reflect those of the portfolio manager(s) only through the end of the period covered and do not necessarily represent the views of Dreyfus or any other person in the Dreyfus organization. Any such views are subject to change at any time based upon market or other conditions and Dreyfus disclaims any responsibility to update such views. These views may not be relied on as investment advice and, because investment decisions for a Dreyfus fund are based on numerous factors, may not be relied on as an indication of trading intent on behalf of any Dreyfus fund. |
| |
Not FDIC-Insured • Not Bank-Guaranteed • May Lose Value |
Contents
T H E F U N D
F O R M O R E I N F O R M AT I O N
Back Cover
| | | | |
| |
Dreyfus/The Boston Company Small Cap Growth Fund
| | The Fund |
A LETTER FROM THE CEO OF DREYFUS
Dear Shareholder:
We are pleased to present this annual report for Dreyfus/The Boston Company Small Cap Growth Fund, covering the 12-month period from October 1, 2016 through September 30, 2017. For information about how the fund performed during the reporting period, as well as general market perspectives, we provide a Discussion of Fund Performance on the pages that follow.
Stocks set a series of new record highs and bonds produced mixed results over the past year in response to changing economic and political conditions. Financial markets during the final months of 2016 were dominated by the election of a new U.S. presidential administration. Equities and corporate-backed bonds surged higher in anticipation of more business-friendly regulatory, tax, and fiscal policies, but high-quality bonds generally lost value due to expectations of rising interest rates and accelerating inflation in a stronger economy. Despite a series of short-term interest rate hikes, bonds recovered most or all of their previous losses over the first nine months of 2017 when it became clearer that pro-growth legislation would take time and political capital to enact. U.S. and international stocks continued to rally as corporate earnings grew and global economic conditions improved.
The markets’ recent strong performance has been supported by solid underlying fundamentals. While we currently expect these favorable conditions to persist, we remain watchful for economic and political developments that could derail the rallies. As always, we encourage you to discuss the risks and opportunities of today’s investment environment with your financial advisor.
Thank you for your continued confidence and support.
Sincerely,

Mark D. Santero
Chief Executive Officer
The Dreyfus Corporation
October 16, 2017
2
DISCUSSION OF FUND PERFORMANCE
For the period from October 1, 2016 through September 30, 2017, as provided by John R. Porter, Todd Wakefield, CFA and Robert C. Zeuthen, CFA, Primary Portfolio Managers
Market and Fund Performance Overview
For the 12-month period ended September 30, 2017, Dreyfus/The Boston Company Small Cap Growth Fund’s Class I shares achieved a total return of 19.75%, and Class Y shares returned 19.81%.1 In comparison, the fund’s benchmark, the Russell 2000® Growth Index (the “Index”), produced a total return of 20.98% for the same period.2
Small-cap stocks gained considerable ground over the reporting period amid better-than-expected corporate earnings, improving global economic prospects, and the potential for more business-friendly tax, regulatory, and fiscal policies from a new U.S. presidential administration. The fund lagged its benchmark, mainly due to security selection shortfalls in the health care and energy sectors.
The Fund’s Investment Approach
The fund seeks long-term growth of capital. To pursue its goal, the fund normally invests at least 80% of its net assets in equity securities of small-cap U.S. companies, i.e., those with total market capitalizations equal to or less than that of the largest company in the Index.
We employ a growth-oriented investment style in managing the fund’s portfolio, which means the portfolio managers seek to identify those small-cap companies which are experiencing or are expected to experience rapid earnings or revenue growth. We focus on high-quality companies and individual stock selection, instead of trying to predict which industries or sectors will perform best and select stocks by: Using fundamental research to identify and follow companies considered to have attractive characteristics; and investing in a company when the research indicates that the company will experience accelerating revenues and expanding operating margins.
The fund’s investment strategy may lead it to emphasize certain industries, such as technology, health care, business services and communications.
Rising Corporate Earnings Drove Markets Higher
While political uncertainties caused U.S. stocks to dip in the weeks before the 2016 presidential election, equity markets were reenergized in November and December when investors began to anticipate lower corporate taxes, reduced regulatory constraints on business, and increased infrastructure spending from the new presidential administration.
Small-cap stocks in 2017 generally continued to build on the momentum established during the final months of 2016. Consecutive quarters of better-than-expected corporate earnings and encouraging global economic developments drove the Index to a series of new highs in February and early March. While concerns about the new U.S. administration’s ability to implement its pro-growth policy proposals slowed the pace of the market’s advance in the spring, most broad measures of stock market performance quickly erased those losses, and the Index reached new all-time highs in June, July, and September. All three major capitalization ranges produced double-digit returns in this environment, but small-cap growth stocks mildly lagged their large-cap counterparts for the reporting period overall.
Security Selection Strategy Enhanced Relative Results
The fund’s performance compared to the Index was dampened by relatively weak stock selections in the health care sector, particularly among biotechnology firms. Most notably, ear diseases specialist Otonomy lost value when phase three trials of a new drug failed to meet expectations. Biopharmaceutical developer Radius Health was hurt by uncertainty surrounding regulatory approvals for a new medicine in the United States and Europe. The fund did not hold cancer immunotherapy
3
DISCUSSION OF FUND PERFORMANCE (continued)
specialist Kite Pharma, missing out on gains stemming from an acquisition offer at a substantial premium to the company’s stock price at the time.
While the fund’s stock selection strategy worked relatively well in the energy sector, overweighted exposure to the struggling industry group weighed on relative performance. Most significantly, expectations of lower normalized oil prices hurt results from oil services provider Oil States International, exploration-and-production company PDC Energy, and commercial sand producer U.S. Silica Holdings.
The fund achieved more favorable relative results through successful stock selections in the information technology sector. Internet software and services stocks fared especially well. Most notably e-commerce website operator Spotify more than doubled in value after penetrating new markets, expanding its services, and adding thousands of new customers. Analytic software developer New Relic reported robust growth stemming from rising demand for its data management services. Cloud-based marketing-and-sales software platform HubSpot launched a new product that was well received by small and midsized businesses. Cybersecurity solutions provider Varonis Systems reported better-than-expected earnings and issued a positive outlook to analysts. In the consumer staples sector, pet food manufacturer Freshpet advanced due to favorable sales trends and strongly positive consumer response to a new advertising campaign.
A Constructive Investment Posture
Although stocks rallied substantially over the reporting period, we believe that market fundamentals remain constructive for small-cap stocks in an environment of rising corporate earnings, muted inflation, and accelerating global economic growth. As of the end of the reporting period, we have maintained overweighted exposure to the information technology sector and, to a lesser extent, the consumer staples sector. In contrast, we have found fewer growth opportunities meeting our investment criteria in the consumer discretionary, industrials, and financials sectors.
October 16, 2017
1 Total return includes reinvestment of dividends and any capital gains paid. Share price and investment return fluctuate such that upon redemption, fund shares may be worth more or less than their original cost. The fund’s returns reflect the absorption of certain expenses by The Dreyfus Corporation pursuant to an agreement in effect through February 1, 2019. Had these expenses not been absorbed, returns would have been lower. Past performance is no guarantee of future results.
2 Source: Lipper Inc. — The Russell 2000® Growth Index measures the performance of the small-cap growth segment of the U.S. equity universe. It includes those Russell 2000 companies with higher growth earning potential as defined by Russell’s leading style methodology. The Russell 2000® Growth Index is constructed to provide a comprehensive and unbiased barometer for the small-cap growth segment. The Russell 2000® Growth Index is completely reconstituted annually to ensure larger stocks do not distort the performance and characteristics of the true small-cap opportunity set and that the represented companies continue to reflect growth characteristics. Investors cannot invest directly in any index.
Please note: the position in any security highlighted with italicized typeface was sold during the reporting period.
Equities are subject generally to market, market sector, market liquidity, issuer, and investment style risks, among other factors, to varying degrees, all of which are more fully described in the fund’s prospectus.
The prices of small company stocks tend to be more volatile than the prices of large company stocks, mainly because these companies have less established and more volatile earnings histories. They also tend to be less liquid than larger company stocks.
A significant portion of the fund’s recent performance is attributable to positive returns from its initial public offering (IPO) investments. There can be no guarantee that IPOs will have or continue to have a positive effect on the fund’s performance. Currently, the fund is relatively small in asset size. IPOs tend to have a reduced effect on performance as a fund’s asset base grows.
4
FUND PERFORMANCE
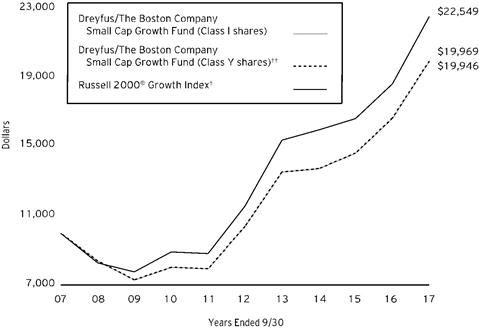
Comparison of change in value of $10,000 investment in Dreyfus/The Boston Company Small Cap Growth Fund Class I shares and Class Y shares and the Russell 2000® Growth Index (the “Index”)
† Source: Lipper Inc.
†† The total return figures presented for Class Y shares of the fund reflect the performance of the fund’s Class I shares for the period prior to 7/1/13 (the inception date for Class Y shares).
Past performance is not predictive of future performance.
The above graph compares a $10,000 investment made in each of the Class I and Class Y shares of Dreyfus/The Boston Company Small Cap Growth Fund on 9/30/07 to a $10,000 investment made in the Index on that date. All dividends and capital gain distributions are reinvested.
The fund’s performance shown in the line graph above takes into account all applicable fees and expenses. The Index measures the performance of the small-cap growth segment of the U.S. equity universe. It includes those Russell 2000 companies with higher growth earning potential as defined by Russell’s leading style methodology. The Index is constructed to provide a comprehensive and unbiased barometer for the small-cap growth segment. The Index is completely reconstituted annually to ensure larger stocks do not distort the performance and characteristics of the true small-cap opportunity set and that the represented companies continue to reflect growth characteristics. Unlike a mutual fund, the Index is not subject to charges, fees and other expenses. Investors cannot invest directly in any index. These factors can contribute to the Index potentially outperforming the fund. Further information relating to fund performance, including expense reimbursements, if applicable, is contained in the Financial Highlights section of the prospectus and elsewhere in this report.
5
FUND PERFORMANCE (continued)
| | | | | | | |
Average Annual Total Returns as of 9/30/17 | |
| Inception
Date | 1 Year | 5 Years | | 10 Years |
Class I shares | 12/23/96 | 19.75% | 13.91% | | 7.15% | |
Class Y shares | 7/1/13 | 19.81% | 13.94% | † | 7.16% | † |
Russell 2000® Growth Index | | 20.98% | 14.28% | | 8.47% | |
† The total return performance figures presented for Class Y shares of the fund reflect the performance of the fund’s Class I shares for the period prior to 7/1/13 (the inception date for Class Y shares).
The performance data quoted represents past performance, which is no guarantee of future results. Share price and investment return fluctuate and an investor’s shares may be worth more or less than original cost upon redemption. Current performance may be lower or higher than the performance quoted. Go to Dreyfus.com for the fund’s most recent month-end returns.
The fund’s performance shown in the graph and table does not reflect the deduction of taxes that a shareholder would pay on fund distributions or the redemption of fund shares.
6
UNDERSTANDING YOUR FUND’S EXPENSES (Unaudited)
As a mutual fund investor, you pay ongoing expenses, such as management fees and other expenses. Using the information below, you can estimate how these expenses affect your investment and compare them with the expenses of other funds. You also may pay one-time transaction expenses, including sales charges (loads) and redemption fees, which are not shown in this section and would have resulted in higher total expenses. For more information, see your fund’s prospectus or talk to your financial adviser.
Review your fund’s expenses
The table below shows the expenses you would have paid on a $1,000 investment in Dreyfus/The Boston Company Small Cap Growth Fund from April 1, 2017 to September 30, 2017. It also shows how much a $1,000 investment would be worth at the close of the period, assuming actual returns and expenses.
| | | | | | | | | | | | | | | |
Expenses and Value of a $1,000 Investment | | |
assuming actual returns for the six months ended September 30, 2017 |
| | | | | | Class I | | Class Y | |
Expenses paid per $1,000† | | | | | | $5.31 | | | $5.31 | |
Ending value (after expenses) | | | | | | $1,116.40 | | | $1,117.00 | |
COMPARING YOUR FUND’S EXPENSES
WITH THOSE OF OTHER FUNDS (Unaudited)
Using the SEC’s method to compare expenses
The Securities and Exchange Commission (“SEC”) has established guidelines to help investors assess fund expenses. Per these guidelines, the table below shows your fund’s expenses based on a $1,000 investment, assuming a hypothetical 5% annualized return. You can use this information to compare the ongoing expenses (but not transaction expenses or total cost) of investing in the fund with those of other funds. All mutual fund shareholder reports will provide this information to help you make this comparison. Please note that you cannot use this information to estimate your actual ending account balance and expenses paid during the period.
| | | | | | | | | | | | | | | | |
Expenses and Value of a $1,000 Investment | | | |
assuming a hypothetical 5% annualized return for the six months ended September 30, 2017 |
| | | | | | | Class I | | Class Y | |
Expenses paid per $1,000† | | | | | | | $5.06 | | | $5.06 | |
Ending value (after expenses) | | | | | | | $1,020.05 | | | $1,020.05 | |
† Expenses are equal to the fund’s annualized expense ratio of 1.00% for Class I and 1.00% for Class Y, multiplied by the average account value over the period, multiplied by 183/365 (to reflect the one-half year period).
7
STATEMENT OF INVESTMENTS
September 30, 2017
| | | | | | | | |
| |
Description | | | | Shares | | Value ($) | |
Common Stocks - 98.0% | | | | | |
Banks - 3.1% | | | | | |
Columbia Banking System | | | | 1,658 | | 69,818 | |
National Bank Holdings, Cl. A | | | | 2,791 | | 99,611 | |
TriState Capital Holdings | | | | 2,105 | a | 48,205 | |
| | | | | 217,634 | |
Capital Goods - 10.8% | | | | | |
Beacon Roofing Supply | | | | 2,603 | a | 133,404 | |
Curtiss-Wright | | | | 538 | | 56,243 | |
Granite Construction | | | | 1,197 | | 69,366 | |
Mercury Systems | | | | 2,923 | a | 151,645 | |
Proto Labs | | | | 959 | a | 77,008 | |
Sun Hydraulics | | | | 1,732 | | 93,528 | |
Universal Forest Products | | | | 678 | | 66,552 | |
Watsco | | | | 262 | | 42,200 | |
Woodward | | | | 700 | | 54,327 | |
| | | | | 744,273 | |
Commercial & Professional Services - 1.2% | | | | | |
Aqua Metals | | | | 2,781 | a | 19,050 | |
WageWorks | | | | 1,089 | a | 66,102 | |
| | | | | 85,152 | |
Consumer Services - 4.9% | | | | | |
Bright Horizons Family Solutions | | | | 442 | a | 38,105 | |
Buffalo Wild Wings | | | | 514 | a | 54,330 | |
Planet Fitness, Cl. A | | | | 7,402 | a | 199,706 | |
Texas Roadhouse | | | | 956 | | 46,978 | |
| | | | | 339,119 | |
Diversified Financials - .9% | | | | | |
WisdomTree Investments | | | | 5,797 | | 59,013 | |
Energy - 2.6% | | | | | |
Laredo Petroleum | | | | 6,317 | a | 81,679 | |
PDC Energy | | | | 1,986 | a | 97,374 | |
| | | | | 179,053 | |
Exchange-Traded Funds - 1.6% | | | | | |
iShares Russell 2000 Growth ETF | | | | 621 | | 111,134 | |
Food & Staples Retailing - 1.0% | | | | | |
Performance Food Group | | | | 2,475 | a | 69,919 | |
Food, Beverage & Tobacco - 3.5% | | | | | |
Calavo Growers | | | | 1,919 | | 140,471 | |
Freshpet | | | | 6,387 | a | 99,957 | |
| | | | | 240,428 | |
Health Care Equipment & Services - 7.1% | | | | | |
Align Technology | | | | 638 | a | 118,840 | |
8
| | | | | | | | |
| |
Description | | | | Shares | | Value ($) | |
Common Stocks - 98.0% (continued) | | | | | |
Health Care Equipment & Services - 7.1% (continued) | | | | | |
Brookdale Senior Living | | | | 4,139 | a | 43,873 | |
iRhythm Technologies | | | | 902 | | 46,796 | |
K2M Group Holdings | | | | 2,132 | a | 45,220 | |
Nevro | | | | 954 | a | 86,700 | |
NxStage Medical | | | | 3,458 | a | 95,441 | |
WellCare Health Plans | | | | 324 | a | 55,644 | |
| | | | | 492,514 | |
Household & Personal Products - 1.8% | | | | | |
Inter Parfums | | | | 3,042 | | 125,482 | |
Materials - 4.0% | | | | | |
Carpenter Technology | | | | 2,087 | | 100,239 | |
Ferroglobe | | | | 3,409 | | 44,862 | |
Summit Materials, Cl. A | | | | 4,073 | a | 130,458 | |
| | | | | 275,559 | |
Media - 1.2% | | | | | |
IMAX | | | | 3,580 | a | 81,087 | |
Pharmaceuticals, Biotechnology & Life Sciences - 13.8% | | | | | |
Aerie Pharmaceuticals | | | | 1,612 | a | 78,343 | |
Cambrex | | | | 1,121 | a | 61,655 | |
Flexion Therapeutics | | | | 4,445 | a | 107,480 | |
Foamix Pharmaceuticals | | | | 7,222 | a | 40,082 | |
Galapagos, ADR | | | | 706 | a | 71,835 | |
Halozyme Therapeutics | | | | 5,817 | a | 101,041 | |
Ligand Pharmaceuticals | | | | 730 | a | 99,389 | |
Natera | | | | 5,109 | a | 65,855 | |
NeoGenomics | | | | 7,539 | a | 83,909 | |
Otonomy | | | | 5,755 | a | 18,704 | |
Portola Pharmaceuticals | | | | 588 | a | 31,770 | |
Radius Health | | | | 1,917 | a | 73,900 | |
Retrophin | | | | 3,144 | a | 78,254 | |
Sage Therapeutics | | | | 716 | a | 44,607 | |
| | | | | 956,824 | |
Real Estate - 2.2% | | | | | |
Digital Realty Trust | | | | 566 | b | 66,975 | |
Monmouth Real Estate Investment | | | | 2,180 | b | 35,294 | |
Physicians Realty Trust | | | | 2,984 | b | 52,906 | |
| | | | | 155,175 | |
Retailing - 3.0% | | | | | |
Carvana | | | | 2,294 | | 33,676 | |
Core-Mark Holding | | | | 1,033 | | 33,201 | |
Duluth Holdings, Cl. B | | | | 2,848 | a | 57,786 | |
Ollie's Bargain Outlet Holdings | | | | 1,731 | a | 80,318 | |
| | | | | 204,981 | |
9
STATEMENT OF INVESTMENTS (continued)
| | | | | | | | |
| |
Description | | | | Shares | | Value ($) | |
Common Stocks - 98.0% (continued) | | | | | |
Semiconductors & Semiconductor Equipment - 6.9% | | | | | |
Impinj | | | | 2,039 | a | 84,843 | |
Inphi | | | | 1,416 | a | 56,201 | |
MaxLinear | | | | 3,352 | a | 79,610 | |
Mellanox Technologies | | | | 1,090 | a | 51,394 | |
Power Integrations | | | | 2,162 | | 158,258 | |
Semtech | | | | 1,262 | a | 47,388 | |
| | | | | 477,694 | |
Software & Services - 23.2% | | | | | |
2U | | | | 1,511 | a | 84,676 | |
CACI International, Cl. A | | | | 719 | a | 100,193 | |
CommVault Systems | | | | 2,074 | a | 126,099 | |
HubSpot | | | | 2,478 | a | 208,276 | |
LogMeIn | | | | 1,297 | | 142,735 | |
Mimecast | | | | 4,185 | a | 118,938 | |
New Relic | | | | 3,042 | a | 151,492 | |
Proofpoint | | | | 1,519 | a | 132,487 | |
Shopify, Cl. A | | | | 1,443 | a | 168,095 | |
Twilio, Cl. A | | | | 5,289 | a | 157,877 | |
Varonis Systems | | | | 3,196 | a | 133,912 | |
Zendesk | | | | 2,864 | a | 83,371 | |
| | | | | 1,608,151 | |
Technology Hardware & Equipment - 4.6% | | | | | |
Airgain | | | | 2,863 | a | 26,025 | |
Lumentum Holdings | | | | 2,117 | a | 115,059 | |
NETGEAR | | | | 1,507 | a | 71,733 | |
Novanta | | | | 2,367 | a | 103,201 | |
| | | | | 316,018 | |
Transportation - .6% | | | | | |
Marten Transport | | | | 2,185 | | 44,902 | |
Total Common Stocks (cost $4,918,805) | | | | 6,784,112 | |
10
| | | | | | | | |
| |
Description | | | | Shares | | Value ($) | |
Other Investment - 2.0% | | | | | |
Registered Investment Company; | | | | | |
Dreyfus Institutional Preferred Government Plus Money Market Fund
(cost $136,268) | | | | 136,268 | c | 136,268 | |
Total Investments (cost $5,055,073) | | 100.0% | | 6,920,380 | |
Liabilities, Less Cash and Receivables | | (.0%) | | (2,314) | |
Net Assets | | 100.0% | | 6,918,066 | |
ADR—American Depository Receipt
ETF—Exchange-Traded Fund
a Non-income producing security.
b Investment in real estate investment trust.
c Investment in affiliated money market mutual fund.
| | |
Portfolio Summary (Unaudited) † | Value (%) |
Software & Services | 23.2 |
Pharmaceuticals, Biotechnology & Life Sciences | 13.8 |
Capital Goods | 10.8 |
Health Care Equipment & Services | 7.1 |
Semiconductors & Semiconductor Equipment | 6.9 |
Consumer Services | 4.9 |
Technology Hardware & Equipment | 4.6 |
Materials | 4.0 |
Food, Beverage & Tobacco | 3.5 |
Banks | 3.1 |
Retailing | 3.0 |
Energy | 2.6 |
Real Estate | 2.2 |
Money Market Investment | 2.0 |
Household & Personal Products | 1.8 |
Exchange-Traded Funds | 1.6 |
Commercial & Professional Services | 1.2 |
Media | 1.2 |
Food & Staples Retailing | 1.0 |
Diversified Financials | .9 |
Transportation | .6 |
| | 100.0 |
† Based on net assets.
See notes to financial statements.
11
STATEMENT OF INVESTMENTS IN AFFILIATED ISSUERS
| | | | | | | |
Registered Investment Companies | Value
9/30/2016 ($) | Purchases ($) | Sales ($) | Value
9/30/2017 ($) | Net
Assets (%) | Dividends/
Distributions ($) |
Dreyfus Institutional Cash Advantage Fund, Institutional Shares | 523,447 | – | 523,447 | – | – | – |
Dreyfus Institutional Preferred Government Plus Money Market Fund | 50,743 | 6,833,435 | 6,747,910 | 136,268 | 2.0 | 950 |
Dreyfus Institutional Preferred Government Money Market Fund, Institutional Shares | – | 5,718,576 | 5,718,576 | – | – | – |
Total | 574,190 | 12,552,011 | 12,989,933 | 136,268 | 2.0 | 950 |
See notes to financial statements.
12
STATEMENT OF ASSETS AND LIABILITIES
September 30, 2017
| | | | | | | |
| | | | | | |
| | | Cost | | Value | |
Assets ($): | | | | |
Investments in securities—See Statement of Investments: | | | |
Unaffiliated issuers | | 4,918,805 | | 6,784,112 | |
Affiliated issuers | | 136,268 | | 136,268 | |
Receivable for investment securities sold | | | | | 43,484 | |
Dividends receivable | | | | | 759 | |
Prepaid expenses | | | | | 17,159 | |
| | | | | 6,981,782 | |
Liabilities ($): | | | | |
Due to The Dreyfus Corporation and affiliates—Note 3(b) | | | | | 1,419 | |
Payable for investment securities purchased | | | | | 15,938 | |
Accrued expenses | | | | | 46,359 | |
| | | | | 63,716 | |
Net Assets ($) | | | 6,918,066 | |
Composition of Net Assets ($): | | | | |
Paid-in capital | | | | | 4,446,388 | |
Accumulated undistributed investment income—net | | 3,510 | |
Accumulated net realized gain (loss) on investments | | | | | 602,861 | |
Accumulated net unrealized appreciation (depreciation)
on investments | | | | 1,865,307 | |
Net Assets ($) | | | 6,918,066 | |
| | | | |
Net Asset Value Per Share | Class I | Class Y | |
Net Assets ($) | 5,376,717 | 1,541,349 | |
Shares Outstanding | 169,872 | 48,630 | |
Net Asset Value Per Share ($) | 31.65 | 31.70 | |
| | | | |
See notes to financial statements. | | | |
13
STATEMENT OF OPERATIONS
Year Ended September 30, 2017
| | | | | | | |
| | | | | | |
| | | | | | |
Investment Income ($): | | | | |
Income: | | | | |
Cash dividends: | |
Unaffiliated issuers | | | 43,378 | |
Affiliated issuers | | | 950 | |
Income from securities lending—Note 1(b) | | | 2,479 | |
Total Income | | | 46,807 | |
Expenses: | | | | |
Investment advisory fee—Note 3(a) | | | 51,138 | |
Professional fees | | | 62,363 | |
Registration fees | | | 35,310 | |
Custodian fees—Note 3(b) | | | 11,269 | |
Prospectus and shareholders’ reports | | | 8,607 | |
Shareholder servicing costs—Note 3(b) | | | 8,047 | |
Administration fee—Note 3(a) | | | 3,835 | |
Trustees’ fees and expenses—Note 3(c) | | | 390 | |
Loan commitment fees—Note 2 | | | 155 | |
Miscellaneous | | | 16,249 | |
Total Expenses | | | 197,363 | |
Less—reduction in expenses due to undertaking—Note 3(a) | | | (133,181) | |
Less—reduction in fees due to earnings credits—Note 3(b) | | | (98) | |
Net Expenses | | | 64,084 | |
Investment (Loss)—Net | | | (17,277) | |
Realized and Unrealized Gain (Loss) on Investments—Note 4 ($): | | |
Net realized gain (loss) on investments | 815,339 | |
Net unrealized appreciation (depreciation) on investments | | | 317,836 | |
Net Realized and Unrealized Gain (Loss) on Investments | | | 1,133,175 | |
Net Increase in Net Assets Resulting from Operations | | 1,115,898 | |
| | | | | | | |
See notes to financial statements. | | | | | |
14
STATEMENT OF CHANGES IN NET ASSETS
| | | | | | | | | | |
| | | | Year Ended September 30, |
| | | | 2017 | | 2016 | |
Operations ($): | | | | | | | | |
Investment (loss)—net | | | (17,277) | | | | (33,140) | |
Net realized gain (loss) on investments | | 815,339 | | | | 1,528,637 | |
Net unrealized appreciation (depreciation)
on investments | | 317,836 | | | | (244,152) | |
Net Increase (Decrease) in Net Assets
Resulting from Operations | 1,115,898 | | | | 1,251,345 | |
Distributions to Shareholders from ($): | |
Net realized gain on investments: | | | | | | | | |
Class I | | | (932,650) | | | | (4,752,698) | |
Class Y | | | (9,494) | | | | (20,348) | |
Total Distributions | | | (942,144) | | | | (4,773,046) | |
Beneficial Interest Transactions ($): | |
Net proceeds from shares sold: | | | | | | | | |
Class I | | | 2,688,791 | | | | 1,052,187 | |
Class Y | | | 1,898,268 | | | | - | |
Distributions reinvested: | | | | | | | | |
Class I | | | 867,499 | | | | 2,738,666 | |
Cost of shares redeemed: | | | | | | | | |
Class I | | | (4,654,863) | | | | (16,873,095) | |
Class Y | | | (565,935) | | | | - | |
Increase (Decrease) in Net Assets
from Beneficial Interest Transactions | 233,760 | | | | (13,082,242) | |
Total Increase (Decrease) in Net Assets | 407,514 | | | | (16,603,943) | |
Net Assets ($): | |
Beginning of Period | | | 6,510,552 | | | | 23,114,495 | |
End of Period | | | 6,918,066 | | | | 6,510,552 | |
Undistributed investment income (loss)—net | 3,510 | | | | (26,849) | |
Capital Share Transactions (Shares): | |
Class I | | | | | | | | |
Shares sold | | | 88,268 | | | | 36,897 | |
Shares issued for distributions reinvested | | | 30,960 | | | | 99,155 | |
Shares redeemed | | | (161,788) | | | | (578,694) | |
Net Increase (Decrease) in Shares Outstanding | (42,560) | | | | (442,642) | |
Class Y | | | | | | | | |
Shares sold | | | 65,193 | | | | - | |
Shares redeemed | | | (18,865) | | | | - | |
Net Increase (Decrease) in Shares Outstanding | 46,328 | | | | - | |
| | | | | | | | | | |
See notes to financial statements. | | | | | | | | |
15
FINANCIAL HIGHLIGHTS
The following tables describe the performance for each share class for the fiscal periods indicated. All information (except portfolio turnover rate) reflects financial results for a single fund share. Total return shows how much your investment in the fund would have increased (or decreased) during each period, assuming you had reinvested all dividends and distributions. These figures have been derived from the fund’s financial statements.
| | | | | | | | | |
| | | | | |
| | | |
Class I Shares | | Year Ended September 30, |
| | 2017 | 2016 | 2015 | 2014 | 2013 |
Per Share Data ($): | | | | | | |
Net asset value, beginning of period | | 30.32 | 35.16 | 52.76 | 70.83 | 60.57 |
Investment Operations: | | | | | | |
Investment (loss)—neta | | (.07) | (.08) | (.17) | (.30) | (.13) |
Net realized and unrealized
gain (loss) on investments | | 5.52 | 4.08 | 3.48 | 1.98 | 16.26 |
Total from Investment Operations | | 5.45 | 4.00 | 3.31 | 1.68 | 16.13 |
Distributions: | | | | | | |
Dividends from net realized
gain on investments | | (4.12) | (8.84) | (20.91) | (19.75) | (5.87) |
Net asset value, end of period | | 31.65 | 30.32 | 35.16 | 52.76 | 70.83 |
Total Return (%) | | 19.75 | 13.83 | 6.50 | 1.46 | 30.20 |
Ratios/Supplemental Data (%): | | | | | | |
Ratio of total expenses
to average net assets | | 3.08 | 2.06 | 1.40 | 1.15 | 1.04 |
Ratio of net expenses
to average net assets | | 1.00 | .98 | .95 | .95 | .98 |
Ratio of net investment (loss)
to average net assets | | (.23) | (.26) | (.41) | (.52) | (.22) |
Portfolio Turnover Rate | | 125.73 | 197.34 | 169.20 | 138.15 | 121.73 |
Net Assets, end of period ($ x 1,000) | | 5,377 | 6,441 | 23,034 | 46,290 | 101,043 |
a Based on average shares outstanding.
See notes to financial statements.
16
| | | | | | | | |
| | |
| | | |
Class Y Shares | | Year Ended September 30, |
| | 2017 | 2016 | 2015 | 2014 | 2013a |
Per Share Data ($): | | | | | | |
Net asset value, beginning of period | | 30.35 | 35.18 | 52.76 | 70.83 | 64.04 |
Investment Operations: | | | | | | |
Investment (loss)—netb | | (.21) | (.07) | (.15) | (.19) | (.10) |
Net realized and unrealized
gain (loss) on investments | | 5.68 | 4.08 | 3.48 | 1.87 | 6.89 |
Total from Investment Operations | | 5.47 | 4.01 | 3.33 | 1.68 | 6.79 |
Distributions: | | | | | | |
Dividends from net realized
gain on investments | | (4.12) | (8.84) | (20.91) | (19.75) | — |
Net asset value, end of period | | 31.70 | 30.35 | 35.18 | 52.76 | 70.83 |
Total Return (%) | | 19.81 | 13.85 | 6.56 | 1.48 | 10.59c |
Ratios/Supplemental Data (%): | | | | | | |
Ratio of total expenses
to average net assets | | 3.18 | 2.17 | 1.40 | 1.11 | 1.07d |
Ratio of net expenses
to average net assets | | 1.00 | .97 | .90 | .95 | .95d |
Ratio of net investment (loss)
to average net assets | | (.69) | (.23) | (.35) | (.38) | (.57)d |
Portfolio Turnover Rate | | 125.73 | 197.34 | 169.20 | 138.15 | 121.73 |
Net Assets, end of period ($ x 1,000) | | 1,541 | 70 | 81 | 156 | 1 |
a From July 1, 2013 (commencement of initial offering) to September 30, 2013.
b Based on average shares outstanding.
c Not annualized.
d Annualized.
See notes to financial statements.
17
NOTES TO FINANCIAL STATEMENTS
NOTE 1—Significant Accounting Policies:
Dreyfus/The Boston Company Small Cap Growth Fund (the “fund”) is a separate diversified series of Dreyfus Investment Funds (the “Trust”), which is registered under the Investment Company Act of 1940, as amended (the “Act”), as an open-end management investment company and operates as a series company currently offering seven series, including the fund. The fund’s investment objective is to seek long-term growth of capital. The Dreyfus Corporation (the “Manager” or “Dreyfus”), a wholly-owned subsidiary of The Bank of New York Mellon Corporation (“BNY Mellon”), serves as the fund’s investment adviser.
MBSC Securities Corporation (the “Distributor”), a wholly-owned subsidiary of Dreyfus, is the distributor of the fund’s shares. The fund is authorized to issue an unlimited number of $.001 par value shares of Beneficial Interest in each of the following classes of shares: Class I and Class Y. Class I shares are sold primarily to bank trust departments and other financial service providers (including The Bank of New York Mellon, a subsidiary of BNY Mellon and an affiliate of Dreyfus, and its affiliates), acting on behalf of customers having a qualified trust or an investment account or relationship at such institution, and bear no Distribution or Shareholder Services Plan fees. Class Y shares are sold at net asset value per share generally to institutional investors, and bear no Distribution or Shareholder Services Plan fees. Class I and Class Y shares are offered without a front-end sales charge or contingent deferred sales charge. Other differences between the classes include the services offered to and the expenses borne by each class, the allocation of certain transfer agency costs, and certain voting rights. Income, expenses (other than expenses attributable to a specific class), and realized and unrealized gains or losses on investments are allocated to each class of shares based on its relative net assets.
The Trust accounts separately for the assets, liabilities and operations of each series. Expenses directly attributable to each series are charged to that series’ operations; expenses which are applicable to all series are allocated among them on a pro rata basis.
The Financial Accounting Standards Board (“FASB”) Accounting Standards Codification is the exclusive reference of authoritative U.S. generally accepted accounting principles (“GAAP”) recognized by the FASB to be applied by nongovernmental entities. Rules and interpretive releases of the Securities and Exchange Commission (“SEC”) under authority of federal laws are also sources of authoritative GAAP for SEC
18
registrants. The fund’s financial statements are prepared in accordance with GAAP, which may require the use of management estimates and assumptions. Actual results could differ from those estimates.
(a) Portfolio valuation: The fair value of a financial instrument is the amount that would be received to sell an asset or paid to transfer a liability in an orderly transaction between market participants at the measurement date (i.e., the exit price). GAAP establishes a fair value hierarchy that prioritizes the inputs of valuation techniques used to measure fair value. This hierarchy gives the highest priority to unadjusted quoted prices in active markets for identical assets or liabilities (Level 1 measurements) and the lowest priority to unobservable inputs (Level 3 measurements).
Additionally, GAAP provides guidance on determining whether the volume and activity in a market has decreased significantly and whether such a decrease in activity results in transactions that are not orderly. GAAP requires enhanced disclosures around valuation inputs and techniques used during annual and interim periods.
Various inputs are used in determining the value of the fund’s investments relating to fair value measurements. These inputs are summarized in the three broad levels listed below:
Level 1—unadjusted quoted prices in active markets for identical investments.
Level 2—other significant observable inputs (including quoted prices for similar investments, interest rates, prepayment speeds, credit risk, etc.).
Level 3—significant unobservable inputs (including the fund’s own assumptions in determining the fair value of investments).
The inputs or methodology used for valuing securities are not necessarily an indication of the risk associated with investing in those securities.
Changes in valuation techniques may result in transfers in or out of an assigned level within the disclosure hierarchy. Valuation techniques used to value the fund’s investments are as follows:
Investments in securities are valued at the last sales price on the securities exchange or national securities market on which such securities are primarily traded. Securities listed on the National Market System for which market quotations are available are valued at the official closing price or, if there is no official closing price that day, at the last sales price. For open short positions, asked prices are used for valuation purposes. Bid price is used when no asked price is available. Registered investment companies
19
NOTES TO FINANCIAL STATEMENTS (continued)
that are not traded on an exchange are valued at their net asset value. All of the preceding securities are generally categorized within Level 1 of the fair value hierarchy.
Securities not listed on an exchange or the national securities market, or securities for which there were no transactions, are valued at the average of the most recent bid and asked prices. These securities are generally categorized within Level 2 of the fair value hierarchy.
Fair valuing of securities may be determined with the assistance of a pricing service using calculations based on indices of domestic securities and other appropriate indicators, such as prices of relevant ADRs and futures. Utilizing these techniques may result in transfers between Level 1 and Level 2 of the fair value hierarchy.
When market quotations or official closing prices are not readily available, or are determined not to reflect accurately fair value, such as when the value of a security has been significantly affected by events after the close of the exchange or market on which the security is principally traded (for example, a foreign exchange or market), but before the fund calculates its net asset value, the fund may value these investments at fair value as determined in accordance with the procedures approved by the Trust’s Board of Trustees (the “Board”). Certain factors may be considered when fair valuing investments such as: fundamental analytical data, the nature and duration of restrictions on disposition, an evaluation of the forces that influence the market in which the securities are purchased and sold, and public trading in similar securities of the issuer or comparable issuers. These securities are either categorized within Level 2 or 3 of the fair value hierarchy depending on the relevant inputs used.
For restricted securities where observable inputs are limited, assumptions about market activity and risk are used and are generally categorized within Level 3 of the fair value hierarchy.
The following is a summary of the inputs used as of September 30, 2017 in valuing the fund’s investments:
20
| | | | | |
| | Level 1 - Unadjusted Quoted Prices | Level 2 - Other Significant Observable Inputs | Level 3 -Significant Unobservable Inputs | Total |
Assets ($) | | | | |
Investments in Securities: | | |
Equity Securities—Domestic Common Stocks† | 6,148,079 | - | - | 6,148,079 |
Equity Securities—Foreign Common Stocks† | 524,899 | - | - | 524,899 |
Exchange-Traded Fund | 111,134 | - | - | 111,134 |
Registered Investment Company | 136,268 | - | - | 136,268 |
† See Statement of Investments for additional detailed categorizations.
At September 30, 2017, there were no transfers between levels of the fair value hierarchy. It is the fund’s policy to recognize transfers between levels at the end of the reporting period.
(b) Securities transactions and investment income: Securities transactions are recorded on a trade date basis. Realized gains and losses from securities transactions are recorded on the identified cost basis. Dividend income is recognized on the ex-dividend date and interest income, including, where applicable, accretion of discount and amortization of premium on investments, is recognized on the accrual basis.
Pursuant to a securities lending agreement with The Bank of New York Mellon, the fund may lend securities to qualified institutions. It is the fund’s policy that, at origination, all loans are secured by collateral of at least 102% of the value of U.S. securities loaned and 105% of the value of foreign securities loaned. Collateral equivalent to at least 100% of the market value of securities on loan is maintained at all times. Collateral is either in the form of cash, which can be invested in certain money market mutual funds managed by Dreyfus, or U.S. Government and Agency securities. The fund is entitled to receive all dividends, interest and distributions on securities loaned, in addition to income earned as a result of the lending transaction. Should a borrower fail to return the securities in a timely manner, The Bank of New York Mellon is required to replace the securities for the benefit of the fund or credit the fund with the market value of the unreturned securities and is subrogated to the fund’s rights against the borrower and the collateral. Additionally, the contractual maturity of security lending transactions are on an overnight and
21
NOTES TO FINANCIAL STATEMENTS (continued)
continuous basis. During the period ended September 30, 2017, The Bank of New York Mellon earned $516 from lending portfolio securities, pursuant to the securities lending agreement.
(c) Affiliated issuers: Investments in other investment companies advised by Dreyfus are defined as “affiliated” under the Act.
(d) Dividends and distributions to shareholders: Dividends and distributions are recorded on the ex-dividend date. Dividends from investment income-net and dividends from net realized capital gains, if any, are normally declared and paid annually, but the fund may make distributions on a more frequent basis to comply with the distribution requirements of the Internal Revenue Code of 1986, as amended (the “Code”). To the extent that net realized capital gains can be offset by capital loss carryovers, it is the policy of the fund not to distribute such gains. Income and capital gain distributions are determined in accordance with income tax regulations, which may differ from GAAP.
(e) Federal income taxes: It is the policy of the fund to continue to qualify as a regulated investment company, if such qualification is in the best interests of its shareholders, by complying with the applicable provisions of the Code, and to make distributions of taxable income sufficient to relieve it from substantially all federal income and excise taxes.
As of and during the period ended September 30, 2017, the fund did not have any liabilities for any uncertain tax positions. The fund recognizes interest and penalties, if any, related to uncertain tax positions as income tax expense in the Statement of Operations. During the period ended September 30, 2017, the fund did not incur any interest or penalties.
Each tax year in the four-year period ended September 30, 2017 remains subject to examination by the Internal Revenue Service and state taxing authorities.
At September 30, 2017, the components of accumulated earnings on a tax basis were as follows: undistributed ordinary income $271,479, undistributed capital gains $462,056 and unrealized appreciation $1,738,143.
The tax character of distributions paid to shareholders during the fiscal periods ended September 30, 2017 and September 30, 2016 were as follows: ordinary income $0 and $750,272, and long-term capital gains $942,144 and $4,022,774, respectively.
During the period ended September 30, 2017, as a result of permanent book to tax differences, primarily due to the tax treatment for net operating losses, real estate investment trusts and treating a portion of the
22
proceeds from redemptions as a distribution for tax purposes, the fund increased accumulated undistributed investment income-net by $47,636, decreased accumulated net realized gain (loss) on investments by $583,485 and increased paid-in capital by $535,849. Net assets and net asset value per share were not affected by this reclassification.
NOTE 2—Bank Lines of Credit:
The fund participates with other Dreyfus-managed funds in an $810 million unsecured credit facility led by Citibank, N.A. and a $300 million unsecured credit facility provided by The Bank of New York Mellon (each, a “Facility”), each to be utilized primarily for temporary or emergency purposes, including the financing of redemptions. Prior to October 5, 2016, the unsecured credit facility with Citibank, N.A. was $555 million. In connection therewith, the fund has agreed to pay its pro rata portion of commitment fees for each Facility. Interest is charged to the fund based on rates determined pursuant to the terms of the respective Facility at the time of borrowing. During the period ended September 30, 2017, the fund did not borrow under the Facilities.
NOTE 3—Investment Advisory Fee, Administration Fee and Other Transactions with Affiliates:
(a) Pursuant to an investment advisory agreement with Dreyfus, the investment advisory fee is computed at the annual rate of .80% of the value of the fund’s average daily net assets and is payable monthly. Dreyfus has contractually agreed, from October 1, 2016 through February 1, 2019, to waive receipt of its fees and/or assume the direct expenses of the fund, so that the direct annual fund operating expenses for Class I and Y shares (excluding taxes, interest expense, brokerage commissions, commitment fees on borrowings and extraordinary expenses) do not exceed 1.00% of the value of the fund’s average daily net assets. The reduction in expenses, pursuant to the undertaking, amounted to $133,181 during the period ended September 30, 2017.
The fund has a Fund Accounting and Administrative Services Agreement (the “Administration Agreement”) with Dreyfus, whereby Dreyfus performs administrative, accounting and recordkeeping services for the fund. The fund has agreed to compensate Dreyfus for providing accounting and recordkeeping services, administration, compliance monitoring, regulatory and shareholder reporting, as well as related facilities, equipment and clerical help. The fee is based on the fund’s average daily net assets and computed at the following annual rates: .06% of the first $500 million, .04% of the next $500 million and .02% in excess of $1 billion.
23
NOTES TO FINANCIAL STATEMENTS (continued)
In addition, after applying any expense limitations or fee waivers that reduce the fees paid to Dreyfus for this service, Dreyfus has contractually agreed in writing to waive any remaining fees for this service to the extent that they exceed both Dreyfus’ costs in providing these services and a reasonable allocation of the costs incurred by Dreyfus and its affiliates related to the support and oversight of these services. The fund also reimburses Dreyfus for the out-of-pocket expenses incurred in performing this service for the fund. Pursuant to the Administration Agreement, the fund was charged $3,835 during the period ended September 30, 2017.
(b) The fund has arrangements with the transfer agent and the custodian whereby the fund may receive earnings credits when positive cash balances are maintained, which are used to offset transfer agency and custody fees. For financial reporting purposes, the fund includes net earnings credits as an expense offset in the Statement of Operations.
The fund compensates Dreyfus Transfer, Inc., a wholly-owned subsidiary of Dreyfus, under a transfer agency agreement for providing transfer agency and cash management services for the fund. The majority of transfer agency fees are comprised of amounts paid on a per account basis, while cash management fees are related to fund subscriptions and redemptions. During the period ended September 30, 2017, the fund was charged $3,914 for transfer agency services and $98 for cash management services. These fees are included in Shareholder servicing costs in the Statement of Operations. Cash management fees were offset by earnings credits of $98.
The fund compensates The Bank of New York Mellon under a custody agreement for providing custodial services for the fund. These fees are determined based on net assets, geographic region and transaction activity. During the period ended September 30, 2017, the fund was charged $11,269 pursuant to the custody agreement.
During the period ended September 30, 2017, the fund was charged $11,281 for services performed by the Chief Compliance Officer and his staff.
The components of “Due to The Dreyfus Corporation and affiliates” in the Statement of Assets and Liabilities consist of: investment advisory fees $4,404, administration fees $330, custodian fees $3,583, Chief Compliance Officer fees $5,604 and transfer agency fees $663, which are offset against an expense reimbursement currently in effect in the amount of $13,165.
(c) Each Board member also serves as a Board member of other funds within the Dreyfus complex. Annual retainer fees and attendance fees are allocated to each fund based on net assets.
24
NOTE 4—Securities Transactions:
The aggregate amount of purchases and sales of investment securities, excluding short-term securities, during the period ended September 30, 2017, amounted to $7,944,485 and $8,802,131, respectively.
At September 30, 2017, the cost of investments for federal income tax purposes was $5,182,237; accordingly, accumulated net unrealized appreciation on investments was $1,738,143, consisting of $1,998,487 gross unrealized appreciation and $260,344 gross unrealized depreciation.
25
REPORT OF INDEPENDENT REGISTERED
PUBLIC ACCOUNTING FIRM
The Board of Trustees and Shareholders of
Dreyfus Investment Funds
We have audited the accompanying statement of assets and liabilities of Dreyfus/The Boston Company Small Cap Growth Fund (the “Fund”), a series of Dreyfus Investment Funds, including the statements of investments and investments in affiliated issuers, as of September 30, 2017, and the related statement of operations for the year then ended, the statements of changes in net assets for each of the years in the two-year period then ended, and the financial highlights for each of the years or periods in the five-year period then ended. These financial statements and financial highlights are the responsibility of the Fund’s management. Our responsibility is to express an opinion on these financial statements and financial highlights based on our audits.
We conducted our audits in accordance with the standards of the Public Company Accounting Oversight Board (United States). Those standards require that we plan and perform the audit to obtain reasonable assurance about whether the financial statements and financial highlights are free of material misstatement. An audit includes examining, on a test basis, evidence supporting the amounts and disclosures in the financial statements. Our procedures included confirmation of securities owned as of September 30, 2017, by correspondence with the custodian and brokers or by other appropriate auditing procedures. An audit also includes assessing the accounting principles used and significant estimates made by management, as well as evaluating the overall financial statement presentation. We believe that our audits provide a reasonable basis for our opinion.
In our opinion, the financial statements and financial highlights referred to above present fairly, in all material respects, the financial position of Dreyfus/The Boston Company Small Cap Growth Fund as of September 30, 2017, the results of its operations for the year then ended, the changes in its net assets for each of the years in the two-year period then ended, and the financial highlights for each of the years or periods in the five-year period then ended, in conformity with U.S. generally accepted accounting principles.

New York, New York
November 22, 2017
26
IMPORTANT TAX INFORMATION (Unaudited)
For federal tax purposes, the fund reports the maximum amount allowable but not less than $4.1249 per share as a capital gain dividend in accordance with Section 852(b)(3)(C) of the Internal Revenue Code.
27
BOARD MEMBERS INFORMATION (Unaudited)
INDEPENDENT BOARD MEMBERS
Joseph S. DiMartino (73)
Chairman of the Board (2008)
Principal Occupation During Past 5 Years:
· Corporate Director and Trustee (1995-present)
Other Public Company Board Memberships During Past 5 Years:
· CBIZ (formerly, Century Business Services, Inc.), a provider of outsourcing functions for small and medium size companies, Director (1997-present)
No. of Portfolios for which Board Member Serves: 127
———————
Francine J. Bovich (66)
Board Member (2011)
Principal Occupation During Past 5 Years:
· Trustee, The Bradley Trusts, private trust funds (2011-present)
Other Public Company Board Memberships During Past 5 Years:
· Annaly Capital Management, Inc., Board Member (May 2014-present)
No. of Portfolios for which Board Member Serves: 75
———————
Kenneth A. Himmel (71)
Board Member (2008)
Principal Occupation During Past 5 Years:
· Managing Partner, Gulf Related, an international real estate development company (2010-present)
· President and CEO, Related Urban Development, a real estate development company (1996-present)
· President and CEO, Himmel & Company, a real estate development company (1980-present)
· CEO, American Food Management, a restaurant company (1983-present)
No. of Portfolios for which Board Member Serves: 28
———————
28
Stephen J. Lockwood (70)
Board Member (2008)
Principal Occupation During Past 5 Years:
· Chairman of the Board, Stephen J. Lockwood and Company LLC, a real estate investment company (2000-present)
No. of Portfolios for which Board Member Serves: 28
———————
Roslyn M. Watson (67)
Board Member (2008)
Principal Occupation During Past 5 Years:
· Principal, Watson Ventures, Inc., a real estate investment company (1993-present)
No. of Portfolios for which Board Member Serves: 61
———————
Benaree Pratt Wiley (71)
Board Member (2008)
Principal Occupation During Past 5 Years:
· Principal, The Wiley Group, a firm specializing in strategy and business development (2005-present)
Other Public Company Board Memberships During Past 5 Years:
· CBIZ (formerly, Century Business Services, Inc.), a provider of outsourcing functions for small and medium size companies, Director (2008-present)
No. of Portfolios for which Board Member Serves: 82
———————
Once elected all Board Members serve for an indefinite term, but achieve Emeritus status upon reaching age 80. The address of the Board Members and Officers is c/o The Dreyfus Corporation, 200 Park Avenue, New York, New York 10166. Additional information about the Board Members is available in the fund’s Statement of Additional Information which can be obtained from Dreyfus free of charge by calling this toll free number: 1-800-DREYFUS.
James M. Fitzgibbons, Emeritus Board Member
29
OFFICERS OF THE FUND (Unaudited)
BRADLEY J. SKAPYAK, President since January 2010.
Chief Operating Officer and a director of the Manager since June 2009, Chairman of Dreyfus Transfer, Inc., an affiliate of the Manager and the transfer agent of the funds, since May 2011 and Chief Executive Officer of MBSC Securities Corporation since August 2016. He is an officer of 61 investment companies (comprised of 127 portfolios) managed by the Manager. He is 58 years old and has been an employee of the Manager since February 1988.
BENNETT A. MACDOUGALL, Chief Legal Officer since October 2015.
Chief Legal Officer of the Manager and Associate General Counsel and Managing Director of BNY Mellon since June 2015; from June 2005 to June 2015, he served in various capacities with Deutsche Bank – Asset & Wealth Management Division, including as Director and Associate General Counsel, and Chief Legal Officer of Deutsche Investment Management Americas Inc. from June 2012 to May 2015. He is an officer of 62 investment companies (comprised of 152 portfolios) managed by the Manager. He is 46 years old and has been an employee of the Manager since June 2015.
JANETTE E. FARRAGHER, Vice President and Secretary since December 2011.
Associate General Counsel of BNY Mellon, and an officer of 62 investment companies (comprised of 152 portfolios) managed by the Manager. She is 54 years old and has been an employee of the Manager since February 1984.
JAMES BITETTO, Vice President and Assistant Secretary since December 2008.
Managing Counsel of BNY Mellon and Secretary of the Manager, and an officer of 62 investment companies (comprised of 152 portfolios) managed by the Manager. He is 51 years old and has been an employee of the Manager since December 1996.
JOSEPH M. CHIOFFI, Vice President and Assistant Secretary since December 2008.
Managing Counsel of BNY Mellon, and an officer of 62 investment companies (comprised of 152 portfolios) managed by the Manager. He is 55 years old and has been an employee of the Manager since June 2000.
MAUREEN E. KANE, Vice President and Assistant Secretary since April 2015.
Managing Counsel of BNY Mellon since July 2014; from October 2004 until July 2014, General Counsel, and from May 2009 until July 2014, Chief Compliance Officer of Century Capital Management. She is an officer of 62 investment companies (comprised of 152 portfolios) managed by the Manager. She is 55 years old and has been an employee of the Manager since July 2014.
SARAH S. KELLEHER, Vice President and Assistant Secretary since April 2014.
Senior Counsel of BNY Mellon since March 2013, from August 2005 to March 2013, Associate General Counsel of Third Avenue Management. She is an officer of 62 investment companies (comprised of 152 portfolios) managed by the Manager. She is 42 years old and has been an employee of the Manager since March 2013.
JEFF PRUSNOFSKY, Vice President and Assistant Secretary since December 2008.
Senior Managing Counsel of BNY Mellon, and an officer of 62 investment companies (comprised of 152 portfolios) managed by the Manager. He is 52 years old and has been an employee of the Manager since October 1990.
NATALYA ZELENSKY, Vice President and Assistant Secretary since March 2017.
Counsel and Vice President of BNY Mellon since May 2016; Attorney at Wildermuth Endowment Strategy Fund/Wildermuth Advisory, LLC from November 2015 until May 2016; Assistant General Counsel at RCS Advisory Services from July 2014 until November 2015; Associate at Sutherland, Asbill & Brennan from January 2013 until January 2014; Associate at K&L Gates from October 2011 until January 2013. She is an officer of 62 investment companies (comprised of 152 portfolios) managed by Dreyfus. She is 32 years old and has been an employee of the Manager since May 2016.
JAMES WINDELS, Treasurer since December 2008.
Director – Mutual Fund Accounting of the Manager, and an officer of 62 investment companies (comprised of 152 portfolios) managed by the Manager. He is 59 years old and has been an employee of the Manager since April 1985.
30
RICHARD CASSARO, Assistant Treasurer since December 2008.
Senior Accounting Manager – Money Market and Municipal Bond Funds of the Manager, and an officer of 62 investment companies (comprised of 152 portfolios) managed by the Manager. He is 58 years old and has been an employee of the Manager since September 1982.
GAVIN C. REILLY, Assistant Treasurer since December 2008.
Tax Manager of the Investment Accounting and Support Department of the Manager, and an officer of 62 investment companies (comprised of 152 portfolios) managed by the Manager. He is 49 years old and has been an employee of the Manager since April 1991.
ROBERT S. ROBOL, Assistant Treasurer since December 2008.
Senior Accounting Manager – Dreyfus Financial Reporting of the Manager, and an officer of 62 investment companies (comprised of 152 portfolios) managed by the Manager. He is 53 years old and has been an employee of the Manager since October 1988.
ROBERT SALVIOLO, Assistant Treasurer since December 2008.
Senior Accounting Manager – Equity Funds of the Manager, and an officer of 62 investment companies (comprised of 152 portfolios) managed by the Manager. He is 50 years old and has been an employee of the Manager since June 1989.
ROBERT SVAGNA, Assistant Treasurer since December 2008.
Senior Accounting Manager – Fixed Income and Equity Funds of the Manager, and an officer of 62 investment companies (comprised of 152 portfolios) managed by the Manager. He is 50 years old and has been an employee of the Manager since November 1990.
JOSEPH W. CONNOLLY, Chief Compliance Officer since December 2008.
Chief Compliance Officer of the Manager and The Dreyfus Family of Funds (62 investment companies, comprised of 152 portfolios). He is 60 years old and has served in various capacities with the Manager since 1980, including manager of the firm’s Fund Accounting Department from 1997 through October 2001.
CARIDAD M. CAROSELLA, Anti-Money Laundering Compliance Officer since January 2016.
Anti-Money Laundering Compliance Officer of the Dreyfus Family of Funds and BNY Mellon Funds Trust since January 2016; from May 2015 to December 2015, Interim Anti-Money Laundering Compliance Officer of the Dreyfus Family of Funds and BNY Mellon Funds Trust and the Distributor; from January 2012 to May 2015, AML Surveillance Officer of the Distributor and from 2007 to December 2011, Financial Processing Manager of the Distributor. She is an officer of 57 investment companies (comprised of 147 portfolios) managed by the Manager. She is 49 years old and has been an employee of the Distributor since 1997.
31
NOTES
32
NOTES
33
Dreyfus/The Boston Company Small Cap Growth Fund
200 Park Avenue
New York, NY 10166
Manager
The Dreyfus Corporation
200 Park Avenue
New York, NY 10166
Custodian
The Bank of New York Mellon
225 Liberty Street
New York, NY 10286
Transfer Agent &
Dividend Disbursing Agent
Dreyfus Transfer, Inc.
200 Park Avenue
New York, NY 10166
Distributor
MBSC Securities Corporation
200 Park Avenue
New York, NY 10166
| | |
Ticker Symbols: | Class I: SSETX Class Y: SSYGX |
Telephone Call your financial representative or 1-800-DREYFUS
Mail The Dreyfus Family of Funds, 144 Glenn Curtiss Boulevard, Uniondale, NY 11556-0144
E-mail Send your request to info@dreyfus.com
Internet Information can be viewed online or downloaded at www.dreyfus.com
The fund files its complete schedule of portfolio holdings with the Securities and Exchange Commission (“SEC”) for the first and third quarters of each fiscal year on Form N-Q. The fund’s Forms N-Q are available on the SEC’s website at www.sec.gov and may be reviewed and copied at the SEC’s Public Reference Room in Washington, D.C. (phone 1-800-SEC-0330 for information).
A description of the policies and procedures that the fund uses to determine how to vote proxies relating to portfolio securities and information regarding how the fund voted these proxies for the most recent 12-month period ended June 30 is available at www.dreyfus.com and on the SEC’s website at www.sec.gov and without charge, upon request, by calling 1-800-DREYFUS.
| | |
© 2017 MBSC Securities Corporation
6941AR0917 | 
|
Dreyfus/The Boston Company Small Cap Value Fund
| | | |

| | ANNUAL REPORT September 30, 2017 |
| |
Save time. Save paper. View your next shareholder report online as soon as it’s available. Log into www.dreyfus.com and sign up for Dreyfus eCommunications. It’s simple and only takes a few minutes. |
| |
The views expressed in this report reflect those of the portfolio manager(s) only through the end of the period covered and do not necessarily represent the views of Dreyfus or any other person in the Dreyfus organization. Any such views are subject to change at any time based upon market or other conditions and Dreyfus disclaims any responsibility to update such views. These views may not be relied on as investment advice and, because investment decisions for a Dreyfus fund are based on numerous factors, may not be relied on as an indication of trading intent on behalf of any Dreyfus fund. |
| |
Not FDIC-Insured • Not Bank-Guaranteed • May Lose Value |
Contents
T H E F U N D
F O R M O R E I N F O R M AT I O N
Back Cover
| | | | |
| |
Dreyfus/The Boston Company Small Cap Value Fund
| | The Fund |
A LETTER FROM THE CEO OF DREYFUS
Dear Shareholder:
We are pleased to present this annual report for Dreyfus/The Boston Company Small Cap Value Fund, covering the 12-month period from October 1, 2016 through September 30, 2017. For information about how the fund performed during the reporting period, as well as general market perspectives, we provide a Discussion of Fund Performance on the pages that follow.
Stocks set a series of new record highs and bonds produced mixed results over the past year in response to changing economic and political conditions. Financial markets during the final months of 2016 were dominated by the election of a new U.S. presidential administration. Equities and corporate-backed bonds surged higher in anticipation of more business-friendly regulatory, tax, and fiscal policies, but high-quality bonds generally lost value due to expectations of rising interest rates and accelerating inflation in a stronger economy. Despite a series of short-term interest rate hikes, bonds recovered most or all of their previous losses over the first nine months of 2017 when it became clearer that pro-growth legislation would take time and political capital to enact. U.S. and international stocks continued to rally as corporate earnings grew and global economic conditions improved.
The markets’ recent strong performance has been supported by solid underlying fundamentals. While we currently expect these favorable conditions to persist, we remain watchful for economic and political developments that could derail the rallies. As always, we encourage you to discuss the risks and opportunities of today’s investment environment with your financial advisor.
Thank you for your continued confidence and support.
Sincerely,

Mark D. Santero
Chief Executive Officer
The Dreyfus Corporation
October 16, 2017
2
DISCUSSION OF FUND PERFORMANCE
For the period from October 1, 2016 through September 30, 2017, as provided by Joseph M. Corrado, CFA, Stephanie K. Brandaleone, CFA, and Jonathan Piskorowski, CFA, Portfolio Managers
Market and Fund Performance Overview
For the 12-month period ended September 30, 2017, Dreyfus/The Boston Company Small Cap Value Fund’s Class A shares achieved a total return of 17.58%, Class C shares returned 16.49%, Class I shares returned 17.98%, and Class Y shares returned 17.93%.1 In comparison, the fund’s benchmark, the Russell 2000® Value Index (the “Index”), produced a total return of 20.55% for the same period.2
Small-cap stocks rallied strongly over the reporting period amid better-than-expected earnings, improving economic conditions, and the potential for more business-friendly U.S. government policies. The fund lagged its benchmark, mainly due to security selection shortfalls in the information technology sector and overweighted exposure in the consumer staples sector.
The Fund’s Investment Approach
The fund seeks long-term growth of capital. To pursue its goal, the fund normally invests at least 80% of its net assets in equity securities of small-cap U.S. companies, i.e., those with market capitalizations that are equal to or less than the total market capitalization of the largest company in the Index.
We use fundamental research and qualitative analysis to select stocks and look for companies with strong competitive positions, high-quality management, and financial strength. We use a consistent three-step fundamental research process to evaluate the stocks, consisting of valuation, which is to identify small-cap companies that are considered to be attractively priced relative to their earnings potential; fundamentals, which is to verify the strength of the underlying business position; and catalyst, which is to identify a specific event that has the potential to cause the stocks to appreciate in value.
Rising Corporate Earnings Drove Markets Higher
While political uncertainties caused U.S. stocks to dip prior to the 2016 presidential election, equity markets were reenergized in November and December when investors began to anticipate lower corporate taxes, reduced regulatory constraints on business, and increased infrastructure spending from the new presidential administration.
Small-cap stocks in 2017 continued to build on the momentum established during the final months of 2016. Consecutive quarters of better-than-expected corporate earnings and encouraging global economic developments drove the Index to a series of new highs early in the year. While concerns about the new U.S. administration’s ability to enact its pro-growth policy proposals slowed the market’s advance in the spring, most broad measures of stock market performance quickly erased those losses, and the Index reached new highs by the reporting period’s end. Small-cap value stocks outperformed large- and mid-cap value stocks for the reporting period overall.
Technology and Consumer Stocks Dampened Relative Results
Although the fund participated substantially in the Index’s gains, relative performance was undermined by stock selection shortfalls in the information technology sector. Most notably, digital printer Electronics for Imaging was hurt by accounting issues, supercomputer maker Cray reported weak quarterly results amid sluggish demand, distributor Tech Data missed earnings targets in part due to execution challenges, services provider Acxiom encountered pricing pressures, and semiconductor manufacturer First Solar struggled with weak bookings.
In the consumer staples sector, overweighted exposure to food retailers hurt relative results when the high-profile acquisition of a major grocery chain changed the competitive landscape, creating pricing pressures and uncertainty for fund holdings United Natural Foods and Sprouts Farmers Market.
3
DISCUSSION OF FUND PERFORMANCE (continued)
Moreover, brewer Boston Beer Company saw sales volumes decline and competitive pressures increase. In other areas, energy producers Callon Petroleum and Oasis Petroleum were hurt by low oil prices, printing products provider LSC Communications reported weak financial results in a struggling industry, and apparel retailer Urban Outfitters saw lower same-store sales and higher promotional expenses.
The fund achieved better relative results in the real estate sector, where underweighted exposure helped cushion weakness in an out-of-favor industry group. In addition, favorable security selections included Pebblebrook Hotel Trust, where non-room revenues increased and expenses declined. Government contractor CoreCivic rallied after the presidential election, and data center specialist CyrusOne benefited from robust demand. Among health care companies, senior-focused service provider Tivity Health posted consistently solid financial results, medical transport company Air Methods was acquired by a private equity firm, home health services provider Amedisys achieved strong results in its hospice division while controlling costs, and Supernus Pharmaceuticals received better-than-expected results from its migraine and bipolar disorder drugs. In the utilities sector, WGL Holdings and Vectren benefited from mergers-and-acquisitions activity. Other strong performers included defense contractor AeroVironment, bank Webster Financial, technology company Brooks Automation, and home furnishings retailer Restoration Hardware.
A Disciplined, Bottom-Up Investment Process
Although our disciplined, research-intensive investment process focuses on the prospects of individual companies rather than broad macroeconomic trends, we currently see heightened market uncertainty due to the challenges facing proposed government policy reforms, escalating geopolitical tensions, and changing monetary policies. As of the reporting period’s end, we have identified ample value-oriented opportunities in the consumer discretionary, information technology, and consumer staples sectors, but fewer in the banking, insurance and real estate industries.
October 16, 2017
1 Total return includes reinvestment of dividends and any capital gains paid, and does not take into consideration the maximum initial sales charge in the case of Class A shares, or the applicable contingent deferred sales charge imposed on redemptions in the case of Class C shares. Past performance is no guarantee of future results. Share price and investment return fluctuate such that upon redemption, fund shares may be worth more or less than their original cost. The fund’s return reflects the absorption of certain fund expenses by The Dreyfus Corporation pursuant to an agreement in effect through February 1, 2019, for Class Y shares, at which time it may be extended, modified, or terminated. Had these expenses not been absorbed, returns would have been lower.
2 Source: Lipper Inc. — The Russell 2000®Value Index measures the performance of the small-cap value segment of the U.S. equity universe. It includes those Russell 2000 companies that are considered more value-oriented relative to the overall market as defined by Russell’s leading style methodology. The Russell 2000® Value Index is constructed to provide a comprehensive and unbiased barometer for the small-cap value segment. The index is completely reconstituted annually to ensure larger stocks do not distort the performance and characteristics of the true small-cap opportunity set and that the represented companies continue to reflect value characteristics. Investors cannot invest directly in any index.
Please note: the position in any security highlighted with italicized typeface was sold during the reporting period.
Equities are subject generally to market, market sector, market liquidity, issuer, and investment style risks, among other factors, to varying degrees, all of which are more fully described in the fund’s prospectus.
Small companies carry additional risks because their earnings and revenues tend to be less predictable and their share prices more volatile than those of larger, more established companies. The shares of smaller companies tend to trade less frequently than those of larger, more established companies, which can adversely affect the pricing of these securities and the fund’s ability to sell these securities.
4
FUND PERFORMANCE
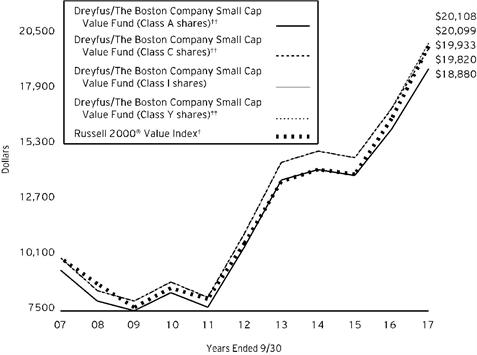
Comparison of change in value of $10,000 investment in Dreyfus/The Boston Company Small Cap Value Fund Class A shares, Class C shares, Class I shares and Class Y shares and the Russell 2000® Value Index (the “Index”)
† Source: Lipper Inc.
†† The total return figures presented for Class A and Class C shares of the fund reflect the performance of the fund’s Class I shares for the period prior to 8/1/16 (the inception date for Class A and Class C shares), adjusted to reflect the applicable sales load for Class A shares.
The total return figures presented for Class Y shares of the fund reflect the performance of the fund’s Class I shares for the period prior to 8/1/16 (the inception date for Class Y shares).
Past performance is not predictive of future performance.
The above graph compares a $10,000 investment made in each of the Class A, Class C, Class I and Class Y shares of Dreyfus/The Boston Company Small Cap Value Fund on 9/30/07 to a $10,000 investment made in the Index on that date. All dividends and capital gain distributions are reinvested.
The fund’s performance shown in the line graph above takes into account all applicable fees and expenses. The Index measures the performance of the small-cap value segment of the U.S. equity universe. It includes those Russell 2000 companies that are considered more value-oriented relative to the overall market as defined by Russell’s leading style methodology. The Russell 2000® Value Index is constructed to provide a comprehensive and unbiased barometer for the small-cap value segment. The index is completely reconstituted annually to ensure larger stocks do not distort the performance and characteristics of the true small-cap opportunity set and that the represented companies continue to reflect value characteristics. Unlike a mutual fund, the Index is not subject to charges, fees and other expenses. Investors cannot invest directly in any index. These factors can contribute to the Index potentially outperforming the fund. Further information relating to fund performance, including expense reimbursements, if applicable, is contained in the Financial Highlights section of the prospectus and elsewhere in this report.
5
FUND PERFORMANCE (continued)
| | | | | |
Average Annual Total Returns as of 9/30/17 |
| | Inception | | | |
| Date | 1 Year | 5 Years | 10 Years |
Class A shares | | | | |
with maximum sales charge (5.75%) | 8/1/16 | 10.84% | 11.11%†† | 6.56%†† |
without sales charge | 8/1/16 | 17.58% | 12.43%†† | 7.19%†† |
Class C shares | | | | |
with applicable redemption charge † | 8/1/16 | 15.49% | 12.19%†† | 7.08%†† |
without redemption | 8/1/16 | 16.49% | 12.19%†† | 7.08%†† |
Class I shares | 2/1/00 | 17.98% | 12.51% | 7.24% |
Class Y shares | 8/1/16 | 17.93% | 12.50%†† | 7.23%†† |
Russell 2000®
Value Index | | 20.55% | 13.27% | 7.14% |
† The maximum contingent deferred sales charge for Class C shares is 1% for shares redeemed within one year of the date of purchase.
†† The total return performance figures presented for Class A and Class C shares of the fund reflect the performance of the fund’s Class I shares for the period prior to 8/1/16 (the inception date for Class A and Class C shares), adjusted to reflect the applicable sales load for Class A shares.
The total return performance figures presented for Class Y shares of the fund reflect the performance of the fund’s Class I shares for the period prior to 8/1/16 (the inception date for Class Y shares).
The performance data quoted represents past performance, which is no guarantee of future results. Share price and investment return fluctuate and an investor’s shares may be worth more or less than original cost upon redemption. Current performance may be lower or higher than the performance quoted. Go to Dreyfus.com for the fund’s most recent month-end returns.
The fund’s performance shown in the graph and table does not reflect the deduction of taxes that a shareholder would pay on fund distributions or the redemption of fund shares. In addition to the performance of Class A shares shown with and without a maximum sales charge, the fund’s performance shown in the table takes into account all other applicable fees and expenses on all classes.
6
UNDERSTANDING YOUR FUND’S EXPENSES (Unaudited)
As a mutual fund investor, you pay ongoing expenses, such as management fees and other expenses. Using the information below, you can estimate how these expenses affect your investment and compare them with the expenses of other funds. You also may pay one-time transaction expenses, including sales charges (loads) and redemption fees, which are not shown in this section and would have resulted in higher total expenses. For more information, see your fund’s prospectus or talk to your financial adviser.
Review your fund’s expenses
The table below shows the expenses you would have paid on a $1,000 investment in Dreyfus/The Boston Company Small Cap Value Fund from April 1, 2017 to September 30, 2017. It also shows how much a $1,000 investment would be worth at the close of the period, assuming actual returns and expenses.
| | | | | | | | | | | | |
Expenses and Value of a $1,000 Investment | | |
assuming actual returns for the six months ended September 30, 2017 |
| | | | Class A | Class C | Class I | Class Y |
Expenses paid per $1,000† | | $7.08 | | $11.88 | | 5.30 | | $5.10 |
Ending value (after expenses) | | $1,030.70 | | $1,025.50 | | 1,032.70 | | $1,032.70 |
COMPARING YOUR FUND’S EXPENSES
WITH THOSE OF OTHER FUNDS (Unaudited)
Using the SEC’s method to compare expenses
The Securities and Exchange Commission (“SEC”) has established guidelines to help investors assess fund expenses. Per these guidelines, the table below shows your fund’s expenses based on a $1,000 investment, assuming a hypothetical 5% annualized return. You can use this information to compare the ongoing expenses (but not transaction expenses or total cost) of investing in the fund with those of other funds. All mutual fund shareholder reports will provide this information to help you make this comparison. Please note that you cannot use this information to estimate your actual ending account balance and expenses paid during the period.
| | | | | | | | | |
Expenses and Value of a $1,000 Investment |
assuming a hypothetical 5% annualized return for the six months ended September 30, 2017 |
| | | Class A | | Class C | | Class I | | Class Y |
Expenses paid per $1,000† | | $7.03 | | $11.81 | | $5.27 | | $5.06 |
Ending value (after expenses) | | $1,018.10 | | $1,013.34 | | $1,019.85 | | $1,020.05 |
† Expenses are equal to the fund’s annualized expense ratio of 1.39% for Class A, 2.34% for Class C, 1.04% for Class I and 1.00% for Class Y, multiplied by the average account value over the period, multiplied by 183/365 (to reflect the one-half year period).
7
STATEMENT OF INVESTMENTS
September 30, 2017
| | | | | | | | |
| |
Description | | | | Shares | | Value ($) | |
Common Stocks - 99.4% | | | | | |
Automobiles & Components - 1.6% | | | | | |
Dana | | | | 58,118 | | 1,624,979 | |
Gentherm | | | | 49,951 | a,b | 1,855,680 | |
| | | | | 3,480,659 | |
Banks - 16.5% | | | | | |
Associated Banc-Corp | | | | 106,286 | | 2,577,435 | |
Banner | | | | 28,981 | | 1,775,956 | |
Brookline Bancorp | | | | 35,760 | | 554,280 | |
Bryn Mawr Bank | | | | 23,070 | a | 1,010,466 | |
Central Pacific Financial | | | | 44,273 | | 1,424,705 | |
CoBiz Financial | | | | 40,478 | | 794,988 | |
CVB Financial | | | | 59,567 | | 1,439,734 | |
FCB Financial Holdings, Cl. A | | | | 22,489 | b | 1,086,219 | |
First Hawaiian | | | | 42,401 | | 1,284,326 | |
First Interstate BancSystem, Cl. A | | | | 22,696 | | 868,122 | |
Fulton Financial | | | | 110,824 | | 2,077,950 | |
Heritage Financial | | | | 34,629 | | 1,021,555 | |
Old National Bancorp | | | | 118,749 | a | 2,173,107 | |
Seacoast Banking Corporation of Florida | | | | 36,895 | b | 881,422 | |
South State | | | | 16,843 | | 1,516,712 | |
Texas Capital Bancshares | | | | 16,399 | b | 1,407,034 | |
UMB Financial | | | | 30,247 | | 2,253,099 | |
Umpqua Holdings | | | | 155,894 | | 3,041,492 | |
Union Bankshares | | | | 40,944 | | 1,445,323 | |
United Community Banks | | | | 68,737 | | 1,961,754 | |
Webster Financial | | | | 79,489 | | 4,177,147 | |
Westamerica Bancorporation | | | | 15,459 | a | 920,429 | |
| | | | | 35,693,255 | |
Capital Goods - 9.7% | | | | | |
Aerojet Rocketdyne Holdings | | | | 41,597 | b | 1,456,311 | |
Aerovironment | | | | 34,833 | a,b | 1,885,162 | |
Astec Industries | | | | 22,896 | | 1,282,405 | |
Chart Industries | | | | 36,493 | a,b | 1,431,620 | |
Comfort Systems USA | | | | 22,771 | | 812,925 | |
EMCOR Group | | | | 27,702 | | 1,921,965 | |
EnerSys | | | | 24,091 | | 1,666,374 | |
Granite Construction | | | | 38,199 | a | 2,213,632 | |
Kaman | | | | 21,358 | a | 1,191,349 | |
Lindsay | | | | 19,436 | a | 1,786,168 | |
MSC Industrial Direct, Cl. A | | | | 20,152 | | 1,522,887 | |
TPI Composites | | | | 27,601 | b | 616,606 | |
Trinity Industries | | | | 49,162 | a | 1,568,268 | |
8
| | | | | | | | |
| |
Description | | | | Shares | | Value ($) | |
Common Stocks - 99.4% (continued) | | | | | |
Capital Goods - 9.7% (continued) | | | | | |
Valmont Industries | | | | 9,938 | | 1,571,198 | |
| | | | | 20,926,870 | |
Commercial & Professional Services - 2.8% | | | | | |
Interface | | | | 81,253 | | 1,779,441 | |
Knoll | | | | 50,186 | | 1,003,720 | |
Korn/Ferry International | | | | 57,207 | | 2,255,672 | |
LSC Communications | | | | 63,768 | a | 1,052,810 | |
| | | | | 6,091,643 | |
Consumer Durables & Apparel - 3.5% | | | | | |
Cavco Industries | | | | 7,465 | b | 1,101,461 | |
Deckers Outdoor | | | | 31,951 | b | 2,185,768 | |
Ethan Allen Interiors | | | | 31,914 | | 1,034,014 | |
G-III Apparel Group | | | | 10,043 | b | 291,448 | |
Oxford Industries | | | | 20,145 | | 1,280,013 | |
TRI Pointe Group | | | | 47,783 | a,b | 659,883 | |
William Lyon Homes, Cl. A | | | | 43,142 | a,b | 991,835 | |
| | | | | 7,544,422 | |
Consumer Services - 1.7% | | | | | |
Belmond, Cl. A | | | | 133,464 | b | 1,821,784 | |
Cheesecake Factory | | | | 44,811 | a | 1,887,439 | |
| | | | | 3,709,223 | |
Diversified Financials - 2.4% | | | | | |
Cohen & Steers | | | | 42,272 | a | 1,669,321 | |
Federated Investors, Cl. B | | | | 71,076 | a | 2,110,957 | |
Morningstar | | | | 16,943 | | 1,439,986 | |
| | | | | 5,220,264 | |
Energy - 6.5% | | | | | |
Callon Petroleum | | | | 147,751 | a,b | 1,660,721 | |
Dril-Quip | | | | 26,632 | a,b | 1,175,803 | |
Geospace Technologies | | | | 4,573 | b | 81,491 | |
Natural Gas Services Group | | | | 29,907 | b | 849,359 | |
Newpark Resources | | | | 146,896 | b | 1,468,960 | |
Oasis Petroleum | | | | 167,770 | b | 1,530,062 | |
Oceaneering International | | | | 44,484 | | 1,168,595 | |
Patterson-UTI Energy | | | | 140,240 | | 2,936,626 | |
PDC Energy | | | | 37,023 | a,b | 1,815,238 | |
RPC | | | | 35,757 | a | 886,416 | |
SRC Energy | | | | 57,401 | a,b | 555,068 | |
| | | | | 14,128,339 | |
Exchange-Traded Funds - 1.0% | | | | | |
iShares Russell 2000 Value ETF | | | | 17,474 | | 2,168,873 | |
Food & Staples Retailing - 3.3% | | | | | |
SpartanNash | | | | 35,394 | | 933,340 | |
9
STATEMENT OF INVESTMENTS (continued)
| | | | | | | | |
| |
Description | | | | Shares | | Value ($) | |
Common Stocks - 99.4% (continued) | | | | | |
Food & Staples Retailing - 3.3% (continued) | | | | | |
Sprouts Farmers Market | | | | 104,911 | b | 1,969,179 | |
United Natural Foods | | | | 104,210 | a,b | 4,334,094 | |
| | | | | 7,236,613 | |
Food, Beverage & Tobacco - 2.8% | | | | | |
Boston Beer, Cl. A | | | | 18,519 | a,b | 2,892,668 | |
Fresh Del Monte Produce | | | | 17,502 | | 795,641 | |
Hain Celestial Group | | | | 55,508 | b | 2,284,154 | |
| | | | | 5,972,463 | |
Health Care Equipment & Services - 6.2% | | | | | |
Allscripts Healthcare Solutions | | | | 83,124 | a,b | 1,182,855 | |
Amedisys | | | | 31,012 | b | 1,735,432 | |
AMN Healthcare Services | | | | 43,473 | a,b | 1,986,716 | |
Analogic | | | | 6,393 | | 535,414 | |
Anika Therapeutics | | | | 18,719 | b | 1,085,702 | |
Globus Medical, Cl. A | | | | 67,815 | a,b | 2,015,462 | |
LifePoint Health | | | | 22,494 | a,b | 1,302,403 | |
Omnicell | | | | 38,765 | b | 1,978,953 | |
Tivity Health | | | | 38,118 | a,b | 1,555,214 | |
| | | | | 13,378,151 | |
Insurance - 1.1% | | | | | |
Safety Insurance Group | | | | 11,143 | | 850,211 | |
Selective Insurance Group | | | | 27,720 | | 1,492,722 | |
| | | | | 2,342,933 | |
Materials - 3.0% | | | | | |
Carpenter Technology | | | | 37,807 | | 1,815,870 | |
Commercial Metals | | | | 79,036 | a | 1,504,055 | |
Hecla Mining | | | | 195,937 | | 983,604 | |
Louisiana-Pacific | | | | 78,412 | b | 2,123,397 | |
| | | | | 6,426,926 | |
Media - 3.5% | | | | | |
E.W. Scripps, Cl. A | | | | 116,152 | a,b | 2,219,665 | |
New York Times, Cl. A | | | | 121,270 | a | 2,376,892 | |
Scholastic | | | | 32,207 | | 1,198,100 | |
Sinclair Broadcast Group, Cl. A | | | | 54,700 | a | 1,753,135 | |
| | | | | 7,547,792 | |
Pharmaceuticals, Biotechnology & Life Sciences - 1.9% | | | | | |
Cambrex | | | | 45,411 | a,b | 2,497,605 | |
Supernus Pharmaceuticals | | | | 43,110 | a,b | 1,724,400 | |
| | | | | 4,222,005 | |
Real Estate - 7.0% | | | | | |
Agree Realty | | | | 22,362 | a,c | 1,097,527 | |
Education Realty Trust | | | | 32,616 | c | 1,171,893 | |
LaSalle Hotel Properties | | | | 51,538 | a,c | 1,495,633 | |
10
| | | | | | | | |
| |
Description | | | | Shares | | Value ($) | |
Common Stocks - 99.4% (continued) | | | | | |
Real Estate - 7.0% (continued) | | | | | |
Outfront Media | | | | 52,890 | a,c | 1,331,770 | |
Pebblebrook Hotel Trust | | | | 71,962 | a,c | 2,600,707 | |
QTS Realty Trust, Cl. A | | | | 27,572 | c | 1,443,670 | |
STAG Industrial | | | | 61,656 | c | 1,693,690 | |
STORE Capital | | | | 49,166 | a,c | 1,222,758 | |
Tanger Factory Outlet Centers | | | | 53,976 | a,c | 1,318,094 | |
Washington Prime Group | | | | 202,821 | a,c | 1,689,499 | |
| | | | | 15,065,241 | |
Retailing - 4.9% | | | | | |
Dillard's, Cl. A | | | | 47,124 | a | 2,642,243 | |
Guess? | | | | 117,672 | a | 2,003,954 | |
Office Depot | | | | 232,280 | | 1,054,551 | |
Shutterfly | | | | 31,875 | b | 1,545,300 | |
Urban Outfitters | | | | 76,597 | a,b | 1,830,668 | |
Williams-Sonoma | | | | 31,633 | a | 1,577,221 | |
| | | | | 10,653,937 | |
Semiconductors & Semiconductor Equipment - 2.5% | | | | | |
Brooks Automation | | | | 48,292 | | 1,466,145 | |
Cirrus Logic | | | | 23,951 | b | 1,277,067 | |
First Solar | | | | 30,831 | b | 1,414,526 | |
Photronics | | | | 129,365 | b | 1,144,880 | |
| | | | | 5,302,618 | |
Software & Services - 6.0% | | | | | |
Acxiom | | | | 77,545 | b | 1,910,709 | |
CSG Systems International | | | | 37,147 | | 1,489,595 | |
DST Systems | | | | 37,936 | | 2,081,928 | |
MicroStrategy, Cl. A | | | | 9,514 | b | 1,215,033 | |
NIC | | | | 56,434 | | 967,843 | |
Shutterstock | | | | 34,881 | a,b | 1,161,188 | |
Teradata | | | | 63,623 | a,b | 2,149,821 | |
Verint Systems | | | | 47,947 | b | 2,006,582 | |
| | | | | 12,982,699 | |
Technology Hardware & Equipment - 5.1% | | | | | |
Ciena | | | | 91,577 | a,b | 2,011,947 | |
Cray | | | | 58,533 | b | 1,138,467 | |
FARO Technologies | | | | 11,679 | a,b | 446,722 | |
II-VI | | | | 20,994 | b | 863,903 | |
Methode Electronics | | | | 18,129 | | 767,763 | |
NETGEAR | | | | 31,524 | b | 1,500,542 | |
NetScout Systems | | | | 53,330 | b | 1,725,225 | |
Plantronics | | | | 22,688 | | 1,003,263 | |
Tech Data | | | | 16,683 | a,b | 1,482,285 | |
| | | | | 10,940,117 | |
11
STATEMENT OF INVESTMENTS (continued)
| | | | | | | | |
| |
Description | | | | Shares | | Value ($) | |
Common Stocks - 99.4% (continued) | | | | | |
Transportation - 1.7% | | | | | |
Hub Group, Cl. A | | | | 54,102 | b | 2,323,681 | |
Marten Transport | | | | 62,452 | | 1,283,389 | |
| | | | | 3,607,070 | |
Utilities - 4.7% | | | | | |
American States Water | | | | 22,887 | a | 1,127,185 | |
Chesapeake Utilities | | | | 23,349 | | 1,827,059 | |
Hawaiian Electric Industries | | | | 50,049 | a | 1,670,135 | |
Portland General Electric | | | | 32,221 | | 1,470,566 | |
Vectren | | | | 24,704 | | 1,624,782 | |
WGL Holdings | | | | 28,296 | | 2,382,523 | |
| | | | | 10,102,250 | |
Total Common Stocks (cost $175,142,852) | | | | 214,744,363 | |
| | | | | | | | |
Other Investment - 1.1% | | | | | |
Registered Investment Company; | | | | | |
Dreyfus Institutional Preferred Government Plus Money Market Fund
(cost $2,351,191) | | | | 2,351,191 | d | 2,351,191 | |
| | | | | | | | |
Investment of Cash Collateral for Securities Loaned - 10.4% | | | | | |
Registered Investment Company; | | | | | |
Dreyfus Institutional Preferred Government Money Market Fund, Institutional Shares
(cost $22,454,034) | | | | 22,454,034 | d | 22,454,034 | |
Total Investments (cost $199,948,077) | | 110.9% | | 239,549,588 | |
Liabilities, Less Cash and Receivables | | (10.9%) | | (23,487,244) | |
Net Assets | | 100.0% | | 216,062,344 | |
ETF—Exchange-Traded Fund
a Security, or portion thereof, on loan. At September 30, 2017, the value of the fund’s securities on loan was $53,711,309 and the value of the collateral held by the fund was $55,159,374, consisting of cash collateral of $22,454,034 and U.S. Government & Agency securities valued at $32,705,340.
b Non-income producing security.
c Investment in real estate investment trust.
d Investment in affiliated money market mutual fund.
12
| | |
Portfolio Summary (Unaudited) † | Value (%) |
Banks | 16.5 |
Money Market Investments | 11.5 |
Capital Goods | 9.7 |
Real Estate | 7.0 |
Energy | 6.5 |
Health Care Equipment & Services | 6.2 |
Software & Services | 6.0 |
Technology Hardware & Equipment | 5.1 |
Retailing | 4.9 |
Utilities | 4.7 |
Media | 3.5 |
Consumer Durables & Apparel | 3.5 |
Food & Staples Retailing | 3.3 |
Materials | 3.0 |
Commercial & Professional Services | 2.8 |
Food, Beverage & Tobacco | 2.8 |
Semiconductors & Semiconductor Equipment | 2.5 |
Diversified Financials | 2.4 |
Pharmaceuticals, Biotechnology & Life Sciences | 1.9 |
Consumer Services | 1.7 |
Transportation | 1.7 |
Automobiles & Components | 1.6 |
Insurance | 1.1 |
Exchange-Traded Funds | 1.0 |
| | 110.9 |
† Based on net assets.
See notes to financial statements.
13
STATEMENT OF INVESTMENTS IN AFFILIATED ISSUERS
| | | | | | | |
Registered Investment Companies | Value
9/30/2016 ($) | Purchases ($) | Sales ($) | Value
9/30/2017 ($) | Net
Assets (%) | Dividends/
Distributions ($) |
Dreyfus Institutional Cash Advantage Fund, Institutional Shares | 14,807,111 | - | 14,807,111 | - | - | - |
Dreyfus Institutional Preferred Government Plus Money Market Fund | 2,846,520 | 77,291,237 | 77,786,566 | 2,351,191 | 1.1 | 20,538 |
Dreyfus Institutional Preferred Government Money Market Fund, Institutional Shares | - | 165,508,791 | 143,054,757 | 22,454,034 | 10.4 | - |
Total | 17,653,631 | 242,800,028 | 235,648,434 | 24,805,225 | 11.5 | 20,538 |
See notes to financial statements.
14
STATEMENT OF ASSETS AND LIABILITIES
September 30, 2017
| | | | | | | |
| | | | | | |
| | | Cost | | Value | |
Assets ($): | | | | |
Investments in securities—See Statement of Investments
(including securities on loan, valued at $53,711,309)—Note 1(b): | | | |
Unaffiliated issuers | 175,142,852 | | 214,744,363 | |
Affiliated issuers | | 24,805,225 | | 24,805,225 | |
Receivable for investment securities sold | | | | | 995,550 | |
Dividends and securities lending income receivable | | | | | 212,240 | |
Prepaid expenses | | | | | 31,175 | |
| | | | | 240,788,553 | |
Liabilities ($): | | | | |
Due to The Dreyfus Corporation and affiliates—Note 3(c) | | | | | 166,140 | |
Cash overdraft due to Custodian | | | | | 431,693 | |
Liability for securities on loan—Note 1(b) | | | | | 22,454,034 | |
Payable for investment securities purchased | | | | | 1,591,999 | |
Payable for shares of Beneficial Interest redeemed | | | | | 20,030 | |
Accrued expenses | | | | | 62,313 | |
| | | | | 24,726,209 | |
Net Assets ($) | | | 216,062,344 | |
Composition of Net Assets ($): | | | | |
Paid-in capital | | | | | 150,531,571 | |
Accumulated undistributed investment income—net | | 531,851 | |
Accumulated net realized gain (loss) on investments | | | | | 25,397,411 | |
Accumulated net unrealized appreciation (depreciation)
on investments | | | | 39,601,511 | |
Net Assets ($) | | | 216,062,344 | |
| | | | | | |
Net Asset Value Per Share | Class A | Class C | Class I | Class Y | |
Net Assets ($) | 231,444 | 26,762 | 208,377,241 | 7,426,897 | |
Shares Outstanding | 9,193 | 1,073 | 8,247,442 | 294,140 | |
Net Asset Value Per Share ($) | 25.18 | 24.94 | 25.27 | 25.25 | |
| | | | | | |
See notes to financial statements. | | | | | |
15
STATEMENT OF OPERATIONS
Year Ended September 30, 2017
| | | | | | | |
| | | | | | |
| | | | | | |
Investment Income ($): | | | | |
Income: | | | | |
Cash dividends: | |
Unaffiliated issuers | | | 3,409,611 | |
Affiliated issuers | | | 20,538 | |
Income from securities lending—Note 1(b) | | | 175,608 | |
Total Income | | | 3,605,757 | |
Expenses: | | | | |
Investment advisory fee—Note 3(a) | | | 1,746,524 | |
Administration fee—Note 3(a) | | | 130,989 | |
Shareholder servicing costs—Note 3(c) | | | 100,540 | |
Professional fees | | | 86,595 | |
Registration fees | | | 83,523 | |
Custodian fees—Note 3(c) | | | 38,301 | |
Prospectus and shareholders’ reports | | | 17,099 | |
Trustees’ fees and expenses—Note 3(d) | | | 16,206 | |
Loan commitment fees—Note 2 | | | 5,663 | |
Interest expense—Note 2 | | | 2,179 | |
Distribution fees—Note 3(b) | | | 287 | |
Miscellaneous | | | 26,448 | |
Total Expenses | | | 2,254,354 | |
Less—reduction in expenses due to undertaking—Note 3(a) | | | (214) | |
Less—reduction in fees due to earnings credits—Note 3(c) | | | (167) | |
Net Expenses | | | 2,253,973 | |
Investment Income—Net | | | 1,351,784 | |
Realized and Unrealized Gain (Loss) on Investments—Note 4 ($): | | |
Net realized gain (loss) on investments | 30,411,050 | |
Net unrealized appreciation (depreciation) on investments | | | 3,211,974 | |
Net Realized and Unrealized Gain (Loss) on Investments | | | 33,623,024 | |
Net Increase in Net Assets Resulting from Operations | | 34,974,808 | |
| | | | | | | |
See notes to financial statements. | | | | | |
16
STATEMENT OF CHANGES IN NET ASSETS
| | | | | | | | | | |
| | | | Year Ended September 30, |
| | | | 2017 | | 2016a | |
Operations ($): | | | | | | | | |
Investment income—net | | | 1,351,784 | | | | 1,368,152 | |
Net realized gain (loss) on investments | | 30,411,050 | | | | 16,248,204 | |
Net unrealized appreciation (depreciation)
on investments | | 3,211,974 | | | | 13,645,153 | |
Net Increase (Decrease) in Net Assets
Resulting from Operations | 34,974,808 | | | | 31,261,509 | |
Distributions to Shareholders from ($): | |
Investment income—net: | | | | | | | | |
Class A | | | (68) | | | | - | |
Class C | | | (86) | | | | - | |
Class I | | | (910,192) | | | | (1,900,456) | |
Class Y | | | (49) | | | | - | |
Net realized gain on investments: | | | | | | | | |
Class A | | | (1,375) | | | | - | |
Class C | | | (2,601) | | | | - | |
Class I | | | (16,890,205) | | | | (20,323,088) | |
Class Y | | | (840) | | | | - | |
Total Distributions | | | (17,805,416) | | | | (22,223,544) | |
Beneficial Interest Transactions ($): | |
Net proceeds from shares sold: | | | | | | | | |
Class A | | | 218,468 | | | | 10,000 | |
Class C | | | 38,302 | | | | 10,000 | |
Class I | | | 27,015,506 | | | | 21,354,015 | |
Class Y | | | 7,060,569 | | | | 10,000 | |
Distributions reinvested: | | | | | | | | |
Class A | | | 561 | | | | - | |
Class C | | | 1,818 | | | | - | |
Class I | | | 17,276,112 | | | | 21,820,149 | |
Cost of shares redeemed: | | | | | | | | |
Class A | | | (7,948) | | | | - | |
Class C | | | (22,836) | | | | - | |
Class I | | | (58,057,045) | | | | (101,891,572) | |
Increase (Decrease) in Net Assets
from Beneficial Interest Transactions | (6,476,493) | | | | (58,687,408) | |
Total Increase (Decrease) in Net Assets | 10,692,899 | | | | (49,649,443) | |
Net Assets ($): | |
Beginning of Period | | | 205,369,445 | | | | 255,018,888 | |
End of Period | | | 216,062,344 | | | | 205,369,445 | |
Undistributed investment income—net | 531,851 | | | | 770,936 | |
17
STATEMENT OF CHANGES IN NET ASSETS (continued)
| | | | | | | | | | |
| | | | Year Ended September 30, |
| | | | 2017 | | 2016a | |
Capital Share Transactions (Shares): | |
Class A | | | | | | | | |
Shares sold | | | 9,063 | | | | 439 | |
Shares issued for distributions reinvested | | | 23 | | | | - | |
Shares redeemed | | | (332) | | | | - | |
Net Increase (Decrease) in Shares Outstanding | 8,754 | | | | 439 | |
Class C | | | | | | | | |
Shares sold | | | 1,554 | | | | 439 | |
Shares issued for distributions reinvested | | | 75 | | | | - | |
Shares redeemed | | | (995) | | | | - | |
Net Increase (Decrease) in Shares Outstanding | 634 | | | | 439 | |
Class I | | | | | | | | |
Shares sold | | | 1,107,768 | | | | 998,157 | |
Shares issued for distributions reinvested | | | 712,417 | | | | 1,055,644 | |
Shares redeemed | | | (2,421,691) | | | | (4,821,491) | |
Net Increase (Decrease) in Shares Outstanding | (601,506) | | | | (2,767,690) | |
Class Y | | | | | | | | |
Shares sold | | | 293,701 | | | | 439 | |
Net Increase (Decrease) in Shares Outstanding | 293,701 | | | | 439 | |
| | | | | | | | | | |
aEffective August 1, 2016, the fund commenced offering Class A, Class C and Class Y shares. | |
See notes to financial statements. | | | | | | | | |
18
FINANCIAL HIGHLIGHTS
The following tables describe the performance for each share class for the fiscal periods indicated. All information (except portfolio turnover rate) reflects financial results for a single fund share. Total return shows how much your investment in the fund would have increased (or decreased) during each period, assuming you had reinvested all dividends and distributions. These figures have been derived from the fund’s financial statements.
| | | | |
| | |
| | | Year Ended September 30, |
Class A Shares | | 2017 | 2016a |
Per Share Data ($): | | | |
Net asset value,
beginning of period | | 23.19 | 22.77 |
Investment Operations: | | | |
Investment income—netb | | .05 | .02 |
Net realized and unrealized
gain (loss) on investments | | 3.94 | .40 |
Total from Investment Operations | | 3.99 | .42 |
Distributions: | | | |
Dividends from investment
income—net | | (.09) | - |
Dividends from net realized
gain on investments | | (1.91) | - |
Total Distributions | | (2.00) | - |
Net asset value, end of period | | 25.18 | 23.19 |
Total Return (%)c | | 17.58 | 1.84d |
Ratios/Supplemental Data (%): | | | |
Ratio of total expenses
to average net assets | | 1.37 | 1.37e |
Ratio of net expenses
to average net assets | | 1.37 | 1.37e |
Ratio of net investment income
to average net assets | | .21 | .46e |
Portfolio Turnover Rate | | 76.86 | 78.56 |
Net Assets, end of period ($ x 1,000) | | 231 | 10 |
a From August 1, 2016 (commencement of initial offering) to September 30, 2016.
b Based on average shares outstanding.
c Exclusive of sales charge.
d Not annualized.
e Annualized.
See notes to financial statements.
19
FINANCIAL HIGHLIGHTS (continued)
| | | | |
| | |
| | | Year Ended September 30, |
Class C Shares | | 2017 | 2016a |
Per Share Data ($): | | | |
Net asset value,
beginning of period | | 23.16 | 22.77 |
Investment Operations: | | | |
Investment (loss)—netb | | (.20) | (.01) |
Net realized and unrealized
gain (loss) on investments | | 3.95 | .40 |
Total from Investment Operations | | 3.75 | .39 |
Distributions: | | | |
Dividends from investment
income—net | | (.06) | - |
Dividends from net realized
gain on investments | | (1.91) | - |
Total Distributions | | (1.97) | - |
Net asset value, end of period | | 24.94 | 23.16 |
Total Return (%)c | | 16.49 | 1.71d |
Ratios/Supplemental Data (%): | | | |
Ratio of total expenses
to average net assets | | 2.30 | 2.13e |
Ratio of net expenses
to average net assets | | 2.30 | 2.13e |
Ratio of net investment (loss)
to average net assets | | (.79) | (.30)e |
Portfolio Turnover Rate | | 76.86 | 78.56 |
Net Assets, end of period ($ x 1,000) | | 27 | 10 |
a From August 1, 2016 (commencement of initial offering) to September 30, 2016.
b Based on average shares outstanding.
c Exclusive of sales charge.
d Not annualized.
e Annualized.
See notes to financial statements.
20
| | | | | | | | |
| | |
| | Year Ended September 30, |
Class I Shares | | 2017 | 2016 | 2015 | 2014 | 2013 |
Per Share Data ($): | | | | | | |
Net asset value,
beginning of period | | 23.20 | 21.95 | 28.21 | 32.76 | 25.65 |
Investment Operations: | | | | | | |
Investment income—neta | | .15 | .14 | .15 | .11 | .26 |
Net realized and unrealized
gain (loss) on investments | | 3.93 | 3.11 | (.51) | 1.15 | 7.29 |
Total from Investment Operations | | 4.08 | 3.25 | (.36) | 1.26 | 7.55 |
Distributions: | | | | | | |
Dividends from investment
income—net | | (.10) | (.17) | (.13) | (.09) | (.22) |
Dividends from net realized
gain on investments | | (1.91) | (1.83) | (5.77) | (5.72) | (.22) |
Total Distributions | | (2.01) | (2.00) | (5.90) | (5.81) | (.44) |
Net asset value, end of period | | 25.27 | 23.20 | 21.95 | 28.21 | 32.76 |
Total Return (%) | | 17.98 | 15.91 | (2.05) | 3.62 | 29.92 |
Ratios/Supplemental Data (%): | | | | | | |
Ratio of total expenses
to average net assets | | 1.03 | 1.00 | .97 | .96 | .99 |
Ratio of net expenses
to average net assets | | 1.03 | 1.00 | .97 | .96 | .99 |
Ratio of net investment income
to average net assets | | .62 | .63 | .62 | .37 | .90 |
Portfolio Turnover Rate | | 76.86 | 78.56 | 76.23 | 68.43 | 76.63 |
Net Assets, end of period ($ x 1,000) | | 208,377 | 205,339 | 255,019 | 318,376 | 385,746 |
a Based on average shares outstanding.
See notes to financial statements.
21
FINANCIAL HIGHLIGHTS (continued)
| �� | | | |
| | |
| | | Year Ended September 30, |
Class Y Shares | | 2017 | 2016a |
Per Share Data ($): | | | |
Net asset value,
beginning of period | | 23.20 | 22.77 |
Investment Operations: | | | |
Investment income—netb | | .10 | .03 |
Net realized and unrealized
gain (loss) on investments | | 3.97 | .40 |
Total from Investment Operations | | 4.07 | .43 |
Distributions: | | | |
Dividends from investment
income—net | | (.11) | - |
Dividends from net realized
gain on investments | | (1.91) | - |
Total Distributions | | (2.02) | - |
Net asset value, end of period | | 25.25 | 23.20 |
Total Return (%) | | 17.93 | 1.89c |
Ratios/Supplemental Data (%): | | | |
Ratio of total expenses
to average net assets | | 1.00 | 1.12d |
Ratio of net expenses
to average net assets | | 1.00 | 1.12d |
Ratio of net investment income
to average net assets | | .42 | .72d |
Portfolio Turnover Rate | | 76.86 | 78.56 |
Net Assets, end of period ($ x 1,000) | | 7,427 | 10 |
a From August 1, 2016 (commencement of initial offering) to September 30, 2016.
b Based on average shares outstanding.
c Not annualized.
d Annualized.
See notes to financial statements.
22
NOTES TO FINANCIAL STATEMENTS
NOTE 1—Significant Accounting Policies:
Dreyfus/The Boston Company Small Cap Value Fund (the “fund”) is a separate diversified series of Dreyfus Investment Funds (the “Trust”), which is registered under the Investment Company Act of 1940, as amended (the “Act”), as an open-end management investment company and operates as a series company currently offering seven series, including the fund. The fund’s investment objective is to seek long-term growth of capital. The Dreyfus Corporation (the “Manager” or “Dreyfus”), a wholly-owned subsidiary of The Bank of New York Mellon Corporation (“BNY Mellon”), serves as the fund’s investment adviser.
Effective March 31, 2017, the fund authorized the issuance of Class T shares, but, as of the date of this report, the fund did not offer Class T shares for purchase.
MBSC Securities Corporation (the “Distributor”), a wholly-owned subsidiary of Dreyfus, is the distributor of the fund’s shares. The fund is authorized to issue an unlimited number of $.001 par value shares of Beneficial Interest in each of the following classes of shares: Class A, Class C, Class I, Class T and Class Y. Class A, Class C and Class T shares are sold primarily to retail investors through financial intermediaries and bear Distribution and/or Shareholder Services Plan fees. Class A and Class T shares generally are subject to a sales charge imposed at the time of purchase. Class C shares are subject to a contingent deferred sales charge (“CDSC”) imposed on Class C shares redeemed within one year of purchase. Class I shares are sold primarily to bank trust departments and other financial service providers (including The Bank of New York Mellon, a subsidiary of BNY Mellon and an affiliate of Dreyfus, and its affiliates), acting on behalf of customers having a qualified trust or an investment account or relationship at such institution, and bear no Distribution or Shareholder Services Plan fees. Class Y shares are sold at net asset value per share generally to institutional investors, and bear no Distribution or Shareholder Services Plan fees. Class I and Class Y shares are offered without a front-end sales charge or CDSC. Other differences between the classes include the services offered to and the expenses borne by each class, the allocation of certain transfer agency costs, and certain voting rights. Income, expenses (other than expenses attributable to a specific class), and realized and unrealized gains or losses on investments are allocated to each class of shares based on its relative net assets.
As of September 30, 2017, MBC Investments Corp., an indirect subsidiary of BNY Mellon, held 439 Class A and 439 Class C shares of the fund.
23
NOTES TO FINANCIAL STATEMENTS (continued)
The Trust accounts separately for the assets, liabilities and operations of each series. Expenses directly attributable to each series are charged to that series’ operations; expenses which are applicable to all series are allocated among them on a pro rata basis.
The Financial Accounting Standards Board (“FASB”) Accounting Standards Codification is the exclusive reference of authoritative U.S. generally accepted accounting principles (“GAAP”) recognized by the FASB to be applied by nongovernmental entities. Rules and interpretive releases of the Securities and Exchange Commission (“SEC”) under authority of federal laws are also sources of authoritative GAAP for SEC registrants. The fund’s financial statements are prepared in accordance with GAAP, which may require the use of management estimates and assumptions. Actual results could differ from those estimates.
(a) Portfolio valuation: The fair value of a financial instrument is the amount that would be received to sell an asset or paid to transfer a liability in an orderly transaction between market participants at the measurement date (i.e., the exit price). GAAP establishes a fair value hierarchy that prioritizes the inputs of valuation techniques used to measure fair value. This hierarchy gives the highest priority to unadjusted quoted prices in active markets for identical assets or liabilities (Level 1 measurements) and the lowest priority to unobservable inputs (Level 3 measurements).
Additionally, GAAP provides guidance on determining whether the volume and activity in a market has decreased significantly and whether such a decrease in activity results in transactions that are not orderly. GAAP requires enhanced disclosures around valuation inputs and techniques used during annual and interim periods.
Various inputs are used in determining the value of the fund’s investments relating to fair value measurements. These inputs are summarized in the three broad levels listed below:
Level 1—unadjusted quoted prices in active markets for identical investments.
Level 2—other significant observable inputs (including quoted prices for similar investments, interest rates, prepayment speeds, credit risk, etc.).
Level 3—significant unobservable inputs (including the fund’s own assumptions in determining the fair value of investments).
The inputs or methodology used for valuing securities are not necessarily an indication of the risk associated with investing in those securities.
24
Changes in valuation techniques may result in transfers in or out of an assigned level within the disclosure hierarchy. Valuation techniques used to value the fund’s investments are as follows:
Investments in securities are valued at the last sales price on the securities exchange or national securities market on which such securities are primarily traded. Securities listed on the National Market System for which market quotations are available are valued at the official closing price or, if there is no official closing price that day, at the last sales price. For open short positions, asked prices are used for valuation purposes. Bid price is used when no asked price is available. Registered investment companies that are not traded on an exchange are valued at their net asset value. All of the preceding securities are generally categorized within Level 1 of the fair value hierarchy.
Securities not listed on an exchange or the national securities market, or securities for which there were no transactions, are valued at the average of the most recent bid and asked prices. These securities are generally categorized within Level 2 of the fair value hierarchy.
Fair valuing of securities may be determined with the assistance of a pricing service using calculations based on indices of domestic securities and other appropriate indicators, such as prices of relevant American Depository Receipts and futures. Utilizing these techniques may result in transfers between Level 1 and Level 2 of the fair value hierarchy.
When market quotations or official closing prices are not readily available, or are determined not to reflect accurately fair value, such as when the value of a security has been significantly affected by events after the close of the exchange or market on which the security is principally traded (for example, a foreign exchange or market), but before the fund calculates its net asset value, the fund may value these investments at fair value as determined in accordance with the procedures approved by the Trust's Board of Trustees (the “Board”). Certain factors may be considered when fair valuing investments such as: fundamental analytical data, the nature and duration of restrictions on disposition, an evaluation of the forces that influence the market in which the securities are purchased and sold, and public trading in similar securities of the issuer or comparable issuers. These securities are either categorized within Level 2 or 3 of the fair value hierarchy depending on the relevant inputs used.
For restricted securities where observable inputs are limited, assumptions about market activity and risk are used and are generally categorized within Level 3 of the fair value hierarchy.
25
NOTES TO FINANCIAL STATEMENTS (continued)
The following is a summary of the inputs used as of September 30, 2017 in valuing the fund’s investments:
| | | | | |
| | Level 1 - Unadjusted Quoted Prices | Level 2 - Other Significant Observable Inputs | Level 3 -Significant Unobservable Inputs | Total |
Assets ($) | | | | |
Investments in Securities: | | |
Equity Securities-Domestic Common Stocks† | 210,753,706 | - | - | 210,753,706 |
Equity Securities-Foreign Common Stocks† | 1,821,784 | - | - | 1,821,784 |
Exchange-Traded Fund | 2,168,873 | - | - | 2,168,873 |
Registered Investment Companies | 24,805,225 | - | - | 24,805,225 |
† See Statement of Investments for additional detailed categorizations.
At September 30, 2017, there were no transfers between levels of the fair value hierarchy. It is the fund’s policy to recognize transfers between levels at the end of the reporting period.
(b) Securities transactions and investment income: Securities transactions are recorded on a trade date basis. Realized gains and losses from securities transactions are recorded on the identified cost basis. Dividend income is recognized on the ex-dividend date and interest income, including, where applicable, accretion of discount and amortization of premium on investments, is recognized on the accrual basis.
Pursuant to a securities lending agreement with The Bank of New York Mellon, the fund may lend securities to qualified institutions. It is the fund’s policy that, at origination, all loans are secured by collateral of at least 102% of the value of U.S. securities loaned and 105% of the value of foreign securities loaned. Collateral equivalent to at least 100% of the market value of securities on loan is maintained at all times. Collateral is either in the form of cash, which can be invested in certain money market mutual funds managed by Dreyfus, or U.S. Government and Agency securities. The fund is entitled to receive all dividends, interest and distributions on securities loaned, in addition to income earned as a result of the lending transaction. Should a borrower fail to return the securities in a timely manner, The Bank of New York Mellon is required to replace the securities for the benefit of the fund or credit the fund with the market
26
value of the unreturned securities and is subrogated to the fund’s rights against the borrower and the collateral. Additionally, the contractual maturity of security lending transactions are on an overnight and continuous basis. During the period ended September 30, 2017, The Bank of New York Mellon earned $33,909 from lending portfolio securities, pursuant to the securities lending agreement.
(c) Affiliated issuers: Investments in other investment companies advised by Dreyfus are defined as “affiliated” under the Act.
(d) Dividends and distributions to shareholders: Dividends and distributions are recorded on the ex-dividend date. Dividends from investment income-net and dividends from net realized capital gains, if any, are normally declared and paid annually, but the fund may make distributions on a more frequent basis to comply with the distribution requirements of the Internal Revenue Code of 1986, as amended (the “Code”). To the extent that net realized capital gains can be offset by capital loss carryovers, it is the policy of the fund not to distribute such gains. Income and capital gain distributions are determined in accordance with income tax regulations, which may differ from GAAP.
(e) Federal income taxes: It is the policy of the fund to continue to qualify as a regulated investment company, if such qualification is in the best interests of its shareholders, by complying with the applicable provisions of the Code, and to make distributions of taxable income sufficient to relieve it from substantially all federal income and excise taxes.
As of and during the period ended September 30, 2017, the fund did not have any liabilities for any uncertain tax positions. The fund recognizes interest and penalties, if any, related to uncertain tax positions as income tax expense in the Statement of Operations. During the period ended September 30, 2017, the fund did not incur any interest or penalties.
Each tax year in the four-year period ended September 30, 2017 remains subject to examination by the Internal Revenue Service and state taxing authorities.
At September 30, 2017, the components of accumulated earnings on a tax basis were as follows: undistributed ordinary income $8,392,659, undistributed capital gains $21,994,928 and unrealized appreciation $35,143,186.
The tax character of distributions paid to shareholders during the fiscal periods ended September 30, 2017 and September 30, 2016 were as follows: ordinary income $1,395,205 and $1,900,456, and long-term capital gains $16,410,211 and $20,323,088, respectively.
27
NOTES TO FINANCIAL STATEMENTS (continued)
During the period ended September 30, 2017, as a result of permanent book to tax differences, primarily due to the tax treatment for real estate investment trusts, the fund decreased accumulated undistributed investment income-net by $680,474 and increased accumulated net realized gain (loss) on investments by the same amount. Net assets and net asset value per share were not affected by this reclassification.
NOTE 2—Bank Lines of Credit:
The fund participates with other Dreyfus-managed funds in an $810 million unsecured credit facility led by Citibank, N.A. and a $300 million unsecured credit facility provided by The Bank of New York Mellon (each, a “Facility”), each to be utilized primarily for temporary or emergency purposes, including the financing of redemptions. Prior to October 5, 2016, the unsecured credit facility with Citibank, N.A. was $555 million. In connection therewith, the fund has agreed to pay its pro rata portion of commitment fees for each Facility. Interest is charged to the fund based on rates determined pursuant to the terms of the respective Facility at the time of borrowing.
The average amount of borrowings outstanding under the Facilities during the period ended September 30, 2017 was approximately $121,100 with a related weighted average annualized interest rate of 1.80%.
NOTE 3—Investment Advisory Fee, Administration Fee and Other Transactions with Affiliates:
(a) Pursuant to an investment advisory agreement with Dreyfus, the investment advisory fee is computed at the annual rate of .80% of the value of the fund’s average daily net assets and is payable monthly. Dreyfus has contractually agreed, from March 23, 2017 through February 1, 2019, to waive receipt of its fees and/or assume the direct expenses of the fund so that the annual fund operating expenses for Class Y shares (excluding taxes, interest, brokerage commissions, commitment fees on borrowings and extraordinary expenses) do not exceed 1.00% of the value of Class Y shares average daily net assets. On or after February 1, 2019, Dreyfus may terminate this expense limitation at any time. The reduction in expenses, pursuant to the undertaking, amounted to $214 during the period ended September 30, 2017.
The fund has a Fund Accounting and Administrative Services Agreement (the “Administration Agreement”) with Dreyfus, whereby Dreyfus performs administrative, accounting and recordkeeping services for the fund. The fund has agreed to compensate Dreyfus for providing accounting and recordkeeping services, administration, compliance monitoring, regulatory and shareholder reporting, as well as related
28
facilities, equipment and clerical help. The fee is based on the fund’s average daily net assets and computed at the following annual rates: .06% of the first $500 million, .04% of the next $500 million and .02% in excess of $1 billion.
In addition, after applying any expense limitations or fee waivers that reduce the fees paid to Dreyfus for this service, Dreyfus has contractually agreed in writing to waive any remaining fees for this service to the extent that they exceed both Dreyfus’ costs in providing these services and a reasonable allocation of the costs incurred by Dreyfus and its affiliates related to the support and oversight of these services. The fund also reimburses Dreyfus for the out-of-pocket expenses incurred in performing this service for the fund. Pursuant to the Administration Agreement, the fund was charged $130,989 during the period ended September 30, 2017.
(b) Under the Distribution Plan adopted pursuant to Rule 12b-1 under the Act, Class C shares pay the Distributor for distributing its shares at an annual rate of .75% of the value of its average daily net assets. During the period ended September 30, 2017, Class C shares were charged $287 pursuant to the Distribution Plan.
(c) Under the Shareholder Services Plan, Class A and Class C shares pay the Distributor at an annual rate of .25% of the value of their average daily net assets for the provision of certain services. The services provided may include personal services relating to shareholder accounts, such as answering shareholder inquiries regarding the fund and providing reports and other information, and services related to the maintenance of shareholder accounts. The Distributor may make payments to Service Agents (securities dealers, financial institutions or other industry professionals) with respect to these services. The Distributor determines the amounts to be paid to Service Agents. During the period ended September 30, 2017, Class A and Class C shares were charged $303 and $96, respectively, pursuant to the Shareholder Services Plan.
Under its terms, the Distribution Plan and Shareholder Services Plan shall remain in effect from year to year, provided such continuance is approved annually by a vote of a majority of those Trustees who are not “interested persons” of the Trust and who have no direct or indirect financial interest in the operation of or in any agreement related to the Distribution Plan or Shareholder Services Plan.
The fund has arrangements with the transfer agent and the custodian whereby the fund may receive earnings credits when positive cash balances are maintained, which are used to offset transfer agency and custody fees.
29
NOTES TO FINANCIAL STATEMENTS (continued)
For financial reporting purposes, the fund includes net earnings credits as an expense offset in the Statement of Operations.
The fund compensates Dreyfus Transfer, Inc., a wholly-owned subsidiary of Dreyfus, under a transfer agency agreement for providing transfer agency and cash management services for the fund. The majority of transfer agency fees are comprised of amounts paid on a per account basis, while cash management fees are related to fund subscriptions and redemptions. During the period ended September 30, 2017, the fund was charged $2,974 for transfer agency services and $128 for cash management services. These fees are included in Shareholder servicing costs in the Statement of Operations. Cash management fees were offset by earnings credits of $128.
The fund compensates The Bank of New York Mellon under a custody agreement for providing custodial services for the fund. These fees are determined based on net assets, geographic region and transaction activity. During the period ended September 30, 2017, the fund was charged $38,301 pursuant to the custody agreement. These fees were partially offset by earnings credits of $39.
During the period ended September 30, 2017, the fund was charged $11,281 for services performed by the Chief Compliance Officer and his staff.
The components of “Due to The Dreyfus Corporation and affiliates” in the Statement of Assets and Liabilities consist of: investment advisory fees $137,353, administration fees $10,236, Distribution Plan fees $16, Shareholder Services Plan fees $50, custodian fees $12,000, Chief Compliance Officer fees $5,604 and transfer agency fees $881.
(d) Each Board member also serves as a Board member of other funds within the Dreyfus complex. Annual retainer fees and attendance fees are allocated to each fund based on net assets.
NOTE 4—Securities Transactions:
The aggregate amount of purchases and sales of investment securities, excluding short-term securities, during the period ended September 30, 2017, amounted to $165,537,234 and $188,858,106, respectively.
At September 30, 2017, the cost of investments for federal income tax purposes was $204,406,402; accordingly, accumulated net unrealized appreciation on investments was $35,143,186, consisting of $44,571,400 gross unrealized appreciation and $9,428,214 gross unrealized depreciation.
30
REPORT OF INDEPENDENT REGISTERED
PUBLIC ACCOUNTING FIRM
The Board of Trustees and Shareholders of
Dreyfus Investment Funds
We have audited the accompanying statement of assets and liabilities of Dreyfus/The Boston Company Small Cap Value Fund (the “Fund”), a series of Dreyfus Investment Funds, including the statements of investments and investments in affiliated issuers, as of September 30, 2017, and the related statement of operations for the year then ended, the statements of changes in net assets for each of the years in the two-year period then ended, and the financial highlights for each of the years or periods in the five-year period then ended. These financial statements and financial highlights are the responsibility of the Fund’s management. Our responsibility is to express an opinion on these financial statements and financial highlights based on our audits.
We conducted our audits in accordance with the standards of the Public Company Accounting Oversight Board (United States). Those standards require that we plan and perform the audit to obtain reasonable assurance about whether the financial statements and financial highlights are free of material misstatement. An audit includes examining, on a test basis, evidence supporting the amounts and disclosures in the financial statements. Our procedures included confirmation of securities owned as of September 30, 2017, by correspondence with the custodian and brokers or by other appropriate auditing procedures. An audit also includes assessing the accounting principles used and significant estimates made by management, as well as evaluating the overall financial statement presentation. We believe that our audits provide a reasonable basis for our opinion.
In our opinion, the financial statements and financial highlights referred to above present fairly, in all material respects, the financial position of Dreyfus/The Boston Company Small Cap Value Fund as of September 30, 2017, the results of its operations for the year then ended, the changes in its net assets for each of the years in the two-year period then ended, and the financial highlights for each of the years or periods in the five-year period then ended, in conformity with U.S. generally accepted accounting principles.

New York, New York
November 22, 2017
31
IMPORTANT TAX INFORMATION (Unaudited)
For federal tax purposes, the fund reports the maximum amount allowable, but not less than $1,395,205 as ordinary income dividends paid during the year ended September 30, 2017 as qualified dividend income in accordance with Section 854(b)(1)(B) of the Internal Revenue Code. Also, the fund reports the maximum amount allowable but not less than 62.42% of ordinary income dividends paid during the year ended September 30, 2017 as eligible for the corporate dividends received deduction provided under Section 243 of the Internal Revenue Code in accordance with Section 854(b)(1)(A) of the Internal Revenue Code. Shareholders will receive notification in early 2018 of the percentage applicable to the preparation of their 2017 income tax returns. The fund reports the maximum amount allowable but not less than $1.8583 per share as a capital gain dividend in accordance with Section 852(b)(3)(C) of the Internal Revenue Code. Also, the fund reports the maximum amount allowable but not less than $.0549 as a short-term capital gain dividend paid on December 21, 2016 in accordance with Sections 871(k)(2) and 881(e) of the Internal Revenue Code.
32
BOARD MEMBERS INFORMATION (Unaudited)
INDEPENDENT BOARD MEMBERS
Joseph S. DiMartino (73)
Chairman of the Board (2008)
Principal Occupation During Past 5 Years:
· Corporate Director and Trustee (1995-present)
Other Public Company Board Memberships During Past 5 Years:
· CBIZ (formerly, Century Business Services, Inc.), a provider of outsourcing functions for small and medium size companies, Director (1997-present)
No. of Portfolios for which Board Member Serves: 127
———————
Francine J. Bovich (66)
Board Member (2011)
Principal Occupation During Past 5 Years:
· Trustee, The Bradley Trusts, private trust funds (2011-present)
Other Public Company Board Memberships During Past 5 Years:
· Annaly Capital Management, Inc., Board Member (May 2014-present)
No. of Portfolios for which Board Member Serves: 75
———————
Kenneth A. Himmel (71)
Board Member (2008)
Principal Occupation During Past 5 Years:
· Managing Partner, Gulf Related, an international real estate development company (2010-present)
· President and CEO, Related Urban Development, a real estate development company (1996-present)
· President and CEO, Himmel & Company, a real estate development company (1980-present)
· CEO, American Food Management, a restaurant company (1983-present)
No. of Portfolios for which Board Member Serves: 28
———————
33
BOARD MEMBERS INFORMATION (Unaudited) (continued)
INDEPENDENT BOARD MEMBERS (continued)
Stephen J. Lockwood (70)
Board Member (2008)
Principal Occupation During Past 5 Years:
· Chairman of the Board, Stephen J. Lockwood and Company LLC, a real estate investment company (2000-present)
No. of Portfolios for which Board Member Serves: 28
———————
Roslyn M. Watson (67)
Board Member (2008)
Principal Occupation During Past 5 Years:
· Principal, Watson Ventures, Inc., a real estate investment company (1993-present)
No. of Portfolios for which Board Member Serves: 61
———————
Benaree Pratt Wiley (71)
Board Member (2008)
Principal Occupation During Past 5 Years:
· Principal, The Wiley Group, a firm specializing in strategy and business development (2005-present)
Other Public Company Board Memberships During Past 5 Years:
· CBIZ (formerly, Century Business Services, Inc.), a provider of outsourcing functions for small and medium size companies, Director (2008-present)
No. of Portfolios for which Board Member Serves: 82
———————
Once elected all Board Members serve for an indefinite term, but achieve Emeritus status upon reaching age 80. The address of the Board Members and Officers is c/o The Dreyfus Corporation, 200 Park Avenue, New York, New York 10166. Additional information about the Board Members is available in the fund’s Statement of Additional Information which can be obtained from Dreyfus free of charge by calling this toll free number: 1-800-DREYFUS.
James M. Fitzgibbons, Emeritus Board Member
34
OFFICERS OF THE FUND (Unaudited)
BRADLEY J. SKAPYAK, President since January 2010.
Chief Operating Officer and a director of the Manager since June 2009, Chairman of Dreyfus Transfer, Inc., an affiliate of the Manager and the transfer agent of the funds, since May 2011 and Chief Executive Officer of MBSC Securities Corporation since August 2016. He is an officer of 61 investment companies (comprised of 127 portfolios) managed by the Manager. He is 58 years old and has been an employee of the Manager since February 1988.
BENNETT A. MACDOUGALL, Chief Legal Officer since October 2015.
Chief Legal Officer of the Manager and Associate General Counsel and Managing Director of BNY Mellon since June 2015; from June 2005 to June 2015, he served in various capacities with Deutsche Bank – Asset & Wealth Management Division, including as Director and Associate General Counsel, and Chief Legal Officer of Deutsche Investment Management Americas Inc. from June 2012 to May 2015. He is an officer of 62 investment companies (comprised of 152 portfolios) managed by the Manager. He is 46 years old and has been an employee of the Manager since June 2015.
JANETTE E. FARRAGHER, Vice President and Secretary since December 2011.
Associate General Counsel of BNY Mellon, and an officer of 62 investment companies (comprised of 152 portfolios) managed by the Manager. She is 54 years old and has been an employee of the Manager since February 1984.
JAMES BITETTO, Vice President and Assistant Secretary since December 2008.
Managing Counsel of BNY Mellon and Secretary of the Manager, and an officer of 62 investment companies (comprised of 152 portfolios) managed by the Manager. He is 51 years old and has been an employee of the Manager since December 1996.
JOSEPH M. CHIOFFI, Vice President and Assistant Secretary since December 2008.
Managing Counsel of BNY Mellon, and an officer of 62 investment companies (comprised of 152 portfolios) managed by the Manager. He is 55 years old and has been an employee of the Manager since June 2000.
MAUREEN E. KANE, Vice President and Assistant Secretary since April 2015.
Managing Counsel of BNY Mellon since July 2014; from October 2004 until July 2014, General Counsel, and from May 2009 until July 2014, Chief Compliance Officer of Century Capital Management. She is an officer of 62 investment companies (comprised of 152 portfolios) managed by the Manager. She is 55 years old and has been an employee of the Manager since July 2014.
SARAH S. KELLEHER, Vice President and Assistant Secretary since April 2014.
Senior Counsel of BNY Mellon since March 2013, from August 2005 to March 2013, Associate General Counsel of Third Avenue Management. She is an officer of 62 investment companies (comprised of 152 portfolios) managed by the Manager. She is 42 years old and has been an employee of the Manager since March 2013.
JEFF PRUSNOFSKY, Vice President and Assistant Secretary since December 2008.
Senior Managing Counsel of BNY Mellon, and an officer of 62 investment companies (comprised of 152 portfolios) managed by the Manager. He is 52 years old and has been an employee of the Manager since October 1990.
NATALYA ZELENSKY, Vice President and Assistant Secretary since March 2017.
Counsel and Vice President of BNY Mellon since May 2016; Attorney at Wildermuth Endowment Strategy Fund/Wildermuth Advisory, LLC from November 2015 until May 2016; Assistant General Counsel at RCS Advisory Services from July 2014 until November 2015; Associate at Sutherland, Asbill & Brennan from January 2013 until January 2014; Associate at K&L Gates from October 2011 until January 2013. She is an officer of 62 investment companies (comprised of 152 portfolios) managed by Dreyfus. She is 32 years old and has been an employee of the Manager since May 2016.
JAMES WINDELS, Treasurer since December 2008.
Director – Mutual Fund Accounting of the Manager, and an officer of 62 investment companies (comprised of 152 portfolios) managed by the Manager. He is 59 years old and has been an employee of the Manager since April 1985.
35
OFFICERS OF THE FUND (Unaudited) (continued)
RICHARD CASSARO, Assistant Treasurer since December 2008.
Senior Accounting Manager – Money Market and Municipal Bond Funds of the Manager, and an officer of 62 investment companies (comprised of 152 portfolios) managed by the Manager. He is 58 years old and has been an employee of the Manager since September 1982.
GAVIN C. REILLY, Assistant Treasurer since December 2008.
Tax Manager of the Investment Accounting and Support Department of the Manager, and an officer of 62 investment companies (comprised of 152 portfolios) managed by the Manager. He is 49 years old and has been an employee of the Manager since April 1991.
ROBERT S. ROBOL, Assistant Treasurer since December 2008.
Senior Accounting Manager – Dreyfus Financial Reporting of the Manager, and an officer of 62 investment companies (comprised of 152 portfolios) managed by the Manager. He is 53 years old and has been an employee of the Manager since October 1988.
ROBERT SALVIOLO, Assistant Treasurer since December 2008.
Senior Accounting Manager – Equity Funds of the Manager, and an officer of 62 investment companies (comprised of 152 portfolios) managed by the Manager. He is 50 years old and has been an employee of the Manager since June 1989.
ROBERT SVAGNA, Assistant Treasurer since December 2008.
Senior Accounting Manager – Fixed Income and Equity Funds of the Manager, and an officer of 62 investment companies (comprised of 152 portfolios) managed by the Manager. He is 50 years old and has been an employee of the Manager since November 1990.
JOSEPH W. CONNOLLY, Chief Compliance Officer since December 2008.
Chief Compliance Officer of the Manager and The Dreyfus Family of Funds (62 investment companies, comprised of 152 portfolios). He is 60 years old and has served in various capacities with the Manager since 1980, including manager of the firm’s Fund Accounting Department from 1997 through October 2001.
CARIDAD M. CAROSELLA, Anti-Money Laundering Compliance Officer since January 2016.
Anti-Money Laundering Compliance Officer of the Dreyfus Family of Funds and BNY Mellon Funds Trust since January 2016; from May 2015 to December 2015, Interim Anti-Money Laundering Compliance Officer of the Dreyfus Family of Funds and BNY Mellon Funds Trust and the Distributor; from January 2012 to May 2015, AML Surveillance Officer of the Distributor and from 2007 to December 2011, Financial Processing Manager of the Distributor. She is an officer of 57 investment companies (comprised of 147 portfolios) managed by the Manager. She is 49 years old and has been an employee of the Distributor since 1997.
36
NOTES
37
Dreyfus/The Boston Company Small Cap Value Fund
200 Park Avenue
New York, NY 10166
Manager
The Dreyfus Corporation
200 Park Avenue
New York, NY 10166
Custodian
The Bank of New York Mellon
225 Liberty Street
New York, NY 10286
Transfer Agent &
Dividend Disbursing Agent
Dreyfus Transfer, Inc.
200 Park Avenue
New York, NY 10166
Distributor
MBSC Securities Corporation
200 Park Avenue
New York, NY 10166
| | |
Ticker Symbols: | Class A: RUDAX Class C: BOSCX Class I: STSVX Class Y: BOSYX |
Telephone Call your financial representative or 1-800-DREYFUS
Mail The Dreyfus Family of Funds, 144 Glenn Curtiss Boulevard, Uniondale, NY 11556-0144
E-mail Send your request to info@dreyfus.com
Internet Information can be viewed online or downloaded at www.dreyfus.com
The fund files its complete schedule of portfolio holdings with the Securities and Exchange Commission (“SEC”) for the first and third quarters of each fiscal year on Form N-Q. The fund’s Forms N-Q are available on the SEC’s website at www.sec.gov and may be reviewed and copied at the SEC’s Public Reference Room in Washington, D.C. (phone 1-800-SEC-0330 for information).
A description of the policies and procedures that the fund uses to determine how to vote proxies relating to portfolio securities and information regarding how the fund voted these proxies for the most recent 12-month period ended June 30 is available at www.dreyfus.com and on the SEC’s website at www.sec.gov and without charge, upon request, by calling 1-800-DREYFUS.
| | |
© 2017 MBSC Securities Corporation
6944AR0917 | 
|
Item 2. Code of Ethics.
The Registrant has adopted a code of ethics that applies to the Registrant's principal executive officer, principal financial officer, principal accounting officer or controller, or persons performing similar functions. There have been no amendments to, or waivers in connection with, the Code of Ethics during the period covered by this Report.
Item 3. Audit Committee Financial Expert.
The Registrant's Board has determined that Joseph S. DiMartino, a member of the Audit Committee of the Board, is an audit committee financial expert as defined by the Securities and Exchange Commission (the "SEC"). Joseph S. DiMartino is "independent" as defined by the SEC for purposes of audit committee financial expert determinations.
Item 4. Principal Accountant Fees and Services.
(a) Audit Fees. The aggregate fees billed for each of the last two fiscal years (the "Reporting Periods") for professional services rendered by the Registrant's principal accountant (the "Auditor") for the audit of the Registrant's annual financial statements or services that are normally provided by the Auditor in connection with the statutory and regulatory filings or engagements for the Reporting Periods, were $167,500 in 2016 and $191,930 in 2017.
(b) Audit-Related Fees. The aggregate fees billed in the Reporting Periods for assurance and related services by the Auditor that are reasonably related to the performance of the audit of the Registrant's financial statements and are not reported under paragraph (a) of this Item 4 were $30,400 in 2016 and $31,300 in 2017. These services consisted of one or more of the following: (i) agreed upon procedures related to compliance with Internal Revenue Code section 817(h), (ii) security counts required by Rule 17f-2 under the Investment Company Act of 1940, as amended, (iii) advisory services as to the accounting or disclosure treatment of Registrant transactions or events and (iv) advisory services to the accounting or disclosure treatment of the actual or potential impact to the Registrant of final or proposed rules, standards or interpretations by the Securities and Exchange Commission, the Financial Accounting Standards Boards or other regulatory or standard-setting bodies.
The aggregate fees billed in the Reporting Periods for non-audit assurance and related services by the Auditor to the Registrant's investment adviser (not including any sub-investment adviser whose role is primarily portfolio management and is subcontracted with or overseen by another investment adviser), and any entity controlling, controlled by or under common control with the investment adviser that provides ongoing services to the Registrant ("Service Affiliates"), that were reasonably related to the performance of the annual audit of the Service Affiliate, which required pre-approval by the Audit Committee were $0 in 2016 and $0 in 2017.
(c) Tax Fees. The aggregate fees billed in the Reporting Periods for professional services rendered by the Auditor for tax compliance, tax advice, and tax planning ("Tax Services") were $16,800 in 2016 and $17,400 in 2017. These services consisted of review or preparation of U.S. federal, state, local and excise tax returns. The aggregate fees billed in the Reporting Periods for Tax Services by the Auditor to Service Affiliates, which required pre-approval by the Audit Committee were $0 in 2016 and $0 in 2017.
(d) All Other Fees. The aggregate fees billed in the Reporting Periods for products and services provided by the Auditor, other than the services reported in paragraphs (a) through (c) of this Item, were $0 in 2016 and $0 in 2017.
The aggregate fees billed in the Reporting Periods for Non-Audit Services by the Auditor to Service Affiliates, other than the services reported in paragraphs (b) through (c) of this Item, which required pre-approval by the Audit Committee, were $0 in 2016 and $0 in 2017.
(e)(1) Audit Committee Pre-Approval Policies and Procedures. The Registrant's Audit Committee has established policies and procedures (the "Policy") for pre-approval (within specified fee limits) of the Auditor's engagements for non-audit services to the Registrant and Service Affiliates without specific case-by-case consideration. The pre-approved services in the Policy can include pre-approved audit services, pre-approved audit-related services, pre-approved tax services and pre-approved all other services. Pre-approval considerations include whether the proposed services are compatible with maintaining the Auditor's independence. Pre-approvals pursuant to the Policy are considered annually.
(e)(2) Note. None of the services described in paragraphs (b) through (d) of this Item 4 were approved by the Audit Committee pursuant to paragraph (c)(7)(i)(C) of Rule 2-01 of Regulation S-X.
(f) None of the hours expended on the principal accountant's engagement to audit the registrant's financial statements for the most recent fiscal year were attributed to work performed by persons other than the principal account's full-time, permanent employees.
Non-Audit Fees. The aggregate non-audit fees billed by the Auditor for services rendered to the Registrant, and rendered to Service Affiliates, for the Reporting Periods were $19,014,000 in 2016 and $20,323,000 in 2017.
Auditor Independence. The Registrant's Audit Committee has considered whether the provision of non-audit services that were rendered to Service Affiliates, which were not pre-approved (not requiring pre-approval), is compatible with maintaining the Auditor's independence.
Item 5. Audit Committee of Listed Registrants.
Not applicable.
Item 6. Investments.
(a) Not applicable.
Item 7. Disclosure of Proxy Voting Policies and Procedures for Closed-End Management Investment Companies.
Not applicable.
Item 8. Portfolio Managers of Closed-End Management Investment Companies.
Not applicable.
Item 9. Purchases of Equity Securities by Closed-End Management Investment Companies and Affiliated Purchasers.
Not applicable.
Item 10. Submission of Matters to a Vote of Security Holders.
There have been no material changes to the procedures applicable to Item 10.
Item 11. Controls and Procedures.
(a) The Registrant's principal executive and principal financial officers have concluded, based on their evaluation of the Registrant's disclosure controls and procedures as of a date within 90 days of the filing date of this report, that the Registrant's disclosure controls and procedures are reasonably designed to ensure that information required to be disclosed by the Registrant on Form N-CSR is recorded, processed, summarized and reported within the required time periods and that information required to be disclosed by the Registrant in the reports that it files or submits on Form N-CSR is accumulated and communicated to the Registrant's management, including its principal executive and principal financial officers, as appropriate to allow timely decisions regarding required disclosure.
(b) There were no changes to the Registrant's internal control over financial reporting that occurred during the second fiscal quarter of the period covered by this report that have materially affected, or are reasonably likely to materially affect, the Registrant's internal control over financial reporting.
Item 12. Exhibits.
(a)(1) Code of ethics referred to in Item 2.
(a)(2) Certifications of principal executive and principal financial officers as required by Rule 30a-2(a) under the Investment Company Act of 1940.
(a)(3) Not applicable.
(b) Certification of principal executive and principal financial officers as required by Rule 30a-2(b) under the Investment Company Act of 1940.
SIGNATURES
Pursuant to the requirements of the Securities Exchange Act of 1934 and the Investment Company Act of 1940, the Registrant has duly caused this Report to be signed on its behalf by the undersigned, thereunto duly authorized.
Dreyfus Investment Funds
By: /s/ Bradley J. Skapyak
Bradley J. Skapyak
President
Date: November 28, 2017
Pursuant to the requirements of the Securities Exchange Act of 1934 and the Investment Company Act of 1940, this Report has been signed below by the following persons on behalf of the Registrant and in the capacities and on the dates indicated.
By: /s/ Bradley J. Skapyak
Bradley J. Skapyak
President
Date: November 28, 2017
By: /s/ James Windels
James Windels
Treasurer
Date: November 28, 2017
EXHIBIT INDEX
(a)(1) Code of ethics referred to in Item 2.
(a)(2) Certifications of principal executive and principal financial officers as required by Rule 30a-2(a) under the Investment Company Act of 1940. (EX-99.CERT)
(b) Certification of principal executive and principal financial officers as required by Rule 30a-2(b) under the Investment Company Act of 1940. (EX-99.906CERT)