We are pleased to present this annual report for Dreyfus/Standish Global Fixed Income Fund, covering the 12-month period from January 1, 2017 through December 31, 2017. For information about how the fund performed during the reporting period, as well as general market perspectives, we provide a Discussion of Fund Performance on the pages that follow.
Stocks set a series of new record highs and bonds produced modestly positive results during 2017. Financial markets early in the year were dominated by the inauguration of a new U.S. president, as equities and corporate-backed bonds surged higher in anticipation of more business-friendly regulatory, tax, and fiscal policies. U.S. and international stocks continued to rally in the spring as corporate earnings grew and global economic conditions improved. Later in the year, the passage of tax reform legislation fueled additional stock market gains.
Despite three short-term interest rate hikes and concerns early in the year that inflation might accelerate in a growing economy, bonds generally produced positive total returns in 2017. Corporate-backed securities and municipal bonds fared particularly well.
The markets’ strong performance last year was supported by solid underlying fundamentals, including sustained economic growth, a robust labor market, and low inflation. We currently expect these favorable conditions to persist in 2018, but we remain watchful for economic and political developments that could negatively impact the markets. As always, we encourage you to discuss the risks and opportunities of today’s investment environment with your financial advisor.
Thank you for your continued confidence and support.
DISCUSSION OF FUND PERFORMANCE
For the period from January 1, 2017 through December 31, 2017, as provided by portfolio managers David Leduc, CFA, and Brendan Murphy, CFA, of Standish Mellon Asset Management Co., Sub-Investment Adviser
Market and Fund Performance Overview
For the 12-month period ended December 31, 2017, Dreyfus/Standish Global Fixed Income Fund’s Class A shares achieved a total return of 4.04%, Class C shares returned 3.29%, Class I shares returned 4.35%, and Class Y shares returned 4.43%.1 In comparison, the Bloomberg Barclays Global Aggregate Index (Hedged) (the “Index”), the fund’s benchmark, produced a total return of 3.04% for the same period.2
Fixed-income securities across a variety of global markets produced positive total returns during 2017 when moderating long-term interest rates and muted inflation offset bouts of market weakness stemming from expectations of greater economic growth and accelerating inflation. The fund outperformed the Index, partly due to favorable country allocations.
The Fund’s Investment Approach
The fund seeks to maximize total return while realizing a market level of income, consistent with preserving principal and liquidity. To pursue its goal, the fund normally invests at least 80% of its net assets, plus any borrowings for investment purposes, in U.S. dollar- and non-U.S. dollar-denominated fixed-income securities of governments and companies located in various countries, including emerging markets. The fund invests principally in bonds, notes, mortgage-related securities, asset-backed securities, floating rate loans (limited to up to 20% of the fund’s net assets) and other floating rate securities and eurodollar and Yankee dollar instruments. The fund generally invests in eight or more countries, but always invests in at least three countries, one of which may be the United States. The fund may invest up to 25% of its assets in emerging markets generally and up to 7% of its net assets in any single emerging market country.
We focus on identifying undervalued government bond markets, currencies, sectors, and securities and de-emphasize the use of interest-rate forecasting. We look for fixed-income securities with the potential for credit upgrades, unique structural characteristics or innovative features. We select securities by using fundamental economic research and quantitative analysis to allocate assets among countries and currencies, and by focusing on sectors and individual securities that appear to be relatively undervalued and actively trading among sectors.
Economic and Political Developments Drove Bond Markets
Longer-term interest rates rose sharply in the weeks prior to the start of 2017 in response to expectations that a new U.S. presidential administration’s more business-friendly policies would boost global economic growth and inflationary pressures. Consequently, most sovereign bonds began the reporting period in the midst of market weakness.
Stronger economic growth in overseas markets during 2017 prompted a gradual move among central banks away from the aggressively accommodative monetary policies of the past few years. Short-term interest rates climbed in the United States, United Kingdom, and Canada when monetary policymakers implemented interest-rate hikes. In contrast, long-term interest rates moderated during the spring, giving back much of the post-election spike when inflationary pressures remained muted. Rising long-term interest rates in the fall were not enough to fully offset those gains. Meanwhile, corporate-backed bonds produced consistently robust returns in an environment of growing corporate earnings.
Country Allocation Strategy Buoyed Fund Results
The fund’s performance compared to the Index benefited from our country allocation strategy. Early in 2017, we increased the fund’s holdings in fundamentally sound, peripheral European countries, such
3
DISCUSSION OF FUND PERFORMANCE (continued)
as Portugal, in the midst of market weakness stemming from political concerns. The bonds rallied when those worries eased. The fund also added value through an emphasis on U.S. dollar-denominated bonds in emerging markets such as Argentina, Brazil, and Morocco.
From a sector allocation perspective, overweighted exposure to investment-grade and high yield corporate bonds helped support relative performance when yield differences narrowed across the market’s credit-quality spectrum. Bonds backed by U.S. and U.K. banks fared especially well.
The fund’s interest-rate strategies also produced positive results. A relatively short average duration in the United States and Europe helped reduce the impact of rising interest rates in the fall, while a long duration position in developing nations magnified the benefits of falling interest rates in those markets. The fund employed futures contracts to establish its interest-rate and currency positions.
On a more negative note, the fund’s holdings of U.S. inflation-adjusted securities lagged market averages in the persistently low inflation environment, and Canadian bonds were hurt by an unexpected interest-rate hike by the Bank of Canada.
Positioned for Continued Economic Growth
Global economic growth is expected to continue in 2018, potentially causing inflation to accelerate. Therefore, most analysts anticipate additional short-term interest-rate hikes from central banks in developed markets.
As of the reporting period’s end, we have retained a generally defensive interest-rate posture, including relatively low durations in markets where interest rates seem poised to rise. We also have maintained the fund’s emphasis on higher-yielding bond market sectors, including the emerging markets and corporate securities.
January 16, 2018
1 Total return includes reinvestment of dividends and any capital gains paid and does not take into consideration the maximum initial sales charge in the case of Class A shares or the applicable contingent deferred sales charge imposed on redemptions in the case of Class C shares. Had these charges been reflected, returns would have been lower. Class I and Class Y are not subject to any initial or deferred sales charge. Past performance is no guarantee of future results. Share price and investment return fluctuate such that upon redemption, fund shares may be worth more or less than their original cost.
2 Source: FactSet. — The Bloomberg Barclays Global Aggregate Index (Hedged) is a flagship measure of global investment-grade debt from 24 local currency markets. This multi-currency benchmark includes treasury, government-related, corporate and securitized fixed-rate bonds from both developed and emerging market issuers. Investors cannot invest directly in any index.
Bonds are subject generally to interest-rate, credit, liquidity, and market risks, to varying degrees, all of which are more fully described in the fund’s prospectus. Generally, all other factors being equal, bond prices are inversely related to interest-rate changes, and rate increases can cause price declines.
Foreign bonds are subject to special risks including exposure to currency fluctuations, changing political and economic conditions, and potentially less liquidity. The fixed-income securities of issuers located in emerging markets can be more volatile and less liquid than those of issuers in more mature economies.
Investments in foreign currencies are subject to the risk that those currencies will decline in value relative to the U.S. dollar, or, in the case of hedged positions, that the U.S. dollar will decline relative to the currency being hedged. Currency rates in foreign countries may fluctuate significantly over short periods of time. A decline in the value of foreign currencies relative to the U.S. dollar will reduce the value of securities held by the fund and denominated in those currencies.
High yield bonds are subject to increased credit risk and are considered speculative in terms of the issuer’s perceived ability to continue making interest payments on a timely basis and to repay principal upon maturity.
The fund may use derivative instruments, such as options, futures, options on futures, forward contracts, swaps (including credit default swaps on corporate bonds and asset-backed securities), options on swaps, and other credit derivatives. A small investment in derivatives could have a potentially large impact on the fund’s performance. The use of derivatives involves risks different from, or possibly greater than, the risks associated with investing directly in the underlying assets.
4
FUND PERFORMANCE
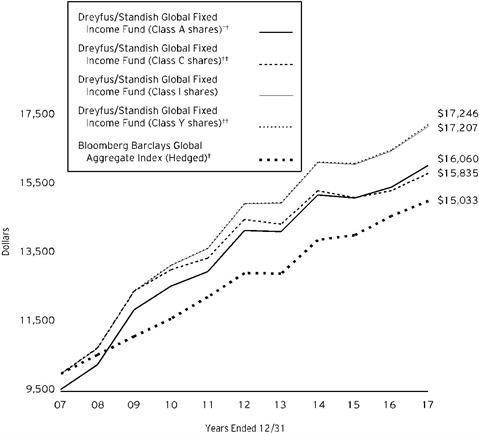
Comparison of change in value of $10,000 investment in Dreyfus/Standish Global Fixed Income Fund Class A shares, Class C shares, Class I shares and Class Y shares and the Bloomberg Barclays Global Aggregate Index (Hedged) (the “Index”)
† Source: FactSet
†† The total return figures presented for Class A and Class C shares of the fund reflect the performance of the fund’s Class I shares for the period prior to 12/2/09 (the inception date for Class A and Class C shares), adjusted to reflect the applicable sales load for Class A shares.
The total return figures presented for Class Y shares of the fund reflect the performance of the fund’s Class I shares for the period prior to 7/1/13 (the inception date for Class Y shares).
Past performance is not predictive of future performance.
The above graph compares a $10,000 investment made in each of the Class A, Class C, Class I and Class Y shares of Dreyfus/Standish Global Fixed Income Fund on 12/31/07 to a $10,000 investment made in the Index on that date. All dividends and capital gain distributions are reinvested.
The fund’s performance shown in the line graph above takes into account the maximum initial sales charge on Class A shares and all other applicable fees and expenses on all classes. The Index is a flagship measure of global investment-grade debt from 24 local currency markets. This multi-currency benchmark includes treasury, government-related, corporate and securitized fixed-rate bonds from both developed and emerging markets issuers. Currency exposure is hedged to the U.S. dollar. Unlike a mutual fund, the Index is not subject to charges, fees and other expenses. Investors cannot invest directly in any index. Further information relating to fund performance, including expense reimbursements, if applicable, is contained in the Financial Highlights section of the prospectus and elsewhere in this report.
5
FUND PERFORMANCE (continued)
| | | | | | | |
Average Annual Total Returns as of 12/31/17 |
| Inception
Date | 1 Year | 5 Years | 10 Years |
Class A shares | | | | | | |
with maximum sales charge (4.5%) | 12/2/09 | -0.64% | 1.60% | | 4.85% | †† |
without sales charge | 12/2/09 | 4.04% | 2.54% | | 5.33% | †† |
Class C shares | | | | | | |
with applicable redemption charge † | 12/2/09 | 2.29% | 1.79% | | 4.70% | †† |
without redemption | 12/2/09 | 3.29% | 1.79% | | 4.70% | †† |
Class I shares | 1/1/94 | 4.35% | 2.84% | | 5.58% | |
Class Y shares | 7/1/13 | 4.43% | 2.89% | †† | 5.60% | †† |
Bloomberg Barclays Global
Aggregate Index ( Hedged ) | | 3.04% | 3.06% | | 4.16% | |
† The maximum contingent deferred sales charge for Class C shares is 1% for shares redeemed within one year of the date of purchase.
†† The total return performance figures presented for Class A and Class C shares of the fund reflect the performance of the fund’s Class I shares for the period prior to 12/2/09 (the inception date for Class A and Class C shares), adjusted to reflect the applicable sales load for Class A shares.
The total return performance figures presented for Class Y shares of the fund reflect the performance of the fund’s Class I shares for the period prior to 7/1/13 (the inception date for Class Y shares).
The performance data quoted represents past performance, which is no guarantee of future results. Share price and investment return fluctuate and an investor’s shares may be worth more or less than original cost upon redemption. Current performance may be lower or higher than the performance quoted. Go to dreyfus.com for the fund’s most recent month-end returns.
The fund’s performance shown in the graph and table does not reflect the deduction of taxes that a shareholder would pay on fund distributions or the redemption of fund shares. In addition to the performance of Class A shares shown with and without a maximum sales charge, the fund’s performance shown in the table takes into account all other applicable fees and expenses on all classes.
6
UNDERSTANDING YOUR FUND’S EXPENSES (Unaudited)
As a mutual fund investor, you pay ongoing expenses, such as management fees and other expenses. Using the information below, you can estimate how these expenses affect your investment and compare them with the expenses of other funds. You also may pay one-time transaction expenses, including sales charges (loads) and redemption fees, which are not shown in this section and would have resulted in higher total expenses. For more information, see your fund’s prospectus or talk to your financial adviser.
Review your fund’s expenses
The table below shows the expenses you would have paid on a $1,000 investment in Dreyfus/Standish Global Fixed Income Fund from July 1, 2017 to December 31, 2017. It also shows how much a $1,000 investment would be worth at the close of the period, assuming actual returns and expenses.
| | | | | | | | | | | | |
Expenses and Value of a $1,000 Investment | | |
assuming actual returns for the six months ended December 31, 2017 |
| | | | Class A | Class C | Class I | Class Y |
Expenses paid per $1,000† | | $4.32 | | $7.91 | | $2.64 | | $2.44 |
Ending value (after expenses) | | $1,014.20 | | $1,010.40 | | $1,015.40 | | $1,016.00 |
COMPARING YOUR FUND’S EXPENSES
WITH THOSE OF OTHER FUNDS (Unaudited)
Using the SEC’s method to compare expenses
The Securities and Exchange Commission (“SEC”) has established guidelines to help investors assess fund expenses. Per these guidelines, the table below shows your fund’s expenses based on a $1,000 investment, assuming a hypothetical 5% annualized return. You can use this information to compare the ongoing expenses (but not transaction expenses or total cost) of investing in the fund with those of other funds. All mutual fund shareholder reports will provide this information to help you make this comparison. Please note that you cannot use this information to estimate your actual ending account balance and expenses paid during the period.
| | | | | | | | | | | | |
Expenses and Value of a $1,000 Investment | | |
assuming a hypothetical 5% annualized return for the six months ended December 31, 2017 |
| | | | Class A | Class C | Class I | Class Y |
Expenses paid per $1,000† | | $4.33 | | $7.93 | | $2.65 | | $2.45 |
Ending value (after expenses) | | $1,020.92 | | $1,017.34 | | $1,022.58 | | $1,022.79 |
† Expenses are equal to the fund’s annualized expense ratio of .85% for Class A, 1.56% for Class C, .52 % for Class I and .48% for Class Y, multiplied by the average account value over the period, multiplied by 184/365 (to reflect the one-half year period).
7
STATEMENT OF INVESTMENTS
December 31, 2017
| | | | | | | | | | |
| |
Description | Coupon
Rate (%) | | Maturity
Date | | Principal
Amount ($) | a | Value ($) | |
Bonds and Notes - 96.5% | | | | | |
Argentina - 2.9% | | | | | |
Argentine Government,
Bonds, Ser. POM, Argentine 7-Day Reference Rate | ARS | 27.28 | | 6/21/20 | | 169,205,000 | b | 9,670,930 | |
Argentine Government,
Sr. Unscd. Bonds | | 6.88 | | 1/26/27 | | 6,900,000 | c | 7,548,600 | |
Argentine Government,
Sr. Unscd. Bonds | EUR | 5.25 | | 1/15/28 | | 6,625,000 | c | 8,284,986 | |
Argentine Government,
Sr. Unscd. Notes | ARS | 5.83 | | 12/31/33 | | 19,751,000 | d | 8,367,001 | |
Argentine Government,
Unscd. Bonds | ARS | 21.20 | | 9/19/18 | | 707,475,000 | c | 37,080,553 | |
Buenos Aires Province,
Sr. Unscd. Notes | | 5.75 | | 6/15/19 | | 7,050,000 | e | 7,321,425 | |
Buenos Aires Province,
Sr. Unscd. Notes | | 9.13 | | 3/16/24 | | 6,800,000 | e | 7,973,000 | |
Buenos Aires Province,
Unscd. Bonds, 3 Month BADLAR + 3.83% | ARS | 25.36 | | 5/31/22 | | 114,000,000 | b | 6,199,281 | |
| | 92,445,776 | |
Australia - 1.5% | | | | | |
Australian Government,
Sr. Unscd. Bonds, Ser. 126 | AUD | 4.50 | | 4/15/20 | | 56,625,000 | | 46,590,149 | |
Bahrain - .3% | | | | | |
Bahraini Government,
Sr. Unscd. Bonds | | 7.00 | | 10/12/28 | | 2,095,000 | e | 2,132,301 | |
Bahraini Government,
Sr. Unscd. Bonds | | 7.50 | | 9/20/47 | | 6,170,000 | e | 5,908,515 | |
| | 8,040,816 | |
Belgium - .9% | | | | | |
Belgium Government,
Unscd. Bonds, Ser. 74 | EUR | 0.80 | | 6/22/25 | | 22,900,000 | e | 28,430,906 | |
Canada - 4.4% | | | | | |
BMW Canada Auto Trust,
Ser. 2016-1, Cl. A3 | CAD | 1.87 | | 4/20/21 | | 8,025,000 | | 6,366,372 | |
BMW Canada Auto Trust,
Ser. 2017-1, Cl. A2 | CAD | 1.68 | | 5/20/20 | | 2,350,000 | | 1,856,818 | |
BMW Canada Auto Trust,
Ser. 2017-1A, Cl. A2 | CAD | 1.68 | | 5/20/20 | | 12,350,000 | e | 9,758,170 | |
Canadian Government,
Unscd. Bonds | CAD | 0.75 | | 9/1/20 | | 10,660,000 | | 8,267,224 | |
Canadian Government,
Unscd. Bonds | CAD | 3.50 | | 12/1/45 | | 18,360,000 | | 18,276,453 | |
Canadian Pacer Auto Receivables Trust,
Ser. 2017-1A, Cl. A4 | | 2.29 | | 1/19/22 | | 6,275,000 | e | 6,236,987 | |
8
| | | | | | | | | | |
| |
Description | Coupon
Rate (%) | | Maturity
Date | | Principal
Amount ($) | a | Value ($) | |
Bonds and Notes - 96.5% (continued) | | | | | |
Canada - 4.4% (continued) | | | | | |
Cenovus Energy,
Notes | | 4.25 | | 4/15/27 | | 6,100,000 | c | 6,095,183 | |
CNH Capital Canada Receivables Trust,
Ser. 2014-1A, Cl. A2 | CAD | 1.80 | | 10/15/20 | | 684,064 | e | 544,569 | |
CNH Capital Canada Receivables Trust,
Ser. 2015-1, Cl. A2 | CAD | 1.35 | | 3/15/21 | | 2,857,083 | | 2,267,438 | |
CNH Capital Canada Receivables Trust,
Ser. 2017-1A, Cl. A2 | CAD | 1.71 | | 5/15/23 | | 11,025,000 | e | 8,680,543 | |
Export Development Canada,
Sr. Unscd. Notes | CAD | 1.80 | | 9/1/22 | | 12,700,000 | | 9,986,625 | |
Ford Auto Securitization Trust,
Ser. 2015-R4, Cl. A3 | CAD | 2.00 | | 11/15/20 | | 11,150,000 | | 8,864,206 | |
Ford Auto Securitization Trust,
Ser. 2017-R2, Cl. A2 | CAD | 1.42 | | 4/15/21 | | 11,255,000 | | 8,883,571 | |
Ford Auto Securitization Trust,
Ser. 2017-R5A, Cl. A3 | CAD | 2.38 | | 3/15/23 | | 8,800,000 | e | 6,971,532 | |
GMF Canada Leasing Trust,
Ser. 16-1A, Cl. A2 | CAD | 1.64 | | 3/20/19 | | 2,864,059 | e | 2,279,171 | |
GMF Canada Leasing Trust,
Ser. 16-1A, Cl. A3 | CAD | 1.83 | | 6/21/21 | | 5,800,000 | e | 4,611,115 | |
GMF Canada Leasing Trust,
Ser. 17-1A, Cl. A3 | CAD | 2.47 | | 9/20/22 | | 6,275,000 | e | 4,989,449 | |
MBARC Credit Canada,
Ser. 2016-A, Cl. A2 | CAD | 1.53 | | 6/17/19 | | 12,756,653 | | 10,141,792 | |
MBARC Credit Canada,
Ser. 2016-AA, Cl. A2 | CAD | 1.53 | | 6/17/19 | | 10,654,704 | e | 8,470,363 | |
MBARC Credit Canada,
Ser. 2016-AA. Cl. A3 | CAD | 1.72 | | 7/15/21 | | 3,350,000 | e | 2,657,560 | |
Teck Resources,
Gtd. Notes | | 6.25 | | 7/15/41 | | 3,575,000 | | 4,111,250 | |
| | 140,316,391 | |
Chile - .5% | | | | | |
Chilean Government,
Unscd. Bonds | CLP | 4.50 | | 3/1/21 | | 8,890,000,000 | | 14,803,425 | |
China - .6% | | | | | |
Alibaba Group Holding,
Sr. Unscd. Notes | | 2.80 | | 6/6/23 | | 3,175,000 | c | 3,167,851 | |
Sinopec Group Overseas Development 2017,
Gtd. Notes | | 2.50 | | 9/13/22 | | 16,800,000 | e | 16,370,491 | |
| | 19,538,342 | |
Colombia - .5% | | | | | |
Colombian Government,
Sr. Unscd. Bonds, Ser. B | COP | 10.00 | | 7/24/24 | | 37,206,900,000 | | 15,062,272 | |
9
STATEMENT OF INVESTMENTS (continued)
| | | | | | | | | | |
| |
Description | Coupon
Rate (%) | | Maturity
Date | | Principal
Amount ($) | a | Value ($) | |
Bonds and Notes - 96.5% (continued) | | | | | |
France - 2.6% | | | | | |
AXA,
Sub. Notes | EUR | 5.25 | | 4/16/40 | | 3,500,000 | | 4,657,792 | |
French Government,
Bonds | EUR | 0.25 | | 11/25/26 | | 30,675,000 | | 35,879,452 | |
French Government,
Bonds | EUR | 0.75 | | 5/25/28 | | 12,650,000 | | 15,131,825 | |
French Government,
Unscd. Bonds | EUR | 2.00 | | 5/25/48 | | 14,200,000 | | 18,004,954 | |
SFR Group,
Sr. Scd. Notes | | 7.38 | | 5/1/26 | | 3,375,000 | e | 3,488,906 | |
Societe Generale,
Sr. Unscd. Notes | EUR | 2.38 | | 2/28/18 | | 5,300,000 | | 6,385,926 | |
| | 83,548,855 | |
Germany - 1.3% | | | | | |
Allianz,
Jr. Sub. Bonds | EUR | 3.38 | | 12/31/49 | | 3,100,000 | | 4,137,747 | |
Allianz,
Sub. Notes | EUR | 5.63 | | 10/17/42 | | 4,300,000 | | 6,289,849 | |
Driver thirteen,
Ser. 13, Cl. A | EUR | 0.00 | | 2/22/21 | | 976,106 | f | 1,173,013 | |
Globaldrive Auto Receivables,
Ser. 16-A, Cl. A | EUR | 0.00 | | 1/20/24 | | 2,635,830 | f | 3,169,821 | |
Globaldrive Auto Receivables,
Ser. 16-B, Cl. A | EUR | 0.13 | | 8/20/24 | | 9,569,095 | | 11,540,390 | |
KFW,
Govt. Gtd. Notes | AUD | 4.00 | | 1/16/19 | | 18,050,000 | | 14,365,315 | |
| | 40,676,135 | |
Ghana - .2% | | | | | |
Ghanaian Government,
Sr. Unscd. Bonds | | 8.13 | | 1/18/26 | | 6,925,000 | c | 7,721,659 | |
Ireland - .6% | | | | | |
AerCap Ireland Capital,
Gtd. Notes | | 4.50 | | 5/15/21 | | 4,550,000 | | 4,781,771 | |
AerCap Ireland Capital,
Gtd. Notes | | 5.00 | | 10/1/21 | | 2,000,000 | | 2,133,572 | |
Irish Government,
Unscd. Bonds | EUR | 2.00 | | 2/18/45 | | 2,150,000 | | 2,712,012 | |
MMC Norilsk Nickel,
Sr. Unscd. Notes | | 4.10 | | 4/11/23 | | 9,500,000 | e | 9,580,028 | |
| | 19,207,383 | |
Israel - .1% | | | | | |
Israeli Government,
Bonds, Ser. 0327 | ILS | 2.00 | | 3/31/27 | | 12,975,000 | | 3,842,739 | |
Italy - 1.7% | | | | | |
Enel,
Sr. Unscd. Bonds | EUR | 4.88 | | 2/20/18 | | 2,165,000 | | 2,615,410 | |
10
| | | | | | | | | | |
| |
Description | Coupon
Rate (%) | | Maturity
Date | | Principal
Amount ($) | a | Value ($) | |
Bonds and Notes - 96.5% (continued) | | | | | |
Italy - 1.7% (continued) | | | | | |
Intesa Sanpaolo,
Gtd. Notes | | 3.88 | | 1/15/19 | | 15,308,000 | | 15,515,142 | |
Intesa Sanpaolo,
Sr. Unscd. Notes | | 3.88 | | 1/16/18 | | 3,585,000 | | 3,587,431 | |
Intesa Sanpaolo,
Sr. Unscd. Notes | EUR | 3.00 | | 1/28/19 | | 1,075,000 | | 1,332,781 | |
Italian Government,
Unscd. Bonds | EUR | 2.70 | | 3/1/47 | | 27,875,000 | e | 30,493,331 | |
| | 53,544,095 | |
Ivory Coast - .2% | | | | | |
Ivory Coast Government,
Sr. Unscd. Bonds | EUR | 5.13 | | 6/15/25 | | 2,450,000 | e | 3,210,231 | |
Ivory Coast Government,
Sr. Unscd. Bonds | | 6.13 | | 6/15/33 | | 3,700,000 | e | 3,771,776 | |
| | 6,982,007 | |
Japan - 20.4% | | | | | |
Development Bank of Japan,
Govt. Gtd. Bonds | JPY | 1.70 | | 9/20/22 | | 325,000,000 | | 3,111,794 | |
Japanese Government,
Sr. Unscd. Bonds, Ser. 118 | JPY | 0.20 | | 6/20/19 | | 3,147,850,000 | | 28,073,849 | |
Japanese Government,
Sr. Unscd. Bonds, Ser. 128 | JPY | 0.10 | | 6/20/21 | | 15,474,750,000 | | 138,368,918 | |
Japanese Government,
Sr. Unscd. Bonds, Ser. 156 | JPY | 0.40 | | 3/20/36 | | 6,655,050,000 | | 58,274,081 | |
Japanese Government,
Sr. Unscd. Bonds, Ser. 19 | JPY | 0.10 | | 9/10/24 | | 6,111,000,000 | g | 57,476,328 | |
Japanese Government,
Sr. Unscd. Bonds, Ser. 20 | JPY | 0.10 | | 3/10/25 | | 6,182,700,000 | g | 58,400,671 | |
Japanese Government,
Sr. Unscd. Bonds, Ser. 21 | JPY | 0.10 | | 3/10/26 | | 3,569,000,000 | g | 33,818,670 | |
Japanese Government,
Sr. Unscd. Bonds, Ser. 22 | JPY | 0.10 | | 3/10/27 | | 6,626,300,000 | g | 63,150,113 | |
Japanese Government,
Sr. Unscd. Bonds, Ser. 307 | JPY | 1.30 | | 3/20/20 | | 3,206,400,000 | | 29,354,973 | |
Japanese Government,
Sr. Unscd. Bonds, Ser. 336 | JPY | 0.50 | | 12/20/24 | | 6,492,400,000 | | 59,872,172 | |
Japanese Government,
Sr. Unscd. Bonds, Ser. 348 | JPY | 0.10 | | 9/20/27 | | 12,058,150,000 | | 107,686,583 | |
Japanese Government,
Sr. Unscd. Bonds, Ser. 44 | JPY | 1.70 | | 9/20/44 | | 513,000,000 | | 5,610,019 | |
OSCAR US Funding Trust VII,
Ser. 2017-2A, Cl. A3 | | 2.45 | | 12/10/21 | | 2,330,000 | e | 2,317,194 | |
OSCAR US Funding Trust VII,
Ser. 2017-2A, Cl. A4 | | 2.76 | | 12/10/24 | | 5,580,000 | e | 5,543,925 | |
| | 651,059,290 | |
11
STATEMENT OF INVESTMENTS (continued)
| | | | | | | | | | |
| |
Description | Coupon
Rate (%) | | Maturity
Date | | Principal
Amount ($) | a | Value ($) | |
Bonds and Notes - 96.5% (continued) | | | | | |
Kazakhstan - .2% | | | | | |
KazTransGas,
Gtd. Notes | | 4.38 | | 9/26/27 | | 6,525,000 | e | 6,565,944 | |
Kuwait - .5% | | | | | |
Kuwaiti Government,
Sr. Unscd. Notes | | 3.50 | | 3/20/27 | | 17,000,000 | e | 17,296,089 | |
Luxembourg - .4% | | | | | |
Altice Financing,
Sr. Scd. Bonds | | 7.50 | | 5/15/26 | | 3,575,000 | e | 3,816,313 | |
E-Carat,
Ser. 16-1, Cl. A | EUR | 0.08 | | 10/18/24 | | 5,670,665 | | 6,827,033 | |
Volkswagen Car Lease,
Ser. 22, Cl. A | EUR | 0.25 | | 8/21/21 | | 1,909,348 | | 2,295,043 | |
| | 12,938,389 | |
Mexico - 1.7% | | | | | |
Banco Nacional de Comercio Exterior,
Sr. Unscd. Notes | | 4.38 | | 10/14/25 | | 7,100,000 | e | 7,401,750 | |
Mexican Government,
Bonds, Ser. M | MXN | 8.00 | | 11/7/47 | | 414,000,000 | | 21,506,608 | |
Mexican Government,
Sr. Unscd. Bonds, Ser. M | MXN | 7.75 | | 11/13/42 | | 389,750,000 | | 19,722,886 | |
Mexico City Airport Trust,
Sr. Scd. Bonds | | 5.50 | | 7/31/47 | | 5,725,000 | e | 5,682,062 | |
| | 54,313,306 | |
Netherlands - 3.0% | | | | | |
ABN AMRO Bank,
Sub. Notes | | 4.75 | | 7/28/25 | | 9,350,000 | e | 9,943,725 | |
ABN AMRO Bank,
Sub. Notes | EUR | 2.88 | | 1/18/28 | | 3,700,000 | c | 4,838,843 | |
Equate Petrochemical,
Gtd. Notes | | 3.00 | | 3/3/22 | | 3,115,000 | e | 3,074,841 | |
Iberdrola International,
Gtd. Notes | EUR | 1.13 | | 1/27/23 | | 1,400,000 | | 1,731,087 | |
Iberdrola International,
Gtd. Notes | EUR | 5.75 | | 2/27/49 | | 800,000 | | 969,020 | |
ING GROEP,
Sub. Notes | EUR | 3.00 | | 4/11/28 | | 2,500,000 | | 3,289,715 | |
Lukoil International Finance,
Gtd. Notes | | 4.75 | | 11/2/26 | | 7,100,000 | e | 7,463,768 | |
Mylan,
Gtd. Notes | | 2.50 | | 6/7/19 | | 6,125,000 | | 6,120,253 | |
Petrobras Global Finance,
Gtd. Notes | | 5.30 | | 1/27/25 | | 6,400,000 | e | 6,427,200 | |
Petrobras Global Finance,
Gtd. Notes | | 7.25 | | 3/17/44 | | 8,350,000 | | 8,704,875 | |
Rabobank Nederland,
Sub. Bonds | EUR | 2.50 | | 5/26/26 | | 6,180,000 | | 7,858,070 | |
12
| | | | | | | | | | |
| |
Description | Coupon
Rate (%) | | Maturity
Date | | Principal
Amount ($) | a | Value ($) | |
Bonds and Notes - 96.5% (continued) | | | | | |
Netherlands - 3.0% (continued) | | | | | |
Schaeffler Finance,
Sr. Scd. Notes | | 4.75 | | 5/15/23 | | 3,375,000 | e | 3,450,938 | |
Shell International Finance,
Gtd. Notes | | 3.75 | | 9/12/46 | | 13,750,000 | | 14,047,225 | |
Vonovia Finance,
Gtd. Notes | EUR | 1.63 | | 12/15/20 | | 9,000,000 | | 11,258,520 | |
WPC,
Gtd. Bonds | EUR | 2.25 | | 7/19/24 | | 6,100,000 | | 7,666,682 | |
| | 96,844,762 | |
New Zealand - 2.4% | | | | | |
New Zealand Government,
Sr. Unscd. Bonds, Ser. 0925 | NZD | 2.00 | | 9/20/25 | | 99,358,000 | h | 78,222,517 | |
Nigeria - .1% | | | | | |
Nigerian Government,
Sr. Unscd. Notes | | 6.50 | | 11/28/27 | | 4,100,000 | e | 4,285,656 | |
Norway - .3% | | | | | |
Norwegian Government,
Unscd. Bonds, Ser. 474 | NOK | 3.75 | | 5/25/21 | | 61,700,000 | e | 8,231,155 | |
Portugal - 1.2% | | | | | |
Portuguese Government,
Sr. Unscd. Bonds | EUR | 4.10 | | 2/15/45 | | 27,200,000 | | 38,365,922 | |
Russia - 1.0% | | | | | |
Russian Government,
Bonds, Ser. 6212 | RUB | 7.05 | | 1/19/28 | | 919,000,000 | | 15,513,996 | |
Russian Government,
Unscd. Bonds, Ser. 6215 | RUB | 7.00 | | 8/16/23 | | 996,225,000 | | 17,288,069 | |
| | 32,802,065 | |
Saudi Arabia - .5% | | | | | |
Saudi Government,
Sr. Unscd. Notes | | 3.63 | | 3/4/28 | | 15,100,000 | e | 14,990,978 | |
Senegal - .5% | | | | | |
Senegalese Government,
Unscd. Notes | | 6.25 | | 5/23/33 | | 7,400,000 | | 7,832,574 | |
Senegalese Government,
Unscd. Notes | | 6.25 | | 5/23/33 | | 7,000,000 | e | 7,409,192 | |
| | 15,241,766 | |
Serbia - .1% | | | | | |
Serbian Government,
Sr. Unscd. Notes | | 7.25 | | 9/28/21 | | 3,600,000 | | 4,122,493 | |
South Africa - 2.6% | | | | | |
South African Government,
Bonds, Ser. 2048 | ZAR | 8.75 | | 2/28/48 | | 1,066,900,000 | | 78,194,780 | |
South African Government,
Bonds, Ser. R186 | ZAR | 10.50 | | 12/21/26 | | 65,800,000 | | 5,945,267 | |
| | 84,140,047 | |
13
STATEMENT OF INVESTMENTS (continued)
| | | | | | | | | | |
| |
Description | Coupon
Rate (%) | | Maturity
Date | | Principal
Amount ($) | a | Value ($) | |
Bonds and Notes - 96.5% (continued) | | | | | |
Spain - 2.4% | | | | | |
BBVA Subordinated Capital,
Gtd. Notes | EUR | 3.50 | | 4/11/24 | | 10,000,000 | | 12,496,232 | |
Driver Espana,
Ser. 3, Cl. A | EUR | 0.68 | | 12/21/26 | | 3,339,564 | | 4,042,593 | |
Spanish Government,
Sr. Unscd. Bonds | EUR | 2.90 | | 10/31/46 | | 43,200,000 | | 52,667,105 | |
Telefonica Emisiones,
Gtd. Notes | EUR | 1.53 | | 1/17/25 | | 5,300,000 | | 6,581,688 | |
| | 75,787,618 | |
Sri Lanka - .5% | | | | | |
Sri Lankan Government,
Sr. Unscd. Bonds | | 5.75 | | 1/18/22 | | 12,075,000 | e | 12,643,044 | |
Sri Lankan Government,
Sr. Unscd. Notes | | 6.20 | | 5/11/27 | | 2,625,000 | e | 2,776,512 | |
| | 15,419,556 | |
Supranational - 3.1% | | | | | |
Asian Development Bank,
Sr. Unscd. Notes | NZD | 3.50 | | 5/30/24 | | 12,575,000 | | 9,062,390 | |
European Investment Bank,
Sr. Unscd. Bonds | CAD | 1.25 | | 11/5/20 | | 15,050,000 | e | 11,724,992 | |
European Investment Bank,
Sr. Unscd. Notes | CAD | 1.13 | | 9/16/21 | | 8,500,000 | | 6,556,658 | |
International Bank for Reconstruction & Development,
Sr. Unscd. Notes | | 1.88 | | 4/21/20 | | 4,500,000 | | 4,481,757 | |
International Bank for Reconstruction & Development,
Sr. Unscd. Notes | NZD | 3.50 | | 1/22/21 | | 50,675,000 | | 36,849,099 | |
International Finance Corporation,
Sr. Unscd. Notes | INR | 6.30 | | 11/25/24 | | 328,130,000 | | 5,183,310 | |
Nordic Investment Bank,
Sr. Unscd. Notes | NOK | 1.38 | | 7/15/20 | | 215,000,000 | | 26,476,376 | |
| | 100,334,582 | |
Switzerland - .3% | | | | | |
Credit Suisse Group,
Sr. Unscd. Notes | | 4.28 | | 1/9/28 | | 8,725,000 | e | 9,104,381 | |
Thailand - .2% | | | | | |
Thai Government,
Sr. Unscd. Bonds | THB | 2.13 | | 12/17/26 | | 257,000,000 | | 7,766,139 | |
Turkey - 1.2% | | | | | |
Turkish Government,
Bonds | TRY | 11.00 | | 2/24/27 | | 51,500,000 | | 13,026,273 | |
Turkish Government,
Sr. Unscd. Notes | | 5.75 | | 5/11/47 | | 8,275,000 | | 8,082,383 | |
14
| | | | | | | | | | |
| |
Description | Coupon
Rate (%) | | Maturity Date | | Principal Amount ($) | a | Value ($) | |
Bonds and Notes - 96.5% (continued) | | | | | |
Turkey - 1.2% (continued) | | | | | |
Turkish Government,
Unscd. Bonds | TRY | 2.00 | | 9/18/24 | | 47,525,000 | i | 15,718,002 | |
| | 36,826,658 | |
Ukraine - .6% | | | | | |
Ukrainian Government,
Sr. Unscd. Notes | | 7.38 | | 9/25/32 | | 14,975,000 | e | 14,751,034 | |
Ukrainian Government,
Sr. Unscd. Notes | | 0.00 | | 5/31/40 | | 7,250,000 | f | 4,015,311 | |
| | 18,766,345 | |
United Arab Emirates - .9% | | | | | |
Abu Dhabi Crude Oil Pipeline,
Sr. Scd. Bonds | | 4.60 | | 11/2/47 | | 15,325,000 | e | 15,804,213 | |
Abu Dhabi Government,
Sr. Unscd. Notes | | 4.13 | | 10/11/47 | | 12,765,000 | e | 12,656,038 | |
| | 28,460,251 | |
United Kingdom - 5.7% | | | | | |
Barclays,
Jr. Sub. Bonds | | 7.88 | | 12/31/49 | | 6,000,000 | | 6,592,500 | |
Barclays,
Sub. Notes | | 5.20 | | 5/12/26 | | 8,100,000 | | 8,653,708 | |
HSBC Holdings,
Sub. Notes | | 4.38 | | 11/23/26 | | 5,800,000 | | 6,064,813 | |
INEOS Finance,
Sr. Scd Bonds | EUR | 2.13 | | 11/15/25 | | 4,325,000 | e | 5,166,316 | |
International Game Technology,
Sr. Scd. Notes | | 6.25 | | 2/15/22 | | 3,275,000 | e | 3,545,188 | |
Lloyds Banking Group,
Sr. Unscd. Notes | | 3.10 | | 7/6/21 | | 4,000,000 | | 4,043,292 | |
Lloyds Banking Group,
Sr. Unscd. Notes | | 3.75 | | 1/11/27 | | 8,500,000 | | 8,646,058 | |
Royal Bank of Scotland Group,
Sr. Unscd. Notes | | 3.88 | | 9/12/23 | | 28,725,000 | | 29,244,253 | |
Santander UK Group Holdings,
Sr. Unscd. Notes | | 3.57 | | 1/10/23 | | 6,525,000 | | 6,624,449 | |
United Kingdom Gilt,
Bonds | GBP | 1.50 | | 7/22/47 | | 26,500,000 | | 33,689,949 | |
United Kingdom Gilt,
Unscd. Bonds | GBP | 3.25 | | 1/22/44 | | 35,550,000 | | 62,521,845 | |
Vodafone Group,
Sr. Unscd. Notes | EUR | 1.25 | | 8/25/21 | | 5,400,000 | | 6,702,566 | |
| | 181,494,937 | |
United States - 27.9% | | | | | |
21st Century Fox America,
Gtd. Notes | | 3.70 | | 10/15/25 | | 2,600,000 | | 2,717,076 | |
Abbott Laboratories,
Sr. Unscd. Notes | | 3.75 | | 11/30/26 | | 2,850,000 | | 2,931,170 | |
15
STATEMENT OF INVESTMENTS (continued)
| | | | | | | | | | |
| |
Description | Coupon
Rate (%) | | Maturity
Date | | Principal
Amount ($) | a | Value ($) | |
Bonds and Notes - 96.5% (continued) | | | | | |
United States - 27.9% (continued) | | | | | |
Abbott Laboratories,
Sr. Unscd. Notes | | 4.90 | | 11/30/46 | | 10,800,000 | | 12,421,138 | |
AbbVie,
Sr. Unscd. Bonds | EUR | 1.38 | | 5/17/24 | | 8,250,000 | | 10,120,494 | |
AEP Transmission,
Sr. Unscd. Notes | | 3.10 | | 12/1/26 | | 3,680,000 | e | 3,690,462 | |
Ally Financial,
Gtd. Notes | | 3.50 | | 1/27/19 | | 3,310,000 | | 3,334,825 | |
Amazon.com,
Sr. Unscd. Notes | | 3.15 | | 8/22/27 | | 11,875,000 | e | 11,913,389 | |
AMC Networks,
Gtd. Notes | | 5.00 | | 4/1/24 | | 2,759,000 | | 2,800,385 | |
AMC Networks,
Gtd. Notes | | 4.75 | | 8/1/25 | | 1,180,000 | | 1,172,625 | |
American Homes 4 Rent Trust,
Ser. 2014-SFR3, Cl. A | | 3.68 | | 12/17/36 | | 4,277,771 | e | 4,436,474 | |
AmeriCredit Automobile Receivable Trust,
Ser. 2017-4, Cl. B | | 2.36 | | 12/19/22 | | 12,025,000 | | 11,961,895 | |
AmeriCredit Automobile Receivables Trust,
Ser. 2013-4, Cl. C | | 2.72 | | 9/9/19 | | 8,803 | | 8,806 | |
Amgen,
Sr. Unscd. Notes | | 4.40 | | 5/1/45 | | 2,825,000 | | 3,083,385 | |
Andeavor Logistics,
Gtd. Notes | | 3.50 | | 12/1/22 | | 2,175,000 | | 2,173,007 | |
Antero Resources,
Gtd. Notes | | 5.63 | | 6/1/23 | | 915,000 | | 956,175 | |
Antero Resources,
Gtd. Notes | | 5.00 | | 3/1/25 | | 2,775,000 | | 2,844,375 | |
Apple,
Sr. Unscd. Notes | | 3.25 | | 2/23/26 | | 8,895,000 | | 9,085,043 | |
Aventura Mall Trust,
Ser. 2013-AVM, Cl. A | | 3.74 | | 12/5/32 | | 2,305,000 | e | 2,376,513 | |
Barclays Commercial Mortgage Securities Trust,
Ser. 2013-TYSN, Cl. A2 | | 3.76 | | 9/5/32 | | 1,245,000 | e | 1,287,139 | |
Bear Stearns ALT-A Trust,
Ser. 2004-2, Cl. 2A1, 1 Year LIBOR + 2.00% | | 3.41 | | 3/25/34 | | 615,904 | b | 618,035 | |
Bear Stearns Commercial Mortgage Securities Trust,
Ser. 2005-PWR10, Cl. AJ | | 5.59 | | 12/11/40 | | 218,695 | | 232,874 | |
Bear Stearns Commercial Mortgage Securities Trust,
Ser. 2007-PWR17, Cl. AJ | | 5.70 | | 6/11/50 | | 95,591 | | 95,771 | |
16
| | | | | | | | | | |
| |
Description | Coupon
Rate (%) | | Maturity
Date | | Principal
Amount ($) | a | Value ($) | |
Bonds and Notes - 96.5% (continued) | | | | | |
United States - 27.9% (continued) | | | | | |
Bear Stearns Commercial Mortgage Securities Trust,
Ser. 2007-PWR18, Cl. AJ | | 6.20 | | 6/11/50 | | 353,632 | | 353,400 | |
Branch Banking & Trust,
Sub. Bonds | | 3.80 | | 10/30/26 | | 10,890,000 | | 11,407,238 | |
Branch Banking & Trust,
Sub. Notes | | 3.63 | | 9/16/25 | | 7,850,000 | | 8,144,036 | |
BWAY Holding,
Sr. Scd. Notes | | 5.50 | | 4/15/24 | | 6,656,000 | e | 6,938,880 | |
Capital Auto Receivables Asset Trust,
Ser. 2014-1, Cl. D | | 3.39 | | 7/22/19 | | 900,000 | | 902,540 | |
Capital Auto Receivables Asset Trust,
Ser. 2014-2, Cl. C | | 2.41 | | 5/20/19 | | 43,248 | | 43,262 | |
Capital Auto Receivables Asset Trust,
Ser. 2014-3, Cl. D | | 3.14 | | 2/20/20 | | 2,850,000 | | 2,869,317 | |
Capital Auto Receivables Asset Trust,
Ser. 2015-2, Cl. B | | 2.29 | | 5/20/20 | | 6,000,000 | | 6,006,734 | |
Capital Auto Receivables Asset Trust,
Ser. 2015-2, Cl. D | | 3.16 | | 11/20/20 | | 7,275,000 | | 7,339,344 | |
Capital One Financial,
Sub. Notes | | 3.75 | | 7/28/26 | | 15,000,000 | | 14,960,130 | |
CarMax Auto Owner Trust,
Ser. 2014-4, Cl. D | | 3.04 | | 5/17/21 | | 2,625,000 | | 2,637,053 | |
CarMax Auto Owner Trust,
Ser. 2015-2, Cl. D | | 3.04 | | 11/15/21 | | 1,000,000 | | 1,005,106 | |
CCO Holdings,
Sr. Unscd. Notes | | 5.88 | | 4/1/24 | | 3,420,000 | e | 3,573,900 | |
Charter Communications Operating,
Sr. Scd. Notes | | 5.38 | | 5/1/47 | | 3,400,000 | | 3,496,203 | |
Cheniere Corpus Christi Holdings,
Sr. Scd. Notes | | 5.13 | | 6/30/27 | | 3,700,000 | | 3,836,530 | |
Cheniere Energy Partners,
Sr. Scd. Notes | | 5.25 | | 10/1/25 | | 5,985,000 | e | 6,104,700 | |
Chrysler Capital Auto Receivables Trust,
Ser. 2013-BA, Cl. C | | 2.24 | | 9/16/19 | | 968,806 | e | 968,945 | |
Chrysler Capital Auto Receivables Trust,
Ser. 2015-AA, Cl. D | | 3.15 | | 1/18/22 | | 3,100,000 | e | 3,132,953 | |
Chrysler Capital Auto Receivables Trust,
Ser. 2015-BA, Cl. C | | 3.26 | | 4/15/21 | | 3,500,000 | e | 3,548,656 | |
Citigroup,
Sr. Unscd. Notes | | 4.65 | | 7/30/45 | | 7,920,000 | | 9,042,864 | |
Citigroup,
Sub. Bonds | | 4.40 | | 6/10/25 | | 5,870,000 | | 6,200,438 | |
Citizens Bank,
Sr. Unscd. Notes | | 2.25 | | 3/2/20 | | 7,775,000 | | 7,741,594 | |
CLUB Credit Trust,
Ser. 2017-P1, Cl. A | | 2.42 | | 9/15/23 | | 7,506,662 | e | 7,503,971 | |
17
STATEMENT OF INVESTMENTS (continued)
| | | | | | | | | | |
| |
Description | Coupon
Rate (%) | | Maturity
Date | | Principal
Amount ($) | a | Value ($) | |
Bonds and Notes - 96.5% (continued) | | | | | |
United States - 27.9% (continued) | | | | | |
Cobalt CMBS Commercial Mortgage Trust,
Ser. 2007-C3, Cl. AJ | | 5.84 | | 5/15/46 | | 3,128,013 | | 3,183,348 | |
Colony American Homes,
Ser. 2014-1A, Cl. C, 1 Month LIBOR + 1.85% | | 3.33 | | 5/17/31 | | 1,625,000 | b,e | 1,631,683 | |
Colony American Homes,
Ser. 2015-1A, Cl. D, 1 Month LIBOR + 2.15% | | 3.58 | | 7/17/32 | | 2,225,000 | b,e | 2,231,132 | |
Colony Starwood Homes,
Ser. 2016-2A, Cl. A, 1 Month LIBOR + 1.25% | | 2.73 | | 12/17/33 | | 12,464,843 | b,e | 12,550,256 | |
Commercial Mortgage Trust,
Ser. 2006-C8, Cl. AJ | | 5.38 | | 12/10/46 | | 5,416,239 | | 5,458,896 | |
Commercial Mortgage Trust,
Ser. 2013-WWP, Cl. B | | 3.73 | | 3/10/31 | | 1,225,000 | e | 1,289,071 | |
Commercial Mortgage Trust,
Ser. 2017-DLTA, Cl. A, 1 Month LIBOR + .85% | | 2.33 | | 8/15/35 | | 11,050,000 | e | 11,074,788 | |
Concho Resources,
Gtd. Notes | | 3.75 | | 10/1/27 | | 3,750,000 | | 3,800,871 | |
Concho Resources,
Gtd. Notes | | 4.88 | | 10/1/47 | | 1,100,000 | | 1,206,739 | |
Corning,
Sr. Unscd. Notes | | 4.38 | | 11/15/57 | | 6,350,000 | | 6,326,654 | |
Cox Communications,
Sr. Unscd. Notes | | 3.35 | | 9/15/26 | | 3,250,000 | e | 3,181,107 | |
Crown Castle International,
Sr. Unscd. Notes | | 2.25 | | 9/1/21 | | 4,675,000 | | 4,599,659 | |
Daimler Finance North America,
Gtd. Notes | | 1.50 | | 7/5/19 | | 8,225,000 | e | 8,129,806 | |
DaVita,
Gtd. Notes | | 5.00 | | 5/1/25 | | 3,600,000 | | 3,607,920 | |
Dell Equipment Finance Trust,
Ser. 2016-1, Cl. A2 | | 1.43 | | 9/24/18 | | 2,076,025 | e | 2,075,015 | |
Dell Equipment Finance Trust,
Ser. 2017-2, Cl. B | | 2.47 | | 10/24/22 | | 2,525,000 | e | 2,511,509 | |
Digital Euro Finco,
Gtd. Bonds | EUR | 2.63 | | 4/15/24 | | 5,814,000 | | 7,493,296 | |
DISH DBS,
Gtd. Notes | | 5.88 | | 11/15/24 | | 3,425,000 | | 3,343,656 | |
Drive Auto Receivables Trust,
Ser. 2015-AA, Cl. C | | 3.06 | | 5/17/21 | | 2,918,839 | e | 2,931,573 | |
Drive Auto Receivables Trust,
Ser. 2016-CA, Cl. C | | 3.02 | | 11/15/21 | | 7,850,000 | e | 7,911,153 | |
Drive Auto Receivables Trust,
Ser. 2016-CA, Cl. D | | 4.18 | | 3/15/24 | | 8,000,000 | e | 8,218,840 | |
18
| | | | | | | | | | |
| |
Description | Coupon
Rate (%) | | Maturity
Date | | Principal
Amount ($) | a | Value ($) | |
Bonds and Notes - 96.5% (continued) | | | | | |
United States - 27.9% (continued) | | | | | |
Drive Auto Receivables Trust,
Ser. 2017-3, Cl. C | | 2.80 | | 7/15/22 | | 6,575,000 | | 6,580,825 | |
DT Auto Owner Trust,
Ser. 2014-3A, Cl. D | | 4.47 | | 11/15/21 | | 2,425,000 | e | 2,454,842 | |
DT Auto Owner Trust,
Ser. 2016-1A, Cl. C | | 3.54 | | 10/15/21 | | 865,000 | e | 868,718 | |
Duke Energy,
Sr. Unscd. Notes | | 2.65 | | 9/1/26 | | 2,800,000 | | 2,687,250 | |
Duke Energy,
Sr. Unscd. Notes | | 3.75 | | 9/1/46 | | 5,375,000 | | 5,333,416 | |
Energy Transfer,
Sr. Unscd. Notes | | 4.75 | | 1/15/26 | | 2,865,000 | | 2,976,502 | |
Energy Transfer,
Sr. Unscd. Notes | | 4.20 | | 4/15/27 | | 2,050,000 | | 2,042,660 | |
Energy Transfer Partners,
Jr. Sub. Notes, Ser. A | | 6.25 | | 12/15/49 | | 19,350,000 | | 18,829,969 | |
Enterprise Fleet Financing,
Ser. 2017-3, Cl. A2 | | 2.13 | | 5/20/23 | | 7,275,000 | e | 7,264,717 | |
EQT,
Sr. Unscd. Notes | | 3.00 | | 10/1/22 | | 2,290,000 | | 2,267,779 | |
EQT,
Sr. Unscd. Notes | | 3.90 | | 10/1/27 | | 11,800,000 | | 11,750,879 | |
First Data,
Scd. Notes | | 5.75 | | 1/15/24 | | 3,425,000 | e | 3,569,706 | |
First Franklin Mortgage Loan Trust,
Ser. 2004-FF4, Cl. M1, 1 Month LIBOR + 0.86% | | 2.18 | | 6/25/34 | | 1,693,118 | b | 1,683,732 | |
Flagship Credit Auto Trust,
Ser. 2015-2, Cl. A | | 1.98 | | 10/15/20 | | 546,764 | e | 546,789 | |
Ford Credit Auto Owner Trust,
Ser. 2014-A, Cl. B | | 1.71 | | 5/15/19 | | 1,640,083 | | 1,640,009 | |
Ford Motor Credit,
Sr. Unscd. Notes | | 2.55 | | 10/5/18 | | 1,700,000 | | 1,705,247 | |
Ford Motor Credit,
Sr. Unscd. Notes | | 3.34 | | 3/18/21 | | 3,475,000 | | 3,531,678 | |
Freeport-McMoRan,
Gtd. Notes | | 5.45 | | 3/15/43 | | 4,275,000 | | 4,291,031 | |
GAHR Commercial Mortgage Trust,
Ser. 2015-NRF, Cl. EFX | | 3.38 | | 12/15/34 | | 3,620,000 | e | 3,598,691 | |
General Electric,
Jr. Sub. Debs., Ser. D | | 5.00 | | 12/31/49 | | 14,935,000 | | 15,410,680 | |
General Motors Financial,
Gtd. Notes | | 3.10 | | 1/15/19 | | 4,475,000 | | 4,500,058 | |
General Motors Financial,
Gtd. Notes | | 2.35 | | 10/4/19 | | 9,650,000 | | 9,624,677 | |
Genesis Energy,
Gtd. Notes | | 6.75 | | 8/1/22 | | 2,100,000 | | 2,189,250 | |
19
STATEMENT OF INVESTMENTS (continued)
| | | | | | | | | | |
| |
Description | Coupon
Rate (%) | | Maturity
Date | | Principal
Amount ($) | a | Value ($) | |
Bonds and Notes - 96.5% (continued) | | | | | |
United States - 27.9% (continued) | | | | | |
Genesis Energy,
Gtd. Notes | | 6.50 | | 10/1/25 | | 3,965,000 | | 4,044,300 | |
Glencore Funding,
Gtd. Notes | | 3.00 | | 10/27/22 | | 4,000,000 | e | 3,968,300 | |
GM Financial Automobile Leasing Trust,
Ser. 2015-1, Cl. D | | 3.01 | | 3/20/20 | | 3,350,000 | | 3,353,058 | |
Goldman Sachs Group,
Sr. Unscd. Notes | | 3.50 | | 11/16/26 | | 10,380,000 | | 10,448,844 | |
Goldman Sachs Group,
Sub. Notes | | 4.25 | | 10/21/25 | | 6,710,000 | | 7,018,090 | |
GS Mortgage Securities Trust,
Ser. 2016-GS2, Cl. A2 | | 2.64 | | 5/10/49 | | 4,200,000 | | 4,203,393 | |
HCA,
Sr. Scd. Notes | | 5.50 | | 6/15/47 | | 3,915,000 | | 3,915,000 | |
Hyatt Hotel Portfolio Trust,
Ser. 2017-HYT2, Cl. B, 1 Month LIBOR + 0.95% | | 2.43 | | 8/9/32 | | 12,831,000 | e | 12,785,709 | |
Hyundai Auto Receivables Trust,
Ser. 2015-A, Cl. C | | 1.98 | | 7/15/20 | | 1,320,000 | | 1,316,920 | |
Icahn Enterprises,
Gtd. Notes | | 5.88 | | 2/1/22 | | 3,765,000 | | 3,826,181 | |
JP Morgan Chase Commercial Mortgage Securities Trust,
Ser. 2006-LDP9, Cl. AM | | 5.37 | | 5/15/47 | | 2,831,799 | | 2,837,569 | |
JP Morgan Chase Commercial Mortgage Securities Trust,
Ser. 2007-LDPX, Cl. AM | | 5.46 | | 1/15/49 | | 2,809,566 | | 2,820,699 | |
JPMorgan Chase & Co.,
Sr. Unscd. Notes | | 3.30 | | 4/1/26 | | 9,610,000 | | 9,693,428 | |
KeyCorp Student Loan Trust,
Ser. 1999-B, Cl. CTFS, 3 Month LIBOR + .90% | | 2.22 | | 11/25/36 | | 11,737 | b | 11,751 | |
Kinder Morgan,
Gtd. Notes | | 4.30 | | 6/1/25 | | 1,950,000 | | 2,033,845 | |
Kinder Morgan,
Gtd. Notes | | 5.55 | | 6/1/45 | | 2,891,000 | | 3,172,812 | |
Kraft Heinz Foods,
Gtd. Notes | EUR | 2.00 | | 6/30/23 | | 5,300,000 | | 6,724,521 | |
Kraft Heinz Foods,
Gtd. Notes | EUR | 2.25 | | 5/25/28 | | 13,575,000 | | 16,704,755 | |
Kubota Credit Owner Trust,
Ser. 2016-1A, Cl. A3 | | 1.50 | | 7/15/20 | | 4,900,000 | e | 4,865,446 | |
Metropolitan Life Global Funding I,
Scd. Notes | | 1.50 | | 1/10/18 | | 4,605,000 | e | 4,604,516 | |
Metropolitan Life Global Funding I,
Sr. Scd. Notes | | 3.00 | | 9/19/27 | | 5,475,000 | e | 5,428,710 | |
20
| | | | | | | | | | |
| |
Description | Coupon
Rate (%) | | Maturity
Date | | Principal
Amount ($) | a | Value ($) | |
Bonds and Notes - 96.5% (continued) | | | | | |
United States - 27.9% (continued) | | | | | |
Morgan Stanley,
Sr. Unscd. Notes | | 4.00 | | 7/23/25 | | 3,450,000 | | 3,614,991 | |
Morgan Stanley Mortgage Loan Trust,
Ser. 2005-1, Cl. 4A1, 1 Month LIBOR + .30% | | 1.63 | | 3/25/35 | | 216,341 | b | 204,627 | |
New Residential Mortgage Loan Trust,
Ser. 2017-3A, Cl. A1 | | 4.00 | | 4/25/57 | | 10,147,786 | e | 10,499,552 | |
Newell Brands,
Sr. Unscd. Notes | | 2.60 | | 3/29/19 | | 737,000 | | 739,684 | |
NGPL PipeCo,
Sr. Unscd. Notes | | 4.38 | | 8/15/22 | | 940,000 | e | 959,388 | |
Occidental Petroleum,
Sr. Unscd. Notes | | 3.00 | | 2/15/27 | | 6,675,000 | | 6,641,919 | |
OneMain Financial Issuance Trust,
Ser. 2014-2A, Cl. A | | 2.47 | | 9/18/24 | | 89,392 | e | 89,520 | |
OneMain Financial Issuance Trust,
Ser. 2015-1A, Cl. A | | 3.19 | | 3/18/26 | | 5,344,000 | e | 5,377,976 | |
OneMain Financial Issuance Trust,
Ser. 2015-1A, Cl. B | | 3.85 | | 3/18/26 | | 3,250,000 | e | 3,285,042 | |
OneMain Financial Issuance Trust,
Ser. 2015-2A, Cl. A | | 2.57 | | 7/18/25 | | 2,772,977 | e | 2,774,636 | |
Oracle,
Sr. Unscd. Notes | | 4.00 | | 7/15/46 | | 11,100,000 | | 11,829,644 | |
OSCAR US Funding Trust VI,
Ser. 2017-1A, Cl. A2A | | 2.30 | | 5/11/20 | | 2,328,995 | e | 2,332,938 | |
OSCAR US Funding Trust VI,
Ser. 2017-1A, Cl. A4 | | 3.30 | | 5/10/24 | | 3,560,000 | e | 3,587,618 | |
Prime Security Services Borrower,
Scd. Notes | | 9.25 | | 5/15/23 | | 3,300,000 | e | 3,671,250 | |
Prosper Marketplace Issuance Trust,
Ser. 2017-1A, Cl. A | | 2.56 | | 6/15/23 | | 3,252,397 | e | 3,263,370 | |
Prosper Marketplace Issuance Trust,
Ser. 2017-3A, Cl. A | | 2.36 | | 11/15/23 | | 12,471,179 | e | 12,481,518 | |
Prudential Financial,
Jr. Sub. Notes | | 4.50 | | 9/15/47 | | 12,100,000 | c | 12,279,080 | |
Prudential Financial,
Sr. Unscd. Notes | | 5.38 | | 6/21/20 | | 2,200,000 | | 2,356,999 | |
Prudential Financial,
Sr. Unscd. Notes | | 4.50 | | 11/15/20 | | 4,000,000 | | 4,229,528 | |
Reynolds Group Issuer,
Gtd. Notes | | 7.00 | | 7/15/24 | | 3,345,000 | c,e | 3,588,767 | |
Santander Drive Auto Receivables Trust,
Ser. 2015-5, Cl. D | | 3.65 | | 12/15/21 | | 886,000 | | 899,771 | |
Santander Retail Auto Lease Trust,
Ser. 2017-A, Cl. A4 | | 2.37 | | 1/20/22 | | 5,975,000 | e | 5,951,907 | |
Scientific Games International,
Gtd. Notes | | 10.00 | | 12/1/22 | | 3,105,000 | | 3,419,381 | |
21
STATEMENT OF INVESTMENTS (continued)
| | | | | | | | | | |
| |
Description | Coupon
Rate (%) | | Maturity Date | | Principal Amount ($) | a | Value ($) | |
Bonds and Notes - 96.5% (continued) | | | | | |
United States - 27.9% (continued) | | | | | |
Sofi Consumer Loan Program,
Ser. 2016-3, Cl. A | | 3.05 | | 12/26/25 | | 562,841 | e | 565,924 | |
Southern,
Sr. Unscd. Notes | | 3.25 | | 7/1/26 | | 9,275,000 | | 9,110,472 | |
Springleaf Funding Trust,
Ser. 2015-AA, Cl. A | | 3.16 | | 11/15/24 | | 9,175,000 | e | 9,212,941 | |
Springleaf Funding Trust,
Ser. 2016-AA, Cl. A | | 2.90 | | 11/15/29 | | 12,150,000 | e | 12,172,465 | |
Sprint Communications,
Sr. Unscd. Notes | | 7.00 | | 8/15/20 | | 4,050,000 | | 4,303,125 | |
Sprint Spectrum,
Sr. Scd. Notes | | 3.36 | | 3/20/23 | | 9,187,500 | e | 9,267,891 | |
Starwood Waypoint Homes Trust,
Ser. 2017-1, Cl. A, 1 Month LIBOR + .95% | | 2.41 | | 1/17/35 | | 15,543,219 | b,e | 15,637,075 | |
Sunoco Logistics Partners Operations,
Gtd. Notes | | 4.00 | | 10/1/27 | | 5,550,000 | | 5,451,322 | |
Sunoco Logistics Partners Operations,
Gtd. Notes | | 5.40 | | 10/1/47 | | 1,900,000 | | 1,923,870 | |
Targa Resources Partners,
Gtd. Bonds | | 5.13 | | 2/1/25 | | 3,425,000 | | 3,519,188 | |
T-Mobile USA,
Gtd. Notes | | 6.00 | | 3/1/23 | | 2,900,000 | | 3,043,550 | |
Towd Point Mortgage Trust,
Ser. 2017-2, Cl. A1 | | 2.75 | | 4/25/57 | | 3,033,828 | e | 3,034,896 | |
Tricon American Homes,
Ser. 2016-SFR1, Cl. A | | 2.59 | | 11/17/33 | | 13,190,000 | e | 13,015,119 | |
Tricon American Homes,
Ser. 2017-SFR2, Cl. A | | 2.93 | | 1/17/36 | | 8,300,000 | e | 8,271,108 | |
U.S. Treasury Inflation Protected Securities,
Bonds | | 0.88 | | 2/15/47 | | 57,175,305 | j | 59,570,447 | |
U.S. Treasury Notes | | 2.00 | | 10/31/22 | | 50,900,000 | c | 50,457,027 | |
UBS Commercial Mortgage Trust,
Ser. 2017-C1, Cl. A4 | | 3.54 | | 11/15/50 | | 7,326,000 | | 7,554,220 | |
United Rentals North America,
Gtd. Notes | | 4.88 | | 1/15/28 | | 5,760,000 | | 5,803,200 | |
Verizon Communications,
Sr. Unscd. Notes | | 4.13 | | 3/16/27 | | 3,750,000 | | 3,916,559 | |
Visa,
Sr. Unscd. Notes | | 2.20 | | 12/14/20 | | 9,250,000 | | 9,245,938 | |
Wells Fargo & Co.,
Sr. Unscd. Notes | | 3.00 | | 4/22/26 | | 6,125,000 | | 6,014,191 | |
Wells Fargo & Co.,
Sub. Notes | | 4.30 | | 7/22/27 | | 1,675,000 | | 1,785,136 | |
22
| | | | | | | | | | |
| |
Description | Coupon
Rate (%) | | Maturity
Date | | Principal
Amount ($) | a | Value ($) | |
Bonds and Notes - 96.5% (continued) | | | | | |
United States - 27.9% (continued) | | | | | |
Zayo Group,
Gtd. Notes | | 5.75 | | 1/15/27 | | 3,055,000 | e | 3,123,738 | |
| | 889,981,282 | |
Uruguay - .5% | | | | | |
Uruguayan Government,
Sr. Unscd. Bonds | UYU | 8.50 | | 3/15/28 | | 265,300,000 | e | 9,266,095 | |
Uruguayan Government,
Sr. Unscd. Notes | UYU | 9.88 | | 6/20/22 | | 194,145,000 | e | 7,162,098 | |
| | 16,428,193 | |
Total Bonds and Notes
(cost $3,026,829,187) | | 3,080,541,271 | |
| | | | | | | | | |
Floating Rate Loan Interests - .2% | | | | | |
United States - .2% | | | | | |
Asurion,
Term Loan, LIBOR + 6.00% | | 7.57 | | 7/14/25 | | 2,085,000 | b | 2,146,893 | |
Univar USA,
Term Loan, LIBOR + 2.50% | | 3.84 | | 7/1/24 | | 4,035,000 | b | 4,053,722 | |
Total Floating Rate Loan Interests
(cost $6,204,883) | | 6,200,615 | |
Description /Number of Contracts/Counterparty | Exercise
Price | | Expiration Date | | Notional
Amount | a | Value ($) | |
Options Purchased - .2% | | | | | |
Call Options - .1% | | | | | |
10 Year Interest Rate Swaption,
Contracts 168,640 Citigroup | | 2.10 | | 4/2018 | | 168,640,000 | | 385,730 | |
British Pound,
Contracts 23,650 Goldman Sachs International | | 1.35 | | 5/2018 | | 23,650,000 | | 688,832 | |
Euro,
Contracts 53,250 JP Morgan Chase Bank | | 1.20 | | 5/2018 | | 53,250,000 | | 1,389,955 | |
Swedish Krona Cross Currency,
Contracts 244,850 Goldman Sachs International | NOK | 1.04 | | 1/2018 | | 244,850,000 | | 5,777 | |
| | 2,470,294 | |
Put Options - .1% | | | | | |
10 Year U.S. Treasury Notes,
Contracts 159,100 Bank of America | | 123.00 | | 2/2018 | | 1,591,000 | | 472,328 | |
British Pound Cross Currency,
Contracts 25,400 JP Morgan Chase Bank | EUR | 0.89 | | 2/2018 | | 25,400,000 | | 247,979 | |
Japanese Yen,
Contracts 30,025 Barclays Bank | | 111.00 | | 1/2018 | | 30,025,000 | | 15,109 | |
23
STATEMENT OF INVESTMENTS (continued)
| | | | | | | | | | |
| |
Description /Number of Contracts/Counterparty | Exercise
Price | | Expiration Date | | Notional
Amount | a | Value ($) | |
Options Purchased - .2% (continued) | | | | | |
Put Options - .1% (continued) | | | | | |
Japanese Yen,
Contracts 30,500 Goldman Sachs International | | 113.40 | | 1/2018 | | 30,500,000 | | 338,418 | |
Japanese Yen Cross Currency,
Contracts 37,775 JP Morgan Chase Bank | CAD | 86.00 | | 1/2018 | | 37,775,000 | | 482 | |
Norwegian Krone,
Contracts 31,550 Citigroup | | 8.24 | | 6/2018 | | 31,550,000 | | 924,499 | |
Norwegian Krone Cross Currency,
Contracts 13,200 Citigroup | EUR | 9.30 | | 2/2018 | | 13,200,000 | | 738 | |
Swedish Krona Cross Currency,
Contracts 13,400 Goldman Sachs International | EUR | 9.80 | | 3/2018 | | 13,400,000 | | 162,907 | |
Turkish Lira,
Contracts 30,850 Citigroup | | 3.81 | | 2/2018 | | 30,850,000 | | 390,305 | |
Turkish Lira,
Contracts 31,300 Citigroup | | 3.93 | | 2/2018 | | 31,300,000 | | 994,526 | |
| | 3,547,291 | |
Total Options Purchased
(cost $6,614,664) | | 6,017,585 | |
Description | Yield at
Date of
Purchase (%) | | Maturity Date | | Principal Amount ($) | | Value ($) | |
Short-Term Investments - 1.1% | | | | | |
U.S. Treasury Bills
(cost $34,907,607) | | 1.18 | | 3/1/18 | | 34,975,000 | k | 34,903,578 | |
Description | | | | | Shares | | Value ($) | |
Other Investment - 1.8% | | | | | |
Registered Investment Company; | | | | | |
Dreyfus Institutional Preferred Government Plus Money Market Fund
(cost $59,181,623) | | | | | | 59,181,623 | l | 59,181,623 | |
24
| | | | | | | | | | |
| |
Description | | | | | Shares | | Value ($) | |
Investment of Cash Collateral for Securities Loaned - 1.1% | | | | | |
Registered Investment Company; | | | | | |
Dreyfus Institutional Preferred Government Money Market Fund, Institutional Shares
(cost $34,513,315) | | | | | | 34,513,315 | l | 34,513,315 | |
Total Investments (cost $3,168,251,279) | | 100.9% | 3,221,357,987 | |
Liabilities, Less Cash and Receivables | | (0.9%) | (29,101,737) | |
Net Assets | | 100.0% | 3,192,256,250 | |
BADLAR—Buenos Aires Interbank Offer Rate
EURIBOR—Euro Interbank Offered Rate
LIBOR—London Interbank Offered Rate
ARS—Argentine Peso
AUD—Australian Dollar
CAD—Canadian Dollar
CLP—Chilean Peso
COP—Colombian Peso
EUR—Euro
GBP—British Pound
ILS—Israeli Shekel
INR—Indian Rupee
JPY—Japanese Yen
MXN—Mexican Peso
NOK—Norwegian Krone
NZD—New Zealand Dollar
RUB—Russian Ruble
THB—Thai Baht
TRY—Turkish Lira
UYU—Uruguayan Peso
ZAR—South African Rand
a Amount stated in U.S. Dollars unless otherwise noted above.
b Variable rate security—rate shown is the interest rate in effect at period end.
c Security, or portion thereof, on loan. At December 31, 2017, the value of the fund’s securities on loan was $35,934,346 and the value of the collateral held by the fund was $37,355,061, consisting of cash collateral of $34,513,315 and U.S. Government & Agency securities valued at $2,841,746.
d Principal amount for accrual purposes is periodically adjusted based on changes in the Argentine Consumer Price Index.
e Security exempt from registration pursuant to Rule 144A under the Securities Act of 1933. These securities may be resold in transactions exempt from registration, normally to qualified institutional buyers. At December 31, 2017, these securities were valued at $693,713,708 or 21.73% of net assets.
f Zero coupon until a specified date at which time the stated coupon rate becomes effective until maturity.
g Principal amount for accrual purposes is periodically adjusted based on changes in the Japanese Consumer Price Index.
h Principal amount for accrual purposes is periodically adjusted based on changes in the New Zealand Consumer Price Index.
i Principal amount for accrual purposes is periodically adjusted based on changes in the Turkish Consumer Price Index.
j Principal amount for accrual purposes is periodically adjusted based on changes in the Consumer Price Index.
k Held by a counterparty for open futures contracts.
l Investment in affiliated money market mutual fund.
25
STATEMENT OF INVESTMENTS (continued)
| | |
Portfolio Summary (Unaudited) † | Value (%) |
Foreign/Governmental | 53.8 |
Corporate Bonds | 25.9 |
Asset-Backed | 10.8 |
Short-Term/Money Market Investments | 4.0 |
U.S. Government | 3.4 |
Commercial Mortgage-Backed | 2.2 |
Residential Mortgage-Backed | .4 |
Floating Rate Loan Interests | .2 |
Options Purchased | .2 |
| | 100.9 |
† Based on net assets.
See notes to financial statements.
26
STATEMENT OF INVESTMENTS IN AFFILIATED ISSUERS
| | | | | | | |
Registered Investment Companies | Value
12/31/16($) | Purchases($) | Sales ($) | Value
12/31/17($) | Net
Assets(%) | Dividends/
Distributions($) |
Dreyfus Institutional Preferred Government Money Market Fund, Institutional Shares | 15,307,041 | 571,777,939 | 552,571,665 | 34,513,315 | 1.1 | – |
Dreyfus Institutional Preferred Government Plus Money Market Fund | 31,616,126 | 1,586,438,114 | 1,558,872,617 | 59,181,623 | 1.8 | 580,834 |
Total | 46,923,167 | 2,158,216,053 | 2,111,444,282 | 93,694,938 | 2.9 | 580,834 |
See notes to financial statements.
27
STATEMENT OF FUTURES
December 31, 2017
| | | | | | | |
Description | Number of
Contracts | Expiration | Notional
Value ($) | Value ($) | Unrealized Appreciation (Depreciation) ($) | |
Futures Long | | |
Australian 3 Year Bond | 513 | 3/2018 | 44,654,792a | 44,468,535 | (186,257) | |
Euro 30 Year Bond | 187 | 3/2018 | 37,604,795a | 36,765,478 | (839,317) | |
Euro BTP Italian Government Bond | 262 | 3/2018 | 43,869,141a | 42,796,938 | (1,072,203) | |
U.S. Treasury 5 Year Notes | 2,876 | 3/2018 | 335,672,497 | 334,087,844 | (1,584,653) | |
Futures Short | | |
Canadian 10 year Bond | 43 | 3/2018 | (4,678,599)a | (4,610,613) | 67,986 | |
Euro-Bobl | 333 | 3/2018 | (52,939,924)a | (52,584,625) | 355,299 | |
Euro-Bond | 121 | 3/2018 | (23,702,209)a | (23,472,931) | 229,278 | |
Euro-Schatz | 18 | 3/2018 | (2,422,222)a | (2,418,351) | 3,871 | |
Long Gilt | 234 | 3/2018 | (39,286,210)a | (39,542,354) | (256,144) | |
U.S. Treasury 10 Year Notes | 2,258 | 3/2018 | (281,676,583) | (280,097,844) | 1,578,739 | |
U.S. Treasury 2 Year Notes | 75 | 3/2018 | (16,092,041) | (16,058,203) | 33,838 | |
U.S. Treasury Long Bond | 120 | 3/2018 | (18,412,257) | (18,360,000) | 52,257 | |
U.S. Treasury Ultra 10 Year Notes | 1,077 | 3/2018 | (144,718,140) | (143,846,813) | 871,327 | |
U.S. Treasury Ultra Long Bond | 17 | 3/2018 | (2,840,131) | (2,850,156) | (10,025) | |
Gross Unrealized Appreciation | | 3,192,595 | |
Gross Unrealized Depreciation | | (3,948,599) | |
a Notional amounts in foreign currency have been converted to USD using relevant foreign exchange rates.
See notes to financial statements.
28
STATEMENT OF OPTIONS WRITTEN
December 31, 2017
| | | | | | | |
Description/ Expiration Date/ Exercise Price | Counterparty | Number of Contracts | Notional Amount | a | Value ($) | |
Call Options: | | | | | | |
British Pound Cross Currency
February 2018 @ GBP 0.96 | JP Morgan Chase Bank | 25,400 | 25,400,000 | EUR | (4,190) | |
Japanese Yen Cross Currency
January 2018 @ JPY 92 | JP Morgan Chase Bank | 37,775 | 37,775,000 | CAD | (1,142) | |
Norwegian Krone Cross Currency
February 2018 @ NOK 9.7 | Citigroup | 13,200 | 13,200,000 | EUR | (309,537) | |
Russian Ruble,
March 2018 @ RUB 62 | Citigroup | 15,700 | 15,700,000 | | (46,999) | |
Swedish Krona Cross Currency
March 2018 @ SEK 10.2 | Goldman Sachs International | 13,400 | 13,400,000 | EUR | (41,656) | |
Turkish Lira,
February 2018 @ TRY 4.26 | Citigroup | 30,850 | 30,850,000 | | (23,757) | |
Turkish Lira,
February 2018 @ TRY 4.32 | Citigroup | 31,300 | 31,300,000 | | (39,056) | |
Put Options: | | | | | | |
Swedish Krona Cross Currency
January 2018 @ SEK 1 | Goldman Sachs International | 244,850 | 244,850,000 | NOK | (250,272) | |
Total Options Written (premiums received $1,715,264) | | | | (716,609) | |
a Notional amount stated in U.S. Dollars unless otherwise indicated.
CAD—Canadian Dollar
EUR—Euro
NOK—Norwegian Krone
See notes to financial statements.
29
STATEMENT OF FORWARD FOREIGN CURRENCY EXCHANGE CONTRACTS December 31, 2017
| | | | | | |
Counterparty/ Purchased
Currency | Purchased Currency
Amounts | Currency
Sold | Sold
Currency
Amounts | Settlement Date | Unrealized Appreciation (Depreciation)($) |
Bank of America | | | |
United States Dollar | 7,379,902 | Thai Baht, | 244,260,000 | 1/31/18 | (122,200) |
Barclays Bank | | | |
United States Dollar | 8,194,868 | Euro, | 6,930,000 | 1/31/18 | (137,205) |
Citigroup | | | |
Czech Koruna, | 679,250,000 | United States Dollar | 31,112,216 | 1/31/18 | 847,591 |
United States Dollar | 23,687,938 | Argentine Peso, | 434,540,000 | 3/15/18 | 1,288,584 |
United States Dollar | 18,784,828 | Peruvian New Sol, | 61,060,000 | 1/10/18 | (35,646) |
United States Dollar | 60,279,781 | Taiwan Dollar, | 1,814,120,000 | 1/31/18 | (802,215) |
United States Dollar | 83,389,787 | South African Rand, | 1,182,995,000 | 1/31/18 | (11,708,392) |
Goldman Sachs International | | | |
British Pound, | 16,140,000 | United States Dollar | 21,546,190 | 1/31/18 | 270,342 |
Peruvian New Sol, | 79,970,000 | United States Dollar | 24,504,367 | 1/10/18 | 144,721 |
United States Dollar | 126,621,951 | Euro, | 107,050,000 | 1/31/18 | (2,086,331) |
United States Dollar | 46,512,134 | Mexican New Peso, | 896,940,000 | 1/31/18 | 1,196,457 |
United States Dollar | 9,924,106 | South African Rand, | 137,150,000 | 1/31/18 | (1,101,059) |
HSBC | | | |
Argentine Peso, | 55,500,000 | United States Dollar | 2,999,999 | 1/31/18 | (76,485) |
Swedish Krona, | 524,925,000 | United States Dollar | 62,374,120 | 1/31/18 | 1,751,913 |
United States Dollar | 59,659,415 | Australian Dollar, | 78,460,000 | 1/31/18 | (1,559,741) |
United States Dollar | 175,758,943 | Canadian Dollar, | 225,140,000 | 1/31/18 | (3,440,288) |
United States Dollar | 99,286,862 | Euro, | 83,955,000 | 1/31/18 | (1,653,856) |
United States Dollar | 555,434,336 | Japanese Yen, | 62,839,008,000 | 1/31/18 | (3,188,103) |
United States Dollar | 8,026,715 | Norwegian Krone, | 67,065,000 | 1/31/18 | (149,633) |
United States Dollar | 115,780,774 | New Zealand Dollar, | 166,935,000 | 1/31/18 | (2,473,456) |
30
| | | | | | |
Counterparty/ Purchased
Currency | Purchased Currency
Amounts | Currency
Sold | Sold
Currency
Amounts | Settlement Date | Unrealized Appreciation (Depreciation)($) |
HSBC (continued) |
United States Dollar | 5,944,490 | South African Rand, | 81,090,000 | 1/31/18 | (574,144) |
JP Morgan Chase Bank | | | |
Colombian Peso, | 1,620,000,000 | United States Dollar | 527,962 | 1/31/18 | 13,072 |
Indonesian Rupiah, | 781,953,915,000 | United States Dollar | 57,380,585 | 1/31/18 | 64,284 |
Norwegian Krone, | 264,140,000 | United States Dollar | 31,791,003 | 1/31/18 | 412,093 |
United States Dollar | 15,280,882 | Chilean Peso, | 9,764,820,000 | 1/31/18 | (585,909) |
United States Dollar | 202,581,420 | Euro, | 171,280,000 | 1/31/18 | (3,351,831) |
United States Dollar | 85,863,792 | British Pound, | 64,320,000 | 1/31/18 | (1,077,926) |
United States Dollar | 3,620,517 | Israeli Shekel | 12,670,000 | 1/31/18 | (25,430) |
United States Dollar | 7,896,004 | Indian Rupee, | 515,230,000 | 1/31/18 | (144,195) |
United States Dollar | 34,191,181 | South Korean Won, | 38,029,825,000 | 1/31/18 | (1,352,538) |
United States Dollar | 5,830,212 | Peruvian New Sol, | 18,910,000 | 1/10/18 | 1,598 |
United States Dollar | 22,103,651 | Philippine Peso, | 1,139,830,000 | 1/31/18 | (694,203) |
United States Dollar | 28,152,513 | Turkish Lira, | 110,210,000 | 1/31/18 | (630,384) |
UBS | | | |
Singapore Dollar, | 29,170,000 | United States Dollar | 21,384,846 | 1/31/18 | 437,095 |
United States Dollar | 94,952,559 | Euro, | 80,290,000 | 1/31/18 | (1,581,658) |
United States Dollar | 45,908,632 | Japanese Yen, | 5,191,440,000 | 1/31/18 | (241,919) |
Gross Unrealized Appreciation | | | 6,427,750 |
Gross Unrealized Depreciation | | | (38,794,747) |
See notes to financial statements.
31
STATEMENT OF SWAP AGREEMENTS
December 31, 2017
| | | | | |
Centrally Cleared Interest Rate Swaps | |
Notional
Amount | Currency/
Floating Rate | (Pay) Receive
Fixed Rate (%) | Expiration | Unrealized (Depreciation) ($) |
235,300,000 | SEK - 3 Month Stockholmn Interbank Offered Rate | (0.44) | 7/18/2022 | (134,589) |
111,000,000 | GBP - 6 MONTH LIBOR | (1.08) | 12/12/2022 | (374,791) |
706,100,000 | SEK - 3 Month Stockholmn Interbank Offered Rate | (0.46) | 7/19/2022 | (485,407) |
235,500,000 | SEK - 3 Month Stockholmn Interbank Offered Rate | (0.42) | 7/20/2022 | (114,200) |
Gross Unrealized Depreciation | (1,108,987) |
GBP—British Pound
LIBOR—London Interbank Offered Rate
SEK—Swedish Krona
† Clearing House-Chicago Mercantile Exchange or LCH (Clearing)
See notes to financial statements.
32
STATEMENT OF ASSETS AND LIABILITIES
December 31, 2017
| | | | | | | |
| | | | | | |
| | | Cost | | Value | |
Assets ($): | | | | |
Investments in securities—See Statement of Investments
(including securities on loan, valued at $35,934,346)—Note 1(c): | | | |
Unaffiliated issuers | 3,074,556,341 | | 3,127,663,049 | |
Affiliated issuers | | 93,694,938 | | 93,694,938 | |
Cash denominated in foreign currency | | | 20,615,663 | | 20,837,817 | |
Dividends, interest and securities lending income receivable | | 26,355,901 | |
Receivable for shares of Beneficial Interest subscribed | | 8,562,371 | |
Unrealized appreciation on forward foreign
currency exchange contracts—Note 4 | | 6,427,750 | |
Cash collateral held by broker—Note 4 | | 4,728,277 | |
Receivable for investment securities sold | | 767,696 | |
Prepaid expenses | | | | | 149,366 | |
| | | | | 3,289,187,165 | |
Liabilities ($): | | | | |
Due to The Dreyfus Corporation and affiliates—Note 3(c) | | | | | 1,435,324 | |
Cash overdraft due to Custodian | | | | | 151,947 | |
Unrealized depreciation on forward foreign
currency exchange contracts—Note 4 | | 38,794,747 | |
Liability for securities on loan—Note 1(c) | | 34,513,315 | |
Payable for shares of Beneficial Interest redeemed | | 13,316,062 | |
Payable for investment securities purchased | | 6,591,459 | |
Payable for futures variation margin—Note 4 | | 890,677 | |
Outstanding options written, at value
(premiums received $1,715,264)—Note 4 | | 716,609 | |
Payable for swap variation margin—Note 4 | | 13,582 | |
Distributions payable | | 12,818 | |
Accrued expenses | | | | | 494,375 | |
| | | | | 96,930,915 | |
Net Assets ($) | | | 3,192,256,250 | |
Composition of Net Assets ($): | | | | |
Paid-in capital | | | | | 3,221,017,098 | |
Accumulated undistributed investment income—net | | 2,103,887 | |
Accumulated net realized gain (loss) on investments | | | | | (51,138,152) | |
Accumulated net unrealized appreciation (depreciation)
on investments, options transactions and foreign currency
transactions [including ($756,004) net unrealized
(depreciation) on futures and ($1,108,987)
net unrealized (depreciation) on centrally cleared swap
agreements] | | | | 20,273,417 | |
Net Assets ($) | | | 3,192,256,250 | |
| | | | | | |
Net Asset Value Per Share | Class A | Class C | Class I | Class Y | |
Net Assets ($) | 175,019,911 | 78,980,253 | 2,689,270,046 | 248,986,040 | |
Shares Outstanding | 8,197,834 | 3,722,272 | 125,770,500 | 11,641,906 | |
Net Asset Value Per Share ($) | 21.35 | 21.22 | 21.38 | 21.39 | |
| | | | | | |
See notes to financial statements. | | | | | |
33
STATEMENT OF OPERATIONS
Year Ended December 31, 2017
| | | | | | | |
| | | | | | |
| | | | | | |
Investment Income ($): | | | | |
Income: | | | | |
Interest (net of $227,451 foreign taxes withheld at source) | | | 76,905,757 | |
Dividends from affiliated issuers | | | 580,834 | |
Income from securities lending—Note 1(c) | | | 172,933 | |
Total Income | | | 77,659,524 | |
Expenses: | | | | |
Investment advisory fee—Note 3(a) | | | 11,463,959 | |
Shareholder servicing costs—Note 3(c) | | | 2,408,228 | |
Custodian fees—Note 3(c) | | | 727,855 | |
Distribution fees—Note 3(b) | | | 650,590 | |
Registration fees | | | 300,059 | |
Administration fee—Note 3(a) | | | 246,309 | |
Trustees’ fees and expenses—Note 3(d) | | | 206,250 | |
Professional fees | | | 166,336 | |
Prospectus and shareholders’ reports | | | 161,504 | |
Loan commitment fees—Note 2 | | | 59,423 | |
Miscellaneous | | | 118,647 | |
Total Expenses | | | 16,509,160 | |
Less—reduction in fees due to earnings credits—Note 3(c) | | | (11,854) | |
Net Expenses | | | 16,497,306 | |
Investment Income—Net | | | 61,162,218 | |
Realized and Unrealized Gain (Loss) on Investments—Note 4 ($): | | |
Net realized gain (loss) on investments and foreign currency transactions | 25,363,199 | |
Net realized gain (loss) on options transactions | (83,060) | |
Net realized gain (loss) on futures | 494,804 | |
Net realized gain (loss) on swap agreements | (1,438,773) | |
Net realized gain (loss) on forward foreign currency exchange contracts | (79,644,510) | |
Net Realized Gain (Loss) | | | (55,308,340) | |
Net unrealized appreciation (depreciation) on investments
and foreign currency transactions | | | 138,891,239 | |
Net unrealized appreciation (depreciation) on options transactions | 1,075,327 | |
Net unrealized appreciation (depreciation) on futures | | | 1,391,889 | |
Net unrealized appreciation (depreciation) on swap agreements | | | (1,108,987) | |
Net unrealized appreciation (depreciation) on
forward foreign currency exchange contracts | | | (29,031,589) | |
Net Unrealized Appreciation (Depreciation) | | | 111,217,879 | |
Net Realized and Unrealized Gain (Loss) on Investments | | | 55,909,539 | |
Net Increase in Net Assets Resulting from Operations | | 117,071,757 | |
| | | | | | | |
See notes to financial statements. | | | | | |
34
STATEMENT OF CHANGES IN NET ASSETS
| | | | | | | | | | |
| | | | Year Ended December 31, |
| | | | 2017 | | 2016 | |
Operations ($): | | | | | | | | |
Investment income—net | | | 61,162,218 | | | | 36,556,854 | |
Net realized gain (loss) on investments | | (55,308,340) | | | | 67,578,473 | |
Net unrealized appreciation (depreciation)
on investments | | 111,217,879 | | | | (53,101,397) | |
Net Increase (Decrease) in Net Assets
Resulting from Operations | 117,071,757 | | | | 51,033,930 | |
Distributions to Shareholders from ($): | |
Investment income—net: | | | | | | | | |
Class A | | | (3,260,511) | | | | (4,909,696) | |
Class C | | | (1,133,417) | | | | (808,845) | |
Class I | | | (56,574,550) | | | | (39,203,238) | |
Class Y | | | (4,685,916) | | | | (1,831,873) | |
Net realized gain on investments: | | | | | | | | |
Class A | | | (812,578) | | | | (1,885,054) | |
Class C | | | (467,696) | | | | (574,620) | |
Class I | | | (11,456,677) | | | | (12,601,405) | |
Class Y | | | (733,417) | | | | (572,867) | |
Total Distributions | | | (79,124,762) | | | | (62,387,598) | |
Beneficial Interest Transactions ($): | |
Net proceeds from shares sold: | | | | | | | | |
Class A | | | 97,421,428 | | | | 212,823,302 | |
Class C | | | 15,024,081 | | | | 51,395,794 | |
Class I | | | 1,500,419,123 | | | | 1,486,557,540 | |
Class Y | | | 165,588,991 | | | | 75,666,411 | |
Distributions reinvested: | | | | | | | | |
Class A | | | 3,749,779 | | | | 6,624,872 | |
Class C | | | 1,448,939 | | | | 1,235,683 | |
Class I | | | 58,419,164 | | | | 42,582,313 | |
Class Y | | | 4,872,366 | | | | 2,365,944 | |
Cost of shares redeemed: | | | | | | | | |
Class A | | | (255,189,439) | | | | (156,385,690) | |
Class C | | | (37,372,585) | | | | (31,014,339) | |
Class I | | | (1,084,463,269) | | | | (947,437,488) | |
Class Y | | | (44,135,859) | | | | (39,695,613) | |
Increase (Decrease) in Net Assets
from Beneficial Interest Transactions | 425,782,719 | | | | 704,718,729 | |
Total Increase (Decrease) in Net Assets | 463,729,714 | | | | 693,365,061 | |
Net Assets ($): | |
Beginning of Period | | | 2,728,526,536 | | | | 2,035,161,475 | |
End of Period | | | 3,192,256,250 | | | | 2,728,526,536 | |
Undistributed investment income—net | 2,103,887 | | | | 13,592,081 | |
35
STATEMENT OF CHANGES IN NET ASSETS (continued)
| | | | | | | | | | |
| | | | Year Ended December 31, |
| | | | 2017 | | 2016 | |
Capital Share Transactions (Shares): | |
Class Aa,b | | | | | | | | |
Shares sold | | | 4,557,196 | | | | 9,903,836 | |
Shares issued for distributions reinvested | | | 176,302 | | | | 315,020 | |
Shares redeemed | | | (12,065,886) | | | | (7,279,340) | |
Net Increase (Decrease) in Shares Outstanding | (7,332,388) | | | | 2,939,516 | |
Class Ca,b | | | | | | | | |
Shares sold | | | 706,216 | | | | 2,404,585 | |
Shares issued for distributions reinvested | | | 68,531 | | | | 59,010 | |
Shares redeemed | | | (1,761,959) | | | | (1,451,030) | |
Net Increase (Decrease) in Shares Outstanding | (987,212) | | | | 1,012,565 | |
Class Ia | | | | | | | | |
Shares sold | | | 70,209,489 | | | | 69,114,509 | |
Shares issued for distributions reinvested | | | 2,743,720 | | | | 2,021,953 | |
Shares redeemed | | | (50,819,310) | | | | (43,981,047) | |
Net Increase (Decrease) in Shares Outstanding | 22,133,899 | | | | 27,155,415 | |
Class Ya | | | | | | | | |
Shares sold | | | 7,753,704 | | | | 3,543,366 | |
Shares issued for distributions reinvested | | | 228,557 | | | | 112,343 | |
Shares redeemed | | | (2,064,800) | | | | (1,837,932) | |
Net Increase (Decrease) in Shares Outstanding | 5,917,461 | | | | 1,817,777 | |
| | | | | | | | | | |
a During the period ended December 31, 2017, 405,453 Class A shares representing $8,547,588 were exchanged for 404,685 Class I shares, 403 Class C shares representing $8,646 were exchanged for 400 Class I shares and 293,825 Class I shares representing $6,258,461 were exchanged for 293,825 Class Y shares. | |
b During the period ended December 31, 2017, 1,371 Class C shares representing $29,404 were automatically converted to 1,360 Class A shares. | |
See notes to financial statements.
| | | | | | | | |
36
FINANCIAL HIGHLIGHTS
The following tables describe the performance for each share class for the fiscal periods indicated. All information (except portfolio turnover rate) reflects financial results for a single fund share. Total return shows how much your investment in the fund would have increased (or decreased) during each period, assuming you had reinvested all dividends and distributions. These figures have been derived from the fund’s financial statements.
| | | | | | | | | | | |
| | | | |
| | | |
Class A Shares | | | Year Ended December 31, |
| | | 2017 | 2016 | 2015 | 2014 | 2013 |
Per Share Data ($): | | | | | | |
Net asset value, beginning of period | | 21.03 | 21.03 | 21.69 | 21.14 | 21.82 |
Investment Operations: | | | | | | |
Investment income—neta | | .38 | .26 | .37 | .44 | .51 |
Net realized and unrealized
gain (loss) on investments | | .47 | .18 | (.50) | 1.15 | (.55) |
Total from Investment Operations | | .85 | .44 | (.13) | 1.59 | (.04) |
Distributions: | | | | | | |
Dividends from
investment income—net | | (.42) | (.32) | (.41) | (.73) | (.62) |
Dividends from net realized
gain on investments | | (.11) | (.12) | (.12) | (.31) | (.02) |
Total Distributions | | (.53) | (.44) | (.53) | (1.04) | (.64) |
Net asset value, end of period | | 21.35 | 21.03 | 21.03 | 21.69 | 21.14 |
Total Return (%)b | | 4.04 | 2.12 | (.61) | 7.55 | (.18) |
Ratios/Supplemental Data (%): | | | | | | |
Ratio of total expenses
to average net assets | | .84 | .81 | .82 | .89 | .88 |
Ratio of net expenses
to average net assets | | .84 | .81 | .82 | .89 | .88 |
Ratio of net investment income
to average net assets | | 1.87 | 1.20 | 1.68 | 2.06 | 2.35 |
Portfolio Turnover Rate | | 95.96 | 125.98 | 178.07 | 180.28 | 189.93 |
Net Assets, end of period ($ x 1,000) | | 175,020 | 326,654 | 264,829 | 122,987 | 104,431 |
a Based on average shares outstanding.
b Exclusive of sales charge.
See notes to financial statements.
37
FINANCIAL HIGHLIGHTS (continued)
| | | | | | | | | |
| | | | |
| | | |
Class C Shares | | | Year Ended December 31, |
| | | 2017 | 2016 | 2015 | 2014 | 2013 |
Per Share Data ($): | | | | | | |
Net asset value, beginning of period | | 20.94 | 20.95 | 21.63 | 21.06 | 21.74 |
Investment Operations: | | | | | | |
Investment income—neta | | .24 | .10 | .21 | .28 | .34 |
Net realized and unrealized
gain (loss) on investments | | .45 | .18 | (.49) | 1.14 | (.55) |
Total from Investment Operations | | .69 | .28 | (.28) | 1.42 | (.21) |
Distributions: | | | | | | |
Dividends from
investment income—net | | (.30) | (.17) | (.28) | (.54) | (.45) |
Dividends from net realized
gain on investments | | (.11) | (.12) | (.12) | (.31) | (.02) |
Total Distributions | | (.41) | (.29) | (.40) | (.85) | (.47) |
Net asset value, end of period | | 21.22 | 20.94 | 20.95 | 21.63 | 21.06 |
Total Return (%)b | | 3.29 | 1.37 | (1.34) | 6.76 | (.94) |
Ratios/Supplemental Data (%): | | | | | | |
Ratio of total expenses
to average net assets | | 1.56 | 1.55 | 1.55 | 1.65 | 1.63 |
Ratio of net expenses
to average net assets | | 1.56 | 1.55 | 1.55 | 1.65 | 1.63 |
Ratio of net investment income
to average net assets | | 1.15 | .47 | .95 | 1.29 | 1.58 |
Portfolio Turnover Rate | | 95.96 | 125.98 | 178.07 | 180.28 | 189.93 |
Net Assets, end of period ($ x 1,000) | | 78,980 | 98,626 | 77,460 | 27,989 | 19,481 |
a Based on average shares outstanding.
b Exclusive of sales charge.
See notes to financial statements.
38
| | | | | | | | | | | | | |
| | | | | | | |
| | | |
Class I Shares | | | Year Ended December 31, |
| | | 2017 | 2016 | 2015 | 2014 | 2013 |
Per Share Data ($): | | | | | | |
Net asset value, beginning of period | | 21.06 | 21.06 | 21.71 | 21.17 | 21.85 |
Investment Operations: | | | | | | |
Investment income—neta | | .47 | .32 | .43 | .51 | .57 |
Net realized and unrealized
gain (loss) on investments | | .44 | .18 | (.48) | 1.14 | (.55) |
Total from Investment Operations | | .91 | .50 | (.05) | 1.65 | .02 |
Distributions: | | | | | | |
Dividends from
investment income—net | | (.48) | (.38) | (.48) | (.80) | (.68) |
Dividends from net realized
gain on investments | | (.11) | (.12) | (.12) | (.31) | (.02) |
Total Distributions | | (.59) | (.50) | (.60) | (1.11) | (.70) |
Net asset value, end of period | | 21.38 | 21.06 | 21.06 | 21.71 | 21.17 |
Total Return (%) | | 4.35 | 2.41 | (.28) | 7.85 | .11 |
Ratios/Supplemental Data (%): | | | | | | |
Ratio of total expenses
to average net assets | | .53 | .52 | .52 | .59 | .57 |
Ratio of net expenses
to average net assets | | .53 | .52 | .52 | .59 | .57 |
Ratio of net investment income
to average net assets | | 2.18 | 1.50 | 1.99 | 2.35 | 2.62 |
Portfolio Turnover Rate | | 95.96 | 125.98 | 178.07 | 180.28 | 189.93 |
Net Assets, end of period ($ x 1,000) | | 2,689,270 | 2,182,666 | 1,610,590 | 627,638 | 271,132 |
a Based on average shares outstanding.
See notes to financial statements.
39
FINANCIAL HIGHLIGHTS (continued)
| | | | | | | | | | | | | |
| | | | | | | |
| | | | | |
Class Y Shares | | | Year Ended December 31, |
| | | 2017 | 2016 | 2015 | 2014 | 2013a | |
Per Share Data ($): | | | | | | | |
Net asset value, beginning of period | | 21.06 | 21.06 | 21.71 | 21.17 | 21.23 | |
Investment Operations: | | | | | | | |
Investment income—netb | | .48 | .33 | .44 | .54 | .30 | |
Net realized and unrealized
gain (loss) on investments | | .45 | .18 | (.49) | 1.12 | .04 | |
Total from Investment Operations | | .93 | .51 | (.05) | 1.66 | .34 | |
Distributions: | | | | | | | |
Dividends from
investment income—net | | (.49) | (.39) | (.48) | (.81) | (.40) | |
Dividends from net realized
gain on investments | | (.11) | (.12) | (.12) | (.31) | - | |
Total Distributions | | (.60) | (.51) | (.60) | (1.12) | (.40) | |
Net asset value, end of period | | 21.39 | 21.06 | 21.06 | 21.71 | 21.17 | |
Total Return (%) | | 4.43 | 2.46 | (.29) | 7.94 | 1.60c | |
Ratios/Supplemental Data (%): | | | | | | | |
Ratio of total expenses
to average net assets | | .48 | .46 | .48 | .54 | .55d | |
Ratio of net expenses
to average net assets | | .48 | .46 | .48 | .54 | .55d | |
Ratio of net investment income
to average net assets | | 2.23 | 1.55 | 2.03 | 2.41 | 2.84d | |
Portfolio Turnover Rate | | 95.96 | 125.98 | 178.07 | 180.28 | 189.93 | |
Net Assets, end of period ($ x 1,000) | | 248,986 | 120,581 | 82,283 | 27,897 | 1 | |
a From the close of business on July 1, 2013 (commencement of initial offering) to December 31, 2013.
b Based on average shares outstanding.
c Not annualized.
d Annualized.
See notes to financial statements.
40
NOTES TO FINANCIAL STATEMENTS
NOTE 1—Significant Accounting Policies:
Dreyfus/Standish Global Fixed Income Fund (the “fund”) is a separate non-diversified series of Dreyfus Investment Funds (the “Trust”), which is registered under the Investment Company Act of 1940, as amended (the “Act”), as an open-end management investment company and operates as a series company currently offering seven series, including the fund. The fund’s investment objective is to seek to maximize total return while realizing a market level of income, consistent with preserving principal and liquidity. The Dreyfus Corporation (the “Manager” or “Dreyfus”), a wholly-owned subsidiary of The Bank of New York Mellon Corporation (“BNY Mellon”), serves as the fund’s investment adviser. Standish Mellon Asset Management Company LLC (“Standish”), a wholly-owned subsidiary of BNY Mellon and an affiliate of Dreyfus, serves as the fund’s sub-investment adviser.
Effective March 31, 2017, the fund authorized the issuance of Class T shares, but, as of the date of this report, the fund did not offer Class T shares for purchase.
MBSC Securities Corporation (the “Distributor”), a wholly-owned subsidiary of Dreyfus, is the distributor of the fund’s shares. The fund is authorized to issue an unlimited number of $.001 par value shares of Beneficial Interest in each of the following classes of shares: Class A, Class C, Class I, Class T and Class Y. Class A, Class C and Class T shares are sold primarily to retail investors through financial intermediaries and bear Distribution and/or Shareholder Services Plan fees. Class A and Class T shares generally are subject to a sales charge imposed at the time of purchase. Class C shares are subject to a contingent deferred sales charge (“CDSC”) imposed on Class C shares redeemed within one year of purchase. Class C shares automatically convert to Class A shares ten years after the date of purchase, without the imposition of a sales charge. Class I shares are sold primarily to bank trust departments and other financial service providers (including The Bank of New York Mellon, a subsidiary of BNY Mellon and an affiliate of Dreyfus, and its affiliates), acting on behalf of customers having a qualified trust or an investment account or relationship at such institution, and bear no Distribution or Shareholder Services Plan fees. Class Y shares are sold at net asset value per share generally to institutional investors, and bear no Distribution or Shareholder Services Plan fees. Class I and Class Y shares are offered without a front-end sales charge or CDSC. Other differences between the classes include the services offered to and the expenses borne by each class, the allocation of certain transfer agency costs, and certain voting rights. Income, expenses (other than expenses attributable to a specific class), and realized
41
NOTES TO FINANCIAL STATEMENTS (continued)
and unrealized gains or losses on investments are allocated to each class of shares based on its relative net assets.
The Trust accounts separately for the assets, liabilities and operations of each series. Expenses directly attributable to each series are charged to that series’ operations; expenses which are applicable to all series are allocated among them on a pro rata basis.
The Financial Accounting Standards Board (“FASB”) Accounting Standards Codification (“ASC”) is the exclusive reference of authoritative U.S. generally accepted accounting principles (“GAAP”) recognized by the FASB to be applied by nongovernmental entities. Rules and interpretive releases of the Securities and Exchange Commission (“SEC”) under authority of federal laws are also sources of authoritative GAAP for SEC registrants. The fund’s financial statements are prepared in accordance with GAAP, which may require the use of management estimates and assumptions. Actual results could differ from those estimates.
(a) Portfolio valuation: The fair value of a financial instrument is the amount that would be received to sell an asset or paid to transfer a liability in an orderly transaction between market participants at the measurement date (i.e., the exit price). GAAP establishes a fair value hierarchy that prioritizes the inputs of valuation techniques used to measure fair value. This hierarchy gives the highest priority to unadjusted quoted prices in active markets for identical assets or liabilities (Level 1 measurements) and the lowest priority to unobservable inputs (Level 3 measurements).
Additionally, GAAP provides guidance on determining whether the volume and activity in a market has decreased significantly and whether such a decrease in activity results in transactions that are not orderly. GAAP requires enhanced disclosures around valuation inputs and techniques used during annual and interim periods.
Various inputs are used in determining the value of the fund’s investments relating to fair value measurements. These inputs are summarized in the three broad levels listed below:
Level 1—unadjusted quoted prices in active markets for identical investments.
Level 2—other significant observable inputs (including quoted prices for similar investments, interest rates, prepayment speeds, credit risk, etc.).
Level 3—significant unobservable inputs (including the fund’s own assumptions in determining the fair value of investments).
42
The inputs or methodology used for valuing securities are not necessarily an indication of the risk associated with investing in those securities.
Changes in valuation techniques may result in transfers in or out of an assigned level within the disclosure hierarchy. Valuation techniques used to value the fund’s investments are as follows:
Registered investment companies that are not traded on an exchange are valued at their net asset value and are generally categorized within Level 1 of the fair value hierarchy.
Investments in securities, floating rate loan interests and other securities, excluding short-term investments (other than U.S. Treasury Bills), futures, options and forward foreign currency exchange contracts (“forward contracts”) are valued each business day by an independent pricing service (the “Service”) approved by the Trust’s Board of Trustees (the “Board”). Investments for which quoted bid prices are readily available and are representative of the bid side of the market in the judgment of the Service are valued at the mean between the quoted bid prices (as obtained by the Service from dealers in such securities) and asked prices (as calculated by the Service based upon its evaluation of the market for such securities). Other investments (which constitute a majority of the portfolio securities) are valued as determined by the Service, based on methods which include consideration of the following: yields or prices of securities of comparable quality, coupon, maturity and type; indications as to values from dealers; and general market conditions. These securities are generally categorized within Level 2 of the fair value hierarchy.
U.S. Treasury Bills are valued at the mean price between quoted bid prices and asked prices by the Service. These securities are generally categorized within Level 2 of the fair value hierarchy.
The Service is engaged under the general supervision of the Board.
When market quotations or official closing prices are not readily available, or are determined to not accurately reflect fair value, such as when the value of a security has been significantly affected by events after the close of the exchange or market on which the security is principally traded (for example, a foreign exchange or market), but before the fund calculates its net asset value, the fund may value these investments at fair value as determined in accordance with the procedures approved by the Board. Certain factors may be considered when fair valuing investments such as: fundamental analytical data, the nature and duration of restrictions on disposition, an evaluation of the forces that influence the market in which the securities are purchased and sold, and public trading in similar securities of the issuer or comparable issuers. These securities are either
43
NOTES TO FINANCIAL STATEMENTS (continued)
categorized within Level 2 or 3 of the fair value hierarchy depending on the relevant inputs used.
For restricted securities where observable inputs are limited, assumptions about market activity and risk are used and are generally categorized within Level 3 of the fair value hierarchy.
Investments denominated in foreign currencies are translated to U.S. dollars at the prevailing rates of exchange.
Futures and options, which are traded on an exchange, are valued at the last sales price on the securities exchange on which such securities are primarily traded or at the last sales price on the national securities market on each business day and are generally categorized within Level 1 of the fair value hierarchy. Options traded over-the-counter (“OTC”) are valued at the mean between the bid and asked price and are generally categorized within Level 2 of the fair value hierarchy. Investments in swap agreements are valued each business day by the Service. Swaps are valued by the Service by using a swap pricing model which incorporates among other factors, default probabilities, recovery rates, credit curves of the underlying issuer and swap spreads on interest rates and are generally categorized within Level 2 of the fair value hierarchy. Forward contracts are valued at the forward rate and are generally categorized within Level 2 of the fair value hierarchy.
The following is a summary of the inputs used as of December 31, 2017 in valuing the fund’s investments:
| | | | | | |
| | Level 1 - Unadjusted Quoted Prices | Level 2 - Other Significant Observable Inputs | Level 3 -Significant Unobservable Inputs | Total |
Assets ($) |
Investments in Securities: |
Asset-Backed | - | 344,327,593 | - | 344,327,593 |
Commercial
Mortgage-Backed | - | 70,280,004 | - | 70,280,004 |
Corporate Bonds | - | 828,344,283 | - | 828,344,283 |
Floating Rate
Loan Interest | - | 6,200,615 | - | 6,200,615 |
Foreign Government | - | 1,716,239,703 | - | 1,716,239,703 |
Registered Investment Companies | 93,694,938 | - | - | 93,694,938 |
Residential
Mortgage-Backed | - | 11,322,214 | - | 11,322,214 |
U.S. Treasury | - | 144,931,052 | - | 144,931,052 |
44
| | | | | |
| | Level 1 - Unadjusted Quoted Prices | Level 2 - Other Significant Observable Inputs | Level 3 -Significant Unobservable Inputs | Total |
Assets ($) |
Other Financial Instruments: |
Futures† | 3,192,595 | - | - | 3,192,595 |
Options Purchased | 472,328 | 5,545,257 | - | 6,017,585 |
Forward Foreign Currency
Exchange Contracts† | - | 6,427,750 | - | 6,427,750 |
Liabilities ($) | | | | |
Other Financial Instruments: |
Futures† | (3,948,599) | - | - | (3,948,599) |
Options Written | - | (716,609) | - | (716,609) |
Forward Foreign Currency
Exchange Contracts† | - | (38,794,747) | - | (38,794,747) |
Swaps† | - | (1,108,987) | - | (1,108,987) |
† Amount shown represents unrealized appreciation (depreciation) at period end.
At December 31, 2017, there were no transfers between levels of the fair value hierarchy. It is the fund’s policy to recognize transfers between levels at the end of the reporting period.
(b) Foreign currency transactions: The fund does not isolate that portion of the results of operations resulting from changes in foreign exchange rates on investments from the fluctuations arising from changes in the market prices of securities held. Such fluctuations are included with the net realized and unrealized gain or loss on investments.
Net realized foreign exchange gains or losses arise from sales of foreign currencies, currency gains or losses realized on securities transactions between trade and settlement date, and the difference between the amounts of dividends, interest and foreign withholding taxes recorded on the fund’s books and the U.S. dollar equivalent of the amounts actually received or paid. Net unrealized foreign exchange gains and losses arise from changes in the value of assets and liabilities other than investments resulting from changes in exchange rates. Foreign currency gains and losses on foreign currency transactions are also included with net realized and unrealized gain or loss on investments.
(c) Securities transactions and investment income: Securities transactions are recorded on a trade date basis. Realized gains and losses from securities transactions are recorded on the identified cost basis.
45
NOTES TO FINANCIAL STATEMENTS (continued)
Dividend income is recognized on the ex-dividend date and interest income, including, where applicable, accretion of discount and amortization of premium on investments, is recognized on the accrual basis.
Pursuant to a securities lending agreement with The Bank of New York Mellon, the fund may lend securities to qualified institutions. It is the fund’s policy that, at origination, all loans are secured by collateral of at least 102% of the value of U.S. securities loaned and 105% of the value of foreign securities loaned. Collateral equivalent to at least 100% of the market value of securities on loan is maintained at all times. Collateral is either in the form of cash, which can be invested in certain money market mutual funds managed by Dreyfus, or U.S. Government and Agency securities. The fund is entitled to receive all dividends, interest and distributions on securities loaned, in addition to income earned as a result of the lending transaction. Should a borrower fail to return the securities in a timely manner, The Bank of New York Mellon is required to replace the securities for the benefit of the fund or credit the fund with the market value of the unreturned securities and is subrogated to the fund’s rights against the borrower and the collateral. Additionally, the contractual maturity of security lending transactions are on an overnight and continuous basis. During the period ended December 31, 2017, The Bank of New York Mellon earned $31,654 from lending portfolio securities, pursuant to the securities lending agreement.
(d) Affiliated issuers: Investments in other investment companies advised by Dreyfus are defined as “affiliated” under the Act.
(e) Risk: Investing in foreign markets may involve special risks and considerations not typically associated with investing in the U.S. These risks include revaluation of currencies, high rates of inflation, repatriation restrictions on income and capital, and adverse political and economic developments. Moreover, securities issued in these markets may be less liquid, subject to government ownership controls and delayed settlements, and their prices may be more volatile than those of comparable securities in the U.S.
The fund invests in floating rate loan interests. The floating rate loans in which the fund invests typically are below investment grade securities, and inherently speculative. In the event of the bankruptcy of a borrower, the fund could experience delays or limitations imposed by insolvency laws with respect to its ability to realize the benefits of any collateral securing the borrower’s loan.
46
The fund invests primarily in debt securities. Failure of an issuer of the debt securities to make timely interest or principal payments, or a decline or the perception of a decline in the credit quality of a debt security, can cause the debt security’s price to fall, potentially lowering the fund’s share price. In addition, the value of debt securities may decline due to general market conditions that are not specifically related to a particular issuer, such as real or perceived adverse economic conditions, changes in outlook for corporate earnings, changes in interest or currency rates or adverse investor sentiment. Such values may also decline because of factors that affect a particular industry or country.
(f) Dividends and distributions to shareholders: Dividends and distributions are recorded on the ex-dividend date. Dividends from investment income-net are normally declared and paid quarterly. Dividends from net realized capital gains, if any, are normally declared and paid annually, but the fund may make distributions on a more frequent basis to comply with the distribution requirements of the Internal Revenue Code of 1986, as amended (the “Code”). To the extent that net realized capital gains can be offset by capital loss carryovers, it is the policy of the fund not to distribute such gains. Income and capital gain distributions are determined in accordance with income tax regulations, which may differ from GAAP.
(g) Federal income taxes: It is the policy of the fund to continue to qualify as a regulated investment company, if such qualification is in the best interests of its shareholders, by complying with the applicable provisions of the Code, and to make distributions of taxable income sufficient to relieve it from substantially all federal income and excise taxes.
As of and during the period ended December 31, 2017, the fund did not have any liabilities for any uncertain tax positions. The fund recognizes interest and penalties, if any, related to uncertain tax positions as income tax expense in the Statement of Operations. During the period ended December 31, 2017, the fund did not incur any interest or penalties.
Each tax year in the four-year period ended December 31, 2017 remains subject to examination by the Internal Revenue Service and state taxing authorities.
At December 31, 2017, the components of accumulated earnings on a tax basis were as follows: undistributed ordinary income $4,080,780, accumulated capital losses $57,512,928 and unrealized appreciation $24,671,300.
Under the Regulated Investment Company Modernization Act of 2010, the fund is permitted to carry forward capital losses for an unlimited
47
NOTES TO FINANCIAL STATEMENTS (continued)
period. Furthermore, capital loss carryovers retain their character as either short-term or long-term capital losses.
The accumulated capital loss carryover is available for federal income tax purposes to be applied against future net realized capital gains, if any, realized subsequent to December 31, 2017. The fund has $26,706,803 of short-term capital losses and $30,806,125 of long-term capital losses which can be carried forward for an unlimited period.
The tax character of distributions paid to shareholders during the fiscal periods ended December 31, 2017 and December 31, 2016 were as follows: ordinary income $65,661,600 and $54,443,931, and long-term capital gains $13,463,162 and $7,943,667, respectively.
During the period ended December 31, 2017, as a result of permanent book to tax differences, primarily due to the tax treatment for paydown gains and losses on mortgage-backed securities, foreign currency transactions, amortization of premiums, swap periodic payments and dividend reclassification, the fund decreased accumulated undistributed investment income-net by $6,996,018 and increased accumulated net realized gain (loss) on investments by the same amount. Net assets and net asset value per share were not affected by this reclassification.
NOTE 2—Bank Lines of Credit:
The fund participates with other Dreyfus-managed funds in an $830 million unsecured credit facility led by Citibank, N.A. and a $300 million unsecured credit facility provided by The Bank of New York Mellon (each, a “Facility”), each to be utilized primarily for temporary or emergency purposes, including the financing of redemptions. Prior to October 4, 2017, the unsecured credit facility with Citibank, N.A. was $810 million. In connection therewith, the fund has agreed to pay its pro rata portion of commitment fees for each Facility. Interest is charged to the fund based on rates determined pursuant to the terms of the respective Facility at the time of borrowing. During the period ended December 31, 2017, the fund did not borrow under the Facilities.
NOTE 3—Investment Advisory Fee, Sub-Investment Advisory Fee, Administration Fee and Other Transactions with Affiliates:
(a) Pursuant to an investment advisory agreement with Dreyfus, the investment advisory fee is computed at the annual rate of .40% of the value of the fund’s average daily net assets and is payable monthly.
Pursuant to a sub-investment advisory agreement between Dreyfus and Standish, Standish serves as the fund’s sub-investment adviser responsible for the day-to-day management of the fund’s portfolio. Dreyfus pays the
48
sub-investment adviser a monthly fee at an annual percentage of the value of the fund’s average daily net assets. Dreyfus has obtained an exemptive order from the SEC (the “Order”), upon which the fund may rely, to use a manager of managers approach that permits Dreyfus, subject to certain conditions and approval by the Board, to enter into and materially amend sub-investment advisory agreements with one or more sub-investment advisers who are either unaffiliated with Dreyfus or are wholly-owned subsidiaries (as defined under the Act) of Dreyfus’ ultimate parent company, BNY Mellon, without obtaining shareholder approval. The Order also allows the fund to disclose the sub-investment advisory fee paid by Dreyfus to any unaffiliated sub-investment adviser in the aggregate with other unaffiliated sub-investment advisers in documents filed with the SEC and provided to shareholders. In addition, pursuant to the Order, it is not necessary to disclose the sub-investment advisory fee payable by Dreyfus separately to a sub-investment adviser that is a wholly-owned subsidiary of BNY Mellon in documents filed with the SEC and provided to shareholders; such fees are to be aggregated with fees payable to Dreyfus. Dreyfus has ultimate responsibility (subject to oversight by the Board) to supervise any sub-investment adviser and recommend the hiring, termination, and replacement of any sub-investment adviser to the Board.
The fund has a Fund Accounting and Administrative Services Agreement (the “Administration Agreement”) with Dreyfus, whereby Dreyfus performs administrative, accounting and recordkeeping services for the fund. The fund has agreed to compensate Dreyfus for providing accounting and recordkeeping services, administration, compliance monitoring, regulatory and shareholder reporting, as well as related facilities, equipment and clerical help. The fee is based on the fund’s average daily net assets and computed at the following annual rates: .10% of the first $500 million, .065% of the next $500 million and .02% in excess of $1 billion.
In addition, after applying any expense limitations or fee waivers that reduce the fees paid to Dreyfus for this service, Dreyfus has contractually agreed in writing to waive any remaining fees for this service to the extent that they exceed both Dreyfus’ costs in providing these services and a reasonable allocation of the costs incurred by Dreyfus and its affiliates related to the support and oversight of these services. The fund also reimburses Dreyfus for the out-of-pocket expenses incurred in performing this service for the fund. Pursuant to the Administration Agreement, the fund was charged $246,309 during the period ended December 31, 2017.
49
NOTES TO FINANCIAL STATEMENTS (continued)
During the period ended December 31, 2017, the Distributor retained $16,718 from commissions earned on sales of the fund’s Class A shares and $33,457 from CDSCs on redemptions of the fund’s Class C shares.
(b) Under the Distribution Plan adopted pursuant to Rule 12b-1 under the Act, Class C shares pay the Distributor for distributing its shares at an annual rate of .75% of the value of its average daily net assets. During the period ended December 31, 2017, Class C shares were charged $650,590 pursuant to the Distribution Plan.
(c) Under the Shareholder Services Plan, Class A and Class C shares pay the Distributor at an annual rate of .25% of the value of their average daily net assets for the provision of certain services. The services provided may include personal services relating to shareholder accounts, such as answering shareholder inquiries regarding the fund and providing reports and other information, and services related to the maintenance of shareholder accounts. The Distributor may make payments to Service Agents (securities dealers, financial institutions or other industry professionals) with respect to these services. The Distributor determines the amounts to be paid to Service Agents. During the period ended December 31, 2017, Class A and Class C shares were charged $443,448 and $216,863, respectively, pursuant to the Shareholder Services Plan.
Under its terms, the Distribution Plan and Shareholder Services Plan shall remain in effect from year to year, provided such continuance is approved annually by a vote of a majority of those Trustees who are not “interested persons” of the Trust and who have no direct or indirect financial interest in the operation of or in any agreement related to the Distribution Plan or Shareholder Services Plan.
The fund has arrangements with the transfer agent and the custodian whereby the fund may receive earnings credits when positive cash balances are maintained, which are used to offset transfer agency and custody fees. For financial reporting purposes, the fund includes net earnings credits as an expense offset in the Statement of Operations.
The fund compensates Dreyfus Transfer, Inc., a wholly-owned subsidiary of Dreyfus, under a transfer agency agreement for providing transfer agency and cash management services for the fund. The majority of transfer agency fees are comprised of amounts paid on a per account basis, while cash management fees are related to fund subscriptions and redemptions. During the period ended December 31, 2017, the fund was charged $49,434 for transfer agency services and $3,122 for cash management services. These fees are included in Shareholder servicing
50
costs in the Statement of Operations. Cash management fees were offset by earnings credits of $3,122.
The fund compensates The Bank of New York Mellon under a custody agreement for providing custodial services for the fund. These fees are determined based on net assets, geographic region and transaction activity. During the period ended December 31, 2017, the fund was charged $727,855 pursuant to the custody agreement. These fees were partially offset by earnings credits of $8,732.
During the period ended December 31, 2017, the fund was charged $11,202 for services performed by the Chief Compliance Officer and his staff.
The components of “Due to The Dreyfus Corporation and affiliates” in the Statement of Assets and Liabilities consist of: investment advisory fees $1,075,253, administration fees $20,531, Distribution Plan fees $50,853, Shareholder Services Plan fees $53,327, custodian fees $219,229, Chief Compliance Officer fees $8,406 and transfer agency fees $7,725.
(d) Each Board member also serves as a Board member of other funds within the Dreyfus complex. Annual retainer fees and attendance fees are allocated to each fund based on net assets.
NOTE 4—Securities Transactions:
The aggregate amount of purchases and sales (including paydowns) of investment securities, excluding short-term securities, futures, options transactions, forward contracts, and swap agreements, during the period ended December 31, 2017, amounted to $2,944,180,698 and $2,649,678,336, respectively.
Floating Rate Loan Interests: Floating rate instruments are loans and other securities with interest rates that adjust or “float” periodically. Floating rate loans are made by banks and other financial institutions to their corporate clients. The rates of interest on the loans adjust periodically by reference to a base lending rate, such as the London Interbank Offered Rate (“LIBOR”) plus a premium or credit spread. Floating rate loans reset on periodic set dates, typically 30 to 90 days, but not to exceed one year. The fund may invest in multiple series or tranches of a loan. A different series or tranche may have varying terms and carry different associated risks.
Derivatives: A derivative is a financial instrument whose performance is derived from the performance of another asset. The fund enters into International Swaps and Derivatives Association, Inc. Master Agreements or similar agreements (collectively, “Master Agreements”) with its OTC
51
NOTES TO FINANCIAL STATEMENTS (continued)
derivative contract counterparties in order to, among other things, reduce its credit risk to counterparties. Master Agreements include provisions for general obligations, representations, collateral and events of default or termination. Under a Master Agreement, the fund may offset with the counterparty certain derivative financial instrument’s payables and/or receivables with collateral held and/or posted and create one single net payment in the event of default or termination.
Each type of derivative instrument that was held by the fund during the period ended December 31, 2017 is discussed below.
Futures: In the normal course of pursuing its investment objective, the fund is exposed to market risk, including interest rate risk as a result of changes in value of underlying financial instruments. The fund invests in futures in order to manage its exposure to or protect against changes in the market. A futures contract represents a commitment for the future purchase or a sale of an asset at a specified date. Upon entering into such contracts, these investments require initial margin deposits with a counterparty, which consist of cash or cash equivalents. The amount of these deposits is determined by the exchange or Board of Trade on which the contract is traded and is subject to change. Accordingly, variation margin payments are received or made to reflect daily unrealized gains or losses which are recorded in the Statement of Operations. When the contracts are closed, the fund recognizes a realized gain or loss which is reflected in the Statement of Operations. There is minimal counterparty credit risk to the fund with futures since they are exchange traded, and the exchange guarantees the futures against default. Futures open at December 31, 2017 are set forth in the Statement of Futures.
Options Transactions: The fund purchases and writes (sells) put and call options to hedge against changes in the values of interest rates and foreign currencies, or as a substitute for an investment. The fund is subject to market risk, interest rate risk and currency risk in the course of pursuing its investment objectives through its investments in options contracts. A call option gives the purchaser of the option the right (but not the obligation) to buy, and obligates the writer to sell, the underlying financial instrument at the exercise price at any time during the option period, or at a specified date. Conversely, a put option gives the purchaser of the option the right (but not the obligation) to sell, and obligates the writer to buy the underlying financial instrument at the exercise price at any time during the option period, or at a specified date.
As a writer of call options, the fund receives a premium at the outset and then bears the market risk of unfavorable changes in the price of the financial instrument underlying the option. Generally, the fund realizes a
52
gain, to the extent of the premium, if the price of the underlying financial instrument decreases between the date the option is written and the date on which the option is terminated. Generally, the fund incurs a loss if the price of the financial instrument increases between those dates.
As a writer of put options, the fund receives a premium at the outset and then bears the market risk of unfavorable changes in the price of the financial instrument underlying the option. Generally, the fund realizes a gain, to the extent of the premium, if the price of the underlying financial instrument increases between the date the option is written and the date on which the option is terminated. Generally, the fund incurs a loss if the price of the financial instrument decreases between those dates. The maximum payout for those contracts is limited to the number of put option contracts written and the related strike prices, respectively.
As a writer of an option, the fund has no control over whether the underlying financial instrument may be sold (call) or purchased (put) and as a result bears the market risk of an unfavorable change in the price of the financial instrument underlying the written option. There is a risk of loss from a change in value of such options which may exceed the related premiums received. This risk is mitigated by Master Agreements between the fund and the counterparty and the posting of collateral, if any, by the counterparty to the fund to cover the fund’s exposure to the counterparty. The Statement of Operations reflects any unrealized gains or losses which occurred during the period as well as any realized gains or losses which occurred upon the expiration or closing of the option transaction. Options written open at December 31, 2017 are set forth in Statement of Options Written.
Forward Foreign Currency Exchange Contracts: The fund enters into forward contracts in order to hedge its exposure to changes in foreign currency exchange rates on its foreign portfolio holdings, to settle foreign currency transactions or as a part of its investment strategy. When executing forward contracts, the fund is obligated to buy or sell a foreign currency at a specified rate on a certain date in the future. With respect to sales of forward contracts, the fund incurs a loss if the value of the contract increases between the date the forward contract is opened and the date the forward contract is closed. The fund realizes a gain if the value of the contract decreases between those dates. With respect to purchases of forward contracts, the fund incurs a loss if the value of the contract decreases between the date the forward contract is opened and the date the forward contract is closed. The fund realizes a gain if the value of the contract increases between those dates. Any realized or unrealized gains or losses which occurred during the period are reflected in the Statement of
53
NOTES TO FINANCIAL STATEMENTS (continued)
Operations. The fund is exposed to foreign currency risk as a result of changes in value of underlying financial instruments. The fund is also exposed to credit risk associated with counterparty nonperformance on these forward contracts, which is generally limited to the unrealized gain on each open contract. This risk may be mitigated by Master Agreements, if any, between the fund and the counterparty and the posting of collateral, if any, by the counterparty to the fund to cover the fund’s exposure to the counterparty. Forward contracts open at December 31, 2017 are set forth in the Statement of Forward Foreign Currency Exchange Contracts.
Swap Agreements: The fund enters into swap agreements to exchange the interest rate on, or return generated by, one nominal instrument for the return generated by another nominal instrument. Swap agreements are privately negotiated in the OTC market or centrally cleared. The fund enters into these agreements to hedge certain market or interest rate risks, to manage the interest rate sensitivity (sometimes called duration) of fixed income securities, to provide a substitute for purchasing or selling particular securities or to increase potential returns.
For OTC swaps, the fund accrues for interim payments on a daily basis, with the net amount recorded within unrealized appreciation (depreciation) on swap agreements in the Statement of Assets and Liabilities. Once the interim payments are settled in cash, the net amount is recorded as a realized gain (loss) on swaps, in addition to realized gain (loss) recorded upon the termination of swap agreements in the Statement of Operations. Upfront payments made and/or received by the fund, are recorded as an asset and/or liability in the Statement of Assets and Liabilities and are recorded as a realized gain or loss ratably over the agreement’s term/event with the exception of forward starting interest rate swaps which are recorded as realized gains or losses on the termination date.
Upon entering into centrally cleared swap agreements, an initial margin deposit is required with a counterparty, which consists of cash or cash equivalents. The amount of these deposits is determined by the exchange on which the agreement is traded and is subject to change. The change in valuation of centrally cleared swaps is recorded as a receivable or payable for variation margin in the Statement of Assets and Liabilities. Payments received from (paid to) the counterparty, including upon termination, are recorded as realized gain (loss) in the Statement of Operations.
Fluctuations in the value of swap agreements are recorded for financial statement purposes as unrealized appreciation or depreciation on swap agreements.
54
Interest Rate Swaps: Interest rate swaps involve the exchange of commitments to pay and receive interest based on a notional principal amount. The fund may elect to pay a fixed rate and receive a floating rate, or receive a fixed rate and pay a floating rate on a notional principal amount. The net interest received or paid on interest rate swap agreements is included within realized gain (loss) on swap agreements in the Statement of Operations. Interest rate swap agreements are subject to general market risk, liquidity risk, counterparty risk and interest rate risk.
For OTC swaps, the fund’s maximum risk of loss from counterparty risk is the discounted value of the cash flows to be received from the counterparty over the agreement’s remaining life, to the extent that the amount is positive. This risk may be mitigated by Master Agreements, if any, between the fund and the counterparty and the posting of collateral, if any, by the counterparty to the fund to cover the fund’s exposure to the counterparty. There is minimal counterparty risk to the fund with centrally cleared swaps since they are exchange traded and the exchange guarantees these swap against default. Interest rate swaps open at December 31, 2017 are set forth in the Statement of Swap Agreements.
Credit Default Swaps: Credit default swaps involve commitments to pay a fixed interest rate in exchange for payment if a credit event affecting a third party (the referenced obligation or index) occurs. Credit events may include a failure to pay interest or principal, bankruptcy, or restructuring. The fund enters into these agreements to manage its exposure to the market or certain sectors of the market, to reduce its risk exposure to defaults of corporate and sovereign issuers, or to create exposure to corporate or sovereign issuers to which it is not otherwise exposed. For those credit default swaps in which the fund is paying a fixed rate, the fund is buying credit protection on the instrument. In the event of a credit event, the fund would receive the full notional amount for the reference obligation. For those credit default swaps in which the fund is receiving a fixed rate, the fund is selling credit protection on the underlying instrument. The maximum payouts for these agreements are limited to the notional amount of each swap. Credit default swaps may involve greater risks than if the fund had invested in the reference obligation directly and are subject to general market risk, liquidity risk, counterparty risk and credit risk. This risk may be mitigated by Master Agreements, if any, between the fund and the counterparty and the posting of collateral, if any, by the counterparty to the fund to cover the fund’s exposure to the counterparty. At December 31, 2017, there were no credit default swap agreements outstanding.
55
NOTES TO FINANCIAL STATEMENTS (continued)
The following tables show the fund’s exposure to different types of market risk as it relates to the Statement of Assets and Liabilities and the Statement of Operations, respectively.
Fair value of derivative instruments as of December 31, 2017 is shown below:
| | | | | | | | |
| | Derivative
Assets ($) | | | | Derivative
Liabilities ($) | |
Interest rate risk | 4,050,653 | 1,2 | Interest rate risk | (5,057,586) | 1,3 |
Foreign exchange risk | 11,587,277 | 2,4 | Foreign exchange risk | (39,511,356) | 4,5 |
Gross fair value of
derivative contracts | 15,637,930 | | | | (44,568,942) | |
| | | | | | | |
Statement of Assets and Liabilities location: | |
1 Includes cumulative appreciation (depreciation) on futures as reported in the Statement of Futures, but only the unpaid variation margin is reported in the Statement of Assets and Liabilities. |
2 Options purchased are included in Investments in securities—Unaffiliated issuers, at value. |
3 Includes cumulative appreciation (depreciation) on swap agreements as reported in the Statement of Swap Agreements. Unrealized appreciation (depreciation) on OTC swap agreements and only unpaid variation margin on cleared swap agreements, are reported in the Statement of Assets and Liabilities. |
4 Unrealized appreciation (depreciation) on forward foreign currency exchange contracts. |
5 Outstanding options written, at value. | |
The effect of derivative instruments in the Statement of Operations during the period ended December 31, 2017 is shown below:
| | | | | | | | | | | |
Amount of realized gain (loss) on derivatives recognized in income ($) | |
Underlying
risk | Futures | 1 | Options
Transactions | 2 | Forward
Contracts | 3 | Swap
Agreements | 4 | Total | |
Interest
rate | 494,804 | | 583,532 | | - | | (1,036,286) | | 42,050 | |
Foreign
exchange | - | | (666,592) | | (79,644,510) | | - | | (80,311,102) | |
Credit | - | | - | | - | | (402,487) | | (402,487) | |
Total | 494,804 | | (83,060) | | (79,644,510) | | (1,438,773) | | (80,671,539) | |
| | | | | | | | | | | |
56
| | | | | | | | | | | | |
Change in unrealized appreciation (depreciation)
on derivatives recognized in income ($) | |
Underlying
risk | Futures | 5 | Options
Transactions | 6 | Forward
Contracts | 7 | Swap
Agreements | 8 | Total | |
Interest
rate | 1,391,889 | | (774,144) | | - | | (1,108,987) | | (491,242) | |
Foreign
exchange | - | �� | 1,849,471 | | (29,031,589) | | - | | (27,182,118) | |
Total | 1,391,889 | | 1,075,327 | | (29,031,589) | | (1,108,987) | | (27,673,360) | |
| | | | | | | | | | | | |
Statement of Operations location: | |
1 Net realized gain (loss) on futures. | | |
2 Net realized gain (loss) on options transactions. |
3 Net realized gain (loss) on forward foreign currency exchange contracts. | | |
4 Net realized gain (loss) on swap agreements. | | |
5 Net unrealized appreciation (depreciation) on futures. | | |
6 Net unrealized appreciation (depreciation) on options transactions. | | |
7 Net unrealized appreciation (depreciation) on forward foreign currency exchange contracts. | |
8 Net unrealized appreciation (depreciation) on swap agreements. | | |
The provisions of ASC Topic 210 “Disclosures about Offsetting Assets and Liabilities” require disclosure on the offsetting of financial assets and liabilities. These disclosures are required for certain investments, including derivative financial instruments subject to Master Agreements which are eligible for offsetting in the Statement of Assets and Liabilities and require the fund to disclose both gross and net information with respect to such investments. For financial reporting purposes, the fund does not offset derivative assets and derivative liabilities that are subject to Master Agreements in the Statement of Assets and Liabilities.
At December 31, 2017, derivative assets and liabilities (by type) on a gross basis are as follows:
| | | | | | |
Derivative Financial Instruments: | | Assets ($) | | Liabilities ($) | |
Futures | | 3,192,595 | | (3,948,599) | |
Options | | 6,017,585 | | (716,608) | |
Forward contracts | | 6,427,750 | | (38,794,747) | |
Swaps | | - | | (1,108,987) | |
Total gross amount of derivative | | | | | |
assets and liabilities in the | | | | | |
Statement of Assets and Liabilities | | 15,637,930 | | (44,568,941) | |
Derivatives not subject to | | | | | |
Master Agreements | | (3,664,923) | | 5,057,586 | |
Total gross amount of assets | | | | | |
and liabilities subject to | | | | | |
Master Agreements | | 11,973,007 | | (39,511,355) | |
57
NOTES TO FINANCIAL STATEMENTS (continued)
The following tables present derivative assets and liabilities net of amounts available for offsetting under Master Agreements and net of related collateral received or pledged, if any, as of December 31, 2017:†
| | | | | | | |
| | | | Financial | | | |
| | | | Instruments | | | |
| | | | and Derivatives | | | |
| | Gross Amount of | | Available | Collateral | | Net Amount of |
Counterparty | Assets ($) | 1 | for Offset ($) | Received ($) | 2 | Assets ($) |
Barclays Bank | 15,109 | | (15,109) | - | | - |
Citigroup | 4,831,973 | | (4,831,973) | - | | - |
Goldman Sachs
International | 2,807,454 | | (2,807,454) | - | | - |
HSBC | 1,751,913 | | (1,751,913) | - | | - |
JP Morgan
Chase Bank | 2,129,463 | | (2,129,463) | - | | - |
UBS | 437,095 | | (437,095) | - | | - |
Total | 11,973,007 | | (11,973,007) | - | | - |
| | | | | | | |
| | | | Financial | | | |
| | | | Instruments | | | |
| | | | and Derivatives | | | |
| | Gross Amount of | | Available | Collateral | | Net Amount of |
Counterparty | Liabilities ($) | 1 | for Offset ($) | Pledged ($) | 2 | Liabilities ($) |
Bank of America | (122,200) | | - | - | | (122,200) |
Barclays Bank | (137,205) | | 15,109 | - | | (122,096) |
Citigroup | (12,965,602) | | 4,831,973 | 8,133,629 | | - |
Goldman Sachs
International | (3,479,318) | | 2,807,454 | - | | (671,864) |
HSBC | (13,115,706) | | 1,751,913 | 7,143,000 | | (4,220,793) |
JP Morgan
Chase Bank | (7,867,748) | | 2,129,463 | 3,820,000 | | (1,918,285) |
UBS | (1,823,577) | | 437,095 | 492,000 | | (894,482) |
Total | (39,511,356) | | 11,973,007 | 19,588,629 | | (7,949,720) |
| | | | | | | |
1 Absent a default event or early termination, OTC derivative assets and liabilities are presented at gross amounts and are not offset in the Statement of Assets and Liabilities. |
2 In some instances, the actual collateral received and/or pledged may be more than the amount shown due to over collateralization. |
† See Statement of Investments for detailed information regarding collateral held for open futures contracts. |
The following summarizes the average market value of derivatives outstanding during the period ended December 31, 2017:
| | | |
| | Average Market Value ($) |
Interest rate futures | | 1,219,550,378 |
Interest rate options contracts | | 748,761 |
Foreign currency options contracts | | 1,910,144 |
Forward contracts | | 2,915,667,420 |
| | | |
58
The following summarizes the average notional value of swap agreements outstanding during the period ended December 31, 2017:
| | | |
| | Average Notional Value ($) |
Interest rate swap agreements | | 251,523,497 |
Credit default swap agreements | | 4,277,812 |
| | | |
At December 31, 2017, the cost of investments for federal income tax purposes was $3,165,187,006; accordingly, accumulated net unrealized appreciation on investments inclusive of derivative contracts was $49,518,039, consisting of $96,263,437 gross unrealized appreciation and $46,745,398 gross unrealized depreciation.
NOTE 5—Subsequent Event:
Effective January 31, 2018, Dreyfus-affiliated investment management firms Standish Mellon Asset Management Company and The Boston Company Asset Management, LLC combined with Mellon Capital Management Corporation to form a specialist multi-asset investment manager to be known as BNY Mellon Asset Management North America Corporation.
59
REPORT OF INDEPENDENT REGISTERED PUBLIC ACCOUNTING FIRM
To the Shareholders and Board of Trustees
Dreyfus Investment Funds:
Opinion on the Financial Statements
We have audited the accompanying statement of assets and liabilities of Dreyfus/Standish Global Fixed Income Fund (the Fund), a series of Dreyfus Investment Funds, including the statements of investments, investments in affiliated issuers, futures, options written, forward foreign currency exchange contracts and swap agreements, as of December 31, 2017, the related statement of operations for the year then ended, the statements of changes in net assets for each of the years in the two-year period then ended, and the related notes (collectively, the financial statements) and the financial highlights for each of the years in the five-year period then ended. In our opinion, the financial statements and financial highlights present fairly, in all material respects, the financial position of the Fund as of December 31, 2017, the results of its operations for the year then ended, the changes in its net assets for each of the years in the two-year period then ended, and the financial highlights for each of the years in the five-year period then ended, in conformity with U.S. generally accepted accounting principles.
Basis for Opinion
These financial statements and financial highlights are the responsibility of the Fund’s management. Our responsibility is to express an opinion on these financial statements and financial highlights based on our audits. We are a public accounting firm registered with the Public Company Accounting Oversight Board (United States) (PCAOB) and are required to be independent with respect to the Fund in accordance with the U.S. federal securities laws and the applicable rules and regulations of the Securities and Exchange Commission and the PCAOB.
We conducted our audits in accordance with the standards of the PCAOB. Those standards require that we plan and perform the audit to obtain reasonable assurance about whether the financial statements and financial highlights are free of material misstatement, whether due to error or fraud. Our audits included performing procedures to assess the risks of material misstatement of the financial statements and financial highlights, whether due to error or fraud, and performing procedures that respond to those risks. Such procedures included examining, on a test basis, evidence regarding the amounts and disclosures in the financial statements and financial highlights. Such procedures also included confirmation of securities owned as of December 31, 2017, by correspondence with the custodian and brokers or by other appropriate auditing procedures. Our audits also included evaluating the accounting principles used and significant estimates made by management, as well as evaluating the overall presentation of the financial statements and financial highlights. We believe that our audits provide a reasonable basis for our opinion.

We have served as the auditor of one or more Dreyfus advised investment companies since 1994.
New York, New York
February 26, 2018
60
IMPORTANT TAX INFORMATION (Unaudited)
For federal tax purposes, the fund reports the maximum amount allowable but not less than 24.43% as interest-related dividends in accordance with Sections 871(k)(1) and 881(e) of the Internal Revenue Code. Also, the fund reports the maximum amount allowable but not less than $.1085 per share as a capital gain dividend in accordance with Section 852(b)(3)(C) of the Internal Revenue Code.
61
BOARD MEMBERS INFORMATION (Unaudited)
INDEPENDENT BOARD MEMBERS
Joseph S. DiMartino (74)
Chairman of the Board (2008)
Principal Occupation During Past 5 Years:
· Corporate Director and Trustee (1995-present)
Other Public Company Board Memberships During Past 5 Years:
· CBIZ (formerly, Century Business Services, Inc.), a provider of outsourcing functions for small and medium size companies, Director (1997-present)
No. of Portfolios for which Board Member Serves: 127
———————
Francine J. Bovich (66)
Board Member (2011)
Principal Occupation During Past 5 Years:
· Trustee, The Bradley Trusts, private trust funds (2011-present)
Other Public Company Board Memberships During Past 5 Years:
· Annaly Capital Management, Inc., Director (May 2014-present)
No. of Portfolios for which Board Member Serves: 73
———————
Kenneth A. Himmel (71)
Board Member (2008)
Principal Occupation During Past 5 Years:
· Managing Partner, Gulf Related, an international real estate development company (2010-present)
· President and CEO, Related Urban Development, a real estate development company (1996-present)
· President and CEO, Himmel & Company, a real estate development company (1980-present)
· CEO, American Food Management, a restaurant company (1983-present)
No. of Portfolios for which Board Member Serves: 26
———————
62
Stephen J. Lockwood (70)
Board Member (2008)
Principal Occupation During Past 5 Years:
· Chairman of the Board, Stephen J. Lockwood and Company LLC, a real estate investment company (2000-present)
No. of Portfolios for which Board Member Serves: 26
———————
Roslyn M. Watson (68)
Board Member (2008)
Principal Occupation During Past 5 Years:
· Principal, Watson Ventures, Inc., a real estate investment company (1993-present)
No. of Portfolios for which Board Member Serves: 59
———————
Benaree Pratt Wiley (71)
Board Member (2008)
Principal Occupation During Past 5 Years:
· Principal, The Wiley Group, a firm specializing in strategy and business development (2005-present)
Other Public Company Board Memberships During Past 5 Years:
· CBIZ (formerly, Century Business Services, Inc.), a provider of outsourcing functions for small and medium size companies, Director (2008-present)
No. of Portfolios for which Board Member Serves: 81
———————
Once elected all Board Members serve for an indefinite term, but achieve Emeritus status upon reaching age 80. The address of the Board Members and Officers is c/o The Dreyfus Corporation, 200 Park Avenue, New York, New York 10166. Additional information about the Board Members is available in the fund’s Statement of Additional Information which can be obtained from Dreyfus free of charge by calling this toll free number: 1-800-DREYFUS.
James M. Fitzgibbons, Emeritus Board Member
63
OFFICERS OF THE FUND (Unaudited)
BRADLEY J. SKAPYAK, President since January 2010.
Chief Operating Officer and a director of the Manager since June 2009, Chairman of Dreyfus Transfer, Inc., an affiliate of the Manager and the transfer agent of the funds, since May 2011 and Chief Executive Officer of MBSC Securities Corporation since August 2016. He is an officer of 63 investment companies (comprised of 127 portfolios) managed by the Manager. He is 59 years old and has been an employee of the Manager since February 1988.
BENNETT A. MACDOUGALL, Chief Legal Officer since October 2015.
Chief Legal Officer of the Manager and Associate General Counsel and Managing Director of BNY Mellon since June 2015; from June 2005 to June 2015, he served in various capacities with Deutsche Bank – Asset & Wealth Management Division, including as Director and Associate General Counsel, and Chief Legal Officer of Deutsche Investment Management Americas Inc. from June 2012 to May 2015. He is an officer of 64 investment companies (comprised of 152 portfolios) managed by the Manager. He is 46 years old and has been an employee of the Manager since June 2015.
JANETTE E. FARRAGHER, Vice President and Secretary since December 2011.
Associate General Counsel of BNY Mellon, and an officer of 64 investment companies (comprised of 152 portfolios) managed by the Manager. She is 55 years old and has been an employee of the Manager since February 1984.
JAMES BITETTO, Vice President and Assistant Secretary since December 2008.
Managing Counsel of BNY Mellon and Secretary of the Manager, and an officer of 64 investment companies (comprised of 152 portfolios) managed by the Manager. He is 51 years old and has been an employee of the Manager since December 1996.
JOSEPH M. CHIOFFI, Vice President and Assistant Secretary since December 2008.
Managing Counsel of BNY Mellon, and an officer of 64 investment companies (comprised of 152 portfolios) managed by the Manager. He is 56 years old and has been an employee of the Manager since June 2000.
MAUREEN E. KANE, Vice President and Assistant Secretary since April 2015.
Managing Counsel of BNY Mellon since July 2014; from October 2004 until July 2014, General Counsel, and from May 2009 until July 2014, Chief Compliance Officer of Century Capital Management. She is an officer of 64 investment companies (comprised of 152 portfolios) managed by the Manager. She is 55 years old and has been an employee of the Manager since July 2014.
SARAH S. KELLEHER, Vice President and Assistant Secretary since April 2014.
Senior Counsel of BNY Mellon since March 2013, from August 2005 to March 2013, Associate General Counsel of Third Avenue Management. She is an officer of 64 investment companies (comprised of 152 portfolios) managed by the Manager. She is 42 years old and has been an employee of the Manager since March 2013.
JEFF PRUSNOFSKY, Vice President and Assistant Secretary since December 2008.
Senior Managing Counsel of BNY Mellon, and an officer of 64 investment companies (comprised of 152 portfolios) managed by the Manager. He is 52 years old and has been an employee of the Manager since October 1990.
NATALYA ZELENSKY, Vice President and Assistant Secretary since March 2017.
Counsel and Vice President of BNY Mellon since May 2016; Attorney at Wildermuth Endowment Strategy Fund/Wildermuth Advisory, LLC from November 2015 until May 2016; Assistant General Counsel at RCS Advisory Services from July 2014 until November 2015; Associate at Sutherland, Asbill & Brennan from January 2013 until January 2014; Associate at K&L Gates from October 2011 until January 2013. She is an officer of 64 investment companies (comprised of 152 portfolios) managed by Dreyfus. She is 32 years old and has been an employee of the Manager since May 2016.
JAMES WINDELS, Treasurer since December 2008.
Director – Mutual Fund Accounting of the Manager, and an officer of 64 investment companies (comprised of 152 portfolios) managed by the Manager. He is 59 years old and has been an employee of the Manager since April 1985.
64
RICHARD CASSARO, Assistant Treasurer since December 2008.
Senior Accounting Manager – Money Market and Municipal Bond Funds of the Manager, and an officer of 64 investment companies (comprised of 152 portfolios) managed by the Manager. He is 58 years old and has been an employee of the Manager since September 1982.
GAVIN C. REILLY, Assistant Treasurer since December 2008.
Tax Manager of the Investment Accounting and Support Department of the Manager, and an officer of 64 investment companies (comprised of 152 portfolios) managed by the Manager. He is 49 years old and has been an employee of the Manager since April 1991.
ROBERT S. ROBOL, Assistant Treasurer since December 2008.
Senior Accounting Manager – Dreyfus Financial Reporting of the Manager, and an officer of 64 investment companies (comprised of 152 portfolios) managed by the Manager. He is 53 years old and has been an employee of the Manager since October 1988.
ROBERT SALVIOLO, Assistant Treasurer since December 2008.
Senior Accounting Manager – Equity Funds of the Manager, and an officer of 64 investment companies (comprised of 152 portfolios) managed by the Manager. He is 50 years old and has been an employee of the Manager since June 1989.
ROBERT SVAGNA, Assistant Treasurer since December 2008.
Senior Accounting Manager – Fixed Income and Equity Funds of the Manager, and an officer of 64 investment companies (comprised of 152 portfolios) managed by the Manager. He is 50 years old and has been an employee of the Manager since November 1990.
JOSEPH W. CONNOLLY, Chief Compliance Officer since December 2008.
Chief Compliance Officer of the Manager and The Dreyfus Family of Funds (64 investment companies, comprised of 152 portfolios). He is 60 years old and has served in various capacities with the Manager since 1980, including manager of the firm’s Fund Accounting Department from 1997 through October 2001.
CARIDAD M. CAROSELLA, Anti-Money Laundering Compliance Officer since January 2016.
Anti-Money Laundering Compliance Officer of the Dreyfus Family of Funds and BNY Mellon Funds Trust since January 2016; from May 2015 to December 2015, Interim Anti-Money Laundering Compliance Officer of the Dreyfus Family of Funds and BNY Mellon Funds Trust and the Distributor; from January 2012 to May 2015, AML Surveillance Officer of the Distributor and from 2007 to December 2011, Financial Processing Manager of the Distributor. She is an officer of 58 investment companies (comprised of 146 portfolios) managed by the Manager. She is 49 years old and has been an employee of the Distributor since 1997.
65
Dreyfus/Standish Global Fixed Income Fund
200 Park Avenue
New York, NY 10166
Investment Adviser
The Dreyfus Corporation
200 Park Avenue
New York, NY 10166
Sub-Investment Adviser
Standish Mellon Asset Management
Company LLC
BNY Mellon Center
201 Washington Street
Suite 2900
Boston, MA 02108-4408
Custodian
The Bank of New York Mellon
225 Liberty Street
New York, NY 10286
Transfer Agent &
Dividend Disbursing Agent
Dreyfus Transfer, Inc.
200 Park Avenue
New York, NY 10166
Distributor
MBSC Securities Corporation
200 Park Avenue
New York, NY 10166
| | |
Ticker Symbols: | Class A: DHGAX Class C: DHGCX Class I: SDGIX Class Y: DSDYX |
Telephone Call your financial representative or 1-800-DREYFUS
Mail The Dreyfus Family of Funds, 144 Glenn Curtiss Boulevard, Uniondale, NY 11556-0144
E-mail Send your request to info@dreyfus.com
Internet Information can be viewed online or downloaded at www.dreyfus.com
The fund files its complete schedule of portfolio holdings with the Securities and Exchange Commission (“SEC”) for the first and third quarters of each fiscal year on Form N-Q. The fund’s Forms N-Q are available on the SEC’s website at www.sec.gov and may be reviewed and copied at the SEC’s Public Reference Room in Washington, D.C. (phone 1-800-SEC-0330 for information).
A description of the policies and procedures that the fund uses to determine how to vote proxies relating to portfolio securities and information regarding how the fund voted these proxies for the most recent 12-month period ended June 30 is available at www.dreyfus.com and on the SEC’s website at www.sec.gov and without charge, upon request, by calling 1-800-DREYFUS.
| | |
© 2018 MBSC Securities Corporation
6940AR1217 | 
|