UNITED STATES
SECURITIES AND EXCHANGE COMMISSION
Washington, D.C. 20549
FORM N-CSR
CERTIFIED SHAREHOLDER REPORT OF REGISTERED MANAGEMENT
INVESTMENT COMPANIES
Investment Company Act file number | 811-04813 |
| |
| Dreyfus Investment Funds | |
| (Exact name of Registrant as specified in charter) | |
| | |
| c/o The Dreyfus Corporation 200 Park Avenue New York, New York 10166 | |
| (Address of principal executive offices) (Zip code) | |
| | |
| Bennett A. MacDougall, Esq. 200 Park Avenue New York, New York 10166 | |
| (Name and address of agent for service) | |
|
Registrant's telephone number, including area code: | (212) 922-6400 |
| |
Date of fiscal year end: | 12/31 | |
Date of reporting period: | 12/31/18 | |
| | | | | | | |
The following N-CSR relates only to the Registrant's series listed below and does not relate to any series of the Registrant with a different fiscal year end and, therefore, different N-CSR reporting requirements. A separate N-CSR will be filed for any series with a different fiscal year end, as appropriate.
Dreyfus/Standish Global Fixed Income Fund
FORM N-CSR
Item 1. Reports to Stockholders.
Dreyfus/Standish Global Fixed Income Fund
| | | |

| | ANNUAL REPORT December 31, 2018 |
| |
Save time. Save paper. View your next shareholder report online as soon as it’s available. Log into www.dreyfus.com and sign up for Dreyfus eCommunications. It’s simple and only takes a few minutes. |
| |
The views expressed in this report reflect those of the portfolio manager(s) only through the end of the period covered and do not necessarily represent the views of Dreyfus or any other person in the Dreyfus organization. Any such views are subject to change at any time based upon market or other conditions and Dreyfus disclaims any responsibility to update such views. These views may not be relied on as investment advice and, because investment decisions for a Dreyfus fund are based on numerous factors, may not be relied on as an indication of trading intent on behalf of any Dreyfus fund. |
| |
Not FDIC-Insured • Not Bank-Guaranteed • May Lose Value |
Contents
THE FUND
FOR MORE INFORMATION
Back Cover
| | | | |
| |
Dreyfus/Standish Global Fixed Income Fund
| | The Fund |
A LETTER FROM THE PRESIDENT OF DREYFUS
Dear Shareholder:
We are pleased to present this annual report for Dreyfus/Standish Global Fixed Income Fund, covering the 12-month period from January 1, 2018 through December 31, 2018. For information about how the fund performed during the reporting period, as well as general market perspectives, we provide a Discussion of Fund Performance on the pages that follow.
The reporting period began with major global economies achieving above-trend growth. In the United States, a robust economy and strong labor market encouraged the Federal Reserve to continue moving away from its accommodative monetary policy while other major central banks began to consider monetary tightening. Both U.S. and non-U.S. equity markets remained on an uptrend. Interest rates rose across the yield curve, putting pressure on bond prices.
A few months into the reporting period, global growth trends began to diverge and market volatility returned. While the U.S. economy continued to grow at a healthy rate, other developed markets began to weaken. However, robust growth and strong corporate earnings continued to support U.S. stock returns while other developed markets declined throughout the summer. In the fall, a broad sell-off occurred, partially offsetting earlier U.S. gains. Emerging markets remained under pressure as weakness in their currencies relative to the U.S. dollar added to investors’ uneasiness. Global equities continued their general decline through the end of the period.
Fixed income markets struggled during the first half of the period as interest rates rose and favorable U.S. equity markets fed investor risk appetites. However, in autumn volatility crept in, the yield curve began a flattening trend that continued through the end of December. As long-term debt yields fell, prices rose for many bonds, leading to moderately positive returns for several fixed income market sectors.
Despite continuing political variables, U.S. inflationary pressures and flagging growth rates, we are optimistic that the U.S. economy will remain strong in the near term. However, we remain attentive to signs that point to potential changes on the horizon. As always, we encourage you to discuss the risks and opportunities in today’s investment environment with your financial advisor.
Thank you for your continued confidence and support.
Sincerely,

Renee Laroche-Morris
President
The Dreyfus Corporation
January 15, 2019
2
DISCUSSION OF FUND PERFORMANCE(Unaudited)
For the period from January 1, 2018 through December 31, 2018, as provided by portfolio managers David Leduc, CFA, Brendan Murphy, CFA, and Scott Zaleski, CFA, of Mellon Investments Corporation (formerly BNY Mellon Asset Management North America Corporation), Sub-Investment Adviser
Market and Fund Performance Overview
For the 12-month period ended December 31, 2018, Dreyfus/Standish Global Fixed Income Fund’s Class A shares achieved a total return of -1.13%, Class C shares returned -1.82%, Class I shares returned -0.79%, and Class Y shares returned -0.75%.1 In comparison, the Bloomberg Barclays Global Aggregate Index (Hedged) (the “Index”), the fund’s benchmark, produced a total return of 1.76% for the same period.2
Global bond markets posted moderately positive returns during 2018, amid fluctuating interest rates, trade concerns, and other geopolitical tensions. The fund underperformed the Index, mainly due to shortfalls among emerging-market bonds.
As of February 22, 2018, Scott Zaleski became a portfolio manager for the fund.
The Fund’s Investment Approach
The fund seeks to maximize total return while realizing a market level of income, consistent with preserving principal and liquidity. To pursue its goal, the fund normally invests at least 80% of its net assets, plus any borrowings for investment purposes, in U.S. dollar- and non-U.S. dollar-denominated, fixed-income securities of governments and companies located in various countries, including emerging markets. The fund invests principally in bonds, notes, mortgage-related securities, asset-backed securities, floating rate loans (limited to up to 20% of the fund’s net assets) and other floating rate securities and Eurodollar and Yankee dollar instruments. The fund generally invests in eight or more countries, but always invests in at least three countries, one of which may be the United States. The fund may invest up to 25% of its assets in emerging markets generally and up to 7% of its net assets in any single emerging-market country.
We focus on identifying undervalued government bond markets, currencies, sectors, and securities and de-emphasize the use of interest-rate forecasting. We look for fixed-income securities with the potential for credit upgrades, unique structural characteristics, or innovative features. We select securities by using fundamental economic research and quantitative analysis to allocate assets among countries and currencies, by focusing on sectors and individual securities that appear to be relatively undervalued, and by actively trading among sectors.
Geopolitics and Trade Undermined Returns From Global Bonds
International bond markets produced mixed results during the start of 2018, as some central banks began to follow the U.S. Federal Reserve (the “Fed”) and looked to remove accommodative monetary policy in response to signals indicating accelerating economic growth. Bond yields rose and prices generally declined in markets where interest rates climbed. U.S.-dollar weakening against most foreign currencies helped boost non-U.S. bond market returns for U.S. residents. U.S. corporate debt soundly outperformed like-duration Treasuries during the beginning of 2018. Emerging-market debt prices also rose. However, this trend reversed during the second quarter, when European economic data proved less
3
DISCUSSION OF FUND PERFORMANCE(Unaudited) (continued)
robust than in the U.S., causing an impact to emerging markets. The dollar began a strengthening trend that lasted throughout much of the year, creating a headwind for non-U.S. bond returns.
Trade and other geopolitical tensions created difficulties for global bond returns throughout much of the second quarter and into the second half of the year. Disputes between the U.S. and China, Italian debt concerns, and Brexit uncertainties affected many developed-market bond prices. Emerging-market returns were hampered by political and financial distress in Turkey and Argentina, low liquidity, and the strong U.S. dollar. However, during the third quarter, there was something of a respite to the spread widening in investment-grade corporate credit and emerging-market debt as Fed minutes began to work in more downside risks. High yield corporate bonds outperformed due to favorable supply-and-demand dynamics. Treasury inflation-protected securities (TIPS) gained ground on mounting inflationary pressures caused by a tightening labor market. However, the strength was short-lived, and markets experienced a sharp sell-off after October comments from Fed Chair Jerome Powell indicated the potential for more rate increases than markets expected. Additionally, concerns over corporate leverage, continued U.S. trade policy and global political pressures sparked a flight to quality. Spreads widened, particularly for corporate bonds, as concerns over a more aggressive Fed, in conjunction with an uncertain trade policy, pushed the markets into a “risk-off” tone. TIPS, mortgage-backed securities, and high yield corporate debt followed suit and most of the U.S. bond market ended with negative excess returns for the year.
Emerging-Market Bonds Constrained Fund Performance
The fund’s performance compared to the Index was undermined predominantly by local-currency emerging-market bonds, which lost value over the reporting period, when the U.S. dollar appreciated against local currencies, and liquidity within the market became limited. Weakness was especially pronounced among local currency-denominated bonds from Argentina and Turkey, which sold off significantly due to concerns over financial stability and fiscal deficits. In addition, an overweight allocation to corporate credit, particularly BBB-rated credits, weighed on relative results during the period. Lower-rated corporate bonds underperformed higher-quality credit during the period. Security selection among corporate bonds also detracted.
The fund fared better with other strategies. Yield-curve positioning was positive, as was country positioning. Tactical duration positions in the U.S., Canada, Australia, and the United Kingdom were additive. From a sector standpoint, relative performance benefited from positioning in asset-backed securities. They are low duration and high quality, which did well in an environment of rising rates and concerns over corporate leverage. Currency positioning within Mexico, Central Europe, and Asia was also additive. Tactical allocations in the Hungarian forint and New Taiwan dollar were particularly beneficial.
At times during the reporting period, the fund employed forward contracts, futures contracts, and swap options to establish its interest-rate and currency exposures.
A Cautiously Opportunistic Investment Posture
We retain a cautious stance against a backdrop of slowing growth, removal of central bank accommodation, and global trade and political uncertainty. Many of these concerns played
4
out in global bond markets at the end of 2018 and we see what we believe to be some opportunities ahead. We expect to see many changes over the coming year both politically and economically as a new head will be named at the European Central Bank, and several peripheral European countries will have elections. We could also see the potential outcome of Brexit. Due to this global uncertainty, we are cautiously optimistic, but have a defensive position.
As of the end of the reporting period, we maintained a short-duration position in developed markets with improving fundamental growth and continue to look for attractive relative-value and yield-curve opportunities. In emerging-market debt, we are seeking out attractively valued higher-quality sovereigns. We have been using bouts of market strength to increase the quality of our corporate debt holdings, as we believe we’ve seen a peak in growth and earnings. We also maintained an overweight position in asset-backed securities due to their relatively high quality and low-duration profile and an underweight to agency mortgage-backed securities due to the imbalanced supply-and-demand technicals.
January 15, 2019
1 Total return includes reinvestment of dividends and any capital gains paid and does not take into consideration the maximum initial sales charge in the case of Class A shares or the applicable contingent deferred sales charge imposed on redemptions in the case of Class C shares. Had these charges been reflected, returns would have been lower. Class I and Class Y are not subject to any initial or deferred sales charge. Past performance is no guarantee of future results. Share price and investment return fluctuate such that upon redemption, fund shares may be worth more or less than their original cost.
2 Source: FactSet. — The Bloomberg Barclays Global Aggregate Index (Hedged) is a flagship measure of global, investment-grade debt from 24 local currency markets. This multi-currency benchmark includes treasury, government-related, corporate, and securitized fixed-rate bonds from both developed- and emerging-market issuers. Currency exposure is hedged to the U.S. dollar. Investors cannot invest directly in any index.
Bonds are subject generally to interest-rate, credit, liquidity, and market risks, to varying degrees, all of which are more fully described in the fund’s prospectus. Generally, all other factors being equal, bond prices are inversely related to interest-rate changes, and rate increases can cause price declines.
Foreign bonds are subject to special risks, including exposure to currency fluctuations, changing political and economic conditions, and potentially less liquidity. The fixed-income securities of issuers located in emerging markets can be more volatile and less liquid than those of issuers in more mature economies.
Investments in foreign currencies are subject to the risk that those currencies will decline in value relative to the U.S. dollar, or, in the case of hedged positions, that the U.S. dollar will decline relative to the currency being hedged. Currency rates in foreign countries may fluctuate significantly over short periods of time. A decline in the value of foreign currencies relative to the U.S. dollar will reduce the value of securities held by the fund and denominated in those currencies.
High yield bonds are subject to increased credit risk and are considered speculative in terms of the issuer’s perceived ability to continue making interest payments on a timely basis and to repay principal upon maturity.
The fund may use derivative instruments, such as options, futures, options on futures, forward contracts, swaps (including credit default swaps on corporate bonds and asset-backed securities), options on swaps, and other credit derivatives. A small investment in derivatives could have a potentially large impact on the fund’s performance. The use of derivatives involves risks different from, or possibly greater than, the risks associated with investing directly in the underlying assets.
5
FUND PERFORMANCE(Unaudited)
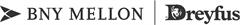
Comparison of change in value of a $10,000 investment in Class A shares, Class C shares and Class I shares of Dreyfus/Standish Global Fixed Income Fund with a hypothetical investment of $10,000 in the Bloomberg Barclays Global Aggregate Index (Hedged) (the “Index”).
† Source: FactSet
†† The total return figures presented for Class A and Class C shares of the fund reflect the performance of the fund’s Class I shares for the period prior to 12/2/09 (the inception date for Class A and Class C shares), adjusted to reflect the applicable sales load for Class A shares.
Past performance is not predictive of future performance.
The line graph above compares a hypothetical $10,000 investment made in each of the Class A, Class C and Class I shares of Dreyfus/Standish Global Fixed Income Fund on 12/31/08 to a hypothetical investment of $10,000 made in the Index on that date. All dividends and capital gain distributions are reinvested.
The fund’s performance shown in the line graph above takes into account the maximum initial sales charge on Class A shares and all other applicable fees and expenses of the applicable classes. The Index is a flagship measure of global investment-grade debt from 24 local currency markets. This multi-currency benchmark includes treasury, government-related, corporate and securitized fixed-rate bonds from both developed and emerging markets issuers. Currency exposure is hedged to the U.S. dollar. Unlike a mutual fund, the Index is not subject to charges, fees and other expenses. Investors cannot invest directly in any index. Further information relating to fund performance, including expense reimbursements, if applicable, is contained in the Financial Highlights section of the prospectus and elsewhere in this report.
6
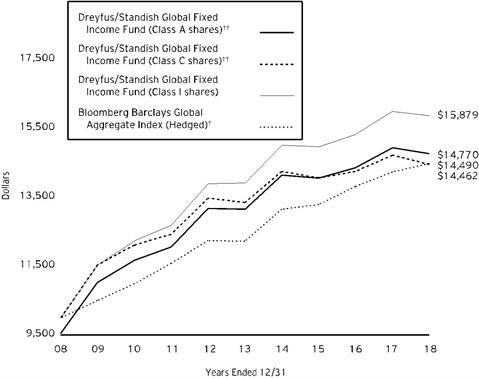
Comparison of change in value of a $1,000,000 investment in Class Y shares of Dreyfus/Standish Global Fixed Income Fund with a hypothetical investment of $1,000,000 in the Bloomberg Barclays Global Aggregate Index (Hedged) (the “Index”).
† Source: FactSet
†† The total return figures presented for Class Y shares of the fund reflect the performance of the fund’s Class I shares for the period prior to 7/1/13 (the inception date for Class Y shares).
Past performance is not predictive of future performance.
The line graph above compares a hypothetical $1,000,000 investment made in Class Y shares of Dreyfus/Standish Global Fixed Income Fund on 12/31/08 to a hypothetical investment of $1,000,000 made in the Index on that date. All dividends and capital gain distributions are reinvested.
The fund’s performance shown in the line graph above takes into account all applicable fees and expenses of the fund’s Class Y shares. The Index is a flagship measure of global investment-grade debt from 24 local currency markets. This multi-currency benchmark includes treasury, government-related, corporate and securitized fixed-rate bonds from both developed and emerging markets issuers. Currency exposure is hedged to the U.S. dollar. Unlike a mutual fund, the Index is not subject to charges, fees and other expenses. Investors cannot invest directly in any index. Further information relating to fund performance, including expense reimbursements, if applicable, is contained in the Financial Highlights section of the prospectus and elsewhere in this report.
7
FUND PERFORMANCE(Unaudited) (continued)
| | | | | | | |
Average Annual Total Returns as of 12/31/18 |
| Inception
Date | 1 Year | 5 Years | | 10 Years | |
Class A shares | | | | | | |
with maximum sales charge (4.5%) | 12/2/09 | -5.59% | 1.40% | | 3.98% | †† |
without sales charge | 12/2/09 | -1.13% | 2.35% | | 4.46% | †† |
Class C shares | | | | | | |
with applicable redemption charge† | 12/2/09 | -2.77% | 1.61% | | 3.76% | †† |
without redemption | 12/2/09 | -1.82% | 1.61% | | 3.76% | †† |
Class I shares | 1/1/94 | -0.79% | 2.66% | | 4.73% | |
Class Y shares | 7/1/13 | -0.75% | 2.71% | | 4.76% | †† |
Bloomberg Barclays Global
Aggregate Index ( Hedged ) | | 1.76% | 3.44% | | 3.78% | |
† The maximum contingent deferred sales charge for Class C shares is 1% for shares redeemed within one year of the date of purchase.
†† The total return performance figures presented for Class A and Class C shares of the fund reflect the performance of the fund’s Class I shares for the period prior to 12/2/09 (the inception date for Class A and Class C shares), adjusted to reflect the applicable sales load for Class A shares.
The total return performance figures presented for Class Y shares of the fund reflect the performance of the fund’s Class I shares for the period prior to 7/1/13 (the inception date for Class Y shares).
The performance data quoted represents past performance, which is no guarantee of future results. Share price and investment return fluctuate and an investor’s shares may be worth more or less than original cost upon redemption. Current performance may be lower or higher than the performance quoted. Go to dreyfus.com for the fund’s most recent month-end returns.
The fund’s performance shown in the graphs and table does not reflect the deduction of taxes that a shareholder would pay on fund distributions or the redemption of fund shares. In addition to the performance of Class A shares shown with and without a maximum sales charge, the fund’s performance shown in the table takes into account all other applicable fees and expenses on all classes.
8
UNDERSTANDING YOUR FUND’S EXPENSES(Unaudited)
As a mutual fund investor, you pay ongoing expenses, such as management fees and other expenses. Using the information below, you can estimate how these expenses affect your investment and compare them with the expenses of other funds. You also may pay one-time transaction expenses, including sales charges (loads) and redemption fees, which are not shown in this section and would have resulted in higher total expenses. For more information, see your fund’s prospectus or talk to your financial adviser.
Review your fund’s expenses
The table below shows the expenses you would have paid on a $1,000 investment in Dreyfus/Standish Global Fixed Income Fund from July 1, 2018 to December 31, 2018. It also shows how much a $1,000 investment would be worth at the close of the period, assuming actual returns and expenses.
| | | | | | | | | | | | |
Expenses and Value of a $1,000 Investment | | |
assuming actual returns for the six months ended December 31, 2018 |
| | | | Class A | Class C | Class I | Class Y |
Expenses paid per $1,000† | | $4.13 | | $7.80 | | $2.62 | | $2.32 |
Ending value (after expenses) | | $1,000.00 | | $996.30 | | $1,001.60 | | $1,001.90 |
COMPARING YOUR FUND’S EXPENSES
WITH THOSE OF OTHER FUNDS(Unaudited)
Using the SEC’s method to compare expenses
The Securities and Exchange Commission (“SEC”) has established guidelines to help investors assess fund expenses. Per these guidelines, the table below shows your fund’s expenses based on a $1,000 investment, assuming a hypothetical 5% annualized return. You can use this information to compare the ongoing expenses (but not transaction expenses or total cost) of investing in the fund with those of other funds. All mutual fund shareholder reports will provide this information to help you make this comparison. Please note that you cannot use this information to estimate your actual ending account balance and expenses paid during the period.
| | | | | | | | | | | | |
Expenses and Value of a $1,000 Investment | | |
assuming a hypothetical 5% annualized return for the six months ended December 31, 2018 |
| | | | Class A | Class C | Class I | Class Y |
Expenses paid per $1,000† | | $4.18 | | $7.88 | | $2.65 | | $2.35 |
Ending value (after expenses) | | $1,021.07 | | $1,017.39 | | $1,022.58 | | $1,022.89 |
† Expenses are equal to the fund’s annualized expense ratio of .82% for Class A, 1.55% for Class C, .52 % for Class I and .46% for Class Y, multiplied by the average account value over the period, multiplied by 184/365 (to reflect the one-half year period).
9
STATEMENT OF INVESTMENTS
December 31, 2018
| | | | | | | | | | |
| |
Description | Coupon
Rate (%) | | Maturity
Date | | Principal
Amount ($) | a | Value ($) | |
Bonds and Notes - 96.9% | | | | | |
Argentina - 1.4% | | | | | |
Argentine Government,
Bonds, Ser. POM, Argentine 7-Day Reference Rate | ARS | 59.26 | | 6/21/2020 | | 95,945,000 | b,c | 2,726,333 | |
Argentine Government,
Sr. Unscd. Bonds | EUR | 5.25 | | 1/15/2028 | | 6,625,000 | | 5,469,782 | |
Argentine Government,
Sr. Unscd. Bonds | | 6.88 | | 1/26/2027 | | 15,025,000 | | 11,503,516 | |
Argentine Government,
Sr. Unscd. Notes | ARS | 5.83 | | 12/31/2033 | | 163,920,047 | d | 4,544,109 | |
Argentine Government,
Unscd. Bonds | ARS | 3.75 | | 2/8/2019 | | 373,695,651 | d | 9,919,800 | |
Buenos Aires Province,
Sr. Unscd. Notes | | 9.13 | | 3/16/2024 | | 6,800,000 | c,e | 5,661,000 | |
Buenos Aires Province,
Unscd. Bonds, 3 Month BADLAR + 3.83% | ARS | 49.22 | | 5/31/2022 | | 114,000,000 | b | 2,723,439 | |
| | 42,547,979 | |
Australia - .7% | | | | | |
Australian Government,
Sr. Unscd. Bonds, Ser. 146 | AUD | 1.75 | | 11/21/2020 | | 27,095,000 | | 19,032,549 | |
Driver Australia Four Trust,
Ser. 4, Cl. A, 1 Month LIBOR + .95% | AUD | 2.97 | | 8/21/2025 | | 776,381 | b | 545,990 | |
Driver Australia Three Trust,
Ser. 3, Cl. A, 1 Month LIBOR + 1.70% | AUD | 3.72 | | 5/21/2024 | | 2,045,758 | b | 1,448,179 | |
| | 21,026,718 | |
Austria - .2% | | | | | |
Suzano Austria,
Gtd. Notes | | 7.00 | | 3/16/2047 | | 4,700,000 | e | 4,833,950 | |
Belgium - .9% | | | | | |
Belgium Government,
Unscd. Bonds, Ser. 74 | EUR | 0.80 | | 6/22/2025 | | 22,900,000 | e | 27,114,984 | |
Canada - 5.2% | | | | | |
BMW Canada Auto Trust,
Ser. 2016-1, Cl. A3 | CAD | 1.87 | | 4/20/2021 | | 5,564,939 | | 4,074,365 | |
BMW Canada Auto Trust,
Ser. 2017-1, Cl. A2 | CAD | 1.68 | | 5/20/2020 | | 1,838,884 | | 1,343,562 | |
BMW Canada Auto Trust,
Ser. 2017-1A, Cl. A2 | CAD | 1.68 | | 5/20/2020 | | 9,663,920 | e | 7,060,849 | |
BMW Canada Auto Trust,
Ser. 2018-1A, Cl. A3 | CAD | 2.82 | | 4/20/2023 | | 12,550,000 | e | 9,176,521 | |
Canadian Government,
Bonds | CAD | 0.50 | | 12/1/2050 | | 16,199,260 | d | 10,989,083 | |
Canadian Government,
Bonds | CAD | 0.75 | | 9/1/2020 | | 10,660,000 | | 7,668,766 | |
10
| | | | | | | | | | |
| |
Description | Coupon
Rate (%) | | Maturity
Date | | Principal
Amount ($) | a | Value ($) | |
Bonds and Notes - 96.9% (continued) | | | | | |
Canada - 5.2% (continued) | | | | | |
Canadian Government,
Bonds | CAD | 3.50 | | 12/1/2045 | | 18,360,000 | | 17,005,728 | |
Canadian Pacer Auto Receivables Trust,
Ser. 2017-1A, Cl. A4 | | 2.29 | | 1/19/2022 | | 6,275,000 | e | 6,198,524 | |
CNH Capital Canada Receivables Trust,
Ser. 2017-1A, Cl. A2 | CAD | 1.71 | | 5/15/2023 | | 7,241,998 | e | 5,254,904 | |
Export Development Canada,
Sr. Unscd. Notes | CAD | 1.80 | | 9/1/2022 | | 12,700,000 | | 9,196,802 | |
Ford Auto Securitization Trust,
Ser. 2015-R4, Cl. A3 | CAD | 2.00 | | 11/15/2020 | | 5,612,173 | | 4,104,467 | |
Ford Auto Securitization Trust,
Ser. 2017-R2, Cl. A2 | CAD | 1.42 | | 4/15/2021 | | 6,831,472 | | 4,979,689 | |
Ford Auto Securitization Trust,
Ser. 2017-R5A, Cl. A3 | CAD | 2.38 | | 3/15/2023 | | 8,800,000 | e | 6,377,164 | |
Ford Auto Securitization Trust,
Ser. 2018-AA, Cl. A3 | CAD | 2.71 | | 9/15/2023 | | 8,175,000 | e | 5,956,995 | |
Ford Auto Securitization Trust,
Ser. 2018-BA, Cl. A3 | CAD | 2.84 | | 1/15/2024 | | 10,425,000 | e | 7,608,906 | |
GMF Canada Leasing Trust,
Ser. 17-1A, Cl. A3 | CAD | 2.47 | | 9/20/2022 | | 6,275,000 | e | 4,585,181 | |
Golden Credit Card Trust,
Ser. 2018-4A, Cl. A | | 3.44 | | 10/15/2025 | | 8,500,000 | e | 8,466,133 | |
Master Credit Card Trust II,
Ser. 18-1A, Cl. A, 1 Month LIBOR + .49% | | 2.97 | | 7/21/2024 | | 10,950,000 | b,e | 10,923,193 | |
MBARC Credit Canada,
Ser. 2016-AA. Cl. A3 | CAD | 1.72 | | 7/15/2021 | | 1,503,645 | e | 1,101,267 | |
MBARC Credit Canada,
Ser. 2018-AA, Cl. A3 | CAD | 2.79 | | 1/17/2023 | | 9,025,000 | e | 6,604,803 | |
Silver Arrow Canada,
Ser. 2018-1A, Cl. A3 | CAD | 3.17 | | 8/15/2025 | | 14,450,000 | e | 10,627,715 | |
Teck Resources,
Gtd. Notes | | 6.25 | | 7/15/2041 | | 1,870,000 | | 1,781,175 | |
Trillium Credit Card Trust II,
Ser. 18-2A, Cl. A1, 1 Month LIBOR + .35% | | 2.86 | | 9/26/2023 | | 11,300,000 | b,e | 11,294,338 | |
| | 162,380,130 | |
Cayman Islands - .5% | | | | | |
CK Hutchison Europe Finance 18,
Gtd. Bonds | EUR | 1.25 | | 4/13/2025 | | 2,045,000 | | 2,289,806 | |
CK Hutchison Finance 16 II,
Gtd. Notes | EUR | 0.88 | | 10/3/2024 | | 5,185,000 | | 5,803,852 | |
Sands China,
Sr. Unscd. Notes | | 4.60 | | 8/8/2023 | | 8,900,000 | e | 8,863,392 | |
| | 16,957,050 | |
11
STATEMENT OF INVESTMENTS (continued)
| | | | | | | | | | |
| |
Description | Coupon
Rate (%) | | Maturity
Date | | Principal
Amount ($) | a | Value ($) | |
Bonds and Notes - 96.9% (continued) | | | | | |
Chile - .4% | | | | | |
Chilean Government,
Bonds | CLP | 4.50 | | 3/1/2021 | | 8,890,000,000 | | 13,066,438 | |
Colombia - .9% | | | | | |
Colombian Government,
Sr. Unscd. Bonds | | 4.00 | | 2/26/2024 | | 8,800,000 | | 8,723,000 | |
Colombian Government,
Sr. Unscd. Notes | | 4.50 | | 3/15/2029 | | 6,300,000 | | 6,237,000 | |
Ecopetrol,
Sr. Unscd. Notes | | 5.88 | | 5/28/2045 | | 14,605,000 | | 13,824,217 | |
| | 28,784,217 | |
Cyprus - .5% | | | | | |
Cyprus Government,
Sr. Unscd. Notes | EUR | 4.25 | | 11/4/2025 | | 12,150,000 | | 16,129,157 | |
France - 2.8% | | | | | |
AXA,
Sub. Notes | EUR | 5.25 | | 4/16/2040 | | 3,500,000 | | 4,230,217 | |
Credit Agricole,
Sub. Bonds | EUR | 2.63 | | 3/17/2027 | | 6,525,000 | | 7,616,224 | |
French Government,
Bonds | EUR | 0.75 | | 5/25/2028 | | 12,650,000 | | 14,627,660 | |
French Government,
Unscd. Bonds | EUR | 2.00 | | 5/25/2048 | | 49,550,000 | e | 61,731,734 | |
| | 88,205,835 | |
Germany - 3.7% | | | | | |
Allianz,
Jr. Sub. Bonds | EUR | 3.38 | | 9/18/2024 | | 3,100,000 | | 3,675,372 | |
Allianz,
Sub. Notes | EUR | 5.63 | | 10/17/2042 | | 4,300,000 | | 5,662,655 | |
Deutsche Bundesrepublik,
Unscd. Bonds | EUR | 0.10 | | 4/15/2026 | | 75,219,753 | d | 93,504,281 | |
KFW,
Govt. Gtd. Notes | AUD | 4.00 | | 1/16/2019 | | 18,050,000 | | 12,723,294 | |
| | 115,565,602 | |
Ghana - .2% | | | | | |
Ghanaian Government,
Sr. Unscd. Bonds | | 8.13 | | 1/18/2026 | | 4,325,000 | c | 4,143,653 | |
Ghanaian Government,
Sr. Unscd. Notes | | 7.63 | | 5/16/2029 | | 4,120,000 | e | 3,704,704 | |
| | 7,848,357 | |
Greece - .5% | | | | | |
Greek Government,
Bonds | EUR | 3.90 | | 1/30/2033 | | 15,225,000 | | 15,905,811 | |
Hungary - .5% | | | | | |
Hungarian Government,
Bonds | EUR | 1.75 | | 10/10/2027 | | 7,175,000 | c | 8,335,230 | |
12
| | | | | | | | | | |
| |
Description | Coupon
Rate (%) | | Maturity
Date | | Principal
Amount ($) | a | Value ($) | |
Bonds and Notes - 96.9% (continued) | | | | | |
Hungary - .5% (continued) | | | | | |
Hungarian Government,
Sr. Unscd. Bonds | EUR | 1.25 | | 10/22/2025 | | 6,840,000 | | 7,777,894 | |
| | 16,113,124 | |
Indonesia - .7% | | | | | |
Indonesia Asahan Aluminium Persero,
Sr. Unscd. Notes | | 5.23 | | 11/15/2021 | | 3,650,000 | e | 3,703,155 | |
Indonesian Government,
Sr. Unscd. Notes | EUR | 3.75 | | 6/14/2028 | | 6,900,000 | | 8,593,959 | |
Indonesian Government,
Sr. Unscd. Notes | | 4.35 | | 1/11/2048 | | 9,500,000 | c | 8,693,659 | |
| | 20,990,773 | |
Ireland - .4% | | | | | |
AerCap Ireland Capital,
Gtd. Notes | | 4.50 | | 5/15/2021 | | 4,550,000 | | 4,565,500 | |
AerCap Ireland Capital,
Gtd. Notes | | 5.00 | | 10/1/2021 | | 2,000,000 | | 2,032,654 | |
Irish Government,
Unscd. Bonds | EUR | 2.00 | | 2/18/2045 | | 2,150,000 | | 2,603,289 | |
Shire Acquisitions Investments Ireland ,
Gtd. Notes | | 2.40 | | 9/23/2021 | | 3,200,000 | | 3,096,228 | |
| | 12,297,671 | |
Israel - .1% | | | | | |
Israeli Government,
Bonds, Ser. 327 | ILS | 2.00 | | 3/31/2027 | | 12,975,000 | | 3,443,969 | |
Italy - 3.0% | | | | | |
Intesa Sanpaolo,
Gtd. Notes | | 3.88 | | 1/15/2019 | | 15,308,000 | | 15,305,333 | |
Intesa Sanpaolo,
Sr. Unscd. Notes | EUR | 3.00 | | 1/28/2019 | | 1,075,000 | | 1,234,146 | |
Italian Government,
Bonds | EUR | 0.95 | | 3/15/2023 | | 48,600,000 | | 54,336,857 | |
Italian Government,
Unscd. Bonds | EUR | 4.00 | | 2/1/2037 | | 18,300,000 | e | 23,308,488 | |
| | 94,184,824 | |
Ivory Coast - .5% | | | | | |
Ivory Coast Government,
Sr. Unscd. Bonds | EUR | 5.13 | | 6/15/2025 | | 1,600,000 | e | 1,762,090 | |
Ivory Coast Government,
Sr. Unscd. Bonds | EUR | 5.25 | | 3/22/2030 | | 13,600,000 | e | 13,780,165 | |
| | 15,542,255 | |
Japan - 21.9% | | | | | |
Development Bank of Japan,
Govt. Gtd. Bonds | JPY | 1.70 | | 9/20/2022 | | 325,000,000 | | 3,155,763 | |
Development Bank of Japan,
Sr. Unscd. Notes | | 3.13 | | 9/6/2023 | | 10,560,000 | e | 10,650,035 | |
13
STATEMENT OF INVESTMENTS (continued)
| | | | | | | | | | |
| |
Description | Coupon
Rate (%) | | Maturity
Date | | Principal
Amount ($) | a | Value ($) | |
Bonds and Notes - 96.9% (continued) | | | | | |
Japan - 21.9% (continued) | | | | | |
Japan Bank for International Cooperation,
Gtd. Notes | | 3.38 | | 10/31/2023 | | 21,350,000 | | 21,766,783 | |
Japanese Government,
Sr. Unscd. Bonds | JPY | 0.10 | | 3/10/2028 | | 9,676,161,509 | d | 91,107,145 | |
Japanese Government,
Sr. Unscd. Bonds, Ser. 118 | JPY | 0.20 | | 6/20/2019 | | 3,147,850,000 | | 28,766,274 | |
Japanese Government,
Sr. Unscd. Bonds, Ser. 128 | JPY | 0.10 | | 6/20/2021 | | 15,474,750,000 | | 142,060,902 | |
Japanese Government,
Sr. Unscd. Bonds, Ser. 156 | JPY | 0.40 | | 3/20/2036 | | 7,625,650,000 | | 69,656,787 | |
Japanese Government,
Sr. Unscd. Bonds, Ser. 19 | JPY | 0.10 | | 9/10/2024 | | 6,190,443,000 | d | 57,948,036 | |
Japanese Government,
Sr. Unscd. Bonds, Ser. 20 | JPY | 0.10 | | 3/10/2025 | | 6,275,440,500 | d | 58,886,826 | |
Japanese Government,
Sr. Unscd. Bonds, Ser. 21 | JPY | 0.10 | | 3/10/2026 | | 3,619,715,490 | d | 34,131,435 | |
Japanese Government,
Sr. Unscd. Bonds, Ser. 22 | JPY | 0.10 | | 3/10/2027 | | 6,740,007,308 | d | 63,645,888 | |
Japanese Government,
Sr. Unscd. Bonds, Ser. 307 | JPY | 1.30 | | 3/20/2020 | | 3,206,400,000 | | 29,768,164 | |
Japanese Government,
Sr. Unscd. Bonds, Ser. 44 | JPY | 1.70 | | 9/20/2044 | | 1,013,000,000 | | 11,545,908 | |
Japanese Government,
Sr. Unscd. Bonds, Ser. 59 | JPY | 0.70 | | 6/20/2048 | | 4,285,000,000 | | 38,930,772 | |
OSCAR US Funding Trust VI,
Ser. 2017-1A, Cl. A2A | | 2.30 | | 5/11/2020 | | 462,354 | e | 462,734 | |
OSCAR US Funding Trust VI,
Ser. 2017-1A, Cl. A4 | | 3.30 | | 5/10/2024 | | 3,560,000 | e | 3,572,887 | |
OSCAR US Funding Trust VII,
Ser. 2017-2A, Cl. A3 | | 2.45 | | 12/10/2021 | | 2,330,000 | e | 2,307,874 | |
OSCAR US Funding Trust VII,
Ser. 2017-2A, Cl. A4 | | 2.76 | | 12/10/2024 | | 8,430,000 | e | 8,338,754 | |
OSCAR US Funding Trust VIII,
Ser.2018-1A, Cl. A4 | | 3.50 | | 5/12/2025 | | 10,400,000 | e | 10,506,163 | |
| | 687,209,130 | |
Kazakhstan - .6% | | | | | |
Kazakhstan Government,
Sr. Unscd. Notes | EUR | 1.55 | | 11/9/2023 | | 8,000,000 | e | 9,230,052 | |
KazMunayGas National Co.,
Sr. Unscd. Notes | | 6.38 | | 10/24/2048 | | 8,000,000 | | 8,074,000 | |
| | 17,304,052 | |
Kenya - .3% | | | | | |
Kenyan Government,
Sr. Unscd. Notes | | 7.25 | | 2/28/2028 | | 9,050,000 | e | 8,113,524 | |
14
| | | | | | | | | | |
| |
Description | Coupon
Rate (%) | | Maturity
Date | | Principal
Amount ($) | a | Value ($) | |
Bonds and Notes - 96.9% (continued) | | | | | |
Luxembourg - .4% | | | | | |
Altice Financing,
Sr. Scd. Bonds | | 7.50 | | 5/15/2026 | | 1,775,000 | e | 1,624,125 | |
E-Carat,
Ser. 16-1, Cl. A, 1 Month EURIBOR + .45% @ Floor | EUR | 0.08 | | 10/18/2024 | | 2,674,092 | b | 3,066,139 | |
Gaz Capital,
Sr. Unscd. Bonds | EUR | 2.50 | | 3/21/2026 | | 7,850,000 | | 8,476,975 | |
| | 13,167,239 | |
Morocco - .3% | | | | | |
OCP Group,
Sr. Unscd. Notes | | 6.88 | | 4/25/2044 | | 7,975,000 | | 8,316,769 | |
Netherlands - 2.7% | | | | | |
ABN AMRO Bank,
Sub. Notes | EUR | 2.88 | | 1/18/2028 | | 3,700,000 | | 4,428,703 | |
ABN AMRO Bank,
Sub. Notes | | 4.75 | | 7/28/2025 | | 9,350,000 | e | 9,321,408 | |
Equate Petrochemical,
Gtd. Notes | | 3.00 | | 3/3/2022 | | 5,295,000 | | 5,128,896 | |
Globaldrive Auto Receivables,
Ser. 16-A, Cl. A, 1 Month EURIBOR + .37% @ Floor | EUR | 0.00 | | 1/20/2024 | | 1,292,742 | b | 1,481,104 | |
Globaldrive Auto Receivables,
Ser. 16-B, Cl. A, 1 Month EURIBOR + .50% @ Floor | EUR | 0.13 | | 8/20/2024 | | 6,392,683 | b | 7,332,385 | |
Iberdrola International,
Gtd. Notes | EUR | 1.13 | | 1/27/2023 | | 1,400,000 | | 1,642,170 | |
ING Groep,
Sub. Notes | EUR | 3.00 | | 4/11/2028 | | 2,500,000 | | 2,974,124 | |
Petrobras Global Finance,
Gtd. Notes | | 5.30 | | 1/27/2025 | | 6,400,000 | | 6,128,000 | |
Petrobras Global Finance,
Gtd. Notes | | 7.25 | | 3/17/2044 | | 2,050,000 | | 2,026,702 | |
Rabobank Nederland,
Sub. Bonds | EUR | 2.50 | | 5/26/2026 | | 6,180,000 | | 7,335,599 | |
SABIC Capital II,
Gtd. Bonds | | 4.00 | | 10/10/2023 | | 10,200,000 | e | 10,168,380 | |
Schaeffler Finance,
Sr. Scd. Notes | | 4.75 | | 5/15/2023 | | 3,375,000 | e | 3,248,437 | |
Teva Pharmaceutical Finance Netherlands II,
Gtd. Notes | EUR | 3.25 | | 4/15/2022 | | 4,320,000 | c | 4,998,052 | |
Vonovia Finance,
Gtd. Notes | EUR | 1.63 | | 12/15/2020 | | 9,000,000 | | 10,561,810 | |
WPC,
Gtd. Bonds | EUR | 2.25 | | 7/19/2024 | | 6,100,000 | | 7,057,414 | |
| | 83,833,184 | |
15
STATEMENT OF INVESTMENTS (continued)
| | | | | | | | | | |
| |
Description | Coupon
Rate (%) | | Maturity
Date | | Principal
Amount ($) | a | Value ($) | |
Bonds and Notes - 96.9% (continued) | | | | | |
New Zealand - 3.0% | | | | | |
New Zealand Government,
Sr. Unscd. Bonds, Ser. 0925 | NZD | 2.00 | | 9/20/2025 | | 121,358,000 | d | 92,530,178 | |
Nigeria - .2% | | | | | |
Nigerian Government,
Sr. Unscd. Notes | | 6.50 | | 11/28/2027 | | 4,100,000 | e | 3,637,602 | |
Nigerian Government,
Sr. Unscd. Notes | | 7.14 | | 2/23/2030 | | 4,615,000 | e | 4,095,997 | |
| | 7,733,599 | |
Norway - .2% | | | | | |
Norwegian Government,
Bonds, Ser. 474 | NOK | 3.75 | | 5/25/2021 | | 61,700,000 | e | 7,576,173 | |
Panama - .3% | | | | | |
Panamanian Government,
Sr. Unscd. Bonds | | 4.00 | | 9/22/2024 | | 7,932,000 | | 8,019,331 | |
Qatar - .6% | | | | | |
Qatari Government,
Sr. Unscd. Notes | | 5.10 | | 4/23/2048 | | 17,050,000 | | 17,947,256 | |
Romania - .5% | | | | | |
Romanian Government,
Sr. Unscd. Notes | EUR | 2.50 | | 2/8/2030 | | 15,350,000 | e | 16,413,313 | |
Senegal - .5% | | | | | |
Senegalese Government,
Sr. Unscd. Bonds | EUR | 4.75 | | 3/13/2028 | | 7,200,000 | e | 7,616,094 | |
Senegalese Government,
Sr. Unscd. Bonds | EUR | 4.75 | | 3/13/2028 | | 8,075,000 | | 8,541,660 | |
| | 16,157,754 | |
South Africa - .0% | | | | | |
Eskom Holdings SOC,
Govt. Gtd. Notes | | 6.35 | | 8/10/2028 | | 1,100,000 | | 1,062,530 | |
Spain - 2.5% | | | | | |
BBVA Subordinated Capital,
Gtd. Notes | EUR | 3.50 | | 4/11/2024 | | 10,000,000 | | 11,529,545 | |
Driver Espana Three,
Ser. 3, Cl. A, 1 Month EURIBOR + 1.05% @ Floor | EUR | 0.68 | | 12/21/2026 | | 1,480,237 | b | 1,701,463 | |
Spanish Government,
Sr. Unscd. Bonds | EUR | 2.90 | | 10/31/2046 | | 48,735,000 | e | 59,883,598 | |
Telefonica Emisiones,
Gtd. Notes | EUR | 1.53 | | 1/17/2025 | | 5,300,000 | c | 6,166,574 | |
| | 79,281,180 | |
Supranational - 4.0% | | | | | |
Arab Petroleum Investments,
Sr. Unscd. Notes | | 4.13 | | 9/18/2023 | | 9,760,000 | e | 9,773,469 | |
Asian Development Bank,
Sr. Unscd. Notes | NZD | 3.50 | | 5/30/2024 | | 12,575,000 | | 8,796,995 | |
16
| | | | | | | | | | |
| |
Description | Coupon
Rate (%) | | Maturity
Date | | Principal
Amount ($) | a | Value ($) | |
Bonds and Notes - 96.9% (continued) | | | | | |
Supranational - 4.0% (continued) | | | | | |
European Investment Bank,
Sr. Unscd. Bonds | CAD | 1.25 | | 11/5/2020 | | 15,050,000 | e | 10,874,981 | |
European Investment Bank,
Sr. Unscd. Notes | CAD | 1.13 | | 9/16/2021 | | 8,500,000 | e | 6,063,404 | |
European Investment Bank,
Sr. Unscd. Notes | AUD | 2.70 | | 1/12/2023 | | 17,225,000 | | 12,267,123 | |
International Bank for Reconstruction & Development,
Sr. Unscd. Notes | | 1.88 | | 4/21/2020 | | 4,500,000 | c | 4,458,577 | |
International Bank for Reconstruction & Development,
Sr. Unscd. Notes | NZD | 3.50 | | 1/22/2021 | | 50,675,000 | | 34,889,747 | |
International Finance Corporation,
Sr. Unscd. Notes | INR | 6.30 | | 11/25/2024 | | 951,180,000 | | 13,056,841 | |
Nordic Investment Bank,
Sr. Unscd. Notes | NOK | 1.38 | | 7/15/2020 | | 215,000,000 | | 24,891,686 | |
West African Development Bank,
Sr. Unscd. Notes | | 5.00 | | 7/27/2027 | | 895,000 | | 841,585 | |
| | 125,914,408 | |
Switzerland - .3% | | | | | |
Credit Suisse Group,
Sr. Unscd. Notes | | 4.28 | | 1/9/2028 | | 8,725,000 | e | 8,431,220 | |
Thailand - .2% | | | | | |
Thai Government,
Sr. Unscd. Bonds | THB | 2.13 | | 12/17/2026 | | 257,000,000 | | 7,726,055 | |
Turkey - .3% | | | | | |
Turkish Government,
Sr. Unscd. Notes | | 7.50 | | 11/7/2019 | | 7,950,000 | | 8,118,413 | |
Ukraine - .1% | | | | | |
Ukrainian Government,
Sr. Unscd. Notes | | 0.00 | | 5/31/2040 | | 7,250,000 | | 4,204,492 | |
United Arab Emirates - .5% | | | | | |
Abu Dhabi Crude Oil Pipeline,
Sr. Scd. Bonds | | 4.60 | | 11/2/2047 | | 9,150,000 | e | 8,957,804 | |
DP World,
Sr. Unscd. Notes | | 6.85 | | 7/2/2037 | | 7,200,000 | c | 8,024,940 | |
| | 16,982,744 | |
United Kingdom - 4.5% | | | | | |
Barclays,
Jr. Sub. Bonds | | 7.88 | | 3/15/2022 | | 2,675,000 | | 2,685,031 | |
Barclays,
Sr. Unscd. Notes | | 4.97 | | 5/16/2029 | | 8,125,000 | | 7,852,908 | |
BAT International Finance,
Gtd. Notes | EUR | 2.25 | | 1/16/2030 | | 6,900,000 | | 7,288,376 | |
Lloyds Banking Group,
Sr. Unscd. Notes | | 3.10 | | 7/6/2021 | | 4,000,000 | | 3,925,758 | |
17
STATEMENT OF INVESTMENTS (continued)
| | | | | | | | | | |
| |
Description | Coupon
Rate (%) | | Maturity
Date | | Principal
Amount ($) | a | Value ($) | |
Bonds and Notes - 96.9% (continued) | | | | | |
United Kingdom - 4.5% (continued) | | | | | |
Lloyds Banking Group,
Sr. Unscd. Notes | | 3.75 | | 1/11/2027 | | 8,500,000 | | 7,826,326 | |
Penarth Master Issuer,
Ser. 18-2A, Cl. A1, 1 Month LIBOR + .45% | | 2.91 | | 9/18/2022 | | 7,800,000 | b,e | 7,774,529 | |
Royal Bank of Scotland Group,
Sr. Unscd. Notes | | 3.88 | | 9/12/2023 | | 28,725,000 | | 27,565,646 | |
Santander UK Group Holdings,
Sr. Unscd. Notes | | 3.57 | | 1/10/2023 | | 6,525,000 | | 6,251,059 | |
United Kingdom Gilt,
Bonds | GBP | 1.50 | | 7/22/2047 | | 10,355,000 | | 12,217,163 | |
United Kingdom Gilt,
Unscd. Bonds | GBP | 3.25 | | 1/22/2044 | | 35,550,000 | | 57,957,711 | |
| | 141,344,507 | |
United States - 29.9% | | | | | |
21st Century Fox America,
Gtd. Notes | | 3.70 | | 10/15/2025 | | 2,600,000 | | 2,621,127 | |
Abbott Laboratories,
Sr. Unscd. Notes | | 3.75 | | 11/30/2026 | | 1,616,000 | | 1,599,511 | |
AbbVie,
Sr. Unscd. Bonds | EUR | 1.38 | | 5/17/2024 | | 8,250,000 | | 9,548,087 | |
AbbVie,
Sr. Unscd. Notes | | 2.50 | | 5/14/2020 | | 3,200,000 | | 3,170,223 | |
AEP Transmission,
Sr. Unscd. Notes | | 3.10 | | 12/1/2026 | | 3,680,000 | | 3,561,253 | |
Amazon.com,
Sr. Unscd. Notes | | 3.15 | | 8/22/2027 | | 11,875,000 | | 11,477,414 | |
American Homes 4 Rent Trust,
Ser. 2014-SFR3, Cl. A | | 3.68 | | 12/17/2036 | | 4,198,874 | e | 4,220,559 | |
American International Group,
Sr. Unscd. Notes | | 4.20 | | 4/1/2028 | | 5,800,000 | | 5,609,836 | |
Americredit Automobile Receivables Trust,
Ser. 2016- 4, Cl. D | | 2.74 | | 12/8/2022 | | 3,300,000 | | 3,260,076 | |
Americredit Automobile Receivables Trust,
Ser. 2018-1, Cl. C | | 3.50 | | 1/18/2024 | | 8,375,000 | | 8,408,369 | |
Americredit Automobile Receivables Trust,
Ser. 2018-1, Cl. D | | 3.82 | | 3/18/2024 | | 8,400,000 | | 8,456,005 | |
AmeriCredit Automobile Receivables Trust,
Ser. 2017-4, Cl. B | | 2.36 | | 12/19/2022 | | 12,025,000 | | 11,877,118 | |
Amgen,
Sr. Unscd. Notes | | 3.88 | | 11/15/2021 | | 3,200,000 | | 3,244,190 | |
18
| | | | | | | | | | |
| |
Description | Coupon
Rate (%) | | Maturity
Date | | Principal
Amount ($) | a | Value ($) | |
Bonds and Notes - 96.9% (continued) | | | | | |
United States - 29.9% (continued) | | | | | |
Andeavor Logistics/Tesoro Logistics Finance,
Gtd. Notes | | 3.50 | | 12/1/2022 | | 2,175,000 | | 2,106,909 | |
Anheuser-Busch InBev Finance,
Gtd. Notes | | 2.65 | | 2/1/2021 | | 3,200,000 | | 3,146,871 | |
Anheuser-Busch InBev Worldwide,
Gtd. Notes | | 3.65 | | 2/1/2026 | | 4,055,000 | e | 3,836,476 | |
Anheuser-Busch InBev Worldwide,
Gtd. Notes | | 4.00 | | 4/13/2028 | | 9,310,000 | | 8,927,662 | |
Apple,
Sr. Unscd. Notes | | 3.25 | | 2/23/2026 | | 8,895,000 | | 8,695,155 | |
Aventura Mall Trust,
Ser. 2013-AVM, Cl. A | | 3.74 | | 12/5/2032 | | 2,305,000 | e | 2,329,780 | |
BANK,
Ser. 2018-BN13, Cl. A5 | | 4.22 | | 8/1/2061 | | 3,300,000 | | 3,428,135 | |
Bank of America,
Sr. Unscd. Notes | | 3.37 | | 1/23/2026 | | 16,375,000 | | 15,675,316 | |
Bank of America,
Sr. Unscd. Notes | | 3.97 | | 3/5/2029 | | 8,900,000 | | 8,666,139 | |
Barclays Commercial Mortgage Securities Trust,
Ser. 2013-TYSN, Cl. A2 | | 3.76 | | 9/5/2032 | | 1,245,000 | e | 1,255,020 | |
BAT Capital,
Gtd. Notes | | 2.30 | | 8/14/2020 | | 3,200,000 | | 3,124,967 | |
Bear Stearns Commercial Mortgage Securities Trust,
Ser. 2005-PWR10, Cl. AJ | | 5.59 | | 12/11/2040 | | 204,850 | | 211,548 | |
Becton Dickinson and Co.,
Sr. Unscd. Notes | | 2.40 | | 6/5/2020 | | 3,200,000 | | 3,152,310 | |
Branch Banking & Trust,
Sub. Bonds | | 3.80 | | 10/30/2026 | | 10,890,000 | | 10,809,586 | |
Branch Banking & Trust,
Sub. Notes | | 3.63 | | 9/16/2025 | | 7,850,000 | | 7,706,888 | |
Capital Auto Receivables Asset Trust,
Ser. 2015-2, Cl. B | | 2.29 | | 5/20/2020 | | 2,440,033 | | 2,438,377 | |
Capital Auto Receivables Asset Trust,
Ser. 2015-2, Cl. D | | 3.16 | | 11/20/2020 | | 7,275,000 | | 7,274,046 | |
Capital One Financial,
Sub. Notes | | 3.75 | | 7/28/2026 | | 15,000,000 | | 13,768,227 | |
CarMax Auto Owner Trust,
Ser. 2014-4, Cl. D | | 3.04 | | 5/17/2021 | | 2,625,000 | | 2,624,350 | |
CarMax Auto Owner Trust,
Ser. 2015-2, Cl. D | | 3.04 | | 11/15/2021 | | 1,000,000 | | 998,030 | |
CarMax Auto Owner Trust,
Ser. 2018-1, Cl. D | | 3.37 | | 7/15/2024 | | 1,360,000 | | 1,345,112 | |
CCO Holdings,
Sr. Unscd. Notes | | 5.88 | | 4/1/2024 | | 1,710,000 | e | 1,705,725 | |
19
STATEMENT OF INVESTMENTS (continued)
| | | | | | | | | | |
| |
Description | Coupon
Rate (%) | | Maturity
Date | | Principal
Amount ($) | a | Value ($) | |
Bonds and Notes - 96.9% (continued) | | | | | |
United States - 29.9% (continued) | | | | | |
CCUBS Commercial Mortgage Trust,
Ser. 2017-C1, Cl. A4 | | 3.54 | | 11/15/2050 | | 7,326,000 | | 7,277,653 | |
Celgene,
Sr. Unscd. Notes | | 2.88 | | 8/15/2020 | | 3,200,000 | | 3,178,544 | |
Cheniere Energy Partners,
Sr. Scd. Notes | | 5.25 | | 10/1/2025 | | 3,935,000 | | 3,684,144 | |
Chrysler Capital Auto Receivables Trust,
Ser. 2015-AA, Cl. D | | 3.15 | | 1/18/2022 | | 3,100,000 | e | 3,099,879 | |
Chrysler Capital Auto Receivables Trust,
Ser. 2015-BA, Cl. C | | 3.26 | | 4/15/2021 | | 3,500,000 | e | 3,502,793 | |
Cigna,
Gtd. Notes | | 3.40 | | 9/17/2021 | | 3,200,000 | | 3,194,632 | |
Citigroup,
Sub. Bonds | | 4.40 | | 6/10/2025 | | 5,870,000 | | 5,751,902 | |
Citizens Bank,
Sr. Unscd. Notes | | 2.25 | | 3/2/2020 | | 7,775,000 | | 7,693,348 | |
CLUB Credit Trust,
Ser. 2017-P1, Cl. A | | 2.42 | | 9/15/2023 | | 1,400,514 | e | 1,396,653 | |
CNH Equipment Trust,
Ser. 2018-A, Cl. A4 | | 3.30 | | 4/15/2025 | | 4,200,000 | | 4,242,507 | |
Colony Starwood Homes Trust,
Ser. 2016-2A, Cl. A, 1 Month LIBOR + 1.25% | | 3.71 | | 12/17/2033 | | 8,896,014 | b,e | 8,921,093 | |
Comcast,
Gtd. Notes | | 3.70 | | 4/15/2024 | | 7,000,000 | | 7,047,201 | |
Commercial Mortgage Trust,
Ser. 2013-WWP, Cl. B | | 3.73 | | 3/10/2031 | | 1,225,000 | e | 1,261,846 | |
Commercial Mortgage Trust,
Ser. 2014-CR16, Cl. A3 | | 3.78 | | 4/1/2047 | | 9,000,000 | | 9,188,177 | |
Conagra Brands,
Sr. Unscd. Notes | | 3.80 | | 10/22/2021 | | 3,200,000 | | 3,203,098 | |
Concho Resources,
Gtd. Notes | | 3.75 | | 10/1/2027 | | 3,750,000 | | 3,538,614 | |
Cox Communications,
Sr. Unscd. Notes | | 3.35 | | 9/15/2026 | | 3,250,000 | e | 3,005,014 | |
Crown Castle International,
Sr. Unscd. Notes | | 3.15 | | 7/15/2023 | | 3,150,000 | | 3,031,014 | |
CVS Health,
Sr. Unscd. Notes | | 2.80 | | 7/20/2020 | | 3,200,000 | | 3,171,797 | |
CVS Health,
Sr. Unscd. Notes | | 4.30 | | 3/25/2028 | | 10,200,000 | | 10,006,520 | |
Daimler Finance North America,
Gtd. Notes | | 1.50 | | 7/5/2019 | | 8,225,000 | e | 8,144,690 | |
Dell Equipment Finance Trust,
Ser. 2017-2, Cl. B | | 2.47 | | 10/24/2022 | | 2,525,000 | e | 2,503,313 | |
20
| | | | | | | | | | |
| |
Description | Coupon
Rate (%) | | Maturity
Date | | Principal
Amount ($) | a | Value ($) | |
Bonds and Notes - 96.9% (continued) | | | | | |
United States - 29.9% (continued) | | | | | |
Dell Equipment Finance Trust,
Ser. 2018-1, Cl. B | | 3.34 | | 6/22/2023 | | 2,090,000 | e | 2,096,631 | |
Dell Equipment Finance Trust,
Ser. 2018-2, Cl. B | | 3.55 | | 10/22/2023 | | 3,700,000 | e | 3,734,595 | |
Dell Equipment Finance Trust,
Ser. 2018-2, Cl. C | | 3.72 | | 10/22/2023 | | 4,200,000 | e | 4,256,504 | |
Dell International/EMC Corp.,
Sr. Scd. Notes | | 6.02 | | 6/15/2026 | | 7,750,000 | e | 7,799,828 | |
Digital Euro Finco,
Gtd. Bonds | EUR | 2.63 | | 4/15/2024 | | 5,814,000 | | 6,877,126 | |
Dollar Tree,
Sr. Unscd. Notes | | 4.20 | | 5/15/2028 | | 2,050,000 | | 1,946,610 | |
Drive Auto Receivables Trust,
Ser. 2015-AA, Cl. C | | 3.06 | | 5/17/2021 | | 104,156 | e | 104,150 | |
Drive Auto Receivables Trust,
Ser. 2016-CA, Cl. C | | 3.02 | | 11/15/2021 | | 6,034,877 | e | 6,031,724 | |
Drive Auto Receivables Trust,
Ser. 2016-CA, Cl. D | | 4.18 | | 3/15/2024 | | 8,000,000 | e | 8,042,893 | |
Drive Auto Receivables Trust,
Ser. 2017-3, Cl. C | | 2.80 | | 7/15/2022 | | 6,575,000 | | 6,559,325 | |
Drive Auto Receivables Trust,
Ser. 2018-1, Cl. C | | 3.22 | | 3/15/2023 | | 16,200,000 | | 16,172,006 | |
Drive Auto Receivables Trust,
Ser. 2018-2, Cl. C | | 3.63 | | 8/15/2024 | | 8,950,000 | | 8,991,073 | |
DT Auto Owner Trust,
Ser. 2018-1A, Cl. B | | 3.04 | | 1/18/2022 | | 8,300,000 | e | 8,280,756 | |
DT Auto Owner Trust,
Ser. 2018-2A, Cl. C | | 3.67 | | 3/15/2024 | | 8,925,000 | e | 8,971,182 | |
Duke Energy,
Sr. Unscd. Notes | | 2.65 | | 9/1/2026 | �� | 2,800,000 | | 2,554,830 | |
Energy Transfer Operating,
Jr. Sub. Notes, Ser. A | | 6.25 | | 2/15/2023 | | 1,795,000 | | 1,505,556 | |
Energy Transfer Operating,
Sr. Unscd. Notes | | 4.20 | | 4/15/2027 | | 2,050,000 | | 1,916,328 | |
Enterprise Fleet Financing,
Ser. 2017-3, Cl. A2 | | 2.13 | | 5/20/2023 | | 6,230,155 | e | 6,176,368 | |
EQT,
Sr. Unscd. Notes | | 3.90 | | 10/1/2027 | | 4,790,000 | | 4,139,094 | |
Exeter Automobile Receivables Trust,
Ser. 2018-3A, Cl. B | | 3.46 | | 10/17/2022 | | 9,900,000 | e | 9,926,382 | |
Exeter Automobile Receivables Trust,
Ser. 2018-1A, Cl. B | | 2.75 | | 4/15/2022 | | 8,075,000 | e | 8,038,133 | |
Federal Home Loan Mortgage Corporation ,
Multifamily Structured Pass Through Certificates | | 3.37 | | 7/25/2025 | | 6,365,000 | f | 6,425,924 | |
21
STATEMENT OF INVESTMENTS (continued)
| | | | | | | | | | |
| |
Description | Coupon
Rate (%) | | Maturity
Date | | Principal
Amount ($) | a | Value ($) | |
Bonds and Notes - 96.9% (continued) | | | | | |
United States - 29.9% (continued) | | | | | |
Federal Home Loan Mortgage Corporation ,
Multifamily Structured Pass Through Certificates | | 3.95 | | 11/1/2030 | | 5,140,000 | f | 5,341,204 | |
Federal Home Loan Mortgage Corporation ,
Multifamily Structured Pass Through Certificates | | 2.80 | | 8/25/2025 | | 4,000,000 | f | 4,013,383 | |
First Data,
Scd. Notes | | 5.75 | | 1/15/2024 | | 1,695,000 | e | 1,661,676 | |
Ford Credit Auto Owner Trust,
Ser. 2018-A, Cl. A3 | | 3.03 | | 11/15/2022 | | 6,850,000 | | 6,861,900 | |
GAHR Commercial Mortgage Trust,
Ser. 2015-NRF, Cl. EFX | | 3.38 | | 12/15/2034 | | 3,620,000 | e | 3,554,693 | |
General Electric,
Jr. Sub. Debs., Ser. D | | 5.00 | | 1/21/2021 | | 41,960,000 | | 32,151,850 | |
General Motors Financial,
Gtd. Notes | | 2.35 | | 10/4/2019 | | 9,650,000 | | 9,567,470 | |
General Motors Financial,
Gtd. Notes | | 3.10 | | 1/15/2019 | | 4,475,000 | | 4,474,860 | |
Genesis Energy,
Gtd. Notes | | 6.50 | | 10/1/2025 | | 2,185,000 | c | 1,933,725 | |
Glencore Funding,
Gtd. Notes | | 3.00 | | 10/27/2022 | | 4,000,000 | e | 3,818,640 | |
GM Financial Automobile Leasing Trust,
Ser. 2018-2, Cl. C | | 3.50 | | 4/20/2022 | | 5,710,000 | | 5,731,522 | |
GM Financial Automobile Leasing Trust,
Ser. 2018-3, Cl. B | | 3.48 | | 7/20/2022 | | 7,860,000 | | 7,914,615 | |
GM Financial Automobile Leasing Trust,
Ser. 2018-3, Cl. C | | 3.70 | | 7/20/2022 | | 7,960,000 | | 8,018,184 | |
Goldman Sachs Group,
Sr. Unscd. Notes | | 3.50 | | 11/16/2026 | | 10,380,000 | | 9,602,269 | |
Goldman Sachs Group,
Sr. Unscd. Notes | | 3.69 | | 6/5/2028 | | 4,200,000 | | 3,909,686 | |
Goldman Sachs Group,
Sr. Unscd. Notes | | 3.81 | | 4/23/2029 | | 4,200,000 | | 3,928,109 | |
Goldman Sachs Group,
Sub. Notes | | 4.25 | | 10/21/2025 | | 6,710,000 | | 6,434,185 | |
GS Mortgage Securities Trust,
Ser. 2016-GS2, Cl. A2 | | 2.64 | | 5/10/2049 | | 4,200,000 | | 4,147,866 | |
HCA,
Sr. Scd. Notes | | 6.50 | | 2/15/2020 | | 2,143,000 | | 2,201,933 | |
Hertz Fleet Lease Funding,
Ser. 2018-1, Cl. A2 | | 3.23 | | 5/10/2032 | | 8,800,000 | e | 8,831,524 | |
Hyundai Auto Receivables Trust,
Ser. 2015-A, Cl. C | | 1.98 | | 7/15/2020 | | 1,320,000 | | 1,315,814 | |
22
| | | | | | | | | | |
| |
Description | Coupon
Rate (%) | | Maturity
Date | | Principal
Amount ($) | a | Value ($) | |
Bonds and Notes - 96.9% (continued) | | | | | |
United States - 29.9% (continued) | | | | | |
InTown Hotel Portfolio Trust,
Ser. 2018-STAY, Cl. A | | 3.16 | | 1/15/2033 | | 3,750,000 | e | 3,722,734 | |
InTown Hotel Portfolio Trust,
Ser. 2018-STAY, Cl. B | | 3.51 | | 1/15/2033 | | 2,750,000 | e | 2,730,253 | |
Invitation Homes Trust,
Ser. 2018-SFR3, Cl. A, 1 Month LIBOR + 1.00% | | 3.46 | | 7/17/2037 | | 6,973,523 | b,e | 6,946,153 | |
JP Morgan Chase Commercial Mortgage Securities Trust,
Ser. 2013-C16, Cl. A3 | | 3.88 | | 12/1/2046 | | 4,000,000 | | 4,092,196 | |
JPMorgan Chase & Co.,
Sr. Unscd. Notes | | 3.30 | | 4/1/2026 | | 9,610,000 | | 9,165,200 | |
Keurig Dr Pepper,
Gtd. Notes | | 3.55 | | 5/25/2021 | | 3,200,000 | e | 3,196,850 | |
Keurig Dr Pepper,
Gtd. Notes | | 4.06 | | 5/25/2023 | | 2,500,000 | e | 2,492,160 | |
KeyCorp Student Loan Trust,
Ser. 1999-B, Cl. CTFS, 3 Month LIBOR + .90% | | 3.59 | | 11/25/2036 | | 7,511 | b | 7,521 | |
Kinder Morgan,
Gtd. Notes | | 4.30 | | 6/1/2025 | | 1,950,000 | | 1,943,005 | |
Kraft Heinz Foods,
Gtd. Notes | EUR | 2.00 | | 6/30/2023 | | 5,300,000 | | 6,298,432 | |
Kraft Heinz Foods,
Gtd. Notes | EUR | 2.25 | | 5/25/2028 | | 20,325,000 | | 22,889,690 | |
Kubota Credit Owner Trust,
Ser. 2016-1A, Cl. A3 | | 1.50 | | 7/15/2020 | | 2,765,011 | e | 2,747,771 | |
Kubota Credit Owner Trust,
Ser. 2018-1A, Cl. A4 | | 3.21 | | 1/15/2025 | | 17,600,000 | e | 17,758,759 | |
McDonald's,
Sr. Unscd. Notes | | 2.20 | | 5/26/2020 | | 3,200,000 | | 3,164,884 | |
Metropolitan Life Global Funding I,
Sr. Scd. Notes | | 3.00 | | 9/19/2027 | | 5,475,000 | e | 5,161,766 | |
Morgan Stanley,
Sr. Unscd. Notes | | 4.00 | | 7/23/2025 | | 3,450,000 | | 3,408,033 | |
Occidental Petroleum,
Sr. Unscd. Bonds | | 3.00 | | 2/15/2027 | | 6,675,000 | | 6,370,331 | |
OneMain Financial Issuance Trust,
Ser. 2015-1A, Cl. A | | 3.19 | | 3/18/2026 | | 1,038,794 | e | 1,039,252 | |
OneMain Financial Issuance Trust,
Ser. 2015-1A, Cl. B | | 3.85 | | 3/18/2026 | | 3,250,000 | e | 3,262,889 | |
OSCAR US Funding Trust V,
Ser. 2016-2A, Cl. A3 | | 2.73 | | 12/15/2020 | | 8,122,362 | e | 8,105,370 | |
Prime Security Services Borrower,
Scd. Notes | | 9.25 | | 5/15/2023 | | 1,221,000 | e | 1,262,209 | |
Prosper marketplace Issuance Trust,
Ser. 2018-2A, Cl. A | | 3.35 | | 10/15/2024 | | 7,428,622 | e | 7,415,947 | |
23
STATEMENT OF INVESTMENTS (continued)
| | | | | | | | | | |
| |
Description | Coupon
Rate (%) | | Maturity
Date | | Principal
Amount ($) | a | Value ($) | |
Bonds and Notes - 96.9% (continued) | | | | | |
United States - 29.9% (continued) | | | | | |
Prosper Marketplace Issuance Trust,
Ser. 2017-3A, Cl. A | | 2.36 | | 11/15/2023 | | 2,894,312 | e | 2,886,715 | |
Prudential Financial,
Jr. Sub. Notes | | 4.50 | | 9/15/2047 | | 2,180,000 | c | 1,869,350 | |
Prudential Financial,
Sr. Unscd. Notes | | 4.50 | | 11/15/2020 | | 4,000,000 | | 4,092,702 | |
Prudential Financial,
Sr. Unscd. Notes | | 5.38 | | 6/21/2020 | | 2,200,000 | | 2,267,605 | |
Reynolds Group Issuer,
Gtd. Notes | | 7.00 | | 7/15/2024 | | 1,610,000 | e | 1,536,544 | |
RMF Buyout Issuance Trust,
Ser. 18-1, Cl. A | | 3.44 | | 11/25/2028 | | 3,085,869 | e | 3,085,867 | |
Santander Drive Auto Receivables Trust,
Ser. 2015-5, Cl. D | | 3.65 | | 12/15/2021 | | 886,000 | | 888,145 | |
Santander Drive Auto Receivables Trust,
Ser. 2016-3, Cl. D | | 2.80 | | 8/15/2022 | | 3,300,000 | | 3,283,242 | |
Santander Drive Auto Receivables Trust,
Ser. 2018-1, Cl. C | | 2.96 | | 3/15/2024 | | 8,500,000 | | 8,465,272 | |
Santander Drive Auto Receivables Trust,
Ser. 2018-2, Cl. C | | 3.35 | | 7/17/2023 | | 5,000,000 | | 5,007,437 | |
Santander Drive Auto Receivables Trust,
Ser. 2018-3, Cl. C | | 3.51 | | 8/15/2023 | | 8,425,000 | | 8,435,438 | |
Santander Retail Auto Lease Trust,
Ser. 2017-A, Cl. A4 | | 2.37 | | 1/20/2022 | | 5,975,000 | e | 5,914,894 | |
SASOL Financing USA,
Gtd. Notes | | 5.88 | | 3/27/2024 | | 12,400,000 | | 12,386,787 | |
Seasoned Credit Risk Transfer Trust,
Ser. 2018-4, Cl. M55D | | 4.00 | | 3/1/2058 | | 8,476,449 | | 8,629,695 | |
Seasoned Loans Structured Transaction,
Ser. 2018-2, Cl. A1 | | 3.50 | | 11/1/2028 | | 10,823,304 | | 10,641,059 | |
SoFi Consumer Loan Program Trust,
Ser. 2016-3, Cl. A | | 3.05 | | 12/26/2025 | | 307,519 | e | 306,936 | |
Southern Co.,
Sr. Unscd. Notes | | 3.25 | | 7/1/2026 | | 9,275,000 | | 8,707,068 | |
Springleaf Funding Trust,
Ser. 2015-AA, Cl. A | | 3.16 | | 11/15/2024 | | 2,305,226 | e | 2,302,196 | |
Springleaf Funding Trust,
Ser. 2016-AA, Cl. A | | 2.90 | | 11/15/2029 | | 11,867,182 | e | 11,800,243 | |
Sprint Communications,
Sr. Unscd. Notes | | 7.00 | | 8/15/2020 | | 1,455,000 | | 1,493,267 | |
24
| | | | | | | | | | | |
| |
Description | Coupon
Rate (%) | | Maturity
Date | | Principal
Amount ($) | a | Value ($) | |
Bonds and Notes - 96.9% (continued) | | | | | |
United States - 29.9% (continued) | | | | | |
Sprint Spectrum,
Sr. Scd. Notes | | 4.74 | | 3/20/2025 | | 8,375,000 | e | 8,238,906 | |
Starwood Waypoint Homes Trust,
Ser. 2017-1, Cl. A, 1 Month LIBOR + .95% | | 3.41 | | 1/17/2035 | | 18,415,130 | b,e | 18,334,465 | |
Sunoco Logistics Partners Operations,
Gtd. Notes | | 4.00 | | 10/1/2027 | | 5,550,000 | | 5,100,871 | |
Targa Resources Partners,
Gtd. Bonds | | 5.13 | | 2/1/2025 | | 1,705,000 | | 1,606,963 | |
Tesla Auto Lease Trust,
Ser. 2018-B, Cl. A | | 3.71 | | 8/20/2021 | | 6,750,000 | e | 6,768,725 | |
T-Mobile USA,
Gtd. Notes | | 6.00 | | 3/1/2023 | | 2,900,000 | | 2,921,547 | |
Tricon American Homes Trust,
Ser. 2016-SFR1, Cl. A | | 2.59 | | 11/17/2033 | | 13,120,874 | e | 12,755,814 | |
Tricon American Homes Trust,
Ser. 2017-SFR2, Cl. A | | 2.93 | | 1/17/2036 | | 8,291,155 | e | 8,051,310 | |
U.S. Treasury Bonds | | 3.38 | | 11/15/2048 | | 2,970,000 | | 3,182,126 | |
United Technologies,
Sr. Unscd. Bonds | EUR | 2.15 | | 5/18/2030 | | 2,775,000 | | 3,164,154 | |
Visa,
Sr. Unscd. Notes | | 2.20 | | 12/14/2020 | | 9,250,000 | | 9,150,223 | |
Wells Fargo & Co.,
Sr. Unscd. Notes | | 3.00 | | 4/22/2026 | | 6,125,000 | | 5,715,925 | |
Wells Fargo & Co.,
Sub. Notes | | 4.30 | | 7/22/2027 | | 1,675,000 | | 1,651,470 | |
Western Gas Partners,
Sr. Unscd. Notes | | 4.50 | | 3/1/2028 | | 2,450,000 | | 2,295,605 | |
Westlake Automobile Receivables Trust,
Ser. 2018-2A, Cl. B | | 3.20 | | 1/16/2024 | | 4,300,000 | e | 4,289,643 | |
Westlake Automobile Receivables Trust,
Ser. 2018-2A, Cl. C | | 3.50 | | 1/16/2024 | | 8,575,000 | e | 8,552,884 | |
Westlake Automobile Receivables Trust,
Ser. 2018-1A, Cl. C | | 2.92 | | 5/15/2023 | | 5,150,000 | e | 5,103,665 | |
Federal National Mortgage Association | | | |
3.50% | | | 33,000,000 | f,g | 33,007,163 | |
Government National Mortgage Association | | | |
4.41%, 1/1/63 | | | 6,433,867 | | 6,507,657 | |
4.41%, 7/1/62 | | | 834,531 | | 841,644 | |
| | 936,709,582 | |
TotalBonds and Notes
(cost $3,121,812,689) | | 3,037,035,477 | |
25
STATEMENT OF INVESTMENTS (continued)
| | | | | | | | | | |
| |
Description /Number of Contracts/Counterparty | Exercise
Price | | Expiration Date | | Notional Amount ($) | a | Value ($) | |
Options Purchased - .1% | | | | | |
Call Options - .0% | | | | | |
Australian Dollar,
Contracts 47,000,000 UBS Securities | | 0.72 | | 2/1/2019 | | 47,000,000 | | 108,428 | |
British Pound,
Contracts 25,000,000 Barclays Capital | | 1.32 | | 2/7/2019 | | 25,000,000 | | 140,335 | |
British Pound,
Contracts 25,000,000 Barclays Capital | | 1.30 | | 2/15/2019 | | 25,000,000 | | 348,240 | |
Chinese Yuan Renminbi,
Contracts 33,600,000 HSBC | | 6.96 | | 1/18/2019 | | 33,600,000 | | 35,162 | |
New Zealand Dollar Cross Currency,
Contracts 11,200,000 J.P. Morgan Securities | AUD | 1.08 | | 5/24/2019 | | 11,200,000 | | 45,651 | |
South Korean Won Cross Currency,
Contracts 3,763,000,000 HSBC | JPY | 1,020 | | 1/18/2019 | | 3,763,000,000 | | 274,947 | |
| | 952,763 | |
Put Options - .1% | | | | | |
British Pound Cross Currency,
Contracts 7,100,000 Goldman Sachs | EUR | 0.87 | | 5/23/2019 | | 7,100,000 | | 87,569 | |
Chilean Peso,
Contracts 8,400,000 J.P. Morgan Securities | | 660.00 | | 1/17/2019 | | 8,400,000 | | 2,364 | |
Indian Rupee,
Contracts 16,200,000 HSBC | | 71.85 | | 2/22/2019 | | 16,200,000 | | 498,797 | |
Indonesian Rupiah,
Contracts 16,200,000 J.P. Morgan Securities | | 14,750 | | 2/21/2019 | | 16,200,000 | | 391,055 | |
Polish Zloty,
Contracts 33,940,000 J.P. Morgan Securities | | 3.71 | | 1/15/2019 | | 33,940,000 | | 108,139 | |
| | 1,087,924 | |
TotalOptions Purchased
(cost $5,002,880) | | 2,040,687 | |
Description | Annualized
Yield (%) | | Maturity Date | | Principal Amount ($) | | | |
Short-Term Investments - 2.3% | | | | | |
U.S. Government Securities | | | | | |
U.S. Treasury Bills | | 2.13 | | 1/3/2019 | | 24,780,000 | h,i | 24,778,433 | |
U.S. Treasury Bills | | 2.29 | | 1/15/2019 | | 34,000,000 | i | 33,971,734 | |
U.S. Treasury Bills | | 2.49 | | 6/13/2019 | | 13,110,000 | i | 12,962,651 | |
TotalShort-Term Investments
(cost $71,713,286) | | 71,712,818 | |
26
| | | | | | | | | | |
| |
Description | 1-Day
Yield (%) | | | | Shares | | Value ($) | |
Investment Companies - 1.6% | | | | | |
Registered Investment Companies - 1.6% | | | | | |
Dreyfus Institutional Preferred Government Plus Money Market Fund
(cost $50,195,156) | | 2.32 | | | | 50,195,156 | j | 50,195,156 | |
| | | | | | | | | |
Investment of Cash Collateral for Securities Loaned - .9% | | | | | |
Registered Investment Companies - .9% | | | | | |
Dreyfus Institutional Preferred Government Money Market Fund, Institutional Shares
(cost $28,724,069) | | 2.69 | | | | 28,724,069 | j | 28,724,069 | |
Total Investments(cost $3,277,448,080) | | 101.8% | 3,189,708,207 | |
Liabilities, Less Cash and Receivables | | (1.8%) | (55,638,300) | |
Net Assets | | 100.0% | 3,134,069,907 | |
BADLAR—Buenos Aires Interbank Offer Rate
EURIBOR—Euro Interbank Offered Rate
LIBOR—London Interbank Offered Rate
ARS—Argentine Peso
AUD—Australian Dollar
CAD—Canadian Dollar
CLP—Chilean Peso
EUR—Euro
GBP—British Pound
ILS—Israeli Shekel
INR—Indian Rupee
JPY—Japanese Yen
NOK—Norwegian Krone
NZD—New Zealand Dollar
THB—Thai Baht
a Amount stated in U.S. Dollars unless otherwise noted above.
b Variable rate security—rate shown is the interest rate in effect at period end.
c Security, or portion thereof, on loan. At December 31, 2018, the value of the fund’s securities on loan was $33,216,149 and the value of the collateral held by the fund was $35,415,436, consisting of cash collateral of $28,724,069 and U.S. Government & Agency securities valued at $6,691,367.
d Principal amount for accrual purposes is periodically adjusted based on changes in the Consumer Price Index.
e Security exempt from registration pursuant to Rule 144A under the Securities Act of 1933. These securities may be resold in transactions exempt from registration, normally to qualified institutional buyers. At December 31, 2018, these securities were valued at $786,622,152 or 25.1% of net assets.
f The Federal Housing Finance Agency (“FHFA”) placed the Federal Home Loan Mortgage Corporation and Federal National Mortgage Association into conservatorship with FHFA as the conservator. As such, the FHFA oversees the continuing affairs of these companies.
g Purchased on a forward commitment basis.
h Held by a counterparty for open exchange traded derivative contracts.
i Security is a discount security. Income is recognized through the accretion of discount.
j Investment in affiliated issuer. The investment objective of this investment company is publicly available and can be found within the investment company’s prospectus.
27
STATEMENT OF INVESTMENTS (continued)
| | |
Portfolio Summary (Unaudited)† | Value (%) |
Foreign/Governmental | 51.9 |
Asset-Backed Ctfs./Auto Receivables | 11.6 |
Banks | 7.6 |
Asset-Backed Certificates | 4.3 |
Energy | 2.7 |
Investment Companies | 2.5 |
Commercial Mortgage Pass-Through Ctfs. | 2.5 |
U.S. Treasury Bills | 2.4 |
Health Care | 1.6 |
U.S. Government Agencies Mortgage-Backed | 1.3 |
Asset-Backed Ctfs./Credit Cards | 1.2 |
Chemicals | 1.1 |
Insurance | 1.0 |
Food Products | 1.0 |
Industrials | 1.0 |
Diversified Financials | .9 |
Real Estate | .9 |
Automobiles & Components | .8 |
Beverage Products | .7 |
Telecommunication Services | .6 |
Utilities | .6 |
Technology Hardware & Equipment | .5 |
Media | .5 |
Retailing | .4 |
Internet Software & Services | .4 |
Agriculture | .3 |
Metals & Mining | .3 |
Commercial & Professional Services | .3 |
Consumer Discretionary | .3 |
Forest Products & Other | .2 |
Aerospace & Defense | .1 |
Options Purchased | .1 |
Information Technology | .1 |
Materials | .1 |
Asset-Backed Ctfs./Student Loans | .0 |
| | 101.8 |
† Based on net assets.
See notes to financial statements.
28
STATEMENT OF INVESTMENTS IN AFFILIATED ISSUERS
| | | | | | | |
Registered Investment Companies | Value
12/31/17($) | Purchases($) | Sales ($) | Value
12/31/18($) | Net
Assets(%) | Dividends/
Distributions($) |
Dreyfus Institutional Preferred Government Money Market Fund, Institutional Shares | 34,513,315 | 704,582,601 | 710,371,847 | 28,724,069 | .9 | – |
Dreyfus Institutional Preferred Government Plus Money Market Fund | 59,181,623 | 1,625,758,104 | 1,634,744,571 | 50,195,156 | 1.6 | 1,250,052 |
Total | 93,694,938 | 2,330,340,705 | 2,345,116,418 | 78,919,225 | 2.5 | 1,250,052 |
See notes to financial statements.
29
STATEMENT OF FUTURES
December 31, 2018
| | | | | | | |
Description | Number of
Contracts | Expiration | Notional
Value ($) | Value ($) | Unrealized Appreciation (Depreciation) ($) | |
Futures Long | | |
Australian 3 Year Bond | 894 | 3/19 | 70,386,040a | 70,658,922 | 272,882 | |
Euro 30 Year Bond | 88 | 3/19 | 17,844,260a | 18,211,192 | 366,932 | |
Euro BTP Italian Government Bond | 676 | 3/19 | 97,235,128a | 99,000,041 | 1,764,913 | |
Long Gilt | 239 | 3/19 | 37,762,150a | 37,521,203 | (240,947) | |
Long Term French Government Future | 211 | 3/19 | 36,512,252a | 36,456,390 | (55,862) | |
U.S. Treasury 5 Year Notes | 1,298 | 3/19 | 146,848,698 | 148,864,375 | 2,015,677 | |
U.S. Treasury Long Bond | 67 | 3/19 | 9,558,070 | 9,782,000 | 223,930 | |
U.S. Treasury Ultra Long Bond | 833 | 3/19 | 128,073,413 | 133,826,656 | 5,753,243 | |
Futures Short | | |
Canadian 10 Year Bond | 338 | 3/19 | 32,771,975a | 33,861,896 | (1,089,921) | |
Euro-Bobl | 943 | 3/19 | 142,822,861a | 143,180,207 | (357,346) | |
Euro-Bond | 812 | 3/19 | 151,625,002a | 152,149,275 | (524,273) | |
Euro-Schatz | 11 | 3/19 | 1,410,232a | 1,410,808 | (576) | |
U.S. Treasury 10 Year Notes | 412 | 3/19 | 49,791,110 | 50,270,440 | (479,330) | |
U.S. Treasury 2 Year Notes | 586 | 3/19 | 124,023,926 | 124,415,125 | (391,199) | |
Gross Unrealized Appreciation | | 10,397,577 | |
Gross Unrealized Depreciation | | (3,139,454) | |
a Notional amounts in foreign currency have been converted to USD using relevant foreign exchange rates.
See notes to financial statements.
30
STATEMENT OF OPTIONS WRITTEN
December 31, 2018
| | | | | | | |
Description/ Contracts/ Counterparties | Exercise Price | Expiration Date | Notional Amount | a | Value ($) | |
Call Options: | | | | | | |
British Pound Cross Currency
Contracts 7,100,000, Goldman Sachs | 0.94 | 5/23/19 | 7,100,000 | EUR | (113,800) | |
Chilean Peso
Contracts 8,400,000, J.P. Morgan Securities | 690 | 1/17/19 | 8,400,000 | | (106,386) | |
Put Options: | | | | | | |
New Zealand Dollar Cross Currency
Contracts 11,200,000, J.P. Morgan Securities | 1.05 | 5/24/19 | 11,200,000 | AUD | (124,703) | |
Total Options Written (premiums received $281,999) | | | | (344,889) | |
a Notional amount stated in U.S. Dollars unless otherwise indicated.
AUD—Australian Dollar
EUR—Euro
See notes to financial statements.
31
STATEMENT OF FORWARD FOREIGN CURRENCY EXCHANGE CONTRACTSDecember 31, 2018
| | | | | | |
Counterparty/ Purchased
Currency | Purchased Currency
Amounts | Currency
Sold | Sold
Currency
Amounts | Settlement Date | Unrealized Appreciation (Depreciation)($) |
Barclays Capital | | | |
United States Dollar | 574,453,672 | Japanese Yen | 64,899,478,000 | 1/31/19 | (19,127,895) |
Indonesian Rupiah | 182,848,205,000 | United States Dollar | 12,436,961 | 2/25/19 | 203,382 |
Russian Ruble | 397,440,000 | United States Dollar | 5,914,066 | 2/25/19 | (254,330) |
United States Dollar | 145,477,376 | New Zealand Dollar | 212,115,000 | 1/31/19 | 3,025,184 |
Brazilian Real | 38,565,000 | United States Dollar | 9,864,812 | 2/4/19 | 63,673 |
United States Dollar | 8,790,659 | Malaysian Ringgit | 36,890,000 | 2/25/19 | (129,426) |
Citigroup | | | |
Colombian Peso | 13,637,200,000 | United States Dollar | 4,160,346 | 2/25/19 | 27,317 |
United States Dollar | 41,264,831 | Australian Dollar | 57,110,000 | 1/31/19 | 1,013,132 |
Norwegian Krone | 260,000,000 | United States Dollar | 30,415,330 | 1/31/19 | (301,197) |
Czech Koruna | 288,600,000 | United States Dollar | 12,748,194 | 2/25/19 | 122,122 |
Swedish Krona | 398,255,000 | United States Dollar | 43,829,356 | 1/31/19 | 1,221,809 |
Singapore Dollar | 16,300,000 | United States Dollar | 11,950,321 | 2/25/19 | 24,165 |
Chilean Peso | 2,659,370,000 | United States Dollar | 3,865,364 | 2/25/19 | (30,073) |
United States Dollar | 16,117,881 | Mexican Peso | 334,180,000 | 2/25/19 | (738,229) |
United States Dollar | 55,386,682 | British Pound | 43,720,000 | 1/31/19 | (427,144) |
Goldman Sachs | | | |
United States Dollar | 71,272,732 | Canadian Dollar | 95,030,000 | 1/31/19 | 1,606,219 |
United States Dollar | 186,409,626 | Euro | 163,475,000 | 1/31/19 | (1,392,089) |
HSBC | | | |
Czech Koruna | 706,200,000 | United States Dollar | 31,197,402 | 2/25/19 | 296,074 |
United States Dollar | 71,746,799 | Euro | 62,890,000 | 1/31/19 | (501,862) |
United States Dollar | 2,986,969 | Romanian Leu | 12,240,000 | 2/25/19 | (22,610) |
J.P. Morgan Securities | | | |
United States Dollar | 16,079,874 | Philippine Peso | 849,950,000 | 2/26/19 | 3,541 |
32
| | | | | | |
Counterparty/ Purchased
Currency | Purchased Currency
Amounts | Currency
Sold | Sold
Currency
Amounts | Settlement Date | Unrealized Appreciation (Depreciation)($) |
J.P. Morgan Securities (continued) |
United States Dollar | 75,005,194 | Canadian Dollar | 100,000,000 | 1/31/19 | 1,695,173 |
United States Dollar | 277,954,442 | Euro | 243,625,000 | 1/31/19 | (1,924,394) |
United States Dollar | 34,799,960 | South Korean Won | 39,136,035,000 | 2/25/19 | (341,439) |
United States Dollar | 13,612,823 | Argentine Peso | 550,000,000 | 2/8/19 | (222,163) |
Indian Rupee | 250,000,000 | United States Dollar | 3,501,646 | 2/25/19 | 56,607 |
United States Dollar | 11,074,769 | Swedish Krona | 100,000,000 | 1/31/19 | (237,371) |
Chilean Peso | 2,650,630,000 | United States Dollar | 3,837,044 | 2/25/19 | (14,358) |
United States Dollar | 5,224,291 | Chilean Peso | 3,504,820,000 | 2/25/19 | 169,709 |
United States Dollar | 17,142,519 | Peruvian Nuevo Sol | 58,000,000 | 2/14/19 | (45,849) |
United States Dollar | 34,033,561 | Hong Kong Dollar | 265,100,000 | 4/10/19 | 79,986 |
United States Dollar | 14,045,150 | Romanian Leu | 57,550,000 | 2/25/19 | (105,279) |
Norwegian Krone | 60,000,000 | United States Dollar | 6,967,649 | 1/31/19 | (18,234) |
United States Dollar | 11,707,403 | Hungarian Forint | 3,305,000,000 | 2/25/19 | (134,072) |
Merrill Lynch, Pierce, Fenner & Smith | | | |
United States Dollar | 7,434,485 | Thai Baht | 244,260,000 | 2/25/19 | (76,445) |
United States Dollar | 776,154 | Euro | 680,000 | 1/31/19 | (5,037) |
UBS Securities | | | |
Australian Dollar | 45,000,000 | United States Dollar | 32,541,300 | 1/31/19 | (824,850) |
United States Dollar | 138,973,516 | Euro | 121,810,000 | 1/31/19 | (963,030) |
Gross Unrealized Appreciation | | | 9,608,093 |
Gross Unrealized Depreciation | | | (27,837,376) |
See notes to financial statements.
33
STATEMENT OF SWAP AGREEMENTS
December 31, 2018
| | | | | |
Centrally Cleared Interest Rate Swaps | |
Received
Reference
Entity | Paid
Reference
Entity | Maturity Date | Notional
Amount ($) | Unrealized (Depreciation) ($) |
NZD-3 Month Bank Bill | NZD 3.21 | 3/20/28 | 49,917,144 | (2,947,685) |
NZD-3 Month Bank Bill | NZD 3.21 | 3/19/28 | 37,439,536 | (2,212,042) |
Gross Unrealized Depreciation | (5,159,727) |
NZD—New Zealand Dollar
See notes to financial statements.
| | | | | | |
OTC Credit Default Swaps | |
| | | | | | |
Reference
Obligation/
Counterparty | Maturity
Date | Notional
Amount ($) | Market
Value ($) | Upfront
Payments/
Receipts ($) | Unrealized (Depreciation)($) |
Purchased Contracts:1 | |
Barclays Capital | | |
Republic of South Africa 2.21% Paid Fixed Rate of 1.00 3 Month | 12/20/23 | 1,150,000 | 61,898 | 61,898 | (383) |
Gross Unrealized Depreciation | (383) |
1 If the fund is a buyer of protection and a credit event occurs, as defined under the terms of the swap agreement, the fund will either (i) receive from the seller of protection an amount equal to the notional amount of the swap and deliver the reference obligation or (ii) receive a net settlement amount in the form of cash or securities equal to the notional amount of the swap less the recovery value of the reference obligation.
See notes to financial statements.
| | | | | | |
Centrally Cleared Credit Default Swaps | |
| | | | | | |
Reference
Obligation | Maturity
Date | Notional
Amount ($)1 | Market
Value ($) | Upfront
Payments/
Receipts ($) | Unrealized Appreciation ($) |
Sold Contracts:2 | |
Ice Cdx Hy Cdsi S31 5Y Prc 20231220 - Boaml Received Fixed Rate of 5.00 3 Month | 12/20/23 | 16,000,000 | 325,820 | 251,276 | 101,210 |
Gross Unrealized Appreciation | 101,210 |
1 The maximum potential amount the fund could be required to pay as a seller of credit protection or receive as a buyer of credit protection if a credit event occurs as defined under the terms of the swap agreement.
2 If the fund is a seller of protection and a credit event occurs, as defined under the terms of the swap agreement, the fund will either (i) pay to the buyer of protection an amount equal to the notional amount of the swap and take delivery of the reference obligation or (ii) pay a net settlement amount in the form of cash or securities equal to the notional amount of the swap less the recovery value of the reference obligation.
See notes to financial statements.
34
STATEMENT OF ASSETS AND LIABILITIES
December 31, 2018
| | | | | | | |
| | | | | | |
| | | Cost | | Value | |
Assets ($): | | | | |
Investments in securities—See Statement of Investments
(including securities on loan, valued at $33,216,149)—Note 1(c): | | | |
Unaffiliated issuers | 3,198,528,855 | | 3,110,788,982 | |
Affiliated issuers | | 78,919,225 | | 78,919,225 | |
Cash | | | | | 7,753,848 | |
Cash denominated in foreign currency | | | 14,452,767 | | 14,384,154 | |
Receivable for shares of Beneficial Interest subscribed | | 25,831,818 | |
Dividends, interest and securities lending income receivable | | 20,935,097 | |
Unrealized appreciation on forward foreign
currency exchange contracts—Note 4 | | 9,608,093 | |
Receivable for investment securities sold | | 8,581,114 | |
Cash collateral held by broker—Note 4 | | 2,870,377 | |
Receivable for futures variation margin—Note 4 | | 648,608 | |
Swap upfront payments—Note 4 | | 313,174 | |
Prepaid expenses | | | | | 71,701 | |
| | | | | 3,280,706,191 | |
Liabilities ($): | | | | |
Due to The Dreyfus Corporation and affiliates—Note 3(c) | | | | 1,497,066 | |
Payable for investment securities purchased | | 40,129,502 | |
Payable for shares of Beneficial Interest redeemed | | 34,319,030 | |
Liability for securities on loan—Note 1(c) | | 28,724,069 | |
Unrealized depreciation on forward foreign
currency exchange contracts—Note 4 | | 27,837,376 | |
Distributions payable | | 12,940,997 | |
Outstanding options written, at value
(premiums received $281,999)—Note 4 | | 344,889 | |
Unrealized depreciation on foreign currency transactions | | 281,676 | |
Payable for swap variation margin—Note 4 | | 147,372 | |
Trustees fees and expenses payable | | 41,264 | |
Unrealized depreciation on swap agreements—Note 4 | | 383 | |
Accrued expenses | | | | | 372,660 | |
| | | | | 146,636,284 | |
Net Assets ($) | | | 3,134,069,907 | |
Composition of Net Assets ($): | | | | |
Paid-in capital | | | | | 3,317,819,867 | |
Total distributable earnings (loss) | | | | | (183,749,960) | |
Net Assets ($) | | | 3,134,069,907 | |
| | | | | | |
Net Asset Value Per Share | Class A | Class C | Class I | Class Y | |
Net Assets ($) | 139,985,554 | 65,001,392 | 2,669,870,748 | 259,212,213 | |
Shares Outstanding | 6,879,651 | 3,226,767 | 130,981,301 | 12,711,333 | |
Net Asset Value Per Share ($) | 20.35 | 20.14 | 20.38 | 20.39 | |
| | | | | | |
See notes to financial statements. | | | | | |
35
STATEMENT OF OPERATIONS
Year Ended December 31, 2018
| | | | | | | |
| | | | | | |
| | | | | | |
Investment Income ($): | | | | |
Income: | | | | |
Interest (net of $234,103 foreign taxes withheld at source) | | | 111,490,048 | |
Dividends from affiliated issuers | | | 1,250,052 | |
Income from securities lending—Note 1(c) | | | 128,455 | |
Total Income | | | 112,868,555 | |
Expenses: | | | | |
Investment advisory fee—Note 3(a) | | | 13,533,532 | |
Shareholder servicing costs—Note 3(c) | | | 2,786,006 | |
Distribution fees—Note 3(b) | | | 557,352 | |
Custodian fees—Note 3(c) | | | 468,087 | |
Administration fee—Note 3(a) | | | 267,440 | |
Registration fees | | | 255,162 | |
Trustees’ fees and expenses—Note 3(d) | | | 251,766 | |
Prospectus and shareholders’ reports | | | 211,996 | |
Professional fees | | | 142,159 | |
Loan commitment fees—Note 2 | | | 75,719 | |
Miscellaneous | | | 149,726 | |
Total Expenses | | | 18,698,945 | |
Less—reduction in fees due to earnings credits—Note 3(c) | | | (11,719) | |
Net Expenses | | | 18,687,226 | |
Investment Income—Net | | | 94,181,329 | |
Realized and Unrealized Gain (Loss) on Investments—Note 4 ($): | | |
Net realized gain (loss) on investments and foreign currency transactions | (74,212,740) | |
Net realized gain (loss) on options transactions | (9,472,834) | |
Net realized gain (loss) on futures | 8,621,697 | |
Net realized gain (loss) on swap agreements | (221,645) | |
Net realized gain (loss) on forward foreign currency exchange contracts | 73,392,365 | |
Net Realized Gain (Loss) | | | (1,893,157) | |
Net unrealized appreciation (depreciation) on investments
and foreign currency transactions | | | (139,236,127) | |
Net unrealized appreciation (depreciation) on options transactions | (3,426,659) | |
Net unrealized appreciation (depreciation) on futures | | | 8,014,127 | |
Net unrealized appreciation (depreciation) on swap agreements | | | (3,949,913) | |
Net unrealized appreciation (depreciation) on
forward foreign currency exchange contracts | | | 14,137,714 | |
Net Unrealized Appreciation (Depreciation) | | | (124,460,858) | |
Net Realized and Unrealized Gain (Loss) on Investments | | | (126,354,015) | |
Net (Decrease) in Net Assets Resulting from Operations | | (32,172,686) | |
| | | | | | | |
See notes to financial statements. | | | | | |
36
STATEMENT OF CHANGES IN NET ASSETS
| | | | | | | | | | |
| | | | Year Ended December 31, |
| | | | 2018 | | 2017 | a |
Operations ($): | | | | | | | | |
Investment income—net | | | 94,181,329 | | | | 61,162,218 | |
Net realized gain (loss) on investments | | (1,893,157) | | | | (55,308,340) | |
Net unrealized appreciation (depreciation)
on investments | | (124,460,858) | | | | 111,217,879 | |
Net Increase (Decrease) in Net Assets
Resulting from Operations | (32,172,686) | | | | 117,071,757 | |
Distributions ($): | |
Distributions to shareholders: | | | | | | | | |
Class A | | | (5,260,052) | | | | (4,073,089) | |
Class C | | | (2,194,803) | | | | (1,601,113) | |
Class I | | | (107,843,590) | | | | (68,031,227) | |
Class Y | | | (10,297,135) | | | | (5,419,333) | |
Total Distributions | | | (125,595,580) | | | | (79,124,762) | |
Beneficial Interest Transactions ($): | |
Net proceeds from shares sold: | | | | | | | | |
Class A | | | 62,703,908 | | | | 97,421,428 | |
Class C | | | 13,983,310 | | | | 15,024,081 | |
Class I | | | 1,365,109,863 | | | | 1,500,419,123 | |
Class Y | | | 80,602,938 | | | | 165,588,991 | |
Distributions reinvested: | | | | | | | | |
Class A | | | 4,383,971 | | | | 3,749,779 | |
Class C | | | 1,988,077 | | | | 1,448,939 | |
Class I | | | 91,848,743 | | | | 58,419,164 | |
Class Y | | | 9,356,331 | | | | 4,872,366 | |
Cost of shares redeemed: | | | | | | | | |
Class A | | | (94,755,909) | | | | (255,189,439) | |
Class C | | | (26,321,176) | | | | (37,372,585) | |
Class I | | | (1,342,003,488) | | | | (1,084,463,269) | |
Class Y | | | (67,314,645) | | | | (44,135,859) | |
Increase (Decrease) in Net Assets
from Beneficial Interest Transactions | 99,581,923 | | | | 425,782,719 | |
Total Increase (Decrease) in Net Assets | (58,186,343) | | | | 463,729,714 | |
Net Assets ($): | |
Beginning of Period | | | 3,192,256,250 | | | | 2,728,526,536 | |
End of Period | | | 3,134,069,907 | | | | 3,192,256,250 | |
37
STATEMENT OF CHANGES IN NET ASSETS (continued)
| | | | | | | | | | |
| | | | Year Ended December 31, |
| | | | 2018 | | 2017 | a |
Capital Share Transactions (Shares): | |
Class Ab | | | | | | | | |
Shares sold | | | 2,957,156 | | | | 4,557,196 | |
Shares issued for distributions reinvested | | | 213,943 | | | | 176,302 | |
Shares redeemed | | | (4,489,282) | | | | (12,065,886) | |
Net Increase (Decrease) in Shares Outstanding | (1,318,183) | | | | (7,332,388) | |
Class Cb,c | | | | | | | | |
Shares sold | | | 665,360 | | | | 706,216 | |
Shares issued for distributions reinvested | | | 98,096 | | | | 68,531 | |
Shares redeemed | | | (1,258,961) | | | | (1,761,959) | |
Net Increase (Decrease) in Shares Outstanding | (495,505) | | | | (987,212) | |
Class Ic | | | | | | | | |
Shares sold | | | 64,264,792 | | | | 70,209,489 | |
Shares issued for distributions reinvested | | | 4,468,305 | | | | 2,743,720 | |
Shares redeemed | | | (63,522,296) | | | | (50,819,310) | |
Net Increase (Decrease) in Shares Outstanding | 5,210,801 | | | | 22,133,899 | |
Class Yc | | | | | | | | |
Shares sold | | | 3,781,585 | | | | 7,753,704 | |
Shares issued for distributions reinvested | | | 455,088 | | | | 228,557 | |
Shares redeemed | | | (3,167,246) | | | | (2,064,800) | |
Net Increase (Decrease) in Shares Outstanding | 1,069,427 | | | | 5,917,461 | |
| | | | | | | | | | |
a Distributions to shareholders include $3,260,511 Class A, $1,133,417 Class C, $56,574,550 Class I and $4,685,916 Class Y distributions from net investment income and $812,578 Class A, $467,696 Class C, $11,456,677 Class I and $733,417 Class Y distributions from net realized gains. Undistributed investment income—net was $2,103,887 in 2017 and is no longer presented as a result of the adoption of SEC’s Disclosure Update and Simplification Rule. | |
b During the period ended December 31, 2018, 686 Class C shares representing $14,401 were automatically converted to 680 Class A shares and during the period ended December 31, 2017, 1,371 Class C shares representing $29,404 were automatically converted to 1,360 Class A shares. | |
c During the period ended December 31, 2018, 6,660 Class A shares representing $141,044 were exchanged for 6,647 Class I shares and 26,329 Class Y shares representing $547,886 were exchanged for 26,342 Class I shares and during the period ended December 31, 2017, 405,453 Class A shares representing $8,547,588 were exchanged for 404,685 Class I shares, 403 Class C shares representing $8,646 were exchanged for 400 Class I shares and 293,825 Class I shares representing $6,258,461 were exchanged for 293,825 Class Y shares. | |
See notes to financial statements. | | | | | | | | |
38
FINANCIAL HIGHLIGHTS
The following tables describe the performance for each share class for the fiscal periods indicated. All information (except portfolio turnover rate) reflects financial results for a single fund share. Total return shows how much your investment in the fund would have increased (or decreased) during each period, assuming you had reinvested all dividends and distributions. These figures have been derived from the fund’s financial statements.
| | | | | | | | | | | | |
| | | | |
| | | |
Class A Shares | | | Year Ended December 31, |
| | | 2018 | 2017 | 2016 | 2015 | 2014 |
Per Share Data ($): | | | | | | |
Net asset value, beginning of period | | 21.35 | 21.03 | 21.03 | 21.69 | 21.14 |
Investment Operations: | | | | | | |
Investment income—neta | | .53 | .38 | .26 | .37 | .44 |
Net realized and unrealized
gain (loss) on investments | | (.77) | .47 | .18 | (.50) | 1.15 |
Total from Investment Operations | | (.24) | .85 | .44 | (.13) | 1.59 |
Distributions: | | | | | | |
Dividends from
investment income—net | | (.76) | (.42) | (.32) | (.41) | (.73) |
Dividends from net realized
gain on investments | | - | (.11) | (.12) | (.12) | (.31) |
Total Distributions | | (.76) | (.53) | (.44) | (.53) | (1.04) |
Net asset value, end of period | | 20.35 | 21.35 | 21.03 | 21.03 | 21.69 |
Total Return (%)b | | (1.13) | 4.04 | 2.12 | (.61) | 7.55 |
Ratios/Supplemental Data (%): | | | | | | |
Ratio of total expenses
to average net assets | | .82 | .84 | .81 | .82 | .89 |
Ratio of net expenses
to average net assets | | .82 | .84 | .81 | .82 | .89 |
Ratio of net investment income
to average net assets | | 2.50 | 1.87 | 1.20 | 1.68 | 2.06 |
Portfolio Turnover Rate | | 99.05 | 95.96 | 125.98 | 178.07 | 180.28 |
Net Assets, end of period ($ x 1,000) | | 139,986 | 175,020 | 326,654 | 264,829 | 122,987 |
a Based on average shares outstanding.
b Exclusive of sales charge.
See notes to financial statements.
39
FINANCIAL HIGHLIGHTS (continued)
| | | | | | | | | | |
| | | | |
| | | |
Class C Shares | | | Year Ended December 31, |
| | | 2018 | 2017 | 2016 | 2015 | 2014 |
Per Share Data ($): | | | | | | |
Net asset value, beginning of period | | 21.22 | 20.94 | 20.95 | 21.63 | 21.06 |
Investment Operations: | | | | | | |
Investment income—neta | | .38 | .24 | .10 | .21 | .28 |
Net realized and unrealized
gain (loss) on investments | | (.78) | .45 | .18 | (.49) | 1.14 |
Total from Investment Operations | | (.40) | .69 | .28 | (.28) | 1.42 |
Distributions: | | | | | | |
Dividends from
investment income—net | | (.68) | (.30) | (.17) | (.28) | (.54) |
Dividends from net realized
gain on investments | | - | (.11) | (.12) | (.12) | (.31) |
Total Distributions | | (.68) | (.41) | (.29) | (.40) | (.85) |
Net asset value, end of period | | 20.14 | 21.22 | 20.94 | 20.95 | 21.63 |
Total Return (%)b | | (1.82) | 3.29 | 1.37 | (1.34) | 6.76 |
Ratios/Supplemental Data (%): | | | | | | |
Ratio of total expenses
to average net assets | | 1.54 | 1.56 | 1.55 | 1.55 | 1.65 |
Ratio of net expenses
to average net assets | | 1.54 | 1.56 | 1.55 | 1.55 | 1.65 |
Ratio of net investment income
to average net assets | | 1.80 | 1.15 | .47 | .95 | 1.29 |
Portfolio Turnover Rate | | 99.05 | 95.96 | 125.98 | 178.07 | 180.28 |
Net Assets, end of period ($ x 1,000) | | 65,001 | 78,980 | 98,626 | 77,460 | 27,989 |
a Based on average shares outstanding.
b Exclusive of sales charge.
See notes to financial statements.
40
| | | | | | | | | | | | | | |
| | | | | | | |
| | | |
Class I Shares | | | Year Ended December 31, |
| | | 2018 | 2017 | 2016 | 2015 | 2014 |
Per Share Data ($): | | | | | | |
Net asset value, beginning of period | | 21.38 | 21.06 | 21.06 | 21.71 | 21.17 |
Investment Operations: | | | | | | |
Investment income—neta | | .60 | .47 | .32 | .43 | .51 |
Net realized and unrealized
gain (loss) on investments | | (.78) | .44 | .18 | (.48) | 1.14 |
Total from Investment Operations | | (.18) | .91 | .50 | (.05) | 1.65 |
Distributions: | | | | | | |
Dividends from
investment income—net | | (.82) | (.48) | (.38) | (.48) | (.80) |
Dividends from net realized
gain on investments | | - | (.11) | (.12) | (.12) | (.31) |
Total Distributions | | (.82) | (.59) | (.50) | (.60) | (1.11) |
Net asset value, end of period | | 20.38 | 21.38 | 21.06 | 21.06 | 21.71 |
Total Return (%) | | (.79) | 4.35 | 2.41 | (.28) | 7.85 |
Ratios/Supplemental Data (%): | | | | | | |
Ratio of total expenses
to average net assets | | .52 | .53 | .52 | .52 | .59 |
Ratio of net expenses
to average net assets | | .52 | .53 | .52 | .52 | .59 |
Ratio of net investment income
to average net assets | | 2.82 | 2.18 | 1.50 | 1.99 | 2.35 |
Portfolio Turnover Rate | | 99.05 | 95.96 | 125.98 | 178.07 | 180.28 |
Net Assets,
end of period ($ x 1,000) | | 2,669,871 | 2,689,270 | 2,182,666 | 1,610,590 | 627,638 |
a Based on average shares outstanding.
See notes to financial statements.
41
FINANCIAL HIGHLIGHTS (continued)
| | | | | | | | | | | | | | | | |
| | | | | | | |
| | | | | |
Class Y Shares | | | Year Ended December 31, |
| | | 2018 | 2017 | 2016 | 2015 | 2014 | |
Per Share Data ($): | | | | | | | |
Net asset value, beginning of period | | 21.39 | 21.06 | 21.06 | 21.71 | 21.17 | |
Investment Operations: | | | | | | | |
Investment income—neta | | .61 | .48 | .33 | .44 | .54 | |
Net realized and unrealized
gain (loss) on investments | | (.78) | .45 | .18 | (.49) | 1.12 | |
Total from Investment Operations | | (.17) | .93 | .51 | (.05) | 1.66 | |
Distributions: | | | | | | | |
Dividends from
investment income—net | | (.83) | (.49) | (.39) | (.48) | (.81) | |
Dividends from net realized
gain on investments | | - | (.11) | (.12) | (.12) | (.31) | |
Total Distributions | | (.83) | (.60) | (.51) | (.60) | (1.12) | |
Net asset value, end of period | | 20.39 | 21.39 | 21.06 | 21.06 | 21.71 | |
Total Return (%) | | (.75) | 4.43 | 2.46 | (.29) | 7.94 | |
Ratios/Supplemental Data (%): | | | | | | | |
Ratio of total expenses
to average net assets | | .45 | .48 | .46 | .48 | .54 | |
Ratio of net expenses
to average net assets | | .45 | .48 | .46 | .48 | .54 | |
Ratio of net investment income
to average net assets | | 2.87 | 2.23 | 1.55 | 2.03 | 2.41 | |
Portfolio Turnover Rate | | 99.05 | 95.96 | 125.98 | 178.07 | 180.28 | |
Net Assets, end of period ($ x 1,000) | | 259,212 | 248,986 | 120,581 | 82,283 | 27,897 | |
a Based on average shares outstanding.
See notes to financial statements.
42
NOTES TO FINANCIAL STATEMENTS
NOTE 1—Significant Accounting Policies:
Dreyfus/Standish Global Fixed Income Fund (the “fund”) is a separate non-diversified series of Dreyfus Investment Funds (the “Trust”), which is registered under the Investment Company Act of 1940, as amended (the “Act”), as an open-end management investment company and operates as a series company currently offering seven series, including the fund. The fund’s investment objective is to seek to maximize total return while realizing a market level of income, consistent with preserving principal and liquidity. The Dreyfus Corporation (the “Manager” or “Dreyfus”), a wholly-owned subsidiary of The Bank of New York Mellon Corporation (“BNY Mellon”), serves as the fund’s investment adviser. Effective January 2, 2019, BNY Mellon Asset Management North America Corporation was renamed Mellon Investments Corporation (the “Sub adviser”). Effective January 31, 2018, the Sub adviser, a wholly-owned subsidiary of BNY Mellon and an affiliate of Dreyfus, serves as the fund’s sub-investment adviser. The Sub adviser is a specialist multi-asset investment manager formed by the combination of certain BNY Mellon affiliated investment management firms, including Standish Mellon Asset Management Company LLC which served as the fund’s sub-investment adviser prior to January 31, 2018.
MBSC Securities Corporation (the “Distributor”), a wholly-owned subsidiary of Dreyfus, is the distributor of the fund’s shares. The fund is authorized to issue an unlimited number of $.001 par value shares of Beneficial Interest in each of the following classes of shares: Class A, Class C, Class I, Class T and Class Y. Class A, Class C and Class T shares are sold primarily to retail investors through financial intermediaries and bear Distribution and/or Shareholder Services Plan fees. Class A and Class T shares generally are subject to a sales charge imposed at the time of purchase. Class C shares are subject to a contingent deferred sales charge (“CDSC”) imposed on Class C shares redeemed within one year of purchase. Class C shares automatically convert to Class A shares ten years after the date of purchase, without the imposition of a sales charge. Class I shares are sold primarily to bank trust departments and other financial service providers (including The Bank of New York Mellon, a subsidiary of BNY Mellon and an affiliate of Dreyfus, and its affiliates), acting on behalf of customers having a qualified trust or an investment account or relationship at such institution, and bear no Distribution or Shareholder Services Plan fees. Class Y shares are sold at net asset value per share generally to institutional investors, and bear no Distribution or Shareholder Services Plan fees. Class I and Class Y shares are offered without a front-end sales charge or CDSC. As of the date of this report, the fund did not
43
NOTES TO FINANCIAL STATEMENTS(continued)
offer Class T shares for purchase. Other differences between the classes include the services offered to and the expenses borne by each class, the allocation of certain transfer agency costs, and certain voting rights. Income, expenses (other than expenses attributable to a specific class), and realized and unrealized gains or losses on investments are allocated to each class of shares based on its relative net assets.
The Trust accounts separately for the assets, liabilities and operations of each series. Expenses directly attributable to each series are charged to that series’ operations; expenses which are applicable to all series are allocated among them on a pro rata basis.
The Financial Accounting Standards Board (“FASB”) Accounting Standards Codification (“ASC”) is the exclusive reference of authoritative U.S. generally accepted accounting principles (“GAAP”) recognized by the FASB to be applied by nongovernmental entities. Rules and interpretive releases of the Securities and Exchange Commission (“SEC”) under authority of federal laws are also sources of authoritative GAAP for SEC registrants. The fund’s financial statements are prepared in accordance with GAAP, which may require the use of management estimates and assumptions. Actual results could differ from those estimates.
(a) Portfolio valuation: The fair value of a financial instrument is the amount that would be received to sell an asset or paid to transfer a liability in an orderly transaction between market participants at the measurement date (i.e., the exit price). GAAP establishes a fair value hierarchy that prioritizes the inputs of valuation techniques used to measure fair value. This hierarchy gives the highest priority to unadjusted quoted prices in active markets for identical assets or liabilities (Level 1 measurements) and the lowest priority to unobservable inputs (Level 3 measurements).
Additionally, GAAP provides guidance on determining whether the volume and activity in a market has decreased significantly and whether such a decrease in activity results in transactions that are not orderly. GAAP requires enhanced disclosures around valuation inputs and techniques used during annual and interim periods.
Various inputs are used in determining the value of the fund’s investments relating to fair value measurements. These inputs are summarized in the three broad levels listed below:
Level 1—unadjusted quoted prices in active markets for identical investments.
44
Level 2—other significant observable inputs (including quoted prices for similar investments, interest rates, prepayment speeds, credit risk, etc.).
Level 3—significant unobservable inputs (including the fund’s own assumptions in determining the fair value of investments).
The inputs or methodology used for valuing securities are not necessarily an indication of the risk associated with investing in those securities.
Changes in valuation techniques may result in transfers in or out of an assigned level within the disclosure hierarchy. Valuation techniques used to value the fund’s investments are as follows:
Registered investment companies that are not traded on an exchange are valued at their net asset value and are generally categorized within Level 1 of the fair value hierarchy.
Investments in securities, excluding short-term investments (other than U.S. Treasury Bills), futures, options and forward foreign currency exchange contracts (“forward contracts”) are valued each business day by an independent pricing service (the “Service”) approved by the Trust’s Board of Trustees (the “Board”).Investments for which quoted bid prices are readily available and are representative of the bid side of the market in the judgment of the Service are valued at the mean between the quoted bid prices (as obtained by the Service from dealers in such securities) and asked prices (as calculated by the Service based upon its evaluation of the market for such securities). Other investments (which constitute a majority of the portfolio securities) are valued as determined by the Service, based on methods which include consideration of the following: yields or prices of securities of comparable quality, coupon, maturity and type; indications as to values from dealers; and general market conditions. These securities are generally categorized within Level 2 of the fair value hierarchy.
U.S. Treasury Bills are valued at the mean price between quoted bid prices and asked prices by the Service. These securities are generally categorized within Level 2 of the fair value hierarchy.
The Service is engaged under the general supervision of the Board.
When market quotations or official closing prices are not readily available, or are determined not to accurately reflect fair value, such as when the value of a security has been significantly affected by events after the close of the exchange or market on which the security is principally traded (for example, a foreign exchange or market), but before the fund calculates its net asset value, the fund may value these investments at fair value as determined in accordance with the procedures approved by the Board.
45
NOTES TO FINANCIAL STATEMENTS(continued)
Certain factors may be considered when fair valuing investments such as: fundamental analytical data, the nature and duration of restrictions on disposition, an evaluation of the forces that influence the market in which the securities are purchased and sold, and public trading in similar securities of the issuer or comparable issuers. These securities are either categorized within Level 2 or 3 of the fair value hierarchy depending on the relevant inputs used.
For restricted securities where observable inputs are limited, assumptions about market activity and risk are used and such securities are generally categorized within Level 3 of the fair value hierarchy.
Investments denominated in foreign currencies are translated to U.S. dollars at the prevailing rates of exchange.
Futures and options, which are traded on an exchange, are valued at the last sales price on the securities exchange on which such securities are primarily traded or at the last sales price on the national securities market on each business day and are generally categorized within Level 1 of the fair value hierarchy. Options traded over-the-counter (“OTC”) are valued at the mean between the bid and asked price and are generally categorized within Level 2 of the fair value hierarchy. Investments in swap agreements are valued each business day by the Service. Swaps are valued by the Service by using a swap pricing model which incorporates among other factors, default probabilities, recovery rates, credit curves of the underlying issuer and swap spreads on interest rates and are generally categorized within Level 2 of the fair value hierarchy. Forward contracts are valued at the forward rate and are generally categorized within Level 2 of the fair value hierarchy.
The following is a summary of the inputs used as of December 31, 2018in valuing the fund’s investments:
| | | | | |
| | Level 1 - Unadjusted Quoted Prices | Level 2 - Other Significant Observable
Inputs | Level 3 -Significant Unobservable Inputs | Total |
Assets ($) |
Investments in Securities: |
Asset-Backed | - | 538,416,891 | - | 538,416,891 |
Commercial
Mortgage-Backed | - | 78,251,166 | - | 78,251,166 |
Corporate Bonds | - | 751,100,163 | - | 751,100,163 |
Foreign Government | - | 1,625,728,667 | - | 1,625,728,667 |
Investment Companies | 78,919,225 | - | - | 78,919,225 |
46
| | | | | |
| | Level 1 - Unadjusted Quoted Prices | Level 2 - Other Significant Observable
Inputs | Level 3 -Significant Unobservable Inputs | Total |
Assets ($) |
Investments in Securities: |
U.S. Government Agencies/
Mortgage-Backed | - | 40,356,464 | - | 40,356,464 |
U.S. Treasury | - | 74,894,944 | - | 74,894,944 |
Other Financial Instruments: |
Futures† | 10,397,577 | - | - | 10,397,577 |
Options Purchased | - | 2,040,687 | - | 2,040,687 |
Forward Foreign Currency
Exchange Contracts† | - | 9,608,093 | - | 9,608,093 |
Swaps† | - | 101,210 | - | 101,210 |
Liabilities ($) | | | | |
Other Financial Instruments: |
Futures† | (3,139,454) | - | - | (3,139,454) |
Options Written | - | (344,889) | - | (344,889) |
Forward Foreign Currency
Exchange Contracts† | - | (27,837,376) | - | (27,837,376) |
Swaps† | - | (5,160,110) | - | (5,160,110) |
† Amount shown represents unrealized appreciation (depreciation) at period end, but only variation margin on exchanged traded and centrally cleared derivatives are reported in the Statement of Assets and Liabilities.
At December 31, 2018, there were no transfers between levels of the fair value hierarchy. It is the fund’s policy to recognize transfers between levels at the end of the reporting period.
(b) Foreign currency transactions: The fund does not isolate that portion of the results of operations resulting from changes in foreign exchange rates on investments from the fluctuations arising from changes in the market prices of securities held. Such fluctuations are included with the net realized and unrealized gain or loss on investments.
Net realized foreign exchange gains or losses arise from sales of foreign currencies, currency gains or losses realized on securities transactions between trade and settlement date, and the difference between the amounts of dividends, interest and foreign withholding taxes recorded on the fund’s books and the U.S. dollar equivalent of the amounts actually received or paid. Net unrealized foreign exchange gains and losses arise from changes in the value of assets and liabilities other than investments
47
NOTES TO FINANCIAL STATEMENTS(continued)
resulting from changes in exchange rates. Foreign currency gains and losses on foreign currency transactions are also included with net realized and unrealized gain or loss on investments.
(c)Securities transactions and investment income: Securities transactions are recorded on a trade date basis. Realized gains and losses from securities transactions are recorded on the identified cost basis. Dividend income is recognized on the ex-dividend date and interest income, including, where applicable, accretion of discount and amortization of premium on investments, is recognized on the accrual basis.
Pursuant to a securities lending agreement with The Bank of New York Mellon, the fund may lend securities to qualified institutions. It is the fund’s policy that, at origination, all loans are secured by collateral of at least 102% of the value of U.S. securities loaned and 105% of the value of foreign securities loaned. Collateral equivalent to at least 100% of the market value of securities on loan is maintained at all times. Collateral is either in the form of cash, which can be invested in certain money market mutual funds managed by Dreyfus, or U.S. Government and Agency securities. The fund is entitled to receive all dividends, interest and distributions on securities loaned, in addition to income earned as a result of the lending transaction. Should a borrower fail to return the securities in a timely manner, The Bank of New York Mellon is required to replace the securities for the benefit of the fund or credit the fund with the market value of the unreturned securities and is subrogated to the fund’s rights against the borrower and the collateral. Additionally, the contractual maturity of security lending transactions are on an overnight and continuous basis. During the period ended December 31, 2018, The Bank of New York Mellon earned $25,400 from lending portfolio securities, pursuant to the securities lending agreement.
(d) Affiliated issuers: Investments in other investment companies advised by Dreyfus are considered “affiliated” under the Act.
(e) Risk: Investing in foreign markets may involve special risks and considerations not typically associated with investing in the U.S. These risks include revaluation of currencies, high rates of inflation, repatriation restrictions on income and capital, and adverse political and economic developments. Moreover, securities issued in these markets may be less liquid, subject to government ownership controls and delayed settlements, and their prices may be more volatile than those of comparable securities in the U.S.
48
The fund invests in floating rate loan interests. The floating rate loans in which the fund invests typically are below investment grade securities, and inherently speculative. In the event of the bankruptcy of a borrower, the fund could experience delays or limitations imposed by insolvency laws with respect to its ability to realize the benefits of any collateral securing the borrower’s loan.
The fund invests primarily in debt securities. Failure of an issuer of the debt securities to make timely interest or principal payments, or a decline or the perception of a decline in the credit quality of a debt security, can cause the debt security’s price to fall, potentially lowering the fund’s share price. In addition, the value of debt securities may decline due to general market conditions that are not specifically related to a particular issuer, such as real or perceived adverse economic conditions, changes in outlook for corporate earnings, changes in interest or currency rates or adverse investor sentiment. Such values may also decline because of factors that affect a particular industry or country.
(f) Dividends and distributions to shareholders:Dividends and distributions are recorded on the ex-dividend date. Dividends from investment income-net are normally declared and paid quarterly. Dividends from net realized capital gains, if any, are normally declared and paid annually, but the fund may make distributions on a more frequent basis to comply with the distribution requirements of the Internal Revenue Code of 1986, as amended (the “Code”). To the extent that net realized capital gains can be offset by capital loss carryovers, it is the policy of the fund not to distribute such gains. Income and capital gain distributions are determined in accordance with income tax regulations, which may differ from GAAP.
(g) Federal income taxes: It is the policy of the fund to continue to qualify as a regulated investment company, if such qualification is in the best interests of its shareholders, by complying with the applicable provisions of the Code, and to make distributions of taxable income and net realized capital gain sufficient to relieve it from substantially all federal income and excise taxes.
As of and during the period ended December 31, 2018, the fund did not have any liabilities for any uncertain tax positions. The fund recognizes interest and penalties, if any, related to uncertain tax positions as income tax expense in the Statement of Operations. During the period ended December 31, 2018, the fund did not incur any interest or penalties.
49
NOTES TO FINANCIAL STATEMENTS(continued)
Each tax year in the four-year period ended December 31, 2018 remains subject to examination by the Internal Revenue Service and state taxing authorities.
At December 31, 2018, the components of accumulated earnings on a tax basis were as follows: accumulated capital losses $77,082,158 and unrealized depreciation $97,138,065. In addition, the fund deferred for tax purposes late year ordinary losses of $9,529,737 to the first day of the following year.
The fund is permitted to carry forward capital losses for an unlimited period. Furthermore, capital loss carryovers retain their character as either short-term or long-term capital losses.
The accumulated capital loss carryover is available for federal income tax purposes to be applied against future netrealized capital gains, if any, realized subsequent to December 31, 2018. The fund has $49,112,894 of short-term capital losses and $27,969,264 of long-term capital losses which can be carried forward for an unlimited period.
The tax character of distributions paid to shareholders during the fiscal periods ended December 31, 2018 and December 31, 2017 were as follows: ordinary income $125,595,580 and $65,661,600, and long-term capital gains $0 and $13,463,162, respectively.
During the period ended December 31, 2018, as a result of permanent book to tax differences, primarily due to the tax treatment for amortization adjustments, the fund increased total distributable earnings (loss) by $2,779,154 and decreased paid-in capital by the same amount. Net assets and net asset value per share were not affected by this reclassification.
(h) New Accounting Pronouncements: In March 2017, the FASB issued Accounting Standards Update 2017-08, Receivables—Nonrefundable Fees and Other Costs (Subtopic 310-20): Premium Amortization On Purchased Callable Debt Securities (“ASU 2017-08”). The update shortens the amortization period for the premium on certain purchased callable debt securities to the earliest call date. ASU 2017-08 will be effective for annual periods beginning after December 15, 2018.
Also in August 2018, the FASB issued Accounting Standards Update 2018-13, Fair Value Measurement (Topic 820): Disclosure Framework—Changes to the Disclosure Requirements for Fair Value Measurement (“ASU 2018-13”). The update provides guidance that eliminates, adds and modifies certain disclosure requirements for fair value measurements. ASU 2018-13 will be effective for annual periods beginning after December 15,
50
2019. Management is currently assessing the potential impact of these changes to future financial statements.
NOTE 2—Bank Lines of Credit:
The fund participates with other Dreyfus-managed long-term open-end funds in a $1.030 billion unsecured credit facility led by Citibank, N.A. (the “Citibank Credit Facility”) and a $300 million unsecured credit facility provided by The Bank of New York Mellon (the “BNYM Credit Facility”), each to be utilized primarily for temporary or emergency purposes, including the financing of redemptions (each, a “Facility”). The Citibank Credit Facility is available in two tranches: (i) Tranche A is in an amount equal to $830 million and is available to all long-term open-ended funds, including the fund, and (ii) Tranche B is in amount equal to $200 million and is available only to the Dreyfus Floating Rate Income Fund, a series of The Dreyfus/Laurel Funds, Inc. Prior to October 3, 2018, the unsecured credit facility with Citibank, N.A. was $830 million. In connection therewith, the fund has agreed to pay its pro rata portion of commitment fees for Tranche A of the Citibank Credit Facility and the BNYM Credit Facility. Interest is charged to the fund based on rates determined pursuant to the terms of the respective Facility at the time of borrowing. During the period ended December 31, 2018, the fund did not borrow under the Facilities.
NOTE 3—Investment Advisory Fee, Sub-Investment Advisory Fee, Administration Fee and Other Transactions with Affiliates:
(a)Pursuant to an investment advisory agreement with Dreyfus, the investment advisory fee is computed at the annual rate of .40% of the value of the fund’s average daily net assets and is payable monthly.
Pursuant to a sub-investment advisory agreement between Dreyfus and the Sub adviser, the Sub adviser serves as the fund’s sub-investment adviser responsible for the day-to-day management of the fund’s portfolio. Dreyfus pays the sub-investment adviser a monthly fee at an annual percentage of the value of the fund’s average daily net assets. Dreyfus has obtained an exemptive order from the SEC (the “Order”), upon which the fund may rely, to use a manager of managers approach that permits Dreyfus, subject to certain conditions and approval by the Board, to enter into and materially amend sub-investment advisory agreements with one or more sub-investment advisers who are either unaffiliated with Dreyfus or are wholly-owned subsidiaries (as defined under the Act) of Dreyfus’ ultimate parent company, BNY Mellon, without obtaining shareholder approval. The Order also allows the fund to disclose the sub-investment advisory fee paid by Dreyfus to any unaffiliated sub-investment adviser in
51
NOTES TO FINANCIAL STATEMENTS(continued)
the aggregate with other unaffiliated sub-investment advisers in documents filed with the SEC and provided to shareholders. In addition, pursuant to the Order, it is not necessary to disclose the sub-investment advisory fee payable by Dreyfus separately to a sub-investment adviser that is a wholly-owned subsidiary of BNY Mellon in documents filed with the SEC and provided to shareholders; such fees are to be aggregated with fees payable to Dreyfus. Dreyfus has ultimate responsibility (subject to oversight by the Board) to supervise any sub-investment adviser and recommend the hiring, termination, and replacement of any sub-investment adviser to the Board.
The fund has a Fund Accounting and Administrative Services Agreement (the “Administration Agreement”) with Dreyfus, whereby Dreyfus performs administrative, accounting and recordkeeping services for the fund. The fund has agreed to compensate Dreyfus for providing accounting and recordkeeping services, administration, compliance monitoring, regulatory and shareholder reporting, as well as related facilities, equipment and clerical help. The fee is based on the fund’s average daily net assets and computed at the following annual rates: .10% of the first $500 million, .065% of the next $500 million and .02% in excess of $1 billion.
In addition, after applying any expense limitations or fee waivers that reduce the fees paid to Dreyfus for this service, Dreyfus has contractually agreed in writing to waive any remaining fees for this service to the extent that they exceed both Dreyfus’ costs in providing these services and a reasonable allocation of the costs incurred by Dreyfus and its affiliates related to the support and oversight of these services. The fund also reimburses Dreyfus for the out-of-pocket expenses incurred in performing this service for the fund. Pursuant to the Administration Agreement, the fund was charged $267,440 during the period ended December 31, 2018.
During the period ended December 31, 2018, the Distributor retained $18,292 from commissions earned on sales of the fund’s Class A shares and $17,657 from CDSC fees on redemptions of the fund’s Class C shares.
(b) Under the Distribution Plan adopted pursuant to Rule 12b-1 under the Act, Class C shares pay the Distributor for distributing its shares at an annual rate of .75% of the value of its average daily net assets. During the period ended December 31, 2018, Class C shares were charged $557,352 pursuant to the Distribution Plan.
(c)Under the Shareholder Services Plan, Class A and Class C shares pay the Distributor at an annual rate of .25% of the value of their average daily net assets for the provision of certain services. The services provided may include personal services relating to shareholder accounts, such as
52
answering shareholder inquiries regarding the fund and providing reports and other information, and services related to the maintenance of shareholder accounts. The Distributor may make payments to Service Agents (securities dealers, financial institutions or other industry professionals) with respect to these services. The Distributor determines the amounts to be paid to Service Agents. During the period ended December 31, 2018, Class A and Class C shares were charged $416,429and $185,784, respectively, pursuant to the Shareholder Services Plan.
Under its terms, the Distribution Plan and Shareholder Services Plan shall remain in effect from year to year, provided such continuance is approved annually by a vote of a majority of those Trustees who are not “interested persons” of the Trust and who have no direct or indirect financial interest in the operation of or in any agreement related to the Distribution Plan or Shareholder Services Plan.
The fund has arrangements with the transfer agent and the custodian whereby the fund may receive earnings credits when positive cash balances are maintained, which are used to offset transfer agency and custody fees. For financial reporting purposes, the fund includes net earnings credits, if any, as an expense offset in the Statement of Operations.
The fund compensates Dreyfus Transfer, Inc., a wholly-owned subsidiary of Dreyfus, under a transfer agency agreement for providing transfer agency and cash management services for the fund. The majority of transfer agency fees are comprised of amounts paid on a per account basis, while cash management fees are related to fund subscriptions and redemptions. During the period ended December 31, 2018, the fund was charged $42,493 for transfer agency services. These fees are included in Shareholder servicing costs in the Statement of Operations.
The fund compensates The Bank of New York Mellon under a custody agreement for providing custodial services for the fund. These fees are determined based on net assets, geographic region and transaction activity. During the period ended December 31, 2018, the fund was charged $468,087 pursuant to the custody agreement. These fees were partially offset by earnings credits of $11,719.
During the period ended December 31, 2018, the fund was charged $12,774 for services performed by the Chief Compliance Officer and his staff. These fees are included in Miscellaneous in the Statement of Operations.
The components of “Due to The Dreyfus Corporation and affiliates” in the Statement of Assets and Liabilities consist of: investment advisory fees $1,089,295, administration fees $33,655, Distribution Plan fees $42,196,
53
NOTES TO FINANCIAL STATEMENTS(continued)
Shareholder Services Plan fees $44,897, custodian fees $274,942, Chief Compliance Officer fees $6,289 and transfer agency fees $5,792.
(d) Each Board member also serves as a Board member of other funds within the Dreyfus complex. Annual retainer fees and attendance fees are allocated to each fund based on net assets.
NOTE 4—Securities Transactions:
The aggregate amount of purchases and sales (including paydowns) of investment securities, excluding short-term securities, futures, options transactions, forward contracts, and swap agreements, during the period ended December 31, 2018, amounted to $3,354,738,384 and $3,181,224,134, respectively.
Derivatives: A derivative is a financial instrument whose performance is derived from the performance of another asset. The fund enters into International Swaps and Derivatives Association, Inc. Master Agreements or similar agreements (collectively, “Master Agreements”) with its OTC derivative contract counterparties in order to, among other things, reduce its credit risk to counterparties. Master Agreements include provisions for general obligations, representations, collateral and events of default or termination. Under a Master Agreement, the fund may offset with the counterparty certain derivative financial instrument’s payables and/or receivables with collateral held and/or posted and create one single net payment in the event of default or termination.
Each type of derivative instrument that was held by the fund during the period ended December 31, 2018 is discussed below.
Futures:In the normal course of pursuing its investment objective, the fund is exposed to market risk, including interest rate riskas a result of changes in value of underlying financial instruments. The fund invests in futures in order to manage its exposure to or protect against changes in the market. A futures contract represents a commitment for the future purchase or a sale of an asset at a specified date. Upon entering into such contracts, these investments require initial margin deposits with a counterparty, which consist of cash or cash equivalents. The amount of these deposits is determined by the exchange or Board of Trade on which the contract is traded and is subject to change. Accordingly, variation margin payments are received or made to reflect daily unrealized gains or losses which are recorded in the Statement of Operations. When the contracts are closed, the fund recognizes a realized gain or loss which is reflected in the Statement of Operations. There is minimal counterparty credit risk to the fund with futures since they are exchange traded, and the
54
exchange guarantees the futures against default. Futures open at December 31, 2018 are set forth in the Statement of Futures.
Options Transactions: The fund purchases and writes (sells) put and call options to hedge against changes in the values of interest rates and foreign currencies, or as a substitute for an investment. The fund is subject to market risk, interest rate risk and currency risk in the course of pursuing its investment objectives through its investments in options contracts. A call option gives the purchaser of the option the right (but not the obligation) to buy, and obligates the writer to sell, the underlying financial instrument at the exercise price at any time during the option period, or at a specified date. Conversely, a put option gives the purchaser of the option the right (but not the obligation) to sell, and obligates the writer to buy the underlying financial instrument at the exercise price at any time during the option period, or at a specified date.
As a writer of call options, the fund receives a premium at the outset and then bears the market risk of unfavorable changes in the price of the financial instrument underlying the option. Generally, the fund realizes a gain, to the extent of the premium, if the price of the underlying financial instrument decreases between the date the option is written and the date on which the option is terminated. Generally, the fund incurs a loss if the price of the financial instrument increases between those dates.The maximum payout for those contracts is limited to the number of call option contracts written and the related strike prices, respectively.
As a writer of put options, the fund receives a premium at the outset and then bears the market risk of unfavorable changes in the price of the financial instrument underlying the option. Generally, the fund realizes a gain, to the extent of the premium, if the price of the underlying financial instrument increases between the date the option is written and the date on which the option is terminated. Generally, the fund incurs a loss if the price of the financial instrument decreases between those dates. The maximum payout for those contracts is limited to the number of put option contracts written and the related strike prices, respectively.
As a writer of an option, the fund has no control over whether the underlying financial instrument may be sold (call) or purchased (put) and as a result bears the market risk of an unfavorable change in the price of the financial instrument underlying the written option. There is a risk of loss from a change in value of such options which may exceed the related premiums received. This risk is mitigated by Master Agreements between the fund and the counterparty and the posting of collateral, if any, by the counterparty to the fund to cover the fund’s exposure to the counterparty. The Statement of Operations reflects any unrealized gains or losses which
55
NOTES TO FINANCIAL STATEMENTS(continued)
occurred during the period as well as any realized gains or losses which occurred upon the expiration or closing of the option transaction.Options written open at December 31, 2018 are set forth in Statement of Options Written.
Forward Foreign Currency Exchange Contracts: The fund enters into forward contracts in order to hedge its exposure to changes in foreign currency exchange rates on its foreign portfolio holdings, to settle foreign currency transactions or as a part of its investment strategy. When executing forward contracts, the fund is obligated to buy or sell a foreign currency at a specified rate on a certain date in the future. With respect to sales of forward contracts, the fund incurs a loss if the value of the contract increases between the date the forward contract is opened and the date the forward contract is closed. The fund realizes a gain if the value of the contract decreases between those dates. With respect to purchases of forward contracts, the fund incurs a loss if the value of the contract decreases between the date the forward contract is opened and the date the forward contract is closed. The fund realizes a gain if the value of the contract increases between those dates. Any realized or unrealized gains or losses which occurred during the period are reflected in the Statement of Operations. The fund is exposed to foreign currency risk as a result of changes in value of underlying financial instruments. The fund is also exposed to credit risk associated with counterparty nonperformance on these forward contracts, which is generally limited to the unrealized gain on each open contract. This risk may be mitigated by Master Agreements, if any, between the fund and the counterparty and the posting of collateral, if any, by the counterparty to the fund to cover the fund’s exposure to the counterparty. Forward contracts open at December 31, 2018 are set forth in the Statement of Forward Foreign Currency Exchange Contracts.
Swap Agreements:The fund enters into swap agreements to exchange the interest rate on, or return generated by, one nominal instrument for the return generated by another nominal instrument. Swap agreements are privately negotiated in the OTC market or centrally cleared. The fund enters into these agreements to hedge certain market or interest rate risks, to manage the interest rate sensitivity (sometimes called duration) of fixed income securities, to provide a substitute for purchasing or selling particular securities or to increase potential returns.
For OTC swaps, the fund accrues for interim payments on a daily basis, with the net amount recorded within unrealized appreciation (depreciation) on swap agreements in the Statement of Assets and Liabilities. Once the interim payments are settled in cash, the net amount is recorded as a realized gain (loss) on swaps, in addition to realized gain (loss) recorded
56
upon the termination of swap agreements in the Statement of Operations. Upfront payments made and/or received by the fund, are recorded as an asset and/or liability in the Statement of Assets and Liabilities and are recorded as a realized gain or loss ratably over the agreement’s term/event with the exception of forward starting interest rate swaps which are recorded as realized gains or losses on the termination date.
Upon entering into centrally cleared swap agreements, an initial margin deposit is required with a counterparty, which consists of cash or cash equivalents. The amount of these deposits is determined by the exchange on which the agreement is traded and is subject to change. The change in valuation of centrally cleared swaps is recorded as a receivable or payable for variation margin in the Statement of Assets and Liabilities. Payments received from (paid to) the counterparty, including upon termination, are recorded as realized gain (loss) in the Statement of Operations.
Fluctuations in the value of swap agreements are recorded for financial statement purposes as unrealized appreciation or depreciation on swap agreements.
Interest Rate Swaps: Interest rate swaps involve the exchange of commitments to pay and receive interest based on a notional principal amount. The fund may elect to pay a fixed rate and receive a floating rate, or receive a fixed rate and pay a floating rate on a notional principal amount. The net interest received or paid on interest rate swap agreements is included within realized gain (loss) on swap agreements in the Statement of Operations. Interest rate swap agreements are subject to general market risk, liquidity risk, counterparty risk and interest rate risk.
For OTC swaps, the fund’s maximum risk of loss from counterparty risk is the discounted value of the cash flows to be received from the counterparty over the agreement’s remaining life, to the extent that the amount is positive. This risk may be mitigated by Master Agreements, if any, between the fund and the counterparty and the posting of collateral, if any, by the counterparty to the fund to cover the fund’s exposure to the counterparty. There is minimal counterparty risk to the fund with centrally cleared swaps since they are exchange traded and the exchange guarantees these swap against default. Interest rate swaps open at December 31, 2018 are set forth in the Statement of Swap Agreements.
Credit Default Swaps: Credit default swaps involve commitments to pay a fixed interest rate in exchange for payment if a credit event affecting a third party (the referenced obligation or index) occurs. Credit events may include a failure to pay interest or principal, bankruptcy, or restructuring. The fund enters into these agreements to manage its exposure to the
57
NOTES TO FINANCIAL STATEMENTS(continued)
market or certain sectors of the market, to reduce its risk exposure to defaults of corporate and sovereign issuers, or to create exposure to corporate or sovereign issuers to which it is not otherwise exposed. For those credit default swaps in which the fund is paying a fixed rate, the fund is buying credit protection on the instrument. In the event of a credit event, the fund would receive the full notional amount for the reference obligation. For those credit default swaps in which the fund is receiving a fixed rate, the fund is selling credit protection on the underlying instrument. The maximum payouts for these agreements are limited to the notional amount of each swap. Credit default swaps may involve greater risks than if the fund had invested in the reference obligation directly and are subject to general market risk, liquidity risk, counterparty risk and credit risk. This risk may be mitigated by Master Agreements, if any, between the fund and the counterparty and the posting of collateral, if any, by the counterparty to the fund to cover the fund’s exposure to the counterparty.
The maximum potential amount of future payments (undiscounted) that a fund as a seller of protection could be required to make under a credit default swap agreement would be an amount equal to the notional amount of the agreement which may exceed the amount of unrealized appreciation or depreciation reflected in the Statement of Assets and Liabilities. Notional amounts of all credit default swap agreements are disclosed in the Statement of Swap Agreements, which summarizes open credit default swaps entered into by the fund. These potential amounts would be partially offset by any recovery values of the respective referenced obligations, underlying securities comprising the referenced index, upfront payments received upon entering into the agreement, or net amounts received from the settlement of buy protection credit default swap agreements entered into by the fund for the same referenced entity or entities. Credit default swaps open at December 31, 2018 are set forth in the Statement of Swap Agreements.
GAAP requires disclosure for (i) the nature and terms of the credit derivative, reasons for entering into the credit derivative, the events or circumstances that would require the seller to perform under the credit derivative, and the current status of the payment/performance risk of the credit derivative, (ii) the maximum potential amount of future payments (undiscounted) the seller could be required to make under the credit derivative, (iii) the fair value of the credit derivative, and (iv) the nature of any recourse provisions and assets held either as collateral or by third parties. All required disclosures have been made and are incorporated within the current period as part of the Notes to the Statement of Investments and disclosures within this Note.
58
The following tables show the fund’s exposure to different types of market risk as it relates to the Statement of Assets and Liabilities and the Statement of Operations, respectively.
Fair value of derivative instruments as of December 31, 2018 is shown below:
| | | | | | | | |
| | Derivative
Assets ($) | | | | Derivative
Liabilities ($) | |
Interest rate risk | 10,397,577 | 1 | Interest rate risk | (8,299,181) | 1,2 |
Foreign exchange risk | 11,648,780 | 3,4 | Foreign exchange risk | (28,182,265) | 4,5 |
Credit risk | 101,210 | 2 | Credit risk | (383) | 2 |
Gross fair value of
derivative contracts | 22,147,567 | | | | (36,481,829) | |
| | | | | | | |
Statement of Assets and Liabilities location: | |
1 Includes cumulative appreciation (depreciation) on futures as reported in the Statement of Futures, but only the unpaid variation margin is reported in the Statement of Assets and Liabilities. |
2 Includes cumulative appreciation (depreciation) on swap agreements as reported in the Statement of Swap Agreements. Unrealized appreciation (depreciation) on OTC swap agreements and only unpaid variation margin on cleared swap agreements, are reported in the Statement of Assets and Liabilities. |
3 Options purchased are included in Investments in securities—Unaffiliated issuers, at value. |
4 Unrealized appreciation (depreciation) on forward foreign currency exchange contracts. |
5 Outstanding options written, at value. | |
The effect of derivative instruments in the Statement of Operations during the period ended December 31, 2018 is shown below:
| | | | | | | | | | | |
Amount of realized gain (loss) on derivatives recognized in income ($) | |
Underlying
risk | Futures | 1 | Options
Transactions | 2 | Forward
Contracts | 3 | Swap
Agreements | 4 | Total | |
Interest
rate | 8,621,697 | | (1,766,420) | | - | | (583,480) | | 6,271,797 | |
Foreign
exchange | - | | (7,706,414) | | 73,392,365 | | - | | 65,685,951 | |
Credit | - | | - | | - | | 361,835 | | 361,835 | |
Total | 8,621,697 | | (9,472,834) | | 73,392,365 | | (221,645) | | 72,319,583 | |
| | | | | | | | | | | |
59
NOTES TO FINANCIAL STATEMENTS(continued)
| | | | | | | | | | | | |
Change in unrealized appreciation (depreciation)
on derivatives recognized in income ($) | |
Underlying
risk | Futures | 5 | Options
Transactions | 6 | Forward
Contracts | 7 | Swap
Agreements | 8 | Total | |
Interest
rate | 8,014,127 | | 774,144 | | - | | (4,050,740) | | 4,737,531 | |
Foreign
exchange | - | | (4,200,803) | | 14,137,714 | | - | | 9,936,911 | |
Credit | - | | - | | - | | 100,827 | | 100,827 | |
Total | 8,014,127 | | (3,426,659) | | 14,137,714 | | (3,949,913) | | 14,775,269 | |
| | | | | | | | | | | | |
Statement of Operations location: | |
1 Net realized gain (loss) on futures. | | |
2 Net realized gain (loss) on options transactions. |
3 Net realized gain (loss) on forward foreign currency exchange contracts. | | |
4 Net realized gain (loss) on swap agreements. | | |
5 Net unrealized appreciation (depreciation) on futures. | | |
6 Net unrealized appreciation (depreciation) on options transactions. | | |
7 Net unrealized appreciation (depreciation) on forward foreign currency exchange contracts. | |
8 Net unrealized appreciation (depreciation) on swap agreements. | | |
The provisions of ASC Topic 210 “Disclosures about Offsetting Assets and Liabilities” require disclosure on the offsetting of financial assets and liabilities. These disclosures are required for certain investments, including derivative financial instruments subject to Master Agreements which are eligible for offsetting in the Statement of Assets and Liabilities and require the fund to disclose both gross and net information with respect to such investments. For financial reporting purposes, the fund does not offset derivative assets and derivative liabilities that are subject to Master Agreements in the Statement of Assets and Liabilities.
At December 31, 2018, derivative assets and liabilities (by type) on a gross basis are as follows:
| | | | | | |
Derivative Financial Instruments: | | Assets ($) | | Liabilities ($) | |
Futures | | 10,397,577 | | (3,139,454) | |
Options | | 2,040,687 | | (344,889) | |
Forward contracts | | 9,608,093 | | (27,837,376) | |
Swaps | | 101,210 | | (5,160,110) | |
Total gross amount of derivative | | | | | |
assets and liabilities in the | | | | | |
Statement of Assets and Liabilities | | 22,147,567 | | (36,481,829) | |
Derivatives not subject to | | | | | |
Master Agreements | | (10,498,787) | | 8,299,181 | |
Total gross amount of assets | | | | | |
and liabilities subject to | | | | | |
Master Agreements | | 11,648,780 | | (28,182,648) | |
60
The following tables present derivative assets and liabilities net of amounts available for offsetting under Master Agreements and net of related collateral received or pledged, if any, as of December 31, 2018:†
| | | | | | | |
| | | | Financial | | | |
| | | | Instruments | | | |
| | | | and Derivatives | | | |
| | Gross Amount of | | Available | Collateral | | Net Amount of |
Counterparty | Assets ($) | 1 | for Offset ($) | Received ($) | 2 | Assets ($) |
Barclays Capital | 3,780,814 | | (3,780,814) | - | | - |
Citigroup | 2,408,545 | | (1,496,643) | - | | 911,902 |
Goldman Sachs
International | 1,693,788 | | (1,505,889) | (187,899) | | - |
HSBC | 1,104,980 | | (524,472) | (580,508) | | - |
J.P. Morgan Securities | 2,552,225 | | (2,552,225) | - | | - |
UBS Securities | 108,428 | | (108,428) | - | | - |
Total | 11,648,780 | | (9,968,471) | (768,407) | | 911,902 |
| | | | | | | |
| | | | Financial | | | |
| | | | Instruments | | | |
| | | | and Derivatives | | | |
| | Gross Amount of | | Available | Collateral | | Net Amount of |
Counterparty | Liabilities ($) | 1 | for Offset ($) | Pledged ($) | 2 | Liabilities ($) |
Barclays Capital | (19,512,034) | | 3,780,814 | - | | (15,731,220) |
Citigroup | (1,496,643) | | 1,496,643 | - | | - |
Goldman Sachs
International | (1,505,889) | | 1,505,889 | - | | - |
HSBC | (524,472) | | 524,472 | - | | - |
J.P. Morgan Securities | (3,274,248) | | 2,552,225 | - | | (722,023) |
Merrill Lynch, Pierce, Fenner & Smith | (81,482) | | - | - | | (81,482) |
UBS Securities | (1,787,880) | | 108,428 | 9,628 | | (1,669,824) |
Total | (28,182,648) | | 9,968,471 | 9,628 | | (18,204,549) |
| | | | | | | |
1 Absent a default event or early termination, OTC derivative assets and liabilities are presented at gross amounts and are not offset in the Statement of Assets and Liabilities. |
2 In some instances, the actual collateral received and/or pledged may be more than the amount shown due to over collateralization. |
† See Statement of Investments for detailed information regarding collateral held for open exchange traded derivative contracts. |
The following summarizes the average market value of derivatives outstanding duringthe period ended December 31, 2018:
| | | |
| | Average Market Value ($) |
Interest rate futures | | 1,368,439,866 |
Interest rate options contracts | | 874,330 |
Foreign currency options contracts | | 3,995,109 |
Forward contracts | | 3,082,459,339 |
| | | |
61
NOTES TO FINANCIAL STATEMENTS(continued)
The following summarizes the average notional value of swap agreements outstanding during the period ended December 31, 2018:
| | | |
| | Average Notional Value ($) |
Interest rate swap agreements | | 266,901,341 |
Credit default swap agreements | | 3,903,077 |
| | | |
At December 31, 2018, the cost of investments for federal income tax purposes was $3,277,544,991; accordingly, accumulated net unrealized depreciation on investments inclusive of derivative contracts was $94,066,313, consisting of $40,433,231 gross unrealized appreciation and $134,499,544 gross unrealized depreciation.
62
REPORT OF INDEPENDENT REGISTERED PUBLIC ACCOUNTING FIRM
To the Shareholders and Board of Trustees
Dreyfus Investment Funds:
Opinion on the Financial Statements
We have audited the accompanying statement of assets and liabilities of Dreyfus/Standish Global Fixed Income Fund (the “Fund”), a series of Dreyfus Investment Funds, including the statements of investments, investments in affiliated issuers, futures, options written, forward foreign currency exchange contracts and swap agreements, as of December 31, 2018, the related statement of operations for the year then ended, the statements of changes in net assets for each of the years in the two-year period then ended, and the related notes (collectively, the financial statements) and the financial highlights for each of the years in the five-year period then ended. In our opinion, the financial statements and financial highlights present fairly, in all material respects, the financial position of the Fund as of December 31, 2018, the results of its operations for the year then ended, the changes in its net assets for each of the years in the two-year period then ended and the financial highlights for each of the years in the five-year period then ended, in conformity with U.S. generally accepted accounting principles.
Basis for Opinion
These financial statements and financial highlights are the responsibility of the Fund’s management. Our responsibility is to express an opinion on these financial statements and financial highlights based on our audits. We are a public accounting firm registered with the Public Company Accounting Oversight Board (United States) (PCAOB) and are required to be independent with respect to the Fund in accordance with the U.S. federal securities laws and the applicable rules and regulations of the Securities and Exchange Commission and the PCAOB.
We conducted our audits in accordance with the standards of the PCAOB. Those standards require that we plan and perform the audit to obtain reasonable assurance about whether the financial statements and financial highlights are free of material misstatement, whether due to error or fraud. Our audits included performing procedures to assess the risks of material misstatement of the financial statements and financial highlights, whether due to error or fraud, and performing procedures that respond to those risks. Such procedures included examining, on a test basis, evidence regarding the amounts and disclosures in the financial statements and financial highlights. Such procedures also included confirmation of securities owned as of December 31, 2018, by correspondence with the custodian and brokers or by other appropriate auditing procedures when replies from brokers were not received. Our audits also included evaluating the accounting principles used and significant estimates made by management, as well as evaluating the overall presentation of the financial statements and financial highlights. We believe that our audits provide a reasonable basis for our opinion.

We have served as the auditor of one or more Dreyfus Corporation investment companies since 1994.
New York, New York
February 28, 2019
63
IMPORTANT TAX INFORMATION(Unaudited)
For federal tax purposes, the fund reports the maximum amount allowable but not less than 24.34% as interest-related dividends in accordance with Sections 871(k)(1) and 881(e) of the Internal Revenue Code.
64
BOARD MEMBERS INFORMATION(Unaudited)
INDEPENDENT BOARD MEMBERS
Joseph S. DiMartino (75)
Chairman of the Board (2008)
Principal Occupation During Past 5 Years:
· Corporate Director and Trustee (1995-present)
Other Public Company Board Memberships During Past 5 Years:
· CBIZ (formerly, Century Business Services, Inc.), a provider of outsourcing functions for small and medium size companies, Director (1997-present)
No. of Portfolios for which Board Member Serves:122
———————
Francine J. Bovich (67)
Board Member (2011)
Principal Occupation During Past 5 Years:
· Trustee, The Bradley Trusts, private trust funds (2011-present)
Other Public Company Board Memberships During Past 5 Years:
· Annaly Capital Management, Inc., a real estate trust, Director (2014-present)
No. of Portfolios for which Board Member Serves:70
———————
Kenneth A. Himmel (72)
Board Member (2008)
Principal Occupation During Past 5 Years:
· Managing Partner, Gulf Related, an international real estate development company (2010-present)
· President and CEO, Related Urban Development, a real estate development company (1996-present)
· President and CEO, Himmel & Company, a real estate development company (1980-present)
· CEO, American Food Management, a restaurant company (1983-present)
No. of Portfolios for which Board Member Serves:23
———————
65
BOARD MEMBERS INFORMATION (Unaudited) (continued)
INDEPENDENT BOARD MEMBERS (continued)
Stephen J. Lockwood (71)
Board Member (2008)
Principal Occupation During Past 5 Years:
· Chairman of the Board, Stephen J. Lockwood and Company LLC, a real estate investment company (2000-present)
No. of Portfolios for which Board Member Serves:23
———————
Roslyn M. Watson (69)
Board Member (2008)
Principal Occupation During Past 5 Years:
· Principal, Watson Ventures, Inc., a real estate investment company (1993-present)
No. of Portfolios for which Board Member Serves:56
———————
Benaree Pratt Wiley (72)
Board Member (2008)
Principal Occupation During Past 5 Years:
· Principal, The Wiley Group, a firm specializing in strategy and business development (2005-present)
Other Public Company Board Memberships During Past 5 Years:
· CBIZ (formerly, Century Business Services, Inc.), a provider of outsourcing functions for small and medium size companies, Director (2008-present)
No. of Portfolios for which Board Member Serves:77
———————
Once elected all Board Members serve for an indefinite term, but achieve Emeritus status upon reaching age 80. The address of the Board Members and Officers is c/o The Dreyfus Corporation, 200 Park Avenue, New York, New York 10166. Additional information about the Board Members is available in the fund’s Statement of Additional Information which can be obtained from Dreyfus free of charge by calling this toll free number: 1-800-DREYFUS.
James M. Fitzgibbons, Emeritus Board Member
66
OFFICERS OF THE FUND(Unaudited)
BRADLEY J. SKAPYAK, President since January 2010.
Chief Operating Officer and a director of the Manager since June 2009, Chairman of Dreyfus Transfer, Inc., an affiliate of the Manager and the transfer agent of the funds, since May 2011 and Chief Executive Officer of MBSC Securities Corporation since August 2016. He is an officer of 62 investment companies (comprised of 122 portfolios) managed by the Manager. He is 60 years old and has been an employee of the Manager since February 1988.
BENNETT A. MACDOUGALL, Chief Legal Officer since October 2015.
Chief Legal Officer of the Manager and Associate General Counsel and Managing Director of BNY Mellon since June 2015; from June 2005 to June 2015, he served in various capacities with Deutsche Bank – Asset & Wealth Management Division, including as Director and Associate General Counsel, and Chief Legal Officer of Deutsche Investment Management Americas Inc. from June 2012 to May 2015. He is an officer of 63 investment companies (comprised of 147 portfolios) managed by the Manager. He is 47 years old and has been an employee of the Manager since June 2015.
JAMES BITETTO, Vice President since August 2005 and Secretary since February 2018.
Managing Counsel of BNY Mellon and Secretary of the Manager, and an officer of 63 investment companies (comprised of 147 portfolios) managed by the Manager. He is 52 years old and has been an employee of the Manager since December 1996.
SONALEE CROSS, Vice President and Assistant Secretary since March 2018.
Counsel of BNY Mellon since October 2016; Associate at Proskauer Rose LLP from April 2016 to September 2016; Attorney at EnTrust Capital from August 2015 to February 2016; Associate at Sidley Austin LLP from September 2013 until August 2015. She is an officer of 63 investment companies (comprised of 147 portfolios) managed by Dreyfus. She is 31 years old and has been an employee of the Manager since October 2016.
SARAH S. KELLEHER, Vice President and Assistant Secretary since April 2014.
Managing Counsel of BNY Mellon since December 2017, from March 2013 to December 2017, Senior Counsel of BNY Mellon. She is an officer of 63 investment companies (comprised of 147 portfolios) managed by the Manager. She is 43 years old and has been an employee of the Manager since March 2013.
JEFF PRUSNOFSKY, Vice President and Assistant Secretary since December 2008.
Senior Managing Counsel of BNY Mellon, and an officer of 63 investment companies (comprised of 147 portfolios) managed by the Manager. He is 53 years old and has been an employee of the Manager since October 1990.
NATALYA ZELENSKY, Vice President and Assistant Secretary since March 2017.
Counsel of BNY Mellon since May 2016; Attorney at Wildermuth Endowment Strategy Fund/Wildermuth Advisory, LLC from November 2015 until May 2016; Assistant General Counsel at RCS Advisory Services from July 2014 until November 2015; Associate at Sutherland, Asbill & Brennan from January 2013 until January 2014. She is an officer of 63 investment companies (comprised of 147 portfolios) managed by Dreyfus. She is 33 years old and has been an employee of the Manager since May 2016.
JAMES WINDELS, Treasurer since December 2008.
Director – Mutual Fund Accounting of the Manager, and an officer of 63 investment companies (comprised of 147 portfolios) managed by the Manager. He is 60 years old and has been an employee of the Manager since April 1985.
GAVIN C. REILLY, Assistant Treasurer since December 2008.
Tax Manager of the Investment Accounting and Support Department of the Manager, and an officer of 63 investment companies (comprised of 147 portfolios) managed by the Manager. He is 50 years old and has been an employee of the Manager since April 1991.
ROBERT S. ROBOL, Assistant Treasurer since December 2008.
Senior Accounting Manager – Dreyfus Financial Reporting of the Manager, and an officer of 63 investment companies (comprised of 147 portfolios) managed by the Manager. He is 54 years old and has been an employee of the Manager since October 1988.
67
OFFICERS OF THE FUND (Unaudited)(continued)
ROBERT SALVIOLO, Assistant Treasurer since December 2008.
Senior Accounting Manager – Equity Funds of the Manager, and an officer of 63 investment companies (comprised of 147 portfolios) managed by the Manager. He is 51 years old and has been an employee of the Manager since June 1989.
ROBERT SVAGNA, Assistant Treasurer since December 2008.
Senior Accounting Manager – Fixed Income and Equity Funds of the Manager, and an officer of 63 investment companies (comprised of 147 portfolios) managed by the Manager. He is 51 years old and has been an employee of the Manager since November 1990.
JOSEPH W. CONNOLLY, Chief Compliance Officer since December 2008.
Chief Compliance Officer of the Manager, the Dreyfus Family of Funds and BNY Mellon Funds Trust (63 investment companies, comprised of 147 portfolios). He is 61 years old and has served in various capacities with the Manager since 1980, including manager of the firm’s Fund Accounting Department from 1997 through October 2001.
CARIDAD M. CAROSELLA, Anti-Money Laundering Compliance Officer since January 2016.
Anti-Money Laundering Compliance Officer of the Dreyfus Family of Funds and BNY Mellon Funds Trust since January 2016; from May 2015 to December 2015, Interim Anti-Money Laundering Compliance Officer of the Dreyfus Family of Funds and BNY Mellon Funds Trust and the Distributor; from January 2012 to May 2015, AML Surveillance Officer of the Distributor and from 2007 to December 2011, Financial Processing Manager of the Distributor. She is an officer of 57 investment companies (comprised of 141 portfolios) managed by the Manager. She is 50 years old and has been an employee of the Distributor since 1997.
68
NOTES
69
Dreyfus/Standish Global Fixed Income Fund
200 Park Avenue
New York, NY 10166
Investment Adviser
The Dreyfus Corporation
200 Park Avenue
New York, NY 10166
Sub-Investment Adviser
Mellon Investments Corporation
BNY Mellon Center
One Boston Place
Boston, MA 02108
Custodian
The Bank of New York Mellon
240 Greenwich Street
New York, NY 10286
Transfer Agent &
Dividend Disbursing Agent
Dreyfus Transfer, Inc.
200 Park Avenue
New York, NY 10166
Distributor
MBSC Securities Corporation
200 Park Avenue
New York, NY 10166
| | |
Ticker Symbols: | Class A: DHGAX Class C: DHGCX Class I: SDGIX Class Y: DSDYX |
Telephone Call your financial representative or 1-800-DREYFUS
Mail The Dreyfus Family of Funds, 144 Glenn Curtiss Boulevard, Uniondale, NY 11556-0144
E-mailSend your request toinfo@dreyfus.com
InternetInformation can be viewed online or downloaded atwww.dreyfus.com
The fund files its complete schedule of portfolio holdings with the Securities and Exchange Commission (“SEC”) for the first and third quarters of each fiscal year on Form N-Q. The fund’s Forms N-Q are available on the SEC’s website atwww.sec.gov.
A description of the policies and procedures that the fund uses to determine how to vote proxies relating to portfolio securities and information regarding how the fund voted these proxies for the most recent 12-month period ended June 30 is available atwww.dreyfus.com and on the SEC’s website atwww.sec.gov and without charge, upon request, by calling 1-800-DREYFUS.
| | |
© 2019 MBSC Securities Corporation
6940AR1218 | 
|
Item 2. Code of Ethics.
The Registrant has adopted a code of ethics that applies to the Registrant's principal executive officer, principal financial officer, principal accounting officer or controller, or persons performing similar functions. There have been no amendments to, or waivers in connection with, the Code of Ethics during the period covered by this Report.
Item 3. Audit Committee Financial Expert.
The Registrant's Board has determined that Joseph S. DiMartino, a member of the Audit Committee of the Board, is an audit committee financial expert as defined by the Securities and Exchange Commission (the "SEC"). Mr. DiMartino is "independent" as defined by the SEC for purposes of audit committee financial expert determinations.
Item 4. Principal Accountant Fees and Services.
(a) Audit Fees. The aggregate fees billed for each of the last two fiscal years (the "Reporting Periods") for professional services rendered by the Registrant's principal accountant (the "Auditor") for the audit of the Registrant's annual financial statements or services that are normally provided by the Auditor in connection with the statutory and regulatory filings or engagements for the Reporting Periods, were $50,555 in 2017 and $51,310 in 2018.
(b) Audit-Related Fees. The aggregate fees billed in the Reporting Periods for assurance and related services by the Auditor that are reasonably related to the performance of the audit of the Registrant's financial statements and are not reported under paragraph (a) of this Item 4 were $5,360 in 2017 and $5,440 in 2018. These services consisted of one or more of the following: (i) agreed upon procedures related to compliance with Internal Revenue Code section 817(h), (ii) security counts required by Rule 17f-2 under the Investment Company Act of 1940, as amended, (iii) advisory services as to the accounting or disclosure treatment of Registrant transactions or events and (iv) advisory services to the accounting or disclosure treatment of the actual or potential impact to the Registrant of final or proposed rules, standards or interpretations by the Securities and Exchange Commission, the Financial Accounting Standards Boards or other regulatory or standard-setting bodies.
The aggregate fees billed in the Reporting Periods for non-audit assurance and related services by the Auditor to the Registrant's investment adviser (not including any sub-investment adviser whose role is primarily portfolio management and is subcontracted with or overseen by another investment adviser), and any entity controlling, controlled by or under common control with the investment adviser that provides ongoing services to the Registrant ("Service Affiliates"), that were reasonably related to the performance of the annual audit of the Service Affiliate, which required pre-approval by the Audit Committee were $0 in 2017 and $0 in 2018.
(c) Tax Fees. The aggregate fees billed in the Reporting Periods for professional services rendered by the Auditor for tax compliance, tax advice, and tax planning ("Tax Services") were $2,900 in 2017 and $2,960 in 2018. These services consisted of review or preparation of U.S. federal, state, local and excise tax returns. The aggregate fees billed in the Reporting Periods for Tax Services by the Auditor to Service Affiliates, which required pre-approval by the Audit Committee were $0 in 2017 and $0 in 2018.
(d) All Other Fees. The aggregate fees billed in the Reporting Periods for products and services provided by the Auditor, other than the services reported in paragraphs (a) through (c) of this Item, were $0 in 2017 and $0 in 2018.
The aggregate fees billed in the Reporting Periods for Non-Audit Services by the Auditor to Service Affiliates, other than the services reported in paragraphs (b) through (c) of this Item, which required pre-approval by the Audit Committee, were $0 in 2017 and $0 in 2018.
(e)(1)Audit Committee Pre-Approval Policies and Procedures. The Registrant's Audit Committee has established policies and procedures (the "Policy") for pre-approval (within specified fee limits) of the Auditor's engagements for non-audit services to the Registrant and Service Affiliates without specific case-by-case consideration. The pre-approved services in the Policy can include pre-approved audit services, pre-approved audit-related services, pre-approved tax services and pre-approved all other services. Pre-approval considerations include whether the proposed services are compatible with maintaining the Auditor's independence. Pre-approvals pursuant to the Policy are considered annually.
(e)(2)Note. None of the services described in paragraphs (b) through (d) of this Item 4 were approved by the Audit Committee pursuant to paragraph (c)(7)(i)(C) of Rule 2-01 of Regulation S-X.
(f) None of the hours expended on the principal accountant's engagement to audit the registrant's financial statements for the most recent fiscal year were attributed to work performed by persons other than the principal account's full-time, permanent employees.
Non-Audit Fees. The aggregate non-audit fees billed by the Auditor for services rendered to the Registrant, and rendered to Service Affiliates, for the Reporting Periods were $20,601,000 in 2017 and $3,650,000 in 2018.
Auditor Independence. The Registrant's Audit Committee has considered whether the provision of non-audit services that were rendered to Service Affiliates, which were not pre-approved (not requiring pre-approval), is compatible with maintaining the Auditor's independence.
Item 5. Audit Committee of Listed Registrants.
Not applicable.
Item 6. Investments.
(a) Not applicable.
Item 7. Disclosure of Proxy Voting Policies and Procedures for Closed-End Management Investment Companies.
Not applicable.
Item 8. Portfolio Managers of Closed-End Management Investment Companies.
Not applicable.
Item 9. Purchases of Equity Securities by Closed-End Management Investment Companies and Affiliated Purchasers.
Not applicable.
Item 10. Submission of Matters to a Vote of Security Holders.
There have been no material changes to the procedures applicable to Item 10.
Item 11. Controls and Procedures.
(a) The Registrant's principal executive and principal financial officers have concluded, based on their evaluation of the Registrant's disclosure controls and procedures as of a date within 90 days of the filing date of this report, that the Registrant's disclosure controls and procedures are reasonably designed to ensure that information required to be disclosed by the Registrant on Form N-CSR is recorded, processed, summarized and reported within the required time periods and that information required to be disclosed by the Registrant in the reports that it files or submits on Form N-CSR is accumulated and communicated to the Registrant's management, including its principal executive and principal financial officers, as appropriate to allow timely decisions regarding required disclosure.
(b) There were no changes to the Registrant's internal control over financial reporting that occurred during the second fiscal quarter of the period covered by this report that have materially affected, or are reasonably likely to materially affect, the Registrant's internal control over financial reporting.
Item 12. Disclosure of Securities Lending Activities for Closed-End Management Investment Companies.
Not applicable.
Item 13. Exhibits.
(a)(1) Code of ethics referred to in Item 2.
(a)(2) Certifications of principal executive and principal financial officers as required by Rule 30a-2(a) under the Investment Company Act of 1940.
(a)(3) Not applicable.
(b) Certification of principal executive and principal financial officers as required by Rule 30a-2(b) under the Investment Company Act of 1940.
SIGNATURES
Pursuant to the requirements of the Securities Exchange Act of 1934 and the Investment Company Act of 1940, the Registrant has duly caused this Report to be signed on its behalf by the undersigned, thereunto duly authorized.
Dreyfus Investment Funds
By: /s/ Bradley J. Skapyak
Bradley J. Skapyak
President
Date: February 25, 2019
Pursuant to the requirements of the Securities Exchange Act of 1934 and the Investment Company Act of 1940, this Report has been signed below by the following persons on behalf of the Registrant and in the capacities and on the dates indicated.
By: /s/ Bradley J. Skapyak
Bradley J. Skapyak
President
Date: February 25, 2019
By: /s/ James Windels
James Windels
Treasurer
Date: February 25, 2019
EXHIBIT INDEX
(a)(1) Code of ethics referred to in Item 2.
(a)(2) Certifications of principal executive and principal financial officers as required by Rule 30a-2(a) under the Investment Company Act of 1940. (EX-99.CERT)
(b) Certification of principal executive and principal financial officers as required by Rule 30a-2(b) under the Investment Company Act of 1940. (EX-99.906CERT)