As filed with the Securities and Exchange Commission on July 6, 2007
UNITED STATES
SECURITIES AND EXCHANGE COMMISSION
Washington, D.C. 20549
FORM N-CSR
CERTIFIED SHAREHOLDER REPORT OF REGISTERED
MANAGEMENT INVESTMENT COMPANIES
Investment Company Act file number 811-4840
The Tocqueville Trust
(Exact name of registrant as specified in charter)
The Tocqueville Trust
40 W. 57th Street, 19th Floor
New York, NY 10019
(Address of principal executive offices) (Zip code)
Robert W. Kleinschmidt, President
The Tocqueville Trust
40 W. 57th Street, 19th Floor
New York, NY 10019
(Name and address of agent for service)
212-698-0800
Registrant's telephone number, including area code
Date of fiscal year end: October 31
Date of reporting period: April 30, 2007
Item 1. Report to Stockholders.
S E M I - A N N U A L R E P O R T
April 30, 2007
The Tocqueville Trust
Mutual Funds
The Tocqueville Fund
The Tocqueville Small Cap Value Fund
The Tocqueville International Value Fund
The Tocqueville Gold Fund
This report is not authorized for distribution to prospective investors unless preceded or accompanied by a currently effective prospectus of The Tocqueville Trust.
Please call 1-800-697-FUND (3863) for a free prospectus. Read it carefully before you invest.
You are invited to visit our website @ www.tocquevillefunds.com
Dear Fellow Shareholder,
Times like these are testing for value investors—especially those with a memory of market cycles past. It is no secret that most of our fund managers have been worried about the global economic environment for some time. It also is no secret that finding true value in ebullient markets has become more and more of a challenge.
It is therefore a tribute to our bottom-up discipline that our funds have continued to perform satisfactorily.
In a word, we all have opinions about the outlook for the economies or the markets, but in the end, individual investment ideas, if compelling enough, will always supersede our “macro” views. This discipline prevented us from being grossly underinvested, as our instincts might have led us to be, during this year’s up legs of the global stock markets.
This is not to say that our portfolio managers have not become more defensive. But in fact, “raising” the proportion of cash in a portfolio is a somewhat illusory way to protect one’s portfolio against major market declines, unless one boosts that proportion to almost 100%. Historically, we have rather viewed cash as “dry powder” to be able to freely take advantage of opportunities created by large declines—in true contrarian-value fashion.
Another way of becoming defensive is in the selection of investments in each fund portfolio. For example, some companies’ shares may represent value only if the next economic cycle allows their profits to expand. If we feel that the economy may be entering a recession, we will probably delay this investment. This kind of screening, together with a somewhat stricter application of our value criteria, results in a more defensive portfolio, without having to make drastic bets on the stock market outlook.
By and large, this kind of prudence characterizes the attitude of our portfolio managers at this juncture and is coherent with our long-term mission to preserve the wealth of our shareholders.
Respectfully,

Dear Fellow Shareholder,
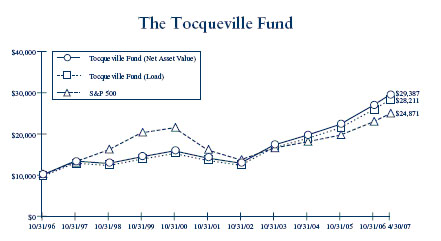
For the first six months of our fiscal year ended April 30, 2007, the Tocqueville Fund registered a gain of 9.40%. Over the same period the S&P 500 Index rose 8.60%. As we have often stated in past letters, six month returns don’t mean very much and relative returns even less. Still it is gratifying to have kept pace with a market that has had a strong upward move, particularly since we expect typically to underperform hot markets.
Our returns were aided by companies that can be characterized as special situations like W.R. Grace, for example, which is emerging from bankruptcy, and Cleveland Cliffs and Alcoa, two companies involved in possible takeover situations, and Weyerhaeuser, in the midst of a restructuring. Most of our technology positions, particularly Cisco and Juniper Networks performed very well in the period as well as our energy names, Murphy Oil and Schlumberger. More important than all of these however, was the fact that the Fund held very few positions that lost it any money in the first half of the fiscal year. Our mantra for many years has been, “The best way to make money in the stock market is to avoid losing it.” The wisdom of that approach was evident in the period.
That said, it does appear, to me, as well as to many others, that the equity markets have come too far too fast. The recent, though long expected, rise in interest rates represents a sea change for the equity markets. Of even greater importance is the impact I expect it will have on the residential housing market. After a wild run-up in home prices that finally peaked early last year, the residential real estate market has weakened considerably in most areas outside of Manhattan. This weakness has occurred within the context of a strong economy, rising employment, low unemployment, and until just recently very low interest rates. How much more downward pressure on home prices will result from the higher interest rates is not known, but I do not expect it to be slight. Nor will this have a salutary effect on consumer spending, as the wealth effect of housing is far greater than the one exerted by the equity markets.
In the near term, the Federal Reserve is probably powerless to fight the rising interest rate scenario, worried, as they are by resurgent inflation and the level of the dollar. No wonder concern over the level of the markets has surfaced in many quarters.
While it is not comforting for a contrarian to find himself in the consensus, it does happen from time to time. But, worrying about the market is my stock in trade. More to the point, it does not inform my investment approach which is to look for unloved shares of solid companies selling at a discount to their intrinsic value. Regardless of how I may feel about the market, I am going to buy stocks that fit that description and sell ones that don’t. Through-out my long career I have been right far more often about individual stocks than I have been about the direction of the markets. So I am determined to stick with what I know how to do.
As a major investor in the Tocqueville Fund, as well, as its manger, I thank you for your support and loyalty to the Fund and our investment approach.
Sincerely,

Robert W. Kleinschmidt
Portfolio Manager
This chart assumes an initial gross investment of $10,000 made on 10/31/96. Returns shown do not reflect the deduction of taxes that a shareholder would pay on fund distributions or the redemption of fund shares. Performance reflects fee waivers in effect. In the absence of fee waivers, total return would be reduced. Returns shown include the reinvestment of all dividends and other distributions. Past performance is not predictive of future performance. Investment return and principal value will fluctuate, so that your shares, when redeemed, may be worth more or less than their original cost.
The Standard & Poor’s 500 Stock Index (S&P 500) is a capital-weighted index, representing the aggregate market value of the common equity of 500 stocks primarily traded on the New York Stock Exchange.
AVERAGE ANNUAL RATE OF RETURN (%)
FOR PERIODS ENDED APRIL 30, 2007
| | | | | |
| | 1 Year | 3 Year | 5 Year | 10 Year |
| Tocqueville Fund—Net Asset Value | 11.07% | 16.29% | 12.45% | 10.31% |
| Tocqueville Fund—Load* | 11.07% | 16.29% | 12.45% | 9.86% |
| Standard & Poor’s 500 Stock Index | 15.24% | 12.25% | 8.54% | 8.05% |
| * Effective February 1, 2000, the Fund eliminated its sales load. | | | | |
The Tocqueville Small Cap Value Fund
Dear Fellow Shareholder,
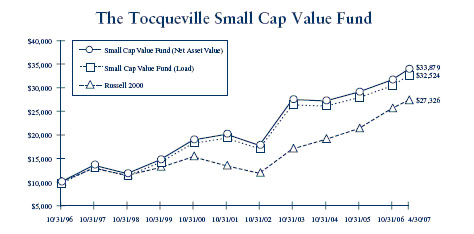
During the first half of this new fiscal year the Tocqueville Small Cap Value Fund posted a gain of 7.10% compared to the benchmark Russell 2000 Index return of 6.86%. Although many of the securities in the portfolio enjoyed modest gains, our returns were clearly driven by strong results in basic industries such as chemicals and energy related businesses. Looking back over the past two years these industrial companies have been the primary beneficiaries of a weak dollar and the expansion of the global economy.
When we examine the disarmingly persuasive argument that new found global prosperity will drive an unprecedented level of demand for the foreseeable future, we must ask ourselves if this is yet another new paradigm thesis packaged in a different, somewhat more fundamental, wrapper. Clearly communism has been discredited as an economically viable platform and China, Russia and the former Soviet Block countries have all embraced capitalism with unbridled enthusiasm creating millions of hungry new consumers. At the same time India and countries along the Pacific Rim have enhanced their standard of living by producing goods and services which can compete in the global marketplace. And, last but not least, the availability of capital and global liquidity have reached entirely new levels as commodity prices around the globe have enabled many emerging economies to recapitalize.
With all of this seemingly synchronized global growth taking place why should anyone be worried? Investors should be fully aware that even though it is currently fashionable to believe that the “new” global expansion will continue unabated for a very long time, I believe global expansion simply cannot continue without the active participation of the largest economic power in the world; the United States.
Although we acknowledge this global expansion may continue over the next several years we are quite cautious when it comes to the United States economy. Ignoring for the moment recent statements made by the esteemed Warren Buffet, we believe that the decline of the housing market will have a significant impact on the U.S. consumer and, in turn, retail spending. The immediate consequence of declining market values in residential real estate will be a de facto tightening of credit as banks move to eliminate secondary loans based on homeowner equity and restore order to the mortgage process. These factors alone should dampen the U.S. economy during 2007 and we look for consumer spending to slow considerably during the second half of the year.
Of course, the U.S. consumer has more to worry about than just housing. Energy prices remain stubbornly high, the dollar is down, Detroit is losing market share, medical insurance premiums continue to escalate, job growth has softened in recent months and we are still funding active military campaigns on two fronts. Thankfully for the American consumer global liquidity is extraordinarily high, U.S. interest rates have remained relatively low for the past five years and Federal Reserve Chairman Bernanke has not moved dramatically in his duty bound fight against inflation.
Given these economic realities we believe that the Tocqueville Small Cap Value Fund should be focused on securities that are less cyclical and less economically sensitive. During the first few months of 2007 we have increased our consumer staples positions and rebalanced our energy holdings while reducing our exposure to financial services companies and industrials. Over the long term we expect that our investments in health care, technology and bio-pharmaceuticals will produce positive results for the patient investor.
We will continue to employ our investment discipline in search of solid companies that are out of favor, under pressure for one reason or another or simply undiscovered by Wall Street. We greatly appreciate your continued support and thank you for your selection of the Tocqueville Small Cap Value Fund.
Sincerely,

Joseph Zock
Portfolio Manager
This chart assumes an initial gross investment of $10,000 made on 10/31/96. Returns shown do not reflect the deduction of taxes that a shareholder would pay on fund distributions or the redemption of fund shares. Performance reflects fee waivers in effect. In the absence of fee waivers, total return would be reduced. Returns shown include the reinvestment of all dividends and other distributions. Past performance is not predictive of future performance. Investment return and principal value will fluctuate, so that your shares, when redeemed, may be worth more or less than their original cost.
The Russell 2000 Index is an unmanaged index which measures the performance of the 2,000 smallest companies in the Russell 3000 Index, which represents approximately 8% of the total market capitalization of the Russell 3000 Index.
AVERAGE ANNUAL RATE OF RETURN (%)
FOR PERIODS ENDED APRIL 30, 2007
| | | | | |
| | 1 Year | 3 Year | 5 Year | 10 Year |
| Tocqueville Small Cap Value Fund—Net Asset Value | 3.71% | 3.07% | 7.04% | 12.60% |
| Tocqueville Small Cap Value Fund—Load* | 3.71% | 3.07% | 7.04% | 12.14% |
| Russell 2000 Index | 7.83% | 14.65% | 11.14% | 10.40% |
| * Effective February 1, 2000, the Fund eliminated its sales load. | | | | |
The Tocqueville International Value Fund
Dear Fellow Shareholder,
For the six months ended April 30th, 2007, the Tocqueville International Value Fund’s total U.S. dollar return was 10.67%. In the same period, the Morgan Stanley EAFE Index had a total U.S. dollar return of 15.68%.
The rally in global equity markets that began last June continued nearly uninterrupted during the six month period, driven by a powerful combination of corporate earnings growth, low interest rates, heated mergers and acquisitions activity, and corporate share repurchases. Liquidity remained abundant, with loose monetary policy and petrodollars creating a tsunami of money looking for investable assets. Global equity markets corrected in late February in response to a government-engineered sell-off in China and growing concerns regarding the U.S. sub-prime lending market, but recovered quickly during March. Toward the end of the period, the volume of carry trades—where investors borrow low yielding currencies to buy risk assets—grew substantially, suggesting a return to high investor risk tolerance.
During the six months, the European BE 500 Index increased by 10.88% in local currency terms, the Japanese Nikkei 225 Index increased by 6.67% in local currency terms and the Morgan Stanley Far East Index increased by
15.01%. The best performing sectors during the period included autos and auto parts, machinery, steel and other materials. Commodity dependent markets like Brazil and Indonesia were strong. India lagged as incipient inflation led the Central Bank to raise interest rates in an attempt to slow growth. The Euro increased by 6.94% against the U.S. dollar as growth prospects there continued to improve, and the Japanese Yen decreased by 2.11% as Japanese sold Yen to buy foreign assets and carry traders sold Yen short to borrow.
We had substantial gains in Finnish telecom equipment provider Nokia, whose operating and financial performance improved markedly and exceeded consensus expectations; in UK heat treatment company Bodycote, which was the subject of a takeover bid; in Anglo-Dutch consumer products company Unilever, which continued to benefit from productivity improvement measures and growth in emerging markets; in Malaysian REIT KLCC, whose prime real estate assets continue to increase in value; in Thai media company BEC World, which was re-rated as its market share of advertising dollars improved; in Japanese conglomerate Hitachi, which announced value-enhancing restructuring measures; and in Tokyo Broadcasting, where takeover rumors forced the realization of intrinsic value. We gave back gains in the Japanese game software stocks, which faded from investor focus after strong run-ups around the 2006 Christmas season, and in British Energy, as warm winter weather caused electricity prices to decline.
During the period, we initiated a new position in French radio operator NRJ, which we believe is overcapitalized, generates ample free cash flow, and trades at a discount to the intrinsic value of the French radio operation, offering the TV, international radio and mobile telecom operations for free. We also took a position in Israeli agricultural chemical producer Makhteshim-Agan, the leading global producer of generic crop protection products, which in our opinion has strong growth prospects and trades at low multiple of cash flow. We reduced our positions in Italian hydraulics manufacturer Interpump and Dutch animal feed maker Nutreco, both of which reached our valuation objectives. We also exited our positions in Dutch bakery ingredients maker CSM, a turnaround situation that had achieved our operational and valuation objectives, and Nintendo, where the success of the new Wii console produced a valuation premium in the stock.
We expect that many of the favorable conditions that have been driving equity market performance will persist. Global growth and improving corporate productivity will support earnings growth and mergers and acquisitions activity will support valuations. That said, there are signs of cost inflation, which could serve to slow earnings growth and eventually cause interest rates to rise, which would be negative for equities. Further, as we have noted in the past, the high level of risk tolerance among investors and low level of risk premium incorporated into equity valuations causes equities to be vulnerable to negative external shocks. We continue to focus our efforts on finding value in individual stocks that have fallen out of favor with investors due to short term operational and financial problems. We recently are finding opportunities in France, where we believe that a more market friendly government under new President Sarkozy will give companies wider scope to grow intrinsic value; in media companies, which generally remain out of favor with their traditional growth investor constituencies and are cheap on a cash flow basis; in Japan, in companies that are restructuring their operations to improve efficiency; and, in infrastructure related companies, that we expect to enjoy a multi-year cycle of growth in demand.
Over the long term, we expect the non-U.S. markets to benefit from improving corporate governance and management practices, the development of local equity cultures and positive capital flows. Against this background, inefficient pricing of equities, particularly among small and mid-cap companies, can provide exceptional opportunities. We continue to employ our investment discipline, seeking to discover fundamentally attractive companies that are out of favor and undervalued, and to provide our shareholders with above average returns with below average risk.
| James Hunt | Francois Sicart |
| Portfolio Manager | Portfolio Manager |

This chart assumes an initial gross investment of $10,000 made on 10/31/96. Returns shown do not reflect the deduction of taxes that a shareholder would pay on fund distributions or the redemption of fund shares. Performance reflects fee waivers in effect. In the absence of fee waivers, total return would be reduced. Returns shown include the reinvestment of all dividends and other distributions. Past performance is not predictive of future performance. Investment return and principal value will fluctuate, so that your shares, when redeemed, may be worth more or less than their original cost.
The Morgan Stanley EAFE Index is an unmanaged market-capitalization-weighted index composed of companies representative of the market structure of 20 Developed Market Countries in Europe, Australia, Asia and the Far East.
AVERAGE ANNUAL RATE OF RETURN (%)
FOR PERIODS ENDED APRIL 30, 2007
| | | | | |
| | 1 Year | 3 Year | 5 Year | 10 Year |
| Tocqueville International Value Fund—Net Asset Value | 7.34% | 19.91% | 17.16% | 5.91% |
| Tocqueville International Value Fund—Load* | 7.34% | 19.91% | 17.16% | 5.47% |
| Morgan Stanley EAFE Index | 20.32% | 23.00% | 17.10% | 9.09% |
| * Effective February 1, 2000, the Fund eliminated its sales load. | | | | |
The Tocqueville Gold Fund
Dear Fellow Shareholder,
Gold has been in a consolidating pattern for the past year. It reached an intraday high of $723/oz. on May 11, 2006 and has been range bound since then. The current gold price of $670/oz. is approximately 8.5% below its 26 year high of a year ago. Gold shares also peaked on the same date and have also been range bound since then. The benchmark XAU Index of Gold and Silver Shares reached 171 on that date and is now trading around 140 or 18% below that peak. Some would say the gold sector has gone to sleep. We suggest that the year long consolidation has provided a powerful base for the next advance.
The catalyst for the next move will be, in our opinion, a broad shift in the pricing of risk by the financial markets. Historically tight credit spreads and low volatility, speculation marked by the private equity boom, and cross currency carry trades funded by a weak Japanese yen are just a few suggestions of the gross mispricing of risk. The truth of the matter is that neither we nor anyone else can predict the timing of a future avalanche in financial asset valuations, but for anyone who cares to look, the mountain peaks are covered with unstable snow packs of leverage, speculation, careless research, and greed. (For more, please refer to our recent web site article, Today’s Avalanche Forecast, at www.tocqueville.com.) The buildup of systemic risk prior to the 2000 dot-com bust looks like a blip by comparison.
The recent decisions by the governments of Kuwait and Syria to abandon their dollar pegs could turn out to be little more than an obscure footnote in the annals of monetary matters. More likely, in our opinion, these actions will be remembered as the beginning of a move to exits by foreign holders of dollar assets. What motivated the managers of these otherwise insignificant currencies to jump ship is rampant local inflation caused by the overvaluation of the U.S. dollar. The accumulation of dollar reserves forces host countries to print local currency, which, in turn leads to (surprise) inflation. The phenomenon has affected not only these tiny countries but the entire Gulf region, bloated with U.S. dollars because of oil exports. In almost all other corners of the globe, major economies including Brazil, Russia, China and India, and others too numerous to mention, face similar issues.
To date, the loss of shelf space by the dollar has been gradual. It is still regarded as the world’s supreme reserve currency. A quickening pace of erosion would rattle the markets. On the other hand, a slower pace might not disturb investor somnolence for a while more. However, the dollar’s decline in status, from senior reserve currency, to something less seems irreversible. The process will be salutary for gold. The time to accumulate the metal is when the alarm bells are silent. In our opinion, gold purchased at anything less than $1000/oz. will seem like a bargain within a few years.
Sincerely,
John C. Hathaway
Portfolio Manager
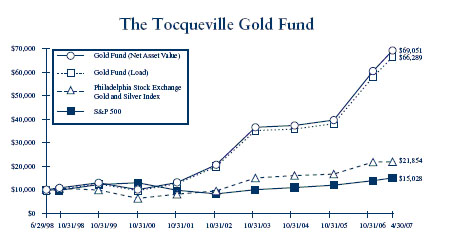
This chart assumes an initial gross investment of $10,000 made on 6/29/98 (commencement of operations). Returns shown do not reflect the deduction of taxes that a shareholder would pay on fund distributions or the redemption of fund shares. Performance reflects fee waivers in effect. In the absence of fee waivers, total return would be reduced. Returns shown include the reinvestment of all dividends and other distributions. Past performance is not predictive of future performance. Investment return and principal value will fluctuate, so that your shares, when redeemed, may be worth more or less than their original cost.
In 2003 and 2006, the performance of The Tocqueville Gold Fund was achieved during a period of unusually favorable market conditions. Such performance may not be sustainable.
The Philadelphia Stock Exchange Gold and Silver Index is an unmanaged capitalization-weighted index which includes the leading companies involved in the mining of gold and silver.
The Standard & Poor’s 500 Stock Index (S&P 500) is a capital-weighted index, representing the aggregate market value of the common equity of 500 stocks primarily traded on the New York Stock Exchange.
AVERAGE ANNUAL RATE OF RETURN (%)
FOR PERIODS ENDED APRIL 30, 2007
| | | | | |
| | | | | Since inception |
| | 1 Year | 3 Year | 5 Year | 6/29/1998 |
| Tocqueville Gold Fund—Net Asset Value | 4.59% | 30.60% | 26.39% | 24.44% |
| Tocqueville Gold Fund—Load* | 4.59% | 30.60% | 26.39% | 23.85% |
| Philadelphia Stock Exchange Gold and Silver Index | (12.15)% | 20.14% | 14.66% | 9.25% |
| Standard & Poor’s 500 Stock Index | 15.24% | 12.25% | 8.54% | 4.67% |
| * Effective February 1, 2000, the Fund eliminated its sales load. | | | | |
Legend Related to Shareholder Letters
Past performance does not guarantee future results. The investment returns and principal value will fluctuate and the investor’s share, when redeemed, may be worth more or less than their original cost. You should consider the investment objectives, risks, charges and expenses of each Fund before investing. The Prospectus contains this and other information about The Tocqueville Trust and you should read it carefully before investing.
Each Fund’s holdings are also subject to change without notice. The mention of specific securities is not a recommendation or solicitation for any person to buy, sell or hold any mentioned security. The securities mentioned in the articles are not representative of each Fund’s entire portfolio.
There are special risks associated with investing in small cap and mid cap stocks, including: small and mid cap companies rely on limited product lines, financial resources and business activities that may make them more susceptible than larger companies to setbacks or downturns; and small and mid cap companies are less liquid and more thinly traded which make them more volatile than stocks of larger companies.
There are special risks associated with investing in foreign securities, including: the value of foreign currencies may decline relative to the US dollar; a foreign government may expropriate a Fund’s assets; and political, social or economic instability in a foreign country in which a Fund invests may cause the value of the Fund’s investments to decline.
The Tocqueville Gold Fund is subject to special risks associated with investing in gold and other precious metals, including: the price of gold/precious metals may be subject to wide fluctuations; the market for gold/precious metals is relatively limited; the sources of gold/precious metals are concentrated in countries that have the potential for instability; and the market for gold/precious metals is unregulated.
This commentary is not an advertisement or solicitation to subscribe to The Tocqueville Trust, which may only be made by Prospectus. This material must be preceded or accompanied by the Trust’s Prospectus.
The Tocqueville Trust Mutual Funds are distributed by Lepercq, de Neuflize/Tocqueville Securities L.P.
Expense Example—April 30, 2007
As a shareholder of The Tocqueville Trust (the “Funds”), you incur ongoing costs, including management fees; distribution fees; and other Fund expenses. This example is intended to help you understand your ongoing costs (in dollars) of investing in the Funds and to compare costs with the ongoing costs of investing in other mutual funds.
The Example is based on an investment of $1,000 invested at the beginning of the period and held the entire period (November 1, 2006-April 30, 2007).
Actual Expenses
The first line of the table below provides information about actual account values and actual expenses. You may use the information in this line, together with the amount you invested, to estimate the expenses that you paid over the period. Simply divide your account value by $1,000 (for example, an $8,600 account value divided by $1,000 = 8.6), then multiply the result by the number in the first line under the heading entitled “Expenses Paid During Period” to estimate the expenses you paid on your account during this period.
Hypothetical Example for Comparison Purposes
The second line of the table below provides information about hypothetical account values and hypothetical expenses based on the Funds’ actual expense ratios and an assumed rate of return of 5% per year before expenses, which is not the Funds’ actual return. The hypothetical account values and expenses may not be used to estimate the actual ending account balance or expenses you paid for the period. You may use this information to compare the ongoing costs of investing in the Funds and other funds. To do so, compare this 5% hypothetical example with the 5% hypothetical examples that appear in the shareholder reports of the other funds.
Please note that the expenses shown in the table are meant to highlight your ongoing costs only and do not reflect any transactional costs, such as sales charges (loads), redemption fees, or exchange fees. Therefore, the second line of the table is useful in comparing ongoing costs only, and will not help you determine the relative costs of owning different funds. In addition, if these transactional costs were included, your costs would have been higher.
The Tocqueville Fund | | | | | | | | | | | |
| | | | | | Expenses Paid |
| | Beginning | | Ending | | During Period* |
| | Account Value | | Account Value | | November 1, 2006 - |
| | November 1, 2006 | | April 30, 2007 | | April 30, 2007 |
| Actual | | $1,000.00 | | | | $1,094.00 | | | | $6.49 | |
| Hypothetical (5% return before expenses) | | 1,000.00 | | | | 1,018.60 | | | | 6.26 | |
| | | | | | | | | | | | |
| * | Expenses are equal to the Fund’s annualized expense ratio of 1.25%, mutiplied by the average account value over the period, muliplied by 181/365 to reflect the one-half year period. |
The Tocqueville Small Cap Value Fund | | | | | | | | | | | |
| | | | | | | | | | Expenses Paid |
| | Beginning | | Ending | | During Period* |
| | Account Value | | Account Value | | November 1, 2006 - |
| | November 1, 2006 | | April 30, 2007 | | April 30, 2007 |
| Actual | | $1,000.00 | | | | $1,071.00 | | | | $6.78 | |
| Hypothetical (5% return before expenses) | | 1,000.00 | | | | 1,018.25 | | | | 6.61 | |
| | | | | | | | | | | | |
| * | Expenses are equal to the Fund’s annualized expense ratio of 1.32%, mutiplied by the average account value over the period, muliplied by 181/365 to reflect the one-half year period. |
The Tocqueville International Value Fund | | | | | | | | | | | |
| | | | | | | | | | Expenses Paid |
| | Beginning | | Ending | | During Period* |
| | Account Value | | Account Value | | November 1, 2006 - |
| | November 1, 2006 | | April 30, 2007 | | April 30, 2007 |
| Actual | | $1,000.00 | | | | $1,106.70 | | | | $8.36 | |
| Hypothetical (5% return before expenses) | | 1,000.00 | | | | 1,016.86 | | | | 8.00 | |
| | | | | | | | | | | | |
| * | Expenses are equal to the Fund’s annualized expense ratio of 1.60%, mutiplied by the average account value over the period, muliplied by 181/365 to reflect the one-half year period. |
The Tocqueville Gold Fund | | | | | | | | | | | |
| | | | | | | | | | Expenses Paid |
| | Beginning | | Ending | | During Period* |
| | Account Value | | Account Value | | November 1, 2006 - |
| | November 1, 2006 | | April 30, 2007 | | April 30, 2007 |
| Actual | | $1,000.00 | | | | $1,144.60 | | | | $7.60 | |
| Hypothetical (5% return before expenses) | | 1,000.00 | | | | 1,017.70 | | | | 7.15 | |
| | | | | | | | | | | | |
| * | Expenses are equal to the Fund’s annualized expense ratio of 1.43%, mutiplied by the average account value over the period, muliplied by 181/365 to reflect the one-half year period. |
The Tocqueville Fund
Financial Highlights
| | Six Months | | | | | | | | | | | | | | | |
Per share operating performance | Ended | | | | | | | | | | | | | | | |
(For a share outstanding throughout the | April 30, | | Years Ended October 31, | |
period) | 2007 | | 2006 | | 2005 | | 2004 | | 2003 | | 2002 | |
| | (unaudited) | | | | | | | | | | | | | | | | |
| Net asset value, beginning of period | $ | 24.25 | | $ | 22.17 | | $ | 20.43 | | $ | 17.99 | | $ | 13.42 | | $ | 14.99 | |
| Operations: | | | | | | | | | | | | | | | | | | |
| Net investment income (loss) | | 0.07 | | | 0.14 | | | 0.15 | | | 0.05 | | | 0.02 | | | (0.01 | ) |
| Net realized and unrealized gain (loss) | | 2.21 | | | 4.33 | | | 2.53 | | | 2.41 | | | 4.55 | | | (1.28 | ) |
| Total from investment operations (1) | | 2.28 | | | 4.47 | | | 2.68 | | | 2.46 | | | 4.57 | | | (1.29 | ) |
| Dividends and distributions to shareholders: | | | | | | | | | | | | | | | | | | |
| Dividends from net investment income | | (0.03 | ) | | (0.22 | ) | | (0.12 | ) | | (0.02 | ) | | — | | | (0.01 | ) |
| Distributions from net realized gains | | — | | | (2.17 | ) | | (0.82 | ) | | — | | | — | | | (0.27 | ) |
| Total dividends and distributions | | (0.03 | ) | | (2.39 | ) | | (0.94 | ) | | (0.02 | ) | | — | | | (0.28 | ) |
| Change in net asset value for the period | | 2.25 | | | 2.08 | | | 1.74 | | | 2.44 | | | 4.57 | | | (1.57 | ) |
| Net asset value, end of period | $ | 26.50 | | $ | 24.25 | | $ | 22.17 | | $ | 20.43 | | $ | 17.99 | | $ | 13.42 | |
| Total return | | 9.4 | %(2) | | 20.5 | % | | 13.4 | % | | 13.7 | % | | 34.1 | % | | (8.9 | )% |
Ratios/supplemental data | | | | | | | | | | | | | | | | | | |
| Net assets, end of period (000) | $ | 470,768 | | $ | 392,495 | | $ | 175,791 | | $ | 145,435 | | $ | 149,497 | | $ | 70,134 | |
| Ratio to average net assets: | | | | | | | | | | | | | | | | | | |
| | 1.25 | %(4) | | 1.30 | % | | 1.34 | % | | 1.34 | | | 1.40 | | | 1.40 | % |
| Net investment income (loss) (3) | | 0.58 | %(4) | | 0.68 | % | | 0.68 | % | | 0.25 | % | | 0.17 | % | | (0.06 | )% |
| Portfolio turnover rate | | 16 | %(2) | | 32 | % | | 45 | % | | 40 | % | | 32 | % | | 62 | % |
| (1) | Total from investment operations per share includes redemption fees of $0.000, $0.002, $0.003, $0.001 and $0.000 per share for the six months ended April 30, 2007 and the four years ended October 31, 2006, 2005, 2004, and 2003, respectively. |
| (3) | Net of fees waived amounting to 0.01%, 0.07% and 0.01% of average net assets for the six months ended April 30, 2007 and the two years ended October 31, 2003 and 2002, respectively. |
The accompanying notes are an integral part of these financial statements.
The Tocqueville Small Cap Value Fund
Financial Highlights
| | Six Months | | | | | | | | | | | | | | | |
Per share operating performance | Ended | | | | | | | | | | | | | | | |
(For a share outstanding throughout the | April 30, | | Years Ended October 31, | |
period) | 2007 | | 2006 | | 2005 | | 2004 | | 2003 | | 2002 | |
| | (unaudited) | | | | | | | | | | | | | | | | |
| Net asset value, beginning of period | $ | 18.04 | | $ | 16.58 | | $ | 16.11 | | $ | | | $ | 12.18 | | $ | 15.09 | |
| Operations: | | | | | | | | | | | | | | | | | | |
| Net investment loss | | (0.03 | ) | | (0.07 | ) | | (0.13 | ) | | (0.11 | ) | | (0.08 | ) | | (0.08 | ) |
| Net realized and unrealized gain (loss) | | | | | | | | | | | | | | | | | | ) |
| Total from investment operations (1) | | | | | | | | | | | | | | | | | (1.53 | ) |
| Distributions to shareholders: | | | | | | | | | | | | | | | | | | |
| Distributions from net realized gains | | (2.17 | ) | | | | | (0.66 | ) | | (2.82 | ) | | | | | (1.38 | ) |
| Total distributions | | (2.17 | ) | | | | | (0.66 | ) | | (2.82 | ) | | | | | (1.38 | ) |
| Change in net asset value for the period | | (1.01 | ) | | | | | | | | (2.72 | ) | | | | | (2.91 | ) |
| Net asset value, end of period | $ | 17.03 | | $ | 18.04 | | $ | 16.58 | | $ | | | $ | 18.83 | | $ | 12.18 | |
| Total return | | | %(2) | | 8.8 | % | | 6.8 | % | | (1.0 | )% | | 54.6 | % | | (11.7 | )% |
Ratios/supplemental data | | | | | | | | | | | | | | | | | | |
| Net assets, end of period (000) | $ | 50,502 | | $ | 52,701 | | $ | 57,576 | | $ | 75,005 | | $ | 73,518 | | $ | 50,879 | |
| Ratio to average net assets: | | | | | | | | | | | | | | | | | | |
| | 1.32 | | | 1.34 | % | | 1.39 | % | | 1.41 | | | 1.36 | | | 1.44 | % |
| Net investment loss | | (0.33 | | | (0.38 | )% | | (0.67 | )% | | (0.61 | )% | | (0.48 | )% | | (0.62 | )% |
| Portfolio turnover rate | | 50 | | | 45 | % | | 30 | % | | 19 | % | | 65 | % | | 25 | % |
| (1) | Total from investment operations per share includes redemption fees of $0.000, $0.015, $0.006, $0.02 and $0.03 per share for the |
| | six months ended April 30, 2007 and the four years ended October 31, 2006, 2005, 2004 and 2003 respectively. |
| (2) | Not annualized. |
| (3) | Annualized. |
The accompanying notes are an integral part of these financial statements.
The Tocqueville International Value Fund
Financial Highlights
| | Six Months | | | | | | | | | | | | | | | |
Per share operating performance | Ended | | | | | | | | | | | | | | | |
(For a share outstanding throughout the | April 30, | | Years Ended October 31, | |
period) | 2007 | | 2006 | | 2005 | | 2004 | | 2003 | | 2002 | |
| | (unaudited) | | | | | | | | | | | | | | | | |
| Net asset value, beginning of period | $ | 16.72 | | $ | | | $ | 13.10 | | $ | 10.90 | | $ | 7.27 | | $ | | |
| Operations: | | | | | | | | | | | | | | | | | | |
| Net investment income | | | | | | | | | | | | | | | | | | |
| Net realized and unrealized gain | | | | | | | | | | | | | | | | | | |
| Total from investment operations (1) | | | | | | | | | | | | | | | | | | |
| Dividends and distributions to shareholders: | | | | | | | | | | | | | | | | | | |
| Dividends from net investment income | | (0.27 | ) | | (0.05 | | | (0.08 | ) | | (0.04 | ) | | (0.01 | ) | | | |
| Distributions from net realized gains | | (2.30 | ) | | (1.86 | ) | | | | | | | | | | | | |
| Total dividends and distributions | | | ) | | (1.91 | ) | | (0.08 | ) | | (0.04 | ) | | (0.01 | ) | | | |
| Change in net asset value for the period | | (0.90 | ) | | | | | | | | | | | | | | | |
| Net asset value, end of period | $ | 15.82 | | $ | | | $ | 16.06 | | $ | 13.10 | | $ | 10.90 | | $ | | |
| Total return | | 10.7 | | | 17.4 | | | 23.3 | | | 20.6 | | | 50.1 | | | 0.4 | |
Ratios/supplemental data | | | | | | | | | | | | | | | | | | |
| Net assets, end of period (000) | $ | 229,439 | | $ | 225,234 | | $ | 215,711 | | $ | 196,424 | | $ | 129,875 | | $ | 78,951 | |
| Ratio to average net assets: | | | | | | | | | | | | | | | | | | |
| | 1.60 | | | 1.61 | | | 1.66 | | | 1.71 | | | 1.77 | | | 1.73 | |
| Net investment income | | 0.19 | | | 1.49 | | | 0.29 | | | 0.85 | | | 0.72 | | | 0.16 | |
| Portfolio turnover rate | | 20 | | | 39 | | | 35 | | | 43 | | | 55 | | | 61 | |
| (1) | Total from investment operations per share includes redemption fees of $0.001, $0.011, $0.003, $0.01, $0.005 and $0.03 per |
| | share for the six months ended April 30, 2007 and the five years ended October 31, 2006, 2005, 2004, 2003 and 2002, |
| | respectively. |
| (2) | Not annualized. |
| (3) | Annualized. |
The accompanying notes are an integral part of these financial statements.
The Tocqueville Gold Fund
Financial Highlights
| Six Months | | | | | | | | | | | | | | | |
Per share operating performance | Ended | | | | | | | | | | | | | | | |
(For a share outstanding throughout the | April 30, | | Years Ended October 31, | |
period) | 2007 | | 2006 | | 2005 | | 2004 | | 2003 | | 2002 | |
| | (unaudited) | | | | | | | | | | | | | | | | |
| Net asset value, beginning of period | $ | | | $ | 35.51 | | $ | 34.84 | | $ | | | $ | 20.49 | | $ | | |
| Operations: | | | | | | | | | | | | | | | | | | |
| Net investment loss | | (0.09 | ) | | (0.22 | ) | | (0.33 | ) | | (0.33 | ) | | (0.14 | ) | | (0.08 | ) |
| Net realized and unrealized gain | | | | | | | | | | | | | | | | | | |
| Total from investment operations (1) | | | | | | | | | | | | | | | | | | |
| Dividends and distributions to shareholders: | | | | | | | | | | | | | | | | | | |
| Dividends from net investment income | | (0.22 | ) | | | | | | | | (0.03 | ) | | | | | | |
| Distributions from net realized gains | | (5.05 | ) | | (2.09 | ) | | (1.36 | ) | | (0.55 | ) | | (1.05 | ) | | (0.06 | ) |
| Total distributions | | (5.27 | ) | | (2.09 | ) | | (1.36 | ) | | (0.58 | ) | | (1.05 | ) | | (0.06 | ) |
| Change in net asset value for the period | | | | | | | | | | | | | | | | | | |
| Net asset value, end of period | $ | | | $ | 51.41 | | $ | 35.51 | | $ | | | $ | 34.71 | | $ | | |
| Total return | | 14.5 | %(2) | | 52.5 | % | | 6.2 | % | | 2.0 | % | | 77.3 | % | | 57.2 | % |
Ratios/supplemental data | | | | | | | | | | | | | | | | | | |
| Net assets, end of period (000) | $ | 1,006,828 | | $ | 833,254 | | $ | 538,492 | | $ | 539,190 | | $ | 433,554 | | $ | 137,210 | |
| Ratio to average net assets: | | | | | | | | | | | | | | | | | | |
| | 1.43 | | | 1.50 | % | | 1.59 | % | | 1.58 | | | 1.68 | | | 1.68 | % |
| Net investment income (loss) | | (0.80 | | | (0.51 | )% | | (0.97 | )% | | (1.11 | )% | | (0.77 | )% | | (0.61 | )% |
| Portfolio turnover rate | | 11 | | | 30 | % | | 27 | % | | 24 | % | | 40 | % | | 72 | % |
| (1) | Total from investment operations per share includes redemption fees of $0.016, $0.06, $0.02, $0.09, $0.05 and $0.09 per share |
| | for the six months ended April 30, 2007 and the five years ended October 31, 2006, 2005, 2004, 2003 and 2002, respectively. |
| (2) | Not annualized. |
| (3) | Annualized. |
The accompanying notes are an integral part of these financial statements.
The Tocqueville Fund
Schedule of Investments as of April 30, 2007
(Unaudited)
| | | | | | | |
Common Stocks—95.0% | Shares | Value | | Common Stocks (continued) | Shares | Value |
Aerospace & Defense—1.0% | | | | Computers & Peripherals—0.8% | | |
| Boeing Co. | 50,000 | $ 4,650,000 | | EMC Corp. (a) | 250,000 | $ 3,795,000 |
Air Freight & Logistics—0.4% | | | | Construction Materials—0.8% | | |
| United Parcel Service, Inc. | 30,000 | 2,112,900 | | Cemex S.A. de C.V. ADR (a)(b) | 112,832 | 3,667,040 |
Airlines—0.6% | | | | Containers & Packaging—0.7% | | |
| SkyWest, Inc. | 112,000 | 3,047,520 | | Sonoco Products Co. | 75,000 | 3,198,000 |
Automobiles—0.8% | | | | Discount—0.4% | | |
| Tata Motors Ltd. ADR (b) | 200,000 | 3,656,000 | | Home Depot, Inc. | 50,000 | 1,893,500 |
Beverages—3.6% | | | | Diversified Financial Services—1.1% | | |
| Anheuser-Busch Companies, Inc. | 200,000 | 9,838,000 | | Citigroup, Inc. | 100,000 | 5,362,000 |
| The Coca-Cola Co. | 100,000 | 5,219,000 | | Diversified Telecommunication Services—3.7% | | |
Koninklijke Grolsch N.V. (b) | | 1,837,737 | | Alaska Communications Systems | | |
| | | | | Group, Inc. | 421,000 | |
Biotechnology—2.2% | | | | Chunghwa Telecom Company Ltd. | | |
| Amgen, Inc. (a) | 75,000 | 4,810,500 | | ADR (b) | 250,000 | 4,975,000 |
| Pharmion Corp. (a) | 190,000 | 5,755,100 | | Verizon Communications, Inc. | 150,000 | 5,727,000 |
| | | 10,565,600 | | | | 17,395,900 |
Capital Markets—0.9% | | | | Electric Utilities—2.6% | | |
| The Bank of New York Co., Inc. | 100,000 | 4,048,000 | | FPL Group, Inc. | 150,000 | 9,655,500 |
Chemicals—4.1% | | | | Korea Electric Power Corp. ADR (b) | 120,000 | 2,481,600 |
| Bayer AG (b) | 25,000 | 1,718,091 | | | | 12,137,100 |
| EI Du Pont de Nemours & Co. | 225,000 | 11,063,250 | | Electrical Appliances, Television And Radio Sets—0.6% | |
| | 6,650,000 | | Samsung Electronics Co., Ltd. | | |
| | | 19,431,341 | | GDR (b) | 9,300 | 2,868,457 |
Commercial Banks—4.4% | | | | Electronic Computers—0.4% | | |
| East West Bancorp, Inc. | 50,000 | 1,993,000 | | Hitachi, Ltd. ADR (b) | 25,000 | 1,898,500 |
| First Midwest Bancorp Inc/IL | 41,200 | 1,480,728 | | Electronic Equipment & Instruments—0.6% | | |
| HSBC Holdings PLC ADR (b) | 24,730 | 2,284,063 | | Molex, Inc. | 100,000 | 2,988,000 |
| M&T Bank Corp. | 10,000 | 1,113,400 | | Energy Equipment & Services—2.0% | | |
| Marshall & Ilsley Corp. | 35,000 | 1,680,700 | | | 125,000 | 9,228,750 |
| Mitsubishi Ufj Financial Group, Inc. | | | | Food & Staples Retailing—1.4% | | |
| ADR (b) | 1,000,000 | 10,450,000 | | | 50,000 | 1,637,000 |
| Wilmington Trust Corp. | 40,000 | 1,618,400 | | | | |
| | | 20,620,291 | | | | |
Commercial Services & Supplies—3.4% | | | | Food Products—2.0% | | |
| Avery Dennison Corp. | 60,000 | 3,732,000 | | | 300,000 | 4,923,000 |
| DeVry, Inc. | 115,000 | 3,793,850 | | | | |
| H&R Block, Inc. | 150,000 | 3,391,500 | | | | |
| Pico Holdings, Inc. (a) | 20,000 | 893,400 | | Health Care Equipment & Supplies—1.7% | | |
| | 4,177,280 | | Medtronic, Inc. | 40,000 | |
| | | | | | | |
Communications Equipment—5.6% | | | | | | |
| Cisco Systems, Inc. (a) | 400,000 | 10,696,000 | | | | |
| Cisco Systems, Inc. (a) | 200,000 | 4,744,000 | | Household Durables—0.3% | | |
| Juniper Networks, Inc. (a) | 225,000 | 5,031,000 | | | 45,000 | |
| Nokia Oyj ADR (b) | 150,000 | 3,787,500 | | | | |
| Nortel Networks Corp. (a)(b) | 100,000 | 2,288,000 | | | | |
| | | 26,546,500 | | | | |
The accompanying notes are an integral part of these financial statements.
The Tocqueville Fund
Schedule of Investments as of April 30, 2007
(Unaudited)
| | | | | | | |
Common Stocks (continued) | Shares | Value | | Common Stocks (continued) | Shares | Value |
Household Products—1.5% | | | | Oil Drilling, Equipment & Services—1.1% | | |
| Colgate-Palmolive Co. | 25,000 | $ 1,693,500 | | Devon Energy Corp. | 71,880 | $ 5,237,895 |
| Kimberly-Clark Corp. | 75,000 | 5,337,750 | | Paper & Forest Products—1.9% | | |
| | | 7,031,250 | | Weyerhaeuser Co. | 110,000 | 8,714,200 |
Industrial Conglomerates—4.7% | | | | Personal Products—0.8% | | |
| 3M Co. | 75,000 | 6,207,750 | | Avon Products, Inc. | 100,000 | 3,980,000 |
| General Electric Co. | 300,100 | 11,061,686 | | Pharmaceuticals—5.0% | | |
| Tyco International Ltd. (b) | 150,000 | 4,894,500 | | Bristol-Myers Squibb Co. | 250,000 | 7,215,000 |
| | | 22,163,936 | | Johnson & Johnson | 40,000 | 2,568,800 |
Insurance—4.5% | | | | Novartis AG ADR (b) | 30,000 | 1,742,700 |
| American International Group, Inc. | 150,000 | 10,486,500 | | Pfizer, Inc. | 400,000 | 10,584,000 |
| Hannover Rueckverscherung AG (b) | 60,000 | 3,066,363 | | Sepracor, Inc. (a) | 25,000 | 1,342,000 |
| IPC Holdings Ltd. (b) | 250,000 | 7,495,000 | | | | 23,452,500 |
| | | 21,047,863 | | Prepackaged Software—0.0% | | |
Internet Software & Services—0.9% | | | | Bio-key International, | | |
| Yahoo!, Inc. (a) | 150,000 | 4,206,000 | | Inc. (a)(c)(e)(f) | 47,090 | — |
IT Services—2.1% | | | | Semiconductor & Semiconductor Equipment—4.6% | |
| Automatic Data Processing, Inc. | 100,000 | 4,476,000 | | Applied Materials, Inc. | 350,000 | 6,727,000 |
| Western Union Co. | 250,000 | 5,262,500 | | Intel Corp. | 500,000 | 10,750,000 |
| | | 9,738,500 | | Ultratech, Inc. (a) | 300,000 | 4,155,000 |
Machinery—2.1% | | | | | | 21,632,000 |
Albany International Corp. | 26,200 | 1,003,460 | | Software—5.4% | | |
Illinois Tool Works, Inc. | | | | | 200,000 | 4,000,000 |
| | | | Electronic Arts, Inc. (a) | | |
| | | | | Mentor Graphics Corp. (a) | | |
| | | | | | | |
| | | | | | | |
Media—3.1% | | | | | | |
| Dow Jones & Co, Inc. | 250,000 | 9,082,500 | | | | |
| Getty Images, Inc. (a) | 35,000 | 1,820,000 | | Specialty Retail—0.3% | | |
| John Wiley & Sons, Inc. | 44,000 | 1,647,800 | | | 65,000 | 1,372,150 |
| Time Warner, Inc. | 100,000 | 2,063,000 | | Thrifts & Mortgage Finance—0.5% | | |
| | | 14,613,300 | | | 40,000 | 2,356,800 |
Metals & Mining—5.4% | | | | | | |
| Alcoa, Inc. | 225,000 | 7,985,250 | | | | 701,000 |
| Cleveland-Cliffs, Inc. | 100,000 | 6,929,000 | | Total Common Stocks (Cost $354,906,123) | | |
| Newmont Mining Corp. | 250,000 | 10,425,000 | | Exchange Traded Fund—0.7% | | |
| | | 25,339,250 | | StreetTRACKS Gold Trust (a) | 50,000 | |
Multiline Retail—0.3% | | | | Total Exchange Traded Fund | | |
| Conn’s, Inc. (a) | 50,000 | 1,297,500 | | | | |
Multi-Utilities & Unregulated Power—0.6% | | | | Preferred Stock—0.1% | | |
| Suez SA (b) | 50,000 | 2,864,395 | | | | |
National Commercial Banks—0.3% | | | | Zymequest, Inc. (a)(c)(e)(f) | 400,000 | 560,000 |
| Hang Seng Bank Ltd. ADR (b) | 100,000 | 1,410,260 | | Total Prefered Stock (Cost $960,000) | | |
Oil & Gas—3.7% | | | | | | |
| Murphy Oil Corp. | 275,000 | 15,246,000 | | | | |
| Total SA ADR (b) | 30,000 | 2,210,700 | | | | |
| | | 17,456,700 | | | | |
The accompanying notes are an integral part of these financial statements.
The Tocqueville Fund
Schedule of Investments as of April 30, 2007
(Unaudited)
| | | | | |
Warrants—0.0% | Shares | Value | | (d) | Security is a “step-up” bond where the coupon rate increases or |
| Bio-key Warrants, $1.00 strike | | | | | steps up at a predetermined rate. Rate shown reflects the original |
| price, expires 4/14/09 (a)(e) | 262,500 | $ — | | | rate. |
| Raytheon Co. Warrants, $37.50 | | | | (e) | Fair valued security. The aggregate value of fair valued securities |
| strike price, expires 6/16/11 (a) | 1,581 | 28,411 | | | at April 30, 2007 was $560,000 which represents 0.1% of net |
| Total Warrants (Cost $0) | | 28,411 | | | assets. |
U.S. Government Agency | Principal | | | (f) | Security is considered illiquid and may be difficult to sell. |
Bonds—0.9% | Amount | | | | |
| Freddie Mac, 3.70%, 8/25/09 (d) | $2,000,000 | 1,984,904 | | | |
| Freddie Mac, 3.90%, 8/27/09 (d) | 2,000,000 | 1,983,422 | | | |
| Total U.S. Government Agency Bonds | | | | | |
| (Cost $4,048,424) | | 3,968,326 | | | |
Short-Term Investments—3.2% | | | | | |
Repurchase Agreement—0.7% | | | | | |
| Repurchase Agreement with U.S. | | | | | |
| Bank, N.A., 5.00%, dated | | | | | |
| 4/30/07, due 5/1/07, | | | | | |
| collateralized by a Freddie Mac | | | | | |
| 15-Year Fixed (Pool # 4622) | | | | | |
| valued at $3,503,875. | | | | | |
| Repurchase proceeds of | | | | | |
| $3,435,477. | | | | | |
| (Cost $3,435,000) | 3,435,000 | 3,435,000 | | | |
U.S. Treasury Bills—2.5% | | | | | |
| 5.06%, 5/03/07 | 4,000,000 | 3,998,906 | | | |
| 4.93%, 6/21/07 | 4,000,000 | 3,972,233 | | | |
| 4.91%, 7/05/07 | 4,000,000 | 3,965,696 | | | |
| Total U.S. Treasury Bills (Cost $11,935,641) | | 11,936,835 | | | |
| Total Short-Term Investments | | | | | |
| (Cost $15,370,641) | | 15,371,835 | | | |
Total Investments | | | | | |
(Cost $378,099,648)—99.9% | | 470,458,037 | | | |
Other Assets in Excess of Liabilities—0.1% | | 309,491 | | | |
Total Net Assets—100.0% | | $470,767,528 | | | |
| | | | | | |
| Percentages are stated as a percent of net assets. | | | | | |
| ADR American Depository Receipt | | | | | |
| GDR Gobal Depository Receipt | | | | | |
| (a) | Non-income producing security. |
| (b) | Foreign issued security. Foreign concentration was as follows: |
| | Bermuda 2.6%; Canada 0.5%; Finland 0.8%; France 1.1%; |
| | Germany 1.0%; Hong Kong 0.3%; India 0.8%; Japan 2.6%; |
| | Mexico 0.8%; Netherlands 3.3%; South Korea 1.1%; Switzerland |
| | 0.4%; Taiwan 1.1%; United Kingdom 0.5%. |
| (c) | Denotes security is fully or partially restricted as to resale. The |
| | aggregate value of restricted securities at April 30, 2007 was |
| | $560,000 which represented 0.1% of net assets. |
The accompanying notes are an integral part of these financial statements.
The Tocqueville Small Cap Value Fund
Schedule of Investments as of April 30, 2007
(Unaudited)
| | | | | | | |
| | | | Common Stocks (continued) | Shares | Value |
| | | | | | |
| Constellation Brands, Inc. (a) | 60,000 | $1,344,600 | | Ceridian Corp. (a) | 45,000 | $ 1,519,200 |
Biotechnology—2.4% | | | | Convergys Corp. (a) | 50,000 | 1,263,000 |
| Pharmion Corp. (a) | 40,000 | 1,211,600 | | | | 2,782,200 |
Chemicals—12.1% | | | | Machinery—4.8% | | |
| Arch Chemicals, Inc. | 39,000 | 1,178,580 | | Federal Signal Corp. | 80,000 | 1,263,200 |
| Cambrex Corp. | 35,000 | 849,100 | | Mueller Water Products, Inc. | 80,000 | 1,146,400 |
| Hercules, Inc. (a) | 70,000 | 1,318,800 | | | | 2,409,600 |
| Olin Corp. | 70,000 | 1,199,800 | | Oil & Gas—1.9% | | |
| Sensient Technologies Corp. | 60,000 | 1,570,800 | | Syntroleum Corp. (a) | 300,000 | 939,000 |
| | | 6,117,080 | | Pharmaceuticals—8.2% | | |
Commercial Physical And Biological Research—2.0% | | | DepoMed, Inc. (a) | 350,000 | 1,204,000 |
| Crucell NV ADR (a)(b) | 40,000 | 1,013,600 | | Perrigo Co. | 80,000 | 1,520,000 |
Commercial Services & Supplies—5.4% | | | | Salix Pharmaceuticals, Ltd. (a) | 110,000 | 1,432,200 |
| ABM Industries, Inc. | 55,000 | 1,547,700 | | | | 4,156,200 |
| FTI Consulting, Inc. (a) | 32,000 | 1,176,640 | | Real Estate Investment Trust—2.4% | | |
| | | 2,724,340 | | National Retail Properties, Inc. | 50,000 | 1,197,500 |
Communications Equipment—2.2% | | | | Semiconductor & Semiconductor Equipment—5.7% | |
| Powerwave Technologies, Inc. (a) | 180,000 | 1,121,400 | | FEI Co. (a) | 40,000 | 1,488,000 |
Computers & Peripherals—1.8% | | | | Ultratech, Inc. (a) | 102,000 | 1,412,700 |
| Presstek, Inc. (a) | 150,000 | 915,000 | | | | 2,900,700 |
Electrical Equipment—3.1% | | | | Software—2.4% | | |
| Baldor Electric Co. | 40,000 | 1,575,600 | | Mentor Graphics Corp. (a) | 75,000 | 1,213,500 |
Electronic Equipment & Instruments—4.8% | | | | Trading Companies & Distributors—2.6% | | |
| Avnet, Inc. (a) | 30,000 | 1,227,000 | | Watsco, Inc. | 25,000 | 1,329,250 |
| Veeco Instruments, Inc. (a) | 65,000 | 1,188,200 | | Total Common Stocks (Cost $41,690,581) | | 48,487,940 |
| | | 2,415,200 | | Short-Term Investments—3.8% | | |
Energy Equipment & Services—8.5% | | | | Repurchase Agreement—3.8% | | |
| Cameron International Corp. (a) | 20,000 | 1,291,400 | | Repurchase Agreement with U.S. | | |
| Hornbeck Offshore Services, Inc. (a) | 50,000 | 1,581,500 | | Bank, N.A., 5.00%, dated | | |
| Input/Output, Inc. (a) | 100,000 | 1,399,000 | | 4/30/07, due 5/1/07, collateralized | | |
| | | 4,271,900 | | by a Freddie Mac 15-Year Fixed | | |
Food & Staples Retailing—2.5% | | | | (Pool # 4622) valued at | | |
| Performance Food Group Co. (a) | 40,000 | 1,250,000 | | $1,926,050. Repurchase proceeds | | |
Food Products—2.7% | | | | of $1,888,262. | | |
| Del Monte Foods Co. | 120,000 | 1,392,000 | | Total Short-Term Investments | | |
Health Care Equipment & Supplies—5.4% | | | | (Cost $1,888,000) | 1,888,000 | 1,888,000 |
| Datascope Corp. | 35,000 | 1,296,750 | | Total Investments | | |
| Wright Medical Group, Inc. (a) | 60,000 | 1,417,200 | | (Cost $43,578,581)—99.8% | | 50,375,940 |
| | | 2,713,950 | | Other Assets in Excess of Liabilities—0.2% | | 125,672 |
Hotels Restaurants & Leisure—5.1% | | | | Total Net Assets—100.0% | | $50,501,612 |
| Bob Evans Farms, Inc. | 35,000 | 1,284,500 | | | | |
| | | | Percentages are stated as a percent of net assets. | | |
| | | | ADR American Depository Receipt | | |
Internet & Catalog Retail—1.8% | | | | (a) | Non-income producing security. |
| Insight Enterprises, Inc. (a) | 46,000 | | | (b) | Foreign issued security. Foreign concentration was as follows: |
| | | | | | |
| | | | | | |
The accompanying notes are an integral part of these financial statements.
The Tocqueville International Value Fund
Schedule of Investments as of April 30, 2007
(Unaudited)
| | | | | | | |
Common Stocks—89.4% | Shares | Value | | Common Stocks (continued) | Shares | Value |
Canada—2.5% | | | | Mexico—2.3% | | |
| Alcan, Inc. | 96,208 | $ 5,673,258 | | Cemex S.A. de C.V. ADR (a) | 161,032 | $ 5,233,540 |
Finland—5.6% | | | | Netherlands—3.1% | | |
| Nokia Oyj ADR | 290,000 | 7,322,500 | | European Aeronautic Defense and | | |
| UPM-Kymmene Oyj | 226,700 | 5,624,266 | | Space Co. | 45,000 | 1,456,625 |
| | | 12,946,766 | | Unilever NV ADR | 185,000 | 5,642,500 |
France—11.9% | | | | | | 7,099,125 |
| M6 Metropole Television | 190,000 | 6,777,658 | | Singapore—1.5% | | |
| NRJ Group | 132,450 | 2,400,327 | | GP Industries | 9,775,949 | 3,378,228 |
| Safran SA | 245,000 | 5,951,227 | | South Korea—4.5% | | |
| Sanofi-Aventis | 75,000 | 6,906,481 | | Halla Climate Control | 385,000 | 3,991,030 |
| Vivendi SA | 125,000 | 5,182,249 | | Samsung Electronics Co., Ltd. | 12,000 | 5,678,376 |
| | | 27,217,942 | | SK Telecom Co., Ltd. ADR | 23,000 | 571,090 |
Germany—1.7% | | | | | | 10,240,496 |
| Siemens AG | 32,600 | 3,953,842 | | Switzerland—5.0% | | |
Greece—1.2% | | | | Ciba Specialty Chemicals AG | 80,800 | 5,355,446 |
| Titan Cement Co., SA | 50,000 | 2,865,760 | | Kudelski SA | 156,000 | 6,032,043 |
Indonesia—1.4% | | | | | | 11,387,489 |
| PT Tempo Scan Pacific Tbk | 34,380,000 | 3,217,329 | | Taiwan—5.0% | | |
Israel—1.5% | | | | Chunghwa Telecom Co., Ltd. ADR | 326,400 | 6,495,360 |
| Makhteshim-Agan Industries, Ltd. | 487,000 | 3,553,686 | | Merrill Taiwan Secom Co., Ltd. | 2,889,977 | 4,982,031 |
Italy—3.4% | | | | | | 11,477,391 |
| Guala Closures SpA | 24,000 | 186,029 | | Thailand—4.8% | | |
| Interpump SpA | 303,300 | 3,588,492 | | Airports of Thailand Public | | |
| Sogefi SpA | 409,500 | 3,928,526 | | Company Ltd. | 1,550,000 | 2,652,049 |
| | | 7,703,047 | | BEC World Pcl | 9,287,200 | 6,276,037 |
Japan—25.7% | | | | TPI Polene Public Company, Ltd. | 6,100,000 | 2,210,209 |
| Aderans Company, Ltd. | 68,000 | 1,525,212 | | | | 11,138,295 |
| Amano Corp. | 330,000 | 4,355,442 | | United Kingdom—4.4% | | |
| Capcom Co., Ltd. | 205,000 | 3,134,578 | | Bodycote International | 641,250 | 3,795,593 |
| Fuji Photo Film Co., Ltd. | 140,000 | 5,835,042 | | GlaxoSmithKline Plc ADR | 107,100 | 6,188,238 |
| Hitachi, Ltd. | 983,000 | 7,519,454 | | | | 9,983,831 |
| | | | | United States—1.6% | | |
| Matsushita Electric Industrial Co., | | | | Freeport-McMoRan Copper & | | |
| Ltd. ADR | 200,000 | 3,886,000 | | | 56,200 | 3,774,392 |
| Mitsubishi Tokyo Financial Group, | | | | Total Common Stocks (Cost $149,750,429) | | 205,100,414 |
| Inc. ADR | 396,000 | 4,138,200 | | Exchange Traded Fund—0.3% | | |
| Nippon Tv Network | 35,100 | 5,804,712 | | CurrencyShares Japanese Yen | | |
| Omron Corp. | 220,000 | 5,947,190 | | | 9,800 | 820,162 |
| SANKYO CO., LTD. | 114,000 | 5,018,538 | | Total Exchange Traded Fund (Cost $833,256) | | 820,162 |
| Secom Co., Ltd. | 77,000 | 3,492,823 | | | | |
| Square Enix Co., Ltd. | 150,000 | 3,841,486 | | | | |
| Tecmo Ltd. | 513,100 | 4,483,211 | | | | |
| | | 58,981,888 | | | | |
Malaysia—2.3% | | | | | | |
| KLCC Property Holdings Berhad | 4,700,000 | 5,274,109 | | | | |
The accompanying notes are an integral part of these financial statements.
The Tocqueville International Value Fund
Schedule of Investments as of April 30, 2007
(Unaudited)
| | | | | | |
Short-Term | Principal | | | | | |
| Amount | Value | | | | |
Variable Rate Demand Notes—7.0% | | | | | | |
| JP Morgan Chase Demand | | | | | | |
| Deposits, 2.00% | $15,973,919 | $ 15,973,919 | | | | |
| Total Short-Term Investments | | | | | | |
| (Cost $15,973,919) | | 15,973,919 | | | | |
Total Investments | | | | | | |
(Cost $166,557,604)—96.7% | | 221,894,495 | | | | |
Other Assets in Excess of Liabilities—3.3% | | 7,544,225 | | | | |
Total Net Assets—100.0% | | $229,438,720 | | | | |
| | | | | | | |
| Percentages are stated as a percent of net assets. | | | | | | |
| ADR American Depository Receipt | | | | | | |
| (a) | Non-income producing security. |
The accompanying notes are an integral part of these financial statements.
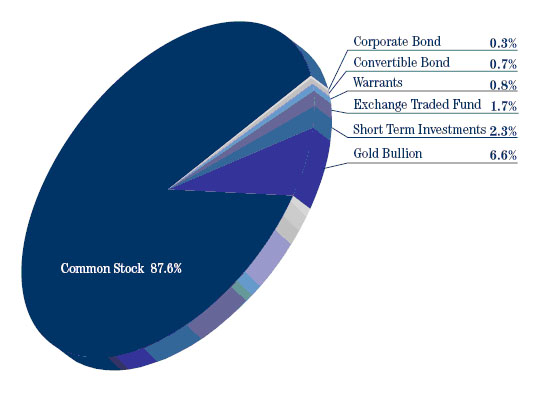
The Tocqueville Gold Fund
Schedule of Investments as of April 30, 2007
(Unaudited)
| | | | | | | |
Common Stocks—87.6% | Shares | Value | | Common Stocks (continued) | Shares | Value |
Gold & Gold Related—73.4% | | | | Semafo, Inc. (a)(b) | 4,900,000 | $ 8,476,439 |
| Agnico-Eagle Mines Ltd. (b) | 402,000 | $14,182,560 | | Shore Gold, Inc. (a)(b) | 2,207,800 | 10,960,427 |
| Alamos Gold, Inc. (a)(b) | 2,615,100 | 15,715,575 | | Sino Gold Ltd. (a)(b) | 2,941,500 | 14,731,686 |
| Almaden Minerals Ltd. (a)(b) | 800,000 | 2,025,408 | | SouthernEra Diamonds, | | |
| Apollo Gold Corp. (a)(b) | 733,000 | 336,814 | | Inc. (a)(b) | 225,000 | 87,170 |
| Aquiline Resources, Inc. (a)(b) | 1,333,333 | 9,754,630 | | Strongbow Exploration, | | |
| Aurelian Resources, Inc. (a)(b) | 189,000 | 5,866,339 | | Inc. (a)(b) | 1,800,000 | 2,254,257 |
| Aurizon Mines Ltd. (a)(b) | 600,000 | 2,054,239 | | Sunridge Gold Corp. (a)(b) | 500,000 | 991,080 |
| Banro Corp. (a)(b) | 631,400 | 6,251,992 | | SXR Uranium One, Inc. (a)(b) | 1,802,500 | 27,039,936 |
| Centamin Egypt Ltd. (a)(b) | 7,830,000 | 7,066,106 | | Troy Resources NL (b)(f) | 3,413,000 | 8,504,012 |
| Cia de Minas Buenaventura SA | | | | U.S. Gold Corp. (a) | 223,000 | 1,340,130 |
| ADR (b) | 563,800 | 18,368,604 | | Wesdome Gold Mines Ltd. (a)(b) | 627,250 | 870,317 |
| Cluff Gold Ltd. (a)(b) | 2,450,000 | 3,796,893 | | Yamana Gold, Inc. (b) | 3,541,532 | 49,330,647 |
| Comaplex Minerals Corp. (a)(b) | 1,918,000 | 8,145,840 | | Zijin Mining Group Co., Ltd. (b) | 37,500,000 | 22,052,056 |
| Crystallex International Corp. (a)(b) | 2,555,600 | 10,196,844 | | | | 738,777,111 |
| Eldorado Gold Corporation | | | | Precious Metals & Related—14.2% | | |
| Ltd. (a)(b) | 1,000,000 | 5,793,315 | | Aber Diamond Corp. (b) | 100,000 | 3,624,000 |
| Euro Ressources S.A. (a)(b)(f) | 2,900,000 | 4,432,375 | | Apex Silver Mines Ltd. (a) | 1,111,800 | 16,665,882 |
| FNX Mining Co, Inc. (a)(b) | 300,000 | 7,189,837 | | Brilliant Mining Corp. (a)(b) | 1,875,000 | 3,665,871 |
| Freeport-McMoRan Copper & Gold, | | | | Cameco Corp. (b) | 236,000 | 11,002,320 |
| Inc. | 150,000 | 10,074,000 | | Impala Platinum Holdings Ltd. | | |
| Fury Explorations Ltd. (a)(b)(f) | 1,500,000 | 1,216,326 | | ADR (b) | 450,000 | 14,708,070 |
| Gabriel Resources Ltd. (a)(b) | 3,300,000 | 11,625,372 | | Impala Platinum Holdings Ltd. | 640,000 | 20,858,722 |
| Gammon Lake Resources, | | | | Ivanhoe Nickel & Platinum | | |
| Inc. (a)(b) | 2,192,100 | 35,452,018 | | Ltd. (a)(b)(c)(d)(e) | 458,333 | 3,666,664 |
| GBS Gold International, Inc. (a)(b) | 2,164,300 | 5,654,987 | | Mvelaphanda Resources | | |
| Gold Eagle Mines Ltd. (a)(b) | 200,000 | 1,538,878 | | Ltd. (a)(b) | 350,000 | 2,866,657 |
| Gold Fields Ltd. (b) | 166,249 | 3,015,663 | | Peru Copper, Inc. (a)(b) | 1,365,000 | 6,247,590 |
| Gold Fields Ltd. ADR (b) | 2,361,500 | 42,436,155 | | Sabina Silver Corp. (a)(b) | 900,000 | 2,473,196 |
| Goldcorp, Inc. (b) | 1,343,950 | 32,711,743 | | Silver Standard Resources, | | |
| Golden Star Resources Ltd. (a) | 5,589,000 | 24,518,532 | | Inc. (a)(b) | 557,000 | 20,291,510 |
| Great Basin Gold Ltd. (a)(b) | 1,000,000 | 2,288,494 | | Silver Wheaton Corp. (a)(b) | 1,687,400 | 18,761,278 |
| Harmony Gold Mining Co., | | | | Stornoway Diamond Corp. (a)(b) | 1,950,000 | 1,686,638 |
| Ltd. (a)(b) | 106,667 | 1,707,549 | | Trade Winds Ventures, Inc. (a)(b) | 1,100,000 | 322,101 |
| Harmony Gold Mining Co., Ltd. | | | | Uramin, Inc. (a)(b) | 2,776,600 | 16,679,767 |
| ADR (a)(b) | 784,400 | 12,456,272 | | | | 143,520,266 |
| Iamgold Corp. (b) | 1,805,700 | 14,645,702 | | Total Common Stocks (Cost $512,210,000) | | 882,297,377 |
| Ivanhoe Mines Ltd. (a)(b) | 4,467,000 | 55,339,445 | | Gold Bullion—6.6% | Ounces | |
| Lundin Mining Corp. (a)(b) | 300,000 | 3,678,710 | | | | 66,413,325 |
| Meridian Gold, Inc. (a)(b) | 550,531 | 13,888,484 | | Total Gold Bullion (Cost $44,609,241) | | |
| Minefinders Corp. (a)(b) | 663,000 | 7,437,021 | | | Shares | |
| Miramar Mining Corp. (a)(b) | 4,331,306 | 18,581,303 | | Gold & Gold Related—0.6% | | |
| New Gold, Inc. (a)(b)(f) | 1,518,500 | 11,172,835 | | Nevsun Resources Ltd. (a)(b)(d) | 202,125 | — |
| Newmont Mining Corp. | 419,800 | 17,505,661 | | Northern Orion Resources, | | |
| NovaGold Resources, Inc. (a)(b) | 880,500 | 12,478,840 | | | | |
| Orezone Resources, Inc. (a)(b) | 5,563,700 | 10,426,611 | | NovaGold Resources, Inc. (a)(b) | 75,000 | 610,190 |
| Osisko Exploration Ltd. (a)(b) | 1,673,200 | 16,136,607 | | Osisko Exploration (a)(b)(d) | | |
| Oxiana Ltd. (b) | 5,000,000 | 12,624,375 | | | | |
| Polyus Gold ADR (a)(b) | 851,616 | 38,748,528 | | Great Basin Gold Ltd. (a) | | |
| Radius Gold, Inc. (a)(b) | 1,329,544 | 634,885 | | | | |
Randgold Resources Ltd. ADR (b) | | | | | | |
| Royal Gold, Inc. | 447,765 | 13,132,947 | | | | |
The accompanying notes are an integral part of these financial statements.
The Tocqueville Gold Fund
Schedule of Investments as of April 30, 2007
(Unaudited)
| | | | | |
Warrants (continued) | Shares | Value | | Percentages are stated as a percent of net assets. |
Precious Metals & Related—0.2% | | | | ADR American Depository Receipt |
| Brilliant Mining (a)(b)(d) | 937,500 | | | (a) | Non-income producing security. |
| PAN American Silver | | | | (b) | Foreign issued security. Foreign concentration was as follows: |
| Corp. (a)(b) | 61,536 | 1,090,560 | | | Australia 4.9%; Canada 51.8%; China 2.2%; France 0.4%; Peru |
| | | 1,705,480 | | | 1.8%; Russia 3.9%; South Africa 11.8%; United Kingdom 4.3%. |
| Total Warrants (Cost $86,900) | | 8,059,936 | | (c) | Denotes security is fully or partially restricted to resale. The |
| | | | | | aggregate value of restricted securities at April 30, 2007 was |
| | Principal | | | | $3,666,664 which represented 0.4% of net assets. |
Corporate Bond—0.3% | Amount | | | (d) | Fair valued security. The aggregate value of fair valued securities |
Gold & Gold Related—0.3% | | | | | at April 30, 2007 was $6,567,858 which represented 0.7% of net |
| Crystallex Intl. Corp. | | | | | assets. |
| 9.375%, 12/30/11 (b) | $ 4,100,000 | 3,280,000 | | (e) | Security is considered illiquid and may be difficult to sell. |
| Total Corporate Bond (Cost $4,100,000) | | 3,280,000 | | (f) | Affiliated company. See Note 8 in Notes to the Financial |
Convertible Bond—0.7% | | | | | Statements. |
Gold & Gold Related—0.7% | | | | | |
| Sino Gold Ltd. | | | | | |
| 5.75%, 3/17/12 (b) | 3,000,000 | 6,732,000 | | | |
| Total Convertible Bond (Cost $3,000,000) | | 6,732,000 | | | |
Exchange Traded Fund—1.7% | | | | | |
| iShares Silver Trust (a) | 131,000 | 17,468,850 | | | |
| Total Exchange Traded Fund | | | | | |
| (Cost $12,982,561) | | 17,468,850 | | | |
Short-Term Investments—2.3% | | | | | |
| Repurchase Agreement with | | | | | |
| U.S. Bank, N.A., 5.00%, | | | | | |
| dated 4/30/07, due 5/1/07, | | | | | |
| collateralized by a Freddie | | | | | |
| Mac 15-Year Fixed (Pool | | | | | |
| #4622) valued at | | | | | |
| $23,310,450. Repurchase | | | | | |
| proceeds of 22,856,174. | | | | | |
| (Cost $22,853,000) | 22,853,000 | 22,853,000 | | | |
| Total Short-Term Investments | | | | | |
| (Cost $22,853,000) | | 22,853,000 | | | |
Total Investments | | | | | |
(Cost $599,841,702)—100.0% | | 1,007,104,488 | | | |
Liabilities in Excess of Other Assets—0.0% | | (276,824) | | | |
Total Net Assets—100.0% | | | | | |
The accompanying notes are an integral part of these financial statements.
Percent of Total Investments
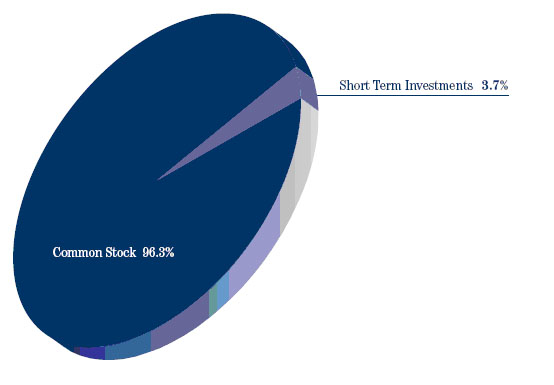
The Tocqueville Fund
Allocation of Portfolio Holdings
April 30, 2007
The Tocqueville Small Cap Value Fund
Allocation of Portfolio Holdings
April 30, 2007
Percent of Total Investments
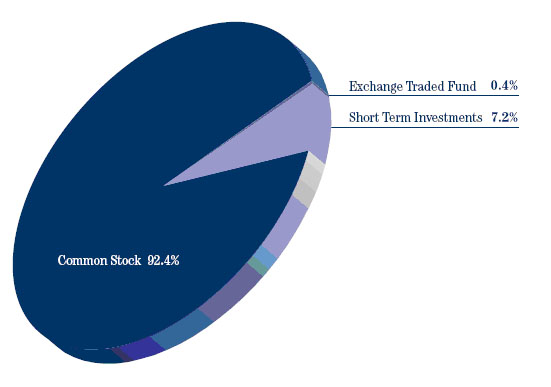
The Tocqueville International Value Fund
Allocation of Portfolio Holdings
April 30, 2007
The Tocqueville Gold Fund
Allocation of Portfolio Holdings
April 30, 2007
The Tocqueville Trust
Statements of Assets and Liabilities
April 30, 2007
(Unaudited)
| | | The | | | Small Cap | | | International | | | | |
| | | Tocqueville | | | Value | | | Value | | | Gold | |
| | | Fund | | | Fund | | | Fund | | | Fund | |
Assets | | | | | | | | | | | | |
| Investments, at value (1) | | | | | | | | | | | | |
| Unaffiliated issuers | | $ | 470,458,037 | | | $ | 50,375,940 | | | $ | 221,894,495 | | | $ | 981,778,940 | |
| Affiliated issuers | | | — | | | | — | | | | — | | | | 25,325,548 | |
| Foreign currencies (2) | | | 1,629 | | | | — | | | | 8,955,562 | | | | — | |
| Cash | | | 1,150,599 | | | | 153 | | | | — | | | | — | |
| Receivable for fund shares sold | | | 1,984,244 | | | | 158,056 | | | | 135,690 | | | | 1,821,846 | |
| Dividends, interest and other receivables | | | 378,525 | | | | 29,150 | | | | 650,564 | | | | 760,871 | |
| Prepaid assets | | | 30,582 | | | | 12,180 | | | | 13,790 | | | | 37,212 | |
| Total Assets | | | 474,003,616 | | | | 50,575,479 | | | | 231,650,101 | | | | 1,009,724,417 | |
Liabilities | | | | | | | | | | | | | | | | |
| Payable for investments purchased | | | 2,158,365 | | | | — | | | | 1,507,465 | | | | — | |
| Payable for fund shares redeemed | | | 547,835 | | | | 12,959 | | | | 163,255 | | | | 1,674,779 | |
| Payable to Adviser | | | 284,182 | | | | 31,178 | | | | 190,827 | | | | 733,944 | |
| Due to custodian | | | — | | | | — | | | | 153,649 | | | | 8,743 | |
| Accrued distribution fee | | | 50,471 | | | | 7,291 | | | | 37,043 | | | | 45,501 | |
| Accrued expenses and other liabilities | | | 195,235 | | | | 22,439 | | | | 159,142 | | | | 433,786 | |
| Total Liabilities | | | 3,236,088 | | | | 73,867 | | | | 2,211,381 | | | | 2,896,753 | |
| Net Assets | | $ | 470,767,528 | | | $ | 50,501,612 | | | $ | 229,438,720 | | | $ | 1,006,827,664 | |
Net assets consist of: | | | | | | | | | | | | | | | | |
| Paid in capital | | | 374,022,569 | | | | 39,378,407 | | | | 161,303,744 | | | | 570,392,058 | |
| Accumulated net investment income (loss) | | | 812,847 | | | | (83,401 | ) | | | (211,322 | ) | | | (16,374,034 | ) |
| Accumulated net realized gain | | | 3,572,959 | | | | 4,409,247 | | | | 13,040,859 | | | | 45,545,971 | |
| Net unrealized appreciation on: | | | | | | | | | | | | | | | | |
| Investments and foreign currency related items | | | 92,359,153 | | | | 6,797,359 | | | | 55,305,439 | | | | 407,263,669 | |
| Net assets | | $ | 470,767,528 | | | $ | 50,501,612 | | | $ | 229,438,720 | | | $ | 1,006,827,664 | |
| Shares of beneficial interest outstanding | | | | | | | | | | | | | | | | |
| (unlimited shares of $0.01 par value authorized) | | | 17,763,508 | | | | 2,964,757 | | | | 14,502,059 | | | | 18,899,222 | |
| Net asset value and redemption price per share | | $ | 26.50 | | | $ | 17.03 | | | $ | 15.82 | | | $ | 53.27 | |
| Maximum offering price per share | | $ | 26.50 | | | $ | 17.03 | | | $ | 15.82 | | | $ | 53.27 | |
| (1) Cost of Investments | | | | | | | | | | | | | | | | |
| Unafilliated issuers | | $ | 378,099,648 | | | $ | 43,578,581 | | | $ | 166,557,604 | | | $ | 576,136,686 | |
| Affiliated issuers | | $ | — | | | $ | — | | | $ | — | | | $ | 23,705,016 | |
| (2) Cost of Foreign Currencies | | $ | 1,516 | | | $ | — | | | $ | 8,995,471 | | | $ | — | |
The accompanying notes are an integral part of these financial statements.
The Tocqueville Trust
Statements of Operations
For the Six Months Ended April 30, 2007
(Unaudited)
| | | The | | | Small Cap | | | International | | | | |
| | | Tocqueville | | | Value | | | Value | | | Gold | |
| | | Fund | | | Fund | | | Fund | | | Fund | |
Investment Income: | | | | | | | | | | | | |
| Dividends* | | | | | | | | | | | | |
| Unaffiliated issuers | | $ | 3,339,137 | | | $ | 198,988 | | | $ | 1,819,217 | | | $ | 2,359,845 | |
| Interest | | | 640,640 | | | | 49,621 | | | | 228,046 | | | | 573,479 | |
| | | | 3,979,777 | | | | 248,609 | | | | 2,047,263 | | | | 2,933,324 | |
Expenses: | | | | | | | | | | | | | | | | |
| Investment Adviser’s fee (See Note 4) | | | 1,627,326 | | | | 188,818 | | | | 1,142,120 | | | | 4,105,704 | |
| Distribution fees (See Note 4) | | | 542,442 | | | | 62,939 | | | | 285,530 | | | | 1,162,794 | |
| Administration fee (See Note 4) | | | 325,465 | | | | 37,763 | | | | 171,318 | | | | 697,676 | |
| Transfer agent and shareholder services fees | | | 74,737 | | | | 10,211 | | | | 44,917 | | | | 185,776 | |
| Professional fees | | | 42,129 | | | | 6,022 | | | | 32,533 | | | | 121,043 | |
| Fund accounting fees | | | 25,313 | | | | 3,496 | | | | 22,074 | | | | 54,084 | |
| Custody fees | | | 21,478 | | | | 5,334 | | | | 78,332 | | | | 113,264 | |
| Registration fees | | | 17,247 | | | | 11,690 | | | | 17,842 | | | | 42,128 | |
| Printing and mailing expense | | | 16,947 | | | | 1,144 | | | | 5,989 | | | | 36,906 | |
| Trustee fees and expenses | | | 13,351 | | | | 1,144 | | | | 11,609 | | | | 46,230 | |
| Insurance expense | | | 6,233 | | | | 1,546 | | | | 6,697 | | | | 23,526 | |
| Other expenses | | | 15,847 | | | | 1,903 | | | | 7,849 | | | | 44,670 | |
| Total expenses before waiver | | | 2,728,515 | | | | 332,010 | | | | 1,826,810 | | | | 6,633,801 | |
| Less: Fees waived (See Note 4) | | | (16,305 | ) | | | — | | | | — | | | | — | |
| Net expenses | | | 2,712,210 | | | | 332,010 | | | | 1,826,810 | | | | 6,633,801 | |
Net Investment Income (Loss) | | | 1,267,567 | | | | (83,401 | ) | | | 220,453 | | | | (3,700,477 | ) |
Realized and Unrealized Gain (Loss): | | | | | | | | | | | | | | | | |
| Net realized gain (loss) on: | | | | | | | | | | | | | | | | |
| Investments | | | | | | | | | | | | | | | | |
| Unaffiliated issuers | | | 17,706,134 | | | | 4,465,732 | | | | 12,733,085 | | | | 46,110,235 | |
| Foreign currency translation | | | (7,593 | ) | | | — | | | | 303,680 | | | | (6,995 | ) |
| | | | 17,698,541 | | | | 4,465,732 | | | | 13,036,765 | | | | 46,103,240 | |
| Net change in unrealized appreciation (depreciation) on: | | | | | | | | | | | | | | | | |
| Investments | | | 19,478,019 | | | | (905,191 | ) | | | 10,207,119 | | | | 79,004,712 | |
| Foreign currency translation | | | 301 | | | | — | | | | (136,834 | ) | | | — | |
| | | | 19,478,320 | | | | (905,191 | ) | | | 10,070,285 | | | | 79,004,712 | |
| Net gain on investments and foreign currency | | | 37,176,861 | | | | 3,560,541 | | | | 23,107,050 | | | | 125,107,952 | |
Net Increase in Net Assets Resulting from Operations | | $ | 38,444,428 | | | $ | 3,477,140 | | | $ | 23,327,503 | | | $ | 121,407,475 | |
| * Net of foreign taxes withheld | | $ | 53,793 | | | $ | — | | | $ | 247,290 | | | $ | 137,266 | |
The accompanying notes are an integral part of these financial statements.
The Tocqueville Trust
Statements of Changes in Net Assets
| | | | |
| | | The Tocqueville Fund | |
| | | For the | | | | |
| | | Six Months | | | For the | |
| | | Ended | | | Year Ended | |
| | | April 30, | | | October 31, | |
| | | 2007 | | | 2006 | |
| | | (Unaudited) | | | | |
Operations: | | | | | | |
| Net investment income (loss) | | $ | 1,267,567 | | | $ | 1,593,038 | |
| Net realized gain on investments and foreign currency | | | 17,698,541 | | | | 26,821,512 | |
| Net change in unrealized appreciation/(depreciation) | | | 19,478,320 | | | | 34,202,302 | |
| Net increase in net assets resulting from operations | | | 38,444,428 | | | | 62,616,852 | |
Dividends and distributions to shareholders: | | | | | | | | |
| Net investment income | | | (454,720 | ) | | | (2,189,946 | ) |
| Net realized gains | | | — | | | | (23,608,046 | ) |
| Total dividends and distributions | | | (454,720 | ) | | | (25,797,992 | ) |
Fund share transactions: | | | | | | | | |
| Shares sold | | | 72,179,546 | | | | 115,739,773 | |
| Shares issued in merger (See Note 7) | | | — | | | | 65,466,749 | |
| Shares issued to holders in reinvestment of dividends | | | 367,310 | | | | 22,804,475 | |
| Shares redeemed* | | | (32,263,985 | ) | | | (24,126,165 | ) |
| Net increase (decrease) | | | 40,282,871 | | | | 179,884,832 | |
| Net increase (decrease) in net assets | | | 78,272,579 | | | | 216,703,692 | |
Net Assets: | | | | | | | | |
| Beginning of period | | | 392,494,949 | | | | 175,791,257 | |
| End of period** | | | 470,767,528 | | | | 392,494,949 | |
| * Net of redemption fees of: | | $ | 1,485 | | | $ | 21,410 | |
| ** Including undistributed net investment income (loss) of: | | $ | 812,847 | | | $ | — | |
Change in shares outstanding: | | | | | | | | |
| Shares sold | | | 2,826,253 | | | | 4,749,006 | |
| Shares issued in Merger (See Note 7) | | | — | | | | 3,528,649 | |
| Shares issued to holders in reinvestment of dividends | | | 14,404 | | | | 949,648 | |
| Shares redeemed | | | (1,259,277 | ) | | | (973,392 | ) |
| Net increase (decrease) | | | 1,581,380 | | | | 8,253,911 | |
The accompanying notes are an integral part of these financial statements.
The Tocqueville Trust
Statements of Changes in Net Assets
| | | | | | | | | | | | | | | | | |
Small Cap Value Fund | | | International Value Fund | | | Gold Fund | |
For the | | | | | | For the | | | | | | For the | | | | |
Six Months | | | For the | | | Six Months | | | For the | | | Six Months | | | For the | |
Ended | | | Year Ended | | | Ended | | | Year Ended | | | Ended | | | Year Ended | |
April 30, | | | October 31, | | | April 30, | | | October 31, | | | April 30, | | | October 31, | |
2007 | | | 2006 | | | 2007 | | | 2006 | | | 2007 | | | 2006 | |
(Unaudited) | | | | | | (Unaudited) | | | | | | (Unaudited) | | | | |
| | | | | | | | | | | | | | | | | |
| $ | (83,401 | ) | | $ | (213,535 | ) | | $ | 220,453 | | | $ | 3,631,180 | | | $ | (3,700,477 | ) | | $ | (3,945,571 | ) |
| | 4,465,732 | | | | 7,602,971 | | | | 13,036,765 | | | | 30,929,378 | | | | 46,103,240 | | | | 84,687,203 | |
| | (905,191 | ) | | | (2,926,625 | ) | | | 10,070,285 | | | | 2,713,904 | | | | 79,004,712 | | | | 201,528,868 | |
| | 3,477,140 | | | | 4,462,811 | | | | 23,327,503 | | | | 37,274,462 | | | | 121,407,475 | | | | 282,270,500 | |
| | | | | | | | | | | | | | | | | | | | | | | |
| | — | | | | — | | | | (3,604,661 | ) | | | (712,009 | ) | | | (3,621,877 | ) | | | — | |
| | (6,159,790 | ) | | | — | | | | (30,743,930 | ) | | | (25,434,697 | ) | | | (84,246,717 | ) | | | (31,702,831 | ) |
| | (6,159,790 | ) | | | — | | | | (34,348,591 | ) | | | (26,146,706 | ) | | | (87,868,594 | ) | | | (31,702,831 | ) |
| | | | | | | | | | | | | | | | | | | | | | | |
| | 3,402,261 | | | | 6,733,616 | | | | 13,663,271 | | | | 62,632,662 | | | | 159,579,847 | | | | 310,226,522 | |
| | — | | | | — | | | | — | | | | — | | | | — | | | | — | |
| | 5,484,786 | | | | — | | | | 29,649,169 | | | | 23,518,380 | | | | 82,687,483 | | | | 29,792,252 | |
| | (8,403,828 | ) | | | (16,071,514 | ) | | | (28,086,538 | ) | | | (87,755,792 | ) | | | (102,233,027 | ) | | | (295,823,614 | ) |
| | 483,219 | | | | (9,337,898 | ) | | | 15,225,902 | | | | (1,604,750 | ) | | | 140,034,303 | | | | 44,195,160 | |
| | (2,199,431 | ) | | | (4,875,087 | ) | | | 4,204,814 | | | | 9,523,006 | | | | 173,573,184 | | | | 294,762,829 | |
| | | | | | | | | | | | | | | | | | | | | | | |
| | 52,701,043 | | | | 57,576,130 | | | | 225,233,906 | | | | 215,710,900 | | | | 833,254,480 | | | | 538,491,651 | |
| | 50,501,612 | | | | 52,701,043 | | | | 229,438,720 | | | | 225,233,906 | | | | 1,006,827,664 | | | | 833,254,480 | |
| $ | 774 | | | $ | 49,477 | | | $ | 18,761 | | | $ | 169,335 | | | $ | 279,040 | | | $ | 1,047,617 | |
| $ | (83,401 | ) | | $ | — | | | $ | (211,322 | ) | | $ | 3,172,886 | | | $ | (16,374,034 | ) | | $ | (9,051,680 | ) |
| | | | | | | | | | | | | | | | | | | | | | | |
| | 202,784 | | | | 380,420 | | | | 877,252 | | | | 3,908,734 | | | | 3,035,314 | | | | 6,528,800 | |
| | — | | | | — | | | | — | | | | — | | | | — | | | | — | |
| | 339,405 | | | | — | | | | 1,955,750 | | | | 1,572,084 | | | | 1,641,276 | | | | 770,224 | |
| | (498,622 | ) | | | (931,299 | ) | | | (1,798,233 | ) | | | (5,447,837 | ) | | | (1,984,139 | ) | | | (6,256,718 | ) |
| | 43,567 | | | | (550,879 | ) | | | 1,034,769 | | | | 32,981 | | | | 2,692,451 | | | | 1,042,306 | |
The accompanying notes are an integral part of these financial statements.
The Tocqueville Trust
The Tocqueville Fund
The Tocqueville Small Cap Value Fund
The Tocqueville International Value Fund
The Tocqueville Gold Fund
Notes to Financial Statements
The Tocqueville Trust (the “Trust”) was organized as a Massachusetts business trust registered under the Investment Company Act of 1940, as amended (the “1940 Act”), as a diversified, open-end management investment company. The Trust consists of four separate funds: The Tocqueville Fund, The Tocqueville Small Cap Value Fund, The Tocqueville International Value Fund and The Tocqueville Gold Fund (individually referred to as the ‘‘Fund’’ and collectively referred to as the ‘‘Funds’’). The objective of The Tocqueville Fund is long-term capital appreciation. The Tocqueville Fund seeks to achieve its investment objective by investing primarily in securities of United States issuers. The objective of The Tocqueville Small Cap Value Fund is long-term capital appreciation. The Tocqueville Small Cap Value Fund seeks to achieve its investment objective by investing at least 80% of its net assets, plus borrowings for investment purposes, in common stocks of companies located in the United States that have market values of less than $3 billion. The objective of The Tocqueville International Value Fund is long-term capital appreciation consistent with preservation of capital. The Tocqueville International Value Fund seeks to achieve its investment objective by investing primarily in non-U.S. companies. The objective of The Tocqueville Gold Fund is to provide long-term capital appreciation. The Tocqueville Gold Fund seeks to achieve its investment objective by investing 80% of its net assets, plus borrowings for investment purposes, in gold and securities of companies located throughout the world that are engaged in mining or processing gold. The following is a summary of significant accounting principles followed by the Trust in the preparation of its financial statements.
2. | | SIGNIFICANT ACCOUNTING POLICIES |
Investments in securities, including foreign securities, traded on an exchange or quoted on the over-the-counter market are valued at the last sale price or, if no sale occurred during the day, at the mean between closing bid and asked prices, as last reported by a pricing service approved by the Trustees. Securities that are principally traded on the National Association of Securities Dealers Automated Quotation (“NASDAQ”) National Market are generally valued at the NASDAQ Official Closing Price (“NOCP”). Investments in gold and silver will be valued on the basis of the respective closing spot prices of the New York Commodity Exchange. Investments in other precious metals will be valued at their respective market values determined on the basis of the mean between the last current bid and asked prices based on dealer or exchange quotations. When market quotations are not readily available, or when restricted securities or other assets are being valued, such assets are valued at fair value as determined in good faith by or under procedures approved by the Trustees. Short-term securities maturing within 60 days are valued on an amortized cost basis. Fixed income securities with maturities greater than 60 days are valued at market price.
Trading in securities on European and Far Eastern securities exchanges normally is completed before the calculation of the Funds’ net asset value. Trading on these foreign exchanges may not take place on all days on which there is regular trading on the New York Stock Exchange (“NYSE”), or may take place on days on which there is no regular trading on the NYSE. Similarly, the Funds may hold securities traded on domestic markets where the market may close early on a given day prior to calculation of the Funds’ net asset value. Events affecting the value of such securities held by the Funds that occur between the close of trading in the security and the close of trading on the NYSE normally will not be reflected in the Funds’ calculation of the net asset value. Significant events will be closely monitored, and where it is determined that an adjustment should be made to the security’s value because significant interim events may materially affect the value of the security, the security will be priced at its fair value in accordance with the procedures approved by the Trustees.
b) | | Restricted and Illiquid Securities |
The Tocqueville Fund and The Tocqueville Gold Fund may invest in securities that are subject to legal or contractual restrictions on resale or are illiquid. A security may be considered illiquid if it lacks a readily available market or if its valuation has not changed for a certain period of time. Disposal of these securities may involve time consuming negotiations and expense, and prompt sale at the current valuation may be difficult.
c) | | Accounting pronouncements |
On July 13, 2006, the Financial Accounting Standards Board (“FASB”) released FASB Interpretation No. 48 “Accounting for Uncertainty in Income Taxes” (“FIN 48”). FIN 48 provides guidance for how uncertain tax positions should be recognized, measured, presented and disclosed in the financial statements. FIN 48 requires the evaluation of tax positions taken or expected to be taken in the course of preparing the Tocqueville Trust’s tax returns to determine whether the tax positions are “more-likely-than-not” of being sustained by the applicable tax authority. Tax positions not deemed to meet the more-likely-than-not threshold would be recorded as a tax benefit or expense in the current year. Adoption of FIN 48 is required for fiscal years beginning after December 15, 2006 and is to be applied to all open tax years as of the effective date. At this time, management is evaluating the implications of FIN 48 and its impact in the financial statements has not yet been determined.
In September 2006, the Financial Accounting Standards Board (FASB) issued Statement on Financial Accounting Standards No. 157, “Fair Value Measurements” (FAS 157). This standard clarifies the definition of fair value for financial reporting, establishes a framework for measuring fair value and requires additional disclosures about the use of fair value measurements. FAS 157 is effective for financial statements issued for fiscal years beginning after November 15, 2007 and interim periods within those fiscal years. As of September 30, 2006, the Funds do not believe the adoption of FAS 157 will impact the amounts reported in the financial statements; however, additional disclosures will be required about the inputs used to develop the measurements of fair value and the effect of certain of the measurements reported in the statement of operations for a fiscal period.
Provision for federal income taxes or excise taxes has not been made since the Funds have elected to be taxed as “regulated investment companies” and intend to distribute substantially all taxable income to shareholders and otherwise comply with the provisions of the Internal Revenue Code applicable to regulated investment companies. Distributions from net realized gains for book purposes may include short-term capital gains which are included as ordinary income to shareholders for tax purposes. Accounting principles generally accepted in the United States of America (“GAAP”) requires that permanent differences between financial reporting and tax reporting be reclassified between various components of net assets.**
| ** | The reclassifications have no effect on net assets or net asset value per share. For the year ended October 31, 2006, the Tocqueville Fund had a decrease in undistributed net investment loss of $9,367, an increase in accumulated realized loss of $4,627,330 and an increase in paid-in capital of $4,617,963. The Small Cap Value Fund had a decrease in undistributed net investment loss of $213,535, a decrease in accumulated realized gains of $1, and a decrease in paid-in capital of $213,534. The International Value Fund had an increase in undistributed net investment of $181,404 and a decrease in accumulated realized gains of $181,404. The Gold Fund had an increase in undistributed net investment loss of $20,906 and an increase in accumulated realized gains of $20,907. |
At October 31, 2006 the cost of investments, gross unrealized appreciation and depreciation of investments and distributable income for tax purposes were as follows:
| | | The | | | Small Cap | | | | | | | |
| | | Tocqueville | | | Value | | | International | | | Gold | |
| | | Fund | | | Fund | | | Value Fund | | | Fund | |
| Cost of Investments | | $ | 322,697,913 | | | $ | 45,116,953 | | | $ | 182,709,360 | | | $ | 518,285,164 | |
| Appreciation | | $ | 75,234,365 | | | $ | 10,794,398 | | | $ | 50,143,742 | | | $ | 343,476,404 | |
| Depreciation | | | (2,751,812 | ) | | | (3,148,335 | ) | | | (4,908,588 | ) | | | (15,774,636 | ) |
| Net unrealized appreciation (depreciation) on investments | | $ | 72,482,553 | | | $ | 7,646,063 | | | $ | 45,235,154 | | | $ | 327,701,768 | |
| Undistributed ordinary income | | $ | — | | | $ | — | | | $ | 4,177,083 | | | $ | 22,329,847 | |
| Undistributed long-term capital gain | | | — | | | | 6,159,792 | | | | 29,743,827 | | | | 65,538,666 | |
| Distributable earnings | | $ | — | | | $ | 6,159,792 | | | $ | 33,920,910 | | | $ | 87,868,513 | |
| Other net unrealized accumulated appreciation (depreciation) | | $ | (13,727,302 | ) | | $ | — | | | $ | — | | | $ | (12,673,556 | ) |
| Total accumulated earnings (losses) | | $ | 58,755,251 | | | $ | 13,805,855 | | | $ | 79,156,064 | | | $ | 402,896,725 | |
Unrealized appreciation and depreciation differ for financial statement and tax purposes primarily due to the tax deferral of wash sale losses (The Tocqueville Gold Fund only) and realization for tax purposes of unrealized losses on passive foreign investment companies (The Tocqueville Gold Fund only).
The tax character of distributions paid during the years ended October 31, 2006 and 2005 was as follows:
| | | October 31, 2006 | |
| | | Long-term | |
| | | Ordinary | | | Capital | | | | |
| | | Income | | | Gain | | | Total | |
| The Tocqueville Fund | | $ | 2,189,946 | | | $ | 23,608,046 | | | $ | 25,797,992 | |
| International Value Fund | | | 712,009 | | | | 25,434,697 | | | | 26,146,706 | |
| Gold Fund | | | — | | | | 31,702,831 | | | | 31,702,831 | |
| | | | | | | | | | | | | |
| | | October 31, 2005 | |
| | | | | | | Long-term | | | | | |
| | | Ordinary | | | Capital | | | | | |
| | | Income | | | Gain | | | Total | |
| The Tocqueville Fund | | $ | 863,340 | | | $ | 5,747,338 | | | $ | 6,610,678 | |
| Small Cap Value Fund | | | — | | | | 3,029,286 | | | | 3,029,286 | |
| International Value Fund | | | 1,164,107 | | | | — | | | | 1,164,107 | |
| Gold Fund | | | — | | | | 21,027,179 | | | | 21,027,179 | |
At October 31, 2006, certain funds had tax basis capital losses which may be carried over to offset future capital gains as shown below.
| | | The | |
| | | Tocqueville | |
| | | Fund | |
| Capital losses expiring in: | | | |
| 2010 | | $ | 11,333,200 | |
| 2013 | | | 2,394,102 | |
| | | $ | 13,727,302 | |
During the year ended October 31, 2006, The Tocqueville Fund and The Tocqueville Small Cap Value Fund utilized $8,209,337 and $1,499,666 of capital loss carryforwards, respectively.
e) | | Foreign currency translation |
Investments and other assets and liabilities denominated in foreign currencies are translated to U.S. dollars at the prevailing rates of exchange, in accordance with the Trust’s Portfolio Securities Valuation and Foreign Exchange Contracts Procedures. The Tocqueville Fund, The Tocqueville International Value Fund and The Tocqueville Gold Fund, are engaged in transactions in securities denominated in foreign currencies and, as a result, enter into foreign exchange contracts. These Funds are exposed to additional market risk as a result of changes in the value of the underlying currency in relation to the U.S. dollar. Risks include potential inability of counterparties to meet the terms of their contracts. The value of foreign currency contracts are marked-to-market on a daily basis, which reflects the changes in the market value of the contract at the close of each day’s trading, resulting in daily unrealized gains and/or losses. When the contracts are closed, the Funds recognize a realized gain or loss.
The Funds do not isolate that portion of the results of operations resulting from changes in foreign exchange rates on investments from the fluctuations arising from changes in market prices of securities held. Such fluctuations are included with the net realized and unrealized gain or loss from investments.
Reported net realized foreign exchange gains or losses arise from sales of foreign currencies, currency gains or losses realized between the trade and settlement dates on securities transactions, the differences between the amounts of dividends, interest, and foreign withholding taxes recorded on the Fund’s books, and the U.S. dollar equivalent of the amounts actually received or paid. Net unrealized foreign exchange gains and losses arise from changes in the value of assets and liabilities other than investments in securities at the end of the fiscal period, resulting from changes in the exchange rates.
f) | | Written option accounting |
The Tocqueville International Value Fund and The Tocqueville Gold Fund may write (sell) covered call options to hedge portfolio investments. When the Funds write (sell) an option, an amount equal to the premium received by the Funds are included in the Statements of Assets and Liabilities as an asset and an equivalent liability. The amount of the liability is subsequently marked-to-market to reflect the current value of the option written. By writing an option, the Funds may become obligated during the term of the option to deliver or purchase the securities underlying the option at the exercise price if the option is exercised. Option contracts are valued at the last sales price reported on the date of
valuation. If no sale is reported, the option contract written is valued at the average of the current bid and asked price reported on the day of valuation. When an option expires on its stipulated expiration date or the Funds enter into a closing purchase transaction, the Funds realize a gain or loss if the cost of the closing purchase transaction differs from the premium received when the option was sold without regard to any unrealized gain or loss on the underlying security, and the liability related to such option is eliminated. When an option is exercised, the premium originally received decreases the cost basis of the security (or increases the proceeds on a sale of the security), and the Funds realize a gain or loss from the sale of the underlying security.
Futures contracts listed for trading on a securities exchange or board of trade shall be valued at the last quoted sales price, or in the absence of a sale, the mean of the last bid and asked prices. When a Fund enters into a futures contract, it makes an initial margin deposit in a segregated account, either in cash or liquid securities. Thereafter, the futures contract is marked to market and the Fund makes (or receives) additional cash payments daily to (or from) the broker. Changes in the value of the contract are recorded as unrealized appreciation (depreciation) until the contract is closed or settled, at which time a realized gain or loss is recognized.
The preparation of financial statements in conformity with accounting principles generally accepted in the United States of America requires management to make estimates and assumptions that affect the reported amounts of assets and liabilities and disclosure of contingent assets and liabilities at the date of the financial statements and the reported amounts of increases and decreases in net assets from operations during the reporting period. Actual results could differ from those estimates.
Investments and shareowner transactions are recorded on trade date. Dividend income is recorded on the ex-dividend date or for foreign securities for which timely information is not available, when the Funds first learn of the dividend, whichever is earlier. Interest income is recognized on the accrual basis and market discount is accounted for on a yield to maturity basis from settlement date. The Funds use the first-in, first-out method for determining realized gain or loss on investments sold for both financial reporting and federal tax purposes. The Funds may be subject to foreign taxes on income, gains on investments or currency repatriation, a portion of which may be recoverable. The Funds will accrue such taxes and recoveries as applicable, based upon their current interpretation of tax rules and regulations that exist in the markets in which it invests. Distributions to shareholders are recorded on the ex-dividend date. Expenses incurred by the Trust not specifically identified to a Fund are allocated on a basis relative to the size of each Fund’s daily net asset value.
The Funds may transfer uninvested cash balances into separate accounts, the daily balance of which is invested in repurchase agreements collateralized by U.S. Treasury or federal agency obligations. The Trust’s custodian takes possession of the collateral pledged for investments in repurchase agreements (“repo” or collectively “repos”). The underlying collateral is valued daily on a mark-to-market basis to ensure that the value, at the time the agreement is entered into, is equal to at least 102% of the repurchase price, including accrued interest. In the event of default of the obligation to repurchase, the Trust has the right to liquidate the collateral and apply the proceeds in satisfaction of the
obligation. If the seller defaults and the value of the collateral declines or if bankruptcy proceedings are commenced with respect to the seller of the security, realization of the collateral by the Trust may be delayed or limited.
The Funds may trade financial instruments with off-balance sheet risk in the normal course of investing activities and to assist in managing exposure to market risks such as interest rates and foreign currency exchange rates. The financial instruments include written options, forward foreign currency exchange contracts and futures contracts. The notional or contractual amounts of these instruments represent the investment the Funds have in particular classes of financial instruments and do not necessarily represent the amounts potentially subject to risk. The measurement of the risks associated with these instruments is meaningful only when all related and offsetting transactions are considered. At October 31, 2006, the Funds did not hold any financial instruments with off-balance sheet risk.
4. | | INVESTMENT ADVISORY AND OTHER AGREEMENTS |
Tocqueville Asset Management L.P. (“Tocqueville”), is the investment adviser (the “Adviser”), to the Trust under Investment Advisory Agreements approved by shareholders. For its services, Tocqueville receives fees from The Tocqueville Fund, calculated daily and payable monthly, at an annual rate of 0.75% on the first $1 billion of the average daily net assets of the Fund, and 0.65% of the average daily net assets in excess of $1 billion. Tocqueville receives fees from The Tocqueville Small Cap Value Fund, calculated daily and payable monthly, at an annual rate of 0.75% on the first $500 million of the average daily net assets of the Fund, and 0.65% of the average daily net assets in excess of $500 million. Tocqueville receives fees from the Tocqueville International Value Fund, calculated daily and payable monthly, at an annual rate of 1.00% on the first $1 billion of the average daily net assets of the Fund, and 0.75% of the average daily net assets in excess of $1 billion. Tocqueville receives fees from The Tocqueville Gold Fund, calculated daily and payable monthly, at an annual rate of 1.00% on the first $500 million of the average daily net assets of the Fund, 0.75% of the average daily net assets in excess of $500 million but not exceeding $1 billion, and 0.65% of the average daily net assets in excess of $1 billion.
With respect to The Tocqueville Fund, effective October 31, 2006, the Adviser has contractually agreed to waive its advisory fees and/or reimburse expenses in order to ensure that The Tocqueville Fund’s total annual operating expenses do not exceed 1.25% of its average daily net assets. The Expense Limitation Agreement will remain in effect until October 31, 2007.
Pursuant to an Administrative Services Agreement, each Fund pays to the Adviser a fee computed and paid monthly at an annual rate of 0.15% of the average daily net assets of the Fund. For the six months ended April 30, 2007, the Adviser has made payments of $67,551, $7,842, $35,562 and $144,782 to U.S. Bancorp Fund Services, LLC for services provided under a Sub-Administration agreement for The Tocqueville Fund, The Tocqueville Small Cap Value Fund, The Tocqueville International Value Fund and The Tocqueville Gold Fund, respectively.
Lepercq, de Neuflize/Tocqueville Securities, L.P., an affiliate of Tocqueville, (the “Distributor”) acts as distributor for shares of the Trust. Each Fund adopted a distribution and service plan pursuant to Rule 12b-1 of the 1940 Act. Pursuant to the plans, each Fund pays to the Distributor distribution and service fees of 0.25% per annum of its average daily net assets.
Commissions earned by the Distributor for services rendered as a registered broker-dealer in securities transactions for The Tocqueville Fund, The Tocqueville Small Cap Value Fund, The Tocqueville International Value Fund and The Tocqueville Gold Fund for the six months ended April 30, 2007, were $109,771, $100,555, $29,203 and $85,931, respectively.
During the year ended October 31, 2004, The Tocqueville Gold Fund received a reimbursement from Tocqueville related to certain losses incurred as a result of a pricing error. The amount of the loss and corresponding reimbursement was $60,626 or $0.004 per share based on average shares outstanding during the year ended October 31, 2004.
5. | FUND SHARE TRANSACTIONS |
The Funds currently offer only one class of shares of beneficial interest. A redemption fee of 2.00% is imposed on redemptions of shares held 120 days or less. This fee is retained by each Fund and is credited to paid in capital.
Redemptions to which the fee applies include redemptions of shares resulting from an exchange made pursuant to the Exchange Privilege, as defined in the Trust’s Prospectus dated February 28, 2007. For a more detailed description of when the redemption fee does not apply, please see the Trust’s Prospectus. The Trust may waive the redemption fee when the Adviser determines that the imposition of the redemption fee is not necessary to protect a Fund from the effects of redemptions by investors who use the Fund as a short-term trading vehicle.
6. | INVESTMENT TRANSACTIONS |
Purchases and sales of investment securities (excluding short-term instruments) for the year ended October 31, 2006 are summarized below.
| | | The | | | | | | | | | | |
| | | Tocqueville | | | Small Cap | | | International | | | Gold | |
| | | Fund | | | Value Fund | | | Value Fund | | | Fund | |
| Purchases: | | $ | 115,197,496 | | | $ | 23,875,897 | | | $ | 39,881,208 | | | $ | 129,123,096 | |
| Sales: | | $ | 66,613,910 | | | $ | 30,545,670 | | | $ | 54,490,550 | | | $ | 100,442,535 | |
Effective October 31, 2006, The Tocqueville Fund acquired, through a non-taxable merger, substantially all of the net assets of The Tocqueville Genesis Fund, a series of the Tocqueville Trust. The Tocqueville Fund issued 628,166 shares (valued at $15,236,046) for the 1,528,711 shares outstanding of The Tocqueville Genesis Fund. The net assets of the Tocqueville Genesis Fund, $15,236,046, included net unrealized appreciation on investment of $1,464,099.
Effective October 31, 2006, The Tocqueville Fund acquired, through a non-taxable merger, substantially all of the net assets of The Tocqueville Alexis Fund, a single series. The Tocqueville Fund issued 2,900,483 shares (valued at $70,350,642) for the 5,366,305 shares outstanding of The Tocqueville Alexis Fund. The net assets of the Tocqueville Alexis Fund, $70,350,642, included net unrealized appreciation on investment of $18,655,613.
8. | TRANSACTIONS WITH AFFILIATES |
The following issuers are affiliated with the Funds; that is, the Fund held 5% or more of the outstanding voting securities during the period from November 1, 2006 through April 30, 2007. As defined in Section (2)(a)(3) of the Investment Company Act of 1940; such issues are:
The Tocqueville Gold Fund | | | | | | |
| | Share Balance | | | Share Balance | Dividend | Value |
Issuer Name | At Nov. 1, 2006 | Additions | Reductions | At April 30, 2007 | Income | At April 30, 2007 |
| Troy Resources NL | 1,463,000 | 1,950,000 | — | 3,413,000 | $— | $ 8,504,012 |
| Fury Explorations Ltd. | 1,500,000 | — | — | 1,500,000 | — | 1,216,326 |
| Euro Ressources S.A. | — | 2,900,000 | — | 2,900,000 | — | 4,432,375 |
| New Gold, Inc. | 516,500 | 1,002,000 | — | 1,518,500 | — | 11,172,835 |
| | | | | | $ — | |
ADDITIONAL INFORMATION (UNAUDITED)
1. | ADDITIONAL DISCLOSURE REGARDING FUND TRUSTEES AND OFFICERS |
Independent Trustees
| | | | | # of | |
| | | | | Portfolios | |
| | | Term of | | in Fund | |
| | Position(s) | Office and | | Complex | |
| | Held with | Length of | Principal Occupation | Overseen | Other Directorships |
Name, Age and Address | the Trust | Time Served (1) | During Past Five Years | By Trustee | Held by Trustee |
| | | | | | |
| Inge Heckel (67) | Trustee | Indefinite Term, | President, New York School of | 4 | Member of the |
| 40 W. 57th St., 19th Floor | | 20 Years Served | Interior Design, from July | | Advisory Council, |
| New York, NY 10019 | | | 1996 to present. | | the Institute of |
| | | | | | Classical |
| | | | | | Architecture; |
| | | | | | Member, Advisory |
| | | | | | Council Olana |
| | | | | | Preservation; |
| | | | | | Member, |
| | | | | | Horticultural |
| | | | | | Committee, |
| | | | | | Wave Hill |
| | | | | | |
| Larry M. Senderhauf (58) | Trustee | Indefinite Term, | Retired. Administrator and | 4 | Advisory Board |
| 40 W. 57th St., 19th Floor | | 7 Years Served | Trustee, LMS 33 Profit and | | Member, Legacy |
| New York, NY 10019 | | | Pension Sharing Fund from | | Bank, Scottsdale, |
| | | | 1983 to present. | | Arizona |
| | | | | | |
| Guy A. Main (70) | Trustee | Indefinite Term, | Retired. Formerly, Executive | 4 | Director, Amwest |
| 40 W. 57th St., 19th Floor | | 5 Years Served | Vice President, Amwest | | Insurance Group, |
| New York, NY 10019 | | | Insurance Group, Inc. from | | Inc. from April 1996 |
| | | | April 1996 to January 2001; | | to January 2001; |
| | | | Chairman, President and Chief | | Chairman, |
| | | | Executive Officer, Condor | | Association of |
| | | | Services Inc. from April 1989 | | California Insurance |
| | | | to April 1996. | | Companies from |
| | | | | | January 1996 to |
| | | | | | January 1998; |
| | | | | | Director, Condor |
| | | | | | Services Inc. from |
| | | | | | April 1989 to |
| | | | | | April 1996. |
Independent Trustees
| | | | | # of | |
| | | | | Portfolios | |
| | | Term of | | in Fund | |
| | Position(s) | Office and | | Complex | |
| | Held with | Length of | Principal Occupation | Overseen | Other Directorships |
Name, Age and Address | the Trust | Time Served (1) | During Past Five Years | By Trustee | Held by Trustee |
| | | | | | |
| Charles W. Caulkins (50) | Trustee | Indefinite Term, | Founder and President, Arbor | 4 | Director, Phoenix |
| 40 W. 57th St., 19th Floor | | 3 Years Served | Marketing, Inc. from October | | House from January |
| New York, NY 10019 | | | 1994 to present. | | 2001 to 2007; |
| | | | | | Director, Bridges to |
| | | | | | Community from |
| | | | | | July 2002 to 2006. |
| | | | | | |
| James W. Gerard (45) | Trustee | Indefinite Term, | Principal, Juniper Capital | 4 | Director, American |
| 40 W. 57th St., 19th Floor | | 4 Years Served | Group, LLC (formerly known | | Overseas Memorial |
| New York, NY 10019 | | | as Argus Advisors | | Day Association, |
| | | | International, LLC), from | | 1988 to present; |
| | | | August 2003 to present; | | Director and |
| | | | Managing Director, The Chart | | Treasurer ASPCA, |
| | | | Group from January 2001 to | | 1988 to present; |
| | | | present; Managing Principal, | | Trustee, Salisbury |
| | | | Ironbound Partners from | | School, 2005 to |
| | | | October 1998 to | | present. |
| | | | December 2000. | | |
| | | | | | |
| William F. Indoe (64) | Trustee | Indefinite Term, | Partner, Sullivan & Cromwell | 4 | None |
| 40 W. 57th St., 19th Floor | | Since December | LLP (attorneys-at-law). | | |
| New York, NY 10019 | | 2006 | | | |
| | | | | | |
| William J. Nolan III (59) | Trustee | Indefinite Term, | Retired, Executive Vice | 4 | Trustee, Adirondock |
| 40 W. 57th St., 19th Floor | | Since December | President & Treasurer | | Museum, Blue Mt. |
| New York, NY 10019 | | 2006 | PaineWebber Inc. 1997-2001. | | Lake, NY 1996 to |
| | | | | | present (Treasurer, |
| | | | | | 2000 to present). |
Interested Trustees (and Officers)*
| | | | | # of | |
| | | | | Portfolios | |
| | | Term of | | in Fund | |
| | Position(s) | Office and | | Complex | |
| | Held with | Length of | Principal Occupation | Overseen | Other Directorships |
Name, Age and Address | the Trust | Time Served (1) | During Past Five Years | By Trustee | Held by Trustee |
| | | | | | |
| Francois D. Sicart (63) | Chairman, | Indefinite Term, | Chairman, Tocqueville | 4 | Chairman and |
| 40 W. 57th St., 19th Floor | Principal | 19 Years Served | Management Corporation, the | | Director, |
| New York, NY 10019 | Executive | | General Partner of Tocqueville | | Tocqueville |
| | Officer and | | Asset Management L.P. and | | Management |
| | Trustee | | Lepercq, de Neuflize/ | | Corporation, the |
| | | | Tocqueville Securities, L.P. | | General Partner of |
| | | | from January 1990 to present; | | Tocqueville Asset |
| | | | Chairman and Founder, | | Management L.P. |
| | | | Tocqueville Asset | | and Lepercq, de |
| | | | Management Corp. from | | Neuflize/ |
| | | | December 1985 to January | | Tocqueville |
| | | | 1990; Vice Chairman of | | Securities, L.P. from |
| | | | Tucker Anthony Management | | January 1990 to |
| | | | Corporation from 1981 to | | present. |
| | | | October 1986; Vice President | | |
| | | | (formerly general partner) | | |
| | | | among other positions with | | |
| | | | Tucker Anthony, Inc. from | | |
| | | | 1969 to January 1990. | | |
| | | | | | |
| Robert W. Kleinschmidt (57) | President, | Indefinite Term, | President, Chief Investment | 4 | President and |
| 40 W. 57th St., 19th Floor | Principal | 14 Years Served | Officer and Director, | | Director, |
| New York, NY 10019 | Operating | | Tocqueville Management | | Tocqueville |
| | Officer, | | Corporation, the General | | Management |
| | Principal | | Partner of Tocqueville Asset | | Corporation, the |
| | Financial | | Management L.P. and | | General Partner of |
| | Officer, and | | Lepercq, de Neuflize/ | | Tocqueville Asset |
| | Trustee | | Tocqueville Securities, L.P. | | Management L.P. |
| | | | from January 1994 to present; | | and Lepercq, de |
| | | | and Managing Director from | | Neuflize/Tocqueville |
| | | | July 1991 to January 1994; | | Securities, L.P. |
| | | | Partner, David J. Greene & Co. | | |
| | | | from May 1978 to July 1991. | | |
| * | “Interested person” of the Trust is defined in the 1940 Act. Mr. Sicart and Mr. Kleinschmidt are considered “interested persons” because of their affiliation with the Adviser. |
Interested Trustees (and Officers)*
| | | | | # of | |
| | | | | Portfolios | |
| | | Term of | | in Fund | |
| | Position(s) | Office and | | Complex | |
| | Held with | Length of | Principal Occupation | Overseen | Other Directorships |
Name, Age and Address | the Trust | Time Served (1) | During Past Five Years | By Trustee | Held by Trustee |
| | | | | | |
| Steve Tyrrell (35) | Secretary, | Indefinite Term, | Director of Operations, | N/A | N/A |
| 40 W. 57th St., 19th Floor | Treasurer | Since 2006 | Tocqueville Asset | | |
| New York, NY 10019 | | | Management L.P. from 2004 | | |
| | | | to present; Assistant Director | | |
| | | | of Operations, 2002-2004; | | |
| | | | Assistant Operations Manager, | | |
| | | | Lepercq, de Neuflize & Co., | | |
| | | | Inc. 1998-2002 | | |
| | | | | | |
| Andrea Yermack (54) | Anti | Indefinite Term, | Director of Compliance (April | N/A | N/A |
| 40 W. 57th St., 19th Floor | Money | Since 2006 | 2006-present), Lepercq, de | | |
| New York, NY 10019 | Laundering | | Neuflize/Tocqueville | | |
| | Compliance | | Securities and Tocqueville | | |
| | Officer | | Asset Management L.P.; Vice | | |
| | | | President/Deputy Director of | | |
| | | | Compliance (June 1999-April | | |
| | | | 2006), Instinet Group, LLC | | |
| | | | | | |
| Thomas Pandick (60) | Chief | Indefinite Term, | Chief Compliance Officer | N/A | N/A |
| 40 W. 57th St., 19th Floor | Compliance | Since 2004 | (October 2004-present), | | |
| New York, NY 10019 | Officer | | Tocqueville Asset | | |
| | | | Management L.P.; General | | |
| | | | Counsel (January-October | | |
| | | | 2004), Tocqueville Asset | | |
| | | | Management L.P.; Vice | | |
| | | | President, Kirkbride Asset | | |
| | | | Management, Inc. (2000-2004) | | |
| 1 | Each Trustee will hold office for an indefinite term until the earliest of (i) the next meeting of shareholders, if any, called for the purpose of considering the election or re-election of such Trustee and until the election and qualification of his or her successor, if any, elected at such meeting, or (ii) the date a Trustee resigns or retires, or a Trustee is removed by the Board of Trustees or shareholders, in accordance with the Trust’s By-Laws, as amended, and Agreement and Declaration of Trust, as amended. Each officer will hold office for an indefinite term until the date he or she resigns or retires or until his or her successor is elected and qualified. |
2. | INVESTMENT ADVISORY AGREEMENT DISCLOSURE |
In determining whether to approve the continuance of the Investment Advisory Agreements on behalf of the Funds, the Trustees, including the disinterested Trustees, considered the following information:
1) | | The nature, extent and quality of services provided by the Adviser. |
The Trustees reviewed in detail the nature and extent of the services provided by the Adviser under the terms of the Funds’ Investment Advisory Agreements and the quality of those services over the past year. The Trustees noted that the services include managing the investment and reinvestment of the Funds’ assets; supervising and managing all aspects of the Funds’ operations; and providing the Board on a regular basis with financial reports and analyses on the Funds’ operations and the operations of comparable investment companies. The Trustees evaluated these factors based on their direct experience with the Adviser and in consultation with Trust counsel. The Trustees concluded that the nature and extent of the services provided under the Investment Advisory Agreements were reasonable and appropriate in relation to the advisory fee, that the level of services provided by the Adviser had not diminished over the past year and that the quality of services continues to be high. The Trustees reviewed the personnel responsible for providing advisory services to the Funds and concluded, based on their experience and interaction with the Adviser, that (i) the Adviser was able to retain quality portfolio managers and other personnel; (ii) the Adviser exhibited a high level of diligence and attention to detail in carrying out its advisory responsibilities under the Investment Advisory Agreements; (iii) the Adviser was responsive to requests of the Trustees; and (iv) the Adviser had kept the Trustees apprised of developments relating to the Funds and the industry in general. The Trustees also focused on the Adviser’s reputation and long-standing relationship with the Trust.
In connection with its assessment of the performance of the Adviser, the Trustees considered the Adviser’s financial condition and whether it has the resources necessary to continue to carry out its obligations under the Investment Advisory Agreements. The Trustees concluded that the Adviser has the financial resources necessary to continue to perform its obligations under the Investment Advisory Agreements and to continue to provide the high quality services that it has provided to the Funds to date.
2) | | The performance of the Funds and the Adviser. |
The Trustees reviewed the investment performance of the Funds, both on an absolute basis and as compared to a peer group for each respective Fund for the one-year, three-year, five-year and ten-year periods, as applicable, ended July 31, 2006. The peer groups were comprised of other funds that had similar investment objectives and sales load structures, as determined by Lipper: The Lipper Multi-Cap Value Funds peer group, with average net assets between $225 million and $275 million, for The Tocqueville Fund; the Lipper Small-Cap Core Funds peer group, with average net assets between $55 million and $65 million, for The Tocqueville Small Cap Value Fund; The Lipper International Small/Mid Cap Growth Funds peer group, with average net assets between $175 million and $225 million, for The Tocqueville International Fund; The Lipper Gold Oriented Funds peer group, with average net assets between $400 million and $1,000 million, for The Tocqueville Gold Fund; and the Lipper Mid-Cap Core Funds peer group, with average net assets between $10 million and $30 million, for The Tocqueville Genesis Fund (the “Peer Groups”).
The Trustees also compared each Fund’s investment performance against its benchmark market indices: the S&P 500 Index for The Tocqueville Fund; The Russell 2000 Index for The Tocqueville Small Cap Value Fund; the Morgan Stanley EAFE Index for The Tocqueville International Value Fund; the S&P 500 Index and the Philadelphia Stock Exchange Gold/Silver Index for The Tocqueville Gold Fund; and the Wilshire 5000 Index for The Tocqueville Genesis Fund (the
“Indices”) for the most recent fiscal quarter ended July 31, 2006, and for the one-year, three-year, five-year and ten-year periods ended July 31, 2006. The Trustees considered the above information as helpful in their assessment of whether the Adviser was obtaining for the Funds’ shareholders the performance that was available in the marketplace given each Fund’s investment objectives, policies, strategies, limitations and restrictions. The Board concluded that the performance of the Funds against their respective Peer Groups was satisfactory. In particular, the Board noted that with the exception of this most recent fiscal quarter, during which time all the Funds performed poorly as compared to their benchmarks, The Tocqueville Fund had performed well as compared to its Index for all periods and generally outperformed the median of its Peer Group, only slightly behind the median of its Peer Group for its ten-year period. The Board noted that with respect to the Tocqueville Small Cap Value Fund that despite underperforming its Index and the median of its Peer Group at various time periods, the Fund had outperformed both its Index and the median of its Peer Group for its ten-year period. The Board observed that The Tocqueville Genesis Fund underperformed the median of its Peer Group and its Index for the one-year period ended July 31, 2006, but also noted that the Fund was still relatively new. The Board further noted that overall The Tocqueville International Value Fund and The Tocqueville Gold Fund generally seemed to be in line with their respective Indices and median Peer Groups.
3) | | The cost of the advisory services and the profits to the Adviser from the relationship with the Trust. |
In connection with the Trustee’s consideration of the level of the advisory fees, the Trustees considered a number of factors. The Trustees compared the level of the advisory fees for each Fund against the advisory fees charged (i) by funds in their respective Peer Groups, (ii) other funds with an investment policy similar to the Funds’ that are advised or sub-advised by the Adviser (the Tocqueville Alexis Fund), and (iii) other types of accounts, such as institutional and pension accounts, with similar investment policies to the Funds’ that are advised or sub-advised by the Adviser, of which there were none. The Trustees also considered comparative total fund expenses of the Funds and the Peer Groups. The Trustees used this comparative fee information and total expense data as a guide to help assess the reasonableness of each Fund’s advisory fee, although they acknowledged that it was difficult to make precise comparisons with other funds since the exact nature of services provided under each Peer Group fund agreement is often not apparent. The Trustees also viewed the Peer Group fee information as a whole as useful in assessing whether the Adviser was providing services at a cost that was competitive with other, similar funds.
The Board noted that the contract rate advisory fee for each of the Funds was reasonable, but above average for the Tocqueville Fund, the Tocqueville Gold Fund and the Tocqueville Genesis Fund, when compared to their respective Peer Groups. The Board noted that the contract advisory fee for all the Funds was higher than the other fund advised by the Adviser. The Board further observed that the total expense ratios of the Funds were also reasonable. The Board noted that all the Funds, except for the Tocqueville Genesis Fund, were below average, when compared to their respective Peer Groups. The Board noted that the total expense ratios for all the Funds were higher than the other fund advised by the Adviser. The Board also noted that The Tocqueville Genesis Fund operates pursuant to an Expense Limitation Agreement whereby the Adviser has agreed to waive a portion of its fee necessary to limit the Fund’s total operating expenses to the level set forth in the Fund’s prospectus. In assessing this information, the Trustees considered both the comparative contract rate advisory fee as well as the level of advisory fee after waivers and/or reimbursement.
The Trustees also considered the profitability to the Adviser and its affiliate arising out of its relationship with the Trust. In this regard, the Trustees reviewed profitability data relating to the Adviser for the year October 31, 2005. The Trustees considered revenues received by the Adviser under the Investment Advisory Agreements and the Administration Agreement as well as revenues received by the Adviser’s affiliate under the 12b-1 plans and related agreements. The
Trustees also received a handout disclosing the Adviser’s financial statements and the Adviser provided an oral update on its profitability numbers since October 31, 2005. The Trustees concluded that the profitability of the Funds to the Adviser was not excessive.
4) | | The extent to which economies of scale will be realized as the Funds grow and whether fee levels reflect those economies of scale. |
With respect to the Trustees’ consideration of economies of scale, the Trustees discussed with the Adviser whether economies of scale would be realized by it in its management of the Fund at higher asset levels. The Trustees also reviewed the Peer Group data to assess whether the Peer Group funds had advisory fee breakpoints and, if so, at what asset levels. The Trustees noted that the Funds currently have advisory fee breakpoints and that they were satisfied that the current breakpoints were appropriate when compared with each Fund’s respective Peer Group. In the event there were significant asset growth in the future, the Trustee’s determined to reassess whether the advisory fees, including the current breakpoint structure, appropriately took into account any economies of scale that had been realized as a result of that growth.
The Board also discussed the Adviser’s practices regarding the selection and compensation of brokers and dealers that execute portfolio transactions for the Funds and the brokers’ and dealers’ provision of brokerage and research services to the Adviser. The Trustees further discussed the potential benefits the Adviser derived from the Funds’ soft dollar arrangements, whereby brokers provide research to the Funds or the Adviser in return for allocating fund brokerage, and other investment data concerning soft dollars.
Based on a consideration of all these factors in their totality, the Trustees, including all of the disinterested Trustees, determined that the Funds’ advisory fees were fair and reasonable with respect to the quality of services that the Adviser provides and in light of the other factors described above that the Trustees deemed relevant. The Trustees based their decision on evaluations of all these factors as a whole and did not consider any one factor as all-important or controlling.
3. | PROXY VOTING POLICIES AND PROCEDURES |
A description of the policies and procedures that The Tocqueville Trust uses to determine how to vote proxies relating to portfolio securities is available without charge upon request by calling 1-800-355-7307. Information regarding how The Tocqueville Trust voted proxies relating to portfolio securities during the most recent 12-month period ended June 30 is available by calling 1-800-355-7307 and it is also available on the SEC’s web site at http://www.sec.gov.
4. | SHAREHOLDER REPORTS AND QUARTERLY PORTFOLIO DISCLOSURE |
The Tocqueville Trust is required to file its complete schedule of portfolio holdings with the SEC for its first and third fiscal quarters on Form N-Q for fiscal quarters ending on or after July 9, 2004. Once filed, the Trust’s Form N-Q will be available without charge, upon request on the SEC’s website (http://www.sec.gov) and may be available by calling 1-800-697-3863. You can also obtain copies of Form N-Q by (i) visiting the SEC’s Public Reference Room in Washington, DC (information on the operation of the Public Reference Room may be obtained by calling 1-202-551-8090); (ii) sending your request and a duplicating fee to the SEC’s Public Reference Room, Washington, DC 20549-0102; or (iii) sending your request electronically to publicinfosec.gov. Quarterly portfolio holdings are also available on the website of The Tocqueville Funds, www.tocquevillefunds.com.
5. | SHAREHOLDER NOTIFICATION OF FEDERAL TAX STATUS |
The Funds designate the following percentages of ordinary dividends declared during the fiscal year ended October 31, 2006 as dividends qualifying for the dividends received deduction available to corporate shareholders:
| The Tocqueville Fund | 100.00% |
| International Value Fund | 10.06% |
The Funds designate the following percentages of ordinary dividends declared from net investment income during the fiscal year ended October 31, 2006 as qualified income under the Jobs and Growth Tax Relief Reconciliation Act of 2003:
| The Tocqueville Fund | 100.00% |
| International Value Fund | 100.00% |
For the year ended October 31, 2006, the funds designate the following percent of ordinary distributions paid as interest-related dividends under the Internal Revenue Code Section 871(k)(1)(c): The Tocqueville Fund—14.67%, International Value Fund—5.67%.
For the fiscal year ended October 31, 2006, the following percentages of its ordinary income distributions paid are designated as short-term capital gain distributions under the Internal Revenue Code Section 871(k)(2)(c): The Tocqueville Fund—0.00%, International Value Fund—0.00%.
For the year ended October 31, 2006, the Tocqueville International Value Fund earned foreign source income and paid foreign taxes which they intend to pass through to their shareholders pursuant to Section 853 of the Internal Revenue Code as follows:
| | Gross Dividend | | Taxes Withheld |
Country | Per Share | | Per Share |
| Austria | | 0.003005 | | | | 0.000451 | |
| Belgium | | 0.005165 | | | | 0.000775 | |
| Brazil | | 0.000000 | | | | 0.000000 | |
| Canada | | 0.003329 | | | | 0.000543 | |
| China | | 0.031157 | | | | 0.006231 | |
| Finland | | 0.026404 | | | | 0.005236 | |
| France | | 0.035990 | | | | 0.005339 | |
| Greece | | 0.005123 | | | | 0.000000 | |
| Hong Kong | | 0.005737 | | | | 0.000000 | |
| Indonesia | | 0.008373 | | | | 0.001256 | |
| Italy | | 0.069221 | | | | 0.010383 | |
| Japan | | 0.048525 | | | | 0.003471 | |
| Malaysia | | 0.008065 | | | | 0.000000 | |
| Mexico | | 0.008872 | | | | 0.000000 | |
| Netherlands | | 0.127689 | | | | 0.019273 | |
| Singapore | | 0.069102 | | | | 0.000000 | |
| South Africa | | 0.000000 | | | | 0.000000 | |
| South Korea | | 0.021978 | | | | 0.003655 | |
| Sweden | | 0.000000 | | | | 0.000000 | |
| Switzerland | | 0.022985 | | | | 0.003448 | |
| Taiwan | | 0.022849 | | | | 0.005242 | |
| Thailand | | 0.011969 | | | | 0.001197 | |
| United Kingdom | | 0.025443 | | | | 0.000000 | |
| | | 0.560983 | | | | 0.066499 | |
For the fiscal year ended October 31, 2006, the Tocqueville Gold Fund earned foreign source income and paid foreign taxes which they intend to pass through to their shareholders pursuant to Section 853 of the Internal Revenue Code as follows:
| | Gross Dividend | | Taxes Withheld |
Country | Per Share | | Per Share |
| Australia | | 0.0178 | | | | 0.0000 | |
| Canada | | 0.1265 | | | | 0.0076 | |
| Hong Kong | | 0.0093 | | | | 0.0000 | |
| Peru | | 0.0155 | | | | 0.0006 | |
| Russia | | 0.0247 | | | | 0.0039 | |
| South Africa | | 0.1439 | | | | 0.0006 | |
| | | 0.3376 | | | | 0.0127 | |
Investment Adviser
Tocqueville Asset Management L.P.
40 W. 57th St., 19th Floor
New York, NY 10019
(212) 698-0800
www.tocqueville.com
Distributor
Lepercq, de Neuflize/Tocqueville Securities, L.P.
40 W. 57th St., 19th Floor
New York, NY 10019
(212) 698-0800
Shareholders’ Servicing and Transfer Agent
U.S. Bancorp Fund Services, LLC
P.O. Box 701
Milwaukee, WI 53201-0701
(800) 697-3863
Custodian
U.S. Bank, N.A.
Custody Operations
1555 River Center Drive, Suite 302
Milwaukee, WI 53212
Board of Trustees
Francois D. Sicart—Chairman
Charles W. Caulkins
James W. Gerard
Inge Heckel
William F. Indoe
Robert W. Kleinschmidt
Guy A. Main
William J. Nolan III
Larry M. Senderhauf
Item 2. Code of Ethics.
Not applicable for semi-annual reports.
Item 3. Audit Committee Financial Expert.
Not applicable for semi-annual reports.
Item 4. Principal Accountant Fees and Services.
Not applicable for semi-annual reports.
Item 5. Audit Committee of Listed Registrants.
Not applicable to registrants who are not listed issuers (as defined in Rule 10A-3 under the Securities Exchange Act of 1934).
Item 6. Schedule of Investments.
Schedule of Investments is included as part of the report to shareholders filed under Item 1 of this Form.
Item 7. Disclosure of Proxy Voting Policies and Procedures for Closed-End Management Investment Companies.
Not applicable to open-end investment companies.
Item 8. Portfolio Managers of Closed-End Management Investment Companies.
Not applicable to open-end investment companies.
Item 9. Purchases of Equity Securities by Closed-End Management Investment Company and Affiliated Purchasers.
Not applicable to open-end investment companies.
Item 10. Submission of Matters to a Vote of Security Holders.
There were no material changes to the procedures by which shareholders may recommend nominees to the registrant’s Board of Trustees that were implemented after the registrant last provided disclosure in response to the requirements of Item 407(c)(2)(iv) of Regulation S-K (as required by Item 22(b)(15) of Schedule 14A), or this Item 10.
Item 11. Controls and Procedures.
| (a) | The registrant’s Principal Executive Officer and Principal Financial Officer have evaluated the design and operation of the registrant's disclosure controls and procedures within 90 days of the filing and have concluded that the registrant’s disclosure controls and procedures were effective in ensuring that information required to be disclosed by the registrant in this Form N-CSR was recorded, processed, summarized and reported on a timely basis. |
| (b) | There were no changes in the registrant's internal controls over financial reporting that occurred during the registrant's second fiscal quarter of the period covered by this report that have materially affected, or are reasonably likely to materially affect, the registrant's internal control over financial reporting. |
Item 12. Exhibits.
(a) | (1) Any code of ethics or amendment thereto, that is subject of the disclosure required by Item 2, to the extent that the registrant intends to satisfy Item 2 requirements through filing an exhibit. 1) Not Applicable. |
| | (2) Certifications pursuant to Section 302 of the Sarbanes-Oxley Act of 2002. Filed herewith. |
| | (3) Not applicable to open-end investment companies. |
(b) | Certifications of Principal Executive Officer and Principal Financial Officer, under Section 906 of the Sarbanes-Oxley Act of 2002 and 18 U.S.C. § 1350. Filed herewith. |
SIGNATURES
Pursuant to the requirements of the Securities Exchange Act of 1934 and the Investment Company Act of 1940, the registrant has duly caused this report to be signed on its behalf by the undersigned, thereunto duly authorized.
(Registrant) The Tocqueville Trust
By (Signature and Title)* /s/ Robert W. Kleinschmidt
Robert W. Kleinschmidt, President
Date June 28, 2007
Pursuant to the requirements of the Securities Exchange Act of 1934 and the Investment Company Act of 1940, this report has been signed below by the following persons on behalf of the registrant and in the capacities and on the dates indicated.
By (Signature and Title)* /s/ Robert W. Kleinschmidt
Robert W. Kleinschmidt, President
Date June 28, 2007 ;
By (Signature and Title)* /s/ Steven J. Tyrrell
Steven J. Tyrrell, Treasurer
Date June 28, 2007
* Print the name and title of each signing officer under his or her signature.