As filed with the Securities and Exchange Commission on 7/8/2009
UNITED STATES
SECURITIES AND EXCHANGE COMMISSION
Washington, D.C. 20549
FORM N-CSR
CERTIFIED SHAREHOLDER REPORT OF REGISTERED
MANAGEMENT INVESTMENT COMPANIES
Investment Company Act file number 811-4840
The Tocqueville Trust
(Exact name of registrant as specified in charter)
The Tocqueville Trust
40 W. 57th Street, 19th Floor
New York, NY 10019
(Address of principal executive offices) (Zip code)
Robert W. Kleinschmidt, President
The Tocqueville Trust
40 W. 57th Street, 19th Floor
New York, NY 10019
(Name and address of agent for service)
212-698-0800
Registrant’s telephone number, including area code
Date of fiscal year end: October 31
Date of reporting period: April 30, 2009
Item 1. Report to Stockholders.
SEMI-ANNUAL REPORT
April 30, 2009
The Tocqueville Trust
Mutual Funds
The Tocqueville Fund
The Tocqueville Small Cap Fund
The Tocqueville International Value Fund
The Tocqueville Gold Fund

This report is not authorized for distribution to prospective investors unless preceded or accompanied by a currently effective prospectus of The Tocqueville Trust. Please call 1-800-697-FUND (3863) for a free prospectus. Read it carefully before you invest.
You are invited to visit our website @ www.tocquevillefunds.com
Dear Fellow Shareholder,
After a timid recovery following the freefall experienced by practically all markets in October and November of 2008, a number of indices made minor new lows in March (for example the S&P 500 index), while others (such as the un-weighted Value Line Arithmetic index) merely revisited their November lows.
As of June 12, the S&P 500 index has now rebounded almost 42% from its March 6 low. The advance was broad-based as illustrated by the fact that on an equally-weighted basis, the stocks making up the index were up almost 61% on average.
It is important to remember that percentage gains or losses depend to a large extent on the level one uses as a base. For example, a stock that has declined 50% from $100 to $50 needs to gain 100% (e.g. to double) to return to its starting price of $100.
Thus, the S&P 500 lost 57.7% from its peak of 1576 on October 11, 2007 to its low of 667 on March 6 2009. It then gained 42% from that low but, at 946 on June 12 2009, that still leaves the index 40% below its peak of 2007. With various degrees of volatility, most global stock markets have followed similar patterns, as have most commodities.
We tend to think that the recovery to-date essentially erases the anomaly of October and November, when panic and forced sales resulted in a chaotic and indiscriminate collapse of stock prices: when one is forced to sell, one does not necessarily sell the stocks that most deserve to be sold, but rather those that can be sold. We also tend to think that the rebound has been and will continue to be just as indiscriminate as the liquidation of October and November.
Once we have rebounded to the levels preceding the October and November capitulation—somewhere between 1,000 and 1,100 on the S&P 500—some correction would not be too surprising and the real work will begin: to identify the potential leaders of the next major advance in global stock prices.
Faithfully Yours,

François Sicart
Chairman
The Tocqueville Fund
Dear Fellow Shareholder,
For the six month period ended April 30, 2009 which marks the first half of our fiscal year, the Tocqueville Fund generated a return of negative 4.09%. This compares with a negative return of 8.53% for the S&P 500, the index against which we are most often compared. These results, though gratifying, hardly begin to tell the story of the past six months.
The period began with the November election of Barack Obama, a truly historic event which was quickly followed by steep declines in the equity markets. A respite in December was offset the following month when the worst single month January decline in stock market history was followed by a nearly equal decline in February. By February’s end, the S&P 500 had declined by 26% since the election and this on top of an 18% decline in the two month period leading up to the election.
From these extremely depressed levels, the S&P 500 staged a rebound of 19% in the last two months of the period, a rebound that continues through this writing. By any measure this was an extraordinarily volatile period in market history, perhaps the most volatile, or certainly close to it. Managing a mutual fund in a period like this was no easy task.
Notwithstanding the difficulties, some themes began to emerge and some opportunities presented themselves. Government policies to address the financial and economic crises became more explicit. Among other things, it became clear that the level of government involvement in the economy, government regulations and government expense, in the form of higher taxes, are to be increased dramatically. It has also become abundantly clear that the government is prepared to use heretofore unheard of sums of deficit financing, as well as money creation, to achieve its goals. The long term effects of these policies seem certain to be much slower sustainable growth rates in the U.S. and rising inflationary and interest rate pressures, as well as a weaker dollar.
Shorter term, however, we would expect the economy to have a normal, if subdued, rebound from the steep declines of the past several quarters, and, thus, we have not been surprised by the rally of the past few months. Stock prices reached levels which suggested depression era extremes, and we do not believe that this represents the most likely outcome. While we are in for a possibly very long period of transition, perhaps along the lines of the Japanese experience since 1990, policy makers have not made the mistakes that were made in the 1930’s, at least not yet.
Our investment approach during this period has been to take advantage of the very low stock prices, especially in commodity oriented names, and in higher quality growth names, particularly those with global franchises. We have also began to research and position companies which would benefit from a rebound in housing activity, although we believe this remains quite a ways off. We have continued to avoid most areas of financial exposure, believing that the future for most financial institutions is fraught with challenges, even if the worst has past. Here especially, the heavy presence of the Federal Government is likely to restrict returns for some time, certainly over our investment time horizon.
Broad themes aside, our contrarian and value style of investing focuses on individual companies and fundamental research. Even in the most difficult of times, good investment opportunities can present themselves when investor psychology becomes more negative than the realities on the ground. That certainly seemed to be the case earlier in the calendar year, particularly just after the announcement of President Obama’s 2010 budget proposals. We will continue to look for opportunities to invest your funds in quality names at bargain prices and will try to use the swings in investor psychology to our advantage. For the foreseeable future, we believe this will remain a stock picker’s market and that the key to acceptable returns will be good stock selection.
As a large shareholder of the Tocqueville Fund, as well as its manager, I want to take this opportunity to thank each of you for your continued interest in and support of the fund.
Sincerely,

Robert W. Kleinschmidt
Portfolio Manager
The Tocqueville Fund
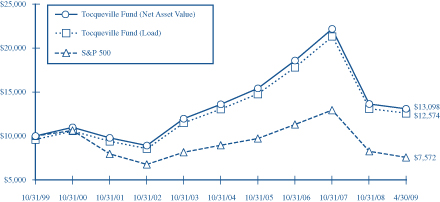
This chart assumes an initial gross investment of $10,000 made on 10/31/99. Returns shown do not reflect the deduction of taxes that a shareholder would pay on fund distributions or the redemption of fund shares. Performance reflects fee waivers in effect. In the absence of fee waivers, total return would be reduced. Returns shown include the reinvestment of all dividends and other distributions. Past performance is not predictive of future performance. Investment return and principal value will fluctuate so that your shares, when redeemed, may be worth more or less than their original cost.
The Standard & Poor’s 500 Stock Index (S&P 500) is a capital-weighted index, representing the aggregate market value of the common equity of 500 stocks primarily traded on the New York Stock Exchange.
AVERAGE ANNUAL RATE OF RETURN (%)
FOR PERIODS ENDED APRIL 30, 2009
| | | | | | | | |
| | | 1 Year | | 3 Year | | 5 Year | | 10 Year |
Tocqueville Fund—Net Asset Value | | -35.23% | | -10.55% | | 0.26% | | 2.21% |
Tocqueville Fund—Load* | | -35.23% | | -10.55% | | 0.26% | | 1.79% |
Standard & Poor’s 500 Stock Index | | -35.31% | | -10.76% | | -2.70% | | -2.48% |
| * | Effective February 1, 2000, the Fund eliminated its sales load. |
The Tocqueville Small Cap Fund
Dear Fellow Shareholder,
The first six months of our fiscal year ended April 30, 2009 were difficult for small cap stocks, with the Russell 2000 Index down 8.40%. The Tocqueville Small Cap Fund was down 2.52% over the same period. The Fund’s outperformance of its benchmark during the period resulted from an absence of financial stocks which did very poorly as cyclical credit issues started to emerge for smaller banks. Financials represented almost half of the negative contribution to performance for the Russell 2000 Index. Our energy holdings were market leaders and generated significant positive returns for the Fund. Unfortunately, this was not enough to get us to positive territory.
The pain experienced by investors over the past year will take a long time to heal but the first step is to find a market bottom. Unfortunately, this is not a singular event but a process. Many pieces of the puzzle need to come together before investors, consumers and businesses will think about a return to “normal.” Fortunately, we believe this may be happening.
Liquidity in the short term money markets has been restored. Healthy corporations are accessing capital in the bond market at reasonable rates. Mortgages have been available for refinancing at historic low rates and credit is available to qualified borrowers for home purchases. Real estate prices in California have shown signs of a turn, a result of lower prices and mortgage rates which have attracted new buyers. Banks have attained healthy profitability due to the low cost of deposits and have cut dividends thus allowing many to earn their way out of this situation without having to raise capital under duress. Retail sales have been firm in certain areas while consumers have already taken their saving rates to 5% from zero two years ago. They are beginning to restore their balance sheets by selling unwanted assets, paying down debt and refinancing mortgages at lower rates. Lower gasoline prices helped for a while. Anecdotal evidence suggests that China is back on a growth path again while oil prices may be signaling that global growth is being restored. Lastly, the recent recovery in share prices has helped to build consumer confidence which should spill over to business spending at some point. In summary, a lot of positive fundamental and psychological news has emerged which should restore investor confidence thus giving us hope that a bottom has been reached. The next step will be a revival of business momentum. No recovery can be expected to be a straight line so it may take several more quarters before signs of growth can emerge.
We expect that there will be lots of volatility, disappointment and missed expectations during this time that will cause markets to back and fill as they crawl their way back. Historically, however, companies that become the best performers in the next cycle begin to show themselves early, outperforming others in restoring business momentum during the ups and downs of the healing process as the energy stocks did over the past six months. This will be a fertile time for opportunistic stock picking strategies like ours. Hence, we continue to look to the future with great optimism.
We remain overweighed in Healthcare, Technology, Energy and Producer Durables. We are building positions opportunistically in consumer stocks and may even purchase financials once we believe the worst of their cyclical credit issues are evident, later this year. Our focus continues on companies most likely to generate positive business momentum over the next twelve months in spite of a lackluster economic environment.
| | | | |
| Sincerely, | | | | |
| | |
 | |  | |  |
| P. Drew Rankin | | Allen Huang | | Douglas Adams |
| Portfolio Manager | | Portfolio Manager | | Portfolio Manager |
The Tocqueville Small Cap Fund
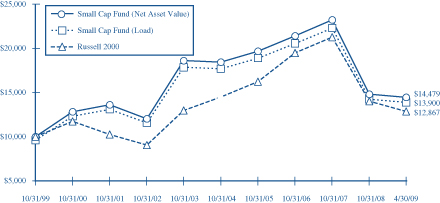
This chart assumes an initial gross investment of $10,000 made on 10/31/99. Returns shown do not reflect the deduction of taxes that a shareholder would pay on fund distributions or the redemption of fund shares. Performance reflects fee waivers in effect. In the absence of fee waivers, total return would be reduced. Returns shown include the reinvestment of all dividends and other distributions. Past performance is not predictive of future performance. Investment return and principal value will fluctuate so that your shares, when redeemed, may be worth more or less than their original cost.
The Russell 2000 Index is an unmanaged index that measures the performance of the 2,000 smallest companies in the Russell 3000 Index, which represents approximately 8% of the total market capitalization of the Russell 3000 Index.
AVERAGE ANNUAL RATE OF RETURN (%)
FOR PERIODS ENDED APRIL 30, 2009
| | | | | | | | |
| | | 1 Year | | 3 Year | | 5 Year | | 10 Year |
Tocqueville Small Cap Fund—Net Asset Value | | -24.78% | | -13.23% | | -7.16% | | 5.20% |
Tocqueville Small Cap Fund—Load* | | -24.78% | | -13.23% | | -7.16% | | 4.77% |
Russell 2000 Index | | -30.74% | | -12.72% | | -1.45% | | 2.53% |
| * | Effective February 1, 2000, the Fund eliminated its sales load. |
The Tocqueville International Value Fund
Dear Fellow Shareholder,
For the six months ended April 30, 2009, global equity markets declined through mid-February as the global economy continued its sharp deceleration and credit markets remained frozen. Markets then rallied through the end of April in the wake of massive monetary and fiscal stimulus, various initiatives aimed at repairing financial institution balance sheets, and stabilizing credit markets. The Tocqueville International Value Fund’s total U.S. dollar return for the period was a gain of 2.71%. In the same period, the Morgan Stanley EAFE Index, the benchmark against which we are most often compared, had a total U.S. dollar loss of 2.35%.
During the six months, the European BE 500 index decreased by 8.06% in local currency terms, the Japanese Nikkei 225 increased by 4.00% in local currency terms, the Morgan Stanley Far East Index increased by 12.68%. Commodity prices generally reached their nadir in November and then slowly recovered as producers exercised supply discipline and investors and central banks sought hard asset inflationary hedges in the face of unprecedented money creation. Oil and gold in particular experienced substantial price increases. Most equity markets decreased during the period. The major exceptions were Brazil and Russia, which bottomed in November and moved up with commodity prices, and China and several Asian markets, which responded favorably to China’s announced fiscal stimulus plan. In terms of sectors, technology services, machinery, energy, chemicals, and mining were up, while real estate, financials, pharmaceuticals and autos were down, among others. The Japanese Yen strengthened while the Euro and most other currencies weakened against the U.S. dollar during the periods of rising risk aversion. This reversed as investors took more risk in March and April.
During the six-month period, most of our positions produced positive returns. Our strategy during the depths of the market turmoil has been to maintain a large exposure to highly cash generative, non-economically sensitive shares, while increasing our exposure to high quality, pro-cyclical companies with strong balance sheets in industrials, resources and technology as exceptional values emerged. During the period, we had healthy contributions from gold, metals and oil producers, like Newmont Mining, Freeport-McMoran and Petrobras; from European and Japanese industrial shares, like Belgian radial tire cord producer Beckaert, German construction machinery maker Wacker, and Japanese robotics maker Fanuc. Our losses were concentrated in consumer staple shares, like Unilever and Nestle, which had heretofore retained their value. We managed to avoid large losses in financials and real estate as we retain a limited exposure to those sectors.
While our pro-cyclical and pro-reflationary viewpoint has gone from being very contrarian in January to more accepted by the consensus today, we nonetheless continue to find exceptional values among well-positioned, financially-sound cyclical companies. During the period, we took positions in Umicore, a Belgian producer of automotive catalysts and other specialty materials; in French outdoor advertising leader JC Decaux; and in the convertible bonds of Mexican telecom provider NIHD. We also added to our positions in Cadbury plc, the UK candy maker, a terrific brand with a plan to improve profitability and returns. We sold our position in Taiwan’s Chunghwa Telecom, which had performed well during the market downturn and reached our valuation objective.
We find that the investment environment has stabilized in recent months. Financial institutions are generally being recapitalized, credit markets are beginning to function, and the economy is beginning to find its footing. With companies globally having implemented radical inventory and cost reductions, the stage is set for a recovery in corporate profits, notwithstanding the headwind from broad-based deleveraging in the U.S. While we are mindful of near term risks, we continue to seek out compelling long term investment opportunities in securities with favorable risk/reward profiles that are out of favor and cheap to intrinsic value. As noted, the current environment has us busy looking at a plethora of opportunities.
Respectfully,
| | | | |
| | |
 | | | | |
| James Hunt | | | | Francois Sicart |
| Portfolio Manager | | | | Portfolio Manager |
The Tocqueville International Value Fund
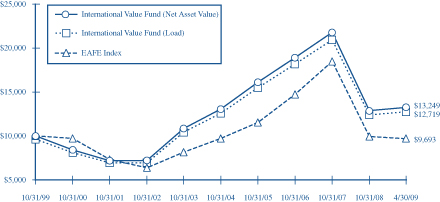
This chart assumes an initial gross investment of $10,000 made on 10/31/99. Returns shown do not reflect the deduction of taxes that a shareholder would pay on fund distributions or the redemption of fund shares. Performance reflects fee waivers in effect. In the absence of fee waivers, total return would be reduced. Returns shown include the reinvestment of all dividends and other distributions. Past performance is not predictive of future performance. Investment return and principal value will fluctuate so that your shares, when redeemed, may be worth more or less than their original cost.
The Morgan Stanley EAFE Index is an unmanaged market-capitalization-weighted index composed of companies representative of the market structure of 21 Developed Market Countries in Europe, Australia, Asia and the Far East.
AVERAGE ANNUAL RATE OF RETURN (%)
FOR PERIODS ENDED APRIL 30, 2009
| | | | | | | | | |
| | | 1 Year | | 3 Year | | 5 Year | | | 10 Year |
Tocqueville International Value Fund—Net Asset Value | | -33.34% | | -12.08% | | 1.77 | % | | 3.45% |
Tocqueville International Value Fund—Load* | | -33.34% | | -12.08% | | 1.77 | % | | 3.03% |
Morgan Stanley EAFE Index | | -42.42% | | -11.91% | | 1.12 | % | | 0.35% |
| * | Effective February 1, 2000, the Fund eliminated its sales load. |
The Tocqueville Gold Fund
Dear Fellow Shareholder,
The prospect of yawning U.S. fiscal deficits has triggered renewed dollar weakness against the Euro. In the six months ended April 30, 2009, the dollar lost 4% against the euro. At the same time, Chinese central bankers have openly worried about their huge exposure to the U.S. dollar and suggested replacing the dollar as a reserve currency. Many other nations with large dollar reserves share these worries, in our view, but have been less vocal on the subject. There is a real possibility that a rout of the U.S. dollar will be the price paid for unprecedented monetary and fiscal stimulus to stabilize the slide in the U.S. economy. While credit spreads have narrowed, allowing the equity market to recover somewhat, serious dollar weakness will present a new set of policy problems which cannot be solved by more stimulus, because it will only exacerbate dollar weakness. We are concerned that the only way to contain dollar weakness may be a sharp rise in interest rates, which in turn would destabilize the economy. Yet, it seems unlikely there would be any political tolerance for higher interest rates. The policy reflex to this dilemma would most likely be a new round of monetary stimulus and debt monetization by the Federal Reserve. In so doing, economic policy would turn overtly to a weak dollar stance. We believe this would risk a cycle of dollar dumping by those who currently hold large dollar reserves and a flow of central bank capital into gold. We also believe that gold is beginning to discount this sort of scenario. Should events play out in this manner, the stage would be set for the metal to trade permanently above $1000. This in turn should breathe new life into the gold share sector, which in our opinion, would be rerated higher, and provide investment returns substantially in excess of the metal itself. While gold shares have provided good returns on a year to date basis, they have not yet returned to valuation levels that prevailed before the implosion of credit in the second half of 2008. The combination of a dynamic rise in the gold price and a return to historical valuation levels by the gold shares would seem to be a compelling investment proposition.
Sincerely,

John C. Hathaway
Portfolio Manager
The Tocqueville Gold Fund
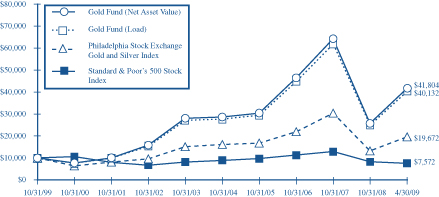
This chart assumes an initial gross investment of $10,000 made on 10/31/99. Returns shown do not reflect the deduction of taxes that a shareholder would pay on fund distributions or the redemption of fund shares. Performance reflects fee waivers in effect. In the absence of fee waivers, total return would be reduced. Returns shown include the reinvestment of all dividends and other distributions. Past performance is not predictive of future performance. Investment return and principal value will fluctuate so that your shares, when redeemed, may be worth more or less than their original cost.
In 2003 and 2006, the performance of The Tocqueville Gold Fund was achieved during a period of unusually favorable market conditions. Such performance may not be sustainable.
The Philadelphia Stock Exchange Gold and Silver Index is an unmanaged capitalization-weighted index which includes the leading companies involved in the mining of gold and silver.
The Standard & Poor’s 500 Stock Index (S&P 500) is a capital-weighted index, representing the aggregate market value of the common equity of 500 stocks primarily traded on the New York Stock Exchange.
AVERAGE ANNUAL RATE OF RETURN (%)
FOR PERIODS ENDED APRIL 30, 2009
| | | | | | | | |
| | | 1 Year | | 3 Year | | 5 Year | | 10 Year |
Tocqueville Gold Fund—Net Asset Value | | -24.69% | | -6.35% | | 11.84% | | 15.85% |
Tocqueville Gold Fund—Load* | | -24.69% | | -6.35% | | 11.84% | | 15.04% |
Philadelphia Stock Exchange Gold and Silver Index | | -29.19% | | -7.80% | | 9.10% | | 6.56% |
Standard & Poor’s 500 Stock Index | | -35.31% | | -10.76% | | -2.70% | | -2.48% |
| * | Effective February 1, 2000, the Fund eliminated its sales load. |
Expense Example—April 30, 2009
As a shareholder of The Tocqueville Trust (the “Funds”), you incur ongoing costs, including management fees; distribution fees; and other Fund expenses. This example is intended to help you understand your ongoing costs (in dollars) of investing in the Funds and to compare costs with the ongoing costs of investing in other mutual funds.
The Example is based on an investment of $1,000 invested at the beginning of the period and held the entire period (November 1, 2008-April 30, 2009).
Actual Expenses
The first line of the table below provides information about actual account values and actual expenses. You may use the information in this line, together with the amount you invested, to estimate the expenses that you paid over the period. Simply divide your account value by $1,000 (for example, an $8,600 account value divided by $1,000 = 8.6), then multiply the result by the number in the first line under the heading entitled “Expenses Paid During Period” to estimate the expenses you paid on your account during this period.
Hypothetical Example for Comparison Purposes
The second line of the table below provides information about hypothetical account values and hypothetical expenses based on the Funds’ actual expense ratios and an assumed rate of return of 5% per year before expenses, which is not the Funds’ actual return. The hypothetical account values and expenses may not be used to estimate the actual ending account balance or expenses you paid for the period. You may use this information to compare the ongoing costs of investing in the Funds and other funds. To do so, compare this 5% hypothetical example with the 5% hypothetical examples that appear in the shareholder reports of the other funds.
Please note that the expenses shown in the table are meant to highlight your ongoing costs only and do not reflect any transactional costs, such as sales charges (loads), redemption fees, or exchange fees. Therefore, the second line of the table is useful in comparing ongoing costs only, and will not help you determine the relative costs of owning different funds. In addition, if these transactional costs were included, your costs would have been higher.
Expense Example Tables
The Tocqueville Fund
| | | | | | | | | |
| | | Beginning
Account Value
November 1, 2008 | | Ending
Account Value
April 30, 2009 | | Expenses Paid
During Period*
November 1, 2008 -
April 30, 2009 |
Actual | | $ | 1,000.00 | | $ | 959.10 | | $ | 6.07 |
Hypothetical (5% return before expenses) | | | 1,000.00 | | | 1018.60 | | | 6.26 |
| * | Expenses are equal to the Fund’s annualized expense ratio of 1.25%, mutiplied by the average account value over the period, muliplied by 181/365 to reflect the one-half year period. |
The Tocqueville Small Cap Fund
| | | | | | | | | |
| | | Beginning
Account Value
November 1, 2008 | | Ending
Account Value
April 30, 2009 | | Expenses Paid
During Period*
November 1, 2008 -
April 30, 2009 |
Actual | | $ | 1,000.00 | | $ | 974.80 | | $ | 6.95 |
Hypothetical (5% return before expenses) | | | 1,000.00 | | | 1017.75 | | | 7.10 |
| * | Expenses are equal to the Fund’s annualized expense ratio of 1.42%, mutiplied by the average account value over the period, muliplied by 181/365 to reflect the one-half year period. |
The Tocqueville International Value Fund
| | | | | | | | | |
| | | Beginning
Account Value
November 1, 2008 | | Ending
Account Value
April 30, 2009 | | Expenses Paid
During Period*
November 1, 2008 -
April 30, 2009 |
Actual | | $ | 1,000.00 | | $ | 1,027.10 | | $ | 8.29 |
Hypothetical (5% return before expenses) | | | 1,000.00 | | | 1,016.61 | | | 8.25 |
| * | Expenses are equal to the Fund’s annualized expense ratio of 1.65%, mutiplied by the average account value over the period, muliplied by 181/365 to reflect the one-half year period. |
The Tocqueville Gold Fund
| | | | | | | | | |
| | | Beginning
Account Value
November 1, 2008 | | Ending
Account Value
April 30, 2009 | | Expenses Paid
During Period*
November 1, 2008 -
April 30, 2009 |
Actual | | $ | 1,000.00 | | $
| 1,623.40
| | $ | 10.21 |
Hypothetical (5% return before expenses) | | | 1,000.00 | | | 1,017.01 | | | 7.85 |
| * | Expenses are equal to the Fund’s annualized expense ratio of 1.57%, mutiplied by the average account value over the period, muliplied by 181/365 to reflect the one-half year period. |
The Tocqueville Fund
Financial Highlights
| | | | | | | | | | | | | | | | | | | | | | | | |
Per share operating
performance
(For a share outstanding
throughout the period) | | Six Months
Ended
April 30,
2009 | | | Years Ended October 31, | |
| | | 2008 | | | 2007 | | | 2006 | | | 2005 | | | 2004 | |
| | | (unaudited) | | | | | | | | | | | | | | | | |
Net asset value, beginning of period | | $ | 16.39 | | | $ | 28.93 | | | $ | 24.25 | | | $ | 22.17 | | | $ | 20.43 | | | $ | 17.99 | |
| | | | | | | | | | | | | | | | | | | | | | | | |
Operations: | | | | | | | | | | | | | | | | | | | | | | | | |
Net investment income | | | 0.19 | | | | 0.24 | | | | 0.18 | | | | 0.14 | | | | 0.15 | | | | 0.05 | |
Net realized and unrealized gain (loss) | | | (0.86 | ) | | | (10.56 | ) | | | 4.53 | | | | 4.33 | | | | 2.53 | | | | 2.41 | |
| | | | | | | | | | | | | | | | | | | | | | | | |
Total from investment operations (1) | | | (0.67 | ) | | | (10.32 | ) | | | 4.71 | | | | 4.47 | | | | 2.68 | | | | 2.46 | |
| | | | | | | | | | | | | | | | | | | | | | | | |
Dividends and distributions to shareholders: | | | | | | | | | | | | | | | | | | | | | | | | |
Dividends from net investment income | | | (0.29 | ) | | | (0.19 | ) | | | (0.03 | ) | | | (0.22 | ) | | | (0.12 | ) | | | (0.02 | ) |
Distributions from net realized gains | | | — | | | | (2.03 | ) | | | — | | | | (2.17 | ) | | | (0.82 | ) | | | — | |
| | | | | | | | | | | | | | | | | | | | | | | | |
Total dividends and distributions | | | (0.29 | ) | | | (2.22 | ) | | | (0.03 | ) | | | (2.39 | ) | | | (0.94 | ) | | | (0.02 | ) |
| | | | | | | | | | | | | | | | | | | | | | | | |
Change in net asset value for the period | | | (0.96 | ) | | | (12.54 | ) | | | 4.68 | | | | 2.08 | | | | 1.74 | | | | 2.44 | |
| | | | | | | | | | | | | | | | | | | | | | | | |
Net asset value, end of period | | $ | 15.43 | | | $ | 16.39 | | | $ | 28.93 | | | $ | 24.25 | | | $ | 22.17 | | | $ | 20.43 | |
| | | | | | | | | | | | | | | | | | | | | | | | |
Total return | | | (4.1 | )%(2) | | | (38.5 | )% | | | 19.4 | % | | | 20.5 | % | | | 13.4 | % | | | 13.7 | % |
Ratios/supplemental data | | | | | | | | | | | | | | | | | | | | | | | | |
Net assets, end of period (000) | | $ | 288,766 | | | $ | 328,609 | | | $ | 523,878 | | | $ | 392,495 | | | $ | 175,791 | | | $ | 145,435 | |
Ratio to average net assets: | | | | | | | | | | | | | | | | | | | | | | | | |
Expenses | | | 1.25 | %(3)(4) | | | 1.25 | %(3) | | | 1.25 | %(3) | | | 1.30 | % | | | 1.34 | % | | | 1.34 | % |
Net investment income | | | 2.34 | %(3)(4) | | | 0.94 | %(3) | | | 0.69 | %(3) | | | 0.68 | % | | | 0.68 | % | | | 0.25 | % |
Portfolio turnover rate | | | 15 | %(2) | | | 51 | % | | | 39 | % | | | 32 | % | | | 45 | % | | | 40 | % |
| (1) | Total from investment operations per share includes redemption fees of $0.002, $0.009, $0.002, $0.002, $0.003 and $0.001 per share for the six months ended April 30, 2009 and the five years ended October 31, 2008, 2007, 2006, 2005, and 2004, respectively. |
| (3) | Net of fees waived amounting to 0.13%, 0.04% and 0.01% of average net assets for the six months ended April 30, 2009 and the two years ended October 31, 2008 and 2007, respectively. |
The accompanying notes are an integral part of these financial statements.
The Tocqueville Small Cap Fund
Financial Highlights
| | | | | | | | | | | | | | | | | | | | | | | | |
Per share operating performance
(For a share outstanding throughout the
period) | | Six Months
Ended
April 30,
2009 | | | Years Ended October 31, | |
| | | 2008 | | | 2007 | | | 2006 | | | 2005 | | | 2004 | |
| | | (unaudited) | | | | | | | | | | | | | | | | |
Net asset value, beginning of period | | $ | 9.77 | | | $ | 17.24 | | | $ | 18.04 | | | $ | 16.58 | | | $ | 16.11 | | | $ | 18.83 | |
| | | | | | | | | | | | | | | | | | | | | | | | |
Operations: | | | | | | | | | | | | | | | | | | | | | | | | |
Net investment income (loss) | | | (0.04 | ) | | | 0.02 | | | | 0.11 | | | | (0.07 | ) | | | (0.13 | ) | | | (0.11 | ) |
Net realized and unrealized gain (loss) | | | (0.22 | ) | | | (5.67 | ) | | | 1.26 | | | | 1.53 | | | | 1.26 | | | | 0.21 | |
| | | | | | | | | | | | | | | | | | | | | | | | |
Total from investment operations (1) | | | (0.26 | ) | | | (5.65 | ) | | | 1.37 | | | | 1.46 | | | | 1.13 | | | | 0.10 | |
| | | | | | | | | | | | | | | | | | | | | | | | |
Distributions to shareholders: | | | | | | | | | | | | | | | | | | | | | | | | |
Dividends from net investment income | | | (0.01 | ) | | | (0.12 | ) | | | — | | | | — | | | | — | | | | — | |
Distributions from net realized gains | | | (0.10 | ) | | | (1.70 | ) | | | (2.17 | ) | | | — | | | | (0.66 | ) | | | (2.82 | ) |
| | | | | | | | | | | | | | | | | | | | | | | | |
Total distributions | | | (0.11 | ) | | | (1.82 | ) | | | (2.17 | ) | | | — | | | | (0.66 | ) | | | (2.82 | ) |
| | | | | | | | | | | | | | | | | | | | | | | | |
Change in net asset value for the period | | | (0.37 | ) | | | (7.47 | ) | | | (0.80 | ) | | | 1.46 | | | | 0.47 | | | | (2.72 | ) |
| | | | | | | | | | | | | | | | | | | | | | | | |
Net asset value, end of period | | $ | 9.40 | | | $ | 9.77 | | | $ | 17.24 | | | $ | 18.04 | | | $ | 16.58 | | | $ | 16.11 | |
| | | | | | | | | | | | | | | | | | | | | | | | |
Total return | | | (2.52 | )%(2) | | | (36.2 | )% | | | 8.4 | % | | | 8.8 | % | | | 6.8 | % | | | (1.0 | )% |
Ratios/supplemental data | | | | | | | | | | | | | | | | | | | | | | | | |
Net assets, end of period (000) | | $ | 31,389 | | | $ | 36,429 | | | $ | 49,543 | | | $ | 52,701 | | | $ | 57,576 | | | $ | 75,005 | |
Ratio to average net assets: | | | | | | | | | | | | | | | | | | | | | | | | |
Expenses | | | 1.42 | %(3) | | | 1.35 | % | | | 1.32 | % | | | 1.34 | % | | | 1.39 | % | | | 1.41 | % |
Net investment income (loss) | | | (0.91 | )%(3) | | | 0.12 | % | | | 0.63 | % | | | (0.38 | )% | | | (0.67 | )% | | | (0.61 | )% |
Portfolio turnover rate | | | 34 | %(2) | | | 169 | % | | | 90 | % | | | 45 | % | | | 30 | % | | | 19 | % |
| (1) | Total from investment operations per share includes redemption fees of $0.001, $0.005, $0.001, $0.015, $0.006 and $0.02 per share for six months ended April 30, 2009 and the five years ended October 31, 2008, 2007, 2006, 2005 and 2004 respectively. |
The accompanying notes are an integral part of these financial statements.
The Tocqueville International Value Fund
Financial Highlights
| | | | | | | | | | | | | | | | | | | | | | | | |
Per share operating performance
(For a share outstanding
throughout the period) | | Six Months
Ended
April 30,
2009 | | | Years Ended October 31, | |
| | | 2008 | | | 2007 | | | 2006 | | | 2005 | | | 2004 | |
| | | (unaudited) | | | | | | | | | | | | | | | | |
Net asset value, beginning of period | | $ | 8.49 | | | $ | 16.48 | | | $ | 16.72 | | | $ | 16.06 | | | $ | 13.10 | | | $ | 10.90 | |
| | | | | | | | | | | | | | | | | | | | | | | | |
Operations: | | | | | | | | | | | | | | | | | | | | | | | | |
Net investment income | | | 0.04 | | | | 0.13 | | | | 0.08 | | | | 0.27 | | | | 0.04 | | | | 0.09 | |
Net realized and unrealized gain (loss) | | | 0.20 | | | | (6.09 | ) | | | 2.25 | | | | 2.30 | | | | 3.00 | | | | 2.15 | |
| | | | | | | | | | | | | | | | | | | | | | | | |
Total from investment operations (1) | | | 0.24 | | | | (5.96 | ) | | | 2.33 | | | | 2.57 | | | | 3.04 | | | | 2.24 | |
| | | | | | | | | | | | | | | | | | | | | | | | |
Dividends and distributions to shareholders: | | | | | | | | | | | | | | | | | | | | | | | | |
Dividends from net investment income | | | (0.20 | ) | | | (0.10 | ) | | | (0.27 | ) | | | (0.05 | ) | | | (0.08 | ) | | | (0.04 | ) |
Distributions from net realized gains | | | (0.50 | ) | | | (1.93 | ) | | | (2.30 | ) | | | (1.86 | ) | | | — | | | | — | |
| | | | | | | | | | | | | | | | | | | | | | | | |
Total dividends and distributions | | | (0.70 | ) | | | (2.03 | ) | | | (2.57 | ) | | | (1.91 | ) | | | (0.08 | ) | | | (0.04 | ) |
| | | | | | | | | | | | | | | | | | | | | | | | |
Change in net asset value for the period | | | (0.46 | ) | | | (7.99 | ) | | | (0.24 | ) | | | 0.66 | | | | 2.96 | | | | 2.20 | |
| | | | | | | | | | | | | | | | | | | | | | | | |
Net asset value, end of period | | $ | 8.03 | | | $ | 8.49 | | | $ | 16.48 | | | $ | 16.72 | | | $ | 16.06 | | | $ | 13.10 | |
| | | | | | | | | | | | | | | | | | | | | | | | |
Total return | | | 2.7 | %(2) | | | (40.8 | )% | | | 15.3 | % | | | 17.4 | % | | | 23.3 | % | | | 20.6 | % |
Ratios/supplemental data | | | | | | | | | | | | | | | | | | | | | | | | |
Net assets, end of period (000) | | $ | 102,168 | | | $ | 118,189 | | | $ | 219,220 | | | $ | 225,234 | | | $ | 215,711 | | | $ | 196,424 | |
Ratio to average net assets: | | | | | | | | | | | | | | | | | | | | | | | | |
Expenses | | | 1.65 | %(3) | | | 1.56 | % | | | 1.59 | % | | | 1.61 | % | | | 1.66 | % | | | 1.71 | % |
Net investment income | | | 0.75 | %(3) | | | 1.07 | % | | | 0.49 | % | | | 1.49 | % | | | 0.29 | % | | | 0.85 | % |
Portfolio turnover rate | | | 16 | %(2) | | | 63 | % | | | 49 | % | | | 39 | % | | | 35 | % | | | 43 | % |
| (1) | Total from investment operations per share includes redemption fees of $0.001, $0.001, $0.002, $0.011, $0.003 and $0.01 per share for the six months ended April 30, 2009 and the five years ended October 31, 2008, 2007, 2006, 2005 and 2004, respectively. |
The accompanying notes are an integral part of these financial statements.
The Tocqueville Gold Fund
Financial Highlights
| | | | | | | | | | | | | | | | | | | | | | | | |
Per share operating performance
(For a share outstanding
throughout the period) | | Six Months
Ended
April 30,
2009 | | | Years Ended October 31, | |
| | | 2008 | | | 2007 | | | 2006 | | | 2005 | | | 2004 | |
| | | (unaudited) | | | | | | | | | | | | | | | | |
Net asset value, beginning of period | | $ | 21.77 | | | $ | 64.36 | | | $ | 51.41 | | | $ | 35.51 | | | $ | 34.84 | | | $ | 34.71 | |
| | | | | | | | | | | | | | | | | | | | | | | | |
Operations: | | | | | | | | | | | | | | | | | | | | | | | | |
Net investment loss | | | (0.18 | ) | | | (0.57 | ) | | | (0.30 | ) | | | (0.22 | ) | | | (0.33 | ) | | | (0.33 | ) |
Net realized and unrealized gain (loss) | | | 13.60 | | | | (33.24 | ) | | | 18.52 | | | | 18.21 | | | | 2.36 | | | | 1.04 | |
| | | | | | | | | | | | | | | | | | | | | | | | |
Total from investment operations (1) | | | 13.42 | | | | (33.81 | ) | | | 18.22 | | | | 17.99 | | | | 2.03 | | | | 0.71 | |
| | | | | | | | | | | | | | | | | | | | | | | | |
Dividends and distributions to shareholders: | | | | | | | | | | | | | | | | | | | | | | | | |
Dividends from net investment income | | | — | | | | (0.46 | ) | | | (0.22 | ) | | | — | | | | — | | | | (0.03 | ) |
Dividends from net realized gains | | | (0.88 | ) | | | (8.32 | ) | | | (5.05 | ) | | | (2.09 | ) | | | (1.36 | ) | | | (0.55 | ) |
| | | | | | | | | | | | | | | | | | | | | | | | |
Total distributions | | | (0.88 | ) | | | (8.78 | ) | | | (5.27 | ) | | | (2.09 | ) | | | (1.36 | ) | | | (0.58 | ) |
| | | | | | | | | | | | | | | | | | | | | | | | |
Change in net asset value for the period | | | 12.54 | | | | (42.59 | ) | | | 12.95 | | | | 15.90 | | | | 0.67 | | | | 0.13 | |
| | | | | | | | | | | | | | | | | | | | | | | | |
Net asset value, end of period | | $ | 34.31 | | | $ | 21.77 | | | $ | 64.36 | | | $ | 51.41 | | | $ | 35.51 | | | $ | 34.84 | |
| | | | | | | | | | | | | | | | | | | | | | | | |
Total return | | | 62.3 | %(2) | | | (60.0 | )% | | | 38.4 | % | | | 52.5 | % | | | 6.2 | % | | | 2.0 | % |
Ratios/supplemental data | | | | | | | | | | | | | | | | | | | | | | | | |
Net assets, end of period (000) | | $ | 624,073 | | | $ | 410,857 | | | $ | 1,231,475 | | | $ | 833,254 | | | $ | 538,492 | | | $ | 539,190 | |
Ratios to average net assets: | | | | | | | | | | | | | | | | | | | | | | | | |
Expenses | | | 1.57 | %(3) | | | 1.43 | % | | | 1.42 | % | | | 1.50 | % | | | 1.59 | % | | | 1.58 | % |
Net investment income (loss) | | | (1.20 | )%(3) | | | (1.07 | )% | | | (0.81 | )% | | | (0.51 | )% | | | (0.97 | )% | | | (1.11 | )% |
Portfolio turnover rate | | | 7 | %(2) | | | 28 | % | | | 26 | % | | | 30 | % | | | 27 | % | | | 24 | % |
| (1) | Total from investment operations per share includes redemption fees of $0.014, $0.027, $0.028, $0.06, $0.02 and $0.09 per share for the six months ended April 30, 2009 and the five years ended October 31, 2008, 2007, 2006, 2005 and 2004, respectively. |
The accompanying notes are an integral part of these financial statements.
The Tocqueville Fund
Schedule of Investments as of April 30, 2009
(Unaudited)
| | | | | |
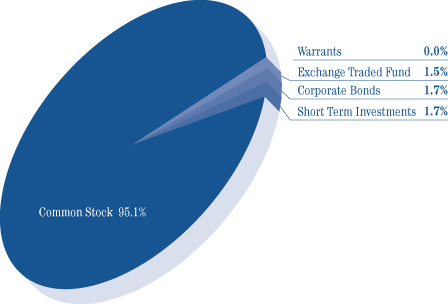
| Common Stocks—95.4% | | Shares | | Value |
Aerospace & Defense—1.4% | | | | | |
The Boeing Co. | | 100,000 | | $ | 4,005,000 |
Air Freight & Logistics—1.8% | | | | | |
United Parcel Service, Inc. | | 100,000 | | | 5,234,000 |
Automobiles—2.1% | | | | | |
Toyota Motor Corp.—ADR (b) | | 75,000 | | | 5,937,000 |
Beverages—2.2% | | | | | |
The Coca-Cola Co. | | 150,000 | | | 6,457,500 |
Biotechnology—3.0% | | | | | |
Amgen, Inc. (a) | | 100,000 | | | 4,847,000 |
Isis Pharmaceuticals, Inc. (a) | | 250,000 | | | 3,920,000 |
| | | | | | 8,767,000 |
Building Products—0.9% | | | | | |
Masco Corp. | | 300,000 | | | 2,658,000 |
Capital Markets—1.4% | | | | | |
The Bank of New York Mellon Corp. | | 75,000 | | | 1,911,000 |
Lazard Ltd. (b) | | 75,000 | | | 2,047,500 |
| | | | | | 3,958,500 |
Chemicals—3.7% | | | | | |
EI Du Pont de Nemours & Co. | | 300,000 | | | 8,370,000 |
W.R. Grace & Co. (a) | | 250,000 | | | 2,207,500 |
| | | | | | 10,577,500 |
Commercial Banks—2.6% | | | | | |
East West Bancorp, Inc. | | 300,000 | | | 2,049,000 |
Mitsubishi UFJ Financial Group, Inc.—ADR (b) | | 1,000,000 | | | 5,420,000 |
| | | | | | 7,469,000 |
Commercial Services & Supplies—1.5% | | | |
Steelcase, Inc. | | 948,000 | | | 4,294,440 |
Communications Equipment—8.0% | | | |
Cisco Systems, Inc. (a) | | 524,000 | | | 10,123,680 |
Corning, Inc. | | 500,000 | | | 7,310,000 |
Nokia OYJ—ADR (b) | | 400,000 | | | 5,656,000 |
| | | | | | 23,089,680 |
Computers & Peripherals—1.1% | | | | | |
EMC Corp. (a) | | 250,000 | | | 3,132,500 |
Consumer Finance—1.3% | | | | | |
American Express Co. | | 150,000 | | | 3,783,000 |
Containers & Packaging—1.7% | | | | | |
Sonoco Products Co. | | 200,000 | | | 4,882,000 |
Diversified Telecommunication Services—3.6% |
Alaska Communications Systems Group, Inc. (c) | | 701,800 | | | 4,231,854 |
Verizon Communications, Inc. | | 200,000 | | | 6,068,000 |
| | | | | | 10,299,854 |
| | | | | |
| Common Stocks (continued) | | Shares | | Value |
Electric Utilities—4.2% | | | | | |
FPL Group, Inc. | | 225,000 | | $ | 12,102,750 |
Electrical Equipment—0.5% | | | | | |
Rockwell Automation, Inc. | | 50,000 | | | 1,579,500 |
Energy Equipment & Services—2.5% | | | |
Schlumberger Ltd. (b) | | 150,000 | | | 7,348,500 |
Food Products—4.2% | | | | | |
Campbell Soup Co. | | 200,000 | | | 5,144,000 |
Kraft Foods, Inc. | | 300,000 | | | 7,020,000 |
| | | | | | 12,164,000 |
Household Products—4.6% | | | | | |
Colgate-Palmolive Co. | | 100,000 | | | 5,900,000 |
Kimberly-Clark Corp. | | 150,000 | | | 7,371,000 |
| | | | | | 13,271,000 |
Industrial Conglomerates—3.5% | | | | | |
3M Co. | | 75,000 | | | 4,320,000 |
General Electric Co. | | 450,000 | | | 5,692,500 |
| | | | | | 10,012,500 |
Internet Software & Services—2.6% | | | |
eBay, Inc. (a) | | 100,000 | | | 1,647,000 |
Google, Inc. (a) | | 15,000 | | | 5,939,550 |
| | | | | | 7,586,550 |
IT Services—3.3% | | | | | |
Automatic Data Processing, Inc. | | 150,000 | | | 5,280,000 |
The Western Union Co. | | 250,000 | | | 4,187,500 |
| | | | | | 9,467,500 |
Machinery—1.7% | | | | | |
Illinois Tool Works, Inc. | | 150,000 | | | 4,920,000 |
Metals & Mining—7.9% | | | | | |
Alcoa, Inc. | | 210,000 | | | 1,904,700 |
BHP Billiton Ltd.—ADR (b) | | 65,000 | | | 3,129,100 |
Cliffs Natural Resources, Inc. | | 250,000 | | | 5,765,000 |
Newmont Mining Corp. | | 300,000 | | | 12,072,000 |
| | | | | | 22,870,800 |
Multi Utilities—0.6% | | | | | |
PNM Resources, Inc. | | 200,000 | | | 1,704,000 |
Multiline Retail—1.0% | | | | | |
Kohl’s Corp. (a) | | 62,500 | | | 2,834,375 |
Oil, Gas & Consumable Fuels—4.7% | | | |
Anadarko Petroleum Corp. | | 50,000 | | | 2,153,000 |
Chesapeake Energy Corp. | | 100,000 | | | 1,971,000 |
Murphy Oil Corp. | | 200,000 | | | 9,542,000 |
| | | | | | 13,666,000 |
Paper & Forest Products—0.5% | | | | | |
Weyerhaeuser Co. | | 42,000 | | | 1,480,920 |
The accompanying notes are an integral part of these financial statements.
The Tocqueville Fund
Schedule of Investments as of April 30, 2009
(Unaudited)
| | | | | | |
| Common Stocks (continued) | | Shares | | Value |
Pharmaceuticals—6.1% | | | | | | |
Bristol-Myers Squibb Co. | | | 300,000 | | $ | 5,760,000 |
Johnson & Johnson | | | 100,000 | | | 5,236,000 |
Pfizer, Inc. | | | 500,000 | | | 6,680,000 |
| | | | | | | 17,676,000 |
Semiconductors & Semiconductor Equipment—4.9% |
Applied Materials, Inc. | | | 500,000 | | | 6,105,000 |
Emcore Corp. (a) | | | 225,000 | | | 279,000 |
Intel Corp. | | | 500,000 | | | 7,890,000 |
| | | | | | | 14,274,000 |
Software—5.2% | | | | | | |
Adobe Systems, Inc. (a) | | | 175,000 | | | 4,786,250 |
Bio-key International,
Inc. (a)(d)(e)(f) | | | 47,090 | | | 0 |
Microsoft Corp. | | | 500,000 | | | 10,130,000 |
| | | | | | | 14,916,250 |
Specialty Retail—1.1% | | | | | | |
Home Depot, Inc. | | | 120,000 | | | 3,158,400 |
Total Common Stocks (Cost $350,630,855) | | | | | | 275,578,019 |
Exchange-Traded Fund—1.5% | | | | | | |
SPDR Gold Trust (a) | | | 50,000 | | | 4,363,500 |
Total Exchange-Traded fund (Cost $4,229,919) | | | | | | 4,363,500 |
Warrants—0.0% | | | | | | |
Emcore Corp. $15.06 exercise price, expires 2/19/13 (a)(e) | | | 39,375 | | | — |
Raytheon Co. $37.50 exercise price, expires 6/16/11 (a) | | | 1,581 | | | 16,759 |
Total Warrants
(Cost $0) | | | | | | 16,759 |
| Corporate Bonds—1.8% | |
| Principal
Amount | | | |
Oil, Gas & Consumable Fuels—0.7% | | | |
Chesapeake Energy Corp. 9.500%, 2/15/2015 | | $ | 2,000,000 | | | 2,030,000 |
Paper & Forest Products—1.1% | | | |
Weyerhaeuser Co.
6.750%, 3/15/2012 | | | 3,000,000 | | | 2,995,824 |
Total Corporate Bonds (Cost $4,619,013) | | | | | | 5,025,824 |
| | | | | | | |
| Short-Term Investments—1.6% | | Principal
Amount | | Value | |
Repurchase Agreement—1.6% | | | | | | | |
Repurchase Agreement with U.S. Bank, N.A., 0.01%, dated 4/30/09, due 5/1/09, collateralized by: Fannie Mae Conventional Level Pay 15 Year Fixed (Pool #555745) valued at $4,815,705. Repurchase proceeds of $4,721,001. (Cost $4,721,000) | | $ | 4,721,000 | | $ | 4,721,000 | |
Total Short-Term Investments (Cost $4,721,000) | | | | | | 4,721,000 | |
Total Investments (Cost $364,200,787)—100.3% | | | | | | 289,705,102 | |
Liabilities in Excess of Other Assets—(0.3)% | | | (938,727 | ) |
Total Net Assets—100.0% | | | | | $ | 288,766,375 | |
| | | | | | | |
Percentages are stated as a percent of net assets.
ADR American Depository Receipt
| (a) | Non-income producing security. |
| (b) | Foreign issued security. Foreign concentration was as follows: Australia 1.1%; Bermuda 0.7%; |
| | Finland 2.0%; Japan 3.9%; Netherlands Antilles 2.5% |
| (c) | Affiliated company. See footnote 8. |
| (d) | Denotes a security is either fully or partially restricted to resale. The aggregate value of restricted securities at April 30, 2009 was $0 which represented 0.0% of net assets. |
| (e) | Fair valued security. The aggregate value of fair valued securities as of April 30, 2009 was $0 which represented 0.0% of net assets. |
| (f) | Security is considered illiquid and may be difficult to sell. |
The accompanying notes are an integral part of these financial statements.
The Tocqueville Small Cap Fund
Schedule of Investments as of April 30, 2009
(Unaudited)
| | | | | |
| Common Stocks—98.2% | | Shares | | Value |
Biotechnology—2.8% | | | | | |
Alkermes, Inc. (a) | | 87,000 | | $ | 665,550 |
Martek Biosciences Corp. | | 12,000 | | | 218,640 |
| | | | | | 884,190 |
Chemicals—2.0% | | | | | |
Landec Corp. (a)(b) | | 49,600 | | | 335,296 |
Minerals Technologies, Inc. | | 8,000 | | | 297,520 |
| | | | | | 632,816 |
Commercial Services & Supplies—3.5% | | | |
EnergySolutions, Inc. | | 114,500 | | | 1,110,650 |
Diversified Financial Services—0.6% | | | | | |
CIT Group, Inc. | | 86,000 | | | 190,920 |
Electrical Equipment—1.4% | | | | | |
Baldor Electric Co. | | 19,000 | | | 440,800 |
Electronic Equipment & Instruments—1.5% |
Electro Scientific Industries, Inc. (a) | | 55,000 | | | 473,000 |
Energy Equipment & Services—8.7% | | | |
CARBO Ceramics, Inc. | | 12,700 | | | 390,017 |
Global Industries Ltd. (a) | | 113,500 | | | 734,345 |
Oceaneering International, Inc. (a) | | 23,500 | | | 1,070,895 |
Tetra Technologies, Inc. (a) | | 92,000 | | | 526,240 |
| | | | | | 2,721,497 |
Food Products—3.5% | | | | | |
The Hain Celestial Group, Inc. (a) | | 65,000 | | | 1,084,850 |
Health Care Equipment & Supplies—12.0% | | | |
Analogic Corp. | | 21,500 | | | 782,600 |
Greatbatch, Inc. (a) | | 42,000 | | | 883,680 |
ICU Medical, Inc. (a) | | 9,300 | | | 349,680 |
Thoratec Corp. (a) | | 32,000 | | | 929,920 |
Wright Medical Group, Inc. (a) | | 60,000 | | | 825,000 |
| | | | | | 3,770,880 |
Health Care Technology—5.1% | | | | | |
Allscripts- Misys Healthcare Solutions, Inc. | | 83,700 | | | 1,039,554 |
IMS Health, Inc. | | 44,500 | | | 558,920 |
| | | | | | 1,598,474 |
Household Products—2.0% | | | | | |
WD-40 Co. | | 23,000 | | | 622,380 |
Internet & Catalog Retail—1.3% | | | | | |
1-800-Flowers.com, Inc. (a)(b) | | 145,500 | | | 424,860 |
Internet Software & Services—5.4% | | | | | |
Perficient, Inc. (a) | | 57,500 | | | 400,775 |
RealNetworks, Inc. (a) | | 174,500 | | | 429,270 |
Valueclick, Inc. (a) | | 44,000 | | | 466,400 |
Websense, Inc. (a) | | 23,000 | | | 410,090 |
| | | | | | 1,706,535 |
| | | | | |
| Common Stocks (continued) | | Shares | | Value |
IT Services—1.1% | | | | | |
Lionbridge Technologies (a)(b) | | 245,500 | | $ | 331,425 |
Life Sciences Tools & Services—1.5% | | | |
Life Technologies Corp. (a) | | 12,300 | | | 458,790 |
Media—0.9% | | | | | |
DreamWorks Animation SKG, Inc. (a) | | 12,200 | | | 292,922 |
Metals & Mining—2.0% | | | | | |
Brush Engineered Materials, Inc. (a) | | 37,500 | | | 634,500 |
Pharmaceuticals—5.7% | | | | | |
King Pharmaceuticals, Inc. (a) | | 40,500 | | | 319,140 |
The Medicines Co. (a) | | 30,500 | | | 304,390 |
Perrigo Co. | | 12,000 | | | 311,040 |
Salix Pharmaceuticals Ltd. (a)(b) | | 77,200 | | | 849,200 |
| | | | | | 1,783,770 |
Real Estate—2.1% | | | | | |
The St Joe Co. (a) | | 26,500 | | | 659,320 |
Road & Rail—1.0% | | | | | |
Arkansas Best Corp. | | 13,500 | | | 311,580 |
Semiconductors & Semiconductor Equipment—13.2% |
Cymer, Inc. (a) | | 32,000 | | | 909,120 |
FEI Co. (a) | | 29,000 | | | 498,220 |
Kopin Corp. (a)(b) | | 193,000 | | | 530,750 |
Silicon Image, Inc. (a) | | 283,500 | | | 771,120 |
Ultratech, Inc. (a)(b) | | 105,000 | | | 1,419,600 |
| | | | | | 4,128,810 |
Software—15.7% | | | | | |
Aspen Technology, Inc. (a) | | 122,000 | | | 946,720 |
Epicor Software Corp. (a) | | 133,000 | | | 734,160 |
Fair Isaac Corp. | | 50,000 | | | 841,000 |
Parametric Technology Corp. (a) | | 84,000 | | | 936,600 |
Symyx Technologies (a)(b) | | 88,000 | | | 425,920 |
TIBCO Software, Inc. (a) | | 165,100 | | | 1,043,432 |
| | | | | | 4,927,832 |
Specialty Retail—4.3% | | | | | |
Bebe Stores, Inc. | | 89,000 | | | 818,800 |
Tractor Supply Co. (a) | | 12,800 | | | 516,864 |
| | | | | | 1,335,664 |
Textiles, Apparel & Luxury Goods—0.9% |
Columbia Sportswear Co. | | 9,500 | | | 291,840 |
Total Common Stocks (Cost $37,606,025) | | | | | 30,818,305 |
The accompanying notes are an integral part of these financial statements.
The Tocqueville Small Cap Fund
Schedule of Investments as of April 30, 2009
(Unaudited)
| | | | | | |
| Short-Term Investments—0.6% | | Principal
Amount | | Value |
Repurchase Agreement—0.6% | | | | | | |
Repurchase Agreement with U.S. Bank, N.A., 0.01% dated 4/30/09, due 5/1/09, collateralized by: Fannie Mae Conventional Level Pay 15 Year Fixed (Pool #555745) valued at $180,721. Repurchase proceeds of $177,000.
(Cost $177,000) | | $ | 177,000 | | $ | 177,000 |
Total Short-term Investments
(Cost $177,000) | | | | | | 177,000 |
Total Investments (Cost $37,783,025)—98.8% | | | | | | 30,995,305 |
Other Assets in Excess of Liabilities—1.2% | | | 393,444 |
Total Net Assets—100.0% | | | | | $ | 31,388,749 |
| | | | | | |
Percentages are stated as a percent of net assets.
| (a) | Non-income producing security. |
| (b) | Affiliated company. See footnote 8. |
The accompanying notes are an integral part of these financial statements.
The Tocqueville International Value Fund
Schedule of Investments as of April 30, 2009
(Unaudited)
| | | | | |
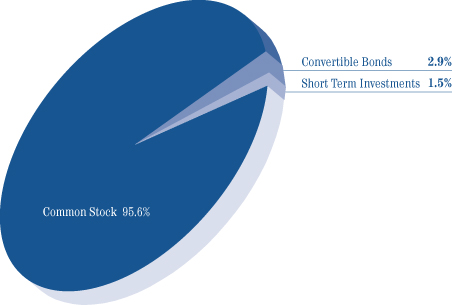
| Common Stocks—92.3% | | Shares | | Value |
Australia—1.4% | | | | | |
BHP Billiton Ltd.—ADR | | 30,000 | | $ | 1,444,200 |
Belgium—3.3% | | | | | |
Bekaert SA | | 15,000 | | | 1,392,008 |
Solvay SA | | 12,000 | | | 1,028,608 |
Umicore | | 50,000 | | | 979,916 |
| | | | | | 3,400,532 |
Brazil—3.5% | | | | | |
Petroleo Brasileiro SA—ADR | | 60,000 | | | 2,014,200 |
Vale SA—ADR | | 94,000 | | | 1,551,940 |
| | | | | | 3,566,140 |
Finland—2.4% | | | | | |
Nokia OYJ—ADR | | 170,000 | | | 2,403,800 |
France—16.5% | | | | | |
Cie de Saint-Gobain | | 55,927 | | | 2,006,409 |
JC Decaux SA | | 69,000 | | | 981,229 |
M6-Metropole Television | | 120,000 | | | 2,242,939 |
Manitou BF SA | | 56,353 | | | 357,244 |
Sanofi-Aventis SA | | 50,000 | | | 2,895,607 |
Total SA—ADR | | 51,200 | | | 2,545,664 |
Veolia Environnement | | 54,300 | | | 1,487,474 |
Veolia Environnement—ADR | | 50,000 | | | 1,365,500 |
Vivendi | | 110,000 | | | 2,957,799 |
| | | | | | 16,839,865 |
Germany—3.9% | | | | | |
Siemens AG—ADR | | 35,000 | | | 2,342,550 |
Wacker Neuson SE | | 180,000 | | | 1,643,292 |
| | | | | | 3,985,842 |
Indonesia—1.6% | | | | | |
Telekomunikasi Indonesia Tbk PT—ADR | | 58,000 | | | 1,666,920 |
Ireland—5.0% | | | | | |
DCC Plc | | 153,105 | | | 2,781,188 |
Experian Plc | | 354,413 | | | 2,333,689 |
| | | | | | 5,114,877 |
Italy—2.7% | | | | | |
C.I.R.—Compagnie Industriali Riunite SpA (a) | | 1,500,000 | | | 1,953,362 |
Interpump Group SpA (a) | | 194,128 | | | 826,445 |
| | | | | | 2,779,807 |
Japan—22.6% | | | | | |
Amada Co Ltd. | | 170,000 | | | 1,052,707 |
Bridgestone Corp. | | 90,000 | | | 1,341,525 |
Canon, Inc.—ADR | | 70,000 | | | 2,114,700 |
Fanuc Ltd. | | 20,000 | | | 1,443,245 |
Kyoto Kimono Yuzen Co. Ltd. | | 350,500 | | | 2,281,058 |
MISUMI Group, Inc. | | 92,500 | | | 1,248,927 |
| | | | | |
| Common Stocks (continued) | | Shares | | Value |
Mitsubishi UFJ Financial Group, Inc.—ADR | | 214,100 | | $ | 1,160,422 |
Nintendo Co., Ltd.—ADR | | 24,000 | | | 802,258 |
Nippon Express Co. Ltd. | | 500,500 | | | 1,784,928 |
Omron Corp. | | 162,000 | | | 2,421,273 |
Panasonic Corp.—ADR | | 150,000 | | | 2,187,000 |
SMC Corp. | | 24,000 | | | 2,354,321 |
Toyota Motor Corp.—ADR | | 37,000 | | | 2,928,920 |
| | | | | | 23,121,284 |
Luxembourg—0.9% | | | | | |
ArcelorMittal—ADR | | 40,000 | | | 943,200 |
Mexico—2.2% | | | | | |
Fomento Economico Mexicano S.A.B. de C.V.—ADR | | 80,000 | | | 2,264,800 |
Netherlands Antilles—2.2% | | | | | |
Schlumberger Ltd. | | 45,000 | | | 2,204,550 |
Netherlands—3.9% | | | | | |
Nutreco Holding NV | | 30,000 | | | 1,029,556 |
Unilever NV—ADR | | 147,500 | | | 2,919,025 |
| | | | | | 3,948,581 |
Singapore—1.5% | | | | | |
GP Industries Ltd. | | 7,788,241 | | | 1,578,517 |
Spain—1.2% | | | | | |
Sol Melia SA | | 245,000 | | | 1,205,758 |
Switzerland—5.7% | | | | | |
ABB Ltd.—ADR | | 75,000 | | | 1,066,500 |
Kudelski SA | | 170,000 | | | 2,429,561 |
Nestle SA | | 71,000 | | | 2,314,368 |
| | | | | | 5,810,429 |
Thailand—1.3% | | | | | |
BEC World PCL | | 2,365,100 | | | 1,323,119 |
United Kingdom—5.5% | | | | | |
Bodycote PLC | | 1 | | | 2 |
BP PLC—ADR | | 28,000 | | | 1,188,880 |
Cadbury PLC—ADR | | 31,600 | | | 950,844 |
Cadbury PLC | | 192,800 | | | 1,441,632 |
Invensys PLC (a) | | 687,400 | | | 2,007,484 |
| | | | | | 5,588,842 |
United States—5.0% | | | | | |
Freeport-McMoRan Copper & Gold, Inc. | | 30,000 | | | 1,279,500 |
Newmont Mining Corp. | | 70,000 | | | 2,816,800 |
NII Holdings, Inc. (a) | | 60,000 | | | 969,600 |
| | | | | | 5,065,900 |
Total Common Stocks (Cost $120,850,027) | | | | | 94,256,963 |
The accompanying notes are an integral part of these financial statements.
The Tocqueville International Value Fund
Schedule of Investments as of April 30, 2009
(Unaudited)
| | | | | | |
| Convertible Bonds—2.8% | | Principal
Amount | | Value |
Luxembourg—2.2% | | | | | | |
Kloeckner & Co Finance International SA
1.500%, 7/27/2012 | | $ | 3,050,000 | | $ | 2,272,880 |
United States—0.6% | | | | | | |
NII Holdings, Inc.
3.125%, 6/15/2012 | | | 825,000 | | | 606,375 |
Total Convertible Bonds (Cost $2,978,626) | | | | | | 2,879,255 |
Short Term Investments—1.4% | | | | | | |
Repurchase Agreement—1.4% | | | | | | |
Repurchase Agreement with U.S. Bank, N.A., 0.01% dated 4/30/09, due 5/1/09, collateralized by: Fannie Mae 15 Year Fixed (Pool #739797) valued at $1,534,115. Repurchase proceeds of $1,504,000. (Cost $1,504,000) | | | 1,504,000 | | | 1,504,000 |
Total Short Term Investments (Cost $1,504,000) | | | | | | 1,504,000 |
Total Investments (Cost $125,332,653)—96.5% | | | | | | 98,640,218 |
Other Assets in Excess of Liabilities—3.5% | | | 3,527,752 |
Total Net Assets—100.0% | | | | | $ | 102,167,970 |
| | | | | | |
Percentages are stated as a percent of net assets.
ADR American Depository Receipt
| (a) | Non-income producing security. |
The accompanying notes are an integral part of these financial statements.
The Tocqueville Gold Fund
Schedule of Investments as of April 30, 2009
(Unaudited)
| | | | | |
| Common Stocks—84.6% | | Shares | | Value |
Financial Services—0.4% | | | | | |
Endeavour Financial Corp. (a) | | 2,000,000 | | $ | 2,396,715 |
Gold & Gold Related—78.7% | | | | | |
Agnico-Eagle Mines Ltd. (b) | | 252,000 | | | 11,115,720 |
Alamos Gold, Inc. (a)(b) | | 2,615,100 | | | 16,984,015 |
Allied Nevada Gold Corp. (a) | | 1,129,848 | | | 6,101,179 |
Andean Resources Ltd. (a)(b) | | 15,771,500 | | | 18,568,325 |
AngloGold Ashanti Ltd.—ADR (b) | | 200,000 | | | 6,160,000 |
Aquiline Resources, Inc. (a)(b) | | 1,333,333 | | | 2,670,465 |
Banro Corp. (a)(b) | | 631,400 | | | 925,962 |
Centamin Egypt Ltd. (a)(b) | | 7,830,000 | | | 6,374,558 |
Cia de Minas Buenaventura SA—ADR (b) | | 853,600 | | | 18,062,176 |
Comaplex Minerals Corp. (a)(b)(f) | | 2,839,000 | | | 7,494,218 |
Detour Gold Corp. (a)(b) | | 280,000 | | | 2,712,478 |
Eldorado Gold Corp. (a)(b) | | 2,026,800 | | | 16,101,621 |
Electrum Ltd. (a)(b)(c)(d)(e) | | 2,095,552 | | | 11,735,091 |
European Goldfields Ltd. (a)(b) | | 4,035,500 | | | 8,555,950 |
Franco-Nevada Corp. (b) | | 1,435,900 | | | 30,551,832 |
Gold Fields Ltd. (b) | | 166,249 | | | 1,734,644 |
Gold Fields Ltd.—ADR (b) | | 1,211,500 | | | 12,599,600 |
Gold Resource Corp. (a)(f) | | 2,300,797 | | | 9,134,164 |
Goldcorp, Inc.—ADR (b) | | 1,268,050 | | | 34,896,736 |
Govi Ex IP Holdings, Inc. (a)(c)(d)(e) | | 1,750,000 | | | 71,225 |
Harmony Gold Mining Co. Ltd. (a)(b) | | 1 | | | 9 |
IAMGOLD Corp. (b) | | 4,291,796 | | | 34,203,453 |
International Tower Hill Mines Ltd. (a)(b)(f) | | 1,993,100 | | | 5,010,727 |
Ivanhoe Australia Ltd. (a)(b) | | 6,464,000 | | | 8,878,669 |
Ivanhoe Mines Ltd. (a)(b) | | 4,467,000 | | | 28,674,449 |
Kinross Gold Corp. (b) | | 1,139,352 | | | 17,593,653 |
Minefinders Corp. (a)(b) | | 1,041,000 | | | 7,580,902 |
New Gold, Inc. (a)(b) | | 3,478,200 | | | 6,266,764 |
Newmont Mining Corp. | | 789,800 | | | 31,781,552 |
Orezone Gold Corp. (a)(b)(f) | | 2,145,463 | | | 575,336 |
Osisko Mining Corp. (a)(b) | | 5,470,000 | | | 25,669,991 |
Randgold Resources Ltd.—ADR (b) | | 858,200 | | | 41,536,880 |
Red Back Mining, Inc. (a)(b) | | 1,245,000 | | | 8,617,866 |
Royal Gold, Inc. | | 691,765 | | | 25,014,222 |
SEMAFO, Inc. (a)(b) | | 4,900,000 | | | 7,555,518 |
Sino Gold Mining Ltd. (a)(b) | | 3,333,700 | | | 13,204,068 |
Witwatersrand Consolidated Gold Resources Ltd. (a)(b) | | 335,000 | | | 2,200,694 |
Yukon-Nevada Gold Corp. (a)(b)(f) | | 8,350,000 | | | 804,701 |
| | | | | | 487,719,413 |
| | | | | |
| Common Stocks (continued) | | Shares | | Value |
Precious Metals & Related—5.5% | | | |
Brilliant Mining Corp. (a)(b) | | 937,500 | | $ | 121,774 |
GoviEx Uranium, Inc. (a)(b)(c)(d)(e) | | 1,750,000 | | | 3,428,775 |
Ivanhoe Nickel & Platinum Ltd. (a)(b)(c)(d)(e) | | 533,333 | | | 2,933,331 |
PAN American Silver Corp. (a)(b) | | 61,536 | | | 1,013,825 |
PAN American Silver Corp.—ADR (a)(b) | | 500,000 | | | 8,240,000 |
Silver Wheaton Corp. (a)(b) | | 1,687,400 | | | 12,938,666 |
Silverstone Resources Corp. (a)(b)(f) | | 6,635,000 | | | 9,229,951 |
| | | | | | 37,906,322 |
Total Common Stocks
(Cost $513,218,653) | | | | | 528,022,450 |
| Gold Billion—14.0% | | Ounces | | | |
Gold Billion (a) | | 98,032 | | | 87,071,761 |
Total Gold Billion
(Cost $44,609,241) | | | | | 87,071,761 |
| Warrants—0.6% | | Shares | | | |
Financial Services—0.1% | | | | | |
Endeavour Financial Corp.
Expires 1/30/14, Exercise Price: CAD $2.50 (a) | | 1,000,000 | | | 410,626 |
Gold & Gold Related—0.5% | | | | | |
Kinross Gold Corp.
Expires 9/13/13, Exercise Price: CAD $32.00 (a)(b) | | 108,032 | | | 378,424 |
Minefinders Corp.
Expires 12/31/11, Exercise Price: CAD $5.00 (a)(b)(d) | | 125,000 | | | 258,055 |
Osisko Mining Corp.
Expires 5/10/09, Exercise Price: CAD $2.00 (a)(b)(d) | | 1,155,000 | | | 2,315,227 |
Osisko Mining Corp.
Expires 11/17/09, Exercise Price: CAD $5.45 (a)(b) | | 600,000 | | | 553,088 |
U.S. Gold Corp.
Expires 2/22/11, Exercise Price: $10.00 (a) | | 111,500 | | | 25,929 |
Yukon-Nevada Gold Corp.
Expires 5/30/12 Exercise Price: CAD $3.00 (a)(b)(d)(f) | | 4,175,000 | | | 0 |
| | | | | | 3,530,723 |
Total Warrants
(Cost $1,314,862) | | | | | 3,941,349 |
The accompanying notes are an integral part of these financial statements.
The Tocqueville Gold Fund
Schedule of Investments as of April 30, 2009
(Unaudited)
| | | | | | |
| Short-Term Investments—0.8% | | Principal
Amount | | Value |
Repurchase Agreement—0.8% | | | | | | |
Repurchase Agreement with U.S. Bank, N.A., 0.01%, dated 4/30/09, due 5/1/09, collateralized by: Fannie Mae Conventional Level Pay 15 Year Fixed (Pool #254919) valued at $4,831,756. Repurchase proceeds of $4,737,001. (Cost $4,737,000) | | $ | 4,737,000 | | $ | 4,737,000 |
Total Short-Term Investments (Cost $4,737,000) | | | | | | 4,737,000 |
Total Investments
(Cost $563,879,756)—100.0% | | | 623,772,560 |
Other Assets in Excess of Liabilities—0.0% | | | 300,055 |
Total Net Assets—100.0% | | | | | $ | 624,072,615 |
| | | | | | |
Percentages are stated as a percent of net assets.
ADR American Depository Receipt
| (a) | Non-income producing security. |
| (b) | Foreign issued security. Foreign concentration was as follows: Australia 7.5%; Canada 50.1%; |
| | France 1.9%; Peru 2.9%; South Africa 3.6%; United Kingdom 6.7% |
| (c) | Denotes a security is either fully or partially restricted to resale. The aggregate value of restricted securities at April 30, 2009 was $20,741,705 which represented 2.9% of net assets. |
| (d) | Fair valued security. The aggregate value of fair valued securities as of April 30, 2009 was $20,741,705 which represented 2.9% of net assets. |
| (e) | Security is considered illiquid and may be difficult to sell. |
| (f) | Affiliated company. See footnote 8. |
The accompanying notes are an integral part of these financial statements.
Percent of Total Investments
The Tocqueville Fund
Allocation of Portfolio Holdings
April 30, 2009
(Unaudited)
The Tocqueville Small Cap Fund
Allocation of Portfolio Holdings
April 30, 2009
(Unaudited)
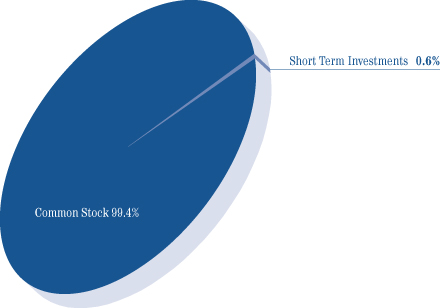
Percent of Total Investments
The Tocqueville International Value Fund
Allocation of Portfolio Holdings
April 30, 2009
(Unaudited)
The Tocqueville Gold Fund
Allocation of Portfolio Holdings
April 30, 2009
(Unaudited)

The Tocqueville Trust
Statements of Assets and Liabilities
April 30, 2009
(Unaudited)
| | | | | | | | | | | | | | | | |
| | | The
Tocqueville
Fund | | | Small Cap
Fund | | | International
Value
Fund | | | Gold
Fund | |
Assets | | | | | | | | | | | | | | | | |
Investments, at value (1) | | | | | | | | | | | | | | | | |
Unaffiliated issuers | | $ | 285,194,248 | | | $ | 26,678,254 | | | $ | 98,640,218 | | | $ | 591,523,463 | |
Affiliated issuers | | | 4,510,854 | | | | 4,317,051 | | | | — | | | $ | 32,249,097 | |
Foreign currencies (2) | | | — | | | | — | | | | 3,933,124 | | | | 806,743 | |
Cash | | | 460 | | | | 6,365 | | | | 57,825 | | | | 11,988 | |
Receivable for investments sold | | | — | | | | 570,338 | | | | 738,244 | | | | — | |
Receivable for fund shares sold | | | 279,828 | | | | 69 | | | | 9,527 | | | | 957,250 | |
Dividends, interest and other receivables | | | 722,450 | | | | 12,944 | | | | 751,904 | | | | 18,628 | |
Prepaid assets | | | 33,576 | | | | 12,334 | | | | 18,336 | | | | 52,955 | |
| | | | | | | | | | | | | | | | |
Total Assets | | | 290,741,416 | | | | 31,597,355 | | | | 104,149,178 | | | | 625,620,124 | |
| | | | | | | | | | | | | | | | |
Liabilities | | | | | | | | | | | | | | | | |
Payable for investments purchased | | | 1,280,043 | | | | — | | | | 1,485,569 | | | | — | |
Payable for fund shares redeemed | | | 284,163 | | | | 161,458 | | | | 326,738 | | | | 669,257 | |
Payable to Adviser | | | 154,895 | | | | 18,630 | | | | 80,863 | | | | 490,250 | |
Due to Custodian | | | — | | | | 6,000 | | | | — | | | | — | |
Accrued distribution fee | | | 40,829 | | | | 5,403 | | | | 17,904 | | | | 42,356 | |
Accrued expenses and other liabilities | | | 215,111 | | | | 17,115 | | | | 70,134 | | | | 345,646 | |
| | | | | | | | | | | | | | | | |
Total Liabilities | | | 1,975,041 | | | | 208,606 | | | | 1,981,208 | | | | 1,547,509 | |
| | | | | | | | | | | | | | | | |
Net Assets | | $ | 288,766,375 | | | $ | 31,388,749 | | | $ | 102,167,970 | | | $ | 624,072,615 | |
| | | | | | | | | | | | | | | | |
Net assets consist of: | | | | | | | | | | | | | | | | |
Paid in capital | | $ | 430,392,255 | | | $ | 46,192,075 | | | $ | 142,514,538 | | | $ | 556,909,057 | |
Accumulated net investment income (loss) | | | 1,695,911 | | | | (132,561 | ) | | | 198,200 | | | | (3,321,318 | ) |
Accumulated net realized gain (loss) | | | (68,827,027 | ) | | | (7,883,045 | ) | | | (13,790,507 | ) | | | 10,573,869 | |
Net unrealized appreciation (depreciation) on: | | | | | | | | | | | | | | | | |
Investments and foreign currency related items | | | (74,494,764 | ) | | | (6,787,720 | ) | | | (26,754,261 | ) | | | 59,911,007 | |
| | | | | | | | | | | | | | | | |
Net assets | | $ | 288,766,375 | | | $ | 31,388,749 | | | $ | 102,167,970 | | | $ | 624,072,615 | |
| | | | | | | | | | | | | | | | |
Shares of beneficial interest outstanding
(unlimited shares of $0.01 par value authorized) | | | 18,714,008 | | | | 3,338,319 | | | | 12,719,658 | | | | 18,191,363 | |
Net asset value and redemption price per share | | $ | 15.43 | | | $ | 9.40 | | | $ | 8.03 | | | $ | 34.31 | |
| | | | | | | | | | | | | | | | |
Maximum offering price per share | | $ | 15.43 | | | $ | 9.40 | | | $ | 8.03 | | | $ | 34.31 | |
| | | | | | | | | | | | | | | | |
(1) Cost of Investments | | | | | | | | | | | | | | | | |
Unaffiliated issuers | | $ | 354,710,503 | | | $ | 32,193,855 | | | $ | 125,332,653 | | | $ | 505,169,275 | |
Affiliated issuers | | $ | 9,490,284 | | | $ | 5,589,170 | | | $ | — | | | $ | 58,710,481 | |
(2) Cost of Foreign Currencies | | $ | — | | | $ | — | | | $ | 4,001,210 | | | $ | 788,326 | |
The accompanying notes are an integral part of these financial statements.
The Tocqueville Trust
Statements of Operations
For the Six Months Ended April 30, 2009
(Unaudited)
| | | | | | | | | | | | | | | | |
| | | The
Tocqueville
Fund | | | Small Cap
Fund | | | International
Value
Fund | | | Gold
Fund | |
Investment Income: | | | | | | | | | | | | | | | | |
Dividends* | | | | | | | | | | | | | | | | |
Unaffiliated issuers | | $ | 4,460,141 | | | $ | 72,535 | | | $ | 1,036,290 | | | $ | 939,068 | |
Affiliated issuers | | | 312,137 | | | | — | | | | — | | | | — | |
Interest | | | 161,979 | | | | 1,368 | | | | 174,465 | | | | 36,847 | |
| | | | | | | | | | | | | | | | |
| | | 4,934,257 | | | | 73,903 | | | | 1,210,755 | | | | 975,915 | |
| | | | | | | | | | | | | | | | |
Expenses: | | | | | | | | | | | | | | | | |
Investment Adviser’s fee (See Note 5) | | | 1,029,820 | | | | 108,778 | | | | 505,442 | | | | 2,619,090 | |
Distribution fees (See Note 5) | | | 343,273 | | | | 36,259 | | | | 126,361 | | | | 674,666 | |
Administration fee (See Note 5) | | | 205,964 | | | | 21,756 | | | | 75,816 | | | | 404,799 | |
Transfer agent and shareholder services fees | | | 95,840 | | | | 6,724 | | | | 23,736 | | | | 158,005 | |
Professional fees | | | 54,325 | | | | 6,076 | | | | 20,543 | | | | 102,520 | |
Fund accounting fees | | | 25,304 | | | | 3,323 | | | | 20,963 | | | | 43,448 | |
Custody fees | | | 19,055 | | | | 4,713 | | | | 21,104 | | | | 31,188 | |
Registration fees | | | 19,945 | | | | 11,414 | | | | 10,294 | | | | 29,016 | |
Printing and mailing expense | | | 22,886 | | | | 2,008 | | | | 7,057 | | | | 53,117 | |
Trustee fees and expenses | | | 28,743 | | | | 3,258 | | | | 12,882 | | | | 47,500 | |
Insurance expense | | | 7,510 | | | | 643 | | | | 3,712 | | | | 18,489 | |
Other expenses | | | 44,486 | | | | 1,512 | | | | 5,198 | | | | 44,926 | |
| | | | | | | | | | | | | | | | |
Total expenses before waiver | | | 1,897,151 | | | | 206,464 | | | | 833,108 | | | | 4,226,764 | |
Less: Fees waived (See Note 5) | | | (180,784 | ) | | | — | | | | — | | | | — | |
| | | | | | | | | | | | | | | | |
Net expenses | | | 1,716,367 | | | | 206,464 | | | | 833,108 | | | | 4,226,766 | |
| | | | | | | | | | | | | | | | |
Net Investment Income (Loss) | | | 3,217,890 | | | | (132,561 | ) | | | 377,647 | | | | (3,250,849 | ) |
| | | | | | | | | | | | | | | | |
Realized and Unrealized Gain (Loss): | | | | | | | | | | | | | | | | |
Net realized gain (loss) on: | | | | | | | | | | | | | | | | |
Investments | | | | | | | | | | | | | | | | |
Unaffiliated issuers | | | (56,841,911 | ) | | | (4,960,286 | ) | | | (13,900,145 | ) | | | 16,753,818 | |
Affiliated issuers | | | (3,862,641 | ) | | | (2,593,868 | ) | | | — | | | | (6,273,923 | ) |
Foreign currency translation | | | — | | | | — | | | | 129,372 | | | | 23,509 | |
| | | | | | | | | | | | | | | | |
| | | (60,704,552 | ) | | | (7,554,154 | ) | | | (13,770,773 | ) | | | 10,503,404 | |
Net change in unrealized appreciation on: | | | | | | | | | | | | | | | | |
Investments | | | 41,740,662 | | | | 6,356,216 | | | | 14,975,258 | | | | 221,579,336 | |
Foreign currency translation | | | — | | | | — | | | | 816,284 | | | | 9,238,246 | |
| | | | | | | | | | | | | | | | |
| | | 41,740,662 | | | | 6,356,216 | | | | 15,791,542 | | | | 230,817,582 | |
Net gain (loss) on investments and foreign currency | | | (18,963,890 | ) | | | (1,197,938 | ) | | | 2,020,769 | | | | 241,320,986 | |
| | | | | | | | | | | | | | | | |
Net Increase (Decrease) in Net Assets Resulting from Operations | | $ | (15,746,000 | ) | | $ | (1,330,499 | ) | | $ | 2,398,416 | | | $ | 238,070,137 | |
| | | | | | | | | | | | | | | | |
* Net of foreign taxes withheld | | $ | 57,824 | | | $ | — | | | $ | 118,687 | | | $ | 91,220 | |
| | | | | | | | | | | | | | | | |
The accompanying notes are an integral part of these financial statements.
The Tocqueville Trust
Statements of Changes in Net Assets
| | | | | | | | |
| | | The Tocqueville Fund | |
| | | For the
Six-Months
Ended
April 30,
2009 | | | For the
Year Ended
October 31,
2008 | |
| | | (Unaudited) | | | | |
Operations: | | | | | | | | |
Net investment income (loss) | | $ | 3,217,890 | | | $ | 4,739,815 | |
Net realized gain (loss) on investments and foreign currency | | | (60,704,552 | ) | | | 2,137,522 | |
Net change in unrealized appreciation (depreciation) | | | 41,740,662 | | | | (227,748,077 | ) |
| | | | | | | | |
Net increase (decrease) in net assets resulting from operations | | | (15,746,000 | ) | | | (220,870,740 | ) |
Dividends and distributions to shareholders: | | | | | | | | |
Net investment income | | | (5,443,842 | ) | | | (3,450,163 | ) |
Net realized gains | | | — | | | | (36,514,100 | ) |
| | | | | | | | |
Total dividends and distributions | | | (5,443,842 | ) | | | (39,964,263 | ) |
Fund share transactions: | | | | | | | | |
Shares sold | | | 42,181,383 | | | | 221,857,644 | |
Shares issued to holders in reinvestment of dividends | | | 4,443,262 | | | | 34,039,145 | |
Shares redeemed* | | | (65,277,678 | ) | | | (190,330,381 | ) |
| | | | | | | | |
Net increase (decrease) | | | (18,653,033 | ) | | | 65,566,408 | |
| | | | | | | | |
Net increase (decrease) in net assets | | | (39,842,875 | ) | | | (195,268,595 | ) |
Net Assets: | | | | | | | | |
Beginning of period | | | 328,609,250 | | | | 523,877,845 | |
| | | | | | | | |
End of period** | | | 288,766,375 | | | | 328,609,250 | |
| | | | | | | | |
* Net of redemption fees of: | | $ | 46,965 | | | $ | 198,509 | |
| | | | | | | | |
** Including undistributed net investment income (loss) of: | | $ | 1,695,911 | | | $ | 3,921,863 | |
| | | | | | | | |
Change in shares outstanding: | | | | | | | | |
Shares sold | | | 2,854,600 | | | | 9,218,902 | |
Shares issued to holders in reinvestment of dividends | | | 286,662 | | | | 1,316,286 | |
Shares redeemed | | | (4,471,012 | ) | | | (8,602,242 | ) |
| | | | | | | | |
Net increase (decrease) | | | (1,329,750 | ) | | | 1,932,946 | |
| | | | | | | | |
The accompanying notes are an integral part of these financial statements.
The Tocqueville Trust
Statements of Changes in Net Assets
| | | | | | | | | | | | | | | | | | | | | | |
| Small Cap Fund | | | International Value Fund | | | Gold Fund | |
For the
Six-Months
Ended
April 30,
2009 | | | For the
Year Ended
October 31,
2008 | | | For the
Six-Months
Ended
April 30,
2009 | | | For the
Year Ended
October 31,
2008 | | | For the
Six-Months
Ended
April 30,
2009 | | | For the
Year Ended
October 31,
2008 | |
| (Unaudited) | | | | | | (Unaudited) | | | | | | (Unaudited) | | | | |
| | | | | | | | | | | | | | | | | | | | | | |
| $ | (132,561 | ) | | $ | 48,407 | | | $ | 377,647 | | | $ | 1,890,571 | | | $ | (3,250,849 | ) | | $ | (10,526,148 | ) |
| | (7,554,154 | ) | | | 169,198 | | | | (13,770,773 | ) | | | 7,318,134 | | | | 10,503,404 | | | | 15,648,877 | |
| | 6,356,216 | | | | (19,843,665 | ) | | | 15,791,542 | | | | (92,861,385 | ) | | | 230,817,582 | | | | (677,969,427 | ) |
| | | | | | | | | | | | | | | | | | | | | | | |
| | (1,330,499 | ) | | | (19,626,060 | ) | | | 2,398,416 | | | | (83,652,680 | ) | | | 238,070,137 | | | | (672,846,698 | ) |
| | | | | | | | | | | | | | | | | | | | | | |
| | (38,161 | ) | | | (335,138 | ) | | | (2,581,608 | ) | | | (1,371,852 | ) | | | — | | | | (8,713,461 | ) |
| | (387,146 | ) | | | (4,709,888 | ) | | | (6,588,457 | ) | | | (25,545,236 | ) | | | (15,650,276 | ) | | | (158,099,409 | ) |
| | | | | | | | | | | | | | | | | | | | | | | |
| | (425,307 | ) | | | (5,045,026 | ) | | | (9,170,065 | ) | | | (26,917,088 | ) | | | (15,650,276 | ) | | | (166,812,870 | ) |
| | | | | | | | | | | | | | | | | | | | | | |
| | 2,768,408 | | | | 20,592,976 | | | | 2,246,029 | | | | 12,725,161 | | | | 65,705,498 | | | | 219,802,295 | |
| | 317,949 | | | | 4,356,344 | | | | 8,163,847 | | | | 23,234,344 | | | | 14,993,130 | | | | 159,171,486 | |
| | (6,370,911 | ) | | | (13,392,617 | ) | | | (19,658,910 | ) | | | (26,421,522 | ) | | | (89,902,568 | ) | | | (359,932,042 | ) |
| | | | | | | | | | | | | | | | | | | | | | | |
| | (3,284,554 | ) | | | 11,556,703 | | | | (9,249,034 | ) | | | 9,537,983 | | | | (9,203,940 | ) | | | 19,041,739 | |
| | | | | | | | | | | | | | | | | | | | | | | |
| | (5,040,360 | ) | | | (13,114,383 | ) | | | (16,020,683 | ) | | | (101,031,785 | ) | | | 213,215,921 | | | | (820,617,829 | ) |
| | | | | | | | | | | | | | | | | | | | | | |
| | 36,429,109 | | | | 49,543,492 | | | | 118,188,653 | | | | 219,220,438 | | | | 410,856,694 | | | | 1,231,474,523 | |
| | | | | | | | | | | | | | | | | | | | | | | |
| | 31,388,749 | | | | 36,429,109 | | | | 102,167,970 | | | | 118,188,653 | | | | 624,072,615 | | | | 410,856,694 | |
| | | | | | | | | | | | | | | | | | | | | | | |
| $ | 1,788 | | | $ | 16,759 | | | $ | 15,947 | | | $ | 19,385 | | | $ | 255,183 | | | $ | 564,671 | |
| | | | | | | | | | | | | | | | | | | | | | | |
| $ | (132,561 | ) | | $ | 38,161 | | | $ | 198,200 | | | $ | 2,402,161 | | | $ | (3,321,318 | ) | | $ | (70,469 | ) |
| | | | | | | | | | | | | | | | | | | | | | | |
| | | | | | | | | | | | | | | | | | | | | | |
| | 344,172 | | | | 1,569,321 | | | | 295,519 | | | | 1,090,157 | | | | 2,093,114 | | | | 4,864,962 | |
| | 36,504 | | | | 303,367 | | | | 996,807 | | | | 1,694,701 | | | | 509,624 | | | | 3,330,644 | |
| | (769,593 | ) | | | (1,019,695 | ) | | | (2,495,922 | ) | | | (2,163,092 | ) | | | (3,285,458 | ) | | | (8,454,843 | ) |
| | | | | | | | | | | | | | | | | | | | | | | |
| | (388,917 | ) | | | 852,993 | | | | (1,203,596 | ) | | | 621,766 | | | | (682,720 | ) | | | (259,237 | ) |
| | | | | | | | | | | | | | | | | | | | | | | |
The accompanying notes are an integral part of these financial statements.
The Tocqueville Trust
The Tocqueville Fund
The Tocqueville Small Cap Fund
The Tocqueville International Value Fund
The Tocqueville Gold Fund
Notes to Financial Statements
1. ORGANIZATION
The Tocqueville Trust (the “Trust”) is a Massachusetts business trust organized on September 17, 1986, currently consisting of four separate funds (each, a “Fund” or, collectively, the “Funds”). Each Fund is an open-end management investment company with a different investment objective. The Tocqueville Fund, The Tocqueville Small Cap Fund, and The Tocqueville International Value Fund are classified as diversified investment companies. The Tocqueville Gold Fund is classified as a non-diversified investment company. The objective of The Tocqueville Fund is long-term capital appreciation. The Tocqueville Fund seeks to achieve its investment objective by investing primarily in securities of United States issuers. The objective of The Tocqueville Small Cap Fund is long-term capital appreciation. The Tocqueville Small Cap Fund seeks to achieve its investment objective by investing, under normal circumstances, at least 80% of its net assets plus borrowings for investment purposes in common stocks of companies located in the United States that have market values of less than $3 billion. The objective of The Tocqueville International Value Fund is long-term capital appreciation consistent with preservation of capital. The Tocqueville International Value Fund seeks to achieve its investment objective by investing primarily in non-U.S. companies. The objective of The Tocqueville Gold Fund is long-term capital appreciation. The Tocqueville Gold Fund seeks to achieve its investment objective by investing, under normal circumstances, at least 80% of its net assets plus borrowings for investment purposes in gold and securities of companies located throughout the world that are engaged in mining or processing gold. The following is a summary of significant accounting principles followed by the Trust in the preparation of its financial statements.
2. SIGNIFICANT ACCOUNTING POLICIES
a) Security valuation
Investments in securities, including foreign securities, traded on an exchange or quoted on the over-the-counter market are valued at the last sale price or, if no sale occurred during the day, at the mean between closing bid and asked prices, as last reported by a pricing service approved by the Trustees. Securities that are principally traded on the National Association of Securities Dealers Automated Quotation National Market (“NASDAQ”) are generally valued at the NASDAQ Official Closing Price (“NOCP”). Investments in gold and silver are valued on the basis of the respective closing spot prices of the New York Commodity Exchange. Investments in other precious metals are valued at their respective market values determined on the basis of the mean between the last current bid and asked prices based on dealer or exchange quotations. When market quotations are not readily available, or when restricted securities or other assets are being valued, such assets are valued at fair value as determined in good faith by or under procedures approved by the Trustees. Short-term securities maturing within 60 days are valued on an amortized cost basis. Fixed income securities with maturities greater than 60 days are valued at market price.
Trading in securities on European and Far Eastern securities exchanges normally is completed before the calculation of the Funds’ net asset value. Trading on these foreign exchanges may not take place on all days on which there is regular trading on the New York Stock Exchange (“NYSE”), or may take place on days on which there is no regular trading on the NYSE. Similarly, the Funds may hold securities traded in domestic markets where the market may close early on a given day prior to calculation of the Funds’ net asset value. Events affecting the value of such securities held by the Funds that occur between the close of trading in the security and the close of trading on the NYSE normally will not be reflected in the Funds’ calculation of the net asset value. Significant events will be closely monitored, and where it is determined that an adjustment should be made to the security’s value because significant interim events may materially affect the value of the security, the security will be priced at its fair value in accordance with the procedures approved by the Trustees.
Investment and shareholder transactions are recorded on trade date. Dividend income is recognized on the ex-dividend date and interest income is recognized on an accrual basis.
b) Restricted and illiquid securities
The Tocqueville Fund and The Tocqueville Gold Fund may invest in securities that are subject to legal or contractual restrictions on resale or are illiquid. A security may be considered illiquid if it lacks a readily available market or if its valuation has not changed for a certain period of time. Disposal of these securities may involve time consuming negotiations and expense, and a prompt sale at the current valuation may be difficult.
c) Accounting pronouncements
On July 13, 2006, the Financial Accounting Standards Board (FASB) released FASB Interpretation No. 48 “Accounting for Uncertainty in Income Taxes” (“FIN 48”). FIN 48 provides guidance for how uncertain tax positions should be recognized, measured, presented and disclosed in the financial statements. FIN 48 requires the evaluation of tax positions taken or expected to be taken in the course of preparing the Funds’ tax returns to determine whether the tax positions are “more-likely-than-not” of being sustained by the applicable tax authority. Tax positions not deemed to meet the more-likely-than-not threshold would be recorded as a tax benefit or expense in the current year. The Funds adopted FIN 48 on November 1, 2007. It made no impact on their financial statements.
The Funds adopted the provisions of Statement of Financial Accounting Standards No. 157, Fair Value Measurements (“SFAS 157”), effective with the beginning of the Funds’ fiscal year. SFAS 157 establishes a hierarchy that prioritizes the inputs to valuation techniques giving the highest priority to readily available unadjusted quoted prices in active markets for identical assets (level 1 measurements) and the lowest priority to unobservable inputs (level 3 measurements) when market prices are not readily available or reliable.
Various inputs are used in determining the value of the Funds’ investments. The inputs are summarized in three broad levels listed below.
| | |
Level 1 - | | quoted prices in active markets for identical securities |
Level 2 - | | other significant observable inputs (including quoted prices for similar securities, interest rates, prepayment speeds, credit risk, etc.) |
Level 3 - | | significant unobservable inputs (including the Funds’ own assumptions in determining fair value of investments) |
The following is a summary of the inputs used, as of April 30, 2009, involving the Funds’ assets carried at value. The inputs of methodology used for valuing securities may not be an indication of the risk associated with investing in those securities.
| | | | | | | | | | | | |
| Description | | Level 1 | | Level 2 | | Level 3 | | Total |
Investments in Securities | | | | | | | | | | | | |
The Tocqueville Fund | | $ | 279,958,278 | | $ | 9,746,824 | | $ | — | | $ | 289,705,102 |
The Tocqueville Small Cap Fund | | | 30,818,305 | | | 177,000 | | | — | | | 30,995,305 |
The Tocqueville International Value Fund | | | 94,256,963 | | | 4,383,255 | | | — | | | 98,640,218 |
The Tocqueville Gold Fund | | | 356,072,352 | | | 249,531,786 | | | 18,168,422 | | | 623,772,560 |
Below is a reconciliation that details the activity of securities in Level 3 since the adoption of the pronouncement on November 1, 2008 to April 30, 2009:
| | | | | | | | | | | | | |
| | | The Tocqueville
Fund | | The Tocqueville
Small Cap Fund | | The Tocqueville
International
Value Fund | | The Tocqueville
Gold Fund | |
Beginning Balance—November 1, 2008 | | $ | — | | $ | — | | $ | — | | $ | 14,186,763 | |
Net purchases/(sales) | | | — | | | — | | | — | | | 5,867,546 | |
Realized gains/(losses) | | | — | | | — | | | — | | | — | |
Change in unrealized appreciation (depreciation) | | | — | | | — | | | — | | | (1,885,887 | ) |
Transfers in/(out) of level 3 | | | — | | | — | | | — | | | — | |
| | | | | | | | | | | | | |
Ending Balance—April 30, 2009 | | $ | — | | $ | — | | $ | — | | $ | 18,168,422 | |
| | | | | | | | | | | | | |
In March 2008, the Financial Accounting Standards Board (FASB) issued Statement of Financial Accounting Standards No. 161, “Disclosures about Derivative Instruments and Hedging Activities” (“SFAS 161”) was issued and is effective for fiscal years beginning after November 15, 2008. SFAS 161 is intended to improve financial reporting for derivative instruments by requiring enhanced disclosure that enables investors to understand how and why an entity uses derivatives, how derivatives are accounted for, and how derivative instruments affect an entity’s results of operations and financial position. Management is currently evaluating the implications of SFAS 161. The impact on the Fund’s financial statement disclosures, if any, is currently being assessed.
d) Foreign currency translation
Investments and other assets and liabilities denominated in foreign currencies are translated to U.S. dollars at the prevailing rates of exchange, in accordance with the Trust’s Portfolio Securities Valuation and Foreign Exchange Contracts Procedures. The Tocqueville Fund, The Tocqueville International Value Fund and The Tocqueville Gold Fund are engaged in transactions in securities denominated in foreign currencies and, as a result, enter into foreign exchange contracts. These Funds are exposed to additional market risk as a result of changes in the value of the underlying currency in relation to the U.S. dollar. Risks include potential inability of counterparties to meet the terms of their contracts. The value of foreign currency contracts are marked-to-market on a daily basis, which reflects the changes in the market value of the contract at the close of each day’s trading, resulting in daily unrealized gains and/or losses. When the contracts are closed, the Funds recognize a realized gain or loss.
The Funds do not isolate that portion of the results of operations resulting from changes in foreign exchange rates on investments from the fluctuations arising from changes in market prices of securities held. Such fluctuations are included with the net realized and unrealized gain or loss from investments.
Reported net realized foreign exchange gains or losses arise from sales of foreign currencies, currency gains or losses realized between the trade and settlement dates on securities transactions, the differences between the amounts of dividends, interest, and foreign withholding taxes recorded on the Fund’s books, and the U.S. dollar equivalent of the amounts actually received or paid. Net unrealized foreign exchange gains and losses arise from changes in the value of assets and liabilities other than investments in securities at the end of the fiscal period, resulting from changes in the exchange rates.
e) Written option accounting
The Tocqueville International Value Fund and The Tocqueville Gold Fund may write (sell) covered call options to hedge portfolio investments. When the Funds write (sell) an option, an amount equal to the premium received by the Funds is included in the Statements of Assets and Liabilities as an asset and an equivalent liability. The amount of the liability is subsequently marked-to-market to reflect the current value of the option written. By writing an option, the Funds may become obligated during the term of the option to deliver or purchase the securities underlying the option at the exercise price if the option is exercised. Option contracts are valued at the last sales price reported on the date of obligation. If the seller defaults and the value of the collateral declines or if bankruptcy proceedings are commenced with respect to the seller of the security, realization of the collateral by the Trust may be delayed or limited.
f) Dividends and distributions to Shareholders
Dividends to shareholders are recorded on the ex-dividend date. Dividends from net investment income are declared and paid annually by the Funds. Distributions of net realized capital gains, if any, will be declared and paid at least annually. Income and capital gain distributions are determined in accordance with income tax regulations which may differ from generally accepted accounting principles. Permanent differences between financial and tax reporting may result in reclassification to capital stock.
g) Use of estimates
The preparation of financial statements in conformity with accounting principles generally accepted in the United States of America requires management to make estimates and assumptions that affect the reported amounts of assets and liabilities and disclosure of contingent assets and liabilities at the date of the financial statements and the reported amounts of revenues and expenses during the reporting period. Actual results could differ from those estimates.
3. FEDERAL INCOME TAX
Provision for federal income taxes or excise taxes has not been made since the Funds have elected to be taxed as Regulated Investment Companies and intend to distribute substantially all taxable income to shareholders and otherwise comply with the provisions of the Internal Revenue Code applicable to Regulated Investment Companies. Distributions from net realized gains for book purposes may include short-term capital gains which are included as ordinary income to shareholders for tax purposes. Additionally, U.S. generally accepted accounting principles require that certain components of net assets relating to permanent differences be reclassified between financial and tax reporting. These reclassifications have no effect on net assets or net asset value per share. For the year ended October 31, 2008, the following table shows the reclassifications made:
| | | | | | | | | | | | |
| | | Undistributed
Net Investment
Income/(Loss) | | | Accumulated Net
Realized
Gain/(Loss) | | | Paid In Capital | |
The Tocqueville Fund | | $ | (94,312 | ) | | $ | 94,312 | | | $ | — | |
Small Cap Fund | | | 7,032 | | | | (7,031 | ) | | | (1 | ) |
International Value Fund | | | 749,281 | | | | (749,281 | ) | | | — | |
Gold Fund | | | 36,570,386 | | | | 72,082 | | | | (36,642,468 | ) |
The permanent differences primarily relate to net operating losses and capital loss carry forward due to expiration.
As of October 31, 2008, the components of accumulated earnings (losses) for income tax purposes were as follows:
| | | | | | | | | | | | | | | | |
| | | Tocqueville
Fund | | | Small Cap
Fund | | | International
Value Fund | | | Gold
Fund | |
Tax cost of investments | | $ | 448,755,122 | | | $ | 48,807,136 | | | $ | 149,208,480 | | | $ | 580,656,007 | |
| | | | | | | | | | | | | | | | |
Unrealized appreciation | | | 16,216,164 | | | | 992,848 | | | | 1,953,220 | | | | 82,848,442 | |
Unrealized depreciation | | | (132,567,658 | ) | | | (14,465,653 | ) | | | (44,518,754 | ) | | | (253,755,015 | ) |
| | | | | | | | | | | | | | | | |
Net unrealized appreciation (depreciation) | | | (116,351,494 | ) | | | (13,472,805 | ) | | | (42,565,534 | ) | | | (170,906,573 | ) |
| | | | | | | | | | | | | | | | |
Undistributed OI | | | 4,000,729 | | | | 38,161 | | | | 2,402,161 | | | | — | |
Undistributed LTG | | | — | | | | 387,124 | | | | 6,588,454 | | | | 15,650,272 | |
| | | | | | | | | | | | | | | | |
Distributable earnings | | | 4,000,729 | | | | 425,285 | | | | 8,990,615 | | | | 15,650,272 | |
| | | | | | | | | | | | | | | | |
Other accumulated gain/(loss) | | | (8,085,273 | ) | | | — | | | | — | | | | — | |
| | | | | | | | | | | | | | | | |
Total accumulated gain/(loss) | | $ | (120,436,038 | ) | | $ | (13,047,520 | ) | | $ | (33,574,919 | ) | | $ | (155,256,301 | ) |
| | | | | | | | | | | | | | | | |
The difference between book-basis and tax-basis unrealized appreciation is attributable primarily to capital loss carry forwards and wash sales.
The tax character of distributions paid during the years ended October 31, 2008 and 2007 was as follows:
| | | | | | | | | |
| | | October 31, 2008 |
| | | Ordinary
Income | | Long-term
Capital
Gain | | Total |
The Tocqueville Fund | | $ | 7,473,581 | | $ | 32,490,682 | | $ | 39,964,263 |
Small Cap Fund | | | 371,265 | | | 4,673,761 | | | 5,045,026 |
International Value Fund | | | 1,371,852 | | | 25,545,236 | | | 26,917,088 |
Gold Fund | | | 12,357,089 | | | 154,455,781 | | | 166,812,870 |
| |
| | | October 31, 2007 |
| | | Ordinary
Income | | Long-term
Capital
Gain | | Total |
The Tocqueville Fund | | $ | 454,720 | | $ | — | | $ | 454,720 |
Small Cap Fund | | | — | | | 6,159,790 | | | 6,159,790 |
International Value Fund | | | 4,604,764 | | | 29,743,827 | | | 34,348,591 |
Gold Fund | | | 22,329,899 | | | 65,538,695 | | | 87,868,594 |
The Funds designated as long-term capital gain dividends, pursuant to Internal Revenue Code Section 852(b)(3), the amounts necessary to reduce the earnings and profits of the Funds related to net capital gains to zero for the tax years ended October 31, 2008 and 2007.
At October 31, 2008, certain funds had tax basis capital losses which may be carried forward to offset future capital gains as shown below.
| | | |
| | | The
Tocqueville
Fund |
Capital losses expiring in: | | | |
2010 | | $ | 8,085,273 |
During the year ended October 31, 2008, The Tocqueville Fund utilized $2,010,695 of capital loss carryforwards.
4. FINANCIAL INSTRUMENTS
The Funds may trade financial instruments with off-balance sheet risk in the normal course of investing activities and to assist in managing exposure to market risks such as interest rates and foreign currency exchange rates. The financial instruments include written options, forward foreign currency exchange contracts and futures contracts. The contractual amounts of these instruments represent the investment the Funds have in particular classes of financial instruments and the amounts potentially subject to risk. The measurement of the risks associated with these instruments is meaningful only when all related and offsetting transactions are considered. At October 31, 2008, the Funds did not hold any financial instruments with off-balance sheet risk.
5. INVESTMENT ADVISORY AND OTHER AGREEMENTS
Tocqueville Asset Management L.P. (“Tocqueville”) is the investment adviser (the “Adviser”) to the Trust under Investment Advisory Agreements approved by shareholders. For its services, Tocqueville receives fees from The Tocqueville Fund, calculated daily and payable monthly, at an annual rate of 0.75% on the first $1 billion of the average daily net assets of the Fund, and 0.65% of the average daily net assets in excess of $1 billion. Tocqueville receives fees from The Tocqueville Small Cap Fund, calculated daily and payable monthly, at an annual rate of 0.75% on the first $500 million of the average daily net assets of the Fund, and 0.65% of the average daily net assets in excess of $500 million. Tocqueville receives fees from the Tocqueville International Value Fund, calculated daily and payable monthly, at an annual rate of 1.00% on the first $1 billion of the average daily net assets of the Fund, and 0.75% of the average daily net assets in excess of $1 billion. Tocqueville receives fees from The Tocqueville Gold Fund, calculated daily and payable monthly, at an annual rate of 1.00% on the first $500 million of the average daily net assets of the Fund, 0.75% of the average daily net assets in excess of $500 million but not exceeding $1 billion, and 0.65% of the average daily net assets in excess of $1 billion.
With respect to The Tocqueville Fund, effective October 31, 2008, the Adviser has contractually agreed to waive its advisory fees and/or reimburse expenses in order to ensure that The Tocqueville Fund’s total annual operating expenses do not exceed 1.25% of its average daily net assets. The Expense Limitation Agreement will remain in effect until October 31, 2009.
Pursuant to an Administrative Services Agreement, each Fund pays to the Adviser a fee computed and paid monthly at an annual rate of 0.15% of the average daily net assets of the Fund. For the six months ended April 30, 2009, the Adviser has made payments of $77,972, $7,934, $27,813 and $129,681 to U.S. Bancorp Fund Services, LLC for services
provided under a Sub-Administration Agreement for The Tocqueville Fund, The Tocqueville Small Cap Fund, The Tocqueville International Value Fund and The Tocqueville Gold Fund, respectively.
Tocqueville Securities, L.P. (the “Distributor”), an affiliate of Tocqueville, acts as distributor for shares of the Trust. Each Fund adopted a distribution and service plan pursuant to Rule 12b-1 of the 1940 Act. Pursuant to the plans, each Fund pays to the Distributor distribution and service fees of 0.25% per annum of its average daily net assets.
Commissions earned by the Distributor for services rendered as a registered broker-dealer in securities transactions for The Tocqueville Fund, The Tocqueville Small Cap Fund, The Tocqueville International Value Fund and The Tocqueville Gold Fund for the six months ended April 30, 2009, were $210,000, $19,811, $33,084 and $122,708, respectively.
6. FUND SHARE TRANSACTIONS
The Funds currently offer only one class of shares of beneficial interest. A redemption fee of 2.00% is imposed on redemptions of shares held 120 days or fewer. This fee is retained by each Fund and is credited to paid in capital. Redemptions to which the fee applies include redemptions of shares resulting from an exchange made pursuant to the Exchange Privilege, as defined in the Trust’s Prospectus dated March 2, 2009. For a more detailed description of when the redemption fee does not apply, please see the Trust’s Prospectus. The Trust may waive the redemption fee when the Adviser determines that the imposition of the redemption fee is not necessary to protect a Fund from the effects of redemptions by investors who use the Fund as a short-term trading vehicle.
7. INVESTMENT TRANSACTIONS
Purchases and sales of investment securities (excluding short-term instruments) for the six months ended April 30, 2009 are summarized below.
| | | | | | | | | | | | |
| | | The
Tocqueville
Fund | | Small Cap
Fund | | International
Value Fund | | Gold
Fund |
Purchases: | | $ | 43,248,974 | | $ | 9,758,255 | | $ | 14,764,193 | | $ | 36,787,100 |
| | | | | | | | | | | | |
Sales: | | $ | 71,724,134 | | $ | 11,327,688 | | $ | 17,747,058 | | $ | 56,121,295 |
| | | | | | | | | | | | |
8. TRANSACTIONS WITH AFFILIATES
The following issuers are affiliated with the Funds; that is, the Adviser had control of 5% or more of the outstanding voting securities during the period from November 1, 2008 through April 30, 2009. As defined in Section (2)(a)(3) of the Investment Company Act of 1940; such issues are:
The Tocqueville Fund
| | | | | | | | | | | | | | | | | | | |
Issuer Name | | Share Balance
at Nov. 1, 2008 | | Additions | | Reductions | | | Share Balance
Apr. 30, 2009 | | Dividend
Income | | Realized
Gain/(Loss) | | | Value
at Apr. 30, 2009 |
Alaska Communication Systems Group, Inc. | | 750,000 | | — | | (48,200 | ) | | 701,800 | | $ | 312,137 | | $ | (89,096 | ) | | $ | 4,231,854 |
Emcore Corp. (a) | | 625,000 | | — | | (400,000 | ) | | 225,000 | | | — | | | (3,773,545 | ) | | | 279,000 |
Emcore Corp. Warrants (a) | | 39,375 | | — | | — | | | 39,375 | | | — | | | — | | | | — |
| | | | | | | | | | | | | | | | | | | |
| | | | | | | | | | | $ | 312,137 | | $ | (3,862,641 | ) | | $ | 4,510,854 |
| | | | | |
| The Tocqueville Small Cap Fund | | | | | | | | | | | | | | | |
Issuer Name | | Share Balance
at Nov. 1, 2008 | | Additions | | Reductions | | | Share Balance
Apr. 30, 2009 | | Dividend
Income | | Realized
Gain/(Loss) | | | Value
at Apr. 30, 2009 |
1-800 Flowers.com, Inc. | | 157,800 | | 9,800 | | (22,100 | ) | | 145,500 | | $ | — | | $ | (126,668 | ) | | $ | 424,860 |
Emcore Corp. (a) | | 195,400 | | — | | (195,400 | ) | | — | | | — | | | (1,769,014 | ) | | | — |
Kopin Corp. | | 372,500 | | 23,300 | | (202,800 | ) | | 193,000 | | | — | | | (158,961 | ) | | | 530,750 |
Landec Corp. | | 57,800 | | — | | (8,200 | ) | | 49,600 | | | — | | | (23,437 | ) | | | 335,296 |
LionBridge Technologies, Inc. | | 266,100 | | 16,700 | | (37,300 | ) | | 245,500 | | | — | | | (91,801 | ) | | | 331,425 |
Salix Pharmaceuticals, Ltd. | | 170,100 | | 7,600 | | (100,500 | ) | | 77,200 | | | — | | | (381,456 | ) | | | 849,200 |
Symyx Technologies | | 61,900 | | 26,400 | | (300 | ) | | 88,000 | | | — | | | (1,199 | ) | | | 425,920 |
Ultratech, Inc. | | 95,700 | | 26,800 | | (17,500 | ) | | 105,000 | | | — | | | (41,332 | ) | | | 1,419,600 |
| | | | | | | | | | | | | | | | | | | |
| | | | | | | | | | | $ | — | | $ | (2,593,868 | ) | | $ | 4,317,051 |
| | | | | | | | | | | | | | | | | | | |
| The Tocqueville Gold Fund | | | | | | | | | | | | | | | | | |
Issuer Name | | Share Balance
at Nov. 1, 2008 | | Additions | | Reductions | | | Share Balance
Apr. 30, 2009 | | Dividend
Income | | Realized
Gain/(Loss) | | | Value
at Apr. 30, 2009 |
Comaplex Minerals Corp. | | 2,839,000 | | — | | — | | | 2,839,000 | | $ | — | | $ | — | | | | 7,494,218 |
Euro Resources S.A. (a) | | 2,900,000 | | — | | (2,900,000 | ) | | — | | | — | | | 128,386 | | | | — |
Gold Resource Corp. | | 2,300,797 | | — | | — | | | 2,300,797 | | | — | | | — | | | | 9,134,164 |
International Tower Hill Mines Ltd. | | — | | 1,993,100 | | — | | | 1,993,100 | | | — | | | — | | | | 5,010,727 |
Nevada Copper Corp. | | 1,000,000 | | — | | (1,000,000 | ) | | — | | | — | | | (2,244,973 | ) | | | — |
Orezone Gold Corp. (b) | | — | | 2,145,463 | | — | | | 2,145,463 | | | — | | | — | | | | 575,336 |
Orezone Resources,
Inc. (a)(b) | | 17,163,700 | | — | | (17,163,700 | ) | | — | | | — | | | — | | | | — |
Silverstone Resources Corp. | | 6,635,000 | | — | | — | | | 6,635,000 | | | — | | | — | | | | 9,229,951 |
Troy Resources Nl (a) | | 2,911,624 | | — | | (2,911,624 | ) | | — | | | — | | | (3,946,639 | ) | | | — |
Troy Resources Nl
Npv (a) | | 100,000 | | 27,500 | | (127,500 | ) | | — | | | — | | | (210,697 | ) | | | — |
Yukon-Nevada Gold Corp. | | 8,350,000 | | — | | — | | | 8,350,000 | | | — | | | — | | | | 804,701 |
Yukon-Nevada Gold Corp. Warrants | | 4,175,000 | | — | | — | | | 4,175,000 | | | — | | | — | | | | — |
| | | | | | | | | | | | | | | | | | | |
| | | | | | | | | | | $ | — | | $ | (6,273,923 | ) | | $ | 32,249,097 |
| (a) | Security is no longer an affiliated company at April 30, 2009. |
| (b) | On February 25, 2009, IAMGOLD acquired Orezone Resources, Inc. As part of the reorganization, shareholders of Orezone Resources, Inc. received 0.125 shares of Orezone Gold Corp. for each share of Orezone Resources, Inc. |
ADDITIONAL INFORMATION (UNAUDITED)
1. ADDITIONAL DISCLOSURE REGARDING FUND TRUSTEES AND OFFICERS
Independent Trustees
| | | | | | | | | | |
Name, Age and Address | | Position(s) Held with the Trust | | Term of Office and Length of Time Served (1) | | Principal Occupation During Past Five Years | | # of
Portfolios
in Fund
Complex
Overseen
By Trustee | | Other Directorships Held by Trustee |
| | | | | |
Larry M. Senderhauf (60) 40 W. 57th St., 19th Floor New York, NY 10019 | | Trustee | | 1998 to December 2008* | | Retired. Administrator and Trustee, LMS 33 Profit and Pension Sharing Fund from 1983 to present. | | 4 | | Advisory Board Member, Legacy Bank, Scottsdale, Arizona |
| | | | | |
Guy A. Main (72) 40 W. 57th St., 19th Floor New York, NY 10019 | | Trustee | | Indefinite Term, Since 2000 | | Retired. Formerly, Executive Vice President, Amwest Insurance Group, Inc. from April 1996 to January 2001; Chairman, President and Chief Executive Officer, Condor Services Inc. from April 1989 to April 1996. | | 4 | | Director, Amwest Insurance Group, Inc. from April 1996 to January 2001; Chairman, Association of California Insurance Companies from January 1996 to January 1998; Director, Condor Services Inc. from April 1989 to April 1996. |
| | | | | |
Charles W. Caulkins (52) 40 W. 57th St., 19th Floor New York, NY 10019 | | Trustee | | Indefinite Term, Since 2003 | | Marketing Manager, L.R. Global Partners from January 2008 to present; President, Arbor Marketing, Inc. from October 1994 to December 2007. | | 4 | | Director, Phoenix House from January 2001 to 2007; Director, Bridges to Community from July 2002 to 2006. |
| | | | | |
James W. Gerard (48) 40 W. 57th St., 19th Floor New York, NY 10019 | | Trustee | | Indefinite Term, Since 2001 | | Principal, Juniper Capital Group, LLC (formerly known as Argus Advisors International, LLC), from August 2003 to present; Managing Director, The Chart Group from January 2001 to present; Managing Principal, Ironbound Partners from October 1998 to December 2000. | | 4 | | Director, American Overseas Memorial Day Association, 1988 to present; Trustee, Salisbury School, 2005 to present; Director and Treasurer ASPCA, 1988 to 2008; |
Independent Trustees
| | | | | | | | | | |
Name, Age and Address | | Position(s) Held with the Trust | | Term of Office and Length of Time Served (1) | | Principal Occupation During Past Five Years | | # of
Portfolios
in Fund
Complex
Overseen
By Trustee | | Other Directorships Held by Trustee |
| | | | | |
William F. Indoe (65) 40 W. 57th St., 19th Floor New York, NY 10019 | | Trustee | | Indefinite Term, Since 2006 | | Partner, Sullivan & Cromwell LLP (attorneys-at-law). | | 4 | | Director, Rho Capital Partners, Inc. |
| | | | | |
William J. Nolan III (61) 40 W. 57th St., 19th Floor New York, NY 10019 | | Trustee | | Indefinite Term, Since 2006 | | Retired, Executive Vice President & Treasurer PaineWebber Inc. 1997-2001. | | 4 | | Trustee, Adirondock Museum, Blue Mt. Lake, NY 1996 to present (Treasurer, 2000 to present). |
Interested Trustees (and Officers)**
| | | | | | | | | | |
Name, Age and Address | | Position(s) Held with the Trust | | Term of Office and Length of Time Served (1) | | Principal Occupation During Past Five Years | | # of
Portfolios
in Fund
Complex
Overseen
By Trustee | | Other Directorships Held by Trustee |
| | | | | |
Francois D. Sicart (65) 40 W. 57th St., 19th Floor New York, NY 10019 | | Chairman and Trustee | | Indefinite Term, Since 1987 | | Chairman, Tocqueville Management Corporation, the General Partner of Tocqueville Asset Management L.P. and Tocqueville Securities, L.P. from January 1990 to present; Chairman and Founder, Tocqueville Asset Management Corp. from December 1985 to January 1990; Vice Chairman of Tucker Anthony Management Corporation from 1981 to October 1986; Vice President (formerly general partner) among other positions with Tucker Anthony, Inc. from 1969 to January 1990. | | 4 | | Chairman and Director, Tocqueville Management Corporation, the General Partner of Tocqueville Asset Management L.P. and Tocqueville Securities, L.P. from January 1990 to present.
|
Interested Trustees (and Officers)**
| | | | | | | | | | |
Name, Age and Address | | Position(s) Held with the Trust | | Term of Office and Length of Time Served (1) | | Principal Occupation During Past Five Years | | # of
Portfolios
in Fund
Complex
Overseen
By Trustee | | Other Directorships Held by Trustee |
| | | | | |
Robert W. Kleinschmidt (59) 40 W. 57th St., 19th Floor New York, NY 10019 | | President and Trustee | | Indefinite Term, Since 1991 | | President, Chief Investment Officer and Director, Tocqueville Management Corporation, the General Partner of Tocqueville Asset Management L.P. and Tocqueville Securities, L.P. from January 1994 to present; and Managing Director from July 1991 to January 1994; Partner, David J. Greene & Co. from May 1978 to July 1991. | | 4 | | President and Director, Tocqueville Management Corporation, the General Partner of Tocqueville Asset Management L.P. and Tocqueville Securities, L.P.
|
| | | | | |
Steven J. Tyrrell (37) 40 W. 57th St., 19th Floor New York, NY 10019
| | Secretary and Treasurer | | Indefinite Term, Since 2006 | | Director of Operations, Tocqueville Asset Management L.P. from 2004 to present; Assistant Director of Operations, 2002-2004; Assistant Operations Manager, Lepercq, de Neuflize & Co., Inc. 1998-2002 | | N/A | | N/A
|
| | | | | |
Elizabeth Bosco (61) 40 W. 57th St., 19th Floor
New York, NY 10019 | | Anti- Money Laundering Compliance Officer
| | Indefinite Term, Since 2009 | | Chief Compliance Officer (January 2009-present), Tocqueville Securities L.P.; Compliance Officer (January 1997-January 2009), Tocqueville Securities L.P. and Tocqueville Asset Management, L.P. | | N/A | | N/A
|
| * | Mr. Senderhauf resigned from the Board of Trustees on December 11, 2008. |
| ** | “Interested person” of the Trust is defined in the 1940 Act. Mr. Sicart and Mr. Kleinschmidt are considered “interested persons” because of their affiliation with the Adviser. |
Interested Trustees (and Officers)*
| | | | | | | | | | |
Name, Age and Address | | Position(s) Held with the Trust | | Term of Office and Length of Time Served (1) | | Principal Occupation During Past Five Years | | # of
Portfolios
in Fund
Complex
Overseen
By Trustee | | Other Directorships Held by Trustee |
| | | | | |
Thomas Pandick (62) 40 W. 57th St., 19th Floor New York, NY 10019
| | Chief Compliance Officer | | Indefinite Term, Since 2004 | | Chief Compliance Officer (October 2004-present), Tocqueville Asset Management L.P.; General Counsel (January-October 2004), Tocqueville Asset Management L.P.; Vice President, Kirkbride Asset Management, Inc. (2000-2004) | | N/A | | N/A
|
| 1 | Each Trustee will hold office for an indefinite term until the earliest of (i) the next meeting of shareholders, if any, called for the purpose of considering the election or re-election of such Trustee and until the election and qualification of his or her successor, if any, elected at such meeting, or (ii) the date a Trustee resigns or retires, or a Trustee is removed by the Board of Trustees or shareholders, in accordance with the Trust’s By-Laws, as amended, and Agreement and Declaration of Trust, as amended. Each officer will hold office for an indefinite term until the date he or she resigns or retires or until his or her successor is elected and qualified. |
2. PROXY VOTING POLICIES AND PROCEDURES
A description of the policies and procedures that The Tocqueville Trust uses to determine how to vote proxies relating to portfolio securities is available without charge upon request by calling 1-800-355-7307. Information regarding how The Tocqueville Trust voted proxies relating to portfolio securities during the most recent 12-month period ended June 30 is available by calling 1-800-355-7307 and it is also available on the SEC’s web site at http://www.sec.gov.
3. SHAREHOLDER REPORTS AND QUARTERLY PORTFOLIO DISCLOSURE
The Tocqueville Trust is required to file its complete schedule of portfolio holdings with the SEC for its first and third fiscal quarters on Form N-Q. The Trust’s Form N-Q will be available without charge, upon request on the SEC’s website (http://www.sec.gov) and may be available by calling 1-800-697-3863. You can also obtain copies of Form N-Q by (i) visiting the SEC’s Public Reference Room in Washington, DC (information on the operation of the Public Reference Room may be obtained by calling 1-202-551-8090); (ii) sending your request and a duplicating fee to the SEC’s Public Reference Room, Washington, DC 20549-0102; or (iii) sending your request electronically to publicinfosec.gov. Quarterly portfolio holdings are also available on the website of The Tocqueville Funds, www.tocquevillefunds.com.
4. SHAREHOLDER NOTIFICATION OF FEDERAL TAX STATUS
The Funds designate the following percentages of ordinary dividends declared during the fiscal year ended October 31, 2008 as dividends qualifying for the dividends received deduction available to corporate shareholders:
| | |
The Tocqueville Fund | | 89.53% |
Small Cap Fund | | 100.00% |
International Value Fund | | 6.31% |
Gold Fund | | 3.10% |
The Funds designate the following percentages of ordinary dividends declared from net investment income during the fiscal year ended October 31, 2008 as qualified income under the Jobs and Growth Tax Relief Reconciliation Act of 2003:
| | |
The Tocqueville Fund | | 100.00% |
Small Cap Fund | | 100.00% |
International Value Fund | | 100.00% |
Gold Fund | | 39.10% |
For the year ended October 31, 2008, the funds designate the following percent of ordinary distributions paid as interest-related dividends under the Internal Revenue Code Section 871(k)(1)(c):
| | |
The Tocqueville Fund | | 15.47% |
Small Cap Fund | | 0.00% |
International Value Fund | | 0.62% |
Gold Fund | | 0.00% |
For the fiscal year ended October 31, 2008, the following percentages of its ordinary income distributions paid are designated as short-term capital gain distributions under the Internal Revenue Code Section 871(k)(2)(c):
| | |
The Tocqueville Fund | | 53.76% |
Small Cap Fund | | 9.73% |
International Value Fund | | 0.00% |
Gold Fund | | 29.48% |
5. FOREIGN TAX CREDIT
For the year ended October 31, 2008, the Tocqueville International Value Fund earned foreign source income and paid foreign taxes which they intend to pass through to their shareholders pursuant to Section 853 of the Internal Revenue Code as follows:
| | | | | | |
Country | | Gross Dividend
Per Share | | Taxes Withheld
Per Share |
Belgium | | $ | 0.001003 | | $ | 0.000150 |
Brazil | | | 0.003798 | | | -0.000218 |
Finland | | | 0.023720 | | | 0.003591 |
France | | | 0.090180 | | | 0.015551 |
Germany | | | 0.005835 | | | 0.001281 |
Greece | | | 0.002355 | | | 0.000000 |
Indonesia | | | 0.013802 | | | 0.002083 |
Italy | | | 0.050148 | | | 0.008826 |
Ireland | | | 0.004622 | | | 0.000010 |
Israel | | | 0.006717 | | | 0.001343 |
Japan | | | 0.047755 | | | 0.003484 |
Mexico | | | 0.009852 | | | 0.000000 |
Netherlands | | | 0.014277 | | | 0.001897 |
Singapore | | | 0.018261 | | | 0.000000 |
South Korea | | | 0.009003 | | | 0.001486 |
Spain | | | 0.003116 | | | 0.000561 |
Sweden | | | 0.010534 | | | 0.001580 |
Switzerland | | | 0.007195 | | | 0.001079 |
Taiwan | | | 0.013743 | | | 0.002956 |
Thailand | | | 0.011887 | | | 0.001188 |
United Kingdom | | | 0.014294 | | | 0.000000 |
| | | | | | |
| | $ | 0.362097 | | $ | 0.046848 |
| | | | | | |
Investment Adviser
Tocqueville Asset Management L.P.
40 W. 57th St., 19th Floor
New York, NY 10019
(212) 698-0800
www.tocqueville.com
Distributor
Tocqueville Securities, L.P.
40 W. 57th St., 19th Floor
New York, NY 10019
(212) 698-0800
Shareholders’ Servicing and Transfer Agent
U.S. Bancorp Fund Services, LLC
P.O. Box 701
Milwaukee, WI 53201-0701
(800) 697-3863
Custodian
U.S. Bank, N.A.
Custody Operations
1555 River Center Drive, Suite 302
Milwaukee, WI 53212
Board of Trustees
François D. Sicart—Chairman
Charles W. Caulkins
James W. Gerard
William F. Indoe
Robert W. Kleinschmidt
Guy A. Main
William J. Nolan III

Tocqueville Funds
c/o US Bancorp Fund Services, LLC
P.O. Box 701
Milwaukee, WI 53201-0701
www.tocquevillefunds.com
TQRPSEMI 09
Item 2. Code of Ethics.
Not applicable for semi-annual reports.
Item 3. Audit Committee Financial Expert.
Not applicable for semi-annual reports.
Item 4. Principal Accountant Fees and Services.
Not applicable for semi-annual reports.
Item 5. Audit Committee of Listed Registrants.
Not applicable to registrants who are not listed issuers (as defined in Rule 10A-3 under the Securities Exchange Act of 1934).
Item 6. Schedule of Investments.
Schedule of Investments is included as part of the report to shareholders filed under Item 1 of this Form.
Item 7. Disclosure of Proxy Voting Policies and Procedures for Closed-End Management Investment Companies.
Not applicable to open-end investment companies.
Item 8. Portfolio Managers of Closed-End Management Investment Companies.
Not applicable to open-end investment companies.
Item 9. Purchases of Equity Securities by Closed-End Management Investment Company and Affiliated Purchasers.
Not applicable to open-end investment companies.
Item 10. Submission of Matters to a Vote of Security Holders.
There were no material changes to the procedures by which shareholders may recommend nominees to the registrant’s Board of Trustees that were implemented after the registrant last provided disclosure in response to the requirements of Item 407(c)(2)(iv) of Regulation S-K (as required by Item 22(b)(15) of Schedule 14A), or this Item 10.
Item 11. Controls and Procedures.
| (a) | The registrant’s Principal Executive Officer and Principal Financial Officer have evaluated the design and operation of the registrant’s disclosure controls and procedures within 90 days of the filing and have concluded that the registrant’s disclosure controls and procedures were effective in ensuring that information required to be disclosed by the registrant in this Form N-CSR was recorded, processed, summarized and reported on a timely basis. |
| (b) | There were no changes in the registrant’s internal controls over financial reporting that occurred during the registrant’s second fiscal quarter of the period covered by this report that have materially affected, or are reasonably likely to materially affect, the registrant’s internal control over financial reporting. |
Item 12. Exhibits.
| (a) | (1) Any code of ethics or amendment thereto, that is subject of the disclosure required by Item 2, to the extent that the registrant intends to satisfy Item 2 requirements through filing an exhibit. 1) Not applicable for semi-annual reports. |
| | (2) Certifications pursuant to Section 302 of the Sarbanes-Oxley Act of 2002. Filed herewith. |
| | (3) Not applicable to open-end investment companies. |
| (b) | Certifications of Principal Executive Officer and Principal Financial Officer, under Section 906 of the Sarbanes-Oxley Act of 2002 and 18 U.S.C. § 1350. Filed herewith. |
SIGNATURES
Pursuant to the requirements of the Securities Exchange Act of 1934 and the Investment Company Act of 1940, the registrant has duly caused this report to be signed on its behalf by the undersigned, thereunto duly authorized.
| | |
(Registrant) | | The Tocqueville Trust |
| | |
| |
By (Signature and Title)* | | /s/ Robert W. Kleinschmidt |
| | Robert W. Kleinschmidt, President |
Pursuant to the requirements of the Securities Exchange Act of 1934 and the Investment Company Act of 1940, this report has been signed below by the following persons on behalf of the registrant and in the capacities and on the dates indicated.
| | |
By (Signature and Title)* | | /s/ Robert W. Kleinschmidt |
| | Robert W. Kleinschmidt, President |
| | |
| |
By (Signature and Title)* | | /s/ Steven J. Tyrrell |
| | Steven J. Tyrrell, Treasurer |
| * | Print the name and title of each signing officer under his or her signature. |