UNITED STATES
SECURITIES AND EXCHANGE COMMISSION
Washington, D.C. 20549
FORM N-CSR
CERTIFIED SHAREHOLDER REPORT OF REGISTERED
MANAGEMENT INVESTMENT COMPANIES
Investment Company Act file number 811-4840
The Tocqueville Trust
(Exact name of registrant as specified in charter)
The Tocqueville Trust
40 W. 57th Street, 19th Floor
New York, NY 10019
(Address of principal executive offices) (Zip code)
Robert W. Kleinschmidt, President
The Tocqueville Trust
40 W. 57th Street, 19th Floor
New York, NY 10019
(Name and address of agent for service)
212-698-0800
Registrant’s telephone number, including area code
Date of fiscal year end: October 31
Date of reporting period: April 30, 2011
| Item 1. | Report to Stockholders. |
SEMI-ANNUAL REPORT
April 30, 2011
The Tocqueville Trust
Mutual Funds
The Tocqueville Fund
The Tocqueville Opportunity Fund
The Tocqueville International Value Fund
The Tocqueville Gold Fund
The Delafield Fund
The Tocqueville Select Fund

This report is not authorized for distribution to prospective investors unless preceded or accompanied by a currently effective prospectus of The Tocqueville Trust. Please call 1-800-697-FUND (3863) for a free prospectus. Read it carefully before you invest.
You are invited to visit our website @ www.tocquevillefunds.com
Dear Fellow Shareholder,
By and large, stock markets in recent months have followed the vagaries of popular perceptions about global economic and political affairs.
When public opinion was not worrying about snowballing deflation, it was concerned about signs of rising inflation. When the consensus stopped forecasting the unavoidable decline of the dollar, it began wondering if the European monetary union and its currency, the Euro, were not about to implode. The attention kept shifting between a watch for signs of slowdowns and a search for possible speculative bubbles in the making,
The U.S. economy did seem to confirm its recovery, but concerns remained about stubborn unemployment and inert housing activity. Despite strong profits (partly due to the translation into cheaper dollars of their foreign profits), industrial corporations have been reluctant to invest and hire permanent workers. Banks, also despite strong recovery profits, have been slow to write down their non-performing mortgage loans. This delays the disposal of distressed properties and thus the recovery that would normally ensue in homebuilding.
Practically every country was, at one time or another, the focus of investor worry. In China, for example, worries about inflation are narrowing the government’s margin for action if the economy should continue to (relatively) slow down. In the property sector, particularly, there has been simultaneous concern about a developing speculative bubble and overbuilding in high-priced projects and a shortage of some types of low-to-moderate income housing.
In individual sectors also, there are cross currents that may prove difficult to navigate. In computer hardware, software, networks and communications, for example, the fast emergence of cloud computing is casting doubt on the future of past and current industry leaders. Similarly the emergence of broad new social networks could be (in fact, is) changing the whole nature of marketing, sales, advertising, distribution and retailing, and even product design, as customers are aggregated into self-sustaining and self-promoting affinity groups.
The challenge for serious investors is that, in stock markets that are generally not as cheap as they historically have been just before strong, secular bull markets, it is the shares of reportedly vulnerable former leaders in maturing sectors that are statistically very cheap. Those of potential future leaders are hard to value until they can translate their initial successes into sustained and projectable growth in profits.
The surer way to losses over time in the stock market is to change strategies according to the current investing fashions. Rather, steadfastness and discipline are the key to success. At Tocqueville, we have assembled a group of fund managers whose disciplines differ somewhat depending on their definition of value and how far into the future they feel confident to project their portfolio companies’ recent growth trends. But they have in common that they all follow a discipline for selecting companies based on extensive fundamental research, and that they each follow their discipline strictly.
I have confidence that this approach will allow us to continue to report satisfactory performances over time.
Faithfully yours,

François Sicart
Chairman
The Tocqueville Fund
Dear Fellow Shareholders,
For the six months ended April 30, 2011, the first half of our fiscal year, the Tocqueville Fund generated a 14.72% rate of return. This compares with a 16.36% rate of return for the S&P 500 index, the benchmark against which we are often measured.
The period just ended commenced with an historic reordering of the political structure in the country, a mere two years after an equally historic election. These dramatic swings cannot help but impact policy initiatives as well as markets and equity valuations. Stock market prices commenced a long upswing in the early autumn when the expected election results were discounted, and resumed their climb shortly after the elections when the extent of the power reversal in Congress, the most dramatic change in almost eighty years, became clear. Markets responded not only to the likelihood that further Federal encroachment that had been the hallmark of the previous Congress, would be stymied, but also to the probability that Federal taxes, which had been scheduled to increase very dramatically, would remain unchanged. Even more important, as the period went on, it started to become increasingly evident that a consensus, of sorts, was emerging regarding the need to rein in government spending at all levels. Obviously, much political wrangling lies ahead, but both sides of the aisle seem to have come to grips with the unsustainability of the current fiscal situation, and given the alternatives, this is a hopeful development for the dollar, bond markets and equity valuations.
Given these developments, it is no surprise that markets lifted over this period, but there remain significant concerns. Chief among these are the rise in commodity prices, particularly oil prices, and the rising specter of global inflation, spurred by an unprecedented policy of easy money being pursued by the Federal Reserve for almost the past three years. European debt worries, the Japanese tsunami and nuclear disaster, the depressed housing market which cannot seem to regain its footing, and stubborn unemployment, all are significant impediments to a better near term economic outlook. That being said, corporate earnings have been generally strong, with some significant exceptions, including for some of our portfolio companies, and corporate balance sheets are in splendid condition.
Against this backdrop, the Fund’s results were satisfactory, in our view. General Electric, the largest position in the Fund, was also the name that had the most significant positive impact on Fund returns, followed closely by two commodity related names, Exxon and Cliffs Natural Resources, and by Pfizer, our second largest position. Rounding out the top five contributors to overall returns was Steelcase, a smaller capitalization equity security, which is consistent with our multicap approach. On the negative side of the ledger, only one position, Cisco Systems, registered a meaningful (more than 0.5%) impact on portfolio results. Indeed, as is often the case when returns are healthy, very few names generated any negative influence at all on the portfolio. Still, large capitalization technology names were weak contributors to results in the period. We remain attracted to the valuation parameters of many of these companies and are more likely to add to our positions than to give up on them. Trading activity during the period was relatively light, as usual, but we did institute a number of new positions, including Alkermes, a smaller capitalization pharmaceutical company with an attractive valuation and a promising drug pipeline, Briggs and Stratton, a small engine maker that dominates many of the markets it serves, and Plexus, a mid-cap electronic manufacturer with attractive financials and a significant upside potential. We also added to positions of larger names where we have been longtime holders, such as Microsoft, Johnson and Johnson, and Weyerhauser on an opportunistic basis. On the sell side, we liquidated positions in W.R. Grace, a chemical manufacturer, in 3M, American Express, and UPS and in Genzyme, the biotech giant, where prices met our objectives. Finally, we unloaded some disappointing performers like Nokia, Isis Pharmaceuticals, Wilmington Trust and The Washington Post, when we became disillusioned with the investment case we had constructed in purchasing these issues.
Going forward, we will continue to monitor the macro developments which exert such a large influence on investor behavior and stock prices, but we will focus the vast bulk of our efforts on individual companies where our fundamental analysis and unique contrarian point of view can add value.
Finally, as a substantial shareholder in your Fund myself, as well as being its portfolio manager, let me take this opportunity to express my gratitude for your loyalty to and support of the Tocqueville Fund.
Sincerely,

Robert W. Kleinschmidt
Portfolio Manager
The Tocqueville Fund
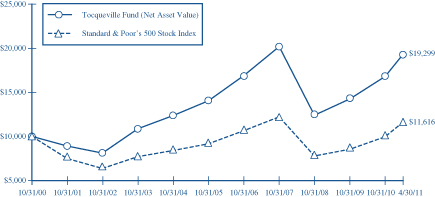
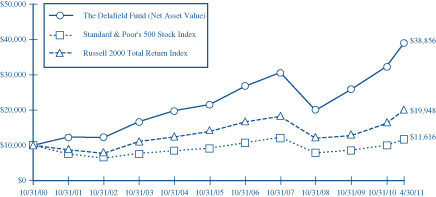
This chart assumes an initial gross investment of $10,000 made on 10/31/00. Returns shown do not reflect the deduction of taxes that a shareholder would pay on fund distributions or the redemption of fund shares. Performance reflects fee waivers in effect. In the absence of fee waivers, total return would be reduced. Returns shown include the reinvestment of all dividends and other distributions. Past performance is not predictive of future performance. Investment return and principal value will fluctuate so that your shares, when redeemed, may be worth more or less than their original cost. The Fund imposes a 2% redemption fee on shares held for 90 days or less.
The Standard & Poor’s 500 Stock Index (S&P 500) is a capital-weighted index, representing the aggregate market value of the common equity of 500 stocks primarily traded on the New York Stock Exchange. Returns assume the reinvestment of all dividends.
AVERAGE ANNUAL RATE OF RETURN (%)
FOR PERIODS ENDED APRIL 30, 2011
| | | | | | | | | | | | | | | | |
| | | 1 Year | | | 3 Year | | | 5 Year | | | 10 Year | |
Tocqueville Fund | | | 14.50% | | | | 1.61% | | | | 3.00% | | | | 6.36% | |
Standard & Poor’s 500 Stock Index | | | 17.22% | | | | 1.73% | | | | 2.95% | | | | 2.82% | |
The Tocqueville Opportunity Fund
Dear Fellow Shareholder,
U.S. equity markets advanced strongly during the six month period ended April 30, 2011, and performance was led by small and SMID (small and mid) capitalization issues. The larger capitalization Standard and Poor’s 500 Index rose 16.36% while the Russell 2000 and the SMID cap Russell 2500 indices rose 23.73% and 23.71% respectively. The Opportunity Fund increased 25.00% during the period. SMID growth oriented issues outperformed value biased issues and the Russell 2500 Growth Index increased 27.08% versus the Russell 2500 Value Index which rose 20.73%.
Over the past six months, we have continued to shift both sector and issue weightings to reflect a broadened investment strategy. From a sector perspective, we have increased commitments to more cyclically exposed issues with additions to the Consumer Discretionary, Technology, and Producer Durable sectors. At the beginning of the period, the Healthcare sector was the largest in the Fund, but we have significantly reduced its position to fourth in the Fund by cutting exposure from 19.5% to 11.6%. The Technology and Consumer Discretionary sectors are now the dominant investments at 22% and 19% respectively. Nearly half of the Fund’s strong performance was led by investment contributions from Technology and Consumer Discretionary issues since the beginning of the fiscal period. While all sectors provided positive performance during the period, the best absolute performance was achieved, surprisingly, from the Consumer Staples sector due to large underlying price increases in several issues: Green Mountain Coffee Roasters, Herbalife, Hain Celestial, and Boston Beer. While we have shifted the composition of the top three sectors, the overall investment commitment to the top three was relatively unchanged at 54%-55% of the Fund.
We have proceeded to diversify the Fund by reducing individual overweighted investments and by adding new investments. The top ten security positions (excluding index ETF’s) were 15.6% of the Fund at the end of the period versus 21.7% six months ago. Only one issue, TIBCO Software, exceeded a 2% weighting in the Fund versus six investments greater than 2% at the beginning of the period. The significant increase in diversification and reduction in commitments to overweighted investments has been implemented in order to reduce risk exposure to any single name or issue. Although this diversification strategy will reduce the “homerun” potential of any successful, large investment, it should mitigate the “strike out” impact of an unexpected, ugly surprise. We have revised the “top ten” holdings to include six new names as well: Baidu, Brigham Exploration, lululemon athletica, Herbalife, Chipotle Mexican Grill, and Apple. We invested in Apple recently when news broke that its Chairman would take a second leave of absence from daily management for health purposes. We believe that Apple’s leading position in the current evolution of mobile and tablet computing was undervalued and represented a unique investment opportunity.
As experienced investors have learned, a critical tenet of successful investing is having the good fortune of being overweighted in issues that rise and being underweighted or not invested in issues that decline. The past six months have provided plenty of excitement, and the Fund had a number of investment standouts: lululelemon (+125.7%), Acme Packet (+108.9%), Ceradyne (+96.6%), Carbo Ceramics (+92.7%), and Tempur Pedic (+82%). Several of these names not only appreciated impressively, but also were among the top ten in overall contribution to the Fund’s performance. We were pleased that a number of the Fund’s investments were boosted by unexpected takeover bids: Fronteer Gold, Graham Packaging, King Pharmaceutical, Pride International, and Sonic Solutions. While we managed to hold most drawdowns to less than a third of a percentage point, the Fund gave up nearly one percent on its investment in Inspire Pharmaceutical; the company made a disappointing announcement on its developmental drug for cystic fibrosis on the first business day of the new year.
While U.S. markets have performed well since their pre-election lift early this past fall, news flow has continued to weigh on sentiment and valuation. A year has gone by since the first demonstrations against austerity measures in Athens previewed the still unresolved issues challenging the European fiscal, monetary and currency systems. Investors continue to be mesmerized by the litany of issues which threaten the rate and sustainability of economic expansion: the Japanese tsunami, the Mid East revolts, the monetary tightenings in China and other emerging market nations, the rise of commodity prices, the moribund real estate market, and the expanding fiscal deficit. Against these headwinds, corporate earnings have exceeded expectations across many sectors of the market. We find reasons to be optimistic that valuations will continue to be supported despite intermittent periods of heightened volatility. We believe smaller capitalization issues should benefit from any increased allocation to U.S. equity from cash and fixed income allocations. While some investors believe they have already missed the best price gains, most significant price moves have been justified by large, positive earnings surprises – and we continue to believe that valuations are attractive and reasonable. Moreover, we expect that those companies which are able to exhibit increased capital returns, market shares, and growth will garner the greatest interest of investors seeking to find investments in companies capable of increasing and sustaining shareholder returns. While investors seek to “go global” in search of growth to diversify away from the “mature” U.S. economy, there are plenty of excellent opportunities to invest for growth in technology, healthcare, energy, and new consumer oriented companies domestically. We look forward to continuing our search for companies which are truly differentiated in their competitive advantage, executive management and vision. We are optimistic that this search and a disciplined approach to risk management will contribute to the success of the shareholders of the Opportunity Fund, and we appreciate your ongoing confidence in our efforts.
Sincerely,

Thomas R. Vandeventer
Portfolio Manager
The Tocqueville Opportunity Fund
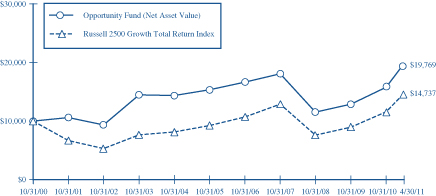
This chart assumes an initial gross investment of $10,000 made on 10/31/00. On July 1, 2010, a new portfolio management team assumed management of The Tocqueville Small Cap Fund and the Fund’s name and investment strategy changed as of October 12, 2010 (See Footnote 1 to the Financial Statements). Returns shown do not reflect the deduction of taxes that a shareholder would pay on fund distributions or the redemption of fund shares. Performance reflects fee waivers in effect. In the absence of fee waivers, total return would be reduced. Returns shown include the reinvestment of all dividends and other distributions. Past performance is not predictive of future performance. Investment return and principal value will fluctuate so that your shares, when redeemed, may be worth more or less than their original cost. The Fund imposes a 2% redemption fee on shares held for 90 days or less.
The Russell 2500 Growth Total Return Index is an unmanaged index that measures the performance of the small to mid-cap growth segment of the U.S. equity universe. It includes those Russell 2500 companies with higher price-to-book ratios and higher forcasted growth values. Returns assume the reinvestment of all dividends.
AVERAGE ANNUAL RATE OF RETURN (%)
FOR PERIODS ENDED APRIL 30, 2011
| | | | | | | | | | | | | | | | |
| | | 1 Year | | | 3 Year | | | 5 Year | | | 10 Year | |
Tocqueville Opportunity Fund | | | 28.30% | | | | 9.71% | | | | 2.78% | | | | 6.00% | |
Russell 2500 Growth Total Return Index | | | 30.07% | | | | 8.79% | | | | 5.91% | | | | 6.39% | |
The Tocqueville International Value Fund
Dear Fellow Shareholder,
For the six months ended April 30, 2011, global equity markets generally advanced in spite of geopolitical turmoil in the Middle East, fiscal problems in southern Europe and natural disaster in Japan. Developed markets in the U.S., Europe and Japan rose as corporate earnings continued to improve, interest rates remained low and liquidity abundant. Markets experienced a brief setback in March following the tsunami and nuclear accident in Japan, and then recovered much or all of what they had lost. The Tocqueville International Value Fund’s total U.S. dollar return for the period was a gain of 16.45%. In the same period, the Morgan Stanley EAFE Index, the benchmark against which we are most often compared, had a total U.S. dollar return of 12.95%.
During the six months, the European BE 500 Index increased by 7.87% in local currency terms, the Japanese Nikkei 225 increased by 8.12% in local currency terms, and the MSCI Asia Pacific ex-Japan Index increased by 5.00% in U.S. dollar currency terms. The CRB Index of commodity prices increased by 23%, with WTI (West Texas Intermediate) crude rising by 35% on the back of improving economic data and turmoil in the Middle East, gold increasing 13% as most central banks persisted with lax monetary policy, industrial metals rising and agricultural commodities mixed. Most developed economy equity markets increased in local currency terms and developed markets generally outperformed emerging markets. While Eastern European markets reversed previous years’ losses, emerging markets in the Middle East declined in reaction to the uncertainty engendered by the so called “Arab Spring”, and markets in Brazil, India and China all declined as their respective Central Banks raised interest rates to prevent economic overheating and combat inflation. In terms of sectors, building materials, machinery, chemicals and energy led advances, while transport and travel and leisure performed less well, in part responding to higher oil prices. The U.S. dollar declined in value against the Euro, Yen and most other currencies and the Federal Reserve continued its quantitative easing to help the economy.
Most of our positions produced positive returns, and we managed to avoid any meaningful losses. Our best results came from our European construction materials and machinery shares. Standout contributors included French aerial platform maker Haulotte Group, Italian hydraulic equipment producer Interpump, German steel distributor Kloeckner, French building products concern Saint Gobain and Belgian chemical producer Solvay. We had meaningful contributions from Japanese pneumatic equipment maker SMC, power tool producer Makita, and conglomerate Hitachi, as well as UK managed services concern Interserve, Spain based hotel concern Sol Melia, and energy related shares Total and Schlumberger. During the period, we had small losses in gold producer Newmont Mining, Italian conglomerate CIR and Telekom Indonesia.
We eliminated our positions in Dutch animal feed concern Nutreco, French water utility Veolia Environnement and Brazilian iron ore producer Vale as they arrived at our valuation objectives, and in Telekom Indonesia, where our investment thesis was undercut by a change in competitive conditions that produced pricing and margins pressures. We took new positions in Spanish information technology concern Indra Systems, which is depressed due to concerns about its government contracts, has a high free cash flow yield and growth opportunities in Latin America; in French pharma concern Ipsen, which trades at a discount to the net present value of cash flows from its existing portfolio of drugs and gives no value to the pipeline of new products; in Australian facilities management and food services concern Spotless Group, which has a strong market position and attractive cash flow characteristics, and is restructuring certain underperforming assets to improve financial performance; in Belgian telecom services provider Mobistar, which has a double digit free cash flow yield and would represent an accretive acquisition for controlling shareholder France Telecom; in French wire and cable producer Nexans, which is implementing a meaningful cost reduction program to enhance margins; and in Greek building materials producer Titan Cement, which serves growing markets in Egypt and the Balkans and continues to produce meaningful free cash flow despite weak conditions in its Greek and U.S. markets, which we expect will improve with time.
As we look forward, we are focused on a number of potential risks, including instability in the Middle East, fallout from U.S. fiscal profligacy, the impact on global growth of tightening credit conditions in BRIC countries, and the potentially destabilizing force of weak sovereign credits in southern Europe and elsewhere. More concretely, the cocktail of economic growth, productivity improvements and low interest rates we have enjoyed in developed economies since mid-2009 is unlikely to last. Growth will likely continue, and perhaps exceed expectations. However, with employment beginning to recover, commodity prices high, and financing costs likely to increase as monetary stimulus abates; we believe productivity and corporate profit margins will face headwinds. As a result, we remain vigilant with respect to the valuations and operating performance of our existing portfolio holdings, and demanding with respect to new ideas. Nonetheless, we are finding numerous attractive opportunities.
We continue to employ our investment discipline, seeking to discover fundamentally attractive companies that are out of favor and undervalued, and to provide our shareholders with above average returns with below average risk over the course of an economic cycle.
Respectfully,
|
|
 |
|
| James Hunt |
| Portfolio Manager |
The Tocqueville International Value Fund
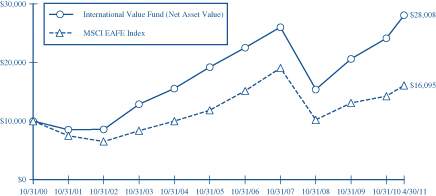
This chart assumes an initial gross investment of $10,000 made on 10/31/00. Returns shown do not reflect the deduction of taxes that a shareholder would pay on fund distributions or the redemption of fund shares. Performance reflects fee waivers in effect. In the absence of fee waivers, total return would be reduced. Returns shown include the reinvestment of all dividends and other distributions. Past performance is not predictive of future performance. Investment return and principal value will fluctuate so that your shares, when redeemed, may be worth more or less than their original cost. The Fund imposes a 2% redemption fee on shares held 90 days or less.
The MSCI EAFE Index is an unmanaged market-capitalization-weighted index composed of companies representative of the market structure of 20 Developed Market Countries in Europe, Australia, Asia and the Far East.
AVERAGE ANNUAL RATE OF RETURN (%)
FOR PERIODS ENDED APRIL 30, 2011
| | | | | | | | | | | | | | | | |
| | | 1 Year | | | 3 Year | | | 5 Year | | | 10 Year | |
Tocqueville International Value Fund | | | 26.69% | | | | 5.82% | | | | 3.85% | | | | 11.09% | |
MSCI EAFE Index | | | 19.70% | | | | -2.37% | | | | 2.02% | | | | 5.74% | |
The Tocqueville Gold Fund
Dear Fellow Shareholder,
During the first six months of the 2011 fiscal year, the Tocqueville Gold Fund appreciated 12.52% vs. 9.51% for the XAU (Philadelphia Stock Exchange Gold/Silver Index) and 16.36% for the S&P 500. The price of gold rose 15.03% during the period and this provided a strong underpinning for gold shares. The Fund’s position in physical gold is 5.4% of its net assets and the balance is in shares of mining or processing companies whose principal business is the production of gold and other precious metals and cash equivalents.
The last six months have been eventful for gold as it marched to new highs of $1500 per ounce. Headlines for much of the start of the year were captivated by the unrest and social upheaval in Northern Africa, and later by the tragic, natural disaster in Japan. Such headlines highlighted the safe haven nature of gold. However, in our opinion, in the context of the investment case for gold, such headlines act as noise to the fundamental rationale for investment, which rests primarily upon monetary debasement. As gathering inflationary forces mount, it will be increasingly difficult to explain it away as short term, and the theoretically unsustainable result of volatility in food and energy. Meanwhile, in Washington, the Federal Reserve maintains that it will ease the markets out of QE2 on June 30th and partisan politics have forestalled efforts at a credible fiscal plan.
Against this backdrop, the Fund performed well during this period. The top contributors over this period included Gold Resources, Silver Wheaton, and Richfield Ventures which appreciated 43.9%, 41.4%, and 276.7% respectively. Notable among these was the performance by Richfield, which was the subject of an acquisition offer. This is another example of our strategy of investing in earlier stage companies that create value through exploration and development, and may eventually be acquired by a producing company. In contrast, our portfolio also had its share of disappointments during the period. The most notable were Semafo, Romarco, and Buenaventura, which declined 28.9%, 29.0%, and 20.3% respectively. Despite the lackluster performance, we continue to believe that these companies will be able to deliver shareholder value over time.
For all the excitement thus far this year, the next two months seem to have the market waiting with bated breath as to ongoing developments on the macroeconomic front. We have our own opinions as to the potential outcomes of these series of events but will also watch with anticipation as they unfold. In the interim, we continue to remain vigilant for investment opportunities in gold mining shares.
Sincerely,

John C. Hathaway
Portfolio Manager
The Tocqueville Gold Fund
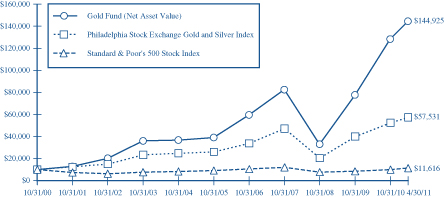
This chart assumes an initial gross investment of $10,000 made on 10/31/00. Returns shown do not reflect the deduction of taxes that a shareholder would pay on fund distributions or the redemption of fund shares. Performance reflects fee waivers in effect. In the absence of fee waivers, total return would be reduced. Returns shown include the reinvestment of all dividends and other distributions. Past performance is not predictive of future performance. Investment return and principal value will fluctuate so that your shares, when redeemed, may be worth more or less than their original cost. The Fund imposes a 2% redemption fee on shares held 90 days or less.
In 2003, 2006, 2009, and 2010 the performance of The Tocqueville Gold Fund was achieved during a period of unusually favorable market conditions. Such performance may not be sustainable.
The Philadelphia Stock Exchange Gold and Silver Index is an unmanaged capitalization-weighted index which includes the leading companies involved in the mining of gold and silver. Returns include the reinvestment of all dividends.
The Standard & Poor’s 500 Stock Index (S&P 500) is a capital-weighted index, representing the aggregate market value of the common equity of 500 stocks primarily traded on the New York Stock Exchange. Returns include the reinvestment of all dividends.
AVERAGE ANNUAL RATE OF RETURN (%)
FOR PERIODS ENDED APRIL 30, 2011
| | | | | | | | | | | | | | | | |
| | | 1 Year | | | 3 Year | | | 5 Year | | | 10 Year | |
Tocqueville Gold Fund | | | 40.22% | | | | 26.59% | | | | 17.22% | | | | 28.35% | |
Philadelphia Stock Exchange Gold and Silver Index | | | 25.50% | | | | 10.10% | | | | 8.09% | | | | 16.30% | |
Standard & Poor’s 500 Stock Index | | | 17.22% | | | | 1.73% | | | | 2.95% | | | | 2.82% | |
The Delafield Fund
Dear Fellow Shareholder,
For the six months ended April 30, 2011, the Fund’s net asset value increased 20.49% versus an increase of 23.73% for the Russell 2000 Index (“Russell 2000”) and 16.36% for the Standard & Poor’s 500 Index (“S&P 500”), each on a total return basis. The Fund’s net asset value as of April 30, 2011 was $32.11 per share. The net asset value amounted to $1,442,420,909 of which 79.6% was invested in equities, 1.6% in fixed income, and the balance held in cash reserves.
The broad market recovery that began two years ago continued during the first half of our fiscal year. The strength was driven by the market’s belief in a sustainable recovery in the global financial system and in worldwide governments’ efforts to stimulate their economies. Additionally, strong corporate earnings reports during the six month period drove stock gains. While we recognize the fundamental improvements that have driven this remarkable comeback, we do worry that investors are not fully discounting some of the underlying global political and economic uncertainties that remain. These include continued weakness in domestic housing values and unemployment rates, the viability of some European banks, soaring energy prices and supply bumps following the Japanese disaster.
By most industry standards we are underinvested, but that does not concern us. In the volatile markets which have developed over the last 15 to 20 years, we have come to believe that the long-term investor’s best hedge against volatility is to have cash with which to invest in equities when prices seem unduly depressed. Thus, we will increase our equity exposure when we believe we have uncovered attractive opportunities.
The Fund portfolio is built using a bottom-up approach. We remain focused on identifying companies where our analytical insight suggests a largely unanticipated improvement in operations. We focus intently on valuation and analyze cash flows and attempt to invest at prices that we believe undervalue the underlying franchise. This is the strategy we consistently employ, that we believe is the best way to increase wealth over time and which drives the performance of the Fund.
The Fund’s portfolio is not constructed with industry allocation targets. However, we were overweight in the industrials sector as a result of investment opportunities that we uncovered in that area, which benefited performance. Our underweight position in financials detracted from performance. Virtually all of our holdings experienced positive returns during the six month period. The largest contributors to our six month performance were Fairchild Semiconductor International Inc, Eastman Chemical Company and Collective Brands, Inc. In contrast, Flextronics International Ltd. was the largest detractor.
Sincerely,
| | |
 | |  |
| |
| J. Dennis Delafield | | Vincent Sellecchia |
| Portfolio Manager | | Portfolio Manager |
The Delafield Fund
This chart assumes an initial gross investment of $10,000 made on 10/31/00. Since the Delafield Fund did not commence operations until 9/28/09, returns prior to that date are those of the Predecessor Fund. The Delafield Fund assumed the net asset value and performance history of the Predecessor Fund (See Footnote 1 to the Financial Statements). Returns shown does not reflect the deduction of taxes that a shareholder would pay on fund distributions or the redemption of fund shares. Performance reflects fee wiaviers in effect. In the absence of fee waivers, total return would be reduced. Returns shown include the reinvestment of all dividends and other distributions. Past performance is not predictive of future performance. Investment return and principal value will fluctuate so that your shares, when redeemed, may be worth more or less than their original cost. The Fund imposes a 2% redemption fee on shares held 90 days or less.
The Standard & Poor’s 500 Stock Index (S&P 500) is a capital-weighted index, representing the aggregate market value of the common equity of 500 stocks primarily traded on the New York Stock Exchange. Returns include the reinvestment of all dividends.
The Russell 2000 Total Return Index is an unmanaged index that measures the performance of the 2,000 smallest companies in the Russell 3000 Index, which represent approximately 8% of the total market capitalization of the Russell 3000 Index. Returns include the reinvestment of all dividends.
AVERAGE ANNUAL RATE OF RETURN (%)
FOR PERIODS ENDED APRIL 30, 2011
| | | | | | | | | | | | | | | | |
| | | 1 Year | | | 3 Year | | | 5 Year | | | 10 Year | |
The Delafield Fund | | | 19.55% | | | | 10.92% | | | | 8.78% | | | | 12.51% | |
Standard & Poor’s 500 Stock Index | | | 17.22% | | | | 1.73% | | | | 2.95% | | | | 2.82% | |
Russell 2000 Total Return Index | | | 22.20% | | | | 8.03% | | | | 3.89% | | | | 7.34% | |
The Tocqueville Select Fund
Dear Fellow Shareholder,
For the six months ended April 30, 2011, the Fund’s net asset value increased 19.69% versus an increase of 23.71% for the Russell 2500 Index (“Russell 2500”) and 23.73% for the Russell 2000 Index (“Russell 2000”), each on a total return basis. The Fund’s net asset value as of April 30, 2011 was $13.25 per share. The net asset value amounted to $86,794,054 of which 81.1% was invested in equities with the balance held in cash reserves.
The broad market recovery that began two years ago continued during the first half of our fiscal year. The strength was driven by the market’s belief in a sustainable recovery in the global financial system and in worldwide governments’ efforts to stimulate their economies. Additionally, strong corporate earnings reports during the six month period drove stock gains. While we recognize the fundamental improvements that have driven this remarkable comeback, we do worry that investors are not fully discounting some of the underlying global political and economic uncertainties that remain. These include continued weakness in domestic housing values and unemployment rates, the viability of some European banks, soaring energy prices and supply bumps following the Japanese disaster.
The Fund portfolio is built using a bottom-up approach. We remain focused on identifying companies where our analytical insight suggests a largely unanticipated improvement in operations. We focus intently on valuation and analyze cash flows and attempt to invest at prices that we believe undervalue the underlying franchise. This is the strategy we consistently employ, that we believe is the best way to increase wealth over time and which drives the performance of the Fund.
The Fund’s portfolio is not constructed with industry allocation targets. However, we were overweight in the industrials sector as a result of investment opportunities that we uncovered in that area, which benefited performance. Our underweight position in energy detracted from performance. Virtually all of our holdings experienced positive returns during the six month period. The largest contributors to our six month performance were TriMas Corporation and Ethan Allen Interiors Inc., while Ruby Tuesday, Inc. and Flextronics International Ltd. were the primary detractors.
| | | | |
| Sincerely, | | | | |
| | |
| | | |  |
| | |
| J. Dennis Delafield | | Vincent Sellecchia | | Donald Wang |
| Portfolio Manager | | Portfolio Manager | | Portfolio Manager |
The Tocqueville Select Fund
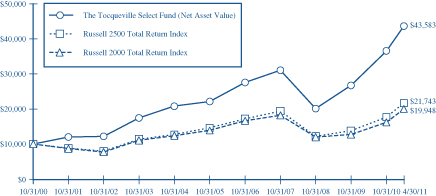
This chart assumes an initial gross investment of $10,000 made on 10/31/00. Since The Tocqueville Select Fund did not commence operations until 9/28/09, returns from the period from September 29, 2008 to September 27, 2009 are those of the Class Y Shares of the Predecessor Fund (See Footnote 1 to the Financial Statements). Prior to that period, returns shown are those of a limited partnership managed by the adviser. Returns shown do not reflect the deduction of taxes that a shareholder would pay on fund distributions or the redemption of fund shares. Performance reflects fee waivers in effect. In the absence of fee waivers, total return would be reduced. Returns shown include the reinvestment of all dividends and other distributions. Past performance is not predictive of future performance. Investment return and principal value will fluctuate so that your shares, when redeemed, may be worth more or less than their original cost. The Fund imposes a 2% redemption fee on shares held 90 days or less.
The Russel 2500 Total Return Index is an unmanaged index that measures the performance of the 2,500 smallest companies in the Russell 3000 Index. Returns include the reinvestment of all dividends.
The Russell 2000 Total Return Index is an unmanaged index that measures the performance of the 2,000 smallest companies in the Russell 3000 Index, which represents approximately 8% of the total market capitalization of the Russell 3000 Index. Returns include the reinvestment of all dividends.
AVERAGE ANNUAL RATE OF RETURN (%)
FOR PERIODS ENDED APRIL 30, 2011
| | | | | | | | | | | | | | | | |
| | | 1 Year | | | 3 Year | | | 5 Year | | | 10 Year | |
The Tocqueville Select Fund | | | 21.58% | | | | 14.97% | | | | 11.90% | | | | 13.93% | |
Russell 2500 Total Return Index | | | 23.89% | | | | 8.02% | | | | 4.91% | | | | 8.24% | |
Russell 2000 Total Return Index | | | 22.20% | | | | 8.03% | | | | 3.89% | | | | 7.34% | |
Expense Example—April 30, 2011 (Unaudited)
As a shareholder of The Tocqueville Trust (the “Funds”), you incur ongoing costs, including management fees; distribution fees; and other Fund expenses. This example is intended to help you understand your ongoing costs (in dollars) of investing in the Funds and to compare costs with the ongoing costs of investing in other mutual funds.
The Example is based on an investment of $1,000 invested at the beginning of the period and held the entire period (November 1, 2010-April 30, 2011).
Actual Expenses
The first line of the table below provides information about actual account values and actual expenses. You may use the information in this line, together with the amount you invested, to estimate the expenses that you paid over the period. Simply divide your account value by $1,000 (for example, an $8,600 account value divided by $1,000 = 8.6), then multiply the result by the number in the first line under the heading entitled “Expenses Paid During Period” to estimate the expenses you paid on your account during this period.
Hypothetical Example for Comparison Purposes
The second line of the table below provides information about hypothetical account values and hypothetical expenses based on the Funds’ actual expense ratios and an assumed rate of return of 5% per year before expenses, which is not the Funds’ actual return. The hypothetical account values and expenses may not be used to estimate the actual ending account balance or expenses you paid for the period. You may use this information to compare the ongoing costs of investing in the Funds and other funds. To do so, compare this 5% hypothetical example with the 5% hypothetical examples that appear in the shareholder reports of the other funds.
Please note that the expenses shown in the table are meant to highlight your ongoing costs only and do not reflect any transactional costs, such as sales charges (loads), redemption fees, or exchange fees. Therefore, the second line of the table is useful in comparing ongoing costs only, and will not help you determine the relative costs of owning different funds. In addition, if these transactional costs were included, your costs would have been higher.
Expense Example Tables (Unaudited)
| | | | | | | | | | | | |
The Tocqueville Fund | | Beginning
Account Value
November 1, 2010 | | | Ending
Account Value
April 30, 2011 | | | Expenses Paid
During Period*
November 1, 2010 -
April 30, 2011 | |
Actual | | $ | 1,000.00 | | | $ | 1,147.20 | | | $ | 6.65 | |
Hypothetical (5% return before expenses) | | | 1,000.00 | | | | 1,018.60 | | | | 6.26 | |
| | | |
| The Tocqueville Opportunity Fund | | | | | | | | | | | | |
Actual | | $ | 1,000.00 | | | $ | 1,250.00 | | | $ | 7.42 | |
Hypothetical (5% return before expenses) | | | 1,000.00 | | | | 1,018.20 | | | | 6.66 | |
| | | |
| The Tocqueville International Value Fund | | | | | | | | | | | | |
Actual | | $ | 1,000.00 | | | $ | 1,164.50 | | | $ | 8.26 | |
Hypothetical (5% return before expenses) | | | 1,000.00 | | | | 1,017.16 | | | | 7.70 | |
| | | |
| The Tocqueville Gold Fund | | | | | | | | | | | | |
Actual | | $ | 1,000.00 | | | $ | 1,125.20 | | | $ | 6.48 | |
Hypothetical (5% return before expenses) | | | 1,000.00 | | | | 1,018.70 | | | | 6.16 | |
| | | |
| The Delafield Fund | | | | | | | | | | | | |
Actual | | $ | 1,000.00 | | | $ | 1,204.90 | | | $ | 6.62 | |
Hypothetical (5% return before expenses) | | | 1,000.00 | | | | 1,018.79 | | | | 6.06 | |
| | | |
| The Tocqueville Select Fund | | | | | | | | | | | | |
Actual | | $ | 1,000.00 | | | $ | 1,196.90 | | | $ | 7.19 | |
Hypothetical (5% return before expenses) | | | 1,000.00 | | | | 1,018.25 | | | | 6.61 | |
| * | Expenses are equal to the Fund’s annualized expense ratio of 1.25%, 1.33%, 1.54%, 1.23%, 1.21% and 1.32% for The Tocqueville Fund, Opportunity Fund, International Value Fund, Gold Fund, Delafield Fund, and Select Fund, respectively, multiplied by the average account value over the period, multiplied by 181/365 to reflect the one-half year period. |
The Tocqueville Fund
Financial Highlights
| | | | | | | | | | | | | | | | | | | | | | | | |
Per share operating performance
(For a share outstanding throughout
the period) | | Six Months
Ended
April 30,
2011 | | | Years Ended October 31, | |
| | | 2010 | | | 2009 | | | 2008 | | | 2007 | | | 2006 | |
| | | (Unaudited) | | | | | | | | | | | | | | | | |
Net asset value, beginning of period | | $ | 21.53 | | | $ | 18.47 | | | $ | 16.39 | | | $ | 28.93 | | | $ | 24.25 | | | $ | 22.17 | |
| | | | | | | | | | | | | | | | | | | | | | | | |
Operations: | | | | | | | | | | | | | | | | | | | | | | | | |
Net investment income | | | 0.11 | | | | 0.32 | | | | 0.28 | | | | 0.24 | | | | 0.18 | | | | 0.14 | |
Net realized and unrealized gain (loss) | | | 3.03 | | | | 2.97 | | | | 2.09 | | | | (10.56 | ) | | | 4.53 | | | | 4.33 | |
| | | | | | | | | | | | | | | | | | | | | | | | |
Total from investment operations (1) | | | 3.14 | | | | 3.29 | | | | 2.37 | | | | (10.32 | ) | | | 4.71 | | | | 4.47 | |
| | | | | | | | | | | | | | | | | | | | | | | | |
Dividends and distributions to shareholders: | | | | | | | | | | | | | | | | | | | | | | | | |
Dividends from net investment income | | | (0.33 | ) | | | (0.23 | ) | | | (0.29 | ) | | | (0.19 | ) | | | (0.03 | ) | | | (0.22 | ) |
Distributions from net realized gains | | | — | | | | — | | | | — | | | | (2.03 | ) | | | — | | | | (2.17 | ) |
| | | | | | | | | | | | | | | | | | | | | | | | |
Total dividends and distributions | | | (0.33 | ) | | | (0.23 | ) | | | (0.29 | ) | | | (2.22 | ) | | | (0.03 | ) | | | (2.39 | ) |
| | | | | | | | | | | | | | | | | | | | | | | | |
Change in net asset value for the period | | | 2.81 | | | | 3.06 | | | | 2.08 | | | | (12.54 | ) | | | 4.68 | | | | 2.08 | |
| | | | | | | | | | | | | | | | | | | | | | | | |
Net asset value, end of period | | $ | 24.34 | | | $ | 21.53 | | | $ | 18.47 | | | $ | 16.39 | | | $ | 28.93 | | | $ | 24.25 | |
| | | | | | | | | | | | | | | | | | | | | | | | |
Total return | | | 14.7 | %(3) | | | 18.0 | % | | | 14.8 | % | | | (38.5 | )% | | | 19.4 | % | | | 20.5 | % |
Ratios/supplemental data | | | | | | | | | | | | | | | | | | | | | | | | |
Net assets, end of period (000) | | $ | 566,163 | | | $ | 489,670 | | | $ | 383,470 | | | $ | 328,609 | | | $ | 523,878 | | | $ | 392,495 | |
Ratio to average net assets: | | | | | | | | | | | | | | | | | | | | | | | | |
Expenses | | | 1.25 | %(4)(2) | | | 1.25 | %(2) | | | 1.25 | %(2) | | | 1.25 | %(2) | | | 1.25 | %(2) | | | 1.30 | % |
Net investment income | | | 0.94 | %(4)(2) | | | 1.66 | %(2) | | | 1.68 | %(2) | | | 0.94 | %(2) | | | 0.69 | %(2) | | | 0.68 | % |
Portfolio turnover rate | | | 12 | %(3) | | | 23 | % | | | 32 | % | | | 51 | % | | | 39 | % | | | 32 | % |
| (1) | Total from investment operations per share includes redemption fees of $0.001 for the six months ended April 30, 2011 and $0.002, $0.004, $0.009, $ 0.002 and $0.002 per share for the five years ended October 31, 2010, 2009, 2008, 2007 and 2006, respectively. |
| (2) | Net of fees waived amounting to 0.01%, 0.08%, 0.04%, and 0.01% of average net assets for the four years ended October 31, 2010, 2009, 2008 and 2007, respectively. The amount of fees waived for the six months ended April 30, 2011 was less than 0.01%. |
The Accompanying Notes are an Integral Part of these Financial Statements.
The Tocqueville Opportunity Fund
Financial Highlights
| | | | | | | | | | | | | | | | | | | | | | | | |
Per share operating performance
(For a share outstanding throughout the
period) | | Six Months
Ended
April 30,
2011 | | | Years Ended October 31, | |
| | | 2010 | | | 2009 | | | 2008 | | | 2007 | | | 2006 | |
| | | (Unaudited) | | | | | | | | | | | | | | | | |
Net asset value, beginning of period | | $ | 13.20 | | | $ | 10.78 | | | $ | 9.77 | | | $ | 17.24 | | | $ | 18.04 | | | $ | 16.58 | |
| | | | | | | | | | | | | | | | | | | | | | | | |
Operations: | | | | | | | | | | | | | | | | | | | | | | | | |
Net investment income (loss) | | | (0.07 | ) | | | (0.12 | ) | | | (0.11 | ) | | | 0.02 | | | | 0.11 | | | | (0.07 | ) |
Net realized and unrealized gain (loss) | | | 3.37 | | | | 2.54 | | | | 1.23 | | | | (5.67 | ) | | | 1.26 | | | | 1.53 | |
| | | | | | | | | | | | | | | | | | | | | | | | |
Total from investment operations (1) | | | 3.30 | | | | 2.42 | | | | 1.12 | | | | (5.65 | ) | | | 1.37 | | | | 1.46 | |
| | | | | | | | | | | | | | | | | | | | | | | | |
Distributions to shareholders: | | | | | | | | | | | | | | | | | | | | | | | | |
Dividends from net investment income | | | — | | | | — | | | | (0.01 | ) | | | (0.12 | ) | | | — | | | | — | |
Distributions from net realized gains | | | — | | | | — | | | | (0.10 | ) | | | (1.70 | ) | | | (2.17 | ) | | | — | |
| | | | | | | | | | | | | | | | | | | | | | | | |
Total distributions | | | — | | | | — | | | | (0.11 | ) | | | (1.82 | ) | | | (2.17 | ) | | | — | |
| | | | | | | | | | | | | | | | | | | | | | | | |
Change in net asset value for the period | | | 3.30 | | | | 2.42 | | | | 1.01 | | | | (7.47 | ) | | | (0.80 | ) | | | 1.46 | |
| | | | | | | | | | | | | | | | | | | | | | | | |
Net asset value, end of period | | $ | 16.50 | | | $ | 13.20 | | | $ | 10.78 | | | $ | 9.77 | | | $ | 17.24 | | | $ | 18.04 | |
| | | | | | | | | | | | | | | | | | | | | | | | |
Total return | | | 25.0 | %(2) | | | 22.6 | % | | | 11.7 | % | | | (36.2 | )% | | | 8.4 | % | | | 8.8 | % |
Ratios/supplemental data | | | | | | | | | | | | | | | | | | | | | | | | |
Net assets, end of period (000) | | $ | 46,207 | | | $ | 32,863 | | | $ | 30,498 | | | $ | 36,429 | | | $ | 49,543 | | | $ | 52,701 | |
Ratio to average net assets: | | | | | | | | | | | | | | | | | | | | | | | | |
Expenses | | | 1.33 | %(3) | | | 1.41 | % | | | 1.41 | % | | | 1.35 | % | | | 1.32 | % | | | 1.34 | % |
Net investment income (loss) | | | (1.02 | )%(3) | | | (1.08 | )% | | | (0.97 | )% | | | 0.12 | % | | | 0.63 | % | | | (0.38 | )% |
Portfolio turnover rate | | | 57 | %(2) | | | 104 | % | | | 62 | % | | | 169 | % | | | 90 | % | | | 45 | % |
| (1) | Total from investment operations per share includes redemption fees of less than $0.001 for the six months ended April 30, 2011 and $0.001, $0.001, $0.005, $0.001 and $0.015 per share for the years ended October 31, 2010, 2009, 2008, 2007 and 2006, respectively. |
The Accompanying Notes are an Integral Part of these Financial Statements.
The Tocqueville International Value Fund
Financial Highlights
| | | | | | | | | | | | | | | | | | | | | | | | |
Per share operating performance
(For a share outstanding throughout
the period) | | Six Months
Ended
April 30,
2011 | | | Years Ended October 31, | |
| | | 2010 | | | 2009 | | | 2008 | | | 2007 | | | 2006 | |
| | | (unaudited) | | | | | | | | | | | | | | | | |
Net asset value, beginning of period | | $ | 12.12 | | | $ | 10.48 | | | $ | 8.49 | | | $ | 16.48 | | | $ | 16.72 | | | $ | 16.06 | |
| | | | | | | | | | | | | | | | | | | | | | | | |
Operations: | | | | | | | | | | | | | | | | | | | | | | | | |
Net investment income | | | 0.03 | | | | 0.11 | | | | 0.10 | | | | 0.13 | | | | 0.08 | | | | 0.27 | |
Net realized and unrealized gain (loss) | | | 1.96 | | | | 1.65 | | | | 2.59 | | | | (6.09 | ) | | | 2.25 | | | | 2.30 | |
| | | | | | | | | | | | | | | | | | | | | | | | |
Total from investment operations (1) | | | 1.99 | | | | 1.76 | | | | 2.69 | | | | (5.96 | ) | | | 2.33 | | | | 2.57 | |
| | | | | | | | | | | | | | | | | | | | | | | | |
Dividends and distributions to shareholders: | | | | | | | | | | | | | | | | | | | | | | | | |
Dividends from net investment income | | | (0.07 | ) | | | (0.12 | ) | | | (0.20 | ) | | | (0.10 | ) | | | (0.27 | ) | | | (0.05 | ) |
Distributions from net realized gains | | | — | | | | — | | | | (0.50 | ) | | | (1.93 | ) | | | (2.30 | ) | | | (1.86 | ) |
| | | | | | | | | | | | | | | | | | | | | | | | |
Total dividends and distributions | | | (0.07 | ) | | | (0.12 | ) | | | (0.70 | ) | | | (2.03 | ) | | | (2.57 | ) | | | (1.91 | ) |
| | | | | | | | | | | | | | | | | | | | | | | | |
Change in net asset value for the period | | | 1.92 | | | | 1.64 | | | | 1.99 | | | | (7.99 | ) | | | (0.24 | ) | | | 0.66 | |
| | | | | | | | | | | | | | | | | | | | | | | | |
Net asset value, end of period | | $ | 14.04 | | | $ | 12.12 | | | $ | 10.48 | | | $ | 8.49 | | | $ | 16.48 | | | $ | 16.72 | |
| | | | | | | | | | | | | | | | | | | | | | | | |
Total return | | | 16.5 | %(2) | | | 17.0 | % | | | 34.0 | % | | | (40.8 | )% | | | 15.3 | % | | | 17.4 | % |
Ratios/supplemental data | | | | | | | | | | | | | | | | | | | | | | | | |
Net assets, end of period (000) | | $ | 193,083 | | | $ | 150,103 | | | $ | 131,613 | | | $ | 118,189 | | | $ | 219,220 | | | $ | 225,234 | |
Ratio to average net assets: | | | | | | | | | | | | | | | | | | | | | | | | |
Expenses | | | 1.54 | %(3) | | | 1.56 | % | | | 1.62 | % | | | 1.56 | % | | | 1.59 | % | | | 1.61 | % |
Net investment income | | | 0.54 | %(3) | | | 1.03 | % | | | 0.96 | % | | | 1.07 | % | | | 0.49 | % | | | 1.49 | % |
Portfolio turnover rate | | | 12 | %(2) | | | 27 | % | | | 27 | % | | | 63 | % | | | 49 | % | | | 39 | % |
| (1) | Total from investment operations per share includes redemption fees of $0.001 for the six months ended April 30, 2011 and $0.002, $0.001, $0.001, $0.002 and $0.011 per share for the five years ended October 31, 2010, 2009, 2008, 2007 and 2006, respectively. |
The Accompanying Notes are an Integral Part of these Financial Statements.
The Tocqueville Gold Fund
Financial Highlights
| | | | | | | | | | | | | | | | | | | | | | | | |
Per share operating performance
(For a share outstanding
throughout the period) | | Six Months
Ended
April 30,
2011 | | | Years Ended October 31, | |
| | | 2010 | | | 2009 | | | 2008 | | | 2007 | | | 2006 | |
| | | (Unaudited) | | | | | | | | | | | | | | | | |
Net asset value, beginning of period | | $ | 82.00 | | | $ | 49.71 | | | $ | 21.77 | | | $ | 64.36 | | | $ | 51.41 | | | $ | 35.51 | |
| | | | | | | | | | | | | | | | | | | | | | | | |
Operations: | | | | | | | | | | | | | | | | | | | | | | | | |
Net investment loss | | | (0.33 | ) | | | (0.58 | ) | | | (0.45 | ) | | | (0.57 | ) | | | (0.30 | ) | | | (0.22 | ) |
Net realized and unrealized gain (loss) | | | 10.51 | | | | 32.96 | | | | 29.28 | | | | (33.24 | ) | | | 18.52 | | | | 18.21 | |
| | | | | | | | | | | | | | | | | | | | | | | | |
Total from investment operations (1) | | | 10.18 | | | | 32.38 | | | | 28.83 | | | | (33.81 | ) | | | 18.22 | | | | 17.99 | |
| | | | | | | | | | | | | | | | | | | | | | | | |
Dividends and distributions to shareholders: | | | | | | | | | | | | | | | | | | | | | | | | |
Dividends from net investment income | | | — | | | | — | | | | — | | | | (0.46 | ) | | | (0.22 | ) | | | — | |
Distributions from net realized gains | |
| (1.61
| )
| | | (0.09 | ) | | | (0.89 | ) | | | (8.32 | ) | | | (5.05 | ) | | | (2.09 | ) |
| | | | | | | | | | | | | | | | | | | | | | | | |
Total distributions | | | (1.61 | ) | | | (0.09 | ) | | | (0.89 | ) | | | (8.78 | ) | | | (5.27 | ) | | | (2.09 | ) |
| | | | | | | | | | | | | | | | | | | | | | | | |
Change in net asset value for the period | | | 8.57 | | | | 32.29 | | | | 27.94 | | | | (42.59 | ) | | | 12.95 | | | | 15.90 | |
| | | | | | | | | | | | | | | | | | | | | | | | |
Net asset value, end of period | | $ | 90.57 | | | $ | 82.00 | | | $ | 49.71 | | | $ | 21.77 | | | $ | 64.36 | | | $ | 51.41 | |
| | | | | | | | | | | | | | | | | | | | | | | | |
Total return | | | 12.5 | %(2) | | | 65.2 | % | | | 135.2 | % | | | (60.0 | )% | | | 38.4 | % | | | 52.5 | % |
Ratios/supplemental data | | | | | | | | | | | | | | | | | | | | | | | | |
Net assets, end of period (000) | | $ | 2,860,970 | | | $ | 2,199,603 | | | $ | 937,492 | | | $ | 410,857 | | | $ | 1,231,475 | | | $ | 833,254 | |
Ratios to average net assets: | | | | | | | | | | | | | | | | | | | | | | | | |
Expenses | | | 1.23 | %(3) | | | 1.34 | % | | | 1.50 | % | | | 1.43 | % | | | 1.42 | % | | | 1.50 | % |
Net investment income (loss) | | | (0.89 | )%(3) | | | (1.11 | )% | | | (1.25 | )% | | | (1.07 | )% | | | (0.81 | )% | | | (0.51 | )% |
Portfolio turnover rate | | | 1 | %(2) | | | 9 | % | | | 9 | % | | | 28 | % | | | 26 | % | | | 30 | % |
| (1) | Total from investment operations per share includes redemption fees of $0.065 for the six months ended April 30, 2011 and $0.056, $0.025, $0.027, $0.028, and $0.060 per share for the five years ended October 31, 2010, 2009, 2008, 2007 and 2006, respectively. |
The Accompanying Notes are an Integral Part of these Financial Statements.
The Delafield Fund
Financial Highlights
| | | | | | | | | | | | | | | | | | | | | | | | |
Per share operating
performance
(For a share outstanding
throughout the period) | | Six Months
Ended
April 30,
2011 | | | Year
Ended
October 31,
2010 | | | January 1,
2009
through
October 31,
2009 | | | Years Ended December 31, | |
| | | | | 2008 | | | 2007 | | | 2006 | |
| | | (Unaudited) | | | | | | | | | | | | | | | | |
Net asset value, beginning of period | | $ | 26.65 | | | $ | 21.35 | | | $ | 15.10 | | | $ | 24.33 | | | $ | 25.64 | | | $ | 23.63 | |
| | | | | | | | | | | | | | | | | | | | | | | | |
Operations: | | | | | | | | | | | | | | | | | | | | | | | | |
Net investment income (loss) | | | (0.04 | ) | | | (0.00 | )(2) | | | 0.03 | | | | 0.07 | | | | 0.17 | | | | 0.19 | |
Net realized and unrealized gain (loss) | | | 5.50 | | | | 5.32 | | | | 6.25 | | | | (9.23 | ) | | | 1.10 | | | | 4.64 | |
| | | | | | | | | | | | | | | | | | | | | | | | |
Total from investment operations (1) | | | 5.46 | | | | 5.32 | | | | 6.28 | | | | (9.16 | ) | | | 1.27 | | | | 4.83 | |
| | | | | | | | | | | | | | | | | | | | | | | | |
Dividends and distributions to shareholders: | | | | | | | | | | | | | | | | | | | | | | | | |
Dividends from net investment income | | | — | | | | — | | | | (0.03 | ) | | | (0.07 | ) | | | (0.16 | ) | | | (0.19 | ) |
Distributions from net realized gains | | | — | | | | — | | | | — | | | | (0.00 | )(2) | | | (2.42 | ) | | | (2.63 | ) |
Return of Capital | | | — | | | | (0.02 | ) | | | (0.00 | )(2) | | | (0.00 | )(2) | | | — | | | | — | |
| | | | | | | | | | | | | | | | | | | | | | | | |
Total distributions | | | — | | | | (0.02 | ) | | | (0.03 | ) | | | (0.07 | ) | | | (2.58 | ) | | | (2.82 | ) |
| | | | | | | | | | | | | | | | | | | | | | | | |
Change in net asset value for the period | | | 5.46 | | | | 5.30 | | | | 6.25 | | | | (9.23 | ) | | | (1.31 | ) | | | 2.01 | |
| | | | | | | | | | | | | | | | | | | | | | | | |
Net asset value, end of period | | $ | 32.11 | | | $ | 26.65 | | | $ | 21.35 | | | $ | 15.10 | | | $ | 24.33 | | | $ | 25.64 | |
| | | | | | | | | | | | | | | | | | | | | | | | |
Total return | | | 20.5 | %(3) | | | 25.0 | % | | | 41.6 | %(3) | | | (37.6 | )% | | | 4.9 | % | | | 20.4 | % |
Ratios/supplemental data | | | | | | | | | | | | | | | | | | | | | | | | |
Net assets, end of period (000) | | $ | 1,442,421 | | | $ | 933,674 | | | $ | 636,548 | | | $ | 404,860 | | | $ | 656,999 | | | $ | 532,108 | |
Ratios to average net assets: | | | | | | | | | | | | | | | | | | | | | | | | |
Expenses | | | 1.21 | %(4) | | | 1.27 | % | | | 1.38 | %(4) | | | 1.34 | %(5) | | | 1.28 | %(5) | | | 1.32 | %(5) |
Net investment income (loss) | | | (0.30 | )%(4) | | | (0.02 | )% | | | 0.21 | %(4) | | | 0.35 | %(5) | | | 0.57 | %(5) | | | 0.82 | %(5) |
Portfolio turnover rate | | | 18 | %(3) | | | 30 | % | | | 46 | %(3) | | | 81 | % | | | 61 | % | | | 72 | % |
| (1) | Total from investment operations per share includes redemption fees of $0.002 for the six months ended April 30, 2011, $0.006 per share for the year ended October 31, 2010, $0.008 per share for the period ended October 31, 2009, $0.01 per share for the fiscal year ended December 31, 2007 and less than $0.01 per share for the fiscal years ended December 31, 2008 and 2006. |
| (2) | Represents less than $0.01. |
| (5) | Net of fees waived amounting to 0.06%, 0.05%, and 0.08% for the fiscal years ended December 31, 2008, 2007, and 2006, respectively. |
The Accompanying Notes are an Integral Part of these Financial Statements.
The Tocqueville Select Fund
Financial Highlights
| | | | | | | | | | | | | | | | |
Per share operating performance
(For a share outstanding throughout the period) | | Six Months
Ended
April 30,
2011 | | | Year
Ended
October 31,
2010 | | | January 1,
2009
through
October 31,
2009 | | | Period from
September 29,
2008 (2)
through
December 31,
2008 | |
| | | (Unaudited) | | | | | | | | | | |
Net asset value, beginning of period | | $ | 11.54 | | | $ | 8.46 | | | $ | 5.77 | | | $ | 8.74 | |
| | | | | | | | | | | | | | | | |
Operations: | | | | | | | | | | | | | | | | |
Net investment income (loss) | | | (0.03 | ) | | | (0.03 | ) | | | (0.00 | )(3) | | | 0.01 | |
Net realized and unrealized gain (loss) | | | 2.27 | | | | 3.12 | | | | 2.70 | | | | (2.97 | ) |
| | | | | | | | | | | | | | | | |
Total from investment operations (1) | | | 2.24 | | | | 3.09 | | | | 2.70 | | | | (2.96 | ) |
| | | | | | | | | | | | | | | | |
Dividends and distributions to shareholders: | | | | | | | | | | | | | | | | |
Dividends from net investment income | | | — | | | | (0.01 | ) | | | (0.00 | )(3) | | | (0.01 | ) |
Distributions from net realized gains | | | (0.53 | ) | | | — | | | | — | | | | — | |
Return of Capital | | | — | | | | — | | | | (0.01 | ) | | | — | |
| | | | | | | | | | | | | | | | |
Total distributions | | | (0.53 | ) | | | (0.01 | ) | | | (0.01 | ) | | | (0.01 | ) |
| | | | | | | | | | | | | | | | |
Change in net asset value for the period | | | 1.71 | | | | 3.08 | | | | 2.69 | | | | (2.97 | ) |
| | | | | | | | | | | | | | | | |
Net asset value, end of period | | $ | 13.25 | | | $ | 11.54 | | | $ | 8.46 | | | $ | 5.77 | |
| | | | | | | | | | | | | | | | |
Total return | | | 19.7 | %(4) | | | 36.6 | % | | | 46.7 | %(4) | | | (33.9 | )%(4) |
Ratios/supplemental data | | | | | | | | | | | | | | | | |
Net assets, end of period (000) | | $ | 86,794 | | | $ | 41,788 | | | $ | 24,681 | | | $ | 9,226 | |
Ratios to average net assets: | | | | | | | | | | | | | | | | |
Expenses | | | 1.32 | %(5) | | | 1.38 | % | | | 1.26 | %(5)(6) | | | 1.15 | %(5)(6) |
Net investment income (loss) | | | (0.75 | )%(5) | | | (0.43 | )% | | | (0.16 | )%(5)(6) | | | 0.29 | %(5)(6) |
Portfolio turnover rate | | | 9 | %(4) | | | 40 | % | | | 24 | %(4) | | | 29 | %(4) |
| (1) | Total from investment operations per share includes redemption fees of $0.005 for the six months ended April 30, 2011 and $0.007 per share for the year ended October 31, 2010. |
| (3) | Represents less than $0.01 per share. |
| (6) | Net of fees waived amounting to 0.77% and 2.32% for the periods ended October 31, 2009 and December 31, 2008, respectively. |
The Accompanying Notes are an Integral Part of these Financial Statements.
The Tocqueville Fund
Schedule of Investments as of April 30, 2011
(Unaudited)
| | | | | | | | |
| Common Stocks—95.5% | | Shares | | | Value | |
Automobiles & Components—1.0% | | | | | |
Toyota Motor Corp.—ADR | | | 72,000 | | | $ | 5,736,960 | |
Banks—2.9% | | | | | | | | |
Banco Santander SA—ADR | | | 500,000 | | | | 6,200,000 | |
East West Bancorp, Inc. | | | 250,000 | | | | 5,282,500 | |
Mitsubishi UFJ Financial Group, Inc.—ADR | | | 1,000,000 | | | | 4,770,000 | |
| | | | | | | | 16,252,500 | |
Capital Goods—10.9% | | | | | | | | |
The Boeing Co. | | | 75,000 | | | | 5,983,500 | |
Briggs & Stratton Corp. | | | 125,065 | | | | 2,950,283 | |
General Electric Co. | | | 1,000,000 | | | | 20,450,000 | |
Illinois Tool Works, Inc. | | | 150,000 | | | | 8,761,500 | |
ITT Corp. | | | 100,000 | | | | 5,779,000 | |
Masco Corp. | | | 500,000 | | | | 6,710,000 | |
Northrop Grumman Corp. | | | 100,000 | | | | 6,361,000 | |
Tyco International Ltd.(a) | | | 100,000 | | | | 4,874,000 | |
| | | | | | | | 61,869,283 | |
Commercial & Professional Services—2.0% | |
Steelcase, Inc. | | | 1,000,000 | | | | 11,550,000 | |
Consumer Services—1.0% | | | | | |
Yum! Brands, Inc. | | | 100,000 | | | | 5,364,000 | |
Diversified Financials—1.5% | | | | | |
The Bank of New York Mellon Corp. | | | 300,000 | | | | 8,688,000 | |
Energy—10.5% | | | | | | | | |
Anadarko Petroleum Corp. | | | 50,000 | | | | 3,947,000 | |
Cameco Corp.(a) | | | 150,000 | | | | 4,422,000 | |
Chesapeake Energy Corp. | | | 250,000 | | | | 8,417,500 | |
Exxon Mobil Corp. | | | 200,000 | | | | 17,600,000 | |
Murphy Oil Corp. | | | 150,000 | | | | 11,622,000 | |
Schlumberger Ltd.(a) | | | 150,000 | | | | 13,462,500 | |
| | | | | | | | 59,471,000 | |
Food & Staples Retailing—1.1% | | | | | |
Safeway, Inc. | | | 250,000 | | | | 6,077,500 | |
Food, Beverage & Tobacco—6.2% | |
Campbell Soup Co. | | | 250,000 | | | | 8,397,500 | |
The Coca-Cola Co. | | | 150,000 | | | | 10,119,000 | |
Kraft Foods, Inc. | | | 300,000 | | | | 10,074,000 | |
Unilever NV—ADR | | | 100,000 | | | | 3,300,000 | |
Zhongpin, Inc.(a)(b) | | | 204,100 | | | | 3,408,470 | |
| | | | | | | | 35,298,970 | |
Health Care Equipment & Services—1.2% | |
St. Jude Medical, Inc. | | | 125,000 | | | | 6,680,000 | |
Household & Personal Products—3.3% | |
Colgate-Palmolive Co. | | | 100,000 | | | | 8,435,000 | |
Kimberly-Clark Corp. | | | 150,000 | | | | 9,909,000 | |
| | | | | | | | 18,344,000 | |
| | | | | | | | |
| Common Stocks (continued) | | Shares | | | Value | |
Insurance—2.0% | |
Aflac, Inc. | | | 47,000 | | | $ | 2,640,930 | |
The Allstate Corp. | | | 75,000 | | | | 2,538,000 | |
Fidelity National Financial, Inc. | | | 400,000 | | | | 6,176,000 | |
| | | | | | | | 11,354,930 | |
Materials—12.7% | |
BHP Billiton Ltd.—ADR | | | 75,000 | | | | 7,593,000 | |
Cliffs Natural Resources, Inc. | | | 100,000 | | | | 9,372,000 | |
EI du Pont de Nemours & Co. | | | 300,000 | | | | 17,037,000 | |
Ferro Corp.(b) | | | 166,500 | | | | 2,497,500 | |
Newmont Mining Corp. | | | 300,000 | | | | 17,583,000 | |
Owens-Illinois, Inc.(b) | | | 250,000 | | | | 7,417,500 | |
Sonoco Products Co. | | | 200,000 | | | | 6,912,000 | |
Vulcan Materials Co. | | | 80,000 | | | | 3,616,000 | |
| | | | | | | | 72,028,000 | |
Pharmaceuticals, Biotechnology & Life Sciences—8.1% | |
Alkermes, Inc (b) | | | 145,000 | | | | 2,090,900 | |
Johnson & Johnson | | | 175,000 | | | | 11,501,000 | |
Merck & Co., Inc. | | | 200,000 | | | | 7,190,000 | |
Myriad Genetics, Inc.(b) | | | 300,000 | | | | 6,432,000 | �� |
Pfizer, Inc. | | | 900,000 | | | | 18,864,000 | |
| | | | | | | | 46,077,900 | |
Real Estate—2.3% | |
CB Richard Ellis Group, Inc.(b) | | | 200,000 | | | | 5,342,000 | |
Weyerhaeuser Co. | | | 320,000 | | | | 7,363,200 | |
| | | | | | | | 12,705,200 | |
Retailing—1.3% | |
Home Depot, Inc. | | | 200,000 | | | | 7,428,000 | |
Semiconductors & Semiconductor Equipment—5.1% | |
Applied Materials, Inc. | | | 750,000 | | | | 11,767,500 | |
Intel Corp. | | | 500,000 | | | | 11,595,000 | |
LSI Corp.(b) | | | 750,000 | | | | 5,497,500 | |
| | | | | | | | 28,860,000 | |
Software & Services—11.3% | |
Adobe Systems, Inc.(b) | | | 150,000 | | | | 5,032,500 | |
Automatic Data Processing, Inc. | | | 150,000 | | | | 8,152,500 | |
Bio-key International,
Inc.(b)(c)(d)(e) | | | 47,090 | | | | — | |
Google, Inc.(b) | | | 15,000 | | | | 8,161,500 | |
Mastercard, Inc. | | | 40,000 | | | | 11,035,600 | |
Microsoft Corp. | | | 650,000 | | | | 16,913,000 | |
Symantec Corp.(b) | | | 450,000 | | | | 8,842,500 | |
Total Systems Services, Inc. | | | 300,000 | | | | 5,655,000 | |
| | | | | | | | 63,792,600 | |
Technology Hardware & Equipment—6.1% | |
Canon, Inc.—ADR | | | 60,000 | | | | 2,830,200 | |
Cisco Systems, Inc. | | | 500,000 | | | | 8,780,000 | |
Corning, Inc. | | | 400,000 | | | | 8,376,000 | |
The Accompanying Footnotes are an Integral Part of these Financial Statements
The Tocqueville Fund
Schedule of Investments as of April 30, 2011
(Unaudited)
| | | | | | | | |
| Common Stocks (continued) | | Shares | | | Value | |
Hitachi Ltd.—ADR | | | 200,000 | | | $ | 10,892,000 | |
Plexus Corp.(b) | | | 100,000 | | | | 3,649,000 | |
| | | | | | | | 34,527,200 | |
Telecommunication Services—2.0% | |
Verizon Communications, Inc. | | | 150,000 | | | | 5,667,000 | |
Vodafone Group PLC—ADR | | | 200,000 | | | | 5,824,000 | |
| | | | | | | | 11,491,000 | |
Utilities—3.0% | |
NextEra Energy, Inc. | | | 300,000 | | | | 16,971,000 | |
Total Common Stocks
(Cost $456,700,220) | | | | | | | 540,568,043 | |
Warrants—0.0% | | | | | | | | |
Capital Goods—0.0% | | | | | | | | |
EMCORE Corp.
Expires: 02/19/13,
Exercise Price:
$15.06(b)(d) | | | 39,375 | | | | 20,269 | |
Raytheon Co.
Expires: 06/16/11,
Exercise Price: $37.50(b) | | | 1,581 | | | | 18,134 | |
Total Warrants
(Cost $0) | | | | | | | 38,403 | |
Short-Term
Investments—2.6% | |
| Principal
Amount |
| | | | |
Repurchase Agreement—2.6% | | | | | |
Repurchase Agreement with U.S. Bank, N.A., 0.01% dated 04/29/2011, due 05/02/2011, collateralized by: Freddie Mac Conventional 15 Year Fixed (Pool #E99837) valued at $1,189,046. Repurchase proceeds of $1,165,626. Freddie Mac 30 Year Variable (Pool #1B2052) valued at $1,972,456. Repurchase proceeds of $1,933,863. | | | | | | | | |
| | | | | | | | |
Short-Term Investments
(continued) | | Principal
Amount | | | Value | |
Fannie Mae Conventional Level Pay 15 Year Fixed (Pool #255494) valued at $11,604,956. Repurchase proceeds of $11,378,164. Freddie Mac 30 Year Fixed Mortgage Backed Securities (Pool #2694) valued at $597,059. Repurchase proceeds of $585,360. | | $ | 15,063,000 | | | $ | 15,063,000 | |
Total Short-Term Investments
(Cost $15,063,000) | | | | | | | 15,063,000 | |
Total Investments
(Cost $471,763,220)—98.1% | | | | 555,669,446 | |
Other Assets in Excess of
Liabilities—1.9% | | | | 10,493,468 | |
Total Net Assets—100.0% | | | $ | 566,162,914 | |
| | | | | | | | |
Percentages are stated as a percent of net assets.
ADR—American Depository Receipt
| (a) | Foreign issued security. Foreign concentration (including ADRs) was as follows: Australia 1.3%; Britian 1.0%; Canada 0.8%; China 0.6%; Curacao 2.4%; Japan 4.3%; Netherlands 0.6%; Spain 1.1%; Switzerland 0.9% |
| (b) | Non-income producing security. |
| (c) | Denotes a security is either fully or partially restricted to resale. The aggregate value of restricted securities at April 30, 2011 was $0 which represented 0.0% of net assets. |
| (d) | Fair valued security. The aggregate value of fair valued securities as of April 30, 2011 was $20,269 which represented 0.0% of net assets. |
| (e) | Security is considered illiquid and may be difficult to sell. |
The Global Industry Classification Standard (GICS®) was developed by and/or is the exclusive property of MSCI, Inc. and Standard & Poor Financial Services LLC (“S&P”). GICS is a service mark of MSCI and S&P and has been licensed for use by U.S. Bancorp Fund Services, LLC.
The Accompanying Footnotes are an Integral Part of these Financial Statements
The Tocqueville Opportunity Fund
Schedule of Investments as of April 30, 2011
(Unaudited)
| | | | | | | | |
| Common Stocks—96.4% | | Shares | | | Value | |
Automobiles & Components—1.8% | | | | | | | | |
BorgWarner, Inc.(a) | | | 6,200 | | | $ | 478,888 | |
Gentex Corp. | | | 11,000 | | | | 344,850 | |
| | | | | | | | 823,738 | |
Banks—1.5% | |
BankUnited, Inc. | | | 3,500 | | | | 98,315 | |
Huntington Bancshares, Inc. | | | 23,300 | | | | 158,207 | |
Pinnacle Financial Partners, Inc.(a) | | | 6,000 | | | | 96,420 | |
Umpqua Holdings Corp. | | | 30,000 | | | | 348,300 | |
| | | | | | | | 701,242 | |
Capital Goods—5.8% | |
Alliant Techsystems, Inc. | | | 2,000 | | | | 141,300 | |
Ceradyne, Inc.(a) | | | 5,000 | | | | 234,300 | |
Citrix Systems, Inc.(a) | | | 3,100 | | | | 261,454 | |
Esterline Technologies Corp.(a) | | | 2,800 | | | | 201,040 | |
Gardner Denver, Inc. | | | 1,600 | | | | 138,256 | |
Harbin Electric, Inc.(a) | | | 11,500 | | | | 215,280 | |
ITT Corp. | | | 2,300 | | | | 132,917 | |
Joy Global, Inc. | | | 4,500 | | | | 454,275 | |
Polypore International, Inc.(a) | | | 2,500 | | | | 154,425 | |
RBC Bearings, Inc.(a) | | | 4,800 | | | | 188,448 | |
TAL International Group, Inc. | | | 4,900 | | | | 176,645 | |
The Toro Co. | | | 2,900 | | | | 196,939 | |
Valmont Industries, Inc. | | | 1,600 | | | | 168,480 | |
| | | | | | | | 2,663,759 | |
Commercial & Professional Services—0.8% | |
Clean Harbors, Inc.(a) | | | 3,500 | | | | 344,750 | |
Consumer Durables & Apparel—5.4% | | | | | |
Deckers Outdoor Corp.(a) | | | 3,500 | | | | 297,010 | |
Fossil, Inc.(a) | | | 3,300 | | | | 316,074 | |
Harman International Industries, Inc. | | | 4,800 | | | | 232,944 | |
Lululemon Athletica, Inc.(a) | | | 5,500 | | | | 550,165 | |
Polo Ralph Lauren Corp. | | | 1,700 | | | | 222,309 | |
Tempur-Pedic International, Inc.(a) | | | 7,000 | | | | 439,460 | |
Tupperware Brands Corp. | | | 6,800 | | | | 432,956 | |
| | | | | | | | 2,490,918 | |
Consumer Services—6.3% | |
China Lodging Group Ltd.—ADR(a) | | | 18,200 | | | | 398,398 | |
Chipotle Mexican Grill, Inc.(a) | | | 1,900 | | | | 506,901 | |
Ctrip.com International Ltd.—ADR(a) | | | 6,500 | | | | 316,680 | |
Gaylord Entertainment Co.(a) | | | 2,500 | | | | 89,675 | |
Hyatt Hotels Corp.(a) | | | 5,700 | | | | 252,567 | |
Intercontinental Hotels Group
PLC—ADR | | | 10,500 | | | | 231,525 | |
MGM Resorts International(a) | | | 9,500 | | | | 120,270 | |
Panera Bread Co.(a) | | | 1,000 | | | | 121,110 | |
Royal Caribbean Cruises Ltd.(a)(b) | | | 7,800 | | | | 310,596 | |
Sotheby’s | | | 5,800 | | | | 293,016 | |
| | | | | | | | |
| Common Stocks (continued) | | Shares | | | Value | |
Texas Roadhouse, Inc. | | | 9,600 | | | $ | 156,192 | |
Wyndham Worldwide Corp. | | | 2,800 | | | | 96,908 | |
| | | | | | | | 2,893,838 | |
Diversified Financials—3.9% | |
Blackstone Group LP | | | 18,400 | | | | 348,496 | |
KKR & Co. LP | | | 19,500 | | | | 369,720 | |
Lazard Ltd.(b) | | | 8,800 | | | | 360,800 | |
MSCI, Inc.(a) | | | 9,200 | | | | 326,324 | |
Netspend Holdings, Inc.(a) | | | 15,500 | | | | 179,955 | |
Portfolio Recovery Associates, Inc.(a) | | | 2,500 | | | | 225,650 | |
| | | | | | | | 1,810,945 | |
Energy—9.3% | |
Brigham Exploration Co.(a) | | | 16,500 | | | | 553,245 | |
Cameron International Corp.(a) | | | 2,800 | | | | 147,616 | |
CARBO Ceramics, Inc. | | | 3,000 | | | | 482,820 | |
Complete Production Services, Inc.(a) | | | 9,800 | | | | 332,612 | |
Concho Resources, Inc.(a) | | | 2,000 | | | | 213,700 | |
Continental Resources, Inc.(a) | | | 3,200 | | | | 219,776 | |
Core Laboratories NV(b) | | | 3,400 | | | | 326,332 | |
Dril-Quip, Inc.(a) | | | 6,500 | | | | 497,640 | |
Noble Corp.(b) | | | 2,000 | | | | 86,020 | |
Oceaneering International, Inc.(a) | | | 4,000 | | | | 349,680 | |
Petrohawk Energy Corp.(a) | | | 5,000 | | | | 135,050 | |
Pioneer Natural Resources Co. | | | 3,000 | | | | 306,690 | |
Rowan Companies., Inc.(a) | | | 5,100 | | | | 212,670 | |
SM Energy Co. | | | 3,000 | | | | 227,580 | |
Whiting Petroleum Corp.(a) | | | 3,100 | | | | 215,450 | |
| | | | | | | | 4,306,881 | |
Food & Staples Retailing—1.0% | |
The Fresh Market, Inc.(a) | | | 11,300 | | | | 472,566 | |
Food, Beverage & Tobacco—2.6% | | | | | | | | |
Boston Beer Co., Inc.(a) | | | 3,300 | | | | 311,058 | |
Green Mountain Coffee
Roasters, Inc.(a) | | | 6,800 | | | | 455,328 | |
The Hain Celestial Group, Inc.(a) | | | 13,100 | | | | 445,531 | |
| | | | | | | | 1,211,917 | |
Health Care Equipment & Services—5.3% | |
Allscripts Healthcare Solutions, Inc.(a) | | | 35,400 | | | | 762,516 | |
Bio-Reference Labs, Inc.(a) | | | 7,400 | | | | 186,554 | |
Greatbatch, Inc.(a) | | | 4,000 | | | | 108,280 | |
HMS Holdings Corp.(a) | | | 2,000 | | | | 157,420 | |
Hologic, Inc.(a) | | | 5,100 | | | | 112,302 | |
Magellan Health Services, Inc.(a) | | | 4,000 | | | | 208,080 | |
Patterson Companies, Inc. | | | 4,000 | | | | 138,840 | |
Sirona Dental Systems, Inc.(a) | | | 7,800 | | | | 445,146 | |
Thoratec Corp.(a) | | | 8,000 | | | | 245,600 | |
Wright Medical Group, Inc.(a) | | | 5,000 | | | | 82,650 | |
| | | | | | | | 2,447,388 | |
The Accompanying Footnotes are an Integral Part of these Financial Statements
The Tocqueville Opportunity Fund
Schedule of Investments as of April 30, 2011
(Unaudited)
| | | | | | | | |
| Common Stocks (continued) | | Shares | | | Value | |
Household & Personal Products—1.6% | |
Church & Dwight Co., Inc. | | | 2,500 | | | $ | 206,200 | |
Herbalife Ltd.(b) | | | 6,000 | | | | 538,680 | |
| | | | | | | | 744,880 | |
Materials—4.7% | | | | | | | | |
Airgas, Inc. | | | 3,750 | | | | 260,437 | |
Albemarle Corp. | | | 4,100 | | | | 289,255 | |
Allied Nevada Gold Corp.(a) | | | 6,000 | | | | 258,360 | |
Crown Holdings, Inc.(a) | | | 5,700 | | | | 213,180 | |
Materion Corp.(a) | | | 8,000 | | | | 334,080 | |
Minerals Technologies, Inc.(c) | | | 3,500 | | | | 238,000 | |
Nalco Holding Co. | | | 8,800 | | | | 257,048 | |
Walter Energy, Inc. | | | 2,300 | | | | 317,906 | |
| | | | | | | | 2,168,266 | |
Media—0.3% | |
Imax Corp.(a)(b) | | | 4,300 | | | | 150,844 | |
Pharmaceuticals, Biotechnology & Life Sciences—6.3% | |
Alexion Pharmaceuticals, Inc.(a) | | | 5,000 | | | | 484,450 | |
Auxilium Pharmaceuticals, Inc.(a) | | | 5,500 | | | | 133,980 | |
BioMarin Pharmaceutical, Inc.(a) | | | 6,400 | | | | 172,096 | |
Covance, Inc.(a) | | | 3,400 | | | | 212,840 | |
Dendreon Corp.(a) | | | 9,000 | | | | 390,870 | |
Human Genome Sciences, Inc.(a) | | | 7,200 | | | | 212,184 | |
Incyte Corp., Ltd.(a) | | | 20,400 | | | | 376,992 | |
Myriad Genetics, Inc.(a) | | | 4,300 | | | | 92,192 | |
Pharmaceutical Product Development, Inc. | | | 15,000 | | | | 462,750 | |
United Therapeutics Corp.(a) | | | 5,700 | | | | 381,672 | |
| | | | | | | | 2,920,026 | |
Retailing—7.2% | |
Advance Auto Parts, Inc. | | | 2,000 | | | | 130,920 | |
CarMax, Inc.(a) | | | 11,000 | | | | 381,700 | |
Dick’s Sporting Goods, Inc.(a) | | | 6,700 | | | | 274,231 | |
LKQ Corp.(a) | | | 9,300 | | | | 234,546 | |
PetSmart, Inc. | | | 8,000 | | | | 337,360 | |
priceline.com, Inc.(a) | | | 1,400 | | | | 765,814 | |
Tractor Supply Co. | | | 12,200 | | | | 754,814 | |
Ulta Salon Cosmetics & Fragrance, Inc.(a) | | | 6,500 | | | | 345,735 | |
Urban Outfitters, Inc.(a) | | | 3,200 | | | | 100,672 | |
| | | | | | | | 3,325,792 | |
Semiconductors & Semiconductor Equipment—4.7% | |
Broadcom Corp.(a) | | | 2,500 | | | | 87,950 | |
Cavium Networks, Inc.(a) | | | 7,500 | | | | 354,150 | |
Cirrus Logic, Inc.(a) | | | 8,400 | | | | 139,104 | |
Marvell Technology Group
Ltd.(a)(b) | | | 7,100 | | | | 109,553 | |
Netlogic Microsystems, Inc.(a) | | | 8,000 | | | | 345,040 | |
Silicon Image, Inc.(a) | | | 31,500 | | | | 262,080 | |
Skyworks Solutions, Inc.(a) | | | 9,500 | | | | 298,870 | |
| | | | | | | | |
| Common Stocks (continued) | | Shares | | | Value | |
Ultratech, Inc.(a)(c) | | | 12,000 | | | $ | 375,720 | |
Veeco Instruments, Inc.(a) | | | 3,500 | | | | 178,955 | |
| | | | | | | | 2,151,422 | |
Software & Services—16.4% | |
Baidu, Inc.—ADR(a) | | | 3,800 | | | | 564,376 | |
comScore, Inc.(a) | | | 6,000 | | | | 178,860 | |
Concur Technologies, Inc.(a) | | | 4,000 | | | | 231,480 | |
Equinix, Inc.(a) | | | 2,300 | | | | 231,518 | |
Facebook, Inc.(a)(d)(e)(f) | | | 10,000 | | | | 314,800 | |
Fair Isaac Corp. | | | 6,000 | | | | 179,280 | |
MercadoLibre, Inc. | | | 3,900 | | | | 356,460 | |
MICROS Systems, Inc.(a) | | | 5,300 | | | | 275,706 | |
Netflix, Inc.(a) | | | 1,500 | | | | 349,005 | |
Parametric Technology Corp.(a) | | | 20,000 | | | | 485,400 | |
RealD, Inc.(a) | | | 7,400 | | | | 215,192 | |
Rovi Corp.(a) | | | 6,528 | | | | 317,000 | |
Salesforce.com, Inc.(a) | | | 2,900 | | | | 401,940 | |
Sapient Corp.(a) | | | 11,500 | | | | 145,187 | |
Sina Corp.(a)(b) | | | 1,500 | | | | 202,125 | |
SuccessFactors, Inc.(a) | | | 5,500 | | | | 190,685 | |
TeleTech Holdings, Inc.(a) | | | 18,000 | | | | 357,660 | |
Tencent Holdings Ltd.(b) | | | 8,900 | | | | 253,263 | |
TIBCO Software, Inc.(a) | | | 44,600 | | | | 1,337,554 | |
Total Systems Services, Inc. | | | 4,900 | | | | 92,365 | |
VanceInfo Technologies, Inc.—ADR(a) | | | 5,200 | | | | 167,232 | |
VeriFone Systems, Inc.(a) | | | 4,500 | | | | 246,690 | |
VMware, Inc.(a) | | | 3,600 | | | | 343,548 | |
Vocus, Inc.(a) | | | 5,100 | | | | 151,113 | |
| | | | | | | | 7,588,439 | |
Technology Hardware & Equipment—8.5% | |
Acme Packet, Inc.(a) | | | 4,500 | | | | 371,745 | |
Apple, Inc.(a) | | | 2,500 | | | | 870,575 | |
Aruba Networks, Inc.(a) | | | 14,000 | | | | 503,020 | |
F5 Networks, Inc.(a) | | | 1,000 | | | | 101,360 | |
Finisar Corp.(a) | | | 4,900 | | | | 137,641 | |
FLIR Systems, Inc. | | | 7,300 | | | | 257,106 | |
Informatica Corp.(a) | | | 6,800 | | | | 380,868 | |
LogMein, Inc.(a) | | | 4,000 | | | | 172,280 | |
Measurement Specialties, Inc.(a) | | | 4,500 | | | | 156,510 | |
Netgear, Inc.(a) | | | 5,600 | | | | 233,800 | |
Plexus Corp.(a) | | | 2,500 | | | | 91,225 | |
RightNow Technologies, Inc.(a) | | | 5,200 | | | | 188,136 | |
Riverbed Technology, Inc.(a) | | | 13,100 | | | | 460,334 | |
| | | | | | | | 3,924,600 | |
Telecommunication Services—0.3% | |
Cogent Communications Group, Inc.(a) | | | 9,800 | | | | 142,198 | |
Transportation—2.7% | | | | | | | | |
Arkansas Best Corp. | | | 7,800 | | | | 179,478 | |
Hertz Global Holdings, Inc.(a) | | | 11,700 | | | | 201,357 | |
The Accompanying Footnotes are an Integral Part of these Financial Statements
The Tocqueville Opportunity Fund
Schedule of Investments as of April 30, 2011
(Unaudited)
| | | | | | | | |
| Common Stocks (continued) | | Shares | | | Value | |
Kansas City Southern(a) | | | 8,600 | | | $ | 499,746 | |
TRW Automotive Holdings Corp.(a) | | | 6,800 | | | | 388,008 | |
| | | | | | | | 1,268,589 | |
Total Common Stocks
(Cost $33,770,770) | | | | | | | 44,552,998 | |
Exchange Traded Funds—3.4% | | | | | |
Diversified Financials—3.4% | | | | | |
iShares Russell 2000 Growth Index Fund | | | 15,300 | | | | 1,511,181 | |
iShares Russell 2000 Index Fund | | | 500 | | | | 43,185 | |
Total Exchange Traded Funds
(Cost $1,525,445) | | | | | | | 1,554,366 | |
Short-Term
Investments—0.5% | |
| Principal
Amount |
| | | | |
Repurchase Agreement—0.5% | | | | | |
Repurchase Agreement with U.S. Bank, N.A., 0.01% dated 04/29/2011, due 05/02/2011, collateralized by: Freddie Mac 30 Year Fixed Mortgage Backed Securities (Pool #2694) valued at $145,051. Repurchase proceeds of $142,194. Fannie Mae 30 Year Variable Mortgage Backed Securities (Pool #2008-48) valued at $108,942. Repurchase proceeds of $106,806. | | $ | 249,000 | | | | 249,000 | |
Total Short-Term Investments
(Cost $249,000) | | | | | | | 249,000 | |
Total Investments
(Cost $35,545,215)—100.3% | | | | 46,356,364 | |
Liabilities in Excess of Other
Assets—(0.3)% | | | | (149,773 | ) |
Total Net Assets—100.0% | | | | | | $ | 46,206,591 | |
| | | | | | | | |
Percentages are stated as a percent of net assets.
ADR—American Depository Receipt
| (a) | Non-income producing security. |
| (b) | Foreign issued security. Foreign concentration was as follows: Britian 0.5%; Bermuda 1.0%; Canada 0.3%; Cayman Islands 5.3%; Liberia 0.7%; Netherlands 0.7%; Switzerland 0.2% |
| (c) | Affiliated company. See Footnote 9. |
| (d) | Denotes a security is either fully or partially restricted to resale. The aggregate value of restricted securities at April 30, 2011 was $314,800 which represented 0.7% of net assets. |
| (e) | Fair valued security. The aggregate value of fair valued securities as of April 30, 2011 was $314,800 which represented 0.7% of net assets. |
| (f) | Security is considered illiquid and may be difficult to sell. |
The Accompanying Footnotes are an Integral Part of these Financial Statements
The Tocqueville International Value Fund
Schedule of Investments as of April 30, 2011
(Unaudited)
| | | | | | | | |
| Common Stocks—91.4% | | Shares | | | Value | |
Australia—2.5% | | | | | | | | |
BHP Billiton Ltd.—ADR | | | 20,000 | | | $ | 2,024,800 | |
Spotless Group Ltd. | | | 1,300,000 | | | | 2,792,849 | |
| | | | | | | | 4,817,649 | |
Belgium—7.0% | |
Bekaert SA | | | 16,500 | | | | 2,064,852 | |
Groupe Bruxelles Lambert SA | | | 30,063 | | | | 2,981,142 | |
Mobistar SA | | | 37,500 | | | | 2,782,160 | |
Solvay SA | | | 24,000 | | | | 3,461,986 | |
Umicore SA | | | 38,400 | | | | 2,202,533 | |
| | | | | | | | 13,492,673 | |
Brazil—1.3% | |
Petroleo Brasileiro SA—ADR | | | 70,000 | | | | 2,613,100 | |
Curacao—1.9% | |
Schlumberger Ltd. | | | 40,000 | | | | 3,590,000 | |
France—15.8% | | | | | | | | |
Bollore | | | 12,803 | | | | 3,219,626 | |
Cie de St-Gobain | | | 56,928 | | | | 3,932,218 | |
Haulotte Group SA(a) | | | 158,065 | | | | 3,504,751 | |
Ipsen SA | | | 72,000 | | | | 2,819,640 | |
Nexans SA | | | 31,055 | | | | 3,291,559 | |
Sanofi-Aventis SA | | | 50,000 | | | | 3,954,677 | |
Total SA—ADR | | | 80,000 | | | | 5,138,400 | |
Vivendi SA | | | 150,000 | | | | 4,706,732 | |
| | | | | | | | 30,567,603 | |
Germany—6.3% | |
Kloeckner & Co. SE(a) | | | 125,000 | | | | 4,492,173 | |
Siemens AG—ADR | | | 25,000 | | | | 3,648,500 | |
Wacker Neuson SE(a) | | | 210,000 | | | | 4,027,994 | |
| | | | | | | | 12,168,667 | |
Greece—2.0% | |
JUMBO SA | | | 153,624 | | | | 1,240,096 | |
Titan Cement Co. SA | | | 101,900 | | | | 2,716,730 | |
| | | | | | | | 3,956,826 | |
Hong Kong—4.5% | |
Clear Media Ltd.(a) | | | 3,800,000 | | | | 2,324,159 | |
Hongkong Electric Holdings Ltd. | | | 375,000 | | | | 2,624,336 | |
PYI Corp. Ltd.(a) | | | 25,370,000 | | | | 1,045,344 | |
Television Broadcasts Ltd. | | | 452,750 | | | | 2,652,519 | |
| | | | | | | | 8,646,358 | |
Ireland—2.4% | |
DCC PLC | | | 138,105 | | | | 4,655,661 | |
Italy—3.3% | | | | | | | | |
Interpump Group SpA | | | 308,537 | | | | 2,787,641 | |
Sogefi SpA | | | 835,400 | | | | 3,501,713 | |
| | | | | | | | 6,289,354 | |
| | | | | | | | |
| Common Stocks (continued) | | Shares | | | Value | |
Japan—18.5% | |
Amada Co., Ltd. | | | 234,000 | | | | 1,866,461 | |
Bridgestone Corp. | | | 176,000 | | | | 3,840,473 | |
Canon, Inc.—ADR | | | 80,000 | | | $ | 3,773,600 | |
Hitachi Ltd. | | | 925,000 | | | | 4,994,761 | |
Kyoto Kimono Yuzen Co., Ltd. | | | 299,500 | | | | 3,267,676 | |
Makita Corp. | | | 84,000 | | | | 3,836,775 | |
MISUMI Group, Inc. | | | 92,500 | | | | 2,325,186 | |
Omron Corp. | | | 137,000 | | | | 3,744,425 | |
SMC Corp. | | | 24,000 | | | | 4,364,174 | |
Takata Corp. | | | 120,000 | | | | 3,623,004 | |
| | | | | | | | 35,636,535 | |
Luxembourg—0.4% | |
SAF-Holland SA(a) | | | 58,370 | | | | 704,154 | |
Mexico—1.9% | | | | | | | | |
Fomento Economico Mexicano S.A.B. de C.V.—ADR | | | 60,000 | | | | 3,774,000 | |
Netherlands—2.4% | | | | | | | | |
Unilever NV—ADR | | | 140,000 | | | | 4,620,000 | |
Norway—1.0% | | | | | | | | |
Orkla ASA | | | 189,351 | | | | 1,918,196 | |
South Africa—0.9% | | | | | | | | |
Gold Fields Ltd.—ADR | | | 100,000 | | | | 1,784,000 | |
Spain—5.5% | | | | | | | | |
Banco Santander SA—ADR | | | 271,549 | | | | 3,367,207 | |
Indra Sistemas SA | | | 134,000 | | | | 3,040,628 | |
Sol Melia SA | | | 325,000 | | | | 4,236,096 | |
| | | | | | | | 10,643,931 | |
Switzerland—2.2% | |
Nestle SA | | | 68,000 | | | | 4,221,503 | |
United Kingdom—9.5% | �� | | | | | | | |
3i Group PLC | | | 470,000 | | | | 2,198,954 | |
Ensco PLC—ADR | | | 25,000 | | | | 1,490,500 | |
Experian PLC | | | 270,000 | | | | 3,637,252 | |
Interserve PLC | | | 800,000 | | | | 3,754,928 | |
Invensys PLC | | | 600,000 | | | | 3,413,510 | |
Reckitt Benckisev Group PLC | | | 5,784 | | | | 321,140 | |
Vodafone Group PLC—ADR | | | 120,000 | | | | 3,494,400 | |
| | | | | | | | 18,310,684 | |
United States—2.1% | |
Newmont Mining Corp. | | | 70,000 | | | | 4,102,700 | |
Total Common Stocks
(Cost $130,031,060) | | | | | | | 176,513,594 | |
Short-Term Investments—8.5% | | | | | |
Money Market Funds—3.5% | | | | | |
AIM STIT-Treasury Portfolio, 0.02%(b) | | | 6,737,227 | | | | 6,737,227 | |
The Accompanying Notes are an Integral Part of these Financial Statements
The Tocqueville International Value Fund
Schedule of Investments as of April 30, 2011
(Unaudited)
| | | | | | | | |
| Repurchase Agreement—5.0% | | Principal
Amount | | | Value | |
Repurchase Agreement with U.S. Bank, N.A., 0.01% dated 04/29/2011, due 05/02/2011, collateralized by: Freddie Mac 30 Year Variable (Pool #1 B2052) valued at $5,186,666. Repurchase proceeds of $5,084,829. Freddie Mac 30 Year Variable Mortgage Backed Securities (Pool #3063) valued at $4,552,381. Repurchase proceeds of $4,463,179. | | $ | 9,548,000 | | | $ | 9,548,000 | |
Total Short Term Investments
(Cost $16,285,227) | | | | | | | 16,285,227 | |
Total Investments
(Cost $146,316,287)—99.9% | | | | 192,798,821 | |
Other Assets in Excess of
Liabilities—0.1% | | | | 284,247 | |
Total Net Assets—100.0% | | | | | | $ | 193,083,068 | |
| | | | | | | | |
Percentages are stated as a percent of net assets.
ADR—American Depository Receipt
| (a) | Non-income producing security. |
| (b) | Variable rate security. The rate shown is as of April 30, 2011. |
The Accompanying Notes are an Integral Part of these Financial Statements
The Tocqueville Gold Fund
Schedule of Investments as of April 30, 2011
(Unaudited)
| | | | | | | | |
| Common Stocks—83.1% | | Shares | | | Value | |
Gold Related—76.9% | | | | | | | | |
Australia—1.4% | | | | | | | | |
Centamin Egypt Ltd.(a) | | | 5,191,100 | | | $ | 11,302,295 | |
Eldorado Gold Corp.(a) | | | 1,544,785 | | | | 27,481,131 | |
| | | | | | | | 38,783,426 | |
Canada—56.0% | | | | | | | | |
Agnico Eagle Mines Ltd. | | | 677,000 | | | | 47,105,660 | |
Agnico Eagle Mines
Ltd.(a) | | | 210,837 | | | | 14,689,399 | |
Alacer Gold Corp.(a) | | | 1,708,900 | | | | 17,826,802 | |
Alamos Gold, Inc. | | | 3,195,200 | | | | 53,627,623 | |
Allied Gold Ltd.(a) | | | 23,860,000 | | | | 14,626,433 | |
Atac Resources Ltd(a)(b) | | | 7,800,000 | | | | 57,625,112 | |
Banro Corp.(a) | | | 5,273,900 | | | | 19,119,035 | |
Barrick Gold Corp. | | | 1,207,300 | | | | 61,584,373 | |
Brazilian Gold Corp.(a) | | | 4,285,800 | | | | 7,191,393 | |
Corvus Gold, Inc.(a)(b) | | | 2,079,901 | | | | 1,890,519 | |
Detour Gold Corp.(a) | | | 1,499,200 | | | | 50,673,166 | |
East Asia Minerals
Corp.(a) | | | 3,823,400 | | | | 22,670,057 | |
Eldorado Gold Corp. | | | 250,000 | | | | 4,645,000 | |
Eldorado Gold Corp.(a) | | | 2,026,800 | | | | 37,723,350 | |
European Goldfields
Ltd.(a) | | | 4,035,500 | | | | 56,129,768 | |
Franco-Nevada Corp. | | | 1,635,900 | | | | 64,872,344 | |
Geomark Exploration
Ltd.(a) | | | 1,337,800 | | | | 1,979,517 | |
Goldcorp, Inc. | | | 718,050 | | | | 40,088,732 | |
Goldcorp, Inc.(a) | | | 2,138,010 | | | | 119,515,245 | |
Golden Star Resources Ltd.(a) | | | 5,812,122 | | | | 18,889,397 | |
Hudbay Minerals, Inc. | | | 378,700 | | | | 6,055,413 | |
IAMGOLD Corp.(a) | | | 3,416,796 | | | | 71,033,533 | |
International Tower Hill Mines Ltd.(a)(b) | | | 5,666,667 | | | | 54,801,039 | |
International Tower Hill Mines Ltd.(a)(b) | | | 2,493,136 | | | | 24,233,282 | |
Ivanhoe Mines Ltd.(a) | | | 5,137,050 | | | | 134,704,022 | |
Minefinders Corp.(a) | | | 1,041,000 | | | | 17,504,952 | |
Nevsun Resources Ltd.(a) | | | 1,441,400 | | | | 9,384,372 | |
New Gold, Inc.(a) | | | 1,589,100 | | | | 17,797,920 | |
Novagold Resources,
Inc.(a) | | | 500,000 | | | | 6,436,612 | |
Orezone Gold Corp.(a) | | | 2,145,462 | | | | 10,204,068 | |
Osisko Mining Corp.(a) | | | 8,434,500 | | | | 123,466,496 | |
Pan American Silver Corp. | | | 1,499,466 | | | | 54,100,733 | |
Pan American Silver Corp.(a) | | | 61,536 | | | | 2,219,758 | |
Premier Gold Mines
Ltd.(a) | | | 886,000 | | | | 6,789,093 | |
Primero Mining Corp.(a) | | | 6,387,800 | | | | 31,258,800 | |
Richfield Ventures
Corp.(a)(b) | | | 2,800,000 | | | | 28,676,214 | |
Romarco Minerals, Inc.(a) | | | 15,387,800 | | | | 29,274,470 | |
SEMAFO, Inc.(a) | | | 5,200,000 | | | | 44,187,497 | |
Silver Wheaton Corp.(a) | | | 2,714,875 | | | | 110,471,582 | |
Strategic Metals Ltd.(a)(b) | | | 10,350,000 | | | | 36,645,881 | |
Torex Gold Resources, Inc.(a) | | | 8,611,700 | | | | 16,565,337 | |
Yamana Gold, Inc. | | | 4,317,500 | | | | 54,875,425 | |
| | | | | | | | 1,603,159,424 | |
| | | | | | | | |
| Common Stocks (continued) | | Shares | | | Value | |
Peru—1.4% | | | | | | | | |
Cia de Minas Buenaventura SA—ADR | | | 953,600 | | | $ | 39,736,512 | |
South Africa—2.5% | | | | | | | | |
AngloGold Ashanti Ltd.—ADR | | | 674,300 | | | | 34,375,814 | |
Gold Fields Ltd. | | | 166,249 | | | | 2,969,944 | |
Gold Fields Ltd.—ADR | | | 1,711,500 | | | | 30,533,160 | |
Harmony Gold Mining Co. Ltd. | | | 1 | | | | 15 | |
Harmony Gold Mining Co. Ltd.—ADR | | | 200,000 | | | | 3,114,000 | |
Witwatersrand Consolidated Gold Resources Ltd.(a) | | | 335,000 | | | | 1,876,562 | |
| | | | | | | | 72,869,495 | |
United Kingdom—2.7% | | | | | | | | |
Randgold Resources Ltd.—ADR(a) | | | 883,200 | | | | 76,458,624 | |
United States—12.9% | | | | | | | | |
Allied Nevada Gold Corp.(a) | | | 1,229,848 | | | | 52,957,255 | |
Electrum Ltd.(a)(c)(d)(e) | | | 2,127,287 | | | | 11,912,807 | |
Freeport-McMoRan Copper & Gold, Inc. | | | 300,000 | | | | 16,509,000 | |
Gold Resource Corp.(b) | | | 3,800,797 | | | | 114,594,029 | |
Newmont Mining Corp. | | | 1,764,800 | | | | 103,434,928 | |
Royal Gold, Inc. | | | 1,152,165 | | | | 70,259,022 | |
| | | | | | | | 369,667,041 | |
Total Gold Related | | | | | | | 2,200,674,522 | |
Other Precious Metals Related—4.3% | |
Canada—3.0% | | | | | | | | |
Scorpio Mining Corp.(a)(b) | | | 24,301,562 | | | | 31,848,995 | |
Tahoe Resources, Inc.(a) | | | 2,406,600 | | | | 54,737,655 | |
| | | | | | | | 86,586,650 | |
South Africa—0.5% | | | | | | | | |
Ivanhoe Nickel & Platinum Ltd.(a)(c)(d)(e) | | | 997,833 | | | | 14,967,495 | |
United States—0.8% | | | | | | | | |
Sunshine Silver
Mines(a)(c)(d)(e) | | | 1,633,545 | | | | 22,583,760 | |
Total Other Precious Metals Related | | | | | | | 124,137,905 | |
Other—1.9% | | | | | | | | |
Australia—0.8% | | | | | | | | |
Ivanhoe Australia Ltd.(a) | | | 6,464,000 | | | | 22,743,350 | |
Panoramic Resources Ltd. | | | 153,660 | | | | 346,957 | |
| | | | | | | | 23,090,307 | |
Canada—0.5% | | | | | | | | |
Cameco Corp. | | | 480,300 | | | | 14,159,244 | |
The Accompanying Footnotes are an Integral Part of these Financial Statements
The Tocqueville Gold Fund
Schedule of Investments as of April 30, 2011
(Unaudited)
| | | | | | | | |
| Common Stocks (continued) | | Shares | | | Value | |
United Kingdom—0.2% | | | | | | | | |
Copper Development
Corp.(a) | | | 12,512,000 | | | $ | 6,949,021 | |
United States—0.4% | | | | | | | | |
Gold Bullion International LLC(a)(c)(d)(e) | | | 5,000,000 | | | | 5,000,000 | |
GoviEx Uranium,
Inc.(a)(c)(d)(e) | | | 1,750,000 | | | | 5,250,000 | |
I-Pulse, Inc.(a)(c)(d)(e) | | | 74,532 | | | | 208,689 | |
| | | | | | | | 10,458,689 | |
Total Other | | | | | | | 54,657,261 | |
Total Common Stocks
(Cost $1,192,859,105) | | | | | | | 2,379,469,688 | |
Closed-Ended Mutual Fund—0.7% | | | | | |
Gold Bullion Related—0.7% | | | | | |
Sprott Physical Gold Trust(a) | | | 1,400,000 | | | | 19,362,000 | |
Total Closed-Ended Mutual Fund
(Cost $14,500,000) | | | | 19,362,000 | |
| Gold Bullion—5.4% | | | Ounces | | | | | |
Gold Bullion(a) | | | 98,032 | | | | 153,292,179 | |
Total Gold Bullion
(Cost $44,609,241) | | | | | | | 153,292,179 | |
Warrants—0.6% | | | | | | | | |
| Gold Related—0.6% | | | Shares | | | | | |
Canada—0.6% | | | | | | | | |
Kinross Gold Corp. Expiration: 9/3/2013, Exercise Price:
CAD $32.00(a) | | | 108,032 | | | | 156,427 | |
Minefinders Corp. Expiration: 12/31/2011, Exercise Price:
CAD $5.00(a) | | | 125,000 | | | | 1,467,790 | |
Pan American Silver Corp. Expiration: 1/4/2015, Exercise Price:
CAD $1.00(a)(d) | | | 133,333 | | | | 1,711,649 | |
Primero Mining Corp. Expiration: 7/20/2015, Exercise Price:
CAD $8.00(a) | | | 1,848,400 | | | | 2,148,962 | |
Richfield Ventures Corp. Expiration: 3/17/2012, Exercise Price:
CAD $2.50(a)(b)(d) | | | 1,400,000 | | | | 10,789,291 | |
Torex Gold Resources, Inc. Expiration: 11/12/2011, Exercise Price:
CAD $1.30(a) | | | 1,250,000 | | | | 726,629 | |
Yukon-Nevada Gold Corp. Expiration: 5/30/2012, Exercise Price:
CAD $3.00(a)(d) | | | 4,175,000 | | | | 80,001 | |
| | | | | | | | 17,080,749 | |
| | | | | | | | |
| Warrants (continued) | | Shares | | | Value | |
Cayman Islands—0.0% | | | | | | | | |
Endeavour Mining Corp. Expiration: 1/30/2014, Exercise Price: CAD $2.50(a) | | | 1,000,000 | | | $ | 824,394 | |
Total Gold Related | | | | | | | 17,905,143 | |
Other Precious Metals Related—0.0% | |
United States—0.0% | | | | | | | | |
Ivanhoe Nickel & Platinum Ltd. IPO Warrants Expiration:
12/31/2011(a)(c)(d)(e) | | | 97,500 | | | | — | |
Total Other Precious Metals Related | | | | | | | — | |
Total Warrants
(Cost $1,314,862) | | | | | | | 17,905,143 | |
| Short-Term Investments—9.7% | |
| Principal
Amount |
| | | | |
U.S. Treasury Bills—7.0% | | | | | |
United States Treasury Bills 0.120%, 05/26/2011(f) | | $ | 100,000,000 | | | | 99,991,689 | |
0.071%, 06/23/2011(f) | | | 100,000,000 | | | | 99,989,742 | |
| | | | | | | | 199,981,431 | |
The Accompanying Footnotes are an Integral Part of these Financial Statements
The Tocqueville Gold Fund
Schedule of Investments as of April 30, 2011
(Unaudited)
| | | | | | | | |
Short-Term
Investments (continued) | | Principal
Amount | | | Value | |
Repurchase Agreement—2.7% | | | | | |
Repurchase Agreement with U.S. Bank, N.A., 0.01% dated 04/29/2011, due 05/02/2011, collateralized by: Freddie Mac 30 Year Variable (Pool #1B2052) valued at $4,301,778. Repurchase proceeds of $4,217,303. Freddie Max 30 Year Variable (Pool #782472) valued at $20,711,769. Repurchase proceeds of $20,306,425. Fannie Mae Convential Level Pay 15 Year Fixed (Pool #254919) valued at $20,138,013. Repurchase proceeds of $19,744,328. Fannie Mae Convential Level Pay 15 Year Fixed (Pool #555408) valued at $32,406,076. Repurchase proceeds of $31,773,008. | | $ | 76,041,000 | | | $ | 76,041,000 | |
Total Short-Term Investments
(Cost $276,022,431) | | | | 276,022,431 | |
Total Investments
(Cost $1,529,305,639)—99.5% | | | | 2,846,051,441 | |
Other Assets in Excess of
Liabilities—0.5% | | | | 14,918,923 | |
Total Net Assets—100.0% | | | | | | $ | 2,860,970,364 | |
| | | | | | | | |
Percentages are stated as a percent of net assets.
ADR—American Depository Reciept
| (a) | Non-income producing security. |
| (b) | Affiliated company. See Footnote 9. |
| (c) | Denotes a security is either fully or partially restricted to resale. The aggregate value of restricted securites at April 30, 2011 was $59,922,751, which represented 2.1% of net assets. |
| (d) | Fair valued security. The aggregate value of fair valued securities as of April 30, 2011 was $72,503,692, which represented 2.5% of net assets. |
| (e) | Security is considered illiquid an may be difficult to sell. |
| (f) | Rate shown is the effective yield based on purchase price. The calculation assumes the security is held to maturity. |
The Accompanying Footnotes are an Integral Part of these Financial Statements
The Delafield Fund
Schedule of Investments as of April 30, 2011
(Unaudited)
| | | | | | | | |
| Common Stocks—78.8% | | Shares | | | Value | |
Aerospace & Defense—1.9% | | | | | | | | |
Honeywell International, Inc. | | | 450,000 | | | $ | 27,553,500 | |
Building Products—2.6% | | | | | | | | |
Griffon Corp.(a) | | | 1,500,000 | | | | 19,110,000 | |
NCI Building Systems, Inc.(a) | | | 500,000 | | | | 6,190,000 | |
Trex Co., Inc.(a) | | | 375,000 | | | | 12,030,000 | |
| | | | | | | | 37,330,000 | |
Chemicals—18.9% | | | | | | | | |
A Schulman, Inc. | | | 575,000 | | | | 14,559,000 | |
Ashland, Inc. | | | 430,000 | | | | 26,694,400 | |
Celanese Corp. | | | 825,000 | | | | 41,184,000 | |
Cytec Industries, Inc. | | | 375,000 | | | | 22,005,000 | |
Eastman Chemical Co. | | | 300,000 | | | | 32,175,000 | |
Ferro Corp.(a) | | | 1,925,000 | | | | 28,875,000 | |
FMC Corp. | | | 320,000 | | | | 28,249,600 | |
Lubrizol Corp. | | | 10,000 | | | | 1,345,200 | |
Minerals Technologies, Inc.(b) | | | 451,300 | | | | 30,688,400 | |
PolyOne Corp. | | | 1,475,000 | | | | 21,358,000 | |
Solutia, Inc.(a) | | | 700,000 | | | | 18,445,000 | |
Spartech Corp.(a) | | | 900,000 | | | | 6,426,000 | |
| | | | | | | | 272,004,600 | |
Commercial Banks—0.6% | | | | | | | | |
Hancock Holding Co. | | | 154,100 | | | | 5,032,906 | |
Whitney Holding Corp. | | | 312,313 | | | | 4,228,718 | |
| | | | | | | | 9,261,624 | |
Commercial Services & Supplies—0.9% | |
RR Donnelley & Sons Co. | | | 650,000 | | | | 12,259,000 | |
Communications Equipment—2.2% | | | | | |
Harris Corp. | | | 600,000 | | | | 31,878,000 | |
Construction & Engineering—1.2% | | | | | |
Insituform Technologies,
Inc.(a) | | | 675,000 | | | | 17,084,250 | |
Containers & Packaging—3.5% | | | | | |
Owens-Illinois, Inc.(a) | | | 1,100,000 | | | | 32,637,000 | |
Sonoco Products Co. | | | 500,000 | | | | 17,280,000 | |
| | | | | | | | 49,917,000 | |
Electrical Equipment—5.9% | | | | | | | | |
Acuity Brands, Inc. | | | 500,000 | | | | 29,400,000 | |
AMETEK, Inc. | | | 275,000 | | | | 12,661,000 | |
Belden, Inc. | | | 360,000 | | | | 13,690,800 | |
Brady Corp. | | | 400,000 | | | | 15,084,000 | |
Hubbell, Inc. | | | 200,000 | | | | 13,998,000 | |
| | | | | | | | 84,833,800 | |
Electronic Equipment, Instruments & Components—8.1% | |
Checkpoint Systems, Inc.(a)(b) | | | 1,675,000 | | | | 35,275,500 | |
Corning, Inc. | | | 800,000 | | | | 16,752,000 | |
| | | | | | | | |
| Common Stocks (continued) | | Shares | | | Value | |
Flextronics International
Ltd.(a)(c) | | | 5,800,000 | | | $ | 40,426,000 | |
Plexus Corp.(a) | | | 675,000 | | | | 24,630,750 | |
| | | | | | | | 117,084,250 | |
Health Care Equipment & Supplies—1.0% | |
Teleflex, Inc. | | | 235,000 | | | | 14,807,350 | |
Household Durables—3.1% | | | | | | | | |
Ethan Allen Interiors, Inc. | | | 450,000 | | | | 10,840,500 | |
Stanley Black & Decker, Inc. | | | 475,000 | | | | 34,508,750 | |
| | | | | | | | 45,349,250 | |
Industrial Conglomerates—3.8% | | | | | |
Carlisle Companies, Inc. | | | 525,000 | | | | 26,008,500 | |
Tyco International Ltd.(c) | | | 600,000 | | | | 29,244,000 | |
| | | | | | | | 55,252,500 | |
Life Sciences Tools & Services—1.3% | |
Thermo Fisher Scientific,
Inc.(a) | | | 300,000 | | | | 17,997,000 | |
Machinery—11.2% | | | | | | | | |
Albany International Corp.(b) | | | 700,000 | | | | 17,717,000 | |
Barnes Group, Inc. | | | 450,000 | | | | 11,133,000 | |
Crane Co. | | | 250,000 | | | | 12,477,500 | |
Dover Corp. | | | 425,000 | | | | 28,917,000 | |
Federal Signal Corp. | | | 1,900,000 | | | | 12,825,000 | |
Harsco Corp. | | | 75,000 | | | | 2,670,000 | |
IDEX Corp. | | | 235,000 | | | | 11,026,200 | |
Ingersoll-Rand PLC(c) | | | 600,000 | | | | 30,300,000 | |
Kennametal, Inc. | | | 725,000 | | | | 30,609,500 | |
Lydall, Inc.(a) | | | 325,000 | | | | 3,168,750 | |
| | | | | | | | 160,843,950 | |
Metals & Mining—0.7% | | | | | | | | |
Commercial Metals Co. | | | 600,000 | | | | 10,056,000 | |
Oil, Gas & Consumable Fuels—2.8% | |
El Paso Corp. | | | 1,275,000 | | | | 24,747,750 | |
Southern Union Co. | | | 525,000 | | | | 15,697,500 | |
| | | | | | | | 40,445,250 | |
Semiconductors & Semiconductor Equipment—4.0% | |
Fairchild Semiconductor International, Inc.(a) | | | 950,000 | | | | 19,921,500 | |
International Rectifier Corp.(a) | | | 400,000 | | | | 13,824,000 | |
LTX-Credence Corp.(a) | | | 1,500,000 | | | | 13,005,000 | |
Teradyne, Inc.(a) | | | 675,000 | | | | 10,867,500 | |
| | | | | | | | 57,618,000 | |
Specialty Retail—3.4% | | | | | | | | |
Collective Brands, Inc.(a) | | | 1,675,000 | | | | 35,175,000 | |
GameStop Corp.(a) | | | 550,000 | | | | 14,124,000 | |
| | | | | | | | 49,299,000 | |
The Accompanying Footnotes are an Integral Part of these Financial Statements
The Delafield Fund
Schedule of Investments as of April 30, 2011
(Unaudited)
| | | | | | | | |
| Common Stocks (continued) | | Shares | | | Value | |
Trading Companies & Distributors—1.7% | |
Rush Enterprises, Inc.(a) | | | 675,000 | | | $ | 14,222,250 | |
WESCO International, Inc.(a) | | | 175,000 | | | | 10,841,250 | |
| | | | | | | | 25,063,500 | |
Total Common Stocks
(Cost $836,742,989) | | | | | | | 1,135,937,824 | |
| Corporate Bonds—0.7% | |
| Principal
Amount |
| | | | |
Aerospace & Defense—0.1% | | | | | |
BAE Systems Holdings, Inc.
4.950%, 06/01/2014 | | $ | 500,000 | | | | 535,660 | |
Honeywell International, Inc.
3.875%, 02/15/2014 | | | 1,000,000 | | | | 1,073,684 | |
| | | | | | | | 1,609,344 | |
Chemicals—0.3% | | | | | | | | |
The Dow Chemical Co.
7.600%, 05/15/2014 | | | 2,500,000 | | | | 2,904,130 | |
5.900%, 02/15/2015 | | | 1,000,000 | | | | 1,125,454 | |
| | | | | | | | 4,029,584 | |
Diversified Financial Services—0.1% | |
JPMorgan Chase & Co.
4.650%, 06/01/2014 | | | 1,000,000 | | | | 1,079,837 | |
Electric Utilities—0.0% | |
Duke Energy Corp.
3.950%, 09/15/2014 | | | 1,000,000 | | | | 1,058,759 | |
Health Care Equipment & Supplies—0.1% | |
St. Jude Medical, Inc.
3.750%, 07/15/2014 | | | 1,000,000 | | | | 1,059,724 | |
Software—0.1% | |
Oracle Corp.
3.750%, 07/08/2014 | | | 1,000,000 | | | | 1,070,555 | |
Total Corporate Bonds
(Cost $8,969,080) | | | | | | | 9,907,803 | |
Foreign Corporate Bonds—0.2% | |
Diversified Telecommunication Services—0.2% | |
Deutsche Telekom International Finance BV(c) 4.875%, 07/08/2014 | | | 3,000,000 | | | | 3,270,975 | |
Total Foreign Corporate Bonds
(Cost $2,988,208) | | | | | | | 3,270,975 | |
| | | | | | | | |
Real Estate Investment Trusts
(REITs)—0.8% | | Shares | | | Value | |
Real Estate —0.8% | |
Kimco Realty Corp. | | | 600,000 | | | $ | 11,724,000 | |
Total Real Estate Investment Trusts
(Cost $5,536,617) | | | | 11,724,000 | |
U.S. Treasury
Obligations—0.7% | |
| Principal
Amount |
| | | | |
United States Treasury Notes—0.7% | |
1.000%, 07/31/2011 | | $ | 10,000,000 | | | | 10,024,610 | |
Total U.S. Treasury Obligations
(Cost $9,992,585) | | | | 10,024,610 | |
Short-Term
Investments—18.3% | | | Shares | | | | | |
Money Market Funds—18.3% | |
AIM STIT-Treasury Portfolio, 0.02%(d) | | | 264,589,757 | | | | 264,589,757 | |
Total Short Term Investments
(Cost $264,589,757) | | | | 264,589,757 | |
Total Investments
(Cost $1,128,819,236)—99.5% | | | | 1,435,454,969 | |
Other Assets in Excess of Liabilities—0.5% | | | | 6,965,940 | |
Total Net Assets—100.0% | | | | | | $ | 1,442,420,909 | |
| | | | | | | | |
Percentages are stated as a percent of net assets.
| (a) | Non-income producing security. |
| (b) | Affiliated company. See Footnote 9. |
| (c) | Foreign issued security. Foreign concentration was as follows: Ireland 2.1%; Netherlands 0.2%; Singapore 2.8%; Switzerland 2.0% |
| (d) | Variable rate security. The rate listed is as of April 30, 2011. |
The Accompanying Footnotes are an Integral Part of these Financial Statements
Tocqueville Select Fund
Schedule of Investments as of April 30, 2011
(Unaudited)
| | | | | | | | |
| Common Stocks—81.1% | | Shares | | | Value | |
Building Products—2.3% | | | | | | | | |
Griffon Corp.(a) | | | 154,200 | | | $ | 1,964,508 | |
Chemicals—10.7% | | | | | | | | |
Ashland, Inc. | | | 34,200 | | | | 2,123,136 | |
Celanese Corp. | | | 46,000 | | | | 2,296,320 | |
Cytec Industries, Inc. | | | 32,600 | | | | 1,912,968 | |
Minerals Technologies, Inc.(b) | | | 44,000 | | | | 2,992,000 | |
| | | | | | | | 9,324,424 | |
Communications Equipment—2.5% | | | | | |
Harris Corp. | | | 40,000 | | | | 2,125,200 | |
Containers & Packaging—5.8% | | | | | |
Owens-Illinois, Inc.(a) | | | 80,000 | | | | 2,373,600 | |
Sonoco Products Co. | | | 77,400 | | | | 2,674,944 | |
| | | | | | | | 5,048,544 | |
Diversified Consumer Services—3.5% | | | | | |
Summer Infant, Inc.(a) | | | 346,533 | | | | 3,063,352 | |
Electrical Equipment—2.8% | | | | | | | | |
Acuity Brands, Inc. | | | 41,200 | | | | 2,422,560 | |
Electronic Equipment, Instruments &
Components—5.9% | |
Checkpoint Systems, Inc.(a)(b) | | | 126,000 | | | | 2,653,560 | |
Flextronics International
Ltd.(a)(c) | | | 351,700 | | | | 2,451,349 | |
| | | | | | | | 5,104,909 | |
Hotels, Restaurants & Leisure—2.1% | | | | | |
Ruby Tuesday, Inc.(a) | | | 171,600 | | | | 1,803,516 | |
Household Durables—6.5% | | | | | | | | |
Ethan Allen Interiors, Inc. | | | 95,500 | | | | 2,300,595 | |
Stanley Black & Decker, Inc. | | | 33,300 | | | | 2,419,245 | |
Universal Electronics, Inc.(a) | | | 34,700 | | | | 960,843 | |
| | | | | | | | 5,680,683 | |
Industrial Conglomerates—2.9% | | | | | |
Carlisle Companies, Inc. | | | 50,000 | | | | 2,477,000 | |
Internet Software & Services—2.6% | | | | | |
j2 Global Communications,
Inc.(a) | | | 77,000 | | | | 2,268,420 | |
IT Services—0.6% | | | | | | | | |
Tier Technologies, Inc.(a) | | | 92,300 | | | | 515,957 | |
Machinery—17.7% | | | | | | | | |
Albany International Corp.(b) | | | 125,500 | | | | 3,176,405 | |
Barnes Group, Inc. | | | 92,400 | | | | 2,285,976 | |
Ingersoll-Rand PLC(c) | | | 60,000 | | | | 3,030,000 | |
Kennametal, Inc. | | | 86,500 | | | | 3,652,030 | |
Trimas Corp.(a) | | | 138,400 | | | | 3,212,264 | |
| | | | | | | | 15,356,675 | |
Professional Services—3.0% | | | | | | | | |
Stantec, Inc.(a)(c) | | | 82,100 | | | | 2,605,033 | |
| | | | | | | | |
| Common Stocks (continued) | | Shares | | | Value | |
Software—3.3% | | | | | | | | |
Monotype Imaging Holdings, Inc.(a) | | | 210,000 | | | $ | 2,856,000 | |
Specialty Retail—6.0% | | | | | | | | |
Collective Brands, Inc.(a) | | | 166,800 | | | | 3,502,800 | |
Foot Locker, Inc. | | | 81,000 | | | | 1,743,120 | |
| | | | | | | | 5,245,920 | |
Textiles, Apparel & Luxury Goods—2.9% | |
Maidenform Brands, Inc.(a) | | | 80,400 | | | | 2,545,464 | |
Total Common Stocks
(Cost $53,119,373) | | | | | | | 70,408,165 | |
| Short-Term Investments—18.5% | |
Money Market Funds—18.5% | |
AIM STIT-Treasury Portfolio, 0.02%(d) | | | 16,011,660 | | | | 16,011,660 | |
Total Short Term Investments
(Cost $16,011,660) | | | | | | | 16,011,660 | |
Total Investments
(Cost $69,131,033)—99.6% | | | | 86,419,825 | |
Other Assets in Excess of
Liabilities—0.4% | | | | 374,229 | |
Total Net Assets—100.0% | | | | | | $ | 86,794,054 | |
| | | | | | | | |
Percentages are stated as a percent of net assets.
| (a) | Non-income producing security. |
| (b) | Affiliated company. See Footnote 9. |
| (c) | Foreign issued security. Foreign concentration was as follows: Canada 3.0%; Ireland 3.5%; Singapore 2.8%. |
| (d) | Variable rate security. The rate shown is as of April 30, 2011. |
The Accompanying Footnotes are an Integral Part of these Financial Statements
Percent of Total Investments
The Tocqueville Fund
Allocation of Portfolio Holdings
April 30, 2011 (Unaudited)
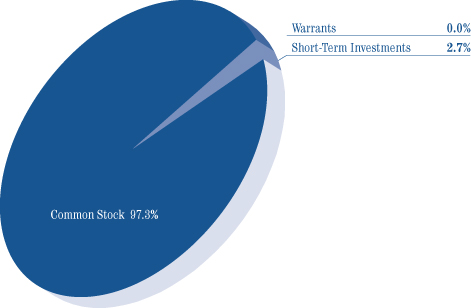
The Tocqueville Opportunity Fund
Allocation of Portfolio Holdings
April 30, 2011 (Unaudited)
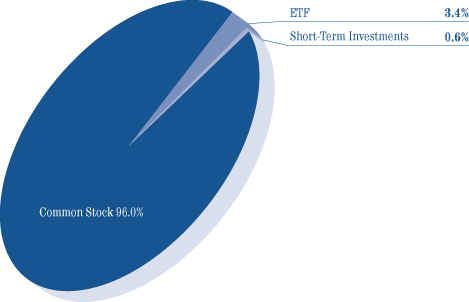
Percent of Total Investments
The Tocqueville International Value Fund
Allocation of Portfolio Holdings
April 30, 2011 (Unaudited)
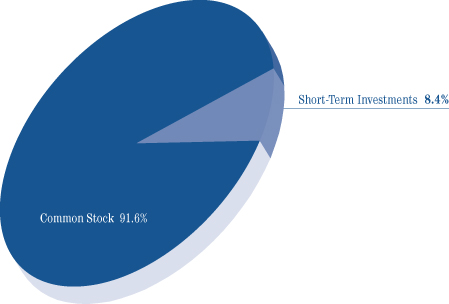
The Tocqueville Gold Fund
Allocation of Portfolio Holdings
April 30, 2011 (Unaudited)
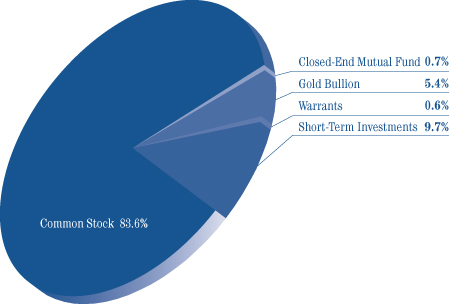
Percent of Total Investments
The Delafield Fund
Allocation of Portfolio Holdings
April 30, 2011 (Unaudited)
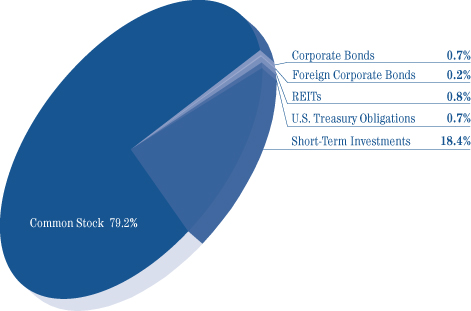
The Tocqueville Select Fund
Allocation of Portfolio Holdings
April 30, 2011 (Unaudited)
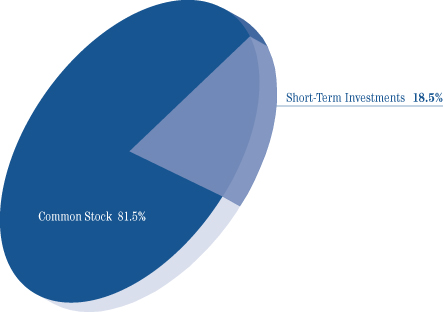
The Tocqueville Trust
Statements of Assets and Liabilities
April 30, 2011
(Unaudited)
| | | | | | | | | | | | | | | | | | | | | | | | |
| | | The
Tocqueville
Fund | | | Opportunity
Fund | | | International
Value
Fund | | | Gold
Fund | | | Delafield
Fund | | | Select
Fund | |
Assets | | | | | | | | | | | | | | | | | | | | | | | | |
Investments, at value (1) | | | | | | | | | | | | | | | | | | | | | | | | |
Unaffiliated issuers | | $ | 555,669,446 | | | $ | 45,480,564 | | | $ | 192,798,821 | | | $ | 2,385,853,846 | | | $ | 1,351,774,069 | | | $ | 77,597,860 | |
Affiliated issuers | | | — | | | | 875,800 | | | | — | | | | 460,197,595 | | | | 83,680,900 | | | | 8,821,965 | |
Foreign currencies (2) | | | — | | | | — | | | | 101,280 | | | | 7,033,495 | | | | — | | | | — | |
Cash | | | 710 | | | | 59 | | | | — | | | | 45,720 | | | | — | | | | — | |
Receivable for investments sold | | | 12,537,075 | | | | 155,037 | | | | — | | | | — | | | | 6,083,285 | | | | — | |
Receivable for foreign currencies sold | | | — | | | | — | | | | — | | | | 33,233 | | | | — | | | | — | |
Receivable for fund shares sold | | | 1,514,006 | | | | 216,181 | | | | 861,553 | | | | 22,662,200 | | | | 8,993,604 | | | | 633,908 | |
Dividends, interest and other receivables | | | 483,839 | | | | 4,585 | | | | 952,333 | | | | 472,435 | | | | 779,895 | | | | 7,901 | |
Prepaid assets | | | 29,321 | | | | 18,094 | | | | 14,519 | | | | 152,872 | | | | 62,972 | | | | 20,828 | |
| | | | | | | | | | | | | | | | | | | | | | | | |
Total Assets | | | 570,234,397 | | | | 46,750,320 | | | | 194,728,506 | | | | 2,876,451,396 | | | | 1,451,374,725 | | | | 87,082,462 | |
| | | | | | | | | | | | | | | | | | | | | | | | |
Liabilities | | | | | | | | | | | | | | | | | | | | | | | | |
Payable for investments purchased | | | 3,145,145 | | | | 396,039 | | | | 1,023,110 | | | | 7,557,121 | | | | 5,115,347 | | | | 67,080 | |
Currency payable | | | — | | | | — | | | | 101,888 | | | | — | | | | — | | | | — | |
Payable for fund shares redeemed | | | 384,033 | | | | 96,947 | | | | 287,827 | | | | 5,509,920 | | | | 2,605,987 | | | | 136,692 | |
Payable to Adviser | | | 340,020 | | | | 26,776 | | | | 149,969 | | | | 1,662,358 | | | | 821,297 | | | | 53,592 | |
Payable to Administrator | | | 77,134 | | | | 5,577 | | | | 22,770 | | | | 377,033 | | | | 199,588 | | | | 11,422 | |
Accrued distribution fee | | | 43,645 | | | | 7,663 | | | | 31,982 | | | | 153,424 | | | | 63,870 | | | | 8,778 | |
Accrued expenses and other liabilities | | | 81,506 | | | | 10,727 | | | | 27,892 | | | | 221,176 | | | | 147,727 | | | | 10,844 | |
| | | | | | | | | | | | | | | | | | | | | | | | |
Total Liabilities | | | 4,071,483 | | | | 543,729 | | | | 1,645,438 | | | | 15,481,032 | | | | 8,953,816 | | | | 288,408 | |
| | | | | | | | | | | | | | | | | | | | | | | | |
Net Assets | | $ | 566,162,914 | | | $ | 46,206,591 | | | $ | 193,083,068 | | | $ | 2,860,970,364 | | | $ | 1,442,420,909 | | | $ | 86,794,054 | |
| | | | | | | | | | | | | | | | | | | | | | | | |
Net assets consist of: | | | | | | | | | | | | | | | | | | | | | | | | |
Paid in capital | | | 515,269,814 | | | | 41,420,849 | | | | 156,115,118 | | | | 1,543,104,221 | | | | 1,107,464,077 | | | | 67,042,424 | |
Accumulated net investment income (loss) | | | 1,321,941 | | | | (193,937 | ) | | | 338,262 | | | | (15,336,261 | ) | | | (1,799,791 | ) | | | (234,969 | ) |
Accumulated net realized gain (loss) | | | (34,335,067 | ) | | | (5,831,470 | ) | | | (9,881,960 | ) | | | 16,411,303 | | | | 30,120,890 | | | | 2,697,807 | |
Net unrealized appreciation on: | | | | | | | | | | | | | | | | | | | | | | | | |
Investments and foreign currency related items | | | 83,906,226 | | | | 10,811,149 | | | | 46,511,648 | | | | 1,316,791,101 | | | | 306,635,733 | | | | 17,288,792 | |
| | | | | | | | | | | | | | | | | | | | | | | | |
Net assets | | $ | 566,162,914 | | | $ | 46,206,591 | | | $ | 193,083,068 | | | $ | 2,860,970,364 | | | $ | 1,442,420,909 | | | $ | 86,794,054 | |
| | | | | | | | | | | | | | | | | | | | | | | | |
Shares of beneficial interest outstanding (unlimited shares of $0.01 par value authorized) | | | 23,261,758 | | | | 2,800,855 | | | | 13,752,629 | | | | 31,586,828 | | | | 44,927,822 | | | | 6,551,553 | |
Net asset value, offering and redemption price per share | | $ | 24.34 | | | $ | 16.50 | | | $ | 14.04 | | | $ | 90.57 | | | $ | 32.11 | | | $ | 13.25 | |
(1) Cost of Investments | | | | | | | | | | | | | | | | | | | | | | | | |
Unaffiliated issuers | | $ | 471,763,220 | | | $ | 35,144,328 | | | $ | 146,316,287 | | | $ | 1,317,202,436 | | | $ | 1,064,475,514 | | | $ | 62,598,886 | |
Affiliated issuers | | $ | — | | | $ | 400,887 | | | $ | — | | | $ | 212,103,203 | | | $ | 64,343,722 | | | $ | 6,532,147 | |
(2) Cost of Foreign Currencies | | $ | — | | | $ | — | | | $ | 101,934 | | | $ | 6,988,196 | | | $ | — | | | $ | — | |
The Accompanying Notes are an Integral Part of these Financial Statements.
The Tocqueville Trust
Statements of Operations
For the Period Ended April 30, 2011
(Unaudited)
| | | | | | | | | | | | | | | | | | | | | | | | |
| | | The
Tocqueville
Fund | | | Opportunity
Fund | | | International
Value
Fund | | | Gold
Fund | | | The
Delafield
Fund | | | Select
Fund | |
Investment Income: | | | | | | | | | | | | | | | | | | | | | | | | |
Dividends* | | | | | | | | | | | | | | | | | | | | | | | | |
Unaffiliated issuers | | $ | 5,602,716 | | | $ | 55,665 | | | $ | 1,729,053 | | | $ | 3,363,439 | | | $ | 4,641,685 | | | $ | 142,796 | |
Affiliated issuers | | | 107,500 | | | | 825 | | | | — | | | | 729,143 | | | | 259,177 | | | | 30,435 | |
Interest | | | 250 | | | | 3 | | | | 1,416 | | | | 175,628 | | | | 439,010 | | | | 1,865 | |
| | | | | | | | | | | | | | | | | | | | | | | | |
| | | 5,710,466 | | | | 56,493 | | | | 1,730,469 | | | | 4,268,210 | | | | 5,339,872 | | | | 175,096 | |
| | | | | | | | | | | | | | | | | | | | | | | | |
Expenses: | | | | | | | | | | | | | | | | | | | | | | | | |
Investment Adviser’s fee (See Note 5) | | | 1,955,592 | | | | 139,228 | | | | 831,323 | | | | 9,233,243 | | | | 4,275,921 | | | | 242,858 | |
Distribution fees (See Note 5) | | | 651,864 | | | | 46,409 | | | | 207,831 | | | | 3,122,111 | | | | 1,478,296 | | | | 75,893 | |
Administration fee (See Note 5) | | | 391,118 | | | | 27,845 | | | | 124,698 | | | | 1,873,267 | | | | 886,978 | | | | 45,536 | |
Transfer agent and shareholder services fees | | | 102,081 | | | | 3,605 | | | | 15,083 | | | | 401,974 | | | | 187,911 | | | | 6,449 | |
Professional fees | | | 37,469 | | | | 9,413 | | | | 14,238 | | | | 180,257 | | | | 69,925 | | | | 5,498 | |
Printing and mailing expense | | | 27,701 | | | | 2,308 | | | | 6,380 | | | | 91,310 | | | | 58,124 | | | | 1,840 | |
Fund accounting fees | | | 20,521 | | | | 3,975 | | | | 16,848 | | | | 84,625 | | | | 40,764 | | | | 2,587 | |
Registration fees | | | 19,300 | | | | 7,250 | | | | 12,090 | | | | 125,253 | | | | 41,088 | | | | 15,846 | |
Trustee fees and expenses | | | 18,985 | | | | 1,388 | | | | 5,559 | | | | 83,395 | | | | 43,668 | | | | 1,584 | |
Custody fees | | | 15,639 | | | | 3,378 | | | | 30,337 | | | | 158,778 | | | | 33,192 | | | | 1,993 | |
Other expenses | | | 7,778 | | | | 1,037 | | | | 2,240 | | | | 31,294 | | | | 14,949 | | | | 822 | |
Insurance expense | | | 3,235 | | | | 181 | | | | 920 | | | | 12,896 | | | | 8,847 | | | | 362 | |
Excise tax | | | — | | | | — | | | | 10,517 | | | | — | | | | — | | | | — | |
| | | | | | | | | | | | | | | | | | | | | | | | |
Total expenses before waiver | | | 3,251,283 | | | | 246,017 | | | | 1,278,064 | | | | 15,398,403 | | | | 7,139,663 | | | | 401,268 | |
Less: Fees waived (See Note 5) | | | (177 | ) | | | — | | | | — | | | | — | | | | — | | | | — | |
| | | | | | | | | | | | | | | | | | | | | | | | |
Net expenses | | | 3,251,106 | | | | 246,017 | | | | 1,278,064 | | | | 15,398,403 | | | | 7,139,663 | | | | 401,268 | |
| | | | | | | | | | | | | | | | | | | | | | | | |
Net Investment Income (Loss) | | | 2,459,360 | | | | (189,524 | ) | | | 452,405 | | | | (11,130,193 | ) | | | (1,799,791 | ) | | | (226,172 | ) |
| | | | | | | | | | | | | | | | | | | | | | | | |
Realized and Unrealized Gain (Loss): | | | | | | | | | | | | | | | | | | | | | | | | |
Net realized gain (loss) on: | | | | | | | | | | | | | | | | | | | | | | | | |
Investments | | | | | | | | | | | | | | | | | | | | | | | | |
Unaffiliated issuers | | | 15,810,946 | | | | 2,216,525 | | | | 2,932,735 | | | | 16,721,982 | | | | 39,592,813 | | | | 2,935,157 | |
Affiliated issuers | | | (938,386 | ) | | | 112,239 | | | | — | | | | — | | | | (2,726,310 | ) | | | — | |
Foreign currency translation | | | 160 | | | | (763 | ) | | | (164,266 | ) | | | (315,533 | ) | | | — | | | | — | |
| | | | | | | | | | | | | | | | | | | | | | | | |
| | | 14,872,720 | | | | 2,328,001 | | | | 2,768,469 | | | | 16,406,449 | | | | 36,866,503 | | | | 2,935,157 | |
Net change in unrealized appreciation on: | | | | | | | | | | | | | | | | | | | | | | | | |
Investments | | | 54,575,056 | | | | 6,164,394 | | | | 18,953,429 | | | | 243,811,294 | | | | 177,018,173 | | | | 7,155,199 | |
Foreign currency translation | | | — | | | | 222 | | | | 4,164,906 | | | | 39,333,453 | | | | — | | | | — | |
| | | | | | | | | | | | | | | | | | | | | | | | |
| | | 54,575,056 | | | | 6,164,616 | | | | 23,118,335 | | | | 283,144,747 | | | | 177,018,173 | | | | 7,155,199 | |
Net gain on investments and foreign currency | | | 69,447,776 | | | | 8,492,617 | | | | 25,886,804 | | | | 299,551,196 | | | | 213,884,676 | | | | 10,090,356 | |
| | | | | | | | | | | | | | | | | | | | | | | | |
Net Increase in Net Assets Resulting from Operations | | $ | 71,907,136 | | | $ | 8,303,093 | | | $ | 26,339,209 | | | $ | 288,421,003 | | | $ | 212,084,885 | | | $ | 9,864,184 | |
| | | | | | | | | | | | | | | | | | | | | | | | |
* Net of foreign taxes withheld | | $ | 75,046 | | | $ | 410 | | | $ | 158,023 | | | $ | 332,177 | | | $ | — | | | $ | — | |
| | | | | | | | | | | | | | | | | | | | | | | | |
The Accompanying Notes are an Integral Part of these Financial Statements.
The Tocqueville Trust
Statements of Changes in Net Assets
| | | | | | | | | | | | | | | | |
| | | The Tocqueville Fund | | | Opportunity Fund | |
| | | For the
Period Ended
April 30,
2011 | | | For the
Year Ended
October 31,
2010 | | | For the
Period Ended
April 30,
2011 | | | For the
Year Ended
October 31,
2010 | |
| | | (Unaudited) | | | | | | (Unaudited) | | | | |
Operations: | | | | | | | | | | | | | | | | |
Net investment income (loss) | | $ | 2,459,360 | | | $ | 7,384,106 | | | $ | (189,524 | ) | | $ | (308,155 | ) |
Net realized gain on investments and foreign currency | | | 14,872,720 | | | | 15,319,648 | | | | 2,328,001 | | | | 1,418,029 | |
Net change in unrealized appreciation | | | 54,575,056 | | | | 49,148,587 | | | | 6,164,616 | | | | 5,071,383 | |
| | | | | | | | | | | | | | | | |
Net increase in net assets resulting from operations | | | 71,907,136 | | | | 71,852,341 | | | | 8,303,093 | | | | 6,181,257 | |
Dividends and distributions to shareholders: | | | | | | | | | | | | | | | | |
Net investment income | | | (7,457,179 | ) | | | (4,954,961 | ) | | | — | | | | — | |
Net realized gains | | | — | | | | — | | | | — | | | | — | |
Return of capital | | | — | | | | — | | | | — | | | | — | |
| | | | | | | | | | | | | | | | |
Total dividends and distributions | | | (7,457,179 | ) | | | (4,954,961 | ) | | | — | | | | — | |
Fund share transactions: | | | | | | | | | | | | | | | | |
Shares sold | | | 64,643,495 | | | | 142,456,732 | | | | 10,555,368 | | | | 5,812,777 | |
Shares issued to holders in reinvestment of dividends | | | 6,567,494 | | | | 4,041,138 | | | | — | | | | — | |
Shares redeemed* | | | (59,167,616 | ) | | | (107,195,396 | ) | | | (5,515,345 | ) | | | (9,628,207 | ) |
| | | | | | | | | | | | | | | | |
Net increase (decrease) | | | 12,043,373 | | | | 39,302,474 | | | | 5,040,023 | | | | (3,815,430 | ) |
| | | | | | | | | | | | | | | | |
Net increase in net assets | | | 76,493,330 | | | | 106,199,854 | | | | 13,343,116 | | | | 2,365,827 | |
Net Assets: | | | | | | | | | | | | | | | | |
Beginning of period | | | 489,669,584 | | | | 383,469,730 | | | | 32,863,475 | | | | 30,497,648 | |
| | | | | | | | | | | | | | | | |
End of period** | | | 566,162,914 | | | | 489,669,584 | | | | 46,206,591 | | | | 32,863,475 | |
| | | | | | | | | | | | | | | | |
* Net of redemption fees of: | | $ | 14,597 | | | $ | 37,740 | | | $ | 1,276 | | | $ | 424 | |
| | | | | | | | | | | | | | | | |
** Including undistributed net investment income (loss) of: | | $ | 1,321,941 | | | $ | 6,319,760 | | | $ | (193,937 | ) | | $ | (4,413 | ) |
| | | | | | | | | | | | | | | | |
The Accompanying Notes are an Integral Part of these Financial Statements.
The Tocqueville Trust
Statements of Changes in Net Assets
| | | | | | | | | | | | | | | | | | | | | | | | | | | | | | |
| International Value Fund | | | Gold Fund | | | Delafield Fund | | | Select Fund | |
For the
Period Ended
April 30,
2011 | | | For the
Year Ended
October 31,
2010 | | | For the
Period Ended
April 30,
2011 | | | For the
Year Ended
October 31,
2010 | | | For the
Period Ended
April 30,
2011 | | | For the Year
Ended
October 31,
2010 | | | For the
Period Ended
April 30,
2011 | | | For the
Year Ended
October 31,
2010 | |
| (Unaudited) | | | | | | (Unaudited) | | | | | | (Unaudited) | | | | | | (Unaudited) | | | | |
| | | | | | | | | | | | | | | | | | | | | | | | | | | | | | |
| $ | 452,405 | | | $ | 1,375,838 | | | $ | (11,130,193 | ) | | $ | (15,630,116 | ) | | $ | (1,799,791 | ) | | $ | (151,360 | ) | | $ | (226,172 | ) | | $ | (136,505 | ) |
| | 2,768,469 | | | | 395,547 | | | | 16,406,449 | | | | 49,553,458 | | | | 36,866,503 | | | | 36,471,167 | | | | 2,935,157 | | | | 2,803,415 | |
| | 23,118,335 | | | | 20,080,959 | | | | 283,144,747 | | | | 681,084,802 | | | | 177,018,173 | | | | 124,092,551 | | | | 7,155,199 | | | | 6,854,132 | |
| | | | | | | | | | | | | | | | | | | | | | | | | | | | | | | |
| | 26,339,209 | | | | 21,852,344 | | | | 288,421,003 | | | | 715,008,144 | | | | 212,084,885 | | | | 160,412,358 | | | | 9,864,184 | | | | 9,521,042 | |
| | | | | | | | | | | | | | | | | | | | | | | | | | | | | | |
| | (831,651 | ) | | | (1,534,647 | ) | | | — | | | | — | | | | — | | | | — | | | | — | | | | (27,613 | ) |
| | — | | | | — | | | | (46,368,277 | ) | | | (1,803,165 | ) | | | — | | | | — | | | | (2,112,007 | ) | | | — | |
| | — | | | | — | | | | — | | | | — | | | | — | | | | (719,160 | ) | | | — | | | | | |
| | | | | | | | | | | | | | | | | | | | | | | | | | | | | | | |
| | (831,651 | ) | | | (1,534,647 | ) | | | (46,368,277 | ) | | | (1,803,165 | ) | | | — | | | | (719,160 | ) | | | (2,112,007 | ) | | | (27,613 | ) |
| | | | | | | | | | | | | | | | | | | | | | | | | | | | | | |
| | 24,936,637 | | | | 15,384,677 | | | | 857,551,877 | | | | 936,511,037 | | | | 410,143,091 | | | | 354,831,009 | | | | 43,315,148 | | | | 14,517,906 | |
| | 615,614 | | | | 1,121,673 | | | | 42,874,881 | | | | 1,723,993 | | | | — | | | | 682,368 | | | | 2,067,329 | | | | 27,465 | |
| | (8,080,084 | ) | | | (18,334,069 | ) | | | (481,111,847 | ) | | | (389,329,542 | ) | | | (113,480,652 | ) | | | (218,080,618 | ) | | | (8,128,738 | ) | | | (6,931,705 | ) |
| | | | | | | | | | | | | | | | | | | | | | | | | | | | | | | |
| | 17,472,167 | | | | (1,827,719 | ) | | | 419,314,911 | | | | 548,905,488 | | | | 296,662,439 | | | | 137,432,759 | | | | 37,253,739 | | | | 7,613,666 | |
| | | | | | | | | | | | | | | | | | | | | | | | | | | | | | | |
| | 42,979,725 | | | | 18,489,978 | | | | 661,367,637 | | | | 1,262,110,467 | | | | 508,747,324 | | | | 297,125,957 | | | | 45,005,916 | | | | 17,107,095 | |
| | | | | | | | | | | | | | | | | | | | | | | | | | | | | | |
| | 150,103,343 | | | | 131,613,365 | | | | 2,199,602,727 | | | | 937,492,260 | | | | 933,673,585 | | | | 636,547,628 | | | | 41,788,138 | | | | 24,681,043 | |
| | | | | | | | | | | | | | | | | | | | | | | | | | | | | | | |
| | 193,083,068 | | | | 150,103,343 | | | | 2,860,970,364 | | | | 2,199,602,727 | | | | 1,442,420,909 | | | | 933,673,585 | | | | 86,794,054 | | | | 41,788,138 | |
| | | | | | | | | | | | | | | | | | | | | | | | | | | | | | | |
| $ | 7,973 | | | $ | 18,321 | | | $ | 1,917,699 | | | $ | 1,224,208 | | | $ | 70,945 | | | $ | 188,324 | | | $ | 26,313 | | | $ | 22,745 | |
| | | | | | | | | | | | | | | | | | | | | | | | | | | | | | | |
| $ | 338,262 | | | $ | 717,508 | | | $ | (15,336,261 | ) | | $ | (4,206,068 | ) | | $ | (1,799,791 | ) | | $ | — | | | $ | (234,969 | ) | | $ | (8,797 | ) |
| | | | | | | | | | | | | | | | | | | | | | | | | | | | | | | |
The Accompanying Notes are an Integral Part of these Financial Statements.
The Tocqueville Trust
The Tocqueville Fund
The Tocqueville Opportunity Fund
The Tocqueville International Value Fund
The Tocqueville Gold Fund
The Delafield Fund
The Tocqueville Select Fund
Notes to Financial Statements
1. ORGANIZATION
The Tocqueville Trust (the “Trust”) is a Massachusetts business trust organized on September 17, 1986, currently consisting of six separate funds (each, a “Fund” or, collectively, the “Funds”). Each Fund is an open-end management investment company with a different investment objective. The Tocqueville Fund, The Tocqueville Opportunity Fund (the “Opportunity Fund”), The Tocqueville International Value Fund (the “International Fund”), and The Delafield Fund are classified as diversified investment companies. The Tocqueville Gold Fund (the “Gold Fund”) and The Tocqueville Select Fund are classified as non-diversified investment companies. The Tocqueville Fund’s investment objective is long-term capital appreciation which it seeks to achieve by investing primarily in securities of United States issuers. The Opportunity Fund’s investment objective is to achieve long-term capital appreciation which it seeks to achieve by investing in the common stocks of small and mid cap companies which have the potential to deliver superior long term earnings growth. The International Fund’s investment objective is long-term capital appreciation consistent with preservation of capital which it seeks to achieve by investing primarily in securities of non-U.S. issuers. The Gold Fund’s investment objective is long-term capital appreciation which it seeks to achieve by investing in gold, securities of companies located throughout the world that are engaged in mining or processing gold (“gold related securities”), other precious metals and securities of companies located throughout the world that are engaged in mining or processing such other precious metals (“other precious metal securities”). The Delafield Fund’s investment objectives are to seek long-term preservation of capital (sufficient growth to outpace inflation over an extended period of time) and growth of capital which it seeks to achieve by investing primarily in the equity securities of domestic companies. The Tocqueville Select Fund’s investment objective is to achieve long-term capital appreciation by investing in a focused group of common stocks issued primarily by small and mid-sized U.S. companies. Current income is a secondary objective for The Tocqueville Select Fund.
On June 22, 2009, the Board of Directors of Delafield Fund, Inc. approved an Agreement and Plan of Reorganization providing for, among other things, the transfer of the assets and liabilities of Delafield Fund, Inc. into The Delafield Fund, a series of The Tocqueville Trust. On September 24, 2009, the shareholders of Delafield Fund, Inc. approved the Agreement and Plan of Reorganization. On July 9, 2009, the Board of Trustees of Delafield Select Fund, a series of Natixis Funds Trust II, approved an Agreement and Plan of Reorganization providing for, among other things, the transfer of the assets and liabilities of Delafield Select Fund into the sole share class of The Select Fund (now The Tocqueville Select Fund), a series of The Tocqueville Trust. On September 24, 2009, the shareholders of Delafield Select Fund approved the Agreement and Plan of Reorganization. The effective date of both reorganizations was September 28, 2009. Transfers into The Delafield Fund and The Select Fund from their predecessor funds amounted to $649,892,191 and $25,888,388, respectively.
The Delafield Fund, a series of the Trust, commenced operations on September 28, 2009 as successor to Delafield Fund, Inc. The predecessor Delafield Fund, Inc. commenced operations on November 19, 1993.
The Tocqueville Select Fund, a series of the Trust, commenced operations on September 28, 2009 as successor to the Delafield Select Fund, a series of Natixis Funds Trust II. The predecessor Delafield Select Fund commenced operations on September 29, 2008 for Class A and Class C shares and on September 26, 2008 for Class Y shares. Prior to September 29, 2008, the predecessor Delafield Select Fund operated as a Delaware limited partnership using substantially the same investment objectives and investment policies as the predecessor fund. The limited partnership was incepted in July 1998.
Effective October 12, 2010, the investment strategy of the Opportunity Fund was changed as described in the supplements dated August 12, 2010 to the Trust’s prospectus and statement of additional information. The Opportunity
Fund will invest primarily in stocks of small and mid capitalization companies, as measured at the time of initial purchase. The Fund seeks to invest in companies which management feels are market leaders in growth industries and have consistent growth in sales and earnings.
The following is a summary of significant accounting principles followed by the Trust in the preparation of its financial statements.
2. SIGNIFICANT ACCOUNTING POLICIES
a) Security valuation
Investments in securities, including foreign securities, traded on an exchange or quoted on the over-the-counter market are valued at the last sale price or, if no sale occurred during the day, at the mean between closing bid and asked prices, as last reported by a pricing service approved by the Trustees. Securities that are principally traded on the National Association of Securities Dealers Automated Quotation National Market (“NASDAQ”) are generally valued at the NASDAQ Official Closing Price (“NOCP”). Investments in gold and silver are valued on the basis of the respective closing spot prices of the New York Commodity Exchange. Investments in other precious metals are valued at their respective market values determined on the basis of the mean between the last current bid and asked prices based on dealer or exchange quotations. When market quotations are not readily available, or when restricted securities or other assets are being valued, such assets are valued at fair value as determined in good faith by or under procedures approved by the Trustees. Short-term securities maturing within 60 days are valued on an amortized cost basis. Fixed income securities with maturities greater than 60 days are valued at market price.
Trading in securities on European and Far Eastern securities exchanges normally is completed before the calculation of the Funds’ net asset value. Trading on these foreign exchanges may not take place on all days on which there is regular trading on the New York Stock Exchange (“NYSE”), or may take place on days on which there is no regular trading on the NYSE. Similarly, the Funds may hold securities traded in domestic markets where the market may close early on a given day prior to calculation of the Funds’ net asset value. Events affecting the value of such securities held by the Funds that occur between the close of trading in the security and the close of trading on the NYSE normally will not be reflected in the Funds’ calculation of the net asset value. Significant events will be closely monitored, and where it is determined that an adjustment should be made to the security’s value because significant interim events may materially affect the value of the security, the security will be priced at its fair value in accordance with the procedures approved by the Trustees.
Investment and shareholder transactions are recorded on trade date. Dividend income is recognized on the ex-dividend date and interest income is recognized on an accrual basis.
b) Restricted and illiquid securities
The Funds may invest in securities that are subject to legal or contractual restrictions on resale or are illiquid. A security may be considered illiquid if it lacks a readily available market or if its valuation has not changed for a certain period of time. Disposal of these securities may involve time consuming negotiations and expense, and a prompt sale at the current valuation may be difficult.
c) Fair valuation pricing inputs
The Trust has adopted authoritative fair valuation accounting standards which establish an authoritative definition of fair value and set out a hierarchy for measuring fair value. These standards require additional disclosures about the
various inputs and valuation techniques used to develop the measurements of fair value and a discussion in changes in valuation techniques and related inputs during the period. These inputs are summarized in the three broad levels listed below.
| | Level 1 - | Quoted prices in active markets for identical securities. |
| | Level 2 - | Other significant observable inputs (including quoted prices for similar securities, interest rates, prepayment speeds, credit risk, etc.). |
| | Level 3 - | Significant unobservable inputs (including the Fund’s own assumptions in determining the fair value of investments). |
Equity investments, including common stocks, foreign issued common stocks, exchange-traded funds, closed end mutual funds and real estate investments trusts, which are traded on an exchange are valued at the last sale price reported by the exchange on which the securities are primarily traded on the day of valuation. If there are no sales on a given day for securities traded on an exchange, the mean between the latest bid and ask price will be used. If there is no Nasdaq Official Closing Price for a Nasdaq-listed security or sale price available for an over-the-counter security, the mean of the latest bid and asked quotations from Nasdaq will be used. When using the market quotations or closing price provided by the pricing service and when the market is considered active, the security will be classified as a Level 1 security.
Investment in mutual funds, including money market funds, are generally priced at the ending net asset value (NAV) provided by the service agent of the funds and will be classified as Level 1 securities.
Debt securities, such as corporate bonds, convertible bonds and U.S. government agency issues for which market quotations are not readily available may be valued based on information supplied by independent pricing services using matrix pricing formulas and/or independent broker bid quotations. Debt securities with remaining maturities of 60 days or less may be valued on an amortized cost basis, which involves valuing an instrument at its cost and thereafter assuming a constant amortization to maturity of any discount or premium, regardless of the impact of fluctuating rates on the fair value of the instrument. On days when the closing price of the S&P 500 moves more than 1% from its previous close, common stocks of the International Value Fund which are traded on non-North American exchanges may be valued using matrix pricing formulas provided by an independent pricing service. Warrants for which the underlying security is registered and equities which are subject to a required holding period, but have a comparable public issue, are valued in good faith by the Advisor pursuant to procedures established under the general supervision and responsibility of the Funds’ Board of Trustees. These securities will generally be classified as Level 2 securities.
Any securities or other assets for which market quotations are not readily available are valued at fair value as determined in good faith by the Advisor pursuant to procedures established under the general supervision and responsibility of the Funds’ Board of Trustees and will be classified as Level 3 securities. In determining fair value, a Fund will seek to assign a value to the security which it believes represents the amount that the Fund could reasonably expect to receive upon its current sale. With respect to securities that are actively traded on U.S. exchanges, the Funds expect that market quotations will generally be available and that fair value might be used only in limited circumstances, such as when trading for a security is halted during the trading day.
For securities traded principally on foreign exchanges, the Funds may use fair value pricing if an event occurs after the close of trading of the principal foreign exchange on which a security is traded, but before calculation of a Fund’s NAV, which a Fund believes affects the value of the security since its last market quotation. Such events may involve situations relating to a single issuer (such as news related to the issuer announced after the close of the principal foreign
exchange), or situations relating to sectors of the market or the markets in generals (such as significant fluctuations in the U.S. or foreign markets or significant changes in exchange rates, natural disasters, armed conflicts, or governmental actions).
In determining whether a significant event has occurred with respect to securities traded principally in foreign markets, the Funds may engage a third party fair value service provider to systematically recommend the adjustment of closing market prices of non-U.S. securities based upon changes in a designated U.S. securities market index occuring from the time of close of the relevant foreign market and the close of the NYSE. Fair value pricing may also be used to value restricted securities held by the Funds or securities with little or no trading activity for extended periods of time. Fair value pricing involves judgements that are inherently subjective and inexact and it is not possible to determine with certainty when, and to what extent, an event will affect a market price. As a result, there can be no assurance that fair value pricing will reflect actual market value and it is possible that the fair value determined for a security may differ materially from the value that could be realized upon the sale of the security.
The following is a summary of the inputs used, as of April 30, 2011, involving the Funds’ assets carried at value. The inputs of methodology used for valuing securities may not be an indication of the risk associated with investing in those securities.
| | | | | | | | | | | | | | | | |
| Description | | Level 1 | | | Level 2 | | | Level 3 | | | Total | |
The Tocqueville Fund | | | | | | | | | | | | | | | | |
Common Stocks* | | $ | 540,568,043 | | | $ | — | | | $ | — | | | $ | 540,568,043 | |
Warrants* | | | — | | | | 38,403 | | | | — | | | | 38,403 | |
Repurchase Agreement | | | — | | | | 15,063,000 | | | | — | | | | 15,063,000 | |
| | | | | | | | | | | | | | | | |
Total Fund | | $ | 540,568,043 | | | $ | 15,101,403 | | | $ | — | | | $ | 555,669,446 | |
| | | | | | | | | | | | | | | | |
| | | | |
| The Tocqueville Opportunity Fund | | Level 1 | | | Level 2 | | | Level 3 | | | Total | |
Common Stocks | | | | | | | | | | | | | | | | |
Consumer Discretionary | | $ | 9,685,130 | | | $ | — | | | $ | — | | | $ | 9,685,130 | |
Consumer Staples | | | 2,429,363 | | | | — | | | | — | | | | 2,429,363 | |
Energy | | | 4,306,881 | | | | — | | | | — | | | | 4,306,881 | |
Financials | | | 2,512,187 | | | | — | | | | — | | | | 2,512,187 | |
Health Care | | | 5,367,414 | | | | — | | | | — | | | | 5,367,414 | |
Industrials | | | 4,277,098 | | | | — | | | | — | | | | 4,277,098 | |
Information Technology | | | 13,349,661 | | | | — | | | | 314,800 | | | | 13,664,461 | |
Materials | | | 2,168,266 | | | | — | | | | — | | | | 2,168,266 | |
Telecommunication Services | | | 142,198 | | | | — | | | | — | | | | 142,198 | |
| | | | | | | | | | | | | | | | |
Total Common Stocks | | | 44,238,198 | | | | — | | | | 314,800 | | | | 44,552,998 | |
Exchange Traded Funds* | | | 1,554,366 | | | | — | | | | — | | | | 1,554,366 | |
Repurchase Agreement | | | — | | | | 249,000 | | | | — | | | | 249,000 | |
| | | | | | | | | | | | | | | | |
Total Fund | | $ | 45,792,564 | | | $ | 249,000 | | | $ | 314,800 | | | $ | 46,356,364 | |
| | | | | | | | | | | | | | | | |
| | | | | | | | | | | | | | | | |
| The Tocqueville International Value Fund | | Level 1 | | | Level 2 | | | Level 3 | | | Total | |
Common Stocks* | | $ | 176,513,594 | | | $ | — | | | $ | — | | | $ | 176,513,594 | |
Money Market Fund | | | 6,737,227 | | | | — | | | | — | | | | 6,737,227 | |
Repurchase Agreement | | | — | | | | 9,548,000 | | | | — | | | | 9,548,000 | |
| | | | | | | | | | | | | | | | |
Total Fund | | $ | 183,250,821 | | | $ | 9,548,000 | | | $ | — | | | $ | 192,798,821 | |
| | | | | | | | | | | | | | | | |
| | | | |
| The Tocqueville Gold Fund | | Level 1 | | | Level 2 | | | Level 3 | | | Total | |
Common Stocks | | | | | | | | | | | | | | | | |
Gold Related | | $ | 2,121,402,417 | | | $ | 67,359,298 | | | $ | 11,912,807 | | | $ | 2,200,674,522 | |
Other Precious Metals Related | | | 86,586,650 | | | | — | | | | 37,551,255 | | | | 124,137,905 | |
Other | | | 44,198,572 | | | | — | | | | 10,458,689 | | | | 54,657,261 | |
| | | | | | | | | | | | | | | | |
Total Common Stocks | | | 2,252,187,639 | | | | 67,359,298 | | | | 59,922,751 | | | | 2,379,469,688 | |
Closed End Mutual Funds* | | | 19,362,000 | | | | — | | | | — | | | | 19,362,000 | |
Warrants* | | | — | | | | 17,905,143 | | | | — | | | | 17,905,143 | |
Gold Bullion | | | — | | | | 153,292,179 | | | | — | | | | 153,292,179 | |
U.S. Treasury Bills | | | — | | | | 199,981,431 | | | | — | | | | 199,981,431 | |
Repurchase Agreement | | | — | | | | 76,041,000 | | | | — | | | | 76,041,000 | |
| | | | | | | | | | | | | | | | |
Total Fund | | $ | 2,271,549,639 | | | $ | 514,579,051 | | | $ | 59,922,751 | | | $ | 2,846,051,441 | |
| | | | | | | | | | | | | | | | |
| | | | |
| The Delafield Fund | | Level 1 | | | Level 2 | | | Level 3 | | | Total | |
Common Stocks* | | $ | 1,135,937,824 | | | $ | — | | | $ | — | | | $ | 1,135,937,824 | |
Corporate Bonds* | | | — | | | | 9,907,803 | | | | — | | | | 9,907,803 | |
Foreign Corporate Bonds* | | | — | | | | 3,270,975 | | | | — | | | | 3,270,975 | |
Real Estate Investment Trust (REIT) | | | 11,724,000 | | | | — | | | | — | | | | 11,724,000 | |
U.S. Treasury Notes | | | — | | | | 10,024,610 | | | | — | | | | 10,024,610 | |
Money Market Funds | | | 264,589,757 | | | | — | | | | — | | | | 264,589,757 | |
| | | | | | | | | | | | | | | | |
Total Fund | | $ | 1,412,251,581 | | | $ | 23,203,388 | | | $ | — | | | $ | 1,435,454,969 | |
| | | | | | | | | | | | | | | | |
| | | | |
| The Tocqueville Select Fund | | Level 1 | | | Level 2 | | | Level 3 | | | Total | |
Common Stocks* | | $ | 70,408,165 | | | $ | — | | | $ | — | | | $ | 70,408,165 | |
Money Market Funds | | | 16,011,660 | | | | — | | | | — | | | | 16,011,660 | |
| | | | | | | | | | | | | | | | |
Total Fund | | $ | 86,419,825 | | | $ | — | | | $ | — | | | $ | 86,419,825 | |
| | | | | | | | | | | | | | | | |
| * | For further information regarding portfolio characteristics, please see the accompanying Schedules of Investments. |
Below is a reconciliation that details the transfer of securities between Level 1 and Level 2 during the reporting period.
| | | | | | | | | | | | | | | | | | | | | | | | |
| | | The
Tocqueville
Fund | | | The
Tocqueville
Opportunity
Fund | | | The
Tocqueville
International
Value Fund | | | The
Tocqueville
Gold Fund | | | The
Delafield
Fund | | | The
Tocqueville
Select Fund | |
Transfers Into Level 1 | | $ | — | | | $ | — | | | $ | — | | | $ | 45,225,000 | | | $ | — | | | $ | — | |
Transfers Out of Level 1 | | | — | | | | — | | | | — | | | | — | | | | — | | | | — | |
| | | | | | | | | | | | | | | | | | | | | | | | |
Net Transfers Into/(Out of) Level 1 | | | — | | | | — | | | | — | | | | 45,225,000 | | | | — | | | | — | |
| | | | | | | | | | | | | | | | | | | | | | | | |
Transfers Into Level 2 | | | — | | | | — | | | | — | | | | — | | | | — | | | | — | |
Transfers Out of Level 2 | | | — | | | | — | | | | — | | | | (45,225,000 | ) | | | — | | | | — | |
| | | | | | | | | | | | | | | | | | | | | | | | |
Net Transfers Into/(Out of) Level 2 | | | — | | | | — | | | | — | | | | (45,225,000 | ) | | | — | | | | — | |
| | | | | | | | | | | | | | | | | | | | | | | | |
The movement from Level 2 to Level 1 was due to the release of restrictions on the security.
Transfers between levels are recognized at the end of the reporting period.
Below is a reconciliation that details the activity of securities in Level 3 during the current fiscal period:
| | | | | | | | | | | | | | | | | | | | | | | | |
| | | The
Tocqueville
Fund | | | The
Tocqueville
Opportunity
Fund | | | The
Tocqueville
International
Value Fund | | | The
Tocqueville
Gold Fund | | | The
Delafield
Fund | | | The
Tocqueville
Select Fund | |
Beginning Balance—November 1, 2010 | | $ | — | | | $ | — | | | $ | — | | | $ | 30,842,633 | | | $ | — | | | $ | — | |
Purchases | | | — | | | | 314,800 | | | | — | | | | 18,635,167 | | | | — | | | | — | |
Sales | | | — | | | | — | | | | — | | | | — | | | | — | | | | — | |
Realized gains | | | — | | | | — | | | | — | | | | — | | | | — | | | | — | |
Realized losses | | | — | | | | — | | | | — | | | | — | | | | — | | | | — | |
Change in unrealized appreciation | | | — | | | | — | | | | — | | | | 10,444,951 | | | | — | | | | — | |
Transfers in/(out) of level 3 | | | — | | | | — | | | | — | | | | — | | | | — | | | | — | |
| | | | | | | | | | | | | | | | | | | | | | | | |
Ending Balance—April 30, 2011 | | $ | — | | | $ | 314,800 | | | $ | — | | | $ | 59,922,751 | | | $ | — | | | $ | — | |
| | | | | | | | | | | | | | | | | | | | | | | | |
d) Derivative instruments and hedging activities
The Trust has adopted derivative instruments disclosure standards in order to enable the investor to understand how and why an entity used derivatives, how derivatives are accounted for, and how derivative instruments affect an entity’s results of operations and financial position.
During the six-month ended April 30, 2011, The Tocqueville Gold Fund held call option contracts. Purchased call options on an equity are typically used to hedge against an equity position in the portfolio. The purchased call options held in the portfolio came attached to the equity position, at no additional cost, when it was purchased. The options were acquired in the normal course of pursuing the Fund’s investment objectives, not necessarily to hedge against a particular position.
Balance sheet—value of derivative instruments at April 30, 2011
The purchased options are no longer held in The Tocqueville Gold Fund. As such, they have no impact on the Fund’s balance sheet.
The effect of derivative instruments on the statement of operations for the period ended April 30, 2011
The purchased options held in The Tocqueville Gold Fund were exchanged as part of a corporate action of the issuer. There was no realized gain or loss resulting from the corporate action. As such, they have no impact on the Fund’s statement of operations.
e) Subsequent Events Evaluation
In preparing these financial statements, the Trust has evaluated events and transactions for potential recognition or disclosure resulting from subsequent events through the date financial statements were available to be issued.
f) Foreign currency translation
Investments and other assets and liabilities denominated in foreign currencies are translated to U.S. dollars at the prevailing rates of exchange, in accordance with the Trust’s Portfolio Securities Valuation and Foreign Exchange Contracts Procedures. The Tocqueville Fund, The Tocqueville International Value Fund, The Tocqueville Gold Fund and The Delafield Fund are engaged in transactions in securities denominated in foreign currencies and, as a result, enter into foreign exchange contracts. These Funds are exposed to additional market risk as a result of changes in the value of the underlying currency in relation to the U.S. dollar. Risks include potential inability of counterparties to meet the terms of their contracts. The value of foreign currency contracts are marked-to-market on a daily basis, which reflects the changes in the market value of the contract at the close of each day’s trading, resulting in daily unrealized gains and/or losses. When the contracts are closed, the Funds recognize a realized gain or loss.
The Funds do not isolate that portion of the results of operations resulting from changes in foreign exchange rates on investments from the fluctuations arising from changes in market prices of securities held. Such fluctuations are included with the net realized and unrealized gain or loss from investments.
Reported net realized foreign exchange gains or losses arise from sales of foreign currencies, currency gains or losses realized between the trade and settlement dates on securities transactions, the differences between the amounts of dividends, interest, and foreign withholding taxes recorded on the Fund’s books, and the U.S. dollar equivalent of the amounts actually received or paid. Net unrealized foreign exchange gains and losses arise from changes in the value of assets and liabilities other than investments in securities at the end of the fiscal period, resulting from changes in the exchange rates.
g) Written option accounting
The Tocqueville Opportunity Fund, The Tocqueville International Value Fund, The Tocqueville Select Fund and The Tocqueville Gold Fund may write (sell) covered call options to hedge portfolio investments. When the Funds write (sell)
an option, an amount equal to the premium received by the Funds is included in the Statements of Assets and Liabilities as an asset and an equivalent liability. The amount of the liability is subsequently marked-to-market to reflect the current value of the option written. By writing an option, the Funds may become obligated during the term of the option to deliver or purchase the securities underlying the option at the exercise price if the option is exercised. Option contracts are valued at the last sales price reported on the date of obligation. If the seller defaults and the value of the collateral declines or if bankruptcy proceedings are commenced with respect to the seller of the security, realization of the collateral by the Funds may be delayed or limited.
h) Dividends and distributions to Shareholders
Dividends to shareholders are recorded on the ex-dividend date. Dividends from net investment income are declared and paid annually by the Funds. Distributions of net realized capital gains, if any, will be declared and paid at least annually. Income and capital gain distributions are determined in accordance with income tax regulations which may differ from generally accepted accounting principles. Permanent differences between financial and tax reporting may result in reclassification to capital stock.
i) Use of estimates
The preparation of financial statements in conformity with accounting principles generally accepted in the United States of America requires management to make estimates and assumptions that affect the reported amounts of assets and liabilities and disclosure of contingent assets and liabilities at the date of the financial statements and the reported amounts of revenues and expenses during the reporting period. Actual results could differ from those estimates.
3. FEDERAL INCOME TAX
There is no tax liability resulting from unrecognized tax benefits relating to uncertain income tax positions taken or expected to be taken on the tax return for the fiscal year-end October 31, 2010, or for any other tax years which are open for exam. As of October 31, 2010, open tax years include the tax years ended October 31, 2007 through 2010. The Trust is also not aware of any tax positions for which it is reasonably possible that the total amounts of unrecognized tax benefits will significantly change in the next six months. The Fund recognizes interest and penalties, if any, related to unrecognized tax benefits as income tax expense in the Statement of Operations. During the period, the Funds did not incur any interest or penalties.
Provision for federal income taxes or excise taxes has not been made since the Funds have elected to be taxed as Regulated Investment Companies and intend to distribute substantially all taxable income to shareholders and otherwise comply with the provisions of the Internal Revenue Code applicable to Regulated Investment Companies. Distributions from net realized gains for book purposes may include short-term capital gains which are included as ordinary income to shareholders for tax purposes. Additionally, U.S. generally accepted accounting principles require that certain components of net assets relating to permanent differences be reclassified between financial and tax reporting. These reclassifications have no effect on net assets or net asset value per share. For the period ended October 31, 2010, the following table shows the reclassifications made:
| | | | | | | | | | | | |
| | | Undistributed
Net Investment
Income/(Loss) | | | Accumulated Net
Realized
Gain/(Loss) | | | Paid In Capital | |
Tocqueville Fund | | $ | — | | | $ | — | | | $ | — | |
Opportunity Fund | | | 303,742 | | | | — | | | | (303,742 | ) |
International Value Fund | | | (288,153 | ) | | | 288,153 | | | | — | |
Gold Fund | | | 11,817,861 | | | | (3,180,244 | ) | | | (8,637,617 | ) |
Delafield Fund | | | 870,520 | | | | (28,650 | ) | | | (841,870 | ) |
Select Fund | | | 164,118 | | | | (164,119 | ) | | | 1 | |
The permanent differences primarily relate to net operating losses and foreign currency reclasses.
As of October 31, 2010, the components of accumulated earnings (losses) for income tax purposes were as follows:
| | | | | | | | | | | | | | | | | | | | | | | | |
| | | Tocqueville
Fund | | | Opportunity
Fund | | | International
Value
Fund | | | Gold Fund | | | Delafield
Fund | | | Select
Fund | |
Tax cost of investments | | $ | 462,438,178 | | | $ | 28,451,500 | | | $ | 124,847,415 | | | $ | 1,136,610,779 | | | $ | 801,140,933 | | | $ | 31,719,009 | |
| | | | | | | | | | | | | | | | | | | | | | | | |
| | | | | | | | | | | | | | | | | | | | | | | | |
Unrealized appreciation | | | 74,974,749 | | | | 5,611,666 | | | | 30,248,853 | | | | 1,044,199,273 | | | | 169,845,704 | | | | 10,484,203 | |
Unrealized depreciation | | | (45,753,706 | ) | | | (1,078,656 | ) | | | (6,888,788 | ) | | | (14,307,390 | ) | | | (40,310,961 | ) | | | (587,939 | ) |
| | | | | | | | | | | | | | | | | | | | | | | | |
Net unrealized appreciation | | | 29,221,043 | | | | 4,533,010 | | | | 23,360,065 | | | | 1,029,891,883 | | | | 129,534,743 | | | | 9,896,264 | |
| | | | | | | | | | | | | | | | | | | | | | | | |
Undistributed operating income | | | 6,319,760 | | | | — | | | | 717,508 | | | | — | | | | — | | | | 282,013 | |
Undistributed long-term gains | | | — | | | | — | | | | — | | | | 46,373,131 | | | | — | | | | 1,829,973 | |
| | | | | | | | | | | | | | | | | | | | | | | | |
Distributable earnings | | | 6,319,760 | | | | — | | | | 717,508 | | | | 46,373,131 | | | | — | | | | 2,111,986 | |
| | | | | | | | | | | | | | | | | | | | | | | | |
Other accumulated loss | | | (49,097,660 | ) | | | (8,050,361 | ) | | | (12,617,181 | ) | | | (451,597 | ) | | | (6,662,796 | ) | | | (8,797 | ) |
| | | | | | | | | | | | | | | | | | | | | | | | |
Total accumulated gain/(loss) | | $ | (13,556,857 | ) | | $ | (3,517,351 | ) | | $ | 11,460,392 | | | $ | 1,075,813,417 | | | $ | 122,871,947 | | | $ | 11,999,453 | |
| | | | | | | | | | | | | | | | | | | | | | | | |
The difference between book-basis and tax-basis unrealized appreciation is attributable primarily to capital loss carry overs.
The tax character of distributions paid during the periods ended October 31, 2010 and 2009 (October 31, 2010 and December 31, 2009 for The Delafield Fund and The Select Fund) was as follows:
| | | | | | | | | | | | | | | | |
| | | October 31, 2010 | |
| | | Ordinary
Income | | | Long Term
Capital
Gain | | | Return of
Capital | | | Total | |
Tocqueville Fund | | $ | 4,954,961 | | | $ | — | | | $ | — | | | $ | 4,954,961 | |
Opportunity Fund | | | — | | | | — | | | | — | | | | — | |
International Value Fund | | | 1,534,647 | | | | — | | | | — | | | | 1,534,647 | |
Gold Fund | | | — | | | | 1,803,165 | | | | — | | | | 1,803,165 | |
Delafield Fund | | | — | | | | — | | | | 719,160 | | | | 719,160 | |
Select Fund | | | 27,613 | | | | — | | | | — | | | | 27,613 | |
| |
| | | October 31, 2009 | |
| | | Ordinary
Income | | | Long Term
Capital
Gain | | | Return of
Capital | | | Total | |
Tocqueville Fund | | $ | 5,443,841 | | | $ | — | | | $ | — | | | $ | 5,443,841 | |
Opportunity Fund | | | 38,161 | | | | 387,146 | | | | — | | | | 425,307 | |
International Value Fund | | | 2,581,611 | | | | 6,588,454 | | | | — | | | | 9,170,065 | |
Gold Fund | | | — | | | | 15,721,021 | | | | — | | | | 15,721,021 | |
Delafield Fund | | | 826,756 | | | | — | | | | 164,562 | | | | 991,318 | |
Select Fund | | | 5,068 | | | | — | | | | 5,751 | | | | 10,819 | |
The Fund designated as long-term capital gain dividend, pursuant to Internal Revenue Cose Section 852(b)(3), the amount necessary to reduce the earnings and profits of the Funds related to net capital gain to zero for the tax years ended October 31, 2010 and 2009.
At October 31, 2010, certain Funds had tax basis capital losses which may be carried forward to offset future capital gains as shown below.
| | | | | | | | | | | | | | | | |
| | | Tocqueville
Fund | | | Opportunity
Fund | | | International
Value Fund | | | Delafield
Fund | |
| Capital losses expiring on: | | | | | | | | | | | | | | | | |
10/31/2017 | | $ | (49,100,379 | ) | | $ | (8,050,361 | ) | | $ | (12,337,944 | ) | | $ | (6,662,796 | ) |
4. FINANCIAL INSTRUMENTS
The Funds may trade financial instruments with off-balance sheet risk in the normal course of investing activities and to assist in managing exposure to market risks such as interest rates and foreign currency exchange rates. The financial instruments include written options, forward foreign currency exchange contracts and futures contracts. The contractual amounts of these instruments represent the investment the Funds have in particular classes of financial instruments and the amounts potentially subject to risk. The measurement of the risks associated with these instruments is meaningful only when all related and offsetting transactions are considered. At April 30, 2011, the Funds did not hold any financial instruments with off-balance sheet risk.
5. INVESTMENT ADVISORY AND OTHER AGREEMENTS
Tocqueville Asset Management L.P. (“Tocqueville”) is the investment adviser (the “Adviser”) to the Trust under Investment Advisory Agreements approved by shareholders. For its services, Tocqueville receives fees from The Tocqueville Fund, calculated daily and payable monthly, at an annual rate of 0.75% on the first $1 billion of the average daily net assets of the Fund, and 0.65% of the average daily net assets in excess of $1 billion. Tocqueville receives fees from The Tocqueville Opportunity Fund, calculated daily and payable monthly, at an annual rate of 0.75% on the first $500 million of the average daily net assets of the Fund, and 0.65% of the average daily net assets in excess of $500 million. Tocqueville receives fees from The Tocqueville International Value Fund, calculated daily and payable monthly, at an annual rate of 1.00% on the first $1 billion of the average daily net assets of the Fund, and 0.75% of the average daily net assets in excess of $1 billion. Tocqueville receives fees from The Tocqueville Gold Fund, calculated daily and payable monthly, at an annual rate of 1.00% on the first $500 million of the average daily net assets of the Fund, 0.75% of the average daily net assets in excess of $500 million but not exceeding $1 billion, and 0.65% of the average daily net assets in excess of $1 billion. Tocqueville receives fees from The Delafield Fund, calculated daily and payable monthly, at an annual rate of 0.80% on the first $250 million of net assets of the Fund; 0.75% on the next $250 million of net assets of the Fund; 0.70% on the next $500 million of net assets of the Fund; and 0.65% on all net assets of the Fund over $1 billion. Tocqueville receives fees from The Tocqueville Select Fund, calculated daily and payable monthly, at an annual rate of 0.80% on all net assets of the Fund.
With respect to The Tocqueville Fund, effective October 31, 2010, the Adviser has contractually agreed to waive its advisory fees and/or reimburse expenses in order to ensure that The Tocqueville Fund’s total annual operating expenses do not exceed 1.25% of its average daily net assets. The Expense Limitation Agreement will remain in effect until March 1, 2012.
Pursuant to an Administrative Services Agreement, each Fund pays to the Adviser a fee computed and paid monthly at an annual rate of 0.15% of the average daily net assets of the Fund. For the six months ended April 30, 2011, the Adviser has made payments of $74,092, $5,385, $23,856, $353,995, $170,948, and $9,050 to U.S. Bancorp Fund Services, LLC for services provided under a Sub-Administration Agreement for The Tocqueville Fund, The Tocqueville Opportunity Fund, The Tocqueville International Value Fund, The Tocqueville Gold Fund, The Delafield Fund and The Tocqueville Select Fund, respectively.
Tocqueville Securities, L.P. (the “Distributor”), an affiliate of Tocqueville, acts as distributor for shares of the Trust. Each Fund adopted a distribution and service plan pursuant to Rule 12b-1 of the 1940 Act. Pursuant to the plans, each Fund pays to the Distributor distribution and service fees of 0.25% per annum of its average daily net assets.
Commissions earned by the Distributor for services rendered as a registered broker-dealer in securities transactions for The Tocqueville Fund, The Tocqueville Opportunity Fund, The Tocqueville International Value Fund, The Tocqueville Gold Fund, The Delafield Fund and The Tocqueville Select Fund for the six months ended April 30, 2011, were $86,033, $7,920, $7,841, $6,000, $10,547, and $2,851, respectively.
6. CAPITAL SHARE TRANSACTIONS.
Transactions in capital shares for each Fund were as follows:
| | | | | | | | |
| | | For the Six-Month
Period Ended
April 30, 2011
(Unaudited) | | | For the Year
Ended
October 31, 2010 | |
| The Tocqueville Fund | | Shares | | | Shares | |
Shares sold | | | 2,798,185 | | | | 7,015,241 | |
Shares issued to holders in reinvestment of dividends | | | 295,833 | | | | 203,892 | |
Shares redeemed | | | (2,574,076 | ) | | | (5,240,419 | ) |
| | | | | | | | |
Net increase | | | 519,942 | | | | 1,978,714 | |
| | |
| The Tocqueville Opportunity Fund | | | | | | |
Shares sold | | | 680,546 | | | | 472,367 | |
Shares issued to holders in reinvestment of dividends | | | — | | | | — | |
Shares redeemed | | | (368,988 | ) | | | (813,438 | ) |
| | | | | | | | |
Net increase (decrease) | | | 311,558 | | | | (341,071 | ) |
| | |
| The Tocqueville International Value Fund | | | | | | |
Shares sold | | | 1,941,690 | | | | 1,398,815 | |
Shares issued to holders in reinvestment of dividends | | | 49,328 | | | | 102,342 | |
Shares redeemed | | | (623,902 | ) | | | (1,671,623 | ) |
| | | | | | | | |
Net increase (decrease) | | | 1,367,116 | | | | (170,466 | ) |
| | |
| The Tocqueville Gold Fund | | | | | | |
Shares sold | | | 10,015,777 | | | | 14,061,481 | |
Shares issued to holders in reinvestment of dividends | | | 498,256 | | | | 30,182 | |
Shares redeemed | | | (5,750,766 | ) | | | (6,127,797 | ) |
| | | | | | | | |
Net increase | | | 4,763,267 | | | | 7,963,866 | |
| | |
| The Delafield Fund | | | | | | |
Shares sold | | | 13,663,136 | | | | 14,274,437 | |
Shares issued to holders in reinvestment of dividends | | | — | | | | 29,759 | |
Shares redeemed | | | (3,775,278 | ) | | | (9,085,090 | ) |
| | | | | | | | |
Net increase | | | 9,887,858 | | | | 5,219,106 | |
| | |
| The Tocqueville Select Fund | | | | | | |
Shares sold | | | 3,410,526 | | | | 1,383,358 | |
Shares issued to holders in reinvestment of dividends | | | 166,855 | | | | 3,045 | |
Shares redeemed | | | (646,621 | ) | | | (683,159 | ) |
| | | | | | | | |
Net increase | | | 2,930,760 | | | | 703,244 | |
7. FUND SHARE TRANSACTIONS
The Funds currently offer only one class of shares of beneficial interest. A redemption fee of 2.00% is imposed on redemptions of shares held 90 days or fewer. This fee is retained by each Fund and is credited to paid in capital. Redemptions to which the fee applies include redemptions of shares resulting from an exchange made pursuant to the Exchange Privilege, as defined in the Trust’s Prospectus dated March 1, 2011. For a more detailed description of when the redemption fee does not apply, please see the Trust’s Prospectus. The Trust may waive the redemption fee when the Adviser determines that the imposition of the redemption fee is not necessary to protect a Fund from the effects of redemptions by investors who use the Fund as a short-term trading vehicle.
8. INVESTMENT TRANSACTIONS
Purchases and sales of investment securities (excluding short-term instruments) for the period ended April 30, 2011 are summarized below.
| | | | | | | | | | | | | | | | | | | | | | | | |
| | | Tocqueville
Fund | | | Opportunity
Fund | | | International
Value Fund | | | Gold
Fund | | | Delafield
Fund | | | Select
Fund | |
Purchases: | | $ | 64,102,581 | | | $ | 26,363,272 | | | $ | 35,845,688 | | | $ | 460,459,476 | | | $ | 349,397,436 | | | $ | 30,775,932 | |
| | | | | | | | | | | | | | | | | | | | | | | | |
Sales: | | $ | 82,430,001 | | | $ | 21,503,680 | | | $ | 18,746,142 | | | $ | 27,558,062 | | | $ | 173,590,397 | | | $ | 4,583,603 | |
| | | | | | | | | | | | | | | | | | | | | | | | |
9) TRANSACTIONS WITH AFFILIATES
The following issuers are affiliated with the Funds; that is, the Adviser had control of 5% or more of the outstanding voting securities during the period from November 1, 2010 through April 30, 2011. As defined in Section (2)(a)(3) of the Investment Company Act of 1940; such issues are:
The Tocqueville Fund
| | | | | | | | | | | | | | | | | | | | | | | | | | | | | | | | |
Issuer Name | | Share Balance
At Nov. 1, 2010 | | | Additions | | | Reductions | | | Share Balance
At April 30, 2011 | | | Dividend
Income | | | Realized
Gain/(Loss) | | | Value
At April 30, 2011 | | | Cost
At April 30, 2011 | |
Alaska Communication
Systems Group, Inc. (a) | | | 550,000 | | | | — | | | | (550,000 | ) | | | — | | | $ | 107,500 | | | $ | (938,386 | ) | | $ | — | | | $ | — | |
| | | | | | | | | | | | | | | | | | | | | | | | | | | | | | | | |
| | | | | | | | | | | | | | | | | | $ | 107,500 | | | $ | (938,386 | ) | | $ | — | | | $ | — | |
The Tocqueville Opportunity Fund
| | | | | | | | | | | | | | | | | | | | | | | | | | | | | | | | |
Issuer Name | | Share Balance
At Nov. 1, 2010 | | | Additions | | | Reductions | | | Share Balance
At April 30, 2011 | | | Dividend
Income | | | Realized
Gain/(Loss) | | | Value
At April 30, 2011 | | | Cost
At April 30, 2011 | |
1-800 Flowers.com, Inc. (a) | | | 50,000 | | | | — | | | | (50,000 | ) | | | — | | | $ | — | | | $ | (187,368 | ) | | $ | — | | | $ | — | |
Landec Corp. (a) | | | 15,000 | | | | — | | | | (15,000 | ) | | | — | | | | — | | | | (48,132 | ) | | | — | | | | — | |
Minerals Technologies, Inc. | | | 13,000 | | | | — | | | | (9,500 | ) | | | 3,500 | | | | 825 | | | | 225,853 | | | | 238,000 | | | | 172,256 | |
Silicon Image, Inc. (a) | | | 75,000 | | | | — | | | | (43,500 | ) | | | 31,500 | | | | — | | | | 183,037 | | | | 262,080 | | | | 86,785 | |
TeleCommunication Systems, Inc. | | | 30,000 | | | | — | | | | (30,000 | ) | | | — | | | | — | | | | (112,668 | ) | | | — | | | | — | |
Ultratech, Inc. | | | 20,000 | | | | — | | | | (8,000 | ) | | | 12,000 | | | | — | | | | 51,517 | | | | 375,720 | | | | 141,846 | |
| | | | | | | | | | | | | | | | | | | | | | | | | | | | | | | | |
| | | | | | | | | | | | | | | | | | $ | 825 | | | $ | 112,239 | | | $ | 875,800 | | | $ | 400,887 | |
| | | | | |
The Tocqueville Gold Fund | | | | | | | | | | | | | | | | | | | | | |
Atac Resources Ltd. | | | 7,000,000 | | | | 800,000 | | | | — | | | | 7,800,000 | | | $ | — | | | $ | — | | | $ | 57,625,112 | | | $ | 25,459,155 | |
Banro Corp. (a) | | | 5,181,100 | | | | 92,800 | | | | — | | | | 5,273,900 | | | | — | | | | — | | | | 19,119,035 | | | | 11,680,400 | |
Corvus Gold, Inc. | | | 2,079,902 | | | | — | | | | (1 | ) | | | 2,079,901 | | | | — | | | | — | | | | 1,890,519 | | | | — | |
Gold Resource Corp. | | | 3,800,797 | | | | — | | | | — | | | | 3,800,797 | | | | 729,143 | | | | — | | | | 114,594,029 | | | | 33,036,368 | |
International Tower Hill Mines Ltd. | | | 2,493,136 | | | | — | | | | — | | | | 2,493,136 | | | | — | | | | — | | | | 24,233,282 | | | | 6,630,927 | |
International Tower Hill Mines Ltd. | | | 1,666,667 | | | | 4,000,000 | | | | — | | | | 5,666,667 | | | | — | | | | — | | | | 54,801,039 | | | | 34,620,679 | |
Primero Mining Corp. (a) | | | 4,621,000 | | | | 1,766,800 | | | | — | | | | 6,387,800 | | | | — | | | | — | | | | 31,258,800 | | | | 33,579,566 | |
Primero Mining Corp. Warrants (a) | | | 1,848,400 | | | | — | | | | — | | | | 1,848,400 | | | | — | | | | — | | | | 2,148,962 | | | | — | |
Richfield Ventures Corp. | | | 2,800,000 | | | | — | | | | — | | | | 2,800,000 | | | | — | | | | — | | | | 28,676,214 | | | | 5,318,268 | |
Richfield Ventures Corp. Warrants | | | 1,400,000 | | | | — | | | | — | | | | 1,400,000 | | | | — | | | | — | | | | 10,789,291 | | | | — | |
Romarco Minerals (a) | | | 15,387,800 | | | | — | | | | — | | | | 15,387,800 | | | | — | | | | — | | | | 29,274,470 | | | | 12,499,755 | |
Scorpio Mining Corp. | | | 16,699,542 | | | | 7,602,020 | | | | — | | | | 24,301,562 | | | | — | | | | — | | | | 31,848,995 | | | | 22,335,245 | |
Strategic Metals Ltd. | | | 10,350,000 | | | | — | | | | — | | | | 10,350,000 | | | | — | | | | — | | | | 36,645,881 | | | | 14,840,544 | |
Torex Gold Resources, Inc. (a) | | | 5,000,000 | | | | 3,611,700 | | | | — | | | | 8,611,700 | | | | — | | | | — | | | | 16,565,337 | | | | 12,102,296 | |
Torex Gold Resources, Inc., Warrants (a) | | | 1,250,000 | | | | — | | | | — | | | | 1,250,000 | | | | — | | | | — | | | | 726,629 | | | | — | |
| | | | | | | | | | | | | | | | | | | | | | | | | | | | | | | | |
| | | | | | | | | | | | | | | | | | $ | 729,143 | | | $ | — | | | $ | 460,197,595 | | | $ | 212,103,203 | |
| | | | |
The Delafield Fund | | | | | | | | | | | | | | | | | |
Albany International Corp. | | | 1,050,000 | | | | — | | | | (350,000 | ) | | | 700,000 | | | $ | 221,187 | | | $ | (2,726,310 | ) | | $ | 17,717,000 | | | $ | 10,924,820 | |
Checkpoint Systems, Inc. | | | 1,300,000 | | | | 375,000 | | | | — | | | | 1,675,000 | | | | — | | | | — | | | | 35,275,500 | | | | 28,141,059 | |
Minerals Technologies, Inc. | | | 334,800 | | | | 116,500 | | | | — | | | | 451,300 | | | | 37,990 | | | | — | | | | 30,688,400 | | | | 25,277,843 | |
| | | | | | | | | | | | | | | | | | | | | | | | | | | | | | | | |
| | | | | | | | | | | | | | | | | | $ | 259,177 | | | $ | (2,726,310 | ) | | $ | 83,680,900 | | | $ | 64,343,722 | |
| | | | |
The Tocqueville Select Fund | | | | | | | | | | | | | | | | | |
Albany International Corp. | | | 108,000 | | | | 17,500 | | | | — | | | | 125,500 | | | $ | 27,060 | | | $ | — | | | $ | 3,176,405 | | | $ | 2,078,227 | |
Checkpoint Systems, Inc. | | | 79,000 | | | | 47,000 | | | | — | | | | 126,000 | | | | — | | | | — | | | | 2,653,560 | | | | 2,008,748 | |
Minerals Technologies, Inc. | | | 29,500 | | | | 14,500 | | | | — | | | | 44,000 | | | | 3,375 | | | | — | | | | 2,992,000 | | | | 2,445,172 | |
| | | | | | | | | | | | | | | | | | | | | | | | | | | | | | | | |
| | | | | | | | | | | | | | | | | | $ | 30,435 | | | $ | — | | | $ | 8,821,965 | | | $ | 6,532,147 | |
| (a) | Security is no longer an affiliated company at April 30, 2011. |
10. LINE OF CREDIT
The Tocqueville Fund, Opportunity Fund, International Value Fund Gold Fund, Delafield Fund, and Select Fund each have a revolving secured credit facility with U.S. Bank, the Trust’s custodian, in the amounts of $40,000,000, $3,000,000, $130,000,000, $10,000,000, $40,000,000 and $9,500,000, respectively, for temporary emergency or extraordinary purposes, including the meeting of redemption requests that otherwise might require the untimely disposition of securities. The lines of credit have a one year term and are reviewed annually by the Board of Trustees. The current agreements run through May 31, 2011. The interest rate as of April 30, 2011 was 2.75%. During the six-months ended April 30, 2011, the Tocqueville Fund’s maximum borrowing was $4,674,200 and average borrowing was $41,834 and the Opportunity Fund’s maximum borrowing was $803,000 and average borrowing was $47,227. This borrowing resulted in interest expenses of $792 and $494, respectively. These amounts are included in Other Expenses on the Funds’ Statement of Operations. The International Value Fund, the Gold Fund, the Delafield Fund, and the Select Fund did not use their lines of credit. None of the Funds had outstanding loan balances as of April 30, 2011.
ADDITIONAL INFORMATION (UNAUDITED)
1. ADDITIONAL DISCLOSURE REGARDING FUND TRUSTEES AND OFFICERS
Independent Trustees
| | | | | | | | | | | | |
Name, Age and Address | | Position(s) Held with the Trust | | Term of Office and Length of Time Served (1) | | Principal Occupation During Past Five Years | | # of
Portfolios
in Fund
Complex
Overseen
By Trustee | | | Other Directorships Held by Trustee |
| | | | | |
Guy A. Main (74) 40 W. 57th St., 19th Floor New York, NY 10019 | | Trustee | | Indefinite Term, Since 2000 | | Retired. Formerly, Executive Vice President, Amwest Insurance Group, Inc. from April 1996 to January 2001; Chairman, President and Chief Executive Officer, Condor Services Inc. from April 1989 to April 1996. | | | 6 | | | Director, Amwest Insurance Group, Inc. from April 1996 to January 2001; Chairman, Association of California Insurance Companies from January 1996 to January 1998; Director, Condor Services Inc. from April 1989 to April 1996. |
| | | | | |
Charles W. Caulkins (54) 40 W. 57th St., 19th Floor New York, NY 10019 | | Trustee | | Indefinite Term, Since 2003 | | Partner, Chora Capital, LLC from June 2010 to present; Marketing Manager, L.R. Global Partners from January 2008 to May 2010; President, Arbor Marketing, Inc. from October 1994 to December 2007. | | | 6 | | | Director, Phoenix House from January 2001 to 2007; Director, Bridges to Community from July 2002 to 2006. |
| | | | | |
James W. Gerard (50) 40 W. 57th St., 19th Floor New York, NY 10019 | | Trustee | | Indefinite Term, Since 2001 | | Managing Director, North Sea Partners, January 2010 to present. Principal, Juniper Capital Group, LLC (formerly known as Argus Advisors International, LLC), from August 2003 to December 2009; Managing Director, The Chart Group from January 2001 to present; Managing Principal, Ironbound Partners from October 1998 to December 2000. | | | 6 | | | Director, American Overseas Memorial Day Association, 1988 to present; Trustee, Salisbury School, 2005 to present; Director, American Friends of Blerancourt, 1992-present; Director and Treasurer ASPCA, 1988 to 2008; |
Independent Trustees
| | | | | | | | | | | | |
Name, Age and Address | | Position(s) Held with the Trust | | Term of Office and Length of Time Served (1) | | Principal Occupation During Past Five Years | | # of
Portfolios
in Fund
Complex
Overseen
By Trustee | | | Other Directorships Held by Trustee |
| | | | | |
William F. Indoe (67) 40 W. 57th St., 19th Floor New York, NY 10019 | | Trustee | | Indefinite Term, Since 2006 | | Senior Counsel, Sullivan & Cromwell LLP (attorneys-at-law) 1990-present. | | | 6 | | | Director, Rho Capital Partners, Inc. |
| | | | | |
William J. Nolan III (63) 40 W. 57th St., 19th Floor New York, NY 10019 | | Trustee | | Indefinite Term, Since 2006 | | Retired, Executive Vice President & Treasurer PaineWebber Inc. 1997-2001. | | | 6 | | | Trustee, Adirondock Museum, Blue Mt. Lake, NY 1996 to present (Treasurer, 2000 to present). |
| | | | | |
Alexander Douglas (63) 40 W. 57th St., 19th Floor New York, NY 10019 | | Trustee | | Indefinite Term, Since 2010 | | President, CEO and owner of Spaulding Law Printing, Inc. | | | 6 | | | None |
Interested Trustees (and Officers)*
| | | | | | | | | | | | |
Name, Age and Address | | Position(s) Held with the Trust | | Term of Office and Length of Time Served (1) | | Principal Occupation During Past Five Years | | # of
Portfolios
in Fund
Complex
Overseen
By Trustee | | | Other Directorships Held by Trustee |
| | | | | |
Francois D. Sicart (67) 40 W. 57th St., 19th Floor New York, NY 10019 | | Chairman and Trustee | | Indefinite Term, Since 1987 | | Chairman, Tocqueville Management Corporation, the General Partner of Tocqueville Asset Management L.P. and Tocqueville Securities, L.P. from January 1990 to present; Chairman and Founder, Tocqueville Asset Management Corp. from December 1985 to January 1990; Vice Chairman of Tucker Anthony Management Corporation from 1981 to October 1986; Vice President (formerly general partner) among other positions with Tucker Anthony, Inc. from 1969 to January 1990. | | | 6 | | | Chairman and Director, Tocqueville Management Corporation, the General Partner of Tocqueville Asset Management L.P. and Tocqueville Securities, L.P. from January 1990 to present.
|
Interested Trustees (and Officers)*
| | | | | | | | | | | | |
Name, Age and Address | | Position(s) Held with the Trust | | Term of Office and Length of Time Served (1) | | Principal Occupation During Past Five Years | | # of
Portfolios
in Fund
Complex
Overseen
By Trustee | | | Other Directorships Held by Trustee |
| | | | | |
Robert W. Kleinschmidt (61) 40 W. 57th St., 19th Floor New York, NY 10019 | | President and Trustee | | Indefinite Term, Since 1991 | | President, Chief Investment Officer and Director, Tocqueville Management Corporation, the General Partner of Tocqueville Asset Management L.P. and Tocqueville Securities, L.P. from January 1994 to present; and Managing Director from July 1991 to January 1994; Partner, David J. Greene & Co. from May 1978 to July 1991. | | | 6 | | | President and Director, Tocqueville Management Corporation, the General Partner of Tocqueville Asset Management L.P. and Tocqueville Securities, L.P.
|
| | | | | |
Cleo Kotis (35) 40 W. 57th St., 19th Floor New York, NY 10019 | | Secretary | | Indefinite Term, Since 2010 | | Director of Operations, the Delafield Group of Tocqueville Asset Management L.P., 2009 to present; Vice President and Chief Operations Officer, the Delafield Fund, Inc. from 2005-2009; Vice President and Chief Operations Officer, Delafield Asset Management from 2005-2009; Vice President, Reich & Tang Asset Management, LLC from 2002-2009. | | | N/A | | | N/A |
| | | | | |
John Cassidy (68) 40 W. 57th St., 19th Floor New York, NY 10019 | | Treasurer | | Indefinite Term, Since 2010 | | Treasurer, Tocqueville Asset Management L.P., from May 2002 to present. | | | N/A | | | N/A |
| | | | | |
Elizabeth Bosco (62) 40 W. 57th St., 19th Floor
New York, NY 10019 | | Anti- Money Laundering Compliance Officer
| | Indefinite Term, Since 2009 | | Chief Compliance Officer (January 2009-present), Tocqueville Securities L.P.; Compliance Officer (January 1997-January 2009), Tocqueville Securities L.P. and Tocqueville Asset Management, L.P. | | | N/A | | | N/A
|
| * | “Interested person” of the Trust is defined in the 1940 Act. Mr. Sicart and Mr. Kleinschmidt are considered “interested persons” because of their affiliation with the Adviser. |
Interested Trustees (and Officers)*
| | | | | | | | | | | | |
Name, Age and Address | | Position(s) Held with the Trust | | Term of Office and Length of Time Served (1) | | Principal Occupation During Past Five Years | | # of
Portfolios
in Fund
Complex
Overseen
By Trustee | | | Other Directorships Held by Trustee |
| | | | | |
Thomas Pandick (64) 40 W. 57th St., 19th Floor New York, NY 10019
| | Chief Compliance Officer | | Indefinite Term, Since 2004 | | Chief Compliance Officer (October 2004-present), Tocqueville Asset Management L.P.; General Counsel (January-October 2004), Tocqueville Asset Management L.P. | | | N/A | | | N/A
|
| 1 | Each Trustee will hold office for an indefinite term until the earliest of (i) the next meeting of shareholders, if any, called for the purpose of considering the election or re-election of such Trustee and until the election and qualification of his or her successor, if any, elected at such meeting, or (ii) the date a Trustee resigns or retires, or a Trustee is removed by the Board of Trustees or shareholders, in accordance with the Trust’s By-Laws, as amended, and Agreement and Declaration of Trust, as amended. Each officer will hold office for an indefinite term until the date he or she resigns or retires or until his or her successor is elected and qualified. |
2. PROXY VOTING POLICIES AND PROCEDURES
A description of the policies and procedures that The Tocqueville Trust uses to determine how to vote proxies relating to portfolio securities is available without charge upon request by calling 1-800-355-7307. Information regarding how The Tocqueville Trust voted proxies relating to portfolio securities during the most recent 12-month period ended June 30 is available by calling 1-800-355-7307 and it is also available on the SEC’s web site at http://www.sec.gov.
3. SHAREHOLDER REPORTS AND QUARTERLY PORTFOLIO DISCLOSURE
The Tocqueville Trust is required to file its complete schedule of portfolio holdings with the SEC for its first and third fiscal quarters on Form N-Q. The Trust’s Form N-Q will be available without charge, upon request on the SEC’s website (http://www.sec.gov) and may be available by calling 1-800-697-3863. You can also obtain copies of Form N-Q by (i) visiting the SEC’s Public Reference Room in Washington, DC (information on the operation of the Public Reference Room may be obtained by calling 1-202-551-8090); (ii) sending your request and a duplicating fee to the SEC’s Public Reference Room, Washington, DC 20549-1520; or (iii) sending your request electronically to publicinfosec.gov. Quarterly portfolio holdings are also available on the website of The Tocqueville Funds, www.tocquevillefunds.com.
4. SHAREHOLDER NOTIFICATION OF FEDERAL TAX STATUS
For the fiscal period ended October 31, 2010, certain dividends paid by the Funds may be subject to a maximum tax rate of 15%, as provided for by the Jobs and Growth Tax Relief Reconciliation Act of 2003. The percentage of dividends declared from ordinary income designated as qualified dividend income was as follows:
| | | | |
Tocqueville Fund | | | 100.00 | % |
Opportunity Fund | | | 0.00 | % |
International Value Fund | | | 100.00 | % |
Gold Fund | | | 0.00 | % |
Delafield Fund | | | 0.00 | % |
Select Fund | | | 97.99 | % |
For corporate shareholders, the percent of ordinary income distributions qualifying for the corporate dividends received deduction for the fiscal period ended October 31, 2010 was as follows:
| | | | |
Tocqueville Fund | | | 100.00 | % |
Opportunity Fund | | | 0.00 | % |
International Value Fund | | | 1.50 | % |
Gold Fund | | | 0.00 | % |
Delafield Fund | | | 0.00 | % |
Select Fund | | | 96.61 | % |
For the period ended October 31, 2010, the funds designate the following percent of ordinary distributions paid as interest-related dividends under the Internal Revenue Code Section 871(k)(1)(c):
| | | | |
Tocqueville Fund | | | 3.04 | % |
Opportunity Fund | | | 0.00 | % |
International Value Fund | | | 0.99 | % |
Gold Fund | | | 0.00 | % |
Delafield Fund | | | 0.00 | % |
Select Fund | | | 0.27 | % |
The percentage of taxable ordinary income distributions that are designated as short-term capital gain distributions under Internal Revenue Section 871(k)(2)(C) for each Fund were as follows.
| | | | |
Tocqueville Fund | | | 0.00 | % |
Opportunity Fund | | | 0.00 | % |
International Value Fund | | | 0.00 | % |
Gold Fund | | | 0.00 | % |
Delafield Fund | | | 0.00 | % |
Select Fund | | | 100.00 | % |
5. FOREIGN TAX CREDIT
For the year ended October 31, 2010, the Tocqueville International Value Fund earned foreign source income and paid foreign taxes which they intend to pass through to their shareholders pursuant to Section 853 of the Internal Revenue Code as follows:
| | | | | | | | |
Country | | Gross Dividend
Per Share | | | Taxes Withheld
Per Share | |
Australia | | $ | 0.00281 | | | $ | 0.00000 | |
Belgium | | | 0.01839 | | | | 0.00276 | |
Brazil | | | 0.01009 | | | | 0.00185 | |
Finland | | | 0.00669 | | | | 0.00105 | |
France | | | 0.05554 | | | | 0.01163 | |
Germany | | | 0.00378 | | | | 0.00113 | |
Hong Kong | | | 0.01192 | | | | 0.00000 | |
Indonesia | | | 0.00596 | | | | 0.00118 | |
Ireland | | | 0.01033 | | | | 0.00119 | |
Japan | | | 0.05112 | | | | 0.00374 | |
Jersey | | | 0.00702 | | | | 0.00050 | |
Mexico | | | 0.00242 | | | | 0.00000 | |
Netherlands | | | 0.01873 | | | | 0.00257 | |
Netherlands Antilles | | | 0.00288 | | | | 0.00000 | |
Singapore | | | 0.00292 | | | | 0.00000 | |
South Africa | | | 0.00064 | | | | 0.00000 | |
Spain | | | 0.00631 | | | | 0.00109 | |
Switzerland | | | 0.01137 | | | | 0.00171 | |
Thailand | | | 0.00866 | | | | 0.00087 | |
United Kingdom | | | 0.02122 | | | | 0.00000 | |
| | | | | | | | |
| | $ | 0.25880 | | | $ | 0.03127 | |
| | | | | | | | |
Investment Adviser
Tocqueville Asset Management L.P.
40 W. 57th St., 19th Floor
New York, NY 10019
(212) 698-0800
www.tocqueville.com
Distributor
Tocqueville Securities, L.P.
40 W. 57th St., 19th Floor
New York, NY 10019
(212) 698-0800
Shareholders’ Servicing and Transfer Agent
U.S. Bancorp Fund Services, LLC
P.O. Box 701
Milwaukee, WI 53201-0701
(800) 697-3863
Custodian
U.S. Bank, N.A.
Custody Operations
1555 River Center Drive, Suite 302
Milwaukee, WI 53212
Board of Trustees
François D. Sicart—Chairman
Charles W. Caulkins
Alexander Douglas
James W. Gerard
William F. Indoe
Robert W. Kleinschmidt
Guy A. Main
William J. Nolan III

Tocqueville Funds
c/o US Bancorp Fund Services, LLC
P.O. Box 701
Milwaukee, WI 53201-0701
www.tocquevillefunds.com
TQRPSEMI 11
Not applicable for semi-annual reports.
| Item 3. | Audit Committee Financial Expert. |
Not applicable for semi-annual reports.
| Item 4. | Principal Accountant Fees and Services. |
Not applicable for semi-annual reports.
| Item 5. | Audit Committee of Listed Registrants. |
Not applicable to registrants who are not listed issuers (as defined in Rule 10A-3 under the Securities Exchange Act of 1934).
| Item 6. | Schedule of Investments. |
Schedule of Investments is included as part of the report to shareholders filed under Item 1 of this Form.
| Item 7. | Disclosure of Proxy Voting Policies and Procedures for Closed-End Management Investment Companies. |
Not applicable to open-end investment companies.
| Item 8. | Portfolio Managers of Closed-End Management Investment Companies. |
Not applicable to open-end investment companies.
| Item 9. | Purchases of Equity Securities by Closed-End Management Investment Company and Affiliated Purchasers. |
Not applicable to open-end investment companies.
| Item 10. | Submission of Matters to a Vote of Security Holders. |
There were no material changes to the procedures by which shareholders may recommend nominees to the registrant’s Board of Trustees that were implemented after the registrant last provided disclosure in response to the requirements of Item 407(c)(2)(iv) of Regulation S-K (as required by Item 22(b)(15) of Schedule 14A), or this Item 10.
| Item 11. | Controls and Procedures. |
| (a) | The registrant’s Principal Executive Officer and Principal Financial Officer have evaluated the design and operation of the registrant’s disclosure controls and procedures within 90 days of the filing and have concluded that the registrant’s disclosure controls and procedures were effective in ensuring that information required to be disclosed by the registrant in this Form
N-CSR was recorded, processed, summarized and reported on a timely basis. |
| (b) | There were no changes in the registrant’s internal controls over financial reporting that occurred during the registrant’s second fiscal quarter of the period covered by this report that have materially affected, or are reasonably likely to materially affect, the registrant’s internal control over financial reporting. |
| (a) (1) | Any code of ethics or amendment thereto, that is subject of the disclosure required by Item 2, to the extent that the registrant intends to satisfy Item 2 requirements through filing an exhibit. 1) Not applicable for semi-annual reports. |
| | (2) | Certifications pursuant to Section 302 of the Sarbanes-Oxley Act of 2002. Filed herewith. |
| | (3) | Not applicable to open-end investment companies. |
| (b) | Certifications of Principal Executive Officer and Principal Financial Officer, under Section 906 of the Sarbanes-Oxley Act of 2002 and 18 U.S.C. § 1350. Filed herewith. |
SIGNATURES
Pursuant to the requirements of the Securities Exchange Act of 1934 and the Investment Company Act of 1940, the registrant has duly caused this report to be signed on its behalf by the undersigned, thereunto duly authorized.
| | |
| (Registrant) The Tocqueville Trust |
| |
| By (Signature and Title)* | | /S/ ROBERT W. KLEINSCHMIDT |
| | Robert W. Kleinschmidt, President |
Date 6/30/2011
Pursuant to the requirements of the Securities Exchange Act of 1934 and the Investment Company Act of 1940, this report has been signed below by the following persons on behalf of the registrant and in the capacities and on the dates indicated.
| | |
| |
| By (Signature and Title)* | | /S/ ROBERT W. KLEINSCHMIDT |
| | Robert W. Kleinschmidt, President |
Date 6/30/2011
| | |
| |
| By (Signature and Title)* | | /S/ JOHN CASSIDY |
| | John Cassidy, Treasurer |
Date 6/30/2011
| * | Print the name and title of each signing officer under his or her signature. |