As filed with the Securities and Exchange Commission on July 7, 2008
UNITED STATES
SECURITIES AND EXCHANGE COMMISSION
Washington, D.C. 20549
FORM N-CSR
CERTIFIED SHAREHOLDER REPORT OF REGISTERED
MANAGEMENT INVESTMENT COMPANIES
Investment Company Act file number 811-4840
The Tocqueville Trust
(Exact name of registrant as specified in charter)
The Tocqueville Trust
40 W. 57th Street, 19th Floor
New York, NY 10019
(Address of principal executive offices) (Zip code)
Robert W. Kleinschmidt, President
The Tocqueville Trust
40 W. 57th Street, 19th Floor
New York, NY 10019
(Name and address of agent for service)
212-698-0800
Registrant's telephone number, including area code
Date of fiscal year end: October 31
Date of reporting period: April 30, 2008
Item 1. Report to Stockholders.
S E M I - A N N U A L R E P O R T
April 30, 2008
The Tocqueville Trust
Mutual Funds
The Tocqueville Fund
The Tocqueville Small Cap Value Fund
The Tocqueville International Value Fund
The Tocqueville Gold Fund
This report is not authorized for distribution to prospective investors unless preceded or accompanied by a currently effective prospectus of The Tocqueville Trust. Please call 1-800-697-FUND (3863) for a free prospectus. Read it carefully before you invest.
You are invited to visit our website @ www.tocquevillefunds.com
Dear Fellow Shareholder,
The past eight months have been trying for investors, but not as damaging to portfolios as might have been expected.
On the backdrop of a developing financial crisis of historic proportions, the U.S. economy has been flirting with recession. Both Europe and Japan gave signs of slowing down as well, a trend which could only be aggravated by a U.S. downturn. In spite of recent talk about the “decoupling” of emerging economies from the developed ones, we doubt that these economies can resist recessions or near-recessions in the United States, Europe and Japan.
To add to current uncertainties, central banks have recently voiced their concern that inflation is accelerating, implying that their monetary policies would become more restrictive than they have recently been.
In spite of this mediocre economic outlook and although no one knows the ultimate size and scope of the losses that will eventually be triggered by the ongoing financial crisis, most global markets, after losing around 20%-25% between October and March, recovered strongly at the first sign that central banks were determined to prevent massive defaults.
Market losses have been somewhat larger in Europe, largely offset by the gains in the Euro against the U.S. dollar. In China, a much larger decline (around 50%) corrected only part of the speculative rise that preceded it.
Altogether, we do not feel that the market corrections to-date, though painful, are quite commensurate with the size of the problems that confront us. So there might remain risks in “the markets”. But, in the sectors that have been hurt the most—either financial companies themselves, or companies that use commodities, which have exploded in price—opportunities have likely surfaced.
Recognizing that market bottoms may not have been reached yet, we nevertheless believe that many individual stocks have grown worthy of our attention.
Thank you for your loyalty to the Tocqueville Funds,
Respectfully,
François Sicart
Dear Fellow Shareholders,
The first six months of the current fiscal year was a difficult time for equity investors. Indeed, for at least the past year equity investing has not been for the faint of heart. Ever since the first meltdown of Chinese stocks in February of 2007, when the Chinese market fell almost ten per cent in one day and sent ripples of worry through-out the global financial scene, equity investing has been a one step forward, two step back exercise. Promising rallies have been followed, and usually quite quickly, by punishing declines. Broad market returns, down 4.68% over the past year and down 9.64% over the past six months as measured by the S&P 500 mask the true extent of the damage. Financial stocks, in particular have been bludgeoned, with many down as much as ninety per cent from their highs less than eighteen months ago. The sharp decline in residential real estate values, after a long and ultimately unsustainable rise in home prices, and the sub-prime debacle which followed have exacted a heavy toll on financial and many non-financial companies through-out the world, resulting in widely publicized bankruptcies and bail-outs.
With a twelve month return of negative 0.53% and a six month decline, as of April 30, 2008, of 8.88%, your fund has managed these difficult times reasonably well though hardly as well as we would have hoped. Although we entered this period significantly underweighted in financial stocks, we began to add them to our portfolios as the crisis unfolded. In retrospect we were too early. While we remain convinced that the financials that we own will generate good returns over the next three to five years, we would have been wiser to restrain our enthusiasm until more of the dust settled. We do not try to pick bottoms in our stock selection, nor do we think it is even possible. But we do try to limit our downside risk, and in the financial stocks for the past year, that has been a tall task.
Financials were not the only names that hurt the portfolio over the last six months. Microsoft, one of our larger holdings declined significantly on the news of, what we viewed as, an ill considered takeover attempt, and has only recently began to recover. We continue to be a believer in the unique strengths of this company, although we, too, were shaken by the near waste of corporate resources a takeover of Yahoo! would have represented. And Pfizer, another large holding, continued its relentless decline. Now selling at nine times expected earnings and sporting a 6.5% yield, Pfizer, which once had the world’s largest market capitalization, is being priced as if it were a second rate electric utility or a deep cyclical selling at peak earnings. It is neither, and we believe the company represents outstanding value at current prices.
As one would expect, our returns were helped by our energy and commodity company holdings along with takeover names like Pharmion, a small cap drug company. Google, which we bought when the stock collapsed after a misunderstood earnings report also added to our results, as did a number of our foreign holdings, in particular an ETF which tracks the Japanese Yen, and Chunghwa Telephone, the leading Taiwanese phone company.
The credit crisis and more recently the oil price shock has pre-occupied equity investors to such an extent that we do not believe that the November elections have yet been reflected in share prices. This will surely come, and we do not view the current political landscape as being favorable for equity investing. This could change of course, and given this wild political year, probably will. But until uncertainty caused by the upcoming elections is resolved, and it may well be resolved before the elections themselves, it is difficult to see how the market can make much headway. That said, we are finding good values in the market and in our existing portfolio, so we have been adding to our positions. We continue to be long term investors with an investment time frame of three to five years. We believe the serious, but temporal issues facing the markets will be a distant memory by the time we are ready to sell most of the stocks in our portfolio, hopefully at much higher prices.
As one of the largest individual shareholders in the fund, as well as its manager, I have a considerably large stake as well as a firm belief in the wisdom of our long term contrarian, value orientation, and I appreciate your continued support of the Tocqueville Fund.
Sincerely,
Robert W. Kleinschmidt
Portfolio Manager
The Tocqueville Fund
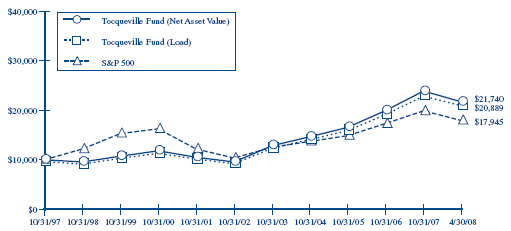
This chart assumes an initial gross investment of $10,000 made on 10/31/97. Returns shown do not reflect the deduction of taxes that a shareholder would pay on fund distributions or the redemption of fund shares. Performance reflects fee waivers in effect. In the absence of fee waivers, total return would be reduced. Returns shown include the reinvestment of all dividends and other distributions. Past performance is not predictive of future performance. Investment return and principal value will fluctuate so that your shares, when redeemed, may be worth more or less than their original cost.
The Standard & Poor’s 500 Stock Index (S&P 500) is a capital-weighted index, representing the aggregate market value of the common equity of 500 stocks primarily traded on the New York Stock Exchange.
AVERAGE ANNUAL RATE OF RETURN (%)
FOR PERIODS ENDED APRIL 30, 2008
| | 1 Year | 3 Year | 5 Year | 10 Year |
| Tocqueville Fund—Net Asset Value | – 0.53% | 12.01% | 16.81% | 6.84% |
| Tocqueville Fund—Load* | – 0.53% | 12.01% | 16.81% | 6.41% |
| Standard & Poor’s 500 Stock Index | – 4.68% | 8.23% | 10.62% | 3.89% |
| * Effective February 1, 2000, the Fund eliminated its sales load. | | | | |
The Tocqueville Small Cap Value Fund
Dear Fellow Shareholders,
Since January 1, 2008 the Tocqueville Small Cap Value Fund has been managed by a new team. This team has been managing small cap separate accounts at Tocqueville Asset Management L.P. since 2000. We are very excited about the opportunity to manage your fund and look forward to a long and rewarding relationship with you.
During the first six months of our fiscal year ending on April 30, 2008, The Tocqueville Small Cap Value Fund declined by 17.28% compared to a decline of 12.92% for the Russell 2000 Index for that same period of time. This has been a very volatile time for small company shares.
Recently, our government instituted several dramatic actions in response to emerging financial difficulties, hoping to forestall an economic contraction. They may succeed short term but not, in our view, without extraordinary long term costs. Foreign holders of U.S. dollars no longer support our spendthrift ways. The recent tax rebates, opening the borrowing window to investment banks, and other measures to bail out over-extended borrowers has been, in our opinion, the “straw that broke the camel’s back”. In addition, the U.S. dollar has lost a significant amount of its value over the past few years. Thus it is understandable that these countries are giving up on us and accelerating their efforts to diversify their financial reserves. We believe the long term ramifications from this preference shift will be enormous for our capital markets.
The equity markets’ focus on recession risk has moderated corporate profit expectations. Over the next two quarters we expect these fears to dissipate. Once investor psychology rebounds from its current sour mood, opportunities should appear both from the continued economic growth plus overseas demand for equities. Selectivity will be essential, as usual, since the overall market could be trapped in a broad trading range because of gradually rising interest rates. So while hurdles remain, we believe significant opportunity awaits for those willing to dig for them. This is our style and we remain optimistic about the future.
It has been a difficult few quarters for small cap stocks. Fears surrounding the financial sector raised concerns about growth and profitability, both sensitive areas for small companies. Reduced liquidity increased volatility and this hurt stocks under $1 billion in market value the most. Steady growers did better than those struggling to improve operationally.
Our portfolio is concentrated in sectors sensitive to current economic concerns (technology and producer durables) plus companies under $1 billion in value. These factors negatively impacted our six-month return. Plus, our style focuses on firms attempting to restore profitability. This universe underperformed the benchmark. Disappointing returns from the industrial segment of the portfolio offset relative strength generated in the consumer, financial and healthcare sectors plus positive returns from energy. Fears of economic difficulties affected our selections in cyclically sensitive areas but this should reverse once growth prospects become more visible.
Small cap stocks should respond favorably to better growth expectations for late 2008. Dollar weakness is stimulating export activity, a new phenomena for small firms. The shifting mix of technology spending toward small projects that enhance existing infrastructure is opening new doors. Plus, a surge in new healthcare products is emerging, many in small niches. These new trends should enhance investor interest in small companies in technology and healthcare, sectors long ignored, regardless of the economic environment. We remain concentrated in these opportunities and excited about the outlook for our portfolio.
| | | |
| P. Drew Rankin | Allen Huang | Douglas Adams |
The Tocqueville Small Cap Value Fund
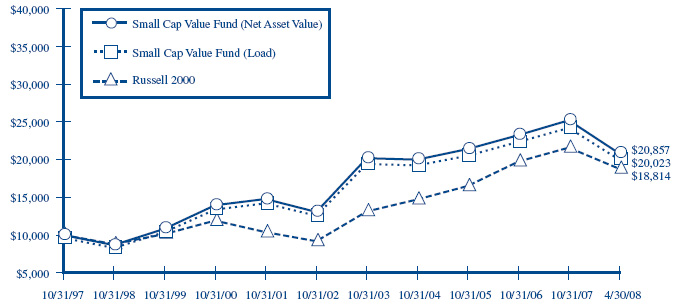
This chart assumes an initial gross investment of $10,000 made on 10/31/97. Returns shown do not reflect the deduction of taxes that a shareholder would pay on fund distributions or the redemption of fund shares. Performance reflects fee waivers in effect. In the absence of fee waivers, total return would be reduced. Returns shown include the reinvestment of all dividends and other distributions. Past performance is not predictive of future performance. Investment return and principal value will fluctuate so that your shares, when redeemed, may be worth more or less than their original cost.
The Russell 2000 Index is an unmanaged index that measures the performance of the 2,000 smallest companies in the Russell 3000 Index, which represents approximately 8% of the total market capitalization of the Russell 3000 Index.
AVERAGE ANNUAL RATE OF RETURN (%)
FOR PERIODS ENDED APRIL 30, 2008
| | 1 Year | 3 Year | 5 Year | 10 Year |
| Tocqueville Small Cap Value Fund—Net Asset Value | – 16.26% | 3.87% | 8.03% | 6.45% |
| Tocqueville Small Cap Value Fund—Load* | – 16.26% | 3.87% | 8.03% | 6.02% |
| Russell 2000 Index | – 10.96% | 8.62% | 13.76% | 5.33% |
| * Effective February 1, 2000, the Fund eliminated its sales load. | | | | |
The Tocqueville International Value Fund
Dear Fellow Shareholder,
For the six months ended April 30th, 2008, global equity markets declined sharply through March as investors digested the breadth of the global financial crisis and the likelihood of an economic slowdown. The Tocqueville International Value Fund’s total U.S. dollar return for the period was a loss of 8.83%. In the same period, the Morgan Stanley EAFE Index had a total U.S. dollar return loss of 8.91%.
During those same six months, the European BE 500 index decreased by 14.66% in local currency terms, the Japanese Nikkei 225 decreased by 16.57% in local currency terms, the Morgan Stanley Far East Index decreased by 15.93%. Commodity prices, and particularly energy and food prices, moved up despite the probability of an economic slowdown, due in part to persistently tight supply conditions and in part to an accelerating flow of speculative money into the asset class. Most equity markets decreased during the period. The greatest losses were suffered by markets that had been the subject of excessive investor enthusiasm, like China, India and Vietnam. Positive returns were earned in Brazil and certain markets in Africa and the Middle East, all net exporters of food or energy. In terms of sectors, energy, chemicals, and steel and other metals were up, while retail, travel, media, and financials were down sharply. The U.S. dollar declined in value versus most currencies, falling by 7.80% against the Euro and 9.97% against the Japanese Yen, as growth in the U.S. slowed and interest rates declined.
During the period, several positions produced positive returns, including Taiwanese telecom service provider Chunghwa, Mexican beer producer FEMSA, Japanese electronics concern Matsushita and logistics concern Nippon Express, and global oil service provider Schlumberger. We managed to avoid large losses in the financials as we retain a limited exposure to the sector. We lost money in industrials globally, like French aerospace concern Safran and UK heat treatment service provider Bodycote, in consumer discretionary shares in Europe, like French TV concern M6, and in telecom equipment and auto parts shares, like Nokia and Sogefi. These are businesses with good long term fundamentals and cheap valuations. Our performance relative to the index was handicapped by our limited exposure to materials and energy, areas which in our view are subject to excessive investor enthusiasm and whose valuations, despite good long term fundamentals, do not provide an adequate margin of safety.
Several of the concerns that we have articulated in previous letters have made themselves known to the broader investment community during these six months, namely: the risk associated with profligate U.S. mortgage financing, the likelihood of economic slowdown in the U.S. and the attendant probability of a global slowdown, incipient inflation, and the negative impact on corporate margins from rising commodity and labor costs. None of these issues has gone away, and in fact they could conceivably lead to further declines in the overall equity market. Having said that, compared with a year ago, when the markets were oblivious to risk, the investment community has adopted a more cautious stance and more risk has been priced into equities. More importantly, the general decline in equity markets and the steep declines in certain sectors has created opportunities to buy individual stocks at the kind of cheap valuation we have not seen since the early part of the decade. From our standpoint as contrarian, value oriented investors, the markets have become more attractive.
In terms of our activity and positioning, we continue to seek and find opportunities in Japan among world class industrials, like SMC Corp, and companies with substantial excess investments and real estate, like Nippon Express. We have taken the opportunity offered by market turbulence to purchase certain great global franchises, like Toyota and Nestle, as investor concerns drive prices down to valuations we deem attractive. The fear surrounding financials has made them attractive from a sentiment standpoint and in valuation terms relative to long term earnings power, and we have begun to build positions in European financial firms, like U.K. credit information firm Experian. Importantly, some of the great small and mid-sized European companies in which we have earned attractive returns in prior cycles have declined substantially in value. We are refreshing our understanding of the businesses with the expectation of building positions in the coming quarters. Overall, we have a limited exposure to emerging markets, other than in attractively valued consumer shares, like Mexican beverage concern FEMSA, and restructuring or recapitalization candidates, like Taiwan’s Chunghwa Telecom. We retain a limited exposure to materials and energy for reasons articulated above. Our industrial exposure is oriented to companies like Hitachi that have technology and a substantial exposure to global spending on infrastructure.
We continue to employ our investment discipline, seeking to discover fundamentally attractive companies that are out of favor and undervalued, and to provide our shareholders with above average returns with below average risk.
Sincerely,
| James Hunt | Francois Sicart |
| Portfolio Manager | Portfolio Manager |
The Tocqueville International Value Fund
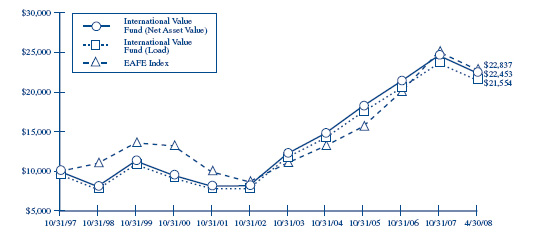
This chart assumes an initial gross investment of $10,000 made on 10/31/97. Returns shown do not reflect the deduction of taxes that a shareholder would pay on fund distributions or the redemption of fund shares. Performance reflects fee waivers in effect. In the absence of fee waivers, total return would be reduced. Returns shown include the reinvestment of all dividends and other distributions. Past performance is not predictive of future performance. Investment return and principal value will fluctuate so that your shares, when redeemed, may be worth more or less than their original cost.
The Morgan Stanley EAFE Index is an unmanaged market-capitalization-weighted index composed of companies representative of the market structure of 20 Developed Market Countries in Europe, Australia, Asia and the Far East.
AVERAGE ANNUAL RATE OF RETURN (%)
FOR PERIODS ENDED APRIL 30, 2008
| | 1 Year | 3 Year | 5 Year | 10 Year |
| Tocqueville International Value Fund—Net Asset Value | – 5.02% | 11.78% | 21.38% | 8.40% |
| Tocqueville International Value Fund—Load* | – 5.02% | 11.78% | 21.38% | 7.96% |
| Morgan Stanley EAFE Index | – 1.31% | 16.74% | 20.92% | 7.05% |
| * Effective February 1, 2000, the Fund eliminated its sales load. | | | | |
The Tocqueville Gold Fund
Dear Fellow Shareholder,
During the fiscal half year ending April 30, 2008, the Tocqueville Gold Fund returned (13.72)% vs. (8.64)% for the benchmark XAU (Philadelphia Stock Exchange index of gold and silver shares) and (9.64)% for the S&P 500.
During the past six months, the Federal Reserve and other world central banks have had to resort to unprecedented measures to prevent a total meltdown of global credit. The Fed, for example, has exchanged high quality treasury bonds held on their balance sheet for much lower quality debt instruments including mortgage backed securities and other difficult to value paper in order to provide liquidity to banks and brokerage houses. The European Central Bank and the Bank of England have undertaken similar initiatives. Financial market confidence remains fragile despite these extraordinary measures and the premiums for risk taking remain high. In short, we believe the environment for gold remains excellent.
In the hours before the dramatic Fed bailout of Bear Stearns and their counterparties in derivatives trades, gold briefly exceeded $1000/oz. Since then, it has been in a corrective mode and in our opinion, is attempting to establish a new base from which can launch to new highs. Shares of companies that are engaged in mining or processing gold (“Gold Shares”) have also entered this corrective phase and appear to be awaiting leadership from the metal before moving higher. However, major gold producers are enjoying significantly higher prices than a year ago and as a result should report favorable earnings comparisons over the next few quarters. The anticipated positive earnings reports will contrast starkly with likely negative earnings comparisons being reported by large segments of the economy including finance, housing and retail. This contrast alone could prove to be the catalyst necessary to attract improved investment interest.
Small and mid cap stocks which represent a significant exposure in the Fund’s portfolio continue to dramatically underperform large cap mining stocks. The reason in our opinion is that generalist investors for the time being prefer the liquidity of large cap Gold Shares despite the superior values offered by the small cap sector. We have no way of knowing how long this valuation disparity will last. However, based on history, the differential ultimately narrows so that smaller cap stocks ultimately provide superior relative performance.
While financial commentary obsesses over the high price of oil, few appear to understand that the strength of oil and other commodity prices in large part reflect the loss of value of the U.S. dollar. A sharp correction in commodity prices, in our opinion, will only come because of what has been dubbed as “demand destruction.” Few seem to realize that demand destruction in the short run is the equivalent of a more serious economic downturn than markets now appear to envision. Under that scenario, U.S. dollar weakness could accelerate because the Fed would be powerless to raise interest rates sufficiently to defend the currency. It seems to us that the Fed’s best option to avoid a prolonged and deep recession would be to validate high commodity prices via inflation, as it did in the 1970’s. Under those circumstances, the upside for gold and Gold Shares should be substantial.
Sincerely,
John C. Hathaway
Portfolio Manager
The Tocqueville Gold Fund
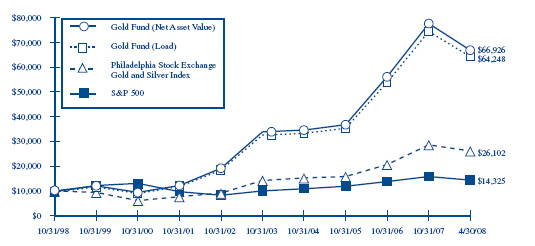
This chart assumes an initial gross investment of $10,000 made on 6/29/98 (commencement of operations). Returns shown do not reflect the deduction of taxes that a shareholder would pay on fund distributions or the redemption of fund shares. Performance reflects fee waivers in effect. In the absence of fee waivers, total return would be reduced. Returns shown include the reinvestment of all dividends and other distributions. Past performance is not predictive of future performance. Investment return and principal value will fluctuate so that your shares, when redeemed, may be worth more or less than their original cost.
In 2003 and 2006, the performance of The Tocqueville Gold Fund was achieved during a period of unusually favorable market conditions. Such performance may not be sustainable.
The Philadelphia Stock Exchange Gold and Silver Index is an unmanaged capitalization-weighted index which includes the leading companies involved in the mining of gold and silver.
The Standard & Poor’s 500 Stock Index (S&P 500) is a capital-weighted index, representing the aggregate market value of the common equity of 500 stocks primarily traded on the New York Stock Exchange.
AVERAGE ANNUAL RATE OF RETURN (%)
FOR PERIODS ENDED APRIL 30, 2008
| | | | | Since inception |
| | 1 Year | 3 Year | 5 Year | 6/29/1998 |
| Tocqueville Gold Fund—Net Asset Value | 4.29% | 29.78% | 26.12% | 22.23% |
| Tocqueville Gold Fund—Load* | 4.29% | 29.78% | 26.12% | 21.70% |
| Philadelphia Stock Exchange Gold and Silver Index | 25.91% | 28.34% | 22.59% | 10.83% |
| Standard & Poor’s 500 Stock Index | – 4.68% | 8.23% | 10.62% | 3.72% |
| * Effective February 1, 2000, the Fund eliminated its sales load. | | | | |
Expense Example—April 30, 2008
As a shareholder of The Tocqueville Trust (the “Funds”), you incur ongoing costs, including management fees; distribution fees; and other Fund expenses. This example is intended to help you understand your ongoing costs (in dollars) of investing in the Funds and to compare costs with the ongoing costs of investing in other mutual funds.
The Example is based on an investment of $1,000 invested at the beginning of the period and held the entire period (November 1, 2007-April 30, 2008).
Actual Expenses
The first line of the table below provides information about actual account values and actual expenses. You may use the information in this line, together with the amount you invested, to estimate the expenses that you paid over the period. Simply divide your account value by $1,000 (for example, an $8,600 account value divided by $1,000 = 8.6), then multiply the result by the number in the first line under the heading entitled “Expenses Paid During Period” to estimate the expenses you paid on your account during this period.
Hypothetical Example for Comparison Purposes
The second line of the table below provides information about hypothetical account values and hypothetical expenses based on the Funds’ actual expense ratios and an assumed rate of return of 5% per year before expenses, which is not the Funds’ actual return. The hypothetical account values and expenses may not be used to estimate the actual ending account balance or expenses you paid for the period. You may use this information to compare the ongoing costs of investing in the Funds and other funds. To do so, compare this 5% hypothetical example with the 5% hypothetical examples that appear in the shareholder reports of the other funds.
Please note that the expenses shown in the table are meant to highlight your ongoing costs only and do not reflect any transactional costs, such as sales charges (loads), redemption fees, or exchange fees. Therefore, the second line of the table is useful in comparing ongoing costs only, and will not help you determine the relative costs of owning different funds. In addition, if these transactional costs were included, your costs would have been higher.
Expense Example Tables
The Tocqueville Fund
| | | | | | Expenses Paid |
| | Beginning | | Ending | | During Period* |
| | Account Value | | Account Value | | November 1, 2007 - |
| | November 1, 2007 | | April 30, 2008 | | April 30, 2008 |
| Actual | $ 1,000.00 | | $ 911.20 | | $ 5.94 |
| Hypothetical (5% return before expenses) | 1,000.00 | | 1,018.65 | | 6.27 |
| | | | | | |
* Expenses are equal to the Fund’s annualized expense ratio of 1.25%, multiplied by the average account value over the period, multiplied by 182/366 to reflect the one-half year period. |
The Tocqueville Small Cap Value Fund
| | | | | | Expenses Paid |
| | Beginning | | Ending | | During Period* |
| | Account Value | | Account Value | | November 1, 2007 - |
| | November 1, 2007 | | April 30, 2008 | | April 30, 2008 |
| Actual | $ 1,000.00 | | $ 827.20 | | $ 6.09 |
| Hypothetical (5% return before expenses) | 1,000.00 | | 1,018.20 | | 6.72 |
| | | | | | |
* Expenses are equal to the Fund’s annualized expense ratio of 1.34%, multiplied by the average account value over the period, multiplied by 182/366 to reflect the one-half year period. |
The Tocqueville International Value Fund
| | | | | | Expenses Paid |
| | Beginning | | Ending | | During Period* |
| | Account Value | | Account Value | | November 1, 2007 - |
| | November 1, 2007 | | April 30, 2008 | | April 30, 2008 |
| Actual | $ 1,000.00 | | $ 911.70 | | $ 7.51 |
| Hypothetical (5% return before expenses) | 1,000.00 | | 1,017.01 | | 7.92 |
| | | | | | |
* Expenses are equal to the Fund’s annualized expense ratio of 1.58%, multiplied by the average account value over the period, multiplied by 182/366 to reflect the one-half year period. |
The Tocqueville Gold Fund
| | | | | | Expenses Paid |
| | Beginning | | Ending | | During Period* |
| | Account Value | | Account Value | | November 1, 2007 - |
| | November 1, 2007 | | April 30, 2008 | | April 30, 2008 |
| Actual | $ 1,000.00 | | $ 862.80 | | $ 6.39 |
| Hypothetical (5% return before expenses) | 1,000.00 | | 1,018.00 | | 6.92 |
| | | | | | |
* Expenses are equal to the Fund’s annualized expense ratio of 1.38%, multiplied by the average account value over the period, multiplied by 182/366 to reflect the one-half year period. |
The Tocqueville Fund
Financial Highlights
| | | | | | | | | | | | | | | | | | | |
| | | Six Months | | | | | | | | | | | | | | | | |
| Per share operating performance | | Ended | | | | | | | | | | | | | | | | |
(For a share outstanding throughout the | | April 30, | | | Years Ended October 31, | |
| | 2008 | | | 2007 | | | 2006 | | | 2005 | | | 2004 | | | 2003 | |
| | | (unaudited) | | | | | | | | | | | | | | | | |
| Net asset value, beginning of period | | $ | 28.93 | | | $ | 24.25 | | | $ | 22.17 | | | $ | 20.43 | | | $ | 17.99 | | | $ | 13.42 | |
| Operations: | | | | | | | | | | | | | | | | | | | | | | | | |
| Net investment income | | | 0.10 | | | | 0.18 | | | | 0.14 | | | | 0.15 | | | | 0.05 | | | | 0.02 | |
| Net realized and unrealized gain (loss) | | | (2.54) | | | | 4.53 | | | | 4.33 | | | | 2.53 | | | | 2.41 | | | | 4.55 | |
| Total from investment operations (1) | | | (2.44) | | | | 4.71 | | | | 4.47 | | | | 2.68 | | | | 2.46 | | | | 4.57 | |
| Dividends and distributions to | | | | | | | | | | | | | | | | | | | | | | | | |
| shareholders: | | | | | | | | | | | | | | | | | | | | | | | | |
| Dividends from net investment income | | | (0.19) | | | | (0.03) | | | | (0.22) | | | | (0.12) | | | | (0.02) | | | | — | |
| Distributions from net realized gains | | | (2.03) | | | | — | | | | (2.17) | | | | (0.82) | | | | — | | | | — | |
| Total dividends and distributions | | | (2.22) | | | | (0.03) | | | | (2.39) | | | | (0.94) | | | | (0.02) | | | | — | |
| Change in net asset value for the period | | | (4.66) | | | | 4.68 | | | | 2.08 | | | | 1.74 | | | | 2.44 | | | | 4.57 | |
| Net asset value, end of period | | $ | 24.27 | | | $ | 28.93 | | | $ | 24.25 | | | $ | 22.17 | | | $ | 20.43 | | | $ | 17.99 | |
| Total return | | | (8.9) | %(2) | | | 19.4 | % | | | 20.5 | % | | | 13.4 | % | | | 13.7 | % | | | 34.1 | % |
| Ratios/supplemental data | | | | | | | | | | | | | | | | | | | | | | | | |
| Net assets, end of period (000) | | $ | 567,354 | | | $ | 523,878 | | | $ | 392,495 | | | $ | 175,791 | | | $ | 145,435 | | | $ | 149,497 | |
| Ratio to average net assets: | | | | | | | | | | | | | | | | | | | | | | | | |
| Expenses (3) | | | 1.25 | %(4) | | | 1.25 | % | | | 1.30 | % | | | 1.34 | % | | | 1.34 | % | | | 1.40 | % |
| Net investment income (3) | | | 0.84 | %(4) | | | 0.69 | % | | | 0.68 | % | | | 0.68 | % | | | 0.25 | % | | | 0.17 | % |
| Portfolio turnover rate | | | 22 | %(2) | | | 39 | % | | | 32 | % | | | 45 | % | | | 40 | % | | | 32 | % |
| | | | | | | | | | | | | | | | | | | | | | | | | |
| (1) | Total from investment operations per share includes redemption fees of $0.006, $0.002, $0.002, $0.003, $0.001 and $0.000 per share for the six months ended April 30, 2008 and the five years ended October 31, 2007, 2006, 2005, 2004, and 2003, respectively. |
| (2) | Not annualized. | | | | | | | | | | | | |
| (3) | Net of fees waived amounting to 0.01%, 0.01% and 0.07% of average net assets for the six months ended April 30, 2008 and the two years ended October 31, 2007 and 2003, respectively. |
| (4) | Annualized. | | | | | | | | | | | | |
The accompanying notes are an integral part of these financial statements.
The Tocqueville Small Cap Value Fund
Financial Highlights
| | | | | | | | | | | | | | | | | | | |
| | | Six Months | | | | | | | | | | | | | | | | |
| Per share operating performance | | Ended | | | | | | | | | | | | | | | | |
(For a share outstanding throughout the | | April 30, | | | Years Ended October 31, | |
| | 2008 | | | 2007 | | | 2006 | | | 2005 | | | 2004 | | | 2003 | |
| | | (unaudited) | | | | | | | | | | | | | | | | |
| Net asset value, beginning of period | | $ | 17.24 | | | $ | 18.04 | | | $ | 16.58 | | | $ | 16.11 | | | $ | 18.83 | | | $ | 12.18 | |
| Operations: | | | | | | | | | | | | | | | | | | | | | | | | |
| Net investment income (loss) | | | (0.03) | | | | 0.11 | | | | (0.07) | | | | (0.13) | | | | (0.11) | | | | (0.08) | |
| Net realized and unrealized gain (loss) | | | (2.73) | | | | 1.26 | | | | 1.53 | | | | 1.26 | | | | 0.21 | | | | 6.73 | |
| Total from investment operations (1) | | | (2.76) | | | | 1.37 | | | | 1.46 | | | | 1.13 | | | | 0.10 | | | | 6.65 | |
| Distributions to shareholders: | | | | | | | | | | | | | | | | | | | | | | | | |
| Dividends from net investment income | | | (0.12) | | | | — | | | | — | | | | — | | | | — | | | | — | |
| Distributions from net realized gains | | | (1.70) | | | | (2.17) | | | | — | | | | (0.66) | | | | (2.82) | | | | — | |
| Total distributions | | | (1.82) | | | | (2.17) | | | | — | | | | (0.66) | | | | (2.82) | | | | — | |
| Change in net asset value for the period | | | (4.58) | | | | (0.80) | | | | 1.46 | | | | 0.47 | | | | (2.72) | | | | 6.65 | |
| Net asset value, end of period | | $ | 12.66 | | | $ | 17.24 | | | $ | 18.04 | | | $ | 16.58 | | | $ | 16.11 | | | $ | 18.83 | |
| Total return | | | (17.3) | %(2) | | | 8.4 | % | | | 8.8 | % | | | 6.8 | % | | | (1.0) | % | | | 54.6 | % |
| Ratios/supplemental data | | | | | | | | | | | | | | | | | | | | | | | | |
| Net assets, end of period (000) | | $ | 36,259 | | | $ | 49,543 | | | $ | 52,701 | | | $ | 57,576 | | | $ | 75,005 | | | $ | 73,518 | |
| Ratio to average net assets: | | | | | | | | | | | | | | | | | | | | | | | | |
| Expenses | | | 1.34 | %(3) | | | 1.32 | % | | | 1.34 | % | | | 1.39 | % | | | 1.41 | % | | | 1.36 | % |
| Net investment income (loss) | | | (0.59) | %(3) | | | 0.63 | % | | | (0.38) | % | | | (0.67) | % | | | (0.61) | % | | | (0.48) | % |
| Portfolio turnover rate | | | 116 | %(2) | | | 90 | % | | | 45 | % | | | 30 | % | | | 19 | % | | | 65 | % |
| | | | | | | | | | | | | | | | | | | | | | | | | |
| (1) | Total from investment operations per share includes redemption fees of $0.002, $0.001, $0.015, $0.006, $0.02 and $0.03 per share for the six months ended April 30,2008 and the five years ended October 31, 2007, 2006, 2005, 2004 and 2003 respectively. |
| (2) | Not annualized. | | | | | | | | | | | |
| (3) | Annualized. | | | | | | | | | | | |
The accompanying notes are an integral part of these financial statements.
The Tocqueville International Value Fund
Financial Highlights
| | | | | | | |
| | | Six Months | | | | |
| Per share operating performance | | Ended | | | | |
(For a share outstanding throughout | | April 30, | | | Years Ended October 31, | |
| the period) | | 2008 | | | 2007 | | | 2006 | | | 2005 | | | 2004 | | | 2003 | |
| | | (unaudited) | | | | | | | | | | | | | | | | |
| Net asset value, beginning of period | | $ | 16.48 | | | $ | 16.72 | | | $ | 16.06 | | | $ | 13.10 | | | $ | 10.90 | | | $ | 7.27 | |
| Operations: | | | | | | | | | | | | | | | | | | | | | | | | |
| Net investment income | | | 0.05 | | | | 0.08 | | | | 0.27 | | | | 0.04 | | | | 0.09 | | | | 0.06 | |
| Net realized and unrealized gain (loss) | | | (1.40) | | | | 2.25 | | | | 2.30 | | | | 3.00 | | | | 2.15 | | | | 3.58 | |
| Total from investment operations (1) | | | (1.35) | | | | 2.33 | | | | 2.57 | | | | 3.04 | | | | 2.24 | | | | 3.64 | |
| Dividends and distributions to | | | | | | | | | | | | | | | | | | | | | | | | |
| shareholders: | | | | | | | | | | | | | | | | | | | | | | | | |
| Dividends from net investment income | | | (0.10) | | | | (0.27) | | | | (0.05) | | | | (0.08) | | | | (0.04) | | | | (0.01) | |
| Distributions from net realized gains | | | (1.94) | | | | (2.30) | | | | (1.86) | | | | — | | | | — | | | | — | |
| Total dividends and distributions | | | (2.04) | | | | (2.57) | | | | (1.91) | | | | (0.08) | | | | (0.04) | | | | (0.01) | |
| Change in net asset value for the period | | | (3.39) | | | | (0.24) | | | | 0.66 | | | | 2.96 | | | | 2.20 | | | | 3.63 | |
| Net asset value, end of period | | $ | 13.09 | | | $ | 16.48 | | | $ | 16.72 | | | $ | 16.06 | | | $ | 13.10 | | | $ | 10.90 | |
| Total return | | | (8.8) | %(2) | | | 15.3 | % | | | 17.4 | % | | | 23.3 | % | | | 20.6 | % | | | 50.1 | % |
| Ratios/supplemental data | | | | | | | | | | | | | | | | | | | | | | | | |
| Net assets, end of period (000) | | $ | 186,791 | | | $ | 219,220 | | | $ | 225,234 | | | $ | 215,711 | | | $ | 196,424 | | | $ | 129,875 | |
| Ratio to average net assets: | | | | | | | | | | | | | | | | | | | | | | | | |
| Expenses | | | 1.58 | %(3) | | | 1.59 | % | | | 1.61 | % | | | 1.66 | % | | | 1.71 | % | | | 1.77 | % |
| Net investment income | | | 0.69 | %(3) | | | 0.49 | % | | | 1.49 | % | | | 0.29 | % | | | 0.85 | % | | | 0.72 | % |
| Portfolio turnover rate | | | 37 | %(2) | | | 49 | % | | | 39 | % | | | 35 | % | | | 43 | % | | | 55 | % |
| | | | | | | | | | | | | | | | | | | | | | | | | |
| (1) | Total from investment operations per share includes redemption fees of $0.000, $0.002, $0.011, $0.003, $0.010 and $0.005 per share for the six months ended April 30, 2008 and the five years ended October 31, 2007, 2006, 2005, 2004 and 2003, respectively. |
| (2) | Not Annualized. | | | | | | | | | | | | |
| (3) | Annualized. | | | | | | | | | | | | |
The accompanying notes are an integral part of these financial statements.
The Tocqueville Gold Fund
Financial Highlights
| | | | | | | | | | | | | | | | | | | |
| | | Six Months | | | | |
| Per share operating performance | | Ended | | | Years Ended October 31, | |
| (For a share outstanding | | April 30, | | | | | | | | | | | | | | | | |
| throughout the period) | | 2008 | | | 2007 | | | 2006 | | | 2005 | | | 2004 | | | 2003 | |
| | | (unaudited) | | | | | | | | | | | | | | | | |
| Net asset value, beginning of period | | $ | 64.36 | | | $ | 51.41 | | | $ | 35.51 | | | $ | 34.84 | | | $ | 34.71 | | | $ | 20.49 | |
| Operations: | | | | | | | | | | | | | | | | | | | | | | | | |
| Net investment loss | | | (0.13) | | | | (0.30) | | | | (0.22) | | | | (0.33) | | | | (0.33) | | | | (0.14) | |
| Net realized and unrealized gain | | | | | | | | | | | | | | | | | | | | | | | | |
| (loss) | | | (8.51) | | | | 18.52 | | | | 18.21 | | | | 2.36 | | | | 1.04 | | | | 15.41 | |
| Total from investment operations (1) | | | (8.64) | | | | 18.22 | | | | 17.99 | | | | 2.03 | | | | 0.71 | | | | 15.27 | |
| Dividends and distributions to | | | | | | | | | | | | | | | | | | | | | | | | |
| shareholders: | | | | | | | | | | | | | | | | | | | | | | | | |
| Dividends from net investment | | | | | | | | | | | | | | | | | | | | | | | | |
| income | | | (0.46) | | | | (0.22) | | | | — | | | | — | | | | (0.03) | | | | — | |
| Dividends from net realized gains | | | (8.32) | | | | (5.05) | | | | (2.09) | | | | (1.36) | | | | (0.55) | | | | (1.05) | |
| Total distributions | | | (8.78) | | | | (5.27) | | | | (2.09) | | | | (1.36) | | | | (0.58) | | | | (1.05) | |
| Change in net asset value for the | | | | | | | | | | | | | | | | | | | | | | | | |
| period | | | (17.42) | | | | 12.95 | | | | 15.90 | | | | 0.67 | | | | 0.13 | | | | 14.22 | |
| Net asset value, end of period | | $ | 46.94 | | | $ | 64.36 | | | $ | 51.41 | | | $ | 35.51 | | | $ | 34.84 | | | $ | 34.71 | |
| Total return | | | (13.7) | %(2) | | | 38.4 | % | | | 52.5 | % | | | 6.2 | % | | | 2.0 | % | | | 77.3 | % |
| Ratios/supplemental data | | | | | | | | | | | | | | | | | | | | | | | | |
| Net assets, end of period (000) | | $ | 998,611 | | | $ | 1,231,475 | | | $ | 833,254 | | | $ | 538,492 | | | $ | 539,190 | | | $ | 433,554 | |
| Ratios to average net assets: | | | | | | | | | | | | | | | | | | | | | | | | |
| Expenses | | | 1.38 | %(3) | | | 1.42 | % | | | 1.50 | % | | | 1.59 | % | | | 1.58 | % | | | 1.68 | % |
| Net investment income (loss) | | | (1.03) | %(3) | | | (0.81) | % | | | (0.51) | % | | | (0.97) | % | | | (1.11) | % | | | (0.77) | % |
| Portfolio turnover rate | | | 15 | %(2) | | | 26 | % | | | 30 | % | | | 27 | % | | | 24 | % | | | 40 | % |
| | | | | | | | | | | | | | | | | | | | | | | | | |
| (1) | Total from investment operations per share includes redemption fees of $0.017, $0.028, $0.06, $0.02, $0.09 and $0.05 per share for the six months ended April 30, 2008 and the five years ended October 31, 2007, 2006, 2005, 2004 and 2003 , respectively. |
| (2) | Not Annualized. | | | | | | | | | | | | |
| (3) | Annualized. | | | | | | | | | | | | |
The accompanying notes are an integral part of these financial statements.
The Tocqueville Fund
Schedule of Investments as of April 30, 2008
(Unaudited)
| Common Stocks—88.1% | Shares | Value |
| Aerospace & Defense—0.7% | | |
| European Aeronautic Defense and | | |
| Space Co. (a)(b) | 150,000 | $ 3,782,615 |
| Air Freight & Logistics—1.3% | | |
| United Parcel Service, Inc. | 100,000 | 7,241,000 |
| Automobiles—1.3% | | |
| Toyota Motor Corp.—ADR (b) | 75,000 | 7,612,500 |
| Beverages—3.6% | | |
| Anheuser-Busch Companies, Inc. | 300,000 | 14,760,000 |
| The Coca-Cola Co. | 100,000 | 5,887,000 |
| | | 20,647,000 |
| Biotechnology—1.9% | | |
| Amgen, Inc. (a) | 200,000 | 8,374,000 |
| Isis Pharmaceuticals, Inc. (a) | 200,000 | 2,356,000 |
| | | 10,730,000 |
| Capital Markets—1.1% | | |
| UBS AG (a)(b) | 189,000 | 6,348,510 |
| Chemicals—4.9% | | |
| EI Du Pont de Nemours & Co. | 325,000 | 15,895,750 |
| W.R. Grace & Co. (a) | 250,000 | 6,340,000 |
| Zoltek Companies, Inc. (a) | 200,000 | 5,334,000 |
| | | 27,569,750 |
| Commercial Banks—3.7% | | |
| East West Bancorp, Inc. | 500,000 | 7,120,000 |
| HSBC Holdings PLC—ADR (b) | 30,958 | 2,686,845 |
| Mitsubishi Ufj Financial Group, | | |
| Inc.—ADR (b) | 1,000,000 | 10,990,000 |
| | | 20,796,845 |
| Commercial Services & Supplies—2.4% | | |
| Avery Dennison Corp. | 70,000 | 3,373,300 |
| Cintas Corp. | 100,000 | 2,961,000 |
| Sotheby’s Holdings | 100,000 | 2,770,000 |
| Steelcase, Inc. | 400,000 | 4,432,000 |
| | | 13,536,300 |
| Communications Equipment—6.4% | | |
| Cisco Systems, Inc. (a) | 500,000 | 12,820,000 |
| Corning, Inc. | 400,000 | 10,684,000 |
| Juniper Networks, Inc. (a) | 200,000 | 5,524,000 |
| Nokia Corp.—ADR (b) | 250,000 | 7,517,500 |
| | | 36,545,500 |
| Computers & Peripherals—0.7% | | |
| EMC Corp. (a) | 250,000 | 3,850,000 |
| Construction Materials—0.6% | | |
| Cemex S.A. de C.V.—ADR (a)(b) | 115,600 | 3,196,340 |
| Containers & Packaging—1.2% | | |
| Sonoco Products Co. | 200,000 | 6,590,000 |
| Common Stocks (continued) | Shares | Value |
| Diversified Financial Services—1.8% | | |
| CIT Group, Inc. | 350,000 | $ 3,811,500 |
| Moody’s Corp. | 175,000 | 6,468,000 |
| | | 10,279,500 |
| Diversified Telecommunication Services—3.1% | | |
| Alaska Communications Systems | | |
| Group, Inc. (c) | 500,000 | 5,590,000 |
| Chunghwa Telecom Co., Ltd.— | | |
| ADR (b) | 250,000 | 6,377,500 |
| Verizon Communications, Inc. | 150,000 | 5,772,000 |
| | | 17,739,500 |
| Electric Utilities—3.1% | | |
| FPL Group, Inc. | 200,000 | 13,258,000 |
| Korea Electric Power Corp.— | | |
| ADR (b) | 120,000 | 1,971,600 |
| PNM Resources, Inc. | 150,000 | 2,173,500 |
| | | 17,403,100 |
| Electrical Appliances, Television And Radio Sets—0.6% | | |
| Samsung Electronics Co., Ltd.— | | |
| ADR (b) | 9,300 | 3,297,411 |
| Energy Equipment & Services—2.7% | | |
| Schlumberger, Ltd. | 150,000 | 15,082,500 |
| Food Products—2.9% | | |
| Campbell Soup Co. | 200,000 | 6,960,000 |
| Kraft Foods, Inc. | 300,000 | 9,489,000 |
| | | 16,449,000 |
| Gaming—0.5% | | |
| Scientific Games Corp.—Class A (a) | 100,000 | 2,816,000 |
| Health Care Equipment & Supplies—0.6% | | |
| Thoratec Corp. (a) | 220,000 | 3,517,800 |
| Household Products—2.9% | | |
| Colgate-Palmolive Co. | 100,000 | 7,070,000 |
| Kimberly-Clark Corp. | 150,000 | 9,598,500 |
| | | 16,668,500 |
| Industrial Conglomerates—3.9% | | |
| 3M Co. | 75,000 | 5,767,500 |
| General Electric Co. | 500,000 | 16,350,000 |
| | | 22,117,500 |
| Insurance—2.8% | | |
| American International Group, Inc. | 350,000 | 16,170,000 |
| Internet Software & Services—1.0% | | |
| Google, Inc. (a) | 10,200 | 5,857,758 |
| IT Services—2.2% | | |
| Automatic Data Processing, Inc. | 150,000 | 6,630,000 |
| Western Union Co. | 250,000 | 5,750,000 |
| | | 12,380,000 |
The accompanying notes are an integral part of these financial statements.
The Tocqueville Fund
Schedule of Investments as of April 30, 2008
(Unaudited)
| Common Stocks (continued) | Shares | Value |
| Machinery—1.6% | | |
| Albany International Group, Inc. | 100,000 | $3,630,000 |
| Illinois Tool Works, Inc. | 100,000 | 5,229,000 |
| | | 8,859,000 |
| Media—0.3% | | |
| Lee Enterprises, Inc. | 225,000 | 1,739,250 |
| Metals & Mining—5.8% | | |
| Alcoa, Inc. | 200,000 | 6,956,000 |
| Cleveland-Cliffs, Inc. | 80,000 | 12,832,000 |
| Newmont Mining Corp. | 300,000 | 13,263,000 |
| | | 33,051,000 |
| Multi-Utilities—0.6% | | |
| Veolia Environnement—ADR (b) | 45,000 | 3,260,250 |
| Oil & Gas—4.4% | | |
| Murphy Oil Corp. | 250,000 | 22,585,000 |
| Total SA—ADR (b) | 30,000 | 2,520,000 |
| | | 25,105,000 |
| Personal Products—1.0% | | |
| Avon Products, Inc. | 150,000 | 5,853,000 |
| Pharmaceuticals—5.0% | | |
| Bristol-Myers Squibb Co. | 300,000 | 6,591,000 |
| Johnson & Johnson | 100,000 | 6,709,000 |
| Pfizer, Inc. | 750,000 | 15,082,500 |
| | | 28,382,500 |
| Prepackaged Software—0.0% | | |
| Bio-key International, | | |
| Inc. (a)(b)(d)(e)(f) | 47,090 | — |
| Semiconductor & Semiconductor Equipment—4.2% | | |
| Applied Materials, Inc. | 500,000 | 9,330,000 |
| Emcore Corp. (a) | 557,000 | 3,442,260 |
| Intel Corp. | 500,000 | 11,130,000 |
| | | 23,902,260 |
| Software—2.5% | | |
| Microsoft Corp. | 500,000 | 14,260,000 |
| Telecommunications—0.8% | | |
| Fairpoint Communications, Inc. | 2,828 | 26,046 |
| NII Holdings, Inc. (a) | 100,000 | 4,574,000 |
| | | 4,600,046 |
| Thrifts & Mortgage Finance—3.8% | | |
| Fannie Mae | 300,000 | 8,490,000 |
| MGIC Investment Corp. | 1,000,000 | 13,030,000 |
| | | 21,520,000 |
| Water Supply—0.2% | | |
| Purecycle Corp. (a) | 200,000 | 1,314,000 |
| Total Common Stocks (Cost $455,316,463) | | 500,071,235 |
| Exchange Traded Funds—3.6% | Shares | Value |
| CurrencyShares Japanese Yen | | |
| Trust (a)(b) | 150,000 | $ 14,392,500 |
| Horizons BetaPro Oil Bear | | |
| ETF (a)(b) | 175,000 | 1,968,772 |
| Streetracks Gold Trust (a) | 50,000 | 4,339,500 |
| Total Exchange Traded Funds | | |
| (Cost $18,210,023) | | 20,700,772 |
| Warrants—0.0% | | |
| Bio-key Warrants, $1.00 strike | | |
| price, expires 4/14/09 (a)(e) | 262,500 | — |
| Emcore Corp. Warrants, $15.06 | | |
| strike price, expires | | |
| 2/15/13 (a)(e) | 39,375 | — |
| Raytheon Co. Warrants, $37.50 | | |
| strike price, expires | | |
| 6/16/11 (a) | 1,581 | 43,556 |
| Total Warrants (Cost $0) | | 43,556 |
| Short-Term | Principal | |
| Investments—8.2% | Amount | |
| Repurchase Agreement—2.9% | | |
| Repurchase Agreement with | | |
| U.S. Bank, N.A., 1.65%, | | |
| dated 4/30/08, due 5/1/08, | | |
| collateralized by a Freddie | | |
| Mac Giant 30-Year (Pool # | | |
| G01762) valued at | | |
| $16,592,858. Repurchase | | |
| proceeds of $16,267,746. | | |
| (Cost 16,267,000) | $16,267,000 | 16,267,000 |
| U.S. Treasury Bills—5.3% | | |
| 1.40%, 05/29/2008 (g) | 10,000,000 | 9,985,273 |
| 1.88%, 07/03/2008 (g) | 10,000,000 | 9,978,120 |
| 1.92%, 08/28/2008 (g) | 10,000,000 | 9,953,890 |
| (Cost $29,889,867) | | 29,917,283 |
| Total Short-Term Investments | | |
| (Cost $46,156,867) | | 46,184,283 |
| Total Investments | | |
| (Cost $519,683,353)—99.9% | | 566,999,846 |
| Other Assets in Excess of Liabilities—0.1% | | 353,659 |
| Total Net Assets—100.0% | | $567,353,505 |
The accompanying notes are an integral part of these Financial Statements.
The Tocqueville Fund
Schedule of Investments as of April 30, 2008
(Unaudited)
| Percentages are stated as a percent of net assets. |
| ADR American Depository Receipt |
| (a) | Non-income producing security. |
| (b) | Foreign issued security. Foreign concentration was as |
| | follows: Canada 0.3%; Finland 1.3%; France 1.0%; Japan |
| | 5.8%; Mexico 0.6%; Netherlands 0.7%; South Korea |
| | 0.9%; Switzerland 1.1%; Taiwan 1.1%; United Kingdom |
| | 0.5%. |
| (c) | Affiliated company, see Note 9. |
| (d) | Denotes security is fully or partially restricted as to resale. |
| | The aggregate value of restricted securities at April 30, |
| | 2008 was $0, which represented 0.0% of net assets. |
| (e) | Fair valued security. The aggregate value of fair valued |
| | securities at April 30, 2008 was $0. Which represented |
| | 0.0% of net assets. |
| (f) | Security is considered illiquid and may be difficult to sell. |
| (g) | Rates shown are the effective yields based on the purchase |
| | price. The calculation assumes the security is held to |
| | maturity. |
The accompanying notes are an integral part of these Financial Statements.
The Tocqueville Small Cap Value Fund
Schedule of Investments as of April 30, 2008
(Unaudited)
| Common Stocks—95.5% | Shares | Value |
| Biotechnology—6.5% | | |
| Alkermes, Inc. (a) | 57,400 | $713,482 |
| Martek Biosciences Corp. (a) | 46,500 | 1,639,590 |
| | | 2,353,072 |
| Chemicals—1.5% | | |
| Landec Corp. (a) | 21,000 | 170,310 |
| Symyx Technologies (a)(b) | 48,700 | 365,737 |
| | | 536,047 |
| Commercial Services & Supplies—1.2% | | |
| ABM Industries, Inc. | 20,000 | 418,800 |
| Communications Equipment—1.1% | | |
| Powerwave Technologies, Inc. (a) | 148,500 | 405,405 |
| Computer Programming Services—0.5% | | |
| Perficient, Inc. (a) | 21,000 | 192,780 |
| Electrical Equipment—2.9% | | |
| Baldor Electric Co. | 33,000 | 1,069,200 |
| Electronic Equipment & Instruments—3.5% | | |
| Electro Scientific Industries, Inc. (a) | 46,500 | 763,065 |
| Gsi Group, Inc. (a) | 62,500 | 509,375 |
| | | 1,272,440 |
| Energy Equipment & Services—4.7% | | |
| Oceaneering International, Inc. (a) | 7,500 | 500,850 |
| Tetra Technologies, Inc. (a) | 73,500 | 1,195,110 |
| | | 1,695,960 |
| Food Products—2.6% | | |
| Hain Celestial Group, Inc. (a) | 19,500 | 481,260 |
| Sanderson Farms, Inc. | 11,500 | 479,205 |
| | | 960,465 |
| Health Care Equipment & Supplies—11.5% | | |
| Analogic Corp. | 24,500 | 1,410,955 |
| Greatbatch, Inc. (a) | 19,000 | 345,420 |
| Thoratec Corp. (a)(b) | 88,000 | 1,407,120 |
| Wright Medical Group, Inc. (a) | 36,600 | 1,021,872 |
| | | 4,185,367 |
| Health Care Providers & Services—1.8% | | |
| Centene Corp. (a) | 35,000 | 642,950 |
| Hotels Restaurants & Leisure—1.4% | | |
| Ambassadors Group, Inc. | 26,000 | 505,960 |
| Internet & Catalog Retail—2.1% | | |
| 1-800-FLOWERS.COM, Inc. (a)(b) | 85,000 | 749,700 |
| Internet Software & Services—6.2% | | |
| Interwoven, Inc. (a) | 81,500 | 917,690 |
| RealNetworks, Inc. (a) | 109,000 | 671,440 |
| Vignette Corp. (a) | 57,800 | 667,590 |
| | | 2,256,720 |
| Common Stocks (continued) | Shares | Value |
| IT Services—1.7% | | |
| Lionbridge Technologies (a)(b) | 206,500 | $609,175 |
| Machinery—2.1% | | |
| Astec Industries, Inc. (a) | 21,000 | 769,650 |
| Metals & Mining—1.7% | | |
| Brush Engineered Materials, Inc. (a) | 19,500 | 604,695 |
| Multiline Retail—0.7% | | |
| Tuesday Morning Corp. (a) | 45,700 | 248,608 |
| Paper & Forest Products—3.6% | | |
| Glatfelter | 89,000 | 1,298,510 |
| Pharmaceuticals—6.3% | | |
| Medicines Co. (a)(b) | 67,500 | 1,333,125 |
| Salix Pharmaceuticals, Ltd. (a) | 133,000 | 933,660 |
| | | 2,266,785 |
| Semiconductor & Semiconductor Equipment—16.5% | | |
| Emcore Corp. (a)(b) | 151,500 | 936,270 |
| Exar Corp. (a) | 114,500 | 965,235 |
| FEI Co. (a) | 45,500 | 995,085 |
| Kopin Corp. (a)(b) | 291,000 | 867,180 |
| Silicon Image, Inc. (a) | 155,500 | 928,335 |
| Ultratech, Inc. (a)(b) | 90,000 | 1,283,400 |
| | | 5,975,505 |
| Software—13.0% | | |
| Aspen Technology, Inc. (a) | 103,000 | 1,415,220 |
| Epicor Software Corp. (a) | 76,000 | 608,000 |
| Mentor Graphics Corp. (a) | 56,500 | 568,955 |
| Parametric Technology Corp. (a) | 42,000 | 732,060 |
| Secure Computing Corp. (a) | 127,000 | 840,740 |
| TIBCO Software, Inc. (a) | 73,100 | 560,677 |
| | | 4,725,652 |
| Specialty Retail—0.9% | | |
| Bebe Stores, Inc. | 32,000 | 319,680 |
| Textiles, Apparel & Luxury Goods—1.5% | | |
| Columbia Sportswear Co. | 13,000 | 545,480 |
| Total Common Stocks (Cost $38,714,313) | | 34,608,606 |
| Exchange Traded Fund—1.9% | | |
| iShares Russell 2000 Index Fund | 9,700 | 692,483 |
| Total Exchange Traded Fund | | |
| (Cost $661,086) | | 692,483 |
The accompanying notes are an integral part of these Financial Statements.
The Tocqueville Small Cap Value Fund
Schedule of Investments as of April 30, 2008
(Unaudited)
| | Principal | |
| Short-Term Investments—2.9% | Amount | Value |
| Repurchase Agreement—2.9% | | |
| Repurchase Agreement with U.S. | | |
| Bank, N.A., 1.65%, dated | | |
| 4/30/08, due 5/1/08, | | |
| collateralized by a Freddie Mac | | |
| Giant 30-Year (Pool # G0514) | | |
| valued at $1,087,579. | | |
| Repurchase proceeds of | | |
| $1,066,049. | $1,066,000 | $ 1,066,000 |
| Total Short-Term Investments | | |
| (Cost $1,066,000) | | 1,066,000 |
| Total Investments | | |
| (Cost $40,441,399)—100.3% | | 36,367,089 |
| Liabilities in Excess of Other Assets—(0.3%) | | (108,506) |
| Total Net Assets—100.0% | | $36,258,583 |
| | | |
| | | |
| Percentages are stated as a percent of net assets. | | |
| (a) Non-income producing security. | | |
| (b) Affiliated company, see Note 9. | | |
The accompanying notes are an integral part of these Financial Statements.
The Tocqueville International Value Fund
Schedule of Investments as of April 30, 2008
(Unaudited)
| Common Stocks—89.5% | Shares | Value |
| Belgium—0.4% | | |
| Solvay SA | 5,000 | $737,161 |
| Bermuda—1.0% | | |
| Celestial NutriFoods, Ltd. | 3,500,000 | 1,884,149 |
| Brazil—1.0% | | |
| Companhia Vale do Rio Doce— | | |
| ADR | 50,000 | 1,954,000 |
| Finland—3.7% | | |
| Nokia Corp.—ADR | 130,000 | 3,909,100 |
| UPM-Kymmene Oyj | 157,700 | 3,058,311 |
| | | 6,967,411 |
| France—14.5% | | |
| Carbone Lorraine | 30,381 | 1,670,307 |
| LVMH Moet Hennessy Louis | | |
| Vuitton SA | 8,000 | 917,134 |
| M6 Metropole Television | 160,000 | 3,715,004 |
| Manitou BF SA | 51,500 | 1,584,170 |
| Safran SA | 155,000 | 3,272,177 |
| Sanofi-Aventis | 60,000 | 4,698,406 |
| Total SA—ADR | 40,000 | 3,360,000 |
| Veolia Environnement | 38,000 | 2,761,457 |
| Vivendi SA | 125,000 | 5,088,378 |
| | | 27,067,033 |
| Germany—2.2% | | |
| Siemens AG—ADR | 34,600 | 4,098,370 |
| Greece—0.8% | | |
| Titan Cement Co. SA | 35,000 | 1,567,384 |
| Indonesia—2.1% | | |
| Telekomunikasi Indonesia Tbk | | |
| PT—ADR | 49,000 | 1,902,180 |
| Tempo Scan Pacific Tbk PT | 34,380,000 | 1,938,582 |
| | | 3,840,762 |
| Ireland—1.8% | | |
| Allied Irish Banks PLC—ADR | 40,000 | 1,705,200 |
| Experian Group, Ltd. | 233,500 | 1,766,547 |
| | | 3,471,747 |
| Israel—1.7% | | |
| Makhteshim-Agan Industries, Ltd. | 350,000 | 3,229,193 |
| Italy—4.1% | | |
| C.I.R.—Compagnie Industriali | | |
| Riunite SpA | 1,000,000 | 2,615,430 |
| Interpump Group SpA | 146,828 | 1,304,516 |
| Sogefi SpA | 161,650 | 807,708 |
| Unicredito Italiano SpA | 375,000 | 2,857,455 |
| | | 7,585,109 |
| Common Stocks (continued) | Shares | Value |
| Japan—21.7% | | |
| Bridgestone Corp. | 50,000 | $913,112 |
| Canon, Inc.—ADR (a) | 4,700 | 234,859 |
| Capcom Co., Ltd. | 75,000 | 2,250,324 |
| Fuji Photo Film Co., Ltd. | 100,000 | 3,837,092 |
| Hitachi, Ltd. | 700,000 | 4,718,950 |
| Kyoto Kimono Yuzen Co., Ltd. | 3,600 | 3,372,025 |
| Matsushita Electric Industrial Co., | | |
| Ltd.—ADR | 165,000 | 3,856,050 |
| Mitsubishi UFJ Financial Group, | | |
| Inc.—ADR | 345,000 | 3,791,550 |
| Nippon Express Co., Ltd. | 700,000 | 3,864,019 |
| Omron Corp. | 162,000 | 3,365,101 |
| Secom Co., Ltd. | 77,000 | 3,583,978 |
| Tecmo Ltd. | 365,000 | 3,885,705 |
| Toyota Motor Corp.—ADR | 27,500 | 2,791,250 |
| | | 40,464,015 |
| Mexico—4.1% | | |
| Cemex S.A.B. de C.V.—ADR (a) | 104,983 | 2,902,780 |
| Fomento Economico Mexicano | | |
| S.A.B. de C.V.—ADR | 108,000 | 4,692,600 |
| | | 7,595,380 |
| Netherlands—5.2% | | |
| ING Groep NV—ADR | 45,000 | 1,709,550 |
| Schlumberger Ltd. | 36,000 | 3,619,800 |
| Unilever NV—ADR | 130,000 | 4,360,200 |
| | | 9,689,550 |
| Singapore—1.5% | | |
| GP Industries | 8,389,241 | 2,876,735 |
| South Korea—1.4% | | |
| Dongyang Mechatro | 334,100 | 2,555,774 |
| Spain—0.9% | | |
| Sol Melia SA | 125,000 | 1,760,536 |
| Sweden—2.7% | | |
| Saab AB | 150,000 | 4,259,300 |
| Sandvik AB | 50,000 | 770,432 |
| | | 5,029,732 |
| Switzerland—4.5% | | |
| Kudelski SA | 170,000 | 2,697,293 |
| Nestle SA | 4,200 | 2,014,573 |
| UBS AG (a) | 110,250 | 3,703,298 |
| | | 8,415,164 |
The accompanying notes are an integral part of these Financial Statements.
The Tocqueville International Value Fund
Schedule of Investments as of April 30, 2008
(Unaudited)
| Common Stocks (continued) | Shares | Value |
| Taiwan—2.4% | | |
| Chunghwa Telecom Co., Ltd.— | | |
| ADR | 174,095 | $4,441,163 |
| Thailand—3.5% | | |
| Bangkok Bank Public Co., Ltd. | 900,000 | 3,973,510 |
| BEC World Pcl | 3,000,100 | 2,625,442 |
| | | 6,598,952 |
| United Kingdom—4.0% | | |
| Bodycote International | 766,250 | 3,683,162 |
| BP PLC—ADR | 28,000 | 2,038,120 |
| Invensys PLC (a) | 275,000 | 1,634,887 |
| | | 7,356,169 |
| United States—4.3% | | |
| Newmont Mining Corp. | 70,000 | 3,094,700 |
| NII Holdings, Inc. (a) | 105,800 | 4,839,292 |
| | | 7,933,992 |
| Total Common Stocks (Cost $149,087,566) | | 167,119,481 |
| Short-Term | Principal | |
| Investments—6.1% | Amount | |
| Variable Rate Demand Notes—6.1% | | |
| JP Morgan Chase Demand | | |
| Deposits 2.000% | $11,407,846 | 11,407,846 |
| Total Short-Term Investments | | |
| (Cost $11,407,846) | | 11,407,846 |
| Total Investments | | |
| (Cost $160,495,412)—95.6% | | 178,527,327 |
| Other Assets in Excess of Liabilities—4.4% | | 8,263,891 |
| Total Net Assets—100.0% | | $186,791,218 |
| | | |
| | | |
| Percentages are stated as a percent of net assets. | |
| ADR American Depository Receipt | |
| (a) Non-income producing security. | |
The accompanying notes are an integral part of these financial statements.
The Tocqueville Gold Fund
Schedule of Investments as of April 30, 2008
(Unaudited)
| Common Stocks—88.9% | Shares | Value |
| Gold & Gold Related—76.1% | | |
| Agnico-Eagle Mines Ltd. (a) | 377,000 | $23,543,650 |
| Alamos Gold, Inc. (a)(b) | 2,615,100 | 15,813,682 |
| Almaden Minerals Ltd. (a)(b) | 800,000 | 1,787,310 |
| Andean Resources (a)(b)(c ) | 15,771,500 | 23,808,733 |
| Aquiline Resources, Inc. (a)(b) | 1,333,333 | 10,181,045 |
| Aurelian Resources, Inc. (a)(b)(c) | 756,000 | 3,077,748 |
| Banro Corp. (a)(b) | 631,400 | 4,984,242 |
| Centamin Egypt Ltd. (a)(b) | 7,830,000 | 10,406,921 |
| Cia de Minas Buenaventura SA— | | |
| ADR (a) | 503,800 | 31,522,766 |
| Cluff Gold Ltd. (a)(b)(c) | 2,990,000 | 5,597,258 |
| Comaplex Minerals Corp. (a)(b) | 1,918,000 | 10,074,690 |
| Detour Gold Corporation (a)(b) | 280,000 | 4,759,972 |
| Eldorado Gold Corporation | | |
| Ltd. (a)(b) | 1,726,800 | 11,779,482 |
| Electrum Ltd. (b)(d)(e) | 1,047,776 | 5,752,290 |
| Euro Ressources S.A. (a)(b)(c) | 2,900,000 | 4,301,797 |
| European Goldfields Ltd. (a)(b) | 3,594,200 | 19,485,981 |
| Exeter Resource Corp. (a)(b)(e) | 570,000 | 2,307,394 |
| FNX Mining Co., Inc. (a)(b) | 300,000 | 6,896,038 |
| Franco Nevada Corp. (a)(b) | 1,405,900 | 24,988,194 |
| GBS Gold International, Inc. (a)(b) | 2,164,300 | 3,137,601 |
| Gold Eagle Mines Ltd. (a)(b) | 200,000 | 1,584,748 |
| Gold Fields Ltd. (a) | 166,249 | 2,198,552 |
| Gold Fields Ltd.—ADR (a) | 2,711,500 | 36,605,250 |
| Gold Resource Corp. (b)(c) | 2,129,700 | 9,988,293 |
| Goldcorp, Inc. (a) | 1,418,050 | 50,652,746 |
| Golden Star Resources Ltd. (b) | 5,589,000 | 18,757,641 |
| Great Basin Gold Ltd. (a)(b) | 3,864,137 | 11,510,685 |
| Iamgold Corp. (a) | 2,918,700 | 17,591,609 |
| Ivanhoe Mines Ltd. (a)(b) | 4,467,000 | 42,758,296 |
| KazakhGold Group, Ltd. (a)(b) | 434,000 | 9,634,800 |
| Kinross Gold Corp. (a) | 899,700 | 17,013,327 |
| Minefinders Corp. (a)(b) | 791,000 | 8,372,614 |
| New Gold, Inc. (a)(b)(c) | 1,518,500 | 11,579,863 |
| Newmont Mining Corp. | 813,800 | 35,978,099 |
| NovaGold Resources, Inc. (a)(b) | 880,500 | 6,478,508 |
| Orezone Resources, Inc. (a)(b) | 17,163,700 | 22,155,506 |
| Osisko Exploration Ltd. (a)(b)(c) | 3,891,900 | 16,423,965 |
| Oxiana Ltd. (a) | 6,681,485 | 20,677,125 |
| Polo Resources Ltd. (a)(b)(c) | 49,275,000 | 11,022,065 |
| Polyus Gold Co.—ADR (a) | 651,616 | 34,535,648 |
| Radius Gold, Inc. (a)(b) | 1,329,544 | 349,845 |
| Randgold Resources Ltd.— | | |
| ADR (a) | 1,663,200 | 75,708,864 |
| Red Back Mining, Inc. (a)(b) | 895,000 | 5,465,445 |
| Regent Pacific Group (a)(b) | 71,000,000 | 7,288,452 |
| Royal Gold, Inc. | 447,765 | 12,667,272 |
| Semafo, Inc. (a)(b) | 4,900,000 | 6,617,019 |
| Common Stocks (continued) | Shares | Value |
| Sino Gold Ltd. (a)(b) | 2,941,500 | $ 13,904,324 |
| Sunridge Gold Corp. (a)(b) | 500,000 | 397,180 |
| Troy Resources NL (a)(c) | 3,549,520 | 8,037,559 |
| Troy Resources NL Npv (a)(b)(c) | 100,000 | 211,498 |
| Wesdome Gold Mines Ltd. (a)(b) | 1,427,250 | 1,913,204 |
| Witwatersrand Consolidated Gold | | |
| Resources, Ltd. (a)(b) | 335,000 | 4,784,607 |
| Yukon-Nevada Gold Corp. (a)(b) | 8,350,000 | 11,939,231 |
| | | 759,010,634 |
| Oil, Gas & Consumable Fuels—1.5% | | |
| Uranium One, Inc. (a)(b) | 3,309,300 | 15,279,759 |
| Precious Metals & Related—11.3% | | |
| Apex Silver Mines Ltd. (a)(b) | 1,111,800 | 11,173,590 |
| Impala Platinum Holdings Ltd. (a) | 640,000 | 26,068,040 |
| Impala Platinum Holdings Ltd.— | | |
| ADR (a) | 450,000 | 18,362,475 |
| Ivanhoe Nickel & Platinum Ltd. | | |
| (a)(b)(d)(e) | 458,333 | 3,666,664 |
| PAN American Silver Corp. (a)(b) | 61,536 | 2,050,589 |
| PAN American Silver Corp.— | | |
| ADR (a)(b) | 130,967 | 4,387,395 |
| Silver Standard Resources, | | |
| Inc. (a)(b) | 557,000 | 14,320,470 |
| Silver Wheaton Corp. (a)(b) | 1,687,400 | 22,367,977 |
| Silverstone Resources Corp. (a)(b) | 5,000,000 | 10,723,861 |
| | | 113,121,061 |
| Total Common Stocks (Cost $663,816,120) | | 887,411,454 |
| Gold Bullion—8.6% | Ounces | |
| Gold Bullion (b) | 98,032 | 86,027,724 |
| Total Gold Bullion (Cost $44,609,241) | | 86,027,724 |
| Exchange Traded Fund—1.9% | Shares | |
| iShares Silver Trust (b) | 113,000 | 18,893,600 |
| Total Exchange Traded Fund | | |
| (Cost $11,125,879) | | 18,893,600 |
| Warrants—0.7% | | |
| Gold & Gold Related—0.7% | | |
| Electrum Ltd. Warrant (a)(b)(d) | 1,047,776 | 1,267,809 |
| Govi High Power Exploration Co. | | |
| Warrant (a)(b)(d) | 1,750,000 | 3,500,000 |
| Great Basin Gold Ltd. (a) | 500,000 | 263,132 |
| Nevsun Resources Ltd. (a)(b) | 202,125 | — |
| NovaGold Resources, Inc. (a)(b) | 75,000 | 114,685 |
| Osisko Exploration Ltd. (a)(c) | 1,155,000 | 1,677,279 |
| U.S. Gold Corp. (b) | 111,500 | 71,964 |
| Yukon-Nevada Gold Corp. (a) | 4,175,000 | — |
| | | 6,894,869 |
The accompanying notes are an integral part of these financial statements.
The Tocqueville Gold Fund
Schedule of Investments as of April 30, 2008
(Unaudited)
| Warrants (continued) | Shares | Value |
| Precious Metals & Related—0.0% | | |
| Brilliant Mining (a)(e) | 937,500 | $54,457 |
| Total Warrants (Cost $0) | | 6,949,326 |
| Total Investments | | |
| (Cost $719,551,240)—100.1% | | 999,282,104 |
| Liabilities in Excess of Other Assets—(0.1)% | | (670,771) |
| Total Net Assets—100.0% | | $998,611,333 |
| Percentages are stated as a percent of net assets. | | |
| ADR American Depository Receipt | | | |
| (a) | Foreign issued security. Foreign concentration was as |
| | follows: Australia 7.7%, Canada 45.5%, Cayman Islands |
| | 1.1%, French Guiana 0.4%, Hong Kong 0.7%, Jersey |
| | 8.5%, Peru 3.2%, Russia 3.5%, South Africa 8.8%, United |
| | Kingdom 0.6%, Virgin Islands 1.1%. | | |
| (b) | Non-income producing security. | | | |
| (c) | Affiliated Company, see Note 9. | | | |
| (d) | Denotes security is fully or partially restricted to resale. |
| | The aggregate value of restricted securities as of April 30, |
| | 2008 was $14,186,763 which represented 1.4% of net |
| | assets. | | | |
| (e) | Security is considered illiquid and may be difficult to sell. |
The accompanying notes are an integral part of these Financial Statements.
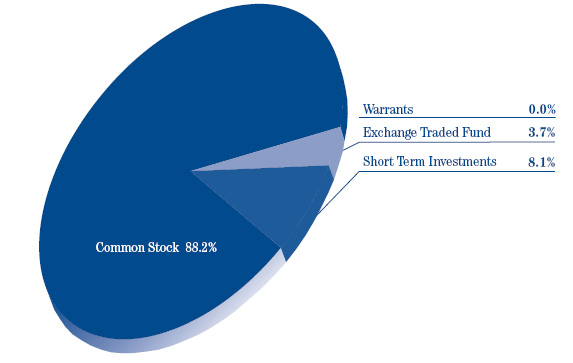
Percent of Total Investments
The Tocqueville Fund
Allocation of Portfolio Holdings
April 30, 2008
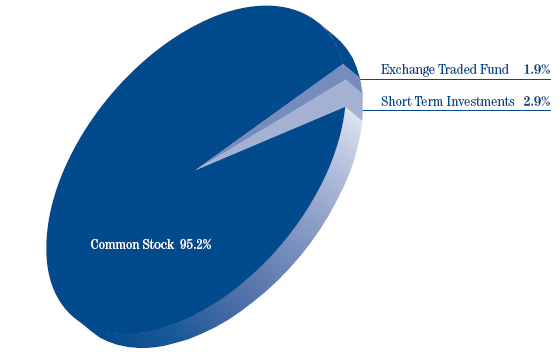
The Tocqueville Small Cap Value Fund
Allocation of Portfolio Holdings
April 30, 2008
Percent of Total Investments
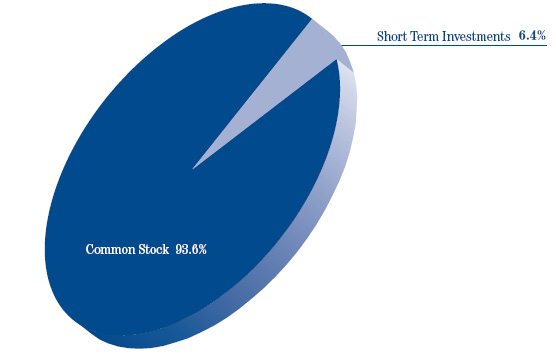
The Tocqueville International Value Fund
Allocation of Portfolio Holdings
April 30, 2008
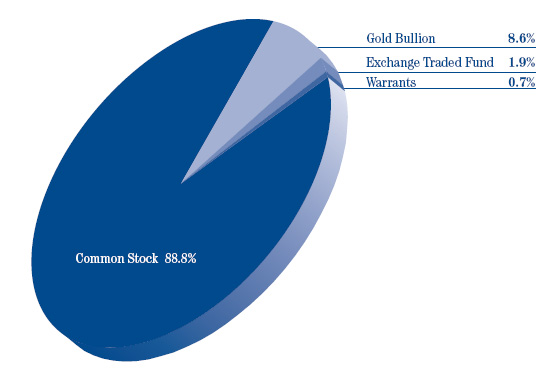
The Tocqueville Gold Fund
Allocation of Portfolio Holdings
April 30, 2008
The Tocqueville Trust
Statements of Assets and Liabilities
April 30, 2008
(Unaudited)
| | | | | | | | | | | | | |
| | | The | | | Small Cap | | | International | | | | |
| | | Tocqueville | | | Value | | | Value | | | Gold | |
| | | Fund | | | Fund | | | Fund | | | Fund | |
| Assets | | | | | | | | | | | | |
| Investments, at value (1) | | | | | | | | | | | | |
Unaffiliated issuers | | $ | 561,409,846 | | | $ | 29,214,847 | | | $ | 178,527,327 | | | $ | 903,556,046 | |
Affiliated issuers | | | 5,590,000 | | | | 7,152,242 | | | | — | | | | 95,726,058 | |
| Foreign currencies (2) | | | 5,607 | | | | — | | | | 7,151,595 | | | | (2,473 | ) |
| Cash | | | 269,268 | | | | 259 | | | | — | | | | 2,931,846 | |
| Receivable for investments sold | | | — | | | | 412,264 | | | | 1,552,816 | | | | 20,659,167 | |
| Receivable for fund shares sold | | | 822,990 | | | | 47,407 | | | | 4,583 | | | | 1,183,044 | |
| Dividends, interest and other receivables | | | 489,017 | | | | 10,510 | | | | 2,504,046 | | | | 110,911 | |
| Prepaid assets | | | 57,415 | | | | 11,625 | | | | 13,353 | | | | 69,779 | |
| Total Assets | | | 568,644,143 | | | | 36,849,154 | | | | 189,753,720 | | | | 1,024,234,378 | |
| Liabilities | | | | | | | | | | | | | | | | |
| Payable for investments purchased | | | 278,443 | | | | 536,475 | | | | 1,124,824 | | | | 12,991,946 | |
| Payable for fund shares redeemed | | | 462,878 | | | | 5,456 | | | | 124,394 | | | | 3,741,059 | |
| Payable to Adviser | | | 333,979 | | | | 21,911 | | | | 151,002 | | | | 759,353 | |
| Due to custodian | | | — | | | | — | | | | 49,190 | | | | — | |
| Accrued distribution fee | | | 37,666 | | | | 5,616 | | | | 32,433 | | | | 23,285 | |
| Accrued expenses and other liabilities | | | 177,672 | | | | 21,113 | | | | 1,480,659 | | | | 8,107,402 | |
| Total Liabilities | | | 1,290,638 | | | | 590,571 | | | | 2,962,502 | | | | 25,623,045 | |
| Net Assets | | $ | 567,353,505 | | | $ | 36,258,583 | | | $ | 186,791,218 | | | $ | 998,611,333 | |
| Net assets consist of: | | | | | | | | | | | | | | | | |
| Paid in capital | | $ | 517,694,668 | | | $ | 37,748,484 | | | $ | 156,102,440 | | | $ | 683,260,043 | |
| Accumulated net investment income (loss) | | | 1,533,244 | | | | (132,821 | ) | | | 423,733 | | | | (31,882,765 | ) |
| Accumulated net realized gain | | | 805,125 | | | | 2,717,230 | | | | 12,073,196 | | | | 67,503,238 | |
| Net unrealized appreciation (depreciation) on: | | | | | | | | | | | | | | | | |
Investments and foreign currency related items | | | 47,320,468 | | | | (4,074,310 | ) | | | 18,191,849 | | | | 279,730,817 | |
| Net assets | | $ | 567,353,505 | | | $ | 36,258,583 | | | $ | 186,791,218 | | | $ | 998,611,333 | |
| Shares of beneficial interest outstanding | | | | | | | | | | | | | | | | |
(unlimited shares of $0.01 par value authorized) | | | 23,379,698 | | | | 2,863,943 | | | | 14,271,432 | | | | 21,274,026 | |
| Net asset value and redemption price per share | | $ | 24.27 | | | $ | 12.66 | | | $ | 13.09 | | | $ | 46.94 | |
| Maximum offering price per share | | $ | 24.27 | | | $ | 12.66 | | | $ | 13.09 | | | $ | 46.94 | |
| (1) Cost of Investments | | | | | | | | | | | | | | | | |
Unaffiliated issuers | | $ | 513,926,327 | | | $ | 31,385,573 | | | $ | 160,495,412 | | | $ | 643,854,261 | |
Affiliated issuers | | $ | 5,757,026 | | | $ | 9,055,826 | | | $ | — | | | $ | 75,696,979 | |
| (2) Cost of Foreign Currencies | | $ | 1,632 | | | $ | — | | | $ | 6,991,661 | | | $ | (2,426 | ) |
The accompanying notes are an integral part of these financial statements.
The Tocqueville Trust
Statements of Operations
For the Six Months Ended April 30, 2008
(Unaudited)
| | | The | | | Small Cap | | | International | | | | |
| | | Tocqueville | | | Value | | | Value | | | Gold | |
| | | Fund | | | Fund | | | Fund | | | Fund | |
| Investment Income: | | | | | | | | | | | | |
| Dividends* | | | | | | | | | | | | |
| Unaffiliated issuers | | $ | 4,873,230 | | | $ | 122,249 | | | $ | 2,007,939 | | | $ | 1,510,164 | |
| Affiliated issuers | | | 215,000 | | | | — | | | | — | | | | — | |
| Interest | | | 509,313 | | | | 26,572 | | | | 160,818 | | | | 432,102 | |
| | | | 5,597,543 | | | | 148,821 | | | | 2,168,757 | | | | 1,942,266 | |
| Expenses: | | | | | | | | | | | | | | | | |
| Investment Adviser’s fee (see Note 5) | | | 2,005,917 | | | | 147,750 | | | | 955,718 | | | | 4,748,295 | |
| Distribution fees (see Note 5) | | | 668,639 | | | | 49,250 | | | | 238,930 | | | | 1,396,049 | |
| Administration fee (see Note 5) | | | 401,183 | | | | 29,550 | | | | 143,358 | | | | 837,629 | |
| Transfer agent and shareholder services fees | | | 92,111 | | | | 6,141 | | | | 29,385 | | | | 204,132 | |
| Professional fees | | | 41,863 | | | | 5,274 | | | | 19,768 | | | | 91,814 | |
| Fund accounting fees | | | 30,105 | | | | 3,068 | | | | 20,576 | | | | 63,809 | |
| Custody fees | | | 36,931 | | | | 6,940 | | | | 61,154 | | | | 149,661 | |
| Registration fees | | | 24,660 | | | | 9,968 | | | | 9,502 | | | | 43,861 | |
| Printing and mailing expense | | | 22,798 | | | | 2,501 | | | | 6,613 | | | | 66,820 | |
| Trustee fees and expenses | | | 24,639 | | | | 1,817 | | | | 13,105 | | | | 58,079 | |
| Insurance expense | | | 13,796 | | | | 1,188 | | | | 4,896 | | | | 23,121 | |
| Other expenses | | | 10,777 | | | | 918 | | | | 4,328 | | | | 27,053 | |
| Total expenses before waiver | | | 3,373,419 | | | | 264,365 | | | | 1,507,333 | | | | 7,710,323 | |
| Less: Fees waived (see Note 5) | | | (32,759 | ) | | | — | | | | — | | | | — | |
| Net expenses | | | 3,340,660 | | | | 264,365 | | | | 1,507,333 | | | | 7,710,323 | |
| Net Investment Income (Loss) | | | 2,256,883 | | | | (115,544 | ) | | | 661,424 | | | | (5,768,057 | ) |
| Realized and Unrealized Gain (Loss): | | | | | | | | | | | | | | | | |
| Net realized gain (loss) on: | | | | | | | | | | | | | | | | |
| Investments | | | | | | | | | | | | | | | | |
| Unaffiliated issuers | | | 11,152,852 | | | | 2,910,552 | | | | 11,362,160 | | | | 67,137,556 | |
| Affiliated issuers | | | — | | | | (89,411 | ) | | | — | | | | (183,205 | ) |
| Foreign currency translation | | | 6,582 | | | | — | | | | 711,166 | | | | 549,105 | |
| | | | 11,159,434 | | | | 2,821,141 | | | | 12,073,326 | | | | 67,503,456 | |
| Net change in unrealized appreciation (depreciation) | | | | | | | | | | | | | | | | |
| on: | | | | | | | | | | | | | | | | |
| Investments | | | (63,304,427 | ) | | | (10,774,038 | ) | | | (36,067,057 | ) | | | (195,801,514 | ) |
| Foreign currency translation | | | (887,755 | ) | | | — | | | | 3,943,324 | | | | (31,530,521 | ) |
| | | | (64,192,182 | ) | | | (10,774,038 | ) | | | (32,123,733 | ) | | | (227,332,035 | ) |
| Net gain on investments and foreign currency | | | (53,032,748 | ) | | | (7,952,897 | ) | | | (20,050,407 | ) | | | (159,828,579 | ) |
| Net Increase in Net Assets Resulting from Operations | | $ | (50,775,865 | ) | | $ | (8,068,441 | ) | | $ | (19,388,983 | ) | | $ | (165,596,636 | ) |
| * Net of foreign taxes withheld | | $ | 30,348 | | | $ | — | | | $ | 208,598 | | | $ | 172,794 | |
The accompanying notes are an integral part of these financial statements.
[This page intentionally left blank]
The Tocqueville Trust
Statements of Changes in Net Assets
| | | The Tocqueville Fund | |
| | | For the | | | | |
| | | Six Months | | | For the | |
| | | Ended | | | Year Ended | |
| | | April 30, | | | October 31, | |
| | | 2008 | | | 2007 | |
| | | (Unaudited) | | | | |
| Operations: | | | | | | |
Net investment income (loss) | | $ | 2,256,883 | | | $ | 3,219,612 | |
Net realized gain on investments and foreign currency | | | 11,159,434 | | | | 40,230,895 | |
Net change in unrealized appreciation (depreciation) | | | (64,192,182 | ) | | | 38,647,927 | |
Net increase (decrease) in net assets resulting from operations | | | (50,775,865 | ) | | | 82,098,434 | |
| Dividends and distributions to shareholders: | | | | | | | | |
Net investment income | | | (3,450,163 | ) | | | (454,720 | ) |
Net realized gains | | | (36,514,100 | ) | | | — | |
Total dividends and distributions | | | (39,964,263 | ) | | | (454,720 | ) |
| Fund share transactions: | | | | | | | | |
Shares sold | | | 156,655,466 | | | | 116,009,361 | |
Shares issued to holders in reinvestment of dividends | | | 34,039,145 | | | | 367,309 | |
Shares redeemed* | | | (56,478,823 | ) | | | (66,637,488 | ) |
Net increase (decrease) | | | 134,215,788 | | | | 49,739,182 | |
Net increase (decrease) in net assets | | | 43,475,660 | | | | 131,382,896 | |
| Net Assets: | | | | | | | | |
Beginning of period | | | 523,877,845 | | | | 392,494,949 | |
End of period** | | | 567,353,505 | | | | 523,877,845 | |
| * Net of redemption fees of: | | $ | 133,543 | | | $ | 27,331 | |
| ** Including undistributed net investment income (loss) of: | | $ | 1,533,244 | | | $ | 2,726,523 | |
| Change in shares outstanding: | | | | | | | | |
Shares sold | | | 6,241,381 | | | | 4,416,384 | |
Shares issued to holders in reinvestment of dividends | | | 1,316,286 | | | | 14,404 | |
Shares redeemed | | | (2,288,780 | ) | | | (2,502,104 | ) |
Net increase (decrease) | | | 5,268,887 | | | | 1,928,684 | |
The accompanying notes are an integral part of these financial statements.
The Tocqueville Trust
Statements of Changes in Net Assets
| Small Cap Value Fund | | | International Value Fund | | | Gold Fund | |
| For the | | | | | | For the | | | | | | For the | | | | |
| Six Months | | | For the | | | Six Months | | | For the | | | Six Months | | | For the | |
| Ended | | | Year Ended | | | Ended | | | Year Ended | | | Ended | | | Year Ended | |
| April 30, | | | October 31, | | | April 30, | | | October 31, | | | April 30, | | | October 31, | |
| 2008 | | | 2007 | | | 2008 | | | 2007 | | | 2008 | | | 2007 | |
| (Unaudited) | | | | | | (Unaudited) | | | | | | (Unaudited) | | | | |
| | | | | | | | | | | | | | | | | |
| $ | (115,544 | ) | | $ | 321,926 | | | $ | 661,424 | | | $ | 1,112,403 | | | $ | (5,768,057 | ) | | $ | (7,970,894 | ) |
| | 2,821,141 | | | | 4,658,397 | | | | 12,073,326 | | | | 25,994,545 | | | | 67,503,456 | | | | 161,899,664 | |
| | (10,774,038 | ) | | | (1,002,822 | ) | | | (32,123,733 | ) | | | 5,080,428 | | | | (227,332,035 | ) | | | 178,803,895 | |
| | (8,068,441 | ) | | | 3,977,501 | | | | (19,388,983 | ) | | | 32,187,376 | | | | (165,596,636 | ) | | | 332,732,665 | |
| | | | | | | | | | | | | | | | | | | | | | | |
| | (335,138 | ) | | | — | | | | (1,371,852 | ) | | | (3,604,661 | ) | | | (8,713,461 | ) | | | (3,621,877 | ) |
| | (4,709,888 | ) | | | (6,159,790 | ) | | | (25,545,236 | ) | | | (30,743,930 | ) | | | (158,099,409 | ) | | | (84,246,717 | ) |
| | (5,045,026 | ) | | | (6,159,790 | ) | | | (26,917,088 | ) | | | (34,348,591 | ) | | | (166,812,870 | ) | | | (87,868,594 | ) |
| | | | | | | | | | | | | | | | | | | | | | | |
| | 4,775,483 | | | | 7,225,777 | | | | 5,266,605 | | | | 22,555,387 | | | | 137,822,308 | | | | 307,337,813 | |
| | 4,356,344 | | | | 5,484,786 | | | | 23,234,344 | | | | 29,649,169 | | | | 159,171,486 | | | | 82,687,483 | |
| | (9,303,269 | ) | | | (13,685,825 | ) | | | (14,624,098 | ) | | | (56,056,809 | ) | | | (197,447,478 | ) | | | (236,669,324 | ) |
| | (171,442 | ) | | | (975,262 | ) | | | 13,876,851 | | | | (3,852,253 | ) | | | 99,546,316 | | | | 153,355,972 | |
| | (13,284,909 | ) | | | (3,157,551 | ) | | | (32,429,220 | ) | | | (6,013,468 | ) | | | (232,863,190 | ) | | | 398,220,043 | |
| | | | | | | | | | | | | | | | | | | | | | | |
| | 49,543,492 | | | | 52,701,043 | | | | 219,220,438 | | | | 225,233,906 | | | | 1,231,474,523 | | | | 833,254,480 | |
| | 36,258,583 | | | | 49,543,492 | | | | 186,791,218 | | | | 219,220,438 | | | | 998,611,333 | | | | 1,231,474,523 | |
| $ | 5,820 | | | $ | 2,650 | | | $ | 13,506 | | | $ | 28,384 | | | $ | 358,170 | | | $ | 515,000 | |
| $ | (132,821 | ) | | $ | 317,861 | | | $ | 423,733 | | | $ | 1,134,161 | | | $ | (31,882,765 | ) | | $ | (17,401,247 | ) |
| | | | | | | | | | | | | | | | | | | | | | | |
| | 359,573 | | | | 419,793 | | | | 392,942 | | | | 1,432,275 | | | | 2,652,807 | | | | 5,771,159 | |
| | 303,367 | | | | 339,405 | | | | 1,694,701 | | | | 1,955,750 | | | | 3,330,644 | | | | 1,641,276 | |
| | (673,240 | ) | | | (806,145 | ) | | | (1,117,699 | ) | | | (3,553,827 | ) | | | (3,842,745 | ) | | | (4,485,886 | ) |
| | (10,300 | ) | | | (46,947 | ) | | | 969,944 | | | | (165,802 | ) | | | 2,140,706 | | | | 2,926,549 | |
The accompanying notes are an integral part of these financial statements.
The Tocqueville Trust
The Tocqueville Fund
The Tocqueville Small Cap Value Fund
The Tocqueville International Value Fund
The Tocqueville Gold Fund
Notes to Financial Statements
The Tocqueville Trust (the “Trust”) was organized as a Massachusetts business trust registered under the Investment Company Act of 1940, as amended (the “1940 Act”), as a diversified, open-end management investment company. The Trust consists of four separate funds: The Tocqueville Fund, The Tocqueville Small Cap Value Fund, The Tocqueville International Value Fund and The Tocqueville Gold Fund (individually referred to as the ‘‘Fund’’ and collectively referred to as the ‘‘Funds’’). The objective of The Tocqueville Fund is long-term capital appreciation. The Tocqueville Fund seeks to achieve its investment objective by investing primarily in securities of United States issuers. The objective of The Tocqueville Small Cap Value Fund is long-term capital appreciation. The Tocqueville Small Cap Value Fund seeks to achieve its investment objective by investing at least 80% of its net assets, plus borrowings for investment purposes, in common stocks of companies located in the United States that have market values of less than $3 billion. The objective of The Tocqueville International Value Fund is long-term capital appreciation consistent with preservation of capital. The Tocqueville International Value Fund seeks to achieve its investment objective by investing primarily in non-U.S. companies. The objective of The Tocqueville Gold Fund is to provide long-term capital appreciation. The Tocqueville Gold Fund seeks to achieve its investment objective by investing 80% of its net assets, plus borrowings for investment purposes, in gold and securities of companies located throughout the world that are engaged in mining or processing gold. The following is a summary of significant accounting principles followed by the Trust in the preparation of its financial statements.
2. | SIGNIFICANT ACCOUNTING POLICIES |
a) Security valuation
Investments in securities, including foreign securities, traded on an exchange or quoted on the over-the-counter market are valued at the last sale price or, if no sale occurred during the day, at the mean between closing bid and asked prices, as last reported by a pricing service approved by the Trustees. Securities that are principally traded on the National Association of Securities Dealers Automated Quotation (“NASDAQ”) National Market are generally valued at the NASDAQ Official Closing Price (“NOCP”). Investments in gold and silver are valued on the basis of the respective closing spot prices of the New York Commodity Exchange. Investments in other precious metals are valued at their respective market values determined on the basis of the mean between the last current bid and asked prices based on dealer or exchange quotations. When market quotations are not readily available, or when restricted securities or other assets are being valued, such assets are valued at fair value as determined in good faith by or under procedures approved by the Trustees. Short-term securities maturing within 60 days are valued on an amortized cost basis. Fixed income securities with maturities greater than 60 days are valued at market price.
Trading in securities on European and Far Eastern securities exchanges normally is completed before the calculation of the Funds’ net asset value. Trading on these foreign exchanges may not take place on all days on which there is regular trading on the New York Stock Exchange (“NYSE”), or may take place on days on which there is no regular trading on the NYSE. Similarly, the Funds may hold securities traded on domestic markets where the market may close early on a given day prior to calculation of the Funds’ net asset value. Events affecting the value of such securities held by the Funds that occur between the close of trading in the security and the close of trading on the NYSE normally will not be reflected in the Funds’ calculation of the net asset value. Significant events will be closely monitored, and where it is determined that an adjustment should be made to the security’s value because significant interim events may materially affect the value of the security, the security will be priced at its fair value in accordance with the procedures approved by the Trustees.
Investment and shareholder transactions are recorded on trade date. Dividend income is recognized on the ex-dividend date and Interest income is recognized on an accrual basis.
b) Restricted and Illiquid Securities
The Tocqueville Fund and The Tocqueville Gold Fund may invest in securities that are subject to legal or contractual restrictions on resale or are illiquid. A security may be considered illiquid if it lacks a readily available market or if its valuation has not changed for a certain period of time. Disposal of these securities may involve time consuming negotiations and expense, and prompt sale at the current valuation may be difficult.
c) Accounting pronouncements
On July 13, 2006, the Financial Accounting Standards Board (FASB) released FASB Interpretation No. 48 “Accounting for Uncertainty in Income Taxes” (“FIN 48”). FIN 48 provides guidance for how uncertain tax positions should be recognized, measured, presented and disclosed in the financial statements. FIN 48 requires the evaluation of tax positions taken or expected to be taken in the course of preparing the Funds’ tax returns to determine whether the tax positions are “more-likely-than-not” of being sustained by the applicable tax authority. Tax positions not deemed to meet the more-likely-than-not threshold would be recorded as a tax benefit or expense in the current year. Adoption of FIN 48 is required as of the date of the last Net Asset Value (“NAV”) calculation in the first required financial statement reporting period for fiscal years beginning after December 15, 2006 and is to be applied to all open tax years as of the effective date. At this time, management is evaluating the implications of FIN 48 and its impact on the financial statements has not yet been determined.
In September 2006, the Financial Accounting Standards Board (FASB) issued Statement on Financial Accounting Standards No. 157, “Fair Value Measurements” (FAS 157). This standard clarifies the definition of fair value for financial reporting, establishes a framework for measuring fair value and requires additional disclosures about the use of fair value measurements. FAS 157 is effective for financial statements issued for fiscal years beginning after November 15, 2007 and interim periods within those fiscal years. At this time, the Funds do not believe the adoption of FAS 157 will impact the amounts reported in the financial statements; however, additional disclosures will be required about the inputs used to develop the measurements of fair value and the effect of certain of the measurements reported in the statement of operations for a fiscal period.
In March 2008, the Financial Accounting Standards Board (FASB) issued Statement of Financial Accounting Standards No. 161, “Disclosures about Derivative Instruments and Hedging Activities” (“SFAS 161”). SFAS 161 is effective for fiscal years beginning after November 15, 2008. SFAS 161 is intended to improve financial reporting for derivative instruments by requiring enhanced disclosure that enables investors to understand how and why an entity uses derivatives, how derivatives are accounted for, and how derivative instruments affect an entity’s results of operations and financial position. Management is currently evaluating the implications of SFAS 161. The impact on the Fund’s financial statement disclosures, if any, is currently being assessed.
d) Foreign currency translation
Investments and other assets and liabilities denominated in foreign currencies are translated to U.S. dollars at the prevailing rates of exchange, in accordance with the Trust’s Portfolio Securities Valuation and Foreign Exchange Contracts Procedures. The Tocqueville Fund, The Tocqueville International Value Fund and The Tocqueville Gold Fund, are engaged in transactions in securities denominated in foreign currencies and, as a result, enter into foreign exchange contracts. These Funds are exposed to additional market risk as a result of changes in the value of the underlying currency in relation to the U.S. dollar. Risks include potential inability of counterparties to meet the terms of their contracts. The value of foreign currency contracts are marked-to-market on a daily basis, which reflects the changes in the market value of the contract at the close of each day’s trading, resulting in daily unrealized gains and/or losses. When the contracts are closed, the Funds recognize a realized gain or loss.
The Funds do not isolate that portion of the results of operations resulting from changes in foreign exchange rates on investments from the fluctuations arising from changes in market prices of securities held. Such fluctuations are included with the net realized and unrealized gain or loss from investments.
Reported net realized foreign exchange gains or losses arise from sales of foreign currencies, currency gains or losses realized between the trade and settlement dates on securities transactions, the differences between the amounts of dividends, interest, and foreign withholding taxes recorded on the Fund’s books, and the U.S. dollar equivalent of the amounts actually received or paid. Net unrealized foreign exchange gains and losses arise from changes in the value of assets and liabilities other than investments in securities at the end of the fiscal period, resulting from changes in the exchange rates.
e) Written option accounting
The Tocqueville International Value Fund and The Tocqueville Gold Fund may write (sell) covered call options to hedge portfolio investments. When the Funds write (sell) an option, an amount equal to the premium received by the Funds are included in the Statements of Assets and Liabilities as an asset and an equivalent liability. The amount of the liability is subsequently marked-to-market to reflect the current value of the option written. By writing an option, the Funds may become obligated during the term of the option to deliver or purchase the securities underlying the option at the exercise price if the option is exercised. Option contracts are valued at the last sales price reported on the date of obligation. If the seller defaults and the value of the collateral declines or if bankruptcy proceedings are commenced with respect to the seller of the security, realization of the collateral by the Trust may be delayed or limited.
f) Distributions to Shareholders
Dividends to shareholders are recorded on ex-dividend date. Dividends from net investment income are declared and paid annually by the Funds. Distributions of net realized capital gains, if any, will be declared and paid at least annually. Income and capital gain distributions are determined in accordance with income tax regulations which may differ from generally accepted accounting principles. Permanent differences between financial reporting and tax are reclassified to capital stock.
g) Use of Estimates
The preparation of financial statements in conformity with accounting principles generally accepted in the United States of America requires management to make estimates and assumptions that affect the reported amounts of assets and liabilities and disclosure of contingent assets and liabilities at the date of the financial statements and the reported amounts of revenues and expenses during the reporting period. Actual results could differ from those estimates.
Provision for federal income taxes or excise taxes has not been made since the Funds have elected to be taxed as “regulated investment companies” and intend to distribute substantially all taxable income to shareholders and otherwise comply with the provisions of the Internal Revenue Code applicable to regulated investment companies. Distributions from net realized gains for book purposes may include short-term capital gains which are included as ordinary income to shareholders for tax purposes. Additionally, U.S. generally accepted accounting principles require that certain components of net assets relating to permanent differences be reclassified between financial and tax reporting. These reclassifications have no effect on net assets or net asset value per share. For the year ended October 31, 2007, the following table shows the reclassifications made:
| | | Undistributed | | | Accumulated | |
| | | Net Investment | | | Net Realized | |
| | | Income/(Loss) | | | Gain/(Loss) | |
| The Tocqueville Fund | | $ | (38,370 | ) | | $ | 38,370 | |
| Small Cap Value Fund | | | (4,065 | ) | | | 4,065 | |
| International Value Fund | | | 453,534 | | | | (453,534 | ) |
| Gold Fund | | | 3,243,204 | | | | (3,243,204 | ) |
The permanent differences primarily relate to net operating losses and capital loss carryover due to expiration.
As of October 31, 2007, the components of accumulated earnings (losses) for income tax purposes were as follows:
| | | | | | Small Cap | | | International | | | | |
| | | Tocqueville | | | Value | | | Value | | | Gold | |
| | | Fund | | | Fund | | | Fund | | | Fund | |
| Tax cost of Investments | | $ | 410,822,045 | | | $ | 43,908,664 | | | $ | 170,041,546 | | | $ | 704,722,095 | |
| | | | | | | | | | | | | | | | | |
| Unrealized Appreciation | | $ | 120,710,195 | | | $ | 9,269,936 | | | $ | 52,793,661 | | | $ | 529,280,047 | |
| Unrealized Depreciation | | | (9,455,769 | ) | | | (2,674,091 | ) | | | (2,478,079 | ) | | | (48,338,713 | ) |
| | | | | | | | | | | | | | | | | |
| Net unrealized appreciation (depreciation) | | $ | 111,254,426 | | | $ | 6,595,845 | | | $ | 50,315,582 | | | $ | 480,941,334 | |
| | | | | | | | | | | | | | | | | |
| Undistributed OI | | $ | 6,744,654 | | | $ | 353,986 | | | $ | 1,134,161 | | | $ | 12,363,898 | |
| Undistributed LTG | | | 32,495,852 | | | | 4,673,734 | | | | 25,545,107 | | | | 154,455,564 | |
| | | | | | | | | | | | | | | | | |
| Distributable earnings | | $ | 39,240,506 | | | $ | 5,027,720 | | | $ | 26,679,268 | | | $ | 166,819,462 | |
| | | | | | | | | | | | | | | | | |
| Other accumulated gain/(loss) | | | (10,095,968 | ) | | | — | | | | — | | | | — | |
| | | | | | | | | | | | | | | | | |
| Total accumulated gain/(loss) | | $ | 140,398,964 | | | $ | 11,623,565 | | | $ | 76,994,850 | | | $ | 647,760,796 | |
The difference between book-basis and tax-basis unrealized appreciation is attributable primarily to capital loss carry overs and partnership adjustments.
The tax character of distributions paid during the years ended October 31, 2007 and 2006 was as follows:
| | | October 31, 2007 | |
| | | | | | Long-term | | | | |
| | | Ordinary | | | Capital | | | | |
| | | Income | | | Gain | | | Total | |
| The Tocqueville Fund | | $ | 454,720 | | | | — | | | $ | 454,720 | |
| Small Cap Value Fund | | | — | | | $ | 6,159,790 | | | | 6,159,790 | |
| International Value Fund | | | 4,604,764 | | | | 29,743,827 | | | | 34,348,591 | |
| Gold Fund | | | 22,329,899 | | | | 65,538,695 | | | | 87,868,594 | |
| | | | | | | | | | | | | |
| | | | | | | | | | | | | |
| | | October 31, 2006 | |
| | | | | | | Long-term | | | | | |
| | | Ordinary | | | Capital | | | | | |
| | | Income | | | Gain | | | Total | |
| The Tocqueville Fund | | $ | 2,189,946 | | | $ | 23,608,046 | | | $ | 25,797,992 | |
| International Value Fund | | | 712,009 | | | | 25,434,697 | | | | 26,146,706 | |
| Gold Fund | | | — | | | | 31,702,831 | | | | 31,702,831 | |
The Funds designated as long-term capital gain dividends, pursuant to Internal Revenue Code Section 852(b)(3), the amounts necessary to reduce the earnings and profits of the Funds related to net capital gains to zero for the tax years ended October 31, 2007 and 2006.
At October 31, 2007, certain funds had tax basis capital losses which may be carried over to offset future capital gains as shown below.
| | | The | |
| | | Tocqueville | |
| | | Fund | |
| Capital losses expiring in: | | | |
| 2010 | | $ | 8,499,900 | |
| 2009 | | | 1,596,068 | |
| | | $ | 10,095,968 | |
During the year ended October 31, 2007, The Tocqueville Fund utilized 3,631,334 of capital loss carryforwards.
The Funds may trade financial instruments with off-balance sheet risk in the normal course of investing activities and to assist in managing exposure to market risks such as interest rates and foreign currency exchange rates. The financial instruments include written options, forward foreign currency exchange contracts and futures contracts. The notional or contractual amounts of these instruments represent the investment the Funds have in particular classes of financial instruments and do not necessarily represent the amounts potentially subject to risk. The measurement of the risks associated with these instruments is meaningful only when all related and offsetting transactions are considered. At October 31, 2007, the Funds did not hold any financial instruments with off-balance sheet risk.
5. | INVESTMENT ADVISORY AND OTHER AGREEMENTS |
Tocqueville Asset Management L.P. (“Tocqueville”) is the investment adviser (the “Adviser”) to the Trust under Investment Advisory Agreements approved by shareholders. For its services, Tocqueville receives fees from The Tocqueville Fund, calculated daily and payable monthly, at an annual rate of 0.75% on the first $1 billion of the average daily net assets of the Fund, and 0.65% of the average daily net assets in excess of $1 billion. Tocqueville receives fees from The Tocqueville Small Cap Value Fund, calculated daily and payable monthly, at an annual rate of 0.75% on the first $500 million of the average daily net assets of the Fund, and 0.65% of the average daily net assets in excess of $500 million. Tocqueville receives fees from the Tocqueville International Value Fund, calculated daily and payable monthly, at an annual rate of 1.00% on the first $1 billion of the average daily net assets of the Fund, and 0.75% of the average daily net assets in excess of $1 billion. Tocqueville receives fees from The Tocqueville Gold Fund, calculated daily and payable monthly, at an annual rate of 1.00% on the first $500 million of the average daily net assets of the Fund, 0.75% of the average daily net assets in excess of $500 million but not exceeding $1 billion, and 0.65% of the average daily net assets in excess of $1 billion.
With respect to The Tocqueville Fund, effective October 31, 2007, the Adviser has contractually agreed to waive its advisory fees and/or reimburse expenses in order to ensure that The Tocqueville Fund’s total annual operating expenses do not exceed 1.25% of its average daily net assets. The Expense Limitation Agreement will remain in effect until October 31, 2008.
Pursuant to an Administrative Services Agreement, each Fund pays to the Adviser a fee computed and paid monthly at an annual rate of 0.15% of the average daily net assets of the Fund. For the six months ended April 30, 2008, the
Adviser has made payments of $79,374, $5,845, $28,359 and $165,694 to U.S. Bancorp Fund Services, LLC for services provided under a Sub-Administration agreement for The Tocqueville Fund, The Tocqueville Small Cap Value Fund, The Tocqueville International Value Fund and The Tocqueville Gold Fund, respectively.
Tocqueville Securities L.P. (the “Distributor”), an affiliate of Tocqueville, acts as distributor for shares of the Trust. Each Fund adopted a distribution and service plan pursuant to Rule 12b-1 of the 1940 Act. Pursuant to the plans, each Fund pays to the Distributor distribution and service fees of 0.25% per annum of its average daily net assets.
Commissions earned by the Distributor for services rendered as a registered broker-dealer in securities transactions for The Tocqueville Fund, The Tocqueville Small Cap Value Fund, The Tocqueville International Value Fund and The Tocqueville Gold Fund for the six months ended April 30, 2008, were $216,933, $107,585, $61,612 and $244,564, respectively.
During the year ended October 31, 2004, The Tocqueville Gold Fund received a reimbursement from Tocqueville related to certain losses incurred as a result of a pricing error. The amount of the loss and corresponding reimbursement was $60,626 or $0.004 per share based on average shares outstanding during the year ended October 31, 2004.
6. | FUND SHARE TRANSACTIONS |
The Funds currently offer only one class of shares of beneficial interest. A redemption fee of 2.00% is imposed on redemptions of shares held 120 days or less. This fee is retained by each Fund and is credited to paid in capital. Redemptions to which the fee applies include redemptions of shares resulting from an exchange made pursuant to the Exchange Privilege, as defined in the Trust’s Prospectus dated February 28, 2008. For a more detailed description of when the redemption fee does not apply, please see the Trust’s Prospectus. The Trust may waive the redemption fee when the Adviser determines that the imposition of the redemption fee is not necessary to protect a Fund from the effects of redemptions by investors who use the Fund as a short-term trading vehicle.
7. | INVESTMENT TRANSACTIONS |
Purchases and sales of investment securities (excluding short-term instruments) for the six months ended April 30, 2008 are summarized below.
| | | The | | | | | | | | | | |
| | | Tocqueville | | | Small Cap | | | International | | | Gold | |
| | | Fund | | | Value Fund | | | Value Fund | | | Fund | |
| Purchases: | | $ | 162,686,311 | | | $ | 45,038,601 | | | $ | 64,133,181 | | | $ | 185,086,939 | |
| Sales: | | $ | 110,726,980 | | | $ | 50,469,202 | | | $ | 73,247,607 | | | $ | 168,026,694 | |
Effective October 31, 2006, The Tocqueville Fund acquired, through a non-taxable merger, substantially all of the net assets of The Tocqueville Genesis Fund, a series of the Tocqueville Trust. The Tocqueville Fund issued 628,166 shares (valued at $15,236,046) for the 1,528,711 shares outstanding of The Tocqueville Genesis Fund. The net assets of the Tocqueville Genesis Fund, $15,236,046, included net unrealized appreciation on investment of $1,464,099.
Effective October 31, 2006, The Tocqueville Fund acquired, through a non-taxable merger, substantially all of the net assets of The Tocqueville Alexis Fund, a single series. The Tocqueville Fund issued 2,900,483 shares (valued at $70,350,642) for the 5,366,305 shares outstanding of The Tocqueville Alexis Fund. The net assets of the Tocqueville Alexis Fund, $70,350,642, included net unrealized appreciation on investment of $18,655,613.
9. | TRANSACTIONS WITH AFFILIATES |
The following issuers are affiliated with the Funds; that is, the Fund held 5% or more of the outstanding voting securities during the period from November 1, 2007 through April 30, 2008. As defined in Section (2)(a)(3) of the Investment Company Act of 1940; such issues are:
| The Tocqueville Fund | | | | | | | | | | | | | | | | | | | | | |
| | | Share Balance | | | | | | | | | Share Balance | | | Dividend | | | Realized | | | Value | |
| Issuer Name | | At Nov. 1, 2007 | | | Additions | | | Reductions | | | Apr. 30, 2008 | | | Income | | | Gain/(Loss) | | | At Apr. 30, 2008 | |
| Alaska Communication | | | | | | | | | | | | | | | | | | | | | |
| Systems Group, Inc. | | | 500,000 | | | | — | | | | — | | | | 500,000 | | | $ | 215,000 | | | $ | 0 | | | $ | 5,590,000 | |
| | | | | | | | | | | | | | | | | | | | | | | | | | | | | |
| The Tocqueville Small Cap Value Fund | | | | | | | | | | | | | | | | | | | | | | | | | |
| | | | | | | | | | | | | | Share Balance | | | Dividend | | | Realized | | | Value | |
| Issuer Name | | | | | Additions | | | Reductions | | | Apr. 30, 2008 | | | Income | | | Gain/(Loss) | | | At Apr. 30, 2008 | |
| 1-800 Flowers.com, Inc. | | | — | | | | 90,500 | | | | (5,500 | ) | | | 85,000 | | | | — | | | $ | (3,085 | ) | | $ | 749,700 | |
| Emcore Corp. | | | — | | | | 201,771 | | | | (50,271 | ) | | | 151,500 | | | | — | | | | 55,184 | | | | 936,270 | |
| Kopin Corp. | | | — | | | | 312,500 | | | | (21,500 | ) | | | 291,000 | | | | — | | | | (14,359 | ) | | | 867,180 | |
| LionBridge | | | | | | | | | | | | | | | | | | | | | | | | | | | | |
| Technologies, Inc. | | | — | | | | 228,000 | | | | (21,500 | ) | | | 206,500 | | | | — | | | | (13,411 | ) | | | 609,175 | |
| Salix Pharmaceuticals, | | | | | | | | | | | | | | | | | | | | | | | | | | | | |
| Ltd. | | | 110,000 | | | | 31,500 | | | | (8,500 | ) | | | 133,000 | | | | — | | | | (56,189 | ) | | | 933,660 | |
| Symyx | | | — | | | | 52,200 | | | | (3,500 | ) | | | 48,700 | | | | — | | | | (2,503 | ) | | | 365,737 | |
| Thoratec Laboratories | | | | | | | | | | | | | | | | | | | | | | | | | | | | |
| Corp. | | | — | | | | 93,500 | | | | (5,500 | ) | | | 88,000 | | | | — | | | | (16,324 | ) | | | 1,407,120 | |
| Ultratech, Inc. | | | 102,000 | | | | 4,000 | | | | (16,000 | ) | | | 90,000 | | | | — | | | | (38,724 | ) | | | 1,283,400 | |
| | | | | | | | | | | | | | | | | | | | | | | | | | | $ | 7,152,242 | |
| The Tocqueville Gold Fund | | | | | | | | | | | | | | | | | | | | | |
| | | Share Balance | | | | | | | | | Share Balance | | | Dividend | | | Realized | | | Value | |
| Issuer Name | | At Nov. 1, 2007 | | | Additions | | | Reductions | | | Apr. 30, 2008 | | | Income | | | Gain/(Loss) | | | At Apr. 30, 2008 | |
| Andean Resources | | | 15,536,500 | | | | 235,000 | | | | — | | | | 15,771,500 | | | | — | | | | — | | | $ | 23,808,733 | |
| Aurelian Resources, | | | | | | | | | | | | | | | | | | | | | | | | | | | | |
| Inc. | | | 756,000 | | | | — | | | | — | | | | 756,000 | | | | — | | | | — | | | | 3,077,748 | |
| Cluff Gold Ltd. | | | 2,450,000 | | | | 540,000 | | | | — | | | | 2,990,000 | | | | — | | | | — | | | | 5,597,258 | |
| Euro Resources SA | | | 2,900,000 | | | | — | | | | — | | | | 2,900,000 | | | | — | | | | — | | | | 4,301,797 | |
| Fury Explorations Ltd. | | | 1,500,000 | | | | — | | | | (1,500,000 | ) | | | — | | | | — | | | $ | (183,205 | ) | | | — | |
| Gold Resource Corp. | | | — | | | | 2,129,700 | | | | — | | | | 2,129,700 | | | | — | | | | — | | | | 9,988,293 | |
| New Gold, Inc. | | | 1,518,500 | | | | | | | | | | | | 1,518,500 | | | | — | | | | — | | | | 11,579,863 | |
| Osisko Mining Corp. | | | 3,891,900 | | | | — | | | | | | | | 3,891,900 | | | | — | | | | — | | | | 16,423,965 | |
| Polo Resources Ltd. | | | — | | | | 49,275,000 | | | | — | | | | 49,275,000 | | | | — | | | | — | | | | 11,022,065 | |
| Troy Resources NL | | | 3,549,520 | | | | — | | | | — | | | | 3,549,520 | | | | — | | | | — | | | | 8,037,559 | |
| Troy Resources NL | | | | | | | | | | | | | | | | | | | | | | | | | | | | |
| Npv | | | — | | | | 100,000 | | | | — | | | | 100,000 | | | | — | | | | — | | | | 211,498 | |
| | | | | | | | | | | | | | | | | | | | | | | | | | | $ | 94,048,779 | |
ADDITIONAL INFORMATION (UNAUDITED)
| 1. | ADDITIONAL DISCLOSURE REGARDING FUND TRUSTEES AND OFFICERS |
Independent Trustees
| | | | | | | | | # of | | |
| | | | | | | | | Portfolios | | |
| | | | | Term of | | | | in Fund | | |
| | | Position(s) | | Office and | | | | Complex | | |
| | | Held with | | Length of | | Principal Occupation | | Overseen | | Other Directorships |
| Name, Age and Address | | the Trust | | Time Served (1) | | During Past Five Years | | By Trustee | | Held by Trustee |
| | | | | | | | | | | |
| Larry M. Senderhauf (59) | | Trustee | | Indefinite Term, | | Retired. Administrator and | | 4 | | Advisory Board |
| 40 W. 57th St., 19th Floor | | | | 8 Years Served | | Trustee, LMS 33 Profit and | | | | Member, Legacy |
| New York, NY 10019 | | | | | | Pension Sharing Fund from | | | | Bank, Scottsdale, |
| | | | | | | 1983 to present. | | | | Arizona |
| | | | | | | | | | | |
| Guy A. Main (71) | | Trustee | | Indefinite Term, | | Retired. Formerly, Executive | | 4 | | Director, Amwest |
| 40 W. 57th St., 19th Floor | | | | 6 Years Served | | Vice President, Amwest | | | | Insurance Group, |
| New York, NY 10019 | | | | | | Insurance Group, Inc. from | | | | Inc. from April 1996 |
| | | | | | | April 1996 to January 2001; | | | | to January 2001; |
| | | | | | | Chairman, President and Chief | | | | Chairman, |
| | | | | | | Executive Officer, Condor | | | | Association of |
| | | | | | | Services Inc. from April 1989 | | | | California Insurance |
| | | | | | | to April 1996. | | | | Companies from |
| | | | | | | | | | | January 1996 to |
| | | | | | | | | | | January 1998; |
| | | | | | | | | | | Director, Condor |
| | | | | | | | | | | Services Inc. from |
| | | | | | | | | | | April 1989 to |
| | | | | | | | | | | April 1996. |
| | | | | | | | | | | |
| Charles W. Caulkins (51) | | Trustee | | Indefinite Term, | | Founder and President, Arbor | | 4 | | Director, Phoenix |
| 40 W. 57th St., 19th Floor | | | | 4 Years Served | | Marketing, Inc. from October | | | | House from January |
| New York, NY 10019 | | | | | | 1994 to 2007; Head of | | | | 2001 to 2007; |
| | | | | | | Marketing, LR Global Partners | | | | Director, Bridges to |
| | | | | | | from 2008 to present. | | | | Community from |
| | | | | | | | | | | July 2002 to 2006. |
| | | | | | | | | | | |
| James W. Gerard (47) | | Trustee | | Indefinite Term, | | Principal, Juniper Capital | | 4 | | Director, American |
| 40 W. 57th St., 19th Floor | | | | 5 Years Served | | Group, LLC (formerly known | | | | Overseas Memorial |
| New York, NY 10019 | | | | | | as Argus Advisors | | | | Day Association, |
| | | | | | | International, LLC), from | | | | 1988 to present; |
| | | | | | | August 2003 to present; | | | | Director ASPCA, |
| | | | | | | Managing Director, The Chart | | | | 1988 to present; |
| | | | | | | Group from January 2001 to | | | | Trustee, Salisbury |
| | | | | | | present; Managing Principal, | | | | School, 2005 to |
| | | | | | | Ironbound Partners from | | | | present; Director, |
| | | | | | | October 1998 to December | | | | American Friends of |
| | | | | | | 2000. | | | | Blérancourt, 1992 to |
| | | | | | | | | | | present. |
| | | | | | | | | # of | | |
| | | | | | | | | Portfolios | | |
| | | | | Term of | | | | in Fund | | |
| | | Position(s) | | Office and | | | | Complex | | |
| | | Held with | | Length of | | Principal Occupation | | Overseen | | Other Directorships |
| Name, Age and Address | | the Trust | | Time Served (1) | | During Past Five Years | | By Trustee | | Held by Trustee |
| | | | | | | | | | | |
| William F. Indoe (66) | | Trustee | | Indefinite Term, | | Partner, Sullivan & Cromwell | | 4 | | None |
| 40 W. 57th St., 19th Floor | | | | Since December | | LLP (attorneys-at-law). | | | | |
| New York, NY 10019 | | | | 2006 | | | | | | |
| | | | | | | | | | | |
| William J. Nolan III (60) | | Trustee | | Indefinite Term, | | Retired, Executive Vice | | 4 | | Trustee, Adirondock |
| 40 W. 57th St., 19th Floor | | | | Since December | | President & Treasurer | | | | Museum, Blue Mt. |
| New York, NY 10019 | | | | 2006 | | PaineWebber Inc. 1997-2001. | | | | Lake, NY 1996 to |
| | | | | | | | | | | 2007 (Treasurer, |
| | | | | | | | | | | 2000 to 2007). |
| Interested Trustees (and Officers)* | | | | | | |
| | | | | | | | | | | |
| | | | | | | | | # of | | |
| | | | | | | | | Portfolios | | |
| | | | | Term of | | | | in Fund | | |
| | | Position(s) | | Office and | | | | Complex | | |
| | | Held with | | Length of | | Principal Occupation | | Overseen | | Other Directorships |
| Name, Age and Address | | the Trust | | Time Served (1) | | During Past Five Years | | By Trustee | | Held by Trustee |
| | | | | | | | | | | |
| Francois D. Sicart (64) | | Chairman, | | Indefinite Term, | | Chairman, Tocqueville | | 4 | | Chairman and |
| 40 W. 57th St., 19th Floor | | Principal | | 20 Years Served | | Management Corporation, the | | | | Director, |
| New York, NY 10019 | | Executive | | | | General Partner of Tocqueville | | | | Tocqueville |
| | | Officer and | | | | Asset Management L.P. and | | | | Management |
| | | Trustee | | | | Tocqueville Securities L.P. | | | | Corporation, the |
| | | | | | | from January 1990 to present; | | | | General Partner of |
| | | | | | | Chairman and Founder, | | | | Tocqueville Asset |
| | | | | | | Tocqueville Asset | | | | Management L.P. |
| | | | | | | Management Corp. from | | | | and Tocqueville |
| | | | | | | December 1985 to January | | | | Securities L.P. from |
| | | | | | | 1990; Vice Chairman of | | | | January 1990 to |
| | | | | | | Tucker Anthony Management | | | | present. |
| | | | | | | Corporation from 1981 to | | | | |
| | | | | | | October 1986; Vice President | | | | |
| | | | | | | (formerly general partner) | | | | |
| | | | | | | among other positions with | | | | |
| | | | | | | Tucker Anthony, Inc. from | | | | |
| | | | | | | 1969 to January 1990. | | | | |
Interested Trustees (and Officers)*
| | | | | | | | | # of | | |
| | | | | | | | | Portfolios | | |
| | | | | Term of | | | | in Fund | | |
| | | Position(s) | | Office and | | | | Complex | | |
| | | Held with | | Length of | | Principal Occupation | | Overseen | | Other Directorships |
| Name, Age and Address | | the Trust | | Time Served (1) | | During Past Five Years | | By Trustee | | Held by Trustee |
| | | | | | | | | | | |
| Robert W. Kleinschmidt (58) | | President, | | Indefinite Term, | | President, Chief Investment | | 4 | | President and |
| 40 W. 57th St., 19th Floor | | Principal | | 15 Years Served | | Officer and Director, | | | | Director, |
| New York, NY 10019 | | Operating | | | | Tocqueville Management | | | | Tocqueville |
| | | Officer, | | | | Corporation, the General | | | | Management |
| | | Principal | | | | Partner of Tocqueville Asset | | | | Corporation, the |
| | | Financial | | | | Management L.P. and | | | | General Partner of |
| | | Officer, and | | | | Tocqueville Securities L.P. | | | | Tocqueville Asset |
| | | Trustee | | | | from January 1994 to present; | | | | Management L.P. |
| | | | | | | and Managing Director from | | | | and Tocqueville |
| | | | | | | July 1991 to January 1994; | | | | Securities L.P. |
| | | | | | | Partner, David J. Greene & Co. | | | | |
| | | | | | | from May 1978 to July 1991. | | | | |
| | | | | | | | | | | |
| Steve Tyrrell (36) | | Secretary, | | Indefinite Term, | | Director of Operations, | | N/A | | N/A |
| 40 W. 57th St., 19th Floor | | Treasurer | | Since 2006 | | Tocqueville Asset | | | | |
| New York, NY 10019 | | | | | | Management L.P. from 2004 | | | | |
| | | | | | | to present; Assistant Director | | | | |
| | | | | | | of Operations, 2002-2004; | | | | |
| | | | | | | Assistant Operations Manager, | | | | |
| | | | | | | Lepercq, de Neuflize & Co., | | | | |
| | | | | | | Inc. 1998-2002 | | | | |
| | | | | | | | | | | |
| Andrea Yermack (55) | | Anti | | Indefinite Term, | | Chief Compliance Officer | | N/A | | N/A |
| 40 W. 57th St., 19th Floor | | Money | | Since 2006 | | (April 2006-present), | | | | |
| New York, NY 10019 | | Laundering | | | | Tocqueville Securities L.P.; | | | | |
| | | Compliance | | | | Vice President/Deputy | | | | |
| | | Officer | | | | Director of Compliance (June | | | | |
| | | | | | | 1999-April 2006), Instinet | | | | |
| | | | | | | Group, LLC | | | | |
| | | | | | | | | | | |
| | | | | | | | | | | |
* “Interested person” of the Trust is defined in the 1940 Act. Mr. Sicart and Mr. Kleinschmidt are considered “interested persons” because of their affiliation with the Adviser. |
Interested Trustees (and Officers)*| | | | | | | | | # of | | |
| | | | | | | | | Portfolios | | |
| | | | | Term of | | | | in Fund | | |
| | | Position(s) | | Office and | | | | Complex | | |
| | | Held with | | Length of | | Principal Occupation | | Overseen | | Other Directorships |
| Name, Age and Address | | the Trust | | Time Served (1) | | During Past Five Years | | By Trustee | | Held by Trustee |
| | | | | | | | | | | |
| Thomas Pandick (61) | | Chief | | Indefinite Term, | | Chief Compliance Officer | | N/A | | N/A |
| 40 W. 57th St., 19th Floor | | Compliance | | Since 2004 | | (October 2004-present), | | | | |
| New York, NY 10019 | | Officer | | | | Tocqueville Asset | | | | |
| | | | | | | Management L.P.; General | | | | |
| | | | | | | Counsel (January-October | | | | |
| | | | | | | 2004), Tocqueville Asset | | | | |
| | | | | | | Management L.P.; Vice | | | | |
| | | | | | | President, Kirkbride Asset | | | | |
| | | | | | | Management, Inc. (2000-2004) | | | | |
| | | | | | | | | | | |
| 1 | Each Trustee will hold office for an indefinite term until the earliest of (i) the next meeting of shareholders, if any, called for the purpose of considering the election or re-election of such Trustee and until the election and qualification of his or her successor, if any, elected at such meeting, or (ii) the date a Trustee resigns or retires, or a Trustee is removed by the Board of Trustees or shareholders, in accordance with the Trust’s By-Laws, as amended, and Agreement and Declaration of Trust, as amended. Each officer will hold office for an indefinite term until the date he or she resigns or retires or until his or her successor is elected and qualified. |
| 2. | INVESTMENT ADVISORY AGREEMENT DISCLOSURE |
In determining whether to approve the continuance of the Investment Advisory Agreements on behalf of the Funds, the Trustees, including the disinterested Trustees, considered the following information:
1) The nature, extent and quality of services provided by the Adviser.
The Trustees reviewed in detail the nature and extent of the services provided by the Adviser under the terms of the Funds’ Investment Advisory Agreements and the quality of those services over the past year. The Trustees noted that the services include: managing the investment and reinvestment of the Funds’ assets; supervising and managing all aspects of the Funds’ operations; and providing the Board on a regular basis with financial reports and analyses on the Funds’ operations and the operations of comparable investment companies. The Trustees evaluated these factors based on their direct experience with the Adviser and in consultation with Trust counsel. The Trustees concluded that the nature and extent of the services provided under the Investment Advisory Agreements were reasonable and appropriate in relation to the advisory fee, that the level of services provided by the Adviser had not diminished over the past year and that the quality of services continues to be high. The Trustees reviewed the personnel responsible for providing advisory services to the Funds and concluded, based on their experience and interaction with the Adviser, that (i) the Adviser was able to retain quality portfolio managers and other personnel; (ii) the Adviser exhibited a high level of diligence and attention to detail in carrying out its advisory responsibilities under the Investment Advisory Agreements; (iii) the Adviser was responsive to requests of the Trustees; and (iv) the Adviser had kept the Trustees apprised of developments relating to the Funds and the industry in general. The Trustees also focused on the Adviser’s reputation and long-standing relationship with the Trust.
In connection with its assessment of the performance of the Adviser, the Trustees considered the Adviser’s financial condition and whether it has the resources necessary to continue to carry out its obligations under the Investment Advisory Agreements. The Trustees concluded that the Adviser has the financial resources necessary to continue to perform its obligations under the Investment Advisory Agreements and to continue to provide the high quality services that it has provided to the Funds to date.
2) The performance of the Funds and the Adviser.
The Trustees reviewed the investment performance of the Funds, both on an absolute basis and as compared to a peer group for each respective Fund for the one-year, three-year, five-year and ten-year periods, as applicable, ended July 31, 2007. The peer groups were comprised of other funds that had similar investment objectives and sales load structures, as determined by Lipper: The Lipper Multi-Cap Value Funds peer group, with average net assets between $400 million and $600 million, for The Tocqueville Fund; the Lipper Small-Cap Core Funds peer group, with average net assets between $45 million and $55 million, for The Tocqueville Small Cap Value Fund; The Lipper International Small/Mid Cap Value Funds peer group, with no discretion to average net assets, for The Tocqueville International Value Fund; and The Lipper Gold Oriented Funds peer group, with average net assets between $700 million and $1,400 million, for The Tocqueville Gold Fund (the “Peer Groups”).
The Trustees also compared each Fund’s investment performance against its benchmark market indices: the S&P 500 Index for The Tocqueville Fund; The Russell 2000 Index for The Tocqueville Small Cap Value Fund; the Morgan Stanley EAFE Index for The Tocqueville International Value Fund; and the S&P 500 Index and the Philadelphia Stock Exchange Gold/Silver Index for The Tocqueville Gold Fund (the “Indices”) for the most recent fiscal quarter ended July 31, 2007,
and for the one-year, three-year, five-year and ten-year periods ended July 31, 2007. The Trustees considered the above information as helpful in their assessment of whether the Adviser was obtaining for the Funds’ shareholders the performance that was available in the marketplace given each Fund’s investment objectives, policies, strategies, limitations and restrictions. The Board concluded that the performance of the Funds against their respective Peer Groups was satisfactory. In particular, the Board noted that The Tocqueville Fund had performed well as compared to its Index for all periods and outperformed the median of its Peer Group for all periods. The Board noted that with respect to The Tocqueville Small Cap Value Fund that despite underperforming its Index and the median of its Peer Group for most periods, the Fund had outperformed both its Index and the median of its Peer Group for its ten-year period. The Board further noted that The Tocqueville International Value Fund, despite showing strong returns, still lagged behind its Index and median of its Peer Group for all periods. The Board lastly noted that The Tocqueville Gold Fund outperformed its Index for all periods and generally was in line with the median of its Peer Group.
3) The cost of the advisory services and the profits to the Adviser from the relationship with the Trust.
In connection with the Trustee’s consideration of the level of the advisory fees, the Trustees considered a number of factors. The Trustees compared the level of the advisory fees for each Fund against the advisory fees charged by funds in their respective Peer Groups. The Adviser noted that it does not advise or sub-advise other funds with an investment policy similar to the Funds’ or other types of accounts, such as institutional and pension accounts, with similar investment policies to the Funds’. The Trustees considered comparative total fund expenses of the Funds and the Peer Groups. The Trustees used this comparative fee information and total expense data as a guide to help assess the reasonableness of each Fund’s advisory fee, although they acknowledged that it was difficult to make precise comparisons with other funds since the exact nature of services provided under each Peer Group fund agreement is often not apparent. The Trustees also viewed the Peer Group fee information as a whole as useful in assessing whether the Adviser was providing services at a cost that was competitive with other, similar funds.
The Board noted that the contract rate advisory fee for each of the Funds was reasonable, but above average for The Tocqueville Fund, The Tocqueville International Value Fund and The Tocqueville Gold Fund, when compared to their respective Peer Groups. The Board further observed that the total expense ratios of the Funds were also reasonable. The Board noted that the total expense ratio for The Tocqueville Fund and The Tocqueville International Value Fund were above average, when compared to their respective Peer Groups; and that the total expense ratio for The Tocqueville Small Cap Value Fund and The Tocqueville Gold Fund were below average, when compared to their respective Peer Groups. The Board noted that The Tocqueville Fund operates pursuant to an Expense Limitation Agreement whereby the Adviser has agreed to waive a portion of its fee necessary to limit the Fund’s total operating expenses to the level set forth in the Fund’s prospectus. In assessing this information, the Trustees considered both the comparative contract rate advisory fee as well as the level of advisory fee after waivers and/or reimbursement.
The Trustees also considered the profitability to the Adviser and its affiliate arising out of its relationship with the Trust. In this regard, the Trustees reviewed profitability data relating to the Adviser for the year October 31, 2006. The Trustees considered revenues received by the Adviser under the Investment Advisory Agreements and the Administration Agreement as well as revenues received by the Adviser’s affiliate under the 12b-1 plans and Related Agreements. The Trustees also received a handout disclosing the Adviser’s financial statements and the Adviser provided an oral update on its profitability numbers since October 31, 2006. The Trustees concluded that the profitability of the Funds to the Adviser was not excessive.
4) The extent to which economies of scale will be realized as the Funds grow and whether fee levels reflect those economies of scale.
With respect to the Trustees’ consideration of economies of scale, the Trustees discussed with the Adviser whether economies of scale would be realized by it in its management of the Fund at higher asset levels. The Trustees also reviewed the Peer Group data to assess whether the Peer Group funds had advisory fee breakpoints and, if so, at what asset levels. The Trustees noted that the Funds currently have advisory fee breakpoints and that they were satisfied that the current breakpoints were appropriate when compared with each Fund’s respective Peer Group. In the event there were significant asset growth in the future, the Trustee’s determined to reassess whether the advisory fees, including the current breakpoint structure, appropriately took into account any economies of scale that had been realized as a result of that growth.
5) Other Factors.
The Board also discussed the Adviser’s practices regarding the selection and compensation of brokers and dealers that execute portfolio transactions for the Funds and the brokers’ and dealers’ provision of brokerage and research services to the Adviser. The Trustees further discussed the potential benefits the Adviser derived from the Funds’ soft dollar arrangements, whereby brokers provide research to the Funds or the Adviser in return for allocating fund brokerage, and other investment data concerning soft dollars.
Based on a consideration of all these factors in their totality, the Trustees, including all of the disinterested Trustees, determined that the Funds’ advisory fees were fair and reasonable with respect to the quality of services that the Adviser provides and in light of the other factors described above that the Trustees deemed relevant. The Trustees based their decision on evaluations of all these factors as a whole and did not consider any one factor as all-important or controlling.
| 3. | PROXY VOTING POLICIES AND PROCEDURES |
A description of the policies and procedures that The Tocqueville Trust uses to determine how to vote proxies relating to portfolio securities is available without charge upon request by calling 1-800-355-7307. Information regarding how The Tocqueville Trust voted proxies relating to portfolio securities during the most recent 12-month period ended June 30 is available by calling 1-800-355-7307 and it is also available on the SEC’s web site at http://www.sec.gov.
| 4. | SHAREHOLDER REPORTS AND QUARTERLY PORTFOLIO DISCLOSURE |
The Tocqueville Trust is required to file its complete schedule of portfolio holdings with the SEC for its first and third fiscal quarters on Form N-Q for fiscal quarters ending on or after July 9, 2004. Once filed, the Trust’s Form N-Q will be available without charge, upon request on the SEC’s website (http://www.sec.gov) and may be available by calling 1-800-697-3863. You can also obtain copies of Form N-Q by (i) visiting the SEC’s Public Reference Room in Washington, DC (information on the operation of the Public Reference Room may be obtained by calling 1-202-551-8090); (ii) sending your request and a duplicating fee to the SEC’s Public Reference Room, Washington, DC 20549-0102; or (iii) sending your request electronically to publicinfosec.gov. Quarterly portfolio holdings are also available on the website of The Tocqueville Funds, www.tocquevillefunds.com.
| 5. | SHAREHOLDER NOTIFICATION OF FEDERAL TAX STATUS |
The Funds designate the following percentages of ordinary dividends declared during the fiscal year ended October 31, 2007 as dividends qualifying for the dividends received deduction available to corporate shareholders:
| The Tocqueville Fund | 88.41% |
| International Value Fund | 9.66% |
The Funds designate the following percentages of ordinary dividends declared from net investment income during the fiscal year ended October 31, 2007 as qualified income under the Jobs and Growth Tax Relief Reconciliation Act of 2003:
| The Tocqueville Fund | 100.00% |
| International Value Fund | 100.00% |
| Gold Fund | 24.10% |
For the year ended October 31, 2007, the funds designate the following percent of ordinary distributions paid as interest-related dividends under the Internal Revenue Code Section 871(k)(1)(c): The Tocqueville Fund—14.72%, International Value Fund—5.71%.
For the fiscal year ended October 31, 2007, the following percentages of its ordinary income distributions paid are designated as short-term capital gain distributions under the Internal Revenue Code Section 871(k)(2)(c): International Value Fund—21.81%, Gold Fund—83.78%.
For the year ended October 31, 2007, the Tocqueville International Value Fund earned foreign source income and paid foreign taxes which they intend to pass through to their shareholders pursuant to Section 853 of the Internal Revenue Code as follows:
| | | Gross Dividend | | Taxes Withheld |
| Country | | Per Share | | Per Share |
| Brazil | | 0.0025 | | 0.0006 |
| Britain | | 0.0245 | | 0.0000 |
| Canada | | 0.0036 | | 0.0006 |
| China | | 0.0266 | | 0.0058 |
| Finland | | 0.0297 | | 0.0061 |
| France | | 0.0564 | | 0.0085 |
| Germany | | 0.0018 | | 0.0003 |
| Greece | | 0.0038 | | 0.0000 |
| Hong Kong | | 0.0008 | | 0.0000 |
| Indonesia | | 0.0074 | | 0.0011 |
| Italy | | 0.0141 | | 0.0021 |
| Japan | | 0.0553 | | 0.0040 |
| Malaysia | | 0.0104 | | 0.0029 |
| Mexico | | 0.0105 | | 0.0000 |
| Netherlands | | 0.0227 | | 0.0042 |
| Singapore | | 0.0159 | | 0.0000 |
| South Korea | | 0.0154 | | 0.0026 |
| Switzerland | | 0.0225 | | 0.0034 |
| Taiwan | | 0.0157 | | 0.0000 |
| Thailand | | 0.0184 | | 0.0018 |
| | | 0.3580 | | 0.0439 |
For the fiscal year ended October 31, 2007, the Tocqueville Gold Fund earned foreign source income and paid foreign taxes which they intend to pass through to their shareholders pursuant to Section 853 of the Internal Revenue Code as follows:
| | | Gross Dividend | | Taxes Withheld |
| Country | | Per Share | | Per Share |
| Australia | | 0.0307 | | 0.0000 |
| Canada | | 0.0409 | | 0.0065 |
| Great Britain | | 0.0050 | | 0.0000 |
| Hong Kong | | 0.0183 | | 0.0000 |
| Peru | | 0.0189 | | 0.0008 |
| Russia | | 0.0056 | | 0.0014 |
| South Africa | | 0.1201 | | 0.0020 |
| | | 0.2395 | | 0.0107 |
Investment Adviser
Tocqueville Asset Management L.P.
40 W. 57th St., 19th Floor
New York, NY 10019
(212) 698-0800
www.tocqueville.com
Distributor
Tocqueville Securities L.P.
40 W. 57th St., 19th Floor
New York, NY 10019
(212) 698-0800
Shareholders’ Servicing and Transfer Agent
U.S. Bancorp Fund Services, LLC
P.O. Box 701
Milwaukee, WI 53201-0701
(800) 697-3863
Custodian
U.S. Bank, N.A.
Custody Operations
1555 River Center Drive, Suite 302
Milwaukee, WI 53212
Board of Trustees
Franc¸ois D. Sicart—Chairman
Charles W. Caulkins
James W. Gerard
William F. Indoe
Robert W. Kleinschmidt
Guy A. Main
William J. Nolan III
Larry M. Senderhauf
Tocqueville Funds
c/o US Bancorp Fund Services, LLC
P.O. Box 701
Milwaukee, WI 53201-0701
www.tocquevillefunds.com
TQRPSEMI 08
Item 2. Code of Ethics.
Not applicable for semi-annual reports.
Item 3. Audit Committee Financial Expert.
Not applicable for semi-annual reports.
Item 4. Principal Accountant Fees and Services.
Not applicable for semi-annual reports.
Item 5. Audit Committee of Listed Registrants.
Not applicable to registrants who are not listed issuers (as defined in Rule 10A-3 under the Securities Exchange Act of 1934).
Item 6. Schedule of Investments.
Schedule of Investments is included as part of the report to shareholders filed under Item 1 of this Form.
Item 7. Disclosure of Proxy Voting Policies and Procedures for Closed-End Management Investment Companies.
Not applicable to open-end investment companies.
Item 8. Portfolio Managers of Closed-End Management Investment Companies.
Not applicable to open-end investment companies.
Item 9. Purchases of Equity Securities by Closed-End Management Investment Company and Affiliated Purchasers.
Not applicable to open-end investment companies.
Item 10. Submission of Matters to a Vote of Security Holders.
There were no material changes to the procedures by which shareholders may recommend nominees to the registrant’s Board of Trustees that were implemented after the registrant last provided disclosure in response to the requirements of Item 407(c)(2)(iv) of Regulation S-K (as required by Item 22(b)(15) of Schedule 14A), or this Item 10.
Item 11. Controls and Procedures.
| (a) | The registrant’s Principal Executive Officer and Principal Financial Officer have evaluated the design and operation of the registrant's disclosure controls and procedures within 90 days of the filing and have concluded that the registrant’s disclosure controls and procedures were effective in ensuring that information required to be disclosed by the registrant in this Form N-CSR was recorded, processed, summarized and reported on a timely basis. |
| (b) | There were no changes in the registrant's internal controls over financial reporting that occurred during the registrant's second fiscal quarter of the period covered by this report that have materially affected, or are reasonably likely to materially affect, the registrant's internal control over financial reporting. |
Item 12. Exhibits.
| (a) | (1) Any code of ethics or amendment thereto, that is subject of the disclosure required by Item 2, to the extent that the registrant intends to satisfy Item 2 requirements through filing an exhibit. 1) Filed herewith. |
| | |
| | (2) Certifications pursuant to Section 302 of the Sarbanes-Oxley Act of 2002. Filed herewith. |
| | |
| | (3) Not applicable to open-end investment companies. |
| (b) | Certifications of Principal Executive Officer and Principal Financial Officer, under Section 906 of the Sarbanes-Oxley Act of 2002 and 18 U.S.C. § 1350. Filed herewith. |
SIGNATURES
Pursuant to the requirements of the Securities Exchange Act of 1934 and the Investment Company Act of 1940, the registrant has duly caused this report to be signed on its behalf by the undersigned, thereunto duly authorized.
(Registrant) The Tocqueville Trust
By (Signature and Title)* /s/ Robert W. Kleinschmidt
Robert W. Kleinschmidt, President
Date 7/7/08 ��
Pursuant to the requirements of the Securities Exchange Act of 1934 and the Investment Company Act of 1940, this report has been signed below by the following persons on behalf of the registrant and in the capacities and on the dates indicated.
By (Signature and Title)* /s/ Robert W. Kleinschmidt
Robert W. Kleinschmidt, President
Date 7/7/08
By (Signature and Title)* /s/ Steven J. Tyrrell
Steven J. Tyrrell, Treasurer
Date 7/7/08
* Print the name and title of each signing officer under his or her signature.