UNITED STATES
SECURITIES AND EXCHANGE COMMISSION
Washington, D.C. 20549
FORM N-CSR
CERTIFIED SHAREHOLDER REPORT OF REGISTERED
MANAGEMENT INVESTMENT COMPANIES
Investment Company Act file number 811-4840
The Tocqueville Trust
(Exact name of registrant as specified in charter)
The Tocqueville Trust
40 West 57th Street, 19th Floor
New York, NY 10019
(Address of principal executive offices) (Zip code)
Robert W. Kleinschmidt
The Tocqueville Trust
40 West 57th Street, 19th Floor
New York, NY 10019
(Name and address of agent for service)
(212) 698-0800
Registrant’s telephone number, including area code
Date of fiscal year end: October 31
Date of reporting period: April 30, 2013
Item 1. Reports to Stockholders.
SEMI-ANNUAL REPORT
April 30, 2013
The Tocqueville Trust
Mutual Funds
The Tocqueville Fund
The Tocqueville Opportunity Fund
The Tocqueville International Value Fund
The Tocqueville Gold Fund
The Delafield Fund
The Tocqueville Select Fund

This report is not authorized for distribution to prospective investors unless preceded or accompanied by a currently effective prospectus of The Tocqueville Trust. Please call 1-800-697-FUND (3863) for a free prospectus. Read it carefully before you invest.
You are invited to visit our website @ www.tocqueville.com/mutual-funds
Dear Fellow Shareholder,
The past year has witnessed the emergence of an economic myth that increasingly has been shaping the behavior of world stock markets. The reasons are clear, but the ultimate outcome is less so.
In recent years, to stimulate the U.S. economy with interest rates already close to zero, the Federal Reserve had initiated a new policy of “quantitative easing”. In effect, that policy promised to increase the nation’s supply of money and liquidity if further interest rate cuts alone would no longer be effective. This year, the Fed essentially promised quantitative easing ad infinitum—or at least until the economy gave clear signs of having resumed a lasting and self-sustaining growth pattern.
This policy allowed the United States to recover from the “Great Recession” faster than other large economies but, since the recovery still seemed fragile, quantitative easing has continued apace. Meanwhile, Japan also has embarked onto its own version of quantitative easing ad infinitum, apparently with some promising early results. And France is pushing hard for Europe to embark even more boldly on the easing path than it already has. In essence, quantitative easing has become global.
At first, massive increases in money supply into an economy that remains weak or hesitant after recession benefits mostly the financial markets. Growth of bank credit in the “real” economy remains subdued—either for lack of loan demand or because of bankers’ hesitancy to lend—so that banks use their excess reserves to purchase government bills and bonds and the new money eventually flows into the stock market as well.
This is a typical post-recession pattern, which normally fades when the real-economy recovers. However, in the aftermath of the recent global financial crisis, the recoveries in the United States, Europe and Japan have been less convincing than usual and the easing pattern has lasted longer. Among investors, this has engendered, if not euphoria, at least complacency that good economic news is good for the stock markets (because it will eventually translate into higher corporate profits), but that bad economic news is also good for the stock market (because it promises more liquidity injection from the central banks). That is the myth that pervades today’s investment scene.
However, this kind of win-win situation is seldom seen in real life for very long. To the extent that the belief in this golden equilibrium gains broad credence and is being reflected in heftier stock market valuations, therefore, investment risk has been and will be rising.
What complicates matters, in terms of how this situation will unwind, is that not all countries are aiming for the same goal. Japan, for example, is desperate to extract its economy from a deflationary spiral and has determined that this necessitated quantitative-type monetary easing. To the extent that this easing is causing weakness in the Japanese yen, this constitutes a welcome stimulus to exports, which were hurt by an overvalued yen. Europe, in spite of being still marred in recession, has paradoxically seen its currency (the Euro) recently appreciate strongly against the U.S. dollar, the Japanese yen and the Chinese renminbi, which is hurting its recovery potential.
In the “old” economies, inflation does not seem an imminent danger and, from a domestic point of view, they can afford policies of currency depreciation. But from an international perspective, the United States and Japan particularly must keep their currencies strong enough to sustain the global demand for their government debt.
Emerging economies have a different challenge: having suffered periodic inflation flare-ups and excessive and de-stabilizing capital inflows, they have welcomed the recent downward correction of several of their currencies. But inflation concerns have increased as a result.
As often, the United States and China will strongly influence the outcome of these global cross-currents. The United States needs to continue to attract capital to its bond markets and is also concerned about the long-term inflationary implications of its recent policies—and therefore about a new round of dollar weakness. Its patience with a sustained weakening of other major currencies might therefore quickly wear thin. In China, which has so far continued to accept and even encourage a slow appreciation of its currency, partly as an inflation-fighting tool, fast-rising wages have joined food commodities as an inflation concern and the renminbi is now overvalued in the opinion of many business people.
In a stock market environment which many investors view as a win/win proposition, uncertainty may come from the rise of new forms of mercantilist policies that are not yet factored in many economic models: less trade barriers, but more currency manipulation.
Respectfully,

François Sicart
Chairman
The Tocqueville Fund
Dear Fellow Shareholder,
It is said that a bull market climbs a wall of worry. The six months ended April 30, 2013 was no exception as investors overcame their myriad fears to drive equity markets to post crisis highs. The European sovereign debt crisis, the effects of U.S. Federal Government budget problems and sequestration, the so-called “hard landing” in China and various geopolitical hot spots each in turn have proven to be not as bad as advertised (so far) and, in any case, have been mitigated by accommodative monetary policies around the globe. In particular, quantitative easing in the U.S. and “Abenomics” in Japan has been supportive of not only their respective equity markets and economies but also those of their trading partners. While fear of what might happen once the Fed curtails its easy money policies likely remains atop investors’ list of concerns, the timing of an eventual tightening is still unknown.
Bearish arguments of future inflationary pressures remain unconfirmed and investors have shaken off weak economic data. For the present, it seems that the Fed’s monetary exertions have served merely to offset the decline in the velocity of money, as individuals and corporations appear content to sit on cash instead of spending or deploying it. Further evidence of this is that commodity markets remain benign and U.S. core inflation lies well below the Fed’s targets.
Still, fear has served to create at least one obvious bubble that of sovereign debt markets both in the U.S. and globally. In addition, the zero interest rate policy, or “ZIRP,” environment has created other distortions, pushing income seeking investors to take risk in terms of duration or credit quality to which they may not be accustomed and to bid up so called dividend yielding defensive equities to valuations that exceed historical precedent.
The true test for Fed Chairman Bernanke’s strategy and the equity markets will come when the economy has recovered sufficiently to lift inflation or at least expectation of it above the stated 2% threshold. Despite numerous suppositions in the financial and popular press, a change in course does not appear imminent. Meanwhile there are other sources for continued, cautious optimism. With Japan’s recent policy changes there is hope that a large but recently moribund sector of the world economy may become part of the global growth engine. In addition, recent academic studies have cast some doubt on the theoretical justification for the “austerity” measures that have dominated the European Central Bank’s prescribed approach to the region’s fiscal problems. If that provides policy makers in Europe the flexibility to change course it may be further, short-term support for the global economy, but only if coupled with local labor market reforms.
Over the period, the Tocqueville Fund returned 13.38% on a net of fees basis while the S&P 500, the index against which we are most often compared, gained 14.42%. Naturally, we would always prefer to exceed the “benchmark”, but it is absolute returns and capital preservation that we count as our highest priorities, so you won’t ever find us complaining about a 13% plus return over a six month period. Indeed, given our cautious approach and investment objectives, we are highly pleased to have kept as close to the market returns as we have since the start of the recovery in 2009. From the market bottom, roughly the end of February 2009, the S&P 500 climbed 141.73%, a 23.59% compound annual return. Over the same period, the Tocqueville Fund generated an annualized return of 21.61%. This is not a result we would have expected given our investment style and history. Normally, we would expect to lag very buoyant markets like this one by a far larger amount, while hopefully doing considerably better than the markets on the downside. Although that was not the case in the 2008 collapse; that has been our history. So, on balance, we are quite pleased with our recent and long term results, given the markets we have been in.
During the six month period, the top performing sectors of the Fund were health care, information technology and financials while materials, telecommunications and energy were the laggards. The top individual contributors to performance in the portfolio were Isis Pharmaceuticals, DuPont and Alkermes, while the largest detractors were Newmont Mining, VeriFone and Cliff Natural Resources.
Portfolio activity was again more concentrated on the sell side rather than the buy side as we monetized numerous positions in response to demand for investor liquidity. We also sold or trimmed positions as prices approached our targets
or in search of better opportunities (Campbell Soup, Fidelity National, NextEra, and Pfizer) and in a few cases as a result of a change in investment thesis such as Cliffs Natural Resources where we became disillusioned by management’s lack of capital discipline in the face of weak end markets. We initiated a number of new holdings during the period, the most notable of which is Apple, a name we had often been asked why it was not owned. The answer to that question lies at the heart of our contrarian investment philosophy. While in the past Apple was a statistically cheap stock, the price had not come under any significant pressure and sentiment was almost universally positive. However, following the decline from its peak, sentiment appeared to shift to concern that it had run out of growth prospects. We believe the company has tremendous balance sheet strength that gives it the flexibility to be more shareholder friendly with respect to financial engineering. We also added C.H. Robinson, an asset light, late cycle transportation and logistics business whose shares had traded below our estimate of intrinsic value due to disappointing quarterly results. Another new position is McDermott International, an engineering and construction firm whose shares are depressed due to poor execution on several large contracts and low utilization of its marine vessel fleet. In our view McDermott’s shares are trading at essentially liquidation value, despite a strong balance sheet and increased presence in the growing deep water arena, a combination we found attractive.
We have begun to see signs of a possible shift in investor sentiment away from the fixed income market and the so-called defensive equity trade as rates tick up slightly. However, we remain cautious because we have seen this happen before and many macro risks abound, particularly related to the uncharted waters of the Fed unwinding its monetary largesse. As the equity markets move higher finding broad contrarian themes becomes more challenging, though they still exist, and our efforts become more concentrated on idiosyncratic distressed and out of favor companies.
Thank you once again for your continued interest in our Fund.
Sincerely,

Robert W. Kleinschmidt
Portfolio Manager
The Tocqueville Fund
(Unaudited)
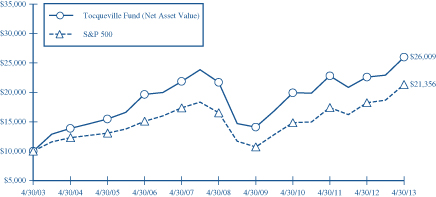
This chart assumes an initial gross investment of $10,000 made on 4/30/03. Returns shown do not reflect the deduction of taxes that a shareholder would pay on fund distributions or the redemption of fund shares. Performance reflects fee waivers in effect. In the absence of fee waivers, total return would be reduced. Returns shown include the reinvestment of all dividends and other distributions. Past performance is not predictive of future performance. Investment return and principal value will fluctuate so that your shares, when redeemed, may be worth more or less than their original cost. The Fund imposes a 2% redemption fee on shares held for 90 days or less.
The Standard & Poor’s 500 Stock Index (S&P 500) is a capital-weighted index, representing the aggregate market value of the common equity of 500 stocks primarily traded on the New York Stock Exchange. Returns assume the reinvestment of all dividends.
AVERAGE ANNUAL RATE OF RETURN (%)
FOR PERIODS ENDED APRIL 30, 2013
| | | | | | | | | | | | | | | | |
| | | 1 Year | | | 3 Year | | | 5 Year | | | 10 Year | |
The Tocqueville Fund | | | 15.01% | | | | 9.29% | | | | 3.64% | | | | 10.03% | |
Standard & Poor’s 500 Stock Index | | | 16.89% | | | | 12.80% | | | | 5.21% | | | | 7.88% | |
The Tocqueville Opportunity Fund
Dear Fellow Shareholder,
U.S. equity markets appreciated significantly during the first half of the fiscal year ended April 30, 2013. The Tocqueville Opportunity Fund gained 13.96% versus an increase of 16.79% for its benchmark, the Russell 2500 Growth Index. In the SMID capitalization asset class, financial issues fueled returns and the financial heavy Russell 2500 Value Index led the Russell 2500 Growth Index with each advancing 18.83% and 16.79% respectively. Value has led growth for the past twelve month period by an even greater margin with the R2500 Value Index 22.25% versus the Growth Index 15.08% since April 30, 2012—driven by a significant turn in the performance of Financials and a low exposure to Technology issues. Moreover, while markets have moved to new highs, the leadership atypically has come from more defensive, higher yielding sectors, including the Utilities and Telecommunications sectors.
Over the past six months, we have significantly reduced investments in the Technology sector as visibility into the capital spending cycle has become considerably opaque – while some of the disruption has been attributed to end of the year (2012) jitters related to the “fiscal cliff” and “sequestration” effects, we believe that substitution effects and competition are impacting the sector. Cloud hosting of data and application solutions has introduced a considerably disruptive dynamic which appears to be significantly altering technology solutions and spending in unpredictable ways. While the Technology sector still ranks in the top four sector weights, we reduced holdings by more than one third over the period. New investments were directed primarily toward industrial, manufacturing, housing, transportation and auto related issues. We are currently over weighted in the Autos and Transportation, Materials and Processing, and Producer Durables sectors, and these three economy sensitive, cyclical sectors collectively represent the largest “sector” weighting of the Fund at approximately 26%. We have gained increased confidence in the economic and market outlook over the first half of the fiscal period due to a number of factors, including: reduced levels of global macro related volatility, safe navigation through the fiscal cliff period, and ongoing commitments to monetary accommodation. We believe that the sustained turns in housing prices and employment which have become apparent over the past several months are critical to improved consumer confidence and ultimately spending. Although the pace of domestic economic growth leaves most unimpressed, housing and employment trends are supportive of its continued positive bias.
Consumer and Healthcare sector investments comprised the #2 and #3 positions respectively with regard to investment weightings and represented nearly 45% of the Fund’s holdings. While we have continued to invest in new Healthcare issues, this sector also provided the best performance on both an absolute and relative basis for the period. Seven of the top 10 absolute price leaders and four of the Fund’s top 10 contributors were Healthcare investments; the price leaders included Aegerion Pharmaceutical (+100.4%), Vertex Pharmaceuticals (+83.7%), and BioMarin Pharmaceutical (+77.3%). From the perspective of the top 25 price leaders during the time period, 17 issues were Healthcare oriented! While we are pleased with the sector overall, there were a couple of significant disappointments, including Clovis Oncology (-45.6%) and Achillion Pharmaceuticals (-23.9%). The Materials sector provided the second best overall contribution to performance during the period; ironically this was due less to what we did own and more to what we did not own. This past December we began reducing the Fund’s investments in gold mining issues just as significant declines in the gold price and mining related issues commenced.
The Fund’s investment in LinkedIn was the #1 relative contributor to performance as the name appreciated nearly 80%, and it was one of the Fund’s top weightings. Hanesbrands’ and Abercrombie & Fitch’s shares each rose nearly 50% during the period, and the pair ranked #5 in overall contribution to performance! This past December we increased the investment in Core Laboratories which had fallen precipitously in October due to an earnings report—CLB did not disappoint on its latest report and was one of the leading performers for the period! There were several significant upsets during the period all unexpected. The Fund’s worst performer was one of its former stars. Although Apple’s share price decline of 23.3% did not rank in the top 10 worst declines, a large relative weighting caused an unfortunate performance impact. Apple and the impact of an investment in chip supplier Cirrus Logic together accounted for much of the Fund’s lagging performance during the period. Although Apple has contributed to the Fund over longer time periods, we moved to the sidelines in the face of increased competition and declining profitability. We were blindsided by rapid changes in the share prices of The Fresh Market (TFM) and Netflix (NFLX). Weighting was the culprit as sellers amassed and drove
TFM’s share price down nearly 40% due to an earnings miss and a management shakeup. And Netflix shocked short sellers with spectacular subscriber gains and a share price that tripled during the first half period—the Fund had not held NFLX at the beginning of the period and performance was impacted by an unprecedented 65% two day price move!
The top 50 holdings of the Fund comprised 42% of the Fund at April 30, 2013 versus 49% at the beginning of the fiscal year. Over the past six months we have broadened the Fund’s diversification in order to accommodate a number of earlier stage smaller capitalization issues, particularly in biotechnology given the increasing record of approval successes. And increased weightings in the Financials, Auto/Transportation, Materials and Durables sectors have resulted from investment in new names and increases in existing names. We continue to believe the Fund is concentrated and nearly every holding is significantly active from a risk perspective.
Although we have witnessed solid and positive trending equity markets over the past six months, it is too soon to lose sight of our risk compass. China related commodities weakness, the rapid decline in the gold price, and the Cyprus bank fiasco are quick reminders that change is swift and constant. As the debate on the impact and relevance of the Federal Reserve’s quantitative easing efforts on asset prices (equities, housing, and commodities) continues, we fully expect that any changes in policy may introduce new volatility into markets. At this time, we believe that any moves to less accommodation may be initially disruptive to liquidity but we are optimistic that this disturbance will be offset by sustainable growth in the underlying economy and employment. As always, we greatly appreciate your continued confidence in our efforts for the shareholders of the Tocqueville Opportunity Fund.
Sincerely,

Thomas R. Vandeventer
Portfolio Manager
The Tocqueville Opportunity Fund
(Unaudited)
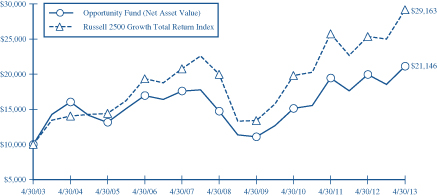
This chart assumes an initial gross investment of $10,000 made on 4/30/03. Returns shown do not reflect the deduction of taxes that a shareholder would pay on fund distributions or the redemption of fund shares. Performance reflects fee waivers in effect. In the absence of fee waivers, total return would be reduced. Returns shown include the reinvestment of all dividends and other distributions. Past performance is not predictive of future performance. Investment return and principal value will fluctuate so that your shares, when redeemed, may be worth more or less than their original cost. The Fund imposes a 2% redemption fee on shares held for 90 days or less.
The Russell 2500 Growth Total Return Index is an unmanaged index that measures the performance of the small to mid-cap growth segment of the U.S. equity universe. It includes those Russell 2500 companies with higher price-to-book ratios and higher forcasted growth values. Returns assume the reinvestment of all dividends.
AVERAGE ANNUAL RATE OF RETURN (%)
FOR PERIODS ENDED APRIL 30, 2013
| | | | | | | | | | | | | | | | |
| | | 1 Year | | | 3 Year | | | 5 Year | | | 10 Year | |
The Tocqueville Opportunity Fund | | | 5.96% | | | | 11.78% | | | | 7.52% | | | | 7.78% | |
Russell 2500 Growth Total Return Index | | | 15.08% | | | | 13.77% | | | | 7.83% | | | | 11.30% | |
The Tocqueville International Value Fund
Dear Fellow Shareholder,
For the six months ended April 30, 2013, global equity markets advanced, driven by incrementally positive economic and political news from Japan and China, continuing stability in the Eurozone, an abatement of fears regarding the U.S. fiscal cliff, coupled with persistent expansive monetary policy and low interest rates. China’s once in a decade political transition went smoothly in November, temporarily removing an important source of uncertainty in the international markets. At around the same time in Japan, it became evident that a change of government would result in policies designed to promote growth and weaken the Yen, a positive for corporate profits. Subsequently, new Prime Minister Abe has followed through with aggressive policy statements and prescriptions. Despite a weak economy, Europe remained quiet for the most part, for the moment taking in stride a failed election in Italy and a banking crisis in Cyprus. The Euro remained stable versus the U.S. dollar, reflecting the tension between economic recession in the Eurozone, a negative for the Euro, and persistent efforts by the U.S. monetary authorities to devalue the U.S. dollar. In contrast, the Yen declined sharply against the U.S. dollar in response to government policy noted above. The CRB Index of commodities declined modestly, with industrial metals faring poorly and gold declining precipitously. Most equity markets advanced high single digits, with Japan producing the largest gains among developed economies, while Brazil declined due to disappointing economic results there. In terms of sectors, advances were led by financials, real estate, transport, machinery, consumer products, pharmaceuticals, furnishings, paper and construction materials, while steel, mining and energy stocks were notable laggards.
The Tocqueville International Fund’s total U.S. dollar return for the period was a gain of 14.64%. In the same period, the Morgan Stanley EAFE Index, the benchmark against we are most often compared, had a total U.S. dollar return of 17.18%. We had meaningful gains in our Japanese holdings, notably tire producer Bridgestone, industrial automation and test equipment concern Omron, household products company Kao, semiconductor manufacturing equipment producer Disco, financial Mitsubishi UFJ, pneumatic equipment producer SMC, and industrial conglomerate Hitachi. We also had significant profits in French logistics-focused holding company Bollore, Hong Kong financial and real estate conglomerate Guoco Group, subject of a going private offer by its controlling shareholder, Hong Kong-based China outdoor advertising company Clear Media, UK fuel distribution concern DCC, and Swiss drug maker Novartis. Our losses were concentrated in the shares of mining companies IAMGold, Newmont Mining and Freeport McMoran, as well as Telecom Italia, where post-election politics hurt investor sentiment.
During the period, we exited our positions in Bridgestone, Japanese power tool maker Makita, Japanese office equipment and camera maker Canon, Japanese chemical maker Asahi Kasei, Japanese auto parts maker Takata, UK auto parts retailer Halfords, UK based telecom services provider Vodafone, and mining conglomerate BHP Billiton, as they approached our estimates of intrinsic value. We also sold German steel distribution concern Kloeckner and gold producer IAMGold, in both cases because management failed to execute on operational and cost objectives. We took new positions in Japanese financials Mitsubishi UFJ and Sumitomo Mitsui, both of which hold strong market positions, trade at a discount to tangible book value, and should benefit from increasing consumer lending activity in Japan and corporate lending in Asia, particularly as European banks reduce their activities in Asia as they work to shore up their capital adequacy; in UK retailer Tesco, which is cash generative, rich in real estate, and where a new returns-oriented management team is in the process of divesting underperforming assets; in Japanese household products company Kao, a market leader with a substantial business in growth markets in Asia, that trades a single digit multiple of cash flow and a deep discount to its global peers; in Cameco Corp, the largest publicly traded producer of uranium, which is depressed along with negative sentiment toward nuclear power generation and is well positioned to benefit from an eventual improvement in demand for uranium; in UK emergency home repair insurer Homeserve, a cash generative business with operational challenges we deem temporary; in Telecom Italia, which is depressed due to investor concerns about growth in its home market and generates a high teens percentage free cash flow yield and has the potential for a corporate event that would be value enhancing; in Dutch company Fugro, the global leader in geological testing and mapping services for the oil industry, which has a strong niche position in its markets, produces significant free cash flow, and has an under-levered balance sheet; and in Dutch mail and logistics company TNT Express, when the price collapsed after a proposed acquisition by UPS was scuttled by anti-trust authorities, enabling us to pick up shares at a substantial discount to intrinsic
value. We also added to positions in Infineon, Hitachi, Beckaert, Akzo Nobel, Itau Unibanco, Nexans, Freeport McMoran, Sogefi, Orkla, and Groupe Bruxelles Lambert.
Our baseline macro scenario has not changed markedly since the last writing, and that is: Europe and the Euro survive, but it remains a growth challenged region; China averts a hard landing and consumer led growth settles at a lower but still enviable level; the U.S. continues to grow albeit below potential as fiscal adjustments take hold; inflation is more probable in light of serial monetary easing; and “Abenomics” is likely to have a stimulating effect in Japan for a period. One important change in the making is that European policy makers seem to have moved away from their insistence on fiscal austerity and toward a more growth oriented stance. Against this backdrop, the market has become more optimistic: today, with several of last year’s major macro risks seemingly having abated, interest rates at multi-year lows, and aggressive monetary policy being pursued throughout the developed world, investors are taking on more risk. Market gains have occurred despite only modest gains in corporate profits, abetted by cheap money and a reduction in risk premium. As the market becomes more complacent, we become more concerned about potential risks, including unrest in the Middle East, inflation, corporate profit margins, and the unknowable consequences of unprecedented expansionary monetary policy.
Despite the recent run-up in stock prices in Japan, the market is still attractively valued on a price/book value basis. Investors have been focused on the impact of government stimulus and a declining Yen, which as we have noted is very important for corporate profitability. Less discussed and potentially more important is the fact that more management teams are focusing on improving corporate profitability and capital allocation from a relatively weak starting point. If this dynamic continues, as we hope and expect, it will help create value for several years. Our due diligence of new investment ideas in Japan is focused on this criterion. The value of our Japanese holdings has increased meaningfully, though U.S. dollar returns have been impacted by the decline in the Yen. Europe is a mixed bag. Economic recession notwithstanding, or perhaps because of it, we are finding value in economically sensitive companies, and “special situations” where managements are creating shareholder value via restructuring and other means of self-improvement. On the other hand, it is more challenging to find value in “quality” stocks characterized by less economic sensitivity and more consistent cash flows. We continue to hold the view that developed markets offer better value than emerging markets, though following several quarters of poor performance; emerging markets are becoming more attractive. In the aggregate, we have reduced our overall exposure to Japan as our stocks have arrived at our estimated of intrinsic value faster than we have been able to replace them. Meanwhile, we have increased our overall exposure to Europe, which continues to be out of favor and underweighted in investor portfolios.
To protect and grow your capital, we continue to seek out companies that have defensible business franchises, pricing power, limited financial leverage and the ability to return cash to shareholders, and which trade at a discount to intrinsic value based on future cash flows in a conservative economic growth scenario.
Respectfully,
James Hunt
Portfolio Manager
The Tocqueville International Value Fund
(Unaudited)
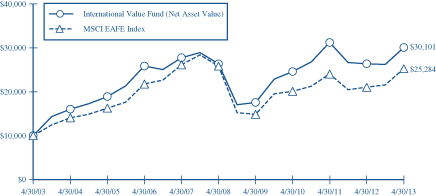
This chart assumes an initial gross investment of $10,000 made on 4/30/03. Returns shown do not reflect the deduction of taxes that a shareholder would pay on fund distributions or the redemption of fund shares. Performance reflects fee waivers in effect. In the absence of fee waivers, total return would be reduced. Returns shown include the reinvestment of all dividends and other distributions. Past performance is not predictive of future performance. Investment return and principal value will fluctuate so that your shares, when redeemed, may be worth more or less than their original cost. The Fund imposes a 2% redemption fee on shares held 90 days or less.
The MSCI EAFE Index is an unmanaged market-capitalization-weighted index composed of companies representative of the market structure of 20 Developed Market Countries in Europe, Australia, Asia and the Far East.
AVERAGE ANNUAL RATE OF RETURN (%)
FOR PERIODS ENDED APRIL 30, 2013
| | | | | | | | | | | | | | | | |
| | | 1 Year | | | 3 Year | | | 5 Year | | | 10 Year | |
The Tocqueville International Value Fund | | | 14.15% | | | | 6.89% | | | | 2.70% | | | | 11.65% | |
MSCI EAFE Index | | | 19.96% | | | | 7.96% | | | | -0.44% | | | | 9.72% | |
The Tocqueville Gold Fund
Dear Fellow Shareholder,
During the reporting period, from November 2012 through April 2013, the Fund was down 38.4% which compares to the Philadelphia Gold and Silver Index which was down 41.4% and the S&P 500 Index which was up 14.4 %.
In response to the downward trend in gold, we reduced exposure to higher cost operating companies and those with limited capital access, whose management teams struggled to execute a faulty strategy. We emphasized those investments that have superior assets and a quality management team that we judge and ability to deliver excess returns. Mining equities suffered across the board declines, because of their leverage to the gold price, while the Fund’s physical gold position fared better on a relative basis, despite the fact that gold prices were down about -17% during the period. Three developing companies—Tahoe Resources, Primero Gold Mines, and Turquoise Hill Resources declined less that the overall group; while those companies initiating start-ups—such as Detour Gold and Banro Corporation suffered from operational set-backs and tighter capital markets.
We believe the premise for investing in gold and gold mining shares remains sound, despite the steep correction over the past six months. Paper currencies appear to us to be more at risk of losing their purchasing power than at any time since the commencement of the gold bull market in 1999. As global economies stagnate, the accumulation of sovereign debt burdens since the credit crisis of 2008 will, in our opinion, ultimately leave policy makers no other choice than to resort to overt inflation.
Gold, to us, is as contrarian today as when we first launched the Tocqueville Gold Fund in 1998. We believe that the combination of extremely negative sentiment and compelling macroeconomic fundamentals suggest that we are approaching the commencement of a powerful new upward leg in the secular bull market for gold.
The bear raid during mid-April was an orchestrated attempt to break the gold market. It resulted in waves of panic selling by frightened investors. We believe it will be remembered as the final capitulation of the lengthy correction that commenced in August of 2011 when gold peaked briefly above $1900/oz. The net result is that bullion banks and other commercial interests used the panic to cover longstanding short positions. The net position of these commercial interests is strongly bullish and similar to where it stood at the end of 2008 when gold finished the year at $875/oz. prior to its two year ascent to all-time highs.
Gold mining shares, in our opinion, represent compelling values. Should the gold price advance strongly as we expect in the months ahead, mining shares should deliver more than satisfactory performance. As was the case at year end 2008, subsequent gains more than offset the drawdowns prior to the bottom.
Over the past few years, positive returns from equities, treasuries, and junk bonds have provided stiff competition for gold and precious metals shares. Should an extended correction in equity and bond markets take place, we expect investment flows would return to precious metals. While the possibility of such a correction is simply a speculation at the moment, we do believe that coordinated central bank policies designed to inflate asset prices is on the verge of obvious failure. The turmoil in the Japanese equity and bond markets, where the most extreme form of quantitative easing has been implemented, hints at the limits of radical monetary experimentation. To the extent that investors come to view quantitative easing as impotent in terms of stimulating economic activity through the inflation of asset prices, we believe that a crisis of confidence could ensue, not only in those policies but also in the value and utility of paper currency. We think this would provide the fuel for gold to trade at new all-time highs.
Extremism in monetary policy has never ended well. The massive buildup of debt on central bank balance sheets has no historical precedent. The secondary effects of this buildup have yet to appear but they will more than likely have a negative impact on capital markets and it is perhaps such an outcome that is in the early stages of being discounted.
Market extremes such as the one we are witnessing in gold right now almost always represent historically outstanding opportunities. This was the case at the bottom in 2008, and there are many parallels in different markets over the decades. Nevertheless, it takes a clear mind and a strong constitution to capitalize on such moments.
The gold mining industry has been undergoing a period of soul searching and introspection, brought on by poor share performance and investor criticism. We are beginning to see heightened responsiveness to shareholder interests, and we at Tocqueville are among the most vocal critics. Nearly 1/3 of CEO’s have been replaced over the past year. Expensive and risky capital expenditure programs are being curtailed, making the way for a new emphasis on higher dividend payouts. In the context of an improving picture for gold prices, we believe that investors will be favorably surprised by the transformation underway within the mining industry.
We appreciate your support through what has been a difficult period for performance and look forward to the unfolding of events in what we believe will be most favorable for our strategy.
Thank you for your continued support.
Sincerely,
| | |
 | |  |
| John C. Hathaway | | Douglas B. Groh |
| Portfolio Manager | | Portfolio Manager |
The Tocqueville Gold Fund
(Unaudited)
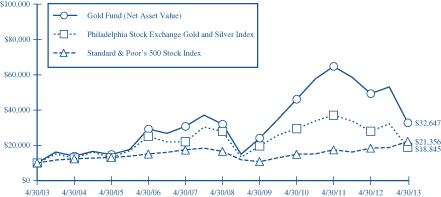
This chart assumes an initial gross investment of $10,000 made on 4/30/03. Returns shown do not reflect the deduction of taxes that a shareholder would pay on fund distributions or the redemption of fund shares. Performance reflects fee waivers in effect. In the absence of fee waivers, total return would be reduced. Returns shown include the reinvestment of all dividends and other distributions. Past performance is not predictive of future performance. Investment return and principal value will fluctuate so that your shares, when redeemed, may be worth more or less than their original cost. The Fund imposes a 2% redemption fee on shares held 90 days or less.
In 2003, 2006, 2009, and 2010 the performance of The Tocqueville Gold Fund was achieved during a period of unusually favorable market conditions. Such performance may not be sustainable.
The Philadelphia Stock Exchange Gold and Silver Index is an unmanaged capitalization-weighted index which includes the leading companies involved in the mining of gold and silver. Returns include the reinvestment of all dividends.
The Standard & Poor’s 500 Stock Index (S&P 500) is a capital-weighted index, representing the aggregate market value of the common equity of 500 stocks primarily traded on the New York Stock Exchange. Returns include the reinvestment of all dividends.
AVERAGE ANNUAL RATE OF RETURN (%)
FOR PERIODS ENDED APRIL 30, 2013
| | | | | | | | | | | | | | | | |
| | | 1 Year | | | 3 Year | | | 5 Year | | | 10 Year | |
The Tocqueville Gold Fund | | | -33.74% | | | | -10.91% | | | | 0.45% | | | | 12.56% | |
Philadelphia Stock Exchange Gold and Silver Index | | | -32.50% | | | | -13.85% | | | | -7.43% | | | | 6.54% | |
Standard & Poor’s 500 Stock Index | | | 16.89% | | | | 12.80% | | | | 5.21% | | | | 7.88% | |
The Delafield Fund
Dear Fellow Shareholder,
For the six months ended April 30, 2013, the Fund’s net asset value increased 15.25% versus an increase of 16.58% for the Russell 2000 Index (“Russell 2000”) and 14.42% for the Standard & Poor’s 500 Index (“S&P 500”), each on a total return basis. The Fund’s net asset value as of April 30, 2013 was $32.40 per share. The net asset value amounted to $1,528,882,122 of which 81.3% was invested in equities, and the balance in cash and equivalents and fixed income securities.
While an uncertain global economic and political environment remained a concern for the first half of the current fiscal year, domestic equity markets were blissfully unaware and rallied for virtually the entire six month period. Despite the uncertain outcome of the U.S. presidential election early in the period, worries regarding the European sovereign debt crisis throughout, and the fiscal cliff standoff, the Russell 2000 and the S&P 500 returned 10.63% and 6.75%, respectively for the first quarter of the fiscal year. Buoyed by the last minute (albeit temporary) fiscal cliff compromise, as well as improved domestic housing and jobs market reports, equity markets in the U.S. continued to rise during the second fiscal quarter.
Despite the uncertain macro-economic environment, our strategy remained constant throughout the period. We are fully committed to our bottom-up investment philosophy and believe that the portfolio is generally composed of companies where managements are taking actions to position their businesses for the long term. However, during the six month period, we were more inclined to reduce equity exposure, as some of our holdings became more fully valued. While our reserves hurt our performance on a relative basis, we remain content to use the cash as a hedge against volatility in the near term and ultimately, we will employ these cash reserves to seize upon attractive and appropriately priced investment opportunities as we uncover them.
Sector weighting is a by-product of our company by company investment approach. However, we had little to no exposure to consumer discretionary, financials or health care stocks during the six month period. This negatively impacted our relative performance, as they were the top three performing categories within the Russell 2000. In contrast, our relatively heavy weighting in the industrials space was a benefit, owing to the sector’s strong showing in both the Russell 2000 and the outperformance of our industrials holdings.
Stock selection contributed favorably to our return during the six month period. Investments in industrials, materials and information technology stocks, which represented about 70% of our portfolio during the first half of the fiscal year, contributed positively to our return on both an absolute and relative basis. With respect to individual stocks, TruBlue, Inc. was the largest positive contributor to the portfolio’s performance, followed by Sealed Air Corporation, Owens-Illinois, Inc. and Avery Dennison Corporation. In contrast, Carpenter Technology Corp., Molycorp, Inc., Acco Brands Corp., Maidenform Brands, Inc. and Allegheny Technologies, Inc. were the largest detractors to our performance during the period.
With respect to movement within the portfolio over the last six months, our most substantial addition was Ascena Retail Group, Inc. The company is a girls’ and women’s specialty retailer and had come under pressure following disappointing same-store sales results and a subsequent earnings shortfall. Though we believe the near-term could remain challenging, we also believe the shares are a compelling value given a number of opportunities for improved earnings power in the future. During the first half of the fiscal year we also exited a long-term holding, Thermo Fisher Scientific Inc, which had been a successful investment, but with shares appearing more fully valued to us, we sold our holdings.
Sincerely,
| | |
 | |  |
| |
| J. Dennis Delafield | | Vincent Sellecchia |
| Portfolio Manager | | Portfolio Manager |
The Delafield Fund
(Unaudited)
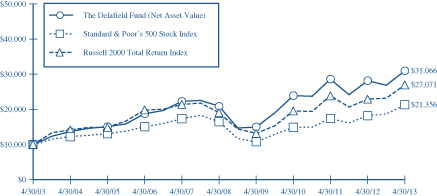
This chart assumes an initial gross investment of $10,000 made on 4/30/03. Since the Delafield Fund did not commence operations until 9/28/09, returns prior to that date are those of the Predecessor Fund. The Delafield Fund assumed the net asset value and performance history of the Predecessor Fund (See Footnote 1 to the Financial Statements). Returns shown does not reflect the deduction of taxes that a shareholder would pay on fund distributions or the redemption of fund shares. Performance reflects fee wiaviers in effect. In the absence of fee waivers, total return would be reduced. Returns shown include the reinvestment of all dividends and other distributions. Past performance is not predictive of future performance. Investment return and principal value will fluctuate so that your shares, when redeemed, may be worth more or less than their original cost. The Fund imposes a 2% redemption fee on shares held 90 days or less.
The Standard & Poor’s 500 Stock Index (S&P 500) is a capital-weighted index, representing the aggregate market value of the common equity of 500 stocks primarily traded on the New York Stock Exchange. Returns include the reinvestment of all dividends.
The Russell 2000 Total Return Index is an unmanaged index that measures the performance of the 2,000 smallest companies in the Russell 3000 Index, which represent approximately 8% of the total market capitalization of the Russell 3000 Index. Returns include the reinvestment of all dividends.
AVERAGE ANNUAL RATE OF RETURN (%)
FOR PERIODS ENDED APRIL 30, 2013
| | | | | | | | | | | | | | | | |
| | | 1 Year | | | 3 Year | | | 5 Year | | | 10 Year | |
The Delafield Fund | | | 10.00% | | | | 9.01% | | | | 8.14% | | | | 12.00% | |
Standard & Poor’s 500 Stock Index | | | 16.89% | | | | 12.80% | | | | 5.21% | | | | 7.88% | |
Russell 2000 Total Return Index | | | 17.69% | | | | 11.25% | | | | 7.27% | | | | 10.47% | |
The Tocqueville Select Fund
Dear Fellow Shareholder,
For the six months ended April 30, 2013, the Fund’s net asset value increased 19.34% versus an increase of 17.94% for the Russell 2500 Index (“Russell 2500”) and 16.58% for the Russell 2000 Index (“Russell 2000”), each on a total return basis. The Fund’s net asset value as of April 30, 2013 was $12.98 per share. The net asset value amounted to $87,473,141 of which 85.8% was invested in equities, and the balance in cash and equivalents.
Despite the uncertain outcome of the U.S. presidential election early in the period, worries regarding the European sovereign debt crisis throughout, and the fiscal cliff standoff, the Russell 2500 and Russell 2000 indices rallied through the first quarter of the fiscal year. During the second fiscal quarter, equity markets in the U.S. continued to rise, buoyed by the last minute (albeit temporary) fiscal cliff compromise, as well as improved domestic housing and jobs market reports.
We remained committed to our investment strategy, where utilizing a strictly bottom-up approach we search for companies that we believe are selling at prices which seem modest in relation to the company’s intrinsic value and where something may change which will alter that company’s future for the better. To that end, our most significant additions to the portfolio during the six month period were Carpenter Technology Corp. (“CRS”) and RPX Corporation (“RPXC”). CRS is a leader in specialty metals for niche aerospace, energy, power and medical markets. We anticipate a significant ramp in earnings power and free cash flow generation in the next eighteen months as the company completes the integration of an acquisition and the startup of a large forging operation. RPXC purchases patents from owners, and offers its entire patent portfolio on a subscription basis to its corporate customer base. With the patent troll epidemic growing, we believe that RPXC is well positioned to show strong revenue and earnings growth. During the first half of the fiscal year we also sold out of our holdings in Harris Corporation after the shares had run up and the valuation appeared to be full.
Sector weighting is a by-product of our company by company investment approach. However, we had no exposure to health care, financials or utilities stocks during the six month period. This negatively impacted our relative performance, as these categories, in aggregate, represented nearly 30% of the Russell 2500 during the period and were among the top performing sectors.
Overall, stock selection drove our performance during the six month period, though selection was mixed by sector. Our holdings in the information technology sector were most beneficial on both an absolute and relative basis, followed by our materials stocks. In contrast, our industrials names underperformed relative to the Russell 2500. With respect to individual stocks, Monotype Imaging Holdings, Universal Electronics, Summer Infant, Inc., Checkpoint Systems, Inc. and J2 Global Inc were the largest positive contributors to the portfolio’s performance. In contrast, Carpenter Technology Corp., Maidenform Brands, Inc., Acco Brands Corp., XO Group, Inc. and Foot Locker Inc. were the largest detractors to our performance during period.
| | | | |
Sincerely, | | | | |
| | | |  |
| | |
| J. Dennis Delafield | | Vincent Sellecchia | | Donald Wang |
| Portfolio Manager | | Portfolio Manager | | Portfolio Manager |
The Tocqueville Select Fund
(Unaudited)
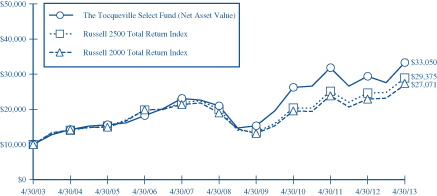
This chart assumes an initial gross investment of $10,000 made on 4/30/03. Since The Tocqueville Select Fund did not commence operations until 9/28/09, returns from the period from September 29, 2008 to September 27, 2009 are those of the Class Y Shares of the Predecessor Fund (See Footnote 1 to the Financial Statements). Prior to that period, returns shown are those of a limited partnership managed by the adviser. Returns shown do not reflect the deduction of taxes that a shareholder would pay on fund distributions or the redemption of fund shares. Performance reflects fee waivers in effect. In the absence of fee waivers, total return would be reduced. Returns shown include the reinvestment of all dividends and other distributions. Past performance is not predictive of future performance. Investment return and principal value will fluctuate so that your shares, when redeemed, may be worth more or less than their original cost. The Fund imposes a 2% redemption fee on shares held 90 days or less.
The Russel 2500 Total Return Index is an unmanaged index that measures the performance of the 2,500 smallest companies in the Russell 3000 Index. Returns include the reinvestment of all dividends.
The Russell 2000 Total Return Index is an unmanaged index that measures the performance of the 2,000 smallest companies in the Russell 3000 Index, which represents approximately 8% of the total market capitalization of the Russell 3000 Index. Returns include the reinvestment of all dividends.
AVERAGE ANNUAL RATE OF RETURN (%)
FOR PERIODS ENDED APRIL 30, 2013
| | | | | | | | | | | | | | | | |
| | | 1 Year | | | 3 Year | | | 5 Year | | | 10 Year | |
The Tocqueville Select Fund | | | 11.85% | | | | 7.88% | | | | 9.43% | | | | 12.70% | |
Russell 2500 Total Return Index | | | 18.96% | | | | 12.95% | | | | 7.95% | | | | 11.38% | |
Russell 2000 Total Return Index | | | 17.69% | | | | 11.25% | | | | 7.27% | | | | 10.47% | |
Expense Example—April 30, 2013 (Unaudited)
As a shareholder of The Tocqueville Trust (the “Funds”), you incur ongoing costs, including management fees; distribution fees; and other Fund expenses. This example is intended to help you understand your ongoing costs (in dollars) of investing in the Funds and to compare costs with the ongoing costs of investing in other mutual funds.
The Example is based on an investment of $1,000 invested at the beginning of the period and held the entire period (November 1, 2012-April 30, 2013).
Actual Expenses
The first line of the table below provides information about actual account values and actual expenses. You may use the information in this line, together with the amount you invested, to estimate the expenses that you paid over the period. Simply divide your account value by $1,000 (for example, an $8,600 account value divided by $1,000 = 8.6), then multiply the result by the number in the first line under the heading entitled “Expenses Paid During Period” to estimate the expenses you paid on your account during this period.
Hypothetical Example for Comparison Purposes
The second line of the table below provides information about hypothetical account values and hypothetical expenses based on the Funds’ actual expense ratios and an assumed rate of return of 5% per year before expenses, which is not the Funds’ actual return. The hypothetical account values and expenses may not be used to estimate the actual ending account balance or expenses you paid for the period. You may use this information to compare the ongoing costs of investing in the Funds and other funds. To do so, compare this 5% hypothetical example with the 5% hypothetical examples that appear in the shareholder reports of the other funds.
Please note that the expenses shown in the table are meant to highlight your ongoing costs only and do not reflect any transactional costs, such as sales charges (loads), redemption fees, or exchange fees. Therefore, the second line of the table is useful in comparing ongoing costs only, and will not help you determine the relative costs of owning different funds. In addition, if these transactional costs were included, your costs would have been higher.
Expense Example Tables (Unaudited)
| | | | | | | | | | | | |
| The Tocqueville Fund | | Beginning
Account Value
November 1, 2012 | | | Ending
Account Value
April 30, 2013 | | | Expenses Paid
During Period*
November 1, 2012 -
April 30, 2013 | |
Actual | | $ | 1,000.00 | | | $ | 1,133.80 | | | $ | 6.67 | |
Hypothetical (5% return before expenses) | | | 1,000.00 | | | | 1,018.55 | | | | 6.31 | |
| | | |
| The Tocqueville Opportunity Fund | | | | | | | | | | | | |
Actual | | $ | 1,000.00 | | | $ | 1,139.60 | | | $ | 6.95 | |
Hypothetical (5% return before expenses) | | | 1,000.00 | | | | 1,018.30 | | | | 6.56 | |
| | | |
| The Tocqueville International Value Fund | | | | | | | | | | | | |
Actual | | $ | 1,000.00 | | | $ | 1,146.40 | | | $ | 7.18 | |
Hypothetical (5% return before expenses) | | | 1,000.00 | | | | 1,018.10 | | | | 6.76 | |
| | | |
| The Tocqueville Gold Fund | | | | | | | | | | | | |
Actual | | $ | 1,000.00 | | | $ | 615.90 | | | $ | 5.25 | |
Hypothetical (5% return before expenses) | | | 1,000.00 | | | | 1,018.30 | | | | 6.56 | |
| | | |
| The Delafield Fund | | | | | | | | | | | | |
Actual | | $ | 1,000.00 | | | $ | 1,152.50 | | | $ | 6.51 | |
Hypothetical (5% return before expenses) | | | 1,000.00 | | | | 1,018.74 | | | | 6.11 | |
| | | |
| The Tocqueville Select Fund | | | | | | | | | | | | |
Actual | | $ | 1,000.00 | | | $ | 1,193.40 | | | $ | 7.40 | |
Hypothetical (5% return before expenses) | | | 1,000.00 | | | | 1,018.05 | | | | 6.80 | |
| * | Expenses are equal to the Fund’s annualized six-month expense ratio (including extraordinary expenses) of 1.26%, 1.31%, 1.35%, 1.31%, 1.22% and 1.36% for The Tocqueville Fund, Opportunity Fund, International Value Fund, Gold Fund, Delafield Fund, and Select Fund, respectively, multiplied by the average account value over the period, multiplied by 181/365 to reflect the one-half year period. |
The Tocqueville Fund
Financial Highlights
| | | | | | | | | | | | | | | | | | | | | | | | |
Per share operating performance (For a share outstanding throughout
the period) | | Six Months
Ended
April 30,
2013 | | | Years Ended October 31, | |
| | | 2012 | | | 2011 | | | 2010 | | | 2009 | | | 2008 | |
| | | (unaudited) | | | | | | | | | | | | | | | | |
Net asset value, beginning of period | | $ | 24.11 | | | $ | 22.23 | | | $ | 21.53 | | | $ | 18.47 | | | $ | 16.39 | | | $ | 28.93 | |
| | | | | | | | | | | | | | | | | | | | | | | | |
Operations: | | | | | | | | | | | | | | | | | | | | | | | | |
Net investment income (1) | | | 0.21 | | | | 0.40 | | | | 0.23 | | | | 0.32 | | | | 0.28 | | | | 0.24 | |
Net realized and unrealized gain (loss) | | | 2.98 | | | | 1.81 | | | | 0.80 | | | | 2.97 | | | | 2.09 | | | | (10.56 | ) |
| | | | | | | | | | | | | | | | | | | | | | | | |
Total from investment operations (2) | | | 3.19 | | | | 2.21 | | | | 1.03 | | | | 3.29 | | | | 2.37 | | | | (10.32 | ) |
| | | | | | | | | | | | | | | | | | | | | | | | |
Distributions to shareholders: | | | | | | | | | | | | | | | | | | | | | | | | |
Dividends from net investment income | | | (0.35 | ) | | | (0.33 | ) | | | (0.33 | ) | | | (0.23 | ) | | | (0.29 | ) | | | (0.19 | ) |
Distributions from net realized gains | | | — | | | | — | | | | — | | | | — | | | | — | | | | (2.03 | ) |
| | | | | | | | | | | | | | | | | | | | | | | | |
Total distributions | | | (0.35 | ) | | | (0.33 | ) | | | (0.33 | ) | | | (0.23 | ) | | | (0.29 | ) | | | (2.22 | ) |
| | | | | | | | | | | | | | | | | | | | | | | | |
Change in net asset value for the period | | | 2.84 | | | | 1.88 | | | | 0.70 | | | | 3.06 | | | | 2.08 | | | | (12.54 | ) |
| | | | | | | | | | | | | | | | | | | | | | | | |
Net asset value, end of period | | $ | 26.95 | | | $ | 24.11 | | | $ | 22.23 | | | $ | 21.53 | | | $ | 18.47 | | | $ | 16.39 | |
| | | | | | | | | | | | | | | | | | | | | | | | |
Total Return | | | 13.4 | %(4) | | | 10.1 | % | | | 4.8 | % | | | 18.0 | % | | | 14.8 | % | | | (38.5 | )% |
Ratios/supplemental data | | | | | | | | | | | | | | | | | | | | | | | | |
Net assets, end of period (000) | | $ | 360,334 | | | $ | 366,025 | | | $ | 491,541 | | | $ | 489,670 | | | $ | 383,470 | | | $ | 328,609 | |
Ratio to average net assets: | | | | | | | | | | | | | | | | | | | | | | | | |
Expense (3) | | | 1.26 | %(5)(6) | | | 1.26 | %(5) | | | 1.25 | % | | | 1.25 | % | | | 1.25 | % | | | 1.25 | % |
Net investment income (3) | | | 1.55 | %(6) | | | 1.33 | % | | | 0.98 | % | | | 1.66 | % | | | 1.68 | % | | | 0.94 | % |
Portfolio turnover rate | | | 8 | %(4) | | | 17 | % | | | 28 | % | | | 23 | % | | | 32 | % | | | 51 | % |
| (1) | Net investment income per share is calculated using the ending balance prior to consideration or adjustment for permanent book-to-tax differences. |
| (2) | Total from investment operations per share includes redemption fees of $0.001 for the six months ended April 30, 2013 and $0.002, $0.002, $0.002, $0.004, and $0.009 per share for the fiscal years ended October 31, 2012, 2011, 2010, 2009, and 2008, respectively. |
| (3) | Net of fees waived amounting to 0.03% for the six months ended April 30, 2013 and 0.03%, 0.01%, 0.01%, 0.08%, and 0.04% of average net assets for the fiscal years ended October 31, 2012, 2011, 2010, 2009, and 2008, respectively. |
| (5) | Includes 0.01% of interest expense which is not included in the Fund’s operating expense cap. |
The Accompanying Notes are an Integral Part of these Financial Statements.
The Tocqueville Opportunity Fund
Financial Highlights
| | | | | | | | | | | | | | | | | | | | | | | | |
Per share operating performance (For a share outstanding throughout
the period) | | Six Months
Ended
April 30,
2013 | | | Years Ended October 31, | |
| | | 2012 | | | 2011 | | | 2010 | | | 2009 | | | 2008 | |
| | | (unaudited) | | | | | | | | | | | | | | | | |
Net asset value, beginning of period | | $ | 15.76 | | | $ | 14.96 | | | $ | 13.20 | | | $ | 10.78 | | | $ | 9.77 | | | $ | 17.24 | |
| | | | | | | | | | | | | | | | | | | | | | | | |
Operations: | | | | | | | | | | | | | | | | | | | | | | | | |
Net investment income (loss) (1) | | | (0.07 | ) | | | (0.11 | ) | | | (0.13 | ) | | | (0.12 | ) | | | (0.11 | ) | | | 0.02 | |
Net realized and unrealized gain (loss) | | | 2.27 | | | | 0.91 | | | | 1.89 | | | | 2.54 | | | | 1.23 | | | | (5.67 | ) |
| | | | | | | | | | | | | | | | | | | | | | | | |
Total from investment operations (2) | | | 2.20 | | | | 0.80 | | | | 1.76 | | | | 2.42 | | | | 1.12 | | | | (5.65 | ) |
| | | | | | | | | | | | | | | | | | | | | | | | |
Distributions to shareholders: | | | | | | | | | | | | | | | | | | | | | | | | |
Dividends from net investment income | | | — | | | | — | | | | — | | | | — | | | | (0.01 | ) | | | (0.12 | ) |
Distributions from net realized gains | | | — | | | | — | | | | — | | | | — | | | | (0.10 | ) | | | (1.70 | ) |
| | | | | | | | | | | | | | | | | | | | | | | | |
Total distributions | | | — | | | | — | | | | — | | | | — | | | | (0.11 | ) | | | (1.82 | ) |
| | | | | | | | | | | | | | | | | | | | | | | | |
Change in net asset value for the period | | | 2.20 | | | | 0.80 | | | | 1.76 | | | | 2.42 | | | | 1.01 | | | | (7.47 | ) |
| | | | | | | | | | | | | | | | | | | | | | | | |
Net asset value, end of period | | $ | 17.96 | | | $ | 15.76 | | | $ | 14.96 | | | $ | 13.20 | | | $ | 10.78 | | | $ | 9.77 | |
| | | | | | | | | | | | | | | | | | | | | | | | |
Total Return | | | 14.0 | %(3) | | | 5.4 | % | | | 13.3 | % | | | 22.6 | % | | | 11.7 | % | | | (36.2 | )% |
Ratios/supplemental data | | | | | | | | | | | | | | | | | | | | | | | | |
Net assets, end of period (000) | | $ | 70,801 | | | $ | 65,455 | | | $ | 46,963 | | | $ | 32,863 | | | $ | 30,498 | | | $ | 36,429 | |
Ratio to average net assets: | | | | | | | | | | | | | | | | | | | | | | | | |
Expense | | | 1.31 | %(4) | | | 1.32 | % | | | 1.36 | % | | | 1.41 | % | | | 1.41 | % | | | 1.35 | % |
Net investment income (loss) | | | (0.74 | )%(4) | | | (0.76 | )% | | | (1.04 | )% | | | (1.08 | )% | | | (0.97 | )% | | | 0.12 | % |
Portfolio turnover rate | | | 54 | %(3) | | | 77 | % | | | 110 | % | | | 104 | % | | | 62 | % | | | 169 | % |
| (1) | Net investment income (loss) per share is calculated using the ending balances prior to consideration or adjustment for permanent book-to-tax differences. |
| (2) | Total from investment operations per share includes redemption fees of less than $0.001 for the six months ended April 30, 2013 and $0.004, $0.001, and $0.005 for the fiscal years ended October 31, 2012, 2009, and 2008, respectively and less than $0.001 for the fiscal years ended October 31, 2011 and 2010. |
The Accompanying Notes are an Integral Part of these Financial Statements.
The Tocqueville International Value Fund
Financial Highlights
| | | | | | | | | | | | | | | | | | | | | | | | |
Per share operating performance (For a share outstanding throughout
the period) | | Six Months
Ended
April 30,
2013 | | | Years Ended October 31, | |
| | | 2012 | | | 2011 | | | 2010 | | | 2009 | | | 2008 | |
| | | (unaudited) | | | | | | | | | | | | | | | | |
Net asset value, beginning of period | | $ | 11.68 | | | $ | 12.00 | | | $ | 12.12 | | | $ | 10.48 | | | $ | 8.49 | | | $ | 16.48 | |
| | | | | | | | | | | | | | | | | | | | | | | | |
Operations: | | | | | | | | | | | | | | | | | | | | | | | | |
Net investment income (1) | | | 0.09 | | | | 0.17 | | | | 0.11 | | | | 0.11 | | | | 0.10 | | | | 0.13 | |
Net realized and unrealized gain (loss) | | | 1.61 | | | | (0.37 | ) | | | (0.16 | ) | | | 1.65 | | | | 2.59 | | | | (6.09 | ) |
| | | | | | | | | | | | | | | | | | | | | | | | |
Total from investment operations (2) | | | 1.70 | | | | (0.20 | ) | | | (0.05 | ) | | | 1.76 | | | | 2.69 | | | | (5.96 | ) |
| | | | | | | | | | | | | | | | | | | | | | | | |
Distributions to shareholders: | | | | | | | | | | | | | | | | | | | | | | | | |
Dividends from net investment income | | | (0.18 | ) | | | (0.12 | ) | | | (0.07 | ) | | | (0.12 | ) | | | (0.20 | ) | | | (0.10 | ) |
Distributions from net realized gains | | | — | | | | — | | | | — | | | | — | | | | (0.50 | ) | | | (1.93 | ) |
| | | | | | | | | | | | | | | | | | | | | | | | |
Total distributions | | | (0.18 | ) | | | (0.12 | ) | | | (0.07 | ) | | | (0.12 | ) | | | (0.70 | ) | | | (2.03 | ) |
| | | | | | | | | | | | | | | | | | | | | | | | |
Change in net asset value for the period | | | 1.52 | | | | (0.32 | ) | | | (0.12 | ) | | | 1.64 | | | | 1.99 | | | | (7.99 | ) |
| | | | | | | | | | | | | | | | | | | | | | | | |
Net asset value, end of period | | $ | 13.20 | | | $ | 11.68 | | | $ | 12.00 | | | $ | 12.12 | | | $ | 10.48 | | | $ | 8.49 | |
| | | | | | | | | | | | | | | | | | | | | | | | |
Total Return | | | 14.6 | %(3) | | | (1.6 | )% | | | (0.5 | )% | | | 17.0 | % | | | 34.0 | % | | | (40.8 | )% |
Ratios/supplemental data | | | | | | | | | | | | | | | | | | | | | | | | |
Net assets, end of period (000) | | $ | 238,360 | | | $ | 218,793 | | | $ | 199,848 | | | $ | 150,103 | | | $ | 131,613 | | | $ | 118,189 | |
Ratio to average net assets: | | | | | | | | | | | | | | | | | | | | | | | | |
Expense | | | 1.35 | %(4)(5) | | | 1.56 | % | | | 1.56 | % | | | 1.56 | % | | | 1.62 | % | | | 1.56 | % |
Net investment income | | | 1.43 | %(4)(5) | | | 1.53 | % | | | 0.99 | % | | | 1.03 | % | | | 0.96 | % | | | 1.07 | % |
Portfolio turnover rate | | | 25 | %(3) | | | 38 | % | | | 30 | % | | | 27 | % | | | 27 | % | | | 63 | % |
| (1) | Net investment income per shares is calculated using the ending balances prior to consideration or adjustment for permanent book-to-tax differences. |
| (2) | Total from investment operations per share includes redemption fees of less than $0.001 for the six months ended April 30, 2013 and $0.001, $0.010, $0.002, $0.001, and $0.001 for the fiscal years ended October 31, 2012, 2011, 2010, 2009, and 2008, respectively. |
| (4) | Net of fees waived amounting to 0.19% of average net assets for the six months ended April 30, 2013. |
The Accompanying Notes are an Integral Part of these Financial Statements.
The Tocqueville Gold Fund
Financial Highlights
| | | | | | | | | | | | | | | | | | | | | | | | |
Per share operating performance (For a share outstanding throughout
the period) | | Six Months
Ended
April 30,
2013 | | | Years Ended October 31, | |
| | | 2012 | | | 2011 | | | 2010 | | | 2009 | | | 2008 | |
| | | (unaudited) | | | | | | | | | | | | | | | | |
Net asset value, beginning of period | | $ | 72.82 | | | $ | 81.97 | | | $ | 82.00 | | | $ | 49.71 | | | $ | 21.77 | | | $ | 64.36 | |
| | | | | | | | | | | | | | | | | | | | | | | | |
Operations: | | | | | | | | | | | | | | | | | | | | | | | | |
Net investment loss (1) | | | (0.17 | ) | | | (0.35 | ) | | | (0.67 | ) | | | (0.58 | ) | | | (0.45 | ) | | | (0.57 | ) |
Net realized and unrealized gain (loss) | | | (27.32 | ) | | | (7.47 | ) | | | 2.25 | | | | 32.96 | | | | 29.28 | | | | (33.24 | ) |
| | | | | | | | | | | | | | | | | | | | | | | | |
Total from investment operations (2) | | | (27.49 | ) | | | (7.82 | ) | | | 1.58 | | | | 32.38 | | | | 28.83 | | | | (33.81 | ) |
| | | | | | | | | | | | | | | | | | | | | | | | |
Distributions to shareholders: | | | | | | | | | | | | | | | | | | | | | | | | |
Dividends from net investment income | | | — | | | | — | | | | — | | | | — | | | | — | | | | (0.46 | ) |
Distributions from net realized gains | | | (1.62 | ) | | | (1.33 | ) | | | (1.61 | ) | | | (0.09 | ) | | | (0.89 | ) | | | (8.32 | ) |
| | | | | | | | | | | | | | | | | | | | | | | | |
Total distributions | | | (1.62 | ) | | | (1.33 | ) | | | (1.61 | ) | | | (0.09 | ) | | | (0.89 | ) | | | (8.78 | ) |
| | | | | | | | | | | | | | | | | | | | | | | | |
Change in net asset value for the period | | | (29.11 | ) | | | (9.15 | ) | | | (0.03 | ) | | | 32.29 | | | | 27.94 | | | | (42.59 | ) |
| | | | | | | | | | | | | | | | | | | | | | | | |
Net asset value, end of period | | $ | 43.71 | | | $ | 72.82 | | | $ | 81.97 | | | $ | 82.00 | | | $ | 49.71 | | | $ | 21.77 | |
| | | | | | | | | | | | | | | | | | | | | | | | |
Total Return | | | (38.4 | )%(3) | | | (9.5 | )% | | | 1.8 | % | | | 65.2 | % | | | 135.2 | % | | | (60.0 | )% |
Ratios/supplemental data | | | | | | | | | | | | | | | | | | | | | | | | |
Net assets, end of period (000) | | $ | 1,401,100 | | | $ | 2,445,913 | | | $ | 2,647,078 | | | $ | 2,199,603 | | | $ | 937,492 | | | $ | 410,857 | |
Ratio to average net assets: | | | | | | | | | | | | | | | | | | | | | | | | |
Expense | | | 1.31 | %(4) | | | 1.28 | % | | | 1.25 | % | | | 1.34 | % | | | 1.50 | % | | | 1.43 | % |
Net investment loss | | | (0.39 | )%(4) | | | (0.56 | )% | | | (0.86 | )% | | | (1.11 | )% | | | (1.25 | )% | | | (1.07 | )% |
Portfolio turnover rate | | | 3 | %(3) | | | 11 | % | | | 3 | % | | | 9 | % | | | 9 | % | | | 28 | % |
| (1) | Net investment loss per share is calculated using the ending balances prior to consideration or adjustment for permanent book-to-tax differences. |
| (2) | Total from investment operations per share includes redemption fees of $0.010 for the six months ended April 30, 2013 and $0.021, $0.102, $0.056, $0.025, and $0.027 for the fiscal years ended October 31, 2012, 2011, 2010, 2009, and 2008, respectively. |
The Accompanying Notes are an Integral Part of these Financial Statements.
The Delafield Fund
Financial Highlights
| | | | | | | | | | | | | | | | | | | | | | | | |
Per share operating performance
(For a share outstanding
throughout the period) | | Six Months
Ended
April 30,
2013 | | | Years Ended October 31, | | | January 1,
2009
through
October 31,
2009 | | | Year Ended
December 31,
2008 | |
| | | 2012 | | | 2011 | | | 2010 | | | |
| | | (unaudited) | | | | | | | | | | | | | | | | |
Net asset value, beginning of period | | $ | 29.79 | | | $ | 27.21 | | | $ | 26.65 | | | $ | 21.35 | | | $ | 15.10 | | | $ | 24.33 | |
| | | | | | | | | | | | | | | | | | | | | | | | |
Operations: | | | | | | | | | | | | | | | | | | | | | | | | |
Net investment income (loss) (1) | | | (0.02 | ) | | | (0.04 | ) | | | (0.08 | ) | | | (0.00 | )(3) | | | 0.03 | | | | 0.07 | |
Net realized and unrealized gain (loss) | | | 4.44 | | | | 2.99 | | | | 0.64 | | | | 5.32 | | | | 6.25 | | | | (9.23 | ) |
| | | | | | | | | | | | | | | | | | | | | | | | |
Total from investment operations (2) | | | 4.42 | | | | 2.95 | | | | 0.56 | | | | 5.32 | | | | 6.28 | | | | (9.16 | ) |
| | | | | | | | | | | | | | | | | | | | | | | | |
Distributions to shareholders: | | | | | | | | | | | | | | | | | | | | | | | | |
Dividends from net investment income | | | — | | | | — | | | | — | | | | — | | | | (0.03 | ) | | | (0.07 | ) |
Distributions from net realized gains | | | (1.81 | ) | | | (0.37 | ) | | | — | | | | — | | | | — | | | | (0.00 | )(3) |
Return of capital | | | — | | | | — | | | | — | | | | (0.02 | ) | | | (0.00 | )(3) | | | (0.00 | )(3) |
| | | | | | | | | | | | | | | | | | | | | | | | |
Total distributions | | | (1.81 | ) | | | (0.37 | ) | | | — | | | | (0.02 | ) | | | (0.03 | ) | | | (0.07 | ) |
| | | | | | | | | | | | | | | | | | | | | | | | |
Change in net asset value for the period | | | 2.61 | | | | 2.58 | | | | 0.56 | | | | 5.30 | | | | 6.25 | | | | (9.23 | ) |
| | | | | | | | | | | | | | | | | | | | | | | | |
Net asset value, end of period | | $ | 32.40 | | | $ | 29.79 | | | $ | 27.21 | | | $ | 26.65 | | | $ | 21.35 | | | $ | 15.10 | |
| | | | | | | | | | | | | | | | | | | | | | | | |
Total Return | | | 15.3 | %(4) | | | 11.0 | % | | | 2.1 | % | | | 25.0 | % | | | 41.6 | %(4) | | | (37.6 | )% |
Ratios/supplemental data | | | | | | | | | | | | | | | | | | | | | | | | |
Net assets, end of period (000) | | $ | 1,528,882 | | | $ | 1,346,273 | | | $ | 1,262,876 | | | $ | 933,674 | | | $ | 636,548 | | | $ | 404,860 | |
Ratio to average net assets: | | | | | | | | | | | | | | | | | | | | | | | | |
Expense | | | 1.22 | %(5) | | | 1.23 | % | | | 1.23 | % | | | 1.27 | % | | | 1.38 | %(5) | | | 1.34 | %(6) |
Net investment income (loss) | | | (0.16 | )%(5) | | | (0.13 | )% | | | (0.30 | )% | | | (0.02 | )% | | | 0.21 | %(5) | | | 0.35 | %(6) |
Portfolio turnover rate | | | 18 | %(4) | | | 49 | % | | | 38 | % | | | 30 | % | | | 46 | %(4) | | | 81 | % |
| (1) | Net investment income (loss) per share is calculated using the ending balances prior to consideration or adjustment for permanent book-to-tax differences. |
| (2) | Total from investment operations per share includes redemption fees of $0.001 for the six months ended April 30, 2013 and $0.003, $0.006, and $0.006 for the fiscal years ended October 31, 2012, 2011, and 2010, $0.008 per share for the period ended October 31, 2009, and less than $0.01 for the fiscal year ended December 31, 2008. |
| (3) | Represents less than $0.01. |
| (6) | Net of fees waived amounting to 0.06% and 0.05% for the fiscal years ended December 31, 2008, and 2007, respectively. |
The Accompanying Notes are an Integral Part of these Financial Statements.
The Tocqueville Select Fund
Financial Highlights
| | | | | | | | | | | | | | | | | | | | | | | | |
Per share operating performance (For a share outstanding throughout
the period) | | Six Months
Ended
April 30,
2013 | | | Years Ended October 31, | | | January 1,
2009
through
October 31,
2009 | | | Period from
September
2008 (3)
through
December 31,
2008 | |
| | | 2012 | | | 2011 | | | 2010 | | | |
| | | (unaudited) | | | | | | | | | | | | | | | | |
Net asset value, beginning of period | | $ | 11.35 | | | $ | 11.06 | | | $ | 11.54 | | | $ | 8.46 | | | $ | 5.77 | | | $ | 8.74 | |
| | | | | | | | | | | | | | | | | | | | | | | | |
Operations: | | | | | | | | | | | | | | | | | | | | | | | | |
Net investment income (loss) (1) | | | (0.03 | ) | | | (0.04 | ) | | | (0.07 | ) | | | (0.03 | ) | | | (0.00 | )(4) | | | 0.01 | |
Net realized and unrealized gain (loss) | | | 2.17 | | | | 0.44 | | | | 0.12 | | | | 3.12 | | | | 2.70 | | | | (2.97 | ) |
| | | | | | | | | | | | | | | | | | | | | | | | |
Total from investment operations (2) | | | 2.14 | | | | 0.40 | | | | 0.05 | | | | 3.09 | | | | 2.70 | | | | (2.96 | ) |
| | | | | | | | | | | | | | | | | | | | | | | | |
Distributions to shareholders: | | | | | | | | | | | | | | | | | | | | | | | | |
Dividends from net investment income | | | — | | | | — | | | | — | | | | (0.01 | ) | | | (0.00 | )(4) | | | (0.01 | ) |
Distributions from net realized gains | | | (0.51 | ) | | | (0.11 | ) | | | (0.53 | ) | | | — | | | | — | | | | — | |
Return of Capital | | | — | | | | — | | | | — | | | | — | | | | (0.01 | ) | | | — | |
| | | | | | | | | | | | | | | | | | | | | | | | |
Total distributions | | | (0.51 | ) | | | (0.11 | ) | | | (0.53 | ) | | | (0.01 | ) | | | (0.01 | ) | | | (0.01 | ) |
| | | | | | | | | | | | | | | | | | | | | | | | |
Change in net asset value for the period | | | 1.63 | | | | 0.29 | | | | (0.48 | ) | | | 3.08 | | | | 2.69 | | | | (2.97 | ) |
| | | | | | | | | | | | | | | | | | | | | | | | |
Net asset value, end of period | | $ | 12.98 | | | $ | 11.35 | | | $ | 11.06 | | | $ | 11.54 | | | $ | 8.46 | | | $ | 5.77 | |
| | | | | | | | | | | | | | | | | | | | | | | | |
Total Return | | | 19.3 | %(5) | | | 3.7 | % | | | (0.1 | )% | | | 36.6 | % | | | 46.7 | %(5) | | | (33.9 | )%(5) |
Ratios/supplemental data | | | | | | | | | | | | | | | | | | | | | | | | |
Net assets, end of period (000) | | $ | 87,473 | | | $ | 84,549 | | | $ | 71,554 | | | $ | 41,788 | | | $ | 24,681 | | | $ | 9,226 | |
Ratio to average net assets: | | | | | | | | | | | | | | | | | | | | | | | | |
Expense | | | 1.36 | %(6) | | | 1.37 | % | | | 1.36 | % | | | 1.38 | % | | | 1.26 | %(6)(7) | | | 1.15 | %(6)(7) |
Net investment income (loss) | | | (0.35 | )%(6) | | | (0.36 | )% | | | (0.67 | )% | | | (0.43 | )% | | | (0.16 | )%(6)(7) | | | 0.29 | %(6)(7) |
Portfolio turnover rate | | | 13 | %(5) | | | 31 | % | | | 28 | % | | | 40 | % | | | 24 | %(5) | | | 29 | %(5) |
| (1) | Net investment income (loss) per share is calculated using the ending balances prior to consideration or adjustment for permanent book-to-tax differences. |
| (2) | Total from investment operations per share includes redemption fees of less than $0.001 for the six months ended April 30, 2013 and $0.002, $0.008, and $0.007 for the fiscal years ended October 31, 2012, 2011, and 2010, respectively. |
| (4) | Represents less than $0.01. |
| (7) | Net of fees waived amounting to 0.77% and 2.32% for the fiscal periods ended October 31, 2009 and December 31, 2008, respectively. |
The Accompanying Notes are an Integral Part of these Financial Statements.
The Tocqueville Fund
Schedule of Investments as of April 30, 2013
(Unaudited)
| | | | | | | | |
| Common Stocks—97.2% | | Shares | | | Value | |
Automobiles & Components—2.7% | | | | | | | | |
Ford Motor Co. | | | 700,000 | | | $ | 9,597,000 | |
Banks—2.0% | | | | | | | | |
M&T Bank Corp. | | | 20,000 | | | | 2,004,000 | |
Mitsubishi UFJ Financial Group, Inc.—ADR | | | 750,000 | | | | 5,085,000 | |
| | | | | | | | 7,089,000 | |
Capital Goods—6.8% | | | | | | | | |
General Electric Co. | | | 500,000 | | | | 11,145,000 | |
Illinois Tool Works, Inc. | | | 100,000 | | | | 6,456,000 | |
The Boeing Co. | | | 75,000 | | | | 6,855,750 | |
| | | | | | | | 24,456,750 | |
Commercial & Professional Services—1.8% | |
Steelcase, Inc. | | | 500,000 | | | | 6,350,000 | |
Consumer Services—1.2% | | | | | | | | |
DeVry, Inc. | | | 150,000 | | | | 4,201,500 | |
Diversified Financials—2.3% | | | | | | | | |
The Bank of New York Mellon Corp. | | | 300,000 | | | | 8,466,000 | |
Energy—11.9% | | | | | | | | |
Cameco Corp.(a) | | | 200,000 | | | | 3,902,000 | |
Chesapeake Energy Corp. | | | 200,000 | | | | 3,908,000 | |
Energen Corp. | | | 100,000 | | | | 4,742,000 | |
Exxon Mobil Corp. | | | 130,000 | | | | 11,568,700 | |
McDermott International, Inc.(a)(b) | | | 150,000 | | | | 1,602,000 | |
Murphy Oil Corp. | | | 100,000 | | | | 6,209,000 | |
Schlumberger Ltd.(a) | | | 150,000 | | | | 11,164,500 | |
| | | | | | | | 43,096,200 | |
Food & Staples Retailing—2.1% | | | | | | | | |
Wal-Mart Stores, Inc. | | | 100,000 | | | | 7,772,000 | |
Food, Beverage & Tobacco—5.4% | | | | | | | | |
Campbell Soup Co. | | | 150,000 | | | | 6,961,500 | |
PepsiCo, Inc. | | | 50,000 | | | | 4,123,500 | |
The Coca-Cola Co. | | | 200,000 | | | | 8,466,000 | |
| | | | | | | | 19,551,000 | |
Household & Personal Products—4.8% | |
Colgate-Palmolive Co. | | | 50,000 | | | | 5,970,500 | |
The Procter & Gamble Co. | | | 150,000 | | | | 11,515,500 | |
| | | | | | | | 17,486,000 | |
Insurance—4.1% | | | | | | | | |
Aflac, Inc. | | | 100,000 | | | | 5,444,000 | |
Fidelity National Financial, Inc. | | | 175,000 | | | | 4,698,750 | |
XL Group PLC(a) | | | 150,000 | | | | 4,671,000 | |
| | | | | | | | 14,813,750 | |
Materials—8.9% | | | | | | | | |
BHP Billiton Ltd.—ADR | | | 75,000 | | | | 5,041,500 | |
EI du Pont de Nemours & Co. | | | 250,000 | | | | 13,627,500 | |
Newmont Mining Corp. | | | 250,000 | | | $ | 8,100,000 | |
Sonoco Products Co. | | | 150,000 | | | | 5,256,000 | |
| | | | | | | | 32,025,000 | |
Pharmaceuticals, Biotechnology & Life Sciences—11.6% | |
Alkermes PLC(a)(b) | | | 200,000 | | | | 6,122,000 | |
Isis Pharmaceuticals, Inc.(b) | | | 300,000 | | | | 6,717,000 | |
Johnson & Johnson | | | 150,000 | | | | 12,784,500 | |
Merck & Co., Inc. | | | 150,000 | | | | 7,050,000 | |
Pfizer, Inc. | | | 320,000 | | | | 9,302,400 | |
| | | | | | | | 41,975,900 | |
Retailing—1.1% | | | | | | | | |
Lowe’s Cos, Inc. | | | 100,000 | | | | 3,842,000 | |
Semiconductors & Semiconductor Equipment—4.7% | |
Applied Materials, Inc. | | | 500,000 | | | | 7,255,000 | |
Intel Corp. | | | 400,000 | | | | 9,580,000 | |
| | | | | | | | 16,835,000 | |
Software & Services—10.8% | | | | | | | | |
Automatic Data Processing, Inc. | | | 100,000 | | | | 6,734,000 | |
Google, Inc.(b) | | | 9,000 | | | | 7,421,130 | |
Mastercard, Inc. | | | 15,000 | | | | 8,293,950 | |
Microsoft Corp. | | | 400,000 | | | | 13,240,000 | |
VeriFone Systems, Inc.(b) | | | 150,000 | | | | 3,222,000 | |
| | | | | | | | 38,911,080 | |
Technology Hardware & Equipment—8.4% | |
Apple, Inc. | | | 10,000 | | | | 4,427,500 | |
Bio-key International, Inc.(b)(c)(d)(e) | | | 47,090 | | | | — | |
Cisco Systems, Inc. | | | 300,000 | | | | 6,276,000 | |
EMC Corp.(b) | | | 200,000 | | | | 4,486,000 | |
Hitachi Ltd.—ADR | | | 75,000 | | | | 4,755,000 | |
Nokia OYJ—ADR(b) | | | 500,000 | | | | 1,690,000 | |
Xerox Corp. | | | 1,000,000 | | | | 8,580,000 | |
| | | | | | | | 30,214,500 | |
Telecommunication Services—1.9% | |
Verizon Communications, Inc. | | | 125,000 | | | | 6,738,750 | |
Transportation—1.6% | | | | | | | | |
C.H. Robinson Worldwide, Inc. | | | 50,000 | | | | 2,969,500 | |
FedEx Corp. | | | 30,000 | | | | 2,820,300 | |
| | | | | | | | 5,789,800 | |
Utilities—3.1% | | | | | | | | |
NextEra Energy, Inc. | | | 135,000 | | | | 11,074,050 | |
Total Common Stocks
(Cost $270,212,523) | | | | | | | 350,285,280 | |
The Accompanying Footnotes are an Integral Part of these Financial Statements.
The Tocqueville Fund
Schedule of Investments as of April 30, 2013
(Unaudited)
| | | | | | | | |
Real Estate Investment Trust
(REIT)—2.1% | | Shares | | | Value | |
Real Estate—2.1% | | | | | | | | |
Weyerhaeuser Co. | | | 250,000 | | | $ | 7,627,500 | |
Total Real Estate Investment Trust
(Cost $4,426,028) | | | | | | | 7,627,500 | |
Short-Term Investment—0.6% | | | | | | | | |
Money Market Fund—0.6% | | | | | | | | |
STIT-Treasury Portfolio, 0.02%(f) | | | 2,106,674 | | | | 2,106,674 | |
Total Short-Term Investment
(Cost $2,106,674) | | | | | | | 2,106,674 | |
Total Investments
(Cost $276,745,225)—99.9% | | | | 360,019,454 | |
Other Assets in Excess of Liabilities—0.1% | | | | 314,364 | |
Total Net Assets—100.0% | | | | | | $ | 360,333,818 | |
| | | | | | | | |
Percentages are stated as a percent of net assets.
ADR American Depository Receipt
| (a) | Foreign issued security. Foreign concentration (including ADR’s) was as follows: Australia 1.4%; Canada 1.1%; Finland 0.5%; Ireland 3.0%; Japan 2.7%; Netherlands Antilles 3.1%; Panama 0.4%. |
| (b) | Non-income producing security. |
| (c) | Denotes a security is either fully or partially restricted to resale. The aggregate value of restricted securities at April 30, 2013 was $0 which represented 0.0% of net assets. |
| (d) | Fair valued security. The aggregate value of fair valued securities as of April 30, 2013 was $0 which represented 0.0% of net assets. |
| (e) | Security is considered illiquid and may be difficult to sell. |
| (f) | Variable rate security. The rate shown is as of 4/30/2013. |
The Global Industry Classification Standard (GICS®) was developed by and/or is the exclusive property of MSCI, Inc. and Standard & Poor Financial Services LLC (“S&P”). GICS is a service mark of MSCI and S&P and has been licensed for use by U.S. Bancorp Fund Services, LLC.
The Accompanying Footnotes are an Integral Part of these Financial Statements.
The Tocqueville Opportunity Fund
Schedule of Investments as of April 30, 2013
(Unaudited)
| | | | | | | | |
| Common Stocks—99.0% | | Shares | | | Value | |
Automobiles & Components—0.8% | | | | | | | | |
Harley-Davidson, Inc. | | | 4,500 | | | $ | 245,925 | |
Standard Motor Products, Inc. | | | 5,600 | | | | 171,584 | |
Tenneco, Inc.(a) | | | 2,900 | | | | 112,143 | |
| | | | | | | | 529,652 | |
Banks—3.0% | | | | | | | | |
Bank of the Ozarks, Inc. | | | 3,400 | | | | 139,162 | |
City National Corp. | | | 3,300 | | | | 188,859 | |
EverBank Financial Corp. | | | 10,000 | | | | 160,000 | |
First Republic Bank | | | 4,900 | | | | 186,102 | |
Pinnacle Financial Partners, Inc.(a) | | | 22,300 | | | | 541,221 | |
Regions Financial Corp. | | | 21,100 | | | | 179,139 | |
SCBT Financial Corp. | | | 8,300 | | | | 396,491 | |
Signature Bank(a) | | | 3,200 | | | | 229,152 | |
Texas Capital Bancshares, Inc.(a) | | | 2,600 | | | | 108,316 | |
| | | | | | | | 2,128,442 | |
Capital Goods—11.4% | | | | | | | | |
Acuity Brands, Inc. | | | 4,200 | | | | 306,432 | |
AMETEK, Inc. | | | 13,950 | | | | 567,905 | |
AO Smith Corp. | | | 5,500 | | | | 414,865 | |
B/E Aerospace, Inc.(a) | | | 6,000 | | | | 376,440 | |
Beacon Roofing Supply, Inc.(a) | | | 5,900 | | | | 224,967 | |
Donaldson Co., Inc. | | | 8,100 | | | | 294,678 | |
DXP Enterprises, Inc.(a) | | | 2,200 | | | | 147,136 | |
ESCO Technologies, Inc. | | | 900 | | | | 32,373 | |
Esterline Technologies Corp.(a) | | | 2,600 | | | | 195,104 | |
Greenbrier Cos, Inc.(a) | | | 6,800 | | | | 153,408 | |
Hexcel Corp.(a) | | | 8,000 | | | | 244,000 | |
Hubbell, Inc. | | | 3,700 | | | | 355,052 | |
Lincoln Electric Holdings, Inc. | | | 10,300 | | | | 543,428 | |
Middleby Corp.(a) | | | 1,500 | | | | 224,370 | |
Nordson Corp. | | | 5,900 | | | | 409,991 | |
Stanley Black & Decker, Inc. | | | 1,300 | | | | 97,253 | |
The Toro Co. | | | 2,300 | | | | 103,523 | |
TransDigm Group, Inc. | | | 3,600 | | | | 528,480 | |
Triumph Group, Inc. | | | 2,900 | | | | 231,710 | |
United Rentals, Inc.(a) | | | 5,900 | | | | 310,399 | |
USG Corp.(a) | | | 8,200 | | | | 213,118 | |
Valmont Industries, Inc. | | | 4,300 | | | | 626,639 | |
WABCO Holdings, Inc.(a) | | | 3,400 | | | | 245,582 | |
Wabtec Corp. | | | 6,400 | | | | 671,616 | |
Watsco, Inc. | | | 4,200 | | | | 354,396 | |
Woodward, Inc. | | | 5,100 | | | | 183,549 | |
| | | | | | | | 8,056,414 | |
Commercial & Professional Services—0.8% | |
Clean Harbors, Inc.(a) | | | 2,400 | | | | 136,728 | |
Equifax, Inc. | | | 7,500 | | | | 459,000 | |
| | | | | | | | 595,728 | |
Consumer Durables & Apparel—9.3% | |
Cie Financiere Richemont SA(b) | | | 3,200 | | | $ | 258,464 | |
Deckers Outdoor Corp.(a) | | | 5,800 | | | | 319,696 | |
Fossil, Inc.(a) | | | 3,800 | | | | 372,856 | |
Hanesbrands, Inc.(a) | | | 14,300 | | | | 717,288 | |
Hermes International(b) | | | 1,100 | | | | 370,998 | |
Lennar Corp. | | | 6,800 | | | | 280,296 | |
Lululemon Athletica, Inc.(a) | | | 3,200 | | | | 243,616 | |
MDC Holdings, Inc. | | | 4,300 | | | | 161,680 | |
Michael Kors Holdings Ltd.(a)(b) | | | 6,200 | | | | 353,028 | |
Polaris Industries, Inc. | | | 4,900 | | | | 422,331 | |
Prada SpA(b) | | | 59,500 | | | | 536,333 | |
PVH Corp. | | | 3,600 | | | | 415,476 | |
Ralph Lauren Corp. | | | 2,400 | | | | 435,792 | |
The Ryland Group, Inc. | | | 11,800 | | | | 531,708 | |
Toll Brothers, Inc.(a) | | | 11,000 | | | | 377,410 | |
Tupperware Brands Corp. | | | 4,100 | | | | 329,230 | |
Under Armour, Inc.(a) | | | 4,300 | | | | 245,444 | |
Whirlpool Corp. | | | 1,600 | | | | 182,848 | |
| | | | | | | | 6,554,494 | |
Consumer Services—4.0% | | | | | | | | |
Chipotle Mexican Grill, Inc.(a) | | | 400 | | | | 145,276 | |
Domino’s Pizza, Inc. | | | 6,800 | | | | 375,360 | |
Dunkin’ Brands Group, Inc. | | | 13,500 | | | | 523,935 | |
Hillenbrand, Inc. | | | 9,900 | | | | 248,787 | |
Panera Bread Co.(a) | | | 3,600 | | | | 638,028 | |
Starbucks Corp. | | | 5,000 | | | | 304,200 | |
Starwood Hotels & Resorts Worldwide, Inc. | | | 3,100 | | | | 200,012 | |
Wyndham Worldwide Corp. | | | 4,000 | | | | 240,320 | |
Wynn Resorts Ltd. | | | 900 | | | | 123,570 | |
| | | | | | | | 2,799,488 | |
Diversified Financials—4.5% | | | | | | | | |
Affiliated Managers Group, Inc.(a) | | | 1,900 | | | | 295,792 | |
Blackstone Group LP | | | 20,400 | | | | 419,220 | |
KKR & Co. LP | | | 21,600 | | | | 453,600 | |
Lazard Ltd.(b) | | | 6,800 | | | | 230,520 | |
MSCI, Inc.(a) | | | 7,000 | | | | 238,700 | |
Portfolio Recovery Associates, Inc.(a) | | | 1,300 | | | | 159,575 | |
T. Rowe Price Group, Inc. | | | 7,800 | | | | 565,500 | |
The Carlyle Group LP | | | 5,200 | | | | 168,896 | |
The Charles Schwab Corp. | | | 27,000 | | | | 457,920 | |
Waddell & Reed Financial, Inc. | | | 4,600 | | | | 197,202 | |
| | | | | | | | 3,186,925 | |
Energy—4.0% | | | | | | | | |
Approach Resources, Inc.(a) | | | 6,900 | | | | 163,668 | |
BPZ Resources, Inc.(a) | | | 42,500 | | | | 90,950 | |
Cameron International Corp.(a) | | | 4,800 | | | | 295,440 | |
Core Laboratories NV(b) | | | 2,000 | | | | 289,560 | |
The Accompanying Footnotes are an Integral Part of these Financial Statements.
The Tocqueville Opportunity Fund
Schedule of Investments as of April 30, 2013
(Unaudited)
| | | | | | | | |
| Common Stocks (continued) | | Shares | | | Value | |
Dresser-Rand Group, Inc.(a) | | | 5,200 | | | $ | 289,172 | |
Dril-Quip, Inc.(a) | | | 3,400 | | | | 284,614 | |
FMC Technologies, Inc.(a) | | | 5,500 | | | | 298,650 | |
Halcon Resources Corp.(a) | | | 51,600 | | | | 337,464 | |
Oceaneering International, Inc. | | | 8,300 | | | | 582,411 | |
SM Energy Co. | | | 2,900 | | | | 176,900 | |
| | | | | | | | 2,808,829 | |
Food & Staples Retailing—0.3% | | | | | | | | |
The Fresh Market, Inc.(a) | | | 5,900 | | | | 241,487 | |
Food Beverage & Tobacco—0.2% | | | | | | | | |
J&J Snack Foods Corp. | | | 2,000 | | | | 150,040 | |
Food, Beverage & Tobacco—2.8% | | | | | | | | |
Annie’s, Inc.(a) | | | 7,300 | | | | 275,867 | |
Beam, Inc. | | | 3,200 | | | | 207,072 | |
Constellation Brands, Inc.(a) | | | 8,400 | | | | 414,540 | |
Green Mountains Coffee Roasters, Inc.(a) | | | 6,000 | | | | 344,400 | |
The Boston Beer Co., Inc.(a) | | | 600 | | | | 101,592 | |
The Hain Celestial Group, Inc.(a) | | | 7,300 | | | | 476,325 | |
WhiteWave Foods Co.(a) | | | 11,000 | | | | 186,010 | |
| | | | | | | | 2,005,806 | |
Health Care Equipment & Services—5.4% | |
Align Technology, Inc.(a) | | | 4,900 | | | | 162,288 | |
athenahealth, Inc.(a) | | | 2,100 | | | | 202,146 | |
Catamaran Corp.(a)(b) | | | 11,700 | | | | 675,441 | |
Cerus Corp.(a) | | | 32,200 | | | | 171,304 | |
DexCom, Inc.(a) | | | 22,500 | | | | 369,225 | |
HeartWare International, Inc.(a) | | | 3,300 | | | | 320,760 | |
HMS Holdings Corp.(a) | | | 4,600 | | | | 115,966 | |
Hologic, Inc.(a) | | | 1,700 | | | | 34,629 | |
IDEXX Laboratories, Inc.(a) | | | 4,100 | | | | 360,636 | |
Insulet Corp.(a) | | | 6,900 | | | | 174,156 | |
MWI Veterinary Supply, Inc.(a) | | | 2,300 | | | | 270,733 | |
ResMed, Inc. | | | 7,400 | | | | 355,348 | |
Sirona Dental Systems, Inc.(a) | | | 3,000 | | | | 220,620 | |
Teleflex, Inc. | | | 1,400 | | | | 109,382 | |
Tornier NV(a) | | | 15,300 | | | | 278,307 | |
| | | | | | | | 3,820,941 | |
Household & Personal Products—0.3% | |
Church & Dwight Co., Inc. | | | 3,700 | | | | 236,393 | |
Insurance—0.3% | | | | | | | | |
RenaissanceRe Holdings Ltd.(b) | | | 2,000 | | | | 187,780 | |
Materials—6.4% | | | | | | | | |
Airgas, Inc. | | | 3,700 | | | | 357,605 | |
Albemarle Corp. | | | 4,000 | | | | 245,000 | |
Aptargroup, Inc. | | | 2,600 | | | | 145,860 | |
Axiall Corp. | | | 4,800 | | | | 251,760 | |
Caesarstone Sdot-Yam Ltd.(a)(b) | | | 12,600 | | | | 295,596 | |
Carpenter Technology Corp. | | | 3,000 | | | $ | 134,880 | |
Crown Holdings, Inc.(a) | | | 5,600 | | | | 239,008 | |
Eastman Chemical Co. | | | 3,400 | | | | 226,610 | |
Ecolab, Inc. | | | 2,600 | | | | 220,012 | |
HB Fuller Co. | | | 3,400 | | | | 128,860 | |
Owens-Illinois, Inc.(a) | | | 17,100 | | | | 449,388 | |
Packaging Corp. of America | | | 5,000 | | | | 237,800 | |
Schweitzer-Mauduit International, Inc. | | | 3,600 | | | | 145,044 | |
Silgan Holdings, Inc. | | | 5,600 | | | | 268,072 | |
The Sherwin-Williams Co. | | | 1,800 | | | | 329,598 | |
The Valspar Corp. | | | 5,300 | | | | 338,246 | |
WR Grace & Co.(a) | | | 7,000 | | | | 539,770 | |
| | | | | | | | 4,553,109 | |
Media—0.4% | | | | | | | | |
Morningstar, Inc. | | | 4,200 | | | | 277,242 | |
Pharmaceuticals & Biotechnology—0.2% | |
Genmab A/S(a)(b) | | | 6,500 | | | | 169,472 | |
Pharmaceuticals, Biotechnology & Life Sciences—17.7% | |
Aegerion Pharmaceuticals, Inc.(a) | | | 3,300 | | | | 138,732 | |
Alexion Pharmaceuticals, Inc.(a) | | | 2,600 | | | | 254,800 | |
Algeta ASA(a)(b) | | | 10,500 | | | | 355,979 | |
Alkermes PLC(a)(b) | | | 6,800 | | | | 208,148 | |
Alnylam Pharmaceuticals, Inc.(a) | | | 16,200 | | | | 387,990 | |
Ariad Pharmaceuticals, Inc.(a) | | | 11,900 | | | | 212,653 | |
BioMarin Pharmaceutical, Inc.(a) | | | 8,700 | | | | 570,720 | |
Cepheid, Inc.(a) | | | 5,500 | | | | 209,715 | |
Cubist Pharmaceuticals, Inc.(a) | | | 3,300 | | | | 151,536 | |
Enanta Pharmaceuticals, Inc.(a) | | | 5,600 | | | | 111,776 | |
Endo Health Solutions, Inc.(a) | | | 4,500 | | | | 164,880 | |
Endocyte, Inc.(a) | | | 23,500 | | | | 326,415 | |
Forest Laboratories, Inc.(a) | | | 900 | | | | 33,669 | |
Genomic Health, Inc.(a) | | | 6,100 | | | | 185,196 | |
Gilead Sciences, Inc.(a) | | | 20,800 | | | | 1,053,312 | |
GTx, Inc.(a) | | | 32,000 | | | | 147,840 | |
Incyte Corp., Ltd.(a) | | | 10,300 | | | | 228,145 | |
Medivation, Inc.(a) | | | 14,200 | | | | 748,482 | |
Neurocrine Biosciences, Inc.(a) | | | 13,800 | | | | 159,252 | |
NPS Pharmaceuticals, Inc.(a) | | | 29,700 | | | | 398,871 | |
OncoGenex Pharmaceutical, Inc.(a) | | | 10,000 | | | | 101,300 | |
Onyx Pharmaceuticals, Inc.(a) | | | 7,600 | | | | 720,480 | |
Orexigen Therapeutics, Inc.(a) | | | 39,200 | | | | 238,336 | |
Pharmacyclics, Inc.(a) | | | 13,900 | | | | 1,132,850 | |
Raptor Pharmaceutical Corp.(a) | | | 19,000 | | | | 131,100 | |
Regeneron Pharmaceuticals, Inc.(a) | | | 2,475 | | | | 532,471 | |
Regulus Therapeutics, Inc.(a) | | | 4,000 | | | | 28,080 | |
Salix Pharmaceuticals, Inc.(a) | | | 6,000 | | | | 313,740 | |
Sarepta Therapeutics, Inc.(a) | | | 7,100 | | | | 206,184 | |
Seattle Genetics, Inc.(a) | | | 12,200 | | | | 450,790 | |
Synageva BioPharma Corp.(a) | | | 5,500 | | | | 284,295 | |
The Medicines Co.(a) | | | 4,600 | | | | 155,296 | |
The Accompanying Footnotes are an Integral Part of these Financial Statements.
The Tocqueville Opportunity Fund
Schedule of Investments as of April 30, 2013
(Unaudited)
| | | | | | | | |
| Common Stocks (continued) | | Shares | | | Value | |
Threshold Pharmaceuticals, Inc.(a) | | | 23,300 | | | $ | 112,306 | |
United Therapeutics Corp.(a) | | | 3,100 | | | | 207,018 | |
Valeant Pharmaceuticals International, Inc.(a)(b) | | | 6,500 | | | | 494,520 | |
Vertex Pharmaceuticals, Inc.(a) | | | 9,900 | | | | 760,518 | |
ViroPharma, Inc.(a) | | | 7,100 | | | | 193,475 | |
Vivus, Inc.(a) | | | 22,700 | | | | 301,683 | |
Warner Chilcott PLC(b) | | | 10,000 | | | | 143,800 | |
| | | | | | | | 12,556,353 | |
Retailing—6.6% | | | | | | | | |
Aeropostale, Inc.(a) | | | 10,000 | | | | 146,600 | |
American Eagle Outfitters, Inc. | | | 10,100 | | | | 196,445 | |
Dick’s Sporting Goods, Inc. | | | 5,300 | | | | 254,930 | |
GNC Holdings, Inc. | | | 12,700 | | | | 575,691 | |
L Brands, Inc. | | | 4,900 | | | | 247,009 | |
LKQ Corp.(a) | | | 17,000 | | | | 409,360 | |
L’Occitane International SA(b) | | | 115,500 | | | | 334,884 | |
PetSmart, Inc. | | | 9,400 | | | | 641,456 | |
priceline.com, Inc.(a) | | | 950 | | | | 661,191 | |
Sally Beauty Holdings, Inc.(a) | | | 8,000 | | | | 240,480 | |
Tractor Supply Co. | | | 1,000 | | | | 107,170 | |
TripAdvisor, Inc.(a) | | | 2,000 | | | | 105,160 | |
Ulta Salon Cosmetics & Fragrance, Inc.(a) | | | 4,900 | | | | 429,485 | |
Urban Outfitters, Inc.(a) | | | 7,700 | | | | 319,088 | |
| | | | | | | | 4,668,949 | |
Semiconductors & Semiconductor Equipment—1.1% | |
Cavium, Inc.(a) | | | 8,800 | | | | 276,760 | |
Cirrus Logic, Inc.(a) | | | 5,200 | | | | 100,412 | |
Skyworks Solutions, Inc.(a) | | | 17,300 | | | | 381,811 | |
| | | | | | | | 758,983 | |
Software & Services—14.6% | | | | | | | | |
Akamai Technologies, Inc.(a) | | | 4,000 | | | | 175,640 | |
Alliance Data Systems Corp.(a) | | | 2,700 | | | | 463,779 | |
ANSYS, Inc.(a) | | | 7,300 | | | | 590,278 | |
Aspen Technology, Inc.(a) | | | 11,700 | | | | 356,616 | |
Cadence Design Systems, Inc.(a) | | | 14,500 | | | | 200,100 | |
CommVault Systems, Inc.(a) | | | 4,700 | | | | 345,638 | |
Concur Technologies, Inc.(a) | | | 4,900 | | | | 358,239 | |
CoreLogic, Inc.(a) | | | 4,200 | | | | 114,576 | |
Equinix, Inc.(a) | | | 1,000 | | | | 214,100 | |
Facebook, Inc.(a) | | | 45,700 | | | | 1,268,632 | |
FactSet Research Systems, Inc. | | | 2,800 | | | | 263,396 | |
Gartner, Inc.(a) | | | 5,200 | | | | 300,820 | |
IAC/InterActiveCorp | | | 7,800 | | | | 367,146 | |
Informatica Corp.(a) | | | 5,500 | | | | 181,115 | |
LinkedIn Corp.(a) | | | 5,000 | | | | 960,450 | |
Manhattan Associates, Inc.(a) | | | 6,500 | | | | 456,365 | |
MICROS Systems, Inc.(a) | | | 3,000 | | | | 127,230 | |
Netflix, Inc.(a) | | | 2,700 | | | | 583,389 | |
NetSuite, Inc.(a) | | | 7,800 | | | $ | 686,088 | |
Nuance Communications, Inc.(a) | | | 12,600 | | | | 239,904 | |
PTC, Inc.(a) | | | 10,900 | | | | 261,709 | |
SolarWinds, Inc.(a) | | | 9,200 | | | | 467,820 | |
Solera Holdings, Inc. | | | 7,400 | | | | 426,092 | |
Teradata Corp.(a) | | | 4,000 | | | | 204,280 | |
Ultimate Software Group, Inc.(a) | | | 4,600 | | | | 444,314 | |
Workday, Inc.(a) | | | 4,000 | | | | 250,600 | |
| | | | | | | | 10,308,316 | |
Technology Hardware & Equipment—0.9% | |
Aruba Networks, Inc.(a) | | | 5,400 | | | | 121,446 | |
FEI Co. | | | 2,300 | | | | 146,924 | |
Trimble Navigation Ltd.(a) | | | 13,000 | | | | 373,620 | |
| | | | | | | | 641,990 | |
Telecommunication Services—0.6% | |
SBA Communications Corp.(a) | | | 5,600 | | | | 442,344 | |
Transportation—3.4% | | | | | | | | |
Alaska Air Group, Inc.(a) | | | 2,000 | | | | 123,280 | |
Delta Air Lines, Inc.(a) | | | 40,500 | | | | 694,170 | |
Genesee & Wyoming, Inc.(a) | | | 3,700 | | | | 315,240 | |
Hertz Global Holdings, Inc.(a) | | | 10,500 | | | | 252,840 | |
Kansas City Southern | | | 3,900 | | | | 425,373 | |
Kirby Corp.(a) | | | 5,100 | | | | 381,939 | |
United Continental Holdings, Inc.(a) | | | 6,700 | | | | 216,410 | |
| | | | | | | | 2,409,252 | |
Total Common Stocks
(Cost $56,874,396) | | | | | | | 70,088,429 | |
Real Estate Investment Trust (REIT)—0.1% | |
Banks—0.1% | | | | | | | | |
Five Oaks Investment Corp. | | | 4,800 | | | | 72,480 | |
Total Real Estate Investment Trust
(Cost $70,661) | | | | | | | 72,480 | |
Exchange Traded Funds—0.8% | | | | | | | | |
Diversified Financials—0.8% | | | | | | | | |
iShares Dow Jones US Home Construction Index Fund | | | 20,500 | | | | 497,330 | |
PowerShares Dynamic Building & Construction Portfolio | | | 3,800 | | | | 74,594 | |
Total Exchange Traded Funds
(Cost $567,293) | | | | | | | 571,924 | |
| Purchased Call Options—0.1% | | | Contracts | | | | | |
Health Care Equipment and Supplies—0.0% | |
ResMed, Inc.
Expiration; 10/19/2013, Strike
Price: $45.00(a) | | | 40 | | | | 20,200 | |
Household & Personal Products—0.1% | |
Herbalife Ltd.
Expiration: 08/17/2013, Strike
Price: $40.00(a) | | | 80 | | | | 32,800 | |
The Accompanying Footnotes are an Integral Part of these Financial Statements.
The Tocqueville Opportunity Fund
Schedule of Investments as of April 30, 2013
(Unaudited)
| | | | | | | | |
| Purchased Call Options (continued) | | Contracts | | | Value | |
Software & Services—0.0% | | | | | | | | |
VeriFone Systems, Inc.
Expiration: 10/19/2013, Strike
Price: $25.00(a) | | | 50 | | | $ | 7,500 | |
Total Purchased Call Options
(Cost $56,026) | | | | | | | 60,500 | |
| Short-Term Investment—0.2% | | | Shares | | | | | |
Money Market Fund—0.2% | | | | | | | | |
STIT-Treasury Portfolio, 0.02%(c) | | | 114,678 | | | | 114,678 | |
Total Short-Term Investment
(Cost $114,678) | | | | | | | 114,678 | |
Total Investments
(Cost $57,683,054)—100.2% | | | | 70,908,011 | |
Liabilities in Excess of Other Assets—(0.2)% | | | | (106,840 | ) |
Total Net Assets—100.0% | | | | | | $ | 70,801,171 | |
| | | | | | | | |
Percentages are stated as a percent of net assets.
| (a) | Non-income producing security. |
| (b) | Foreign issued Security. Foreign concentration was as follows: Bermuda 0.6%; Canada 1.7%; Denmark 0.2%; France 0.5%; Ireland 0.5%; Israel 0.4%; Italy 0.8%; Luxembourg 0.5%; Netherlands 0.8%; Norway 0.5%; Switzerland 0.4%; Virgin Islands 0.5%. |
| (c) | Variable rate security. The rate shown is as of 4/30/2013. |
The Accompanying Footnotes are an Integral Part of these Financial Statements.
The Tocqueville International Value Fund
Schedule of Investments as of April 30, 2013
(Unaudited)
| | | | | | | | |
| Common Stocks—96.1% | | Shares | | | Value | |
Belgium—3.5% | | | | | | | | |
Groupe Bruxelles Lambert SA | | | 55,000 | | | $ | 4,259,018 | |
NV Bekaert SA | | | 130,000 | | | | 4,185,927 | |
| | | | | | | | 8,444,945 | |
Bermuda—0.5% | | | | | | | | |
Guoco Group Ltd. | | | 96,100 | | | | 1,147,357 | |
Brazil—1.8% | | | | | | | | |
Itau Unibanco Holding SA | | | 248,700 | | | | 4,185,621 | |
Canada—1.4% | | | | | | | | |
Cameco Corp. | | | 167,100 | | | | 3,260,121 | |
China—1.0% | | | | | | | | |
China COSCO Holdings Co., Ltd.(a) | | | 5,435,000 | | | | 2,297,224 | |
France—12.9% | | | | | | | | |
Bollore SA | | | 15,400 | | | | 6,489,932 | |
Cie de St-Gobain | | | 129,700 | | | | 5,201,972 | |
Haulotte Group SA(a) | | | 182,500 | | | | 1,526,181 | |
Metropole Television SA | | | 280,000 | | | | 4,686,763 | |
Nexans SA | | | 77,584 | | | | 3,560,263 | |
Sanofi | | | 52,740 | | | | 5,780,126 | |
Vivendi SA | | | 158,759 | | | | 3,596,137 | |
| | | | | | | | 30,841,374 | |
Germany—5.5% | | | | | | | | |
Infineon Technologies AG | | | 590,000 | | | | 4,658,120 | |
Siemens AG—ADR | | | 50,000 | | | | 5,225,500 | |
Wacker Neuson SE | | | 220,000 | | | | 3,230,479 | |
| | | | | | | | 13,114,099 | |
Hong Kong—4.1% | | | | | | | | |
Chow Tai Fook Jewellery Group Ltd. | | | 1,600,000 | | | | 2,152,536 | |
Clear Media Ltd. | | | 3,813,000 | | | | 2,751,596 | |
Television Broadcasts Ltd. | | | 656,500 | | | | 4,944,804 | |
| | | | | | | | 9,848,936 | |
Indonesia—0.9% | | | | | | | | |
Timah Persero Tbk PT | | | 14,995,000 | | | | 2,190,064 | |
Ireland—3.9% | | | | | | | | |
CRH PLC | | | 186,323 | | | | 4,005,798 | |
DCC PLC | | | 145,500 | | | | 5,322,592 | |
| | | | | | | | 9,328,390 | |
Italy—3.8% | | | | | | | | |
Sogefi SpA | | | 1,250,000 | | | | 3,621,614 | |
Telecom Italia SpA | | | 6,500,000 | | | | 5,499,914 | |
| | | | | | | | 9,121,528 | |
Japan—26.9% | | | | | | | | |
Asics Corp. | | | 220,500 | | | | 3,974,134 | |
Disco Corp. | | | 85,900 | | | | 5,542,504 | |
Hitachi Ltd. | | | 1,113,500 | | | $ | 7,104,652 | |
Horiba Ltd. | | | 112,300 | | | | 4,054,942 | |
Hoya Corp. | | | 250,600 | | | | 5,007,630 | |
Kao Corp. | | | 180,000 | | | | 6,222,496 | |
Kyoto Kimono Yuzen Co., Ltd. | | | 300,700 | | | | 3,294,328 | |
MISUMI Group, Inc. | | | 137,500 | | | | 4,190,517 | |
Mitsubishi UFJ Financial Group, Inc. | | | 750,000 | | | | 5,100,785 | |
Omron Corp. | | | 190,400 | | | | 6,005,847 | |
Shiseido Co., Ltd. | | | 205,000 | | | | 2,931,425 | |
SMC Corp. | | | 28,300 | | | | 5,663,774 | |
Sumitomo Mitsui Financial Group, Inc. | | | 106,000 | | | | 5,007,232 | |
| | | | | | | | 64,100,266 | |
Luxembourg—1.4% | | | | | | | | |
SAF-Holland SA(a) | | | 388,500 | | | | 3,226,884 | |
Netherlands—7.9% | | | | | | | | |
Akzo Nobel NV | | | 73,600 | | | | 4,437,343 | |
Fugro NV | | | 58,400 | | | | 3,378,268 | |
TNT Express NV | | | 526,300 | | | | 4,043,610 | |
Unilever NV—ADR | | | 165,000 | | | | 7,009,200 | |
| | | | | | | | 18,868,421 | |
Norway—5.0% | | | | | | | | |
Orkla ASA | | | 720,000 | | | | 6,480,187 | |
Statoil ASA—ADR | | | 225,000 | | | | 5,512,500 | |
| | | | | | | | 11,992,687 | |
Singapore—1.9% | | | | | | | | |
Singapore Post Ltd. | | | 4,345,000 | | | | 4,550,662 | |
Sweden—0.5% | | | | | | | | |
Lindab International AB | | | 157,174 | | | | 1,229,542 | |
Switzerland—5.2% | | | | | | | | |
Nestle SA | | | 85,000 | | | | 6,070,123 | |
Novartis AG—ADR | | | 85,000 | | | | 6,269,600 | |
| | | | | | | | 12,339,723 | |
United Kingdom—3.5% | | | | | | | | |
Homeserve PLC | | | 1,120,000 | | | | 3,643,040 | |
Tesco PLC | | | 827,600 | | | | 4,707,050 | |
| | | | | | | | 8,350,090 | |
United States—4.5% | | | | | | | | |
Aflac, Inc. | | | 71,500 | | | | 3,892,460 | |
Freeport-McMoRan Copper & Gold, Inc. | | | 124,900 | | | | 3,800,707 | |
Newmont Mining Corp. | | | 90,000 | | | | 2,916,000 | |
| | | | | | | | 10,609,167 | |
Total Common Stocks
(Cost $198,027,196) | | | | | | | 229,047,101 | |
The Accompanying Footnotes are an Integral Part of these Financial Statements.
The Tocqueville International Value Fund
Schedule of Investments as of April 30, 2013
(Unaudited)
| | | | | | | | |
| Short-Term Investment—4.3% | | Shares | | | Value | |
Money Market Fund—4.3% | | | | | | | | |
STIT-Treasury Portfolio, 0.02%(b) | | | 10,370,856 | | | $ | 10,370,856 | |
Total Short-Term Investment (Cost $10,370,856) | | | | | | | 10,370,856 | |
Total Investments
(Cost $208,398,052)—100.4% | | | | 239,417,957 | |
Liabilities in Excess of Other Assets—(0.4)% | | | | (1,058,096 | ) |
Total Net Assets—100.0% | | | | | | $ | 238,359,861 | |
| | | | | | | | |
Percentages are stated as a percent of net assets.
ADR American Depository Receipt
| (a) | Non-income producing security. |
| (b) | Variable rate security. The rate listed is as of April 30, 2013. |
Schedule of Open Forward Currency Contracts
April 30, 2013
(Unaudited)
| | | | | | | | | | | | | | | | | | | | | | | | |
Counterparties of
Contracts | | Forward Expiration Date | | | Currency to be
Received | | | Currency to be
Delivered | | | Amount of
Currency to be
Delivered | | | Amount of
Currency to be
Received | | | Unrealized
Depreciation | |
U.S. Bank N.A. | | | 5/9/2013 | | | | U.S. Dollars | | | | Yen | | | | 1,000,000,000 | | | | 10,017,029 | | | $ | (241,256 | ) |
U.S. Bank N.A. | | | 5/9/2013 | | | | U.S. Dollars | | | | Yen | | | | 1,984,000,000 | | | | 19,977,847 | | | | (374,590 | ) |
| | | | | | | | | | | | | | | | | | | | | | | | |
| | | | | | | | | | | | | | | | | | | | | | $ | (615,846 | ) |
| | | | | | | | | | | | | | | | | | | | | | | | |
The Accompanying Footnotes are an Integral Part of these Financial Statements.
The Tocqueville Gold Fund
Schedule of Investments as of April 30, 2013
(Unaudited)
| | | | | | | | |
| Common Stocks—84.5% | | Shares | | | Value | |
Gold Related Securities—72.3% | |
Canada—55.0% | | | | | | | | |
Agnico Eagle Mines Ltd. | | | 893,000 | | | $ | 28,834,970 | |
Agnico Eagle Mines Ltd.(a) | | | 210,837 | | | | 6,805,717 | |
Alacer Gold Corp. | | | 3,126,800 | | | | 9,373,106 | |
Alamos Gold, Inc.(b) | | | 2,596,400 | | | | 36,141,888 | |
Atac Resources Ltd.(b)(c) | | | 10,963,700 | | | | 12,406,192 | |
B2Gold Corp.(b) | | | 10,267,100 | | | | 24,900,798 | |
Banro Corp.(b) | | | 8,383,000 | | | | 10,730,240 | |
Barisan Gold Corp.(b)(c) | | | 877,100 | | | | 39,178 | |
Braeval Mining Corp.(b) | | | 1,666,667 | | | | 194,385 | |
Brazilian Gold Corp.(b) | | | 4,285,800 | | | | 542,399 | |
Corvus Gold, Inc.(b)(c) | | | 2,079,901 | | | | 1,478,810 | |
Corvus Gold, Inc.(a)(b)(c) | | | 1,500,000 | | | | 1,072,013 | |
Corvus Gold, Inc.(a)(b)(c)(d)(e)(f) | | | 4,600,000 | | | | 3,221,758 | |
Dalradian Resources, Inc.(b) | | | 1,250,000 | | | | 880,937 | |
Detour Gold Corp.(b) | | | 2,647,900 | | | | 31,855,227 | |
East Asia Minerals Corp.(b)(c) | | | 10,544,400 | | | | 1,569,963 | |
Eldorado Gold Corp. | | | 8,189,885 | | | | 64,863,889 | |
Eldorado Gold Corp.(a) | | | 1,000,000 | | | | 7,911,063 | |
Franco-Nevada Corp. | | | 1,364,300 | | | | 59,395,700 | |
GoGold Resources, Inc.(b)(c) | | | 8,100,000 | | | | 9,246,116 | |
Goldcorp, Inc. | | | 518,050 | | | | 15,323,919 | |
Goldcorp, Inc.(a) | | | 2,138,010 | | | | 63,283,992 | |
IAMGOLD Corp. | | | 2,083,396 | | | | 11,187,836 | |
International Tower Hill Mines Ltd.(b)(c) | | | 5,738,836 | | | | 5,681,448 | |
International Tower Hill Mines Ltd.(a)(b)(c) | | | 7,589,744 | | | | 7,608,955 | |
Kinross Gold Corp. | | | 3,982,600 | | | | 21,665,344 | |
New Gold, Inc.(b) | | | 5,440,240 | | | | 43,413,115 | |
Novagold Resources, Inc.(b) | | | 4,181,300 | | | | 10,327,811 | |
Orezone Gold Corp.(b) | | | 995,462 | | | | 711,506 | |
Osisko Mining Corp.(b) | | | 9,695,500 | | | | 40,901,161 | |
Pan American Silver Corp. | | | 2,248,098 | | | | 29,674,894 | |
Primero Mining Corp.(b)(c) | | | 4,840,700 | | | | 28,589,176 | |
Regulus Resources, Inc.(b) | | | 2,609,000 | | | | 310,765 | |
Rockhaven Resources Ltd.(b)(c) | | | 5,000,000 | | | | 794,084 | |
Romarco Minerals, Inc.(b) | | | 13,887,800 | | | | 6,323,115 | |
SEMAFO, Inc. | | | 8,676,200 | | | | 16,106,498 | |
Silver Wheaton Corp. | | | 1,984,875 | | | | 48,688,984 | |
Strategic Metals Ltd.(b)(c) | | | 10,926,900 | | | | 5,260,356 | |
Sunward Resources Ltd.(b) | | | 660,800 | | | | 275,484 | |
Torex Gold Resources, Inc.(b)(c) | | | 25,260,500 | | | | 35,103,181 | |
True Gold Mining, Inc.(b) | | | 3,204,000 | | | | 890,486 | |
Turquoise Hill Resources Ltd.(b) | | | 2,245,632 | | | | 15,786,793 | |
Turquoise Hill Resources Ltd.(a)(b) | | | 100,000 | | | | 704,750 | |
Yamana Gold, Inc. | | | 4,160,500 | | | | 51,174,150 | |
| | | | | | | | 771,252,152 | |
Peru—0.8% | | | | | | | | |
Cia de Minas Buenaventura SA—ADR | | | 553,600 | | | $ | 11,083,072 | |
South Africa—1.7% | | | | | | | | |
Gold Fields Ltd.—ADR | | | 2,641,950 | | | | 19,708,947 | |
Gold Fields Ltd.(a) | | | 166,249 | | | | 1,183,298 | |
Harmony Gold Mining Co., Ltd. | | | 1 | | | | 5 | |
Sibanye Gold Ltd—ADR(b) | | | 660,487 | | | | 2,542,875 | |
Sibanye Gold Ltd.(a)(b) | | | 166,249 | | | | 157,476 | |
| | | | | | | | 23,592,601 | |
United Kingdom—3.8% | | | | | | | | |
Randgold Resources Ltd.—ADR | | | 652,900 | | | | 53,394,162 | |
United States—11.0% | | | | | | | | |
Allied Nevada Gold Corp.(b) | | | 816,048 | | | | 8,731,714 | |
Electrum Ltd.(b)(d)(e)(f) | | | 2,127,287 | | | | 5,530,946 | |
Gold Resource Corp.(c) | | | 3,055,997 | | | | 31,293,409 | |
Newmont Mining Corp. | | | 1,523,600 | | | | 49,364,640 | |
Royal Gold, Inc. | | | 1,059,165 | | | | 58,868,391 | |
| | | | | | | | 153,789,100 | |
Total Gold Related Securities | | | | | | | 1,013,111,087 | |
Other Precious Metals Related Securities—11.0% | |
Canada—9.7% | | | | | | | | |
Bear Creek Mining Corp.(b)(c) | | | 7,413,200 | | | | 18,322,366 | |
Ivanplats Ltd.—Class A(b) | | | 7,147,300 | | | | 21,283,339 | |
Ivanplats Ltd.—Class B(b)(d)(e)(f) | | | 5,775,415 | | | | 16,338,213 | |
MAG Silver Corp.(b)(c) | | | 2,960,700 | | | | 22,382,892 | |
Plata Latina Minerals Corp.(b)(c)(d)(e)(f) | | | 2,000,000 | | | | 505,832 | |
Scorpio Mining Corp.(b)(c) | | | 25,668,419 | | | | 11,856,243 | |
Scorpio Mining Corp.(a)(b)(c) | | | 522,400 | | | | 238,527 | |
Silver Range Resources Ltd.(b)(c) | | | 3,450,000 | | | | 547,918 | |
Silvercrest Mines Inc.(b) | | | 755,600 | | | | 1,657,527 | |
Tahoe Resources, Inc.(b) | | | 2,474,100 | | | | 42,976,575 | |
| | | | | | | | 136,109,432 | |
United States—1.3% | | | | | | | | |
Sunshine Mining & Refining(b)(d)(e)(f) | | | 1,633,545 | | | | 17,560,609 | |
Total Other Precious Metals Related Securities | | | | | | | 153,670,041 | |
Other Securities—1.2% | | | | | | | | |
Australia—0.1% | | | | | | | | |
Ivanhoe Australia Ltd.(b) | | | 7,616,387 | | | | 1,421,262 | |
United Kingdom—0.4% | | | | | | | | |
Copper Development Corp.(b) | | | 12,512,000 | | | | 437,299 | |
West African Minerals Corp.(b) | | | 9,000,000 | | | | 4,683,350 | |
| | | | | | | | 5,120,649 | |
The Accompanying Footnotes are an Integral Part of these Financial Statements.
The Tocqueville Gold Fund
Schedule of Investments as of April 30, 2013
(Unaudited)
| | | | | | | | |
| Common Stocks (continued) | | Shares | | | Value | |
United States—0.7% | | | | | | | | |
Gold Bullion International LLC(b)(d)(e)(f) | | | 5,000,000 | | | $ | 5,837,000 | |
GoviEx Uranium Inc.(b)(d)(e)(f) | | | 1,750,000 | | | | 3,937,500 | |
I-Pulse, Inc.(b)(d)(e)(f) | | | 74,532 | | | | 237,757 | |
| | | | | | | | 10,012,257 | |
Total Other Securities | | | | | | | 16,554,168 | |
Total Common Stocks
(Cost $1,478,761,072) | | | | | | | 1,183,335,296 | |
Closed-End Mutual Fund—1.2% | | | | | |
Gold Related Securities—1.2% | | | | | |
Canada—1.2% | | | | | | | | |
Sprott Physical Gold Trust(b) | | | 1,400,000 | | | | 17,280,620 | |
Total Closed-End Mutual Fund (Cost $14,500,000) | | | | | | | 17,280,620 | |
Private Fund—1.4% | | | | | | | | |
Gold Related Securities—1.4% | | | | | |
United States—1.4% | | | | | | | | |
Eidesis Special Opportunities II
LP(b)(d)(e)(f) | | | 25,000 | | | | 20,153,945 | |
Total Private Fund
(Cost $25,000,000) | | | | | | | 20,153,945 | |
| Gold Bullion—10.5% | | | Ounces | | | | | |
Gold Bullion(b) | | | 99,340 | | | | 146,700,399 | |
Total Gold Bullion
(Cost $46,772,300) | | | | | | | 146,700,399 | |
| Warrants—0.2% | | | Shares | | | | | |
Gold Related Securities—0.2% | | | | | |
Canada—0.2% | | | | | | | | |
East Asia Minerals Corp. Expiration: 12/15/2013, Exercise Price: CAD $0.78(b)(c)(d)(e)(f) | | | 6,500,000 | | | | 35,486 | |
GoGold Resources, Inc. Expiration: 01/24/2015, Exercise Price: CAD $1.50(b)(c)(d)(e)(f) | | | 4,050,000 | | | | 974,862 | |
Kinross Gold Corp.
Expiration: 09/03/2013, Exercise Price: CAD $32.00(b) | | | 108,032 | | | | 536 | |
Pan American Silver Corp. Expiration: 01/04/2015, Exercise Price: CAD $35.00(b)(d)(e)(f) | | | 133,333 | | | | 22,023 | |
Primero Mining Corp.
Expiration: 07/20/2015, Exercise Price: CAD $8.00(b)(c) | | | 1,848,400 | | | | 1,853,079 | |
Regulus Resources, Inc. Expiration: 03/06/2014, Exercise Price: CAD $1.60(b)(d)(e)(f) | | | 1,304,500 | | | | 1,165 | |
True Gold Mining, Inc. Expiration: 10/06/2013, Exercise Price: CAD $1.87(b)(d)(e)(f) | | | 1,602,000 | | | $ | — | |
| | | | | | | | 2,887,151 | |
Cayman Islands—0.0% | | | | | | | | |
Endeavour Mining Corp. Expiration: 01/30/2014, Exercise Price: CAD $2.50(b) | | | 1,000,000 | | | | 69,482 | |
Total Gold Related Securities | | | | | | | 2,956,633 | |
Other Precious Metals Related Securities—0.0% | |
Canada—0.0% | | | | | | | | |
Plata Latina Minerals Corp. Expiration: 03/08/2015, Exercise Price: CAD $0.65(b)(c)(d)(e)(f) | | | 1,000,000 | | | | — | |
Total Other Precious Metals Related Securities | | | | | | | — | |
Total Warrants
(Cost $1,314,862) | | | | | | | 2,956,633 | |
Short-Term Investment—2.0 | | | | | | | | |
Money Market Fund—2.0% | | | | | | | | |
STIT—Treasury Portfolio, 0.02%(g) | | | 27,415,995 | | | | 27,415,995 | |
Total Short-Term Investment (Cost $27,415,995) | | | | | | | 27,415,995 | |
Total Investments
(Cost $1,593,764,229)—99.8% | | | | 1,397,842,888 | |
Other Assets in Excess of Liabilities—0.2% | | | | 3,257,366 | |
Total Net Assets—100.0% | | | | | | $ | 1,401,100,254 | |
| | | | | | | | |
Percentages are stated as a percent of net assets.
ADR American Depository Receipt
| (a) | Denotes an issue that is traded on foreign exchange when a company is listed more than once. |
| (b) | Non-income producing security. |
| (c) | Affiliated company. See Footnote 8. |
| (d) | Denotes a security is either fully or partially restricted to resale. The aggregate value of restricted securities at April 30, 2013 was $74,357,096, which represented 5.3% of net assets. |
| (e) | Fair Valued security. The aggregate value of fair valued securities as of April 30, 2013 was $74,357,096, which represented 5.3% of net assets. |
| (f) | Security is considered illiquid and may be difficult to sell. |
| (g) | Variable rate security. The rate shown is as of 4/30/2013. |
The Accompanying Footnotes are an Integral Part of these Financial Statements.
The Delafield Fund
Schedule of Investments as of April 30, 2013
(Unaudited)
| | | | | | | | |
| Common Stocks—80.8% | | Shares | | | Value | |
Aerospace & Defense—2.5% | |
Honeywell International, Inc. | | | 525,000 | | | $ | 38,608,500 | |
Building Products—0.4% | |
Griffon Corp. | | | 650,000 | | | | 6,695,000 | |
Capital Markets—1.1% | |
The Bank of New York Mellon Corp. | | | 600,000 | | | | 16,932,000 | |
Chemicals—13.8% | | | | | | | | |
Ashland, Inc. | | | 375,000 | | | | 31,953,750 | |
Cabot Corp. | | | 100,000 | | | | 3,756,000 | |
Celanese Corp. | | | 475,000 | | | | 23,469,750 | |
Chemtura Corp.(a) | | | 1,100,000 | | | | 23,386,000 | |
Eastman Chemical Co. | | | 775,000 | | | | 51,653,750 | |
HB Fuller Co. | | | 500,000 | | | | 18,950,000 | |
Minerals Technologies, Inc. | | | 560,000 | | | | 22,752,800 | |
OM Group, Inc.(a) | | | 100,000 | | | | 2,447,000 | |
PolyOne Corp. | | | 1,475,000 | | | | 33,231,750 | |
| | | | | | | | 211,600,800 | |
Commercial Services & Supplies—3.6% | |
ACCO Brands Corp.(a) | | | 2,135,000 | | | | 14,411,250 | |
Avery Dennison Corp. | | | 800,000 | | | | 33,160,000 | |
Tyco International Ltd.(b) | | | 250,000 | | | | 8,030,000 | |
| | | | | | | | 55,601,250 | |
Communications Equipment—1.0% | |
Harris Corp. | | | 325,000 | | | | 15,015,000 | |
Computers & Peripherals—0.8% | |
Hewlett-Packard Co. | | | 600,000 | | | | 12,360,000 | |
Construction & Engineering—0.6% | |
Aegion Corp.(a) | | | 450,000 | | | | 9,477,000 | |
Containers & Packaging—5.3% | |
Owens-Illinois, Inc.(a) | | | 1,350,000 | | | | 35,478,000 | |
Sealed Air Corp. | | | 1,425,000 | | | | 31,521,000 | |
Sonoco Products Co. | | | 400,000 | | | | 14,016,000 | |
| | | | | | | | 81,015,000 | |
Electrical Equipment—3.1% | |
Acuity Brands, Inc. | | | 265,000 | | | | 19,334,400 | |
Brady Corp. | | | 400,000 | | | | 13,552,000 | |
Hubbell, Inc. | | | 150,000 | | | | 14,394,000 | |
| | | | | | | | 47,280,400 | |
Electronic Equipment, Instruments & Components—6.7% | |
Checkpoint Systems, Inc.(a)(c) | | | 1,125,000 | | | | 13,016,250 | |
Flextronics International Ltd.(a)(b) | | | 4,750,000 | | | | 33,962,500 | |
Ingram Micro, Inc.(a) | | | 1,200,000 | | | | 21,372,000 | |
Kemet Corp.(a)(c) | | | 2,275,000 | | | | 14,173,250 | |
Plexus Corp.(a) | | | 750,000 | | | | 20,227,500 | |
| | | | | | | | 102,751,500 | |
Energy Equipment & Services—0.4% | |
Hercules Offshore, Inc.(a) | | | 700,000 | | | $ | 5,159,000 | |
Industrial Conglomerates—1.8% | |
Carlisle Cos., Inc. | | | 425,000 | | | | 27,569,750 | |
Insurance—1.5% | |
XL Group PLC(b) | | | 750,000 | | | | 23,355,000 | |
IT Services—0.9% | |
VeriFone Systems, Inc.(a) | | | 600,000 | | | | 12,888,000 | |
Machinery—15.2% | |
Albany International Corp. | | | 525,000 | | | | 15,251,250 | |
Crane Co. | | | 425,000 | | | | 22,877,750 | |
Dover Corp. | | | 725,000 | | | | 50,010,500 | |
Federal Signal Corp.(a) | | | 1,200,000 | | | | 9,312,000 | |
Harsco Corp. | | | 575,000 | | | | 12,552,250 | |
IDEX Corp. | | | 325,000 | | | | 16,909,750 | |
Ingersoll-Rand PLC(b) | | | 350,000 | | | | 18,830,000 | |
Kennametal, Inc. | | | 925,000 | | | | 36,990,750 | |
Stanley Black & Decker, Inc. | | | 450,000 | | | | 33,664,500 | |
Timken Co. | | | 300,000 | | | | 15,771,000 | |
| | | | | | | | 232,169,750 | |
Metals & Mining—6.1% | |
Allegheny Technologies, Inc. | | | 200,000 | | | | 5,396,000 | |
AM Castle & Co.(a) | | | 750,000 | | | | 12,990,000 | |
Carpenter Technology Corp. | | | 950,000 | | | | 42,712,000 | |
Horsehead Holding Corp.(a) | | | 500,000 | | | | 5,350,000 | |
Molycorp, Inc.(a) | | | 2,100,000 | | | | 12,264,000 | |
Universal Stainless & Alloy Products, Inc.(a)(c) | | | 411,901 | | | | 14,400,059 | |
| | | | | | | | 93,112,059 | |
Professional Services—1.8% | |
TrueBlue, Inc.(a) | | | 1,325,000 | | | | 27,454,000 | |
Semiconductors & Semiconductor Equipment—6.3% | |
Brooks Automation, Inc. | | | 1,600,000 | | | | 15,552,000 | |
Diodes, Inc.(a) | | | 450,000 | | | | 9,117,000 | |
Fairchild Semiconductor International, Inc.(a) | | | 2,100,000 | | | | 27,090,000 | |
Infineon Technologies AG(b) | | | 2,000,000 | | | | 15,790,236 | |
LTX-Credence Corp.(a)(c) | | | 2,150,000 | | | | 12,685,000 | |
Teradyne, Inc.(a) | | | 950,000 | | | | 15,618,000 | |
| | | | | | | | 95,852,236 | |
Specialty Retail—4.8% | |
Ascena Retail Group, Inc.(a) | | | 1,025,000 | | | | 18,962,500 | |
Staples, Inc. | | | 2,750,000 | | | | 36,410,000 | |
The Finish Line, Inc. | | | 925,000 | | | | 17,935,750 | |
| | | | | | | | 73,308,250 | |
Textiles, Apparel & Luxury Goods—0.7% | |
Maidenform Brands, Inc.(a)(c) | | | 625,000 | | | | 11,250,000 | |
The Accompanying Footnotes are an Integral Part of these Financial Statements.
The Delafield Fund
Schedule of Investments as of April 30, 2013
(Unaudited)
| | | | | | | | |
| Common Stocks (continued) | | Shares | | | Value | |
Trading Companies & Distributors—2.4% | |
Rush Enterprises, Inc.(a) | | | 475,000 | | | $ | 10,872,750 | |
WESCO International, Inc.(a) | | | 350,000 | | | | 25,091,500 | |
| | | | | | | | 35,964,250 | |
Total Common Stocks
(Cost $908,870,878) | | | | | | | 1,235,418,745 | |
| Corporate Bonds—3.2% | |
| Principal
Amount |
| | | | |
Commercial Banks—1.5% | |
Abbey National Treasury Services PLC 1.631%, 06/10/2013(b)(d) | | $ | 2,500,000 | | | | 2,503,420 | |
BNP Paribas SA 1.179%, 01/10/2014(b)(d) | | | 10,000,000 | | | | 10,041,190 | |
Canadian Imperial Bank of Commerce 0.389%, 10/10/2014(b)(d) | | | 5,000,000 | | | | 4,995,250 | |
Royal Bank of Canada 0.510%, 01/06/2015(b)(d) | | | 5,000,000 | | | | 5,008,995 | |
| | | | | | | | 22,548,855 | |
Diversified Financial Services—1.7% | |
General Electric Capital Corp. 0.659%, 01/09/2015(d) | | | 14,000,000 | | | | 14,032,592 | |
The Goldman Sachs Group, Inc. 1.273%, 02/07/2014(d) | | | 13,000,000 | | | | 13,066,950 | |
| | | | | | | | 27,099,542 | |
Total Corporate Bonds
(Cost $49,639,344) | | | | 49,648,397 | |
Real Estate—0.5% | | | | | | | | |
Kimco Realty Corp. | | | 300,000 | | | $ | 7,134,000 | |
Total Real Estate Investment Trust
(Cost $1,933,802) | | | | | | | 7,134,000 | |
Short-Term Investments—15.4% | | | | | |
Money Market Fund—2.3% | |
STIT-Treasury
Portfolio, 0.02%(d) | | | 35,504,280 | | | | 35,504,280 | |
U.S. Treasury Bills—13.1% | |
| Principal
Amount |
| | | | |
0.081%, 05/16/2013(e) | | $ | 50,000,000 | | | | 49,998,332 | |
0.111%, 06/27/2013(e) | | | 50,000,000 | | | | 49,991,248 | |
0.080%, 07/25/2013(e) | | | 50,000,000 | | | | 49,994,400 | |
0.056%, 08/22/2013(e) | | | 50,000,000 | | | | 49,991,750 | |
| | | | | | | | 199,975,730 | |
Total Short-Term Investments
(Cost $235,475,801) | | | | 235,480,010 | |
Total Investments
(Cost $1,195,919,825)—99.9% | | | | 1,527,681,152 | |
Other Assets in Excess of Liabilities—0.1% | | | | 1,200,970 | |
Total Net Assets—100.0% | | | | | | $ | 1,528,882,122 | |
| | | | | | | | |
Percentages are stated as a percent of net assets.
| (a) | Non-income producing security. |
| (b) | Foreign issued Security. Foreign Concentration (including ADR’s) was as follows: Bermuda 1.2%; Canada 0.3%; France 0.7%; Germany 1.0%; Ireland 1.5%; Singapore 2.2%; Switzerland 0.5%; United Kingdom 0.2%. |
| (c) | Affiliated company. See Footnote 8. |
| (d) | Variable rate security. The rate shown is as of 4/30/2013. |
| (e) | Rate shown is the effective yield based on purchased price. The calculation assumes the security is held to maturity. |
The Accompanying Footnotes are an Integral Part of these Financial Statements.
The Tocqueville Select Fund
Schedule of Investments as of April 30, 2013
(Unaudited)
| | | | | | | | |
| Common Stocks—85.8% | | Shares | | | Value | |
Chemicals—8.9% | | | | | |
Ashland, Inc. | | | 33,600 | | | $ | 2,863,056 | |
Celanese Corp. | | | 50,000 | | | | 2,470,500 | |
Minerals Technologies, Inc. | | | 61,000 | | | | 2,478,430 | |
| | | | | 7,811,986 | |
Commercial Services & Supplies—6.0% | | | | | |
ACCO Brands Corp.(a) | | | 363,000 | | | | 2,450,250 | |
Avery Dennison Corp. | | | 67,600 | | | | 2,802,020 | |
| | | | | 5,252,270 | |
Containers & Packaging—6.3% | | | | | |
Owens-Illinois, Inc.(a) | | | 107,000 | | | | 2,811,960 | |
Sonoco Products Co. | | | 77,400 | | | | 2,712,096 | |
| | | | | | | | 5,524,056 | |
Electrical Equipment—2.9% | | | | | |
Acuity Brands, Inc. | | | 34,500 | | | | 2,517,120 | |
Electronic Equipment, Instruments & Components—6.1% | |
Checkpoint Systems, Inc.(a)(b) | | | 167,000 | | | | 1,932,190 | |
Flextronics International Ltd.(a)(c) | | | 472,200 | | | | 3,376,230 | |
| | | | | | | | 5,308,420 | |
Household Durables—4.8% | | | | | |
Universal Electronics, Inc.(a) | | | 184,115 | | | | 4,230,963 | |
Industrial Conglomerates—3.0% | | | | | |
Carlisle Cos., Inc. | | | 40,500 | | | | 2,627,235 | |
Internet Software & Services—3.3% | |
j2 Global, Inc. | | | 71,500 | | | | 2,910,050 | |
IT Services—3.5% | |
EPAM Systems, Inc.(a) | | | 87,000 | | | | 1,870,500 | |
VeriFone Systems, Inc.(a) | | | 53,300 | | | | 1,144,884 | |
| | | | | | | | 3,015,384 | |
Leisure Equipment & Products—2.7% | |
Summer Infant, Inc.(a)(b) | | | 814,933 | | | | 2,330,708 | |
Machinery—15.5% | |
Albany International Corp. | | | 58,000 | | | | 1,684,900 | |
Harsco Corp. | | | 81,000 | | | | 1,768,230 | |
Ingersoll-Rand PLC(c) | | | 40,000 | | | | 2,152,000 | |
Kennametal, Inc. | | | 96,000 | | | | 3,839,040 | |
Stanley Black & Decker, Inc. | | | 39,900 | | | | 2,984,919 | |
Trimas Corp.(a) | | | 37,300 | | | | 1,137,650 | |
| | | | | | | | 13,566,739 | |
Metals & Mining—3.1% | |
Carpenter Technology Corp. | | | 60,000 | | | | 2,697,600 | |
Perfessional Services—3.1% | |
RPX Corp.(a) | | | 205,000 | | | | 2,749,050 | |
Professional Services—4.3% | |
Stantec, Inc.(c) | | | 87,600 | | | | 3,741,396 | |
Semiconductors & Semiconductor Equipment—1.1% | |
Diodes, Inc.(a) | | | 46,000 | | | $ | 931,960 | |
Software—4.1% | | | | | |
Monotype Imaging Holdings, Inc. | | | 155,900 | | | | 3,615,321 | |
Specialty Retail—3.8% | | | | | |
Staples, Inc. | | | 247,000 | | | | 3,270,280 | |
Textiles, Apparel & Luxury Goods—3.3% | | | | | |
Maidenform Brands, Inc.(a)(b) | | | 160,400 | | | | 2,887,200 | |
Total Common Stocks
(Cost $59,936,911) | | | | | | | 74,987,738 | |
Short-Term Investments—13.8% | | | | | |
Money Market Funds—8.1% | | | | | |
STIT-Treasury Portfolio, 0.02%(d) | | | 4,210,138 | | | | 4,210,138 | |
First American Treasury Obligations Fund, 0.00%(d) | | | 2,895,083 | | | | 2,895,083 | |
| | | | | | | | 7,105,221 | |
| U.S. Treasury Bills—5.7% | |
| Principal
Amount |
| | | | |
0.055%, 08/01/2013(e) | | | 1,000,000 | | | | 999,879 | |
0.069%, 07/25/2013(e) | | | 2,000,000 | | | | 1,999,776 | |
0.075%, 09/12/2013(e) | | | 2,000,000 | | | | 1,999,516 | |
| | | | | | | | 4,999,171 | |
Total Short-Term Investments
(Cost $12,104,206) | | | | 12,104,392 | |
Total Investments
(Cost $72,041,117)—99.6% | | | | | | | 87,092,130 | |
Other Assets in Excess of Liabilities—0.4% | | | | 381,011 | |
Total Net Assets—100.0% | | | | | | $ | 87,473,141 | |
| | | | | | | | |
Percentages are stated as a percent of net assets.
| (a) | Non-income producing security. |
| (b) | Affiliated company. See Footnote 8. |
| (c) | Foreign issued security. Foreign concentration was as follows: Bermuda 2.5%; Canada 4.3%; Singapore 3.9%; |
| (d) | Variable rate security. The rate shown is as of 4/30/2013. |
| (e) | Rate shown is the effective yield based on purchase price. The calculation assumes the security is held to maturity. |
The Accompanying Footnotes are an Integral Part of these Financial Statements.
Percent of Total Investments
The Tocqueville Fund
Allocation of Portfolio Holdings
April 30, 2013 (Unaudited)
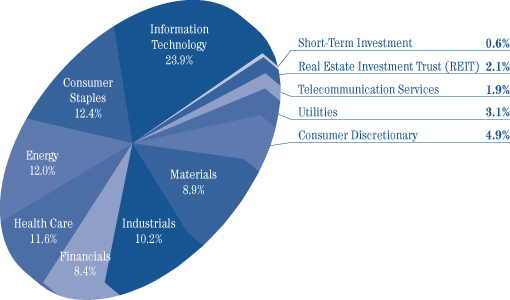
The Tocqueville Opportunity Fund
Allocation of Portfolio Holdings
April 30, 2013 (Unaudited)
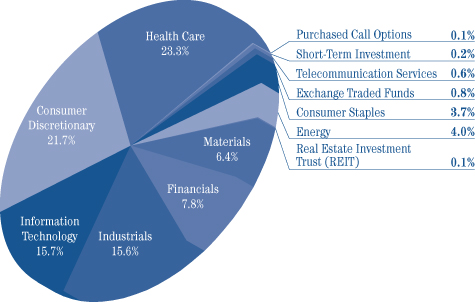
Percent of Total Investments
The Tocqueville International Value Fund
Allocation of Portfolio Holdings
April 30, 2013 (Unaudited)
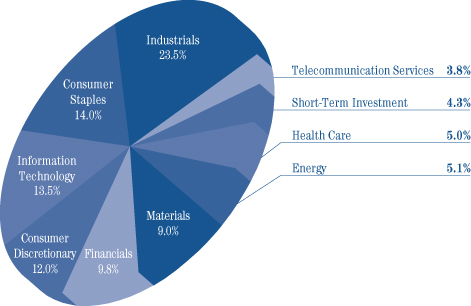
The Tocqueville Gold Fund
Allocation of Portfolio Holdings
April 30, 2013 (Unaudited)
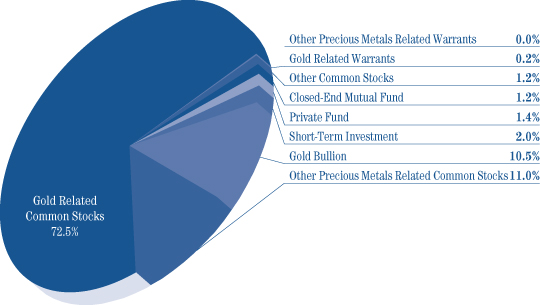
Percent of Total Investments
The Delafield Fund
Allocation of Portfolio Holdings
April 30, 2013 (Unaudited)
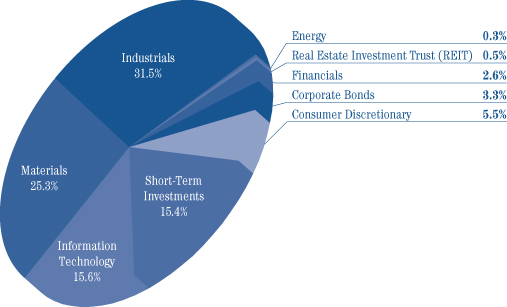
The Tocqueville Select Fund
Allocation of Portfolio Holdings
April 30, 2013 (Unaudited)
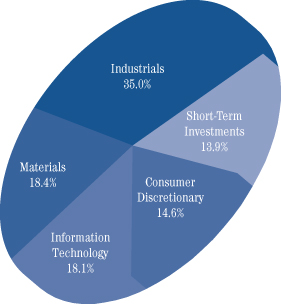
The Tocqueville Trust
Statements of Assets & Liabilities
April 30, 2013
(Unaudited)
| | | | | | | | | | | | | | | | | | | | | | | | |
| | | The
Tocqueville
Fund | | | The
Tocqueville
Opportunity
Fund | | | The
Tocqueville
International
Value Fund | | | The
Tocqueville
Gold Fund | | | The
Delafield
Fund | | | The
Tocqueville
Select Fund | |
Assets: | | | | | | | | | | | | | | | | | | | | | | | | |
Investments, at value (1) | | | | | | | | | | | | | | | | | | | | | | | | |
Unaffiliated Issuers | | $ | 360,019,454 | | | $ | 70,908,011 | | | $ | 239,417,957 | | | $ | 1,154,209,490 | | | $ | 1,434,702,593 | | | $ | 79,942,032 | |
Affiliated Issuers | | | — | | | | — | | | | — | | | | 243,633,398 | | | | 92,978,559 | | | | 7,150,098 | |
Foreign currencies, at value (2) | | | — | | | | — | | | | 1,088 | | | | 70 | | | | — | | | | — | |
Receivable for investments sold | | | 667,480 | | | | 1,319,063 | | | | — | | | | 4,711,665 | | | | 2,673,959 | | | | 401,136 | |
Receivable for foreign currencies sold | | | — | | | | — | | | | 3,225 | | | | 17,754 | | | | — | | | | — | |
Receivable for fund shares sold | | | 245,195 | | | | 7,843 | | | | 163,488 | | | | 7,708,792 | | | | 1,937,095 | | | | 76,522 | |
Dividends, interest and other receivables | | | 258,606 | | | | 6,030 | | | | 1,726,871 | | | | 1,118,002 | | | | 393,113 | | | | 21,160 | |
Prepaid assets | | | 17,205 | | | | 12,140 | | | | 23,324 | | | | 66,023 | | | | 39,130 | | | | 10,314 | |
Return of capital receivable | | | — | | | | 6,120 | | | | — | | | | — | | | | — | | | | — | |
| | | | | | | | | | | | | | | | | | | | | | | | |
Total Assets | | | 361,207,940 | | | | 72,259,207 | | | | 241,335,953 | | | | 1,411,465,194 | | | | 1,532,724,449 | | | | 87,601,262 | |
| | | | | | | | | | | | | | | | | | | | | | | | |
Liabilities: | | | | | | | | | | | | | | | | | | | | | | | | |
Payable for investments purchased | | | — | | | | 1,369,925 | | | | 1,757,211 | | | | — | | | | — | | | | — | |
Payable to custodian | | | — | | | | — | | | | 230,887 | | | | 733,774 | | | | — | | | | — | |
Currency payable | | | — | | | | — | | | | — | | | | 29,002 | | | | — | | | | — | |
Depreciation on forward currency contracts | | | — | | | | — | | | | 615,846 | | | | — | | | | — | | | | — | |
Payable for fund shares redeemed | | | 443,392 | | | | 2,944 | | | | 112,536 | | | | 7,685,757 | | | | 2,277,925 | | | | 19,691 | |
Payable to Adviser | | | 215,683 | | | | 42,629 | | | | 134,347 | | | | 980,096 | | | | 886,049 | | | | 56,826 | |
Payable to Administrator | | | 50,327 | | | | 9,428 | | | | 30,112 | | | | 203,577 | | | | 220,867 | | | | 12,466 | |
Payable to Trustees | | | 12,831 | | | | 1,915 | | | | 6,206 | | | | 89,014 | | | | 36,939 | | | | 2,599 | |
Payable to Chief Compliance Officer | | | 1,051 | | | | 115 | | | | 344 | | | | 8,204 | | | | 1,916 | | | | 219 | |
Accrued distribution fee | | | 44,984 | | | | 12,533 | | | | 37,884 | | | | 41,662 | | | | 123,300 | | | | 10,397 | |
Accrued expenses and other liabilities | | | 105,854 | | | | 18,547 | | | | 50,719 | | | | 593,854 | | | | 295,331 | | | | 25,923 | |
| | | | | | | | | | | | | | | | | | | | | | | | |
Total Liabilities | | | 874,122 | | | | 1,458,036 | | | | 2,976,092 | | | | 10,364,940 | | | | 3,842,327 | | | | 128,121 | |
| | | | | | | | | | | | | | | | | | | | | | | | |
Net Assets | | $ | 360,333,818 | | | $ | 70,801,171 | | | $ | 238,359,861 | | | $ | 1,401,100,254 | | | $ | 1,528,882,122 | | | $ | 87,473,141 | |
| | | | | | | | | | | | | | | | | | | | | | | | |
Net assets consist of: | | | | | | | | | | | | | | | | | | | | | | | | |
Paid in capital | | $ | 289,951,265 | | | $ | 59,333,136 | | | $ | 215,542,929 | | | $ | 1,630,731,588 | | | $ | 1,187,445,297 | | | $ | 68,839,699 | |
Accumulated net investment income gain (loss) | | | 1,150,347 | | | | (660,483 | ) | | | 802,024 | | | | (42,510,098 | ) | | | (2,692,713 | ) | | | (428,459 | ) |
Accumulated net realized gain (loss) | | | (14,042,023 | ) | | | (1,096,439 | ) | | | (8,376,227 | ) | | | 8,789,151 | | | | 12,368,212 | | | | 4,010,888 | |
Net unrealized appreciation (depreciation) on: | | | | | | | | | | | | | | | | | | | | | | | | |
Investments and foreign currency related items | | | 83,274,229 | | | | 13,224,957 | | | | 30,391,135 | | | | (195,910,387 | ) | | | 331,761,326 | | | | 15,051,013 | |
| | | | | | | | | | | | | | | | | | | | | | | | |
Net assets | | $ | 360,333,818 | | | $ | 70,801,171 | | | $ | 238,359,861 | | | $ | 1,401,100,254 | | | $ | 1,528,882,122 | | | $ | 87,473,141 | |
| | | | | | | | | | | | | | | | | | | | | | | | |
Shares of beneficial interest outstanding (unlimited shares of $0.01 par value autorized) | | | 13,368,233 | | | | 3,942,796 | | | | 18,063,726 | | | | 32,052,003 | | | | 47,187,993 | | | | 6,737,094 | |
Net asset value, offering and redemption price per share | | $ | 26.95 | | | $ | 17.96 | | | $ | 13.20 | | | $ | 43.71 | | | $ | 32.40 | | | $ | 12.98 | |
| | | | | | | | | | | | | | | | | | | | | | | | |
(1) Cost of investments | | | | | | | | | | | | | | | | | | | | | | | | |
Unafilliated issuers | | $ | 276,745,225 | | | $ | 57,683,054 | | | $ | 208,398,052 | | | $ | 1,198,746,290 | | | $ | 1,112,556,978 | | | $ | 62,809,115 | |
Affiliated issuers | | $ | — | | | $ | — | | | $ | — | | | $ | 395,017,939 | | | $ | 83,362,847 | | | $ | 9,232,002 | |
(2) Cost of foreign currencies | | $ | — | | | $ | — | | | $ | 1,073 | | | $ | 70 | | | $ | — | | | $ | — | |
The Accompanying Notes are an Integral Part of these Financial Statements.
The Tocqueville Trust
Statements of Operations
For the Period Ended April 30, 2013
(Unaudited)
| | | | | | | | | | | | | | | | | | | | | | | | |
| | | The
Tocqueville
Fund | | | The
Tocqueville
Opportunity
Fund | | | The
Tocqueville
International
Value Fund | | | The
Tocqueville
Gold Fund | | | The
Delafield
Fund | | | The
Tocqueville
Select Fund | |
Investment Income: | | | | | | | | | | | | | | | | | | | | | | | | |
Dividends* | | | | | | | | | | | | | | | | | | | | | | | | |
Unaffiliated issuers | | | 4,998,292 | | | | 189,798 | | | | 3,170,372 | | | | 7,588,963 | | | | 7,567,819 | | | | 425,567 | |
Affiliated issuers | | | — | | | | — | | | | — | | | | 1,247,159 | | | | — | | | | — | |
Interest | | | 45 | | | | 8 | | | | 886 | | | | 1,841 | | | | 155,446 | | | | 1,565 | |
| | | | | | | | | | | | | | | | | | | | | | | | |
Total investment income | | | 4,998,337 | | | | 189,806 | | | | 3,171,258 | | | | 8,837,963 | | | | 7,723,265 | | | | 427,132 | |
| | | | | | | | | | | | | | | | | | | | | | | | |
Expenses: | | | | | | | | | | | | | | | | | | | | | | | | |
Investment Adviser’s fee (See Note 4) | | | 1,337,090 | | | | 250,613 | | | | 1,143,211 | | | | 7,354,904 | | | | 5,212,513 | | | | 337,070 | |
Distribution fees (See Note 4) | | | 445,696 | | | | 83,538 | | | | 285,803 | | | | 2,399,674 | | | | 1,837,926 | | | | 105,334 | |
Administration fees (See Note 4) | | | 267,418 | | | | 50,123 | | | | 171,482 | | | | 1,439,804 | | | | 1,102,756 | | | | 63,200 | |
Transfer agent and shareholder services fees | | | 107,406 | | | | 9,770 | | | | 43,571 | | | | 630,376 | | | | 345,450 | | | | 26,988 | |
Printing and mailing expense | | | 22,656 | | | | 2,453 | | | | 9,874 | | | | 136,781 | | | | 86,604 | | | | 4,136 | |
Trustee fees and expenses | | | 22,483 | | | | 4,263 | | | | 13,494 | | | | 138,000 | | | | 85,701 | | | | 5,326 | |
Professional fees | | | 20,635 | | | | 5,742 | | | | 13,063 | | | | 127,911 | | | | 70,723 | | | | 6,285 | |
Other expenses (See Note 11) | | | 20,351 | | | | 2,901 | | | | 14,403 | | | | 79,750 | | | | 28,853 | | | | 2,318 | |
Registration fees | | | 18,150 | | | | 11,819 | | | | 15,882 | | | | 60,193 | | | | 47,465 | | | | 13,452 | |
Fund accounting fees | | | 15,004 | | | | 8,561 | | | | 21,227 | | | | 84,958 | | | | 53,002 | | | | 4,240 | |
Custody fees | | | 10,782 | | | | 5,738 | | | | 30,451 | | | | 142,310 | | | | 49,360 | | | | 4,333 | |
Insurance expense | | | 4,059 | | | | 1,009 | | | | 2,353 | | | | 22,082 | | | | 15,308 | | | | 905 | |
| | | | | | | | | | | | | | | | | | | | | | | | |
Total expenses before waiver | | | 2,291,730 | | | | 436,530 | | | | 1,764,814 | | | | 12,616,743 | | | | 8,935,661 | | | | 573,587 | |
Less: Fees waived (See Note 4) | | | (50,895 | ) | | | — | | | | (224,965 | ) | | | — | | | | — | | | | — | |
| | | | | | | | | | | | | | | | | | | | | | | | |
Net expenses | | | 2,240,835 | | | | 436,530 | | | | 1,539,849 | | | | 12,616,743 | | | | 8,935,661 | | | | 573,587 | |
| | | | | | | | | | | | | | | | | | | | | | | | |
Net Investment Income (Loss) | | | 2,757,502 | | | | (246,724 | ) | | | 1,631,409 | | | | (3,778,780 | ) | | | (1,212,396 | ) | | | (146,455 | ) |
| | | | | | | | | | | | | | | | | | | | | | | | |
Realized and Unrealized Gain (Loss): | | | | | | | | | | | | | | | | | | | | | | | | |
Net realized gain (loss) on: | | | | | | | | | | | | | | | | | | | | | | | | |
Investments | | | | | | | | | | | | | | | | | | | | | | | | |
Unaffiliated issuers | | | 10,051,361 | | | | 4,095,429 | | | | 6,269,802 | | | | 8,861,354 | | | | 20,603,984 | | | | 4,567,890 | |
Affililiated issuers | | | — | | | | — | | | | — | | | | 5,068,320 | | | | (7,534,387 | ) | | | (258,436 | ) |
Forward currency contracts | | | — | | | | — | | | | 1,827,046 | | | | — | | | | — | | | | — | |
Foreign currency translation | | | 26 | | | | (2,213 | ) | | | (252,118 | ) | | | (45,626 | ) | | | (1,932 | ) | | | (8 | ) |
| | | | | | | | | | | | | | | | | | | | | | | | |
| | | 10,051,387 | | | | 4,093,216 | | | | 7,844,730 | | | | 13,884,048 | | | | 13,067,665 | | | | 4,309,446 | |
Net change in unrealized appreciation (depreciation) on: | | | | | | | | | | | | | | | | | | | | | | | | |
Investments | | | 32,126,250 | | | | 4,930,403 | | | | 30,841,894 | | | | (925,675,125 | ) | | | 191,081,906 | | | | 10,755,533 | |
Forward currency contracts | | | — | | | | — | | | | (796,577 | ) | | | — | | | | — | | | | — | |
Foreign currency translation | | | — | | | | (1,148 | ) | | | (8,370,638 | ) | | | (3,496,179 | ) | | | 228,183 | | | | — | |
| | | | | | | | | | | | | | | | | | | | | | | | |
| | | 32,126,250 | | | | 4,929,255 | | | | 21,674,679 | | | | (929,171,304 | ) | | | 191,310,089 | | | | 10,755,533 | |
Net gain (loss) on investments and foreign currency | | | 42,177,637 | | | | 9,022,471 | | | | 29,519,409 | | | | (915,287,256 | ) | | | 204,377,754 | | | | 15,064,979 | |
| | | | | | | | | | | | | | | | | | | | | | | | |
Net Increase (Decrease) in Net Assets Resulting from Operations | | $ | 44,935,139 | | | $ | 8,775,747 | | | $ | 31,150,818 | | | $ | (919,066,036 | ) | | $ | 203,165,358 | | | $ | 14,918,524 | |
| | | | | | | | | | | | | | | | | | | | | | | | |
* Net of foreign taxes withheld of: | | $ | 20,613 | | | $ | 989 | | | $ | 330,368 | | | $ | 994,744 | | | $ | 5,625 | | | $ | 4,319 | |
| | | | | | | | | | | | | | | | | | | | | | | | |
The Accompanying Notes are an Integral Part of these Financial Statements.
The Tocqueville Trust
Statements of Changes in Net Assets
| | | | | | | | | | | | | | | | |
| | | The Tocqueville Fund | | | The Tocqueville
Opportunity Fund | |
| | | For the
Period Ended
April 30,
2013 | | | For the
Year Ended
October 31,
2012 | | | For the
Period Ended
April 30,
2013 | | | For the
Year Ended
October 31,
2012 | |
| | | (Unaudited) | | | | | | (Unaudited) | | | | |
Operations: | | | | | | | | | | | | | | | | |
Net investment income (loss) | | $ | 2,757,502 | | | $ | 5,182,520 | | | $ | (246,724 | ) | | $ | (476,649 | ) |
Net realized gain (loss) on sale of investments and foreign currency | | | 10,051,387 | | | | 7,286,414 | | | | 4,093,216 | | | | (3,282 | ) |
Net change in unrealized appreciation (depreciation) | | | 32,126,250 | | | | 21,609,077 | | | | 4,929,255 | | | | 2,048,387 | |
| | | | | | | | | | | | | | | | |
Net increase (decrease) in net assets resulting from operations | | | 44,935,139 | | | | 34,078,011 | | | | 8,775,747 | | | | 1,568,456 | |
Dividends and distributions to shareholders: | | | | | | | | | | | | | | | | |
Net investment income | | | (5,030,132 | ) | | | (5,526,502 | ) | | | — | | | | — | |
Net realized gains | | | — | | | | — | | | | — | | | | — | |
| | | | | | | | | | | | | | | | |
Total dividends and distributions | | | (5,030,132 | ) | | | (5,526,502 | ) | | | — | | | | — | |
Fund share transactions: | | | | | | | | | | | | | | | | |
Shares sold | | | 16,546,200 | | | | 56,283,828 | | | | 2,945,597 | | | | 29,832,239 | |
Shares issued to holders in reinvestment of dividends | | | 4,132,373 | | | | 4,694,231 | | | | — | | | | — | |
Shares redeemed* | | | (66,274,350 | ) | | | (215,046,320 | ) | | | (6,374,783 | ) | | | (12,908,921 | ) |
| | | | | | | | | | | | | | | | |
Net increase (decrease) from capital share transactions | | | (45,595,777 | ) | | | (154,068,261 | ) | | | (3,429,186 | ) | | | 16,923,318 | |
| | | | | | | | | | | | | | | | |
Net increase (decrease) in net assets | | | (5,690,770 | ) | | | (125,516,752 | ) | | | 5,346,561 | | | | 18,491,774 | |
Net Assets: | | | | | | | | | | | | | | | | |
Beginning of period | | | 366,024,588 | | | | 491,541,340 | | | | 65,454,610 | | | | 46,962,836 | |
| | | | | | | | | | | | | | | | |
End of period** | | $ | 360,333,818 | | | $ | 366,024,588 | | | $ | 70,801,171 | | | $ | 65,454,610 | |
| | | | | | | | | | | | | | | | |
* Net of redemption fees of: | | $ | 8,876 | | | $ | 27,989 | | | $ | 840 | | | $ | 15,791 | |
| | | | | | | | | | | | | | | | |
** Including undistributed net investment income (loss) of: | | $ | 1,150,347 | | | $ | 3,422,977 | | | $ | (660,483 | ) | | $ | (413,759 | ) |
| | | | | | | | | | | | | | | | |
The Accompanying Notes are an Integral Part of these Financial Statements.
The Tocqueville Trust
Statements of Changes in Net Assets
| | | | | | | | | | | | | | | | | | | | | | | | | | | | | | |
The Tocqueville
International Value Fund | | | The Tocqueville Gold Fund | | | The Delafield Fund | | | The Tocqueville
Select Fund | |
For the
Period Ended
April 30,
2013 | | | For the
Year Ended
October 31,
2012 | | | For the
Period Ended
April 30,
2013 | | | For the
Year Ended
October 31,
2012 | | | For the
Period Ended
April 30,
2013 | | | For the
Year Ended
October 31,
2012 | | | For the
Period Ended
April 30,
2013 | | | For the
Year Ended
October 31,
2012 | |
| (Unaudited) | | | | | | (Unaudited) | | | | | | (Unaudited) | | | | | | (Unaudited) | | | | |
| | | | | | | | | | | | | | | | | | | | | | | | | | | | | | |
| $ | 1,631,409 | | | $ | 3,195,774 | | | $ | (3,778,780 | ) | | $ | (12,910,775 | ) | | $ | (1,212,396 | ) | | $ | (1,702,775 | ) | | $ | (146,455 | ) | | $ | (310,262 | ) |
| | | | | | | |
| | 7,844,730 | | | | (8,353,588 | ) | | | 13,884,048 | | | | 47,601,049 | | | | 13,067,665 | | | | 80,464,787 | | | | 4,309,446 | | | | 3,393,207 | |
| | 21,674,679 | | | | 1,130,171 | | | | (929,171,304 | ) | | | (283,854,786 | ) | | | 191,310,089 | | | | 51,265,070 | | | | 10,755,533 | | | | (456,174 | ) |
| | | | | | | | | | | | | | | | | | | | | | | | | | | | | | |
| | | | | | | |
| | 31,150,818 | | | | (4,027,643 | ) | | | (919,066,036 | ) | | | (249,164,512 | ) | | | 203,165,358 | | | | 130,027,082 | | | | 14,918,524 | | | | 2,626,771 | |
| | | | | | | | | | | | | | | | | | | | | | | | | | | | | | |
| | (3,270,329 | ) | | | (2,105,224 | ) | | | — | | | | — | | | | — | | | | — | | | | — | | | | — | |
| | — | | | | — | | | | (53,161,749 | ) | | | (42,282,689 | ) | | | (80,537,788 | ) | | | (16,542,579 | ) | | | (3,451,599 | ) | | | (766,158 | ) |
| | | | | | | | | | | | | | | | | | | | | | | | | | | | | | |
| | (3,270,329 | ) | | | (2,105,224 | ) | | | (53,161,749 | ) | | | (42,282,689 | ) | | | (80,537,788 | ) | | | (16,542,579 | ) | | | (3,451,599 | ) | | | (766,158 | ) |
| | | | | | | | | | | | | | | | | | | | | | | | | | | | | | |
| | 17,741,455 | | | | 70,782,405 | | | | 434,278,014 | | | | 768,183,795 | | | | 197,739,874 | | | | 362,662,133 | | | | 5,963,641 | | | | 30,896,673 | |
| | 2,452,030 | | | | 1,547,905 | | | | 48,734,410 | | | | 39,153,702 | | | | 75,042,452 | | | | 15,316,165 | | | | 3,271,889 | | | | 675,793 | |
| | (28,506,657 | ) | | | (47,252,825 | ) | | | (555,597,195 | ) | | | (717,055,407 | ) | | | (212,801,210 | ) | | | (408,065,143 | ) | | | (17,777,827 | ) | | | (20,438,315 | ) |
| | | | | | | | | | | | | | | | | | | | | | | | | | | | | | |
| | (8,313,172 | ) | | | 25,077,485 | | | | (72,584,771 | ) | | | 90,282,090 | | | | 59,981,116 | | | | (30,086,845 | ) | | | (8,542,297 | ) | | | 11,134,151 | |
| | | | | | | | | | | | | | | | | | | | | | | | | | | | | | |
| | 19,567,317 | | | | 18,944,618 | | | | (1,044,812,556 | ) | | | (201,165,111 | ) | | | 182,608,686 | | | | 83,397,658 | | | | 2,924,628 | | | | 12,994,764 | |
| | | | | | | | | | | | | | | | | | | | | | | | | | | | | | |
| | 218,792,544 | | | | 199,847,926 | | | | 2,445,912,810 | | | | 2,647,077,921 | | | | 1,346,273,436 | | | | 1,262,875,778 | | | | 84,548,513 | | | | 71,553,749 | |
| | | | | | | | | | | | | | | | | | | | | | | | | | | | | | |
| $ | 238,359,861 | | | $ | 218,792,544 | | | $ | 1,401,100,254 | | | $ | 2,445,912,810 | | | $ | 1,528,882,122 | | | $ | 1,346,273,436 | | | $ | 87,473,141 | | | $ | 84,548,513 | |
| | | | | | | | | | | | | | | | | | | | | | | | | | | | | | |
| $ | 9,083 | | | $ | 27,394 | | | $ | 334,866 | | | $ | 698,471 | | | $ | 44,592 | | | $ | 155,189 | | | $ | 1,873 | | | $ | 15,430 | |
| | | | | | | | | | | | | | | | | | | | | | | | | | | | | | |
| $ | 802,024 | | | $ | 2,440,944 | | | $ | (42,510,098 | ) | | $ | (38,731,318 | ) | | $ | (2,692,713 | ) | | $ | (1,480,317 | ) | | $ | (428,459 | ) | | $ | (282,004 | ) |
| | | | | | | | | | | | | | | | | | | | | | | | | | | | | | |
The Accompanying Notes are an Integral Part of these Financial Statements.
The Tocqueville Trust
The Tocqueville Fund
The Tocqueville Opportunity Fund
The Tocqueville International Value Fund
The Tocqueville Gold Fund
The Delafield Fund
The Tocqueville Select Fund
Notes to Financial Statements
(Unaudited)
1. ORGANIZATION
The Tocqueville Trust (the “Trust”) is a Massachusetts business trust registered under the Investment Company Act of 1940 and organized on September 17, 1986, currently consisting of six separate funds (each, a “Fund” or, collectively, the “Funds”). Each Fund is an open-end management investment company with a different investment objective. The Tocqueville Fund, The Tocqueville Opportunity Fund (the “Opportunity Fund”), The Tocqueville International Value Fund (the “International Fund”), and The Delafield Fund are classified as diversified investment companies. The Tocqueville Gold Fund (the “Gold Fund”) and The Tocqueville Select Fund (the “Select Fund”) are classified as non-diversified investment companies. The Tocqueville Fund’s investment objective is long-term capital appreciation which it seeks to achieve by investing primarily in securities of United States issuers. The Opportunity Fund’s investment objective is to achieve long-term capital appreciation which it seeks to achieve by investing in the common stocks of small and mid cap companies which have the potential to deliver superior long term earnings growth. The International Fund’s investment objective is long-term capital appreciation consistent with preservation of capital which it seeks to achieve by investing primarily in securities of non-U.S. issuers. The Gold Fund’s investment objective is long-term capital appreciation which it seeks to achieve by investing in gold, securities of companies located throughout the world that are engaged in mining or processing gold (“gold related securities”), other precious metals and securities of companies located throughout the world that are engaged in mining or processing such other precious metals (“other precious metal securities”). The Delafield Fund’s investment objectives are to seek long-term preservation of capital (sufficient growth to outpace inflation over an extended period of time) and growth of capital which it seeks to achieve by investing primarily in the equity securities of domestic companies. The Tocqueville Select Fund’s investment objective is to achieve long-term capital appreciation by investing in a focused group of common stocks issued primarily by small and mid-sized U.S. companies. Current income is a secondary objective for The Tocqueville Select Fund.
On June 22, 2009, the Board of Directors of Delafield Fund, Inc. approved an Agreement and Plan of Reorganization providing for, among other things, the transfer of the assets and liabilities of Delafield Fund, Inc. into The Delafield Fund, a series of The Tocqueville Trust. On September 24, 2009, the shareholders of Delafield Fund, Inc. approved the Agreement and Plan of Reorganization. On July 9, 2009, the Board of Trustees of Delafield Select Fund, a series of Natixis Funds Trust II, approved an Agreement and Plan of Reorganization providing for, among other things, the transfer of the assets and liabilities of Delafield Select Fund into the sole share class of The Select Fund (now The Tocqueville Select Fund), a series of The Tocqueville Trust. On September 24, 2009, the shareholders of Delafield Select Fund approved the Agreement and Plan of Reorganization. The effective date of both reorganizations was September 28, 2009. Transfers into The Delafield Fund and The Select Fund from their predecessor funds amounted to $649,892,191 and $25,888,388, respectively.
The Delafield Fund, a series of the Trust, commenced operations on September 28, 2009 as successor to Delafield Fund, Inc. The predecessor Delafield Fund, Inc. commenced operations on November 19, 1993.
The Tocqueville Select Fund, a series of the Trust, commenced operations on September 28, 2009 as successor to the Delafield Select Fund, a series of Natixis Funds Trust II. The predecessor Delafield Select Fund commenced operations on September 29, 2008 for Class A and Class C shares and on September 26, 2008 for Class Y shares. Prior to September 29, 2008, the predecessor Delafield Select Fund operated as a Delaware limited partnership using substantially the same investment objectives and investment policies as the predecessor fund. The limited partnership was incepted in July 1998.
Effective October 12, 2010, the investment strategy of the Opportunity Fund was changed as described in the supplements dated August 12, 2010 to the Trust’s prospectus and statement of additional information. The Opportunity
Fund will invest primarily in stocks of small and mid capitalization companies, as measured at the time of initial purchase. The Fund seeks to invest in companies which management feels are market leaders in growth industries and have consistent growth in sales and earnings.
2. SIGNIFICANT ACCOUNTING POLICIES
The following is a summary of significant accounting principles followed by the Trust in the preparation of its financial statements.
a) Security valuation
Investments in securities, including foreign securities, traded on an exchange or quoted on the over-the-counter market are valued at the last sale price or, if no sale occurred during the day, at the mean between closing bid and asked prices, as last reported by a pricing service approved by the Trustees. Securities that are principally traded on the National Association of Securities Dealers Automated Quotation National Market (“NASDAQ”) are generally valued at the NASDAQ Official Closing Price (“NOCP”). Investments in gold and silver are valued on the basis of the respective closing spot prices of the New York Commodity Exchange. Investments in other precious metals are valued at their respective market values determined on the basis of the mean between the last current bid and asked prices based on dealer or exchange quotations. When market quotations are not readily available, or when restricted securities or other assets are being valued, such assets are valued at fair value as determined in good faith by or under procedures approved by the Trustees. Short-term securities maturing within 60 days are valued on an amortized cost basis. Fixed income securities with maturities greater than 60 days are valued at market price.
Trading in securities on European and Far Eastern securities exchanges normally is completed before the calculation of the Funds’ net asset value. Trading on these foreign exchanges may not take place on all days on which there is regular trading on the New York Stock Exchange (“NYSE”), or may take place on days on which there is no regular trading on the NYSE. Similarly, the Funds may hold securities traded in domestic markets where the market may close early on a given day prior to calculation of the Funds’ net asset value. Events affecting the value of such securities held by the Funds that occur between the close of trading in the security and the close of trading on the NYSE normally will not be reflected in the Funds’ calculation of the net asset value. Significant events will be closely monitored, and where it is determined that an adjustment should be made to the security’s value because significant interim events may materially affect the value of the security, the security will be priced at its fair value in accordance with the procedures approved by the Trustees.
Investment and shareholder transactions are recorded on trade date. Dividend income is recognized on the ex-dividend date and interest income is recognized on an accrual basis.
b) Repurchase agreements
The Funds may enter into repurchase agreements with institutions that the Adviser has determined are creditworthy. Each repurchase agreement is recorded at cost. Under the terms of a typical repurchase agreement, the Fund acquires a debt security subject to an obligation of the seller to repurchase, and of the Fund to resell, the security at an agreed-upon price and time, thereby determining the yield during the Fund’s holding period. When entering into repurchase agreements, it is the Fund’s policy that its custodian or a third party custodian, acting on the Fund’s behalf, take possession of the underlying collateral securities, the market value of which, at all times, at least equals the principal
amount of the repurchase transaction, including accrued interest. To the extent that any repurchase transaction maturity exceeds one business day, the value of the collateral is marked to market and measured against the value of the agreement in an effort to ensure the adequacy of the collateral. If the counterparty defaults, the Fund generally has the right to use the collateral to satisfy the terms of the repurchase transaction.
c) Restricted and illiquid securities
The Funds may invest in securities that are subject to legal or contractual restrictions on resale or are illiquid. A security may be considered illiquid if it lacks a readily available market or if its valuation has not changed for a certain period of time. Disposal of these securities may involve time consuming negotiations and expense, and a prompt sale at the current valuation may be difficult.
d) Fair valuation measurement
The Trust has adopted authoritative fair valuation accounting standards which establish an authoritative definition of fair value and set out a hierarchy for measuring fair value. These standards require additional disclosures about the various inputs and valuation techniques used to develop the measurements of fair value and a discussion in changes in valuation techniques and related inputs during the period. These inputs are summarized in the three broad levels listed below.
| | Level 1 - | Quoted prices in active markets for identical securities. |
| | Level 2 - | Other significant observable inputs (including quoted prices for similar securities, interest rates, prepayment speeds, credit risk, etc.). |
| | Level 3 - | Significant unobservable inputs (including the Fund’s own assumptions in determining the fair value of investments). |
Equity investments, including common stocks, foreign issued common stocks, exchange-traded funds, closed end mutual funds and real estate investments trusts, which are traded on an exchange are valued at the last sale price reported by the exchange on which the securities are primarily traded on the day of valuation. If there are no sales on a given day for securities traded on an exchange, the mean between the latest bid and ask price will be used. If there is no Nasdaq Official Closing Price for a Nasdaq-listed security or sale price available for an over-the-counter security, the mean of the latest bid and asked quotations from Nasdaq will be used. When using the market quotations or closing price provided by the pricing service and when the market is considered active, the security will be classified as a Level 1 security. On days when the closing price of the S&P 500 moves more than 1% from its previous close, common stocks of the International Value Fund which are traded on non-North American exchanges may be valued using matrix pricing formulas provided by an independent pricing service. These securities will generally be classified as Level 2 securities. Gold bullion is valued at the mean of the closing bid and ask prices from the New York Mercantile Exchange and is classified as a Level 1.
Investment in mutual funds, including money market funds, are generally priced at the ending net asset value (NAV) provided by the service agent of the funds and will be classified as Level 1 securities.
Debt securities, such as corporate bonds, convertible bonds and U.S. government agency issues for which market quotations are not readily available may be valued based on information supplied by independent pricing services using matrix pricing formulas and/or independent broker bid quotations. Debt securities with remaining maturities of 60 days or
less may be valued on an amortized cost basis, which involves valuing an instrument at its cost and thereafter assuming a constant amortization to maturity of any discount or premium, regardless of the impact of fluctuating rates on the fair value of the instrument. Warrants for which the underlying security is registered and equities which are subject to a required holding period, but have a comparable public issue, are valued in good faith by the Advisor pursuant to procedures established under the general supervision and responsibility of the Funds’ Board of Trustees. These securities will generally be classified as Level 2 securities. Forward currency contracts derive their value from the underlying currency prices. These are valued by a pricing service using pricing models. The models use inputs that are observed from active markets, such as exchange rates. These contracts are classified as Level 2. Options can diverge from the prices of their underlying instruments. These are valued at the composite last price reported by the exchange on which the options are primarily traded on the day of the valuation. If there is no composite last price on a given day the mean between the latest bid and ask price will be used. These contracts are classified as Level 2.
Any securities or other assets for which market quotations are not readily available are valued at fair value as determined in good faith by the Advisor pursuant to procedures established under the general supervision and responsibility of the Funds’ Board of Trustees and will be classified as Level 3 securities. In determining fair value, a Fund will seek to assign a value to the security which it believes represents the amount that the Fund could reasonably expect to receive upon its current sale. With respect to securities that are actively traded on U.S. exchanges, the Funds expect that market quotations will generally be available and that fair value might be used only in limited circumstances, such as when trading for a security is halted during the trading day.
The Gold Fund currently invests in a private fund that primarily invests in physical gold and is subject to redemption restrictions. This private fund investment can only be disposed of on the last day of a given month with notice given 25 business days in advance of redemption. This investment is currently valued at $20,153,945 which represents 1.4% of the Gold Fund’s net assets.
For securities traded principally on foreign exchanges, the Funds may use fair value pricing if an event occurs after the close of trading of the principal foreign exchange on which a security is traded, but before calculation of a Fund’s NAV, which a Fund believes affects the value of the security since its last market quotation. Such events may involve situations relating to a single issuer (such as news related to the issuer announced after the close of the principal foreign exchange), or situations relating to sectors of the market or the markets in general (such as significant fluctuations in the U.S. or foreign markets or significant changes in exchange rates, natural disasters, armed conflicts, or governmental actions).
In determining whether a significant event has occurred with respect to securities traded principally in foreign markets, the Funds may engage a third party fair value service provider to systematically recommend the adjustment of closing market prices of non-U.S. securities based upon changes in a designated U.S. securities market index occuring from the time of close of the relevant foreign market and the close of the NYSE. Fair value pricing may also be used to value restricted securities held by the Funds or securities with little or no trading activity for extended periods of time. Fair value pricing involves judgements that are inherently subjective and inexact and it is not possible to determine with certainty when, and to what extent, an event will affect a market price. As a result, there can be no assurance that fair value pricing will reflect actual market value and it is possible that the fair value determined for a security may differ materially from the value that could be realized upon the sale of the security.
The following is a summary of the inputs used, as of April 30, 2013, involving the Funds’ assets carried at fair value. The inputs of methodology used for valuing securities may not be an indication of the risk associated with investing in those securities.
| | | | | | | | | | | | | | | | |
| Description | | Level 1 | | | Level 2 | | | Level 3 | | | Total | |
The Tocqueville Fund | | | | | | | | | | | | | | | | |
Common Stocks* | | $ | 350,285,280 | | | $ | — | | | $ | — | | | $ | 350,285,280 | |
Real Estate Investment Trust (REIT)* | | | 7,627,500 | | | | — | | | | — | | | | 7,627,500 | |
Money Market Fund | | | 2,106,674 | | | | — | | | | — | | | | 2,106,674 | |
| | | | | | | | | | | | | | | | |
Total Fund | | $ | 360,019,454 | | | $ | — | | | $ | — | | | $ | 360,019,454 | |
| | | | | | | | | | | | | | | | |
| | | | |
| The Tocqueville Opportunity Fund | | Level 1 | | | Level 2 | | | Level 3 | | | Total | |
Common Stocks* | | $ | 70,088,429 | | | $ | — | | | $ | — | | | $ | 70,088,429 | |
Real Estate Investment Trust (REIT)* | | | 72,480 | | | | — | | | | — | | | | 72,480 | |
Exchange Traded Funds* | | | 571,924 | | | | — | | | | — | | | | 571,924 | |
Purchased Call Options* | | | — | | | | 60,500 | | | | — | | | | 60,500 | |
Money Market Fund | | | 114,678 | | | | — | | | | — | | | | 114,678 | |
| | | | | | | | | | | | | | | | |
Total Fund | | $ | 70,847,511 | | | $ | 60,500 | | | $ | — | | | $ | 70,908,011 | |
| | | | | | | | | | | | | | | | |
| | | | |
| The Tocqueville International Value Fund | | Level 1 | | | Level 2 | | | Level 3 | | | Total | |
Common Stocks* | | $ | 229,047,101 | | | $ | — | | | $ | — | | | $ | 229,047,101 | |
Money Market Fund | | | 10,370,856 | | | | — | | | | — | | | | 10,370,856 | |
| | | | | | | | | | | | | | | | |
Total Fund | | $ | 239,417,957 | | | $ | — | | | $ | — | | | $ | 239,417,957 | |
| | | | | | | | | | | | | | | | |
Other Financial Instruments** | | | | | | | | | | | | | | | | |
Total Forward Currency Contracts | | $ | — | | | $ | (615,846 | ) | | $ | — | | | $ | (615,846 | ) |
| | | | | | | | | | | | | | | | |
| | | | |
| The Tocqueville Gold Fund | | Level 1 | | | Level 2 | | | Level 3 | | | Total | |
Common Stocks | | | | | | | | | | | | | | | | |
Gold Related | | $ | 1,003,646,877 | | | $ | 3,933,264 | | | $ | 5,530,946 | | | $ | 1,013,111,087 | |
Other Precious Metals Related | | | 119,265,387 | | | | 16,844,045 | | | | 17,560,609 | | | | 153,670,041 | |
Other | | | 6,541,911 | | | | — | | | | 10,012,257 | | | | 16,554,168 | |
| | | | | | | | | | | | | | | | |
Total Common Stocks | | | 1,129,454,175 | | | | 20,777,309 | | | | 33,103,812 | | | | 1,183,335,296 | |
Closed End Mutual Fund* | | | 17,280,620 | | | | — | | | | — | | | | 17,280,620 | |
Private Fund* | | | — | | | | — | | | | 20,153,945 | | | | 20,153,945 | |
Warrants* | | | — | | | | 2,956,633 | | | | — | | | | 2,956,633 | |
Gold Bullion | | | 146,700,399 | | | | — | | | | — | | | | 146,700,399 | |
Money Market Fund | | | 27,415,995 | | | | — | | | | — | | | | 27,415,995 | |
| | | | | | | | | | | | | | | | |
Total Fund | | $ | 1,320,851,189 | | | $ | 23,733,942 | | | $ | 53,257,757 | | | $ | 1,397,842,888 | |
| | | | | | | | | | | | | | | | |
| | | | | | | | | | | | | | | | |
| The Delafield Fund | | Level 1 | | | Level 2 | | | Level 3 | | | Total | |
Common Stocks* | | $ | 1,235,418,745 | | | $ | — | | | $ | — | | | $ | 1,235,418,745 | |
Corporate Bonds* | | | — | | | | 49,648,397 | | | | — | | | | 49,648,397 | |
Real Estate Investment Trust (REIT)* | | | 7,134,000 | | | | — | | | | — | | | | 7,134,000 | |
Money Market Funds | | | 35,504,280 | | | | — | | | | — | | | | 35,504,280 | |
U.S. Treasury Bills | | | — | | | | 199,975,730 | | | | — | | | | 199,975,730 | |
| | | | | | | | | | | | | | | | |
Total Fund | | $ | 1,278,057,025 | | | $ | 249,624,127 | | | $ | — | | | $ | 1,527,681,152 | |
| | | | | | | | | | | | | | | | |
| | | | |
| The Tocqueville Select Fund | | Level 1 | | | Level 2 | | | Level 3 | | | Total | |
Common Stocks* | | $ | 74,987,738 | | | $ | — | | | $ | — | | | $ | 74,987,738 | |
Money Market Fund | | | 7,105,221 | | | | — | | | | — | | | | 7,105,221 | |
U.S. Treasury Bills | | | — | | | | 4,999,171 | | | | — | | | | 4,999,171 | |
| | | | | | | | | | | | | | | | |
Total Fund | | $ | 82,092,959 | | | $ | 4,999,171 | | | $ | — | | | $ | 87,092,130 | |
| | | | | | | | | | | | | | | | |
| * | For further information regarding portfolio characteristics, please see the accompanying Schedules of Investments. |
| ** | Other financial instruments are derivative instruments not reflected in the Schedule of Investments, such as forward currency contracts, which are reflected at the unrealized appreciation (depreciation) on the instrument. |
Below is a reconciliation that details the transfer of securities between Level 1 and Level 2 during the reporting period.
| | | | | | | | | | | | | | | | | | | | | | | | |
| | | The
Tocqueville
Fund | | | The
Tocqueville
Opportunity
Fund | | | The
Tocqueville
International
Value Fund | | | The
Tocqueville
Gold Fund | | | The
Delafield
Fund | | | The
Tocqueville
Select Fund | |
Transfers Into Level 1 | | $ | — | | | $ | 83,280 | | | $ | — | | | $ | 2,722,307 | | | $ | — | | | $ | — | |
Transfers Out of Level 1 | | | — | | | | — | | | | — | | | | (711,506 | ) | | | — | | | | — | |
| | | | | | | | | | | | | | | | | | | | | | | | |
Net Transfers Into/(Out of ) Level 1 | | | — | | | | 83,280 | | | | — | | | | 2,010,801 | | | | — | | | | — | |
| | | | | | | | | | | | | | | | | | | | | | | | |
Transfers Into Level 2 | | | — | | | | — | | | | — | | | | 711,506 | | | | — | | | | — | |
Transfers Out of Level 2 | | | — | | | | (83,280 | ) | | | — | | | | (2,722,307 | ) | | | — | | | | — | |
| | | | | | | | | | | | | | | | | | | | | | | | |
Net Transfers Into/(Out of ) Level 2 | | $ | — | | | $ | (83,280 | ) | | $ | — | | | $ | (2,010,801 | ) | | $ | — | | | $ | — | |
| | | | | | | | | | | | | | | | | | | | | | | | |
Below is a reconciliation that details the activity of securities in Level 3 during the current fiscal period:
| | | | | | | | | | | | | | | | | | | | | | | | |
| | | The
Tocqueville
Fund | | | The
Tocqueville
Opportunity
Fund | | | The
Tocqueville
International
Value Fund | | | The
Tocqueville
Gold Fund | | | The
Delafield
Fund | | | The
Tocqueville
Select
Fund | |
Beginning Balance—November 1, 2012 | | $ | — | | | $ | — | | | $ | — | | | $ | 58,132,557 | | | $ | — | | | $ | — | |
Purchases | | | — | | | | — | | | | — | | | | — | | | | — | | | | — | |
Sales | | | — | | | | — | | | | — | | | | — | | | | — | | | | — | |
Realized gains | | | — | | | | — | | | | — | | | | — | | | | — | | | | — | |
Realized losses | | | — | | | | — | | | | — | | | | — | | | | — | | | | — | |
Change in unrealized depreciation | | | — | | | | — | | | | — | | | | (4,874,800 | ) | | | — | | | | — | |
Transfers in/(out) of Level 3 | | | — | | | | — | | | | — | | | | — | | | | — | | | | — | |
| | | | | | | | | | | | | | | | | | | | | | | | |
Ending Balance—April 30, 2013 | | $ | — | | | $ | — | | | $ | — | | | $ | 53,257,757 | | | $ | — | | | $ | — | |
| | | | | | | | | | | | | | | | | | | | | | | | |
The movement from Level 2 to Level 1 in the Opportunity Fund was due to the sales restrictions being lifted on a security during the period ended April 30, 2013. The movement from Level 2 to Level 1 in the Gold Fund was due to the release of restrictions on securities and the conversion of warrants to common stock. The movement from Level 1 to Level 2 in the Gold Fund was from the securities being priced using the mean of the bid and ask price due to the lack of trading volume on April 30, 2013. Transfers between levels are recognized at the end of the reporting period.
The Tocqueville Gold Fund
| | | | | | | | | | |
Type of Security | | Industry | | Fair Value at 4/30/2013 | | Valuation Techniques | | Unobservable Inputs | | Range |
Common Stocks | | | | | | | | | | |
| | Gold Related | | $5,530,946 | | Latest company financing price | | Financing prices | | N/A |
| | Other Precious Metals Related | | 17,560,609 | | Discounted Cash Flow and Net Asset Value of Resources | | Discount applied to cash flows | | 5% |
| | | | | | | Discount to market value of resources | | 25% -65% |
| | Other | | 4,175,257 | | Latest company financing price | | Financing prices | | N/A |
| | | | 5,837,000 | | Cost | | Cost | | N/A |
Private Fund | | Gold Related | | 20,153,945 | | NAV from Custodian | | Illiquidity discount | | 2% |
The significant unobservable inputs used in the fair value measurement of the Trust’s common stocks are the most recent financing prices of the portfolio company, which approximates the companies’ value in the market place; net asset value of resources and the discounted cash flows from the sale of the mineral resources, which approximates what the company could receive selling its mineral deposits once mined; and the cost of the portfolio security, which approximates fair value in this case. The significant unobservable inputs for the private fund is the discount for illiquidity applied to the Net Asset Value per share determined by the private fund’s custodian.
Significant changes in the companies’ ability to receive financing for new projects in the future would be an indication of the companies’ financial position and market value. An increase in the discount applied to the value of resources, future expected cash flows, or to account for illiquidity would decrease the value of the portfolio security.
The Trust’s valuation procedures have been adopted by the Trust’s Board of Trustees, which has established a Valuation Committee to oversee the valuation process. The Valuation Committee meets on an as needed basis to evaluate changes in the valuation of portfolio securities. The full findings and valuations are then reviewed quarterly by the Independent Trustees.
e) Derivative instruments and hedging activities
The Funds’ Adviser may use derivative instruments, such as purchased call options and forward currency contracts, as a means to manage exposure to different types of risk, including market risk and exchange rate risk. The Trust has adopted disclosure standards in order to enable the investor to understand how and why an entity used derivatives, how derivatives are accounted for, and how derivatives affect an entity’s results of operations and financial position.
In the Opportunity Fund, the Advisor used purchased call options to adjust market risk on the underlying equity security that was held in the Fund.
In the International Value Fund, the Advisor used forward currency contracts to adjust exposure to foreign exchange rate risk.
Balance Sheet—Values of Derivative Instruments as of April 30, 2013.
The Tocqueville Opportunity Fund
| | | | | | | | | | | | |
| | | Asset Derivatives | | | Liability Derivatives | |
| Derivatives not accounted for as hedging instruments | | Balance Sheet
Location | | Value | | | Balance Sheet
Location | | Value | |
Purchased Call Options | | Investments,
at value | | $ | 60,500 | | | | | $ | — | |
| | | | | | | | | | | | |
Total | | | | $ | 60,500 | | | | | $ | — | |
| | | | | | | | | | | | |
The Tocqueville International Value Fund
| | | | | | | | | | | | |
| | | Asset Derivatives | | | Liability Derivatives | |
| Derivatives not accounted for as hedging instruments | | Balance Sheet
Location | | Value | | | Balance Sheet
Location | | Value | |
Forward Currency Contracts | | | | $ | — | | | Depreciation
on forward
currency
contracts | | $ | (615,846 | ) |
| | | | | | | | | | | | |
Total | | | | $ | — | | | | | $ | (615,846 | ) |
| | | | | | | | | | | | |
The Effect of Derivative Instruments on the Statement of Operations for the six months ended April 30, 2013.
The Tocqueville Opportunity Fund
| | | | | | | | |
| | | Net Realized
Gain on Derivatives | | | Net Change in
Unrealized
Appreciation on
Derivatives | |
Purchased Call Options | | $ | — | | | $ | 4,474 | |
| | | | | | | | |
Total | | $ | — | | | $ | 4,474 | |
| | | | | | | | |
The Tocqueville International Value Fund
| | | | | | | | |
| | | Net Realized
Gain on Forward
Currency Contracts | | | Net Change in
Unrealized
Depreciation on
Forward Currency
Contracts | |
Foreign Currency Forward Contract | | $ | 1,827,046 | | | $ | (796,577 | ) |
| | | | | | | | |
Total | | $ | 1,827,046 | | | $ | (796,577 | ) |
| | | | | | | | |
Derivatives Risk
The risks of using the types of derivatives in which the Funds may engage include the risk that movements in the value of the derivative may not fully offset or complement instruments currently held in the Funds in the manner intended by the Adviser; the risk that the counterparty to a derivative contract may fail to comply with their obligations to the Fund; the risk that the derivative may not possess a liquid secondary market at a time when the Fund would look to disengage the position; the risk that additional capital from the Fund may be called upon to fulfill the conditions of the derivative contract; and the risk that the cost of the derivative contracts may reduce the overall returns experienced by the Funds. The measurement of risks associated with these instruments is meaningful only when all related offsetting transactions are considered. The use of purchased call options creates leverage in the Fund. The use of forward currency contracts do not create leverage in the Funds.
The average monthly market value of call options during the period ended April 30, 2013 was as follows:
| | | | |
| | | Opportunity
Fund | |
Purchased Call Options | | $ | 26,133 | |
Written Call Options | | $ | — | |
The average monthly notional amount of forward currency contracts during the period ended April 30, 2013 was as follows:
| | | | |
| | | International
Value Fund | |
Long Positions | | $ | 1,428,929 | |
Forward Currency Contracts | | | | |
Short Positions | | $ | 12,324,432 | |
Forward Currency Contracts | | | | |
f) Foreign currency translation
Investments and other assets and liabilities denominated in foreign currencies are translated to U.S. dollars at the prevailing rates of exchange, in accordance with the Trust’s Portfolio Securities Valuation and Foreign Exchange Contracts Procedures. The Tocqueville Fund, The Tocqueville Opportunity Fund, The Tocqueville International Value Fund, The Tocqueville Gold Fund, The Delafield Fund and The Tocqueville Select Fund have engaged in transactions in securities denominated in foreign currencies and, as a result, entered into foreign exchange contracts. These Funds are exposed to additional market risk as a result of changes in the value of the underlying currency in relation to the U.S. dollar. Risks include potential inability of counterparties to meet the terms of their contracts. The value of foreign currency contracts are marked-to-market on a daily basis, which reflects the changes in the market value of the contract at the close of each day’s trading, resulting in daily unrealized gains and/or losses. When the contracts are closed, the Funds recognize a realized gain or loss.
The Funds do not isolate that portion of the results of operations resulting from changes in foreign exchange rates on investments from the fluctuations arising from changes in market prices of securities held. Such fluctuations are included with the net realized and unrealized gain or loss from investments.
Reported net realized foreign exchange gains or losses arise from sales of foreign currencies, currency gains or losses realized between the trade and settlement dates on securities transactions, the differences between the amounts of dividends, interest, and foreign withholding taxes recorded on the Fund’s books, and the U.S. dollar equivalent of the amounts actually received or paid. Net unrealized foreign exchange gains and losses arise from changes in the value of assets and liabilities other than investments in securities at the end of the fiscal period, resulting from changes in the exchange rates.
g) Written option accounting
The Tocqueville Opportunity Fund, The Tocqueville International Value Fund, The Tocqueville Select Fund and The Tocqueville Gold Fund may write (sell) covered call options to hedge portfolio investments. When the Funds write (sell) an option, an amount equal to the premium received by the Funds is included in the Statements of Assets and Liabilities as an asset and an equivalent liability. The amount of the liability is subsequently marked-to-market to reflect the current value of the option written. By writing an option, the Funds may become obligated during the term of the option to deliver or purchase the securities underlying the option at the exercise price if the option is exercised. Option contracts are valued at the last sales price reported on the date of obligation. If the seller defaults and the value of the collateral declines or if bankruptcy proceedings are commenced with respect to the seller of the security, realization of the collateral by the Funds may be delayed or limited.
h) Dividends and distributions to shareholders
Dividends to shareholders are recorded on the ex-dividend date. Dividends from net investment income are declared and paid annually by the Funds. Distributions of net realized capital gains, if any, will be declared and paid at least annually. Income and capital gain distributions are determined in accordance with income tax regulations which may differ from generally accepted accounting principles. Permanent differences between financial and tax reporting may result in reclassification to capital stock.
i) Use of estimates
The preparation of financial statements in conformity with accounting principles generally accepted in the United States of America requires management to make estimates and assumptions that affect the reported amounts of assets and liabilities and disclosure of contingent assets and liabilities at the date of the financial statements and the reported amounts of revenues and expenses during the reporting period. Actual results could differ from those estimates.
j) Indemnification
In the normal course of business the Funds enter into contracts that contain general indemnification clauses. The Funds’ maximum exposure under these arrangements is unknown, as this would involve future claims against a Fund that have not yet occurred. Based on experience, the Funds expect the risk of loss to be remote.
k) Recent accounting pronouncement
In January, 2013, the FASB issue ASU No. 2013-01 “Clarifying the Scope of Disclosures about Offsetting Assets and Liabilities” in GAAP and International Reporting Financial Standards (“IFRS”). ASU No. 2013-01 clarifies ASU No. 2011-11, Disclosures about Offsetting Assets and Liabilities to increase comparability and reduce presentation differences between financial statements prepare in accordance with GAAP and financial statements prepared in accordance with IFRS. This requires increased disclosure about derivative instruments that are offset in a reporting entity’s Statement of Assets and Liabilities and derivative instruments that are subject to a master netting agreement (“MNA”). Specifically, the ASU requires reporting entities to present separately for assets and liabilities, a) the gross amounts of those recognized assets and recognized liabilities, b) the amounts offset to determine the net amounts presented in the Statement of Assets and Liabilities, c) The net amount presented in the Statement of Assets and Liabilities, d) the amounts subject to an enforceable MNA not included in (b), and e) the net amount after deducting the amounts from (d) and (c). The effective date of the ASU is for interim and annual periods beginning on or after January 1, 2013. The Trust is currently evaluating the impact of the ASU on its financial statements.
l) Subsequent events evaluation
In preparing these financial statements, the Trust has evaluated events and transactions for potential recognition or disclosure resulting from subsequent events through the date financial statements were available to be issued.
3. FEDERAL INCOME TAX
There is no tax liability resulting from unrecognized tax benefits relating to uncertain income tax positions taken or expected to be taken on the tax return for the fiscal year-end October 31, 2012, or for any other tax years which are open for exam. As of October 31, 2012, open tax years include the tax years ended October 31, 2009 through 2012. The Trust is also not aware of any tax positions for which it is reasonably possible that the total amounts of unrecognized tax benefits
will significantly change in the next six months. The Fund recognizes interest and penalties, if any, related to unrecognized tax benefits as income tax expense in the Statement of Operations. During the period, the Funds did not incur any interest or penalties.
Provision for federal income taxes or excise taxes has not been made since the Funds have elected to be taxed as Regulated Investment Companies and intend to distribute substantially all taxable income to shareholders and otherwise comply with the provisions of the Internal Revenue Code applicable to Regulated Investment Companies. Distributions from net realized gains for book purposes may include short-term capital gains which are included as ordinary income to shareholders for tax purposes. Additionally, U.S. generally accepted accounting principles require that certain components of net assets relating to permanent differences be reclassified between financial and tax reporting. These reclassifications have no effect on net assets or net asset value per share. For the period ended October 31, 2012, the following table shows the reclassifications made:
| | | | | | | | | | | | |
| | | Undistributed
Net Investment
Income/(Loss) | | | Accumulated Net
Realized
Gain/(Loss) | | | Paid In Capital | |
Tocqueville Fund | | $ | (369,993 | ) | | $ | 369,993 | | | $ | — | |
Opportunity Fund | | | 62,890 | | | | (358 | ) | | | (62,532 | ) |
International Value Fund | | | 194,750 | | | | (184,233 | ) | | | (10,517 | ) |
Gold Fund | | | 1,178,078 | | | | 466,383 | | | | (1,644,461 | ) |
Delafield Fund | | | 222,458 | | | | (226,820 | ) | | | 4,362 | |
Select Fund | | | 37,055 | | | | (852 | ) | | | (36,203 | ) |
The permanent differences primarily relate to net operating losses and foreign currency reclasses.
As of October 31, 2012, the components of accumulated earnings (losses) for income tax purposes were as follows:
| | | | | | | | | | | | | | | | | | | | | | | | |
| | | Tocqueville
Fund | | | Opportunity
Fund | | | International
Value
Fund | | | Gold Fund | | | Delafield
Fund | | | Select
Fund | |
Tax cost of investments | | $ | 314,428,795 | | | $ | 57,284,392 | | | $ | 206,498,483 | | | $ | 1,762,889,825 | | | $ | 1,207,589,382 | | | $ | 80,832,159 | |
| | | | | | | | | | | | | | | | | | | | | | | | |
| | | | | | | | | | | | | | | | | | | | | | | | |
Unrealized appreciation | | | 70,662,725 | | | | 11,134,061 | | | | 24,625,645 | | | | 953,942,757 | | | | 214,838,649 | | | | 12,604,632 | |
Unrealized depreciation | | | (19,622,154 | ) | | | (2,947,384 | ) | | | (16,874,740 | ) | | | (264,507,117 | ) | | | (75,084,195 | ) | | | (8,607,689 | ) |
| | | | | | | | | | | | | | | | | | | | | | | | |
Net unrealized appreciation | | | 51,040,571 | | | | 8,186,677 | | | | 7,750,905 | | | | 689,435,640 | | | | 139,754,454 | | | | 3,996,943 | |
| | | | | | | | | | | | | | | | | | | | | | | | |
Undistributed operating income | | | 3,422,977 | | | | — | | | | 3,019,379 | | | | — | | | | — | | | | — | |
Undistributed long-term gains | | | — | | | | — | | | | — | | | | 53,161,462 | | | | 80,535,118 | | | | 3,451,578 | |
| | | | | | | | | | | | | | | | | | | | | | | | |
Distributable earnings | | | 3,422,977 | | | | — | | | | 3,019,379 | | | | 53,161,462 | | | | 80,535,118 | | | | 3,451,578 | |
| | | | | | | | | | | | | | | | | | | | | | | | |
Other accumulated gain/(loss) | | | (23,986,002 | ) | | | (5,494,389 | ) | | | (15,833,841 | ) | | | (651 | ) | | | (1,480,317 | ) | | | (282,004 | ) |
| | | | | | | | | | | | | | | | | | | | | | | | |
Total accumulated gain/(loss) | | $ | 30,477,546 | | | $ | 2,692,288 | | | $ | (5,063,557 | ) | | $ | 742,596,451 | | | $ | 218,809,255 | | | $ | 7,166,517 | |
| | | | | | | | | | | | | | | | | | | | | | | | |
The difference between book-basis and tax-basis unrealized appreciation is attributable primarily to wash sale deferrals and passive foreign investment companies (PFIC’s).
The tax character of distributions paid during the periods ended October 31, 2012 and 2011 was as follows:
| | | | | | | | | | | | |
| | | October 31, 2012 | |
| | | Ordinary
Income | | | Long Term
Capital
Gain | | | Total | |
Tocqueville Fund | | $ | 5,526,502 | | | $ | — | | | $ | 5,526,502 | |
Opportunity Fund | | | — | | | | — | | | | — | |
International Value Fund | | | 2,105,224 | | | | — | | | | 2,105,224 | |
Gold Fund | | | 15,486,206 | | | | 26,796,483 | | | | 42,282,689 | |
Delafield Fund | | | — | | | | 16,542,579 | | | | 16,542,579 | |
Select Fund | | | — | | | | 766,158 | | | | 766,158 | |
| |
| | | October 31, 2011 | |
| | | Ordinary
Income | | | Long Term
Capital
Gain | | | Total | |
Tocqueville Fund | | $ | 7,457,179 | | | $ | — | | | $ | 7,457,179 | |
Opportunity Fund | | | — | | | | — | | | | — | |
International Value Fund | | | 831,651 | | | | — | | | | 831,651 | |
Gold Fund | | | — | | | | 46,368,277 | | | | 46,368,277 | |
Delafield Fund | | | — | | | | — | | | | — | |
Select Fund | | | 282,014 | | | | 1,829,993 | | | | 2,112,007 | |
The Fund designated as long-term capital gain dividend, pursuant to Internal Revenue Code Section 852(b)(3), the amount necessary to reduce the earnings and profits of the Funds related to net capital gain to zero for the tax years ended October 31, 2012 and 2011.
At October 31, 2012 the Opportunity Fund, Delafield Fund and Select Fund had net Post-October capital losses of $413,759, $1,480,317, and $273,207, respectively.
At October 31, 2012 certain Funds had tax basis capital losses which may be carried forward to offset future capital gains as shown below.
| | | | | | | | | | | | |
| | | Capital losses Expiring | |
| | | 10/31/2017 | | | Indefinite ST | | | Indefinite LT | |
Tocqueville Fund | | | 23,986,002 | | | | — | | | | — | |
Opportunity Fund | | | 5,080,630 | | | | — | | | | — | |
International Value Fund | | | 7,254,600 | | | | 5,364,413 | | | | 3,206,554 | |
To the extent that Funds listed above may realize future net capital gains, those gains will be offset by any of their unused respective capital loss carryforwards
On December 22, 2010, the Regulated Investment Company Modernization Act of 2010 (the “Act”) was enacted, which changed various technical rules governing the tax treatment of RICs. The changes are generally effective for taxable years beginning after the date of enactment. One of the more prominent changes addresses capital loss carryforwards. Under the Act, each Fund will be permitted to carry forward capital losses incurred in taxable years beginning after the date of enactment for an unlimited period. However, any losses incurred during those future taxable years will be required to be utilized prior to the losses incurred in pre-enactment years, which carry an expiration date. As a result of this ordering rule, pre-enactment capital loss carryforwards may be more likely to expire unused. Additionally, post-enactment capital loss carryforwards will retain their character as either short-term or long-term capital losses rather than being considered all short-term as permitted under previous regulation.
4. INVESTMENT ADVISORY AND OTHER AGREEMENTS
Tocqueville Asset Management L.P. (“Tocqueville”) is the investment adviser (the “Adviser”) to the Trust under Investment Advisory Agreements approved by shareholders. For its services, Tocqueville receives fees from The Tocqueville Fund, calculated daily and payable monthly, at an annual rate of 0.75% on the first $1 billion of the average daily net assets of the Fund, and 0.65% of the average daily net assets in excess of $1 billion. Tocqueville receives fees from The Tocqueville Opportunity Fund, calculated daily and payable monthly, at an annual rate of 0.75% on the first $500 million of the average daily net assets of the Fund, and 0.65% of the average daily net assets in excess of $500 million. Tocqueville receives fees from The Tocqueville International Value Fund, calculated daily and payable monthly, at an annual rate of 1.00% on the first $1 billion of the average daily net assets of the Fund, and 0.75% of the average daily net assets in excess of $1 billion. Tocqueville receives fees from The Tocqueville Gold Fund, calculated daily and payable monthly, at an annual rate of 1.00% on the first $500 million of the average daily net assets of the Fund, 0.75% of the average daily net assets in excess of $500 million but not exceeding $1 billion, and 0.65% of the average daily net assets in excess of $1 billion. Tocqueville receives fees from The Delafield Fund, calculated daily and payable monthly, at an annual rate of 0.80% on the first $250 million of net assets of the Fund; 0.75% on the next $250 million of net assets of the Fund; 0.70% on the next $500 million of net assets of the Fund; and 0.65% on all net assets of the Fund over $1 billion. Tocqueville receives fees from The Tocqueville Select Fund, calculated daily and payable monthly, at an annual rate of 0.80% on all net assets of the Fund.
With respect to The Tocqueville Fund, effective October 31, 2012, the Adviser has contractually agreed to waive its advisory fees and/or reimburse expenses in order to ensure that The Tocqueville Fund’s total annual operating expenses do not exceed 1.25% of its average daily net assets (excluding taxes, interest expense, acquired fund fees and expenses, or extraordinary expenses such as litigation). The Expense Limitation Agreement will remain in effect until March 1, 2014. For the six months ended April 30, 2013, the Adviser waived $50,895 of the advisory fee. Such amount is not subject to recoupment by the Adviser.
With respect to The Tocqueville International Value Fund, effective January 1, 2013, the Adviser has contractually agreed to waive its advisory fees and/or reimburse expenses in order to ensure that The Tocqueville International Value Fund’s total annual operating expenses do not exceed 1.25% of its average daily net assets (excluding taxes, interest expense, acquired fund fees and expenses, or extraordinary expenses such as litigation). The Expense Limitation Agreement will remain in effect until March 1, 2014. For the six months ended April 30, 2013, the Adviser waived $224,965 of the advisory fee. Such amount is not subject to recoupment by the Adviser.
Pursuant to an Administrative Services Agreement, each Fund pays to the Adviser a fee computed and paid monthly at an annual rate of 0.15% of the average daily net assets of the Fund. For the six months ended April 30, 2013, the
Adviser has made payments of $43,759, $8,204, $28,061, $235,082, $180,534, and $10,341 to U.S. Bancorp Fund Services, LLC for services provided under a Sub-Administration Agreement for The Tocqueville Fund, The Tocqueville Opportunity Fund, The Tocqueville International Value Fund, The Tocqueville Gold Fund, The Delafield Fund and The Tocqueville Select Fund, respectively.
Tocqueville Securities, L.P. (the “Distributor”), an affiliate of Tocqueville, acts as distributor for shares of the Trust. Each Fund adopted a distribution and service plan pursuant to Rule 12b-1 of the 1940 Act. Pursuant to the plans, each Fund pays to the Distributor distribution and service fees of 0.25% per annum of its average daily net assets.
Commissions earned by the Distributor for services rendered as a registered broker-dealer in securities transactions for The Tocqueville Fund, The Tocqueville Opportunity Fund, The Tocqueville International Value Fund, The
Tocqueville Gold Fund, The Delafield Fund and The Tocqueville Select Fund for the six months ended April 30, 2013, were $75,468, $49,938, $8,337, $3,000, $9,000, and $19,512, respectively.
5. CAPITAL SHARE TRANSACTIONS.
Transactions in capital shares for each Fund were as follows:
| | | | | | | | |
| | | For the Six-Months
Ended
April 30, 2013
(Unaudited) | | | For the Year
Ended
October 31, 2012 | |
| The Tocqueville Fund | | Shares | | | Shares | |
Shares sold | | | 657,981 | | | | 2,417,617 | |
Shares issued to holders in reinvestment dividends | | | 171,255 | | | | 210,977 | |
Shares redeemed | | | (2,642,435 | ) | | | (9,561,092 | ) |
| | | | | | | | |
Net decrease | | | (1,813,199 | ) | | | (6,932,498 | ) |
| | |
| The Tocqueville Opportunity Fund | | | | | | |
Shares sold | | | 177,357 | | | | 1,838,335 | |
Shares issued to holders in reinvestment dividends | | | – | | | | – | |
Shares redeemed | | | (388,990 | ) | | | (823,770 | ) |
| | | | | | | | |
Net increase (decrease) | | | (211,633 | ) | | | 1,014,565 | |
| | |
| The Tocqueville International Value Fund | | | | | | |
Shares sold | | | 1,417,528 | | | | 6,098,494 | |
Shares issued to holders in reinvestment dividends | | | 197,585 | | | | 139,955 | |
Shares redeemed | | | (2,280,762 | ) | | | (4,162,884 | ) |
| | | | | | | | |
Net increase (decrease) | | | (665,649 | ) | | | 2,075,565 | |
| | |
| The Tocqueville Gold Fund | | | | | | |
Shares sold | | | 7,856,577 | | | | 10,956,862 | |
Shares issued to holders in reinvestment dividends | | | 783,134 | | | | 539,233 | |
Shares redeemed | | | (10,176,449 | ) | | | (10,200,599 | ) |
| | | | | | | | |
Net increase (decrease) | | | (1,536,738 | ) | | | 1,295,496 | |
| | | | | | | | |
| | | For the Six-Months
Ended
April 30, 2013
(Unaudited) | | | For the Year
Ended
October 31, 2012 | |
The Delafield Fund | | Shares | | | Shares | |
Shares sold | | | 6,257,606 | | | | 12,276,891 | |
Shares issued to holders in reinvestment dividends | | | 2,479,103 | | | | 562,887 | |
Shares redeemed | | | (6,738,982 | ) | | | (14,055,439 | ) |
| | | | | | | | |
Net increase (decrease) | | | 1,997,727 | | | | (1,215,661 | ) |
| | |
| The Tocqueville Select Fund | | | | | | |
Shares sold | | | 488,262 | | | | 2,720,578 | |
Shares issued to holders in reinvestment dividends | | | 280,128 | | | | 62,056 | |
Shares redeemed | | | (1,481,466 | ) | | | (1,803,804 | ) |
| | | | | | | | |
Net increase (decrease) | | | (713,076 | ) | | | 978,830 | |
6. FUND SHARE TRANSACTIONS
The Funds currently offer only one class of shares of beneficial interest. A redemption fee of 2.00% is imposed on redemptions of shares held 90 days or fewer. This fee is retained by each Fund and is credited to paid in capital. Redemptions to which the fee applies include redemptions of shares resulting from an exchange made pursuant to the Exchange Privilege, as defined in the Trust’s Prospectus dated February 28, 2013. For a more detailed description of when the redemption fee does not apply, please see the Trust’s Prospectus.
7. INVESTMENT TRANSACTIONS
Purchases and sales of investment securities (excluding short-term instruments) for the period ended April 30, 2013 are summarized below.
| | | | | | | | | | | | | | | | | | | | | | | | |
| | | Tocqueville
Fund | | | Opportunity
Fund | | | International
Value Fund | | | Gold Fund | | | Delafield
Fund | | | Select
Fund | |
Purchases: | | $ | 27,314,076 | | | $ | 36,421,638 | | | $ | 55,618,197 | | | $ | 66,454,303 | | | $ | 231,847,597 | | | $ | 9,797,348 | |
| | | | | | | | | | | | | | | | | | | | | | | | |
Sales: | | $ | 75,139,418 | | | $ | 39,958,573 | | | $ | 57,771,578 | | | $ | 174,457,640 | | | $ | 213,334,548 | | | $ | 25,401,531 | |
| | | | | | | | | | | | | | | | | | | | | | | | |
U.S. Government Security Purchases: | | $ | — | | | $ | — | | | $ | — | | | $ | — | | | $ | — | | | $ | — | |
| | | | | | | | | | | | | | | | | | | | | | | | |
U.S. Government Security Sales: | | $ | — | | | $ | — | | | $ | — | | | $ | — | | | $ | — | | | $ | — | |
| | | | | | | | | | | | | | | | | | | | | | | | |
8. TRANSACTIONS WITH AFFILIATES
The following issuers are affiliated with the Funds; that is, the Adviser had control of 5% or more of the outstanding voting securities during the period from November 1, 2012 through April 30, 2013. As defined in Section (2)(a)(3) of the Investment Company Act of 1940; such issues are:
| | | | | | | | | | | | | | | | | | | | | | | | | | | | | | | | | | | | | | | | | | | | |
| | | November 1, 2012 | | | Additions | | | Reductions | | | Share
Balance at
April 30,
2013 | | | Dividend
Income | | | Realized
Gain/(Loss) | | | Value at
April 30,
2013 | | | Cost at
April 30,
2013 | |
Issuer Name | | Share
Balance | | | Cost | | | Shares | | | Cost | | | Shares | | | Cost | | | | | | |
The Tocqueville Gold Fund | | | | | | | | | | | | | | | | | | | | | | | | | | | | | | | | | | | | | |
Atac Resources Ltd. | | | 10,261,700 | | | $ | 37,121,703 | | | | 702,000 | | | $ | 1,968,031 | | | | — | | | $ | — | | | | 10,963,700 | | | $ | — | | | $ | — | | | $ | 12,406,192 | | | $ | 39,089,734 | |
Atac Resources Ltd. (b) | | | 702,000 | | | | 1,968,031 | | | | — | | | | — | | | | (702,000 | ) | | | (1,968,031 | ) | | | — | | | | — | | | | — | | | | — | | | | — | |
Atac Resources Ltd. Warrants | | | 351,000 | | | | — | | | | — | | | | — | | | | (351,000 | ) | | | — | | | | — | | | | — | | | | — | | | | — | | | | — | |
Barisan Gold Corp. | | | 877,100 | | | | — | | | | — | | | | — | | | | — | | | | — | | | | 877,100 | | | | — | | | | — | | | | 39,178 | | | | — | |
Bear Creek Mining Corp. | | | 6,061,800 | | | | 23,977,515 | | | | 1,351,400 | | | | 4,783,666 | | | | — | | | | — | | | | 7,413,200 | | | | — | | | | — | | | | 18,322,366 | | | | 28,761,181 | |
Blue Gold Mining, Inc. (a)(c) | | | 4,000,000 | | | | 3,845,969 | | | | — | | | | — | | | | (4,000,000 | ) | | | (3,845,969 | ) | | | — | | | | — | | | | — | | | | — | | | | — | |
Blue Gold Mining, Inc. Warrants (a)(c) | | | 2,000,000 | | | | — | | | | — | | | | — | | | | (2,000,000 | ) | | | — | | | | — | | | | — | | | | — | | | | — | | | | — | |
Corvus Gold, Inc. | | | 2,079,901 | | | | 1,617,492 | | | | — | | | | — | | | | — | | | | — | | | | 2,079,901 | | | | — | | | | — | | | | 1,478,810 | | | | 1,617,492 | |
Corvus Gold, Inc. | | | 1,500,000 | | | | 1,002,144 | | | | — | | | | — | | | | — | | | | — | | | | 1,500,000 | | | | — | | | | — | | | | 1,072,013 | | | | 1,002,144 | |
Corvus Gold, Inc. | | | — | | | | — | | | | 4,600,000 | | | | 3,937,233 | | | | — | | | | — | | | | 4,600,000 | | | | — | | | | — | | | | 3,221,758 | | | | 3,937,233 | |
East Asia Minerals Corp. | | | 10,544,400 | | | | 21,793,116 | | | | — | | | | — | | | | — | | | | — | | | | 10,544,400 | | | | — | | | | — | | | | 1,569,963 | | | | 21,793,116 | |
East Asia Minerals Corp. Warrants | | | 6,500,000 | | | | — | | | | — | | | | — | | | | — | | | | — | | | | 6,500,000 | | | | — | | | | — | | | | 35,486 | | | | — | |
Eidesis Special Opportunities II LP (a) | | | 25,000 | | | | 25,000,000 | | | | — | | | | — | | | | — | | | | — | | | | 25,000 | | | | — | | | | — | | | | 20,153,945 | | | | 25,000,000 | |
GoGold Resources, Inc. | | | 8,100,000 | | | | 9,990,010 | | | | — | | | | — | | | | — | | | | — | | | | 8,100,000 | | | | — | | | | — | | | | 9,246,116 | | | | 9,990,010 | |
GoGold Resources, Inc. Warrants | | | 4,050,000 | | | | — | | | | — | | | | — | | | | — | | | | — | | | | 4,050,000 | | | | — | | | | — | | | | 974,862 | | | | — | |
Gold Bullion International LLC (a) | | | 5,000,000 | | | | 5,000,000 | | | | — | | | | — | | | | — | | | | — | | | | 5,000,000 | | | | — | | | | — | | | | 5,837,000 | | | | 5,000,000 | |
Gold Resource Corp. | | | 3,655,997 | | | | 37,246,000 | | | | — | | | | — | | | | (600,000 | ) | | | (2,400,000 | ) | | | 3,055,997 | | | | 1,247,159 | | | | 5,068,320 | | | | 31,293,409 | | | | 34,846,000 | |
International Tower Hill Mines Ltd. | | | 5,738,836 | | | | 20,953,121 | | | | — | | | | — | | | | — | | | | — | | | | 5,738,836 | | | | — | | | | — | | | | 5,681,448 | | | | 20,953,121 | |
International Tower Hill Mines Ltd. | | | 5,666,667 | | | | 33,656,021 | | | | 1,923,077 | | | | 4,974,877 | | | | — | | | | — | | | | 7,589,744 | | | | — | | | | — | | | | 7,608,955 | | | | 38,630,898 | |
International Tower Hill Mines Ltd. (b) | | | 1,923,077 | | | | 4,974,877 | | | | — | | | | — | | | | (1,923,077 | ) | | | (4,974,877 | ) | | | — | | | | — | | | | — | | | | — | | | | — | |
Mag Silver Corp. | | | 1,218,000 | | | | 12,876,363 | | | | 1,742,700 | | | | 18,687,456 | | | | — | | | | — | | | | 2,960,700 | | | | — | | | | — | | | | 22,382,892 | | | | 31,563,819 | |
Plata Latina Minerals Corp. | | | — | | | | — | | | | 2,000,000 | | | | 797,806 | | | | — | | | | — | | | | 2,000,000 | | | | — | | | | — | | | | 505,832 | | | | 797,806 | |
Plata Latina Minerals Corp. Warrants | | | — | | | | — | | | | 1,000,000 | | | | — | | | | — | | | | — | | | | 1,000,000 | | | | — | | | | — | | | | — | | | | — | |
Primero Mining Corp. | | | 4,840,700 | | | | 24,573,319 | | | | — | | | | — | | | | — | | | | — | | | | 4,840,700 | | | | — | | | | — | | | | 28,589,176 | | | | 24,573,319 | |
Primero Mining Corp. Warrants | | | 1,848,400 | | | | — | | | | — | | | | — | | | | — | | | | — | | | | 1,848,400 | | | | — | | | | — | | | | 1,853,079 | | | | — | |
Rockhaven Resources Ltd. | | | 5,000,000 | | | | 6,265,337 | | | | — | | | | — | | | | — | | | | — | | | | 5,000,000 | | | | — | | | | — | | | | 794,084 | | | | 6,265,337 | |
Scorpio Mining Corp. | | | 25,668,419 | | | | 23,975,473 | | | | — | | | | — | | | | — | | | | — | | | | 25,668,419 | | | | — | | | | — | | | | 11,856,243 | | | | 23,975,473 | |
Scorpio Mining Corp. | | | 522,400 | | | | 984,285 | | | | — | | | | — | | | | — | | | | — | | | | 522,400 | | | | — | | | | — | | | | 238,527 | | | | 984,285 | |
Silver Range Resources Ltd. | | | 3,450,000 | | | | — | | | | — | | | | — | | | | — | | | | — | | | | 3,450,000 | | | | — | | | | — | | | | 547,918 | | | | — | |
Silver Range Resources Ltd. Warrants | | | 1,725,000 | | | | — | | | | — | | | | — | | | | (1,725,000 | ) | | | — | | | | — | | | | — | | | | — | | | | — | | | | — | |
Strategic Metals Ltd. | | | 10,926,900 | | | | 15,810,172 | | | | — | | | | — | | | | — | | | | — | | | | 10,926,900 | | | | — | | | | — | | | | 5,260,356 | | | | 15,810,172 | |
| | | | | | | | | | | | | | | | | | | | | | | | | | | | | | | | | | | | | | | | | | | | |
| | | November 1, 2012 | | | Additions | | | Reductions | | | Share
Balance at
April 30,
2013 | | | Dividend
Income | | | Realized
Gain/(Loss) | | | Value at
April 30,
2013 | | | Cost at
April 30,
2013 | |
Issuer Name | | Share
Balance | | | Cost | | | Shares | | | Cost | | | Shares | | | Cost | | | | | | |
Sunshine Mining & Refining (a) | | | 1,633,545 | | | $ | 18,353,107 | | | | — | | | $ | — | | | | — | | | $ | — | | | | 1,633,545 | | | $ | — | | | $ | — | | | $ | 17,560,609 | | | $ | 18,353,107 | |
Torex Gold Mining | | | 25,250,600 | | | | 42,051,513 | | | | 9,900 | | | | 22,179 | | | | — | | | | — | | | | 25,260,500 | | | | — | | | | — | | | | 35,103,181 | | | | 42,073,692 | |
| | | | | | | | | | | | | | | | | | | | | | | | | | | | | | | | | | | | | | | | | | | | |
| | | | | | $ | 373,035,568 | | | | | | | $ | 35,171,248 | | | | | | | $ | (13,188,877 | ) | | | | | | $ | 1,247,159 | | | $ | 5,068,320 | | | $ | 243,633,398 | | | $ | 395,017,939 | |
The Delafield Fund | | | | | | | | | | | | | | | | | | | | | | | | | | | | | | | | | | | | | |
Checkpoint Systems, Inc. | | | 2,250,000 | | | $ | 34,749,063 | | | | — | | | $ | — | | | | (1,125,000 | ) | | $ | (19,998,906 | ) | | | 1,125,000 | | | $ | — | | | $ | (8,334,793 | ) | | $ | 13,016,250 | | | $ | 14,750,157 | |
Kemet Corp. | | | 2,000,000 | | | | 11,848,966 | | | | 600,000 | | | | 2,618,973 | | | | (325,000 | ) | | | (2,649,767 | ) | | | 2,275,000 | | | | — | | | | (612,589 | ) | | | 14,173,250 | | | | 11,818,172 | |
LTX-Credence Corp. | | | 2,150,000 | | | | 15,463,159 | | | | — | | | | — | | | | — | | | | — | | | | 2,150,000 | | | | — | | | | — | | | | 12,685,000 | | | | 15,463,159 | |
Maidenform Brands, Inc. | | | 625,000 | | | | 11,372,034 | | | | — | | | | — | | | | — | | | | — | | | | 625,000 | | | | — | | | | — | | | | 11,250,000 | | | | 11,372,034 | |
TrueBlue, Inc. (a) | | | 1,550,000 | | | | 20,893,292 | | | | — | | | | — | | | | (225,000 | ) | | | (3,251,285 | ) | | | 1,325,000 | | | | — | | | | 1,454,897 | | | | 27,454,000 | | | | 17,642,007 | |
Universal Stainless & Alloy | | | 425,000 | | | | 12,856,365 | | | | 2,401 | | | | 75,626 | | | | (15,500 | ) | | | (614,673 | ) | | | 411,901 | | | | — | | | | (41,902 | ) | | | 14,400,059 | | | | 12,317,318 | |
| | | | | | | | | | | | | | | | | | | | | | | | | | | | | | | | | | | | | | | | | | | | |
| | | | | | $ | 107,182,879 | | | | | | | $ | 2,694,599 | | | | | | | $ | (26,514,631 | ) | | | | | | $ | — | | | $ | (7,534,387 | ) | | $ | 92,978,559 | | | $ | 83,362,847 | |
The Tocqueville Select Fund | | | | | | | | | | | | | | | | | | | | | | | | | | | | | | | | | | | | | |
Checkpoint Systems, Inc. | | | 255,000 | | | $ | 3,303,378 | | | | — | | | $ | — | | | | (88,000 | ) | | $ | (1,405,496 | ) | | | 167,000 | | | $ | — | | | $ | (258,436 | ) | | $ | 1,932,190 | | | $ | 1,897,882 | |
Maidenform Brands, Inc. | | | 160,400 | | | | 3,362,679 | | | | — | | | | — | | | | — | | | | — | | | | 160,400 | | | | — | | | | — | | | | 2,887,200 | | | | 3,362,679 | |
Summer Infant, Inc. | | | 739,933 | | | | 3,816,381 | | | | 75,000 | | | | 155,060 | | | | — | | | | — | | | | 814,933 | | | | — | | | | — | | | | 2,330,708 | | | | 3,971,441 | |
| | | | | | | | | | | | | | | | | | | | | | | | | | | | | | | | | | | | | | | | | | | | |
| | | | | | $ | 10,482,438 | | | | | | | $ | 155,060 | | | | | | | $ | (1,405,496 | ) | | | | | | $ | — | | | $ | (258,436 | ) | | $ | 7,150,098 | | | $ | 9,232,002 | |
| | | | | | | | | | | | | | | | | | | | | | | | | | | | | | | | | | | | | | | | | | | | |
| (a) | Security is no longer an affiliated company at April 30, 2013. |
| (b) | Private security restrictions lifted during period and combined with other non restricted securities. |
| (c) | Merger and name change to Riverstone Resources, Inc. |
9. LINE OF CREDIT
The Tocqueville Fund, Opportunity Fund, International Value Fund, Gold Fund, Delafield Fund, and Select Fund each have a revolving secured credit facility with U.S. Bank, the Trust’s custodian, in the amounts of $40,000,000, $5,000,000, $15,000,000, $130,000,000, $50,000,000 and $9,500,000, respectively, for temporary emergency or extraordinary purposes, including the meeting of redemption requests that otherwise might require the untimely disposition of securities. Each Fund’s line of credit is secured by the respective fund’s assets. The lines of credit have a one year term and are reviewed annually by the Board of Trustees. The current agreements run through May 31, 2013. The interest rate as of October 31, 2012 was 2.75%. During the six months ended April 30, 2013, the Tocqueville Fund’s maximum borrowing was $4,257,000 and average borrowing was $810,301, the Opportunity Fund’s maximum borrowing was $1,368,000 and average borrowing was $62,951, the Gold Fund’s maximum borrowing was $18,790,000 and average borrowing was $2,058,098 and the Select Fund’s maximum borrowing was $426,000 and average borrowing was $3,463. This borrowing resulted in interest expenses of $12,352, $1,068, $32,838 and $96, respectively. These amounts are included in Other Expenses on the Funds’ Statement of Operations. The International Value Fund and the Delafield Fund, did not use their lines of credit.
10. OTHER EXPENSES
Other expenses include reimbursement to the Adviser for compensation of the Trust’s Chief Compliance Officer. For the six months ended April 30, 2013, reimbursement to the Adviser for compensation of the Trust’s Chief Compliance Officer from the Funds amounted to $6,506, $1,221, $4,178, $34,652, $26,904 and $1,538 for the Tocqueville Fund, Opportunity Fund, International Value Fund, Gold Fund, Delafield Fund, and Select Fund, respectively.
ADDITIONAL INFORMATION (UNAUDITED)
1. ADDITIONAL DISCLOSURE REGARDING FUND TRUSTEES AND OFFICERS
Independent Trustees
| | | | | | | | | | | | |
Name, Age and Address | | Position(s) Held with the Trust | | Term of Office and Length of Time Served (1) | | Principal Occupation During Past Five Years | | # of
Portfolios
in Fund
Complex
Overseen
By Trustee | | | Other Directorships Held by Trustee |
| | | | | |
Guy A. Main (76) 40 W. 57th St., 19th Floor New York, NY 10019 | | Trustee | | Indefinite Term, Since 2000 | | Retired. Formerly, Executive Vice President, Amwest Insurance Group, Inc. from April 1996 to January 2001; Chairman, President and Chief Executive Officer, Condor Services Inc. from April 1989 to April 1996. | | | 6 | | | Director, Amwest Insurance Group, Inc. from April 1996 to January 2001; Chairman, Association of California Insurance Companies from January 1996 to January 1998; Director, Condor Services Inc. from April 1989 to April 1996. |
| | | | | |
Charles W. Caulkins (56) 40 W. 57th St., 19th Floor New York, NY 10019 | | Trustee | | Indefinite Term, Since 2003 | | Partner, Chora Capital, LLC from June 2010 to present; Marketing Manager, L.R. Global Partners from January 2008 to May 2010; President, Arbor Marketing, Inc. from October 1994 to December 2007. | | | 6 | | | Director, Phoenix House from January 2001 to 2007; Director, Bridges to Community from July 2002 to 2006. |
| | | | | |
James W. Gerard (52) 40 W. 57th St., 19th Floor New York, NY 10019 | | Trustee | | Indefinite Term, Since 2001 | | Managing Director, North Sea Partners, January 2010 to present. Principal, Juniper Capital Group, LLC (formerly known as Argus Advisors International, LLC), from August 2003 to December 2009; Managing Director, The Chart Group from January 2001 to present; Managing Principal, Ironbound Partners from October 1998 to December 2000. | | | 6 | | | Director, American Overseas Memorial Day Association, 1988 to present; Trustee, Salisbury School, 2005 to present; Director, American Friends of Blerancourt, 1992-present; Director and Treasurer ASPCA, 1988 to 2008. |
Independent Trustees
| | | | | | | | | | | | |
Name, Age and Address | | Position(s) Held with the Trust | | Term of Office and Length of Time Served (1) | | Principal Occupation During Past Five Years | | # of
Portfolios
in Fund
Complex
Overseen
By Trustee | | | Other Directorships Held by Trustee |
| | | | | |
William F. Indoe (71) 40 W. 57th St., 19th Floor New York, NY 10019 | | Trustee | | Indefinite Term, Since 2006 | | Senior Counsel 2009-present, Partner 1976-1990, and Associate 1968-1976, Sullivan & Cromwell LLP (attorneys-at-law). | | | 6 | | | Director, Rho Capital Partners, Inc. |
| | | | | |
William J. Nolan III (65) 40 W. 57th St., 19th Floor New York, NY 10019 | | Trustee | | Indefinite Term, Since 2006 | | Retired, Executive Vice President & Treasurer PaineWebber Inc. 1997-2001. | | | 6 | | | Trustee, Adirondock Museum, Blue Mt. Lake, NY 1996 to present (Treasurer, 2000 to present). |
| | | | | |
Alexander Douglas (65) 40 W. 57th St., 19th Floor New York, NY 10019 | | Trustee | | Indefinite Term, Since 2010 | | President, CEO and owner of Spaulding Law Printing, Inc. | | | 6 | | | None |
Interested Trustees (and Officers)*
| | | | | | | | | | | | |
Name, Age and Address | | Position(s) Held with the Trust | | Term of Office and Length of Time Served (1) | | Principal Occupation During Past Five Years | | # of
Portfolios
in Fund
Complex
Overseen
By Trustee | | | Other Directorships Held by Trustee |
| | | | | |
Francois D. Sicart (69) 40 W. 57th St., 19th Floor New York, NY 10019 | | Chairman and Trustee | | Indefinite Term, Since 1987 | | Chairman, Tocqueville Management Corporation, the General Partner of Tocqueville Asset Management L.P. and Tocqueville Securities, L.P. from January 1990 to present; Chairman and Founder, Tocqueville Asset Management Corp. from December 1985 to January 1990; Vice Chairman of Tucker Anthony Management Corporation from 1981 to October 1986; Vice President (formerly general partner) among other positions with Tucker Anthony, Inc. from 1969 to January 1990. | | | 6 | | | Chairman and Director, Tocqueville Management Corporation, the General Partner of Tocqueville Asset Management L.P. and Tocqueville Securities, L.P. from January 1990 to present.
|
Interested Trustees (and Officers)*
| | | | | | | | | | | | |
Name, Age and Address | | Position(s) Held with the Trust | | Term of Office and Length of Time Served (1) | | Principal Occupation During Past Five Years | | # of
Portfolios
in Fund
Complex
Overseen
By Trustee | | | Other Directorships Held by Trustee |
| | | | | |
Robert W. Kleinschmidt (63) 40 W. 57th St., 19th Floor New York, NY 10019 | | President and Trustee | | Indefinite Term, Since 1991 | | President, Chief Investment Officer and Director, Tocqueville Management Corporation, the General Partner of Tocqueville Asset Management L.P. and Tocqueville Securities, L.P. from January 1994 to present; and Managing Director from July 1991 to January 1994; Partner, David J. Greene & Co. from May 1978 to July 1991. | | | 6 | | | President and Director, Tocqueville Management Corporation, the General Partner of Tocqueville Asset Management L.P. and Tocqueville Securities, L.P.
|
| | | | | |
Cleo Kotis (37) 40 W. 57th St., 19th Floor New York, NY 10019 | | Secretary | | Indefinite Term, Since 2010 | | Director of Operations, the Delafield Group of Tocqueville Asset Management L.P., 2009 to present; Vice President and Chief Operations Officer, the Delafield Fund, Inc. from 2005-2009; Vice President and Chief Operations Officer, Delafield Asset Management from 2005-2009; Vice President, Reich & Tang Asset Management, LLC from 2002-2009. | | | N/A | | | N/A |
| | | | | |
John Cassidy (70) 40 W. 57th St., 19th Floor New York, NY 10019 | | Treasurer | | Indefinite Term, Since 2010 | | Treasurer, Tocqueville Asset Management L.P., from May 2002 to present. | | | N/A | | | N/A |
| | | | | |
Elizabeth Bosco (64) 40 W. 57th St., 19th Floor
New York, NY 10019 | | Anti-Money Laundering Compliance Officer
| | Indefinite Term, Since 2009 | | Chief Compliance Officer (January 2009-present), Tocqueville Securities L.P.; Compliance Officer (January 1997-January 2009), Tocqueville Securities L.P. and Tocqueville Asset Management, L.P. | | | N/A | | | N/A
|
| * | “Interested person” of the Trust is defined in the 1940 Act. Mr. Sicart and Mr. Kleinschmidt are considered “interested persons” because of their affiliation with the Adviser. |
Interested Trustees (and Officers)*
| | | | | | | | | | | | |
Name, Age and Address | | Position(s) Held with the Trust | | Term of Office and Length of Time Served (1) | | Principal Occupation During Past Five Years | | # of
Portfolios
in Fund
Complex
Overseen
By Trustee | | | Other Directorships Held by Trustee |
| | | | | |
Thomas Pandick (66) 40 W. 57th St., 19th Floor New York, NY 10019
| | Chief Compliance Officer | | Indefinite Term, Since 2004 | | Chief Compliance Officer (October 2004-present), Tocqueville Asset Management L.P.; General Counsel (January-October 2004), Tocqueville Asset Management L.P. | | | N/A | | | N/A
|
| (1) | Each Trustee will hold office for an indefinite term until the earliest of (i) the next meeting of shareholders, if any, called for the purpose of considering the election or re-election of such Trustee and until the election and qualification of his or her successor, if any, elected at such meeting, or (ii) the date a Trustee resigns or retires, or a Trustee is removed by the Board of Trustees or shareholders, in accordance with the Trust’s By-Laws, as amended, and Agreement and Declaration of Trust, as amended. Each officer will hold office for an indefinite term until the date he or she resigns or retires or until his or her successor is elected and qualified. |
2. PROXY VOTING POLICIES AND PROCEDURES
A description of the policies and procedures that The Tocqueville Trust uses to determine how to vote proxies relating to portfolio securities is available without charge upon request by calling 1-800-355-7307. Information regarding how The Tocqueville Trust voted proxies relating to portfolio securities during the most recent 12-month period ended June 30 is available by calling 1-800-355-7307 and it is also available on the SEC’s web site at http://www.sec.gov.
3. SHAREHOLDER REPORTS AND QUARTERLY PORTFOLIO DISCLOSURE
The Tocqueville Trust is required to file its complete schedule of portfolio holdings with the SEC for its first and third fiscal quarters on Form N-Q. The Trust’s Form N-Q will be available without charge, upon request on the SEC’s website (http://www.sec.gov) and may be available by calling 1-800-697-3863. You can also obtain copies of Form N-Q by (i) visiting the SEC’s Public Reference Room in Washington, DC (information on the operation of the Public Reference Room may be obtained by calling 1-202-551-8090); (ii) sending your request and a duplicating fee to the SEC’s Public Reference Room, Washington, DC 20549-1520; or (iii) sending your request electronically to publicinfosec.gov. Quarterly portfolio holdings are also available on the website of The Tocqueville Funds, www.tocqueville.com/mutual-funds.
4. SHAREHOLDER NOTIFICATION OF FEDERAL TAX STATUS
For the fiscal period ended October 31, 2012, certain dividends paid by the Funds may be subject to a maximum tax rate of 15%, as provided for by the Jobs and Growth Tax Relief Reconciliation Act of 2003. The percentage of dividends declared from ordinary income designated as qualified dividend income was as follows:
| | | | |
Tocqueville Fund | | | 100.00 | % |
Opportunity Fund | | | 0.00 | % |
International Value Fund | | | 100.00 | % |
Gold Fund | | | 0.00 | % |
Delafield Fund | | | 0.00 | % |
Select Fund | | | 0.00 | % |
For corporate shareholders, the percent of ordinary income distributions qualifying for the corporate dividends received deduction for the fiscal period ended October 31, 2012 was as follows:
| | | | |
Tocqueville Fund | | | 100.00 | % |
Opportunity Fund | | | 0.00 | % |
International Value Fund | | | 4.53 | % |
Gold Fund | | | 0.00 | % |
Delafield Fund | | | 0.00 | % |
Select Fund | | | 0.00 | % |
For the period ended October 31, 2012, the funds designate the following percent of ordinary distributions paid as interest-related dividends under the Internal Revenue Code Section 871(k)(1)(c):
| | | | |
Tocqueville Fund | | | 0.01 | % |
Opportunity Fund | | | 0.00 | % |
International Value Fund | | | 0.05 | % |
Gold Fund | | | 0.00 | % |
Delafield Fund | | | 0.00 | % |
Select Fund | | | 0.00 | % |
The percentage of taxable ordinary income distributions that are designated as short-term capital gain distributions under Internal Revenue Section 871(k)(2)(C) for each Fund were as follows.
| | | | |
Tocqueville Fund | | | 0.00 | % |
Opportunity Fund | | | 0.00 | % |
International Value Fund | | | 0.00 | % |
Gold Fund | | | 100.00 | % |
Delafield Fund | | | 0.00 | % |
Select Fund | | | 0.00 | % |
5. FOREIGN TAX CREDIT
For the year ended October 31, 2012, the Tocqueville International Value Fund earned foreign source income and paid foreign taxes which they intend to pass through to their shareholders pursuant to Section 853 of the Internal Revenue Code as follows:
| | | | | | | | |
Country | | Gross Dividend
Per Share | | | Taxes Withheld
Per Share | |
Australia | | $ | 0.00976 | | | $ | 0.00000 | |
Belgium | | | 0.01232 | | | | 0.00185 | |
Brazil | | | 0.00098 | | | | 0.00013 | |
Canada | | | 0.00319 | | | | 0.00048 | |
Switzerland | | | 0.00974 | | | | 0.00146 | |
Germany | | | 0.01495 | | | | 0.00229 | |
Spain | | | 0.00259 | | | | 0.00067 | |
France | | | 0.07493 | | | | 0.01130 | |
Hong Kong | | | 0.01185 | | | | 0.00000 | |
Ireland | | | 0.01726 | | | | 0.00000 | |
Italy | | | 0.01369 | | | | 0.00205 | |
Jersey | | | 0.00137 | | | | 0.00000 | |
Japan | | | 0.06648 | | | | 0.00465 | |
Mexico | | | 0.00000 | | | | 0.00000 | |
Netherlands | | | 0.02917 | | | | 0.00438 | |
Norway | | | 0.05739 | | | | 0.00981 | |
| | | | | | | | |
| | $ | 0.32567 | | | $ | 0.03907 | |
| | | | | | | | |
Investment Adviser
Tocqueville Asset Management L.P.
40 W. 57th St., 19th Floor
New York, NY 10019
(212) 698-0800
www.tocqueville.com
Distributor
Tocqueville Securities, L.P.
40 W. 57th St., 19th Floor
New York, NY 10019
(212) 698-0800
Shareholders’ Servicing and Transfer Agent
U.S. Bancorp Fund Services, LLC
P.O. Box 701
Milwaukee, WI 53201-0701
(800) 697-3863
Custodian
U.S. Bank, N.A.
Custody Operations
1555 River Center Drive, Suite 302
Milwaukee, WI 53212
Board of Trustees
François D. Sicart—Chairman
Charles W. Caulkins
Alexander Douglas
James W. Gerard
William F. Indoe
Robert W. Kleinschmidt
Guy A. Main
William J. Nolan III

Tocqueville Funds
c/o US Bancorp Fund Services, LLC
P.O. Box 701
Milwaukee, WI 53201-0701
www.tocqueville.com/mutual-funds
TQRPSEMI 13
Item 2. Code of Ethics.
Not applicable for semi-annual reports.
Item 3. Audit Committee Financial Expert.
Not applicable for semi-annual reports.
Item 4. Principal Accountant Fees and Services.
Not applicable for semi-annual reports.
Item 5. Audit Committee of Listed Registrants.
Not applicable to registrants who are not listed issuers (as defined in Rule 10A-3 under the Securities Exchange Act of 1934).
Item 6. Investments.
Schedule of Investments is included as part of the report to shareholders filed under Item 1 of this Form.
Item 7. Disclosure of Proxy Voting Policies and Procedures for Closed-End Management Investment Companies.
Not applicable to open-end investment companies.
Item 8. Portfolio Managers of Closed-End Management Investment Companies.
Not applicable to open-end investment companies.
Item 9. Purchases of Equity Securities by Closed-End Management Investment Company and Affiliated Purchasers.
Not applicable to open-end investment companies.
Item 10. Submission of Matters to a Vote of Security Holders.
There have been no material changes to the procedures by which shareholders may recommend nominees to the registrant’s board of trustees.
Item 11. Controls and Procedures.
| (a) | The Registrant’s President and Treasurer have reviewed the Registrant’s disclosure controls and procedures (as defined in Rule 30a-3(c) under the Investment Company Act of 1940 (the “Act”)) as of a date within 90 days of the filing of this report, as required by Rule 30a-3(b) under the Act and Rules 13a-15(b) or 15d-15(b) under the Securities Exchange Act of 1934. Based on their review, such officers have concluded that the disclosure controls and procedures are effective in ensuring that information required to be disclosed in this report is appropriately recorded, processed, summarized and reported and made known to them by others within the Registrant and by the Registrant’s service provider. |
| (b) | There were no changes in the Registrant’s internal control over financial reporting (as defined in Rule 30a-3(d) under the Act) that occurred during the second fiscal quarter of the period covered by this report that has materially affected, or is reasonably likely to materially affect, the Registrant’s internal control over financial reporting. |
Item 12. Exhibits.
| (a) | (1) Any code of ethics or amendment thereto, that is the subject of the disclosure required by Item 2, to the extent that the registrant intends to satisfy Item 2 requirements through filing an exhibit. Not Applicable. |
(2) A separate certification for each principal executive and principal financial officer pursuant to Section 302 of the
Sarbanes-Oxley Act of 2002. Filed herewith.
(3) Any written solicitation to purchase securities under Rule 23c-1 under the Act sent or given during the period covered by the report by or on behalf of the registrant to 10 or more persons. Not applicable to open-end investment companies.
| (b) | Certifications pursuant to Section 906 of the Sarbanes-Oxley Act of 2002. Furnished herewith. |
2
SIGNATURES
Pursuant to the requirements of the Securities Exchange Act of 1934 and the Investment Company Act of 1940, the registrant has duly caused this report to be signed on its behalf by the undersigned, thereunto duly authorized.
| | |
| (Registrant) | | The Tocqueville Trust |
| | |
| |
By (Signature and Title)* | | /s/ Robert W. Kleinschmidt |
| | Robert W. Kleinschmidt, President |
| |
| Date June 27, 2013 | | |
Pursuant to the requirements of the Securities Exchange Act of 1934 and the Investment Company Act of 1940, this report has been signed below by the following persons on behalf of the registrant and in the capacities and on the dates indicated.
| | |
| By (Signature and Title)* | | /s/ Robert W. Kleinschmidt |
| | Robert W. Kleinschmidt, President |
| | |
| |
| Date June 27, 2013 | | |
| |
| By (Signature and Title)* | | /s/ John Cassidy |
| | John Cassidy, Treasurer |
| |
| Date June 27, 2013 | | |
| * | Print the name and title of each signing officer under his or her signature. |
3