UNITED STATES
SECURITIES AND EXCHANGE COMMISSION
Washington, D.C. 20549
FORM N-CSR
CERTIFIED SHAREHOLDER REPORT OF REGISTERED
MANAGEMENT INVESTMENT COMPANIES
Investment Company Act file number 811-4840
The Tocqueville Trust
(Exact name of registrant as specified in charter)
The Tocqueville Trust
40 West 57th Street, 19th Floor
New York, NY 10019
(Address of principal executive offices) (Zip code)
Robert W. Kleinschmidt
The Tocqueville Trust
40 West 57th Street, 19th Floor
New York, NY 10019
(Name and address of agent for service)
(212) 698-0800
Registrant’s telephone number, including area code
Date of fiscal year end: October 31
Date of reporting period: April 30, 2015
Item 1. Reports to Stockholders.
SEMI-ANNUAL REPORT
April 30, 2015
The Tocqueville Trust
Mutual Funds
The Tocqueville Fund
The Tocqueville Opportunity Fund
The Tocqueville International Value Fund
The Tocqueville Gold Fund
The Delafield Fund
The Tocqueville Select Fund
The Tocqueville Alternative Strategies Fund

This report is not authorized for distribution to prospective investors unless preceded or accompanied by a currently effective prospectus of The Tocqueville Trust. Please call 1-800-697-FUND (3863) for a free prospectus. Read it carefully before you invest.
You are invited to visit our website @ www.tocqueville.com/mutual-funds
Dear Fellow Shareholder,
Since the U.S. stock market bottomed six years ago, the S&P 500 index has appreciated more than 200% (without dividends) and the NASDAQ Composite Index almost 300%. Other leading indices have not been idle. While a number of them started recovering a bit later, Japan’s Nikkei has now gained almost 180% and Germany’s DAX 200%. India has appreciated 220% as well, but many emerging markets or those sensitive to natural resources were not as buoyant: Russia rose only 67% and Brazil 44%, while China owed its 120% gain entirely to a speculative spike in recent months.
In theory, the age of a bull market has no import on its future direction. In most cases, however, valuation measures, while well below the recent peaks of 2000 or 2007, have merely retreated towards their long-term historical averages. So, I believe that while it cannot be argued that the current environment reflects the euphoria that often precedes major declines or corrections, neither can it be said that present conditions have bubble characteristics.
What is most striking in the current environment, in my view, is the prevailing and widespread complacency. Many of the world’s problems, which by historical standards are severe or even unprecedented, seem remote and relatively painless to the majority of investors, despite the sensational reporting in the media.
The United Nations reports that almost 60 million people were forcefully uprooted by conflict and persecution at the end of last year? This leaves more than 6 billion people largely unaffected (unless the displaced try to settle close by). U.S. unemployment rate is 5.5%? 94.5% of the labor force is working. The gross domestic products of major countries are hesitant or halting? This will motivate central banks to pour more money onto the financial markets, promising to push stocks higher.
Perhaps the most menacing headline I could imagine came out a few days ago:
Companies issue record levels of perpetual debt
Global issuance of corporate bonds that may never be redeemed has surged to record levels as companies lock in finance at historically low interest rates.
But one does not have to predict the future to perpetuity to imagine what might happen to a bond without a maturity date, issued when interest rates are historically very low. Without the prospect of redemption at par value upon maturity there is no price or time limit on the potential loss whenever interest rates rise again.
The first portfolios I worked on in the early 1970s on Wall Street were full of not perpetual, but very long-term bonds purchased in the 1940s and 1950s with coupons of 2% to 3%. By the 1970s, with interest rates at 6%-plus, these bonds were often selling at 50 cents on the issuance price dollar.
Today’s repeat of history, in my view, is a sign of the prevailing complacency and should serve as a reminder that it is dangerous in investing to assume that any condition may be perpetual.
Respectfully,

François Sicart
Chairman
The Tocqueville Fund
The six month period that ended April 30, 2015 was full of surprises for investors but, after suffering several bouts of volatility, global equity markets continued their upward trajectory. Throughout this period of time, investors seemed to focus their attention on commodities and currencies while choosing to overlook the worsening geopolitical situations in the Middle East, South China Sea and Ukraine. At the same time, investors continued to evidence their appetite for risk as U.S. equity markets advanced despite weakening economic data, signs of labor cost inflation and fears over the Federal Reserve’s eventual decision to raise interest rates. Only recently have investors begun to take pause in renewed worries of a Greek default and/or exit from the Euro and the possibility of higher borrowing costs.
Perhaps the biggest shock for investors over the period was the decline in energy and other commodity prices and the concomitant increase in the U.S. dollar exchange rate. For oil, while soft demand growth from the U.S. and Europe was part of the story and the end of China’s fixed investment boom another, investors significantly underestimated the disruption to the world’s energy supply-demand balance due to the impact of new technology in the U.S. energy production industry. The surge in the dollar was partly due to investors beginning to anticipate the Fed’s eventual tightening but also due to weakness in the rest of the world that transmitted dollar strength through the easy monetary policy of Europe, Japan and China. In addition, investors were slow to incorporate currency changes into their estimates and were caught off guard as companies began to report results during the period. In some ways, investors were either incorrect or early in their assumptions about the immediate benefits to consumer spending from lower energy prices, although on the latter point, it took longer than the period covered by this report to figure that out. Indeed, since bottoming in January, oil prices have rallied back by almost 30% and actual retail sales have yet to show any meaningful improvement.
Over the six months ended April 30, 2015, the portfolio returned 3.31% while the S&P 500 gained 4.40%. This result is due largely to stock selection, particularly in technology which was a strong contributor for the market but where the Fund’s stocks greatly underperformed. In addition, being underweight in the consumer discretionary sector, which led the market, was a detriment as investors chased hope for improved retail spending. On the other hand, while the energy sector was the weakest for the market, the Fund’s positions in that sector fared better and it had strong performance from a few healthcare names.
The top performing sectors of the portfolio over the period were healthcare, industrials and financials while energy, consumer staples and technology were the laggards. The top individual contributors to performance in the portfolio were Isis Pharmaceuticals, which continues to show success in developing and partnering new products, Allergan, which was acquired by Actavis, and Amazon, which surprised investors by showing improved profits. The largest detractors were DeVry Education, a for-profit education provider that suffered from increased governmental scrutiny and regulation in the U.S. despite possessing a rapidly growing business in Brazil, Applied Materials, which had been hurt by a cyclical slowdown in semiconductor demand and Exxon Mobil, which was caught up in the energy decline.
With mid-year approaching, the outlook for equity markets seems mixed. In the U.S., the rise in buybacks, dividends and mergers & acquisitions has lately not been enough to overcome the specter of an eventual rate increase, the rise in the dollar, and weak economic growth. We believe that the greatest hope for U.S. equities lies in the consumer sector, which is the largest part of the domestic economy. Despite lower energy and commodity prices, rising labor rates and employment are signs that parts of the economy have normalized, consumer spending remains weak and household formation below trend. In our view, part of that is due to consumers repairing balance sheets and part of that is the misleading nature of the employment statistics which do not account for the decline in labor force participation and employees working fewer hours than they would like. We also believe that it is due to the hidden “taxes” of Obamacare that have siphoned off a larger portion of consumer budgets into healthcare. Still, we remain optimistic that consumer activity will improve from currently depressed levels in the second half of the year as further income gains take hold.
The Federal Reserve has a difficult decision coming up if the economy improves. In some ways, it may be an even more difficult one if it does not. We think the decision is obvious and that the oceans of liquidity and suppressed interest rates have in many ways hindered the recovery by skewing capital allocation. However, until the market sees how the economy reacts to higher interest rates, the Federal Reserve will likely to be range bound.
With U.S. equities near their recent highs, it is certainly more difficult to find broad sectors that appeal to us as contrarian value investors. However, there are always individual companies that fall out of favor for one reason or another and we will continue to search for these opportunities to purchase quality businesses at a substantial discount to intrinsic value.
Sincerely,

Robert W. Kleinschmidt
Portfolio Manager
The Tocqueville Fund
(Unaudited)
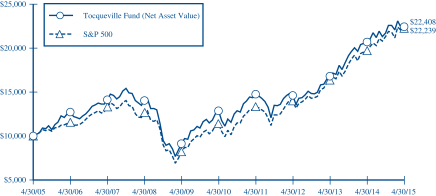
This chart assumes an initial gross investment of $10,000 made on 4/30/05. Returns shown do not reflect the deduction of taxes that a shareholder would pay on fund distributions or the redemption of fund shares. Performance reflects fee waivers in effect. In the absence of fee waivers, total return would be reduced. Returns shown include the reinvestment of all dividends and other distributions. Past performance is not predictive of future performance. Investment return and principal value will fluctuate so that your shares, when redeemed, may be worth more or less than their original cost. The Fund imposes a 2% redemption fee on shares held for 90 days or less.
The Standard & Poor’s 500 Stock Index (S&P 500) is a capital-weighted index, representing the aggregate market value of the common equity of 500 stocks primarily traded on the New York Stock Exchange. Returns assume the reinvestment of all dividends.
AVERAGE ANNUAL RATE OF RETURN (%)
FOR PERIODS ENDED APRIL 30, 2015
| | | | | | | | | | | | | | | | |
| | | 1 Year | | | 3 Year | | | 5 Year | | | 10 Year | |
The Tocqueville Fund | | | 8.28% | | | | 15.32% | | | | 11.72% | | | | 8.40% | |
Standard & Poor’s 500 Stock Index | | | 12.98% | | | | 16.73% | | | | 14.33% | | | | 8.32% | |
The Tocqueville Opportunity Fund
As the first half of the 2015 fiscal year commenced this past November, small and mid-cap cap growth equities had struggled with a persistent volatility throughout most of 2014. Although the Russell 2500 Growth Index (SMID Growth benchmark) had appreciated nearly 4% through the end of October 2014, there were numerous swings in the index of 5% or more; and the Fund experienced a decline of nearly 14% during the March/April period and a pullback of nearly 10% during the July/October period. And while small and mid-cap’s had managed a gain (+4%) through the end of October, the gain significantly trailed the S&P 500 Index which had managed to appreciate nearly 11% over the same period as investors crowded into larger cap issues.
The past six months has delivered an altogether different pattern of performance as SMID growth issues have shaken away from the volatility bands of 2014 and moved on to achieve new highs and smartly outperformed their larger cap competitors—with the Russell 2500 Growth Index and the S&P 500 Index up 8.31% and up 4.40% respectively. However, the advance to new highs for the benchmarks only began in February 2015, and a look back over the past year and a half is revealing and important—in effect, small and mid-cap growth issues have traded sideways for nearly 17-18 months. The lows of this long period of consolidation had been set in late September 2013, and were tested in April and September 2014; the highs were established in March 2014 but could not be exceeded despite five solid runs at the prior high. We believe this long period of consolidation has several important implications: 1) it allowed the historical valuation premium of small and mid-cap caps to compress vis a vis large cap issues which were outperforming, 2) it demonstrated underlying strong support for SMID cap issues during periods of heightened volatility and sell-offs, 3) it provided reasonable evidence that volatility during the period was being driven by traders and market sentiment shifts as opposed to improving valuation and fundamentals.
The Fund gained 12.99% through the six-month period ending April 30, 2015, versus an increase of 8.31% for the benchmark Russell 2500 Growth Index. Investment performance was driven by healthcare sector investments which accounted for one half of the Fund’s absolute performance despite representing less than one third of the Fund’s investments. Technology and consumer sector investments in order also posted strong absolute performance, and accounted for nearly two fifths of the Fund’s performance. The picture of the Fund’s near 6% excess relative performance (versus its benchmark) was similar in only certain respects—healthcare sector investments led and accounted for nearly half of the performance. While energy and financial sector investments provided the second and third leading boosts to relative performance. In both cases, the principal drivers of performance included security selection and significant underweighting of both sectors. On an overall basis, the Fund experienced positive sector performance on an absolute basis in all sectors but energy which declined 0.02%, on a relative basis, the Fund had positive performance in all sectors and outperformed the benchmark in all sectors (Consumer sectors combined basis).
Eight of the Fund’s portfolio holdings experienced takeovers during the period—seven healthcare issues and one financial holding. Several were significant holdings of the Fund, including: Auspex Pharmaceutical, Allergan, NPS Pharmaceutical, Pharmacyclics, Prosensa and Salix Pharmaceuticals. Eighteen issues appreciated greater than 50% during the period; while ten issues declined more than 30%. Auspex RX was the leading gainer (+271%) followed by Bluebird Bio (+217%); Stratasys Ltd (-69%) and OvaScience (-47%) were the two leading decliners but together their impact was less than 0.20% to the Fund’s performance due to the diversification strategy. On a relative basis, seven of the leading issues were healthcare investments (led by Pharmacyclics), and three were technology issues which included Palo Alto Networks and Manhattan Associates. Six of the leading relative underperformers were healthcare issues (led by Puma Biotechnology) and three were technology issues (including Workday and Netsuite). On an absolute basis, Pharmacyclics was the leading issue and accounted for more than ten percent of the Fund’s total return; Puma Bio was the worst, but only impacted the total return by 0.36%.
During the period, there were only minor shifts in sector allocations. Due to a the significant share of the Fund’s Healthcare issues which were taken over, we reinvested proceeds back into a number of smaller issues with promising technology and good trial results—the healthcare allocation rose to 32.6% of the Fund from the beginning of period weighting of 31.6%. Consumer investment allocation increased to approximately 21% from 19%; technology investments
declined just a bit to 22.5% from 23%. Shifts in the economy sensitive sectors were somewhat more significant and reflected a view that the U.S, economy has continued to face headwinds which do not favor accelerated, cyclical growth—financials were down 2.6% to just under 8%; materials were down 1% to just over 3%, and industrials were down over 1% to just above 10%. Two important changes in the Fund’s allocation included: 1) an increased energy exposure to nearly 2.5% of the portfolio from next to nothing in order to participate in any potential recovery due to an improved pricing environment and a more rational competitive industry structure (albeit this is still unclear), and 2) the beginning of a significant reduction in the exposure to airline investments as competitive issues with pricing and capacity and prospectively higher fuel costs may be signaling the end of the current cycle for the time being.
The Fund continues to be well diversified, and in fact is somewhat more diversified with newly initiated investments since the beginning of the period. This is most attributable to the fact that several big weighted names disappeared as a result of Mergers & Acquisitions. The top 50 issues represented 48.2% of the Fund at period end versus a prior 52.2% whereas the top 125 holdings represented 76.9% at the end of the period versus 82.2% at the beginning. Over time, we would expect and hope that recent, newly initiated investments should expand the concentration of weights in the top 125 names.
Finally, as indicated in our discussion of sector based allocation, we anticipate that growth oriented issues should continue to lead Fund based returns until it becomes a bit clearer how and when industrial and cyclical demand becomes recharged. The U.S. economy continues along its steady but slow path of growth with intermittent periods of strength and weakness; we are encouraged by the steadiness and resiliency but less impressed with the degree of growth. Nevertheless, we are alert to the benefit of ongoing accommodation to the business cycle and look forward to a period of accelerated growth in the future—we believe such anticipated growth would lead us to expand our commitments in these economy sensitive areas, led by the financials and industrial sectors.
As always, we appreciate your confidence in our efforts on behalf of shareholders of the Opportunity Fund and we remain committed to its ongoing successes.
Sincerely,

Thomas R. Vandeventer
Portfolio Manager
The Tocqueville Opportunity Fund
(Unaudited)
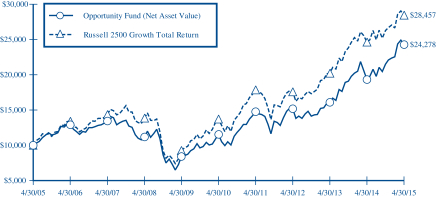
This chart assumes an initial gross investment of $10,000 made on 4/30/05. Returns shown do not reflect the deduction of taxes that a shareholder would pay on fund distributions or the redemption of fund shares. Returns shown include the reinvestment of all dividends and other distributions. Past performance is not predictive of future performance. Investment return and principal value will fluctuate so that your shares, when redeemed, may be worth more or less than their original cost. The Fund imposes a 2% redemption fee on shares held for 90 days or less.
The chart and table include The Opportunity Fund’s performance achieved prior to the changes effected in 2010 to its investment strategy.
The Russell 2500 Growth Total Return Index is an unmanaged index that measures the performance of the small to mid-cap growth segment of the U.S. equity universe. It includes those Russell 2500 companies with higher price-to-book ratios and higher forecasted growth values. Returns assume the reinvestment of all dividends.
AVERAGE ANNUAL RATE OF RETURN (%)
FOR PERIODS ENDED APRIL 30, 2015
| | | | | | | | | | | | | | | | |
| | | 1 Year | | | 3 Year | | | 5 Year | | | 10 Year | |
The Tocqueville Opportunity Fund | | | 25.74% | | | | 16.90% | | | | 16.05% | | | | 9.28% | |
Russell 2500 Growth Total Return Index | | | 15.54% | | | | 17.42% | | | | 15.68% | | | | 11.02% | |
The Tocqueville International Value Fund
Dear Fellow Shareholder,
For the six months ended April 30, 2015, global equity markets generally rose in the context of cross currents and bouts of volatility. At 2014 calendar year-end, markets declined in response to concerns about Chinese growth, the possibility of a Greek default, and the uncertainty deriving from a sharp decline in oil prices and a sharp increase in the value of the U.S. dollar. Then in January 2015, markets rallied in reaction to improving economic data and aggressive monetary easing in Europe, and an improvement of corporate earnings and corporate governance in Japan. The U.S. dollar increased in value against most currencies, amplifying a decline in commodity prices, which led to declines in the currencies and equity markets of commodity producing nations. Japan, Germany and Hong Kong were among the best performing markets globally, while commodity dependent Brazil and Mexico were among the worst. In terms of sectors, auto and auto related, paper and forest products, travel and leisure, and rubber products were among the best performers, while oil and gas and mining stocks were among the worst.
The Fund’s total U.S. dollar return for the six-month period was a gain of 11.63%. In the same period, the Morgan Stanley EAFE Index, the benchmark against which we are most often compared, had a total U.S. dollar return of 6.81%.
During the period, the Fund had gains in a diverse group of stocks. Notable contributors to profits were Japanese semiconductor manufacturing toolmaker Disco, Japanese mega bank Mitsubishi UFJ, Ireland based construction products maker CRH, Japanese industrial products distributor Misumi, French wire and cable producer Nexans, German compact construction equipment maker Wacker Neuson, and German semiconductor maker Infineon. Meaningful losses were limited to companies related to the commodity complex, notably global copper and energy concern Freeport McMoRan and oil country tubular goods producer Vallourec.
The Fund exited positions in Japanese imaging technology company Fujifilm and Swedish building products company Lindab as they approached our estimates of fair value. The Fund also exited Freeport McMoRan and Vallourec as our estimates of medium-term earnings power were undercut by the steep decline in oil prices. A new position in Danish facilities management company ISS was established, a quality business with strong and recurring cash flow generation trading at an attractive valuation due to a stock overhang. The Fund purchased French information technology concern Sopra, whose earnings power is misunderstood and underestimated by the market following its combination with competitor Steria. The Fund bought Japanese power tool maker Makita, a leading global franchise trading at an attractive valuation due to investor concerns about its European exposure. Another new position is Ireland-based drug maker Shire, which has several interesting products in its pipeline and in our judgment, stands to benefit from industry consolidation either as an acquirer or an acquisition target. Finally, the Fund purchased UK design software concern Aveva, a unique and defensible business franchise, when it became oversold due to exaggerated concerns about its business exposure to oil and gas producers. The Actavis, Amano, CRH, Greatview Aseptic Packaging, Ipsos, Saint Gobain, Sanofi and Shiseido positions were increased.
During the period, there was a decrease of the Fund’s exposure to Japan and an increase in the Fund’s exposure to Europe and Asia. Cash reserves remained steady at approximately 7%.
In developed markets outside the U.S., we believe the combination of monetary stimulus, more competitive foreign exchange rates and lower oil prices provides a more constructive macro backdrop for stock picking. In Europe, economic indicators such as bank lending, retail sales and employment have shown improvement; while in Japan strong machinery orders and consumer confidence indicate a strengthening economy. Against this backdrop, we believe valuations are reasonable in absolute terms and in general there exists a significant opportunity to grow corporate earnings via increased operating efficiency. Better capital allocation practices are also being adopted in Japan and should boost returns. Increased shareholder activism is helping to ensure that these operating and capital allocations improvements will be realized. We remain vigilant regarding the pace of economic growth in the U.S. and its potential impact on nascent recoveries in Japan and Europe.
In our effort to help protect and grow your capital, we continue to seek out companies that have defensible business franchises, pricing power, free cash generation, limited financial leverage and sound capital allocation practices, and which trade at a discount to intrinsic value based on future cash flows in a conservative economic growth scenario.
Respectfully,

James Hunt
Portfolio Manager
The Tocqueville International Value Fund
(Unaudited)
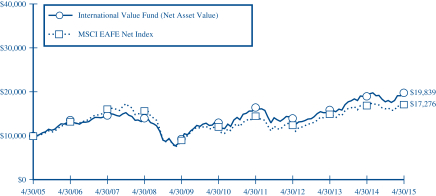
This chart assumes an initial gross investment of $10,000 made on 4/30/05. Returns shown do not reflect the deduction of taxes that a shareholder would pay on fund distributions or the redemption of fund shares. Performance reflects fee waivers in effect. In the absence of fee waivers, total return would be reduced. Returns shown include the reinvestment of all dividends and other distributions. Past performance is not predictive of future performance. Investment return and principal value will fluctuate so that your shares, when redeemed, may be worth more or less than their original cost. The Fund imposes a 2% redemption fee on shares held 90 days or less.
The MSCI EAFE Index is an unmanaged market-capitalization-weighted index composed of companies representative of the market structure of 21 Developed Market Countries in Europe, Australia, Asia and the Far East.
AVERAGE ANNUAL RATE OF RETURN (%)
FOR PERIODS ENDED APRIL 30, 2015
| | | | | | | | | | | | | | | | |
| | | 1 Year | | | 3 Year | | | 5 Year | | | 10 Year | |
The Tocqueville International Value Fund | | | 4.08% | | | | 12.38% | | | | 8.72% | | | | 7.09% | |
MSCI EAFE Net Index | | | 1.66% | | | | 11.22% | | | | 7.40% | | | | 5.62% | |
The Tocqueville Gold Fund
The Fund rose 6.7% during the six month period ended April 30, 2015, while the Philadelphia Gold and Silver index was up 13.0%, and the gold bullion price increased 0.9% to finish April at $1,182.40 per ounce.
Some of the better performing stocks in the Fund during the six month period were the larger and better capitalized mining companies positioned to take advantage of the trending gold market. We believe that Randgold should now benefit from robust cash flow generation after the capital spending and mine building it undertook the past five years. Agnico Eagle continues to have good success adding to its resource base by acquisition and discovery. Detour Gold has been resolving start-up issues and by de-risking its mine it is now enjoying a better valuation. Newmont’s restructuring efforts, cost focus and debt reduction, are attributable for the positive re-rating its stock is receiving. The same is beginning to occur for Newcrest, which was added to the portfolio during the period. We continued to add to GoGold, which is establishing low cost operations with modest capital budgets in Mexico. A couple of stocks that hurt performance were subject to financial distress from Guatemala, which imposed additional royalties in the case of Tahoe Resources; and from Greece with its issues, in the case of Eldorado.
Lower valuations in the sector and tight capital markets for mining finance have encouraged more merger and acquisition activity, with companies such as Goldcorp acquiring resources through its acquisition of Probe Mines. Semafo added to its resource position in western Africa through an acquisition during the period. Tahoe Resources acquired Peruvian assets that should diversify its risk away from one mine, one country exposure. Agnico Eagle made numerous small strategic investments in junior mining or exploration companies that are unable to access capital in a traditional way. Premier Gold is finding partners to do joint ventures with as a way to diversify risk and establish North American production.
We predicted the flourishing of mergers & acquisitions activity in this sector well over a year ago. That has certainly been the case over the past six months. Larger companies such as Newmont, Barrick, and AngloGold Ashanti have divested quality assets to repair balance sheets and streamline operations. In this atmosphere of depressed valuations, these transactions could prove to be a win/win situation for both buyers and sellers. We believe a more efficient and better industry structure should result. This sort of cleansing is typically characteristic of an industry response at the bottom of a price cycle.
Operating costs continue to improve due to lower oil prices and weaker local currencies for those with non-U.S. operations. Gold producers are reporting those benefits and we believe that the favorable trend should continue well into the year. The industry’s all-in-cost of production is holding steady at around $1,100 per ounce, and we believe may even begin to decline slightly.
We added to the gold bullion position during the period as gold prices sold off in late 2014, recognizing the attractive gold price level and that the bottoming process the industry has been going through will limit supply in the future, as some higher cost operators close or sell down mining assets. We believe that the supply of newly mined gold is near a peak that will not be surpassed for many years.
We continue to favor precious metals royalty companies, such as Royal Gold, Osisko Royalties, Franco Nevada, and Silver Wheaton which provide capital for mining operations and offer investors an attractive business model combined with exposure to rising gold prices. Royalty companies are highly diversified geographically, offer easily understandable growth prospects, and generate high returns on capital.
By our assessment, sector managements have responded appropriately to the current gold price environment and, in particular, portfolio companies are in a much better position to make the most of rising gold prices. However, this is not fully appreciated by the broader market and we think that significant valuation expansion lies ahead.
We attempt to provide maximum exposure to a potential rise in precious metals prices, whether through exploration and discovery, mine development, precious metal production and/or astute mergers & acquisitions; while protecting
against downside exposure by investing only in those companies that are well managed. We believe that a significant rise in the gold price is simply a matter of time, and will occur when the financial markets recognize that the efforts of quantitative easing have succeeded only in inflating the value of financial assets while doing little, if anything, for economic growth.
We appreciate your continued interest and support as Tocqueville Gold Fund investors.
Sincerely,
| | |
 | |  |
| |
John C. Hathaway Portfolio Manager | | Douglas B. Groh Portfolio Manager |
The Tocqueville Gold Fund
(Unaudited)
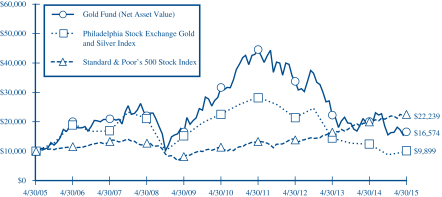
This chart assumes an initial gross investment of $10,000 made on 4/30/05. Returns shown do not reflect the deduction of taxes that a shareholder would pay on fund distributions or the redemption of fund shares. Returns shown include the reinvestment of all dividends and other distributions. Past performance is not predictive of future performance. Investment return and principal value will fluctuate so that your shares, when redeemed, may be worth more or less than their original cost. The Fund imposes a 2% redemption fee on shares held 90 days or less.
In 2006, 2009, and 2010 the performance of The Tocqueville Gold Fund was achieved during a period of unusually favorable market conditions. Such performance may not be sustainable.
The Philadelphia Stock Exchange Gold and Silver Index is an unmanaged capitalization-weighted index which includes the leading companies involved in the mining of gold and silver. Returns include the reinvestment of all dividends.
The Standard & Poor’s 500 Stock Index (S&P 500) is a capital-weighted index, representing the aggregate market value of the common equity of 500 stocks primarily traded on the New York Stock Exchange. Returns include the reinvestment of all dividends.
AVERAGE ANNUAL RATE OF RETURN (%)
FOR PERIODS ENDED APRIL 30, 2015
| | | | | | | | | | | | | | | | |
| | | 1 Year | | | 3 Year | | | 5 Year | | | 10 Year | |
The Tocqueville Gold Fund | | | -17.68% | | | | -21.10% | | | | -12.12% | | | | 5.18% | |
Philadelphia Stock Exchange Gold and Silver Index | | | -20.12% | | | | -22.54% | | | | -15.13% | | | | -0.10% | |
Standard & Poor’s 500 Stock Index | | | 12.98% | | | | 16.73% | | | | 14.33% | | | | 8.32% | |
The Delafield Fund
Dear Fellow Shareholder,
For the six months ended April 30, 2015, the Fund’s net asset value increased 0.56% versus an increase of 4.65% for the Russell 2000 Index (“Russell 2000”) and 4.40% for the Standard & Poor’s 500 Index (“S&P 500”), each on a total return basis. Owing to the smaller average market capitalization of companies in the Russell 2000, we view it as the more appropriate of the two comparative indices. The Fund’s net asset value as of April 30, 2015, was $32.83 per share. The net asset value amounted to $985,113,139, of which 84.6% was invested in equities, and the balance in cash and equivalents and fixed income securities.
Despite the Federal Reserve’s October 2014 decision to effectively end the Quantitative Easing program, investors were seemingly encouraged by continued signs of strength in the U.S. economy as well as solid third quarter earnings and drove continued gains in the major indices to close out the 2014 calendar year. Markets experienced a new year’s hangover, tumbling in January 2015 on the continued drop in oil prices, the surge in the U.S. dollar and renewed worries about international economic activity, particularly in China. Optimism returned, however, for the balance of the first calendar quarter and into the second quarter, with fundamental economic and corporate data supporting indices just shy of record highs.
The Fund’s performance during this time period was out of step with the market overall. In fact, it was very much a tale of two halves for the Fund. The fiscal first quarter performance was disappointing, with the previously mentioned drop in oil prices and foreign exchange rate volatility combining to create market uncertainty in a number of our holdings. In the fiscal second quarter, with a resumption of stability in macro factors, including oil prices, external concerns were mitigated. The Fund’s investments outperformed in this second half of the period as their earnings exhibited signs of operational strength.
For the six month period, the Fund’s exposure to the rapid decline in oil prices was particularly painful on an absolute and relative basis. The Fund’s direct energy sector holdings declined about 7% during the period, which was favorable relative to the energy component of the Russell 2000, but detracted from the absolute return. However, the tangential exposure in the portfolio to energy was material and the resulting consequences unanticipated. A number of the Fund’s holdings in the industrials and materials sectors experienced declines related to energy prices; some, like Dover Corporation and WESCO International., Inc. as a result of end market exposure, others, like Eastman Chemical Corporation, as a function of energy related input cost variations. In the aggregate, we estimate that energy related weakness impacted relative performance by about 200 basis points during the period, with the indirect impact most felt in the industrials and materials holdings.
During the entire period, the market, as defined by the Russell 2000, also favored large over small and health care and high tech over basic industry. Activist involvement as well as merger & acquisitions activity was also focused in these areas. Unfortunately, we were not participants in those areas, which further contributed to the Fund’s lag. For example, the health care component of the Russell 2000 represented about 15% of its holdings and was the strongest contributor, generating a return in excess of 13%. In contrast, the Fund had strong performance in the consumer discretionary space, with those stocks increasing about 12% in the aggregate, but it was underweight the Russell 2000 Index, and so the relative performance there was essentially in line.
Ryerson Inc. (materials) was the largest individual detractor from the six month performance, with the shares down on weak earnings and depressed metal prices driving expectations for continued sluggish demand. Conversely, Fairchild Semiconductor International (information technology) was the largest contributor. The stock benefited from good earnings results, evidence of the company’s manufacturing consolidation progressing and expectations that they will continue to utilize free cash flow for substantial share repurchases.
Despite the difficult period we experienced, we remain confident in both the investment approach and the portfolio. We believe that the special situation stocks remain largely on track with their respective internal improvement strategies
and that as their progress begins to be reflected in their financial results, our patience will be rewarded. Lastly, the opportunities presented to us through our bottom-up and value investment approach have resulted in a portfolio with heavy exposure to the industrials and materials sectors. As already discussed, these sectors were out of favor in recent quarters, but we believe are also most likely to eventually benefit from the continuing, albeit gradual, improvement in the U.S. economy as well as signs of stabilization in China and Europe.
Sincerely,
| | |
 | |  |
| |
J. Dennis Delafield Portfolio Manager | | Vincent Sellecchia Portfolio Manager |
The Delafield Fund
(Unaudited)
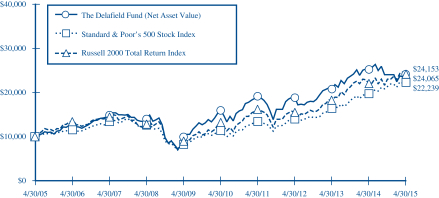
This chart assumes an initial gross investment of $10,000 made on 4/30/05. Since the Delafield Fund did not commence operations until 9/28/09, returns prior to that date are those of the Predecessor Fund. The Delafield Fund assumed the net asset value and performance history of the Predecessor Fund (See Footnote 1 to the Financial Statements). Returns shown do not reflect the deduction of taxes that a shareholder would pay on fund distributions or the redemption of fund shares. Performance reflects fee waivers in effect. In the absence of fee waivers, total return would be reduced. Returns shown include the reinvestment of all dividends and other distributions. Past performance is not predictive of future performance. Investment return and principal value will fluctuate so that your shares, when redeemed, may be worth more or less than their original cost. The Fund imposes a 2% redemption fee on shares held 90 days or less.
The Standard & Poor’s 500 Stock Index (S&P 500) is a capital-weighted index, representing the aggregate market value of the common equity of 500 stocks primarily traded on the New York Stock Exchange. Returns include the reinvestment of all dividends.
The Russell 2000 Total Return Index is an unmanaged index that measures the performance of the 2,000 smallest companies in the Russell 3000 Index, which represent approximately 10% of the total market capitalization of the Russell 3000 Index. Returns include the reinvestment of all dividends.
AVERAGE ANNUAL RATE OF RETURN (%)
FOR PERIODS ENDED APRIL 30, 2015
| | | | | | | | | | | | | | | | |
| | | 1 Year | | | 3 Year | | | 5 Year | | | 10 Year | |
The Delafield Fund | | | -3.98% | | | | 8.79% | | | | 8.68% | | | | 9.22% | |
Standard & Poor’s 500 Stock Index | | | 12.98% | | | | 16.73% | | | | 14.33% | | | | 8.32% | |
Russell 2000 Total Return Index | | | 9.71% | | | | 15.87% | | | | 12.73% | | | | 9.18% | |
The Tocqueville Select Fund
Dear Fellow Shareholder,
For the six months ended April 30, 2015, the Fund’s net asset value increased 3.54% versus an increase of 5.64% for the Russell 2500 Index (“Russell 2500”) and 4.65% for the Russell 2000 Index (“Russell 2000”), each on a total return basis. The net asset value as of April 30, 2015 was $13.59 per share. The net asset value amounted to $98,477,499 of which 94.9% was invested in equities, and the balance in cash and cash equivalents.
The final calendar quarter of 2014 was marked by continued gains in the major indices on continued signs of strength in the U.S. economy as well as solid third quarter earnings. However, the new year brought renewed volatility. Markets tumbled in January 2015 on worries over a continued drop in oil prices, the surge in the U.S. dollar and sluggish international economic activity, particularly in China. Optimism returned, however, for the balance of the first calendar quarter and into the second quarter, with fundamental economic and corporate data supporting indices just shy of record highs.
The Fund’s fiscal first quarter performance was disappointing. Macro events, including the previously mentioned drop in oil prices and foreign exchange rate volatility, clouded the market’s forecast for a number of the Fund’s holdings. Performance in the fiscal second quarter was very strong on both an absolute and relative basis, but not enough to entirely offset the fiscal first quarter shortfall. The Fund’s investments outperformed in the second half of the period as their earnings exhibited signs of operational strength in a more stable macro environment.
For the six month period ended April 30, 2015, the Fund’s exposure to the rapid decline in oil prices was painful on an absolute and relative basis. Direct energy sector holdings declined about 17% during the period, detracting from the absolute return by about 115 basis points, but only slightly underperforming the energy component of the Russell 2500. However, the tangential exposure in the portfolio to energy was material and the resulting consequences unanticipated. A number of the Fund’s holdings in the industrials sector experienced declines related to energy prices owing to end market exposure. These included Dover Corporation, WESCO International, Civeo Corp, Harsco Corporation and MRC Global Inc. Combined these accounted for about a 70 basis point absolute negative return and, close to 130 basis points of relative underperformance.
During the period, the market, as defined by the Russell 2500, also continued to favor health care and high tech over basic industry. As always, sector weighting remains a by-product of our company by company investment approach. However, the Fund had no exposure to health care, which was the strongest component of the Russell 2500, contributing nearly 185 basis points to its return. In contrast, we had strong performance in the consumer discretionary and information technology sectors. The Fund’s holdings in these sectors experienced aggregate gains of about 21% and 14%, respectively. The Fund was overweight in both sectors and they contributed about 250 basis points to the relative performance.
With respect to individual stocks selection, Staples Inc. (consumer discretionary) was the largest contributor to the Fund’s six month performance, followed by EPAM Systems and J2 Global Inc. In contrast, Harsco Corporation (industrials) was the largest detractor, with Oil States International Inc. and Stantec Inc. following.
Sincerely,
| | | | |
| | | |  |
| | |
J. Dennis Delafield Portfolio Manager | | Vincent Sellecchia Portfolio Manager | | Donald Wang Portfolio Manager |
The Tocqueville Select Fund
(Unaudited)
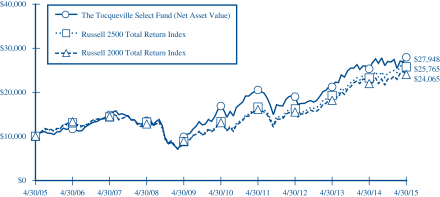
This chart assumes an initial gross investment of $10,000 made on 4/30/05. Since The Tocqueville Select Fund did not commence operations until 9/28/09, returns from the period from September 29, 2008 to September 27, 2009 are those of the Class Y Shares of the Predecessor Fund (See Footnote 1 to the Financial Statements). Prior to that period, returns shown are those of a limited partnership managed by the adviser. Returns shown do not reflect the deduction of taxes that a shareholder would pay on fund distributions or the redemption of fund shares. Performance reflects fee waivers in effect. In the absence of fee waivers, total return would be reduced. Returns shown include the reinvestment of all dividends and other distributions. Past performance is not predictive of future performance. Investment return and principal value will fluctuate so that your shares, when redeemed, may be worth more or less than their original cost. The Fund imposes a 2% redemption fee on shares held 90 days or less.
In 2013 the performance of The Tocqueville Select Fund was achieved during a period of unusually favorable market conditions. Such performance may not be sustainable.
The Russell 2500 Total Return Index is an unmanaged index that measures the performance of the 2,500 smallest companies in the Russell 3000 Index. Returns include the reinvestment of all dividends.
The Russell 2000 Total Return Index is an unmanaged index that measures the performance of the 2,000 smallest companies in the Russell 3000 Index, which represents approximately 8% of the total market capitalization of the Russell 3000 Index. Returns include the reinvestment of all dividends.
AVERAGE ANNUAL RATE OF RETURN (%)
FOR PERIODS ENDED APRIL 30, 2015
| | | | | | | | | | | | | | | | |
| | | 1 Year | | | 3 Year | | | 5 Year | | | 10 Year | |
The Tocqueville Select Fund | | | 10.51% | | | | 13.82% | | | | 10.60% | | | | 10.82% | |
Russell 2500 Total Return Index | | | 10.70% | | | | 16.73% | | | | 14.01% | | | | 9.93% | |
Russell 2000 Total Return Index | | | 9.71% | | | | 15.87% | | | | 12.73% | | | | 9.18% | |
The Tocqueville Alternative Strategies Fund
Over the six month period ending April 30, 2015, the Fund generated a total return of 4.23% versus a total return of 4.40% for the S&P 500 and a 0.49% gain for the Hedge Fund Research North America Index (HFRXNA).
Of the 423 basis points (or 4.23%) the Fund gained in the period, Amazon (AMZN), a long equity trade and the Fund’s largest equity holding, accounted for 133 basis points of positive performance. We have a high degree of confidence that Amazon’s management will continue to achieve growth rates above its peer group and we are excited about the investments they continue to redeploy in their new business segments, most notably, Amazon Web Services (AWS).
The Fund did hold a handful of poorly performing positions, including Freeport McMoRan Copper (“FCX”), whose ill-timed acquisition of Plains Exploration & Production put stress on the balance sheet ahead of steep commodity price declines that reduced future cash flow outlook. As a result, FCX significantly reduced its dividend and is seeking to sell some non-core assets to reduce leverage. Consequently, we have closed our position.
The Fund’s four main strategy classifications, Convertible Arbitrage, Fixed Income, Special Situations and Long Equity contributed approximately +47 basis points, -22 basis points, +243 basis points and +269 basis points, respectively. In addition, the portfolio gave up approximately 114 basis points in its portfolio hedges, primarily as a result of index hedges that hurt the portfolio as stock markets performed well.
We have been actively integrating Tocqueville research ideas into our long only and hedged investments since June 2014. In the last few months, we have continued to add exposure to health care equity names (including biotech) and we have added a number of diversified convertible bond positions, both hedged and unhedged. Over the coming months, we expect interest rates to rise, although quite slowly, thanks to a cautious Federal Reserve, even though we believe rates should already be higher. As a result, our team has been fairly aggressive about hedging the interest rate exposure in the portfolio.
The portfolio remains only minimally exposed to energy companies. Although we have been looking for an entry point to increase the Fund’s exposure to energy, most market participants’ view on oil appears to be too bullish from our perspective, because there is still a glut of oil and because production continues to increase (thanks to productivity improvements) despite the higher cost of capital for U.S. oil companies.
With the depth of Tocqueville research, our idea generation tools, our experienced team and our ability to go anywhere in the capital structure, we believe that we have a sustainable process which will serve us well in any market environment, including today’s. Thank you for investing with us.
Sincerely,

Kenneth Lee
Portfolio Manager
The Tocqueville Alternative Strategies Fund
(Unaudited)
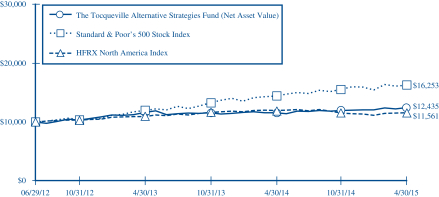
This chart assumes an initial gross investment of $10,000 made on June 29, 2012. Since the Tocqueville Alternative Strategies Fund did not commence operations until June 30, 2014, returns prior to that date are those of the Predecessor Fund (See Footnote 1 to the Financial Statements). Returns shown do not reflect the deduction of taxes that a shareholder would pay on fund distributions or the redemption of fund shares. Performance reflects fee waivers in effect. In the absence of fee waivers, total return would be reduced. Returns shown include the reinvestment of all dividends and other distributions. Past performance is not predictive of future performance. Investment return and principal value will fluctuate so that your shares, when redeemed, may be worth more or less than their original cost. The Fund imposes a 2% redemption fee on shares held for 90 days or less.
The Standard & Poor’s 500 Stock Index (S&P 500) is a capital-weighted index, representing the aggregate market value of the common equity of 500 stocks primarily traded on the New York Stock Exchange. Returns include the reinvestment of all dividends.
The HFRX North America Index is designed to reflect the performance of the North American region of the hedge fund universe. Regional Investment Focus is designed to reflect the primary focus of the Fund’s strategic exposure, over various market cycles, independent of the investment manager’s physical location or the domiciled registration location of the fund. Fund investing in North America typically have greater than 50% exposure in North America. Returns include the reinvestment of all dividends
AVERAGE ANNUAL RATE OF RETURN (%)
FOR PERIODS ENDED APRIL 30, 2015
| | | | | | | | |
| | | 1 Year | | | Inception(1) | |
The Tocqueville Alternative Strategies Fund | | | 7.38% | | | | 7.99% | |
Standard & Poor’s 500 Stock Index | | | 12.98% | | | | 18.68% | |
HFRX North America Index | | | -3.34% | | | | 5.25% | |
| (1) | Inception of the Predecessor Fund was June 29, 2012. |
Expense Example—April 30, 2015 (Unaudited)
As a shareholder of The Tocqueville Trust (the “Funds”), you incur ongoing costs, including management fees; distribution fees; and other Fund expenses. This example is intended to help you understand your ongoing costs (in dollars) of investing in the Funds and to compare costs with the ongoing costs of investing in other mutual funds.
The Example is based on an investment of $1,000 invested at the beginning of the period and held the entire period (November 1, 2014-April 30, 2015).
Actual Expenses
The first line of the table below provides information about actual account values and actual expenses. You may use the information in this line, together with the amount you invested, to estimate the expenses that you paid over the period. Simply divide your account value by $1,000 (for example, an $8,600 account value divided by $1,000 = 8.6), then multiply the result by the number in the first line under the heading entitled “Expenses Paid During Period” to estimate the expenses you paid on your account during this period.
Hypothetical Example for Comparison Purposes
The second line of the table below provides information about hypothetical account values and hypothetical expenses based on the Funds’ actual expense ratios and an assumed rate of return of 5% per year before expenses, which is not the Funds’ actual return. The hypothetical account values and expenses may not be used to estimate the actual ending account balance or expenses you paid for the period. You may use this information to compare the ongoing costs of investing in the Funds and other funds. To do so, compare this 5% hypothetical example with the 5% hypothetical examples that appear in the shareholder reports of the other funds.
Please note that the expenses shown in the table are meant to highlight your ongoing costs only and do not reflect any transactional costs, such as sales charges (loads), redemption fees, or exchange fees. Therefore, the second line of the table is useful in comparing ongoing costs only, and will not help you determine the relative costs of owning different funds. In addition, if these transactional costs were included, your costs would have been higher.
Expense Example Tables (Unaudited)
| | | | | | | | | | | | |
| The Tocqueville Fund | | Beginning
Account Value
November 1, 2014 | | | Ending
Account Value
April 30, 2015 | | | Expenses Paid
During Period*
November 1, 2014 -
April 30, 2015 | |
Actual | | $ | 1,000.00 | | | $ | 1,033.10 | | | $ | 6.30 | |
Hypothetical (5% return before expenses) | | | 1,000.00 | | | | 1,018.60 | | | | 6.26 | |
| | | |
| The Tocqueville Opportunity Fund | | | | | | | | | | | | |
Actual | | $ | 1,000.00 | | | $ | 1,129.90 | | | $ | 6.87 | |
Hypothetical (5% return before expenses) | | | 1,000.00 | | | | 1,018.35 | | | | 6.51 | |
| | | |
| The Tocqueville International Value Fund | | | | | | | | | | | | |
Actual | | $ | 1,000.00 | | | $ | 1,116.30 | | | $ | 6.56 | |
Hypothetical (5% return before expenses) | | | 1,000.00 | | | | 1,018.60 | | | | 6.26 | |
| | | |
| The Tocqueville Gold Fund | | | | | | | | | | | | |
Actual | | $ | 1,000.00 | | | $ | 1,066.50 | | | $ | 7.12 | |
Hypothetical (5% return before expenses) | | | 1,000.00 | | | | 1,017.90 | | | | 6.95 | |
| | | |
| The Delafield Fund | | | | | | | | | | | | |
Actual | | $ | 1,000.00 | | | $ | 1,005.60 | | | $ | 6.17 | |
Hypothetical (5% return before expenses) | | | 1,000.00 | | | | 1,018.65 | | | | 6.21 | |
| | | |
| The Tocqueville Select Fund | | | | | | | | | | | | |
Actual | | $ | 1,000.00 | | | $ | 1,035.40 | | | $ | 6.76 | |
Hypothetical (5% return before expenses) | | | 1,000.00 | | | | 1,018.15 | | | | 6.71 | |
| | | |
| The Tocqueville Alternative Strategies Fund | | | | | | | | | | | | |
Actual | | $ | 1,000.00 | | | $ | 1,042.30 | | | $ | 14.53 | |
Hypothetical (5% return before expenses) | | | 1,000.00 | | | | 1,010.56 | | | | 14.31 | |
| * | Expenses are equal to the Fund’s annualized six-month expense ratio (including interest expense and dividends and interest expense on short sales) of 1.25%, 1.30%, 1.25%, 1.39%, 1.24%, 1.34%, 2.87% for The Tocqueville Fund, Opportunity Fund, International Value Fund, Gold Fund, Delafield Fund, Select Fund, and Alternative Strategies Fund respectively, multiplied by the average account value over the period, multiplied by 181/365 to reflect the one-half year period. |
The Tocqueville Fund
Financial Highlights
| | | | | | | | | | | | | | | | | | | | | | | | |
Per share operating performance
(For a share outstanding throughout
the period) | | Six Months
Ended
April 30,
2015 | | | Years Ended October 31, | |
| | | 2014 | | | 2013 | | | 2012 | | | 2011 | | | 2010 | |
| | | (unaudited) | | | | | | | | | | | | | | | | |
Net asset value, beginning of period | | $ | 34.18 | | | $ | 30.67 | | | $ | 24.11 | | | $ | 22.23 | | | $ | 21.53 | | | $ | 18.47 | |
| | | | | | | | | | | | | | | | | | | | | | | | |
Operations: | | | | | | | | | | | | | | | | | | | | | | | | |
Net investment income (1) | | | 0.13 | | | | 0.28 | | | | 0.40 | | | | 0.40 | | | | 0.23 | | | | 0.32 | |
Net realized and unrealized gain | | | 0.97 | | | | 3.78 | | | | 6.51 | | | | 1.81 | | | | 0.80 | | | | 2.97 | |
| | | | | | | | | | | | | | | | | | | | | | | | |
Total from investment operations* | | | 1.10 | | | | 4.06 | | | | 6.91 | | | | 2.21 | | | | 1.03 | | | | 3.29 | |
| | | | | | | | | | | | | | | | | | | | | | | | |
Distributions to shareholders: | | | | | | | | | | | | | | | | | | | | | | | | |
Dividends from net investment income | | | (0.25 | ) | | | (0.30 | ) | | | (0.35 | ) | | | (0.33 | ) | | | (0.33 | ) | | | (0.23 | ) |
Distributions from net realized gains | | | (1.20 | ) | | | (0.25 | ) | | | — | | | | — | | | | — | | | | — | |
| | | | | | | | | | | | | | | | | | | | | | | | |
Total distributions | | | (1.45 | ) | | | (0.55 | ) | | | (0.35 | ) | | | (0.33 | ) | | | (0.33 | ) | | | (0.23 | ) |
| | | | | | | | | | | | | | | | | | | | | | | | |
Change in net asset value for the period | | | (0.35 | ) | | | 3.51 | | | | 6.56 | | | | 1.88 | | | | 0.70 | | | | 3.06 | |
| | | | | | | | | | | | | | | | | | | | | | | | |
Net asset value, end of period | | $ | 33.83 | | | $ | 34.18 | | | $ | 30.67 | | | $ | 24.11 | | | $ | 22.23 | | | $ | 21.53 | |
| | | | | | | | | | | | | | | | | | | | | | | | |
* Includes redemption fees per share of | | | 0.00 | (2) | | | 0.00 | (2) | | | 0.00 | (2) | | | 0.00 | (2) | | | 0.00 | (2) | | | 0.00 | (2) |
Total Return | | | 3.3 | %(4) | | | 13.4 | % | | | 29.0 | % | | | 10.1 | % | | | 4.8 | % | | | 18.0 | % |
Ratios/supplemental data | | | | | | | | | | | | | | | | | | | | | | | | |
Net assets, end of period (000) | | $ | 375,992 | | | $ | 380,561 | | | $ | 348,269 | | | $ | 366,025 | | | $ | 491,541 | | | $ | 489,670 | |
Ratio to average net assets: | | | | | | | | | | | | | | | | | | | | | | | | |
Expense before waiver/reimbursement | | | 1.25 | %(5) | | | 1.25 | % | | | 1.28 | % | | | 1.29 | % | | | 1.26 | % | | | 1.26 | % |
Expense after waiver/reimbursement | | | 1.25 | %(5) | | | 1.24 | % | | | 1.26 | %(3) | | | 1.26 | %(3) | | | 1.25 | % | | | 1.25 | % |
Net investment income before waiver/reimbursement | | | 0.74 | %(5) | | | 0.84 | % | | | 1.33 | % | | | 1.30 | % | | | 0.97 | % | | | 1.65 | % |
Net investment income after waiver/reimbursement | | | 0.74 | %(5) | | | 0.85 | % | | | 1.35 | % | | | 1.33 | % | | | 0.98 | % | | | 1.66 | % |
Portfolio turnover rate | | | 7 | %(4) | | | 19 | % | | | 16 | % | | | 17 | % | | | 28 | % | | | 23 | % |
| (1) | Net investment income per share is calculated using the ending balance prior to consideration or adjustment for permanent book-to-tax differences. |
| (2) | Represents less than $0.01 |
| (3) | Includes 0.01% of interest expense which is not included in the Fund’s operating expense cap. |
The Accompanying Footnotes are an Integral Part of these Financial Statements.
The Tocqueville Opportunity Fund
Financial Highlights
| | | | | | | | | | | | | | | | | | | | | | | | |
Per share operating performance (For a share outstanding throughout
the period) | | Six Months
Ended
April 30,
2015 | | | Years Ended October 31, | |
| | | 2014 | | | 2013 | | | 2012 | | | 2011 | | | 2010 | |
| | | (unaudited) | | | | | | | | | | | | | | | | |
Net asset value, beginning of period | | $ | 22.78 | | | $ | 21.29 | | | $ | 15.76 | | | $ | 14.96 | | | $ | 13.20 | | | $ | 10.78 | |
| | | | | | | | | | | | | | | | | | | | | | | | |
Operations: | | | | | | | | | | | | | | | | | | | | | | | | |
Net investment loss (1) | | | (0.08 | ) | | | (0.22 | ) | | | (0.13 | ) | | | (0.11 | ) | | | (0.13 | ) | | | (0.12 | ) |
Net realized and unrealized gain | | | 2.68 | | | | 2.80 | | | | 5.66 | | | | 0.91 | | | | 1.89 | | | | 2.54 | |
| | | | | | | | | | | | | | | | | | | | | | | | |
Total from investment operations* | | | 2.60 | | | | 2.58 | | | | 5.53 | | | | 0.80 | | | | 1.76 | | | | 2.42 | |
| | | | | | | | | | | | | | | | | | | | | | | | |
Distributions to shareholders: | | | | | | | | | | | | | | | | | | | | | | | | |
Dividends from net investment income | | | — | | | | — | | | | — | | | | — | | | | — | | | | — | |
Distributions from net realized gains | | | (3.20 | ) | | | (1.09 | ) | | | — | | | | — | | | | — | | | | — | |
| | | | | | | | | | | | | | | | | | | | | | | | |
Total distributions | | | (3.20 | ) | | | (1.09 | ) | | | — | | | | — | | | | — | | | | — | |
| | | | | | | | | | | | | | | | | | | | | | | | |
Change in net asset value for the period | | | (0.60 | ) | | | 1.49 | | | | 5.53 | | | | 0.80 | | | | 1.76 | | | | 2.42 | |
| | | | | | | | | | | | | | | | | | | | | | | | |
Net asset value, end of period | | $ | 22.18 | | | $ | 22.78 | | | $ | 21.29 | | | $ | 15.76 | | | $ | 14.96 | | | $ | 13.20 | |
| | | | | | | | | | | | | | | | | | | | | | | | |
* Includes redemption fees per share of | | | 0.00 | (2) | | | 0.00 | (2) | | | 0.00 | (2) | | | 0.00 | (2) | | | 0.00 | (2) | | | 0.00 | (2) |
Total Return | | | 13.0 | %(3) | | | 12.6 | % | | | 35.1 | % | | | 5.4 | % | | | 13.3 | % | | | 22.6 | % |
Ratios/supplemental data | | | | | | | | | | | | | | | | | | | | | | | | |
Net assets, end of period (000) | | $ | 102,603 | | | $ | 80,324 | | | $ | 80,609 | | | $ | 65,455 | | | $ | 46,963 | | | $ | 32,863 | |
Ratio to average net assets: | | | | | | | | | | | | | | | | | | | | | | | | |
Expense | | | 1.30 | %(4) | | | 1.30 | % | | | 1.30 | % | | | 1.32 | % | | | 1.36 | % | | | 1.41 | % |
Net investment loss | | | (0.91 | )%(4) | | | (0.90 | )% | | | (0.64 | )% | | | (0.76 | )% | | | (1.04 | )% | | | (1.08 | )% |
Portfolio turnover rate | | | 50 | %(3) | | | 92 | % | | | 100 | % | | | 77 | % | | | 110 | % | | | 104 | % |
| (1) | Net investment loss per share is calculated using the ending balance prior to consideration or adjustment for permanent book-to-tax differences. |
| (2) | Represents less than $0.01 |
The Accompanying Footnotes are an Integral Part of these Financial Statements.
The Tocqueville International Value Fund
Financial Highlights
| | | | | | | | | | | | | | | | | | | | | | | | |
Per share operating performance (For a share outstanding throughout
the period) | | Six Months
Ended
April 30,
2015 | | | Years Ended October 31, | |
| | | 2014 | | | 2013 | | | 2012 | | | 2011 | | | 2010 | |
| | | (unaudited) | | | | | | | | | | | | | | | | |
Net asset value, beginning of period | | $ | 14.48 | | | $ | 14.71 | | | $ | 11.68 | | | $ | 12.00 | | | $ | 12.12 | | | $ | 10.48 | |
| | | | | | | | | | | | | | | | | | | | | | | | |
Operations: | | | | | | | | | | | | | | | | | | | | | | | | |
Net investment income (1) | | | 0.06 | | | | 0.15 | | | | 0.24 | | | | 0.17 | | | | 0.11 | | | | 0.11 | |
Net realized and unrealized gain (loss) | | | 1.50 | | | | (0.15 | ) | | | 2.97 | | | | (0.37 | ) | | | (0.16 | ) | | | 1.65 | |
| | | | | | | | | | | | | | | | | | | | | | | | |
Total from investment operations* | | | 1.56 | | | | — | | | | 3.21 | | | | (0.20 | ) | | | (0.05 | ) | | | 1.76 | |
| | | | | | | | | | | | | | | | | | | | | | | | |
Distributions to shareholders: | | | | | | | | | | | | | | | | | | | | | | | | |
Dividends from net investment income | | | (0.32 | ) | | | (0.23 | ) | | | (0.18 | ) | | | (0.12 | ) | | | (0.07 | ) | | | (0.12 | ) |
Distributions from net realized gains | | | (0.52 | ) | | | — | | | | — | | | | — | | | | — | | | | — | |
| | | | | | | | | | | | | | | | | | | | | | | | |
Total distributions | | | (0.84 | ) | | | (0.23 | ) | | | (0.18 | ) | | | (0.12 | ) | | | (0.07 | ) | | | (0.12 | ) |
| | | | | | | | | | | | | | | | | | | | | | | | |
Change in net asset value for the period | | | 0.72 | | | | (0.23 | ) | | | 3.03 | | | | (0.32 | ) | | | (0.12 | ) | | | 1.64 | |
| | | | | | | | | | | | | | | | | | | | | | | | |
Net asset value, end of period | | $ | 15.20 | | | $ | 14.48 | | | $ | 14.71 | | | $ | 11.68 | | | $ | 12.00 | | | $ | 12.12 | |
| | | | | | | | | | | | | | | | | | | | | | | | |
* Includes redemption fees per share of | | | 0.00 | (2) | | | 0.00 | (2) | | | 0.00 | (2) | | | 0.00 | (2) | | | 0.01 | | | | 0.00 | (2) |
Total Return | | | 11.6 | %(4) | | | (0.0 | )% | | | 27.8 | % | | | (1.6 | )% | | | (0.5 | )% | | | 17.0 | % |
Ratios/supplemental data | | | | | | | | | | | | | | | | | | | | | | | | |
Net assets, end of period (000) | | $ | 264,060 | | | $ | 237,051 | | | $ | 262,981 | | | $ | 218,793 | | | $ | 199,848 | | | $ | 150,103 | |
Ratio to average net assets: | | | | | | | | | | | | | | | | | | | | | | | | |
Expense before waiver/reimbursement | | | 1.56 | %(5) | | | 1.54 | % | | | 1.55 | % | | | 1.56 | % | | | 1.56 | % | | | 1.56 | % |
Expense after waiver/reimbursement | | | 1.25 | %(5) | | | 1.25 | % | | | 1.30 | %(3) | | | 1.56 | % | | | 1.56 | % | | | 1.56 | % |
Net investment income before waiver/reimbursement | | | 0.44 | %(5) | | | 0.62 | % | | | 1.55 | % | | | 1.53 | % | | | 0.99 | % | | | 1.03 | % |
Net investment income after waiver/reimbursement | | | 0.75 | %(5) | | | 0.91 | % | | | 1.80 | %(3) | | | 1.53 | % | | | 0.99 | % | | | 1.03 | % |
Portfolio turnover rate | | | 26 | %(4) | | | 31 | % | | | 37 | % | | | 38 | % | | | 30 | % | | | 27 | % |
| (1) | Net investment income per share is calculated using the ending balance prior to consideration or adjustment for permanent book-to-tax differences. |
| (2) | Represents less than $0.01 |
| (3) | Expense cap of 1.25% was implemented on January 1, 2013. |
The Accompanying Footnotes are an Integral Part of these Financial Statements.
The Tocqueville Gold Fund
Financial Highlights
| | | | | | | | | | | | | | | | | | | | | | | | |
Per share operating performance (For a share outstanding
throughout the period) | | Six Months
Ended
April 30,
2015 | | | Years Ended October 31, | |
| | | 2014 | | | 2013 | | | 2012 | | | 2011 | | | 2010 | |
| | | (unaudited) | | | | | | | | | | | | | | | | |
Net asset value, beginning of period | | $ | 30.38 | | | $ | 38.01 | | | $ | 72.82 | | | $ | 81.97 | | | $ | 82.00 | | | $ | 49.71 | |
| | | | | | | | | | | | | | | | | | | | | | | | |
Operations: | | | | | | | | | | | | | | | | | | | | | | | | |
Net investment loss (1) | | | (0.11 | ) | | | (0.08 | ) | | | (0.26 | ) | | | (0.35 | ) | | | (0.67 | ) | | | (0.58 | ) |
Net realized and unrealized gain (loss) | | | 2.13 | | | | (7.55 | ) | | | (32.93 | ) | | | (7.47 | ) | | | 2.25 | | | | 32.96 | |
| | | | | | | | | | | | | | | | | | | | | | | | |
Total from investment operations* | | | 2.02 | | | | (7.63 | ) | | | (33.19 | ) | | | (7.82 | ) | | | 1.58 | | | | 32.38 | |
| | | | | | | | | | | | | | | | | | | | | | | | |
Distributions to shareholders: | | | | | | | | | | | | | | | | | | | | | | | | |
Dividends from net investment income | | | — | | | | — | | | | — | | | | — | | | | — | | | | — | |
Distributions from net realized gains | | | — | | | | — | | | | (1.62 | ) | | | (1.33 | ) | | | (1.61 | ) | | | (0.09 | ) |
| | | | | | | | | | | | | | | | | | | | | | | | |
Total distributions | | | — | | | | — | | | | (1.62 | ) | | | (1.33 | ) | | | (1.61 | ) | | | (0.09 | ) |
| | | | | | | | | | | | | | | | | | | | | | | | |
Change in net asset value for the period | | | 2.02 | | | | (7.63 | ) | | | (34.81 | ) | | | (9.15 | ) | | | (0.03 | ) | | | 32.29 | |
| | | | | | | | | | | | | | | | | | | | | | | | |
Net asset value, end of period | | $ | 32.40 | | | $ | 30.38 | | | $ | 38.01 | | | $ | 72.82 | | | $ | 81.97 | | | $ | 82.00 | |
| | | | | | | | | | | | | | | | | | | | | | | | |
* Includes redemption fees per share of | | | 0.00 | (2) | | | 0.02 | | | | 0.02 | | | | 0.02 | | | | 0.10 | | | | 0.06 | |
Total Return | | | 6.7 | %(3) | | | (20.1 | )% | | | (46.4 | )% | | | (9.5 | )% | | | 1.8 | % | | | 65.2 | % |
Ratios/supplemental data | | | | | | | | | | | | | | | | | | | | | | | | |
Net assets, end of period (000) | | $ | 1,235,076 | | | $ | 1,138,557 | | | $ | 1,215,081 | | | $ | 2,445,913 | | | $ | 2,647,078 | | | $ | 2,199,603 | |
Ratio to average net assets: | | | | | | | | | | | | | | | | | | | | | | | | |
Expense | | | 1.39 | %(4) | | | 1.36 | % | | | 1.34 | % | | | 1.28 | % | | | 1.25 | % | | | 1.34 | % |
Net investment loss | | | (0.73 | )%(4) | | | (0.78 | )% | | | (0.41 | )% | | | (0.56 | )% | | | (0.86 | )% | | | (1.11 | )% |
Portfolio turnover rate | | | 4 | %(3) | | | 10 | % | | | 14 | % | | | 11 | % | | | 3 | % | | | 9 | % |
| (1) | Net investment loss per share is calculated using the ending balance prior to consideration or adjustment for permanent book-to-tax differences. |
| (2) | Represents less than $0.01 |
The Accompanying Footnotes are an Integral Part of these Financial Statements.
The Delafield Fund
Financial Highlights
| | | | | | | | | | | | | | | | | | | | | | | | |
Per share operating performance (For a share outstanding
throughout the period) | | Six Months
Ended
April 30,
2015 | | | Years Ended October 31, | |
| | | 2014 | | | 2013 | | | 2012 | | | 2011 | | | 2010 | |
| | | (unaudited) | | | | | | | | | | | | | | | | |
Net asset value, beginning of period | | $ | 36.40 | | | $ | 37.13 | | | $ | 29.79 | | | $ | 27.21 | | | $ | 26.65 | | | $ | 21.35 | |
| | | | | | | | | | | | | | | | | | | | | | | | |
Operations: | | | | | | | | | | | | | | | | | | | | | | | | |
Net investment loss (1) | | | (0.07 | ) | | | (0.10 | ) | | | (0.05 | ) | | | (0.04 | ) | | | (0.08 | ) | | | (0.00 | )(2) |
Net realized and unrealized gain | | | 0.13 | | | | 0.70 | | | | 9.19 | | | | 2.99 | | | | 0.64 | | | | 5.32 | |
| | | | | | | | | | | | | | | | | | | | | | | | |
Total from investment operations * | | | 0.06 | | | | 0.60 | | | | 9.14 | | | | 2.95 | | | | 0.56 | | | | 5.32 | |
| | | | | | | | | | | | | | | | | | | | | | | | |
Distributions to shareholders: | | | | | | | | | | | | | | | | | | | | | | | | |
Dividends from net investment income | | | — | | | | — | | | | — | | | | — | | | | — | | | | — | |
Distributions from net realized gains | | | (3.63 | ) | | | (1.33 | ) | | | (1.80 | ) | | | (0.37 | ) | | | — | | | | — | |
Return of capital | | | — | | | | — | | | | — | | | | — | | | | — | | | | (0.02 | ) |
| | | | | | | | | | | | | | | | | | | | | | | | |
Total distributions | | | (3.63 | ) | | | (1.33 | ) | | | (1.80 | ) | | | (0.37 | ) | | | — | | | | (0.02 | ) |
| | | | | | | | | | | | | | | | | | | | | | | | |
Change in net asset value for the period | | | (3.57 | ) | | | (0.73 | ) | | | 7.34 | | | | 2.58 | | | | 0.56 | | | | 5.30 | |
| | | | | | | | | | | | | | | | | | | | | | | | |
Net asset value, end of period | | $ | 32.83 | | | $ | 36.40 | | | $ | 37.13 | | | $ | 29.79 | | | $ | 27.21 | | | $ | 26.65 | |
| | | | | | | | | | | | | | | | | | | | | | | | |
* Includes redemption fees per share of | | | 0.00 | (2) | | | 0.00 | (2) | | | 0.00 | (2) | | | 0.00 | (2) | | | 0.01 | | | | 0.01 | |
Total Return | | | 0.6 | %(3) | | | 1.6 | % | | | 32.1 | % | | | 11.0 | % | | | 2.1 | % | | | 25.0 | % |
Ratios/supplemental data | | | | | | | | | | | | | | | | | | | | | | | | |
Net assets, end of period (000) | | $ | 985,113 | | | $ | 1,475,139 | | | $ | 1,759,341 | | | $ | 1,346,273 | | | $ | 1,262,876 | | | $ | 933,674 | |
Ratio to average net assets: | | | | | | | | | | | | | | | | | | | | | | | | |
Expense | | | 1.24 | %(4) | | | 1.21 | % | | | 1.21 | % | | | 1.23 | % | | | 1.23 | % | | | 1.27 | % |
Net investment loss | | | (0.16 | )%(4) | | | (0.24 | )% | | | (0.15 | )% | | | (0.13 | )% | | | (0.30 | )% | | | (0.02 | )% |
Portfolio turnover rate | | | 7 | %(3) | | | 34 | % | | | 34 | % | | | 49 | % | | | 38 | % | | | 30 | % |
| (1) | Net investment loss per share is calculated using the ending balance prior to consideration or adjustment for permanent book-to-tax differences. |
| (2) | Represents less than $0.01 |
The Accompanying Footnotes are an Integral Part of these Financial Statements.
The Tocqueville Select Fund
Financial Highlights
| | | | | | | | | | | | | | | | | | | | | | | | |
Per share operating performance (For a share outstanding throughout
the period) | | Six Months
Ended
April 30,
2015 | | | Years Ended October 31, | |
| | | 2014 | | | 2013 | | | 2012 | | | 2011 | | | 2010 | |
| | | (unaudited) | | | | | | | | | | | | | | | | |
Net asset value, beginning of period | | $ | 14.90 | | | $ | 15.57 | | | $ | 11.35 | | | $ | 11.06 | | | $ | 11.54 | | | $ | 8.46 | |
| | | | | | | | | | | | | | | | | | | | | | | | |
Operations: | | | | | | | | | | | | | | | | | | | | | | | | |
Net investment loss (1) | | | (0.04 | ) | | | (0.07 | ) | | | (0.06 | ) | | | (0.04 | ) | | | (0.07 | ) | | | (0.03 | ) |
Net realized and unrealized gain | | | 0.47 | | | | 0.94 | | | | 4.79 | | | | 0.44 | | | | 0.12 | | | | 3.12 | |
| | | | | | | | | | | | | | | | | | | | | | | | |
Total from investment operations * | | | 0.43 | | | | 0.87 | | | | 4.73 | | | | 0.40 | | | | 0.05 | | | | 3.09 | |
| | | | | | | | | | | | | | | | | | | | | | | | |
Distributions to shareholders: | | | | | | | | | | | | | | | | | | | | | | | | |
Dividends from net investment income | | | — | | | | — | | | | — | | | | — | | | | — | | | | (0.01 | ) |
Distributions from net realized gains | | | (1.74 | ) | | | (1.54 | ) | | | (0.51 | ) | | | (0.11 | ) | | | (0.53 | ) | | | — | |
| | | | | | | | | | | | | | | | | | | | | | | | |
Total distributions | | | (1.74 | ) | | | (1.54 | ) | | | (0.51 | ) | | | (0.11 | ) | | | (0.53 | ) | | | (0.01 | ) |
| | | | | | | | | | | | | | | | | | | | | | | | |
Change in net asset value for the period | | | (1.31 | ) | | | (0.67 | ) | | | 4.22 | | | | 0.29 | | | | (0.48 | ) | | | 3.08 | |
| | | | | | | | | | | | | | | | | | | | | | | | |
Net asset value, end of period | | $ | 13.59 | | | $ | 14.90 | | | $ | 15.57 | | | $ | 11.35 | | | $ | 11.06 | | | $ | 11.54 | |
| | | | | | | | | | | | | | | | | | | | | | | | |
* Includes redemption fees per share of | | | 0.00 | (2) | | | 0.00 | (2) | | | 0.00 | (2) | | | 0.00 | (2) | | | 0.01 | | | | 0.01 | |
Total Return | | | 3.5 | %(3) | | | 6.1 | % | | | 43.2 | % | | | 3.7 | % | | | (0.1 | )% | | | 36.6 | % |
Ratios/supplemental data | | | | | | | | | | | | | | | | | | | | | | | | |
Net assets, end of period (000) | | $ | 98,477 | | | $ | 108,060 | | | $ | 99,888 | | | $ | 84,549 | | | $ | 71,554 | | | $ | 41,788 | |
Ratio to average net assets: | | | | | | | | | | | | | | | | | | | | | | | | |
Expense | | | 1.34 | %(4) | | | 1.32 | % | | | 1.34 | % | | | 1.37 | % | | | 1.36 | % | | | 1.38 | % |
Net investment loss | | | (0.62 | )%(4) | | | (0.50 | )% | | | (0.39 | )% | | | (0.36 | )% | | | (0.67 | )% | | | (0.43 | )% |
Portfolio turnover rate | | | 20 | %(3) | | | 32 | % | | | 28 | % | | | 31 | % | | | 28 | % | | | 40 | % |
| (1) | Net investment loss per share is calculated using the ending balance prior to consideration or adjustment for permanent book-to-tax differences. |
| (2) | Represents less than $0.01 |
The Accompanying Footnotes are an Integral Part of these Financial Statements.
The Tocqueville Alternative Strategies Fund
Financial Highlights
| | | | | | | | | | | | | | | | |
Per share operating performance (For a share outstanding throughout the period) | | Six Months
Ended
April 30,
2015 | | | For the Period
January 1, 2014
to
October 31,
2014 | | | For the Period
June 1, 2013
to
December 31,
2013† | | | For the Period
June 29, 2012(3)
to
May 31,
2013† | |
| | | (unaudited) | | | | | | | | | | |
Net asset value, beginning of period | | $ | 27.26 | | | $ | 26.19 | | | $ | 29.06 | | | $ | 25.00 | |
| | | | | | | | | | | | | | | | |
Operations: | | | | | | | | | | | | | | | | |
Net investment income (loss) | | | 0.04 | (1) | | | (0.20 | )(1) | | | (0.15 | )(2) | | | (0.04 | )(2) |
Net realized and unrealized gain (loss) | | | 1.09 | | | | 1.27 | | | | (0.98 | ) | | | 4.75 | |
| | | | | | | | | | | | | | | | |
Total from investment operations | | | 1.13 | | | | 1.07 | | | | (1.13 | ) | | | 4.71 | |
| | | | | | | | | | | | | | | | |
Distributions to shareholders: | | | | | | | | | | | | | | | | |
Dividends from net investment income | | | — | | | | — | | | | (0.11 | ) | | | (0.02 | ) |
Distributions from net realized gains | | | (0.58 | ) | | | — | | | | (1.63 | ) | | | (0.63 | ) |
| | | | | | | | | | | | | | | | |
Total distributions | | | (0.58 | ) | | | — | | | | (1.74 | ) | | | (0.65 | ) |
| | | | | | | | | | | | | | | | |
Change in net asset value for the period | | | 0.55 | | | | 1.07 | | | | (2.87 | ) | | | 4.06 | |
| | | | | | | | | | | | | | | | |
Net asset value, end of period | | $ | 27.81 | | | $ | 27.26 | | | $ | 26.19 | | | $ | 29.06 | |
| | | | | | | | | | | | | | | | |
* Includes redemption fees per share of | | | 0.00 | (4) | | | 0.00 | (4) | | | 0.00 | (4) | | | 0.00 | (4) |
Total Return | | | 4.2 | %(5) | | | 4.1 | %(5) | | | (3.8 | )%(5) | | | 19.2 | %(5) |
Ratios/supplemental data | | | | | | | | | | | | | | | | |
Net assets, end of period (000) | | $ | 43,070 | | | $ | 39,143 | | | $ | 36,594 | | | $ | 38,846 | |
Ratio to average net assets: | | | | | | | | | | | | | | | | |
Expense before waiver/reimbursement | | | 2.96 | %(6) | | | 3.31 | %(6) | | | 3.25 | %(6) | | | 3.21 | %(6) |
Expense after waiver/reimbursement | | | 2.88 | %(6) | | | 2.66 | %(6) | | | 2.86 | %(6) | | | 2.63 | %(6) |
Net investment income (loss) before waiver/reimbursement | | | 0.20 | %(6) | | | (1.52 | )%(6) | | | (1.33 | )%(6) | | | (0.72 | )%(6) |
Net investment income (loss) after waiver/reimbursement | | | 0.28 | %(6) | | | (0.87 | )%(6) | | | (0.94 | )%(6) | | | (0.14 | )%(6) |
Ratio to average net assets (excluding dividends and interest on securities sold short): | | | | | | | | | | | | | | | | |
Expense before waiver/reimbursement | | | 1.98 | %(6) | | | 2.60 | %(6) | | | 2.38 | %(6) | | | 2.57 | %(6) |
Expense after waiver/reimbursement | | | 1.90 | %(6) | | | 1.96 | %(6) | | | 1.99 | %(6) | | | 1.99 | %(6) |
Net investment income (loss) before waiver/reimbursement | | | 1.17 | %(6) | | | (0.81 | )%(6) | | | (0.46 | )%(6) | | | (0.08 | )%(6) |
Net investment income (loss) after waiver/reimbursement | | | 1.25 | %(6) | | | (0.16 | )%(6) | | | (0.07 | )%(6) | | | 0.50 | %(6) |
Portfolio turnover rate | | | 45 | %(5) | | | 99 | %(5) | | | 69 | %(5) | | | 91 | %(5) |
| † | Information shown is for Predecessor Fund—Class I |
| (1) | Net investment income (loss) per share is calculated using the ending balance prior to consideration or adjustment for permanent book-to-tax differences. |
| (2) | Net investment loss per share is calculated based on average shares outstanding during the period. |
| (3) | Inception of Predecessor Fund—Class I |
| (4) | Represents less than $0.01. |
The Accompanying Footnotes are an Integral Part of these Financial Statements.
The Tocqueville Fund
Schedule of Investments as of April 30, 2015
(Unaudited)
| | | | | | | | |
| Common Stocks—97.6% | | Shares | | | Value | |
Automobiles & Components—2.1% | | | | | | | | |
Ford Motor Co. | | | 500,000 | | | $ | 7,900,000 | |
Banks—0.6% | | | | | | | | |
M&T Bank Corp. | | | 20,000 | | | | 2,393,400 | |
Capital Goods—7.2% | | | | | | | | |
Allison Transmission Holdings, Inc. | | | 100,000 | | | | 3,068,000 | |
General Electric Co. | | | 400,000 | | | | 10,832,000 | |
Illinois Tool Works, Inc. | | | 50,000 | | | | 4,679,000 | |
SolarCity Corp.(a) | | | 25,000 | | | | 1,501,250 | |
The Boeing Co. | | | 50,000 | | | | 7,167,000 | |
| | | | | | | | 27,247,250 | |
Commercial & Professional Services—2.7% | | | | | |
Pitney Bowes, Inc. | | | 250,000 | | | | 5,592,500 | |
Steelcase, Inc. | | | 250,000 | | | | 4,392,500 | |
| | | | | | | | 9,985,000 | |
Consumer Durables & Apparel—0.8% | | | | | |
Mattel, Inc. | | | 100,000 | | | | 2,816,000 | |
Consumer Services—2.4% | | | | | | | | |
DeVry Education Group, Inc. | | | 175,000 | | | | 5,292,000 | |
McDonald’s Corp. | | | 40,000 | | | | 3,862,000 | |
| | | | | | | | 9,154,000 | |
Diversified Financials—5.3% | | | | | | | | |
Capital One Financial Corp. | | | 75,000 | | | | 6,063,750 | |
Lazard Ltd.(b) | | | 100,000 | | | | 5,303,000 | |
The Bank of New York Mellon Corp. | | | 200,000 | | | | 8,468,000 | |
| | | | | | | | 19,834,750 | |
Energy—10.1% | | | | | | | | |
Energen Corp. | | | 100,000 | | | | 7,117,000 | |
Exxon Mobil Corp. | | | 100,000 | | | | 8,737,000 | |
Frank’s International NV(b) | | | 200,000 | | | | 4,160,000 | |
Murphy Oil Corp. | | | 100,000 | | | | 4,761,000 | |
Noble Energy, Inc. | | | 75,000 | | | | 3,804,000 | |
Schlumberger Ltd.(b) | | | 100,000 | | | | 9,461,000 | |
| | | | | | | | 38,040,000 | |
Food & Staples Retailing—2.1% | | | | | | | | |
Wal-Mart Stores, Inc. | | | 100,000 | | | | 7,805,000 | |
Food, Beverage & Tobacco—3.6% | | | | | | | | |
Campbell Soup Co. | | | 125,000 | | | | 5,588,750 | |
The Coca-Cola Co. | | | 200,000 | | | | 8,112,000 | |
| | | | | | | | 13,700,750 | |
Health Care Equipment & Services—1.2% | |
Express Scripts Holding Co.(a) | | | 50,000 | | | | 4,320,000 | |
Household & Personal Products—3.9% | | | | | |
Colgate-Palmolive Co. | | | 100,000 | | | | 6,728,000 | |
The Procter & Gamble Co. | | | 100,000 | | | | 7,951,000 | |
| | | | | | | | 14,679,000 | |
| Common Stocks (continued) | | Shares | | | Value | |
Insurance—3.2% | | | | | | | | |
Aflac, Inc. | | | 100,000 | | | $ | 6,304,000 | |
XL Group PLC(b) | | | 150,000 | | | | 5,562,000 | |
| | | | | | | | 11,866,000 | |
Materials—6.2% | | | | | | | | |
BHP Billiton Ltd.—ADR(b) | | | 75,000 | | | | 3,846,750 | |
EI du Pont de Nemours & Co. | | | 150,000 | | | | 10,980,000 | |
Goldcorp, Inc.(b) | | | 225,000 | | | | 4,236,750 | |
Sonoco Products Co. | | | 100,000 | | | | 4,469,000 | |
| | | | | | | | 23,532,500 | |
Pharmaceuticals, Biotechnology & Life Sciences—13.7% | |
Alkermes PLC(a)(b) | | | 125,000 | | | | 6,921,250 | |
Eisai Co., Ltd.(b) | | | 30,000 | | | | 2,018,090 | |
Isis Pharmaceuticals, Inc.(a) | | | 125,000 | | | | 7,090,000 | |
Johnson & Johnson | | | 100,000 | | | | 9,920,000 | |
Merck & Co., Inc. | | | 150,000 | | | | 8,934,000 | |
Momenta Pharmaceuticals, Inc.(a) | | | 250,000 | | | | 4,362,500 | |
Omeros Corp.(a) | | | 150,000 | | | | 3,018,000 | |
Pfizer, Inc. | | | 200,000 | | | | 6,786,000 | |
PTC Therapeutics, Inc.(a) | | | 45,000 | | | | 2,643,750 | |
| | | | | | | | 51,693,590 | |
Retailing—2.6% | | | | | | | | |
Amazon.com, Inc.(a) | | | 15,000 | | | | 6,326,700 | |
Target Corp. | | | 45,000 | | | | 3,547,350 | |
| | | | | | | | 9,874,050 | |
Semiconductors & Semiconductor Equipment—4.3% | |
Applied Materials, Inc. | | | 400,000 | | | | 7,916,000 | |
Intel Corp. | | | 250,000 | | | | 8,137,500 | |
| | | | | | | | 16,053,500 | |
Software & Services—11.2% | | | | | | | | |
Automatic Data Processing, Inc. | | | 100,000 | | | | 8,454,000 | |
Facebook, Inc.(a) | | | 75,000 | | | | 5,907,750 | |
Google, Inc.—Class A(a) | | | 7,000 | | | | 3,841,390 | |
Google, Inc.—Class C(a) | | | 7,019 | | | | 3,771,707 | |
IAC/InterActiveCorp | | | 31,000 | | | | 2,164,420 | |
Microsoft Corp. | | | 250,000 | | | | 12,160,000 | |
Xerox Corp. | | | 500,000 | | | | 5,750,000 | |
| | | | | | | | 42,049,267 | |
Technology Hardware & Equipment—7.5% | |
Apple, Inc. | | | 60,000 | | | | 7,509,000 | |
Bio-key International, Inc.(a)(c)(d)(e)
(Originally acquired 09/16/2005, Cost $0) | | | 23,545 | | | | — | |
BlackBerry Ltd.(a)(b) | | | 300,000 | | | | 3,048,000 | |
EMC Corp. | | | 400,000 | | | | 10,764,000 | |
The Accompanying Footnotes are an Integral Part of these Financial Statements.
The Tocqueville Fund
Schedule of Investments as of April 30, 2015
(Unaudited)
| | | | | | | | |
| Common Stocks (continued) | | Shares | | | Value | |
QUALCOMM, Inc. | | | 75,000 | | | $ | 5,100,000 | |
SanDisk Corp. | | | 25,000 | | | | 1,673,500 | |
| | | | | | | | 28,094,500 | |
Telecommunication Services—1.3% | | | | | |
Verizon Communications, Inc. | | | 100,000 | | | | 5,044,000 | |
Transportation—2.9% | | | | | | | | |
CH Robinson Worldwide, Inc. | | | 30,000 | | | | 1,931,700 | |
Delta Air Lines, Inc. | | | 200,000 | | | | 8,928,000 | |
| | | | | | | | 10,859,700 | |
Utilities—2.7% | | | | | | | | |
NextEra Energy, Inc. | | | 100,000 | | | | 10,093,000 | |
Total Common Stocks
(Cost $238,295,566) | | | | | | | 367,035,257 | |
Real Estate Investment Trust (REIT)—2.1% | |
Real Estate—2.1% | | | | | | | | |
Weyerhaeuser Co. | | | 250,000 | | | | 7,877,500 | |
Total Real Estate Investment Trust
(Cost $4,426,162) | | | | | | | 7,877,500 | |
Total Investments
(Cost $242,721,728)—99.7% | | | | | | | 374,912,757 | |
Other Assets in Excess of Liabilities—0.3% | | | | 1,078,749 | |
Total Net Assets—100.0% | | | | | | $ | 375,991,506 | |
| | | | | | | | |
Percentages are stated as a percent of net assets.
ADR American Depository Receipt
| (a) | Non-income producing security. |
| (b) | Foreign issued security. Foreign concentration (including ADR’s) was as follows: Australia 1.0%; Bermuda 1.4%; Canada 1.9%; Curacao 2.5%; Ireland 3.3%; Japan 0.5%; Netherlands 1.1%. |
| (c) | Denotes a security that is either fully or partially restricted to resale. The aggregate value of restricted securities as of April 30, 2015 was $0 which represented 0.0% of net assets. |
| (d) | Security is fair valued using procedures approved by the Board of Trustees. The aggregate value of fair valued securities as of April 30, 2015 was $0 which represented 0.0% of net assets. |
| (e) | Security is considered illiquid and may be difficult to sell. |
The Global Industry Classification Standard (GICS®) was developed by and/or is the exclusive property of MSCI, Inc. and Standard & Poor Financial Services LLC (“S&P”). GICS is a service mark of MSCI and S&P and has been licensed for use by U.S. Bancorp Fund Services, LLC.
The Accompanying Footnotes are an Integral Part of these Financial Statements.
The Tocqueville Opportunity Fund
Schedule of Investments as of April 30, 2015
(Unaudited)
| | | | | | | | |
| Common Stocks—99.1% | | Shares | | | Value | |
Automobiles & Components—2.8% | | | | | |
BorgWarner, Inc. | | | 8,500 | | | $ | 503,200 | |
Delphi Automotive PLC(a) | | | 4,700 | | | | 390,100 | |
Gentherm, Inc.(b) | | | 10,500 | | | | 553,665 | |
Johnson Controls, Inc. | | | 4,000 | | | | 201,520 | |
Lear Corp. | | | 2,500 | | | | 277,575 | |
Metaldyne Performance Group, Inc.(b) | | | 5,000 | | | | 90,300 | |
Remy International, Inc. | | | 10,000 | | | | 222,500 | |
Tenneco, Inc.(b) | | | 2,000 | | | | 116,900 | |
Tesla Motors, Inc.(b) | | | 1,800 | | | | 406,890 | |
The Goodyear Tire & Rubber Co. | | | 5,000 | | | | 141,825 | |
| | | | | | | | 2,904,475 | |
Banks—4.9% | | | | | | | | |
Bank of the Ozarks, Inc. | | | 29,000 | | | | 1,124,040 | |
BofI Holding, Inc.(b) | | | 8,000 | | | | 734,480 | |
Home BancShares, Inc. | | | 7,500 | | | | 246,600 | |
Pinnacle Financial Partners, Inc. | | | 31,000 | | | | 1,477,150 | |
Signature Bank(b) | | | 9,500 | | | | 1,273,855 | |
South State Corp. | | | 2,000 | | | | 135,440 | |
| | | | | | | | 4,991,565 | |
Capital Goods—6.3% | | | | | | | | |
Acuity Brands, Inc. | | | 2,000 | | | | 333,900 | |
Allegion PLC(a) | | | 2,000 | | | | 122,300 | |
Allison Transmission Holdings, Inc. | | | 8,500 | | | | 260,780 | |
AMETEK, Inc. | | | 500 | | | | 26,210 | |
AO Smith Corp. | | | 4,500 | | | | 287,550 | |
Armstrong World Industries, Inc.(b) | | | 4,500 | | | | 246,330 | |
Astronics Corp.(b) | | | 5,000 | | | | 336,550 | |
Colfax Corp.(b) | | | 500 | | | | 24,795 | |
Fortune Brands Home & Security, Inc. | | | 3,000 | | | | 133,800 | |
Graco, Inc. | | | 1,700 | | | | 121,754 | |
HEICO Corp. | | | 2,400 | | | | 134,016 | |
Hexcel Corp. | | | 3,800 | | | | 190,570 | |
IDEX Corp. | | | 3,200 | | | | 240,032 | |
Lennox International, Inc. | | | 2,000 | | | | 211,920 | |
Lincoln Electric Holdings, Inc. | | | 500 | | | | 33,430 | |
Nordson Corp. | | | 1,500 | | | | 119,475 | |
PACCAR, Inc. | | | 3,000 | | | | 196,050 | |
PGT, Inc.(b) | | | 10,000 | | | | 113,200 | |
RBC Bearings, Inc. | | | 1,000 | | | | 72,990 | |
Spirit AeroSystems Holdings, Inc.(b) | | | 4,500 | | | | 229,005 | |
The Middleby Corp.(b) | | | 8,500 | | | | 861,390 | |
TransDigm Group, Inc. | | | 3,600 | | | | 763,668 | |
Trex Co., Inc.(b) | | | 4,000 | | | | 187,680 | |
United Rentals, Inc.(b) | | | 1,000 | | | | 96,580 | |
WABCO Holdings, Inc.(b) | | | 3,500 | | | | 435,575 | |
Wabtec Corp. | | | 5,000 | | | | 470,250 | |
Watsco, Inc. | | | 2,100 | | | | 252,609 | |
| | | | | | | | 6,502,409 | |
| Common Stocks (continued) | | Shares | | | Value | |
Commercial & Professional Services—0.9% | |
Cintas Corp. | | | 3,000 | | | $ | 239,850 | |
Copart, Inc.(b) | | | 1,000 | | | | 35,570 | |
Equifax, Inc. | | | 3,500 | | | | 339,255 | |
Robert Half International, Inc. | | | 6,500 | | | | 360,425 | |
| | | | | | | | 975,100 | |
Commercial & Professional Services—0.1% | |
Multi-Color Corp. | | | 2,000 | | | | 125,560 | |
Consumer Durables & Apparel—3.7% | |
Fossil Group, Inc.(b) | | | 500 | | | | 41,990 | |
Hanesbrands, Inc. | | | 37,200 | | | | 1,156,176 | |
Harman International Industries, Inc. | | | 7,500 | | | | 977,850 | |
Helen of Troy Ltd.(a)(b) | | | 2,000 | | | | 175,220 | |
Jarden Corp.(b) | | | 4,500 | | | | 230,310 | |
Mohawk Industries, Inc.(b) | | | 2,400 | | | | 416,400 | |
Polaris Industries, Inc. | | | 2,750 | | | | 376,640 | |
Under Armour, Inc.(b) | | | 6,000 | | | | 465,300 | |
| | | | | | | | 3,839,886 | |
Consumer Services—4.2% | | | | | | | | |
BJ’s Restaurants, Inc.(b) | | | 3,000 | | | | 140,400 | |
Bob Evans Farms, Inc. | | | 4,000 | | | | 172,080 | |
Buffalo Wild Wings, Inc.(b) | | | 800 | | | | 127,440 | |
Chipotle Mexican Grill, Inc.(b) | | | 400 | | | | 248,536 | |
Domino’s Pizza, Inc. | | | 6,000 | | | | 647,100 | |
Dunkin’ Brands Group, Inc. | | | 3,700 | | | | 192,807 | |
Jack in the Box, Inc. | | | 5,600 | | | | 485,912 | |
Popeyes Louisiana Kitchen, Inc.(b) | | | 15,500 | | | | 863,040 | |
Restaurant Brands International, Inc.(a) | | | 8,663 | | | | 353,277 | |
Restaurant Brands International LP(a) | | | 37 | | | | 1,447 | |
Shake Shack, Inc.(b) | | | 500 | | | | 34,375 | |
Starbucks Corp. | | | 15,500 | | | | 768,490 | |
Wyndham Worldwide Corp. | | | 3,000 | | | | 256,200 | |
| | | | | | | | 4,291,104 | |
Diversified Financials—2.4% | | | | | | | | |
Affiliated Managers Group, Inc.(b) | | | 1,200 | | | | 271,356 | |
CBOE Holdings, Inc. | | | 3,400 | | | | 191,318 | |
KKR & Co. LP | | | 14,000 | | | | 315,140 | |
Lazard Ltd.(a) | | | 4,800 | | | | 254,544 | |
MSCI, Inc. | | | 500 | | | | 30,595 | |
PRA Group, Inc.(b) | | | 2,000 | | | | 109,550 | |
T. Rowe Price Group, Inc. | | | 1,200 | | | | 97,416 | |
The Blackstone Group LP | | | 11,500 | | | | 471,040 | |
The Charles Schwab Corp. | | | 10,000 | | | | 305,000 | |
Waddell & Reed Financial, Inc. | | | 4,600 | | | | 226,872 | |
WisdomTree Investments, Inc. | | | 8,500 | | | | 161,840 | |
| | | | | | | | 2,434,671 | |
Energy—2.4% | | | | | | | | |
Cameron International Corp.(b) | | | 2,000 | | | | 109,640 | |
Cheniere Energy, Inc.(b) | | | 500 | | | | 38,245 | |
The Accompanying Footnotes are an Integral Part of these Financial Statements.
The Tocqueville Opportunity Fund
Schedule of Investments as of April 30, 2015
(Unaudited)
| | | | | | | | |
| Common Stocks (continued) | | Shares | | | Value | |
Concho Resources, Inc.(b) | | | 2,300 | | | $ | 291,318 | |
Continental Resources, Inc.(b) | | | 1,500 | | | | 78,945 | |
Core Laboratories NV(a) | | | 2,500 | | | | 328,200 | |
Diamondback Energy, Inc.(b) | | | 2,500 | | | | 206,425 | |
Dril-Quip, Inc.(b) | | | 2,500 | | | | 199,300 | |
Frank’s International NV(a) | | | 5,000 | | | | 104,000 | |
Gulfport Energy Corp.(b) | | | 2,000 | | | | 97,880 | |
Helmerich & Payne, Inc. | | | 2,000 | | | | 155,940 | |
Oceaneering International, Inc. | | | 5,000 | | | | 275,550 | |
Pioneer Natural Resources Co. | | | 1,700 | | | | 293,726 | |
Seadrill Ltd.(a) | | | 10,000 | | | | 130,900 | |
SM Energy Co. | | | 3,000 | | | | 173,910 | |
| | | | | | | | 2,483,979 | |
Food & Staples Retailing—0.4% | | | | | | | | |
Rite Aid Corp.(b) | | | 7,500 | | | | 57,825 | |
Sprouts Farmers Market, Inc.(b) | | | 5,000 | | | | 159,925 | |
United Natural Foods, Inc.(b) | | | 2,500 | | | | 168,650 | |
| | | | | | | | 386,400 | |
Food, Beverage & Tobacco—4.3% | | | | | | | | |
Constellation Brands, Inc.(b) | | | 8,000 | | | | 927,520 | |
Monster Beverage Corp.(b) | | | 9,500 | | | | 1,302,545 | |
The Boston Beer Co., Inc.(b) | | | 2,500 | | | | 619,500 | |
The Hain Celestial Group, Inc.(b) | | | 14,200 | | | | 855,408 | |
The WhiteWave Foods Co.(b) | | | 15,000 | | | | 659,550 | |
| | | | | | | | 4,364,523 | |
Health Care Equipment & Services—3.1% | |
Acadia Healthcare Co., Inc.(b) | | | 2,500 | | | | 171,250 | |
Align Technology, Inc.(b) | | | 3,800 | | | | 223,592 | |
athenahealth, Inc.(b) | | | 1,100 | | | | 134,926 | |
Brookdale Senior Living, Inc.(b) | | | 4,000 | | | | 144,920 | |
Centene Corp.(b) | | | 5,000 | | | | 309,950 | |
DexCom, Inc.(b) | | | 10,200 | | | | 689,214 | |
Hanger, Inc.(b) | | | 5,500 | | | | 122,870 | |
IDEXX Laboratories, Inc.(b) | | | 2,800 | | | | 351,036 | |
Insulet Corp.(b) | | | 2,500 | | | | 74,625 | |
ResMed, Inc. | | | 500 | | | | 31,970 | |
Sirona Dental Systems, Inc.(b) | | | 2,100 | | | | 194,775 | |
Teleflex, Inc. | | | 2,100 | | | | 258,216 | |
Tenet Healthcare Corp.(b) | | | 5,200 | | | | 248,872 | |
Universal Health Services, Inc. | | | 1,400 | | | | 163,730 | |
Veeva Systems, Inc.(b) | | | 1,000 | | | | 26,550 | |
| | | | | | | | 3,146,496 | |
Household & Personal Products—0.2% | |
Church & Dwight Co., Inc. | | | 2,800 | | | | 227,276 | |
Herbalife Ltd.(a)(b) | | | 500 | | | | 20,760 | |
| | | | | | | | 248,036 | |
Insurance—0.2% | | | | | | | | |
Arthur J. Gallagher & Co. | | | 4,200 | | | | 200,886 | |
RenaissanceRe Holdings Ltd.(a) | | | 500 | | | | 51,245 | |
| | | | | | | | 252,131 | |
| Common Stocks (continued) | | Shares | | | Value | |
Materials—3.5% | | | | | | | | |
AptarGroup, Inc. | | | 500 | | | $ | 31,035 | |
Ball Corp. | | | 6,000 | | | | 440,460 | |
Caesarstone Sdot-Yam Ltd.(a) | | | 3,500 | | | | 207,340 | |
Crown Holdings, Inc.(b) | | | 4,000 | | | | 217,040 | |
Eagle Materials, Inc. | | | 2,000 | | | | 166,780 | |
Huntsman Corp. | | | 4,600 | | | | 106,030 | |
International Flavors & Fragrances, Inc. | | | 2,000 | | | | 229,500 | |
Martin Marietta Materials, Inc. | | | 2,000 | | | | 285,300 | |
Owens-Illinois, Inc.(b) | | | 1,500 | | | | 35,865 | |
Packaging Corp. of America | | | 7,200 | | | | 498,168 | |
PolyOne Corp. | | | 4,000 | | | | 156,200 | |
RPM International, Inc. | | | 5,500 | | | | 261,470 | |
Sealed Air Corp. | | | 9,000 | | | | 410,400 | |
The Sherwin-Williams Co. | | | 700 | | | | 194,600 | |
The Valspar Corp. | | | 2,000 | | | | 162,200 | |
WR Grace & Co.(b) | | | 1,500 | | | | 145,080 | |
| | | | | | | | 3,547,468 | |
Media—0.1% | | | | | | | | |
Morningstar, Inc. | | | 600 | | | | 45,534 | |
The Interpublic Group of Cos., Inc. | | | 1,000 | | | | 20,840 | |
| | | | | | | | 66,374 | |
Pharmaceuticals, Biotechnology & Life Sciences—29.5% | |
ACADIA Pharmaceuticals, Inc.(b) | | | 14,500 | | | | 495,465 | |
Acceleron Pharma, Inc.(b) | | | 7,000 | | | | 193,550 | |
Actavis plc(a)(b) | | | 4,500 | | | | 1,272,870 | |
Agios Pharmaceuticals, Inc.(b) | | | 4,000 | | | | 369,360 | |
Alexion Pharmaceuticals, Inc.(b) | | | 4,500 | | | | 761,535 | |
Alkermes PLC(a)(b) | | | 9,000 | | | | 498,330 | |
Alnylam Pharmaceuticals, Inc.(b) | | | 19,500 | | | | 1,986,465 | |
Applied Genetic Technologies Corp.(b) | | | 9,000 | | | | 172,260 | |
Avalanche Biotechnologies, Inc.(b) | | | 6,500 | | | | 207,090 | |
Bellicum Pharmaceuticals, Inc.(b) | | | 15,000 | | | | 359,700 | |
BioMarin Pharmaceutical, Inc.(b) | | | 10,500 | | | | 1,176,525 | |
Bluebird Bio, Inc.(b) | | | 11,500 | | | | 1,531,685 | |
Celldex Therapeutics, Inc.(b) | | | 6,000 | | | | 144,000 | |
Chimerix, Inc.(b) | | | 7,000 | | | | 238,000 | |
Clovis Oncology, Inc.(b) | | | 8,000 | | | | 642,880 | |
Dicerna Pharmaceuticals, Inc.(b) | | | 3,000 | | | | 60,210 | |
Eisai Co., Ltd.(a) | | | 1,800 | | | | 121,085 | |
Endo International PLC(a)(b) | | | 1,000 | | | | 84,065 | |
Five Prime Therapeutics, Inc.(b) | | | 12,000 | | | | 240,720 | |
Genfit(a)(b) | | | 500 | | | | 21,851 | |
Genmab A/S(a)(b) | | | 8,500 | | | | 657,057 | |
GW Pharmaceuticals PLC—ADR(a)(b) | | | 6,500 | | | | 680,225 | |
Illumina, Inc.(b) | | | 1,500 | | | | 276,375 | |
Incyte Corp.(b) | | | 11,500 | | | | 1,117,340 | |
Innate Pharma SA(a)(b) | | | 5,000 | | | | 87,863 | |
Inovio Pharmaceuticals, Inc.(b) | | | 35,000 | | | | 285,600 | |
Intercept Pharmaceuticals, Inc.(b) | | | 6,500 | | | | 1,643,265 | |
The Accompanying Footnotes are an Integral Part of these Financial Statements.
The Tocqueville Opportunity Fund
Schedule of Investments as of April 30, 2015
(Unaudited)
| | | | | | | | |
| Common Stocks (continued) | | Shares | | | Value | |
Intrexon Corp.(b) | | | 11,000 | | | $ | 427,130 | |
Isis Pharmaceuticals, Inc.(b) | | | 3,000 | | | | 170,160 | |
Jazz Pharmaceuticals PLC(a)(b) | | | 2,400 | | | | 428,880 | |
Juno Therapeutics, Inc.(b) | | | 16,000 | | | | 683,840 | |
Karyopharm Therapeutics, Inc.(b) | | | 8,000 | | | | 217,280 | |
Kite Pharma, Inc.(b) | | | 11,000 | | | | 554,180 | |
La Jolla Pharmaceutical Co.(b) | | | 500 | | | | 9,505 | |
Mallinckrodt PLC(a)(b) | | | 4,000 | | | | 452,720 | |
Medivation, Inc.(b) | | | 8,000 | | | | 965,920 | |
Mettler-Toledo International, Inc.(b) | | | 1,350 | | | | 427,963 | |
Mylan NV(a)(b) | | | 8,000 | | | | 578,080 | |
Neurocrine Biosciences, Inc.(b) | | | 3,500 | | | | 119,315 | |
NewLink Genetics Corp.(b) | | | 7,500 | | | | 334,500 | |
Northwest Biotherapeutics, Inc.(b) | | | 1,000 | | | | 7,860 | |
Omeros Corp.(b) | | | 6,500 | | | | 130,780 | |
OncoMed Pharmaceuticals, Inc.(b) | | | 15,000 | | | | 359,700 | |
Ophthotech Corp.(b) | | | 9,500 | | | | 430,160 | |
OvaScience, Inc.(b) | | | 1,000 | | | | 24,745 | |
Pacira Pharmaceuticals, Inc.(b) | | | 6,000 | | | | 410,880 | |
PAREXEL International Corp.(b) | | | 3,200 | | | | 203,440 | |
PerkinElmer, Inc. | | | 500 | | | | 25,630 | |
Perrigo Co. PLC(a) | | | 3,000 | | | | 549,840 | |
Portola Pharmaceuticals, Inc.(b) | | | 9,500 | | | | 339,055 | |
PTC Therapeutics, Inc.(b) | | | 22,500 | | | | 1,321,875 | |
Puma Biotechnology, Inc.(b) | | | 3,000 | | | | 541,740 | |
Receptos, Inc.(b) | | | 2,500 | | | | 368,350 | |
Regeneron Pharmaceuticals, Inc.(b) | | | 2,900 | | | | 1,326,634 | |
Regulus Therapeutics, Inc.(b) | | | 21,000 | | | | 263,550 | |
Relypsa, Inc.(b) | | | 6,500 | | | | 188,045 | |
Sage Therapeutics, Inc.(b) | | | 9,000 | | | | 477,000 | |
Sangamo BioSciences, Inc.(b) | | | 1,500 | | | | 18,555 | |
Seattle Genetics, Inc.(b) | | | 3,600 | | | | 123,624 | |
Shire PLC—ADR(a) | | | 1,400 | | | | 340,914 | |
Stemline Therapeutics, Inc.(b) | | | 500 | | | | 6,945 | |
Synageva BioPharma Corp.(b) | | | 1,700 | | | | 156,332 | |
TESARO, Inc.(b) | | | 6,000 | | | | 326,820 | |
uniQure B.V.(a)(b) | | | 15,500 | | | | 388,275 | |
United Therapeutics Corp.(b) | | | 1,500 | | | | 239,535 | |
Valeant Pharmaceuticals International, Inc.(a)(b) | | | 1,000 | | | | 216,930 | |
Vertex Pharmaceuticals, Inc.(b) | | | 4,500 | | | | 554,760 | |
ZIOPHARM Oncology, Inc.(b) | | | 23,500 | | | | 207,035 | |
| | | | | | | | 30,243,853 | |
Retailing—5.0% | | | | | | | | |
Advance Auto Parts, Inc. | | | 1,200 | | | | 171,600 | |
Foot Locker, Inc. | | | 1,300 | | | | 77,285 | |
GNC Holdings, Inc. | | | 4,500 | | | | 193,725 | |
HomeAway, Inc.(b) | | | 5,000 | | | | 139,750 | |
L Brands, Inc. | | | 3,500 | | | | 312,760 | |
Liberty TripAdvisor Holdings, Inc.(b) | | | 3,000 | | | | 89,130 | |
Liberty Ventures(b) | | | 6,500 | | | | 270,920 | |
| Common Stocks (continued) | | Shares | | | Value | |
Lithia Motors, Inc. | | | 3,000 | | | $ | 299,190 | |
Macy’s, Inc. | | | 500 | | | | 32,315 | |
O’Reilly Automotive, Inc.(b) | | | 1,000 | | | | 217,830 | |
Restoration Hardware Holdings, Inc.(b) | | | 8,500 | | | | 732,445 | |
Signet Jewelers Ltd.(a) | | | 2,000 | | | | 268,260 | |
The Priceline Group, Inc.(b) | | | 1,000 | | | | 1,237,810 | |
TripAdvisor, Inc.(b) | | | 1,000 | | | | 80,490 | |
Ulta Salon Cosmetics & Fragrance, Inc.(b) | | | 3,300 | | | | 498,597 | |
Williams-Sonoma, Inc. | | | 7,500 | | | | 551,475 | |
| | | | | | | | 5,173,582 | |
Semiconductors & Semiconductor Equipment—3.3% | |
Ambarella, Inc.(a)(b) | | | 2,500 | | | | 182,875 | |
Cavium, Inc.(b) | | | 8,300 | | | | 537,757 | |
Cypress Semiconductor Corp. | | | 10,000 | | | | 133,200 | |
NXP Semiconductors NV(a)(b) | | | 9,000 | | | | 865,080 | |
Qorvo, Inc.(b) | | | 7,500 | | | | 494,325 | |
Skyworks Solutions, Inc. | | | 11,500 | | | | 1,060,875 | |
SunEdison, Inc.(b) | | | 4,100 | | | | 103,812 | |
| | | | | | | | 3,377,924 | |
Software & Services—16.8% | | | | | | | | |
Alliance Data Systems Corp.(b) | | | 450 | | | | 133,789 | |
ANSYS, Inc.(b) | | | 1,000 | | | | 85,840 | |
Aspen Technology, Inc.(b) | | | 5,000 | | | | 221,950 | |
Broadridge Financial Solutions, Inc. | | | 5,500 | | | | 296,560 | |
Cadence Design Systems, Inc.(b) | | | 14,500 | | | | 270,425 | |
CoStar Group, Inc.(b) | | | 1,450 | | | | 296,424 | |
Demandware, Inc.(b) | | | 7,500 | | | | 462,000 | |
EPAM Systems, Inc.(b) | | | 2,500 | | | | 161,775 | |
FactSet Research Systems, Inc. | | | 2,500 | | | | 393,475 | |
FireEye, Inc.(b) | | | 11,500 | | | | 474,950 | |
FleetCor Technologies, Inc.(b) | | | 3,600 | | | | 579,204 | |
Fleetmatics Group PLC(a)(b) | | | 12,500 | | | | 569,750 | |
Fortinet, Inc.(b) | | | 8,000 | | | | 301,920 | |
Gartner, Inc.(b) | | | 5,200 | | | | 431,496 | |
Global Payments, Inc. | | | 2,800 | | | | 280,784 | |
GrubHub, Inc.(b) | | | 4,000 | | | | 164,680 | |
Guidewire Software, Inc.(b) | | | 3,500 | | | | 174,825 | |
IAC/InterActiveCorp | | | 6,000 | | | | 418,920 | |
LinkedIn Corp.(b) | | | 3,800 | | | | 958,094 | |
Manhattan Associates, Inc.(b) | | | 28,500 | | | | 1,497,960 | |
Marketo, Inc.(b) | | | 2,000 | | | | 56,900 | |
MAXIMUS, Inc. | | | 3,000 | | | | 192,030 | |
NetSuite, Inc.(b) | | | 8,300 | | | | 793,231 | |
Pandora Media, Inc.(b) | | | 500 | | | | 8,920 | |
Paycom Software, Inc.(b) | | | 5,000 | | | | 158,050 | |
PTC, Inc.(b) | | | 7,500 | | | | 287,550 | |
Qlik Technologies, Inc.(b) | | | 3,700 | | | | 128,723 | |
Rackspace Hosting, Inc.(b) | | | 5,500 | | | | 296,450 | |
Red Hat, Inc.(b) | | | 3,500 | | | | 263,410 | |
The Accompanying Footnotes are an Integral Part of these Financial Statements.
The Tocqueville Opportunity Fund
Schedule of Investments as of April 30, 2015
(Unaudited)
| | | | | | | | |
| Common Stocks (continued) | | Shares | | | Value | |
ServiceNow, Inc.(b) | | | 19,500 | | | $ | 1,459,770 | |
SolarWinds, Inc.(b) | | | 4,000 | | | | 195,120 | |
Solera Holdings, Inc. | | | 700 | | | | 33,964 | |
Splunk, Inc.(b) | | | 19,000 | | | | 1,260,555 | |
SS&C Technologies Holdings, Inc. | | | 4,100 | | | | 246,697 | |
Synchronoss Technologies, Inc.(b) | | | 5,000 | | | | 229,400 | |
Tableau Software, Inc.(b) | | | 12,500 | | | | 1,223,000 | |
The Ultimate Software Group, Inc.(b) | | | 5,050 | | | | 839,411 | |
Workday, Inc.(b) | | | 11,000 | | | | 1,003,310 | |
Yelp, Inc.(b) | | | 3,500 | | | | 137,865 | |
Zillow Group, Inc.(b) | | | 2,220 | | | | 216,761 | |
| | | | | | | | 17,205,938 | |
Technology Hardware & Equipment—2.3% | |
3D Systems Corp.(b) | | | 500 | | | | 12,545 | |
Belden, Inc. | | | 2,800 | | | | 235,060 | |
FEI Co. | | | 1,000 | | | | 75,460 | |
FLIR Systems, Inc. | | | 5,200 | | | | 160,628 | |
IPG Photonics Corp.(b) | | | 1,900 | | | | 168,302 | |
Methode Electronics, Inc. | | | 4,000 | | | | 169,840 | |
Palo Alto Networks, Inc.(b) | | | 9,000 | | | | 1,329,480 | |
Stratasys Ltd.(a)(b) | | | 1,000 | | | | 37,450 | |
Trimble Navigation Ltd.(b) | | | 2,000 | | | | 50,860 | |
Zebra Technologies Corp.(b) | | | 1,500 | | | | 138,120 | |
| | | | | | | | 2,377,745 | |
Transportation—2.7% | | | | | | | | |
Alaska Air Group, Inc. | | | 4,000 | | | | 256,240 | |
American Airlines Group, Inc. | | | 7,000 | | | | 337,995 | |
Avis Budget Group, Inc.(b) | | | 5,000 | | | | 270,700 | |
Kansas City Southern | | | 5,500 | | | | 563,695 | |
Old Dominion Freight Line, Inc.(b) | | | 5,000 | | | | 355,650 | |
Southwest Airlines Co. | | | 8,500 | | | | 344,760 | |
Spirit Airlines, Inc.(b) | | | 7,500 | | | | 513,525 | |
United Continental Holdings, Inc.(b) | | | 2,000 | | | | 119,480 | |
| | | | | | | | 2,762,045 | |
Total Common Stocks
(Cost $79,921,727) | | | | | | | 101,701,264 | |
Real Estate Investment Trusts (REITs)—0.3% | |
Real Estate—0.1% | | | | | | | | |
Extra Space Storage, Inc. | | | 2,000 | | | | 131,860 | |
Software & Services—0.2% | | | | | | | | |
Equinix, Inc. | | | 716 | | | | 183,246 | |
Total Real Estate Investment Trusts
(Cost $180,165) | | | | | | | 315,106 | |
Closed-End Fund—0.1% | | | | | | | | |
Diversified Financials—0.1% | | | | | | | | |
FS Investment Corp. | | | 7,500 | | | | 78,525 | |
Total Closed-End Fund
(Cost $78,821) | | | | | | | 78,525 | |
| Purchased Call Options—0.2% | | Contracts | | | Value | |
Consumer Durables & Apparel—0.1% | |
NIKE, Inc.
Expiration: July 2015,
Exercise Price: $97.50(b) | | | 200 | | | $ | 81,000 | |
Retailing—0.1% | | | | | | | | |
The Priceline Group, Inc.
Expiration: October 2015,
Exercise Price: $1,200.00(b) | | | 10 | | | | 107,950 | |
Total Purchased Call Options
(Cost $187,880) | | | | | | | 188,950 | |
| Short-Term Investment—0.8% | | | Shares | | | | | |
Money Market Fund—0.8% | | | | | | | | |
STIT-Treasury Portfolio—Institutional Class, 0.010%(d) | | | 862,550 | | | | 862,550 | |
Total Short-Term Investment
(Cost $862,550) | | | | | | | 862,550 | |
Total Investments
(Cost $81,231,143)—100.5% | | | | | | | 103,146,395 | |
Liabilities in Excess of Other Assets—(0.5)% | | | | (542,900 | ) |
Total Net Assets—100.0% | | | | | | $ | 102,603,495 | |
| | | | | | | | |
Percentages are stated as a percent of net assets.
ADR American Depository Receipt
| (a) | Foreign issued security. Foreign concentration (including ADR’s) was as follows: Bermuda 0.9%; Cayman Islands 0.2%; Canada 0.6%; Denmark 0.6%; France 0.1%; Ireland 3.9%; Israel 0.2%; Japan 0.1%; Jersey 0.7%; Netherlands 2.2%; United Kingdom 0.7%. |
| (b) | Non-income producing security. |
| (c) | Denotes an issue that is traded on a foreign exchange when a company is listed more than once. |
| (d) | Rate listed is the 7-day effective yield. |
The Accompanying Footnotes are an Integral Part of these Financial Statements.
The Tocqueville International Value Fund
Schedule of Investments as of April 30, 2015
(Unaudited)
| | | | | | | | |
| Common Stocks—90.0% | | Shares | | | Value | |
Australia—2.1% | | | | | | | | |
Incitec Pivot Ltd. | | | 1,755,305 | | | $ | 5,542,366 | |
Belgium—3.4% | | | | | | | | |
Groupe Bruxelles Lambert SA | | | 58,600 | | | | 5,154,700 | |
NV Bekaert SA | | | 132,800 | | | | 3,877,726 | |
| | | | | | | | 9,032,426 | |
Canada—1.5% | | | | | | | | |
BlackBerry Ltd.(a) | | | 106,200 | | | | 1,078,992 | |
Superior Plus Corp. | | | 245,700 | | | | 2,824,583 | |
| | | | | | | | 3,903,575 | |
Cayman Islands—1.9% | | | | | | | | |
Greatview Aseptic Packaging Co., Ltd. | | | 8,310,300 | | | | 5,017,993 | |
Denmark—2.1% | | | | | | | | |
ISS A/S | | | 165,089 | | | | 5,583,781 | |
France—14.9% | | | | | | | | |
Bollore SA | | | 952,300 | | | | 5,456,593 | |
Cie de Saint-Gobain | | | 136,728 | | | | 6,248,475 | |
IPSOS | | | 197,200 | | | | 5,823,510 | |
Metropole Television SA | | | 155,589 | | | | 3,249,481 | |
Nexans SA(a) | | | 96,659 | | | | 3,798,136 | |
Rexel SA | | | 65,800 | | | | 1,243,461 | |
Sanofi | | | 72,350 | | | | 7,408,931 | |
Sopra Steria Group | | | 69,591 | | | | 6,155,896 | |
| | | | | | | | 39,384,483 | |
Germany—5.2% | | | | | | | | |
Infineon Technologies AG | | | 412,915 | | | | 4,905,333 | |
Siemens AG—ADR | | | 49,575 | | | | 5,393,265 | |
Wacker Neuson SE | | | 128,375 | | | | 3,310,313 | |
| | | | | | | | 13,608,911 | |
Hong Kong—4.7% | | | | | | | | |
Clear Media Ltd. | | | 3,623,800 | | | | 4,259,416 | |
Hopewell Holdings Ltd. | | | 1,092,250 | | | | 4,206,626 | |
Television Broadcasts Ltd. | | | 589,000 | | | | 3,841,527 | |
| | | | | | | | 12,307,569 | |
Ireland—4.6% | | | | | | | | |
Actavis plc(a) | | | 21,200 | | | | 5,996,632 | |
CRH PLC | | | 221,963 | | | | 6,259,447 | |
| | | | | | | | 12,256,079 | |
Japan—21.7% | | | | | | | | |
Amano Corp. | | | 440,600 | | | | 5,727,062 | |
Disco Corp. | | | 19,000 | | | | 1,744,054 | |
Hitachi Ltd. | | | 908,640 | | | | 6,234,914 | |
Hoya Corp. | | | 120,700 | | | | 4,691,530 | |
Kao Corp. | | | 103,100 | | | | 4,964,170 | |
| Common Stocks (continued) | | Shares | | | Value | |
Makita Corp. | | | 93,100 | | | $ | 4,701,784 | |
MISUMI Group, Inc. | | | 126,100 | | | | 4,768,354 | |
Mitsubishi UFJ Financial Group, Inc. | | | 908,000 | | | | 6,508,854 | |
Miura Co., Ltd. | | | 114,000 | | | | 1,290,854 | |
Shiseido Co., Ltd. | | | 293,000 | | | | 5,306,638 | |
SMC Corp. | | | 19,000 | | | | 5,757,287 | |
Toho Co., Ltd. | | | 171,600 | | | | 4,284,251 | |
Toyo Suisan Kaisha Ltd. | | | 41,400 | | | | 1,452,814 | |
| | | | | | | | 57,432,566 | |
Jersey—1.5% | | | | | | | | |
Shire PLC | | | 47,000 | | | | 3,848,911 | |
Luxembourg—0.7% | | | | | | | | |
SAF-Holland SA | | | 128,175 | | | | 1,953,014 | |
Netherlands—5.2% | | | | | | | | |
Akzo Nobel NV | | | 73,625 | | | | 5,656,275 | |
Koninklijke Ten Cate NV | | | 232,800 | | | | 5,431,887 | |
Unilever NV—ADR | | | 60,000 | | | | 2,608,800 | |
| | | | | | | | 13,696,962 | |
Norway—5.1% | | | | | | | | |
Orkla ASA | | | 636,600 | | | | 4,996,621 | |
Statoil ASA—ADR | | | 256,650 | | | | 5,448,680 | |
Stolt-Nielsen Ltd. | | | 161,916 | | | | 3,021,262 | |
| | | | | | | | 13,466,563 | |
Republic of Korea—2.1% | | | | | | | | |
Kia Motors Corp. | | | 120,000 | | | | 5,552,239 | |
Singapore—1.5% | | | | | | | | |
Singapore Post Ltd. | | | 2,711,800 | | | | 3,914,403 | |
Spain—1.5% | | | | | | | | |
Applus Services SA(a) | | | 317,673 | | | | 3,847,004 | |
Switzerland—3.0% | | | | | | | | |
Novartis AG—ADR | | | 49,425 | | | | 5,031,465 | |
Syngenta AG—ADR | | | 44,900 | | | | 3,010,096 | |
| | | | | | | | 8,041,561 | |
United Kingdom—5.4% | | | | | | | | |
AVEVA Group PLC | | | 180,023 | | | | 4,672,800 | |
DCC PLC | | | 87,500 | | | | 5,586,021 | |
Diageo PLC—ADR | | | 9,500 | | | | 1,054,690 | |
Smiths Group PLC | | | 166,625 | | | | 2,928,540 | |
| | | | | | | | 14,242,051 | |
United States—1.9% | | | | | | | | |
Aflac, Inc. | | | 77,900 | | | | 4,910,816 | |
Total Common Stocks
(Cost $189,396,040) | | | | | | | 237,543,273 | |
The Accompanying Footnotes are an Integral Part of these Financial Statements.
The Tocqueville International Value Fund
Schedule of Investments as of April 30, 2015
(Unaudited)
| | | | | | | | |
| Preferred Stock—2.4% | | Shares | | | Value | |
Republic of Korea—2.4% | | | | | | | | |
Samsung Electronics Co., Ltd. | | | 6,200 | | | $ | 6,304,104 | |
Total Preferred Stocks
(Cost $5,564,913) | | | | | | | 6,304,104 | |
Short-Term Investments—5.7% | | | | | |
Money Market Fund—5.0% | | | | | | | | |
STIT-Treasury Portfolio—Institutional Class, 0.010%(b) | | | 13,132,827 | | | | 13,132,827 | |
| Commercial Paper—0.7% | |
| Principal
Amount |
| | | | |
U.S. Bank N.A.
0.020%, 05/01/2015 | | $ | 1,951,000 | | | | 1,951,000 | |
Total Short-Term Investments
(Cost $15,083,827) | | | | | | | 15,083,827 | |
Total Investments
(Cost $210,044,780)—98.1% | | | | 258,931,204 | |
Other Assets in Excess of Liabilities—1.9% | | | | 5,128,835 | |
Total Net Assets—100.0% | | | | | | $ | 264,060,039 | |
| | | | | | | | |
Percentages are stated as a percent of net assets.
ADR American Depository Receipt
| (a) | Non-income producing security |
| (b) | Rate listed is the 7-day effective yield. |
Schedule of Open Forward Currency Contracts
April 30, 2015
(Unaudited)
| | | | | | | | | | | | | | | | | | | | | | | | |
Counterparties of
Contracts | | Forward Settlement Date | | | Currency to be
Received | | | Currency to be
Delivered | | | Amount of
Currency to be
Delivered | | | Amount of
Currency to be
Received | | | Unrealized
Appreciation/
(Depreciation) | |
U.S. Bank N.A. | | | 6/30/2015 | | | | U.S. Dollars | | | | Euro | | | | 11,850,000 | | | | 13,222,230 | | | $ | (94,439 | ) |
U.S. Bank N.A. | | | 6/30/2015 | | | | U.S. Dollars | | | | Japanese Yen | | | | 1,500,000,000 | | | | 12,625,200 | | | | 53,023 | |
| | | | | | | | | | | | | | | | | | | | | | | | |
| | | | | | | | | | | | | | | | | | | | | | $ | (41,416 | ) |
| | | | | | | | | | | | | | | | | | | | | | | | |
| | | | | | | | | | | | | | | | | | | | | | | | |
The Accompanying Footnotes are an Integral Part of these Financial Statements.
The Tocqueville Gold Fund
Schedule of Investments as of April 30, 2015
(Unaudited)
| | | | | | | | |
| Common Stocks—85.3% | | Shares | | | Value | |
Gold Related Securities—77.0% | | | | | | | | |
Australia—1.4% | | | | | | | | |
Newcrest Mining Ltd.(a) | | | 1,500,000 | | | $ | 17,152,557 | |
Canada—58.1% | | | | | | | | |
Agnico Eagle Mines Ltd. | | | 1,531,073 | | | | 46,391,512 | |
Agnico Eagle Mines Ltd.(b) | | | 540,985 | | | | 16,375,277 | |
Alacer Gold Corp. | | | 4,626,800 | | | | 10,469,262 | |
Alamos Gold, Inc. | | | 3,210,000 | | | | 22,213,200 | |
Almaden Minerals Ltd.(a) | | | 866,667 | | | | 689,598 | |
Almaden Minerals Ltd.(a)(c)(d)(e) (Originally acquired 02/03/2015, Cost $1,210,068) | | | 1,200,000 | | | | 935,731 | |
Anthem United, Inc.(a)(c)(d)(e)(f) (Originally acquired 04/03/2014, Cost $905,961) | | | 5,000,000 | | | | 953,170 | |
Argonaut Gold, Inc.(a)(f) | | | 2,687,000 | | | | 4,521,019 | |
ATAC Resources Ltd.(a)(f) | | | 11,516,891 | | | | 5,154,680 | |
B2Gold Corp.(a) | | | 13,927,100 | | | | 21,587,005 | |
Barisan Gold Corp.(a) | | | 877,100 | | | | 32,714 | |
Brazil Resources, Inc.(a) | | | 202,392 | | | | 122,458 | |
Continental Gold Ltd.(a) | | | 2,039,900 | | | | 3,719,668 | |
Corvus Gold, Inc.(a)(f) | | | 2,150,901 | | | | 1,419,595 | |
Corvus Gold, Inc.(a)(c)(d)(e)(f) (Originally acquired 02/27/2015, Cost $1,199,904) | | | 1,500,000 | | | | 974,720 | |
Corvus Gold, Inc.(a)(b)(f) | | | 9,130,000 | | | | 6,053,875 | |
Dalradian Resources, Inc.(a) | | | 1,750,000 | | | | 1,305,850 | |
Dalradian Resources, Inc.(a)(b) | | | 850,000 | | | | 634,065 | |
Detour Gold Corp.(a)(f) | | | 5,871,600 | | | | 62,049,648 | |
East Asia Minerals Corp.(a)(f) | | | 20,309,333 | | | | 252,499 | |
East Asia Minerals Corp.(a)(c)(d)(e)(f)
(Originally acquired 03/04/2015, Cost $374,778) | | | 46,175,600 | | | | 562,604 | |
Eldorado Gold Corp. | | | 9,439,885 | | | | 46,821,830 | |
Eldorado Gold Corp.(b) | | | 1,000,000 | | | | 4,981,351 | |
Falco Resources Ltd.(a) | | | 2,222,300 | | | | 865,712 | |
Franco-Nevada Corp. | | | 100,000 | | | | 5,183,000 | |
Franco-Nevada Corp.(b) | | | 1,127,700 | | | | 58,548,801 | |
GoGold Resources, Inc.(a)(f) | | | 20,730,300 | | | | 25,773,270 | |
Goldcorp, Inc. | | | 780,850 | | | | 14,703,405 | |
Goldcorp, Inc.(b) | | | 2,138,010 | | | | 40,243,852 | |
IAMGOLD Corp.(a) | | | 4,883,396 | | | | 10,938,807 | |
International Tower Hill Mines Ltd.(a)(f) | | | 5,738,836 | | | | 2,180,758 | |
International Tower Hill Mines Ltd.(a)(b)(f) | | | 11,289,744 | | | | 4,351,207 | |
Kinross Gold Corp.(a) | | | 2,800,000 | | | | 6,804,000 | |
New Gold, Inc.(a) | | | 6,841,640 | | | | 23,124,743 | |
NOVAGOLD RESOURCES, INC.(a) | | | 4,181,300 | | | | 16,056,192 | |
| Common Stocks (continued) | | Shares | | | Value | |
OceanaGold Corp. | | | 250,000 | | | $ | 476,585 | |
Osisko Gold Royalties Ltd.(f) | | | 3,197,540 | | | | 42,854,722 | |
Pan American Silver Corp. | | | 2,398,098 | | | | 22,829,893 | |
Premier Gold Mines Ltd.(a) | | | 2,730,000 | | | | 5,566,349 | |
Primero Mining Corp.(a)(f) | | | 7,968,800 | | | | 29,391,761 | |
Rockhaven Resources Ltd.(a)(f) | | | 6,400,000 | | | | 1,007,874 | |
Romarco Minerals, Inc.(a) | | | 18,387,800 | | | | 6,891,747 | |
Rubicon Minerals Corp.(a)(f) | | | 11,730,000 | | | | 12,930,709 | |
SEMAFO, Inc.(a)(f) | | | 10,314,200 | | | | 31,767,736 | |
Silver Wheaton Corp. | | | 1,884,875 | | | | 37,207,433 | |
Strategic Metals Ltd.(a)(f) | | | 10,926,900 | | | | 2,717,008 | |
Torex Gold Resources, Inc.(a)(f) | | | 34,685,500 | | | | 32,198,723 | |
Yamana Gold, Inc. | | | 5,007,412 | | | | 19,128,314 | |
Yamana Gold, Inc.(b) | | | 1,351,906 | | | | 5,165,592 | |
| | | | | | | | 717,129,524 | |
Jersey—4.5% | | | | | | | | |
Randgold Resources Ltd.—ADR | | | 727,900 | | | | 55,444,143 | |
Peru—0.7% | | | | | | | | |
Cia de Minas Buenaventura SAA—ADR | | | 803,600 | | | | 8,984,248 | |
South Africa—2.3% | | | | | | | | |
Gold Fields Ltd.—ADR | | | 6,141,950 | | | | 28,068,712 | |
Gold Fields Ltd.(b) | | | 166,249 | | | | 758,558 | |
| | | | | | | | 28,827,270 | |
United Kingdom—1.5% | | | | | | | | |
Fresnillo PLC | | | 1,640,000 | | | | 18,112,576 | |
United States—8.5% | | | | | | | | |
Electrum Ltd.(a)(c)(d)(e) (Originally acquired 12/21/2007, Cost 13,065,361) | | | 2,127,287 | | | | 1,063,643 | |
Newmont Mining Corp. | | | 1,210,300 | | | | 32,060,847 | |
Royal Gold, Inc. | | | 1,119,600 | | | | 72,247,788 | |
| | | | | | | | 105,372,278 | |
Total Gold Related Securities | | | | | | | 951,022,596 | |
Other Precious Metals Related Securities—7.7% | |
Canada—6.7% | | | | | | | | |
Bear Creek Mining Corp.(a)(f) | | | 7,413,200 | | | | 6,943,155 | |
Ivanhoe Mines Ltd.—Class A(a) | | | 11,058,850 | | | | 10,632,628 | |
Ivanhoe Mines Ltd.—Class B(a)(c)(d)(e)(g) (Originally acquired 08/15/2001, Cost $2,385,440) | | | 1,559,365 | | | | 1,424,302 | |
MAG Silver Corp.(a)(f) | | | 2,960,700 | | | | 20,636,079 | |
Plata Latina Minerals Corp.(a) | | | 2,000,000 | | | | 66,307 | |
Scorpio Mining Corp.(a)(f) | | | 25,668,419 | | | | 4,222,455 | |
Scorpio Mining Corp.(a)(b)(f) | | | 522,400 | | | | 82,268 | |
Silver Range Resources Ltd.(a)(f) | | | 3,450,000 | | | | 257,356 | |
The Accompanying Footnotes are an Integral Part of these Financial Statements.
The Tocqueville Gold Fund
Schedule of Investments as of April 30, 2015
(Unaudited)
| | | | | | | | |
| Common Stocks (continued) | | Shares | | | Value | |
SilverCrest Mines, Inc.(a) | | | 755,600 | | | $ | 814,157 | |
Tahoe Resources, Inc. | | | 2,650,000 | | | | 37,449,233 | |
| | | | | | | | 82,527,940 | |
United States—1.0% | | | | | | | | |
Stillwater Mining Co.(a) | | | 510,900 | | | | 6,861,387 | |
Sunshine Mining & Refining(a)(c)(d)(e)
(Originally acquired 03/15/2011, Cost $18,353,107) | | | 1,633,545 | | | | 5,717,407 | |
| | | | | | | | 12,578,794 | |
Total Other Precious Metals Related Securities | | | | | | | 95,106,734 | |
Other Securities—0.6% | | | | | | | | |
Canada—0.0% | | | | | | | | |
Oban Mining(a) | | | 530,785 | | | | 52,793 | |
United States—0.6% | | | | | | | | |
Gold Bullion International LLC(a)(c)(d)(e)(f)
(Originally acquired 05/12/2010, Cost $5,000,000) | | | 5,000,000 | | | | 6,893,000 | |
I-Pulse, Inc.(a)(c)(d)(e) (Originally acquired 10/09/2007, Cost $175,524) | | | 74,532 | | | | 640,975 | |
| | | | | | | | 7,533,975 | |
Total Other Securities | | | | | | | 7,586,768 | |
Total Common Stocks (Cost $1,643,045,666) | | | | | | | 1,053,716,098 | |
Private Fund—1.3% | |
Gold Related Securities—1.3% | |
United States—1.3% | |
Tocqueville Bullion Reserve LP(a)(c)(d)(e)(f)
(Originally acquired 11/28/2011, Cost $25,000,000) | | | 13,806 | | | | 15,721,097 | |
Total Private Fund
(Cost $25,000,000) | | | | | | | 15,721,097 | |
| Gold Bullion—11.5% | | | Ounces | | | | | |
Gold Bullion(a) | | | 119,680 | | | | 141,744,858 | |
Total Gold Bullion
(Cost $70,975,249) | | | | | | | 141,744,858 | |
| Warrants—0.1% | | | Shares | | | | | |
Gold Related Securities—0.1% | |
Canada—0.1% | | | | | | | | |
Almaden Minerals Ltd.
Expiration: 07/31/2015,
Exercise Price: CAD $2.00(a)(c)(d)(e)
(Originally acquired 07/31/2014, Cost $0) | | | 433,333 | | | | 36 | |
| Warrants (continued) | | Shares | | | Value | |
Almaden Minerals Ltd.
Expiration: 02/05/2016,
Exercise Price: CAD $2.00(a)(c)(d)(e)
(Originally acquired 02/03/2015, Cost $0) | | | 600,000 | | | $ | 6,863 | |
Anthem United, Inc.
Expiration: 03/31/2019,
Exercise Price: CAD $0.35(a)(c)(d)(e)(f)
(Originally acquired 04/03/2014, Cost $0) | | | 1,250,000 | | | | 133,547 | |
East Asia Minerals Corp.
Expiration: 12/15/2016,
Exercise Price: CAD $0.78(a)(c)(d)(e)(f)
(Originally acquired 12/05/2011, Cost $0) | | | 6,500,000 | | | | 64,111 | |
East Asia Minerals Corp.
Expiration: 12/05/2019,
Exercise Price: CAD $0.05(a)(c)(d)(e)(f)
(Originally acquired 12/05/2014, Cost $0) | | | 9,764,933 | | | | — | |
Osisko Gold Royalties Ltd.
Expiration: 02/18/2022,
Exercise Price: CAD $36.50(a)(f) | | | 274,000 | | | | 510,982 | |
Primero Mining Corp.
Expiration: 07/20/2015,
Exercise Price: CAD $8.00(a)(f) | | | 1,848,400 | | | | 45,961 | |
Total Gold Related Securities | | | | | | | 761,500 | |
Total Warrants (Cost $0) | | | | | | | 761,500 | |
Rights—0.0% | |
Gold Related Securities—0.0% | |
Canada—0.0% | |
East Asia Minerals Corp.
Expiration: 03/05/2020,
Exercise Price: CAD $1.50(a)(c)(d)(e)(f)
(Originally acquired 03/04/2015, Cost $0) | | | 46,175,600 | | | | 470,750 | |
Dalradian Resources, Inc.
Expiration: 07/31/2017,
Exercise Price: CAD $1.50(a) | | | 875,000 | | | | 135,982 | |
Total Rights (Cost $0) | | | | | | | 606,732 | |
The Accompanying Footnotes are an Integral Part of these Financial Statements.
The Tocqueville Gold Fund
Schedule of Investments as of April 30, 2015
(Unaudited)
| | | | | | | | |
| Short-Term Investment—1.7% | | Shares | | | Value | |
Money Market Fund—1.7% | |
STIT—Treasury Portfolio—Institutional Class, 0.010%(h) | | | 21,589,747 | | | $ | 21,589,747 | |
Total Short-Term Investment (Cost $21,589,747) | | | | | | | 21,589,747 | |
Total Investments
(Cost $1,760,610,662)—99.9% | | | | 1,234,140,032 | |
Other Assets in Excess of Liabilities—0.1% | | | | 936,166 | |
Total Net Assets—100.0% | | | | | | $ | 1,235,076,198 | |
| | | | | | | | |
Percentages are stated as a percent of net assets.
ADR American Depository Receipt
| (a) | Non-income producing security. |
| (b) | Denotes an issue that is traded on a foreign exchange when a company is listed more than once. |
| (c) | Denotes a security that is either fully or partially restricted to resale. The value of restricted securities as of April 30, 2015 was $35,561,956, which represented 2.9% of net assets. |
| (d) | Securities are fair valued using procedures approved by the Board of Trustees. The aggregate value of fair valued securities as of April 30, 2015 was $35,561,956, which represented 2.9% of net assets. |
| (e) | Security is considered illiquid and may be difficult to sell. |
| (f) | Affiliated company. See Footnote 8. |
| (g) | Convertible into Ivanplats Ltd.—Class A shares. |
| (h) | Rate listed is the 7-day effective yield. |
The Accompanying Footnotes are an Integral Part of these Financial Statements.
The Delafield Fund
Schedule of Investments as of April 30, 2015
(Unaudited)
| | | | | | | | |
| Common Stocks—84.6% | | Shares | | | Value | |
Aerospace & Defense—4.1% | | | | | | | | |
Honeywell International, Inc. | | | 300,000 | | | $ | 30,276,000 | |
Precision Castparts Corp. | | | 49,000 | | | | 10,127,810 | |
| | | | | | | | 40,403,810 | |
Chemicals—16.7% | | | | | | | | |
Albemarle Corp. | | | 136,022 | | | | 8,120,513 | |
Cabot Corp. | | | 275,000 | | | | 11,753,500 | |
Eastman Chemical Co. | | | 535,000 | | | | 40,777,700 | |
HB Fuller Co. | | | 450,000 | | | | 18,796,500 | |
Minerals Technologies, Inc. | | | 500,000 | | | | 33,865,000 | |
OM Group, Inc. | | | 305,000 | | | | 9,162,200 | |
PolyOne Corp. | | | 1,075,000 | | | | 41,978,750 | |
| | | | | | | | 164,454,163 | |
Commercial Services & Supplies—0.6% | |
ACCO Brands Corp.(a) | | | 700,000 | | | | 5,509,000 | |
Computers & Peripherals—2.2% | |
Diebold, Inc. | | | 300,000 | | | | 10,431,000 | |
Hewlett-Packard Co. | | | 350,000 | | | | 11,539,500 | |
| | | | | | | | 21,970,500 | |
Construction & Engineering—1.1% | |
Aegion Corp.(a) | | | 369,400 | | | | 6,804,348 | |
KBR, Inc. | | | 250,000 | | | | 4,367,500 | |
| | | | | | | | 11,171,848 | |
Containers & Packaging—5.0% | | | | | | | | |
Avery Dennison Corp. | | | 550,000 | | | | 30,574,500 | |
Owens-Illinois, Inc.(a) | | | 800,000 | | | | 19,128,000 | |
| | | | | | | | 49,702,500 | |
Electronic Equipment, Instruments & Components—10.9% | |
Checkpoint Systems, Inc. | | | 575,000 | | | | 5,957,000 | |
Flextronics International Ltd.(a)(b) | | | 2,575,000 | | | | 29,676,875 | |
Ingram Micro, Inc.(a) | | | 1,000,000 | | | | 25,160,000 | |
Jabil Circuit, Inc. | | | 575,000 | | | | 12,949,000 | |
Kemet Corp.(a)(c) | | | 2,700,000 | | | | 11,664,000 | |
Plexus Corp.(a) | | | 500,000 | | | | 21,525,000 | |
| | | | | | | | 106,931,875 | |
Energy Equipment & Services—3.1% | |
Frank’s International NV(b) | | | 550,000 | | | | 11,440,000 | |
McDermott International, Inc.(a)(b) | | | 1,500,000 | | | | 7,875,000 | |
Weatherford International PLC(a)(b) | | | 750,000 | | | | 10,912,500 | |
| | | | | | | | 30,227,500 | |
Industrial Conglomerates—1.7% | | | | | | | | |
Carlisle Cos., Inc. | | | 175,000 | | | | 16,887,500 | |
Insurance—1.4% | | | | | | | | |
XL Group PLC(b) | | | 375,000 | | | | 13,905,000 | |
| Common Stocks (continued) | | Shares | | | Value | |
Machinery—15.0% | | | | | | | | |
Crane Co. | | | 325,000 | | | $ | 19,860,750 | |
Dover Corp. | | | 550,000 | | | | 41,646,000 | |
Harsco Corp. | | | 680,000 | | | | 10,934,400 | |
Joy Global, Inc. | | | 125,000 | | | | 5,330,000 | |
Kennametal, Inc. | | | 660,000 | | | | 23,370,600 | |
Stanley Black & Decker, Inc. | | | 225,000 | | | | 22,207,500 | |
The Timken Co. | | | 200,000 | | | | 7,858,000 | |
Xerium Technologies, Inc.(a)(c) | | | 905,000 | | | | 16,090,900 | |
| | | | | | | | 147,298,150 | |
Metals & Mining—6.1% | | | | | | | | |
Allegheny Technologies, Inc. | | | 560,000 | | | | 19,034,400 | |
Carpenter Technology Corp. | | | 375,000 | | | | 16,218,750 | |
Horsehead Holding Corp.(a) | | | 600,000 | | | | 8,970,000 | |
Ryerson Holding Corp.(a)(c) | | | 1,500,000 | | | | 8,310,000 | |
Universal Stainless & Alloy Products, Inc.(a)(c) | | | 375,000 | | | | 7,875,000 | |
| | | | | | | | 60,408,150 | |
Oil, Gas & Consumable Fuels—4.1% | |
Boardwalk Pipeline Partners LP | | | 1,100,000 | | | | 19,261,000 | |
CONSOL Energy, Inc. | | | 550,000 | | | | 17,864,000 | |
Southwestern Energy Co.(a) | | | 125,000 | | | | 3,503,750 | |
| | | | | | | | 40,628,750 | |
Professional Services—3.1% | | | | | | | | |
TrueBlue, Inc.(a) | | | 1,075,000 | | | | 30,938,500 | |
Semiconductors & Semiconductor Equipment—2.8% | |
Fairchild Semiconductor International, Inc.(a) | | | 675,000 | | | | 12,261,375 | |
Teradyne, Inc. | | | 825,000 | | | | 15,056,250 | |
| | | | | | | | 27,317,625 | |
Specialty Retail—3.0% | | | | | | | | |
Ascena Retail Group, Inc.(a) | | | 1,250,000 | | | | 18,737,500 | |
Pier 1 Imports, Inc. | | | 850,000 | | | | 10,752,500 | |
| | | | | | | | 29,490,000 | |
Trading Companies & Distributors—3.7% | |
Rush Enterprises, Inc.(a) | | | 275,000 | | | | 7,188,500 | |
WESCO International, Inc.(a) | | | 400,000 | | | | 28,856,000 | |
| | | | | | | | 36,044,500 | |
Total Common Stocks
(Cost $547,185,441) | | | | | | | 833,289,371 | |
| Corporate Bonds—2.1% | |
| Principal
Amount |
| | | | |
Banks—0.4% | | | | | | | | |
Wells Fargo Bank N.A.
0.467%, 05/16/2016(d) | | $ | 4,000,000 | | | | 3,993,200 | |
The Accompanying Footnotes are an Integral Part of these Financial Statements.
The Delafield Fund
Schedule of Investments as of April 30, 2015
(Unaudited)
| | | | | | | | |
| Corporate Bonds (continued) | | Principal
Amount | | | Value | |
Capital Markets—0.5% | | | | | | | | |
The Goldman Sachs Group, Inc.
0.715%, 03/22/2016(d) | | $ | 5,000,000 | | | $ | 4,999,820 | |
Consumer Finance—0.5% | | | | | | | | |
American Express Credit Corp.
0.789%, 07/29/2016(d) | | | 5,000,000 | | | | 5,017,300 | |
Pharmaceuticals—0.7% | | | | | | | | |
Merck & Co., Inc.
0.446%, 05/18/2016(d) | | | 7,200,000 | | | | 7,212,708 | |
Total Corporate Bonds
(Cost $21,231,027) | | | | | | | 21,223,028 | |
| Short-Term Investments—12.7% | | | Shares | | | | | |
Money Market Fund—5.1% | | | | | | | | |
STIT-Treasury Portfolio—Institutional Class, 0.010%(e) | | | 49,996,973 | | | | 49,996,973 | |
| Commercial Paper—7.6% | |
| Principal
Amount |
| | | | |
U.S. Bank N.A.
0.020%, 05/01/2015 | | $ | 74,584,000 | | | | 74,584,000 | |
Total Short-Term Investments
(Cost $124,580,973) | | | | | | | 124,580,973 | |
Total Investments
(Cost $692,997,441)—99.4% | | | | 979,093,372 | |
Other Assets in Excess of Liabilities—0.6% | | | | 6,019,767 | |
Total Net Assets—100.0% | | | | | | $ | 985,113,139 | |
| | | | | | | | |
Percentages are stated as a percent of net assets.
| (a) | Non-income producing security. |
| (b) | Foreign issued security. Foreign concentration was as follows: Ireland 2.5%; Netherlands 1.2%; Panama 0.8%; Singapore 3.0%. |
| (c) | Affiliated company. See Footnote 8. |
| (d) | Variable rate security. The rate shown is as of 04/30/2015. |
| (e) | Rate listed is the 7-day effective yield. |
The Accompanying Footnotes are an Integral Part of these Financial Statements.
The Tocqueville Select Fund
Schedule of Investments as of April 30, 2015
(Unaudited)
| | | | | | | | |
| Common Stocks—94.9% | | Shares | | | Value | |
Aerospace & Defense—1.1% | | | | | | | | |
Precision Castparts Corp. | | | 5,000 | | | $ | 1,033,450 | |
Chemicals—4.3% | | | | | | | | |
Minerals Technologies, Inc. | | | 62,500 | | | | 4,233,125 | |
Commercial Services & Supplies—3.2% | |
ACCO Brands Corp.(a) | | | 403,600 | | | | 3,176,332 | |
Containers & Packaging—6.7% | | | | | | | | |
Avery Dennison Corp. | | | 77,500 | | | | 4,308,225 | |
Owens-Illinois, Inc.(a) | | | 97,000 | | | | 2,319,270 | |
| | | | | | | | 6,627,495 | |
Electronic Equipment, Instruments & Components—8.0% | |
Flextronics International Ltd.(a)(b) | | | 346,200 | | | | 3,989,955 | |
Jabil Circuit, Inc. | | | 173,900 | | | | 3,916,228 | |
| | | | | | | | 7,906,183 | |
Energy Equipment & Services—1.3% | |
Oil States International, Inc.(a) | | | 27,600 | | | | 1,313,484 | |
Industrial Conglomerates—3.3% | | | | | | | | |
Carlisle Cos., Inc. | | | 33,500 | | | | 3,232,750 | |
Internet Software & Services—8.6% | |
j2 Global, Inc. | | | 61,400 | | | | 4,259,318 | |
Web.com Group, Inc.(a) | | | 226,000 | | | | 4,151,620 | |
| | | | | | | | 8,410,938 | |
IT Services—4.1% | | | | | | | | |
EPAM Systems, Inc.(a) | | | 62,600 | | | | 4,050,846 | |
Leisure Products—2.7% | | | | | | | | |
Summer Infant, Inc.(a)(c) | | | 867,933 | | | | 2,673,234 | |
Machinery—17.5% | | | | | | | | |
Dover Corp. | | | 57,400 | | | | 4,346,328 | |
Kennametal, Inc. | | | 118,000 | | | | 4,178,380 | |
Stanley Black & Decker, Inc. | | | 39,900 | | | | 3,938,130 | |
Xerium Technologies, Inc.(a)(c) | | | 265,000 | | | | 4,711,700 | |
| | | | | | | | 17,174,538 | |
Metals & Mining—5.8% | | | | | | | | |
Carpenter Technology Corp. | | | 76,000 | | | | 3,287,000 | |
Signature Group Holdings, Inc.(a) | | | 328,333 | | | | 2,416,531 | |
| | | | | | | | 5,703,531 | |
Oil, Gas & Consumable Fuels—3.0% | |
CONSOL Energy, Inc. | | | 90,700 | | | | 2,945,936 | |
Professional Services—6.1% | | | | | | | | |
RPX Corp.(a) | | | 153,000 | | | | 2,380,680 | |
Stantec, Inc.(b) | | | 135,200 | | | | 3,649,048 | |
| | | | | | | | 6,029,728 | |
Semiconductors & Semiconductor Equipment—3.3% | |
Fairchild Semiconductor International, Inc.(a) | | | 179,700 | | | | 3,264,251 | |
| Common Stocks (continued) | | Shares | | | Value | |
Specialty Retail—8.0% | | | | | | | | |
Ascena Retail Group, Inc.(a) | | | 291,500 | | | $ | 4,369,585 | |
Pier 1 Imports, Inc. | | | 280,000 | | | | 3,542,000 | |
| | | | | | | | 7,911,585 | |
Trading Companies & Distributors—7.9% | |
MRC Global, Inc.(a) | | | 261,000 | | | | 3,810,600 | |
WESCO International, Inc.(a) | | | 55,500 | | | | 4,003,770 | |
| | | | | | | | 7,814,370 | |
Total Common Stocks
(Cost $76,352,892) | | | | | | | 93,501,776 | |
Short-Term Investments—5.4% | | | | | | | | |
Money Market Fund—5.1% | | | | | | | | |
STIT-Treasury Portfolio—Institutional Class, 0.010%(d) | | | 4,992,758 | | | | 4,992,758 | |
| Commercial Paper—0.3% | |
| Principal
Amount |
| | | | |
U.S. Bank N.A.
0.020%, 05/01/2015 | | $ | 288,000 | | | | 288,000 | |
Total Short-Term Investments (Cost $5,280,758) | | | | | | | 5,280,758 | |
Total Investments
(Cost $81,633,650)—100.3% | | | | | | | 98,782,534 | |
Liabilities in Excess of Other Assets—(0.3)% | | | | (305,035 | ) |
Total Net Assets—100.0% | | | | | | $ | 98,477,499 | |
| | | | | | | | |
Percentages are stated as a percent of net assets.
| (a) | Non-income producing security. |
| (b) | Foreign issued security. Foreign concentration was as follows: Canada 3.7%; Singapore 4.1%. |
| (c) | Affiliated company. See Footnote 8. |
| (d) | Rate listed is the 7-day effective yield. |
The Accompanying Footnotes are an Integral Part of these Financial Statements.
The Tocqueville Alternative Strategies Fund
Schedule of Investments as of April 30, 2015
(Unaudited)
| | | | | | | | |
| Common Stocks—34.9% | | Shares | | | Value | |
Airlines—0.6% | | | | | | | | |
Delta Air Lines, Inc. | | | 6,000 | | | $ | 267,840 | |
Biotechnology—6.1% | | | | | | | | |
Alkermes PLC(a)(b) | | | 5,000 | | | | 276,850 | |
Isis Pharmaceuticals, Inc.(a) | | | 8,000 | | | | 453,760 | |
Momenta Pharmaceuticals, Inc.(a) | | | 32,500 | | | | 567,125 | |
PTC Therapeutics, Inc.(a) | | | 14,000 | | | | 822,500 | |
Sangamo BioSciences, Inc.(a) | | | 40,000 | | | | 494,800 | |
| | | | | | | | 2,615,035 | |
Consumer Finance—0.9% | | | | | | | | |
American Express Co. | | | 5,000 | | | | 387,250 | |
Health Care Providers & Services—1.4% | | | | | |
Hanger, Inc.(a) | | | 26,500 | | | | 592,010 | |
Hotels, Restaurants & Leisure—2.6% | | | | | |
Bob Evans Farms, Inc. | | | 13,000 | | | | 559,260 | |
McDonald’s Corp. | | | 6,000 | | | | 579,300 | |
| | | | | | | | 1,138,560 | |
Internet & Catalog Retail—4.2% | | | | | |
Amazon.com, Inc.(a) | | | 3,500 | | | | 1,476,231 | |
TripAdvisor, Inc.(a) | | | 4,000 | | | | 321,960 | |
| | | | | | | | 1,798,191 | |
Internet Software & Services—4.3% | | | | | |
eBay, Inc.(a) | | | 7,500 | | | | 436,950 | |
IAC/InterActiveCorp | | | 8,800 | | | | 614,416 | |
Inuvo, Inc.(a)(c) | | | 350,000 | | | | 815,500 | |
| | | | | | | | 1,866,866 | |
Machinery—1.5% | | | | | | | | |
Allison Transmission Holdings, Inc. | | | 21,500 | | | | 659,620 | |
Metals & Mining—1.4% | | | | | | | | |
Alamos Gold, Inc.(b) | | | 85,000 | | | | 588,200 | |
Oil, Gas & Consumable Fuels—0.1% | |
Gulf Coast Ultra Deep Royalty Trust(a) | | | 50,000 | | | | 40,000 | |
Pharmaceuticals—5.0% | | | | | | | | |
Actavis plc(a)(b) | | | 3,310 | | | | 936,266 | |
Eisai Co., Ltd.—ADR(b) | | | 7,000 | | | | 467,040 | |
Eisai Co., Ltd.(b)(d) | | | 4,000 | | | | 269,079 | |
Omeros Corp.(a) | | | 23,000 | | | | 462,760 | |
| | | | | | | | 2,135,145 | |
Road & Rail—0.9% | | | | | | | | |
Kansas City Southern | | | 4,000 | | | | 409,960 | |
Software—1.7% | | | | | | | | |
Splunk, Inc.(a) | | | 11,000 | | | | 729,796 | |
Specialty Retail—2.1% | | | | | | | | |
Dick’s Sporting Goods, Inc. | | | 7,000 | | | | 379,820 | |
Vitamin Shoppe, Inc.(a) | | | 13,000 | | | | 544,440 | |
| | | | | | | | 924,260 | |
| Common Stocks (continued) | | Shares | | | Value | |
Technology Hardware, Storage & Peripherals—2.1% | |
BlackBerry Ltd.(a)(b) | | | 88,000 | | | $ | 894,080 | |
Total Common Stocks
(Cost $12,958,962) | | | | | | | 15,046,813 | |
| Convertible Bonds—42.2% | |
| Principal
Amount |
| | | | |
Air Freight & Logistics—1.2% | |
UTi Worldwide, Inc.
4.500%, 03/01/2019*(b) | | $ | 500,000 | | | | 499,375 | |
Automobiles—3.2% | | | | | | | | |
Tesla Motors, Inc.
1.250%, 03/01/2021* | | | 1,500,000 | | | | 1,392,188 | |
Biotechnology—1.3% | | | | | | | | |
Acorda Therapeutics, Inc.
1.750%, 06/15/2021 | | | 550,000 | | | | 543,125 | |
Health Care Equipment & Supplies—1.3% | |
The Spectranetics Corp.
2.625%, 06/01/2034*(e) | | | 500,000 | | | | 548,438 | |
Internet Software & Services—3.5% | |
Twitter, Inc.
1.000%, 09/15/2021 | | | 500,000 | | | | 455,625 | |
Web.com Group, Inc.
1.000%, 08/15/2018 | | | 1,150,000 | | | | 1,060,156 | |
| | | | | | | | 1,515,781 | |
Life Sciences Tools & Services—1.4% | |
Fluidigm Corp.
2.750%, 02/01/2034(e) | | | 600,000 | | | | 609,750 | |
Machinery—4.4% | | | | | | | | |
Chart Industries, Inc.
2.000%, 08/01/2018* | | | 1,250,000 | | | | 1,320,312 | |
Navistar International Corp.
4.500%, 10/15/2018* | | | 650,000 | | | | 595,969 | |
| | | | | | | | 1,916,281 | |
Metals & Mining—10.4% | |
B2Gold Corp.
3.250%, 10/01/2018*(b) | | | 1,600,000 | | | | 1,380,999 | |
NOVAGOLD RESOURCES, INC.
5.500%, 05/01/2015*(b) | | | 1,000,000 | | | | 1,000,000 | |
RTI International Metals, Inc.
1.625%, 10/15/2019* | | | 1,000,000 | | | | 1,190,000 | |
Stillwater Mining Co.
1.750%, 10/15/2032*(e) | | | 750,000 | | | | 891,563 | |
| | | | | | | | 4,462,562 | |
Oil, Gas & Consumable Fuels—1.0% | |
Energy XXI Ltd.
3.000%, 12/15/2018*(b) | | | 1,100,000 | | | | 419,375 | |
The Accompanying Footnotes are an Integral Part of these Financial Statements.
The Tocqueville Alternative Strategies Fund
Schedule of Investments as of April 30, 2015
(Unaudited)
| | | | | | | | |
| Convertible Bonds (continued) | | Principal
Amount | | | Value | |
Real Estate Investment Trusts (REIT)—2.4% | |
Starwood Property Trust, Inc.
3.750%, 10/15/2017* | | $ | 1,000,000 | | | $ | 1,045,000 | |
Semiconductors & Semiconductor Equipment—5.1% | |
SunEdison, Inc.
0.250%, 01/15/2020* | | | 1,500,000 | | | | 1,693,124 | |
SunPower Corp.
0.875%, 06/01/2021 | | | 500,000 | | | | 509,688 | |
| | | | | | | | 2,202,812 | |
Software—4.6% | | | | | | | | |
Nuance Communications, Inc.
2.750%, 11/01/2031*(e) | | | 1,250,000 | | | | 1,252,343 | |
TiVo, Inc.
2.000%, 10/01/2021 | | | 750,000 | | | | 722,813 | |
| | | | | | | | 1,975,156 | |
Technology Hardware, Storage & Peripherals—2.4% | |
SanDisk Corp.
0.500%, 10/15/2020 | | | 1,000,000 | | | | 1,033,750 | |
Total Convertible Bonds
(Cost $17,709,436) | | | | | | | 18,163,593 | |
Corporate Bonds—14.1% | | | | | | | | |
Auto Components—1.8% | | | | | | | | |
The Goodyear Tire & Rubber Co.
8.250%, 08/15/2020(e) | | | 750,000 | | | | 795,000 | |
Banks—3.4% | | | | | | | | |
JPMorgan Chase & Co.
5.150%, 12/29/2049*(e)(f) | | | 1,000,000 | | | | 971,875 | |
Wachovia Capital Trust III
5.570%, 03/15/2042*(e)(f) | | | 500,000 | | | | 500,625 | |
| | | | | | | | 1,472,500 | |
Capital Markets—1.8% | | | | | | | | |
Goldman Sachs Capital II
4.000%, 06/01/2043*(e)(f) | | | 1,000,000 | | | | 782,500 | |
Food & Staples Retailing—1.2% | | | | | | | | |
Bunge Ltd. Finance Corp.
4.100%, 03/15/2016 * | | | 500,000 | | | | 512,488 | |
Insurance—0.6% | | | | | | | | |
Prudential Financial, Inc.
5.625%, 06/15/2043*(e)(f) | | | 250,000 | | | | 268,125 | |
Metals & Mining—3.6% | | | | | | | | |
IAMGOLD Corp.
6.750%, 10/01/2020(b)(e) | | | 1,500,000 | | | | 1,290,000 | |
Noranda Aluminum Acquisition Corp.
11.000%, 06/01/2019(e) | | | 250,000 | | | | 238,750 | |
| | | | | | | | 1,528,750 | |
| Convertible Bonds (continued) | | Principal
Amount | | | Value | |
Oil, Gas & Consumable Fuels—1.7% | | | | | |
W&T Offshore, Inc.
8.500%, 06/15/2019*(e) | | $ | 1,000,000 | | | $ | 720,000 | |
Total Corporate Bonds
(Cost $6,034,170) | | | | | | | 6,079,363 | |
| Exchange-Traded Fund (ETF)—1.5% | | | Shares | | | | | |
Capital Markets—1.5% | | | | | | | | |
SPDR Gold Shares*(a) | | | 5,700 | | | | 646,779 | |
Total Exchange-Traded Fund
(Cost $829,093) | | | | | | | 646,779 | |
Closed-End Funds—2.2% | | | | | | | | |
Capital Markets—2.2% | | | | | | | | |
BlackRock Debt Strategies Fund, Inc. | | | 110,496 | | | | 419,885 | |
Credit Suisse Asset Management Income Fund, Inc. | | | 60,000 | | | | 195,600 | |
Western Asset Income Fund | | | 23,000 | | | | 319,930 | |
| | | | | | | | 935,415 | |
Total Closed-End Funds (Cost $951,995) | | | | | | | 935,415 | |
Preferred Stocks—7.3% | | | | | | | | |
Banks—5.6% | | | | | | | | |
Bank of America Corp.
6.625%, 12/31/2049(e) | | | 11,500 | | | | 298,770 | |
Citigroup Capital XIII
7.875%, 12/31/2049(e)(f) | | | 20,000 | | | | 517,800 | |
Citigroup, Inc.
6.875%, 12/31/2049*(e)(f) | | | 15,000 | | | | 408,300 | |
HSBC USA, Inc.
3.500%, 12/31/2049*(e)(f) | | | 15,000 | | | | 348,300 | |
U.S. Bancorp
3.500%, 12/31/2049*(e)(f) | | | 1,000 | | | | 832,500 | |
| | | | | | | | 2,405,670 | |
Consumer Finance—1.7% | | | | | | | | |
SLM Corp.
1.971%, 12/31/2049*(e)(f) | | | 12,000 | | | | 739,500 | |
Total Preferred Stocks
(Cost $3,123,153) | | | | | | | 3,145,170 | |
| Purchased Call Option—0.0% | | | Contracts | | | | | |
Oil, Gas & Consumable Fuels—0.0% | |
Halcon Resources Corp.
Expiration: January 2016, Exercise Price: $5.00 | | | 400 | | | | 2,000 | |
Total Purchased Call Option
(Cost $46,400) | | | | | | | 2,000 | |
The Accompanying Footnotes are an Integral Part of these Financial Statements.
The Tocqueville Alternative Strategies Fund
Schedule of Investments as of April 30, 2015
(Unaudited)
| | | | | | | | |
| Warrants—0.1% | | Shares | | | Value | |
Internet Software & Services—0.1% | |
Inuvo, Inc.
Expiration: 06/21/16, Exercise Price: $2.20(a)(c)(g)(h)(i)
(Originally acquired 06/21/2011, Cost $0) | | | 31,750 | | | $ | 25,965 | |
Oil, Gas & Consumable Fuels—0.0% | |
Magnum Hunter Resources Corp.
Expiration: 04/15/16, Exercise Price:
$8.50(a)(g)(h)(i)
(Originally acquired 04/15/2013, Cost $0) | | | 4,000 | | | | 832 | |
Total Warrants
(Cost $0) | | | | | | | 26,797 | |
Short-Term Investments—6.0% | | | | | | | | |
Money Market Fund—3.1% | | | | | | | | |
STIT-Treasury Portfolio—Institutional Class,
0.010%(j) | | | 1,363,051 | | | | 1,363,051 | |
| Commerical Paper—2.9% | |
| Principal
Amount |
| | | | |
U.S. Bank N.A.
0.020%, 05/01/2015 | | $ | 1,239,000 | | | | 1,239,000 | |
Total Short-Term Investments
(Cost $2,602,051) | | | | 2,602,051 | |
Total Investments
(Cost $44,255,260)—108.3% | | | | | | | 46,647,981 | |
Liabilities in Excess of Other Assets—(8.3)% | | | | (3,577,869 | ) |
Total Net Assets—100.0% | | | | | | $ | 43,070,112 | |
| | | | | | | | |
| Securities Sold Short | | | Shares | | | | | |
Common Stocks—(9.6)% | | | | | | | | |
Air Freight & Logistics—(0.5)% | | | | | | | | |
UTi Worldwide, Inc.(a)(b) | | | (23,000 | ) | | | (207,690 | ) |
Automobiles—(1.2)% | | | | | | | | |
Tesla Motors, Inc.(a) | | | (2,230 | ) | | | (504,092 | ) |
Biotechnology—(0.3)% | | | | | | | | |
Acorda Therapeutics, Inc.(a) | | | (3,850 | ) | | | (115,770 | ) |
Health Care Equipment & Supplies—(0.6)% | |
The Spectranetics Corp.(a) | | | (10,000 | ) | | | (256,500 | ) |
Life Sciences Tools & Services—(0.6)% | | | | | |
Fluidigm Corp.(a) | | | (6,580 | ) | | | (246,487 | ) |
Machinery—(0.3)% | | | | | | | | |
Chart Industries, Inc.(a) | | | (3,600 | ) | | | (145,980 | ) |
Securities Sold Short
(continued) | | Shares | | | Value | |
Metals & Mining—(2.6)% | | | | | | | | |
Alcoa, Inc. | | | (10,000 | ) | | $ | (134,200 | ) |
RTI International Metals, Inc.(a) | | | (11,100 | ) | | | (417,915 | ) |
Stillwater Mining Co.(a) | | | (42,500 | ) | | | (570,775 | ) |
| | | | | | | | (1,122,890 | ) |
Oil, Gas & Consumable Fuels—(0.9)% | | | | | |
Energy XXI Ltd.(b) | | | (90,000 | ) | | | (393,300 | ) |
Semiconductors & Semiconductor Equipment—(2.4)% | |
SunEdison, Inc.(a) | | | (37,400 | ) | | | (946,968 | ) |
SunPower Corp.(a) | | | (2,500 | ) | | | (80,475 | ) |
| | | | | | | | (1,027,443 | ) |
Software—(0.2)% | | | | | | | | |
TiVo, Inc.(a) | | | (7,850 | ) | | | (86,743 | ) |
Total Common Stocks
(Proceeds $3,740,284) | | | | | | | (4,106,895 | ) |
Exchange-Traded Funds (ETF)—(13.3)% | | | | | |
Capital Markets—(13.3)% | | | | | | | | |
iShares Nasdaq Biotechnology ETF | | | (3,000 | ) | | | (1,000,980 | ) |
iShares Russell 2000 ETF | | | (8,000 | ) | | | (969,280 | ) |
iShares U.S. Energy ETF | | | (6,000 | ) | | | (279,540 | ) |
iShares U.S. Healthcare ETF | | | (7,500 | ) | | | (1,137,150 | ) |
Market Vectors Semiconductor ETF | | | (7,000 | ) | | | (388,220 | ) |
Powershares QQQ Trust Series 1 | | | (5,600 | ) | | | (602,728 | ) |
SPDR S&P 500 ETF Trust | | | (6,500 | ) | | | (1,355,380 | ) |
| | | | | | | | (5,733,278 | ) |
Total Exchange-Traded Funds (Proceeds $5,290,771) | | | | | | | (5,733,278 | ) |
U.S. Treasury Notes—
(14.1)% | | Principal
Amount | | | | |
1.750%, 09/30/2019 | | $ | (1,000,000 | ) | | | (1,016,875 | ) |
2.125%, 09/30/2021 | | | (1,000,000 | ) | | | (1,023,281 | ) |
1.750%, 05/15/2022 | | | (2,500,000 | ) | | | (2,491,603 | ) |
2.375%, 08/15/2024 | | | (1,500,000 | ) | | | (1,545,117 | ) |
| | | | | | | | (6,076,876 | ) |
Total U.S. Treasury Notes
(Proceeds $6,012,989) | | | | | | | (6,076,876 | ) |
Total Securities Sold Short
(Proceeds $15,044,044)—(37.0)% | | | $ | (15,917,049 | ) |
| | | | | | | | |
The Accompanying Footnotes are an Integral Part of these Financial Statements.
The Tocqueville Alternative Strategies Fund
Schedule of Investments as of April 30, 2015
(Unaudited)
Percentages are stated as a percent of net assets.
ADR American Depository Receipt
| * | All or a portion of this security is segregated as collateral for securities sold short. |
| (a) | Non-income producing security. |
| (b) | Foreign issued security. Foreign concentration (including ADR’s) was as follows: Bermuda 1.0%; Canada 12.0%; Ireland 2.8%; Japan 1.7%; Virgin Islands 1.2%. |
| (c) | Affiliated company. See Footnote 8. |
| (d) | Denotes an issue that is traded on a foreign exchange when a company is listed more than once. |
| (f) | Variable rate security. The rate shown is as of 04/30/2015. |
| (g) | Denotes a security is either fully or partially restricted to resale. The aggregate value of restricted securities as of April 30, 2015 was $26,797, which represented 0.1% of net assets. |
| (h) | Securites are fair valued using procedures approved by the Board of Trustees. The aggregate value of fair valued securities as of April 30, 2015 was $26,797, which represented 0.1% of net assets. |
| (i) | Security is considered illiquid and may be difficult to sell. |
| (j) | Rate listed is the 7-day effective yield. |
The Accompanying Footnotes are an Integral Part of these Financial Statements.
Percent of Total Investments
The Tocqueville Fund
Allocation of Portfolio Holdings
April 30, 2015 (Unaudited)
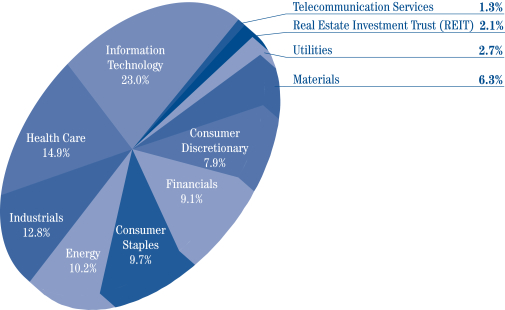
The Tocqueville Opportunity Fund
Allocation of Portfolio Holdings
April 30, 2015 (Unaudited)
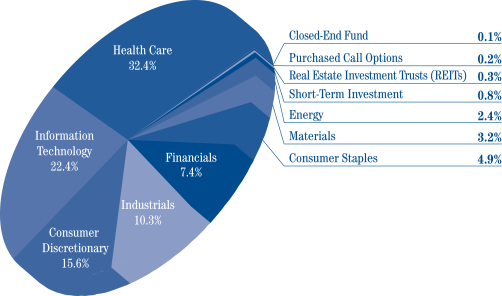
Percent of Total Investments
The Tocqueville International Value Fund
Allocation of Portfolio Holdings
April 30, 2015 (Unaudited)
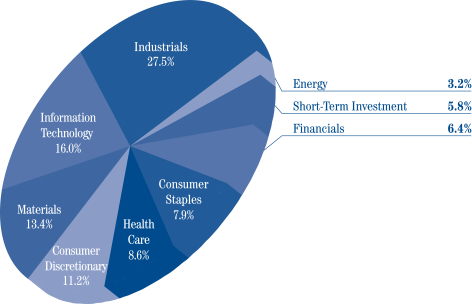
The Tocqueville Gold Fund
Allocation of Portfolio Holdings
April 30, 2015 (Unaudited)
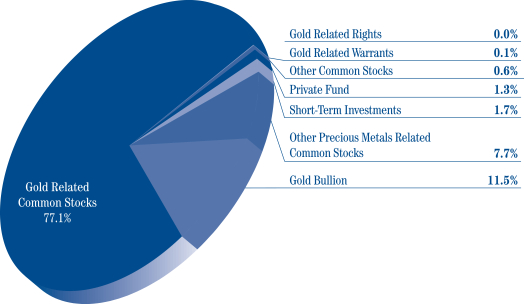
Percent of Total Investments
The Delafield Fund
Allocation of Portfolio Holdings
April 30, 2015 (Unaudited)
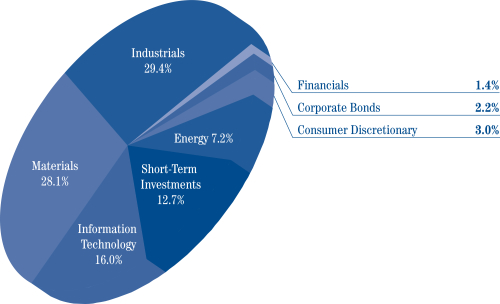
The Tocqueville Select Fund
Allocation of Portfolio Holdings
April 30, 2015 (Unaudited)

Percent of Total Investments
The Tocqueville Alternative Strategies Fund
Allocation of Portfolio Holdings
Long Positions
April 30, 2015 (Unaudited)
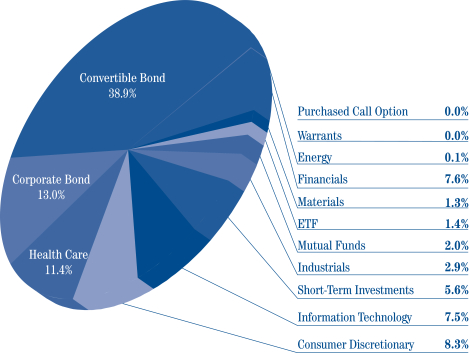
The Tocqueville Alternative Strategies Fund
Allocation of Portfolio Holdings
Short Positions
April 30, 2015 (Unaudited)
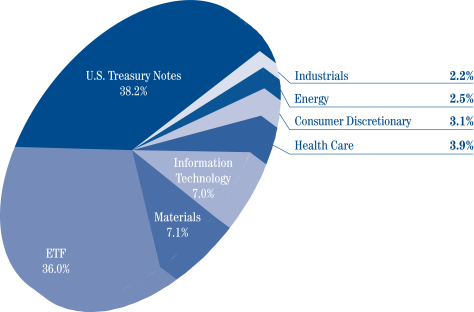
The Tocqueville Trust
Statements of Assets & Liabilities
For the Period Ended April 30, 2015
(Unaudited)
| | | | | | | | | | | | | | | | | | | | | | | | | | | | |
| | | The
Tocqueville
Fund | | | The
Tocqueville
Opportunity
Fund | | | The
Tocqueville
International
Value Fund | | | The
Tocqueville
Gold Fund | | | The
Delafield
Fund | | | The
Tocqueville
Select Fund | | | The
Tocqueville
Alternative
Strategies
Fund | |
Assets: | | | | | | | | | | | | | | | | | | | | | | | | | | | | |
Investments, at value (1) | | | | | | | | | | | | | | | | | | | | | | | | | | | | |
Unaffiliated issuers | | $ | 374,912,757 | | | $ | 103,146,395 | | | $ | 258,931,204 | | | $ | 911,043,693 | | | $ | 935,153,472 | | | $ | 91,397,600 | | | $ | 45,806,516 | |
Affiliated issuers | | | — | | | | — | | | | — | | | | 323,096,339 | | | | 43,939,900 | | | | 7,384,934 | | | | 841,465 | |
Foreign currencies, at value (2) | | | — | | | | — | | | | — | | | | 356,216 | | | | — | | | | — | | | | — | |
Cash | | | 760 | | | | — | | | | — | | | | 15,400 | | | | — | | | | — | | | | — | |
Due from custodian | | | — | | | | — | | | | 6,716 | | | | — | | | | — | | | | — | | | | — | |
Segregated cash at broker | | | — | | | | — | | | | — | | | | — | | | | — | | | | — | | | | 12,299,126 | |
Receivable for investments sold | | | 640,284 | | | | 331,524 | | | | 2,423,116 | | | | — | | | | 9,332,145 | | | | — | | | | — | |
Receivable for fund shares sold | | | 741,756 | | | | 990,425 | | | | 3,182,820 | | | | 3,474,804 | | | | 380,536 | | | | 101,400 | | | | 185,068 | |
Dividends, interest and other receivables | | | 314,794 | | | | 15,760 | | | | 1,324,862 | | | | 531,422 | | | | 276,056 | | | | 20,028 | | | | 213,187 | |
Prepaid assets | | | 22,299 | | | | 14,402 | | | | 29,772 | | | | 57,970 | | | | 33,444 | | | | 10,702 | | | | 31,668 | |
Return of capital receivable | | | 35,000 | | | | 17,020 | | | | — | | | | — | | | | — | | | | — | | | | — | |
| | | | | | | | | | | | | | | | | | | | | | | | | | | | |
Total Assets | | | 376,667,650 | | | | 104,515,526 | | | | 265,898,490 | | | | 1,238,575,844 | | | | 989,115,553 | | | | 98,914,664 | | | | 59,377,030 | |
| | | | | | | | | | | | | | | | | | | | | | | | | | | | |
Liabilities: | | | | | | | | | | | | | | | | | | | | | | | | | | | | |
Securities sold short, at value (3) | | | — | | | | — | | | | — | | | | — | | | | — | | | | — | | | | 15,917,049 | |
Unrealized depreciation on forward currency contracts | | | — | | | | — | | | | 41,416 | | | | — | | | | — | | | | — | | | | — | |
Payable for investments purchased | | | — | | | | 1,776,540 | | | | 1,041,954 | | | | — | | | | — | | | | — | | | | 274,972 | |
Payable for loans outstanding | | | 96,000 | | | | — | | | | — | | | | — | | | | — | | | | — | | | | — | |
Due to custodian | | | — | | | | — | | | | 354,214 | | | | — | | | | — | | | | — | | | | — | |
Payable for fund shares redeemed | | | 182,647 | | | | 13,194 | | | | 147,865 | | | | 2,097,251 | | | | 2,759,275 | | | | 318,546 | | | | — | |
Payable to Adviser (See Note 10) | | | 230,828 | | | | 62,726 | | | | 147,677 | | | | 826,755 | | | | 616,154 | | | | 65,702 | | | | 42,584 | |
Payable to Administrator | | | 62,186 | | | | 15,422 | | | | 38,319 | | | | 169,646 | | | | 161,811 | | | | 16,579 | | | | 5,990 | |
Payable to Trustees | | | 11,236 | | | | 3,273 | | | | 9,009 | | | | 35,001 | | | | 64,565 | | | | 3,421 | | | | 945 | |
Accrued distribution fee | | | 38,967 | | | | 16,479 | | | | 1,291 | | | | 35,355 | | | | 38,450 | | | | 9,982 | | | | 3,359 | |
Accrued expenses and other liabilities | | | 54,280 | | | | 24,397 | | | | 56,706 | | | | 335,638 | | | | 362,159 | | | | 22,935 | | | | 62,019 | |
| | | | | | | | | | | | | | | | | | | | | | | | | | | | |
Total Liabilities | | | 676,144 | | | | 1,912,031 | | | | 1,838,451 | | | | 3,499,646 | | | | 4,002,414 | | | | 437,165 | | | | 16,306,918 | |
| | | | | | | | | | | | | | | | | | | | | | | | | | | | |
Net Assets | | $ | 375,991,506 | | | $ | 102,603,495 | | | $ | 264,060,039 | | | $ | 1,235,076,198 | | | $ | 985,113,139 | | | $ | 98,477,499 | | | $ | 43,070,112 | |
| | | | | | | | | | | | | | | | | | | | | | | | | | | | |
Net assets consist of: | | | | | | | | | | | | | | | | | | | | | | | | | | | | |
Paid in capital | | $ | 226,002,055 | | | $ | 75,352,333 | | | $ | 207,408,120 | | | $ | 1,825,842,060 | | | $ | 622,590,566 | | | $ | 77,185,699 | | | $ | 39,877,506 | |
Accumulated net investment income gain (loss) | | | 986,980 | | | | (376,947 | ) | | | (88,430 | ) | | | (14,779,598 | ) | | | (5,159,652 | ) | | | (792,729 | ) | | | (17,583 | ) |
Accumulated net realized gain (loss) | | | 16,811,442 | | | | 5,712,890 | | | | 7,945,308 | | | | (49,519,348 | ) | | | 81,586,294 | | | | 4,935,645 | | | | 1,688,962 | |
Net unrealized appreciation (depreciation) on: | | | | | | | | | | | | | | | | | | | | | | | | | | | | |
Investments and foreign currency related items | | | 132,191,029 | | | | 21,915,219 | | | | 48,795,041 | | | | (526,466,916 | ) | | | 286,095,931 | | | | 17,148,884 | | | | 1,521,227 | |
| | | | | | | | | | | | | | | | | | | | | | | | | | | | |
Net assets | | $ | 375,991,506 | | | $ | 102,603,495 | | | $ | 264,060,039 | | | $ | 1,235,076,198 | | | $ | 985,113,139 | | | $ | 98,477,499 | | | $ | 43,070,112 | |
| | | | | | | | | | | | | | | | | | | | | | | | | | | | |
Shares of beneficial interest outstanding (unlimited shares of $0.01 par value autorized) | | | 11,112,740 | | | | 4,626,164 | | | | 17,370,513 | | | | 38,119,518 | | | | 30,007,799 | | | | 7,247,872 | | | | 1,549,005 | |
Net asset value, offering and redemption price per share | | $ | 33.83 | | | $ | 22.18 | | | $ | 15.20 | | | $ | 32.40 | | | $ | 32.83 | | | $ | 13.59 | | | $ | 27.81 | |
| | | | | | | | | | | | | | | | | | | | | | | | | | | | |
(1) Cost of investments | | | | | | | | | | | | | | | | | | | | | | | | | | | | |
Unaffiliated issuers | | $ | 242,721,728 | | | $ | 81,231,143 | | | $ | 210,044,780 | | | $ | 1,149,121,132 | | | $ | 642,891,017 | | | $ | 74,187,628 | | | $ | 43,666,933 | |
Affiliated issuers | | $ | — | | | $ | — | | | $ | — | | | $ | 611,489,530 | | | $ | 50,106,424 | | | $ | 7,446,022 | | | $ | 588,327 | |
(2) Cost of foreign currencies | | $ | — | | | $ | — | | | $ | — | | | $ | 352,502 | | | $ | — | | | $ | — | | | $ | — | |
(3) Proceeds of securities sold short | | $ | — | | | $ | — | | | $ | — | | | $ | — | | | $ | — | | | $ | — | | | $ | 15,044,044 | |
The Accompanying Footnotes are an Integral Part of these Financial Statements.
The Tocqueville Trust
Statements of Operations
For the Period Ended April 30, 2015
(Unaudited)
| | | | | | | | | | | | | | | | | | | | | | | | | | | | |
| | | The
Tocqueville
Fund | | | The
Tocqueville
Opportunity
Fund | | | The
Tocqueville
International
Value Fund | | | The
Tocqueville
Gold Fund | | | The
Delafield
Fund | | | The
Tocqueville
Select Fund | | | The
Tocqueville
Alternative
Strategies
Fund | |
Investment Income: | | | | | | | | | | | | | | | | | | | | | | | | | | | | |
Dividends* | | | | | | | | | | | | | | | | | | | | | | | | | | | | |
Unaffiliated issuers | | | 3,848,222 | | | | 163,356 | | | | 2,341,815 | | | | 3,840,499 | | | | 6,409,586 | | | | 362,671 | | | | 153,407 | |
Affiliated issuers | | | — | | | | — | | | | — | | | | 145,377 | | | | — | | | | — | | | | — | |
Interest | | | 117 | | | | 88 | | | | 2,058 | | | | 6,909 | | | | 76,865 | | | | 1,053 | | | | 493,118 | |
| | | | | | | | | | | | | | | | | | | | | | | | | | | | |
Total investment income | | | 3,848,339 | | | | 163,444 | | | | 2,343,873 | | | | 3,992,785 | | | | 6,486,451 | | | | 363,724 | | | | 646,525 | |
| | | | | | | | | | | | | | | | | | | | | | | | | | | | |
Expenses: | | | | | | | | | | | | | | | | | | | | | | | | | | | | |
Investment Adviser’s fee
(See Note 4) | | | 1,451,528 | | | | 310,963 | | | | 1,170,572 | | | | 5,070,137 | | | | 4,323,964 | | | | 405,661 | | | | 266,519 | |
Distribution fees (See
Note 4) | | | 483,843 | | | | 103,654 | | | | 292,643 | | | | 1,520,917 | | | | 1,496,186 | | | | 126,769 | | | | 51,254 | |
Administration fees (See Note 4) | | | 290,294 | | | | 62,193 | | | | 175,586 | | | | 819,301 | | | | 807,425 | | | | 76,062 | | | | 30,752 | |
Transfer agent and shareholder services fees | | | 66,010 | | | | 8,550 | | | | 42,448 | | | | 440,518 | | | | 312,993 | | | | 19,757 | | | | 5,493 | |
Trustee fees and expenses | | | 29,236 | | | | 6,438 | | | | 18,479 | | | | 94,434 | | | | 112,820 | | | | 8,059 | | | | 2,507 | |
Printing and mailing expense | | | 20,040 | | | | 3,181 | | | | 15,710 | | | | 113,683 | | | | 99,261 | | | | 5,679 | | | | 3,808 | |
Legal fees | | | 17,819 | | | | 3,790 | | | | 12,178 | | | | 73,526 | | | | 76,205 | | | | 5,556 | | | | 7,721 | |
Fund accounting fees | | | 16,553 | | | | 11,503 | | | | 22,657 | | | | 53,306 | | | | 59,235 | | | | 4,981 | | | | 5,163 | |
Audit fees | | | 13,724 | | | | 4,325 | | | | 9,018 | | | | 40,284 | | | | 44,411 | | | | 5,215 | | | | 3,152 | |
Blue sky fees | | | 12,367 | | | | 11,125 | | | | 12,569 | | | | 34,506 | | | | 18,366 | | | | 12,211 | | | | 22,547 | |
Custody fees | | | 10,241 | | | | 8,035 | | | | 34,089 | | | | 123,465 | | | | 42,576 | | | | 3,192 | | | | 3,537 | |
Other expenses (See
Note 11) | | | 9,062 | | | | 2,082 | | | | 16,828 | | | | 28,742 | | | | 35,747 | | | | 2,803 | | | | 1,000 | |
Insurance expense | | | 3,806 | | | | 1,086 | | | | 2,898 | | | | 16,943 | | | | 16,306 | | | | 1,088 | | | | 1,629 | |
Interest expense | | | 2,712 | | | | 2,834 | | | | — | | | | 182 | | | | — | | | | — | | | | 92,566 | |
Registration fees | | | 813 | | | | 632 | | | | 820 | | | | 1,991 | | | | 2,251 | | | | 285 | | | | 1,532 | |
Interest expense on securities sold short | | | — | | | | — | | | | — | | | | — | | | | — | | | | — | | | | 58,740 | |
Dividends expense on securities sold short | | | — | | | | — | | | | — | | | | — | | | | — | | | | — | | | | 48,561 | |
| | | | | | | | | | | | | | | | | | | | | | | | | | | | |
Total expenses before waiver | | | 2,428,048 | | | | 540,391 | | | | 1,826,495 | | | | 8,431,935 | | | | 7,447,746 | | | | 677,318 | | | | 606,481 | |
Less: Fees waived (See Note 4) | | | (9,926 | ) | | | — | | | | (363,280 | ) | | | — | | | | — | | | | — | | | | (17,086 | ) |
| | | | | | | | | | | | | | | | | | | | | | | | | | | | |
Net expenses | | | 2,418,122 | | | | 540,391 | | | | 1,463,215 | | | | 8,431,935 | | | | 7,447,746 | | | | 677,318 | | | | 589,395 | |
| | | | | | | | | | | | | | | | | | | | | | | | | | | | |
Net Investment Income (Loss) | | | 1,430,217 | | | | (376,947 | ) | | | 880,658 | | | | (4,439,150 | ) | | | (961,295 | ) | | | (313,594 | ) | | | 57,130 | |
| | | | | | | | | | | | | | | | | | | | | | | | | | | | |
Realized and Unrealized Gain (Loss): | | | | | | | | | | | | | | | | | | | | | | | | | | | | |
Net realized gain (loss) on: | | | | | | | | | | | | | | | | | | | | | | | | | | | | |
Investments | | | | | | | | | | | | | | | | | | | | | | | | | | | | |
Unaffiliated issuers | | | 16,918,240 | | | | 6,336,351 | | | | 5,099,819 | | | | (40,030,278 | ) | | | 89,747,940 | | | | 5,105,634 | | | | 2,037,040 | |
Affiliated issuers | | | — | | | | — | | | | — | | | | (153,295 | ) | | | (7,370,418 | ) | | | — | | | | — | |
Securities sold short | | | — | | | | — | | | | — | | | | — | | | | — | | | | — | | | | (277,271 | ) |
Forward currency contracts | | | — | | | | — | | | | 3,472,922 | | | | — | | | | — | | | | — | | | | — | |
Foreign currency translation | | | 626 | | | | (718 | ) | | | (99,473 | ) | | | 251,678 | | | | (5,950 | ) | | | (62 | ) | | | (1,818 | ) |
| | | | | | | | | | | | | | | | | | | | | | | | | | | | |
| | | 16,918,866 | | | | 6,335,633 | | | | 8,473,268 | | | | (39,931,895 | ) | | | 82,371,572 | | | | 5,105,572 | | | | 1,757,951 | |
Net change in unrealized appreciation (depreciation) on: | | | | | | | | | | | | | | | | | | | | | | | | | | | | |
Investments | | | (5,548,608 | ) | | | 3,001,491 | | | | 16,703,810 | | | | 153,926,003 | | | | (85,166,852 | ) | | | (1,420,539 | ) | | | 351,602 | |
Securities sold short | | | — | | | | — | | | | — | | | | — | | | | — | | | | — | | | | (484,848 | ) |
Forward currency contracts | | | — | | | | — | | | | (261,349 | ) | | | — | | | | — | | | | — | | | | — | |
Foreign currency translation | | | (2,768 | ) | | | (15,051 | ) | | | (9,157 | ) | | | (39,751,270 | ) | | | 61,363 | | | | — | | | | 9,275 | |
| | | | | | | | | | | | | | | | | | | | | | | | | | | | |
| | | (5,551,376 | ) | | | 2,986,440 | | | | 16,433,304 | | | | 114,174,733 | | | | (85,105,489 | ) | | | (1,420,539 | ) | | | (123,971 | ) |
Net gain (loss) on investments and foreign currency | | | 11,367,490 | | | | 9,322,073 | | | | 24,906,572 | | | | 74,242,838 | | | | (2,733,917 | ) | | | 3,685,033 | | | | 1,633,980 | |
| | | | | | | | | | | | | | | | | | | | | | | | | | | | |
Net Increase (Decrease) in Net Assets Resulting from Operations | | $ | 12,797,707 | | | $ | 8,945,126 | | | $ | 25,787,230 | | | $ | 69,803,688 | | | $ | (3,695,212 | ) | | $ | 3,371,439 | | | $ | 1,691,110 | |
| | | | | | | | | | | | | | | | | | | | | | | | | | | | |
* Net of foreign taxes withheld of: | | $ | 19,791 | | | $ | 599 | | | $ | 276,863 | | | $ | 508,873 | | | $ | 37,125 | | | $ | 3,323 | | | $ | 268 | |
| | | | | | | | | | | | | | | | | | | | | | | | | | | | |
The Accompanying Footnotes are an Integral Part of these Financial Statements.
The Tocqueville Trust
Statements of Changes in Net Assets
| | | | | | | | | | | | | | | | | | | | | | | | |
| | | The Tocqueville Fund | | | The Tocqueville
Opportunity Fund | | | The Tocqueville
International Value Fund | |
| | | For the
Period Ended
April 30,
2015 | | | For the
Year Ended
October 31,
2014 | | | For the
Period Ended
April 30,
2015 | | | For the
Year Ended
October 31,
2014 | | | For the
Period Ended
April 30,
2015 | | |
For the
Year Ended
October 31,
2014 | |
| | | (Unaudited) | | | | | | (Unaudited) | | | | | | (Unaudited) | | | | |
Operations: | | | | | | | | | | | | | | | | | | | | | | | | |
Net investment income (loss) | | $ | 1,430,217 | | | $ | 3,147,289 | | | $ | (376,947 | ) | | $ | (753,596 | ) | | $ | 880,658 | | | $ | 2,435,541 | |
Net realized gain (loss) on sale of investments, foreign currency, and securities sold short | | | 16,918,866 | | | | 15,406,460 | | | | 6,335,633 | | | | 12,216,924 | | | | 8,473,268 | | | | 17,926,515 | |
Net change in unrealized appreciation (depreciation) | | | (5,551,376 | ) | | | 27,645,101 | | | | 2,986,440 | | | | (2,101,499 | ) | | | 16,433,304 | | | | (19,822,967 | ) |
| | | | | | | | | | | | | | | | | | | | | | | | |
Net increase (decrease) in net assets resulting from operations | | | 12,797,707 | | | | 46,198,850 | | | | 8,945,126 | | | | 9,361,829 | | | | 25,787,230 | | | | 539,089 | |
| | | | | | | | | | | | | | | | | | | | | | | | |
Dividends and distributions to shareholders: | | | | | | | | | | | | | | | | | | | | | | | | |
Net investment income | | | (2,801,877 | ) | | | (3,425,837 | ) | | | — | | | | — | | | | (5,099,005 | ) | | | (4,005,675 | ) |
Net realized gains | | | (13,296,075 | ) | | | (2,781,747 | ) | | | (10,178,189 | ) | | | (4,131,999 | ) | | | (8,275,518 | ) | | | — | |
| | | | | | | | | | | | | | | | | | | | | | | | |
Total dividends and distributions | | | (16,097,952 | ) | | | (6,207,584 | ) | | | (10,178,189 | ) | | | (4,131,999 | ) | | | (13,374,523 | ) | | | (4,005,675 | ) |
Fund share transactions: | | | | | | | | | | | | | | | | | | | | | | | | |
Shares sold | | | 26,571,188 | | | | 48,540,663 | | | | 28,038,025 | | | | 8,062,871 | | | | 46,660,565 | | | | 64,986,954 | |
Shares sold—Predecessor Fund Class I | | | — | | | | — | | | | — | | | | — | | | | — | | | | — | |
Shares sold—Predecessor Fund Class C | | | — | | | | — | | | | — | | | | — | | | | — | | | | — | |
Shares issued to holders in reinvestment of dividends | | | 15,075,202 | | | | 5,727,081 | | | | 9,830,855 | | | | 3,947,515 | | | | 12,789,710 | | | | 3,955,730 | |
Shares issued to holders in reinvestment of dividends—Predecessor Fund Class I | | | — | | | | — | | | | — | | | | — | | | | — | | | | — | �� |
Shares issued to holders in reinvestment of dividends—Predecessor Fund Class C | | | — | | | | — | | | | — | | | | — | | | | — | | | | — | |
Shares redeemed* | | | (42,916,002 | ) | | | (61,966,744 | ) | | | (14,356,484 | ) | | | (17,525,024 | ) | | | (44,853,714 | ) | | | (91,406,713 | ) |
Shares redeemed—Predecessor Fund Class I* | | | — | | | | — | | | | — | | | | — | | | | — | | | | — | |
Shares redeemed—Predecessor Fund Class C* | | | — | | | | — | | | | — | | | | — | | | | — | | | | — | |
Transfers into Fund from: | | | | | | | | | | | | | | | | | | | | | | | | |
Predecessor Fund—Class I | | | — | | | | — | | | | — | | | | — | | | | — | | | | — | |
Predecessor Fund—Class C | | | — | | | | — | | | | — | | | | — | | | | — | | | | — | |
Transfers out of Predecessor Fund—Class I into Fund | | | — | | | | — | | | | — | | | | — | | | | — | | | | — | |
Transfers out of Predecessor Fund—Class C into Fund | | | — | | | | — | | | | — | | | | — | | | | — | | | | — | |
| | | | | | | | | | | | | | | | | | | | | | | | |
Net increase (decrease) | | | (1,269,612 | ) | | | (7,699,000 | ) | | | 23,512,396 | | | | (5,514,638 | ) | | | 14,596,561 | | | | (22,464,029 | ) |
| | | | | | | | | | | | | | | | | | | | | | | | |
Net increase (decrease) in net assets | | | (4,569,857 | ) | | | 32,292,266 | | | | 22,279,333 | | | | (284,808 | ) | | | 27,009,268 | | | | (25,930,615 | ) |
Net Assets: | | | | | | | | | | | | | | | | | | | | | | | | |
Beginning of period | | | 380,561,363 | | | | 348,269,097 | | | | 80,324,162 | | | | 80,608,970 | | | | 237,050,771 | | | | 262,981,386 | |
| | | | | | | | | | | | | | | | | | | | | | | | |
End of period** | | $ | 375,991,506 | | | $ | 380,561,363 | | | $ | 102,603,495 | | | $ | 80,324,162 | | | $ | 264,060,039 | | | $ | 237,050,771 | |
| | | | | | | | | | | | | | | | | | | | | | | | |
* Net of redemption fees of: | | $ | 12,874 | | | $ | 6,837 | | | $ | 3,117 | | | $ | 4,879 | | | $ | 5,088 | | | $ | 16,383 | |
| | | | | | | | | | | | | | | | | | | | | | | | |
** Including undistributed net investment income (loss) of: | | $ | 986,980 | | | $ | 2,358,640 | | | $ | (376,947 | ) | | $ | — | | | $ | (88,430 | ) | | $ | 4,129,917 | |
| | | | | | | | | | | | | | | | | | | | | | | | |
| (1) | Results shown are those of the Predecessor Fund. See Footnote 1. |
The Accompanying Notes are an Integral Part of these Financial Statements.
The Tocqueville Trust
Statements of Changes in Net Assets
| | | | | | | | | | | | | | | | | | | | | | | | | | | | | | | | | | |
The Tocqueville
Gold Fund | | | The Delafield Fund | | | The Tocqueville
Select Fund | | | The Tocqueville
Alternative Strategies Fund | |
For the
Period
Ended
April 30,
2015 | | | For the
Year
Ended
October 31,
2014 | | | For the
Period
Ended
April 30,
2015 | | | For the
Year
Ended
October 31,
2014 | | | For the
Period
Ended
April 30,
2015 | | | For the
Year
Ended
October 31,
2014 | | | For the
Period
Ended
April 30,
2015 | | | For the Period
January 1,
2014
to October 31,
2014 | | | For the Period
June 1, 2013
to
December 31,
2013(1) | |
| (Unaudited) | | | | | | (Unaudited) | | | | | | (Unaudited) | | | | | | (Unaudited) | | | | | | | |
| | | | | | | | | | | | | | | | | | | | | | | | | | | | | | | | | | |
| $ | (4,439,150 | ) | | $ | (10,287,466 | ) | | $ | (961,295 | ) | | $ | (4,079,587 | ) | | $ | (313,594 | ) | | $ | (522,438 | ) | | $ | 57,130 | | | $ | (291,198 | ) | | $ | (219,558 | ) |
| | (39,931,895 | ) | | | (4,221,429 | ) | |
|
82,371,572 |
| | | 166,547,066 | | | | 5,105,572 | | | | 13,674,117 | | | | 1,757,951 | | | | 508,454 | | | | 629,461 | |
| | 114,174,733 | | | | (274,322,894 | ) | | | (85,105,489 | ) | | | (126,401,486 | ) | | | (1,420,539 | ) | | | (6,858,895 | ) | | | (123,971 | ) | | | 1,284,500 | | | | (1,950,488 | ) |
| | | | | | | | | | | | | | | | | | | | | | | | | | | | | | | | | | |
|
69,803,688 |
| | | (288,831,789 | ) | | | (3,695,212 | ) | | | 36,065,993 | | | | 3,371,439 | | | | 6,292,784 | | | | 1,691,110 | | | | 1,501,756 | | | | (1,540,585 | ) |
| | | | | | | | | | | | | | | | | | | | | | | | | | | | | | | | | | |
| | | | | | | | | | | | | | | | | | | | | | | | | | |
| | — | | | | — | | | | — | | | | — | | | | — | | | | — | | | | — | | | | — | | | | (151,536 | ) |
| | — | | | | — | | | | (136,125,451 | ) | | | (61,841,266 | ) | | | (12,348,792 | ) | | | (9,932,816 | ) | | | (852,478 | ) | | | — | | | | (2,234,040 | ) |
| | | | | | | | | | | | | | | | | | | | | | | | | | | | | | | | | | |
| | — | | | | — | | | | (136,125,451 | ) | | | (61,841,266 | ) | | | (12,348,792 | ) | | | (9,932,816 | ) | | | (852,478 | ) | | | — | | | | (2,385,576 | ) |
| | | | | | | | | | | | | | | | | | | | | | | | | | | | | | | | | | |
| | 246,971,397 | | | | 662,295,777 | | | | 57,287,701 | | | | 200,760,342 | | | | 4,599,186 | | | | 16,655,565 | | | | 5,957,945 | | | | 6,810,152 | | | | — | |
| | — | | | | — | | | | — | | | | — | | | | — | | | | — | | | | — | | | | 6,305,831 | | | | 8,987,962 | |
| | — | | | | — | | | | — | | | | — | | | | — | | | | — | | | | — | | | | 102,500 | | | | 1,222,630 | |
| | — | | | | — | | | | 128,320,111 | | | | 58,365,398 | | | | 12,127,056 | | | | 9,680,740 | | | | 845,263 | | | | — | | | | — | |
|
— |
| | | — | | | | — | | | | — | | | | — | | | | — | | | | — | | | | — | | | | 1,183,824 | |
|
— |
| | | — | | | | — | | | | — | | | | — | | | | — | | | | — | | | | — | | | | 67,455 | |
| | (220,256,027 | ) | | | (449,988,243 | ) | | | (535,813,009 | ) | | | (517,552,743 | ) | | | (17,331,084 | ) | | | (14,524,187 | ) | | | (3,715,059 | ) | | | (8,344,933 | ) | | | — | |
| | — | | | | — | | | | — | | | | — | | | | — | | | | — | | | | — | | | | (4,678,480 | ) | | | (8,580,347 | ) |
| | — | | | | — | | | | — | | | | — | | | | — | | | | — | | | | — | | | | (354,715 | ) | | | — | |
| | | | | | | | | | | | | | | | | | | | | | | | | | | | | | | | | | |
| | — | | | | — | | | | — | | | | — | | | | — | | | | — | | | | — | | | | 37,578,661 | | | | — | |
| | — | | | | — | | | | — | | | | — | | | | — | | | | — | | | | — | | | | 1,035,984 | | | | — | |
| | — | | | | — | | | | — | | | | — | | | | — | | | | — | | | | — | | | | (37,578,661 | ) | | | — | |
| | — | | | | — | | | | — | | | | — | | | | — | | | | — | | | | — | | | | (1,035,984 | ) | | | — | |
| | | | | | | | | | | | | | | | | | | | | | | | | | | | | | | | | | |
| | 26,715,370 | | | | 212,307,534 | | | | (350,205,197 | ) | | | (258,427,003 | ) | | | (604,842 | ) | | | 11,812,118 | | | | 3,088,149 | | | | (159,645 | ) | | | 2,881,524 | |
| | | | | | | | | | | | | | | | | | | | | | | | | | | | | | | | | | |
| | 96,519,058 | | | | (76,524,255 | ) | | | (490,025,860 | ) | | | (284,202,276 | ) | | | (9,582,195 | ) | | | 8,172,086 | | | | 3,926,781 | | | | 1,342,111 | | | | (1,044,637 | ) |
| | | | | | | | | | | | | | | | | | | | | | | | | | | | | | | | | | |
| | 1,138,557,140 | | | | 1,215,081,395 | | | | 1,475,138,999 | | | | 1,759,341,275 | | | | 108,059,694 | | | | 99,887,608 | | | | 39,143,331 | | | | 37,801,220 | | | | 38,845,857 | |
| | | | | | | | | | | | | | | | | | | | | | | | | | | | | | | | | | |
| $ | 1,235,076,198 | | | $ | 1,138,557,140 | | | $ | 985,113,139 | | | $ | 1,475,138,999 | | | $ | 98,477,499 | | | $ | 108,059,694 | | | $ | 43,070,112 | | | $ | 39,143,331 | | | $ | 37,801,220 | |
| | | | | | | | | | | | | | | | | | | | | | | | | | | | | | | | | | |
| $ | 188,233 | | | $ | 610,399 | | | $ | 85,271 | | | $ | 50,053 | | | $ | 289 | | | $ | 1,184 | | | $ | 2,129 | | | $ | 2,575 | | | $ | 2,385 | |
| | | | | | | | | | | | | | | | | | | | | | | | | | | | | | | | | | |
| $ | (14,779,598 | ) | | $ | (10,340,448 | ) | | $ | (5,159,652 | ) | | $ | (4,198,357 | ) | | $ | (792,729 | ) | | $ | (479,135 | ) | | $ | (17,583 | ) | | $ | (74,713 | ) | | $ | (185,738 | ) |
| | | | | | | | | | | | | | | | | | | | | | | | | | | | | | | | | | |
The Accompanying Notes are an Integral Part of these Financial Statements.
The Tocqueville Trust
Statements of Cash Flows
| | | | |
| | | The Tocqueville
Alternative
Strategies Fund | |
| | | For the Period
November 1, 2014
to
April 30, 2015 | |
| | | (Unaudited) | |
Cash flows from operating activities | | | | |
Net increase in net assets resulting from operations | | $ | 1,691,110 | |
Adjustments to reconcile net increase (decrease) in net assets resulting from operations to net cash provided by (used in) operating activities: | | | | |
Net realized gain on investments and foreign currency translation | | | (2,035,592 | ) |
Net realized loss on securities sold short | | | 277,271 | |
Net change in unrealized gain on investments and foreign currency translation | | | (360,877 | ) |
Net change in unrealized (gain)/loss on securities sold short | | | 484,848 | |
Amortization and accretion of premium and discount | | | (82,116 | ) |
Changes in assets and liabilities: | | | | |
Segregated cash at broker | | | (3,595,920 | ) |
Receivable from/Payable to Adviser | | | 68,372 | |
Dividends, interest and other receivables | | | 11,782 | |
Prepaid assets | | | (10,650 | ) |
Payable to Trustees | | | (914 | ) |
Accrued distribution fees | | | (1,947 | ) |
Accrued expenses and other liabilities | | | (17,475 | ) |
Purchases of investments | | | (20,759,141 | ) |
Proceeds from sale of investments | | | 21,843,172 | |
Net purchases and sales of short-term investments | | | 1,532,653 | |
Payments to close short transactions | | | 2,486,116 | |
Proceeds from securities sold short | | | (3,621,179 | ) |
| | | | |
Net cash provided by (used in) operating activities | | | (2,090,487 | ) |
| | | | |
Cash flows from financing activities: | | | | |
Proceeds from shares issued | | | 5,806,761 | |
Payment on shares redeemed | | | (3,715,059 | ) |
Dividends paid to shareholders, net of reinvestments | | | (7,215 | ) |
| | | | |
Net cash provided by (used in) financing activities | | | 2,084,487 | |
| | | | |
Net increase (decrease) in cash | | | (6,000 | ) |
| | | | |
Cash, beginning of period | | | 6,000 | |
| | | | |
Cash, end of period | | $ | — | |
| | | | |
Non-cash financing activities | | | | |
Reinvested dividends | | $ | 845,263 | |
The Accompanying Notes are an Integral Part of these Financial Statements.
The Tocqueville Trust
The Tocqueville Fund
The Tocqueville Opportunity Fund
The Tocqueville International Value Fund
The Tocqueville Gold Fund
The Delafield Fund
The Tocqueville Select Fund
The Tocqueville Alternative Strategies Fund
Notes to Financial Statements
(Unaudited)
1. ORGANIZATION
The Tocqueville Trust (the “Trust”) is a Massachusetts business trust registered under the Investment Company Act of 1940 and organized on September 17, 1986, currently consisting of seven separate funds (each, a “Fund” or, collectively, the “Funds”). Each Fund is an open-end management investment company with a different investment objective. The Tocqueville Fund, The Tocqueville Opportunity Fund (the “Opportunity Fund”), The Tocqueville International Value Fund (the “International Fund”), and The Delafield Fund are classified as diversified investment companies. The Tocqueville Gold Fund (the “Gold Fund”), The Tocqueville Select Fund (the “Select Fund”) and The Tocqueville Alternative Strategies Fund (the “Alternative Strategies Fund”) are classified as non-diversified investment companies. The Tocqueville Fund’s investment objective is long-term capital appreciation which it seeks to achieve by investing primarily in securities of United States issuers. The Opportunity Fund’s investment objective is to achieve long-term capital appreciation which it seeks to achieve by investing in the common stocks of small and mid-cap companies which have the potential to deliver superior long term earnings growth. The International Fund’s investment objective is long-term capital appreciation consistent with preservation of capital which it seeks to achieve by investing primarily in securities of non-U.S. issuers. The Gold Fund’s investment objective is long-term capital appreciation which it seeks to achieve by investing in gold, securities of companies located throughout the world that are engaged in mining or processing gold (“gold related securities”), other precious metals and securities of companies located throughout the world that are engaged in mining or processing such other precious metals (“other precious metal securities”). The Delafield Fund’s investment objectives are to seek long-term preservation of capital (sufficient growth to outpace inflation over an extended period of time) and growth of capital which it seeks to achieve by investing primarily in the equity securities of domestic companies. The Tocqueville Select Fund’s investment objective is to achieve long-term capital appreciation by investing in a focused group of common stocks issued primarily by small and mid-sized U.S. companies. Current income is a secondary objective for The Tocqueville Select Fund. The Tocqueville Alternative Strategies Fund’s investment objective seeks higher returns and lower volatility than the Standard & Poor’s (“S&P”) 500 Index over a 3-5 year time horizon.
On June 22, 2009, the Board of Directors of Delafield Fund, Inc. approved an Agreement and Plan of Reorganization providing for, among other things, the transfer of the assets and liabilities of Delafield Fund, Inc. into The Delafield Fund, a series of The Tocqueville Trust. On September 24, 2009, the shareholders of Delafield Fund, Inc. approved the Agreement and Plan of Reorganization. On July 9, 2009, the Board of Trustees of Delafield Select Fund, a series of Natixis Funds Trust II, approved an Agreement and Plan of Reorganization providing for, among other things, the transfer of the assets and liabilities of Delafield Select Fund into the sole share class of The Select Fund (now The Tocqueville Select Fund), a series of The Tocqueville Trust. On September 24, 2009, the shareholders of Delafield Select Fund approved the Agreement and Plan of Reorganization. The effective date of both reorganizations was September 28, 2009. Transfers into The Delafield Fund and The Select Fund from their predecessor funds amounted to $649,892,191 and $25,888,388, respectively.
The Delafield Fund, a series of the Trust, commenced operations on September 28, 2009 as successor to Delafield Fund, Inc. The predecessor Delafield Fund, Inc. commenced operations on November 19, 1993.
The Tocqueville Select Fund, a series of the Trust, commenced operations on September 28, 2009 as successor to the Delafield Select Fund, a series of Natixis Funds Trust II. The predecessor Delafield Select Fund commenced operations on September 29, 2008 for Class A and Class C shares and on September 26, 2008 for Class Y shares. Prior to September 29, 2008, the predecessor Delafield Select Fund operated as a Delaware limited partnership using substantially the same investment objectives and investment policies as the predecessor fund. The limited partnership was incepted in July 1998.
On April 15, 2014, the Board of Trustees of the Bridgehampton Value Strategies Fund, a series of Investment Management Series Trust, approved an Agreement and Plan of Reorganization providing for, among other things, the transfer of the assets and liabilities of the Bridgehampton Value Strategies Fund into the sole share class of The Tocqueville Alternative Strategies Fund, a newly-created series of The Tocqueville Trust. On June 20, 2014, the shareholders of the Bridgehampton Value Strategies Fund approved the Agreement and Plan of Reorganization. The effective date of the reorganization was June 27, 2014. Transfers into the Tocqueville Alternative Strategies Fund from its predecessor fund amounted to $38,614,645.
The Tocqueville Alternative Strategies Fund, a series of the Trust, commenced operations at the close of business on June 27, 2014 as successor to the Bridgehampton Value Strategies Fund, a series of Investment Managers Series Trust. The predecessor Bridgehampton Value Strategies Fund commenced operations on June 3, 2013 for Class C shares and June 29, 2012 for Class I shares, after the conversion of a limited liability company account, Bridgehampton Multi-Strategy Fund LLC, which commenced operations October 1, 2006, into Class I shares of the Fund. From October 1, 2006 to May 7, 2010, the name of the predecessor account was Bridgehampton Arbitrage LLC.
2. SIGNIFICANT ACCOUNTING POLICIES
The following is a summary of significant accounting principles followed by the Trust in the preparation of its financial statements.
a) Security valuation and security transactions
Investments in securities, including foreign securities, traded on an exchange or quoted on the over-the-counter market are valued at the last sale price or, if no sale occurred during the day, at the mean between closing bid and asked prices, as last reported by a pricing service approved by the Trustees. Securities that are principally traded on the National Association of Securities Dealers Automated Quotation National Market (“NASDAQ”) are generally valued at the NASDAQ Official Closing Price (“NOCP”). If there is no Nasdaq Official Closing Price for a Nasdaq-listed security or sale price available for an over-the-counter security, the mean of the latest bid and asked quotations from Nasdaq will be used. Investments in gold will be valued at the spot price of gold determined based on the mean of the last bid and asked price at the close of the New York Commodity Exchange. When market quotations for securities are not readily available, or when restricted securities or other assets are being valued, such assets are valued at fair value as determined in good faith by or under procedures approved by the Trustees. Short-term securities maturing within 60 days are valued on an amortized cost basis. Fixed income securities with maturities greater than 60 days are valued at market price. Debt securities, such as corporate bonds, convertible bonds and U.S. government agency issues for which market quotations are not readily available may be valued based on information supplied by independent pricing services using matrix pricing formulas and/or independent broker bid quotations. Debt securities with remaining maturities of 60 days or less may be valued on an amortized cost basis, which involves valuing an instrument at its cost and thereafter assuming a constant amortization to maturity of any discount or premium, regardless of the impact of fluctuating rates on the fair value of the instrument.
Trading in securities on European and Far Eastern securities exchanges normally is completed before the calculation of the Funds’ net asset value. Trading on these foreign exchanges may not take place on all days on which there is regular trading on the New York Stock Exchange (“NYSE”), or may take place on days on which there is no regular trading on the NYSE. Similarly, the Funds may hold securities traded in domestic markets where the market may close early on a given day prior to calculation of the Funds’ net asset value. Events affecting the value of such securities held by the Funds that
occur between the close of trading in the security and the close of trading on the NYSE normally will not be reflected in the Funds’ calculation of the net asset value. Significant events will be closely monitored, and where it is determined that an adjustment should be made to the security’s value because significant interim events may materially affect the value of the security, the security will be priced at its fair value in accordance with the procedures approved by the Trustees.
Investment and shareholder transactions are recorded on trade date. Dividend income is recognized on the ex-dividend date. Interest income is recognized on an accrual basis and includes, where applicable, the amortization of premiums and accretion of discounts. Net realized gains and losses from sales of securities are determined on the specific identification cost method.
b) Restricted and illiquid securities
The Funds may invest in securities that are subject to legal or contractual restrictions on resale or are illiquid. A security may be considered illiquid if it lacks a readily available market or if its valuation has not changed for a certain period of time. Disposal of these securities may involve time consuming negotiations and expense, and a prompt sale at the current valuation may be difficult.
c) Fair valuation measurements
The Trust has adopted authoritative fair valuation accounting standards which establish an authoritative definition of fair value and set out a hierarchy for measuring fair value. These standards require additional disclosures about the various inputs and valuation techniques used to develop the measurements of fair value and a discussion in changes in valuation techniques and related inputs during the period. These inputs are summarized in the three broad levels listed below.
| | Level 1 - | Quoted prices in active markets for identical securities. |
| | Level 2 - | Other significant observable inputs (including quoted prices for similar securities, interest rates, prepayment speeds, credit risk, etc.). |
| | Level 3 - | Significant unobservable inputs (including the Fund’s own assumptions in determining the fair value of investments). |
When using the market quotations or closing price provided by the pricing service for equity investments (including securities sold short), including common stocks, preferred stocks, foreign issued common stocks, exchange-traded funds, closed end mutual funds and real estate investment trusts, which are traded on an exchange are valued at the last sale price reported by the exchange on which the securities are primarily traded on the day of valuation and when the market is considered active, the security will be classified as a Level 1 security. When using the mean between the latest bid and ask price, the security will be classified as Level 2. On days when the closing price of the S&P 500 moves more than 1% from its previous close, common stocks of the International Value Fund which are traded on non-North American exchanges may be valued using matrix pricing formulas provided by an independent pricing service. These securities will generally be classified as Level 2 securities. Gold bullion is valued at the mean of the closing bid and ask prices from the New York Mercantile Exchange and is classified as a Level 2.
Investment in mutual funds, including money market funds, are generally priced at the ending net asset value (NAV) provided by the service agent of the funds and will be classified as Level 1 securities.
Debt securities, such as corporate bonds, convertible bonds, bank loan obligations and U.S. government agency issues for which market quotations are not readily available may be valued based on information supplied by independent pricing services using matrix pricing formulas and/or independent broker bid quotations and are classified as Level 2. Debt securities with remaining maturities of 60 days or less may be valued on an amortized cost basis, which involves valuing an instrument at its cost and thereafter assuming a constant amortization to maturity of any discount or premium, regardless of the impact of fluctuating rates on the fair value of the instrument and are classified as Level 2. Warrants for which the underlying security is registered and equities which are subject to a required holding period, but have a comparable public issue, are valued in good faith by the Adviser pursuant to procedures established under the general supervision and responsibility of the Funds’ Board of Trustees. These securities will generally be classified as Level 2 securities. Forward currency contracts derive their value from the underlying currency prices. These are valued by a pricing service using pricing models. The models use inputs that are observed from active markets, such as exchange rates. These contracts are classified as Level 2. Options can diverge from the prices of their underlying instruments. These are valued at the composite last price reported by the exchange on which the options are primarily traded on the day of the valuation and are classified as Level 1. If there is no composite last price on a given day the mean between the latest bid and ask price will be used. These contracts are classified as Level 2.
Any securities or other assets for which market quotations are not readily available are valued at fair value as determined in good faith by the Adviser pursuant to procedures established under the general supervision and responsibility of the Funds’ Board of Trustees and will be classified as Level 3 securities. In determining fair value, a Fund will seek to assign a value to the security which it believes represents the amount that the Fund could reasonably expect to receive upon its current sale. With respect to securities that are actively traded on U.S. exchanges, the Funds expect that market quotations will generally be available and that fair value might be used only in limited circumstances, such as when trading for a security is halted during the trading day.
The Gold Fund currently invests in a private fund that primarily invests in physical gold and is subject to redemption restrictions. This private fund investment can only be disposed of with notice given 24 hours in advance of redemption. This investment is currently valued at $15,721,097 which represents 1.3% of the Gold Fund’s net assets and is classified as Level 3.
For securities traded principally on foreign exchanges, the Funds may use fair value pricing if an event occurs after the close of trading of the principal foreign exchange on which a security is traded, but before calculation of a Fund’s NAV, which a Fund believes affects the value of the security since its last market quotation. Such events may involve situations relating to a single issuer (such as news related to the issuer announced after the close of the principal foreign exchange), or situations relating to sectors of the market or the markets in general (such as significant fluctuations in the U.S. or foreign markets or significant changes in exchange rates, natural disasters, armed conflicts, or governmental actions).
In determining whether a significant event has occurred with respect to securities traded principally in foreign markets, the Funds may engage a third party fair value service provider to systematically recommend the adjustment of closing market prices of non-U.S. securities based upon changes in a designated U.S. securities market index occurring from the time of close of the relevant foreign market and the close of the NYSE. Fair value pricing may also be used to value restricted securities held by the Funds or securities with little or no trading activity for extended periods of time. Fair value pricing involves judgments that are inherently subjective and inexact and it is not possible to determine with certainty when, and to what extent, an event will affect a market price. As a result, there can be no assurance that fair value pricing will reflect actual market value and it is possible that the fair value determined for a security may differ materially from the value that could be realized upon the sale of the security.
The following is a summary of the inputs used, as of April 30, 2015, involving the Funds’ assets and liabilities carried at fair value. The inputs of methodology used for valuing securities may not be an indication of the risk associated with investing in those securities.
| | | | | | | | | | | | | | | | |
| Description | | Level 1 | | | Level 2 | | | Level 3 | | | Total | |
The Tocqueville Fund | | | | | | | | | | | | | | | | |
Assets | | | | | | | | | | | | | | | | |
Common Stocks* | | $ | 367,035,257 | | | $ | — | | | $ | — | | | $ | 367,035,257 | |
Real Estate Investment Trust (REIT)* | | | 7,877,500 | | | | — | | | | — | | | | 7,877,500 | |
| | | | | | | | | | | | | | | | |
Total Assets | | $ | 374,912,757 | | | $ | — | | | $ | — | | | $ | 374,912,757 | |
| | | | | | | | | | | | | | | | |
| | | | |
| The Tocqueville Opportunity Fund | | Level 1 | | | Level 2 | | | Level 3 | | | Total | |
Assets | | | | | | | | | | | | | | | | |
Common Stocks* | | $ | 101,701,264 | | | $ | — | | | $ | — | | | $ | 101,701,264 | |
Real Estate Investment Trusts (REITs)* | | | 315,106 | | | | — | | | | — | | | | 315,106 | |
Closed-End Fund* | | | 78,525 | | | | — | | | | — | | | | 78,525 | |
Purchased Call Options* | | | — | | | | 188,950 | | | | — | | | | 188,950 | |
Money Market Fund | | | 862,550 | | | | — | | | | — | | | | 862,550 | |
| | | | | | | | | | | | | | | | |
Total Assets | | $ | 102,957,445 | | | $ | 188,950 | | | $ | — | | | $ | 103,146,395 | |
| | | | | | | | | | | | | | | | |
| | | | |
| The Tocqueville International Value Fund | | Level 1 | | | Level 2 | | | Level 3 | | | Total | |
Assets | | | | | | | | | | | | | | | | |
Common Stocks* | | $ | 237,543,273 | | | $ | — | | | $ | — | | | $ | 237,543,273 | |
Preferred Stock* | | | 6,304,104 | | | | — | | | | — | | | | 6,304,104 | |
Money Market Fund | | | 13,132,827 | | | | — | | | | — | | | | 13,132,827 | |
Commercial Paper | | | — | | | | 1,951,000 | | | | — | | | | 1,951,000 | |
Forward Currency Contract | | | — | | | | 53,023 | | | | — | | | | 53,023 | |
| | | | | | | | | | | | | | | | |
Total Assets | | $ | 256,980,204 | | | $ | 2,004,023 | | | $ | — | | | $ | 258,984,227 | |
| | | | | | | | | | | | | | | | |
Liabilities | | | | | | | | | | | | | | | | |
Forward Currency Contract** | | $ | — | | | $ | (94,439 | ) | | $ | — | | | $ | (94,439 | ) |
| | | | | | | | | | | | | | | | |
Total Liabilities | | $ | — | | | $ | (94,439 | ) | | $ | — | | | $ | (94,439 | ) |
| | | | | | | | | | | | | | | | |
| | | | |
| The Tocqueville Gold Fund | | Level 1 | | | Level 2 | | | Level 3 | | | Total | |
Assets | | | | | | | | | | | | | | | | |
Common Stocks | | | | | | | | | | | | | | | | |
Gold Related | | $ | 914,764,992 | | | $ | 35,193,961 | | | $ | 1,063,643 | | | $ | 951,022,596 | |
Other Precious Metals Related | | | 87,641,362 | | | | 1,747,965 | | | | 5,717,407 | | | | 95,106,734 | |
Other | | | 52,793 | | | | — | | | | 7,533,975 | | | | 7,586,768 | |
| | | | | | | | | | | | | | | | |
Total Common Stocks | | | 1,002,459,147 | | | | 36,941,926 | | | | 14,315,025 | | | | 1,053,716,098 | |
Private Fund* | | | — | | | | — | | | | 15,721,097 | | | | 15,721,097 | |
Gold Bullion | | | — | | | | 141,744,858 | | | | — | | | | 141,744,858 | |
Warrants | | | — | | | | 761,500 | | | | — | | | | 761,500 | |
Rights | | | — | | | | 606,732 | | | | — | | | | 606,732 | |
Money Market Fund | | | 21,589,747 | | | | — | | | | — | | | | 21,589,747 | |
| | | | | | | | | | | | | | | | |
Total Assets | | $ | 1,024,048,894 | | | $ | 180,055,016 | | | $ | 30,036,122 | | | $ | 1,234,140,032 | |
| | | | | | | | | | | | | | | | |
| | | | | | | | | | | | | | | | |
| The Delafield Fund | | Level 1 | | | Level 2 | | | Level 3 | | | Total | |
Assets | | | | | | | | | | | | | | | | |
Common Stocks* | | $ | 833,289,371 | | | $ | — | | | $ | — | | | $ | 833,289,371 | |
Corporate Bonds* | | | — | | | | 21,223,028 | | | | — | | | | 21,223,028 | |
Money Market Fund | | | 49,996,973 | | | | — | | | | — | | | | 49,996,973 | |
Commercial Paper | | | — | | | | 74,584,000 | | | | — | | | | 74,584,000 | |
| | | | | | | | | | | | | | | | |
Total Assets | | $ | 883,286,344 | | | $ | 95,807,028 | | | $ | — | | | $ | 979,093,372 | |
| | | | | | | | | | | | | | | | |
| | | | |
| The Tocqueville Select Fund | | Level 1 | | | Level 2 | | | Level 3 | | | Total | |
Assets | | | | | | | | | | | | | | | | |
Common Stocks* | | $ | 93,501,776 | | | $ | — | | | $ | — | | | $ | 93,501,776 | |
Money Market Fund | | | 4,992,758 | | | | — | | | | — | | | | 4,992,758 | |
Commercial Paper | | | — | | | | 288,000 | | | | — | | | | 288,000 | |
| | | | | | | | | | | | | | | | |
Total Assets | | $ | 98,494,534 | | | $ | 288,000 | | | $ | — | | | $ | 98,782,534 | |
| | | | | | | | | | | | | | | | |
| | | | |
| The Tocqueville Alternative Strategies Fund | | Level 1 | | | Level 2 | | | Level 3 | | | Total | |
Assets | | | | | | | | | | | | | | | | |
Common Stocks* | | $ | 15,046,813 | | | $ | — | | | $ | — | | | $ | 15,046,813 | |
Convertible Bonds* | | | — | | | | 18,163,593 | | | | — | | | | 18,163,593 | |
Corporate Bonds* | | | — | | | | 6,079,363 | | | | — | | | | 6,079,363 | |
Exchange-Traded Fund* | | | 646,779 | | | | — | | | | — | | | | 646,779 | |
Closed-End Funds* | | | 935,415 | | | | — | | | | — | | | | 935,415 | |
Preferred Stocks | | | | | | | | | | | | | | | | |
Banks | | | 2,405,670 | | | | — | | | | — | | | | 2,405,670 | |
Consumer Finance | | | — | | | | 739,500 | | | | — | | | | 739,500 | |
| | | | | | | | | | | | | | | | |
Total Preferred Stocks | | | 2,405,670 | | | | 739,500 | | | | — | | | | 3,145,170 | |
Purchased Call Options* | | | — | | | | 2,000 | | | | — | | | | 2,000 | |
Warrants* | | | — | | | | 26,797 | | | | — | | | | 26,797 | |
Money Market Fund | | | 1,363,051 | | | | — | | | | — | | | | 1,363,051 | |
Commercial Paper | | | — | | | | 1,239,000 | | | | — | | | | 1,239,000 | |
| | | | | | | | | | | | | | | | |
Total Assets | | $ | 20,397,728 | | | $ | 26,250,253 | | | $ | — | | | $ | 46,647,981 | |
| | | | | | | | | | | | | | | | |
Liabilities | | | | | | | | | | | | | | | | |
Securities Sold Short | | | | | | | | | | | | | | | | |
Common Stocks* | | $ | 4,106,895 | | | $ | — | | | $ | — | | | $ | 4,106,895 | |
Exchange-Traded Funds* | | | 5,733,278 | | | | — | | | | — | | | | 5,733,278 | |
U.S. Treasury Notes | | | — | | | | 6,076,876 | | | | — | | | | 6,076,876 | |
| | | | | | | | | | | | | | | | |
Total Liabilities | | $ | 9,840,173 | | | $ | 6,076,876 | | | $ | — | | | $ | 15,917,049 | |
| | | | | | | | | | | | | | | | |
| * | For further information regarding portfolio characteristics, please see the accompanying Schedules of Investments. |
| ** | Other financial instruments are derivative instruments not reflected in the Schedule of Investments, such as forward currency contracts, which are reflected at the unrealized appreciation (depreciation) on the instrument. |
Below is a reconciliation that details the transfer of securities between Level 1 and Level 2 during the reporting period.
| | | | | | | | | | | | | | | | | | | | | | | | | | | | |
| | | The
Tocqueville
Fund | | | The
Tocqueville
Opportunity
Fund | | | The
Tocqueville
International
Value Fund | | | The
Tocqueville
Gold Fund | | | The
Delafield
Fund | | | The
Tocqueville
Select Fund | | | The
Tocqueville
Alternative
Strategies
Fund | |
Transfers Into Level 1 | | $ | — | | | $ | — | | | $ | — | | | $ | 1,588,024 | | | $ | — | | | $ | — | | | $ | 416,250 | |
Transfers Out of Level 1 | | | — | | | | — | | | | — | | | | (28,424,570 | ) | | | — | | | | — | | | | — | |
| | | | | | | | | | | | | | | | | | | | | | | | | | | | |
Net Transfers Into/(Out of ) Level 1 | | | — | | | | — | | | | — | | | | (26,836,546 | ) | | | — | | | | — | | | | 416,250 | |
| | | | | | | | | | | | | | | | | | | | | | | | | | | | |
Transfers Into Level 2 | | | — | | | | — | | | | — | | | | 28,424,570 | | | | — | | | | — | | | | — | |
Transfers Out of Level 2 | | | — | | | | — | | | | — | | | | (1,588,024 | ) | | | — | | | | — | | | | (416,250 | ) |
| | | | | | | | | | | | | | | | | | | | | | | | | | | | |
Net Transfers Into/(Out of ) Level 2 | | $ | — | | | $ | — | | | $ | — | | | $ | 26,836,546 | | | $ | — | | | $ | — | | | $ | (416,250 | ) |
| | | | | | | | | | | | | | | | | | | | | | | | | | | | |
Below is a reconciliation that details the activity of securities in Level 3 during the current fiscal period:
| | | | | | | | | | | | | | | | | | | | | | | | | | | | |
| | | The
Tocqueville
Fund | | | The
Tocqueville
Opportunity
Fund | | | The
Tocqueville
International
Value Fund | | | The
Tocqueville
Gold Fund | | | The
Delafield
Fund | | | The
Tocqueville
Select Fund | | | The
Tocqueville
Alternative
Strategies
Fund | |
Beginning Balance—November 1, 2014 | | $ | — | | | $ | — | | | $ | — | | | $ | 31,803,883 | | | $ | — | | | $ | — | | | $ | — | |
Purchases | | | — | | | | — | | | | — | | | | — | | | | — | | | | — | | | | — | |
Sales | | | — | | | | — | | | | — | | | | — | | | | — | | | | — | | | | — | |
Realized gains | | | — | | | | — | | | | — | | | | — | | | | — | | | | — | | | | — | |
Realized losses | | | — | | | | — | | | | — | | | | — | | | | — | | | | — | | | | — | |
Change in unrealized depreciation | | | — | | | | — | | | | — | | | | (1,767,761 | ) | | | — | | | | — | | | | — | |
Transfers in/(out) of Level 3 | | | — | | | | — | | | | — | | | | — | | | | — | | | | — | | | | — | |
| | | | | | | | | | | | | | | | | | | | | | | | | | | | |
Ending Balance—April 30, 2015 | | $ | — | | | $ | — | | | $ | — | | | $ | 30,036,122 | | | $ | — | | | $ | — | | | $ | — | |
| | | | | | | | | | | | | | | | | | | | | | | | | | | | |
The movement from Level 2 to Level 1 in the Gold Fund was due to the use of market quotations or closing prices provided by the pricing service because the market was considered active. The movement from Level 1 to Level 2 in the Gold Fund was from the securities being priced using the mean of the bid and ask price due to the lack of trading volume on April 30, 2015. The movement from Level 2 to Level 1 in the Alternative Strategies Fund was from the security being priced using the official closing price on April 30, 2015. Transfers between levels are recognized at the end of the reporting period.
The Tocqueville Gold Fund
Significant Unobservable Inputs for Level 3 Portfolio Company Securities
| | | | | | | | | | | | |
Type of Security | | Industry | | Fair Value at 4/30/2015 | | | Valuation Techniques | | Unobservable Inputs | | Range |
Common Stock | | | | | | | | | | | | |
| | Gold Related | | | $ 1,063,643 | | | Latest company valuation | | Financing prices | | $0.50 |
| | Other Precious Metals Related | | | 5,717,407 | | | Latest company financing price | | Financing prices | | 3.50 |
| | Other | | | 640,975 | | | Latest company financing price | | Financing prices | | 8.60 |
| | | | | 6,893,000 | | | Latest company financing price | | Financing prices | | 1.38 |
Private Fund | | Gold Related | | | 15,721,097 | | | NAV from custodian discounted by adviser | | Illiquidity discount | | 2% |
The significant unobservable inputs used in the fair value measurement of the Gold Fund’s common stocks are the most recent financing prices of the portfolio company, which approximate the companies’ value in the market place. The significant unobservable input for the private fund is the discount for illiquidity applied to the net asset value per share determined by the private fund’s custodian.
Significant changes in the companies’ ability to receive financing for new projects in the future would be an indication of the companies’ financial position and market value. An increase in the discount applied to the value of resources, future expected cash flows, or to account for illiquidity would decrease the value of the portfolio security.
The Trust’s valuation procedures have been adopted by the Trust’s Board of Trustees, which has established a Valuation Committee to oversee the valuation process. The Valuation Committee meets on an as needed basis to evaluate changes in the valuation of portfolio securities. The full findings and valuations are then reviewed quarterly by the Independent Trustees.
d) Derivative Instruments and Hedging Activities
The Funds’ Adviser may use derivative instruments, such as options and forward currency contracts, as a means to manage exposure to different types of risk, including market risk and exchange rate risk, and to gain exposure to underlying securities. The Trust has adopted disclosure standards in order to enable the investor to understand how and why an entity used derivatives, how derivatives are accounted for, and how derivatives affect an entity’s results of operations and financial position.
In the Opportunity Fund and the Alternative Strategies Fund, the Adviser used options to gain exposure to the underlying equity security. In the International Value Fund, the Adviser used forward currency contracts to adjust exposure to foreign exchange rate risk.
Offsetting on the Statement of Assets and Liabilities
In December 2011, the Financial Accounting Standard Board (“FASB”) issued Accounting Standards Update No. 2011-11 “Disclosures about Offsetting Assets and Liabilities” (“ASU 2011-11”). This disclosure requirement is
intended to help investors and other financial statement users better assess the effect or potential effect of offsetting arrangements on a fund’s financial position. ASU 2011-11 requires entities to disclose both gross and net information about both instruments and transaction eligible for offset on the statement of Assets and Liabilities, and disclose instruments and transactions subject to master netting or similar agreements. In addition, in January 2013, FASB issued Accounting Standards Update No. 2013-1 “Clarifying the Scope of Offsetting Assets and Liabilities” (“ASU 2013-1”), specifying exactly which transactions are subject to offsetting disclosures. The scope of the disclosure requirements is limited to derivative instruments, repurchase agreements and reverse repurchase agreements, and securities borrowing and securities lending transactions. ASU 2011-11 and ASU 2013-1 are effective for financial statements with fiscal years beginning on or after January 1, 2013.
The Trust adopted the disclosure requirement on offsetting as of November 1, 2013. For financial reporting purposes, the Funds offsets financial assets and financial liabilities that are subject to master netting arrangements or similar agreements within appreciation on forward currency contracts and depreciation on forward currency contracts on the Statement of Assets and Liabilities.
At April 30, 2015, the amount of derivative assets and liabilities by type that are subject to offsetting for the Tocqueville International Value Fund are as follows:
Forward Currency Contracts*
| | | | | | | | | | | | | | | | | | | | | | | | |
| | | | | | | | | | | | Gross Amounts not
Offset in the Statement
of Assets and
Liabilities | | | | |
| | | Gross
Amounts of
Recognized
Assets | | | Gross
Amounts
Offset in the
Statements of
Assets and
Liabilities | | | Net Amounts
of Assets
Presented
in the
Statement of
Assets and
Liabilities | | | Financial
Instruments | | | Collateral
Amounts
Received | | | Net
Amount | |
Tocqueville International Value Fund | | $ | 53,023 | | | $ | 53,023 | | | | $— | | | $ | — | | | $ | — | | | $ | — | |
| | | | | |
| | | | | | | | | | | | Gross Amounts not
Offset in the Statement
of Assets and
Liabilities | | | | |
| | | Gross
Amounts of
Recognized
Liabilities | | | Gross
Amounts
Offset in the
Statements of
Assets and
Liabilities | | | Net Amounts
of Liabilities
Presented
in the
Statement of
Assets and
Liabilities | | | Financial
Instruments | | | Collateral
Amounts
Received | | | Net
Amount | |
Tocqueville International Value Fund | | $ | (94,439 | ) | | $ | 53,023 | | | $ | (41,416 | ) | | $ | — | | | $ | — | | | $ | (41,416 | ) |
| * | The respective counterparties for each contract are disclosed in the Open Forward Currency Contract detail within the Schedule of Investments. |
Balance Sheet—Values of Derivative Instruments as of April 30, 2015.
| | | | | | | | | | | | |
| | | Asset Derivatives | | | Liability Derivatives | |
| Derivatives not accounted for as hedging instruments | | Balance Sheet
Location | | Value | | | Balance Sheet
Location | | Value | |
The Tocqueville Opportunity Fund | | | | | | | | | | | | |
Purchased Call Options | | Investments,
at Value | | $ | 188,950 | | | | | $ | — | |
| | | | | | | | | | | | |
Total | | | | $ | 188,950 | | | | | $ | — | |
| | | | | | | | | | | | |
| | | | |
The Tocqueville Alternative Strategies Fund | | | | | | | | | | | | |
Purchased Call Options | | Investments,
at Value | | $ | 2,000 | | | | | $ | — | |
| | | | | | | | | | | | |
Total | | | | $ | 2,000 | | | | | $ | — | |
| | | | | | | | | | | | |
The Effect of Derivative Instruments on the Statement of Operations for the period ended April 30, 2015.
| | | | | | | | |
| | | Net Realized
Gain on Investments | | | Net Change in
Unrealized
Depreciation on
Investments | |
The Tocqueville Opportunity Fund | | | | | | | | |
Purchased Call Options | | $ | 113,050 | | | $ | (76,525 | ) |
| | | | | | | | |
Total | | $ | 113,050 | | | $ | (76,525 | ) |
| | | | | | | | |
| | | | | | | | |
| | | Net Realized
Gain on Forward
Currency Contracts | | | Net Change in
Unrealized
Depreciation on
Forward Currency
Contracts | |
The Tocqueville International Value Fund | | | | | | | | |
Foreign Currency Forward Contract | | $ | 3,472,922 | | | $ | (261,349 | ) |
| | | | | | | | |
Total | | $ | 3,472,922 | | | $ | (261,349 | ) |
| | | | | | | | |
| | | | | | | | |
| | | Net Realized
Gain on
Investments | | | Net Change in
Unrealized
Depreciation on
Investments | |
The Tocqueville Alternative Strategies Fund | | | | | | | | |
Purchased Call Options | | $ | 118,930 | | | $ | (11,997 | ) |
| | | | | | | | |
Total | | $ | 118,930 | | | $ | (11,997 | ) |
| | | | | | | | |
Derivatives Risk
The risks of using the types of derivatives in which the Funds may engage include the risk that movements in the value of the derivative may not fully offset or complement instruments currently held in the Funds in the manner intended by the Adviser; the risk that the counterparty to a derivative contract may fail to comply with their obligations to the Fund; the risk that the derivative may not possess a liquid secondary market at a time when the Fund would look to disengage the position; the risk that additional capital from the Fund may be called upon to fulfill the conditions of the derivative contract; and the risk that the cost of the derivative contracts may reduce the overall returns experienced by the Funds. The measurement of risks associated with these instruments is meaningful only when all related offsetting transactions are considered. The use of options and forward currency contracts do not create leverage in the Funds.
The average monthly value of options in the Opportunity Fund during the period ended April 30, 2015 was $541,428.
Transactions in options in the Opportunity Fund during the period ended April 30, 2015 were as follows:
| | | | | | | | |
| | | Notional
Amount | | | Contracts | |
Outstanding, beginning of period: | | $ | 5,203,750 | | | | 685 | |
Options purchased | | | 7,112,500 | | | | 870 | |
Options terminated in closing transactions | | | (5,558,750 | ) | | | (955 | ) |
Options exercised | | | (175,000 | ) | | | (50 | ) |
Options expired | | | (3,432,500 | ) | | | (340 | ) |
| | | | | | | | |
Outstanding, end of period: | | $ | 3,150,000 | | | | 210 | |
The average monthly value of options in the Alternative Strategies Fund during the period ended April 30, 2015 was $60,083.
Transactions in options in the Alternative Strategies Fund during the period ended April 30, 2015 were as follows:
| | | | | | | | |
| | | Notional
Amount | | | Contracts | |
Outstanding, beginning of period: | | $ | 1,780,000 | | | | 780 | |
Options purchased | | | — | | | | — | |
Options terminated in closing transactions | | | (1,220,000 | ) | | | (300 | ) |
Options exercised | | | — | | | | — | |
Options expired | | | (360,000 | ) | | | (80 | ) |
| | | | | | | | |
Outstanding, end of period: | | $ | 200,000 | | | | 400 | |
The average monthly notional amount of forward currency contracts during the period ended April 30, 2015 was as follows:
| | | | |
| | | International
Value Fund | |
Long Positions | | | | |
Forward currency contracts | | $ | — | |
Short Positions | | | | |
Forward currency contracts | | $ | 46,396,453 | |
e) Foreign currency translation
Investments and other assets and liabilities denominated in foreign currencies are translated to U.S. dollars at the prevailing rates of exchange, in accordance with the Trust’s Portfolio Securities Valuation and Foreign Exchange Contracts Procedures. The Tocqueville Fund, The Tocqueville Opportunity Fund, The Tocqueville International Value Fund, The Tocqueville Gold Fund, The Delafield Fund, The Tocqueville Select Fund and The Tocqueville Alternative Strategies Fund have engaged in transactions in securities denominated in foreign currencies and, as a result, entered into foreign exchange transactions. The Tocqueville International Value Fund has entered into forward contracts. These Funds are exposed to additional market risk as a result of changes in the value of the underlying currency in relation to the U.S. dollar. Risks include potential inability of counterparties to meet the terms of their obligations. The value of foreign currencies are marked-to-market on a daily basis, which reflects the changes in the market value of the contract at the close of each day’s trading, resulting in daily unrealized gains and/or losses. When the transactions are settled or the contracts are closed, the Funds recognize a realized gain or loss.
The Funds isolate that portion of the results of operations resulting from changes in foreign exchange rates on investments from the fluctuations arising from changes in market prices of securities held. Such fluctuations are reflected as net realized and unrealized gain or loss on foreign currency translation.
Reported net realized foreign exchange gains or losses arise from sales of foreign currencies, currency gains or losses realized between the trade and settlement dates on securities transactions, the differences between the amounts of dividends, interest, and foreign withholding taxes recorded on the Fund’s books, and the U.S. dollar equivalent of the amounts actually received or paid. Net unrealized foreign exchange gains and losses arise from changes in the value of assets and liabilities other than investments in securities at the end of the fiscal period, resulting from changes in the exchange rates.
f) Dividends and distributions to shareholders
Dividends to shareholders are recorded on the ex-dividend date. Dividends from net investment income are declared and paid annually by the Funds. Distributions of net realized capital gains, if any, will be declared and paid at least annually. Income and capital gain distributions are determined in accordance with income tax regulations which may differ from generally accepted accounting principles. Permanent differences between financial and tax reporting may result in reclassification to capital stock.
g) Use of estimates
The preparation of financial statements in conformity with accounting principles generally accepted in the United States of America requires management to make estimates and assumptions that affect the reported amounts of assets and liabilities and disclosure of contingent assets and liabilities at the date of the financial statements and the reported amounts of revenues and expenses during the reporting period. Actual results could differ from those estimates.
h) Indemnification
In the normal course of business the Funds enter into contracts that contain general indemnification clauses. The Funds’ maximum exposure under these arrangements is unknown, as this would involve future claims against a Fund that have not yet occurred. Based on experience, the Funds expect the risk of loss to be remote.
(i) Short Sales
Short sales are transactions under which the Funds sell a security they do not own. To complete such a transaction, the Funds must borrow the security to make delivery to the buyer. The Funds then are obligated to replace the security borrowed by purchasing the security at the market price at the time of replacement. The price at such time may be more or less than the price at which the security was sold by the Funds. Until the security is replaced, the Funds are required to pay the lender amounts equal to dividend or interest that accrue during the period of the loan which is recorded as an expense on the Statements of Operations. To borrow the security, the Funds also may be required to pay a premium or an interest fee, which would decrease proceeds of the security sold. The proceeds of the short sale will be retained by the broker, to the extent necessary to meet margin requirements, until the short position is closed out. A gain, limited to the price at which the Funds sell the security short, or a loss, potentially unlimited in size, will be recognized upon the closing of a short sale. The Funds may not always be able to borrow a security or to close out a short position at a particular time or at an acceptable price. If the price of the borrowed security increases between the date of the short sale and the date on which the Funds replace the security, the Funds will experience a loss. The Funds’ loss on a short sale is limited only by the maximum attainable price of the security (which could be limitless) less the price the Funds paid for the security at the time it was borrowed.
j) Subsequent events evaluation
On June 18, 2015, the Board of Trustees of the Trust approved the elimination of the redemption fee for The Tocqueville Fund, The Tocqueville Opportunity Fund, The Tocqueville International Value Fund, The Delafield Fund, The Tocqueville Select Fund and The Tocqueville Alternative Strategies Fund effective July 1, 2015.
In preparing these financial statements, the Trust has evaluated events and transactions for potential recognition or disclosure resulting from subsequent events through the date financial statements were available to be issued.
3. FEDERAL INCOME TAX
There is no tax liability resulting from unrecognized tax benefits relating to uncertain income tax positions taken or expected to be taken on the tax return for the fiscal year-end October 31, 2014, or for any other tax years which are open for exam. As of October 31, 2014, open tax years include the tax years ended October 31, 2011 through 2014. The Trust is also not aware of any tax positions for which it is reasonably possible that the total amounts of unrecognized tax benefits will significantly change in the next six months. The Funds recognize interest and penalties, if any, related to unrecognized tax benefits as income tax expense in the Statement of Operations. During the period, the Funds did not incur any interest or penalties.
Provision for federal income taxes or excise taxes has not been made since the Funds have elected to be taxed as Regulated Investment Companies and intend to distribute substantially all taxable income to shareholders and otherwise comply with the provisions of the Internal Revenue Code applicable to Regulated Investment Companies. Distributions from net realized gains for book purposes may include short-term capital gains which are included as ordinary income to shareholders for tax purposes. Additionally, accounting principles generally accepted in the United States of America require that certain components of net assets relating to permanent differences be reclassified between financial and tax
reporting. These reclassifications have no effect on net assets or net asset value per share. For the period ended October 31, 2014, the following table shows the reclassifications made:
| | | | | | | | | | | | |
| | | Undistributed
Net Investment
Income/(Loss) | | | Accumulated Net
Realized
Gain/(Loss) | | | Paid In Capital | |
Tocqueville Fund | | $ | (187,341 | ) | | $ | (2,110,354 | ) | | $ | 2,297,695 | |
Opportunity Fund | | | 1,180,894 | | | | (2,577,975 | ) | | | 1,397,081 | |
International Value Fund | | | 2,568,276 | | | | (4,594,913 | ) | | | 2,026,637 | |
Gold Fund | | | 42,486,029 | | | | 162,109 | | | | (42,648,138 | ) |
Delafield Fund | | | (118,770 | ) | | | (30,402,746 | ) | | | 30,521,516 | |
Select Fund | | | 430,638 | | | | (1,265,361 | ) | | | 834,723 | |
Alternative Strategies Fund | | | 402,223 | | | | (111,716 | ) | | | (290,507 | ) |
The permanent differences primarily relate to net operating losses, foreign currency reclasses and usage of tax equalization.
As of October 31, 2014, the components of accumulated earnings (losses) for income tax purposes were as follows:
| | | | | | | | | | | | | | | | | | | | | | | | | | | | |
| | | Tocqueville
Fund | | | Opportunity
Fund | | | International
Value Fund | | | Gold
Fund | | | Delafield
Fund | | | Select
Fund | | | Alternative
Strategies
Fund | |
Tax cost of Investments | | $ | 242,884,525 | | | $ | 61,951,803 | | | $ | 206,581,992 | | | $ | 1,733,391,924 | | | $ | 1,107,661,103 | | | $ | 88,600,817 | | | $ | 43,071,989 | |
| | | | | | | | | | | | | | | | | | | | | | | | | | | | |
Unrealized Appreciation | | | 141,154,948 | | | | 20,330,407 | | | | 42,784,013 | | | | 185,951,545 | | | | 422,349,763 | | | | 22,801,144 | | | | 4,207,131 | |
Unrealized Depreciation | | | (3,519,951 | ) | | | (2,022,482 | ) | | | (11,687,572 | ) | | | (827,162,265 | ) | | | (51,908,717 | ) | | | (4,401,597 | ) | | | (2,321,055 | ) |
| | | | | | | | | | | | | | | | | | | | | | | | | | | | |
Net unrealized appreciation (depreciation) | | | 137,634,997 | | | | 18,307,925 | | | | 31,096,441 | | | | (641,210,720 | ) | | | 370,441,046 | | | | 18,399,547 | | | | 1,886,076 | |
| | | | | | | | | | | | | | | | | | | | | | | | | | | | |
Undistributed operating income | | | 2,358,640 | | | | 787,554 | | | | 4,908,168 | | | | — | | | | | | | | — | | | | — | |
Undistributed long-term gains | | | 13,296,059 | | | | 9,388,784 | | | | 8,275,406 | | | | — | | | | 136,100,547 | | | | 12,348,740 | | | | 852,471 | |
| | | | | | | | | | | | | | | | | | | | | | | | | | | | |
Distributable earnings | | | 15,654,699 | | | | 10,176,338 | | | | 13,183,574 | | | | — | | | | 136,100,547 | | | | 12,348,740 | | | | 852,471 | |
| | | | | | | | | | | | | | | | | | | | | | | | | | | | |
Other accumulated gain/(loss) | | | — | | | | (38 | ) | | | (40,803 | ) | | | (19,358,830 | ) | | | (4,198,357 | ) | | | (479,135 | ) | | | (384,572 | ) |
| | | | | | | | | | | | | | | | | | | | | | | | | | | | |
Total accumulated gain/(loss) | | $ | 153,289,696 | | | $ | 28,484,225 | | | $ | 44,239,212 | | | $ | (660,569,550 | ) | | $ | 502,343,236 | | | $ | 30,269,152 | | | $ | 2,353,975 | |
| | | | | | | | | | | | | | | | | | | | | | | | | | | | |
The difference between book-basis and tax-basis unrealized appreciation is attributable primarily to wash sale deferrals and passive foreign investment companies (PFIC’s).
The tax character of distributions paid during the periods ended October 31, 2014 and 2013 was as follows:
| | | | | | | | | | | | |
| | | October 31, 2014 | |
| | | Ordinary
Income | | | Long Term
Capital
Gain | | | Total | |
Tocqueville Fund | | $ | 3,425,837 | | | $ | 2,781,747 | | | $ | 6,207,584 | |
Opportunity Fund | | | — | | | | 4,131,999 | | | | 4,131,999 | |
International Value Fund | | | 4,005,675 | | | | — | | | | 4,005,675 | |
Gold Fund | | | — | | | | — | | | | — | |
Delafield Fund | | | 2,044,951 | | | | 59,796,315 | | | | 61,841,266 | |
Select Fund | | | — | | | | 9,932,816 | | | | 9,932,816 | |
Alternative Strategies Fund | | | — | | | | — | | | | — | |
| |
| | | October 31, 2013 | |
| | | Ordinary
Income | | | Long Term
Capital
Gain | | | Total | |
Tocqueville Fund | | $ | 5,030,132 | | | $ | — | | | $ | 5,030,132 | |
Opportunity Fund | | | — | | | | — | | | | — | |
International Value Fund | | | 3,270,330 | | | | — | | | | 3,270,330 | |
Gold Fund | | | — | | | | 53,161,749 | | | | 53,161,749 | |
Delafield Fund | | | — | | | | 80,537,788 | | | | 80,537,788 | |
Select Fund | | | — | | | | 3,451,599 | | | | 3,451,599 | |
The tax character of distributions paid during the seven months ended December 31, 2013 and during the period June 29, 2012 (commencement of operations) through May 31, 2013 for the predecessor fund of the Alternative Strategies Fund was as follows:
| | | | | | | | |
| Distributions paid from | | For the Period
January 1, 2014
to October 31, 2014 | | | For the Period
June 1, 2013
to December 31, 2013 | |
Ordinary income | | $ | 1,482,558 | | | $ | 187,454 | |
Net Long-term capital gains | | $ | 903,018 | | | $ | 482,735 | |
| | | | | | | | |
Total distributions paid | | $ | 2,385,576 | | | $ | 670,189 | |
The Fund designated as long-term capital gain dividend, pursuant to Internal Revenue Code Section 852(b)(3), the amount necessary to reduce the earnings and profits of the Funds related to net capital gain to zero for the tax years ended October 31, 2014 and 2013.
For the fiscal year ended October 31, 2014 the Gold Fund, Delafield Fund, and Select Fund had late year losses of $9,774,191, $4,198,357, and $470,338, respectively.
At October 31, 2014 certain Funds had tax basis capital losses which may be carried forward to offset future capital gains as shown below.
| | | | | | | | |
| | | Capital losses Expiring | |
| | | Indefinite ST | | | Indefinite LT | |
Gold Fund | | $ | 9,587,410 | | | | — | |
To the extent that Funds listed above may realize future net capital gains, those gains will be offset by any of their unused respective capital loss carryforwards.
4. INVESTMENT ADVISORY AND OTHER AGREEMENTS
Tocqueville Asset Management L.P. (“Tocqueville”) is the investment adviser (the “Adviser”) to the Trust under Investment Advisory Agreements approved by shareholders. For its services, Tocqueville receives fees from The Tocqueville Fund, calculated daily and payable monthly, at an annual rate of 0.75% on the first $1 billion of the average daily net assets of the Fund, and 0.65% of the average daily net assets in excess of $1 billion. Tocqueville receives fees from The Tocqueville Opportunity Fund, calculated daily and payable monthly, at an annual rate of 0.75% on the first $500 million of the average daily net assets of the Fund, and 0.65% of the average daily net assets in excess of $500 million. Tocqueville receives fees from The Tocqueville International Value Fund, calculated daily and payable monthly, at an annual rate of 1.00% on the first $1 billion of the average daily net assets of the Fund, and 0.75% of the average daily net assets in excess of $1 billion. Tocqueville receives fees from The Tocqueville Gold Fund, calculated daily and payable monthly, at an annual rate of 1.00% on the first $500 million of the average daily net assets of the Fund, 0.75% of the average daily net assets in excess of $500 million but not exceeding $1 billion, and 0.65% of the average daily net assets in excess of $1 billion. Tocqueville receives fees from The Delafield Fund, calculated daily and payable monthly, at an annual rate of 0.80% on the first $250 million of net assets of the Fund; 0.75% on the next $250 million of net assets of the Fund; 0.70% on the next $500 million of net assets of the Fund; and 0.65% on all net assets of the Fund over $1 billion. Tocqueville receives fees from The Tocqueville Select Fund, calculated daily and payable monthly, at an annual rate of 0.80% on all net assets of the Fund. Tocqueville receives fees from The Tocqueville Alternative Strategies Fund, calculated daily and payable monthly, at an annual rate of 1.30% on the first $500 million of net assets of the Fund; 1.25% on the next $500 million of net assets of the Fund; and 1.20% on all net assets of the Fund over $1 billion.
With respect to The Tocqueville Fund, the Adviser has contractually agreed to waive its advisory fees and/or reimburse expenses in order to ensure that The Tocqueville Fund’s total annual operating expenses do not exceed 1.25% of its average daily net assets (excluding taxes, interest expense, acquired fund fees and expenses, or extraordinary expenses such as litigation). The Expense Limitation Agreement will remain in effect until March 1, 2016. For the six months ended April 30, 2015, the Adviser waived $9,926 of the advisory fee. Such amount is not subject to recoupment by the Adviser.
With respect to The Tocqueville International Value Fund, the Adviser has contractually agreed to waive its advisory fees and/or reimburse expenses in order to ensure that The Tocqueville International Value Fund’s total annual operating expenses do not exceed 1.25% of its average daily net assets (excluding taxes, interest expense, acquired fund fees and expenses, or extraordinary expenses such as litigation). The Expense Limitation Agreement will remain in effect until March 1, 2016. For the six months ended April 30, 2015, the Adviser waived $363,280 of the advisory fee. Such amount is not subject to recoupment by the Adviser.
With respect to The Tocqueville Alternative Strategies Fund, the Adviser has contractually agreed to waive its advisory fees and/or reimburse expenses in order to ensure that The Tocqueville Alternative Strategies Fund’s total annual operating expenses do not exceed 1.90% of its average daily net assets (excluding taxes, dividends and interest expense on short sales, acquired fund fees and expenses, or extraordinary expenses such as litigation). The Expense Limitation Agreement will remain in effect until March 1, 2016. For the six months ended April 30, 2015, the Adviser waived $17,086 of the advisory fee. Such amount is not subject to recoupment by the Adviser.
Pursuant to an Administrative Services Agreement, each Fund pays to the Adviser a fee computed and paid monthly at an annual rate of 0.15% on the first $400 million of the average daily net assets of each Fund; 0.13% on the next $600 million of the average daily net assets of each Fund; and 0.12% on all the average daily net assets of each Fund over $1 billion. For the six months ended April 30, 2015, the Adviser has made payments of $49,741, $10,671, $30,103, $156,419, $153,532, $13,029, $5,270 to U.S. Bancorp Fund Services, LLC for services provided under a Sub-Administration Agreement for The Tocqueville Fund, The Tocqueville Opportunity Fund, The Tocqueville International Value Fund, The Tocqueville Gold Fund, The Delafield Fund, The Tocqueville Select Fund and The Tocqueville Alternative Strategies Fund, respectively.
Tocqueville Securities, L.P. (the “Distributor”), an affiliate of Tocqueville, acts as distributor for shares of the Trust. Each Fund adopted a distribution and service plan pursuant to Rule 12b-1 of the 1940 Act. Pursuant to the plans, each Fund pays to the Distributor distribution and service fees of 0.25% per annum of its average daily net assets.
Commissions earned by the Distributor for services rendered as a registered broker-dealer in securities transactions for The Tocqueville Fund, The Tocqueville Opportunity Fund, The Tocqueville International Value Fund, The Tocqueville Gold Fund, The Delafield Fund, The Tocqueville Select Fund and The Tocqueville Alternative Strategies Fund for the six months ended April 30, 2015, were $34,075, $12,148, $0, $375, $6,221, $10,722, $551, respectively.
5. CAPITAL SHARE TRANSACTIONS.
Transactions in capital shares for each Fund were as follows:
| | | | | | | | |
| | | For the Six-Months
Ended
April 30, 2015
(Unaudited) | | | For the Year
Ended
October 31, 2014 | |
| The Tocqueville Fund | | Shares | | | Shares | |
Shares sold | | | 777,415 | | | | 1,496,275 | |
Shares issued to holders in reinvestment dividends | | | 455,582 | | | | 185,944 | |
Shares redeemed | | | (1,255,815 | ) | | | (1,900,663 | ) |
| | | | | | | | |
Net decrease | | | (22,818 | ) | | | (218,444 | ) |
| | |
| The Tocqueville Opportunity Fund | | | | | | |
Shares sold | | | 1,247,060 | | | | 365,439 | |
Shares issued to holders in reinvestment dividends | | | 493,022 | | | | 188,786 | |
Shares redeemed | | | (639,947 | ) | | | (815,128 | ) |
| | | | | | | | |
Net increase (decrease) | | | 1,100,135 | | | | (260,903 | ) |
| | | | | | | | |
| | | For the Six-Months
Ended
April 30, 2015
(Unaudited) | | | For the Year
Ended
October 31, 2014 | |
| The Tocqueville International Value Fund | | Shares | | | Shares | |
Shares sold | | | 3,248,310 | | | | 4,236,272 | |
Shares issued to holders in reinvestment dividends | | | 958,749 | | | | 272,246 | |
Shares redeemed | | | (3,206,067 | ) | | | (6,013,133 | ) |
| | | | | | | | |
Net increase (decrease) | | | 1,000,992 | | | | (1,504,615 | ) |
| | |
| The Tocqueville Gold Fund | | | | | | |
Shares sold | | | 7,509,913 | | | | 17,656,219 | |
Shares issued to holders in reinvestment dividends | | | — | | | | — | |
Shares redeemed | | | (6,872,406 | ) | | | (12,141,438 | ) |
| | | | | | | | |
Net increase | | | 637,507 | | | | 5,514,781 | |
| | |
| The Delafield Fund | | | | | | |
Shares sold | | | 1,759,492 | | | | 5,318,910 | |
Shares issued to holders in reinvestment dividends | | | 4,059,478 | | | | 1,587,742 | |
Shares redeemed | | | (16,336,134 | ) | | | (13,763,895 | ) |
| | | | | | | | |
Net decrease | | | (10,517,164 | ) | | | (6,857,243 | ) |
| | |
| The Tocqueville Select Fund | | | | | | |
Shares sold | | | 348,157 | | | | 1,150,692 | |
Shares issued to holders in reinvestment dividends | | | 940,811 | | | | 684,635 | |
Shares redeemed | | | (1,291,095 | ) | | | (1,002,652 | ) |
| | | | | | | | |
Net increase (decrease) | | | (2,127 | ) | | | 832,675 | |
| | | | | | | | | | | | |
| | | For the Six-Months
Ended April 30, 2015
(Unaudited) | | | For the Period
January 1, 2014 to
October 31, 2014 | | | For the Period
June 1, 2013 to
December 31, 2013 | |
The Tocqueville Alternative Strategies Fund
(See Footnote 1) | | Shares | | | Shares | | | Shares | |
Shares sold | | | 217,547 | | | | 250,099 | | | | — | |
Shares issued to holders in reinvestment dividends | | | 31,741 | | | | — | | | | — | |
Shares redeemed | | | (136,422 | ) | | | (308,999 | ) | | | — | |
Transfers in | | | | | | | | | | | — | |
From Predecessor Fund—Class I | | | — | | | | 1,458,541 | | | | — | |
From Predecessor Fund—Class M | | | — | | | | 36,498 | | | | — | |
| | | | | | | | | | | | |
Total transfers in | | | — | | | | 1,495,039 | | | | — | |
| | | | | | | | | | | | |
Net increase | | | 112,866 | | | | 1,436,139 | | | | — | |
| | | | | | | | | | | | |
| | | For the Six-Months
Ended April 30, 2015
(Unaudited) | | | For the Period
January 1, 2014 to
October 31, 2014 | | | For the Period
June 1, 2013 to
December 31, 2013 | |
The Tocqueville Alternative Strategies Fund
(See Footnote 1) | | Shares | | | Shares | | | Shares | |
| Predecessor Fund—Class I (See Footnote 1) | | | | | | | | | |
Fund share transactions: | | | | | | | | | | | | |
Shares sold | | | — | | | | 237,764 | | | | 328,467 | |
Shares issued to holders in reinvestment of dividends | | | — | | | | — | | | | 45,690 | |
Shares redeemed | | | — | | | | (176,276 | ) | | | (313,717 | ) |
Transfers out to The Tocqueville Alternative Strategies Fund | | | — | | | | (1,458,541 | ) | | | — | |
| | | | | | | | | | | | |
Net increase (decrease) | | | — | | | | (1,397,053 | ) | | | 60,440 | |
| | | |
| Predecessor Fund—Class M (See Footnote 1) | | | | | | | | | |
Shares sold | | | — | | | | 3,855 | | | | 43,583 | |
Shares issued to holders in reinvestment of dividends | | | — | | | | — | | | | 2,606 | |
Shares redeemed | | | — | | | | (13,290 | ) | | | — | |
Transfers out to The Tocqueville Alternative Strategies Fund | | | — | | | | (36,754 | ) | | | — | |
| | | | | | | | | | | | |
Net increase (decrease) | | | — | | | | (46,189 | ) | | | 46,189 | |
6. FUND SHARE TRANSACTIONS
The Funds currently offer only one class of shares of beneficial interest. A redemption fee of 2.00% is imposed on redemptions of shares held 90 days or fewer. This fee is retained by each Fund and is credited to paid in capital. Redemptions to which the fee applies include redemptions of shares resulting from an exchange made pursuant to the Exchange Privilege, as defined in the Trust’s Prospectus dated February 27, 2015. For a more detailed description of when the redemption fee does not apply, please see the Trust’s Prospectus. On June 18, 2015, the Board of Trustees of the Trust approved the elimination of the redemption fee for The Tocqueville Fund, The Tocqueville Opportunity Fund, The Tocqueville International Value Fund, The Delafield Fund, The Tocqueville Select Fund and The Tocqueville Alternative Strategies Fund effective July 1, 2015.
7. INVESTMENT TRANSACTIONS
Purchases and sales of investment securities (excluding short-term instruments) for the period ended April 30, 2015 are summarized below.
| | | | | | | | | | | | | | | | | | | | | | | | | | | | |
| | | Tocqueville
Fund | | | Opportunity
Fund | | | International
Value Fund | | | Gold Fund | | | Delafield
Fund | | | Select
Fund | | | Alternative
Strategies
Fund | |
Purchases: | | $ | 28,080,605 | | | $ | 54,565,517 | | | $ | 58,046,557 | | | $ | 159,677,107 | | | $ | 77,823,614 | | | $ | 18,998,528 | | | $ | 19,466,192 | |
| | | | | | | | | | | | | | | | | | | | | | | | | | | | |
Sales: | | $ | 38,964,866 | | | $ | 42,403,737 | | | $ | 57,421,943 | | | $ | 45,732,716 | | | $ | 530,757,463 | | | $ | 24,512,136 | | | $ | 18,082,581 | |
| | | | | | | | | | | | | | | | | | | | | | | | | | | | |
U.S. Government Security Purchases: | | $ | — | | | $ | — | | | $ | — | | | $ | — | | | $ | — | | | $ | — | | | $ | — | |
| | | | | | | | | | | | | | | | | | | | | | | | | | | | |
U.S. Government Security Sales: | | $ | — | | | $ | — | | | $ | — | | | $ | — | | | $ | — | | | $ | — | | | $ | — | |
| | | | | | | | | | | | | | | | | | | | | | | | | | | | |
8. Transactions with Affiliates
The following issuers are affiliated with the Funds; that is, the Adviser had control of 5% or more of the outstanding voting securities during the period from November 1, 2014 through April 30, 2015. As defined in Section (2)(a)(3) of the Investment Company Act of 1940; such issues are:
| | | | | | | | | | | | | | | | | | | | | | | | | | | | | | | | | | | | | | | | | | | | |
Issuer
Name | | November 1, 2014 | | | Additions | | | Reductions | | | April 30,
2015 | | | Dividend | | | Realized | | | April 30, 2015 | |
| | Share
Balance | | | Cost | | | Share
Balance | | | Cost | | | Share
Balance | | | Cost | | | Share
Balance | | | Income | | | Loss | | | Value | | | Cost | |
The Tocqueville Gold Fund | | | | | | | | | | | | | | | | | | | | | | | | | | | | | |
Anthem United, Inc. | | | 5,000,000 | | | $ | 905,961 | | | | — | | | $ | — | | | | — | | | $ | — | | | | 5,000,000 | | | $ | — | | | $ | — | | | $ | 953,170 | | | $ | 905,961 | |
Anthem United, Inc. Warrants | | | 1,250,000 | | | | — | | | | — | | | | — | | | | — | | | | — | | | | 1,250,000 | | | | — | | | | — | | | | 133,547 | | | | — | |
Argonaut Gold, Inc. | | | 2,687,000 | | | | 12,286,127 | | | | — | | | | — | | | | — | | | | — | | | | 2,687,000 | | | | — | | | | — | | | | 4,521,019 | | | | 12,286,127 | |
ATAC Resources Ltd. | | | 11,516,891 | | | | 39,793,482 | | | | — | | | | — | | | | — | | | | — | | | | 11,516,891 | | | | — | | | | — | | | | 5,154,680 | | | | 39,793,482 | |
ATAC Resources Ltd. Warrants(a) | | | 276,595 | | | | — | | | | — | | | | — | | | | (276,595 | ) | | | — | | | | — | | | | — | | | | — | | | | — | | | | — | |
Bear Creek Mining Corp. | | | 7,413,200 | | | | 28,761,181 | | | | — | | | | — | | | | — | | | | — | | | | 7,413,200 | | | | — | | | | — | | | | 6,943,155 | | | | 28,761,181 | |
Corvus Gold, Inc. | | | 2,079,901 | | | | 1,617,492 | | | | 71,000 | | | | 40,073 | | | | — | | | | — | | | | 2,150,901 | | | | — | | | | — | | | | 1,419,595 | | | | 1,657,565 | |
Corvus Gold, Inc. | | | — | | | | — | | | | 1,500,000 | | | | 1,199,904 | | | | — | | | | — | | | | 1,500,000 | | | | — | | | | — | | | | 974,720 | | | | 1,199,904 | |
Corvus Gold, Inc. | | | 9,130,000 | | | | 8,120,992 | | | | — | | | | — | | | | — | | | | — | | | | 9,130,000 | | | | — | | | | — | | | | 6,053,875 | | | | 8,120,992 | |
Detour Gold Corp. | | | 5,296,600 | | | | 95,459,261 | | | | 575,000 | | | | 4,576,961 | | | | — | | | | — | | | | 5,871,600 | | | | — | | | | — | | | | 62,049,648 | | | | 100,036,222 | |
East Asia Minerals Corp. | | | 10,544,400 | | | | 21,793,116 | | | | 9,764,933 | | | | 128,126 | | | | — | | | | — | | | | 20,309,333 | | | | — | | | | — | | | | 252,499 | | | | 21,921,242 | |
East Asia Minerals Corp.(b) | | | — | | | | — | | | | 9,764,933 | | | | 128,126 | | | | (9,764,933 | ) | | | (128,126 | ) | | | — | | | | — | | | | — | | | | — | | | | — | |
East Asia Minerals Corp. | | | — | | | | — | | | | 46,175,600 | | | | 374,778 | | | | — | | | | — | | | | 46,175,600 | | | | — | | | | — | | | | 562,604 | | | | 374,778 | |
East Asia Minerals Corp. Warrants | | | 6,500,000 | | | | — | | | | — | | | | — | | | | — | | | | — | | | | 6,500,000 | | | | — | | | | — | | | | 64,111 | | | | — | |
East Asia Minerals Corp. Warrants | | | — | | | | — | | | | 9,764,933 | | | | — | | | | — | | | | — | | | | 9,764,933 | | | | — | | | | — | | | | — | | | | — | |
East Asia Minerals Corp. Right | | | — | | | | — | | | | 46,175,600 | | | | — | | | | — | | | | — | | | | 46,175,600 | | | | — | | | | — | | | | 470,750 | | | | — | |
GoGold Resources, Inc. | | | 12,555,000 | | | | 15,654,082 | | | | 8,175,300 | | | | 10,123,442 | | | | — | | | | — | | | | 20,730,300 | | | | — | | | | — | | | | 25,773,270 | | | | 25,777,524 | |
Gold Bullion International LLC | | | 5,000,000 | | | | 5,000,000 | | | | — | | | | — | | | | — | | | | — | | | | 5,000,000 | | | | — | | | | — | | | | 6,893,000 | | | | 5,000,000 | |
International Tower Hill Mines Ltd. | | | 5,738,836 | | | | 20,953,121 | | | | — | | | | — | | | | — | | | | — | | | | 5,738,836 | | | | — | | | | — | | | | 2,180,758 | | | | 20,953,121 | |
International Tower Hill Mines Ltd. | | | 7,589,744 | | | | 38,630,898 | | | | 3,700,000 | | | | 1,482,514 | | | | — | | | | — | | | | 11,289,744 | | | | — | | | | — | | | | 4,351,207 | | | | 40,113,412 | |
International Tower Hill Mines Ltd.(b) | | | — | | | | — | | | | 3,700,000 | | | | 1,482,514 | | | | (3,700,000 | ) | | | (1,482,514 | ) | | | — | | | | — | | | | — | | | | — | | | | — | |
MAG Silver Corp. | | | 2,960,700 | | | | 31,563,819 | | | | — | | | | — | | | | — | | | | — | | | | 2,960,700 | | | | — | | | | — | | | | 20,636,079 | | | | 31,563,819 | |
Osisko Gold Royalties Ltd. | | | 2,549,540 | | | | 36,115,325 | | | | 648,000 | | | | 9,443,613 | | | | | | | | | | | | 3,197,540 | | | | 145,377 | | | | — | | | | 42,854,722 | | | | 45,558,938 | |
Osisko Gold Royalties Ltd. Warrants | | | — | | | | — | | | | 274,000 | | | | — | | | | | | | | | | | | 274,000 | | | | — | | | | — | | | | 510,982 | | | | — | |
Primero Mining Corp. | | | 8,468,800 | | | | 50,943,246 | | | | | | | | | | | | (500,000 | ) | | | (2,066,721 | ) | | | 7,968,800 | | | | — | | | | (153,295 | ) | | | 29,391,761 | | | | 48,876,525 | |
Primero Mining Corp. Warrants | | | 1,848,400 | | | | — | | | | — | | | | — | | | | — | | | | — | | | | 1,848,400 | | | | — | | | | — | | | | 45,961 | | | | — | |
Rockhaven Resources Ltd. | | | 6,400,000 | | | | 6,455,589 | | | | — | | | | — | | | | — | | | | — | | | | 6,400,000 | | | | — | | | | — | | | | 1,007,874 | | | | 6,455,589 | |
Rockhaven Resources Ltd. Warrants(a) | | | 700,000 | | | | — | | | | — | | | | — | | | | (700,000 | ) | | | — | | | | — | | | | — | | | | — | | | | — | | | | — | |
Rubicon Minerals Corp. | | | 11,230,000 | | | | 15,650,482 | | | | 500,000 | | | | 651,729 | | | | — | | | | — | | | | 11,730,000 | | | | — | | | | — | | | | 12,930,709 | | | | 16,302,211 | |
Rubicon Minerals Corp. Warrants(a) | | | 3,064,000 | | | | — | | | | — | | | | — | | | | (3,064,000 | ) | | | — | | | | — | | | | — | | | | — | | | | — | | | | — | |
| | | | | | | | | | | | | | | | | | | | | | | | | | | | | | | | | | | | | | | | | | | | |
Issuer
Name | | November 1, 2014 | | | Additions | | | Reductions | | | April 30,
2015 | | | Dividend | | | Realized | | | April 30, 2015 | |
| | Share
Balance | | | Cost | | | Share
Balance | | | Cost | | | Share
Balance | | | Cost | | | Share
Balance | | | Income | | | Loss | | | Value | | | Cost | |
Scorpio Mining Corp. | | | 25,668,419 | | | $ | 23,975,473 | | | | — | | | $ | — | | | | — | | | $ | — | | | | 25,668,419 | | | $ | — | | | $ | — | | | $ | 4,222,455 | | | $ | 23,975,473 | |
Scorpio Mining Corp. | | | 522,400 | | | | 984,285 | | | | — | | | | — | | | | — | | | | — | | | | 522,400 | | | | — | | | | — | | | | 82,268 | | | | 984,285 | |
SEMAFO, Inc. | | | 8,814,200 | | | | 32,105,425 | | | | 1,500,000 | | | | 4,752,100 | | | | — | | | | — | | | | 10,314,200 | | | | — | | | | — | | | | 31,767,736 | | | | 36,857,525 | |
Silver Range Resources Ltd. | | | 3,450,000 | | | | — | | | | — | | | | — | | | | — | | | | — | | | | 3,450,000 | | | | — | | | | — | | | | 257,356 | | | | — | |
Strategic Metals Ltd. | | | 10,926,900 | | | | 15,810,172 | | | | — | | | | — | | | | — | | | | — | | | | 10,926,900 | | | | — | | | | — | | | | 2,717,008 | | | | 15,810,172 | |
Tocqueville Bullion Reserve LP(c) | | | 13,806 | | | | 25,000,000 | | | | — | | | | — | | | | — | | | | — | | | | 13,806 | | | | — | | | | — | | | | 15,721,097 | | | | 25,000,000 | |
Torex Gold Resources, Inc. | | | 34,685,500 | | | | 53,203,482 | | | | — | | | | — | | | | — | | | | — | | | | 34,685,500 | | | | — | | | | — | | | | 32,198,723 | | | | 53,203,482 | |
| | | | | | | | | | | | | | | | | | | | | | | | | | | | | | | | | | | | | | | | | | | | |
| | | | | | $ | 580,783,011 | | | | | | | $ | 34,383,880 | | | | | | | $ | (3,677,361 | ) | | | | | | $ | 145,377 | | | $ | (153,295 | ) | | $ | 323,096,339 | | | $ | 611,489,530 | |
The Delafield Fund | | | | | | | | | | | | | | | | | | | | | | | | | | | | | | | | | |
AM Castle & Co.(a) | | | 1,200,000 | | | $ | 12,556,037 | | | | — | | | $ | — | | | | (1,200,000 | ) | | $ | (12,556,037 | ) | | | — | | | $ | — | | | $ | (7,152,095 | ) | | $ | — | | | $ | — | |
Kemet Corp. | | | 2,600,000 | | | | 12,503,673 | | | | 100,000 | | | | 391,499 | | | | — | | | | — | | | | 2,700,000 | | | | — | | | | — | | | | 11,664,000 | | | | 12,895,172 | |
Ryerson Holding Corp. | | | 725,000 | | | | 8,236,736 | | | | 775,000 | | | | 6,592,541 | | | | — | | | | — | | | | 1,500,000 | | | | — | | | | — | | | | 8,310,000 | | | | 14,829,277 | |
Universal Stainless & Alloy | | | 400,000 | | | | 11,307,053 | | | | — | | | | — | | | | (25,000 | ) | | | (881,072 | ) | | | 375,000 | | | | — | | | | (218,323 | ) | | | 7,875,000 | | | | 10,425,981 | |
Xerium Technologies, Inc. | | | 750,000 | | | | 9,602,917 | | | | 155,000 | | | | 2,353,077 | | | | — | | | | — | | | | 905,000 | | | | — | | | | — | | | | 16,090,900 | | | | 11,955,994 | |
| | | | | | | | | | | | | | | | | | | | | | | | | | | | | | | | | | | | | | | | | | | | |
| | | | | | $ | 54,206,416 | | | | | | | $ | 9,337,117 | | | | | | | $ | (13,437,109 | ) | | | | | | $ | — | | | $ | (7,370,418 | ) | | $ | 43,939,900 | | | $ | 50,106,424 | |
The Tocqueville Select Fund | | | | | | | | | | | | | | | | | | | | | | | | | | | | | | | | | |
Summer Infant, Inc. | | | 814,933 | | | $ | 3,971,441 | | | | 53,000 | | | $ | 99,973 | | | | — | | | $ | — | | | | 867,933 | | | $ | — | | | $ | — | | | $ | 2,673,234 | | | $ | 4,071,414 | |
Xerium Technologies, Inc. | | | 265,000 | | | | 3,374,608 | | | | — | | | | — | | | | — | | | | — | | | | 265,000 | | | | — | | | | — | | | | 4,711,700 | | | | 3,374,608 | |
| | | | | | | | | | | | | | | | | | | | | | | | | | | | | | | | | | | | | | | | | | | | |
| | | | | | $ | 7,346,049 | | | | | | | $ | 99,973 | | | | | | | $ | — | | | | | | | $ | — | | | $ | — | | | $ | 7,384,934 | | | $ | 7,446,022 | |
The Tocqueville Alternative Strategies Fund | | | | | | | | | | | | | | | | | | | | | | | | | |
Inuvo, Inc. | | | 350,000 | | | $ | 588,327 | | | | — | | | $ | — | | | | — | | | $ | — | | | | 350,000 | | | $ | — | | | $ | — | | | $ | 815,500 | | | $ | 588,327 | |
Inuvo, Inc. Warrants | | | 31,750 | | | | — | | | | — | | | | — | | | | — | | | | — | | | | 31,750 | | | | — | | | | — | | | | 25,965 | | | | — | |
| | | | | | | | | | | | | | | | | | | | | | | | | | | | | | | | | | | | | | | | | | | | |
| | | | | | $ | 588,327 | | | | | | | $ | — | | | | | | | $ | — | | | | | | | $ | — | | | $ | — | | | $ | 841,465 | | | $ | 588,327 | |
| (a) | Security is no longer an affiliated company at April 30, 2015. |
| (b) | Private security restrictions lifted during period and combined with other non-restricted securities. |
| (c) | Tocqueville Bullion Reserve (“TBR”) is a Delaware Limited Partnership created for the purpose of owning physical gold. The General Partner of TBR is TERA Management LLC (“Tera”), a Delaware Limited Liability Company, which is equally owned and managed by Tocqueville Partners II LLC (“TP2”), a Delaware Limited Liability Company, and Eidesis Real Assets LLC (“Eidesis”), a Delaware Limited Liability Company. The Managing Member of TP2 is Robert Kleinschmidt, President of the Trust, who has a 51% participating percentage in TP2 and the sole Non-Managing Member is John Hathaway, co-portfolio manager of the Tocqueville Gold Fund, who has a 49% participating percentage. |
9. LINE OF CREDIT
The Tocqueville Trust has a $300,000,000 line of credit (the “Line”), which is uncommitted, with U.S. Bank NA. The Line is for temporary emergency or extraordinary purposes, including the meeting of redemption requests that otherwise might require the untimely disposition of securities. The Line is secured by the Trust’s assets. The Line has a one year term and is reviewed annually by the Board of Trustees. The current agreement runs through May 29, 2015. The interest rate as of
April 30, 2015 was 2.75%. During the period ended April 30, 2015, the Tocqueville Fund’s maximum borrowing was $3,008,000 and average borrowing was $179,650, the Opportunity Fund’s maximum borrowing was $3,113,000 and average borrowing was $198,870, and the Gold Fund’s maximum borrowing was $400,000 and average borrowing was $3,252. This borrowing resulted in interest expenses of $2,712, $2,834, and $182, respectively. These amounts are included in Other Expenses on the Funds’ Statement of Operations. The International Value Fund, The Delafield Fund, The Select Fund and The Alternative Strategies Fund did not use the Line.
For the period ended April 30, 2015 the outstanding loan amounts for The Tocqueville Fund, The Tocqueville Opportunity Fund, The Tocqueville International Value Fund, The Tocqueville Gold Fund, The Delafield Fund, The Tocqueville Select Fund and The Tocqueville Alternative Strategies Fund were $83,000, $0, $0, $0, $0, $0, $0, respectively.
10. OTHER EXPENSES
Other expenses include reimbursement to the Adviser for compensation of the Trust’s Chief Compliance Officer. For the six months ended April 30, 2015, reimbursement to the Adviser for compensation of the Trust’s Chief Compliance Officer from the Funds amounted to $8,923, $1,922, $5,408, $28,053, $27,412, $2,336, $946 for the Tocqueville Fund, Opportunity Fund, International Value Fund, Gold Fund, Delafield Fund, Select Fund and Alternative Strategies Fund, respectively.
ADDITIONAL INFORMATION (UNAUDITED)
1. ADDITIONAL DISCLOSURE REGARDING FUND TRUSTEES AND OFFICERS
Independent Trustees
| | | | | | | | | | | | |
Name and Age | | Position(s)
Held with
the Trust | | Term of Office and Length of Time Served (1) | | Principal Occupation(s)
During Past Five Years | | Number of
Funds
in Fund
Complex
Overseen
By Trustee | | | Other
Directorships
Held by Trustee |
| | | | | |
Charles W. Caulkins Year of Birth: 1956 | | Trustee; Member of Audit Committee; Member of Governance and Nominating Committee | | Indefinite Term, Since 2003 | | Private Investor from January 2012 – present; Partner, Chora Capital, LLC from June 2010 – December 2011; Director of Marketing, L.R. Global Partners from January 2008 – May 2010; President, Arbor Marketing, Inc. from October 1994 to December 2007. | | | 7 | | | Director, Stepping Stones from January 2012 – 2013; Director, Phoenix House from January 2001 to 2007. |
| | | | | |
Alexander Douglas Year of Birth: 1947 | | Trustee; Member of Audit Committee; Member of Governance and Nominating Committee | | Indefinite Term, Since 2010 | | Retired. Formerly, President, CEO and owner of Spaulding Law Printing, Inc. from 1992 to November 2014. | | | 7 | | | None |
| | | | | |
Charles F. Gauvin Year of Birth: 1956 | | Trustee; Member of Audit Committee; Member of Governance and Nominating Committee | | Indefinite Term, Since February 2015 | | Executive Director, Maine Audubon, from August 2014 – present; Chief Development Officer, Carnegie Endowment for International Peace, from September 2011 – May 2014; Partner, The Riparian Fund/Legacy Ranch Partners (private equity real estate fund), from February 2010 – December 2012; President and CEO, Trout Unlimited (fish and river conservation), from April 1991 – February 2010. | | | 7 | | | Director, Bioqual, Inc., July 1992 – present. |
Independent Trustees
| | | | | | | | | | | | |
Name and Age | | Position(s)
Held with
the Trust | | Term of Office and Length of Time Served (1) | | Principal Occupation(s)
During Past Five Years | | Number of
Funds
in Fund
Complex
Overseen
By Trustee | | | Other
Directorships
Held by Trustee |
| | | | | |
James W. Gerard Year of Birth: 1961 | | Trustee; Member of Audit Committee; Member of Governance and Nominating Committee | | Indefinite Term, Since 2001 | | Managing Director, Hycroft Advisors (formerly known as North Sea Partners), from January 2010 – present; Managing Director, de Visscher & Co., 2014 to present; Principal, Juniper Capital Group, LLC (formerly known as Argus Advisors International, LLC) from August 2003 to December 2009; Managing Director, The Chart Group from January 2001 to present. | | | 7 | | | President, American Overseas Memorial Day Association, 1998 to present; President, Little Baby Face Foundation, 2015 to present; Director and Treasurer ASPCA, 1998 to 2008; Trustee, Salisbury School, 2005 to present; Director, American Friends of Bleraucourt, 1992 to present. |
| | | | | |
William F. Indoe Year of Birth: 1942 | | Trustee; Member of Audit Committee; Member of Governance and Nominating Committee | | Indefinite Term, Since December 2006 | | Retired. Formerly, Sullivan & Cromwell LLP (attorneys-at-law). 1968 – 2011. | | | 7 | | | Director, Rho Capital Partners, Inc. |
| | | | | |
William J. Nolan III Year of Birth: 1947 | | Trustee; Chair of Audit Committee; Member of Governance and Nominating Committee | | Indefinite Term, Since December 2006 | | Retired. Executive Vice President & Treasurer PaineWebber Inc. 1997 – 2001. | | | 7 | | | Trustee, Adirondack Museum, Blue Mt. Lake, NY 1996 to present (Treasurer, 2000 to 2013; Chair of the Investment Committee, 2009 – present). |
Interested Trustees2 (and Officers)
| | | | | | | | | | | | |
Name and Age | | Position(s)
Held with
the Trust | | Term of Office and Length of Time Served (1) | | Principal Occupation(s)
During Past Five Years | | Number of
Funds
in Fund
Complex
Overseen
By Trustee | | | Other
Directorships
Held by Trustee |
| | | | | |
Helen Balk Year of Birth: 1972 | | Treasurer | | Indefinite Term, Since 2014 | | Controller/Treasurer of Tocqueville Asset Management from January 2014 to present; Manager/Staff Accountant at Pegg & Pegg LLP from August 1995 to January 2014. | | | N/A | | | N/A |
| | | | | |
Elizabeth Bosco Year of Birth: 1947 | | Anti-Money Laundering Compliance Officer | | Indefinite Term, Since 2009 | | Chief Compliance Officer of Tocqueville Securities, L.P. from January 2009 to present; Compliance Officer, Tocqueville Securities L.P. and Tocqueville Asset Management from January 1997 to January 2009. | | | N/A | | | N/A |
| | | | | |
Robert W. Kleinschmidt Year of Birth: 1949 | | President and Trustee | | Indefinite Term, Since 1991 | | President and Chief Investment Officer of Tocqueville Asset Management; Director, Tocqueville Management Corporation, the General Partner of Tocqueville Asset Management L.P. and Tocqueville Securities L.P. from January 1994 to present; and Managing Director from July 1991 to January 1994; Partner, David J. Greene & Co. from May 1978 to July 1991. | | | 7 | | | President and Director, Tocqueville Management Corporation, the General Partner of Tocqueville Asset Management L.P. and Tocqueville Securities L.P. |
| | | | | |
Cleo Kotis Year of Birth: 1975 | | Secretary | | Indefinite Term, Since 2010 | | Director of Operations, the Delafield Group of Tocqueville Asset Management L.P., 2009 to present; Vice President and Chief Operations Officer, the Delafield Fund, Inc. from 2005 – 2009; Vice President and Chief Operations Officer, Delafield Asset Management from 2005 – 2009; Vice President, Reich & Tang Asset Management, LLC from 2002 – 2009. | | | N/A | | | N/A |
Interested Trustees2 (and Officers)
| | | | | | | | | | | | |
Name and Age | | Position(s)
Held with
the Trust | | Term of Office and Length of Time Served (1) | | Principal Occupation(s)
During Past Five Years | | Number of
Funds
in Fund
Complex
Overseen
By Trustee | | | Other
Directorships
Held by Trustee |
| | | | | |
Thomas Pandick Year of Birth: 1947 | | Chief Compliance Officer | | Indefinite Term, Since 2004 | | Chief Compliance Officer (October 2004 – present) Tocqueville Asset Management L.P. | | | N/A | | | N/A |
| | | | | |
François D. Sicart Year of Birth: 1943 | | Chairman and Trustee | | Indefinite Term, Since 1987 | | Chairman, Tocqueville Management Corporation, the General Partner of Tocqueville Asset Management L.P. and Tocqueville Securities L.P. from January 1990 to present; Chairman and Founder, Tocqueville Asset Management Corporation from December 1985 to January 1990; Vice Chairman of Tucker Anthony Management Corporation from 1981 to October 1986; Vice President (formerly general partner) among other positions with Tucker Anthony, Inc. from 1969 to January 1990. | | | 7 | | | Chairman and Director, Tocqueville Management Corporation, the General Partner of Tocqueville Asset Management L.P. and Tocqueville Securities L.P. from January 1990 to present. |
| 1 | Each Trustee will hold office for an indefinite term until the earliest of (i) the next meeting of shareholders, if any, called for the purpose of considering the election or re-election of such Trustee and until the election and qualification of his or her successor, if any, elected at such meeting, or (ii) the date a Trustee resigns or retires, or a Trustee is removed by the Board of Trustees or shareholders, in accordance with the Trust’s By-Laws, as amended, and Agreement and Declaration of Trust, as amended. Each officer will hold office for an indefinite term until the date he or she resigns or retires or until his or her successor is elected and qualifies. |
| 2 | “Interested person” of the Trust as defined in the 1940 Act. Mr. Sicart and Mr. Kleinschmidt are considered “interested persons” because of their affiliation with the Advisor. |
The Statement of Additional Information includes additional information about the Trustees and is available free of charge by calling the Funds toll free at 1-800-355-7307.
2. PROXY VOTING POLICIES AND PROCEDURES
A description of the policies and procedures that The Tocqueville Trust uses to determine how to vote proxies relating to portfolio securities is available without charge upon request by calling 1-800-355-7307. Information regarding how The Tocqueville Trust voted proxies relating to portfolio securities during the most recent 12-month period ended June 30 is available by calling 1-800-355-7307 and it is also available on the SEC’s web site at http://www.sec.gov.
3. SHAREHOLDER REPORTS AND QUARTERLY PORTFOLIO DISCLOSURE
The Tocqueville Trust is required to file its complete schedule of portfolio holdings with the SEC for its first and third fiscal quarters on Form N-Q. The Trust’s Form N-Q will be available without charge, upon request on the SEC’s website (http://www.sec.gov) and may be available by calling 1-800-697-3863. You can also obtain copies of Form N-Q by (i) visiting the SEC’s Public Reference Room in Washington, DC (information on the operation of the Public Reference Room may be obtained by calling 1-202-551-8090); (ii) sending your request and a duplicating fee to the SEC’s Public Reference Room, Washington, DC 20549-1520; or (iii) sending your request electronically to publicinfosec.gov. Quarterly portfolio holdings are also available on the website of The Tocqueville Funds, www.tocqueville.com/mutual-funds.
4. SHAREHOLDER NOTIFICATION OF FEDERAL TAX STATUS
For the fiscal period ended October 31, 2014, certain dividends paid by the Funds may be subject to a maximum tax rate of 15%, as provided for by the Jobs and Growth Tax Relief Reconciliation Act of 2003. The percentage of dividends declared from ordinary income designated as qualified dividend income was as follows:
| | | | |
Tocqueville Fund | | | 100.00 | % |
Opportunity Fund | | | 0.00 | % |
International Value Fund | | | 99.80 | % |
Gold Fund | | | 0.00 | % |
Delafield Fund | | | 0.00 | % |
Select Fund | | | 0.00 | % |
Alternative Strategies Fund | | | 0.00 | % |
For corporate shareholders, the percent of ordinary income distributions qualifying for the corporate dividends received deduction for the fiscal period ended October 31, 2014 was as follows:
| | | | |
Tocqueville Fund | | | 90.25 | % |
Opportunity Fund | | | 0.00 | % |
International Value Fund | | | 10.05 | % |
Gold Fund | | | 0.00 | % |
Delafield Fund | | | 0.00 | % |
Select Fund | | | 0.00 | % |
Alternative Strategies Fund | | | 0.00 | % |
For the period ended October 31, 2014, the funds designate the following percent of ordinary distributions paid as interest-related dividends under the Internal Revenue Code Section 871(k)(1)(c):
| | | | |
Tocqueville Fund | | | 0.00 | % |
Opportunity Fund | | | 0.00 | % |
International Value Fund | | | 0.02 | % |
Gold Fund | | | 0.00 | % |
Delafield Fund | | | 0.00 | % |
Select Fund | | | 0.00 | % |
Alternative Strategies Fund | | | 0.00 | % |
The percentage of taxable ordinary income distributions that are designated as short-term capital gain distributions under Internal Revenue Section 871(k)(2)(C) for each Fund were as follows.
| | | | |
Tocqueville Fund | | | 0.00 | % |
Opportunity Fund | | | 0.00 | % |
International Value Fund | | | 0.00 | % |
Gold Fund | | | 0.00 | % |
Delafield Fund | | | 100.00 | % |
Select Fund | | | 0.00 | % |
Alternative Strategies Fund | | | 0.00 | % |
5. FOREIGN TAX CREDIT
For the year ended October 31, 2014, the Tocqueville International Value Fund earned foreign source income and paid foreign taxes which they intend to pass through to their shareholders pursuant to Section 853 of the Internal Revenue Code as follows:
| | | | | | | | |
Country | | Gross Dividend
Per Share | | | Taxes Withheld
Per Share | |
Netherlands Antilles | | | 0.00662 | | | | 0.00000 | |
Australia | | | 0.00264 | | | | 0.00000 | |
Belgium | | | 0.02247 | | | | 0.00337 | |
Bermuda | | | 0.00113 | | | | 0.00000 | |
Brazil | | | 0.00131 | | | | 0.00015 | |
Canada | | | 0.00895 | | | | 0.00134 | |
Switzerland | | | 0.01427 | | | | 0.00128 | |
Germany | | | 0.02580 | | | | 0.00299 | |
France | | | 0.05187 | | | | 0.00767 | |
Hong Kong | | | 0.03051 | | | | 0.00000 | |
Ireland | | | 0.00842 | | | | 0.00000 | |
Japan | | | 0.06740 | | | | 0.00885 | |
South Korea | | | 0.00020 | | | | 0.00003 | |
Cayman Islands | | | 0.00918 | | | | 0.00000 | |
Luxembourg | | | 0.00678 | | | | 0.00102 | |
Netherlands | | | 0.02510 | | | | 0.00376 | |
Norway | | | 0.04578 | | | | 0.00765 | |
| | | | | | | | |
| | | 0.32843 | | | | 0.03811 | |
| | | | | | | | |
6. RESULTS OF THE SPECIAL MEETING OF SHAREHOLDERS OF THE TRUST
A special meeting of the Trust’s shareholders was held on February 2, 2015. The matter voted on by the shareholders and the results of the vote at the shareholders meeting were as follows:
Proposal 1:
To elect eight Trustees to serve on the Board of Trustees until their resignation, retirement, death or removal or until their respective successors are duly elected and qualified.
| | | | | | | | | | | | |
| | | Shares
Voted | | | % of Shares
Voted | | | % of Fund’s
Outstanding
Shares Voted | |
| 1a. Charles W. Caulkins | | | | | | | | | | | | |
For | | | 89,424,812 | | | | 98.1 | % | | | 75.2 | % |
Withheld | | | 1,732,175 | | | | 1.9 | % | | | 1.5 | % |
| | | |
| 1b. Alexander Douglas | | | | | | | | | | | | |
For | | | 89,450,278 | | | | 98.1 | % | | | 75.2 | % |
Withheld | | | 1,706,709 | | | | 1.9 | % | | | 1.4 | % |
| | | |
| 1c. Charles F. Gauvin | | | | | | | | | | | | |
For | | | 89,424,186 | | | | 98.1 | % | | | 75.2 | % |
Withheld | | | 1,732,801 | | | | 1.9 | % | | | 1.5 | % |
| | | |
| 1d. James W. Gerard | | | | | | | | | | | | |
For | | | 88,957,404 | | | | 97.6 | % | | | 74.8 | % |
Withheld | | | 2,199,583 | | | | 2.4 | % | | | 1.8 | % |
| | | |
| 1e. William F. Indoe | | | | | | | | | | | | |
For | | | 89,315,427 | | | | 98.0 | % | | | 75.1 | % |
Withheld | | | 1,841,561 | | | | 2.0 | % | | | 1.5 | % |
| | | |
| 1f. William J. Nolan III | | | | | | | | | | | | |
For | | | 77,316,033 | | | | 84.8 | % | | | 65.0 | % |
Withheld | | | 13,840,954 | | | | 15.2 | % | | | 11.6 | % |
| | | |
| 1g. Robert W. Kleinschmidt | | | | | | | | | | | | |
For | | | 89,391,883 | | | | 98.1 | % | | | 75.2 | % |
Withheld | | | 1,765,105 | | | | 1.9 | % | | | 1.5 | % |
| | | |
| 1h. Francois D. Sicart | | | | | | | | | | | | |
For | | | 89,307,706 | | | | 98.0 | % | | | 75.1 | % |
Withheld | | | 1,849,282 | | | | 2.0 | % | | | 1.6 | % |
Accordingly, the proposals were approved by the Funds’ shareholders. No Trustees other than these elected are now in office.
Investment Adviser
Tocqueville Asset Management L.P.
40 W. 57th St., 19th Floor
New York, NY 10019
(212) 698-0800
www.tocqueville.com
Distributor
Tocqueville Securities, L.P.
40 W. 57th St., 19th Floor
New York, NY 10019
(212) 698-0800
Shareholders’ Servicing and Transfer Agent
U.S. Bancorp Fund Services, LLC
P.O. Box 701
Milwaukee, WI 53201-0701
(800) 697-3863
Custodian
U.S. Bank, N.A.
Custody Operations
1555 River Center Drive, Suite 302
Milwaukee, WI 53212
Board of Trustees
François D. Sicart—Chairman
Charles W. Caulkins
Alexander Douglas
Charles F. Gauvin
James W. Gerard
William F. Indoe
Robert W. Kleinschmidt
William J. Nolan III

Tocqueville Funds
c/o US Bancorp Fund Services, LLC
P.O. Box 701
Milwaukee, WI 53201-0701
www.tocqueville.com/mutual-funds
TQ-SEMI Tocqueville Semi Annual Report 4/30/2015
Item 2. Code of Ethics.
Not applicable for semi-annual reports.
Item 3. Audit Committee Financial Expert.
Not applicable for semi-annual reports.
Item 4. Principal Accountant Fees and Services.
Not applicable for semi-annual reports.
Item 5. Audit Committee of Listed Registrants.
Not applicable to registrants who are not listed issuers (as defined in Rule 10A-3 under the Securities Exchange Act of 1934).
Item 6. Investments.
Schedule of Investments is included as part of the report to shareholders filed under Item 1 of this Form.
Item 7. Disclosure of Proxy Voting Policies and Procedures for Closed-End Management Investment Companies.
Not applicable to open-end investment companies.
Item 8. Portfolio Managers of Closed-End Management Investment Companies.
Not applicable to open-end investment companies.
Item 9. Purchases of Equity Securities by Closed-End Management Investment Company and Affiliated Purchasers.
Not applicable to open-end investment companies.
Item 10. Submission of Matters to a Vote of Security Holders.
There have been no material changes to the procedures by which shareholders may recommend nominees to the registrant’s board of trustees.
Item 11. Controls and Procedures.
| (a) | The Registrant’s President and Treasurer have reviewed the Registrant’s disclosure controls and procedures (as defined in Rule 30a-3(c) under the Investment Company Act of 1940 (the “Act”)) as of a date within 90 days of the filing of this report, as required by Rule 30a-3(b) under the Act and Rules 13a-15(b) or 15d-15(b) under the Securities Exchange Act of 1934. Based on their review, such officers have concluded that the disclosure controls and procedures are effective in ensuring that information required to be disclosed in this report is appropriately recorded, processed, summarized and reported and made known to them by others within the Registrant and by the Registrant’s service provider. |
| (b) | There were no changes in the Registrant’s internal control over financial reporting (as defined in Rule 30a-3(d) under the Act) that occurred during the second fiscal quarter of the period covered by this report that has materially affected, or is reasonably likely to materially affect, the Registrant’s internal control over financial reporting. |
Item 12. Exhibits.
| (a) | (1) Any code of ethics or amendment thereto, that is the subject of the disclosure required by Item 2, to the extent that the registrant intends to satisfy Item 2 requirements through filing an exhibit. Not Applicable. |
(2) A separate certification for each principal executive and principal financial officer pursuant to Section 302 of the Sarbanes-Oxley Act of 2002. Filed herewith.
(3) Any written solicitation to purchase securities under Rule 23c-1 under the Act sent or given during the period covered by the report by or on behalf of the registrant to 10 or more persons. Not applicable to open-end investment companies.
| (b) | Certifications pursuant to Section 906 of the Sarbanes-Oxley Act of 2002. Furnished herewith. |
SIGNATURES
Pursuant to the requirements of the Securities Exchange Act of 1934 and the Investment Company Act of 1940, the registrant has duly caused this report to be signed on its behalf by the undersigned, thereunto duly authorized.
| | | | |
| | |
| | (Registrant) | | The Tocqueville Trust |
| | | | |
| | |
| | By (Signature and Title)* | | /s/ Robert W. Kleinschmidt |
| | | | Robert W. Kleinschmidt, President |
Pursuant to the requirements of the Securities Exchange Act of 1934 and the Investment Company Act of 1940, this report has been signed below by the following persons on behalf of the registrant and in the capacities and on the dates indicated.
| | | | |
| | |
| | By (Signature and Title)* | | /s/ Robert W. Kleinschmidt |
| | | | Robert W. Kleinschmidt, President |
| | | | |
| | |
| | By (Signature and Title)* | | /s/ Helen Balk |
| | | | Helen Balk, Treasurer |
| * | Print the name and title of each signing officer under his or her signature. |