As filed with the Securities and Exchange Commission on July 7th, 2017
UNITED STATES
SECURITIES AND EXCHANGE COMMISSION
Washington, D.C. 20549
FORM N-CSR
CERTIFIED SHAREHOLDER REPORT OF REGISTERED
MANAGEMENT INVESTMENT COMPANIES
Investment Company Act file number 811-4840
The Tocqueville Trust
(Exact name of registrant as specified in charter)
The Tocqueville Trust
40 West 57th Street, 19th Floor
New York, NY 10019
(Address of principal executive offices) (Zip code)
Robert W. Kleinschmidt
The Tocqueville Trust
40 West 57th Street, 19th Floor
New York, NY 10019
(Name and address of agent for service)
(212) 698-0800
Registrant’s telephone number, including area code
Date of fiscal year end: October 31, 2017
Date of reporting period: April 30, 2017
Item 1. Reports to Stockholders.

The Tocqueville Trust
Mutual Funds
Semi-Annual Report
April 30, 2017
The Tocqueville Fund
The Tocqueville Opportunity Fund
The Tocqueville International Value Fund
The Tocqueville Gold Fund
The Delafield Fund
The Tocqueville Select Fund

This report is not authorized for distribution to prospective investors unless preceded or accompanied by a currently effective prospectus of The Tocqueville Trust. Please call 1-800-697-FUND (3863) for a free prospectus. Read it carefully before you invest.
You are invited to visit our website @ www.tocquevillefunds.com
Chairman’s Letter
Dear Fellow Shareholder,
The six-month period ended April 30, 2017 was an eventful one, beginning with the unexpected election of Donald Trump to the Presidency. The maintenance of control of both houses of Congress by the Republican Party was also a surprise. The worldwide rally that followed was a surprise, as well, initially, given the widespread predictions of catastrophe should Trump win. What quickly set in to the investing public, however, was that this combination of the Congress and the Presidency could lead to pro-growth policies that would reverse the unfortunate trends of the previous eight years, in which U.S. economic growth registered the poorest record since World War II. The anti-business rhetoric, high tax marginal tax rates, the Obamacare taxes (which rank as the third largest in U.S. history) and, most importantly, the regulatory explosion of the previous administration took a heavy toll on economic growth, so the potential of the reversal of these policies sent the markets soaring, in one of history’s largest post-election rallies.
Potential is one thing, however, and execution is quite another. The political inexperience of the Trump Administration and the unusual character of the President himself (qualities that, in part, were what got him elected) began to surface fairly quickly after the transition of power; and some of the euphoria came out of the markets as the reality set in. Change has proven more difficult than had been expected, and most pro-growth policies now seem to have been pushed farther out into the indefinite future.
The intense acrimony between the mainstream press and the President, along with the hostility of the opposition party, which questions the legitimacy of the recent election, has created a Watergate type atmosphere which cannot be helpful to the markets in the long term. That said, the markets have been amazingly resilient thus far to the suggestion of underlying political chaos, which is either prescient, short-sighted, or a reflection of just how pent-up was the frustration with the previous period of sluggish growth. In part, because the economy has acted fairly well during the period, we opt for the latter explanation, but time will tell.
As bottom-up stock pickers who aspire to holding the investments we acquire for the funds through economic cycles and longer, this macroeconomic and political backdrop carries less weight than you might think. Our research and analysis is focused on valuation, free cash flows, margins, market share, competitive position, defensible franchises, quality of management, conservative balance sheets, intelligent use of capital, shareholder orientation and other microeconomic factors which, we have found over the years, tend to trump macroeconomic considerations, particularly over longer periods of time. We expect that will be the case in the current period as well.
Sincerely,

Robert W. Kleinschmidt
Chairman
The Tocqueville Fund
Dear Fellow Shareholder,
Much has been written, including by us, of the impact of the surprising U.S. election on financial markets. Perhaps as important was that economic data over the six months ended April 30, 2017 was also supportive, as earnings reports showed some improvement, labor markets tightened, interest rates and commodities rose. Notwithstanding, the only recently hawkish tendencies of the Yellen Fed, with central banks in the U.K., Europe and China remaining largely accommodative and at least roughly neutral in Japan, it seemed as if markets were entering a period of synchronized global expansion. However, in March and April markets began to lose momentum and shift as investors worried that the Trump agenda would be more difficult to achieve for myriad reasons. That along with the election in France which seemed to, for the moment, remove the worst-case scenario for the Euro and contributed to a reversal in interest rates and the dollar. Oil prices also declined, as supply exceeded expectations and demand growth did not materialize. Stocks that had benefitted from the rise in rates and oil prices and hoped for stimulus post the election gave back much of their previous gains.
During this period, the Tocqueville Fund modestly underperformed the S&P 500®, the benchmark with which we are typically compared, returning 10.83% compared to 13.32% for the index, respectively. This was largely due to being underweight financials which tend not to pass our investment discipline that seeks to avoid opaque business models and structural leverage but can react strongly to perceptions of rising interest rates, which was the case in the last few months of 2016 and early part of 2017. In absolute terms, it was a robust period for the Fund with double digit returns and with most sectors contributing positively. The strongest sectors were information technology, industrials and healthcare, while the leading detractors were energy, telecommunications and utilities. The top performing positions during the period were Applied Materials, Ionis, Automated Data Processing, Boeing and Apple while the weakest were QUALCOMM, Pitney Bowes, Schlumberger, Xerox and Noble Energy.
Over the past six months, we established a few new positions and added to existing ones opportunistically. One of these is Diebold, a provider of hardware and software to the banking and retail industries whose shares were out of favor as a result of concerns about its merger with Wincor Nixdorf, as well as the health and capital spending patterns of its target markets. Our view was that the synergy opportunities from the merger are significant, the company was poised to generate substantial free cash flow, that management which had been doing some heavy insider buying was more than capable of successfully integrating the two companies and that the shares were undervalued. We also purchased Bank of America whose shares traded below book value, despite the sea change in the financial services industry following the election, based on the expectation of continued increase in rates, looser capital and regulatory restrictions and with legal issues in the rear view mirror. In addition, we purchased William Sonoma, the furnishing and
home goods retailer. The retail industry generally is deeply out of favor due to both internet based, as well as traditional competition, changing consumer spending habits and pressure on discretionary income from healthcare costs. However, while its shares seemed to reflect this pessimism and traded at a discount to intrinsic value, William Sonoma is one of the leaders in transitioning its business model online and now generates more than half its revenue from the internet, a significant portion of its products are proprietary and it should benefit from new household formation which has been lagging in recent years. Another recent purchase was Palo Alto Networks, the computer network security systems provider, whose shares had declined as a result of seemingly self-inflicted growing pains that caused it to miss earnings expectations over the past year. With the shares trading below what we considered intrinsic value, it represented an opportunity to acquire a growing and highly cash generative leader in cyber security. Other additions included Abbott Labs, Alcoa, Arconic, Goldcorp, Kansas City Southern, Macy’s, Pitney Bowes, Signature Bank, Snap On, and U.S. Concrete.
Over the same period, a variety of names were reduced or sold as they reached our valuation objectives, circumstances changed or better opportunities came along. These include Aflac, Alkermes, Alphabet (Google), Amazon, Applied Materials, Automated Date Processing, Bank of New York, Bioverativ, H&R Block, Delta, Exxon, GE, Johnson & Johnson, Merck, Microsoft, NextEra, Sonoco Products, Weyerhaeuser and Xerox. Disappointingly, we exited Macy’s and Pitney Bowes, ultimately concluding that both were most likely value traps, though we booked only a small loss in the former and small gain in the latter over the period.
Looking forward, markets in the U.S. appear more fully valued than the rest of the world but if, and it remains a big if, the Trump agenda succeeds then earnings growth expectations may be revised upwards and that valuation would not seem as inflated and there might be room for further advancement. Still, volatility has been at historic lows and the longer it takes to achieve those policy aims or if it appears that Trump’s election promises will be unmet we would expect those seemingly benign conditions to not last.
Sincerely,
Robert W. Kleinschmidt
Portfolio Manager
The Tocqueville Fund
(Unaudited)
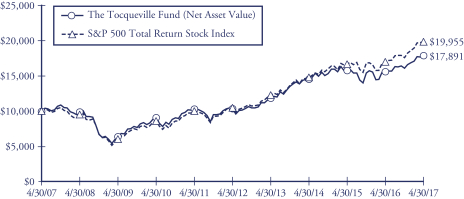
This chart assumes an initial gross investment of $10,000 made on 4/30/07. Returns shown do not reflect the deduction of taxes that a shareholder would pay on fund distributions or the redemption of fund shares. Performance reflects fee waivers in effect. In the absence of fee waivers, total return would be reduced. Returns shown include the reinvestment of all dividends and other distributions. Past performance is not predictive of future performance. Investment return and principal value will fluctuate so that your shares, when redeemed, may be worth more or less than their original cost.
The Standard & Poor’s 500 Total Return Stock Index (S&P 500) is a capital-weighted index, representing the aggregate market value of the common equity of 500 stocks primarily traded on the New York Stock Exchange. Returns assume the reinvestment of all dividends.
AVERAGE ANNUAL RATE OF RETURN (%)
FOR YEARS ENDED APRIL 30, 2017
| | | | | | | | | | | | | | | | |
| | | 1 Year | | | 3 Year | | | 5 Year | | | 10 Year | |
The Tocqueville Fund | | | 14.78% | | | | 6.89% | | | | 11.58% | | | | 5.99% | |
Standard & Poor’s 500 Total Return Stock Index | | | 17.92% | | | | 10.47% | | | | 13.68% | | | | 7.15% | |
The Tocqueville Opportunity Fund
Dear Fellow Shareholder,
We are pleased to provide this investment overview for the first six-month period of fiscal year 2017 for the Opportunity Fund. During the period for the six months ended April 30, 2017, the Fund appreciated 13.58%. The Fund under performed its benchmark, the Russell 2500 Growth Total Return Index, which gained 17.04%.
During the campaign, candidate Trump had assumed a vilifying posture toward many technology companies and high profile tech CEO’s—and instead, the “Make America Great Again” emphasized a revitalized industrial sector. In addition to the President’s announced intent to go after Jeff Bezos, the President had squared off against most Silicon Valley leaders over immigration laws and visas which would directly impact the pool of talent available to these companies. In addition to a sell-off of Technology investments, the election resulted in an immediate rotation to perceived beneficiaries of the Republican victories and majorities in the House and the Senate—the so called “Trump rally” extended to the more cyclical sectors including: industrials, basic materials, financials, and energy. Based on Trump’s campaign promises, investors presumed that these sectors would benefit most significantly from tax reform, regulatory relief, and infrastructure spending.
During the remaining five months of the first half fiscal period, the Fund slightly outperformed the benchmark, rising 8.27%. Investors came back to technology investments which reported solid end of year 2016 results, an optimistic outlook for 2017, and strong first quarter 2017 revenues—and somewhere along the line the new President not only moderated his views toward Silicon Valley, but also tech company capital repatriation became a cornerstone of his tax reform efforts. The Trump rally shifted into its own entropic state as the new administration immediately got bogged down in myriad controversies; health care reform failed. A promise of tax and regulatory relief and a path to infrastructure stimulus became more remote toward the end of the April period end, and investors reacted by selling Trump stocks.
The Fund’s return was led principally by investments in the healthcare and technology sectors—these investments comprised nearly four-fifths of the total return. healthcare investments led on the scale of relative performance. Since the beginning of 2017, technology issues have been leaders in both absolute and relative returns. Healthcare investments suffered terribly in the early days of the 2016 campaigns as sentiment turned negative on fears of price controls; we argued that the sell-off was unwarranted and overlooked investment fundamentals. Healthcare investments have led the Fund’s returns since the bottom in February 2016 through the end of 2016, through the end of April 2017 (nearly 14 months), and for the 2017 calendar year to date through April 30, 2017.
The Fund had positive contributions from all sectors except consumer staples and energy—the drags were moderate, however, at -0.05% and -0.26% respectively. On a relative basis, staples actually contributed a positive 0.49%, while energy detracted 0.37%. Following the election, we increased energy investments; it has been tempting to try to bottom tick this industry, but we have concluded that pricing cycles are contracting rapidly. We subsequently sold energy holdings.
Eight of the Fund’s top 10 contributors were healthcare investments, including the top 3: Incyte Corporation, SAGE Therapeutics, and bluebird bio. The three investments also led on a relative basis. Other top 10 Healthcare investments included Clovis and Tesaro—each with recently approved PARP inhibitors (Ovarian cancer). NVIDIA Corporation and Shopify were the Fund’s leading technology contributors. As might be expected given the heavy sell off in technology issues at the beginning of the period, the three worst performers over the time period were tech issues as well, and included: Acacia Communications, Finisar Corporation, and Paylocity. The damage was not lethal, and collectively the three detracted less than 1% to the Fund’s return; on a relative basis, the hit was more significant as the investments were overweight and detracted 1.57%, accounting for nearly three-quarters of the Fund’s relative underperformance during the entire time period. Although we view the past six months as generally a slow period for M&A activity, we had two takeovers during the period—Harmon International and Zeltiq Aesthetics – the impact was insignificant, as the positions were small. While the SMID space has been a fertile area for takeovers, the pace of activity continues to be dragged down by regulatory and tax policy uncertainty—as legislative progress continues to be impaired by political controversies and sideshows in Washington, the risk increases that reform is delayed into 2018 at the earliest and M&A combinations will be delayed as well.
Technology, healthcare and industrial sector investments led all other sectors in terms of investment commitments at the period’s end; this was unchanged from the period’s beginning. The order of commitment was unchanged as well, and investments in each sector increased a bit over the six months. Funding for the increases were predominantly from reductions in the consumer (both discretionary and staples) and energy sectors—as stated before energy was reduced to near zero. Investments in financials were increased steadily and significantly from under 4% before the election to the third highest allocation in the Fund—the allocation was swiftly reduced in late March after the defeat of the healthcare repeal effort as the favorable outlook for the industry’s fortunes dissipated rapidly (tax cuts/margins/reform/growth).
The Top 10, top 25 and top 50 positions comprised approximately 30%, 57% and 75% respectively at the period’s end. 93% of the Fund’s investments were diversified into the top 100 positions. The Fund continues to be managed in a very active manner reflecting confidence in the long-term outlook and investment fundamentals of the principal holdings; of the top 10 investments, more than 95% of the allocation is active. While short-term volatility may deter many active investment approaches from fundamental research and valuation, the Fund will continue to be managed with a longer-term, fundamental orientation.
As always, we greatly appreciate your ongoing confidence in our efforts on your behalf.
Sincerely,

Thomas R. Vandeventer
Portfolio Manager
The Tocqueville Opportunity Fund
(Unaudited)
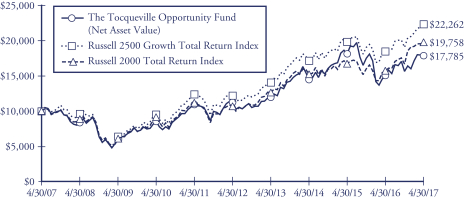
This chart assumes an initial gross investment of $10,000 made on 4/30/07. Returns shown do not reflect the deduction of taxes that a shareholder would pay on fund distributions or the redemption of fund shares. Returns shown include the reinvestment of all dividends and other distributions. Past performance is not predictive of future performance. Investment return and principal value will fluctuate so that your shares, when redeemed, may be worth more or less than their original cost.
The chart and table reflect The Opportunity Fund’s performance achieved prior to the changes effected in 2010 to its investment strategy.
The Russell 2500 Growth Total Return Index is an unmanaged index that measures the performance of the small to mid-cap growth segment of the U.S. equity universe. It includes those Russell 2500 companies with higher price-to-book ratios and higher forecasted growth values. Returns assume the reinvestment of all dividends
The Russell 2000 Total Return Index is an unmanaged index that measures the performance of the 2,000 smallest companies in the Russell 3000 Index. Returns include the reinvestment of all dividends.
AVERAGE ANNUAL RATE OF RETURN (%)
FOR YEARS ENDED APRIL 30, 2017
| | | | | | | | | | | | | | | | |
| | | 1 Year | | | 3 Year | | | 5 Year | | | 10 Year | |
The Tocqueville Opportunity Fund | | | 18.09% | | | | 7.22% | | | | 9.38% | | | | 5.93% | |
Russell 2500 Growth Total Return Index | | | 20.72% | | | | 9.15% | | | | 12.75% | | | | 8.33% | |
Russell 2000 Total Return Index | | | 25.63% | | | | 9.03% | | | | 12.95% | | | | 7.05% | |
The Tocqueville International Value Fund
Dear Fellow Shareholder,
Global equity markets generally rallied during the period, as economic indicators suggested improving consumer confidence and growth in most developed economies, and stability in China. The election in the U.S. and the new administration’s promise of tax reform and infrastructure spending added to optimism regarding global growth and led to a rise in inflationary expectations, interest rates and the U.S. dollar early in the period. These latter effects had largely reversed by period end, but improving growth and corporate earnings supported equities, with most markets increasing double digits in local currency terms. Despite rising growth expectations, commodity prices were flattish and oil declined, as a result of continued increases in U.S. shale production. In this context, financials, information technology, industrial and materials led gains while telecom, utility and energy related shares performed poorly.
The Fund’s total U.S. dollar return for the six-month period ending April 30th was a gain of 12.84% on a net basis during the period. This compares with a gain of 11.47% in the Morgan Stanley EAFE® Net Index, against which our international strategy is most often compared.
During the period, the Fund benefited from stock selection in the industrials, information technology, healthcare and real estate areas. This was offset in part by a low exposure to financials and weak performance of energy related shares. Results benefited from corporate activity in several of the Fund’s stocks. During the period, Unilever received a takeover offer from Kraft Heinz, Zodiac received a takeover offer from Safran, Akzo Nobel received a takeover offer from PPG Industries, Spotless Group received a takeover offer from Downer EDI, Global Logistics effectively put itself up for sale in response to pressure from shareholders, and TV Broadcasts offered to repurchase 27.4% of its shares at a roughly 30% premium to the market price. We also had strong contributions from Wacker Neuson, Sopra Steria Group and Samsung Electronics.
During the period, we sold positions in branded food products company Orkla, industrial products distributor Rexel, U.K. drug maker GlaxoSmithkline, mining concern Rio Tinto, and fuel distributor Superior Plus, as their share prices approached our estimates of intrinsic value. We purchased shares of UBS, a leading global wealth management franchise which trades at a reasonable multiple of current cash flow, has excess capital that we believe should be returned to shareholders, and whose earnings will derive a meaningful benefit from any increase in interest rates in the U.S. and elsewhere. We took a new position in diversified mining company BHP Billiton, which following several years of rationalizing assets, costs and capital expenditures, is poised to generate substantial amounts of free cash flow at prevailing commodity prices. We acquired a position in U.K. building materials distributor Travis Perkins, a well-managed and well-capitalized business with strong market positions and returns on capital, which trades at a
discount to intrinsic value due to concerns about the construction volumes post-Brexit. We purchased shares of Banco Santander, which were out of favor due to exposure to Latin America and residual concerns about Spanish housing, and whose business is improving in both regions. We also purchased shares of Bureau Veritas, a leading global inspection and certification firm, whose shares came under pressure due to weakness in its marine and energy markets, providing an opportunity to build a position in this high return and cash generative franchise. During the period, we added to Bayer, Smiths Group, Publicis, ISS, Cobham, and Nokia, inter alia.
Improving economic data, still low interest rates, and the absence of meaningful geopolitical events have produced high risk tolerance and low volatility. While we continue to see evidence of a synchronized global expansion, we also believe that markets are somewhat complacent about risk. At the very least, policy uncertainty should translate to a higher risk premium for equities. Absent tax reform, it will become more difficult, in our view, for U.S. companies in the aggregate to grow earnings in the face of high labor market participation and rising wage expenses. On the other hand, outside the U.S., in both developed and most emerging markets, we see more potential for earnings growth based on economic expansion and the potential for operational and margin improvements. We believe, these latter factors will be encouraged by a growing focus by activist investors on the non-U.S. markets. Corporate activity in our portfolio would seem to support this view.
Our investment objective remains to generate positive absolute returns and to exceed the returns of the major indices over the course of an economic cycle. To protect and grow your capital, we continue to seek out compelling long-term investment opportunities in companies that have defensible business franchises, are out of favor or misunderstood, and trade at a substantial discount to intrinsic value.
Sincerely,
James Hunt
Portfolio Manager
The Tocqueville International Value Fund
(Unaudited)
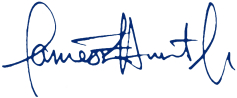
This chart assumes an initial gross investment of $10,000 made on 4/30/07. Returns shown do not reflect the deduction of taxes that a shareholder would pay on fund distributions or the redemption of fund shares. Performance reflects fee waivers in effect. In the absence of fee waivers, total return would be reduced. Returns shown include the reinvestment of all dividends and other distributions. Past performance is not predictive of future performance. Investment return and principal value will fluctuate so that your shares, when redeemed, may be worth more or less than their original cost.
The MSCI EAFE Index is an unmanaged market-capitalization-weighted index composed of companies representative of the market structure of 21 Developed Market Countries in Europe, Australia, Asia and the Far East.
The Standard & Poor’s 500 Total Return Stock Index (S&P 500) is a capital-weighted index, representing the aggregate market value of the common equity of 500 stocks primarily traded on the New York Stock Exchange. Returns include the reinvestment of all dividends.
AVERAGE ANNUAL RATE OF RETURN (%)
FOR YEARS ENDED APRIL 30, 2017
| | | | | | | | | | | | | | | | |
| | | 1 Year | | | 3 Year | | | 5 Year | | | 10 Year | |
The Tocqueville International Value Fund | | | 12.37% | | | | 4.76% | | | | 9.42% | | | | 4.07% | |
MSCI EAFE Net Index | | | 11.29% | | | | 0.86% | | | | 6.78% | | | | 0.87% | |
Standard & Poor’s 500 Total Return Stock Index | | | 17.92% | | | | 10.47% | | | | 13.68% | | | | 7.15% | |
The Tocqueville Gold Fund
Dear Fellow Shareholder,
During the period from November 2016 through April 2017, initial disinterest in gold gave way to a more supportive gold market as heightened global anxiety from shifting investment views and political attitudes took hold. By the end of April, gold prices finished about where they began, closing off 0.4%, at $1,268.30 per ounce. The Tocqueville Gold Fund was off 7.27% for the period, while the Philadelphia Gold and Silver index was down 4.09%. Gold prices traded within a broad range as markets saw U.S. dollar strength early in the period and then U.S. dollar weakness as the U.S. Federal Reserve raised rates during the period to which gold responded quite favorably.
The November election of President Donald Trump, seen as a positive for broader financial markets initially, was reassessed as the new administration took office and saw gold recover from its late 2016 low. After the Fed raised rates in mid-December 2016, investors bid gold up at the start of the year as the U.S. dollar weakened and populist sentiments increased in Europe, the U.S. and around the world. Gold markets continued to strengthen into late February, before gold prices took a modest dip in early March as the Fed raised rates again. However, gold found solid support at $1,200 per ounce, where it appears to have established an important base in technical and fundamental terms. Gold markets brushed off the Fed’s March rate increase as quickly as earlier ones while geopolitical tensions in the Middle East and the Asian region drew attention away from economic activity during April, as the Trump administration responded to global developments.
A core position in the Fund and largest holding is physical gold. It makes up about 12% of the Fund’s assets. The Fund’s gold is vaulted outside the financial system at a secure Brinks facility and is not traded. We monitor and audit it regularly. Holding physical gold has reduced the volatility of the overall Fund and did so in the recent period, but it also gives Fund shareholders direct exposure to gold that the Fund owns.
Aside from the position in physical gold, the majority of the Fund’s holdings are in precious metal mining equities, in which it seeks exposure across various aspects of the value creation spectrum within the precious metals mining sector. This broad exposure helps diversify risk and capture the value inherent in discovery, development and production. Gold focused mining equities make up about 70% of the Fund’s assets, while approximately 15% of the Fund is exposed to silver mining companies. Though there are many industrial applications for silver, it is a monetary metal similar to gold and frequently occurs with gold in multi-metallic orebodies.
During the period, the precious metal mining stocks that contributed the most to the Fund’s performance included Ivanhoe Mines, Osisko Mining, Falco Resources, Oceana Gold, Eldorado Gold and Pan American Silver. Ivanhoe Mines and Osisko Mining have had significant exploration success over the past year and continue to expand
the size of the orebodies they discovered. Falco Resources has made solid progress de-risking its project while Oceana Gold is becoming recognized for its growth and the successful start-up of its Haile gold mine earlier in the year. Eldorado Gold is benefitting from the advancement of its mine projects and strategy to grow its production base. Pan American Silver is finishing a capital spending cycle and will see profits grow as it harvests production from its investments.
Detour Gold, Semafo, Wheaton Precious Metals, Mag Silver, Torex Gold and Agnico-Eagle declined during the period, primarily as those holdings corrected from much stronger performance during the first half of the 2016 calendar year. During the period, new positions were established in AngloGold Ashanti, IAMGold and Independence Group as those stocks presented attractive valuations. Positions that were eliminated because they were either fully valued or presented limited value creation opportunities unassociated with the moves in precious metal markets included Hochschild Mining, Gold Road, JDL Gold, Rubicon, Silver Range and Tahoe Resources.
Performance during the past six months was pressured by the initial perceptions of the positive economic impact that would result from the surprise election of Donald Trump, as noted above. The so called “Trump Trade” consisted of knee jerk selling of gold and precious metals stocks and an equally knee jerk run up in the U.S. trade weighted dollar (DXY) and equity market indexes. As anyone can now see, the potential positives from a Trump administration seem increasingly imaginary. As many aspects of the Trump Agenda have either failed or begun to fizzle, gold and precious metals have been the beneficiaries. We do not believe misfortunes of the Administration are the primary driver of gold’s resurgence, but we think they can certainly be counted as contributors to the general category of bad public policy; both fiscal and monetary. We believe those factors are starting to play out with increasing intensity and will result in strong performance for our gold strategy during the remainder of 2017.
Sincerely,
| | | | |

| | 
| | 
|
| John C. Hathaway | | Douglas B. Groh | | Ryan McIntyre |
| Portfolio Manager | | Portfolio Manager | | Portfolio Manager |
The Tocqueville Gold Fund
(Unaudited)
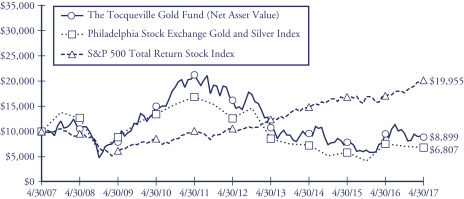
This chart assumes an initial gross investment of $10,000 made on 4/30/07. Returns shown do not reflect the deduction of taxes that a shareholder would pay on fund distributions or the redemption of fund shares. Returns shown include the reinvestment of all dividends and other distributions. Past performance is not predictive of future performance. Investment return and principal value will fluctuate so that your shares, when redeemed, may be worth more or less than their original cost. The Fund imposes a 2% redemption fee on shares held 90 days or less.
In 2009, 2010, and 2016 the performance of The Tocqueville Gold Fund was achieved during a period of unusually favorable market conditions. Such performance may not be sustainable.
The Philadelphia Stock Exchange Gold and Silver Index is an unmanaged capitalization-weighted index which includes the leading companies involved in the mining of gold and silver. Returns include the reinvestment of all dividends.
The Standard & Poor’s 500 Total Return Stock Index (S&P 500) is a capital-weighted index, representing the aggregate market value of the common equity of 500 stocks primarily traded on the New York Stock Exchange. Returns include the reinvestment of all dividends.
AVERAGE ANNUAL RATE OF RETURN (%)
FOR YEARS ENDED APRIL 30, 2017
| | | | | | | | | | | | | | | | |
| | | 1 Year | | | 3 Year | | | 5 Year | | | 10 Year | |
The Tocqueville Gold Fund | | | -8.71% | | | | -2.52% | | | | -11.18% | | | | -1.16% | |
Philadelphia Stock Exchange Gold and Silver Index | | | -10.02% | | | | -2.58% | | | | -11.67% | | | | -3.76% | |
Standard & Poor’s 500 Total Return Stock Index | | | 17.92% | | | | 10.47% | | | | 13.68% | | | | 7.15% | |
The Delafield Fund
Dear Fellow Shareholder,
For the six months ended April 30, 2017, the Fund’s net asset value increased 14.51% versus an increase of 18.37% for the Russell 2000 ® Total Return Index (“Russell 2000”) and an increase of 13.32% for the Standard & Poor’s 500 Index (“S&P 500”), each on a total return basis. Owing to the smaller average market capitalization of companies in the Russell 2000, we view it as the more appropriately comparative index to the Fund. The Fund’s net asset value as of April 30, 2017 was $25.40 per share. The net asset value amounted to $399,507,861 of which 76.9% was invested in equities, and the balance in cash and equivalents.
There was little market volatility for nearly the entire first half of the fiscal year. Equity markets rallied sharply on the heels of the Trump victory in November and U.S. equities held those gains in December, despite the Fed’s move to raise rates mid-month. Strong consumer confidence and an improved unemployment report were among the economic data points that buoyed investor conviction and kept the rally going into January. The optimism that catapulted markets in the fourth fiscal quarter waned somewhat in the first fiscal quarter of 2017, yet markets remained in positive territory. The Trump rally lost some steam, with the new administration’s failure to make good on its promise to repeal and replace the American Health Care Act, causing investors to question the outcome of several other important campaign pledges. However, encouraging domestic economic statistics, including labor force participation, consumer confidence and ISM manufacturing data, were enough to offset these doubts. Directionally, our own performance mirrored that of the market, with the Fund generating a particularly strong return in the first half of the period, and a more modest increase in the second half.
For the entire six-month period, our top contributors included TrueBlue Inc., Diebold Nixdorf, Kemet Corp., and Korn Ferry. TrueBlue benefited from meeting earnings expectations and from investors’ more optimistic outlook for organic growth prospects under the Trump administration. Diebold shares responded favorably to in-line earnings results, management’s confidence in meeting full year earnings expectations and an encouraging investor meeting hosted later in the period. While relatively solid earnings results benefited Kemet shares during the period, the stock surged following the Company’s announcement that they had reached a long-awaited agreement to acquire NEC Tokin Corporation under very favorable terms. Similar to TruBlue, Korn Ferry reported results which were satisfactory and the stock also was the beneficiary of expectations for an improving labor market under the new administration.
In contrast, Sequential Brands Group Inc., Horizon Global Corporation, Babcock & Wilcox Enterprises Inc, and Aspen Aerogels Inc. were the largest detractors to our performance. Sequential disappointed the market with a weaker than expected earnings
outlook and later in the period, announced the unexpected departure of the CEO. Horizon also reported weaker than expected earnings results and launched an unexpected and dilutive equity and convertible financing transaction. Babcock & Wilcox shares traded down after the Company announced that it would fail to meet completion deadlines on several waste-to-energy projects in its backlog, which would necessitate write-downs of expected profit contribution on those projects, as well as a temporary suspension of new bidding activity. Aspen Aerogels reported sluggish financial results and a lukewarm near term outlook for its end markets, and the stock responded in kind.
We added a number of new positions to the portfolio during the six-month period, the largest of which included Avnet, Inc., Franks International and Tesco Corp. In contrast, the largest portfolio deletions included Kemet Corp., Teradyne Inc., Pier 1 Imports Inc., and Carpenter Technology Corp.
Looking forward, we are cautiously optimistic. We have been wary all along that it would take time for President Trump’s agenda to be implemented and that perceived delays or actual setbacks might lead to disappointment. Through the first half of the fiscal year, investors eagerly anticipated quick progress on all fronts. However, early into the second half, many now seem more skeptical as to how much can be accomplished. Our domestic economic situation is more encouraging than the political morass, with forward progress continuing. Employment is high, labor force participation is increasing, consumer confidence is robust and the ISM Index is signaling manufacturing growth. We continue to believe that the uncertainty could make for a more volatile investment climate, and as a result, we expect to continue to hold sizeable cash reserves, while at the same time, actively pursue unappreciated investment opportunities.
Sincerely,
| | |
 | |  |
| J. Dennis Delafield | | Vincent Sellecchia |
| Portfolio Manager | | Portfolio Manager |
| | |
 | |  |
| Joshua Kaufthal | | James Maxwell |
| Portfolio Manager | | Portfolio Manager |
The Delafield Fund
(Unaudited)
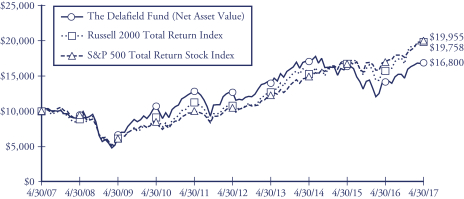
This chart assumes an initial gross investment of $10,000 made on 4/30/07. Since the Delafield Fund did not commence operations until 9/28/09, returns prior to that date are those of the Predecessor Fund. The Delafield Fund assumed the net asset value and performance history of the Predecessor Fund (See Footnote 1 to the Financial Statements). Returns shown do not reflect the deduction of taxes that a shareholder would pay on fund distributions or the redemption of fund shares. Performance reflects fee waivers in effect. In the absence of fee waivers, total return would be reduced. Returns shown include the reinvestment of all dividends and other distributions. Past performance is not predictive of future performance. Investment return and principal value will fluctuate so that your shares, when redeemed, may be worth more or less than their original cost.
The Russell 2000 Total Return Index is an unmanaged index that measures the performance of the 2,000 smallest companies in the Russell 3000 Index, which represent approximately 10% of the total market capitalization of the Russell 3000 Index. Returns include the reinvestment of all dividends.
The Standard & Poor’s 500 Total Return Stock Index (S&P 500) is a capital-weighted index, representing the aggregate market value of the common equity of 500 stocks primarily traded on the New York Stock Exchange. Returns include the reinvestment of all dividends.
AVERAGE ANNUAL RATE OF RETURN (%)
FOR YEARS ENDED APRIL 30, 2017
| | | | | | | | | | | | | | | | |
| | | 1 Year | | | 3 Year | | | 5 Year | | | 10 Year | |
The Delafield Fund | | | 18.95% | | | | -0.32% | | | | 5.84% | | | | 5.32% | |
Russell 2000 Total Return Index | | | 25.63% | | | | 9.03% | | | | 12.95% | | | | 7.05% | |
Standard & Poor’s 500 Total Return Stock Index | | | 17.92% | | | | 10.47% | | | | 13.68% | | | | 7.15% | |
The Tocqueville Select Fund
Dear Fellow Shareholder,
For the six months ended April 30, 2017, the Fund’s net asset value increased 11.04% versus increases of 15.65% for the Russell 2500® Total Return Index (“Russell 2500”) and 18.37% for the Russell 2000® Total Return Index (“Russell 2000”), each on a total return basis. The net asset value as of April 30, 2017 was $12.10 per share. The net asset value amounted to $59,782,637 of which 87.2% was invested in equities, and the balance in cash and equivalents.
Equity markets rallied sharply on the heels of the Trump victory in November and U.S. equities held those gains in December, despite the Fed’s move to raise rates mid-month. Strong consumer confidence and an improved unemployment report were among the economic data points that buoyed investor conviction and kept the rally going into January. The optimism that catapulted markets in the fourth fiscal quarter waned somewhat in the first fiscal quarter of 2017, yet markets remained in positive territory. The Trump rally lost some steam, with the new administration’s failure to make good on its promise to repeal and replace the American Health Care Act, causing investors to question the outcome of several other important campaign pledges. However, encouraging domestic economic statistics, including labor force participation, consumer confidence and ISM manufacturing data, were enough to offset these doubts.
For the entire six-month period, our top contributors included TrueBlue Inc., Pier 1 Imports Inc., j2 Global Inc. and TEGNA Inc. TrueBlue benefited from meeting earnings expectations and from investors’ more optimistic outlook for organic growth prospects under the Trump administration. After a period of sluggish results, Pier 1 reported consecutive quarters of better than expected earnings and investors cheered the favorable results and improved business prospects. j2 Global shares responded strongly following the announced acquisition of Everyday Health, Inc., which was expected to be accretive to 2017 results, while TEGNA rallied after management announced the re-activation of their share repurchase activity as well as offered an encouraging business update at an investor conference.
In contrast, Real Industry Inc., and Horizon Global Corporation were the largest detractors to our performance. Real Industry shares sank on disappointing earnings results and expectations for continued end market challenges. Horizon also reported weaker than anticipated earnings results and launched an unexpected and dilutive equity and convertible financing transaction.
The largest new position we added during the six-month period was G-III Apparel Group, Ltd. In contrast, the largest portfolio deletions included Consol Energy Inc., Ralph Lauren Corporation, Summer Infant Inc, and Web.com Group Inc.
Looking forward, we are cautiously optimistic. We have been wary all along that it would take time for President Trump’s agenda to be implemented and that perceived
delays or actual setbacks might lead to disappointment. Through the first half of the fiscal year, investors eagerly anticipated quick progress on all fronts. However, early into the second half, many now seem more skeptical as to how much can be accomplished. Our domestic economic situation is more encouraging than the political morass, with forward progress continuing. Employment is high, labor force participation is increasing, consumer confidence is robust and the ISM Index is signaling manufacturing growth. We continue to believe that the uncertainty could make for a more volatile investment climate which could yield the value and special situation opportunities which we look to invest in.
Sincerely,
| | |
| | |
| Joshua Kaufthal | | James Maxwell |
| Portfolio Manager | | Portfolio Manager |
The Tocqueville Select Fund
(Unaudited)
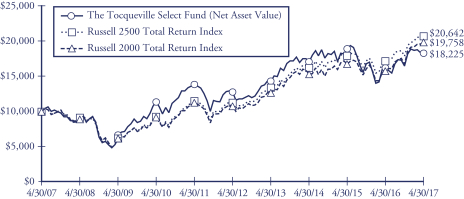
This chart assumes an initial gross investment of $10,000 made on 4/30/07. Since The Tocqueville Select Fund did not commence operations until 9/28/09, returns from the period from September 29, 2008 to September 27, 2009 are those of the Class Y Shares of the Predecessor Fund (See Footnote 1 to the Financial Statements). Prior to that period, returns shown are those of a limited partnership managed by the adviser. Returns shown do not reflect the deduction of taxes that a shareholder would pay on fund distributions or the redemption of fund shares. Performance reflects fee waivers in effect. In the absence of fee waivers, total return would be reduced. Returns shown include the reinvestment of all dividends and other distributions. Past performance is not predictive of future performance. Investment return and principal value will fluctuate so that your shares, when redeemed, may be worth more or less than their original cost.
In 2013 the performance of The Tocqueville Select Fund was achieved during a period of unusually favorable market conditions. Such performance may not be sustainable.
The Russell 2500 Total Return Index is an unmanaged index that measures the performance of the 2,500 smallest companies in the Russell 3000 Index. Returns include the reinvestment of all dividends.
The Russell 2000 Total Return Index is an unmanaged index that measures the performance of the 2,000 smallest companies in the Russell 3000 Index. Returns include the reinvestment of all dividends.
AVERAGE ANNUAL RATE OF RETURN (%)
FOR YEARS ENDED APRIL 30, 2017
| | | | | | | | | | | | | | | | |
| | | 1 Year | | | 3 Year | | | 5 Year | | | 10 Year | |
The Tocqueville Select Fund | | | 12.82% | | | | 2.27% | | | | 7.38% | | | | 6.19% | |
Russell 2500 Total Return Index | | | 20.69% | | | | 8.55% | | | | 12.94% | | | | 7.52% | |
Russell 2000 Total Return Index | | | 25.63% | | | | 9.03% | | | | 12.95% | | | | 7.05% | |
Expense Example—April 30, 2017 (Unaudited)
As a shareholder of The Tocqueville Trust (the “Funds”), you incur ongoing costs, including management fees; distribution fees; and other Fund expenses. This example is intended to help you understand your ongoing costs (in dollars) of investing in the Funds and to compare costs with the ongoing costs of investing in other mutual funds.
The Example is based on an investment of $1,000 invested at the beginning of the period and held the entire period (November 1, 2016-April 30, 2017).
Actual Expenses
The first line of the table below provides information about actual account values and actual expenses. You may use the information in this line, together with the amount you invested, to estimate the expenses that you paid over the period. Simply divide your account value by $1,000 (for example, an $8,600 account value divided by $1,000 = 8.6), then multiply the result by the number in the first line under the heading entitled “Expenses Paid During Period” to estimate the expenses you paid on your account during this period.
Hypothetical Example for Comparison Purposes
The second line of the table below provides information about hypothetical account values and hypothetical expenses based on the Funds’ actual expense ratios and an assumed rate of return of 5% per year before expenses, which is not the Funds’ actual return. The hypothetical account values and expenses may not be used to estimate the actual ending account balance or expenses you paid for the period. You may use this information to compare the ongoing costs of investing in the Funds and other funds. To do so, compare this 5% hypothetical example with the 5% hypothetical examples that appear in the shareholder reports of the other funds.
Please note that the expenses shown in the table are meant to highlight your ongoing costs only and do not reflect any transactional costs, such as sales charges (loads), redemption fees, or exchange fees. Therefore, the second line of the table is useful in comparing ongoing costs only, and will not help you determine the relative costs of owning different funds. In addition, if these transactional costs were included, your costs would have been higher.
Expense Example Tables (Unaudited)
The Tocqueville Fund
| | | | | | | | | | | | |
| | | Beginning
Account Value
November 1, 2016 | | | Ending
Account Value
April 30,
2017 | | | Expenses Paid
During Period*
November 1, 2016 -
April 30, 2017 | |
Actual | | $ | 1,000.00 | | | $ | 1,108.30 | | | $ | 6.59 | |
Hypothetical (5% return before expenses) | | | 1,000.00 | | | | 1,018.55 | | | | 6.31 | |
| * | Expenses are equal to the Fund’s annualized six-month expense ratio (including interest expense) of 1.26% for The Tocqueville Fund, multiplied by the average account value over the period, multiplied by 181/365 to reflect the one-half year period. |
The Tocqueville Opportunity Fund
| | | | | | | | | | | | |
| | | Beginning
Account Value
November 1, 2016 | | | Ending
Account Value
April 30,
2017 | | | Expenses Paid
During Period*
November 1, 2016 -
April 30, 2017 | |
Actual | | $ | 1,000.00 | | | $ | 1,135.80 | | | $ | 6.94 | |
Hypothetical (5% return before expenses) | | | 1,000.00 | | | | 1,018.30 | | | | 6.56 | |
| * | Expenses are equal to the Fund’s annualized six-month expense ratio (including interest expense) of 1.31% for The Tocqueville Opportunity Fund, multiplied by the average account value over the period, multiplied by 181/365 to reflect the one-half year period. |
The Tocqueville International Value Fund
| | | | | | | | | | | | |
| | | Beginning
Account Value
November 1, 2016 | | | Ending
Account Value
April 30,
2017 | | | Expenses Paid
During Period*
November 1, 2016 -
April 30, 2017 | |
Actual | | $ | 1,000.00 | | | $ | 1,128.40 | | | $ | 6.60 | |
Hypothetical (5% return before expenses) | | | 1,000.00 | | | | 1,018.60 | | | | 6.26 | |
| * | Expenses are equal to the Fund’s annualized six-month expense ratio of 1.25% for The Tocqueville International Value Fund, multiplied by the average account value over the period, multiplied by 181/365 to reflect the one-half year period. |
The Tocqueville Gold Fund
| | | | | | | | | | | | |
| | | Beginning
Account Value
November 1, 2016 | | | Ending
Account Value
April 30,
2017 | | | Expenses Paid
During Period*
November 1, 2016 -
April 30, 2017 | |
Actual | | $ | 1,000.00 | | | $ | 927.30 | | | $ | 6.64 | |
Hypothetical (5% return before expenses) | | | 1,000.00 | | | | 1,017.90 | | | | 6.95 | |
| * | Expenses are equal to the Fund’s annualized six-month expense ratio (including interest expense) of 1.39% for The Tocqueville Gold Fund, multiplied by the average account value over the period, multiplied by 181/365 to reflect the one-half year period. |
The Delafield Fund
| | | | | | | | | | | | |
| | | Beginning
Account Value
November 1, 2016 | | | Ending
Account Value
April 30,
2017 | | | Expenses Paid
During Period*
November 1, 2016 -
April 30, 2017 | |
Actual | | $ | 1,000.00 | | | $ | 1,145.10 | | | $ | 6.65 | |
Hypothetical (5% return before expenses) | | | 1,000.00 | | | | 1,018.60 | | | | 6.26 | |
| * | Expenses are equal to the Fund’s annualized six-month expense ratio of 1.25% for The Delafield Fund, multiplied by the average account value over the period, multiplied by 181/365 to reflect the one-half year period. |
The Tocqueville Select Fund
| | | | | | | | | | | | |
| | | Beginning
Account Value
November 1, 2016 | | | Ending
Account Value
April 30,
2017 | | | Expenses Paid
During Period*
November 1, 2016 -
April 30, 2017 | |
Actual | | $ | 1,000.00 | | | $ | 1,110.40 | | | $ | 6.54 | |
Hypothetical (5% return before expenses) | | | 1,000.00 | | | | 1,018.60 | | | | 6.26 | |
| * | Expenses are equal to the Fund’s annualized six-month expense ratio of 1.25% for The Tocqueville Select Fund, multiplied by the average account value over the period, multiplied by 181/365 to reflect the one-half year period. |
The Tocqueville Fund
Financial Highlights
| | | | | | | | | | | | | | | | | | | | | | | | |
Per share operating
performance
(For a share outstanding
throughout the period) | | Six Months
Ended
April 30,
2017 | | | Years Ended October 31, | |
| | | 2016 | | | 2015 | | | 2014 | | | 2013 | | | 2012 | |
| | | (unaudited) | | | | | | | | | | | | | | | | |
Net asset value, beginning of period | | $ | 33.72 | | | $ | 32.91 | | | $ | 34.18 | | | $ | 30.67 | | | $ | 24.11 | | | $ | 22.23 | |
| | | | | | | | | | | | | | | | | | | | | | | | |
Operations: | | | | | | | | | | | | | | | | | | | | | | | | |
Net investment income (1) | | | 0.19 | | | | 0.42 | | | | 0.37 | | | | 0.28 | | | | 0.40 | | | | 0.40 | |
Net realized and unrealized gain (loss) | | | 3.37 | | | | 1.07 | | | | (0.19 | ) | | | 3.78 | | | | 6.51 | | | | 1.81 | |
| | | | | | | | | | | | | | | | | | | | | | | | |
Total from investment operations * | | | 3.56 | | | | 1.49 | | | | 0.18 | | | | 4.06 | | | | 6.91 | | | | 2.21 | |
| | | | | | | | | | | | | | | | | | | | | | | | |
Distributions to shareholders: | | | | | | | | | | | | | | | | | | | | | | | | |
Dividends from net investment income | | | (0.39 | ) | | | (0.35 | ) | | | (0.25 | ) | | | (0.30 | ) | | | (0.35 | ) | | | (0.33 | ) |
Distributions from net realized gains | | | (1.50 | ) | | | (0.33 | ) | | | (1.20 | ) | | | (0.25 | ) | | | — | | | | — | |
| | | | | | | | | | | | | | | | | | | | | | | | |
Total distributions | | | (1.89 | ) | | | (0.68 | ) | | | (1.45 | ) | | | (0.55 | ) | | | (0.35 | ) | | | (0.33 | ) |
| | | | | | | | | | | | | | | | | | | | | | | | |
Change in net asset value for the period | | | 1.67 | | | | 0.81 | | | | (1.27 | ) | | | 3.51 | | | | 6.56 | | | | 1.88 | |
| | | | | | | | | | | | | | | | | | | | | | | | |
Net asset value, end of period | | $ | 35.39 | | | $ | 33.72 | | | $ | 32.91 | | | $ | 34.18 | | | $ | 30.67 | | | $ | 24.11 | |
| | | | | | | | | | | | | | | | | | | | | | | | |
* Includes redemption fees per share of | | | N/A | | | | N/A | | | $ | 0.00 | (2) | | $ | 0.00 | (2) | | $ | 0.00 | (2) | | $ | 0.00 | (2) |
Total Return | | | 10.8 | %(4) | | | 4.6 | % | | | 0.5 | % | | | 13.4 | % | | | 29.0 | % | | | 10.1 | % |
Ratios/supplemental data | | | | | | | | | | | | | | | | | | | | | | | | |
Net assets, end of period (000) | | $ | 285,342 | | | $ | 283,126 | | | $ | 309,267 | | | $ | 380,561 | | | $ | 348,269 | | | $ | 366,025 | |
Ratio to average net assets: | | | | | | | | | | | | | | | | | | | | | | | | |
Expenses before waiver/reimbursement | | | 1.27 | %(5) | | | 1.27 | % | | | 1.29 | % | | | 1.25 | % | | | 1.28 | % | | | 1.29 | % |
Expenses after waiver/reimbursement | | | 1.26 | %(3)(5) | | | 1.24 | %(3) | | | 1.25 | % | | | 1.24 | % | | | 1.26 | %(3) | | | 1.26 | %(3) |
Net investment income before waiver/reimbursement | | | 1.02 | %(5) | | | 1.18 | % | | | 0.91 | % | | | 0.84 | % | | | 1.33 | % | | | 1.30 | % |
Net investment income after waiver/reimbursement | | | 1.03 | %(5) | | | 1.21 | % | | | 0.95 | % | | | 0.85 | % | | | 1.35 | % | | | 1.33 | % |
Portfolio turnover rate | | | 6 | %(4) | | | 12 | % | | | 15 | % | | | 19 | % | | | 16 | % | | | 17 | % |
| (1) | Net investment income per share is calculated using the ending balance prior to consideration or adjustment for permanent book-to-tax differences. |
| (2) | Represents less than $0.01. |
| (3) | Includes 0.01% of interest expense which is not included in the Fund’s operating expense cap. |
The Accompanying Notes are an Integral Part of these Financial Statements.
The Tocqueville Opportunity Fund
Financial Highlights
| | | | | | | | | | | | | | | | | | | | | | | | |
Per share operating
performance
(For a share outstanding
throughout the period) | | Six Months
Ended
April 30,
2017 | | | Years Ended October 31, | |
| | | 2016 | | | 2015 | | | 2014 | | | 2013 | | | 2012 | |
| | | (unaudited) | | | | | | | | | | | | | | | | |
Net asset value, beginning of period | | $ | 19.14 | | | $ | 21.41 | | | $ | 22.78 | | | $ | 21.29 | | | $ | 15.76 | | | $ | 14.96 | |
| | | | | | | | | | | | | | | | | | | | | | | | |
Operations: | | | | | | | | | | | | | | | | | | | | | | | | |
Net investment loss (1) | | | (0.21 | ) | | | (0.29 | ) | | | (0.15 | ) | | | (0.22 | ) | | | (0.13 | ) | | | (0.11 | ) |
Net realized and unrealized gain (loss) | | | 2.81 | | | | (1.98 | ) | | | 1.98 | | | | 2.80 | | | | 5.66 | | | | 0.91 | |
| | | | | | | | | | | | | | | | | | | | | | | | |
Total from investment operations * | | | 2.60 | | | | (2.27 | ) | | | 1.83 | | | | 2.58 | | | | 5.53 | | | | 0.80 | |
| | | | | | | | | | | | | | | | | | | | | | | | |
Distributions to shareholders: | | | | | | | | | | | | | | | | | | | | | | | | |
Dividends from net investment income | | | — | | | | — | | | | — | | | | — | | | | — | | | | — | |
Distributions from net realized gains | | | — | | | | — | | | | (3.20 | ) | | | (1.09 | ) | | | — | | | | — | |
| | | | | | | | | | | | | | | | | | | | | | | | |
Total distributions | | | — | | | | — | | | | (3.20 | ) | | | (1.09 | ) | | | — | | | | — | |
| | | | | | | | | | | | | | | | | | | | | | | | |
Change in net asset value for the period | | | 2.60 | | | | (2.27 | ) | | | (1.37 | ) | | | 1.49 | | | | 5.53 | | | | 0.80 | |
| | | | | | | | | | | | | | | | | | | | | | | | |
Net asset value, end of period | | $ | 21.74 | | | $ | 19.14 | | | $ | 21.41 | | | $ | 22.78 | | | $ | 21.29 | | | $ | 15.76 | |
| | | | | | | | | | | | | | | | | | | | | | | | |
* Includes redemption fees per share of | | | N/A | | | | N/A | | | $ | 0.00 | (2) | | $ | 0.00 | (2) | | $ | 0.00 | (2) | | $ | 0.00 | (2) |
Total Return | | | 13.6 | %(5) | | | (10.6 | )% | | | 9.1 | % | | | 12.6 | % | | | 35.1 | % | | | 5.4 | % |
Ratios/supplemental data | | | | | | | | | | | | | | | | | | | | | | | | |
Net assets, end of period (000) | | $ | 71,578 | | | $ | 92,958 | | | $ | 153,456 | | | $ | 80,324 | | | $ | 80,609 | | | $ | 65,455 | |
Ratio to average net assets: | | | | | | | | | | | | | | | | | | | | | | | | |
Expenses before waiver/reimbursement | | | 1.43 | %(6) | | | 1.38 | % | | | 1.31 | % | | | 1.30 | % | | | 1.30 | % | | | 1.32 | % |
Expenses after waiver/reimbursement | | | 1.31 | %(3)(4)(6) | | | 1.38 | % | | | 1.31 | % | | | 1.30 | % | | | 1.30 | % | | | 1.32 | % |
Net investment income before waiver/reimbursement | | | (1.10 | )%(6) | | | (0.94 | )% | | | (0.95 | )% | | | (0.90 | )% | | | (0.64 | )% | | | (0.76 | )% |
Net investment income after waiver/reimbursement | | | (0.98 | )%(4)(6) | | | (0.94 | )% | | | (0.95 | )% | | | (0.90 | )% | | | (0.64 | )% | | | (0.76 | )% |
Portfolio turnover rate | | | 80 | %(5) | | | 108 | % | | | 101 | % | | | 92 | % | | | 100 | % | | | 77 | % |
| (1) | Net investment loss per share is calculated using the ending balance prior to consideration or adjustment for permanent book-to-tax differences. |
| (2) | Represents less than $0.01. |
| (3) | Includes 0.06% of interest expense which is not included in the Fund’s operating expense cap. |
| (4) | Expense waiver of 1.25% was implemented on November 1, 2016. |
The Accompanying Notes are an Integral Part of these Financial Statements.
The Tocqueville International Value Fund
Financial Highlights
| | | | | | | | | | | | | | | | | | | | | | | | |
Per share operating
performance
(For a share outstanding
throughout the period) | | Six Months
Ended
April 30,
2017 | | | Years Ended October 31, | |
| | | 2016 | | | 2015 | | | 2014 | | | 2013 | | | 2012 | |
| | | (unaudited) | | | | | | | | | | | | | | | | |
Net asset value, beginning of period | | $ | 14.44 | | | $ | 14.59 | | | $ | 14.48 | | | $ | 14.71 | | | $ | 11.68 | | | $ | 12.00 | |
| | | | | | | | | | | | | | | | | | | | | | | | |
Operations: | | | | | | | | | | | | | | | | | | | | | | | | |
Net investment income (1) | | | 0.05 | | | | 0.14 | | | | 0.15 | | | | 0.15 | | | | 0.24 | | | | 0.17 | |
Net realized and unrealized gain (loss) | | | 1.77 | | | | 0.14 | | | | 0.80 | | | | (0.15 | ) | | | 2.97 | | | | (0.37 | ) |
| | | | | | | | | | | | | | | | | | | | | | | | |
Total from investment operations * | | | 1.82 | | | | 0.28 | | | | 0.95 | | | | — | | | | 3.21 | | | | (0.20 | ) |
| | | | | | | | | | | | | | | | | | | | | | | | |
Distributions to shareholders: | | | | | | | | | | | | | | | | | | | | | | | | |
Dividends from net investment income | | | (0.14 | ) | | | (0.25 | ) | | | (0.32 | ) | | | (0.23 | ) | | | (0.18 | ) | | | (0.12 | ) |
Distributions from net realized gains | | | (0.08 | ) | | | (0.18 | ) | | | (0.52 | ) | | | — | | | | — | | | | — | |
| | | | | | | | | | | | | | | | | | | | | | | | |
Total distributions | | | (0.22 | ) | | | (0.43 | ) | | | (0.84 | ) | | | (0.23 | ) | | | (0.18 | ) | | | (0.12 | ) |
| | | | | | | | | | | | | | | | | | | | | | | | |
Change in net asset value for the period | | | 1.60 | | | | (0.15 | ) | | | 0.11 | | | | (0.23 | ) | | | 3.03 | | | | (0.32 | ) |
| | | | | | | | | | | | | | | | | | | | | | | | |
Net asset value, end of period | | $ | 16.04 | | | $ | 14.44 | | | $ | 14.59 | | | $ | 14.48 | | | $ | 14.71 | | | $ | 11.68 | |
| | | | | | | | | | | | | | | | | | | | | | | | |
* Includes redemption fees per share of | | | N/A | | | | N/A | | | $ | 0.00 | (2) | | $ | 0.00 | (2) | | $ | 0.00 | (2) | | $ | 0.00 | (2) |
Total Return | | | 12.8 | %(4) | | | 2.0 | % | | | 7.2 | % | | | (0.0 | )% | | | 27.8 | % | | | (1.6 | )% |
Ratios/supplemental data | | | | | | | | | | | | | | | | | | | | | | | | |
Net assets, end of period (000) | | $ | 752,646 | | | $ | 525,808 | | | $ | 333,762 | | | $ | 237,051 | | | $ | 262,981 | | | $ | 218,793 | |
Ratio to average net assets: | | | | | | | | | | | | | | | | | | | | | | | | |
Expenses before waiver/reimbursement | | | 1.53 | %(5) | | | 1.58 | % | | | 1.57 | % | | | 1.54 | % | | | 1.55 | % | | | 1.56 | % |
Expenses after waiver/reimbursement | | | 1.25 | %(5) | | | 1.25 | % | | | 1.25 | % | | | 1.25 | % | | | 1.30 | %(3) | | | 1.56 | % |
Net investment income before waiver/reimbursement | | | 0.39 | %(5) | | | 0.90 | % | | | 0.71 | % | | | 0.62 | % | | | 1.55 | % | | | 1.53 | % |
Net investment income after waiver/reimbursement | | | 0.67 | %(5) | | | 1.23 | % | | | 1.03 | % | | | 0.91 | % | | | 1.80 | %(3) | | | 1.53 | % |
Portfolio turnover rate | | | 16 | %(4) | | | 26 | % | | | 42 | % | | | 31 | % | | | 37 | % | | | 38 | % |
| (1) | Net investment income per share is calculated using the ending balance prior to consideration or adjustment for permanent book-to-tax differences. |
| (2) | Represents less than $0.01. |
| (3) | Expense waiver of 1.25% was implemented on January 1, 2013. |
The Accompanying Notes are an Integral Part of these Financial Statements.
The Tocqueville Gold Fund
Financial Highlights
| | | | | | | | | | | | | | | | | | | | | | | | |
Per share operating
performance
(For a share outstanding
throughout the period) | | Six Months
Ended
April 30,
2017 | | | Years Ended October 31, | |
| | | 2016 | | | 2015 | | | 2014 | | | 2013 | | | 2012 | |
| | | (unaudited) | | | | | | | | | | | | | | | | |
Net asset value, beginning of period | | $ | 39.32 | | | $ | 26.04 | | | $ | 30.38 | | | $ | 38.01 | | | $ | 72.82 | | | $ | 81.97 | |
| | | | | | | | | | | | | | | | | | | | | | | | |
Operations: | | | | | | | | | | | | | | | | | | | | | | | | |
Net investment loss (1) | | | (0.18 | ) | | | (0.33 | ) | | | (0.27 | ) | | | (0.08 | ) | | | (0.26 | ) | | | (0.35 | ) |
Net realized and unrealized gain (loss) | | | (2.68 | ) | | | 13.61 | | | | (4.07 | ) | | | (7.55 | ) | | | (32.93 | ) | | | (7.47 | ) |
| | | | | | | | | | | | | | | | | | | | | | | | |
Total from investment operations * | | | (2.86 | ) | | | 13.28 | | | | (4.34 | ) | | | (7.63 | ) | | | (33.19 | ) | | | (7.82 | ) |
| | | | | | | | | | | | | | | | | | | | | | | | |
Distributions to shareholders: | | | | | | | | | | | | | | | | | | | | | | | | |
Dividends from net investment income | | | — | | | | — | | | | — | | | | — | | | | — | | | | — | |
Distributions from net realized gains | | | — | | | | — | | | | — | | | | — | | | | (1.62 | ) | | | (1.33 | ) |
| | | | | | | | | | | | | | | | | | | | | | | | |
Total distributions | | | — | | | | — | | | | — | | | | — | | | | (1.62 | ) | | | (1.33 | ) |
| | | | | | | | | | | | | | | | | | | | | | | | |
Change in net asset value for the period | | | (2.86 | ) | | | 13.28 | | | | (4.34 | ) | | | (7.63 | ) | | | (34.81 | ) | | | (9.15 | ) |
| | | | | | | | | | | | | | | | | | | | | | | | |
Net asset value, end of period | | $ | 36.46 | | | $ | 39.32 | | | $ | 26.04 | | | $ | 30.38 | | | $ | 38.01 | | | $ | 72.82 | |
| | | | | | | | | | | | | | | | | | | | | | | | |
* Includes redemption fees per share of | | $ | 0.00 | (2) | | $ | 0.01 | | | $ | 0.01 | | | $ | 0.02 | | | $ | 0.02 | | | $ | 0.02 | |
Total Return | | | (7.3 | )%(3) | | | 51.0 | % | | | (14.3 | )% | | | (20.1 | )% | | | (46.4 | )% | | | (9.5 | )% |
Ratios/supplemental data | | | | | | | | | | | | | | | | | | | | | | | | |
Net assets, end of period (000) | | $ | 1,222,159 | | | $ | 1,365,282 | | | $ | 947,367 | | | $ | 1,138,557 | | | $ | 1,215,081 | | | $ | 2,445,913 | |
Ratio to average net assets: | | | | | | | | | | | | | | | | | | | | | | | | |
Expense | | | 1.39 | %(4) | | | 1.39 | % | | | 1.43 | % | | | 1.36 | % | | | 1.34 | % | | | 1.28 | % |
Net investment loss | | | (0.89 | )%(4) | | | (0.91 | )% | | | (0.84 | )% | | | (0.78 | )% | | | (0.41 | )% | | | (0.56 | )% |
Portfolio turnover rate | | | 8 | %(3) | | | 15 | % | | | 11 | % | | | 10 | % | | | 14 | % | | | 11 | % |
| (1) | Net investment loss per share is calculated using the ending balance prior to consideration or adjustment for permanent book-to-tax differences. |
| (2) | Represents less than $0.01. |
The Accompanying Notes are an Integral Part of these Financial Statements.
The Delafield Fund
Financial Highlights
| | | | | | | | | | | | | | | | | | | | | | | | |
Per share operating
performance
(For a share outstanding
throughout the period) | | Six Months
Ended
April 30,
2017 | | | Years Ended October 31, | |
| | | 2016 | | | 2015 | | | 2014 | | | 2013 | | | 2012 | |
| | | (unaudited) | | | | | | | | | | | | | | | | |
Net asset value, beginning of period | | $ | 26.47 | | | $ | 28.64 | | | $ | 36.40 | | | $ | 37.13 | | | $ | 29.79 | | | $ | 27.21 | |
| | | | | | | | | | | | | | | | | | | | | | | | |
Operations: | | | | | | | | | | | | | | | | | | | | | | | | |
Net investment loss (1) | | | (0.06 | ) | | | (0.15 | ) | | | (0.14 | ) | | | (0.10 | ) | | | (0.05 | ) | | | (0.04 | ) |
Net realized and unrealized gain (loss) | | | 3.82 | | | | 0.78 | | | | (3.99 | ) | | | 0.70 | | | | 9.19 | | | | 2.99 | |
| | | | | | | | | | | | | | | | | | | | | | | | |
Total from investment operations * | | | 3.76 | | | | 0.63 | | | | (4.13 | ) | | | 0.60 | | | | 9.14 | | | | 2.95 | |
| | | | | | | | | | | | | | | | | | | | | | | | |
Distributions to shareholders: | | | | | | | | | | | | | | | | | | | | | | | | |
Dividends from net investment income | | | — | | | | — | | | | — | | | | — | | | | — | | | | — | |
Distributions from net realized gains | | | (4.83 | ) | | | (2.80 | ) | | | (3.63 | ) | | | (1.33 | ) | | | (1.80 | ) | | | (0.37 | ) |
| | | | | | | | | | | | | | | | | | | | | | | | |
Total distributions | | | (4.83 | ) | | | (2.80 | ) | | | (3.63 | ) | | | (1.33 | ) | | | (1.80 | ) | | | (0.37 | ) |
| | | | | | | | | | | | | | | | | | | | | | | | |
Change in net asset value for the period | | | (1.07 | ) | | | (2.17 | ) | | | (7.76 | ) | | | (0.73 | ) | | | 7.34 | | | | 2.58 | |
| | | | | | | | | | | | | | | | | | | | | | | | |
Net asset value, end of period | | $ | 25.40 | | | $ | 26.47 | | | $ | 28.64 | | | $ | 36.40 | | | $ | 37.13 | | | $ | 29.79 | |
| | | | | | | | | | | | | | | | | | | | | | | | |
* Includes redemption fees per share of | | | N/A | | | | N/A | | | $ | 0.00 | (2) | | $ | 0.00 | (2) | | $ | 0.00 | (2) | | $ | 0.00 | (2) |
Total Return | | | 14.5 | %(4) | | | 3.3 | % | | | (12.3 | )% | | | 1.6 | % | | | 32.1 | % | | | 11.0 | % |
Ratios/supplemental data | | | | | | | | | | | | | | | | | | | | | | | | |
Net assets, end of period (000) | | $ | 399,508 | | | $ | 400,827 | | | $ | 674,525 | | | $ | 1,475,139 | | | $ | 1,759,341 | | | $ | 1,346,273 | |
Ratio to average net assets: | | | | | | | | | | | | | | | | | | | | | | | | |
Expenses before waiver/reimbursement | | | 1.32 | %(5) | | | 1.29 | % | | | 1.25 | % | | | 1.21 | % | | | 1.21 | % | | | 1.23 | % |
Expenses after waiver/reimbursement | | | 1.25 | %(3)(5) | | | 1.29 | % | | | 1.25 | % | | | 1.21 | % | | | 1.21 | % | | | 1.23 | % |
Net investment income before waiver/reimbursement | | | (0.38 | )%(5) | | | (0.33 | )% | | | (0.15 | )% | | | (0.24 | )% | | | (0.15 | )% | | | (0.13 | )% |
Net investment income after waiver/reimbursement | | | (0.45 | )%(3)(5) | | | (0.33 | )% | | | (0.15 | )% | | | (0.24 | )% | | | (0.15 | )% | | | (0.13 | )% |
Portfolio turnover rate | | | 19 | %(4) | | | 39 | % | | | 19 | % | | | 34 | % | | | 34 | % | | | 49 | % |
| (1) | Net investment loss per share is calculated using the ending balance prior to consideration or adjustment for permanent book-to-tax differences. |
| (2) | Represents less than $0.01. |
| (3) | Expense waiver of 1.25% was implemented on November 1, 2016. |
The Accompanying Notes are an Integral Part of these Financial Statements.
Tocqueville Select Fund
Financial Highlights
| | | | | | | | | | | | | | | | | | | | | | | | |
Per share operating
performance
(For a share outstanding
throughout the period) | | Six Months
Ended
April 30,
2017 | | | Years Ended October 31, | |
| | | 2016 | | | 2015 | | | 2014 | | | 2013 | | | 2012 | |
| | | (unaudited) | | | | | | | | | | | | | | | | |
Net asset value, beginning of period | | $ | 11.43 | | | $ | 12.08 | | | $ | 14.90 | | | $ | 15.57 | | | $ | 11.35 | | | $ | 11.06 | |
| | | | | | | | | | | | | | | | | | | | | | | | |
Operations: | | | | | | | | | | | | | | | | | | | | | | | | |
Net investment loss (1) | | | (0.02 | ) | | | (0.07 | ) | | | (0.08 | ) | | | (0.07 | ) | | | (0.06 | ) | | | (0.04 | ) |
Net realized and unrealized gain (loss) | | | 1.31 | | | | (0.18 | ) | | | (1.00 | ) | | | 0.94 | | | | 4.79 | | | | 0.44 | |
| | | | | | | | | | | | | | | | | | | | | | | | |
Total from investment operations * | | | 1.29 | | | | (0.25 | ) | | | (1.08 | ) | | | 0.87 | | | | 4.73 | | | | 0.40 | |
| | | | | | | | | | | | | | | | | | | | | | | | |
Distributions to shareholders: | | | | | | | | | | | | | | | | | | | | | | | | |
Dividends from net investment income | | | — | | | | — | | | | — | | | | — | | | | — | | | | — | |
Distributions from net realized gains | | | (0.62 | ) | | | (0.40 | ) | | | (1.74 | ) | | | (1.54 | ) | | | (0.51 | ) | | | (0.11 | ) |
| | | | | | | | | | | | | | | | | | | | | | | | |
Total distributions | | | (0.62 | ) | | | (0.40 | ) | | | (1.74 | ) | | | (1.54 | ) | | | (0.51 | ) | | | (0.11 | ) |
| | | | | | | | | | | | | | | | | | | | | | | | |
Change in net asset value for the period | | | 0.67 | | | | (0.65 | ) | | | (2.82 | ) | | | (0.67 | ) | | | 4.22 | | | | 0.29 | |
| | | | | | | | | | | | | | | | | | | | | | | | |
Net asset value, end of period | | $ | 12.10 | | | $ | 11.43 | | | $ | 12.08 | | | $ | 14.90 | | | $ | 15.57 | | | $ | 11.35 | |
| | | | | | | | | | | | | | | | | | | | | | | | |
* Includes redemption fees per share of | | | N/A | | | | N/A | | | $ | 0.00 | (2) | | $ | 0.00 | (2) | | $ | 0.00 | (2) | | $ | 0.00 | (2) |
Total Return | | | 11.0 | %(4) | | | (1.9 | )% | | | (8.0 | )% | | | 6.1 | % | | | 43.2 | % | | | 3.7 | % |
Ratios/supplemental data | | | | | | | | | | | | | | | | | | | | | | | | |
Net assets, end of period (000) | | $ | 59,783 | | | $ | 63,812 | | | $ | 81,813 | | | $ | 108,060 | | | $ | 99,888 | | | $ | 84,549 | |
Ratio to average net assets: | | | | | | | | | | | | | | | | | | | | | | | | |
Expenses before waiver/reimbursement | | | 1.37 | %(5) | | | 1.37 | % | | | 1.36 | % | | | 1.32 | % | | | 1.34 | % | | | 1.37 | % |
Expenses after waiver/reimbursement | | | 1.25 | %(3)(5) | | | 1.37 | % | | | 1.36 | % | | | 1.32 | % | | | 1.34 | % | | | 1.37 | % |
Net investment income before waiver/reimbursement | | | (0.42 | )%(5) | | | (0.45 | )% | | | (0.52 | )% | | | (0.50 | )% | | | (0.39 | )% | | | (0.36 | )% |
Net investment income after waiver/reimbursement | | | (0.30 | )%(3)(5) | | | (0.45 | )% | | | (0.52 | )% | | | (0.50 | )% | | | (0.39 | )% | | | (0.36 | )% |
Portfolio turnover rate | | | 11 | %(4) | | | 32 | % | | | 43 | % | | | 32 | % | | | 28 | % | | | 31 | % |
| (1) | Net investment loss per share is calculated using the ending balance prior to consideration or adjustment for permanent book-to-tax differences. |
| (2) | Represents less than $0.01. |
| (3) | Expense waiver of 1.25% was implemented on November 1, 2016. |
The Accompanying Notes are an Integral Part of these Financial Statements.
The Tocqueville Fund
Schedule of Investments as of April 30, 2017
(Unaudited)
| | | | | | | | |
| Common Stocks—96.6% | | Shares | | | Value | |
Automobiles & Components—1.4% | |
Ford Motor Co. | | | 350,000 | | | $ | 4,014,500 | |
Banks—1.3% | | | | | | | | |
Bank of America Corp. | | | 100,000 | | | | 2,334,000 | |
Signature Bank(a) | | | 10,000 | | | | 1,384,500 | |
| | | | | | | | 3,718,500 | |
Capital Goods—10.5% | | | | | | | | |
Arconic, Inc. | | | 150,000 | | | | 4,099,500 | |
Caterpillar, Inc. | | | 25,000 | | | | 2,556,500 | |
General Electric Co. | | | 300,000 | | | | 8,697,000 | |
Illinois Tool Works, Inc. | | | 40,000 | | | | 5,523,600 | |
Snap-on, Inc. | | | 10,000 | | | | 1,675,300 | |
The Boeing Co. | | | 40,000 | | | | 7,393,200 | |
| | | | | | | | 29,945,100 | |
Commercial & Professional Services—1.2% | |
Steelcase, Inc.—Class A | | | 200,000 | | | | 3,410,000 | |
Consumer Services—2.0% | | | | | | | | |
McDonald’s Corp. | | | 40,000 | | | | 5,597,200 | |
Diversified Financials—4.0% | | | | | | | | |
Lazard Ltd.—Class A(b) | | | 100,000 | | | | 4,294,000 | |
The Bank of New York Mellon Corp. | | | 150,000 | | | | 7,059,000 | |
| | | | | | | | 11,353,000 | |
Energy—5.9% | | | | | | | | |
Exxon Mobil Corp. | | | 100,000 | | | | 8,165,000 | |
Noble Energy, Inc. | | | 100,000 | | | | 3,233,000 | |
Schlumberger Ltd.(b) | | | 75,000 | | | | 5,444,250 | |
| | | | | | | | 16,842,250 | |
Food & Staples Retailing—2.6% | |
Wal-Mart Stores, Inc. | | | 100,000 | | | | 7,518,000 | |
Food, Beverage & Tobacco—3.8% | |
Campbell Soup Co. | | | 75,000 | | | | 4,315,500 | |
The Coca-Cola Co. | | | 150,000 | | | | 6,472,500 | |
| | | | | | | | 10,788,000 | |
Health Care Equipment & Services—0.8% | |
Abbott Laboratories | | | 50,000 | | | | 2,182,000 | |
Household & Personal Products—5.6% | |
Colgate-Palmolive Co. | | | 100,000 | | | | 7,204,000 | |
The Procter & Gamble Co. | | | 100,000 | | | | 8,733,000 | |
| | | | | | | | 15,937,000 | |
Insurance—2.4% | | | | | | | | |
Aflac, Inc. | | | 50,000 | | | $ | 3,744,000 | |
XL Group Ltd.(b) | | | 75,000 | | | | 3,138,750 | |
| | | | | | | | 6,882,750 | |
Materials—7.1% | | | | | | | | |
Alcoa Corp. | | | 100,000 | | | | 3,373,000 | |
BHP Billiton Ltd.—ADR(b) | | | 50,000 | | | | 1,780,000 | |
EI du Pont de Nemours & Co. | | | 100,000 | | | | 7,975,000 | |
Goldcorp, Inc.(b) | | | 100,000 | | | | 1,396,000 | |
Sonoco Products Co. | | | 75,000 | | | | 3,923,250 | |
U.S. Concrete, Inc.(a) | | | 30,000 | | | | 1,860,000 | |
| | | | | | | | 20,307,250 | |
Media—1.1% | | | | | | | | |
The Interpublic Group of Companies, Inc. | | | 1,536 | | | | 36,203 | |
The Walt Disney Co. | | | 27,500 | | | | 3,179,000 | |
| | | | | | | | 3,215,203 | |
Pharmaceuticals, Biotechnology & Life Sciences—12.5% | |
Alkermes PLC(a)(b) | | | 75,000 | | | | 4,368,750 | |
Biogen, Inc.(a) | | | 5,000 | | | | 1,356,050 | |
Ionis Pharmaceuticals, Inc.(a) | | | 100,000 | | | | 4,819,000 | |
Johnson & Johnson | | | 75,000 | | | | 9,260,250 | |
Merck & Co., Inc. | | | 145,000 | | | | 9,037,850 | |
Pfizer, Inc. | | | 200,000 | | | | 6,784,000 | |
| | | | | | | | 35,625,900 | |
Retailing—4.2% | | | | | | | | |
Amazon.com, Inc.(a) | | | 10,000 | | | | 9,249,900 | |
Williams-Sonoma, Inc. | | | 50,000 | | | | 2,702,500 | |
| | | | | | | | 11,952,400 | |
Semiconductors & Semiconductor Equipment—7.4% | |
Applied Materials, Inc. | | | 225,000 | | | | 9,137,250 | |
Intel Corp. | | | 200,000 | | | | 7,230,000 | |
QUALCOMM, Inc. | | | 90,000 | | | | 4,836,600 | |
| | | | | | | | 21,203,850 | |
Software & Services—11.8% | |
Alphabet, Inc.—Class A(a) | | | 7,000 | | | | 6,471,640 | |
Automatic Data Processing, Inc. | | | 90,000 | | | | 9,404,100 | |
The Accompanying Footnotes are an Integral Part of these Financial Statements.
The Tocqueville Fund
Schedule of Investments as of April 30, 2017
(Unaudited)
| | | | | | | | |
| Common Stocks—96.6% | | Shares | | | Value | |
Facebook, Inc.—Class A(a) | | | 50,000 | | | $ | 7,512,500 | |
Microsoft Corp. | | | 150,000 | | | | 10,269,000 | |
| | | | | | | | 33,657,240 | |
Technology Hardware & Equipment—3.0% | |
Apple, Inc. | | | 50,000 | | | | 7,182,500 | |
Bio-key International, Inc. (a)(c)(d)(e) (Originally acquired 09/16/2005, Cost $0) | | | 1,963 | | | | — | |
Diebold Nixdorf, Inc. | | | 50,000 | | | | 1,410,000 | |
Palo Alto Networks, Inc. (a) | | | 1,300 | | | | 140,933 | |
| | | | | | | | 8,733,433 | |
Telecommunication Services—1.6% | |
Verizon Communications, Inc. | | | 100,000 | | | | 4,591,000 | |
Transportation—2.9% | | | | | | | | |
Delta Air Lines, Inc. | | | 150,000 | | | | 6,816,000 | |
Kansas City Southern | | | 15,000 | | | | 1,351,050 | |
| | | | | | | | 8,167,050 | |
Utilities—3.5% | | | | | | | | |
NextEra Energy, Inc. | | | 75,000 | | | | 10,017,000 | |
Total Common Stocks (Cost $148,300,236) | | | | | | | 275,658,626 | |
Preferred Stock—0.0% | | | | | | | | |
Health Care Equipment & Supplies—0.0% | |
Zymequest, Inc.(a)(c)(d)(e) (Originally acquired 10/13/2016, Cost $0) | | | 400,000 | | | | 1,600 | |
Total Preferred Stock (Cost $—) | | | | | | | 1,600 | |
Real Estate Investment Trust (REIT)—2.4% | |
Real Estate—2.4% | | | | | | | | |
Weyerhaeuser Co. | | | 200,000 | | | | 6,774,000 | |
Total Real Estate Investment Trust
(Cost $3,645,641) | | | | | | | 6,774,000 | |
Exchange-Traded Fund (ETF)—1.0% | |
Metals & Mining—1.0% | | | | | | | | |
SPDR S&P Metals & Mining ETF | | | 100,000 | | | | 2,980,000 | |
Total Exchange-Traded Fund
(Cost $1,495,845) | | | | | | | 2,980,000 | |
Money Market Fund—0.0% | | | | | |
STIT-Treasury Portfolio—Institutional Class, 0.620%(f) | | | 916 | | | $ | 916 | |
Total Short-Term Investment
(Cost $916) | | | | | | | 916 | |
Total Investments
(Cost $153,442,638)—100.0% | | | | 285,415,142 | |
Liabilities in Excess of Other Assets—0.0% | | | | (73,176 | ) |
Total Net Assets—100.0% | | | | | | $ | 285,341,966 | |
| | | | | | | | |
Percentages are stated as a percent of net assets.
| (a) | Non-income producing security. |
| (b) | Foreign issued security. Foreign concentration (including ADR’s) was as follows: Australia 0.6%; Bermuda 2.6%; Canada 0.5%; Curacao 1.9%; Ireland 1.5%. |
| (c) | Denotes a security that is either fully or partially restricted to resale. The aggregate value of restricted securities as of April 30, 2017 was $0 which represented 0.0% of net assets. |
| (d) | Security is fair valued using procedures approved by the Board of Trustees. The aggregate value of fair valued securities as of April 30, 2017 was $0 which represented 0.0% of net assets. |
| (e) | Security is considered illiquid and may be difficult to sell. |
| (f) | Rate listed is the 7-day effective yield. |
The Global Industry Classification Standard (GICS®) was developed by and/or is the exclusive property of MSCI, Inc. and Standard & Poor Financial Services LLC (“S&P”). GICS is a service mark of MSCI and S&P and has been licensed for use by U.S. Bancorp Fund Services, LLC.
The Accompanying Footnotes are an Integral Part of these Financial Statements.
The Tocqueville Opportunity Fund
Schedule of Investments as of April 30, 2017
(Unaudited)
| | | | | | | | |
| Common Stocks—101.8% | | Shares | | | Value | |
Automobiles & Components—0.8% | |
Adient PLC(a) | | | 3,000 | | | $ | 220,680 | |
Lear Corp. | | | 1,000 | | | | 142,660 | |
Tesla, Inc.(b) | | | 500 | | | | 157,035 | |
Thor Industries, Inc. | | | 500 | | | | 48,090 | |
| | | | | | | | 568,465 | |
Banks—4.5% | |
Bank of the Ozarks, Inc. | | | 7,000 | | | | 332,290 | |
Commerce Bancshares, Inc. | | | 4,000 | | | | 219,800 | |
Customers Bancorp, Inc.(b) | | | 3,500 | | | | 108,255 | |
Enterprise Financial Services Corp. | | | 13,000 | | | | 549,250 | |
First Financial Bankshares, Inc. | | | 2,500 | | | | 99,875 | |
Home BancShares, Inc. | | | 10,000 | | | | 254,500 | |
IBERIABANK Corp. | | | 3,000 | | | | 238,050 | |
Pinnacle Financial Partners, Inc. | | | 10,000 | | | | 640,000 | |
Signature Bank(b) | | | 500 | | | | 69,225 | |
South State Corp. | | | 1,000 | | | | 88,150 | |
Sterling Bancorp | | | 6,500 | | | | 151,125 | |
SVB Financial Group(b) | | | 2,500 | | | | 439,850 | |
| | | | | | | | 3,190,370 | |
Capital Goods—9.7% | |
Acuity Brands, Inc. | | | 500 | | | | 88,050 | |
AO Smith Corp. | | | 10,000 | | | | 538,800 | |
Donaldson Co., Inc. | | | 5,000 | | | | 231,400 | |
Dycom Industries, Inc.(b) | | | 2,000 | | | | 211,320 | |
Esterline Technologies Corp.(b) | | | 2,000 | | | | 182,900 | |
Fortune Brands Home & Security, Inc. | | | 5,500 | | | | 350,570 | |
Granite Construction, Inc. | | | 1,500 | | | | 79,065 | |
HD Supply Holdings, Inc.(b) | | | 1,500 | | | | 60,450 | |
HEICO Corp. | | | 1,875 | | | | 133,256 | |
Hexcel Corp. | | | 5,500 | | | | 284,625 | |
Hubbell, Inc. | | | 1,700 | | | | 192,321 | |
IDEX Corp. | | | 2,500 | | | | 261,900 | |
Lennox International, Inc. | | | 3,200 | | | | 529,248 | |
Lincoln Electric Holdings, Inc. | | | 1,500 | | | | 133,545 | |
Masonite International Corp.(a)(b) | | | 500 | | | | 41,600 | |
MasTec, Inc.(b) | | | 3,000 | | | | 132,450 | |
Nordson Corp. | | | 4,000 | | | | 500,800 | |
Quanta Services, Inc.(b) | | | 2,000 | | | | 70,880 | |
RBC Bearings, Inc.(b) | | | 2,500 | | | | 250,750 | |
SiteOne Landscape Supply, Inc.(b) | | | 11,000 | | | | 525,910 | |
Snap-on, Inc. | | | 700 | | | | 117,271 | |
Spirit AeroSystems Holdings, Inc.—Class A | | | 4,000 | | | | 228,640 | |
The Middleby Corp.(b) | | | 2,000 | | | | 272,260 | |
United Rentals, Inc.(b) | | | 3,000 | | | | 328,980 | |
WABCO Holdings, Inc.(b) | | | 3,000 | | | | 356,610 | |
Wabtec Corp. | | | 500 | | | | 41,945 | |
Watsco, Inc. | | | 3,500 | | | | 485,800 | |
Welbilt, Inc.(b) | | | 7,000 | | | | 143,500 | |
Woodward, Inc. | | | 2,500 | | | | 169,175 | |
| | | | | | | | 6,944,021 | |
Commercial & Professional Services—0.3% | |
Copart, Inc.(b) | | | 5,400 | | | | 166,860 | |
Equifax, Inc. | | | 500 | | | | 67,655 | |
| | | | | | | | 234,515 | |
Consumer Durables & Apparel—0.5% | |
Cavco Industries, Inc.(b) | | | 500 | | | | 59,375 | |
Leggett & Platt, Inc. | | | 3,000 | | | | 157,620 | |
Mohawk Industries, Inc.(b) | | | 500 | | | | 117,395 | |
| | | | | | | | 334,390 | |
Consumer Services—0.8% | |
Domino’s Pizza, Inc. | | | 1,500 | | | | 272,085 | |
Restaurant Brands International LP(a) | | | 37 | | | | 2,095 | |
Vail Resorts, Inc. | | | 1,500 | | | | 296,490 | |
| | | | | | | | 570,670 | |
Diversified Financials—0.6% | |
CBOE Holdings, Inc. | | | 3,000 | | | | 247,230 | |
FactSet Research Systems, Inc. | | | 800 | | | | 130,608 | |
MSCI, Inc. | | | 500 | | | | 50,160 | |
Silver Run Acquisition Corp. II(b) | | | 7,000 | | | | 72,310 | |
| | | | | | | | 500,308 | |
Energy—0.0% | |
US Silica Holdings, Inc. | | | 500 | | | | 20,750 | |
Food, Beverage & Tobacco—0.1% | |
Calbee, Inc.(a) | | | 1,000 | | | | 34,896 | |
Monster Beverage Corp.(b) | | | 500 | | | | 22,690 | |
| | | | | | | | 57,586 | |
The Accompanying Notes are an Integral Part of these Financial Statements.
The Tocqueville Opportunity Fund
Schedule of Investments as of April 30, 2017
(Unaudited)
| | | | | | | | |
| Common Stocks—101.8% | | Shares | | | Value | |
Health Care Equipment & Services—3.0% | |
ABIOMED, Inc.(b) | | | 500 | | | $ | 65,160 | |
Align Technology, Inc.(b) | | | 1,500 | | | | 201,930 | |
Cardiovascular Systems, Inc.(b) | | | 4,500 | | | | 134,415 | |
DexCom, Inc.(b) | | | 3,000 | | | | 233,880 | |
Glaukos Corp.(b) | | | 9,500 | | | | 451,535 | |
IDEXX Laboratories, Inc.(b) | | | 2,500 | | | | 419,325 | |
K2M Group Holdings, Inc.(b) | | | 16,000 | | | | 354,400 | |
Teleflex, Inc. | | | 1,000 | | | | 206,890 | |
Wright Medical Group NV(a)(b) | | | 1,500 | | | | 45,585 | |
| | | | | | | | 2,113,120 | |
Materials—2.6% | |
AptarGroup, Inc. | | | 1,500 | | | | 120,450 | |
Axalta Coating Systems Ltd.(a)(b) | | | 500 | | | | 15,685 | |
Berry Global Group, Inc.(b) | | | 4,000 | | | | 200,000 | |
Eagle Materials, Inc. | | | 3,000 | | | | 287,910 | |
GCP Applied Technologies, Inc.(b) | | | 2,500 | | | | 82,250 | |
Martin Marietta Materials, Inc. | | | 2,500 | | | | 550,475 | |
Packaging Corp. of America | | | 3,500 | | | | 345,730 | |
RPM International, Inc. | | | 1,500 | | | | 78,840 | |
Sealed Air Corp. | | | 1,000 | | | | 44,020 | |
U.S. Concrete, Inc.(b) | | | 1,500 | | | | 93,000 | |
Worthington Industries, Inc. | | | 1,500 | | | | 65,250 | |
| | | | | | | | 1,883,610 | |
Media—0.2% | |
Liberty Media Corp—Liberty SiriusXM—Class C(b) | | | 1,000 | | | | 37,990 | |
Scripps Networks Interactive, Inc.—Class A | | | 1,000 | | | | 74,720 | |
| | | | | | | | 112,710 | |
Pharmaceuticals, Biotechnology & Life Sciences—33.3% | |
ACADIA Pharmaceuticals, Inc.(b) | | | 15,000 | | | | 514,950 | |
Aclaris Therapeutics, Inc.(b) | | | 6,000 | | | | 168,660 | |
Advaxis, Inc.(b) | | | 20,000 | | | | 171,200 | |
Aerie Pharmaceuticals, Inc.(b) | | | 45,000 | | | | 1,982,250 | |
Affimed NV(a)(b) | | | 4,500 | | | | 10,125 | |
Agios Pharmaceuticals, Inc.(b) | | | 500 | | | | 24,855 | |
Alder Biopharmaceuticals, Inc.(b) | | | 1,500 | | | | 30,075 | |
Alkermes PLC(a)(b) | | | 4,500 | | | | 262,125 | |
Alnylam Pharmaceuticals, Inc.(b) | | | 12,000 | | | | 643,200 | |
Avexis, Inc.(b) | | | 1,500 | | | | 120,750 | |
Axovant Sciences Ltd(a)(b) | | | 1,000 | | | | 24,240 | |
Bellicum Pharmaceuticals, Inc.(b) | | | 1,000 | | | | 13,370 | |
Bluebird Bio, Inc.(b) | | | 21,500 | | | | 1,912,425 | |
Cellectis SA—ADR(a)(b) | | | 500 | | | | 12,055 | |
Clovis Oncology, Inc. (b) | | | 15,500 | | | | 897,295 | |
DBV Technologies SA—ADR(a)(b) | | | 7,500 | | | | 264,975 | |
Dermira, Inc.(b) | | | 7,500 | | | | 255,450 | |
Fate Therapeutics, Inc.(b) | | | 15,000 | | | | 68,850 | |
Five Prime Therapeutics, Inc.(b) | | | 3,000 | | | | 104,580 | |
Forward Pharma A/S—ADR(a)(b) | | | 1,000 | | | | 19,730 | |
Genfit (a)(b) | | | 500 | | | | 17,293 | |
Genmab A/S(a)(b) | | | 8,500 | | | | 1,690,477 | |
GW Pharmaceuticals PLC—ADR(a)(b) | | | 11,000 | | | | 1,306,030 | |
Incyte Corp.(b) | | | 19,500 | | | | 2,423,460 | |
Inovio Pharmaceuticals, Inc.(b) | | | 1,000 | | | | 6,290 | |
Intra-Cellular Therapies, Inc.(b) | | | 4,000 | | | | 55,280 | |
Ionis Pharmaceuticals, Inc.(b) | | | 500 | | | | 24,095 | |
Kite Pharma, Inc.(b) | | | 15,000 | | | | 1,231,200 | |
La Jolla Pharmaceutical Co.(b) | | | 1,500 | | | | 43,500 | |
Lion Biotechnologies, Inc.(b) | | | 23,000 | | | | 157,550 | |
Mettler-Toledo International, Inc.(b) | | | 500 | | | | 256,710 | |
Neurocrine Biosciences, Inc.(b) | | | 5,500 | | | | 293,700 | |
Portola Pharmaceuticals, Inc.(b) | | | 3,500 | | | | 139,965 | |
Sage Therapeutics, Inc.(b) | | | 35,000 | | | | 2,485,000 | |
Sarepta Therapeutics, Inc.(b) | | | 1,500 | | | | 54,390 | |
Seattle Genetics, Inc.(b) | | | 16,000 | | | | 1,092,800 | |
Spark Therapeutics, Inc.(b) | | | 33,000 | | | | 1,913,010 | |
TESARO, Inc.(b) | | | 19,000 | | | | 2,804,210 | |
Ultragenyx Pharmaceutical, Inc.(b) | | | 500 | | | | 32,195 | |
Xencor, Inc.(b) | | | 11,500 | | | | 295,205 | |
| | | | | | | | 23,823,520 | |
The Accompanying Footnotes are an Integral Part of these Financial Statements.
The Tocqueville Opportunity Fund
Schedule of Investments as of April 30, 2017
(Unaudited)
| | | | | | | | |
| Common Stocks—101.8% | | Shares | | | Value | |
Retailing—0.8% | |
Pool Corp. | | | 2,500 | | | $ | 299,050 | |
Ulta Beauty, Inc.(b) | | | 1,000 | | | | 281,440 | |
| | | | | | | | 580,490 | |
Semiconductors & Semiconductor Equipment—11.0% | |
Advanced Micro Devices, Inc.(b) | | | 20,000 | | | | 266,000 | |
Ambarella, Inc.(a)(b) | | | 500 | | | | 28,110 | |
ams AG(a) | | | 10,500 | | | | 675,377 | |
Analog Devices, Inc. | | | 3,000 | | | | 228,600 | |
Broadcom Ltd.(a) | | | 2,000 | | | | 441,620 | |
Cavium, Inc.(b) | | | 4,000 | | | | 275,400 | |
Impinj, Inc.(b) | | | 18,000 | | | | 674,640 | |
Inphi Corp.(b) | | | 32,500 | | | | 1,346,150 | |
MACOM Technology Solutions Holdings, Inc.(b) | | | 5,000 | | | | 244,400 | |
Micron Technology, Inc.(b) | | | 23,000 | | | | 636,410 | |
NVIDIA Corp. | | | 19,500 | | | | 2,033,850 | |
Skyworks Solutions, Inc. | | | 2,500 | | | | 249,350 | |
Xilinx, Inc. | | | 12,500 | | | | 788,875 | |
| | | | | | | | 7,888,782 | |
Software & Services—22.7% | |
Activision Blizzard, Inc. | | | 2,500 | | | | 130,625 | |
Adobe Systems, Inc.(b) | | | 6,500 | | | | 869,310 | |
ANSYS, Inc.(b) | | | 1,000 | | | | 110,160 | |
Aspen Technology, Inc.(b) | | | 6,000 | | | | 368,940 | |
Barracuda Networks, Inc.(b) | | | 500 | | | | 10,165 | |
Broadridge Financial Solutions, Inc. | | | 500 | | | | 34,970 | |
Cadence Design Systems, Inc.(b) | | | 5,000 | | | | 162,850 | |
Cornerstone OnDemand, Inc.(b) | | | 2,500 | | | | 98,200 | |
CoStar Group, Inc.(b) | | | 200 | | | | 48,178 | |
Electronic Arts, Inc.(b) | | | 500 | | | | 47,410 | |
EPAM Systems, Inc.(b) | | | 2,000 | | | | 154,000 | |
Euronet Worldwide, Inc.(b) | | | 2,000 | | | | 165,240 | |
Fair Isaac Corp. | | | 2,500 | | | | 338,700 | |
FleetCor Technologies, Inc.(b) | | | 500 | | | | 70,570 | |
Fortinet, Inc.(b) | | | 3,500 | | | | 136,500 | |
Gartner, Inc.(b) | | | 1,000 | | | | 114,090 | |
Global Payments, Inc. | | | 3,500 | | | | 286,160 | |
Guidewire Software, Inc.(b) | | | 1,500 | | | | 92,235 | |
Manhattan Associates, Inc.(b) | | | 700 | | | | 32,683 | |
New Relic, Inc.(b) | | | 40,000 | | | | 1,599,200 | |
Paycom Software, Inc.(b) | | | 15,000 | | | | 903,750 | |
Paylocity Holding Corp.(b) | | | 45,000 | | | | 1,774,800 | |
Proofpoint, Inc.(b) | | | 24,000 | | | | 1,808,880 | |
PTC, Inc.(b) | | | 1,500 | | | | 81,075 | |
ServiceNow, Inc.(b) | | | 22,000 | | | | 2,078,560 | |
Shopify, Inc.—Class A(a)(b) | | | 15,000 | | | | 1,139,250 | |
Splunk, Inc.(b) | | | 10,500 | | | | 675,255 | |
SS&C Technologies Holdings, Inc. | | | 2,000 | | | | 73,480 | |
Tableau Software, Inc.—Class A(b) | | | 1,000 | | | | 53,680 | |
The Ultimate Software Group, Inc.(b) | | | 2,800 | | | | 567,476 | |
Total System Services, Inc. | | | 2,000 | | | | 114,620 | |
Tyler Technologies, Inc.(b) | | | 1,500 | | | | 245,385 | |
Vantiv, Inc.—Class A(b) | | | 6,500 | | | | 403,260 | |
Workday, Inc.—Class A(b) | | | 16,000 | | | | 1,398,400 | |
Zillow Group, Inc.—Class A(b) | | | 2,001 | | | | 77,018 | |
| | | | | | | | 16,265,075 | |
Technology Hardware & Equipment—10.1% | |
Acacia Communications, Inc.(b) | | | 3,000 | | | | 137,520 | |
Ciena Corp.(b) | | | 5,500 | | | | 126,005 | |
Fabrinet(a)(b) | | | 13,500 | | | | 468,045 | |
Finisar Corp.(b) | | | 47,500 | | | | 1,084,900 | |
II-VI, Inc.(b) | | | 6,500 | | | | 215,475 | |
Lumentum Holdings, Inc.(b) | | | 29,000 | | | | 1,239,750 | |
Oclaro, Inc.(b) | | | 240,000 | | | | 1,922,400 | |
Viavi Solutions, Inc.(b) | | | 50,000 | | | | 500,000 | |
Western Digital Corp. | | | 17,000 | | | | 1,514,190 | |
| | | | | | | | 7,208,285 | |
Transportation—0.8% | |
Alaska Air Group, Inc. | | | 3,500 | | | | 297,815 | |
Hawaiian Holdings, Inc.(b) | | | 2,500 | | | | 135,750 | |
Old Dominion Freight Line, Inc. | | | 800 | | | | 70,816 | |
Spirit Airlines, Inc.(b) | | | 1,000 | | | | 57,270 | |
| | | | | | | | 561,651 | |
Total Common Stocks
(Cost $59,548,660) | | | | | | | 72,858,318 | |
The Accompanying Footnotes are an Integral Part of these Financial Statements.
The Tocqueville Opportunity Fund
Schedule of Investments as of April 30, 2017
(Unaudited)
| | | | | | | | |
Real Estate Investment Trust
(REIT)—0.0% | | Shares | | | Value | |
Real Estate—0.0% | |
Equinix, Inc. | | | 1 | | | $ | 418 | |
Total Real Estate Investment Trust
(Cost $297) | | | | | | | 418 | |
Exchange-Traded Funds (ETFs)—0.2% | |
Funds, Trusts, and Other Financial Vehicles—0.2% | |
Direxion Daily Financial Bull 3X Shares(b) | | | 1,500 | | | | 66,150 | |
SPDR S&P Regional Banking ETF | | | 1,000 | | | | 54,050 | |
Total Exchange-Traded Funds
(Cost $119,316) | | | | | | | 120,200 | |
Purchased Call
Options—1.0% | | Contracts | | | | |
Banks—0.1% | |
Bank of America Corp. Expiration: November 2017, Exercise Price $26.00(b) | | | 450 | | | | 32,850 | |
Wells Fargo & Co. Expiration: June 2017, Exercise Price $57.50(b) | | | 800 | | | | 18,400 | |
| | | | | | | | 51,250 | |
Diversified Financials—0.0% | |
Synchrony Financial Expiration: September 2017, Exercise Price $37.00(b) | | | 300 | | | | 9,000 | |
Pharmaceuticals, Biotechnology & Life Sciences—0.4% | |
Bristol-Myers Squibb Co. Expiration: September 2017, Exercise Price $60.00(b) | | | 400 | | | | 62,000 | |
Kite Pharma, Inc.
Expiration: July 2017, Exercise Price $50.00(b) | | | 75 | | | | 240,375 | |
| | | | | | | | 302,375 | |
Retailing—0.1% | |
Netflix, Inc. Expiration: September 2017, Exercise Price $150.00(b) | | | 50 | | | | 64,000 | |
Technology Hardware & Equipment—0.2% | |
Apple, Inc.
Expiration: November 2017, Exercise Price $145.00(b) | | | 200 | | | | 159,000 | |
Transportation—0.2% | |
American Airlines Group, Inc. Expiration: August 2017, Exercise Price $45.00(b) | | | 400 | | | | 76,400 | |
Delta Air Lines, Inc. Expiration: June 2017, Exercise Price $50.00(b) | | | 1,500 | | | | 45,000 | |
| | | | | | | | 121,400 | |
Total Purchased Call Options
(Cost $965,006) | | | | | | | 707,025 | |
Short-Term
Investment—0.0% | | Shares | | | | |
Money Market Fund—0.0% | |
STIT-Treasury Portfolio—Institutional Class, 0.620%(c) | | | 200 | | | | 200 | |
Total Short-Term Investment
(Cost $200) | | | | 200 | |
Total Investments
(Cost $60,633,479)—103.0% | | | | 73,686,161 | |
Liabilities in Excess of Other Assets—(3.0)% | | | | (2,108,478 | ) |
Total Net Assets—100.0% | | | | | | $ | 71,577,683 | |
| | | | | | | | |
Percentages are stated as a percent of net assets.
| ADR | American Depository Receipt |
| (a) | Foreign issued security. Foreign concentration (including ADR’s) was as follows: Austria 0.9%; Bermuda 0.1%; Canada 1.6%; Cayman Islands 0.7% Denmark 2.4%; France 0.4%; Ireland 0.7%; Japan 0.0%; Netherlands 0.1%; United Kingdom 1.8%; Singapore 0.6%. |
| (b) | Non-income producing security. |
| (c) | Rate listed is the 7-day effective yield. |
The Accompanying Footnotes are an Integral Part of these Financial Statements.
The Tocqueville International Value Fund
Schedule of Investments as of April 30, 2017
(Unaudited)
| | | | | | | | |
| Common Stocks—84.6% | | Shares | | | Value | |
Australia—1.2% | | | | | | | | |
BHP Billiton Ltd.—ADR | | | 225,000 | | | $ | 8,010,000 | |
Spotless Group Holdings Ltd. | | | 1,612,490 | | | | 1,302,806 | |
| | | | | | | | 9,312,806 | |
Belgium—2.2% | | | | | | | | |
Groupe Bruxelles Lambert SA | | | 172,500 | | | | 16,545,929 | |
Brazil—1.0% | | | | | | | | |
Ambev SA—ADR | | | 1,375,000 | | | | 7,878,750 | |
Canada—2.5% | | | | | | | | |
Goldcorp, Inc. | | | 635,050 | | | | 8,865,298 | |
Potash Corp of Saskatchewan, Inc. | | | 571,860 | | | | 9,652,997 | |
| | | | | | | | 18,518,295 | |
Cayman Islands—0.9% | | | | | | | | |
Greatview Aseptic Packaging Co., Ltd. | | | 13,680,500 | | | | 7,082,911 | |
Denmark—2.2% | | | | | | | | |
ISS A/S | | | 391,989 | | | | 16,259,796 | |
Finland—1.6% | | | | | | | | |
Nokia OYJ—ADR | | | 2,100,000 | | | | 12,033,000 | |
France—15.1% | | | | | | | | |
Bollore SA | | | 3,406,550 | | | | 13,861,028 | |
Bureau Veritas SA | | | 480,000 | | | | 11,121,788 | |
Cie de Saint-Gobain | | | 261,456 | | | | 14,107,363 | |
IPSOS | | | 310,615 | | | | 9,962,709 | |
Publicis Groupe SA | | | 264,900 | | | | 19,124,756 | |
Sanofi | | | 196,030 | | | | 18,523,642 | |
Sopra Steria Group | | | 116,000 | | | | 17,391,836 | |
Zodiac Aerospace | | | 403,989 | | | | 9,807,055 | |
| | | | | | | | 113,900,177 | |
Germany—8.0% | |
Bayer AG | | | 156,850 | | | | 19,407,562 | |
Infineon Technologies AG | | | 635,115 | | | | 13,127,561 | |
Siemens AG—ADR | | | 234,700 | | | | 16,830,102 | |
Wacker Neuson SE | | | 438,519 | | | | 11,078,696 | |
| | | | | | | | 60,443,921 | |
Hong Kong—1.8% | | | | | | | | |
Clear Media Ltd. | | | 9,305,100 | | | $ | 10,288,025 | |
Television Broadcasts Ltd. | | | 868,350 | | | | 3,337,940 | |
| | | | | | | | 13,625,965 | |
Ireland—1.8% | | | | | | | | |
CRH PLC | | | 364,063 | | | | 13,260,680 | |
Japan—14.0% | | | | | | | | |
Amano Corp. | | | 802,400 | | | | 17,137,162 | |
FANUC, Ltd. | | | 75,000 | | | | 15,269,707 | |
Hitachi Ltd. | | | 3,117,440 | | | | 17,221,888 | |
Hoya Corp. | | | 226,400 | | | | 10,820,288 | |
Kao Corp. | | | 192,600 | | | | 10,628,379 | |
Makita Corp. | | | 420,000 | | | | 14,985,468 | |
MISUMI Group, Inc. | | | 266,600 | | | | 5,050,752 | |
SMC Corp. | | | 23,015 | | | | 6,487,100 | |
Toho Co., Ltd. | | | 264,000 | | | | 7,577,565 | |
| | | | | | | | 105,178,309 | |
Netherlands—3.5% | | | | | | | | |
Akzo Nobel NV | | | 121,400 | | | | 10,617,916 | |
Unilever NV—ADR | | | 307,000 | | | | 16,037,680 | |
| | | | | | | | 26,655,596 | |
Netherlands Antilles—1.9% | |
Schlumberger Ltd. | | | 201,500 | | | | 14,626,885 | |
Singapore—1.0% | | | | | | | | |
Global Logistic Properties Ltd. | | | 3,593,700 | | | | 7,403,691 | |
Spain—3.5% | | | | | | | | |
Applus Services SA | | | 1,254,455 | | | | 15,725,060 | |
Banco Santander SA | | | 1,683,000 | | | | 10,968,000 | |
| | | | | | | | 26,693,060 | |
Switzerland—4.7% | | | | | | | | |
Credit Suisse Group AG—ADR | | | 613,500 | | | | 9,362,010 | |
Novartis AG—ADR | | | 207,000 | | | | 15,945,210 | |
UBS Group AG | | | 579,350 | | | | 9,854,743 | |
| | | | | | | | 35,161,963 | |
United Kingdom—15.3% | | | | | |
AVEVA Group PLC | | | 590,000 | | | | 15,564,271 | |
Barclays PLC—ADR | | | 685,000 | | | | 7,404,850 | |
Cobham PLC | | | 4,568,000 | | | | 7,837,917 | |
Countrywide PLC | | | 3,545,391 | | | | 7,788,187 | |
DCC PLC | | | 93,375 | | | | 8,621,897 | |
The Accompanying Footnotes are an Integral Part of these Financial Statements.
The Tocqueville International Value Fund
Schedule of Investments as of April 30, 2017
(Unaudited)
| | | | | | | | |
| Common Stocks—84.6% | | Shares | | | Value | |
Diageo PLC—ADR | | | 124,000 | | | $ | 14,561,320 | |
Kingfisher PLC | | | 1,026,325 | | | | 4,540,413 | |
Lloyds Banking Group PLC | | | 11,482,500 | | | | 10,317,355 | |
Royal Dutch Shell PLC—Class B—ADR | | | 254,000 | | | | 13,746,480 | |
Smiths Group PLC | | | 571,170 | | | | 12,142,225 | |
Travis Perkins PLC | | | 588,500 | | | | 12,273,753 | |
| | | | | | | | 114,798,668 | |
United States—2.4% | | | | | | | | |
Aflac, Inc. | | | 191,000 | | | | 14,302,080 | |
Oceaneering International, Inc. | | | 130,000 | | | | 3,430,700 | |
| | | | | | | | 17,732,780 | |
Total Common Stocks
(Cost $536,799,130) | | | | 637,113,182 | |
Preferred Stocks—3.9% | |
Brazil—1.3% | |
Telefonica Brasil SA—ADR | | | 650,000 | | | | 9,613,500 | |
Republic of Korea—2.6% | | | | | |
Samsung Electronics Co., Ltd. | | | 13,000 | | | | 20,019,028 | |
Total Preferred Stocks
(Cost $21,855,515) | | | | 29,632,528 | |
Real Estate Investment Trust (REIT)—0.5% | |
Mexico—0.5% | |
Fibra Uno Administracion SA de CV | | | 2,150,000 | | | | 3,747,175 | |
Total Real Estate Investment Trust
(Cost $3,158,142) | | | | 3,747,175 | |
United Kingdom—0.2% | | | | | |
Cobham PLC(a) | | | 1,827,200 | | | $ | 1,348,959 | |
Total Right
(Cost $1,208,212) | | | | 1,348,959 | |
Short-Term Investments—9.8% | | | | | |
Money Market Fund—4.8% | | | | | |
STIT-Treasury Portfolio—Institutional Class, 0.620%(b) | | | 35,982,319 | | | | 35,982,319 | |
Money Market Deposit
Account—5.0% | | Principal
Amount | | | | |
U.S. Bank Money Market Deposit Account, 0.30%(c) | | $ | 37,649,296 | | | | 37,649,296 | |
Total Short-Term Investments
(Cost $73,631,615) | | | | 73,631,615 | |
Total Investments
(Cost $636,652,614)—99.0% | | | | 745,473,459 | |
Other Assets in Excess of
Liabilities—1.0% | | | | 7,172,768 | |
Total Net Assets—100.0% | | | $ | 752,646,227 | |
| | | | | | | | |
Percentages are stated as a percent of net assets.
ADR American Depository Receipt
| (a) | Non-income producing security. |
| (b) | Rate listed is the 7-day effective yield. |
| (c) | Variable rate security. The rate listed is as of 04/30/2017. |
Schedule of Open Forward Currency Contracts
April 30, 2017
(Unaudited)
| | | | | | | | | | | | | | | | | | | | | | | | |
Counterparty of
Contract | | Forward
Settlement
Date | | | Currency to
be Received | | | Currency to
be Delivered | | | Amount of
Currency to
be Delivered | | | Amount of
Currency to
be Received | | | Unrealized
Appreciation | |
U.S. Bank | | | 6/2/2017 | | | | U.S. Dollars | | | | Japanese Yen | | | | 2,600,000,000 | | | | 23,516,004 | | | $ | 160,524 | |
U.S. Bank | | | 6/2/2017 | | | | U.S. Dollars | | | | Japanese Yen | | | | 642,000,000 | | | | 5,807,485 | | | | 40,478 | |
| | | | | | | | | | | | | | | | | | | | | | | | |
| | | | | | | | | | | | | | | | | | | | | | $ | 201,002 | |
| | | | | | | | | | | | | | | | | | | | | | | | |
The Accompanying Footnotes are an Integral Part of these Financial Statements.
The Tocqueville Gold Fund
Schedule of Investments as of April 30, 2017
(Unaudited)
| | | | | | | | |
| Common Stocks—85.4% | | Shares | | | Value | |
Gold Related Securities—78.2% | | | | | |
Australia—5.2% | | | | | | | | |
Evolution Mining Ltd. | | | 12,386,774 | | | $ | 21,240,247 | |
Independence Group NL | | | 4,576,400 | | | | 11,171,396 | |
Newcrest Mining Ltd. | | | 1,925,100 | | | | 30,502,456 | |
| | | | | | | | 62,914,099 | |
Canada—59.6% | | | | | | | | |
Agnico Eagle Mines Ltd. | | | 577,073 | | | | 27,601,402 | |
Agnico Eagle Mines Ltd.(a) | | | 526,485 | | | | 25,166,218 | |
Alacer Gold Corp.(b) | | | 4,091,800 | | | | 6,474,699 | |
Alamos Gold, Inc.—Class A | | | 6,073,000 | | | | 43,482,680 | |
Almaden Minerals Ltd. (b)(c)(d)(e)(f) (Originally acquired 02/03/17, Cost $164,930) | | | 159,170 | | | | 228,543 | |
Almaden Minerals Ltd.(a)(b)(c) | | | 5,448,149 | | | | 7,982,344 | |
Almadex Minerals Ltd.(b) | | | 1,240,000 | | | | 1,026,483 | |
Argonaut Gold, Inc.(b) | | | 2,837,000 | | | | 4,572,287 | |
ATAC Resources Ltd.(b)(c) | | | 10,016,891 | | | | 4,182,724 | |
AuRico Metals, Inc.(b)(c) | | | 7,411,437 | | | | 6,026,662 | |
B2Gold Corp.(b) | | | 13,130,700 | | | | 33,351,978 | |
Corvus Gold, Inc.(b)(c) | | | 3,350,901 | | | | 2,094,313 | |
Corvus Gold, Inc.(a)(b)(c) | | | 13,030,000 | | | | 8,113,622 | |
Dalradian Resources, Inc.(b) | | | 1,750,000 | | | | 1,585,500 | |
Dalradian Resources, Inc.(a)(b) | | | 5,529,000 | | | | 4,981,993 | |
Detour Gold Corp.(b) | | | 3,536,200 | | | | 44,686,605 | |
East Asia Minerals Corp.(b)(c)(d)(e)(f) (Originally acquired 03/03/17, Cost $500,000) | | | 6,642,500 | | | | 1,049,136 | |
East Asia Minerals Corp.(a)(b)(c) | | | 6,648,493 | | | | 1,071,513 | |
Eldorado Gold Corp. | | | 5,611,785 | | | | 20,539,133 | |
Eldorado Gold Corp.(a) | | | 1,000,000 | | | | 3,655,544 | |
Falco Resources Ltd.(b)(c) | | | 16,222,300 | | | | 16,043,445 | |
Franco-Nevada Corp. | | | 910,900 | | | | 61,952,277 | |
GoGold Resources, Inc.(b)(c) | | | 15,289,000 | | | $ | 7,504,216 | |
Goldcorp, Inc. | | | 647,350 | | | | 9,037,006 | |
Goldcorp, Inc.(a) | | | 1,948,910 | | | | 27,155,246 | |
IAMGOLD Corp.(b) | | | 1,476,200 | | | | 6,111,468 | |
International Tower Hill Mines Ltd.(b)(c) | | | 5,738,836 | | | | 2,869,418 | |
International Tower Hill Mines Ltd.(a)(b)(c) | | | 11,289,744 | | | | 5,706,695 | |
International Tower Hill Mines
Ltd.(a)(b)(c)(d)(e)(f) (Originally acquired 12/23/16, Cost $4,339,946) | | | 9,041,554 | | | | 4,478,883 | |
Jaguar Mining, Inc.(b)(c) | | | 65,858,798 | | | �� | 27,018,004 | |
Klondex Mines Ltd.(b) | | | 2,958,500 | | | | 10,576,521 | |
Novagold Resources, Inc.(b) | | | 3,667,300 | | | | 15,329,314 | |
NuLegacy Gold Corp.(b)(c) | | | 28,556,090 | | | | 5,752,847 | |
OceanaGold Corp. | | | 4,431,459 | | | | 14,486,440 | |
OceanaGold Corp. (a) | | | 6,649,600 | | | | 21,677,389 | |
Osisko Gold Royalties Ltd.(c) | | | 3,184,740 | | | | 33,922,655 | |
Osisko Mining, Inc.(b)(c) | | | 5,704,239 | | | | 20,601,369 | |
Pan American Silver Corp. | | | 3,218,298 | | | | 53,970,857 | |
Premier Gold Mines Ltd.(b)(c) | | | 9,643,160 | | | | 19,497,543 | |
Richmont Mines, Inc.(b) | | | 1,739,500 | | | | 13,150,903 | |
Rockhaven Resources Ltd.(b) | | | 4,631,500 | | | | 542,867 | |
SEMAFO, Inc.(b)(c) | | | 11,991,000 | | | | 27,344,276 | |
Silver Wheaton Corp. | | | 1,561,075 | | | | 31,174,668 | |
Strategic Metals Ltd.(b)(c) | | | 10,463,400 | | | | 4,675,780 | |
Torex Gold Resources, Inc.(b)(c) | | | 2,366,950 | | | | 40,089,289 | |
| | | | | | | | 728,542,755 | |
The Accompanying Footnotes are an Integral Part of these Financial Statements.
The Tocqueville Gold Fund
Schedule of Investments as of April 30, 2017
(Unaudited)
| | | | | | | | |
| Common Stocks—85.4% | | Shares | | | Value | |
Jersey—2.9% | | | | | | | | |
Randgold Resources Ltd.— ADR | | | 403,600 | | | $ | 35,512,764 | |
South Africa—0.9% | | | | | | | | |
AngloGold Ashanti Ltd.— ADR | | | 948,500 | | | | 10,841,355 | |
United Kingdom—3.4% | | | | | | | | |
Fresnillo PLC | | | 2,223,800 | | | | 41,821,542 | |
United States—6.2% | | | | | | | | |
Electrum Ltd.(b)(d)(e)(f) (Originally acquired 12/21/07, Cost $13,065,361) | | | 2,127,287 | | | | 702,005 | |
Newmont Mining Corp. | | | 1,192,200 | | | | 40,308,282 | |
Royal Gold, Inc. | | | 495,600 | | | | 35,029,008 | |
| | | | | | | | 76,039,295 | |
Total Gold Related Securities | | | | | | | 955,671,810 | |
Other Precious Metals Related Securities—6.6% | |
Canada—6.1% | | | | | | | | |
Bear Creek Mining Corp.(b)(c) | | | 7,413,200 | | | | 12,490,649 | |
Ivanhoe Mines Ltd.—Class A(b) | | | 7,882,379 | | | | 27,659,496 | |
MAG Silver Corp.(b)(c) | | | 2,827,100 | | | | 34,547,162 | |
Plata Latina Minerals Corp.(b) | | | 1,609,000 | | | | 47,148 | |
| | | | | | | | 74,744,455 | |
United States—0.5% | | | | | | | | |
Sunshine Mining & Refining(b)(d)(e)(f) (originally acquired 03/15/11, Cost $18,353,107) | | | 1,633,545 | | | | 5,717,408 | |
Total Other Precious Metals Related Securities | | | | | | | 80,461,863 | |
Other Securities—0.6% | | | | | | | | |
United States—0.6% | | | | | | | | |
Gold Bullion International LLC(b)(c)(d)(e)(f) (Originally acquired 05/12/10, Cost $5,000,000) | | | 5,000,000 | | | $ | 6,893,000 | |
I-Pulse, Inc.(b)(d)(e)(f) (Originally acquired 10/09/07, Cost $175,524) | | | 74,532 | | | | 640,975 | |
Total Other Securities | | | | | | | 7,533,975 | |
Total Common Stocks
(Cost $1,186,611,827) | | | | | | | 1,043,667,648 | |
Private Fund—1.4% | | | | | | | | |
Gold Related Securities—1.4% | |
Tocqueville Bullion Reserve LP—Class G(b)(c)(d)(e)(f) (Originally acquired 11/28/11, Cost $25,000,000) | | | 13,806 | | | | 16,954,107 | |
Total Private Fund (Cost $25,000,000) | | | | | | | 16,954,107 | |
Gold Bullion—12.4% | | | | | | | | |
Gold Bullion(b) | | | 119,680 | | | | 151,788,365 | |
Total Gold Bullion (Cost $70,975,249) | | | | | | | 151,788,365 | |
Warrants—0.4% | | | | | | | | |
Gold Related Securities—0.4% | | | | | |
Canada—0.4% | | | | | | | | |
Almaden Minerals Ltd.
Expiration: 08/08/2019, Exercise Price: CAD $2.00(b)(c)(d)(e)(f) (Originally acquired 02/03/17, Cost $0) | | | 79,585 | | | | 52,617 | |
The Accompanying Footnotes are an Integral Part of these Financial Statements.
The Tocqueville Gold Fund
Schedule of Investments as of April 30, 2017
(Unaudited)
| | | | | | | | |
| Warrants—0.4% | | Shares | | | Value | |
Almaden Minerals Ltd.
Expiration: 11/11/2018, Exercise Price: CAD $2.00(b)(c)(d)(e)(f) (Originally acquired 05/11/16, Cost $0) | | | 740,741 | | | $ | 509,275 | |
Almaden Minerals Ltd.
Expiration: 11/05/2017, Exercise Price: CAD $1.00(b)(c)(d)(e)(f) (Originally acquired 11/04/15, Cost $0) | | | 875,000 | | | | 667,924 | |
East Asia Minerals Corp.
Expiration: 12/05/2019, Exercise Price: CAD $1.00(b)(c)(d)(e)(f) (Originally acquired 12/05/14, Cost $0) | | | 976,493 | | | | — | |
East Asia Minerals Corp.
Expiration: 03/08/2022, Exercise Price: CAD $0.50(b)(c)(d)(e)(f) (Originally acquired 03/03/17, Cost $0) | | | 3,321,250 | | | | 535,273 | |
East Asia Minerals Corp.
Expiration: 03/05/2020, Exercise Price: CAD $1.00(b)(c)(d)(e)(f) (Originally acquired 03/04/15, Cost $0) | | | 4,617,560 | | | | 744,195 | |
Falco Resources Ltd.
Expiration: 05/22/2018, Exercise Price: CAD $1.45(b)(c)(d)(e)(f) (Originally acquired 11/18/16, Cost $0) | | | 7,000,000 | | | | 1,744,039 | |
JDL Gold Corp.
Expiration: 04/16/2019, Exercise Price: CAD $2.92 (b)(d)(e)(f) (Originally acquired 04/03/14, Cost $0) | | | 150,000 | | | | 6,747 | |
NuLegacy Gold Corp.
Expiration: 04/12/2018, Exercise Price: CAD $0.65(b)(c)(d)(e)(f) (Originally acquired 10/07/16, Cost $0) | | | 9,020,590 | | | $ | 296,050 | |
Osisko Gold Royalties Ltd.
Expiration: 02/18/2022, Exercise Price: CAD $36.50(b)(c) | | | 274,000 | | | | 531,922 | |
Total Warrants
(Cost $1) | | | | | | | 5,088,042 | |
Right—0.0% | | | | | | | | |
Gold Related Securities—0.0% | |
Dalradian Resources, Inc. | | | | | | | | |
Expiration: 07/31/2017, Exercise Price: CAD $1.50(b) | | | 875,000 | | | | 38,460 | |
Total Right
(Cost $1) | | | | | | | 38,460 | |
Short-Term Investment—0.2% | |
Money Market Fund—0.2% | | | | | |
STIT—Treasury Portfolio—Institutional Class, 0.620%(g) | | | 2,504,094 | | | | 2,504,094 | |
Total Short-Term Investment (Cost $2,504,094) | | | | | | | 2,504,094 | |
Total Investments
(Cost $1,285,091,172)—99.8% | | | | 1,220,040,716 | |
Other Assets in Excess of Liabilities—0.2% | | | | 2,117,823 | |
Total Net Assets—100.0% | | | $ | 1,222,158,539 | |
| | | | | | | | |
The Accompanying Footnotes are an Integral Part of these Financial Statements.
The Tocqueville Gold Fund
Schedule of Investments as of April 30, 2017
(Unaudited)
Percentages are stated as a percent of net assets.
ADR American Depository Receipt
| (a) | Denotes an issue that is traded on a foreign exchange when a company is listed more than once. |
| (b) | Non-income producing security. |
| (c) | Affiliated company. See Footnote 8. |
| (d) | Denotes a security that is either fully or partially restricted to resale. The value of restricted securities as of April 30, 2017 was $41,220,177, which represented 3.4% of net assets. |
| (e) | Securities are fair valued using procedures approved by the Board of Trustees. The aggregate value of fair valued securities as of April 30, 2017 was $41,220,177, which represented 3.4% of net assets. |
| (f) | Security is considered illiquid and may be difficult to sell. |
| (g) | Rate listed is the 7-day effective yield. |
The Accompanying Footnotes are an Integral Part of these Financial Statements.
The Delafield Fund
Schedule of Investments as of April 30, 2017
(Unaudited)
| | | | | | | | |
| Common Stocks—76.9% | | Shares | | | Value | |
Aerospace & Defense —2.6% | |
Ducommun, Inc.(a) | | | 180,000 | | | $ | 5,290,200 | |
Honeywell International, Inc. | | | 35,000 | | | | 4,589,900 | |
Triumph Group, Inc. | | | 25,000 | | | | 655,000 | |
| | | | | | | | 10,535,100 | |
Auto Components—3.5% | |
Gentex Corp. | | | 240,000 | | | | 4,956,000 | |
Horizon Global Corp.(a)(b) | | | 650,000 | | | | 9,158,500 | |
| | | | | | | | 14,114,500 | |
Chemicals—10.5% | |
Calgon Carbon Corp. | | | 225,000 | | | | 3,273,750 | |
Eastman Chemical Co. | | | 175,000 | | | | 13,956,250 | |
HB Fuller Co. | | | 165,000 | | | | 8,716,950 | |
Minerals Technologies, Inc. | | | 85,000 | | | | 6,689,500 | |
PolyOne Corp. | | | 235,000 | | | | 9,214,350 | |
| | | | | | | | 41,850,800 | |
Commercial Services & Supplies—1.7% | |
Team, Inc.(a) | | | 245,000 | | | | 6,590,500 | |
Construction & Engineering—1.8% | |
KBR, Inc. | | | 500,000 | | | | 7,025,000 | |
Construction and Engineering—1.7% | |
Aegion Corp.(a) | | | 305,000 | | | | 6,960,100 | |
Construction Materials —2.9% | |
U.S. Concrete, Inc.(a) | | | 185,000 | | | | 11,470,000 | |
Electrical Equipment—0.1% | |
Babcock & Wilcox Enterprises, Inc.(a) | | | 50,000 | | | | 468,500 | |
Electronic Equipment, Instruments & Components—6.5% | |
Avnet, Inc. | | | 60,000 | | | | 2,321,400 | |
Electro Scientific Industries, Inc.(a) | | | 351,350 | | | | 2,452,423 | |
Flex Ltd.(a)(c) | | | 450,000 | | | | 6,957,000 | |
Plexus Corp.(a) | | | 70,000 | | | | 3,639,300 | |
TTM Technologies, Inc.(a) | | | 640,000 | | | | 10,707,200 | |
| | | | | | | | 26,077,323 | |
Energy Equipment & Services—1.7% | |
Aspen Aerogels, Inc.(a) | | | 600,000 | | | | 2,436,000 | |
Frank’s International NV(c) | | | 185,000 | | | | 1,683,500 | |
McDermott International, Inc.(a)(c) | | | 250,000 | | | | 1,635,000 | |
Tesco Corp.(a)(c) | | | 150,000 | | | $ | 982,500 | |
| | | | | | | | 6,737,000 | |
Health Care Equipment & Supplies—3.1% | |
Abbott Laboratories | | | 160,000 | | | | 6,982,400 | |
Invacare Corp. | | | 375,000 | | | | 5,512,500 | |
| | | | | | | | 12,494,900 | |
IT Services—0.8% | |
DXC Technology Co.(a) | | | 42,952 | | | | 3,236,004 | |
Machinery—10.7% | |
Barnes Group, Inc. | | | 105,000 | | | | 5,771,850 | |
Crane Co. | | | 85,000 | | | | 6,792,350 | |
Dover Corp. | | | 110,000 | | | | 8,676,800 | |
Harsco Corp.(a) | | | 575,000 | | | | 7,503,750 | |
Stanley Black & Decker, Inc. | | | 55,000 | | | | 7,488,250 | |
Xerium Technologies, Inc.(a)(b) | | | 900,000 | | | | 6,399,000 | |
| | | | | | | | 42,632,000 | |
Media—3.8% | |
TEGNA, Inc. | | | 590,000 | | | | 15,033,200 | |
Metals & Mining—0.1% | |
Real Industry, Inc.(a)(b) | | | 225,000 | | | | 585,000 | |
Oil, Gas & Consumable Fuels—3.6% | |
Boardwalk Pipeline Partners LP | | | 445,000 | | | | 8,072,300 | |
Marathon Petroleum Corp. | | | 125,000 | | | | 6,367,500 | |
| | | | | | | | 14,439,800 | |
Professional Services—5.6% | |
Korn/Ferry International | | | 265,000 | | | | 8,586,000 | |
TrueBlue, Inc.(a) | | | 500,000 | | | | 13,675,000 | |
| | | | | | | | 22,261,000 | |
Specialty Retail—0.7% | |
Ascena Retail Group, Inc.(a) | | | 725,000 | | | | 2,834,750 | |
Technology Hardware, Storage & Peripherals—5.9% | |
Diebold Nixdorf, Inc. | | | 510,000 | | | | 14,382,000 | |
Hewlett Packard Enterprise Co. | | | 500,000 | | | | 9,315,000 | |
| | | | | | | | 23,697,000 | |
The Accompanying Notes are an Integral Part of these Financial Statements.
The Delafield Fund
Schedule of Investments as of April 30, 2017
(Unaudited)
| | | | | | | | |
| Common Stocks—76.9% | | Shares | | | Value | |
Textiles, Apparel & Luxury Goods—6.4% | |
G-III Apparel Group Ltd.(a) | | | 450,000 | | | $ | 10,665,000 | |
PVH Corp. | | | 47,000 | | | | 4,748,410 | |
Ralph Lauren Corp. | | | 65,000 | | | | 5,246,800 | |
Sequential Brands Group, Inc.(a) | | | 1,000,000 | | | | 3,370,000 | |
Unifi, Inc.(a) | | | 50,000 | | | | 1,403,500 | |
| | | | | | | | 25,433,710 | |
Trading Companies & Distributors—3.2% | |
Rush Enterprises, Inc. —Class A(a) | | | 145,000 | | | | 5,473,750 | |
WESCO International, Inc.(a) | | | 120,000 | | | | 7,314,000 | |
| | | | | | | | 12,787,750 | |
Total Common Stocks
(Cost $228,840,912) | | | | 307,263,937 | |
Short-Term Investments—22.9% | |
Money Market Fund—5.0% | |
STIT-Treasury Portfolio—Institutional Class—0.620%(d) | | | 20,001,335 | | | | 20,001,335 | |
Money Market Deposit
Account—17.9% | | Principal
Amount | | | | |
U.S. Bank Money Market Deposit Account, 0.30%(e) | | $ | 71,522,497 | | | | 71,522,497 | |
Total Short-Term Investments
(Cost $91,523,832) | | | | 91,523,832 | |
Total Investments
(Cost $320,364,744) —99.8% | | | | 398,787,769 | |
Other Assets in Excess of Liabilities—0.2% | | | | 720,092 | |
Total Net Assets—100.0% | | | $ | 399,507,861 | |
| | | | | | | | |
Percentages are stated as a percent of net assets.
| (a) | Non-income producing security. |
| (b) | Affiliated company. See Footnote 8. |
| (c) | Foreign issued security. Foreign concentration was as follows: Canada 0.2%; Panama 0.4%; Netherlands 0.4%; Singapore 1.7%. |
| (d) | Rate listed is the 7-day effective yield. |
| (e) | Variable rate security. The rate listed is as of 04/30/2017. |
The Accompanying Notes are an Integral Part of these Financial Statements.
The Tocqueville Select Fund
Schedule of Investments as of April 30, 2017
(Unaudited)
| | | | | | | | |
| Common Stocks—87.2% | | Shares | | | Value | |
Auto Components—7.6% | |
Gentex Corp. | | | 108,000 | | | $ | 2,230,200 | |
Horizon Global Corp.(a)(b) | | | 162,000 | | | | 2,282,580 | |
| | | | | | | | 4,512,780 | |
Chemicals—9.1% | |
Eastman Chemical Co. | | | 40,000 | | | | 3,190,000 | |
Minerals Technologies, Inc. | | | 28,900 | | | | 2,274,430 | |
| | | | | | | | 5,464,430 | |
Commercial Services & Supplies—2.6% | |
Team, Inc.(a) | | | 58,000 | | | | 1,560,200 | |
Computers & Peripherals—4.9% | |
Diebold Nixdorf, Inc. | | | 105,000 | | | | 2,961,000 | |
Electronic Equipment, Instruments & Components—3.7% | |
Flex Ltd.(a)(c) | | | 142,200 | | | | 2,198,412 | |
Industrial Conglomerates—2.2% | |
Carlisle Cos., Inc. | | | 12,700 | | | | 1,287,653 | |
Internet Software & Services—5.2% | |
j2 Global, Inc. | | | 34,400 | | | | 3,104,256 | |
IT Services—4.2% | |
EPAM Systems, Inc.(a) | | | 32,300 | | | | 2,487,100 | |
Machinery—18.0% | |
Dover Corp. | | | 41,800 | | | | 3,297,184 | |
Harsco Corp.(a) | | | 180,700 | | | | 2,358,135 | |
Stanley Black & Decker, Inc. | | | 23,900 | | | | 3,253,985 | |
Xerium Technologies, Inc.(a)(b) | | | 265,000 | | | | 1,884,150 | |
| | | | | | | | 10,793,454 | |
Media—5.8% | |
TEGNA, Inc. | | | 136,000 | | | | 3,465,280 | |
Metals & Mining—2.1% | |
Real Industry, Inc.(a)(b) | | | 482,881 | | | | 1,255,490 | |
Professional Services—8.9% | |
ICF International, Inc.(a) | | | 49,400 | | | | 2,181,010 | |
TrueBlue, Inc.(a) | | | 115,000 | | | | 3,145,250 | |
| | | | | | | | 5,326,260 | |
Specialty Retail—4.6% | |
Ascena Retail Group, Inc.(a) | | | 270,500 | | | | 1,057,655 | |
Pier 1 Imports, Inc. | | | 255,200 | | | | 1,720,048 | |
| | | | | | | | 2,777,703 | |
Textiles, Apparel & Luxury Goods—4.3% | |
G-III Apparel Group Ltd.(a) | | | 109,000 | | | | 2,583,300 | |
Trading Companies & Distributors—4.0% | |
WESCO International, Inc.(a) | | | 38,900 | | | | 2,370,955 | |
Total Common Stocks
(Cost $44,919,468) | | | | 52,148,273 | |
Short-Term Investments—13.1% | | | | | |
Money Market Fund—5.0% | | | | | |
STIT-Treasury Portfolio— Institutional Class, 0.620%(d) | | | 2,981,241 | | | | 2,981,241 | |
Money Market Deposit
Account—8.1% | | Principal
Amount | | | | |
U.S. Bank Money Market Deposit Account, 0.30%(e) | | $ | 4,848,465 | | | | 4,848,465 | |
Total Short-Term Investments
(Cost $7,829,706) | | | | 7,829,706 | |
Total Investments
(Cost $52,749,174)—100.3% | | | | 59,977,979 | |
Liabilities in Excess of
Other Assets—(0.3)% | | | | (195,342 | ) |
Total Net Assets—100.0% | | | $ | 59,782,637 | |
| | | | | | | | |
Percentages are stated as a percent of net assets.
| (a) | Non-income producing security. |
| (b) | Affiliated Company. See Footnote 8. |
| (c) | Foreign issued security. Foreign concentration was as follows: Singapore 3.7% |
| (d) | Rate listed is the 7-day effective yield. |
| (e) | Variable rate security. The rate listed is as of 04/30/2017. |
The Accompanying Notes are an Integral Part of these Financial Statements.
Percent of Total Investments
The Tocqueville Fund
Allocation of Portfolio Holdings
April 30, 2017 (Unaudited)
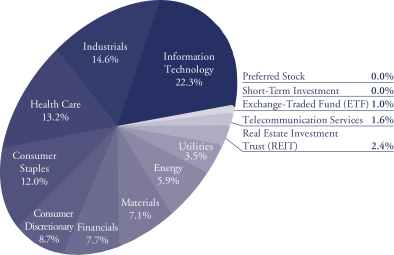
The Tocqueville Opportunity Fund
Allocation of Portfolio Holdings
April 30, 2017 (Unaudited)
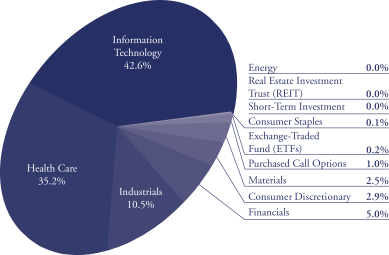
Percent of Total Investments
The Tocqueville International Value Fund
Allocation of Portfolio Holdings
April 30, 2017 (Unaudited)
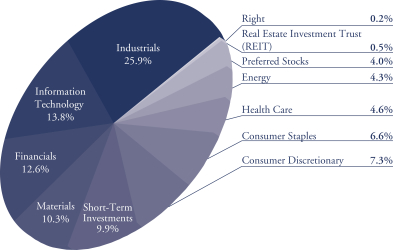
The Tocqueville Gold Fund
Allocation of Portfolio Holdings
April 30, 2017 (Unaudited)
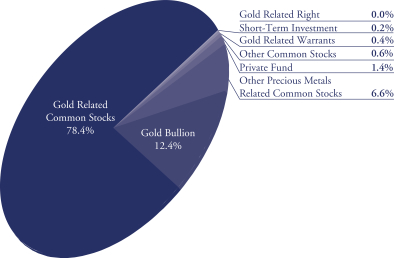
Percent of Total Investments
The Delafield Fund
Allocation of Portfolio Holdings
April 30, 2017 (Unaudited)
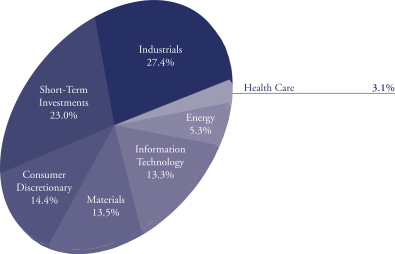
The Tocqueville Select Fund
Allocation of Portfolio Holdings
April 30, 2017 (Unaudited)
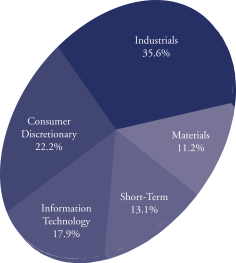
The Tocqueville Trust
Statements of Assets & Liabilities
April 30, 2017
(Unaudited)
| | | | | | | | | | | | |
| | | The
Tocqueville
Fund | | | The
Tocqueville
Opportunity
Fund | | | The
Tocqueville
International
Value Fund | |
Assets: | | | | | | | | | | | | |
Investments, at value (1) | | | | | | | | | | | | |
Unaffiliated issuers | | $ | 285,415,142 | | | $ | 73,686,161 | | | $ | 745,473,459 | |
Foreign currencies, at value (2) | | | — | | | | — | | | | 558,358 | |
Unrealized appreciation on forward currency contracts | | | — | | | | — | | | | 201,002 | |
Receivable for investments sold | | | — | | | | 3,402,136 | | | | 4,280,193 | |
Receivable for Fund shares sold | | | 7,786 | | | | 400 | | | | 4,841,375 | |
Dividends, interest and other receivables | | | 327,809 | | | | 5,183 | | | | 2,673,415 | |
Other assets | | | 17,450 | | | | 14,995 | | | | 86,214 | |
| | | | | | | | | | | | |
Total Assets | | | 285,768,187 | | | | 77,108,875 | | | | 758,114,016 | |
| | | | | | | | | | | | |
Liabilities: | | | | | | | | | | | | |
Payable for investments purchased | | | — | | | | 1,461,299 | | | | 4,289,326 | |
Payable for loans outstanding | | | 103,000 | | | | 3,940,000 | | | | — | |
Payable for foreign currencies purchased | | | — | | | | — | | | | 3,813 | |
Payable for Fund shares redeemed | | | 12,590 | | | | 24,433 | | | | 521,420 | |
Payable to Adviser (see Note 10) | | | 173,265 | | | | 39,210 | | | | 432,406 | |
Payable to Administrator | | | 38,283 | | | | 3,660 | | | | 92,547 | |
Payable to Trustees | | | 11,019 | | | | 6,753 | | | | 18,154 | |
Accrued distribution fee | | | 37,858 | | | | 8,810 | | | | 20,475 | |
Accrued expenses and other liabilities | | | 50,206 | | | | 47,027 | | | | 89,648 | |
| | | | | | | | | | | | |
Total Liabilities | | | 426,221 | | | | 5,531,192 | | | | 5,467,789 | |
| | | | | | | | | | | | |
Net Assets | | $ | 285,341,966 | | | $ | 71,577,683 | | | $ | 752,646,227 | |
| | | | | | | | | | | | |
Net assets consist of: | | | | | | | | | | | | |
Paid in capital | | $ | 133,847,073 | | | $ | 60,219,535 | | | $ | 642,432,340 | |
Accumulated net investment income (loss) | | | 1,030,520 | | | | (1,273,256 | ) | | | 732,990 | |
Accumulated net realized gain (loss) | | | 18,491,934 | | | | (421,199 | ) | | | 458,158 | |
Net unrealized appreciation on: | | | | | | | | | | | | |
Investments and foreign currency related items | | | 131,972,439 | | | | 13,052,603 | | | | 109,022,739 | |
| | | | | | | | | | | | |
Net assets | | $ | 285,341,966 | | | $ | 71,577,683 | | | $ | 752,646,227 | |
| | | | | | | | | | | | |
Shares of beneficial interest outstanding (unlimited shares of $0.01 par value authorized) | | | 8,061,697 | | | | 3,292,995 | | | | 46,921,098 | |
Net asset value, offering and redemption price per share | | $ | 35.39 | | | $ | 21.74 | | | $ | 16.04 | |
| | | | | | | | | | | | |
(1) Cost of investments | | | | | | | | | | | | |
Unafilliated issuers | | $ | 153,442,638 | | | $ | 60,633,479 | | | $ | 636,652,614 | |
(2) Cost of foreign currencies | | $ | — | | | $ | — | | | $ | 555,512 | |
The Accompanying Notes are an Integral Part of these Financial Statements.
The Tocqueville Trust
Statements of Assets & Liabilities
April 30, 2017
(Unaudited)
| | | | | | | | | | | | |
| | | The
Tocqueville
Gold Fund | | | The
Delafield Fund | | | The
Tocqueville
Select Fund | |
Assets: | | | | | | | | | | | | |
Investments, at value (1) | | | | | | | | | | | | |
Unaffiliated issuers | | $ | 897,821,226 | | | $ | 382,645,269 | | | $ | 54,555,759 | |
Affiliated issuers | | | 322,219,490 | | | | 16,142,500 | | | | 5,422,220 | |
Foreign currencies, at value (2) | | | 108,572 | | | | — | | | | — | |
Receivable for investments sold | | | — | | | | 2,513,729 | | | | — | |
Receivable for Fund shares sold | | | 4,568,378 | | | | 55,145 | | | | 238 | |
Receivable for foreign currencies sold | | | 140,925 | | | | — | | | | — | |
Dividends, interest and other receivables | | | 888,044 | | | | 93,622 | | | | 20,554 | |
Other assets | | | 55,776 | | | | 22,832 | | | | 11,841 | |
| | | | | | | | | | | | |
Total Assets | | | 1,225,802,411 | | | | 401,473,097 | | | | 60,010,612 | |
| | | | | | | | | | | | |
Liabilities: | | | | | | | | | | | | |
Payable for investments purchased | | | — | | | | 1,013,319 | | | | 122,981 | |
Payable for Fund shares redeemed | | | 2,189,915 | | | | 479,983 | | | | 32,476 | |
Payable to Adviser (see Note 10) | | | 871,767 | | | | 236,739 | | | | 33,887 | |
Payable to Administrator | | | 149,269 | | | | 57,809 | | | | 8,025 | |
Payable to Trustees | | | 55,743 | | | | 20,563 | | | | 3,252 | |
Accrued distribution fee | | | 57,180 | | | | 31,040 | | | | 7,531 | |
Accrued expenses and other liabilities | | | 319,998 | | | | 125,783 | | | | 19,823 | |
| | | | | | | | | | | | |
Total Liabilities | | | 3,643,872 | | | | 1,965,236 | | | | 227,975 | |
| | | | | | | | | | | | |
Net Assets | | $ | 1,222,158,539 | | | $ | 399,507,861 | | | $ | 59,782,637 | |
| | | | | | | | | | | | |
Net assets consist of: | | | | | | | | | | | | |
Paid in capital | | $ | 1,655,748,019 | | | $ | 290,511,403 | | | $ | 51,537,560 | |
Accumulated net investment loss | | | (21,840,071 | ) | | | (3,063,131 | ) | | | (344,840 | ) |
Accumulated net realized gain (loss) | | | (346,696,497 | ) | | | 33,636,564 | | | | 1,361,112 | |
Net unrealized appreciation (depreciation) on: | | | | | | | | | | | | |
Investments and foreign currency related items | | | (65,052,912 | ) | | | 78,423,025 | | | | 7,228,805 | |
| | | | | | | | | | | | |
Net assets | | $ | 1,222,158,539 | | | $ | 399,507,861 | | | $ | 59,782,637 | |
| | | | | | | | | | | | |
Shares of beneficial interest outstanding (unlimited shares of $0.01 par value authorized) | | | 33,518,171 | | | | 15,731,181 | | | | 4,940,691 | |
Net asset value, offering and redemption price per share | | $ | 36.46 | | | $ | 25.40 | | | $ | 12.10 | |
| | | | | | | | | | | | |
(1) Cost of investments | | | | | | | | | | | | |
Unaffiliated issuers | | $ | 835,130,814 | | | $ | 298,326,097 | | | $ | 45,132,181 | |
Affiliated issuers | | $ | 449,960,358 | | | $ | 22,038,647 | | | $ | 7,616,993 | |
(2) Cost of foreign currencies | | $ | 110,850 | | | $ | — | | | $ | — | |
The Accompanying Notes are an Integral Part of these Financial Statements.
The Tocqueville Trust
Statements of Operations
For the Period Ended April 30, 2017
(Unaudited)
| | | | | | | | | | | | |
| | | The
Tocqueville
Fund | | | The
Tocqueville
Opportunity
Fund | | | The
Tocqueville
International
Value Fund | |
Investment Income: | | | | | | | | | | | | |
Dividends* | | | | | | | | | | | | |
Unaffiliated issuers | | $ | 3,228,338 | | | $ | 136,611 | | | $ | 5,677,369 | |
Interest | | | | | | | | | | | | |
Unaffiliated issuers | | | 1,809 | | | | 73 | | | | 82,709 | |
| | | | | | | | | | | | |
Total investment income | | | 3,230,147 | | | | 136,684 | | | | 5,760,078 | |
| | | | | | | | | | | | |
Expenses: | | | | | | | | | | | | |
Investment Adviser’s fee (See Note 4) | | | 1,060,967 | | | | 309,519 | | | | 2,998,854 | |
Distribution fees (See Note 4) | | | 353,656 | | | | 103,173 | | | | 749,714 | |
Administration fees (See Note 4) | | | 212,193 | | | | 61,903 | | | | 429,522 | |
Transfer agent and shareholder services fees | | | 40,064 | | | | 18,273 | | | | 110,294 | |
Trustee fees and expenses | | | 29,114 | | | | 10,513 | | | | 48,106 | |
Legal fees | | | 22,278 | | | | 13,249 | | | | 36,769 | |
Fund accounting fees | | | 13,931 | | | | 11,596 | | | | 34,176 | |
Blue sky fees | | | 12,130 | | | | 13,584 | | | | 27,221 | |
Printing and mailing expense | | | 11,489 | | | | 5,614 | | | | 25,268 | |
Audit fees | | | 10,866 | | | | 3,635 | | | | 19,141 | |
Other expenses (See Note 10) | | | 9,136 | | | | 3,169 | | | | 30,357 | |
Interest expense | | | 8,047 | | | | 25,222 | | | | — | |
Custody fees | | | 7,257 | | | | 9,635 | | | | 60,820 | |
Insurance expense | | | 3,706 | | | | 1,540 | | | | 6,127 | |
Registration fees | | | 1,172 | | | | 902 | | | | 1,080 | |
| | | | | | | | | | | | |
Total expenses before waiver | | | 1,796,006 | | | | 591,527 | | | | 4,577,449 | |
Less: Fees waived (See Note 4) | | | (19,680 | ) | | | (50,441 | ) | | | (828,882 | ) |
| | | | | | | | | | | | |
Net expenses | | | 1,776,326 | | | | 541,086 | | | | 3,748,567 | |
| | | | | | | | | | | | |
Net Investment Income (Loss) | | | 1,453,821 | | | | (404,402 | ) | | | 2,011,511 | |
| | | | | | | | | | | | |
The Accompanying Notes are an Integral Part of these Financial Statements.
The Tocqueville Trust
Statements of Operations
For the Period Ended April 30, 2017
(Unaudited)
| | | | | | | | | | | | |
| | | The
Tocqueville
Fund | | | The
Tocqueville
Opportunity
Fund | | | The
Tocqueville
International
Value Fund | |
Realized and Unrealized Gain (Loss): | | | | | | | | | | | | |
Net realized gain (loss) on: | | | | | | | | | | | | |
Investments | | | | | | | | | | | | |
Unaffiliated issuers | | | 18,599,376 | | | | 5,133,165 | | | | (474,261 | ) |
Forward currency contracts | | | — | | | | — | | | | 2,061,704 | |
Foreign currency translation | | | 1 | | | | (870 | ) | | | (283,092 | ) |
| | | | | | | | | | | | |
| | | 18,599,377 | | | | 5,132,295 | | | | 1,304,351 | |
Net change in unrealized appreciation (depreciation) on: | | | | | | | | | | | | |
Investments | | | 9,431,816 | | | | 6,297,217 | | | | 67,764,990 | |
Forward currency contracts | | | — | | | | — | | | | (327,714 | ) |
Foreign currency translation | | | (32 | ) | | | 12,532 | | | | 6,253,732 | |
| | | | | | | | | | | | |
| | | 9,431,784 | | | | 6,309,749 | | | | 73,691,008 | |
| | | | | | | | | | | | |
Net gain on investments and foreign currency | | | 28,031,161 | | | | 11,442,044 | | | | 74,995,359 | |
| | | | | | | | | | | | |
Net Increase in Net Assets Resulting from Operations | | $ | 29,484,982 | | | $ | 11,037,642 | | | $ | 77,006,870 | |
| | | | | | | | | | | | |
* Net of foreign taxes withheld of: | | $ | 600 | | | $ | 37 | | | $ | 510,121 | |
| | | | | | | | | | | | |
The Accompanying Notes are an Integral Part of these Financial Statements.
The Tocqueville Trust
Statements of Operations
For the Period Ended April 30, 2017
(Unaudited)
| | | | | | | | | | | | |
| | | The
Tocqueville
Gold Fund | | | The
Delafield Fund | | | The
Tocqueville
Select Fund | |
Investment Income: | | | | | | | | | | | | |
Dividends* | | | | | | | | | | | | |
Unaffiliated issuers | | $ | 2,859,553 | | | $ | 1,532,702 | | | $ | 283,258 | |
Affiliated issuers | | | 189,008 | | | | — | | | | — | |
Interest | | | | | | | | | | | | |
Unaffiliated issuers | | | 15,926 | | | | 101,474 | | | | 10,003 | |
| | | | | | | | | | | | |
Total investment income | | | 3,064,487 | | | | 1,634,176 | | | | 293,261 | |
| | | | | | | | | | | | |
Expenses: | | | | | | | | | | | | |
Investment Adviser’s fee (See Note 4) | | | 5,096,072 | | | | 1,601,740 | | | | 246,102 | |
Distribution fees (See Note 4) | | | 1,530,892 | | | | 513,251 | | | | 76,907 | |
Administration fees (See Note 4) | | | 824,089 | | | | 306,448 | | | | 46,144 | |
Transfer agent and shareholder services fees | | | 381,013 | | | | 95,312 | | | | 14,047 | |
Custody fees | | | 141,382 | | | | 20,496 | | | | 2,173 | |
Legal fees | | | 126,746 | | | | 35,495 | | | | 5,991 | |
Trustee fees and expenses | | | 114,069 | | | | 43,571 | | | | 6,157 | |
Printing and mailing expense | | | 87,906 | | | | 31,245 | | | | 3,531 | |
Fund accounting fees | | | 58,782 | | | | 20,539 | | | | 3,528 | |
Audit fees | | | 45,731 | | | | 16,955 | | | | 2,178 | |
Other expenses (See Note 10) | | | 39,539 | | | | 13,661 | | | | 1,991 | |
Blue sky fees | | | 26,509 | | | | 12,848 | | | | 11,222 | |
Insurance expense | | | 14,411 | | | | 5,181 | | | | 724 | |
Interest expense | | | 13,010 | | | | — | | | | — | |
Registration fees | | | 2,617 | | | | 2,347 | | | | 368 | |
| | | | | | | | | | | | |
Total expenses before waiver | | | 8,502,768 | | | | 2,719,089 | | | | 421,063 | |
Less: Fees waived (See Note 4) | | | — | | | | (152,833 | ) | | | (36,529 | ) |
| | | | | | | | | | | | |
Net expenses | | | 8,502,768 | | | | 2,566,256 | | | | 384,534 | |
| | | | | | | | | | | | |
Net Investment Loss | | | (5,438,281 | ) | | | (932,080 | ) | | | (91,273 | ) |
| | | | | | | | | | | | |
The Accompanying Notes are an Integral Part of these Financial Statements.
The Tocqueville Trust
Statements of Operations
For the Period Ended April 30, 2017
(Unaudited)
| | | | | | | | | | | | |
| | | The
Tocqueville
Gold Fund | | | The
Delafield Fund | | | The
Tocqueville
Select Fund | |
Realized and Unrealized Gain (Loss): | | | | | | | | | | | | |
Net realized gain (loss) on: | | | | | | | | | | | | |
Investments | | | | | | | | | | | | |
Unaffiliated issuers | | | (22,131,047 | ) | | | 34,206,583 | | | | 946,547 | |
Affiliated issuers | | | (4,049,950 | ) | | | — | | | | 414,581 | |
Foreign currency translation | | | (127,010 | ) | | | — | | | | — | |
| | | | | | | | | | | | |
| | | (26,308,007 | ) | | | 34,206,583 | | | | 1,361,128 | |
Net change in unrealized appreciation (depreciation) on: | | | | | | | | | | | | |
Investments | | | (83,281,019 | ) | | | 23,288,994 | | | | 5,103,308 | |
Foreign currency translation | | | 10,381,262 | | | | — | | | | — | |
| | | | | | | | | | | | |
| | | (72,899,757 | ) | | | 23,288,994 | | | | 5,103,308 | |
| | | | | | | | | | | | |
Net gain (loss) on investments and foreign currency | | | (99,207,764 | ) | | | 57,495,577 | | | | 6,464,436 | |
| | | | | | | | | | | | |
Net Increase (Decrease) in Net Assets Resulting from Operations | | $ | (104,646,045 | ) | | $ | 56,563,497 | | | $ | 6,373,163 | |
| | | | | | | | | | | | |
* Net of foreign taxes withheld of: | | $ | 292,758 | | | $ | — | | | $ | — | |
| | | | | | | | | | | | |
The Accompanying Notes are an Integral Part of these Financial Statements.
The Tocqueville Trust
Statements of Changes in Net Assets
(Unaudited)
| | | | | | | | | | | | | | | | | | | | | | | | |
| | | The Tocqueville Fund | | | The Tocqueville
Opportunity Fund | | | The Tocqueville
International Value Fund | |
| | | For the
Period Ended
April 30,
2017 | | | For the
Year Ended
October 31,
2016 | | | For the
Period Ended
April 30,
2017 | | | For the
Year Ended
October 31,
2016 | | | For the
Period Ended
April 30,
2017 | | | For the
Year Ended
October 31,
2016 | |
Operations: | | | | | | | | | | | | | | | | | | | | | | | | |
Net investment income (loss) | | $ | 1,453,821 | | | $ | 3,504,104 | | | $ | (404,402 | ) | | $ | (1,102,452 | ) | | $ | 2,011,511 | | | $ | 5,276,060 | |
Net realized gain (loss) on sale of investments and foreign currency | | | 18,599,377 | | | | 14,211,605 | | | | 5,132,295 | | | | (4,565,431 | ) | | | 1,304,351 | | | | 3,100,018 | |
Net change in unrealized appreciation (depreciation) | | | 9,431,784 | | | | (5,407,512 | ) | | | 6,309,749 | | | | (12,488,398 | ) | | | 73,691,008 | | | | 2,377,901 | |
| | | | | | | | | | | | | | | | | | | | | | | | |
Net increase (decrease) in net assets resulting from operations | | | 29,484,982 | | | | 12,308,197 | | | | 11,037,642 | | | | (18,156,281 | ) | | | 77,006,870 | | | | 10,753,979 | |
| | | | | | | | | | | | | | | | | | | | | | | | |
Dividends and distributions to shareholders: | | | | | | | | | | | | | | | | | | | | | | | | |
Net investment income | | | (3,191,286 | ) | | | (3,200,195 | ) | | | — | | | | — | | | | (5,348,368 | ) | | | (5,967,776 | ) |
Net realized gains | | | (12,245,533 | ) | | | (3,072,752 | ) | | | — | | | | — | | | | (2,913,833 | ) | | | (4,247,573 | ) |
| | | | | | | | | | | | | | | | | | | | | | | | |
Total dividends and distributions | | | (15,436,819 | ) | | | (6,272,947 | ) | | | — | | | | — | | | | (8,262,201 | ) | | | (10,215,349 | ) |
Fund share transactions: | | | | | | | | | | | | | | | | | | | | | | | | |
Shares sold | | | 15,725,818 | | | | 25,016,349 | | | | 5,122,057 | | | | 22,021,161 | | | | 237,204,398 | | | | 301,099,948 | |
Shares issued to holders in reinvestment of dividends | | | 14,742,845 | | | | 5,849,599 | | | | — | | | | — | | | | 7,212,804 | | | | 9,226,995 | |
Shares redeemed | | | (42,300,609 | ) | | | (63,042,445 | ) | | | (37,540,474 | ) | | | (64,362,409 | ) | | | (86,323,702 | ) | | | (118,819,277 | ) |
| | | | | | | | | | | | | | | | | | | | | | | | |
Net increase (decrease) | | | (11,831,946 | ) | | | (32,176,497 | ) | | | (32,418,417 | ) | | | (42,341,248 | ) | | | 158,093,500 | | | | 191,507,666 | |
| | | | | | | | | | | | | | | | | | | | | | | | |
Net increase (decrease) in net assets | | | 2,216,217 | | | | (26,141,247 | ) | | | (21,380,775 | ) | | | (60,497,529 | ) | | | 226,838,169 | | | | 192,046,296 | |
Net Assets: | | | | | | | | | | | | | | | | | | | | | | | | |
Beginning of period | | | 283,125,749 | | | | 309,266,996 | | | | 92,958,458 | | | | 153,455,987 | | | | 525,808,058 | | | | 333,761,762 | |
| | | | | | | | | | | | | | | | | | | | | | | | |
End of period* | | $ | 285,341,966 | | | $ | 283,125,749 | | | $ | 71,577,683 | | | $ | 92,958,458 | | | $ | 752,646,227 | | | $ | 525,808,058 | |
| | | | | | | | | | | | | | | | | | | | | | | | |
* Including undistributed net investment income (loss) of: | | $ | 1,030,520 | | | $ | 2,767,985 | | | $ | (1,273,256 | ) | | $ | (868,854 | ) | | $ | 732,990 | | | $ | 4,069,847 | |
| | | | | | | | | | | | | | | | | | | | | | | | |
The Accompanying Notes are an Integral Part of these Financial Statements.
The Tocqueville Trust
Statements of Changes in Net Assets
(Unaudited)
| | | | | | | | | | | | | | | | | | | | | | | | |
| | | The Tocqueville Gold Fund | | | The Delafield Fund | | | The Tocqueville Select Fund | |
| | | For the
Period Ended
April 30,
2017 | | | For the
Year Ended
October 31,
2016 | | | For the
Period Ended
April 30,
2017 | | | For the
Year Ended
October 31,
2016 | | | For the
Period Ended
April 30,
2017 | | | For the
Year Ended
October 31,
2016 | |
Operations: | | | | | | | | | | | | | | | | | | | | | | | | |
Net investment loss | | $ | (5,438,281 | ), | | $ | (11,183,827 | ) | | $ | (932,080 | ) | | $ | (1,567,530 | ) | | $ | (91,273 | ) | | $ | (300,067 | ) |
Net realized gain (loss) on sale of investments and foreign currency | | | (26,308,007 | ) | | | (197,265,554 | ) | | | 34,206,583 | | | | 91,740,571 | | | | 1,361,128 | | | | 3,638,104 | |
Net change in unrealized appreciation (depreciation) | | | (72,899,757 | ) | | | 694,885,236 | | | | 23,288,994 | | | | (99,178,781 | ) | | | 5,103,308 | | | | (5,616,215 | ) |
| | | | | | | | | | | | | | | | | | | | | | | | |
Net increase (decrease) in net assets resulting from operations | | | (104,646,045 | ) | | | 486,435,855 | | | | 56,563,497 | | | | (9,005,740 | ) | | | 6,373,163 | | | | (2,278,178 | ) |
| | | | | | | | | | | | | | | | | | | | | | | | |
Dividends and distributions to shareholders: | | | | | | | | | | | | | | | | | | | | | | | | |
Net investment income | | | — | | | | — | | | | — | | | | — | | | | — | | | | — | |
Net realized gains | | | — | | | | — | | | | (71,259,512 | ) | | | (62,285,610 | ) | | | (3,023,170 | ) | | | (2,573,589 | ) |
| | | | | | | | | | | | | | | | | | | | | | | | |
Total dividends and distributions | | | — | | | | — | | | | (71,259,512 | ) | | | (62,285,610 | ) | | | (3,023,170 | ) | | | (2,573,589 | ) |
Fund share transactions: | | | | | | | | | | | | | | | | | | | | | | | | |
Shares sold | | | 173,202,650 | | | | 424,034,799 | | | | 12,843,673 | | | | 36,427,575 | | | | 2,469,592 | | | | 4,929,975 | |
Shares issued to holders in reinvestment of dividends | | | — | | | | — | | | | 68,515,995 | | | | 59,082,717 | | | | 2,918,410 | | | | 2,508,581 | |
Shares redeemed* | | | (211,680,113 | ) | | | (492,555,310 | ) | | | (67,982,754 | ) | | | (297,916,569 | ) | | | (12,767,443 | ) | | | (20,587,532 | ) |
| | | | | | | | | | | | | | | | | | | | | | | | |
Net increase (decrease) | | | (38,477,463 | ) | | | (68,520,511 | ) | | | 13,376,914 | | | | (202,406,277 | ) | | | (7,379,441 | ) | | | (13,148,976 | ) |
| | | | | | | | | | | | | | | | | | | | | | | | |
Net increase (decrease) in net assets | | | (143,123,508 | ) | | | 417,915,344 | | | | (1,319,101 | ) | | | (273,697,627 | ) | | | (4,029,448 | ) | | | (18,000,743 | ) |
The Accompanying Notes are an Integral Part of these Financial Statements.
The Tocqueville Trust
Statements of Changes in Net Assets
(Unaudited)
| | | | | | | | | | | | | | | | | | | | | | | | |
| | | The Tocqueville Gold Fund | | | The Delafield Fund | | | The Tocqueville Select Fund | |
| | | For the
Period Ended
April 30, 2017 | | | For the
Year Ended
October 31,
2016 | | | For the
Period Ended
April 30,
2017 | | | For the
Year Ended
October 31,
2016 | | | For the
Period Ended
April 30,
2017 | | | For the
Year Ended
October 31,
2016 | |
Net Assets: | | | | | | | | | | | | | | | | | | | | | | | | |
Beginning of period | | | 1,365,282,047 | | | | 947,366,703 | | | | 400,826,962 | | | | 674,524,589 | | | | 63,812,085 | | | | 81,812,828 | |
| | | | | | | | | | | | | | | | | | | | | | | | |
End of period** | | $ | 1,222,158,539 | | | $ | 1,365,282,047 | | | $ | 399,507,861 | | | $ | 400,826,962 | | | $ | 59,782,637 | | | $ | 63,812,085 | |
| | | | | | | | | | | | | | | | | | | | | | | | |
* Net of redemption fees of: | | $ | 157,352 | | | $ | 324,599 | | | $ | — | | | $ | — | | | $ | — | | | $ | — | |
| | | | | | | | | | | | | | | | | | | | | | | | |
** Including undistributed net investment loss of: | | $ | (21,840,071 | ) | | $ | (16,401,790 | ) | | $ | (3,063,131 | ) | | $ | (2,131,051 | ) | | $ | (344,840 | ) | | $ | (253,567 | ) |
| | | | | | | | | | | | | | | | | | | | | | | | |
The Accompanying Notes are an Integral Part of these Financial Statements.
The Tocqueville Trust
Notes to Financial Statements
1. ORGANIZATION
The Tocqueville Trust (the “Trust”) is a Massachusetts business trust registered under the Investment Company Act of 1940 and organized on September 17, 1986, consisting of six separate funds (each, a “Fund” or, collectively, the “Funds”). Each Fund is an open-end management investment company with a different investment objective. The Tocqueville Fund, The Tocqueville Opportunity Fund (the “Opportunity Fund”), The Tocqueville International Value Fund (the “International Fund”), The Delafield Fund and The Tocqueville Select Fund (the “Select Fund”) are classified as diversified investment companies. The Tocqueville Gold Fund (the “Gold Fund”) is classified as a non-diversified investment company. The Tocqueville Fund’s investment objective is long-term capital appreciation which it seeks to achieve by investing primarily in securities of United States issuers. The Opportunity Fund’s investment objective is to achieve long-term capital appreciation which it seeks to achieve by investing in the common stocks of small and mid-cap companies which have the potential to deliver superior long term earnings growth. The International Fund’s investment objective is long-term capital appreciation consistent with preservation of capital which it seeks to achieve by investing primarily in securities of non-U.S. issuers. The Gold Fund’s investment objective is long-term capital appreciation which it seeks to achieve by investing in gold, securities of companies located throughout the world that are engaged in mining or processing gold (“gold related securities”), other precious metals and securities of companies located throughout the world that are engaged in mining or processing such other precious metals (“other precious metal securities”). The Delafield Fund’s investment objectives are to seek long-term preservation of capital (sufficient growth to outpace inflation over an extended period of time) and growth of capital which it seeks to achieve by investing primarily in the equity securities of domestic companies. The Tocqueville Select Fund’s investment objective is to achieve long-term capital appreciation by investing in a focused group of common stocks issued primarily by small and mid-sized U.S. companies. Current income is a secondary objective for The Tocqueville Select Fund.
The Delafield Fund, a series of the Trust, commenced operations on September 28, 2009 as successor to Delafield Fund, Inc. The predecessor Delafield Fund, Inc. commenced operations on November 19, 1993.
The Tocqueville Select Fund, a series of the Trust, commenced operations on September 28, 2009 as successor to the Delafield Select Fund, a series of Natixis Funds Trust II. The predecessor Delafield Select Fund commenced operations on September 29, 2008 for Class A and Class C shares and on September 26, 2008 for Class Y shares. Prior to September 29, 2008, the predecessor Delafield Select Fund operated as a Delaware limited partnership using substantially the same investment objectives and investment policies as the predecessor fund. The limited partnership was incepted in July 1998.
2. SIGNIFICANT ACCOUNTING POLICIES
The following is a summary of significant accounting principles followed by the Trust in the preparation of its financial statements.
a) Security valuation and security transactions
Investments in securities, including foreign securities, traded on an exchange or quoted on the over-the-counter market are valued at the last sale price or, if no sale occurred during the day, at the mean between closing bid and asked prices, as last reported by a pricing service approved by the Trustees. Securities that are principally traded on the National Association of Securities Dealers Automated Quotation National Market (“NASDAQ”) are generally valued at the NASDAQ Official Closing Price (“NOCP”). If there is no NASDAQ Official Closing Price for a NASDAQ-listed security or sale price available for an over-the-counter security, the mean of the latest bid and asked quotations from NASDAQ will be used. Investments in gold will be valued at the spot price of gold determined based on the mean of the last bid and asked price at the close of the New York Commodity Exchange. When market quotations for securities are not readily available, or when restricted securities or other assets are being valued, such assets are valued at fair value as determined in good faith by or under procedures approved by the Trustees. Money market funds are valued at market price. Money market deposit accounts are reflected at cost as this is a cash instrument. Fixed income securities are valued at market price. Fixed Income securities, such as corporate bonds, convertible bonds and U.S. government agency issues for which market quotations are not readily available may be valued based on information supplied by independent pricing services using matrix pricing formulas and/or independent broker bid quotations.
Trading in securities on foreign securities exchanges normally is completed before the calculation of the Funds’ net asset value. Trading on these foreign exchanges may not take place on all days on which there is regular trading on the New York Stock Exchange (“NYSE”), or may take place on days on which there is no regular trading on the NYSE. Similarly, the Funds may hold securities traded in domestic markets where the market may close early on a given day prior to calculation of the Funds’ net asset value. Events affecting the value of such securities held by the Funds that occur between the close of trading in the security and the close of trading on the NYSE normally will not be reflected in the Funds’ calculation of the net asset value. However, significant events will be closely monitored, and where it is determined that an adjustment should be made to the security’s value because significant interim events may materially affect the value of the security, the security will be priced at its fair value in accordance with the procedures approved by the Trustees.
Investment and shareholder transactions are recorded on trade date. Dividend income is recognized on the ex-dividend date. Interest income is recognized on an accrual basis and includes, where applicable, the amortization of premiums and accretion of discounts. Net realized gains and losses from sales of securities are determined on the specific identification cost method.
b) Restricted and illiquid securities
The Funds may invest in securities that are subject to legal or contractual restrictions on resale or are illiquid. A security may be considered illiquid if it lacks a readily available market or if its valuation has not changed for a certain period of time. Disposal of these securities may involve time consuming negotiations and expense, and a prompt sale at the current valuation may be difficult.
c) Fair Valuation Measurements
The Trust has adopted authoritative fair valuation accounting standards which establish an authoritative definition of fair value and set out a hierarchy for measuring fair value. These standards require additional disclosures about the various inputs and valuation techniques used to develop the measurements of fair value and a discussion in changes in valuation techniques and related inputs during the period. These inputs are summarized in the three broad levels listed below.
| | • | Level 1 - Quoted prices in active markets for identical securities. |
| | • | Level 2 - Other significant observable inputs (including quoted prices for similar securities, interest rates, prepayment speeds, credit risk, etc.). |
| | • | Level 3 - Significant unobservable inputs (including the Fund’s own assumptions in determining the fair value of investments). |
When using the market quotations or closing price provided by the pricing service for equity investments, including common stocks, preferred stocks, foreign issued common stocks, exchange-traded funds, closed end mutual funds and real estate investment trusts, which are traded on an exchange are valued at the last sale price reported by the exchange on which the securities are primarily traded on the day of valuation and when the market is considered active, the security will be classified as a Level 1 security. When using the mean between the latest bid and ask price, the security will be classified as Level 2. Common stocks of the International Value Fund that are traded on non-North American exchanges are valued using matrix pricing formulas provided by an independent pricing service. These securities will generally be classified as Level 2 securities. Gold bullion is valued at the mean of the closing bid and ask prices from the New York Mercantile Exchange and is classified as a Level 2.
Investment in mutual funds, including money market funds, are generally priced at the ending net asset value (NAV) provided by the service agent of the funds and will be classified as Level 1 securities.
Debt securities, such as corporate bonds, convertible bonds, commercial paper, money market deposit accounts and U.S. government agency issues for which market quotations are not readily available may be valued based on information supplied by independent pricing services using matrix pricing formulas and/or independent broker bid quotations and are classified as Level 2. Warrants and rights for which the underlying security is registered and equities which are subject to a required holding period, but have a comparable public issue, are valued in good faith by the adviser pursuant to procedures established under the general supervision and responsibility of the Funds’ Board of
Trustees. These securities will generally be classified as Level 2 securities. If the warrant or right is exchange traded and the official closing price of the exchange is used, these instruments are classified as Level 1 securities. Forward currency contracts derive their value from the underlying currency prices. These are valued by a pricing service using pricing models. The models use inputs that are observed from active markets, such as exchange rates. These contracts are classified as Level 2. Options can diverge from the prices of their underlying instruments. These are valued at the composite last price reported by the exchange on which the options are primarily traded on the day of the valuation and are classified as Level 1. If there is no composite last price on a given day the mean between the latest bid and ask price will be used. These contracts are classified as Level 2.
Any securities or other assets for which market quotations are not readily available are valued at fair value as determined in good faith by the Adviser pursuant to procedures established under the general supervision and responsibility of the Funds’ Board of Trustees and will be classified as Level 3 securities. In determining fair value, a Fund will seek to assign a value to the security which it believes represents the amount that the Fund could reasonably expect to receive upon its current sale. With respect to securities that are actively traded on U.S. exchanges, the Funds expect that market quotations will generally be available and that fair value might be used only in limited circumstances, such as when trading for a security is halted during the trading day.
For securities traded principally on foreign exchanges, the Funds may use fair value pricing if an event occurs after the close of trading of the principal foreign exchange on which a security is traded, but before calculation of a Fund’s NAV, which a Fund believes affects the value of the security since its last market quotation. Such events may involve situations relating to a single issuer (such as news related to the issuer announced after the close of the principal foreign exchange), or situations relating to sectors of the market or the markets in general (such as significant fluctuations in the U.S. or foreign markets or significant changes in exchange rates, natural disasters, armed conflicts, or governmental actions).
In determining whether a significant event has occurred with respect to securities traded principally in foreign markets, the Funds may engage a third party fair value service provider to systematically recommend the adjustment of closing market prices of non-U.S. securities based upon changes in a designated U.S. securities market index occurring from the time of close of the relevant foreign market and the close of the NYSE. Fair value pricing may also be used to value restricted securities held by the Funds or securities with little or no trading activity for extended periods of time. Fair value pricing involves judgments that are inherently subjective and inexact and it is not possible to determine with certainty when, and to what extent, an event will affect a market price. As a result, there can be no assurance that fair value pricing will reflect actual market value and it is possible that the fair value determined for a security may differ materially from the value that could be realized upon the sale of the security.
The following is a summary of the inputs used, as of April 30, 2017, involving the Funds’ assets and liabilities carried at fair value. The inputs of methodology used for valuing securities may not be an indication of the risk associated with investing in those securities.
| | | | | | | | | | | | | | | | |
| Description | | Level 1 | | | Level 2 | | | Level 3 | | | Total | |
The Tocqueville Fund | | | | | | | | | | | | | | | | |
Assets | | | | | | | | | | | | | | | | |
Common Stocks* | | $ | 275,658,626 | | | $ | — | | | $ | — | | | $ | 275,658,626 | |
Preferred Stock* | | | — | | | | — | | | | 1,600 | | | | 1,600 | |
Real Estate Investment Trust (REIT)* | | | 6,774,000 | | | | — | | | | — | | | | 6,774,000 | |
Exchange-Traded Fund (ETF)* | | | 2,980,000 | | | | — | | | | — | | | | 2,980,000 | |
Money Market Fund | | | 916 | | | | — | | | | — | | | | 916 | |
| | | | | | | | | | | | | | | | |
Total Assets | | $ | 285,413,542 | | | $ | — | | | $ | 1,600 | | | $ | 285,415,142 | |
| | | | | | | | | | | | | | | | |
| | | | |
| The Tocqueville Opportunity Fund | | Level 1 | | | Level 2 | | | Level 3 | | | Total | |
Assets | | | | | | | | | | | | | | | | |
Common Stocks | | | | | | | | | | | | | | | | |
Automobiles & Components | | $ | 568,465 | | | $ | — | | | $ | — | | | $ | 568,465 | |
Banks | | | 3,190,370 | | | | — | | | | — | | | | 3,190,370 | |
Capital Goods | | | 6,944,021 | | | | — | | | | — | | | | 6,944,021 | |
Commercial & Professional Services | | | 234,515 | | | | — | | | | — | | | | 234,515 | |
Consumer Durables & Apparel | | | 334,390 | | | | — | | | | — | | | | 334,390 | |
Consumer Services | | | 568,575 | | | | 2,095 | | | | — | | | | 570,670 | |
Diversified Financials | | | 500,308 | | | | — | | | | — | | | | 500,308 | |
Energy | | | 20,750 | | | | — | | | | — | | | | 20,750 | |
Food, Beverage & Tobacco | | | 57,586 | | | | — | | | | — | | | | 57,586 | |
Health Care Equipment & Services | | | 2,113,120 | | | | — | | | | — | | | | 2,113,120 | |
Materials | | | 1,883,610 | | | | — | | | | — | | | | 1,883,610 | |
Media | | | 112,710 | | | | — | | | | — | | | | 112,710 | |
Pharmaceuticals, Biotechnology & Life Sciences | | | 23,823,520 | | | | — | | | | — | | | | 23,823,520 | |
Retailing | | | 580,490 | | | | — | | | | — | | | | 580,490 | |
Semiconductors & Semiconductor Equipment | | | 7,888,782 | | | | — | | | | — | | | | 7,888,782 | |
Software & Services | | | 16,265,075 | | | | — | | | | — | | | | 16,265,075 | |
Technology Hardware & Equipment | | | 7,208,285 | | | | — | | | | — | | | | 7,208,285 | |
Transportation | | | 561,651 | | | | — | | | | — | | | | 561,651 | |
| | | | | | | | | | | | | | | | |
Total Common Stocks | | | 72,856,223 | | | | 2,095 | | | | — | | | | 72,858,318 | |
Real Estate Investment Trust (REIT)* | | | 418 | | | | — | | | | — | | | | 418 | |
Exchange-Traded Funds (ETFs)* | | | 120,200 | | | | — | | | | — | | | | 120,200 | |
Purchased Call Options | | | | | | | | | | | | | | | | |
Banks | | | 51,250 | | | | — | | | | — | | | | 51,250 | |
Diversified Financials | | | 9,000 | | | | — | | | | — | | | | 9,000 | |
Pharmaceuticals, Biotechnology & Life Sciences | | | 62,000 | | | | 240,375 | | | | — | | | | 302,375 | |
Retailing | | | 64,000 | | | | — | | | | — | | | | 64,000 | |
Technology Hardware & Equipment | | | 159,000 | | | | — | | | | — | | | | 159,000 | |
Transportation | | | 121,400 | | | | — | | | | — | | | | 121,400 | |
| | | | | | | | | | | | | | | | |
Total Purchased Call Options | | | 466,650 | | | | 240,375 | | | | — | | | | 707,025 | |
Money Market Fund | | | 200 | | | | — | | | | — | | | | 200 | |
| | | | | | | | | | | | | | | | |
Total Assets | | $ | 73,443,691 | | | $ | 242,470 | | | $ | — | | | $ | 73,686,161 | |
| | | | | | | | | | | | | | | | |
| | | | | | | | | | | | | | | | |
| The Tocqueville International Value Fund | | Level 1 | | | Level 2 | | | Level 3 | | | Total | |
Assets | | | | | | | | | | | | | | | | |
Common Stocks | | | | | | | | | | | | | | | | |
Australia | | $ | 8,010,000 | | | $ | 1,302,806 | | | $ | — | | | $ | 9,312,806 | |
Belgium | | | — | | | | 16,545,929 | | | | — | | | | 16,545,929 | |
Brazil | | | 7,878,750 | | | | — | | | | — | | | | 7,878,750 | |
Canada | | | 18,518,295 | | | | — | | | | — | | | | 18,518,295 | |
Cayman Islands | | | — | | | | 7,082,911 | | | | — | | | | 7,082,911 | |
Denmark | | | — | | | | 16,259,796 | | | | — | | | | 16,259,796 | |
Finland | | | 12,033,000 | | | | — | | | | — | | | | 12,033,000 | |
France | | | — | | | | 113,900,177 | | | | — | | | | 113,900,177 | |
Germany | | | 16,830,102 | | | | 43,613,819 | | | | — | | | | 60,443,921 | |
Hong Kong | | | 13,625,965 | | | | — | | | | — | | | | 13,625,965 | |
Ireland | | | — | | | | 13,260,680 | | | | — | | | | 13,260,680 | |
Japan | | | — | | | | 105,178,309 | | | | — | | | | 105,178,309 | |
Netherlands | | | 16,037,680 | | | | 10,617,916 | | | | — | | | | 26,655,596 | |
Netherlands Antilles | | | 14,626,885 | | | | — | | | | — | | | | 14,626,885 | |
Singapore | | | — | | | | 7,403,691 | | | | — | | | | 7,403,691 | |
Spain | | | — | | | | 26,693,060 | | | | — | | | | 26,693,060 | |
Switzerland | | | 35,161,963 | | | | — | | | | — | | | | 35,161,963 | |
United Kingdom | | | 35,712,650 | | | | 79,086,018 | | | | — | | | | 114,798,668 | |
United States | | | 17,732,780 | | | | — | | | | — | | | | 17,732,780 | |
| | | | | | | | | | | | | | | | |
Total Common Stocks | | | 196,168,070 | | | | 440,945,112 | | | | — | | | | 637,113,182 | |
Preferred Stocks | | | | | | | | | | | | | | | | |
Brazil | | | 9,613,500 | | | | — | | | | — | | | | 9,613,500 | |
Republic of Korea | | | — | | | | 20,019,028 | | | | — | | | | 20,019,028 | |
| | | | | | | | | | | | | | | | |
Total Preferred Stocks | | | 9,613,500 | | | | 20,019,028 | | | | — | | | | 29,632,528 | |
Real Estate Investment Trust (REIT)* | | | 3,747,175 | | | | — | | | | — | | | | 3,747,175 | |
Right* | | | 1,348,959 | | | | — | | | | — | | | | 1,348,959 | |
Money Market Fund | | | 35,982,319 | | | | — | | | | — | | | | 35,982,319 | |
Money Market Deposit Account | | | — | | | | 37,649,296 | | | | — | | | | 37,649,296 | |
Forward Currency Contracts** | | | — | | | | 201,002 | | | | — | | | | 201,002 | |
| | | | | | | | | | | | | | | | |
Total Assets | | $ | 246,860,023 | | | $ | 498,814,438 | | | $ | — | | | $ | 745,674,461 | |
| | | | | | | | | | | | | | | | |
| | | | |
| The Tocqueville Gold Fund | | Level 1 | | | Level 2 | | | Level 3 | | | Total | |
Assets | | | | | | | | | | | | | | | | |
Common Stocks | | | | | | | | | | | | | | | | |
Gold Related | | $ | 949,213,243 | | | $ | 5,756,562 | | | $ | 702,005 | | | $ | 955,671,810 | |
Other Precious Metals Related | | | 74,744,455 | | | | — | | | | 5,717,408 | | | | 80,461,863 | |
Other | | | — | | | | — | | | | 7,533,975 | | | | 7,533,975 | |
| | | | | | | | | | | | | | | | |
Total Common Stocks | | | 1,023,957,698 | | | | 5,756,562 | | | | 13,953,388 | | | | 1,043,667,648 | |
Private Fund*** ^ | | | — | | | | — | | | | — | | | | 16,954,107 | |
Gold Bullion | | | — | | | | 151,788,365 | | | | — | | | | 151,788,365 | |
Warrants* | | | — | | | | 5,088,042 | | | | — | | | | 5,088,042 | |
Right* | | | 38,460 | | | | — | | | | — | | | | 38,460 | |
Money Market Fund | | | 2,504,094 | | | | — | | | | — | | | | 2,504,094 | |
| | | | | | | | | | | | | | | | |
Total Assets | | $ | 1,026,500,252 | | | $ | 162,632,969 | | | $ | 13,953,388 | | | $ | 1,220,040,716 | |
| | | | | | | | | | | | | | | | |
| | | | | | | | | | | | | | | | |
| The Delafield Fund | | Level 1 | | | Level 2 | | | Level 3 | | | Total | |
Assets | | | | | | | | | | | | | | | | |
Common Stocks* | | $ | 307,263,937 | | | $ | — | | | $ | — | | | $ | 307,263,937 | |
Money Market Fund | | | 20,001,335 | | | | — | | | | — | | | | 20,001,335 | |
Money Market Deposit Account | | | — | | | | 71,522,497 | | | | — | | | | 71,522,497 | |
| | | | | | | | | | | | | | | | |
Total Assets | | $ | 327,265,272 | | | $ | 71,522,497 | | | $ | — | | | $ | 398,787,769 | |
| | | | | | | | | | | | | | | | |
| | | | |
| The Tocqueville Select Fund | | Level 1 | | | Level 2 | | | Level 3 | | | Total | |
Assets | | | | | | | | | | | | | | | | |
Common Stocks* | | $ | 52,148,273 | | | $ | — | | | $ | — | | | $ | 52,148,273 | |
Money Market Fund | | | 2,981,241 | | | | — | | | | — | | | | 2,981,241 | |
Money Market Deposit Account | | | — | | | | 4,848,465 | | | | — | | | | 4,848,465 | |
| | | | | | | | | | | | | | | | |
Total Assets | | $ | 55,129,514 | | | $ | 4,848,465 | | | $ | — | | | $ | 59,977,979 | |
| | | | | | | | | | | | | | | | |
| * | For further information regarding portfolio characteristics, please see the accompanying Schedules of Investments. |
| ** | Derivative instruments not reflected in the Schedule of Investments, such as forward currency contracts, are reflected at the unrealized appreciation (depreciation) on the instrument. |
| *** | Certain investments that are measured at fair value using the net asset value per share (or its equivalent) practical expedient have not been categorized in the fair value hierarchy. The fair value amounts presented in the table are intended to permit reconciliation of the fair value hierarchy to the amounts presented in the Statement of Assets and Liabilities. |
| ^ | The Gold Fund currently invests in a private fund that primarily invests in physical gold and is subject to redemption restrictions. This private fund investment can only be disposed of with notice given 24 hours in advance of redemption. |
Below is a reconciliation that details the transfer of securities between Level 1 and Level 2 during the reporting period:
| | | | | | | | | | | | |
| | | The
Tocqueville
Opportunity
Fund | | | The
Tocqueville
International
Value Fund | | | The
Tocqueville
Gold Fund | |
Transfers Into Level 1 | | $ | — | | | $ | 11,836,388 | | | $ | 3,296,374 | |
Transfers Out of Level 1 | | | (2,095 | ) | | | — | | | | (531,922 | ) |
| | | | | | | | | | | | |
Net Transfers Into/(Out of ) Level 1 | | | (2,095 | ) | | | 11,836,388 | | | | 2,764,452 | |
| | | | | | | | | | | | |
Transfers Into Level 2 | | | 2,095 | | | | — | | | | 531,922 | |
Transfers Out of Level 2 | | | — | | | | (11,836,388 | ) | | | (3,296,374 | ) |
| | | | | | | | | | | | |
Net Transfers Into/(Out of ) Level 2 | | $ | 2,095 | | | $ | (11,836,388 | ) | | $ | (2,764,452 | ) |
| | | | | | | | | | | | |
Below is a reconciliation that details the activity of securities in Level 3 during the current fiscal period:
| | | | | | | | |
| | | The
Tocqueville
Fund | | | The
Tocqueville
Gold Fund | |
Beginning Balance—November 1, 2016 | | $ | 1,600 | | | $ | 30,223,082 | |
Purchases | | | — | | | | — | |
Sales | | | — | | | | — | |
Realized gains | | | — | | | | — | |
Realized losses | | | — | | | | — | |
Change in unrealized appreciation | | | — | | | | 684,413 | |
Transfers in/(out) of Level 3 | | | — | | | | (16,954,107 | ) |
| | | | | | | | |
Ending Balance—April 30, 2017 | | $ | 1,600 | | | $ | 13,953,388 | |
| | | | | | | | |
The movement from Level 1 to Level 2 in the Opportunity Fund and the Gold Fund was from the securities being priced using the mean of the bid and ask price due to the lack of trading volume on April 30, 2017. The movement from Level 2 to Level 1 in the International Value Fund and the Gold Fund was due to the use of market quotations or closing prices provided by the pricing service because the market was considered active. There were no transfers between levels in The Tocqueville Fund, The Delafield Fund or The Select Fund. Transfers between levels are recognized at the end of the reporting period.
The movement out of Level 3 in the Gold Fund was due to the Private Fund held, which is measured at fair value using the net asset value per share (or its equivalent) practical expedient, no longer being categorized in the fair value hierarchy.
As of April 30, 2017, the change in unrealized appreciation on positions still held in the Tocqueville Gold Fund was $684,413.
Significant Unobservable Inputs for Level 3 Portfolio Company Securities
| | | | | | | | | | | | |
Fund | | Type of
Security | | Industry | | Fair Value
at 4/30/2017 | | Valuation
Techniques | | Unobservable
Inputs | | Range |
The Tocqueville Fund | | Preferred Stock | | Health Care | | $1,600 | | Latest company valuation | | Financing
prices | | $0.004 |
The Tocqueville Gold Fund | | Common Stock | | Gold Related | | $702,005 | | Latest company valuation | | Financing
prices | | $0.33 |
| | | | Other Precious
Metals Related | | 5,717,408 | | Latest company financing price | | Financing
prices | | $3.50 |
| | | | Other | | 7,533,975 | | Latest company financing price | | Financing
prices | | $1.38-$8.60 |
The significant unobservable inputs used in the fair value measurement of the Tocqueville Fund’s preferred stock and the Gold Fund’s common stocks are the most recent financing prices of the portfolio company, which approximate the companies’ value in the market place.
Significant changes in the companies’ ability to receive financing for new projects in the future would be an indication of the companies’ financial position and market value.
The Trust’s valuation procedures have been adopted by the Trust’s Board of Trustees, which has established a Valuation Committee to oversee the valuation process. The Valuation Committee meets on an as needed basis to evaluate changes in the valuation of portfolio securities. The full findings and valuations are then reviewed quarterly by the Independent Trustees.
d) Derivative Instruments and Hedging Activities
The Funds’ Adviser may use derivative instruments, such as options and forward currency contracts, as a means to manage exposure to different types of risk, including market risk and exchange rate risk, and to gain exposure to underlying securities. The Trust has adopted disclosure standards in order to enable the investor to understand how and why an entity used derivatives, how derivatives are accounted for, and how derivatives affect an entity’s results of operations and financial position.
In the Opportunity Fund, the Adviser used options to gain exposure to the underlying equity security. In the International Value Fund, the Adviser used forward currency contracts to adjust exposure to foreign exchange rate risk.
Balance Sheet—Values of Derivative Instruments as of April 30, 2017.
The Tocqueville Opportunity Fund
| | | | | | | | | | | | |
| | | Asset Derivatives | | | Liability Derivatives | |
| Derivatives not accounted for as hedging instruments | | Balance Sheet
Location | | Value | | | Balance Sheet
Location | | Value | |
Purchased Options | | Investments,
at Value | | $ | 707,025 | | | | | $ | — | |
| | | | | | | | | | | | |
Total | | | | $ | 707,025 | | | | | $ | — | |
| | | | | | | | | | | | |
Tocqueville International Value Fund
| | | | | | | | | | | | |
| | | Asset Derivatives | | | Liability Derivatives | |
| | | Balance Sheet
Location | | Value | | | Balance Sheet
Location | | Value | |
Forward Currency Contracts* | | Appreciation
on forward
currency
contracts | | $ | 201,002 | | | | | | | |
| | | | | | | | | | | | |
Total | | | | $ | 201,002 | | | | | $ | — | |
| | | | | | | | | | | | |
| * | The respective counterparty for each contract is disclosed in the Open Forward Currency Contract detail within the Schedule of Investments. |
The Effect of Derivative Instruments on the Statement of Operations for the period ended April 30, 2017.
The Tocqueville Opportunity Fund
| | | | | | | | |
| | | Net Realized
Loss on Investments | | | Net Change in
Unrealized
Depreciation on
Investments | |
Purchased Options | | $ | (126,829 | ) | | $ | (35,118 | ) |
| | | | | | | | |
Total | | $ | (126,829 | ) | | $ | (35,118 | ) |
| | | | | | | | |
The Tocqueville International Value Fund
| | | | | | | | |
| | | Net Realized
Gain on Forward
Currency Contracts | | | Net Change in
Unrealized
Depreciation on
Forward Currency
Contracts | |
Foreign Currency Forward Contracts | | $ | 2,061,704 | | | $ | (327,714 | ) |
| | | | | | | | |
Total | | $ | 2,061,704 | | | $ | (327,714 | ) |
| | | | | | | | |
Derivatives Risk
The risks of using the types of derivatives in which the Funds may engage include the risk that movements in the value of the derivative may not fully offset or complement instruments currently held in the Funds in the manner intended by the Adviser; the risk that the counterparty to a derivative contract may fail to comply with their obligations to the Fund; the risk that the derivative may not possess a liquid secondary market at a time when the Fund would look to disengage the position; the risk that additional capital from the Fund may be called upon to fulfill the conditions of the derivative contract; and the risk that the cost of the derivative contracts may reduce the overall returns experienced by the Funds. The measurement of risks associated with these instruments is meaningful only when all related offsetting transactions are considered. The use of options and forward currency contracts do not create leverage in the Funds.
The average monthly value of call options in the Opportunity Fund during the period ended April 30, 2017 was $778,023.
Transactions in options in the Opportunity Fund during the period ended April 30, 2017 were as follows:
| | | | | | | | |
| | | Notional
Amount | | | Contracts | |
Outstanding, beginning of period: | | $ | 21,943,750 | | | | 1,295 | |
Options purchased | | | 42,960,000 | | | | 7,385 | |
Options terminated in closing transactions | | | (27,587,750 | ) | | | (3,143 | ) |
Options exercised | | | (350,000 | ) | | | (50 | ) |
Options expired | | | (14,361,000 | ) | | | (1,312 | ) |
| | | | | | | | |
Outstanding, end of period: | | $ | 22,605,000 | | | | 4,175 | |
The average monthly notional amount of forward currency contracts during the period ended April 30, 2017 was as follows:
| | | | |
| | | International
Value Fund | |
Long Positions | | $ | — | |
Forward currency contracts | | | | |
Short Positions | | $ | 19,736,956 | |
Forward currency contracts | | | | |
Offsetting on the Statement of Assets and Liabilities
For financial reporting purposes, the Funds may offset financial assets and financial liabilities that are subject to master netting arrangements or similar agreements within appreciation on forward currency contracts and depreciation on forward currency contracts on the Statement of Assets and Liabilities.
As of April 30, 2017 the Funds did not have assets or liabilities that were subject to offsetting.
e) Foreign currency translation
Investments and other assets and liabilities denominated in foreign currencies are translated to U.S. dollars at the prevailing rates of exchange, in accordance with the Trust’s Portfolio Securities Valuation and Foreign Exchange Contracts Procedures. The Tocqueville Fund, The Tocqueville Opportunity Fund, The Tocqueville International Value Fund and The Tocqueville Gold Fund have engaged in transactions in securities denominated in foreign currencies and, as a result, entered into foreign exchange transactions. The Tocqueville International Value Fund has entered into forward contracts. These Funds are exposed to additional market risk as a result of changes in the value of the underlying currency in relation to the U.S. dollar. Risks include potential inability of counterparties to meet the terms of their obligations. The value of foreign currencies are marked-to-market on a daily basis, which reflects the changes in the market value of the contract at the close of each day’s trading, resulting in daily unrealized gains and/or losses. When the transactions are settled or the contracts are closed, the Funds recognize a realized gain or loss.
The Funds isolate that portion of the results of operations resulting from changes in foreign exchange rates on investments from the fluctuations arising from changes in market prices of securities held. Such fluctuations are reflected as net realized and unrealized gain or loss on foreign currency translation.
Reported net realized foreign exchange gains or losses arise from sales of foreign currencies, currency gains or losses realized between the trade and settlement dates on securities transactions, the differences between the amounts of dividends, interest, and foreign withholding taxes recorded on the Fund’s books, and the U.S. dollar equivalent of the amounts actually received or paid. Net unrealized foreign exchange gains and losses arise from changes in the value of assets and liabilities other than investments in securities at the end of the fiscal year, resulting from changes in the exchange rates.
f) Dividends and distributions to shareholders
Dividends to shareholders are recorded on the ex-dividend date. Dividends from net investment income are declared and paid annually by the Funds. Distributions of net realized capital gains, if any, will be declared and paid at least annually. Income and capital gain distributions are determined in accordance with income tax regulations which may differ from generally accepted accounting principles. Permanent differences between financial and tax reporting may result in reclassification to capital stock.
g) Use of estimates
The preparation of financial statements in conformity with accounting principles generally accepted in the United States of America requires management to make estimates and assumptions that affect the reported amounts of assets and liabilities and disclosure of contingent assets and liabilities at the date of the financial statements and the reported amounts of revenues and expenses during the reporting year. Actual results could differ from those estimates.
h) Indemnification
In the normal course of business the Funds enter into contracts that contain general indemnification clauses. The Funds’ maximum exposure under these arrangements is unknown, as this would involve future claims against a Fund that have not yet occurred. Based on experience, the Funds expect the risk of loss to be remote.
i) Subsequent events evaluation
In preparing these financial statements, the Trust has evaluated events and transactions for potential recognition or disclosure resulting from subsequent events through the date financial statements were available to be issued. This evaluation did not result in any subsequent events, other than those noted above, that necessitated disclosure and/or adjustments.
j) Recent accounting pronouncements
In May 2015, the Financial Accounting Standards Board (“FASB”) issued Accounting Standards Update (“ASU”) No. 2015-07 “Disclosure for Investments in Certain Entities that Calculate Net Asset Value per Share (or Its Equivalent)”. The amendments in ASU No. 2015-07 remove the requirement to categorize within the fair value hierarchy investments measured using the NAV practical expedient. The ASU also removes certain disclosure requirements for investments that qualify, but do not utilize, the NAV practical expedient. Management has reflected these changes in the Fund’s financial statements and related disclosures.
k) Regulatory matter
In October 2016, the Securities and Exchange Commission (the “SEC”) released its Final Rule on Investment Company Reporting Modernization (the “Rule”). The Rule which introduces two new regulatory reporting forms for investment companies—Form N-PORT and Form N-CEN—also contains amendments to Regulation S-X which impact financial statement presentation, particularly the presentation of derivative investments. Although still evaluating the impact of the Rule, management believes that many of the Regulation S-X amendments are consistent with the Funds’ current financial statement presentation and expects that the Funds will be able to comply with the Rule’s Regulation S-X amendments by the August 1, 2017 compliance date.
3. FEDERAL INCOME TAX
There is no tax liability resulting from unrecognized tax benefits relating to uncertain income tax positions taken or expected to be taken on the tax return for the fiscal year-end October 31, 2016, or for any other tax years which are open for exam. As of October 31, 2016, open tax years include the tax years ended October 31, 2013 through 2016. The Trust is also not aware of any tax positions for which it is reasonably possible that the total amounts of unrecognized tax benefits will significantly change in the next six months. The Funds recognize interest and penalties, if any, related to unrecognized tax benefits as income tax expense in the Statement of Operations. During the year, the Funds did not incur any interest or penalties.
Provision for federal income taxes or excise taxes has not been made since the Funds have elected to be taxed as Regulated Investment Companies and intend to distribute substantially all taxable income to shareholders and otherwise comply with the provisions of the Internal Revenue Code applicable to Regulated Investment Companies. Distributions from net realized gains for book purposes may include short-term capital gains which are included as ordinary income to shareholders for tax purposes. Additionally, accounting principles generally accepted in the United States of America require that certain components of net assets relating to permanent differences be reclassified between financial and tax reporting. These reclassifications have no effect on net assets or net asset value per share. For the year ended October 31, 2016, the following table shows the reclassifications made:
| | | | | | | | | | | | |
| | | Undistributed
Net Investment
Income/(Loss) | | | Accumulated Net
Realized
Gain/(Loss) | | | Paid In Capital | |
Tocqueville Fund | | $ | (286,182 | ) | | $ | (1,966,070 | ) | | $ | 2,252,252 | |
Opportunity Fund | | | 1,197,696 | | | | (41,598 | ) | | | (1,156,098 | ) |
International Value Fund | | | (1,018,374 | ) | | | (621,812 | ) | | | 1,640,186 | |
Gold Fund | | | 3,540,867 | | | | 401,085 | | | | (3,941,952 | ) |
Delafield Fund | | | 1,255,432 | | | | (21,428,918 | ) | | | 20,173,486 | |
Select Fund | | | 457,330 | | | | (614,925 | ) | | | 157,595 | |
The permanent differences primarily relate to net operating losses, foreign currency reclasses, the usage of tax equalization, Partnerships, and PFICs.
As of October 31, 2016, the components of accumulated earnings (losses) for income tax purposes were as follows:
| | | | | | | | | | | | | | | | | | | | | | | | |
| | | Tocqueville
Fund | | | Opportunity
Fund | | | International
Value Fund | | | Gold
Fund | | | Delafield Fund | | | Select Fund | |
Tax cost of Investments | | $ | 160,789,511 | | | $ | 87,319,957 | | | $ | 491,551,224 | | | $ | 1,373,772,582 | | | $ | 346,326,461 | | | $ | 61,771,903 | |
| | | | | | | | | | | | | | | | | | | | | | | | |
Unrealized Appreciation | | | 122,667,226 | | | | 14,522,310 | | | | 62,985,744 | | | | 389,453,381 | | | | 81,677,597 | | | | 12,593,122 | |
Unrealized Depreciation | | | (233,946 | ) | | | (9,041,112 | ) | | | (30,239,280 | ) | | | (398,003,248 | ) | | | (27,703,238 | ) | | | (10,476,422 | ) |
| | | | | | | | | | | | | | | | | | | | | | | | |
Net unrealized appreciation (depreciation) | | | 122,433,280 | | | | 5,481,198 | | | | 32,746,464 | | | | (8,549,867 | ) | | | 53,974,359 | | | | 2,116,700 | |
| | | | | | | | | | | | | | | | | | | | | | | | |
Undistributed operating income | | | 2,767,985 | | | | — | | | | 5,348,368 | | | | — | | | | — | | | | — | |
Undistributed long-term gains | | | 12,245,498 | | | | — | | | | 2,913,556 | | | | — | | | | 71,259,379 | | | | 3,023,154 | |
| | | | | | | | | | | | | | | | | | | | | | | | |
Distributable earnings | | | 15,013,483 | | | | — | | | | 8,261,924 | | | | — | | | | 71,259,379 | | | | 3,023,154 | |
| | | | | | | | | | | | | | | | | | | | | | | | |
Other accumulated gain/(loss) | | | (33 | ) | | | (5,160,692 | ) | | | 460,830 | | | | (320,393,568 | ) | | | (1,541,265 | ) | | | (244,770 | ) |
| | | | | | | | | | | | | | | | | | | | | | | | |
Total accumulated gain | | $ | 137,446,730 | | | $ | 320,506 | | | $ | 41,469,218 | | | $ | (328,943,435 | ) | | $ | 123,692,473 | | | $ | 4,895,084 | |
| | | | | | | | | | | | | | | | | | | | | | | | |
The difference between book-basis and tax-basis unrealized appreciation is attributable primarily to wash sale deferrals and passive foreign investment companies (PFIC’s).
The tax character of distributions paid during the years ended October 31, 2016 and 2015 was as follows:
| | | | | | | | | | | | |
| | | October 31, 2016 | |
| | | Ordinary
Income | | | Long Term
Capital Gain | | | Total | |
Tocqueville Fund | | $ | 3,200,195 | | | $ | 3,072,752 | | | $ | 6,272,947 | |
Opportunity Fund | | | — | | | | — | | | | — | |
International Value Fund | | | 5,967,776 | | | | 4,247,573 | | | | 10,215,349 | |
Gold Fund | | | — | | | | — | | | | — | |
Delafield Fund | | | — | | | | 62,285,610 | | | | 62,285,610 | |
Select Fund | | | — | | | | 2,573,589 | | | | 2,573,589 | |
| |
| | | October 31, 2015 | |
| | | Ordinary
Income | | | Long Term
Capital Gain | | | Total | |
Tocqueville Fund | | $ | 2,801,877 | | | $ | 13,296,075 | | | $ | 16,097,952 | |
Opportunity Fund | | | 787,557 | | | | 9,390,632 | | | | 10,178,189 | |
International Value Fund | | | 5,099,005 | | | | 8,275,518 | | | | 13,374,523 | |
Gold Fund | | | — | | | | — | | | | — | |
Delafield Fund | | | — | | | | 136,125,451 | | | | 136,125,451 | |
Select Fund | | | — | | | | 12,348,792 | | | | 12,348,792 | |
The Fund designated as long-term capital gain dividend, pursuant to Internal Revenue Code Section 852(b)(3), the amount necessary to reduce the earnings and profits of the Funds related to net capital gain to zero for the tax years ended October 31, 2016 and 2015.
For the fiscal year ended October 31, 2016 the Opportunity Fund, Delafield Fund, and Select Fund had late year losses of $868,854, $1,541,264 and $244,770, respectively.
At October 31, 2016 certain Funds had tax basis capital losses which may be carried forward to offset future capital gains as shown below.
| | | | | | | | |
| | | Capital Losses Expiring | |
| | | Indefinite Short Term | | | Indefinite Long Term | |
Opportunity Fund | | $ | 4,291,683 | | | $ | — | |
Gold Fund | | | — | | | | 320,388,468 | |
To the extent that Funds listed above may realize future net capital gains, those gains will be offset by any of their unused respective capital loss carryforwards
4. INVESTMENT ADVISORY AND OTHER AGREEMENTS
Tocqueville Asset Management L.P. (“Tocqueville”) is the investment adviser (the “Adviser”) to the Trust under Investment Advisory Agreements approved by shareholders. For its services, Tocqueville receives fees from The Tocqueville Fund, calculated daily and
payable monthly, at an annual rate of 0.75% on the first $1 billion of the average daily net assets of the Fund, and 0.65% of the average daily net assets in excess of $1 billion. Tocqueville receives fees from The Tocqueville Opportunity Fund, calculated daily and payable monthly, at an annual rate of 0.75% on the first $500 million of the average daily net assets of the Fund, and 0.65% of the average daily net assets in excess of $500 million. Tocqueville receives fees from The Tocqueville International Value Fund, calculated daily and payable monthly, at an annual rate of 1.00% on the first $1 billion of the average daily net assets of the Fund, and 0.75% of the average daily net assets in excess of $1 billion. Tocqueville receives fees from The Tocqueville Gold Fund, calculated daily and payable monthly, at an annual rate of 1.00% on the first $500 million of the average daily net assets of the Fund, 0.75% of the average daily net assets in excess of $500 million but not exceeding $1 billion, and 0.65% of the average daily net assets in excess of $1 billion. Tocqueville receives fees from The Delafield Fund, calculated daily and payable monthly, at an annual rate of 0.80% on the first $250 million of net assets of the Fund; 0.75% on the next $250 million of net assets of the Fund; 0.70% on the next $500 million of net assets of the Fund; and 0.65% on all net assets of the Fund over $1 billion. Tocqueville receives fees from The Tocqueville Select Fund, calculated daily and payable monthly, at an annual rate of 0.80% on all net assets of the Fund.
With respect to The Tocqueville Fund, The Tocqueville Opportunity Fund, The Tocqueville International Value Fund, The Delafield Fund and The Tocqueville Select Fund, the Adviser has contractually agreed to waive its advisory fees and/or reimburse expenses in order to ensure that The Tocqueville Fund, The Tocqueville Opportunity Fund, The Tocqueville International Value Fund, The Delafield Fund and The Tocqueville Select Fund, total annual operating expenses do not exceed 1.25% of its average daily net assets (excluding taxes, interest expense, acquired fund fees and expenses, or extraordinary expenses such as litigation). The Expense Limitation Agreements will remain in effect until March 1, 2018 for each fund. For the six months ended April 30, 2017, the Adviser waived $19,680, $50,441, $828,882, $152,833, and $36,529 of the advisory fee for The Tocqueville Fund, The Tocqueville Opportunity Fund, The Tocqueville International Value Fund, The Delafield Fund and The Tocqueville Select Fund, respectively. Such amounts are not subject to recoupment by the Adviser.
Pursuant to an Administrative Services Agreement, each Fund pays to the Adviser a fee computed and paid monthly at an annual rate of 0.15% on the first $400 million of the average daily net assets of each fund; 0.13% on the next $600 million of the average daily net assets of each fund; and 0.12% on all the average daily net assets of each fund over $1 billion. For the six months ended April 30, 2017, the Adviser has made payments of $38,099, $11,121, $80,751, $165,124, $55,303, $8,286, to U.S. Bancorp Fund Services, LLC for services provided under a Sub-Administration Agreement for The Tocqueville Fund, The Tocqueville Opportunity Fund, The Tocqueville International Value Fund, The Tocqueville Gold Fund, The Delafield Fund and The Tocqueville Select Fund, respectively.
Tocqueville Securities, L.P. (the “Distributor”), an affiliate of Tocqueville, acts as distributor for shares of the Trust. Each Fund adopted a distribution and service plan
pursuant to Rule 12b-1 of the 1940 Act. Pursuant to the plans, each Fund pays to the Distributor distribution and service fees of 0.25% per annum of its average daily net assets.
Commissions earned by the Distributor for services rendered as a registered broker-dealer in securities transactions for The Tocqueville Fund, The Tocqueville Opportunity Fund, The Tocqueville International Value Fund, The Tocqueville Gold Fund, The Delafield Fund and The Tocqueville Select Fund for the six months ended April 30, 2017, were $10,689, $41,513, $36,913, $0, $4,868, $16,112, respectively.
5. CAPITAL SHARE TRANSACTIONS.
Transactions in capital shares for each Fund were as follows:
| | | | | | | | |
| | | For the
Six-Months
Ended
April 30, 2017
(Unaudited) | | | For the Year
Ended
October 31, 2016 | |
| The Tocqueville Fund | | Shares | | | Shares | |
Shares sold | | | 461,258 | | | | 758,998 | |
Shares issued to holders in reinvestment dividends | | | 435,792 | | | | 180,320 | |
Shares redeemed | | | (1,231,448 | ) | | | (1,941,924 | ) |
| | | | | | | | |
Net decrease | | | (334,398 | ) | | | (1,002,606 | ) |
| | |
| The Tocqueville Opportunity Fund | | | | | | | | |
Shares sold | | | 242,037 | | | | 1,126,477 | |
Shares issued to holders in reinvestment dividends | | | — | | | | — | |
Shares redeemed | | | (1,806,335 | ) | | | (3,435,340 | ) |
| | | | | | | | |
Net decrease | | | (1,564,298 | ) | | | (2,308,863 | ) |
| | |
| The Tocqueville International Value Fund | | | | | | | | |
Shares sold | | | 15,862,710 | | | | 21,229,873 | |
Shares issued to holders in reinvestment dividends | | | 509,379 | | | | 668,623 | |
Shares redeemed | | | (5,854,148 | ) | | | (8,378,756 | ) |
| | | | | | | | |
Net increase | | | 10,517,941 | | | | 13,519,740 | |
| | |
| The Tocqueville Gold Fund | | | | | | | | |
Shares sold | | | 4,749,971 | | | | 12,486,612 | |
Shares issued to holders in reinvestment dividends | | | — | | | | — | |
Shares redeemed | | | (5,955,367) | | | | (14,150,662 | ) |
| | | | | | | | |
Net decrease | | | (1,205,396) | | | | (1,664,050 | ) |
| | |
| The Delafield Fund | | | | | | | | |
Shares sold | | | 499,037 | | | | 1,518,777 | |
Shares issued to holders in reinvestment dividends | | | 2,739,544 | | | | 2,473,115 | |
Shares redeemed | | | (2,647,266) | | | | (12,406,861 | ) |
| | | | | | | | |
Net increase (decrease) | | | 591,315 | | | | (8,414,969 | ) |
| | |
| The Tocqueville Select Fund | | | | | | | | |
Shares sold | | | 199,584 | | | | 440,494 | |
Shares issued to holders in reinvestment dividends | | | 231,253 | | | | 229,723 | |
Shares redeemed | | | (1,074,328) | | | | (1,860,720 | ) |
| | | | | | | | |
Net decrease | | | (643,491) | | | | (1,190,503 | ) |
6. FUND SHARE TRANSACTIONS
Each Fund currently offers only one class of shares of beneficial interest. A redemption fee of 2.00% is imposed on redemptions of shares held 90 days or fewer for The Tocqueville Gold Fund. This fee is retained by the Fund and is credited to paid in capital. Redemptions to which the fee applies include redemptions of shares resulting from an exchange made pursuant to the Exchange Privilege, as defined in the Trust’s Prospectus dated February 28, 2017. For a more detailed description of when the redemption fee does not apply, please see the Trust’s Prospectus.
7. INVESTMENT TRANSACTIONS
Purchases and sales of investment securities (excluding short-term instruments) for the period ended April 30, 2017 are summarized below.
| | | | | | | | | | | | | | | | | | | | | | | | |
| | | Tocqueville
Fund | | | Opportunity
Fund | | | International
Value Fund | | | Gold Fund | | | Delafield
Fund | | | Select
Fund | |
Purchases: | | $ | 17,800,802 | | | $ | 67,179,984 | | | $ | 209,828,989 | | | $ | 102,614,409 | | | $ | 59,167,620 | | | $ | 6,100,770 | |
| | | | | | | | | | | | | | | | | | | | | | | | |
Sales: | | $ | 42,833,699 | | | $ | 97,179,516 | | | $ | 86,372,978 | | | $ | 125,584,967 | | | $ | 120,452,226 | | | $ | 15,159,252 | |
| | | | | | | | | | | | | | | | | | | | | | | | |
U.S. Government Security Purchases: | | $ | — | | | $ | — | | | $ | — | | | $ | — | | | $ | — | | | $ | — | |
| | | | | | | | | | | | | | | | | | | | | | | | |
U.S. Government Security Sales: | | $ | — | | | $ | — | | | $ | — | | | $ | — | | | $ | — | | | $ | — | |
| | | | | | | | | | | | | | | | | | | | | | | | |
8. TRANSACTIONS WITH AFFILIATES (UNAUDITED)
The following issuers are affiliated with the Funds; that is, the Adviser had control of 5% or more of the outstanding voting securities during the period from November 1, 2016 through April 30, 2017. As defined in Section (2)(a)(3) of the Investment Company Act of 1940; such issues are:
| | | | | | | | | | | | | | | | | | | | | | | | | | | | | | | | | | | | | | | | | | | | |
| | | November 1, 2016 | | | Additions | | | Reductions | | | April 30, 2017 | | | Dividend
Income | | | Realized
Gain/(Loss) | | | April 30, 2017 | |
Issuer Name | | Share
Balance | | | Cost | | | Share
Balance | | | Cost | | | Share
Balance | | | Cost | | | Share
Balance | | | | | Value | | | Cost | |
The Tocqueville Gold Fund | | | | | | | | | | | | | | | | | | | | | | | | | | | | | | | | | | | | | | | | | | | | |
Almaden Minerals Ltd. | | | 1,481,482 | | | $ | 1,556,421 | | | | 3,966,667 | | | $ | 3,323,845 | | | | — | | | $ | — | | | | 5,448,149 | | | $ | — | | | $ | — | | | $ | 7,982,344 | | | $ | 4,880,266 | |
Almaden Minerals Ltd.(a) | | | 3,966,667 | | | | 3,323,845 | | | | — | | | | — | | | | (3,966,667 | ) | | | (3,323,845 | ) | | | — | | | | — | | | | — | | | | — | | | | — | |
Almaden Minerals Ltd. | | | — | | | | — | | | | 159,170 | | | | 164,930 | | | | — | | | | — | | | | 159,170 | | | | — | | | | — | | | | 228,543 | | | | 164,930 | |
Almaden Minerals Ltd. Warrant | | | 740,741 | | | | — | | | | — | | | | — | | | | — | | | | — | | | | 740,741 | | | | — | | | | — | | | | 509,275 | | | | — | |
Almaden Minerals Ltd. Warrant | | | 875,000 | | | | — | | | | — | | | | — | | | | — | | | | — | | | | 875,000 | | | | — | | | | — | | | | 667,924 | | | | — | |
Almaden Minerals Ltd. Warrant | | | — | | | | — | | | | 79,585 | | | | — | | | | — | | | | — | | | | 79,585 | | | | — | | | | — | | | | 52,617 | | | | — | |
ATAC Resources Ltd. | | | 10,016,891 | | | | 32,715,236 | | | | — | | | | — | | | | — | | | | — | | | | 10,016,891 | | | | — | | | | — | | | | 4,182,724 | | | | 32,715,236 | |
AuRico Metals, Inc. | | | 7,411,437 | | | | 4,616,358 | | | | — | | | | — | | | | — | | | | — | | | | 7,411,437 | | | | — | | | | — | | | | 6,026,662 | | | | 4,616,358 | |
Bear Creek Mining Corp. | | | 7,413,200 | | | | 28,761,181 | | | | — | | | | — | | | | — | | | | — | | | | 7,413,200 | | | | — | | | | — | | | | 12,490,649 | | | | 28,761,181 | |
Corvus Gold, Inc. | | | 3,350,901 | | | | 2,356,445 | | | | — | | | | — | | | | — | | | | — | | | | 3,350,901 | | | | — | | | | — | | | | 2,094,313 | | | | 2,356,445 | |
Corvus Gold, Inc. | | | 13,030,000 | | | | 10,588,821 | | | | — | | | | — | | | | — | | | | — | | | | 13,030,000 | | | | — | | | | — | | | | 8,113,622 | | | | 10,588,821 | |
East Asia Minerals Corp. | | | 66,484,933 | | | | 22,296,021 | | | | 194,440 | | | | 3,148,570 | | | | (60,030,880 | ) | | | (3,148,570 | ) | | | 6,648,493 | | | | — | | | | — | | | | 1,071,513 | | | | 22,296,021 | |
East Asia Minerals Corp. | | | — | | | | — | | | | 66,425,000 | | | | 500,000 | | | | (59,782,500 | ) | | | — | | | | 6,642,500 | | | | — | | | | — | | | | 1,049,136 | | | | 500,000 | |
East Asia Minerals Corp. Warrant | | | 6,500,000 | | | | — | | | | — | | | | — | | | | (6,500,000 | ) | | | — | | | | — | | | | — | | | | — | | | | — | | | | — | |
East Asia Minerals Corp. Warrant | | | 9,764,933 | | | | — | | | | — | | | | — | | | | (8,788,440 | ) | | | — | | | | 976,493 | | | | — | | | | — | | | | — | | | | — | |
East Asia Minerals Corp. Warrant | | | — | | | | — | | | | 33,212,500 | | | | — | | | | (29,891,250 | ) | | | — | | | | 3,321,250 | | | | — | | | | — | | | | 535,273 | | | | — | |
East Asia Minerals Corp. Warrant | | | 46,175,600 | | | | — | | | | — | | | | — | | | | (41,558,040 | ) | | | — | | | | 4,617,560 | | | | — | | | | — | | | | 744,195 | | | | — | |
Falco Resources Ltd. | | | 2,222,300 | | | | 886,202 | | | | 14,000,000 | | | | 11,086,852 | | | | — | | | | — | | | | 16,222,300 | | | | — | | | | — | | | | 16,043,445 | | | | 11,973,054 | |
Falco Resources Ltd. Warrant | | | — | | | | — | | | | 7,000,000 | | | | — | | | | — | | | | — | | | | 7,000,000 | | | | — | | | | — | | | | 1,744,039 | | | | — | |
GoGold Resources, Inc. | | | 19,546,700 | | | | 24,317,749 | | | | — | | | | — | | | | (4,257,700 | ) | | | (5,251,169 | ) | | | 15,289,000 | | | | — | | | | (3,713,018 | ) | | | 7,504,216 | | | | 19,066,580 | |
Gold Bullion International LLC | | | 5,000,000 | | | | 5,000,000 | | | | — | | | | — | | | | — | | | | — | | | | 5,000,000 | | | | — | | | | — | | | | 6,893,000 | | | | 5,000,000 | |
International Tower Hill Mines Ltd. | | | 5,738,836 | | | | 20,953,121 | | | | — | | | | — | | | | — | | | | — | | | | 5,738,836 | | | | — | | | | — | | | | 2,869,418 | | | | 20,953,120 | |
International Tower Hill Mines Ltd. | | | 11,289,744 | | | | 40,113,412 | | | | — | | | | — | | | | — | | | | — | | | | 11,289,744 | | | | — | | | | — | | | | 5,706,695 | | | | 40,113,412 | |
International Tower Hill Mines Ltd. | | | — | | | | — | | | | 9,041,554 | | | | 4,339,946 | | | | — | | | | — | | | | 9,041,554 | | | | — | | | | — | | | | 4,478,883 | | | | 4,339,946 | |
Jaguar Mining, Inc. | | | 65,858,798 | | | | 7,512,329 | | | | — | | | | — | | | | — | | | | — | | | | 65,858,798 | | | | — | | | | — | | | | 27,018,004 | | | | 7,512,329 | |
MAG Silver Corp. | | | 2,945,400 | | | | 32,406,929 | | | | — | | | | — | | | | (118,300 | ) | | | (1,185,744 | ) | | | 2,827,100 | | | | — | | | | 192,799 | | | | 34,547,162 | | | | 31,221,185 | |
NuLegacy Gold Corp. | | | 19,535,500 | | | | 3,102,220 | | | | 9,020,590 | | | | 3,055,985 | | | | — | | | | — | | | | 28,556,090 | | | | — | | | | — | | | | 5,752,847 | | | | 6,158,205 | |
NuLegacy Gold Corp.(a) | | | 9,553,152 | | | | 3,236,406 | | | | — | | | | — | | | | (9,553,152 | ) | | | (3,236,406 | ) | | | — | | | | — | | | | — | | | | — | | | | — | |
NuLegacy Gold Corp.(a) | | | — | | | | — | | | | 9,020,590 | | | | 3,055,985 | | | | (9,020,590 | ) | | | (3,055,985 | ) | | | — | | | | — | | | | — | | | | — | | | | — | |
| | | | | | | | | | | | | | | | | | | | | | | | | | | | | | | | | | | | | | | | | | | | |
| | | November 1, 2016 | | | Additions | | | Reductions | | | April 30, 2017 | | | Dividend
Income | | | Realized
Gain/(Loss) | | | April 30, 2017 | |
Issuer Name | | Share
Balance | | | Cost | | | Share
Balance | | | Cost | | | Share
Balance | | | Cost | | | Share
Balance | | | | | Value | | | Cost | |
NuLegacy Gold Corp. Warrant(a) | | | 9,553,152 | | | $ | — | | | | — | | | $ | — | | | | (9,553,152 | ) | | $ | — | | | | — | | | $ | — | | | $ | — | | | $ | — | | | $ | — | |
NuLegacy Gold Corp. Warrant | | | — | | | | — | | | | 9,020,590 | | | | — | | | | — | | | | — | | | | 9,020,590 | | | | — | | | | — | | | | 296,050 | | | | — | |
Osisko Gold Royalties Ltd. | | | 3,184,740 | | | | 45,233,444 | | | | — | | | | — | | | | — | | | | — | | | | 3,184,740 | | | | 189,008 | | | | — | | | | 33,922,655 | | | | 45,233,444 | |
Osisko Gold Royalties Ltd. Warrant | | | 274,000 | | | | — | | | | — | | | | — | | | | — | | | | — | | | | 274,000 | | | | — | | | | — | | | | 531,922 | | | | — | |
Osisko Mining, Inc.(a) | | | 1,123,239 | | | | 3,496,359 | | | | — | | | | — | | | | (1,123,239 | ) | | | (3,496,359 | ) | | | — | | | | — | | | | — | | | | — | | | | — | |
Osisko Mining, Inc. | | | 2,730,000 | | | | 5,760,157 | | | | 2,974,239 | | | | 8,890,639 | | | | — | | | | — | | | | 5,704,239 | | | | — | | | | — | | | | 20,601,369 | | | | 14,650,796 | |
Premier Gold Mines Ltd. | | | 7,857,660 | | | | 15,522,203 | | | | 1,785,500 | | | | 2,852,630 | | | | — | | | | — | | | | 9,643,160 | | | | — | | | | — | | | | 19,497,543 | | | | 18,374,833 | |
Rockhaven Resources Ltd.(b) | | | 6,400,000 | | | | 6,455,589 | | | | — | | | | — | | | | (1,768,500 | ) | | | (2,216,050 | ) | | | 4,631,500 | | | | — | | | | (2,002,106 | ) | | | 542,867 | | | | 4,239,539 | |
Rubicon Minerals Corp.(a)(b) | | | 11,275,000 | | | | 15,678,646 | | | | — | | | | — | | | | (11,275,000 | ) | | | (15,678,646 | ) | | | — | | | | — | | | | — | | | | — | | | | — | |
Rubicon Minerals Corp.(b) | | | — | | | | — | | | | 69,556 | | | | 15,678,646 | | | | (69,556 | ) | | | (15,678,646 | ) | | | — | | | | — | | | | (15,562,638 | ) | | | — | | | | — | |
SEMAFO, Inc. | | | 10,224,200 | | | | 38,716,798 | | | | 2,750,000 | | | | 6,859,325 | | | | (983,200 | ) | | | (1,444,259 | ) | | | 11,991,000 | | | | — | | | | 1,426,425 | | | | 27,344,276 | | | | 44,131,864 | |
Strategic Metals Ltd. | | | 10,463,400 | | | | 15,145,574 | | | | — | | | | — | | | | — | | | | — | | | | 10,463,400 | | | | — | | | | — | | | | 4,675,780 | | | | 15,145,574 | |
Tocqueville Bullion Reserve LP—Class G(c) | | | 13,806 | | | | 25,000,000 | | | | — | | | | — | | | | — | | | | — | | | | 13,806 | | | | — | | | | — | | | | 16,954,107 | | | | 25,000,000 | |
Torex Gold Resources, Inc. | | | 3,278,550 | | | | 49,114,641 | | | | — | | | | — | | | | (911,600 | ) | | | (14,907,883 | ) | | | 2,366,950 | | | | — | | | | (1,956,156 | ) | | | 40,089,289 | | | | 34,206,758 | |
| | | | | | | | | | | | | | | | | | | | | | | | | | | | | | | | | | | | | | | | | | | | |
| | | | | | $ | 463,866,107 | | | | | | | $ | 62,957,353 | | | | | | | $ | (72,623,562 | ) | | | | | | $ | 189,008 | | | $ | (7,614,694 | ) | | $ | 322,762,357 | | | $ | 454,199,897 | |
The Delafield Fund | | | | | | | | | | | | | | | | | | | | | | | | | | | | | | | | | | | | | | | | | | | | |
Horizon Global Corp. | | | 250,000 | | | $ | 3,064,902 | | | | 400,000 | | | $ | 5,829,339 | | | | — | | | $ | — | | | | 650,000 | | | $ | — | | | $ | — | | | $ | 9,158,500 | | | $ | 8,894,241 | |
Real Industry, Inc. | | | 103,746 | | | | 623,945 | | | | 121,254 | | | | 478,143 | | | | — | | | | — | | | | 225,000 | | | | — | | | | — | | | | 585,000 | | | | 1,102,088 | |
Xerium Technologies, Inc. | | | 900,000 | | | | 12,042,318 | | | | — | | | | — | | | | — | | | | — | | | | 900,000 | | | | — | | | | — | | | | 6,399,000 | | | | 12,042,318 | |
| | | | | | | | | | | | | | | | | | | | | | | | | | | | | | | | | | | | | | | | | | | | |
| | | | | | $ | 15,731,165 | | | | | | | $ | 6,307,482 | | | | | | | $ | — | | | | | | | $ | — | | | $ | — | | | $ | 16,142,500 | | | $ | 22,038,647 | |
The Tocqueville Select Fund | | | | | | | | | | | | | | | | | | | | | | | | | | | | | | | | | | | | | | | | | | | | |
Horizon Global Corp. | | | 201,000 | | | $ | 2,392,259 | | | | — | | | $ | — | | | | (39,000 | ) | | $ | (516,862 | ) | | | 162,000 | | | $ | — | | | $ | 414,581 | | | $ | 2,282,580 | | | $ | 1,875,397 | |
Real Industry, Inc. | | | 265,581 | | | | 1,617,153 | | | | 217,300 | | | | 749,835 | | | | — | | | | — | | | | 482,881 | | | | — | | | | — | | | | 1,255,490 | | | | 2,366,988 | |
Summer Infant, Inc.(b) | | | 631,231 | | | | 2,401,056 | | | | — | | | | — | | | | (631,231 | ) | | | (2,401,056 | ) | | | — | | | | — | | | | (1,201,961 | ) | | | — | | | | — | |
Xerium Technologies, Inc. | | | 265,000 | | | | 3,374,608 | | | | — | | | | — | | | | — | | | | — | | | | 265,000 | | | | — | | | | — | | | | 1,884,150 | | | | 3,374,608 | |
| | | | | | | | | | | | | | | | | | | | | | | | | | | | | | | | | | | | | | | | | | | | |
| | | | | | $ | 9,785,076 | | | | | | | $ | 749,835 | | | | | | | $ | (2,917,918 | ) | | | | | | $ | — | | | $ | (787,380 | ) | | $ | 5,422,220 | | | $ | 7,616,993 | |
| | | | | | | | | | | | | | | | | | | | | | | | | | | | | | | | | | | | | | | | | | | | |
| (a) | Private security restrictions lifted during period and combined with other non restricted securities |
| (b) | Security is no longer an affiliated company at April 30, 2017. |
| (c) | Tocqueville Bullion Reserve (“TBR”) is a Delaware Limited Partnership created for the purpose of owning physical gold. The General Partner of TBR is TERA Management LLC (“Tera”), a Delaware Limited Liability Company, which is equally owned and managed by Tocqueville Partners II LLC (“TP2”), a Delaware Limited Liability Company, and Eidesis Real Assets LLC (“Eidesis”), a Delaware Limited Liability Company. The Managing Member of TP2 is Robert Kleinschmidt, President of the Trust, who has a 51% participating percentage in TP2 and the sole Non-Managing Member is John Hathaway, co-portfolio manager of the Tocqueville Gold Fund, who has a 49% participating percentage. |
9. LINE OF CREDIT
The Tocqueville Trust has a $300,000,000 line of credit (the “Line”), which is uncommitted, with U.S. Bank NA. The Line is for temporary emergency or extraordinary purposes, including the meeting of redemption requests that otherwise might require the untimely disposition of securities. The Line is secured by the Trust’s assets. The Line has a one year term and is reviewed annually by the Board of Trustees. The current agreement runs through May 26, 2018. The interest rate as of April 30, 2017 was 3.50%. During the period ended April 30, 2017, the Tocqueville Fund’s maximum borrowing was $6,137,000 and average borrowing was $439,610, the Opportunity Fund’s maximum borrowing was $6,496,000 and average borrowing was $1,571,756, and the Gold Fund’s maximum borrowing was $9,412,000 and average borrowing was $748,772. This borrowing resulted in interest expenses of $8,047, $25,222 and $13,010, respectively. The International Value Fund, The Delafield Fund and The Select Fund did not use the Line.
10. OTHER EXPENSES
Other expenses include reimbursement to the Adviser for compensation of the Trust’s Chief Compliance Officer. For the period ended April 30, 2017, reimbursement to the Adviser for compensation of the Trust’s Chief Compliance Officer from the Funds amounted to $7,978, $2,332, $16,858, $34,512, $11,585, $1,736 for the Tocqueville Fund, Opportunity Fund, International Value Fund, Gold Fund, Delafield Fund, and Select Fund respectively.
ADDITIONAL INFORMATION (UNAUDITED)
1. ADDITIONAL DISCLOSURE REGARDING FUND TRUSTEES AND OFFICERS
Independent Trustees
| | | | | | | | | | | | |
Name and Age | | Position(s) Held
with the Trust | | Term of Office
and Length of
Time Served (1) | | Principal Occupation(s) During Past Five Years | | Number of Funds
in Fund Complex
Overseen By Trustee | | | Other Directorships Held by Trustee |
| | | | | |
Charles W. Caulkins Year of Birth: 1956 | | Trustee; Member of Audit Committee; Member of Governance and Nominating Committee | | Indefinite Term, Since 2003 | | Private Investor dba Plan B Partners from January 2012 – present. | | | 6 | | | None |
| | | | | |
Alexander Douglas Year of Birth: 1947 | | Trustee; Member of Audit Committee; Member of Governance and Nominating Committee | | Indefinite Term, Since 2010 | | Retired. Formerly, President, CEO and owner of Spaulding Law Printing, Inc. from 1992 to November 2014. | | | 6 | | | None |
ADDITIONAL INFORMATION (UNAUDITED)
Independent Trustees
| | | | | | | | | | |
Name and Age | | Position(s) Held
with the Trust | | Term of Office
and Length of
Time Served (1) | | Principal Occupation(s) During Past Five Years | | Number of Funds
in Fund Complex
Overseen By Trustee | | Other Directorships Held by Trustee |
| | | | | |
Charles F. Gauvin Year of Birth: 1956 | | Trustee; Member of Audit Committee; Member of Governance and Nominating Committee | | Indefinite Term, Since February 2015 | | Chief Development Officer, Woods Hole Oceanographic Institution, from February 2016 – present; Executive Director, Maine Audubon, from August 2014 – January 2016; Chief Development Officer, Carnegie Endowment for International Peace, from September 2011 – May 2014; Partner, The Riparian Fund/Legacy Ranch Partners (private equity real estate fund), from February 2010 – December 2012. | | 6 | | Director, Bioqual, Inc., July 1992 – present. |
| | | | | |
James W. Gerard Year of Birth: 1961 | | Trustee; Member of Audit Committee; Member of Governance and Nominating Committee | | Indefinite Term, Since 2001 | | Managing Director, Hycroft Advisors, from January 2010-present; Managing Director, deVisscher & Co., LLC from January 2013 to present; The Chart Group from January 2001 to present. | | 6 | | President, American Overseas Memorial Day Association, 1998 to present; Trustee, Salisbury School, 2005 to present; Director, American Friends of Bleraucourt, 1992 to present; President, Little Baby Face Foundation, March 2015 to present. |
ADDITIONAL INFORMATION (UNAUDITED)
Independent Trustees
| | | | | | | | | | |
Name and Age | | Position(s) Held
with the Trust | | Term of Office
and Length of
Time Served (1) | | Principal Occupation(s) During Past Five Years | | Number of Funds
in Fund Complex
Overseen By Trustee | | Other Directorships Held by Trustee |
| | | | | |
William F. Indoe Year of Birth: 1942 | | Trustee; Member of Audit Committee; Member of Governance and Nominating Committee | | Indefinite Term, Since December 2006 | | Retired. Formerly, Sullivan & Cromwell LLP (attorneys-at-law). 1968 – 2011. | | 6 | | Director, Rho Capital Partners, Inc. |
| | | | | |
William J. Nolan III Year of Birth: 1947 | | Trustee; Chair of Audit Committee; Member of Governance and Nominating Committee | | Indefinite Term, Since December 2006 | | Retired. Executive Vice President & Treasurer PaineWebber Inc. 1997 – 2001. | | 6 | | Trustee, Adirondack Museum, Blue Mt. Lake, NY 1996 to present (Treasurer, 2000 to 2013; Executive Committee, 2000 – present). |
ADDITIONAL INFORMATION (UNAUDITED)
Interested Trustees2 and Officers
| | | | | | | | | | |
Name and Age | | Position(s) Held
with the Trust | | Term of Office
and Length of
Time Served (1) | | Principal Occupation(s) During Past Five Years | | Number of Funds
in Fund Complex
Overseen By Trustee | | Other Directorships Held by Trustee |
| | | | | |
Helen Balk Year of Birth:1972 | | Treasurer | | Indefinite Term, Since 2014 | | Controller / Treasurer of Tocqueville Asset Management from January 2014 to present; Manager / Staff Accountant at Pegg & Pegg LLP from August 1995 to January 2014. | | N/A | | N/A |
| | | | | |
Elizabeth Bosco Year of Birth: 1947 | | Anti-Money Laundering Compliance Officer | | Indefinite Term, Since 2009 | | Chief Compliance Officer of Tocqueville Securities, L.P. from January 2009 to present; Compliance Officer, Tocqueville Asset Management from January 2009 to present. | | N/A | | N/A |
| | | | | |
Robert W. Kleinschmidt Year of Birth: 1949 | | Chairman, President, and Trustee | | Indefinite Term, Chairman Since 2016, and President and Trustee Since 1991 | | President and Chief Investment Officer of Tocqueville Asset Management; Director, Tocqueville Management Corporation, the General Partner of Tocqueville Asset Management L.P. and Tocqueville Securities L.P. from January 1994 to present. | | 6 | | President and Director, Tocqueville Management Corporation, the General Partner of Tocqueville Asset Management L.P. and Tocqueville Securities L.P. |
| | | | | |
Cleo Kotis Year of Birth: 1975 | | Secretary | | Indefinite Term, Since 2010 | | Director of Operations, the Delafield Group of Tocqueville Asset Management L.P., 2009 to present. | | N/A | | N/A |
| | | | | |
Thomas Pandick Year of Birth: 1947 | | Chief Compliance Officer | | Indefinite Term, Since 2004 | | Chief Compliance Officer (October 2004 – present) Tocqueville Asset Management L.P. | | N/A | | N/A |
| 1 | Each Trustee will hold office for an indefinite term until the earliest of (i) the next meeting of shareholders, if any, called for the purpose of considering the election or re-election of such Trustee and until the election and qualification of his or her successor, if any, elected at such meeting, or (ii) the date a Trustee resigns or retires, or a Trustee is removed by the Board of Trustees or shareholders, in accordance with the Trust’s By-Laws, as amended, and Agreement and Declaration of Trust, as amended. Each officer will hold office for an indefinite term until the date he or she resigns or retires or until his or her successor is elected and qualifies. |
| 2 | “Interested person” of the Trust as defined in the 1940 Act. Mr. Kleinschmidt is considered “interested person” because of his affiliation with the Advisor. |
The Statement of Additional Information includes additional information about the Trustees and is available free of charge by calling the Funds toll free at 1-800-355-7307.
2. PROXY VOTING POLICIES AND PROCEDURES
A description of the policies and procedures that The Tocqueville Trust uses to determine how to vote proxies relating to portfolio securities is available without charge upon request by calling 1-800-355-7307. Information regarding how The Tocqueville Trust voted proxies relating to portfolio securities during the most recent 12-month period ended June 30 is available by calling 1-800-355-7307 and it is also available on the SEC’s web site at http://www.sec.gov.
3. SHAREHOLDER REPORTS AND QUARTERLY PORTFOLIO DISCLOSURE
The Tocqueville Trust is required to file its complete schedule of portfolio holdings with the SEC for its first and third fiscal quarters on Form N-Q. The Trust’s Form N-Q will be available without charge, upon request on the SEC’s website (http://www.sec.gov) and may be available by calling 1-800-697-3863. You can also obtain copies of Form N-Q by (i) visiting the SEC’s Public Reference Room in Washington, DC (information on the operation of the Public Reference Room may be obtained by calling 1-202-551-8090); (ii) sending your request and a duplicating fee to the SEC’s Public Reference Room, Washington, DC 20549-1520; or (iii) sending your request electronically to publicinfosec.gov. Quarterly portfolio holdings are also available on the website of The Tocqueville Funds, www.tocquevillefunds.com
4. SHAREHOLDER NOTIFICATION OF FEDERAL TAX STATUS
For the fiscal year ended October 31, 2016, certain dividends paid by the Funds may be subject to a maximum tax rate of 15%, as provided for by the Jobs and Growth Tax Relief Reconciliation Act of 2003. The percentage of dividends declared from ordinary income designated as qualified dividend income was as follows:
| | | | |
Tocqueville Fund | | | 100.00 | % |
Opportunity Fund | | | 0.00 | % |
International Value Fund | | | 76.37 | % |
Gold Fund | | | 0.00 | % |
Delafield Fund | | | 0.00 | % |
Select Fund | | | 0.00 | % |
For corporate shareholders, the percent of ordinary income distributions qualifying for the corporate dividends received deduction for the fiscal year ended October 31, 2016 was as follows:
| | | | |
Tocqueville Fund | | | 100.00 | % |
Opportunity Fund | | | 0.00 | % |
International Value Fund | | | 4.19 | % |
Gold Fund | | | 0.00 | % |
Delafield Fund | | | 0.00 | % |
Select Fund | | | 0.00 | % |
For the year ended October 31, 2016, the funds designate the following percent of ordinary distributions paid as interest-related dividends under the Internal Revenue Code Section 871(k)(1)(c):
| | | | |
Tocqueville Fund | | | 0.00 | % |
Opportunity Fund | | | 0.00 | % |
International Value Fund | | | 0.05 | % |
Gold Fund | | | 0.00 | % |
Delafield Fund | | | 0.00 | % |
Select Fund | | | 0.00 | % |
The percentage of taxable ordinary income distributions that are designated as short-term capital gain distributions under Internal Revenue Section 871(k)(2)(C) for each Fund were as follows.
| | | | |
Tocqueville Fund | | | 0.00 | % |
Opportunity Fund | | | 0.00 | % |
International Value Fund | | | 0.00 | % |
Gold Fund | | | 0.00 | % |
Delafield Fund | | | 0.00 | % |
Select Fund | | | 0.00 | % |
5. FOREIGN TAX CREDIT
For the year ended October 31, 2016, the Tocqueville International Value Fund earned foreign source income and paid foreign taxes which they intend to pass through to their shareholders pursuant to Section 853 of the Internal Revenue Code as follows:
| | | | | | | | |
Country | | Gross Dividend
Per Share | | | Taxes Withheld
Per Share | |
Australia | | | 0.0141 | | | | 0.0008 | |
Belgium | | | 0.0108 | | | | 0.0016 | |
Canada | | | 0.0144 | | | | 0.0022 | |
Switzerland | | | 0.0072 | | | | 0.0011 | |
Germany | | | 0.0160 | | | | 0.0019 | |
Denmark | | | 0.0075 | | | | 0.0011 | |
France | | | 0.0506 | | | | 0.0067 | |
Spain | | | 0.0038 | | | | 0.0006 | |
Finland | | | 0.0095 | | | | 0.0014 | |
Japan | | | 0.0396 | | | | 0.0040 | |
South Korea | | | 0.0052 | | | | 0.0009 | |
Netherlands | | | 0.0136 | | | | 0.0020 | |
Norway | | | 0.0074 | | | | 0.0011 | |
| | | | | | | | |
| | | 0.19977 | | | | 0.02534 | |
| | | | | | | | |
Investment Adviser
Tocqueville Asset Management L.P.
40 W. 57th St., 19th Floor
New York, NY 10019
(212) 698-0800
www.tocqueville.com
Distributor
Tocqueville Securities, L.P.
40 W. 57th St., 19th Floor
New York, NY 10019
(212) 698-0800
Shareholders’ Servicing and Transfer Agent
U.S. Bancorp Fund Services, LLC
P.O. Box 701
Milwaukee, WI 53201-0701
(800) 697-3863
Custodian
U.S. Bank, N.A.
Custody Operations
1555 River Center Drive, Suite 302
Milwaukee, WI 53212
Board of Trustees
Robert W. Kleinschmidt—Chairman
Charles W. Caulkins
Alexander Douglas
Charles F. Gauvin
James W. Gerard
William F. Indoe
William J. Nolan III
Tocqueville Funds
c/o US Bancorp Fund Services, LLC
P.O. Box 701
Milwaukee, WI 53201-0701
www.tocquevillefunds.com
TQ-SEMI Tocqueville Semi Annual Report 4/30/2017
Item 2. Code of Ethics.
Not applicable for semi-annual reports.
Item 3. Audit Committee Financial Expert.
Not applicable for semi-annual reports.
Item 4. Principal Accountant Fees and Services.
Not applicable for semi-annual reports.
Item 5. Audit Committee of Listed Registrants.
Not applicable to registrants who are not listed issuers (as defined in Rule 10A-3 under the Securities Exchange Act of 1934).
Item 6. Investments.
Schedule of Investments is included as part of the report to shareholders filed under Item 1 of this Form.
Item 7. Disclosure of Proxy Voting Policies and Procedures for Closed-End Management Investment Companies.
Not applicable to open-end investment companies.
Item 8. Portfolio Managers of Closed-End Management Investment Companies.
Not applicable to open-end investment companies.
Item 9. Purchases of Equity Securities by Closed-End Management Investment Company and Affiliated Purchasers.
Not applicable to open-end investment companies.
Item 10. Submission of Matters to a Vote of Security Holders.
There have been no material changes to the procedures by which shareholders may recommend nominees to the registrant’s board of trustees.
1
Item 11. Controls and Procedures.
| (a) | The Registrant’s President and Treasurer have reviewed the Registrant’s disclosure controls and procedures (as defined in Rule 30a-3(c) under the Investment Company Act of 1940 (the “Act”)) as of a date within 90 days of the filing of this report, as required by Rule 30a-3(b) under the Act and Rules 13a-15(b) or 15d-15(b) under the Securities Exchange Act of 1934. Based on their review, such officers have concluded that the disclosure controls and procedures are effective in ensuring that information required to be disclosed in this report is appropriately recorded, processed, summarized and reported and made known to them by others within the Registrant and by the Registrant’s service provider. |
| (b) | There were no changes in the Registrant’s internal control over financial reporting (as defined in Rule 30a-3(d) under the Act) that occurred during the second fiscal quarter of the period covered by this report that has materially affected, or is reasonably likely to materially affect, the Registrant’s internal control over financial reporting. |
Item 12. Exhibits.
| (a) | (1) Any code of ethics or amendment thereto, that is the subject of the disclosure required by Item 2, to the extent that the registrant intends to satisfy Item 2 requirements through filing an exhibit. Not Applicable. |
(2) A separate certification for each principal executive and principal financial officer pursuant to Section 302 of the Sarbanes-Oxley Act of 2002. Filed herewith.
(3) Any written solicitation to purchase securities under Rule 23c-1 under the Act sent or given during the period covered by the report by or on behalf of the registrant to 10 or more persons. Not applicable to open-end investment companies.
| (b) | Certifications pursuant to Section 906 of the Sarbanes-Oxley Act of 2002. Furnished herewith. |
2
SIGNATURES
Pursuant to the requirements of the Securities Exchange Act of 1934 and the Investment Company Act of 1940, the registrant has duly caused this report to be signed on its behalf by the undersigned, thereunto duly authorized.
(Registrant) The Tocqueville Trust
By (Signature and Title)* /s/ Robert W. Kleinschmidt
Robert W. Kleinschmidt, President
Date 7/07/17
Pursuant to the requirements of the Securities Exchange Act of 1934 and the Investment Company Act of 1940, this report has been signed below by the following persons on behalf of the registrant and in the capacities and on the dates indicated.
By (Signature and Title)* /s/ Robert W. Kleinschmidt
Robert W. Kleinschmidt, President
Date 7/07/17
By (Signature and Title)* /s/ Helen Balk
Helen Balk, Treasurer
Date 7/07/17
| * | Print the name and title of each signing officer under his or her signature. |
3