UNITED STATES
SECURITIES AND EXCHANGE COMMISSION
Washington, D.C. 20549
FORMN-CSR
CERTIFIED SHAREHOLDER REPORT OF REGISTERED
MANAGEMENT INVESTMENT COMPANIES
Investment Company Act file number811-04840
The Tocqueville Trust
(Exact name of registrant as specified in charter)
The Tocqueville Trust
40 West 57th Street, 19th Floor
New York, NY 10019
(Address of principal executive offices) (Zip code)
Robert W. Kleinschmidt
The Tocqueville Trust
40 West 57th Street, 19th Floor
New York, NY 10019
(Name and address of agent for service)
(212)698-0800
Registrant’s telephone number, including area code
Date of fiscal year end: October 31, 2019
Date of reporting period: April 30, 2019
| Item 1. | Reports to Stockholders. |

The Tocqueville Trust
Mutual Funds
Semi-Annual Report
April 30, 2019
The Tocqueville Fund
The Tocqueville Opportunity Fund
The Tocqueville Gold Fund
The Tocqueville Phoenix Fund
The Tocqueville Select Fund
Beginning on January 1, 2021, as permitted by regulations adopted by the U.S. Securities and Exchange Commission, paper copies of the Funds’ annual and semiannual shareholder reports will no longer be sent by mail, unless you specifically request paper copies of the reports. Instead, the reports will be made available on the Funds’ website (http://tocquevillefunds.com/mutual-funds/download-information-literature-center), and you will be notified by mail each time a report is posted and provided with a website link to access the report.
If you already elected to receive shareholder reports electronically, you will not be affected by this change and you need not take any action. You may elect to receive shareholder reports and other communications from the Funds electronically anytime by contacting your financial intermediary (such as a broker-dealer or a bank) or, if you are a direct investor, by calling1-800-697-3863, or by enrolling at www.tocquevillefunds.com.
You may elect to receive all future reports in paper free of charge. If you invest through a financial intermediary, you can contact your financial intermediary to request that you continue to receive paper copies of your shareholder reports. If you invest directly with the Funds, you can call1-800-697-3863 to let the Funds know you wish to continue receiving paper copies of your shareholder reports. Your election to receive reports in paper will apply to all funds held in your account if you invest through your financial intermediary or all Funds held with the Fund complex if you invest directly with the Funds.

This report is not authorized for distribution to prospective investors unless preceded or accompanied by a currently effective prospectus of The Tocqueville Trust. Please call1-800-697-FUND (3863) for a free prospectus. Read it carefully before you invest.
You are invited to visit our website @www.tocquevillefunds.com
Chairman’s Letter
Dear Fellow Shareholder,
As of this writing, equity markets continue to focus on international trade issues and their possible impact on global growth. The interest rate panic that was behind the calendar 2018 fourth quartersell-off has subsided, with rates falling to three-year lows, and a chastened FED vowing not to raise short-term rates any further, any time soon. The good news on rates triggered a powerful rally in equities in the first calendar quarter of 2019, but growing pessimism on trade, particularly with China, the world’s second largest economy, has brought equities down to earth more recently. Still, equities have generated solid returns in the first half of our fiscal year, as the strong U.S. economy has more than offset the trade concerns as well as the ongoing political shenanigans in our nation’s capital.
Gold prices, always a good barometer of investor confidence in government, have remained depressed, signaling greater optimism in political developments than, perhaps, our national media suggests. Record low unemployment, productivity gains, and rising wage rates, along with respectable earnings reports, are, no doubt, instrumental in this brighter outlook, and certainly of greater importance to investors than the political drama unleashed by the recent elections and the warring factions in Washington. Of course, should the latter get much worse, or the former no better, this could change over the course of the next six months, but our crystal ball is too cloudy to make that call. Rather, we think that the volatility in the markets that shows up in response to temporal issues gives our analysts and our managers an opportunity to find attractive long-term investments at attractive prices, so we welcome it. The equity markets continue, in our view, to be the preferred place to invest for the long term and the best place to preserve capital against the rapaciousness of taxes and the ongoing depreciation of currencies.
Asco-investors with all of our shareholders, the portfolio managers of all our funds and I thank you for your continued support.
Sincerely,

Robert W. Kleinschmidt
Chairman
The Tocqueville Fund
Dear Fellow Shareholder,
Thesix-month period ended April 30, 2019 was a positive one for equity markets overall bookended by periods of volatility. Investors initially fled equity markets toward the end of calendar 2018 as concerns over the Federal Reserve’s interest rate policy, in particular, coupled with the Trump Administration’s aggressive trade policies, began to upset global commercial activity and exacerbated some signs of weakness that had been percolating since the prior spring, caused markets to doubt the growth narrative. When, in December, the Fed signaled that it might be more data dependent (and therefore dovish) in its interest rate posture and the Trump Administration reinforced the notion that trade negotiations were progressing, markets rallied strongly. Prior concerns returned to the forefront at the end of the period when it became more apparent, through heated rhetoric and additional tariffs, that, trade talks were still stuck on the crucial issues of intellectual property, technology transfers and the restructuring of the Chinese economy. Still, the more enlightened Fed policy, as well as better than feared earnings data was enough for the S&P to gain 9.76% for the period.
During the same period, the Fund returned 11.50%. All sectors were positive contributors, but the strongest sectors for the Fund were Information Technology, Consumer Staples and Industrials while the weakest were Real Estate, Energy and Utilities. The top performing individual names were Microsoft, Procter & Gamble, Applied Materials, Noble Energy and Amazon while the laggards were Apple, Haliburton, Biogen, Pioneer Natural Resources and Pfizer.
Over the past six months, we added a few new names to the portfolio. One of these was Nvidia, a manufacturer of graphics processing units (GPUs) typically used in video games but increasingly in other applications requiring rapid calculations like machine learning or autonomous vehicles. Nvidia’s shares had fallen out of favor because of concerns about a slowdown in demand for gaming equipment due to new game formats, an inventory overhang from cryptocurrencies where GPUs had been used for “mining”, and the overall China trade fears. Our view is that this slowdown is a temporary blip, that inventories will be cleared over time and that the secular trends are likely to continue indefinitely. Hence, we believed that the shares were trading at a significant discount to intrinsic value.
Another new purchase was Raytheon, the defense contractor. Raytheon’s shares had been under pressure because of concerns that defense spending would not be as favorable as expected with the Democrats winning in themid-term elections, as well as the Trump administration proposing a budget that was less than expected. Policies of military disengagement also contributed to weakness in Defense names. Our view is that the world remains a dangerous place, that Raytheon is less vulnerable than the other large defense contractors to budget pressures and it is well positioned for the sorts of spending that is likely to be a priority for the military in the future, namely cyber security and missile technology. The business has a strong balance sheet, generates consistent returns on capital and was trading at an attractive valuation considering the overall quality of the company.
We also added United Technologies, a multi-industry conglomerate with traditionally attractive returns on capital that has seen its valuation compress because of concerns over
China and recent performance issues at its Pratt and Whitney aerospace division. Our view is that the pending separation into three distinct companies focused on aerospace, HVAC equipment and elevators, with a high service component brought on by investor activism, will be value enhancing as the individual businesses receive higher ratings over time.
Other positions that were added or increased include Biogen, Capital One, Constellation Brands, FedEx, Nektar Therapeutics, Noble Energy, Parker Hannifin, Schlumberger, Vulcan Materials, Walt Disney and Weyerhaeuser.
A variety of positions were reduced or eliminated during the period as they approached our valuation targets, in order to make room for an idea with a better risk reward profile, in response to a change in circumstances or to investors’ desire for liquidity. Of those sold or reduced for fundamental reasons, Goldcorp was sold following its announced merger with Newmont Mining and Boeing was reduced following the crash of two of its 737 Max jets that called into question the prospects of the 737 Max jets platform and potential related liabilities. Other sales included Apple, Automated Data Processing, Bank of New York, Brighthouse Financial, Facebook, Fluor, Halliburton, Ionis Pharmaceuticals, Johnson & Johnson, JPMorgan Chase, McDonald’s, Merck, Nektar Therapeutics, Nextera Energy and Pioneer Natural Resources.
Our view is that in spite of markets still being near their highs, equities represent the more attractive asset class relative to fixed income. The trade disputes have definitely raised questions about sustainability of global growth, but domestic corporate earnings have generally been better than expected even in the face of supply chain challenges, rising labor costs and the recovery in energy prices. If the trade situation resolves itself eventually, which we suspect it will, it will likely be a positive for equity markets, certainly for those sectors exposed to China such as technology, industrials, and agriculture, and likely bring back concerns of rates moving up to the detriment of bonds. Conversely, if the trade dispute drags on and begins more materially to impact the domestic economy, the Fed has some, but not much room to maneuver. The Fed could cut rates again, but that might give rise to concerns about credit quality and a looming recession that could weigh on both equity and fixed income investors. With rates as low as they are, rate reductions may have a limited effect, forcing the Fed to other,non-traditional, measures to prevent a recession. On balance, however, we think that is an unlikely scenario. In the meantime, while we await a resolution to these macro and geopolitical factors, we will continue to focus our efforts on looking for opportunities where quality companies get oversold and fall out of favor due to these or other temporary concerns. As long-term, value-oriented investors, it is precisely concerns such as these that give us the chance to own good companies at great prices.
Sincerely,
| | |
| |  |
Robert W. Kleinschmidt Portfolio Manager | | Peter Shawn Director of Research |
The Tocqueville Fund
(Unaudited)
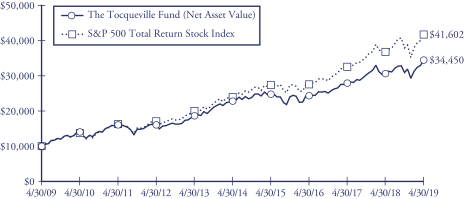
This chart assumes an initial gross investment of $10,000 made on 4/30/09. Returns shown do not reflect the deduction of taxes that a shareholder would pay on fund distributions or the redemption of fund shares. Performance reflects fee waivers in effect. In the absence of fee waivers, total return would be reduced. Returns shown include the reinvestment of all dividends and other distributions. Past performance is not predictive of future performance. Investment return and principal value will fluctuate so that your shares, when redeemed, may be worth more or less than their original cost.
The Standard & Poor’s 500 Total Return Stock Index (S&P 500) is a capital-weighted index, representing the aggregate market value of the common equity of 500 stocks primarily traded on the New York Stock Exchange. Returns assume the reinvestment of all dividends.
AVERAGE ANNUAL RATE OF RETURN (%)
FOR YEARS ENDED APRIL 30, 2019
| | | | | | | | | | | | | | | | |
| | | 1 Year | | | 3 Year | | | 5 Year | | | 10 Year | |
The Tocqueville Fund | | | 12.63% | | | | 12.50% | | | | 8.66% | | | | 13.17% | |
Standard & Poor’s 500 Total Return Stock Index | | | 13.49% | | | | 14.87% | | | | 11.63% | | | | 15.32% | |
The Tocqueville Opportunity Fund
Dear Fellow Shareholder,
We are pleased to provide this investment overview for the firstsix-month period of the fiscal year 2019 for the Tocqueville Opportunity Fund. The end of this fiscal year (October 2019) will mark the ninth consecutive year of management of the Fund as a growth fund. During thesix-month period ended April 30, 2019, the Fund appreciated 18.11%, and outperformed the SMID cap growth benchmark, the Russell 2500® Growth Total Return Index, which gained 11.86%.
Investors will recall that the passage of the Tax Cuts and Jobs Act of 2017 at the end of 2017 set the stage for a strong start for 2018 financial markets. But early on in 2018, the Administration adopted a serious new trade policy with regard to U.S. trading partners, with a particular focus on Chinese trade. Against a background of targeted, first round tariffs, Fed tightening, and increased evidence of slowing housing and capital investment, the broad market struggled throughout most of 2018 to recover its peak level in January, only to be done in late in the year by interest rate fears. Although the early months of 2019 have been characterized with ongoing trade concerns and the recent imposition of another round of significant tariff increases, markets have acted more sanguinely due to evidence of sustained growth in the U.S., low inflation, and a 10 year Treasury yield which closed at 2.50% on April 30, 2019, versus a peak in November 2018 at nearly 3.25%.
Over the past six months, investments in Technology, Communication Services, and Industrials provided the leading contributions to the Fund’s absolute and relative (versus the Fund’s benchmark) performances. Relative to the benchmark, Healthcare investments detracted the most; investments in Utilities, Materials, and Real Estate also provided negative attributed returns—the Fund held no investments in Real Estate or Utilities over the six months and consequently surrendered an insignificant 0.10% of relative performance—it lost 0.02% on the relative Materials investments. On the positive side, the Fund gained 8.98% of relative gains on investments in Technology, Communication Services and Industrials. The Fund had no Energy investments during the six months, adding to relative performance. On a relative basis, the top ten performers included eight Technology issues, one Internet issue and one Healthcare investment (SAGE Therapeutics); the largest detractors included Nvidia, Sarepta Therapeutics, and STAAR Surgical. Investments in Shopify, ServiceNow and Workday were the leading drivers of absolute and relative performance respectively for the Fund during the period. With a high concentration of investment in the top 100 names at nearly 87%, the Fund benefitted significantly from the fact that 21 issues gained 50% or more in price during the period; only two issues fell 50% or more—Roku(-51.8%) and Inogen(-53.95%)—insignificant at less than 0.15% of investments.
At the close of the first six months of fiscal year 2019, the Fund had maintained its largest commitments in Technology holdings. The overall allocation to Technology
investments was relatively unchanged from the start of the fiscal year on October 31, 2018. We continue to believe that certain Technology investments are benefitting from the secular shift of spending fromon-premise hardware and software capital spending to hybrid- cloud, edge, and public cloud business models—enabling increased productivity, competitiveness and lower total cost of ownership. Current and future drivers of this massive, digital transformation of business models include: Artificial Intelligence, Machine Learning, 5G applications (Autonomous Driving), Natural Language Processing, etc. The Fund increased its exposure to the Industrials sector to a slightly overweight exposure from a significant underweight position when the fiscal period commenced. The Industrial sector was heavily oversold in late 2018, investments have been targeted with low/no China exposure and include holdings in: aerospace and defense, business services, distribution, and equipment. Funding for the increase in Industrials was provided by reducing Healthcare holdings—now moved to an underweight position. Investments have been tilted to Biotechnology companies with approved products, and toward Services and Specialty Medical investments. During the last election cycle (2015-2016), Healthcare investments significantly underperformed the broad markets and did not regain their beginning of election cycle price levels for two years.
The Fund benefitted from seven takeovers during the past six months after a dry spell frommid-2018—the total number of takeovers in the Fund is nearly 110 since late 2010. The current period takeovers included: Esterline, Apptio, Loxo Oncology, Ultimate Software, Spark Therapeutics, Worldpay, WellCare Health Plans, and Ingersoll-Rand. Often, Fund holdings are buyers of other existing holdings—Transdigm and Fidelity National were acquirers. The SMID capitalization andMid-capitalization segments continue to provide the most attractive opportunities for takeovers and consolidation; a steady economy and good industrial and tax policy should encourage continued activity.
The Top 10 and Top 25 positions comprised approximately 32% and 45% of the Fund’s holdings at the end of the period. Approximately 87% of the Fund’s holdings were invested in the Top 100 positions. Smaller positions continue to serve a critical role in the Fund’s outperformance of its benchmark—providing a foothold in new, rapid expanding opportunities and minimizing risk in more binary outcome situations.
The Fund’s investments are well placed in competitively advantaged companies—many, like the Top 3 holdings—Shopify, ServiceNow and Workday—are long-term investments made years ago which have continued to execute at the highest level and drive significant excess returns. We believe that these companies are led by smart, vested, and visionary managements competing in very large and expanding markets. Substitution, innovation, obsolescence, and digital transformation represent a major threat to many legacy business models and disruption is an ever-present risk to many mature companies. We continue to seek to identify the leading, strategic opportunities while avoiding the value traps of fading companies. As always, we appreciate your continued confidence in our efforts.
Sincerely,

Thomas R. Vandeventer
Portfolio Manager
The Tocqueville Opportunity Fund
(Unaudited)
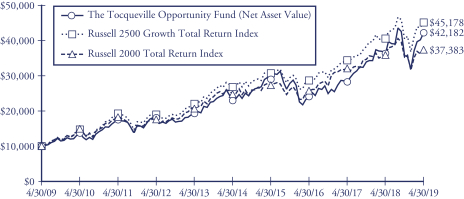
This chart assumes an initial gross investment of $10,000 made on 4/30/09. Returns shown do not reflect the deduction of taxes that a shareholder would pay on fund distributions or the redemption of fund shares. Returns shown include the reinvestment of all dividends and other distributions. Past performance is not predictive of future performance. Investment return and principal value will fluctuate so that your shares, when redeemed, may be worth more or less than their original cost.
The chart and table reflect The Opportunity Fund’s performance achieved prior to the changes effected in 2010 to its investment strategy.
The Russell 2500 Growth Total Return Index is an unmanaged index that measures the performance of the small to mid-cap growth segment of the U.S. equity universe. It includes those Russell 2500 companies with higher price-to-book ratios and higher forecasted growth values. Returns assume the reinvestment of all dividends
The Russell 2000 Total Return Index is an unmanaged index that measures the performance of the 2,000 smallest companies in the Russell 3000 Index. Returns include the reinvestment of all dividends.
AVERAGE ANNUAL RATE OF RETURN (%)
FOR YEARS ENDED APRIL 30, 2019
| | | | | | | | | | | | | | | | |
| | | 1 Year | | | 3 Year | | | 5 Year | | | 10 Year | |
The Tocqueville Opportunity Fund | | | 16.53% | | | | 20.84% | | | | 12.99% | | | | 15.48% | |
Russell 2500 Growth Total Return Index | | | 12.02% | | | | 16.56% | | | | 11.27% | | | | 16.28% | |
Russell 2000 Total Return Index | | | 4.61% | | | | 13.60% | | | | 8.63% | | | | 14.10% | |
The Tocqueville Gold Fund
Dear Fellow Shareholder,
During the first half of the Fund’s 2019 fiscal year—November 1st through April 30th—gold markets recovered from their mid-summer and autumn correction especially as the U.S. Federal Reserve’s posture on interest rates caused broader markets to swoon at the end of 2018. The government shutdown and ongoing China-U.S. trade war rhetoric also provided support for gold in early 2019 even as the U.S. dollar rose, and as U.S. equity markets rebounded to record levels. For the period, the Tocqueville Gold Fund rose 5.31%, while the Philadelphia Stock Exchange Gold and Silver Index increased 11.46%.
In our quarterly investment letters, we have expanded on the investment case for precious metal exposure. The main thesis being that government sponsored currencies will ultimately become debased when debt and credit become so massive that economic growth cannot effectively pay for the interest on those liabilities or even pay back the obligations that fed that growth. Because gold has been considered a standard of value throughout millennia it is a form of insurance and a hedge to the destruction of financial assets that would get swamped by enormous debt loads.
The Fund invests not only in gold bullion but also in precious metal mining companies that create value in ways that are not solely dependent on rising metal prices. We are constantly monitoring activities and developments in the global precious metals sector for underappreciated value creation opportunities. Those investment opportunities present themselves through the potential for geologic discovery, as well as in mine development and/or through improved efficiencies brought on by production enhancement projects. Corporate strategies can also create compelling investment situations whether it is through financial structuring or mergers, acquisitions and joint ventures. Exposure to various stages of resource development and mining activity allows the Fund to diversify risk while also capturing different elements of value enhancement.
Approximately 72% of the Fund’s assets are gold mining equities focused on gold discovery, mine project development or production, while approximately 13% of the Fund is exposed to silver mining stocks. Silver has numerous industrial applications but is also considered a monetary metal similar to gold. Often the metals appear together, and mining companies will mine both to improve margins, but companies where the majority of the revenues come from silver production are considered silver mining companies. Generally, silver mining companies have greater leverage to the movement in metal prices.
The largest single position in the Fund is the 97,849 ounces of gold bullion that makes up about 15% of the Fund’s assets. That gold is stored outside the financial system in a secure vault that is monitored and audited on a regular basis. The Fund’s direct ownership and exposure to physical gold helped reduce the Fund’s volatility during the period. In order to maintain the 15% exposure on gold bullion, approximately
21,000 ounces were sold during the reporting period. The Fund’s gold bullion position was the largest contributor to positive performance during the first half of the year.
The precious metal stocks that contributed the most to performance during the period included Mag Silver Corp., Wheaton Precious Metals Corp., Detour Gold Corporation, and Franco-Nevada Corporation. After some delays, Mag Silver received the go ahead for its mine development project with joint venture partner, Fresnillo, which was well received by the market. Wheaton Precious Metals received a favorable court decision regarding its tax status in Canada that had been overhanging the stock for an extended period. Detour Gold Corporation was re-rated by the broader market as it restructured its board of directors in response to investor activism. Franco-Nevada Corporation benefitted from the royalty model it has applied to the oil and gas sector.
Corvus Gold Inc., Pan American Silver Corp., Jaguar Mining Inc., IAMGOLD Corporation, and Gold Standard Ventures Corp. corrected during the period, which dampened the Fund’s performance. In the case of Corvus Gold, Pan American and Gold Standard Ventures, those three stocks corrected from a period of outperformance during calendar 2018. Jaguar Mining and IAMGOLD experienced mining challenges at their underground mines which delayed some mining activity and will result in less gold production this year than what was originally expected.
Several positions were eliminated because they were either fully valued or presented limited value creation opportunities, such as Barrick Gold which became fully valued after it closed its merger with Randgold. The GoGold position was eliminated because of its limited options for value creation. GoldCorp was also sold during the period as its stock fully reflected the value of the Newmont bid for the company.
New names added during the period included Wesdome Gold Mines Ltd. and AngloGold Ashanti Limited. Wesdome has identified gold ore zones at its operating Eagle River mine which should extend the mine-life of that operation and which will also provide the capital from its operating cash flow to restart Wesdome’s idled Kiena mine complex where high-grade ore zones are also being discovered. AngloGold Ashanti had been undervalued by the market, but new management has been successfully restructuring the company to improve its geographic and operating risk exposure.
Currently, precious metals and related mining stocks have consolidated into a relatively narrow trading range and appear poised to breakout to higher levels as they await direction from the broader markets. For the remainder of 2019, we expect the U.S. Federal Reserve to keep interest rates low with a bias to lowering them while market volatility is likely to intensify along with the trade war. Low interest rates and continued volatility should be constructive for precious metal markets.
Over the past ten years, the spring and early summer months have tended to be favorable periods to increase exposure to precious metals and the related mining stocks. With the recent consolidation of the gold price below $1,300 per ounce and the ultra-cheap valuations in the gold mining sector, the coming months should present a similar opportunity.
Sincerely,
| | | | |
 | |  | |  |
| John C. Hathaway | | Douglas B. Groh | | Ryan McIntyre |
| Portfolio Manager | | Portfolio Manager | | Portfolio Manager |
The Tocqueville Gold Fund—Investor Class
(Unaudited)
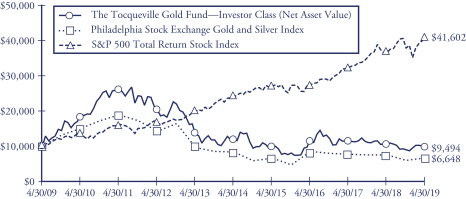
This chart assumes an initial gross investment of $10,000 made on 4/30/09. Returns shown do not reflect the deduction of taxes that a shareholder would pay on fund distributions or the redemption of fund shares. Returns shown include the reinvestment of all dividends and other distributions. Past performance is not predictive of future performance. Investment return and principal value will fluctuate so that your shares, when redeemed, may be worth more or less than their original cost. The Fund imposes a 2% redemption fee on shares held 90 days or less.
In 2009, 2010, and 2016 the performance of The Tocqueville Gold Fund—Investor Class was achieved during a period of unusually favorable market conditions. Such performance may not be sustainable.
The Philadelphia Stock Exchange Gold and Silver Index is an unmanaged capitalization-weighted index which includes the leading companies involved in the mining of gold and silver. Returns include the reinvestment of all dividends.
The Standard & Poor’s 500 Total Return Stock Index (S&P 500) is a capital-weighted index, representing the aggregate market value of the common equity of 500 stocks primarily traded on the New York Stock Exchange. Returns include the reinvestment of all dividends.
AVERAGE ANNUAL RATE OF RETURN (%)
FOR YEARS ENDED APRIL 30, 2019
| | | | | | | | | | | | | | | | |
| | | 1 Year | | | 3 Year | | | 5 Year | | | 10 Year | |
The Tocqueville Gold Fund—Investor Class | | | -12.34% | | | | -8.55% | | | | -4.94% | | | | -0.52% | |
Philadelphia Stock Exchange Gold and Silver Index | | | -11.41% | | | | -7.81% | | | | -4.25% | | | | -4.00% | |
Standard & Poor’s 500 Total Return Stock Index | | | 13.49% | | | | 14.87% | | | | 11.63% | | | | 15.32% | |
The Tocqueville Gold Fund—Institutional Class
(Unaudited)
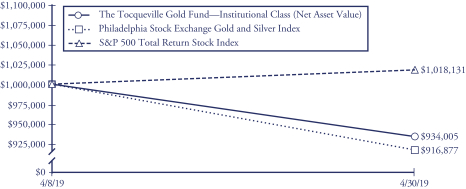
This chart assumes an initial gross investment of $1,000,000 made on 4/8/19 (commencement of operations for Institutional Class). Returns shown do not reflect the deduction of taxes that a shareholder would pay on fund distributions or the redemption of fund shares. Returns shown include the reinvestment of all dividends and other distributions. Past performance is not predictive of future performance. Investment return and principal value will fluctuate so that your shares, when redeemed, may be worth more or less than their original cost. The Fund imposes a 2% redemption fee on shares held 90 days or less.
The Philadelphia Stock Exchange Gold and Silver Index is an unmanaged capitalization-weighted index which includes the leading companies involved in the mining of gold and silver. Returns include the reinvestment of all dividends.
The Standard & Poor’s 500 Total Return Stock Index (S&P 500) is a capital-weighted index, representing the aggregate market value of the common equity of 500 stocks primarily traded on the New York Stock Exchange. Returns include the reinvestment of all dividends.
TOTAL RETURN (%)
FOR PERIOD ENDED APRIL 30, 2019
| | | | |
| | | Since Inception
(April 8, 2019) | |
The Tocqueville Gold Fund—Institutional Class | | | -6.60% | |
Philadelphia Stock Exchange Gold and Silver Index | | | -8.31% | |
Standard & Poor’s 500 Total Return Stock Index | | | 1.81% | |
The Tocqueville Phoenix Fund
Dear Fellow Shareholder,
For the six months ended April 30, 2019, the Fund’s net asset value increased 11.00% versus an increase of 6.06% for the Russell 2000 Index (“Russell 2000”) and an increase of 9.76% for the Standard & Poor’s 500 Index (“S&P 500”), each on a total return basis. Owing to the smaller average market capitalization of companies in the Russell 2000, we view it as the more appropriately comparative index to the Fund. The Fund’s net asset value as of April 30, 2019 was $20.89 per share. The net asset value amounted to $208,763,744 of which 89.4% was invested in equities, and the balance in cash and equivalents.
Domestic equities posted solid returns for thesix-month period, but the path toward realizing those returns was not without its challenges, particularly during the first couple of months of the period. While indices eked out gains in November 2018 thanks to a late month rally, trading for the bulk of the month was bearish, in particular among theso-called FAANG stocks, which entered bear market territory. And then came December 2018, when a convergence of negative news drove market declines of historic proportions and the return of hyper-volatility. During the month of December, the Russell 2000 dropped 11.9% and was down 10.5% through the two months ended December 31, 2018. U.S. stocks then rebounded meaningfully in the first calendar quarter of 2019. President Trump delayed an anticipated increase in tariffs on Chinese imports and markets rallied on hopes that a resolution to the U.S./China trade war may be more likely. A deceleration in the rate of growth of the U.S. economy prompted the Federal Reserve Board to delay any incremental rate hikes for the time being, further encouraging investors. Lastly, fourth quarter earnings reports were generallyin-line or slightly better than expected, which also seemed to embolden market bulls despite the more cautious forward outlook issued by a number of companies.
Despite continued headwinds from the market’s predilection for growth and scale, we outperformed for thesix-month period. As we mentioned in the 2018 Annual Report, when markets are in opposition to our investment approach, stock picking is critical to success, and our stock selection contributed favorably to our relative performance for thissix-month period. As we have also written in the past, sector allocation is aby-product of ourbottom-up investment process. Nonetheless, our inadvertent sector weightings also added to our relative return for the period, as we were overweight (and outperformed) the strongest sector within the Russell 2000, Information Technology, which contributed about 540 basis points to our absolute return and 230 basis points to our performance relative to the Russell 2000. We also had relatively little exposure to both Energy and Healthcare, both of which were particularly weak during the period, which also benefited our relative performance.
For the entiresix-month period, our top contributor was US Concrete Inc., which rose steadily off its lows on an improved outlook for 2019, as well as hopes for an expanded infrastructure budget out of the Washington D.C. Flex Ltd., Fabrinet, Tegna Inc. and Lumentum Holdings, were also among our top performing holdings, with each adding about 100 basis points to performance.
In contrast, Cars.com, PolyOne Corporation and Greenbrier Companies Inc. were the largest detractors to our performance. Cars surprised investors to the downside with mediocre guidance for 2019 and while their strategic review remains ongoing, the protracted process has likely dampened some enthusiasm that a takeout is likely. PolyOne’s shares traded off after the company reported earnings that were in line with expectations but warned of a slowdown in their end markets and cautioned on the potential impact of tariffs to their business. Greenbrier, which we ultimately exited during the period, weakened as investors became more concerned about its ability to meet expectations for 2019, as its guidance relies on an exceptionally strong second half of the year.
We opportunistically put capital to work following December’s correction, and we added a number of new positions to the portfolio during thesix-month period, the largest of which included Loews Corporation, Louisiana Pacific Corporation, Stanley Black & Decker Inc, and Tile Shop Holdings Inc. The largest portfolio deletions included Ducommun Incorporated, Electronics for Imaging Inc. (which announced it was being acquired), Hanesbrands Inc, and Minerals Technologies.
Sincerely,
| | | | |
 | |  | |  |
| J. Dennis Delafield | | Joshua Kaufthal | | James Maxwell |
| Portfolio Manager | | Portfolio Manager | | Portfolio Manager |
The Tocqueville Phoenix Fund
(Unaudited)
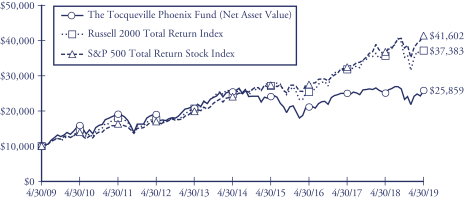
This chart assumes an initial gross investment of $10,000 made on 4/30/09. On February 15, 2019, The Delafield Fund’s name changed to The Tocqueville Phoenix Fund. Since the Tocqueville Phoenix Fund did not commence operations until 9/28/09, returns prior to that date are those of the Predecessor Fund. The Tocqueville Phoenix Fund assumed the net asset value and performance history of the Predecessor Fund (See Footnote 1 to the Financial Statements). Returns shown do not reflect the deduction of taxes that a shareholder would pay on fund distributions or the redemption of fund shares. Performance reflects fee waivers in effect. In the absence of fee waivers, total return would be reduced. Returns shown include the reinvestment of all dividends and other distributions. Past performance is not predictive of future performance. Investment return and principal value will fluctuate so that your shares, when redeemed, may be worth more or less than their original cost.
The Russell 2000 Total Return Index is an unmanaged index that measures the performance of the 2,000 smallest companies in the Russell 3000 Index, which represent approximately 10% of the total market capitalization of the Russell 3000 Index. Returns include the reinvestment of all dividends.
The Standard & Poor’s 500 Total Return Stock Index (S&P 500) is a capital-weighted index, representing the aggregate market value of the common equity of 500 stocks primarily traded on the New York Stock Exchange. Returns include the reinvestment of all dividends.
AVERAGE ANNUAL RATE OF RETURN (%)
FOR YEARS ENDED APRIL 30, 2019
| | | | | | | | | | | | | | | | |
| | | 1 Year | | | 3 Year | | | 5 Year | | | 10 Year | |
The Tocqueville Phoenix Fund* | | | 3.23% | | | | 7.05% | | | | 0.43% | | | | 9.97% | |
Russell 2000 Total Return Index | | | 4.61% | | | | 13.60% | | | | 8.63% | | | | 14.10% | |
Standard & Poor’s 500 Total Return Stock Index | | | 13.49% | | | | 14.87% | | | | 11.63% | | | | 15.32% | |
| * | Prior to February 15, 2019, the Fund’s name was The Delafield Fund. |
The Tocqueville Select Fund
Dear Fellow Shareholder,
For the six months ended April 30, 2019, the Fund’s net asset value increased 11.19% versus increases of 8.76% for the Russell 2500 Index (“Russell 2500”) and 6.06% for the Russell 2000 Index (“Russell 2000”), each on a total return basis. The Fund’s net asset value as of April 30, 2019 was $12.12 per share. The net asset value amounted to $40,313,535 of which 93.6% was invested in equities, and the balance in cash and equivalents.
Domestic equities managed to put up solid returns for thesix-month period, but not without a good bit of volatility intra-period. While indices eked out gains in November 2018 thanks to a late month rally, trading for the bulk of the month was bearish, in particular among theso-called FAANG stocks, which entered bear market territory. And then came December 2018, when a convergence of negative news drove market declines of historic proportions and the return of hyper-volatility. During the month of December, the Russell 2500 dropped nearly 11% and was down roughly 9.3% through the two months ended December 31, 2018. U.S. stocks then rebounded meaningfully in the first calendar quarter of 2019. President Trump delayed an anticipated increase in tariffs on Chinese imports and markets rallied on hopes that a resolution to the U.S./China trade war may be more likely. A deceleration in the rate of growth in the U.S. economy prompted the Federal Reserve Board to delay any incremental rate hikes for the time being, further encouraging investors. Lastly, fourth quarter earnings reports were generallyin-line or slightly better than expected, which also seemed to embolden market bulls despite the more cautious forward outlook issued by a number of companies.
As we have discussed in the past, stock picking is critical to our success, in particular during times such as these, when our value strategy is in opposition to the market’s preference. Stock selection did contribute favorably to our relative performance for thissix-month period, with the selection effect representing roughly one third of our relative outperformance for the period. Sector allocation also added to our relative return for the period, although inadvertently, as sector weighting has always been aby-product of ourbottom-up investment process. During the period we were overweight (and outperformed) the strongest sector within the Russell 2500, Information Technology, which contributed about 800 basis points to our absolute return. Our relative lack of exposure to Energy also benefited our relative performance, as it was the weakest sector in the Russell 2500.
Not surprisingly given our aforementioned strength in Information Technology during the period, three of our top four contributors came from within that sector, including Epam Systems Inc., Fabrinet and Flex Lt. In contrast, Tile Shop Holdings, Harsco and Cars.com were the largest detractors to our performance.
We added a number of new positions to the portfolio during the period, including Cross Country Healthcare Inc, PVH Corp and Solaris Oilfield Infrastructure Inc. We also exited four investments, Apogee Enterprises Inc, Gentex Corp., Minerals Technologies Inc, and Trueblue Inc.
Sincerely,
| | |
| | |
| J. Dennis Delafield | | Joshua Kaufthal |
| Portfolio Manager | | Portfolio Manager |
| | |
 | | |
| Donald Wang | | James Maxwell |
| Portfolio Manager | | Portfolio Manager |
The Tocqueville Select Fund
(Unaudited)
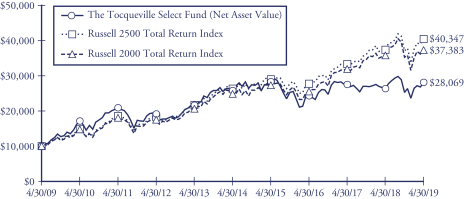
This chart assumes an initial gross investment of $10,000 made on 4/30/09. Since The Tocqueville Select Fund did not commence operations until 9/28/09, returns from the period from September 29, 2008 to September 27, 2009 are those of the Class Y Shares of the Predecessor Fund (See Footnote 1 to the Financial Statements). Prior to that period, returns shown are those of a limited partnership managed by the adviser. Returns shown do not reflect the deduction of taxes that a shareholder would pay on fund distributions or the redemption of fund shares. Performance reflects fee waivers in effect. In the absence of fee waivers, total return would be reduced. Returns shown include the reinvestment of all dividends and other distributions. Past performance is not predictive of future performance. Investment return and principal value will fluctuate so that your shares, when redeemed, may be worth more or less than their original cost.
In 2013 the performance of The Tocqueville Select Fund was achieved during a period of unusually favorable market conditions. Such performance may not be sustainable.
The Russell 2500 Total Return Index is an unmanaged index that measures the performance of the 2,500 smallest companies in the Russell 3000 Index. Returns include the reinvestment of all dividends.
The Russell 2000 Total Return Index is an unmanaged index that measures the performance of the 2,000 smallest companies in the Russell 3000 Index. Returns include the reinvestment of all dividends.
AVERAGE ANNUAL RATE OF RETURN (%)
FOR YEARS ENDED APRIL 30, 2019
| | | | | | | | | | | | | | | | |
| | | 1 Year | | | 3 Year | | | 5 Year | | | 10 Year | |
The Tocqueville Select Fund | | | 6.32% | | | | 4.83% | | | | 1.78% | | | | 10.87% | |
Russell 2500 Total Return Index | | | 7.89% | | | | 13.31% | | | | 9.04% | | | | 14.97% | |
Russell 2000 Total Return Index | | | 4.61% | | | | 13.60% | | | | 8.63% | | | | 14.10% | |
Expense Example—April 30, 2019 (Unaudited)
As a shareholder of The Tocqueville Trust (the “Funds”), you incur ongoing costs, including management fees; distribution fees; and other Fund expenses. This example is intended to help you understand your ongoing costs (in dollars) of investing in the Funds and to compare costs with the ongoing costs of investing in other mutual funds.
The Example is based on an investment of $1,000 invested at the beginning of the period and held the entire period (November 1, 2018-April 30, 2019). For The Toqueville Gold Fund—Institutional Class, the example is based on an investment of $1,000 invested on April 8, 2019, the commencement of operations and held through April 30, 2019.
Actual Expenses
The first line of the table below provides information about actual account values and actual expenses. You may use the information in this line, together with the amount you invested, to estimate the expenses that you paid over the period. Simply divide your account value by $1,000 (for example, an $8,600 account value divided by $1,000 = 8.6), then multiply the result by the number in the first line under the heading entitled “Expenses Paid During Period” to estimate the expenses you paid on your account during this period.
Hypothetical Example for Comparison Purposes
The second line of the table below provides information about hypothetical account values and hypothetical expenses based on the Funds’ actual expense ratios and an assumed rate of return of 5% per year before expenses, which is not the Funds’ actual return. The hypothetical account values and expenses may not be used to estimate the actual ending account balance or expenses you paid for the period. You may use this information to compare the ongoing costs of investing in the Funds and other funds. To do so, compare this 5% hypothetical example with the 5% hypothetical examples that appear in the shareholder reports of the other funds.
Please note that the expenses shown in the table are meant to highlight your ongoing costs only and do not reflect any transactional costs, such as sales charges (loads), redemption fees, or exchange fees. Therefore, the second line of the table is useful in comparing ongoing costs only, and will not help you determine the relative costs of owning different funds. In addition, if these transactional costs were included, your costs would have been higher.
Expense Example Tables (Unaudited)
The Tocqueville Fund
| | | | | | | | | | | | |
| | | Beginning
Account Value
November 1, 2018 | | | Ending
Account Value
April 30,
2019 | | | Expenses Paid
During Period*
November 1, 2018 -
April 30, 2019 | |
Actual | | $ | 1,000.00 | | | $ | 1,115.00 | | | $ | 6.56 | |
Hypothetical (5% return before expenses) | | | 1,000.00 | | | | 1,018.60 | | | | 6.26 | |
| * | Expenses are equal to the Fund’s annualized six-month expense ratio (including interest expense) of 1.25% for The Tocqueville Fund, multiplied by the average account value over the period, multiplied by 181/365 to reflect the one-half year period. |
The Tocqueville Opportunity Fund
| | | | | | | | | | | | |
| | | Beginning
Account Value
November 1, 2018 | | | Ending
Account Value
April 30,
2019 | | | Expenses Paid
During Period*
November 1, 2018 -
April 30, 2019 | |
Actual | | $ | 1,000.00 | | | $ | 1,181.10 | | | $ | 6.81 | |
Hypothetical (5% return before expenses) | | | 1,000.00 | | | | 1,018.55 | | | | 6.31 | |
| * | Expenses are equal to the Fund’s annualized six-month expense ratio (including interest expense) of 1.26% for The Tocqueville Opportunity Fund, multiplied by the average account value over the period, multiplied by 181/365 to reflect the one-half year period. |
The Tocqueville Gold Fund—Investor Class
| | | | | | | | | | | | |
| | | Beginning
Account Value
November 1, 2018 | | | Ending
Account Value
April 30,
2019 | | | Expenses Paid
During Period*
November 1, 2018 -
April 30, 2019 | |
Actual | | $ | 1,000.00 | | | $ | | | | $ | | |
Hypothetical (5% return before expenses) | | | 1,000.00 | | | | | | | | | |
| * | Expenses are equal to the Fund’s annualized six-month expense ratio (including interest expense) of 1.49% for The Tocqueville Gold Fund Investor Class, multiplied by the average account value over the period, multiplied by 181/365 to reflect the one-half year period. |
The Tocqueville Gold Fund—Institutional Class
| | | | | | | | | | | | |
| | | Beginning
Account Value
April 8, 2019 | | | Ending
Account Value
April 30,
2019 | | | Expenses Paid
During Period*
April 8, 2019 -
April 30, 2019 | |
Actual | | $ | 1,000.00 | | | $ | 934.00 | | | $ | 0.78 | |
Hypothetical (5% return before expenses) | | | 1,000.00 | | | | 1,018.20 | | | | 6.66 | |
| * | Actual expenses are equal to the Fund’s annualized six-month expense ratio of 1.33% for The Tocqueville Gold Fund Institutional Class multiplied by the average value over the period, multiplied by 22/365 to reflect the period. Hypothetical expenses are equal to the Fund’s annualized six-month expense ratio of 1.33% for The Tocqueville Gold Fund Institutional Class multiplied by the average value over the period, multiplied by 181/365 for comparison purposes. |
The Tocqueville Phoenix Fund
| | | | | | | | | | | | |
| | | Beginning
Account Value
November 1, 2018 | | | Ending
Account Value
April 30,
2019 | | | Expenses Paid
During Period*
November 1, 2018 -
April 30, 2019 | |
Actual | | $ | 1,000.00 | | | $ | 1,110.00 | | | $ | 6.54 | |
Hypothetical (5% return before expenses) | | | 1,000.00 | | | | 1,018.60 | | | | 6.26 | |
| * | Expenses are equal to the Fund’s annualized six-month expense ratio of 1.25% for The Tocqueville Phoenix Fund, multiplied by the average account value over the period, multiplied by 181/365 to reflect the one-half year period. |
The Tocqueville Select Fund
| | | | | | | | | | | | |
| | | Beginning
Account Value
November 1, 2018 | | | Ending
Account Value
April 30,
2019 | | | Expenses Paid
During Period*
November 1, 2018 -
April 30, 2019 | |
Actual | | $ | 1,000.00 | | | $ | 1,111.90 | | | $ | 6.55 | |
Hypothetical (5% return before expenses) | | | 1,000.00 | | | | 1,018.60 | | | | 6.26 | |
| * | Expenses are equal to the Fund’s annualized six-month expense ratio of 1.25% for The Tocqueville Select Fund, multiplied by the average account value over the period, multiplied by 181/365 to reflect the one-half year period. |
The Tocqueville Fund
Financial Highlights
| | | | | | | | | | | | | | | | | | | | | | | | |
Per share operating performance
(For a share outstanding
throughout the period) | | Six Months
Ended
April 30,
2019 | | | Years Ended October 31, | |
| | 2018 | | | 2017 | | | 2016 | | | 2015 | | | 2014 | |
| | | (Unaudited) | | | | | | | | | | | | | | | | |
Net asset value, beginning of period | | $ | 35.84 | | | $ | 38.60 | | | $ | 33.72 | | | $ | 32.91 | | | $ | 34.18 | | | $ | 30.67 | |
| | | | | | | | | | | | | | | | | | | | | | | | |
Operations: | | | | | | | | | | | | | | | | | | | | | | | | |
Net investment income (1) | | | 0.22 | | | | 0.35 | | | | 0.37 | | | | 0.42 | | | | 0.37 | | | | 0.28 | |
Net realized and unrealized gain (loss) | | | 3.55 | | | | 0.45 | | | | 6.40 | | | | 1.07 | | | | (0.19 | ) | | | 3.78 | |
| | | | | | | | | | | | | | | | | | | | | | | | |
Total from investment operations * | | | 3.77 | | | | 0.80 | | | | 6.77 | | | | 1.49 | | | | 0.18 | | | | 4.06 | |
| | | | | | | | | | | | | | | | | | | | | | | | |
Distributions to shareholders: | | | | | | | | | | | | | | | | | | | | | | | | |
Dividends from net investment income | | | (0.34 | ) | | | (0.33 | ) | | | (0.39 | ) | | | (0.35 | ) | | | (0.25 | ) | | | (0.30 | ) |
Distributions from net realized gains | | | (2.59 | ) | | | (3.23 | ) | | | (1.50 | ) | | | (0.33 | ) | | | (1.20 | ) | | | (0.25 | ) |
| | | | | | | | | | | | | | | | | | | | | | | | |
Total distributions | | | (2.93 | ) | | | (3.56 | ) | | | (1.89 | ) | | | (0.68 | ) | | | (1.45 | ) | | | (0.55 | ) |
| | | | | | | | | | | | | | | | | | | | | | | | |
Change in net asset value for the period | | | 0.84 | | | | (2.76 | ) | | | 4.88 | | | | 0.81 | | | | (1.27 | ) | | | 3.51 | |
| | | | | | | | | | | | | | | | | | | | | | | | |
Net asset value, end of period | | $ | 36.68 | | | $ | 35.84 | | | $ | 38.60 | | | $ | 33.72 | | | $ | 32.91 | | | $ | 34.18 | |
| | | | | | | | | | | | | | | | | | | | | | | | |
* Includes redemption fees per share of | | | N/A | | | | N/A | | | | N/A | | | | N/A | | | | 0.00 | (2) | | | 0.00 | (2) |
Total Return | | | 11.5 | % | | | 2.0 | % | | | 20.9 | % | | | 4.6 | % | | | 0.5 | % | | | 13.4 | % |
Ratios/supplemental data | | | | | | | | | | | | | | | | | | | | | | | | |
Net assets, end of period (000) | | $ | 281,790 | | | $ | 272,043 | | | $ | 293,637 | | | $ | 283,126 | | | $ | 309,267 | | | $ | 380,561 | |
Ratio to average net assets: | | | | | | | | | | | | | | | | | | | | | | | | |
Expenses before waiver/reimbursement | | | 1.29 | % | | | 1.26 | % | | | 1.27 | % | | | 1.27 | % | | | 1.29 | % | | | 1.25 | % |
Expenses after waiver/reimbursement | | | 1.25 | % | | | 1.25 | % | | | 1.26 | %(3) | | | 1.24 | %(3) | | | 1.25 | % | | | 1.24 | % |
Net investment income before waiver/reimbursement | | | 1.19 | % | | | 0.91 | % | | | 0.97 | % | | | 1.18 | % | | | 0.91 | % | | | 0.84 | % |
Net investment income after waiver/reimbursement | | | 1.23 | % | | | 0.92 | % | | | 0.98 | % | | | 1.21 | % | | | 0.95 | % | | | 0.85 | % |
Portfolio turnover rate | | | 9 | % | | | 19 | % | | | 10 | % | | | 12 | % | | | 15 | % | | | 19 | % |
| (1) | Net investment income per share is calculated using the ending balance prior to consideration or adjustment for permanentbook-to-tax differences. |
| (2) | Represents less than $0.01. |
| (3) | Includes 0.01% of interest expense which is not included in the Fund’s operating expense cap. |
The Accompanying Notes are an Integral Part of these Financial Statements.
The Tocqueville Opportunity Fund
Financial Highlights
| | | | | | | | | | | | | | | | | | | | | | | | |
Per share operating performance
(For a share outstanding
throughout the period) | | Six Months
Ended
April 30,
2019 | | | Years Ended October 31, | |
| | 2018 | | | 2017 | | | 2016 | | | 2015 | | | 2014 | |
| | | (Unaudited) | | | | | | | | | | | | | | | | |
Net asset value, beginning of period | | $ | 26.60 | | | $ | 26.12 | | | $ | 19.14 | | | $ | 21.41 | | | $ | 22.78 | | | $ | 21.29 | |
| | | | | | | | | | | | | | | | | | | | | | | | |
Operations: | | | | | | | | | | | | | | | | | | | | | | | | |
Net investment loss (1) | | | (0.11 | ) | | | (0.29 | ) | | | (0.37 | ) | | | (0.29 | ) | | | (0.15 | ) | | | (0.22 | ) |
Net realized and unrealized gain (loss) | | | 4.39 | | | | 1.63 | | | | 7.35 | | | | (1.98 | ) | | | 1.98 | | | | 2.80 | |
| | | | | | | | | | | | | | | | | | | | | | | | |
Total from investment operations * | | | 4.28 | | | | 1.34 | | | | 6.98 | | | | (2.27 | ) | | | 1.83 | | | | 2.58 | |
| | | | | | | | | | | | | | | | | | | | | | | | |
Distributions to shareholders: | | | | | | | | | | | | | | | | | | | | | | | | |
Dividends from net investment income | | | — | | | | — | | | | — | | | | — | | | | — | | | | — | |
Distributions from net realized gains | | | (2.49 | ) | | | (0.86 | ) | | | — | | | | — | | | | (3.20 | ) | | | (1.09 | ) |
| | | | | | | | | | | | | | | | | | | | | | | | |
Total distributions | | | (2.49 | ) | | | (0.86 | ) | | | — | | | | — | | | | (3.20 | ) | | | (1.09 | ) |
| | | | | | | | | | | | | | | | | | | | | | | | |
Change in net asset value for the period | | | 1.79 | | | | 0.48 | | | | 6.98 | | | | (2.27 | ) | | | (1.37 | ) | | | 1.49 | |
| | | | | | | | | | | | | | | | | | | | | | | | |
Net asset value, end of period | | $ | 28.39 | | | $ | 26.60 | | | $ | 26.12 | | | $ | 19.14 | | | $ | 21.41 | | | $ | 22.78 | |
| | | | | | | | | | | | | | | | | | | | | | | | |
* Includes redemption fees per share of | | | N/A | | | | N/A | | | | N/A | | | | N/A | | | | 0.00 | (2) | | | 0.00 | (2) |
Total Return | | | 18.1 | % | | | 5.3 | % | | | 36.5 | % | | | -10.6 | % | | | 9.1 | % | | | 12.6 | % |
Ratios/supplemental data | | | | | | | | | | | | | | | | | | | | | | | | |
Net assets, end of period (000) | | $ | 93,986 | | | $ | 82,106 | | | $ | 77,773 | | | $ | 92,958 | | | $ | 153,456 | | | $ | 80,324 | |
Ratio to average net assets: | | | | | | | | | | | | | | | | | | | | | | | | |
Expenses before waiver/reimbursement | | | 1.40 | % | | | 1.33 | % | | | 1.38 | % | | | 1.38 | % | | | 1.31 | % | | | 1.30 | % |
Expenses after waiver/reimbursement | | | 1.26 | %(3) | | | 1.26 | %(3) | | | 1.30 | %(3)(4) | | | 1.38 | % | | | 1.31 | % | | | 1.30 | % |
Net investment income before waiver/reimbursement | | | (1.18 | )% | | | (1.13 | )% | | | (1.05 | )% | | | (0.94 | )% | | | (0.95 | )% | | | (0.90 | )% |
Net investment income after waiver/reimbursement | | | (1.04 | )% | | | (1.06 | )% | | | (0.97 | )%(4) | | | (0.94 | )% | | | (0.95 | )% | | | (0.90 | )% |
Portfolio turnover rate | | | 93 | % | | | 151 | % | | | 133 | % | | | 108 | % | | | 101 | % | | | 92 | % |
| (1) | Net investment loss per share is calculated using the ending balance prior to consideration or adjustment for permanentbook-to-tax differences. |
| (2) | Represents less than $0.01. |
| (3) | Includes interest expense of 0.01% for the six months ended April 30, 2019, 0.01% for the year ended October 31, 2018 and 0.05% for the year ended October 31, 2017. Interest expense is not included in the Fund’s operating expense cap. |
| (4) | Expense waiver of 1.25% was implemented on November 1, 2016. |
The Accompanying Notes are an Integral Part of these Financial Statements.
The Tocqueville Gold Fund—Investor Class
Financial Highlights
| | | | | | | | | | | | | | | | | | | | | | | | |
Per share operating performance
(For a share outstanding
throughout the period) | | Six Months
Ended
April 30,
2019 | | | Years Ended October 31, | |
| | 2018 | | | 2017 | | | 2016 | | | 2015 | | | 2014 | |
| | | (Unaudited) | | | | | | | | | | | | | | | | |
Net asset value, beginning of period | | $ | 29.01 | | | $ | 35.64 | | | $ | 39.32 | | | $ | 26.04 | | | $ | 30.38 | | | $ | 38.01 | |
| | | | | | | | | | | | | | | | | | | | | | | | |
Operations: | | | | | | | | | | | | | | | | | | | | | | | | |
Net investment loss (1) | | | (0.16 | ) | | | (0.38 | ) | | | (0.39 | ) | | | (0.33 | ) | | | (0.27 | ) | | | (0.08 | ) |
Net realized and unrealized gain (loss) | | | 1.70 | | | | (6.25 | ) | | | (3.29 | ) | | | 13.61 | | | | (4.07 | ) | | | (7.55 | ) |
| | | | | | | | | | | | | | | | | | | | | | | | |
Total from investment operations * | | | 1.54 | | | | (6.63 | ) | | | (3.68 | ) | | | 13.28 | | | | (4.34 | ) | | | (7.63 | ) |
| | | | | | | | | | | | | | | | | | | | | | | | |
Distributions to shareholders: | | | | | | | | | | | | | | | | | | | | | | | | |
Dividends from net investment income | | | — | | | | — | | | | — | | | | — | | | | — | | | | — | |
Distributions from net realized gains | | | — | | | | — | | | | — | | | | — | | | | — | | | | — | |
| | | | | | | | | | | | | | | | | | | | | | | | |
Total distributions | | | — | | | | — | | | | — | | | | — | | | | — | | | | — | |
| | | | | | | | | | | | | | | | | | | | | | | | |
Change in net asset value for the period | | | 1.54 | | | | (6.63 | ) | | | (3.68 | ) | | | 13.28 | | | | (4.34 | ) | | | (7.63 | ) |
| | | | | | | | | | | | | | | | | | | | | | | | |
Net asset value, end of period | | $ | 30.55 | | | $ | 29.01 | | | $ | 35.64 | | | $ | 39.32 | | | $ | 26.04 | | | $ | 30.38 | |
| | | | | | | | | | | | | | | | | | | | | | | | |
* Includes redemption fees per share of | | | 0.01 | | | | 0.00 | (2) | | | 0.01 | | | | 0.01 | | | | 0.01 | | | | 0.02 | |
Total Return | | | 5.3 | % | | | -18.6 | % | | | -9.4 | % | | | 51.0 | % | | | -14.3 | % | | | -20.1 | % |
Ratios/supplemental data | | | | | | | | | | | | | | | | | | | | | | | | |
Net assets, end of period (000) | | $ | 835,981 | | | $ | 859,394 | | | $ | 1,153,287 | | | $ | 1,365,282 | | | $ | 947,367 | | | $ | 1,138,557 | |
Ratio to average net assets: | | | | | | | | | | | | | | | | | | | | | | | | |
Expense | | | 1.49 | % | | | 1.42 | % | | | 1.38 | % | | | 1.39 | % | | | 1.43 | % | | | 1.36 | % |
Net investment loss | | | (0.73 | )% | | | (0.88 | )% | | | (0.95 | )% | | | (0.91 | )% | | | (0.84 | )% | | | (0.78 | )% |
Portfolio turnover rate | | | 9 | % | | | 9 | % | | | 14 | % | | | 15 | % | | | 11 | % | | | 10 | % |
| (1) | Net investment loss per share is calculated using the ending balance prior to consideration or adjustment for permanentbook-to-tax differences. |
| (2) | Represents less than $0.01. |
The Accompanying Notes are an Integral Part of these Financial Statements.
The Tocqueville Gold Fund—Institutional Class
Financial Highlights
| | | | |
Per share operating performance
(For a share outstanding throughout the period) | | April 8, 2019(1)
through
April 30, 2019 | |
|
| | | (Unaudited) | |
Net asset value, beginning of period (1) | | $ | 32.73 | |
| | | | |
Operations: | | | | |
Net investment income (2) | | | 0.00 | (3) |
Net realized and unrealized loss | | | (2.16 | ) |
| | | | |
Total from investment operations * | | | (2.16 | ) |
| | | | |
Distributions to shareholders: | | | | |
Dividends from net investment income | | | — | |
Distributions from net realized gains | | | — | |
| | | | |
Total distributions | | | — | |
| | | | |
Change in net asset value for the period | | | (2.16 | ) |
| | | | |
Net asset value, end of period | | $ | 30.57 | |
| | | | |
* Includes redemption fees per share of | | | | |
Total Return | | | -6.6 | % |
Ratios/supplemental data | | | | |
Net assets, end of period (000) | | $ | 20 | |
Ratio to average net assets: | | | | |
Expense | | | 1.33 | % |
Net investment loss | | | 0.90 | % |
Portfolio turnover rate | | | 9 | % |
| (1) | Institutional Class shares commenced operations on April 8, 2019. |
| (2) | Net investment income per share is calculated using the ending balance prior to consideration or adjustment for permanentbook-to-tax differences. |
| (3) | Represents less than $0.01. |
The Accompanying Notes are an Integral Part of these Financial Statements.
The Tocqueville Phoenix Fund
Financial Highlights
| | | | | | | | | | | | | | | | | | | | | | | | |
Per share operating performance
(For a share outstanding
throughout the period) | | Six Months
Ended
April 30,
2019 | | | Years Ended October 31, | |
| | 2018 | | | 2017 | | | 2016 | | | 2015 | | | 2014 | |
| | | (Unaudited) | | | | | | | | | | | | | | | | |
Net asset value, beginning of period | | $ | 20.20 | | | $ | 26.40 | | | $ | 26.47 | | | $ | 28.64 | | | $ | 36.40 | | | $ | 37.13 | |
| | | | | | | | | | | | | | | | | | | | | | | | |
Operations: | | | | | | | | | | | | | | | | | | | | | | | | |
Net investment loss (1) | | | (0.01 | ) | | | (0.14 | ) | | | (0.15 | ) | | | (0.15 | ) | | | (0.14 | ) | | | (0.10 | ) |
Net realized and unrealized gain (loss) | | | 2.05 | | | | (2.27 | ) | | | 4.91 | | | | 0.78 | | | | (3.99 | ) | | | 0.70 | |
| | | | | | | | | | | | | | | | | | | | | | | | |
Total from investment operations * | | | 2.04 | | | | (2.41 | ) | | | 4.76 | | | | 0.63 | | | | (4.13 | ) | | | 0.60 | |
| | | | | | | | | | | | | | | | | | | | | | | | |
Distributions to shareholders: | | | | | | | | | | | | | | | | | | | | | | | | |
Dividends from net investment income | | | 0.00 | (2) | | | — | | | | — | | | | — | | | | — | | | | — | |
Distributions from net realized gains | | | (1.35 | ) | | | (3.79 | ) | | | (4.83 | ) | | | (2.80 | ) | | | (3.63 | ) | | | (1.33 | ) |
| | | | | | | | | | | | | | | | | | | | | | | | |
Total distributions | | | (1.35 | ) | | | (3.79 | ) | | | (4.83 | ) | | | (2.80 | ) | | | (3.63 | ) | | | (1.33 | ) |
| | | | | | | | | | | | | | | | | | | | | | | | |
Change in net asset value for the period | | | 0.69 | | | | (6.20 | ) | | | (0.07 | ) | | | (2.17 | ) | | | (7.76 | ) | | | (0.73 | ) |
| | | | | | | | | | | | | | | | | | | | | | | | |
Net asset value, end of period | | $ | 20.89 | | | $ | 20.20 | | | $ | 26.40 | | | $ | 26.47 | | | $ | 28.64 | | | $ | 36.40 | |
| | | | | | | | | | | | | | | | | | | | | | | | |
* Includes redemption fees per share of | | | N/A | | | | N/A | | | | N/A | | | | N/A | | | | 0.00 | (2) | | | 0.00 | (2) |
Total Return | | | 11.0 | % | | | (10.6 | )% | | | 19.0 | % | | | 3.3 | % | | | (12.3 | )% | | | 1.6 | % |
Ratios/supplemental data | | | | | | | | | | | | | | | | | | | | | | | | |
Net assets, end of period (000) | | $ | 208,764 | | | $ | 237,119 | | | $ | 373,353 | | | $ | 400,827 | | | $ | 674,525 | | | $ | 1,475,139 | |
Ratio to average net assets: | | | | | | | | | | | | | | | | | | | | | | | | |
Expenses before waiver/reimbursement | | | 1.40 | % | | | 1.32 | % | | | 1.31 | % | | | 1.29 | % | | | 1.25 | % | | | 1.21 | % |
Expenses after waiver/reimbursement | | | 1.25 | % | | | 1.25 | % | | | 1.25 | %(3) | | | 1.29 | % | | | 1.25 | % | | | 1.21 | % |
Net investment income before waiver/reimbursement | | | (0.23 | )% | | | (0.55 | )% | | | (0.55 | )% | | | (0.33 | )% | | | (0.15 | )% | | | (0.24 | )% |
Net investment income after waiver/reimbursement | | | (0.08 | )% | | | (0.48 | )% | | | (0.49 | )%(3) | | | (0.33 | )% | | | (0.15 | )% | | | (0.24 | )% |
Portfolio turnover rate | | | 23 | % | | | 40 | % | | | 36 | % | | | 39 | % | | | 19 | % | | | 34 | % |
| (1) | Net investment loss per share is calculated using the ending balance prior to consideration or adjustment for permanentbook-to-tax differences. |
| (2) | Represents less than $0.01. |
| (3) | Expense waiver of 1.25% was implemented on November 1, 2016. |
The Accompanying Notes are an Integral Part of these Financial Statements.
The Tocqueville Select Fund
Financial Highlights
| | | | | | | | | | | | | | | | | | | | | | | | |
Per share operating performance
(For a share outstanding
throughout the period) | | Six Months
Ended
April 30,
2019 | | | Years Ended October 31, | |
| | 2018 | | | 2017 | | | 2016 | | | 2015 | | | 2014 | |
| | | (Unaudited) | | | | | | | | | | | | | | | | |
Net asset value, beginning of period | | $ | 10.90 | | | $ | 11.87 | | | $ | 11.43 | | | $ | 12.08 | | | $ | 14.90 | | | $ | 15.57 | |
| | | | | | | | | | | | | | | | | | | | | | | | |
Operations: | | | | | | | | | | | | | | | | | | | | | | | | |
Net investment loss (1) | | | (0.01 | ) | | | (0.05 | ) | | | (0.06 | ) | | | (0.07 | ) | | | (0.08 | ) | | | (0.07 | ) |
Net realized and unrealized gain (loss) | | | 1.23 | | | | (0.70 | ) | | | 1.12 | | | | (0.18 | ) | | | (1.00 | ) | | | 0.94 | |
| | | | | | | | | | | | | | | | | | | | | | | | |
Total from investment operations * | | | 1.22 | | | | (0.75 | ) | | | 1.06 | | | | (0.25 | ) | | | (1.08 | ) | | | 0.87 | |
| | | | | | | | | | | | | | | | | | | | | | | | |
Distributions to shareholders: | | | | | | | | | | | | | | | | | | | | | | | | |
Dividends from net investment income | | | — | | | | — | | | | — | | | | — | | | | — | | | | — | |
Distributions from net realized gains | | | — | | | | (0.22 | ) | | | (0.62 | ) | | | (0.40 | ) | | | (1.74 | ) | | | (1.54 | ) |
| | | | | | | | | | | | | | | | | | | | | | | | |
Total distributions | | | — | | | | (0.22 | ) | | | (0.62 | ) | | | (0.40 | ) | | | (1.74 | ) | | | (1.54 | ) |
| | | | | | | | | | | | | | | | | | | | | | | | |
Change in net asset value for the period | | | 1.22 | | | | (0.97 | ) | | | 0.44 | | | | (0.65 | ) | | | (2.82 | ) | | | (0.67 | ) |
| | | | | | | | | | | | | | | | | | | | | | | | |
Net asset value, end of period | | $ | 12.12 | | | $ | 10.90 | | | $ | 11.87 | | | $ | 11.43 | | | $ | 12.08 | | | $ | 14.90 | |
| | | | | | | | | | | | | | | | | | | | | | | | |
* Includes redemption fees per share of | | | N/A | | | | N/A | | | | N/A | | | | N/A | | | | 0.00 | (2) | | | 0.00 | (2) |
Total Return | | | 11.2 | % | | | (6.4 | )% | | | 8.9 | % | | | (1.9 | )% | | | (8.0 | )% | | | 6.1 | % |
Ratios/supplemental data | | | | | | | | | | | | | | | | | | | | | | | | |
Net assets, end of period (000) | | $ | 40,314 | | | $ | 39,225 | | | $ | 49,453 | | | $ | 63,812 | | | $ | 81,813 | | | $ | 108,060 | |
Ratio to average net assets: | | | | | | | | | | | | | | | | | | | | | | | | |
Expenses before waiver/reimbursement | | | 1.44 | % | | | 1.37 | % | | | 1.37 | % | | | 1.37 | % | | | 1.36 | % | | | 1.32 | % |
Expenses after waiver/reimbursement | | | 1.25 | % | | | 1.25 | % | | | 1.25 | %(3) | | | 1.37 | % | | | 1.36 | % | | | 1.32 | % |
Net investment income before waiver/reimbursement | | | (0.34 | )% | | | (0.50 | )% | | | (0.47 | )% | | | (0.45 | )% | | | (0.52 | )% | | | (0.50 | )% |
Net investment income after waiver/reimbursement | | | (0.15 | )% | | | (0.38 | )% | | | (0.35 | )%(3) | | | (0.45 | )% | | | (0.52 | )% | | | (0.50 | )% |
Portfolio turnover rate | | | 15 | % | | | 27 | % | | | 24 | % | | | 32 | % | | | 43 | % | | | 32 | % |
| (1) | Net investment loss per share is calculated using the ending balance prior to consideration or adjustment for permanentbook-to-tax differences. |
| (2) | Represents less than $0.01. |
| (3) | Expense waiver of 1.25% was implemented on November 1, 2016. |
The Accompanying Notes are an Integral Part of these Financial Statements.
The Tocqueville Fund
Schedule of Investments as of April 30, 2019
(Unaudited)
| | | | | | | | |
| Common Stocks—96.2% | | Shares | | | Value | |
Automobiles & Components—1.3% | |
Ford Motor Co. | | | 350,000 | | | $ | 3,657,500 | |
Banks—1.1% | | | | | | | | |
Bank of America Corp. | | | 100,000 | | | | 3,058,000 | |
Capital Goods—8.5% | | | | | | | | |
Arconic, Inc. | | | 175,000 | | | | 3,759,000 | |
Caterpillar, Inc. | | | 25,000 | | | | 3,485,500 | |
Illinois Tool Works, Inc. | | | 40,000 | | | | 6,225,200 | |
Parker-Hannifin Corp. | | | 15,000 | | | | 2,716,200 | |
Raytheon Co. | | | 10,000 | | | | 1,775,900 | |
The Boeing Co. | | | 10,000 | | | | 3,776,900 | |
United Technologies Corp. | | | 15,000 | | | | 2,139,150 | |
| | | | | | | | 23,877,850 | |
Commercial & Professional Services—1.2% | |
Steelcase, Inc.—Class A | | | 200,000 | | | | 3,458,000 | |
Consumer Services—2.1% | |
McDonald’s Corp. | | | 30,000 | | | | 5,927,100 | |
Diversified Financials—2.6% | |
Capital One Financial Corp. | | | 25,000 | | | | 2,320,750 | |
The Bank of New York Mellon Corp. | | | 100,000 | | | | 4,966,000 | |
| | | | | | | | 7,286,750 | |
Energy—6.7% | | | | | | | | |
Exxon Mobil Corp. | | | 100,000 | | | | 8,028,000 | |
Noble Energy, Inc. | | | 200,000 | | | | 5,412,000 | |
Schlumberger Ltd.(a) | | | 125,000 | | | | 5,335,000 | |
| | | | | | | | 18,775,000 | |
Food & Staples Retailing—3.3% | |
Walmart, Inc. | | | 90,000 | | | | 9,255,600 | |
Food, Beverage & Tobacco—4.7% | |
Campbell Soup Co. | | | 100,000 | | | | 3,869,000 | |
Constellation Brands, Inc.—Class A | | | 10,000 | | | | 2,116,700 | |
The Coca-Cola Co. | | | 150,000 | | | | 7,359,000 | |
| | | | | | | | 13,344,700 | |
Health Care Equipment & Services—1.4% | |
Abbott Laboratories | | | 50,000 | | | | 3,978,000 | |
Household & Personal Products—6.4% | |
Colgate-Palmolive Co. | | | 100,000 | | | | 7,279,000 | |
The Procter & Gamble Co. | | | 100,000 | | | $ | 10,648,000 | |
| | | | | | | | 17,927,000 | |
Insurance—2.6% | | | | | | | | |
Aflac, Inc. | | | 100,000 | | | | 5,038,000 | |
MetLife, Inc. | | | 50,000 | | | | 2,306,500 | |
| | | | | | | | 7,344,500 | |
Materials—7.2% | | | | | | | | |
BHP Group Ltd.—ADR(a) | | | 50,000 | | | | 2,647,500 | |
Dow, Inc.(b) | | | 33,333 | | | | 1,890,981 | |
DowDuPont, Inc. | | | 100,000 | | | | 3,845,000 | |
Nutrien Ltd.(a) | | | 40,000 | | | | 2,167,200 | |
Sonoco Products Co. | | | 75,000 | | | | 4,729,500 | |
Vulcan Materials Co. | | | 40,000 | | | | 5,044,400 | |
| | | | | | | | 20,324,581 | |
Media & Entertainment—7.1% | |
Alphabet, Inc.—Class A(b) | | | 7,000 | | | | 8,392,720 | |
Facebook, Inc.—Class A(b) | | | 25,000 | | | | 4,835,000 | |
The Walt Disney Co. | | | 50,000 | | | | 6,848,500 | |
| | | | | | | | 20,076,220 | |
Pharmaceuticals, Biotechnology & Life Sciences—9.8% | |
Biogen, Inc.(b) | | | 12,500 | | | | 2,865,500 | |
Ionis Pharmaceuticals, Inc.(b) | | | 40,000 | | | | 2,973,200 | |
Johnson & Johnson | | | 40,000 | | | | 5,648,000 | |
Merck & Co., Inc. | | | 100,000 | | | | 7,871,000 | |
Pfizer, Inc. | | | 200,000 | | | | 8,122,000 | |
| | | | | | | | 27,479,700 | |
Retailing—3.4% | | | | | | | | |
Amazon.com, Inc.(b) | | | 5,000 | | | | 9,632,600 | |
Semiconductors & Semiconductor Equipment—7.6% | |
Applied Materials, Inc. | | | 150,000 | | | | 6,610,500 | |
Intel Corp. | | | 150,000 | | | | 7,656,000 | |
NVIDIA Corp. | | | 15,000 | | | | 2,715,000 | |
QUALCOMM, Inc. | | | 50,000 | | | | 4,306,500 | |
| | | | | | | | 21,288,000 | |
Software & Services—7.6% | |
Automatic Data Processing, Inc. | | | 50,000 | | | | 8,219,500 | |
The Accompanying Footnotes are an Integral Part of these Financial Statements.
The Tocqueville Fund
Schedule of Investments as of April 30, 2019
(Unaudited)
| | | | | | | | |
| Common Stocks—96.2% | | Shares | | | Value | |
Microsoft Corp. | | | 100,000 | | | $ | 13,060,000 | |
| | | | | | | | 21,279,500 | |
Technology Hardware & Equipment—2.8% | |
Apple, Inc. | | | 40,000 | | | | 8,026,800 | |
Bio-key International, Inc.(b)(c)(d)
(Originally acquired 09/16/05, Cost $0) | | | 1,963 | | | | — | |
| | | | | | | | 8,026,800 | |
Telecommunication Services—2.0% | |
Verizon Communications, Inc. | | | 100,000 | | | | 5,719,000 | |
Transportation—3.4% | |
Delta Air Lines, Inc. | | | 100,000 | | | | 5,829,000 | |
FedEx Corp. | | | 10,000 | | | | 1,894,600 | |
Kansas City Southern | | | 15,000 | | | | 1,847,100 | |
| | | | | | | | 9,570,700 | |
Utilities—3.4% | |
NextEra Energy, Inc. | | | 50,000 | | | | 9,722,000 | |
Total Common Stocks
(Cost $133,055,425) | | | | | | | 271,009,101 | |
Preferred Stock—0.0% | |
Health Care Equipment & Supplies—0.0% | |
Velico Medical, Inc.(b)(c)(d)
(Originally acquired 10/13/16, Cost $0) | | | 400,000 | | | | 1,600 | |
Total Preferred Stock
(Cost $0) | | | | | | | 1,600 | |
Real Estate Investment Trust (REIT)—2.4% | |
Real Estate—2.4% | | | | | | | | |
Weyerhaeuser Co. | | | 250,000 | | | | 6,700,000 | |
Total Real Estate Investment Trust
(Cost $4,725,263) | | | | 6,700,000 | |
Exchange-Traded Fund (ETF)—1.0% | |
Metals and Mining—1.0% | | | | | | | | |
SPDR S&P Metals & Mining ETF | | | 100,000 | | | | 2,883,000 | |
Total Exchange-Traded Fund
(Cost $1,495,845) | | | | 2,883,000 | |
| Short-Term Investment—0.0% | | Shares | | | Value | |
Money Market Fund—0.0% | |
STIT-Treasury
Portfolio—Institutional Class, 2.319%(e) | | | 472 | | | $ | 472 | |
Total Short-Term Investment
(Cost $472) | | | | 472 | |
Total Investments
(Cost $139,277,005)—99.6% | | | | 280,594,173 | |
Other Assets in Excess of Liabilities—0.4% | | | | 1,196,093 | |
Total Net Assets—100.0% | | | | | | $ | 281,790,266 | |
| | | | | | | | |
Percentages are stated as a percent of net assets.
ADR American Depository Receipt
| (a) | Foreign issued Security. Foreign Concentration (including ADR’s) was as follows: Australia 0.9%; Canada 0.8%; Curacao 1.9%. |
| (b) | Non-income producing security. |
| (c) | Denotes a security that is either fully or partially restricted to resale. The aggregate value of restricted securities as of April 30, 2019 was $1,600 which represented 0.0% of net assets. |
| (d) | Security is fair valued using procedures approved by the Board of Trustees which includes significant unobservable inputs and is deemed a Level 3 security. See Footnote 2. The aggregate value of fair value securities as of April 30, 2019 was $1,600 which represented 0.0% of net assets. |
| (e) | Rate listed is the7-day effective yield. |
The Global Industry Classification Standard (GICS®) was developed by and/or is the exclusive property of MSCI, Inc. and Standard & Poor Financial Services LLC (“S&P”). GICS is a service mark of MSCI and S&P and has been licensed for use by U.S. Bank Global Fund Services.
The Accompanying Footnotes are an Integral Part of these Financial Statements.
The Tocqueville Opportunity Fund
Schedule of Investments as of April 30, 2019
(Unaudited)
| | | | | | | | |
| Common Stocks—99.1% | | Shares | | | Value | |
Automobiles & Components—0.0% | |
Delphi Technologies PLC(a) | | | 1 | | | $ | 22 | |
Capital Goods—13.3% | |
Allison Transmission Holdings, Inc. | | | 1,000 | | | | 46,860 | |
AMETEK, Inc. | | | 4,000 | | | | 352,680 | |
AO Smith Corp. | | | 5,500 | | | | 289,135 | |
Cummins, Inc. | | | 1,400 | | | | 232,806 | |
Emerson Electric Co. | | | 4,000 | | | | 283,960 | |
Fastenal Co. | | | 6,000 | | | | 423,300 | |
Fortive Corp. | | | 7,500 | | | | 647,550 | |
Gardner Denver Holdings, Inc.(b) | | | 4,500 | | | | 151,875 | |
Graco, Inc. | | | 5,000 | | | | 256,250 | |
Harris Corp. | | | 4,500 | | | | 758,250 | |
HD Supply Holdings, Inc.(b) | | | 4,000 | | | | 182,760 | |
HEICO Corp. | | | 3,843 | | | | 405,552 | |
Hexcel Corp. | | | 2,000 | | | | 141,420 | |
Honeywell International, Inc. | | | 4,000 | | | | 694,520 | |
Hubbell, Inc. | | | 2,500 | | | | 319,000 | |
Huntington Ingalls Industries, Inc. | | | 1,000 | | | | 222,580 | |
IDEX Corp. | | | 2,500 | | | | 391,650 | |
Ingersoll-Rand PLC(a) | | | 4,500 | | | | 551,745 | |
Lennox International, Inc. | | | 1,300 | | | | 352,885 | |
Lincoln Electric Holdings, Inc. | | | 3,000 | | | | 261,810 | |
Masco Corp. | | | 6,500 | | | | 253,890 | |
Nordson Corp. | | | 2,500 | | | | 364,875 | |
Parker-Hannifin Corp. | | | 1,500 | | | | 271,620 | |
PGT Innovations, Inc.(b) | | | 15,000 | | | | 219,900 | |
RBC Bearings, Inc.(b) | | | 500 | | | | 68,775 | |
Rockwell Automation, Inc. | | | 3,500 | | | | 632,485 | |
Sensata Technologies Holding PLC(a)(b) | | | 4,500 | | | | 224,730 | |
SiteOne Landscape Supply, Inc.(b) | | | 8,000 | | | | 538,400 | |
Spirit AeroSystems Holdings, Inc.—Class A | | | 3,000 | | | | 260,700 | |
The Middleby Corp.(b) | | | 2,000 | | | | 264,260 | |
TransDigm Group, Inc.(b) | | | 1,500 | | | | 723,780 | |
Trex Co., Inc.(b) | | | 2,000 | | | | 138,540 | |
United Rentals, Inc.(b) | | | 2,500 | | | | 352,300 | |
United Technologies Corp. | | | 1,500 | | | | 213,915 | |
Wabtec Corp. | | | 500 | | | | 37,035 | |
Watsco, Inc. | | | 1,500 | | | | 237,705 | |
Welbilt, Inc.(b) | | | 7,500 | | | | 126,225 | |
Woodward, Inc. | | | 3,500 | | | | 381,150 | |
Xylem, Inc. | | | 3,000 | | | | 250,200 | |
| | | | | | | | 12,527,073 | |
Commercial & Professional Services—3.9% | |
Cintas Corp. | | | 3,000 | | | | 651,420 | |
Copart, Inc.(b) | | | 7,000 | | | | 471,240 | |
CoStar Group, Inc.(b) | | | 1,500 | | | | 744,375 | |
Equifax, Inc. | | | 2,500 | | | | 314,875 | |
Robert Half International, Inc. | | | 3,000 | | | | 186,270 | |
TransUnion | | | 8,500 | | | | 592,025 | |
Verisk Analytics, Inc. | | | 5,000 | | | | 705,700 | |
| | | | | | | | 3,665,905 | |
Consumer Durables & Apparel—2.0% | |
Leggett & Platt, Inc. | | | 500 | | | | 19,680 | |
Lululemon Athletica, Inc.(b) | | | 5,500 | | | | 969,925 | |
NIKE, Inc.—Class B | | | 8,000 | | | | 702,640 | |
Roku, Inc.(b) | | | 3,000 | | | | 190,770 | |
| | | | | | | | 1,883,015 | |
Consumer Services—1.5% | | | | | | | | |
Domino’s Pizza, Inc. | | | 1,000 | | | | 270,580 | |
Planet Fitness, Inc.—Class A(b) | | | 6,500 | | | | 492,050 | |
Restaurant Brands International LP | | | 37 | | | | 2,430 | |
Starbucks Corp. | | | 4,000 | | | | 310,720 | |
Vail Resorts, Inc. | | | 1,500 | | | | 343,275 | |
| | | | | | | | 1,419,055 | |
Diversified Financials—1.8% | | | | | | | | |
Cboe Global Markets, Inc. | | | 1,500 | | | | 152,415 | |
FactSet Research Systems, Inc. | | | 400 | | | | 110,348 | |
MarketAxess Holdings, Inc. | | | 1,000 | | | | 278,330 | |
MSCI, Inc. | | | 1,500 | | | | 338,070 | |
S&P Global, Inc. | | | 3,500 | | | | 772,310 | |
SEI Investments Co. | | | 500 | | | | 27,225 | |
| | | | | | | | 1,678,698 | |
Health Care Equipment & Services—5.7% | |
ABIOMED, Inc.(b) | | | 1,300 | | | | 360,633 | |
Align Technology, Inc.(b) | | | 1,750 | | | | 568,190 | |
Boston Scientific Corp.(b) | | | 1,000 | | | | 37,120 | |
DexCom, Inc.(b) | | | 3,000 | | | | 363,210 | |
Glaukos Corp.(b) | | | 4,000 | | | | 288,520 | |
IDEXX Laboratories, Inc.(b) | | | 3,500 | | | | 812,000 | |
The Accompanying Footnotes are an Integral Part of these Financial Statements.
The Tocqueville Opportunity Fund
Schedule of Investments as of April 30, 2019
(Unaudited)
| | | | | | | | |
| Common Stocks—99.1% | | Shares | | | Value | |
Inogen, Inc.(b) | | | 200 | | | $ | 17,460 | |
Insulet Corp.(b) | | | 4,500 | | | | 388,125 | |
Intuitive Surgical, Inc.(b) | | | 1,500 | | | | 765,945 | |
iRhythm Technologies, Inc.(b) | | | 5,000 | | | | 381,550 | |
Medidata Solutions, Inc.(b) | | | 2,500 | | | | 225,850 | |
STAAR Surgical Co.(b) | | | 1,500 | | | | 48,720 | |
Veeva Systems, Inc.—Class A(b) | | | 7,000 | | | | 979,090 | |
WellCare Health Plans, Inc.(b) | | | 500 | | | | 129,175 | |
| | | | | | | | 5,365,588 | |
Materials—2.3% | | | | | | | | |
Eagle Materials, Inc. | | | 3,500 | | | | 318,185 | |
Ingevity Corp.(b) | | | 1,500 | | | | 172,515 | |
Martin Marietta Materials, Inc. | | | 2,000 | | | | 443,800 | |
Summit Materials, Inc.—Class A(b) | | | 7,000 | | | | 122,640 | |
The Sherwin-Williams Co. | | | 500 | | | | 227,415 | |
Vulcan Materials Co. | | | 6,500 | | | | 819,715 | |
Worthington Industries, Inc. | | | 500 | | | | 20,065 | |
| | | | | | | | 2,124,335 | |
Media & Entertainment—2.6% | |
Discovery, Inc.—Class A(b) | | | 7,500 | | | | 231,750 | |
Facebook, Inc.—Class A(b) | | | 7,500 | | | | 1,450,500 | |
IAC/InterActiveCorp(b) | | | 2,000 | | | | 449,680 | |
Live Nation Entertainment, Inc.(b) | | | 2,000 | | | | 130,680 | |
Match Group, Inc. | | | 2,500 | | | | 151,000 | |
Spotify Technology SA(a)(b) | | | 500 | | | | 67,885 | |
| | | | | | | | 2,481,495 | |
Pharmaceuticals, Biotechnology & Life Sciences—12.4% | |
ACADIA Pharmaceuticals, Inc.(b) | | | 10,000 | | | | 240,500 | |
Acceleron Pharma, Inc.(b) | | | 2,000 | | | | 81,460 | |
Aerie Pharmaceuticals, Inc.(b) | | | 500 | | | | 19,075 | |
Agios Pharmaceuticals, Inc.(b) | | | 2,000 | | | | 111,840 | |
Amarin Corp. PLC—ADR(a)(b) | | | 50,000 | | | | 935,000 | |
Array BioPharma, Inc.(b) | | | 5,000 | | | | 113,050 | |
Atara Biotherapeutics, Inc.(b) | | | 7,500 | | | | 252,000 | |
Audentes Therapeutics, Inc.(b) | | | 3,500 | | | | 132,265 | |
Bluebird Bio, Inc.(b) | | | 4,500 | | | | 638,235 | |
Cellectis SA—ADR(a)(b) | | | 2,500 | | | | 49,350 | |
CRISPR Therapeutics AG(a)(b) | | | 500 | | | | 20,095 | |
Editas Medicine, Inc.(b) | | | 500 | | | | 12,375 | |
Galapagos NV(a)(b) | | | 4,000 | | | | 457,839 | |
Genfit(a)(b) | | | 500 | | | | 12,595 | |
Genmab A/S(a)(b) | | | 5,000 | | | | 830,041 | |
Global Blood Therapeutics, Inc.(b) | | | 1,500 | | | | 83,100 | |
GW Pharmaceuticals PLC—ADR(a)(b) | | | 4,000 | | | | 677,240 | |
Hua Medicine(a)(b) | | | 22,000 | | | | 19,771 | |
Illumina, Inc.(b) | | | 1,000 | | | | 312,000 | |
Immunomedics, Inc.(b) | | | 10,000 | | | | 160,200 | |
Intellia Therapeutics, Inc.(b) | | | 5,000 | | | | 76,900 | |
Intra-Cellular Therapies, Inc.(b) | | | 12,500 | | | | 164,625 | |
Iovance Biotherapeutics, Inc.(b) | | | 30,000 | | | | 342,000 | |
Madrigal Pharmaceuticals, Inc.(b) | | | 500 | | | | 53,040 | |
Neurocrine Biosciences, Inc.(b) | | | 5,500 | | | | 397,320 | |
Pacira BioSciences, Inc.(b) | | | 2,500 | | | | 99,550 | |
PRA Health Sciences, Inc.(b) | | | 500 | | | | 48,410 | |
REGENXBIO, Inc.(b) | | | 9,000 | | | | 453,600 | |
Sage Therapeutics, Inc.(b) | | | 16,500 | | | | 2,775,795 | |
Sarepta Therapeutics, Inc.(b) | | | 9,500 | | | | 1,110,930 | |
Seattle Genetics, Inc.(b) | | | 2,500 | | | | 169,450 | |
Viking Therapeutics, Inc.(b) | | | 45,000 | | | | 352,350 | |
Voyager Therapeutics, Inc.(b) | | | 12,000 | | | | 253,200 | |
Xencor, Inc.(b) | | | 2,500 | | | | 76,775 | |
Zogenix, Inc.(b) | | | 2,500 | | | | 97,475 | |
| | | | | | | | 11,629,451 | |
Retailing—5.3% | | | | | | | | |
Alibaba Group Holding Ltd.—ADR(a)(b) | | | 300 | | | | 55,671 | |
Amazon.com, Inc.(b) | | | 1,300 | | | | 2,504,476 | |
Etsy, Inc.(b) | | | 2,000 | | | | 135,080 | |
Expedia Group, Inc. | | | 2,000 | | | | 259,680 | |
Five Below, Inc.(b) | | | 2,000 | | | | 292,780 | |
Pool Corp. | | | 1,500 | | | | 275,610 | |
The Home Depot, Inc. | | | 4,500 | | | | 916,650 | |
Ulta Beauty, Inc.(b) | | | 700 | | | | 244,286 | |
Wayfair, Inc.—Class A(b) | | | 1,800 | | | | 291,870 | |
| | | | | | | | 4,976,103 | |
The Accompanying Footnotes are an Integral Part of these Financial Statements.
The Tocqueville Opportunity Fund
Schedule of Investments as of April 30, 2019
(Unaudited)
| | | | | | | | |
| Common Stocks—99.1% | | Shares | | | Value | |
Semiconductors & Semiconductor Equipment—0.6% | |
Advanced Micro Devices, Inc.(b) | | | 1,500 | | | $ | 41,445 | |
ams AG(a) | | | 4,000 | | | | 168,762 | |
Micron Technology, Inc.(b) | | | 1,000 | | | | 42,060 | |
NVIDIA Corp. | | | 1,500 | | | | 271,500 | |
| | | | | | | | 523,767 | |
Software & Services—47.1% | |
Adobe, Inc.(b) | | | 4,500 | | | | 1,301,625 | |
ANSYS, Inc.(b) | | | 1,500 | | | | 293,700 | |
Appian Corp.(b) | | | 2,000 | | | | 72,180 | |
Aspen Technology, Inc.(b) | | | 2,000 | | | | 243,820 | |
Atlassian Corp. PLC—Class A(a)(b) | | | 3,500 | | | | 385,525 | |
Cadence Design Systems, Inc.(b) | | | 5,000 | | | | 346,900 | |
Cloudera, Inc.(b) | | | 1,500 | | | | 16,695 | |
Coupa Software, Inc.(b) | | | 15,500 | | | | 1,601,615 | |
DocuSign, Inc.(b) | | | 2,000 | | | | 113,340 | |
Dropbox, Inc.—Class A(b) | | | 500 | | | | 12,190 | |
EPAM Systems, Inc.(b) | | | 1,000 | | | | 179,360 | |
Euronet Worldwide, Inc.(b) | | | 2,500 | | | | 374,725 | |
Fair Isaac Corp.(b) | | | 1,500 | | | | 419,625 | |
Fidelity National Information Services, Inc. | | | 1,500 | | | | 173,895 | |
Fiserv, Inc.(b) | | | 4,000 | | | | 348,960 | |
Fortinet, Inc.(b) | | | 4,500 | | | | 420,390 | |
Gartner, Inc.(b) | | | 1,000 | | | | 158,970 | |
Global Payments, Inc. | | | 3,500 | | | | 511,245 | |
GoDaddy, Inc.—Class A(b) | | | 6,000 | | | | 489,000 | |
Guidewire Software, Inc.(b) | | | 2,500 | | | | 266,250 | |
Mastercard, Inc.—Class A | | | 1,000 | | | | 254,240 | |
MongoDB, Inc.(b) | | | 2,500 | | | | 352,300 | |
New Relic, Inc.(b) | | | 23,000 | | | | 2,420,520 | |
Nutanix, Inc.—Class A(b) | | | 5,000 | | | | 215,950 | |
Okta, Inc.(b) | | | 21,000 | | | | 2,184,630 | |
Palo Alto Networks, Inc.(b) | | | 3,500 | | | | 870,905 | |
Paycom Software, Inc.(b) | | | 10,500 | | | | 2,126,565 | |
Paylocity Holding Corp.(b) | | | 17,500 | | | | 1,689,625 | |
PayPal Holdings, Inc.(b) | | | 18,000 | | | | 2,029,860 | |
Pegasystems, Inc. | | | 500 | | | | 37,505 | |
Proofpoint, Inc.(b) | | | 2,000 | | | | 250,840 | |
PTC, Inc.(b) | | | 500 | | | | 45,235 | |
RealPage, Inc.(b) | | | 500 | | | | 32,605 | |
ServiceNow, Inc.(b) | | | 17,000 | | | | 4,615,670 | |
Shopify, Inc.—Class A(a)(b) | | | 19,000 | | | | 4,627,070 | |
Splunk, Inc.(b) | | | 9,000 | | | | 1,242,360 | |
Square, Inc.—Class A(b) | | | 8,500 | | | | 618,970 | |
SS&C Technologies Holdings, Inc. | | | 2,000 | | | | 135,320 | |
Tableau Software, Inc.—Class A(b) | | | 3,000 | | | | 365,430 | |
Talend SA—ADR(a)(b) | | | 1,000 | | | | 49,580 | |
Tencent Holdings Ltd.(a) | | | 3,000 | | | | 148,379 | |
The Trade Desk, Inc.—Class A(b) | | | 2,000 | | | | 442,960 | |
Total System Services, Inc. | | | 11,000 | | | | 1,124,640 | |
Twilio, Inc.—Class A(b) | | | 20,000 | | | | 2,742,800 | |
Tyler Technologies, Inc.(b) | | | 1,000 | | | | 231,910 | |
Upland Software, Inc.(b) | | | 3,000 | | | | 139,470 | |
WEX, Inc.(b) | | | 2,000 | | | | 420,600 | |
Wix.com Ltd.(a)(b) | | | 3,500 | | | | 469,560 | |
Workday, Inc.—Class A(b) | | | 19,500 | | | | 4,009,785 | |
Worldpay, Inc.—Class A(b) | | | 3,000 | | | | 351,630 | |
Zendesk, Inc.(b) | | | 16,000 | | | | 1,404,480 | |
Zscaler, Inc.(b) | | | 13,000 | | | | 888,030 | |
| | | | | | | | 44,269,434 | |
Technology Hardware & Equipment—0.2% | |
II-VI, Inc.(b) | | | 500 | | | | 19,920 | |
Lumentum Holdings, Inc.(b) | | | 3,000 | | | | 185,910 | |
Viavi Solutions, Inc.(b) | | | 1,000 | | | | 13,300 | |
| | | | | | | | 219,130 | |
Transportation—0.4% | | | | | | | | |
Kansas City Southern | | | 3,000 | | | | 369,420 | |
Knight-Swift Transportation Holdings, Inc. | | | 500 | | | | 16,675 | |
| | | | | | | | 386,095 | |
Total Common Stocks
(Cost $61,066,466) | | | | | | | 93,149,166 | |
Real Estate Investment Trust (REIT)—0.0% | |
Real Estate—0.0% | | | | | | | | |
Equinix, Inc. | | | 1 | | | | 455 | |
Total Real Estate Investment Trust
(Cost $297) | | | | 455 | |
The Accompanying Footnotes are an Integral Part of these Financial Statements.
The Tocqueville Opportunity Fund
Schedule of Investments as of April 30, 2019
(Unaudited)
| | | | | | | | | | | | |
Exchange-Traded
Fund (ETF)—0.5% | | | | | Shares | | | Value | |
Funds, Trusts, and Other Financial Vehicles—0.5% | |
Direxion Daily Financial Bull 3X Shares | | | | | | | 6,500 | | | $ | 481,845 | |
Total Exchange-Traded Fund
(Cost $478,990) | | | | 481,845 | |
Purchased Call
Options—0.2% | | Contracts | | | Notional
Amount | | | | |
Health Care Equipment & Services—0.0% | |
WellCare Health Plans, Inc. Expiration: May 2019, Exercise Price $270.00(b) | | | 100 | | | | 2,700,000 | | | | 21,000 | |
Media & Entertainment—0.1% | |
Alphabet, Inc. Expiration: May 2019, Exercise Price $1,275.00(b) | | | 40 | | | | 5,100,000 | | | | 600 | |
Netflix, Inc. Expiration: May 2019, Exercise Price $375.00(b) | | | 75 | | | | 2,812,500 | | | | 72,000 | |
| | | | | | | | | | | | 72,600 | |
Pharmaceuticals, Biotechnology & Life Sciences—0.0% | |
Heron Therapeutics, Inc. Expiration: May 2019, Exercise Price $30.00(b) | | | 250 | | | | 750,000 | | | | 12,500 | |
Technology Hardware & Equipment—0.1% | |
Apple, Inc. Expiration: May 2019, Exercise Price $207.50(b) | | | 150 | | | | 3,112,500 | | | $ | 33,000 | |
Total Purchased Call Options
(Cost $291,534) | | | | 139,100 | |
Short-Term
Investment—0.8% | | | Shares | | | | |
Money Market Fund—0.8% | |
STIT-Treasury Portfolio—Institutional Class, 2.319%(c) | | | | 746,755 | | | | 746,755 | |
Total Short-Term Investment
(Cost $746,755) | | | | 746,755 | |
Total Investments
(Cost $62,584,042)—100.6% | | | | 94,517,321 | |
Liabilities in Excess of Other Assets—(0.6)% | | | | (531,559 | ) |
Total Net Assets—100.0% | | | $ | 93,985,762 | |
| | | | | | | | | | | | |
Percentages are stated as a percent of net assets.
ADR American Depository Receipt
| (a) | Foreign issued Security. Foreign Concentration (including ADR’s) was as follows: Austria 0.2%; Belgium 0.5%; Canada 4.9%; Cayman Islands 0.2%; Denmark 0.9%; France 0.1%; Ireland 0.6%; Israel 0.5%; Jersey 0.0%; Luxembourg 0.1%; Switzerland 0.0%; United Kingdom 2.4%. |
| (b) | Non-income producing security. |
| (c) | Rate listed is the7-day effective yield. |
The Accompanying Footnotes are an Integral Part of these Financial Statements.
The Tocqueville Gold Fund
Schedule of Investments as of April 30, 2019
(Unaudited)
| | | | | | | | |
| Common Stocks—81.8% | | Shares | | | Value | |
Gold Related Securities—71.4% | |
Australia—5.6% | |
Evolution Mining Ltd. | | | 5,193,374 | | | $ | 11,678,813 | |
Newcrest Mining Ltd. | | | 654,300 | | | | 11,535,835 | |
Northern Star Resources Ltd. | | | 3,187,500 | | | | 18,403,165 | |
West African Resources Ltd.(a) | | | 27,400,000 | | | | 5,311,799 | |
| | | | | | | | 46,929,612 | |
Canada—55.2% | | | | | | | | |
Agnico Eagle Mines Ltd. | | | 82,200 | | | | 3,403,902 | |
Agnico Eagle Mines Ltd.(b) | | | 501,485 | | | | 20,767,625 | |
Alacer Gold Corp.(a) | | | 3,000,000 | | | | 7,949,541 | |
Alamos Gold, Inc.—Class A | | | 3,545,800 | | | | 16,487,970 | |
Almaden Minerals Ltd.—Class B(a)(c) | | | 5,600,619 | | | | 2,884,547 | |
Argonaut Gold, Inc.(a)(c) | | | 2,837,000 | | | | 3,663,514 | |
ATAC Resources Ltd.(a)(c) | | | 9,784,891 | | | | 1,570,316 | |
B2Gold Corp.(a) | | | 8,730,700 | | | | 23,747,504 | |
Barkerville Gold Mines Ltd.(a)(c)(d)(e)
(Originally acquired 03/29/2019, Cost 4,579,639) | | | 17,000,000 | | | | 4,601,179 | |
Barkerville Gold Mines Ltd.(a)(b)(c) | | | 7,110,000 | | | | 1,963,648 | |
Corvus Gold, Inc.(a)(c) | | | 3,226,901 | | | | 4,001,357 | |
Corvus Gold, Inc.(a)(b)(c) | | | 17,279,330 | | | | 21,152,572 | |
Detour Gold Corp.(a) | | | 4,591,140 | | | | 40,781,194 | |
East Asia Minerals Corp.(a)(c) | | | 13,290,993 | | | | 570,450 | |
Falco Resources Ltd.(a)(c) | | | 16,222,300 | | | | 2,906,137 | |
Franco-Nevada Corp.(a) | | | 539,900 | | | | 38,684,035 | |
Gold Standard Ventures Corp.(a) | | | 7,011,700 | | | | 7,379,635 | |
IAMGOLD Corp.(a) | | | 5,059,000 | | | | 15,328,770 | |
International Tower Hill Mines Ltd.(a)(c) | | | 5,738,836 | | | | 2,641,586 | |
International Tower Hill Mines Ltd.(a)(b)(c) | | | 20,331,298 | | | | 9,409,125 | |
Jaguar Mining, Inc.(a)(c) | | | 64,330,707 | | | | 5,522,155 | |
Kinross Gold Corp.(a) | | | 4,234,167 | | | $ | 13,464,651 | |
Novagold Resources, Inc.(a) | | | 2,831,300 | | | | 11,325,200 | |
NuLegacy Gold Corp.(a)(c) | | | 28,556,090 | | | | 2,131,529 | |
OceanaGold Corp. | | | 4,431,459 | | | | 12,541,029 | |
OceanaGold Corp.(b) | | | 2,404,400 | | | | 6,748,185 | |
Osisko Gold Royalties Ltd. | | | 24,340 | | | | 275,042 | |
Osisko Gold Royalties Ltd.(b) | | | 2,014,400 | | | | 22,764,810 | |
Osisko Mining, Inc.(a) | | | 7,704,239 | | | | 15,987,001 | |
Pan American Silver Corp. | | | 2,237,798 | | | | 28,442,413 | |
Premier Gold Mines Ltd.(a)(c) | | | 8,630,160 | | | | 10,822,325 | |
Rockhaven Resources Ltd.(a) | | | 4,631,500 | | | | 362,997 | |
SEMAFO, Inc.(a)(c) | | | 10,563,000 | | | | 28,620,449 | |
Strategic Metals Ltd.(a)(c) | | | 10,113,400 | | | | 2,189,211 | |
Torex Gold Resources, Inc.(a)(c) | | | 2,093,400 | | | | 20,016,761 | |
Trifecta Gold Ltd.(a)(c) | | | 2,325,199 | | | | 82,442 | |
Wesdome Gold Mines Ltd.(a) | | | 2,482,700 | | | | 7,838,935 | |
Wheaton Precious Metals Corp. | | | 1,602,375 | | | | 34,739,490 | |
Yamana Gold, Inc. | | | 3,524,000 | | | | 7,717,560 | |
| | | | | | | | 461,486,792 | |
Peru—1.6% | | | | | | | | |
Cia de Minas Buenaventura SAA— ADR | | | 798,100 | | | | 12,937,201 | |
South Africa—2.3% | |
AngloGold Ashanti Ltd.— ADR | | | 1,612,800 | | | | 19,031,040 | |
United Kingdom—2.0% | |
Fresnillo PLC | | | 1,742,300 | | | | 17,012,456 | |
United States—4.7% | |
Contango ORE, Inc.(a) | | | 263,200 | | | | 6,619,480 | |
The Accompanying Footnotes are an Integral Part of these Financial Statements.
The Tocqueville Gold Fund
Schedule of Investments as of April 30, 2019
(Unaudited)
| | | | | | | | |
| Common Stocks—81.8% | | Shares | | | Value | |
Electrum Ltd.(a)(d)(e)
(Originally acquired 12/21/07, Cost $13,065,361) | | | 2,127,287 | | | $ | 106,364 | |
Newmont Goldcorp Corp. | | | 502,700 | | | | 15,613,862 | |
Royal Gold, Inc. | | | 198,700 | | | | 17,298,822 | |
| | | | | | | | 39,638,528 | |
Total Gold Related Securities | | | | 597,035,629 | |
Other Precious Metals Related Securities—9.5% | |
Canada—8.2% | | | | | | | | |
Bear Creek Mining Corp.(a)(c) | | | 7,413,200 | | | | 7,746,869 | |
Ivanhoe Mines Ltd.—Class A(a) | | | 7,882,379 | | | | 19,180,828 | |
MAG Silver Corp.(a)(c) | | | 2,773,600 | | | | 27,264,488 | |
MAG Silver Corp.(a)(c) | | | 1,432,665 | | | | 14,073,204 | |
Nickel Creek Platinum Ltd.(a)(c) | | | 12,379,201 | | | | 462,014 | |
| | | | | | | | 68,727,403 | |
United States—1.3% | | | | | | | | |
Sunshine Mining & Refining(a)(d)(e)
(Originally acquired 03/15/11, Cost $21,353,108) | | | 2,300,212 | | | | 10,350,954 | |
Total Other Precious Metals Related Securities | | | | 79,078,357 | |
Other Securities—0.9% | | | | | | | | |
United States—0.9% | | | | | | | | |
Gold Bullion International LLC(a)(c)(d)(e) (Originally acquired 05/12/10, Cost $5,000,000) | | | 5,000,000 | | | | 6,893,000 | |
I-Pulse, Inc.(a)(d)(e) (Originally acquired 10/09/07, Cost $175,524) | | | 74,532 | | | | 804,945 | |
Total Other Securities | | | | | | | 7,697,945 | |
Total Common Stocks
(Cost $919,894,804) | | | | 683,811,931 | |
Gold Related Security—2.0% | |
Tocqueville Bullion Reserve LP(a)(c)(d)(e)
(Originally acquired 11/28/11, Cost $25,000,000) | | | 13,806 | | | $ | 16,882,835 | |
Total Private Fund
(Cost $25,000,000) | | | | | | | 16,882,835 | |
| Gold Bullion—15.0% | | Ounces | | | | |
Gold Bullion(a) | | | 97,849 | | | | 125,594,459 | |
Total Gold Bullion
(Cost $44,489,086) | | | | | | | 125,594,459 | |
| Warrants—0.1% | | Shares | | | | |
Gold Related Securities—0.1% | |
Canada—0.1% | | | | | | | | |
Almaden Minerals Ltd. Expiration: 08/08/2019, Exercise Price: CAD $2.00(a)(c)(d)(e) (Originally acquired 02/03/17, Cost $0) | | | 79,585 | | | | 42 | |
East Asia Minerals Corp. Expiration: 03/10/2020, Exercise Price: CAD $0.15(a)(c)(d)(e) (Originally acquired 03/04/15, Cost $0) | | | 4,617,560 | | | | 185,778 | |
East Asia Minerals Corp. Expiration: 03/08/2022, Exercise Price: CAD $0.50(a)(c)(d)(e) (Originally acquired 03/03/17, Cost $0) | | | 3,321,250 | | | | 148,746 | |
East Asia Minerals Corp. Expiration: 12/05/2019, Exercise Price: CAD $0.50(a)(c)(d)(e) (Originally acquired 12/05/14, Cost $0) | | | 976,493 | | | | — | |
The Accompanying Footnotes are an Integral Part of these Financial Statements.
The Tocqueville Gold Fund
Schedule of Investments as of April 30, 2019
(Unaudited)
| | | | | | | | |
| Warrants—0.1% | | Shares | | | Value | |
Osisko Gold Royalties Ltd. Expiration: 02/18/2022, Exercise Price: CAD $36.50 (a) | | | 274,000 | | | $ | 136,008 | |
Total Gold Related Securities | | | | 470,574 | |
Other Precious Metals Related Security—0.0% | |
Canada—0.0% | |
Nickel Creek Platinum Ltd. Expiration: 08/08/2022, Exercise Price: CAD $0.35(a)(c)(d)(e)
(Originally acquired 08/04/17, Cost $0) | | | 6,189,601 | | | | 36,037 | |
Total Warrants
(Cost $1) | | | | 506,611 | |
Short-Term Investment—0.9% | |
Money Market Fund—0.9% | |
STIT—Treasury Portfolio—
Institutional Class, 2.319%(f) | | | 7,793,357 | | | | 7,793,357 | |
Total Short-Term Investment
(Cost $7,793,357) | | | | 7,793,357 | |
Total Investments
(Cost $997,177,248)—99.8% | | | | 834,589,193 | |
Other Assets in Excess of Liabilities—0.2% | | | | 1,411,899 | |
Total Net Assets—100.0% | | | $ | 836,001,092 | |
| | | | | | | | |
Percentages are stated as a percent of net assets.
ADR American Depository Receipt
| (a) | Non-income producing security. |
| (b) | Denotes an issue that is traded on a foreign exchange when a company is listed more than once. |
| (c) | Affiliated company. See Footnote 8. |
| (d) | Denotes a security that is either fully or partially restricted to resale. The value of restricted securities as of April 30, 2019 was $40,009,880, which represented 4.8% of net assets. |
| (e) | Security is fair valued using procedures approved by the Board of Trustees which includes significant unobservable inputs and is deemed either a Level 2 or 3 security. See Footnote 2. The aggregate value of fair valued securities as of April 30, 2019 was $40,009,880, which represented 4.8% of net assets. |
| (f) | Rate listed is the7-day effective yield. |
The Accompanying Footnotes are an Integral Part of these Financial Statements.
The Tocqueville Phoenix Fund
Schedule of Investments as of April 30, 2019
(Unaudited)
| | | | | | | | |
| Common Stocks—89.4% | | Shares | | | Value | |
Auto Components—3.7% | |
Garrett Motion, Inc.(a) | | | 234,200 | | | $ | 4,402,960 | |
Gentex Corp. | | | 100,000 | | | | 2,303,000 | |
Visteon Corp.(a) | | | 16,000 | | | | 1,056,320 | |
| | | | | | | | 7,762,280 | |
Building Products—2.7% | |
Apogee Enterprises, Inc. | | | 140,000 | | | | 5,642,000 | |
Chemicals—12.9% | | | | | | | | |
Eastman Chemical Co. | | | 110,000 | | | | 8,676,800 | |
GCP Applied Technologies, Inc.(a) | | | 105,000 | | | | 3,022,950 | |
HB Fuller Co. | | | 122,500 | | | | 5,998,825 | |
PolyOne Corp. | | | 156,682 | | | | 4,330,690 | |
WR Grace & Co. | | | 65,000 | | | | 4,912,700 | |
| | | | | | | | 26,941,965 | |
Commercial Services & Supplies—1.3% | |
Team, Inc.(a) | | | 160,000 | | | | 2,704,000 | |
Communications Equipment—2.7% | |
Lumentum Holdings, Inc.(a) | | | 91,000 | | | | 5,639,270 | |
Construction & Engineering—1.1% | |
Aegion Corp.(a) | | | 120,000 | | | | 2,389,200 | |
Construction Materials—3.9% | |
U.S. Concrete, Inc.(a) | | | 175,000 | | | | 8,247,750 | |
Diversified Telecommunication Services—0.5% | |
CenturyLink, Inc. | | | 85,000 | | | | 970,700 | |
Electrical Equipment—3.4% | |
Acuity Brands, Inc. | | | 48,000 | | | | 7,023,840 | |
Electronic Equipment, Instruments & Components—16.8% | |
Avnet, Inc. | | | 80,000 | | | | 3,888,800 | |
Fabrinet(a)(b) | | | 75,000 | | | | 4,539,000 | |
Flex Ltd.(a)(b) | | | 775,000 | | | | 8,556,000 | |
Plexus Corp.(a) | | | 97,500 | | | | 5,867,550 | |
TTM Technologies, Inc.(a) | | | 925,000 | | | | 12,247,000 | |
| | | | | | | | 35,098,350 | |
Energy Equipment & Services—1.7% | |
McDermott International, Inc.(a)(b) | | | 312,500 | | | | 2,528,128 | |
Solaris Oilfield Infrastructure, Inc.—Class A | | | 60,000 | | | | 1,019,400 | |
| | | | | | | | 3,547,528 | |
Food Products—0.5% | |
Landec Corp.(a) | | | 90,000 | | | | 945,900 | |
Health Care Providers & Services—0.8% | |
Cross Country Healthcare, Inc.(a) | | | 225,000 | | | | 1,586,250 | |
Household Durables—3.9% | |
Mohawk Industries, Inc.(a) | | | 38,800 | | | | 5,286,500 | |
Newell Brands, Inc. | | | 205,000 | | | | 2,947,900 | |
| | | | | | | | 8,234,400 | |
Insurance—2.2% | |
Loews Corp. | | | 90,000 | | | | 4,616,100 | |
Interactive Media & Services—2.2% | |
Cars.com, Inc.(a) | | | 222,200 | | | | 4,623,982 | |
Machinery—9.1% | |
Crane Co. | | | 72,500 | | | | 6,166,125 | |
Harsco Corp.(a) | | | 330,000 | | | | 7,471,200 | |
REV Group, Inc. | | | 245,000 | | | | 3,109,050 | |
Stanley Black & Decker, Inc. | | | 15,300 | | | | 2,242,980 | |
| | | | | | | | 18,989,355 | |
Media—2.9% | |
TEGNA, Inc. | | | 375,000 | | | | 5,970,000 | |
Metals & mining—2.0% | |
Commercial Metals Co. | | | 245,000 | | | | 4,236,050 | |
Paper & Forest Products—1.0% | |
Louisiana-Pacific Corp. | | | 82,000 | | | | 2,054,100 | |
Professional Services—2.2% | |
TrueBlue, Inc.(a) | | | 190,000 | | | | 4,590,400 | |
Semiconductors & Semiconductor Equipment—0.8% | |
ams AG(b) | | | 38,000 | | | | 1,603,239 | |
Specialty Retail—0.7% | |
Tile Shop Holdings, Inc. | | | 300,000 | | | | 1,458,000 | |
Technology Hardware, Storage & Peripherals—0.9% | |
Hewlett Packard Enterprise Co. | | | 125,000 | | | | 1,976,250 | |
Textiles, Apparel & Luxury Goods—3.4% | |
PVH Corp. | | | 55,100 | | | | 7,107,349 | |
The Accompanying Footnotes are an Integral Part of these Financial Statements.
The Tocqueville Phoenix Fund
Schedule of Investments as of April 30, 2019
(Unaudited)
| | | | | | | | |
| Common Stocks—89.4% | | Shares | | | Value | |
Trading Companies & Distributors—6.1% | |
Rush Enterprises, Inc.—Class A | | | 124,400 | | | $ | 5,275,804 | |
WESCO International, Inc.(a) | | | 129,100 | | | | 7,389,684 | |
| | | | | | | | 12,665,488 | |
Total Common Stocks
(Cost $150,910,307) | | | | 186,623,746 | |
Short-Term Investments—11.3% | |
Money Market Fund—5.0% | |
STIT-Treasury Portfolio—Institutional Class, 2.319%(c) | | | 10,400,000 | | | | 10,400,000 | |
Money Market Deposit Account—6.3% | |
U.S. Bank Money Market Deposit Account, 0.300% | | | 13,220,798 | | | | 13,220,798 | |
Total Short-Term Investments
(Cost $23,620,798) | | | | 23,620,798 | |
Total Investments
(Cost $174,531,105)—100.7% | | | | 210,244,544 | |
Liabilities in Excess of Other Assets—(0.7)% | | | | (1,480,800 | ) |
Total Net Assets—100.0% | | | $ | 208,763,744 | |
| | | | | | | | |
Percentages are stated as a percent of net assets.
| (a) | Non-income producing security. |
| (b) | Foreign issued security. Foreign concentration was as follows: Austria 0.8%; Cayman Islands 2.2%; Panama 1.2%; Singapore 4.1%. |
| (c) | Rate listed is the7-day effective yield. |
The Accompanying Footnotes are an Integral Part of these Financial Statements.
The Tocqueville Select Fund
Schedule of Investments as of April 30, 2019
(Unaudited)
| | | | | | | | |
| Common Stocks—93.6% | | Shares | | | Value | |
Chemicals—8.7% | | | | | | | | |
Eastman Chemical Co. | | | 21,500 | | | $ | 1,695,920 | |
WR Grace & Co. | | | 24,200 | | | | 1,829,036 | |
| | | | | | | | 3,524,956 | |
Commercial Services & Supplies—3.2% | |
Team, Inc.(a) | | | 76,100 | | | | 1,286,090 | |
Electrical Equipment—3.9% | |
Acuity Brands, Inc. | | | 10,700 | | | | 1,565,731 | |
Electronic Equipment, Instruments & Components—13.4% | |
Fabrinet(a)(b) | | | 29,600 | | | | 1,791,392 | |
Flex Ltd.(a)(b) | | | 161,500 | | | | 1,782,960 | |
TTM Technologies, Inc.(a) | | | 138,100 | | | | 1,828,444 | |
| | | | | | | | 5,402,796 | |
Energy Equipment & Services—4.5% | |
Solaris Oilfield Infrastructure, Inc.—Class A | | | 107,000 | | | | 1,817,930 | |
Health Care Providers & Services—2.8% | |
Cross Country Healthcare, Inc.(a) | | | 160,000 | | | | 1,128,000 | |
Household Durables—6.3% | |
Mohawk Industries, Inc.(a) | | | 11,000 | | | | 1,498,750 | |
Newell Brands, Inc. | | | 73,100 | | | | 1,051,178 | |
| | | | | | | | 2,549,928 | |
Interactive Media & Services—3.4% | |
Cars.com, Inc.(a) | | | 65,733 | | | | 1,367,903 | |
IT Services—7.2% | | | | | | | | |
EPAM Systems, Inc.(a) | | | 16,300 | | | | 2,923,568 | |
Machinery—10.1% | | | | | | | | |
Harsco Corp.(a) | | | 84,200 | | | | 1,906,288 | |
Stanley Black & Decker, Inc. | | | 14,650 | | | | 2,147,690 | |
| | | | | | | | 4,053,978 | |
Media—5.4% | | | | | | | | |
TEGNA, Inc. | | | 136,000 | | | | 2,165,120 | |
Professional Services—4.8% | |
ICF International, Inc. | | | 24,800 | | | | 1,931,176 | |
Software—6.2% | | | | | | | | |
j2 Global, Inc. | | | 28,400 | | | | 2,488,408 | |
| | | | | | | | |
| Common Stocks—93.6% | | Shares | | | Value | |
Specialty Retail—3.5% | | | | | | | | |
Tile Shop Holdings, Inc. | | | 294,000 | | | $ | 1,428,840 | |
Textiles, Apparel & Luxury Goods—4.5% | |
PVH Corp. | | | 14,000 | | | | 1,805,860 | |
Trading Companies & Distributors—5.7% | |
WESCO International, Inc.(a) | | | 40,300 | | | | 2,306,772 | |
Total Common Stocks
(Cost $28,795,644) | | | | 37,747,056 | |
Short-Term Investments—6.5% | |
Money Market Fund—5.0% | |
STIT-Treasury Portfolio—Institutional Class, 2.319%(c) | | | 2,000,000 | | | | 2,000,000 | |
Money Market Deposit Account—1.5% | |
U.S. Bank Money Market Deposit Account, 0.300% | | | 603,765 | | | | 603,765 | |
Total Short-Term Investments
(Cost $2,603,765) | | | | 2,603,765 | |
Total Investments
(Cost $31,399,409)—100.1% | | | | 40,350,821 | |
Liabilities in Excess of Other Assets—(0.1)% | | | | (37,286 | ) |
Total Net Assets—100.0% | | | | | | $ | 40,313,535 | |
| | | | | | | | |
Percentages are stated as a percent of net assets.
| (a) | Non-income producing security. |
| (b) | Foreign issued security. Foreign concentration was as follows: Cayman Islands 4.4%; Singapore 4.4%. |
| (c) | Rate listed is the7-day effective yield. |
The Accompanying Footnotes are an Integral Part of these Financial Statements.
Percent of Total Investments
The Tocqueville Fund
Allocation of Portfolio Holdings
April 30, 2019
(Unaudited)
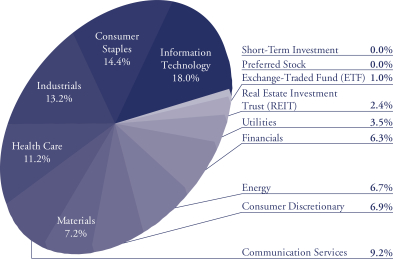
The Tocqueville Opportunity Fund
Allocation of Portfolio Holdings
April 30, 2019
(Unaudited)
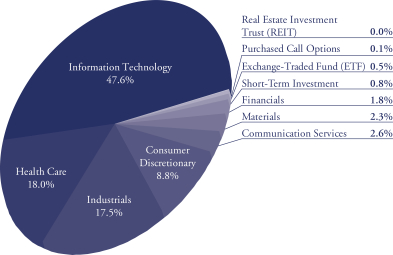
Percent of Total Investments
The Tocqueville Gold Fund
Allocation of Portfolio Holdings
April 30, 2019
(Unaudited)
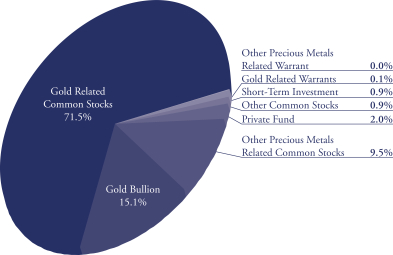
The Tocqueville Phoenix Fund
Allocation of Portfolio Holdings
April 30, 2019
(Unaudited)
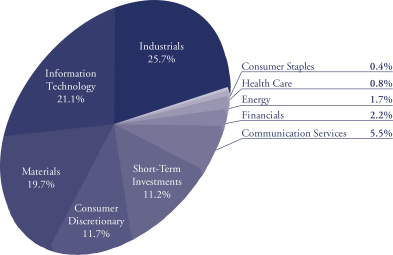
Percent of Total Investments
The Tocqueville Select Fund
Allocation of Portfolio Holdings
April 30, 2019
(Unaudited)
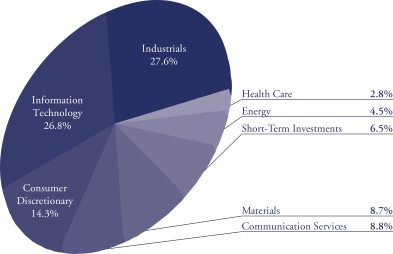
The Toqueville Trust
Statements of Assets & Liabilities
April 30, 2019
(Unaudited)
| | | | | | | | | | | | | | | | | | | | |
| | | The
Tocqueville
Fund | | | The
Tocqueville
Opportunity
Fund | | | The
Tocqueville
Gold Fund | | | The
Tocqueville
Phoenix
Fund | | | The
Tocqueville
Select Fund | |
Assets: | | | | | | | | | | | | | | | | | | | | |
Investments, at value (1) | | | | | | | | | | | | | | | | | | | | |
Unaffiliated issuers | | $ | 280,594,173 | | | $ | 94,517,321 | | | $ | 636,146,877 | | | $ | 210,244,544 | | | $ | 40,350,821 | |
Affiliated issuers | | | — | | | | — | | | | 198,442,316 | | | | — | | | | — | |
Foreign currencies, at value (2) | | | — | | | | — | | | | 895,017 | | | | — | | | | — | |
Receivable for investments sold | | | 2,581,271 | | | | 812,986 | | | | — | | | | — | | | | — | |
Receivable for Fund shares sold | | | 17,443 | | | | 113,016 | | | | 1,914,639 | | | | 28,322 | | | | 2,181 | |
Dividends, interest and other receivables | | | 307,586 | | | | 8,795 | | | | 808,045 | | | | 60,458 | | | | 4,219 | |
Other assets | | | 18,096 | | | | 15,969 | | | | 49,941 | | | | 21,978 | | | | 10,644 | |
| | | | | | | | | | | | | | | | | | | | |
Total Assets | | | 283,518,569 | | | | 95,468,087 | | | | 838,256,835 | | | | 210,355,302 | | | | 40,367,865 | |
| | | | | | | | | | | | | | | | | | | | |
Liabilities: | | | | | | | | | | | | | | | | | | | | |
Payable for investments purchased | | | 1,067,320 | | | | 1,346,544 | | | | — | | | | 1,036,298 | | | | — | |
Payable for loans outstanding | | | 237,000 | | | | — | | | | — | | | | — | | | | — | |
Payable for foreign currencies purchased | | | — | | | | — | | | | — | | | | — | | | | — | |
Payable for Fund shares redeemed | | | 117,713 | | | | 45,835 | | | | 1,143,014 | | | | 294,386 | | | | 10,000 | |
Payable to Adviser (see Note 10) | | | 152,985 | | | | 31,035 | | | | 642,427 | | | | 109,432 | | | | 16,751 | |
Payable to Administrator | | | 39,615 | | | | 12,234 | | | | 105,796 | | | | 26,776 | | | | 1,802 | |
Payable to Trustees | | | 13,708 | | | | 5,828 | | | | 35,658 | | | | 14,108 | | | | 2,067 | |
Accrued distribution fee | | | 42,777 | | | | 12,596 | | | | 38,016 | | | | 23,541 | | | | 5,502 | |
Accrued expenses and other liabilities | | | 57,185 | | | | 28,253 | | | | 290,832 | | | | 87,017 | | | | 18,208 | |
| | | | | | | | | | | | | | | | | | | | |
Total Liabilities | | | 1,728,303 | | | | 1,482,325 | | | | 2,255,743 | | | | 1,591,558 | | | | 54,330 | |
| | | | | | | | | | | | | | | | | | | | |
Net Assets | | $ | 281,790,266 | | | $ | 93,985,762 | | | $ | 836,001,092 | | | $ | 208,763,744 | | | $ | 40,313,535 | |
| | | | | | | | | | | | | | | | | | | | |
The Accompanying Notes are an Integral Part of these Financial Statements.
The Toqueville Trust
Statements of Assets & Liabilities
April 30, 2019
(Unaudited)
| | | | | | | | | | | | | | | | | | | | |
| | | The
Tocqueville
Fund | | | The
Tocqueville
Opportunity
Fund | | | The
Tocqueville
Gold Fund | | | The
Tocqueville
Phoenix
Fund | | | The
Tocqueville
Select Fund | |
Net assets consist of: | | | | | | | | | | | | | | | | | | | | |
Paid in capital | | $ | 124,316,081 | | | $ | 60,869,321 | | | $ | 1,433,950,890 | | | $ | 171,298,848 | | | $ | 33,261,197 | |
Total distributable earnings | | | 157,474,185 | | | | 33,116,441 | | | | (597,949,798 | ) | | | 37,464,896 | | | | 7,052,338 | |
| | | | | | | | | | | | | | | | | | | | |
Net assets | | $ | 281,790,266 | | | $ | 93,985,762 | | | $ | 836,001,092 | | | $ | 208,763,744 | | | $ | 40,313,535 | |
| | | | | | | | | | | | | | | | | | | | |
Investor Class | | | | | | | | | | | | | | | | | | | | |
Net assets | | $ | 281,790,266 | | | $ | 93,985,762 | | | $ | 835,981,000 | | | $ | 208,763,744 | | | $ | 40,313,535 | |
Shares of beneficial interest outstanding (unlimited shares of $0.01 par value authorized) | | | 7,682,086 | | | | 3,310,454 | | | | 27,361,453 | | | | 9,995,300 | | | | 3,325,670 | |
Net asset value, offering and redemption price per share | | $ | 36.68 | | | $ | 28.39 | | | $ | 30.55 | | | $ | 20.89 | | | $ | 12.12 | |
| | | | | | | | | | | | | | | | | | | | |
Institutional Class | | | | | | | | | | | | | | | | | | | | |
Net assets | | $ | — | | | $ | — | | | $ | 20,092 | | | $ | — | | | $ | — | |
Shares of beneficial interest outstanding (unlimited shares of $0.01 par value authorized) | | | — | | | | — | | | | 657 | | | | — | | | | — | |
Net asset value, offering and redemption price per share | | $ | — | | | $ | — | | | $ | 30.57 | | | $ | — | | | $ | — | |
| | | | | | | | | | | | | | | | | | | | |
(1) Cost of investments | | | | | | | | | | | | | | | | | | | | |
Unaffiliated issuers | | $ | 139,277,005 | | | $ | 62,584,042 | | | $ | 603,597,165 | | | $ | 174,531,105 | | | $ | 31,399,409 | |
Affiliated issuers | | $ | — | | | $ | — | | | $ | 393,580,083 | | | $ | — | | | $ | — | |
(2) Cost of foreign currencies | | $ | — | | | $ | — | | | $ | 895,017 | | | $ | — | | | $ | — | |
The Accompanying Notes are an Integral Part of these Financial Statements.
The Tocqueville Trust
Statements of Operations
(Unaudited)
| | | | | | | | | | | | | | | | | | | | |
| | | The
Tocqueville
Fund | | | The
Tocqueville
Opportunity
Fund | | | The
Tocqueville
Gold Fund | | | The
Tocqueville
Phoenix
Fund | | | The
Tocqueville
Select Fund | |
Investment Income: | | | | | | | | | | | | | | | | | | | | |
Dividends* | | $ | 3,247,463 | | | $ | 92,225 | | | $ | 3,084,413 | | | $ | 1,105,860 | | | $ | 191,350 | |
Interest | | | 31,939 | | | | 759 | | | | 163,270 | | | | 133,903 | | | | 20,129 | |
| | | | | | | | | | | | | | | | | | | | |
Total investment income | | | 3,279,402 | | | | 92,984 | | | | 3,247,683 | | | | 1,239,763 | | | | 211,479 | |
| | | | | | | | | | | | | | | | | | | | |
Expenses: | | | | | | | | | | | | | | | | | | | | |
Investment Adviser’s fee (See Note 4) | | | 991,321 | | | | 307,400 | | | | 3,835,966 | | | | 845,873 | | | | 154,133 | |
Distribution (12b-1) fees—Investor Class Only (See Note 4) | | | 330,441 | | | | 102,467 | | | | 1,072,034 | | | | 264,336 | | | | 48,167 | |
Administration fees (See Note 4) | | | 198,264 | | | | 61,480 | | | | 597,129 | | | | 158,601 | | | | 28,900 | |
Transfer agent and shareholder services fees | | | 35,169 | | | | 13,870 | | | | 321,986 | | | | 59,596 | | | | 7,902 | |
Legal fees | | | 30,531 | | | | 8,766 | | | | 114,668 | | | | 29,646 | | | | 4,489 | |
Trustee fees and expenses | | | 29,731 | | | | 9,787 | | | | 91,808 | | | | 26,294 | | | | 4,569 | |
Other expenses (See Note 10) | | | 22,694 | | | | 23,052 | | | | 47,657 | | | | 15,119 | | | | 6,148 | |
Fund accounting fees | | | 15,962 | | | | 10,803 | | | | 50,038 | | | | 14,912 | | | | 2,790 | |
Blue sky fees | | | 13,531 | | | | 12,233 | | | | 20,003 | | | | 12,450 | | | | 12,489 | |
Audit fees | | | 13,133 | | | | 5,536 | | | | 43,375 | | | | 10,896 | | | | 4,101 | |
Printing and mailing expense | | | 8,908 | | | | 3,165 | | | | 54,629 | | | | 20,425 | | | | 1,598 | |
Custody fees | | | 6,971 | | | | 8,428 | | | | 87,590 | | | | 14,425 | | | | 1,144 | |
Insurance expense | | | 3,713 | | | | 1,011 | | | | 13,091 | | | | 3,762 | | | | 543 | |
Registration fees | | | 1,686 | | | | 1,249 | | | | 3,434 | | | | 1,342 | | | | 530 | |
Interest expense | | | 1,348 | | | | 5,533 | | | | 23,883 | | | | — | | | | — | |
| | | | | | | | | | | | | | | | | | | | |
Total expenses before waiver | | | 1,703,403 | | | | 574,780 | | | | 6,377,291 | | | | 1,477,677 | | | | 277,503 | |
Less: Fees waived (See Note 4) | | | (49,853 | ) | | | (56,913 | ) | | | — | | | | (158,362 | ) | | | (36,670 | ) |
| | | | | | | | | | | | | | | | | | | | |
Net expenses | | | 1,653,550 | | | | 517,867 | | | | 6,377,291 | | | | 1,319,315 | | | | 240,833 | |
| | | | | | | | | | | | | | | | | | | | |
Net Investment Income (Loss) | | | 1,625,852 | | | | (424,883 | ) | | | (3,129,608 | ) | | | (79,552 | ) | | | (29,354 | ) |
| | | | | | | | | | | | | | | | | | | | |
The Accompanying Notes are an Integral Part of these Financial Statements.
The Tocqueville Trust
Statements of Operations
(Unaudited)
| | | | | | | | | | | | | | | | | | | | |
| | | The
Tocqueville
Fund | | | The
Tocqueville
Opportunity
Fund | | | The
Tocqueville
Gold Fund | | | The
Tocqueville
Phoenix
Fund | | | The
Tocqueville
Select Fund | |
Realized and Unrealized Gain (Loss): | | | | | | | | | | | | | | | | | | | | |
Net realized gain (loss) on: | | | | | | | | | | | | | | | | | | | | |
Investments | | | | | | | | | | | | | | | | | | | | |
Unaffiliated issuers | | $ | 14,951,183 | | | $ | 3,349,669 | | | $ | (33,295,334 | ) | | $ | 1,967,031 | | | $ | 2,410,279 | |
Affililiated issuers | | | — | | | | — | | | | (366,326 | ) | | | — | | | | — | |
Foreign currency translation | | | — | | | | (4,813 | ) | | | (137,082 | ) | | | (674 | ) | | | — | |
Written Option | | | — | | | | 4,761 | | | | — | | | | — | | | | — | |
| | | | | | | | | | | | | | | | | | | | |
| | | 14,951,183 | | | | 3,349,617 | | | | (33,798,742 | ) | | | 1,966,357 | | | | 2,410,279 | |
Net change in unrealized appreciation (depreciation) on: | | | | | | | | | | | | | | | | | | | | |
Investments | | | 12,872,077 | | | | 11,582,600 | | | | 71,897,337 | | | | 19,289,772 | | | | 1,654,351 | |
Foreign currency translation | | | (33 | ) | | | 4,041 | | | | 6,467,483 | | | | (14,814 | ) | | | — | |
| | | | | | | | | | | | | | | | | | | | |
| | | 12,872,044 | | | | 11,586,641 | | | | 78,364,820 | | | | 19,274,958 | | | | 1,654,351 | |
Net gain on investments and foreign currency | | | 27,823,227 | | | | 14,936,258 | | | | 44,566,078 | | | | 21,241,315 | | | | 4,064,630 | |
| | | | | | | | | | | | | | | | | | | | |
Net Increase in Net Assets Resulting from Operations | | $ | 29,449,079 | | | $ | 14,511,375 | | | $ | 41,436,470 | | | $ | 21,161,763 | | | $ | 4,035,276 | |
| | | | | | | | | | | | | | | | | | | | |
* Net of foreign taxes withheld of: | | $ | 5,460 | | | $ | 58 | | | $ | 194,247 | | | $ | — | | | $ | — | |
| | | | | | | | | | | | | | | | | | | | |
The Accompanying Notes are an Integral Part of these Financial Statements.
The Tocqueville Trust
Statements of Changes in Net Assets
| | | | | | | | | | | | | | | | |
| | | The Tocqueville Fund | | | The Tocqueville
Opportunity Fund | |
| | | For the
Period Ended
April 30,
2019
(Unaudited) | | | For the
Year Ended
October 31,
2018 | | | For the
Period Ended
April 30,
2019
(Unaudited) | | | For the
Year Ended
October 31,
2018 | |
Operations: | | | | | | | | | | | | | | | | |
Net investment income (loss) | | $ | 1,625,852 | | | $ | 2,674,174 | | | $ | (424,883 | ) | | $ | (928,400 | ) |
Net realized gain on sale of investments and foreign currency | | | 14,951,183 | | | | 21,495,197 | | | | 3,349,617 | | | | 9,080,674 | |
Net change in unrealized appreciation (depreciation) | | | 12,872,044 | | | | (17,842,653 | ) | | | 11,586,641 | | | | (4,554,160 | ) |
| | | | | | | | | | | | | | | | |
Net increase in net assets resulting from operations | | | 29,449,079 | | | | 6,326,718 | | | | 14,511,375 | | | | 3,598,114 | |
| | | | | | | | | | | | | | | | |
Net dividends and distributions to shareholders | | | (21,894,505 | ) | | | (26,828,335 | ) | | | (7,593,052 | ) | | | (2,589,302 | ) |
| | | | | | | | | | | | | | | | |
Total dividends and distributions | | | (21,894,505 | ) | | | (26,828,335 | ) | | | (7,593,052 | ) | | | (2,589,302 | ) |
Fund share transactions: | | | | | | | | | | | | | | | | |
Shares sold | | | 5,892,020 | | | | 14,681,016 | | | | 5,739,061 | | | | 16,112,469 | |
Shares issued to holders in reinvestment of dividends | | | 20,884,877 | | | | 25,480,630 | | | | 7,252,927 | | | | 2,468,524 | |
Shares redeemed | | | (24,584,679 | ) | | | (41,253,735 | ) | | | (8,030,306 | ) | | | (15,257,530 | ) |
| | | | | | | | | | | | | | | | |
Net increase (decrease) | | | 2,192,218 | | | | (1,092,089 | ) | | | 4,961,682 | | | | 3,323,463 | |
| | | | | | | | | | | | | | | | |
Net increase (decrease) in net assets | | | 9,746,792 | | | | (21,593,706 | ) | | | 11,880,005 | | | | 4,332,275 | |
Net Assets: | | | | | | | | | | | | | | | | |
Beginning of period | | | 272,043,474 | | | | 293,637,180 | | | | 82,105,757 | | | | 77,773,482 | |
| | | | | | | | | | | | | | | | |
End of period | | $ | 281,790,266 | | | $ | 272,043,474 | | | $ | 93,985,762 | | | $ | 82,105,757 | |
| | | | | | | | | | | | | | | | |
The Accompanying Notes are an Integral Part of these Financial Statements.
The Tocqueville Trust
Statements of Changes in Net Assets
| | | | | | | | | | | | | | | | | | | | | | | | |
| | | The Tocqueville
Gold Fund | | | The Tocqueville
Phoenix Fund | | | The Tocqueville
Select Fund | |
| | | For the
Period Ended
April 30,
2019
(Unaudited) | | | For the
Year Ended
October 31,
2018 | | | For the
Period Ended
April 30,
2019
(Unaudited) | | | For the
Year Ended
October 31,
2018 | | | For the
Period Ended
April 30,
2019
(Unaudited) | | | For the
Year Ended
October 31,
2018 | |
Operations: | | | | | | | | | | | | | | | | | | | | | | | | |
Net investment loss | | $ | (3,129,608 | ) | | $ | (8,974,770 | ) | | $ | (79,552 | ) | | $ | (1,507,510 | ) | | $ | (29,354 | ) | | $ | (173,063 | ) |
Net realized gain (loss) on sale of investments and foreign currency | | | (33,798,742 | ) | | | 5,535,322 | | | | 1,966,357 | | | | 21,617,558 | | | | 2,410,279 | | | | (4,128,184 | ) |
Net change in unrealized appreciation (depreciation) | | | 78,364,820 | | | | (191,416,194 | ) | | | 19,274,958 | | | | (48,172,817 | ) | | | 1,654,351 | | | | 1,590,296 | |
| | | | | | | | | | | | | | | | | | | | | | | | |
Net increase (decrease) in net assets resulting from operations | | | 41,436,470 | | | | (194,855,642 | ) | | | 21,161,763 | | | | (28,062,769 | ) | | | 4,035,276 | | | | (2,710,951 | ) |
| | | | | | | | | | | | | | | | | | | | | | | | |
Net dividends and distributions to shareholders—Investor Class | | | — | | | | — | | | | (14,885,322 | ) | | | (51,947,188 | ) | | | — | | | | (903,727 | ) |
Net dividends and distributions to shareholders—Institutional Class | | | — | | | | — | | | | — | | | | — | | | | — | | | | — | |
| | | | | | | | | | | | | | | | | | | | | | | | |
Total dividends and distributions | | | — | | | | — | | | | (14,885,322 | ) | | | (51,947,188 | ) | | | — | | | | (903,727 | ) |
Fund share transactions: | | | | | | | | | | | | | | | | | | | | | | | | |
Shares sold—Investor Class | | | 128,600,850 | | | | 213,886,198 | | | | 3,930,128 | | | | 14,347,640 | | | | 1,066,823 | | | | 2,787,932 | |
Shares sold—Institutional Class | | | 19,893 | | | | — | | | | — | | | | — | | | | — | | | | — | |
Shares issued to holders in reinvestment of dividends—Investor Class | | | — | | | | — | | | | 13,333,981 | | | | 50,048,422 | | | | — | | | | 890,838 | |
Shares issued to holders in reinvestment of dividends—Institutional Class | | | — | | | | — | | | | — | | | | — | | | | — | | | | — | |
Shares redeemed—Investor Class* | | | (193,450,450 | ) | | | (312,923,463 | ) | | | (51,895,599 | ) | | | (120,620,354 | ) | | | (4,013,168 | ) | | | (10,292,016 | ) |
Shares redeemed—Institutional Class* | | | — | | | | — | | | | — | | | | — | | | | — | | | | — | |
| | | | | | | | | | | | | | | | | | | | | | | | |
Net decrease | | | (64,829,707 | ) | | | (99,037,265 | ) | | | (34,631,490 | ) | | | (56,224,292 | ) | | | (2,946,345 | ) | | | (6,613,246 | ) |
| | | | | | | | | | | | | | | | | | | | | | | | |
Net increase (decrease) in net assets | | | (23,393,237 | ) | | | (293,892,907 | ) | | | (28,355,049 | ) | | | (136,234,249 | ) | | | 1,088,931 | | | | (10,227,924 | ) |
Net Assets: | | | | | | | | | | | | | | | | | | | | | | | | |
Beginning of period | | | 859,394,329 | | | | 1,153,287,236 | | | | 237,118,793 | | | | 373,353,042 | | | | 39,224,604 | | | | 49,452,528 | |
| | | | | | | | | | | | | | | | | | | | | | | | |
End of period** | | $ | 836,001,092 | | | $ | 859,394,329 | | | $ | 208,763,744 | | | $ | 237,118,793 | | | $ | 40,313,535 | | | $ | 39,224,604 | |
| | | | | | | | | | | | | | | | | | | | | | | | |
* Net of redemption fees of: | | $ | 149,035 | | | $ | 67,378 | | | $ | — | | | $ | — | | | $ | — | | | $ | — | |
| | | | | | | | | | | | | | | | | | | | | | | | |
The Accompanying Notes are an Integral Part of these Financial Statements.
The Tocqueville Trust
Notes to Financial Statements
(Unaudited)
1. ORGANIZATION
The Tocqueville Trust (the “Trust”) is a Massachusetts business trust registered under the Investment Company Act of 1940 and organized on September 17, 1986, consisting of five separate funds (each, a “Fund” or, collectively, the “Funds”). Each Fund is anopen-end management investment company with a different investment objective. The Tocqueville Fund, The Tocqueville Opportunity Fund (the “Opportunity Fund”), The Tocqueville Phoenix Fund and The Tocqueville Select Fund (the “Select Fund”) are classified as diversified investment companies. The Tocqueville Gold Fund (the “Gold Fund”) is classified as anon-diversified investment company. The Tocqueville Fund’s investment objective is long-term capital appreciation which it seeks to achieve by investing primarily in securities of United States issuers. The Opportunity Fund’s investment objective is to achieve long-term capital appreciation which it seeks to achieve by investing in the common stocks of small and mid-cap companies which have the potential to deliver superior long term earnings growth. The Gold Fund’s investment objective is long-term capital appreciation which it seeks to achieve by investing in gold, securities of companies located throughout the world that are engaged in mining or processing gold (“gold related securities”), other precious metals and securities of companies located throughout the world that are engaged in mining or processing such other precious metals (“other precious metal securities”). The Tocqueville Phoenix Fund’s investment objectives are to seek long-term preservation of capital (sufficient growth to outpace inflation over an extended period of time) and growth of capital which it seeks to achieve by investing primarily in the equity securities of domestic companies. The Tocqueville Select Fund’s investment objective is to achieve long-term capital appreciation by investing in a focused group of common stocks issued primarily by small andmid-sized U.S. companies. Current income is a secondary objective for The Tocqueville Select Fund.
Effective April 8, 2019, The Tocqueville Gold Fund issued Institutional class shares, and renamed the existing class as Investor class.
The Tocqueville Phoenix Fund (formerly known as The Delafield Fund), a series of the Trust, commenced operations on September 28, 2009 as successor to Delafield Fund, Inc. The predecessor Delafield Fund, Inc. commenced operations on November 19, 1993. The Delafield Fund changed its name to The Tocqueville Phoenix Fund on February 15, 2019.
The Tocqueville Select Fund, a series of the Trust, commenced operations on September 28, 2009 as successor to the Delafield Select Fund, a series of Natixis Funds Trust II. The predecessor Delafield Select Fund commenced operations on September 29, 2008 for Class A and Class C shares and on September 26, 2008 for Class Y shares. Prior to September 29, 2008, the predecessor Delafield Select Fund operated as a Delaware
limited partnership using substantially the same investment objectives and investment policies as the predecessor fund. The limited partnership was incepted in July 1998.
2. SIGNIFICANT ACCOUNTING POLICIES
The following is a summary of significant accounting principles followed by the Trust in the preparation of its financial statements.
a) Security valuation and security transactions
Investments in securities, including foreign securities, traded on an exchange or quoted on the over-the-counter market are valued at the last sale price or, if no sale occurred during the day, at the mean between closing bid and asked prices, as last reported by a pricing service approved by the Trustees. Securities that are principally traded on the National Association of Securities Dealers Automated Quotation National Market (“NASDAQ”) are generally valued at the NASDAQ Official Closing Price (“NOCP”). If there is no NASDAQ Official Closing Price for a NASDAQ-listed security or sale price available for an over-the-counter security, the mean of the latest bid and asked quotations from NASDAQ will be used. Investments in gold will be valued at the spot price of gold determined based on the mean of the last bid and asked price at the close of the New York Commodity Exchange. When market quotations for securities are not readily available, or when restricted securities or other assets are being valued, such assets are valued at fair value as determined in good faith by or under procedures approved by the Trustees. Money market funds are valued at market price. Money market deposit accounts are reflected at cost as this is a cash instrument. Fixed income securities are valued at market price. Fixed Income securities, such as corporate bonds, convertible bonds and U.S. government agency issues for which market quotations are not readily available may be valued based on information supplied by independent pricing services using matrix pricing formulas and/or independent broker bid quotations.
Trading in securities on foreign securities exchanges normally is completed before the calculation of the Funds’ net asset value. Trading on these foreign exchanges may not take place on all days on which there is regular trading on the New York Stock Exchange (“NYSE”), or may take place on days on which there is no regular trading on the NYSE. Similarly, the Funds may hold securities traded in domestic markets where the market may close early on a given day prior to calculation of the Funds’ net asset value. Events affecting the value of such securities held by the Funds that occur between the close of trading in the security and the close of trading on the NYSE normally will not be reflected in the Funds’ calculation of the net asset value. However, significant events will be closely monitored, and where it is determined that an adjustment should be made to the security’s value because significant interim events may materially affect the value of the security, the security will be priced at its fair value in accordance with the procedures approved by the Trustees.
Investment and shareholder transactions are recorded on trade date. Dividend income is recognized on the ex-dividend date. Interest income is recognized on an accrual
basis and includes, where applicable, the amortization of premiums and accretion of discounts. Net realized gains and losses from sales of securities are determined on the specific identification cost method.
b) Restricted and illiquid securities
The Funds may invest in securities that are subject to legal or contractual restrictions on resale or are illiquid. A security may be considered illiquid if it lacks a readily available market or if its valuation has not changed for a certain period of time. Disposal of these securities may involve time consuming negotiations and expense, and a prompt sale at the current valuation may be difficult.
c) Fair Valuation Measurements
The Trust has adopted authoritative fair valuation accounting standards which establish an authoritative definition of fair value and set out a hierarchy for measuring fair value. These standards require additional disclosures about the various inputs and valuation techniques used to develop the measurements of fair value and a discussion in changes in valuation techniques and related inputs during the period. These inputs are summarized in the three broad levels listed below.
| | Level 1 - | Quoted prices in active markets for identical securities. |
| | Level 2 - | Other significant observable inputs (including quoted prices for similar securities, interest rates, prepayment speeds, credit risk, etc.). |
| | Level 3 - | Significant unobservable inputs (including the Fund’s own assumptions in determining the fair value of investments). |
When using the market quotations or closing price provided by the pricing service for equity investments, including common stocks, preferred stocks, foreign issued common stocks, exchange-traded funds, closed end mutual funds and real estate investment trusts, which are traded on an exchange are valued at the last sale price reported by the exchange on which the securities are primarily traded on the day of valuation and when the market is considered active, the security will be classified as a Level 1 security. When using the mean between the latest bid and ask price, the security will be classified as Level 2. Gold bullion is valued at the mean of the closing bid and ask prices from the New York Mercantile Exchange and is classified as a Level 2.
Investment in mutual funds, including money market funds, are generally priced at the ending net asset value (NAV) provided by the service agent of the funds and will be classified as Level 1 securities.
Debt securities, such as corporate bonds, convertible bonds, commercial paper, money market deposit accounts and U.S. government agency issues for which market quotations are not readily available may be valued based on information supplied by independent pricing services using matrix pricing formulas and/or independent broker bid quotations and are classified as Level 2. Warrants and rights for which the underlying security is registered and equities which are subject to a required holding period, but have
a comparable public issue, are valued in good faith by the adviser pursuant to procedures established under the general supervision and responsibility of the Funds’ Board of Trustees. These securities will generally be classified as Level 2 securities. If the warrant or right is exchange traded and the official closing price of the exchange is used, these instruments are classified as Level 1 securities. Options can diverge from the prices of their underlying instruments. These are valued at the composite last price reported by the exchange on which the options are primarily traded on the day of the valuation and are classified as Level 1. If there is no composite last price on a given day the mean between the latest bid and ask price will be used. These contracts are classified as Level 2.
Any securities or other assets for which market quotations are not readily available are valued at fair value as determined in good faith by the Adviser pursuant to procedures established under the general supervision and responsibility of the Funds’ Board of Trustees and will be classified as Level 3 securities. In determining fair value, a Fund will seek to assign a value to the security which it believes represents the amount that the Fund could reasonably expect to receive upon its current sale. With respect to securities that are actively traded on U.S. exchanges, the Funds expect that market quotations will generally be available and that fair value might be used only in limited circumstances, such as when trading for a security is halted during the trading day.
For securities traded principally on foreign exchanges, the Funds may use fair value pricing if an event occurs after the close of trading of the principal foreign exchange on which a security is traded, but before calculation of a Fund’s NAV, which a Fund believes affects the value of the security since its last market quotation. Such events may involve situations relating to a single issuer (such as news related to the issuer announced after the close of the principal foreign exchange), or situations relating to sectors of the market or the markets in general (such as significant fluctuations in the U.S. or foreign markets or significant changes in exchange rates, natural disasters, armed conflicts, or governmental actions).
In determining whether a significant event has occurred with respect to securities traded principally in foreign markets, the Funds may engage a third party fair value service provider to systematically recommend the adjustment of closing market prices ofnon-U.S. securities based upon changes in a designated U.S. securities market index occurring from the time of close of the relevant foreign market and the close of the NYSE. Fair value pricing may also be used to value restricted securities held by the Funds or securities with little or no trading activity for extended periods of time. Fair value pricing involves judgments that are inherently subjective and inexact and it is not possible to determine with certainty when, and to what extent, an event will affect a market price. As a result, there can be no assurance that fair value pricing will reflect actual market value and it is possible that the fair value determined for a security may differ materially from the value that could be realized upon the sale of the security.
The following is a summary of the inputs used, as of April 30, 2019, involving the Funds’ assets and liabilities carried at fair value. The inputs of methodology used for valuing securities may not be an indication of the risk associated with investing in those securities.
| | | | | | | | | | | | | | | | |
Description | | Level 1 | | | Level 2 | | | Level 3 | | | Total | |
The Tocqueville Fund* | | | | | | | | | | | | | | | | |
Assets | | | | | | | | | | | | | | | | |
Common Stocks | | $ | 271,009,101 | | | $ | — | | | $ | — | | | $ | 271,009,101 | |
Preferred Stock | | | — | | | | — | | | | 1,600 | | | | 1,600 | |
Real Estate Investment Trust (REIT) | | | 6,700,000 | | | | — | | | | — | | | | 6,700,000 | |
Exchange-Traded Fund (ETF) | | | 2,883,000 | | | | — | | | | — | | | | 2,883,000 | |
Money Market Fund | | | 472 | | | | — | | | | — | | | | 472 | |
| | | | | | | | | | | | | | | | |
Total Assets | | $ | 280,592,573 | | | $ | — | | | $ | 1,600 | | | $ | 280,594,173 | |
| | | | | | | | | | | | | | | | |
| | | | |
| The Tocqueville Opportunity Fund* | | Level 1 | | | Level 2 | | | Level 3 | | | Total | |
Assets | | | | | | | | | | | | | | | | |
Common Stocks | | | | | | | | | | | | | | | | |
Automobiles & Components | | $ | 22 | | | $ | — | | | $ | — | | | $ | 22 | |
Capital Goods | | | 12,527,073 | | | | — | | | | — | | | | 12,527,073 | |
Commercial & Professional Services | | | 3,665,905 | | | | — | | | | — | | | | 3,665,905 | |
Consumer Durables & Apparel | | | 1,883,015 | | | | — | | | | — | | | | 1,883,015 | |
Consumer Services | | | 1,416,625 | | | | 2,430 | | | | — | | | | 1,419,055 | |
Diversified Financials | | | 1,678,698 | | | | — | | | | — | | | | 1,678,698 | |
Health Care Equipment & Services | | | 5,365,588 | | | | — | | | | — | | | | 5,365,588 | |
Materials | | | 2,124,335 | | | | — | | | | — | | | | 2,124,335 | |
Media & Entertainment | | | 2,481,495 | | | | — | | | | — | | | | 2,481,495 | |
Pharmaceuticals, Biotechnology & Life Sciences | | | 11,629,451 | | | | — | | | | — | | | | 11,629,451 | |
Retailing | | | 4,976,103 | | | | — | | | | — | | | | 4,976,103 | |
Semiconductors & Semiconductor Equipment | | | 523,767 | | | | — | | | | — | | | | 523,767 | |
Software & Services | | | 44,269,434 | | | | — | | | | — | | | | 44,269,434 | |
Technology Hardware & Equipment | | | 219,130 | | | | — | | | | — | | | | 219,130 | |
Transportation | | | 386,095 | | | | — | | | | — | | | | 386,095 | |
| | | | | | | | | | | | | | | | |
Total Common Stocks | | | 93,146,736 | | | | 2,430 | | | | — | | | | 93,149,166 | |
Real Estate Investment Trust (REIT) | | | 455 | | | | — | | | | — | | | | 455 | |
Exchange-Traded Fund (ETF) | | | 481,845 | | | | — | | | | — | | | | 481,845 | |
Purchased Call Options | | | 139,100 | | | | — | | | | — | | | | 139,100 | |
Money Market Fund | | | 746,755 | | | | — | | | | — | | | | 746,755 | |
| | | | | | | | | | | | | | | | |
Total Assets | | $ | 94,514,891 | | | $ | 2,430 | | | $ | — | | | $ | 94,517,321 | |
| | | | | | | | | | | | | | | | |
| | | | | | | | | | | | | | | | |
| The Tocqueville Gold Fund* | | Level 1 | | | Level 2 | | | Level 3 | | | Total | |
Assets | | | | | | | | | | | | | | | | |
Common Stocks | | | | | | | | | | | | | | | | |
Gold Related | | $ | 585,055,714 | | | $ | 11,873,551 | | | $ | 106,364 | | | $ | 597,035,629 | |
Other Precious Metals Related | | | 68,727,403 | | | | — | | | | 10,350,954 | | | | 79,078,357 | |
Other | | | — | | | | — | | | | 7,697,945 | | | | 7,697,945 | |
| | | | | | | | | | | | | | | | |
Total Common Stocks | | | 653,783,117 | | | | 11,873,551 | | | | 18,155,263 | | | | 683,811,931 | |
Private Fund ^ | | | — | | | | — | | | | 16,882,835 | | | | 16,882,835 | |
Gold Bullion | | | — | | | | 125,594,459 | | | | — | | | | 125,594,459 | |
Warrants | | | — | | | | 506,611 | | | | — | | | | 506,611 | |
Money Market Fund | | | 7,793,357 | | | | — | | | | — | | | | 7,793,357 | |
| | | | | | | | | | | | | | | | |
Total Assets | | $ | 661,576,474 | | | $ | 137,974,621 | | | $ | 35,038,098 | | | $ | 834,589,193 | |
| | | | | | | | | | | | | | | | |
| | | | |
| The Tocqueville Phoenix Fund* | | Level 1 | | | Level 2 | | | Level 3 | | | Total | |
Assets | | | | | | | | | | | | | | | | |
Common Stocks | | $ | 186,623,746 | | | $ | — | | | $ | — | | | $ | 186,623,746 | |
Money Market Fund | | | 10,400,000 | | | | — | | | | — | | | | 10,400,000 | |
Money Market Deposit Account | | | — | | | | 13,220,798 | | | | — | | | | 13,220,798 | |
| | | | | | | | | | | | | | | | |
Total Assets | | $ | 197,023,746 | | | $ | 13,220,798 | | | $ | — | | | $ | 210,244,544 | |
| | | | | | | | | | | | | | | | |
| | | | |
| The Tocqueville Select Fund* | | Level 1 | | | Level 2 | | | Level 3 | | | Total | |
Assets | | | | | | | | | | | | | | | | |
Common Stocks | | $ | 37,747,056 | | | $ | — | | | $ | — | | | $ | 37,747,056 | |
Money Market Fund | | | 2,000,000 | | | | — | | | | — | | | | 2,000,000 | |
Money Market Deposit Account | | | — | | | | 603,765 | | | | — | | | | 603,765 | |
| | | | | | | | | | | | | | | | |
Total Assets | | $ | 39,747,056 | | | $ | 603,765 | | | $ | — | | | $ | 40,350,821 | |
| | | | | | | | | | | | | | | | |
| * | For further information regarding portfolio characteristics, please see the accompanying Schedules of Investments. |
| ^ | The Gold Fund currently invests in a private fund that primarily invests in physical gold and is subject to redemption restrictions. This private fund investment can only be disposed of with notice given 24 hours in advance of redemption. Due to the elapsed time, the investment of the Gold Fund is not subject to any redemption fees going forward. |
Below is a reconciliation that details the activity of securities in Level 3 during the current fiscal period:
| | | | | | | | |
| | | The
Tocqueville
Fund | | | The
Tocqueville
Gold Fund | |
Beginning Balance—November 1, 2018 | | $ | 1,600 | | | $ | 34,104,458 | |
Purchases | | | — | | | | — | |
Sales | | | — | | | | — | |
Realized gains | | | — | | | | — | |
Realized losses | | | — | | | | — | |
Change in unrealized appreciation | | | — | | | | 933,640 | |
Transfers in/(out) of Level 3 | | | — | | | | — | |
| | | | | | | | |
Ending Balance—April 30, 2019 | | $ | 1,600 | | | $ | 35,038,098 | |
| | | | | | | | |
As of April 30, 2019 the change in unrealized appreciation on positions still held for securities that were considered Level 3 was $933,640.
The following table summarizes quantitative information about significant unobservable valuation inputs for Level 3 fair value measurement as of April 30, 2019.
| | | | | | | | | | | | |
Fund | | Type of
Security | | Industry | | Fair
Value at
4/30/2019 | | Valuation
Techniques | | Unobservable
Inputs | | Range |
The Tocqueville Fund | | Preferred Stock | | Health Care
Equipment &
Supplies | | $ 1,600 | | Latest company valuation | | Financing
prices | | $0.004 |
The Tocqueville Gold Fund | | Common Stock | | Gold Related | | 106,364 | | Latest company valuation | | Financing
prices | | $0.05 |
| | | | Other
Precious
Metals
Related | | 10,350,954 | | Latest company financing price | | Financing
prices | | $4.50 |
| | | | Other | | 7,697,945 | | Latest company financing price | | Financing
prices | | $1.38-$10.80 |
| | Private Fund | | Gold Related | | 16,882,835 | | Latest price change of comparable proxy investment | | Adviser
deemed
comparable
proxy
investment | | $1,153.57-$1,280.08 |
The significant unobservable inputs used in the fair value measurement of the Tocqueville Fund’s preferred stock and the Gold Fund’s common stocks are the most recent financing prices of the portfolio company, which approximate the companies’ value in the market place. The significant unobservable inputs used for the private fund is the latest price change of an Adviser deemed comparable proxy investment.
Significant changes in the companies’ ability to receive financing for new projects in the future would be an indication of the companies’ financial position and market value. Significant changes in the latest price change of the comparable proxy investment or a change in the adviser deemed comparable proxy investment could impact the value of the security.
The Trust’s valuation procedures have been adopted by the Trust’s Board of Trustees, which has established a Valuation Committee to oversee the valuation process. The Valuation Committee meets on an as needed basis to evaluate changes in the valuation of portfolio securities. The full findings and valuations are then reviewed quarterly by the Independent Trustees.
Derivative Instruments and Hedging Activities
The Funds’ Adviser may use derivative instruments, such as options, as a means to manage exposure to different types of risk, including market risk and exchange rate risk,
and to gain exposure to underlying securities. The Trust has adopted disclosure standards in order to enable the investor to understand how and why an entity used derivatives, how derivatives are accounted for, and how derivatives affect an entity’s results of operations and financial position.
In the Opportunity Fund, the Adviser used options to gain exposure to the underlying equity security and to earn premium income.
Balance Sheet—Values of Derivative Instruments as of April 30, 2019.
The Tocqueville Opportunity Fund
| | | | | | | | | | | | |
| | | Asset Derivatives | | | Liability Derivatives | |
| Derivatives not accounted for as hedging instruments | | Balance Sheet
Location | | Value | | | Balance Sheet
Location | | Value | |
Purchased Options | | Investments,
at Value | | $ | 139,100 | | | Investments,
at Value | | $ | — | |
| | | | | | | | | | | | |
Total | | | | $ | 139,100 | | | | | $ | — | |
| | | | | | | | | | | | |
The Effect of Derivative Instruments on the Statement of Operations for the period ended April 30, 2019.
The Tocqueville Opportunity Fund
| | | | | | | | |
| | | Net Realized Loss
on Investments | | | Net Change in
Unrealized
Appreciation on
Investments | |
Purchased Options | | $ | (218,904 | ) | | $ | 410,365 | |
Written Option | | | (4,761 | ) | | | — | |
| | | | | | | | |
Total | | $ | (223,665 | ) | | $ | 410,365 | |
| | | | | | | | |
Derivatives Risk
The risks of using the types of derivatives in which the Funds may engage include the risk that movements in the value of the derivative may not fully offset or complement instruments currently held in the Funds in the manner intended by the Adviser; the risk that the counterparty to a derivative contract may fail to comply with their obligations to the Fund; the risk that the derivative may not possess a liquid secondary market at a time when the Fund would look to disengage the position; the risk that additional capital from the Fund may be called upon to fulfill the conditions of the derivative contract; and the risk that the cost of the derivative contracts may reduce the overall returns experienced by the Funds. The measurement of risks associated with these instruments is meaningful only when all related offsetting transactions are considered. The Fund may enter into written call options to hedge against changes in the value of equities. The Fund’s option component of the overall investment strategy is often referred to as a“buy-write” strategy (also called a “covered call” strategy), in which the Adviser (as defined below) writes (sells)
a call option contract while at the same time owning an equivalent number of shares of the underlying stock to generate moderate current income. The writing of call options is intended to reduce the volatility of the portfolio and to earn premium income. Written call options expose the Fund to minimal counterparty credit risk since they are exchange traded and the exchange’s clearing house guarantees the options against default. As the writer of a call option, the Fund has the obligation to sell the security at the exercise price during the exercise period in the event the option is exercised. The use of options do not create leverage in the Funds.
The average monthly value of purchased options in the Opportunity Fund during the period ended April 30, 2019 was $305,017.
Transactions in options in the Opportunity Fund during the period ended April 30, 2019 were as follows:
| | | | | | | | |
| | | Notional
Amount | | | Contracts | |
Outstanding, beginning of period: | | $ | 21,937,500 | | | | 1,170 | |
Options purchased | | | 73,872,500 | | | | 3,005 | |
Options terminated in closing transactions | | | (47,560,000 | ) | | | (1,815 | ) |
Options exercised | | | — | | | | — | |
Options expired | | | (33,775,000 | ) | | | (1,745 | ) |
| | | | | | | | |
Outstanding, end of period: | | $ | 14,475,000 | | | | 615 | |
e) Foreign currency translation
Investments and other assets and liabilities denominated in foreign currencies are translated to U.S. dollars at the prevailing rates of exchange, in accordance with the Trust’s Portfolio Securities Valuation and Foreign Exchange Contracts Procedures. The Tocqueville Fund, The Tocqueville Opportunity Fund, and The Tocqueville Gold Fund, and The Tocqueville Phoenix Fund have engaged in transactions in securities denominated in foreign currencies and, as a result, entered into foreign exchange transactions. These Funds are exposed to additional market risk as a result of changes in the value of the underlying currency in relation to the U.S. dollar. Risks include potential inability of counterparties to meet the terms of their obligations. The value of foreign currencies are marked-to-market on a daily basis, which reflects the changes in the market value of the contract at the close of each day’s trading, resulting in daily unrealized gains and/or losses. When the transactions are settled or the contracts are closed, the Funds recognize a realized gain or loss.
The Funds isolate that portion of the results of operations resulting from changes in foreign exchange rates on investments from the fluctuations arising from changes in market prices of securities held. Such fluctuations are reflected as net realized and unrealized gain or loss on foreign currency translation.
Reported net realized foreign exchange gains or losses arise from sales of foreign currencies, currency gains or losses realized between the trade and settlement dates on securities transactions, the differences between the amounts of dividends, interest, and
foreign withholding taxes recorded on the Fund’s books, and the U.S. dollar equivalent of the amounts actually received or paid. Net unrealized foreign exchange gains and losses arise from changes in the value of assets and liabilities other than investments in securities at the end of the fiscal year, resulting from changes in the exchange rates.
f) Dividends and distributions to shareholders
Dividends to shareholders are recorded on the ex-dividend date. Dividends from net investment income are declared and paid annually by the Funds. Distributions of net realized capital gains, if any, will be declared and paid at least annually. Income and capital gain distributions are determined in accordance with income tax regulations which may differ from generally accepted accounting principles. Permanent differences between financial and tax reporting may result in reclassification to capital stock.
g) Allocation of Income, Expenses and Gains/Losses
Income, expenses (other than those deemed attributable to a specific share class), and gains and losses of the Fund are allocated daily to each class of shares based upon the ratio of net assets represented by each class as a percentage of the net assets of the Fund. Expenses deemed directly attributable to a class of shares are recorded by the specific class. Most Fund expenses are allocated by class based on relative net assets.
h) Use of estimates
The preparation of financial statements in conformity with accounting principles generally accepted in the United States of America requires management to make estimates and assumptions that affect the reported amounts of assets and liabilities and disclosure of contingent assets and liabilities at the date of the financial statements and the reported amounts of revenues and expenses during the reporting year. Actual results could differ from those estimates.
i) Indemnification
In the normal course of business the Funds enter into contracts that contain general indemnification clauses. The Funds’ maximum exposure under these arrangements is unknown, as this would involve future claims against a Fund that have not yet occurred. Based on experience, the Funds expect the risk of loss to be remote.
j) Subsequent events evaluation
The Board of Trustees approved a $135,000,000 umbrella line of credit (the “Line”) for The Tocqueville Fund, The Tocqueville Opportunity Fund, The Tocqueville Gold Fund, The Tocqueville Phoenix Fund, and the Tocqueville Select Fund on March 21, 2019. The Line is for temporary emergency and extraordinary purposes, including the meeting of redemption requests that otherwise might require the untimely disposition of securities. The Line is secured by the Trust’s assets. The line is effective May 25, 2019 and has a one-year term. The interest rate is prime rate minus 0.50%.
In preparing these financial statements, the Trust has evaluated events and transactions for potential recognition or disclosure resulting from subsequent events through the date financial statements were available to be issued. This evaluation did not result in any subsequent events, other than those noted above, that necessitated disclosure and/or adjustments.
3. FEDERAL INCOME TAX
There is no tax liability resulting from unrecognized tax benefits relating to uncertain income tax positions taken or expected to be taken on the tax return for the fiscalyear-end October 31, 2018, or for any other tax years which are open for exam. As of October 31, 2018, open tax years include the tax years ended October 31, 2015 through 2018. The Trust is also not aware of any tax positions for which it is reasonably possible that the total amounts of unrecognized tax benefits will significantly change in the next six months. The Funds recognize interest and penalties, if any, related to unrecognized tax benefits as income tax expense in the Statement of Operations. During the year, the Funds did not incur any interest or penalties.
Provision for federal income taxes or excise taxes has not been made since the Funds have elected to be taxed as Regulated Investment Companies and intend to distribute substantially all taxable income to shareholders and otherwise comply with the provisions of the Internal Revenue Code applicable to Regulated Investment Companies. Distributions from net realized gains for book purposes may include short-term capital gains which are included as ordinary income to shareholders for tax purposes. Additionally, accounting principles generally accepted in the United States of America require that certain components of net assets relating to permanent differences be reclassified between financial and tax reporting. These reclassifications have no effect on net assets or net asset value per share. For the year ended October 31, 2018, the following table shows the reclassifications made:
| | | | | | | | | | | | |
| | | Undistributed
Net Investment
Income/(Loss) | | | Accumulated Net
Realized
Gain/(Loss) | | | Paid In Capital | |
Tocqueville Fund | | $ | (255,910 | ) | | $ | (2,077,060 | ) | | $ | 2,332,970 | |
Opportunity Fund | | | 914,313 | | | | (1,636,210 | ) | | | 721,897 | |
Gold Fund | | | 16,829,513 | | | | (2,321,521 | ) | | | (14,507,992 | ) |
Phoenix Fund | | | 2,127,124 | | | | (6,885,940 | ) | | | 4,758,816 | |
Select Fund | | | 38,440 | | | | 36 | | | | (38,476 | ) |
The permanent differences primarily relate to net operating losses, foreign currency reclasses, the usage of tax equalization, Partnerships, and PFICs.
As of October 31, 2018, the components of accumulated earnings (losses) for income tax purposes were as follows:
| | | | | | | | | | | | | | | | | | | | |
| | | Tocqueville
Fund | | | Opportunity
Fund | | | Gold
Fund | | | Phoenix Fund | | | Select Fund | |
Tax cost of Investments | | $ | 142,247,183 | | | $ | 62,674,596 | | | $ | 1,113,608,673 | | | $ | 221,615,767 | | | $ | 32,057,578 | |
| | | | | | | | | | | | | | | | | | | | |
Unrealized Appreciation | | | 129,677,022 | | | | 23,419,455 | | | | 164,356,476 | | | | 34,648,434 | | | | 9,871,400 | |
Unrealized Depreciation | | | (1,231,931 | ) | | | (4,167,667 | ) | | | (418,538,882 | ) | | | (18,279,499 | ) | | | (2,583,136 | ) |
| | | | | | | | | | | | | | | | | | | | |
Net unrealized appreciation (depreciation) | | | 128,445,091 | | | | 19,251,788 | | | | (254,182,406 | ) | | | 16,368,935 | | | | 7,288,264 | |
| | | | | | | | | | | | | | | | | | | | |
Undistributed operating income | | | 2,114,645 | | | | — | | | | — | | | | 49,879 | | | | — | |
Undistributed long-term gains | | | 19,359,873 | | | | 7,593,051 | | | | — | | | | 14,769,641 | | | | — | |
| | | | | | | | | | | | | | | | | | | | |
Distributable earnings | | | 21,474,518 | | | | 7,593,051 | | | | — | | | | 14,819,520 | | | | — | |
| | | | | | | | | | | | | | | | | | | | |
Other accumulated gain/(loss) | | | 2 | | | | (646,721 | ) | | | (385,203,862 | ) | | | — | | | | (4,271,202 | ) |
| | | | | | | | | | | | | | | | | | | | |
Total accumulated gain/(loss) | | $ | 149,919,611 | | | $ | 26,198,118 | | | $ | (639,386,268 | ) | | $ | 31,188,455 | | | $ | 3,017,062 | |
| | | | | | | | | | | | | | | | | | | | |
The difference between book-basis andtax-basis unrealized appreciation is attributable primarily to wash sale deferrals and passive foreign investment companies (PFIC’s).
The tax character of distributions paid during the years ended October 31, 2018 and 2017 was as follows:
| | | | | | | | | | | | |
| | | October 31, 2018 | |
| | | Ordinary
Income | | | Long Term
Capital Gain | | | Total | |
Tocqueville Fund | | $ | 2,493,282 | | | $ | 24,335,053 | | | $ | 26,828,335 | |
Opportunity Fund | | | — | | | | 2,589,302 | | | | 2,589,302 | |
Gold Fund | | | — | | | | — | | | | — | |
Phoenix Fund | | | 2,432,967 | | | | 49,514,221 | | | | 51,947,188 | |
Select Fund | | | — | | | | 903,727 | | | | 903,727 | |
| |
| | | October 31, 2017 | |
| | | Ordinary
Income | | | Long Term
Capital Gain | | | Total | |
Tocqueville Fund | | $ | 3,191,286 | | | $ | 12,245,533 | | | $ | 15,436,819 | |
Opportunity Fund | | | — | | | | — | | | | — | |
Gold Fund | | | — | | | | — | | | | — | |
Phoenix Fund | | | — | | | | 71,259,512 | | | | 71,259,512 | |
Select Fund | | | — | | | | 3,023,170 | | | | 3,023,170 | |
The Fund designated as long-term capital gain dividend, pursuant to Internal Revenue Code Section 852(b)(3), the amount necessary to reduce the earnings and profits of the Funds related to net capital gain to zero for the tax years ended October 31, 2018 and 2017.
For the fiscal year ended October 31, 2018 the Opportunity Fund, Gold Fund, and Select Fund had late year losses of $646,060, $7,503,492 and $143,018, respectively.
At October 31, 2018 certain Funds had tax basis capital losses which may be carried forward to offset future capital gains as shown below.
| | | | | | | | |
| | | Capital Losses Expiring
Indefinite Short Term | | | Capital Losses Expiring
Indefinite Long Term | |
Gold Fund | | $ | 2,295,524 | | | $ | 375,404,846 | |
Select Fund | | | 737,776 | | | | 3,390,408 | |
To the extent that Funds listed above may realize future net capital gains, those gains will be offset by any of their unused respective capital loss carryforwards
4. INVESTMENT ADVISORY AND OTHER AGREEMENTS
Tocqueville Asset Management L.P. (“Tocqueville”) is the investment adviser (the “Adviser”) to the Trust under Investment Advisory Agreements approved by shareholders. For its services, Tocqueville receives fees from The Tocqueville Fund, calculated daily and payable monthly, at an annual rate of 0.75% on the first $1 billion of the average daily
net assets of the Fund, and 0.65% of the average daily net assets in excess of $1 billion. Tocqueville receives fees from The Tocqueville Opportunity Fund, calculated daily and payable monthly, at an annual rate of 0.75% on the first $500 million of the average daily net assets of the Fund, and 0.65% of the average daily net assets in excess of $500 million. Tocqueville receives fees from The Tocqueville Gold Fund, calculated daily and payable monthly, at an annual rate of 1.00% on the first $500 million of the average daily net assets of the Fund, 0.75% of the average daily net assets in excess of $500 million but not exceeding $1 billion, and 0.65% of the average daily net assets in excess of $1 billion. Tocqueville receives fees from The Tocqueville Phoenix Fund, calculated daily and payable monthly, at an annual rate of 0.80% on the first $250 million of net assets of the Fund; 0.75% on the next $250 million of net assets of the Fund; 0.70% on the next $500 million of net assets of the Fund; and 0.65% on all net assets of the Fund over $1 billion. Tocqueville receives fees from The Tocqueville Select Fund, calculated daily and payable monthly, at an annual rate of 0.80% on all net assets of the Fund.
With respect to The Tocqueville Fund, The Tocqueville Opportunity Fund, The Tocqueville Phoenix Fund and The Tocqueville Select Fund, the Adviser has contractually agreed to waive its advisory fees and/or reimburse expenses in order to ensure that The Tocqueville Fund’s total annual operating expenses do not exceed 1.25% of its average daily net assets (excluding taxes, interest expense, acquired fund fees and expenses, or extraordinary expenses such as litigation). The Expense Limitation Agreements will remain in effect until March 1, 2020 for each Fund. For the six months ended April 30, 2019, the Adviser waived $49,853, $56,913, $158,362, and $36,670 of the advisory fee for The Tocqueville Fund, The Tocqueville Opportunity Fund, The Tocqueville Phoenix Fund, and The Tocqueville Select Fund respectively. Such amounts are not subject to recoupment by the Adviser.
Pursuant to an Administrative Services Agreement, each Fund pays to the Adviser a fee computed and paid monthly at an annual rate of 0.15% on the first $400 million of the average daily net assets of each Fund; 0.13% on the next $600 million of the average daily net assets of each Fund; and 0.12% on all the average daily net assets of each Fund over $1 billion. For the six months ended April 30, 2019, the Adviser has made payments of $39,774, $12,398, $129,262, $31,730, $4,717, to U.S. Bancorp Fund Services, LLC for services provided under a Sub-Administration Agreement for The Tocqueville Fund, The Tocqueville Opportunity Fund, The Tocqueville Gold Fund, The Tocqueville Phoenix Fund and The Tocqueville Select Fund, respectively.
Tocqueville Securities, L.P. (the “Distributor”), an affiliate of Tocqueville, acts as distributor for shares of the Trust. The Tocqueville Fund, The Tocqueville Opportunity Fund, The Tocqueville Gold Fund—Investor Class, The Tocqueville Phoenix Fund, and The Tocqueville Select Fund adopted a distribution and service plan pursuant to Rule 12b-1 of the 1940 Act. Pursuant to the plans, each Fund pays to the Distributor distribution and service fees of 0.25% per annum of its average daily net assets.
Commissions earned by the Distributor for services rendered as a registeredbroker-dealer in securities transactions for The Tocqueville Fund, The Tocqueville
Opportunity Fund, The Tocqueville Gold Fund, The Tocqueville Phoenix Fund and The Tocqueville Select Fund for the six months ended April 30, 2019, were $1,575, $19,739, $0, $2,349, $2,407, respectively.
5. CAPITAL SHARE TRANSACTIONS.
Transactions in capital shares for each Fund were as follows:
| | | | | | | | |
| | | For the Six Months
Ended
April 30, 2019
(unaudited) | | | For the Year
Ended
October 31, 2018 | |
| The Tocqueville Fund | | Shares | | | Shares | |
Shares sold | | | 177,473 | | | | 400,145 | |
Shares issued to holders in reinvestment dividends | | | 638,291 | | | | 705,639 | |
Shares redeemed | | | (724,358 | ) | | | (1,122,176 | ) |
| | | | | | | | |
Net increase (decrease) | | | 91,406 | | | | (16,392 | ) |
| | |
| The Tocqueville Opportunity Fund | | | | | | | | |
Shares sold | | | 236,598 | | | | 566,780 | |
Shares issued to holders in reinvestment dividends | | | 310,884 | | | | 97,416 | |
Shares redeemed | | | (323,553 | ) | | | (555,070 | ) |
| | | | | | | | |
Net increase | | | 223,929 | | | | 109,126 | |
| | |
| The Tocqueville Gold Fund—Investor Class | | | | | | | | |
Shares sold | | | 59,238,421 | | | | 6,517,002 | |
Shares issued to holders in reinvestment dividends | | | — | | | | — | |
Shares redeemed | | | (61,499,771 | ) | | | (9,256,841 | ) |
| | | | | | | | |
Net decrease | | | (2,261,350 | ) | | | (2,739,839 | ) |
| | |
| The Tocqueville Gold Fund—Institutional Class | | | | | | | | |
Shares sold | | | 657 | | | | | |
Shares issued to holders in reinvestment dividends | | | — | | | | | |
Shares redeemed | | | — | | | | | |
| | | | | | | | |
Net increase | | | 657 | | | | | |
| | |
| The Tocqueville Phoenix Fund | | | | | | | | |
Shares sold | | | 211,797 | | | | 621,501 | |
Shares issued to holders in reinvestment dividends | | | 722,709 | | | | 2,222,399 | |
Shares redeemed | | | (2,678,795 | ) | | | (5,243,871 | ) |
| | | | | | | | |
Net decrease | | | (1,744,289 | ) | | | (2,399,971 | ) |
| | |
| The Tocqueville Select Fund | | | | | | | | |
Shares sold | | | 94,920 | | | | 233,208 | |
Shares issued to holders in reinvestment dividends | | | — | | | | 76,796 | |
Shares redeemed | | | (369,252 | ) | | | (875,383 | ) |
| | | | | | | | |
Net decrease | | | (274,332 | ) | | | (565,379 | ) |
6. FUND SHARE TRANSACTIONS
Each Fund currently offers only one class of shares of beneficial interest with the exception of The Tocqueville Gold Fund. A redemption fee of 2.00% is imposed on redemptions of shares held 90 days or fewer for The Tocqueville Gold Fund. This fee is retained by the Fund and is credited to paid in capital. Redemptions to which the fee applies include redemptions of shares resulting from an exchange made pursuant to the Exchange Privilege, as defined in the Trust’s Prospectus dated February 15, 2019. For a more detailed description of when the redemption fee does not apply, please see the Trust’s Prospectus.
7. INVESTMENT TRANSACTIONS
Purchases and sales of investment securities (excluding short-term instruments) for the period ended April 30, 2019 are summarized below.
| | | | | | | | | | | | | | | | | | | | |
| | | Tocqueville
Fund | | | Opportunity
Fund | | | Gold Fund | | | Phoenix
Fund | | | Select
Fund | |
Purchases: | | $ | 25,104,019 | | | $ | 78,544,999 | | | $ | 72,012,604 | | | $ | 47,884,527 | | | $ | 5,499,704 | |
| | | | | | | | | | | | | | | | | | | | |
Sales: | | $ | 36,748,200 | | | $ | 81,240,018 | | | $ | 115,244,713 | | | $ | 39,373,733 | | | $ | 8,235,951 | |
| | | | | | | | | | | | | | | | | | | | |
U.S. Government Security Purchases: | | $ | — | | | $ | — | | | $ | — | | | $ | — | | | $ | — | |
| | | | | | | | | | | | | | | | | | | | |
U.S. Government Security Sales: | | $ | — | | | $ | — | | | $ | — | | | $ | — | | | $ | — | |
| | | | | | | | | | | | | | | | | | | | |
8. TRANSACTIONS WITH AFFILIATES (Unaudited)*
The following issuers are affiliated with the Funds; that is, the Adviser had control of 5% or more of the outstanding voting securities during the period from November 1, 2018 through April 30, 2019. As defined in Section (2)(a)(3) of the Investment Company Act of 1940; such issues are:
| | | | | | | | | | | | | | | | | | | | | | | | | | | | | | | | | | | | | | | | | | | | | | | | |
| | | November 1, 2018 | | | Additions | | | Reductions | | | April 30,
2019 | | | Dividend
Income | | | Realized
Gain/(Loss) | | | Change in
Gross
Unrealized
Appreciation/
(Depreciation) | | | April 30, 2019 | |
Issuer Name | | Share
Balance | | | Cost | | | Share
Balance | | | Cost | | | Share
Balance | | | Cost | | | Share
Balance | | | Value | | | Cost | |
The Tocqueville Gold Fund | | | | | | | | | | | | | | | | | | | | | | | | | | | | | | | | | | | | | | | | | | | | | | | | |
Almaden Minerals Ltd.—Class B | | | 5,607,319 | | | $ | 4,657,349 | | | | — | | | $ | — | | | | (6,700 | ) | | $ | (7,992 | ) | | | 5,600,619 | | | $ | — | | | $ | (2,536 | ) | | $ | 38,725 | | | $ | 2,884,547 | | | $ | 4,649,357 | |
Almaden Minerals Ltd. Warrant | | | 740,741 | | | | — | | | | — | | | | — | | | | (740,741 | ) | | | — | | | | — | | | | — | | | | — | | | | — | | | | — | | | | — | |
Almaden Minerals Ltd. Warrant | | | 79,585 | | | | — | | | | — | | | | — | | | | — | | | | — | | | | 79,585 | | | | — | | | | — | | | | (1,101 | ) | | | 42 | | | | — | |
Argonaut Gold, Inc. | | | 2,837,000 | | | | 12,710,613 | | | | — | | | | — | | | | — | | | | — | | | | 2,837,000 | | | | — | | | | — | | | | 883,515 | | | | 3,663,514 | | | | 12,710,613 | |
ATAC Resources Ltd. | | | 9,784,891 | | | | 31,231,836 | | | | — | | | | — | | | | — | | | | — | | | | 9,784,891 | | | | — | | | | — | | | | (1,179,815 | ) | | | 1,570,316 | | | | 31,231,836 | |
Barkerville Gold Mines Ltd. | | | 7,110,000 | | | | 4,926,516 | | | | — | | | | — | | | | — | | | | — | | | | 7,110,000 | | | | — | | | | — | | | | (304,725 | ) | | | 1,963,648 | | | | 4,926,516 | |
Barkerville Gold Mines Ltd. | | | — | | | | — | | | | 17,000,000 | | | | 4,579,639 | | | | — | | | | — | | | | 17,000,000 | | | | — | | | | — | | | | 21,541 | | | | 4,601,179 | | | | 4,579,639 | |
Bear Creek Mining Corp. | | | 7,413,200 | | | | 28,761,181 | | | | — | | | | — | | | | — | | | | — | | | | 7,413,200 | | | | — | | | | — | | | | 538,926 | | | | 7,746,869 | | | | 28,761,181 | |
Corvus Gold, Inc. | | | 3,226,901 | | | | 2,212,904 | | | | — | | | | — | | | | — | | | | — | | | | 3,226,901 | | | | — | | | | — | | | | (2,378,226 | ) | | | 4,001,357 | | | | 2,212,904 | |
Corvus Gold, Inc. | | | 15,317,930 | | | | 12,975,684 | | | | 1,961,400 | | | | 2,564,588 | | | | — | | | | — | | | | 17,279,330 | | | | — | | | | — | | | | (11,315,985 | ) | | | 21,152,572 | | | | 15,540,272 | |
East Asia Minerals Corp. | | | 13,290,993 | | | | 22,796,021 | | | | — | | | | — | | | | — | | | | — | | | | 13,290,993 | | | | — | | | | — | | | | (287,717 | ) | | | 570,450 | | | | 22,796,021 | |
East Asia Minerals Corp. Warrant | | | 976,493 | | | | — | | | | — | | | | — | | | | — | | | | — | | | | 976,493 | | | | — | | | | — | | | | — | | | | — | | | | — | |
East Asia Minerals Corp. Warrant | | | 3,321,250 | | | | — | | | | — | | | | — | | | | — | | | | — | | | | 3,321,250 | | | | — | | | | — | | | | (65,699 | ) | | | 148,746 | | | | — | |
East Asia Minerals Corp. Warrant | | | 4,617,560 | | | | — | | | | — | | | | — | | | | — | | | | — | | | | 4,617,560 | | | | — | | | | — | | | | (106,053 | ) | | | 185,778 | | | | — | |
Falco Resources Ltd. | | | 16,222,300 | | | | 11,973,054 | | | | — | | | | — | | | | — | | | | — | | | | 16,222,300 | | | | — | | | | — | | | | (1,098,760 | ) | | | 2,906,137 | | | | 11,973,054 | |
Gold Bullion International LLC | | | 5,000,000 | | | | 5,000,000 | | | | — | | | | — | | | | — | | | | — | | | | 5,000,000 | | | | — | | | | — | | | | — | | | | 6,893,000 | | | | 5,000,000 | |
International Tower Hill Mines Ltd. | | | 5,738,836 | | | | 20,953,121 | | | | — | | | | — | | | | — | | | | — | | | | 5,738,836 | | | | — | | | | — | | | | (84,361 | ) | | | 2,641,586 | | | | 20,953,121 | |
International Tower Hill Mines Ltd. | | | 20,331,298 | | | | 44,453,358 | | | | — | | | | — | | | | — | | | | — | | | | 20,331,298 | | | | — | | | | — | | | | 142,705 | | | | 9,409,125 | | | | 44,453,358 | |
Jaguar Mining, Inc. | | | 64,330,707 | | | | 8,127,887 | | | | — | | | | — | | | | — | | | | — | | | | 64,330,707 | | | | — | | | | — | | | | (4,495,540 | ) | | | 5,522,155 | | | | 8,127,887 | |
MAG Silver Corp. | | | 2,661,600 | | | | 29,536,706 | | | | 324,000 | | | | 2,935,632 | | | | (212,000 | ) | | | (2,237,978 | ) | | | 2,773,600 | | | | — | | | | (756,848 | ) | | | 7,536,394 | | | | 27,264,488 | | | | 30,234,360 | |
MAG Silver Corp. | | | 1,432,665 | | | | 15,000,003 | | | | — | | | | — | | | | — | | | | — | | | | 1,432,665 | | | | — | | | | — | | | | 3,778,084 | | | | 14,073,204 | | | | 15,000,003 | |
Nickel Creek Platinum | | | 12,379,201 | | | | 2,544,342 | | | | — | | | | — | | | | — | | | | — | | | | 12,379,201 | | | | — | | | | — | | | | (619,385 | ) | | | 462,014 | | | | 2,544,342 | |
Nickel Creek Platinum Warrant | | | 6,189,601 | | | | — | | | | — | | | | — | | | | — | | | | — | | | | 6,189,601 | | | | — | | | | — | | | | (157,204 | ) | | | 36,037 | | | | — | |
NuLegacy Gold Corp. | | | 28,556,090 | | | | 6,158,205 | | | | — | | | | — | | | | — | | | | — | | | | 28,556,090 | | | | — | | | | — | | | | (1,556,067 | ) | | | 2,131,529 | | | | 6,158,205 | |
Premier Gold Mines Ltd. | | | 8,630,160 | | | | 15,782,521 | | | | — | | | | — | | | | — | | | | — | | | | 8,630,160 | | | | — | | | | — | | | | (453,360 | ) | | | 10,822,325 | | | | 15,782,521 | |
SEMAFO, Inc. | | | 11,300,000 | | | | 43,116,829 | | | | — | | | | — | | | | (737,000 | ) | | | (1,082,606 | ) | | | 10,563,000 | | | | — | | | | 393,058 | | | | 5,069,055 | | | | 28,620,449 | | | | 42,034,223 | |
Strategic Metals Ltd. | | | 10,113,400 | | | | 14,557,309 | | | | — | | | | — | | | | — | | | | — | | | | 10,113,400 | | | | — | | | | — | | | | (461,192 | ) | | | 2,189,211 | | | | 14,557,309 | |
| | | | | | | | | | | | | | | | | | | | | | | | | | | | | | | | | | | | | | | | | | | | | | | | |
| | | November 1, 2018 | | | Additions | | | Reductions | | | April 30,
2019 | | | Dividend
Income | | | Realized
Gain/(Loss) | | | Change in
Gross
Unrealized
Appreciation/
(Depreciation) | | | April 30, 2019 | |
Issuer Name | | Share
Balance | | | Cost | | | Share
Balance | | | Cost | | | Share
Balance | | | Cost | | | Share
Balance | | | Value | | | Cost | |
Tocqueville Bullion Reserve LP—Class G (a) | | | 13,806 | | | $ | 25,000,000 | | | | — | | | $ | — | | | | — | | | $ | — | | | | 13,806 | | | $ | — | | | $ | — | | | $ | 769,671 | | | $ | 16,882,835 | | | $ | 25,000,000 | |
Torex Gold Resources, Inc. | | | 1,678,100 | | | | 20,058,180 | | | | 415,300 | | | | 4,295,181 | | | | — | | | | — | | | | 2,093,400 | | | | — | | | | — | | | | 437,734 | | | | 20,016,761 | | | | 24,353,361 | |
Trifecta Gold Ltd. | | | 2,325,199 | | | | — | | | | — | | | | — | | | | — | | | | — | | | | 2,325,199 | | | | — | | | | — | | | | (27,950 | ) | | | 82,442 | | | | — | |
| | | | | | | | | | | | | | | | | | | | | | | | | | | | | | | | | | | | | | | | | | | | | | | | |
| | | | | | $ | 382,533,619 | | | | | | | $ | 14,375,040 | | | | | | | $ | (3,328,576 | ) | | | | | | $ | — | | | $ | (366,326 | ) | | $ | (5,376,790 | ) | | $ | 198,442,316 | | | $ | 393,580,083 | |
| | | | | | | | | | | | | | | | | | | | | | | | | | | | | | | | | | | | | | | | | | | | | | | | |
| * | All affiliates listed are neither majority-owned subsidiaries or other controlled companies. |
| (a) | Tocqueville Bullion Reserve (“TBR”) is a Delaware Limited Partnership created for the purpose of owning physical gold. The General Partner of TBR is TERA Management LLC (“Tera”), a Delaware Limited Liability Company, which is equally owned and managed by Tocqueville Partners II LLC (“TP2”), a Delaware Limited Liability Company, and Eidesis Real Assets LLC (“Eidesis”), a Delaware Limited Liability Company. The Managing Member of TP2 is Robert Kleinschmidt, President of the Trust, who has a 51% participating percentage in TP2 and the soleNon-Managing Member is John Hathaway,co-portfolio manager of the Tocqueville Gold Fund, who has a 49% participating percentage. |
9. LINE OF CREDIT
The Tocqueville Trust has a $300,000,000 line of credit (the “Line”), which is uncommitted, with U.S. Bank NA. The Line is for temporary emergency or extraordinary purposes, including the meeting of redemption requests that otherwise might require the untimely disposition of securities. The Line is secured by the Trust’s assets. The Line has a one year term and is reviewed annually by the Board of Trustees. The interest rate as of April 30, 2019 was 5.00%. During the period ended April 30, 2019, the Tocqueville Fund’s maximum borrowing was $820,000 and average borrowing was $64,585, the Opportunity Fund’s maximum borrowing was $2,037,000 and average borrowing was $209,463, and the Gold Fund’s maximum borrowing was $20,690,000 and average borrowing was $1,013,789. This borrowing resulted in interest expenses of $1,348, $5,533 and $23,883, respectively. The Tocqueville Phoenix Fund and The Select Fund did not use the Line.
10. OTHER EXPENSES
Other expenses include reimbursement to the Adviser for compensation of the Trust’s Chief Compliance Officer. For the period ended April 30, 2019, reimbursement to the Adviser for compensation of the Trust’s Chief Compliance Officer from the Funds amounted to $11,169, $3,470, $36,557, $7,100, $1,679 for the Tocqueville Fund, Opportunity Fund, Gold Fund, Phoenix Fund, and Select Fund respectively.
ADDITIONAL INFORMATION (UNAUDITED)
1. ADDITIONAL DISCLOSURE REGARDING FUND TRUSTEES AND OFFICERS
Independent Trustees
| | | | | | | | | | | | |
Name and Age | | Position(s) Held
with the Trust | | Term of Office
and Length of
Time Served (1) | | Principal Occupation(s) During Past Five Years | | Number of Funds
in Fund Complex
Overseen By Trustee | | | Other Directorships Held by Trustee |
| | | | | |
Charles W. Caulkins Year of Birth: 1956 | | Trustee; Member of Audit Committee; Member of Governance and Nominating Committee | | Indefinite Term, Since 2003 | | Private Investor dba Plan B Partners from January 2012 – present. | | | 5 | | | None |
| | | | | |
Alexander Douglas Year of Birth: 1947 | | Trustee; Member of Audit Committee; Member of Governance and Nominating Committee | | Indefinite Term, Since 2010 | | Retired. Formerly, President, CEO and owner of Spaulding Law Printing, Inc. from 1992 to November 2014. | | | 5 | | | None |
ADDITIONAL INFORMATION (UNAUDITED)
Independent Trustees
| | | | | | | | | | | | |
Name and Age | | Position(s) Held
with the Trust | | Term of Office
and Length of
Time Served (1) | | Principal Occupation(s) During Past Five Years | | Number of Funds
in Fund Complex
Overseen By Trustee | | | Other Directorships Held by Trustee |
| | | | | |
Charles F. Gauvin Year of Birth: 1956 | | Trustee; Member of Audit Committee; Member of Governance and Nominating Committee | | Indefinite Term, Since February 2015 | | Chief Development Officer, Woods Hole Oceanographic Institution, from February 2016 – present; Executive Director, Maine Audubon, from August 2014 – January 2016; Chief Development Officer, Carnegie Endowment for International Peace, from September 2011 – May 2014. | | | 5 | | | Director, Bioqual, Inc., July 1992 – present. |
| | | | | |
James W. Gerard Year of Birth: 1961 | | Trustee; Member of Audit Committee; Member of Governance and Nominating Committee | | Indefinite Term, Since 2001 | | Managing Director, Hycroft Advisors, from January 2010-present; Managing Director, deVisscher & Co., LLC from January 2013 to present; The Chart Group from January 2001 to present. | | | 5 | | | President, American Overseas Memorial Day Association, 1998 to present; Trustee, Salisbury School, 2005 to present; Director, American Friends of Bleraucourt, 1992 to present; President, Little Baby Face Foundation, March 2015 to present. |
| | | | | |
William J. Nolan III Year of Birth: 1947 | | Trustee; Chair of Audit Committee; Member of Governance and Nominating Committee | | Indefinite Term, Since December 2006 | | Retired. Executive Vice President & Treasurer PaineWebber Inc. 1997 – 2001. | | | 5 | | | Trustee, Adirondack Museum, Blue Mt. Lake, NY 1996 to 2017 (Treasurer, 2000 to 2013; Executive Committee, 2000 – 2017). |
ADDITIONAL INFORMATION (UNAUDITED)
Interested Trustees(2) and Officers
| | | | | | | | | | |
Name and Age | | Position(s) Held
with the Trust | | Term of Office
and Length of
Time Served (1) | | Principal Occupation(s) During Past Five Years | | Number of Funds
in Fund Complex
Overseen By Trustee | | Other Directorships Held by Trustee |
| | | | | |
Helen Balk Year of Birth:1972 | | Treasurer | | Indefinite Term, Since 2014 | | Controller / Treasurer of Tocqueville Asset Management from January 2014 to present; Manager / Staff Accountant at Pegg & Pegg LLP from August 1995 to January 2014. | | N/A | | N/A |
| | | | | |
Robert W. Kleinschmidt Year of Birth: 1949 | | Chairman, President, and Trustee | | Indefinite Term, Chairman Since 2016, and President and Trustee Since 1991 | | President and Chief Investment Officer of Tocqueville Asset Management; Director, Tocqueville Management Corporation, the General Partner of Tocqueville Asset Management L.P. and Tocqueville Securities L.P. from January 1994 to present. | | 5 | | President and Director, Tocqueville Management Corporation, the General Partner of Tocqueville Asset Management L.P. and Tocqueville Securities L.P. |
| | | | | |
Stephan Yevak Year of Birth: 1959 | | Anti-Money Laundering Compliance Officer | | Indefinite Term, Since 2018 | | Deputy Chief Compliance Officer, Tocqueville Securities, L.P. from August 2011 to present; Deputy Chief Compliance Officer, Tocqueville Asset Management from August 2011 to present. Anti-Money Laundering Compliance Officer to both entities from March 2018 to present. | | N/A | | N/A |
| | | | | |
Cleo Kotis Year of Birth: 1975 | | Secretary | | Indefinite Term, Since 2010 | | Director of Operations, the Delafield Group of Tocqueville Asset Management L.P., 2009 to present. | | N/A | | N/A |
ADDITIONAL INFORMATION (UNAUDITED)
Interested Trustees(2) and Officers
| | | | | | | | | | |
Name and Age | | Position(s) Held
with the Trust | | Term of Office
and Length of
Time Served (1) | | Principal Occupation(s) During Past Five Years | | Number of Funds
in Fund Complex
Overseen By Trustee | | Other Directorships Held by Trustee |
| | | | | |
Thomas Pandick Year of Birth: 1947 | | Chief Compliance Officer | | Indefinite Term, Since 2004 | | Chief Compliance Officer (October 2004 –present) Tocqueville Asset Management L.P. | | N/A | | N/A |
| (1) | Each Trustee will hold office for an indefinite term until the earliest of (i) the next meeting of shareholders, if any, called for the purpose of considering the election or re-election of such Trustee and until the election and qualification of his or her successor, if any, elected at such meeting, or (ii) the date a Trustee resigns or retires, or a Trustee is removed by the Board of Trustees or shareholders, in accordance with the Trust’s By-Laws, as amended, and Agreement and Declaration of Trust, as amended. Each officer will hold office for an indefinite term until the date he or she resigns or retires or until his or her successor is elected and qualifies. |
| (2) | “Interested person” of the Trust as defined in the 1940 Act. Mr. Kleinschmidt is considered “interested person” because of his affiliation with the Advisor. |
The Statement of Additional Information includes additional information about the Trustees and is available free of charge by calling the Funds toll free at1-800-355-7307.
2. PROXY VOTING POLICIES AND PROCEDURES
A description of the policies and procedures that The Tocqueville Trust uses to determine how to vote proxies relating to portfolio securities is available without charge upon request by calling1-800-355-7307. Information regarding how The Tocqueville Trust voted proxies relating to portfolio securities during the most recent 12-month period ended June 30 is available by calling 1-800-355-7307 and it is also available on the SEC’s web site athttp://www.sec.gov.
3. SHAREHOLDER REPORTS AND QUARTERLY PORTFOLIO DISCLOSURE
The Tocqueville Trust is required to file its complete schedule of portfolio holdings with the SEC for its first and third fiscal quarters on FormN-PORT. The Trust’sForm N-PORT will be available without charge, upon request on the SEC’s website (http://www.sec.gov). You can also obtain copies of FormN-PORT by (i) visiting the SEC’s Public Reference Room in Washington, DC (information on the operation of the Public Reference Room may be obtained by calling1-202-551-8090); (ii) sending your request and a duplicating fee to the SEC’s Public Reference Room, Washington, DC 20549-1520; or (iii) sending your request electronically to publicinfosec.gov. Quarterly portfolio holdings are also available on the website of The Tocqueville Funds, www.tocquevillefunds.com.
4. SHAREHOLDER NOTIFICATION OF FEDERAL TAX STATUS
For the fiscal year ended October 31, 2018, certain dividends paid by the Funds may be subject to a maximum tax rate of 15%, as provided for by the Jobs and Growth Tax Relief Reconciliation Act of 2003. The percentage of dividends declared from ordinary income designated as qualified dividend income was as follows:
| | | | |
Tocqueville Fund | | | 100.00 | % |
Opportunity Fund | | | 0.00 | % |
Gold Fund | | | 0.00 | % |
Phoenix Fund | | | 100.00 | % |
Select Fund | | | 0.00 | % |
For corporate shareholders, the percent of ordinary income distributions qualifying for the corporate dividends received deduction for the fiscal year ended October 31, 2018 was as follows:
| | | | |
Tocqueville Fund | | | 100.00 | % |
Opportunity Fund | | | 0.00 | % |
Gold Fund | | | 0.00 | % |
Phoenix Fund | | | 100.00 | % |
Select Fund | | | 0.00 | % |
For the year ended October 31, 2018, the funds designate the following percent of ordinary distributions paid as interest-related dividends under the Internal Revenue Code Section 871(k)(1)(c):
| | | | |
Tocqueville Fund | | | 0.08 | % |
Opportunity Fund | | | 0.00 | % |
Gold Fund | | | 0.00 | % |
Phoenix Fund | | | 3.95 | % |
Select Fund | | | 0.00 | % |
The percentage of taxable ordinary income distributions that are designated as short-term capital gain distributions under Internal Revenue Section 871(k)(2)(C) for each Fund were as follows.
| | | | |
Tocqueville Fund | | | 0.00 | % |
Opportunity Fund | | | 0.00 | % |
Gold Fund | | | 0.00 | % |
Phoenix Fund | | | 100.00 | % |
Select Fund | | | 0.00 | % |
Investment Adviser
Tocqueville Asset Management L.P.
40 W. 57th St., 19th Floor
New York, NY 10019
(212) 698-0800
www.tocqueville.com
Distributor
Tocqueville Securities, L.P.
40 W. 57th St., 19th Floor
New York, NY 10019
(212) 698-0800
Shareholders’ Servicing and Transfer Agent
U.S. Bank Global Fund Services
615 East Michigan Street
Milwaukee, WI 53202
Custodian
U.S. Bank, N.A.
Custody Operations
1555 River Center Drive, Suite 302
Milwaukee, WI 53212
Board of Trustees
Robert W. Kleinschmidt—Chairman
Charles W. Caulkins
Alexander Douglas
Charles F. Gauvin
James W. Gerard
William J. Nolan III
Independent Registered Public Accounting Firm
Grant Thornton LLP
171 North Clark St., Suite 200
Chicago, IL 60601
Tocqueville Funds
c/o US Bancorp Fund Services, LLC
P.O. Box 701
Milwaukee, WI 53201-0701
www.tocquevillefunds.com
TQ-SEMI Tocqueville Semi-Annual Report 4/30/2019
Not applicable for semi-annual reports.
| Item 3. | Audit Committee Financial Expert. |
Not applicable for semi-annual reports.
| Item 4. | Principal Accountant Fees and Services. |
Not applicable for semi-annual reports.
| Item 5. | Audit Committee of Listed Registrants. |
Not applicable to registrants who are not listed issuers (as defined in Rule10A-3 under the Securities Exchange Act of 1934).
Schedule of Investments is included as part of the report to shareholders filed under Item 1 of this Form.
| Item 7. | Disclosure of Proxy Voting Policies and Procedures forClosed-End Management Investment Companies. |
Not applicable toopen-end investment companies.
| Item 8. | Portfolio Managers ofClosed-End Management Investment Companies. |
Not applicable toopen-end investment companies.
| Item 9. | Purchases of Equity Securities byClosed-End Management Investment Company and Affiliated Purchasers. |
Not applicable toopen-end investment companies.
| Item 10. | Submission of Matters to a Vote of Security Holders. |
There have been no material changes to the procedures by which shareholders may recommend nominees to the registrant’s board of trustees.
1
| Item 11. | Controls and Procedures. |
| (a) | The Registrant’s President and Treasurer have reviewed the Registrant’s disclosure controls and procedures (as defined in Rule30a-3(c) under the Investment Company Act of 1940 (the “Act”)) as of a date within 90 days of the filing of this report, as required by Rule30a-3(b) under the Act and Rules13a-15(b) or15d-15(b) under the Securities Exchange Act of 1934. Based on their review, such officers have concluded that the disclosure controls and procedures are effective in ensuring that information required to be disclosed in this report is appropriately recorded, processed, summarized and reported and made known to them by others within the Registrant and by the Registrant’s service provider. |
| (b) | There were no changes in the Registrant’s internal control over financial reporting (as defined in Rule30a-3(d) under the Act) that occurred during the second fiscal quarter of the period covered by this report that has materially affected, or is reasonably likely to materially affect, the Registrant’s internal control over financial reporting. |
| Item 12. | Disclosure of Securities Lending Activities for Closed-End Management Investment Companies |
Not applicable to open-end investment companies.
| | |
| (a) | | (1)Any code of ethics or amendment thereto, that is the subject of the disclosure required by Item 2, to the extent that the registrant intends to satisfy Item 2 requirements through filing an exhibit.Not Applicable. |
| |
| | (2)A separate certification for each principal executive and principal financial officer pursuant to Section 302 of the Sarbanes-Oxley Act of 2002.Filed herewith. |
| |
| | (3)Any written solicitation to purchase securities under Rule 23c-1 under the Act sent or given during the period covered by the report by or on behalf of the registrant to 10 or more persons.Not applicable toopen-end investment companies. |
| |
| | (4)Change in the registrant’s independent public accountant. There was no change in the registrant’s independent public accountant for the period covered by this report. |
| |
| (b) | | Certifications pursuant to Section 906 of the Sarbanes-Oxley Act of 2002. Furnished herewith. |
2
SIGNATURES
Pursuant to the requirements of the Securities Exchange Act of 1934 and the Investment Company Act of 1940, the registrant has duly caused this report to be signed on its behalf by the undersigned, thereunto duly authorized.
|
| (Registrant) The Tocqueville Trust |
|
| By (Signature and Title)* /s/ Robert W. Kleinschmidt |
Robert W. Kleinschmidt, President |
|
| Date 7/1/2019 |
Pursuant to the requirements of the Securities Exchange Act of 1934 and the Investment Company Act of 1940, this report has been signed below by the following persons on behalf of the registrant and in the capacities and on the dates indicated.
|
| By (Signature and Title)* /s/ Robert W. Kleinschmidt |
Robert W. Kleinschmidt, President |
|
| Date 7/1/2019 |
|
| By (Signature and Title)* /s/ Helen Balk |
Helen Balk, Treasurer |
|
| Date 7/1/2019 |
| * | Print the name and title of each signing officer under his or her signature. |
3