This report is not authorized for distribution to prospective investors unless preceded or
accompanied by a currently effective prospectus of The Tocqueville Trust. Please call
1-800-697-FUND (3863) for a free prospectus. Read it carefully before you invest. |
| |
| You are invited to visit our website @ www.tocquevillefunds.com |
Chairman’s Letter
Dear Shareholders,
Everything old is new again!
Old adages, like the gods of the copybook headings, have a history of returning, “with terror and slaughter,” more often than not. So, too, do “chickens come home to roost”, however belatedly. Thus, after decades of reckless (and largely wasteful and inefficient) government spending, and a decade of near zero interest rate, easy money policy (culminating in a highly political and totally unnecessary $2 trillion government giveaway into an already robust $20 trillion economy in March 2021), the sleeping dragon of inflation has raised its long dormant head.
Almost immediately inflation surged to forty-year highs. Still, in the pattern of denial honed over so many years of quiescent prices, experts at the Fed and representatives in Congress, as well as at the White House, intoned that the problem was “transitory” and did nothing about it. Indeed, at the Fed, the business of money creation and interest rate suppression continued unabated until only recently this past March when bond purchases stopped, and May when the overnight rate was raised by fifty basis points. And so, the Fed, late to the game as usual, is now embarking on an aggressive tightening program, well after the horse has left the barn. Will they go too far? History suggests yes, but only time will tell. Fears of recession, which have suddenly appeared, are predicated on this track record, but at least the Fed is finally facing the problem, unlike the ruling party in Congress and in the White House, which continues to address it with the same agenda that did so much to create it in the first place.
It would have been difficult to devise a more efficient plan to revive inflation back to the levels not seen since the 1970’s and 1980’s. For those of us who lived through the last inflationary period (I started my Wall Street career in 1976) it is more or less gospel that inflation, once ignited, does not go gentle into that good night.
Against this formidable backdrop of policy mismanagement and falling markets, it is up to our portfolio managers to plot a reasonable course over the long-term investment horizon. That we have been here before and that nothing about the current situation is really brand new provides some comfort. Markets recover when circumstances change, as well they might in the coming months, and superior investment opportunities arise when selling is indiscriminate, as it has been. Interest rates have risen rapidly but they are still low by historical standards. Both consumer and corporate balance sheets are in sound shape. There is much to suggest a better investment environment provided the inflation genie can be put back into the bottle. Easier said than done.
Sincerely,

Robert W. Kleinschmidt
Chairman
The Tocqueville Fund
Dear Shareholders,
The six month period ending April 30, 2022, has been marked by an increase in volatility, sector rotation and market pullback. Continued recovery from the COVID-19 pandemic and absorption of tremendous liquidity from global central bank stimulus and relief payments drove performance early in the period; but recognition that eventually the piper must be paid rose to the forefront as a new year unfolded. Expectations about interest rates and inflation have clearly become the primary concerns for investors even as the invasion of Ukraine and recurring lockdowns in China have also weighed on the dynamics of securities markets.
The tipping point in sentiment probably originates from December when Fed Chairman Powell finally gave up the ghost that inflation was transitory. Since then, the Fed has drained significant liquidity from markets by discontinuing asset purchases even if it has not yet unwound its balance sheet. Still, the U.S. dollar’s leading role in global finance and borrowing means the Fed’s rapid conversion to tighter credit compounds the problem worldwide, trumping other central banks with aggressive rate rises and boosting the dollar’s exchange rate. It is a reasonable bet that, just as the Fed overreacted to the need for liquidity over the past few years, it will overreact to the need to reduce it over the next few. Fearing this is reason enough for the sharp correction in the markets since the beginning of the calendar year.
The Fund outperformed the benchmark despite losing 3.45% net of fees during the period compared to the S&P 500 which lost -9.65% and the Russell 1000 and 3000 Value indices which lost 3.94% and 4.30%, respectively. The strongest contributing sectors were Energy, Materials and Consumer Staples, while the laggards were Communication Services, Information Technology and Consumer Discretionary. The top performing individual names were Chevron, Nutrien, Weyerhaeuser, Pfizer and Halliburton while the detractors were Disney, Alphabet, Amazon, eBay and NextEra.
Several new positions were taken during the period. One of these is Activision Blizzard, the video gaming company, whose shares have been under significant pressure due to allegations of a toxic workplace environment, calls for the CEO to be replaced, worries about future growth as COVID moves to the rear-view mirror and China’s crack down on gaming. In January, Microsoft announced its intention to acquire the company at $95 per share in cash, a significant premium to the then market price. However, investors seemed to doubt that the transaction would be completed for antitrust reasons as the shares were trading at a deep discount to the offer price. We believe that the risks of FTC action against the transaction are overblown and that other suitors could emerge. Moreover, in the absence of the deal closing, we expect the company will take the necessary steps to repair its reputation, have durable gaming franchises with best-in-class intellectual property, and that games will remain an enduring part of popular social activities. Indeed, we believe that the valuation with some deal expectation in the price is well supported with strong free cash flow generation, solid organic growth and low capital intensity, and if it were to turn lower, it would represent another buying opportunity.
Another purchase was Halliburton, a leading provider of field services and products to the oil and gas industry. Several years of underinvestment by oil and gas producers driven by market sentiment and political alignment against fossil fuels and historically poor capital management by E&P companies has left the industry unable to meet recovered demand in a post-COVID environment. Disruptions from sanctions imposed on Russia have only exacerbated this problem. Notwithstanding the recent rise in oil prices, the sector’s market weighting remains near its lowest percentage of the S&P 500 in the past forty years. As a result, we expect a resurgent capital investment cycle that will benefit Halliburton, which has taken steps to improve capital returns for shareholders, suggesting its shares were undervalued in our view. Other positions that were initiated or added to include Caterpillar, Cisco and Occidental Petroleum.
A variety of positions were reduced or eliminated during the period due to changes in circumstances, prices reaching targets or in response to investor requests for liquidity. These included Alibaba, Alphabet, Amazon, Apple, Applied Materials, Berkshire Hathaway, Cisco, Coca-Cola, Constellation Brands, Delta, Gilead, Intel Mesabi Trust, Meta (Facebook), Microsoft, Nvidia, Pfizer and Weyerhaeuser.
Anticipating (i.e., guessing) market direction from here will remain challenging in our estimation. Some argue that the aggressive Fed has already discounted the market, and most surprises now lie with central banks outside the U.S. Others suggest the Fed’s trajectory is unprecedented and not fully understood or appreciated. On the one hand, employment data and consumer balance sheets appear healthy, tax receipts are up, company surveys are mostly positive, the yield spread between the ten-year and Fed Funds remains positive, and the rising dollar should keep commodities under some pressure. On the other hand, bond yields mortgage rates and the dollar index have increased dramatically, while markets generally have plunged. Two things are certain in our view. First, these developments mean there has already been significant tightening, perhaps not directly controlled by the Fed. It is also possible that the invisible hand of markets with inflation, taxes, the dollar and supply chain resilience will do what the Fed intends. Second, for the moment, the cost of doing business for many companies has increased, so the question about sustainability of margins needs to be asked. In the end, we will continue to seek value opportunities in market dislocation and uncertainty.
Sincerely,
| |  |
| Robert W. Kleinschmidt | Peter D. Shawn |
| Portfolio Manager | Portfolio Manager for the Investment Adviser |
The Tocqueville Fund
(Unaudited)
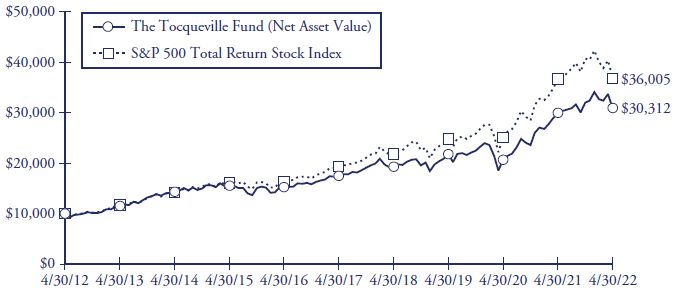
This chart assumes an initial gross investment of $10,000 made on 4/30/12. Returns shown do not reflect the deduction of taxes that a shareholder would pay on fund distributions or the redemption of fund shares. Performance reflects fee waivers in effect. In the absence of fee waivers, total return would be reduced. Returns shown include the reinvestment of all dividends and other distributions. Past performance is not predictive of future performance. Investment return and principal value will fluctuate so that your shares, when redeemed, may be worth more or less than their original cost.
The Standard & Poor’s 500 Total Return Stock Index (S&P 500) is a capital-weighted index, representing the aggregate market value of the common equity of 500 stocks primarily traded on the New York Stock Exchange. Returns assume the reinvestment of all dividends.
AVERAGE ANNUAL RATE OF RETURN (%)
FOR YEARS ENDED APRIL 30, 2022
| | 1 Year | 3 Year | 5 Year | 10 Year |
| The Tocqueville Fund | 3.16% | 12.20% | 11.87% | 11.73% |
| Standard & Poor’s 500 Total Return Stock Index | 0.21% | 13.85% | 13.66% | 13.67% |
The Tocqueville Opportunity Fund
Dear Shareholders,
We are pleased to provide our investment overview for the first six-month period of the fiscal year 2022. During the six-month period which ended on April 30, 2022, the Tocqueville Opportunity Fund net asset value declined 37.14% compared to the Russell 2500 Growth Index, which declined 25.96%.
Since our last update, three macroeconomic developments have occurred that negatively impacted equity markets: 1) The Omicron variant of COVID-19 wreaked havoc on already fragile supply chains, 2) Russia unexpectedly invaded Ukraine causing commodity prices to increase from already elevated levels, and 3) inflation as measured by the CPI reached levels not seen in forty years. The consequence of these developments led the Federal Reserve to embark on a quantitative tightening cycle, which entails raising short term interest rates and reducing the size of its balance sheet. The combination of rising interest rates and persistently high inflation is weighing on consumer confidence, and even caused the US economy to unexpectedly shrink during the first quarter of 2022. Congress and the Biden Administration seem unable to come to terms with how to fix rising prices, namely oil prices. The Administration authorized oil to be released from the SPR (strategic oil reserve) but has not encouraged investment in the Oil and Gas sector, instead opting for greener solutions such as solar and wind. Input prices not just for oil but others such as natural gas, steel, copper, and fertilizer are at levels not seen for over a decade. Businesses in all sectors of the economy are not only struggling to keep up with higher prices, but the shortage of workers adds another layer of complexity and cost as they try to recover from a multiyear pandemic.
With inflation still on the minds of investors and the Federal Reserve, the yield on risk free assets has increased dramatically. The yield on the 10-year Treasury bond as of April 30, 2022, was approximately 3% which is an increase of 150 basis points since the start of 2022. This has caused investors to reallocate or rotate funds towards cyclical investments at the expense of growth-oriented investments. This rotation has caused our holdings in the Information Technology sector to underperform the broader market as valuation multiples have significantly compressed. Despite the valuation compression, the Fund continues to be overweight in Information Technology as we believe the long-term fundamentals remain intact.
While the Information Technology sector remains out of favor, we believe the opportunity set in front of many of our companies remains attractive. The quarterly results from our top holdings indicate customers are still spending money to get more productive and efficient through digital transformations. As an example, more employers are offering hybrid work solutions and are needing to rapidly invest to ensure their networks are accessible, efficient, and secure. This has created demand for all sorts of software solutions related to the cloud, such as workflow management and payroll processing just to name a few. The Fund’s investments in Service Now and Paylocity are emblematic of these trends, and we are seeing accelerating demand for its products as a result. We continue to be long term believers in these companies as they offer an attractive pay back to its users while delivering shareholders superior growth and strong recurring revenues with little to no churn.
Investments in Healthcare and Industrials provided the leading contributions on a relative basis versus the benchmark. The Information Technology sector was the leading driver of relative underperformance versus the benchmark. Looking at individual securities Zendesk, LPL Financial, Waste Connections, and Aspen Technologies were the top contributors to performance while Shopify, ServiceNow, Okta, Paycom and Paylocity were detractors from performance.
As always, we sincerely appreciate your continued support.
Sincerely,

Paul Lambert
Portfolio Manager
The Tocqueville Opportunity Fund
(Unaudited)

This chart assumes an initial gross investment of $10,000 made on 4/30/12. Returns shown do not reflect the deduction of taxes that a shareholder would pay on fund distributions or the redemption of fund shares. Returns shown include the reinvestment of all dividends and other distributions. Past performance is not predictive of future performance. Investment return and principal value will fluctuate so that your shares, when redeemed, may be worth more or less than their original cost.
The Russell 2500 Growth Total Return Index is an unmanaged index that measures the performance of the small to mid-cap growth segment of the U.S. equity universe. It includes those Russell 2500 companies with higher price-to-book ratios and higher forecasted growth values. Returns assume the reinvestment of all dividends.
AVERAGE ANNUAL RATE OF RETURN (%)
FOR YEARS ENDED APRIL 30, 2022
| 1 Year | 3 Year | 5 Year | 10 Year |
| The Tocqueville Opportunity Fund | –28.35% | 6.00% | 12.21% | 10.79% |
| Russell 2500 Growth Total Return Index | –23.08% | 7.28% | 10.12% | 11.43% |
The Tocqueville Phoenix Fund
Dear Shareholders,
For the six months ended April 30, 2022, the Tocqueville Phoenix Fund’s net asset value decreased 11.81%, versus decreases of 9.50% for the Russell 2000 Value Index and 18.38% for the Russell 2000 Index, each on a total return basis. The Fund’s net asset value as of April 30, 2022, was $21.04 per share. Total net assets amounted to $148,466,603 of which 91.5% was invested in equities, with the balance held in reserve.
The Fund, along with all major indices, suffered losses during the first six months of the fiscal year. While disappointing, we remain confident in the Fund’s ability to perform well in all market environments and are using this correction to buy more shares in our higher conviction ideas at more favorable prices.
Many of the economic tailwinds that benefited 2021 are behind us, and consensus estimates for 2022 GDP moved lower during the period. In an effort to maintain price stability, the Federal Reserve approved its first interest rate increase since 2018 and signaled there would be further increases at each of the remaining meetings this calendar year. While necessary to contain inflation, the Fed’s actions and commentary around future rate increases have already resulted in higher rates for new mortgages, car loans, credit cards and corporate refinancing. On top of this, U.S. consumers are facing higher heating, electricity and gasoline costs due to the Russia-Ukraine war and its impact on global energy markets. The upward pressure on consumer budgets has resulted in the lowest level of consumer sentiment in over a decade, and we expect consumers to pare back purchases of discretionary items if these trends continue. To put some of the impacts into perspective—mortgage rates increasing from 3% to 5% makes the monthly payment on a new $600,000 home approximately $700 higher per month; current gasoline prices result in the average U.S. driver spending approximately $80 more per month; while food and utilities are up approximately $50 per month. Unfortunately, salaries and wages have not kept up with these increases, leaving the Federal Reserve in a difficult position: continue to increase rates to curtail inflation, or backtrack on the expected increases to preserve maximum employment. We believe the Fed will likely take a more measured approach than many expect, resulting in inflation staying higher for longer.
On April 30, 2022, the Fund held 40 positions, with a median market capitalization of $1.4 billion and an average position size of 2.3%. Since 2019, we have refreshed approximately 60% of the portfolio, and in the past six months, we added three new positions (On24, Airspan Networks and Lakeland Industries) while exiting three (TEGNA, Acuity Brands and Spok Holdings). The companies we own serve long-term growing markets and have low balance sheet leverage to mitigate stock selection risk. In calendar year 2021, approximately 55% of our holdings generated higher earnings per share than they did in the year prior to the COVID-19 pandemic, and we expect that trend to continue with earnings growth to average approximately 30% in 2022. The average price to forward earnings multiple of the portfolio is a modest 10 times, and the free cash flow yield is approximately 10%. In addition, we are encouraged that insiders have purchased shares in over 40% of our companies within the past 12 months, and approximately 15% of the portfolio has either activist involvement and/or has commenced a strategic review process to enhance shareholder value. Lantheus Holdings, TEGNA, and ABM Industries were the Fund’s top contributors during the past six months. While AMS-Osram, Mayville Engineering, and Unisys were the Fund’s largest detractors.
Historically, value stocks, such as the ones we own, have outperformed during periods of higher inflation, in part due to a higher discount rate being applied to future cash flows. This was evident in calendar year 2021, as the Russell 2000 Value Index outperformed the Russell 2000 Growth Index for the first time in five years.
We hope you are safe and with very best wishes.
Sincerely,
 |  |
| James Maxwell | Michael Sellecchia |
| Portfolio Manager | Portfolio Manager |
The Tocqueville Phoenix Fund
(Unaudited)
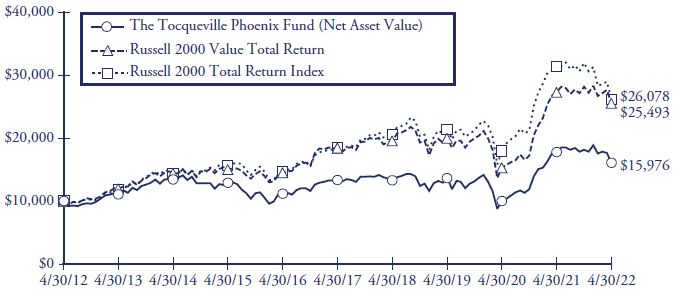
This chart assumes an initial gross investment of $10,000 made on 4/30/12. On February 15, 2019, The Delafield Fund’s name changed to The Tocqueville Phoenix Fund. Returns shown do not reflect the deduction of taxes that a shareholder would pay on fund distributions or the redemption of fund shares. Performance reflects fee waivers in effect. In the absence of fee waivers, total return would be reduced. Returns shown include the reinvestment of all dividends and other distributions. Past performance is not predictive of future performance. Investment return and principal value will fluctuate so that your shares, when redeemed, may be worth more or less than their original cost.
The Russell 2000 Value Total Return Index measures performance of the small cap value segment of the U.S. equity universe. Securities are categorized as growth or value based on their relative book-to-price ratios, historical sales growth, and expected earnings growth. Returns include the reinvestment of all dividends.
The Russell 2000 Total Return Index is an unmanaged index that measures the performance of the 2,000 smallest companies in the Russell 3000 Index, which represent approximately 10% of the total market capitalization of the Russell 3000 Index. Returns include the reinvestment of all dividends.
AVERAGE ANNUAL RATE OF RETURN (%)
FOR YEARS ENDED APRIL 30, 2022
| 1 Year | 3 Year | 5 Year | 10 Year |
| The Tocqueville Phoenix Fund*(a) | –10.18% | 5.26% | 3.76% | 4.80% |
| Russell 2000 Value Total Return Index | –6.59% | 8.38% | 6.75% | 9.81% |
| Russell 2000 Total Return Index | –16.87% | 6.73% | 7.24% | 10.06% |
| * | Prior to February 15, 2019, the Fund’s name was The Delafield Fund. |
| (a) | On November 15, 2019, The Tocqueville Phoenix Fund acquired all the net assets of The Tocqueville Select Fund. |
Expense Example—April 30, 2022 (Unaudited)
As a shareholder of The Tocqueville Trust (the “Funds”), you incur ongoing costs, including management fees; distribution fees; and other Fund expenses. This example is intended to help you understand your ongoing costs (in dollars) of investing in the Funds and to compare costs with the ongoing costs of investing in other mutual funds.
The Example is based on an investment of $1,000 invested at the beginning of the period and held the entire period (November 1, 2021-April 30, 2022).
Actual Expenses
The first line of the table below provides information about actual account values and actual expenses. You may use the information in this line, together with the amount you invested, to estimate the expenses that you paid over the period. Simply divide your account value by $1,000 (for example, an $8,600 account value divided by $1,000 = 8.6), then multiply the result by the number in the first line under the heading entitled “Expenses Paid During Period” to estimate the expenses you paid on your account during this period.
Hypothetical Example for Comparison Purposes
The second line of the table below provides information about hypothetical account values and hypothetical expenses based on the Funds’ actual expense ratios and an assumed rate of return of 5% per year before expenses, which is not the Funds’ actual return. The hypothetical account values and expenses may not be used to estimate the actual ending account balance or expenses you paid for the period. You may use this information to compare the ongoing costs of investing in the Funds and other funds. To do so, compare this 5% hypothetical example with the 5% hypothetical examples that appear in the shareholder reports of the other funds.
Please note that the expenses shown in the table are meant to highlight your ongoing costs only and do not reflect any transactional costs, such as sales charges (loads), redemption fees, or exchange fees. Therefore, the second line of the table is useful in comparing ongoing costs only, and will not help you determine the relative costs of owning different funds. In addition, if these transactional costs were included, your costs would have been higher.
Expense Example Tables (Unaudited)
The Tocqueville Fund
| | Beginning
Account Value
November 1, 2021 | | Ending
Account Value
April 30, 2022 | | Expenses Paid
During Period*
November 1, 2021-
April 30, 2022 |
| Actual | $1,000.00 | | $ 965.50 | | $6.09 |
| Hypothetical (5% return before expenses) | 1,000.00 | | 1,018.60 | | 6.26 |
| * | Expenses are equal to the Fund’s annualized six-month expense ratio (including interest expense) of 1.25% for The Tocqueville Fund, multiplied by the average account value over the period, multiplied by 181/365 to reflect the one-half year period. |
The Tocqueville Opportunity Fund
| | Beginning
Account Value
November 1, 2021 | | Ending
Account Value
April 30, 2022 | | Expenses Paid
During Period*
November 1, 2021-
April 30, 2022 |
| Actual | $1,000.00 | | $ 628.60 | | $5.05 |
| Hypothetical (5% return before expenses) | 1,000.00 | | 1,018.60 | | 6.26 |
| * | Expenses are equal to the Fund’s annualized six-month expense ratio (including interest expense) of 1.25% for The Tocqueville Opportunity Fund, multiplied by the average account value over the period, multiplied by 181/365 to reflect the one-half year period. |
The Tocqueville Phoenix Fund
| | Beginning
Account Value
November 1, 2021 | | Ending
Account Value
April 30, 2022 | | Expenses Paid
During Period*
November 1, 2021-
April 30, 2022 |
| Actual | $1,000.00 | | $ 881.90 | | $5.83 |
| Hypothetical (5% return before expenses) | 1,000.00 | | 1,018.60 | | 6.26 |
| * | Expenses are equal to the Fund’s annualized six-month expense ratio (including interest expense) of 1.25% for The Tocqueville Phoenix Fund, multiplied by the average account value over the period, multiplied by 181/365 to reflect the one-half year period. |
The Tocqueville Fund
Financial Highlights
Per share operating
performance
(For a share outstanding | | Six Months
Ended
April 30, | | | Years Ended October 31, | |
| throughout the period) | | 2022 | | | 2021 | | | 2020 | | | 2019 | | | 2018 | | | 2017 | |
| | | (Unaudited) | | | | | | | | | | | | | | | | |
| Net asset value, beginning of period | | $ | 48.39 | | | $ | 37.03 | | | $ | 37.80 | | | $ | 35.84 |
| | $ | 38.60 | | | $ | 33.72 | |
| Operations: | | | | | | | | | | | | | | | | | | | | | | | | |
| Net investment income (1) | | | 0.16 | | | | 0.25 | | | | 0.31 | | | | 0.43 | | | | 0.35 | | | | 0.37 | |
| Net realized and unrealized gain (loss) | | | (1.46 | ) | | | 12.49 | | | | 1.58 | | | | 4.46 | | | | 0.45 | | | | 6.40 | |
| Total from investment operations | | | (1.30 | ) | | | 12.74 | | | | 1.89 | | | | 4.89 | | | | 0.80 | | | | 6.77 | |
| Distributions to shareholders: | | | | | | | | | | | | | | | | | | | | | | | | |
| Dividends from net investment income | | | (0.20 | ) | | | (0.25 | ) | | | (0.37 | ) | | | (0.34 | ) | | | (0.33 | ) | | | (0.39 | ) |
| Distributions from net realized gains | | | (4.77 | ) | | | (1.13 | ) | | | (2.29 | ) | | | (2.59 | ) | | | (3.23 | ) | | | (1.50 | ) |
| Total distributions | | | (4.97 | ) | | | (1.38 | ) | | | (2.66 | ) | | | (2.93 | ) | | | (3.56 | ) | | | (1.89 | ) |
| Change in net asset value for the period | | | (6.27 | ) | | | 11.36 | | | | (0.77 | ) | | | 1.96 | | | | (2.76 | ) | | | 4.88 | |
| Net asset value, end of period | | $ | 42.12 | | | $ | 48.39 | | | $ | 37.03 | | | $ | 37.80 |
| | $ | 35.84 | | | $ | 38.60 | |
| Total Return | | | –3.5 | %(2) | | | 35.2 | % | | | 5.0 | % | | | 14.9 | % | | | 2.0 | % | | | 20.9 | % |
| Ratios/supplemental data | | | | | | | | | | | | | | | | | | | | | | | | |
| Net assets, end of period (000) | | $ | 284,819 | | | $ | 313,739 | | | $ | 251,096 | | | $ | 285,070 | | | $ | 272,043 | | | $ | 293,637 | |
| Ratio to average net assets: | | | | | | | | | | | | | | | | | | | | | | | | |
| Expenses before waiver | | | 1.30 | %(3) | | | 1.34 | % | | | 1.38 | % | | | 1.30 | % | | | 1.26 | % | | | 1.27 | % |
| Expenses after waiver | | | 1.25 | %(3) | | | 1.25 | % | | | 1.25 | % | | | 1.25 | %(4) | | | 1.25 | % | | | 1.26 | %(4) |
| Net investment income before waiver | | | 0.64 | %(3) | | | 0.46 | % | | | 0.69 | % | | | 1.11 | % | | | 0.91 | % | | | 0.97 | % |
| Net investment income after waiver | | | 0.69 | %(3) | | | 0.55 | % | | | 0.82 | % | | | 1.16 | % | | | 0.92 | % | | | 0.98 | % |
| Portfolio turnover rate | | | 3 | %(2) | | | 11 | % | | | 9 | % | | | 13 | % | | | 19 | % | | | 10 | % |
| (1) | Net investment income per share is calculated using the ending balance prior to consideration or adjustment for permanent book-to-tax differences. |
| (4) | Includes 0.01% of interest expense which is not included in the Fund’s operating expense cap. |
The Accompanying Notes are an Integral Part of these Financial Statements.
The Tocqueville Opportunity Fund
Financial Highlights
| | | Six Months | | | | | | | | | | | | | | | | |
| Per share operating performance | | Ended | | | | | | | | | | | | | | | | |
| (For a share outstanding | | April 30, | | | Years Ended October 31, | |
| throughout the period) | | 2022 | | | 2021 | | | 2020 | | | 2019 | | | 2018 | | | 2017 | |
| | | (Unaudited) | | | | | | | | | | | | | | | | |
| Net asset value, beginning of period | | $ | 49.05 | | | $ | 38.34 | | | $ | 28.11 | | | $ | 26.60 | | | $ | 26.12 | | | $ | 19.14 | |
| Operations: | | | | | | | | | | | | | | | | | | | | | | | | |
| Net investment loss (1) | | | (0.21 | ) | | | (0.53 | ) | | | (0.40 | ) | | | (0.29 | ) | | | (0.29 | ) | | | (0.37 | ) |
| Net realized and unrealized gain (loss) | | | (17.16 | ) | | | 12.76 | | | | 12.29 | | | | 4.29 | | | | 1.63 | | | | 7.35 | |
| Total from investment operations | | | (17.37 | ) | | | 12.23 | | | | 11.89 | | | | 4.00 | | | | 1.34 | | | | 6.98 | |
| Distributions to shareholders: | | | | | | | | | | | | | | | | | | | | | | | | |
| Distributions from net realized gains | | | (2.74 | ) | | | (1.52 | ) | | | (1.66 | ) | | | (2.49 | ) | | | (0.86 | ) | | | — | |
| Total distributions | | | (2.74 | ) | | | (1.52 | ) | | | (1.66 | ) | | | (2.49 | ) | | | (0.86 | ) | | | — | |
| Change in net asset value for the period | | | (20.11 | ) | | | 10.71 | | | | 10.23 | | | | 1.51 | | | | 0.48 | | | | 6.98 | |
| Net asset value, end of period | | $ | 28.94 | | | $ | 49.05 | | | $ | 38.34 | | | $ | 28.11 | | | $ | 26.60 | | | $ | 26.12 | |
| Total Return | | | – 37.1 | %(2) | | | 32.6 | % | | | 44.3 | % | | | 16.9 | % | | | 5.3 | % | | | 36.5 | % |
| Ratios/supplemental data | | | | | | | | | | | | | | | | | | | | | | | | |
| Net assets, end of period (000) | | $ | 65,892 | | | $ | 111,189 | | | $ | 91,147 | | | $ | 84,583 | | | $ | 82,106 | | | $ | 77,773 | |
| Ratio to average net assets: | | | | | | | | | | | | | | | | | | | | | | | | |
| Expenses before waiver | | | 1.41 | %(3) | | | 1.40 | % | | | 1.49 | % | | | 1.41 | % | | | 1.33 | % | | | 1.38 | % |
| Expenses after waiver | | | 1.25 | %(3) | | | 1.26 | %(4) | | | 1.26 | %(4) | | | 1.28 | %(4) | | | 1.26 | %(4) | | | 1.30 | %(4)(5) |
| Net investment loss before waiver | | | (1.12 | )%(3) | | | (1.28 | )% | | | (1.18 | )% | | | (1.10 | )% | | | (1.13 | )% | | | (1.05 | )% |
| Net investment loss after waiver | | | (1.27 | )%(3) | | | (1.13 | )% | | | (0.95 | )% | | | (0.97 | )% | | | (1.06 | )% | | | (0.97 | )%(5) |
| Portfolio turnover rate | | | 7 | %(2) | | | 20 | % | | | 30 | % | | | 133 | % | | | 151 | % | | | 133 | % |
| (1) | Net investment loss per share is calculated using the ending balance prior to consideration or adjustment for permanent book-to-tax differences. |
| (4) | Includes interest expense of 0.01% for the year ended October 31, 2021, 0.01% for the year ended October 31, 2020, 0.03% for the year ended October 31, 2019, 0.01% for the year ended October 31, 2018, and 0.05% for the year ended October 31, 2017. Interest expense is not included in the Fund’s operating expense cap. |
| (5) | Expense waiver of 1.25% was implemented on November 1, 2016. |
The Accompanying Notes are an Integral Part of these Financial Statements.
The Tocqueville Phoenix Fund
Financial Highlights
| | | Six Months | | | | | | | | | | | | | | | | |
| Per share operating performance | | Ended | | | | | | | | | | | | | | | | |
| (For a share outstanding | | April 30, | | | Years Ended October 31, | |
| throughout the period) | | 2022 | | | 2021 | | | 2020 | | | 2019 | | | 2018 | | | 2017 | |
| | | (Unaudited) | | | | | | | | | | | | | | | | | | | | | |
| Net asset value, beginning of period | | $ | 26.53 | | | $ | 17.67 | | | $ | 19.98 | | | $ | 20.20 | | | $ | 26.40 | | | $ | 26.47 | |
| Operations: | | | | | | | | | | | | | | | | | | | | | | | | |
| Net investment loss (1) | | | (0.05 | ) | | | (0.16 | ) | | | (0.03 | ) | | | (0.03 | ) | | | (0.14 | ) | | | (0.15 | ) |
| Net realized and unrealized gain (loss) | | | (2.69 | ) | | | 9.40 | | | | (1.81 | ) | | | 1.16 | | | | (2.27 | ) | | | 4.91 | |
| Total from investment operations | | | (2.74 | ) | | | 9.24 | | | | (1.84 | ) | | | 1.13 | | | | (2.41 | ) | | | 4.76 | |
| Distributions to shareholders: | | | | | | | | | | | | | | | | | | | | | | | | |
| Dividends from net investment income | | | — | | | | — | | | | — | | | | — | (2) | | | — | | | | — | |
| Distributions from net realized gains | | | (2.75 | ) | | | (0.38 | ) | | | (0.47 | ) | | | (1.35 | ) | | | (3.79 | ) | | | (4.83 | ) |
| Total distributions | | | (2.75 | ) | | | (0.38 | ) | | | (0.47 | ) | | | (1.35 | ) | | | (3.79 | ) | | | (4.83 | ) |
| Change in net asset value for the period | | | (5.49 | ) | | | 8.86 | | | | (2.31 | ) | | | (0.22 | ) | | | (6.20 | ) | | | (0.07 | ) |
| Net asset value, end of period | | $ | 21.04 | | | $ | 26.53 | | | $ | 17.67 | | | $ | 19.98 | | | $ | 20.20 | | | $ | 26.40 | |
| | | | | | | | | | | | | | | | | | | | | | | | | |
| Total Return | | | – 11.8 | %(3) | | | 52.8 | % | | | (9.5 | )% | | | 6.2 | % | | | (10.6 | )% | | | 19.0 | % |
| Ratios/supplemental data | | | | | | | | | | | | | | | | | | | | | | | | |
| Net assets, end of period (000) | | $ | 148,467 | | | $ | 177,082 | | | $ | 131,658 | | | $ | 160,433 | | | $ | 237,119 | | | $ | 373,353 | |
| Ratio to average net assets: | | | | | | | | | | | | | | | | | | | | | | | | |
| Expenses before waiver | | | 1.41 | %(4) | | | 1.43 | % | | | 1.50 | % | | | 1.39 | % | | | 1.32 | % | | | 1.31 | % |
| Expenses after waiver | | | 1.25 | %(4) | | | 1.25 | % | | | 1.25 | % | | | 1.25 | % | | | 1.25 | % | | | 1.25 | %(5) |
| Net investment loss before waiver | | | (0.76 | )%(4) | | | (0.78 | )% | | | (0.41 | )% | | | (0.24 | )% | | | (0.55 | )% | | | (0.55 | )% |
| Net investment loss after waiver | | | (0.60 | )%(4) | | | (0.60 | )% | | | (0.16 | )% | | | (0.10 | )% | | | (0.48 | )% | | | (0.49 | )%(5) |
| Portfolio turnover rate | | | 11 | %(3) | | | 21 | % | | | 24 | % | | | 40 | % | | | 40 | % | | | 36 | % |
| (1) | Net investment loss per share is calculated using the ending balance prior to consideration or adjustment for permanent book-to-tax differences. |
| (2) | Represents less than $0.01. |
| (5) | Expense waiver of 1.25% was implemented on November 1, 2016. |
The Accompanying Notes are an Integral Part of these Financial Statements.
The Tocqueville Fund
Schedule of Investments as of April 30, 2022
(Unaudited)
| Common Stocks—97.4% | | Shares | | | Value | |
| Banks—1.5% | | | | | | | | |
| Bank of America Corp. | | | 120,000 | | | $ | 4,281,600 | |
| Capital Goods—7.7% | | | | | | | | |
| Caterpillar, Inc. | | | 25,000 | | | | 5,263,500 | |
| Deere & Co. | | | 20,000 | | | | 7,551,000 | |
| Illinois Tool Works, Inc. | | | 25,000 | | | | 4,927,750 | |
| Parker-Hannifin Corp. | | | 15,000 | | | | 4,062,300 | |
| | | | | | | | 21,804,550 | |
| Commercial & Professional Services—2.7% |
| Republic Services, Inc. | | | 40,000 | | | | 5,370,800 | |
| Steelcase, Inc.—Class A | | | 200,000 | | | | 2,346,000 | |
| | | | | | | | 7,716,800 | |
| Consumer Services—3.7% | | | | | | | | |
| Expedia Group, Inc.(a) | | | 25,000 | | | | 4,368,750 | |
| McDonald’s Corp. | | | 25,000 | | | | 6,229,000 | |
| | | | | | | | 10,597,750 | |
| Diversified Financials—2.3% | | | | | | | | |
| The Charles Schwab Corp. | | | 100,000 | | | | 6,633,000 | |
| Energy—6.4% | | | | | | | | |
| Cameco Corp.—ADR(b) | | | 25,000 | | | | 645,250 | |
| Chevron Corp. | | | 40,000 | | | | 6,266,800 | |
| Diamondback Energy, Inc. | | | 40,000 | | | | 5,049,200 | |
| Halliburton Co. | | | 100,000 | | | | 3,562,000 | |
| Occidental Petroleum Corp. | | | 50,000 | | | | 2,754,500 | |
| | | | | | | | 18,277,750 | |
| Food & Staples Retailing—2.4% | | | | | | | | |
| Walmart, Inc. | | | 45,000 | | | | 6,884,550 | |
| Food, Beverage & Tobacco—2.3% | | | | | | | | |
| The Coca-Cola Co. | | | 100,000 | | | | 6,461,000 | |
| Health Care Equipment & Services—2.0% |
| Abbott Laboratories | | | 50,000 | | | | 5,675,000 | |
| Household & Personal Products—5.5% | | | | | | | | |
| Colgate-Palmolive Co. | | | 100,000 | | | | 7,705,000 | |
| The Procter & Gamble Co. | | | 50,000 | | | | 8,027,500 | |
| | | | | | | | 15,732,500 | |
| Insurance—2.0% | | | | | | | | |
| Aflac, Inc. | | | 100,000 | | | | 5,728,000 | |
| Materials—13.6% | | | | | | | | |
| BHP Group Ltd.—ADR(b) | | | 50,000 | | | | 3,349,000 | |
| Dow, Inc. | | | 40,000 | | |
| 2,660,000 | |
| DuPont de Nemours, Inc. | | | 25,000 | | | | 1,648,250 | |
| Freeport-McMoRan, Inc. | | | 100,000 | | | | 4,055,000 | |
| Newmont Mining Corp. | | | 10,000 | | | | 728,500 | |
| Nutrien Ltd.(a) | | | 50,000 | | | | 4,912,500 | |
| Pan American Silver Corp.—ADR(b) | | | 100,000 | | | | 2,477,000 | |
| Sibanye Stillwater Ltd.—ADR(b) | | | 100,000 | | | | 1,374,000 | |
| Sonoco Products Co. | | | 75,000 | | | | 4,643,250 | |
| South32 Ltd.—ADR | | | 100,000 | | | | 1,659,000 | |
| Vulcan Materials Co. | | | 40,000 | | | | 6,891,600 | |
| Wheaton Precious Metals Corp.—ADR(b) | | | 100,000 | | | | 4,486,000 | |
| | | | | | | | 38,884,100 | |
| Media & Entertainment—5.2% | | | | | | | | |
| Alphabet, Inc.—Class A(a) | | | 4,000 | | | | 9,128,760 | |
| The Walt Disney Co.(a) | | | 50,000 | | | | 5,581,500 | |
| | | | | | | | 14,710,260 | |
| Pharmaceuticals, Biotechnology & Life Sciences—7.4% | | | | | | | | |
| Johnson & Johnson | | | 20,000 | | | | 3,609,200 | |
| Merck & Co., Inc. | | | 100,000 | | | | 8,869,000 | |
| Pfizer, Inc. | | | 175,000 | | | | 8,587,250 | |
| | | | | | | | 21,065,450 | |
| Real Estate—0.2% | | | | | | | | |
| Tejon Ranch Co.(a) | | | 25,000 | | | | 457,750 | |
| Retailing—4.0% | | | | | | | | |
| Amazon.com, Inc.(a) | | | 2,500 | | | | 6,214,075 | |
| eBay, Inc. | | | 100,000 | | | | 5,192,000 | |
| | | | | | | | 11,406,075 | |
| Semiconductors & Semiconductor Equipment—8.8% | | | | | | | | |
| Applied Materials, Inc. | | | 70,000 | | | | 7,724,500 | |
| Intel Corp. | | | 90,000 | | | | 3,923,100 | |
| NVIDIA Corp. | | | 35,000 | | | | 6,491,450 | |
| QUALCOMM, Inc. | | | 50,000 | | | | 6,984,500 | |
| | | | | | | | 25,123,550 | |
| Software & Services—7.6% | | | | | | | | |
| Activision Blizzard, Inc. | | | 25,000 | | | | 1,890,000 | |
The Accompanying Footnotes are an Integral Part of these Financial Statements.
The Tocqueville Fund
Schedule of Investments as of April 30, 2022
(Unaudited)
| Common Stocks—97.4% | | Shares | | | Value | |
| Automatic Data Processing, Inc. | | | 40,000 | | | $ | 8,727,200 | |
| Microsoft Corp. | | | 40,000 | | | | 11,100,800 | |
| | | | | | | | 21,718,000 | |
| Technology Hardware & Equipment—3.9% |
| Apple, Inc. | | | 70,000 | | | | 11,035,500 | |
| Telecommunication Services—1.6% | | | | | | | | |
| Verizon Communications, Inc. | | | 100,000 | | | | 4,630,000 | |
| Transportation—1.4% | | | | | | | | |
| Delta Air Lines, Inc.(a) | | | 90,000 | | | | 3,872,700 | |
| Utilities—5.2% | | | | | | | | |
| Dominion Energy, Inc. | | | 50,000 | | | | 4,082,000 | |
| NextEra Energy, Inc. | | | 150,000 | | | | 10,653,000 | |
| | | | | | | | 14,735,000 | |
| Total Common Stocks | | | | | | | | |
| (Cost $114,398,080) | | | | | | | 277,430,885 | |
| Real Estate Investment Trust (REIT)—2.5% |
| Real Estate—2.5% | | | | | | | | |
| Weyerhaeuser Co. | | | 175,000 | | | | 7,213,500 | |
| Total Real Estate Investment Trust | | | | | | | | |
| (Cost $3,359,578) | | | | | | | 7,213,500 | |
| Short-Term Investment—0.1% | | Shares | | Value | |
| Money Market Mutual Fund—0.1% | | | | | | | | |
| STIT Treasury Portfolio—Institutional Class, 0.226%(c) | | | 232,853 | | | $ | 232,853 | |
| Total Short-Term Investment | | | | | | | | |
| (Cost $232,853) | | | | | | | 232,853 | |
| Total Investments | | | | | | | | |
| (Cost $117,990,511)—100.0% | | | | | | | 284,877,238 | |
| Liabilities in Excess of Other Assets—0.0% | | | | | | | (58,572 | ) |
| Total Net Assets—100.0% | | | | | | $ | 284,818,666 | |
Percentages are stated as a percent of net assets.
ADR American Depository Receipt
| (a) | Non-income producing security. |
| (b) | Foreign issued Security. Foreign Concentration (including ADR’s) was as follows: Australia 1.8%; Canada 4.4%; South Africa 0.5%. |
| (c) | Rate listed is the 7-day effective yield. |
The Global Industry Classification Standard (GICS®) was developed by and/or is the exclusive property of MSCI, Inc. and Standard & Poor Financial Services LLC (“S&P”). GICS is a service mark of MSCI and S&P and has been licensed for use by U.S. Bank Global Fund Services.
The Accompanying Footnotes are an Integral Part of these Financial Statements.
The Tocqueville Opportunity Fund
Schedule of Investments as of April 30, 2022
(Unaudited)
| Common Stocks—94.2% | | Shares | | | Value | |
| Capital Goods—6.9% | | | | | | | | |
| Advanced Drainage Systems, Inc. | | | 2,500 | | | $ | 256,150 | |
| Bloom Energy Corp.(a) | | | 10,000 | | | | 185,600 | |
| Dover Corp. | | | 2,000 | | | | 266,600 | |
| HEICO Corp. | | | 3,843 | | | | 542,747 | |
| Hubbell, Inc. | | | 2,500 | | | | 488,400 | |
| IDEX Corp. | | | 2,500 | | | | 474,550 | |
| Masco Corp. | | | 6,000 | | | | 316,140 | |
| Nordson Corp. | | | 2,000 | | | | 431,380 | |
| nVent Electric Plc—ADR(b) | | | 10,000 | | | | 337,800 | |
| Plug Power, Inc.(a) | | | 10,000 | | | | 210,200 | |
| Simpson Manufacturing Co, Inc. | | | 2,500 | | | | 259,175 | |
| SiteOne Landscape Supply, Inc.(a) | | | 2,500 | | | | 352,575 | |
| Trex Co., Inc.(a) | | | 5,000 | | | | 290,950 | |
| WillScot Mobile Mini Holdings Corp.(a) | | | 3,000 | | | | 105,300 | |
| | | | | | | | 4,517,567 | |
| Commercial & Professional Services—9.9% | | | | | | | | |
| Booz Allen Hamilton Holding Corp. | | | 6,500 | | | | 530,595 | |
| Cintas Corp. | | | 3,500 | | | | 1,390,410 | |
| Copart, Inc.(a) | | | 7,000 | | | | 795,550 | |
| CoStar Group, Inc.(a) | | | 10,000 | | | | 636,200 | |
| Exponent, Inc. | | | 5,000 | | | | 479,050 | |
| TransUnion | | | 8,500 | | | | 743,920 | |
| Verisk Analytics, Inc. | | | 4,000 | | | | 816,200 | |
| Waste Connections, Inc.—ADR(b) | | | 8,000 | | | | 1,103,760 | |
| | | | | | | | 6,495,685 | |
| Consumer Durables & Apparel—0.6% | | | | | | | | |
| TopBuild Corp.(a) | | | 1,500 | | | | 271,710 | |
| YETI Holdings, Inc.(a) | | | 2,500 | | | | 122,175 | |
| | | | | | | | 393,885 | |
| Consumer Services—0.8% | | | | | | | | |
| Bright Horizons Family Solutions, Inc.(a) | | | 1,700 | | | | 194,208 | |
| Churchill Downs, Inc. | | | 1,500 | | | | 304,410 | |
| Restaurant Brands International LP | | | 37 | | |
| 2,166 | |
| | | | | | | | 500,784 | |
| Diversified Financials—5.1% | | | | | | | | |
| Coinbase Global, Inc.—Class A(a) | | | 1,200 | | | | 135,252 | |
| LPL Financial Holdings, Inc. | | | 2,500 | | | | 469,675 | |
| MarketAxess Holdings, Inc. | | | 1,250 | | | | 329,513 | |
| MSCI, Inc. | | | 2,000 | | | | 842,500 | |
| S&P Global, Inc. | | | 2,500 | | | | 941,250 | |
| Tradeweb Markets, Inc.—Class A | | | 9,000 | | | | 640,710 | |
| | | | | | | | 3,358,900 | |
| Food, Beverage & Tobacco—0.2% | | | | | | | | |
| Freshpet, Inc.(a) | | | 1,200 | | | | 112,020 | |
| Health Care Equipment & Services—11.4% |
| DexCom, Inc.(a) | | | 7,000 | | | | 2,860,060 | |
| IDEXX Laboratories, Inc.(a) | | | 2,800 | | | | 1,205,344 | |
| Insulet Corp.(a) | | | 5,600 | | | | 1,338,344 | |
| Intuitive Surgical, Inc.(a) | | | 1,950 | | | | 466,635 | |
| Shockwave Medical, Inc.(a) | | | 1,200 | | | | 181,356 | |
| Tandem Diabetes Care, Inc.(a) | | | 4,500 | | | | 434,160 | |
| Veeva Systems, Inc.—Class A(a) | | | 5,500 | | | | 1,000,725 | |
| | | | | | | | 7,486,624 | |
| Media & Entertainment—0.3% | | | | | | | | |
| IAC/InterActiveCorp(a) | | | 2,500 | | | | 207,200 | |
| Pharmaceuticals, Biotechnology & Life Sciences—6.8% | | | | | | | | |
| Avantor, Inc.(a) | | | 12,000 | | | | 382,560 | |
| Bio-Techne Corp. | | | 1,200 | | | | 455,628 | |
| Charles River Laboratories International, Inc.(a) | | | 2,400 | | | | 579,624 | |
| Elanco Animal Health, Inc.(a) | | | 10,000 | | | | 253,100 | |
| Genmab A/S(a)(b) | | | 3,000 | | | | 1,065,776 | |
| Iovance Biotherapeutics, Inc.(a) | | | 50,000 | | | | 757,500 | |
| Mirati Therapeutics, Inc.(a) | | | 2,000 | | | | 123,580 | |
| Neurocrine Biosciences, Inc.(a) | | | 4,000 | | | | 360,120 | |
| Repligen Corp.(a) | | | 1,000 | | | | 157,240 | |
| Seagen, Inc.(a) | | | 2,500 | | | | 327,525 | |
| | | | | | | | 4,462,653 | |
The Accompanying Footnotes are an Integral Part of these Financial Statements.
The Tocqueville Opportunity Fund
Schedule of Investments as of April 30, 2022
(Unaudited)
| Common Stocks—94.2% | | Shares | | | Value | |
| Retailing—3.4% | | | | | | | | |
| Floor & Decor Holdings, Inc.—Class A(a) | | | 3,000 |
| | $ | 239,160 | |
| Pool Corp. | | | 2,750 | | | | 1,114,355 | |
| RH(a) | | | 2,150 | | | | 722,658 | |
| Williams-Sonoma, Inc. | | | 1,500 | | | | 195,720 | |
| | | | | | | | 2,271,893 | |
| Semiconductors & Semiconductor Equipment—0.2% | | | | | | | | |
| Entegris, Inc. | | | 1,500 | | | | 167,085 | |
| Software & Services—47.9% | | | | | | | | |
| ANSYS, Inc.(a) | | | 1,500 | | | | 413,535 | |
| Aspen Technology, Inc.(a) | | | 2,000 | | | | 317,080 | |
| Atlassian Corp. PLC—Class A(a)(b) | | | 3,500 | | | | 786,905 | |
| Avalara, Inc.(a) | | | 7,000 | | | | 532,490 | |
| Cadence Design Systems, Inc.(a) | | | 5,000 | | | | 754,250 | |
| Coupa Software, Inc.(a) | | | 5,000 | | | | 431,500 | |
| EPAM Systems, Inc.(a) | | | 3,500 | | | | 927,465 | |
| Fair Isaac Corp.(a) | | | 1,500 | | | | 560,265 | |
| Fortinet, Inc.(a) | | | 4,500 | | | | 1,300,545 | |
| Marqeta, Inc.(a) | | | 16,565 | | | | 154,054 | |
| MongoDB, Inc.(a) | | | 2,500 | | | | 887,325 | |
| Okta, Inc.(a) | | | 16,000 | | | | 1,908,960 | |
| Paycom Software, Inc.(a) | | | 9,800 | | | | 2,758,406 | |
| Paylocity Holding Corp.(a) | | | 22,500 | | | | 4,266,675 | |
| ServiceNow, Inc.(a) | | | 13,000 | | | | 6,215,300 | |
| Shopify, Inc.—Class A(a)(b) | | | 5,650 | | | | 2,411,533 | |
| TaskUS, Inc.(a) | | | 8,000 | | | | 231,120 | |
| Twilio, Inc.—Class A(a) | | | 9,500 | | | | 1,062,290 | |
| Tyler Technologies, Inc.(a) | | | 1,000 | | | | 394,710 | |
| Unity Software, Inc.(a) | | | 6,000 | | | | 398,460 | |
| Workday, Inc.—Class A(a) | | | 16,500 | | | | 3,410,550 | |
| Zendesk, Inc.(a) | | | 12,000 | | | | 1,464,480 | |
| | | | | | | | 31,587,898 | |
| Transportation—0.7% | | | | | | | | |
| GXO Logistics, Inc.(a) | | | 4,000 |
| | $ | 236,760 | |
| Saia, Inc.(a) | | | 1,200 | | | | 247,152 | |
| | | | | | | | 483,912 | |
| Total Common Stocks | | | | | | | | |
| (Cost $30,796,246) | | | | | | | 62,046,106 | |
| Short-Term Investment—5.0% | | | | | | | | |
| Money Market Mutual Fund—5.0% | | | | | | | | |
| STIT Treasury Portfolio—Institutional Class, 0.226%(c) | | | 3,308,989 | | | | 3,308,989 | |
| Total Short-Term Investment | | | | | | | | |
| (Cost $3,308,989) | | | | | | | 3,308,989 | |
| Total Investments | | | | | | | | |
| (Cost $34,105,235)—99.2% | | | | | | | 65,355,095 | |
| Other Assets in Excess of Liabilities—0.8% | | | | | | | 536,528 | |
| Total Net Assets—100.0% | | | | | | $ | 65,891,623 | |
Percentages are stated as a percent of net assets.
ADR American Depository Receipt
| (a) | Non-income producing security. |
| (b) | Foreign issued Security. Foreign Concentration (including ADR’s) was as follows: Canada 5.3%; Denmark 1.6%; Ireland 0.5%; United Kingdom 1.2%. |
| (c) | Rate listed is the 7-day effective yield. |
The Accompanying Footnotes are an Integral Part of these Financial Statements.
The Tocqueville Phoenix Fund
Schedule of Investments as of April 30, 2022
(Unaudited)
| Common Stocks—91.5% | | Shares | | | Value | |
| Auto Components—3.9% | | | | | | | | |
| Lear Corp. | | | 15,000 | | | $ | 1,919,100 | |
| Modine Manufacturing Co.(a) | | | 70,000 | | | | 553,000 | |
| Visteon Corp.(a) | | | 31,000 | | | | 3,246,010 | |
| | | | | | | | 5,718,110 | |
| Building Products—4.0% | | | | | | | | |
| Apogee Enterprises, Inc. | | | 135,000 | | | | 5,940,000 | |
| Chemicals—8.8% | | | | | | | | |
| Avient Corp. | | | 70,000 | | | | 3,446,800 | |
| Innospec, Inc. | | | 29,000 | | | | 2,763,990 | |
| Orion Engineered Carbons SA—ADR(b) | | | 455,000 | | | | 6,870,500 | |
| | | | | | | | 13,081,290 | |
| Commercial Services & Supplies—5.2% | | | | | | | | |
| ABM Industries, Inc. | | | 105,000 | | | | 5,068,350 | |
| Harsco Corp.(a) | | | 270,000 | | | | 2,759,400 | |
| | | | | | | | 7,827,750 | |
| Communications Equipment—6.6% | | | | | | | | |
| Airspan Networks Holdings, Inc.(a) | | | 200,000 | | | | 502,000 | |
| Comtech Telecommunications Corp. | | | 190,435 | | | | 2,589,916 | |
| Lumentum Holdings, Inc.(a) | | | 83,000 | | | | 6,740,430 | |
| | | | | | | | 9,832,346 | |
| Electronic Equipment, Instruments & Components—18.3% | | | | | | | | |
| Fabrinet—ADR(a)(b) | | | 62,100 | | | | 6,097,599 | |
| Flex Ltd.—ADR(a)(b) | | | 415,000 | | | | 6,843,350 | |
| II-VI, Inc.(a) | | | 35,000 | | | | 2,142,350 | |
| Knowles Corp.(a) | | | 85,000 | | | | 1,574,200 | |
| Plexus Corp.(a) | | | 60,000 | | | | 4,868,400 | |
| TTM Technologies, Inc.(a) | | | 400,000 | | | | 5,580,000 | |
| | | | | | | | 27,105,899 | |
| Food Products—4.7% | | | | | | | | |
| Farmer Brothers Co.(a) | | | 500,000 | | | | 3,140,000 | |
| Landec Corp.(a) | | | 378,700 | | | | 3,768,065 | |
| | | | | | | | 6,908,065 | |
| Health Care Equipment & Supplies—3.1% | | | | | | | | |
| Inogen, Inc.(a) | | | 175,000 | | |
| 4,424,000 | |
| Lantheus Holdings, Inc.(a) | | | 3,000 | | | | 199,230 | |
| | | | | | | | 4,623,230 | |
| Health Care Providers & Services—2.2% | | | | | | | | |
| Cross Country Healthcare, Inc.(a) | | | 175,000 | | | | 3,279,500 | |
| Household Durables—2.7% | | | | | | | | |
| Mohawk Industries, Inc.(a) | | | 19,700 | | | | 2,778,882 | |
| Newell Brands, Inc. | | | 55,000 | | | | 1,273,250 | |
| | | | | | | | 4,052,132 | |
| Interactive Media & Services—2.7% | | | | | | | | |
| Cars.com, Inc.(a) | | | 363,500 | | | | 4,042,120 | |
| IT Services—4.4% | | | | | | | | |
| DXC Technology Co.(a) | | | 124,000 | | | | 3,558,800 | |
| Unisys Corp.(a) | | | 204,598 | | | | 2,907,338 | |
| | | | | | | | 6,466,138 | |
| Machinery—8.7% | | | | | | | | |
| Crane Co. | | | 57,500 | | | | 5,533,225 | |
| Mayville Engineering Co., Inc.(a) | | | 401,311 | | | | 3,322,855 | |
| REV Group, Inc. | | | 75,000 | | | | 894,000 | |
| Stanley Black & Decker, Inc. | | | 26,000 | | | | 3,123,900 | |
| | | | | | | | 12,873,980 | |
| Pharmaceuticals—1.7% | | | | | | | | |
| Phibro Animal Health Corp. | | | 140,000 | | | | 2,518,600 | |
| Professional Services—2.8% | | | | | | | | |
| BGSF, Inc. | | | 300,000 | | | | 3,663,000 | |
| Mistras Group, Inc.(a) | | | 80,000 | | | | 455,200 | |
| | | | | | | | 4,118,200 | |
| Semiconductors & Semiconductor Equipment—4.2% | | | | | | | | |
| ams AG(a)(b) | | | 500,000 | | | | 6,240,041 | |
| Software—1.7% | | | | | | | | |
| ON24, Inc.(a) | | | 200,000 | | | | 2,534,000 | |
| Textiles, Apparel & Luxury Goods—2.8% | | | | | | | | |
| Lakeland Industries, Inc.(a) | | | 20,000 | | | | 323,600 | |
| PVH Corp. | | | 53,000 | | | | 3,857,340 | |
| | | | | | | | 4,180,940 | |
The Accompanying Footnotes are an Integral Part of these Financial Statements.
The Tocqueville Phoenix Fund
Schedule of Investments as of April 30, 2022
(Unaudited)
| Common Stocks—91.5% | | Shares | | | Value | |
| Trading Companies & Distributors—3.0% | | | | | | | | |
| Rush Enterprises, Inc.—Class A | | | 88,000 | | | $ | 4,477,440 | |
| Total Common Stocks | | | | | | | | |
| (Cost $116,806,866) | | | | | | | 135,819,781 | |
| Short-Term Investment—5.0% | | | | | | | | |
| Money Market Mutual Fund—5.0% | | | | | | | | |
| STIT Treasury Portfolio—Institutional Class, 0.226%(c) | | | 7,400,000 | | | | 7,400,000 | |
| Total Short-Term Investment | | | | | | | | |
| (Cost $7,400,000) | | | | | | | 7,400,000 | |
| Total Investments | | | | | | | | |
| (Cost $124,206,866)—96.5% | | | | | | | 143,219,781 | |
| Other Assets in Excess of Liabilities—3.5% | | | | | | | 5,246,822 | |
| Total Net Assets—100.0% | | | | | | $ | 148,466,603 | |
Percentages are stated as a percent of net assets.
ADR American Depository Receipt
| (a) | Non-income producing security. |
| (b) | Foreign issued Security. Foreign Concentration (including ADR’s) was as follows: Austria 4.2%; Cayman Islands 4.1%; Luxembourg 4.6%; Singapore 4.6%. |
| (c) | Rate listed is the 7-day effective yield. |
The Accompanying Footnotes are an Integral Part of these Financial Statements.
Percent of Total Investments (Unaudited)
The Tocqueville Fund
Allocation of Portfolio Holdings
April 30, 2022

The Tocqueville Opportunity Fund
Allocation of Portfolio Holdings
April 30, 2022
Percent of Total Investments (Unaudited)
The Tocqueville Phoenix Fund
Allocation of Portfolio Holdings
April 30, 2022

The Tocqueville Trust
Statements of Assets and Liabilities
April 30, 2022
(Unaudited)
| | | The
Tocqueville
Fund | | | The
Tocqueville
Opportunity
Fund | | | The
Tocqueville
Phoenix
Fund | |
| Assets: | | | | | | | | | | | | |
| Investments, at value (1) | | $ | 284,877,238 | | | $ | 65,355,095 | | | $ | 143,219,781 | |
| Cash cash equivalents | | | — | | | | 595,779 | | | | 6,109,130 | |
| Receivable for Fund shares sold | | | 100 | | | | 17,713 | | | | 4,229 | |
| Dividends, interest and other receivables | | | 266,488 | | | | 3,532 | | | | 40,889 | |
| Other assets | | | 29,555 | | | | 16,731 | | | | 27,904 | |
| Total Assets | | | 285,173,381 | | | | 65,988,850 | | | | 149,401,933 | |
| Liabilities: | | | | | | | | | | | | |
| Payable for investments purchased | | | — | | | | — | | | | 592,983 | |
| Payable for Fund shares redeemed | | | 3,200 | | | | 812 | | | | 179,047 | |
| Payable to Adviser | | | 173,635 | | | | 33,226 | | | | 79,843 | |
| Payable to Administrator | | | 47,201 | | | | 11,062 | | | | 17,060 | |
| Payable to Trustees | | | 27,692 | | | | 12,494 | | | | 15,611 | |
| Accrued distribution fee | | | 49,618 | | | | 9,989 | | | | 17,204 | |
| Accrued expenses and other liabilities | | | 53,369 | | | | 29,644 | | | | 33,582 | |
| Total Liabilities | | | 354,715 | | | | 97,227 | | | | 935,330 | |
| Net Assets | | $ | 284,818,666 | | | $ | 65,891,623 | | | $ | 148,466,603 | |
| | | | | | | | | | | | | |
| Net assets consist of: | | | | | | | | | | | | |
| Paid in capital | | $ | 99,078,907 | | | $ | 29,157,986 | | | $ | 118,432,853 | |
| Total distributable earnings | | | 185,739,759 | | | | 36,733,637 | | | | 30,033,750 | |
| Net assets | | $ | 284,818,666 | | | $ | 65,891,623 | | | $ | 148,466,603 | |
| Shares of beneficial interest outstanding (unlimited shares of $0.01 par value authorized) | | | 6,761,583 | | | | 2,276,821 | | | | 7,057,770 | |
| Net asset value, offering and redemption price per share | | $ | 42.12 | | | $ | 28.94 | | | $ | 21.04 | |
| (1) Cost of investments | | $ | 117,990,511 | | | $ | 34,105,235 | | | $ | 124,206,866 | |
The Accompanying Notes are an Integral Part of these Financial Statements.
The Tocqueville Trust
Statements of Operations
(Unaudited)
| | | The
Tocqueville
Fund | | | The
Tocqueville
Opportunity
Fund | | | The
Tocqueville
Phoenix
Fund | |
| Investment Income: | | | | | | | | | | | | |
| Dividends* | | $ | 2,979,295 | | | $ | 57,644 | | | $ | 544,945 | |
| Interest | | | 115 | | | | 931 | | | | 2,235 | |
| Total investment income | | | 2,979,410 | | | | 58,575 | | | | 547,180 | |
| Expenses: | | | | | | | | | | | | |
| Investment Adviser’s fee (See Note 4) | | | 1,150,917 | | | | 320,787 | | | | 676,793 | |
| Distribution (12b-1) fees (See Note 4) | | | 383,639 | | | | 106,929 | | | | 211,498 | |
| Administration fees (See Note 4) | | | 230,184 | | | | 64,158 | | | | 126,898 | |
| Transfer agent and shareholder services fees | | | 46,865 | | | | 21,163 | | | | 43,771 | |
| Trustee fees and expenses | | | 43,447 | | | | 15,479 | | | | 24,456 | |
| Legal fees | | | 30,944 | | | | 10,432 | | | | 17,651 | |
| Other expenses | | | 30,843 | | | | 15,458 | | | | 20,366 | |
| Fund accounting fees | | | 26,600 | | | | 10,150 | | | | 15,298 | |
| Printing and mailing expense | | | 13,558 | | | | 5,907 | | | | 20,167 | |
| Blue sky fees | | | 13,293 | | | | 11,671 | | | | 12,656 | |
| Insurance expense | | | 10,108 | | | | 2,576 | | | | 5,437 | |
| Custody fees | | | 7,767 | | | | 6,020 | | | | 8,320 | |
| Audit fees | | | 6,150 | | | | 7,421 | | | | 7,421 | |
| Registration fees | | | 2,913 | | | | 1,782 | | | | 2,130 | |
| Interest expense | | | 1,872 | | | | 1,790 | | | | — | |
| Total expenses before waiver | | | 1,999,100 | | | | 601,723 | | | | 1,192,862 | |
| Less: Fees waived (See Note 4) | | | (80,368 | ) | | | (65,287 | ) | | | (135,374 | ) |
| Net expenses | | | 1,918,732 | | | | 536,436 | | | | 1,057,488 | |
| Net Investment Income (Loss) | | | 1,060,678 | | | | (477,861 | ) | | | (510,308 | ) |
| Realized and Unrealized Gain (Loss): | | | | | | | | | | | | |
| Net realized gain (loss) on: | | | | | | | | | | | | |
| Investments | | | 17,818,101 | | | | 6,288,327 | | | | 11,572,181 | |
| Foreign currency translation | | | — | | | | — | | | | (2,930 | ) |
| | | | 17,818,101 | | | | 6,288,327 | | | | 11,569,251 | |
| Net change in unrealized depreciation on Investments | | | (28,266,840 | ) | | | (45,732,182 | ) | | | (30,912,527 | ) |
| Net loss on investments and foreign currency | | | (10,448,739 | ) | | | (39,443,855 | ) | | | (19,343,276 | ) |
| Net decrease in Net Assets Resulting from Operations | | $ | (9,388,061 | ) | | $ | (39,921,716 | ) | | $ | (19,853,584 | ) |
| * Net of foreign taxes withheld of: | | $ | 22,718 | | | $ | 486 | | | $ | 2,468 | |
The Accompanying Notes are an Integral Part of these Financial Statements.
The Tocqueville Trust
Statements of Changes in Net Assets
(Unaudited)
| | | The Tocqueville Fund | | | The Tocqueville
Opportunity Fund | | | The Tocqueville
Phoenix Fund | |
| | | For the Six -
Months Ended
April 30,
2022 | | | For the
Year Ended
October 31,
2021 | | | For the Six -
Months Ended
April 30,
2022 | | | For the
Year Ended
October 31,
2021 | | | For the Six -
Months Ended
April 30,
2022 | | | For the
Year Ended
October 31,
2021 | |
| Operations: | | | | | | | | | | | | | | | | | | |
| Net investment income (loss) | | $ | 1,060,678 | | | $ | 1,614,750 | | | $ | (477,861 | ) | | $ | (1,165,395 | ) | | $ | (510,308 | ) | | $ | (1,034,171 | ) |
| Net realized gain on sale of investments and foreign currency | | | 17,818,101 | | | | 32,413,869 | | | | 6,288,327 | | | | 8,976,875 | | | | 11,569,251 | | | | 20,189,000 | |
| Net realized loss on written options | | | — | | | | — | | | | — | | | | (179,344 | ) | | | — | | | | — | |
| Net change in unrealized appreciation (depreciation) | | | (28,266,840 | ) | | | 51,257,914 | | | | (45,732,182 | ) | | | 20,759,746 | | | | (30,912,527 | ) | | | 47,541,402 | |
| Net increase (decrease) in net assets resulting from operations | | | (9,388,061 | ) | | | 85,286,533 | | | | (39,921,716 | ) | | | 28,391,882 | | | | (19,853,584 | ) | | | 66,696,231 | |
| Total dividends and distributions | | | (32,027,478 | ) | | | (9,233,776 | ) | | | (6,183,352 | ) | | | (3,607,856 | ) | | | (17,861,486 | ) | | | (2,758,109 | ) |
| Fund share transactions: | | | | | | | | | | | | | | | | | | | | | | | | |
| Shares sold | | | 1,628,655 | | | | 7,070,997 | | | | 2,875,437 | | | | 10,665,735 | | | | 7,900,527 | | | | 7,574,788 | |
| Shares issued to holders in reinvestment of dividends | | | 30,439,280 | | | | 8,758,558 | | | | 6,056,414 | | | | 3,539,900 | | | | 17,378,188 | | | | 2,688,871 | |
| Shares redeemed | | | (19,573,229 | ) | | | (29,239,052 | ) | | | (8,124,496 | ) | | | (18,947,317 | ) | | | (16,179,347 | ) | | | (28,777,744 | ) |
| Net decrease | | | 12,494,706 | | | | (13,409,497 | ) | | | 807,355 | | | | (4,741,682 | ) | | | 9,099,368 | | | | (18,514,085 | ) |
| Net increase (decrease) in net assets | | | (28,920,833 | ) | | | 62,643,260 | | | | (45,297,713 | ) | | | 20,042,344 | | | | (28,615,702 | ) | | | 45,424,037 | |
| Net Assets: | | | | | | | | | | | | | | | | | | | | | | | | |
| Beginning of period | | | 313,739,499 | | | | 251,096,239 | | | | 111,189,336 | | | | 91,146,992 | | | | 177,082,305 | | | | 131,658,268 | |
| End of period | | $ | 284,818,666 | | | $ | 313,739,499 | | | $ | 65,891,623 | | | $ | 111,189,336 | | | $ | 148,466,603 | | | $ | 177,082,305 | |
| * Net of redemption fees of: | | $ | — | | | $ | — | | | $ | — | | | $ | — | | | $ | — | | | $ | — | |
The Accompanying Notes are an Integral Part of these Financial Statements.
The Tocqueville Trust
Notes to Financial Statements
The Tocqueville Trust (the “Trust”) is a Massachusetts business trust registered under the Investment Company Act of 1940 and organized on September 17, 1986, consisting of three separate funds (each, a “Fund” or, collectively, the “Funds”). Each Fund is an open-end management investment company with a different investment objective. The Tocqueville Fund, The Tocqueville Opportunity Fund (the “Opportunity Fund”), and The Tocqueville Phoenix Fund are each classified as diversified investment companies. The Tocqueville Fund’s investment objective is long-term capital appreciation, which it seeks to achieve by investing primarily in securities of United States issuers. The Opportunity Fund’s investment objective is to achieve long-term capital appreciation, which it seeks to achieve by investing in the common stocks of small and mid-cap companies which have the potential to deliver superior long term earnings growth. The Tocqueville Phoenix Fund’s investment objectives are to seek long-term preservation of capital (sufficient growth to outpace inflation over an extended period of time) and growth of capital, which it seeks to achieve by investing primarily in common stocks of small and mid-cap value companies that the portfolio managers consider to be undervalued, generate strong free cash flow, have shareholder friendly management teams and possess a catalyst for improved financial performance.
The Tocqueville Phoenix Fund (formerly known as The Delafield Fund), a series of the Trust, commenced operations on September 28, 2009, as successor to Delafield Fund, Inc. The predecessor Delafield Fund, Inc. commenced operations on November 19, 1993. The Delafield Fund changed its name to The Tocqueville Phoenix Fund on February 15, 2019. On November 15, 2019, The Tocqueville Phoenix Fund acquired all the net assets of The Tocqueville Select Fund.
| 2. | SIGNIFICANT ACCOUNTING POLICIES |
The following is a summary of significant accounting policies consistently followed by the Portfolios in the preparation of their financial statements. These policies are in conformity with accounting principles generally accepted in the United States of America (“U.S. GAAP”). The Funds follow accounting and reporting guidance under Financial Accounting Standards Board (“FASB”) Accounting Standards Codification Topic 946, “Financial Services—Investment Companies.”
a) Security valuation and security transactions
Investments in securities, including foreign securities, traded on an exchange or quoted on the over-the-counter market are valued at the last sale price or, if no sale occurred during the day, at the mean between closing bid and ask prices, as last reported by a pricing service approved by the Trustees. Securities that are principally traded on the National Association of Securities Dealers Automated Quotation National Market (“NASDAQ”) are generally valued at the NASDAQ Official Closing Price (“NOCP”). If there is no NASDAQ Official Closing Price for a NASDAQ-listed security or sale price available for an over-the-counter security, the mean of the latest bid and asked quotations from NASDAQ will be used. When market quotations for securities are not readily available, or when restricted securities or other assets are being valued, such assets are valued at fair value as determined in good faith by or under procedures approved by the Trustees. Money market funds are valued at net asset value (“NAV”). Fixed income securities, such as corporate bonds, convertible bonds and U.S. government agency issues are valued based on evaluated mean prices supplied by independent pricing services using matrix pricing formulas and/or independent broker bid quotations.
Trading in securities on foreign securities exchanges normally is completed before the calculation of the Funds’ NAV. Trading on these foreign exchanges may not take place on all days on which there is regular trading on the New York Stock Exchange (“NYSE”), or may take place on days on which there is no regular trading on the NYSE. Similarly, the Funds may hold securities traded in domestic markets where the market may close early on a given day prior to calculation of the Funds’ NAV. Events affecting the value of such securities held by the Funds that occur between the close of trading in the security and the close of trading on the NYSE normally will not be reflected in the Funds’ calculation of the NAV. However, significant events will be closely monitored, and where it is determined that an adjustment should be made to the security’s value because significant interim events may materially affect the value of the security, the security will be priced at its fair value in accordance with the procedures approved by the Trustees.
Cash and cash equivalents may exceed federal insurance limits. Money market deposit accounts are considered cash equivalents and reflected at cost.
Investment transactions are recorded on trade date. Dividend income is recognized on the ex-dividend date. Interest income is recognized on an accrual basis and includes, where applicable, the amortization of premiums and accretion of discounts. Net realized gains and losses from sales of securities are determined on the specific identification cost method.
b) Restricted and illiquid securities
The Funds may invest in securities that are subject to legal or contractual restrictions on resale or are illiquid. A security may be considered illiquid if it lacks a readily available market or if its valuation has not changed for a certain period of time. Disposal of these securities may involve time consuming negotiations and expense, and a prompt sale at the current valuation may be difficult.
c) Fair Valuation Measurements
The Trust has adopted authoritative fair valuation accounting standards which establish an authoritative definition of fair value and set out a hierarchy for measuring fair value. These standards require additional disclosures about the various inputs and valuation techniques used to develop the measurements of fair value, and a discussion of changes in valuation techniques and related inputs during the period. These inputs are summarized in the three broad levels listed below.
| • | Level 1 - Quoted prices in active markets for identical securities. |
| • | Level 2 - Other significant observable inputs (including quoted prices for similar securities, interest rates, prepayment speeds, credit risk, etc.). |
| • | Level 3 - Significant unobservable inputs (including the Fund’s own assumptions in determining the fair value of investments). |
When using the market quotations or closing price provided by the pricing service for equity investments—including common stocks, preferred stocks, foreign issued common stocks, exchange-traded funds, closed end mutual funds and real estate investment trusts—which are traded on an exchange are valued at the last sale price reported by the exchange on which the securities are primarily traded on the day of valuation and when the market is considered active, the security will be classified as a Level 1 security. When using the mean between the latest bid and ask price, the security will be classified as Level 2.
Investment in mutual funds, including money market funds, are generally priced at the ending NAV provided by the service agent of the funds and will be classified as Level 1 securities.
Fixed income securities, such as corporate bonds, convertible bonds, commercial paper, money market deposit accounts and U.S. government agency issues are valued based on evaluated mean prices supplied by independent pricing services using matrix pricing formulas and/or independent broker bid quotations and are classified as Level 2.
Options are valued at the composite last price reported by the exchange on which the options are primarily traded on the day of the valuation and are classified as Level 1. If there is no composite last price on a given day, the mean between the latest bid and ask price will be used. These contracts are classified as Level 2.
Any securities or other assets for which market quotations are not readily available are valued at fair value as determined in good faith by the Adviser pursuant to procedures established under the general supervision and responsibility of the Funds’ Board of Trustees and may be classified as Level 3 securities. In determining fair value, a Fund will seek to assign a value to the security which it believes represents the amount that the Fund could reasonably expect to receive upon its current sale. With respect to securities that are actively traded on U.S. exchanges, the Funds expect that market quotations will generally be available and that fair value might be used only in limited circumstances, such as when trading for a security is halted during the trading day.
In determining whether a significant event has occurred with respect to securities traded principally in foreign markets, the Funds may engage a third party fair value service provider to systematically recommend the adjustment of closing market prices of non-U.S. securities based upon changes in a designated U.S. securities market index occurring from the time of close of the relevant foreign market and the close of the NYSE.
Fair value pricing may also be used to value restricted securities held by the Funds or securities with little or no trading activity for extended periods of time. Fair value pricing involves judgments that are inherently subjective and inexact and it is not possible to determine with certainty when, and to what extent, an event will affect a market price. As a result, there can be no assurance that fair value pricing will reflect actual market value and it is possible that the fair value determined for a security may differ materially from the value that could be realized upon the sale of the security.
The following is a summary of the inputs used, as of April 30, 2022, involving the Funds’ assets and liabilities carried at fair value. The inputs of methodology used for valuing securities may not be an indication of the risk associated with investing in those securities.
| Description | | Level 1 | | | Level 2 | | | Level 3 | | | Total | |
| The Tocqueville Fund* | | | | | | | | | | | | | | | | |
| Assets | | | | | | | | | | | | | | | | |
| Common Stocks | | $ | 277,430,885 | | | $ | — | | | $ | — | | | $ | 277,430,885 | |
| Real Estate Investment Trust (REIT) | | | 7,213,500 | | | | — | | | | — | | | | 7,213,500 | |
| Money Market Fund | | | 232,853 | | | | — | | | | — | | | | 232,853 | |
| Total Assets | | $ | 284,877,238 | | | $ | — | | | $ | — | | | $ | 284,877,238 | |
| The Tocqueville Opportunity Fund* | | Level 1 | | | Level 2 | | | Level 3 | | | Total | |
| Assets | | | | | | | | | | | | |
| Common Stocks | | $ | 62,043,940 | | | $ | 2,166 | | | $ | — | | | $ | 62,046,106 | |
| Money Market Fund | | | 3,308,989 | | | | — | | | | — | | | | 3,308,989 | |
| Total Assets | | $ | 65,352,929 | | | $ | 2,166 | | | $ | — | | | $ | 65,355,095 | |
| The Tocqueville Phoenix Fund* | | Level 1 | | | Level 2 | | | Level 3 | | | Total | |
| Assets | | | | | | | | | | | | |
| Common Stocks | | $ | 135,819,781 | | | $ | — | | | $ | — | | | $ | 135,819,781 | |
| Money Market Fund | | | 7,400,000 | | | | — | | | | — | | | | 7,400,000 | |
| Total Assets | | $ | 143,219,781 | | | $ | — | | | $ | — | | | $ | 143,219,781 | |
| * | For further information regarding portfolio characteristics, please see the accompanying Schedules of Investments. |
The Trust’s valuation procedures have been adopted by the Trust’s Board of Trustees, which has established a Valuation Committee to oversee the valuation process. The Valuation Committee meets on an as needed basis to evaluate changes in the valuation of portfolio securities. The full findings and valuations are then reviewed quarterly by the Independent Trustees.
The Funds did not hold any investments during the period ended April 30, 2022, with significant unobservable inputs which would be classified as Level 3.
d) Derivative Instruments and Hedging Activities
The Funds’ Adviser may use derivative instruments, such as purchased and written options, as a means to manage exposure to different types of risk, including market risk and exchange rate risk, and to gain exposure to underlying securities. The Trust has adopted disclosure standards in order to enable the investor to understand how and why an entity used derivatives, how derivatives are accounted for, and how derivatives affect an entity’s results of operations and financial position.
In general an option contract is an agreement between a buyer and seller that gives the purchaser of the option the right to buy or sell a particular asset at a specified future date at an agreed upon price (commonly knows as the “strike price”).
When the Funds purchase an option, an amount equal to the premium paid by the Funds are recorded as an investment and subsequently adjusted to the current value of the option purchased. If an option expires on the stipulated expiration date or if the Funds enter into a closing sale transaction, a gain or loss is realized. If a purchased call or put option is exercised, the cost of the security acquired is increased by the premium paid for the call, or in the case of a put, a gain or loss is realized from the sale of the underlying security, and the proceeds from such sale are decreased by the premium originally paid. Purchased options are non-income producing securities.
When the Funds write an option, an amount equal to the premium received by the Funds are recorded as a liability and subsequently adjusted to the current value of the option written. Premiums received from writing options that expire unexercised are treated by the Funds on the expiration date as realized gain from written options. The difference between the premium and the amount paid on effecting a closing purchase transaction, including brokerage commissions, is also treated as a realized gain, or if the premium is less than the amount paid for the closing purchase transaction, as a realized loss. If a written call or put option is exercised, the premium is added or subtracted, respectively, from the proceeds or cost basis, respectively, to the related transaction of the underlying security. The Funds, as writers of an option, would bear the market risk of an unfavorable change in the price of the security underlying the written option.
Derivatives Risk
The risks of using the types of derivatives in which the Funds may engage include: the risk that movements in the value of the derivative may not fully offset or complement instruments currently held in the Funds in the manner intended by the Adviser; the risk that the counterparty to a derivative contract may fail to comply with their obligations to the Funds; the risk that the derivative may not possess a liquid secondary market at a time when the Funds would look to disengage the position; the risk that additional capital from the Funds may be called upon to fulfill the conditions of the derivative contract; and the risk that the cost of the derivative contracts may reduce the overall returns experienced by the Funds. The measurement of risks associated with these instruments is meaningful only when all related offsetting transactions are considered. The Funds may enter into written call options to hedge against changes in the value of equities. The Funds’ option component of the overall investment strategy is often referred to as a “buy-write” strategy (also called a “covered call” strategy), in which the Adviser (as defined below) writes (sells) a call option contract while at the same time owning an equivalent number of shares of the underlying stock to generate moderate current income. The writing of call options is intended to reduce the volatility of the portfolio and to earn premium income. Written call options expose the Funds to minimal counterparty credit risk since they are exchange traded and the exchange’s clearing house guarantees the options against default. As the writer of a call option each Fund has the obligation to sell the security at the exercise price during the exercise period in the event the option is exercised. The use of options do not create leverage in the Funds. The Funds did not transact in options during the period ended April 30, 2022.
e) Foreign currency translation
Investments and other assets and liabilities denominated in foreign currencies are translated to U.S. dollars at the prevailing rates of exchange, in accordance with the Trust’s Portfolio Securities Valuation and Foreign Exchange Contracts Procedures. The Funds have engaged in transactions in securities denominated in foreign currencies and, as a result, entered into foreign exchange transactions. The Funds are exposed to additional market risk as a result of changes in the value of the underlying currency in relation to the U.S. dollar. Risks include potential inability of counterparties to meet the terms of their obligations. The value of foreign currencies are marked-to-market on a daily basis, which reflects the changes in the market value of the contract at the close of each day’s trading, resulting in daily unrealized gains and/or losses. When the transactions are settled or the contracts are closed, the Funds recognize a realized gain or loss.
The Funds do not isolate that portion of the results of operations resulting from changes in foreign exchange rates on investments from the fluctuations arising from changes in market prices of securities held. Such fluctuations are reflected as net realized and unrealized gain or loss on investments.
Reported net realized foreign exchange gains or losses arise from sales of foreign currencies, currency gains or losses realized between the trade and settlement dates on securities transactions, the differences between the amounts of dividends, interest, and foreign withholding taxes recorded on the Funds’ books, and the U.S. dollar equivalent of the amounts actually received or paid. Net unrealized foreign exchange gains and losses arise from changes in the value of assets and liabilities other than investments in securities at the end of the fiscal period, resulting from changes in the exchange rates.
f) Shareholder transactions and distributions
Shareholder transactions are recorded on trade date. Dividends to shareholders are recorded on the ex-dividend date. Dividends from net investment income are declared and paid annually by the Funds. Distributions of net realized capital gains, if any, will be declared and paid at least annually. Income and capital gain distributions are determined in accordance with income tax regulations which may differ from generally accepted accounting principles. Permanent differences between financial and tax reporting may result in reclassification to capital stock.
g) Allocation of Income, Expenses and Gains/Losses
Income, expenses (other than those deemed attributable to a specific share class), and gains and losses of the Fund are allocated daily to each class of shares based upon the ratio of net assets represented by each class as a percentage of the net assets of the Fund. Expenses deemed directly attributable to a class of shares are recorded by the specific class. Most Fund expenses are allocated by class based on relative net assets.
h) Use of estimates
The preparation of financial statements in conformity with U.S. GAAP requires management to make estimates and assumptions that affect the reported amounts of assets and liabilities and disclosure of contingent assets and liabilities at the date of the financial statements and the reported amounts of income and expenses during the reporting period. Actual results could differ from those estimates.
i) Indemnification
In the normal course of business the Funds enter into contracts that contain general indemnification clauses. The Funds’ maximum exposure under these arrangements is unknown, as this would involve future claims against a Fund that have not yet occurred. Based on experience, the Funds expect the risk of loss to be remote.
j) Coronavirus (“COVID-19”) and Global Health Event Risk
Since March 2020, there has been an outbreak of a highly contagious form of a novel coronavirus known as “COVID-19.” COVID-19 has been declared a pandemic by the World Health Organization and, in response to the outbreak, the U.S. Health and Human Services Secretary has declared a public health emergency in the United States. COVID-19 had a devastating impact on the global economy, including the U.S. economy, and resulted in a global economic recession. Many states issued orders requiring the closure of non-essential businesses and/or requiring residents to stay at home. The COVID-19 pandemic and preventative measures taken to contain or mitigate its spread have caused, and are continuing to cause, business shutdowns, cancellations of events and travel, significant reductions in demand for certain goods and services, reductions in business activity and financial transactions, supply chain interruptions and overall economic and financial market instability both globally and in the United States. Such effects will likely continue for the duration of the pandemic, which is uncertain, and for some period thereafter. While several countries, as well as certain states, counties, and cities in the United States, began to relax the early public health restrictions with a view to partially or fully reopening their economies, many cities, both globally and in the United States, continue to experience, from time to time, surges in the reported number of cases and hospitalizations related to the COVID-19 pandemic. Recurring COVID-19 outbreaks, newly discovered variant and sub-variant strains of the virus and increases in cases can, and has, led to the re-introduction of restrictions and business shutdowns in certain states, counties, and cities in the United States and globally, and could continue to lead to the re-introduction of such restrictions elsewhere. Even after the COVID-19 pandemic subsides, the U.S. economy and most other major global economies may continue to experience a substantial economic downturn or recession, and our business and operations, as well as the business and operations of our portfolio companies, could be materially adversely affected by a prolonged economic downturn or recession in the United States and other major markets.
The current economic situation and the unprecedented measures taken by state, local and national governments around the world to combat the spread of COVID-19, as well as various social, political and psychological tensions in the United States and around the world, may continue to contribute to severe market disruptions and volatility and reduced economic activity, may have long-term negative effects on the U.S. and worldwide financial markets and economy and may cause further economic uncertainties in the United States and worldwide. It is difficult to predict how long the financial markets and economic activity will continue to be impacted by these events in the future on the U.S. economy and securities markets.
k) Political Risks Relating to Russia’s Invasion of Ukraine
In February 2022, Russia began its invasion of Ukraine that significantly amplified already existing geopolitical tensions among Russia, Ukraine, Europe, NATO and the United States. Russia’s military invasion of Ukraine, the resulting responses by the United States and other countries, and the potential for wider conflict has increased volatility and uncertainty in the financial markets, specifically on companies in the oil and gas sector, finance and resource extraction. The United States, other countries and certain international organizations have imposed broad-ranging economic sanctions on Russia and on certain Russian individuals, banking entities and corporations as a response to Russia’s invasion of Ukraine. These sanctions have included freezing certain Russian assets and prohibited trading in certain Russian securities and doing business with specific Russian corporate entities, large financial institutions, officials and oligarchs. The sanctions also included the removal of some Russian banks from the Society for Worldwide Interbank Financial Telecommunications (SWIFT), the electronic network that connects banks globally, and imposed restrictive measures to prevent the Russian Central Bank from undermining the impact of the sanctions. These sanctions could become broader in the future, including banning Russia from global payments systems that facilitate cross-border payments. A number of large corporations have also announced plans to divest interests or otherwise curtail business dealings with certain Russian businesses.
The extent and duration of Russia’s military actions, resulting sanctions and consequent future market disruptions are impossible to predict, but could be significant and may negatively affect global supply chains, inflation, oil and gas supply, and global growth. Russian military action (including cyberattacks and espionage) or actual and threatened responses to such actions, including purchasing and financing restrictions, boycotts or changes in consumer or purchaser preferences, sanctions, tariffs or cyberattacks on the Russian government and Russian individuals, may have an impact not only on Russia, but the global economy.
In addition, conflict between Ukraine and Russia is likely to negatively impact other regional and global economic markets (including Europe, Asia and the United States), companies in other countries (particularly those that have exposure to Russia and Ukraine) and on various sectors, industries and markets for securities and commodities globally, such as oil and natural gas and banking. The potential for a wider conflict could increase financial market volatility, cause severe negative effects on regional and global economic markets, industries, and companies and have a negative effect on investments and performance beyond any direct exposure to Russian and Ukrainian issuers or those of adjoining geographic regions. These and any related events could have a significant impact on investment performance.
l) Inflation Risk
Inflation risk is the risk that the value of assets or income from investments will be less in the future as inflation decreases the value of money. Inflation risk is linked to increases in the prices of goods and services and a decrease in the purchasing power of money. Since the beginning of 2021, inflation has risen at its highest rate in four decades. Inflation has had, and is expected to continue to have, a major impact on the U.S. economy in 2022 for an indefinite period. While the Biden Administration and the Federal Reserve have attempted efforts to reduce the effects of inflation on the U.S. economy and financial markets, the mitigating effects of such efforts are highly uncertain. Furthermore, any such mitigating efforts––such as raising benchmark interest rates—may have other detrimental effects on the U.S. economy and capital markets.
m) Subsequent events evaluation
In preparing these financial statements, the Trust has evaluated events and transactions for potential recognition or disclosure resulting from subsequent events through the date financial statements were available to be issued. This evaluation did not result in any subsequent events, that necessitated disclosure and/or adjustments.
There is no tax liability resulting from unrecognized tax benefits relating to uncertain income tax positions taken or expected to be taken on the tax return for the fiscal year-end October 31, 2021, or for any other tax years which are open for exam. As of October 31, 2021, open tax years include the tax years ended October 31, 2018 through 2021. The Trust is also not aware of any tax positions for which it is reasonably possible that the total amounts of unrecognized tax benefits will significantly change in the next six months. The Funds recognize interest and penalties, if any, related to unrecognized tax benefits as income tax expense in the Statement of Operations. During the year, the Funds did not incur any interest or penalties.
Provision for federal income taxes or excise taxes has not been made since the Funds intend to continue to comply with the requirements of subchapter M of the Internal Revenue Code necessary to qualify as Regulated Investment Companies and intend to distribute substantially all taxable income to shareholders and otherwise comply with the provisions of the Internal Revenue Code applicable to Regulated Investment Companies. Distributions from net realized gains for book purposes may include short-term capital gains which are included as ordinary income to shareholders for tax purposes. Additionally, accounting principles generally accepted in the United States of America require that certain components of net assets relating to permanent differences be reclassified between financial and tax reporting. These reclassifications have no effect on net assets or NAV per share. For the year ended October 31, 2021, the following table shows the reclassifications made:
| | | | Distributable
Earnings | | | Paid In Capital | |
| Tocqueville Fund | | | $ | (1,921,099 | ) | | $ | 1,921,099 | |
| Opportunity Fund | | | | (677,319 | ) | | | 677,319 | |
| Phoenix Fund | | | | (920,056 | ) | | | 920,056 | |
The permanent differences primarily relate to the usage of deemed distributions for tax purposes.
As of October 31, 2021, the components of distributable earnings (accumulated losses) for income tax purposes were as follows:
| | | Tocqueville | | | Opportunity | | | Phoenix | |
| | | Fund | �� | | Fund | | | Fund | |
| Tax cost of Investments | | $ | 119,012,155 | | | $ | 34,838,024 | | | $ | 122,316,255 | |
| Unrealized Appreciation | | $ | 195,687,402 | | | $ | 77,555,753 | | | $ | 52,498,547 | |
| Unrealized Depreciation | | | (533,835 | ) | | | (900,305 | ) | | | (2,626,873 | ) |
| Net unrealized appreciation (depreciation) | | | 195,153,567 | | | | 76,655,448 | | | | 49,871,674 | |
| Undistributed operating income | | | 1,267,241 | | | | 479,301 | | | | 263,413 | |
| Undistributed long-term gains | | | 30,734,490 | | | | 5,703,957 | | | | 17,598,002 | |
| Distributable earnings | | | 32,001,731 | | | | 6,183,258 | | | | 17,861,415 | |
| Other accumulated gain/(loss) | | | — | | | | (1 | ) | | | — | |
| Total distributable earnings | | $ | 227,155,298 | | | $ | 82,838,705 | | | $ | 67,733,089 | |
The difference between book-basis and tax-basis unrealized appreciation is attributable primarily to wash sale deferrals and straddle loss defferals.
The tax character of distributions paid during the years ended October 31, 2021 and 2020 was as follows:
| | | October 31, 2021 | |
| | | Ordinary
Income | | | Long Term
Capital Gain | | | Total | |
| Tocqueville Fund | | $ | 1,693,360 | | | $ | 7,540,416 | | | $ | 9,233,776 | |
| Opportunity Fund | | | — | | | | 3,607,856 | | | | 3,607,856 | |
| Phoenix Fund | | | — | | | | 2,758,109 | | | | 2,758,109 | |
| | | October 31, 2020 | |
| | | Ordinary
Income | | | Long Term
Capital Gain | | | Total | |
| Tocqueville Fund | | $ | 2,806,607 | | | $ | 17,197,787 | | | $ | 20,004,394 | |
| Opportunity Fund | | | — | | | | 4,684,120 | | | | 4,684,120 | |
| Phoenix Fund | | | — | | | | 3,732,986 | | | | 3,732,986 | |
The Funds designated as long-term capital gain dividend, pursuant to Internal Revenue Code Section 852(b)(3), the amount necessary to reduce the earnings and profits of the Funds related to net capital gain to zero for the tax years ended October 31, 2021 and 2020.
For the fiscal year ended October 31, 2021, the Funds did not have any late year losses.
| 4. | INVESTMENT ADVISORY AND OTHER AGREEMENTS |
Tocqueville Asset Management L.P. (“Tocqueville”) is the investment adviser (the “Adviser”) to the Trust under Investment Advisory Agreements approved by shareholders. For its services, Tocqueville receives fees from The Tocqueville Fund, calculated daily and payable monthly, at an annual rate of 0.75% on the first $1 billion of the average daily net assets of the Fund, and 0.65% of the average daily net assets in excess of $1 billion. Tocqueville receives fees from the Opportunity Fund, calculated daily and payable monthly, at an annual rate of 0.75% on the first $500 million of the average daily net assets of the Fund, and 0.65% of the average daily net assets in excess of $500 million. Tocqueville receives fees from The Tocqueville Phoenix Fund, calculated daily and payable monthly, at an annual rate of 0.80% on the first $250 million of net assets of the Fund; 0.75% on the next $250 million of net assets of the Fund; 0.70% on the next $500 million of net assets of the Fund; and 0.65% on all net assets of the Fund over $1 billion.
With respect to The Tocqueville Fund, the Opportunity Fund, and The Tocqueville Phoenix Fund, the Adviser has contractually agreed to waive its advisory fees and/or reimburse expenses in order to ensure that each Fund’s total annual operating expenses do not exceed 1.25% of its average daily net assets (excluding taxes, interest expense, acquired fund fees and expenses, or extraordinary expenses such as litigation). The Expense Limitation Agreements will remain in effect until March 1, 2023, for each Fund. For the period ended April 30, 2022, the Adviser waived $80,368, $65,287, and $135,374 of the advisory fee for The Tocqueville Fund, the Opportunity Fund, and The Tocqueville Phoenix Fund, respectively. Such amounts are not subject to recoupment by the Adviser.
Pursuant to an Administrative Services Agreement, each Fund pays to the Adviser a fee computed and paid monthly at an annual rate of 0.15% on the first $400 million of the average daily net assets of each Fund; 0.13% on the next $600 million of the average daily net assets of each Fund; and 0.12% on all the average daily net assets of each Fund over $1 billion. For the period ended April 30, 2022, the Adviser has made payments of $68,294, $18,982, and $37,637, to U.S. Bancorp Fund Services, LLC for services provided under a Sub-Administration Agreement for The Tocqueville Fund, the Opportunity Fund, and The Tocqueville Phoenix Fund, respectively.
Tocqueville Securities, L.P. (the “Distributor”), an affiliate of Tocqueville, acts as distributor for shares of the Trust. The Tocqueville Fund, the Opportunity Fund, and the Tocqueville Phoenix Fund, adopted a distribution and service plan pursuant to Rule 12b-1 of the 1940 Act. Pursuant to the plans, each Fund pays to the Distributor distribution and service fees of 0.25% per annum of its average daily net assets. For the period ended April 30, 2022, fees paid to the Distributor for services by the Tocqueville Fund, Opportunity Fund, and Tocqueville Phoenix Fund were $383,639, $106,929, and $211,498, respectively.
Commissions earned by the Distributor for services rendered as a registered broker-dealer in securities transactions for The Tocqueville Fund, the Opportunity Fund, and The Tocqueville Phoenix Fund for the period ended April 30, 2022, were $2,085, $4,245, and $6,756, respectively.
| 5. | CAPITAL SHARE TRANSACTIONS. |
Transactions in capital shares for each Fund were as follows:
| | | For the Six Months Ended April 30, 2022 (Unaudited) | | | For the Year Ended October 31, 2021 | |
| The Tocqueville Fund | | Shares | | | Shares | |
| Shares sold | | | 35,679 | | | | 158,773 | |
| Shares issued to holders in reinvestment dividends | | | 669,731 | | | | 218,200 | |
| Shares redeemed | | | (427,446 | ) | | | (673,876 | ) |
| Net increase (decrease) | | | 277,964 | | | | (296,903 | ) |
| | | | | | | | | |
| The Tocqueville Opportunity Fund | | | | | | | | |
| Shares sold | | | 80,945 | | | | 243,635 | |
| Shares issued to holders in reinvestment dividends | | | 144,338 | | | | 85,134 | |
| Shares redeemed | | | (215,446 | ) | | | (439,355 | ) |
| Net increase (decrease) | | | 9,837 | | | | (110,586 | ) |
| | | | | | | | | |
| The Tocqueville Phoenix Fund | | | | | | | | |
| Shares sold | | | 329,562 | | | | 301,106 | |
| Shares issued to holders in reinvestment dividends | | | 709,314 | | | | 125,825 | |
| Shares redeemed | | | (656,202 | ) | | | (1,201,210 | ) |
| Net increase (decrease) | | | 382,674 | | | | (774,279 | ) |
| 6. | INVESTMENT TRANSACTIONS |
Purchases and sales of investment securities (excluding short-term investments) for the period ended April 30, 2022, are summarized below.
| | | Tocqueville Fund | | | Opportunity Fund | | | Phoenix Fund | |
| Purchases: | | $ | 8,885,825 | | | $ | 5,928,209 | | | $ | 17,825,863 | |
| Sales: | | $ | 27,938,113 | | | $ | 15,707,340 | | | $ | 26,001,665 | |
The Tocqueville Trust has a line of credit (the “Line”), which is uncommitted, in the amount of $50,000,000, 10% of The Tocqueville Fund’s or the Opportunity Fund’s gross market value, 15% of The Tocqueville Phoenix Fund’s gross market value or 33.33% of the fair value of a Fund’s investments, whichever is less, with U.S. Bank NA. The Line is for temporary emergency or extraordinary purposes, including the meeting of redemption requests that otherwise might require the untimely disposition of securities. The Line is secured by the Trust’s assets. The Line has a one-year term and is reviewed annually by the Board of Trustees. The Line matures, unless renewed, on January 18, 2023. Interest is charged at the greater of 0.00% and the prime rate minus 0.50%. The interest rate as of and for the period ended April 30, 2022, was 3.00%. The average interest rate during the period ended April 30, 2022, was 2.75%. During the period ended April 30, 2022, The Tocqueville Fund’s maximum borrowing was $4,045,000 and average borrowing was $148,776, the Opportunity Fund’s maximum borrowing was $1,556,000 and average borrowing was $136,208. This borrowing resulted in interest expenses of $1,872, and $1,790, respectively. The Tocqueville Phoenix Fund did not use the Line.
| 8. | LIQUIDITY RISK MANAGEMENT PROGRAM |
Consistent with Rule 22e-4 under the Investment Company Act of 1940, the Funds have established a liquidity risk management program to manage “liquidity risk” (the “LRMP”). “Liquidity Risk” is defined as the risk that the Fund could not meet requests to redeem shares issued by a Fund without significant dilution of remaining investors’ interest in the Fund. The LRMP is overseen by the Program Administrator, a committee comprised of representatives of the Funds’ investment adviser, officers of the Trust and an independent member of the Trust’s Board of Trustees. The Funds’ Board of Trustees has approved the designation of the Program Administrator to oversee the LRMP. The LRMP’s principal objectives include supporting each Fund’s compliance with limits on investments in illiquid assets and mitigating the risk that a Fund will be unable to meet its redemption obligations timely. The LRMP also includes a number of elements that support the management and assessment of liquidity risk, including an annual assessment of factors that influence a Fund’s liquidity and the periodic classification and reclassification of the Fund’s investments into groupings that reflect the Program Administrator’s assessment of their relative liquidity under current market conditions. During the period covered by the report, it was determined that: (1) the LRMP continues to be reasonably designed to effectively assess and manage the Funds’ Liquidity Risk; and (2) the LRMP has been adequately and effectively implemented with respect to each Fund during the reporting period. There can be no assurance that the LRMP will achieve its objectives in the future. Please refer to your Fund’s prospectus for more information regarding the Fund’s exposure to liquidity risk and other principal risks to which an investment in the Fund may be subject.
ADDITIONAL INFORMATION (UNAUDITED)
| 1. | ADDITIONAL DISCLOSURE REGARDING FUND TRUSTEES AND OFFICERS |
Independent Trustees
| Name and Age | | Position(s) Held with the Trust | | Term of Office and Length of Time Served (1) | | Principal Occupation(s) During Past Five Years | | Number of Funds in Fund Complex Overseen By Trustee | | Other Directorships Held by Trustee |
| | | | | | | | | | | |
George Cooke Year of Birth: 1952 | | Trustee; Member of Audit Committee; Member of Governance and Nominating Committee | | Indefinite Term, Since 2020 | | Business Development, Tocqueville Capital Management, June 2015 – April 2020. | | 3 | | None |
| | | | | | | | | | | |
Charles F. Gauvin Year of Birth: 1956 | | Trustee; Member of Audit Committee; Member of Governance and Nominating Committee | | Indefinite Term, Since February 2015 | | Independent consultant on strategy, leadership and philanthropy, from 2018 – present; Chief Development Officer, Woods Hole Oceanographic Institution, from February 2016 – 2018; Executive Director, Maine Audubon, from August 2014 – January 2016 | | 3 | | Director, Bioqual, Inc., July 1992 – present. |
| | | | | | | | | | | |
James W. Gerard Year of Birth: 1961 | | Trustee; Member of Audit Committee; Member of Governance and Nominating Committee | | Indefinite Term, Since 2001 | | Managing Director, Hycroft Advisors, from January 2010-present; Managing Director, deVisscher & Co., LLC from January 2013 to present; The Chart Group from January 2001 to present. | | 3 | | President, American Overseas Memorial Day Association, 1998 – present; Trustee, Salisbury School, 2005 – present; Director, American Friends of Bleraucourt, 1992 – present; President, Little Baby Face Foundation, March 2015 – present. |
ADDITIONAL INFORMATION (UNAUDITED)
Interested Trustees(2) and Officers
| Name and Age | | Position(s) Held with the Trust | | Term of Office and Length of Time Served (1) | | Principal Occupation(s) During Past Five Years | | Number of Funds in Fund Complex Overseen By Trustee | | Other Directorships Held by Trustee |
| | | | | | | | | | | |
Jeff Zatkowsky Year of Birth: 1970 | | Treasurer | | Indefinite Term, Since 2021 | | Controller / Treasurer of Tocqueville Asset Management from February 2021 to present; CFO, SMT Financial Corp., December 2019 – February 2021; Controller, Summit Financial Corp., August 2014 - November 2019; Manager, Citco Fund Services, March 2007 – July 2014. | | N/A | | N/A |
| | | | | | | | | | | |
Robert W. Kleinschmidt Year of Birth: 1949 | | Chairman, President, and Trustee | | Indefinite Term, Chairman Since 2016, and President and Trustee Since 1991 | | Chief Executive Officer, President and Chief Investment Officer, Tocqueville Asset Management; Director, Tocqueville Management Corporation, General Partner, Tocqueville Asset Management L.P. and Tocqueville Securities L.P., January 1994 to present. | | 3 | | President and Director, Tocqueville Management Corporation, the General Partner of Tocqueville Asset Management L.P. and Tocqueville Securities L.P. |
| | | | | | | | | | | |
Stephan Yevak Year of Birth: 1959 | | Anti-Money Laundering Compliance Officer | | Indefinite Term, Since 2018 | | Deputy Chief Compliance Officer, Tocqueville Securities, L.P. from August 2011 to present; Deputy Chief Compliance Officer, Tocqueville Asset Management from August 2011 to present. Anti-Money Laundering Compliance Officer to both entities from March 2018 to present. | | N/A | | N/A |
ADDITIONAL INFORMATION (UNAUDITED)
Interested Trustees(2) and Officers
| Name and Age | | Position(s) Held with the Trust | | Term of Office and Length of Time Served (1) | | Principal Occupation(s) During Past Five Years | | Number of Funds in Fund Complex Overseen By Trustee | | Other Directorships Held by Trustee |
| | | | | | | | | | | |
Cleo Kotis Year of Birth: 1975 | | Secretary | | Indefinite Term, Since 2010 | | Director of Operations, the Delafield Group of Tocqueville Asset Management L.P., 2009 to present. | | N/A | | N/A |
| | | | | | | | | | | |
Charles Martin Year of Birth: 1988 | | Chief Compliance Officer | | Indefinite Term, Since 2020 | | Managing Director, Vigilant Compliance, LLC, 2012 – present. | | N/A | | N/A |
| (1) | Each Trustee will hold office for an indefinite term until the earliest of (i) the next meeting of shareholders, if any, called for the purpose of considering the election or re-election of such Trustee and until the election and qualification of his or her successor, if any, elected at such meeting, or (ii) the date a Trustee resigns or retires, or a Trustee is removed by the Board of Trustees or shareholders, in accordance with the Trust’s By-Laws, as amended, and Agreement and Declaration of Trust, as amended. Each officer will hold office for an indefinite term until the date he or she resigns or retires or until his or her successor is elected and qualifies. |
| (2) | “Interested person” of the Trust as defined in the 1940 Act. Mr. Kleinschmidt is considered “interested person” because of his affiliation with the Advisor. |
The Statement of Additional Information includes additional information about the Trustees and is available free of charge by calling the Funds toll free at 1-800-355-7307.
| 2. | PROXY VOTING POLICIES AND PROCEDURES |
A description of the policies and procedures that The Tocqueville Trust uses to determine how to vote proxies relating to portfolio securities is available without charge upon request by calling 1-800-355-7307. Information regarding how The Tocqueville Trust voted proxies relating to portfolio securities during the most recent 12-month period ended June 30 is available by calling 1-800-355-7307 and it is also available on the SEC’s web site at http://www.sec.gov.
| 3. | SHAREHOLDER REPORTS AND QUARTERLY PORTFOLIO DISCLOSURE |
The Tocqueville Trust will file its complete schedule of portfolio holdings with the SEC for the first and third quarters of each fiscal year on Part F of Form N-PORT. The Fund’s Part F of Form N-PORT will be available on the EDGAR database on the SEC’s website at www.sec.gov. These Forms may also be reviewed and copied at the SEC’s Public Reference Room in Washington D.C. Information about the operation of the Public Reference Room may be obtained by calling 1-800-SEC-0330. Quarterly portfolio holdings are also available on the website of The Tocqueville Funds, www.tocquevillefunds.com.
| 4. | SHAREHOLDER NOTIFICATION OF FEDERAL TAX STATUS |
For the fiscal year ended October 31, 2021, certain dividends paid by the Funds may be subject to a maximum tax rate of 23%, as provided for by the Tax Cuts and Jobs Act of 2017. The percentage of dividends declared from ordinary income designated as qualified dividend income was as follows:
| Tocqueville Fund | 100.00% |
| Opportunity Fund | 0.00% |
| Phoenix Fund | 0.00% |
For corporate shareholders, the percent of ordinary income distributions qualifying for the corporate dividends received deduction for the fiscal year ended October 31, 2021, was as follows:
| Tocqueville Fund | 100.00% |
| Opportunity Fund | 0.00% |
| Phoenix Fund | 0.00% |
For the year ended October 31, 2021, the funds designate the following percent of ordinary distributions paid as interest-related dividends under the Internal Revenue Code Section 871(k)(1)(c):
| Tocqueville Fund | 0.05% |
| Opportunity Fund | 0.00% |
| Phoenix Fund | 0.00% |
The percentage of taxable ordinary income distributions that are designated as short-term capital gain distributions under Internal Revenue Section 871(k)(2)(C) for each Fund were as follows.
| Tocqueville Fund | 0.00% |
| Opportunity Fund | 0.00% |
| Phoenix Fund | 0.00% |
[This page intentionally left blank]
Investment Adviser
Tocqueville Asset Management L.P.
40 W. 57th St., 19th Floor
New York, NY 10019
(212) 698-0800
www.tocqueville.com
Distributor
Tocqueville Securities, L.P.
40 W. 57th St., 19th Floor
New York, NY 10019
(212) 698-0800
Shareholders’ Servicing and Transfer Agent
U.S. Bank Global Fund Services, LLC doing business as
U.S. Bank Global Fund Services
615 East Michigan Street
Milwaukee, WI 53202
Custodian
U.S. Bank, N.A.
Custody Operations
1555 River Center Drive, Suite 302
Milwaukee, WI 53212
Board of Trustees
Robert W. Kleinschmidt—Chairman
George Cooke
Charles F. Gauvin
James W. Gerard
Independent Registered Public Accounting Firm
Cohen & Company, Ltd.
342 North Water Street, Suite 830
Milwaukee, WI 53202

Tocqueville Funds
c/o US Bancorp Fund Services, LLC
P.O. Box 701
Milwaukee, WI 53201-0701
www.tocquevillefunds.com
TQ SEMI-4-30-22