
| | This report is not authorized for distribution to prospective investors unless preceded or accompanied by a currently effective prospectus of The Tocqueville Trust. Please call 1-800-697-FUND (3863) for a free prospectus. Read it carefully before you invest. | |
| | | |
| | You are invited to visit our website @ www.tocquevillefunds.com | |
Chairman’s Note
Dear Fellow Shareholder,
The broad market’s gain of some twenty-five percent over the first six months of our fiscal year ending in October, was breathtaking through the end of March. An April sell-off let off a little of the steam, but on the whole a remarkable six months. Notwithstanding recent dramatic geopolitical events, the U.S. equity markets appear to have roared on, focusing instead on one key variable: the overnight rate of interest controlled by the Federal Reserve (Fed), and one new development: the emergence of Artificial Intelligence (AI) as a disruptive force.
While both, no doubt, are of great importance, there is some skepticism in this observer’s mind, that they are as transcendentally important as recent market valuations are making them out to be. Interest rates are not so high, for example, that a slight decline in them should make much of a difference. (In fact, we are pleased with the Fed’s reticence to reduce the target rate. The Fed will need some room to lower rates in a soft economic environment and, currently, we are not in one). Nor, in our view, is the ubiquity, and therefore, unreliability of AI quite the game changer many may claim. Technological advancements, even the best of them, take years to work their way through the economic system, and there will no doubt be ample fits and starts along the way. Trees, even artificially enhanced smart ones, do not grow straight to the sky.
In the next six months, the truly unique U.S. Presidential election will begin to overshadow both these market drivers, as it should. The candidates are far apart in their views on a host of issues, so the outcome will matter. Only rarely in history (1860 and 1944 come to mind) has the choice of a Vice Presidential candidate loomed as important. While Las Vegas oddsmakers currently favor one of the two contenders, November is still a long way away. Which one is better for market valuations or economic progress is for the voters and investors to decide.
I cast my vote for prudence.
Sincerely,

Robert W. Kleinschmidt
Chairman
Semi-Annual Report | 1
The Tocqueville Fund
Dear Fellow Shareholder,
Equity markets reached record highs before pulling back slightly over the six-month period ended April 30, 2024. Overall, the period was marked by economic stability and hope for a more accommodative monetary policy even if that hope has remained somewhat unrequited thus far. In recent weeks there have been reports of consumers slowing spending in the face of perhaps dwindling savings from leftover COVID stimulus or pressures from inflation and yet investors seem convinced that a recession is not yet in view. Market performance remains driven by the “Magnificent Seven” (Alphabet, Amazon, Apple, Meta Platforms, Microsoft, Nvidia and Tesla), so there is a vulnerability caused by continued concentration that seems very difficult to shake given the growth disparity between those large cap technology stocks propelled by enthusiasm for AI and anything else related thereto and the rest of the economy.
During the period, Ten-Year Treasury yields were somewhat flat after recovering from a dip in the early months and the yield curve also remained a bit inverted. High yield spreads are still quite tight, and the market seems to be saying defaults will remain low given the perceptions about the outlook for a recession. There just is not much of a premium in investment grade corporate bonds either. Indeed, we find it hard to see how anyone would want to own a bond with a maturity beyond more than a couple of years given the prospect of continued inflation and rising fiscal burdens.
Commodities were mixed during the period with precious metals moving higher, particularly gold, which reached a new high, while oil was relatively flat and natural gas was sharply lower. Cryptocurrencies advanced following approval of spot ETF vehicles as well as perhaps reflecting some of the inflationary concerns expressed by gold.
While all sectors of the market were positive during the period, information technology, financials, and communication services were the largest contributors to the market. Real estate, utilities, and energy were the laggards.
The Fund gained 21.10% on a net basis during the period compared to the S&P 500, Russell 1000 Value and Russell 3000 Value which gained 20.98%, 17.90% and 17.87%, respectively. Information technology, industrials, and materials were the largest contributing sectors to the portfolio while real estate, utilities and healthcare were the weakest. The top individual contributors were NVIDIA, Applied Materials, QUALCOMM, Alphabet and Shopify. Paycom, Cross Country Healthcare, Pfizer, ON Semiconductor and Warner Bros. Discovery, were the greatest detractors.
During the period, we purchased Air Products & Chemicals, a leading industrial gas company and the largest producer of hydrogen. Industrial gases have uses that span many industries from energy production to pharmaceuticals, but hydrogen is often considered a key to decarbonization. Air Products & Chemicals’ shares have underperformed recently due to delays and cost overruns at large scale projects in the Middle East and Louisiana that are important to its growth prospects. However, our view is that these are mere delays and that the business, which has been historically well managed, is one of three main players in an oligopoly that has traditionally possessed pricing power through economic cycles and strong returns on invested capital. Moreover, their long tenured CEO might be nearing the end of his career and that could be a positive catalyst for change in our view.
2 | April 30, 2024
Another recent purchase was Southwestern Energy, a natural gas producer. The shares had underperformed the market and natural gas has arguably been the weakest commodity in the energy complex as weather, storage, delayed LNG (Liquefied Natural Gas) exports, by-product output from shale drilling, and lack of pipeline capacity have weighed on prices. However, it was announced that Southwestern Energy is merging with Chesapeake Energy in a stock for stock transaction that is expected to be significantly accretive to the combined company and well capitalized, which we believe will result in operational efficiencies. We also believe that the confluence of events impacting natural gas prices is likely to ameliorate itself.
During the period, we also purchased Biogen, Exxon Mobil, ON Semiconductor, Palo Alto Networks, and Rocket Labs. We also added to positions in Newmont, Novo-Nordisk, Nutrien, Pfizer, Schrodinger, and Texas Pacific Land.
During the period, a variety of positions were trimmed or sold as price targets were achieved, circumstances changed, to take some profits, or to make room for better ideas. Positions liquidated included Apogee Enterprises, Bank of America, Biomarin, Charles Schwab, Lumentum, Nextracker (received in spin-off from Flex), Pan American Silver, Paycom, Range Resources, RTX, South32, Steelcase, Vivendi and Warner Bros. Discovery (after a particularly disappointing call with management). Positions trimmed include Alphabet, Apple, Cars.com, Crane, Cross Country Healthcare, Lifecore Biomedical, Nvidia, Orion, and ServiceNow.
Looking ahead, we remain less certain of a Fed pivot and of the several rate cuts that the market seems to anticipate even if those expectations have been somewhat tempered lately. Hence, allocating significant capital to fixed income, appears ill-advised to us at this time. We continue to believe there is a case for higher for longer interest rates as the Fed may come to see inflation as the tool to mitigate growing fiscal burdens but simultaneously realizing that unleashing it too aggressively with further rate cuts or monetary expansion may be politically untenable. Election uncertainty grows closer with each passing day, especially as the current administration navigates multiple geopolitical problems that seem intractable at the moment. Through all this we continue to search for contrarian ideas that fit with our discipline.
Sincerely,
| |  |
| Robert W. Kleinschmidt | Peter Shawn |
| Portfolio Manager | Director of Research |
Semi-Annual Report | 3
The Tocqueville Fund
(Unaudited)

This chart assumes an initial gross investment of $10,000 made on 4/30/14. Returns shown do not reflect the deduction of taxes that a shareholder would pay on fund distributions or the redemption of fund shares. Performance reflects fee waivers in effect. In the absence of fee waivers, total return would be reduced. Returns shown include the reinvestment of all dividends and other distributions. Past performance is not predictive of future performance. Investment return and principal value will fluctuate so that your shares, when redeemed, may be worth more or less than their original cost.
The Standard & Poor’s 500 Total Return Stock Index (S&P 500) is a capital-weighted index, representing the aggregate market value of the common equity of 500 stocks primarily traded on the New York Stock Exchange. Returns assume the reinvestment of all dividends.
AVERAGE ANNUAL RATE OF RETURN (%)
FOR YEARS ENDED APRIL 30, 2024
| | | 1 Year | | 3 Year | | 5 Year | | 10 Year |
| The Tocqueville Fund | | | 20.95 | % | | | 6.92 | % | | | 10.85 | % | | | 9.75 | % |
| Standard & Poor’s 500 Total Return Stock Index | | | 22.66 | % | | | 8.06 | % | | | 13.19 | % | | | 12.41 | % |
4 | April 30, 2024
Expense Example—April 30, 2024 (Unaudited)
As a shareholder of the Tocqueville Fund (the “Fund”), you incur ongoing costs, including management fees, distribution fees, and other Fund expenses. This example is intended to help you understand your ongoing costs (in dollars) of investing in the Fund and to compare costs with the ongoing costs of investing in other mutual funds. The Example is based on an investment of $1,000 invested at the beginning of the period and held the entire period (November 1, 2023 - April 30, 2024).
Actual Expenses
The first line of the table below provides information about actual account values and actual expenses. You may use the information in this line, together with the amount you invested, to estimate the expenses that you paid over the period. Simply divide your account value by $1,000 (for example, an $8,600 account value divided by $1,000 = 8.6), then multiply the result by the number in the first line under the heading entitled “Expenses Paid During Period” to estimate the expenses you paid on your account during this period.
Hypothetical Example for Comparison Purposes
The second line of the table below provides information about hypothetical account values and hypothetical expenses based on the Fund’s actual expense ratios and an assumed rate of return of 5% per year before expenses, which is not the Fund’s actual return. The hypothetical account values and expenses may not be used to estimate the actual ending account balance or expenses you paid for the period. You may use this information to compare the ongoing costs of investing in the Fund and other funds. To do so, compare this 5% hypothetical example with the 5% hypothetical examples that appear in the shareholder reports of the other funds. Please note that the expenses shown in the table are meant to highlight your ongoing costs only and do not reflect any transactional costs, such as sales charges (loads), redemption fees, or exchange fees. Therefore, the second line of the table is useful in comparing ongoing costs only, and will not help you determine the relative costs of owning different funds. In addition, if these transactional costs were included, your costs would have been higher.
Semi-Annual Report | 5
Expense Example Tables (Unaudited)
The Tocqueville Fund
| | | Beginning
Account Value
November 1, 2023 | | Ending
Account Value
April 30, 2024 | | Expenses Paid
During Period*
November 1, 2023 -
April 30, 2024 |
| Actual | | $1,000.00 | | | $1,211.00 | | | $6.60 | |
| Hypothetical (5% return before expenses) | | 1,000.00 | | | 1,018.90 | | | 6.02 | |
| * | Expenses are equal to the Fund’s annualized six-month expense ratio (including interest expense) of 1.20% for the Tocqueville Fund, multiplied by the average account value over the period, multiplied by 182/366 to reflect the one-half year period. |
6 | April 30, 2024
The Tocqueville Fund
Financial Highlights
Per share operating performance
(For a share outstanding
throughout the period) | | Six Months
Ended
April 30, | | | Years Ended October 31, | |
| | | 2024 | | | 2023 | | | 2022 | | | 2021 | | | 2020 | | | 2019 | |
| | | (Unaudited) | | | | | | | | | | | | | | | | |
| | | | | | | | | | | | | | | | | | | |
| Net asset value, beginning of period | | $ | 39.28 | | | $ | 39.55 | | | $ | 48.39 | | | $ | 37.03 | | | $ | 37.80 | | | $ | 35.84 | |
| Operations: | | | | | | | | | | | | | | | | | | | | | | | | |
| Net investment income (1) | | | 0.09 | | | | 0.07 | | | | 0.43 | | | | 0.25 | | | | 0.31 | | | | 0.43 | |
| Net realized and unrealized gain | | | 7.90 | | | | 1.59 | | | | (4.30 | ) | | | 12.49 | | | | 1.58 | | | | 4.46 | |
| Total from investment operations | | | 7.99 | | | | 1.66 | | | | (3.87 | ) | | | 12.74 | | | | 1.89 | | | | 4.89 | |
| Distributions to shareholders: | | | | | | | | | | | | | | | | | | | | | | | | |
| Dividends from net investment income | | | (0.22 | ) | | | (0.24 | ) | | | (0.20 | ) | | | (0.25 | ) | | | (0.37 | ) | | | (0.34 | ) |
| Distributions from net realized gains | | | (2.26 | ) | | | (1.69 | ) | | | (4.77 | ) | | | (1.13 | ) | | | (2.29 | ) | | | (2.59 | ) |
| Total distributions | | | (2.48 | ) | | | (1.93 | ) | | | (4.97 | ) | | | (1.38 | ) | | | (2.66 | ) | | | (2.93 | ) |
| Change in net asset value for the period | | | 5.51 | | | | (0.27 | ) | | | (8.84 | ) | | | 11.36 | | | | (0.77 | ) | | | 1.96 | |
| Net asset value, end of period | | $ | 44.79 | | | $ | 39.28 | | | $ | 39.55 | | | $ | 48.39 | | | $ | 37.03 | | | $ | 37.80 | |
| Total Return | | | 21.1 | %(2) | | | 4.2 | % | | | – 9.3 | % | | | 35.2 | % | | | 5.0 | % | | | 14.9 | % |
| Ratios/supplemental data | | | | | | | | | | | | | | | | | | | | | | | | |
| Net assets, end of period (000) | | $ | 464,111 | | | $ | 412,912 | | | $ | 258,843 | | | $ | 313,739 | | | $ | 251,096 | | | $ | 285,070 | |
| Ratio to average net assets: | | | | | | | | | | | | | | | | | | | | | | | | |
| Expenses before waiver | | | 1.34 | %(3) | | | 1.35 | % | | | 1.33 | % | | | 1.34 | % | | | 1.38 | % | | | 1.30 | % |
| Expenses after waiver | | | 1.20 | %(3) | | | 1.20 | % | | | 1.25 | % | | | 1.25 | % | | | 1.25 | % | | | 1.25 | %(4) |
| Net investment income before waiver | | | 0.29 | %(3) | | | 0.37 | % | | | 0.91 | % | | | 0.46 | % | | | 0.69 | % | | | 1.11 | % |
| Net investment income after waiver | | | 0.43 | %(3) | | | 0.52 | % | | | 0.99 | % | | | 0.55 | % | | | 0.82 | % | | | 1.16 | % |
| Portfolio turnover rate | | | 7 | %(2) | | | 22 | % | | | 6 | % | | | 11 | % | | | 9 | % | | | 13 | % |
| (1) | Net investment income per share is calculated using the ending balance prior to consideration or adjustment for permanent book-to-tax differences. |
| (4) | Includes 0.01% of interest expense which is not included in the Fund’s operating expense cap. |
The Accompanying Notes are an Integral Part of these Financial Statements.
Semi-Annual Report | 7
The Tocqueville Fund
Schedule of Investments as of April 30, 2024
(Unaudited)
| Common Stocks—94.5% | | Shares | | | Value | |
| Automobiles & Components—1.0% | | | | | | |
| Toyota Motor Corp.—ADR | | | 20,000 | | | $ | 4,546,200 | |
| Biotechnology—0.9% | | | | | | | | |
| Biogen, Inc.(a) | | | 20,000 | | | | 4,296,400 | |
| Capital Goods—10.7% | | | | | | | | |
| Caterpillar, Inc. | | | 25,000 | | | | 8,364,250 | |
| Crane Co. | | | 75,000 | | | | 10,500,750 | |
| Deere & Co. | | | 20,000 | | | | 7,828,200 | |
| Illinois Tool Works, Inc. | | | 25,000 | | | | 6,102,750 | |
| Mayville Engineering Co., Inc.(a) | | | 500,000 | | | | 6,880,000 | |
| Parker-Hannifin Corp. | | | 15,000 | | | | 8,173,650 | |
| Rocket Lab USA, Inc.(a) | | | 500,000 | | | | 1,880,000 | |
| | | | | | | | 49,729,600 | |
| Commercial & Professional Services—4.9% | | | | | | | | |
| ABM Industries, Inc. | | | 125,000 | | | | 5,462,500 | |
| Automatic Data Processing, Inc. | | | 40,000 | | | | 9,675,600 | |
| Republic Services, Inc. | | | 40,000 | | | | 7,668,000 | |
| | | | | | | | 22,806,100 | |
| Consumer Discretionary Distribution & Retail—1.9% | | | | | | | | |
| Amazon.com, Inc.(a) | | | 50,000 | | | | 8,750,000 | |
| Consumer Durables & Apparel—1.4% | | | | | | | | |
| NIKE, Inc.—Class B | | | 25,000 | | | | 2,306,500 | |
| Sony Group Corp.—ADR | | | 50,000 | | | | 4,128,500 | |
| | | | | | | | 6,435,000 | |
| Consumer Services—2.1% | | | | | | | | |
| Expedia Group, Inc.—Class A(a) | | | 20,000 | | | | 2,692,600 | |
| McDonald’s Corp. | | | 25,000 | | | | 6,826,000 | |
| Restaurant Brands International LP | | | 37 | | | | 2,853 | |
| | | | | | | | 9,521,453 | |
| Consumer Staples Distribution & Retail—1.7% | | | | | | | | |
| Walmart, Inc. | | | 135,000 | | | | 8,012,250 | |
| Energy—8.3% | | | | | | | | |
| Cameco Corp. | | | 75,000 | | | | 3,422,250 | |
| Chevron Corp. | | | 40,000 | | | | 6,450,800 | |
| Diamondback Energy, Inc. | | | 40,000 | | | | 8,045,200 | |
| Exxon Mobil Corp. | | | 25,000 | | | | 2,956,750 | |
| Halliburton Co. | | | 100,000 | | | | 3,747,000 | |
| Occidental Petroleum Corp. | | | 75,000 | | | | 4,960,500 | |
| Southwestern Energy Co.(a) | | | 500,000 | | | | 3,745,000 | |
| Texas Pacific Land Corp. | | | 9,000 | | | | 5,186,700 | |
| | | | | | | | 38,514,200 | |
| Financial Services—0.7% | | | | | | | | |
| Intercontinental Exchange, Inc. | | | 25,000 | | | | 3,219,000 | |
| Food, Beverage & Tobacco—1.3% | | | | | | | | |
| Coca-Cola Co. | | | 100,000 | | | | 6,177,000 | |
| Health Care Equipment & Services—2.2% | | | | | | | | |
| Abbott Laboratories | | | 50,000 | | | | 5,298,500 | |
| Cross Country Healthcare, Inc.(a) | | | 150,000 | | | | 2,640,000 | |
| Schrodinger, Inc./ United States(a) | | | 100,000 | | | | 2,438,000 | |
| | | | | | | | 10,376,500 | |
| Household & Personal Products—3.8% | | | | | | | | |
| Colgate-Palmolive Co. | | | 100,000 | | | | 9,192,000 | |
| Procter & Gamble Co. | | | 50,000 | | | | 8,160,000 | |
| | | | | | | | 17,352,000 | |
| Insurance—1.8% | | | | | | | | |
| Aflac, Inc. | | | 100,000 | | | | 8,365,000 | |
| Materials—11.9% | | | | | | | | |
| Air Products and Chemicals, Inc. | | | 10,000 | | | | 2,363,400 | |
| Avient Corp. | | | 100,000 | | | | 4,242,000 | |
| BHP Group Ltd.—ADR | | | 50,000 | | | | 2,758,000 | |
| Dow, Inc. | | | 40,000 | | | | 2,276,000 | |
| Freeport-McMoRan, Inc. | | | 100,000 | | | | 4,994,000 | |
| Newmont Mining Corp. | | | 200,000 | | | | 8,128,000 | |
| Nutrien Ltd. | | | 75,000 | | | | 3,957,750 | |
| Orion SA | | | 300,000 | | | | 7,098,000 | |
| Sonoco Products Co. | | | 75,000 | | | | 4,203,750 | |
| Vulcan Materials Co. | | | 40,000 | | | | 10,305,200 | |
| Wheaton Precious Metals Corp. | | | 100,000 | | | | 5,214,000 | |
| | | | | | | | 55,540,100 | |
The Accompanying Footnotes are an Integral Part of these Financial Statements.
8 | April 30, 2024
The Tocqueville Fund
Schedule of Investments as of April 30, 2024
(Unaudited)
| Common Stocks—94.5% | | Shares | | | Value | |
| Media & Entertainment—5.8% | | | | | | |
| Alphabet, Inc.—Class A(a) | | | 100,000 | | | $ | 16,278,000 | |
| Cars.com, Inc.(a) | | | 300,000 | | | | 5,013,000 | |
| Walt Disney Co. | | | 50,000 | | | | 5,555,000 | |
| | | | | | | | 26,846,000 | |
| Pharmaceuticals, Biotechnology & Life Sciences—5.6% | | | | | | | | |
| Johnson & Johnson | | | 20,000 | | | | 2,891,800 | |
| Lifecore Biomedical, Inc.(a) | | | 200,000 | | | | 1,284,000 | |
| Merck & Co., Inc. | | | 100,000 | | | | 12,922,000 | |
| Novo Nordisk AS—Class A—ADR | | | 30,000 | | | | 3,849,300 | |
| Pfizer, Inc. | | | 200,000 | | | | 5,124,000 | |
| | | | | | | | 26,071,100 | |
| Semiconductors & Semiconductor Equipment—11.6% | | | | | | | | |
| Applied Materials, Inc. | | | 70,000 | | | | 13,905,500 | |
| Marvell Technology, Inc. | | | 100,000 | | | | 6,591,000 | |
| NVIDIA Corp. | | | 20,000 | | | | 17,280,400 | |
| ON Semiconductor Corp.(a) | | | 50,000 | | | | 3,508,000 | |
| QUALCOMM, Inc. | | | 75,000 | | | | 12,438,750 | |
| | | | | | | | 53,723,650 | |
| Software & Services—8.5% | | | | | | | | |
| Adobe, Inc.(a) | | | 10,000 | | | | 4,628,300 | |
| Microsoft Corp. | | | 40,000 | | | | 15,573,200 | |
| Palo Alto Networks, Inc.(a) | | | 8,500 | | | | 2,472,565 | |
| ServiceNow, Inc.(a) | | | 12,500 | | | | 8,666,625 | |
| Shopify, Inc.—Class A(a) | | | 115,000 | | | | 8,073,000 | |
| | | | | | | | 39,413,690 | |
| Technology Hardware & Equipment—5.0% | | | | | | | | |
| Apple, Inc. | | | 50,000 | | | | 8,516,500 | |
| Crane NXT Co. | | | 50,000 | | | | 3,040,500 | |
| Flex Ltd.(a) | | | 400,000 | | | | 11,460,000 | |
| | | | | | | | 23,017,000 | |
| Telecommunication Services—0.9% | | | | | | | | |
| Verizon Communications, Inc. | | | 100,000 | | | | 3,949,000 | |
| Utilities—2.5% | | | | | | | | |
| NextEra Energy, Inc. | | | 175,000 | | | | 11,719,750 | |
| Total Common Stocks | | | | | | | | |
| (Cost $191,442,712) | | | | | | | 438,380,993 | |
| Real Estate Investment Trusts—1.1% | | | | | | | | |
| Weyerhaeuser Co. | | | 175,000 | | | | 5,279,750 | |
| Total Real Estate Investment Trusts | | | | | | | | |
| (Cost $3,359,578) | | | | | | | 5,279,750 | |
| Short-Term Investments—4.4% | | | | | | | | |
| Money Market Funds—4.4% | | | | | | | | |
| Invesco Treasury | | | | | | | | |
| Portfolio—Class | | | | | | | | |
| Institutional, 5.23%(b) | | | 20,478,514 | | | | 20,478,514 | |
| Total Short-Term Investments | | | | | | | | |
| (Cost $20,478,514) | | | | | | | 20,478,514 | |
| Total Investments—100.0% | | | | | | | | |
| (Cost $215,280,804) | | | | | | | 464,139,257 | |
| Liabilities in Excess of Other | | | | | | | | |
| Assets—(0.0)%(c) | | | | | | | (28,050 | ) |
| Total Net Assets—100.0% | | | | | | $ | 464,111,207 | |
Percentages are stated as a percent of net assets.
The Global Industry Classification Standard (GICS®) was developed by and/or is the exclusive property of MSCI, Inc. and Standard & Poor’s Financial Services LLC (“S&P”). GICS is a service mark of MSCI, Inc. and S&P and has been licensed for use by U.S. Bank Global Fund Services.
ADR—American Depositary Receipt
| (a) | Non-income producing security. |
| (b) | The rate shown represents the 7-day effective yield as of April 30, 2024. |
| (c) | Represents less than 0.05% of net assets. |
The Accompanying Footnotes are an Integral Part of these Financial Statements.
Semi-Annual Report | 9
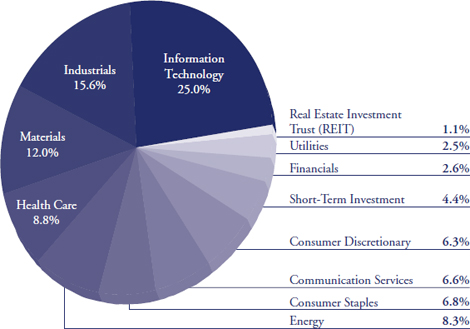
Percent of Total Investments (Unaudited)
The Tocqueville Fund
Allocation of Portfolio Holdings
April 30, 2024
10 | April 30, 2024
The Tocqueville Trust
Statements of Assets & Liabilities
April 30, 2024
(Unaudited)
| | | The | |
| | | Tocqueville | |
| | | Fund | |
| Assets: | | | | |
| Investments, at value (1) | | $ | 464,139,257 | |
| Receivable for Fund shares purchased | | | 161,631 | |
| Dividends, interest and other receivables | | | 415,429 | |
| Other assets | | | 21,596 | |
| Total Assets | | | 464,737,913 | |
| Liabilities: | | | | |
| Payable for Fund shares redeemed | | | 62,460 | |
| Payable to Adviser | | | 235,744 | |
| Payable to Administrator | | | 82,659 | |
| Payable to Trustees | | | 38,291 | |
| Accrued distribution fee | | | 65,250 | |
| Accrued expenses and other liabilities | | | 142,302 | |
| Total Liabilities | | | 626,706 | |
| Net Assets | | $ | 464,111,207 | |
| Net assets consist of: | | | | |
| Paid in capital | | $ | 189,402,933 | |
| Total distributable earnings | | | 274,708,274 | |
| Net assets | | $ | 464,111,207 | |
| Shares of beneficial interest outstanding (unlimited shares of $0.01 par value authorized) | | | 10,361,115 | |
| Net asset value, offering and redemption price per share | | $ | 44.79 | |
| (1) Cost of investments | | $ | 215,209,882 | |
The Accompanying Notes are an Integral Part of these Financial Statements.
Semi-Annual Report | 11
The Tocqueville Trust
Statements of Operations
(Unaudited)
| | | The | |
| | | Tocqueville | |
| | | Fund | |
| Investment Income: | | | | |
| Dividends* | | $ | 3,376,142 | |
| Interest | | | 294,201 | |
| Total investment income | | | 3,670,343 | |
| | | | | |
| Expenses: | | | | |
| Investment Adviser’s fee (See Note 4) | | | 1,688,821 | |
| Distribution (12b-1) fees (See Note 4) | | | 562,940 | |
| Administration fees (See Note 4) | | | 332,511 | |
| Transfer agent and shareholder services fees | | | 90,010 | |
| Trustee fees and expenses | | | 63,036 | |
| Legal fees | | | 67,248 | |
| Other expenses | | | 43,780 | |
| Fund accounting fees | | | 41,066 | |
| Printing and mailing expense | | | 16,868 | |
| Insurance expense | | | 56,336 | |
| Blue sky fees | | | 17,736 | |
| Custody fees | | | 27,285 | |
| Audit fees | | | 10,012 | |
| Registration fees | | | 3,008 | |
| Total expenses before waiver | | | 3,020,657 | |
| Less: Fees waived (See Note 4) | | | (318,543 | ) |
| Net expenses | | | 2,702,114 | |
| Net Investment Income | | | 968,229 | |
| Realized and Unrealized Gain (Loss): | | | | |
| Net realized gain on: | | | | |
| Investments | | | 25,400,721 | |
| Foreign currency translation | | | (35,709 | ) |
| | | | 25,365,012 | |
| Net change in unrealized appreciation (depreciation) on: | | | | |
| Investments | | | 58,200,225 | |
| Foreign currency translation | | | 293 | |
| | | | 58,200,518 | |
| Net gain on investments and foreign currency | | | 83,565,530 | |
| Net Increase in Net Assets Resulting from Operations | | $ | 84,533,759 | |
| * Net of foreign taxes withheld of: | | $ | 29,964 | |
The Accompanying Notes are an Integral Part of these Financial Statements.
12 | April 30, 2024
The Tocqueville Trust
Statements of Changes in Net Assets
(Unaudited)
| | | The Tocqueville Fund | |
| | | | For the Six - | | | | For the | |
| | | | Months Ended | | | | Year Ended | |
| | | | April 30, | | | | October 31, | |
| | | | 2024 | | | | 2023 | |
| Operations: | | | | | | | | |
| Net investment income | | $ | 968,229 | | | $ | 2,233,453 | |
| Net realized gain on sale of investments and foreign currency | | | 25,365,012 | | | | 25,414,184 | |
| Net change in unrealized appreciation (depreciation) | | | 58,200,518 | | | | (15,094,435 | ) |
| Net increase (decrease) in net assets resulting from operations | | | 84,533,759 | | | | 12,553,202 | |
| Total dividends and distributions | | | (25,690,435 | ) | | | (21,098,680 | ) |
| Fund share transactions: | | | | | | | | |
| Proceed from merger (see Note 9) | | | — | | | | 186,394,040 | |
| Shares sold | | | 4,694,803 | | | | 6,710,060 | |
| Shares issued to holders in reinvestment of dividends | | | 24,719,331 | | | | 20,328,860 | |
| Shares redeemed | | | (37,058,225 | ) | | | (50,818,399 | ) |
| Net increase | | | (7,644,091 | ) | | | 162,614,561 | |
| Net increase (decrease) in net assets | | | 51,199,233 | | | | 154,069,083 | |
| Net Assets: | | | | | | | | |
| Beginning of period | | | 412,911,974 | | | | 258,842,891 | |
| End of period | | $ | 464,111,207 | | | $ | 412,911,974 | |
The Accompanying Notes are an Integral Part of these Financial Statements.
Semi-Annual Report | 13
The Tocqueville Trust
Notes to Financial Statements
The Tocqueville Trust (the “Trust”) is a Massachusetts business trust registered under the Investment Company Act of 1940, as amended, and organized on September 17, 1986, consisting of one fund, the Tocqueville Fund (the “Fund”). The Fund is an open-end management investment company. The Fund’s investment objective is long-term capital appreciation, which it seeks to achieve by investing primarily in securities of United States issuers. Tocqueville Asset Management L.P. is the investment adviser to the Fund (“Tocqueville,” or the “Adviser”).
On November 18, 2022, the Tocqueville Fund acquired all the net assets of the Tocqueville Opportunity Fund and Tocqueville Phoenix Fund. For more information regarding the reorganization see note 8.
| 2. | SIGNIFICANT ACCOUNTING POLICIES |
The following is a summary of significant accounting policies consistently followed by the Portfolio in the preparation of its financial statement. These policies are in conformity with accounting principles generally accepted in the United States of America (“U.S. GAAP”). The Fund follows accounting and reporting guidance under Financial Accounting Standards Board (“FASB”) Accounting Standards Codification Topic 946, “Financial Services—Investment Companies.”
a) Security valuation and security transactions
Investments in securities, including foreign securities, traded on an exchange or quoted on the over-the-counter market are valued at the last sale price or, if no sale occurred during the day, at the mean between closing bid and ask prices, as last reported by a pricing service approved by the Trustees. Securities that are principally traded on the National Association of Securities Dealers Automated Quotation National Market (“NASDAQ”) are generally valued at the NASDAQ Official Closing Price (“NOCP”). If there is no NASDAQ Official Closing Price for a NASDAQ-listed security or sale price available for an over-the-counter security, the mean of the latest bid and asked quotations from NASDAQ will be used. When market quotations for securities are not readily available, or when restricted securities or other assets are being valued, such assets are valued at fair value as determined in good faith by or under procedures approved by the Trustees. Money market funds are valued at net asset value (“NAV”). Fixed income securities, such as corporate bonds, convertible bonds and U.S. government agency issues are valued based on evaluated mean prices supplied by independent pricing services using matrix pricing formulas and/or independent broker bid quotations.
Trading in securities on foreign securities exchanges normally is completed before the calculation of the Fund’s NAV. Trading on these foreign exchanges may not take place on all days on which there is regular trading on the New York Stock Exchange (“NYSE”), or may take place on days on which there is no regular trading on the NYSE. Similarly, the Fund may hold securities traded in domestic markets where the market may close early on a given day prior to calculation of the Fund’s NAV. Events affecting the value of such securities held by the Fund that occur between the close of trading in the security and the close of trading on the NYSE normally will not be reflected in the Fund’s calculation of the NAV. However, significant events will be closely monitored, and where it is determined that an adjustment should be made to the security’s value because significant interim events may materially affect the value of the security, the security will be priced at its fair value in accordance with the procedures approved by the Trustees.
14 | April 30, 2024
Cash and cash equivalents may exceed federal insurance limits. Money market deposit accounts are considered cash equivalents and reflected at cost.
Investment transactions are recorded on trade date. Dividend income is recognized on the ex-dividend date. Interest income is recognized on an accrual basis and includes, where applicable, the amortization of premiums and accretion of discounts. Net realized gains and losses from sales of securities are determined on the specific identification cost method.
b) Restricted and illiquid securities
The Fund may invest in securities that are subject to legal or contractual restrictions on resale or are illiquid. A security may be considered illiquid if it lacks a readily available market or if its valuation has not changed for a certain period of time. Disposal of these securities may involve time consuming negotiations and expense, and a prompt sale at the current valuation may be difficult.
c) Fair Valuation Measurements
The Trust has adopted authoritative fair valuation accounting standards that establish an authoritative definition of fair value and set out a hierarchy for measuring fair value. These standards require additional disclosures about the various inputs and valuation techniques used to develop the measurements of fair value, and a discussion of changes in valuation techniques and related inputs during the year. These inputs are summarized in the three broad levels listed below.
| ● | Level 1 - Quoted prices in active markets for identical securities. |
| ● | Level 2 - Other significant observable inputs (including quoted prices for similar securities, interest rates, prepayment speeds, credit risk, etc.). |
| ● | Level 3 - Significant unobservable inputs (including the Fund’s own assumptions in determining the fair value of investments). |
When using the market quotations or closing price provided by the pricing service for equity investments—including common stocks, preferred stocks, foreign issued common stocks, exchange-traded funds, closed-end funds and real estate investment trusts—which are traded on an exchange are valued at the last sale price reported by the exchange on which the securities are primarily traded on the day of valuation and when the market is considered active, the security will be classified as a Level 1 security. When using the mean between the latest bid and ask price, the security will be classified as Level 2.
Semi-Annual Report | 15
Investment in mutual funds, including money market funds, are generally priced at the ending NAV provided by the service agent of the funds and will be classified as Level 1 securities.
Fixed income securities, such as corporate bonds, convertible bonds, commercial paper, money market deposit accounts and U.S. government agency issues are valued based on evaluated mean prices supplied by independent pricing services using matrix pricing formulas and/or independent broker bid quotations and are classified as Level 2.
Options are valued at the composite last price reported by the exchange on which the options are primarily traded on the day of the valuation and are classified as Level 1. If there is no composite last price on a given day, the mean between the latest bid and ask price will be used. These contracts are classified as Level 2.
Any securities or other assets for which market quotations are not readily available are valued at fair value as determined in good faith by the Adviser pursuant to procedures established under the general supervision and responsibility of the Fund’s Board of Trustees and may be classified as Level 3 securities. In determining fair value, the Fund will seek to assign a value to the security that it believes represents the amount the Fund could reasonably expect to receive upon its current sale. With respect to securities that are actively traded on U.S. exchanges, the Fund expects that market quotations will generally be available and that fair value might be used only in limited circumstances, such as when trading for a security is halted during the trading day.
In determining whether a significant event has occurred with respect to securities traded principally in foreign markets, the Fund may engage a third party fair value service provider to systematically recommend the adjustment of closing market prices of non-U.S. securities based upon changes in a designated U.S. securities market index occurring from the time of close of the relevant foreign market and the close of the NYSE. Fair value pricing may also be used to value restricted securities held by the Fund or securities with little or no trading activity for extended periods of time. Fair value pricing involves judgments that are inherently subjective and inexact and it is not possible to determine with certainty when, and to what extent, an event will affect a market price. As a result, there can be no assurance that fair value pricing will reflect actual market value and it is possible that the fair value determined for a security may differ materially from the value that could be realized upon the sale of the security.
16 | April 30, 2024
The following is a summary of the inputs used, as of April 30, 2024, involving the Fund’s assets and liabilities carried at fair value. The inputs of methodology used for valuing securities may not be an indication of the risk associated with investing in those securities.
| Description | | Level 1 | | | Level 2 | | | Level 3 | | | Total | |
| The Tocqueville Fund* | | | | | | | | | | | | | | | | |
| Assets | | | | | | | | | | | | | | | | |
| Common Stocks | | $ | 438,378,140 | | | $ | 2,853 | | | $ | — | | | $ | 438,380,993 | |
| Real Estate Investment Trust (REIT) | | | 5,279,750 | | | | — | | | | — | | | | 5,279,750 | |
| Money Market Fund | | | 20,478,514 | | | | — | | | | — | | | | 20,478,514 | |
| Total Assets | | $ | 464,136,404 | | | $ | 2,853 | | | $ | — | | | $ | 464,139,257 | |
| * | For further information regarding portfolio characteristics, please see the accompanying Schedules of Investments. |
The Trust’s valuation procedures have been adopted by the Trust’s Board of Trustees, which has established a Valuation Committee to oversee the valuation process. The Valuation Committee meets on an as needed basis, or at least annually to evaluate changes in the valuation of portfolio securities. The full findings and valuations are then reviewed quarterly by the Independent Trustees.
During the current period ended April 30, 2024, the Fund did not hold any investments with significant unobservable inputs that would be classified as Level 3.
d) Derivative Instruments and Hedging Activities
The Adviser may use derivative instruments, such as purchased and written options, as a means to manage exposure to different types of risk, including market risk and exchange rate risk, and to gain exposure to underlying securities. The Trust has adopted disclosure standards in order to enable the investor to understand how and why an entity used derivatives, how derivatives are accounted for, and how derivatives affect an entity’s results of operations and financial position.
In general, an option contract is an agreement between a buyer and seller that gives the purchaser of the option the right to buy or sell a particular asset at a specified future date at an agreed upon price (commonly knows as the “strike price”).
When the Fund purchases an option, an amount equal to the premium paid by the Fund is recorded as an investment and subsequently adjusted to the current value of the option purchased. If an option expires on the stipulated expiration date or if the Fund enters into a closing sale transaction, a gain or loss is realized. If a purchased call or put option is exercised, the cost of the security acquired is increased by the premium paid for the call, or in the case of a put, a gain or loss is realized from the sale of the underlying security, and the proceeds from such sale are decreased by the premium originally paid. Purchased options are non-income producing securities.
When the Fund writes an option, an amount equal to the premium received by the Fund is recorded as a liability and subsequently adjusted to the current value of the option written. Premiums received from writing options that expire unexercised are treated by the Fund on the expiration date as realized gain from written options. The difference between the premium and the amount paid on effecting a closing purchase transaction, including brokerage commissions, is also treated as a realized gain, or if the premium is less than the amount paid for the closing purchase transaction, as a realized loss. If a written call or put option is exercised, the premium is added or subtracted, respectively, from the proceeds or cost basis, respectively, to the related transaction of the underlying security. The Fund, as writers of an option, would bear the market risk of an unfavorable change in the price of the security underlying the written option.
Semi-Annual Report | 17
Derivatives Risk
The risks of using the types of derivatives in which the Fund may engage include: the risk that movements in the value of the derivative may not fully offset or complement instruments currently held in the Fund in the manner intended by the Adviser; the risk that the counterparty to a derivative contract may fail to comply with their obligations to the Fund; the risk that the derivative may not possess a liquid secondary market at a time when the Fund would look to disengage the position; the risk that additional capital from the Fund may be called upon to fulfill the conditions of the derivative contract; and the risk that the cost of the derivative contracts may reduce the overall returns experienced by the Fund. The measurement of risks associated with these instruments is meaningful only when all related offsetting transactions are considered. The Fund may enter into written call options to hedge against changes in the value of equities. The Fund’s option component of the overall investment strategy is often referred to as a “buy-write” strategy (also called a “covered call” strategy), in which the Adviser (as defined below) writes (sells) a call option contract while at the same time owning an equivalent number of shares of the underlying stock to generate moderate current income. The writing of call options is intended to reduce the volatility of the portfolio and to earn premium income. Written call options expose the Fund to minimal counterparty credit risk since they are exchange traded and the exchange’s clearing house guarantees the options against default. As the writer of a call option the Fund has the obligation to sell the security at the exercise price during the exercise period in the event the option is exercised. The use of options does not create leverage in the Fund. The Fund did not transact in written options during the period ended April 30, 2024.
e) Foreign currency translation
Investments and other assets and liabilities denominated in foreign currencies are translated to U.S. dollars at the prevailing rates of exchange, in accordance with the Trust’s Portfolio Securities Valuation and Foreign Exchange Contracts Procedures. The Fund has engaged in transactions in securities denominated in foreign currencies and, as a result, entered into foreign exchange transactions. The Fund is exposed to additional market risk as a result of changes in the value of the underlying currency in relation to the U.S. dollar. Risks include potential inability of counterparties to meet the terms of their obligations. The value of foreign currencies are marked-to-market on a daily basis, which reflects the changes in the market value of the contract at the close of each day’s trading, resulting in daily unrealized gains and/or losses. When the transactions are settled or the contracts are closed, the Fund recognizes a realized gain or loss.
18 | April 30, 2024
The Fund does not isolate that portion of the results of operations resulting from changes in foreign exchange rates on investments from the fluctuations arising from changes in market prices of securities held. Such fluctuations are reflected as net realized and unrealized gain or loss on investments.
Reported net realized foreign exchange gains or losses arise from sales of foreign currencies, currency gains or losses realized between the trade and settlement dates on securities transactions, the differences between the amounts of dividends, interest, and foreign withholding taxes recorded on the Fund’s books, and the U.S. dollar equivalent of the amounts actually received or paid. Net unrealized foreign exchange gains and losses arise from changes in the value of assets and liabilities other than investments in securities at the end of the fiscal year, resulting from changes in the exchange rates.
f) Shareholder transactions and distributions
Shareholder transactions are recorded on trade date. Dividends to shareholders are recorded on the ex-dividend date. Dividends from net investment income are declared and paid annually by the Fund. Distributions of net realized capital gains, if any, will be declared and paid at least annually. Income and capital gain distributions are determined in accordance with income tax regulations which may differ from generally accepted accounting principles. Permanent differences between financial and tax reporting may result in reclassification to capital stock.
g) Use of estimates
The preparation of financial statements in conformity with U.S. GAAP requires management to make estimates and assumptions that affect the reported amounts of assets and liabilities and disclosure of contingent assets and liabilities at the date of the financial statements and the reported amounts of income and expenses during the reporting year. Actual results could differ from those estimates.
h) Indemnification
In the normal course of business the Fund enters into contracts that contain general indemnification clauses. The Fund’s maximum exposure under these arrangements is unknown, as this would involve future claims against the Fund that have not yet occurred. Based on experience, the Fund expects the risk of loss to be remote.
i) Market Risk
The market value of a security the Fund holds will fluctuate, sometimes rapidly and unpredictably. These fluctuations may cause a security to be worth less than it was at the time of purchase. Market risk may affect an individual security, a particular sector or the entire market. Global economies and financial markets are increasingly interconnected, which increases the likelihood that events or conditions in one country or region will adversely impact markets or issuers in other countries or regions. Securities in the Fund’s portfolio may underperform in comparison to securities in general financial markets, a particular financial market, or other asset classes due to a number of factors, including inflation (or expectations of inflation), deflation (or expectations of deflation), interest rates, global demand for particular products or resources, market instability, debt crises and downgrades, embargoes, tariffs, sanctions and other trade barriers, regulatory events, other governmental trade or market control programs and related geopolitical events. In addition, the value of the Fund’s investments may be negatively affected by the occurrence of global events such as war, terrorism, environmental disasters, natural disasters or events, country instability, and infectious disease epidemics or pandemics.
Semi-Annual Report | 19
j) Political Risks Relating to Russia’s Invasion of Ukraine
Russia’s military invasion of Ukraine, which began in February 2022, the resulting responses by the United States and other countries, and the potential for wider conflict have increased volatility and uncertainty in the financial markets and adversely affected regional and global economies. The United States and other countries have imposed broad-ranging economic sanctions on Russia and certain Russian individuals, banking entities and corporations as a response to Russia’s invasion of Ukraine. The United States and other countries have also imposed economic sanctions on Belarus and may impose sanctions on other countries that support Russia’s military invasion. These sanctions, as well as any other economic consequences related to the invasion, such as additional sanctions, boycotts or changes in consumer or purchaser preferences or cyberattacks on governments, companies or individuals, may have unpredictable effects on financial and capital markets globally.
The extent and duration of Russia’s military actions and the repercussions of such actions (including any retaliatory actions or countermeasures that may be taken by those subject to sanctions) are impossible to predict, but could continue to result in significant market disruptions, including in the oil and natural gas markets, and may continue to negatively affect global supply chains (including global food supplies), inflation and global growth. These and any related events could significantly impact the Fund’s performance and the value of an investment in the Fund, even beyond any exposure the Fund may have to Russian issuers or issuers in other countries directly affected by the invasion.
k) Israel-Hamas Conflict Risk
In October 2023, Hamas terrorists infiltrated Israel’s southern border from the Gaza Strip and conducted a series of attacks on civilian and military targets. Hamas also launched extensive rocket attacks on the Israeli population and industrial centers located along Israel’s border with the Gaza Strip and in other areas within the State of Israel. Following the attack, Israel’s security cabinet declared war against Hamas, and a military campaign was initiated. These events may result in significant market disruptions and may adversely affect regional and global economies. Furthermore, the conflict between Israel and Hamas and the involvement of the United States and other countries could present material uncertainty and risk to the Fund and the performance of its investments or operations, and its ability to achieve its investment objectives. To the extent that third parties, investors, or related customer bases have material operations or assets in Israel or Palestine, they may have adverse consequences related to the ongoing conflict. The extent and duration of the military action and any market disruptions are impossible to predict, but could be substantial.
20 | April 30, 2024
l) Inflation Risk
Inflation risk is the risk that the value of assets or income from investments will be worth less in the future as inflation decreases the value of money. As inflation increases, the real value of the Fund’s shares and distributions thereon can decline. Inflation risk is linked to increases in the prices of goods and services and a decrease in the purchasing power of money. Inflation often is accompanied or followed by a recession, or period of decline in economic activity, which may include job loss and other hardships and may cause the value of securities to go down generally. Inflation risk is greater for fixed-income instruments with longer maturities. In addition, this risk may be significantly elevated compared to normal conditions because of recent monetary policy measures and the current interest rate environment. Inflation has recently increased and it cannot be predicted whether it may decline.
Although the Federal Reserve has raised the federal funds rate, there is no guarantee that such increases will be effective at lowering inflation. Unanticipated or persistent inflation may have a material and adverse impact on the financial conditions or operating results of issuers in which the Fund may invest, which may cause the value of the Fund’s investments to decline. In addition, higher interest rates that often accompany or follow periods of high inflation may cause investors to favor asset classes other than common stocks, which may lead to broader market declines not necessarily related to the performance of any specific investments or specific issuers.
m) Subsequent events evaluation
In preparing these financial statements, the Trust has evaluated events and transactions for potential recognition or disclosure resulting from subsequent events through the date financial statements were available to be issued. This evaluation did not result in any subsequent events, that necessitated disclosure and/or adjustments.
There is no tax liability resulting from unrecognized tax benefits relating to uncertain income tax positions taken or expected to be taken on the tax return for the fiscal year-end October 31, 2023, or for any other tax years which are open for exam. As of October 31, 2023, open tax years include the tax years ended October 31, 2020 through 2023. The Trust is also not aware of any tax positions for which it is reasonably possible that the total amounts of unrecognized tax benefits will significantly change in the next six months. The Fund recognizes interest and penalties, if any, related to unrecognized tax benefits as income tax expense in the Statement of Operations. During the year, the Fund did not incur any interest or penalties.
Semi-Annual Report | 21
Provision for federal income taxes or excise taxes has not been made since the Fund intends to continue to comply with the requirements of subchapter M of the Internal Revenue Code necessary to qualify as Regulated Investment Companies and intend to distribute substantially all taxable income to shareholders and otherwise comply with the provisions of the Internal Revenue Code applicable to Regulated Investment Companies. Distributions from net realized gains for book purposes may include short-term capital gains, which are included as ordinary income to shareholders for tax purposes. Additionally, accounting principles generally accepted in the United States of America require that certain components of net assets relating to permanent differences be reclassified between financial and tax reporting. These reclassifications have no effect on net assets or NAV per share. For the year ended October 31, 2023, the following table shows the reclassifications made:
| | | | Distributable | | | | |
| | | | Earnings | | | Paid In Capital | |
| Tocqueville Fund | | | $ | (2,275,366 | ) | | $ | 2,275,366 | |
The permanent differences primarily relate to fund reorganization and the usage of deemed distributions for tax purposes.
As of October 31, 2023, the components of distributable earnings (accumulated losses) for income tax purposes were as follows:
| | | Tocqueville | |
| | | Fund | |
| Tax cost of Investments | | $ | 216,148,646 | |
| Unrealized Appreciation | | $ | 199,774,391 | |
| Unrealized Depreciation | | | (9,099,009 | ) |
| Net unrealized appreciation (depreciation) | | | 190,675,382 | |
| Undistributed operating income | | | 1,940,448 | |
| Undistributed long-term gains | | | 23,390,344 | |
| Distributable earnings | | | 25,330,792 | |
| Other accumulated gain/(loss) | | | (141,224 | ) |
| Total distributable earnings | | $ | 215,864,950 | |
The difference between book-basis and tax-basis unrealized appreciation is attributable primarily to wash sale deferrals.
The tax character of distributions paid during the years ended October 31, 2023 and 2022 was as follows:
| | | October 31, 2023 | |
| | | Ordinary | | | Long Term | | | |
| | | Income | | | Capital Gain | | Total | |
| Tocqueville Fund | | $ | 2,620,243 | | | $ | 18,478,437 | | $ | 21,098,680 | |
| | | October 31, 2022 | |
| | | Ordinary | | | Long Term | | | | |
| | | Income | | | Capital Gain | | | Total | |
| Tocqueville Fund | | $ | 1,292,985 | | | $ | 30,734,493 | | $ | 32,027,478 | |
22 | April 30, 2024
The Fund designated as long-term capital gain dividend, pursuant to Internal Revenue Code Section 852(b)(3), the amount necessary to reduce the earnings and profits of the Fund related to net capital gain to zero for the tax years ended October 31, 2023 and 2022.
| 4. | INVESTMENT ADVISORY AND OTHER AGREEMENTS |
Tocqueville is the investment adviser to the Fund under an Investment Advisory Agreement approved by shareholders. For its services, Tocqueville receives fees from the Fund, calculated daily and payable monthly, at an annual rate of 0.75% on the first $1 billion of the average daily net assets of the Fund, and 0.65% of the average daily net assets in excess of $1 billion.
With respect to the Fund, the Adviser has contractually agreed to waive its advisory fees and/or reimburse expenses in order to ensure that the Fund’s total annual operating expenses do not exceed 1.20%, of its average daily net assets (excluding taxes, interest expense, acquired fund fees and expenses, or extraordinary expenses such as litigation). Prior to October 1, 2022, the Fund had an expense limit of 1.25%. The Expense Limitation Agreement for the Fund will remain in effect until March 1, 2025. For the period ended April 30, 2024, the Adviser waived $318,543 of the advisory fee for the Fund. Such amount is not subject to recoupment by the Adviser.
Pursuant to an Administrative Services Agreement, the Fund pays to the Adviser a fee computed and paid monthly at an annual rate of 0.15% on the first $400 million of the average daily net assets of each Fund; 0.13% on the next $600 million of the average daily net assets of each Fund; and 0.12% on all the average daily net assets of each Fund over $1 billion. For the period ended April 30, 2024, the Adviser made $107,927 in payments to U.S. Bancorp Fund Services, LLC for services provided under a Sub-Administration Agreement for the Fund.
Tocqueville Securities, L.P. (the “Distributor”), an affiliate of Tocqueville, acts as distributor for shares of the Trust. The Fund, adopted a distribution and service plan pursuant to Rule 12b-1 of the 1940 Act. Pursuant to the plan, the Fund pays to the Distributor distribution and service fees of 0.25% per annum of its average daily net assets.
Commissions earned by the Distributor for services rendered as a registered broker-dealer in securities transactions for the Fund for the period ended April 30, 2024 was, $0.
| 5. | CAPITAL SHARE TRANSACTION. |
Transactions in capital shares for the Fund were as follows:
| | | For the
Six Months
Ended
April 30, 2024
(Unaudited) | | | For the Year
Ended
October 31, 2023 | |
| The Tocqueville Fund | | Shares | | | Shares | |
| Shares sold | | | 108,577 | | | | 4,712,746 | |
| Shares issued to holders in reinvestment dividends | | | 619,067 | | | | 518,593 | |
| | | For the
Six Months
Ended
April 30, 2024
(Unaudited) | | | For the Year
Ended
October 31, 2023 | |
| The Tocqueville Fund | | Shares | | | Shares | |
| Shares redeemed | | | (877,502 | ) | | | (1,264,731 | ) |
| Net increase | | | (149,858 | ) | | | 3,966,608 | |
For more information regarding the reorganization see note 8.
| 6. | INVESTMENT TRANSACTIONS |
Purchases and sales of investment securities (excluding short-term investments) for the period ended April 30, 2024, are summarized below.
| | | | Tocqueville | |
| | | | Fund | |
| Purchases: | | | $ | 30,856,791 | |
| Sales: | | | $ | 66,763,148 | |
The Tocqueville Trust has a line of credit (the “Line”), which is uncommitted, in the amount of $40,000,000, 10% of the Fund’s gross market value, or 33.33% of the fair value of the Fund’s investments, whichever is less, with U.S. Bank NA. The Line is for temporary emergency or extraordinary purposes, including the meeting of redemption requests that otherwise might require the untimely disposition of securities. The Line is secured by the Trust’s assets. The Line has a one-year term and is reviewed annually by the Board of Trustees. The Line matures, unless renewed, on January 16, 2025. Interest is charged at the greater of 0.00% and the prime rate minus 0.50%. The interest rate as of the period ended April 30, 2024, was 8%. The average interest rate during the period ended April 30, 2024, was 0%. During the period ended April 30, 2024, the Fund’s maximum borrowing was $0 and average borrowing was $0.
On November 18, 2022, the Tocqueville Fund (the “Acquiring Fund”) acquired all the net assets of the Tocqueville Opportunity Fund and the Tocqueville Phoenix Fund (the “Acquired Funds”) pursuant to Agreement and Plan of Reorganization (the “Plan of Reorganization”) approved by shareholders on November 15, 2022, in a special meeting. The purpose of the transaction was to combine the three funds managed by the Adviser with comparable investment objectives and strategies. The acquisition was accomplished by a tax-free exchange of 4,544,733 shares of the Acquiring Fund (valued at $186,394,040) for all 8,356,590 shares of the Acquired Funds at the close of business November 17, 2022. For financial reporting purposes, assets received, and shares issued by the Acquiring Fund were recorded at fair value; however, the cost basis of the investments received from the Acquired Funds was carried forward to align ongoing reporting to the Acquiring Fund’s realized and unrealized gains and losses with amounts distributable to shareholders for tax purposes. The Acquired Funds’ net assets at that date were $186,394,040. The aggregate net assets of the Acquiring Fund immediately before the acquisition were $267,574,191. The aggregate net assets of the Acquiring Fund immediately after the acquisition were $453,968,232. Because the combined investment portfolios have been managed as a single integrated portfolio since the acquisition was completed. 100% of the costs associated with the Plan of Reorganization were paid by the Adviser.
The details of the reorganization are shown below:
| | | Pre-
Reorganization
Net Assets | | | Pre-
Reorganization
Shares
Outstanding | | | Pre-
Reorganization
Net Asset
Value | | | Post-
Reorganization
Net Assets | | | Post-
Reorganization
Shares
Outstanding | | | Post-
Reorganization
Exchange
Ratio | |
| The Tocqueville Fund | | $ | 267,574,191 | | | | 6,524,094 | | | $ | 41.01 | | | $ | 453,968,232 | | | | 11,068,825 | | | | — | |
| The Tocqueville Opportunity Fund | | | 52,841,965 | | | | 2,065,186 | | | | 25.59 | | | | — | | | | — | | | | 0.62387231 | |
| The Tocqueville Phoenix Fund | | | 133,552,075 | | | | 6,291,404 | | | | 21.23 | | | | — | | | | — | | | | 0.51758214 | |
As a tax-free reorganization, any unrealized appreciation or depreciation on the securities on the date of reorganization was treated as a non-taxable event, thus the cost basis of the securities held reflect the historical cost basis as of the date of reorganization. Immediately prior to the reorganization, the fair value of investments, the net unrealized appreciation and cost basis of the Tocqueville Opportunity Fund was $52,846,100, $29,397,497, and $23,488,603 respectively and the fair value of investments, net unrealized appreciation, and cost basis of the Tocqueville Phoenix Fund was $133,570,961, $30,098,800, and $103,472,161 respectively.
Assuming the acquisition had been completed on November 1, 2022, the beginning of the annual reporting period of the Acquiring Fund, the Acquired Funds’ pro forma results of operations for the period ended October 31, 2023, are as follows:*
Net Investment Income: $2,229,841
Net Realized Gain on Investments: $25,415,287
Net Unrealized Appreciation on Investments: $(10,729,929)
Net Increase in Net Assets Resulting from Operations: $16,915,199
| * | This information is unaudited. |
| 9. | TAILORED SHAREHOLDER REPORTS |
In October 2022, the Securities and Exchange Commission (the “SEC”) adopted a final rule relating to Tailored Shareholder Reports for Mutual Funds and Exchange-Traded Funds; Fee Information in Investment Company Advertisements. The rule and form amendments will, among other things, require the Fund to transmit concise and visually engaging shareholder reports that highlight key information. The amendments will require that funds tag information in a structured data format and that certain more in-depth information be made available online and available for delivery free of charge to investors on request. The amendments became effective January 24, 2023. There is an 18-month transition period after the effective date of the amendment.
ADDITIONAL INFORMATION (UNAUDITED)
| 1. | ADDITIONAL DISCLOSURE REGARDING FUND TRUSTEES AND OFFICERS |
Independent Trustees
| Name and Age | | Position(s) Held
with the Trust | | Term of Office
and Length of
Time Served (1) | | Principal Occupation(s)
During Past Five Years | | Number of Funds
in Fund Complex
Overseen By Trustee | | Other Directorships
Held by Trustee |
| | | | | | | | | | | |
George Cooke
Year of Birth:
1952 | | Trustee; Member of Audit Committee; Member of Governance and Nominating Committee | | Indefinite Term,
Since 2020 | | Business Development, Tocqueville Capital Management, June 2015 – April 2020. | | 1 | | None |
| | | | | | | | | | | |
James W.
Gerard
Year of Birth:
1961 | | Trustee; Member of Audit Committee; Member of Governance and Nominating Committee | | Indefinite Term,
Since 2001 | | Managing Director, Hycroft Advisors, from January 2010-present; Managing Director, deVisscher & Co., LLC from January 2013 to present; The Chart Group from January 2001 to present. | | 1 | | President, American Overseas Memorial Day Association, 1998 – present; Trustee, Salisbury School, 2005 – present; Director, American Friends of Bleraucourt, 1992 –present; President, Little Baby Face Foundation, March 2015 – present. |
ADDITIONAL INFORMATION (UNAUDITED)
Interested Trustees(2) and Officers
| Name and Age | | Position(s) Held
with the Trust | | Term of Office
and Length of
Time Served (1) | | Principal Occupation(s)
During Past Five Years | | Number of Funds
in Fund Complex
Overseen By Trustee | | Other Directorships
Held by Trustee |
| | | | | | | | | | | |
Jeff Zatkowsky
Year of Birth: 1970 | | Treasurer | | Indefinite Term, Since 2021 | | Controller / Treasurer of Tocqueville Asset Management from February 2021 to present; CFO, SMT Financial Corp., December 2019 – February 2021; Controller, Summit Financial Corp., August 2014 – November 2019. | | N/A | | N/A |
| | | | | | | | | | | |
Robert W. Kleinschmidt
Year of Birth: 1949 | | Chairman, President, and Trustee | | Indefinite Term, Chairman Since 2016, and President and Trustee Since 1991 | | Chief Executive Officer and President, January 1994 - August 2023, and Chief Investment Officer, January 1994 to present, Tocqueville Asset Management; Director, Tocqueville Management Corporation, General Partner, Tocqueville Asset Management L.P. and Tocqueville Securities L.P., January 1994 to present. | | 1 | | President and Director, Tocqueville Management Corporation, the General Partner of Tocqueville Asset Management L.P. and Tocqueville Securities L.P. |
| | | | | | | | | | | |
Stephan Yevak
Year of Birth: 1959 | | Anti-Money Laundering Compliance Officer | | Indefinite Term, Since 2018 | | Deputy Chief Compliance Officer, Tocqueville Securities, L.P. from August 2011 to present; Deputy Chief Compliance Officer, Tocqueville Asset Management from August 2011 to present. Anti-Money Laundering Compliance Officer to both entities from March 2018 to present. | | N/A | | N/A |
ADDITIONAL INFORMATION (UNAUDITED)
Interested Trustees(2) and Officers
| Name and Age | | Position(s) Held
with the Trust | | Term of Office
and Length of
Time Served (1) | | Principal Occupation(s)
During Past Five Years | | Number of Funds
in Fund Complex
Overseen By Trustee | | Other Directorships
Held by Trustee |
| | | | | | | | | | | |
Cleo Kotis
Year of Birth: 1975 | | Secretary | | Indefinite Term, Since 2010 | | Director of Human Resources of Tocqueville Management Corp. from January 2018 to present; Director of Office Services of Tocqueville Asset Management from June 2015 to present; Operations Director of the Tocqueville-Delafield Group from September 2009 to December 2022. | | N/A | | N/A |
| | | | | | | | | | | |
Charles Martin
Year of Birth: 1988 | | Chief Compliance Officer | | Indefinite Term, Since 2020 | | Managing Director, Vigilant Compliance, LLC, 2012 – present. | | N/A | | N/A |
| (1) | Each Trustee will hold office for an indefinite term until the earliest of (i) the next meeting of shareholders, if any, called for the purpose of considering the election or re-election of such Trustee and until the election and qualification of his or her successor, if any, elected at such meeting, or (ii) the date a Trustee resigns or retires, or a Trustee is removed by the Board of Trustees or shareholders, in accordance with the Trust’s By-Laws, as amended, and Agreement and Declaration of Trust, as amended. Each officer will hold office for an indefinite term until the date he or she resigns or retires or until his or her successor is elected and qualifies. |
| (2) | “Interested person” of the Trust as defined in the 1940 Act. Mr. Kleinschmidt is considered “interested person” because of his affiliation with the Adviser. |
The Statement of Additional Information includes additional information about the Trustees and is available free of charge by calling the Fund toll free at 1-800-355-7307.
| 2. | PROXY VOTING POLICIES AND PROCEDURES |
A description of the policies and procedures that The Tocqueville Trust uses to determine how to vote proxies relating to portfolio securities is available without charge upon request by calling 1-800-355-7307. The Trust’s proxy voting records relating to portfolio securities for the 12 month period ended June 30, 2023, may be obtained upon request and without charge by calling 1-800-355-7307 or by emailing ckotis@tocqueville.com. The voting record may also be accessed through www.tocquevillefunds.com/fundinformation and on the Securities and Exchange Commission’s website at http://www.sec.gov.
| 3. | SHAREHOLDER REPORTS AND QUARTERLY PORTFOLIO DISCLOSURE |
The Tocqueville Trust will file its complete schedule of portfolio holdings with the SEC for the first and third quarters of each fiscal year on Part F of Form N-PORT. The Fund’s Part F of Form N-PORT will be available on the EDGAR database on the SEC’s website at www.sec.gov. These Forms may also be reviewed and copied at the SEC’s Public Reference Room in Washington D.C. Information about the operation of the Public Reference Room may be obtained by calling 1-800-SEC-0330. Quarterly portfolio holdings are also available on the website of the Tocqueville Funds, www.tocquevillefunds.com.
| 4. | SHAREHOLDER NOTIFICATION OF FEDERAL TAX STATUS |
For the fiscal year ended October 31, 2023, certain dividends paid by the Fund may be subject to a maximum tax rate of 23%, as provided for by the Tax Cuts and Jobs Act of 2017. The percentage of dividends declared from ordinary income designated as qualified dividend income was as follows:
For corporate shareholders, the percent of ordinary income distributions qualifying for the corporate dividends received deduction for the fiscal year ended October 31, 2023, was as follows:
For the fiscal year ended October 31, 2023, the Fund designated the following percent of ordinary distributions paid as interest-related dividends under the Internal Revenue Code Section 871(k)(1)(c):
The percentage of taxable ordinary income distributions that are designated as short-term capital gain distributions under Internal Revenue Section 871(k)(2)(C) for the Fund was as follows.
Semi-Annual Report | 29
[This page intentionally left blank]
[This page intentionally left blank]
Investment Adviser
Tocqueville Asset Management L.P.
40 W. 57th St., 19th Floor
New York, NY 10019
(212) 698-0800
www.tocqueville.com
Distributor
Tocqueville Securities, L.P.
40 W. 57th St., 19th Floor
New York, NY 10019
(212) 698-0800
Shareholders’ Servicing and Transfer Agent
U.S. Bank Global Fund Services, LLC doing business as
U.S. Bank Global Fund Services
615 East Michigan Street
Milwaukee, WI 53202
Custodian
U.S. Bank, N.A.
Custody Operations
1555 River Center Drive, Suite 302
Milwaukee, WI 53212
Board of Trustees
Robert W. Kleinschmidt—Chairman
George Cooke
James W. Gerard
Independent Registered Public Accounting Firm
Cohen & Company, Ltd.
342 North Water Street, Suite 830
Milwaukee, WI 53202

Tocqueville Funds
c/o US Bancorp Fund Services, LLC
P.O. Box 701
Milwaukee, WI 53201-0701
www.tocquevillefunds.com
TQ SEMI 4-30-24