UNITED STATES
SECURITIES AND EXCHANGE COMMISSION
Washington, D.C. 20549
FORM N-CSR
CERTIFIED SHAREHOLDER REPORT OF REGISTERED
MANAGEMENT INVESTMENT COMPANIES
Investment Company Act file number 811-04840
The Tocqueville Trust
(Exact name of registrant as specified in charter)
The Tocqueville Trust
40 W. 57th St., 19th Floor
New York, NY 10019
(Address of principal executive offices) (Zip code)
Robert W. Kleinschmidt
The Tocqueville Trust
40 W. 57th St., 19th Floor
New York, NY 10019
(Name and address of agent for service)
(212) 698-0800
Registrant's telephone number, including area code
Date of fiscal year end: October 31, 2021
Date of reporting period: April 30, 2021
Item 1. Reports to Stockholders.

| This report is not authorized for distribution to prospective investors unless preceded or |
| accompanied by a currently effective prospectus of The Tocqueville Trust. Please call |
| 1-800-697-FUND (3863) for a free prospectus. Read it carefully before you invest. |
| |
| You are invited to visit our website @ www.tocquevillefunds.com |
Chairman’s Letter
Dear Fellow Shareholders,
“What a Difference a Day Makes,” goes the old standard by Dinah Washington, and, in the last six months, we have been visited by any number difference making days. From November 3rd, to January 6th, to January 20th, to the day of our first inoculation and the days of official re-openings, and, for some, the days the government checks arrived in the mail, or when unemployment ended and jobs started back up again, it seems as if we have had nothing but days making a big (predominately positive) difference, since the close of our fiscal year last October.
The equity markets have noticed, generating strong results all around the world. So, too, alas, have the fixed income markets, where rates have started what we fear may be a very long climb, fed by the nascent expectations of higher inflation.
While the resurging economy is real, and likely lasting, in our opinion, at least for the immediate future, night does follow day, even big important ones. The mere prospect of higher taxes, stifling regulations, precedent shattering (for this country) changes to the Judiciary, expansion of statehood for political purposes, upending of long-established parliamentary principles, costly Green diktats, political and race-based capital allocation requirements, punitive changes in long standing estate tax conventions, and much more in the progressive agenda (is there ever enough?) is frightening. Their implementation, should that come to pass, could not but negatively affect the economy and the markets.
History is replete with examples of faltering and failed economies which had pursued many of these same policies advocated by the progressive left, which seems to have gained the upper hand in the new administration, at least for the time being.
Perceiving, perhaps incorrectly, only a short-term majority in Congress, the new administration is like a reckless young man in a hurry. Big changes, such as the ones the administration and its progressive wing are promulgating, should be well thought through and debated. Some bipartisan agreement should be encouraged. Markets like certainty, so that they have time to react and plan around it. Rushing a radical agenda through a narrow window seldom achieves the results desired, and, indeed, invites backlash. One hopes cooler heads will prevail.
Under a different set of circumstances, it might be expected that an independent FED would take away some of the big spending, inflationary punch in the punch bowl, but the FED, working hand in glove with the Treasury, seems to have become increasingly subject to political pressures—another goal of the progressive left—and is, so far, accommodating the dangerous expansion of government. The Supreme Court, itself threatened, may try to rein in some of the overreach, particularly in the HR1 bill, but the Justices will have to tread softly, as they did in the Hughes Court in the 1930’s after FDR threaten to pack it.
Semi-Annual Report | 1
The genius of American Capitalism is its ability to adapt to most anything, and already we are seeing public corporations adopt a different posture on a wide range of noneconomic issues, no doubt due to a savvy sense of self preservation. This market driven adaptability, coupled with the post Covid rebound may be enough, or even more than enough, to ward off the worst consequences of an agenda that has wrecked so many Latin American economies and weakened so many European ones. We should be so lucky.
The genius of the American political system, meanwhile, is that it generally returns to the mean. Let’s hope so. That seems to be what the markets are expecting, rather than the dire scenario that might result. The risk is that “this time it’s different.” Enormously high spending, massive increases in the money supply, vast expansion of government purview and widespread implementation of the progressive agenda all could mean a day of reckoning is coming. And what a difference that day would make.
In the pages that follow, our managers will report on the period just past, and how they are dealing with the challenges that lay ahead.
| Sincerely, | |
 | |
| Robert W. Kleinschmidt | |
| Chairman | | |
2 | April 30, 2021
The Tocqueville Fund
Dear Fellow Shareholders,
Equity markets rallied onward during the six months which ended April 30, 2021, overcoming two brief corrections at the end of January and again at the end of February. The principal factors behind the market’s trajectory were the ongoing central bank stimulus, the roll out of multiple COVID-19 vaccines, robust earnings recovery and the anticipated reopening of large swaths of the economy. Investors in the U.S. looked past the potential for rising long term interest rates which, in the case of the ten-year Treasury, have nearly tripled since last Spring at the outset of the pandemic, as well as the specter of inflation and despite rising commodity prices in dollar terms.
The Tocqueville Fund gained 26.51% net of fees during the period, in line with the overall market, as measured by the S&P 500, which returned 28.85%. The sector rotation can be observed in the relative performance of the Russell 1000 Value Index which returned 36.30% compared to the Russell 1000 Growth Index which returned 24.31%. Information technology, industrials and communications services were our best performing sectors while utilities, consumer staples and real estate were the laggards, albeit still positive. The biggest contributors to performance during the quarter were Applied Materials, Alphabet, Disney, Deere, and Charles Schwab while the biggest, though modest, detractors were Wheaton Precious Metals, Procter & Gamble, Alibaba, Gilead, and ACADIA Pharmaceuticals.
A variety of new positions were added during the quarter.
Expedia, the online travel agency, is a business most directly impacted by the COVID-19 pandemic, with non-essential travel severely curtailed. As a result, there is considerable pent-up demand for travel that bodes well for the near term. Being a capital light business, the company was able to navigate the difficult period without too much damage to its balance sheet. Moreover, its rapidly growing VRBO business, akin to the more well-known Airbnb, was not getting appropriate credit in the market.
Another new position is Alibaba, the Chinese e-commerce leader. Alibaba’s stock had underperformed recently, in part due to sector rotation, but also because of the political pressure that the Chinese government had aimed at its founder and the view that competition had increased as well as their spending needs to keep pace. Our view was the political pressure, which focused on ANT, Alibaba’s fintech subsidiary, would pass and spending would moderate, providing an opportunity to purchase shares at a sizeable discount to our estimates of intrinsic value.
We also added Republic Services, a leader in the waste management business. Republic Services had underperformed and was out of favor with investors because it suffered an unexpectedly large loss of volumes due to the pandemic where the business had traditionally been perceived to be very defensive. Commercial customer closures caused the business to appear more cyclical in this crisis than in other downturns. Our view was that this was an opportunity to acquire a stable business with historical pricing power that would benefit from volume recovery, at an attractive discount.
Semi-Annual Report | 3
Other positions that were purchased or increased include ACADIA Pharmaceuticals, Allegro Microsystems, and Gilead Sciences, EBAY, all undervalued in our view, as well likely recovery and inflation beneficiaries Cameco, Chevron, Diamondback Energy, Dominion Energy, Dow, DuPont, Rockwell Automation, Sibanye Stillwater, South32 and Tejon Ranch.
During the periods, we decreased or sold positions in a variety of names, and for a variety of reasons: changes in outlook or circumstances, prices approaching our targets, making room for better ideas, or simply to meet shareholder demands for liquidity. Sales included shares of Amazon, Apple, Applied Materials, Boeing, Caterpillar, Coca Cola, Constellation Brands, Facebook, Fidelity National, Ionis, Johnson & Johnson, McDonald’s, Microsoft, NEXTERA, Procter & Gamble, Rockwell Automation, and Walmart.
The outlook for the market and the types of stocks that may continue to do well depends greatly on the prospects of continued yield curve steepening and for inflation to take hold. The increase in yields so far seems to be based on investor conviction that we are about to see a traditional upsurge in inflation. Much of the recently observed inflation, however, appears to be the result of supply chain bottlenecks and excess liquidity. After a decade or more of deflation fears, the Fed likely will not be quick to act against inflationary pressures until it is convinced that they are for real. That could prove to be wise, or reckless. As always, the future is indeterminate. Careful stock selection remains our favored method for dealing with the uncertainty.
Sincerely,
| |  |
| Robert W. Kleinschmidt | Peter D. Shawn |
| Portfolio Manager | Portfolio Manager for the Investment |
| | Adviser |
4 | April 30, 2021
The Tocqueville Fund
(Unaudited)

This chart assumes an initial gross investment of $10,000 made on 4/30/11. Returns shown do not reflect the deduction of taxes that a shareholder would pay on fund distributions or the redemption of fund shares. Performance reflects fee waivers in effect. In the absence of fee waivers, total return would be reduced. Returns shown include the reinvestment of all dividends and other distributions. Past performance is not predictive of future performance. Investment return and principal value will fluctuate so that your shares, when redeemed, may be worth more or less than their original cost.
The Standard & Poor’s 500 Total Return Stock Index (S&P 500) is a capital-weighted index, representing the aggregate market value of the common equity of 500 stocks primarily traded on the New York Stock Exchange. Returns assume the reinvestment of all dividends.
AVERAGE ANNUAL RATE OF RETURN (%)
FOR YEARS ENDED APRIL 30, 2021
| | 1 Year | 3 Year | 5 Year | 10 Year |
| The Tocqueville Fund | 44.46% | 15.54% | 14.29% | 11.28% |
| Standard & Poor’s 500 Total Return Stock Index | 45.98% | 18.67% | 17.42% | 14.17% |
Semi-Annual Report | 5
| The Tocqueville Opportunity Fund |
Dear Fellow Shareholders,
We are pleased to provide our investment overview for the first six-month period of the fiscal year 2021. During the six-month period ended on April 30, 2021, the Tocqueville Opportunity Fund appreciated 16.32% net of fees compared to the Russell 2500 Growth Index, which appreciated 32.00%.
Since our last update, the economic backdrop in the United States has improved dramatically as COVID-19 vaccines were developed earlier than expected. The rapid distribution of these vaccines as well as easing of pandemic restrictions has allowed the economy to positively rebound from last year. In addition, the Biden Administration has pursued aggressive fiscal policies in concert with continued accommodative monetary policy from the Federal Reserve. The combination of these policies, along with an improving US economy, has prompted market participants to become more concerned about inflation and rising interest rates. Inflation is still very topical among investors with commodity prices increasing rapidly. Commodities including lumber, copper, and oil are materially higher than they were last year. Part of the increase in price can be explained by supply chains not being able to fulfill demand since they were shut down last year and have been slow to reopen. This has been exacerbated by the shortage of labor as workers have been slow to return partly because of generous stimulus packages Congress has passed. We believe that supply chains will adjust as we get into the latter point of this year as the stimulus rolls off and logistical bottleneck issues are resolved.
Notwithstanding what could be temporary inflation concerns, the yield on risk free assets has increased. The yield on the 10-year treasury bond ended the first quarter yielding 1.74% which is an increase of 80bps since the start of 2021. This has caused investors to reallocate or rotate funds towards cyclical investments at the expense of growth-oriented investments. This rotation has caused our holding in the Information Technology sector to underperform the broader market as valuation multiples have compressed. Despite the valuation compression, the Fund continues to be overweight Information Technology, as we believe the long-term fundamentals remain intact.
One of the many lasting impacts of COVID-19 is how the consumption habits of both businesses and consumers have been permanently altered. To stay ahead of the curve, businesses must digitize and automate to ensure they remain as productive as possible. Shopify, one of the Fund’s top holdings, enables this change quickly and seamlessly allowing a merchant to setup an online store in hours. In addition to a website, Shopify helps merchants fulfill orders, manage inventory, direct marketing spend, and facilitate payments among other services. It is our belief that this trend toward E-commerce will only become more important as consumers are buying more products online. Shopify’s value proposition sets it up for years of rapid growth which is evidenced by its recent partnerships with Facebook, Google, Wal-Mart, and Pinterest. Another theme that has come to the forefront has been the need for businesses to accelerate their digital transformation to the cloud. With more employees working from home businesses are needing to rapidly invest to ensure their network is accessible, efficient, and secure. This has created demand for all sorts of software solutions related to the cloud such as workflow management and cyber security just to name a few. The Fund’s investments in Service Now and Okta are emblematic of these trends and are seeing accelerating demand for its products as a result. We continue to be long term believers in these companies as they offer an attractive pay back to its users while delivering shareholders superior growth and strong recurring revenues with little to no churn.
6 | April 30, 2021
The Fund’s allocation to its top 10 and 50 positions at the end of the fiscal period totaled 49% and 88%, respectively. The Fund’s active share relative to its benchmark continues to be high, ranging from a low of 78% to a high of 85% during the past 12 months. As always, we sincerely appreciate your continued support.
Sincerely,

| Paul Lambert |
| Portfolio Manager |
Semi-Annual Report | 7
| The Tocqueville Opportunity Fund |
| (Unaudited) |

This chart assumes an initial gross investment of $10,000 made on 4/30/11. Returns shown do not reflect the deduction of taxes that a shareholder would pay on fund distributions or the redemption of fund shares. Returns shown include the reinvestment of all dividends and other distributions. Past performance is not predictive of future performance. Investment return and principal value will fluctuate so that your shares, when redeemed, may be worth more or less than their original cost.
The Russell 2500 Growth Total Return Index is an unmanaged index that measures the performance of the small to mid-cap growth segment of the U.S. equity universe. It includes those Russell 2500 companies with higher price-to-book ratios and higher forecasted growth values. Returns assume the reinvestment of all dividends.
AVERAGE ANNUAL RATE OF RETURN (%)
FOR YEARS ENDED APRIL 30, 2021
| | 1 Year | 3 Year | 5 Year | 10 Year |
| The Tocqueville Opportunity Fund | 50,57% | 24.65% | 24.01% | 14.85% |
| Russell 2500 Growth Total Return Index | 67.27% | 21.60% | 20.51% | 14.21% |
8 | April 30, 2021
| The Tocqueville Phoenix Fund |
Dear Fellow Shareholders,
For the six months ended April 30, 2021 the Tocqueville Phoenix Fund’s net asset value increased 50.04% net of fees, versus increases of 59.17% for the Russell 2000 Value Index and 48.06% for the Russell 2000 Index, each on a total return basis. The Fund’s net asset value as of April 30, 2021 was $26.05 per share. Total net assets amounted to $179,674,808 of which 91.3% was invested in equities, with the balance held in reserve.
Fiscal and monetary stimulus, removal of many COVID-19 restrictions, and successful distribution of COVID-19 vaccinations helped the U.S. economy recover over the past six months. Small capitalization stocks benefited the most, due to their increased exposure to an improving domestic economy. The Fund’s holdings generally reported positive year-end 2020 results and provided encouraging commentary around expectations for 2021.
The U.S. government’s strategy to counter the economic impact of COVID-19 has been extraordinary. In early March, President Biden signed an additional $1.9 trillion stimulus bill named “The American Rescue Plan”. This comes on top of the $900 billion package that was signed in December 2020, and the $2 trillion CARES Act that was signed by President Trump at the height of the pandemic last year. All-in, there will likely be over $5 trillion of fiscal stimulus to help the U.S. economy recover from its near total shutdown in 2020. Importantly, it is worth noting that there will be more fiscal aid for the U.S. economy in 2021 than there was in 2020 (~$3 trillion, versus ~$2 trillion). Stimulus payments will largely assist families at the lower end of the economic spectrum, while the higher end of the spectrum is benefitting from a surging housing market (driven by record low mortgage rates), higher investment portfolios and near record personal savings levels.
As of April 30th, approximately 45% of the U.S. population has had at least one dose of a COVID-19 vaccine and many states have reduced or eliminated COVID-19 restrictions on businesses and residents. COVID-19 hospitalizations have declined substantially from the January 2021 peak, and it is expected that if the vaccination schedule continues at its current pace the worst of the pandemic may be behind us. If this were to hold true, we would expect the U.S. economy to experience substantial economic growth in 2021 versus 2020.
In addition to the fiscal stimulus referenced above, on March 31st President Biden presented Part I of his “Build Back Better” agenda with a $2.3 trillion infrastructure plan named the “American Jobs Plan”. Funds are earmarked for infrastructure, clean energy, and modernizing manufacturing and are expected to be funded through further government debt and increasing the corporate tax rate to 28% (from 21%). Considering a large portion of the Fund generates revenue from the construction and materials sectors we believe this would very likely benefit many companies in the portfolio.
Semi-Annual Report | 9
While we are cautiously optimistic about the prospects of future economic growth, we are concerned that such dramatic government intervention in the economy may result in substantial inflation. We are already seeing evidence of such in many chemicals and building materials. Historically, however, value stocks, such as those we own in the Fund, have outperformed during periods of higher inflation and we are hopeful that will continue in the future.
With respect to the specifics of the portfolio, all portfolio companies benefited from a return to normal demand, and all portfolio companies contributed positively during the period. Acuity Brands, PVH Corp, and Crane Co. were the Fund’s top performers. We took advantage of strong market conditions to sell out of eight positions in the period, while buying five more that met our investment criteria. We believe that our portfolio companies will continue to execute on their strategic initiatives and expect the market to reward that progress.
Sincerely,
 |  |
| James Maxwell | Michael Sellecchia |
| Portfolio Manager | Portfolio Manager |
10 | April 30, 2021
| The Tocqueville Phoenix Fund |
| (Unaudited) |
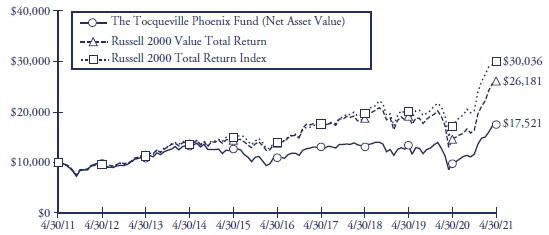
This chart assumes an initial gross investment of $10,000 made on 4/30/11. On February 15, 2019, The Delafield Fund’s name changed to The Tocqueville Phoenix Fund. Returns shown do not reflect the deduction of taxes that a shareholder would pay on fund distributions or the redemption of fund shares. Performance reflects fee waivers in effect. In the absence of fee waivers, total return would be reduced. Returns shown include the reinvestment of all dividends and other distributions. Past performance is not predictive of future performance. Investment return and principal value will fluctuate so that your shares, when redeemed, may be worth more or less than their original cost.
The Russell 2000 Value Total Return Index measures performance of the small cap value segment of the U.S. equity universe. Securities are categorized as growth or value based on their relative book-to-price ratios, historical sales growth, and expected earnings growth. Returns include the reinvestment of all dividends.
The Russell 2000 Total Return Index is an unmanaged index that measures the performance of the 2,000 smallest companies in the Russell 3000 Index, which represent approximately 10% of the total market capitalization of the Russell 3000 Index. Returns include the reinvestment of all dividends.
AVERAGE ANNUAL RATE OF RETURN (%)
FOR YEARS ENDED APRIL 30, 2021
| | | 1 Year | 3 Year | 5 Year | 10 Year |
| The Tocqueville Phoenix Fund* | 77.93% | 10.26% | 9.76% | 5.77% |
| Russell 2000 Value Total Return Index | 78.96% | 11.68% | 13.54% | 10.10% |
| Russell 2000 Total Return Index | 74.91% | 15.23% | 16.48% | 11.63% |
* Prior to February 15, 2019, the Fund’s name was The Delafield Fund.
Semi-Annual Report | 11
Expense Example—April 30, 2021 (Unaudited)
As a shareholder of The Tocqueville Trust (the “Funds”), you incur ongoing costs, including management fees; distribution fees; and other Fund expenses. This example is intended to help you understand your ongoing costs (in dollars) of investing in the Funds and to compare costs with the ongoing costs of investing in other mutual funds.
The Example is based on an investment of $1,000 invested at the beginning of the period and held the entire period (November 1, 2020-April 30, 2021).
Actual Expenses
The first line of the table below provides information about actual account values and actual expenses. You may use the information in this line, together with the amount you invested, to estimate the expenses that you paid over the period. Simply divide your account value by $1,000 (for example, an $8,600 account value divided by $1,000 = 8.6), then multiply the result by the number in the first line under the heading entitled “Expenses Paid During Period” to estimate the expenses you paid on your account during this period.
Hypothetical Example for Comparison Purposes
The second line of the table below provides information about hypothetical account values and hypothetical expenses based on the Funds’ actual expense ratios and an assumed rate of return of 5% per year before expenses, which is not the Funds’ actual return. The hypothetical account values and expenses may not be used to estimate the actual ending account balance or expenses you paid for the period. You may use this information to compare the ongoing costs of investing in the Funds and other funds. To do so, compare this 5% hypothetical example with the 5% hypothetical examples that appear in the shareholder reports of the other funds.
Please note that the expenses shown in the table are meant to highlight your ongoing costs only and do not reflect any transactional costs, such as sales charges (loads), redemption fees, or exchange fees. Therefore, the second line of the table is useful in comparing ongoing costs only, and will not help you determine the relative costs of owning different funds. In addition, if these transactional costs were included, your costs would have been higher.
12 | April 30, 2021
Expense Example Tables (Unaudited)
The Tocqueville Fund
| | | Beginning
Account Value
November 1, 2020 | | | Ending
Account Value
April 30, 2021 | | | Expenses Paid
During Period*
November 1, 2020-
April 30, 2021 | |
| Actual | | $ | 1,000.00 | | | $ | 1,265.10 | | | $ | 7.02 | |
| Hypothetical (5% return before expenses) | | | 1,000.00 | | | | 1,018.60 | | | | 6.26 | |
| * | Expenses are equal to the Fund’s annualized six-month expense ratio (including interest expense) of 1.25% for The Tocqueville Fund, multiplied by the average account value over the period, multiplied by 181/365 to reflect the one-half year period. |
The Tocqueville Opportunity Fund
| | | Beginning
Account Value
November 1, 2020 | | | Ending
Account Value
April 30, 2021 | | | Expenses Paid
During Period*
November 1, 2020-
April 30, 2021 | |
| Actual | | $ | 1,000.00 | | | $ | 1,163.20 | | | $ | 6.76 | |
| Hypothetical (5% return before expenses) | | | 1,000.00 | | | | 1,018.55 | | | | 6.31 | |
| * | Expenses are equal to the Fund’s annualized six-month expense ratio (including interest expense) of 1.26% for The Tocqueville Opportunity Fund, multiplied by the average account value over the period, multiplied by 181/365 to reflect the one-half year period. |
The Tocqueville Phoenix Fund
| | | Beginning
Account Value
November 1, 2020 | | | Ending
Account Value
April 30, 2021 | | | Expenses Paid
During Period*
November 1, 2020-
April 30, 2021 | |
| Actual | | $ | 1,000.00 | | | $ | 1,500.40 | | | $ | 7.75 | |
| Hypothetical (5% return before expenses) | | | 1,000.00 | | | | 1,018.60 | | | | 6.26 | |
| * | Expenses are equal to the Fund’s annualized six-month expense ratio (including interest expense) of 1.25% for The Tocqueville Phoenix Fund, multiplied by the average account value over the period, multiplied by 181/365 to reflect the one-half year period. |
Semi-Annual Report | 13
The Tocqueville Fund
Financial Highlights
Per share operating performance
(For a share outstanding | | Six Months
Ended
April 30, | | | Years Ended October 31, | |
| throughout the period) | | 2021 | | | 2020 | | | 2019 | | | 2018 | | | 2017 | | | 2016 | |
| | | (Unaudited) | | | | | | | | | | | | | | | | |
| Net asset value, beginning of period | | $ | 37.03 | | | $ | 37.80 | | | $ | 35.84 | | | $ | 38.60 | | | $ | 33.72 | | | $ | 32.91 | |
| Operations: | | | | | | | | | | | | | | | | | | | | | | | | |
| Net investment income (1) | | | 0.11 | | | | 0.31 | | | | 0.43 | | | | 0.35 | | | | 0.37 | | | | 0.42 | |
| Net realized and unrealized gain | | | 9.53 | | | | 1.58 | | | | 4.46 | | | | 0.45 | | | | 6.40 | | | | 1.07 | |
| Total from investment operations | | | 9.64 | | | | 1.89 | | | | 4.89 | | | | 0.80 | | | | 6.77 | | | | 1.49 | |
| Distributions to shareholders: | | | | | | | | | | | | | | | | | | | | | | | | |
| Dividends from net investment income | | | (0.25 | ) | | | (0.37 | ) | | | (0.34 | ) | | | (0.33 | ) | | | (0.39 | ) | | | (0.35 | ) |
| Distributions from net realized gains | | | (1.13 | ) | | | (2.29 | ) | | | (2.59 | ) | | | (3.23 | ) | | | (1.50 | ) | | | (0.33 | ) |
| Total distributions | | | (1.38 | ) | | | (2.66 | ) | | | (2.93 | ) | | | (3.56 | ) | | | (1.89 | ) | | | (0.68 | ) |
| Change in net asset value for the period | | | 8.26 | | | | (0.77 | ) | | | 1.96 | | | | (2.76 | ) | | | 4.88 | | | | 0.81 | |
| Net asset value, end of period | | $ | 45.29 | | | $ | 37.03 | | | $ | 37.80 | | | $ | 35.84 | | | $ | 38.60 | | | $ | 33.72 | |
| Total Return | | | 26.5 | %(3) | | | 5.0 | % | | | 14.9 | % | | | 2.0 | % | | | 20.9 | % | | | 4.6 | % |
| Ratios/supplemental data | | | | | | | | | | | | | | | | | | | | | | | | |
| Net assets, end of period (000) | | $ | 299,520 | | | $ | 251,096 | | | $ | 285,070 | | | $ | 272,043 | | | $ | 293,637 | | | $ | 283,126 | |
| Ratio to average net assets: | | | | | | | | | | | | | | | | | | | | | | | | |
| Expenses before waiver/ reimbursement | | | 1.38 | %(4) | | | 1.38 | % | | | 1.30 | % | | | 1.26 | % | | | 1.27 | % | | | 1.27 | % |
| Expenses after waiver/ reimbursement | | | 1.25 | %(4) | | | 1.25 | % | | | 1.25 | %(2) | | | 1.25 | % | | | 1.26 | %(2) | | | 1.24 | %(2) |
| Net investment income before waiver/reimbursement | | | 0.40 | %(4) | | | 0.69 | % | | | 1.11 | % | | | 0.91 | % | | | 0.97 | % | | | 1.18 | % |
| Net investment income after waiver/reimbursement | | | 0.53 | %(4) | | | 0.82 | % | | | 1.16 | % | | | 0.92 | % | | | 0.98 | % | | | 1.21 | % |
| Portfolio turnover rate | | | 10 | %(3) | | | 9 | % | | | 13 | % | | | 19 | % | | | 10 | % | | | 12 | % |
| (1) | Net investment income per share is calculated using the ending balance prior to consideration or adjustment for permanent book-to-tax differences. |
| (2) | Includes 0.01% of interest expense which is not included in the Fund’s operating expense cap. |
The Accompanying Footnotes are an Integral Part of these Financial Statements.
14 | April 30, 2021
The Tocqueville Opportunity Fund
Financial Highlights
Per share operating performance
(For a share outstanding | | Six Months
Ended
April 30, | | | Years Ended October 31, | |
| throughout the period) | | 2021 | | | 2020 | | | 2019 | | | 2018 | | | 2017 | | | 2016 | |
| | | (Unaudited) | | | | | | | | | | | | | | | | |
| Net asset value, beginning of period | | $ | 38.34 | | | $ | 28.11 | | | $ | 26.60 | | | $ | 26.12 | | | $ | 19.14 | | | $ | 21.41 | |
| Operations: | | | | | | | | | | | | | | | | | | | | | | | | |
| Net investment loss (1) | | | (0.25 | ) | | | (0.40 | ) | | | (0.29 | ) | | | (0.29 | ) | | | (0.37 | ) | | | (0.29 | ) |
| Net realized and unrealized gain (loss) | | | 6.46 | | | | 12.29 | | | | 4.29 | | | | 1.63 | | | | 7.35 | | | | (1.98 | ) |
| Total from investment operations | | | 6.21 | | | | 11.89 | | | | 4.00 | | | | 1.34 | | | | 6.98 | | | | (2.27 | ) |
| Distributions to shareholders: | | | | | | | | | | | | | | | | | | | | | | | | |
| Dividends from net investment income | | | — | | | | — | | | | — | | | | — | | | | — | | | | — | |
| Distributions from net realized gains | | | (1.52 | ) | | | (1.66 | ) | | | (2.49 | ) | | | (0.86 | ) | | | — | | | | — | |
| Total distributions | | | (1.52 | ) | | | (1.66 | ) | | | (2.49 | ) | | | (0.86 | ) | | | — | | | | — | |
| Change in net asset value for the period | | | 4.69 | | | | 10.23 | | | | 1.51 | | | | 0.48 | | | | 6.98 | | | | (2.27 | ) |
| Net asset value, end of period | | $ | 43.03 | | | $ | 38.34 | | | $ | 28.11 | | | $ | 26.60 | | | $ | 26.12 | | | $ | 19.14 | |
| | | | | | | | | | | | | | | | | | | | | | | | | |
| Total Return | | | 16.3 | %(4) | | | 44.3 | % | | | 16.9 | % | | | 5.3 | % | | | 36.5 | % | | | (10.6 | )% |
| Ratios/supplemental data | | | | | | | | | | | | | | | | | | | | | | | | |
| Net assets, end of period (000) | | $ | 101,251 | | | $ | 91,147 | | | $ | 84,583 | | | $ | 82,106 | | | $ | 77,773 | | | $ | 92,958 | |
| Ratio to average net assets: | | | | | | | | | | | | | | | | | | | | | | | | |
| Expenses before waiver/ reimbursement | | | 1.45 | %(5) | | | 1.49 | % | | | 1.41 | % | | | 1.33 | % | | | 1.38 | % | | | 1.38 | % |
| Expenses after waiver/ reimbursement | | | 1.26 | %(2)(5) | | | 1.26 | %(2) | | | 1.28 | %(2) | | | 1.26 | %(2) | | | 1.30 | %(2)(3) | | | 1.38 | % |
| Net investment income before waiver/reimbursement | | | (1.33 | )%(5) | | | (1.18 | )% | | | (1.10 | )% | | | (1.13 | )% | | | (1.05 | )% | | | (0.94 | )% |
| Net investment income after waiver/reimbursement | | | (1.14 | )%(5) | | | (0.95 | )% | | | (0.97 | )% | | | (1.06 | )% | | | (0.97 | )%(3) | | | (0.94 | )% |
| Portfolio turnover rate | | | 14 | %(4) | | | 30 | % | | | 133 | % | | | 151 | % | | | 133 | % | | | 108 | % |
| (1) | Net investment loss per share is calculated using the ending balance prior to consideration or adjustment for permanent book-to-tax differences. |
| (2) | Includes interest expense of 0.01% for the six months ended April 30, 2021, 0.01% for the year ended October 31, 2020, 0.03% for the year ended October 31, 2019, 0.01% for the year ended October 31, 2018, and 0.05% for the year ended October 31, 2017. Interest expense is not included in the Fund’s operating expense cap. |
| (3) | Expense waiver of 1.25% was implemented on November 1, 2016. |
The Accompanying Footnotes are an Integral Part of these Financial Statements.
Semi-Annual Report | 15
The Tocqueville Phoenix Fund
Financial Highlights
Per share operating performance
(For a share outstanding | | Six Months
Ended
April 30, | | | Years Ended October 31, | |
| throughout the period) | | 2021 | | | 2020 | | | 2019 | | | 2018 | | | 2017 | | | 2016 | |
| | | (Unaudited) | | | | | | | | | | | | | | | | |
| Net asset value, beginning of period | | $ | 17.67 | | | $ | 19.98 | | | $ | 20.20 | | | $ | 26.40 | | | $ | 26.47 | | | $ | 28.64 | |
| Operations: | | | | | | | | | | | | | | | | | | | | | | | | |
| Net investment loss (1) | | | (0.07 | ) | | | (0.03 | ) | | | (0.03 | ) | | | (0.14 | ) | | | (0.15 | ) | | | (0.15 | ) |
| Net realized and unrealized gain (loss) | | | 8.83 | | | | (1.81 | ) | | | 1.16 | | | | (2.27 | ) | | | 4.91 | | | | 0.78 | |
| Total from investment operations | | | 8.76 | | | | (1.84 | ) | | | 1.13 | | | | (2.41 | ) | | | 4.76 | | | | 0.63 | |
| Distributions to shareholders: | | | | | | | | | | | | | | | | | | | | | | | | |
| Dividends from net investment income | | | — | | | | — | | | | 0.00 | (2) | | | — | | | | — | | | | | |
| Distributions from net realized gains | | | (0.38 | ) | | | (0.47 | ) | | | (1.35 | ) | | | (3.79 | ) | | | (4.83 | ) | | | (2.80 | ) |
| Total distributions | | | (0.38 | ) | | | (0.47 | ) | | | (1.35 | ) | | | (3.79 | ) | | | (4.83 | ) | | | (2.80 | ) |
| Change in net asset value for the period | | | 8.38 | | | | (2.31 | ) | | | (0.22 | ) | | | (6.20 | ) | | | (0.07 | ) | | | (2.17 | ) |
| Net asset value, end of period | | $ | 26.05 | | | $ | 17.67 | | | $ | 19.98 | | | $ | 20.20 | | | $ | 26.40 | | | $ | 26.47 | |
| Total Return | | | 50.0 | %(4) | | | (9.5 | )% | | | 6.2 | % | | | (10.6 | )% | | | 19.0 | % | | | 3.3 | % |
| Ratios/supplemental data | | | | | | | | | | | | | | | | | | | | | | | | |
| Net assets, end of period (000) | | $ | 179,675 | | | $ | 131,658 | | | $ | 160,433 | | | $ | 237,119 | | | $ | 373,353 | | | $ | 400,827 | |
| Ratio to average net assets: | | | | | | | | | | | | | | | | | | | | | | | | |
| Expenses before waiver/ reimbursement | | | 1.47 | %(5) | | | 1.50 | % | | | 1.39 | % | | | 1.32 | % | | | 1.31 | % | | | 1.29 | % |
| Expenses after waiver/ reimbursement | | | 1.25 | %(5) | | | 1.25 | % | | | 1.25 | % | | | 1.25 | % | | | 1.25 | %(3) | | | 1.29 | % |
| Net investment income before waiver/reimbursement | | | (0.83 | )%(5) | | | (0.41 | )% | | | (0.24 | )% | | | (0.55 | )% | | | (0.55 | )% | | | (0.33 | )% |
| Net investment income after waiver/reimbursement | | | (0.61 | )%(5) | | | (0.16 | )% | | | (0.10 | )% | | | (0.48 | )% | | | (0.49 | )%(3) | | | (0.33 | )% |
| Portfolio turnover rate | | | 9 | %(4) | | | 24 | % | | | 40 | % | | | 40 | % | | | 36 | % | | | 39 | % |
| (1) | Net investment loss per share is calculated using the ending balance prior to consideration or adjustment for permanent book-to-tax differences. |
| (2) | Represents less than $0.01. |
| (3) | Expense waiver of 1.25% was implemented on November 1, 2016. |
The Accompanying Footnotes are an Integral Part of these Financial Statements.
16 | April 30, 2021
The Tocqueville Fund
Schedule of Investments as of April 30, 2021
(Unaudited)
| Common Stocks—97.2% | | Shares | | | Value | |
| Banks—1.6% | | | | | | | | |
| Bank of America Corp. | | | 120,000 | | | $ | 4,863,600 | |
| Capital Goods—7.5% | | | | | | | | |
| Caterpillar, Inc. | | | 20,000 | | | | 4,562,200 | |
| Deere & Co. | | | 20,000 | | | | 7,417,000 | |
| Illinois Tool Works, Inc. | | | 25,000 | | | | 5,761,500 | |
| Parker-Hannifin Corp. | | | 15,000 | | | | 4,707,150 | |
| | | | | | | | 22,447,850 | |
| Commercial & Professional Services—2.3% | | | | | | | | |
| Republic Services, Inc. | | | 40,000 | | | | 4,252,000 | |
| Steelcase, Inc.—Class A | | | 200,000 | | | | 2,760,000 | |
| | | | | | | | 7,012,000 | |
| Consumer Services—3.4% | | | | | | | | |
| Expedia Group, Inc. | | | 25,000 | | | | 4,405,750 | |
| McDonald’s Corp. | | | 25,000 | | | | 5,902,000 | |
| | | | | | | | 10,307,750 | |
| Diversified Financials—3.3% | | | | | | | | |
| Berkshire Hathaway, Inc.— Class B(a) | | | 10,000 | | | | 2,749,500 | |
| The Charles Schwab Corp. | | | 100,000 | | | | 7,040,000 | |
| | | | | | | | 9,789,500 | |
| Energy—2.6% | | | | | | | | |
| Cameco Corp.(b) | | | 25,000 | | | | 420,250 | |
| Chevron Corp. | | | 40,000 | | | | 4,122,800 | |
| Diamondback Energy, Inc. | | | 40,000 | | | | 3,269,200 | |
| | | | | | | | 7,812,250 | |
| Food & Staples Retailing—2.1% | | | | | | | | |
| Walmart, Inc. | | | 45,000 | | | | 6,295,950 | |
| Food, Beverage & Tobacco—2.9% | | | | | | | | |
| Constellation Brands, Inc.— Class A | | | 7,500 | | | | 1,802,400 | |
| The Coca-Cola Co. | | | 125,000 | | | | 6,747,500 | |
| | | | | | | | 8,549,900 | |
| Health Care Equipment & Services—2.0% | | | | | | | | |
| Abbott Laboratories | | | 50,000 | | | | 6,004,000 | |
| Household & Personal Products—4.9% | | | | | | | | |
| Colgate-Palmolive Co. | | | 100,000 | | | | 8,070,000 | |
| The Procter & Gamble Co. | | | 50,000 | | | | 6,671,000 | |
| | | | | | | | 14,741,000 | |
| Insurance—1.8% | | | | | | | | |
| Aflac, Inc. | | | 100,000 | | | | 5,373,000 | |
| Materials—12.5% | | | | | | | | |
| BHP Group Ltd.—ADR(b) | | | 50,000 | | | | 3,638,000 | |
| Dow, Inc. | | | 40,000 | | | | 2,500,000 | |
| DuPont de Nemours, Inc. | | | 30,000 | | | | 2,313,300 | |
| Freeport-McMoRan, Inc. | | | 100,000 | | | | 3,771,000 | |
| Nutrien Ltd.(b) | | | 50,000 | | | | 2,759,500 | |
| Pan American Silver Corp.(b) | | | 100,000 | | | | 3,182,000 | |
| Sibanye Stillwater Ltd.— ADR | | | 100,000 | | | | 1,865,000 | |
| Sonoco Products Co. | | | 75,000 | | | | 4,909,500 | |
| South32 Ltd.—ADR(b) | | | 100,000 | | | | 1,100,000 | |
| Vulcan Materials Co. | | | 40,000 | | | | 7,129,600 | |
| Wheaton Precious Metals Corp.(b) | | | 100,000 | | | | 4,132,000 | |
| | | | | | | | 37,299,900 | |
| Media & Entertainment—8.1% | | | | | | | | |
| Alphabet, Inc.—Class A(a) | | | 5,000 | | | | 11,767,500 | |
| Facebook, Inc.—Class A(a) | | | 10,000 | | | | 3,250,800 | |
| The Walt Disney Co.(a) | | | 50,000 | | | | 9,301,000 | |
| | | | | | | | 24,319,300 | |
| Pharmaceuticals, Biotechnology & Life Sciences—7.2% | | | | | | | | |
| Gilead Sciences, Inc. | | | 35,000 | | | | 2,221,450 | |
| Johnson & Johnson | | | 25,000 | | | | 4,068,250 | |
| Merck & Co., Inc. | | | 100,000 | | | | 7,450,000 | |
| Pfizer, Inc. | | | 200,000 | | | | 7,730,000 | |
| | | | | | | | 21,469,700 | |
| Real Estate—0.0% | | | | | | | | |
| Tejon Ranch Co.(a) | | | 10,000 | | | | 158,200 | |
| Retailing—5.7% | | | | | | | | |
| Alibaba Group Holding Ltd.—ADR(a)(b) | | | 5,000 | | | | 1,154,750 | |
| Amazon.com, Inc.(a) | | | 3,000 | | | | 10,402,260 | |
| eBay, Inc. | | | 100,000 | | | | 5,579,000 | |
| | | | | | | | 17,136,010 | |
| Semiconductors & Semiconductor Equipment—10.6% | | | | | | | | |
| Applied Materials, Inc. | | | 75,000 | | | | 9,953,250 | |
| Intel Corp. | | | 100,000 | | | | 5,753,000 | |
The Accompanying Footnotes are an Integral Part of these Financial Statements.
The Tocqueville Fund
Schedule of Investments as of April 30, 2021
(Unaudited)
| Common Stocks—97.2% | | Shares | | | Value | |
| NVIDIA Corp. | | | 15,000 | | | $ | 9,005,700 | |
| QUALCOMM, Inc. | | | 50,000 | | | | 6,940,000 | |
| | | | | | | | 31,651,950 | |
| Software & Services—6.7% | | | | | | | | |
| Automatic Data Processing, Inc. | | | 40,000 | | | | 7,479,600 | |
| Microsoft Corp. | | | 50,000 | | | | 12,609,000 | |
| | | | | | | | 20,088,600 | |
| Technology Hardware & Equipment—3.3% | | | | | | | | |
| Apple, Inc. | | | 75,000 | | | | 9,859,500 | |
| Telecommunication Services—1.9% | | | | | | | | |
| Verizon Communications, Inc. | | | 100,000 | | | | 5,779,000 | |
| Transportation—1.6% | | | | | | | | |
| Delta Air Lines, Inc.(a) | | | 100,000 | | | | 4,692,000 | |
| Utilities—5.2% | | | | | | | | |
| Dominion Energy, Inc. | | | 50,000 | | | | 3,995,000 | |
| NextEra Energy, Inc. | | | 150,000 | | | | 11,626,500 | |
| | | | | | | | 15,621,500 | |
| Total Common Stocks | | | | | | | | |
| (Cost $116,047,912) | | | | | | | 291,272,460 | |
| Real Estate Investment Trust (REIT)—2.6% | | | | | | | | |
| Real Estate—2.6% | | | | | | | | |
| Weyerhaeuser Co. | | | 200,000 | | | | 7,754,000 | |
| Total Real Estate Investment Trust | | | | | | | | |
| (Cost $3,868,090) | | | | | | | 7,754,000 | |
| Short-Term Investment—0.1% | | | |
| Money Market Fund—0.1% | | | | | | | | |
| Invesco Treasury Portfolio— Institutional Class, 0.010%(c) | | | 209,490 | | | | 209,490 | |
| Total Short-Term Investment | | | | | | | | |
| (Cost $209,490) | | | | | | | 209,490 | |
| Total Investments | | | | | | | | |
| (Cost $120,125,492)—99.9% | | | | | | | 299,235,950 | |
| Other Assets in Excess of | | | | | | | | |
| Liabilities—0.1% | | | | | | | 284,284 | |
| Total Net Assets—100.0% | | | | | | $ | 299,520,234 | |
Percentages are stated as a percent of net assets. ADR American Depository Receipt
| (a) | Non-income producing security. |
| (b) | Foreign issued Security. Foreign Concentration (including ADR’s) was as follows: Australia 1.6%; Canada 3.5%; Cayman Islands 0.4%; South Africa 0.6%. |
| (c) | Rate listed is the 7-day effective yield. |
The Global Industry Classification Standard (GICS®) was developed by and/or is the exclusive property of MSCI, Inc. and Standard & Poor Financial Services LLC (“S&P”). GICS is a service mark of MSCI and S&P and has been licensed for use by U.S. Bank Global Fund Services.
The Accompanying Footnotes are an Integral Part of these Financial Statements.
The Tocqueville Opportunity Fund
Schedule of Investments as of April 30, 2021
(Unaudited)
| Common Stocks—100.6% | | Shares | | | Value | |
| Capital Goods—5.8% | | | | | | |
| Advanced Drainage Systems, Inc. | | | 2,500 | | | $ | 279,150 | |
| Builders FirstSource, Inc.(a) | | | 15,000 | | | | 730,050 | |
| Dover Corp. | | | 2,000 | | | | 298,380 | |
| HEICO Corp. | | | 3,843 | | | | 541,094 | |
| Hubbell, Inc. | | | 2,500 | | | | 480,025 | |
| IDEX Corp. | | | 2,500 | | | | 560,500 | |
| Masco Corp. | | | 11,000 | | | | 702,680 | |
| Nordson Corp. | | | 2,000 | | | | 422,820 | |
| nVent Electric PLC(b) | | | 10,000 | | | | 304,500 | |
| Simpson Manufacturing Co., Inc. | | | 2,500 | | | | 281,750 | |
| SiteOne Landscape Supply, Inc.(a) | | | 2,500 | | | | 448,450 | |
| The Middleby Corp.(a) | | | 1,500 | | | | 271,980 | |
| Trex Co., Inc.(a) | | | 5,000 | | | | 539,950 | |
| | | | | | | | 5,861,329 | |
| Commercial & Professional Services—6.7% | | | | | | | | |
| Booz Allen Hamilton Holding Corp. | | | 6,500 | | | | 539,175 | |
| Cintas Corp. | | | 3,000 | | | | 1,035,420 | |
| Copart, Inc.(a) | | | 7,000 | | | | 871,570 | |
| CoStar Group, Inc.(a) | | | 1,000 | | | | 854,430 | |
| Exponent, Inc. | | | 5,000 | | | | 481,650 | |
| TransUnion | | | 8,500 | | | | 889,015 | |
| Verisk Analytics, Inc. | | | 7,000 | | | | 1,317,400 | |
| Waste Connections, Inc.(b) | | | 7,000 | | | | 833,770 | |
| | | | | | | | 6,822,430 | |
| Consumer Durables & Apparel—0.3% | | | | | | | | |
| TopBuild Corp.(a) | | | 1,500 | | | | 333,570 | |
| Consumer Services—1.2% | | | | | | | | |
| Bright Horizons Family | | | | | | | | |
| Solutions, Inc.(a) | | | 3,500 | | | | 506,905 | |
| Brinker International, Inc. | | | 6,000 | | | | 402,780 | |
| DraftKings, Inc.—Class A(a) | | | 5,000 | | | | 283,300 | |
| Restaurant Brands International LP(c) | | | 37 | | | | 2,806 | |
| | | | | | | | 1,195,791 | |
| Diversified Financials—3.6% | | | | | | | | |
| LPL Financial Holdings, Inc. | | | 2,500 | | | | 391,750 | |
| MarketAxess Holdings, Inc. | | | 1,250 | | | | 610,575 | |
| MSCI, Inc. | | | 2,000 | | | | 971,540 | |
| S&P Global, Inc. | | | 2,500 | | | | 975,975 | |
| Tradeweb Markets, Inc.— Class A | | | 9,000 | | | | 731,520 | |
| | | | | | | | 3,681,360 | |
| Food, Beverage & Tobacco—0.3% | | | | | | | | |
| Beyond Meat, Inc.(a) | | | 2,000 | | | | 263,360 | |
| Health Care Equipment & Services—9.3% | | | | | | | | |
| Chemed Corp. | | | 750 | | | | 357,457 | |
| Dexcom, Inc.(a) | | | 7,000 | | | | 2,702,700 | |
| IDEXX Laboratories, Inc.(a) | | | 2,800 | | | | 1,537,172 | |
| Insulet Corp.(a) | | | 6,000 | | | | 1,771,320 | |
| Intuitive Surgical, Inc.(a) | | | 650 | | | | 562,250 | |
| Lucira Health, Inc.(a) | | | 25,000 | | | | 156,500 | |
| Masimo Corp.(a) | | | 1,500 | | | | 349,005 | |
| Tandem Diabetes Care, Inc.(a) | | | 4,500 | | | | 413,550 | |
| Veeva Systems, Inc.—Class A(a) | | | 5,500 | | | | 1,553,475 | |
| | | | | | | | 9,403,429 | |
| Media & Entertainment—2.8% | | | | | | | | |
| IAC/InterActiveCorp(a) | | | 1,300 | | | | 329,511 | |
| Pinterest, Inc.—Class A(a) | | | 27,000 | | | | 1,791,990 | |
| Roku, Inc.(a) | | | 2,000 | | | | 685,940 | |
| | | | | | | | 2,807,441 | |
| Pharmaceuticals, Biotechnology & Life Sciences—7.1% | | | | | | | | |
| 10X Genomics, Inc.—Class A(a) | | | 2,000 | | | | 395,600 | |
| Acceleron Pharma, Inc.(a) | | | 2,000 | | | | 249,940 | |
| Avantor, Inc.(a) | | | 12,000 | | | | 384,480 | |
| Bio-Techne Corp. | | | 1,200 | | | | 512,988 | |
| Charles River Laboratories | | | | | | | | |
| International, Inc.(a) | | | 2,400 | | | | 797,880 | |
| Elanco Animal Health, Inc.(a) | | | 10,000 | | | | 317,100 | |
| Genmab A/S(a)(b) | | | 3,000 | | | | 1,100,980 | |
| Invitae Corp.(a) | | | 9,000 | | | | 314,100 | |
| Iovance Biotherapeutics, Inc.(a) | | | 43,000 | | | | 1,351,920 | |
| Mirati Therapeutics, Inc.(a) | | | 2,000 | | | | 332,440 | |
| Neurocrine Biosciences, Inc.(a) | | | 7,500 | | | | 708,675 | |
| Pacira BioSciences, Inc.(a) | | | 5,000 | | | | 315,900 | |
| Seagen, Inc.(a) | | | 2,500 | | | | 359,400 | |
| | | | | | | | 7,141,403 | |
The Accompanying Footnotes are an Integral Part of these Financial Statements.
The Tocqueville Opportunity Fund
Schedule of Investments as of April 30, 2021
(Unaudited)
| Common Stocks—100.6% | | Shares | | | Value | |
| Retailing—3.1% | | | | | | | | |
| Floor & Decor Holdings, | | | | | | | | |
| Inc.—Class A(a) | | | 3,000 | | | $ | 332,760 | |
| Magnite, Inc.(a) | | | 5,000 | | | | 200,250 | |
| Pool Corp. | | | 2,750 | | | | 1,161,930 | |
| RH(a) | | | 2,150 | | | | 1,479,243 | |
| | | | | | | | 3,174,183 | |
| Securities, Commodity Contracts, and Other Financial Investments and Related Activities—0.2% | | | | | | | | |
| Northern Star Acquisition Corp.(a) | | | 20,000 | | | | 228,200 | |
| Software & Services—59.3% | | | | | | | | |
| ANSYS, Inc.(a) | | | 1,500 | | | | 548,490 | |
| Aspen Technology, Inc.(a) | | | 2,000 | | | | 261,680 | |
| Atlassian Corp. PLC— Class A(a)(b) | | | 3,500 | | | | 831,460 | |
| Avalara, Inc.(a) | | | 5,000 | | | | 708,550 | |
| Cadence Design Systems, Inc.(a) | | | 5,000 | | | | 658,850 | |
| Coupa Software, Inc.(a) | | | 14,500 | | | | 3,901,080 | |
| CyberArk Software Ltd.(a)(b) | | | 2,000 | | | | 281,000 | |
| EPAM Systems, Inc.(a) | | | 2,000 | | | | 915,500 | |
| Fair Isaac Corp.(a) | | | 1,500 | | | | 782,115 | |
| Fidelity National Information Services, Inc. | | | 10,786 | | | | 1,649,179 | |
| Fiserv, Inc.(a) | | | 14,875 | | | | 1,786,785 | |
| Fortinet, Inc.(a) | | | 4,500 | | | | 919,035 | |
| fuboTV, Inc.(a) | | | 10,000 | | | | 201,600 | |
| Global Payments, Inc. | | | 12,531 | | | | 2,689,529 | |
| MongoDB, Inc.(a) | | | 2,500 | | | | 743,650 | |
| Okta, Inc.(a) | | | 21,000 | | | | 5,663,700 | |
| Paycom Software, Inc.(a) | | | 9,800 | | | | 3,767,218 | |
| Paylocity Holding Corp.(a) | | | 22,500 | | | | 4,347,900 | |
| ServiceNow, Inc.(a) | | | 17,000 | | | | 8,608,290 | |
| Shopify, Inc.—Class A(a)(b) | | | 8,500 | | | | 10,051,335 | |
| Twilio, Inc.—Class A(a) | | | 9,500 | | | | 3,494,100 | |
| Tyler Technologies, Inc.(a) | | | 1,000 | | | | 424,860 | |
| Unity Software, Inc.(a) | | | 2,500 | | | | 253,950 | |
| Workday, Inc.—Class A(a) | | | 17,000 | | | | 4,199,000 | |
| Zendesk, Inc.(a) | | | 16,000 | | | | 2,338,400 | |
| | | | | | | | 60,027,256 | |
| Technology Hardware & Equipment—0.6% | | | | | | | | |
| PAR Technology Corp.(a) | | | 7,500 | | | | 616,050 | |
| Transportation—0.3% | | | | | | | | |
| Saia, Inc.(a) | | | 1,200 | | | | 281,400 | |
| Total Common Stocks | | | | | | | | |
| (Cost $36,974,287) | | | | | | | 101,837,202 | |
| Short-Term Investment—0.0% | | | | | | | | |
| Money Market Fund—0.0% | | | | | | | | |
| Invesco Treasury | | | | | | | | |
| Portfolio—Institutional | | | | | | | | |
| Class, 0.010%(d) | | | 617 | | | | 617 | |
| Total Short-Term Investment | | | | | | | | |
| (Cost $617) | | | | | | | 617 | |
| Total Investments | | | | | | | | |
| (Cost $36,974,904)—100.6% | | | | | | | 101,837,819 | |
| Liabilities in Excess of | | | | | | | | |
| Other Assets—(0.6)% | | | | | | | (586,959 | ) |
| Total Net Assets—100.0% | | | | | | $ | 101,250,860 | |
Percentages are stated as a percent of net assets.
| (a) | Non-income producing security. |
| (b) | Foreign issued Security. Foreign Concentration (including ADR’s) was as follows: Canada 10.7%; Denmark 1.1%; Ireland 0.3%; Israel 0.3%; United Kingdom 0.8%. |
| (d) | Rate listed is the 7-day effective yield. |
The Accompanying Footnotes are an Integral Part of these Financial Statements.
The Tocqueville Phoenix Fund
Schedule of Investments as of April 30, 2021
(Unaudited)
| Common Stocks—91.3% | | Shares | | | Value | |
| Auto Components—4.3% | | | | | | |
| Lear Corp. | | | 15,000 | | | $ | 2,757,600 | |
| Modine Manufacturing Co.(a) | | | 70,000 | | | | 1,139,600 | |
| Visteon Corp.(a) | | | 31,000 | | | | 3,776,110 | |
| | | | | | | | 7,673,310 | |
| Building Products—2.7% | | | | | | | | |
| Apogee Enterprises, Inc. | | | 135,000 | | | | 4,742,550 | |
| Chemicals—8.6% | | | | | | | | |
| Avient Corp. | | | 85,000 | | | | 4,315,450 | |
| HB Fuller Co. | | | 35,000 | | | | 2,338,700 | |
| Innospec, Inc. | | | 29,000 | | | | 2,824,890 | |
| Orion Engineered Carbons SA(b) | | | 300,000 | | | | 5,958,000 | |
| | | | | | | | 15,437,040 | |
| Commercial Services & Supplies—5.8% | | | | | | | | |
| ABM Industries, Inc. | | | 105,000 | | | | 5,398,050 | |
| Harsco Corp.(a) | | | 280,000 | | | | 5,020,400 | |
| | | | | | | | 10,418,450 | |
| Communications Equipment—4.9% | | | | | | | | |
| Comtech | | | | | | | | |
| Telecommunications Corp. | | | 110,000 | | | | 2,637,800 | |
| Lumentum Holdings, Inc.(a) | | | 73,000 | | | | 6,208,650 | |
| | | | | | | | 8,846,450 | |
| Construction Materials—1.2% | | | | | | | | |
| U.S. Concrete, Inc.(a) | | | 34,000 | | | | 2,155,940 | |
| Electrical Equipment—3.8% | | | | | | | | |
| Acuity Brands, Inc. | | | 37,000 | | | | 6,864,240 | |
| Electronic Equipment, Instruments & Components—15.7% | | | | | | | | |
| Fabrinet(a)(b) | | | 62,100 | | | | 5,317,002 | |
| Flex Ltd.(a)(b) | | | 415,000 | | | | 7,221,000 | |
| II-VI, Inc.(a) | | | 35,000 | | | | 2,349,900 | |
| Knowles Corp.(a) | | | 85,000 | | | | 1,776,500 | |
| Plexus Corp.(a) | | | 60,000 | | | | 5,546,400 | |
| TTM Technologies, Inc.(a) | | | 400,000 | | | | 6,000,000 | |
| | | | | | | | 28,210,802 | |
| Food Products—0.7% | | | | | | | | |
| Landec Corp.(a) | | | 108,677 | | | | 1,230,223 | |
| Health Care Equipment & Supplies—2.6% |
| Inogen, Inc.(a) | | | 35,000 | | | | 2,288,650 | |
| Lantheus Holdings, Inc.(a) | | | 97,200 | | | | 2,303,640 | |
| | | | | | | | 4,592,290 | |
| Health Care Providers & Services—2.6% | | | | | | | | |
| Cross Country Healthcare, Inc.(a) | | | 352,000 | | | | 4,688,640 | |
| Household Durables—4.5% | | | | | | | | |
| Mohawk Industries, Inc.(a) | | | 19,700 | | | | 4,048,350 | |
| Newell Brands, Inc. | | | 150,000 | | | | 4,044,000 | |
| | | | | | | | 8,092,350 | |
| Interactive Media & Services—1.8% | | | | | | | | |
| Cars.com, Inc.(a) | | | 250,000 | | | | 3,302,500 | |
| IT Services—6.8% | | | | | | | | |
| DXC Technology Co. | | | 209,000 | | | | 6,878,190 | |
| Unisys Corp.(a) | | | 225,000 | | | | 5,400,000 | |
| | | | | | | | 12,278,190 | |
| Machinery—10.7% | | | | | | | | |
| Crane Co. | | | 57,500 | | | | 5,408,450 | |
| Lydall, Inc.(a) | | | 150,000 | | | | 5,527,500 | |
| Mayville Engineering Co., Inc.(a) | | | 96,993 | | | | 1,514,061 | |
| REV Group, Inc. | | | 75,000 | | | | 1,368,000 | |
| Stanley Black & Decker, Inc. | | | 26,000 | | | | 5,376,020 | |
| | | | | | | | 19,194,031 | |
| Media—4.0% | | | | | | | | |
| TEGNA, Inc. | | | 361,000 | | | | 7,241,660 | |
| Pharmaceuticals—1.9% | | | | | | | | |
| Phibro Animal Health | | | | | | | | |
| Corp.—Class A | | | 140,000 | | | | 3,432,800 | |
| Professional Services—1.3% | | | | | | | | |
| BGSF, Inc. | | | 106,985 | | | | 1,498,860 | |
| Mistras Group, Inc.(a) | | | 80,000 | | | | 890,400 | |
| | | | | | | | 2,389,260 | |
| Textiles, Apparel & Luxury Goods—3.4% | | | | | | | | |
| PVH Corp. | | | 53,000 | | | | 5,998,540 | |
| Trading Companies & Distributors—2.4% |
| Rush Enterprises, Inc.— Class A | | | 88,000 | | | | 4,343,680 | |
The Accompanying Footnotes are an Integral Part of these Financial Statements.
The Tocqueville Phoenix Fund
Schedule of Investments as of April 30, 2021
(Unaudited)
| Common Stocks—91.3% | | Shares | | | Value | |
| Wireless Telecommunication Services—1.6% | | | | | | | | |
| Spok Holdings, Inc. | | | 280,000 | | | $ | 2,875,600 | |
| Total Common Stocks | | | | | | | | |
| (Cost $105,058,406) | | | | | | | 164,008,546 | |
| Short-Term Investment—5.0% | | | | | | | | |
| Money Market Fund—5.0% | | | | | | | | |
| Invesco Treasury | | | | | | | | |
| Portfolio—Institutional | | | | | | | | |
| Class, 0.010%(c) | | | 9,100,000 | | | | 9,100,000 | |
| Total Short-Term Investment | | | | | | | | |
| (Cost $9,100,000) | | | | | | | 9,100,000 | |
| Total Investments | | | | | | | | |
| (Cost $114,158,406)—96.3% | | | | | | | 173,108,546 | |
| Other Assets in Excess of | | | | | | | | |
| Liabilities—3.7% | | | | | | | 6,566,262 | |
| Total Net Assets—100.0% | | | | | | $ | 179,674,808 | |
Percentages are stated as a percent of net assets.
| (a) | Non-income producing security. |
| (b) | Foreign issued Security. Foreign Concentration (including ADR’s) was as follows: Cayman Islands 3.0%; Luxembourg 3.3%; Singapore 4.0%. |
| (c) | Rate listed is the 7-day effective yield. |
The Accompanying Footnotes are an Integral Part of these Financial Statements.
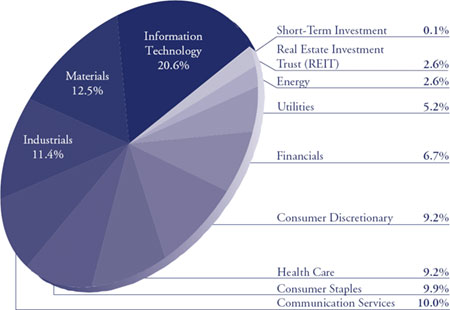
Percent of Total Investments
The Tocqueville Fund
Allocation of Portfolio Holdings
April 30, 2021
(Unaudited)
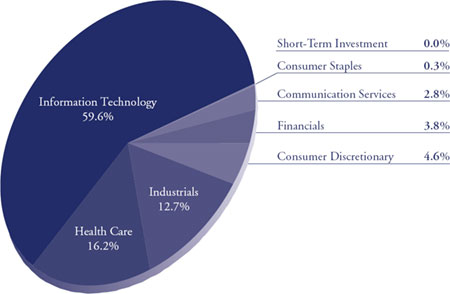
The Tocqueville Opportunity Fund
Allocation of Portfolio Holdings
April 30, 2021
(Unaudited)
Semi-Annual Report | 23
Percent of Total Investments
The Tocqueville Phoenix Fund
Allocation of Portfolio Holdings
April 30, 2021
(Unaudited)

24 | April 30, 2021
The Tocqueville Trust
Statements of Assets & Liabilities
April 30, 2021
(Unaudited)
| | | The
Tocqueville
Fund | | | The
Tocqueville
Opportunity
Fund | | | The
Tocqueville
Phoenix
Fund | |
| Assets: | | | | | | | | | | | | |
| Investments, at fair value (1) | | $ | 299,235,950 | | | $ | 101,837,819 | | | $ | 173,108,546 | |
| Cash and cash equivalents | | | — | | | | — | | | | 6,070,030 | |
| Receivable for investments sold | | | 3,144,283 | | | | — | | | | 1,247,042 | |
| Receivable for Fund shares sold | | | 14,757 | | | | 4,307 | | | | 36,955 | |
| Dividends, interest and other receivables | | | 224,150 | | | | 1,752 | | | | 42,088 | |
| Other assets | | | 27,240 | | | | 20,078 | | | | 24,391 | |
| Total Assets | | | 302,646,380 | | | | 101,863,956 | | | | 180,529,052 | |
| Liabilities: | | | | | | | | | | | | |
| Payable for investments purchased | | | 2,775,940 | | | | — | | | | 97,207 | |
| Payable for loans outstanding | | | — | | | | 476,000 | | | | — | |
| Payable for Fund shares redeemed | | | 2,223 | | | | 69 | | | | 537,967 | |
| Payable to Adviser | | | 154,365 | | | | 45,569 | | | | 88,653 | |
| Payable to Administrator | | | 45,911 | | | | 15,462 | | | | 20,367 | |
| Payable to Trustees | | | 22,946 | | | | 9,996 | | | | 11,832 | |
| Accrued distribution fee | | | 49,254 | | | | 13,923 | | | | 22,952 | |
| Accrued expenses and other liabilities | | | 75,507 | | | | 52,077 | | | | 75,266 | |
| Total Liabilities | | | 3,126,146 | | | | 613,096 | | | | 854,244 | |
| Net Assets | | $ | 299,520,234 | | | $ | 101,250,860 | | | $ | 179,674,808 | |
| Net assets consist of: | | | | | | | | | | | | |
| Paid in capital | | $ | 90,754,585 | | | $ | 31,428,047 | | | $ | 114,357,841 | |
| Total distributable earnings | | | 208,765,649 | | | | 69,822,813 | | | | 65,316,967 | |
| Net assets | | $ | 299,520,234 | | | $ | 101,250,860 | | | $ | 179,674,808 | |
| Shares of beneficial interest outstanding (unlimited shares of $0.01 par value authorized) | | | 6,613,343 | | | | 2,352,775 | | | | 6,898,558 | |
| Net asset value, offering and redemption price per share | | $ | 45.29 | | | $ | 43.03 | | | $ | 26.05 | |
| | | | | | | | | | | | | |
| (1) Cost of investments | | $ | 120,125,492 | | | $ | 36,974,904 | | | $ | 114,158,406 | |
The Accompanying Notes are an Integral Part of these Financial Statements.
Semi-Annual Report | 25
The Tocqueville Trust
Statements of Operations
(Unaudited)
| | | The
Tocqueville
Fund | | | The
Tocqueville
Opportunity
Fund | | | The
Tocqueville
Phoenix
Fund | |
| Investment Income: | | | | | | | | | | | | |
| Dividends* | | $ | 2,491,838 | | | $ | 59,673 | | | $ | 525,905 | |
| Interest | | | 72 | | | | 16 | | | | 418 | |
| Total investment income | | | 2,491,910 | | | | 59,689 | | | | 526,323 | |
| Expenses: | | | | | | | | | | | | |
| Investment Adviser’s fee (See Note 4) | | | 1,052,322 | | | | 380,678 | | | | 659,187 | |
| Distribution (12b-1) fees (See Note 4) | | | 350,774 | | | | 126,893 | | | | 205,996 | |
| Administration fees (See Note 4) | | | 210,464 | | | | 76,136 | | | | 123,597 | |
| Legal fees | | | 94,975 | | | | 37,518 | | | | 54,108 | |
| Transfer agent and shareholder services fees | | | 54,237 | | | | 25,211 | | | | 51,491 | |
| Trustee fees and expenses | | | 40,245 | | | | 16,307 | | | | 22,040 | |
| Other expenses | | | 32,208 | | | | 17,435 | | | | 20,808 | |
| Fund accounting fees | | | 24,609 | | | | 10,122 | | | | 13,286 | |
| Audit fees | | | 21,733 | | | | 12,598 | | | | 14,773 | |
| Insurance expense | | | 17,407 | | | | 5,047 | | | | 9,680 | |
| Blue sky fees | | | 12,858 | | | | 12,214 | | | | 13,874 | |
| Printing and mailing expense | | | 12,245 | | | | 3,874 | | | | 14,678 | |
| Custody fees | | | 7,203 | | | | 5,796 | | | | 4,402 | |
| Registration fees | | | 1,608 | | | | 1,521 | | | | 1,521 | |
| Interest expense | | | 560 | | | | 5,125 | | | | — | |
| Total expenses before waiver | | | 1,933,448 | | | | 736,475 | | | | 1,209,441 | |
| Less: Fees waived (See Note 4) | | | (179,019 | ) | | | (96,886 | ) | | | (179,462 | ) |
| Net expenses | | | 1,754,429 | | | | 639,589 | | | | 1,029,979 | |
| Net Investment Income (Loss) | | | 737,481 | | | | (579,900 | ) | | | (503,656 | ) |
| Realized and Unrealized Gain: | | | | | | | | | | | | |
| Net realized gain on: | | | | | | | | | | | | |
| Investments | | | 29,023,499 | | | | 6,636,809 | | | | 7,297,609 | |
| Foreign currency translation | | | — | | | | 1,142 | | | | — | |
| | | | 29,023,499 | | | | 6,637,951 | | | | 7,297,609 | |
| Net change in unrealized appreciation on investments | | | 35,214,805 | | | | 8,640,620 | | | | 56,566,100 | |
| Net gain on investments and foreign currency | | | 64,238,304 | | | | 15,278,571 | | | | 63,863,709 | |
| Net Increase in Net Assets Resulting from Operations | | $ | 64,975,785 | | | $ | 14,698,671 | | | $ | 63,360,053 | |
| * Net of foreign taxes withheld of: | | $ | 25,598 | | | $ | 627 | | | $ | — | |
The Accompanying Footnotes are an Integral Part of these Financial Statements.
26 | April 30, 2021
The Tocqueville Trust
Statements of Changes in Net Assets
(Unaudited)
| | | The Tocqueville Fund | | | The Tocqueville
Opportunity Fund | | | The Tocqueville
Phoenix Fund | |
| | | For the
Period Ended
April 30,
2021 | | | For the
Year Ended
October 31,
2020 | | | For the
Period Ended
April 30,
2021 | | | For the
Year Ended
October 31,
2020 | | | For the
Period Ended
April 30,
2021 | | | For the
Year Ended
October 31,
2020 | |
| Operations: | | | | | | | | | | | | | | | | | | |
| Net investment income (loss) | | $ | 737,481 | | | $ | 2,140,752 | | | $ | (579,900 | ) | | $ | (798,233 | ) | | $ | (503,656 | ) | | $ | (230,473 | ) |
| Net realized gain on sale of investments and foreign currency | | | 29,023,499 | | | | 9,207,859 | | | | 6,637,951 | | | | 4,435,871 | | | | 7,297,609 | | | | 3,324,516 | |
| Net realized gain on written options | | | — | | | | — | | | | — | | | | 602,485 | | | | — | | | | — | |
| Net change in unrealized appreciation (depreciation) | | | 35,214,805 | | | | (841,853 | ) | | | 8,640,620 | | | | 27,115,889 | | | | 56,566,100 | | | | (23,588,188 | ) |
| Net change in unrealized appreciation on written options | | | — | | | | — | | | | — | | | | 40,806 | | | | — | | | | — | |
| Net increase (decrease) in net assets resulting from operations | | | 64,975,785 | | | | 10,506,758 | | | | 14,698,671 | | | | 31,396,818 | | | | 63,360,053 | | | | (20,494,145 | ) |
| Total dividends and distributions | | | (9,233,776 | ) | | | (20,004,394 | ) | | | (3,607,856 | ) | | | (4,684,120 | ) | | | (2,758,109 | ) | | | (3,732,986 | ) |
| Fund share transactions: | | | | | | | | | | | | | | | | | | | | | | | | |
| Net assets from merger | | | — | | | | — | | | | — | | | | — | | | | — | | | | 33,427,094 | |
| Shares sold | | | 3,128,696 | | | | 3,714,741 | | | | 7,996,763 | | | | 19,679,061 | | | | 3,979,902 | | | | 4,772,451 | |
| Shares issued to holders in reinvestment of dividends | | | 8,758,557 | | | | 19,015,810 | | | | 3,539,900 | | | | 4,449,601 | | | | 2,688,871 | | | | 3,437,712 | |
| Shares redeemed | | | (19,205,267 | ) | | | (47,206,946 | ) | | | (12,523,610 | ) | | | (44,276,906 | ) | | | (19,254,177 | ) | | | (46,184,545 | ) |
| Net decrease | | | (7,318,014 | ) | | | (24,476,395 | ) | | | (986,947 | ) | | | (20,148,244 | ) | | | (12,585,404 | ) | | | (4,547,288 | ) |
| Net increase (decrease) in net assets | | | 48,423,995 | | | | (33,974,031 | ) | | | 10,103,868 | | | | 6,564,454 | | | | 48,016,540 | | | | (28,774,419 | ) |
| Net Assets: | | | | | | | | | | | | | | | | | | | | | | | | |
| Beginning of period | | | 251,096,239 | | | | 285,070,270 | | | | 91,146,992 | | | | 84,582,538 | | | | 131,658,268 | | | | 160,432,687 | |
| End of period | | $ | 299,520,234 | | | $ | 251,096,239 | | | $ | 101,250,860 | | | $ | 91,146,992 | | | $ | 179,674,808 | | | $ | 131,658,268 | |
The Accompanying Footnotes are an Integral Part of these Financial Statements.
Semi-Annual Report | 27
The Tocqueville Trust Notes to
Financial Statements
(Unaudited)
The Tocqueville Trust (the “Trust”) is a Massachusetts business trust registered under the Investment Company Act of 1940 and organized on September 17, 1986, consisting of three separate funds (each, a “Fund” or, collectively, the “Funds”). Each Fund is an open-end management investment company with a different investment objective. The Tocqueville Fund, The Tocqueville Opportunity Fund (the “Opportunity Fund”), and The Tocqueville Phoenix Fund are each classified as diversified investment companies. The Tocqueville Fund’s investment objective is long-term capital appreciation which it seeks to achieve by investing primarily in securities of United States issuers. The Opportunity Fund’s investment objective is to achieve long-term capital appreciation which it seeks to achieve by investing in the common stocks of small and mid-cap companies which have the potential to deliver superior long term earnings growth. The Tocqueville Phoenix Fund’s investment objectives are to seek long-term preservation of capital (sufficient growth to outpace inflation over an extended period of time) and growth of capital which it seeks to achieve by investing primarily in common stocks of small and mid-cap value companies that the portfolio managers consider to be undervalued, generate strong free cash flow, have shareholder friendly management teams and possess a catalyst for improved financial performance.
The Tocqueville Phoenix Fund (formerly known as The Delafield Fund), a series of the Trust, commenced operations on September 28, 2009 as successor to Delafield Fund, Inc. The predecessor Delafield Fund, Inc. commenced operations on November 19, 1993. The Delafield Fund changed its name to The Tocqueville Phoenix Fund on February 15, 2019. On November 15, 2019, The Tocqueville Phoenix Fund acquired all the net assets of The Tocqueville Select Fund.
| 2. | SIGNIFICANT ACCOUNTING POLICIES |
The following is a summary of significant accounting policies consistently followed by the Portfolios in the preparation of their financial statements. These policies are in conformity with accounting principles generally accepted in the United States of America (“U.S. GAAP”). The Funds follow accounting and reporting guidance under Financial Accounting Standards Board (“FASB”) Accounting Standards Codification Topic 946, “Financial Services – Investment Companies.”
a) Security valuation and security transactions
Investments in securities, including foreign securities, traded on an exchange or quoted on the over-the-counter market are valued at the last sale price or, if no sale occurred during the day, at the mean between closing bid and asked prices, as last reported by a pricing service approved by the Trustees. Securities that are principally traded on the National Association of Securities Dealers Automated Quotation National Market (“NASDAQ”) are generally valued at the NASDAQ Official Closing Price (“NOCP”). If there is no NASDAQ Official Closing Price for a NASDAQ-listed security or sale price available for an over-the-counter security, the mean of the latest bid and asked quotations from NASDAQ will be used. Investments in gold will be valued at the spot price of gold determined based on the mean of the last bid and asked price at the close of the New York Commodity Exchange. When market quotations for securities are not readily available, or when restricted securities or other assets are being valued, such assets are valued at fair value as determined in good faith by or under procedures approved by the Trustees. Money market funds are valued at market price. Money market deposit accounts are reflected at cost as this is a cash instrument. Fixed income securities are valued at market price. Fixed Income securities, such as corporate bonds, convertible bonds and U.S. government agency issues for which market quotations are not readily available may be valued based on information supplied by independent pricing services using matrix pricing formulas and/or independent broker bid quotations.
28 | April 30, 2021
Trading in securities on foreign securities exchanges normally is completed before the calculation of the Funds’ net asset value. Trading on these foreign exchanges may not take place on all days on which there is regular trading on the New York Stock Exchange (“NYSE”), or may take place on days on which there is no regular trading on the NYSE. Similarly, the Funds may hold securities traded in domestic markets where the market may close early on a given day prior to calculation of the Funds’ net asset value. Events affecting the value of such securities held by the Funds that occur between the close of trading in the security and the close of trading on the NYSE normally will not be reflected in the Funds’ calculation of the net asset value. However, significant events will be closely monitored, and where it is determined that an adjustment should be made to the security’s value because significant interim events may materially affect the value of the security, the security will be priced at its fair value in accordance with the procedures approved by the Trustees.
Investment and shareholder transactions are recorded on trade date. Dividend income is recognized on the ex-dividend date. Interest income is recognized on an accrual basis and includes, where applicable, the amortization of premiums and accretion of discounts. Net realized gains and losses from sales of securities are determined on the specific identification cost method.
b) Restricted and illiquid securities
The Funds may invest in securities that are subject to legal or contractual restrictions on resale or are illiquid. A security may be considered illiquid if it lacks a readily available market or if its valuation has not changed for a certain period of time. Disposal of these securities may involve time consuming negotiations and expense, and a prompt sale at the current valuation may be difficult.
Semi-Annual Report | 29
c) Fair Valuation Measurements
The Trust has adopted authoritative fair valuation accounting standards which establish an authoritative definition of fair value and set out a hierarchy for measuring fair value. These standards require additional disclosures about the various inputs and valuation techniques used to develop the measurements of fair value and a discussion in changes in valuation techniques and related inputs during the period. These inputs are summarized in the three broad levels listed below.
| • | Level 1 - Quoted prices in active markets for identical securities. |
| • | Level 2 - Other significant observable inputs (including quoted prices for similar securities, interest rates, prepayment speeds, credit risk, etc.). |
| • | Level 3 - Significant unobservable inputs (including the Fund’s own assumptions in determining the fair value of investments). |
When using the market quotations or closing price provided by the pricing service for equity investments, including common stocks, preferred stocks, foreign issued common stocks, exchange-traded funds, closed end mutual funds and real estate investment trusts, which are traded on an exchange are valued at the last sale price reported by the exchange on which the securities are primarily traded on the day of valuation and when the market is considered active, the security will be classified as a Level 1 security. When using the mean between the latest bid and ask price, the security will be classified as Level 2. Gold bullion is valued at the mean of the closing bid and ask prices from the New York Mercantile Exchange and is classified as a Level 2.
Investment in mutual funds, including money market funds, are generally priced at the ending net asset value (NAV) provided by the service agent of the funds and will be classified as Level 1 securities.
Debt securities, such as corporate bonds, convertible bonds, commercial paper, money market deposit accounts and U.S. government agency issues for which market quotations are not readily available may be valued based on information supplied by independent pricing services using matrix pricing formulas and/or independent broker bid quotations and are classified as Level 2. Options can diverge from the prices of their underlying instruments. These are valued at the composite last price reported by the exchange on which the options are primarily traded on the day of the valuation and are classified as Level 1. If there is no composite last price on a given day the mean between the latest bid and ask price will be used. These contracts are classified as Level 2.
Any securities or other assets for which market quotations are not readily available are valued at fair value as determined in good faith by the Adviser pursuant to procedures established under the general supervision and responsibility of the Funds’ Board of Trustees and will be classified as Level 3 securities. In determining fair value, a Fund will seek to assign a value to the security which it believes represents the amount that the Fund could reasonably expect to receive upon its current sale. With respect to securities that are actively traded on U.S. exchanges, the Funds expect that market quotations will generally be available and that fair value might be used only in limited circumstances, such as when trading for a security is halted during the trading day.
Any securities or other assets for which market quotations are not readily available are valued at fair value as determined in good faith by the Adviser pursuant to procedures established under the general supervision and responsibility of the Funds’ Board of Trustees and will be classified as Level 3 securities. In determining fair value, a Fund will seek to assign a value to the security which it believes represents the amount that the Fund could reasonably expect to receive upon its current sale. With respect to securities that are actively traded on U.S. exchanges, the Funds expect that market quotations will generally be available and that fair value might be used only in limited circumstances, such as when trading for a security is halted during the trading day.
30 | April 30, 2021
In determining whether a significant event has occurred with respect to securities traded principally in foreign markets, the Funds may engage a third party fair value service provider to systematically recommend the adjustment of closing market prices of non-U.S. securities based upon changes in a designated U.S. securities market index occurring from the time of close of the relevant foreign market and the close of the NYSE. Fair value pricing may also be used to value restricted securities held by the Funds or securities with little or no trading activity for extended periods of time. Fair value pricing involves judgments that are inherently subjective and inexact and it is not possible to determine with certainty when, and to what extent, an event will affect a market price. As a result, there can be no assurance that fair value pricing will reflect actual market value and it is possible that the fair value determined for a security may differ materially from the value that could be realized upon the sale of the security.
The following is a summary of the inputs used, as of April 30, 2021, involving the Funds’ assets and liabilities carried at fair value. The inputs of methodology used for valuing securities may not be an indication of the risk associated with investing in those securities.
| Description | | Level 1 | | | Level 2 | | | Level 3 | | | Total | |
| The Tocqueville Fund* | | | | | | | | | | | | |
| Assets | | | | | | | | | | | | |
| Common Stocks | | $ | 291,272,460 | | | $ | — | | | $ | — | | | $ | 291,272,460 | |
| Real Estate Investment Trust (REIT) | | | 7,754,000 | | | | — | | | | — | | | | 7,754,000 | |
| Money Market Fund | | | 209,490 | | | | — | | | | — | | | | 209,490 | |
| Total Assets | | $ | 299,235,950 | | | $ | — | | | $ | — | | | $ | 299,235,950 | |
| | | | | | | | | | | | | | | | | |
| The Tocqueville Opportunity Fund* | | | Level 1 | | | | Level 2 | | | | Level 3 | | | | Total | |
| Assets | | | | | | | | | | | | | | | | |
| Common Stocks | | $ | 101,834,396 | | | $ | 2,806 | | | $ | — | | | $ | 101,837,202 | |
| Money Market Fund | | | 617 | | | | — | | | | — | | | | 617 | |
| Total Assets | | $ | 101,835,013 | | | $ | 2,806 | | | $ | — | | | $ | 101,837,819 | |
| | | | | | | | | | | | | | | | | |
| The Tocqueville Phoenix Fund* | | | Level 1 | | | | Level 2 | | | | Level 3 | | | | Total | |
| Assets | | | | | | | | | | | | | | | | |
| Common Stocks | | $ | 164,008,546 | | | $ | — | | | $ | — | | | $ | 164,008,546 | |
| Money Market Fund | | | 9,100,000 | | | | — | | | | — | | | | 9,100,000 | |
| Total Assets | | $ | 173,108,546 | | | $ | — | | | $ | — | | | $ | 173,108,546 | |
| * | For further information regarding portfolio characteristics, please see the accompanying Schedules of Investments. |
Semi-Annual Report | 31
The Funds did not hold any investments during the period ended April 30, 2021 with significant unobservable inputs which would be classified as Level 3.
The Trust’s valuation procedures have been adopted by the Trust’s Board of Trustees, which has established a Valuation Committee to oversee the valuation process. The Valuation Committee meets on an as needed basis to evaluate changes in the valuation of portfolio securities. The full findings and valuations are then reviewed quarterly by the Independent Trustees.
d) Derivative Instruments and Hedging Activities
The Funds’ Adviser may use derivative instruments, such as options, as a means to manage exposure to different types of risk, including market risk and exchange rate risk, and to gain exposure to underlying securities. The Trust has adopted disclosure standards in order to enable the investor to understand how and why an entity used derivatives, how derivatives are accounted for, and how derivatives affect an entity’s results of operations and financial position.
In the Opportunity Fund, the Adviser used options to gain exposure to the underlying equity security and earn premium income.
The Effect of Derivative Instruments on the Statement of Operations for the period ended April 30, 2021
The Tocqueville Opportunity Fund
| | Net Realized | | | Unrealized | |
| | Loss | | | Appreciation on | |
| | on Investments | | | Investments | |
Purchased Options | | $ | (179,344 | ) | | $ | — | |
Total | | $ | (179,344 | ) | | $ | — | |
Derivatives Risk
The risks of using the types of derivatives in which the Funds may engage include the risk that movements in the value of the derivative may not fully offset or complement instruments currently held in the Funds in the manner intended by the Adviser; the risk that the counterparty to a derivative contract may fail to comply with their obligations to the Fund; the risk that the derivative may not possess a liquid secondary market at a time when the Fund would look to disengage the position; the risk that additional capital from the Fund may be called upon to fulfill the conditions of the derivative contract; and the risk that the cost of the derivative contracts may reduce the overall returns experienced by the Funds. The measurement of risks associated with these instruments is meaningful only when all related offsetting transactions are considered. The Fund may enter into written call options to hedge against changes in the value of equities. The Fund’s option component of the overall investment strategy is often referred to as a “buy-write” strategy (also called a “covered call” strategy), in which the Adviser (as defined below) writes (sells) a call option contract while at the same time owning an equivalent number of shares of the underlying stock to generate moderate current income. The writing of call options is intended to reduce the volatility of the portfolio and to earn premium income. Written call options expose the Fund to minimal counterparty credit risk since they are exchange traded and the exchange’s clearing house guarantees the options against default. As the writer of a call option, the Fund has the obligation to sell the security at the exercise price during the exercise period in the event the option is exercised. The use of options do not create leverage in the Funds.
32 | April 30, 2021
The average monthly value of purchased options in the Opportunity Fund during the period ended April 30, 2021 was $55,021.
Transactions in options in the Opportunity Fund during the period ended April 30, 2021 were as follows:
| | Notional | | | | |
| | | Amount | | | Contracts | |
Outstanding, beginning of period: | | $ | — | | | | — | |
Options purchased | | | 8,600,000 | | | | 500 | |
Options terminated in closing transactions | | | — | | | | — | |
Options exercised | | | — | | | | — | |
Options expired | | | (8,600,000 | ) | | | (500 | ) |
Outstanding, end of period: | | $ | — | | | | — | |
e) Foreign currency translation
Investments and other assets and liabilities denominated in foreign currencies are translated to U.S. dollars at the prevailing rates of exchange, in accordance with the Trust’s Portfolio Securities Valuation and Foreign Exchange Contracts Procedures. The Tocqueville Opportunity Fund (the “Fund”) has engaged in transactions in securities denominated in foreign currencies and, as a result, entered into foreign exchange transactions. The Fund is exposed to additional market risk as a result of changes in the value of the underlying currency in relation to the U.S. dollar. Risks include potential inability of counterparties to meet the terms of their obligations. The value of foreign currencies are marked-to-market on a daily basis, which reflects the changes in the market value of the contract at the close of each day’s trading, resulting in daily unrealized gains and/or losses. When the transactions are settled or the contracts are closed, the Fund recognizes a realized gain or loss.
The Fund isolates that portion of the results of operations resulting from changes in foreign exchange rates on investments from the fluctuations arising from changes in market prices of securities held. Such fluctuations are reflected as net realized and unrealized gain or loss on foreign currency translation.
Reported net realized foreign exchange gains or losses arise from sales of foreign currencies, currency gains or losses realized between the trade and settlement dates on securities transactions, the differences between the amounts of dividends, interest, and foreign withholding taxes recorded on the Fund’s books, and the U.S. dollar equivalent of the amounts actually received or paid. Net unrealized foreign exchange gains and losses arise from changes in the value of assets and liabilities other than investments in securities at the end of the fiscal period, resulting from changes in the exchange rates.
Semi-Annual Report | 33
f) Dividends and distributions to shareholders
Dividends to shareholders are recorded on the ex-dividend date. Dividends from net investment income are declared and paid annually by the Funds. Distributions of net realized capital gains, if any, will be declared and paid at least annually. Income and capital gain distributions are determined in accordance with income tax regulations which may differ from generally accepted accounting principles. Permanent differences between financial and tax reporting may result in reclassification to capital stock.
g) Allocation of Income, Expenses and Gains/Losses
Income, expenses (other than those deemed attributable to a specific share class), and gains and losses of the Fund are allocated daily to each class of shares based upon the ratio of net assets represented by each class as a percentage of the net assets of the Fund. Expenses deemed directly attributable to a class of shares are recorded by the specific class. Most Fund expenses are allocated by class based on relative net assets.
h) Use of estimates
The preparation of financial statements in conformity with accounting principles generally accepted in the United States of America requires management to make estimates and assumptions that affect the reported amounts of assets and liabilities and disclosure of contingent assets and liabilities at the date of the financial statements and the reported amounts of revenues and expenses during the reporting period. Actual results could differ from those estimates.
i) Indemnification
In the normal course of business the Funds enter into contracts that contain general indemnification clauses. The Funds’ maximum exposure under these arrangements is unknown, as this would involve future claims against a Fund that have not yet occurred. Based on experience, the Funds expect the risk of loss to be remote.
j) COVID-19
The global outbreak of COVID-19 (commonly referred to as “coronavirus”) has disrupted economic markets and the prolonged economic impact is uncertain. The ultimate economic fallout from the pandemic, and the long-term impact on economies, markets, industries and individual issuers, are not known. The operational and financial performance of the issuers of securities in which the Funds invest depends on future developments, including the duration and spread of the outbreak, and such uncertainty may in turn adversely affect the value and liquidity of the Funds’ investments, impair the Funds’ ability to satisfy redemption requests, and negatively impact the Funds’ performance.
34 | April 30, 2021
k) Subsequent events evaluation
In preparing these financial statements, the Trust has evaluated events and transactions for potential recognition or disclosure resulting from subsequent events through the date financial statements were available to be issued. This evaluation did not result in any subsequent events, that necessitated disclosure and/or adjustments.
There is no tax liability resulting from unrecognized tax benefits relating to uncertain income tax positions taken or expected to be taken on the tax return for the fiscal year-end October 31, 2020, or for any other tax years which are open for exam. As of October 31, 2020, open tax years include the tax years ended October 31, 2017 through 2020. The Trust is also not aware of any tax positions for which it is reasonably possible that the total amounts of unrecognized tax benefits will significantly change in the next six months. The Funds recognize interest and penalties, if any, related to unrecognized tax benefits as income tax expense in the Statement of Operations. During the year, the Funds did not incur any interest or penalties.
Provision for federal income taxes or excise taxes has not been made since the Funds have elected to be taxed as Regulated Investment Companies and intend to distribute substantially all taxable income to shareholders and otherwise comply with the provisions of the Internal Revenue Code applicable to Regulated Investment Companies. Distributions from net realized gains for book purposes may include short-term capital gains which are included as ordinary income to shareholders for tax purposes. Additionally, accounting principles generally accepted in the United States of America require that certain components of net assets relating to permanent differences be reclassified between financial and tax reporting. These reclassifications have no effect on net assets or net asset value per share. For the year ended October 31, 2020, the following table shows the reclassifications made:
| | Undistributed | | | Accumulated Net | | | | |
| | Net Investment | | | Realized | | | | |
| | Income/(Loss) | | | Gain/(Loss) | | | Paid In Capital | |
Tocqueville Fund | | $ | (171,558 | ) | | $ | (1,667,493 | ) | | $ | 1,839,051 | |
Opportunity Fund | | | 784,547 | | | | (1,224,373 | ) | | | 439,826 | |
Phoenix Fund | | | 193,829 | | | | (550,343 | ) | | | 356,514 | |
The permanent differences primarily relate to net operating losses, foreign currency reclasses and the usage of tax equalization.
Semi-Annual Report | 35
As of October 31, 2020, the components of accumulated earnings (losses) for income tax purposes were as follows:
| | | Tocqueville | | | Opportunity | | | Phoenix | |
| | | Fund | | | Fund | | | Fund | |
| Tax cost of Investments | | $ | 107,382,917 | | | $ | 36,758,381 | | | $ | 122,934,684 | |
| | | | | | | | | | | | | |
| Unrealized Appreciation | | | 145,236,700 | | | | 56,300,703 | | | | 21,818,399 | |
| Unrealized Depreciation | | | (1,341,047 | ) | | | (438,611 | ) | | | (19,512,355 | ) |
| Net unrealized appreciation (depreciation) | | | 143,895,653 | | | | 55,862,092 | | | | 2,306,044 | |
| | | | | | | | | | | | | |
| Undistributed operating income | | | 1,587,630 | | | | — | | | | — | |
| Undistributed long-term gains | | | 7,540,357 | | | | 3,607,842 | | | | 2,661,195 | |
| Distributable earnings | | | 9,127,987 | | | | 3,607,842 | | | | 2,661,195 | |
| Other accumulated gain/(loss) | | | — | | | | (737,936 | ) | | | (252,216 | ) |
| Total accumulated gain/(loss) | | $ | 153,023,640 | | | $ | 58,731,998 | | | $ | 4,715,023 | |
The difference between book-basis and tax-basis unrealized appreciation is attributable primarily to wash sale deferrals and passive foreign investment companies (PFIC’s).
The tax character of distributions paid during the years ended October 31, 2020 and 2019 was as follows:
| | | October 31, 2020 | |
| | | | | | | | | | |
| | | | Ordinary
Income | | | | Long Term
Capital Gain | | | | Total | |
Tocqueville Fund | | $ | 2,806,607 | | | $ | 17,197,787 | | | $ | 20,004,394 | |
Opportunity Fund | | | — | | | | 4,684,120 | | | | 4,684,120 | |
Phoenix Fund | | | — | | | | 3,732,986 | | | | 3,732,986 | |
| | | October 31, 2019 | |
| | | Ordinary | | | Long Term | | | | |
| | | Income | | | Capital Gain | | | Total | |
Tocqueville Fund | | $ | 2,534,561 | | | $ | 19,359,944 | | | $ | 21,894,505 | |
Opportunity Fund | | | — | | | | 7,593,052 | | | | 7,593,052 | |
Phoenix Fund | | | 2,829,094 | | | | 12,056,228 | | | | 14,885,322 | |
The Fund designated as long-term capital gain dividend, pursuant to Internal Revenue Code Section 852(b)(3), the amount necessary to reduce the earnings and profits of the Funds related to net capital gain to zero for the tax years ended October 31, 2020 and 2019.
For the fiscal year ended October 31, 2020, the Opportunity Fund and Phoenix Fund had late year losses of $737,936 and $252,216, respectively.
| 4. | INVESTMENT ADVISORY AND OTHER AGREEMENTS |
Tocqueville Asset Management L.P. (“Tocqueville”) is the investment adviser (the “Adviser”) to the Trust under Investment Advisory Agreements approved by shareholders. For its services, Tocqueville receives fees from The Tocqueville Fund, calculated daily and payable monthly, at an annual rate of 0.75% on the first $1 billion of the average daily net assets of the Fund, and 0.65% of the average daily net assets in excess of $1 billion. Tocqueville receives fees from The Tocqueville Opportunity Fund, calculated daily and payable monthly, at an annual rate of 0.75% on the first $500 million of the average daily net assets of the Fund, and 0.65% of the average daily net assets in excess of $500 million. Tocqueville receives fees from The Tocqueville Phoenix Fund, calculated daily and payable monthly, at an annual rate of 0.80% on the first $250 million of net assets of the Fund; 0.75% on the next $250 million of net assets of the Fund; 0.70% on the next $500 million of net assets of the Fund; and 0.65% on all net assets of the Fund over $1 billion.
36 | April 30, 2021
With respect to The Tocqueville Fund, The Tocqueville Opportunity Fund, and The Tocqueville Phoenix Fund, the Adviser has contractually agreed to waive its advisory fees and/or reimburse expenses in order to ensure that each Fund’s total annual operating expenses do not exceed 1.25% of its average daily net assets (excluding taxes, interest expense, acquired fund fees and expenses, or extraordinary expenses such as litigation). The Expense Limitation Agreements will remain in effect until March 1, 2022 for each Fund. For the period ended April 30, 2021, the Adviser waived $179,019, $96,886, and $179,462 of the advisory fee for The Tocqueville Fund, The Tocqueville Opportunity Fund, and The Tocqueville Phoenix Fund, respectively. Such amounts are not subject to recoupment by the Adviser.
Pursuant to an Administrative Services Agreement, each Fund pays to the Adviser a fee computed and paid monthly at an annual rate of 0.15% on the first $400 million of the average daily net assets of each Fund; 0.13% on the next $600 million of the average daily net assets of each Fund; and 0.12% on all the average daily net assets of each Fund over $1 billion. For the period ended April 30, 2021, the Adviser has made payments of $62,977, $22,800, and $36,963, to U.S. Bancorp Fund Services, LLC for services provided under a Sub-Administration Agreement for The Tocqueville Fund, The Tocqueville Opportunity Fund, and The Tocqueville Phoenix Fund, respectively.
Tocqueville Securities, L.P. (the “Distributor”), an affiliate of Tocqueville, acts as distributor for shares of the Trust. The Tocqueville Fund, The Tocqueville Opportunity Fund, and the Tocqueville Phoenix Fund, adopted a distribution and service plan pursuant to Rule 12b-1 of the 1940 Act. Pursuant to the plans, each Fund pays to the Distributor distribution and service fees of 0.25% per annum of its average daily net assets.
Commissions earned by the Distributor for services rendered as a registered broker-dealer in securities transactions for The Tocqueville Fund, The Tocqueville Opportunity Fund, and The Tocqueville Phoenix Fund for the period ended April 30, 2021, were $6,612, $2,015, and $5,963, respectively.
Semi-Annual Report | 37
| 5. | CAPITAL SHARE TRANSACTIONS. |
Transactions in capital shares for each Fund were as follows:
| | | For the Six Months | | | | |
| | | Ended | | | For the Year | |
| | | April 30, 2021 | | | Ended | |
| | | (Unaudited) | | | October 31, 2020 | |
| The Tocqueville Fund | | Shares | | | Shares | |
| Shares sold | | | 72,762 | | | | 103,586 | |
| Shares issued to holders in reinvestment dividends | | | 218,200 | | | | 513,802 | |
| Shares redeemed | | | (458,141 | ) | | | (1,379,364 | ) |
| Net decrease | | | (167,179 | ) | | | (761,976 | ) |
| | | | | | | | | |
| The Tocqueville Opportunity Fund | | | | | | | | |
| Shares sold | | | 183,790 | | | | 626,039 | |
| Shares issued to holders in reinvestment dividends | | | 85,134 | | | | 155,689 | |
| Shares redeemed | | | (293,719 | ) | | | (1,413,648 | ) |
| Net decrease | | | (24,795 | ) | | | (631,920 | ) |
| | | | | | | | | |
| The Tocqueville Phoenix Fund | | | | | | | | |
| Shares issued in connection with merger | | | — | | | | 1,635,723 | |
| Shares sold | | | 166,420 | | | | 283,424 | |
| Shares issued to holders in reinvestment dividends | | | 125,824 | | | | 169,346 | |
| Shares redeemed | | | (843,061 | ) | | | (2,666,919 | ) |
| Net decrease | | | (550,817 | ) | | | (578,426 | ) |
| 6. | INVESTMENT TRANSACTIONS |
Purchases and sales of investment securities (excluding short-term investments) for the period ended April 30, 2021 are summarized below.
| | | Tocqueville | | | Opportunity | | | Phoenix | |
| | | Fund | | | Fund | | | Fund | |
Purchases: | | $ | 28,606,679 | | | $ | 13,905,954 | | | $ | 13,714,614 | |
Sales: | | $ | 44,248,689 | | | $ | 20,104,078 | | | $ | 32,210,505 | |
The Tocqueville Trust has a $50,000,000 line of credit (the “Line”), which is uncommitted, with U.S. Bank NA. The Line is for temporary emergency or extraordinary purposes, including the meeting of redemption requests that otherwise might require the untimely disposition of securities. The Line is secured by the Trust’s assets. The Line has a one year term and is reviewed annually by the Board of Trustees. The interest rate as of April 30, 2021 was 2.75%. The average interest rate during the period ended April 30, 2021 was 2.75%. During the six months ended April 30, 2021, the Tocqueville Fund’s maximum borrowing was $1,634,000 and average borrowing was $48,935, the Opportunity Fund’s maximum borrowing was $3,153,000 and average borrowing was $354,573. This borrowing resulted in interest expenses of $560, and $5,125, respectively. The Tocqueville Phoenix Fund did not use the Line.
38 | April 30, 2021
| 8. | LIQUIDITY RISK MANAGEMENT PROGRAM |
Consistent with Rule 22e-4 under the Investment Company Act of 1940, the Funds have established a liquidity risk management program to manage “liquidity risk” (the “LRMP”). “Liquidity Risk” is defined as the risk that the Fund could not meet requests to redeem shares issued by a Fund without significant dilution of remaining investors’ interest in the Fund. The LRMP is overseen by the Program Administrator, a committee comprised of representatives of the Funds’ investment adviser, officers of the Trust and an independent member of the Trust’s Board of Trustees. The Funds’ Board of Trustees has approved the designation of the Program Administrator to oversee the LRMP.
The LRMP’s principal objectives include supporting each Fund’s compliance with limits on investments in illiquid assets and mitigating the risk that a Fund will be unable to meet its redemption obligations timely. The LRMP also includes a number of elements that support the management and assessment of liquidity risk, including an annual assessment of factors that influence a Fund’s liquidity and the periodic classification and re-classification of the Fund’s investments into groupings that reflect the Program Administrator’s assessment of their relative liquidity under current market conditions.
During the period covered by the report, it was determined that that: (1) the LRMP continues to be reasonably designed to effectively assess and manage the Funds’ Liquidity Risk; and (2) the LRMP has been adequately and effectively implemented with respect to each Fund during the reporting period. There can be no assurance that the LRMP will achieve its objectives in the future. Please refer to your Fund’s prospectus for more information regarding the Fund’s exposure to liquidity risk and other principal risks to which an investment in the Fund may be subject.
Semi-Annual Report | 39
ADDITIONAL INFORMATION (UNAUDITED)
1. ADDITIONAL DISCLOSURE REGARDING FUND TRUSTEES AND OFFICERS
Independent Trustees
| Name and Age | | Position(s) Held
with the Trust | | Term of Office
and Length of
Time Served (1) | | Principal Occupation(s)
During Past Five Years | | Number of Funds
in Fund Complex
Overseen By Trustee | | Other Directorships
Held by Trustee |
| | | | | | | | | | | |
George Cooke Year of Birth: 1952 | | Trustee; Member of Audit Committee; Member of Governance and Nominating Committee | | Indefinite Term, Since 2020 | | Business Development, Tocqueville Capital Management, June 2015 – April 2020. | | 3 | | None |
| | | | | | | | | | | |
Charles F. Gauvin Year of Birth: 1956 | | Trustee; Member of Audit Committee; Member of Governance and Nominating Committee | | Indefinite Term, Since February 2015 | | Independent consultant on strategy, leadership and philanthropy, from 2018 –present; Chief Development Officer, Woods Hole Oceanographic Institution, from February 2016 – 2018; Executive Director, Maine Audubon, from August 2014 –January 2016 | | 3 | | Director, Bioqual, Inc., July 1992 – present. |
| | | | | | | | | | |
James W. Gerard Year of Birth: 1961 | | Trustee; Member of Audit Committee; Member of Governance and Nominating Committee | | Indefinite Term, Since 2001 | | Managing Director, Hycroft Advisors, from January 2010-present; Managing Director, deVisscher & Co., LLC from January 2013 to present; The Chart Group from January 2001 to present. | | 3 | | President, American Overseas Memorial Day Association, 1998 – present; Trustee, Salisbury School, 2005 – present; Director, American Friends of Bleraucourt, 1992 – present; President, Little Baby Face Foundation, March 2015 – present. |
ADDITIONAL INFORMATION (UNAUDITED)
Interested Trustees(2) and Officers
| Name and Age | | Position(s) Held
with the Trust | | Term of Office
and Length of
Time Served (1) | | Principal Occupation(s)
During Past Five Years | | Number of Funds
in Fund Complex
Overseen By Trustee | | Other Directorships
Held by Trustee |
| | | | | | | | | | | |
Helen Balk (3) Year of Birth: 1972 | Treasurer | Indefinite Term, Since 2014 | | Controller / Treasurer of Tocqueville Asset Management from January 2014 to present. | | N/A | N/A |
| | | | | | | |
| | | | | | | | | | | |
Robert W. Kleinschmidt Year of Birth: 1949 | | Chairman, President, and Trustee | | Indefinite Term, Chairman Since 2016, and President and Trustee Since 1991 | | Chief Executive Officer, President and Chief Investment Officer, Tocqueville Asset Management; Director, Tocqueville Management Corporation, General Partner, Tocqueville Asset Management L.P. and Tocqueville Securities L.P., January 1994 to present. | | 3 | | President and Director, Tocqueville Management Corporation, the General Partner of Tocqueville Asset Management L.P. and Tocqueville Securities L.P. |
| | | | | | | | | | | |
Stephan Yevak Year of Birth: 1959 | | Anti-Money Laundering Compliance Officer | | Indefinite Term, Since 2018 | | Deputy Chief Compliance Officer, Tocqueville Securities, L.P. from August 2011 to present; Deputy Chief Compliance Officer, Tocqueville Asset Management from August 2011 to present. Anti-Money Laundering Compliance Officer to both entities from March 2018 to present. | | N/A | | N/A |
| | | | | | | | | | | |
Cleo Kotis Year of Birth: 1975 | | Secretary | | Indefinite Term, Since 2010 | | Director of Operations, the Delafield Group of Tocqueville Asset Management L.P., 2009 to present. | | N/A | | N/A |
ADDITIONAL INFORMATION (UNAUDITED)
Interested Trustees(2) and Officers
| Name and Age | | Position(s) Held
with the Trust | | Term of Office
and Length of
Time Served (1) | | Principal Occupation(s)
During Past Five Years | | Number of Funds
in Fund Complex
Overseen By Trustee | | Other Directorships
Held by Trustee |
| | | | | | | | | | | |
| Charles Martin Year of Birth: 1988 | | Chief Compliance Officer | | Indefinite Term, Since 2020 | | Managing Director, Vigilant Compliance, LLC, 2012 – present. | | N/A | | N/A |
| | | | | | | | | | | |
| (1) | Each Trustee will hold office for an indefinite term until the earliest of (i) the next meeting of shareholders, if any, called for the purpose of considering the election or re-election of such Trustee and until the election and qualification of his or her successor, if any, elected at such meeting, or (ii) the date a Trustee resigns or retires, or a Trustee is removed by the Board of Trustees or shareholders, in accordance with the Trust’s By-Laws, as amended, and Agreement and Declaration of Trust, as amended. Each officer will hold office for an indefinite term until the date he or she resigns or retires or until his or her successor is elected and qualifies. |
| (2) | “Interested person” of the Trust as defined in the 1940 Act. Mr. Kleinschmidt is considered “interested person” because of his affiliation with the Advisor. |
| (3) | Mr. Jeff Zatkowsky replaced Ms. Balk as the Trust’s Treasurer on June 1, 2021. |
The Statement of Additional Information includes additional information about the Trustees and is available free of charge by calling the Funds toll free at 1-800-355-7307.
2. | PROXY VOTING POLICIES AND PROCEDURES |
A description of the policies and procedures that The Tocqueville Trust uses to determine how to vote proxies relating to portfolio securities is available without charge upon request by calling 1-800-355-7307. Information regarding how The Tocqueville Trust voted proxies relating to portfolio securities during the most recent 12-month period ended June 30 is available by calling 1-800-355-7307 and it is also available on the SEC’s web site at http://www.sec.gov.
| 3. | SHAREHOLDER REPORTS AND QUARTERLY PORTFOLIO DISCLOSURE |
The Tocqueville Trust will file its complete schedule of portfolio holdings with the SEC for the first and third quarters of each fiscal year on Part F of Form N-PORT. The Fund’s Part F of Form N-PORT will be available on the EDGAR database on the SEC’s website at www.sec.gov. These Forms may also be reviewed and copied at the SEC’s Public Reference Room in Washington D.C. Information about the operation of the Public Reference Room may be obtained by calling 1-800-SEC-0330. Quarterly portfolio holdings are also available on the website of The Tocqueville Funds, www.tocquevillefunds.com.
| 4. | SHAREHOLDER NOTIFICATION OF FEDERAL TAX STATUS |
For the fiscal year ended October 31, 2020, certain dividends paid by the Funds may be subject to a maximum tax rate of 23%, as provided for by the Tax Cuts and Jobs Act of 2017. The percentage of dividends declared from ordinary income designated as qualified dividend income was as follows:
Tocqueville Fund | 100.00% |
Opportunity Fund | 0.00% |
Phoenix Fund | 0.00% |
For corporate shareholders, the percent of ordinary income distributions qualifying for the corporate dividends received deduction for the fiscal year ended October 31, 2020 was as follows:
Tocqueville Fund | 100.00% |
Opportunity Fund | 0.00% |
Phoenix Fund | 0.00% |
For the year ended October 31, 2020, the funds designate the following percent of ordinary distributions paid as interest-related dividends under the Internal Revenue Code Section 871(k)(1)(c):
Tocqueville Fund | 0.72% |
Opportunity Fund | 0.00% |
Phoenix Fund | 0.00% |
Semi-Annual Report | 43
The percentage of taxable ordinary income distributions that are designated as short-term capital gain distributions under Internal Revenue Section 871(k)(2)(C) for each Fund were as follows.
Tocqueville Fund | 0.00% |
Opportunity Fund | 0.00% |
Phoenix Fund | 0.00% |
[This page intentionally left blank]
[This page intentionally left blank]
[This page intentionally left blank]
[This page intentionally left blank]
[This page intentionally left blank]
[This page intentionally left blank]
[This page intentionally left blank]
Investment Adviser
Tocqueville Asset Management L.P.
40 W. 57th St., 19th Floor
New York, NY 10019
(212) 698-0800
www.tocqueville.com
Distributor
Tocqueville Securities, L.P.
40 W. 57th St., 19th Floor
New York, NY 10019
(212) 698-0800
Shareholders’ Servicing and Transfer Agent
U.S. Bank Global Fund Services, LLC doing business as
U.S. Bank Global Fund Services
615 East Michigan Street
Milwaukee, WI 53202
Custodian
U.S. Bank, N.A.
Custody Operations
1555 River Center Drive, Suite 302
Milwaukee, WI 53212
Board of Trustees
Robert W. Kleinschmidt—Chairman
George Cooke
Charles F. Gauvin
James W. Gerard
Independent Registered Public Accounting Firm
Grant Thornton LLP
171 North Clark St., Suite 200
Chicago, IL 60601

Tocqueville Funds
c/o US Bancorp Fund Services, LLC
P.O. Box 701
Milwaukee, WI 53201-0701
www.tocquevillefunds.com
TQ SEMI-4-30
Item 2. Code of Ethics.
Not applicable for semi-annual reports.
Item 3. Audit Committee Financial Expert.
Not applicable for semi-annual reports.
Item 4. Principal Accountant Fees and Services.
Not applicable for semi-annual reports.
Item 5. Audit Committee of Listed Registrants.
Not applicable to registrants who are not listed issuers (as defined in Rule 10A-3 under the Securities Exchange Act of 1934).
Item 6. Investments.
Schedule of Investments is included as part of the report to shareholders filed under Item 1 of this Form.
Item 7. Disclosure of Proxy Voting Policies and Procedures for Closed-End Management Investment Companies.
Not applicable to open-end investment companies.
Item 8. Portfolio Managers of Closed-End Management Investment Companies.
Not applicable to open-end investment companies.
Item 9. Purchases of Equity Securities by Closed‑End Management Investment Company and Affiliated Purchasers.
Not applicable to open-end investment companies.
Item 10. Submission of Matters to a Vote of Security Holders.
There have been no material changes to the procedures by which shareholders may recommend nominees to the registrant’s board of trustees.
Item 11. Controls and Procedures.
(a) | The Registrant’s President and Treasurer have reviewed the Registrant's disclosure controls and procedures (as defined in Rule 30a-3(c) under the Investment Company Act of 1940 (the “Act”)) as of a date within 90 days of the filing of this report, as required by Rule 30a-3(b) under the Act and Rules 13a-15(b) or 15d‑15(b) under the Securities Exchange Act of 1934. Based on their review, such officers have concluded that the disclosure controls and procedures are effective in ensuring that information required to be disclosed in this report is appropriately recorded, processed, summarized and reported and made known to them by others within the Registrant and by the Registrant’s service provider. |
(b) | There were no changes in the Registrant's internal control over financial reporting (as defined in Rule 30a-3(d) under the Act) that occurred during the second fiscal quarter of the period covered by this report that has materially affected, or is reasonably likely to materially affect, the Registrant's internal control over financial reporting. |
Item 12. Disclosure of Securities Lending Activities for Closed-End Management Investment Companies
Not applicable to open-end investment companies.
Item 13. Exhibits.
| (a) | (1) Any code of ethics or amendment thereto, that is the subject of the disclosure required by Item 2, to the extent that the registrant intends to satisfy Item 2 requirement through filing an exhibit. Not Applicable. |
(3) Any written solicitation to purchase securities under Rule 23c‑1 under the Act sent or given during the period covered by the report by or on behalf of the registrant to 10 or more persons. Not applicable to open-end investment companies.
(4) Change in the registrant’s independent public accountant. There was no change in the registrant’s independent public accountant for the period covered by this report.
SIGNATURES
Pursuant to the requirements of the Securities Exchange Act of 1934 and the Investment Company Act of 1940, the registrant has duly caused this report to be signed on its behalf by the undersigned, thereunto duly authorized.
(Registrant) The Tocqueville Trust
By (Signature and Title)* /s/ Robert W. Kleinschmidt
Robert W. Kleinschmidt, President
Date June 30, 2021
Pursuant to the requirements of the Securities Exchange Act of 1934 and the Investment Company Act of 1940, this report has been signed below by the following persons on behalf of the registrant and in the capacities and on the dates indicated.
By (Signature and Title)* /s/ Robert W. Kleinschmidt
Robert W. Kleinschmidt, President
Date June 30, 2021
By (Signature and Title)* /s/ Jeff Zatkowsky
Jeff Zatkowsky, Treasurer
Date June 30, 2021
* Print the name and title of each signing officer under his or her signature