UNITED STATES
SECURITIES AND EXCHANGE COMMISSION
Washington, D.C. 20549
FORM N-CSR
CERTIFIED SHAREHOLDER REPORT OF REGISTERED
MANAGEMENT INVESTMENT COMPANIES
Investment Company Act file number 811-4840
The Tocqueville Trust
(Exact name of registrant as specified in charter)
The Tocqueville Trust
40 West 57th Street, 19th Floor
New York, NY 10019
(Address of principal executive offices) (Zip code)
Robert W. Kleinschmidt
The Tocqueville Trust
40 West 57th Street, 19th Floor
New York, NY 10019
(Name and address of agent for service)
(212) 698-0800
Registrant’s telephone number, including area code
Date of fiscal year end: October 31
Date of reporting period: April 30, 2016
| Item 1. | Reports to Stockholders. |

The Tocqueville Trust
Mutual Funds
Semi-Annual Report
April 30, 2016
The Tocqueville Fund
The Tocqueville Opportunity Fund
The Tocqueville International Value Fund
The Tocqueville Gold Fund
The Delafield Fund
The Tocqueville Select Fund
The Tocqueville Alternative Strategies Fund

This report is not authorized for distribution to prospective investors unless preceded or accompanied by a currently effective prospectus of The Tocqueville Trust. Please call 1-800-697-FUND (3863) for a free prospectus. Read it carefully before you invest.
You are invited to visit our website @ www.tocqueville.com/mutual-funds
Chairman’s Letter
Dear Fellow Shareholder,
The high short-term volatility of the major markets over the reporting period has made it seem as if a lot was happening. In fact, however, most major markets declined over the reporting period, while in the United States, the S&P 500, after trending irregularly down, is not materially different from its levels of a year or more ago.
In terms of valuation, the price/earnings ratio on the S&P 500, at around 17.5, is in the neighborhood of its long-term historical average. While this does not necessarily call for an immediate, severe correction, it does not leave a lot of room for significant returns over the next 7-10 years, which is why my recent letters have remained cautious about accepting more risk.
It should also be noted that reported earnings, often whispered in advance to analysts by corporate managements, have increasingly diverged on the upside from those computed under “Generally Accepted Accounting Principles” (GAAP). This could indicate a growing creativity on the part of accounting “engineers”, with the risk of an eventual fall down to earth.
In addition, many costs have been largely suppressed in the last couple of years, from commodities and energy prices to interest rates. To the extent that this has helped many businesses attain record profit margins, another support of stock market prices may be in danger of disappearing, especially as some early signs of reflation may be appearing.
Under this set of circumstances, it is best to remember that a stronger economy is not necessarily the prelude to a buoyant stock market.
Respectfully,

François Sicart
The Tocqueville Fund
Dear Fellow Shareholder,
U.S. equities markets were little changed over the six-month period ended April 30, 2016, masking fairly significant swings in both directions over the period. Like the oft quoted passage from Shakespeare, whose 400th birthday may have been the most significant event of the half year, “it can all signify nothing, but, probably not”. Market swings were in reaction to Fed moves, or lack thereof, a continued desultory economy—the worst post war “recovery” on record—pressure on corporate profit margins, the surprising strength of the dollar, collapsing commodity prices, China worries, and last but not least, U.S. presidential politics.
All of these factors weighed on the markets in the past six months, but it is the latter, surely, which will weigh on it the most in the next six. No conversation amongst financial types, lawyers, businessman, college professors, indeed, the whole gambit of society, can go very long without turning to Donald Trump. So let’s discuss the issue head on. Trump doesn’t appear to be a traditional Republican in almost any sense, which explains, in part, why the Republican establishment has had and is having such a difficult time embracing him. His economic policies are closer to Bill Clinton’s than to George Bush, but they are more business friendly than those of the current administration. Wall Street seems to favor the likely Democratic candidate. Trump’s economic policies, to the extent they can be deciphered, are not the cause for concern. Rather, it is his foreign policy that has many outside observers spooked. The American electorate only infrequently considers foreign policy a key element in their presidential decision making and it is doubtful that foreign policy, aside from immigration and terrorism, two issues that Trump owns, will play much of a role in this year’s elections. If it does, that will not be good news for Mr. Trump, so it is reasonable to expect that the Democratic candidate will attempt to raise it. It is also reasonable to expect that Mr. Trump will raise the issue of Benghazi, ISIS, Syria, Libya and other areas of Democratic vulnerability in the debates. After months of predicting a Democratic landslide, the polls are now showing Mr. Trump drawing even with Mrs. Clinton in the key battleground states of Florida, Ohio and Pennsylvania. Pundits have been consistently wrong on the Trump phenomenon. While we cannot predict election results, we are confident that the market will react positively to an emerging consensus, whatever it may be. The devil you know is usually more comforting than the devil you don’t, but in either case, it is uncertainty which most troubles markets.
During the period, the Tocqueville Fund (the “Fund”) moderately outperformed the S&P 500, a distinction without much of a difference. The Fund’s returns were aided by good results from long-term holdings like Applied Materials, NextEra Energy, Campbell Soup, Facebook, General Electric, Alcoa, McDonald’s and Wal-Mart, among others. No clear pattern emerges to account for this collection of names. On the negative side, however, a very clear explanation reveals itself. Biotechnology names, which had been so
strong throughout most of the past few years, were major detractors from performance. PTC Therapeutics, Momenta Pharmaceuticals, Ionis Pharmaceuticals, Omeros and Alkermes combined to cost the portfolio 2.14% in performance. Financials, of which the Fund owns relatively few, also held back gains by 49 bps. Apple was also a laggard, costing the portfolio as much as 40 basis points. With all these head winds, the fact that the Fund out-performed the S&P 500, even if only modestly, was encouraging.
New positons acquired during the period included Alcoa and a Metals Mining ETF, in an attempt, successful so far, to take advantage of the oversold position in commodities. Other new names included Macy’s, Johnson Controls and Walt Disney, when market action provided attractive entry points. On the sell side, we eliminated positions in ADT, Allison Transmissions Avnet, Blackberry Ltd, and EMC, mostly to make room for better opportunities in other names. We trimmed Ionis Pharmaceuticals at very good prices in December (otherwise the damage from biotech stocks would have been much worse). We also chose to stop the bleeding in Momenta Pharmaceuticals and Omeros by liquidating our positions.
The account was down more than 6% in the first three months of the period, and up more than 7% in the last three months. In between, there was considerable volatility—sound and fury. I expect more of the same until this historic election process draws to a close.
Sincerely,

Robert W. Kleinschmidt
Portfolio Manager
The Tocqueville Fund
(Unaudited)
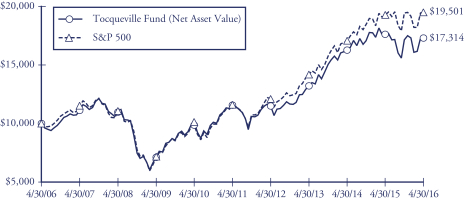
This chart assumes an initial gross investment of $10,000 made on 4/30/06. Returns shown do not reflect the deduction of taxes that a shareholder would pay on fund distributions or the redemption of fund shares. Performance reflects fee waivers in effect. In the absence of fee waivers, total return would be reduced. Returns shown include the reinvestment of all dividends and other distributions. Past performance is not predictive of future performance. Investment return and principal value will fluctuate so that your shares, when redeemed, may be worth more or less than their original cost.
The Standard & Poor’s 500 Stock Index (S&P 500) is a capital-weighted index, representing the aggregate market value of the common equity of 500 stocks primarily traded on the New York Stock Exchange. Returns assume the reinvestment of all dividends.
AVERAGE ANNUAL RATE OF RETURN (%)
FOR PERIODS ENDED APRIL 30, 2016
| | | | | | | | | | | | | | | | |
| | | 1 Year | | | 3 Year | | | 5 Year | | | 10 Year | |
The Tocqueville Fund | | | -1.74% | | | | 9.43% | | | | 8.36% | | | | 5.64% | |
Standard & Poor’s 500 Stock Index | | | 1.21% | | | | 11.26% | | | | 11.02% | | | | 6.91% | |
The Tocqueville Opportunity Fund
Dear Fellow Shareholder,
We are pleased to provide this investment overview for the first six-month period ended April 30, 2016 for the Tocqueville Opportunity Fund (the “Fund”). During the period, the Fund declined by 14.01% versus the Russell 2500 Growth Index which declined by 3.05%.
Early February marked the cyclical low for a significant correction for both small cap growth and small-to-mid (“SMID”) cap growth stocks with peak to trough corrections of 30.2% and 22% respectively. Small-cap growth issue prices peaked in June 2015 and SMID cap growth issue prices peaked in April 2015. The decline was concentrated during 10 weeks from early December 2015 through the second week of February 2016, and exceeded the 4 month correction (July through November 2011) due to instability in the European financial and currency markets. Over the past 5 1/2 years there have been 6 corrections of greater than 11.5%—they lasted an average of less than 3 months. Two of the corrections occurred in 2015, this one and last summer’s—both caused by global “growth scares” and China’s currency devaluations.
Market behavior, can be attributed to all host of factors—all related to rising macro risks including: slowing growth in China, continuing U.S. dollar strength, and the devaluation of the Chinese currency. An expected increase in the Fed Funds rate was deferred from September to December 2015 because of global market volatility. Fear gripped markets again in early 2016 as currency volatility, EU bank default risk, energy credit risk, oil price collapse, sovereign fund redemption, and healthcare regulation overwhelmed investor confidence. The Fund was inordinately impacted due to its concentration in smaller capitalization stocks and traditionally more volatile growth sectors including technology, healthcare and consumer discretionary issues. Growth stocks have performed distinctly less well over the past 5-6 months; small cap and SMID cap value issues have outperformed by more than 6% and 5% respectively. Although elevated macro concerns outweighed all other considerations during this difficult period, the actual impact to the operating fundamentals of the majority of the Fund’s investments has been nearly non-existent. Bearish investor sentiment superseded improving investment fundamentals and solid underlying execution for our investments. Despite this unsettling paradox, we are confident that execution and attractive fundamentals will determine the longer-term valuation of the Fund’s investments.
From the closing low on February 9, 2015, the Fund gained 20.5% through the end of April, exceeding small cap and SMID cap growth benchmarks. During the six-month period healthcare, technology and consumer discretionary investments accounted for nearly all of the Fund’s relative underperformance. A multiyear cycle of healthcare outperformance (4Q2011—2Q2015) ended with increasing political rancor. The ensuing correction in biotechnology issues was the worst since 2000 and 3rd worst in the industry’s
35 year history. Nevertheless, we would argue that the industry outlook is brighter than ever before, due to the advances in the understanding of diseases and the new approaches to discovery and design. Encouragingly, healthcare investments were among the leaders of the Fund’s recovery in performance over the past three months. Healthcare issues comprised 7 of the top 10 absolute performers and 6 of the top 10 relative performers off the lows. Milestones and news has been solid: Medivation, Acadia Pharmaceuticals, Spark Therapeutics, Tesaro, and GW Pharma all benefitted from significant events. Not everything in healthcare recovered—Chimerix, Clovis Oncology and Aratana Therapeutics all had late stage products which did not cross the finish line. Technology sector investments led all other sectors in the recovery—we had increased investments in technology during the correction. Leading issues from February 9th through April 30th included Paycom Software (+69.8%) and Splunk (+62.8%). Healthcare and technology investments accounted for nearly two thirds of the Fund’s gains from the February low, we believe the resurgence in prices demonstrated that the fundamentals of these investments never really changed.
Investments in healthcare have remained constant and lead all other sectors in share of investments. We have continued to increase commitments in technology, which comprise 30% of the Fund today. We reduced investments in the consumer sectors, despite evidence that employment and wage gains are steadily improving; there is considerable disruption of historical models of consumption due to the internet, the mobile phone and direct to consumer sales. We also have reduced investments in financial services by nearly half, as low interest rate have continued to impact profitability and growth across the sector. Finally, we have added investments in the energy sector—U.S. rig counts have collapsed, development projects have been shelved, financing has disappeared, outages have soared.
At the period’s end, the Top 10, Top 25, and Top 50 positions comprised 21.1%, 39.4%, and 59.6% respectively of the Fund’s holdings. While the Fund is very well diversified, we have increased our commitments to the leading weights over the past six months—at the period’s beginning the Top 10/25/50 allocations were 17.8%, 34.2% and 52.7% respectively. The Top 100 positions account for 81% of the Fund today, up from less than 75% six months ago. We believe the most recent turbulent period has provided a solid opportunity to deepen our commitments in the Fund’s leading investments at “one-off” prices—time will prove whether this strategy will be rewarded, but the early signs are supportive.
This has been a difficult period for small-cap growth issues. While such periods may shake the conviction of many, I have remained confident that the Fund’s investments are well placed in those companies which possess leading innovation, market share and vision—companies which are competitively advantaged and led by the best managements. The recent period of volatility may have forced me to lengthen the time horizons for expected returns on these investments, but by no means have I lowered my expectations. If there is a silver lining, I believe that the worst is most likely behind now—after all, we have passed through the worst period for smaller growth issues in nearly six years and the worst in sixteen years for healthcare issues! But, I believe, fundamentals are inescapably attractive.
As always I greatly appreciate your continued confidence in our efforts on behalf of the Fund and its shareholders.
Sincerely,

Thomas R. Vandeventer
Portfolio Manager
The Tocqueville Opportunity Fund
(Unaudited)
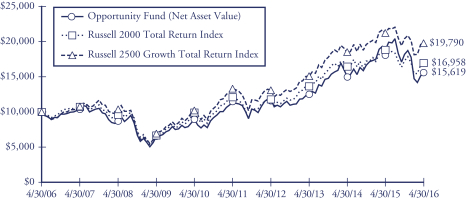
This chart assumes an initial gross investment of $10,000 made on 4/30/06. Returns shown do not reflect the deduction of taxes that a shareholder would pay on fund distributions or the redemption of fund shares. Returns shown include the reinvestment of all dividends and other distributions. Past performance is not predictive of future performance. Investment return and principal value will fluctuate so that your shares, when redeemed, may be worth more or less than their original cost.
The chart and table reflect The Opportunity Fund’s performance achieved prior to the changes effected in 2010 to its investment strategy.
The Russell 2500 Growth Total Return Index is an unmanaged index that measures the performance of the small to mid-cap growth segment of the U.S. equity universe. It includes those Russell 2500 companies with higher price-to-book ratios and higher forecasted growth values. Returns assume the reinvestment of all dividends.
AVERAGE ANNUAL RATE OF RETURN (%)
FOR PERIODS ENDED APRIL 30, 2016
| | | | | | | | | | | | | | | | |
| | | 1 Year | | | 3 Year | | | 5 Year | | | 10 Year | |
The Tocqueville Opportunity Fund | | | -17.00% | | | | 7.76% | | | | 6.37% | | | | 4.56% | |
Russell 2500 Growth Total Return Index | | | -6.76% | | | | 9.47% | | | | 8.23% | | | | 7.06% | |
The Tocqueville International Value Fund
Dear Fellow Shareholder,
Global equity markets in the aggregate were flat to slightly down during the six-month period ending April 30, 2016, but there were wide swings in investor sentiment and divergences in performance among countries, sectors, and currencies. Markets declined through mid-February, as investors focused on the impact of flagging growth and possible currency devaluation in China, low oil prices and their implications for credit markets and certain financial institutions, and generally weak economic data in the U.S. Most assets linked to commodities and emerging markets came under stress. Then the U.S. dollar weakened against most major currencies and oil prices recovered, sparking a recovery in equities, led by emerging markets and commodities. Japan and Europe finished down in the high single digits, while Latin American emerging markets and commodity producing nations were generally up.
High yield credit spreads tightened moderately. In terms of industry attribution, declines in Europe and Japan were led by financials, retail, travel and transport, while energy, construction, and mining shares fared relatively well.
The Tocqueville International Value Fund’s (the “Fund”) total U.S. dollar return for the six-month period was a gain of 2.43% on a net basis during the period. This compares with a loss of 3.07% in the Morgan Stanley EAFE Net Index.
During the period, the Fund benefitted from stock selection in the consumer, industrial and materials sectors, as well as from a low exposure to the financials sector. The Fund had meaningful gains in the French marketing research concern Ipsos, Japanese time management system maker Amano Corp., Belgian wire and cable producer Bekaert, French advertising concern Publicis, Swiss agricultural chemical concern Syngenta (subject of a takeover offer by ChemChina) and Japanese power tool maker Makita. The Fund had losses in health care shares, including Sanofi, Shire and Allergan, as attacks by U.S. politicians on drug prices caused valuations to compress, as well as in Japanese industrial conglomerate Hitachi and French conglomerate Bollore.
We exited positions in Bekaert and Japanese cosmetics and household products maker Shiseido, as each approached our estimates of intrinsic value. We sold our position in Syngenta, following the takeover offer by ChemChina, and we tendered the shares of specialty chemicals producer Royal Ten Cate, subject of a takeover offer by Gilde Partners. We exited our position in Norwegian oil & gas producer Statoil, when a questionable capital allocation decision by company management undercut our investment thesis. We took a new position in Volkswagen (“VW”) preferred share class, when the shares fell in the wake of disclosures regarding the emissions scandal. The resulting decline in VW’s enterprise value discounted fines and penalties and permanent damage to the brand that exceeded our own estimates. Further, the preferred share class suffered more than the common share class due to the market’s misperception that VW
would issue additional preferred shares in order to pay for the fines and penalties. We believe, the result was that we were able to purchase VW and VW owned car makers, Audi and Porsche, at a low multiple of free cash flow. We purchased shares of Zodiac Aerospace, a niche manufacturer of aerospace equipment, with strong positions in specialized markets. In our judgement, operating margins and the share price are depressed due to temporary production problems, causing the stock to trade at a deep discount to intrinsic value. We believe that operating margins will recover over time and that Zodiac should be an attractive acquisition candidate for a larger player. We bought shares of Schlumberger, a global oil services company with attractive return on capital and free cash generation characteristics. The share price had declined with the price of oil, and while profits will be depressed for a period due to a decline in exploration and production activity, Schlumberger is managing its expenses well and taking market share, which should result in strong cash flows when activity recovers. We also took a position in Global Logistic Properties, which owns and leases out modern warehouse facilities in China and Japan, when China fears caused it to trade at a meaningful discount to the net asset value of its properties. During the period, we added to the Fund’s holdings in Aveva, Kingfisher, Sanofi, Smiths Group, Bollore, Applus, Publicis, Hitachi and Novartis, inter alia.
There was no meaningful change in the portfolio’s geographic exposures. The Fund began the period with approximately 11% in cash reserves and finished the period with approximately 11% in cash reserves.
In our view, global growth continues at a modest pace. It would appear that the strength of the U.S. dollar in recent years has been a sufficient negative for the U.S. economy to have caused the Fed to pause its efforts at normalizing rates, which has helped to cause a moderation or even reversal in U.S. dollar strengthening. A stabilizing dollar should be sufficient to reverse the pressure on commodities and emerging markets absent another leg down in commodity supply demand fundamentals. That said, wide swings in prices and valuations during the quarter suggest a fragile market psychology and a high degree of uncertainty regarding the macroeconomic backdrop. Volatility creates mispricing opportunities and we are focused on taking advantage of the swings, by identifying good assets that become oversold for the wrong reasons. We believe one broad area of opportunity at present is drug makers, where the political rhetoric referred to above is creating certain opportunities.
As always, we aim to protect and grow your capital by identifying companies that have defensible business franchises and limited financial leverage, and which are misunderstood by the market causing them to trade at a substantial discount to intrinsic value based on future cash flows, in a conservative economic growth scenario.
Respectfully,

James Hunt
Portfolio Manager
The Tocqueville International Value Fund
(Unaudited)
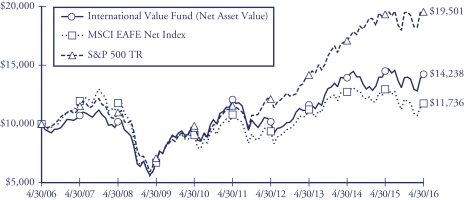
This chart assumes an initial gross investment of $10,000 made on 4/30/06. Returns shown do not reflect the deduction of taxes that a shareholder would pay on fund distributions or the redemption of fund shares. Performance reflects fee waivers in effect. In the absence of fee waivers, total return would be reduced. Returns shown include the reinvestment of all dividends and other distributions. Past performance is not predictive of future performance. Investment return and principal value will fluctuate so that your shares, when redeemed, may be worth more or less than their original cost.
The MSCI EAFE Index is an unmanaged market-capitalization-weighted index composed of companies representative of the market structure of 21 Developed Market Countries in Europe, Australia, Asia and the Far East.
AVERAGE ANNUAL RATE OF RETURN (%)
FOR PERIODS ENDED APRIL 30, 2016
| | | | | | | | | | | | | | | | |
| | | 1 Year | | | 3 Year | | | 5 Year | | | 10 Year | |
The Tocqueville International Value Fund | | | -1.68% | | | | 6.93% | | | | 3.34% | | | | 3.60% | |
MSCI EAFE Net Index | | | -9.32% | | | | 1.48% | | | | 1.69% | | | | 1.61% | |
The Tocqueville Gold Fund
Dear Fellow Shareholder,
Over the past six months, through April 30, 2016, a significant change in market attitude toward gold stocks and gold in general has taken place. During the six-month period, gold rose 13.1% finishing at U.S. $1,290.50 per oz., while the Tocqueville Gold Fund (the “Fund”) returned 53.38%. Comparatively, the Philadelphia Stock Exchange Gold and Silver index increased 81.13%. Gold now appears to have recovered from a bottoming out process that occurred during the second half of 2015, after trending downward for four years.
The markets’ assessment of the U.S. Federal Reserve’s interest rate posture weighed on gold at the end of 2015 but gold recovered as markets concluded that after the December increase another rate increase was unlikely, especially as the European Central Bank and the Bank of Japan continued to ease. As the 2016 calendar year got underway, global investors were most concerned that Chinese markets and global economic fundamentals would deteriorate, while oil prices continued a downward trend that began in 2014.
During the period, we eliminated or reduced a number of positions, which we thought offered less return potential. We sold Continental Gold and Primero Mining as they faced permitting and tax issues, respectively. Those concerns are likely to impede their stock price performance. Iamgold, Kinross and New Gold were also eliminated as we assessed their capital allocation strategy as less than advantageous to shareholder value creation over the long-term. We reduced the Gold Fields position, as its South African mine continues to struggle and this has become a larger concern for the company’s long-term success.
We sold small positions in Cia de Minas Buenaventura and Silvercrest as we determined that such small weightings in those two names are better utilized in several new positions for the Fund—TMAC Resources, NuLegacy Gold, Hochschild Mining and Richmont Mines. We added to Alamos Gold as the prospects for the company improved and we saw a compelling valuation. We added to positions in OceanaGold and Osisko Gold Royalties as valuations for those companies were, to us, compelling in early 2016. An investment in Jaguar Mining was made early in the period as we saw it as attractively valued at the time.
A new position was initiated in Barrick Gold, while we added to Newmont Mining, as we recognized the markets’ preference for liquidity as the gold price began to turn in early 2016. We also added to silver dominant names such as Pan American Silver and Tahoe Resources, as we anticipated a recovery in silver following gold’s move.
Gold mining companies’ profit reports over the past two quarters showed that a challenging environment has begun to turn in their favor. What is most encouraging for
investors is the discipline and focus undertaken by majority of the industry over the past few years, in terms of cost control. As a result, we believe that the fundamentals for the companies have generally improved: the balance sheets are in better shape, assets have seen better stewardship, and now, with improved gold prices and cost discipline instilled during the downturn, portfolio companies should be in a better position to generate cash flow of much higher quality.
In our view, the move in precious metal prices during the period reflects the fading investor confidence in the extreme monetary policies that boosted financial asset prices in recent years. Despite the substantial rally in gold and gold stocks since the beginning of the year, we believe gold mining equities remain severely undervalued and are long-term options on the potential increase in the price of gold.
Sincerely,
| | |
 | |  |
| |
| John C. Hathaway | | Douglas B. Groh |
| Portfolio Manager | | Portfolio Manager |
The Tocqueville Gold Fund
(Unaudited)
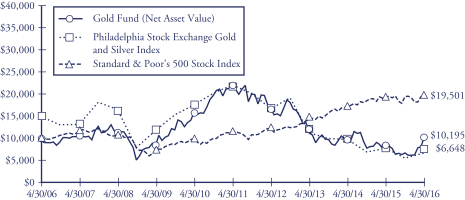
This chart assumes an initial gross investment of $10,000 made on 4/30/06. Returns shown do not reflect the deduction of taxes that a shareholder would pay on fund distributions or the redemption of fund shares. Returns shown include the reinvestment of all dividends and other distributions. Past performance is not predictive of future performance. Investment return and principal value will fluctuate so that your shares, when redeemed, may be worth more or less than their original cost. The Fund imposes a 2% redemption fee on shares held 90 days or less.
In 2006, 2009, and 2010 the performance of The Tocqueville Gold Fund was achieved during a period of unusually favorable market conditions. Such performance may not be sustainable.
The Philadelphia Stock Exchange Gold and Silver Index is an unmanaged capitalization-weighted index which includes the leading companies involved in the mining of gold and silver. Returns include the reinvestment of all dividends.
The Standard & Poor’s 500 Stock Index (S&P 500) is a capital-weighted index, representing the aggregate market value of the common equity of 500 stocks primarily traded on the New York Stock Exchange. Returns include the reinvestment of all dividends.
AVERAGE ANNUAL RATE OF RETURN (%)
FOR PERIODS ENDED APRIL 30, 2016
| | | | | | | | | | | | | | | | |
| | | 1 Year | | | 3 Year | | | 5 Year | | | 10 Year | |
The Tocqueville Gold Fund | | | 23.27% | | | | -2.96% | | | | -14.36% | | | | 0.19% | |
Philadelphia Stock Exchange Gold and Silver Index | | | 28.57% | | | | -3.97% | | | | -14.71% | | | | -3.99% | |
Standard & Poor’s 500 Stock Index | | | 1.21% | | | | 11.26% | | | | 11.02% | | | | 6.91% | |
The Delafield Fund
Dear Fellow Shareholder,
For the six months ended April 30, 2016, the Delafield Fund’s (the “Fund”) net asset value decreased 0.60% versus a decline of 1.90% for the Russell 2000 Index (“Russell 2000”) and an increase of 0.43% for the Standard & Poor’s 500 Index (“S&P 500”), each on a total return basis. Owing to the smaller average market capitalization of companies in the Russell 2000, we view it as the more appropriately comparative index for the Fund. The Fund’s net asset value as of April 30, 2016 was $25.48 per share. The net asset value amounted to $445,802,667 of which 76.8% was invested in equities, and the balance in cash and cash equivalents.
Broken down into two halves, this period was characterized by substantial volatility. From November 1, 2015 through January 31, 2016, the Russell 2000 experienced a 10.56% decline and the portfolio trailed the Index, declining 15.04% for the same period. During this first half of the period, worldwide economic and political uncertainty and instability were the dominant theme. More specifically, the slowdown in China and consequent weakness in commodity metal prices, the energy sector’s woes, and a strong dollar continued to be among the leading headlines and largely overshadowed the continued, albeit gradual, improvement in the domestic economic picture. Unfortunately, these macro fears most severely challenged stocks in the industrial, material, energy and retail sectors. These represent a core group of industries which have traditionally been the most fertile for our strategy of discovering unloved and misunderstood opportunities in which to invest in. While the majority of the Fund’s holdings in these sectors continued to make progress with their respective operational initiatives during the first half of the period, these accomplishments were overshadowed by external issues noted above, and as a result, exposure to these sectors contributed to the Fund’s relative underperformance.
Both the market and the Fund’s portfolio snapped back sharply in the second half of the period, despite the persistence of an uncertain geo-political and global economic backdrop. From February 1, 2016 through April 30, 2016, the Index returned 9.67%. The Fund’s performance during this half of the period was satisfactory, with a 16.99% gain, net of fees. A stabilization in energy and commodity prices as well as a somewhat weaker dollar benefited investors’ macro perspective and helped to drive this market rally. Further, a fairly benign fourth calendar quarter earnings season seemingly emboldened market confidence. While the portfolio benefited from these external factors, performance was also augmented with strong stock selection. The Fund outperformed the comparable Index holdings in three of the four most heavily weighted sectors during the second half of the time period.
For the entire six month period, top performance contributors included Consol Energy Inc., Hewlett Packard Enterprise Company, and Boardwalk Pipeline Partners LP. Consol, which has generally been a disappointing investment, responded favorably to
energy price stabilization, as well as evidence that operational improvements are beginning to take hold. Hewlett Packard Enterprise Co. had a successful debut following its spin-off from HP Inc., while Boardwalk, like Consol, was the beneficiary of a stabilized energy price environment and also reported stronger than expected earnings and cash flow.
In contrast, TrueBlue, Inc., Harsco Corporation, and Xerium Technologies Inc, were the largest detractors to performance. TrueBlue disappointed the market with weaker than expected earnings and the unexpected loss of contract work with Amazon. Harsco reported in-line earnings during the period, but provided investors with a weaker than expected outlook for the balance of the year, while Xerium’s shares declined on soft earnings results.
We added a number of new positions to the portfolio during the six month period, the largest of which included Team Inc., Tegna Inc., and Gentex Corporation. In contrast, the largest portfolio deletions included two companies which announced deals to be acquired, namely Ingram Micro Inc. and Fairchild Semiconductor International Inc., as well as our successful investment in Avery Dennison Corporation.
In the near-term, the U.S. Presidential election, the movement of the U.S. dollar and energy prices are likely to dominate the headlines. Further, an ever increasing deficit in both private and public pension funding levels, as well as a very skittish bond market will remain a concern. Finally we expect that market volatility will continue to be an issue as ETFs, computer traded portfolios and hedge funds dominate day to day investment activity. On the plus side is the domestic economy which is growing, albeit at a moderate pace. Consumer disposable income and net-worth are both rising and employment is strong. Globally, commodity prices, in general, are likely to remain in check due to diminished growth expectations for the Chinese economy. This macro backdrop could make for a tentative investment climate, which we believe could be ripe for the discovery of the value and special situation opportunities which we look to invest in.
Sincerely,
| | |

| |  |
| J. Dennis Delafield | | Vincent Sellecchia |
| Portfolio Manager | | Portfolio Manager |
The Delafield Fund
(Unaudited)
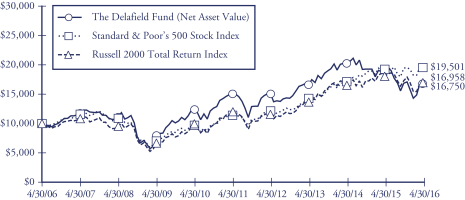
This chart assumes an initial gross investment of $10,000 made on 4/30/06. Since the Delafield Fund did not commence operations until 9/28/09, returns prior to that date are those of the Predecessor Fund. The Delafield Fund assumed the net asset value and performance history of the Predecessor Fund (See Footnote 1 to the Financial Statements). Returns shown do not reflect the deduction of taxes that a shareholder would pay on fund distributions or the redemption of fund shares. Performance reflects fee waivers in effect. In the absence of fee waivers, total return would be reduced. Returns shown include the reinvestment of all dividends and other distributions. Past performance is not predictive of future performance. Investment return and principal value will fluctuate so that your shares, when redeemed, may be worth more or less than their original cost.
The Standard & Poor’s 500 Stock Index (S&P 500) is a capital-weighted index, representing the aggregate market value of the common equity of 500 stocks primarily traded on the New York Stock Exchange. Returns include the reinvestment of all dividends.
The Russell 2000 Total Return Index is an unmanaged index that measures the performance of the 2,000 smallest companies in the Russell 3000 Index, which represent approximately 10% of the total market capitalization of the Russell 3000 Index. Returns include the reinvestment of all dividends.
AVERAGE ANNUAL RATE OF RETURN (%)
FOR PERIODS ENDED APRIL 30, 2016
| | | | | | | | | | | | | | | | |
| | | 1 Year | | | 3 Year | | | 5 Year | | | 10 Year | |
The Delafield Fund | | | -13.29% | | | | 0.50% | | | | 1.92% | | | | 5.29% | |
Standard & Poor’s 500 Stock Index | | | 1.21% | | | | 11.26% | | | | 11.02% | | | | 6.91% | |
Russell 2000 Total Return Index | | | -5.94% | | | | 7.53% | | | | 6.98% | | | | 5.42% | |
The Tocqueville Select Fund
Dear Fellow Shareholder,
For the six months ended April 30, 2016, the Tocqueville Select Fund’s (the “Fund) net asset value decreased 3.47% versus decreases of 0.36% for the Russell 2500 Index (“Russell 2500”) and 1.90% for the Russell 2000 Index (“Russell 2000”), each on a total return basis. The net asset value as of April 30, 2016 was $11.25 per share. The net asset value amounted to $67,718,853 of which 95.8% was invested in equities, and the balance in cash and cash equivalents.
During this first half of the period, worldwide economic and political uncertainty and instability were the dominant theme. From November 1, 2015 through January 31, 2016, the Russell 2500 experienced a 9.99% decline and the Fund trailed, declining 16.43% for the same period. The slowdown in China and consequent weakness in commodity metal prices, the energy sector’s woes, and a strong dollar continued to be among the leading headlines and largely overshadowed the continued, albeit gradual, improvement in the domestic economic picture. Unfortunately, these macro fears most severely challenged stocks in the industrial, material, energy and retail sectors, which also represent a core group of industries which have traditionally been the most fertile for the Fund’s investment strategy. While the majority of the Fund’s holdings in these sectors continued to make progress with their respective operational initiatives during the first half of the period, these accomplishments were overshadowed by external issues, and exposure to these sectors detracted from performance during the first half of the six month period.
Both the market and the Fund’s portfolio snapped back sharply in the second half of the period. From February 1, 2016 through April 30, 2016, the Russell 2500 returned 10.70%. The Fund outperformed the Russell 2500 by over 450 basis points during this half of the period, with the Fund generating a 15.50% net return. A stabilization in energy and commodity prices, as well as a moderately weaker dollar benefited investors’ macro perspective and helped to drive this market rally. Further, a fairly benign fourth calendar quarter earnings season seemingly emboldened market confidence. While the Fund benefited from these external factors, relative outperformance during the second half of the period was driven by strong stock selection, particularly in the consumer discretionary and materials sectors.
For the entire six month period, Fund’s performances benefited from holdings of Consol Energy Inc., Horizon Global Corporation, and Wesco International Inc. Consol Energy, which generally has not performed in line with our expectations, responded favorably to energy price stabilization, as well as evidence that operational improvements are beginning to take hold. Shares in Horizon Global Corporation rose following the company’s fourth quarter earnings release, which included a more favorable outlook on the strength in profit’s in their America’s segment, while Wesco benefited from an upbeat investor day presentation, as well as solid first quarter earnings.
In contrast, Xerium Technologies, Ascena Retail Group Inc. and Harsco Corporation detracted from performance. Xerium’s shares declined on soft earnings results, Ascena traded off on retail industry concerns, while Harsco reported in-line earnings during the period, but provided investors with a weaker than expected outlook for the balance of the year.
We added a number of new positions to the portfolio during the six month period, the largest of which included TrueBlue Inc., Tegna Inc., and ICF International Inc. In contrast, the largest portfolio deletions included Fairchild Semiconductor International Inc., which announced that it had agreed to be acquired, our successful investment in Avery Dennison Corporation, as well as Jabil Circuit Inc. and Kennametal Inc.
In the near-term, the U.S. Presidential election, the movement of the U.S. dollar and energy prices are likely to dominate the headlines. Further, an ever increasing deficit in both private and public pension funding levels, as well as a very skittish bond market will remain a concern. Finally we expect that market volatility will continue to be an issue, as ETFs, computer traded portfolios and hedge funds dominate day to day investment activity. On the plus side is the domestic economy which is growing, albeit at a moderate pace. Consumer disposable income and net-worth are both rising, and employment is strong. Globally, commodity prices, in general, are likely to remain in check, due to diminished growth expectations for the Chinese economy. This macro backdrop could make for a tentative investment climate, which we believe could be ripe for the discovery of the value and special situation opportunities which we look to invest in.
Sincerely,
The Tocqueville Select Fund
(Unaudited)
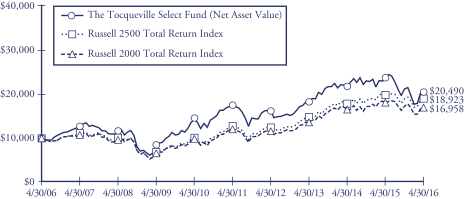
This chart assumes an initial gross investment of $10,000 made on 4/30/06. Since The Tocqueville Select Fund did not commence operations until 9/28/09, returns from the period from September 29, 2008 to September 27, 2009 are those of the Class Y Shares of the Predecessor Fund (See Footnote 1 to the Financial Statements). Prior to that period, returns shown are those of a limited partnership managed by the adviser. Returns shown do not reflect the deduction of taxes that a shareholder would pay on fund distributions or the redemption of fund shares. Performance reflects fee waivers in effect. In the absence of fee waivers, total return would be reduced. Returns shown include the reinvestment of all dividends and other distributions. Past performance is not predictive of future performance. Investment return and principal value will fluctuate so that your shares, when redeemed, may be worth more or less than their original cost.
In 2013 the performance of The Tocqueville Select Fund was achieved during a period of unusually favorable market conditions. Such performance may not be sustainable.
The Russell 2500 Total Return Index is an unmanaged index that measures the performance of the 2,500 smallest companies in the Russell 3000 Index. Returns include the reinvestment of all dividends.
The Russell 2000 Total Return Index is an unmanaged index that measures the performance of the 2,000 smallest companies in the Russell 3000 Index, which represents approximately 8% of the total market capitalization of the Russell 3000 Index. Returns include the reinvestment of all dividends.
AVERAGE ANNUAL RATE OF RETURN (%)
FOR PERIODS ENDED APRIL 30, 2016
| | | | | | | | | | | | | | | | |
| | | 1 Year | | | 3 Year | | | 5 Year | | | 10 Year | |
The Tocqueville Select Fund | | | -14.20% | | | | 4.19% | | | | 3.15% | | | | 7.44% | |
Russell 2500 Total Return Index | | | -4.27% | | | | 8.57% | | | | 8.28% | | | | 6.59% | |
Russell 2000 Total Return Index | | | -5.94% | | | | 7.53% | | | | 6.98% | | | | 5.42% | |
The Tocqueville Alternative Strategies Fund
Dear Fellow Shareholder,
As you are aware, it was announced on April 25, 2016 that the Tocqueville Alternative Strategies Fund (“TALSX” or “Fund”) would be liquidated on May 17, 2016.
Over the six-month period ending April 30, 2016, the Fund generated a total return of -4.74% versus a total return of +0.43% for the S&P 500 and a -7.58% loss for the Hedge Fund Research North America Index (HFRXNA).
Of the 474 basis points (or 4.74 percentage points) the Fund lost in the period, Allergan PLC. (AGN), a Long Equity position, accounted for over 100 basis points of negative performance as a result of Pfizer (PFE) canceling its merger agreement amid new U.S. Tax inversion regulations that, in our view, specifically targeted the PFE and AGN merger. Part of our rationale for owning AGN despite the known deal risk was that we felt it was undervalued even at higher prices on a standalone basis, and as such we purchased more stock when it fell. In addition, PTC Therapeutics Inc. (PTCT) negatively impacted performance by 107 bps in Long Equity and 81 bps in Convertible Arbitrage, more than reversing prior gains in the name, after the Company received a refuse to file letter from the FDA for its lead drug candidate. Offsetting a portion of the losses in the Healthcare sector were gains in Healthcare specific index hedges that together added approximately 61 basis points to performance.
We had a handful of positive performing positions, including Tyson Foods Inc. (TSN) that added 47 basis points to performance. Earlier this year TSN raised its dividend by 50% to $0.60 per share and issued optimistic full year 2016 guidance that was above Street consensus. Subsequently, we have closed our position in TSN as we view shares reflect fair value. Other positive performing positions included General Electric (Fixed Income), Weyerhaeuser (Long Equity), and Omeros Corp. (Long Equity), which together contributed over 100 basis points to performance.
All four of the Fund’s core strategies declined during the period with Convertible Arbitrage, Fixed Income, Special Situations and Long Equity detracting approximately 24 basis points, 81 basis points, 92 basis points and 264 basis points, respectively. In addition, overall the portfolio was hurt by approximately 10 basis points in its portfolio hedges, primarily as a result of broad market index hedges hurting the portfolio as stock markets performed well outside of healthcare. As our results and the results of the HFRXNA indicate, it was a difficult period for non-traditional investment strategies.
Sincerely,

Kenneth Lee
Portfolio Manager
The Tocqueville Alternative Strategies Fund
(Unaudited)
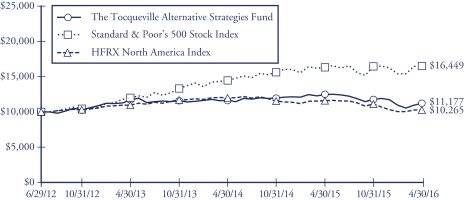
This chart assumes an initial gross investment of $10,000 made on June 29, 2012. Since the Tocqueville Alternative Strategies Fund did not commence operations until June 30, 2014, returns prior to that date are those of the Predecessor Fund (See Footnote 1 to the Financial Statements). Returns shown do not reflect the deduction of taxes that a shareholder would pay on fund distributions or the redemption of fund shares. Performance reflects fee waivers in effect. In the absence of fee waivers, total return would be reduced. Returns shown include the reinvestment of all dividends and other distributions. Past performance is not predictive of future performance. Investment return and principal value will fluctuate so that your shares, when redeemed, may be worth more or less than their original cost.
The Standard & Poor’s 500 Stock Index (S&P 500) is a capital-weighted index, representing the aggregate market value of the common equity of 500 stocks primarily traded on the New York Stock Exchange. Returns include the reinvestment of all dividends.
The HFRX North America Index is designed to reflect the performance of the North American region of the hedge fund universe. Regional Investment Focus is designed to reflect the primary focus of the Fund’s strategic exposure, over various market cycles, independent of the investment manager’s physical location or the domiciled registration location of the fund. Funds investing in North America typically have greater than 50% exposure in North America. Returns include the reinvestment of all dividends
AVERAGE ANNUAL RATE OF RETURN (%)
FOR PERIODS ENDED APRIL 30, 2016
| | | | | | | | | | | | |
| | | 1 Year | | | 3 Year | | | Inception(1) | |
The Tocqueville Alternative Strategies Fund | | | -10.12% | | | | -1.32% | | | | 2.94% | |
Standard & Poor’s 500 Stock Index | | | 1.21% | | | | 11.26% | | | | 13.85% | |
HFRX North America Index | | | -11.21% | | | | -2.10% | | | | 0.68% | |
| (1) | Inception of the Predecessor Fund was June 29, 2012. |
Expense Example—April 30, 2016 (Unaudited)
As a shareholder of The Tocqueville Trust (the “Funds”), you incur ongoing costs, including management fees; distribution fees; and other Fund expenses. This example is intended to help you understand your ongoing costs (in dollars) of investing in the Funds and to compare costs with the ongoing costs of investing in other mutual funds.
The Example is based on an investment of $1,000 invested at the beginning of the period and held the entire period (November 1, 2015-April 30, 2016).
Actual Expenses
The first line of the table below provides information about actual account values and actual expenses. You may use the information in this line, together with the amount you invested, to estimate the expenses that you paid over the period. Simply divide your account value by $1,000 (for example, an $8,600 account value divided by $1,000 = 8.6), then multiply the result by the number in the first line under the heading entitled “Expenses Paid During Period” to estimate the expenses you paid on your account during this period.
Hypothetical Example for Comparison Purposes
The second line of the table below provides information about hypothetical account values and hypothetical expenses based on the Funds’ actual expense ratios and an assumed rate of return of 5% per year before expenses, which is not the Funds’ actual return. The hypothetical account values and expenses may not be used to estimate the actual ending account balance or expenses you paid for the period. You may use this information to compare the ongoing costs of investing in the Funds and other funds. To do so, compare this 5% hypothetical example with the 5% hypothetical examples that appear in the shareholder reports of the other funds.
Please note that the expenses shown in the table are meant to highlight your ongoing costs only and do not reflect any transactional costs, such as sales charges (loads), redemption fees, or exchange fees. Therefore, the second line of the table is useful in comparing ongoing costs only, and will not help you determine the relative costs of owning different funds. In addition, if these transactional costs were included, your costs would have been higher.
Expense Example Tables (Unaudited)
The Tocqueville Fund
| | | | | | | | | | | | |
| | | Beginning
Account Value
November 1, 2015 | | | Ending
Account Value
April 30, 2016 | | | Expenses Paid
During Period*
November 1, 2015 -
April 30, 2016 | |
Actual | | $ | 1,000.00 | | | $ | 1,010.10 | | | $ | 6.30 | |
Hypothetical (5% return before expenses) | | | 1,000.00 | | | | 1,018.60 | | | | 6.32 | |
| * | Expenses are equal to the Fund’s annualized six-month expense ratio (including interest expense) of 1.26% for The Tocqueville Fund, multiplied by the average account value over the period, multiplied by 182/366 to reflect the one-half year period. |
The Tocqueville Opportunity Fund
| | | | | | | | | | | | |
| | | Beginning
Account Value
November 1, 2015 | | | Ending
Account Value
April 30, 2016 | | | Expenses Paid
During Period*
November 1, 2015 -
April 30, 2016 | |
Actual | | $ | 1,000.00 | | | $ | 859.90 | | | $ | 6.24 | |
Hypothetical (5% return before expenses) | | | 1,000.00 | | | | 1,018.15 | | | | 6.77 | |
| * | Expenses are equal to the Fund’s annualized six-month expense ratio (including interest expense) of 1.35% for The Tocqueville Opportunity Fund, multiplied by the average account value over the period, multiplied by 182/366 to reflect the one-half year period. |
The Tocqueville International Value Fund
| | | | | | | | | | | | |
| | | Beginning
Account Value
November 1, 2015 | | | Ending
Account Value
April 30, 2016 | | | Expenses Paid
During Period*
November 1, 2015 -
April 30, 2016 | |
Actual | | $ | 1,000.00 | | | $ | 1,024.30 | | | $ | 6.29 | |
Hypothetical (5% return before expenses) | | | 1,000.00 | | | | 1,018.65 | | | | 6.27 | |
| * | Expenses are equal to the Fund’s annualized six-month expense ratio of 1.25% for The Tocqueville International Value Fund, multiplied by the average account value over the period, multiplied by 182/366 to reflect the one-half year period. |
The Tocqueville Gold Fund
| | | | | | | | | | | | |
| | | Beginning
Account Value
November 1, 2015 | | | Ending
Account Value
April 30, 2016 | | | Expenses Paid
During Period*
November 1, 2015 -
April 30, 2016 | |
Actual | | $ | 1,000.00 | | | $ | 1,535.80 | | | $ | 9.21 | |
Hypothetical (5% return before expenses) | | | 1,000.00 | | | | 1,017.60 | | | | 7.32 | |
| * | Expenses are equal to the Fund’s annualized six-month expense ratio (including interest expense) of 1.46% for The Tocqueville Gold Fund, multiplied by the average account value over the period, multiplied by 182/366 to reflect the one-half year period. |
The Delafield Fund
| | | | | | | | | | | | |
| | | Beginning
Account Value
November 1, 2015 | | | Ending
Account Value
April 30, 2016 | | | Expenses Paid
During Period*
November 1, 2015 -
April 30, 2016 | |
Actual | | $ | 1,000.00 | | | $ | 994.00 | | | $ | 6.74 | |
Hypothetical (5% return before expenses) | | | 1,000.00 | | | | 1,018.10 | | | | 6.82 | |
| * | Expenses are equal to the Fund’s annualized six-month expense ratio of 1.36% for The Delafield Fund, multiplied by the average account value over the period, multiplied by 182/366 to reflect the one-half year period. |
The Tocqueville Select Fund
| | | | | | | | | | | | |
| | | Beginning
Account Value
November 1, 2015 | | | Ending
Account Value
April 30, 2016 | | | Expenses Paid
During Period*
November 1, 2015 -
April 30, 2016 | |
Actual | | $ | 1,000.00 | | | $ | 965.30 | | | $ | 6.79 | |
Hypothetical (5% return before expenses) | | | 1,000.00 | | | | 1,017.95 | | | | 6.97 | |
| * | Expenses are equal to the Fund’s annualized six-month expense ratio of 1.39% for The Tocqueville Select Fund, multiplied by the average account value over the period, multiplied by 182/366 to reflect the one-half year period. |
The Tocqueville Alternative Strategies Fund
| | | | | | | | | | | | |
| | | Beginning
Account Value
November 1, 2015 | | | Ending
Account Value
April 30, 2016 | | | Expenses Paid
During Period*
November 1, 2015 -
April 30, 2016 | |
Actual | | $ | 1,000.00 | | | $ | 952.60 | | | $ | 14.37 | |
Hypothetical (5% return before expenses) | | | 1,000.00 | | | | 1,010.14 | | | | 14.79 | |
| * | Expenses are equal to the Fund’s annualized six-month expense ratio (including interest expense and dividends and interest expense on short sales) of 2.96% for The Tocqueville Alternative Strategies Fund, multiplied by the average account value over the period, multiplied by 182/366 to reflect the one-half year period. |
The Tocqueville Fund
Financial Highlights
| | | | | | | | | | | | | | | | | | | | | | | | |
Per share operating performance
(For a share outstanding
throughout the period) | | Six Months
Ended
April 30,
2016 | | | Years Ended October 31, | |
| | | 2015 | | | 2014 | | | 2013 | | | 2012 | | | 2011 | |
| | | (unaudited) | | | | | | | | | | | | | | | | |
Net asset value, beginning of period | | $ | 32.91 | | | $ | 34.18 | | | $ | 30.67 | | | $ | 24.11 | | | $ | 22.23 | | | $ | 21.53 | |
| | | | | | | | | | | | | | | | | | | | | | | | |
Operations: | | | | | | | | | | | | | | | | | | | | | | | | |
Net investment income (1) | | | 0.20 | | | | 0.37 | | | | 0.28 | | | | 0.40 | | | | 0.40 | | | | 0.23 | |
Net realized and unrealized gain (loss) | | | 0.13 | | | | (0.19 | ) | | | 3.78 | | | | 6.51 | | | | 1.81 | | | | 0.80 | |
| | | | | | | | | | | | | | | | | | | | | | | | |
Total from investment operations * | | | 0.33 | | | | 0.18 | | | | 4.06 | | | | 6.91 | | | | 2.21 | | | | 1.03 | |
| | | | | | | | | | | | | | | | | | | | | | | | |
Distributions to shareholders: | | | | | | | | | | | | | | | | | | | | | | | | |
Dividends from net investment income | | | (0.35 | ) | | | (0.25 | ) | | | (0.30 | ) | | | (0.35 | ) | | | (0.33 | ) | | | (0.33 | ) |
Distributions from net realized gains | | | (0.33 | ) | | | (1.20 | ) | | | (0.25 | ) | | | — | | | | — | | | | — | |
| | | | | | | | | | | | | | | | | | | | | | | | |
Total distributions | | | (0.68 | ) | | | (1.45 | ) | | | (0.55 | ) | | | (0.35 | ) | | | (0.33 | ) | | | (0.33 | ) |
| | | | | | | | | | | | | | | | | | | | | | | | |
Change in net asset value for the period | | | (0.35 | ) | | | (1.27 | ) | | | 3.51 | | | | 6.56 | | | | 1.88 | | | | 0.70 | |
| | | | | | | | | | | | | | | | | | | | | | | | |
Net asset value, end of period | | $ | 32.56 | | | $ | 32.91 | | | $ | 34.18 | | | $ | 30.67 | | | $ | 24.11 | | | $ | 22.23 | |
| | | | | | | | | | | | | | | | | | | | | | | | |
* Includes redemption fees per share of (see Note 6) | | | N/A | | | $ | 0.00 | (2) | | $ | 0.00 | (2) | | $ | 0.00 | (2) | | $ | 0.00 | (2) | | $ | 0.00 | (2) |
Total return | | | 1.0 | %(4) | | | 0.5 | % | | | 13.4 | % | | | 29.0 | % | | | 10.1 | % | | | 4.8 | % |
Ratios/supplemental data | | | | | | | | | | | | | | | | | | | | | | | | |
Net assets, end of period (000) | | $ | 286,294 | | | $ | 309,267 | | | $ | 380,561 | | | $ | 348,269 | | | $ | 366,025 | | | $ | 491,541 | |
Ratio to average net assets: | | | | | | | | | | | | | | | | | | | | | | | | |
Expenses before waiver/reimbursement | | | 1.31 | %(5) | | | 1.29 | % | | | 1.25 | % | | | 1.28 | % | | | 1.29 | % | | | 1.26 | % |
Expenses after waiver/reimbursement | | | 1.26 | %(3)(5) | | | 1.25 | % | | | 1.24 | % | | | 1.26 | %(3) | | | 1.26 | %(3) | | | 1.25 | % |
Net investment income before waiver/reimbursement | | | 1.14 | %(5) | | | 0.91 | % | | | 0.84 | % | | | 1.33 | % | | | 1.30 | % | | | 0.97 | % |
Net investment income after waiver/reimbursement | | | 1.19 | %(5) | | | 0.95 | % | | | 0.85 | % | | | 1.35 | % | | | 1.33 | % | | | 0.98 | % |
Portfolio turnover rate | | | 9 | %(4) | | | 15 | % | | | 19 | % | | | 16 | % | | | 17 | % | | | 28 | % |
| (1) | Net investment income per share is calculated using the ending balance prior to consideration or adjustment for permanent book-to-tax differences. |
| (2) | Represents less than $0.01. |
| (3) | Includes 0.01% of interest expense which is not included in the Fund’s operating expense cap. |
The Accompanying Notes are an Integral Part of these Financial Statements.
The Tocqueville Opportunity Fund
Financial Highlights
| | | | | | | | | | | | | | | | | | | | | | | | |
Per share operating performance
(For a share outstanding
throughout the period) | | Six Months
Ended
April 30,
2016 | | | Years Ended October 31, | |
| | | 2015 | | | 2014 | | | 2013 | | | 2012 | | | 2011 | |
| | | (unaudited) | | | | | | | | | | | | | | | | |
Net asset value, beginning of period | | $ | 21.41 | | | $ | 22.78 | | | $ | 21.29 | | | $ | 15.76 | | | $ | 14.96 | | | $ | 13.20 | |
| | | | | | | | | | | | | | | | | | | | | | | | |
Operations: | | | | | | | | | | | | | | | | | | | | | | | | |
Net investment loss (1) | | | (0.12 | ) | | | (0.15 | ) | | | (0.22 | ) | | | (0.13 | ) | | | (0.11 | ) | | | (0.13 | ) |
Net realized and unrealized gain (loss) | | | (2.88 | ) | | | 1.98 | | | | 2.80 | | | | 5.66 | | | | 0.91 | | | | 1.89 | |
| | | | | | | | | | | | | | | | | | | | | | | | |
Total from investment operations * | | | (3.00 | ) | | | 1.83 | | | | 2.58 | | | | 5.53 | | | | 0.80 | | | | 1.76 | |
| | | | | | | | | | | | | | | | | | | | | | | | |
Distributions to shareholders: | | | | | | | | | | | | | | | | | | | | | | | | |
Dividends from net investment income | | | — | | | | — | | | | — | | | | — | | | | — | | | | — | |
Distributions from net realized gains | | | — | | | | (3.20 | ) | | | (1.09 | ) | | | — | | | | — | | | | — | |
| | | | | | | | | | | | | | | | | | | | | | | | |
Total distributions | | | — | | | | (3.20 | ) | | | (1.09 | ) | | | — | | | | — | | | | — | |
| | | | | | | | | | | | | | | | | | | | | | | | |
Change in net asset value for the period | | | (3.00 | ) | | | (1.37 | ) | | | 1.49 | | | | 5.53 | | | | 0.80 | | | | 1.76 | |
| | | | | | | | | | | | | | | | | | | | | | | | |
Net asset value, end of period | | $ | 18.41 | | | $ | 21.41 | | | $ | 22.78 | | | $ | 21.29 | | | $ | 15.76 | | | $ | 14.96 | |
| | | | | | | | | | | | | | | | | | | | | | | | |
* Includes redemption fees per share of (see Note 6) | | | N/A | | | $ | 0.00 | (2) | | $ | 0.00 | (2) | | $ | 0.00 | (2) | | $ | 0.00 | (2) | | $ | 0.00 | (2) |
Total return | | | (14.0 | )%(3) | | | 9.1 | % | | | 12.6 | % | | | 35.1 | % | | | 5.4 | % | | | 13.3 | % |
Ratios/supplemental data | | | | | | | | | | | | | | | | | | | | | | | | |
Net assets, end of period (000) | | $ | 111,798 | | | $ | 153,456 | | | $ | 80,324 | | | $ | 80,609 | | | $ | 65,455 | | | $ | 46,963 | |
Ratio to average net assets: | | | | | | | | | | | | | | | | | | | | | | | | |
Expense | | | 1.35 | %(4) | | | 1.31 | % | | | 1.30 | % | | | 1.30 | % | | | 1.32 | % | | | 1.36 | % |
Net investment loss | | | (0.94 | )%(4) | | | (0.95 | )% | | | (0.90 | )% | | | (0.64 | )% | | | (0.76 | )% | | | (1.04 | )% |
Portfolio turnover rate | | | 44 | %(3) | | | 101 | % | | | 92 | % | | | 100 | % | | | 77 | % | | | 110 | % |
| (1) | Net investment loss per share is calculated using the ending balance prior to consideration or adjustment for permanent book-to-tax differences. |
| (2) | Represents less than $0.01. |
The Accompanying Notes are an Integral Part of these Financial Statements.
The Tocqueville International Value Fund
Financial Highlights
| | | | | | | | | | | | | | | | | | | | | | | | |
Per share operating
performance
(For a share outstanding
throughout the period) | | Six Months
Ended
April 30,
2016 | | | Years Ended October 31, | |
| | | 2015 | | | 2014 | | | 2013 | | | 2012 | | | 2011 | |
| | | (unaudited) | | | | | | | | | | | | | | | | |
Net asset value, beginning of period | | $ | 14.59 | | | $ | 14.48 | | | $ | 14.71 | | | $ | 11.68 | | | $ | 12.00 | | | $ | 12.12 | |
| | | | | | | | | | | | | | | | | | | | | | | | |
Operations: | | | | | | | | | | | | | | | | | | | | | | | | |
Net investment income (1) | | | 0.03 | | | | 0.15 | | | | 0.15 | | | | 0.24 | | | | 0.17 | | | | 0.11 | |
Net realized and unrealized gain (loss) | | | 0.31 | | | | 0.80 | | | | (0.15 | ) | | | 2.97 | | | | (0.37 | ) | | | (0.16 | ) |
| | | | | | | | | | | | | | | | | | | | | | | | |
Total from investment operations * | | | 0.34 | | | | 0.95 | | | | — | | | | 3.21 | | | | (0.20 | ) | | | (0.05 | ) |
| | | | | | | | | | | | | | | | | | | | | | | | |
Distributions to shareholders: | | | | | | | | | | | | | | | | | | | | | | | | |
Dividends from net investment income | | | (0.25 | ) | | | (0.32 | ) | | | (0.23 | ) | | | (0.18 | ) | | | (0.12 | ) | | | (0.07 | ) |
Distributions from net realized gains | | | (0.18 | ) | | | (0.52 | ) | | | — | | | | — | | | | — | | | | — | |
| | | | | | | | | | | | | | | | | | | | | | | | |
Total distributions | | | (0.43 | ) | | | (0.84 | ) | | | (0.23 | ) | | | (0.18 | ) | | | (0.12 | ) | | | (0.07 | ) |
| | | | | | | | | | | | | | | | | | | | | | | | |
Change in net asset value for the period | | | (0.09 | ) | | | 0.11 | | | | (0.23 | ) | | | 3.03 | | | | (0.32 | ) | | | (0.12 | ) |
| | | | | | | | | | | | | | | | | | | | | | | | |
Net asset value, end of period | | $ | 14.50 | | | $ | 14.59 | | | $ | 14.48 | | | $ | 14.71 | | | $ | 11.68 | | | $ | 12.00 | |
| | | | | | | | | | | | | | | | | | | | | | | | |
* Includes redemption fees per share of (see Note 6) | | | N/A | | | $ | 0.00 | (2) | | $ | 0.00 | (2) | | $ | 0.00 | (2) | | $ | 0.00 | (2) | | $ | 0.01 | |
Total return | | | 2.4 | %(4) | | | 7.2 | % | | | (0.0 | )% | | | 27.8 | % | | | (1.6 | )% | | | (0.5 | )% |
Ratios/supplemental data | | | | | | | | | | | | | | | | | | | | | | | | |
Net assets, end of period (000) | | $ | 438,849 | | | $ | 333,762 | | | $ | 237,051 | | | $ | 262,981 | | | $ | 218,793 | | | $ | 199,848 | |
Ratio to average net assets: | | | | | | | | | | | | | | | | | | | | | | | | |
Expenses before waiver/reimbursement | | | 1.54 | %(5) | | | 1.57 | % | | | 1.54 | % | | | 1.55 | % | | | 1.56 | % | | | 1.56 | % |
Expenses after waiver/reimbursement | | | 1.25 | %(5) | | | 1.25 | % | | | 1.25 | % | | | 1.30 | %(3) | | | 1.56 | % | | | 1.56 | % |
Net investment income before waiver/reimbursement | | | 0.34 | %(5) | | | 0.71 | % | | | 0.62 | % | | | 1.55 | % | | | 1.53 | % | | | 0.99 | % |
Net investment income after waiver/reimbursement | | | 0.63 | %(5) | | | 1.03 | % | | | 0.91 | % | | | 1.80 | %(3) | | | 1.53 | % | | | 0.99 | % |
Portfolio turnover rate | | | 18 | %(4) | | | 42 | % | | | 31 | % | | | 37 | % | | | 38 | % | | | 30 | % |
| (1) | Net investment income per share is calculated using the ending balance prior to consideration or adjustment for permanent book-to-tax differences. |
| (2) | Represents less than $0.01. |
| (3) | Expense cap of 1.25% was implemented on January 1, 2013. |
The Accompanying Notes are an Integral Part of these Financial Statements.
The Tocqueville Gold Fund
Financial Highlights
| | | | | | | | | | | | | | | | | | | | | | | | |
Per share operating performance
(For a share outstanding
throughout the period) | | Six Months
Ended
April 30,
2016 | | | Years Ended October 31, | |
| | | 2015 | | | 2014 | | | 2013 | | | 2012 | | | 2011 | |
| | | (unaudited) | | | | | | | | | | | | | | | | |
Net asset value, beginning of period | | $ | 26.04 | | | $ | 30.38 | | | $ | 38.01 | | | $ | 72.82 | | | $ | 81.97 | | | $ | 82.00 | |
| | | | | | | | | | | | | | | | | | | | | | | | |
Operations: | | | | | | | | | | | | | | | | | | | | | | | | |
Net investment loss (1) | | | (0.11 | ) | | | (0.27 | ) | | | (0.08 | ) | | | (0.26 | ) | | | (0.35 | ) | | | (0.67 | ) |
Net realized and unrealized gain (loss) | | | 14.01 | | | | (4.07 | ) | | | (7.55 | ) | | | (32.93 | ) | | | (7.47 | ) | | | 2.25 | |
| | | | | | | | | | | | | | | | | | | | | | | | |
Total from investment operations * | | | 13.90 | | | | (4.34 | ) | | | (7.63 | ) | | | (33.19 | ) | | | (7.82 | ) | | | 1.58 | |
| | | | | | | | | | | | | | | | | | | | | | | | |
Distributions to shareholders: | | | | | | | | | | | | | | | | | | | | | | | | |
Dividends from net investment income | | | — | | | | — | | | | — | | | | — | | | | — | | | | — | |
Distributions from net realized gains | | | — | | | | — | | | | — | | | | (1.62 | ) | | | (1.33 | ) | | | (1.61 | ) |
| | | | | | | | | | | | | | | | | | | | | | | | |
Total distributions | | | — | | | | — | | | | — | | | | (1.62 | ) | | | (1.33 | ) | | | (1.61 | ) |
| | | | | | | | | | | | | | | | | | | | | | | | |
Change in net asset value for the period | | | 13.90 | | | | (4.34 | ) | | | (7.63 | ) | | | (34.81 | ) | | | (9.15 | ) | | | (0.03 | ) |
| | | | | | | | | | | | | | | | | | | | | | | | |
Net asset value, end of period | | $ | 39.94 | | | $ | 26.04 | | | $ | 30.38 | | | $ | 38.01 | | | $ | 72.82 | | | $ | 81.97 | |
| | | | | | | | | | | | | | | | | | | | | | | | |
* Includes redemption fees per share of (see Note 6) | | $ | 0.00 | (2) | | $ | 0.01 | | | $ | 0.02 | | | $ | 0.02 | | | $ | 0.02 | | | $ | 0.10 | |
Total return | | | 53.4 | %(3) | | | (14.3 | )% | | | (20.1 | )% | | | (46.4 | )% | | | (9.5 | )% | | | 1.8 | % |
Ratios/supplemental data | | | | | | | | | | | | | | | | | | | | | | | | |
Net assets, end of period (000) | | $ | 1,436,348 | | | $ | 947,367 | | | $ | 1,138,557 | | | $ | 1,215,081 | | | $ | 2,445,913 | | | $ | 2,647,078 | |
Ratio to average net assets: | | | | | | | | | | | | | | | | | | | | | | | | |
Expense | | | 1.46 | %(4) | | | 1.43 | % | | | 1.36 | % | | | 1.34 | % | | | 1.28 | % | | | 1.25 | % |
Net investment loss | | | (0.78 | )%(4) | | | (0.84 | )% | | | (0.78 | )% | | | (0.41 | )% | | | (0.56 | )% | | | (0.86 | )% |
Portfolio turnover rate | | | 8 | %(3) | | | 11 | % | | | 10 | % | | | 14 | % | | | 11 | % | | | 3 | % |
| (1) | Net investment loss per share is calculated using the ending balance prior to consideration or adjustment for permanent book-to-tax differences. |
| (2) | Represents less than $0.01. |
The Accompanying Notes are an Integral Part of these Financial Statements.
The Delafield Fund
Financial Highlights
| | | | | | | | | | | | | | | | | | | | | | | | |
Per share operating performance
(For a share outstanding
throughout the period) | | Six Months
Ended
April 30,
2016 | | | Years Ended October 31, | |
| | | 2015 | | | 2014 | | | 2013 | | | 2012 | | | 2011 | |
| | | (unaudited) | | | | | | | | | | | | | | | | |
Net asset value, beginning of period | | $ | 28.64 | | | $ | 36.40 | | | $ | 37.13 | | | $ | 29.79 | | | $ | 27.21 | | | $ | 26.65 | |
| | | | | | | | | | | | | | | | | | | | | | | | |
Operations: | | | | | | | | | | | | | | | | | | | | | | | | |
Net investment loss (1) | | | (0.08 | ) | | | (0.14 | ) | | | (0.10 | ) | | | (0.05 | ) | | | (0.04 | ) | | | (0.08 | ) |
Net realized and unrealized gain (loss) | | | (0.28 | ) | | | (3.99 | ) | | | 0.70 | | | | 9.19 | | | | 2.99 | | | | 0.64 | |
| | | | | | | | | | | | | | | | | | | | | | | | |
Total from investment operations * | | | (0.36 | ) | | | (4.13 | ) | | | 0.60 | | | | 9.14 | | | | 2.95 | | | | 0.56 | |
| | | | | | | | | | | | | | | | | | | | | | | | |
Distributions to shareholders: | | | | | | | | | | | | | | | | | | | | | | | | |
Dividends from net investment income | | | — | | | | — | | | | — | | | | — | | | | — | | | | — | |
Distributions from net realized gains | | | (2.80 | ) | | | (3.63 | ) | | | (1.33 | ) | | | (1.80 | ) | | | (0.37 | ) | | | — | |
| | | | | | | | | | | | | | | | | | | | | | | | |
Total distributions | | | (2.80 | ) | | | (3.63 | ) | | | (1.33 | ) | | | (1.80 | ) | | | (0.37 | ) | | | — | |
| | | | | | | | | | | | | | | | | | | | | | | | |
Change in net asset value for the period | | | (3.16 | ) | | | (7.76 | ) | | | (0.73 | ) | | | 7.34 | | | | 2.58 | | | | 0.56 | |
| | | | | | | | | | | | | | | | | | | | | | | | |
Net asset value, end of period | | $ | 25.48 | | | $ | 28.64 | | | $ | 36.40 | | | $ | 37.13 | | | $ | 29.79 | | | $ | 27.21 | |
| | | | | | | | | | | | | | | | | | | | | | | | |
* Includes redemption fees per share of (see Note 6) | | | N/A | | | $ | 0.00 | (2) | | $ | 0.00 | (2) | | $ | 0.00 | (2) | | $ | 0.00 | (2) | | $ | 0.01 | |
Total return | | | (0.6 | )%(3) | | | (12.3 | )% | | | 1.6 | % | | | 32.1 | % | | | 11.0 | % | | | 2.1 | % |
Ratios/supplemental data | | | | | | | | | | | | | | | | | | | | | | | | |
Net assets, end of period (000) | | $ | 445,803 | | | $ | 674,525 | | | $ | 1,475,139 | | | $ | 1,759,341 | | | $ | 1,346,273 | | | $ | 1,262,876 | |
Ratio to average net assets: | | | | | | | | | | | | | | | | | | | | | | | | |
Expense | | | 1.36 | %(4) | | | 1.25 | % | | | 1.21 | % | | | 1.21 | % | | | 1.23 | % | | | 1.23 | % |
Net investment loss | | | (0.35 | )%(4) | | | (0.15 | )% | | | (0.24 | )% | | | (0.15 | )% | | | (0.13 | )% | | | (0.30 | )% |
Portfolio turnover rate | | | 15 | %(3) | | | 19 | % | | | 34 | % | | | 34 | % | | | 49 | % | | | 38 | % |
| (1) | Net investment loss per share is calculated using the ending balance prior to consideration or adjustment for permanent book-to-tax differences. |
| (2) | Represents less than $0.01. |
The Accompanying Notes are an Integral Part of these Financial Statements.
The Tocqueville Select Fund
Financial Highlights
| | | | | | | | | | | | | | | | | | | | | | | | |
Per share operating performance
(For a share outstanding
throughout the period) | | Six Months
Ended
April 30,
2016 | | | Years Ended October 31, | |
| | | 2015 | | | 2014 | | | 2013 | | | 2012 | | | 2011 | |
| | | (unaudited) | | | | | | | | | | | | | | | | |
Net asset value, beginning of period | | $ | 12.08 | | | $ | 14.90 | | | $ | 15.57 | | | $ | 11.35 | | | $ | 11.06 | | | $ | 11.54 | |
| | | | | | | | | | | | | | | | | | | | | | | | |
Operations: | | | | | | | | | | | | | | | | | | | | | | | | |
Net investment loss (1) | | | (0.03 | ) | | | (0.08 | ) | | | (0.07 | ) | | | (0.06 | ) | | | (0.04 | ) | | | (0.07 | ) |
Net realized and unrealized gain (loss) | | | (0.40 | ) | | | (1.00 | ) | | | 0.94 | | | | 4.79 | | | | 0.44 | | | | 0.12 | |
| | | | | | | | | | | | | | | | | | | | | | | | |
Total from investment operations * | | | (0.43 | ) | | | (1.08 | ) | | | 0.87 | | | | 4.73 | | | | 0.40 | | | | 0.05 | |
| | | | | | | | | | | | | | | | | | | | | | | | |
Distributions to shareholders: | | | | | | | | | | | | | | | | | | | | | | | | |
Dividends from net investment income | | | — | | | | — | | | | — | | | | — | | | | — | | | | — | |
Distributions from net realized gains | | | (0.40 | ) | | | (1.74 | ) | | | (1.54 | ) | | | (0.51 | ) | | | (0.11 | ) | | | (0.53 | ) |
| | | | | | | | | | | | | | | | | | | | | | | | |
Total distributions | | | (0.40 | ) | | | (1.74 | ) | | | (1.54 | ) | | | (0.51 | ) | | | (0.11 | ) | | | (0.53 | ) |
| | | | | | | | | | | | | | | | | | | | | | | | |
Change in net asset value for the period | | | (0.83 | ) | | | (2.82 | ) | | | (0.67 | ) | | | 4.22 | | | | 0.29 | | | | (0.48 | ) |
| | | | | | | | | | | | | | | | | | | | | | | | |
Net asset value, end of period | | $ | 11.25 | | | $ | 12.08 | | | $ | 14.90 | | | $ | 15.57 | | | $ | 11.35 | | | $ | 11.06 | |
| | | | | | | | | | | | | | | | | | | | | | | | |
* Includes redemption fees per share of (see Note 6) | | | N/A | | | $ | 0.00 | (2) | | $ | 0.00 | (2) | | $ | 0.00 | (2) | | $ | 0.00 | (2) | | $ | 0.01 | |
Total return | | | (3.5 | )%(3) | | | (8.0 | )% | | | 6.1 | % | | | 43.2 | % | | | 3.7 | % | | | (0.1 | )% |
Ratios/supplemental data | | | | | | | | | | | | | | | | | | | | | | | | |
Net assets, end of period (000) | | $ | 67,719 | | | $ | 81,813 | | | $ | 108,060 | | | $ | 99,888 | | | $ | 84,549 | | | $ | 71,554 | |
Ratio to average net assets: | | | | | | | | | | | | | | | | | | | | | | | | |
Expense | | | 1.39 | %(4) | | | 1.36 | % | | | 1.32 | % | | | 1.34 | % | | | 1.37 | % | | | 1.36 | % |
Net investment loss | | | (0.42 | )%(4) | | | (0.52 | )% | | | (0.50 | )% | | | (0.39 | )% | | | (0.36 | )% | | | (0.67 | )% |
Portfolio turnover rate | | | 25 | %(3) | | | 43 | % | | | 32 | % | | | 28 | % | | | 31 | % | | | 28 | % |
| (1) | Net investment loss per share is calculated using the ending balance prior to consideration or adjustment for permanent book-to-tax differences. |
| (2) | Represents less than $0.01. |
The Accompanying Notes are an Integral Part of these Financial Statements.
The Tocqueville Alternative Strategies Fund
Financial Highlights
| | | | | | | | | | | | | | | | | | | | |
Per share operating performance
(For a share outstanding
throughout the period) | | Six Months
Ended
April 30,
2016 | | | Year ended
10/31/2015 | | | For the Period
January 1, 2014
to
October 31,
2014 | | | For the Period
June 1, 2013
to
December 31,
2013† | | | For the Period
June 29, 2012(3)
to
May 31,
2013† | |
| | | (unaudited) | | | | | | | | | | | | | |
Net asset value, beginning of period | | $ | 26.24 | | | $ | 27.26 | | | $ | 26.19 | | | $ | 29.06 | | | $ | 25.00 | |
| | | | | | | | | | | | | | | | | | | | |
Operations: | | | | | | | | | | | | | | | | | | | | |
Net investment income (loss) | | | 0.15 | (1) | | | 0.08 | (1) | | | (0.20 | )(1) | | | (0.15 | )(2) | | | (0.04 | )(2) |
Net realized and unrealized gain (loss) | | | (1.39 | ) | | | (0.52 | ) | | | 1.27 | | | | (0.98 | ) | | | 4.75 | |
| | | | | | | | | | | | | | | | | | | | |
Total from investment operations * | | | (1.24 | ) | | | (0.44 | ) | | | 1.07 | | | | (1.13 | ) | | | 4.71 | |
| | | | | | | | | | | | | | | | | | | | |
Distributions to shareholders: | | | | | | | | | | | | | | | | | | | | |
Dividends from net investment income | | | (0.07 | ) | | | — | | | | — | | | | (0.11 | ) | | | (0.02 | ) |
Distributions from net realized gains | | | — | | | | (0.58 | ) | | | — | | | | (1.63 | ) | | | (0.63 | ) |
| | | | | | | | | | | | | | | | | | | | |
Total distributions | | | (0.07 | ) | | | (0.58 | ) | | | — | | | | (1.74 | ) | | | (0.65 | ) |
| | | | | | | | | | | | | | | | | | | | |
Change in net asset value for the period | | | (1.31 | ) | | | (1.02 | ) | | | 1.07 | | | | (2.87 | ) | | | 4.06 | |
| | | | | | | | | | | | | | | | | | | | |
Net asset value, end of period | | $ | 24.93 | | | $ | 26.24 | | | $ | 27.26 | | | $ | 26.19 | | | $ | 29.06 | |
| | | | | | | | | | | | | | | | | | | | |
* Includes redemption fees per share of (see Note 6) | | | N/A | | | $ | 0.00 | (4) | | $ | 0.00 | (4) | | $ | 0.00 | (4) | | $ | 0.00 | (4) |
Total return | | | (4.7 | )%(5) | | | (1.7 | )% | | | 4.1 | %(5) | | | (3.8 | )%(5) | | | 19.2 | %(5) |
Ratios/supplemental data | | | | | | | | | | | | | | | | | | | | |
Net assets, end of period (000) | | $ | 30,646 | | | $ | 44,735 | | | $ | 39,143 | | | $ | 36,594 | | | $ | 38,846 | |
Ratio to average net assets: | | | | | | | | | | | | | | | | | | | | |
Expenses before waiver/reimbursement | | | 2.97 | %(6) | | | 2.98 | % | | | 3.31 | %(6) | | | 3.25 | %(6) | | | 3.21 | %(6) |
Expenses after waiver/reimbursement | | | 2.96 | %(6) | | | 2.86 | % | | | 2.66 | %(6) | | | 2.86 | %(6) | | | 2.63 | %(6) |
Net investment income (loss) before waiver/reimbursement | | | 0.87 | %(6) | | | 0.15 | % | | | (1.52 | )%(6) | | | (1.33 | )%(6) | | | (0.72 | )%(6) |
Net investment income (loss) after waiver/reimbursement | | | 0.88 | %(6) | | | 0.27 | % | | | (0.87 | )%(6) | | | (0.94 | )%(6) | | | (0.14 | )%(6) |
Ratio to average net assets (excluding dividends and interest on securities sold short): | | | | | | | | | | | | | | | | | | | | |
Expenses before waiver/reimbursement | | | 1.91 | %(6) | | | 2.00 | % | | | 2.60 | %(6) | | | 2.38 | %(6) | | | 2.57 | %(6) |
Expenses after waiver/reimbursement | | | 1.90 | %(6) | | | 1.88 | % | | | 1.96 | %(6) | | | 1.99 | %(6) | | | 1.99 | %(6) |
Net investment income (loss) before waiver/reimbursement | | | 1.92 | %(6) | | | 1.12 | % | | | (0.81 | )%(6) | | | (0.46 | )%(6) | | | (0.08 | )%(6) |
Net investment income (loss) after waiver/reimbursement | | | 1.93 | %(6) | | | 1.24 | % | | | (0.16 | )%(6) | | | (0.07 | )%(6) | | | 0.50 | %(6) |
Portfolio turnover rate | | | 42 | %(5) | | | 72 | % | | | 99 | %(5) | | | 69 | %(5) | | | 91 | %(5) |
| † | Information shown is for Predecessor Fund—Class I |
| (1) | Net investment income (loss) per share is calculated using the ending balance prior to consideration or adjustment for permanent book-to-tax differences. |
| (2) | Net investment loss per share is calculated based on average shares outstanding during the period. |
| (3) | Inception of Predecessor Fund—Class I |
| (4) | Represents less than $0.01. |
The Accompanying Notes are an Integral Part of these Financial Statements.
The Tocqueville Fund
Schedule of Investments as of April 30, 2016
(Unaudited)
| | | | | | | | |
| Common Stocks—96.3% | | Shares | | | Value | |
Automobiles & Components—2.3% | |
Ford Motor Co. | | | 400,000 | | | $ | 5,424,000 | |
Johnson Controls, Inc. | | | 26,800 | | | | 1,109,520 | |
| | | | | | | | 6,533,520 | |
Capital Goods—8.8% | | | | | | | | |
Caterpillar, Inc. | | | 25,000 | | | | 1,943,000 | |
General Electric Co. | | | 400,000 | | | | 12,300,000 | |
Illinois Tool Works, Inc. | | | 40,000 | | | | 4,180,800 | |
The Boeing Co. | | | 50,000 | | | | 6,740,000 | |
| | | | | | | | 25,163,800 | |
Commercial & Professional Services—2.5% | |
Pitney Bowes, Inc. | | | 200,000 | | | | 4,194,000 | |
Steelcase, Inc.—Class A | | | 200,000 | | | | 3,052,000 | |
| | | | | | | | 7,246,000 | |
Consumer Services—1.8% | | | | | | | | |
McDonald’s Corp. | | | 40,000 | | | | 5,059,600 | |
Diversified Financials—4.1% | |
Lazard Ltd.—Class A(a) | | | 100,000 | | | | 3,605,000 | |
The Bank of New York Mellon Corp. | | | 200,000 | | | | 8,048,000 | |
| | | | | | | | 11,653,000 | |
Energy—8.7% | | | | | | | | |
Cameco Corp.(a) | | | 250,000 | | | | 3,127,500 | |
Exxon Mobil Corp. | | | 125,000 | | | | 11,050,000 | |
Frank’s International NV (a) | | | 75,000 | | | | 1,248,750 | |
Noble Energy, Inc. | | | 100,000 | | | | 3,611,000 | |
Schlumberger Ltd.(a) | | | 75,000 | | | | 6,025,500 | |
| | | | | | | | 25,062,750 | |
Food & Staples Retailing—2.3% | |
Wal-Mart Stores, Inc. | | | 100,000 | | | | 6,687,000 | |
Food, Beverage & Tobacco—3.9% | |
Campbell Soup Co. | | | 75,000 | | | | 4,628,250 | |
The Coca-Cola Co. | | | 150,000 | | | | 6,720,000 | |
| | | | | | | | 11,348,250 | |
Household & Personal Products—5.3% | |
Colgate-Palmolive Co. | | | 100,000 | | | | 7,092,000 | |
The Procter & Gamble Co. | | | 100,000 | | | | 8,012,000 | |
| | | | | | | | 15,104,000 | |
Insurance—3.3% | | | | | | | | |
Aflac, Inc. | | | 100,000 | | | $ | 6,897,000 | |
XL Group PLC(a) | | | 75,000 | | | | 2,454,750 | |
| | | | | | | | 9,351,750 | |
Materials—5.9% | | | | | | | | |
Alcoa, Inc. | | | 400,000 | | | | 4,468,000 | |
BHP Billiton Ltd.—ADR(a) | | | 50,000 | | | | 1,567,000 | |
EI du Pont de Nemours & Co. | | | 100,000 | | | | 6,591,000 | |
Sonoco Products Co. | | | 90,000 | | | | 4,220,100 | |
| | | | | | | | 16,846,100 | |
Pharmaceuticals, Biotechnology & Life
Sciences—13.1% | |
Alkermes PLC(a)(b) | | | 150,000 | | | | 5,962,500 | |
Biogen, Inc.(b) | | | 5,000 | | | | 1,374,950 | |
Ionis Pharmaceuticals, Inc.(b) | | | 100,000 | | | | 4,097,000 | |
Johnson & Johnson | | | 100,000 | | | | 11,208,000 | |
Merck & Co., Inc. | | | 150,000 | | | | 8,226,000 | |
Pfizer, Inc. | | | 200,000 | | | | 6,542,000 | |
| | | | | | | | 37,410,450 | |
Retailing—4.8% | | | | | | | | |
Amazon.com, Inc.(b) | | | 13,000 | | | | 8,574,670 | |
Macy’s, Inc. | | | 50,000 | | | | 1,979,500 | |
Target Corp. | | | 40,000 | | | | 3,180,000 | |
| | | | | | | | 13,734,170 | |
Semiconductors & Semiconductor
Equipment—4.2% | |
Applied Materials, Inc. | | | 300,000 | | | | 6,141,000 | |
Intel Corp. | | | 200,000 | | | | 6,056,000 | |
| | | | | | | | 12,197,000 | |
Software & Services—13.2% | |
Alphabet, Inc.—Class A(b) | | | 7,000 | | | | 4,955,160 | |
Alphabet, Inc.—Class C(b) | | | 5,000 | | | | 3,465,050 | |
Automatic Data Processing, Inc. | | | 100,000 | | | | 8,844,000 | |
Facebook, Inc.—Class A(b) | | | 50,000 | | | | 5,879,000 | |
Microsoft Corp. | | | 200,000 | | | | 9,974,000 | |
Xerox Corp. | | | 500,000 | | | | 4,800,000 | |
| | | | | | | | 37,917,210 | |
The Accompanying Notes are an Integral Part of these Financial Statements.
The Tocqueville Fund
Schedule of Investments as of April 30, 2016
(Unaudited)
| | | | | | | | |
| Common Stocks—96.3% | | Shares | | | Value | |
Technology Hardware & Equipment—3.4% | |
Apple, Inc. | | | 50,000 | | | $ | 4,687,000 | |
Bio-key International, Inc.(b)(c)(d)(e)(Originally acquired 09/16/2015, Cost $0) | | | 23,545 | | | | — | |
QUALCOMM, Inc. | | | 100,000 | | | | 5,052,000 | |
| | | | | | | | 9,739,000 | |
Telecommunication Services—1.8% | |
Verizon Communications, Inc. | | | 100,000 | | | | 5,094,000 | |
Transportation—2.8% | |
Delta Air Lines, Inc. | | | 190,000 | | | | 7,917,300 | |
Utilities—4.1% | |
NextEra Energy, Inc. | | | 100,000 | | | | 11,758,000 | |
Total Common Stocks
(Cost $163,318,710) | | | | | | | 275,822,900 | |
Real Estate Investment Trust (REIT)—2.7% | |
Real Estate—2.7% | | | | | | | | |
Weyerhaeuser Co. | | | 240,000 | | | | 7,708,800 | |
Total Real Estate Investment Trust
(Cost $4,270,762) | | | | 7,708,800 | |
Exchange-Traded Fund (ETF)—0.9% | |
Metals & Mining—0.9% | |
SPDR S&P Metals & Mining ETF | | | 100,000 | | | | 2,462,000 | |
Total Exchange-Traded Fund
(Cost $1,495,845) | | | | 2,462,000 | |
Short-Term Investment—0.0% | |
Money Market Fund—0.0% | |
STIT-Treasury Portfolio—Institutional Class, 0.240%(f) | | | 883 | | | | 883 | |
Total Short-Term Investment
(Cost $883) | | | | 883 | |
Total Investments
(Cost $169,086,200)—99.9% | | | | 285,994,583 | |
Other Assets in Excess of Liabilities—0.1% | | | | 299,844 | |
Total Net Assets—100.0% | | | $ | 286,294,427 | |
| | | | | | | | |
Percentages are stated as a percent of net assets.
| (a) | Foreign issued security. Foreign concentration was as follows: Australia 0.6%; Bermuda 1.3%; Canada 1.1%; Curacao 2.1%; Ireland 2.9%; Netherlands 0.4%. |
| (b) | Non-income producing security. |
| (c) | Denotes a security that is either fully or partially restricted to resale. The aggregate value of restricted securities as of April 30, 2016 was $0 which represented 0.0% of net assets. |
| (d) | Security is fair valued using procedures approved by the Board of Trustees. The aggregate value of fair valued securities as of April 30, 2016 was $0 which represented 0.0% of net assets. |
| (e) | Security is considered illiquid and may be difficult to sell. |
| (f) | Rate listed is the 7-day effective yield. |
The Global Industry Classification Standard (GICS®) was developed by and/or is the exclusive property of MSCI, Inc. and Standard & Poor Financial Services LLC (“S&P”). GICS is a service mark of MSCI and S&P and has been licensed for use by U.S. Bancorp Fund Services, LLC.
The Accompanying Notes are an Integral Part of these Financial Statements.
The Tocqueville Opportunity Fund
Schedule of Investments as of April 30, 2016
(Unaudited)
| | | | | | | | |
| Common Stocks—100.2% | | Shares | | | Value | |
Automobiles & Components—0.8% | |
Delphi Automotive PLC(a) | | | 3,000 | | | $ | 220,890 | |
Gentex Corp. | | | 2,000 | | | | 32,080 | |
Johnson Controls, Inc. | | | 7,500 | | | | 310,500 | |
Lear Corp. | | | 1,500 | | | | 172,695 | |
Tesla Motors, Inc.(b) | | | 700 | | | | 168,532 | |
| | | | | | | | 904,697 | |
Banks—2.2% | | | | | | | | |
Bank of the Ozarks, Inc. | | | 8,000 | | | | 330,400 | |
Customers Bancorp, Inc.(b) | | | 2,000 | | | | 51,960 | |
Home BancShares, Inc. | | | 7,000 | | | | 300,930 | |
Opus Bank | | | 9,000 | | | | 325,080 | |
Pinnacle Financial Partners, Inc. | | | 23,500 | | | | 1,155,495 | |
Signature Bank(b) | | | 1,000 | | | | 137,830 | |
South State Corp. | | | 3,000 | | | | 209,940 | |
| | | | | | | | 2,511,635 | |
Capital Goods—9.0% | | | | | | | | |
Acuity Brands, Inc. | | | 4,500 | | | | 1,097,505 | |
Allegion PLC(a) | | | 4,500 | | | | 294,525 | |
AO Smith Corp. | | | 10,000 | | | | 772,200 | |
Armstrong Flooring, Inc.(b) | | | 250 | | | | 3,640 | |
Armstrong World Industries, Inc.(b) | | | 500 | | | | 20,405 | |
B/E Aerospace, Inc. | | | 8,000 | | | | 389,040 | |
Fortune Brands Home & Security, Inc. | | | 6,000 | | | | 332,460 | |
Graco, Inc. | | | 2,500 | | | | 195,975 | |
HD Supply Holdings, Inc.(b) | | | 13,000 | | | | 445,640 | |
HEICO Corp. | | | 1,500 | | | | 91,965 | |
Hexcel Corp. | | | 4,500 | | | | 203,715 | |
IDEX Corp. | | | 1,000 | | | | 81,900 | |
Lennox International, Inc. | | | 3,200 | | | | 431,840 | |
Lincoln Electric Holdings, Inc. | | | 500 | | | | 31,335 | |
Masco Corp. | | | 7,500 | | | | 230,325 | |
Nordson Corp. | | | 4,000 | | | | 306,920 | |
PACCAR, Inc. | | | 2,000 | | | | 117,820 | |
RBC Bearings, Inc.(b) | | | 2,500 | | | | 183,250 | |
Snap-on, Inc. | | | 4,500 | | | | 716,760 | |
Spirit AeroSystems Holdings, Inc.—Class A(b) | | | 8,000 | | | | 377,200 | |
The Middleby Corp.(b) | | | 9,500 | | | | 1,041,580 | |
TransDigm Group, Inc.(b) | | | 4,800 | | | | 1,093,776 | |
WABCO Holdings, Inc.(b) | | | 4,500 | | | $ | 504,720 | |
Wabtec Corp. | | | 7,000 | | | | 580,510 | |
Watsco, Inc. | | | 3,000 | | | | 403,410 | |
Woodward, Inc. | | | 2,000 | | | | 108,420 | |
| | | | | | | | 10,056,836 | |
Commercial & Professional Services—0.6% | |
Cintas Corp. | | | 2,000 | | | | 179,560 | |
Copart, Inc.(b) | | | 2,700 | | | | 115,668 | |
Equifax, Inc. | | | 500 | | | | 60,125 | |
Tyco International Plc(a) | | | 8,000 | | | | 308,160 | |
| | | | | | | | 663,513 | |
Consumer Durables & Apparel—2.5% | |
GoPro, Inc.—Class A(b) | | | 1,000 | | | | 12,640 | |
Hanesbrands, Inc. | | | 6,000 | | | | 174,180 | |
Harman International Industries, Inc. | | | 5,000 | | | | 383,800 | |
Leggett & Platt, Inc. | | | 9,500 | | | | 468,255 | |
lululemon athletica, Inc.(b) | | | 5,000 | | | | 327,750 | |
Mohawk Industries, Inc.(b) | | | 1,500 | | | | 288,945 | |
Newell Brands, Inc. | | | 862 | | | | 39,255 | |
Tempur Sealy International, Inc.(b) | | | 3,000 | | | | 182,010 | |
Under Armour, Inc.—Class A(b) | | | 8,000 | | | | 351,520 | |
Under Armour, Inc.—Class C(b) | | | 8,000 | | | | 326,400 | |
Whirlpool Corp. | | | 1,500 | | | | 261,210 | |
| | | | | | | | 2,815,965 | |
Consumer Services—1.6% | | | | | | | | |
Domino’s Pizza, Inc. | | | 6,000 | | | | 725,280 | |
Norwegian Cruise Line Holdings Ltd.(a)(b) | | | 9,000 | | | | 440,010 | |
Panera Bread Co.—Class A(b) | | | 200 | | | | 42,898 | |
Restaurant Brands International LP(b) | | | 37 | | | | 1,597 | |
Royal Caribbean Cruises Ltd.(a) | | | 6,500 | | | | 503,100 | |
Wyndham Worldwide Corp. | | | 500 | | | | 35,475 | |
| | | | | | | | 1,748,360 | |
Diversified Financials—1.5% | | | | | | | | |
CBOE Holdings, Inc. | | | 6,500 | | | | 402,740 | |
Evercore Partners, Inc.—Class A | | | 5,500 | | | | 284,020 | |
The Accompanying Notes are an Integral Part of these Financial Statements.
The Tocqueville Opportunity Fund
Schedule of Investments as of April 30, 2016
(Unaudited)
| | | | | | | | |
| Common Stocks—100.2% | | Shares | | | Value | |
Lazard Ltd.—Class A(a) | | | 1,000 | | | $ | 36,050 | |
MSCI, Inc. | | | 4,500 | | | | 341,730 | |
SEI Investments Co. | | | 2,000 | | | | 96,160 | |
Synchrony Financial(b) | | | 13,000 | | | | 397,410 | |
The Blackstone Group LP | | | 1,000 | | | | 27,440 | |
The Carlyle Group LP | | | 1,500 | | | | 25,110 | |
The Charles Schwab Corp. | | | 1,500 | | | | 42,615 | |
Waddell & Reed Financial, Inc.—Class A | | | 500 | | | | 10,170 | |
| | | | | | | | 1,663,445 | |
Energy—2.3% | | | | | | | | |
Concho Resources, Inc.(b) | | | 3,000 | | | | 348,510 | |
Continental Resources, Inc.(b) | | | 3,000 | | | | 111,780 | |
Core Laboratories NV(a) | | | 3,000 | | | | 400,980 | |
EOG Resources, Inc. | | | 7,000 | | | | 578,340 | |
Matador Resources Co.(b) | | | 5,000 | | | | 107,750 | |
National Oilwell Varco, Inc. | | | 3,500 | | | | 126,140 | |
Pioneer Natural Resources Co. | | | 2,800 | | | | 465,080 | |
Weatherford International PLC(a)(b) | | | 47,500 | | | | 386,175 | |
| | | | | | | | 2,524,755 | |
Food, Beverage & Tobacco—3.0% | |
Calbee, Inc.(a) | | | 6,000 | | | | 243,891 | |
Constellation Brands, Inc.—Class A | | | 6,000 | | | | 936,360 | |
Mead Johnson Nutrition Co. | | | 3,000 | | | | 261,450 | |
Monster Beverage Corp.(b) | | | 3,500 | | | | 504,770 | |
The Hain Celestial Group, Inc.(b) | | | 2,000 | | | | 83,720 | |
The WhiteWave Foods Co.(b) | | | 33,000 | | | | 1,326,930 | |
Tyson Foods, Inc.—Class A | | | 500 | | | | 32,910 | |
| | | | | | | | 3,390,031 | |
Health Care Equipment & Services—4.4% | |
ABIOMED, Inc.(b) | | | 6,500 | | | | 631,410 | |
Acadia Healthcare Co., Inc.(b) | | | 22,500 | | | | 1,421,775 | |
athenahealth, Inc.(b) | | | 3,000 | | | | 399,900 | |
Centene Corp.(b) | | | 500 | | | | 30,980 | |
DENTSPLY SIRONA, Inc. | | | 7,163 | | | | 426,915 | |
DexCom, Inc.(b) | | | 3,500 | | | | 225,330 | |
EndoChoice Holdings, Inc.(b) | | | 80,000 | | | | 441,600 | |
IDEXX Laboratories, Inc.(b) | | | 3,500 | | | | 295,225 | |
Teleflex, Inc. | | | 1,000 | | | | 155,780 | |
Tenet Healthcare Corp.(b) | | | 500 | | | | 15,845 | |
VCA, Inc.(b) | | | 6,000 | | | | 377,820 | |
Zeltiq Aesthetics, Inc.(b) | | | 17,000 | | | | 508,300 | |
| | | | | | | | 4,930,880 | |
Household & Personal Products—0.6% | |
Church & Dwight Co., Inc. | | | 1,000 | | | | 92,700 | |
Herbalife Ltd.(a)(b) | | | 500 | | | | 28,975 | |
Reckitt Benckiser Group PLC(a) | | | 5,500 | | | | 534,739 | |
| | | | | | | | 656,414 | |
Materials—3.0% | |
AptarGroup, Inc. | | | 2,500 | | | | 190,000 | |
Axalta Coating Systems Ltd.(a)(b) | | | 2,500 | | | | 71,175 | |
Ball Corp. | | | 8,000 | | | | 571,040 | |
Crown Holdings, Inc.(b) | | | 500 | | | | 26,480 | |
Eagle Materials, Inc. | | | 3,000 | | | | 222,360 | |
GCP Applied Technologies, Inc.(b) | | | 2,500 | | | | 55,325 | |
International Flavors & Fragrances, Inc. | | | 2,750 | | | | 328,543 | |
Martin Marietta Materials, Inc. | | | 3,000 | | | | 507,690 | |
Packaging Corp. of America | | | 5,500 | | | | 356,840 | |
PolyOne Corp. | | | 4,000 | | | | 143,920 | |
RPM International, Inc. | | | 2,500 | | | | 126,325 | |
Sealed Air Corp. | | | 12,000 | | | | 568,320 | |
WR Grace & Co.(b) | | | 2,500 | | | | 191,700 | |
| | | | | | | | 3,359,718 | |
Media—0.2% | | | | | | | | |
Morningstar, Inc. | | | 500 | | | | 41,600 | |
The Interpublic Group of Cos., Inc. | | | 4,000 | | | | 91,760 | |
Time Warner, Inc. | | | 500 | | | | 37,570 | |
| | | | | | | | 170,930 | |
Pharmaceuticals, Biotechnology & Life
Sciences—32.3% | |
ACADIA Pharmaceuticals, Inc.(b) | | | 53,000 | | | | 1,711,900 | |
Acceleron Pharma, Inc.(b) | | | 14,500 | | | | 434,275 | |
Acorda Therapeutics, Inc.(b) | | | 6,000 | | | | 155,100 | |
Advaxis, Inc.(b) | | | 40,000 | | | | 309,600 | |
Aerie Pharmaceuticals, Inc.(b) | | | 30,500 | | | | 483,730 | |
The Accompanying Notes are an Integral Part of these Financial Statements.
The Tocqueville Opportunity Fund
Schedule of Investments as of April 30, 2016
(Unaudited)
| | | | | | | | |
| Common Stocks—100.2% | | Shares | | | Value | |
Affimed NV(a)(b) | | | 4,500 | | | $ | 18,225 | |
Agios Pharmaceuticals, Inc.(b) | | | 10,000 | | | | 489,500 | |
Alder Biopharmaceuticals, Inc.(b) | | | 17,500 | | | | 464,625 | |
Alexion Pharmaceuticals, Inc.(b) | | | 8,000 | | | | 1,114,240 | |
Alnylam Pharmaceuticals, Inc.(b) | | | 26,500 | | | | 1,776,560 | |
Anacor Pharmaceuticals, Inc.(b) | | | 14,000 | | | | 878,360 | |
Applied Genetic Technologies Corp.(b) | | | 34,000 | | | | 534,140 | |
Atara Biotherapeutics, Inc.(b) | | | 4,000 | | | | 72,040 | |
Bellicum Pharmaceuticals, Inc.(b) | | | 1,000 | | | | 10,140 | |
BioMarin Pharmaceutical, Inc.(b) | | | 12,500 | | | | 1,058,500 | |
Bluebird Bio, Inc.(b) | | | 26,500 | | | | 1,175,275 | |
Cancer Genetics, Inc.(b) | | | 23,800 | | | | 63,308 | |
Cellectis SA—ADR(a)(b) | | | 24,000 | | | | 653,040 | |
DBV Technologies SA—ADR(a)(b) | | | 22,000 | | | | 747,340 | |
Eisai Co., Ltd.(a)(b) | | | 3,000 | | | | 192,716 | |
Epizyme, Inc.(b) | | | 22,500 | | | | 234,450 | |
Fate Therapeutics, Inc.(b) | | | 22,000 | | | | 41,800 | |
Five Prime Therapeutics, Inc.(b) | | | 32,000 | | | | 1,522,880 | |
Forward Pharma A/S—ADR(a)(b) | | | 5,500 | | | | 115,170 | |
Genfit(a)(b) | | | 500 | | | | 17,076 | |
Genmab A/S(a)(b) | | | 8,500 | | | | 1,259,366 | |
GW Pharmaceuticals PLC—ADR(a)(b) | | | 21,000 | | | | 1,701,420 | |
Incyte Corp.(b) | | | 25,000 | | | | 1,806,750 | |
Innate Pharma SA(a)(b) | | | 10,000 | | | | 144,735 | |
Inovio Pharmaceuticals, Inc.(b) | | | 55,000 | | | | 576,400 | |
Intercept Pharmaceuticals, Inc.(b) | | | 200 | | | | 30,148 | |
Intra-Cellular Therapies, Inc.(b) | | | 54,000 | | | | 1,853,280 | |
Intrexon Corp.(b) | | | 12,500 | | | | 334,125 | |
Jazz Pharmaceuticals PLC(a)(b) | | | 5,700 | | | | 858,990 | |
Juno Therapeutics, Inc.(b) | | | 26,000 | | | | 1,094,340 | |
Kite Pharma, Inc.(b) | | | 22,500 | | | | 1,041,300 | |
La Jolla Pharmaceutical Co.(b) | | | 11,000 | | | | 203,610 | |
Medivation, Inc.(b) | | | 13,500 | | | | 780,300 | |
Mettler-Toledo International, Inc.(b) | | | 500 | | | | 178,975 | |
Mirati Therapeutics, Inc.(b) | | | 6,000 | | | | 124,320 | |
Neurocrine Biosciences, Inc.(b) | | | 25,000 | | | | 1,139,500 | |
NewLink Genetics Corp.(b) | | | 10,500 | | | | 170,205 | |
Northwest Biotherapeutics, Inc.(b) | | | 1,000 | | | | 1,400 | |
Ophthotech Corp.(b) | | | 33,000 | | | | 1,542,420 | |
Pacific Biosciences of California, Inc.(b) | | | 21,000 | | | | 202,650 | |
PAREXEL International Corp.(b) | | | 500 | | | | 30,550 | |
Portola Pharmaceuticals, Inc.(b) | | | 3,500 | | | | 83,160 | |
ProQR Thrapeutics NV(a)(b) | | | 19,000 | | | | 105,070 | |
Regeneron Pharmaceuticals, Inc.(b) | | | 1,250 | | | | 470,887 | |
Regulus Therapeutics, Inc.(b) | | | 20,000 | | | | 116,800 | |
Sage Therapeutics, Inc.(b) | | | 27,500 | | | | 1,036,475 | |
Seattle Genetics, Inc.(b) | | | 14,500 | | | | 514,460 | |
Spark Therapeutics, Inc.(b) | | | 33,500 | | | | 1,202,315 | |
TESARO, Inc.(b) | | | 19,000 | | | | 787,360 | |
Trevena, Inc.(b) | | | 32,000 | | | | 249,280 | |
Ultragenyx Pharmaceutical, Inc.(b) | | | 11,500 | | | | 777,630 | |
uniQure NV(a)(b) | | | 35,500 | | | | 459,015 | |
Vertex Pharmaceuticals, Inc.(b) | | | 8,500 | | | | 716,890 | |
ZIOPHARM Oncology, Inc.(b) | | | 25,284 | | | | 198,732 | |
| | | | | | | | 36,066,848 | |
Retailing—4.6% | | | | | | | | |
Advance Auto Parts, Inc. | | | 2,500 | | | | 390,250 | |
Amazon.com, Inc.(b) | | | 1,350 | | | | 890,446 | |
Foot Locker, Inc. | | | 500 | | | | 30,720 | |
GNC Holdings, Inc. | | | 4,000 | | | | 97,440 | |
L Brands, Inc. | | | 1,000 | | | | 78,290 | |
Liberty Ventures—Class A(b) | | | 500 | | | | 20,000 | |
Lithia Motors, Inc.—Class A | | | 500 | | | | 41,510 | |
LKQ Corp.(b) | | | 12,000 | | | | 384,600 | |
L’Occitane International SA(a) | | | 125,000 | | | | 241,076 | |
The Michaels Cos, Inc.(b) | | | 12,000 | | | | 341,160 | |
Netflix, Inc.(b) | | | 500 | | | | 45,015 | |
The Accompanying Notes are an Integral Part of these Financial Statements.
The Tocqueville Opportunity Fund
Schedule of Investments as of April 30, 2016
(Unaudited)
| | | | | | | | |
| Common Stocks—100.2% | | Shares | | | Value | |
O’Reilly Automotive, Inc.(b) | | | 1,000 | | | $ | 262,680 | |
Restoration Hardware Holdings, Inc.(b) | | | 500 | | | | 21,635 | |
The Priceline Group, Inc.(b) | | | 700 | | | | 940,562 | |
Ulta Salon Cosmetics & Fragrance, Inc.(b) | | | 6,000 | | | | 1,249,680 | |
Wayfair, Inc.—Class A(b) | | | 2,500 | | | | 94,375 | |
| | | | | | | | 5,129,439 | |
Semiconductors & Semiconductor
Equipment—0.5% | |
Ambarella, Inc.(a)(b) | | | 500 | | | | 20,550 | |
Cavium, Inc.(b) | | | 3,500 | | | | 172,795 | |
NVIDIA Corp. | | | 7,500 | | | | 266,475 | |
NXP Semiconductors NV(a)(b) | | | 500 | | | | 42,640 | |
Skyworks Solutions, Inc. | | | 1,000 | | | | 66,820 | |
| | | | | | | | 569,280 | |
Software & Services—26.8% | |
Adobe Systems, Inc.(b) | | | 15,500 | | | | 1,460,410 | |
Alliance Data Systems Corp.(b) | | | 450 | | | | 91,489 | |
Alphabet, Inc.—Class C(b) | | | 275 | | | | 190,578 | |
ANSYS, Inc.(b) | | | 1,000 | | | | 90,770 | |
Aspen Technology, Inc.(b) | | | 6,500 | | | | 247,195 | |
Broadridge Financial Solutions, Inc. | | | 5,500 | | | | 329,120 | |
Cadence Design Systems, Inc.(b) | | | 15,000 | | | | 347,850 | |
CoStar Group, Inc.(b) | | | 2,000 | | | | 394,620 | |
CyberArk Software Ltd.(a)(b) | | | 1,000 | | | | 40,840 | |
Demandware, Inc.(b) | | | 7,500 | | | | 345,600 | |
DST Systems, Inc. | | | 2,000 | | | | 241,360 | |
EPAM Systems, Inc.(b) | | | 8,500 | | | | 619,905 | |
Euronet Worldwide, Inc.(b) | | | 12,000 | | | | 925,200 | |
FactSet Research Systems, Inc. | | | 2,300 | | | | 346,725 | |
FireEye, Inc.(b) | | | 12,000 | | | | 208,200 | |
FleetCor Technologies, Inc.(b) | | | 4,300 | | | | 665,124 | |
Fleetmatics Group PLC(a)(b) | | | 9,500 | | | | 344,375 | |
Fortinet, Inc.(b) | | | 9,500 | | | | 308,845 | |
Gartner, Inc.(b) | | | 2,700 | | | | 235,359 | |
Global Payments, Inc. | | | 21,000 | | | | 1,515,780 | |
Manhattan Associates, Inc.(b) | | | 52,000 | | | | 3,148,080 | |
Mobileye NV(a)(b) | | | 11,000 | | | | 419,650 | |
NetSuite, Inc.(b) | | | 8,300 | | | | 672,632 | |
New Relic, Inc.(b) | | | 4,000 | | | | 103,120 | |
Pandora Media, Inc.(b) | | | 500 | | | | 4,965 | |
Paycom Software, Inc.(b) | | | 95,000 | | | | 3,629,950 | |
PayPal Holdings, Inc.(b) | | | 23,000 | | | | 901,140 | |
PTC, Inc.(b) | | | 3,500 | | | | 127,610 | |
Qlik Technologies, Inc.(b) | | | 500 | | | | 15,395 | |
Red Hat, Inc.(b) | | | 1,000 | | | | 73,370 | |
salesforce.com, inc.(b) | | | 22,500 | | | | 1,705,500 | |
ServiceNow, Inc.(b) | | | 32,000 | | | | 2,287,360 | |
Splunk, Inc.(b) | | | 12,000 | | | | 623,760 | |
SS&C Technologies Holdings, Inc. | | | 3,500 | | | | 214,025 | |
Tableau Software, Inc.—Class A(b) | | | 2,000 | | | | 103,400 | |
The Ultimate Software Group, Inc.(b) | | | 11,000 | | | | 2,162,490 | |
Total System Services, Inc. | | | 22,500 | | | | 1,150,650 | |
Tyler Technologies, Inc.(b) | | | 6,250 | | | | 915,063 | |
Vantiv, Inc.—Class A(b) | | | 17,000 | | | | 927,180 | |
Workday, Inc.—Class A(b) | | | 22,200 | | | | 1,664,556 | |
Zillow Group, Inc.—Class A(b) | | | 1 | | | | 25 | |
Zillow Group, Inc.—Class C(b) | | | 8,002 | | | | 192,368 | |
| | | | | | | | 29,991,634 | |
Technology Hardware & Equipment—3.7% | |
Belden, Inc. | | | 1,500 | | | | 94,710 | |
Palo Alto Networks, Inc.(b) | | | 24,500 | | | | 3,696,315 | |
Universal Display Corp.(b) | | | 5,500 | | | | 320,705 | |
| | | | | | | | 4,111,730 | |
Transportation—0.6% | | | | | | | | |
Alaska Air Group, Inc. | | | 7,000 | | | | 493,010 | |
Hawaiian Holdings, Inc.(b) | | | 5,500 | | | | 231,385 | |
| | | | | | | | 724,395 | |
Total Common Stocks
(Cost $108,602,151) | | | | 111,990,505 | |
Real Estate Investment Trusts (REITs)—0.2% | |
Real Estate—0.2% | | | | | | | | |
Equinix, Inc. | | | 401 | | | | 132,470 | |
Extra Space Storage, Inc. | | | 500 | | | | 42,475 | |
| | | | | | | | 174,945 | |
Total Real Estate Investment Trusts
(Cost $89,362) | | | | 174,945 | |
The Accompanying Notes are an Integral Part of these Financial Statements.
The Tocqueville Opportunity Fund
Schedule of Investments as of April 30, 2016
(Unaudited)
| | | | | | | | |
Purchased Call Options—0.5% | | Contracts | | | Value | |
Consumer Services—0.1% | |
Starbucks Corp.
Expiration: January 2017, Exercise Price $57.50(b) | | | 375 | | | $ | 133,125 | |
Pharmaceuticals, Biotechnology & Life
Sciences—0.2% | |
Celgene Corp.
Expiration: January 2017, Exercise Price $105.00(b) | | | 125 | | | | 142,125 | |
Gilead Sciences, Inc.
Expiration: August 2016, Exercise Price $95.00(b) | | | 150 | | | | 38,550 | |
| | | | | | | | 180,675 | |
Retailing—0.1% | |
The Priceline Group, Inc.
Expiration: January 2017, Exercise Price $1,300.00(b) | | | 10 | | | | 152,000 | |
Software & Services—0.1% | |
Alphabet, Inc.
Expiration: September 2016, Exercise Price $725.00(b) | | | 35 | | | | 90,650 | |
Technology Hardware & Equipment—0.0% | |
Apple, Inc.
Expiration: October 2016,
Exercise Price $100.00(b) | | | 100 | | | | 39,500 | |
Total Purchased Call Options
(Cost $890,395) | | | | | | | 595,950 | |
Money Market Fund—0.0% | |
STIT-Treasury Portfolio—Institutional Class, 0.240%(c) | | | 231 | | | | 231 | |
Total Short-Term Investment
(Cost $231) | | | | 231 | |
Total Investments
(Cost $109,582,139)—100.9% | | | | 112,761,631 | |
Liabilities in Excess of Other Assets—(0.9)% | | | | (963,171 | ) |
Total Net Assets—100.0% | | | $ | 111,798,460 | |
| | | | | | | | |
| Percentages | are stated as a percent of net assets. |
| ADR | American Depository Receipt |
| (a) | Foreign issued security. Foreign concentration (including ADR’s) was as follows: Bermuda 0.5%; Cayman Islands 0.0% Denmark 1.2%; France 1.4%; Ireland 2.0%; Israel 0.0%; Japan 0.4%; Jersey 0.2%; Liberia 0.5%; Luxembourg 0.2%; Netherlands 1.3%; United Kingdom 2.0%. |
| (b) | Non-income producing security. |
| (c) | Rate listed is the 7-day effective yield. |
The Accompanying Notes are an Integral Part of these Financial Statements.
The Tocqueville International Value Fund
Schedule of Investments as of April 30, 2016
(Unaudited)
| | | | | | | | |
| Common Stocks—85.8% | | Shares | | | Value | |
Australia—1.5% | |
Incitec Pivot Ltd. | | | 1,683,405 | | | $ | 4,090,908 | |
Spotless Group Holdings Ltd. | | | 2,507,300 | | | | 2,457,393 | |
| | | | | | | | 6,548,301 | |
Belgium—2.4% | |
Groupe Bruxelles Lambert SA | | | 119,000 | | | | 10,528,498 | |
Canada—2.5% | |
Potash Corp. of Saskatchewan, Inc. | | | 276,200 | | | | 4,894,264 | |
Superior Plus Corp. | | | 674,500 | | | | 5,870,359 | |
| | | | | | | | 10,764,623 | |
Cayman Islands—1.5% | |
Greatview Aseptic Packaging Co., Ltd. | | | 13,080,500 | | | | 6,624,306 | |
Denmark—2.1% | |
ISS A/S | | | 244,314 | | | | 9,280,176 | |
Finland—1.0% | |
Nokia OYJ—ADR | | | 772,725 | | | | 4,535,896 | |
France—18.0% | |
Bollore SA | | | 2,013,350 | | | | 7,973,297 | |
Cie de Saint-Gobain | | | 219,056 | | | | 10,037,752 | |
Europcar Groupe SA(a) | | | 470,000 | | | | 5,449,591 | |
IPSOS | | | 299,990 | | | | 8,945,332 | |
Publicis Groupe SA | | | 163,975 | | | | 12,134,738 | |
Rexel SA | | | 560,000 | | | | 8,491,087 | |
Sanofi | | | 135,800 | | | | 11,193,582 | |
Sopra Steria Group | | | 69,442 | | | | 8,077,559 | |
Zodiac Aerospace | | | 274,875 | | | | 6,449,031 | |
| | | | | | | | 78,751,969 | |
Germany—5.0% | |
Infineon Technologies AG | | | 521,415 | | | | 7,439,364 | |
Siemens AG—ADR | | | 81,575 | | | | 8,547,429 | |
Wacker Neuson SE | | | 345,261 | | | | 5,848,636 | |
| | | | | | | | 21,835,429 | |
Hong Kong—2.8% | |
Clear Media Ltd. | | | 5,492,500 | | | | 5,168,882 | |
Hopewell Holdings Ltd. | | | 1,193,550 | | | | 4,020,135 | |
Television Broadcasts Ltd. | | | 868,350 | | | | 3,239,473 | |
| | | | | | | | 12,428,490 | |
Ireland—3.8% | |
Allergan plc(a) | | | 34,000 | | | | 7,363,040 | |
CRH PLC | | | 319,563 | | | | 9,300,257 | |
| | | | | | | | 16,663,297 | |
Japan—14.5% | |
Amano Corp. | | | 690,400 | | | | 11,294,431 | |
Hitachi Ltd. | | | 2,026,840 | | | | 9,287,438 | |
Hoya Corp. | | | 171,300 | | | | 6,559,810 | |
Kao Corp. | | | 163,200 | | | | 9,027,731 | |
Makita Corp. | | | 145,800 | | | | 9,197,561 | |
MISUMI Group, Inc. | | | 331,600 | | | | 4,579,322 | |
SMC Corp. | | | 29,600 | | | | 7,218,247 | |
Toho Co., Ltd. | | | 260,000 | | | | 6,589,712 | |
| | | | | | | | 63,754,252 | |
Netherlands—3.9% | |
Akzo Nobel NV | | | 137,750 | | | | 9,786,723 | |
Unilever NV—ADR | | | 170,000 | | | | 7,483,400 | |
| | | | | | | | 17,270,123 | |
Netherlands Antilles—1.5% | |
Schlumberger Ltd. | | | 84,000 | | | | 6,748,560 | |
Norway—1.3% | |
Orkla ASA | | | 673,200 | | | | 5,876,990 | |
Singapore—2.3% | | | | | | | | |
Global Logistic Properties Ltd. | | | 3,931,000 | | | | 5,574,347 | |
Singapore Post Ltd. | | | 3,711,800 | | | | 4,323,374 | |
| | | | | | | | 9,897,721 | |
Spain—1.8% | |
Applus Services SA | | | 870,055 | | | | 8,050,468 | |
Switzerland—2.0% | |
Novartis AG—ADR | | | 115,225 | | | | 8,753,643 | |
United Kingdom—15.4% | |
AVEVA Group PLC | | | 428,800 | | | | 10,098,092 | |
Countrywide PLC | | | 660,300 | | | | 3,433,046 | |
DCC PLC | | | 101,475 | | | | 9,000,368 | |
Diageo PLC—ADR | | | 88,775 | | | | 9,616,996 | |
GlaxoSmithKline PLC—ADR | | | 190,400 | | | | 8,170,064 | |
Kingfisher PLC | | | 1,364,200 | | | | 7,268,105 | |
Rio Tinto PLC | | | 124,100 | | | | 4,163,110 | |
The Accompanying Notes are an Integral Part of these Financial Statements.
The Tocqueville International Value Fund
Schedule of Investments as of April 30, 2016
(Unaudited)
| | | | | | | | |
| Common Stocks—85.8% | | Shares | | | Value | |
Royal Dutch Shell PLC—ADR | | | 103,175 | | | $ | 5,504,386 | |
Smiths Group PLC | | | 623,000 | | | | 10,110,308 | |
| | | | | | | | 67,364,475 | |
United States—2.5% | |
Aflac, Inc. | | | 160,800 | | | | 11,090,376 | |
| | | | | | | | 11,090,376 | |
Total Common Stocks
(Cost $336,285,985) | | | | 376,767,593 | |
Preferred Stocks—2.7% | |
Germany—0.6% | |
Volkswagen AG | | | 18,610 | | | | 2,699,638 | |
Republic of Korea—2.1% | |
Samsung Electronics Co., Ltd. | | | 10,000 | | | | 9,132,888 | |
Total Preferred Stocks
(Cost $10,920,311) | | | | 11,832,526 | |
Short-Term Investments—11.0% | |
Money Market Fund—5.0% | | | | | |
STIT-Treasury Portfolio—Institutional Class, 0.240%(b) | | | 21,942,132 | | | | 21,942,132 | |
Commercial
Paper—1.4% | | Principal
Amount | | | | |
U.S. Bank N.A.
0.100%, 05/02/2016 | | $ | 6,257,000 | | | | 6,257,000 | |
US Treasury Bill—4.6% | |
0.366%, 09/22/2016(c) | | | 20,000,000 | | | | 19,977,840 | |
Total Short-Term Investments
(Cost $48,170,394) | | | | 48,176,972 | |
Total Investments
(Cost $395,376,690)—99.5% | | | | 436,777,091 | |
Other Assets in Excess of Liabilities—0.5% | | | | 2,072,263 | |
Total Net Assets—100.0% | | | $ | 438,849,354 | |
| | | | | | | | |
| Percentages | are stated as a percent of net assets. |
| ADR | American Depository Receipt |
| (a) | Non-income producing security. |
| (b) | Rate listed is the 7-day effective yield. |
| (c) | Rate shown is the effective yield based on purchase price. The calculation assumes the security is held to maturity. |
The Accompanying Notes are an Integral Part of these Financial Statements.
The Tocqueville Gold Fund
Schedule of Investments as of April 30, 2016
(Unaudited)
| | | | | | | | |
| Common Stocks—86.2% | | Shares | | | Value | |
Gold Related Securities—78.0% | |
Australia—2.5% | | | | | | | | |
Evolution Mining Ltd. | | | 9,343,478 | | | $ | 13,924,495 | |
Newcrest Mining Ltd.(a) | | | 1,500,000 | | | | 21,635,822 | |
| | | | | | | | 35,560,317 | |
Canada—62.0% | | | | | | | | |
Agnico Eagle Mines Ltd. | | | 1,089,773 | | | | 51,448,183 | |
Agnico Eagle Mines Ltd.(b) | | | 526,485 | | | | 24,887,085 | |
Alacer Gold Corp.(a) | | | 4,091,800 | | | | 11,088,005 | |
Alamos Gold, Inc. | | | 6,100,000 | | | | 43,920,000 | |
Almaden Minerals Ltd.(a) | | | 3,816,667 | | | | 4,228,236 | |
Almadex Minerals Ltd.(a) | | | 1,240,000 | | | | 375,548 | |
Anthem United, Inc. (a)(c)(d)(e)(f)
(Originally acquired 04/03/2014, Cost $1,779,257) | | | 8,075,000 | | | | 675,759 | |
Argonaut Gold, Inc.(a) | | | 2,687,000 | | | | 6,296,150 | |
ATAC Resources Ltd.(a)(c) | | | 11,516,891 | | | | 6,608,880 | |
AuRico Metals, Inc.(a)(c) | | | 7,411,437 | | | | 5,316,246 | |
B2Gold Corp.(a) | | | 12,984,100 | | | | 28,824,702 | |
Barisan Gold Corp.(a) | | | 877,100 | | | | 17,476 | |
Barrick Gold Corp. | | | 1,766,200 | | | | 34,211,294 | |
Corvus Gold, Inc.(a)(c) | | | 3,350,901 | | | | 2,838,213 | |
Corvus Gold, Inc.(a)(b)(c)(d)(e)(f)
(Originally Acquired 03/09/2016, Cost $1,267,925) | | | 2,400,000 | | | | 2,005,770 | |
Corvus Gold, Inc.(a)(b)(c) | | | 10,630,000 | | | | 9,065,195 | |
Dalradian Resources, Inc.(a) | | | 1,750,000 | | | | 1,475,600 | |
Dalradian Resources, Inc.(a)(b) | | | 5,429,000 | | | | 4,629,815 | |
Detour Gold Corp.(a) | | | 4,750,200 | | | | 101,879,239 | |
East Asia Minerals Corp.(a)(c) | | | 66,484,933 | | | | 529,887 | |
Eldorado Gold Corp. | | | 4,214,685 | | | | 17,743,824 | |
Eldorado Gold Corp.(b) | | | 1,000,000 | | | | 4,216,147 | |
Falco Resources Ltd.(a) | | | 2,222,300 | | | | 1,027,285 | |
Franco-Nevada Corp. | | | 1,127,700 | | | | 79,182,570 | |
GoGold Resources, Inc.(a)(c) | | | 20,670,300 | | | | 23,722,987 | |
Goldcorp, Inc. | | | 738,350 | | | | 14,877,753 | |
Goldcorp, Inc.(b) | | | 1,948,910 | | | | 39,267,112 | |
International Tower Hill Mines Ltd.(a)(c) | | | 5,738,836 | | | | 4,224,357 | |
International Tower Hill Mines Ltd.(a)(b)(c) | | | 11,289,744 | | | | 8,278,126 | |
Klondex Mines Ltd.(a) | | | 2,608,500 | | | | 9,875,169 | |
Novagold Resources, Inc.(a) | | | 4,181,300 | | | | 27,136,637 | |
NuLegacy Gold Corp.(a)(c) | | | 19,535,500 | | | | 5,605,149 | |
OceanaGold Corp. | | | 4,431,459 | | | | 15,953,252 | |
OceanaGold Corp.(b) | | | 9,282,100 | | | | 33,216,410 | |
Osisko Gold Royalties Ltd.(c) | | | 3,675,640 | | | | 49,215,551 | |
Pan American Silver Corp. | | | 2,930,298 | | | | 45,917,770 | |
Premier Gold Mines Ltd.(a)(c) | | | 7,857,660 | | | | 23,484,678 | |
Pretium Resources, Inc.(a) | | | 100,000 | | | | 823,304 | |
Richmont Mines, Inc.(a) | | | 200,000 | | | | 1,555,750 | |
Rockhaven Resources Ltd.(a)(c) | | | 6,400,000 | | | | 994,660 | |
Rubicon Minerals Corp.(a)(c) | | | 11,275,000 | | | | 449,311 | |
SEMAFO, Inc.(a)(c) | | | 10,090,200 | | | | 44,852,957 | |
Silver Wheaton Corp. | | | 1,738,575 | | | | 36,423,146 | |
Strategic Metals Ltd.(a)(c) | | | 10,926,900 | | | | 3,918,949 | |
TMAC Resources, Inc.(a) | | | 70,100 | | | | 643,622 | |
Torex Gold Resources, Inc.(a)(c) | | | 32,925,500 | | | | 58,519,060 | |
| | | | | | | | 891,446,819 | |
Jersey—4.7% | | | | | | | | |
Randgold Resources Ltd.— ADR | | | 675,000 | | | | 67,837,500 | |
South Africa—1.1% | | | | | | | | |
Gold Fields Ltd.— ADR | | | 3,139,950 | | | | 14,757,765 | |
Gold Fields Ltd.(b) | | | 166,249 | | | | 755,377 | |
| | | | | | | | 15,513,142 | |
The Accompanying Notes are an Integral Part of these Financial Statements.
The Tocqueville Gold Fund
Schedule of Investments as of April 30, 2016
(Unaudited)
| | | | | | | | |
| Common Stocks—86.2% | | Shares | | | Value | |
United Kingdom—1.9% | | | | | |
Fresnillo PLC | | | 1,640,000 | | | $ | 26,670,758 | |
United States—5.8% | | | | | | | | |
Electrum Ltd.(a)(d)(e)(f)
(Originally acquired 12/21/2007, Cost $13,065,361) | | | 2,127,287 | | | | 829,642 | |
Newmont Mining Corp. | | | 1,331,500 | | | | 46,562,555 | |
Royal Gold, Inc. | | | 570,500 | | | | 35,724,710 | |
| | | | | | | | 83,116,907 | |
Total Gold Related Securities | | | | | | | 1,120,145,443 | |
Other Precious Metals Related Securities—7.7% | |
Canada—7.0% | | | | | | | | |
Americas Silver Corp.(a)(c) | | | 18,525,419 | | | | 5,670,631 | |
Americas Silver Corp.(a)(b)(c) | | | 522,400 | | | | 158,215 | |
Bear Creek Mining Corp.(a)(c) | | | 7,413,200 | | | | 13,884,610 | |
Ivanhoe Mines Ltd.—Class A(a) | | | 7,882,379 | | | | 6,533,573 | |
MAG Silver Corp.(a)(c) | | | 2,951,400 | | | | 38,368,200 | |
Plata Latina Minerals Corp.(a) | | | 2,000,000 | | | | 95,640 | |
Silver Range Resources Ltd.(a)(c) | | | 3,450,000 | | | | 384,953 | |
Tahoe Resources, Inc. | | | 2,500,000 | | | | 35,307,244 | |
| | | | | | | | 100,403,066 | |
United Kingdom—0.4% | | | | | |
Hochschild Mining PLC(a) | | | 2,500,000 | | | | 5,689,373 | |
United States—0.3% | | | | | | | | |
Sunshine Mining & Refining(a)(d)(e)(f)
(Originally acquired 03/15/2011,
Cost $18,353,107) | | | 1,633,545 | | | | 4,900,635 | |
Total Other Precious Metals Related Securities | | | | 110,993,074 | |
Other Securities—0.5% | | | | | | | | |
Canada—0.0% | | | | | | | | |
Oban Mining Corp.(a) | | | 26,539 | | | | 31,727 | |
United States—0.5% | | | | | | | | |
Gold Bullion International LLC(a)(c)(d)(e)(f)
(Originally acquired 05/12/2010,
Cost $5,000,000) | | | 5,000,000 | | | | 6,893,000 | |
I-Pulse, Inc.(a)(d)(e)(f)
(Originally acquired 10/09/2007,
Cost $175,524) | | | 74,532 | | | | 640,975 | |
Total Other Securities | | | | | | | 7,565,702 | |
Total Common Stocks
(Cost $1,294,346,555) | | | | | | | 1,238,704,219 | |
| Private Fund—1.2% | | | | | | |
Gold Related Securities—1.2% | | | | | |
United States—1.2% | | | | | |
Tocqueville Bullion Reserve LP—Class G (a)(c)(d)(e)(f)
(Originally acquired 11/28/2011,
Cost $25,000,000) | | | 13,806 | | | | 17,324,163 | |
Total Private Fund
(Cost $25,000,000) | | | | | | | 17,324,163 | |
| Gold Bullion—10.8% | | Ounces | | | | |
Gold Bullion(a) | | | 119,680 | | | | 154,744,450 | |
Total Gold Bullion
(Cost $70,975,249) | | | | | | | 154,744,450 | |
The Accompanying Notes are an Integral Part of these Financial Statements.
The Tocqueville Gold Fund
Schedule of Investments as of April 30, 2016
(Unaudited)
| | | | | | | | |
| Convertible Bond—1.0% | | Principal
Amount | | | Value | |
Gold Related Securities—1.0% | | | | | |
Canada—1.0% | | | | | | | | |
Jaguar Mining, Inc. 12.000%, 10/23/2018 (d)(e)(f)(Originally acquired 10/20/2015,
Cost $7,500,000) | | $ | 7,500,000 | | | $ | 14,866,772 | |
Total Convertible Bond
(Cost $7,500,000) | | | | | | | 14,866,772 | |
| Warrants—0.1% | | Shares | | | | |
Gold Related Securities—0.1% | | | | | |
Canada—0.1% | | | | | | | | |
Almaden Minerals Ltd.
Expiration: 11/05/2017, Exercise Price: CAD $1.00 (a)(d)(e)(f)(Originally acquired 11/04/2015, Cost $0) | | | 875,000 | | | | 428,120 | |
Anthem United, Inc.
Expiration: 03/31/2019, Exercise Price: CAD $0.35 (a)(c)(d)(e)(f)(Originally acquired 04/03/2014, Cost $0) | | | 1,250,000 | | | | 23,611 | |
East Asia Minerals Corp.
Expiration: 12/15/2016, Exercise Price: CAD $0.78 (a)(c)(d)(e)(f)(Originally acquired 12/05/2011, Cost $0) | | | 6,500,000 | | | | 45,589 | |
East Asia Minerals Corp.
Expiration: 12/05/2019, Exercise Price: CAD $0.10 (a)(c)(d)(e)(f)(Originally acquired 12/05/2014, Cost $0) | | | 9,764,933 | | | | — | |
Osisko Gold Royalties Ltd.
Expiration: 02/18/2022, Exercise Price: CAD $36.50 (a)(c) | | | 274,000 | | | $ | 687,894 | |
Total Gold Related Securities | | | | 1,185,214 | |
Total Warrants (Cost $0) | | | | 1,185,214 | |
Rights—0.0% | | | | | | | | |
Gold Related Securities—0.0% | | | | | |
Canada—0.0% | | | | | | | | |
Dalradian Resources, Inc.(a)
Expiration: 07/31/2017, Exercise Price: CAD $1.50(a) | | | 875,000 | | | | 153,423 | |
East Asia Minerals Corp.(a)(c)(d)(e)(f)
(Originally acquired 03/04/2015, Cost $0) Expiration: 03/05/2020, Exercise Price: CAD $0.10 (a) | | | 46,175,600 | | | | 368,021 | |
Total Rights (Cost $0) | | | | | | | 521,444 | |
Short-Term Investment—0.7% | |
Money Market Fund—0.7% | |
STIT—Treasury Portfolio—Institutional Class, 0.240% (g) | | | 8,450,973 | | | | 8,450,973 | |
Total Short-Term Investment
(Cost $8,450,973) | | | | 8,450,973 | |
Total Investments
(Cost $1,406,272,777)—100.0% | | | | 1,435,797,235 | |
Other Assets in Excess of Liabilities—0.0% | | | | 551,234 | |
Total Net Assets—100.0% | | | $ | 1,436,348,469 | |
| | | | | | | | |
The Accompanying Notes are an Integral Part of these Financial Statements.
The Tocqueville Gold Fund
Schedule of Investments as of April 30, 2016
(Unaudited)
| Percentages | are stated as a percent of net assets. |
| ADR | American Depository Receipt |
| (a) | Non-income producing security. |
| (b) | Denotes an issue that is traded on a foreign exchange when a company is listed more than once. |
| (c) | Affiliated company. See Footnote 8. |
| (d) | Denotes a security that is either fully or partially restricted to resale. The value of restricted securities as of April 30, 2016 was $49,002,057, which represented 3.4% of net assets. |
| (e) | Securities are fair valued using procedures approved by the Board of Trustees. The aggregate value of fair valued securities as of April 30, 2016 was $49,002,057, which represented 3.4% of net assets. |
| (f) | Security is considered illiquid and may be difficult to sell. |
| (g) | Rate listed is the 7-day effective yield. |
The Accompanying Notes are an Integral Part of these Financial Statements.
The Delafield Fund
Schedule of Investments as of April 30, 2016
(Unaudited)
| | | | | | | | |
| Common Stocks—76.8% | | Shares | | | Value | |
Aerospace & Defense—1.8% | |
Honeywell International, Inc. | | | 70,000 | | | $ | 7,998,900 | |
Air Freight & Logistics—0.3% | | | | | |
Park-Ohio Holdings Corp. | | | 50,000 | | | | 1,272,500 | |
Auto Components—2.4% | | | | | | | | |
Gentex Corp. | | | 350,000 | | | | 5,614,000 | |
Horizon Global Corp.(a)(b) | | | 425,000 | | | | 5,214,750 | |
| | | | | | | | 10,828,750 | |
Chemicals—13.2% | | | | | | | | |
Calgon Carbon Corp. | | | 150,000 | | | | 2,458,500 | |
Eastman Chemical Co. | | | 225,000 | | | | 17,185,500 | |
HB Fuller Co. | | | 260,000 | | | | 11,627,200 | |
Minerals Technologies, Inc. | | | 280,000 | | | | 16,772,000 | |
PolyOne Corp. | | | 300,000 | | | | 10,794,000 | |
| | | | | | | | 58,837,200 | |
Commercial Services & Supplies—2.1% | |
Team, Inc.(a) | | | 325,000 | | | | 9,337,250 | |
Construction & Engineering—2.4% | |
KBR, Inc. | | | 450,000 | | | | 7,002,000 | |
MasTec, Inc.(a) | | | 165,000 | | | | 3,738,900 | |
| | | | | | | | 10,740,900 | |
Construction and Engineering—1.6% | |
Aegion Corp.(a) | | | 325,000 | | | | 6,899,750 | |
Electronic Equipment, Instruments & Components—10.0% | |
Flextronics International Ltd.(a)(c) | | | 1,625,000 | | | | 19,743,750 | |
Jabil Circuit, Inc. | | | 230,000 | | | | 3,992,800 | |
Kemet Corp.(a)(b) | | | 2,250,000 | | | | 5,220,000 | |
Plexus Corp.(a) | | | 225,000 | | | | 9,396,000 | |
Zebra Technologies Corp.—Class A(a) | | | 100,000 | | | | 6,256,000 | |
| | | | | | | | 44,608,550 | |
Energy Equipment & Services—2.9% | |
Aspen Aerogels, Inc.(a) | | | 391,550 | | | | 1,863,778 | |
Frank’s International NV(c) | | | 325,000 | | | | 5,411,250 | |
McDermott International, Inc.(a)(c) | | | 1,250,000 | | | | 5,675,000 | |
| | | | | | | | 12,950,028 | |
Industrial Conglomerates—1.3% | |
Carlisle Cos., Inc. | | | 55,000 | | | $ | 5,604,500 | |
Insurance—0.9% | | | | | | | | |
XL Group PLC(c) | | | 120,000 | | | | 3,927,600 | |
Machinery—10.5% | | | | | | | | |
Crane Co. | | | 175,000 | | | | 9,724,750 | |
Dover Corp. | | | 190,000 | | | | 12,483,000 | |
Harsco Corp. | | | 1,000,000 | | | | 7,090,000 | |
Stanley Black & Decker, Inc. | | | 115,000 | | | | 12,870,800 | |
Xerium Technologies, Inc.(a)(b) | | | 900,000 | | | | 4,761,000 | |
| | | | | | | | 46,929,550 | |
Media—1.4% | | | | | | | | |
TEGNA, Inc. | | | 275,000 | | | | 6,424,000 | |
Metals & Mining—2.5% | | | | | | | | |
Carpenter Technology Corp. | | | 250,000 | | | | 8,852,500 | |
Real Industry, Inc.(a) | | | 100,000 | | | | 884,000 | |
Ryerson Holding Corp.(a) | | | 150,000 | | | | 1,332,000 | |
| | | | | | | | 11,068,500 | |
Oil, Gas & Consumable Fuels—4.0% | |
Boardwalk Pipeline Partners LP | | | 700,000 | | | | 11,389,000 | |
CONSOL Energy, Inc. | | | 450,000 | | | | 6,772,500 | |
| | | | | | | | 18,161,500 | |
Professional Services—3.5% | |
TrueBlue, Inc.(a) | | | 835,000 | | | | 15,606,150 | |
Semiconductors & Semiconductor Equipment—2.3% | |
Teradyne, Inc. | | | 550,000 | | | | 10,400,500 | |
Specialty Retail—3.2% | | | | | | | | |
Ascena Retail Group, Inc.(a) | | | 1,250,000 | | | | 11,012,500 | |
Pier 1 Imports, Inc. | | | 450,000 | | | | 3,100,500 | |
| | | | | | | | 14,113,000 | |
Technology Hardware, Storage & Peripherals—3.7% | |
Diebold, Inc. | | | 275,000 | | | | 7,224,250 | |
Hewlett Packard Enterprise Co. | | | 550,000 | | | | 9,163,000 | |
| | | | | | | | 16,387,250 | |
The Accompanying Notes are an Integral Part of these Financial Statements.
The Delafield Fund
Schedule of Investments as of April 30, 2016
(Unaudited)
| | | | | | | | |
| Common Stocks—76.8% | | Shares | | | Value | |
Textiles, Apparel & Luxury Goods—2.9% | |
PVH Corp. | | | 47,000 | | | $ | 4,493,200 | |
Ralph Lauren Corp. | | | 60,000 | | | | 5,592,600 | |
Sequential Brands Group, Inc.(a) | | | 475,000 | | | | 2,636,250 | |
| | | | | | | | 12,722,050 | |
Trading Companies & Distributors—3.9% | |
Rush Enterprises, Inc.—Class A(a) | | | 275,000 | | | | 5,414,750 | |
WESCO International, Inc.(a) | | | 205,000 | | | | 12,051,950 | |
| | | | | | | | 17,466,700 | |
Total Common Stocks
(Cost $270,143,059) | | | | | | | 342,285,128 | |
Short-Term Investments—22.6% | |
Money Market Fund—5.1% | | | | | |
STIT-Treasury Portfolio—Institutional Class, 0.240%(d) | | | 22,577,709 | | | | 22,577,709 | |
Commercial
Paper—17.5% | | Principal
Amount | | | | |
U.S. Bank N.A.
0.100%, 05/02/2016 $78,114,000 | | | | 78,114,000 | |
Total Short-Term Investments
(Cost $100,691,709) | | | | 100,691,709 | |
Total Investments
(Cost $370,834,768)—99.4% | | | | 442,976,837 | |
Other Assets in Excess of Liabilities—0.6% | | | | 2,825,830 | |
Total Net Assets—100.0% | | | $ | 445,802,667 | |
| | | | | | | | |
| Percentages | are stated as a percent of net assets. |
| (a) | Non-income producing security. |
| (b) | Affiliated company. See Footnote 8. |
| (c) | Foreign issued security. Foreign concentration was as follows: Ireland 0.9%; Netherlands 1.2%; Panama 1.3%; Singapore 4.4%. |
| (d) | Rate listed is the 7-day effective yield. |
The Accompanying Notes are an Integral Part of these Financial Statements.
The Tocqueville Select Fund
Schedule of Investments as of April 30, 2016
(Unaudited)
| | | | | | | | |
| Common Stocks—95.8% | | Shares | | | Value | |
Auto Components—10.0% | | | | | | | | |
Gentex Corp. | | | 142,000 | | | $ | 2,277,680 | |
Horizon Global Corp.(a)(b) | | | 368,000 | | | | 4,515,360 | |
| | | | | | | | 6,793,040 | |
Chemicals—8.6% | | | | | | | | |
Eastman Chemical Co. | | | 35,000 | | | | 2,673,300 | |
Minerals Technologies, Inc. | | | 53,000 | | | | 3,174,700 | |
| | | | | | | | 5,848,000 | |
Commercial Services & Supplies—2.2% | |
Team, Inc.(a) | | | 50,700 | | | | 1,456,611 | |
Electronic Equipment, Instruments & Components—4.6% | |
Flextronics International Ltd.(a)(c) | | | 256,200 | | | | 3,112,830 | |
Industrial Conglomerates—3.5% | |
Carlisle Cos., Inc. | | | 23,500 | | | | 2,394,650 | |
Internet Software & Services—11.2% | | | | | |
j2 Global, Inc. | | | 54,100 | | | | 3,436,432 | |
Web.com Group, Inc.(a) | | | 206,000 | | | | 4,117,940 | |
| | | | | | | | 7,554,372 | |
IT Services—4.1% | |
EPAM Systems, Inc.(a) | | | 37,700 | | | | 2,749,461 | |
Leisure Products—1.4% | |
Summer Infant, Inc.(a)(b) | | | 674,016 | | | | 943,622 | |
Machinery—14.7% | | | | | | | | |
Dover Corp. | | | 41,800 | | | | 2,746,260 | |
Harsco Corp. | | | 310,800 | | | | 2,203,572 | |
Stanley Black & Decker, Inc. | | | 32,400 | | | | 3,626,208 | |
Xerium Technologies, Inc.(a)(b) | | | 265,000 | | | | 1,401,850 | |
| | | | | | | | 9,977,890 | |
Media—3.7% | |
TEGNA, Inc. | | | 108,000 | | | | 2,522,880 | |
Metals & Mining—7.2% | |
Carpenter Technology Corp. | | | 72,000 | | | | 2,549,520 | |
Real Industry, Inc.(a) | | | 265,581 | | | | 2,347,736 | |
| | | | | | | | 4,897,256 | |
Oil, Gas & Consumable Fuels—3.2% | |
CONSOL Energy, Inc. | | | 142,500 | | | $ | 2,144,625 | |
Professional Services—8.0% | | | | | | | | |
ICF International, Inc.(a) | | | 66,700 | | | | 2,625,979 | |
TrueBlue, Inc.(a) | | | 150,000 | | | | 2,803,500 | |
| | | | | | | | 5,429,479 | |
Specialty Retail—7.3% | | | | | | | | |
Ascena Retail Group, Inc. | | | 296,500 | | | | 2,612,165 | |
Pier 1 Imports, Inc. | | | 341,000 | | | | 2,349,490 | |
| | | | | | | | 4,961,655 | |
Textiles, Apparel & Luxury Goods—2.0% | |
Ralph Lauren Corp. | | | 14,500 | | | | 1,351,545 | |
Trading Companies & Distributors—4.1% | |
WESCO International, Inc.(a) | | | 46,900 | | | | 2,757,251 | |
Total Common Stocks
(Cost $63,129,623) | | | | 64,895,167 | |
Short-Term Investment—1.4% | |
Money Market Fund—1.4% | |
STIT-Treasury Portfolio—Insititutional Class, 0.240%(d) | | | 937,929 | | | | 937,929 | |
Total Short-Term Investment
(Cost $937,929) | | | | 937,929 | |
Total Investments
(Cost $64,067,552)—97.2% | | | | 65,833,096 | |
Other Assets in Excess of Liabilities—2.8% | | | | 1,885,757 | |
Total Net Assets—100.0% | | | $ | 67,718,853 | |
| | | | | | | | |
Percentages are stated as a percent of net assets.
| (a) | Non-income producing security. |
| (b) | Affiliated Company. See Footnote 8. |
| (c) | Foreign issued security. Foreign concentration was as follows: Singapore 4.6% |
| (d) | Rate listed is the 7-day effective yield. |
The Accompanying Notes are an Integral Part of these Financial Statements.
The Tocqueville Alternative Strategies Fund
Schedule of Investments as of April 30, 2016
(Unaudited)
| | | | | | | | |
| Common Stocks—27.6% | | Shares | | | Value | |
Biotechnology—3.1% | |
Biogen, Inc.(a) | | | 2,800 | | | $ | 769,971 | |
PTC Therapeutics, Inc.(a) | | | 24,480 | | | | 181,642 | |
| | | | | | | | 951,613 | |
Communications Equipment—1.5% | | | | | |
QUALCOMM, Inc. | | | 9,000 | | | | 454,680 | |
Health Care Providers & Services—0.9% | |
Hanger, Inc.(a) | | | 40,000 | | | | 275,600 | |
Internet & Catalog Retail—1.5% | | | | | |
Amazon.com, Inc.(a) | | | 700 | | | | 461,713 | |
Internet Software & Services—2.0% | | | | | |
Inuvo, Inc.(a)(b) | | | 350,000 | | | | 623,000 | |
Machinery—1.5% | | | | | | | | |
Caterpillar, Inc. | | | 6,000 | | | | 466,320 | |
Metals & Mining—1.6% | | | | | | | | |
Rio Tinto PLC—ADR(c) | | | 14,000 | | | | 471,240 | |
Oil, Gas & Consumable Fuels—1.7% | | | | | |
Exxon Mobil Corp. | | | 6,000 | | | | 530,400 | |
Pharmaceuticals—6.6% | |
AbbVie, Inc. | | | 5,000 | | | | 305,000 | |
Allergan plc(a)(c) | | | 4,880 | | | | 1,056,813 | |
Omeros Corp.(a) | | | 50,000 | | | | 662,500 | |
| | | | | | | | 2,024,313 | |
Road & Rail—1.7% | |
Union Pacific Corp. | | | 6,000 | | | | 523,380 | |
Semiconductors & Semiconductor Equipment—1.5% | |
Micron Technology, Inc.(a) | | | 42,350 | | | | 455,263 | |
Software—3.1% | |
Microsoft Corp. | | | 5,000 | | | | 249,350 | |
Splunk, Inc.(a) | | | 13,500 | | | | 701,730 | |
| | | | | | | | 951,080 | |
Specialty Retail—0.9% | |
Dick’s Sporting Goods, Inc. | | | 6,000 | | | | 278,040 | |
Total Common Stocks
(Cost $8,787,098) | | | | | | | 8,466,642 | |
Automobiles—1.5% | |
Tesla Motors, Inc.
1.250%, 03/01/2021 | | $ | 500,000 | | | $ | 460,313 | |
Biotechnology—1.5% | | | | | | | | |
PTC Therapeutics, Inc. 3.000%, 08/15/2022 | | | 1,000,000 | | | | 458,125 | |
Life Sciences Tools & Services—1.7% | | | | | |
Fluidigm Corp.
2.750%,02/01/2034(d) | | | 850,000 | | | | 539,218 | |
Metals & Mining—1.5% | | | | | | | | |
B2Gold Corp.
3.250%, 10/01/2018(c) | | | 500,000 | | | | 463,437 | |
| | | | | | | | 463,437 | |
Semiconductors & Semiconductor Equipment—2.5% | |
Micron Technology, Inc. 3.000%, 11/15/2043(d) | | | 500,000 | | | | 356,563 | |
SunPower Corp.
0.875%, 06/01/2021 | | | 500,000 | | | | 400,937 | |
| | | | | | | | 757,500 | |
Total Convertible Bonds
(Cost $3,378,637) | | | | 2,678,593 | |
Corporate Bonds—9.5% | | | | | |
Banks—5.2% | | | | | | | | |
Wachovia Capital Trust III 5.570%, 03/15/2042(d)(e) | | | 500,000 | | | | 499,375 | |
USB Capital IX
3.500%, 04/15/2042(d)(e) | | | 1,125,000 | | | | 852,188 | |
XLIT Ltd.
6.500%,12/29/2049(c)(d)(e) | | | 350,000 | | | | 245,875 | |
| | | | | | | | 1,597,438 | |
Capital Markets—1.3% | | | | | | | | |
Goldman Sachs Capital II 4.000%,06/01/2043(d)(e) | | | 533,000 | | | | 385,412 | |
Metals & Mining—2.6% | |
IAMGOLD Corp.
6.750%,10/01/2020(c)(d) | | | 1,000,000 | | | | 812,000 | |
The Accompanying Notes are an Integral Part of these Financial Statements.
The Tocqueville Alternative Strategies Fund
Schedule of Investments as of April 30, 2016
(Unaudited)
| | | | | | | | |
| Corporate Bonds—9.5% | | Principal
Amount | | | Value | |
Oil, Gas & Consumable Fuels—0.4% | |
W&T Offshore, Inc. 8.500%, 06/15/2019(d) | | $ | 750,000 | | | $ | 123,750 | |
Total Corporate Bonds
(Cost $3,432,173) | | | | 2,918,600 | |
| Preferred Stock—1.8% | | Shares | | | | |
Diversified Financials—1.8% | | | | | |
Citigroup Capital XIII 7.008%, 12/31/2049(d)(e) | | | 20,528 | | | | 536,807 | |
Total Preferred Stock
(Cost $539,712) | | | | 536,807 | |
Real Estate Investment Trust—1.3% | |
Real Estate Investment Trust (REIT)—1.3% | |
Weyerhaeuser Co. | | | 12,090 | | | | 388,331 | |
Total Real Estate Investment Trust (Cost $281,266) | | | | 388,331 | |
Warrant—0.0% | |
Internet Software & Services—0.0% | |
Inuvo, Inc. Expiration: 06/21/2016, Exercise Price: $2.20(a)(b)(f)(g)(h) (Originally acquired 06/21/2011, Cost $0) | | | 31,750 | | | | 1,108 | |
Total Warrant (Cost $0) | | | | 1,108 | |
Short-Term Investments—31.2% | |
Money Market Fund—4.9% | |
STIT-Treasury Portfolio—Institutional Class, 0.240%(i) | | | 1,485,014 | | | | 1,485,014 | |
Commercial
Paper—26.3% | | Principal
Amount | | | | |
U.S. Bank N.A.
0.100%, 05/02/2016 | | $ | 8,065,000 | | | | 8,065,000 | |
Total Short-Term Investments
(Cost $9,550,014) | | | | 9,550,014 | |
Total Investments
(Cost $25,968,900)—80.1% | | | | 24,540,095 | |
Other Assets in Excess of Liabilities—19.9% | | | | 6,106,182 | |
Total Net Assets—100.0% | | | $ | 30,646,277 | |
| | | | | | | | |
| Percentages | are stated as a percent of net assets. |
| ADR | American Depository Receipt |
| (a) | Non-income producing security. |
| (b) | Affiliated company. See Footnote 8. |
| (c) | Foreign issued Security. Foreign Concentration (including ADR’s) was as follows: Canada 4.2%; Ireland 4.3%; United Kingdom 1.6%. |
| (e) | Variable rate security. The rate shown is as of 4/30/2016. |
| (f) | Denotes a security that is either fully or partially restricted to resale. The aggregate value of restricted securities at April 30, 2016 was $1,108 which represented 0.0% of net assets. |
| (g) | Securities are fair valued using procedures approved by the Board of Trustees. The aggregate value of fair valued securities as of April 30, 2016 was $1,108, which represented 0.0% of net assets |
| (h) | Security is considered illiquid and may be difficult to sell. |
| (i) | Rate listed is the 7-day effective yield. |
The Accompanying Notes are an Integral Part of these Financial Statements.
Percent of Total Investments
The Tocqueville Fund
Allocation of Portfolio Holdings
April 30, 2016 (Unaudited)
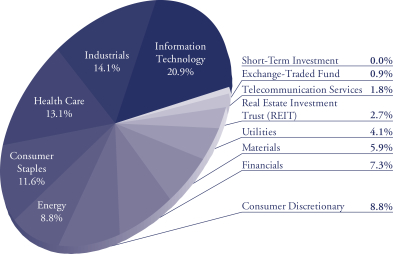
The Tocqueville Opportunity Fund
Allocation of Portfolio Holdings
April 30, 2016 (Unaudited)
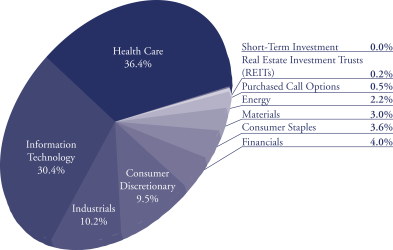
Percent of Total Investments
The Tocqueville International Value Fund
Allocation of Portfolio Holdings
April 30, 2016 (Unaudited)
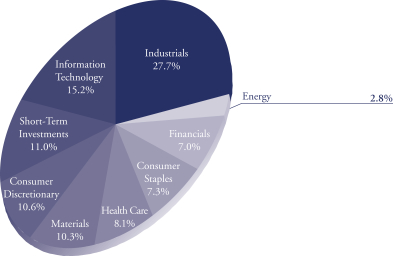
The Tocqueville Gold Fund
Allocation of Portfolio Holdings
April 30, 2016 (Unaudited)
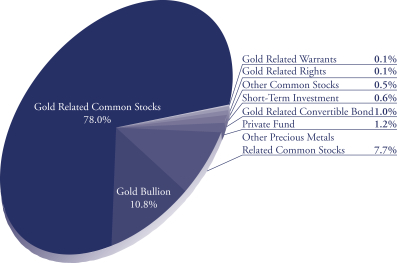
Percent of Total Investments
The Delafield Fund
Allocation of Portfolio Holdings
April 30, 2016 (Unaudited)
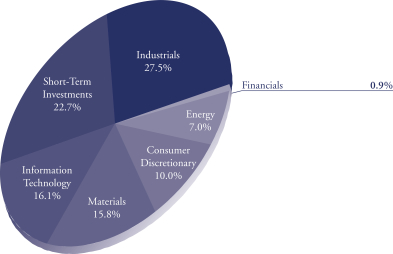
The Tocqueville Select Fund
Allocation of Portfolio Holdings
April 30, 2016 (Unaudited)
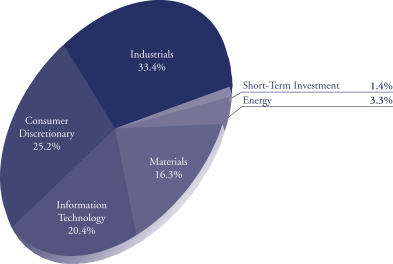
Percent of Total Investments
The Tocqueville Alternative Strategies Fund
Allocation of Portfolio Holdings
April 30, 2016 (Unaudited)
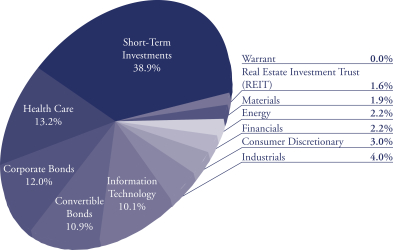
The Tocqueville Trust
Statements of Assets & Liabilities
April 30, 2016 (Unaudited)
| | | | | | | | | | | | | | | | |
| | | The
Tocqueville
Fund | | | The
Tocqueville
Opportunity
Fund | | | The
Tocqueville
International
Value Fund | | | The
Tocqueville
Gold Fund | |
Assets: | | | | | | | | | | | | | | | | |
Investments, at value (1) | | | | | | | | | | | | | | | | |
Unaffiliated issuers | | $ | 285,994,583 | | | $ | 112,761,631 | | | $ | 436,777,091 | | | $ | 993,507,224 | |
Affiliated issuers | | | — | | | | — | | | | — | | | | 442,290,011 | |
Foreign currencies, at value (2) | | | — | | | | — | | | | — | | | | 1,105,479 | |
Cash | | | — | | | | 620 | | | | — | | | | — | |
Receivable for investments sold | | | — | | | | 1,957,018 | | | | 1,226,574 | | | | — | |
Receivable for Fund shares sold | | | 655,766 | | | | 724,843 | | | | 3,093,981 | | | | 3,471,818 | |
Dividends, interest and other receivables | | | 301,122 | | | | 18,287 | | | | 1,440,888 | | | | 617,499 | |
Other assets | | | 15,779 | | | | 23,908 | | | | 46,650 | | | | 22,654 | |
Return of capital receivable | | | 38,000 | | | | 661 | | | | — | | | | — | |
| | | | | | | | | | | | | | | | |
Total Assets | | | 287,005,250 | | | | 115,486,968 | | | | 442,585,184 | | | | 1,441,014,685 | |
| | | | | | | | | | | | | | | | |
Liabilities: | | | | | | | | | | | | | | | | |
Payable for investments purchased | | | — | | | | 1,693,844 | | | | 2,590,552 | | | | 3,419 | |
Payable for loans outstanding | | | — | | | | 783,000 | | | | — | | | | — | |
Due to custodian | | | 230,000 | | | | — | | | | — | | | | — | |
Payable for foreign currencies purchased | | | — | | | | — | | | | 2,565 | | | | 3 | |
Payable for Fund shares redeemed | | | 113,468 | | | | 1,083,030 | | | | 743,433 | | | | 3,054,739 | |
Payable to Adviser (see Note 10) | | | 166,493 | | | | 72,181 | | | | 248,013 | | | | 851,148 | |
Payable to Administrator | | | 39,527 | | | | 12,043 | | | | 57,081 | | | | 145,929 | |
Payable to Trustees | | | 15,890 | | | | 5,912 | | | | 6,558 | | | | 29,276 | |
Accrued distribution fee | | | 34,506 | | | | 11,570 | | | | 23,172 | | | | 44,307 | |
Accrued expenses and other liabilities | | | 110,939 | | | | 26,928 | | | | 64,456 | | | | 537,395 | |
| | | | | | | | | | | | | | | | |
Total Liabilities | | | 710,823 | | | | 3,688,508 | | | | 3,735,830 | | | | 4,666,216 | |
| | | | | | | | | | | | | | | | |
Net Assets | | $ | 286,294,427 | | | $ | 111,798,460 | | | $ | 438,849,354 | | | $ | 1,436,348,469 | |
| | | | | | | | | | | | | | | | |
The Accompanying Notes are an Integral Part of these Financial Statements.
The Tocqueville Trust
Statements of Assets & Liabilities
April 30, 2016 (Unaudited)
| | | | | | | | | | | | | | | | |
| | | The
Tocqueville
Fund | | | The
Tocqueville
Opportunity
Fund | | | The
Tocqueville
International
Value Fund | | | The
Tocqueville
Gold Fund | |
Net assets consist of: | | | | | | | | | | | | | | | | |
Paid in capital | | $ | 156,799,548 | | | $ | 117,186,464 | | | $ | 392,780,224 | | | $ | 1,761,348,376 | |
Accumulated net investment income (loss) | | | 1,267,158 | | | | (1,568,929 | ) | | | 987,399 | | | | (12,616,388 | ) |
Accumulated net realized gain (loss) | | | 11,319,242 | | | | (6,998,974 | ) | | | 3,658,360 | | | | (341,908,150 | ) |
Net unrealized appreciation on: | | | | | | | | | | | | | | | | |
Investments and foreign currency related items | | | 116,908,479 | | | | 3,179,899 | | | | 41,423,371 | | | | 29,524,631 | |
| | | | | | | | | | | | | | | | |
Net assets | | $ | 286,294,427 | | | $ | 111,798,460 | | | $ | 438,849,354 | | | $ | 1,436,348,469 | |
| | | | | | | | | | | | | | | | |
Shares of beneficial interest outstanding (unlimited shares of $0.01 par value authorized) | | | 8,793,227 | | | | 6,072,101 | | | | 30,256,041 | | | | 35,962,243 | |
Net asset value, offering and redemption price per share | | $ | 32.56 | | | $ | 18.41 | | | $ | 14.50 | | | $ | 39.94 | |
| | | | | | | | | | | | | | | | |
(1) Cost of investments | | | | | | | | | | | | | | | | |
Unafilliated issuers | | $ | 169,086,200 | | | $ | 109,582,139 | | | $ | 395,376,690 | | | $ | 859,299,420 | |
Affiliated issuers | | $ | — | | | $ | — | | | $ | — | | | $ | 546,973,356 | |
(2) Cost of foreign currencies | | $ | — | | | $ | — | | | $ | — | | | $ | 1,105,303 | |
The Accompanying Notes are an Integral Part of these Financial Statements.
The Tocqueville Trust
Statements of Assets & Liabilities
April 30, 2016 (Unaudited)
| | | | | | | | | | | | |
| | | The
Delafield Fund | | | The
Tocqueville
Select Fund | | | The
Tocqueville
Alternative
Strategies Fund | |
Assets: | | | | | | | | | | | | |
Investments, at value (1) | | | | | | | | | | | | |
Unaffiliated issuers | | $ | 426,449,087 | | | $ | 58,972,264 | | | $ | 23,915,987 | |
Affiliated issuers | | | 16,527,750 | | | | 6,860,832 | | | | 624,108 | |
Cash | | | — | | | | — | | | | 504,007 | |
Segregated cash at broker | | | — | | | | — | | | | 2,572,799 | |
Receivable for investments sold | | | 9,226,593 | | | | 2,424,759 | | | | 5,839,931 | |
Receivable for Fund shares sold | | | 227,084 | | | | 709,676 | | | | — | |
Dividends, interest and other receivables | | | 117,653 | | | | 37,380 | | | | 133,132 | |
Other assets | | | 10,624 | | | | 8,857 | | | | 9,238 | |
Receivable from distributor | | | — | | | | — | | | | 390 | |
| | | | | | | | | | | | |
Total Assets | | | 452,558,791 | | | | 69,013,768 | | | | 33,599,592 | |
| | | | | | | | | | | | |
Liabilities: | | | | | | | | | | | | |
Payable for investments purchased | | | 4,785,020 | | | | 250,307 | | | | 2,566,853 | |
Payable for Fund shares redeemed | | | 1,168,352 | | | | 944,168 | | | | 315,373 | |
Payable to Adviser (see Note 10) | | | 293,619 | | | | 44,952 | | | | 37,681 | |
Payable to Administrator | | | 64,965 | | | | 9,448 | | | | 3,169 | |
Payable to Trustees | | | 57,364 | | | | 4,600 | | | | 1,490 | |
Accrued distribution fee | | | 20,658 | | | | 8,136 | | | | — | |
Accrued expenses and other liabilities | | | 366,146 | | | | 33,304 | | | | 28,749 | |
| | | | | | | | | | | | |
Total Liabilities | | | 6,756,124 | | | | 1,294,915 | | | | 2,953,315 | |
| | | | | | | | | | | | |
Net Assets | | $ | 445,802,667 | | | $ | 67,718,853 | | | $ | 30,646,277 | |
| | | | | | | | | | | | |
The Accompanying Notes are an Integral Part of these Financial Statements.
The Tocqueville Trust
Statements of Assets & Liabilities
April 30, 2016 (Unaudited)
| | | | | | | | | | | | |
| | | The
Delafield Fund | | | The
Tocqueville
Select Fund | | | The
Tocqueville
Alternative
Strategies Fund | |
Net assets consist of: | | | | | | | | | | | | |
Paid in capital | | $ | 319,398,919 | | | $ | 63,631,106 | | | $ | 32,533,790 | |
Accumulated net investment income (loss) | | | (2,715,834 | ) | | | (553,300 | ) | | | 179,491 | |
Accumulated net realized gain (loss) | | | 56,977,513 | | | | 2,875,503 | | | | (639,830 | ) |
Net unrealized appreciation (depreciation) on: | | | | | | | | | | | | |
Investments and foreign currency related items | | | 72,142,069 | | | | 1,765,544 | | | | (1,427,174 | ) |
| | | | | | | | | | | | |
Net assets | | $ | 445,802,667 | | | $ | 67,718,853 | | | $ | 30,646,277 | |
| | | | | | | | | | | | |
Shares of beneficial interest outstanding (unlimited shares of $0.01 par value authorized) | | | 17,497,336 | | | | 6,017,734 | | | | 1,229,463 | |
Net asset value, offering and redemption price per share | | $ | 25.48 | | | $ | 11.25 | | | $ | 24.93 | |
| | | | | | | | | | | | |
(1) Cost of investments | | | | | | | | | | | | |
Unafilliated issuers | | $ | 342,591,766 | | | $ | 52,979,615 | | | $ | 25,380,573 | |
Affiliated issuers | | $ | 28,243,002 | | | $ | 11,087,937 | | | $ | 588,327 | |
The Accompanying Notes are an Integral Part of these Financial Statements.
The Tocqueville Trust
Statements of Operations
For the Period Ended April 30, 2016 (Unaudited)
| | | | | | | | | | | | | | | | |
| | | The
Tocqueville
Fund | | | The
Tocqueville
Opportunity
Fund | | | The
Tocqueville
International
Value Fund | | | The
Tocqueville
Gold Fund | |
Investment Income: | | | | | | | | | | | | | | | | |
Dividends* | | | | | | | | | | | | | | | | |
Unaffiliated issuers | | $ | 3,527,978 | | | $ | 263,378 | | | $ | 3,472,769 | | | $ | 2,705,736 | |
Affiliated issuers | | | — | | | | — | | | | — | | | | 184,097 | |
Interest | | | 234 | | | | 43 | | | | 31,072 | | | | 467,385 | |
| | | | | | | | | | | | | | | | |
Total investment income | | | 3,528,212 | | | | 263,421 | | | | 3,503,841 | | | | 3,357,218 | |
| | | | | | | | | | | | | | | | |
Expenses: | | | | | | | | | | | | | | | | |
Investment Adviser’s fee (see Note 4) | | | 1,081,863 | | | | 483,705 | | | | 1,862,883 | | | | 4,293,748 | |
Distribution fees (see Note 4) | | | 360,621 | | | | 161,235 | | | | 465,721 | | | | 1,235,196 | |
Administration fees (see Note 4) | | | 216,372 | | | | 96,741 | | | | 278,922 | | | | 678,741 | |
Transfer agent and shareholder services fees | | | 76,634 | | | | 28,764 | | | | 57,148 | | | | 426,524 | |
Trustee fees and expenses | | | 34,104 | | | | 17,132 | | | | 34,572 | | | | 100,120 | |
Legal fees | | | 19,698 | | | | 6,240 | | | | 14,002 | | | | 83,734 | |
Printing and mailing expense | | | 18,552 | | | | 5,166 | | | | 16,284 | | | | 80,452 | |
Audit fees | | | 16,056 | | | | 7,794 | | | | 18,640 | | | | 51,636 | |
Fund accounting fees | | | 15,688 | | | | 16,650 | | | | 28,532 | | | | 44,696 | |
Blue sky fees | | | 14,384 | | | | 16,086 | | | | 18,992 | | | | 27,454 | |
Other expenses (see Note 10) | | | 11,366 | | | | 5,988 | | | | 23,782 | | | | 32,648 | |
Interest expense | | | 8,013 | | | | 8,032 | | | | — | | | | 10,633 | |
Custody fees | | | 7,576 | | | | 11,797 | | | | 42,908 | | | | 129,888 | |
Insurance expense | | | 4,514 | | | | 1,848 | | | | 4,742 | | | | 15,902 | |
Registration fees | | | 1,344 | | | | 1,074 | | | | 1,256 | | | | 3,404 | |
| | | | | | | | | | | | | | | | |
Total expenses before waiver | | | 1,886,785 | | | | 868,252 | | | | 2,868,384 | | | | 7,214,776 | |
Less: Fees waived (see Note 4) | | | (75,668 | ) | | | — | | | | (539,781 | ) | | | — | |
| | | | | | | | | | | | | | | | |
Net expenses | | | 1,811,117 | | | | 868,252 | | | | 2,328,603 | | | | 7,214,776 | |
| | | | | | | | | | | | | | | | |
Net Investment Income (Loss) | | | 1,717,095 | | | | (604,831 | ) | | | 1,175,238 | | | | (3,857,558 | ) |
| | | | | | | | | | | | | | | | |
The Accompanying Notes are an Integral Part of these Financial Statements.
The Tocqueville Trust
Statements of Operations
For the Period Ended April 30, 2016 (Unaudited)
| | | | | | | | | | | | | | | | |
| | | The
Tocqueville
Fund | | | The
Tocqueville
Opportunity
Fund | | | The
Tocqueville
International
Value Fund | | | The
Tocqueville
Gold Fund | |
Realized and Unrealized Gain (Loss): | | | | | | | | | | | | | | | | |
Net realized gain (loss) on: | | | | | | | | | | | | | | | | |
Investments | | | | | | | | | | | | | | | | |
Unaffiliated issuers | | | 11,426,314 | | | | (6,049,266 | ) | | | 4,308,143 | | | | (164,505,971 | ) |
Affililiated issuers | | | — | | | | — | | | | — | | | | (53,808,397 | ) |
Forward currency contracts | | | — | | | | — | | | | 2,337 | | | | — | |
Foreign currency translation | | | 373 | | | | (3,243 | ) | | | (241,554 | ) | | | (69,761 | ) |
| | | | | | | | | | | | | | | | |
| | | 11,426,687 | | | | (6,052,509 | ) | | | 4,068,926 | | | | (218,384,129 | ) |
Net change in unrealized appreciation (depreciation) on: | | | | | | | | | | | | | | | | |
Investments | | | (11,039,688 | ) | | | (16,132,903 | ) | | | (5,917,268 | ) | | | 674,846,758 | |
Forward currency contracts | | | — | | | | — | | | | 48,730 | | | | — | |
Foreign currency translation | | | — | | | | 81,550 | | | | 14,338,079 | | | | 41,716,264 | |
| | | | | | | | | | | | | | | | |
| | | (11,039,688 | ) | | | (16,051,353 | ) | | | 8,469,541 | | | | 716,563,022 | |
Net gain (loss) on investments and foreign currency | | | 386,999 | | | | (22,103,862 | ) | | | 12,538,467 | | | | 498,178,893 | |
| | | | | | | | | | | | | | | | |
Net Increase (Decrease) in Net Assets Resulting from Operations | | $ | 2,104,094 | | | $ | (22,708,693 | ) | | $ | 13,713,705 | | | $ | 494,321,335 | |
| | | | | | | | | | | | | | | | |
* Net of foreign taxes withheld of: | | $ | 2,845 | | | $ | 571 | | | $ | 351,790 | | | $ | 363,598 | |
| | | | | | | | | | | | | | | | |
The Accompanying Notes are an Integral Part of these Financial Statements.
The Tocqueville Trust
Statements of Operations
For the Period Ended April 30, 2016 (Unaudited)
| | | | | | | | | | | | |
| | | The
Delafield Fund | | | The
Tocqueville
Select Fund | | | The
Tocqueville
Alternative
Strategies Fund | |
| Investment Income: | | | | | | | | | |
Dividends* | | | | | | | | | | | | |
Unaffiliated issuers | | $ | 2,580,433 | | | $ | 329,467 | | | $ | 248,478 | |
Affiliated issuers | | | — | | | | — | | | | — | |
Interest | | | 42,023 | | | | 2,334 | | | | 533,732 | |
| | | | | | | | | | | | |
Total investment income | | | 2,622,456 | | | | 331,801 | | | | 782,210 | |
| | | | | | | | | | | | |
Expenses: | | | | | | | | | | | | |
Investment Adviser’s fee (see Note 4) | | | 1,991,012 | | | | 272,222 | | | | 254,877 | |
Distribution fees (see Note 4) | | | 647,032 | | | | 85,069 | | | | 50,975 | |
Administration fees (see Note 4) | | | 376,232 | | | | 51,042 | | | | 30,585 | |
Transfer agent and shareholder services fees | | | 174,444 | | | | 19,762 | | | | 4,750 | |
Trustee fees and expenses | | | 73,572 | | | | 8,648 | | | | 4,790 | |
Legal fees | | | 54,278 | | | | 5,842 | | | | 12,818 | |
Printing and mailing expense | | | 54,958 | | | | 5,002 | | | | 2,630 | |
Audit fees | | | 34,250 | | | | 3,118 | | | | 1,286 | |
Fund accounting fees | | | 32,340 | | | | 4,468 | | | | 5,748 | |
Blue sky fees | | | 19,656 | | | | 11,924 | | | | 13,180 | |
Other expenses (see Note 10) | | | 23,180 | | | | 2,818 | | | | 3,728 | |
Interest expense | | | — | | | | — | | | | 91,852 | |
Custody fees | | | 23,039 | | | | 2,882 | | | | 2,487 | |
Insurance expense | | | 11,846 | | | | 1,386 | | | | 940 | |
Registration fees | | | 3,498 | | | | 88 | | | | 1,890 | |
Interest expense on securities sold short | | | — | | | | — | | | | 64,092 | |
Dividends expense on securities sold short | | | — | | | | — | | | | 59,363 | |
| | | | | | | | | | | | |
Total expenses before waiver | | | 3,519,337 | | | | 474,271 | | | | 605,991 | |
Less: Fees waived (see Note 4) | | | — | | | | — | | | | (3,272 | ) |
| | | | | | | | | | | | |
Net expenses | | | 3,519,337 | | | | 474,271 | | | | 602,719 | |
| | | | | | | | | | | | |
Net Investment Income (Loss) | | | (896,881 | ) | | | (142,470 | ) | | | 179,491 | |
| | | | | | | | | | | | |
The Accompanying Notes are an Integral Part of these Financial Statements.
The Tocqueville Trust
Statements of Operations
For the Period Ended April 30, 2016 (Unaudited)
| | | | | | | | | | | | |
| | | The
Delafield Fund | | | The
Tocqueville
Select Fund | | | The
Tocqueville
Alternative
Strategies Fund | |
Realized and Unrealized Gain (Loss): | | | | | | | | | | | | |
Net realized gain (loss) on: | | | | | | | | | | | | |
Investments | | | | | | | | | | | | |
Unaffiliated issuers | | | 63,719,971 | | | | 2,875,695 | | | | (2,119,245 | ) |
Affililiated issuers | | | (7,120,298 | ) | | | — | | | | — | |
Securities sold short | | | — | | | | — | | | | 1,630,056 | |
Foreign currency translation | | | — | | | | (167 | ) | | | (767 | ) |
| | | | | | | | | | | | |
| | | 56,599,673 | | | | 2,875,528 | | | | (489,956 | ) |
Net change in unrealized appreciation (depreciation) on: | | | | | | | | | | | | |
Investments | | | (82,170,743 | ) | | | (5,976,168 | ) | | | (458,235 | ) |
Securities sold short | | | — | | | | — | | | | (1,482,677 | ) |
Foreign currency translation | | | — | | | | — | | | | 118 | |
| | | | | | | | | | | | |
| | | (82,170,743 | ) | | | (5,976,168 | ) | | | (1,940,794 | ) |
Net loss on investments and foreign currency | | | (25,571,070 | ) | | | (3,100,640 | ) | | | (2,430,750 | ) |
| | | | | | | | | | | | |
Net Decrease in Net Assets Resulting from Operations | | $ | (26,467,951 | ) | | $ | (3,243,110 | ) | | $ | (2,251,259 | ) |
| | | | | | | | | | | | |
* Net of foreign taxes withheld of: | | $ | 21,938 | | | $ | 912 | | | $ | 494 | |
| | | | | | | | | | | | |
The Accompanying Notes are an Integral Part of these Financial Statements.
The Tocqueville Trust
Statements of Changes in Net Assets (Unaudited)
| | | | | | | | | | | | | | | | | | | | | | | | |
| | | The Tocqueville Fund | | | The Tocqueville
Opportunity Fund | | | The Tocqueville
International Value Fund | |
| | | For the
Period Ended
April 30,
2016 | | | For the
Year Ended
October 31,
2015 | | | For the
Period Ended
April 30,
2016 | | | For the
Year Ended
October 31,
2015 | | | For the
Period Ended
April 30,
2016 | | | For the
Year Ended
October 31,
2015 | |
Operations: | | | | | | | | | | | | | | | | | | | | | | | | |
Net investment income (loss) | | $ | 1,717,095 | | | $ | 3,498,172 | | | $ | (604,831 | ) | | $ | (1,075,757 | ) | | $ | 1,175,238 | | | $ | 2,768,058 | |
Net realized gain (loss) on sale of investments, foreign currency, and securities sold short | | | 11,426,687 | | | | 6,212,028 | | | | (6,052,509 | ) | | | 338,220 | | | | 4,068,926 | | | | 10,180,364 | |
Net change in unrealized appreciation (depreciation) | | | (11,039,688 | ) | | | (9,794,238 | ) | | | (16,051,353 | ) | | | 302,473 | | | | 8,469,541 | | | | 592,093 | |
| | | | | | | | | | | | | | | | | | | | | | | | |
Net increase (decrease) in net assets resulting from operations | | | 2,104,094 | | | | (84,038 | ) | | | (22,708,693 | ) | | | (435,064 | ) | | | 13,713,705 | | | | 13,540,515 | |
| | | | | | | | | | | | | | | | | | | | | | | | |
Dividends and distributions to shareholders: | | | | | | | | | | | | | | | | | | | | | | | | |
Net investment income | | | (3,200,195 | ) | | | (2,801,877 | ) | | | — | | | | — | | | | (5,967,776 | ) | | | (5,099,005 | ) |
Net realized gains | | | (3,072,752 | ) | | | (13,296,075 | ) | | | — | | | | (10,178,189 | ) | | | (4,247,573 | ) | | | (8,275,518 | ) |
| | | | | | | | | | | | | | | | | | | | | | | | |
Total dividends and distributions | | | (6,272,947 | ) | | | (16,097,952 | ) | | | — | | | | (10,178,189 | ) | | | (10,215,349 | ) | | | (13,374,523 | ) |
Fund share transactions: | | | | | | | | | | | | | | | | | | | | | | | | |
Shares sold | | | 10,667,978 | | | | 37,315,146 | | | | 19,803,721 | | | | 114,212,927 | | | | 143,717,236 | | | | 156,381,171 | |
Shares issued to holders in reinvestment of dividends | | | 5,849,599 | | | | 15,075,202 | | | | — | | | | 9,830,855 | | | | 9,226,995 | | | | 12,789,709 | |
Shares redeemed* | | | (35,321,293 | ) | | | (107,502,725 | ) | | | (38,752,555 | ) | | | (40,298,704 | ) | | | (51,354,995 | ) | | | (72,625,881 | ) |
| | | | | | | | | | | | | | | | | | | | | | | | |
Net increase (decrease) | | | (18,803,716 | ) | | | (55,112,377 | ) | | | (18,948,834 | ) | | | 83,745,078 | | | | 101,589,236 | | | | 96,544,999 | |
| | | | | | | | | | | | | | | | | | | | | | | | |
Net increase (decrease) in net assets | | | (22,972,569 | ) | | | (71,294,367 | ) | | | (41,657,527 | ) | | | 73,131,825 | | | | 105,087,592 | | | | 96,710,991 | |
Net Assets: | | | | | | | | | | | | | | | | | | | | | | | | |
Beginning of period | | | 309,266,996 | | | | 380,561,363 | | | | 153,455,987 | | | | 80,324,162 | | | | 333,761,762 | | | | 237,050,771 | |
| | | | | | | | | | | | | | | | | | | | | | | | |
End of period** | | $ | 286,294,427 | | | $ | 309,266,996 | | | $ | 111,798,460 | | | $ | 153,455,987 | | | $ | 438,849,354 | | | $ | 333,761,762 | |
| | | | | | | | | | | | | | | | | | | | | | | | |
* Net of redemption fees of: | | $ | — | | | $ | 14,088 | | | $ | — | | | $ | 10,031 | | | $ | — | | | $ | 7,448 | |
| | | | | | | | | | | | | | | | | | | | | | | | |
** Including undistributed net investment income (loss) of: | | $ | 1,267,158 | | | $ | 2,750,258 | | | $ | (1,568,929 | ) | | $ | (964,098 | ) | | $ | 987,399 | | | $ | 5,779,937 | |
| | | | | | | | | | | | | | | | | | | | | | | | |
The Accompanying Notes are an Integral Part of these Financial Statements.
The Tocqueville Trust
Statements of Changes in Net Assets (Unaudited)
| | | | | | | | | | | | | | | | | | | | | | | | |
| | | The Tocqueville Gold Fund | | | The Delafield Fund | | | The Tocqueville Select Fund | |
| | | For the
Period Ended
April 30,
2016 | | | For the
Year Ended
October 31,
2015 | | | For the
Period Ended
April 30,
2016 | | | For the
Year Ended
October 31,
2015 | | | For the
Period Ended
April 30,
2016 | | | For the
Year Ended
October 31,
2015 | |
Operations: | | | | | | | | | | | | | | | | | | | | | | | | |
Net investment income (loss) | | $ | (3,857,558 | ) | | $ | (9,564,009 | ) | | $ | (896,881 | ) | | $ | (1,556,346 | ) | | $ | (142,470 | ) | | $ | (503,599 | ) |
Net realized gain (loss) on sale of investments, foreign currency, and securities sold short | | | (218,384,129 | ) | | | (113,852,609 | ) | | | 56,599,673 | | | | 100,006,757 | | | | 2,875,528 | | | | 3,836,047 | |
Net change in unrealized appreciation (depreciation) | | | 716,563,022 | | | | (46,396,742 | ) | | | (82,170,743 | ) | | | (216,888,608 | ) | | | (5,976,168 | ) | | | (10,827,711 | ) |
| | | | | | | | | | | | | | | | | | | | | | | | |
Net increase (decrease) in net assets resulting from operations | | | 494,321,335 | | | | (169,813,360 | ) | | | (26,467,951 | ) | | | (118,438,197 | ) | | | (3,243,110 | ) | | | (7,495,263 | ) |
| | | | | | | | | | | | | | | | | | | | | | | | |
Dividends and distributions to shareholders: | | | | | | | | | | | | | | | | | | | | | | | | |
Net investment income | | | — | | | | — | | | | — | | | | — | | | | — | | | | — | |
Net realized gains | | | — | | | | — | | | | (62,285,610 | ) | | | (136,125,451 | ) | | | (2,573,589 | ) | | | (12,348,792 | ) |
| | | | | | | | | | | | | | | | | | | | | | | | |
Total dividends and distributions | | | — | | | | — | | | | (62,285,610 | ) | | | (136,125,451 | ) | | | (2,573,589 | ) | | | (12,348,792 | ) |
Fund share transactions: | | | | | | | | | | | | | | | | | | | | | | | | |
Shares sold | | | 190,312,585 | | | | 389,454,957 | | | | 29,483,491 | | | | 83,154,620 | | | | 2,967,972 | | | | 8,301,845 | |
Shares issued to holders in reinvestment of dividends | | | — | | | | — | | | | 59,082,718 | | | | 128,320,111 | | | | 2,508,581 | | | | 12,127,056 | |
Shares redeemed* | | | (195,652,154 | ) | | | (410,832,034 | ) | | | (228,534,570 | ) | | | (757,525,493 | ) | | | (13,753,829 | ) | | | (26,831,712 | ) |
| | | | | | | | | | | | | | | | | | | | | | | | |
Net increase (decrease) | | | (5,339,569 | ) | | | (21,377,077 | ) | | | (139,968,361 | ) | | | (546,050,762 | ) | | | (8,277,276 | ) | | | (6,402,811 | ) |
| | | | | | | | | | | | | | | | | | | | | | | | |
Net increase (decrease) in net assets | | | 488,981,766 | | | | (191,190,437 | ) | | | (228,721,922 | ) | | | (800,614,410 | ) | | | (14,093,975 | ) | | | (26,246,866 | ) |
Net Assets: | | | | | | | | | | | | | | | | | | | | | | | | |
Beginning of period | | | 947,366,703 | | | | 1,138,557,140 | | | | 674,524,589 | | | | 1,475,138,999 | | | | 81,812,828 | | | | 108,059,694 | |
| | | | | | | | | | | | | | | | | | | | | | | | |
End of period** | | $ | 1,436,348,469 | | | $ | 947,366,703 | | | $ | 445,802,667 | | | $ | 674,524,589 | | | $ | 67,718,853 | | | $ | 81,812,828 | |
| | | | | | | | | | | | | | | | | | | | | | | | |
* Net of redemption fees of: | | $ | 109,828 | | | $ | 254,299 | | | $ | — | | | $ | 90,239 | | | $ | — | | | $ | 874 | |
| | | | | | | | | | | | | | | | | | | | | | | | |
** Including undistributed net investment income (loss) of: | | $ | (12,616,388 | ) | | $ | (8,758,830 | ) | | $ | (2,715,834 | ) | | $ | (1,818,953 | ) | | $ | (553,300 | ) | | $ | (410,830 | ) |
| | | | | | | | | | | | | | | | | | | | | | | | |
The Accompanying Notes are an Integral Part of these Financial Statements.
The Tocqueville Trust
Statements of Changes in Net Assets (Unaudited)
| | | | | | | | |
| | | The Tocqueville Alternative
Strategies Fund | |
| | | For the
Period Ended
April 30,
2016 | | | For the
Year Ended
October 31,
2015 | |
Operations: | | | | | | | | |
Net investment income (loss) | | $ | 179,491 | | | $ | 117,196 | |
Net realized gain (loss) on sale of investments, foreign currency, and securities sold short | | | (489,956 | ) | | | (12,795 | ) |
Net change in unrealized appreciation (depreciation) | | | (1,940,794 | ) | | | (1,131,578 | ) |
| | | | | | | | |
Net increase (decrease) in net assets resulting from operations | | | (2,251,259 | ) | | | (1,027,177 | ) |
| | | | | | | | |
Dividends and distributions to shareholders: | | | | | | | | |
Net investment income | | | (114,238 | ) | | | — | |
Net realized gains | | | — | | | | (852,479 | ) |
| | | | | | | | |
Total dividends and distributions | | | (114,238 | ) | | | (852,479 | ) |
Fund share transactions: | | | | | | | | |
Shares sold | | | 812,216 | | | | 12,945,356 | |
Shares issued to holders in reinvestment of dividends | | | 105,099 | | | | 845,263 | |
Shares redeemed* | | | (12,640,724 | ) | | | (6,319,111 | ) |
| | | | | | | | |
Net increase (decrease) | | | (11,723,409 | ) | | | 7,471,508 | |
| | | | | | | | |
Net increase (decrease) in net assets | | | (14,088,906 | ) | | | 5,591,852 | |
Net Assets: | | | | | | | | |
Beginning of period | | | 44,735,183 | | | | 39,143,331 | |
| | | | | | | | |
End of period** | | $ | 30,646,277 | | | $ | 44,735,183 | |
| | | | | | | | |
* Net of redemption fees of: | | $ | — | | | $ | 2,261 | |
| | | | | | | | |
** Including undistributed net investment income (loss) of: | | $ | 179,491 | | | $ | 114,238 | |
| | | | | | | | |
The Accompanying Notes are an Integral Part of these Financial Statements.
The Tocqueville Trust
Statements of Cash Flows
For the Period Ended April 30, 2016 (Unaudited)
| | | | |
| | | The Tocqueville
Alternative
Strategies Fund | |
Cash flows from operating activities | | | | |
Net decrease in net assets resulting from operations | | $ | (2,251,259 | ) |
Adjustments to reconcile net increase (decrease) in net assets resulting from operations to net cash provided by (used in) operating activities: | | | | |
Net realized loss on investments and foreign currency translation | | | 2,119,152 | |
Net realized gain on securities sold short | | | (1,630,056 | ) |
Net change in unrealized loss on investments and foreign currency translation | | | 458,117 | |
Net change in unrealized loss on securities sold short | | | 1,482,677 | |
Amortization and accretion of premium and discount | | | (160,342 | ) |
Changes in assets and liabilities: | | | | |
Segregated cash at broker | | | 10,648,564 | |
Receivable from/Payable to Adviser | | | (7,551 | ) |
Receivable from/Payable to Administrator | | | (2,954 | ) |
Dividends, interest and other receivables | | | 77,981 | |
Other Assets | | | 1,239 | |
Payable to Trustees | | | (448 | ) |
Accrued distribution fees | | | (4,232 | ) |
Accrued expenses and other liabilities | | | 286,110 | |
Purchases of investments | | | (14,486,682 | ) |
Proceeds from sale of investments | | | 37,901,938 | |
Net purchases and sales of short-term investments | | | (6,914,456 | ) |
Payments to close short transactions | | | (19,293,841 | ) |
Proceeds from securities sold short | | | 4,065,391 | |
| | | | |
Net cash used in operating activities | | | 12,289,348 | |
| | | | |
Cash flows from financing activities: | | | | |
Proceeds from shares issued | | | 864,522 | |
Payment on shares redeemed | | | (12,640,724 | ) |
Dividends paid to shareholders, net of reinvestments | | | (9,139 | ) |
| | | | |
Net cash provided by financing activities | | | (11,785,341 | ) |
| | | | |
Net increase in cash | | | 504,007 | |
| | | | |
Cash, beginning of period | | | — | |
| | | | |
Cash, end of period | | $ | 504,007 | |
| | | | |
Non-cash financing activity | | | | |
Reinvested dividends | | $ | 105,099 | |
The Accompanying Notes are an Integral Part of these Financial Statements.
The Tocqueville Trust
Notes to Financial Statements
1. ORGANIZATION
The Tocqueville Trust (the “Trust”) is a Massachusetts business trust registered under the Investment Company Act of 1940 and organized on September 17, 1986, currently consisting of seven separate funds (each, a “Fund” or, collectively, the “Funds”). Each Fund is an open-end management investment company with a different investment objective. The Tocqueville Fund, The Tocqueville Opportunity Fund (the “Opportunity Fund”), The Tocqueville International Value Fund (the “International Fund”), and The Delafield Fund are classified as diversified investment companies. The Tocqueville Gold Fund (the “Gold Fund”), The Tocqueville Select Fund (the “Select Fund”) and The Tocqueville Alternative Strategies Fund (the “Alternative Strategies Fund”) are classified as non-diversified investment companies. The Tocqueville Fund’s investment objective is long-term capital appreciation which it seeks to achieve by investing primarily in securities of United States issuers. The Opportunity Fund’s investment objective is to achieve long-term capital appreciation which it seeks to achieve by investing in the common stocks of small and mid-cap companies which have the potential to deliver superior long term earnings growth. The International Fund’s investment objective is long-term capital appreciation consistent with preservation of capital which it seeks to achieve by investing primarily in securities of non-U.S. issuers. The Gold Fund’s investment objective is long-term capital appreciation which it seeks to achieve by investing in gold, securities of companies located throughout the world that are engaged in mining or processing gold (“gold related securities”), other precious metals and securities of companies located throughout the world that are engaged in mining or processing such other precious metals (“other precious metal securities”). The Delafield Fund’s investment objectives are to seek long-term preservation of capital (sufficient growth to outpace inflation over an extended period of time) and growth of capital which it seeks to achieve by investing primarily in the equity securities of domestic companies. The Tocqueville Select Fund’s investment objective is to achieve long-term capital appreciation by investing in a focused group of common stocks issued primarily by small and mid-sized U.S. companies. Current income is a secondary objective for The Tocqueville Select Fund. The Tocqueville Alternative Strategies Fund’s investment objective seeks higher returns and lower volatility than the Standard & Poor’s (“S&P”) 500 Index over a 3-5 year time horizon.
On June 22, 2009, the Board of Directors of Delafield Fund, Inc. approved an Agreement and Plan of Reorganization providing for, among other things, the transfer of the assets and liabilities of Delafield Fund, Inc. into The Delafield Fund, a series of The Tocqueville Trust. On September 24, 2009, the shareholders of Delafield Fund, Inc. approved the Agreement and Plan of Reorganization. On July 9, 2009, the Board of Trustees of Delafield Select Fund, a series of Natixis Funds Trust II, approved an Agreement and Plan of Reorganization providing for, among other things, the transfer of the assets and liabilities of Delafield Select Fund into the sole share class of The Select
Fund (now The Tocqueville Select Fund), a series of The Tocqueville Trust. On September 24, 2009, the shareholders of Delafield Select Fund approved the Agreement and Plan of Reorganization. The effective date of both reorganizations was September 28, 2009. Transfers into The Delafield Fund and The Select Fund from their predecessor funds amounted to $649,892,191 and $25,888,388, respectively.
The Delafield Fund, a series of the Trust, commenced operations on September 28, 2009 as successor to Delafield Fund, Inc. The predecessor Delafield Fund, Inc. commenced operations on November 19, 1993.
The Tocqueville Select Fund, a series of the Trust, commenced operations on September 28, 2009 as successor to the Delafield Select Fund, a series of Natixis Funds Trust II. The predecessor Delafield Select Fund commenced operations on September 29, 2008 for Class A and Class C shares and on September 26, 2008 for Class Y shares. Prior to September 29, 2008, the predecessor Delafield Select Fund operated as a Delaware limited partnership using substantially the same investment objectives and investment policies as the predecessor fund. The limited partnership was incepted in July 1998.
On April 15, 2014, the Board of Trustees of the Bridgehampton Value Strategies Fund, a series of Investment Management Series Trust, approved an Agreement and Plan of Reorganization providing for, among other things, the transfer of the assets and liabilities of the Bridgehampton Value Strategies Fund into the sole share class of The Tocqueville Alternative Strategies Fund, a newly-created series of The Tocqueville Trust. On June 20, 2014, the shareholders of the Bridgehampton Value Strategies Fund approved the Agreement and Plan of Reorganization. The effective date of the reorganization was June 27, 2014. Transfers into the Tocqueville Alternative Strategies Fund from its predecessor fund amounted to $38,614,645.
The Tocqueville Alternative Strategies Fund, a series of the Trust, commenced operations at the close of business on June 27, 2014 as successor to the Bridgehampton Value Strategies Fund, a series of Investment Managers Series Trust. The predecessor Bridgehampton Value Strategies Fund commenced operations on June 3, 2013 for Class C shares and June��29, 2012 for Class I shares, after the conversion of a limited liability company account, Bridgehampton Multi-Strategy Fund LLC, which commenced operations October 1, 2006, into Class I shares of the Fund. From October 1, 2006 to May 7, 2010, the name of the predecessor account was Bridgehampton Arbitrage LLC.
On April 25, 2016, the Board of Trustees of The Tocqueville Trust determined that it was advisable to liquidate, dissolve and terminate the legal existence of The Tocqueville Alternative Strategies Fund. Shareholders were notified immediately and the Fund ceased sales of Fund shares. Shareholders were given the options to redeem shares of the Fund, receive an in-kind redemptions of securities, or receive cash on the liquidation date. The liquidation was completed on May 17, 2016.
2. SIGNIFICANT ACCOUNTING POLICIES
The following is a summary of significant accounting principles followed by the Trust in the preparation of its financial statements.
a) Security valuation and security transactions
Investments in securities, including foreign securities, traded on an exchange or quoted on the over-the-counter market are valued at the last sale price or, if no sale occurred during the day, at the mean between closing bid and asked prices, as last reported by a pricing service approved by the Trustees. Securities that are principally traded on the National Association of Securities Dealers Automated Quotation National Market (“NASDAQ”) are generally valued at the NASDAQ Official Closing Price (“NOCP”). If there is no NASDAQ Official Closing Price for a NASDAQ-listed security or sale price available for an over-the-counter security, the mean of the latest bid and asked quotations from NASDAQ will be used. Investments in gold will be valued at the spot price of gold determined based on the mean of the last bid and asked price at the close of the New York Commodity Exchange. When market quotations for securities are not readily available, or when restricted securities or other assets are being valued, such assets are valued at fair value as determined in good faith by or under procedures approved by the Trustees. Fixed income securities are valued at market price. Fixed Income securities, such as corporate bonds, convertible bonds and U.S. government agency issues for which market quotations are not readily available may be valued based on information supplied by independent pricing services using matrix pricing formulas and/or independent broker bid quotations.
Trading in securities on foreign securities exchanges normally is completed before the calculation of the Funds’ net asset value. Trading on these foreign exchanges may not take place on all days on which there is regular trading on the New York Stock Exchange (“NYSE”), or may take place on days on which there is no regular trading on the NYSE. Similarly, the Funds may hold securities traded in domestic markets where the market may close early on a given day prior to calculation of the Funds’ net asset value. Events affecting the value of such securities held by the Funds that occur between the close of trading in the security and the close of trading on the NYSE normally will not be reflected in the Funds’ calculation of the net asset value. However, significant events will be closely monitored, and where it is determined that an adjustment should be made to the security’s value because significant interim events may materially affect the value of the security, the security will be priced at its fair value in accordance with the procedures approved by the Trustees.
Investment and shareholder transactions are recorded on trade date. Dividend income is recognized on the ex-dividend date. Interest income is recognized on an accrual basis and includes, where applicable, the amortization of premiums and accretion of discounts. Net realized gains and losses from sales of securities are determined on the specific identification cost method.
b) Restricted and illiquid securities
The Funds may invest in securities that are subject to legal or contractual restrictions on resale or are illiquid. A security may be considered illiquid if it lacks a readily available market or if its valuation has not changed for a certain period of time. Disposal of these securities may involve time consuming negotiations and expense, and a prompt sale at the current valuation may be difficult.
c) Fair Valuation Measurements
The Trust has adopted authoritative fair valuation accounting standards which establish an authoritative definition of fair value and set out a hierarchy for measuring fair value. These standards require additional disclosures about the various inputs and valuation techniques used to develop the measurements of fair value and a discussion in changes in valuation techniques and related inputs during the period. These inputs are summarized in the three broad levels listed below.
| | Level 1 - | Quoted prices in active markets for identical securities. |
| | Level 2 - | Other significant observable inputs (including quoted prices for similar securities, interest rates, prepayment speeds, credit risk, etc.). |
| | Level 3 - | Significant unobservable inputs (including the Fund’s own assumptions in determining the fair value of investments). |
When using the market quotations or closing price provided by the pricing service for equity investments (including securities sold short), including common stocks, preferred stocks, foreign issued common stocks, exchange-traded funds, warrants, rights, closed end mutual funds and real estate investment trusts, which are traded on an exchange are valued at the last sale price reported by the exchange on which the securities are primarily traded on the day of valuation and when the market is considered active, the security will be classified as a Level 1 security. When using the mean between the latest bid and ask price, the security will be classified as Level 2. Common stocks of the International Value Fund that are traded on non-North American exchanges may be valued using matrix pricing formulas provided by an independent pricing service. These securities will generally be classified as Level 2 securities. Gold bullion is valued at the mean of the closing bid and ask prices from the New York Mercantile Exchange and is classified as a Level 2.
Investment in mutual funds, including money market funds, are generally priced at the ending net asset value (NAV) provided by the service agent of the funds and will be classified as Level 1 securities.
Debt securities, such as corporate bonds, convertible bonds, commercial paper and U.S. government agency issues for which market quotations are not readily available may be valued based on information supplied by independent pricing services using matrix pricing formulas and/or independent broker bid quotations and are classified as Level 2. Warrants for which the underlying security is registered and equities which are subject to a required holding period, but have a comparable public issue, are valued in good faith by the adviser pursuant to procedures established under the general supervision and responsibility of the Funds’ Board of Trustees. These securities will generally be classified
as Level 2 securities. Forward currency contracts derive their value from the underlying currency prices. These are valued by a pricing service using pricing models. The models use inputs that are observed from active markets, such as exchange rates. These contracts are classified as Level 2. Options can diverge from the prices of their underlying instruments. These are valued at the composite last price reported by the exchange on which the options are primarily traded on the day of the valuation and are classified as Level 1. If there is no composite last price on a given day the mean between the latest bid and ask price will be used. These contracts are classified as Level 2.
Any securities or other assets for which market quotations are not readily available are valued at fair value as determined in good faith by the Adviser pursuant to procedures established under the general supervision and responsibility of the Funds’ Board of Trustees and will be classified as Level 3 securities. In determining fair value, a Fund will seek to assign a value to the security which it believes represents the amount that the Fund could reasonably expect to receive upon its current sale. With respect to securities that are actively traded on U.S. exchanges, the Funds expect that market quotations will generally be available and that fair value might be used only in limited circumstances, such as when trading for a security is halted during the trading day.
The Gold Fund currently invests in a private fund that primarily invests in physical gold and is subject to redemption restrictions. This private fund investment can only be disposed of with notice given 24 hours in advance of redemption. This investment is currently valued at $17,324,163 which represents 1.2% of the Gold Fund’s net assets and is classified as Level 3.
For securities traded principally on foreign exchanges, the Funds may use fair value pricing if an event occurs after the close of trading of the principal foreign exchange on which a security is traded, but before calculation of a Fund’s NAV, which a Fund believes affects the value of the security since its last market quotation. Such events may involve situations relating to a single issuer (such as news related to the issuer announced after the close of the principal foreign exchange), or situations relating to sectors of the market or the markets in general (such as significant fluctuations in the U.S. or foreign markets or significant changes in exchange rates, natural disasters, armed conflicts, or governmental actions).
In determining whether a significant event has occurred with respect to securities traded principally in foreign markets, the Funds may engage a third party fair value service provider to systematically recommend the adjustment of closing market prices of non-U.S. securities based upon changes in a designated U.S. securities market index occurring from the time of close of the relevant foreign market and the close of the NYSE. Fair value pricing may also be used to value restricted securities held by the Funds or securities with little or no trading activity for extended periods of time. Fair value pricing involves judgements that are inherently subjective and inexact and it is not possible to determine with certainty when, and to what extent, an event will affect a market price. As a result, there can be no assurance that fair value pricing will reflect actual market value and it is possible that the fair value determined for a security may differ materially from the value that could be realized upon the sale of the security.
The following is a summary of the inputs used, as of April 30, 2016, involving the Funds’ assets and liabilities carried at fair value. The inputs of methodology used for valuing securities may not be an indication of the risk associated with investing in those securities.
| | | | | | | | | | | | | | | | |
| Description | | Level 1 | | | Level 2 | | | Level 3 | | | Total | |
The Tocqueville Fund | | | | | | | | | | | | | | | | |
Assets | | | | | | | | | | | | | | | | |
Common Stocks* | | $ | 275,822,900 | | | $ | — | | | $ | — | | | $ | 275,822,900 | |
Real Estate Investment Trust (REIT)* | | | 7,708,800 | | | | — | | | | — | | | | 7,708,800 | |
Exchange-Traded Fund (ETF)* | | | 2,462,000 | | | | — | | | | — | | | | 2,462,000 | |
Money Market Fund | | | 883 | | | | — | | | | — | | | | 883 | |
| | | | | | | | | | | | | | | | |
Total Assets | | $ | 285,994,583 | | | $ | — | | | $ | — | | | $ | 285,994,583 | |
| | | | | | | | | | | | | | | | |
| | | | |
| The Tocqueville Opportunity Fund | | Level 1 | | | Level 2 | | | Level 3 | | | Total | |
Assets | | | | | | | | | | | | | | | | |
Common Stocks* | | $ | 111,990,505 | | | $ | — | | | $ | — | | | $ | 111,990,505 | |
Real Estate Investment Trusts (REITs)* | | | 174,945 | | | | — | | | | — | | | | 174,945 | |
Purchased Call Options* | | | 595,950 | | | | | | | | | | | | 595,950 | |
Money Market Fund | | | 231 | | | | — | | | | — | | | | 231 | |
| | | | | | | | | | | | | | | | |
Total Assets | | $ | 112,761,631 | | | $ | — | | | $ | — | | | $ | 112,761,631 | |
| | | | | | | | | | | | | | | | |
| | | | |
| The Tocqueville International Value Fund | | Level 1 | | | Level 2 | | | Level 3 | | | Total | |
Assets | | | | | | | | | | | | | | | | |
Common Stocks | | | | | | | | | | | | |
Australia | | $ | — | | | $ | 6,548,301 | | | $ | — | | | $ | 6,548,301 | |
Belgium | | | — | | | | 10,528,498 | | | | — | | | | 10,528,498 | |
Canada | | | 10,764,623 | | | | — | | | | — | | | | 10,764,623 | |
Cayman Islands | | | — | | | | 6,624,306 | | | | — | | | | 6,624,306 | |
Denmark | | | — | | | | 9,280,176 | | | | — | | | | 9,280,176 | |
Finland | | | 4,535,896 | | | | — | | | | — | | | | 4,535,896 | |
France | | | — | | | | 78,751,969 | | | | — | | | | 78,751,969 | |
Germany | | | 8,547,429 | | | | 13,288,000 | | | | — | | | | 21,835,429 | |
Hong Kong | | | — | | | | 12,428,490 | | | | — | | | | 12,428,490 | |
Ireland | | | 7,363,040 | | | | 9,300,257 | | | | — | | | | 16,663,297 | |
Japan | | | — | | | | 63,754,252 | | | | — | | | | 63,754,252 | |
Netherlands | | | 7,483,400 | | | | 9,786,723 | | | | — | | | | 17,270,123 | |
Netherlands Antilles | | | 6,748,560 | | | | — | | | | — | | | | 6,748,560 | |
Norway | | | — | | | | 5,876,990 | | | | — | | | | 5,876,990 | |
Singapore | | | — | | | | 9,897,721 | | | | — | | | | 9,897,721 | |
Spain | | | — | | | | 8,050,468 | | | | — | | | | 8,050,468 | |
Switzerland | | | 8,753,643 | | | | — | | | | — | | | | 8,753,643 | |
United Kingdom | | | 23,291,446 | | | | 44,073,029 | | | | — | | | | 67,364,475 | |
United States | | | 11,090,376 | | | | — | | | | — | | | | 11,090,376 | |
| | | | | | | | | | | | | | | | |
Total Common Stocks | | | 88,578,413 | | | | 288,189,180 | | | | — | | | | 376,767,593 | |
Preferred Stocks* | | | — | | | | 11,832,526 | | | | — | | | | 11,832,526 | |
Money Market Fund | | | 21,942,132 | | | | — | | | | — | | | | 21,942,132 | |
Commercial Paper | | | — | | | | 6,257,000 | | | | — | | | | 6,257,000 | |
U.S. Treasury Bill | | | — | | | | 19,977,840 | | | | — | | | | 19,977,840 | |
| | | | | | | | | | | | | | | | |
Total Assets | | $ | 110,520,545 | | | $ | 326,256,546 | | | $ | — | | | $ | 436,777,091 | |
| | | | | | | | | | | | | | | | |
| | | | | | | | | | | | | | | | |
| The Tocqueville Gold Fund | | Level 1 | | | Level 2 | | | Level 3 | | | Total | |
Assets | | | | | | | | | | | | | | | | |
Common Stocks | | | | | | | | | | | | |
Gold Related | | $ | 1,116,616,796 | | | $ | 2,699,005 | | | $ | 829,642 | | | $ | 1,120,145,443 | |
Other Precious Metals Related | | | 105,996,799 | | | | 95,640 | | | | 4,900,635 | | | | 110,993,074 | |
Other | | | 31,727 | | | | — | | | | 7,533,975 | | | | 7,565,702 | |
| | | | | | | | | | | | | | | | |
Total Common Stocks | | | 1,222,645,322 | | | | 2,794,645 | | | | 13,264,252 | | | | 1,238,704,219 | |
Private Fund* | | | — | | | | — | | | | 17,324,163 | | | | 17,324,163 | |
Gold Bullion | | | — | | | | 154,744,450 | | | | — | | | | 154,744,450 | |
Convertible Bond* | | | — | | | | — | | | | 14,866,772 | | | | 14,866,772 | |
Warrants | | | | | | | | | | | | | | | | |
Gold Related | | | 687,894 | | | | 497,320 | | | | — | | | | 1,185,214 | |
Rights* | | | — | | | | 521,444 | | | | — | | | | 521,444 | |
Money Market Fund | | | 8,450,973 | | | | — | | | | — | | | | 8,450,973 | |
| | | | | | | | | | | | | | | | |
Total Assets | | $ | 1,231,784,189 | | | $ | 158,557,859 | | | $ | 45,455,187 | | | $ | 1,435,797,235 | |
| | | | | | | | | | | | | | | | |
| | | | |
| The Delafield Fund | | Level 1 | | | Level 2 | | | Level 3 | | | Total | |
Assets | | | | | | | | | | | | | | | | |
Common Stocks* | | $ | 342,285,128 | | | $ | — | | | $ | — | | | $ | 342,285,128 | |
Money Market Fund | | | 22,577,709 | | | | — | | | | — | | | | 22,577,709 | |
Commercial Paper | | | — | | | | 78,114,000 | | | | — | | | | 78,114,000 | |
| | | | | | | | | | | | | | | | |
Total Assets | | $ | 364,862,837 | | | $ | 78,114,000 | | | $ | — | | | $ | 442,976,837 | |
| | | | | | | | | | | | | | | | |
| | | | |
| The Tocqueville Select Fund | | Level 1 | | | Level 2 | | | Level 3 | | | Total | |
Assets | | | | | | | | | | | | | | | | |
Common Stocks* | | $ | 64,895,167 | | | $ | — | | | $ | — | | | $ | 64,895,167 | |
Money Market Fund | | | 937,929 | | | | — | | | | — | | | | 937,929 | |
| | | | | | | | | | | | | | | | |
Total Assets | | $ | 65,833,096 | | | $ | — | | | $ | — | | | $ | 65,833,096 | |
| | | | | | | | | | | | | | | | |
| | | | |
The Tocqueville Alternative Strategies
Fund | | Level 1 | | | Level 2 | | | Level 3 | | | Total | |
Assets | | | | | | | | | | | | | | | | |
Common Stocks* | | $ | 8,466,642 | | | $ | — | | | $ | — | | | $ | 8,466,642 | |
Convertible Bonds* | | | — | | | | 2,678,593 | | | | — | | | | 2,678,593 | |
Corporate Bonds* | | | — | | | | 2,918,600 | | | | — | | | | 2,918,600 | |
Preferred Stock* | | | 536,807 | | | | — | | | | — | | | | 536,807 | |
Real Estate Investment Trust (REIT)* | | | 388,331 | | | | — | | | | — | | | | 388,331 | |
Warrant* | | | — | | | | 1,108 | | | | — | | | | 1,108 | |
Money Market Fund | | | 1,485,014 | | | | — | | | | — | | | | 1,485,014 | |
Commercial Paper | | | — | | | | 8,065,000 | | | | — | | | | 8,065,000 | |
| | | | | | | | | | | | | | | | |
Total Assets | | $ | 10,876,794 | | | $ | 13,663,301 | | | $ | — | | | $ | 24,540,095 | |
| | | | | | | | | | | | | | | | |
| * | For further information regarding portfolio characteristics, please see the accompanying Schedules of Investments. |
Below is a reconciliation that details the transfer of securities between Level 1 and Level 2 during the reporting period:
| | | | |
| | | The
Tocqueville
Gold Fund | |
Transfers Into Level 1 | | $ | 1,072,846 | |
Transfers Out of Level 1 | | | (95,640 | ) |
| | | | |
Net Transfers Into/(Out of ) Level 1 | | | 977,206 | |
| | | | |
Transfers Into Level 2 | | | 95,640 | |
Transfers Out of Level 2 | | | (1,072,846 | ) |
| | | | |
Net Transfers Into/(Out of ) Level 2 | | $ | (977,206 | ) |
| | | | |
Below is a reconciliation that details the activity of securities in Level 3 during the current fiscal period:
| | | | |
| | | The
Tocqueville
Gold Fund | |
Beginning Balance—November 1, 2015 | | $ | 35,911,551 | |
Purchases | | | — | |
Sales | | | — | |
Realized gains | | | — | |
Realized losses | | | — | |
Change in unrealized depreciation | | | 9,543,636 | |
Transfers in/(out) of Level 3 | | | — | |
| | | | |
Ending Balance—April 30, 2016 | | $ | 45,455,187 | |
| | | | |
The movement from Level 2 to Level 1 in the Gold Fund was due to the use of market quotations or closing prices provided by the pricing service because the market was considered active. The movement from Level 1 to Level 2 in the Gold Fund was from the securities being priced using the mean of the bid and ask price due to the lack of trading volume on April 30, 2016. There were no transfers between levels in The Tocqueville Fund, The Opportunity Fund, The International Value Fund, The Delafield Fund, The Select Fund or The Alternative Strategies Fund. Transfers between levels are recognized at the end of the reporting period.
The Tocqueville Gold Fund
Significant Unobservable Inputs for Level 3 Portfolio Company Securities
| | | | | | | | | | | | |
Type of Security | | Industry | | Fair Value
at 4/30/2016 | | | Valuation
Techniques | | Unobservable
Inputs | | Range |
Common Stock | | | | | | | | | | | | |
| | Gold Related | | | $ 829,642 | | | Latest company valuation | | Financing prices | | $0.39 |
| | Other Precious Metals Related | | | 4,900,635 | | | Latest company financing price | | Financing prices | | $3.00 |
| | Other | | | 7,533,975 | | | Latest company financing price | | Financing prices | | $1.38-$8.60 |
Private Fund | | Gold Related | | | 17,324,163 | | | NAV from Fund Administrator | | Non-publically traded NAV | | $1,254.82 |
Convertible Bond | | Gold Related | | | 14,866,772 | | | Intrinsic value of the underlying equity price | | Illiquidity discount | | 25% |
The significant unobservable inputs used in the fair value measurement of the Gold Fund’s common stocks are the most recent financing prices of the portfolio company, which approximate the companies’ value in the market place. The significant unobservable inputs for the private fund is the non-publically traded net asset value per share determined by the private fund’s administrator.
Significant changes in the companies’ ability to receive financing for new projects in the future would be an indication of the companies’ financial position and market value. An increase in the discount applied to the value of resources, future expected cash flows, or to account for illiquidity would decrease the value of the portfolio security.
The Trust’s valuation procedures have been adopted by the Trust’s Board of Trustees, which has established a Valuation Committee to oversee the valuation process. The Valuation Committee meets on an as needed basis to evaluate changes in the valuation of portfolio securities. The full findings and valuations are then reviewed quarterly by the Independent Trustees.
d) Derivative Instruments and Hedging Activities
The Funds’ Adviser may use derivative instruments, such as options and forward currency contracts, as a means to manage exposure to different types of risk, including market risk and exchange rate risk, and to gain exposure to underlying securities. The Trust has adopted disclosure standards in order to enable the investor to understand how and why an entity used derivatives, how derivatives are accounted for, and how derivatives affect an entity’s results of operations and financial position.
In the Opportunity Fund and the Alternative Strategies Fund, the Adviser used options to gain exposure to the underlying equity security. In the International Value Fund, the Adviser used forward currency contracts to adjust exposure to foreign exchange rate risk.
Balance Sheet—Values of Derivative Instruments as of April 30, 2016.
The Tocqueville Opportunity Fund
| | | | | | | | | | | | |
| | | Asset Derivatives | | | Liability Derivatives | |
| Derivatives not accounted for as hedging instruments | | Balance Sheet
Location | | Value | | | Balance Sheet
Location | | Value | |
Purchased Options | | Investments,
at Value | | $ | 595,950 | | | | | $ | — | |
| | | | | | | | | | | | |
Total | | | | $ | 595,950 | | | | | $ | — | |
| | | | | | | | | | | | |
Offsetting on the Statement of Assets and Liabilities
For financial reporting purposes, the Fund offsets financial assets and financial liabilities that are subject to master netting arrangements or similar agreements within appreciation on forward currency contracts and depreciation on forward currency contracts on the Statement of Assets and Liabilities.
As of April 30, 2016, The Tocqueville Fund, Tocqueville Opportunity Fund, Tocqueville International Value Fund, Tocqueville Gold Fund, The Delafield Fund, Tocqueville Select Fund, and Tocqueville Alternative Strategies Fund were not subject to offsetting.
The Effect of Derivative Instruments on the Statement of Operations for the period ended April 30, 2016.
The Tocqueville Opportunity Fund
| | | | | | | | |
| | | Net Realized
Gain on Investments | | | Net Change in
Unrealized
Appreciation on
Investments | |
Purchased Options | | $ | 217,185 | | | $ | 1,803,535 | |
| | | | | | | | |
Total | | $ | 217,185 | | | $ | 1,803,535 | |
| | | | | | | | |
The Tocqueville Alternative Strategies Fund
| | | | | | | | |
| | | Net Realized
Gain on Investments | | | Net Change in
Unrealized
Depreciation on
Investments | |
Purchased Options | | $ | 26,216 | | | $ | (5,108 | ) |
| | | | | | | | |
Total | | $ | 26,216 | | | $ | (5,108 | ) |
| | | | | | | | |
The Tocqueville International Value Fund
| | | | | | | | |
| | | Net Realized
Gain on Forward
Currency Contracts | | | Net Change in
Unrealized
Appreciation on
Forward Currency
Contracts | |
Foreign Currency Forward Contract | | $ | 2,337 | | | $ | 48,730 | |
| | | | | | | | |
Total | | $ | 2,337 | | | $ | 48,730 | |
| | | | | | | | |
Derivatives Risk
The risks of using the types of derivatives in which the Funds may engage include the risk that movements in the value of the derivative may not fully offset or complement instruments currently held in the Funds in the manner intended by the Adviser; the risk that the counterparty to a derivative contract may fail to comply with their obligations to the Fund; the risk that the derivative may not possess a liquid secondary market at a time when the Fund would look to disengage the position; the risk that additional capital from the Fund may be called upon to fulfill the conditions of the derivative contract; and the risk that the cost of the derivative contracts may reduce the overall returns experienced by the Funds. The measurement of risks associated with these instruments is meaningful only when all related offsetting transactions are considered. The use of options and forward currency contracts do not create leverage in the Funds.
The average monthly value of call options in the Opportunity Fund during the period ended April 30, 2016 was $760,947.
Transactions in options in the Opportunity Fund during the period ended April 30, 2016 were as follows:
| | | | | | | | |
| | | Notional
Amount | | | Contracts | |
Outstanding, beginning of period: | | $ | 21,517,500 | | | | 1,820 | |
Options purchased | | | 15,563,750 | | | | 1,505 | |
Options terminated in closing transactions | | | (15,362,500 | ) | | | (1,750 | ) |
Options exercised | | | — | | | | — | |
Options expired | | | (11,987,500 | ) | | | (780 | ) |
| | | | | | | | |
Outstanding, end of period: | | $ | 9,731,250 | | | | 795 | |
The average monthly value of call options in the Alternative Strategies Fund during the period ended April 30, 2016 was $30,438.
Transactions in options in the Alternative Strategies Fund during the period ended April 30, 2016 were as follows:
| | | | | | | | |
| | | Notional
Amount | | | Contracts | |
Outstanding, beginning of period: | | $ | 262,500 | | | | 75 | |
Options purchased | | | 1,357,500 | | | | 215 | |
Options terminated in closing transactions | | | (1,357,500 | ) | | | (215 | ) |
Options exercised | | | — | | | | — | |
Options expired | | | (262,500 | ) | | | (75 | ) |
| | | | | | | | |
Outstanding, end of period: | | $ | — | | | | — | |
The average monthly notional amount of forward currency contracts during the period ended April 30, 2016 was as follows:
| | | | |
| | | International
Value Fund | |
Long Positions | | $ | — | |
Forward currency contracts | | | | |
Short Positions | | $ | 6,997,570 | |
Forward currency contracts | | | | |
e) Foreign currency translation
Investments and other assets and liabilities denominated in foreign currencies are translated to U.S. dollars at the prevailing rates of exchange, in accordance with the Trust’s Portfolio Securities Valuation and Foreign Exchange Contracts Procedures. The Tocqueville Fund, The Tocqueville Opportunity Fund, The Tocqueville International Value Fund, The Tocqueville Gold Fund, The Tocqueville Select Fund and The Tocqueville Alternative Strategies Fund have engaged in transactions in securities denominated in foreign currencies and, as a result, entered into foreign exchange transactions. The Tocqueville International Value Fund has entered into forward contracts. These Funds are exposed to additional market risk as a result of changes in the value of the underlying currency in relation to the U.S. dollar. Risks include potential inability of counterparties to meet the terms of their obligations. The value of foreign currencies are marked-to-market on a daily basis, which reflects the changes in the market value of the contract at the close of each day’s trading, resulting in daily unrealized gains and/or losses. When the transactions are settled or the contracts are closed, the Funds recognize a realized gain or loss.
The Funds isolate that portion of the results of operations resulting from changes in foreign exchange rates on investments from the fluctuations arising from changes in market prices of securities held. Such fluctuations are reflected as net realized and unrealized gain or loss on foreign currency translation.
Reported net realized foreign exchange gains or losses arise from sales of foreign currencies, currency gains or losses realized between the trade and settlement dates on securities transactions, the differences between the amounts of dividends, interest, and foreign withholding taxes recorded on the Fund’s books, and the U.S. dollar equivalent of the amounts actually received or paid. Net unrealized foreign exchange gains and losses arise from changes in the value of assets and liabilities other than investments in securities at the end of the fiscal period, resulting from changes in the exchange rates.
f) Dividends and distributions to shareholders
Dividends to shareholders are recorded on the ex-dividend date. Dividends from net investment income are declared and paid annually by the Funds. Distributions of net realized capital gains, if any, will be declared and paid at least annually. Income and capital gain distributions are determined in accordance with income tax regulations which
may differ from generally accepted accounting principles. Permanent differences between financial and tax reporting may result in reclassification to capital stock.
g) Use of estimates
The preparation of financial statements in conformity with accounting principles generally accepted in the United States of America requires management to make estimates and assumptions that affect the reported amounts of assets and liabilities and disclosure of contingent assets and liabilities at the date of the financial statements and the reported amounts of revenues and expenses during the reporting period. Actual results could differ from those estimates.
h) Indemnification
In the normal course of business the Funds enter into contracts that contain general indemnification clauses. The Funds’ maximum exposure under these arrangements is unknown, as this would involve future claims against a Fund that have not yet occurred. Based on experience, the Funds expect the risk of loss to be remote.
i) Short Sales
Short sales are transactions under which the Funds sell a security they do not own. To complete such a transaction, the Funds must borrow the security to make delivery to the buyer. The Funds then are obligated to replace the security borrowed by purchasing the security at the market price at the time of replacement. The price at such time may be more or less than the price at which the security was sold by the Funds. Until the security is replaced, the Funds are required to pay the lender amounts equal to dividend or interest that accrue during the period of the loan which is recorded as an expense on the Statements of Operations. To borrow the security, the Funds also may be required to pay a premium or an interest fee, which would decrease proceeds of the security sold. The proceeds of the short sale will be retained by the broker, to the extent necessary to meet margin requirements, until the short position is closed out. A gain, limited to the price at which the Funds sell the security short, or a loss, potentially unlimited in size, will be recognized upon the closing of a short sale. The Funds may not always be able to borrow a security or to close out a short position at a particular time or at an acceptable price. If the price of the borrowed security increases between the date of the short sale and the date on which the Funds replace the security, the Funds will experience a loss. The Funds’ loss on a short sale is limited only by the maximum attainable price of the security (which could be limitless) less the price the Funds received for the security at the time it was borrowed.
j) Subsequent events evaluation
In preparing these financial statements, the Trust has evaluated events and transactions for potential recognition or disclosure resulting from subsequent events through the date financial statements were available to be issued. This evaluation did not result in any subsequent events, other than those noted above, that necessitated disclosure and/or adjustments.
3. FEDERAL INCOME TAX
There is no tax liability resulting from unrecognized tax benefits relating to uncertain income tax positions taken or expected to be taken on the tax return for the fiscal year-end October 31, 2015, or for any other tax years which are open for exam. As of October 31, 2015, open tax years include the tax years ended October 31, 2012 through 2015. The Trust is also not aware of any tax positions for which it is reasonably possible that the total amounts of unrecognized tax benefits will significantly change in the next six months. The Funds recognize interest and penalties, if any, related to unrecognized tax benefits as income tax expense in the Statement of Operations. During the period, the Funds did not incur any interest or penalties.
Provision for federal income taxes or excise taxes has not been made since the Funds have elected to be taxed as Regulated Investment Companies and intend to distribute substantially all taxable income to shareholders and otherwise comply with the provisions of the Internal Revenue Code applicable to Regulated Investment Companies. Distributions from net realized gains for book purposes may include short-term capital gains which are included as ordinary income to shareholders for tax purposes. Additionally, accounting principles generally accepted in the United States of America require that certain components of net assets relating to permanent differences be reclassified between financial and tax reporting. These reclassifications have no effect on net assets or net asset value per share. For the period ended October 31, 2015, the following table shows the reclassifications made:
| | | | | | | | | | | | |
| | | Undistributed
Net Investment
Income/(Loss) | | | Accumulated Net
Realized Loss | | | Paid In Capital | |
Tocqueville Fund | | $ | (304,677 | ) | | $ | (3,139,297 | ) | | $ | 3,443,974 | |
Opportunity Fund | | | 111,659 | | | | (661,942 | ) | | | 550,283 | |
International Value Fund | | | 3,980,967 | | | | (5,815,397 | ) | | | 1,834,430 | |
Gold Fund | | | 11,145,627 | | | | (83,959 | ) | | | (11,061,668 | ) |
Delafield Fund | | | 3,935,750 | | | | (36,558,029 | ) | | | 36,622,279 | |
Select Fund | | | 571,904 | | | | (1,092,556 | ) | | | 520,652 | |
Alternative Strategies Fund | | | 71,755 | | | | (68,089 | ) | | | (3,666 | ) |
The permanent differences primarily relate to net operating losses, foreign currency reclasses, the usage of tax equalization, Partnerships, and PFICs.
As of October 31, 2015, the components of accumulated earnings (losses) for income tax purposes were as follows:
| | | | | | | | | | | | | | | | | | | | | | | | | | | | |
| | | Tocqueville
Fund | | | Opportunity
Fund | | | International
Value Fund | | | Gold
Fund | | | Delafield Fund | | | Select Fund | | | Alternative
Strategies
Fund | |
Tax cost of Investments | | $ | 181,629,377 | | | $ | 136,403,897 | | | $ | 303,055,555 | | | $ | 1,641,235,348 | | | $ | 522,631,842 | | | $ | 74,138,563 | | | $ | 47,967,968 | |
| | | | | | | | | | | | | | | | | | | | | | | | | | | | |
Unrealized Appreciation | | | 127,952,792 | | | | 29,918,298 | | | | 48,232,356 | | | | 138,530,623 | | | | 209,481,378 | | | | 17,389,591 | | | | 4,331,810 | |
Unrealized Depreciation | | | (112,033 | ) | | | (11,648,977 | ) | | | (15,752,490 | ) | | | (825,546,821 | ) | | | (54,830,750 | ) | | | (9,656,676 | ) | | | (5,319,820 | ) |
| | | | | | | | | | | | | | | | | | | | | | | | | | | | |
Net unrealized appreciation (depreciation) | | | 127,840,759 | | | | 18,269,321 | | | | 32,479,866 | | | | (687,016,198 | ) | | | 154,650,628 | | | | 7,732,915 | | | | (988,010 | ) |
| | | | | | | | | | | | | | | | | | | | | | | | | | | | |
Undistributed operating income | | | 2,750,258 | | | | — | | | | 5,967,776 | | | | — | | | | — | | | | — | | | | 114,238 | |
Undistributed long-term gains | | | 3,072,715 | | | | — | | | | 4,247,533 | | | | — | | | | 62,260,802 | | | | 2,573,564 | | | | — | |
| | | | | | | | | | | | | | | | | | | | | | | | | | | | |
Distributable earnings | | | 5,822,973 | | | | — | | | | 10,215,309 | | | | — | | | | 62,260,802 | | | | 2,573,564 | | | | 114,238 | |
| | | | | | | | | | | | | | | | | | | | | | | | | | | | |
Other accumulated gain/(loss) | | | — | | | | (948,632 | ) | | | (124,401 | ) | | | (132,305,044 | ) | | | (1,754,121 | ) | | | (402,033 | ) | | | 1,351,756 | |
| | | | | | | | | | | | | | | | | | | | | | | | | | | | |
Total accumulated gain/(loss) | | $ | 133,663,732 | | | $ | 17,320,689 | | | $ | 42,570,774 | | | $ | (819,321,242 | ) | | $ | 215,157,309 | | | $ | 9,404,446 | | | $ | 477,984 | |
| | | | | | | | | | | | | | | | | | | | | | | | | | | | |
The difference between book-basis and tax-basis unrealized appreciation is attributable primarily to wash sale deferrals and passive foreign investment companies (PFIC’s).
The tax character of distributions paid during the periods ended October 31, 2015 and 2014 was as follows:
| | | | | | | | | | | | |
| | | October 31, 2015 | |
| | | Ordinary
Income | | | Long Term
Capital Gain | | | Total | |
Tocqueville Fund | | $ | 2,801,877 | | | $ | 13,296,075 | | | $ | 16,097,952 | |
Opportunity Fund | | | 787,557 | | | | 9,390,632 | | | | 10,178,189 | |
International Value Fund | | | 5,099,005 | | | | 8,275,518 | | | | 13,374,523 | |
Gold Fund | | | — | | | | — | | | | — | |
Delafield Fund | | | — | | | | 136,125,451 | | | | 136,125,451 | |
Select Fund | | | — | | | | 12,348,792 | | | | 12,348,792 | |
Alternative Strategies Fund | | | — | | | | 852,479 | | | | 852,479 | |
| |
| | | October 31, 2014 | |
| | | Ordinary
Income | | | Long Term
Capital Gain | | | Total | |
Tocqueville Fund | | $ | 3,425,837 | | | $ | 2,781,747 | | | $ | 6,207,584 | |
Opportunity Fund | | | — | | | | 4,131,999 | | | | 4,131,999 | |
International Value Fund | | | 4,005,675 | | | | — | | | | 4,005,675 | |
Gold Fund | | | — | | | | — | | | | — | |
Delafield Fund | | | 2,044,951 | | | | 59,796,315 | | | | 61,841,266 | |
Select Fund | | | — | | | | 9,932,816 | | | | 9,932,816 | |
The tax character of distributions paid during the seven months ended December 31, 2013 and during the period June 29, 2012 (commencement of operations) through May 31, 2013 for the predecessor fund of the Alternative Strategies Fund was as follows:
| | | | | | | | |
| | | For the Period
January 1, 2014
to October 31, 2014 | | | For the Period
June 1, 2013
to December 31, 2013 | |
Distributions paid from | | | | | | | | |
Ordinary income | | $ | 1,482,558 | | | $ | 187,454 | |
Net Long-term capital gains | | $ | 903,018 | | | $ | 482,735 | |
| | | | | | | | |
Total distributions paid | | $ | 2,385,576 | | | $ | 670,189 | |
The Fund designated as long-term capital gain dividend, pursuant to Internal Revenue Code Section 852(b)(3), the amount necessary to reduce the earnings and profits of the Funds related to net capital gain to zero for the tax years ended October 31, 2015 and 2014.
For the fiscal year ended October 31, 2015 the Opportunity Fund, Gold Fund, Delafield Fund, and Select Fund had late year losses of $948,558, $8,758,830, $1,754,121 and $402,033, respectively.
At October 31, 2015 certain Funds had tax basis capital losses which may be carried forward to offset future capital gains as shown below.
| | | | | | | | |
| | | Capital losses Expiring | |
| | | Indefinite ST | | | Indefinite LT | |
Gold Fund | | $ | 4,781,530 | | | $ | 118,742,470 | |
Alternative Strategies Fund | | | — | | | | 133,276 | |
To the extent that Funds listed above may realize future net capital gains, those gains will be offset by any of their unused respective capital loss carryforwards
4. INVESTMENT ADVISORY AND OTHER AGREEMENTS
Tocqueville Asset Management L.P. (“Tocqueville”) is the investment adviser (the “Adviser”) to the Trust under Investment Advisory Agreements approved by shareholders. For its services, Tocqueville receives fees from The Tocqueville Fund, calculated daily and payable monthly, at an annual rate of 0.75% on the first $1 billion of the average daily net assets of the Fund, and 0.65% of the average daily net assets in excess of $1 billion. Tocqueville receives fees from The Tocqueville Opportunity Fund, calculated daily and payable monthly, at an annual rate of 0.75% on the first $500 million of the average daily net assets of the Fund, and 0.65% of the average daily net assets in excess of $500 million. Tocqueville receives fees from The Tocqueville International Value Fund, calculated daily and payable monthly, at an annual rate of 1.00% on the first $1 billion of the average daily net assets of the Fund, and 0.75% of the average daily net assets in excess of $1 billion. Tocqueville receives fees from The Tocqueville Gold Fund, calculated daily and payable monthly, at an annual rate of 1.00% on the first $500 million of the average daily net assets of the Fund, 0.75% of the average daily net assets in excess of $500 million but not exceeding $1 billion, and 0.65% of the average daily net assets in excess of $1 billion. Tocqueville receives fees from The Delafield Fund, calculated daily and payable monthly, at an annual rate of 0.80% on the first $250 million of net assets of the Fund; 0.75% on the next $250 million of net assets of the Fund; 0.70% on the next $500 million of net assets of the Fund; and 0.65% on all net assets of the Fund over $1 billion. Tocqueville receives fees from The Tocqueville Select Fund, calculated daily and payable monthly, at an annual rate of 0.80% on all net assets of the Fund. Tocqueville receives fees from The Tocqueville Alternative Strategies Fund, calculated daily and payable monthly, at an annual rate of 1.25% on the first $1 billion of net assets of the Fund; and 1.00% on all net assets of the Fund over $1 billion. Prior to October 1, 2015 Tocqueville received fees from The Tocqueville Alternative Strategies Fund, calculated daily and payable monthly, at an annual rate of 1.30% on the first $500 million of net assets of the Fund; 1.25% on the next $500 million of net assets of the Fund; and 1.20% on all net assets of the Fund over $1 billion.
With respect to The Tocqueville Fund, the Adviser has contractually agreed to waive its advisory fees and/or reimburse expenses in order to ensure that The Tocqueville Fund’s total annual operating expenses do not exceed 1.25% of its average daily net assets (excluding taxes, interest expense, acquired fund fees and expenses, or extraordinary
expenses such as litigation). The Expense Limitation Agreement will remain in effect until March 1, 2017. For the six months ended April 30, 2016, the Adviser waived $75,668 of the advisory fee. Such amount is not subject to recoupment by the Adviser.
With respect to The Tocqueville International Value Fund, the Adviser has contractually agreed to waive its advisory fees and/or reimburse expenses in order to ensure that The Tocqueville International Value Fund’s total annual operating expenses do not exceed 1.25% of its average daily net assets (excluding taxes, interest expense, acquired fund fees and expenses, or extraordinary expenses such as litigation). The Expense Limitation Agreement will remain in effect until March 1, 2017. For the six months ended April 30, 2016, the Adviser waived $539,781 of the advisory fee. Such amount is not subject to recoupment by the Adviser.
With respect to The Tocqueville Alternative Strategies Fund, the Adviser contractually agreed to waive its advisory fees and/or reimburse expenses in order to ensure that The Tocqueville Alternative Strategies Fund’s total annual operating expenses did not exceed 1.90% of its average daily net assets (excluding taxes, dividends and interest expense on short sales, acquired fund fees and expenses, or extraordinary expenses such as litigation). The Expense Limitation Agreement remained effective until the liquidation was completed on May 17, 2016. For the six months ended April 30, 2016, the Adviser waived $3,272 of the advisory fee. Such amount is not subject to recoupment by the Advisor.
Pursuant to an Administrative Services Agreement, each Fund pays to the Adviser a fee computed and paid monthly at an annual rate of 0.15% on the first $400 million of the average daily net assets of each fund; 0.13% on the next $600 million of the average daily net assets of each fund; and 0.12% on all the average daily net assets of each fund over $1 billion. For the six months ended April 30, 2016, the Adviser has made payments of $39,809, $17,794, $51,423, $136,366, $71,402, $9,386, $5,632 to U.S. Bancorp Fund Services, LLC for services provided under a Sub-Administration Agreement for The Tocqueville Fund, The Tocqueville Opportunity Fund, The Tocqueville International Value Fund, The Tocqueville Gold Fund, The Delafield Fund, The Tocqueville Select Fund and The Tocqueville Alternative Strategies Fund, respectively.
Tocqueville Securities, L.P. (the “Distributor”), an affiliate of Tocqueville, acts as distributor for shares of the Trust. Each Fund adopted a distribution and service plan pursuant to Rule 12b-1 of the 1940 Act. Pursuant to the plans, each Fund pays to the Distributor distribution and service fees of 0.25% per annum of its average daily net assets.
Commissions earned by the Distributor for services rendered as a registered broker-dealer in securities transactions for The Tocqueville Fund, The Tocqueville Opportunity Fund, The Tocqueville International Value Fund, The Tocqueville Gold Fund, The Delafield Fund, The Tocqueville Select Fund and The Tocqueville Alternative Strategies Fund for the period ended April 30, 2016, were $43,195, $13,105, $1,800 $1,521, $15,225, $19,676, $94, respectively.
5. CAPITAL SHARE TRANSACTIONS.
Transactions in capital shares for each Fund were as follows:
| | | | | | | | |
| | | For the
Six-Months
Ended
April 30, 2016
(Unaudited) | | | For the Year
Ended
October 31, 2015 | |
| The Tocqueville Fund | | Shares | | | Shares | |
Shares sold | | | 332,296 | | | | 1,103,428 | |
Shares issued to holders in reinvestment dividends | | | 180,321 | | | | 455,582 | |
Shares redeemed | | | (1,118,091 | ) | | | (3,295,867 | ) |
| | | | | | | | |
Net decrease | | | (605,474 | ) | | | (1,736,857 | ) |
| | |
| The Tocqueville Opportunity Fund | | | | | | | | |
Shares sold | | | 1,012,953 | | | | 4,986,584 | |
Shares issued to holders in reinvestment dividends | | | — | | | | 493,022 | |
Shares redeemed | | | (2,107,008 | ) | | | (1,839,479 | ) |
| | | | | | | | |
Net increase (decrease) | | | (1,094,055 | ) | | | 3,640,127 | |
| | |
| The Tocqueville International Value Fund | | | | | | | | |
Shares sold | | | 10,458,926 | | | | 10,658,518 | |
Shares issued to holders in reinvestment dividends | | | 668,623 | | | | 958,749 | |
Shares redeemed | | | (3,754,925 | ) | | | (5,103,371 | ) |
| | | | | | | | |
Net increase | | | 7,372,624 | | | | 6,513,896 | |
| | |
| The Tocqueville Gold Fund | | | | | | | | |
Shares sold | | | 6,790,298 | | | | 12,786,647 | |
Shares issued to holders in reinvestment dividends | | | — | | | | — | |
Shares redeemed | | | (7,215,672 | ) | | | (13,881,041 | ) |
| | | | | | | | |
Net decrease | | | (425,374 | ) | | | (1,094,394 | ) |
| | |
| The Delafield Fund | | | | | | | | |
Shares sold | | | 1,253,696 | | | | 2,623,792 | |
Shares issued to holders in reinvestment dividends | | | 2,473,115 | | | | 4,059,478 | |
Shares redeemed | | | (9,784,310 | ) | | | (23,653,398 | ) |
| | | | | | | | |
Net decrease | | | (6,057,499 | ) | | | (16,970,128 | ) |
| | |
| The Tocqueville Select Fund | | | | | | | | |
Shares sold | | | 270,607 | | | | 639,547 | |
Shares issued to holders in reinvestment dividends | | | 229,723 | | | | 940,811 | |
Shares redeemed | | | (1,257,281 | ) | | | (2,055,672 | ) |
| | | | | | | | |
Net decrease | | | (756,951 | ) | | | (475,314 | ) |
| | |
| The Tocqueville Alternative Strategies Fund | | | | | | | | |
Shares sold | | | 32,494 | | | | 469,939 | |
Shares issued to holders in reinvestment dividends | | | 4,090 | | | | 31,741 | |
Shares redeemed | | | (511,897 | ) | | | (233,043 | ) |
| | | | | | | | |
Net increase (decrease) | | | (475,313 | ) | | | 268,637 | |
6. FUND SHARE TRANSACTIONS
The Funds currently offer only one class of shares of beneficial interest. A redemption fee of 2.00% is imposed on redemptions of shares held 90 days or fewer for The Tocqueville Gold Fund. This fee is retained by the Fund and is credited to paid in capital. Redemptions to which the fee applies include redemptions of shares resulting from an exchange made pursuant to the Exchange Privilege, as defined in the Trust’s Prospectus dated February 26, 2016. For a more detailed description of when the redemption fee does not apply, please see the Trust’s Prospectus. On June 18, 2015, the Board of Trustees of the Trust approved the elimination of the redemption fee for The Tocqueville Fund, The Tocqueville Opportunity Fund, The Tocqueville International Value Fund, The Delafield Fund, The Tocqueville Select Fund and The Tocqueville Alternative Strategies Fund effective July 1, 2015.
7. INVESTMENT TRANSACTIONS
Purchases and sales of investment securities (excluding short-term instruments) for the period ended April 30, 2016 are summarized below.
| | | | | | | | | | | | | | | | | | | | | | | | | | | | |
| | | Tocqueville
Fund | | | Opportunity
Fund | | | International
Value Fund | | | Gold Fund | | | Delafield
Fund | | | Select
Fund | | | Alternative
Strategies
Fund | |
Purchases: | | $ | 27,322,864 | | | $ | 58,149,285 | | | $ | 137,695,382 | | | $ | 86,198,083 | | | $ | 65,814,290 | | | $ | 16,029,729 | | | $ | 16,091,301 | |
| | | | | | | | | | | | | | | | | | | | | | | | | | | | |
Sales: | | $ | 49,374,600 | | | $ | 76,821,447 | | | $ | 59,549,020 | | | $ | 106,544,576 | | | $ | 288,005,601 | | | $ | 23,076,723 | | | $ | 42,915,023 | |
| | | | | | | | | | | | | | | | | | | | | | | | | | | | |
U.S. Government Security Purchases: | | $ | — | | | $ | — | | | $ | — | | | $ | — | | | $ | — | | | $ | — | | | $ | — | |
| | | | | | | | | | | | | | | | | | | | | | | | | | | | |
U.S. Government Security Sales: | | $ | — | | | $ | — | | | $ | — | | | $ | — | | | $ | — | | | $ | — | | | $ | — | |
| | | | | | | | | | | | | | | | | | | | | | | | | | | | |
8. TRANSACTIONS WITH AFFILIATES
The following issuers are affiliated with the Funds; that is, the Adviser had control of 5% or more of the outstanding voting securities during the period from November 1, 2015 through April 30, 2016. As defined in Section (2)(a)(3) of the Investment Company Act of 1940; such issues are:
| | | | | | | | | | | | | | | | | | | | | | | | | | | | | | | | | | | | | | | | | | | | |
| | | November 1, 2015 | | | Additions | | | Reductions | | | April 30, 2016 | | | Dividend
Income | | | Realized
Gain/(Loss) | | | April 30, 2016 | |
Issuer Name | | Share
Balance | | | Cost | | | Share
Balance | | | Cost | | | Share
Balance | | | Cost | | | Share
Balance | | | | | Value | | | Cost | |
The Tocqueville Gold Fund | | | | | | | | | | | | | | | | | | | | | | | | | | | | | | | | | | | | | | | | | | | | |
Americas Silver Corp. | | | 25,668,419 | | | $ | 23,975,473 | | | | — | | | $ | — | | | | (7,143,000 | ) | | $ | (6,142,981 | ) | | | 18,525,419 | | | $ | — | | | $ | (5,789,066 | ) | | $ | 5,670,631 | | | $ | 17,832,492 | |
Americas Silver Corp. | | | 522,400 | | | | 984,285 | | | | — | | | | — | | | | — | | | | — | | | | 522,400 | | | | — | | | | — | | | | 158,215 | | | | 984,285 | |
Anthem United, Inc. | | | 8,075,000 | | | | 1,779,257 | | | | — | | | | — | | | | — | | | | — | | | | 8,075,000 | | | | — | | | | — | | | | 675,759 | | | | 1,779,257 | |
Anthem United, Inc. Warrant | | | 1,250,000 | | | | — | | | | — | | | | — | | | | — | | | | — | | | | 1,250,000 | | | | — | | | | — | | | | 23,611 | | | | — | |
Argonaut Gold, Inc.(a) | | | 2,687,000 | | | | 12,286,127 | | | | — | | | | — | | | | — | | | | — | | | | 2,687,000 | | | | — | | | | — | | | | 6,296,150 | | | | 12,286,127 | |
ATAC Resources Ltd. | | | 11,516,891 | | | | 39,793,482 | | | | — | | | | — | | | | — | | | | — | | | | 11,516,891 | | | | — | | | | — | | | | 6,608,880 | | | | 39,793,482 | |
AuRico Metals, Inc. | | | 1,411,437 | | | | 1,395,088 | | | | 6,000,000 | | | | 3,221,270 | | | | | | | | | | | | 7,411,437 | | | | | | | | | | | | 5,316,246 | | | | 4,616,358 | |
Bear Creek Mining Corp. | | | 7,413,200 | | | | 28,761,181 | | | | — | | | | — | | | | — | | | | — | | | | 7,413,200 | | | | — | | | | — | | | | 13,884,610 | | | | 28,761,181 | |
Corvus Gold, Inc. | | | 3,350,901 | | | | 2,356,445 | | | | — | | | | — | | | | — | | | | — | | | | 3,350,901 | | | | — | | | | — | | | | 2,838,213 | | | | 2,356,445 | |
Corvus Gold, Inc. | | | 10,630,000 | | | | 9,320,896 | | | | — | | | | — | | | | — | | | | — | | | | 10,630,000 | | | | — | | | | — | | | | 9,065,195 | | | | 9,320,896 | |
Corvus Gold, Inc. | | | — | | | | — | | | | 2,400,000 | | | | 1,267,925 | | | | — | | | | — | | | | 2,400,000 | | | | — | | | | — | | | | 2,005,770 | | | | 1,267,925 | |
Detour Gold Corp.(a) | | | 5,604,200 | | | | 91,506,440 | | | | — | | | | — | | | | (854,000 | ) | | | (28,127,998 | ) | | | 4,750,200 | | | | — | | | | (14,356,621 | ) | | | 101,879,239 | | | | 63,378,442 | |
East Asia Minerals Corp. | | | 66,484,933 | | | | 22,296,021 | | | | — | | | | — | | | | — | | | | — | | | | 66,484,933 | | | | — | | | | — | | | | 529,887 | | | | 22,296,021 | |
East Asia Minerals Corp. Warrant | | | 6,500,000 | | | | — | | | | — | | | | — | | | | — | | | | — | | | | 6,500,000 | | | | — | | | | — | | | | 45,589 | | | | — | |
East Asia Minerals Corp. Warrant | | | 9,764,933 | | | | — | | | | — | | | | — | | | | — | | | | — | | | | 9,764,933 | | | | — | | | | — | | | | — | | | | — | |
East Asia Minerals Corp. Right | | | 46,175,600 | | | | — | | | | — | | | | — | | | | — | | | | — | | | | 46,175,600 | | | | — | | | | — | | | | 368,021 | | | | — | |
GoGold Resources, Inc. | | | 20,670,300 | | | | 25,703,524 | | | | — | | | | — | | | | — | | | | — | | | | 20,670,300 | | | | — | | | | — | | | | 23,722,987 | | | | 25,703,524 | |
Gold Bullion International LLC | | | 5,000,000 | | | | 5,000,000 | | | | — | | | | — | | | | — | | | | — | | | | 5,000,000 | | | | — | | | | — | | | | 6,893,000 | | | | 5,000,000 | |
International Tower Hill Mines Ltd. | | | 5,738,836 | | | | 20,953,121 | | | | — | | | | — | | | | — | | | | — | | | | 5,738,836 | | | | — | | | | — | | | | 4,224,357 | | | | 20,953,121 | |
International Tower Hill Mines Ltd. | | | 11,289,744 | | | | 40,113,412 | | | | — | | | | — | | | | — | | | | — | | | | 11,289,744 | | | | — | | | | — | | | | 8,278,126 | | | | 40,113,412 | |
MAG Silver Corp. | | | 2,951,400 | | | | 31,481,549 | | | | — | | | | — | | | | — | | | | — | | | | 2,951,400 | | | | — | | | | — | | | | 38,368,200 | | | | 31,481,549 | |
NuLegacy Gold Corp. | | | — | | | | — | | | | 19,535,500 | | | | 3,102,220 | | | | — | | | | — | | | | 19,535,500 | | | | — | | | | — | | | | 5,605,149 | | | | 3,102,220 | |
Osisko Gold Royalties Ltd. | | | 3,114,140 | | | | 44,534,686 | | | | 561,500 | | | | 6,859,309 | | | | — | | | | — | | | | 3,675,640 | | | | 184,097 | | | | — | | | | 49,215,551 | | | | 51,393,995 | |
Osisko Gold Royalties Ltd. Warrant | | | 274,000 | | | | — | | | | — | | | | — | | | | — | | | | — | | | | 274,000 | | | | — | | | | — | | | | 687,894 | | | | — | |
Premier Gold Mines Ltd. | | | 7,857,660 | | | | 15,522,203 | | | | — | | | | — | | | | — | | | | — | | | | 7,857,660 | | | | — | | | | — | | | | 23,484,678 | | | | 15,522,203 | |
Primero Mining Corp.(a) | | | 6,909,800 | | | | 44,503,243 | | | | — | | | | — | | | | (6,909,800 | ) | | | (44,503,243 | ) | | | — | | | | — | | | | (31,823,917 | ) | | | — | | | | — | |
Rockhaven Resources Ltd. | | | 6,400,000 | | | | 6,455,589 | | | | — | | | | — | | | | — | | | | — | | | | 6,400,000 | | | | — | | | | — | | | | 994,660 | | | | 6,455,589 | |
Rubicon Minerals Corp. | | | 11,275,000 | | | | 15,678,646 | | | | — | | | | — | | | | — | | | | — | | | | 11,275,000 | | | | — | | | | — | | | | 449,311 | | | | 15,678,646 | |
SEMAFO, Inc. | | | 10,285,200 | | | | 36,814,926 | | | | — | | | | — | | | | (195,000 | ) | | | (286,443 | ) | | | 10,090,200 | | | | — | | | | 207,690 | | | | 44,852,957 | | | | 36,528,483 | |
Silver Range Resources Ltd. | | | 3,450,000 | | | | — | | | | — | | | | — | | | | — | | | | — | | | | 3,450,000 | | | | — | | | | — | | | | 384,953 | | | | — | |
Strategic Metals Ltd. | | | 10,926,900 | | | | 15,810,172 | | | | — | | | | — | | | | — | | | | — | | | | 10,926,900 | | | | — | | | | — | | | | 3,918,949 | | | | 15,810,172 | |
| | | | | | | | | | | | | | | | | | | | | | | | | | | | | | | | | | | | | | | | | | | | |
| | | November 1, 2015 | | | Additions | | | Reductions | | | April 30, 2016 | | | Dividend
Income | | | Realized
Gain/(Loss) | | | April 30, 2016 | |
Issuer Name | | Share
Balance | | | Cost | | | Share
Balance | | | Cost | | | Share
Balance | | | Cost | | | Share
Balance | | | | | Value | | | Cost | |
Tocqueville Bullion Reserve LP—Class G(b) | | | 13,806 | | | $ | 25,000,000 | | | | — | | | $ | — | | | | — | | | $ | — | | | | 13,806 | | | $ | — | | | $ | — | | | $ | 17,324,163 | | | $ | 25,000,000 | |
Torex Gold Resources, Inc. | | | 34,615,500 | | | | 53,049,316 | | | | — | | | | | | | | (1,690,000 | ) | | | (3,491,785 | ) | | | 32,925,500 | | | | — | | | | (2,046,483 | ) | | | 58,519,060 | | | | 49,557,531 | |
| | | | | | | | | | | | | | | | | | | | | | | | | | | | | | | | | | | | | | | | | | | | |
| | | | | | $ | 615,075,082 | | | | | | | $ | 14,450,724 | | | | | | | $ | (82,552,450 | ) | | | | | | $ | 184,097 | | | $ | (53,808,397 | ) | | $ | 442,290,011 | | | $ | 546,973,356 | |
The Delafield Fund | | | | | | | | | | | | | | | | | | | | | | | | | | | | | | | | | | | | | | | | | | | | |
Horizon Global Corp. | | | 425,000 | | | $ | 5,335,877 | | | | — | | | $ | — | | | | — | | | $ | — | | | | 425,000 | | | $ | — | | | $ | — | | | $ | 5,214,750 | | | $ | 5,335,877 | |
Kemet Corp. | | | 2,850,000 | | | | 13,351,401 | | | | — | | | | — | | | | (600,000 | ) | | | (3,388,149 | ) | | | 2,250,000 | | | | — | | | | (1,952,866 | ) | | | 5,220,000 | | | | 9,963,252 | |
Ryerson Holding Corp.(a) | | | 1,300,000 | | | | 12,470,700 | | | | — | | | | — | | | | (1,150,000 | ) | | | (11,569,145 | ) | | | 150,000 | | | | — | | | | (5,050,932 | ) | | | 1,332,000 | | | | 901,555 | |
Xerium Technologies, Inc. | | | 950,000 | | | | 12,669,193 | | | | — | | | | — | | | | (50,000 | ) | | | (626,875 | ) | | | 900,000 | | | | — | | | | (116,500 | ) | | | 4,761,000 | | | | 12,042,318 | |
| | | | | | | | | | | | | | | | | | | | | | | | | | | | | | | | | | | | | | | | | | | | |
| | | | | | $ | 43,827,171 | | | | | | | $ | — | | | | | | | $ | (15,584,169 | ) | | | | | | $ | — | | | $ | (7,120,298 | ) | | $ | 16,527,750 | | | $ | 28,243,002 | |
The Tocqueville Select Fund | | | | | | | | | | | | | | | | | | | | | | | | | | | | | | | | | | | | | | | | | | | | |
Horizon Global Corp. | | | 328,000 | | | $ | 4,274,125 | | | | 40,000 | | | $ | 373,605 | | | | — | | | $ | — | | | | 368,000 | | | $ | — | | | $ | — | | | $ | 4,515,360 | | | $ | 4,647,730 | |
Summer Infant, Inc. | | | 674,016 | | | | 2,691,994 | | | | — | | | | — | | | | — | | | | — | | | | 674,016 | | | | — | | | | — | | | | 943,622 | | | | 2,691,994 | |
Xerium Technologies, Inc. | | | 265,000 | | | | 3,374,608 | | | | — | | | | — | | | | — | | | | — | | | | 265,000 | | | | — | | | | — | | | | 1,401,850 | | | | 3,748,213 | |
| | | | | | | | | | | | | | | | | | | | | | | | | | | | | | | | | | | | | | | | | | | | |
| | | | | | $ | 10,340,727 | | | | | | | $ | 373,605 | | | | | | | $ | — | | | | | | | $ | — | | | $ | — | | | $ | 6,860,832 | | | $ | 11,087,937 | |
The Tocqueville Alternative Strategies Fund | | | | | | | | | | | | | | | | | | | | | | | | | | | | | | | | | | | | | | | | | | | | |
Inuvo, Inc. | | | 350,000 | | | $ | 588,327 | | | | — | | | $ | — | | | | — | | | $ | — | | | | 350,000 | | | $ | — | | | $ | — | | | $ | 623,000 | | | $ | 588,327 | |
Inuvo, Inc. Warrant | | | 31,750 | | | | — | | | | — | | | | — | | | | — | | | | — | | | | 31,750 | | | | — | | | | — | | | | 1,108 | | | | — | |
| | | | | | | | | | | | | | | | | | | | | | | | | | | | | | | | | | | | | | | | | | | | |
| | | | | | $ | 588,327 | | | | | | | $ | — | | | | | | | $ | — | | | | | | | $ | — | | | $ | — | | | $ | 624,108 | | | $ | 588,327 | |
| (a) | Security is no longer an affiliated company at April 30, 2016. |
| (b) | Tocqueville Bullion Reserve (“TBR”) is a Delaware Limited Partnership created for the purpose of owning physical gold. The General Partner of TBR is TERA Management LLC (“Tera”), a Delaware Limited Liability Company, which is equally owned and managed by Tocqueville Partners II LLC (“TP2”), a Delaware Limited Liability Company, and Eidesis Real Assets LLC (“Eidesis”), a Delaware Limited Liability Company. The Managing Member of TP2 is Robert Kleinschmidt, President of the Trust, who has a 51% participating percentage in TP2 and the sole Non-Managing Member is John Hathaway, co-portfolio manager of the Tocqueville Gold Fund, who has a 49% participating percentage. |
9. LINE OF CREDIT
The Tocqueville Trust has a $300,000,000 line of credit (the “Line”), which is uncommitted, with U.S. Bank NA. The Line is for temporary emergency or extraordinary purposes, including the meeting of redemption requests that otherwise might require the untimely disposition of securities. The Line is secured by the Trust’s assets. The Line has a one year term and is reviewed annually by the Board of Trustees. The current agreement runs through May 27, 2017. The interest rate as of April 30, 2016 was 3.00%. During the period ended April 30, 2016, the Tocqueville Fund’s maximum borrowing was $4,308,000 and average borrowing was $596,056, the Opportunity Fund’s maximum borrowing was $3,584,000 and average borrowing was $530,379, the Gold Fund’s maximum borrowing was $8,000,000 and average borrowing was $705,355 and the Alternative Strategies Fund’s maximum borrowing was $382,000 and average borrowing was $3,081. This borrowing resulted in interest expenses of $8,013, $8,032, $10,633 and $32, respectively. The International Value Fund, The Delafield Fund and The Select Fund did not use the Line.
For the period ended April 30, 2016 the outstanding loan amounts for The Tocqueville Fund, The Tocqueville Opportunity Fund, The Tocqueville International Value Fund, The Tocqueville Gold Fund, The Delafield Fund, The Tocqueville Select Fund and The Tocqueville Alternative Strategies Fund were $0, $783,000, $0, $0, $0, $0, $0, respectively.
10. OTHER EXPENSES
Other expenses include reimbursement to the Adviser for compensation of the Trust’s Chief Compliance Officer. For the six months ended April 30, 2016, reimbursement to the Adviser for compensation of the Trust’s Chief Compliance Officer from the Funds amounted to $9,010, $4,032, $11,630, $30,762, $16,168, $2,122, $1,277 for the Tocqueville Fund, Opportunity Fund, International Value Fund, Gold Fund, Delafield Fund, Select Fund and Alternative Strategies Fund, respectively.
ADDITIONAL INFORMATION (UNAUDITED)
1. ADDITIONAL DISCLOSURE REGARDING FUND TRUSTEES AND OFFICERS
Independent Trustees
| | | | | | | | | | | | |
Name and Age | | Position(s) Held
with the Trust | | Term of Office
and Length of Time Served (1) | | Principal Occupation(s)
During Past Five Years | | Number of Funds
in Fund Complex
Overseen By Trustee | | | Other Directorships
Held by Trustee |
| | | | | |
Charles W. Caulkins Year of Birth: 1956 | | Trustee; Member of Audit Committee; Member of Governance and Nominating Committee | | Indefinite Term, Since 2003 | | Private Investor from January 2012 –present; Partner, Chora Capital, LLC from June 2010 – December 2011; Director of Marketing, L.R. Global Partners from January 2008 – May 2010; President, Arbor Marketing, Inc. from October 1994 to December 2007. | | | 7 | | | Director, Stepping Stones from January 2012 – 2013; Director, Phoenix House from January 2001 to 2007. |
| | | | | |
Alexander Douglas Year of Birth: 1947 | | Trustee; Member of Audit Committee; Member of Governance and Nominating Committee | | Indefinite Term, Since 2010 | | Retired. Formerly, President, CEO and owner of Spaulding Law Printing, Inc. from 1992 to November 2014 | | | 7 | | | None |
| | | | | |
Charles F. Gauvin Year of Birth: 1956 | | Trustee; Member of Audit Committee; Member of Governance and Nominating Committee | | Indefinite Term, Since February 2015 | | Chief Development Officer, Woods Hole Oceanographic Institution, from February 2016 – present; Executive Director, Maine Audubon, from August 2014 – January 2016; Chief Development Officer, Carnegie Endowment for International Peace, from September 2011 – May 2014; Partner, The Riparian Fund/Legacy Ranch Partners (private equity real estate fund), from February 2010 – December 2012; President and CEO, Trout Unlimited (fish and river conservation), from April 1991 – February 2010. | | | 7 | | | Director, Bioqual, Inc., July 1992 – present. |
ADDITIONAL INFORMATION (UNAUDITED)
Independent Trustees
| | | | | | | | | | | | |
Name and Age | | Position(s) Held
with the Trust | | Term of Office
and Length of Time Served (1) | | Principal Occupation(s)
During Past Five Years | | Number of Funds
in Fund Complex
Overseen By Trustee | | | Other Directorships
Held by Trustee |
| | | | | |
James W. Gerard Year of Birth: 1961 | | Trustee; Member of Audit Committee; Member of Governance and Nominating Committee | | Indefinite Term, Since 2001 | | Managing Director, Hycroft Advisors, from January 2010-present; Managing Director, deVisscher & Co., LLC from January 2013 to present; Principal, Juniper Capital Group, LLC (formerly known as Argus Advisors International, LLC) from August 2003 to December 2009; Managing Director, The Chart Group from January 2001 to present. | | | 7 | | | President, American Overseas Memorial Day Association, 1998 to present; Director and Treasurer ASPCA, 1998 to 2008; Trustee, Salisbury School, 2005 to present; Director, American Friends of Bleraucourt, 1992 to present; President, Little Baby Face Foundation, March 2015 to present. |
| | | | | |
William F. Indoe Year of Birth; 1942 | | Trustee; Member of Audit Committee; Member of Governance and Nominating- Committee | | Indefinite Term, Since December 2006 | | Retired. Formerly, Sullivan & Cromwell LLP (attorneys-at-law). 1968 – 2011. | | | 7 | | | Director, Rho Capital Partners, Inc. |
| | | | | |
William J. Nolan III Year of Birth: 1947 | | Trustee; Chair of Audit Committee; Member of Governance and Nominating Committee | | Indefinite Term, Since December 2006 | | Retired. Executive Vice President & Treasurer PaineWebber Inc. 1997 – 2001. | | | 7 | | | Trustee, Adirondack Museum, Blue Mt. Lake, NY 1996 to present (Treasurer, 2000 to 2013; Chair of the Investment Committee, 2009 – present). |
ADDITIONAL INFORMATION (UNAUDITED)
Interested Trustees2 and Officers
| | | | | | | | | | | | |
Name and Age | | Position(s) Held
with the Trust | | Term of Office
and Length of
Time Served (1) | | Principal Occupation(s)
During Past Five Years | | Number of Funds
in Fund Complex
Overseen By Trustee | | | Other Directorships
Held by Trustee |
| | | | | |
Helen Balk Year of Birth: 1972 | | Treasurer | | Indefinite Term, Since 2014 | | Controller / Treasurer of Tocqueville Asset Management from January 2014 to present; Manager/ Staff Accountant at Pegg & Pegg LLP from August 1995 to January 2014. | | | N/A | | | N/A |
| | | | | |
Elizabeth Bosco Year of Birth: 1947 | | Anti-Money Laundering Compliance Officer | | Indefinite Term, Since 2009 | | Chief Compliance Officer of Tocqueville Securities, L.P. from January 2009 to present; Compliance Officer, Tocqueville Asset Management from January 2009 to present. | | | N/A | | | N/A |
| | | | | |
Robert W. Kleinschmidt Year of Birth: 1949 | | President and Trustee | | Indefinite Term, Since 1991 | | President and Chief Investment Officer of Tocqueville Asset Management; Director, Tocqueville Management Corporation, the General Partner of Tocqueville Asset Management L.P. and Tocqueville Securities L.P. from January 1994 to present; and Managing Director from July 1991 to January 1994; Partner, David J, Greene & Co. from May 1978 to July 1991. | | | 7 | | | President and Director, Tocqueville Management Corporation, the General Partner of Tocqueville Asset Management L.P. and Tocqueville Securities L.P. |
| | | | | |
Cleo Kotis Year of Birth: 1975 | | Secretary | | Indefinite Term, Since 2010 | | Director of Operations, the Delafield Group of Tocqueville Asset Management L.P., 2009 to present; Vice President and Chief Operations Officer, the Delafield Fund, Inc. from 2005 – 2009; Vice President and Chief Operations Officer, Delafield Asset Management from 2005 – 2009; Vice President, Reich & Tang Asset Management, LLC from 2002 – 2009. | | | N/A | | | N/A |
ADDITIONAL INFORMATION (UNAUDITED)
Interested Trustees2 and Officers
| | | | | | | | | | | | |
Name and Age | | Position(s) Held
with the Trust | | Term of Office
and Length of
Time Served (1) | | Principal Occupation(s)
During Past Five Years | | Number of Funds
in Fund Complex
Overseen By Trustee | | | Other Directorships
Held by Trustee |
| | | | | |
Thomas Pandick Year of Birth: 1947 | | Chief Compliance Officer | | Indefinite Term, Since 2004 | | Chief Compliance Officer (October 2004 –present) Tocqueville Asset Management L.P. | | | N/A | | | N/A |
| | | | | |
François D. Sicart Year of Birth: 1943 | | Chairman and Trustee | | Indefinite Term, Since 1987 | | Chairman, Tocqueville Management Corporation, the General Partner of Tocqueville Asset Management L.P. and Tocqueville Securities L.P. from January 1990 to present; Chairman and Founder, Tocqueville Asset Management Corporation from December 1985 to January 1990; Vice Chairman of Tucker Anthony Management Corporation from 1981 to October 1986; Vice President (formerly general partner) among other positions with Tucker Anthony, Inc. from 1969 to January 1990. | | | 7 | | | Chairman and Director, Tocqueville Management Corporation, the General Partner of Tocqueville Asset Management L.P. and Tocqueville Securities L.P. from January 1990 to present. |
| 1 | Each Trustee will hold office for an indefinite term until the earliest of (i) the next meeting of shareholders, if any, called for the purpose of considering the election or re-election of such Trustee and until the election and qualification of his or her successor, if any, elected at such meeting, or (ii) the date a Trustee resigns or retires, or a Trustee is removed by the Board of Trustees or shareholders, in accordance with the Trust’s By-Laws, as amended, and Agreement and Declaration of Trust, as amended. Each officer will hold office for an indefinite term until the date he or she resigns or retires or until his or her successor is elected and qualifies. |
| 2 | “Interested person” of the Trust as defined in the 1940 Act. Mr. Sicart and Mr. Kleinschmidt are considered “interested persons” because of their affiliation with the Advisor. |
2. PROXY VOTING POLICIES AND PROCEDURES
A description of the policies and procedures that The Tocqueville Trust uses to determine how to vote proxies relating to portfolio securities is available without charge upon request by calling 1-800-355-7307. Information regarding how The Tocqueville Trust voted proxies relating to portfolio securities during the most recent 12-month period ended June 30 is available by calling 1-800-355-7307 and it is also available on the SEC’s web site at http://www.sec.gov.
3. SHAREHOLDER REPORTS AND QUARTERLY PORTFOLIO DISCLOSURE
The Tocqueville Trust is required to file its complete schedule of portfolio holdings with the SEC for its first and third fiscal quarters on Form N-Q. The Trust’s Form N-Q will be available without charge, upon request on the SEC’s website (http://www.sec.gov) and may be available by calling 1-800-697-3863. You can also obtain copies of Form N-Q by (i) visiting the SEC’s Public Reference Room in Washington, DC (information on the operation of the Public Reference Room may be obtained by calling 1-202-551-8090); (ii) sending your request and a duplicating fee to the SEC’s Public Reference Room, Washington, DC 20549-1520; or (iii) sending your request electronically to publicinfosec.gov. Quarterly portfolio holdings are also available on the website of The Tocqueville Funds, www.tocqueville.com/mutual-funds.
4. SHAREHOLDER NOTIFICATION OF FEDERAL TAX STATUS
For the fiscal period ended October 31, 2015, certain dividends paid by the Funds may be subject to a maximum tax rate of 15%, as provided for by the Jobs and Growth Tax Relief Reconciliation Act of 2003. The percentage of dividends declared from ordinary income designated as qualified dividend income was as follows:
| | | | |
Tocqueville Fund | | | 100.00 | % |
Opportunity Fund | | | 0.00 | % |
International Value Fund | | | 91.80 | % |
Gold Fund | | | 0.00 | % |
Delafield Fund | | | 0.00 | % |
Select Fund | | | 0.00 | % |
Alternative Strategies Fund | | | 0.00 | % |
For corporate shareholders, the percent of ordinary income distributions qualifying for the corporate dividends received deduction for the fiscal period ended October 31, 2015 was as follows:
| | | | |
Tocqueville Fund | | | 47.28 | % |
Opportunity Fund | | | 0.00 | % |
International Value Fund | | | 5.20 | % |
Gold Fund | | | 0.00 | % |
Delafield Fund | | | 0.00 | % |
Select Fund | | | 0.00 | % |
Alternative Strategies Fund | | | 0.00 | % |
For the period ended October 31, 2015, the funds designate the following percent of ordinary distributions paid as interest-related dividends under the Internal Revenue Code Section 871(k)(1)(c):
| | | | |
Tocqueville Fund | | | 0.00 | % |
Opportunity Fund | | | 0.00 | % |
International Value Fund | | | 0.02 | % |
Gold Fund | | | 0.00 | % |
Delafield Fund | | | 0.00 | % |
Select Fund | | | 0.00 | % |
Alternative Strategies Fund | | | 0.00 | % |
The percentage of taxable ordinary income distributions that are designated as short-term capital gain distributions under Internal Revenue Section 871(k)(2)(C) for each Fund were as follows.
| | | | |
Tocqueville Fund | | | 0.00 | % |
Opportunity Fund | | | 100.00 | % |
International Value Fund | | | 0.00 | % |
Gold Fund | | | 0.00 | % |
Delafield Fund | | | 0.00 | % |
Select Fund | | | 0.00 | % |
Alternative Strategies Fund | | | 0.00 | % |
5. FOREIGN TAX CREDIT
For the year ended October 31, 2015, the Tocqueville International Value Fund earned foreign source income and paid foreign taxes which they intend to pass through to their shareholders pursuant to Section 853 of the Internal Revenue Code as follows:
| | | | | | | | |
Country | | Gross Dividend
Per Share | | | Taxes Withheld
Per Share | |
Australia | | | 0.0077 | | | | 0.0002 | |
Belgium | | | 0.0139 | | | | 0.0021 | |
Canada | | | 0.0080 | | | | 0.0012 | |
Switzerland | | | 0.0098 | | | | 0.0015 | |
Germany | | | 0.0132 | | | | 0.0014 | |
Denmark | | | 0.0051 | | | | 0.0008 | |
France | | | 0.0026 | | | | 0.0075 | |
Spain | | | 0.0497 | | | | 0.0005 | |
Hong Kong | | | 0.0431 | | | | 0.0000 | |
Ireland | | | 0.0072 | | | | 0.0000 | |
Jersey | | | 0.0004 | | | | 0.0000 | |
Japan | | | 0.0373 | | | | 0.0037 | |
South Korea | | | 0.0053 | | | | 0.0009 | |
Cayman Islands | | | 0.0108 | | | | 0.0000 | |
Luxembourg | | | 0.0024 | | | | 0.0004 | |
Netherlands | | | 0.0164 | | | | 0.0025 | |
Norway | | | 0.0220 | | | | 0.0028 | |
| | | | | | | | |
| | | 0.25466 | | | | 0.02541 | |
| | | | | | | | |
Investment Adviser
Tocqueville Asset Management L.P.
40 W. 57th St., 19th Floor
New York, NY 10019
(212) 698-0800
www.tocqueville.com
Distributor
Tocqueville Securities, L.P.
40 W. 57th St., 19th Floor
New York, NY 10019
(212) 698-0800
Shareholders’ Servicing and Transfer Agent
U.S. Bancorp Fund Services, LLC
P.O. Box 701
Milwaukee, WI 53201-0701
(800) 697-3863
Custodian
U.S. Bank, N.A.
Custody Operations
1555 River Center Drive, Suite 302
Milwaukee, WI 53212
Board of Trustees
François D. Sicart—Chairman
Charles W. Caulkins
Alexander Douglas
Charles F. Gauvin
James W. Gerard
William F. Indoe
Robert W. Kleinschmidt
William J. Nolan III
Tocqueville Funds
c/o US Bancorp Fund Services, LLC
P.O. Box 701
Milwaukee, WI 53201-0701
www.tocqueville.com/mutual-funds
TQ-SEMI Tocqueville Semi Annual Report 4/30/2016
Not applicable for semi-annual reports.
| Item 3. | Audit Committee Financial Expert. |
Not applicable for semi-annual reports.
| Item 4. | Principal Accountant Fees and Services. |
Not applicable for semi-annual reports.
| Item 5. | Audit Committee of Listed Registrants. |
Not applicable to registrants who are not listed issuers (as defined in Rule 10A-3 under the Securities Exchange Act of 1934).
Schedule of Investments is included as part of the report to shareholders filed under Item 1 of this Form.
| Item 7. | Disclosure of Proxy Voting Policies and Procedures for Closed-End Management Investment Companies. |
Not applicable to open-end investment companies.
| Item 8. | Portfolio Managers of Closed-End Management Investment Companies. |
Not applicable to open-end investment companies.
| Item 9. | Purchases of Equity Securities by Closed-End Management Investment Company and Affiliated Purchasers. |
Not applicable to open-end investment companies.
| Item 10. | Submission of Matters to a Vote of Security Holders. |
There have been no material changes to the procedures by which shareholders may recommend nominees to the registrant’s board of trustees.
| Item 11. | Controls and Procedures. |
| (a) | The Registrant’s President and Treasurer have reviewed the Registrant’s disclosure controls and procedures (as defined in Rule 30a-3(c) under the Investment Company Act of 1940 (the “Act”)) as of a date within 90 days of the filing of this report, as required by Rule 30a-3(b) under the Act and Rules 13a-15(b) or 15d-15(b) under the Securities Exchange Act of 1934. Based on their review, such officers have concluded that the disclosure controls and procedures are effective in ensuring that information required to be disclosed in this report is appropriately recorded, processed, summarized and reported and made known to them by others within the Registrant and by the Registrant’s service provider. |
| (b) | There were no changes in the Registrant’s internal control over financial reporting (as defined in Rule 30a-3(d) under the Act) that occurred during the second fiscal quarter of the period covered by this report that has materially affected, or is reasonably likely to materially affect, the Registrant’s internal control over financial reporting. |
| (a) | (1) Any code of ethics or amendment thereto, that is the subject of the disclosure required by Item 2, to the extent that the registrant intends to satisfy Item 2 requirements through filing an exhibit. Not Applicable. |
(2) A separate certification for each principal executive and principal financial officer pursuant to Section 302 of the Sarbanes-Oxley Act of 2002. Filed herewith.
(3) Any written solicitation to purchase securities under Rule 23c-1 under the Act sent or given during the period covered by the report by or on behalf of the registrant to 10 or more persons. Not applicable to open-end investment companies.
| (b) | Certifications pursuant to Section 906 of the Sarbanes-Oxley Act of 2002. Furnished herewith. |
SIGNATURES
Pursuant to the requirements of the Securities Exchange Act of 1934 and the Investment Company Act of 1940, the registrant has duly caused this report to be signed on its behalf by the undersigned, thereunto duly authorized.
| | |
| |
(Registrant) | | The Tocqueville Trust |
| | |
| |
By (Signature and Title)* | | /s/ Robert W. Kleinschmidt |
| | Robert W. Kleinschmidt, President |
Pursuant to the requirements of the Securities Exchange Act of 1934 and the Investment Company Act of 1940, this report has been signed below by the following persons on behalf of the registrant and in the capacities and on the dates indicated.
| | |
| |
By (Signature and Title)* | | /s/ Robert W. Kleinschmidt |
| | Robert W. Kleinschmidt, President |
| | |
| |
By (Signature and Title)* | | /s/ Helen Balk |
| | Helen Balk, Treasurer |
| * | Print the name and title of each signing officer under his or her signature. |