UNITED STATES
SECURITIES AND EXCHANGE COMMISSION
Washington, D.C. 20549
FORM N-CSR
CERTIFIED SHAREHOLDER REPORT OF REGISTERED
MANAGEMENT INVESTMENT COMPANIES
Investment Company Act file number 811-4840
The Tocqueville Trust
(Exact name of registrant as specified in charter)
The Tocqueville Trust
40 West 57th Street, 19th Floor
New York, NY 10019
(Address of principal executive offices) (Zip code)
Robert W. Kleinschmidt
The Tocqueville Trust
40 West 57th Street, 19th Floor
New York, NY 10019
(Name and address of agent for service)
(212) 698-0800
Registrant’s telephone number, including area code
Date of fiscal year end: October 31
Date of reporting period: April 30, 2012
Item 1. Reports to Stockholders.
SEMI-ANNUAL REPORT
April 30, 2012
The Tocqueville Trust
Mutual Funds
The Tocqueville Fund
The Tocqueville Opportunity Fund
The Tocqueville International Value Fund
The Tocqueville Gold Fund
The Delafield Fund
The Tocqueville Select Fund

This report is not authorized for distribution to prospective investors unless preceded or accompanied by a currently effective prospectus of The Tocqueville Trust. Please call 1-800-697-FUND (3863) for a free prospectus. Read it carefully before you invest.
You are invited to visit our website @ www.tocqueville.com/mutual-funds
Dear Fellow Shareholder,
The stock market, as measured by the American S&P 500 index, has about doubled from the level to which it had fallen in the spring of 2009. Other market indices, in the United States and globally, have risen somewhat more or less, but most are up substantially from their Great Recession lows.
On the other hand, historians and serious students of the market, who tend to define “secular” bear markets in terms of valuation measures such as Price/Earnings ratios rather than simply prices, argue that we have been in such a long-term bear market since early 2000, the peak of the “tech” and Internet bubble.
Surely, the aftermath of the 2007-2010 financial crisis has been quite scary. Many countries are struggling with unsustainable levels of debt; elected governments are abdicating their fiscal responsibilities, leaving central banks to deal with both deflationary and inflationary threats; for corporations and governments alike, access to liquidity is uncertain; Europe is threatening to break down; the United States economy is facing a potentially disastrous fiscal cliff if all the “Bush” tax cuts are allowed to expire at once; and consumers are feeling the pain of de-leveraging almost everywhere.
On the other hand, twelve years of bear market is a long time. By now, courtesy of CNBC, Bloomberg TV and the likes, no one can ignore the world economies’ predicament. While it can’t quite be said yet that stock market investors have capitulated, they have been exiting equity mutual funds and individual shares steadily for months. So, from a purely contrarian perspective, things are becoming more alluring.
I am no market analyst but, in my recollection, major bear markets end either in a selling climax (like 1974) or in an extended attrition (like 1982). No one can say for sure how it will happen this time. But, already, some values are appearing.
In the United States some financially solid companies are selling at low price/earnings ratios and offering dividend yields that are very competitive with quality long-term bonds. In Europe, many companies are suffering of having their share prices labeled in Euros, whereas a majority of their revenues and profits comes from outside Europe. Similar comments could be made about other regions as well, with China’s Shanghai index, for example, still 50% below its peak high as economists debate whether the economy will grow at 6%, 7% or 8%.
We believe that opportunities might become more compelling in coming months.
Faithfully yours,

François Sicart
Chairman
The Tocqueville Fund
Dear Fellow Shareholder,
The investment world continues to be buffeted by the sovereign debt storm emanating from Europe. During periods of relative calm on that front, markets have rallied; only to plunge once again as the storm intensifies. These are dangerous times, and for more than just the mutual fund investor. We continue to be impressed with the magnitude of government fiscal and demographic problems, not only in Europe, but all over the developed world, even China. Being unsolvable by the political process, these problems are not about to go away, and we remain convinced that it is the bond market that will eventually play the role of the adult in bringing government borrowing and spending into line with what their respective economies can afford. That is not a pleasant thought and hardly an optimal solution, but the evidence is scant that governments or the general public they represent are willing to take their medicine and scale back the spending and the programs that have brought us to this precarious point. It is very hard to take away from people (voters no less) that which they feel entitled to receive. Nowhere has this been done on any kind of meaningful scale without social unrest and worse.
In an effort to avoid the inevitable, we expect central banks to continue to create money out of thin air, in order to pay for unaffordable government obligations with ever decreasing (in value) paper currencies. This isn’t a bad strategy, given the circumstances, and given the fact that the global deleveraging process has slowed what monetary economists call the velocity of money. Eventually, however, we expect the general public to get wise to the trick and to increase their inflationary expectations, leading to a rise in interest rates and the bond vigilantes’ pillaging of the debt markets. When all this is to happen is not within our power to predict with any degree of accuracy, but it is within our investment horizon, and thus we remain very cautious in our investment strategy.
Large, well-capitalized, dividend paying global companies with dominant market shares and high returns on capital strike me as the best place to weather the ongoing storms. All the more so, because many names in this category are not expensive by historical valuation yardsticks. Higher beta financial names, while quite possibly providing attractive trading opportunities from time to time, do not qualify for this designation, and we have generally avoided them. The large technology companies, other than Apple, consumer staple names and some pharmaceuticals remain our primary holdings along with a menu of well-run cyclical names, industrials as well as commodity producers, which would benefit from a stronger global economy than what markets are currently predicting. Why? Because we might be wrong.
The Fund’s results over the six month period ended April 30, 2012 were generally favorable as investors gained 8.53%. This was a bit disappointing relative to the S&P 500’s very strong 12.77% gain, but not surprising given our general underrepresentation in Financials and the absence of Apple in our portfolio. All but one sector of the fund, Energy, contributed to performance and several of our largest positions had the most significant impact on returns. The top five contributors to performance during the period all meet the criteria mentioned above of high quality dividend paying global companies and included Pfizer, MasterCard, Microsoft, General Electric and Home Depot. On the other side of the coin, with the exception of Newmont Mining which was the largest negative influence, the five names that were the biggest detractors from performance largely were victims of certain aspects of the fears facing the global economy. For instance, Chesapeake Energy and CARBO Ceramics succumbed to declining natural gas prices brought on by a glut of production in the face of a weak U.S. economy, Cliffs Natural Resources declined due to concerns that Chinese demand for iron ore was softening and Banco Santander was impacted by the European sovereign debt crisis. Newmont, however, declined somewhat ironically for the opposite reasons as perceptions of the economy had at the time improved sufficiently to slow the upward price momentum of gold as a safe haven. In some cases, such as Chesapeake, these lower prices presented further opportunity, and we added to our holdings, but in the case of CARBO Ceramics we judged the company was more susceptible to competition than we had previously anticipated and exited the position.
Trading activity was more concentrated on the sell side rather than the buy side as we monetized positions in response to demand for investor liquidity and in a few cases as a result of a change in investment thesis such as Vulcan Materials which received and then rebuffed a hostile takeover proposal. We initiated a number of new holdings including: Baker Hughes, which we believed to be attractively valued with significant opportunity for margin improvement despite
concerns about the impact of natural gas prices on drilling activity; Xerox, which is very cash generative with a high degree of recurring service revenue but suffers under the misperception that demand for copiers is likely to decline rapidly; and PepsiCo, which we believe will unlock value through the eventual split of its beverage and snack businesses. We also partially swapped Lowes for Home Depot as the former had underperformed and offered more upside than the latter which had approached our price target.
While we remain vigilant on the macroeconomic front in the face of the previously mentioned threats, we continue to look for equities that trade at a significant discount to their intrinsic value utilizing conservative assumptions that reflect our cautious outlook for the global economy.
Lastly, please let me extend our thanks for your continued interest in our Fund.
Sincerely,

Robert W. Kleinschmidt
Portfolio Manager
The Tocqueville Fund
(Unaudited)
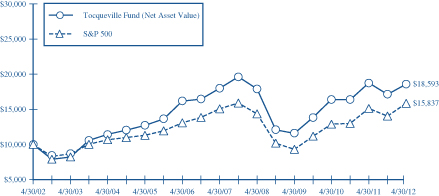
This chart assumes an initial gross investment of $10,000 made on 4/30/02. Returns shown do not reflect the deduction of taxes that a shareholder would pay on fund distributions or the redemption of fund shares. Performance reflects fee waivers in effect. In the absence of fee waivers, total return would be reduced. Returns shown include the reinvestment of all dividends and other distributions. Past performance is not predictive of future performance. Investment return and principal value will fluctuate so that your shares, when redeemed, may be worth more or less than their original cost. The Fund imposes a 2% redemption fee on shares held for 90 days or less.
The Standard & Poor’s 500 Stock Index (S&P 500) is a capital-weighted index, representing the aggregate market value of the common equity of 500 stocks primarily traded on the New York Stock Exchange. Returns assume the reinvestment of all dividends.
AVERAGE ANNUAL RATE OF RETURN (%)
FOR PERIODS ENDED APRIL 30, 2012
| | | | | | | | | | | | | | | | |
| | | 1 Year | | | 3 Year | | | 5 Year | | | 10 Year | |
Tocqueville Fund | | | -0.88% | | | | 17.09% | | | | 0.68% | | | | 6.40% | |
Standard & Poor’s 500 Stock Index | | | 4.76% | | | | 19.46% | | | | 1.01% | | | | 4.71% | |
The Tocqueville Opportunity Fund
Dear Fellow Shareholder,
U.S. equity markets advanced smartly during the first half of the fiscal year ended April 30, 2012. The Tocqueville Opportunity Fund appreciated 13.30%, and outperformed its benchmark (Russell 2500 Growth Index) which gained 11.72%. During the six month period, the large capitalization Standard and Poor’s 500 Index rose 12.77% and outperformed the small capitalization Russell 2000 Index, which gained 11.02%. In the SMID capitalization asset class, value stocks lead the growth issues counterpart as the Russell 2500 Value Index gained 12.32%.
The Consumer/Consumer Discretionary and Technology sectors have continued to hold the #1 and #2 positions with regard to investment weightings on an adjusted basis (from Unclassified), and collectively represent nearly half of the Fund’s investment allocations at 51.5%. Nevertheless, commitments to the top two sectors were reduced slightly over the past six months. We have continued to increase investment in the Health Care sector to approximately 16% of the Fund from under 12% on April 30, 2011. These three sectors represented nearly two-thirds of the Fund’s investments on April 30, 2012. During the period, investments in the Health Care and Consumer Discretionary sectors provided the top and second best performance on both an absolute basis and relative basis. Although sector allocations, other than the increases in Health Care, have remained relatively stable, we have continued to diversify the portfolio with new investment positions. The top 10 and top 25 holdings, as a percentage of the Fund total, have actually declined respectively since October 31, 2011 (16.7% versus 17.7%, and 30.6% versus 33.9%). During the period of increased macro-economic uncertainty and market volatility, the Fund’s diversification strategy has mitigated exposure to individual issue price risk. While the number of “home runs” may have been limited, we believe that containing “concentration” risk has been a critical and successful investment strategy for controlling overall portfolio risks. Measured against a benchmark with in excess of 2000 positions, the Fund’s 50% allocation to the top 50 names could be easily mistaken for being relatively concentrated.
During the six months ended April 30, 2012, four of the top five price leaders were Health Care issues: Pharmasset, Illumina, Alnylam Pharmaceuticals and Incyte. Pharmasset was taken over by Gilead Sciences and Roche made a hostile bid to buy Illumina in January. Equinix, Inc. provided the third best individual stock appreciation during the period with a gain of 71%; Equinix is an owner and provider of data center services and IT services for businesses. When accounting for the combination of weighting and price gain, the leading relative performance for the Fund included two Biotechnology holdings: Pharmasset and Alexion Pharmaceuticals. Apple, Facebook and Priceline.com also provided leading relative performance. The Fund also benefitted from merger/acquisition activity. Additional holdings which were taken over included: Success Factors (SAP), GeoResources (Halcon Resources), Gen-Probe (Hologic), Nalco (Ecolab), and Taleo (Oracle). Over the past twelve month period ended April 30, 2012, the Fund has benefitted from 17 takeovers/takeover attempts; the high level of activity has confirmed the considerable attractiveness of smaller capitalization issues as large capitalization companies seek to consolidate companies in order to sustain their own growth rates and competitive advantages as well as utilize their considerable balance sheets, which are cash laden.
While we were pleased with the overall performance during the period, there were several disappointing investments, which impacted the Fund. From a sector standpoint, the Fund’s largest drawdown was attributable to Financial Services; the Fund’s most underweight sector. This sector’s 14+% rally during the period exceeded the Fund’s collective Financial Services holdings’ performance and the Russell 2500 Growth Index as well. Allscripts Healthcare, Deckers Outdoor, and Accretive Health all declined over 50% during the period due to disappointing earnings, management turmoil, and/or legal actions. While the declines were significant, the overall impacts to the Fund were limited to less than 6/10ths of one percent on an absolute basis due to the Fund’s diversification strategy.
Investors will recall that the commencement date of the current fiscal period coincided with the ending of the waterfall correction from July 2011. That swift, severe market decline was driven by uncertainty with U.S. deficit financing and a rapid loss of confidence with the resolve of European decision makers to address the risks of the EU sovereign debt and any associated risks of financial contagion, devaluation or breakup of the EU currency bloc. As we moved into the Fund’s new fiscal year, the combination of extremely negative sentiment and attractive equity valuations
provided the impetus for substantial market gains. Furthermore, the European Central Bank provided a newly supportive, short-term financing and liquidity measure for the banking system—the Long Term Refinancing Operation. Although markets proved rewarding through the end of the first six month period, the European situation has continued to represent the single greatest macro risk confronting investors. Recent election results in Europe have indicated that there is considerable political turmoil and dissatisfaction with current economic reform. Moreover, there is increased concern with recessionary risks and weakness in the Spanish banking system. On the U.S. side, the economy had performed well enough through the end of April—the median price for existing homes in April was +10.1% from a year earlier. The April jobs report was weak and with the warm winter having shifted economic activity to the early months, investors had begun to shift to a less positive view on the sustainability of growth. Moreover, with the U.S. in an election year, investors have become increasingly concerned with the brinkmanship and gridlock over the expiration of tax cuts and the extension of fiscal stimulus which is being referred to as the “fiscal cliff”. We believe headway towards resolution of European and U.S. policy and economic risks will be critical for financial markets from the current price levels. Against these aforementioned headwinds, we will continue to maintain a diversified investment profile and a focus on those opportunities where solid execution is ongoing. As we have witnessed over the past six months, investors gravitate most quickly to invest in those companies with the steady or improved growth rates and leading market share positions. We expect that any near-term volatility will present continued opportunity to initiate or increase investments in such issues. We appreciate very much your ongoing confidence in our efforts on behalf of the Tocqueville Opportunity Fund.
Sincerely,

Thomas R. Vandeventer
Portfolio Manager
The Tocqueville Opportunity Fund
(Unaudited)
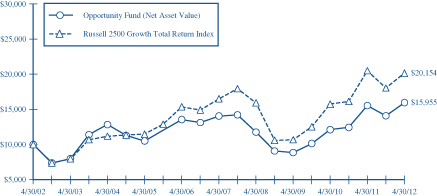
This chart assumes an initial gross investment of $10,000 made on 4/30/02. On July 1, 2010, a new portfolio management team assumed management of The Tocqueville Small Cap Fund and the Fund’s name and investment strategy changed as of October 12, 2010 (See Footnote 1 to the Financial Statements). Returns shown do not reflect the deduction of taxes that a shareholder would pay on fund distributions or the redemption of fund shares. Returns shown include the reinvestment of all dividends and other distributions. Past performance is not predictive of future performance. Investment return and principal value will fluctuate so that your shares, when redeemed, may be worth more or less than their original cost. The Fund imposes a 2% redemption fee on shares held for 90 days or less.
The Russell 2500 Growth Total Return Index is an unmanaged index that measures the performance of the small to mid-cap growth segment of the U.S. equity universe. It includes those Russell 2500 companies with higher price-to-book ratios and higher forcasted growth values. Returns assume the reinvestment of all dividends.
AVERAGE ANNUAL RATE OF RETURN (%)
FOR PERIODS ENDED APRIL 30, 2012
| | | | | | | | | | | | | | | | |
| | | 1 Year | | | 3 Year | | | 5 Year | | | 10 Year | |
Tocqueville Opportunity Fund | | | 2.73% | | | | 21.72% | | | | 2.58% | | | | 4.78% | |
Russell 2500 Growth Total Return Index | | | -1.61% | | | | 23.64% | | | | 4.08% | | | | 7.26% | |
The Tocqueville International Value Fund
Dear Fellow Shareholder,
For the six months ended April 30, 2012, global equity markets produced modest gains. Equities advanced during much of the period as the European Central Bank’s LTRO helped to temporarily diffuse investor concerns about a financial meltdown in Europe, while improving macroeconomic data in Japan and the U.S. gave rise to the perception that a global recovery might gain traction. Then in April markets declined as a slowdown in LTRO activity and weak macroeconomic data in Europe caused investors once again to focus on risks, principal among them a possible slowdown in China, deterioration in Spain’s banking system, and a looming fiscal cliff in the U.S. The Tocqueville International Value Fund’s total U.S. dollar return for the period was a loss of 1.18%. In the same period, the Morgan Stanley EAFE Index, the benchmark against which we are most often compared, had a total U.S. dollar return of 2.71%.
During the six months, the European BE 500 index increased by 7.13% in local currency terms, the Japanese Nikkei 225 increased by 7.02% in local currency terms, and the MSCI Asia Pacific ex-Japan increased by 4.21%. The CRB Index of commodity prices declined by 4%, with industrial metals generally declining, gold declining, and agricultural commodities mixed, and oil increasing in value. Among developed equity markets, the U.S. fared well, while northern Europe and Japan made modest gains and southern Europe declined. Emerging markets were mixed, with Latin America and most of Asia up modestly and China down. In terms of sectors, beverages, consumer products and computer services led advances, while energy and telecom equipment declined. Most major currencies declined in value against the U.S. dollar as the market became more convinced about a recovery in the U.S. and fearful of a slowdown elsewhere.
Our holdings produced mixed results during the period, with our best performance coming from consumer related shares in the Asia Pacific region and our worst performance from gold mining shares. Standout positive contributors were Australian business services concern Spotless Group, subject of a takeover offer; Hong Kong broadcast television concern Television Broadcasts; Chinese outdoor advertising company Clear Media; Italian hydraulic equipment maker Interpump; German compact equipment maker Wacker Neuson; and, Japanese industrial conglomerate Hitachi. We had notable losses in Newmont Mining and Barrick Gold, as well as Spanish IT concern Indra Sistemas, Belgian wireless telecom services provider Mobistar and Italian auto parts maker Sogefi.
During the period, we exited positions in UK credit scoring concern Experian, Mexican beverage producer FEMSA, and UK business and construction services concern Interserve, which following strong performance approached our estimates of intrinsic value. We sold French integrated oil producer Total after a gas leak in the North Sea created an unquantifiable liability for the company. We sold Mobistar, where our investment thesis was undercut by a change in competitive conditions that had a negative impact on pricing and profit margins. And we sold Spanish IT services provider Indra Sistemas, where weakening payment terms from government customers undercut our thesis regarding free cash generation. We took new positions in Japanese company Disco, the global leader in chip dicing and wafer grinding equipment and related consumables which was depressed due to worries about the global IT cycle, in French television broadcaster M6, which generates a double digit free cash flow yield in a tepid economic environment, in Japanese footwear maker Asics, which is the global leader in performance running shoes and trades at a marked discount to intrinsic value, and in drug maker Novartis, which has a high free cash yield based on its existing pharma portfolio and where we were not paying much for an attractive pipeline of new products and the eye care franchise.
Developed market equity markets outside the U.S. are trading at very low valuations on a number of cash flow and book value metrics. Emerging markets valuations continue to deflate and are also reaching more attractive levels in absolute terms. There are indeed a number of potentially dangerous risks facing the global economy. Europe is slowing down and could slow further if the EU does not take action to recapitalize its banks, institute labor reforms and growth oriented economic policies, and provide for some form of jointly guaranteed debt issuance. And while the U.S. continues on a path of slow and uneven improvement, the so called fiscal cliff could knock the economy off track unless politicians take action to address spending cuts and tax increases scheduled to take effect in 2013. On the other hand, we think fears relating to China are overdone, and we are on balance sanguine about the skill with which the economy is being managed during a period of political transition as well as transition to a more consumer driven economic model. With sentiment
generally quite negative, interest rates low and valuations cheap, we think the balance of risks is in our favor. And there is no shortage of interesting stocks to investigate. But we will retain a portion of our cash position so that if a negative scenario develops we are in a position to capitalize on it.
We continue to employ our investment discipline, seeking to discover fundamentally attractive companies that are out of favor and undervalued, and to provide our shareholders with above average returns with below average risk over the course of an economic cycle.
Respectfully,
James Hunt
Portfolio Manager
The Tocqueville International Value Fund
(Unaudited)
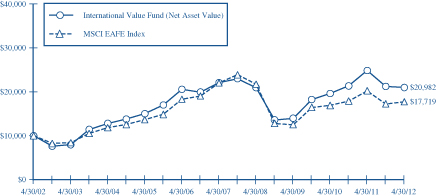
This chart assumes an initial gross investment of $10,000 made on 4/30/02. Returns shown do not reflect the deduction of taxes that a shareholder would pay on fund distributions or the redemption of fund shares. Performance reflects fee waivers in effect. In the absence of fee waivers, total return would be reduced. Returns shown include the reinvestment of all dividends and other distributions. Past performance is not predictive of future performance. Investment return and principal value will fluctuate so that your shares, when redeemed, may be worth more or less than their original cost. The Fund imposes a 2% redemption fee on shares held 90 days or less.
The MSCI EAFE Index is an unmanaged market-capitalization-weighted index composed of companies representative of the market structure of 22 Developed Market Countries in Europe, Australia, Asia and the Far East.
AVERAGE ANNUAL RATE OF RETURN (%)
FOR PERIODS ENDED APRIL 30, 2012
| | | | | | | | | | | | | | | | |
| | | 1 Year | | | 3 Year | | | 5 Year | | | 10 Year | |
Tocqueville International Value Fund | | | -15.54% | | | | 14.50% | | | | -1.01% | | | | 7.69% | |
MSCI EAFE Index | | | -12.38% | | | | 12.30% | | | | -4.25% | | | | 5.89% | |
The Tocqueville Gold Fund
Dear Fellow Shareholder,
During the first six months of the 2012 fiscal year, the Tocqueville Gold Fund declined 15.91% vs. declines of 17.34% for the XAU (Philadelphia Stock Exchange Gold/Silver Index), and 2.92% for physical gold. In contrast, the S&P 500 gained 12.77% over this period. Currently, the Fund’s position in physical gold is 7.6% of its net assets and the balance is in shares of mining or processing companies whose principal business is the production of gold and other precious metals, and cash equivalents.
The first half of the fiscal year has been lively, to say the least. The gold market was whipsawed with liquidation selling in December, followed by news in January from the Federal Reserve that interest rates would be exceptionally low into 2014, and finally capped off in February by Fed Chairman Bernanke’s pronouncement that future quantitative easing was unlikely. Gold and precious metals shares meanwhile followed suit as investor sentiment ended the period at extreme lows.
Discouraged investors must be asking what it will take for precious metals shares to break out of their extended funk. We believe that the catalyst will be a move to new highs by gold during the remainder of the year. While this assertion may seem simplistic, the shares have underperformed the metal for an extended period, despite record earnings, cash flow, and dividends. From a contrarian point of view, we believe the stocks are table pounding buys unless the gold price plummets to levels substantially below that of December. We believe such a scenario is highly unlikely.
Against this backdrop, the Fund performed well relative to its benchmark during this period. The top contributors over this period included Gold Resource, European Goldfields, and Franco-Nevada which appreciated 22.1%, 17.6%, and 13.7% respectively. Notable among these was the performance by European Goldfields, which was the subject of an acquisition offer. This is another example of our strategy of investing in earlier stage companies that create value through exploration and development, and may eventually be acquired by a producing company. In contrast, our portfolio also had its share of disappointments during the period. The most notable were Ivanhoe Mines, Newmont, and IAMGOLD, which declined 42.9%, 27.8%, and 41.9% respectively. Despite the lackluster performance, we continue to believe that these companies will be able to deliver shareholder value over time.
Gold stocks are, in our view, demonstrably cheap and offer value comparable to the bottom in 2008. The ratio of the XAU to the price of gold is actually lower than at the historic low. Based on steadily rising inflation, negative real interest rates, the worsening sovereign debt crisis in Europe, and the prospect of further debt monetization by the Fed past the scheduled end of “Operation Twist” on June 30, or the likelihood of substantially higher interest rates which would stymie the feeble economic recovery, it would seem that the rationale for gold to surpass its highs of September 2011 is compelling.
Sincerely,

John C. Hathaway
Portfolio Manager
The Tocqueville Gold Fund
(Unaudited)
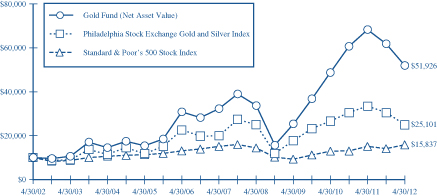
This chart assumes an initial gross investment of $10,000 made on 4/30/02. Returns shown do not reflect the deduction of taxes that a shareholder would pay on fund distributions or the redemption of fund shares. Returns shown include the reinvestment of all dividends and other distributions. Past performance is not predictive of future performance. Investment return and principal value will fluctuate so that your shares, when redeemed, may be worth more or less than their original cost. The Fund imposes a 2% redemption fee on shares held 90 days or less.
In 2003, 2006, 2009, and 2010 the performance of The Tocqueville Gold Fund was achieved during a period of unusually favorable market conditions. Such performance may not be sustainable.
The Philadelphia Stock Exchange Gold and Silver Index is an unmanaged capitalization-weighted index which includes the leading companies involved in the mining of gold and silver. Returns include the reinvestment of all dividends.
The Standard & Poor’s 500 Stock Index (S&P 500) is a capital-weighted index, representing the aggregate market value of the common equity of 500 stocks primarily traded on the New York Stock Exchange. Returns include the reinvestment of all dividends.
AVERAGE ANNUAL RATE OF RETURN (%)
FOR PERIODS ENDED APRIL 30, 2012
| | | | | | | | | | | | | | | | |
| | | 1 Year | | | 3 Year | | | 5 Year | | | 10 Year | |
Tocqueville Gold Fund | | | -23.90% | | | | 27.04% | | | | 10.00% | | | | 17.91% | |
Philadelphia Stock Exchange Gold and Silver Index | | | -24.57% | | | | 12.43% | | | | 4.85% | | | | 9.64% | |
Standard & Poor’s 500 Stock Index | | | 4.76% | | | | 19.46% | | | | 1.01% | | | | 4.71% | |
The Delafield Fund
Dear Fellow Shareholder,
For the six months ended April 30, 2012, the Fund’s net asset value increased 16.25% versus an increase of 11.02% for the Russell 2000 Index (“Russell 2000”) and 12.77% for the Standard & Poor’s 500 Index (“S&P 500”), each on a total return basis. The Fund’s net asset value as of April 30, 2012 was $31.21 per share. The net asset value amounted to $1,456,843,629, of which 82.7% was invested in equities, and the balance in treasury bills and cash reserves.
Equities experienced a strong recovery for almost the entire first half of the fiscal year. Investors responded enthusiastically to modest improvement in U.S. economic indicators and to solid corporate earnings. A pause in negative Eurozone related headlines during this period also seemed to calm investors’ nerves and helped drive the market’s upturn. Market volatility was prominent during the first three months of the period but was fairly benign for the last three months.
Industry weighting remains a coincidental result of our bottom-up investment approach. However, we had limited exposure to the energy sector, which benefited our performance relative to the Russell 2000, as it was among the weakest sectors for the period. We also had virtually no exposure to the financial sector, which negatively impacted our relative performance.
Our stock selection was generally positive to our return during the six month period, with our performance in five of the seven sectors in which we had exposure outperforming the corresponding index return. Investments in the industrials sector were most beneficial to performance relative to the Russell 2000, with holdings in materials also contributing favorably. Shares of Solutia Inc. advanced following the announcement of a takeover proposal in late January and the stock was the largest positive contributor to the portfolio’s performance. Ironically, our holdings in Eastman Chemical Company, Solutia’s would be suitor, were up nicely as well and it was the next largest positive contributor to performance. In contrast, Checkpoint Systems and Ferro Corporation were the largest detractors to our performance during the period.
We remain focused on identifying companies where our analytical insight suggests a largely unanticipated improvement in operations. Over the last six months we added a number of new names to the Fund that we believe represent good investment opportunities. For example, we established a position in Acco Brands Corporation, a company with $1.4 billion in sales, focused on products for the office supplies market (staplers, calendars, etc.). In November 2011, the company announced it would combine Acco with the office products business of MeadWestvaco Corporation. We believe that the transaction should be very positive as it is expected to sharply improve earnings to $1+ per share and provide greater clout with their suppliers and customers. Also, free cash flow should be nicely positive which should allow for debt reduction. Another new addition to the Fund during the period is Harsco Corporation, which announced the resignation of its CEO in late February. The company’s infrastructure and metals and mining operations have been underperforming for some time, and we believe that better execution under new management could lead to considerable improvements in both businesses. Looking out a couple of years, we believe that modest but achievable improvements in the operations could lead to a significant improvement in EBITDA.
Sincerely,
| | |
 | |  |
| |
| J. Dennis Delafield | | Vincent Sellecchia |
| Portfolio Manager | | Portfolio Manager |
The Delafield Fund
(Unaudited)
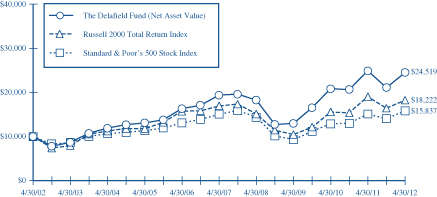
This chart assumes an initial gross investment of $10,000 made on 4/30/02. Since the Delafield Fund did not commence operations until 9/28/09, returns prior to that date are those of the Predecessor Fund. The Delafield Fund assumed the net asset value and performance history of the Predecessor Fund (See Footnote 1 to the Financial Statements). Returns shown does not reflect the deduction of taxes that a shareholder would pay on fund distributions or the redemption of fund shares. Performance reflects fee wiaviers in effect. In the absence of fee waivers, total return would be reduced. Returns shown include the reinvestment of all dividends and other distributions. Past performance is not predictive of future performance. Investment return and principal value will fluctuate so that your shares, when redeemed, may be worth more or less than their original cost. The Fund imposes a 2% redemption fee on shares held 90 days or less.
The Russell 2000 Total Return Index is an unmanaged index that measures the performance of the 2,000 smallest companies in the Russell 3000 Index, which represent approximately 8% of the total market capitalization of the Russell 3000 Index. Returns include the reinvestment of all dividends.
The Standard & Poor’s 500 Stock Index (S&P 500) is a capital-weighted index, representing the aggregate market value of the common equity of 500 stocks primarily traded on the New York Stock Exchange. Returns include the reinvestment of all dividends.
AVERAGE ANNUAL RATE OF RETURN (%)
FOR PERIODS ENDED APRIL 30, 2012
| | | | | | | | | | | | | | | | |
| | | 1 Year | | | 3 Year | | | 5 Year | | | 10 Year | |
The Delafield Fund | | | -1.49% | | | | 23.59% | | | | 4.81% | | | | 9.38% | |
Russell 2000 Total Return Index | | | -4.25% | | | | 20.34% | | | | 1.45% | | | | 6.19% | |
Standard & Poor’s 500 Stock Index | | | 4.76% | | | | 19.46% | | | | 1.01% | | | | 4.71% | |
The Tocqueville Select Fund
Dear Fellow Shareholder,
For the six months ended April 30, 2012, the Fund’s net asset value increased 10.60% versus an increase of 12.03% for the Russell 2500 Index (“Russell 2500”) and 11.02% for the Russell 2000 Index (“Russell 2000”), each on a total return basis. The Fund’s net asset value as of April 30, 2012 was $12.11 per share. The net asset value amounted to $93,938,492, of which 82.1% was invested in equities with the balance held in treasury bills and cash reserves.
Equities experienced a strong recovery for almost the entire first half of the fiscal year. Investors responded enthusiastically to modest improvement in U.S. economic indicators and to solid corporate earnings. A pause in negative Eurozone related headlines during this period also seemed to calm investors’ nerves and helped drive the market’s upturn. Market volatility was prominent during the first three months of the period but was fairly benign for the last three months.
The Fund’s portfolio is built using a bottom-up approach. We focus intently on valuation and analyze cash flows and attempt to invest at prices that we believe undervalue the underlying franchise. We added several new stocks to the Fund since the start of the fiscal year. For example, we started a position in Avery Dennison Corporation, which designs and manufactures pressure sensitive and self-adhesive materials, retail branding and information tags and labels, and a variety of specialty materials. We believe that the long-term earnings power of the businesses is attractive and that the company should continue to generate ample free cash flow to further reduce debt, fund an annual common dividend and repurchase a substantial number of shares.
The Fund’s portfolio is not constructed with industry allocation targets. However, we were overweight in the industrials and materials sectors which benefited performance. We had no exposure to the energy and utilities sectors, which also helped our relative performance. Conversely, our avoidance of the financial sector negatively impacted our return relative to the Russell 2500.
Our stock selection was mixed during the six month period. Our investments in the industrials and materials sectors outperformed the corresponding index return, while consumer discretionary and information technology holdings underperformed. Solutia Inc. was the largest contributor to our performance, with the shares advancing on an announced takeover proposal from Eastman Chemical Company. In contrast, Summer Infant, Inc. and Checkpoint Systems were the largest detractors to our performance during the period.
| | | | |
| Sincerely, | | | | |
| | |
| | | |  |
| | |
| J. Dennis Delafield | | Vincent Sellecchia | | Donald Wang |
| Portfolio Manager | | Portfolio Manager | | Portfolio Manager |
The Tocqueville Select Fund
(Unaudited)
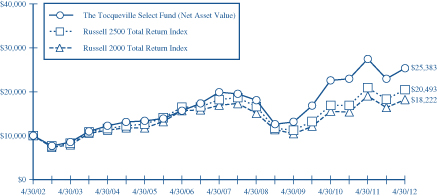
This chart assumes an initial gross investment of $10,000 made on 4/30/02. Since The Tocqueville Select Fund did not commence operations until 9/28/09, returns from the period from September 29, 2008 to September 27, 2009 are those of the Class Y Shares of the Predecessor Fund (See Footnote 1 to the Financial Statements). Prior to that period, returns shown are those of a limited partnership managed by the adviser. Returns shown do not reflect the deduction of taxes that a shareholder would pay on fund distributions or the redemption of fund shares. Performance reflects fee waivers in effect. In the absence of fee waivers, total return would be reduced. Returns shown include the reinvestment of all dividends and other distributions. Past performance is not predictive of future performance. Investment return and principal value will fluctuate so that your shares, when redeemed, may be worth more or less than their original cost. The Fund imposes a 2% redemption fee on shares held 90 days or less.
The Russel 2500 Total Return Index is an unmanaged index that measures the performance of the 2,500 smallest companies in the Russell 3000 Index. Returns include the reinvestment of all dividends.
The Russell 2000 Total Return Index is an unmanaged index that measures the performance of the 2,000 smallest companies in the Russell 3000 Index, which represents approximately 8% of the total market capitalization of the Russell 3000 Index. Returns include the reinvestment of all dividends.
AVERAGE ANNUAL RATE OF RETURN (%)
FOR PERIODS ENDED APRIL 30, 2012
| | | | | | | | | | | | | | | | |
| | | 1 Year | | | 3 Year | | | 5 Year | | | 10 Year | |
The Tocqueville Select Fund | | | -7.68% | | | | 24.42% | | | | 5.01% | | | | 9.76% | |
Russell 2500 Total Return Index | | | -2.23% | | | | 22.13% | | | | 2.35% | | | | 7.44% | |
Russell 2000 Total Return Index | | | -4.25% | | | | 20.34% | | | | 1.45% | | | | 6.19% | |
Expense Example—April 30, 2012 (Unaudited)
As a shareholder of The Tocqueville Trust (the “Funds”), you incur ongoing costs, including management fees; distribution fees; and other Fund expenses. This example is intended to help you understand your ongoing costs (in dollars) of investing in the Funds and to compare costs with the ongoing costs of investing in other mutual funds.
The Example is based on an investment of $1,000 invested at the beginning of the period and held the entire period (November 1, 2011-April 30, 2012).
Actual Expenses
The first line of the table below provides information about actual account values and actual expenses. You may use the information in this line, together with the amount you invested, to estimate the expenses that you paid over the period. Simply divide your account value by $1,000 (for example, an $8,600 account value divided by $1,000 = 8.6), then multiply the result by the number in the first line under the heading entitled “Expenses Paid During Period” to estimate the expenses you paid on your account during this period.
Hypothetical Example for Comparison Purposes
The second line of the table below provides information about hypothetical account values and hypothetical expenses based on the Funds’ actual expense ratios and an assumed rate of return of 5% per year before expenses, which is not the Funds’ actual return. The hypothetical account values and expenses may not be used to estimate the actual ending account balance or expenses you paid for the period. You may use this information to compare the ongoing costs of investing in the Funds and other funds. To do so, compare this 5% hypothetical example with the 5% hypothetical examples that appear in the shareholder reports of the other funds.
Please note that the expenses shown in the table are meant to highlight your ongoing costs only and do not reflect any transactional costs, such as sales charges (loads), redemption fees, or exchange fees. Therefore, the second line of the table is useful in comparing ongoing costs only, and will not help you determine the relative costs of owning different funds. In addition, if these transactional costs were included, your costs would have been higher.
Expense Example Tables (Unaudited)
| | | | | | | | | | | | |
The Tocqueville Fund | | Beginning
Account Value
November 1, 2011 | | | Ending
Account Value
April 30, 2012 | | | Expenses Paid
During Period*
November 1, 2011 -
April 30, 2012 | |
Actual | | $ | 1,000.00 | | | $ | 1,085.30 | | | $ | 6.53 | |
Hypothetical (5% return before expenses) | | | 1,000.00 | | | | 1,018.60 | | | | 6.32 | |
| | | |
| The Tocqueville Opportunity Fund | | | | | | | | | | | | |
Actual | | $ | 1,000.00 | | | $ | 1,133.00 | | | $ | 6.89 | |
Hypothetical (5% return before expenses) | | | 1,000.00 | | | | 1,018.40 | | | | 6.52 | |
| | | |
| The Tocqueville International Value Fund | | | | | | | | | | | | |
Actual | | $ | 1,000.00 | | | $ | 988.20 | | | $ | 7.66 | |
Hypothetical (5% return before expenses) | | | 1,000.00 | | | | 1,017.16 | | | | 7.77 | |
| | | |
| The Tocqueville Gold Fund | | | | | | | | | | | | |
Actual | | $ | 1,000.00 | | | $ | 840.90 | | | $ | 5.81 | |
Hypothetical (5% return before expenses) | | | 1,000.00 | | | | 1,018.55 | | | | 6.37 | |
| | | |
| The Delafield Fund | | | | | | | | | | | | |
Actual | | $ | 1,000.00 | | | $ | 1,162.50 | | | $ | 6.61 | |
Hypothetical (5% return before expenses) | | | 1,000.00 | | | | 1,018.75 | | | | 6.17 | |
| | | |
| The Tocqueville Select Fund | | | | | | | | | | | | |
Actual | | $ | 1,000.00 | | | $ | 1,106.00 | | | $ | 7.07 | |
Hypothetical (5% return before expenses) | | | 1,000.00 | | | | 1,018.15 | | | | 6.77 | |
| * | Expenses are equal to the Fund’s annualized six-month expense ratio (including extraordinary expenses) of 1.26%, 1.30%, 1.55%, 1.27%, 1.23% and 1.35% for The Tocqueville Fund, Opportunity Fund, International Value Fund, Gold Fund, Delafield Fund, and Select Fund, respectively, multiplied by the average account value over the period, multiplied by 182/366 to reflect the one-half year period. |
The Tocqueville Fund
Financial Highlights
| | | | | | | | | | | | | | | | | | | | | | | | |
Per share operating performance (For a share outstanding
throughout the period) | | Six Months
Ended
April 30,
2012 | | | Years Ended October 31, | |
| | | 2011 | | | 2010 | | | 2009 | | | 2008 | | | 2007 | |
| | | (unaudited) | | | | | | | | | | | | | | | | |
Net asset value, beginning of period | | $ | 22.23 | | | $ | 21.53 | | | $ | 18.47 | | | $ | 16.39 | | | $ | 28.93 | | | $ | 24.25 | |
| | | | | | | | | | | | | | | | | | | | | | | | |
Operations: | | | | | | | | | | | | | | | | | | | | | | | | |
Net investment income | | | 0.22 | | | | 0.23 | | | | 0.32 | | | | 0.28 | | | | 0.24 | | | | 0.18 | |
Net realized and unrealized gain (loss) | | | 1.65 | | | | 0.80 | | | | 2.97 | | | | 2.09 | | | | (10.56 | ) | | | 4.53 | |
| | | | | | | | | | | | | | | | | | | | | | | | |
Total from investment operations (1) | | | 1.87 | | | | 1.03 | | | | 3.29 | | | | 2.37 | | | | (10.32 | ) | | | 4.71 | |
| | | | | | | | | | | | | | | | | | | | | | | | |
Dividends and distributions to shareholders: | | | | | | | | | | | | | | | | | | | | | | | | |
Dividends from net investment income | | | (0.33 | ) | | | (0.33 | ) | | | (0.23 | ) | | | (0.29 | ) | | | (0.19 | ) | | | (0.03 | ) |
Distributions from net realized gains | | | — | | | | — | | | | — | | | | — | | | | (2.03 | ) | | | — | |
| | | | | | | | | | | | | | | | | | | | | | | | |
Total dividends and distributions | | | (0.33 | ) | | | (0.33 | ) | | | (0.23 | ) | | | (0.29 | ) | | | (2.22 | ) | | | (0.03 | ) |
| | | | | | | | | | | | | | | | | | | | | | | | |
Change in net asset value for the period | | | 1.54 | | | | 0.70 | | | | 3.06 | | | | 2.08 | | | | (12.54 | ) | | | 4.68 | |
| | | | | | | | | | | | | | | | | | | | | | | | |
Net asset value, end of period | | $ | 23.77 | | | $ | 22.23 | | | $ | 21.53 | | | $ | 18.47 | | | $ | 16.39 | | | $ | 28.93 | |
| | | | | | | | | | | | | | | | | | | | | | | | |
Total return | | | 8.53 | %(3) | | | 4.77 | % | | | 17.95 | % | | | 14.80 | % | | | (38.47 | )% | | | 19.43 | % |
Ratios/supplemental data | | | | | | | | | | | | | | | | | | | | | | | | |
Net assets, end of period (000) | | $ | 396,536 | | | $ | 491,541 | | | $ | 489,670 | | | $ | 383,470 | | | $ | 328,609 | | | $ | 523,878 | |
Ratio to average net assets: | | | | | | | | | | | | | | | | | | | | | | | | |
Expenses (2) | | | 1.25 | %(4)(5) | | | 1.25 | % | | | 1.25 | % | | | 1.25 | % | | | 1.25 | % | | | 1.25 | % |
Net investment income (2) | | | 1.34 | %(4) | | | 0.98 | % | | | 1.66 | % | | | 1.68 | % | | | 0.94 | % | | | 0.69 | % |
Portfolio turnover rate | | | 7 | %(3) | | | 28 | % | | | 23 | % | | | 32 | % | | | 51 | % | | | 39 | % |
| (1) | Total from investment operations per share includes redemption fees of $0.001 for the six months ended April 30, 2012 and $0.002, $0.002, $0.004, $0.009 and $0.002 per share for the fiscal years ended October 31, 2011, 2010, 2009, 2008 and 2007, respectively. |
| (2) | Net of fees waived amounting to 0.03% for the six months ended April 30, 2012 and 0.01%, 0.01%, 0.08%, 0.04% and 0.01% of average net assets for the fiscal years ended October 31, 2011, 2010, 2009, 2008 and 2007, respectively. |
| (5) | Including interest expense increases the ratio by 0.01%. |
The Accompanying Notes are an Integral Part of these Financial Statements.
The Tocqueville Opportunity Fund
Financial Highlights
| | | | | | | | | | | | | | | | | | | | | | | | |
Per share operating performance (For a share outstanding throughout the
period) | | Six Months
Ended
April 30,
2012 | | | Years Ended October 31, | |
| | | 2011 | | | 2010 | | | 2009 | | | 2008 | | | 2007 | |
| | | (unaudited) | | | | | | | | | | | | | | | | |
Net asset value, beginning of period | | $ | 14.96 | | | $ | 13.20 | | | $ | 10.78 | | | $ | 9.77 | | | $ | 17.24 | | | $ | 18.04 | |
| | | | | | | | | | | | | | | | | | | | | | | | |
Operations: | | | | | | | | | | | | | | | | | | | | | | | | |
Net investment income (loss) | | | (0.06 | ) | | | (0.13 | ) | | | (0.12 | ) | | | (0.11 | ) | | | 0.02 | | | | 0.11 | |
Net realized and unrealized gain (loss) | | | 2.05 | | | | 1.89 | | | | 2.54 | | | | 1.23 | | | | (5.67 | ) | | | 1.26 | |
| | | | | | | | | | | | | | | | | | | | | | | | |
Total from investment operations (1) | | | 1.99 | | | | 1.76 | | | | 2.42 | | | | 1.12 | | | | (5.65 | ) | | | 1.37 | |
| | | | | | | | | | | | | | | | | | | | | | | | |
Dividends and distributions to shareholders: | | | | | | | | | | | | | | | | | | | | | | | | |
Dividends from net investment income | | | — | | | | — | | | | — | | | | (0.01 | ) | | | (0.12 | ) | | | — | |
Distributions from net realized gains | | | — | | | | — | | | | — | | | | (0.10 | ) | | | (1.70 | ) | | | (2.17 | ) |
| | | | | | | | | | | | | | | | | | | | | | | | |
Total dividends and distributions | | | — | | | | — | | | | — | | | | (0.11 | ) | | | (1.82 | ) | | | (2.17 | ) |
| | | | | | | | | | | | | | | | | | | | | | | | |
Change in net asset value for the period | | | 1.99 | | | | 1.76 | | | | 2.42 | | | | 1.01 | | | | (7.47 | ) | | | (0.80 | ) |
| | | | | | | | | | | | | | | | | | | | | | | | |
Net asset value, end of period | | $ | 16.95 | | | $ | 14.96 | | | $ | 13.20 | | | $ | 10.78 | | | $ | 9.77 | | | $ | 17.24 | |
| | | | | | | | | | | | | | | | | | | | | | | | |
Total return | | | 13.30 | %(2) | | | 13.33 | % | | | 22.56 | % | | | 11.68 | % | | | (36.16 | )% | | | 8.42 | % |
Ratios/supplemental data | | | | | | | | | | | | | | | | | | | | | | | | |
Net assets, end of period (000) | | $ | 73,653 | | | $ | 46,963 | | | $ | 32,863 | | | $ | 30,498 | | | $ | 36,429 | | | $ | 49,543 | |
Ratio to average net assets: | | | | | | | | | | | | | | | | | | | | | | | | |
Expenses | | | 1.30 | %(3) | | | 1.36 | % | | | 1.41 | % | | | 1.41 | % | | | 1.35 | % | | | 1.32 | % |
Net investment income (loss) | | | (0.92 | )%(3) | | | (1.04 | )% | | | (1.08 | )% | | | (0.97 | )% | | | 0.12 | % | | | 0.63 | % |
Portfolio turnover rate | | | 29 | %(2) | | | 110 | % | | | 104 | % | | | 62 | % | | | 169 | % | | | 90 | % |
| (1) | Total from investment operations per share includes redemption fees of less than $0.001 for the six months ended April 30, 2012 and the fiscal years ended October 31, 2011 and 2010, $0.001, $0.005 and $0.001 for the fiscal years ended October 31, 2009, 2008 and 2007, respectively. |
The Accompanying Notes are an Integral Part of these Financial Statements.
The Tocqueville International Value Fund
Financial Highlights
| | | | | | | | | | | | | | | | | | | | | | | | |
Per share operating performance
(For a share outstanding throughout
the period) | | Six Months
Ended
April 30,
2012 | | | Years Ended October 31, | |
| | | 2011 | | | 2010 | | | 2009 | | | 2008 | | | 2007 | |
| | | (unaudited) | | | | | | | | | | | | | | | | |
Net asset value, beginning of period | | $ | 12.00 | | | $ | 12.12 | | | $ | 10.48 | | | $ | 8.49 | | | $ | 16.48 | | | $ | 16.72 | |
| | | | | | | | | | | | | | | | | | | | | | | | |
Operations: | | | | | | | | | | | | | | | | | | | | | | | | |
Net investment income | | | 0.07 | | | | 0.11 | | | | 0.11 | | | | 0.10 | | | | 0.13 | | | | 0.08 | |
Net realized and unrealized gain (loss) | | | (0.22 | ) | | | (0.16 | ) | | | 1.65 | | | | 2.59 | | | | (6.09 | ) | | | 2.25 | |
| | | | | | | | | | | | | | | | | | | | | | | | |
Total from investment operations (1) | | | (0.15 | ) | | | (0.05 | ) | | | 1.76 | | | | 2.69 | | | | (5.96 | ) | | | 2.33 | |
| | | | | | | | | | | | | | | | | | | | | | | | |
Dividends and distributions to shareholders: | | | | | | | | | | | | | | | | | | | | | | | | |
Dividends from net investment income | | | (0.12 | ) | | | (0.07 | ) | | | (0.12 | ) | | | (0.20 | ) | | | (0.10 | ) | | | (0.27 | ) |
Distributions from net realized gains | | | — | | | | — | | | | — | | | | (0.50 | ) | | | (1.93 | ) | | | (2.30 | ) |
| | | | | | | | | | | | | | | | | | | | | | | | |
Total dividends and distributions | | | (0.12 | ) | | | (0.07 | ) | | | (0.12 | ) | | | (0.70 | ) | | | (2.03 | ) | | | (2.57 | ) |
| | | | | | | | | | | | | | | | | | | | | | | | |
Change in net asset value for the period | | | (0.27 | ) | | | (0.12 | ) | | | 1.64 | | | | 1.99 | | | | (7.99 | ) | | | (0.24 | ) |
| | | | | | | | | | | | | | | | | | | | | | | | |
Net asset value, end of period | | $ | 11.73 | | | $ | 12.00 | | | $ | 12.12 | | | $ | 10.48 | | | $ | 8.49 | | | $ | 16.48 | |
| | | | | | | | | | | | | | | | | | | | | | | | |
Total return | | | (1.18 | )%(2) | | | (0.47 | )% | | | 16.96 | % | | | 34.04 | % | | | (40.82 | )% | | | 15.29 | % |
Ratios/supplemental data | | | | | | | | | | | | | | | | | | | | | | | | |
Net assets, end of period (000) | | $ | 224,526 | | | $ | 199,848 | | | $ | 150,103 | | | $ | 131,613 | | | $ | 118,189 | | | $ | 219,220 | |
Ratio to average net assets: | | | | | | | | | | | | | | | | | | | | | | | | |
Expenses | | | 1.55 | %(3) | | | 1.56 | % | | | 1.56 | % | | | 1.62 | % | | | 1.56 | % | | | 1.59 | % |
Net investment income | | | 1.37 | %(3) | | | 0.99 | % | | | 1.03 | % | | | 0.96 | % | | | 1.07 | % | | | 0.49 | % |
Portfolio turnover rate | | | 20 | %(2) | | | 30 | % | | | 27 | % | | | 27 | % | | | 63 | % | | | 49 | % |
| (1) | Total from investment operations per share includes redemption fees of $0.001 for the six months ended April 30, 2012 and $0.010, $0.002, $0.001, $0.001 and $0.002 per share for the fiscal years ended October 31, 2011, 2010, 2009, 2008 and 2007, respectively. |
The Accompanying Notes are an Integral Part of these Financial Statements.
The Tocqueville Gold Fund
Financial Highlights
| | | | | | | | | | | | | | | | | | | | | | | | |
Per share operating performance
(For a share outstanding
throughout the period) | | Six Months
Ended
April 30,
2012 | | | Years Ended October 31, | |
| | | 2011 | | | 2010 | | | 2009 | | | 2008 | | | 2007 | |
| | | (unaudited) | | | | | | | | | | | | | | | | |
Net asset value, beginning of period | | $ | 81.97 | | | $ | 82.00 | | | $ | 49.71 | | | $ | 21.77 | | | $ | 64.36 | | | $ | 51.41 | |
| | | | | | | | | | | | | | | | | | | | | | | | |
Operations: | | | | | | | | | | | | | | | | | | | | | | | | |
Net investment loss | | | (0.23 | ) | | | (0.67 | ) | | | (0.58 | ) | | | (0.45 | ) | | | (0.57 | ) | | | (0.30 | ) |
Net realized and unrealized gain (loss) | | | (12.72 | ) | | | 2.25 | | | | 32.96 | | | | 29.28 | | | | (33.24 | ) | | | 18.52 | |
| | | | | | | | | | | | | | | | | | | | | | | | |
Total from investment operations (1) | | | (12.95 | ) | | | 1.58 | | | | 32.38 | | | | 28.83 | | | | (33.81 | ) | | | 18.22 | |
| | | | | | | | | | | | | | | | | | | | | | | | |
Dividends and distributions to shareholders: | | | | | | | | | | | | | | | | | | | | | | | | |
Dividends from net investment income | | | — | | | | — | | | | — | | | | — | | | | (0.46 | ) | | | (0.22 | ) |
Distributions from net realized gains | | | (1.33 | ) | | | (1.61 | ) | | | (0.09 | ) | | | (0.89 | ) | | | (8.32 | ) | | | (5.05 | ) |
| | | | | | | | | | | | | | | | | | | | | | | | |
Total dividends and distributions | | | (1.33 | ) | | | (1.61 | ) | | | (0.09 | ) | | | (0.89 | ) | | | (8.78 | ) | | | (5.27 | ) |
| | | | | | | | | | | | | | | | | | | | | | | | |
Change in net asset value for the period | | | (14.28 | ) | | | (0.03 | ) | | | 32.29 | | | | 27.94 | | | | (42.59 | ) | | | 12.95 | |
| | | | | | | | | | | | | | | | | | | | | | | | |
Net asset value, end of period | | $ | 67.69 | | | $ | 81.97 | | | $ | 82.00 | | | $ | 49.71 | | | $ | 21.77 | | | $ | 64.36 | |
| | | | | | | | | | | | | | | | | | | | | | | | |
Total return | | | (15.91 | )%(2) | | | 1.84 | % | | | 65.22 | % | | | 135.22 | % | | | (59.98 | )% | | | 38.35 | % |
Ratios/supplemental data | | | | | | | | | | | | | | | | | | | | | | | | |
Net assets, end of period (000) | | $ | 2,167,211 | | | $ | 2,647,078 | | | $ | 2,199,603 | | | $ | 937,492 | | | $ | 410,857 | | | $ | 1,231,475 | |
Ratios to average net assets: | | | | | | | | | | | | | | | | | | | | | | | | |
Expenses | | | 1.27 | %(3) | | | 1.25 | % | | | 1.34 | % | | | 1.50 | % | | | 1.43 | % | | | 1.42 | % |
Net investment income (loss) | | | (0.59 | )%(3) | | | (0.86 | )% | | | (1.11 | )% | | | (1.25 | )% | | | (1.07 | )% | | | (0.81 | )% |
Portfolio turnover rate | | | 4 | %(2) | | | 3 | % | | | 9 | % | | | 9 | % | | | 28 | % | | | 26 | % |
| (1) | Total from investment operations per share includes redemption fees of $0.015 for the six months ended April 30, 2012 and $0.102, $0.056, $0.025, $0.027 and $0.028 per share for the fiscal years ended October 31, 2011, 2010, 2009, 2008 and 2007, respectively. |
The Accompanying Notes are an Integral Part of these Financial Statements.
The Delafield Fund
Financial Highlights
| | | | | | | | | | | | | | | | | | | | | | | | |
Per share operating
performance (For a share
outstanding throughout the
period) | | Six Months
Ended
April 30,
2012 | | | Years Ended
October 31, | | | January 1,
2009
through
October 31, | | | Years Ended
December 31, | |
| | | 2011 | | | 2010 | | | 2009 | | | 2008 | | | 2007 | |
| | | (unaudited) | | | | | | | | | | | | | | | | |
Net asset value, beginning of period | | $ | 27.21 | | | $ | 26.65 | | | $ | 21.35 | | | $ | 15.10 | | | $ | 24.33 | | | $ | 25.64 | |
| | | | | | | | | | | | | | | | | | | | | | | | |
Operations: | | | | | | | | | | | | | | | | | | | | | | | | |
Net investment income (loss) | | | (0.02 | ) | | | (0.08 | ) | | | (0.00 | )(2) | | | 0.03 | | | | 0.07 | | | | 0.17 | |
Net realized and unrealized gain (loss) | | | 4.39 | | | | 0.64 | | | | 5.32 | | | | 6.25 | | | | (9.23 | ) | | | 1.10 | |
| | | | | | | | | | | | | | | | | | | | | | | | |
Total from investment operations (1) | | | 4.37 | | | | 0.56 | | | | 5.32 | | | | 6.28 | | | | (9.16 | ) | | | 1.27 | |
| | | | | | | | | | | | | | | | | | | | | | | | |
Dividends and distributions to shareholders: | | | | | | | | | | | | | | | | | | | | | | | | |
Dividends from net investment income | | | — | | | | — | | | | — | | | | (0.03 | ) | | | (0.07 | ) | | | (0.16 | ) |
Distributions from net realized gains | | | (0.37 | ) | | | — | | | | — | | | | — | | | | (0.00 | )(2) | | | (2.42 | ) |
Return of capital | | | — | | | | — | | | | (0.02 | ) | | | (0.00 | )(2) | | | (0.00 | )(2) | | | — | |
| | | | | | | | | | | | | | | | | | | | | | | | |
Total dividends and distributions | | | (0.37 | ) | | | — | | | | (0.02 | ) | | | (0.03 | ) | | | (0.07 | ) | | | (2.58 | ) |
| | | | | | | | | | | | | | | | | | | | | | | | |
Change in net asset value for the period | | | 4.00 | | | | 0.56 | | | | 5.30 | | | | 6.25 | | | | (9.23 | ) | | | (1.31 | ) |
| | | | | | | | | | | | | | | | | | | | | | | | |
Net asset value, end of period | | $ | 31.21 | | | $ | 27.21 | | | $ | 26.65 | | | $ | 21.35 | | | $ | 15.10 | | | $ | 24.33 | |
| | | | | | | | | | | | | | | | | | | | | | | | |
Total return | | | 16.25 | %(3) | | | 2.10 | % | | | 24.96 | % | | | 41.61 | %(3) | | | (37.62 | )% | | | 4.90 | % |
Ratios/supplemental data | | | | | | | | | | | | | | | | | | | | | | | | |
Net assets, end of period (000) | | $ | 1,456,844 | | | $ | 1,262,876 | | | $ | 933,674 | | | $ | 636,548 | | | $ | 404,860 | | | $ | 656,999 | |
Ratios to average net assets: | | | | | | | | | | | | | | | | | | | | | | | | |
Expenses | | | 1.23 | %(4) | | | 1.23 | % | | | 1.27 | % | | | 1.38 | %(4) | | | 1.34 | %(5) | | | 1.28 | %(5) |
Net investment income (loss) | | | (0.15 | )%(4) | | | (0.30 | )% | | | (0.02 | )% | | | 0.21 | %(4) | | | 0.35 | %(5) | | | 0.57 | %(5) |
Portfolio turnover rate | | | 26 | %(3) | | | 38 | % | | | 30 | % | | | 46 | %(3) | | | 81 | % | | | 61 | % |
| (1) | Total from investment operations per share includes redemption fees of $0.001 for the six months ended April 30, 2012 and $0.006 per share for the fiscal years ended October 31, 2011 and 2010, $0.008 per share for the period ended October 31, 2009, $0.01 for the fiscal year ended December 31, 2007 and less than $0.01 per share for the fiscal year ended December 31, 2008. |
| (2) | Represents less than $0.01. |
| (5) | Net of fees waived amounting to 0.06% and 0.05% for the fiscal years ended December 31, 2008 and 2007 respectively. |
The Accompanying Notes are an Integral Part of these Financial Statements.
The Tocqueville Select Fund
Financial Highlights
| | | | | | | | | | | | | | | | | | | | |
Per share operating performance
(For a share outstanding throughout the
period) | | Six Months
Ended
April 30,
2012 | | | Years Ended
October 31, | | | January 1, 2009
through
October 31, | | | Period from
September 29,
2008 (2)
through
December 31,
2008 | |
| | | 2011 | | | 2010 | | | 2009 | | |
| | | (unaudited) | | | | | | | | | | | | | |
Net asset value, beginning of period | | $ | 11.06 | | | $ | 11.54 | | | $ | 8.46 | | | $ | 5.77 | | | $ | 8.74 | |
| | | | | | | | | | | | | | | | | | | | |
Operations: | | | | | | | | | | | | | | | | | | | | |
Net investment income (loss) | | | (0.03 | ) | | | (0.07 | ) | | | (0.03 | ) | | | (0.00 | )(3) | | | 0.01 | |
Net realized and unrealized gain (loss) | | | 1.19 | | | | 0.12 | | | | 3.12 | | | | 2.70 | | | | (2.97 | ) |
| | | | | | | | | | | | | | | | | | | | |
Total from investment operations (1) | | | 1.16 | | | | 0.05 | | | | 3.09 | | | | 2.70 | | | | (2.96 | ) |
| | | | | | | | | | | | | | | | | | | | |
Dividends and distributions to shareholders: | | | | | | | | | | | | | | | | | | | | |
Dividends from net investment income | | | — | | | | — | | | | (0.01 | ) | | | (0.00 | )(3) | | | (0.01 | ) |
Distributions from net realized gains | | | (0.11 | ) | | | (0.53 | ) | | | — | | | | — | | | | — | |
Return of capital | | | — | | | | — | | | | — | | | | (0.01 | ) | | | — | |
| | | | | | | | | | | | | | | | | | | | |
Total dividends and distributions | | | (0.11 | ) | | | (0.53 | ) | | | (0.01 | ) | | | (0.01 | ) | | | (0.01 | ) |
| | | | | | | | | | | | | | | | | | | | |
Change in net asset value for the period | | | 1.05 | | | | (0.48 | ) | | | 3.08 | | | | 2.69 | | | | (2.97 | ) |
| | | | | | | | | | | | | | | | | | | | |
Net asset value, end of period | | $ | 12.11 | | | $ | 11.06 | | | $ | 11.54 | | | $ | 8.46 | | | $ | 5.77 | |
| | | | | | | | | | | | | | | | | | | | |
Total return | | | 10.60 | %(4) | | | (0.10 | )% | | | 36.55 | % | | | 46.73 | %(4) | | | (33.88 | )%(4) |
Ratios/supplemental data | | | | | | | | | | | | | | | | | | | | |
Net assets, end of period (000) | | $ | 93,938 | | | $ | 71,554 | | | $ | 41,788 | | | $ | 24,681 | | | $ | 9,226 | |
Ratios to average net assets: | | | | | | | | | | | | | | | | | | | | |
Expenses (6) | | | 1.35 | %(5) | | | 1.36 | % | | | 1.38 | % | | | 1.26 | %(5) | | | 1.15 | %(5) |
Net investment income (loss) (6) | | | (0.56 | )%(5) | | | (0.67 | )% | | | (0.43 | )% | | | (0.16 | )%(5) | | | 0.29 | %(5) |
Portfolio turnover rate | | | 14 | %(4) | | | 28 | % | | | 40 | % | | | 24 | %(4) | | | 29 | %(4) |
| (1) | Total from investment operations includes redemption fees of $0.001 for the six months ended April 30, 2012, $0.008 and $0.007 per share for the fiscal years ended October 31, 2011 and 2010 respectively. |
| (3) | Represents less than $0.01 per share. |
| (6) | Net of fees waived amounting to 0.77% and 2.32% for the periods ended October 31, 2009 and December 31, 2008, respectively. |
The Accompanying Notes are an Integral Part of these Financial Statements.
The Tocqueville Fund
Schedule of Investments as of April 30, 2012
(Unaudited)
| | | | | | | | |
| Common Stocks—98.7% | | Shares | | | Value | |
Automobiles & Components—1.4% | |
Ford Motor Co. | | | 504,000 | | | $ | 5,685,120 | |
Banks—1.6% | | | | | | | | |
Banco Santander SA—ADR | | | 438,632 | | | | 2,776,541 | |
Mitsubishi UFJ Financial Group, Inc.—ADR | | | 750,000 | | | | 3,570,000 | |
| | | | | | | | 6,346,541 | |
Capital Goods—8.1% | | | | | | | | |
The Boeing Co. | | | 75,000 | | | | 5,760,000 | |
General Electric Co. | | | 750,000 | | | | 14,685,000 | |
Illinois Tool Works, Inc. | | | 125,000 | | | | 7,172,500 | |
Xylem, Inc. | | | 165,000 | | | | 4,600,200 | |
| | | | | | | | 32,217,700 | |
Commercial & Professional Services—1.6% | |
Steelcase, Inc. | | | 750,500 | | | | 6,484,320 | |
Diversified Financials—1.8% | |
The Bank of New York Mellon Corp. | | | 300,000 | | | | 7,095,000 | |
Energy—10.7% | | | | | | | | |
Baker Hughes, Inc. | | | 55,000 | | | | 2,426,050 | |
Cameco Corp.(a) | | | 171,400 | | | | 3,787,940 | |
Chesapeake Energy Corp. | | | 300,000 | | | | 5,532,000 | |
Exxon Mobil Corp. | | | 150,000 | | | | 12,951,000 | |
Murphy Oil Corp. | | | 150,000 | | | | 8,245,500 | |
Schlumberger Ltd.(a) | | | 125,000 | | | | 9,267,500 | |
| | | | | | | | 42,209,990 | |
Food & Staples Retailing—1.5% | | | | | | | | |
Wal-Mart Stores, Inc. | | | 100,000 | | | | 5,891,000 | |
Food, Beverage & Tobacco—5.2% | | | | | | | | |
Campbell Soup Co. | | | 200,000 | | | | 6,766,000 | |
The Coca-Cola Co. | | | 100,000 | | | | 7,632,000 | |
PepsiCo, Inc. | | | 50,000 | | | | 3,300,000 | |
Unilever NV—ADR | | | 85,600 | | | | 2,940,360 | |
| | | | | | | | 20,638,360 | |
Health Care Equipment & Services—1.0% | |
St. Jude Medical, Inc. | | | 100,000 | | | | 3,872,000 | |
Household & Personal Products—3.9% | |
Colgate-Palmolive Co. | | | 75,000 | | | | 7,420,500 | |
The Procter & Gamble Co. | | | 125,000 | | | | 7,955,000 | |
| | | | | | | | 15,375,500 | |
Insurance—3.0% | | | | | | | | |
Aflac, Inc. | | | 171,500 | | | | 7,724,360 | |
Fidelity National Financial, Inc. | | | 216,000 | | | | 4,162,320 | |
| | | | | | | | 11,886,680 | |
Materials—13.9% | | | | | | | | |
BHP Billiton Ltd.—ADR | | | 63,900 | | | | 4,747,770 | |
Cliffs Natural Resources, Inc. | | | 75,000 | | | | 4,669,500 | |
| Common Stocks (continued) | | Shares | | | Value | |
EI du Pont de Nemours & Co. | | | 250,000 | | | $ | 13,365,000 | |
Newmont Mining Corp. | | | 200,000 | | | | 9,530,000 | |
Owens-Illinois, Inc.(b) | | | 300,000 | | | | 6,975,000 | |
Sonoco Products Co. | | | 150,000 | | | | 4,969,500 | |
Vulcan Materials Co. | | | 100,000 | | | | 4,281,000 | |
Weyerhaeuser Co. | | | 325,000 | | | | 6,617,000 | |
| | | | | | | | 55,154,770 | |
Pharmaceuticals, Biotechnology & Life Sciences—10.4% | |
Alkermes PLC(a)(b) | | | 250,000 | | | | 4,325,000 | |
Johnson & Johnson | | | 150,000 | | | | 9,763,500 | |
Merck & Co., Inc. | | | 150,000 | | | | 5,886,000 | |
Myriad Genetics, Inc.(b) | | | 200,000 | | | | 5,202,000 | |
Pfizer, Inc. | | | 700,000 | | | | 16,051,000 | |
| | | | | | | | 41,227,500 | |
Real Estate—1.0% | | | | | | | | |
CBRE Group, Inc.(b) | | | 215,000 | | | | 4,044,150 | |
Retailing—2.5% | | | | | | | | |
The Home Depot, Inc. | | | 100,000 | | | | 5,179,000 | |
Lowe’s Companies, Inc. | | | 150,000 | | | | 4,720,500 | |
| | | | | | | | 9,899,500 | |
Semiconductors & Semiconductor Equipment—4.8% | |
Applied Materials, Inc. | | | 650,000 | | | | 7,793,500 | |
Intel Corp. | | | 400,000 | | | | 11,360,000 | |
| | | | | | | | 19,153,500 | |
Software & Services—13.4% | | | | | | | | |
Adobe Systems, Inc.(b) | | | 150,000 | | | | 5,034,000 | |
Akamai Technologies, Inc.(b) | | | 150,000 | | | | 4,890,000 | |
Automatic Data Processing, Inc. | | | 125,000 | | | | 6,952,500 | |
Google, Inc.(b) | | | 15,000 | | | | 9,078,450 | |
Mastercard, Inc. | | | 25,000 | | | | 11,306,750 | |
Microsoft Corp. | | | 500,000 | | | | 16,010,000 | |
| | | | | | | | 53,271,700 | |
Technology Hardware & Equipment—7.3% | |
Bio-key International, Inc.(b)(c)(d)(e) | | | 47,090 | | | | — | |
Canon, Inc.—ADR | | | 51,500 | | | | 2,336,040 | |
Cisco Systems, Inc. | | | 500,000 | | | | 10,075,000 | |
Hitachi Ltd.—ADR | | | 150,000 | | | | 9,495,000 | |
Plexus Corp.(b) | | | 125,000 | | | | 4,046,250 | |
Xerox Corp. | | | 400,000 | | | | 3,112,000 | |
| | | | | | | | 29,064,290 | |
Telecommunication Services—2.5% | | | | | | | | |
Verizon Communications, Inc. | | | 125,000 | | | | 5,047,500 | |
Vodafone Group PLC—ADR | | | 171,400 | | | | 4,770,062 | |
| | | | | | | | 9,817,562 | |
The Accompanying Footnotes are an Integral Part of these Financial Statements.
The Tocqueville Fund
Schedule of Investments as of April 30, 2012
(Unaudited)
| | | | | | | | |
| Common Stocks (continued) | | Shares | | | Value | |
Utilities—3.1% | | | | | | | | |
NextEra Energy, Inc. | | | 190,000 | | | $ | 12,226,500 | |
Total Common Stocks (Cost $338,113,351) | | | | | | | 391,561,683 | |
Warrants—0.0% | | | | | | | | |
Technology Hardware & Equipment—0.0% | |
EMCORE Corp. | | | | | | | | |
Expiration: 02/19/13, Exercise Price: $60.24(b)(c)(d)(e) | | | 9,844 | | | | 80 | |
Total Warrants
(Cost $0) | | | | | | | 80 | |
| Short-Term Investments—1.6% | |
| Principal
Amount |
| | | | |
Repurchase Agreement—1.6% | | | | | | | | |
Repurchase Agreement with U.S. Bank, N.A., 0.01% dated 4/30/2012, due 5/01/2012, collateralized by: Freddie Mac Giant 30 Year Fixed (Pool #G01543) valued at $2,013,512. Repurchase proceeds of $1,973,981. Fannie Mae Conventional Level Pay 15 Year Fixed (Pool #676656) valued at $4,417,344. Repurchase proceeds of $4,331,021. | | $ | 6,305,000 | | | | 6,305,000 | |
Total Short-Term Investments (Cost $6,305,000) | | | | | | | 6,305,000 | |
Total Investments
(Cost $344,418,351)—100.3% | | | | 397,866,763 | |
Liabilities in Excess of Other Assets—(0.3)% | | | | (1,330,979 | ) |
Total Net Assets—100.0% | | | | | | $ | 396,535,784 | |
| | | | | | | | |
Percentages are stated as a percent of net assets.
ADR—American Depository Receipt
| (a) | Foreign issued security. Foreign concentration (including ADRs) was as follows: Australia 1.2%; Britain 1.2%; Canada 1.0%; Curacao 2.3%; Ireland 1.1%; Japan 3.9%; Netherlands 0.7%; Spain 0.7%; |
| (b) | Non-income producing security. |
| (c) | Denotes a security is either fully or partially restricted to resale. The aggregate value of restricted securities at April 30, 2012 was $80 which represented 0.0% of net assets. |
| (d) | Fair valued security. The aggregate value of fair valued securities as of April 30, 2012 was $80 which represented 0.0% of net assets. |
| (e) | Security is considered illiquid and may be difficult to sell. |
The Global Industry Classification Standard (GICS®) was developed by and/or is the exclusive property of MSCI, Inc. and Standard & Poor Financial Services LLC (“S&P”). GICS is a service mark of MSCI and S&P and has been licensed for use by U.S. Bancorp Fund Services, LLC.
The Accompanying Footnotes are an Integral Part of these Financial Statements.
The Tocqueville Opportunity Fund
Schedule of Investments as of April 30, 2012
(Unaudited)
| | | | | | | | |
| Common Stocks—97.3% | | Shares | | | Value | |
Automobiles & Components—1.5% | | | | | | | | |
BorgWarner, Inc.(a) | | | 9,000 | | | $ | 711,360 | |
Gentex Corp. | | | 17,500 | | | | 384,475 | |
| | | | | | | | 1,095,835 | |
Banks—1.7% | | | | | | | | |
BankUnited, Inc. | | | 14,500 | | | | 356,700 | |
Pinnacle Financial Partners, Inc.(a) | | | 13,000 | | | | 237,900 | |
Signature Bank(a) | | | 10,500 | | | | 689,745 | |
| | | | | | | | 1,284,345 | |
Capital Goods—6.8% | | | | | | | | |
AO Smith Corp. | | | 10,500 | | | | 499,800 | |
Acuity Brands, Inc. | | | 4,200 | | | | 233,394 | |
AMETEK, Inc. | | | 8,700 | | | | 437,871 | |
BE Aerospace, Inc.(a) | | | 5,000 | | | | 235,150 | |
Dover Corp. | | | 3,500 | | | | 219,310 | |
Esterline Technologies Corp.(a) | | | 3,300 | | | | 226,017 | |
Gardner Denver, Inc. | | | 3,500 | | | | 227,990 | |
Hexcel Corp.(a) | | | 8,000 | | | | 219,040 | |
Joy Global, Inc. | | | 3,100 | | | | 219,387 | |
Polypore International, Inc.(a) | | | 6,000 | | | | 224,100 | |
RBC Bearings, Inc.(a) | | | 4,800 | | | | 225,024 | |
Robbins & Myers, Inc. | | | 2,400 | | | | 116,904 | |
SeaCube Container Leasing Ltd.(b) | | | 11,000 | | | | 204,050 | |
Spirit Aerosystems Holdings, Inc.(a) | | | 8,000 | | | | 200,000 | |
Timken Co. | | | 5,000 | | | | 282,550 | |
TransDigm Group, Inc.(a) | | | 3,900 | | | | 491,868 | |
Valmont Industries, Inc. | | | 2,500 | | | | 309,825 | |
WABCO Holdings, Inc.(a) | | | 7,200 | | | | 453,816 | |
| | | | | | | | 5,026,096 | |
Commercial & Professional Services—2.0% | | | | | |
Acacia Research Corp.(a) | | | 3,100 | | | | 127,100 | |
Clean Harbors, Inc.(a) | | | 6,500 | | | | 443,560 | |
Mistras Group, Inc.(a) | | | 11,100 | | | | 260,517 | |
Nielsen Holdings NV(a)(b) | | | 3,700 | | | | 108,114 | |
Portfolio Recovery Associates, Inc.(a) | | | 7,500 | | | | 516,150 | |
| | | | | | | | 1,455,441 | |
Consumer Durables & Apparel—6.2% | | | | | |
Deckers Outdoor Corp.(a) | | | 5,800 | | | | 295,858 | |
Fossil, Inc.(a) | | | 4,700 | | | | 614,149 | |
Hanesbrands, Inc.(a) | | | 7,500 | | | | 211,650 | |
Harman International Industries, Inc. | | | 2,000 | | | | 99,160 | |
Lululemon Athletica, Inc.(a) | | | 13,900 | | | | 1,030,546 | |
Polaris Industries, Inc. | | | 7,000 | | | | 556,080 | |
Prada SpA(b) | | | 38,000 | | | | 258,112 | |
Ralph Lauren Corp. | | | 3,500 | | | | 602,945 | |
Tempur-Pedic International, Inc.(a) | | | 7,000 | | | | 411,880 | |
Tupperware Brands Corp. | | | 7,500 | | | | 467,175 | |
| | | | | | | | 4,547,555 | |
Consumer Services—4.5% | | | | | | | | |
BJ’s Restaurants, Inc.(a) | | | 5,100 | | | $ | 220,269 | |
Buffalo Wild Wings, Inc.(a) | | | 2,400 | | | | 201,240 | |
Chipotle Mexican Grill, Inc.(a) | | | 2,000 | | | | 828,300 | |
Dunkin’ Brands Group, Inc. | | | 9,500 | | | | 307,515 | |
Hyatt Hotels Corp.(a) | | | 6,500 | | | | 279,695 | |
Panera Bread Co.(a) | | | 2,175 | | | | 343,476 | |
Sotheby’s | | | 9,100 | | | | 357,812 | |
Starwood Hotels & Resorts Worldwide, Inc. | | | 5,000 | | | | 296,000 | |
Wyndham Worldwide Corp. | | | 4,000 | | | | 201,360 | |
Wynn Resorts Ltd. | | | 2,000 | | | | 266,800 | |
| | | | | | | | 3,302,467 | |
Diversified Financials—3.7% | | | | | | | | |
Blackstone Group LP | | | 28,000 | | | | 379,680 | |
The Charles Schwab Corp. | | | 28,500 | | | | 407,550 | |
KKR & Co. LP | | | 28,000 | | | | 395,360 | |
Lazard Ltd.(b) | | | 6,000 | | | | 165,060 | |
MSCI, Inc.(a) | | | 15,500 | | | | 567,145 | |
Och-Ziff Capital Management Group LLC | | | 20,000 | | | | 175,600 | |
T. Rowe Price Group, Inc. | | | 10,500 | | | | 662,708 | |
| | | | | | | | 2,753,103 | |
Energy—9.1% | | | | | | | | |
Approach Resources, Inc.(a) | | | 6,800 | | | | 243,984 | |
Basic Energy Services, Inc.(a) | | | 10,500 | | | | 151,200 | |
BPZ Resources, Inc.(a) | | | 61,000 | | | | 247,050 | |
Cabot Oil & Gas Corp. | | | 8,090 | | | | 284,283 | |
Concho Resources, Inc.(a) | | | 6,400 | | | | 685,952 | |
Continental Resources, Inc.(a) | | | 2,300 | | | | 205,275 | |
Core Laboratories NV(b) | | | 6,500 | | | | 890,370 | |
Dril-Quip, Inc.(a) | | | 3,200 | | | | 215,648 | |
Endeavour International Corp.(a) | | | 8,000 | | | | 99,840 | |
Energy XXI Bermuda Ltd.(a)(b) | | | 14,000 | | | | 527,520 | |
EOG Resources, Inc. | | | 2,400 | | | | 263,544 | |
Gulfport Energy Corp.(a) | | | 7,500 | | | | 196,575 | |
Oasis Petroleum, Inc.(a) | | | 10,500 | | | | 347,235 | |
Oceaneering International, Inc. | | | 4,200 | | | | 216,846 | |
Pioneer Natural Resources Co. | | | 5,300 | | | | 613,846 | |
Plains Exploration & Production Co.(a) | | | 2,700 | | | | 110,295 | |
Rosetta Resources, Inc.(a) | | | 5,500 | | | | 276,485 | |
Rowan Companies PLC(a) | | | 5,500 | | | | 189,915 | |
SM Energy Co. | | | 5,500 | | | | 363,605 | |
Superior Energy Services, Inc.(a) | | | 9,500 | | | | 255,740 | |
Whiting Petroleum Corp.(a) | | | 6,000 | | | | 343,200 | |
| | | | | | | | 6,728,408 | |
Food & Staples Retailing—1.0% | | | | | | | | |
The Fresh Market, Inc.(a) | | | 15,000 | | | | 767,550 | |
The Accompanying Footnotes are an Integral Part of these Financial Statements.
The Tocqueville Opportunity Fund
Schedule of Investments as of April 30, 2012
(Unaudited)
| | | | | | | | |
| Common Stocks (continued) | | Shares | | | Value | |
Food, Beverage & Tobacco—2.9% | | | | | | | | |
The Boston Beer Co., Inc.(a) | | | 4,000 | | | $ | 413,280 | |
Green Mountains Coffee Roasters, Inc.(a) | | | 8,500 | | | | 414,375 | |
The Hain Celestial Group, Inc.(a) | | | 14,500 | | | | 685,850 | |
Monster Beverage Corp.(a) | | | 9,000 | | | | 584,640 | |
| | | | | | | | 2,098,145 | |
Health Care Equipment & Services—5.6% | | | | | |
athenahealth, Inc.(a) | | | 4,000 | | | | 289,800 | |
Bio-Reference Labs, Inc.(a) | | | 4,600 | | | | 98,072 | |
Computer Programs & Systems, Inc. | | | 1,900 | | | | 113,221 | |
DexCom, Inc.(a) | | | 22,500 | | | | 220,275 | |
HeartWare International, Inc.(a) | | | 5,500 | | | | 428,780 | |
HMS Holdings Corp.(a) | | | 9,500 | | | | 228,570 | |
IDEXX Laboratories, Inc.(a) | | | 4,100 | | | | 360,513 | |
Insulet Corp.(a) | | | 9,500 | | | | 169,670 | |
Intuitive Surgical, Inc.(a) | | | 525 | | | | 303,555 | |
Magellan Health Services, Inc.(a) | | | 5,000 | | | | 221,400 | |
MAKO Surgical Corp.(a) | | | 12,500 | | | | 516,375 | |
MWI Veterinary Supply, Inc.(a) | | | 2,000 | | | | 188,800 | |
Sirona Dental Systems, Inc.(a) | | | 12,000 | | | | 606,120 | |
St. Jude Medical, Inc. | | | 2,500 | | | | 96,800 | |
Tornier NV(a)(b) | | | 9,000 | | | | 213,660 | |
Varian Medical Systems, Inc.(a) | | | 1,400 | | | | 88,788 | |
| | | | | | | | 4,144,399 | |
Household & Personal Products—2.2% | | | | | |
Church & Dwight Co., Inc. | | | 3,700 | | | | 187,960 | |
Herbalife Ltd.(b) | | | 15,200 | | | | 1,068,864 | |
Mead Johnson Nutrition Co. | | | 4,000 | | | | 342,240 | |
| | | | | | | | 1,599,064 | |
Materials—4.6% | | | | | | | | |
Airgas, Inc. | | | 6,000 | | | | 549,840 | |
Albemarle Corp. | | | 8,500 | | | | 555,050 | |
Allied Nevada Gold Corp.(a) | | | 4,500 | | | | 131,805 | |
AptarGroup, Inc. | | | 3,800 | | | | 207,138 | |
Celanese Corp. | | | 1,900 | | | | 92,074 | |
Crown Holdings, Inc.(a) | | | 10,000 | | | | 369,800 | |
Ecolab, Inc. | | | 7,000 | | | | 445,830 | |
Materion Corp.(a) | | | 4,600 | | | | 113,666 | |
Minerals Technologies, Inc.(c) | | | 700 | | | | 46,970 | |
Owens-Illinois, Inc.(a) | | | 9,400 | | | | 218,550 | |
Royal Gold, Inc. | | | 3,000 | | | | 185,880 | |
Sealed Air Corp. | | | 7,300 | | | | 140,014 | |
Silgan Holdings, Inc. | | | 8,000 | | | | 350,960 | |
| | | | | | | | 3,407,577 | |
Pharmaceuticals, Biotechnology & Life Sciences—10.0% | |
Aegerion Pharmaceuticals, Inc.(a) | | | 18,500 | | | | 230,325 | |
Alexion Pharmaceuticals, Inc.(a) | | | 10,700 | | | | 966,424 | |
Alkermes PLC(a)(b) | | | 5,900 | | | | 102,070 | |
Alnylam Pharmaceuticals, Inc.(a) | | | 16,000 | | | $ | 182,240 | |
Auxilium Pharmaceuticals, Inc.(a) | | | 12,000 | | | | 215,040 | |
BioMarin Pharmaceutical, Inc.(a) | | | 10,000 | | | | 347,000 | |
Cepheid, Inc.(a) | | | 9,500 | | | | 364,895 | |
Clovis Oncology, Inc.(a) | | | 12,200 | | | | 218,746 | |
Covance, Inc.(a) | | | 2,200 | | | | 102,872 | |
Dendreon Corp.(a) | | | 11,800 | | | | 137,470 | |
Endo Pharmaceuticals Holdings, Inc.(a) | | | 8,000 | | | | 281,120 | |
Exact Sciences Corp.(a) | | | 15,500 | | | | 166,935 | |
Forest Laboratories, Inc.(a) | | | 8,350 | | | | 290,830 | |
Genomic Health, Inc.(a) | | | 6,000 | | | | 171,960 | |
Idenix Pharmaceuticals, Inc.(a) | | | 10,800 | | | | 94,716 | |
Incyte Corp., Ltd.(a) | | | 27,500 | | | | 623,700 | |
Life Technologies Corp.(a) | | | 2,500 | | | | 115,900 | |
Onyx Pharmaceuticals, Inc.(a) | | | 5,700 | | | | 259,407 | |
Pharmacyclics, Inc.(a) | | | 11,500 | | | | 316,940 | |
Questcor Pharmaceuticals, Inc.(a) | | | 3,500 | | | | 157,150 | |
Regeneron Pharmaceuticals, Inc.(a) | | | 4,400 | | | | 595,144 | |
Salix Pharmaceuticals, Inc.(a) | | | 5,000 | | | | 247,000 | |
Seattle Genetics, Inc.(a) | | | 12,500 | | | | 247,125 | |
United Therapeutics Corp.(a) | | | 4,700 | | | | 205,625 | |
Valeant Pharmaceuticals International, Inc.(a)(b) | | | 7,500 | | | | 417,225 | |
Vivus, Inc.(a) | | | 13,000 | | | | 314,860 | |
| | | | | | | | 7,372,719 | |
Real Estate—0.3% | | | | | | | | |
E-House China Holdings Ltd.—ADR | | | 25,000 | | | | 185,500 | |
Retailing—7.7% | | | | | | | | |
Abercrombie & Fitch Co. | | | 4,500 | | | | 225,765 | |
American Eagle Outfitters, Inc. | | | 11,000 | | | | 198,110 | |
GNC Holdings, Inc. | | | 12,000 | | | | 468,720 | |
LKQ Corp.(a) | | | 8,500 | | | | 284,325 | |
L’Occitane International SA(b) | | | 60,000 | | | | 160,079 | |
PetSmart, Inc. | | | 9,400 | | | | 547,644 | |
priceline.com, Inc.(a) | | | 1,800 | | | | 1,369,476 | |
Teavana Holdings, Inc.(a) | | | 10,000 | | | | 208,900 | |
Tiffany & Co. | | | 5,500 | | | | 376,530 | |
Tractor Supply Co. | | | 11,000 | | | | 1,082,510 | |
TripAdvisor, Inc.(a) | | | 4,500 | | | | 168,795 | |
Ulta Salon Cosmetics & Fragrance, Inc. | | | 6,500 | | | | 573,170 | |
| | | | | | | | 5,664,024 | |
Semiconductors & Semiconductor Equipment—1.9% | |
Atmel Corp.(a) | | | 16,000 | | | | 141,920 | |
Broadcom Corp. | | | 5,000 | | | | 183,000 | |
Cavium, Inc.(a) | | | 9,500 | | | | 277,970 | |
Cirrus Logic, Inc.(a) | | | 9,500 | | | | 260,110 | |
Cypress Semiconductor Corp. | | | 13,000 | | | | 201,500 | |
Skyworks Solutions, Inc.(a) | | | 11,000 | | | | 298,540 | |
| | | | | | | | 1,363,040 | |
The Accompanying Footnotes are an Integral Part of these Financial Statements.
The Tocqueville Opportunity Fund
Schedule of Investments as of April 30, 2012
(Unaudited)
| | | | | | | | |
| Common Stocks (continued) | | Shares | | | Value | |
Software & Services—18.3% | | | | | | | | |
ANSYS, Inc.(a) | | | 5,200 | | | $ | 348,764 | |
Ariba, Inc.(a) | | | 9,800 | | | | 374,360 | |
Baidu, Inc.—ADR(a) | | | 3,500 | | | | 464,450 | |
Check Point Software Technologies Ltd.(a)(b) | | | 3,400 | | | | 197,642 | |
Citrix Systems, Inc.(a) | | | 3,500 | | | | 299,635 | |
CommVault Systems, Inc.(a) | | | 4,700 | | | | 244,729 | |
comScore, Inc.(a) | | | 11,000 | | | | 219,120 | |
Concur Technologies, Inc.(a) | | | 6,500 | | | | 367,640 | |
Ebix, Inc. | | | 13,000 | | | | 265,850 | |
Equinix, Inc.(a) | | | 2,900 | | | | 476,180 | |
Facebook, Inc.(a)(d)(e)(f) | | | 30,000 | | | | 1,174,500 | |
FactSet Research Systems, Inc. | | | 2,800 | | | | 293,608 | |
Informatica Corp.(a) | | | 10,500 | | | | 483,210 | |
Kenexa Corp.(a) | | | 7,000 | | | | 228,690 | |
Linkedin Corp.(a) | | | 6,500 | | | | 704,925 | |
LogMein, Inc.(a) | | | 3,000 | | | | 108,030 | |
Manhattan Associates, Inc.(a) | | | 6,000 | | | | 300,900 | |
MICROS Systems, Inc.(a) | | | 7,800 | | | | 443,274 | |
NetSuite, Inc.(a) | | | 9,700 | | | | 430,486 | |
Nuance Communications, Inc.(a) | | | 16,100 | | | | 393,484 | |
Parametric Technology Corp.(a) | | | 10,900 | | | | 235,222 | |
Rackspace Hosting, Inc.(a) | | | 6,000 | | | | 348,540 | |
Red Hat, Inc.(a) | | | 7,500 | | | | 447,075 | |
Salesforce.com, Inc.(a) | | | 7,000 | | | | 1,090,110 | |
Sapient Corp. | | | 16,500 | | | | 197,505 | |
SolarWinds, Inc.(a) | | | 7,500 | | | | 351,825 | |
Solera Holdings, Inc. | | | 5,900 | | | | 265,146 | |
Teradata Corp.(a) | | | 2,200 | | | | 153,516 | |
TIBCO Software, Inc.(a) | | | 39,500 | | | | 1,299,550 | |
Ultimate Software Group, Inc.(a) | | | 6,400 | | | | 493,824 | |
VeriFone Systems, Inc.(a) | | | 5,200 | | | | 247,728 | |
VirnetX Holding Corp.(a) | | | 4,000 | | | | 99,360 | |
VMware, Inc.(a) | | | 3,800 | | | | 424,536 | |
| | | | | | | | 13,473,414 | |
Technology Hardware & Equipment—5.3% | |
Acme Packet, Inc.(a) | | | 7,000 | | | | 196,490 | |
Apple, Inc.(a) | | | 3,300 | | | | 1,927,992 | |
Aruba Networks, Inc.(a) | | | 20,000 | | | | 422,400 | |
F5 Networks, Inc.(a) | | | 2,200 | | | | 294,646 | |
Finisar Corp.(a) | | | 6,000 | | | | 99,120 | |
Fusion-io, Inc.(a) | | | 21,000 | | | | 538,650 | |
Measurement Specialties, Inc.(a) | | | 4,500 | | | | 160,785 | |
Riverbed Technology, Inc.(a) | | | 13,700 | | | | 270,301 | |
| | | | | | | | 3,910,384 | |
Telecommunication Services—0.2% | | | | | | | | |
Cogent Communications Group, Inc.(a) | | | 7,000 | | | | 131,110 | |
Transportation—1.8% | | | | | | | | |
Genesee & Wyoming, Inc.(a) | | | 3,300 | | | $ | 177,903 | |
Hertz Global Holdings, Inc.(a) | | | 25,000 | | | | 385,250 | |
Kansas City Southern | | | 10,000 | | | | 770,200 | |
| | | | | | | | 1,333,353 | |
Total Common Stocks
(Cost $59,460,838) | | | | | | | 71,643,529 | |
Exchange Traded Fund—1.6% | | | | | | | | |
Diversified Financials—1.6% | | | | | | | | |
iShares Russell 2000 Growth Index Fund | | | 12,500 | | | | 1,171,250 | |
Total Exchange Traded Fund (Cost $1,182,555) | | | | | | | | |
Closed-End Mutual Funds—1.0% | | | | | | | | |
Funds, Trusts, and Other Financial Vehicles—1.0% | | | | | | | | |
Firsthand Technology Value Fund(a) | | | 9,500 | | | | 249,565 | |
GSV Capital Corp.(a) | | | 28,000 | | | | 479,360 | |
Total Closed-End Mutual Funds (Cost $720,252) | | | | | | | 728,925 | |
Total Investments (Cost $61,363,645)—99.9% | | | | | | | 73,543,704 | |
Other Assets in Excess of Liabilities—0.1% | | | | | | | 109,369 | |
Total Net Assets—100.0% | | | | | | $ | 73,653,073 | |
| | | | | | | | |
Percentages are stated as a percent of net assets.
ADR—American Depository Receipt
| (a) | Non-income producing security. |
| (b) | Foreign issued security. Foreign concentration (including ADRs) was as follows: Bermuda 1.2%; Canada 0.6%; Cayman Islands 2.3%; Ireland 0.1%; Israel 0.3%; Italy 0.4%; Luxembourg 0.2%; Netherlands 1.6% |
| (c) | Affiliated company. See Footnote 8. |
| (d) | Denotes a security is either fully or partially restricted to resale. The aggregate value of restricted securities at April 30, 2012 was $1,174,500 which represented 1.6% of net assets. |
| (e) | Fair valued security. The aggregate value of fair valued securities as of April 30, 2012 was $1,174,500 which represented 1.6% of net assets. |
| (f) | Security is considered illiquid and may be difficult to sell. |
The Accompanying Footnotes are an Integral Part of these Financial Statements.
The Tocqueville International Value Fund
Schedule of Investments as of April 30, 2012
(Unaudited)
| | | | | | | | |
| Common Stocks—90.6% | | Shares | | | Value | |
Australia—2.8% | | | | | | | | |
BHP Billiton Ltd.—ADR | | | 30,000 | | | $ | 2,229,000 | |
Spotless Group Ltd. | | | 1,500,000 | | | | 4,001,084 | |
| | | | | | | | 6,230,084 | |
Belgium—3.1% | | | | | | | | |
Groupe Bruxelles Lambert SA | | | 50,000 | | | | 3,468,748 | |
NV Bekaert SA | | | 40,000 | | | | 1,184,973 | |
Umicore SA | | | 42,000 | | | | 2,279,128 | |
| | | | | | | | 6,932,849 | |
Canada—2.1% | | | | | | | | |
Barrick Gold Corp. | | | 35,000 | | | | 1,415,050 | |
Eldorado Gold Corp. | | | 75,000 | | | | 1,063,500 | |
IAMGOLD Corp. | | | 182,000 | | | | 2,256,800 | |
| | | | | | | | 4,735,350 | |
France—13.5% | | | | | | | | |
Bollore | | | 20,000 | | | | 4,341,726 | |
Carrefour SA | | | 50,633 | | | | 1,017,070 | |
Cie de St-Gobain | | | 94,000 | | | | 3,937,508 | |
Haulotte Group SA(a) | | | 182,500 | | | | 1,944,676 | |
Ipsen SA | | | 120,000 | | | | 3,199,111 | |
Metropole Television SA | | | 210,000 | | | | 3,224,525 | |
Nexans SA | | | 66,000 | | | | 3,299,301 | |
Sanofi | | | 75,000 | | | | 5,724,327 | |
Vivendi SA | | | 202,025 | | | | 3,734,518 | |
| | | | | | | | 30,422,762 | |
Germany—5.0% | | | | | | | | |
Kloeckner & Co. SE | | | 260,000 | | | | 3,527,652 | |
Siemens AG—ADR | | | 45,000 | | | | 4,179,150 | |
Wacker Neuson SE | | | 220,000 | | | | 3,632,886 | |
| | | | | | | | 11,339,688 | |
Hong Kong—3.6% | | | | | | | | |
Clear Media Ltd.(a) | | | 3,800,000 | | | | 2,316,640 | |
PYI Corp. Ltd. | | | 35,398,000 | | | | 912,479 | |
Television Broadcasts Ltd. | | | 650,000 | | | | 4,775,315 | |
| | | | | | | | 8,004,434 | |
Ireland—4.2% | | | | | | | | |
CRH PLC | | | 181,850 | | | | 3,686,539 | |
DCC PLC | | | 225,000 | | | | 5,658,804 | |
| | | | | | | | 9,345,343 | |
Italy—2.5% | | | | | | | | |
Interpump Group SpA | | | 260,537 | | | | 2,324,437 | |
Sogefi SpA | | | 1,250,000 | | | | 3,398,592 | |
| | | | | | | | 5,723,029 | |
Japan—27.4% | | | | | | | | |
Asahi Kasei Corp. | | | 558,000 | | | | 3,466,533 | |
Asics Corp. | | | 322,500 | | | | 3,502,098 | |
Bridgestone Corp. | | | 165,000 | | | | 3,936,936 | |
Canon, Inc.—ADR | | | 120,000 | | | $ | 5,443,200 | |
Disco Corp. | | | 85,000 | | | | 5,104,897 | |
Hitachi Ltd. | | | 925,000 | | | | 5,931,864 | |
Horiba Ltd. | | | 100,000 | | | | 3,533,317 | |
Hoya Corp. | | | 210,000 | | | | 4,839,679 | |
Kyoto Kimono Yuzen Co., Ltd. | | | 299,500 | | | | 3,683,730 | |
Makita Corp. | | | 120,000 | | | | 4,644,288 | |
MISUMI Group, Inc. | | | 140,000 | | | | 3,293,086 | |
Omron Corp. | | | 210,000 | | | | 4,489,855 | |
SMC Corp. | | | 28,000 | | | | 4,702,906 | |
Takata Corp. | | | 200,000 | | | | 4,922,345 | |
| | | | | | | | 61,494,734 | |
Luxembourg—1.5% | | | | | | | | |
SAF-Holland SA(a) | | | 388,500 | | | | 3,265,527 | |
Netherlands—6.2% | | | | | | | | |
Akzo Nobel NV | | | 77,000 | | | | 4,126,420 | |
Koninklijke Philips Electronics NV—ADR | | | 210,000 | | | | 4,197,900 | |
Unilever NV—ADR | | | 165,000 | | | | 5,667,750 | |
| | | | | | | | 13,992,070 | |
Norway—4.9% | | | | | | | | |
Orkla ASA | | | 720,000 | | | | 5,289,020 | |
Statoil ASA—ADR | | | 210,000 | | | | 5,651,100 | |
| | | | | | | | 10,940,120 | |
Singapore—1.5% | | | | | | | | |
Singapore Post Ltd. | | | 4,000,000 | | | | 3,280,808 | |
Switzerland—4.0% | | | | | | | | |
Nestle SA | | | 85,000 | | | | 5,206,853 | |
Novartis AG—ADR | | | 69,000 | | | | 3,806,730 | |
| | | | | | | | 9,013,583 | |
United Kingdom—3.7% | | | | | | | | |
Halfords Group PLC | | | 675,000 | | | | 3,013,608 | |
HSBC Holdings PLC—ADR | | | 20,000 | | | | 903,400 | |
Vodafone Group PLC—ADR | | | 160,000 | | | | 4,452,800 | |
| | | | | | | | 8,369,808 | |
United States—4.6% | | | | | | | | |
Aflac, Inc. | | | 95,000 | | | | 4,278,800 | |
Freeport-McMoRan Copper & Gold, Inc. | | | 43,300 | | | | 1,658,390 | |
Newmont Mining Corp. | | | 90,000 | | | | 4,288,500 | |
| | | | | | | | 10,225,690 | |
Total Common Stocks
(Cost $197,168,905) | | | | | | | 203,315,879 | |
Short-Term Investments—8.6% | | | | | | | | |
Money Market Fund—3.7% | | | | | | | | |
AIM STIT-Treasury Portfolio, 0.02%(b) | | | 8,282,598 | | | | 8,282,598 | |
The Accompanying Footnotes are an Integral Part of these Financial Statements.
The Tocqueville International Value Fund
Schedule of Investments as of April 30, 2012
(Unaudited)
| | | | | | | | |
| Repurchase Agreement—4.9% | | Principal
Amount | | | Value | |
Repurchase Agreement with U.S. Bank, N.A., 0.01% dated 4/30/2012, due 5/01/2012, collateralized by: Fannie Mae Conventional Level Pay 30 Year Fixed (Pool #694838) valued at $11,286,363. Repurchase proceeds of $11,065,003. | | $ | 11,065,000 | | | $ | 11,065,000 | |
Total Short-Term Investments
(Cost $19,347,598) | | | | | | | 19,347,598 | |
Total Investments
(Cost $216,516,503)—99.2% | | | | | | | 222,663,477 | |
Other Assets in Excess of Liabilities—0.8% | | | | 1,862,542 | |
Total Net Assets—100.0% | | | | | | $ | 224,526,019 | |
| | | | | | | | |
Percentages are stated as a percent of net assets.
ADR—American Depository Receipt
| (a) | Non-income producing security. |
| (b) | Variable rate security. The rate listed is as of April 30, 2012. |
Schedule of Open Forward Currency Contracts
as of April 30, 2012
(Unaudited)
| | | | | | | | | | | | |
| Forward Expiration Date | | Currency to be
Received | | Currency to be
Delivered | | Amount of
Currency to be
Delivered | | Amount of
Currency to be
Received | | Unrealized
Appreciation
(Depreciation) | |
5/31/2012 | | U.S. Dollars | | Euro | | 10,500,000 | | 13,897,275 | | $ | (3,274 | ) |
| | | | | | | | | | | | |
| | | | | | | | | | $ | (3,274 | ) |
| | | | | | | | | | | | |
The Accompanying Footnotes are an Integral Part of these Financial Statements.
The Tocqueville Gold Fund
Schedule of Investments as of April 30, 2012
(Unaudited)
| | | | | | | | |
| Common Stocks—88.3% | | Shares | | | Value | |
Gold Related—80.3% | | | | | | | | |
Australia—1.0% | | | | | | | | |
Eldorado Gold Corp.(a) | | | 1,544,785 | | | $ | 22,099,629 | |
Canada—56.8% | | | | | | | | |
Agnico Eagle Mines Ltd. | | | 893,000 | | | | 35,648,560 | |
Agnico Eagle Mines Ltd.(a) | | | 210,837 | | | | 8,421,955 | |
Alacer Gold Corp.(b) | | | 4,626,800 | | | | 37,469,656 | |
Alamos Gold, Inc. | | | 3,395,200 | | | | 62,140,220 | |
Allied Gold Mining PLC(b) | | | 3,976,667 | | | | 7,246,039 | |
Atac Resources Ltd.(b)(c) | | | 10,261,700 | | | | 28,359,003 | |
B2Gold Corp.(b) | | | 1,500,000 | | | | 5,607,000 | |
Banro Corp.(b) | | | 7,519,500 | | | | 31,970,340 | |
Barisan Gold Corp.(b) | | | 877,100 | | | | 170,918 | |
Barrick Gold Corp. | | | 1,207,300 | | | | 48,811,139 | |
Blue Gold Mining, Inc.(b)(c) | | | 4,000,000 | | | | 2,024,599 | |
Brazilian Gold Corp.(b) | | | 4,285,800 | | | | 1,605,250 | |
Corvus Gold, Inc.(b)(c) | | | 2,079,901 | | | | 1,642,276 | |
Dalradian Resources, Inc.(b) | | | 1,250,000 | | | | 1,708,255 | |
Detour Gold Corp.(b) | | | 2,069,900 | | | | 51,084,843 | |
East Asia Minerals Corp.(b)(c) | | | 10,544,400 | | | | 3,255,598 | |
Eldorado Gold Corp. | | | 250,000 | | | | 3,545,000 | |
Eldorado Gold Corp.(a) | | | 6,516,500 | | | | 92,353,090 | |
Franco-Nevada Corp. | | | 1,635,900 | | | | 73,378,275 | |
Goldcorp, Inc. | | | 718,050 | | | | 27,472,593 | |
Goldcorp, Inc.(a) | | | 2,138,010 | | | | 81,875,708 | |
HudBay Minerals, Inc. | | | 378,700 | | | | 3,991,498 | |
IAMGOLD Corp. | | | 400,000 | | | | 4,960,000 | |
IAMGOLD Corp.(a) | | | 3,416,796 | | | | 42,370,553 | |
International Tower Hill Mines Ltd.(a)(b)(c) | | | 5,666,667 | | | | 21,511,364 | |
International Tower Hill Mines Ltd.(b)(c) | | | 5,238,836 | | | | 20,117,130 | |
Ivanhoe Mines Ltd.(b) | | | 3,614,950 | | | | 42,193,019 | |
Kinross Gold Corp. | | | 2,509,600 | | | | 22,460,920 | |
Nevsun Resources Ltd. | | | 725,100 | | | | 2,671,827 | |
New Gold, Inc.(b) | | | 1,589,100 | | | | 14,460,810 | |
New Gold, Inc.(a)(b) | | | 3,851,140 | | | | 35,086,562 | |
Novagold Resources, Inc.(b) | | | 4,237,500 | | | | 30,542,086 | |
Orezone Gold Corp.(b) | | | 2,145,462 | | | | 3,713,863 | |
Osisko Mining Corp.(b) | | | 8,934,500 | | | | 91,981,440 | |
Pan American Silver Corp. | | | 1,499,466 | | | | 29,254,582 | |
Pan American Silver Corp.(a) | | | 748,632 | | | | 14,558,102 | |
Premier Gold Mines Ltd.(b) | | | 986,000 | | | | 4,771,048 | |
Primero Mining Corp.(b) | | | 4,264,800 | | | | 11,742,933 | |
Rockhaven Resources Ltd.(b)(c) | | | 5,000,000 | | | | 1,746,216 | |
Romarco Minerals, Inc.(b) | | | 16,887,800 | | | | 17,266,465 | |
SEMAFO, Inc. | | | 5,200,000 | | | | 26,425,064 | |
Silver Wheaton Corp. | | | 2,714,875 | | | | 82,887,716 | |
Strategic Metals Ltd.(b)(c) | | | 10,926,900 | | | | 12,056,811 | |
Sunward Resources Ltd.(b) | | | 660,800 | | | | 1,264,273 | |
Torex Gold Resources, Inc.(b) | | | 12,517,400 | | | | 21,794,734 | |
Wesdome Gold Mines Ltd.(b) | | | 1,469,700 | | | $ | 1,978,743 | |
Yamana Gold, Inc. | | | 4,317,500 | | | | 63,467,250 | |
| | | | | | | | 1,231,065,326 | |
Peru—1.9% | | | | | | | | |
Cia de Minas Buenaventura SA—ADR | | | 978,600 | | | | 40,386,822 | |
South Africa—3.0% | | | | | | | | |
AngloGold Ashanti
Ltd.—ADR | | | 824,300 | | | | 28,339,434 | |
Gold Fields Ltd.(a) | | | 166,249 | | | | 2,115,179 | |
Gold Fields Ltd.—ADR | | | 2,641,950 | | | | 34,001,896 | |
Harmony Gold Mining Co., Ltd. | | | 1 | | | | 10 | |
Witwatersrand Consolidated Gold Resources Ltd.(b) | | | 335,000 | | | | 1,723,839 | |
| | | | | | | | 66,180,358 | |
United Kingdom—3.7% | | | | | | | | |
Randgold Resources
Ltd.—ADR(b) | | | 891,200 | | | | 79,450,480 | |
United States—13.9% | | | | | | | | |
Allied Nevada Gold Corp.(b) | | | 1,229,848 | | | | 36,022,248 | |
Electrum Holdings Ltd.(b)(d)(e)(f) | | | 2,127,287 | | | | 5,530,946 | |
Gold Resource Corp.(c) | | | 3,721,997 | | | | 100,940,559 | |
Newmont Mining Corp. | | | 1,814,800 | | | | 86,475,220 | |
Royal Gold, Inc. | | | 1,152,165 | | | | 71,388,143 | |
| | | | | | | | 300,357,116 | |
Total Gold Related | | | | | | | 1,739,539,731 | |
Other Precious Metals Related—5.7% | | | | | |
Canada—4.0% | | | | | | | | |
Bear Creek Mining Corp.(b) | | | 3,033,100 | | | | 10,285,858 | |
MAG Silver Corp.(b) | | | 200,000 | | | | 2,006,000 | |
Scorpio Mining Corp.(a)(b)(c) | | | 522,400 | | | | 555,266 | |
Scorpio Mining Corp.(b)(c) | | | 25,668,419 | | | | 25,668,419 | |
Silver Range Resources Ltd.(b)(c) | | | 3,450,000 | | | | 2,532,014 | |
Tahoe Resources, Inc.(b) | | | 2,406,600 | | | | 45,288,955 | |
| | | | | | | | 86,336,512 | |
South Africa—0.7% | | | | | | | | |
Ivanplats Ltd.(b)(d)(e)(f) | | | 5,239,165 | | | | 15,717,495 | |
United States—1.0% | | | | | | | | |
Sunshine Silver Mines(b)(d)(e)(f) | | | 1,633,545 | | | | 22,583,760 | |
Total Other Precious Metals Related | | | | | | | 124,637,767 | |
Other—2.3% | | | | | | | | |
Australia—0.4% | | | | | | | | |
Ivanhoe Australia Ltd.(b) | | | 6,464,000 | | | | 8,418,947 | |
The Accompanying Footnotes are an Integral Part of these Financial Statements.
The Tocqueville Gold Fund
Schedule of Investments as of April 30, 2012
(Unaudited)
| | | | | | | | |
| Common Stocks (continued) | | Shares | | | Value | |
Canada—0.9% | | | | | | | | |
Cameco Corp. | | | 480,300 | | | $ | 10,614,630 | |
Trevali Mining Corp.(b)(c) | | | 6,375,000 | | | | 8,195,830 | |
| | | | | | | | 18,810,460 | |
United Kingdom—0.5% | | | | | | | | |
Copper Development Corp.(b) | | | 12,512,000 | | | | 4,518,030 | |
West African Minerals Corp.(b) | | | 10,000,000 | | | | 6,491,610 | |
| | | | | | | | 11,009,640 | |
United States—0.5% | | | | | | | | |
Gold Bullion International LLC(b)(c)(d)(e)(f) | | | 5,000,000 | | | | 5,836,800 | |
GoviEx Uranium, Inc.(b)(d)(e)(f) | | | 1,750,000 | | | | 5,250,000 | |
I-Pulse, Inc.(b)(d)(e)(f) | | | 74,532 | | | | 156,517 | |
| | | | | | | | 11,243,317 | |
Total Other | | | | | | | 49,482,364 | |
Total Common Stocks
(Cost $1,494,619,483) | | | | | | | 1,913,659,862 | |
Subscription Receipts—0.1% | | | | | | | | |
Gold Related Securities—0.1% | | | | | | | | |
Canada—0.1% | | | | | | | | |
Regulus Resources, Inc.(b)(c)(d)(e)(f) | | | 2,609,000 | | | | 3,037,253 | |
Total Subscription Receipts
(Cost $2,998,551) | | | | | | | 3,037,253 | |
Closed-End Mutual Fund—0.9% | | | | | |
Gold Related Securities—0.9% | | | | | |
Canada—0.9% | | | | | | | | |
Sprott Physical Gold Trust Unit(b) | | | 1,400,000 | | | | 19,908,000 | |
Total Closed-End Mutual Fund
(Cost $14,500,000) | | | | | | | 19,908,000 | |
Private Fund—1.1% | | | | | | | | |
Gold Related Securities—1.1% | | | | | |
United States—1.1% | | | | | | | | |
Eidesis Special Opportunities II LP(b)(c)(d)(e)(f) | | | 25,000 | | | | 22,955,765 | |
Total Private Fund
(Cost $25,000,000) | | | | | | | 22,955,765 | |
| Gold Bullion—7.6% | | | Ounces | | | | | |
Gold Bullion(b) | | | 98,132 | | | | 163,364,774 | |
Total Gold Bullion
(Cost $44,773,750) | | | | | | | 163,364,774 | |
Gold Related Securities—0.1% | | | | | |
Canada—0.1% | | | | | | | | |
Blue Gold Mining, Inc. Expiration: 09/20/13, Exercise Price: CAD $1.50(b)(c)(d)(e)(f) | | | 2,000,000 | | | $ | 7,693 | |
East Asia Minerals Corp. Expiration: 12/15/13, Exercise Price: CAD $0.78(b)(c)(d)(e)(f) | | | 6,500,000 | | | | 533,370 | |
Kinross Gold Corp. Expiration: 09/03/13, Exercise Price: CAD
$32.00(b) | | | 108,032 | | | | 53,587 | |
Pan American Silver Corp. Expiration: 01/04/15, Exercise Price: CAD $35.00(b)(d)(e)(f) | | | 133,333 | | | | 265,294 | |
Primero Mining Corp. Expiration: 07/20/15, Exercise Price: CAD $8.00(b) | | | 1,848,400 | | | | 477,139 | |
| | | | | | | | 1,337,083 | |
Cayman Islands—0.0% | | | | | | | | |
Endeavour Mining Corp. Expiration: 01/30/14, Exercise Price: CAD $2.50(b) | | | 1,000,000 | | | | 516,273 | |
Total Gold Related Securities | | | | | | | 1,853,356 | |
Other Precious Metals Related Securities—0.0% | |
Canada—0.0% | | | | | | | | |
Silver Range Resources Ltd. Expiration: 02/10/13, Exercise Price: CAD $0.85(b)(c) | | | 1,725,000 | | | | 506,403 | |
United States—0.0% | | | | | | | | |
Ivanplats Ltd. IPO Warrants Expiration: 12/31/12(b)(d)(e)(f) | | | 487,500 | | | | — | |
Total Other Precious Metals Related Securities | | | | | | | 506,403 | |
Total Warrants
(Cost $1,314,861) | | | | | | | 2,359,759 | |
| Short-Term Investments—1.9% | |
| Principal
Amount |
| | | | |
U.S. Treasury Bills—1.4% | | | | | | | | |
0.063%, 07/19/2012(g) | | $ | 30,000,000 | | | | 29,994,570 | |
The Accompanying Footnotes are an Integral Part of these Financial Statements.
The Tocqueville Gold Fund
Schedule of Investments as of April 30, 2012
(Unaudited)
| | | | | | | | |
| Repurchase Agreement—0.5% | | Principal
Amount | | | Value | |
Repurchase Agreement with U.S. Bank, N.A., 0.01% dated 4/30/2012, due 5/01/2012, collateralized by: Freddie Mac Giant 30 Year Fixed (Pool #G01543) valued at $2,547,113. Repurchase proceeds of $2,497,355. Freddie Mac 30 Year Variable (Pool #1B2502) valued at $5,033,806. Repurchase proceeds of $4,935,295. Freddie Mac 30 Year Variable (Pool #3448) valued at $3,681,680. Repurchase proceeds of $3,609,353. | | $ | 11,042,000 | | | $ | 11,042,000 | |
Total Short-Term Investments
(Cost $41,037,872) | | | | 41,036,570 | |
Total Investments
(Cost $1,624,244,517)—100.0% | | | | 2,166,321,983 | |
Other Assets in Excess of Liabilities—0.0% | | | | 889,136 | |
Total Net Assets—100.0% | | | | | | $ | 2,167,211,119 | |
| | | | | | | | |
Percentages are stated as a percent of net assets.
ADR—American Depository Receipt
| (a) | Denotes an issue that is traded on a foreign exchange when a company is listed more than once. |
| (b) | Non-income producing security. |
| (c) | Affiliated company. See Footnote 8. |
| (d) | Denotes a security is either fully or partially restricted to resale. The aggregate value of restricted securities at April 30, 2012 was $81,874,893, which represented 3.8% of net assets. |
| (e) | Fair valued security. The aggregate value of fair valued securities as of April 30, 2012 was $81,874,893, which represented 3.8% of net assets. |
| (f) | Security is considered illiquid and may be difficult to sell. |
| (g) | Rate shown is the effective yield based on purchase price. The calculation assumes the security is held to maturity. |
The Accompanying Footnotes are an Integral Part of these Financial Statements.
The Delafield Fund
Schedule of Investments as of April 30, 2012
(Unaudited)
| | | | | | | | |
| Common Stocks—82.3% | | Shares | | | Value | |
Aerospace & Defense—2.3% | | | | | | | | |
Honeywell International, Inc. | | | 540,000 | | | $ | 32,756,400 | |
Building Products—1.8% | | | | | | | | |
Griffon Corp. | | | 1,550,000 | | | | 15,360,500 | |
Trex Co., Inc.(a) | | | 350,000 | | | | 11,200,000 | |
| | | | | | | | 26,560,500 | |
Capital Markets—1.0% | | | | | | | | |
The Bank of New York Mellon Corp. | | | 600,000 | | | | 14,190,000 | |
Chemicals—15.7% | | | | | | | | |
Ashland, Inc. | | | 500,000 | | | | 32,935,000 | |
Celanese Corp. | | | 575,000 | | | | 27,864,500 | |
Chemtura Corp.(a) | | | 1,050,000 | | | | 17,871,000 | |
Cytec Industries, Inc. | | | 125,000 | | | | 7,946,250 | |
Eastman Chemical Co. | | | 800,000 | | | | 43,176,000 | |
Ferro Corp.(a)(b) | | | 2,000,000 | | | | 10,380,000 | |
FMC Corp. | | | 125,000 | | | | 13,806,250 | |
HB Fuller Co. | | | 525,000 | | | | 17,272,500 | |
Minerals Technologies, Inc.(b) | | | 360,000 | | | | 24,156,000 | |
OM Group, Inc.(a) | | | 352,800 | | | | 8,509,536 | |
PolyOne Corp. | | | 1,500,000 | | | | 20,790,000 | |
Tronox, Inc.(a) | | | 20,000 | | | | 3,743,000 | |
| | | | | | | | 228,450,036 | |
Commercial Banks—0.7% | | | | | | | | |
Hancock Holding Co. | | | 325,000 | | | | 10,458,500 | |
Commercial Services & Supplies—3.6% | |
ACCO Brands Corp.(a) | | | 2,150,000 | | | | 22,682,500 | |
Avery Dennison Corp. | | | 800,000 | | | | 25,584,000 | |
Layne Christensen Co.(a) | | | 175,000 | | | | 3,596,250 | |
| | | | | | | | 51,862,750 | |
Communications Equipment—1.6% | |
Harris Corp. | | | 525,000 | | | | 23,908,500 | |
Computers & Peripherals—0.2% | |
Intermec, Inc.(a) | | | 622,700 | | | | 3,312,764 | |
Construction & Engineering—1.2% | |
Aegion Corp.(a) | | | 948,000 | | | | 17,301,000 | |
Containers & Packaging—4.0% | | | | | | | | |
Owens-Illinois, Inc.(a) | | | 1,400,000 | | | | 32,550,000 | |
Sealed Air Corp. | | | 600,000 | | | | 11,508,000 | |
Sonoco Products Co. | | | 450,000 | | | | 14,908,500 | |
| | | | | | | | 58,966,500 | |
Electrical Equipment—3.8% | | | | | | | | |
Acuity Brands, Inc. | | | 350,000 | | | | 19,449,500 | |
Brady Corp. | | | 400,000 | | | | 12,412,000 | |
Hubbell, Inc. | | | 300,000 | | | | 24,072,000 | |
| | | | | | | | 55,933,500 | |
Electronic Equipment, Instruments & Components—6.3% | |
Checkpoint Systems, Inc.(a)(b) | | | 2,500,000 | | | $ | 27,400,000 | |
Flextronics International Ltd.(a)(c) | | | 3,500,000 | | | | 23,310,000 | |
Ingram Micro, Inc.(a) | | | 850,000 | | | | 16,541,000 | |
Kemet Corp.(a) | | | 1,046,492 | | | | 8,905,647 | |
Plexus Corp.(a) | | | 475,000 | | | | 15,375,750 | |
| | | | | | | | 91,532,397 | |
Household Durables—2.1% | | | | | | | | |
Stanley Black & Decker, Inc. | | | 415,000 | | | | 30,361,400 | |
Industrial Conglomerates—5.9% | |
Carlisle Companies, Inc. | | | 650,000 | | | | 35,789,000 | |
Teleflex, Inc. | | | 225,000 | | | | 14,100,750 | |
Tyco International Ltd.(c) | | | 640,000 | | | | 35,923,200 | |
| | | | | | | | 85,812,950 | |
Insurance—2.4% | | | | | | | | |
Alleghany Corp.(a) | | | 55,000 | | | | 18,859,500 | |
XL Group PLC(c) | | | 750,000 | | | | 16,132,500 | |
| | | | | | | | 34,992,000 | |
Life Sciences Tools & Services—1.2% | |
Thermo Fisher Scientific, Inc. | | | 325,000 | | | | 18,086,250 | |
Machinery—13.0% | | | | | | | | |
Albany International Corp. | | | 650,000 | | | | 15,665,000 | |
Crane Co. | | | 325,000 | | | | 14,342,250 | |
Dover Corp. | | | 575,000 | | | | 36,029,500 | |
Federal Signal Corp.(a)(b) | | | 2,450,000 | | | | 12,642,000 | |
Harsco Corp. | | | 750,000 | | | | 16,725,000 | |
IDEX Corp. | | | 325,000 | | | | 14,075,750 | |
Ingersoll-Rand PLC(c) | | | 625,000 | | | | 26,575,000 | |
Kennametal, Inc. | | | 825,000 | | | | 34,839,750 | |
Timken Co. | | | 325,000 | | | | 18,365,750 | |
| | | | | | | | 189,260,000 | |
Metals & Mining—2.9% | | | | | | | | |
AM Castle & Co.(a) | | | 750,000 | | | | 10,042,500 | |
Kaiser Aluminum Corp. | | | 285,000 | | | | 14,982,450 | |
Universal Stainless & Alloy(a)(b) | | | 367,000 | | | | 17,028,800 | |
| | | | | | | | 42,053,750 | |
Oil, Gas & Consumable Fuels—0.9% | |
Chesapeake Energy Corp. | | | 250,000 | | | | 4,610,000 | |
Southwestern Energy Co.(a) | | | 250,000 | | | | 7,895,000 | |
| | | | | | | | 12,505,000 | |
Professional Services—1.8% | | | | | | | | |
TrueBlue, Inc.(a)(b) | | | 1,500,000 | | | | 25,890,000 | |
Semiconductors & Semiconductor Equipment—5.0% | |
Brooks Automation, Inc. | | | 1,150,000 | | | | 13,524,000 | |
Diodes, Inc.(a) | | | 175,000 | | | | 3,900,750 | |
Fairchild Semiconductor International, Inc.(a) | | | 1,400,000 | | | | 19,838,000 | |
The Accompanying Footnotes are an Integral Part of these Financial Statements.
The Delafield Fund
Schedule of Investments as of April 30, 2012
(Unaudited)
| | | | | | | | |
| Common Stocks (continued) | |
Shares | | | Value | |
FormFactor, Inc.(a) | | | 600,000 | | | $ | 3,360,000 | |
Infineon Technologies AG(c) | | | 390,000 | | | | 3,882,654 | |
LTX-Credence Corp.(a)(b) | | | 2,148,200 | | | | 14,822,580 | |
Teradyne, Inc.(a) | | | 800,000 | | | | 13,768,000 | |
| | | | | | | | 73,095,984 | |
Specialty Retail—1.4% | | | | | | | | |
Collective Brands, Inc.(a) | | | 1,000,000 | | | | 20,770,000 | |
Textiles, Apparel & Luxury Goods—1.6% | |
Deckers Outdoor Corp.(a) | | | 120,000 | | | | 6,121,200 | |
Maidenform Brands, Inc.(a)(b) | | | 775,000 | | | | 17,693,250 | |
| | | | | | | | 23,814,450 | |
Trading Companies & Distributors—1.9% | |
Rush Enterprises, Inc.(a) | | | 150,000 | | | | 2,712,000 | |
WESCO International, Inc.(a) | | | 375,000 | | | | 24,896,250 | |
| | | | | | | | 27,608,250 | |
Total Common Stocks
(Cost $959,579,872) | | | | | | | 1,199,482,881 | |
Real Estate Investment Trust (REIT)—0.4% | |
Real Estate—0.4% | | | | | | | | |
Kimco Realty Corp. | | | 300,000 | | | | 5,823,000 | |
Total Real Estate Investment Trust
(Cost $1,823,936) | | | | 5,823,000 | |
Short-Term Investments—17.4% | | | | | |
Money Market Funds—5.5% | | | | | |
AIM STIT-Treasury Portfolio, 0.02%(d) | | | 79,617,450 | | | | 79,617,450 | |
| U.S. Treasury Bills—6.9% | |
| Principal
Amount |
| | | | |
0.082%, 06/28/2012(e) | | $ | 50,000,000 | | | | 49,993,402 | |
0.088%, 07/26/2012(e) | | | 50,000,000 | | | | 49,989,250 | |
| | | | | | | | 99,982,652 | |
Repurchase Agreement with U.S. Bank, N.A., 0.01% dated 4/30/2012, due 5/01/2012, collateralized by: Fannie Mae Conventional Level Pay 15 Year Fixed (Pool #555745) valued at $55,849,209. Repurchase proceeds of $54,757,809. Fannie Mae Conventional Level Pay 15 Year Fixed (Pool #729590) valued at $19,042,700. Repurchase proceeds of $18,669,211. | | $ | 73,427,000 | | | $ | 73,427,000 | |
Total Short-Term Investments
(Cost $253,027,530) | | | | | | | 253,027,102 | |
Total Investments
(Cost $1,214,431,338)—100.1% | | | | 1,458,332,983 | |
Liabilities in Excess of Other Assets—(0.1)% | | | | (1,489,354 | ) |
Total Net Assets—100.0% | | | | | | $ | 1,456,843,629 | |
| | | | | | | | |
Percentages are stated as a percent of net assets.
| (a) | Non-income producing security. |
| (b) | Affiliated company. See Footnote 8. |
| (c) | Foreign issued security. Foreign concentration (including ADRs) was as follows: Germany 0.3%; Ireland 2.9%; Singapore 1.6%; Switzerland 2.5% |
| (d) | Variable rate security. The rate listed is as of April 30, 2012. |
| (e) | Rate shown is the effective yield based on purchase price. The calculation assumes the security is held to maturity. |
The Accompanying Footnotes are an Integral Part of these Financial Statements.
The Tocqueville Select Fund
Schedule of Investments as of April 30, 2012
(Unaudited)
| | | | | | | | |
| Common Stocks—82.1% | | Shares | | | Value | |
Chemicals—11.7% | | | | | | | | |
Ashland, Inc. | | | 42,200 | | | $ | 2,779,714 | |
Celanese Corp. | | | 56,000 | | | | 2,713,760 | |
Cytec Industries, Inc. | | | 19,700 | | | | 1,252,329 | |
Ferro Corp.(a)(b) | | | 305,000 | | | | 1,582,950 | |
Minerals Technologies, Inc.(b) | | | 40,000 | | | | 2,684,000 | |
| | | | | | | | 11,012,753 | |
Commercial Services & Supplies—3.0% | |
Avery Dennison Corp. | | | 89,600 | | | | 2,865,408 | |
Communications Equipment—2.9% | |
Harris Corp. | | | 59,500 | | | | 2,709,630 | |
Computers & Peripherals—1.5% | | | | | | | | |
Logitech International SA(a)(c) | | | 140,000 | | | | 1,421,000 | |
Containers & Packaging—5.1% | | | | | | | | |
Owens-Illinois, Inc.(a) | | | 95,000 | | | | 2,208,750 | |
Sonoco Products Co. | | | 77,400 | | | | 2,564,262 | |
| | | | | | | | 4,773,012 | |
Electrical Equipment—2.2% | | | | | | | | |
Acuity Brands, Inc. | | | 36,500 | | | | 2,028,305 | |
Electronic Equipment, Instruments & Components—5.6% | |
Checkpoint Systems, Inc.(a)(b) | | | 252,000 | | | | 2,761,920 | |
Flextronics International Ltd.(a)(c) | | | 382,200 | | | | 2,545,452 | |
| | | | | | | | 5,307,372 | |
Household Durables—5.4% | | | | | | | | |
Stanley Black & Decker, Inc. | | | 33,400 | | | | 2,443,544 | |
Universal Electronics, Inc.(a) | | | 152,900 | | | | 2,587,068 | |
| | | | | | | | 5,030,612 | |
Industrial Conglomerates—3.5% | | | | | | | | |
Carlisle Companies, Inc. | | | 59,000 | | | | 3,248,540 | |
Internet Software & Services—4.7% | |
j2 Global, Inc. | | | 98,300 | | | | 2,539,089 | |
XO Group, Inc.(a) | | | 200,000 | | | | 1,854,000 | |
| | | | | | | | 4,393,089 | |
Leisure Equipment & Products—3.0% | |
Summer Infant, Inc.(a) | | | 535,933 | | | | 2,867,241 | |
Machinery—15.5% | | | | | | | | |
Albany International Corp. | | | 119,500 | | | | 2,879,950 | |
Harsco Corp. | | | 80,000 | | | | 1,784,000 | |
Ingersoll-Rand PLC (c) | | | 76,000 | | | | 3,231,520 | |
Kennametal, Inc. | | | 89,000 | | | | 3,758,470 | |
Trimas Corp.(a) | | | 133,500 | | | | 2,938,335 | |
| | | | | | | | 14,592,275 | |
Professional Services—4.2% | | | | | | | | |
Stantec, Inc.(c) | | | 121,100 | | | | 3,946,649 | |
Semiconductors & Semiconductor Equipment—1.8% | |
Diodes, Inc.(a) | | | 74,000 | | | | 1,649,460 | |
Software—3.2% | | | | | | | | |
Monotype Imaging Holdings, Inc.(a) | | | 210,000 | | | $ | 2,979,900 | |
Specialty Retail—4.9% | | | | | | | | |
Collective Brands, Inc.(a) | | | 140,900 | | | | 2,926,493 | |
Foot Locker, Inc. | | | 56,000 | | | | 1,713,040 | |
| | | | | | | | 4,639,533 | |
Textiles, Apparel & Luxury Goods—3.9% | |
Maidenform Brands, Inc.(a)(b) | | | 160,400 | | | | 3,661,932 | |
Total Common Stocks (Cost $66,694,990) | | | | | | | 77,126,711 | |
Short-Term Investments—19.1% | | | | | | | | |
Money Market Fund—8.8% | | | | | | | | |
AIM STIT-Treasury Portfolio, 0.02%(d) | | | 8,248,585 | | | | 8,248,585 | |
| U.S. Treasury Bills—5.3% | |
| Principal
Amount |
| | | | |
0.077%, 06/28/2012(e) | | $ | 5,000,000 | | | | 4,999,383 | |
Repurchase Agreement—5.0% | | | | | | | | |
Repurchase Agreement with U.S. Bank, N.A., 0. 01% dated 4/30/2012, due 5/01/2012, collateralized by: Freddie Mac 30 Year Variable (Pool #2727) valued at $2,444,982. Repurchase proceeds of $2,397,010. Freddie Mac 30 Year Variable (Pool #3448) valued at $1,422,053. Repurchase proceeds of $1,394,184. Fannie Mae Conventional Level Pay 15 Year Fixed (Pool #729590) valued at $953,439. Repurchase proceeds of $934,807. | | | 4,726,000 | | | | 4,726,000 | |
Total Short-Term Investments (Cost $17,973,968) | | | | | | | 17,973,968 | |
Total Investments (Cost $84,668,958)—101.2% | | | | | | | 95,100,679 | |
Liabilities in Excess of Other Assets—(1.2)% | | | | (1,162,187 | ) |
Total Net Assets—100.0% | | | | | | $ | 93,938,492 | |
| | | | | | | | |
Percentages are stated as a percent of net assets.
| (a) | Non-income producing security. |
| (b) | Affiliated company. See Footnote 8. |
| (c) | Foreign issued security. Foreign concentration (including ADRs) was as follows: Canada 4.2%; Ireland 3.4%; Singapore 2.7%; Switzerland 1.5%. |
| (d) | Variable rate security. The rate shown is as of April 30, 2012. |
| (e) | Rate shown is the effective yield based on purchase price. The calculation assumes the security is held to maturity. |
The Accompanying Footnotes are an Integral Part of these Financial Statements.
Percent of Total Investments
The Tocqueville Fund
Allocation of Portfolio Holdings
April 30, 2012 (Unaudited)
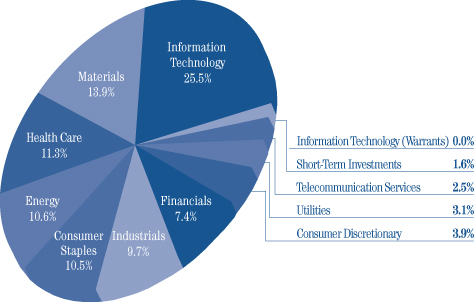
The Tocqueville Opportunity Fund
Allocation of Portfolio Holdings
April 30, 2012 (Unaudited)
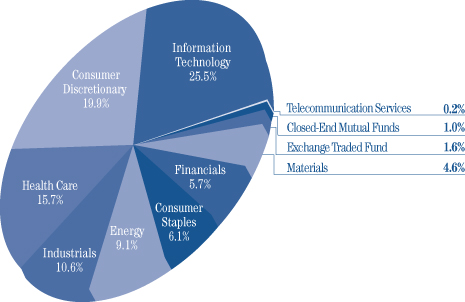
Percent of Total Investments
The Tocqueville International Value Fund
Allocation of Portfolio Holdings
April 30, 2012 (Unaudited)
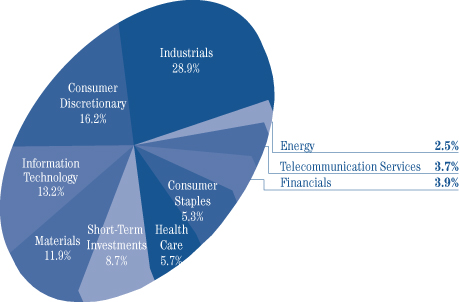
The Tocqueville Gold Fund
Allocation of Portfolio Holdings
April 30, 2012 (Unaudited)
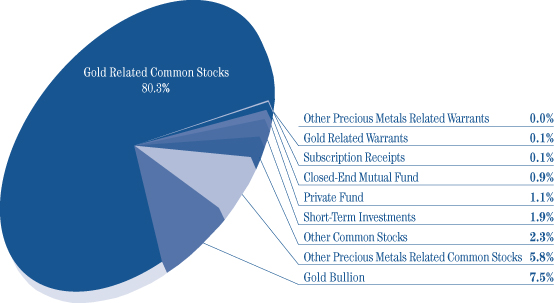
Percent of Total Investments
The Delafield Fund
Allocation of Portfolio Holdings
April 30, 2012 (Unaudited)
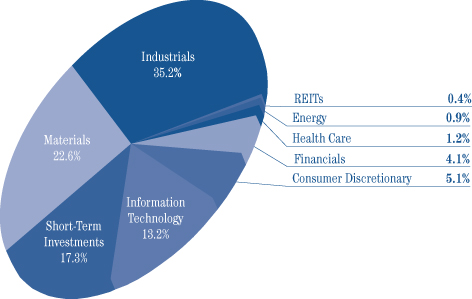
The Tocqueville Select Fund
Allocation of Portfolio Holdings
April 30, 2012 (Unaudited)
.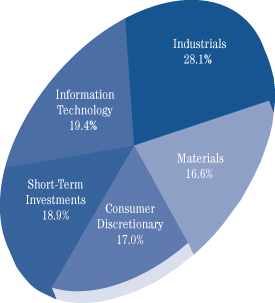
The Tocqueville Trust
Statements of Assets and Liabilities
April 30, 2012
(Unaudited)
| | | | | | | | | | | | | | | | | | | | | | | | |
| | | Tocqueville
Fund | | | Opportunity
Fund | | | International
Value
Fund | | | Gold
Fund | | | Delafield
Fund | | | Select
Fund | |
Assets | | | | | | | | | | | | | | | | | | | | | | | | |
Investments, at value (1) | | | | | | | | | | | | | | | | | | | | | | | | |
Unaffiliated issuers | | $ | 397,866,763 | | | $ | 73,496,734 | | | $ | 222,663,477 | | | $ | 1,904,839,614 | | | $ | 1,292,655,353 | | | $ | 81,529,927 | |
Affiliated issuers | | | — | | | | 46,970 | | | | — | | | | 261,482,369 | | | | 165,677,630 | | | | 13,570,752 | |
Foreign currencies (2) | | | — | | | | — | | | | 237,984 | | | | 41,798 | | | | — | | | | — | |
Cash | | | 58 | | | | 230,732 | | | | — | | | | 943,218 | | | | — | | | | — | |
Receivable for investments sold | | | — | | | | 854,743 | | | | 2,492,347 | | | | 111 | | | | 4,617,569 | | | | 374,457 | |
Receivable for fund shares sold | | | 566,530 | | | | 301,068 | | | | 1,859,011 | | | | 6,244,609 | | | | 4,770,321 | | | | — | |
Dividends, interest and other receivables | | | 429,630 | | | | 12,774 | | | | 1,498,192 | | | | 375,391 | | | | 584,096 | | | | 24,633 | |
Prepaid assets | | | 23,238 | | | | 10,386 | | | | 39,549 | | | | 66,237 | | | | 56,455 | | | | 12,940 | |
| | | | | | | | | | | | | | | | | | | | | | | | |
Total Assets | | | 398,886,219 | | | | 74,953,407 | | | | 228,790,560 | | | | 2,173,993,347 | | | | 1,468,361,424 | | | | 95,512,709 | |
| | | | | | | | | | | | | | | | | | | | | | | | |
Liabilities | | | | | | | | | | | | | | | | | | | | | | | | |
Payable for investments purchased | | | 845,808 | | | | 791,343 | | | | 3,619,986 | | | | — | | | | 8,003,219 | | | | 1,281,112 | |
Payable for loans outstanding | | | — | | | | 326,000 | | | | — | | | | — | | | | — | | | | — | |
Depreciation on forward currency contracts | | | — | | | | — | | | | 3,274 | | | | — | | | | — | | | | — | |
Payable for fund shares redeemed | | | 984,757 | | | | 94,176 | | | | 305,632 | | | | 3,900,910 | | | | 1,771,350 | | | | 174,097 | |
Payable to Adviser | | | 232,870 | | | | 44,608 | | | | 180,935 | | | | 1,341,615 | | | | 838,153 | | | | 60,852 | |
Payable to Administrator | | | 62,883 | | | | 10,979 | | | | 32,618 | | | | 349,641 | | | | 233,549 | | | | 15,097 | |
Accrued distribution fee | | | 80,879 | | | | 14,870 | | | | 45,236 | | | | 445,079 | | | | 294,501 | | | | 19,016 | |
Payable to Trustees | | | 13,467 | | | | 1,319 | | | | 5,598 | | | | 77,194 | | | | 30,555 | | | | 1,237 | |
Payable to Chief Compliance Officer | | | 1,072 | | | | 33 | | | | 498 | | | | 8,156 | | | | 1,683 | | | | 123 | |
Accrued expenses and other liabilities | | | 128,699 | | | | 17,006 | | | | 70,764 | | | | 659,633 | | | | 344,785 | | | | 22,683 | |
| | | | | | | | | | | | | | | | | | | | | | | | |
Total Liabilities | | | 2,350,435 | | | | 1,300,334 | | | | 4,264,541 | | | | 6,782,228 | | | | 11,517,795 | | | | 1,574,217 | |
| | | | | | | | | | | | | | | | | | | | | | | | |
Net Assets | | $ | 396,535,784 | | | $ | 73,653,073 | | | $ | 224,526,019 | | | $ | 2,167,211,119 | | | $ | 1,456,843,629 | | | $ | 93,938,492 | |
| | | | | | | | | | | | | | | | | | | | | | | | |
Net assets consist of: | | | | | | | | | | | | | | | | | | | | | | | | |
Paid in capital | | $ | 371,920,459 | | | $ | 65,681,899 | | | $ | 228,291,621 | | | $ | 1,598,591,291 | | | $ | 1,171,380,759 | | | $ | 80,929,737 | |
Accumulated net investment income (loss) | | | 1,254,768 | | | | (259,080 | ) | | | 462,294 | | | | (34,088,493 | ) | | | (1,024,959 | ) | | | (241,709 | ) |
Accumulated net realized gain (loss) | | | (30,087,855 | ) | | | (3,949,805 | ) | | | (10,394,124 | ) | | | 60,625,198 | | | | 42,586,184 | | | | 2,818,743 | |
Net unrealized appreciation on: | | | | | | | | | | | | | | | | | | | | | | | | |
Investments and foreign currency related items | | | 53,448,412 | | | | 12,180,059 | | | | 6,166,228 | | | | 542,083,123 | | | | 243,901,645 | | | | 10,431,721 | |
| | | | | | | | | | | | | | | | | | | | | | | | |
Net assets | | $ | 396,535,784 | | | $ | 73,653,073 | | | $ | 224,526,019 | | | $ | 2,167,211,119 | | | $ | 1,456,843,629 | | | $ | 93,938,492 | |
| | | | | | | | | | | | | | | | | | | | | | | | |
Shares of beneficial interest outstanding (unlimited shares of $0.01 par value authorized) | | | 16,679,484 | | | | 4,344,964 | | | | 19,138,976 | | | | 32,018,378 | | | | 46,675,459 | | | | 7,755,794 | |
Net asset value, offering and redemption price per share | | $ | 23.77 | | | $ | 16.95 | | | $ | 11.73 | | | $ | 67.69 | | | $ | 31.21 | | | $ | 12.11 | |
| | | | | | | | | | | | | | | | | | | | | | | | |
(1) Cost of investments | | | | | | | | | | | | | | | | | | | | | | | | |
| Unaffiliated issuers | | $ | 344,418,351 | | | $ | 61,327,113 | | | $ | 216,516,503 | | | $ | 1,379,201,054 | | | $ | 1,058,360,086 | | | $ | 71,299,492 | |
| Affiliated issuers | | $ | — | | | $ | 36,532 | | | $ | — | | | $ | 245,043,463 | | | $ | 156,071,252 | | | $ | 13,369,466 | |
(2) Cost of foreign currencies | | $ | — | | | $ | — | | | $ | 238,003 | | | $ | 36,141 | | | $ | — | | | $ | — | |
The Accompanying Notes are an Integral Part of these Financial Statements.
The Tocqueville Trust
Statements of Operations
For the Period Ended April 30, 2012
(Unaudited)
| | | | | | | | | | | | | | | | | | | | | | | | |
| | | Tocqueville
Fund | | | Opportunity
Fund | | | International
Value
Fund | | | Gold
Fund | | | Delafield
Fund | | | Select
Fund | |
Investment Income: | | | | | | | | | | | | | | | | | | | | | | | | |
Dividends* | | | | | | | | | | | | | | | | | | | | | | | | |
Unaffiliated issuers | | $ | 5,137,353 | | | $ | 107,385 | | | $ | 3,005,161 | | | $ | 7,111,675 | | | $ | 6,853,797 | | | $ | 289,868 | |
Affiliated issuers | | | — | | | | 135 | | | | — | | | | 1,105,764 | | | | 214,500 | | | | 35,070 | |
Interest | | | 162 | | | | 10 | | | | 822 | | | | 4,846 | | | | 23,603 | | | | 1,489 | |
| | | | | | | | | | | | | | | | | | | | | | | | |
| | | 5,137,515 | | | | 107,530 | | | | 3,005,983 | | | | 8,222,285 | | | | 7,091,900 | | | | 326,427 | |
| | | | | | | | | | | | | | | | | | | | | | | | |
Expenses: | | | | | | | | | | | | | | | | | | | | | | | | |
Investment Adviser’s fee (See Note 4) | | | 1,482,436 | | | | 211,251 | | | | 1,028,605 | | | | 8,950,180 | | | | 4,736,333 | | | | 331,498 | |
Distribution fees (See Note 4) | | | 494,146 | | | | 70,417 | | | | 257,151 | | | | 3,012,049 | | | | 1,654,317 | | | | 103,593 | |
Administration fee (See Note 4) | | | 296,487 | | | | 42,250 | | | | 154,291 | | | | 1,807,229 | | | | 992,590 | | | | 62,156 | |
Transfer agent and shareholder services fees | | | 120,555 | | | | 6,406 | | | | 35,726 | | | | 646,308 | | | | 347,524 | | | | 21,092 | |
Professional fees | | | 31,297 | | | | 5,946 | | | | 14,354 | | | | 158,855 | | | | 78,563 | | | | 7,111 | |
Other expenses (See Note 11) | | | 31,030 | | | | 1,022 | | | | 5,327 | | | | 59,024 | | | | 26,017 | | | | 1,529 | |
Printing and mailing expense | | | 28,137 | | | | 1,947 | | | | 8,069 | | | | 150,903 | | | | 80,463 | | | | 3,943 | |
Trustee fees and expenses | | | 23,788 | | | | 2,724 | | | | 10,375 | | | | 134,828 | | | | 67,690 | | | | 3,980 | |
Registration fees | | | 18,671 | | | | 12,907 | | | | 19,556 | | | | 95,120 | | | | 49,243 | | | | 17,410 | |
Fund accounting fees | | | 16,748 | | | | 6,703 | | | | 18,550 | | | | 97,302 | | | | 47,974 | | | | 3,561 | |
Custody fees | | | 13,953 | | | | 4,673 | | | | 40,461 | | | | 178,701 | | | | 24,503 | | | | 2,550 | |
Insurance expense | | | 4,550 | | | | 364 | | | | 1,644 | | | | 21,658 | | | | 11,642 | | | | 916 | |
| | | | | | | | | | | | | | | | | | | | | | | | |
Total expenses before waiver | | | 2,561,798 | | | | 366,610 | | | | 1,594,109 | | | | 15,312,157 | | | | 8,116,859 | | | | 559,339 | |
Less: Fees waived (See Note 4) | | | (68,601 | ) | | | — | | | | — | | | | — | | | | — | | | | — | |
| | | | | | | | | | | | | | | | | | | | | | | | |
Net expenses | | | 2,493,197 | | | | 366,610 | | | | 1,594,109 | | | | 15,312,157 | | | | 8,116,859 | | | | 559,339 | |
| | | | | | | | | | | | | | | | | | | | | | | | |
Net Investment Income (Loss) | | | 2,644,318 | | | | (259,080 | ) | | | 1,411,874 | | | | (7,089,872 | ) | | | (1,024,959 | ) | | | (232,912 | ) |
| | | | | | | | | | | | | | | | | | | | | | | | |
Realized and Unrealized Gain (Loss): | | | | | | | | | | | | | | | | | | | | | | | | |
Net realized gain (loss) on: | | | | | | | | | | | | | | | | | | | | | | | | |
Investments | | | | | | | | | | | | | | | | | | | | | | | | |
Unaffiliated issuers | | | 1,662,110 | | | | 1,229,286 | | | | (2,929,121 | ) | | | 60,816,311 | | | | 47,589,388 | | | | 3,057,951 | |
Affiliated issuers | | | — | | | | 8,394 | | | | — | | | | (38,202 | ) | | | (4,617,236 | ) | | | — | |
Forward currency contracts | | | — | | | | — | | | | 375,361 | | | | — | | | | — | | | | — | |
Foreign currency translation | | | (148 | ) | | | (1,470 | ) | | | (157,228 | ) | | | (152,331 | ) | | | 13,664 | | | | 105 | |
| | | | | | | | | | | | | | | | | | | | | | | | |
| | | 1,661,962 | | | | 1,236,210 | | | | (2,710,988 | ) | | | 60,625,778 | | | | 42,985,816 | | | | 3,058,056 | |
Net change in unrealized appreciation (depreciation) on: | | | | | | | | | | | | | | | | | | | | | | | | |
Investments | | | 23,909,510 | | | | 5,932,679 | | | | 2,057,357 | | | | (479,246,650 | ) | | | 154,765,518 | | | | 5,680,067 | |
Forward currency contracts | | | — | | | | — | | | | (108,873 | ) | | | — | | | | — | | | | — | |
Foreign currency translation | | | — | | | | 65 | | | | (3,368,541 | ) | | | 4,214,070 | | | | (50,040 | ) | | | — | |
| | | | | | | | | | | | | | | | | | | | | | | | |
| | | 23,909,510 | | | | 5,932,744 | | | | (1,420,057 | ) | | | (475,032,580 | ) | | | 154,715,478 | | | | 5,680,067 | |
Net gain (loss) on investments and foreign currency | | | 25,571,472 | | | | 7,168,954 | | | | (4,131,045 | ) | | | (414,406,802 | ) | | | 197,701,294 | | | | 8,738,123 | |
| | | | | | | | | | | | | | | | | | | | | | | | |
Net Increase (Decrease) in Net Assets Resulting from Operations | | $ | 28,215,790 | | | $ | 6,909,874 | | | $ | (2,719,171 | ) | | $ | (421,496,674 | ) | | $ | 196,676,335 | | | $ | 8,505,211 | |
| | | | | | | | | | | | | | | | | | | | | | | | |
* Net of foreign taxes withheld | | $ | 60,370 | | | $ | 479 | | | $ | 365,274 | | | $ | 712,606 | | | $ | — | | | $ | 2,739 | |
| | | | | | | | | | | | | | | | | | | | | | | | |
The Accompanying Notes are an Integral Part of these Financial Statements.
[This page intentionally left blank]
The Tocqueville Trust
Statements of Changes in Net Assets
| | | | | | | | | | | | | | | | |
| | | Tocqueville Fund | | | Opportunity Fund | |
| | | For the
Period Ended
April 30,
2012 | | | For the
Year Ended
October 31,
2011 | | | For the
Period Ended
April 30,
2012 | | | For the
Year Ended
October 31,
2011 | |
| | | (Unaudited) | | | | | | (Unaudited) | | | | |
Operations: | | | | | | | | | | | | | | | | |
Net investment income (loss) | | $ | 2,644,318 | | | $ | 5,079,622 | | | $ | (259,080 | ) | | $ | (424,842 | ) |
Net realized gain (loss) on investments and foreign
currency | | | 1,661,962 | | | | 17,652,719 | | | | 1,236,210 | | | | 3,042,114 | |
Net change in unrealized appreciation (depreciation) | | | 23,909,510 | | | | 207,732 | | | | 5,932,744 | | | | 1,600,782 | |
| | | | | | | | | | | | | | | | |
Net increase (decrease) in net assets resulting from operations | | | 28,215,790 | | | | 22,940,073 | | | | 6,909,874 | | | | 4,218,054 | |
Dividends and distributions to shareholders: | | | | | | | | | | | | | | | | |
Net investment income | | | (5,526,502 | ) | | | (7,457,179 | ) | | | — | | | | — | |
Net realized gains | | | — | | | | — | | | | — | | | | — | |
| | | | | | | | | | | | | | | | |
Total dividends and distributions | | | (5,526,502 | ) | | | (7,457,179 | ) | | | — | | | | — | |
Fund share transactions: | | | | | | | | | | | | | | | | |
Shares sold | | | 36,600,395 | | | | 104,940,298 | | | | 23,756,555 | | | | 17,172,239 | |
Shares issued to holders in reinvestment of dividends | | | 4,694,230 | | | | 6,567,494 | | | | — | | | | — | |
Shares redeemed* | | | (158,989,469 | ) | | | (125,118,930 | ) | | | (3,976,192 | ) | | | (7,290,932 | ) |
| | | | | | | | | | | | | | | | |
Net increase (decrease) | | | (117,694,844 | ) | | | (13,611,138 | ) | | | 19,780,363 | | | | 9,881,307 | |
| | | | | | | | | | | | | | | | |
Net increase (decrease) in net assets | | | (95,005,556 | ) | | | 1,871,756 | | | | 26,690,237 | | | | 14,099,361 | |
Net Assets: | | | | | | | | | | | | | | | | |
Beginning of period | | | 491,541,340 | | | | 489,669,584 | | | | 46,962,836 | | | | 32,863,475 | |
| | | | | | | | | | | | | | | | |
End of period** | | $ | 396,535,784 | | | $ | 491,541,340 | | | $ | 73,653,073 | | | $ | 46,962,836 | |
| | | | | | | | | | | | | | | | |
* Net of redemption fees of: | | $ | 18,432 | | | $ | 54,120 | | | $ | 3,161 | | | $ | 2,364 | |
| | | | | | | | | | | | | | | | |
** Including accumulated net investment income (loss) of: | | $ | 1,254,768 | | | $ | 4,136,952 | | | $ | (259,080 | ) | | $ | — | |
| | | | | | | | | | | | | | | | |
The Accompanying Notes are an Integral Part of these Financial Statements.
The Tocqueville Trust
Statements of Changes in Net Assets
| | | | | | | | | | | | | | | | | | | | | | | | | | | | | | |
| International Value Fund | | | Gold Fund | | | Delafield Fund | | | Select Fund | |
For the
Period Ended
April 30,
2012 | | | For the
Year Ended
October 31,
2011 | | | For the
Period Ended
April 30,
2012 | | | For the
Year Ended
October 31,
2011 | | | For the
Period Ended
April 30,
2012 | | | For the
Year Ended
October 31,
2011 | | | For the
Period Ended
April 30,
2012 | | | For the
Year Ended
October 31,
2011 | |
| (Unaudited) | | | | | | (Unaudited) | | | | | | (Unaudited) | | | | | | (Unaudited) | | | | |
| | | | | | | | | | | | | | | | | | | | | | | | | | | | | | |
| $ | 1,411,874 | | | $ | 1,851,852 | | | $ | (7,089,872 | ) | | $ | (22,318,902 | ) | | $ | (1,024,959 | ) | | $ | (3,728,541 | ) | | $ | (232,912 | ) | | $ | (462,741 | ) |
| (2,710,988 | ) | | | 4,385,228 | | | | 60,625,778 | | | | 41,808,457 | | | | 42,985,816 | | | | 22,888,560 | | | | 3,058,056 | | | | 764,193 | |
| | (1,420,057 | ) | | | (15,807,028 | ) | | | (475,032,580 | ) | | | (16,530,651 | ) | | | 154,715,478 | | | | (40,431,393 | ) | | | 5,680,067 | | | | (5,381,939 | ) |
| | | | | | | | | | | | | | | | | | | | | | | | | | | | | | |
| (2,719,171 | ) | | | (9,569,948 | ) | | | (421,496,674 | ) | | | 2,958,904 | | | | 196,676,335 | | | | (21,271,374 | ) | | | 8,505,211 | | | | (5,080,487 | ) |
| | | | | | | | | | | | | | | | | | | | | | | | | | | | | | |
| | (2,105,224 | ) | | | (831,651 | ) | | | — | | | | — | | | | — | | | | — | | | | — | | | | — | |
| | — | | | | — | | | | (42,282,689 | ) | | | (46,368,277 | ) | | | (16,542,579 | ) | | | — | | | | (766,157 | ) | | | (2,112,007 | ) |
| | | | | | | | | | | | | | | | | | | | | | | | | | | | | | |
| | (2,105,224 | ) | | | (831,651 | ) | | | (42,282,689 | ) | | | (46,368,277 | ) | | | (16,542,579 | ) | | | — | | | | (766,157 | ) | | | (2,112,007 | ) |
| | | | | | | | | | | | | | | | | | | | | | | | | | | | | | |
| | 52,261,521 | | | | 107,151,161 | | | | 371,032,548 | | | | 1,494,120,323 | | | | 207,538,275 | | | | 714,889,299 | | | | 23,911,487 | | | | 60,470,466 | |
| | 1,547,905 | | | | 615,614 | | | | 39,153,702 | | | | 42,874,881 | | | | 15,316,165 | | | | — | | | | 675,794 | | | | 2,067,329 | |
| | (24,306,938 | ) | | | (47,620,593 | ) | | | (426,273,689 | ) | | | (1,046,110,637 | ) | | | (209,020,345 | ) | | | (364,415,732 | ) | | | (9,941,592 | ) | | | (25,579,690 | ) |
| | | | | | | | | | | | | | | | | | | | | | | | | | | | | | |
| | 29,502,488 | | | | 60,146,182 | | | | (16,087,439 | ) | | | 490,884,567 | | | | 13,834,095 | | | | 350,473,567 | | | | 14,645,689 | | | | 36,958,105 | |
| | | | | | | | | | | | | | | | | | | | | | | | | | | | | | |
| | 24,678,093 | | | | 49,744,583 | | | | (479,866,802 | ) | | | 447,475,194 | | | | 193,967,851 | | | | 329,202,193 | | | | 22,384,743 | | | | 29,765,611 | |
| | | | | | | | | | | | | | | | | | | | | | | | | | | | | | |
| | 199,847,926 | | | | 150,103,343 | | | | 2,647,077,921 | | | | 2,199,602,727 | | | | 1,262,875,778 | | | | 933,673,585 | | | | 71,553,749 | | | | 41,788,138 | |
| | | | | | | | | | | | | | | | | | | | | | | | | | | | | | |
| $ | 224,526,019 | | | $ | 199,847,926 | | | $ | 2,167,211,119 | | | $ | 2,647,077,921 | | | $ | 1,456,843,629 | | | $ | 1,262,875,778 | | | $ | 93,938,492 | | | $ | 71,553,749 | |
| | | | | | | | | | | | | | | | | | | | | | | | | | | | | | |
| $ | 21,270 | | | $ | 153,900 | | | $ | 468,396 | | | $ | 3,132,177 | | | $ | 57,435 | | | $ | 277,875 | | | $ | 9,937 | | | $ | 48,586 | |
| | | | | | | | | | | | | | | | | | | | | | | | | | | | | | |
| $ | 462,294 | | | $ | 1,155,644 | | | $ | (34,088,493 | ) | | $ | (26,998,621 | ) | | $ | (1,024,959 | ) | | $ | — | | | $ | (241,709 | ) | | $ | (8,797 | ) |
| | | | | | | | | | | | | | | | | | | | | | | | | | | | | | |
The Accompanying Notes are an Integral Part of these Financial Statements.
The Tocqueville Trust
The Tocqueville Fund
The Tocqueville Opportunity Fund
The Tocqueville International Value Fund
The Tocqueville Gold Fund
The Delafield Fund
The Tocqueville Select Fund
Notes to Financial Statements
April 30, 2012 (Unaudited)
1. ORGANIZATION
The Tocqueville Trust (the “Trust”) is a Massachusetts business trust organized on September 17, 1986, currently consisting of six separate funds (each, a “Fund” or, collectively, the “Funds”). Each Fund is an open-end management investment company with a different investment objective. The Tocqueville Fund, The Tocqueville Opportunity Fund (the “Opportunity Fund”), The Tocqueville International Value Fund (the “International Fund”), and The Delafield Fund are classified as diversified investment companies. The Tocqueville Gold Fund (the “Gold Fund”) and The Tocqueville Select Fund (the “Select Fund”) are classified as non-diversified investment companies. The Tocqueville Fund’s investment objective is long-term capital appreciation which it seeks to achieve by investing primarily in securities of United States issuers. The Opportunity Fund’s investment objective is to achieve long-term capital appreciation which it seeks to achieve by investing in the common stocks of small and mid cap companies which have the potential to deliver superior long term earnings growth. The International Fund’s investment objective is long-term capital appreciation consistent with preservation of capital which it seeks to achieve by investing primarily in securities of non-U.S. issuers. The Gold Fund’s investment objective is long-term capital appreciation which it seeks to achieve by investing in gold, securities of companies located throughout the world that are engaged in mining or processing gold (“gold related securities”), other precious metals and securities of companies located throughout the world that are engaged in mining or processing such other precious metals (“other precious metal securities”). The Delafield Fund’s investment objectives are to seek long-term preservation of capital (sufficient growth to outpace inflation over an extended period of time) and growth of capital which it seeks to achieve by investing primarily in the equity securities of domestic companies. The Tocqueville Select Fund’s investment objective is to achieve long-term capital appreciation by investing in a focused group of common stocks issued primarily by small and mid-sized U.S. companies. Current income is a secondary objective for The Tocqueville Select Fund.
On June 22, 2009, the Board of Directors of Delafield Fund, Inc. approved an Agreement and Plan of Reorganization providing for, among other things, the transfer of the assets and liabilities of Delafield Fund, Inc. into The Delafield Fund, a series of The Tocqueville Trust. On September 24, 2009, the shareholders of Delafield Fund, Inc. approved the Agreement and Plan of Reorganization. On July 9, 2009, the Board of Trustees of Delafield Select Fund, a series of Natixis Funds Trust II, approved an Agreement and Plan of Reorganization providing for, among other things, the transfer of the assets and liabilities of Delafield Select Fund into the sole share class of The Select Fund (now The Tocqueville Select Fund), a series of The Tocqueville Trust. On September 24, 2009, the shareholders of Delafield Select Fund approved the Agreement and Plan of Reorganization. The effective date of both reorganizations was September 28, 2009. Transfers into The Delafield Fund and The Select Fund from their predecessor funds amounted to $649,892,191 and $25,888,388, respectively.
The Delafield Fund, a series of the Trust, commenced operations on September 28, 2009 as successor to Delafield Fund, Inc. The predecessor Delafield Fund, Inc. commenced operations on November 19, 1993.
The Tocqueville Select Fund, a series of the Trust, commenced operations on September 28, 2009 as successor to the Delafield Select Fund, a series of Natixis Funds Trust II. The predecessor Delafield Select Fund commenced operations on September 29, 2008 for Class A and Class C shares and on September 26, 2008 for Class Y shares. Prior to September 29, 2008, the predecessor Delafield Select Fund operated as a Delaware limited partnership using substantially the same investment objectives and investment policies as the predecessor fund. The limited partnership was incepted in July 1998.
Effective October 12, 2010, the investment strategy of the Opportunity Fund was changed as described in the supplements dated August 12, 2010 to the Trust’s prospectus and statement of additional information. The Opportunity
Fund will invest primarily in stocks of small and mid capitalization companies, as measured at the time of initial purchase. The Fund seeks to invest in companies which management feels are market leaders in growth industries and have consistent growth in sales and earnings.
2. SIGNIFICANT ACCOUNTING POLICIES
The following is a summary of significant accounting principles followed by the Trust in the preparation of its financial statements.
a) Security valuation
Investments in securities, including foreign securities, traded on an exchange or quoted on the over-the-counter market are valued at the last sale price or, if no sale occurred during the day, at the mean between closing bid and asked prices, as last reported by a pricing service approved by the Trustees. Securities that are principally traded on the National Association of Securities Dealers Automated Quotation National Market (“NASDAQ”) are generally valued at the NASDAQ Official Closing Price (“NOCP”). Investments in gold and silver are valued on the basis of the respective closing spot prices of the New York Commodity Exchange. Investments in other precious metals are valued at their respective market values determined on the basis of the mean between the last current bid and asked prices based on dealer or exchange quotations. When market quotations are not readily available, or when restricted securities or other assets are being valued, such assets are valued at fair value as determined in good faith by or under procedures approved by the Trustees. Short-term securities maturing within 60 days are valued on an amortized cost basis. Fixed income securities with maturities greater than 60 days are valued at market price.
Trading in securities on European and Far Eastern securities exchanges normally is completed before the calculation of the Funds’ net asset value. Trading on these foreign exchanges may not take place on all days on which there is regular trading on the New York Stock Exchange (“NYSE”), or may take place on days on which there is no regular trading on the NYSE. Similarly, the Funds may hold securities traded in domestic markets where the market may close early on a given day prior to calculation of the Funds’ net asset value. Events affecting the value of such securities held by the Funds that occur between the close of trading in the security and the close of trading on the NYSE normally will not be reflected in the Funds’ calculation of the net asset value. Significant events will be closely monitored, and where it is determined that an adjustment should be made to the security’s value because significant interim events may materially affect the value of the security, the security will be priced at its fair value in accordance with the procedures approved by the Trustees.
Investment and shareholder transactions are recorded on trade date. Dividend income is recognized on the ex-dividend date and interest income is recognized on an accrual basis.
b) Repurchase agreements
The Funds may enter into repurchase agreements with institutions that the Adviser has determined are creditworthy. Each repurchase agreement is recorded at cost. Under the terms of a typical repurchase agreement, the Fund acquires a debt security subject to an obligation of the seller to repurchase, and of the Fund to resell, the security at an agreed-upon price and time, thereby determining the yield during the Fund’s holding period. When entering into repurchase agreements, it is the Fund’s policy that its custodian or a third party custodian, acting on the Fund’s behalf, take possession of the underlying collateral securities, the market value of which, at all times, at least equals the principal
amount of the repurchase transaction, including accrued interest. To the extent that any repurchase transaction maturity exceeds one business day, the value of the collateral is marked to market and measured against the value of the agreement in an effort to ensure the adequacy of the collateral. If the counterparty defaults, the Fund generally has the right to use the collateral to satisfy the terms of the repurchase transaction.
c) Restricted and illiquid securities
The Funds may invest in securities that are subject to legal or contractual restrictions on resale or are illiquid. A security may be considered illiquid if it lacks a readily available market or if its valuation has not changed for a certain period of time. Disposal of these securities may involve time consuming negotiations and expense, and a prompt sale at the current valuation may be difficult.
d) Fair valuation pricing inputs
The Trust has adopted authoritative fair valuation accounting standards which establish an authoritative definition of fair value and set out a hierarchy for measuring fair value. These standards require additional disclosures about the various inputs and valuation techniques used to develop the measurements of fair value and a discussion in changes in valuation techniques and related inputs during the period. These inputs are summarized in the three broad levels listed below.
| | Level 1 - | Quoted prices in active markets for identical securities. |
| | Level 2 - | Other significant observable inputs (including quoted prices for similar securities, interest rates, prepayment speeds, credit risk, etc.). |
| | Level 3 - | Significant unobservable inputs (including the Fund’s own assumptions in determining the fair value of investments). |
Equity investments, including common stocks, foreign issued common stocks, exchange-traded funds, closed end mutual funds and real estate investments trusts, which are traded on an exchange are valued at the last sale price reported by the exchange on which the securities are primarily traded on the day of valuation. If there are no sales on a given day for securities traded on an exchange, the mean between the latest bid and ask price will be used. If there is no Nasdaq Official Closing Price for a Nasdaq-listed security or sale price available for an over-the-counter security, the mean of the latest bid and asked quotations from Nasdaq will be used. When using the market quotations or closing price provided by the pricing service and when the market is considered active, the security will be classified as a Level 1 security.
Investment in mutual funds, including money market funds, are generally priced at the ending net asset value (NAV) provided by the service agent of the funds and will be classified as Level 1 securities.
Debt securities, such as corporate bonds, convertible bonds and U.S. government agency issues for which market quotations are not readily available may be valued based on information supplied by independent pricing services using matrix pricing formulas and/or independent broker bid quotations. Debt securities with remaining maturities of 60 days or less may be valued on an amortized cost basis, which involves valuing an instrument at its cost and thereafter assuming a constant amortization to maturity of any discount or premium, regardless of the impact of fluctuating rates on the fair value of the instrument. On days when the closing price of the S&P 500 moves more than 1% from its previous close, common stocks of the International Value Fund which are traded on non-North American exchanges may be valued using matrix pricing formulas provided by an independent pricing service. All warrants held by the Funds for which there is no
quoted price are valued using the Black-Scholes model. Equities which are subject to a required holding period, but have a comparable public issue, are valued in good faith by the Advisor pursuant to procedures established under the general supervision and responsibility of the Funds’ Board of Trustees. These securities will generally be classified as Level 2 securities.
Any securities or other assets for which market quotations are not readily available are valued at fair value as determined in good faith by the Advisor pursuant to procedures established under the general supervision and responsibility of the Funds’ Board of Trustees and will be classified as Level 3 securities. In determining fair value, a Fund will seek to assign a value to the security which it believes represents the amount that the Fund could reasonably expect to receive upon its current sale. With respect to securities that are actively traded on U.S. exchanges, the Funds expect that market quotations will generally be available and that fair value might be used only in limited circumstances, such as when trading for a security is halted during the trading day.
For securities traded principally on foreign exchanges, the Funds may use fair value pricing if an event occurs after the close of trading of the principal foreign exchange on which a security is traded, but before calculation of a Fund’s NAV, which a Fund believes affects the value of the security since its last market quotation. Such events may involve situations relating to a single issuer (such as news related to the issuer announced after the close of the principal foreign exchange), or situations relating to sectors of the market or the markets in generals (such as significant fluctuations in the U.S. or foreign markets or significant changes in exchange rates, natural disasters, armed conflicts, or governmental actions).
In determining whether a significant event has occurred with respect to securities traded principally in foreign markets, the Funds may engage a third party fair value service provider to systematically recommend the adjustment of closing market prices of non-U.S. securities based upon changes in a designated U.S. securities market index occuring from the time of close of the relevant foreign market and the close of the NYSE. Fair value pricing may also be used to value restricted securities held by the Funds or securities with little or no trading activity for extended periods of time. Fair value pricing involves judgements that are inherently subjective and inexact and it is not possible to determine with certainty when, and to what extent, an event will affect a market price. As a result, there can be no assurance that fair value pricing will reflect actual market value and it is possible that the fair value determined for a security may differ materially from the value that could be realized upon the sale of the security.
The following is a summary of the inputs used, as of April 30, 2012, involving the Funds’ assets carried at fair value. The inputs of methodology used for valuing securities may not be an indication of the risk associated with investing in those securities.
| | | | | | | | | | | | | | | | |
| Description | | Level 1 | | | Level 2 | | | Level 3 | | | Total | |
The Tocqueville Fund | | | | | | | | | | | | | | | | |
Common Stocks* | | $ | 391,561,683 | | | $ | — | | | $ | — | | | $ | 391,561,683 | |
Warrants* | | | — | | | | 80 | | | | — | | | | 80 | |
Repurchase Agreement | | | — | | | | 6,305,000 | | | | — | | | | 6,305,000 | |
| | | | | | | | | | | | | | | | |
Total Fund | | $ | 391,561,683 | | | $ | 6,305,080 | | | $ | — | | | $ | 397,866,763 | |
| | | | | | | | | | | | | | | | |
| | | | | | | | | | | | | | | | |
| The Tocqueville Opportunity Fund | | Level 1 | | | Level 2 | | | Level 3 | | | Total | |
Common Stocks | | | | | | | | | | | | | | | | |
Consumer Discretionary | | $ | 14,609,881 | | | $ | — | | | $ | — | | | $ | 14,609,881 | |
Consumer Staples | | | 4,464,759 | | | | — | | | | — | | | | 4,464,759 | |
Energy | | | 6,728,408 | | | | — | | | | — | | | | 6,728,408 | |
Financials | | | 4,222,947 | | | | — | | | | — | | | | 4,222,947 | |
Health Care | | | 11,517,119 | | | | — | | | | — | | | | 11,517,119 | |
Industrials | | | 7,814,890 | | | | — | | | | — | | | | 7,814,890 | |
Information Technology | | | 17,572,338 | | | | — | | | | 1,174,500 | | | | 18,746,838 | |
Materials | | | 3,407,577 | | | | — | | | | — | | | | 3,407,577 | |
Telecommunication Services | | | 131,110 | | | | — | | | | — | | | | 131,110 | |
| | | | | | | | | | | | | | | | |
Total Common Stocks | | | 70,469,029 | | | | — | | | | 1,174,500 | | | | 71,643,529 | |
Closed-End Mutual Funds* | | | 728,925 | | | | — | | | | — | | | | 728,925 | |
Exchange Traded Fund* | | | 1,171,250 | | | | — | | | | — | | | | 1,171,250 | |
| | | | | | | | | | | | | | | | |
Total Fund | | $ | 72,369,204 | | | $ | — | | | $ | 1,174,500 | | | $ | 73,543,704 | |
| | | | | | | | | | | | | | | | |
| | | | |
| The Tocqueville International Value Fund | | Level 1 | | | Level 2 | | | Level 3 | | | Total | |
Common Stocks* | | $ | 203,315,879 | | | $ | — | | | $ | — | | | $ | 203,315,879 | |
Money Market Fund | | | 8,282,598 | | | | — | | | | — | | | | 8,282,598 | |
Repurchase Agreement | | | — | | | | 11,065,000 | | | | — | | | | 11,065,000 | |
| | | | | | | | | | | | | | | | |
Total Fund | | $ | 211,598,477 | | | $ | 11,065,000 | | | $ | — | | | $ | 222,663,477 | |
| | | | | | | | | | | | | | | | |
Other Financial Instruments** | | | | | | | | | | | | | | | | |
Total Forward Currency Contracts | | | — | | | $ | (3,274 | ) | | | — | | | $ | (3,274 | ) |
| | | | | | | | | | | | | | | | |
| | | | |
| The Tocqueville Gold Fund | | Level 1 | | | Level 2 | | | Level 3 | | | Total | |
Common Stocks | | | | | | | | | | | | | | | | |
Gold Related | | $ | 1,734,008,785 | | | $ | — | | | $ | 5,530,946 | | | $ | 1,739,539,731 | |
Other Precious Metals Related | | | 86,336,512 | | | | — | | | | 38,301,255 | | | | 124,637,767 | |
Other | | | 38,239,047 | | | | — | | | | 11,243,317 | | | | 49,482,364 | |
| | | | | | | | | | | | | | | | |
Total Common Stocks | | | 1,858,584,344 | | | | — | | | | 55,075,518 | | | | 1,913,659,862 | |
Subscription Receipts* | | | — | | | | — | | | | 3,037,253 | | | | 3,037,253 | |
Closed End Mutual Fund* | | | 19,908,000 | | | | — | | | | — | | | | 19,908,000 | |
Private Fund* | | | — | | | | — | | | | 22,955,765 | | | | 22,955,765 | |
Warrants* | | | — | | | | 2,359,759 | | | | — | | | | 2,359,759 | |
Gold Bullion | | | — | | | | 163,364,774 | | | | — | | | | 163,364,774 | |
U.S. Treasury Bills | | | — | | | | 29,994,570 | | | | — | | | | 29,994,570 | |
Repurchase Agreement | | | — | | | | 11,042,000 | | | | — | | | | 11,042,000 | |
| | | | | | | | | | | | | | | | |
Total Fund | | $ | 1,878,492,344 | | | $ | 206,761,103 | | | $ | 81,068,536 | | | $ | 2,166,321,983 | |
| | | | | | | | | | | | | | | | |
| | | | | | | | | | | | | | | | |
| The Delafield Fund | | Level 1 | | | Level 2 | | | Level 3 | | | Total | |
Common Stocks* | | $ | 1,199,482,881 | | | $ | — | | | $ | — | | | $ | 1,199,482,881 | |
Real Estate Investment Trust (REIT) | | | 5,823,000 | | | | — | | | | — | | | | 5,823,000 | |
U.S. Treasury Bills | | | — | | | | 99,982,652 | | | | — | | | | 99,982,652 | |
Money Market Fund | | | 79,617,450 | | | | — | | | | — | | | | 79,617,450 | |
Repurchase Agreement | | | — | | | | 73,427,000 | | | | — | | | | 73,427,000 | |
| | | | | | | | | | | | | | | | |
Total Fund | | $ | 1,284,923,331 | | | $ | 173,409,652 | | | $ | — | | | $ | 1,458,332,983 | |
| | | | | | | | | | | | | | | | |
| | | | |
| The Tocqueville Select Fund | | Level 1 | | | Level 2 | | | Level 3 | | | Total | |
Common Stocks* | | $ | 77,126,711 | | | $ | — | | | $ | — | | | $ | 77,126,711 | |
U.S. Treasury Bills | | | — | | | | 4,999,383 | | | | — | | | | 4,999,383 | |
Money Market Fund | | | 8,248,585 | | | | — | | | | — | | | | 8,248,585 | |
Repurchase Agreement | | | — | | | | 4,726,000 | | | | — | | | | 4,726,000 | |
| | | | | | | | | | | | | | | | |
Total Fund | | $ | 85,375,296 | | | $ | 9,725,383 | | | $ | — | | | $ | 95,100,679 | |
| | | | | | | | | | | | | | | | |
| * | For further information regarding portfolio characteristics, please see the accompanying Schedules of Investments. |
| ** | Other financial instruments are derivative instruments not reflected in the Schedule of Investments, such as forward currency contracts, which are reflected at the unrealized appreciation (depreciation) on the instrument. |
Below is a reconciliation that details the transfer of securities between Level 1 and Level 2 during the reporting period.
| | | | | | | | | | | | | | | | | | | | | | | | |
| | | The
Tocqueville
Fund | | | The
Tocqueville
Opportunity
Fund | | | The
Tocqueville
International
Value Fund | | | The
Tocqueville
Gold Fund | | | The
Delafield
Fund | | | The
Tocqueville
Select Fund | |
Transfers Into Level 1 | | $ | — | | | $ | — | | | $ | 117,130,340 | | | $ | 10,220,428 | | | $ | — | | | $ | — | |
Transfers Out of Level 1 | | | — | | | | — | | | | — | | | | — | | | | — | | | | — | |
| | | | | | | | | | | | | | | | | | | | | | | | |
Net Transfers Into/(Out of )
Level 1 | | | — | | | | — | | | | 117,130,340 | | | | 10,220,428 | | | | — | | | | — | |
| | | | | | | | | | | | | | | | | | | | | | | | |
Transfers Into Level 2 | | | — | | | | — | | | | — | | | | — | | | | — | | | | — | |
Transfers Out of Level 2 | | | — | | | | — | | | | (117,130,340 | ) | | | (10,220,428 | ) | | | — | | | | — | |
| | | | | | | | | | | | | | | | | | | | | | | | |
Net Transfers Into/(Out of )
Level 2 | | $ | — | | | $ | — | | | $ | (117,130,340 | ) | | $ | (10,220,428 | ) | | $ | — | | | $ | — | |
| | | | | | | | | | | | | | | | | | | | | | | | |
The movement from Level 2 to Level 1 in the International Value Fund was due to non-North American traded securities being fair valued on October 31, 2011 and not on April 30, 2012. The movement from Level 2 to Level 1 in the Gold Fund was due to the release of restrictions on securities.
Transfers between levels are recognized at the end of the reporting period.
Below is a reconciliation that details the activity of securities in Level 3 during the current fiscal period:
| | | | | | | | | | | | | | | | | | | | | | | | |
| | | The
Tocqueville
Fund | | | The
Tocqueville
Opportunity
Fund | | | The
Tocqueville
International
Value Fund | | | The
Tocqueville
Gold Fund | | | The
Delafield
Fund | | | The
Tocqueville
Select
Fund | |
Beginning Balance—November 1, 2011 | | $ | — | | | $ | 810,000 | | | $ | — | | | $ | 59,870,579 | | | $ | — | | | $ | — | |
Purchases | | | — | | | | — | | | | — | | | | 27,998,551 | | | | — | | | | — | |
Sales | | | — | | | | — | | | | — | | | | — | | | | — | | | | — | |
Realized gains | | | — | | | | — | | | | — | | | | — | | | | — | | | | — | |
Realized losses | | | — | | | | — | | | | — | | | | — | | | | — | | | | — | |
Change in unrealized appreciation (depreciation) | | | — | | | | 364,500 | | | | — | | | | (6,800,594 | ) | | | — | | | | — | |
Transfers in/(out) of Level 3 | | | — | | | | — | | | | — | | | | — | | | | — | | | | — | |
| | | | | | | | | | | | | | | | | | | | | | | | |
Ending Balance—April 30, 2012 | | $ | — | | | $ | 1,174,500 | | | $ | — | | | $ | 81,068,536 | | | $ | — | | | $ | — | |
| | | | | | | | | | | | | | | | | | | | | | | | |
e) Derivative instruments and hedging activities
The Funds’ Adviser may use derivative instruments, such as purchased options, written options and forward currency contracts, as a means to manage exposure to different types of risk, including market risk and exchange rate risk. The Trust has adopted disclosure standards in order to enable the investor to understand how and why an entity used derivatives, how derivatives are accounted for, and how derivatives affect an entity’s results of operatioins and financial position.
In the International Value Fund, the Adviser used forward currency contracts to adjust exposure to foreign exchange rate risk.
The Tocqueville International Value Fund
Balance Sheet—Values of Derivative Instruments as of April 30, 2012.
| | | | | | | | | | | | |
| | | Asset Derivatives | | | Liability Derivatives | |
| Derivatives not accounted for as hedging instruments | | Balance Sheet
Location | | Value | | | Balance Sheet
Location | | Value | |
Forward currency contracts | | Appreciation on
forward currency
contracts | | $ | — | | | | | $ | 3,274 | |
| | | | | | | | | | | | |
Total | | | | $ | — | | | | | $ | 3,274 | |
| | | | | | | | | | | | |
The Effect of Derivative Instruments on the Statement of Operations for the six months ended April 30, 2012.
| | | | | | | | |
| | | Net Realized
Gain on Forward
Currency Contracts | | | Net Change in
Unrealized
Depreciation on
Forward Currency
Contracts | |
Forward currency contracts | | $ | 375,361 | | | $ | (108,873 | ) |
| | | | | | | | |
Total | | $ | 375,361 | | | $ | (108,873 | ) |
| | | | | | | | |
Derivatives Risk
The risks of using the types of derivatives in which the Funds may engage include the risk that movements in the value of the derivative may not fully offset or complement instruments currently held in the Funds in the manner intended by the Adviser; the risk that the counterparty to a derivative contract may fail to comply with their obligations to the Fund; the risk that the derivative may not possess a liquid secondary market at a time when the Fund would look to disengage the position; the risk that additional capital from the Fund may be called upon to fulfill the conditions of the derivative contract; and the risk that the cost of the derivative contracts may reduce the overall returns experienced by the Funds. The measurement of risks associated with these instruments is meaningful only when all related offsetting transactions are considered.
The average monthly notional amount of forward currency contracts during the six months ended April 30, 2012 was as follows:
| | | | |
| | | International
Value Fund | |
Long Positions | | $ | 1,837,200 | |
Forward currency contracts | | | | |
Short Positions | | $ | 13,209,565 | |
Forward currency contracts | | | | |
f) Foreign currency translation
Investments and other assets and liabilities denominated in foreign currencies are translated to U.S. dollars at the prevailing rates of exchange, in accordance with the Trust’s Portfolio Securities Valuation and Foreign Exchange Contracts Procedures. All of the Funds are engaged in transactions in securities denominated in foreign currencies and, as a result, entered into foreign exchange contracts. These Funds are exposed to additional market risk as a result of changes in the value of the underlying currency in relation to the U.S. dollar. Risks include potential inability of counterparties to meet the terms of their contracts. The value of foreign currency contracts are marked-to-market on a daily basis, which reflects the changes in the market value of the contract at the close of each day’s trading, resulting in daily unrealized gains and/or losses. When the contracts are closed, the Funds recognize a realized gain or loss.
The Funds do not isolate that portion of the results of operations resulting from changes in foreign exchange rates on investments from the fluctuations arising from changes in market prices of securities held. Such fluctuations are included with the net realized and unrealized gain or loss from investments.
Reported net realized foreign exchange gains or losses arise from sales of foreign currencies, currency gains or losses realized between the trade and settlement dates on securities transactions, the differences between the amounts of dividends, interest, and foreign withholding taxes recorded on the Fund’s books, and the U.S. dollar equivalent of the amounts actually received or paid. Net unrealized foreign exchange gains and losses arise from changes in the value of assets and liabilities other than investments in securities at the end of the fiscal period, resulting from changes in the exchange rates.
g) Written option accounting
The Tocqueville Opportunity Fund, The Tocqueville International Value Fund, The Tocqueville Select Fund and The Tocqueville Gold Fund may write (sell) covered call options to hedge portfolio investments. When the Funds write (sell) an option, an amount equal to the premium received by the Funds is included in the Statements of Assets and Liabilities as an asset and an equivalent liability. The amount of the liability is subsequently marked-to-market to reflect the current value of the option written. By writing an option, the Funds may become obligated during the term of the option to deliver or purchase the securities underlying the option at the exercise price if the option is exercised. Option contracts are valued at the last sales price reported on the date of obligation. If the seller defaults and the value of the collateral declines or if bankruptcy proceedings are commenced with respect to the seller of the security, realization of the collateral by the Funds may be delayed or limited.
h) Dividends and distributions to Shareholders
Dividends to shareholders are recorded on the ex-dividend date. Dividends from net investment income are declared and paid annually by the Funds. Distributions of net realized capital gains, if any, will be declared and paid at least annually. Income and capital gain distributions are determined in accordance with income tax regulations which may differ from generally accepted accounting principles. Permanent differences between financial and tax reporting may result in reclassification to capital stock.
i) Use of estimates
The preparation of financial statements in conformity with accounting principles generally accepted in the United States of America requires management to make estimates and assumptions that affect the reported amounts of assets and liabilities and disclosure of contingent assets and liabilities at the date of the financial statements and the reported amounts of revenues and expenses during the reporting period. Actual results could differ from those estimates.
j) Subsequent Events Evaluation
In preparing these financial statements, the Trust has evaluated events and transactions for potential recognition or disclosure resulting from subsequent events through the date financial statements were available to be issued.
3. FEDERAL INCOME TAX
There is no tax liability resulting from unrecognized tax benefits relating to uncertain income tax positions taken or expected to be taken on the tax return for the fiscal year-end October 31, 2011, or for any other tax years which are open for exam. As of October 31, 2011, open tax years include the tax years ended October 31, 2008 through 2011. The Trust is
also not aware of any tax positions for which it is reasonably possible that the total amounts of unrecognized tax benefits will significantly change in the next six months. The Fund recognizes interest and penalties, if any, related to unrecognized tax benefits as income tax expense in the Statement of Operations. During the period, the Funds did not incur any interest or penalties.
Provision for federal income taxes or excise taxes has not been made since the Funds have elected to be taxed as Regulated Investment Companies and intend to distribute substantially all taxable income to shareholders and otherwise comply with the provisions of the Internal Revenue Code applicable to Regulated Investment Companies. Distributions from net realized gains for book purposes may include short-term capital gains which are included as ordinary income to shareholders for tax purposes. Additionally, U.S. generally accepted accounting principles require that certain components of net assets relating to permanent differences be reclassified between financial and tax reporting. These reclassifications have no effect on net assets or net asset value per share. For the period ended October 31, 2011, the following table shows the reclassifications made:
| | | | | | | | | | | | |
| | | Undistributed
Net Investment
Income/(Loss) | | | Accumulated Net
Realized
Gain/(Loss) | | | Paid In Capital | |
Tocqueville Fund | | $ | 194,749 | | | $ | (194,749 | ) | | $ | — | |
Opportunity Fund | | | 429,255 | | | | (68,658 | ) | | | (360,597 | ) |
International Value Fund | | | (582,065 | ) | | | 582,065 | | | | — | |
Gold Fund | | | (473,651 | ) | | | 468,798 | | | | 4,853 | |
Delafield Fund | | | 3,728,541 | | | | — | | | | (3,728,541 | ) |
Select Fund | | | 462,741 | | | | 1 | | | | (462,742 | ) |
The permanent differences primarily relate to net operating losses and foreign currency reclasses.
As of October 31, 2011, the components of accumulated earnings (losses) for income tax purposes were as follows:
| | | | | | | | | | | | | | | | | | | | | | | | |
| | | Tocqueville
Fund | | | Opportunity
Fund | | | International
Value
Fund | | | Gold Fund | | | Delafield
Fund | | | Select
Fund | |
Tax cost of investments | | $ | 458,734,358 | | | $ | 40,738,754 | | | $ | 191,744,902 | | | $ | 1,658,428,518 | | | $ | 1,151,191,764 | | | $ | 66,954,312 | |
| | | | | | | | | | | | | | | | | | | | | | | | |
| | | | | | | | | | | | | | | | | | | | | | | | |
Unrealized appreciation | | | 74,992,389 | | | | 8,282,070 | | | | 24,448,810 | | | | 1,126,526,760 | | | | 164,370,470 | | | | 9,554,381 | |
Unrealized depreciation | | | (45,560,895 | ) | | | (2,037,211 | ) | | | (17,405,997 | ) | | | (136,422,418 | ) | | | (75,578,854 | ) | | | (5,040,056 | ) |
| | | | | | | | | | | | | | | | | | | | | | | | |
Net unrealized appreciation | | | 29,431,494 | | | | 6,244,859 | | | | 7,042,813 | | | | 990,104,342 | | | | 88,791,616 | | | | 4,514,325 | |
| | | | | | | | | | | | | | | | | | | | | | | | |
Undistributed operating income | | | 4,136,952 | | | | — | | | | 1,261,244 | | | | 15,486,206 | | | | — | | | | — | |
Undistributed long-term gains | | | — | | | | — | | | | — | | | | 26,795,902 | | | | 16,537,498 | | | | 764,173 | |
| | | | | | | | | | | | | | | | | | | | | | | | |
Distributable earnings | | | 4,136,952 | | | | — | | | | 1,261,244 | | | | 42,282,108 | | | | 16,537,498 | | | | 764,173 | |
| | | | | | | | | | | | | | | | | | | | | | | | |
Other accumulated gain/(loss) | | | (31,642,409 | ) | | | (5,183,559 | ) | | | (7,245,264 | ) | | | 12,741 | | | | — | | | | (8,797 | ) |
| | | | | | | | | | | | | | | | | | | | | | | | |
Total accumulated gain/(loss) | | $ | 1,926,037 | | | $ | 1,061,300 | | | $ | 1,058,793 | | | $ | 1,032,399,191 | | | $ | 105,329,114 | | | $ | 5,269,701 | |
| | | | | | | | | | | | | | | | | | | | | | | | |
The difference between book-basis and tax-basis unrealized appreciation is attributable primarily to wash sale deferrals and passive foreign investment companies (PFIC’s).
The tax character of distributions paid during the periods ended October 31, 2011 and 2010 was as follows:
| | | | | | | | | | | | | | | | |
| | | October 31, 2011 | |
| | | Ordinary
Income | | | Long Term
Capital
Gain | | | Return of
Capital | | | Total | |
Tocqueville Fund | | $ | 7,457,179 | | | $ | — | | | $ | — | | | $ | 7,457,179 | |
Opportunity Fund | | | — | | | | — | | | | — | | | | — | |
International Value Fund | | | 831,651 | | | | — | | | | — | | | | 831,651 | |
Gold Fund | | | — | | | | 46,368,277 | | | | — | | | | 46,368,277 | |
Delafield Fund | | | — | | | | — | | | | — | | | | — | |
Select Fund | | | 282,014 | | | | 1,829,993 | | | | — | | | | 2,112,007 | |
| |
| | | October 31, 2010 | |
| | | Ordinary
Income | | | Long Term
Capital
Gain | | | Return of
Capital | | | Total | |
Tocqueville Fund | | $ | 4,954,961 | | | $ | — | | | $ | — | | | $ | 4,954,961 | |
Opportunity Fund | | | — | | | | — | | | | — | | | | — | |
International Value Fund | | | 1,534,647 | | | | — | | | | — | | | | 1,534,647 | |
Gold Fund | | | — | | | | 1,803,165 | | | | — | | | | 1,803,165 | |
Delafield Fund | | | — | | | | — | | | | 719,160 | | | | 719,160 | |
Select Fund | | | 27,613 | | | | — | | | | — | | | | 27,613 | |
The Fund designated as long-term capital gain dividend, pursuant to Internal Revenue Code Section 852(b)(3), the amount necessary to reduce the earnings and profits of the Funds related to net capital gain to zero for the tax years ended October 31, 2011 and 2010.
At October 31, 2011, certain Funds had tax basis capital losses which may be carried forward to offset future capital gains as shown below.
| | | | | | | | | | | | |
| | | Tocqueville
Fund | | | Opportunity
Fund | | | International
Value Fund | |
| Capital losses expiring on: | | | | | | | | | | | | |
10/31/2017 | | $ | 31,642,409 | | | $ | 5,183,559 | | | $ | 7,254,600 | |
4. INVESTMENT ADVISORY AND OTHER AGREEMENTS
Tocqueville Asset Management L.P. (“Tocqueville”) is the investment adviser (the “Adviser”) to the Trust under Investment Advisory Agreements approved by shareholders. For its services, Tocqueville receives fees from The Tocqueville Fund, calculated daily and payable monthly, at an annual rate of 0.75% on the first $1 billion of the average daily net assets of the Fund, and 0.65% of the average daily net assets in excess of $1 billion. Tocqueville receives fees from The Tocqueville Opportunity Fund, calculated daily and payable monthly, at an annual rate of 0.75% on the first $500 million of the average daily net assets of the Fund, and 0.65% of the average daily net assets in excess of $500 million. Tocqueville receives fees from The Tocqueville International Value Fund, calculated daily and payable monthly, at an annual rate of 1.00% on the first $1 billion of the average daily net assets of the Fund, and 0.75% of the average
daily net assets in excess of $1 billion. Tocqueville receives fees from The Tocqueville Gold Fund, calculated daily and payable monthly, at an annual rate of 1.00% on the first $500 million of the average daily net assets of the Fund, 0.75% of the average daily net assets in excess of $500 million but not exceeding $1 billion, and 0.65% of the average daily net assets in excess of $1 billion. Tocqueville receives fees from The Delafield Fund, calculated daily and payable monthly, at an annual rate of 0.80% on the first $250 million of net assets of the Fund; 0.75% on the next $250 million of net assets of the Fund; 0.70% on the next $500 million of net assets of the Fund; and 0.65% on all net assets of the Fund over $1 billion. Tocqueville receives fees from The Tocqueville Select Fund, calculated daily and payable monthly, at an annual rate of 0.80% on all net assets of the Fund.
With respect to The Tocqueville Fund, effective October 31, 2011, the Adviser has contractually agreed to waive its advisory fees and/or reimburse expenses in order to ensure that The Tocqueville Fund’s total annual operating expenses do not exceed 1.25% of its average daily net assets. The Expense Limitation Agreement will remain in effect until March 1, 2013. For the six months ended April 30, 2012, the Adviser waived $68,601 of the advisory fee. Such amount is not subject to recoupment by the Adviser.
Pursuant to an Administrative Services Agreement, each Fund pays to the Adviser a fee calculated daily and paid monthly at an annual rate of 0.15% of the average daily net assets of the Fund. For the six months ended April 30, 2012, the Adviser has made payments of $47,726, $6,806, $24,831, $290,849, $159,790, and $10,006 to U.S. Bancorp Fund Services, LLC for services provided under a Sub-Administration Agreement for The Tocqueville Fund, The Tocqueville Opportunity Fund, The Tocqueville International Value Fund, The Tocqueville Gold Fund, The Delafield Fund and The Tocqueville Select Fund, respectively.
Tocqueville Securities, L.P. (the “Distributor”), an affiliate of Tocqueville, acts as distributor for shares of the Trust. Each Fund adopted a distribution and service plan pursuant to Rule 12b-1 of the 1940 Act. Pursuant to the plans, each Fund pays to the Distributor distribution and service fees of 0.25% per annum of its average daily net assets.
Commissions earned by the Distributor for services rendered as a registered broker-dealer in securities transactions for The Tocqueville Fund, The Tocqueville Opportunity Fund, The Tocqueville International Value Fund, The Tocqueville Gold Fund, The Delafield Fund and The Tocqueville Select Fund for the six months ended April 30, 2012, were $94,899, $19,891, $31,029, $1,533, $58,170, and $18,627 respectively.
5. CAPITAL SHARE TRANSACTIONS.
Transactions in capital shares for each Fund were as follows:
| | | | | | | | |
| | | For the Six-Months
Ended
April 30, 2012
(unaudited) | | | For the Year
Ended
October 31, 2011 | |
| The Tocqueville Fund | | Shares | | | Shares | |
Shares sold | | | 1,574,597 | | | | 4,607,900 | |
Shares issued to holders in reinvestment of dividends | | | 210,977 | | | | 295,833 | |
Shares redeemed | | | (7,220,020 | ) | | | (5,531,619 | ) |
| | | | | | | | |
Net decrease | | | (5,434,446 | ) | | | (627,886 | ) |
| | | | | | | | |
| | | For the Six-Months
Ended
April 30, 2012
(unaudited) | | | For the Year
Ended
October 31, 2011 | |
The Tocqueville Opportunity Fund | | Shares | | | Shares | |
Shares sold | | | 1,459,311 | | | | 1,140,439 | |
Shares issued to holders in reinvestment of dividends | | | — | | | | — | |
Shares redeemed | | | (254,211 | ) | | | (489,872 | ) |
| | | | | | | | |
Net increase | | | 1,205,100 | | | | 650,567 | |
| | |
| The Tocqueville International Value Fund | | | | | | |
Shares sold | | | 4,467,181 | | | | 8,270,352 | |
Shares issued to holders in reinvestment of dividends | | | 139,955 | | | | 49,328 | |
Shares redeemed | | | (2,121,970 | ) | | | (4,051,383 | ) |
| | | | | | | | |
Net increase | | | 2,485,166 | | | | 4,268,297 | |
| | |
| The Tocqueville Gold Fund | | | | | | |
Shares sold | | | 4,931,251 | | | | 17,575,521 | |
Shares issued to holders in reinvestment of dividends | | | 539,233 | | | | 498,255 | |
Shares redeemed | | | (5,745,351 | ) | | | (12,604,092 | ) |
| | | | | | | | |
Net increase (decrease) | | | (274,867 | ) | | | 5,469,684 | |
| | |
| The Delafield Fund | | | | | | |
Shares sold | | | 6,987,187 | | | | 24,411,778 | |
Shares issued to holders in reinvestment of dividends | | | 562,887 | | | | — | |
Shares redeemed | | | (7,280,542 | ) | | | (13,045,815 | ) |
| | | | | | | | |
Net increase | | | 269,532 | | | | 11,365,963 | |
| | |
| The Tocqueville Select Fund | | | | | | |
Shares sold | | | 2,097,195 | | | | 4,890,152 | |
Shares issued to holders in reinvestment of dividends | | | 62,056 | | | | 166,855 | |
Shares redeemed | | | (874,797 | ) | | | (2,206,460 | ) |
| | | | | | | | |
Net increase | | | 1,284,454 | | | | 2,850,547 | |
6. FUND SHARE TRANSACTIONS
The Funds currently offer only one class of shares of beneficial interest. A redemption fee of 2.00% is imposed on redemptions of shares held 90 days or fewer. This fee is retained by each Fund and is credited to paid in capital. Redemptions to which the fee applies include redemptions of shares resulting from an exchange made pursuant to the Exchange Privilege, as defined in the Trust’s Prospectus dated February 28, 2012. For a more detailed description of when the redemption fee does not apply, please see the Trust’s Prospectus.
7. INVESTMENT TRANSACTIONS
Purchases and sales of investment securities (excluding short-term instruments) for the period ended April 30, 2012 are summarized below.
| | | | | | | | | | | | | | | | | | | | | | | | |
| | | Tocqueville
Fund | | | Opportunity
Fund | | | International
Value Fund | | | Gold
Fund | | | Delafield
Fund | | | Select
Fund | |
Purchases (Non-U.S. Government Securities): | | $ | 27,722,529 | | | $ | 36,110,856 | | | $ | 55,382,555 | | | $ | 145,894,205 | | | $ | 294,199,425 | | | $ | 15,117,934 | |
| | | | | | | | | | | | | | | | | | | | | | | | |
Sales (Non-U.S. Government Securities): | | $ | 149,833,499 | | | $ | 16,515,613 | | | $ | 38,484,895 | | | $ | 87,955,482 | | | $ | 365,965,273 | | | $ | 9,532,467 | |
| | | | | | | | | | | | | | | | | | | | | | | | |
8. TRANSACTIONS WITH AFFILIATES
The following issuers are affiliated with the Funds; that is, the Adviser had control of 5% or more of the outstanding voting securities during the period from November 1, 2011 through April 30, 2012. As defined in Section (2)(a)(3) of the Investment Company Act of 1940; such issues are:
| | | | | | | | | | | | | | | | | | | | | | | | | | | | | | | | |
Issuer Name | | Share Balance
At Nov. 1,
2011 | | | Additions | | | Reductions | | | Share Balance
At April 30,
2012 | | | Dividend
Income | | | Realized
Gain/(Loss) | | | Value
At April 30,
2012 | | | Cost
At April 30,
2012 | |
The Tocqueville Opportunity Fund | | | | | | | | | | | | | | | | | | | | | |
Minerals Technologies, Inc. | | | 2,000 | | | | — | | | | (1,300 | ) | | | 700 | | | $ | 135 | | | $ | 8,394 | | | $ | 46,970 | | | $ | 36,532 | |
| | | | | | | | | | | | | | | | | | | | | | | | | | | | | | | | |
| | | | | | | | | | | | | | | | | | $ | 135 | | | $ | 8,394 | | | $ | 46,970 | | | $ | 36,532 | |
| | | | | |
The Tocqueville Gold Fund | | | | | | | | | | | | | | | | | | | | | |
Atac Resources Ltd. | | | 10,261,700 | | | | — | | | | — | | | | 10,261,700 | | | $ | — | | | $ | — | | | $ | 28,359,003 | | | $ | 37,121,703 | |
Blue Gold Mining, Inc. | | | 4,000,000 | | | | — | | | | — | | | | 4,000,000 | | | | — | | | | — | | | | 2,024,599 | | | | 3,845,969 | |
Blue Gold Mining, Inc. Warrants | | | 2,000,000 | | | | — | | | | — | | | | 2,000,000 | | | | — | | | | — | | | | 7,693 | | | | — | |
Corvus Gold, Inc. | | | 2,079,901 | | | | — | | | | — | | | | 2,079,901 | | | | — | | | | — | | | | 1,642,276 | | | | 1,617,492 | |
East Asia Minerals Corp. | | | 4,044,400 | | | | 6,500,000 | | | | — | | | | 10,544,400 | | | | — | | | | — | | | | 3,255,598 | | | | 21,793,116 | |
East Asia Minerals Corp. Warrants | | | — | | | | 6,500,000 | | | | — | | | | 6,500,000 | | | | — | | | | — | | | | 533,370 | | | | — | |
Eidesis Special Opportunities II LP | | | — | | | | 25,000 | | | | — | | | | 25,000 | | | | — | | | | — | | | | 22,955,765 | | | | 25,000,000 | |
Gold Bullion International LLC | | | 5,000,000 | | | | — | | | | — | | | | 5,000,000 | | | | — | | | | — | | | | 5,836,800 | | | | 5,000,000 | |
Gold Resource Corp. | | | 3,642,297 | | | | 79,700 | | | | — | | | | 3,721,997 | | | | 1,105,764 | | | | — | | | | 100,940,559 | | | | 37,509,999 | |
International Tower Hill Mines Ltd. | | | 2,493,136 | | | | 2,745,700 | | | | — | | | | 5,238,836 | | | | — | | | | — | | | | 20,117,130 | | | | 19,598,960 | |
International Tower Hill Mines Ltd. | | | 5,666,667 | | | | — | | | | — | | | | 5,666,667 | | | | — | | | | — | | | | 21,511,364 | | | | 33,656,021 | |
Regulus Resources, Inc. | | | — | | | | 2,609,000 | | | | — | | | | 2,609,000 | | | | — | | | | — | | | | 3,037,253 | | | | 2,998,551 | |
Rockhaven Resources Ltd. | | | 5,000,000 | | | | — | | | | — | | | | 5,000,000 | | | | — | | | | — | | | | 1,746,216 | | | | 6,265,337 | |
Scorpio Mining Corp. | | | 522,400 | | | | — | | | | — | | | | 522,400 | | | | — | | | | — | | | | 555,266 | | | | 984,285 | |
| | | | | | | | | | | | | | | | | | | | | | | | | | | | | | | | |
Issuer Name | | Share Balance
At Nov. 1,
2011 | | | Additions | | | Reductions | | | Share Balance
At April 30,
2012 | | | Dividend
Income | | | Realized
Gain/(Loss) | | | Value
At April 30,
2012 | | | Cost
At April 30,
2012 | |
Scorpio Mining Corp. | | | 25,668,419 | | | | — | | | | — | | | | 25,668,419 | | | $ | — | | | $ | — | | | $ | 25,668,419 | | | $ | 23,975,473 | |
Silver Range Resources Ltd. | | | 3,450,000 | | | | — | | | | — | | | | 3,450,000 | | | | — | | | | — | | | | 2,532,014 | | | | — | |
Silver Range Resources Ltd. Warrants | | | 1,725,000 | | | | — | | | | — | | | | 1,725,000 | | | | — | | | | — | | | | 506,403 | | | | — | |
Strategic Metals Ltd. | | | 10,350,000 | | | | 576,900 | | | | — | | | | 10,926,900 | | | | — | | | | — | | | | 12,056,811 | | | | 15,810,172 | |
Trevali Mining Corp. | | | 8,000,000 | | | | — | | | | (1,625,000 | ) | | | 6,375,000 | | | | — | | | | (38,202 | ) | | | 8,195,830 | | | | 9,866,385 | |
| | | | | | | | | | | | | | | | | | | | | | | | | | | | | | | | |
| | | | | | | | | | | | | | | | | | $ | 1,105,764 | | | $ | (38,202 | ) | | $ | 261,482,369 | | | $ | 245,043,463 | |
| | | | | |
The Delafield Fund | | | | | | | | | | | | | | | | | | | | | |
Albany International Corp. (a) | | | 725,000 | | | | — | | | | (75,000 | ) | | | 650,000 | | | $ | 175,500 | | | $ | (280,846 | ) | | $ | 15,665,000 | | | $ | 9,219,690 | |
Checkpoint Systems, Inc. | | | 2,150,000 | | | | 350,000 | | | | — | | | | 2,500,000 | | | | — | | | | — | | | | 27,400,000 | | | | 40,386,380 | |
Federal Signal Corp. | | | 1,900,000 | | | | 550,000 | | | | — | | | | 2,450,000 | | | | — | | | | — | | | | 12,642,000 | | | | 14,411,252 | |
Ferro Corp. | | | 2,400,000 | | | | 100,000 | | | | (500,000 | ) | | | 2,000,000 | | | | — | | | | (4,057,377 | ) | | | 10,380,000 | | | | 12,257,066 | |
LTX-Credence Corp. | | | 2,000,000 | | | | 148,200 | | | | — | | | | 2,148,200 | | | | — | | | | — | | | | 14,822,580 | | | | 15,451,056 | |
Maidenform Brands, Inc. | | | — | | | | 775,000 | | | | — | | | | 775,000 | | | | — | | | | — | | | | 17,693,250 | | | | 14,143,044 | |
Minerals Technologies, Inc. | | | 420,000 | | | | — | | | | (60,000 | ) | | | 360,000 | | | | 39,000 | | | | (279,013 | ) | | | 24,156,000 | | | | 19,076,188 | |
TrueBlue, Inc. | | | 1,475,000 | | | | 25,000 | | | | — | | | | 1,500,000 | | | | — | | | | — | | | | 25,890,000 | | | | 20,240,042 | |
Universal Stainless & Alloy | | | 234,000 | | | | 133,000 | | | | — | | | | 367,000 | | | | — | | | | — | | | | 17,028,800 | | | | 10,886,534 | |
| | | | | | | | | | | | | | | | | | | | | | | | | | | | | | | | |
| | | | | | | | | | | | | | | | | | $ | 214,500 | | | $ | (4,617,236 | ) | | $ | 165,677,630 | | | $ | 156,071,252 | |
| | | | | |
The Tocqueville Select Fund | | | | | | | | | | | | | | | | | | | | | |
Albany International Corp. (a) | | | 119,500 | | | | — | | | | — | | | | 119,500 | | | $ | 31,070 | | | $ | — | | | $ | 2,879,950 | | | $ | 1,901,613 | |
Checkpoint Systems, Inc. | | | 173,000 | | | | 79,000 | | | | — | | | | 252,000 | | | | — | | | | — | | | | 2,761,920 | | | | 3,765,320 | |
Ferro Corp. | | | — | | | | 305,000 | | | | — | | | | 305,000 | | | | — | | | | — | | | | 1,582,950 | | | | 1,986,163 | |
Maidenform Brands, Inc. | | | 100,400 | | | | 60,000 | | | | — | | | | 160,400 | | | | — | | | | — | | | | 3,661,932 | | | | 3,362,678 | |
Minerals Technologies, Inc. | | | 40,000 | | | | — | | | | — | | | | 40,000 | | | | 4,000 | | | | — | | | | 2,684,000 | | | | 2,353,692 | |
| | | | | | | | | | | | | | | | | | | | | | | | | | | | | | | | |
| | | | | | | | | | | | | | | | | | $ | 35,070 | | | $ | — | | | $ | 13,570,752 | | | $ | 13,369,466 | |
| (a) | Security is no longer an affiliated company at April 30, 2012. |
9. LINE OF CREDIT
The Tocqueville Fund, Opportunity Fund, International Value Fund, Gold Fund, Delafield Fund, and Select Fund each have a revolving secured credit facility with U.S. Bank, the Trust’s custodian, in the amounts of $40,000,000,
$3,000,000, $10,000,000, $130,000,000, $40,000,000 and $9,500,000, respectively, for temporary emergency or extraordinary purposes, including the meeting of redemption requests that otherwise might require the untimely disposition of securities. Each Fund’s line of credit is secured by the respective fund’s assets. The lines of credit have a one-year term and are reviewed annually by the Board of Trustees. The current agreements run through May 31, 2012 and have been subsequently been renewed in the amounts of $40,000,000, $5,000,000, $15,000,000, $130,000,000, $50,000,000, and $9,500,000, respectively, through May 31, 2013. The interest rate as of April 30, 2012 was 2.75%. During the six months ended April 30, 2012, the Tocqueville Fund’s maximum borrowing was $40,000,000 and average borrowing was $1,209,188, the Opportunity Fund’s maximum borrowing was $326,200 and average borrowing was $17,484, and the Gold Fund’s maximum borrowing was $9,453,000 and average borrowing was $400,652. This borrowing resulted in interest expenses of $22,470, $33, and $3,414, respectively. These amounts are included in Other Expenses on the Funds’ Statement of Operations. The International Value Fund, the Delafield Fund, and the Select Fund did not use their lines of credit. The Opportunity Fund had an outstanding loan balance in the amount of $326,000 as of April 30, 2012.
10. NEW TAX LAW
On December 22, 2010, The Regulated Investment Company Modernization Act of 2010 (the “Modernization Act”) was signed into law. The Modernization Act is the first major piece of legislation affecting regulated investment companies (“RICs”) since 1986 and it modernizes several of the federal income and excise tax provisions related to RICs. Some highlights of the enacted provisions are as follows: New capital losses may now be carried forward indefinitely, and retain the character of the original loss. Under preenactment law, capital losses could be carried forward for eight years, and carried forward as short-term capital losses, irrespective of the character of the original loss.
The Modernization Act contains simplification provisions, which are aimed at preventing disqualification of a RIC for “inadvertent” failures of the asset diversification and/or qualifying income tests. Additionally, the Modernization Act exempts RICs from the preferential dividend rule, and repealed the 60-day designation requirement for certain types of paythrough income and gains.
Finally, the Modernization Act contains several provisions aimed at preserving the character of distributions made by a RIC during the portion of its taxable year ending after October 31 or December 31, reducing the circumstances under which a RIC might be required to file amended Forms 1099 to restate previously reported distributions. The provisions related to the RIC Modernization Act for qualification testing are effective for the October 31, 2011 taxable year. The effective date for changes in the treatment of capital losses is October 31, 2012 taxable year.
11. OTHER EXPENSES
Other expenses includes Chief Compliance Officer compensation. For the six months ended April 30, 2012, compensation to the Trust’s Chief Compliance Officer from the Funds amounted to $6,164, $728, $3,082, $38,862, $18,560, and $1,171 for the Tocqueville Fund, Opportunity Fund, International Value Fund, Gold Fund, Delafield Fund, and Select Fund, respectively.
ADDITIONAL INFORMATION (UNAUDITED)
1. ADDITIONAL DISCLOSURE REGARDING FUND TRUSTEES AND OFFICERS
Independent Trustees
| | | | | | | | | | | | |
Name, Age and Address | | Position(s) Held with the Trust | | Term of Office and Length of Time Served (1) | | Principal Occupation During Past Five Years | | # of
Portfolios
in Fund
Complex
Overseen
By Trustee | | | Other Directorships Held by Trustee |
| | | | | |
Guy A. Main (75) 40 W. 57th St., 19th Floor New York, NY 10019 | | Trustee | | Indefinite Term, Since 2000 | | Retired. Formerly, Executive Vice President, Amwest Insurance Group, Inc. from April 1996 to January 2001. | | | 6 | | | Director, Amwest Insurance Group, Inc. from April 1996 to January 2001; Chairman, Association of California Insurance Companies from January 1996 to January 1998. |
| | | | | |
Charles W. Caulkins (55) 40 W. 57th St., 19th Floor New York, NY 10019 | | Trustee | | Indefinite Term, Since 2003 | | Partner, Chora Capital, LLC from June 2010 to November 2011; Director of Marketing, L.R. Global Partners from January 2008 to May 2010; President, Arbor Marketing, Inc. from October 1994 to December 2007. | | | 6 | | | Director, Stepping Stones from January 2012-present; Director, Phoenix House from January 2001 to 2007. |
| | | | | |
James W. Gerard (51) 40 W. 57th St., 19th Floor New York, NY 10019 | | Trustee | | Indefinite Term, Since 2001 | | Managing Director, North Sea Partners, January 2010 to present. Principal, Juniper Capital Group, LLC (formerly known as Argus Advisors International, LLC), from August 2003 to December 2009; Managing Director, The Chart Group from January 2001 to present. | | | 6 | | | Director, American Overseas Memorial Day Association, 1988 to present; Director and Treasurer ASPCA, 1998 to 2008; Trustee, Salisbury School, 2005 to present; Director, American Friends of Blerancourt, 1992-present. |
Independent Trustees
| | | | | | | | | | | | |
Name, Age and Address | | Position(s) Held with the Trust | | Term of Office and Length of Time Served (1) | | Principal Occupation During Past Five Years | | # of
Portfolios
in Fund
Complex
Overseen
By Trustee | | | Other Directorships Held by Trustee |
| | | | | |
William F. Indoe (69) 40 W. 57th St., 19th Floor New York, NY 10019 | | Trustee | | Indefinite Term, Since 2006 | | Senior Counsel, Sullivan & Cromwell LLP (attorneys-at-law) 1990-present. | | | 6 | | | Director, Rho Capital Partners, Inc. |
| | | | | |
William J. Nolan III (64) 40 W. 57th St., 19th Floor New York, NY 10019 | | Trustee | | Indefinite Term, Since 2006 | | Retired, Executive Vice President & Treasurer PaineWebber Inc. 1997-2001. | | | 6 | | | Trustee, Adirondock Museum, Blue Mt. Lake, NY 1996 to present (Treasurer, 2000 to present). |
| | | | | |
Alexander Douglas (64) 40 W. 57th St., 19th Floor New York, NY 10019 | | Trustee | | Indefinite Term, Since 2010 | | President, CEO and owner of Spaulding Law Printing, Inc. | | | 6 | | | None |
Interested Trustees (and Officers)*
| | | | | | | | | | | | |
Name, Age and Address | | Position(s) Held with the Trust | | Term of Office and Length of Time Served (1) | | Principal Occupation During Past Five Years | | # of
Portfolios
in Fund
Complex
Overseen
By Trustee | | | Other Directorships Held by Trustee |
| | | | | |
Francois D. Sicart (68) 40 W. 57th St., 19th Floor New York, NY 10019 | | Chairman and Trustee | | Indefinite Term, Since 1987 | | Chairman, Tocqueville Management Corporation, the General Partner of Tocqueville Asset Management L.P. and Tocqueville Securities, L.P. from January 1990 to present; Chairman and Founder, Tocqueville Asset Management Corp. from December 1985 to January 1990; Vice Chairman of Tucker Anthony Management Corporation from 1981 to October 1986; Vice President (formerly general partner) among other positions with Tucker Anthony, Inc. from 1969 to January 1990. | | | 6 | | | Chairman and Director, Tocqueville Management Corporation, the General Partner of Tocqueville Asset Management L.P. and Tocqueville Securities, L.P. from January 1990 to present.
|
Interested Trustees (and Officers)*
| | | | | | | | | | | | |
Name, Age and Address | | Position(s) Held with the Trust | | Term of Office and Length of Time Served (1) | | Principal Occupation During Past Five Years | | # of
Portfolios
in Fund
Complex
Overseen
By Trustee | | | Other Directorships Held by Trustee |
| | | | | |
Robert W. Kleinschmidt (62) 40 W. 57th St., 19th Floor New York, NY 10019 | | President and Trustee | | Indefinite Term, Since 1991 | | President, Chief Investment Officer and Director, Tocqueville Management Corporation, the General Partner of Tocqueville Asset Management L.P. and Tocqueville Securities, L.P. from January 1994 to present; and Managing Director from July 1991 to January 1994; Partner, David J. Greene & Co. from May 1978 to July 1991. | | | 6 | | | President and Director, Tocqueville Management Corporation, the General Partner of Tocqueville Asset Management L.P. and Tocqueville Securities, L.P.
|
| | | | | |
Cleo Kotis (36) 40 W. 57th St., 19th Floor New York, NY 10019 | | Secretary | | Indefinite Term, Since 2010 | | Director of Operations, the Delafield Group of Tocqueville Asset Management L.P., 2009 to present; Vice President and Chief Operations Officer, the Delafield Fund, Inc. from 2005-2009; Vice President and Chief Operations Officer, Delafield Asset Management from 2005-2009; Vice President, Reich & Tang Asset Management, LLC from 2002-2009. | | | N/A | | | N/A |
| | | | | |
John Cassidy (69) 40 W. 57th St., 19th Floor New York, NY 10019 | | Treasurer | | Indefinite Term, Since 2010 | | Treasurer, Tocqueville Asset Management L.P., from May 2002 to present. | | | N/A | | | N/A |
| | | | | |
Elizabeth Bosco (63) 40 W. 57th St., 19th Floor
New York, NY 10019 | | Anti- Money Laundering Compliance Officer
| | Indefinite Term, Since 2009 | | Chief Compliance Officer (January 2009-present), Tocqueville Securities L.P.; Compliance Officer (January 1997-January 2009), Tocqueville Securities L.P. and Tocqueville Asset Management, L.P. | | | N/A | | | N/A
|
| * | “Interested person” of the Trust is defined in the 1940 Act. Mr. Sicart and Mr. Kleinschmidt are considered “interested persons” because of their affiliation with the Adviser. |
Interested Trustees (and Officers)*
| | | | | | | | | | | | |
Name, Age and Address | | Position(s) Held with the Trust | | Term of Office and Length of Time Served (1) | | Principal Occupation During Past Five Years | | # of
Portfolios
in Fund
Complex
Overseen
By Trustee | | | Other Directorships Held by Trustee |
| | | | | |
Thomas Pandick (65) 40 W. 57th St., 19th Floor New York, NY 10019
| | Chief Compliance Officer | | Indefinite Term, Since 2004 | | Chief Compliance Officer (October 2004-present), Tocqueville Asset Management L.P.; General Counsel (January-October 2004), Tocqueville Asset Management L.P. | | | N/A | | | N/A
|
| (1) | Each Trustee will hold office for an indefinite term until the earliest of (i) the next meeting of shareholders, if any, called for the purpose of considering the election or re-election of such Trustee and until the election and qualification of his or her successor, if any, elected at such meeting, or (ii) the date a Trustee resigns or retires, or a Trustee is removed by the Board of Trustees or shareholders, in accordance with the Trust’s By-Laws, as amended, and Agreement and Declaration of Trust, as amended. Each officer will hold office for an indefinite term until the date he or she resigns or retires or until his or her successor is elected and qualified. |
2. PROXY VOTING POLICIES AND PROCEDURES
A description of the policies and procedures that The Tocqueville Trust uses to determine how to vote proxies relating to portfolio securities is available without charge upon request by calling 1-800-355-7307. Information regarding how The Tocqueville Trust voted proxies relating to portfolio securities during the most recent 12-month period ended June 30 is available by calling 1-800-355-7307 and it is also available on the SEC’s web site at http://www.sec.gov.
3. SHAREHOLDER REPORTS AND QUARTERLY PORTFOLIO DISCLOSURE
The Tocqueville Trust is required to file its complete schedule of portfolio holdings with the SEC for its first and third fiscal quarters on Form N-Q. The Trust’s Form N-Q will be available without charge, upon request on the SEC’s website (http://www.sec.gov) and may be available by calling 1-800-697-3863. You can also obtain copies of Form N-Q by (i) visiting the SEC’s Public Reference Room in Washington, DC (information on the operation of the Public Reference Room may be obtained by calling 1-202-551-8090); (ii) sending your request and a duplicating fee to the SEC’s Public Reference Room, Washington, DC 20549-1520; or (iii) sending your request electronically to publicinfosec.gov. Quarterly portfolio holdings are also available on the website of The Tocqueville Funds, www.tocquevillefunds.com.
4. SHAREHOLDER NOTIFICATION OF FEDERAL TAX STATUS
For the fiscal period ended October 31, 2011, certain dividends paid by the Funds may be subject to a maximum tax rate of 15%, as provided for by the Jobs and Growth Tax Relief Reconciliation Act of 2003. The percentage of dividends declared from ordinary income designated as qualified dividend income was as follows:
| | | | |
Tocqueville Fund | | | 100.00 | % |
Opportunity Fund | | | 0.00 | % |
International Value Fund | | | 100.00 | % |
Gold Fund | | | 0.00 | % |
Delafield Fund | | | 0.00 | % |
Select Fund | | | 97.99 | % |
For corporate shareholders, the percent of ordinary income distributions qualifying for the corporate dividends received deduction for the fiscal period ended October 31, 2011 was as follows:
| | | | |
Tocqueville Fund | | | 100.00 | % |
Opportunity Fund | | | 0.00 | % |
International Value Fund | | | 2.35 | % |
Gold Fund | | | 0.00 | % |
Delafield Fund | | | 0.00 | % |
Select Fund | | | 96.61 | % |
For the period ended October 31, 2011, the funds designate the following percent of ordinary distributions paid as interest-related dividends under the Internal Revenue Code Section 871(k)(1)(c):
| | | | |
Tocqueville Fund | | | 1.42 | % |
Opportunity Fund | | | 0.00 | % |
International Value Fund | | | 0.86 | % |
Gold Fund | | | 0.00 | % |
Delafield Fund | | | 0.00 | % |
Select Fund | | | 0.27 | % |
The percentage of taxable ordinary income distributions that are designated as short-term capital gain distributions under Internal Revenue Section 871(k)(2)(C) for each Fund were as follows.
| | | | |
Tocqueville Fund | | | 0.00 | % |
Opportunity Fund | | | 0.00 | % |
International Value Fund | | | 0.00 | % |
Gold Fund | | | 0.00 | % |
Delafield Fund | | | 0.00 | % |
Select Fund | | | 100.00 | % |
5. FOREIGN TAX CREDIT
For the year ended October 31, 2011, the Tocqueville International Value Fund earned foreign source income and paid foreign taxes which they intend to pass through to their shareholders pursuant to Section 853 of the Internal Revenue Code as follows:
| | | | | | | | |
Country | | Gross Dividend
Per Share | | | Taxes Withheld
Per Share | |
Australia | | $ | 0.01374 | | | $ | 0.00024 | |
Belgium | | | 0.03435 | | | | 0.00515 | |
Brazil | | | 0.00601 | | | | 0.00081 | |
Canada | | | 0.00036 | | | | 0.00005 | |
Curacao | | | 0.00171 | | | | 0.00000 | |
Finland | | | 0.00000 | | | | 0.00000 | |
France | | | 0.06775 | | | | 0.00773 | |
Germany | | | 0.01178 | | | | 0.00177 | |
Greece | | | 0.00070 | | | | 0.00015 | |
Hong Kong | | | 0.02227 | | | | 0.00000 | |
Indonesia | | | 0.00000 | | | | 0.00000 | |
Ireland | | | 0.00862 | | | | 0.00114 | |
Italy | | | 0.01246 | | | | 0.00187 | |
Japan | | | 0.04606 | | | | 0.00322 | |
Jersey | | | 0.00455 | | | | 0.00000 | |
Mexico | | | 0.00358 | | | | 0.00000 | |
Netherlands | | | 0.01322 | | | | 0.00198 | |
Netherlands Antilles | | | 0.00000 | | | | 0.00000 | |
Singapore | | | 0.00000 | | | | 0.00000 | |
South Africa | | | 0.00059 | | | | 0.00000 | |
Spain | | | 0.02662 | | | | 0.00377 | |
Switzerland | | | 0.00848 | | | | 0.00127 | |
Thailand | | | 0.00000 | | | | 0.00000 | |
| | | | | | | | |
| | $ | 0.28285 | | | $ | 0.02915 | |
| | | | | | | | |
Investment Adviser
Tocqueville Asset Management L.P.
40 W. 57th St., 19th Floor
New York, NY 10019
(212) 698-0800
www.tocqueville.com
Distributor
Tocqueville Securities, L.P.
40 W. 57th St., 19th Floor
New York, NY 10019
(212) 698-0800
Shareholders’ Servicing and Transfer Agent
U.S. Bancorp Fund Services, LLC
P.O. Box 701
Milwaukee, WI 53201-0701
(800) 697-3863
Custodian
U.S. Bank, N.A.
Custody Operations
1555 River Center Drive, Suite 302
Milwaukee, WI 53212
Board of Trustees
François D. Sicart—Chairman
Charles W. Caulkins
Alexander Douglas
James W. Gerard
William F. Indoe
Robert W. Kleinschmidt
Guy A. Main
William J. Nolan III

Tocqueville Funds
c/o US Bancorp Fund Services, LLC
P.O. Box 701
Milwaukee, WI 53201-0701
www.tocqueville.com/mutual-funds
TQRPSEMI 12
Item 2. Code of Ethics.
Not applicable for semi-annual reports.
Item 3. Audit Committee Financial Expert.
Not applicable for semi-annual reports.
Item 4. Principal Accountant Fees and Services.
Not applicable for semi-annual reports.
Item 5. Audit Committee of Listed Registrants.
Not applicable to registrants who are not listed issuers (as defined in Rule 10A-3 under the Securities Exchange Act of 1934).
Item 6. Investments.
Schedule of Investments is included as part of the report to shareholders filed under Item 1 of this Form.
Item 7. Disclosure of Proxy Voting Policies and Procedures for Closed-End Management Investment Companies.
Not applicable to open-end investment companies.
Item 8. Portfolio Managers of Closed-End Management Investment Companies.
Not applicable to open-end investment companies.
Item 9. Purchases of Equity Securities by Closed-End Management Investment Company and Affiliated Purchasers.
Not applicable to open-end investment companies.
Item 10. Submission of Matters to a Vote of Security Holders.
There have been no material changes to the procedures by which shareholders may recommend nominees to the registrant’s board of trustees.
Item 11. Controls and Procedures.
| (a) | The Registrant’s President and Treasurer have reviewed the Registrant’s disclosure controls and procedures (as defined in Rule 30a-3(c) under the Investment Company Act of 1940 (the “Act”)) as of a date within 90 days of the filing of this report, as required by Rule 30a-3(b) under the Act and Rules 13a-15(b) or 15d-15(b) under the Securities Exchange Act of 1934. Based on their review, such officers have concluded that the disclosure controls and procedures are effective in ensuring that information required to be disclosed in this report is appropriately recorded, processed, summarized and reported and made known to them by others within the Registrant and by the Registrant’s service provider. |
| (b) | There were no changes in the Registrant’s internal control over financial reporting (as defined in Rule 30a-3(d) under the Act) that occurred during the second fiscal quarter of the period covered by this report that has materially affected, or is reasonably likely to materially affect, the Registrant’s internal control over financial reporting. |
Item 12. Exhibits.
| (a) | (1) Any code of ethics or amendment thereto, that is the subject of the disclosure required by Item 2, to the extent that the registrant intends to satisfy Item 2 requirements through filing an exhibit. Not Applicable for semi-annual reports. |
(2) A separate certification for each principal executive and principal financial officer pursuant to Section 302 of the Sarbanes-Oxley Act of 2002. Filed herewith.
(3) Any written solicitation to purchase securities under Rule 23c-1 under the Act sent or given during the period covered by the report by or on behalf of the registrant to 10 or more persons. Not applicable to open-end investment companies.
| (b) | Certifications pursuant to Section 906 of the Sarbanes-Oxley Act of 2002. Furnished herewith. |
2
SIGNATURES
Pursuant to the requirements of the Securities Exchange Act of 1934 and the Investment Company Act of 1940, the registrant has duly caused this report to be signed on its behalf by the undersigned, thereunto duly authorized.
| | |
(Registrant) | | The Tocqueville Trust |
| | |
| |
By (Signature and Title)* | | /s/ Robert W. Kleinschmidt |
| | Robert W. Kleinschmidt, President |
Pursuant to the requirements of the Securities Exchange Act of 1934 and the Investment Company Act of 1940, this report has been signed below by the following persons on behalf of the registrant and in the capacities and on the dates indicated.
| | |
By (Signature and Title)* | | /s/ Robert W. Kleinschmidt |
| | Robert W. Kleinschmidt, President |
| | |
| |
By (Signature and Title)* | | /s/ John Cassidy |
| | John Cassidy, Treasurer |
| * | Print the name and title of each signing officer under his or her signature. |