UNITED STATES
SECURITIES AND EXCHANGE COMMISSION
Washington, D.C. 20549
FORM N-CSR
CERTIFIED SHAREHOLDER REPORT OF REGISTERED
MANAGEMENT INVESTMENT COMPANIES
Investment Company Act file number 811-04861
Fidelity Garrison Street Trust
(Exact name of registrant as specified in charter)
245 Summer St., Boston, MA 02210
(Address of principal executive offices) (Zip code)
Margaret Carey, Secretary
245 Summer St.
Boston, Massachusetts 02210
(Name and address of agent for service)
Registrant's telephone number, including area code:
617-563-7000
| |
Date of fiscal year end: | August 31 |
|
|
Date of reporting period: | February 28, 2023 |
Item 1.
Reports to Stockholders
Fidelity® Education Income Fund
Semi-Annual Report
February 28, 2023
Contents
To view a fund's proxy voting guidelines and proxy voting record for the 12-month period ended June 30, visit http://www.fidelity.com/proxyvotingresults or visit the Securities and Exchange Commission's (SEC) web site at http://www.sec.gov.
You may also call 1-800-544-8544 to request a free copy of the proxy voting guidelines.
Standard & Poor's, S&P and S&P 500 are registered service marks of The McGraw-Hill Companies, Inc. and have been licensed for use by Fidelity Distributors Corporation.
Other third-party marks appearing herein are the property of their respective owners.
All other marks appearing herein are registered or unregistered trademarks or service marks of FMR LLC or an affiliated company. © 2023 FMR LLC. All rights reserved.
This report and the financial statements contained herein are submitted for the general information of the shareholders of the Fund. This report is not authorized for distribution to prospective investors in the Fund unless preceded or accompanied by an effective prospectus.
A fund files its complete schedule of portfolio holdings with the SEC for the first and third quarters of each fiscal year on Form N-PORT. Forms N-PORT are available on the SEC's web site at http://www.sec.gov. A fund's Forms N-PORT may be reviewed and copied at the SEC's Public Reference Room in Washington, DC. Information regarding the operation of the SEC's Public Reference Room may be obtained by calling 1-800-SEC-0330.
For a complete list of a fund's portfolio holdings, view the most recent holdings listing, semiannual report, or annual report on Fidelity's web site at http://www.fidelity.com, http://www.institutional.fidelity.com, or http://www.401k.com, as applicable.
NOT FDIC INSURED •MAY LOSE VALUE •NO BANK GUARANTEE
Neither the Fund nor Fidelity Distributors Corporation is a bank.
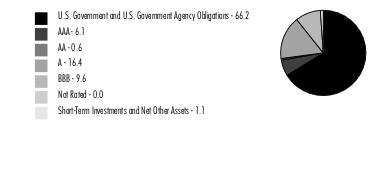
Quality Diversification (% of Fund's net assets) |
|
Percentages shown as 0.0% may reflect amounts less than 0.05%. |
| |
| We have used ratings from Moody's Investors Service, Inc. Where Moody's® ratings are not available, we have used S&P® ratings. All ratings are as of the date indicated and do not reflect subsequent changes. |
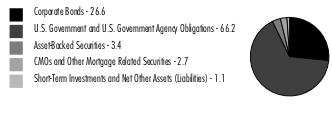
Asset Allocation (% of Fund's net assets) |
|
Foreign investments - 7.3% |
|
Showing Percentage of Net Assets
| Nonconvertible Bonds - 26.6% |
| | | Principal Amount (a) | Value ($) |
| COMMUNICATION SERVICES - 1.1% | | | |
| Diversified Telecommunication Services - 0.7% | | | |
| AT&T, Inc.: | | | |
| 1.65% 2/1/28 | | 2,750,000 | 2,336,284 |
| 4.25% 3/1/27 | | 400,000 | 387,751 |
| 4.3% 2/15/30 | | 250,000 | 234,519 |
| Verizon Communications, Inc.: | | | |
| 2.1% 3/22/28 | | 500,000 | 431,552 |
| 2.355% 3/15/32 | | 2,000,000 | 1,572,304 |
| 3% 3/22/27 | | 78,000 | 72,069 |
| | | | 5,034,479 |
| Entertainment - 0.1% | | | |
| The Walt Disney Co. 1.75% 1/13/26 | | 306,000 | 279,523 |
| Media - 0.3% | | | |
| Comcast Corp.: | | | |
| 2.35% 1/15/27 | | 500,000 | 453,048 |
| 3.95% 10/15/25 | | 725,000 | 704,890 |
| Magallanes, Inc.: | | | |
| 3.755% 3/15/27 (b) | | 1,000,000 | 917,334 |
| 4.054% 3/15/29 (b) | | 6,000 | 5,366 |
| | | | 2,080,638 |
| Wireless Telecommunication Services - 0.0% | | | |
| Rogers Communications, Inc. 3.2% 3/15/27 (b) | | 19,000 | 17,470 |
TOTAL COMMUNICATION SERVICES | | | 7,412,110 |
| CONSUMER DISCRETIONARY - 2.0% | | | |
| Automobiles - 1.1% | | | |
| Daimler Finance North America LLC: | | | |
| 0.75% 3/1/24 (b) | | 500,000 | 477,538 |
| 1.45% 3/2/26 (b) | | 2,500,000 | 2,243,553 |
| General Motors Financial Co., Inc.: | | | |
| 1.05% 3/8/24 | | 18,000 | 17,192 |
| 1.25% 1/8/26 | | 500,000 | 442,238 |
| 2.35% 2/26/27 | | 3,000,000 | 2,651,329 |
| Toyota Motor Corp. 3.419% 7/20/23 | | 355,000 | 352,648 |
| Volkswagen Group of America Finance LLC: | | | |
| 1.25% 11/24/25 (b) | | 1,000,000 | 895,450 |
| 3.95% 6/6/25 (b) | | 227,000 | 219,486 |
| 4.35% 6/8/27 (b) | | 200,000 | 191,901 |
| | | | 7,491,335 |
| Multiline Retail - 0.3% | | | |
| Dollar General Corp. 4.625% 11/1/27 | | 2,406,000 | 2,348,648 |
| Specialty Retail - 0.6% | | | |
| Lowe's Companies, Inc. 4.4% 9/8/25 | | 2,275,000 | 2,235,708 |
| The Home Depot, Inc. 2.875% 4/15/27 | | 2,028,000 | 1,884,031 |
| | | | 4,119,739 |
TOTAL CONSUMER DISCRETIONARY | | | 13,959,722 |
| CONSUMER STAPLES - 0.6% | | | |
| Tobacco - 0.6% | | | |
| BAT Capital Corp. 4.7% 4/2/27 | | 801,000 | 774,062 |
| BAT International Finance PLC 1.668% 3/25/26 | | 2,750,000 | 2,442,159 |
| Philip Morris International, Inc. 1.5% 5/1/25 | | 750,000 | 693,834 |
| | | | 3,910,055 |
| ENERGY - 0.5% | | | |
| Energy Equipment & Services - 0.0% | | | |
| Baker Hughes Co.: | | | |
| 1.231% 12/15/23 | | 16,000 | 15,504 |
| 2.061% 12/15/26 | | 15,000 | 13,408 |
| | | | 28,912 |
| Oil, Gas & Consumable Fuels - 0.5% | | | |
| Canadian Natural Resources Ltd. 2.05% 7/15/25 | | 315,000 | 290,892 |
| ConocoPhillips Co. 2.4% 3/7/25 | | 30,000 | 28,409 |
| Enbridge, Inc.: | | | |
| 2.15% 2/16/24 | | 12,000 | 11,618 |
| 2.5% 2/14/25 | | 12,000 | 11,331 |
| Energy Transfer LP 4.2% 9/15/23 | | 73,000 | 72,500 |
| Exxon Mobil Corp. 2.992% 3/19/25 | | 210,000 | 201,612 |
| MPLX LP: | | | |
| 1.75% 3/1/26 | | 2,000,000 | 1,788,530 |
| 4% 3/15/28 | | 760,000 | 711,464 |
| 4.5% 7/15/23 | | 350,000 | 348,753 |
| | | | 3,465,109 |
TOTAL ENERGY | | | 3,494,021 |
| FINANCIALS - 19.4% | | | |
| Banks - 12.9% | | | |
| Bank of America Corp.: | | | |
| 1.197% 10/24/26 (c) | | 500,000 | 444,921 |
| 1.734% 7/22/27 (c) | | 500,000 | 440,391 |
| 2.456% 10/22/25 (c) | | 500,000 | 474,482 |
| 2.551% 2/4/28 (c) | | 850,000 | 759,877 |
| 2.651% 3/11/32 (c) | | 2,750,000 | 2,233,892 |
| 3.458% 3/15/25 (c) | | 393,000 | 384,103 |
| 4.827% 7/22/26 (c) | | 2,500,000 | 2,459,349 |
| 4.948% 7/22/28 (c) | | 3,750,000 | 3,667,752 |
| Banque Federative du Credit Mutuel SA 4.524% 7/13/25 (b) | | 449,000 | 438,770 |
| Barclays PLC: | | | |
| 1.007% 12/10/24 (c) | | 750,000 | 722,168 |
| 2.279% 11/24/27 (c) | | 1,300,000 | 1,143,713 |
| 2.852% 5/7/26 (c) | | 750,000 | 702,220 |
| 5.304% 8/9/26 (c) | | 2,500,000 | 2,462,860 |
| BNP Paribas SA U.S. Secured Overnight Fin. Rate (SOFR) Index + 1.000% 1.323% 1/13/27 (b)(c)(d) | | 750,000 | 664,053 |
| Canadian Imperial Bank of Commerce: | | | |
| 3.45% 4/7/27 | | 1,150,000 | 1,076,408 |
| 3.945% 8/4/25 | | 495,000 | 479,532 |
| Citigroup, Inc.: | | | |
| 1.122% 1/28/27 (c) | | 3,000,000 | 2,635,980 |
| 3.07% 2/24/28 (c) | | 3,000,000 | 2,722,626 |
| 3.106% 4/8/26 (c) | | 1,100,000 | 1,044,589 |
| 4.14% 5/24/25 (c) | | 2,500,000 | 2,453,869 |
| 4.4% 6/10/25 | | 250,000 | 244,609 |
| DNB Bank ASA: | | | |
| 0.856% 9/30/25 (b)(c) | | 2,500,000 | 2,308,408 |
| 1.605% 3/30/28 (b)(c) | | 2,250,000 | 1,922,350 |
| Fifth Third Bancorp 3.65% 1/25/24 | | 168,000 | 165,607 |
| HSBC Holdings PLC: | | | |
| 1.589% 5/24/27 (c) | | 550,000 | 481,150 |
| 2.251% 11/22/27 (c) | | 1,300,000 | 1,143,532 |
| 3.803% 3/11/25 (c) | | 2,250,000 | 2,202,728 |
| 3.95% 5/18/24 (c) | | 750,000 | 746,672 |
| 5.21% 8/11/28 (c) | | 2,827,000 | 2,764,357 |
| Huntington Bancshares, Inc.: | | | |
| 2.625% 8/6/24 | | 450,000 | 432,753 |
| 4.443% 8/4/28 (c) | | 2,261,000 | 2,159,709 |
| Huntington National Bank 5.699% 11/18/25 (c) | | 1,490,000 | 1,492,041 |
| JPMorgan Chase & Co.: | | | |
| 0.697% 3/16/24 (c) | | 500,000 | 498,780 |
| 0.824% 6/1/25 (c) | | 63,000 | 59,102 |
| 1.47% 9/22/27 (c) | | 3,080,000 | 2,670,115 |
| 2.083% 4/22/26 (c) | | 500,000 | 464,289 |
| 2.58% 4/22/32 (c) | | 3,000,000 | 2,430,965 |
| 2.947% 2/24/28 (c) | | 3,318,000 | 3,009,328 |
| 3.54% 5/1/28 (c) | | 350,000 | 323,664 |
| 4.851% 7/25/28 (c) | | 3,750,000 | 3,661,347 |
| KeyBank NA 4.15% 8/8/25 | | 250,000 | 243,824 |
| KeyCorp 3.878% 5/23/25 (c) | | 177,000 | 173,174 |
| Mitsubishi UFJ Financial Group, Inc.: | | | |
| 0.848% 9/15/24 (c) | | 750,000 | 730,189 |
| 0.953% 7/19/25 (c) | | 750,000 | 700,173 |
| 1.64% 10/13/27 (c) | | 1,300,000 | 1,127,924 |
| Mizuho Financial Group, Inc.: | | | |
| 0.849% 9/8/24 (c) | | 500,000 | 486,859 |
| 1.234% 5/22/27 (c) | | 2,050,000 | 1,777,138 |
| 2.651% 5/22/26 (c) | | 500,000 | 466,329 |
| National Australia Bank Ltd. 2.875% 4/12/23 | | 468,000 | 466,816 |
| NatWest Group PLC: | | | |
| 1.642% 6/14/27 (c) | | 3,300,000 | 2,896,008 |
| 4.269% 3/22/25 (c) | | 200,000 | 196,354 |
| PNC Financial Services Group, Inc.: | | | |
| 3.5% 1/23/24 | | 200,000 | 196,860 |
| 5.354% 12/2/28 (c) | | 1,020,000 | 1,022,739 |
| Rabobank Nederland 1.98% 12/15/27 (b)(c) | | 3,050,000 | 2,657,450 |
| Santander Holdings U.S.A., Inc. 2.49% 1/6/28 (c) | | 773,000 | 673,269 |
| Societe Generale: | | | |
| 2.226% 1/21/26 (b)(c) | | 2,500,000 | 2,323,427 |
| 2.797% 1/19/28 (b)(c) | | 950,000 | 843,089 |
| Sumitomo Mitsui Financial Group, Inc.: | | | |
| 1.402% 9/17/26 | | 750,000 | 650,913 |
| 1.474% 7/8/25 | | 2,500,000 | 2,274,773 |
| 2.696% 7/16/24 | | 500,000 | 481,266 |
| The Toronto-Dominion Bank 2.8% 3/10/27 | | 64,000 | 58,494 |
| Truist Financial Corp. 4.26% 7/28/26 (c) | | 2,960,000 | 2,885,401 |
| Wells Fargo & Co.: | | | |
| 1.654% 6/2/24 (c) | | 750,000 | 742,586 |
| 2.164% 2/11/26 (c) | | 750,000 | 700,930 |
| 2.188% 4/30/26 (c) | | 2,676,000 | 2,488,095 |
| 3.526% 3/24/28 (c) | | 3,288,000 | 3,044,681 |
| 4.808% 7/25/28 (c) | | 1,250,000 | 1,217,024 |
| | | | 88,118,846 |
| Capital Markets - 4.4% | | | |
| Credit Suisse Group AG: | | | |
| 1.305% 2/2/27 (b)(c) | | 1,300,000 | 1,047,591 |
| 2.593% 9/11/25 (b)(c) | | 2,500,000 | 2,265,112 |
| 3.091% 5/14/32 (b)(c) | | 250,000 | 175,909 |
| 6.373% 7/15/26 (b)(c) | | 300,000 | 282,216 |
| Deutsche Bank AG New York Branch: | | | |
| 2.129% 11/24/26 (c) | | 750,000 | 672,180 |
| 2.311% 11/16/27 (c) | | 3,300,000 | 2,865,232 |
| Goldman Sachs Group, Inc.: | | | |
| 1.757% 1/24/25 (c) | | 500,000 | 481,268 |
| 2.64% 2/24/28 (c) | | 2,563,000 | 2,290,284 |
| 4.482% 8/23/28 (c) | | 2,500,000 | 2,395,951 |
| Intercontinental Exchange, Inc.: | | | |
| 3.65% 5/23/25 | | 314,000 | 306,014 |
| 3.75% 9/21/28 | | 125,000 | 117,284 |
| 4% 9/15/27 | | 1,981,000 | 1,925,294 |
| 4.35% 6/15/29 | | 2,500,000 | 2,412,292 |
| Moody's Corp. 3.75% 3/24/25 | | 750,000 | 725,397 |
| Morgan Stanley: | | | |
| 0.79% 5/30/25 (c) | | 750,000 | 702,332 |
| 2.188% 4/28/26 (c) | | 750,000 | 699,046 |
| 2.239% 7/21/32 (c) | | 2,750,000 | 2,139,095 |
| 3.591% 7/22/28 (c) | | 1,050,000 | 969,201 |
| 3.737% 4/24/24 (c) | | 500,000 | 498,528 |
| 4.679% 7/17/26 (c) | | 1,842,000 | 1,806,440 |
| S&P Global, Inc. 2.45% 3/1/27 (b) | | 2,814,000 | 2,561,195 |
| UBS Group AG 4.703% 8/5/27 (b)(c) | | 2,500,000 | 2,420,127 |
| | | | 29,757,988 |
| Consumer Finance - 1.1% | | | |
| AerCap Ireland Capital Ltd./AerCap Global Aviation Trust 2.45% 10/29/26 | | 700,000 | 617,100 |
| American Express Co.: | | | |
| 2.25% 3/4/25 | | 35,000 | 32,918 |
| 2.55% 3/4/27 | | 54,000 | 48,881 |
| Capital One Financial Corp.: | | | |
| 1.343% 12/6/24 (c) | | 850,000 | 819,254 |
| 1.878% 11/2/27 (c) | | 3,400,000 | 2,971,169 |
| 4.985% 7/24/26 (c) | | 2,701,000 | 2,657,271 |
| Hyundai Capital America 1% 9/17/24 (b) | | 74,000 | 68,854 |
| John Deere Capital Corp. 3.4% 6/6/25 | | 355,000 | 342,472 |
| | | | 7,557,919 |
| Diversified Financial Services - 0.6% | | | |
| Athene Global Funding: | | | |
| 1.716% 1/7/25 (b) | | 600,000 | 556,021 |
| 1.73% 10/2/26 (b) | | 573,000 | 493,402 |
| Corebridge Financial, Inc.: | | | |
| 3.5% 4/4/25 (b) | | 508,000 | 485,902 |
| 3.65% 4/5/27 (b) | | 2,762,000 | 2,577,076 |
| | | | 4,112,401 |
| Insurance - 0.4% | | | |
| American International Group, Inc. 2.5% 6/30/25 | | 383,000 | 360,509 |
| Equitable Financial Life Global Funding: | | | |
| 1.1% 11/12/24 (b) | | 500,000 | 465,459 |
| 1.4% 8/27/27 (b) | | 700,000 | 586,662 |
| 1.7% 11/12/26 (b) | | 799,000 | 696,253 |
| MassMutual Global Funding II 4.15% 8/26/25 (b) | | 463,000 | 449,976 |
| RGA Global Funding 2% 11/30/26 (b) | | 30,000 | 26,490 |
| | | | 2,585,349 |
TOTAL FINANCIALS | | | 132,132,503 |
| HEALTH CARE - 0.5% | | | |
| Biotechnology - 0.1% | | | |
| Amgen, Inc. 5.15% 3/2/28 (e) | | 378,000 | 376,504 |
| Health Care Providers & Services - 0.4% | | | |
| CVS Health Corp. 4.3% 3/25/28 | | 110,000 | 105,160 |
| Humana, Inc. 3.7% 3/23/29 | | 2,500,000 | 2,268,123 |
| UnitedHealth Group, Inc. 3.7% 5/15/27 | | 399,000 | 380,600 |
| | | | 2,753,883 |
| Pharmaceuticals - 0.0% | | | |
| AstraZeneca Finance LLC 0.7% 5/28/24 | | 60,000 | 56,751 |
TOTAL HEALTH CARE | | | 3,187,138 |
| INDUSTRIALS - 0.8% | | | |
| Aerospace & Defense - 0.1% | | | |
| Raytheon Technologies Corp. 3.95% 8/16/25 | | 116,000 | 112,729 |
| The Boeing Co.: | | | |
| 1.95% 2/1/24 | | 307,000 | 296,496 |
| 5.04% 5/1/27 | | 500,000 | 492,478 |
| | | | 901,703 |
| Machinery - 0.2% | | | |
| Daimler Trucks Finance North America LLC 2% 12/14/26 (b) | | 500,000 | 442,398 |
| Parker Hannifin Corp.: | | | |
| 3.65% 6/15/24 | | 440,000 | 430,117 |
| 4.25% 9/15/27 | | 217,000 | 207,607 |
| | | | 1,080,122 |
| Road & Rail - 0.2% | | | |
| Canadian Pacific Railway Co. 1.75% 12/2/26 | | 1,517,000 | 1,343,418 |
| Trading Companies & Distributors - 0.3% | | | |
| Air Lease Corp.: | | | |
| 2.2% 1/15/27 | | 2,530,000 | 2,222,751 |
| 3.25% 3/1/25 | | 97,000 | 92,049 |
| | | | 2,314,800 |
TOTAL INDUSTRIALS | | | 5,640,043 |
| INFORMATION TECHNOLOGY - 0.4% | | | |
| Software - 0.4% | | | |
| Roper Technologies, Inc.: | | | |
| 1% 9/15/25 | | 2,076,000 | 1,870,231 |
| 1.75% 2/15/31 | | 750,000 | 578,393 |
| | | | 2,448,624 |
| REAL ESTATE - 0.3% | | | |
| Equity Real Estate Investment Trusts (REITs) - 0.3% | | | |
| Crown Castle International Corp. 3.15% 7/15/23 | | 399,000 | 395,840 |
| Ventas Realty LP 2.65% 1/15/25 | | 2,000,000 | 1,889,444 |
| | | | 2,285,284 |
| UTILITIES - 1.0% | | | |
| Electric Utilities - 0.8% | | | |
| Alabama Power Co. 3.05% 3/15/32 | | 2,526,000 | 2,151,163 |
| Duke Energy Corp. 4.3% 3/15/28 | | 1,341,000 | 1,280,724 |
| Eversource Energy 0.8% 8/15/25 | | 43,000 | 38,304 |
| Exelon Corp. 2.75% 3/15/27 | | 1,006,000 | 912,070 |
| Southern Co. 3.25% 7/1/26 | | 500,000 | 466,204 |
| Virginia Electric & Power Co. 2.4% 3/30/32 | | 500,000 | 403,938 |
| | | | 5,252,403 |
| Independent Power and Renewable Electricity Producers - 0.0% | | | |
| Exelon Generation Co. LLC 3.25% 6/1/25 | | 178,000 | 169,210 |
| Multi-Utilities - 0.2% | | | |
| NiSource, Inc. 0.95% 8/15/25 | | 1,500,000 | 1,352,379 |
| Sempra Energy 3.3% 4/1/25 | | 28,000 | 26,801 |
| | | | 1,379,180 |
TOTAL UTILITIES | | | 6,800,793 |
| TOTAL NONCONVERTIBLE BONDS (Cost $185,707,666) | | | 181,270,293 |
| | | | |
| U.S. Treasury Obligations - 65.0% |
| | | Principal Amount (a) | Value ($) |
| U.S. Treasury Notes: | | | |
| 0.625% 7/31/26 | | 223,300 | 196,722 |
| 0.75% 12/31/23 | | 15,973,400 | 15,406,220 |
| 0.75% 3/31/26 | | 28,048,900 | 25,098,287 |
| 0.875% 1/31/24 | | 15,749,800 | 15,151,185 |
| 1.75% 3/15/25 | | 4,068,500 | 3,827,554 |
| 2.25% 4/30/24 | | 49,000 | 47,409 |
| 2.5% 4/30/24 | | 11,749,900 | 11,398,780 |
| 2.5% 3/31/27 | | 678,700 | 632,994 |
| 2.625% 4/15/25 | | 57,349,000 | 54,880,304 |
| 2.75% 2/15/24 | | 34,203,800 | 33,436,887 |
| 2.75% 4/30/27 | | 16,773,900 | 15,787,778 |
| 2.75% 7/31/27 | | 500,000 | 469,727 |
| 2.75% 8/15/32 | | 7,291,700 | 6,626,332 |
| 2.875% 4/30/29 | | 19,656,500 | 18,325,079 |
| 3.125% 8/15/25 | | 66,297,000 | 64,002,505 |
| 3.5% 9/15/25 | | 21,279,200 | 20,719,790 |
| 3.5% 1/31/28 | | 6,600,000 | 6,399,422 |
| 3.875% 1/15/26 | | 12,900,000 | 12,678,281 |
| 3.875% 11/30/27 | | 15,500,000 | 15,279,004 |
| 4% 12/15/25 | | 18,200,000 | 17,956,859 |
| 4% 2/15/26 | | 11,900,000 | 11,735,445 |
| 4% 2/29/28 | | 15,000,000 | 14,888,672 |
| 4.125% 9/30/27 | | 7,162,000 | 7,124,511 |
| 4.125% 10/31/27 | | 50,177,900 | 49,927,011 |
| 4.5% 11/15/25 | | 21,200,000 | 21,164,391 |
| TOTAL U.S. TREASURY OBLIGATIONS (Cost $451,193,238) | | | 443,161,149 |
| | | | |
| U.S. Government Agency - Mortgage Securities - 1.2% |
| | | Principal Amount (a) | Value ($) |
| Fannie Mae - 1.1% | | | |
| 2% 2/1/28 | | 250,000 | 233,684 |
| 2.5% 1/1/28 to 11/1/36 | | 2,064,122 | 1,920,891 |
| 3% 8/1/32 to 12/1/36 | | 5,515,426 | 5,164,263 |
TOTAL FANNIE MAE | | | 7,318,838 |
| Freddie Mac - 0.1% | | | |
| 2.5% 1/1/28 | | 300,000 | 285,310 |
| 3% 7/1/32 to 10/1/35 | | 700,326 | 659,487 |
TOTAL FREDDIE MAC | | | 944,797 |
| TOTAL U.S. GOVERNMENT AGENCY - MORTGAGE SECURITIES (Cost $8,487,606) | | | 8,263,635 |
| | | | |
| Asset-Backed Securities - 3.4% |
| | | Principal Amount (a) | Value ($) |
| American Express Credit Account Master Trust: | | | |
| Series 2021-1 Class A, 0.9% 11/15/26 | | 100,000 | 93,162 |
| Series 2022-2 Class A, 3.39% 5/15/27 | | 600,000 | 578,484 |
| Series 2022-3 Class A, 3.75% 8/15/27 | | 3,570,000 | 3,465,236 |
| Series 2022-4 Class A, 4.95% 10/15/27 | | 1,122,000 | 1,121,819 |
| Bank of America Credit Card Master Trust: | | | |
| Series 2021-A1 Class A1, 0.44% 9/15/26 | | 80,000 | 75,857 |
| Series 2022-A1 Class A1, 3.53% 11/15/27 | | 2,624,000 | 2,537,536 |
| Series 2022-A2, Class A2, 5% 4/15/28 | | 1,294,000 | 1,296,832 |
| Capital One Multi-Asset Execution Trust: | | | |
| Series 2021-A3 Class A3, 1.04% 11/15/26 | | 97,000 | 90,412 |
| Series 2022-A1 Class A1, 2.8% 3/15/27 | | 148,000 | 141,184 |
| Series 2022-A2 Class A, 3.49% 5/15/27 | | 5,671,000 | 5,483,873 |
| Series 2022-A3 Class A, 4.95% 10/15/27 | | 1,603,000 | 1,600,695 |
| Chase Issuance Trust Series 2022-A1 Class A, 3.97% 9/15/27 | | 560,000 | 545,322 |
| Discover Card Execution Note Trust: | | | |
| Series 2021-A1 Class A1, 0.58% 9/15/26 | | 80,000 | 74,451 |
| Series 2022-A1 Class A1, 1.96% 2/15/27 | | 49,000 | 46,028 |
| Series 2022-A2 Class A, 3.32% 5/15/27 | | 540,000 | 520,399 |
| Series 2022-A3 Class A3, 3.56% 7/15/27 | | 2,540,000 | 2,453,980 |
| Series 2022-A4, Class A, 5.03% 10/15/27 | | 1,613,000 | 1,613,604 |
| Ford Credit Auto Owner Trust: | | | |
| Series 2019-1 Class A, 3.52% 7/15/30 (b) | | 320,000 | 314,857 |
| Series 2021-A Class A3, 0.3% 8/15/25 | | 334,423 | 323,896 |
| Honda Auto Receivables Owner Trust Series 2021-1 Class A3, 0.27% 4/21/25 | | 493,098 | 478,949 |
| Verizon Master Trust: | | | |
| Series 2021-1 Class A, 0.5% 5/20/27 | | 59,000 | 55,713 |
| Series 2021-2 Class A, 0.99% 4/20/28 | | 90,000 | 84,116 |
| Series 2022-5 Class A1A, 3.72% 7/20/27 | | 277,000 | 273,202 |
| TOTAL ASSET-BACKED SECURITIES (Cost $23,662,188) | | | 23,269,607 |
| | | | |
| Collateralized Mortgage Obligations - 0.1% |
| | | Principal Amount (a) | Value ($) |
| Private Sponsor - 0.1% | | | |
CSAIL Commercial Mortgage Trust Series 2015-C2 Class ASB, 3.2241% 6/15/57 (Cost $517,617) | | 518,677 | 503,965 |
| | | | |
| Commercial Mortgage Securities - 2.6% |
| | | Principal Amount (a) | Value ($) |
| BANK sequential payer Series 2017-BNK9 Class ASB, 3.47% 11/15/54 | | 3,206,097 | 3,058,612 |
| BX Commercial Mortgage Trust floater: | | | |
| Series 2021-PAC Class A, 1 month U.S. LIBOR + 0.680% 5.2771% 10/15/36 (b)(c)(d) | | 100,000 | 97,719 |
| Series 2022-LP2 Class A, CME Term SOFR 1 Month Index + 1.010% 5.5754% 2/15/39 (b)(c)(d) | | 92,839 | 91,459 |
| BX Trust: | | | |
| floater: | | | |
Series 2021-ACNT Class A, 1 month U.S. LIBOR + 0.850% 5.438% 11/15/38 (b)(c)(d) | | 100,000 | 98,310 |
Series 2021-BXMF Class A, 1 month U.S. LIBOR + 0.630% 5.2239% 10/15/26 (b)(c)(d) | | 100,000 | 97,563 |
Series 2022-GPA Class A, CME Term SOFR 1 Month Index + 2.160% 6.7275% 10/15/39 (b)(c)(d) | | 17,000 | 16,968 |
| floater sequential payer Series 2019-XL Class A, CME Term SOFR 1 Month Index + 1.030% 5.597% 10/15/36 (b)(c)(d) | | 1,580,585 | 1,572,644 |
| CD Mortgage Trust sequential payer Series 2017-CD5 Class AAB, 3.22% 8/15/50 | | 621,115 | 588,154 |
| Credit Suisse Mortgage Trust floater Series 2019-ICE4 Class A, 1 month U.S. LIBOR + 0.980% 5.568% 5/15/36 (b)(c)(d) | | 3,112,257 | 3,096,632 |
| CSAIL Commercial Mortgage Trust Series 2017-CX9 Class A2, 3.0538% 9/15/50 | | 29,370 | 29,308 |
| ELP Commercial Mortgage Trust floater Series 2021-ELP Class A, 1 month U.S. LIBOR + 0.700% 5.289% 11/15/38 (b)(c)(d) | | 770,000 | 749,740 |
| GS Mortgage Securities Trust sequential payer: | | | |
| Series 2015-GC28 Class AAB, 3.206% 2/10/48 | | 86,355 | 84,190 |
| Series 2015-GC32 Class AAB, 3.513% 7/10/48 | | 287,489 | 278,560 |
| Series 2016-GS2 Class AAB, 2.922% 5/10/49 | | 639,992 | 613,442 |
| Series 2017-GS7 Class AAB, 3.203% 8/10/50 | | 2,397,608 | 2,287,026 |
| JPMorgan Chase Commercial Mortgage Securities Trust sequential payer Series 2019-COR4 Class ASB, 3.9381% 3/10/52 | | 1,000,000 | 947,622 |
| Life Financial Services Trust floater Series 2022-BMR2 Class A1, CME Term SOFR 1 Month Index + 1.290% 5.8577% 5/15/39 (b)(c)(d) | | 445,000 | 443,330 |
| MSCCG Trust floater Series 2018-SELF Class A, 1 month U.S. LIBOR + 0.900% 5.488% 10/15/37 (b)(c)(d) | | 1,919,130 | 1,904,107 |
| SREIT Trust floater Series 2021-MFP Class A, 1 month U.S. LIBOR + 0.730% 5.3187% 11/15/38 (b)(c)(d) | | 200,000 | 195,689 |
| Wells Fargo Commercial Mortgage Trust sequential payer: | | | |
| Series 2015-C27 Class ASB, 3.278% 2/15/48 | | 291,387 | 283,887 |
| Series 2019-C50 Class ASB, 3.635% 5/15/52 | | 1,000,000 | 944,305 |
| WF-RBS Commercial Mortgage Trust sequential payer Series 2014-C20 Class ASB, 3.638% 5/15/47 | | 471,984 | 465,754 |
| TOTAL COMMERCIAL MORTGAGE SECURITIES (Cost $18,050,386) | | | 17,945,021 |
| | | | |
| Money Market Funds - 0.7% |
| | | Shares | Value ($) |
Fidelity Cash Central Fund 4.63% (f) (Cost $4,406,583) | | 4,405,702 | 4,406,583 |
| | | | |
| TOTAL INVESTMENT IN SECURITIES - 99.6% (Cost $692,025,284) | 678,820,253 |
NET OTHER ASSETS (LIABILITIES) - 0.4% | 2,534,900 |
| NET ASSETS - 100.0% | 681,355,153 |
| | |
Legend
| (a) | Amount is stated in United States dollars unless otherwise noted. |
| (b) | Security exempt from registration under Rule 144A of the Securities Act of 1933. These securities may be resold in transactions exempt from registration, normally to qualified institutional buyers. At the end of the period, the value of these securities amounted to $40,405,306 or 5.9% of net assets. |
| (c) | Coupon rates for floating and adjustable rate securities reflect the rates in effect at period end. |
| (d) | Coupon is indexed to a floating interest rate which may be multiplied by a specified factor and/or subject to caps or floors. |
| (e) | Security or a portion of the security purchased on a delayed delivery or when-issued basis. |
| (f) | Affiliated fund that is generally available only to investment companies and other accounts managed by Fidelity Investments. The rate quoted is the annualized seven-day yield of the fund at period end. A complete unaudited listing of the fund's holdings as of its most recent quarter end is available upon request. In addition, each Fidelity Central Fund's financial statements are available on the SEC's website or upon request. |
Affiliated Central Funds
Fiscal year to date information regarding the Fund's investments in Fidelity Central Funds, including the ownership percentage, is presented below.
| Affiliate | Value, beginning of period ($) | Purchases ($) | Sales Proceeds ($) | Dividend Income ($) | Realized Gain (loss) ($) | Change in Unrealized appreciation (depreciation) ($) | Value, end of period ($) | % ownership, end of period |
| Fidelity Cash Central Fund 4.63% | 4,178,473 | 503,408,801 | 503,180,691 | 103,546 | - | - | 4,406,583 | 0.0% |
| Total | 4,178,473 | 503,408,801 | 503,180,691 | 103,546 | - | - | 4,406,583 | |
| | | | | | | | | |
Amounts in the dividend income column in the above table include any capital gain distributions from underlying funds, which are presented in the corresponding line item in the Statement of Operations, if applicable.
Amounts included in the purchases and sales proceeds columns may include in-kind transactions, if applicable.
Investment Valuation
The following is a summary of the inputs used, as of February 28, 2023, involving the Fund's assets and liabilities carried at fair value. The inputs or methodology used for valuing securities may not be an indication of the risk associated with investing in those securities. For more information on valuation inputs, and their aggregation into the levels used below, please refer to the Investment Valuation section in the accompanying Notes to Financial Statements.
| Valuation Inputs at Reporting Date: |
| Description | Total ($) | Level 1 ($) | Level 2 ($) | Level 3 ($) |
Investments in Securities: | | | | |
|
| Corporate Bonds | 181,270,293 | - | 181,270,293 | - |
|
| U.S. Government and Government Agency Obligations | 443,161,149 | - | 443,161,149 | - |
|
| U.S. Government Agency - Mortgage Securities | 8,263,635 | - | 8,263,635 | - |
|
| Asset-Backed Securities | 23,269,607 | - | 23,269,607 | - |
|
| Collateralized Mortgage Obligations | 503,965 | - | 503,965 | - |
|
| Commercial Mortgage Securities | 17,945,021 | - | 17,945,021 | - |
|
| Money Market Funds | 4,406,583 | 4,406,583 | - | - |
| Total Investments in Securities: | 678,820,253 | 4,406,583 | 674,413,670 | - |
| Statement of Assets and Liabilities |
| | | | February 28, 2023 (Unaudited) |
| | | | | |
| Assets | | | | |
| Investment in securities, at value - See accompanying schedule: | | | | |
Unaffiliated issuers (cost $687,618,701) | $ | 674,413,670 | | |
Fidelity Central Funds (cost $4,406,583) | | 4,406,583 | | |
| | | | | |
| | | | | |
| Total Investment in Securities (cost $692,025,284) | | | $ | 678,820,253 |
| Receivable for investments sold | | | | 25,909,386 |
| Interest receivable | | | | 4,817,178 |
| Distributions receivable from Fidelity Central Funds | | | | 11,709 |
Total assets | | | | 709,558,526 |
| Liabilities | | | | |
| Payable for investments purchased | | | | |
Regular delivery | $ | 27,826,031 | | |
Delayed delivery | | 377,342 | | |
| Total Liabilities | | | | 28,203,373 |
| Net Assets | | | $ | 681,355,153 |
| Net Assets consist of: | | | | |
| Paid in capital | | | $ | 699,808,406 |
| Total accumulated earnings (loss) | | | | (18,453,253) |
| Net Assets | | | $ | 681,355,153 |
Net Asset Value , offering price and redemption price per share ($681,355,153 ÷ 75,464,568 shares) | | | $ | 9.03 |
| Statement of Operations |
| | | | Six months ended February 28, 2023 (Unaudited) |
| Investment Income | | | | |
| Interest | | | $ | 12,596,750 |
| Income from Fidelity Central Funds | | | | 103,546 |
| Total Income | | | | 12,700,296 |
| Expenses | | | | |
| Independent trustees' fees and expenses | $ | 1,033 | | |
| Total expenses before reductions | | 1,033 | | |
| Expense reductions | | (305) | | |
| Total expenses after reductions | | | | 728 |
| Net Investment income (loss) | | | | 12,699,568 |
| Realized and Unrealized Gain (Loss) | | | | |
| Net realized gain (loss) on: | | | | |
| Investment Securities: | | | | |
| Unaffiliated issuers | | (4,461,923) | | |
| Total net realized gain (loss) | | | | (4,461,923) |
| Change in net unrealized appreciation (depreciation) on investment securities | | | | (8,852,782) |
| Net gain (loss) | | | | (13,314,705) |
| Net increase (decrease) in net assets resulting from operations | | | $ | (615,137) |
| Statement of Changes in Net Assets |
| |
| | Six months ended February 28, 2023 (Unaudited) | | Year ended August 31, 2022 |
| Increase (Decrease) in Net Assets | | | | |
| Operations | | | | |
| Net investment income (loss) | $ | 12,699,568 | $ | 2,283,639 |
| Net realized gain (loss) | | (4,461,923) | | (775,412) |
| Change in net unrealized appreciation (depreciation) | | (8,852,782) | | (4,473,970) |
| Net increase (decrease) in net assets resulting from operations | | (615,137) | | (2,965,743) |
| Distributions to shareholders | | (12,684,877) | | (2,334,309) |
| Share transactions | | | | |
| Proceeds from sales of shares | | 477,652,500 | | 210,735,306 |
| Reinvestment of distributions | | 12,684,877 | | 2,334,309 |
| Cost of shares redeemed | | (26,440,000) | | (7,950,228) |
Net increase (decrease) in net assets resulting from share transactions | | 463,897,377 | | 205,119,387 |
| Total increase (decrease) in net assets | | 450,597,363 | | 199,819,335 |
| | | | | |
| Net Assets | | | | |
| Beginning of period | | 230,757,790 | | 30,938,455 |
| End of period | $ | 681,355,153 | $ | 230,757,790 |
| | | | | |
| Other Information | | | | |
| Shares | | | | |
| Sold | | 52,013,731 | | 22,461,551 |
| Issued in reinvestment of distributions | | 1,398,683 | | 248,508 |
| Redeemed | | (2,895,217) | | (842,446) |
| Net increase (decrease) | | 50,517,197 | | 21,867,613 |
| | | | | |
Financial Highlights
| Fidelity® Education Income Fund |
| |
| | Six months ended (Unaudited) February 28, 2023 | | Years ended August 31, 2022 | | 2021 A |
Selected Per-Share Data | | | | | | |
| Net asset value, beginning of period | $ | 9.25 | $ | 10.05 | $ | 10.00 |
| Income from Investment Operations | | | | | | |
Net investment income (loss) B,C | | .173 | | .224 | | .036 |
| Net realized and unrealized gain (loss) | | (.220) | | (.858) | | .052 |
| Total from investment operations | | (.047) | | (.634) | | .088 |
| Distributions from net investment income | | (.173) | | (.153) | | (.038) |
| Distributions from net realized gain | | - | | (.013) | | - |
| Total distributions | | (.173) | | (.166) | | (.038) |
| Net asset value, end of period | $ | 9.03 | $ | 9.25 | $ | 10.05 |
Total Return D,E | | (.50)% | | (6.34)% | | .89% |
Ratios to Average Net Assets C,F,G | | | | | | |
Expenses before reductions H | | -% I | | -% | | -% I |
Expenses net of fee waivers, if any H | | -% I | | -% | | -% I |
Expenses net of all reductions H | | -% I | | -% | | -% I |
| Net investment income (loss) | | 3.81% I | | 2.40% | | .79% I |
| Supplemental Data | | | | | | |
| Net assets, end of period (000 omitted) | $ | 681,355 | $ | 230,758 | $ | 30,938 |
Portfolio turnover rate J | | 84% I | | 80% | | 87% K,L |
A For the period March 16, 2021 (commencement of operations) through August 31, 2021.
B Calculated based on average shares outstanding during the period.
C Net investment income (loss) is affected by the timing of the declaration of dividends by any underlying mutual funds or exchange-traded funds (ETFs). Net investment income (loss) of any mutual funds or ETFs is not included in the Fund's net investment income (loss) ratio.
D Total returns for periods of less than one year are not annualized.
E Total returns would have been lower if certain expenses had not been reduced during the applicable periods shown.
F Fees and expenses of any underlying mutual funds or exchange-traded funds (ETFs) are not included in the Fund's expense ratio. The Fund indirectly bears its proportionate share of these expenses. For additional expense information related to investments in Fidelity Central Funds, please refer to the "Investments in Fidelity Central Funds" note found in the Notes to Financial Statements section of the most recent Annual or Semi-Annual report.
G Expense ratios reflect operating expenses of the class. Expenses before reductions do not reflect amounts reimbursed, waived, or reduced through arrangements with the investment adviser, brokerage services, or other offset arrangements, if applicable, and do not represent the amount paid by the class during periods when reimbursements, waivers or reductions occur.
H Amount represents less than .005%.
I Annualized.
J Amount does not include the portfolio activity of any underlying mutual funds or exchange-traded funds (ETFs).
K Amount not annualized.
L Portfolio turnover rate excludes securities received or delivered in-kind.
For the period ended February 28, 2023
1. Organization.
Fidelity Education Income Fund (the Fund) is a fund of Fidelity Garrison Street Trust (the Trust) and is authorized to issue an unlimited number of shares. The Trust is registered under the Investment Company Act of 1940, as amended (the 1940 Act), as an open-end management investment company organized as a Massachusetts business trust. Shares are offered only to Fidelity managed 529 plans.
2. Investments in Fidelity Central Funds.
Funds may invest in Fidelity Central Funds, which are open-end investment companies generally available only to other investment companies and accounts managed by the investment adviser and its affiliates. The Schedule of Investments lists any Fidelity Central Funds held as an investment as of period end, but does not include the underlying holdings of each Fidelity Central Fund. An investing fund indirectly bears its proportionate share of the expenses of the underlying Fidelity Central Funds.
Based on its investment objective, each Fidelity Central Fund may invest or participate in various investment vehicles or strategies that are similar to those of the investing fund. These strategies are consistent with the investment objectives of the investing fund and may involve certain economic risks which may cause a decline in value of each of the Fidelity Central Funds and thus a decline in the value of the investing fund.
| Fidelity Central Fund | Investment Manager | Investment Objective | Investment Practices | Expense Ratio A |
| Fidelity Money Market Central Funds | Fidelity Management & Research Company LLC (FMR) | Each fund seeks to obtain a high level of current income consistent with the preservation of capital and liquidity. | Short-term Investments | Less than .005% |
A Expenses expressed as a percentage of average net assets and are as of each underlying Central Fund's most recent annual or semi-annual shareholder report.
A complete unaudited list of holdings for each Fidelity Central Fund is available upon request or at the Securities and Exchange Commission website at www.sec.gov. In addition, the financial statements of the Fidelity Central Funds which contain the significant accounting policies (including investment valuation policies) of those funds, and are not covered by the Report of Independent Registered Public Accounting Firm, are available on the Securities and Exchange Commission website or upon request.
3. Significant Accounting Policies.
The Fund is an investment company and applies the accounting and reporting guidance of the Financial Accounting Standards Board (FASB) Accounting Standards Codification Topic 946 Financial Services - Investment Companies . The financial statements have been prepared in conformity with accounting principles generally accepted in the United States of America (GAAP), which require management to make certain estimates and assumptions at the date of the financial statements. Actual results could differ from those estimates. Subsequent events, if any, through the date that the financial statements were issued have been evaluated in the preparation of the financial statements. The Fund's Schedule of Investments lists any underlying mutual funds or exchange-traded funds (ETFs) but does not include the underlying holdings of these funds. The following summarizes the significant accounting policies of the Fund:
Investment Valuation. Investments are valued as of 4:00 p.m. Eastern time on the last calendar day of the period. The Board of Trustees (the Board) has designated the Fund's investment adviser as the valuation designee responsible for the fair valuation function and performing fair value determinations as needed. The investment adviser has established a Fair Value Committee (the Committee) to carry out the day-to-day fair valuation responsibilities and has adopted policies and procedures to govern the fair valuation process and the activities of the Committee. In accordance with these fair valuation policies and procedures, which have been approved by the Board, the Fund attempts to obtain prices from one or more third party pricing services or brokers to value its investments. When current market prices, quotations or currency exchange rates are not readily available or reliable, investments will be fair valued in good faith by the Committee, in accordance with the policies and procedures. Factors used in determining fair value vary by investment type and may include market or investment specific events, transaction data, estimated cash flows, and market observations of comparable investments. The frequency that the fair valuation procedures are used cannot be predicted and they may be utilized to a significant extent. The Committee manages the Fund's fair valuation practices and maintains the fair valuation policies and procedures. The Fund's investment adviser reports to the Board information regarding the fair valuation process and related material matters.
The Fund categorizes the inputs to valuation techniques used to value its investments into a disclosure hierarchy consisting of three levels as shown below:
Level 1 - unadjusted quoted prices in active markets for identical investments
Level 2 - other significant observable inputs (including quoted prices for similar investments, interest rates, prepayment speeds, etc.)
Level 3 - unobservable inputs (including the Fund's own assumptions based on the best information available)
Valuation techniques used to value the Fund's investments by major category are as follows:
Debt securities, including restricted securities, are valued based on evaluated prices received from third party pricing services or from brokers who make markets in such securities. Corporate bonds and U.S. government and government agency obligations are valued by pricing services who utilize matrix pricing which considers yield or price of bonds of comparable quality, coupon, maturity and type or by broker-supplied prices. Asset backed securities, collateralized mortgage obligations, commercial mortgage securities and U.S. government agency mortgage securities are valued by pricing services who utilize matrix pricing which considers prepayment speed assumptions, attributes of the collateral, yield or price of bonds of comparable quality, coupon, maturity and type or by broker-supplied prices. When independent prices are unavailable or unreliable, debt securities may be valued utilizing pricing methodologies which consider similar factors that would be used by third party pricing services. Debt securities are generally categorized as Level 2 in the hierarchy but may be Level 3 depending on the circumstances.
Investments in open-end mutual funds, including the Fidelity Central Funds, are valued at their closing net asset value (NAV) each business day and are categorized as Level 1 in the hierarchy.
Changes in valuation techniques may result in transfers in or out of an assigned level within the disclosure hierarchy. The aggregate value of investments by input level as of February 28, 2023 is included at the end of the Fund's Schedule of Investments.
Investment Transactions and Income. For financial reporting purposes, the Fund's investment holdings and NAV include trades executed through the end of the last business day of the period. The NAV per share for processing shareholder transactions is calculated as of the close of business of the New York Stock Exchange (NYSE), normally 4:00 p.m. Eastern time and includes trades executed through the end of the prior business day. Gains and losses on securities sold are determined on the basis of identified cost. Income and capital gain distributions from Fidelity Central Funds, if any, are recorded on the ex-dividend date. Interest income is accrued as earned and includes coupon interest and amortization of premium and accretion of discount on debt securities as applicable. Debt obligations may be placed on non-accrual status and related interest income may be reduced by ceasing current accruals and writing off interest receivables when the collection of all or a portion of interest has become doubtful based on consistently applied procedures. A debt obligation is removed from non-accrual status when the issuer resumes interest payments or when collectability of interest is reasonably assured.
Expenses. Expenses directly attributable to a fund are charged to that fund. Expenses attributable to more than one fund are allocated among the respective funds on the basis of relative net assets or other appropriate methods. Expenses included in the accompanying financial statements reflect the expenses of that fund and do not include any expenses associated with any underlying mutual funds or exchange-traded funds. Although not included in a fund's expenses, a fund indirectly bears its proportionate share of these expenses through the net asset value of each underlying mutual fund or exchange-traded fund. Expense estimates are accrued in the period to which they relate and adjustments are made when actual amounts are known.
Income Tax Information and Distributions to Shareholders. Each year, the Fund intends to qualify as a regulated investment company under Subchapter M of the Internal Revenue Code, including distributing substantially all of its taxable income and realized gains. As a result, no provision for U.S. Federal income taxes is required. The Fund files a U.S. federal tax return, in addition to state and local tax returns as required. The Fund's federal income tax returns are subject to examination by the Internal Revenue Service (IRS) for a period of three fiscal years after they are filed. State and local tax returns may be subject to examination for an additional fiscal year depending on the jurisdiction.
Distributions are declared and recorded daily and paid monthly from net investment income. Distributions from realized gains, if any, are declared and recorded on the ex-dividend date. Income and capital gain distributions are determined in accordance with income tax regulations, which may differ from GAAP.
Capital accounts within the financial statements are adjusted for permanent book-tax differences. These adjustments have no impact on net assets or the results of operations. Capital accounts are not adjusted for temporary book-tax differences which will reverse in a subsequent period.
Book-tax differences are primarily due to capital loss carryforwards and losses deferred due to wash sales.
As of period end, the cost and unrealized appreciation (depreciation) in securities, and derivatives if applicable, for federal income tax purposes were as follows:
| Gross unrealized appreciation | $235,104 |
| Gross unrealized depreciation | (13,442,862) |
| Net unrealized appreciation (depreciation) | $(13,207,758) |
| Tax cost | $692,028,011 |
Capital loss carryforwards are only available to offset future capital gains of the Fund to the extent provided by regulations and may be limited. The capital loss carryforward information presented below, including any applicable limitation, is estimated as of prior fiscal period end and is subject to adjustment.
Short-term | $(534,954) |
Long-term | (138,004) |
| Total capital loss carryforward | $(672,958) |
Delayed Delivery Transactions and When-Issued Securities. During the period, certain Funds transacted in securities on a delayed delivery or when-issued basis. Payment and delivery may take place after the customary settlement period for that security. The price of the underlying securities and the date when the securities will be delivered and paid for are fixed at the time the transaction is negotiated. Securities purchased on a delayed delivery or when-issued basis are identified as such in the Schedule of Investments. Compensation for interest forgone in the purchase of a delayed delivery or when-issued debt security may be received. With respect to purchase commitments, each applicable Fund identifies securities as segregated in its records with a value at least equal to the amount of the commitment. Payables and receivables associated with the purchases and sales of delayed delivery securities having the same coupon, settlement date and broker are offset. Delayed delivery or when-issued securities that have been purchased from and sold to different brokers are reflected as both payables and receivables in the Statement of Assets and Liabilities under the caption "Delayed delivery", as applicable. Losses may arise due to changes in the value of the underlying securities or if the counterparty does not perform under the contract's terms, or if the issuer does not issue the securities due to political, economic, or other factors.
Restricted Securities (including Private Placements). Funds may invest in securities that are subject to legal or contractual restrictions on resale. These securities generally may be resold in transactions exempt from registration or to the public if the securities are registered. Disposal of these securities may involve time-consuming negotiations and expense, and prompt sale at an acceptable price may be difficult. Information regarding restricted securities held at period end is included at the end of the Schedule of Investments, if applicable.
4. Purchases and Sales of Investments.
Purchases and sales of securities, other than short-term securities, U.S. government securities and in-kind transactions, as applicable, are noted in the table below.
| | Purchases ($) | Sales ($) |
| Fidelity Education Income Fund | 144,623,996 | 3,618,399 |
5. Fees and Other Transactions with Affiliates.
Management Fee. Fidelity Management & Research Company LLC (the investment adviser) and its affiliates provide the Fund with investment management related services and the Fund does not pay any fees for these services. Under the management contract, the investment adviser or an affiliate pays all other expenses of the Fund, excluding fees and expenses of the independent Trustees, and certain miscellaneous expenses such as proxy and shareholder meeting expenses.
Interfund Trades. Funds may purchase from or sell securities to other Fidelity Funds under procedures adopted by the Board. The procedures have been designed to ensure these interfund trades are executed in accordance with Rule 17a-7 of the 1940 Act. Any interfund trades are included within the respective purchases and sales amounts shown in the Purchases and Sales of Investments note. During the period, there were no interfund trades.
6. Committed Line of Credit.
Certain Funds participate with other funds managed by the investment adviser or an affiliate in a $4.25 billion credit facility (the "line of credit") to be utilized for temporary or emergency purposes to fund shareholder redemptions or for other short-term liquidity purposes. The commitment fees on the pro-rata portion of the line of credit are borne by the investment adviser. During the period, there were no borrowings on this line of credit.
7. Expense Reductions.
Through arrangements with the Fund's custodian, credits realized as a result of certain uninvested cash balances were used to reduce the Fund's expenses by $305.
8. Other.
A fund's organizational documents provide former and current trustees and officers with a limited indemnification against liabilities arising in connection with the performance of their duties to the fund. In the normal course of business, a fund may also enter into contracts that provide general indemnifications. A fund's maximum exposure under these arrangements is unknown as this would be dependent on future claims that may be made against a fund. The risk of material loss from such claims is considered remote.
At the end of the period, accounts managed by the investment adviser or its affiliates were the owners of record of all of the outstanding shares of the Fund.
9. Risk and Uncertainties.
Many factors affect a fund's performance. Developments that disrupt global economies and financial markets, such as pandemics, epidemics, outbreaks of infectious diseases, war, terrorism, and environmental disasters, may significantly affect a fund's investment performance. The effects of these developments to a fund will be impacted by the types of securities in which a fund invests, the financial condition, industry, economic sector, and geographic location of an issuer, and a fund's level of investment in the securities of that issuer. Significant concentrations in security types, issuers, industries, sectors, and geographic locations may magnify the factors that affect a fund's performance.
As a shareholder, you incur two types of costs: (1) transaction costs, which may include sales charges (loads) on purchase payments or redemption proceeds, as applicable and (2) ongoing costs, which generally include management fees, distribution and/or service (12b-1) fees and other Fund expenses. This Example is intended to help you understand your ongoing costs (in dollars) of investing in a fund and to compare these costs with the ongoing costs of investing in other mutual funds.
| The Example is based on an investment of $1,000 invested at the beginning of the period and held for the entire period (September 1, 2022 to February 28, 2023). |
Actual Expenses
The first line of the accompanying table provides information about actual account values and actual expenses. You may use the information in this line, together with the amount you invested, to estimate the expenses that you paid over the period. Simply divide your account value by $1,000.00 (for example, an $8,600 account value divided by $1,000.00 = 8.6), then multiply the result by the number in the first line for a class/Fund under the heading entitled "Expenses Paid During Period" to estimate the expenses you paid on your account during this period. If any fund is a shareholder of any underlying mutual funds or exchange-traded funds (ETFs) (the Underlying Funds), such fund indirectly bears its proportional share of the expenses of the Underlying Funds in addition to the direct expenses incurred presented in the table. These fees and expenses are not included in the annualized expense ratio used to calculate the expense estimate in the table below.
Hypothetical Example for Comparison Purposes
The second line of the accompanying table provides information about hypothetical account values and hypothetical expenses based on the actual expense ratio and an assumed rate of return of 5% per year before expenses, which is not the actual return. The hypothetical account values and expenses may not be used to estimate the actual ending account balance or expenses you paid for the period. You may use this information to compare the ongoing costs of investing in the Fund and other funds. To do so, compare this 5% hypothetical example with the 5% hypothetical examples that appear in the shareholder reports of the other funds. If any fund is a shareholder of any Underlying Funds, such fund indirectly bears its proportional share of the expenses of the Underlying Funds in addition to the direct expenses as presented in the table. These fees and expenses are not included in the annualized expense ratio used to calculate the expense estimate in the table below.
Please note that the expenses shown in the table are meant to highlight your ongoing costs only and do not reflect any transaction costs. Therefore, the second line of the table is useful in comparing ongoing costs only, and will not help you determine the relative total costs of owning different funds. In addition, if these transactional costs were included, your costs would have been higher.
| | | | | Annualized Expense Ratio- A | | Beginning Account Value September 1, 2022 | | Ending Account Value February 28, 2023 | | Expenses Paid During Period- C September 1, 2022 to February 28, 2023 |
| | | | | | | | | | |
| Fidelity® Education Income Fund | | | | -%- D | | | | | | |
| Actual | | | | | | $ 1,000 | | $ 995.00 | | $- E |
Hypothetical- B | | | | | | $ 1,000 | | $ 1,024.79 | | $- E |
| |
A Annualized expense ratio reflects expenses net of applicable fee waivers.
B 5% return per year before expenses
C Expenses are equal to the annualized expense ratio, multiplied by the average account value over the period, multiplied by 181/ 365 (to reflect the one-half year period). The fees and expenses of any Underlying Funds are not included in each annualized expense ratio.
D Amount represents less than .005%.
E Amount represents less than $.005.
Board Approval of Investment Advisory Contracts and Management Fees
Fidelity Education Income Fund
Each year, the Board of Trustees, including the Independent Trustees (together, the Board), votes on the renewal of the management contract with Fidelity Management & Research Company LLC (FMR) and the sub-advisory agreements (together, the Advisory Contracts) for the fund. FMR and the sub-advisers are referred to herein as the Investment Advisers. The Board, assisted by the advice of fund counsel and Independent Trustees' counsel, requests and considers a broad range of information relevant to the renewal of the Advisory Contracts throughout the year.
The Board meets regularly and, at each of its meetings, covers an extensive agenda of topics and materials and considers factors that are relevant to its annual consideration of the renewal of the fund's Advisory Contracts, including the services and support provided to the fund and its shareholders. The Board has established four standing committees (Committees) - Operations, Audit, Fair Valuation, and Governance and Nominating - each composed of and chaired by Independent Trustees with varying backgrounds, to which the Board has assigned specific subject matter responsibilities in order to enhance effective decision-making by the Board. The Operations Committee, of which all the Independent Trustees are members, meets regularly throughout the year and requests, receives and considers, among other matters, information related to the annual consideration of the renewal of the fund's Advisory Contracts before making its recommendation to the Board. The Board also meets as needed to review matters specifically related to the Board's annual consideration of the renewal of the Advisory Contracts. Members of the Board may also meet from time to time with trustees of other Fidelity funds through joint ad hoc committees to discuss certain matters relevant to all of the Fidelity funds.
At its September 2022 meeting, the Board unanimously determined to renew the fund's Advisory Contracts. In considering whether to renew the Advisory Contracts for the fund, the Board considered all factors it believed relevant and reached a determination, with the assistance of fund counsel and Independent Trustees' counsel and through the exercise of its business judgment, that the renewal of the Advisory Contracts was in the best interests of the fund and its shareholders and the fact that no fee is payable under the management contract was fair and reasonable.
Nature, Extent, and Quality of Services Provided . The Board considered Fidelity's staffing as it relates to the fund, including the backgrounds of investment personnel of Fidelity, and also considered the fund's investment objective, strategies, and related investment philosophy. The Independent Trustees also had discussions with senior management of Fidelity's investment operations and investment groups. The Board considered the structure of the investment personnel compensation program and whether this structure provides appropriate incentives to act in the best interests of the fund. The Board also considered the steps Fidelity had taken to ensure the continued provision of high quality services to the Fidelity funds throughout the COVID-19 pandemic, including the expansion of staff in client facing positions to maintain service levels in periods of high volumes and volatility.
Resources Dedicated to Investment Management and Support Services. The Board reviewed the general qualifications and capabilities of Fidelity's investment staff, including its size, education, experience, and resources, as well as Fidelity's approach to recruiting, training, managing, and compensating investment personnel. The Board noted the resources devoted to Fidelity's global investment organization, and that Fidelity's analysts have extensive resources, tools, and capabilities that allow them to conduct quantitative and fundamental analysis, as well as credit analysis of issuers, counterparties, and guarantors. Further, the Board considered that Fidelity's investment professionals have sufficient access to global information and data so as to provide competitive investment results over time, and that those professionals also have access to sophisticated tools that permit them to assess portfolio construction and risk and performance attribution characteristics continuously, as well as to transmit new information and research conclusions rapidly around the world. Additionally, in its deliberations, the Board considered Fidelity's trading, risk management, compliance, cybersecurity, and technology and operations capabilities and resources, which are integral parts of the investment management process.
Administrative Services. The Board considered (i) the nature, extent, quality, and cost of advisory and administrative services performed by the Investment Advisers and their affiliates under the Advisory Contracts and under separate agreements covering transfer agency, pricing and bookkeeping, and securities lending services for the fund; (ii) the nature and extent of the supervision of third party service providers, principally custodians, subcustodians, and pricing vendors; and (iii) the resources devoted to, and the record of compliance with, the fund's compliance policies and procedures.
Investment Performance. The Board considered whether the fund has operated in accordance with its investment objective, as well as its record of compliance with its investment restrictions. The Board reviewed the fund's absolute investment performance, as well as the fund's relative investment performance. In this regard, the Board noted that the fund is designed to offer an investment option for 529 plans managed by Fidelity and ultimately to enhance the performance of those 529 plans.
Based on its review, the Board concluded that the nature, extent, and quality of services provided to the fund under the Advisory Contracts should continue to benefit the shareholders of the fund.
Competitiveness of Management Fee and Total Expense Ratio. The Board considered that the fund does not pay FMR a management fee for investment advisory services, but that FMR receives fees for providing services to 529 plans that invest in the fund. The Board also noted that FMR or an affiliate undertakes to pay all operating expenses of the fund, except Independent Trustee fees and expenses, custodian fees and expenses, proxy and shareholder meeting expenses, interest, taxes, and extraordinary expenses (such as litigation expenses). The Board further noted that the fund pays its non-operating expenses, including brokerage commissions and fees and expenses associated with the fund's securities lending program, if applicable.
Based on its review, the Board considered that the fund does not pay a management fee and concluded that the fund's total expense ratio was reasonable in light of the services that the fund and its shareholders receive and the other factors considered.
Costs of the Services and Profitability. The Board considered the level of Fidelity's profits in respect of all the Fidelity funds.
A public accounting firm has been engaged annually by the Board as part of the Board's assessment of Fidelity's profitability analysis. The engagement includes the review and assessment of the methodologies used by Fidelity in determining the revenues and expenses attributable to Fidelity's mutual fund business, and completion of agreed-upon procedures in respect of the mathematical accuracy of certain fund profitability information and its conformity to established allocation methodologies. After considering the reports issued under the engagement and information provided by Fidelity, the Board concluded that while other allocation methods may also be reasonable, Fidelity's profitability methodologies are reasonable in all material respects.
The Board also reviewed Fidelity's non-fund businesses and potential indirect benefits such businesses may have received as a result of their association with Fidelity's mutual fund business (i.e., fall-out benefits) as well as cases where Fidelity's affiliates may benefit from the funds' business. The Board considered areas where potential indirect benefits to the Fidelity funds from their relationships with Fidelity may exist. The Board's consideration of these matters was informed by the findings of a joint ad hoc committee created by it and the boards of other Fidelity funds to evaluate potential fall-out benefits.
The Board concluded that the costs of the services provided by and the profits realized by Fidelity in connection with the operation of the fund were not relevant to the renewal of the Advisory Contracts because the fund pays no advisory fees and FMR or an affiliate bears all expenses of the fund, with limited exceptions.
Economies of Scale. The Board concluded that because the fund pays no advisory fees and FMR or an affiliate bears all expenses of the fund with certain limited exceptions, the realization of economies of scale was not a material factor in the Board's decision to renew the fund's Advisory Contracts.
Additional Information Requested by the Board. In order to develop fully the factual basis for consideration of the Fidelity funds' advisory contracts, the Board requested and received additional information on certain topics, including: (i) Fidelity's fund profitability methodology, profitability trends for certain funds, the allocation of various costs to different funds, and the impact of certain factors on fund profitability results; (ii) portfolio manager changes that have occurred during the past year and the amount of the investment that each portfolio manager has made in the Fidelity fund(s) that he or she manages; (iii) the extent to which current market conditions have affected retention and recruitment of personnel; (iv) the arrangements with and compensation paid to certain fund sub-advisers on behalf of the Fidelity funds and the treatment of such compensation within Fidelity's fund profitability methodology; (v) the terms of the funds' various management fee structures, including the basic group fee and the terms of Fidelity's voluntary expense limitation arrangements; (vi) Fidelity's transfer agent, pricing and bookkeeping fees, expense and service structures for different funds and classes relative to competitive trends; (vii) the impact on fund profitability of recent industry trends, such as the growth in passively managed funds and the changes in flows for different types of funds; (viii) the types of management fee and total expense comparisons provided, and the challenges and limitations associated with such information; and (ix) explanations regarding the relative total expense ratios and management fees of certain funds and classes, total expense and management fee competitive trends, and methodologies for total expense and management fee competitive comparisons. In addition, the Board considered its discussions with Fidelity regarding Fidelity's efforts to maintain the continuous investment and shareholder services necessary for the funds during the current pandemic and economic circumstances.
Based on its evaluation of all of the conclusions noted above, and after considering all factors it believed relevant, the Board concluded that the advisory fee arrangements are fair and reasonable and that the fund's Advisory Contracts should be renewed.
The Securities and Exchange Commission adopted Rule 22e-4 under the Investment Company Act of 1940 (the Liquidity Rule) to promote effective liquidity risk management throughout the open-end investment company industry, thereby reducing the risk that funds will be unable to meet their redemption obligations and mitigating dilution of the interests of fund shareholders.
The Fund has adopted and implemented a liquidity risk management program (the Program) reasonably designed to assess and manage the Fund's liquidity risk and to comply with the requirements of the Liquidity Rule. The Fund's Board of Trustees (the Board) has designated the Fund's investment adviser as administrator of the Program. The Fidelity advisers have established a Liquidity Risk Management Committee (the LRM Committee) to manage the Program for each of the Fidelity Funds. The LRM Committee monitors the adequacy and effectiveness of implementation of the Program and on a periodic basis assesses each Fund's liquidity risk based on a variety of factors including (1) the Fund's investment strategy, (2) portfolio liquidity and cash flow projections during normal and reasonably foreseeable stressed conditions, (3) shareholder redemptions, (4) borrowings and other funding sources and (5) certain factors specific to ETFs including the effect of the Fund's prices and spreads, market participants, and basket compositions on the overall liquidity of the Fund's portfolio, as applicable.
In accordance with the Program, each of the Fund's portfolio investments is classified into one of four defined liquidity categories based on a determination of a reasonable expectation for how long it would take to convert the investment to cash (or sell or dispose of the investment) without significantly changing its market value.
- Highly liquid investments - cash or convertible to cash within three business days or less
- Moderately liquid investments - convertible to cash in three to seven calendar days
- Less liquid investments - can be sold or disposed of, but not settled, within seven calendar days
- Illiquid investments - cannot be sold or disposed of within seven calendar days
Liquidity classification determinations take into account a variety of factors including various market, trading and investment-specific considerations, as well as market depth, and generally utilize analysis from a third-party liquidity metrics service.
The Liquidity Rule places a 15% limit on a fund's illiquid investments and requires funds that do not primarily hold assets that are highly liquid investments to determine and maintain a minimum percentage of the fund's net assets to be invested in highly liquid investments (highly liquid investment minimum or HLIM). The Program includes provisions reasonably designed to comply with the 15% limit on illiquid investments and for determining, periodically reviewing and complying with the HLIM requirement as applicable.
At a recent meeting of the Fund's Board of Trustees, the LRM Committee provided a written report to the Board pertaining to the operation, adequacy, and effectiveness of the Program for the period December 1, 2021 through November 30, 2022. The report concluded that the Program is operating effectively and is reasonably designed to assess and manage the Fund's liquidity risk.
1.9901558.101
EDI-SANN-0423
Item 2.
Code of Ethics
Not applicable.
Item 3.
Audit Committee Financial Expert
Not applicable.
Item 4.
Principal Accountant Fees and Services
Not applicable.
Item 5.
Audit Committee of Listed Registrants
Not applicable.
Item 6.
Investments
(a)
Not applicable.
(b)
Not applicable
Item 7.
Disclosure of Proxy Voting Policies and Procedures for Closed-End Management Investment Companies
Not applicable.
Item 8.
Portfolio Managers of Closed-End Management Investment Companies
Not applicable.
Item 9.
Purchase of Equity Securities by Closed-End Management Investment Company and Affiliated Purchasers
Not applicable.
Item 10.
Submission of Matters to a Vote of Security Holders
There were no material changes to the procedures by which shareholders may recommend nominees to the Fidelity Garrison Street Trust’s Board of Trustees.
Item 11.
Controls and Procedures
(a)(i) The President and Treasurer and the Chief Financial Officer have concluded that the Fidelity Garrison Street Trust’s (the “Trust”) disclosure controls and procedures (as defined in Rule 30a-3(c) under the Investment Company Act) provide reasonable assurances that material information relating to the Trust is made known to them by the appropriate persons, based on their evaluation of these controls and procedures as of a date within 90 days of the filing date of this report.
(a)(ii) There was no change in the Trust’s internal control over financial reporting (as defined in Rule 30a-3(d) under the Investment Company Act) that occurred during the period covered by this report that has materially affected, or is reasonably likely to materially affect, the Trust’s internal control over financial reporting.
Item 12.
Disclosure of Securities Lending Activities for Closed-End Management
Investment Companies
Not applicable.
Item 13.
Exhibits
SIGNATURES
Pursuant to the requirements of the Securities Exchange Act of 1934 and the Investment Company Act of 1940, the registrant has duly caused this report to be signed on its behalf by the undersigned, thereunto duly authorized.
Fidelity Garrison Street Trust
| |
By: | /s/Laura M. Del Prato |
| Laura M. Del Prato |
| President and Treasurer |
|
|
Date: | April 20, 2023 |
Pursuant to the requirements of the Securities Exchange Act of 1934 and the Investment Company Act of 1940, this report has been signed below by the following persons on behalf of the registrant and in the capacities and on the dates indicated.
| |
By: | /s/Laura M. Del Prato |
| Laura M. Del Prato |
| President and Treasurer |
|
|
Date: | April 20, 2023 |
| |
By: | /s/John J. Burke III |
| John J. Burke III |
| Chief Financial Officer |
|
|
Date: | April 20, 2023 |