UNITED STATES
SECURITIES AND EXCHANGE COMMISSION
Washington, D.C. 20549
FORM N-CSR
CERTIFIED SHAREHOLDER REPORT OF REGISTERED
MANAGEMENT INVESTMENT COMPANIES
Investment Company Act file number 811-04861
Fidelity Garrison Street Trust
(Exact name of registrant as specified in charter)
245 Summer St., Boston, MA 02210
(Address of principal executive offices) (Zip code)
Margaret Carey, Secretary
245 Summer St.
Boston, Massachusetts 02210
(Name and address of agent for service)
Registrant's telephone number, including area code:
617-563-7000
| |
Date of fiscal year end: | September 30 |
|
|
Date of reporting period: | March 31, 2023 |
Item 1.
Reports to Stockholders
Fidelity® Money Market Central Fund
Semi-Annual Report
March 31, 2023
Contents
To view a fund's proxy voting guidelines and proxy voting record for the 12-month period ended June 30, visit http://www.fidelity.com/proxyvotingresults or visit the Securities and Exchange Commission's (SEC) web site at http://www.sec.gov.
You may also call 1-800-544-8544 to request a free copy of the proxy voting guidelines.
Standard & Poor's, S&P and S&P 500 are registered service marks of The McGraw-Hill Companies, Inc. and have been licensed for use by Fidelity Distributors Corporation.
Other third-party marks appearing herein are the property of their respective owners.
All other marks appearing herein are registered or unregistered trademarks or service marks of FMR LLC or an affiliated company. © 2023 FMR LLC. All rights reserved.
A fund files its complete schedule of portfolio holdings with the SEC for the first and third quarters of each fiscal year on Form N-PORT. Forms N-PORT are available on the SEC's web site at http://www.sec.gov. A fund's Forms N-PORT may be reviewed and copied at the SEC's Public Reference Room in Washington, DC. Information regarding the operation of the SEC's Public Reference Room may be obtained by calling 1-800-SEC-0330.
| Effective Maturity Diversification (% of Fund's Investments) |
| Days |
| 1 - 7 | 73.0 | |
| 8 - 30 | 2.4 | |
| 31 - 60 | 13.0 | |
| 61 - 90 | 8.6 | |
| 91 - 180 | 3.0 | |
| Effective maturity is determined in accordance with the requirements of Rule 2a-7 under the Investment Company Act of 1940. |
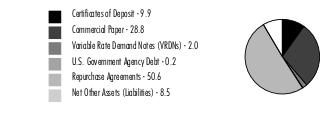
Asset Allocation (% of Fund's net assets) |
|
|
Showing Percentage of Net Assets
| Certificate of Deposit - 9.9% |
| | | Yield (%)(a) | Principal Amount (b) | Value ($) |
| Domestic Certificates Of Deposit - 0.6% | | | | |
| Bank of America NA | | | | |
| 7/11/23 to 8/31/23 (c) | | 5.12 to 5.14 | 8,000,000 | 7,996,622 |
| | | | | |
| New York Branch, Yankee Dollar, Foreign Banks - 9.3% | | | | |
| Bank of Montreal | | | | |
| 4/4/23 (c)(d) | | 5.24 | 2,000,000 | 2,000,078 |
| Canadian Imperial Bank of Commerce | | | | |
| 4/4/23 (c)(d) | | 5.23 | 12,000,000 | 12,000,474 |
| Credit Agricole CIB | | | | |
| 5/2/23 to 6/15/23 | | 4.82 to 5.02 | 27,000,000 | 26,995,319 |
| Mitsubishi UFJ Trust & Banking Corp. | | | | |
| 5/4/23 to 5/5/23 | | 4.82 to 4.82 | 14,000,000 | 13,999,257 |
| Mizuho Corporate Bank Ltd. | | | | |
| 5/5/23 to 5/12/23 | | 4.81 to 4.85 | 30,000,000 | 29,993,252 |
| MUFG Bank Ltd. | | | | |
| 4/19/23 to 4/21/23 (c)(d) | | 5.17 to 5.19 | 17,000,000 | 17,002,596 |
| Sumitomo Mitsui Trust Bank Ltd. | | | | |
| 5/8/23 to 6/15/23 | | 4.82 to 5.00 | 17,000,000 | 16,996,643 |
TOTAL NEW YORK BRANCH, YANKEE DOLLAR, FOREIGN BANKS | | | | 118,987,619 |
| TOTAL CERTIFICATE OF DEPOSIT (Cost $127,000,000) | | | | 126,984,241 |
| | | | | |
| Financial Company Commercial Paper - 21.8% |
| | | Yield (%)(a) | Principal Amount (b) | Value ($) |
| Australia & New Zealand Banking Group Ltd. | | | | |
| 4/5/23 to 4/12/23 (c)(d) | | 5.19 to 5.22 | 20,000,000 | 20,005,855 |
| Bank of Montreal | | | | |
| 5/2/23 to 9/5/23 (c) | | 5.17 to 5.52 | 26,000,000 | 25,831,804 |
| Bank of Nova Scotia | | | | |
| 5/1/23 to 7/17/23 (c) | | 5.13 to 5.52 | 26,000,000 | 25,939,129 |
| Barclays Bank PLC/Barclays U.S. CCP Funding LLC | | | | |
| 5/5/23 to 6/1/23 (e) | | 4.84 to 5.02 | 6,000,000 | 5,962,075 |
| BofA Securities, Inc. | | | | |
| 4/17/23 to 8/7/23 (c)(d) | | 5.20 to 5.52 | 21,000,000 | 21,002,924 |
| Commonwealth Bank of Australia | | | | |
| 4/27/23 (c)(d) | | 5.22 | 9,000,000 | 9,002,046 |
| DNB Bank ASA | | | | |
| 4/10/23 (c)(d) | | 5.19 | 7,000,000 | 7,000,573 |
| Federation des caisses Desjardin | | | | |
| 4/11/23 to 7/19/23 (c) | | 4.80 to 5.20 | 22,000,000 | 21,932,017 |
| J.P. Morgan Securities, LLC | | | | |
| 5/10/23 to 5/24/23 (c)(d) | | 5.41 to 5.41 | 9,000,000 | 9,000,913 |
| Lloyds Bank PLC | | | | |
| 5/11/23 to 5/12/23 | | 4.90 to 4.92 | 18,000,000 | 17,896,885 |
| Mitsubishi UFJ Trust & Banking Corp. | | | | |
| 4/13/23 | | 4.82 | 2,000,000 | 1,996,532 |
| Mizuho Bank Ltd. Singapore Branch | | | | |
| 4/6/23 to 6/9/23 | | 4.80 to 5.04 | 15,000,000 | 14,921,240 |
| National Australia Bank Ltd. | | | | |
| 4/13/23 to 4/28/23 (c)(d) | | 5.19 to 5.22 | 28,000,000 | 28,001,448 |
| National Bank of Canada | | | | |
| 5/25/23 | | 5.26 | 10,000,000 | 9,925,933 |
| Royal Bank of Canada | | | | |
| 4/3/23 (c)(d) | | 5.23 | 9,000,000 | 9,005,543 |
| Sumitomo Mitsui Trust Bank Ltd. | | | | |
| 4/11/23 to 5/24/23 | | 4.81 to 4.92 | 11,000,000 | 10,937,027 |
| Svenska Handelsbanken AB | | | | |
| 4/13/23 to 9/5/23 (c) | | 5.08 to 5.32 | 21,000,000 | 20,843,308 |
| Svenska Handelsbanken, Inc. | | | | |
| 7/24/23 (c)(d) | | 5.23 | 4,000,000 | 4,000,200 |
| The Toronto-Dominion Bank | | | | |
| 7/24/23 to 9/5/23 | | 5.18 to 5.34 | 11,000,000 | 10,798,901 |
| Toyota Motor Credit Corp. | | | | |
| 8/30/23 | | 5.33 | 1,000,000 | 978,399 |
| UBS AG London Branch | | | | |
| 5/23/23 | | 5.45 | 3,000,000 | 2,978,456 |
| TOTAL FINANCIAL COMPANY COMMERCIAL PAPER (Cost $277,951,467) | | | | 277,961,208 |
| | | | | |
| Asset Backed Commercial Paper - 7.0% |
| | | Yield (%)(a) | Principal Amount (b) | Value ($) |
| Atlantic Asset Securitization LLC (Liquidity Facility Credit Agricole CIB) | | | | |
| | | | | |
| 6/15/23 | | 5.03 | 18,000,000 | 17,791,951 |
| 6/22/23 | | 5.02 | 18,000,000 | 17,771,459 |
| Gotham Funding Corp. (Liquidity Facility Bank of Tokyo-Mitsubishi UFJ Ltd.) | | | | |
| | | | | |
| 4/11/23 | | 4.81 | 4,000,000 | 3,994,089 |
| 5/1/23 | | 4.83 | 4,000,000 | 3,982,936 |
| Liberty Street Funding LLC (Liquidity Facility Bank of Nova Scotia) | | | | |
| 5/18/23 | | 4.93 | 19,000,000 | 18,872,827 |
| Sheffield Receivables Corp. (Liquidity Facility Barclays Bank PLC) | | | | |
| 6/1/23 | | 4.97 | 27,000,000 | 26,760,850 |
| TOTAL ASSET BACKED COMMERCIAL PAPER (Cost $89,245,343) | | | | 89,174,112 |
| | | | | |
| Variable Rate Demand Note - 2.0% |
| | | Yield (%)(a) | Principal Amount (b) | Value ($) |
| Florida - 2.0% | | | | |
| Florida Timber Fin. III LLC Taxable Series 2008, LOC Wells Fargo Bank NA, VRDN | | | | |
| 4/7/23 (c) | | 4.84 | 25,155,000 | 25,155,000 |
| | | | | |
| TOTAL VARIABLE RATE DEMAND NOTE (Cost $25,155,000) | | | | 25,155,000 |
| | | | | |
| U.S. Government Agency Debt - 0.2% |
| | | Yield (%)(a) | Principal Amount (b) | Value ($) |
| Federal Agencies - 0.2% | | | | |
| Federal Home Loan Bank | | | | |
| 9/19/23 | | 5.11 | 2,000,000 | 1,956,208 |
| | | | | |
| TOTAL U.S. GOVERNMENT AGENCY DEBT (Cost $1,952,690) | | | | 1,956,208 |
| | | | | |
| U.S. Government Agency Repurchase Agreement - 44.5% |
| | | Maturity Amount ($) | Value ($) |
| In a joint trading account at 4.8% dated 3/31/23 due 4/3/23 (Collateralized by U.S. Government Obligations) # | | 487,239,881 | 487,045,000 |
| With: | | | |
| ABN AMRO Bank NV at 4.81%, dated 3/31/23 due 4/3/23 (Collateralized by U.S. Government Obligations valued at $2,041,229, 5.00% - 6.00%, 8/20/52 - 2/1/53) | | 2,000,802 | 2,000,000 |
| BMO Harris Bank NA at 4.81%, dated 3/23/23 due 4/7/23 | | | |
(Collateralized by U.S. Government Obligations valued at $1,021,499, 3.00%, 1/20/48) | | 1,002,672 | 1,000,000 |
(Collateralized by U.S. Government Obligations valued at $1,021,499, 3.00%, 1/20/48) | | 1,004,276 | 1,000,000 |
(Collateralized by U.S. Government Obligations valued at $2,042,999, 3.00%, 1/20/48) | | 2,011,223 | 2,000,000 |
| BNP Paribas, SA at 4.81%, dated: | | | |
3/27/23 due 4/7/23 (Collateralized by U.S. Treasury Obligations valued at $1,030,896, 0.13% - 5.50%, 11/30/23 - 3/1/53) | | 1,001,871 | 999,985 |
3/30/23 due 4/6/23 (Collateralized by U.S. Government Obligations valued at $12,246,895, 0.38% - 4.00%, 4/30/24 - 11/15/52) | | 12,011,223 | 12,000,000 |
| BofA Securities, Inc. at: | | | |
4.82%, dated 3/28/23 due 4/4/23 (Collateralized by U.S. Treasury Obligations valued at $3,062,508, 0.13%, 5/31/23) | | 3,002,812 | 2,999,984 |
4.87%, dated: | | | |
| 3/17/23 due 4/7/23 (Collateralized by U.S. Treasury Obligations valued at $1,022,326, 0.13%, 5/31/23) (c)(d)(f) | | 1,004,329 | 1,000,000 |
| 3/20/23 due 4/7/23 (Collateralized by U.S. Treasury Obligations valued at $1,021,929, 0.13%, 5/31/23) (c)(d)(f) | | 1,003,923 | 1,000,000 |
| 3/21/23 due 4/7/23 (Collateralized by U.S. Treasury Obligations valued at $1,021,829, 0.13%, 5/31/23) (c)(d)(f) | | 1,004,599 | 1,000,000 |
| 3/24/23 due 4/7/23 (Collateralized by U.S. Treasury Obligations valued at $2,042,765, 0.13%, 5/31/23) (c)(d)(f) | | 2,008,928 | 2,000,000 |
| CIBC Bank U.S.A. at 4.81%, dated 3/23/23 due 4/7/23 (Collateralized by U.S. Government Obligations valued at $4,085,997, 2.31% - 6.00%, 7/14/36 - 3/1/53) | | 4,022,447 | 4,000,000 |
| Citibank NA at 4.83%, dated 3/30/23 due 4/6/23 (Collateralized by U.S. Treasury Obligations valued at $2,061,045, 0.75% - 4.05%, 12/1/36 - 2/15/42) | | 2,001,878 | 2,000,000 |
| Citigroup Global Capital Markets, Inc. at: | | | |
4.81%, dated 3/23/23 due 4/7/23 (Collateralized by U.S. Government Obligations valued at $2,043,068, 2.25% - 6.50%, 10/31/24 - 12/20/52) | | 2,011,223 | 2,000,000 |
4.83%, dated 3/30/23 due 4/6/23 (Collateralized by U.S. Government Obligations valued at $2,041,107, 2.25% - 5.50%, 10/31/24 - 9/20/52) | | 2,001,878 | 2,000,000 |
| Goldman Sachs & Co. at 4.81%, dated: | | | |
3/27/23 due 4/3/23 (Collateralized by U.S. Government Obligations valued at $6,125,725, 1.13% - 6.00%, 2/1/33 - 7/1/52) | | 6,005,612 | 5,999,982 |
3/29/23 due 4/5/23 (Collateralized by U.S. Government Obligations valued at $6,124,089, 3.18% - 4.00%, 4/20/48 - 8/15/57) | | 6,005,612 | 6,000,000 |
3/30/23 due: | | | |
| 4/4/23 (Collateralized by U.S. Government Obligations valued at $5,102,726, 2.00% - 6.00%, 3/1/35 - 6/1/56) | | 5,003,340 | 5,000,000 |
| 4/6/23 (Collateralized by U.S. Government Obligations valued at $3,061,636, 2.00%, 2/1/52) | | 3,002,806 | 3,000,000 |
| RBC Dominion Securities at 4.81%, dated 3/23/23 due 4/7/23 (Collateralized by U.S. Government Obligations valued at $8,172,037, 0.13% - 6.00%, 8/31/23 - 2/20/53) | | 8,044,893 | 8,000,000 |
| RBC Financial Group at 4.81%, dated 3/23/23 due 4/7/23 (Collateralized by U.S. Government Obligations valued at $14,310,920, 0.13% - 6.50%, 1/15/26 - 4/1/53) | | 14,078,563 | 14,000,000 |
| TD Securities (U.S.A.) at 4.82%, dated 3/31/23 due 4/3/23 (Collateralized by U.S. Government Obligations valued at $3,061,230, 4.50%, 9/20/52) | | 3,001,205 | 3,000,000 |
| TOTAL U.S. GOVERNMENT AGENCY REPURCHASE AGREEMENT (Cost $569,045,000) | | | 569,044,951 |
| | | | |
| U.S. Treasury Repurchase Agreement - 3.1% |
| | | Maturity Amount ($) | Value ($) |
| With: | | | |
| ABN AMRO Bank NV at 4.8%, dated 3/31/23 due 4/3/23 (Collateralized by U.S. Treasury Obligations valued at $3,061,287, 0.38% - 2.75%, 1/31/24 - 5/31/29) | | 3,001,200 | 3,000,000 |
| Barclays Bank PLC at 4.8%, dated 3/31/23 due 4/3/23 (Collateralized by U.S. Treasury Obligations valued at $5,102,069, 2.63%, 4/15/25) | | 5,002,000 | 5,000,000 |
| Fixed Income Clearing Corp. - BNYM at 4.81%, dated 3/31/23 due 4/3/23 (Collateralized by U.S. Treasury Obligations valued at $7,140,096, 2.75%, 5/15/25) | | 7,002,806 | 7,000,000 |
| Fixed Income Clearing Corp. - SSB at: | | | |
4.81%, dated 3/31/23 due 4/3/23 (Collateralized by U.S. Treasury Obligations valued at $4,078,933, 1.13%, 8/31/28) | | 4,001,603 | 4,000,000 |
4.88%, dated 3/31/23 due 4/3/23 (Collateralized by U.S. Treasury Obligations valued at $3,064,568, 2.38%, 2/15/42) | | 3,001,220 | 2,999,999 |
| ING Financial Markets LLC at 4.81%, dated 3/31/23 due 4/3/23 (Collateralized by U.S. Treasury Obligations valued at $2,042,124, 3.25%, 8/31/24) | | 2,000,802 | 2,000,000 |
| MUFG Securities EMEA PLC at: | | | |
4.82%, dated: | | | |
| 3/31/23 due 4/3/23 (Collateralized by U.S. Treasury Obligations valued at $2,040,934, 1.13%, 2/29/28) | | 2,000,803 | 2,000,000 |
| 4/3/23 due 4/4/23 (g) | | 2,000,268 | 2,000,000 |
4.83%, dated 3/31/23 due 4/3/23 (Collateralized by U.S. Treasury Obligations valued at $4,077,925, 1.88%, 2/28/29) | | 4,001,610 | 4,000,000 |
| RBS Securities, Inc. at: | | | |
4.8%, dated 3/31/23 due 4/3/23 (Collateralized by U.S. Treasury Obligations valued at $1,020,454, 1.38%, 11/15/40) | | 1,000,400 | 1,000,000 |
4.82%, dated 3/30/23 due 4/6/23 (Collateralized by U.S. Treasury Obligations valued at $3,061,746, 4.25%, 5/15/39) | | 3,002,812 | 3,000,000 |
| Societe Generale at 4.81%, dated 3/30/23 due 4/6/23 (Collateralized by U.S. Treasury Obligations valued at $4,082,199, 0.00% - 1.25%, 6/29/23 - 8/15/31) | | 4,003,741 | 4,000,000 |
| TOTAL U.S. TREASURY REPURCHASE AGREEMENT (Cost $40,000,000) | | | 39,999,999 |
| | | | |
| Other Repurchase Agreement - 3.0% |
| | | Maturity Amount ($) | Value ($) |
| Other Repurchase Agreement - 3.0% | | | |
| With: | | | |
| BMO Capital Markets Corp. at: | | | |
4.96%, dated 3/31/23 due 4/3/23 (Collateralized by Corporate Obligations valued at $1,093,653, 2.47%, 12/13/29) | | 1,000,413 | 1,000,000 |
5.02%, dated 3/31/23 due 4/3/23 (Collateralized by Corporate Obligations valued at $1,070,929, 2.25% - 7.75%, 10/15/24 - 6/1/77) | | 1,000,418 | 1,000,000 |
| BMO Chicago Branch at 5.02%, dated 3/31/23 due 4/3/23 (Collateralized by Mortgage Loan Obligations valued at $1,031,773, 0.75% - 4.63%, 12/15/28 - 5/16/59) | | 1,000,418 | 1,000,000 |
| BNP Paribas Prime Brokerage, Inc. at: | | | |
5.07%, dated 3/31/23 due 4/3/23 (Collateralized by Equity Securities valued at $2,160,917) | | 2,000,845 | 2,000,000 |
5.08%, dated 3/31/23 due 4/6/23 (Collateralized by Equity Securities valued at $3,241,382) (c)(d)(f) | | 3,002,540 | 3,000,000 |
5.27%, dated 3/29/23 due 5/5/23 (Collateralized by Corporate Obligations valued at $5,403,965, 0.00% - 6.50%, 6/1/23 - 1/1/99) (c)(d)(f) | | 5,045,381 | 5,000,000 |
| HSBC Securities, Inc. at 5.05%, dated 3/31/23 due 4/3/23 (Collateralized by Corporate Obligations valued at $1,080,396, 0.00% - 4.30%, 1/31/24 - 2/15/47) | | 1,000,421 | 1,000,000 |
| ING Financial Markets LLC at 5.05%, dated 3/31/23 due 4/3/23 (Collateralized by Equity Securities valued at $1,080,455) | | 1,000,421 | 1,000,000 |
| J.P. Morgan Securities, LLC at 5.39%, dated 3/27/23 due 6/29/23 (Collateralized by Corporate Obligations valued at $11,892,455, 0.00% - 3.50%, 12/1/26 - 1/1/99) (c)(d)(f) | | 11,197,633 | 10,999,999 |
| Mitsubishi UFJ Securities (U.S.A.), Inc. at: | | | |
5.05%, dated 3/31/23 due 4/3/23 (Collateralized by Corporate Obligations valued at $1,020,468, 5.03%, 11/22/28) | | 1,000,421 | 1,000,000 |
5.34%, dated 3/31/23 due 4/3/23 (Collateralized by Equity Securities valued at $1,080,483) | | 1,000,445 | 1,000,000 |
| Mizuho Securities U.S.A., Inc. at: | | | |
5.09%, dated 3/31/23 due 4/3/23 (Collateralized by Equity Securities valued at $1,080,486) | | 1,000,424 | 1,000,000 |
5.32%, dated 3/7/23 due 5/8/23 (Collateralized by Corporate Obligations valued at $1,054,065, 2.31%, 11/20/51) (c)(d)(f) | | 1,009,162 | 1,000,000 |
| RBC Capital Markets Co. at 5.32%, dated 3/27/23 due 5/26/23 (Collateralized by Corporate Obligations valued at $1,051,114, 6.24%, 7/20/28) (c)(d)(f) | | 1,008,867 | 1,000,000 |
| RBS Securities, Inc. at 5.07%, dated 3/31/23 due 4/3/23 (Collateralized by U.S. Government Obligations valued at $1,021,113, 4.00%, 9/27/29) | | 1,000,423 | 1,000,000 |
| Truist Securities, Inc. at: | | | |
5.1%, dated 3/31/23 due 4/3/23 (Collateralized by U.S. Government Obligations valued at $1,020,434, 4.00%, 9/1/41) | | 1,000,425 | 1,000,000 |
5.35%, dated 3/31/23 due 4/3/23 (Collateralized by Corporate Obligations valued at $1,079,991, 0.13% - 3.88%, 12/15/24 - 11/15/41) | | 1,000,446 | 1,000,000 |
| Wells Fargo Securities, LLC at: | | | |
4.98%, dated 3/31/23 due 4/3/23 (Collateralized by Commercial Paper valued at $3,091,283, 0.00%, 8/30/23) | | 3,001,245 | 3,000,000 |
5.37%, dated 1/26/23 due 4/26/23 (Collateralized by Corporate Obligations valued at $1,060,662, 4.63%, 3/1/24) | | 1,013,425 | 1,000,000 |
5.4%, dated 2/3/23 due 5/4/23 (Collateralized by Commercial Paper valued at $1,059,293, 0.00%, 4/12/23) | | 1,013,500 | 1,000,000 |
| TOTAL OTHER REPURCHASE AGREEMENT (Cost $39,000,000) | | | 38,999,999 |
| | | | |
| TOTAL INVESTMENT IN SECURITIES - 91.5% (Cost $1,169,349,500) | 1,169,275,718 |
NET OTHER ASSETS (LIABILITIES) - 8.5% | 108,581,856 |
| NET ASSETS - 100.0% | 1,277,857,574 |
| | |
Security Type Abbreviations
| VRDN | - | VARIABLE RATE DEMAND NOTE (A debt instrument that is payable upon demand, either daily, weekly or monthly) |
The date shown for securities represents the date when principal payments must be paid, taking into account any call options exercised by the issuer and any permissible maturity shortening features other than interest rate resets.
Legend
| (a) | Yield represents either the annualized yield at the date of purchase, or the stated coupon rate, or, for floating and adjustable rate securities, the rate at period end. |
| (b) | Amount is stated in United States dollars unless otherwise noted. |
| (c) | Coupon rates for floating and adjustable rate securities reflect the rates in effect at period end. |
| (d) | Coupon is indexed to a floating interest rate which may be multiplied by a specified factor and/or subject to caps or floors. |
| (e) | Security exempt from registration under Rule 144A of the Securities Act of 1933. These securities may be resold in transactions exempt from registration, normally to qualified institutional buyers. At the end of the period, the value of these securities amounted to $5,962,075 or 0.5% of net assets. |
| (f) | The maturity amount is based on the rate at period end. |
| (g) | Represents a forward settling transaction and therefore no collateral securities had been allocated as of period end. The agreement contemplated the delivery of U.S. Treasury Obligations as collateral on settlement date. |
Investment Valuation
The following is a summary of the inputs used, as of March 31, 2023, involving the Fund's assets and liabilities carried at fair value. The inputs or methodology used for valuing securities may not be an indication of the risk associated with investing in those securities. For more information on valuation inputs, and their aggregation into the levels used below, please refer to the Investment Valuation section in the accompanying Notes to Financial Statements.
| Valuation Inputs at Reporting Date: |
| Description | Total ($) | Level 1 ($) | Level 2 ($) | Level 3 ($) |
Investments in Securities: | | | | |
|
| Certificate of Deposit | 126,984,241 | - | 126,984,241 | - |
|
| Financial Company Commercial Paper | 277,961,208 | - | 277,961,208 | - |
|
| Asset Backed Commercial Paper | 89,174,112 | - | 89,174,112 | - |
|
| Variable Rate Demand Note | 25,155,000 | - | 25,155,000 | - |
|
| U.S. Government Agency Debt | 1,956,208 | - | 1,956,208 | - |
|
| U.S. Government Agency Repurchase Agreement | 569,044,951 | - | 569,044,951 | - |
|
| U.S. Treasury Repurchase Agreement | 39,999,999 | - | 39,999,999 | - |
|
| Other Repurchase Agreement | 38,999,999 | - | 38,999,999 | - |
| Total Investments in Securities: | 1,169,275,718 | - | 1,169,275,718 | - |
| Other Information |
| # Additional information on each counterparty to the repurchase agreement is as follows: |
| Repurchase Agreement / Counterparty | Value ($) | |
| $487,045,000 due 4/03/23 at 4.80% | | |
| BNY Mellon Capital Markets LLC | 1,940,000 | |
| Bank of America, N.A. | 5,575,000 | |
| BofA Securities, Inc. | 774,000 | |
| Citigroup Global Markets, Inc. | 3,871,000 | |
| HSBC Securities (USA), Inc. | 697,000 | |
| JP Morgan Securities LLC | 433,000,000 | |
| Mitsubishi UFJ Securities Holdings Ltd | 1,161,000 | |
| Mizuho Securities USA, Inc. | 387,000 | |
| Nomura Securities International | 6,194,000 | |
| RBC Dominion Securities, Inc. | 4,645,000 | |
| Sumitomo Mitsui Banking Corp. | 21,059,000 | |
| Wells Fargo Securities LLC | 7,742,000 | |
| | 487,045,000 | |
| | | |
| Statement of Assets and Liabilities |
| | | | March 31, 2023 (Unaudited) |
| | | | | |
| Assets | | | | |
Investment in securities, at value (including repurchase agreements of $648,044,950) - See accompanying schedule Unaffiliated issuers (cost $1,169,349,500): | | | $ | 1,169,275,718 |
| Cash | | | | 60,256,000 |
| Receivable for fund shares sold | | | | 2,853 |
| Interest receivable | | | | 1,838,136 |
| Receivable for interfund loans | | | | 50,323,000 |
| Other affiliated receivables | | | | 28,349 |
Total assets | | | | 1,281,724,056 |
| Liabilities | | | | |
| Payable for investments purchased | $ | 2,000,000 | | |
| Payable for fund shares redeemed | | 1,861,991 | | |
| Other payables and accrued expenses | | 4,491 | | |
| Total Liabilities | | | | 3,866,482 |
| Net Assets | | | $ | 1,277,857,574 |
| Net Assets consist of: | | | | |
| Paid in capital | | | $ | 1,277,931,815 |
| Total accumulated earnings (loss) | | | | (74,241) |
| Net Assets | | | $ | 1,277,857,574 |
Net Asset Value , offering price and redemption price per share ($1,277,857,574 ÷ 1,278,021,316 shares) | | | $ | 0.9999 |
| Statement of Operations |
| | | | Six months ended March 31, 2023 (Unaudited) |
| Investment Income | | | | |
| Interest (including $601,118 from affiliated interfund lending) | | | $ | 29,254,389 |
| Expenses | | | | |
| Custodian fees and expenses | $ | 12,389 | | |
| Independent trustees' fees and expenses | | 2,810 | | |
| Total Expenses | | | | 15,199 |
| Net Investment income (loss) | | | | 29,239,190 |
| Realized and Unrealized Gain (Loss) | | | | |
| Net realized gain (loss) on: | | | | |
| Investment Securities: | | | | |
| Unaffiliated issuers | | (1,026) | | |
| Total net realized gain (loss) | | | | (1,026) |
| Change in net unrealized appreciation (depreciation) on investment securities | | | | (58,147) |
| Net increase in net assets resulting from operations | | | $ | 29,180,017 |
| Statement of Changes in Net Assets |
| |
| | Six months ended March 31, 2023 (Unaudited) | | Year ended September 30, 2022 |
| Increase (Decrease) in Net Assets | | | | |
| Operations | | | | |
| Net investment income (loss) | $ | 29,239,190 | $ | 14,440,325 |
| Net realized gain (loss) | | (1,026) | | 2,591 |
| Change in net unrealized appreciation (depreciation) | | (58,147) | | (58,881) |
Net increase in net assets resulting from operations | | 29,180,017 | | 14,384,035 |
| Distributions to shareholders | | (29,241,112) | | (14,486,964) |
| Affiliated share transactions | | | | |
| Proceeds from sales of shares | | 53,710,309 | | 452,697,024 |
| Reinvestment of distributions | | 29,241,112 | | 14,486,964 |
| Cost of shares redeemed | | (202,503,940) | | (401,492,239) |
Net increase (decrease) in net assets and shares resulting from share transactions | | (119,552,519) | | 65,691,749 |
| Total increase (decrease) in net assets | | (119,613,614) | | 65,588,820 |
| | | | | |
| Net Assets | | | | |
| Beginning of period | | 1,397,471,188 | | 1,331,882,368 |
| End of period | $ | 1,277,857,574 | $ | 1,397,471,188 |
| | | | | |
| Other Information | | | | |
| Shares | | | | |
| Sold | | 53,711,225 | | 452,717,979 |
| Issued in reinvestment of distributions | | 29,242,898 | | 14,488,117 |
| Redeemed | | (202,514,026) | | (401,522,135) |
| Net increase (decrease) | | (119,559,903) | | 65,683,961 |
| | | | | |
Financial Highlights
| Fidelity® Money Market Central Fund |
| |
| | Six months ended (Unaudited) March 31, 2023 | | Years ended September 30, 2022 | | 2021 | | 2020 | | 2019 | | 2018 |
Selected Per-Share Data | | | | | | | | | | | | |
| Net asset value, beginning of period | $ | .9999 | $ | 1.0000 | $ | 1.0000 | $ | 1.0000 | $ | 1.0000 | $ | 1.0001 |
| Income from Investment Operations | | | | | | | | | | | | |
Net investment income (loss) A | | .0217 | | .0093 | | .0018 | | .0116 | | .0253 | | .0190 |
| Net realized and unrealized gain (loss) | | - B | | (.0001) | | - B | | - B | | - B | | (.0001) |
| Total from investment operations | | .0217 | | .0092 | | .0018 | | .0116 | | .0253 | | .0189 |
| Distributions from net investment income | | (.0217) | | (.0093) | | (.0018) | | (.0116) | | (.0253) | | (.0190) |
| Distributions from net realized gain | | - | | - B | | - | | - | | - | | - |
| Total distributions | | (.0217) | | (.0093) | | (.0018) | | (.0116) | | (.0253) | | (.0190) |
| Net asset value, end of period | $ | .9999 | $ | .9999 | $ | 1.0000 | $ | 1.0000 | $ | 1.0000 | $ | 1.0000 |
Total Return C,D | | 2.19% | | .93% | | .18% | | 1.16% | | 2.56% | | 1.91% |
Ratios to Average Net Assets A,E,F | | | | | | | | | | | | |
| Expenses before reductions | | -% G,H | | -% G | | -% G | | .01% | | .01% | | -% G |
| Expenses net of fee waivers, if any | | -% G,H | | -% G | | -% G | | .01% | | .01% | | -% G |
| Expenses net of all reductions | | -% G,H | | -% G | | -% G | | .01% | | .01% | | -% G |
| Net investment income (loss) | | 4.35% H | | .91% | | .18% | | 1.22% | | 2.53% | | 1.89% |
| Supplemental Data | | | | | | | | | | | | |
| Net assets, end of period (000 omitted) | $ | 1,277,858 | $ | 1,397,471 | $ | 1,331,882 | $ | 1,308,709 | $ | 1,820,832 | $ | 1,692,048 |
A Net investment income (loss) is affected by the timing of the declaration of dividends by any underlying mutual funds or exchange-traded funds (ETFs). Net investment income (loss) of any mutual funds or ETFs is not included in the Fund's net investment income (loss) ratio.
B Amount represents less than $.00005 per share.
C Total returns for periods of less than one year are not annualized.
D Total returns would have been lower if certain expenses had not been reduced during the applicable periods shown.
E Fees and expenses of any underlying mutual funds or exchange-traded funds (ETFs) are not included in the Fund's expense ratio. The Fund indirectly bears its proportionate share of these expenses.
F Expense ratios reflect operating expenses of the class. Expenses before reductions do not reflect amounts reimbursed, waived, or reduced through arrangements with the investment adviser, brokerage services, or other offset arrangements, if applicable, and do not represent the amount paid by the class during periods when reimbursements, waivers or reductions occur.
G Amount represents less than .005%.
H Annualized.
For the period ended March 31, 2023
1. Organization.
Fidelity Money Market Central Fund (the Fund) is a fund of Fidelity Garrison Street Trust (the Trust) and is authorized to issue an unlimited number of shares. The Trust is registered under the Investment Company Act of 1940, as amended (the 1940 Act), as an open-end management investment company organized as a Massachusetts business trust. Shares of the Fund are only offered to other investment companies and accounts (the Investing Funds) managed by Fidelity Management & Research Company LLC (FMR), or its affiliates. The Fund has been designated an institutional money market fund, and the value of the Fund's shares are calculated to four decimal places that fluctuates based upon changes in the value of the Fund's investments.
2. Significant Accounting Policies.
The Fund is an investment company and applies the accounting and reporting guidance of the Financial Accounting Standards Board (FASB) Accounting Standards Codification Topic 946 Financial Services - Investment Companies . The financial statements have been prepared in conformity with accounting principles generally accepted in the United States of America (GAAP), which require management to make certain estimates and assumptions at the date of the financial statements. Actual results could differ from those estimates. Subsequent events, if any, through the date that the financial statements were issued have been evaluated in the preparation of the financial statements. The Fund's Schedule of Investments lists any underlying mutual funds or exchange-traded funds (ETFs) but does not include the underlying holdings of these funds. The following summarizes the significant accounting policies of the Fund:
Investment Valuation. Investments are valued as of 4:00 p.m. Eastern time on the last calendar day of the period. The Board of Trustees (the Board) has designated the Fund's investment adviser as the valuation designee responsible for the fair valuation function and performing fair value determinations as needed. The investment adviser has established a Fair Value Committee (the Committee) to carry out the day-to-day fair valuation responsibilities and has adopted policies and procedures to govern the fair valuation process and the activities of the Committee. In accordance with these fair valuation policies and procedures, which have been approved by the Board, the Fund attempts to obtain prices from one or more third party pricing services or brokers to value its investments. When current market prices, quotations or currency exchange rates are not readily available or reliable, investments will be fair valued in good faith by the Committee, in accordance with the policies and procedures. Factors used in determining fair value vary by investment type and may include market or investment specific events, transaction data, estimated cash flows, and market observations of comparable investments. The frequency that the fair valuation procedures are used cannot be predicted and they may be utilized to a significant extent. The Committee manages the Fund's fair valuation practices and maintains the fair valuation policies and procedures. The Fund's investment adviser reports to the Board information regarding the fair valuation process and related material matters.
The Fund categorizes the inputs to valuation techniques used to value its investments into a disclosure hierarchy consisting of three levels as shown below:
Level 1 - unadjusted quoted prices in active markets for identical investments
Level 2 - other significant observable inputs (including quoted prices for similar investments, interest rates, prepayment speeds, etc.)
Level 3 - unobservable inputs (including the Fund's own assumptions based on the best information available)
Valuation techniques used to value the Fund's investments by major category are as follows:
Debt securities, including restricted securities, are valued based on evaluated prices received from third party pricing services or from brokers who make markets in such securities. U.S. government and government agency obligations, commercial paper, certificates of deposit and other short-term securities are valued by pricing services who utilize matrix pricing which considers yield or price of bonds of comparable quality, coupon, maturity and type or by broker-supplied prices. When independent prices are unavailable or unreliable, debt securities may be valued utilizing pricing methodologies which consider similar factors that would be used by third party pricing services. Debt securities are generally categorized as Level 2 in the hierarchy but may be Level 3 depending on the circumstances.
Short-term securities with remaining maturities of sixty days or less may be valued at amortized cost, which approximates fair value, and are categorized as Level 2 in the hierarchy.
Securities held by a money market fund are generally high quality and liquid; however, they are reflected as Level 2 because the inputs used to determine fair value are not quoted prices in an active market.
The aggregate value of investments by input level as of March 31, 2023 is included at the end of the Fund's Schedule of Investments.
Investment Transactions and Income. Security transactions are accounted for as of trade date. Gains and losses on securities sold are determined on the basis of identified cost. Interest income is accrued as earned and includes coupon interest and amortization of premium and accretion of discount on debt securities as applicable.
Expenses. Expenses directly attributable to a fund are charged to that fund. Expenses attributable to more than one fund are allocated among the respective funds on the basis of relative net assets or other appropriate methods. Expenses included in the accompanying financial statements reflect the expenses of that fund and do not include any expenses associated with any underlying mutual funds or exchange-traded funds. Although not included in a fund's expenses, a fund indirectly bears its proportionate share of these expenses through the net asset value of each underlying mutual fund or exchange-traded fund. Expense estimates are accrued in the period to which they relate and adjustments are made when actual amounts are known.
Income Tax Information and Distributions to Shareholders. Each year, the Fund intends to qualify as a regulated investment company under Subchapter M of the Internal Revenue Code, including distributing substantially all of its taxable income and realized gains. As a result, no provision for U.S. Federal income taxes is required. The Fund files a U.S. federal tax return, in addition to state and local tax returns as required. The Fund's federal income tax returns are subject to examination by the Internal Revenue Service (IRS) for a period of three fiscal years after they are filed. State and local tax returns may be subject to examination for an additional fiscal year depending on the jurisdiction.
Distributions are declared and recorded daily and paid monthly from net investment income. Distributions from realized gains, if any, are declared and recorded on the ex-dividend date. Income and capital gain distributions are determined in accordance with income tax regulations, which may differ from GAAP.
Capital accounts within the financial statements are adjusted for permanent book-tax differences. These adjustments have no impact on net assets or the results of operations. Capital accounts are not adjusted for temporary book-tax differences which will reverse in a subsequent period.
As of period end, the cost and unrealized appreciation (depreciation) in securities for federal income tax purposes were as follows:
| Gross unrealized appreciation | $45,817 |
| Gross unrealized depreciation | (119,599) |
| Net unrealized appreciation (depreciation) | $(73,782) |
| Tax cost | $1,169,349,500 |
Repurchase Agreements. Pursuant to an Exemptive Order issued by the Securities and Exchange Commission, funds and other registered investment companies having management contracts with Fidelity Management and Research Company LLC, or its affiliates are permitted to transfer uninvested cash balances into joint trading accounts which are then invested in repurchase agreements. Funds may also invest directly with institutions in repurchase agreements. Upon settlement date, collateral is held in segregated accounts with custodian banks and may be obtained in the event of a default of the counterparty. The collateral balance is monitored on a daily basis to ensure it is at least equal to the principal amount of the repurchase agreement (including accrued interest). In the event of a default by the counterparty, realization of the collateral proceeds could be delayed, during which time the value of the collateral may decline.
Restricted Securities (including Private Placements). Funds may invest in securities that are subject to legal or contractual restrictions on resale. These securities generally may be resold in transactions exempt from registration or to the public if the securities are registered. Disposal of these securities may involve time-consuming negotiations and expense, and prompt sale at an acceptable price may be difficult. Information regarding restricted securities held at period end is included at the end of the Schedule of Investments, if applicable.
3. Fees and Other Transactions with Affiliates.
Management Fee and Expense Contract. Fidelity Management & Research Company LLC (the investment adviser) provides the Fund with investment management services. The Fund does not pay any fees for these services. Pursuant to the Fund's management contract, the investment adviser receives a monthly management fee that represents a portion of the management fees it receives from the Investing Funds. In addition, under an expense contract, the investment adviser also pays all other expenses of the Fund, excluding custody fees, the compensation of the independent Trustees, and certain miscellaneous expenses such as proxy and shareholder meeting expenses.
Interfund Lending Program. Pursuant to an Exemptive Order issued by the Securities and Exchange Commission (the SEC), the Fund, along with other registered investment companies having management contracts with FMR, or other affiliated entities of FMR, may participate in an interfund lending program. This program provides an alternative credit facility allowing the Fund to borrow from, or lend money to, other participating affiliated funds. Any open loans at period end are presented as Receivable for interfund loans in the Statement of Assets and Liabilities, and any accrued interest is included in Other affiliated receivables. Activity in this program during the period for which loans were outstanding was as follows:
| | | Average Loan Balance | Weighted Average Interest Rate |
| Fidelity Money Market Central Fund | Lender | 16,772,181 | 4.40% |
Interfund Trades. Funds may purchase from or sell securities to other Fidelity Funds under procedures adopted by the Board. The procedures have been designed to ensure these interfund trades are executed in accordance with Rule 17a-7 of the 1940 Act. During the period, there were no interfund trades.
4. Other.
A fund's organizational documents provide former and current trustees and officers with a limited indemnification against liabilities arising in connection with the performance of their duties to the fund. In the normal course of business, a fund may also enter into contracts that provide general indemnifications. A fund's maximum exposure under these arrangements is unknown as this would be dependent on future claims that may be made against a fund. The risk of material loss from such claims is considered remote.
At the end of the period, mutual funds managed by the investment adviser or its affiliates were the owners of record of all of the outstanding shares of the Fund.
5. Risk and Uncertainties.
Many factors affect a fund's performance. Developments that disrupt global economies and financial markets, such as pandemics, epidemics, outbreaks of infectious diseases, war, terrorism, and environmental disasters, may significantly affect a fund's investment performance. The effects of these developments to a fund will be impacted by the types of securities in which a fund invests, the financial condition, industry, economic sector, and geographic location of an issuer, and a fund's level of investment in the securities of that issuer. Significant concentrations in security types, issuers, industries, sectors, and geographic locations may magnify the factors that affect a fund's performance.
As a shareholder, you incur two types of costs: (1) transaction costs, which may include sales charges (loads) on purchase payments or redemption proceeds, as applicable and (2) ongoing costs, which generally include management fees, distribution and/or service (12b-1) fees and other Fund expenses. This Example is intended to help you understand your ongoing costs (in dollars) of investing in a fund and to compare these costs with the ongoing costs of investing in other mutual funds.
| The Example is based on an investment of $1,000 invested at the beginning of the period and held for the entire period (October 1, 2022 to March 31, 2023). |
Actual Expenses
The first line of the accompanying table provides information about actual account values and actual expenses. You may use the information in this line, together with the amount you invested, to estimate the expenses that you paid over the period. Simply divide your account value by $1,000.00 (for example, an $8,600 account value divided by $1,000.00 = 8.6), then multiply the result by the number in the first line for a class/Fund under the heading entitled "Expenses Paid During Period" to estimate the expenses you paid on your account during this period. If any fund is a shareholder of any underlying mutual funds or exchange-traded funds (ETFs) (the Underlying Funds), such fund indirectly bears its proportional share of the expenses of the Underlying Funds in addition to the direct expenses incurred presented in the table. These fees and expenses are not included in the annualized expense ratio used to calculate the expense estimate in the table below.
Hypothetical Example for Comparison Purposes
The second line of the accompanying table provides information about hypothetical account values and hypothetical expenses based on the actual expense ratio and an assumed rate of return of 5% per year before expenses, which is not the actual return. The hypothetical account values and expenses may not be used to estimate the actual ending account balance or expenses you paid for the period. You may use this information to compare the ongoing costs of investing in the Fund and other funds. To do so, compare this 5% hypothetical example with the 5% hypothetical examples that appear in the shareholder reports of the other funds. If any fund is a shareholder of any Underlying Funds, such fund indirectly bears its proportional share of the expenses of the Underlying Funds in addition to the direct expenses as presented in the table. These fees and expenses are not included in the annualized expense ratio used to calculate the expense estimate in the table below.
Please note that the expenses shown in the table are meant to highlight your ongoing costs only and do not reflect any transaction costs. Therefore, the second line of the table is useful in comparing ongoing costs only, and will not help you determine the relative total costs of owning different funds. In addition, if these transactional costs were included, your costs would have been higher.
| | | | | Annualized Expense Ratio- A | | Beginning Account Value October 1, 2022 | | Ending Account Value March 31, 2023 | | Expenses Paid During Period- C October 1, 2022 to March 31, 2023 |
| | | | | | | | | | |
| Fidelity® Money Market Central Fund | | | | 0.0023% | | | | | | |
| Actual | | | | | | $ 1,000 | | $ 1,021.90 | | $ .01 |
Hypothetical- B | | | | | | $ 1,000 | | $ 1,024.92 | | $ .01 |
| |
A Annualized expense ratio reflects expenses net of applicable fee waivers.
B 5% return per year before expenses
C Expenses are equal to the annualized expense ratio, multiplied by the average account value over the period, multiplied by 182/ 365 (to reflect the one-half year period). The fees and expenses of any Underlying Funds are not included in each annualized expense ratio.
1.756671.122
CFM-SANN-0523
Item 2.
Code of Ethics
Not applicable.
Item 3.
Audit Committee Financial Expert
Not applicable.
Item 4.
Principal Accountant Fees and Services
Not applicable.
Item 5.
Audit Committee of Listed Registrants
Not applicable.
Item 6.
Investments
(a)
Not applicable.
(b)
Not applicable
Item 7.
Disclosure of Proxy Voting Policies and Procedures for Closed-End Management Investment Companies
Not applicable.
Item 8.
Portfolio Managers of Closed-End Management Investment Companies
Not applicable.
Item 9.
Purchase of Equity Securities by Closed-End Management Investment Company and Affiliated Purchasers
Not applicable.
Item 10.
Submission of Matters to a Vote of Security Holders
There were no material changes to the procedures by which shareholders may recommend nominees to the Fidelity Garrison Street Trust’s Board of Trustees.
Item 11.
Controls and Procedures
(a)(i) The President and Treasurer and the Chief Financial Officer have concluded that the Fidelity Garrison Street Trust’s (the “Trust”) disclosure controls and procedures (as defined in Rule 30a-3(c) under the Investment Company Act) provide reasonable assurances that material information relating to the Trust is made known to them by the appropriate persons, based on their evaluation of these controls and procedures as of a date within 90 days of the filing date of this report.
(a)(ii) There was no change in the Trust’s internal control over financial reporting (as defined in Rule 30a-3(d) under the Investment Company Act) that occurred during the period covered by this report that has materially affected, or is reasonably likely to materially affect, the Trust’s internal control over financial reporting.
Item 12.
Disclosure of Securities Lending Activities for Closed-End Management
Investment Companies
Not applicable.
Item 13.
Exhibits
SIGNATURES
Pursuant to the requirements of the Securities Exchange Act of 1934 and the Investment Company Act of 1940, the registrant has duly caused this report to be signed on its behalf by the undersigned, thereunto duly authorized.
Fidelity Garrison Street Trust
| |
By: | /s/Laura M. Del Prato |
| Laura M. Del Prato |
| President and Treasurer |
|
|
Date: | May 19, 2023 |
Pursuant to the requirements of the Securities Exchange Act of 1934 and the Investment Company Act of 1940, this report has been signed below by the following persons on behalf of the registrant and in the capacities and on the dates indicated.
| |
By: | /s/Laura M. Del Prato |
| Laura M. Del Prato |
| President and Treasurer |
|
|
Date: | May 19, 2023 |
| |
By: | /s/John J. Burke III |
| John J. Burke III |
| Chief Financial Officer |
|
|
Date: | May 19, 2023 |