UNITED STATES
SECURITIES AND EXCHANGE COMMISSION
Washington, D.C. 20549
FORM N-CSR
CERTIFIED SHAREHOLDER REPORT OF REGISTERED
MANAGEMENT INVESTMENT COMPANIES
Investment Company Act file number 811-04861
Fidelity Garrison Street Trust
(Exact name of registrant as specified in charter)
245 Summer St., Boston, MA 02210
(Address of principal executive offices) (Zip code)
Margaret Carey, Secretary
245 Summer St.
Boston, Massachusetts 02210
(Name and address of agent for service)
Registrant's telephone number, including area code:
617-563-7000
| |
Date of fiscal year end: | December 31 |
|
|
Date of reporting period: | June 30, 2024 |
Item 1.
Reports to Stockholders
| |
| | SEMI-ANNUAL SHAREHOLDER REPORT | AS OF JUNE 30, 2024 | |
| | Fidelity® VIP Investment Grade Central Fund VIP Investment Grade Central Fund true |
| | | |
This semi-annual shareholder report contains information about Fidelity® VIP Investment Grade Central Fund for the period January 1, 2024 to June 30, 2024. You can find additional information about the Fund at fundresearch.fidelity.com/prospectus/sec. You can also request this information by contacting us at 1-800-544-8544.
What were your Fund costs for the last six months?(based on hypothetical $10,000 investment)
| | Costs of a $10,000 investment | Costs paid as a percentage of a $10,000 investment | |
| VIP Investment Grade Central Fund | $ 0 A | 0.00%B | |
A Amount represents less than $.50
B Amount represents less than 0.005%
Key Fund Statistics (as of June 30, 2024)
KEY FACTS | | |
| Fund Size | $2,975,910,228 | |
| Number of Holdings | 1,927 | |
| Portfolio Turnover | 201% | |
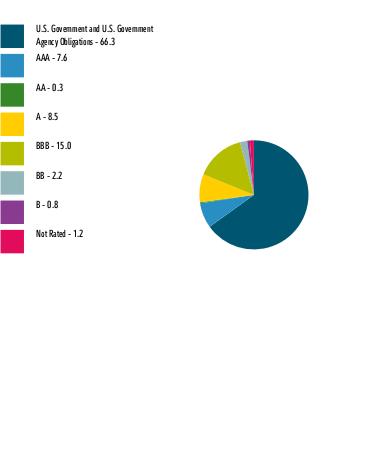
What did the Fund invest in?
(as of June 30, 2024)
| U.S. Government and U.S. Government Agency Obligations | 66.3 |
| AAA | 7.6 |
| AA | 0.3 |
| A | 8.5 |
| BBB | 15.0 |
| BB | 2.2 |
| B | 0.8 |
| Not Rated | 1.2 |
QUALITY DIVERSIFICATION (% of Fund's net assets) |
|
| Short-Term Investments and Net Other Assets (Liabilities) - (1.9)%* |
| |
| We have used ratings from Moody's Investors Service, Inc. Where Moody's® ratings are not available, we have used S&P® ratings. All ratings are as of the date indicated and do not reflect subsequent changes. |
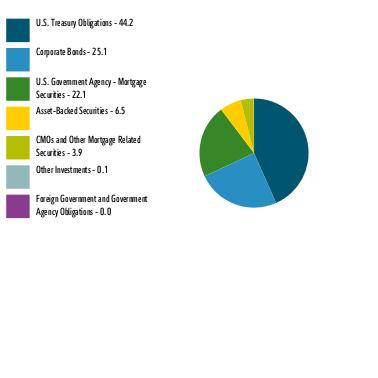
| U.S. Treasury Obligations | 44.2 |
| Corporate Bonds | 25.1 |
| U.S. Government Agency - Mortgage Securities | 22.1 |
| Asset-Backed Securities | 6.5 |
| CMOs and Other Mortgage Related Securities | 3.9 |
| Other Investments | 0.1 |
| Foreign Government and Government Agency Obligations | 0.0 |
ASSET ALLOCATION (% of Fund's net assets) |
|
| Short-Term Investments and Net Other Assets (Liabilities) - (1.9)% |
|
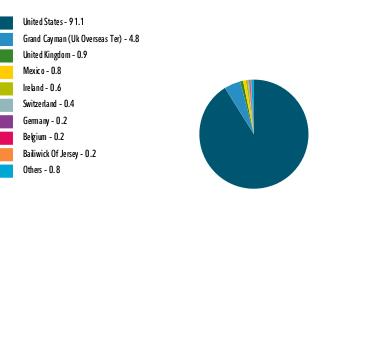
| United States | 91.1 |
| Grand Cayman (Uk Overseas Ter) | 4.8 |
| United Kingdom | 0.9 |
| Mexico | 0.8 |
| Ireland | 0.6 |
| Switzerland | 0.4 |
| Germany | 0.2 |
| Belgium | 0.2 |
| Bailiwick Of Jersey | 0.2 |
| Others | 0.8 |
GEOGRAPHIC DIVERSIFICATION (% of Fund's net assets) |
|
| |
|
TOP HOLDINGS (% of Fund's net assets) | | |
| US Treasury Notes | 33.2 | |
| US Treasury Bonds | 11.0 | |
| Uniform Mortgage Backed Securities | 7.9 | |
| Ginnie Mae II Pool | 5.4 | |
| Fannie Mae Mortgage pass-thru certificates | 4.4 | |
| Freddie Mac Gold Pool | 4.0 | |
| JPMorgan Chase & Co | 1.3 | |
| Bank of America Corp | 1.3 | |
| Morgan Stanley | 1.2 | |
| Citigroup Inc | 0.9 | |
| | 70.6 | |
| |
| Fidelity, the Fidelity Investments Logo and all other Fidelity trademarks or service marks used herein are trademarks or service marks of FMR LLC. Any third-party marks that are used herein are trademarks or service marks of their respective owners. © 2024 FMR LLC. All rights reserved. |
| | For additional information about the Fund; including its prospectus, financial information, holdings and proxy information, scan the QR code or visit fundresearch.fidelity.com/prospectus/sec 1.9916116.100 1619-TSRS-0824 |
Item 2.
Code of Ethics
Not applicable.
Item 3.
Audit Committee Financial Expert
Not applicable.
Item 4.
Principal Accountant Fees and Services
Not applicable.
Item 5.
Audit Committee of Listed Registrants
Not applicable.
Item 6.
Investments
(a)
Not applicable.
(b)
Not applicable
Item 7.
Financial Statements and Financial Highlights for Open-End Management Investment Companies
Fidelity® VIP Investment Grade Central Fund
Semi-Annual Report
June 30, 2024
Contents
To view a fund's proxy voting guidelines and proxy voting record for the 12-month period ended June 30, visit http://www.fidelity.com/proxyvotingresults or visit the Securities and Exchange Commission's (SEC) web site at http://www.sec.gov.
You may also call 1-800-544-8544 to request a free copy of the proxy voting guidelines.
Standard & Poor's, S&P and S&P 500 are registered service marks of The McGraw-Hill Companies, Inc. and have been licensed for use by Fidelity Distributors Corporation.
Other third-party marks appearing herein are the property of their respective owners.
All other marks appearing herein are registered or unregistered trademarks or service marks of FMR LLC or an affiliated company. © 2024 FMR LLC. All rights reserved.
A fund files its complete schedule of portfolio holdings with the SEC for the first and third quarters of each fiscal year on Form N-PORT. Forms N-PORT are available on the SEC's web site at http://www.sec.gov. A fund's Forms N-PORT may be reviewed and copied at the SEC's Public Reference Room in Washington, DC. Information regarding the operation of the SEC's Public Reference Room may be obtained by calling 1-800-SEC-0330.
Item 7: Financial Statements and Financial Highlights for Open-End Management Investment Companies (Semi-Annual Report)
Fidelity® VIP Investment Grade Central Fund
Schedule of Investments June 30, 2024 (Unaudited)
Showing Percentage of Net Assets
| Nonconvertible Bonds - 25.1% |
| | | Principal Amount (a) | Value ($) |
| COMMUNICATION SERVICES - 2.2% | | | |
| Diversified Telecommunication Services - 0.6% | | | |
| AT&T, Inc.: | | | |
| 2.55% 12/1/33 | | 4,584,000 | 3,644,954 |
| 3.8% 12/1/57 | | 4,678,000 | 3,268,219 |
| 4.3% 2/15/30 | | 859,000 | 822,954 |
| 4.75% 5/15/46 | | 4,816,000 | 4,165,228 |
| Verizon Communications, Inc.: | | | |
| 2.1% 3/22/28 | | 1,835,000 | 1,650,272 |
| 2.55% 3/21/31 | | 1,698,000 | 1,442,635 |
| 3% 3/22/27 | | 397,000 | 375,615 |
| 4.862% 8/21/46 | | 2,282,000 | 2,069,523 |
| 5.012% 4/15/49 | | 89,000 | 85,993 |
| | | | 17,525,393 |
| Entertainment - 0.3% | | | |
| The Walt Disney Co.: | | | |
| 3.8% 3/22/30 | | 7,061,000 | 6,687,803 |
| 4.7% 3/23/50 | | 2,229,000 | 2,013,836 |
| | | | 8,701,639 |
| Media - 1.1% | | | |
| Charter Communications Operating LLC/Charter Communications Operating Capital Corp.: | | | |
| 2.25% 1/15/29 | | 1,100,000 | 940,150 |
| 4.4% 4/1/33 | | 1,073,000 | 945,896 |
| 4.908% 7/23/25 | | 273,000 | 270,348 |
| 5.05% 3/30/29 | | 850,000 | 817,439 |
| 5.25% 4/1/53 | | 816,000 | 640,170 |
| 5.375% 5/1/47 | | 5,834,000 | 4,660,822 |
| 5.5% 4/1/63 | | 1,073,000 | 831,464 |
| 6.1% 6/1/29 | | 1,956,000 | 1,962,397 |
| 6.484% 10/23/45 | | 842,000 | 769,066 |
| 6.55% 6/1/34 | | 1,067,000 | 1,067,355 |
| Comcast Corp.: | | | |
| 2.937% 11/1/56 | | 2,100,000 | 1,266,752 |
| 3.9% 3/1/38 | | 329,000 | 278,841 |
| 4.65% 7/15/42 | | 779,000 | 697,704 |
| Discovery Communications LLC 3.625% 5/15/30 | | 1,066,000 | 938,022 |
| Fox Corp.: | | | |
| 4.709% 1/25/29 | | 563,000 | 552,965 |
| 5.476% 1/25/39 | | 555,000 | 529,133 |
| 5.576% 1/25/49 | | 368,000 | 337,871 |
| Time Warner Cable LLC: | | | |
| 4.5% 9/15/42 | | 283,000 | 207,128 |
| 5.5% 9/1/41 | | 521,000 | 433,881 |
| 5.875% 11/15/40 | | 460,000 | 399,127 |
| 6.55% 5/1/37 | | 6,199,000 | 5,870,480 |
| 7.3% 7/1/38 | | 1,160,000 | 1,173,876 |
| Warnermedia Holdings, Inc.: | | | |
| 3.638% 3/15/25 | | 694,000 | 683,238 |
| 3.755% 3/15/27 | | 1,357,000 | 1,288,363 |
| 4.054% 3/15/29 | | 470,000 | 434,042 |
| 4.279% 3/15/32 | | 1,970,000 | 1,719,470 |
| 5.05% 3/15/42 | | 996,000 | 810,155 |
| 5.141% 3/15/52 | | 2,807,000 | 2,185,553 |
| | | | 32,711,708 |
| Wireless Telecommunication Services - 0.2% | | | |
| T-Mobile U.S.A., Inc.: | | | |
| 3.75% 4/15/27 | | 1,871,000 | 1,798,331 |
| 3.875% 4/15/30 | | 2,705,000 | 2,528,706 |
| 4.375% 4/15/40 | | 404,000 | 350,089 |
| 4.5% 4/15/50 | | 793,000 | 662,287 |
| | | | 5,339,413 |
TOTAL COMMUNICATION SERVICES | | | 64,278,153 |
| CONSUMER DISCRETIONARY - 0.4% | | | |
| Automobiles - 0.0% | | | |
| General Motors Financial Co., Inc. 5.85% 4/6/30 | | 953,000 | 964,661 |
| Hotels, Restaurants & Leisure - 0.0% | | | |
| McDonald's Corp.: | | | |
| 3.5% 7/1/27 | | 517,000 | 495,449 |
| 3.6% 7/1/30 | | 615,000 | 569,493 |
| | | | 1,064,942 |
| Leisure Products - 0.1% | | | |
| Hasbro, Inc. 3% 11/19/24 | | 1,348,000 | 1,334,913 |
| Specialty Retail - 0.3% | | | |
| AutoNation, Inc. 4.75% 6/1/30 | | 234,000 | 223,628 |
| AutoZone, Inc.: | | | |
| 3.625% 4/15/25 | | 350,000 | 344,652 |
| 4% 4/15/30 | | 1,629,000 | 1,531,776 |
| Lowe's Companies, Inc.: | | | |
| 3.35% 4/1/27 | | 211,000 | 201,312 |
| 3.75% 4/1/32 | | 649,000 | 589,228 |
| 4.25% 4/1/52 | | 2,647,000 | 2,080,329 |
| 4.45% 4/1/62 | | 2,720,000 | 2,114,583 |
| 4.5% 4/15/30 | | 1,170,000 | 1,135,403 |
| O'Reilly Automotive, Inc. 4.2% 4/1/30 | | 361,000 | 343,591 |
| | | | 8,564,502 |
TOTAL CONSUMER DISCRETIONARY | | | 11,929,018 |
| CONSUMER STAPLES - 0.9% | | | |
| Beverages - 0.5% | | | |
| Anheuser-Busch InBev Worldwide, Inc.: | | | |
| 3.5% 6/1/30 | | 1,135,000 | 1,054,436 |
| 4.75% 4/15/58 | | 1,764,000 | 1,565,693 |
| 5.8% 1/23/59 (Reg. S) | | 3,472,000 | 3,612,734 |
| Molson Coors Beverage Co.: | | | |
| 3% 7/15/26 | | 2,300,000 | 2,201,794 |
| 5% 5/1/42 | | 4,016,000 | 3,673,322 |
| The Coca-Cola Co.: | | | |
| 3.375% 3/25/27 | | 1,742,000 | 1,681,950 |
| 3.45% 3/25/30 | | 1,064,000 | 995,040 |
| | | | 14,784,969 |
| Food Products - 0.0% | | | |
| General Mills, Inc. 2.875% 4/15/30 | | 220,000 | 195,138 |
| Tobacco - 0.4% | | | |
| Altria Group, Inc.: | | | |
| 4.25% 8/9/42 | | 1,696,000 | 1,349,461 |
| 4.5% 5/2/43 | | 1,137,000 | 930,733 |
| 4.8% 2/14/29 | | 311,000 | 305,875 |
| 5.95% 2/14/49 | | 407,000 | 399,059 |
| BAT Capital Corp. 6.421% 8/2/33 | | 1,030,000 | 1,076,890 |
| Imperial Brands Finance PLC: | | | |
| 4.25% 7/21/25 (b) | | 4,751,000 | 4,678,761 |
| 6.125% 7/27/27 (b) | | 1,136,000 | 1,155,713 |
| Reynolds American, Inc.: | | | |
| 4.45% 6/12/25 | | 446,000 | 440,776 |
| 5.7% 8/15/35 | | 373,000 | 364,222 |
| 6.15% 9/15/43 | | 1,227,000 | 1,181,002 |
| 7.25% 6/15/37 | | 909,000 | 982,362 |
| | | | 12,864,854 |
TOTAL CONSUMER STAPLES | | | 27,844,961 |
| ENERGY - 2.6% | | | |
| Energy Equipment & Services - 0.0% | | | |
| Halliburton Co.: | | | |
| 3.8% 11/15/25 | | 18,000 | 17,614 |
| 4.85% 11/15/35 | | 661,000 | 628,713 |
| | | | 646,327 |
| Oil, Gas & Consumable Fuels - 2.6% | | | |
| Canadian Natural Resources Ltd. 5.85% 2/1/35 | | 766,000 | 759,828 |
| Cenovus Energy, Inc.: | | | |
| 3.75% 2/15/52 | | 2,600,000 | 1,831,998 |
| 5.25% 6/15/37 | | 1,010,000 | 965,088 |
| Columbia Pipeline Group, Inc. 4.5% 6/1/25 | | 410,000 | 404,963 |
| Columbia Pipelines Operating Co. LLC: | | | |
| 5.927% 8/15/30 (b) | | 394,000 | 402,453 |
| 6.036% 11/15/33 (b) | | 1,061,000 | 1,084,254 |
| 6.497% 8/15/43 (b) | | 317,000 | 330,149 |
| 6.544% 11/15/53 (b) | | 571,000 | 601,657 |
| 6.714% 8/15/63 (b) | | 342,000 | 361,827 |
| DCP Midstream Operating LP: | | | |
| 5.6% 4/1/44 | | 376,000 | 360,079 |
| 6.45% 11/3/36 (b) | | 760,000 | 799,842 |
| 6.75% 9/15/37 (b) | | 1,037,000 | 1,119,568 |
| Enbridge, Inc. 4.25% 12/1/26 | | 544,000 | 531,098 |
| Energy Transfer LP: | | | |
| 3.75% 5/15/30 | | 710,000 | 653,132 |
| 4.95% 6/15/28 | | 1,242,000 | 1,225,590 |
| 5% 5/15/50 | | 2,045,000 | 1,735,828 |
| 5.25% 4/15/29 | | 629,000 | 626,510 |
| 5.4% 10/1/47 | | 414,000 | 370,359 |
| 5.8% 6/15/38 | | 692,000 | 677,337 |
| 6% 6/15/48 | | 451,000 | 434,573 |
| 6.25% 4/15/49 | | 432,000 | 429,748 |
| Enterprise Products Operating LP 3.7% 2/15/26 | | 1,472,000 | 1,434,150 |
| Hess Corp.: | | | |
| 4.3% 4/1/27 | | 1,500,000 | 1,462,555 |
| 5.6% 2/15/41 | | 4,059,000 | 4,045,825 |
| 7.125% 3/15/33 | | 308,000 | 345,715 |
| 7.3% 8/15/31 | | 411,000 | 458,141 |
| 7.875% 10/1/29 | | 1,346,000 | 1,505,333 |
| Kinder Morgan Energy Partners LP 6.55% 9/15/40 | | 141,000 | 145,183 |
| Kinder Morgan, Inc. 5.55% 6/1/45 | | 747,000 | 696,751 |
| MPLX LP: | | | |
| 4.8% 2/15/29 | | 345,000 | 338,165 |
| 4.875% 12/1/24 | | 839,000 | 835,408 |
| 4.95% 9/1/32 | | 2,116,000 | 2,024,607 |
| 5.5% 2/15/49 | | 1,036,000 | 955,668 |
| Occidental Petroleum Corp.: | | | |
| 5.55% 3/15/26 | | 1,587,000 | 1,583,995 |
| 6.2% 3/15/40 | | 521,000 | 522,015 |
| 6.45% 9/15/36 | | 1,412,000 | 1,474,838 |
| 6.6% 3/15/46 | | 1,751,000 | 1,826,701 |
| 7.5% 5/1/31 | | 2,356,000 | 2,599,212 |
| Petroleos Mexicanos: | | | |
| 4.5% 1/23/26 | | 1,632,000 | 1,550,910 |
| 5.95% 1/28/31 | | 1,957,000 | 1,572,939 |
| 6.35% 2/12/48 | | 4,049,000 | 2,568,281 |
| 6.49% 1/23/27 | | 1,175,000 | 1,126,708 |
| 6.5% 3/13/27 | | 1,481,000 | 1,410,504 |
| 6.5% 1/23/29 | | 1,705,000 | 1,538,763 |
| 6.7% 2/16/32 | | 4,635,000 | 3,877,965 |
| 6.75% 9/21/47 | | 3,713,000 | 2,446,384 |
| 6.84% 1/23/30 | | 1,999,000 | 1,757,921 |
| 6.95% 1/28/60 | | 2,417,000 | 1,587,365 |
| 7.69% 1/23/50 | | 4,972,000 | 3,583,718 |
| Phillips 66 Co. 3.85% 4/9/25 | | 188,000 | 185,509 |
| Plains All American Pipeline LP/PAA Finance Corp.: | | | |
| 3.55% 12/15/29 | | 405,000 | 369,809 |
| 3.6% 11/1/24 | | 426,000 | 422,808 |
| Sabine Pass Liquefaction LLC 4.5% 5/15/30 | | 2,447,000 | 2,347,484 |
| The Williams Companies, Inc.: | | | |
| 3.5% 11/15/30 | | 2,609,000 | 2,364,814 |
| 3.9% 1/15/25 | | 373,000 | 369,454 |
| 4.65% 8/15/32 | | 2,206,000 | 2,095,351 |
| 5.3% 8/15/52 | | 500,000 | 462,516 |
| Transcontinental Gas Pipe Line Co. LLC: | | | |
| 3.25% 5/15/30 | | 312,000 | 281,522 |
| 3.95% 5/15/50 | | 1,007,000 | 762,723 |
| Western Midstream Operating LP: | | | |
| 3.95% 6/1/25 | | 266,000 | 260,978 |
| 4.5% 3/1/28 | | 613,000 | 591,122 |
| 4.65% 7/1/26 | | 2,778,000 | 2,724,010 |
| 4.75% 8/15/28 | | 354,000 | 345,987 |
| 6.35% 1/15/29 | | 978,000 | 1,008,706 |
| | | | 75,574,394 |
TOTAL ENERGY | | | 76,220,721 |
| FINANCIALS - 12.7% | | | |
| Banks - 5.7% | | | |
| Bank of America Corp.: | | | |
| 2.299% 7/21/32 (c) | | 4,656,000 | 3,811,525 |
| 3.419% 12/20/28 (c) | | 5,817,000 | 5,469,863 |
| 3.5% 4/19/26 | | 1,541,000 | 1,493,557 |
| 3.95% 4/21/25 | | 1,265,000 | 1,246,838 |
| 4.2% 8/26/24 | | 6,127,000 | 6,111,543 |
| 4.25% 10/22/26 | | 1,307,000 | 1,274,559 |
| 4.45% 3/3/26 | | 465,000 | 457,273 |
| 5.015% 7/22/33 (c) | | 17,054,000 | 16,668,940 |
| 5.468% 1/23/35 (c) | | 1,410,000 | 1,408,574 |
| Barclays PLC: | | | |
| 5.088% 6/20/30 (c) | | 2,253,000 | 2,153,979 |
| 5.2% 5/12/26 | | 1,908,000 | 1,886,096 |
| 5.829% 5/9/27 (c) | | 2,670,000 | 2,673,915 |
| 6.224% 5/9/34 (c) | | 2,277,000 | 2,333,083 |
| 6.49% 9/13/29 (c) | | 642,000 | 664,597 |
| 6.692% 9/13/34 (c) | | 3,300,000 | 3,498,450 |
| BNP Paribas SA 2.219% 6/9/26 (b)(c) | | 2,313,000 | 2,235,922 |
| Citigroup, Inc.: | | | |
| 3.875% 3/26/25 | | 2,914,000 | 2,873,870 |
| 4.3% 11/20/26 | | 532,000 | 518,938 |
| 4.412% 3/31/31 (c) | | 3,258,000 | 3,105,103 |
| 4.45% 9/29/27 | | 5,245,000 | 5,112,479 |
| 4.6% 3/9/26 | | 673,000 | 662,187 |
| 4.91% 5/24/33 (c) | | 3,492,000 | 3,353,229 |
| 5.5% 9/13/25 | | 1,694,000 | 1,692,134 |
| 6.174% 5/25/34 (c) | | 1,574,000 | 1,600,743 |
| 6.27% 11/17/33 (c) | | 7,000,000 | 7,331,330 |
| Citizens Financial Group, Inc.: | | | |
| 2.638% 9/30/32 | | 1,490,000 | 1,143,070 |
| 5.841% 1/23/30 (c) | | 9,000,000 | 8,971,879 |
| Commonwealth Bank of Australia 3.61% 9/12/34 (b)(c) | | 802,000 | 722,403 |
| Cooperatieve Rabobank UA 4.375% 8/4/25 | | 2,285,000 | 2,249,050 |
| HSBC Holdings PLC 4.95% 3/31/30 | | 437,000 | 429,521 |
| Intesa Sanpaolo SpA 5.71% 1/15/26 (b) | | 3,922,000 | 3,884,715 |
| JPMorgan Chase & Co.: | | | |
| 2.956% 5/13/31 (c) | | 1,324,000 | 1,160,379 |
| 3.875% 9/10/24 | | 13,419,000 | 13,366,568 |
| 4.125% 12/15/26 | | 4,319,000 | 4,207,841 |
| 4.493% 3/24/31 (c) | | 3,926,000 | 3,781,632 |
| 4.586% 4/26/33 (c) | | 12,887,000 | 12,293,375 |
| 4.912% 7/25/33 (c) | | 5,229,000 | 5,078,598 |
| 5.717% 9/14/33 (c) | | 2,500,000 | 2,534,607 |
| NatWest Group PLC 3.073% 5/22/28 (c) | | 1,427,000 | 1,335,296 |
| Santander Holdings U.S.A., Inc.: | | | |
| 2.49% 1/6/28 (c) | | 1,754,000 | 1,616,401 |
| 6.499% 3/9/29 (c) | | 2,600,000 | 2,648,258 |
| Societe Generale 1.488% 12/14/26 (b)(c) | | 2,986,000 | 2,791,459 |
| Wells Fargo & Co.: | | | |
| 2.406% 10/30/25 (c) | | 1,400,000 | 1,384,095 |
| 3.526% 3/24/28 (c) | | 2,893,000 | 2,759,481 |
| 4.478% 4/4/31 (c) | | 4,386,000 | 4,199,133 |
| 4.897% 7/25/33 (c) | | 5,000,000 | 4,809,322 |
| 5.013% 4/4/51 (c) | | 4,931,000 | 4,491,732 |
| 5.499% 1/23/35 (c) | | 1,539,000 | 1,533,603 |
| Westpac Banking Corp. 4.11% 7/24/34 (c) | | 1,139,000 | 1,052,414 |
| | | | 168,083,559 |
| Capital Markets - 3.5% | | | |
| Affiliated Managers Group, Inc. 3.5% 8/1/25 | | 572,000 | 559,414 |
| Ares Capital Corp. 3.875% 1/15/26 | | 3,822,000 | 3,690,255 |
| Athene Global Funding: | | | |
| 5.339% 1/15/27 (b) | | 4,132,000 | 4,130,965 |
| 5.583% 1/9/29 (b) | | 2,079,000 | 2,087,410 |
| Blackstone Private Credit Fund: | | | |
| 4.7% 3/24/25 | | 5,035,000 | 4,984,946 |
| 7.05% 9/29/25 | | 2,656,000 | 2,681,585 |
| Deutsche Bank AG 4.5% 4/1/25 | | 3,669,000 | 3,624,307 |
| Deutsche Bank AG New York Branch 6.72% 1/18/29 (c) | | 1,600,000 | 1,651,172 |
| Goldman Sachs Group, Inc.: | | | |
| 2.383% 7/21/32 (c) | | 2,893,000 | 2,375,820 |
| 3.102% 2/24/33 (c) | | 4,837,000 | 4,131,101 |
| 3.691% 6/5/28 (c) | | 12,774,000 | 12,219,887 |
| 3.8% 3/15/30 | | 4,751,000 | 4,441,860 |
| 4.25% 10/21/25 | | 696,000 | 683,803 |
| 6.75% 10/1/37 | | 689,000 | 743,313 |
| Moody's Corp.: | | | |
| 3.25% 1/15/28 | | 732,000 | 692,235 |
| 3.75% 3/24/25 | | 1,557,000 | 1,535,891 |
| Morgan Stanley: | | | |
| 3.125% 7/27/26 | | 6,737,000 | 6,440,833 |
| 3.622% 4/1/31 (c) | | 3,078,000 | 2,824,417 |
| 3.625% 1/20/27 | | 3,374,000 | 3,253,029 |
| 4.431% 1/23/30 (c) | | 1,348,000 | 1,304,041 |
| 4.889% 7/20/33 (c) | | 6,522,000 | 6,287,270 |
| 5% 11/24/25 | | 4,489,000 | 4,458,020 |
| 5.25% 4/21/34 (c) | | 2,830,000 | 2,785,725 |
| 5.424% 7/21/34 (c) | | 3,524,000 | 3,506,249 |
| 6.296% 10/18/28 (c) | | 2,500,000 | 2,579,388 |
| 6.342% 10/18/33 (c) | | 5,000,000 | 5,307,448 |
| Peachtree Corners Funding Trust 3.976% 2/15/25 (b) | | 1,534,000 | 1,511,759 |
| Sixth Street Specialty Lending, Inc. 6.125% 3/1/29 | | 1,805,000 | 1,781,635 |
| UBS Group AG: | | | |
| 1.494% 8/10/27 (b)(c) | | 1,788,000 | 1,640,415 |
| 2.593% 9/11/25 (b)(c) | | 3,245,000 | 3,223,435 |
| 3.75% 3/26/25 | | 1,429,000 | 1,409,283 |
| 3.869% 1/12/29 (b)(c) | | 1,233,000 | 1,163,840 |
| 4.125% 9/24/25 (b) | | 1,614,000 | 1,582,546 |
| 4.194% 4/1/31 (b)(c) | | 2,950,000 | 2,753,898 |
| 4.55% 4/17/26 | | 790,000 | 776,312 |
| | | | 104,823,507 |
| Consumer Finance - 2.0% | | | |
| AerCap Ireland Capital Ltd./AerCap Global Aviation Trust: | | | |
| 1.65% 10/29/24 | | 886,000 | 873,996 |
| 2.45% 10/29/26 | | 1,236,000 | 1,152,982 |
| 3% 10/29/28 | | 1,295,000 | 1,176,858 |
| 3.3% 1/30/32 | | 1,385,000 | 1,190,015 |
| 3.5% 1/15/25 | | 2,546,000 | 2,514,080 |
| 4.45% 4/3/26 | | 959,000 | 941,313 |
| 6.45% 4/15/27 | | 4,054,000 | 4,146,521 |
| 6.5% 7/15/25 | | 1,112,000 | 1,120,504 |
| Ally Financial, Inc.: | | | |
| 5.125% 9/30/24 | | 656,000 | 654,328 |
| 5.8% 5/1/25 | | 1,606,000 | 1,604,473 |
| 6.7% 2/14/33 | | 5,000,000 | 4,970,855 |
| 7.1% 11/15/27 | | 2,560,000 | 2,667,322 |
| 8% 11/1/31 | | 829,000 | 914,874 |
| Capital One Financial Corp.: | | | |
| 2.636% 3/3/26 (c) | | 1,495,000 | 1,462,988 |
| 3.273% 3/1/30 (c) | | 1,912,000 | 1,725,863 |
| 3.65% 5/11/27 | | 4,134,000 | 3,953,192 |
| 3.8% 1/31/28 | | 2,165,000 | 2,058,184 |
| 4.927% 5/10/28 (c) | | 2,300,000 | 2,267,396 |
| 4.985% 7/24/26 (c) | | 2,151,000 | 2,132,299 |
| 5.247% 7/26/30 (c) | | 2,770,000 | 2,721,304 |
| 5.468% 2/1/29 (c) | | 1,952,000 | 1,942,973 |
| 5.817% 2/1/34 (c) | | 2,680,000 | 2,652,497 |
| Discover Financial Services: | | | |
| 3.95% 11/6/24 | | 873,000 | 867,395 |
| 4.1% 2/9/27 | | 875,000 | 841,218 |
| 4.5% 1/30/26 | | 1,437,000 | 1,408,411 |
| 6.7% 11/29/32 | | 537,000 | 560,356 |
| Ford Motor Credit Co. LLC 4.063% 11/1/24 | | 5,400,000 | 5,367,454 |
| Synchrony Financial: | | | |
| 3.95% 12/1/27 | | 2,356,000 | 2,200,180 |
| 4.25% 8/15/24 | | 2,051,000 | 2,046,060 |
| 5.15% 3/19/29 | | 2,051,000 | 1,969,379 |
| | | | 60,105,270 |
| Financial Services - 0.8% | | | |
| Corebridge Financial, Inc.: | | | |
| 3.5% 4/4/25 | | 646,000 | 635,248 |
| 3.65% 4/5/27 | | 2,280,000 | 2,181,793 |
| 3.85% 4/5/29 | | 904,000 | 847,263 |
| 3.9% 4/5/32 | | 1,076,000 | 963,124 |
| 4.35% 4/5/42 | | 245,000 | 201,445 |
| 4.4% 4/5/52 | | 724,000 | 569,207 |
| Corebridge Global Funding 5.9% 9/19/28 (b) | | 1,659,000 | 1,693,735 |
| Equitable Holdings, Inc.: | | | |
| 4.35% 4/20/28 | | 1,304,000 | 1,260,524 |
| 4.572% 2/15/29 (b) | | 450,000 | 432,586 |
| Jackson Financial, Inc.: | | | |
| 3.125% 11/23/31 | | 273,000 | 228,806 |
| 5.17% 6/8/27 | | 1,014,000 | 1,010,798 |
| 5.67% 6/8/32 | | 1,092,000 | 1,099,167 |
| Jbs U.S.A. Holding Lux/ Jbs U.S.A. F: | | | |
| 2.5% 1/15/27 | | 4,189,000 | 3,897,646 |
| 3% 5/15/32 | | 3,400,000 | 2,798,959 |
| 3.625% 1/15/32 | | 320,000 | 276,249 |
| 5.125% 2/1/28 | | 1,340,000 | 1,324,580 |
| 5.5% 1/15/30 | | 380,000 | 374,209 |
| 5.75% 4/1/33 | | 1,961,000 | 1,956,316 |
| Pine Street Trust II 5.568% 2/15/49 (b) | | 1,748,000 | 1,603,801 |
| | | | 23,355,456 |
| Insurance - 0.7% | | | |
| AIA Group Ltd.: | | | |
| 3.2% 9/16/40 (b) | | 1,070,000 | 781,642 |
| 3.375% 4/7/30 (b) | | 2,257,000 | 2,055,204 |
| Five Corners Funding Trust II 2.85% 5/15/30 (b) | | 3,419,000 | 3,010,339 |
| Liberty Mutual Group, Inc. 4.569% 2/1/29 (b) | | 1,255,000 | 1,223,470 |
| Marsh & McLennan Companies, Inc.: | | | |
| 4.375% 3/15/29 | | 1,220,000 | 1,191,877 |
| 4.75% 3/15/39 | | 560,000 | 520,262 |
| Massachusetts Mutual Life Insurance Co. 3.729% 10/15/70 (b) | | 1,782,000 | 1,203,604 |
| MetLife, Inc. 5.375% 7/15/33 | | 3,527,000 | 3,555,465 |
| Pacific LifeCorp 5.125% 1/30/43 (b) | | 1,611,000 | 1,489,578 |
| Swiss Re Finance Luxembourg SA 5% 4/2/49 (b)(c) | | 200,000 | 192,500 |
| Teachers Insurance & Annuity Association of America 4.9% 9/15/44 (b) | | 1,640,000 | 1,449,697 |
| TIAA Asset Management Finance LLC 4.125% 11/1/24 (b) | | 543,000 | 539,605 |
| Unum Group: | | | |
| 3.875% 11/5/25 | | 1,491,000 | 1,451,869 |
| 4% 6/15/29 | | 1,353,000 | 1,275,063 |
| 5.75% 8/15/42 | | 2,232,000 | 2,146,135 |
| | | | 22,086,310 |
TOTAL FINANCIALS | | | 378,454,102 |
| HEALTH CARE - 1.4% | | | |
| Biotechnology - 0.3% | | | |
| Amgen, Inc.: | | | |
| 5.15% 3/2/28 | | 1,463,000 | 1,462,785 |
| 5.25% 3/2/30 | | 1,336,000 | 1,345,800 |
| 5.25% 3/2/33 | | 1,508,000 | 1,503,605 |
| 5.6% 3/2/43 | | 1,433,000 | 1,412,259 |
| 5.65% 3/2/53 | | 712,000 | 701,208 |
| 5.75% 3/2/63 | | 1,298,000 | 1,271,044 |
| | | | 7,696,701 |
| Health Care Providers & Services - 0.9% | | | |
| Centene Corp.: | | | |
| 2.45% 7/15/28 | | 3,009,000 | 2,671,480 |
| 2.625% 8/1/31 | | 1,403,000 | 1,152,168 |
| 3.375% 2/15/30 | | 1,564,000 | 1,388,228 |
| 4.25% 12/15/27 | | 1,762,000 | 1,682,334 |
| 4.625% 12/15/29 | | 2,738,000 | 2,589,669 |
| Cigna Group: | | | |
| 3.05% 10/15/27 | | 982,000 | 922,088 |
| 4.375% 10/15/28 | | 1,860,000 | 1,806,192 |
| 4.8% 8/15/38 | | 1,158,000 | 1,064,022 |
| 4.9% 12/15/48 | | 1,157,000 | 1,016,901 |
| CVS Health Corp.: | | | |
| 3% 8/15/26 | | 192,000 | 182,958 |
| 3.625% 4/1/27 | | 551,000 | 528,536 |
| 4.78% 3/25/38 | | 1,830,000 | 1,633,854 |
| 5% 1/30/29 | | 1,114,000 | 1,102,573 |
| 5.25% 1/30/31 | | 457,000 | 451,814 |
| HCA Holdings, Inc.: | | | |
| 3.5% 9/1/30 | | 1,260,000 | 1,136,566 |
| 3.625% 3/15/32 | | 287,000 | 252,808 |
| 5.625% 9/1/28 | | 1,311,000 | 1,323,621 |
| 5.875% 2/1/29 | | 1,446,000 | 1,472,171 |
| Humana, Inc. 3.7% 3/23/29 | | 827,000 | 775,522 |
| Sabra Health Care LP 3.2% 12/1/31 | | 2,870,000 | 2,385,728 |
| Toledo Hospital 5.325% 11/15/28 | | 647,000 | 617,885 |
| | | | 26,157,118 |
| Pharmaceuticals - 0.2% | | | |
| Bayer U.S. Finance II LLC 4.25% 12/15/25 (b) | | 1,338,000 | 1,308,936 |
| Elanco Animal Health, Inc. 6.65% 8/28/28 (c) | | 409,000 | 414,591 |
| Mylan NV 4.55% 4/15/28 | | 1,227,000 | 1,181,999 |
| Utah Acquisition Sub, Inc. 3.95% 6/15/26 | | 782,000 | 758,221 |
| Viatris, Inc.: | | | |
| 1.65% 6/22/25 | | 302,000 | 290,246 |
| 2.7% 6/22/30 | | 1,533,000 | 1,301,132 |
| 3.85% 6/22/40 | | 262,000 | 191,312 |
| 4% 6/22/50 | | 757,000 | 509,444 |
| | | | 5,955,881 |
TOTAL HEALTH CARE | | | 39,809,700 |
| INDUSTRIALS - 0.6% | | | |
| Aerospace & Defense - 0.3% | | | |
| BAE Systems PLC 3.4% 4/15/30 (b) | | 696,000 | 630,351 |
| The Boeing Co.: | | | |
| 5.04% 5/1/27 | | 909,000 | 888,972 |
| 5.15% 5/1/30 | | 909,000 | 872,900 |
| 5.705% 5/1/40 | | 920,000 | 848,208 |
| 5.805% 5/1/50 | | 920,000 | 829,104 |
| 5.93% 5/1/60 | | 908,000 | 811,799 |
| 6.259% 5/1/27 (b) | | 645,000 | 649,360 |
| 6.298% 5/1/29 (b) | | 827,000 | 838,628 |
| 6.388% 5/1/31 (b) | | 626,000 | 637,304 |
| 6.528% 5/1/34 (b) | | 670,000 | 686,013 |
| 6.858% 5/1/54 (b) | | 1,009,000 | 1,035,407 |
| 7.008% 5/1/64 (b) | | 952,000 | 974,724 |
| | | | 9,702,770 |
| Building Products - 0.0% | | | |
| Carrier Global Corp.: | | | |
| 5.9% 3/15/34 | | 316,000 | 329,799 |
| 6.2% 3/15/54 | | 328,000 | 351,170 |
| | | | 680,969 |
| Professional Services - 0.0% | | | |
| Thomson Reuters Corp. 3.85% 9/29/24 | | 317,000 | 315,272 |
| Trading Companies & Distributors - 0.1% | | | |
| Air Lease Corp.: | | | |
| 3.375% 7/1/25 | | 1,977,000 | 1,931,817 |
| 4.25% 9/15/24 | | 1,093,000 | 1,089,305 |
| | | | 3,021,122 |
| Transportation Infrastructure - 0.2% | | | |
| Avolon Holdings Funding Ltd.: | | | |
| 4.25% 4/15/26 (b) | | 485,000 | 471,075 |
| 4.375% 5/1/26 (b) | | 1,433,000 | 1,393,932 |
| 6.375% 5/4/28 (b) | | 2,451,000 | 2,489,024 |
| | | | 4,354,031 |
TOTAL INDUSTRIALS | | | 18,074,164 |
| INFORMATION TECHNOLOGY - 0.7% | | | |
| Electronic Equipment, Instruments & Components - 0.1% | | | |
| Dell International LLC/EMC Corp.: | | | |
| 5.85% 7/15/25 | | 397,000 | 397,962 |
| 6.02% 6/15/26 | | 342,000 | 345,578 |
| 6.1% 7/15/27 | | 729,000 | 747,562 |
| 6.2% 7/15/30 | | 631,000 | 662,420 |
| | | | 2,153,522 |
| Semiconductors & Semiconductor Equipment - 0.4% | | | |
| Broadcom, Inc.: | | | |
| 1.95% 2/15/28 (b) | | 510,000 | 456,531 |
| 2.45% 2/15/31 (b) | | 4,340,000 | 3,654,760 |
| 2.6% 2/15/33 (b) | | 4,340,000 | 3,517,161 |
| 3.5% 2/15/41 (b) | | 3,505,000 | 2,686,765 |
| 3.75% 2/15/51 (b) | | 1,645,000 | 1,225,027 |
| | | | 11,540,244 |
| Software - 0.2% | | | |
| Oracle Corp.: | | | |
| 1.65% 3/25/26 | | 1,992,000 | 1,867,197 |
| 2.3% 3/25/28 | | 3,147,000 | 2,845,216 |
| 2.8% 4/1/27 | | 1,797,000 | 1,687,118 |
| 3.6% 4/1/40 | | 1,797,000 | 1,381,202 |
| | | | 7,780,733 |
TOTAL INFORMATION TECHNOLOGY | | | 21,474,499 |
| MATERIALS - 0.1% | | | |
| Chemicals - 0.1% | | | |
| Celanese U.S. Holdings LLC: | | | |
| 6.35% 11/15/28 | | 1,381,000 | 1,418,951 |
| 6.55% 11/15/30 | | 1,399,000 | 1,461,945 |
| 6.7% 11/15/33 | | 817,000 | 858,544 |
| | | | 3,739,440 |
| REAL ESTATE - 2.5% | | | |
| Equity Real Estate Investment Trusts (REITs) - 2.2% | | | |
| Alexandria Real Estate Equities, Inc. 4.9% 12/15/30 | | 1,278,000 | 1,250,760 |
| American Homes 4 Rent LP: | | | |
| 2.375% 7/15/31 | | 231,000 | 187,684 |
| 3.625% 4/15/32 | | 989,000 | 864,670 |
| 5.5% 7/15/34 | | 3,001,000 | 2,948,604 |
| Boston Properties, Inc.: | | | |
| 3.25% 1/30/31 | | 1,190,000 | 1,005,814 |
| 4.5% 12/1/28 | | 1,193,000 | 1,125,381 |
| 6.75% 12/1/27 | | 1,655,000 | 1,697,734 |
| Brixmor Operating Partnership LP: | | | |
| 4.05% 7/1/30 | | 1,554,000 | 1,442,148 |
| 4.125% 6/15/26 | | 1,425,000 | 1,387,387 |
| 4.125% 5/15/29 | | 1,549,000 | 1,462,038 |
| Corporate Office Properties LP: | | | |
| 2% 1/15/29 | | 199,000 | 168,732 |
| 2.25% 3/15/26 | | 510,000 | 481,504 |
| 2.75% 4/15/31 | | 509,000 | 420,836 |
| Healthcare Realty Holdings LP: | | | |
| 3.1% 2/15/30 | | 402,000 | 351,524 |
| 3.5% 8/1/26 | | 419,000 | 401,383 |
| Healthpeak OP, LLC: | | | |
| 3.25% 7/15/26 | | 176,000 | 168,561 |
| 3.5% 7/15/29 | | 201,000 | 185,673 |
| Hudson Pacific Properties LP 4.65% 4/1/29 | | 2,374,000 | 1,828,301 |
| Invitation Homes Operating Partnership LP 4.15% 4/15/32 | | 1,453,000 | 1,325,535 |
| Kite Realty Group Trust: | | | |
| 4% 3/15/25 | | 1,912,000 | 1,883,195 |
| 4.75% 9/15/30 | | 2,980,000 | 2,846,369 |
| LXP Industrial Trust (REIT) 2.7% 9/15/30 | | 560,000 | 472,473 |
| Omega Healthcare Investors, Inc.: | | | |
| 3.25% 4/15/33 | | 1,945,000 | 1,572,203 |
| 3.375% 2/1/31 | | 1,027,000 | 877,139 |
| 3.625% 10/1/29 | | 1,814,000 | 1,619,468 |
| 4.5% 1/15/25 | | 821,000 | 814,408 |
| 4.5% 4/1/27 | | 4,967,000 | 4,808,639 |
| 4.75% 1/15/28 | | 1,958,000 | 1,894,554 |
| 5.25% 1/15/26 | | 1,744,000 | 1,727,122 |
| Phillips Edison Grocery Center Operating Partnership I LP 5.75% 7/15/34 | | 473,000 | 467,108 |
| Piedmont Operating Partnership LP 2.75% 4/1/32 | | 451,000 | 330,774 |
| Realty Income Corp.: | | | |
| 2.2% 6/15/28 | | 244,000 | 218,309 |
| 2.85% 12/15/32 | | 301,000 | 248,067 |
| 3.25% 1/15/31 | | 313,000 | 276,878 |
| 3.4% 1/15/28 | | 489,000 | 460,923 |
| Retail Opportunity Investments Partnership LP 4% 12/15/24 | | 300,000 | 296,866 |
| Simon Property Group LP 2.45% 9/13/29 | | 499,000 | 438,397 |
| SITE Centers Corp.: | | | |
| 3.625% 2/1/25 | | 694,000 | 684,786 |
| 4.25% 2/1/26 | | 906,000 | 895,981 |
| Store Capital LLC: | | | |
| 2.75% 11/18/30 | | 2,676,000 | 2,217,244 |
| 4.625% 3/15/29 | | 550,000 | 519,444 |
| Sun Communities Operating LP: | | | |
| 2.3% 11/1/28 | | 512,000 | 450,076 |
| 2.7% 7/15/31 | | 1,323,000 | 1,092,708 |
| Ventas Realty LP: | | | |
| 3% 1/15/30 | | 2,340,000 | 2,065,869 |
| 3.5% 2/1/25 | | 1,976,000 | 1,948,189 |
| 4% 3/1/28 | | 688,000 | 656,235 |
| 4.125% 1/15/26 | | 478,000 | 467,047 |
| 4.375% 2/1/45 | | 234,000 | 183,755 |
| 4.75% 11/15/30 | | 3,072,000 | 2,948,441 |
| VICI Properties LP: | | | |
| 4.375% 5/15/25 | | 256,000 | 252,601 |
| 4.75% 2/15/28 | | 2,029,000 | 1,981,818 |
| 4.95% 2/15/30 | | 2,648,000 | 2,554,632 |
| 5.125% 5/15/32 | | 720,000 | 685,970 |
| 5.75% 4/1/34 | | 374,000 | 370,495 |
| Vornado Realty LP 2.15% 6/1/26 | | 578,000 | 533,077 |
| WP Carey, Inc.: | | | |
| 2.4% 2/1/31 | | 1,166,000 | 967,239 |
| 3.85% 7/15/29 | | 391,000 | 365,068 |
| 4% 2/1/25 | | 1,644,000 | 1,624,293 |
| | | | 63,422,129 |
| Real Estate Management & Development - 0.3% | | | |
| Brandywine Operating Partnership LP: | | | |
| 3.95% 11/15/27 | | 1,415,000 | 1,282,091 |
| 4.55% 10/1/29 | | 1,792,000 | 1,559,716 |
| 8.05% 3/15/28 | | 2,334,000 | 2,421,254 |
| CBRE Group, Inc. 2.5% 4/1/31 | | 1,708,000 | 1,418,851 |
| Tanger Properties LP: | | | |
| 2.75% 9/1/31 | | 1,346,000 | 1,096,578 |
| 3.125% 9/1/26 | | 1,874,000 | 1,766,640 |
| | | | 9,545,130 |
TOTAL REAL ESTATE | | | 72,967,259 |
| UTILITIES - 1.0% | | | |
| Electric Utilities - 0.4% | | | |
| Alabama Power Co. 3.05% 3/15/32 | | 2,030,000 | 1,755,352 |
| Cleco Corporate Holdings LLC: | | | |
| 3.375% 9/15/29 | | 1,057,000 | 925,487 |
| 3.743% 5/1/26 | | 4,043,000 | 3,897,472 |
| Duke Energy Corp. 2.45% 6/1/30 | | 854,000 | 733,273 |
| Duquesne Light Holdings, Inc.: | | | |
| 2.532% 10/1/30 (b) | | 405,000 | 340,715 |
| 2.775% 1/7/32 (b) | | 1,402,000 | 1,137,958 |
| Entergy Corp. 2.8% 6/15/30 | | 876,000 | 765,108 |
| Exelon Corp.: | | | |
| 2.75% 3/15/27 | | 449,000 | 420,818 |
| 3.35% 3/15/32 | | 546,000 | 478,693 |
| 4.05% 4/15/30 | | 534,000 | 501,108 |
| 4.1% 3/15/52 | | 404,000 | 310,564 |
| 4.7% 4/15/50 | | 238,000 | 200,740 |
| Southern Co. 5.7% 3/15/34 | | 2,053,000 | 2,087,259 |
| | | | 13,554,547 |
| Gas Utilities - 0.0% | | | |
| Nakilat, Inc. 6.067% 12/31/33 (b) | | 444,988 | 461,119 |
| Independent Power and Renewable Electricity Producers - 0.2% | | | |
| Emera U.S. Finance LP 3.55% 6/15/26 | | 580,000 | 556,207 |
| The AES Corp.: | | | |
| 2.45% 1/15/31 | | 673,000 | 554,088 |
| 3.3% 7/15/25 (b) | | 2,635,000 | 2,568,810 |
| 3.95% 7/15/30 (b) | | 2,298,000 | 2,101,137 |
| | | | 5,780,242 |
| Multi-Utilities - 0.4% | | | |
| Berkshire Hathaway Energy Co. 4.05% 4/15/25 | | 3,813,000 | 3,771,416 |
| Consolidated Edison Co. of New York, Inc. 3.35% 4/1/30 | | 242,000 | 222,177 |
| NiSource, Inc.: | | | |
| 2.95% 9/1/29 | | 2,624,000 | 2,358,418 |
| 3.6% 5/1/30 | | 1,602,000 | 1,470,100 |
| Puget Energy, Inc.: | | | |
| 4.1% 6/15/30 | | 1,032,000 | 949,469 |
| 4.224% 3/15/32 | | 1,875,000 | 1,680,605 |
| WEC Energy Group, Inc. CME Term SOFR 3 Month Index + 2.110% 7.6965% 5/15/67 (c)(d) | | 437,000 | 431,998 |
| | | | 10,884,183 |
TOTAL UTILITIES | | | 30,680,091 |
| TOTAL NONCONVERTIBLE BONDS (Cost $799,178,283) | | | 745,472,108 |
| | | | |
| U.S. Treasury Obligations - 44.2% |
| | | Principal Amount (a) | Value ($) |
| U.S. Treasury Bonds: | | | |
| 1.125% 5/15/40 | | 12,353,900 | 7,601,992 |
| 1.75% 8/15/41 | | 43,542,800 | 28,772,266 |
| 1.875% 11/15/51 | | 13,856,800 | 8,043,439 |
| 2% 11/15/41 | | 16,500,000 | 11,335,371 |
| 2% 8/15/51 | | 56,304,200 | 33,822,109 |
| 2.25% 2/15/52 | | 36,300,000 | 23,124,234 |
| 2.875% 5/15/52 | | 23,300,000 | 17,077,262 |
| 3% 2/15/47 | | 25,251,500 | 19,352,907 |
| 3.375% 8/15/42 | | 34,200,000 | 28,885,641 |
| 3.625% 5/15/53 | | 26,100,000 | 22,210,488 |
| 4.125% 8/15/53 | | 53,171,000 | 49,513,417 |
| 4.25% 2/15/54 | | 67,700,000 | 64,463,094 |
| 4.625% 5/15/54 | | 12,830,000 | 13,008,417 |
| U.S. Treasury Notes: | | | |
| 1.25% 5/31/28 | | 63,257,700 | 56,081,905 |
| 1.75% 1/31/29 | | 24,900,000 | 22,201,851 |
| 2.375% 3/31/29 | | 20,000,000 | 18,296,094 |
| 3.375% 5/15/33 | | 74,100,000 | 68,672,754 |
| 3.5% 2/15/33 | | 63,000,000 | 59,047,734 |
| 3.75% 6/30/30 | | 64,800,000 | 62,724,375 |
| 3.875% 11/30/27 | | 55,000,000 | 53,953,711 |
| 3.875% 12/31/27 | | 69,000,000 | 67,679,299 |
| 3.875% 11/30/29 | | 123,000,000 | 120,136,392 |
| 3.875% 12/31/29 | | 85,000,000 | 82,981,250 |
| 3.875% 8/15/33 | | 5,308,000 | 5,106,462 |
| 4% 6/30/28 | | 17,000,000 | 16,741,680 |
| 4% 1/31/29 | | 75,000,000 | 73,845,704 |
| 4% 1/31/31 | | 57,600,000 | 56,441,250 |
| 4% 2/15/34 | | 17,800,000 | 17,277,125 |
| 4.125% 8/31/30 | | 24,900,000 | 24,582,914 |
| 4.125% 11/15/32 | | 71,600,000 | 70,394,547 |
| 4.375% 11/30/30 | | 88,200,000 | 88,272,351 |
| 4.875% 10/31/30 | | 22,600,000 | 23,238,273 |
| TOTAL U.S. TREASURY OBLIGATIONS (Cost $1,441,894,014) | | | 1,314,886,308 |
| | | | |
| U.S. Government Agency - Mortgage Securities - 30.1% |
| | | Principal Amount (a) | Value ($) |
| Fannie Mae - 6.3% | | | |
| Refinitiv USD IBOR Consumer Cash Fallbacks Term 1Y + 1.310% 6.438% 5/1/34 (c)(d) | | 6,289 | 6,318 |
| Refinitiv USD IBOR Consumer Cash Fallbacks Term 1Y + 1.420% 5.572% 9/1/33 (c)(d) | | 16,085 | 16,165 |
| Refinitiv USD IBOR Consumer Cash Fallbacks Term 1Y + 1.480% 5.73% 7/1/34 (c)(d) | | 776 | 789 |
| Refinitiv USD IBOR Consumer Cash Fallbacks Term 1Y + 1.550% 5.803% 6/1/36 (c)(d) | | 1,943 | 1,981 |
| Refinitiv USD IBOR Consumer Cash Fallbacks Term 1Y + 1.550% 7.174% 10/1/33 (c)(d) | | 760 | 767 |
| Refinitiv USD IBOR Consumer Cash Fallbacks Term 1Y + 1.560% 7.359% 7/1/35 (c)(d) | | 1,063 | 1,075 |
| Refinitiv USD IBOR Consumer Cash Fallbacks Term 1Y + 1.640% 6.274% 11/1/36 (c)(d) | | 17,950 | 18,285 |
| Refinitiv USD IBOR Consumer Cash Fallbacks Term 1Y + 1.700% 7.16% 6/1/42 (c)(d) | | 11,346 | 11,597 |
| Refinitiv USD IBOR Consumer Cash Fallbacks Term 1Y + 1.730% 7.393% 5/1/36 (c)(d) | | 10,859 | 11,083 |
| Refinitiv USD IBOR Consumer Cash Fallbacks Term 1Y + 1.750% 6.325% 7/1/35 (c)(d) | | 1,253 | 1,277 |
| Refinitiv USD IBOR Consumer Cash Fallbacks Term 1Y + 1.780% 6.163% 2/1/36 (c)(d) | | 6,081 | 6,205 |
| Refinitiv USD IBOR Consumer Cash Fallbacks Term 1Y + 1.800% 6.05% 7/1/41 (c)(d) | | 3,431 | 3,521 |
| Refinitiv USD IBOR Consumer Cash Fallbacks Term 1Y + 1.810% 6.068% 9/1/41 (c)(d) | | 5,070 | 5,216 |
| Refinitiv USD IBOR Consumer Cash Fallbacks Term 1Y + 1.810% 6.145% 7/1/41 (c)(d) | | 6,816 | 7,005 |
| Refinitiv USD IBOR Consumer Cash Fallbacks Term 1Y + 1.820% 6.195% 12/1/35 (c)(d) | | 6,320 | 6,467 |
| Refinitiv USD IBOR Consumer Cash Fallbacks Term 1Y + 1.830% 6.08% 10/1/41 (c)(d) | | 4,409 | 4,458 |
| Refinitiv USD IBOR Consumer Cash Fallbacks Term 1Y + 1.950% 6.385% 9/1/36 (c)(d) | | 11,404 | 11,713 |
| Refinitiv USD IBOR Consumer Cash Fallbacks Term 1Y + 1.950% 7.515% 7/1/37 (c)(d) | | 4,337 | 4,462 |
| U.S. TREASURY 1 YEAR INDEX + 1.940% 5.87% 10/1/33 (c)(d) | | 16,227 | 16,393 |
| U.S. TREASURY 1 YEAR INDEX + 2.200% 6.583% 3/1/35 (c)(d) | | 1,417 | 1,431 |
| U.S. TREASURY 1 YEAR INDEX + 2.220% 6.392% 8/1/36 (c)(d) | | 19,167 | 19,396 |
| U.S. TREASURY 1 YEAR INDEX + 2.280% 6.402% 10/1/33 (c)(d) | | 2,240 | 2,269 |
| U.S. TREASURY 1 YEAR INDEX + 2.420% 6.851% 5/1/35 (c)(d) | | 2,418 | 2,452 |
| 1.5% 11/1/35 to 6/1/51 | | 10,129,662 | 8,497,220 |
| 2% 10/1/35 to 2/1/52 | | 63,073,737 | 51,648,789 |
| 2.5% 7/1/31 to 5/1/53 | | 44,639,874 | 37,583,252 |
| 3% 8/1/32 to 5/1/52 | | 24,932,913 | 21,842,076 |
| 3.5% 8/1/34 to 5/1/52 | | 16,902,223 | 15,533,352 |
| 4% 7/1/39 to 4/1/52 | | 12,480,306 | 11,664,466 |
| 4.5% to 4.5% 5/1/25 to 12/1/52 | | 11,740,028 | 11,240,974 |
| 5% 9/1/25 to 12/1/52 | | 4,445,277 | 4,341,715 |
| 5.5% 10/1/52 to 8/1/53 | | 12,511,049 | 12,429,413 |
| 6% 10/1/34 to 6/1/53 | | 6,065,544 | 6,163,575 |
| 6.5% 7/1/32 to 3/1/54 | | 5,856,055 | 6,045,337 |
| 7% to 7% 8/1/25 to 2/1/29 | | 12,324 | 12,659 |
| 7.5% to 7.5% 9/1/25 to 11/1/31 | | 19,466 | 20,019 |
| 8.5% 6/1/25 | | 29 | 29 |
TOTAL FANNIE MAE | | | 187,183,201 |
| Freddie Mac - 4.6% | | | |
| Refinitiv USD IBOR Consumer Cash Fallbacks Term 1Y + 1.370% 5.625% 3/1/36 (c)(d) | | 9,763 | 9,866 |
| Refinitiv USD IBOR Consumer Cash Fallbacks Term 1Y + 1.650% 7.299% 4/1/35 (c)(d) | | 9,840 | 9,927 |
| Refinitiv USD IBOR Consumer Cash Fallbacks Term 1Y + 1.880% 6.13% 9/1/41 (c)(d) | | 6,919 | 7,096 |
| Refinitiv USD IBOR Consumer Cash Fallbacks Term 1Y + 1.880% 7.255% 4/1/41 (c)(d) | | 1,628 | 1,663 |
| Refinitiv USD IBOR Consumer Cash Fallbacks Term 1Y + 1.910% 6.16% 6/1/41 (c)(d) | | 5,104 | 5,251 |
| Refinitiv USD IBOR Consumer Cash Fallbacks Term 1Y + 1.910% 7.213% 5/1/41 (c)(d) | | 14,828 | 15,154 |
| Refinitiv USD IBOR Consumer Cash Fallbacks Term 1Y + 1.910% 7.336% 6/1/41 (c)(d) | | 13,938 | 14,283 |
| Refinitiv USD IBOR Consumer Cash Fallbacks Term 1Y + 1.910% 7.562% 5/1/41 (c)(d) | | 16,055 | 16,447 |
| Refinitiv USD IBOR Consumer Cash Fallbacks Term 1Y + 2.030% 6.158% 3/1/33 (c)(d) | | 148 | 150 |
| Refinitiv USD IBOR Consumer Cash Fallbacks Term 1Y + 2.160% 6.41% 11/1/35 (c)(d) | | 703 | 720 |
| Refinitiv USD IBOR Consumer Cash Fallbacks Term 1Y + 3.000% 8.626% 10/1/35 (c)(d) | | 689 | 709 |
| U.S. TREASURY 1 YEAR INDEX + 2.240% 6.371% 1/1/35 (c)(d) | | 1,090 | 1,098 |
| 1.5% 8/1/35 to 4/1/51 | | 26,154,546 | 21,276,437 |
| 2% 6/1/35 to 3/1/52 | | 28,116,425 | 23,418,549 |
| 2.5% 8/1/32 to 1/1/52 | | 23,008,052 | 19,298,883 |
| 3% 6/1/31 to 5/1/52 | | 12,911,491 | 11,198,379 |
| 3.5% 3/1/32 to 4/1/52 | | 30,165,122 | 27,520,953 |
| 4% 5/1/37 to 10/1/52 | | 7,616,828 | 7,163,070 |
| 4.5% 7/1/25 to 10/1/48 | | 4,893,572 | 4,731,229 |
| 5% 1/1/40 to 12/1/52 | | 4,291,014 | 4,200,266 |
| 5.5% 9/1/52 to 8/1/53 | | 10,249,072 | 10,206,224 |
| 6% 4/1/32 to 6/1/53 | | 1,841,885 | 1,867,301 |
| 6.5% 1/1/53 to 1/1/54 | | 4,383,759 | 4,503,388 |
| 7.5% 8/1/26 to 11/1/31 | | 2,584 | 2,691 |
| 8% 4/1/27 to 5/1/27 | | 176 | 177 |
| 8.5% 5/1/27 to 1/1/28 | | 280 | 285 |
TOTAL FREDDIE MAC | | | 135,470,196 |
| Ginnie Mae - 6.5% | | | |
| 3% 12/20/42 to 4/20/47 | | 1,867,377 | 1,660,485 |
| 3.5% 12/20/40 to 1/20/50 | | 1,265,676 | 1,156,117 |
| 4% 3/15/40 to 10/20/52 | | 8,670,980 | 8,111,429 |
| 4.5% 5/15/39 to 4/20/53 | | 5,773,534 | 5,516,943 |
| 5% 3/15/39 to 4/20/48 | | 606,744 | 604,784 |
| 6.5% 4/15/35 to 11/15/35 | | 13,812 | 14,215 |
| 7% 1/15/28 to 7/15/32 | | 64,376 | 65,594 |
| 7.5% to 7.5% 11/15/25 to 10/15/28 | | 9,027 | 9,153 |
| 8% 3/15/30 to 9/15/30 | | 1,804 | 1,871 |
| 2% 10/20/50 to 2/20/52 | | 24,501,144 | 19,846,567 |
| 2% 7/1/54 (e) | | 11,350,000 | 9,190,506 |
| 2% 7/1/54 (e) | | 14,100,000 | 11,417,280 |
| 2% 7/1/54 (e) | | 4,500,000 | 3,643,813 |
| 2% 7/1/54 (e) | | 1,400,000 | 1,133,631 |
| 2% 7/1/54 (e) | | 7,400,000 | 5,992,048 |
| 2% 8/1/54 (e) | | 2,850,000 | 2,309,863 |
| 2% 8/1/54 (e) | | 16,950,000 | 13,737,609 |
| 2.5% 6/20/51 to 12/20/51 | | 7,270,275 | 6,093,510 |
| 2.5% 7/1/54 (e) | | 11,500,000 | 9,671,378 |
| 2.5% 7/1/54 (e) | | 15,500,000 | 13,035,336 |
| 3% 7/1/54 (e) | | 8,050,000 | 7,019,491 |
| 3% 7/1/54 (e) | | 7,875,000 | 6,866,894 |
| 3% 7/1/54 (e) | | 3,400,000 | 2,964,754 |
| 3% 7/1/54 (e) | | 4,125,000 | 3,596,944 |
| 3% 8/1/54 (e) | | 12,000,000 | 10,468,525 |
| 3% 8/1/54 (e) | | 2,000,000 | 1,744,754 |
| 3.5% 7/1/54 (e) | | 4,900,000 | 4,404,035 |
| 3.5% 7/1/54 (e) | | 5,600,000 | 5,033,183 |
| 3.5% 8/1/54 (e) | | 7,450,000 | 6,699,132 |
| 4% 7/1/54 (e) | | 7,300,000 | 6,746,190 |
| 4% 8/1/54 (e) | | 7,300,000 | 6,763,508 |
| 4.5% 7/1/54 (e) | | 2,800,000 | 2,661,599 |
| 5.5% 7/1/54 (e) | | 2,800,000 | 2,778,019 |
| 5.5% 7/1/54 (e) | | 2,400,000 | 2,381,160 |
| 5.5% 7/1/54 (e) | | 3,400,000 | 3,373,309 |
| 5.5% 8/1/54 (e) | | 3,400,000 | 3,371,716 |
| 5.5% 8/1/54 (e) | | 900,000 | 892,513 |
| 6.5% 7/1/54 (e) | | 1,000,000 | 1,013,886 |
| 6.5% 8/1/54 (e) | | 1,000,000 | 1,012,832 |
TOTAL GINNIE MAE | | | 193,004,576 |
| Uniform Mortgage Backed Securities - 12.7% | | | |
| 2% 7/1/39 (e) | | 600,000 | 527,390 |
| 2% 8/1/39 (e) | | 600,000 | 527,906 |
| 2% 7/1/54 (e) | | 42,000,000 | 32,848,595 |
| 2% 7/1/54 (e) | | 13,550,000 | 10,597,582 |
| 2% 7/1/54 (e) | | 10,350,000 | 8,094,832 |
| 2% 7/1/54 (e) | | 7,350,000 | 5,748,504 |
| 2% 7/1/54 (e) | | 15,700,000 | 12,279,118 |
| 2% 7/1/54 (e) | | 9,800,000 | 7,664,672 |
| 2% 7/1/54 (e) | | 23,300,000 | 18,223,149 |
| 2% 7/1/54 (e) | | 6,050,000 | 4,731,762 |
| 2% 7/1/54 (e) | | 19,325,000 | 15,114,264 |
| 2% 8/1/54 (e) | | 61,600,000 | 48,226,061 |
| 2% 8/1/54 (e) | | 28,000,000 | 21,920,937 |
| 2% 8/1/54 (e) | | 9,650,000 | 7,554,894 |
| 2% 8/1/54 (e) | | 9,675,000 | 7,574,467 |
| 2.5% 7/1/54 (e) | | 16,100,000 | 13,149,173 |
| 2.5% 7/1/54 (e) | | 4,250,000 | 3,471,055 |
| 2.5% 7/1/54 (e) | | 4,200,000 | 3,430,219 |
| 2.5% 7/1/54 (e) | | 15,900,000 | 12,985,829 |
| 2.5% 7/1/54 (e) | | 7,025,000 | 5,737,450 |
| 2.5% 7/1/54 (e) | | 10,550,000 | 8,616,383 |
| 2.5% 7/1/54 (e) | | 2,350,000 | 1,919,289 |
| 2.5% 7/1/54 (e) | | 850,000 | 694,211 |
| 2.5% 7/1/54 (e) | | 5,250,000 | 4,287,774 |
| 2.5% 7/1/54 (e) | | 450,000 | 367,523 |
| 2.5% 7/1/54 (e) | | 1,600,000 | 1,306,750 |
| 2.5% 8/1/54 (e) | | 26,650,000 | 21,785,333 |
| 2.5% 8/1/54 (e) | | 11,325,000 | 9,257,745 |
| 2.5% 8/1/54 (e) | | 4,200,000 | 3,433,336 |
| 3% 7/1/54 (e) | | 13,000,000 | 11,062,194 |
| 3% 7/1/54 (e) | | 6,650,000 | 5,658,738 |
| 3% 7/1/54 (e) | | 7,700,000 | 6,552,223 |
| 3% 8/1/54 (e) | | 11,250,000 | 9,580,084 |
| 3% 8/1/54 (e) | | 8,500,000 | 7,238,286 |
| 3.5% 7/1/54 (e) | | 5,650,000 | 5,000,688 |
| 3.5% 7/1/54 (e) | | 1,400,000 | 1,239,109 |
| 3.5% 7/1/54 (e) | | 50,000 | 44,254 |
| 3.5% 7/1/54 (e) | | 3,250,000 | 2,876,502 |
| 3.5% 8/1/54 (e) | | 10,350,000 | 9,162,171 |
| 4% 7/1/54 (e) | | 6,450,000 | 5,900,743 |
| 4% 7/1/54 (e) | | 4,200,000 | 3,842,344 |
| 4% 7/1/54 (e) | | 4,850,000 | 4,436,992 |
| 4% 8/1/54 (e) | | 4,850,000 | 4,439,266 |
| 4.5% 7/1/54 (e) | | 3,200,000 | 3,016,374 |
| 6.5% 7/1/54 (e) | | 6,400,000 | 6,513,496 |
TOTAL UNIFORM MORTGAGE BACKED SECURITIES | | | 378,639,667 |
| TOTAL U.S. GOVERNMENT AGENCY - MORTGAGE SECURITIES (Cost $920,980,953) | | | 894,297,640 |
| | | | |
| Asset-Backed Securities - 6.5% |
| | | Principal Amount (a) | Value ($) |
| Aaset 2024-1 U.S. Ltd. / Aaset 20 Series 2024-1A: | | | |
| Class A1, 6.261% 5/16/49 (b) | | 1,671,000 | 1,672,337 |
| Class A2, 6.261% 5/16/49 (b) | | 1,526,000 | 1,527,984 |
| AASET Trust: | | | |
| Series 2018-1A Class A, 3.844% 1/16/38 (b) | | 672,250 | 481,998 |
| Series 2019-1 Class A, 3.844% 5/15/39 (b) | | 158,412 | 149,704 |
| Series 2019-2: | | | |
Class A, 3.376% 10/16/39 (b) | | 1,076,093 | 1,022,308 |
Class B, 4.458% 10/16/39 (b) | | 315,410 | 164,016 |
| Series 2021-1A Class A, 2.95% 11/16/41 (b) | | 1,382,130 | 1,273,813 |
| Series 2021-2A Class A, 2.798% 1/15/47 (b) | | 2,820,334 | 2,521,966 |
| Aimco Series 2024-BA Class ARR, CME Term SOFR 3 Month Index + 1.500% 6.8277% 4/16/37 (b)(c)(d) | | 2,577,000 | 2,592,387 |
| AIMCO CLO Series 2021-AA Class AR2, CME Term SOFR 3 Month Index + 1.400% 6.7187% 10/17/34 (b)(c)(d) | | 2,489,000 | 2,492,587 |
| Aimco Clo 22 Ltd. / Aimco Clo 2 Series 2024-22A Class A, CME Term SOFR 3 Month Index + 1.500% 6.8266% 4/19/37 (b)(c)(d) | | 4,137,000 | 4,145,262 |
| AIMCO CLO Ltd. Series 2021-11A Class AR, CME Term SOFR 3 Month Index + 1.390% 6.7087% 10/17/34 (b)(c)(d) | | 1,280,878 | 1,281,945 |
| AIMCO CLO Ltd. / AIMCO CLO LLC Series 2021-14A Class A, CME Term SOFR 3 Month Index + 1.250% 6.5762% 4/20/34 (b)(c)(d) | | 3,132,569 | 3,133,797 |
| Allegro CLO XV, Ltd. / Allegro CLO VX LLC Series 2022-1A Class A, CME Term SOFR 3 Month Index + 1.500% 6.8246% 7/20/35 (b)(c)(d) | | 1,736,000 | 1,738,361 |
| Allegro CLO, Ltd. Series 2021-1A Class A, CME Term SOFR 3 Month Index + 1.400% 6.7262% 7/20/34 (b)(c)(d) | | 1,532,085 | 1,533,455 |
| Apollo Aviation Securitization Equity Trust Series 2020-1A Class A, 3.351% 1/16/40 (b) | | 356,087 | 327,590 |
| Ares CLO Series 2024-54A Class AR, CME Term SOFR 3 Month Index + 1.270% 6.5986% 10/15/32 (b)(c)(d) | | 2,687,000 | 2,687,940 |
| Ares LIX CLO Ltd. Series 2021-59A Class A, CME Term SOFR 3 Month Index + 1.290% 6.6152% 4/25/34 (b)(c)(d) | | 1,039,487 | 1,040,209 |
| Ares Ln Funding V Ltd. Series 2024-ALF5A Class A1, CME Term SOFR 3 Month Index + 1.500% 6.8235% 7/25/37 (b)(c)(d) | | 2,418,000 | 2,418,665 |
| Ares LV CLO Ltd. Series 2021-55A Class A1R, CME Term SOFR 3 Month Index + 1.390% 6.7202% 7/15/34 (b)(c)(d) | | 1,931,133 | 1,934,634 |
| Ares LVIII CLO LLC Series 2022-58A Class AR, CME Term SOFR 3 Month Index + 1.330% 6.6586% 1/15/35 (b)(c)(d) | | 2,545,000 | 2,546,105 |
| Ares XLI CLO Ltd. / Ares XLI CLO LLC Series 2021-41A Class AR2, CME Term SOFR 3 Month Index + 1.330% 6.6602% 4/15/34 (b)(c)(d) | | 2,173,138 | 2,173,138 |
| Babson CLO Ltd. Series 2021-1A Class AR, CME Term SOFR 3 Month Index + 1.410% 6.7402% 10/15/36 (b)(c)(d) | | 1,292,534 | 1,293,487 |
| Barings CLO Ltd.: | | | |
| Series 2021-1A Class A, CME Term SOFR 3 Month Index + 1.280% 6.6052% 4/25/34 (b)(c)(d) | | 2,282,638 | 2,283,261 |
| Series 2021-4A Class A, CME Term SOFR 3 Month Index + 1.480% 6.8062% 1/20/32 (b)(c)(d) | | 1,923,581 | 1,925,903 |
| Barings CLO Ltd. 2023-IV Series 2024-4A Class A, CME Term SOFR 3 Month Index + 1.750% 7.0612% 1/20/37 (b)(c)(d) | | 3,122,000 | 3,153,935 |
| Beechwood Park CLO Ltd. Series 2022-1A Class A1R, CME Term SOFR 3 Month Index + 1.300% 6.6171% 1/17/35 (b)(c)(d) | | 2,560,000 | 2,553,667 |
| BETHP Series 2021-1A Class A, CME Term SOFR 3 Month Index + 1.390% 6.7202% 1/15/35 (b)(c)(d) | | 1,953,217 | 1,955,590 |
| Blackbird Capital Aircraft: | | | |
| Series 2016-1A Class A, 4.213% 12/16/41 (b) | | 1,221,774 | 1,209,764 |
| Series 2021-1A Class A, 2.443% 7/15/46 (b) | | 2,058,339 | 1,841,452 |
| Bristol Park CLO, Ltd. Series 2020-1A Class AR, CME Term SOFR 3 Month Index + 1.250% 6.5802% 4/15/29 (b)(c)(d) | | 1,081,471 | 1,082,108 |
| Carlyle U.S. CLO Ltd. Series 2024-11A Class A1R, CME Term SOFR 3 Month Index + 1.410% 0% 7/25/37 (b)(c)(d) | | 2,843,000 | 2,843,000 |
| Castlelake Aircraft Securitization Trust Series 2019-1A: | | | |
| Class A, 3.967% 4/15/39 (b) | | 1,094,688 | 985,498 |
| Class B, 5.095% 4/15/39 (b) | | 666,261 | 452,732 |
| Castlelake Aircraft Structured Trust: | | | |
| Series 2018-1 Class A, 4.125% 6/15/43 (b) | | 344,837 | 321,575 |
| Series 2021-1A Class A, 3.474% 1/15/46 (b) | | 263,585 | 247,938 |
| Cedar Funding Ltd.: | | | |
| Series 2021-10A Class AR, CME Term SOFR 3 Month Index + 1.360% 6.6862% 10/20/32 (b)(c)(d) | | 1,561,530 | 1,562,731 |
| Series 2021-12A Class A1R, CME Term SOFR 3 Month Index + 1.390% 6.7152% 10/25/34 (b)(c)(d) | | 1,198,676 | 1,200,460 |
| Series 2022-15A Class A, CME Term SOFR 3 Month Index + 1.320% 6.6446% 4/20/35 (b)(c)(d) | | 2,429,000 | 2,430,856 |
| Cedar Funding Xvii Clo Ltd. Series 2023-17A Class A, CME Term SOFR 3 Month Index + 1.850% 7.1746% 7/20/36 (b)(c)(d) | | 1,848,000 | 1,857,011 |
| CEDF Series 2021-6A Class ARR, CME Term SOFR 3 Month Index + 1.310% 6.6362% 4/20/34 (b)(c)(d) | | 1,887,884 | 1,888,207 |
| Columbia Cent CLO 29 Ltd./Columbia Cent CLO 29 Corp. Series 2021-29A Class AR, CME Term SOFR 3 Month Index + 1.430% 6.7562% 10/20/34 (b)(c)(d) | | 1,944,015 | 1,947,223 |
| Columbia Cent CLO 31 Ltd. Series 2021-31A Class A1, CME Term SOFR 3 Month Index + 1.460% 6.7862% 4/20/34 (b)(c)(d) | | 2,085,721 | 2,088,042 |
| Columbia Cent CLO Ltd. / Columbia Cent CLO Corp. Series 2021-30A Class A1, CME Term SOFR 3 Month Index + 1.570% 6.8962% 1/20/34 (b)(c)(d) | | 2,729,841 | 2,731,842 |
| DB Master Finance LLC: | | | |
| Series 2017-1A Class A2II, 4.03% 11/20/47 (b) | | 1,733,438 | 1,645,972 |
| Series 2021-1A Class A23, 2.791% 11/20/51 (b) | | 4,653,675 | 3,854,245 |
| Dryden 98 CLO Ltd. Series 2022-98A Class A, CME Term SOFR 3 Month Index + 1.300% 6.6246% 4/20/35 (b)(c)(d) | | 2,990,000 | 2,994,548 |
| Dryden CLO, Ltd.: | | | |
| Series 2021-76A Class A1R, CME Term SOFR 3 Month Index + 1.410% 6.7362% 10/20/34 (b)(c)(d) | | 2,447,693 | 2,449,419 |
| Series 2024-83A Class AR, CME Term SOFR 3 Month Index + 1.530% 6.8642% 4/18/37 (b)(c)(d) | | 2,356,000 | 2,359,298 |
| Dryden Senior Loan Fund: | | | |
| Series 2021-85A Class AR, CME Term SOFR 3 Month Index + 1.410% 6.7402% 10/15/35 (b)(c)(d) | | 3,517,039 | 3,520,785 |
| Series 2021-90A Class A1A, CME Term SOFR 3 Month Index + 1.390% 6.7174% 2/20/35 (b)(c)(d) | | 2,075,083 | 2,076,098 |
| Series 2024-85A Class A1R2, CME Term SOFR 3 Month Index + 1.380% 0% 7/15/37 (b)(c)(d) | | 2,257,000 | 2,257,000 |
| Eaton Vance CLO, Ltd.: | | | |
| Series 2021-2A Class AR, CME Term SOFR 3 Month Index + 1.410% 6.7402% 1/15/35 (b)(c)(d) | | 2,283,000 | 2,286,319 |
| Series 2024-1A Class AR2, CME Term SOFR 3 Month Index + 1.510% 6.8399% 7/15/37 (b)(c)(d) | | 2,272,000 | 2,270,553 |
| Eaton Vance CLO, Ltd. / Eaton Vance CLO LLC Series 2021-1A Class A13R, CME Term SOFR 3 Month Index + 1.510% 6.8402% 1/15/34 (b)(c)(d) | | 444,749 | 445,288 |
| Flatiron CLO Ltd. Series 2021-1A: | | | |
| Class A1, CME Term SOFR 3 Month Index + 1.370% 6.6982% 7/19/34 (b)(c)(d) | | 1,392,832 | 1,395,572 |
| Class AR, CME Term SOFR 3 Month Index + 1.340% 6.6683% 11/16/34 (b)(c)(d) | | 1,993,704 | 1,993,704 |
| Flatiron CLO Ltd. / Flatiron CLO LLC Series 2024-1A Class AR, CME Term SOFR 3 Month Index + 1.380% 6.6613% 5/20/36 (b)(c)(d) | | 2,662,000 | 2,666,076 |
| Horizon Aircraft Finance I Ltd. Series 2018-1 Class A, 4.458% 12/15/38 (b) | | 605,399 | 550,664 |
| Horizon Aircraft Finance Ltd. Series 2019-1 Class A, 3.721% 7/15/39 (b) | | 1,982,244 | 1,812,501 |
| Invesco CLO Ltd. Series 2021-3A Class A, CME Term SOFR 3 Month Index + 1.390% 6.7162% 10/22/34 (b)(c)(d) | | 1,367,988 | 1,369,788 |
| Invesco U.S. Clo 2024-1 Ltd. Series 2024-1RA Class AR, CME Term SOFR 3 Month Index + 1.550% 6.8694% 4/15/37 (b)(c)(d) | | 2,115,000 | 2,126,345 |
| Invesco U.S. CLO Ltd. Series 2024-3A Class A, CME Term SOFR 3 Month Index + 1.510% 6.8292% 7/20/37 (b)(c)(d) | | 1,856,000 | 1,855,740 |
| KKR CLO Ltd. Series 2022-41A Class A1, CME Term SOFR 3 Month Index + 1.330% 6.6586% 4/15/35 (b)(c)(d) | | 3,167,000 | 3,167,621 |
| Madison Park Funding Series 2024-19A Class AR3, CME Term SOFR 3 Month Index + 1.600% 6.9246% 1/22/37 (b)(c)(d) | | 1,000,000 | 1,007,041 |
| Madison Park Funding L Ltd. / Madison Park Funding L LLC Series 2021-50A Class A, CME Term SOFR 3 Month Index + 1.400% 6.7282% 4/19/34 (b)(c)(d) | | 2,186,940 | 2,190,653 |
| Madison Park Funding LII Ltd. / Madison Park Funding LII LLC Series 2021-52A Class A, CME Term SOFR 3 Month Index + 1.360% 6.6862% 1/22/35 (b)(c)(d) | | 2,223,747 | 2,223,847 |
| Madison Park Funding XLV Ltd./Madison Park Funding XLV LLC Series 2021-45A Class AR, CME Term SOFR 3 Month Index + 1.380% 6.7102% 7/15/34 (b)(c)(d) | | 1,390,072 | 1,390,906 |
| Madison Park Funding XXXII, Ltd. / Madison Park Funding XXXII LLC Series 2021-32A Class A2R, CME Term SOFR 3 Month Index + 1.460% 6.7862% 1/22/31 (b)(c)(d) | | 573,573 | 572,238 |
| Madison Pk Funding Lxvii Ltd. / Mad Series 2024-67A Class A1, CME Term SOFR 3 Month Index + 1.510% 6.8002% 4/25/37 (b)(c)(d) | | 2,724,000 | 2,729,516 |
| Magnetite CLO LTD Series 2023-36A Class A, CME Term SOFR 3 Month Index + 1.800% 7.1246% 4/22/36 (b)(c)(d) | | 1,275,000 | 1,282,862 |
| Magnetite CLO Ltd. Series 2021-27A Class AR, CME Term SOFR 3 Month Index + 1.400% 6.7262% 10/20/34 (b)(c)(d) | | 461,006 | 461,237 |
| Magnetite IX, Ltd. / Magnetite IX LLC Series 2021-30A Class A, CME Term SOFR 3 Month Index + 1.390% 6.7152% 10/25/34 (b)(c)(d) | | 2,357,478 | 2,358,732 |
| Magnetite XXI Ltd. Series 2021-21A Class AR, CME Term SOFR 3 Month Index + 1.280% 6.6062% 4/20/34 (b)(c)(d) | | 1,823,166 | 1,824,110 |
| Magnetite XXIII, Ltd. Series 2021-23A Class AR, CME Term SOFR 3 Month Index + 1.390% 6.7152% 1/25/35 (b)(c)(d) | | 5,340,000 | 5,342,318 |
| Magnetite XXIX, Ltd. / Magnetite XXIX LLC Series 2021-29A Class A, CME Term SOFR 3 Month Index + 1.250% 6.5802% 1/15/34 (b)(c)(d) | | 1,828,036 | 1,829,270 |
| Milos CLO, Ltd. Series 2020-1A Class AR, CME Term SOFR 3 Month Index + 1.330% 6.6562% 10/20/30 (b)(c)(d) | | 1,447,082 | 1,448,167 |
| Neuberger Berman Loan Advisers Series 2024-25A Class AR2, CME Term SOFR 3 Month Index + 1.400% 6.723% 7/18/38 (b)(c)(d) | | 2,147,000 | 2,147,000 |
| Oak Hill Credit Partners Series 2024-18A: | | | |
| Class A1, 6.7917% 4/20/37 (b)(c) | | 3,069,000 | 3,089,685 |
| Class A2, CME Term SOFR 3 Month Index + 1.650% 6.9417% 4/20/37 (b)(c)(d) | | 250,000 | 251,177 |
| Park Place Securities, Inc. Series 2005-WCH1 Class M4, CME Term SOFR 1 Month Index + 1.350% 6.7047% 1/25/36 (c)(d) | | 19,523 | 19,260 |
| Peace Park CLO, Ltd. Series 2021-1A Class A, CME Term SOFR 3 Month Index + 1.390% 6.7162% 10/20/34 (b)(c)(d) | | 760,982 | 761,614 |
| PK ALIFT Loan Funding 3 LP Series 2024-1 Class A1, 5.842% 9/15/39 (b) | | 506,000 | 506,101 |
| Planet Fitness Master Issuer LLC: | | | |
| Series 2019-1A Class A2, 3.858% 12/5/49 (b) | | 1,419,130 | 1,296,332 |
| Series 2022-1A: | | | |
Class A2I, 3.251% 12/5/51 (b) | | 1,538,585 | 1,444,116 |
Class A2II, 4.008% 12/5/51 (b) | | 1,374,365 | 1,207,143 |
| Project Silver Series 2019-1 Class A, 3.967% 7/15/44 (b) | | 1,077,414 | 976,493 |
| Rockland Park CLO Ltd. Series 2021-1A Class A, CME Term SOFR 3 Month Index + 1.380% 6.7062% 4/20/34 (b)(c)(d) | | 2,604,698 | 2,607,355 |
| RR Ltd. Series 2022-7A Class A1AB, CME Term SOFR 3 Month Index + 1.340% 6.6686% 1/15/37 (b)(c)(d) | | 2,626,000 | 2,627,297 |
| Sapphire Aviation Finance Series 2020-1A Class A, 3.228% 3/15/40 (b) | | 1,151,178 | 1,056,367 |
| SBA Tower Trust: | | | |
| Series 2019, 2.836% 1/15/50 (b) | | 1,902,000 | 1,868,593 |
| 1.884% 7/15/50 (b) | | 733,000 | 689,343 |
| 2.328% 7/15/52 (b) | | 560,000 | 502,769 |
| Subway Funding LLC Issuer Series 2024-1A: | | | |
| Class A23, 6.505% 7/30/54 (b) | | 1,953,000 | 1,990,480 |
| Class A2I, 6.028% 7/30/54 (b) | | 3,746,000 | 3,779,047 |
| Class A2II, 6.268% 7/30/54 (b) | | 2,227,000 | 2,256,989 |
| SYMP Series 2022-32A Class A1, CME Term SOFR 3 Month Index + 1.320% 6.6464% 4/23/35 (b)(c)(d) | | 2,727,000 | 2,731,920 |
| Symphony Clo 43 Ltd. Series 2024-43A Class A1, CME Term SOFR 3 Month Index + 1.520% 6.8465% 4/15/37 (b)(c)(d) | | 1,886,000 | 1,895,636 |
| Symphony CLO XXI, Ltd. Series 2021-21A Class AR, CME Term SOFR 3 Month Index + 1.320% 6.6502% 7/15/32 (b)(c)(d) | | 256,728 | 256,904 |
| Symphony CLO XXV Ltd. / Symphony CLO XXV LLC Series 2021-25A Class A, CME Term SOFR 3 Month Index + 1.240% 6.5682% 4/19/34 (b)(c)(d) | | 2,313,924 | 2,316,300 |
| Symphony CLO XXVI Ltd. / Symphony CLO XXVI LLC Series 2021-26A Class AR, CME Term SOFR 3 Month Index + 1.340% 6.6662% 4/20/33 (b)(c)(d) | | 2,177,375 | 2,179,304 |
| Terwin Mortgage Trust Series 2003-4HE Class A1, CME Term SOFR 1 Month Index + 0.970% 6.3197% 9/25/34 (c)(d) | | 2,073 | 2,087 |
| Thunderbolt Aircraft Lease Ltd. Series 2018-A Class A, 4.147% 9/15/38 (b)(c) | | 1,306,720 | 1,182,203 |
| Thunderbolt III Aircraft Lease Ltd. Series 2019-1 Class A, 3.671% 11/15/39 (b) | | 1,615,395 | 1,413,519 |
| Voya Clo 2023-1 Ltd. Series 2023-1A Class A1, CME Term SOFR 3 Month Index + 1.800% 7.1702% 1/20/37 (b)(c)(d) | | 2,387,000 | 2,412,899 |
| Voya Clo Ltd. Series 2024-1A Class A1, CME Term SOFR 3 Month Index + 1.520% 6.8461% 4/15/37 (b)(c)(d) | | 1,190,000 | 1,190,697 |
| Voya CLO Ltd./Voya CLO LLC: | | | |
| Series 2021-2A Class A1R, CME Term SOFR 3 Month Index + 1.420% 6.7482% 7/19/34 (b)(c)(d) | | 1,277,198 | 1,277,788 |
| Series 2021-3A Class AR, CME Term SOFR 3 Month Index + 1.410% 6.7362% 10/20/34 (b)(c)(d) | | 2,613,900 | 2,614,671 |
| Voya CLO, Ltd. Series 2021-1A Class AR, CME Term SOFR 3 Month Index + 1.410% 6.7393% 7/16/34 (b)(c)(d) | | 1,289,773 | 1,292,030 |
| TOTAL ASSET-BACKED SECURITIES (Cost $196,510,878) | | | 194,318,035 |
| | | | |
| Collateralized Mortgage Obligations - 0.0% |
| | | Principal Amount (a) | Value ($) |
| Private Sponsor - 0.0% | | | |
| Sequoia Mortgage Trust floater Series 2004-6 Class A3B, CME Term SOFR 6 Month Index + 1.300% 6.5772% 7/20/34 (c)(d) | | 396 | 361 |
| U.S. Government Agency - 0.0% | | | |
| Fannie Mae planned amortization class Series 1999-57 Class PH, 6.5% 12/25/29 | | 12,931 | 12,950 |
| TOTAL COLLATERALIZED MORTGAGE OBLIGATIONS (Cost $12,805) | | | 13,311 |
| | | | |
| Commercial Mortgage Securities - 3.9% |
| | | Principal Amount (a) | Value ($) |
| BAMLL Commercial Mortgage Securities Trust: | | | |
| floater Series 2022-DKLX: | | | |
Class A, CME Term SOFR 1 Month Index + 1.150% 6.479% 1/15/39 (b)(c)(d) | | 1,415,000 | 1,401,292 |
Class B, CME Term SOFR 1 Month Index + 1.550% 6.879% 1/15/39 (b)(c)(d) | | 267,000 | 263,245 |
Class C, CME Term SOFR 1 Month Index + 2.150% 7.479% 1/15/39 (b)(c)(d) | | 191,000 | 187,896 |
| sequential payer Series 2019-BPR Class ANM, 3.112% 11/5/32 (b) | | 1,183,000 | 1,083,924 |
| Series 2019-BPR: | | | |
Class BNM, 3.465% 11/5/32 (b) | | 265,000 | 228,231 |
Class CNM, 3.8425% 11/5/32 (b)(c) | | 110,000 | 79,062 |
| BANK sequential payer: | | | |
| Series 2018-BN10 Class A5, 3.688% 2/15/61 | | 118,089 | 111,456 |
| Series 2019-BN21 Class A5, 2.851% 10/17/52 | | 201,824 | 176,993 |
| BBCMS Mortgage Trust sequential payer Series 2023-C21 Class A3, 6.5063% 9/15/56 (c) | | 1,307,000 | 1,375,624 |
| Benchmark Mortgage Trust: | | | |
| sequential payer: | | | |
Series 2018-B4 Class A5, 4.121% 7/15/51 | | 420,518 | 400,490 |
Series 2019-B10 Class A4, 3.717% 3/15/62 | | 389,846 | 362,892 |
| Series 2018-B8 Class A5, 4.2317% 1/15/52 | | 2,882,896 | 2,707,661 |
| BLP Commercial Mortgage Trust sequential payer Series 2024-IND2 Class A, CME Term SOFR 1 Month Index + 1.340% 6.671% 3/15/41 (b)(c)(d) | | 1,221,000 | 1,211,843 |
| BMP floater Series 2024-MF23: | | | |
| Class A, CME Term SOFR 1 Month Index + 1.370% 6.7008% 6/15/41 (b)(c)(d) | | 1,665,000 | 1,653,553 |
| Class B, CME Term SOFR 1 Month Index + 1.640% 6.9704% 6/15/41 (b)(c)(d) | | 822,000 | 816,869 |
| Class C, CME Term SOFR 1 Month Index + 1.840% 7.1701% 6/15/41 (b)(c)(d) | | 581,000 | 576,640 |
| BPR Trust floater Series 2022-OANA: | | | |
| Class A, CME Term SOFR 1 Month Index + 1.890% 7.2268% 4/15/37 (b)(c)(d) | | 5,047,000 | 5,046,999 |
| Class B, CME Term SOFR 1 Month Index + 2.440% 7.7758% 4/15/37 (b)(c)(d) | | 1,341,000 | 1,340,999 |
| BX Commercial Mortgage Trust: | | | |
| floater: | | | |
Series 2019-IMC: | | | |
| Class B, CME Term SOFR 1 Month Index + 1.340% 6.6753% 4/15/34 (b)(c)(d) | | 1,007,281 | 988,411 |
| Class C, CME Term SOFR 1 Month Index + 1.640% 6.9753% 4/15/34 (b)(c)(d) | | 665,897 | 649,264 |
| Class D, CME Term SOFR 1 Month Index + 1.940% 7.2753% 4/15/34 (b)(c)(d) | | 699,023 | 679,817 |
Series 2021-LBA Class AJV, CME Term SOFR 1 Month Index + 0.910% 6.2435% 2/15/36 (b)(c)(d) | | 278,000 | 274,438 |
Series 2021-PAC: | | | |
| Class A, CME Term SOFR 1 Month Index + 0.800% 6.1326% 10/15/36 (b)(c)(d) | | 2,648,253 | 2,614,439 |
| Class B, CME Term SOFR 1 Month Index + 1.010% 6.3423% 10/15/36 (b)(c)(d) | | 396,287 | 389,623 |
| Class C, CME Term SOFR 1 Month Index + 1.210% 6.5421% 10/15/36 (b)(c)(d) | | 530,325 | 520,250 |
| Class D, CME Term SOFR 1 Month Index + 1.410% 6.7418% 10/15/36 (b)(c)(d) | | 514,682 | 501,057 |
| Class E, CME Term SOFR 1 Month Index + 2.060% 7.391% 10/15/36 (b)(c)(d) | | 1,789,733 | 1,745,141 |
Series 2022-IND Class A, CME Term SOFR 1 Month Index + 1.490% 6.8198% 4/15/37 (b)(c)(d) | | 2,014,481 | 2,008,831 |
Series 2022-LP2: | | | |
| Class A, CME Term SOFR 1 Month Index + 1.010% 6.3417% 2/15/39 (b)(c)(d) | | 2,841,884 | 2,809,925 |
| Class B, CME Term SOFR 1 Month Index + 1.310% 6.6411% 2/15/39 (b)(c)(d) | | 856,361 | 845,125 |
| Class C, CME Term SOFR 1 Month Index + 1.560% 6.8905% 2/15/39 (b)(c)(d) | | 856,361 | 844,590 |
| Class D, CME Term SOFR 1 Month Index + 1.960% 7.2896% 2/15/39 (b)(c)(d) | | 856,361 | 843,520 |
Series 2023-XL3: | | | |
| Class A, CME Term SOFR 1 Month Index + 1.760% 7.0903% 12/9/40 (b)(c)(d) | | 1,881,000 | 1,882,171 |
| Class B, CME Term SOFR 1 Month Index + 2.190% 7.5197% 12/9/40 (b)(c)(d) | | 416,000 | 416,648 |
| Class C, CME Term SOFR 1 Month Index + 2.640% 7.969% 12/9/40 (b)(c)(d) | | 225,000 | 225,351 |
| floater sequential payer: | | | |
Series 2019-IMC Class A, CME Term SOFR 1 Month Index + 1.040% 6.3753% 4/15/34 (b)(c)(d) | | 780,087 | 771,319 |
Series 2021-SOAR Class A, CME Term SOFR 1 Month Index + 0.780% 6.1135% 6/15/38 (b)(c)(d) | | 213,047 | 210,657 |
Series 2024-XL5 Class A, CME Term SOFR 1 Month Index + 1.390% 6.7205% 3/15/41 (b)(c)(d) | | 6,699,452 | 6,661,768 |
| BX Commercial Mortgage Trust 2024-Xl4: | | | |
| floater: | | | |
Series 2024-XL4 Class B, CME Term SOFR 1 Month Index + 1.790% 7.1083% 2/15/39 (b)(c)(d) | | 364,434 | 361,929 |
Series 2024-XL5: | | | |
| Class B, CME Term SOFR 1 Month Index + 1.690% 7.0201% 3/15/41 (b)(c)(d) | | 1,145,025 | 1,137,527 |
| Class C, CME Term SOFR 1 Month Index + 1.940% 7.2697% 3/15/41 (b)(c)(d) | | 1,519,987 | 1,506,716 |
| floater sequential payer Series 2024-XL4 Class A, CME Term SOFR 1 Month Index + 1.440% 6.7709% 2/15/39 (b)(c)(d) | | 2,824,857 | 2,815,146 |
| BX Commercial Mtg Trust floater Series 2024-MDHS Class A, 6.9913% 5/15/41 (b)(c) | | 3,847,000 | 3,837,376 |
| BX Trust floater: | | | |
| Series 2022-GPA Class A, CME Term SOFR 1 Month Index + 2.160% 7.4938% 8/15/39 (b)(c)(d) | | 1,921,595 | 1,922,191 |
| Series 2022-IND: | | | |
Class B, CME Term SOFR 1 Month Index + 1.940% 7.2688% 4/15/37 (b)(c)(d) | | 1,026,874 | 1,022,382 |
Class C, CME Term SOFR 1 Month Index + 2.290% 7.6188% 4/15/37 (b)(c)(d) | | 231,899 | 231,102 |
Class D, CME Term SOFR 1 Month Index + 2.830% 8.1678% 4/15/37 (b)(c)(d) | | 194,113 | 193,446 |
| Series 2024-CNYN: | | | |
Class A, CME Term SOFR 1 Month Index + 1.440% 6.7707% 4/15/29 (b)(c)(d) | | 4,430,361 | 4,433,086 |
Class B, CME Term SOFR 1 Month Index + 1.690% 7.0204% 4/15/29 (b)(c)(d) | | 706,433 | 702,016 |
Class C, CME Term SOFR 1 Month Index + 1.940% 7.27% 4/15/29 (b)(c)(d) | | 586,211 | 583,278 |
| CF Hippolyta Issuer LLC sequential payer Series 2021-1A Class A1, 1.53% 3/15/61 (b) | | 2,918,461 | 2,673,166 |
| Computershare Corporate Trust Series 2018-C48 Class A5, 4.302% 1/15/52 | | 850,545 | 813,611 |
| Credit Suisse Mortgage Trust sequential payer Series 2020-NET Class A, 2.2569% 8/15/37 (b) | | 532,946 | 504,095 |
| DTP Commercial Mortgage Trust 2023-Ste2 sequential payer Series 2023-STE2 Class A, 6.038% 1/15/41 (b)(c) | | 563,000 | 563,556 |
| ELP Commercial Mortgage Trust floater Series 2021-ELP: | | | |
| Class A, CME Term SOFR 1 Month Index + 0.810% 6.1445% 11/15/38 (b)(c)(d) | | 3,654,041 | 3,610,673 |
| Class B, CME Term SOFR 1 Month Index + 1.230% 6.5637% 11/15/38 (b)(c)(d) | | 1,013,820 | 1,001,189 |
| Extended Stay America Trust floater Series 2021-ESH: | | | |
| Class A, CME Term SOFR 1 Month Index + 1.190% 6.5235% 7/15/38 (b)(c)(d) | | 1,100,247 | 1,096,121 |
| Class B, CME Term SOFR 1 Month Index + 1.490% 6.8235% 7/15/38 (b)(c)(d) | | 626,378 | 623,843 |
| Class C, CME Term SOFR 1 Month Index + 1.810% 7.1435% 7/15/38 (b)(c)(d) | | 2,266,763 | 2,261,116 |
| Class D, CME Term SOFR 1 Month Index + 2.360% 7.6935% 7/15/38 (b)(c)(d) | | 931,397 | 930,816 |
| GS Mortgage Securities Trust floater Series 2021-IP: | | | |
| Class A, CME Term SOFR 1 Month Index + 1.060% 6.3935% 10/15/36 (b)(c)(d) | | 1,559,690 | 1,540,194 |
| Class B, CME Term SOFR 1 Month Index + 1.260% 6.5935% 10/15/36 (b)(c)(d) | | 241,085 | 235,510 |
| Class C, CME Term SOFR 1 Month Index + 1.660% 6.9935% 10/15/36 (b)(c)(d) | | 2,497,757 | 2,411,897 |
| Intown Mortgage Trust floater sequential payer Series 2022-STAY Class A, CME Term SOFR 1 Month Index + 2.480% 7.8176% 8/15/39 (b)(c)(d) | | 2,328,000 | 2,332,351 |
| JPMorgan Chase Commercial Mortgage Securities Trust Series 2018-WPT: | | | |
| Class CFX, 4.9498% 7/5/33 (b) | | 223,602 | 178,884 |
| Class DFX, 5.3503% 7/5/33 (b) | | 386,779 | 290,089 |
| Life Financial Services Trust floater Series 2022-BMR2: | | | |
| Class A1, CME Term SOFR 1 Month Index + 1.290% 6.6241% 5/15/39 (b)(c)(d) | | 3,430,000 | 3,368,903 |
| Class B, CME Term SOFR 1 Month Index + 1.790% 7.1228% 5/15/39 (b)(c)(d) | | 2,383,000 | 2,320,461 |
| Class C, CME Term SOFR 1 Month Index + 2.090% 7.422% 5/15/39 (b)(c)(d) | | 1,335,000 | 1,295,794 |
| Class D, CME Term SOFR 1 Month Index + 2.540% 7.8708% 5/15/39 (b)(c)(d) | | 1,187,000 | 1,128,902 |
| LIFE Mortgage Trust floater Series 2021-BMR: | | | |
| Class A, CME Term SOFR 1 Month Index + 0.810% 6.1435% 3/15/38 (b)(c)(d) | | 2,199,143 | 2,159,330 |
| Class B, CME Term SOFR 1 Month Index + 0.990% 6.3235% 3/15/38 (b)(c)(d) | | 530,641 | 518,053 |
| Class C, CME Term SOFR 1 Month Index + 1.210% 6.5435% 3/15/38 (b)(c)(d) | | 333,761 | 325,010 |
| Class D, CME Term SOFR 1 Month Index + 1.510% 6.8435% 3/15/38 (b)(c)(d) | | 464,311 | 450,977 |
| Class E, CME Term SOFR 1 Month Index + 1.860% 7.1935% 3/15/38 (b)(c)(d) | | 405,819 | 390,112 |
| Morgan Stanley Capital I Trust: | | | |
| sequential payer Series 2019-MEAD Class A, 3.17% 11/10/36 (b) | | 2,570,651 | 2,450,571 |
| Series 2018-H4 Class A4, 4.31% 12/15/51 | | 1,895,246 | 1,813,513 |
| Series 2019-MEAD: | | | |
Class B, 3.283% 11/10/36 (b)(c) | | 371,442 | 350,377 |
Class C, 3.283% 11/10/36 (b)(c) | | 356,413 | 330,854 |
| Open Trust 2023-Air sequential payer Series 2023-AIR: | | | |
| Class A, CME Term SOFR 1 Month Index + 3.080% 8.4179% 10/15/28 (b)(c)(d) | | 1,507,779 | 1,524,742 |
| Class B, CME Term SOFR 1 Month Index + 3.830% 9.1548% 10/15/28 (b)(c)(d) | | 908,279 | 910,550 |
| OPG Trust floater Series 2021-PORT Class A, CME Term SOFR 1 Month Index + 0.590% 5.9275% 10/15/36 (b)(c)(d) | | 211,037 | 207,478 |
| Providence Place Group Ltd. Partnership Series 2000-C1 Class A2, 7.75% 7/20/28 (b) | | 754,409 | 764,068 |
| SPGN Mortgage Trust floater Series 2022-TFLM: | | | |
| Class B, CME Term SOFR 1 Month Index + 2.000% 7.3288% 2/15/39 (b)(c)(d) | | 642,000 | 629,878 |
| Class C, CME Term SOFR 1 Month Index + 2.650% 7.9788% 2/15/39 (b)(c)(d) | | 334,000 | 324,553 |
| SREIT Trust floater Series 2021-MFP: | | | |
| Class A, CME Term SOFR 1 Month Index + 0.840% 6.1741% 11/15/38 (b)(c)(d) | | 3,228,793 | 3,198,540 |
| Class B, CME Term SOFR 1 Month Index + 1.190% 6.5231% 11/15/38 (b)(c)(d) | | 1,978,713 | 1,949,049 |
| Class C, CME Term SOFR 1 Month Index + 1.440% 6.7723% 11/15/38 (b)(c)(d) | | 840,856 | 828,250 |
| Class D, CME Term SOFR 1 Month Index + 1.690% 7.0215% 11/15/38 (b)(c)(d) | | 552,647 | 544,362 |
| VLS Commercial Mortgage Trust: | | | |
| sequential payer Series 2020-LAB Class A, 2.13% 10/10/42 (b) | | 1,766,729 | 1,416,441 |
| Series 2020-LAB Class B, 2.453% 10/10/42 (b) | | 113,488 | 90,589 |
| Wells Fargo Commercial Mortgage Trust: | | | |
| floater Series 2021-FCMT Class A, CME Term SOFR 1 Month Index + 1.310% 6.6435% 5/15/31 (b)(c)(d) | | 1,349,000 | 1,314,573 |
| sequential payer Series 2015-C26 Class A4, 3.166% 2/15/48 | | 1,026,911 | 1,012,039 |
| TOTAL COMMERCIAL MORTGAGE SECURITIES (Cost $119,403,387) | | | 116,339,289 |
| | | | |
| Foreign Government and Government Agency Obligations - 0.0% |
| | | Principal Amount (a) | Value ($) |
| Kingdom of Saudi Arabia: | | | |
| 3.25% 10/22/30 (b) | | 966,000 | 869,098 |
| 4.5% 4/22/60 (b) | | 736,000 | 596,620 |
| TOTAL FOREIGN GOVERNMENT AND GOVERNMENT AGENCY OBLIGATIONS (Cost $1,690,890) | | | 1,465,718 |
| | | | |
| Bank Notes - 0.1% |
| | | Principal Amount (a) | Value ($) |
| Discover Bank 5.974% 8/9/28 (c)(d) | | 847,000 | 845,932 |
| Regions Bank 6.45% 6/26/37 | | 2,368,000 | 2,414,448 |
| TOTAL BANK NOTES (Cost $3,282,079) | | | 3,260,380 |
| | | | |
| Money Market Funds - 6.9% |
| | | Shares | Value ($) |
Fidelity Cash Central Fund 5.38% (f) (Cost $206,179,616) | | 206,138,782 | 206,180,010 |
| | | | |
| TOTAL INVESTMENT IN SECURITIES - 116.8% (Cost $3,689,132,905) | 3,476,232,799 |
NET OTHER ASSETS (LIABILITIES) - (16.8)% | (500,322,571) |
| NET ASSETS - 100.0% | 2,975,910,228 |
| | |
| TBA Sale Commitments |
| | Principal Amount (a) | Value ($) |
| Ginnie Mae | | |
| 2% 7/1/54 | (2,850,000) | (2,307,751) |
| 2% 7/1/54 | (16,950,000) | (13,725,029) |
| 2% 7/1/54 | (650,000) | (526,329) |
| 3% 7/1/54 | (12,000,000) | (10,463,838) |
| 3% 7/1/54 | (2,000,000) | (1,743,973) |
| 3% 7/1/54 | (4,125,000) | (3,596,944) |
| 3.5% 7/1/54 | (7,450,000) | (6,695,930) |
| 4% 7/1/54 | (7,300,000) | (6,746,190) |
| 5.5% 7/1/54 | (3,400,000) | (3,373,309) |
| 5.5% 7/1/54 | (3,400,000) | (3,373,309) |
| 5.5% 7/1/54 | (900,000) | (892,935) |
| 6.5% 7/1/54 | (1,000,000) | (1,013,886) |
| | | |
| TOTAL GINNIE MAE | | (54,459,423) |
| | | |
| Uniform Mortgage Backed Securities | | |
| 2% 7/1/39 | (600,000) | (527,390) |
| 2% 7/1/54 | (61,600,000) | (48,177,939) |
| 2% 7/1/54 | (6,050,000) | (4,731,762) |
| 2% 7/1/54 | (28,000,000) | (21,899,063) |
| 2% 7/1/54 | (9,650,000) | (7,547,356) |
| 2% 7/1/54 | (9,675,000) | (7,566,908) |
| 2% 7/1/54 | (19,325,000) | (15,114,264) |
| 2.5% 7/1/54 | (26,650,000) | (21,765,556) |
| 2.5% 7/1/54 | (10,550,000) | (8,616,383) |
| 2.5% 7/1/54 | (11,325,000) | (9,249,340) |
| 2.5% 7/1/54 | (4,200,000) | (3,430,219) |
| 3% 7/1/54 | (11,250,000) | (9,573,053) |
| 3% 7/1/54 | (8,500,000) | (7,232,973) |
| 3.5% 7/1/54 | (10,350,000) | (9,160,553) |
| 4% 7/1/54 | (4,850,000) | (4,436,992) |
| 4% 7/1/54 | (4,850,000) | (4,436,992) |
| | | |
| TOTAL UNIFORM MORTGAGE BACKED SECURITIES | | (183,466,743) |
| | | |
TOTAL TBA SALE COMMITMENTS (Proceeds $239,491,482) | | (237,926,166) |
Legend
| (a) | Amount is stated in United States dollars unless otherwise noted. |
| (b) | Security exempt from registration under Rule 144A of the Securities Act of 1933. These securities may be resold in transactions exempt from registration, normally to qualified institutional buyers. At the end of the period, the value of these securities amounted to $386,530,905 or 13.0% of net assets. |
| (c) | Coupon rates for floating and adjustable rate securities reflect the rates in effect at period end. |
| (d) | Coupon is indexed to a floating interest rate which may be multiplied by a specified factor and/or subject to caps or floors. |
| (e) | Security or a portion of the security purchased on a delayed delivery or when-issued basis. |
| (f) | Affiliated fund that is generally available only to investment companies and other accounts managed by Fidelity Investments. The rate quoted is the annualized seven-day yield of the fund at period end. A complete unaudited listing of the fund's holdings as of its most recent quarter end is available upon request. In addition, each Fidelity Central Fund's financial statements are available on the SEC's website or upon request. |
Affiliated Central Funds
Fiscal year to date information regarding the Fund's investments in Fidelity Central Funds, including the ownership percentage, is presented below.
| Affiliate | Value, beginning of period ($) | Purchases ($) | Sales Proceeds ($) | Dividend Income ($) | Realized Gain (loss) ($) | Change in Unrealized appreciation (depreciation) ($) | Value, end of period ($) | % ownership, end of period |
| Fidelity Cash Central Fund 5.38% | 155,019,316 | 224,530,268 | 173,369,930 | 4,448,345 | 356 | - | 206,180,010 | 0.4% |
| Fidelity Securities Lending Cash Central Fund 5.38% | - | 123,674,448 | 123,674,448 | 13,582 | - | - | - | 0.0% |
| Total | 155,019,316 | 348,204,716 | 297,044,378 | 4,461,927 | 356 | - | 206,180,010 | |
| | | | | | | | | |
Amounts in the dividend income column in the above table include any capital gain distributions from underlying funds, which are presented in the corresponding line item in the Statement of Operations, if applicable.
Amounts in the dividend income column for Fidelity Securities Lending Cash Central Fund represents the income earned on investing cash collateral, less rebates paid to borrowers and any lending agent fees associated with the loan, plus any premium payments received for lending certain types of securities.
Amounts included in the purchases and sales proceeds columns may include in-kind transactions, if applicable.
Investment Valuation
The following is a summary of the inputs used, as of June 30, 2024, involving the Fund's assets and liabilities carried at fair value. The inputs or methodology used for valuing securities may not be an indication of the risk associated with investing in those securities. For more information on valuation inputs, and their aggregation into the levels used below, please refer to the Investment Valuation section in the accompanying Notes to Financial Statements.
| Valuation Inputs at Reporting Date: |
| Description | Total ($) | Level 1 ($) | Level 2 ($) | Level 3 ($) |
Investments in Securities: | | | | |
|
| Corporate Bonds | 745,472,108 | - | 745,472,108 | - |
|
| U.S. Government and Government Agency Obligations | 1,314,886,308 | - | 1,314,886,308 | - |
|
| U.S. Government Agency - Mortgage Securities | 894,297,640 | - | 894,297,640 | - |
|
| Asset-Backed Securities | 194,318,035 | - | 194,318,035 | - |
|
| Collateralized Mortgage Obligations | 13,311 | - | 13,311 | - |
|
| Commercial Mortgage Securities | 116,339,289 | - | 116,339,289 | - |
|
| Foreign Government and Government Agency Obligations | 1,465,718 | - | 1,465,718 | - |
|
| Bank Notes | 3,260,380 | - | 3,260,380 | - |
|
| Money Market Funds | 206,180,010 | 206,180,010 | - | - |
| Total Investments in Securities: | 3,476,232,799 | 206,180,010 | 3,270,052,789 | - |
Other Financial Instruments: | | | | |
TBA Sale Commitments | (237,926,166) | - | (237,926,166) | - |
| Total Other Financial Instruments: | (237,926,166) | - | (237,926,166) | - |
Financial Statements (Unaudited)
| Statement of Assets and Liabilities |
| | | | June 30, 2024 (Unaudited) |
| | | | | |
| Assets | | | | |
| Investment in securities, at value - See accompanying schedule: | | | | |
Unaffiliated issuers (cost $3,482,953,289) | $ | 3,270,052,789 | | |
Fidelity Central Funds (cost $206,179,616) | | 206,180,010 | | |
| | | | | |
| | | | | |
| Total Investment in Securities (cost $3,689,132,905) | | | $ | 3,476,232,799 |
| Cash | | | | 24,810 |
| Foreign currency held at value (cost $2) | | | | 2 |
| Receivable for investments sold | | | | 10,775,080 |
| Receivable for TBA sale commitments | | | | 239,491,482 |
| Receivable for fund shares sold | | | | 23,974 |
| Interest receivable | | | | 28,111,460 |
| Distributions receivable from Fidelity Central Funds | | | | 899,268 |
| Other receivables | | | | 234 |
Total assets | | | | 3,755,559,109 |
| Liabilities | | | | |
| Payable for investments purchased | | | | |
Regular delivery | $ | 11,470,197 | | |
Delayed delivery | | 529,295,292 | | |
| TBA sale commitments, at value | | 237,926,166 | | |
| Payable for fund shares redeemed | | 212,766 | | |
| Distributions payable | | 741,248 | | |
| Other payables and accrued expenses | | 3,212 | | |
| Total liabilities | | | | 779,648,881 |
| Net Assets | | | $ | 2,975,910,228 |
| Net Assets consist of: | | | | |
| Paid in capital | | | $ | 3,316,495,159 |
| Total accumulated earnings (loss) | | | | (340,584,931) |
| Net Assets | | | $ | 2,975,910,228 |
Net Asset Value, offering price and redemption price per share ($2,975,910,228 ÷ 32,509,804 shares) | | | $ | 91.54 |
| Statement of Operations |
| | | | Six months ended June 30, 2024 (Unaudited) |
| Investment Income | | | | |
| Interest | | | $ | 58,960,562 |
| Income from Fidelity Central Funds (including $13,582 from security lending) | | | | 4,461,927 |
| Total income | | | | 63,422,489 |
| Expenses | | | | |
| Custodian fees and expenses | $ | 3,822 | | |
| Independent trustees' fees and expenses | | 3,895 | | |
| Total expenses before reductions | | 7,717 | | |
| Expense reductions | | (4,466) | | |
| Total expenses after reductions | | | | 3,251 |
| Net Investment income (loss) | | | | 63,419,238 |
| Realized and Unrealized Gain (Loss) | | | | |
| Net realized gain (loss) on: | | | | |
| Investment Securities: | | | | |
| Unaffiliated issuers | | (18,808,821) | | |
| Fidelity Central Funds | | 356 | | |
| Total net realized gain (loss) | | | | (18,808,465) |
| Change in net unrealized appreciation (depreciation) on: | | | | |
| Investment Securities: | | | | |
| Unaffiliated issuers | | (51,732,119) | | |
| TBA Sale commitments | | 2,038,654 | | |
| Total change in net unrealized appreciation (depreciation) | | | | (49,693,465) |
| Net gain (loss) | | | | (68,501,930) |
| Net increase (decrease) in net assets resulting from operations | | | $ | (5,082,692) |
| Statement of Changes in Net Assets |
| |
| | Six months ended June 30, 2024 (Unaudited) | | Year ended December 31, 2023 |
| Increase (Decrease) in Net Assets | | | | |
| Operations | | | | |
| Net investment income (loss) | $ | 63,419,238 | $ | 106,209,295 |
| Net realized gain (loss) | | (18,808,465) | | (63,205,474) |
| Change in net unrealized appreciation (depreciation) | | (49,693,465) | | 117,119,041 |
| Net increase (decrease) in net assets resulting from operations | | (5,082,692) | | 160,122,862 |
| Distributions to shareholders | | (61,815,464) | | (104,264,033) |
| | | | | |
| Affiliated share transactions | | | | |
| Proceeds from sales of shares | | 127,524,732 | | 338,241,421 |
| Reinvestment of distributions | | 61,726,795 | | 103,871,155 |
| Cost of shares redeemed | | (43,219,174) | | (59,752,309) |
| | | | | |
Net increase (decrease) in net assets resulting from share transactions | | 146,032,353 | | 382,360,267 |
| Total increase (decrease) in net assets | | 79,134,197 | | 438,219,096 |
| | | | | |
| Net Assets | | | | |
| Beginning of period | | 2,896,776,031 | | 2,458,556,935 |
| End of period | $ | 2,975,910,228 | $ | 2,896,776,031 |
| | | | | |
| Other Information | | | | |
| Shares | | | | |
| Sold | | 1,396,534 | | 3,635,153 |
| Issued in reinvestment of distributions | | 674,483 | | 1,131,990 |
| Redeemed | | (474,322) | | (651,693) |
| Net increase (decrease) | | 1,596,695 | | 4,115,450 |
| | | | | |
Financial Highlights
VIP Investment Grade Central Fund |
| |
| | Six months ended (Unaudited) June 30, 2024 | | Years ended December 31, 2023 | | 2022 | | 2021 | | 2020 | | 2019 |
Selected Per-Share Data | | | | | | | | | | | | |
| Net asset value, beginning of period | $ | 93.71 | $ | 91.75 | $ | 109.19 | $ | 114.93 | $ | 108.80 | $ | 102.31 |
| Income from Investment Operations | | | | | | | | | | | | |
Net investment income (loss) A,B | | 1.988 | | 3.608 | | 2.711 | | 2.481 | | 3.026 | | 3.371 |
| Net realized and unrealized gain (loss) | | (2.222) | | 1.882 | | (16.386) | | (2.817) | | 7.583 | | 6.606 |
| Total from investment operations | | (.234) | | 5.490 | | (13.675) | | (.336) | | 10.609 | | 9.977 |
| Distributions from net investment income | | (1.936) | | (3.530) | | (2.765) | | (2.717) | | (3.070) | | (3.487) |
| Distributions from net realized gain | | - | | - | | (1.000) | | (2.687) | | (1.409) | | - |
| Total distributions | | (1.936) | | (3.530) | | (3.765) | | (5.404) | | (4.479) | | (3.487) |
| Net asset value, end of period | $ | 91.54 | $ | 93.71 | $ | 91.75 | $ | 109.19 | $ | 114.93 | $ | 108.80 |
Total Return C,D | | | | 6.13% | | (12.69)% | | (.28)% | | 9.87% | | 9.87% |
Ratios to Average Net Assets B,E,F | | | | | | | | | | | | |
Expenses before reductions G | | -% H | | -% | | -% | | -% | | -% | | -% |
Expenses net of fee waivers, if any G | | | | -% | | -% | | -% | | -% | | -% |
Expenses net of all reductions G | | -% H | | -% | | -% | | -% | | -% | | -% |
| Net investment income (loss) | | 4.36% H | | 3.93% | | 2.79% | | 2.23% | | 2.68% | | 3.16% |
| Supplemental Data | | | | | | | | | | | | |
| Net assets, end of period (000 omitted) | $ | 2,975,910 | $ | 2,896,776 | $ | 2,458,557 | $ | 2,404,652 | $ | 7,119,394 | $ | 6,014,480 |
Portfolio turnover rate I | | | | 205% | | 188% | | 178% J | | 169% | | 146% |
ACalculated based on average shares outstanding during the period.
BNet investment income (loss) is affected by the timing of the declaration of dividends by any underlying mutual funds or exchange-traded funds (ETFs). Net investment income (loss) of any mutual funds or ETFs is not included in the Fund's net investment income (loss) ratio.
CTotal returns for periods of less than one year are not annualized.
DTotal returns would have been lower if certain expenses had not been reduced during the applicable periods shown.
EFees and expenses of any underlying mutual funds or exchange-traded funds (ETFs) are not included in the Fund's expense ratio. The Fund indirectly bears its proportionate share of these expenses. For additional expense information related to investments in Fidelity Central Funds, please refer to the "Investments in Fidelity Central Funds" note found in the Notes to Financial Statements section of the most recent Annual or Semi-Annual report.
FExpense ratios reflect operating expenses of the class. Expenses before reductions do not reflect amounts reimbursed, waived, or reduced through arrangements with the investment adviser, brokerage services, or other offset arrangements, if applicable, and do not represent the amount paid by the class during periods when reimbursements, waivers or reductions occur.
GAmount represents less than .005%.
HAnnualized.
IAmount does not include the portfolio activity of any underlying mutual funds or exchange-traded funds (ETFs).
JPortfolio turnover rate excludes securities received or delivered in-kind.
Notes to Financial Statements
(Unaudited)For the period ended June 30, 2024
1. Organization.
Fidelity VIP Investment Grade Central Fund (the Fund) is a fund of Fidelity Garrison Street Trust (the Trust) and is authorized to issue an unlimited number of shares. Shares of the Fund are only offered to other investment companies and accounts managed by Fidelity Management & Research Company LLC (FMR), or its affiliates (the Investing Funds). The Trust is registered under the Investment Company Act of 1940, as amended (the 1940 Act), as an open-end management investment company organized as a Massachusetts business trust.
2. Investments in Fidelity Central Funds.
Funds may invest in Fidelity Central Funds, which are open-end investment companies generally available only to other investment companies and accounts managed by the investment adviser and its affiliates. The Schedule of Investments lists any Fidelity Central Funds held as an investment as of period end, but does not include the underlying holdings of each Fidelity Central Fund. An investing fund indirectly bears its proportionate share of the expenses of the underlying Fidelity Central Funds.
Based on its investment objective, each Fidelity Central Fund may invest or participate in various investment vehicles or strategies that are similar to those of the investing fund. These strategies are consistent with the investment objectives of the investing fund and may involve certain economic risks which may cause a decline in value of each of the Fidelity Central Funds and thus a decline in the value of the investing fund.
| Fidelity Central Fund | Investment Manager | Investment Objective | Investment Practices | Expense RatioA |
| Fidelity Money Market Central Funds | Fidelity Management & Research Company LLC (FMR) | Each fund seeks to obtain a high level of current income consistent with the preservation of capital and liquidity. | Short-term Investments | Less than .005% |
A Expenses expressed as a percentage of average net assets and are as of each underlying Central Fund's most recent annual or semi-annual shareholder report.
A complete unaudited list of holdings for each Fidelity Central Fund is available upon request or at the Securities and Exchange Commission website at www.sec.gov. In addition, the financial statements of the Fidelity Central Funds which contain the significant accounting policies (including investment valuation policies) of those funds, and are not covered by the Report of Independent Registered Public Accounting Firm, are available on the Securities and Exchange Commission website or upon request.
3. Significant Accounting Policies.
The Fund is an investment company and applies the accounting and reporting guidance of the Financial Accounting Standards Board (FASB) Accounting Standards Codification Topic 946 Financial Services - Investment Companies. The financial statements have been prepared in conformity with accounting principles generally accepted in the United States of America (GAAP), which require management to make certain estimates and assumptions at the date of the financial statements. Actual results could differ from those estimates. Subsequent events, if any, through the date that the financial statements were issued have been evaluated in the preparation of the financial statements. The Fund's Schedule of Investments lists any underlying mutual funds or exchange-traded funds (ETFs) but does not include the underlying holdings of these funds. The following summarizes the significant accounting policies of the Fund:
Investment Valuation. Investments are valued as of 4:00 p.m. Eastern time on the last calendar day of the period. The Board of Trustees (the Board) has designated the Fund's investment adviser as the valuation designee responsible for the fair valuation function and performing fair value determinations as needed. The investment adviser has established a Fair Value Committee (the Committee) to carry out the day-to-day fair valuation responsibilities and has adopted policies and procedures to govern the fair valuation process and the activities of the Committee. In accordance with these fair valuation policies and procedures, which have been approved by the Board, the Fund attempts to obtain prices from one or more third party pricing services or brokers to value its investments. When current market prices, quotations or currency exchange rates are not readily available or reliable, investments will be fair valued in good faith by the Committee, in accordance with the policies and procedures. Factors used in determining fair value vary by investment type and may include market or investment specific events, transaction data, estimated cash flows, and market observations of comparable investments. The frequency that the fair valuation procedures are used cannot be predicted and they may be utilized to a significant extent. The Committee manages the Fund's fair valuation practices and maintains the fair valuation policies and procedures. The Fund's investment adviser reports to the Board information regarding the fair valuation process and related material matters.
The Fund categorizes the inputs to valuation techniques used to value its investments into a disclosure hierarchy consisting of three levels as shown below:
Level 1 - unadjusted quoted prices in active markets for identical investments
Level 2 - other significant observable inputs (including quoted prices for similar investments, interest rates, prepayment speeds, etc.)
Level 3 - unobservable inputs (including the Fund's own assumptions based on the best information available)
Valuation techniques used to value the Fund's investments by major category are as follows:
Debt securities, including restricted securities, are valued based on evaluated prices received from third party pricing services or from brokers who make markets in such securities. Corporate bonds, bank notes, foreign government and government agency obligations and U.S. government and government agency obligations are valued by pricing services who utilize matrix pricing which considers yield or price of bonds of comparable quality, coupon, maturity and type or by broker-supplied prices. Asset backed securities, collateralized mortgage obligations, commercial mortgage securities and U.S. government agency mortgage securities are valued by pricing services who utilize matrix pricing which considers prepayment speed assumptions, attributes of the collateral, yield or price of bonds of comparable quality, coupon, maturity and type or by broker-supplied prices. Brokers which make markets in asset backed securities, collateralized mortgage obligations and commercial mortgage securities may also consider such factors as the structure of the issue, cash flow assumptions, the value of underlying assets as well as any guarantees. When independent prices are unavailable or unreliable, debt securities may be valued utilizing pricing methodologies which consider similar factors that would be used by third party pricing services. Debt securities are generally categorized as Level 2 in the hierarchy but may be Level 3 depending on the circumstances.
Investments in open-end mutual funds, including the Fidelity Central Funds, are valued at their closing net asset value (NAV) each business day and are categorized as Level 1 in the hierarchy.
Changes in valuation techniques may result in transfers in or out of an assigned level within the disclosure hierarchy. The aggregate value of investments by input level as of June 30, 2024 is included at the end of the Fund's Schedule of Investments.
Investment Transactions and Income. For financial reporting purposes, the Fund's investment holdings and NAV include trades executed through the end of the last business day of the period. The NAV per share for processing shareholder transactions is calculated as of the close of business of the New York Stock Exchange (NYSE), normally 4:00 p.m. Eastern time and includes trades executed through the end of the prior business day. Gains and losses on securities sold are determined on the basis of identified cost and include proceeds received from litigation. Income and capital gain distributions from Fidelity Central Funds, if any, are recorded on the ex-dividend date. Interest income is accrued as earned and includes coupon interest and amortization of premium and accretion of discount on debt securities as applicable. Debt obligations may be placed on non-accrual status and related interest income may be reduced by ceasing current accruals and writing off interest receivables when the collection of all or a portion of interest has become doubtful based on consistently applied procedures. A debt obligation is removed from non-accrual status when the issuer resumes interest payments or when collectability of interest is reasonably assured.
Expenses. Expenses directly attributable to a fund are charged to that fund. Expenses attributable to more than one fund are allocated among the respective funds on the basis of relative net assets or other appropriate methods. Expenses included in the accompanying financial statements reflect the expenses of that fund and do not include any expenses associated with any underlying mutual funds or exchange-traded funds. Although not included in a fund's expenses, a fund indirectly bears its proportionate share of these expenses through the net asset value of each underlying mutual fund or exchange-traded fund. Expense estimates are accrued in the period to which they relate and adjustments are made when actual amounts are known.
Income Tax Information and Distributions to Shareholders. Each year, the Fund intends to qualify as a regulated investment company under Subchapter M of the Internal Revenue Code, including distributing substantially all of its taxable income and realized gains. As a result, no provision for U.S. Federal income taxes is required. The Fund files a U.S. federal tax return, in addition to state and local tax returns as required. The Fund's federal income tax returns are subject to examination by the Internal Revenue Service (IRS) for a period of three fiscal years after they are filed. State and local tax returns may be subject to examination for an additional fiscal year depending on the jurisdiction.
Distributions are declared and recorded daily and paid monthly from net investment income. Distributions from realized gains, if any, are declared and recorded on the ex-dividend date. Income and capital gain distributions are determined in accordance with income tax regulations, which may differ from GAAP.
Capital accounts within the financial statements are adjusted for permanent book-tax differences. These adjustments have no impact on net assets or the results of operations. Capital accounts are not adjusted for temporary book-tax differences which will reverse in a subsequent period.
Book-tax differences are primarily due to market discount, capital loss carryforwards and losses deferred due to wash sales.
As of period end, the cost and unrealized appreciation (depreciation) in securities, and derivatives if applicable, for federal income tax purposes were as follows:
| Gross unrealized appreciation | $9,033,705 |
| Gross unrealized depreciation | (216,386,447) |
| Net unrealized appreciation (depreciation) | $(207,352,742) |
| Tax cost | $3,685,150,857 |
Capital loss carryforwards are only available to offset future capital gains of the Fund to the extent provided by regulations and may be limited. The capital loss carryforward information presented below, including any applicable limitation, is estimated as of prior fiscal period end and is subject to adjustment.
Short-term | $(52,080,650) |
Long-term | (63,153,561) |
| Total capital loss carryforward | $(115,234,211) |
Delayed Delivery Transactions and When-Issued Securities. During the period, certain Funds transacted in securities on a delayed delivery or when-issued basis. Payment and delivery may take place after the customary settlement period for that security. The price of the underlying securities and the date when the securities will be delivered and paid for are fixed at the time the transaction is negotiated. Securities purchased on a delayed delivery or when-issued basis are identified as such in the Schedule of Investments. Compensation for interest forgone in the purchase of a delayed delivery or when-issued debt security may be received. With respect to purchase commitments, each applicable Fund identifies securities as segregated in its records with a value at least equal to the amount of the commitment. Payables and receivables associated with the purchases and sales of delayed delivery securities having the same coupon, settlement date and broker are offset. Delayed delivery or when-issued securities that have been purchased from and sold to different brokers are reflected as both payables and receivables in the Statement of Assets and Liabilities under the caption "Delayed delivery", as applicable. Losses may arise due to changes in the value of the underlying securities or if the counterparty does not perform under the contract's terms, or if the issuer does not issue the securities due to political, economic, or other factors.
To-Be-Announced (TBA) Securities and Mortgage Dollar Rolls. TBA securities involve buying or selling mortgage-backed securities (MBS) on a forward commitment basis. A TBA transaction typically does not designate the actual security to be delivered and only includes an approximate principal amount; however delivered securities must meet specified terms defined by industry guidelines, including issuer, rate and current principal amount outstanding on underlying mortgage pools. Funds may enter into a TBA transaction with the intent to take possession of or deliver the underlying MBS, or a fund may elect to extend the settlement by entering into either a mortgage or reverse mortgage dollar roll. Mortgage dollar rolls are transactions where a fund sells TBA securities and simultaneously agrees to repurchase MBS on a later date at a lower price and with the same counterparty. Reverse mortgage dollar rolls involve the purchase and simultaneous agreement to sell TBA securities on a later date at a lower price. Transactions in mortgage dollar rolls and reverse mortgage dollar rolls are accounted for as purchases and sales and may result in an increase to a fund's portfolio turnover rate.
Purchases and sales of TBA securities involve risks similar to those discussed above for delayed delivery and when-issued securities. Also, if the counterparty in a mortgage dollar roll or a reverse mortgage dollar roll transaction files for bankruptcy or becomes insolvent, a fund's right to repurchase or sell securities may be limited. Additionally, when a fund sells TBA securities without already owning or having the right to obtain the deliverable securities (an uncovered forward commitment to sell), it incurs a risk of loss because it could have to purchase the securities at a price that is higher than the price at which it sold them. A fund may be unable to purchase the deliverable securities if the corresponding market is illiquid.
TBA securities subject to a forward commitment to sell at period end are included at the end of the Schedule of Investments under the caption "TBA Sale Commitments." The value of these commitments and proceeds to be received at contractual settlement date are reflected in the Statement of Assets and Liabilities as "TBA sale commitments, at value" and "Receivable for TBA sale commitments," respectively. If the TBA sale commitment is closed through the acquisition of an offsetting TBA purchase commitment, a fund realizes a gain or loss. If a fund delivers securities under the commitment, a fund realizes a gain or loss from the sale of the securities based upon the price established at the date the commitment was entered into.
Restricted Securities (including Private Placements). Funds may invest in securities that are subject to legal or contractual restrictions on resale. These securities generally may be resold in transactions exempt from registration or to the public if the securities are registered. Disposal of these securities may involve time-consuming negotiations and expense, and prompt sale at an acceptable price may be difficult. Information regarding restricted securities held at period end is included at the end of the Schedule of Investments, if applicable.
4. Purchases and Sales of Investments.
Purchases and sales of securities, other than short-term securities, U.S. government securities and in-kind transactions, as applicable, are noted in the table below.
| | Purchases ($) | Sales ($) |
| Fidelity VIP Investment Grade Central Fund | 1,800,274,217 | 1,710,913,388 |
5. Fees and Other Transactions with Affiliates.
Management Fee and Expense Contract. Fidelity Management & Research Company LLC (the investment adviser) provides the Fund with investment management services. The Fund does not pay any fees for these services. Pursuant to the Fund's expense contract, the investment adviser also pays all other expenses of the Fund, excluding custody fees, the compensation of the independent Trustees, and certain miscellaneous expenses such as proxy and shareholder meeting expenses.
Interfund Trades. Funds may purchase from or sell securities to other Fidelity Funds under procedures adopted by the Board. The procedures have been designed to ensure these interfund trades are executed in accordance with Rule 17a-7 of the 1940 Act. Any interfund trades are included within the respective purchases and sales amounts shown in the Purchases and Sales of Investments note. During the period, there were no interfund trades.
Sub-Advisory Arrangements. Effective March 1, 2024, the Fund's sub-advisory agreements with FMR Investment Management (UK) Limited, Fidelity Management & Research (Hong Kong) Limited, and Fidelity Management & Research (Japan) Limited were amended to provide that the investment adviser pays each sub-adviser monthly fees equal to 110% of the sub-adviser's costs for providing sub-advisory services.
6. Security Lending.
Funds lend portfolio securities from time to time in order to earn additional income. Lending agents are used, including National Financial Services (NFS), an affiliate of the investment adviser. Pursuant to a securities lending agreement, NFS will receive a fee, which is capped at 9.9% of a fund's daily lending revenue, for its services as lending agent. A fund may lend securities to certain qualified borrowers, including NFS. On the settlement date of the loan, a fund receives collateral (in the form of U.S. Treasury obligations, letters of credit and/or cash) against the loaned securities and maintains collateral in an amount not less than 100% of the market value of the loaned securities during the period of the loan. The market value of the loaned securities is determined at the close of business of a fund and any additional required collateral is delivered to a fund on the next business day. A fund or borrower may terminate the loan at any time, and if the borrower defaults on its obligation to return the securities loaned because of insolvency or other reasons, a fund may apply collateral received from the borrower against the obligation. A fund may experience delays and costs in recovering the securities loaned. Any cash collateral received is invested in the Fidelity Securities Lending Cash Central Fund. Any loaned securities are identified as such in the Schedule of Investments, and the value of loaned securities and cash collateral at period end, as applicable, are presented in the Statement of Assets and Liabilities. Security lending income represents the income earned on investing cash collateral, less rebates paid to borrowers and any lending agent fees associated with the loan, plus any premium payments received for lending certain types of securities. Security lending income is presented in the Statement of Operations as a component of income from Fidelity Central Funds. Affiliated security lending activity, if any, was as follows:
| | Total Security Lending Fees Paid to NFS ($) | Security Lending Income From Securities Loaned to NFS ($) | Value of Securities Loaned to NFS at Period End ($) |
| Fidelity VIP Investment Grade Central Fund | 1,444 | - | - |
7. Expense Reductions.
Through arrangements with the Fund's custodian, credits realized as a result of certain uninvested cash balances were used to reduce the Fund's expenses by $4,466.
8. Other.
A fund's organizational documents provide former and current trustees and officers with a limited indemnification against liabilities arising in connection with the performance of their duties to the fund. In the normal course of business, a fund may also enter into contracts that provide general indemnifications. A fund's maximum exposure under these arrangements is unknown as this would be dependent on future claims that may be made against a fund. The risk of material loss from such claims is considered remote.
At the end of the period, mutual funds managed by FMR or its affiliates were the owners of record of all of the outstanding shares as shown below.
| Fund | Ownership % |
| VIP Asset Manager Portfolio | 10.8% |
| VIP Asset Manager Growth Portfolio | 1.7% |
| VIP Balanced Portfolio | 87.5% |
9. Credit Risk.
The Fund invests a significant portion of its assets in structured securities of issuers backed by commercial and residential mortgage loans, credit card receivables and automotive loans. The value and related income of these securities is sensitive to changes in economic conditions, including delinquencies and/or defaults.
10. Risk and Uncertainties.
Many factors affect a fund's performance. Developments that disrupt global economies and financial markets, such as pandemics, epidemics, outbreaks of infectious diseases, war, terrorism, and environmental disasters, may significantly affect a fund's investment performance. The effects of these developments to a fund will be impacted by the types of securities in which a fund invests, the financial condition, industry, economic sector, and geographic location of an issuer, and a fund's level of investment in the securities of that issuer. Significant concentrations in security types, issuers, industries, sectors, and geographic locations may magnify the factors that affect a fund's performance.
Item 8: Changes in and Disagreements with Accountants for Open-End Management Investment Companies
Note: This is not applicable for any fund included in this document.
Item 9: Proxy Disclosures for Open-End Management Investment Companies
Note: This is not applicable for any fund included in this document.
Item 10: Remuneration Paid to Directors, Officers, and others of Open-End Management Investment Companies
Note: This information is disclosed as part of the financial statements for each Fund as part of Item 7: Financial Statements and Financial Highlights for Open-End Management Investment companies.
Item 11: Statement Regarding Basis for Approval of Investment Advisory Contract
Board Approval of Investment Advisory Contracts
VIP Investment Grade Central Fund
At its January 2024 meeting, the Board of Trustees, including the Independent Trustees (together, the Board), approved an amended and restated management contract with Fidelity Management & Research Company LLC (FMR) (the Management Contract), and amended and restated sub-advisory agreements (the Sub-Advisory Contracts, and together with the Management Contract, the Advisory Contracts) for the fund, including the fund's sub-advisory agreements with FMR Investment Management (UK) Limited (FMR UK), Fidelity Management & Research (Hong Kong) Limited (FMR H.K.), and Fidelity Management & Research (Japan) Limited (FMR Japan). The Advisory Contracts will be effective March 1, 2024. The Board will consider the annual renewal of the fund's Advisory Contracts in September 2024, following its review of additional materials provided by FMR.
Management Contract. The Board approved the Management Contract, which eliminates the fee that FMR previously received from each investing fund's investment adviser. The Board noted the fund will continue to pay no management fee to FMR for services provided under the Management Contract.
Sub-Advisory Contracts. In connection with the Management Contract changes, the Board considered the Sub-Advisory Contracts, which changed the arrangements for fees paid by FMR to the sub-advisers under the agreements. The Board noted that the agreements with FMR UK, FMR H.K., and FMR Japan were amended to provide that FMR will compensate each sub-adviser at a fee equal to 110% of the sub-adviser's costs incurred in providing services under the agreement. The Board considered that, under the Sub-Advisory Contracts, FMR, and not the fund, will continue to pay the sub-advisory fees to each applicable sub-adviser.
The Board considered that the approval of the fund's Advisory Contracts will not result in any changes in the investment process or strategies employed in the management of the fund's assets or the day-to-day management of the fund or the persons primarily responsible for such management. Further, the Board considered that the Management Contract would not change the obligations and services of FMR and its affiliates on behalf of the fund, and, in particular, there would be no change in the nature and level of advisory, management, administration, transfer agent, and pricing and bookkeeping services provided to the fund by FMR and its affiliates.
In connection with its consideration of future renewals of the fund's Advisory Contracts, the Board will consider: (i) the nature, extent and quality of services provided to the funds, including shareholder and administrative services and investment performance; (ii) the competitiveness of the management fee and total expenses for the fund; (iii) the costs of the services and profitability, including the revenues earned and the expenses incurred in conducting the business of developing, marketing, distributing, managing, administering, and servicing the fund and its shareholders, to the extent applicable; and (iv) whether there have been economies of scale in respect of the Fidelity funds, whether the Fidelity funds (including the fund) have appropriately benefited from any such economies of scale, and whether there is the potential for realization of any further economies.
Based on its evaluation of all of the conclusions noted above, and after considering all factors it believed relevant, the Board concluded that the fund's management fee structure is fair and reasonable, and that the fund's Advisory Contracts should be approved.
1.831205.118
VIGC-SANN-0824
Item 8.
Changes in and Disagreements with Accountants for Open-End Management Investment Companies
See Item 7.
Item 9.
Proxy Disclosures for Open-End Management Investment Companies
See Item 7.
Item 10.
Remuneration Paid to Directors, Officers, and Others of Open-End Management Investment Companies
See Item 7.
Item 11.
Statement Regarding Basis for Approval of Investment Advisory Contract
See Item 7.
Item 12.
Disclosure of Proxy Voting Policies and Procedures for Closed-End Management Investment Companies
Not applicable.
Item 13.
Portfolio Managers of Closed-End Management Investment Companies
Not applicable.
Item 14.
Purchases of Equity Securities by Closed-End Management Investment Company and Affiliated Purchasers
Not applicable.
Item 15.
Submission of Matters to a Vote of Security Holders
There were no material changes to the procedures by which shareholders may recommend nominees to the Fidelity Garrison Street Trust’s Board of Trustees.
Item 16.
Controls and Procedures
(a)(i) The President and Treasurer and the Chief Financial Officer have concluded that the Fidelity Garrison Street Trust’s (the “Trust”) disclosure controls and procedures (as defined in Rule 30a-3(c) under the Investment Company Act) provide reasonable assurances that material information relating to the Trust is made known to them by the appropriate persons, based on their evaluation of these controls and procedures as of a date within 90 days of the filing date of this report.
(a)(ii) There was no change in the Trust’s internal control over financial reporting (as defined in Rule 30a-3(d) under the Investment Company Act) that occurred during the period covered by this report that has materially affected, or is reasonably likely to materially affect, the Trust’s internal control over financial reporting.
Item 17.
Disclosure of Securities Lending Activities for Closed-End Management Investment Companies
Not applicable.
Item 18.
Recovery of Erroneously Awarded Compensation
(a)
Not applicable.
(b)
Not applicable.
Item 19.
Exhibits
SIGNATURES
Pursuant to the requirements of the Securities Exchange Act of 1934 and the Investment Company Act of 1940, the registrant has duly caused this report to be signed on its behalf by the undersigned, thereunto duly authorized.
Fidelity Garrison Street Trust
|
By: | /s/Laura M. Del Prato |
| Laura M. Del Prato |
| President and Treasurer (Principal Executive Officer) |
|
|
Date: | August 22, 2024 |
Pursuant to the requirements of the Securities Exchange Act of 1934 and the Investment Company Act of 1940, this report has been signed below by the following persons on behalf of the registrant and in the capacities and on the dates indicated.
|
By: | /s/Laura M. Del Prato |
| Laura M. Del Prato |
| President and Treasurer (Principal Executive Officer) |
|
|
Date: | August 22, 2024 |
|
By: | /s/John J. Burke III |
| John J. Burke III |
| Chief Financial Officer (Principal Financial Officer) |
|
|
Date: | August 22, 2024 |