| | |
OMB APPROVAL |
OMB Number: | | 3235-0570 |
| |
Expires: | | September 30, 2007 |
|
Estimated average burden |
hours per response | | 19.4 |
UNITED STATES
SECURITIES AND EXCHANGE COMMISSION
Washington, D.C. 20549
FORM N-CSR
CERTIFIED SHAREHOLDER REPORT OF REGISTERED
MANAGEMENT INVESTMENT COMPANIES
Investment Company Act file number 811-4854
The Oberweis Funds
(Exact name of registrant as specified in charter)
| | |
| 3333 Warrenville Road, Suite 500, Lisle, IL | | 60532 |
|
| (Address of principal executive offices) | | (Zip code) |
| | |
James W. Oberweis The Oberweis Funds 3333 Warrenville Road, Suite 500 Lisle, IL 60532 | | Copy to: James A. Arpaia Vedder, Price, Kaufman, & Kammholz, P.C. 222 North LaSalle Street, Suite 2600 Chicago, IL 60601 |
(Name and address of agent for service)
Registrant’s telephone number, including area code: (800) 323-6166
Date of fiscal year end: December 31
Date of reporting period: December 31, 2005
Form N-CSR is to be used by management investment companies to file reports with the Commission not later than 10 days after the transmission to stockholders of any report that is required to be transmitted to stockholders under Rule 30e-1 under the Investment Company Act of 1940 (17 CFR 270.30e-1). The Commission may use the information provided on Form N-CSR in its regulatory, disclosure review, inspection, and policymaking roles.
A registrant is required to disclose the information specified by Form N-CSR, and the Commission will make this information public. A registrant is not required to respond to the collection of information contained in Form N-CSR unless the Form displays a currently valid Office of Management and Budget (“OMB”) control number. Please direct comments concerning the accuracy of the information collection burden estimate and any suggestions for reducing the burden to Secretary, Securities and Exchange Commission, 450 Fifth Street, NW, Washington, DC 20549-0609. The OMB has reviewed this collection of information under the clearance requirements of 44 U.S.C. § 3507.
ITEM 1. | REPORTS TO STOCKHOLDERS. |
The Annual Report to Stockholders Follows.

The
Oberweis
Funds
Annual Report
Audited
December 31, 2005
1-800-245-7311
www.oberweisfunds.com
| | |
| Trustees and Officers | | |
| James D. Oberweis | | Katherine Smith Dedrick |
| Trustee | | Trustee |
| |
| Gary D. McDaniel | | James G. Schmidt |
| Trustee | | Trustee |
| |
| James W. Oberweis | | Patrick B. Joyce |
| President | | Executive Vice President |
| | | Treasurer |
| |
| David I. Covas | | Martin L. Yokosawa |
| Vice President | | Senior Vice President |
| |
| Eric V. Hannemann | | |
| Secretary | | |
Manager and Investment Advisor
Oberweis Asset Management, Inc.
3333 Warrenville Road, Suite 500, Lisle, IL 60532
1-800-323-6166
www.oberweisfunds.com
Distributor
Oberweis Securities, Inc.
3333 Warrenville Road, Suite 500, Lisle, IL 60532
1-630-577-2300
www.oberweisfunds.com
Custodian
UMB Bank, n.a.
928 Grand Blvd., Kansas City, MO 64106
Transfer Agent
UMB Fund Services, Inc.
P.O. Box 711 Milwaukee, WI 53201-0711
1-800-245-7311
Counsel
Vedder, Price, Kaufman & Kammholz, P.C.
222 North LaSalle Street, Chicago, IL 60601
Independent Registered Public Accounting Firm
PricewaterhouseCoopers LLP
One North Wacker Drive, Chicago, IL 60606

The Oberweis Funds
Emerging Growth Fund
Micro-Cap Fund
Mid-Cap Fund
China Opportunities Fund
1-800-245-7311
www.oberweisfunds.com
PRESIDENT’S LETTER
Dear Fellow Oberweis Funds Shareholder:
I am pleased to report another year of positive returns for The Oberweis Funds. Among the U.S. funds, the Oberweis Micro-Cap Fund appreciated +12.72%, the Emerging Growth Fund appreciated +2.74%, and the Mid-Cap Fund appreciated +4.85%. In the same period, the Russell 2000 Growth Index returned +4.15%. As you may recall, we started a new fund in 2005. The China Opportunities Fund commenced operations on October 1, 2005. In its first quarter, this new fund appreciated +7.80%. For comparison, the MSCI China Index, in U.S. dollar terms, returned -0.36% in the final quarter of the year.
2005 will surely be remembered for its unpredictable events. Commodities, oil, and gold prices surged amid continued geopolitical uncertainties, increased demand in Asia, and supply disruptions associated with natural disasters in the U.S. The price of gold reached $544.50 an ounce on December 12th, a record high since 1983, while oil went to a record of more than $70/barrel. Hurricane Katrina wreaked havoc with the lives of many in New Orleans and the Mississippi Delta. In addition to costing Americans an estimated $200 billion for reconstruction, the hurricane fueled higher energy prices due to constriction of supply and refining capacity. Yet even in the face of adverse developments, global equity markets still eked out gains for the year, in part due to reasonable valuations and modest expectations going into the year.
Although many macroeconomic events are difficult to predict, we believe there remains an opportunity to achieve above-average returns through prudent individual stock selection. Our investment strategy remains steadfast in each of the four funds. We strive to identify companies which have exceptionally high growth potential, are not widely followed by institutional investors, and can be purchased at low valuations in relation to their expected rates of growth. With respect to the current valuation of the U.S. funds, the average forward P/E ratio as of year-end was 24.1 times for the Micro-Cap Fund, 23.6 times for the Emerging Growth Fund, and 24.6 times for the Mid-Cap Fund. Notably, each of the three average P/E ratios is somewhat lower than the comparable ratios listed in last year’s annual report. On a P/E basis, this suggests that the funds may be more attractively priced than at the beginning of 2005. However, stock prices (and therefore P/Es) also reflect investor expectations for future growth; thus lower P/Es may represent either more attractive investment opportunities or more modest expectations for future growth (or a combination of both). The average P/E based on latest twelve months earnings for the China Opportunities Fund was 23.2 times. Note that because many of our investment holdings in China do not have analyst estimates, we compute the average P/E using historical earnings rather than estimated future earnings. Therefore, the average P/E for the China Opportunities Fund is not comparable to the average P/Es of our other funds. (The P/E based on future earnings, for growth stocks, will generally be lower than the P/E based on historical earnings). At year-end, the weighted-average market cap for the Micro-Cap, Emerging Growth, Mid-Cap and China Opportunities Funds was $336 million, $853 million, $2.0 billion, and $983 million, respectively.
Although the Micro-Cap Fund is currently closed to new shareholders, the Emerging Growth Fund, Mid-Cap Fund, and China Opportunities Fund remain open. Shares may be purchased either directly through The Oberweis Funds or through one of our many brokerage firm partners. If you have any questions about your account, please call our shareholder services representatives at (800) 245-7311. You may also download a prospectus and purchase shares online at www.oberweisfunds.com. Thank you for investing with us in The Oberweis Funds.
Sincerely,

James W. Oberweis
President & Portfolio Manager
1
THE OBERWEIS FUNDS
MANAGEMENT DISCUSSION ON FUND PERFORMANCE
For the annual period ending December 31, 2005, The Oberweis Micro-Cap Fund appreciated +12.72% and the Emerging Growth Fund appreciated +2.74%. For comparison, the benchmark Russell 2000 Growth Index appreciated +4.15%. The Oberweis Mid-Cap Fund appreciated +4.85%. The Russell 2500 Growth Index appreciated +8.11%. The Oberweis China Opportunities Fund returned +7.80% since its inception on October 1, 2005 versus -0.36% for its benchmark, the MSCI China Index.
Three of the four Oberweis Funds invest primarily in United States stocks, namely Micro-Cap, Emerging Growth, and Mid-Cap. These three funds are positioned to take advantage of the long-term price appreciation that occurs when the market places an appropriately high value on fast growing, profitable companies primarily located in the United States. The China Opportunities Fund is positioned to take advantage of the long-term price appreciation that occurs when the market places an appropriately high value on China-related fast-growing, profitable companies.
In 2005, the U.S. small-cap equity market delivered modest results overall, with the Russell 2000 Index rising 4.55%. Large-cap equities slightly outperformed small-cap equities, with the S&P 500 Index rising 4.91% and the Russell 1000 appreciating 6.27%. Within the small-cap marketplace, value once again edged out growth for the year, with the Russell 2000 Value Index gaining 4.71% and the Russell 2000 Growth Index gaining 4.15%. Commodities, oil, and gold prices surged amid continued geopolitical uncertainties, increased demand in Asia, and supply disruptions associated with natural disasters in the U.S.
By all metrics, the Micro-Cap Fund experienced strong performance in 2005, finishing the year with a significantly better return than its benchmark, the Russell 2000 Growth Index. The Emerging Growth Fund and Mid-Cap Funds trailed their benchmark indices returns for the year (Russell 2000 Growth Index and Russell 2500 Growth Index, respectively), primarily due to significant weights in technology in the first quarter. Both the Emerging Growth and Mid-Cap funds performed well in the final nine months of the year, although the gains achieved in the final nine months did not lead to excess returns over the benchmark for the year. The China Opportunities Fund, in its first and only quarter, experienced exceptionally favorable gains and significantly exceeded the return of its benchmark, the MSCI China Index.
The Micro-Cap Fund particularly benefited from investments in Somanetics Corp., Quality Systems Inc., GMX Resources, Barrett Business Services, and Viropharma Inc. The Emerging Growth Fund derived significant gains from investments in aQuantive Inc., LCA-Vision Inc., Hansen Natural Corp., Carrizo Oil, and Focus Media Holdings LTD. The Mid-Cap Fund particularly benefited from investments in Intuitive Surgical Inc., Celgene Corp., Focus Media Holdings LTD, Ultra Petroleum Corp., and Akamai Technologies. The China Opportunities Fund benefited from investments in Bodisen Biotech, Raffles Education, Century Sunshine Ecological, Prime Success, and Fuji Food and Catering Services. The portfolio turnover rates were 76% rate for the Micro-Cap Fund, 75% for the Emerging Growth Fund, 119% for the Mid-Cap Fund, and 14% for the China Opportunities Fund. The net expense ratios of the four funds were 1.70% for Micro-Cap, 1.42% for Emerging Growth, 2.00% for Mid-Cap, and 2.49% for China Opportunities.
2
THE OBERWEIS FUNDS
MANAGEMENT DISCUSSION ON FUND PERFORMANCE
(cont’d.)
The SEC adopted a requirement that Funds present their portfolio holdings in a table, chart or graph format in their annual and semi-annual reports to shareholders, whether or not a schedule of investments is utilized. The following tables, which present portfolio holdings as a percentage of net assets, are provided in compliance with this requirement.
Oberweis Emerging Growth Fund
| | | |
| Asset Allocation | | | |
| Common Stocks | | 99.0% | |
| Commercial Paper | | 1.7% | |
| Other Liabilities in excess of Assets | | (0.7% | ) |
| | |
|
|
| | | 100.0% | |
| | |
| Top Holdings | | |
| Ceradyne, Inc. | | 3.5% |
| Focus Media Hldg. Ltd. | | 3.1% |
| Kos Pharmaceuticals, Inc. | | 2.7% |
| aQuantive, Inc. | | 2.5% |
| Carrizo Oil & Gas, Inc. | | 2.3% |
| Euronet Worldwide, Inc. | | 2.1% |
| LifeCell Corp. | | 2.1% |
| A.S.V., Inc. | | 2.0% |
| Trident Microsystems, Inc. | | 2.0% |
| United Therapeutics Corp. | | 1.9% |
| Other Holdings | | 75.8% |
| | |
|
| | | 100.0% |
| | |
| Top Industries | | |
| Technology - Computer Services Software & Systems | | 12.0% |
| Healthcare - Drugs & Pharmaceuticals | | 9.3% |
| Consumer Discretionary - Advertising Agency | | 8.3% |
| Healthcare - Medical & Dental Services | | 7.8% |
| Other Energy - Oil Crude Producer | | 7.2% |
| Technology - Communication Technology | | 5.6% |
| Technology - Computer Technology | | 5.1% |
| Materials & Production - Misc. Materials & Commodities | | 4.1% |
| Healthcare - Biotechnology | | 3.5% |
| Healthcare - Electronic Medical Systems | | 2.8% |
| Other Industries | | 34.3% |
| | |
|
| | | 100.0% |
Oberweis Micro-Cap Fund
| | | |
| Asset Allocation | | | |
| Common Stocks | | 93.8% | |
| Commercial Paper | | 8.3% | |
| Other Liabilities in excess of Assets | | (2.1% | ) |
| | |
|
|
| | | 100.0% | |
| | |
| Top Holdings | | |
| Somanetics Corp. | | 3.9% |
| Palomar Medical Technologies, Inc. | | 3.7% |
| I.D. Systems, Inc. | | 3.3% |
| GMX Resources, Inc. | | 2.5% |
| Vasco Data Security International, Inc. | | 2.5% |
| Health Grades, Inc. | | 2.5% |
| Quality Systems, Inc. | | 2.4% |
| Barrett Business Services, Inc. | | 2.4% |
| Aldila, Inc. | | 2.3% |
| Merge Technologies, Inc. | | 2.1% |
| Other Holdings | | 72.4% |
| | |
|
| | | 100.0% |
| | |
| Top Industries | | |
| Technology - Computer Service Software & System | | 13.4% |
| Other Energy - Oil Crude Producer | | 8.0% |
| Health Care - Electronic Medical Systems | | 7.5% |
| Technology - Computer Technology | | 5.8% |
| Consumer Discretionary - Misc. | | 5.4% |
| Health Care - Medical & Dental | | 5.3% |
| Health Care - Facilities | | 5.3% |
| Producer Durables - Electronics | | 4.7% |
| Consumer Discretionary - Service Commercial | | 4.6% |
| Consumer Discretionary - Wholesale | | 3.8% |
| Other Industries | | 36.2% |
| | |
|
| | | 100.0% |
3
THE OBERWEIS FUNDS
MANAGEMENT DISCUSSION ON FUND PERFORMANCE
(cont’d.)
Oberweis Mid-Cap Fund
| | |
| Asset Allocation | | |
| Common Stocks | | 98.9% |
| Other Assets in excess of Liabilities | | 1.1% |
| | |
|
| | | 100.0% |
| | |
| Top Holdings | | |
| Focus Media Hldg. Ltd. | | 4.4% |
| Intuitive Surgical, Inc. | | 3.2% |
| Ceradyne, Inc. | | 3.2% |
| Trident Microsystems, Inc. | | 3.0% |
| Irobot Corp. | | 2.9% |
| A.S.V., Inc. | | 2.7% |
| Kos Pharmaceuticals, Inc. | | 2.7% |
| HealthExtras, Inc. | | 2.5% |
| Helmerich & Payne | | 2.5% |
| Ultra Petroleum Corp. | | 2.3% |
| Other Holdings | | 70.6% |
| | |
|
| | | 100.0% |
| | |
| Top Industries | | |
| Technology - Computer Service Software & Systems | | 11.6% |
| Technology - Computer Technology | | 7.6% |
| Other Energy - Machine Oilwell | | 7.6% |
| Consumer Discretionary - Advertising Agency | | 6.9% |
| Healthcare - Drugs & Pharmaceuticals | | 6.0% |
| Other Energy Crude Oil Producer | | 4.9% |
| Healthcare - Biotech Research & Production | | 4.8% |
Healthcare - Medical & Dental
Instruments / Supplies | | 4.4% |
| Consumer Discretionary - Retail | | 4.4% |
| Producer Durables - Machinery Construction | | 4.3% |
| Other Industries | | 37.5% |
| | |
|
| | | 100.0% |
Oberweis China Opportunities Fund
| | |
| Asset Allocation | | |
| Common Stocks | | 97.7% |
| Other Assets in excess of Liabilities | | 2.3% |
| | |
|
| | | 100.0% |
| | |
| Top Holdings | | |
Century Sunshine Ecological
Technology Ltd. | | 4.7% |
| Lee & Man Paper Manufacturing Ltd. | | 4.5% |
| Focus Media Hldg. Ltd. ADR | | 4.5% |
| Li Ning Co., Ltd. | | 4.2% |
| Raffles Education Corp. Ltd. | | 4.0% |
Fu Ji Food & Catering Services
Holding Ltd. | | 3.9% |
| AsiaPharma Group Ltd. | | 3.2% |
| Pearl Energy Ltd. | | 3.1% |
| Golden Meditech Co., Ltd. | | 3.1% |
| Guangzhou R&F Properties Co., Ltd. | | 2.8% |
| Other Holdings | | 62.0% |
| | |
|
| | | 100.0% |
| | |
| Top Industries | | |
Financials - Real Estate
Operations / Development | | 6.3% |
Consumer Non-Cyclical - Food
Misc / Diversified | | 5.0% |
| Basic Materials - Agriculture Chemicals | | 4.7% |
| Communications - Advertising Sales | | 4.4% |
| Basic Materials - Paper & Related Products | | 4.4% |
| Consumer Cyclical - Leisure and Recreational Products | | 4.2% |
| Consumer Non-Cyclical - Schools | | 3.9% |
| Communications - Web Portals/ISP | | 3.3% |
| Consumer Non-Cyclical - Medical Drugs | | 3.1% |
| Energy - Oil Comp-Exploration & Production | | 3.1% |
| Other Industries | | 57.6% |
| | |
|
| | | 100.0% |
4
THE OBERWEIS FUNDS
MANAGEMENT DISCUSSION OF FUND PERFORMANCE
(cont’d.)
Average Annual Total Returns(1)
Periods ended 12/31/05
| | | | | | | | |
| | | One
Year | | Five
Years | | Ten
Years | | Since
Inception
1/7/87 |
| | |
|
OBEGX | | +2.74% | | +6.87% | | +7.54% | | +11.58% |
Russell 2000 Growth | | +4.15% | | +2.28% | | +4.69% | | +7.56% |
Russell 2000 | | +4.55% | | +8.22% | | +9.26% | | +10.16% |
Growth of an Assumed $10,000 Investment
from January 7, 1987 to December 31, 2005
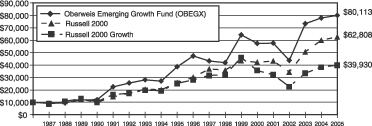
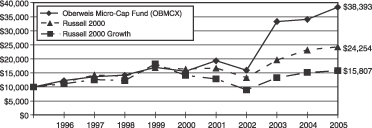
Average Annual Total Returns(1)
Periods ended 12/31/05
| | | | | | | | |
| | | One Year | | Five
Years | | Ten
Years | | Since
Inception
1/1/96 |
| | |
|
OBMCX | | +12.72% | | +19.75% | | +14.40% | | +14.40% |
Russell 2000 Growth | | +4.15% | | +2.28% | | +4.69% | | +4.69% |
Russell 2000 | | +4.55% | | +8.22% | | +9.26% | | +9.26% |
Growth of an Assumed $10,000 Investment
from January 1, 1996 to December 31, 2005
Average Annual Total Returns(1)
Periods ended 12/31/05
| | | | | | |
| | | One
Year | | Five
Years | | Since
Inception
9/15/96 |
| | |
|
OBMDX | | +4.85% | | -6.05% | | +6.51% |
Russell 2500 Growth | | +8.17% | | +2.78% | | +6.73% |
Russell 2000 Growth | | +4.15% | | +2.28% | | +4.18% |
Growth of an Assumed $10,000 Investment
from September 15, 1996 to December 31, 2005
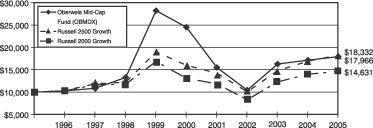
| (1) | | Performance data represents past performance, which is no guarantee of future results. Current performance may be higher or lower than the performance shown. You can obtain performance data current to the most recent month by visiting www.oberweisfunds.com. Returns are historical and include changes in share price and reinvestment of dividends and capital gains. Investment return and principal value will fluctuate so that shares, when redeemed, may be worth more or less than their original cost. The Oberweis Funds invest in rapidly growing smaller and medium sized companies, which may offer greater return potential. However, these investments often involve greater risks and volatility. There is no guarantee that the portfolios can achieve their objectives. The Russell 2000 Growth Index measures the performance of those Russell 2000 companies with higher price-to-book ratios and higher forecasted earnings growth rates. The Russell 2000 Index measures the performance of 2000 companies with small-market capitalizations. The Russell 2500 Growth Index measures the performance of Russell 2500 companies with lower price-to-book ratios and lower forecasted growth values. The Russell indices are unmanaged and are not available for investment. A sales load of 4% was charged on the Oberweis Emerging Growth Fund until December 31, 1991 and is not reflected in the total return figures or graph above. |
5
THE OBERWEIS FUNDS
MANAGEMENT DISCUSSION OF FUND PERFORMANCE
(cont’d.)
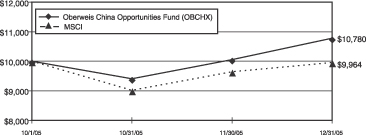
Average Annual Total Returns(1)
Periods ended 12/31/05
| | |
| | | Since
Inception
10/1/05 |
| | |
|
OBCHX | | +7.80% |
MSCI | | -0.36% |
Growth of an Assumed $10,000 Investment
from October 1, 2005 to December 31, 2005
| (1) | | Performance data represents past performance, which is no guarantee of future results. Returns are historical and include changes in share price and reinvestment of dividends and capital gains. Current performance may be higher or lower than the performance shown. You can obtain performance data current to the most recent month by visiting www.oberweisfunds.com. The principal value and investment return of an investment will fluctuate so that your shares, when redeemed, may be worth more or less than their original cost. The Oberweis Funds invest in rapidly growing smaller and medium sized companies, which may offer greater return potential. However, these investments often involve greater risks and volatility. Foreign and emerging market investing involves special risks such as currency fluctuation and less public disclosure, as well as economic and political risk. There is no guarantee that the portfolios can achieve their objectives. |
| | | The MSCI China Index is a free float-adjusted market capitalization-weighted index of Chinese equities that includes Red Chips and H shares listed on the Hong Kong exchange, and B shares listed on the Shanghai and Shenzhen exchanges. Investors cannot invest directly in market indexes. |
6
OBERWEIS EMERGING GROWTH FUND
Portfolio of Investments
December 31, 2005 (value in thousands)
| | | | | |
| Shares | | Company (Closing Price) | | Value |
| | | | | | |
| | | COMMON STOCK - 99.0% | | | |
| | | Consumer Discretionary - Advertising
Agency - 8.3% | | | |
| 178,174 | | aQuantive, Inc. @ 25.24 | | $ | 4,497 |
| 166,100 | | Focus Media Hldg. Ltd. @ 33.77 | | | 5,609 |
| 176,600 | | ValueClick, Inc. @ 18.11 | | | 3,198 |
| 81,750 | | Ventiv Health, Inc. @ 23.62 | | | 1,931 |
| | | | |
|
|
| | | | | | 15,235 |
| | | | |
|
|
| | | Consumer Discretionary - Commercial Information Service - 1.0% | | | |
| 109,594 | | Lecg Corp. @ 17.38 | | | 1,905 |
| | | | |
|
|
| | | Consumer Discretionary - Consumer Electronics - 2.8% | | | |
| 101,500 | | iVillage, Inc. @ 8.02 | | | 814 |
| 92,493 | | Jamdat Mobile, Inc. @ 26.58 | | | 2,458 |
| 97,800 | | WebSideStory, Inc. @ 18.13 | | | 1,773 |
| | | | |
|
|
| | | | | | 5,045 |
| | | | |
|
|
| | | Consumer Discretionary - Consumer
Products - 0.7% | | | |
| 36,265 | | USANA Health Sciences, Inc. @ 38.36 | | | 1,391 |
| | | | |
|
|
| | | Consumer Discretionary - Cosmetics - 0.7% | | | |
| 43,782 | | Parlux Fragrances, Inc. @ 30.53 | | | 1,337 |
| | | | |
|
|
| | | Consumer Discretionary - Retail - 2.1% | | | |
| 82,649 | | Stamps.com, Inc. @ 22.96 | | | 1,898 |
| 56,967 | | Volcom, Inc. @ 34.01 | | | 1,937 |
| | | | |
|
|
| | | | | | 3,835 |
| | | | |
|
|
| | | Consumer Discretionary - Service
Commercial - 1.8% | | | |
| 39,265 | | CRA International, Inc. @ 47.69 | | | 1,873 |
| 23,546 | | Ctrip.com International Ltd. @ 57.75 | | | 1,360 |
| | | | |
|
|
| | | | | | 3,233 |
| | | | |
|
|
| | | Consumer Discretionary - Wholesale - 1.7% | | | |
| 76,000 | | Central European Distribution Corp. @ 40.14 | | | 3,051 |
| | | | |
|
|
| | | Financial Services - Banks - 0.4% | | | |
| 19,158 | | *Mercantile Bank Corp. @ 38.50 | | | 738 |
| | | | |
|
|
| | | Financial Services - Diverse - 2.1% | | | |
| 141,968 | | Euronet Worldwide, Inc. @ 27.80 | | | 3,947 |
| | | | |
|
|
| | | Financial Services - Financial Data Product Services - 1.2% | | | |
| 172,400 | | Tradestation Group, Inc. @ 12.38 | | | 2,134 |
| | | | |
|
|
| | | | | |
| Shares | | Company (Closing Price) | | Value |
| | | | | | |
| | | Financial Services - Insurance - 1.2% | | | |
| 90,100 | | HealthExtras, Inc. @ 25.10 | | $ | 2,262 |
| | | | |
|
|
| | | Health Care - Biotechnology - 3.5% | | | |
| 124,531 | | Adeza Biomedical Corp. @ 21.05 | | | 2,621 |
| 25,209 | | Anika Therapeutics, Inc. @ 11.69 | | | 295 |
| 73,124 | | ArthroCare Corp. @ 42.14 | | | 3,081 |
| 51,260 | | Vnus Medical Technologies, Inc. @ 8.38 | | | 430 |
| | | | |
|
|
| | | | | | 6,427 |
| | | | |
|
|
| | | Health Care - Drugs &
Pharmaceuticals - 9.3% | | | |
| 82,900 | | Adams Respiratory Therapeutics, Inc. @ 40.66 | | | 3,370 |
| 84,500 | | Aspreva Pharmaceuticals Corp. @ 15.72 | | | 1,328 |
| 83,567 | | First Horizon Pharmaceutical Corp. @ 17.25 | | | 1,442 |
| 94,798 | | Kos Pharmaceuticals, Inc. @ 51.73 | | | 4,904 |
| 72,600 | | Quidel Corp. @ 10.76 | | | 781 |
| 98,669 | | Salix Pharmaceuticals Ltd. @ 17.58 | | | 1,735 |
| 49,991 | | United Therapeutics Corp. @ 69.12 | | | 3,455 |
| | | | |
|
|
| | | | | | 17,015 |
| | | | |
|
|
| | | Health Care - Electronic Medical
Systems - 2.8% | | | |
| 57,871 | | Aspect Medical Systems, Inc. @ 34.35 | | | 1,988 |
| 62,114 | | IntraLase Corp. @ 17.83 | | | 1,107 |
| 63,382 | | Syneron Medical Ltd. @ 31.75 | | | 2,012 |
| | | | |
|
|
| | | | | | 5,107 |
| | | | |
|
|
| | | Health Care - Facilities - 2.8% | | | |
| 39,666 | | American Healthways, Inc. @ 45.25 | | | 1,795 |
| 71,705 | | *LCA-Vision, Inc. @ 47.51 | | | 3,407 |
| | | | |
|
|
| | | | | | 5,202 |
| | | | |
|
|
| | | Health Care - Management Services - 0.5% | | | |
| 36,319 | | Centene Corp. @ 26.29 | | | 955 |
| | | | |
|
|
| | | Health Care - Medical & Dental
Services - 7.8% | | | |
| 33,688 | | American Science & Engineering, Inc. @ 62.37 | | | 2,101 |
| 60,000 | | ICU Medical, Inc. @ 39.21 | | | 2,353 |
| 82,500 | | Kyphon, Inc. @ 40.83 | | | 3,368 |
| 32,200 | | Laserscope, Inc. @ 22.46 | | | 723 |
| 204,614 | | LifeCell Corp. @ 19.04 | | | 3,895 |
| 54,000 | | Palomar Medical Technologies, Inc. @ 35.04 | | | 1,892 |
| | | | |
|
|
| | | | | | 14,332 |
| | | | |
|
|
See accompanying notes to financial statements.
7
OBERWEIS EMERGING GROWTH FUND
Portfolio of Investments (cont’d.)
| | | | | |
| Shares | | Company (Closing Price) | | Value |
| | | | | | |
| | | Health Care - Services - 0.5% | | | |
| 53,347 | | LHC Group, Inc. @ 17.43 | | $ | 930 |
| | | | |
|
|
| | | Materials & Production - Misc. Materials & Commodities - 4.1% | | | |
| 147,350 | | Ceradyne, Inc. @ 43.80 | | | 6,454 |
| 58,295 | | Charles & Colvard Ltd. @ 20.20 | | | 1,178 |
| | | | |
|
|
| | | | | | 7,632 |
| | | | |
|
|
| | | Other Energy - Machine Oilwell
Equipment - 2.2% | | | |
| 41,900 | | Dril Quip, Inc. @ 47.20 | | | 1,978 |
| 40,400 | | Lufkin Industries, Inc. @ 49.87 | | | 2,015 |
| | | | |
|
|
| | | | | | 3,993 |
| | | | |
|
|
| | | Other Energy - Misc. - 1.0% | | | |
| 53,675 | | Veritas DGC, Inc. @ 35.49 | | | 1,905 |
| | | | |
|
|
| | | Other Energy - Oil Crude Producer - 7.2% | | | |
| 80,791 | | ATP Oil & Gas Corp. @ 37.01 | | | 2,990 |
| 116,300 | | Bronco Drilling Company, Inc. @ 23.01 | | | 2,676 |
| 174,543 | | Carrizo Oil & Gas, Inc. @ 24.70 | | | 4,311 |
| 68,900 | | Petrohawk Energy Corp. @ 13.22 | | | 911 |
| 50,800 | | Pioneer Drilling Co. @ 17.93 | | | 911 |
| 36,622 | | Whiting Petroleum Corp. @ 40.00 | | | 1,465 |
| | | | |
|
|
| | | | | | 13,264 |
| | | | |
|
|
| | | Producer Durables - Homebuilding - 1.0% | | | |
| 59,455 | | Desarrolladora Homex S.A. Development Corp. @ 30.68 | | | 1,824 |
| | | | |
|
|
| | | Producer Durables - Machinery - Construction - 2.0% | | | |
| 150,026 | | A.S.V., Inc. @ 24.98 | | | 3,748 |
| | | | |
|
|
| | | Producer Durables - Misc. - 2.5% | | | |
| 44,900 | | Bucyrus International, Inc. @ 52.70 | | | 2,366 |
| 154,245 | | Turbochef Technologies, Inc. @ 14.36 | | | 2,215 |
| | | | |
|
|
| | | | | | 4,581 |
| | | | |
|
|
| | | Technology - Communication
Technology - 5.6% | | | |
| 179,270 | | Audicodes Ltd. @ 11.10 | | | 1,990 |
| 43,085 | | Comtech Telecommunications Corp. @ 30.55 | | | 1,316 |
| 409,211 | | Glenayre Technologies, Inc. @ 3.25 | | | 1,330 |
| 104,741 | | Ixia @ 14.80 | | | 1,550 |
| 90,547 | | Orckit Communications Ltd. @ 24.38 | | | 2,208 |
| 43,053 | | Talx Corp. @ 45.71 | | | 1,968 |
| | | | |
|
|
| | | | | | 10,362 |
| | | | |
|
|
| | | | | |
| Shares | | Company (Closing Price) | | Value |
| | | | | | |
| | | Technology - Computer Services Software & Systems - 12.0% | | | |
| 54,543 | | Blue Coat Systems, Inc. @ 45.72 | | $ | 2,494 |
| 140,800 | | Concur Technologies, Inc. @ 12.89 | | | 1,815 |
| 98,484 | | Jupitermedia Corp. @ 14.78 | | | 1,456 |
| 90,613 | | Merge Technologies, Inc. @ 25.04 | | | 2,268 |
| 197,862 | | Online Resources, Inc. @ 11.05 | | | 2,186 |
| 143,491 | | Openwave Systems, Inc. @ 17.47 | | | 2,507 |
| 115,135 | | PDF Solutions, Inc. @ 16.25 | | | 1,871 |
| 115,955 | | Rightnow Technologies, Inc. @ 18.46 | | | 2,141 |
| 37,000 | | Retalix Ltd. @ 24.46 | | | 905 |
| 57,382 | | Safenet, Inc. @ 32.22 | | | 1,849 |
| 164,900 | | VASCO Data Security International, Inc. @ 9.86 | | | 1,626 |
| 59,100 | | Zoran Corp. @ 16.21 | | | 958 |
| | | | |
|
|
| | | | | | 22,076 |
| | | | |
|
|
| | | Technology - Computer Technology - 5.1% | | | |
| 57,244 | | M-Systems Flash Disk Pioneers Ltd.@ 33.12 | | | 1,896 |
| 77,000 | | Rackable Systems, Inc. @ 28.48 | | | 2,192 |
| 139,300 | | Silicon Motion Technology Corp. @ 12.00 | | | 1,672 |
| 202,000 | | Trident Microsystems, Inc. @ 18.00 | | | 3,636 |
| | | | |
|
|
| | | | | | 9,396 |
| | | | |
|
|
| | | Technology - Electronics - 0.6% | | | |
| 23,800 | | Supertex, Inc. @ 44.25 | | | 1,053 |
| | | | |
|
|
| | | Technology - Electronics
Semi-Conductors - 2.4% | | | |
| 63,100 | | Ikanos Communications @ 14.74 | | | 930 |
| 66,900 | | Saifun Semiconductor Ltd. @ 31.47 | | | 2,105 |
| 53,203 | | Tessera Technologies, Inc. @ 25.85 | | | 1,375 |
| | | | |
|
|
| | | | | | 4,410 |
| | | | |
|
|
| | | Technology - Electronics Technology - 0.6% | | | |
| 68,900 | | Essex Corp. @ 17.05 | | | 1,175 |
| | | | |
|
|
| | | Technology - Misc. Technology - 1.5% | | | |
| 80,600 | | iRobot Corp. @ 33.33 | | | 2,686 |
| | | | |
|
|
| | | Total Common Stocks
(Cost: $134,888,000) | | $ | 182,186 |
| | | | |
|
|
See accompanying notes to financial statements.
8
OBERWEIS EMERGING GROWTH FUND
Portfolio of Investments (cont’d.)
| | | | | | | |
Face
Amount | | Company (Closing Price) | | Value | |
| | | | | | | | |
| | | | COMMERCIAL PAPER - 1.7% | | | | |
| $ | 3,200,000 | | General Electric Capital Corporation
4.18%, due 01-03-06 | | $ | 3,200 | |
| | | | | |
|
|
|
| | |
| | | | Total Commercial Paper
(Cost: $3,200,000) | | | 3,200 | |
| | | | | |
|
|
|
| | |
| | | | Total Investments - 100.7%
(Cost: $138,088,000) | | | 185,386 | |
| | |
| | | | Other Liabilities less Assets (0.7%) | | | (1,407 | ) |
| | | | | |
|
|
|
| | |
| | | | NET ASSETS - 100% | | $ | 183,979 | |
| | | | | |
|
|
|
Notes to Portfolio of Investments
| * | Income producing security during the year ended December 31, 2005. |
Based on the cost of investments of $138,106,000 for federal income tax purposes at December 31, 2005, the aggregate gross unrealized appreciation was $52,061,000, the aggregate gross unrealized depreciation was $4,781,000 and the net unrealized appreciation of investments was $47,280,000.
See accompanying notes to financial statements.
9
OBERWEIS MICRO-CAP FUND
Portfolio of Investments
December 31, 2005 (value in thousands)
| | | | | |
| Shares | | Company (Closing Price) | | Value |
| | | | | | |
| | | COMMON STOCK - 93.8% | | | |
| | | Auto & Transport - Auto Parts - 0.4% | | | |
| 37,600 | | Hoku Scientific, Inc. @ 7.59 | | $ | 285 |
| | | | |
|
|
| | | Consumer Discretionary - Casinos & Gambling - 0.5% | | | |
| 27,788 | | Gaming Partners International Corp. @11.18 | | | 311 |
| | | | |
|
|
| | | Consumer Discretionary - Commercial Information Service - 0.8% | | | |
| 104,800 | | Traffix, Inc. @ 5.12 | | | 537 |
| | | | |
|
|
| | | Consumer Discretionary - Consumer Electronics - 2.9% | | | |
| 27,875 | | Rimage Corp. @ 28.98 | | | 808 |
| 62,731 | | WebSideStory, Inc. @ 18.13 | | | 1,137 |
| | | | |
|
|
| | | | | | 1,945 |
| | | | |
|
|
| | | Consumer Discretionary - Education Services - 0.3% | | | |
| 44,883 | | Competitive Technology, Inc. @ 3.91 | | | 175 |
| | | | |
|
|
| | | Consumer Discretionary - Leisure Time - 2.2% | | | |
| 60,115 | | *Aldila, Inc. @ 25.43 | | | 1,529 |
| | | | |
|
|
| | | Consumer Discretionary - Misc. - 5.4% | | | |
| 65,406 | | Barrett Business Services, Inc. @ 24.99 | | | 1,634 |
| 150,400 | | Home Solutions of America, Inc. @ 4.48 | | | 674 |
| 64,932 | | Kenexa Corp. @ 21.10 | | | 1,370 |
| | | | |
|
|
| | | | | | 3,678 |
| | | | |
|
|
| | | Consumer Discretionary - Retail - 0.2% | | | |
| 11,275 | | Celebrate Express, Inc. @ 13.50 | | | 152 |
| 400 | | Golf Galaxy @ 19.15 | | | 8 |
| | | | |
|
|
| | | | | | 160 |
| | | | |
|
|
| | | Consumer Discretionary - Service
Commercial - 4.6% | | | |
| 97,200 | | Bodisen Biotech, Inc. @ 14.00 | | | 1,361 |
| 115,328 | | eDiets.com @ 6.12 | | | 706 |
| 40,413 | | First Advantage Corp. @ 26.71 | | | 1,079 |
| | | | |
|
|
| | | | | | 3,146 |
| | | | |
|
|
| | | Consumer Discretionary - Wholesale - 3.8% | | | |
| 54,940 | | Allion Healthcare, Inc. @ 11.65 | | | 640 |
| 30,193 | | Central European Distribution Corp. @ 40.14 | | | 1,212 |
| 35,100 | | Infosonics Corp. @ 16.24 | | | 570 |
| 22,394 | | Lazare Kaplan International, Inc. @ 7.87 | | | 176 |
| | | | |
|
|
| | | | | | 2,598 |
| | | | |
|
|
| | | | | |
| Shares | | Company (Closing Price) | | Value |
| | | | | | |
| | | Consumer Staples - Foods - 0.5% | | | |
| 60,000 | | Medifast, Inc. @ 5.24 | | $ | 314 |
| | | | |
|
|
| | | Financial Services - Banks - 2.2% | | | |
| 13,135 | | Dearborn Bankcorp, Inc. @ 24.75 | | | 325 |
| 15,162 | | St. Joseph Capital Corp. @ 29.78 | | | 452 |
| 20,400 | | Valley Bancorp, Inc. @ 34.69 | | | 708 |
| | | | |
|
|
| | | | | | 1,485 |
| | | | |
|
|
| | | Financial Services - Financial Data Product Services - 0.9% | | | |
| 89,729 | | Cybersource Corp. @ 6.60 | | | 592 |
| | | | |
|
|
| | | Financial Services - Insurance - 1.2% | | | |
| 33,859 | | HealthExtras, Inc. @ 25.10 | | | 850 |
| | | | |
|
|
| | | Health Care - Biotechnology - 0.4% | | | |
| 24,408 | | Anika Therapeutics, Inc. @ 11.69 | | | 285 |
| | | | |
|
|
| | | Health Care - Drugs &
Pharmaceuticals - 3.0% | | | |
| 50,243 | | Bentley Pharmaceuticals, Inc. @ 16.41 | | | 825 |
| 68,052 | | ViroPharma, Inc. @ 18.50 | | | 1,259 |
| | | | |
|
|
| | | | | | 2,084 |
| | | | |
|
|
| | | Health Care - Electronic Medical
Systems - 7.5% | | | |
| 42,500 | | Criticare Systems, Inc. @ 4.96 | | | 211 |
| 41,240 | | Healthtronics, Inc. @ 7.65 | | | 315 |
| 33,600 | | Q-Med, Inc. @ 9.67 | | | 325 |
| 21,300 | | Quality Systems, Inc. @ 76.76 | | | 1,635 |
| 82,622 | | Somanetics Corp. @ 32.00 | | | 2,644 |
| | | | |
|
|
| | | | | | 5,130 |
| | | | |
|
|
| | | Health Care - Facilities - 5.3% | | | |
| 263,772 | | Health Grades, Inc. @ 6.32 | | | 1,667 |
| 217,211 | | Paincare Holdings, Inc. @ 3.26 | | | 708 |
| 21,337 | | Psychiatric Solutions, Inc. @ 58.74 | | | 1,253 |
| | | | |
|
|
| | | | | | 3,628 |
| | | | |
|
|
| | | Health Care - Management Services - 1.9% | | | |
| 50,389 | | Vital Images, Inc. @ 26.15 | | | 1,318 |
| | | | |
|
|
| | | Health Care - Medical & Dental - 5.3% | | | |
| 191,800 | | Alpha Pro Tech Ltd. @ 2.30 | | | 441 |
| 31,900 | | Intricon Corp. @ 4.11 | | | 131 |
| 71,291 | | Palomar Medical Technologies, Inc. @ 35.04 | | | 2,498 |
| 74,427 | | Vascular Solutions, Inc. @ 7.56 | | | 563 |
| | | | |
|
|
| | | | | | 3,633 |
| | | | |
|
|
See accompanying notes to financial statements.
10
OBERWEIS MICRO-CAP FUND
Portfolio of Investments (cont’d.)
| | | | | |
| Shares | | Company (Closing Price) | | Value |
| | | | | | |
| | | Health Care - Misc. - 1.5% | | | |
| 128,200 | | A.D.A.M., INC. @ 8.06 | | $ | 1,033 |
| | | | |
|
|
| | | Materials & Products - Chemicals - 0.1% | | | |
| 19,458 | | Flexible Solutions International, Inc. @ 2.90 | | | 56 |
| | | | |
|
|
| | | Medical Products - Engineering & Contracting Services - 1.8% | | | |
| 29,860 | | *VSE Corp. @ 42.09 | | | 1,257 |
| | | | |
|
|
| | | Other Energy - Oil Crude Producer - 8.0% | | | |
| 31,000 | | Arena Resources, Inc. @ 27.60 | | | 856 |
| 42,090 | | Dawson Geophysical Co. @ 30.82 | | | 1,297 |
| 42,992 | | Edge Petroleum Corp. @ 24.91 | | | 1,071 |
| 47,000 | | GMX Resources, Inc. @ 36.00 | | | 1,692 |
| 132,603 | | Vaalco Energy, Inc. @ 4.24 | | | 562 |
| | | | |
|
|
| | | | | | 5,478 |
| | | | |
|
|
| | | Other Energy - Misc. - 2.2% | | | |
| 106,800 | | ENGlobal Corp. @ 8.42 | | | 899 |
| 33,700 | | Flotek Industries, Inc. @ 18.65 | | | 628 |
| | | | |
|
|
| | | | | | 1,527 |
| | | | |
|
|
| | | Producer Durables - Control & Filter
Devices - 2.3% | | | |
| 33,778 | | Hurco Companies, Inc. @ 30.82 | | | 1,041 |
| 91,400 | | International Displayworks, Inc. @ 5.94 | | | 543 |
| | | | |
|
|
| | | | | | 1,584 |
| | | | |
|
|
| | | Producer Durables - Electronics - 4.7% | | | |
| 93,194 | | I.D. Systems, Inc. @ 23.85 | | | 2,223 |
| 46,421 | | Iris International, Inc. @ 21.86 | | | 1,015 |
| | | | |
|
|
| | | | | | 3,238 |
| | | | |
|
|
| | | Producer Durables - Machinery
Construction - 0.3% | | | |
| 19,800 | | Paragon Technologies, Inc. @ 9.95 | | | 197 |
| | | | |
|
|
| | | Producer Durables - Metal Fabricating - 0.1% | | | |
| 3,400 | | Graham Corp. @ 22.50 | | | 76 |
| | | | |
|
|
| | | Producer Durables - Misc. - 1.7% | | | |
| 13,102 | | Dynamic Materials Corp. @ 30.02 | | | 393 |
| 56,900 | | Fuel Tech N.V. @ 9.07 | | | 516 |
| 58,800 | | Henry Bros Electronics, Inc. @ 4.48 | | | 263 |
| | | | |
|
|
| | | | | | 1,172 |
| | | | |
|
|
| | | Producer Durables -
Telecommunications - 0.1% | | | |
| 7,100 | | Scopus Video Network Ltd. @ 6.00 | | | 43 |
| | | | |
|
|
| | | | | |
| Shares | | Company (Closing Price) | | Value |
| | | | | | |
| | | Technology - Communication - 1.9% | | | |
| 16,200 | | Comarco, Inc.@ 9.98 | | $ | 162 |
| 14,900 | | Optelecom, Inc. @ 13.40 | | | 200 |
| 34,000 | | Radyne Corp. @ 14.57 | | | 495 |
| 56,600 | | Relm Wireles Corp. @ 7.31 | | | 414 |
| | | | |
|
|
| | | | | | 1,271 |
| | | | |
|
|
| | | Technology - Computer Service Software & System - 13.2% | | | |
| 100,900 | | Applix, Inc. @ 7.30 | | | 737 |
| 37,666 | | Astea International, Inc. @ 14.17 | | | 534 |
| 86,278 | | Datatrak International, Inc. @ 9.99 | | | 862 |
| 23,500 | | Edgewater Technology, Inc. @ 5.90 | | | 139 |
| 28,400 | | Fundtech Ltd. @ 10.23 | | | 291 |
| 54,718 | | Merge Technologies, Inc. @ 25.04 | | | 1,370 |
| 3,380 | | Moldflow Corp. @ 13.94 | | | 47 |
| 74,131 | | Pacificnet, Inc. @ 6.77 | | | 502 |
| 90,370 | | Perficient, Inc. @ 8.91 | | | 805 |
| 25,968 | | SI International, Inc. @ 30.57 | | | 794 |
| 138,493 | | Youbet.com, Inc. @ 4.73 | | | 655 |
| 169,608 | | Vasco Data Security International, Inc. @ 9.86 | | | 1,671 |
| 59,200 | | Vocus, Inc.@ 10.39 | | | 615 |
| | | | |
|
|
| | | | | | 9,022 |
| | | | |
|
|
| | | Technology - Computer Technology - 5.8% | | | |
| 231,696 | | ACE Communications Corp. @ 3.14 | | | 728 |
| 73,700 | | LanVision System, Inc. @ 5.75 | | | 424 |
| 30,600 | | Neoware Systems, Inc. @ 23.30 | | | 713 |
| 145,992 | | Peerless Systems, Inc. @ 8.43 | | | 1,231 |
| 30,600 | | Rackable Systems, Inc. @ 28.48 | | | 871 |
| | | | |
|
|
| | | | | | 3,967 |
| | | | |
|
|
| | | Technology Electronics - 0.6% | | | |
| 31,500 | | Micronetics, Inc. @ 12.02 | | | 379 |
| | | | |
|
|
| | | Utilities - Utilities Misc. - 0.2% | | | |
| 71,400 | | Hudson Technologies, Inc. @ 1.73 | | | 124 |
| | | | |
|
|
| | |
| | | Total Common Stocks
(Cost $45,994,000) | | $ | 64,107 |
| | | | |
|
|
See accompanying notes to financial statements.
11
OBERWEIS MICRO-CAP FUND
Portfolio of Investments (cont’d.)
| | | | | | | |
Face
Amount | | Company (Closing Price) | | Value | |
| | | | | | | | |
| | | | COMMERCIAL PAPER - 8.3% | | | | |
| $ | 3,300,000 | | American Express 4.00%, due 01-03-06 | | $ | 3,300 | |
| | 300,000 | | GE Capital Corp. 3.88%, due 01-06-06 | | | 300 | |
| | 1,000,000 | | GE Capital Corp. 4.26%, due 01-05-06 | | | 1,000 | |
| | 1,100,000 | | GE Capital Corp. 4.26%, due 01-03-06 | | | 1,100 | |
| | | | | |
|
|
|
| | |
| | | | Total Commercial Paper
(Cost: $5,700,000) | | | 5,700 | |
| | | | | |
|
|
|
| | |
| | | | Total Investments - 102.1%
(Cost: $51,694,000) | | | 69,807 | |
| | |
| | | | Other Liabilities less Assets - (2.1%) | | | (1,452 | ) |
| | | | | |
|
|
|
| | |
| | | | NET ASSETS - 100.0% | | $ | 68,355 | |
| | | | | |
|
|
|
Notes to Portfolio of Investments
| * | Income producing security during the year ended December 31, 2005. |
Based on the cost of investments of $51,698,000 for federal income tax purposes at December 31, 2005, the aggregate gross unrealized appreciation was $20,413,000, the aggregate gross unrealized depreciation was $2,304,000 and the net unrealized appreciation of investments was $18,109,000.
See accompanying notes to financial statements.
12
OBERWEIS MID-CAP FUND
Portfolio of Investments
December 31, 2005 (value in thousands)
| | | | | |
| Shares | | Company (Closing Price) | | Value |
| | | | | | |
| | | COMMON STOCKS - 98.8% | | | |
| | | Consumer Discretionary - Advertising
Agency - 6.9% | | | |
| 4,631 | | aQuantive, Inc. @ 25.24 | | $ | 117 |
| 11,500 | | Focus Media Hldg. Ltd. @ 33.77 | | | 388 |
| 5,581 | | ValueClick, Inc. @ 18.11 | | | 101 |
| | | | |
|
|
| | | | | | 606 |
| | | | |
|
|
| | | Consumer Discretionary - Restaurants - 3.7% | | | |
| 2,548 | | Panera Bread Co. @ 65.68 | | | 167 |
| 4,332 | | The Cheesecake Factory, Inc. @ 37.39 | | | 162 |
| | | | |
|
|
| | | | | | 329 |
| | | | |
|
|
| | | Consumer Discretionary - Retail - 4.4% | | | |
| 6,200 | | Coldwater Creek, Inc. @ 30.53 | | | 189 |
| 3,646 | | Urban Outfitters, Inc. @ 25.31 | | | 93 |
| 3,100 | | Volcom, Inc. @ 34.01 | | | 105 |
| | | | |
|
|
| | | | | | 387 |
| | | | |
|
|
| | | Consumer Discretionary - Service
Commercial - 3.0% | | | |
| 2,051 | | Ctrip.com International Ltd. @ 57.75 | | | 118 |
| 3,072 | | CRA International, Inc. @ 47.69 | | | 147 |
| | | | |
|
|
| | | | | | 265 |
| | | | |
|
|
| | | Consumer Discretionary - Wholesale - 2.0% | | | |
| 4,335 | | Central European Distribution Corp. @ 40.14 | | | 174 |
| | | | |
|
|
| | | Financial Services - Diverse Financial
Services - 1.6% | | | |
| 5,061 | | Euronet Worldwide, Inc. @ 27.80 | | | 141 |
| | | | |
|
|
| | | Financial Services - Insurance - 2.5% | | | |
| 8,700 | | HealthExtras, Inc. @ 25.10 | | | 218 |
| | | | |
|
|
| | | Health Care - Biotech Research &
Production - 4.8% | | | |
| 4,574 | | Arthrocare Corp. @ 42.14 | | | 193 |
| 1,794 | | Celgene Corp. @ 64.80 | | | 116 |
| 3,060 | | Integra Lifesciences Holdings Corp. @ 35.46 | | | 109 |
| | | | |
|
|
| | | | | | 418 |
| | | | |
|
|
| | | Health Care - Drugs & Pharmaceuticals - 6.0% | | | |
| 3,156 | | Adams Respiratory Therapeutics, Inc. @ 40.66 | | | 128 |
| 4,508 | | Kos Pharmaceuticals, Inc. @ 51.73 | | | 233 |
| 2,376 | | United Therapeutics Corp. @ 69.12 | | | 164 |
| | | | |
|
|
| | | | | | 525 |
| | | | |
|
|
| | | Health Care - Electrical Medical Systems - 3.2% | | | |
| 2,391 | | Intuitive Surgical, Inc. @ 117.27 | | | 280 |
| | | | |
|
|
| | | | | |
| Shares | | Company (Closing Price) | | Value |
| | | | | | |
| | | Health Care - Facilities - 3.7% | | | |
| 1,883 | | American Healthways, Inc.@ 45.25 | | $ | 85 |
| 3,067 | | Lca-vision, Inc. @ 47.51 | | | 146 |
| 1,600 | | Psychiatric Solutions, Inc. @ 58.74 | | | 94 |
| | | | |
|
|
| | | | | | 325 |
| | | | |
|
|
| | | Health Care - Medical & Dental Instruments / Supplies - 4.4% | | | |
| 5,431 | | Cytyc Corp. @ 28.33 | | | 153 |
| 3,681 | | Kyphon, Inc. @ 40.83 | | | 150 |
| 2,136 | | Resmed, Inc. @ 38.31 | | | 82 |
| | | | |
|
|
| | | | | | 385 |
| | | | |
|
|
| | | Material Producer - Misc. Materials & Commodities - 3.2% | | | |
| 6,387 | | Ceradyne, Inc. @ 43.80 | | | 280 |
| | | | |
|
|
| | | Other Energy - Machine Oilwell - 7.5% | | | |
| 2,900 | | Dril-Quip, Inc. @ 47.20 | | | 137 |
| 3,500 | | Helmerich & Payne, Inc. @ 61.91 | | | 217 |
| 2,033 | | Hydril Co. @ 62.60 | | | 127 |
| 3,500 | | Oceaneering International, Inc. @ 49.78 | | | 174 |
| | | | |
|
|
| | | | | | 655 |
| | | | |
|
|
| | | Other Energy - Misc. - 0.9% | | | |
| 2,299 | | Veritas DGC, Inc. @ 35.49 | | | 82 |
| | | | |
|
|
| | | Other Energy - Crude Oil Producer - 4.9% | | | |
| 7,200 | | Petrohawk Energy Corp. @ 13.22 | | | 95 |
| 7,500 | | Pioneer Drilling Co. @ 17.93 | | | 135 |
| 3,671 | | Ultra Petroleum Corp. @ 55.80 | | | 205 |
| | | | |
|
|
| | | | | | 435 |
| | | | |
|
|
| | | Producer Durables - Machinery -
Construction - 4.3% | | | |
| 4,300 | | Astec Industries, Inc. @ 32.66 | | | 140 |
| 9,368 | | A.S.V., Inc. @ 24.98 | | | 234 |
| | | | |
|
|
| | | | | | 374 |
| | | | |
|
|
| | | Producer Durables - Machinery
Industrial - 2.2% | | | |
| 4,833 | | Joy Global, Inc. @ 40.00 | | | 193 |
| | | | |
|
|
| | | Producer Durables - Machinery -
Specialty - 3.2% | | | |
| 2,201 | | *JLG Industries, Inc. @ 45.66 | | | 101 |
| 14,200 | | Powerwave Technologies, Inc. @ 12.57 | | | 179 |
| | | | |
|
|
| | | | | | 280 |
| | | | |
|
|
See accompanying notes to financial statements.
13
OBERWEIS MID-CAP FUND
Portfolio of Investments (cont’d.)
| | | | | |
| Shares | | Company (Closing Price) | | Value |
| | | | | | |
| | | Technology - Communication
Technology - 3.1% | | | |
| 3,600 | | Comtech Telecommunications Corp. @ 30.55 | | $ | 110 |
| 3,778 | | J2 Global Communications, Inc. @ 42.74 | | | 162 |
| | | | |
|
|
| | | | | | 272 |
| | | | |
|
|
| | | Technology - Computer Service Software & Systems - 11.6% | | | |
| 8,585 | | Akamai Technologies, Inc. @ 19.93 | | | 171 |
| 2,800 | | F5 Networks, Inc. @ 57.19 | | | 160 |
| 2,954 | | Navteq Corp. @ 43.87 | | | 130 |
| 1,534 | | Netease.com, Inc. @ 56.16 | | | 86 |
| 10,556 | | Openwave Systems, Inc. @ 17.47 | | | 184 |
| 3,104 | | Sra International, Inc. @ 30.54 | | | 95 |
| 4,100 | | Tom On-Line Inc. @ 19.82 | | | 81 |
| 1,700 | | Websense, Inc. @ 65.64 | | | 112 |
| | | | |
|
|
| | | | | | 1,019 |
| | | | |
|
|
| | | Technology - Computer Technology - 7.6% | | | |
| 5,180 | | Cogent, Inc. @ 22.68 | | | 118 |
| 5,083 | | M-Systems Flash Disk Pioneers, Ltd. @ 33.12 | | | 168 |
| 3,343 | | Nvidia Corp. @ 36.56 | | | 122 |
| 14,428 | | Trident Microsystems, Inc. @ 18.00 | | | 260 |
| | | | |
|
|
| | | | | | 668 |
| | | | |
|
|
| | | Technology - Electronics
Semi-Conductors - 1.2% | | | |
| 3,600 | | Sift Technology Hldgs Inc. @ 29.80 | | | 107 |
| | | | |
|
|
| | | Technology - Misc. Technology - 2.9% | | | |
| 7,600 | | Irobot Corp. @ 33.33 | | | 253 |
| | | | |
|
|
| | |
| | | Total Common Stocks
(Cost: $7,110,000) | | $ | 8,671 |
| | | | |
|
|
| | |
| | | Total Investments - 98.8%
(Cost: $7,110,000) | | | 8,671 |
| | |
| | | Other Assets less Liabilities - 1.2% | | | 102 |
| | | | |
|
|
| | |
| | | NET ASSETS - 100.0% | | $ | 8,773 |
| | | | |
|
|
Notes to Portfolio of Investments
| * | Income producing security during the year ended December 31, 2005. |
Based on the cost of investments of $7,111,000 for federal income tax purposes at December 31, 2005, the aggregate gross unrealized appreciation was $1,637,000, the aggregate gross unrealized depreciation was $77,000 and the net unrealized appreciation of investments was $1,560,000.
See accompanying notes to financial statements.
14
OBERWEIS CHINA OPPORTUNITIES FUND
Portfolio of Investments
December 31, 2005 (value in thousands)
| | | | | |
| Shares | | Company (Closing Price) | | Value |
| | | | | | |
| | | COMMON STOCKS - 97.7% | | | |
| | | Hong Kong - 66.9% | | | |
| | | Basic Materials - Agriculture
Chemicals - 4.7% | | | |
| 1,070,000 | | Century Sunshine Ecological Technology Holdings Ltd. @ 0.3256 | | $ | 348 |
| | | | |
|
|
| | | Basic Materials - Gold Mining - 1.6% | | | |
| 272,000 | | †Zijin Mining Group Co., Ltd. @ .4411 | | | 120 |
| | | | |
|
|
| | | Basic Materials - Paper & Related
Products - 4.5% | | | |
| 300,000 | | †Lee & Man Paper Manufacturing Ltd. @ 1.1073 | | | 332 |
| | | | |
|
|
| | | Basic Materials - PetroChemicals - 0.8% | | | |
| 170,000 | | †Jilin Chemical Industrial Co., Ltd. @ 0.3573 | | | 61 |
| | | | |
|
|
| | | Consumer Cyclical - Airlines - 2.2% | | | |
| 226,000 | | †Air China Ltd. @ 0.3187 | | | 72 |
| 462,000 | | †China National Aviation Co., Ltd. @ 0.1948 | | | 90 |
| | | | |
|
|
| | | | | | 162 |
| | | | |
|
|
| | | Consumer Cyclical - Apparel
Manufactures - 2.3% | | | |
| 147,000 | | †Ports Design Limited @ 1.1633 | | | 171 |
| | | | |
|
|
| | | Consumer Cyclical - Distribution /
Wholesale - 2.6% | | | |
| 100,000 | | †Li & Fung, Ltd. @ 1.9241 | | | 192 |
| | | | |
|
|
| | | Consumer Cyclical - Footwear & Related Apparel - 2.5% | | | |
| 372,000 | | †*Prime Success International Group Ltd. @ 0.5011 | | | 186 |
| | | | |
|
|
| | | Consumer Cyclical - Leisure & Recreational Products - 4.2% | | | |
| 440,000 | | Li Ning Co., Ltd. @ .7093 | | | 312 |
| | | | |
|
|
| | | Consumer Cyclical - Misc
Manufacturer - 2.4% | | | |
| 560,000 | | †Peace Mark Holdings Ltd. @ 0.3173 | | | 178 |
| | | | |
|
|
| | | Consumer Cyclical - Retail Consumer Electronics - 1.4% | | | |
| 300,000 | | China Paradise Electronics Retail Ltd. @ 0.3547 | | | 106 |
| | | | |
|
|
| | | Consumer Cyclical - Retail -
Hypermarkets - 1.8% | | | |
| 70,000 | | Wumart Stores, Inc. @ 1.9216 | | | 134 |
| | | | |
|
|
| | | | | |
| Shares | | Company (Closing Price) | | Value |
| | | | | | |
| | | Consumer Cyclical - Retail - Major Department Stores - 0.8% | | | |
| 44,000 | | †Lifestlye International Holdings Ltd. @ 1.3914 | | $ | 61 |
| | | | |
|
|
| | | Consumer Cyclical - Textile Products - 2.1% | | | |
| 117,000 | | †Weiqiao Textile Co. Ltd. @ 1.3675 | | | 160 |
| | | | |
|
|
| | | Consumer Non-Cyclical - Food-
Misc / Diversified - 5.0% | | | |
| 160,000 | | China Yurun Food Group Ltd. @ 0.5578 | | | 89 |
| 174,000 | | †Fu Ji Food & Catering Services Holdings Ltd. @ 1.6379 | | | 285 |
| | | | |
|
|
| | | | | | 374 |
| | | | |
|
|
| | | Consumer Non-Cyclical - Food-Wholesale / Distribution - 1.8% | | | |
| 915,000 | | *Heng Tai Consumables Group Ltd. @ 0.1457 | | | 133 |
| | | | |
|
|
| | | Consumer Non-Cyclical - Medical
Instruments - 3.0% | | | |
| 944,000 | | Golden Meditech Co., Ltd. @ 0.2399 | | | 226 |
| | | | |
|
|
| | | Consumer Non-Cyclical -
Printing-Commercial - 1.5% | | | |
| 178,000 | | Vision Grande Group Holdings Ltd. @ .6417 | | | 114 |
| | | | |
|
|
| | | Consumer Non-Cyclical - Public
Thoroughfares - 1.6% | | | |
| 142,000 | | †Anhui Expressway Co., Ltd. @ 0.4832 | | | 69 |
| 76,000 | | †Zhejang Expressway Co., Ltd. @ 0.6176 | | | 47 |
| | | | |
|
|
| | | | | | 116 |
| | | | |
|
|
| | | Diversified - Diversified Operations - 0.4% | | | |
| 324,000 | | †China Resources Logic Ltd. @ 0.1004 | | | 33 |
| | | | |
|
|
| | | Energy - Oil Field Services - 1.8% | | | |
| 334,000 | | †China Oilfield Services Ltd. @ 0.4095 | | | 137 |
| | | | |
|
|
| | | Energy - Pipelines - 2.1% | | | |
| 836,000 | | †China Gas Holdings Ltd. @ 0.1870 | | | 156 |
| | | | |
|
|
| | | Financials - Real Estate Operations /
Development - 6.3% | | | |
| 60,000 | | Guangzhou R&F Properties Co., Ltd. @ 3.4822 | | | 209 |
| 212,000 | | †*Hopson Development Holdings Ltd. @ 1.2309 | | | 261 |
| | | | |
|
|
| | | | | | 470 |
| | | | |
|
|
| | | Industrial - Electronic Components-
Misc - 0.8% | | | |
| 46,000 | | Truly International Holdings Ltd. @ 1.2961 | | | 60 |
| | | | |
|
|
See accompanying notes to financial statements.
15
OBERWEIS CHINA OPPORTUNITIES FUND
Portfolio of Investments (cont’d.)
| | | | | | |
| Shares | | | Company (Closing Price) | | Value |
| | | | | | | |
| | | | Industrial - Machinery - Construction &
Mining - 1.4% | | | |
| 532,000 | | | China Infrastructure @ 0.1960 | | $ | 104 |
| | | | | |
|
|
| | | | Industrial - Metal Processors &
Fabrication - 0.8% | | | |
| 126,000 | | | †Jiangxi Copper Co. Ltd. @ 0.4734 | | | 60 |
| | | | | |
|
|
| | | | Industrial - Power Conversion / Supply
Equipment - 1.2% | | | |
| 86,000 | | | †Dongfang Electrical Machinery Ltd. @ 1.0194 | | | 88 |
| | | | | |
|
|
| | | | Technology - Computers-Integrated
Systems - 1.1% | | | |
| 522,000 | | | †Citic 21 Cn Co., Ltd. @ 0.1623 | | | 85 |
| | | | | |
|
|
| | | | Technology - Enterprise Software /
Services - 0.8% | | | |
| 560,000 | | | †Chinasoft International Ltd. @ 0.1098 | | | 61 |
| | | | | |
|
|
| | | | Technology Components-Integrated
Circuit - 1.3% | | | |
| 236,000 | | | †Solomon Systech International Ltd. @ 0.4141 | | | 98 |
| | | | | |
|
|
| | | | Utilities - Gas-Distribution - 2.1% | | | |
| 200,000 | | | Xinao Gas Holdings Ltd. @ 0.7932 | | | 159 |
| | | | | |
|
|
| | | | Singapore - 16.8% | | | |
| | | | Consumer Non-Cyclical - Agriculture
Bio-Tech - 2.4% | | | |
| 654,000 | | | †China Sun Bio-Chem Technology Group Co. @ 0.2756 | | | 180 |
| | | | | |
|
|
| | | | Consumer Non-Cyclical - Healthcare Safety Devices - 0.6% | | | |
| 46,000 | | | †Osim International Ltd. @ 0.9540 | | | 44 |
| | | | | |
|
|
| | | | Consumer Non-Cyclical - Medical
Drugs - 3.1% | | | |
| 622,000 | | | †AsiaPharma Group Ltd. @ 0.3751 | | | 233 |
| | | | | |
|
|
| | | | Consumer Non-Cyclical - Schools - 3.9% | | | |
| 288,000 | | | †*Raffles Education Corp. Ltd. @ 1.0099 | | | 291 |
| | | | | |
|
|
| | | | Energy - Oil Comp-Exploration &
Production - 3.1% | | | |
| 260,000 | | | †Pearl Energy Ltd. @ 0.8813 | | | 229 |
| | | | | |
|
|
| | | | Industrial - Transport-Marine - 2.4% | | | |
| 206,000 | | | †*Ezra Holdings Ltd. @ 0.8743 | | | 180 |
| | | | | |
|
|
| | | | Industrial - Water Treatment Systems - 1.3% | | | |
| 151,000 | | | †*Bio-Treat Technology Ltd. @ .6708 | | | 101 |
| | | | | |
|
|
| | | | | |
| Shares | | Company (Closing Price) | | Value |
| | | | | | |
| | | United States - 14.0% | | | |
| | | Communications - Advertising Sales - 4.4% | | | |
| 9,800 | | Focus Media Holdings Ltd. ADR @ 33.7700 | | $ | 331 |
| | | | |
|
|
| | | Communications - E-Commerce /
Services - 0.8% | | | |
| 1,100 | | Ctrip.com International Ltd. ADR @ 57.7500 | | | 64 |
| | | | |
|
|
| | | Communications - Web Portals / ISP - 3.3% | | | |
| 2,000 | | Netease.com, Inc. @ 56.1600 | | | 112 |
| 6,600 | | Tom On-Line Inc. ADR @ 19.8200 | | | 131 |
| | | | |
|
|
| | | | | | 243 |
| | | | |
|
|
| | | Consumer Non-Cyclical Agriculture
Bio-Tech - 2.8% | | | |
| 14,800 | | Bodisen Biotech, Inc. ADR @ 14.00 | | | 207 |
| | | | |
|
|
| | | Energy - Energy-Alternative Sources - 1.6% | | | |
| 4,300 | | Suntech Power Holdings Co., Ltd. ADR
@ 27.2500 | | | 117 |
| | | | |
|
|
| | | Technology - Electronic
Components-Semis - 1.1% | | | |
| 6,863 | | Silicon Motion Technology Corp. ADR
@ 12.0000 | | | 82 |
| | | | |
|
|
| | |
| | | Total Common Stocks
(Cost: $6,744,000) | | $ | 7,299 |
| | | | |
|
|
| | |
| | | Total Investments - 97.7%
(Cost: $6,744,000) | | | 7,299 |
| | |
| | | Other Assets less Liabilities - 2.3% | | | 172 |
| | | | |
|
|
| | |
| | | Net Assets - 100% | | $ | 7,471 |
| | | | |
|
|
Notes to Portfolio of Investments
| * | Income producing security during the year ended December 31, 2005. |
Based on the cost of investments of $6,744,000 for federal income tax purposes at December 31, 2005, the aggregate gross unrealized appreciation was $802,000, the aggregate gross unrealized depreciation was $247,000 and the net unrealized appreciation of investments was $555,000.
ADR American Depositary Receipt
See accompanying notes to financial statements.
16
THE OBERWEIS FUNDS
Statement of Assets and Liabilities
December 31, 2005 (in thousands, except pricing of shares)
| | | | | | | | | | | | | | |
| | | Emerging
Growth
Fund | | Micro-Cap
Fund | | Mid-Cap
Fund | | | China
Opportunities
Fund | |
| | | | |
| Assets: | | | | | | | | | | | | | | |
Investment securities at value | | $ | 185,386 | | $ | 69,807 | | $ | 8,671 | | | $ | 7,299 | |
(Cost: $138,088, $51,694, $7,110
and $6,744, respectively) | | | | | | | | | | | | | | |
Cash | | | 208 | | | 242 | | | — | | | | 93 | |
Receivable from fund shares sold | | | 320 | | | 540 | | | 17 | | | | 100 | |
Receivable from securities sold | | | 126 | | | 116 | | | 114 | | | | 51 | |
Dividends and interest receivable | | | 5 | | | 2 | | | __ | | | | 8 | |
Due from Advisor | | | — | | | — | | | — | | | | 14 | |
Prepaid expenses | | | 59 | | | 27 | | | 11 | | | | 20 | |
| | |
|
| |
|
| |
|
|
| |
|
|
|
Total Assets | | | 186,104 | | | 70,734 | | | 8,813 | | | | 7,585 | |
| | |
|
| |
|
| |
|
|
| |
|
|
|
| | | | |
| Liabilities: | | | | | | | | | | | | | | |
Payable to custodian bank | | | — | | | — | | | 11 | | | | — | |
Payable for fund shares redeemed | | | 260 | | | 201 | | | 2 | | | | — | |
Payable for securities purchased | | | 1,617 | | | 2,054 | | | — | | | | 89 | |
Payable to advisor (see note 2) | | | 130 | | | 54 | | | 8 | | | | 7 | |
Payable to distributor | | | 40 | | | 14 | | | 2 | | | | 1 | |
Accrued expenses | | | 78 | | | 56 | | | 17 | | | | 17 | |
| | |
|
| |
|
| |
|
|
| |
|
|
|
Total Liabilities | | | 2,125 | | | 2,379 | | | 40 | | | | 114 | |
| | |
|
| |
|
| |
|
|
| |
|
|
|
| Net Assets | | $ | 183,979 | | $ | 68,355 | | $ | 8,773 | | | $ | 7,471 | |
| | |
|
| |
|
| |
|
|
| |
|
|
|
| Analysis of net assets: | | | | | | | | | | | | | | |
Capital | | $ | 132,865 | | $ | 49,237 | | $ | 8,579 | | | $ | 6,930 | |
Accumulated net realized gains (losses) on investment and foreign currency transactions | | | 3,816 | |
| 1,005 | | | (1,367 | ) | | | (14 | ) |
Net unrealized appreciation of investments and translation of assets and liabilities denominated in foreign currencies. | | | 47,298 | |
| 18,113 | | | 1,561 | | | | 555 | |
| | |
|
| |
|
| |
|
|
| |
|
|
|
Net Assets | | $ | 183,979 | | $ | 68,355 | | $ | 8,773 | | | $ | 7,471 | |
| | |
|
| |
|
| |
|
|
| |
|
|
|
| The Pricing of Shares: | | | | | | | | | | | | | | |
Net asset value and offering price per share | | | | | | | | | | | | | | |
| Emerging Growth Fund: | | | | | | | | | | | | | | |
($183,978,669 divided by 6,825,650 shares outstanding) | | $ | 26.95 | | | | | | | | | | | |
| | |
|
| | | | | | | | | | | |
| Micro-Cap Fund: | | | | | | | | | | | | | | |
($68,355,223 divided by 3,949,878 shares outstanding) | | | | | $ | 17.31 | | | | | | | | |
| | | | | |
|
| | | | | | | | |
| Mid-Cap Fund: | | | | | | | | | | | | | | |
($8,772,695 divided by 700,302 shares outstanding) | | | | | | | | $ | 12.53 | | | | | |
| | | | | | | | |
|
|
| | | | |
| China Opportunities Fund: | | | | | | | | | | | | | | |
($7,470,732 divided by 692,899 shares outstanding) | | | | | | | | | | | | $ | 10.78 | |
| | | | | | | | | | | | |
|
|
|
See accompanying notes to financial statements.
17
THE OBERWEIS FUNDS
Statement of Operations
Year Ended December 31, 2005 (in thousands)
| | | | | | | | | | | | | | | | |
| | | Emerging
Growth
Fund | | | Micro-Cap
Fund | | | Mid-Cap
Fund | | | China
Opportunities
Fund | |
| | | | |
| Investment Income: | | | | | | | | | | | | | | | | |
Interest | | $ | 156 | | | $ | 70 | | | $ | — | | | $ | 2 | |
Dividends | | | 94 | | | | 207 | | | | 9 | | | | 13 | |
| | |
|
|
| |
|
|
| |
|
|
| |
|
|
|
Total Income | | | 250 | | | | 277 | | | | 9 | | | | 15 | |
| | |
|
|
| |
|
|
| |
|
|
| |
|
|
|
| | | | |
| Expenses: | | | | | | | | | | | | | | | | |
Investment advisory fees | | | 687 | | | | 277 | | | | 36 | | | | 16 | |
Management fees | | | 662 | | | | 185 | | | | 36 | | | | — | |
Distribution fees (see note 2) | | | 414 | | | | 116 | | | | 22 | | | | 3 | |
Transfer agent fees and expenses | | | 199 | | | | 69 | | | | 31 | | | | 6 | |
Professional fees | | | 103 | | | | 35 | | | | 8 | | | | 14 | |
Custodian fees and expenses | | | 91 | | | | 43 | | | | 34 | | | | 12 | |
Shareholder reports | | | 83 | | | | 16 | | | | 5 | | | | 1 | |
Federal and state registration fees | | | 48 | | | | 30 | | | | 16 | | | | 6 | |
Insurance | | | 28 | | | | 7 | | | | 2 | | | | — | |
Trustees’ fees | | | 23 | | | | 6 | | | | 1 | | | | — | |
Miscellaneous | | | 8 | | | | 2 | | | | — | | | | — | |
| | |
|
|
| |
|
|
| |
|
|
| |
|
|
|
Total expenses before reimbursed expenses | | | 2,346 | | | | 786 | | | | 191 | | | | 58 | |
Earnings credit (see note 2) | | | (12 | ) | | | (9 | ) | | | (2 | ) | | | (2 | ) |
Expenses reimbursed (see note 2) | | | — | | | | — | | | | (11 | ) | | | (24 | ) |
| | |
|
|
| |
|
|
| |
|
|
| |
|
|
|
Total Expenses | | | 2,334 | | | | 777 | | | | 178 | | | | 32 | |
| | |
|
|
| |
|
|
| |
|
|
| |
|
|
|
| Net Investment Loss | | | (2,084 | ) | | | (500 | ) | | | (169 | ) | | | (17 | ) |
| | | | |
| Net Realized and Unrealized Gains (Losses) from Investments: | | | | | | | | | | | | | | | | |
| Net realized gains (losses) on investment transactions | | | 11,809 | | | | 4,865 | | | | 998 | | | | (14 | ) |
| Net realized gains (losses) on foreign currency transactions | | | — | | | | — | | | | — | | | | — | |
| | |
|
|
| |
|
|
| |
|
|
| |
|
|
|
| Net realized gains (losses) on investment and foreign currency transactions | | | 11,809 | | | | 4,865 | | | | 998 | | | | (14 | ) |
| Increase (decrease) in unrealized appreciation on investments and translation of assets and liabilities denominated in foreign currencies | | | (5,371 | ) | | | 1,558 | | | | (487 | ) | | | 555 | |
| | |
|
|
| |
|
|
| |
|
|
| |
|
|
|
| Net realized/unrealized gains (losses) on investments and foreign currencies | | | 6,438 | | | | 6,423 | | | | 511 | | | | 541 | |
| | |
|
|
| |
|
|
| |
|
|
| |
|
|
|
| Net increase in net assets resulting from operations | | $ | 4,354 | | | $ | 5,923 | | | $ | 342 | | | $ | 524 | |
| | |
|
|
| |
|
|
| |
|
|
| |
|
|
|
See accompanying notes to financial statements.
18
THE OBERWEIS FUNDS
Statements of Changes in Net Assets (in thousands)
| | | | | | | | |
| | | Emerging Growth Fund
| |
| | | Year Ended
December 31, 2005 | | | Year Ended
December 31, 2004 | |
| | |
| |
| From Operations: | | | | | | | | |
Net investment loss | | $ | (2,084 | ) | | $ | (2,537 | ) |
Net realized gains on investments | | | 11,809 | | | | 18,699 | |
Decrease in net unrealized appreciation of investments | | | (5,371 | ) | | | (10,025 | ) |
| | |
|
|
| |
|
|
|
Net increase in net assets resulting from operations | | | 4,354 | | | | 6,137 | |
| | |
|
|
| |
|
|
|
| | |
| From Distributions: | | | | | | | | |
Distributions from net realized gains on investments | | | (11,084 | ) | | | (4,683 | ) |
| | |
|
|
| |
|
|
|
| | |
| From Capital Share Transactions: | | | | | | | | |
Net proceeds from sale of shares | | | 55,337 | | | | 86,918 | |
Proceeds from reinvestment of distributions | | | 10,521 | | | | 4,473 | |
Redemption of shares | | | (50,763 | ) | | | (159,926 | ) |
| | |
|
|
| |
|
|
|
Net increase (decrease) from capital share transactions | | | 15,095 | | | | (68,535 | ) |
| | |
|
|
| |
|
|
|
Total increase (decrease) in net assets | | | 8,365 | | | | (67,081 | ) |
| | |
| Net Assets: | | | | | | | | |
Beginning of year | | | 175,614 | | | | 242,695 | |
| | |
|
|
| |
|
|
|
End of year | | $ | 183,979 | | | $ | 175,614 | |
| | |
|
|
| |
|
|
|
| | |
| Accumulated Net Investment Gain | | $ | 3,816 | | | $ | 3,091 | |
| | |
|
|
| |
|
|
|
| | |
| Transactions in Shares: | | | | | | | | |
Shares sold | | | 2,071 | | | | 3,276 | |
Shares issued in reinvestment of dividends | | | 392 | | | | 174 | |
Less shares redeemed | | | (1,924 | ) | | | (6,136 | ) |
| | |
|
|
| |
|
|
|
Net increase (decrease) from capital share transactions | | | 539 | | | | (2,686 | ) |
| | |
|
|
| |
|
|
|
See accompanying notes to financial statements.
19
THE OBERWEIS FUNDS
Statements of Changes in Net Assets (in thousands)
| | | | | | | | |
| | | Micro-Cap Fund
| |
| | | Year Ended December 31, 2005 | | | Year Ended December 31, 2004 | |
| | |
| |
| From Operations: | | | | | | | | |
Net investment loss | | $ | (500 | ) | | $ | (929 | ) |
Net realized gains on investments | | | 4,865 | | | | 27,170 | |
Increase (decrease) in net unrealized appreciation of investments | | | 1,558 | | | | (28,225 | ) |
| | |
|
|
| |
|
|
|
Net increase (decrease) in net assets resulting from operations | | | 5,923 | | | | (1,984 | ) |
| | |
|
|
| |
|
|
|
| | |
| From Distributions: | | | | | | | | |
Distributions from net realized gains on investments | | | (6,356 | ) | | | (13,764 | ) |
| | |
|
|
| |
|
|
|
| | |
| From Capital Share Transactions: | | | | | | | | |
Net proceeds from sale of shares | | | 27,620 | | | | 15,331 | |
Proceeds from reinvestment of distributions | | | 6,110 | | | | 12,993 | |
Redemption of shares | | | (11,618 | ) | | | (65,446 | ) |
| | |
|
|
| |
|
|
|
Net increase (decrease) from capital share transactions | | | 22,112 | | | | (37,122 | ) |
| | |
|
|
| |
|
|
|
Total increase (decrease) in net assets | | | 21,679 | | | | (52,870 | ) |
| | |
| Net Assets: | | | | | | | | |
Beginning of year | | | 46,676 | | | | 99,546 | |
| | |
|
|
| |
|
|
|
End of year | | $ | 68,355 | | | $ | 46,676 | |
| | |
|
|
| |
|
|
|
| | |
| Accumulated Net Investment Gain | | $ | 1,005 | | | $ | 2,496 | |
| | |
|
|
| |
|
|
|
| | |
| Transactions in Shares: | | | | | | | | |
Shares sold | | | 1,598 | | | | 716 | |
Shares issued in reinvestment of dividends | | | 370 | | | | 877 | |
Less shares redeemed | | | (686 | ) | | | (2,716 | ) |
| | |
|
|
| |
|
|
|
Net increase (decrease) from capital share transactions | | | 1,282 | | | | (1,123 | ) |
| | |
|
|
| |
|
|
|
See accompanying notes to financial statements.
20
THE OBERWEIS FUNDS
Statements of Changes in Net Assets (in thousands)
| | | | | | | | |
| | | Mid-Cap Fund
| |
| | | Year Ended
December 31, 2005 | | | Year Ended
December 31, 2004 | |
| | |
| |
| From Operations: | | | | | | | | |
Net investment loss | | $ | (169 | ) | | $ | (166 | ) |
Net realized gains on investments | | | 998 | | | | 1,474 | |
Decrease in net unrealized appreciation of investments | | | (487 | ) | | | (1,073 | ) |
| | |
|
|
| |
|
|
|
Net increase in net assets resulting from operations | | | 342 | | | | 235 | |
| | |
|
|
| |
|
|
|
| | |
| From Capital Share Transactions: | | | | | | | | |
Net proceeds from sale of shares | | | 776 | | | | 4,520 | |
Redemption of shares | | | (2,771 | ) | | | (5,149 | ) |
| | |
|
|
| |
|
|
|
Net decrease from capital share transactions | | | (1,995 | ) | | | (629 | ) |
| | |
|
|
| |
|
|
|
Total decrease in net assets | | | (1,653 | ) | | | (394 | ) |
| | |
| Net Assets: | | | | | | | | |
Beginning of year | | | 10,426 | | | | 10,820 | |
| | |
|
|
| |
|
|
|
End of year | | $ | 8,773 | | | $ | 10,426 | |
| | |
|
|
| |
|
|
|
| | |
| Accumulated Net Investment Loss | | $ | (1,367 | ) | | $ | (2,365 | ) |
| | |
|
|
| |
|
|
|
| | |
| Transactions in Shares: | | | | | | | | |
Shares sold | | | 67 | | | | 381 | |
Less shares redeemed | | | (239 | ) | | | (460 | ) |
| | |
|
|
| |
|
|
|
Net decrease from capital share transactions | | | (172 | ) | | | (79 | ) |
| | |
|
|
| |
|
|
|
See accompanying notes to financial statements.
21
THE OBERWEIS FUNDS
Statements of Changes in Net Assets (in thousands)
| | | | |
| | | China Opportunities Fund
| |
| | | Period Ended December 31, 2005(a) | |
| | |
| |
| From Operations: | | | | |
Net investment loss | | $ | (17 | ) |
Net realized losses on investment and foreign currency transactions | | | (14 | ) |
Increase in net unrealized appreciation on investments and translation of assets and liabilities denominated in foreign currencies | | | 555 | |
| | |
|
|
|
Net increase in net assets resulting from operations | | | 524 | |
| | |
|
|
|
| |
| From Capital Share Transactions: | | | | |
Net proceeds from sale of shares | | | 6,977 | |
Redemption of shares | | | (30 | ) |
| | |
|
|
|
Net increase from capital share transactions | | | 6,947 | |
| | |
|
|
|
Total increase in net assets | | | 7,471 | |
| |
| Net Assets: | | | | |
Beginning of period | | | — | |
| | |
|
|
|
End of period | | $ | 7,471 | |
| | |
|
|
|
| |
| Accumulated Net Investment Loss | | $ | (14 | ) |
| | |
|
|
|
| |
| Transactions in Shares: | | | | |
Shares sold | | | 696 | |
Less shares redeemed | | | (3 | ) |
| | |
|
|
|
Net increase from capital share transactions | | | 693 | |
| | |
|
|
|
(a) For the period from October 1, 2005 (commencement of operations) through December 31, 2005.
See accompanying notes to financial statements.
22
THE OBERWEIS FUNDS
Notes to Financial Statements
December 31, 2005
1. Significant Accounting Policies
Description of business. The Oberweis Funds (the “Trust”) is registered under the Investment Company Act of 1940 as a diversified open-end management investment company. The Trust is authorized to operate numerous Funds under various trading strategies. The Trust consists of four Funds: the Oberweis Emerging Growth Fund, the Oberweis Micro-Cap Fund, Oberweis Mid-Cap Fund, and the Oberweis China Opportunities Fund (collectively, the Funds).
Investment valuation. Investments in securities are stated at value as of the close of the regular trading session on the New York Stock Exchange (NYSE) (generally 3 p.m., Central Standard Time). Each listed and unlisted security for which last sale information is regularly reported is valued at the last reported sales price on that day. If there has been no sale on such day, then such security is valued at the current day’s bid price. Any unlisted security for which last sale information is not regularly reported and any listed debt security which has an inactive listed market for which over-the-counter market quotations are readily available is valued at the closing bid price determined on the basis of reasonable inquiry. Options are valued at the last reported bid price on the primary exchange as of the close of the regular trading session of the Chicago Board Options Exchange (CBOE). Restricted securities and any other securities or other assets for which market quotations are not readily available are valued by appraisal at their fair value as determined in good faith under procedures established by and under the general supervision and responsibility of the Board of Trustees. Short-term debt instruments maturing within 60 days are valued by the amortized cost method, which approximates fair value.
The Oberweis China Opportunities Fund holds foreign equity securities. Foreign securities at fair value are described in the circumstances below. Generally, trading in foreign securities markets is completed each day at various times prior to the close of the regular trading session of the NYSE. Due to the time differences between the closings of the relevant foreign securities exchanges and the close of the regular trading session of the NYSE for the Funds, the Funds will fair value their foreign investments when it is determined that the market quotations for the foreign investments either are not readily available or are unreliable and, therefore, do not represent fair value. When the fair value prices are utilized, these prices will attempt to reflect the impact of the U.S. financial markets’ perceptions and trading activities on the Funds’ foreign investments since the last closing prices of the foreign investments were calculated on their primary foreign securities markets or exchanges. For these purposes, the Board of Trustees of the Trust has determined that movements in relevant indices, after the close of the foreign securities exchanges, may demonstrate that market quotations are unreliable, and may trigger fair value pricing for certain securities. Consequently, fair valuation of portfolio securities may occur on a daily basis. In determining fair value prices, the Trust utilizes data furnished by an independent pricing service (and that data draws upon, among other information, the market values of foreign investments). When a Fund uses fair value pricing, the values assigned to the Fund’s foreign investments may not be the quoted or published prices of the investments on their primary markets or exchanges.
Foreign Currency Transactions. The accounting records of the Funds are maintained in U.S. dollars. Foreign currency amounts are translated into U.S. dollars at the current rate of exchange to determine the value of investments, assets and liabilities. Purchases and sales of securities, and income and expenses are translated at the prevailing rate of exchange on the respective date of these transactions. The Funds do not isolate that portion of the results of operations resulting from changes in foreign exchange rates on investments from fluctuations arising from changes in market prices of securities held. These fluctuations are included with the net realized and unrealized gains or losses from investments and foreign currencies.
Risks Associated with Foreign Securities and Currencies. Investments in securities of foreign issuers carry certain risks not ordinarily associated with investments in securities of U.S. issuers. These risks include future political and economic developments, and the possible imposition of exchange controls or other foreign governmental laws and restrictions. In addition, with respect to certain countries, there is the possibility of expropriation of assets, confiscatory taxation, political or social instability or diplomatic developments, which could adversely affect investments in those countries.
Certain countries also may impose substantial restrictions on investments in their capital markets by foreign entities, including restrictions on investments in issuers of industries deemed sensitive to relevant national interests. These factors may limit the
23
investment opportunities available and result in a lack of liquidity and a high price volatility with respect to securities of issuers from developing countries.
Fund share valuation. Fund shares are sold and redeemed on a continuous basis at net asset value. On each day the New York Stock Exchange is open for trading, the net asset value per share is determined as of the later of the close of the New York Stock Exchange or the CBOE by dividing the total value of each Fund’s investments and other assets, less liabilities, by the number of each Fund’s shares outstanding.
Investment transactions and investment income. Investment transactions are accounted for on the trade date (date the order to buy or sell is executed). Dividend income is recorded on the ex-dividend date, and interest income is recorded on the accrual basis and includes amortization of premium and discount. Realized gains and losses from investment transactions are reported on an identified cost basis. Gains and losses on premiums from expired options are recognized on the date of expiration.
Federal income taxes and dividends to shareholders. It is the Fund’s policy and it intends to comply with the provisions of the Internal Revenue Code available to investment companies and therefore no federal income tax provision is required. Dividends payable to its shareholders are recorded by each Fund on the ex-dividend date. Dividends are determined in accordance with income tax principles which may treat certain transactions differently from generally accepted accounting principles. These “book/tax” differences are either considered temporary or permanent in nature. To the extent these differences are considered permanent in nature, such amounts are reclassified within the composition of net assets based on their federal tax basis treatment; temporary differences do not require reclassification. The tax character of distributions paid during the fiscal year ended December 31, 2005, to shareholders of record on November 10, 2005, were as follows (amounts in thousands):
| | | | | | | | | |
| | | Distributions
Paid From
Ordinary
Income
| | Distributions
Paid From
Net Long-Term
Capital Gains
| | Total
Distributions
Paid
|
| Emerging Growth Fund | | $ | — | | $ | 11,084 | | $ | 11,084 |
| Micro-Cap Fund | | | — | | | 6,356 | | | 6,356 |
No distributions were required for the Mid-Cap Fund and China Opportunities Fund. The Funds designate the following amounts as long-term capital gain distributions.
| | | |
| | | Amount
|
| Emerging Growth Fund | | $ | 11,084 |
| Micro-Cap Fund | | | 6,356 |
The tax character of distributions paid during the fiscal year ended December 31, 2004, to shareholders of record on November 11, 2004, were as follows (amounts in thousands):
| | | | | | | | | |
| | | Distributions
Paid From
Ordinary
Income
| | Distributions
Paid From
Net Long-Term
Capital Gains
| | Total
Distributions
Paid
|
| Emerging Growth Fund | | $ | 0 | | $ | 4,683 | | $ | 4,683 |
| Micro-Cap Fund | | | 0 | | | 13,764 | | | 13,764 |
No distributions were required for the Mid-Cap Fund. The Funds designate the following amounts as long-term capital gain distributions. The amounts designated may not agree with the long-term capital gains in the tax character of distribution table due to utilization of earnings and profits distributed to shareholders on redemption of shares (amounts in thousands):
| | | |
| | | Amount
|
| Emerging Growth Fund | | $ | 8,565 |
| Micro-Cap Fund | | | 16,410 |
24
The tax components of undistributed net investment income and net realized gains at December 31, 2005 were as follows (amounts in thousands):
| | | | | | |
| | | Undistributed
Ordinary
Income
| | Undistributed
Net Long-Term
Capital Gains
|
| Emerging Growth Fund | | $ | — | | $ | 3,833 |
| Micro-Cap Fund | | | — | | | 1,008 |
As of December 31, 2005, the following Fund has net capital loss carryforwards to offset future net capital gains, if any, to the extent provided by treasury regulations (amounts in thousands):
| | | | | | |
| | | 2010
| | 2011
| | 2013
|
| Mid-Cap Fund | | $658 | | $709 | | $0 |
| China Opportunities Fund | | 0 | | 0 | | 3 |
Net capital losses incurred after October 31 and within the taxable year are deemed to arise on the first business day of the Fund’s next taxable year. For the year ended December 31, 2005, the China Opportunities Fund deferred to January 1, 2006 post-October capital losses of $11,000.
Use of estimates. The preparation of financial statements in conformity with generally accepted accounting principles requires management to make estimates and assumptions that affect the amounts reported in the financial statements and accompanying notes. Actual results may differ from those estimates.
Indemnifications. Under the Funds’ organizational documents, its present and former Officers and Trustees are indemnified against certain liabilities arising out of the performance of their duties to the Funds. In addition, in the normal course of business, the Fund enters into contracts that provide general indemnifications to other parties. The Funds’ maximum exposure under these arrangements is unknown as this would involve future claims that may be made against the Fund that have not yet occurred. However, the Fund has not had prior claims or losses pursuant to these contracts and expects the risk of loss to be remote.
2. Transactions with affiliates
The Funds have written agreements with Oberweis Asset Management, Inc. (“OAM”) as the Funds’ investment adviser and manager. Oberweis Securities, Inc. (“Oberweis Securities”), the Funds’ principal distributor, is an affiliate of OAM.
Investment advisory agreement. For investment advisory services, the Emerging Growth Fund paid monthly investment advisory fees at an annual rate equal to .45% of the first $50,000,000 of average daily net assets and .40% of average daily net assets in excess of $50 million. The Micro-Cap Fund paid monthly investment advisory fees at an annual rate equal to .60% of average daily net assets. The Mid-Cap Fund paid monthly investment advisory fees at an annual rate equal to .40% of average daily net assets. For investment advisory and management services, the China Opportunities Fund paid monthly investment advisory and management fees at an annual rate equal to 1.25% of average daily net assets. For the year ended December 31, 2005, the Emerging Growth Fund, Micro-Cap Fund, and Mid-Cap Fund, incurred investment advisory fees totaling $687,000, $277,000, and $36,000, respectively. For the year ended December 31, 2005, the China Opportunities Fund incurred investment advisory and management fees totaling $16,000.
Management agreement. For management services and facilities furnished, the Emerging Growth Fund, Micro-Cap Fund, and Mid-Cap Fund each paid a monthly fee at an annual rate equal to .40% of average daily net assets. For the year ended December 31, 2005, the Emerging Growth Fund, Micro-Cap Fund, and Mid-Cap Fund incurred management fees totaling $662,000, $185,000 and $36,000, respectively.
Expense reimbursement. OAM is contractually obligated to reduce its management fees or reimburse the Emerging Growth Fund, Micro-Cap Fund, and Mid-Cap Fund to the extent that total ordinary operating expenses, as defined, exceed in any one year the following amounts expressed as a percentage of each Fund’s average daily net assets: 2% of the first $25,000,000; plus 1.8% of the next $25,000,000; plus 1.6% of average daily net assets in excess of $50,000,000. OAM is also contractually obligated to reduce its investment and management fees or reimburse the China Opportunities Fund to the extent that total ordinary operating expenses, as defined, exceed in any one year the following amounts expressed as a percentage of each Fund’s average daily net assets: 2.49% on all assets. For the year ended December 31, 2005 OAM reimbursed the Mid-Cap Fund and China Opportunities Fund $11,000 and $24,000, respectively.
25
Officers and trustees. Certain officers or trustees of the Funds are also officers or directors of OAM and Oberweis Securities. During the year ended December 31, 2005, the Funds made no direct payments to its officers and paid $30,000 to its unaffiliated trustees.
Distribution and shareholder service expense. The Funds have a distribution and shareholder services agreement with Oberweis Securities. For services under the distribution and shareholder servicing agreement, the Funds pay Oberweis Securities a fee at the annual rate of .25% of the average daily net assets as compensation for services. For the year ended December 31, 2005, the Emerging Growth Fund, Micro-Cap Fund, Mid-Cap Fund and China Opportunities Fund incurred distribution fees totaling $414,000, $116,000, $22,000, and $3,000, respectively.
Commissions. For the year ended December 31, 2005, the Emerging Growth Fund, Micro-Cap Fund, Mid-Cap Fund and China Opportunities Fund did not execute any security transactions through Oberweis Securities and therefore did not pay commissions to Oberweis Securities.
3. Investment transactions
The cost of securities purchased and proceeds from securities sold during the year ended December 31, 2005, other than options written and money market investments, aggregated $130,081,000 and $121,740,000, respectively, for the Emerging Growth Fund, $46,176,000 and $33,961,000, respectively, for the Micro-Cap Fund, $10,629,000 and $12,649,000, respectively, for the Mid-Cap Fund, and $7,326,000 and $567,000, respectively, for the China Opportunities Fund. The Funds did not hold government securities during the year ended December 31, 2005.
The funds may write covered call options. The premiums received provide a partial hedge (protection) against declining prices and enables each Fund to generate a higher return during periods when OAM does not expect the underlying security to make any major price moves in the near future but still deems the underlying security to be, over the long term, an attractive investment for each Fund. The Funds write covered call options for which premiums received are recorded as liabilities and are subsequently adjusted to the current value of the options written. Premiums received from writing options that expire are treated as realized gains. Premiums received from writing options, which are either exercised or closed, are offset against the proceeds received or amount paid on the transaction to determine realized gains or losses. Amounts recovered for securities litigation are included in the realized gains of the Fund and is recorded when received. The funds did not write covered call options for the year ended December 31, 2005.
4. Redemption fee
The Oberweis Funds are designed for long-term investors. To discourage market timers redemptions of shares of the Emerging Growth Fund, Micro-Cap Fund, and Mid-Cap Fund within 90 days of purchase are subject to a 1% redemption fee of the total redemption amount and 2% for the China Opportunities Fund. The redemption fee applies only to shares acquired on or after January 1, 2004 and do not apply to exchanges. The redemption fee is deducted from the redemption proceeds and is retained by the Fund.
The redemption fee is retained by the Funds for the expense they incur in connection with shareholder redemptions. Redemption fees received by the Emerging Growth Fund, Micro-Cap Fund, Mid-Cap Fund and China Opportunities Fund were $19,000, $22,000, $0 and $2,000, respectively, for the year ended December 31, 2005, and were recorded as a reduction of the cost of shares redeemed in the statements of changes in net assets.
5. Earnings credits and interest charges
The Trust, as part of the agreement with the Custodian, receives credits against its custodian fees on its uninvested cash balances and is allowed to borrow for temporary purposes. Borrowings are not to exceed 5% of the value of each Funds total assets at the time of any such borrowing. Interest on amounts borrowed is calculated at the prime rate and is payable monthly. During the year ended December 31, 2005, the Emerging Growth Fund, Micro-Cap Fund, Mid-Cap Fund, and China Opportunities Fund received credits of $12,000, $9,000, $2,000 and $2,000, respectively. During the year ended December 31, 2005, the Emerging Growth Fund, Micro-Cap Fund, Mid-Cap Fund and the China Opportunities Fund incurred interest charges of $2,000, $0, $1,000 and $0, respectively, which is included in custodian fees and expenses in the statement of operations.
26
FINANCIAL HIGHLIGHTS
Per share income and capital changes for a share outstanding throughout each period is as follows:
| | | | | | | | | | | | | | | | | | | | |
| | | Emerging Growth Fund
| |
| | | Years ended December 31, | |
| | | 2005 | | | 2004 | | | 2003 | | | 2002 | | | 2001 | |
| | |
| |
| Net asset value at beginning of year | | $ | 27.93 | | | $ | 27.05 | | | $ | 16.13 | | | $ | 21.29 | | | $ | 21.19 | |
| Income (loss) from investment operations: | | | | | | | | | | | | | | | | | | | | |
| Net investment loss(a) | | | (.33 | ) | | | (.36 | ) | | | (.27 | ) | | | (.26 | ) | | | (.31 | ) |
| Net realized and unrealized gain (loss) on investments | | | 1.09 | | | | 1.99 | | | | 11.19 | | | | (4.90 | ) | | | .41 | |
| | |
|
|
| |
|
|
| |
|
|
| |
|
|
| |
|
|
|
| Total from investment operations | | | .76 | | | | 1.63 | | | | 10.92 | | | | (5.16 | ) | | | .10 | |
| Redemption Fees | | | — | | | | .01 | | | | — | | | | — | | | | — | |
| Less distributions: | | | | | | | | | | | | | | | | | | | | |
| Distribution from net realized gains on investments | | | (1.74 | ) | | | (.76 | ) | | | — | | | | — | | | | — | |
| | |
|
|
| |
|
|
| |
|
|
| |
|
|
| |
|
|
|
| Net asset value at end of year | | $ | 26.95 | | | $ | 27.93 | | | $ | 27.05 | | | $ | 16.13 | | | $ | 21.29 | |
| | |
|
|
| |
|
|
| |
|
|
| |
|
|
| |
|
|
|
| Total Return (%) | | | 2.74 | | | | 6.3 | | | | 67.7 | | | | (24.2 | ) | | | 0.5 | |
| Ratio/Supplemental Data | | | | | | | | | | | | | | | | | | | | |
| Net Assets at end of year (in thousands) | | $ | 183,979 | | | $ | 175,614 | | | $ | 242,695 | | | $ | 61,292 | | | $ | 79,014 | |
| Ratio of expenses to average net assets (%) | | | 1.42 | | | | 1.44 | | | | 1.37 | | | | 1.57 | | | | 1.65 | |
| Ratio of net investment loss to average net assets (%) | | | (1.26 | ) | | | (1.38 | ) | | | (1.18 | ) | | | (1.48 | ) | | | (1.51 | ) |
| Portfolio turnover rate (%) | | | 75 | | | | 55 | | | | 56 | | | | 66 | | | | 66 | |
| Average commission rate paid | | $ | .0176 | | | $ | .0199 | | | $ | .0206 | | | $ | .0265 | | | $ | .0336 | |
Notes:
| (a) | The net investment loss per share data was determined using average shares outstanding during the year. |
27
FINANCIAL HIGHLIGHTS
Per share income and capital changes for a share outstanding throughout the period is as follows:
| | | | | | | | | | | | | | | | | | | | |
| | | Micro-Cap Fund
| |
| | | Years ended December 31, | |
| | | | 2005 | | | | 2004 | | | | 2003 | | | | 2002 | | | | 2001 | |
| | |
| |
| Net asset value at beginning of year | | $ | 17.50 | | | $ | 26.26 | | | $ | 13.86 | | | $ | 16.77 | | | $ | 13.54 | |
| Income (loss) from investment operations: | | | | | | | | | | | | | | | | | | | | |
| Net investment loss(a) | | | (.18 | ) | | | (.36 | ) | | | (.31 | ) | | | (.24 | ) | | | (.24 | ) |
| Net realized and unrealized gain (loss) on investments | | | 2.29 | | | | (.54 | ) | | | 15.36 | | | | (2.67 | ) | | | 3.47 | |
| | |
|
|
| |
|
|
| |
|
|
| |
|
|
| |
|
|
|
| Total from investment operations | | | 2.11 | | | | (.90 | ) | | | 15.05 | | | | (2.91 | ) | | | 3.23 | |
| Redemption Fees | | | .01 | | | | .04 | | | | .05 | | | | — | | | | — | |
| Less distributions: | | | | | | | | | | | | | | | | | | | | |
| Distribution from net realized gains on investments | | | (2.31 | ) | | | (7.90 | ) | | | (2.70 | ) | | | — | | | | — | |
| | |
|
|
| |
|
|
| |
|
|
| |
|
|
| |
|
|
|
| Net asset value at end of year | | $ | 17.31 | | | $ | 17.50 | | | $ | 26.26 | | | $ | 13.86 | | | $ | 16.77 | |
| | |
|
|
| |
|
|
| |
|
|
| |
|
|
| |
|
|
|
| Total Return (%) | | | 12.72 | | | | 2.2 | | | | 108.9 | | | | (17.3 | ) | | | 23.9 | |
| Ratio/Supplemental Data | | | | | | | | | | | | | | | | | | | | |
| Net Assets at end of year (in thousands) | | $ | 68,355 | | | $ | 46,676 | | | $ | 99,546 | | | $ | 21,978 | | | $ | 47,817 | |
| Ratio of expenses to average net assets (%) | | | 1.70 | | | | 1.70 | | | | 1.60 | | | | 1.93 | | | | 1.98 | |
| Ratio of net investment loss to average net assets (%) | | | (1.08 | ) | | | (1.54 | ) | | | (1.47 | ) | | | (1.64 | ) | | | (1.59 | ) |
| Portfolio turnover rate (%) | | | 76 | | | | 58 | | | | 87 | | | | 81 | | | | 82 | |
| Average commission rate paid | | $ | .0171 | | | $ | .0195 | | | $ | .0200 | | | $ | .0256 | | | $ | .0307 | |
Notes:
| (a) | The net investment loss per share data was determined using average shares outstanding during the year. |
28
FINANCIAL HIGHLIGHTS
Per share income and capital changes for a share outstanding throughout the period is as follows:
| | | | | | | | | | | | | | | | | | | | |
| | | Mid-Cap Fund
| |
| | | Years ended December 31, | |
| | | | 2005 | | | | 2004 | | | | 2003 | | | | 2002 | | | | 2001 | |
| | |
| |
| Net asset value at beginning of year | | $ | 11.95 | | | $ | 11.37 | | | $ | 7.29 | | | $ | 10.83 | | | $ | 17.12 | |
| Income (loss) from investment operations: | | | | | | | | | | | | | | | | | | | | |
| Net investment loss(a) | | | (.22 | ) | | | (.17 | ) | | | (.18 | ) | | | (.17 | ) | | | (.21 | ) |
| Net realized and unrealized gain (loss) on investments | | | .80 | | | | .74 | | | | 4.25 | | | | (3.37 | ) | | | (6.08 | ) |
| | |
|
|
| |
|
|
| |
|
|
| |
|
|
| |
|
|
|
| Total from investment operations | | | .58 | | | | .57 | | | | 4.07 | | | | (3.54 | ) | | | (6.29 | ) |
| Redemption Fees | | | — | | | | .01 | | | | .01 | | | | — | | | | — | |
| Less distributions: | | | | | | | | | | | | | | | | | | | | |
| Distribution from net realized gains on investments | | | — | | | | — | | | | — | | | | — | | | | — | |
| | |
|
|
| |
|
|
| |
|
|
| |
|
|
| |
|
|
|
| Net asset value at end of year | | $ | 12.53 | | | $ | 11.95 | | | $ | 11.37 | | | $ | 7.29 | | | $ | 10.83 | |
| | |
|
|
| |
|
|
| |
|
|
| |
|
|
| |
|
|
|
| Total Return (%) | | | 4.85 | | | | 5.1 | | | | 56.0 | | | | (32.7 | ) | | | (36.7 | ) |
| Ratio/Supplemental Data | | | | | | | | | | | | | | | | | | | | |
| Net Assets at end of year (in thousands) | | $ | 8,773 | | | $ | 10,426 | | | $ | 10,820 | | | $ | 4,370 | | | $ | 6,449 | |
| Ratio of expenses to average net assets (%) | | | 2.00 | (b) | | | 1.96 | | | | 2.00 | (b) | | | 2.00 | (b) | | | 2.00 | (b) |
| Ratio of net investment loss to average net assets (%) | | | (1.90 | ) | | | (1.52 | ) | | | (1.91 | ) | | | (1.91 | ) | | | (1.75 | ) |
| Portfolio turnover rate (%) | | | 119 | | | | 86 | | | | 29 | | | | 66 | | | | 115 | |
| Average commission rate paid | | $ | .0168 | | | $ | .0196 | | | $ | .0200 | | | $ | .0256 | | | $ | .0312 | |
Notes:
| (a) | The net investment loss per share data was determined using average shares outstanding during the year. |
| (b) | Net of expense reimbursement from related parties. The expense ratios would have been 2.14%, 2.31%, 2.66%, and 2.60%, for 2005, 2003, 2002 and 2001 respectively, before expense reimbursement and earnings credits. |
29
FINANCIAL HIGHLIGHTS
Per share income and capital changes for a share outstanding throughout the period is as follows:
| | | | |
| | | China Opportunities Fund | |
| | |
| |
| | | October 1, 2005 (commencement of
operations) - December 31, 2005 | |
| | |
| |
| Net asset value at beginning of period | | $ | 10.00 | |
| Income (loss) from investment operations: | | | | |
| Net investment loss(a) | | | (.03 | ) |
| Net realized and unrealized gains (losses) on investments and translation of assets and liabilities denominated in foreign currencies | | | .81 | |
| | |
|
|
|
| Total from investment operations | | | .78 | |
| Less distributions: | | | | |
| Distribution from net realized gains on investments | | | — | |
| | |
|
|
|
| Net asset value at end of period | | $ | 10.78 | |
| | |
|
|
|
| Total Return (%) | | | 7.80 | |
| Ratio/Supplemental Data | | | | |
| Net Assets at end of period (in thousands) | | $ | 7,471 | |
| Ratio of expenses to average net assets (%) | | | 2.49 | (b)(c) |
| Ratio of net investment loss to average net assets (%) | | | (1.34 | )(c) |
| Portfolio turnover rate (%) | | | 14 | (d) |
| Average commission rate paid | | $ | .0011 | |
Notes:
| (a) | The net investment loss per share data was determined using average shares outstanding during the period. |
| (b) | Net of expense reimbursement from related parties. The expense ratios would have been 4.57%, for 2005, before expense reimbursement and earnings credits. |
30
REPORT OF INDEPENDENT REGISTERED PUBLIC ACCOUNTING FIRM
To the Board of Trustees and Shareholders of
The Oberweis Funds
In our opinion, the accompanying statements of assets and liabilities, including the portfolios of investments, and the related statements of operations and of changes in net assets and the financial highlights present fairly, in all material respects, the financial position of the Oberweis Emerging Growth Fund, Oberweis Micro-Cap Fund, Oberweis Mid-Cap Fund and Oberweis China Opportunities Fund (four funds constituting The Oberweis Funds, hereafter referred to as the “Funds”) at December 31, 2005, the results of each of their operations for year then ended or the period from October 1, 2005 through December 31, 2005 for the China Opportunities Fund, the changes in each of their net assets for the two years then ended or period indicated and the financial highlights for each of the four years then ended or period indicated, in conformity with accounting principles generally accepted in the United States of America. These financial statements and financial highlights (hereafter referred to as “financial statements”) are the responsibility of the Funds’ management; our responsibility is to express an opinion on these financial statements based on our audits. We conducted our audits of these financial statements in accordance with the standards of the Public Company Accounting Oversight Board (United States). Those standards require that we plan and perform the audit to obtain reasonable assurance about whether the financial statements are free of material misstatement. An audit includes examining, on a test basis, evidence supporting the amounts and disclosures in the financial statements, assessing the accounting principles used and significant estimates made by management, and evaluating the overall financial statement presentation. We believe that our audits, which included confirmation of securities at December 31, 2005 by correspondence with the custodian and brokers, provide a reasonable basis for our opinion. The financial highlights for the year ended December 31, 2001 were audited by other auditors, whose report dated February 5, 2002, expressed an unqualified opinion on those financial highlights.

February 15, 2006
Chicago, Illinois
31
Trustees and Officers of The Oberweis Funds
| | | | | | | | | | |
Name, Address
and Age | | Position Held
with Fund | | Term of Office
and Length of
Time Served | | Principal Occupation
Last Five Years | | Number of
Portfolios
Overseen by
Trustee | | Other
Directorships |
| | | | | |
Katherine Smith Dedrick (48) 3333 Warrenville Road,
Suite 500 Lisle, IL 60532 | | Trustee | | Trustee since November, 2004(1) | | Partner - Levenfeld Pearlstein, LLC, January 2005 to present; Partner - Hinshaw & Culbertson 1985 to January 2005. | | 4 | | None |
| | | | | |
Gary D. McDaniel (57) 3333 Warrenville Road,
Suite 500 Lisle, IL 60532 | | Trustee | | Trustee since
May, 2004(1) | | Vice President/General Manager of the Flexible Packaging Group - Smurfit Stone Container, March 1988 to present. | | 4 | | None |
| | | | | |
James G. Schmidt (58) 3333 Warrenville Road,
Suite 500 Lisle, IL 60532 | | Trustee | | Trustee since November, 2003(1) | | Senior Vice President and Chief Financial Officer - Federal Heath Sign Co., May 2003 to present; Vice President - Finance Federal Sign division of Federal Signal Corp. October, 1991 to April, 2003. | | 4 | | None |
| | | | | |
James D. Oberweis (59) 3333 Warrenville Road,
Suite 500 Lisle, IL 60532 | | Trustee(2) | | Trustee and Officer since
July, 1986(1) | | Director - Oberweis Asset Management, Inc. September, 1994 to present. Chairman - September 2001 to present. President - September, 1989 to August, 2001. | | 4 | | None |
| | | | | |
James W. Oberweis (31) 3333 Warrenville Road,
Suite 500 Lisle, IL 60532 | | President | | Officer since August, 1996(3) | | President - Oberweis Asset Management, Inc., September, 2001 to present; Senior Vice President May, 1996 to August, 2001; Portfolio Manager from December, 1995 to present; President and Director - - Oberweis Securities, Inc., September, 1996 to present. | | Not Applicable | | None |
| | | | | |
Patrick B. Joyce (46) 3333 Warrenville Road,
Suite 500 Lisle, IL 60532 | | Executive Vice President and Treasurer | | Officer since October, 1994(3) | | Executive Vice President, Secretary and Director - Oberweis Asset Management, Inc., September, 1994 to present; Executive Vice President and Director - Oberweis Securities, Inc. September, 1996 to present. | | Not Applicable | | None |
| | | | | |
Martin L. Yokosawa (45) 3333 Warrenville Road,
Suite 500 Lisle, IL 60532 | | Senior Vice President | | Officer since October, 1994(3) | | Senior Vice President - Oberweis Asset Management, Inc., September, 1994 to Present; Senior Vice President - Oberweis Securities, Inc., January, 1997 to present. | | Not Applicable | | None |
| | | | | |
David I. Covas (30) 3333 Warrenville Road,
Suite 500 Lisle, IL 60532 | | Vice President | | Officer since August, 2004(3) | | Vice President - Oberweis Asset Management, Inc., September, 2003 to present; Research Analyst June, 1997 to August, 2003. | | Not Applicable | | None |
| | | | | |
Eric V. Hannemann (32) 3333 Warrenville Road,
Suite 500 Lisle, IL 60532 | | Secretary | | Officer since August, 2005(3) | | Assistant Vice President of Accounting - Oberweis Asset Management and Oberweis Securities, Inc., June, 2004 to present; Portfolio and Staff Accountant - Vestor Capital Corp. April, 2003 to June, 2004; Staff Accountant - Green, Plage & Associates, Inc., November, 1999 to April, 2003. | | Not Applicable | | None |
| (1) | Unless otherwise noted, each trustee shall serve as a trustee of the Fund until the next meeting of shareholders, if any, called for the purpose of considering the election or re-election of such trustee or of a successor to such trustee, and until the election and qualification of his successor, if any, elected at such meeting, or until such trustee sooner dies, resigns, retires or is removed. |
| (2) | James D. Oberweis is an interested trustee of the Fund by reason of his position as the Chairman of Oberweis Asset Management, Inc., the Fund’s investment advisor. |
| (3) | Elected annually by board of trustees. |
The Statement of Additional Information includes additional information about Fund officers and trustees and is available upon request without charge, by calling the Fund at 1-800-323-6166.
32
THE OBERWEIS FUNDS
Supplemental Information
Proxy Voting:
The Oberweis Funds has delegated authority to vote proxies related to the Funds’ (Emerging Growth Fund, Micro-Cap Fund, Mid-Cap Fund, and China Opportunities Fund) Portfolio securities to the Funds’ investment adviser, Oberweis Asset Management, Inc. (“OAM”). A description of the policies and procedures that OAM uses in fulfilling this responsibility is available, without charge upon request, by calling 1-800-323-6166. It also appears on www.oberweisfunds.com and in the Funds’ Statement of Additional Information, which can be found on the Securities and Exchange Commission’s (“SEC”) website at http://www.sec.gov. Information on how the Funds voted proxies relating to portfolio securities during the most recent 12 month period ended June 30 is available (1) without charge, upon request, by calling 1-800-323-6166, and (2) on the SEC’s website at http://www.sec.gov.
Availability of Schedules of Portfolio Investments:
The Funds file their complete schedule of portfolio investments with the SEC for the first and third quarter of each fiscal year (March 31 and September 30) on Form NQ. The Funds’ Forms NQ are available, without charge, on the SEC’s website at http://www.sec.gov and may be reviewed and copied at the SEC’s Public Reference Room in Washington, D.C. Information on the operation of the Public Reference Room may be obtained by calling 1-800-SEC-0330.
Approval of Investment Adviser Contract:
The Investment Advisory Agreement with respect to the Emerging Growth, Micro-Cap and Mid-Cap Funds was last approved, and the Investment Advisory and Management Agreement for the China Opportunities Fund was initially approved, by the Board of Trustees, including all of the trustees who are not parties to such agreements or interested persons of any such party, on August 10, 2005. The Board of Trustees, including a majority of the independent trustees, determined that approval of the agreements was in the best interests of the Trust. The independent trustees were assisted by independent legal counsel in making their determination.
The Board noted that OAM has a long association with the Emerging Growth, Micro-Cap and Mid-Cap Funds, in each case since the inception of the Funds. The Board recognizes that a long-term relationship with a capable, conscientious investment adviser is in the best interests of shareholders and that shareholders have invested in the Funds knowing that OAM managed the Funds and knowing the investment advisory fee schedule.
Nature, Quality and Extent of Services. With respect to the nature, quality and extent of the services provided by OAM to the Emerging Growth, Micro-Cap and Mid-Cap Funds and of the services to be provided by OAM to the China Opportunities Fund, the Board considered the functions performed by OAM and the personnel providing such services, OAM’s financial condition, the compliance regime created by OAM, including the fact that the Funds have had no material compliance issues, and OAM’s financial support of the Funds. The Board also considered the investment strategy and process for the China Opportunities Fund. Based on the information provided, the Board concluded that the nature and extent of services to be provided to the China Opportunities Fund was appropriate and that the quality would be good.
The Board also reviewed and discussed reports prepared by OAM containing information on total returns and average annual total returns over various periods of time of the Emerging Growth, Micro-Cap and Mid-Cap Funds as compared to relevant market indices and other mutual funds pursuing broadly similar strategies. The Board concluded that as to each Fund, the investment performance was satisfactory, and in some cases, good versus relevant market indices, and was in line with the other mutual funds included in the reports. Based on the information provided, the Board concluded that the nature and extent of services provided to each Fund were appropriate and that the quality was good.
Fees and Expenses. For each Fund, the Board compared the amounts paid to OAM for advisory services (for advisory and management services for the China Opportunities Fund) and each Fund’s expense ratio (or expense cap for the China Opportunities Fund) with other registered funds pursuing broadly similar strategies as included in reports prepared by OAM. This information
33
THE OBERWEIS FUNDS
Supplemental Information (cont’d.)
showed that each Fund’s advisory fee (advisory and management fee for the China Opportunities Fund) was in the mid-range compared to other mutual funds pursuing broadly similar strategies, that the expense ratio of the Emerging Growth Fund and the projected expense ratio of the China Opportunities Fund were in line with those of similar mutual funds, and that the expense ratios of the Micro-Cap and Mid-Cap Funds were higher than average. In addition, the Board considered amounts paid to OAM by other registered funds, for which OAM acts as a subadviser. For each Fund (except for the China Opportunities Fund because OAM does not manage other China accounts), the Board considered amounts paid to OAM by OAM’s other clients. With respect to OAM’s other clients, the Board noted that the mix of services provided and the level of responsibility required under the agreements with the Funds were greater than OAM’s obligations for similar client accounts and that the advisory fees of such accounts are less relevant to the Board’s consideration because they reflect different competitive forces than those in the mutual fund marketplace.
The Board also considered that OAM continues to reimburse expenses for the Mid-Cap Fund, has agreed to bear organizational expenses of the China Opportunities Fund, and has proposed an expense cap for the China Opportunities Fund. Based on the information considered, the Board concluded that each Fund’s advisory fee (advisory and management fee for the China Opportunities Fund), coupled with any applicable expense caps, was reasonable and appropriate in amount given the quality of services provided or expected to be provided.
Profitability. With respect to the costs of services provided and profits realized by OAM, the Board considered the advisory fees received by OAM from each of the Emerging Growth, Micro-Cap and Mid-Cap Funds and the proposed advisory and management fee rate for the China Opportunities Fund. The Board also considered the fact that OAM continues to reimburse expenses for the Mid-Cap Fund and that OAM has agreed to bear the organizational expenses and to cap expenses for the China Opportunities Fund. Based on this information, the Board concluded for each Fund that OAM’s profitability was not unreasonable.
Economies of Scale. The Board considered the extent to which economies of scale would be realized as each Fund grows and whether fee levels reflect economies of scale for the benefit of Fund shareholders. The Board reviewed each Fund’s asset size, expense ratios and the expense caps in place and/or proposed, as applicable. The Board noted that the advisory fee for the Emerging Growth Fund has a breakpoint designed to share economies of scale with shareholders. The Board also noted OAM’s representation that the Micro-Cap and China Opportunities Funds have capacity constraints and that the current size of the Mid-Cap Fund does not lend itself to economies of scale. The Board concluded with respect to each of the Funds, that the total expense ratios, after giving effect to the expense caps proposed by the Adviser, were reasonable.
Other Benefits to OAM and its Affiliates. The Board considered the character and amount of other incidental benefits received by OAM and its affiliates from their relationship with the Funds, including fees received by an affiliate of OAM for distribution services and brokerage transactions placed through such affiliate of OAM. The Board also considered benefits to OAM related to soft dollars. The Board concluded that, taking into account these benefits, the Funds’ advisory fees were reasonable.
Based on all of the information considered and the conclusions reached, the Board determined to approve the agreements. The Board of Trustees, including the independent trustees, did not identify any single factor or group of factors as all important or controlling and considered all factors together.
Expense Examples:
As a shareholder of The Oberweis Funds, you may incur two types of costs: (1) transaction costs, including redemption fees and (2) ongoing costs, including management fees; distribution (and/or service) 12b-1 fees; and other Fund expenses. This example is intended to help you understand your ongoing costs (in dollars) of investing in The Oberweis Funds and to compare these costs with the ongoing costs of investing in other mutual funds.
The Example is based on an investment of $1,000 investment at the beginning of the period and held for the entire period from January 1, 2005 through December 31, 2005.
34
THE OBERWEIS FUNDS
Supplemental Information (cont’d.)
Actual Expenses:
The first line for each Fund in the table below provides information about actual account values and actual expenses. You may use the information below, together with the amount you invested, to estimate the expenses that you paid over the period. Simply divide your account value by $1,000 (for example, an $8,600 account value divided by $1,000=8.6), then multiply the result by the number in the table under the heading entitled “Expenses Paid During Period” to estimate the expenses you paid on your account during this period.
Hypothetical Example for Comparison Purposes:
The second line for each Fund in the table below provides information about hypothetical account values and hypothetical expenses based on each Fund’s actual expense ratio and an assumed rate of return of 5% per year before expenses, which is not the Fund’s actual return. The hypothetical account values and expenses may not be used to estimate the actual ending account balance or expenses you paid for the period. You may use this information to compare this 5% hypothetical example with the 5% hypothetical examples that appear in the shareholder reports of other funds.
Please note that the expenses shown in the table are meant to highlight your ongoing costs only and do not reflect any transactional costs, such as redemption fees. Therefore, the second line for each Fund in the table is useful in comparing ongoing costs only, and will not help you determine the relative total costs of owning different funds. In addition, if these transactional costs were included, your costs would have been higher.
| | | | | | | | | | | | |
| | | Beginning
Account Value
7/1/05
| | Ending
Account Value
12/31/05
| | Expense Paid
During Period*
7/1/05-12/31/05
| | Expense Ratio
During Period
7/1/05-12/31/05
| |
| Emerging Growth Fund | | | | | | | | | | | | |
| Actual | | $ | 1,000 | | $ | 1,027.40 | | $ | 7.26 | | 1.42 | % |
| Hypothetical (5% return before expenses) | | $ | 1,000 | | $ | 1,035.80 | | $ | 7.29 | | 1.42 | % |
| | | | |
| Micro-Cap Fund | | | | | | | | | | | | |
| Actual | | $ | 1,000 | | $ | 1,127.20 | | $ | 9.11 | | 1.70 | % |
| Hypothetical (5% return before expenses) | | $ | 1,000 | | $ | 1,033.00 | | $ | 8.71 | | 1.70 | % |
| | | | |
| Mid-Cap Fund | | | | | | | | | | | | |
| Actual | | $ | 1,000 | | $ | 1,048.50 | | $ | 10.33 | | 2.00 | % |
| Hypothetical (5% return before expenses) | | $ | 1,000 | | $ | 1,030.00 | | $ | 10.23 | | 2.00 | % |
| * | Expenses are equal to the average account value times the Fund’s annualized expense ratio multiplied by the number of days in the most recent fiscal half-year divided by the number of days in the fiscal year. |
| | | | | | | | | | | | |
| | | Beginning
Account Value
10/1/05
| | Ending
Account Value
12/31/05
| | Expense Paid
During Period**
10/1/05-12/31/05
| | Expense Ratio
During Period
10/1/05-12/31/05
| |
| China Opportunities Fund | | | | | | | | | | | | |
| Actual | | $ | 1,000.00 | | $ | 1,078.00 | | $ | 6.52 | | 2.49 | % |
| Hypothetical (5% return before expenses) | | $ | 1,000.00 | | $ | 1,025.10 | | $ | 6.35 | | 2.49 | % |
| ** | Expenses are equal to the average account value times the Fund’s annualized expense ratio multiplied by the number of days in the period (commencement of operations) divided by the number of days in the fiscal year. |
35
ITEM 2. CODE OF ETHICS.
| | (a) | As of December 31, 2005, the registrant has adopted a code of ethics that applies to the registrant’s principal executive officer, principal financial officer, principal accounting officer, or persons performing similar functions. |
| | (b) | A copy of the code of ethics may be obtained upon request, without charge, by contacting the registrant in writing at its principal executive office. |
ITEM 3. AUDIT COMMITTEE FINANCIAL EXPERT
| | (a) | (1) The registrant’s board of trustees has determined that the registrant has at least one audit committee financial expert serving on the audit committee. |
| | (b) | The audit committee financial expert is James G. Schmidt. Mr. Schmidt is independent as defined in Form N-CSR Item 3 (a) (2). |
ITEM 4. PRINCIPAL ACCOUNTANT FEES AND SERVICES.
(a)-(d)
| | | | |
| | | 2004 | | 2005 |
Audit fees | | 31,750 | | 50,000 |
Audit-Related Fees | | N/A | | N/A |
Tax Fees | | 17,750 | | 12,000 |
All Other Fees | | N/A | | N/A |
Audit Fees include amounts related to the audit of the registrant’s annual financial statements and services normally provided by the principal accountant in connection with statutory and regulatory filings. Tax Fees principally include tax compliance, tax advice, tax planning and preparation of tax returns.
(e)(1) The registrant’s audit committee pre-approves all audit services provided by the registrant’s principal accountant for the registrant and all non-audit services provided by the registrant’s principal accountant for the registrant, its investment adviser and any entity controlling, controlled by, or under common
control with the investment adviser (“Adviser Affiliate”) that provides ongoing services to the registrant, if the engagement by the investment adviser or Adviser Affiliate relates directly to the operations and financial reporting of the registrant.
(e)(2) No services included in (b) – (d) above were approved pursuant to paragraph (c)(7)(i)(C) of Rule 2-01 of Regulation S-X.
(f) Not Applicable.
(g) The aggregate fees billed for the most recent fiscal year and the preceding fiscal year by the registrant’s principal accountant for non-audit services rendered to the registrant, its investment, and Adviser Affiliate that provides ongoing services to the registrant for 2005 and 2004 were $15,052 and 17,750, respectively.
(h) Non-audit services rendered to the registrant’s investment adviser and any Adviser Affiliate that were not pre-approved pursuant to Paragraph (c) (7) (ii) of Rule 2-01 of Regulation S-X were considered by the registrant’s audit committee as to whether they were compatible with maintaining the principal account’s independence.
ITEM 5. AUDIT COMMITTEE OF LISTED REGISTRANTS.
Not Applicable to the registrant.
ITEM 6. SCHEDULE OF INVESTMENTS.
See Schedule I in Item 1.
ITEM 7. DISCLOSURE OF PROXY VOTING POLICIES AND PROCEDURES FOR CLOSED-END MANAGEMENT INVESTMENT COMPANIES.
Not Applicable to the registrant.
ITEM 8. PORTFOLIO MANAGERS OF CLOSED-END MANAGEMENT INVESTMENT COMPANIES.
Not Applicable to the registrant.
ITEM 9. PURCHASES OF EQUITY SECURITIES BY CLOSED-END MANAGEMENT INVESTMENT COMPANY AND AFFILIATED PURCHASERS.
Not Applicable to the registrant.
ITEM 10. SUBMISSION OF MATTERS TO A VOTE OF SECURITY HOLDERS.
There have been no material changes to the procedures by which shareholders may recommend nominees to the registrant’s board of trustees since registrant last disclosed such procedures in its proxy statement dated April 16, 2004.
ITEM 11. CONTROLS AND PROCEDURES.
| | (a) | The registrant’s principal executive and principal financial officers, or persons performing similar functions, have concluded that the registrant’s disclosure controls and procedures (as defined in Rule 30a-3 (c) under the Investment Company Act of 1940, as amended (the “1940 Act”) (17CFR 270.30a-3(c))) are effective, as of a date within 90 days of the filing date of the report that includes the disclosure required by this paragraph, based on their evaluation of these controls and procedures required by Rule 30a-3(b) under the 1940 Act (17 CFR 270.30a-3(b)) and Rules 13a-15(b) or 15d-15(b) under the Exchange Act (17 CFR 240.13a-15(b) or 240.15d-15(b)). |
| | (b) | There has been no change to the registrant’s internal control over financial reporting (as defined in Rule 30a-3(d) under the 1940 Act (17 CFR 270.30a-3(d)) that occurred during the second fiscal quarter of the period covered by this report that has materially affected, or is reasonably likely to materially affect, the registrant’s internal control over financial reporting. |
ITEM 12. EXHIBITS.
| | (a) (1) | Code of Ethics applicable to its Principal Executive and Principal Accounting Officers pursuant to Section 406 of the Sarbanes-Oxley Act of 2002 attached hereto as Exhibit 99.406. Code of Ethics. |
| | (a) (2) | Certifications pursuant to Rule 30a-2 under the Investment Company Act of 1940 (17CFR 270.30a-2) in the exact form set forth below: EX-99. CERT attached hereto. |
| | (a) (3) | Any written solicitation to purchase securities under Rule 23 c-1 under the Investment Company Act of 1940 (17 CFR 270.23c-1) sent or given during the period covered by the report by or on behalf of the registrant to 10 or more persons. Not Applicable to the registrant. |
| | (b) | If the report is filed under Section 13(a) or 15(d) of the Exchange Act, provide the certifications required by Rule 30a-2(b) under the 1940 Act (17 CFR 270.30a-2(b)), Rule 13a-14(b) or Rule 15d-14(b) under the Exchange Act (17 CFR 240.13a-14(b) or 240.15d-14(b)), and Section 1350 of Chapter 63 of Title 18 of the United States Code (18 U.S.C. 1350) as an exhibit. A certification furnished pursuant to this paragraph will not be deemed “filed” for purposes of Section 18 of the Exchange Act (15 U.S. C. 78r), or otherwise subject to the liability of that section. Such certification will not be deemed to be incorporated by reference into any filing under the Securities Act of 1933 or the Exchange Act, except to the extent that the registrant specifically incorporates it by reference. EX-99.906 CERT attached hereto. |
SIGNATURES
Pursuant to the requirements of the Securities Exchange Act of 1934 and the Investment Company Act of 1940, the registrant has duly caused this report to be signed on its behalf by the undersigned, thereunto duly authorized.
(Registrant) The Oberweis Funds
| | |
By (Signature and Title*) | | /s/ James W. Oberweis |
| | James W. Oberweis |
| | President, The Oberweis Funds |
Pursuant to the requirements of the Securities Exchange Act of 1934 and the Investment Company Act of 1940, this report has been signed below by the following persons on behalf of the registrant and in the capacities and on the dates indicated.
| | |
By (Signature and Title*) | | /s/ James W. Oberweis |
| | James W. Oberweis |
| | President, The Oberweis Funds |
| | |
By (Signature and Title*) | | /s/ Patrick B. Joyce |
| | Patrick B. Joyce |
| | Executive Vice President and Treasurer, |
| | The Oberweis Funds |
Date 03/03/2006
/*/ | Print the name and title of each signing officer under his or her signature. |