| | |
OMB APPROVAL |
OMB Number: | | 3235-0570 |
Expires: | | August 31, 2010 |
Estimated average burden |
hours per response | | 18.9 |
UNITED STATES
SECURITIES AND EXCHANGE COMMISSION
Washington, D.C. 20549
FORM N-CSR
CERTIFIED SHAREHOLDER REPORT OF REGISTERED
MANAGEMENT INVESTMENT COMPANIES
| | |
Investment Company Act file number | | 811-4854 |
The Oberweis Funds
|
| (Exact name of registrant as specified in charter) |
| | |
| 3333 Warrenville Rd. Ste. 500, Lisle, IL | | 60532 |
| (Address of principal executive offices) | | (Zip code) |
James W. Oberweis,
The Oberweis Funds, 3333 Warrenville Road, Suite 500, Lisle, IL 60532
|
| (Name and address of agent for service) |
Copy To:
James A. Arpaia,
Vedder Price P.C. 222 North Lasalle Street, Suite 2600, Chicago, IL 60601
Registrant’s telephone number, including area code: (800) 323-6166
Date of fiscal year end: December 31
Date of reporting period: December 31, 2007
Form N-CSR is to be used by management investment companies to file reports with the Commission not later than 10 days after the transmission to stockholders of any report that is required to be transmitted to stockholders under Rule 30e-1 under the Investment Company Act of 1940 (17 CFR 270.30e-1). The Commission may use the information provided on Form N-CSR in its regulatory, disclosure review, inspection, and policymaking roles.
A registrant is required to disclose the information specified by Form N-CSR, and the Commission will make this information public. A registrant is not required to respond to the collection of information contained in Form N-CSR unless the Form displays a currently valid Office of Management and Budget (“OMB”) control number. Please direct comments concerning the accuracy of the information collection burden estimate and any suggestions for reducing the burden to Secretary, Securities and Exchange Commission, 450 Fifth Street, NW, Washington, DC 20549-0609. The OMB has reviewed this collection of information under the clearance requirements of 44 U.S.C. §3507.
| ITEM 1. | REPORTS TO STOCKHOLDERS. |
The Annual Report to Stockholders Follows.

The OBERWEIS FUNDS
A VISION FOR FUTURE GROWTH
ANNUAL REPORT
AUDITED
DECEMBER 31, 2007
| | • | | The Emerging Growth Fund |
| | • | | The China Opportunities Fund |
| | • | | The International Opportunities Fund |
1-800-245-7311
www.oberweisfunds.com
PRESIDENT’S LETTER
Dear Fellow Oberweis Funds Shareholder:
I am pleased to report a solid year for The Oberweis Funds. The China Opportunities Fund again delivered strong gains, appreciating +59.29%, following a gain of +81.17% in 2006. Our newest Fund, the International Opportunities Fund, returned +41.00% in 2007. Among our U.S.-focused Funds, the Micro-Cap Fund returned +10.17%, the Emerging Growth Fund returned +6.82%, and the Mid-Cap Fund returned +14.99%.
On a global basis, China was again a great place to invest in 2007. Despite governmental measures designed to slow the economy, growth in China continued at a rapid pace. Within the U.S., small-cap growth equities delivered good results, particularly when compared to their small-cap value brethren. After value stocks dominated the market from 2000-2006, the tables turned in 2007; the Russell 2000 Growth Index returned 7.1%, significantly better than the Russell 2000 Value Index return of -9.8%. On a capitalization basis, larger-cap stocks performed better than small-cap stocks during the year, with the Russell 1000 Growth Index (a large cap proxy) outperforming the Russell 2000 Growth Index by 470 basis points. Finally, in the international marketplace, the benchmark S&P/Citigroup EMI Growth World Ex-US Index returned +7.1% for the period February 1, 2007 through December 31, 2007. Our International Opportunities Fund performed much better, stemming from favorable stock selection in the industrial and consumer discretionary sectors.
While the year was a positive one, it looked much better prior to the fourth quarter. Gains were eroded in the final five months as investors reacted to the sub-prime mortgage crisis, looming $100 per barrel crude oil, accelerating inflation, and the prospect of a recession in 2008. After gaining almost 10% through late July, the S&P 500 Index dropped nearly 12% over the following four weeks as the magnitude of the housing market crisis became more apparent to the market. While the final tally on the S&P 500 Index produced a modest 5.5% gain for the year, stock volatility increased in the latter half of the year as investors reacted skittishly to news on the housing market, banking write-downs, and Federal Reserve moves (both speculated and actual). To stem a possible financial crisis, the Fed reduced interest rates three times late in the year and repeatedly injected liquidity into the system through open market operations. The correction has accelerated into January 2008. Due to the recent decline, stock valuations for smaller, high-growth companies, as measured by average P/E ratios as of the end of January 2008, are substantially lower than historical averages.
The average forward P/E ratio at the end of 2007 was 20.0 times for the Micro-Cap Fund, 24.3 times for the Emerging Growth Fund, 26.0 times for the Mid-Cap Fund, 33.5 times for the China Opportunities Fund, and 20.4 times for the International Opportunities Fund. As of 12/31/07, the weighted average market capitalization was $387 million for the Micro-Cap, $1.2 billion for the Emerging Growth, $3.4 billion for the Mid-Cap, $2.4 billion for International Opportunities and $5.9 billion for China Opportunities.
We are also proud to announce the launch of our sixth Fund, The Oberweis Asia Opportunities Fund (OBAOX), on February 1, 2008. Interested investors may obtain a prospectus at www.oberweisfunds.com. At present, all of The Oberweis Funds are open to new investors. If you have any questions about your account, please contact shareholder services at (800) 245-7311. Thank you for investing with us in The Oberweis Funds.
|
| Sincerely, |
|
 |
James W. Oberweis, CFA President & Portfolio Manager |
2
THE OBERWEIS FUNDS
MANAGEMENT DISCUSSION
ON FUND PERFORMANCE
Market Environment
Global equities returned 7.11% in 2007, as measured by the S&P Citigroup BMI World Index. Emerging Asian countries including China led global returns. U.S. returns were more modest, with the S&P 500 returning 5.5% for the year. On a capitalization basis, larger-cap stocks performed better than small-cap stocks during the year, with the Russell 1000 Growth Index (a large cap proxy) outperforming the Russell 2000 Growth Index by 470 basis points. Domestic small-cap growth stocks outperformed small-cap value. After value stocks dominated the market from 2000-2006, the tables turned in 2007; the Russell 2000 Growth Index returned 7.1%, significantly better than the Russell 2000 Value Index return of -9.8%.
Gains were eroded in the final five months as investors reacted to the sub-prime mortgage crisis, looming $100 per barrel crude oil, accelerating inflation, and the prospect of a recession in 2008. Stock volatility increased in the latter half of the year as investors reacted skittishly to news on the housing market, banking write-downs, and Federal Reserve moves (both speculated and actual). To stem a possible financial crisis, the Fed reduced interest rates three times late in the year and repeatedly injected liquidity into the system through open market operations.
Discussion of The Oberweis Funds
For the year ending December 31, 2007, the Oberweis Micro-Cap Fund appreciated +10.17% and the Emerging Growth Fund appreciated +6.82%. For comparison, the benchmark Russell 2000 Growth Index appreciated +7.05%.
For the Micro-Cap Fund, the energy and technology sectors were the most important contributors to performance. The Fund’s holdings in these two sectors outperformed the corresponding sectors of the benchmark and the Fund benefited from higher relative weightings in these sectors as well. Healthcare was the greatest detractor to Fund performance. At the stock level, Vasco Data Security and Flotek Industries were among the top contributors to performance, while Kenexa and Vital Images were among the top detractors.
For the Emerging Growth Fund, financials and consumer discretionary were the most important contributing sectors compared to the benchmark. Stock selections in these two sectors significantly outperformed the benchmark sector returns. However, these gains were offset by the Fund’s healthcare and producer durables holdings, which underperformed and caused the Fund to slightly trail its benchmark for the year. At the stock level, Aquantive and Sigma Designs were among the top contributors to performance, while Heelys and Optium were among the top detractors.
The Oberweis Mid-Cap Fund appreciated +14.99%. For comparison, the Russell 2500 Growth Index appreciated +9.69% and the Russell Midcap Growth Index gained 11.43%. Favorable appreciation in the Fund’s consumer discretionary holdings helped performance. At the stock level, Intuitive Surgical and Baidu.com were among the top contributors to performance, while Heelys and Force Protection were among the top detractors.
3
THE OBERWEIS FUNDS
MANAGEMENT DISCUSSION
ON FUND PERFORMANCE (continued)
The Oberweis China Opportunities Fund returned +59.29% for the year ended December 31, 2007. The benchmark S&P/Citigroup EMI China Index returned +78.36%. Despite strong absolute gains, the Fund underperformed its benchmark for the year. The benchmark index includes larger capitalization issues as well as A-shares, neither of which have played a significant role in the Fund but both of which performed particularly well for the index in 2007. Baidu.com and China National Building Materials were among the top contributors; China Life Insurance and Pine Agritech were among the top detractors.
Since inception on 2/1/2007, the Oberweis International Opportunities Fund returned +41.00% versus +7.10% for the S&P/Citigroup EMI Growth World Ex-US Index. A higher relative weight and strong stock selection in industrials materially contributed to performance. Also, favorable stock selection in the consumer sector contributed. At the stock level, Meyer Burger Technology and Korea Line Corp were among the top contributors to performance; Moneysupermarket.com and Temenos Group AG were among the top detractors.
The annual portfolio turnover rates were 65% for the Micro-Cap Fund, 85% for the Emerging Growth Fund, 110% for the Mid-Cap Fund, and 68% for the China Opportunities Fund. For the period February 1, 2007 through December 31, 2007, the portfolio turnover rate was 126% for the International Opportunities Fund. The annual net expense ratios were 1.58% for Micro-Cap, 1.28% for Emerging Growth, 1.80% for Mid-Cap, 1.78% for China Opportunities. For the period February 1, 2007 through December 31, 2007, the annualized net expense ratio was 1.99% for International Opportunities.
4
THE OBERWEIS FUNDS
MANAGEMENT DISCUSSION
ON FUND PERFORMANCE (continued)
The SEC adopted a requirement that Funds present their portfolio holdings in a table, chart or graph format in their annual and semi-annual reports to shareholders, whether or not a schedule of investments is utilized. The following tables, which present portfolio holdings as a percentage of net assets, are provided in compliance with this requirement.
Oberweis Emerging Growth Fund
At December 31, 2007
| | | |
Asset Allocation | | | |
Common Stocks | | 95.9 | % |
Commercial Paper | | 3.1 | % |
Warrants | | 0.3 | % |
Other Assets in excess of Liabilities | | 0.7 | % |
| | | |
| | 100.0 | % |
| |
Top Holdings | | | |
Focus Media Hldg. Ltd. | | 3.9 | % |
Sigma Designs, Inc. | | 3.2 | % |
Vasco Data Security Intl., Inc. | | 2.6 | % |
eHealth, Inc. | | 2.5 | % |
Synaptics, Inc. | | 2.4 | % |
Carrizo Oil & Gas, Inc. | | 2.4 | % |
Synchronoss Technologies, Inc. | | 2.3 | % |
Omrix Biopharmaceuticals, Inc. | | 2.1 | % |
Shoretel, Inc. | | 2.0 | % |
Zoltek Companies, Inc. | | 2.0 | % |
Other Holdings | | 74.6 | % |
| | | |
| | 100.0 | % |
| |
Top Industries | | | |
Computer Services Software & Systems | | 19.4 | % |
Communication Technology | | 7.9 | % |
Oil Crude Producer | | 6.0 | % |
Electronics Semi-Conductors | | 5.8 | % |
Advertising Agency | | 5.5 | % |
Computer Technology | | 5.2 | % |
Service Commercial | | 4.0 | % |
Healthcare Management Services | | 3.8 | % |
Drugs & Pharmaceuticals | | 3.6 | % |
Electronic Medical Systems | | 3.6 | % |
Other Industries | | 35.2 | % |
| | | |
| | 100.0 | % |
Oberweis Micro-Cap Fund
At December 31, 2007
| | | |
Asset Allocation | | | |
Common Stocks | | 98.9 | % |
Commercial Paper | | 1.7 | % |
Warrants | | 0.5 | % |
Other Liabilities in excess of Assets | | (1.1 | )% |
| | | |
| | 100.0 | % |
| |
Top Holdings | | | |
Double-Take Software, Inc. | | 3.5 | % |
Omrix Biopharmaceuticals, Inc. | | 3.2 | % |
LSB Industries, Inc. | | 2.9 | % |
Vocus, Inc. | | 2.8 | % |
T-3 Energy Services, Inc. | | 2.7 | % |
Vasco Data Security Intl., Inc. | | 2.6 | % |
Astronics Corp. | | 2.6 | % |
Cybersource Corp. | | 2.6 | % |
Sigma Designs, Inc. | | 2.5 | % |
Perficient, Inc. | | 2.5 | % |
Other Holdings | | 72.1 | % |
| | | |
| | 100.0 | % |
| |
Top Industries | | | |
Computer Services Software & Systems | | 23.4 | % |
Machine Oilwell Equipment | | 8.2 | % |
Service Commercial | | 7.9 | % |
Chemicals | | 5.8 | % |
Biotechnology | | 4.9 | % |
Electronic Semi-Conductors | | 4.2 | % |
Communication Technology | | 3.7 | % |
Electronic Medical Systems | | 3.4 | % |
Metal Fabricating | | 3.1 | % |
Technology Misc. | | 2.8 | % |
Other Industries | | 32.6 | % |
| | | |
| | 100.0 | % |
5
THE OBERWEIS FUNDS
MANAGEMENT DISCUSSION
ON FUND PERFORMANCE (continued)
Oberweis Mid-Cap Fund
At December 31, 2007
| | | |
Asset Allocation | | | |
Common Stocks | | 99.0 | % |
Other Assets in excess of Liabilities | | 1.0 | % |
| | | |
| | 100.0 | % |
| |
Top Holdings | | | |
Illumina, Inc. | | 4.5 | % |
Intuitive Surgical, Inc. | | 4.5 | % |
Omrix Biopharmaceutical, Inc. | | 3.9 | % |
FLIR Systems, Inc. | | 3.7 | % |
Nuance Communications, Inc. | | 3.2 | % |
Hologic, Inc. | | 3.2 | % |
BE Aerospace, Inc. | | 2.9 | % |
Cubist Pharmaceuticals, Inc. | | 2.5 | % |
Chipotle Mexican Grill, Inc. | | 2.4 | % |
Vasco Data Security Intl., Inc. | | 2.4 | % |
Other Holdings | | 66.8 | % |
| | | |
| | 100.0 | % |
| |
Top Industries | | | |
Computer Services Software & Systems | | 16.7 | % |
Electronic Medical Systems | | 13.9 | % |
Biotech Research & Production | | 8.4 | % |
Machine Oilwell | | 6.9 | % |
Health Care Management Services | | 4.7 | % |
Retail | | 4.5 | % |
Communication Technology | | 4.0 | % |
Electronics | | 3.7 | % |
Textile-Apparel Manufacturer | | 3.6 | % |
Electronics Semi-Conductors | | 3.2 | % |
Other Industries | | 30.4 | % |
| | | |
| | 100.0 | % |
Oberweis China Opportunities Fund
At December 31, 2007
| | | |
Asset Allocation | | | |
Common Stocks | | 98.8 | % |
Commercial Paper | | 1.7 | % |
Warrants | | 0.1 | % |
Other Liabilities in excess of Assets | | (0.6 | )% |
| | | |
| | 100.0 | % |
| |
Top Holdings | | | |
Suntech Power Hldgs. Co. Ltd | | 3.3 | % |
Lee Man Paper Manufacturing Ltd | | 3.2 | % |
Baidu.com, Inc. ADR | | 2.9 | % |
Focus Media Hldgs. Ltd | | 2.8 | % |
China National Building Material Co. Ltd | | 2.8 | % |
Ezra Hldgs. Ltd | | 2.4 | % |
Raffles Education Corp. Ltd | | 2.3 | % |
Li Ning Co. Ltd | | 2.2 | % |
China Resources Power Hldgs. Co. | | 2.0 | % |
Parkson Retail Group Ltd | | 2.0 | % |
Other Holdings | | 74.1 | % |
| | | |
| | 100.0 | % |
| |
Top Industries | | | |
Internet Software & Services | | 7.5 | % |
Textile, Apparel & Luxury Goods | | 7.0 | % |
Electrical Equipment | | 6.7 | % |
Paper & Forest Products | | 6.6 | % |
Hotels Restaurants & Leisure | | 5.5 | % |
Energy Equipment & Services | | 4.9 | % |
Media | | 4.8 | % |
Machinery | | 4.5 | % |
Multiline Retail | | 4.1 | % |
Diversified Consumer Services | | 4.1 | % |
Other Industries | | 44.3 | % |
| | | |
| | 100.0 | % |
6
THE OBERWEIS FUNDS
MANAGEMENT DISCUSSION
ON FUND PERFORMANCE (continued)
Oberweis International Opportunities Fund
At December 31, 2007
| | | |
Asset Allocation | | | |
Common Stocks | | 92.2 | % |
Commercial Paper | | 5.7 | % |
Other Assets in excess of Liabilities | | 2.1 | % |
| | | |
| | 100.0 | % |
| |
Top Holdings | | | |
Game Group | | 3.8 | % |
Wellstream Hldgs. PLC | | 3.6 | % |
Flsmidth & Co. AS | | 3.5 | % |
Roth & Rau AG | | 3.0 | % |
Hellenic Exchanges | | 2.8 | % |
Meyer Burger Technology AG | | 2.7 | % |
Boskalis Westminster | | 2.7 | % |
Aixtron AG | | 2.5 | % |
Schoeller-Bleckmann Oilfield | | 2.4 | % |
Tradus PLC | | 2.2 | % |
Other Holdings | | 70.8 | % |
| | | |
| | 100.0 | % |
| |
Top Industries | | | |
Machinery | | 18.4 | % |
Construction & Engineering | | 12.2 | % |
Energy Equipment & Services | | 9.4 | % |
Specialty Retail | | 5.8 | % |
Software | | 4.2 | % |
Textile, Apparel & Luxury Goods | | 3.4 | % |
Capital Markets | | 3.1 | % |
Electronic Equipment & Instruments | | 3.0 | % |
Diversified Financial Services | | 2.8 | % |
Commercial Service & Supply | | 2.7 | % |
Other Industries | | 35.0 | % |
| | | |
| | 100.0 | % |
7
THE OBERWEIS FUNDS
MANAGEMENT DISCUSSION
ON FUND PERFORMANCE (continued)
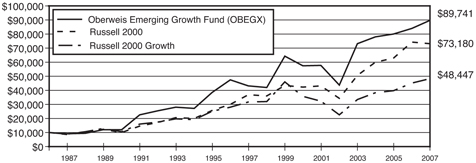
Average Annual Total Returns (1)
Periods ended 12/31/07
| | | | | | | | | | | | | | | |
| | | One
Year | | | Five
Years | | | Ten
Years | | | Since
Inception
1/7/87 | | | Expense
Ratio (2) | |
OBEGX | | +6.82 | % | | +15.45 | % | | +7.55 | % | | +11.02 | % | | 1.29 | % |
Russell 2000 Growth | | +7.05 | % | | +16.50 | % | | +4.32 | % | | +7.81 | % | | | |
Russell 2000 | | -1.57 | % | | +16.25 | % | | +7.08 | % | | +9.95 | % | | | |
Growth of an Assumed $10,000 Investment
from January 7, 1987 to December 31, 2007
(1) | Performance data represents past performance, which is no guarantee of future results. Current performance may be higher or lower than the performance shown. You can obtain performance data current to the most recent month by visiting www.oberweisfunds.com. Returns are historical and include changes in share price and reinvestment of dividends and capital gains. Investment return and principal value will fluctuate so that shares, when redeemed, may be worth more or less than their original cost. The Oberweis Funds invest in rapidly growing smaller and medium sized companies, which may offer greater return potential. However, these investments often involve greater risks and volatility. There is no guarantee that the portfolios can achieve their objectives. |
The Russell 2000 Growth Index measures the performance of those Russell 2000 companies with higher price-to-book ratios and higher forecasted earnings growth rates. The Russell 2000 Index measures the performance of 2000 companies with small-market capitalizations. The Russell indices are unmanaged and are not available for investment. A sales load of 4% was charged on the Oberweis Emerging Growth Fund until December 31, 1991 and is not reflected in the total return figures or graph above.
(2) | Expense ratio is the total annual fund operating expense ratio gross of any fee waivers or expense reimbursement. |
8
THE OBERWEIS FUNDS
MANAGEMENT DISCUSSION
ON FUND PERFORMANCE (continued)
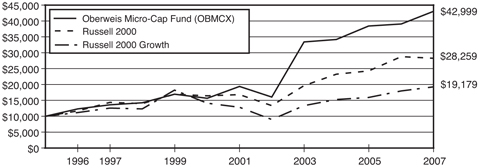
Average Annual Total Returns (1)
Periods ended 12/31/07
| | | | | | | | | | | | | | | |
| | | One
Year | | | Five
Years | | | Ten
Years | | | Since
Inception
1/1/96 | | | Expense
Ratio (2) | |
OBMCX | | +10.17 | % | | +21.93 | % | | +12.21 | % | | +12.92 | % | | 1.59 | % |
Russell 2000 Growth | | +7.05 | % | | +16.50 | % | | +4.32 | % | | +5.58 | % | | | |
Russell 2000 | | -1.57 | % | | +16.25 | % | | +7.08 | % | | +9.04 | % | | | |
Growth of an Assumed $10,000 Investment
from January 1, 1996 to December 31, 2007
(1) | Performance data represents past performance, which is no guarantee of future results. Current performance may be higher or lower than the performance shown. You can obtain performance data current to the most recent month by visiting www.oberweisfunds.com. Returns are historical and include changes in share price and reinvestment of dividends and capital gains. Investment return and principal value will fluctuate so that shares, when redeemed, may be worth more or less than their original cost. The Oberweis Funds invest in rapidly growing smaller and medium sized companies, which may offer greater return potential. However, these investments often involve greater risks and volatility. There is no guarantee that the portfolios can achieve their objectives. |
The Russell 2000 Growth Index measures the performance of those Russell 2000 companies with higher price-to-book ratios and higher forecasted earnings growth rates. The Russell 2000 Index measures the performance of 2000 companies with small-market capitalizations. The Russell indices are unmanaged and are not available for investment.
(2) | Expense ratio is the total annual fund operating expense ratio gross of any fee waivers or expense reimbursement. |
9
THE OBERWEIS FUNDS
MANAGEMENT DISCUSSION
ON FUND PERFORMANCE (continued)
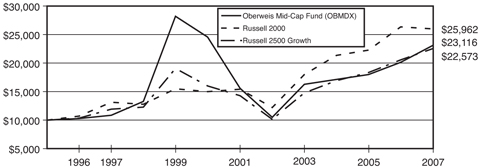
Average Annual Total Returns (1)
Period ended 12/31/07
| | | | | | | | | | | | | | | |
| | | One
Year | | | Five
Years | | | Ten
Years | | | Since
Inception
9/15/96 | | | Expense
Ratio (2) | |
OBMDX | | +14.99 | % | | +17.20 | % | | +7.86 | % | | +7.70 | % | | 1.83 | % |
Russell 2500 Growth | | +9.69 | % | | +17.43 | % | | +6.63 | % | | +7.47 | % | | | |
Russell 2000 | | -1.57 | % | | +16.25 | % | | +7.08 | % | | +8.81 | % | | | |
Growth of an Assumed $10,000 Investment
from September 15, 1996 to December 31, 2007
(1) | Performance data represents past performance, which is no guarantee of future results. Current performance may be higher or lower than the performance shown. You can obtain performance data current to the most recent month by visiting www.oberweisfunds.com. Returns are historical and include changes in share price and reinvestment of dividends and capital gains. Investment return and principal value will fluctuate so that shares, when redeemed, may be worth more or less than their original cost. The Oberweis Funds invest in rapidly growing smaller and medium sized companies, which may offer greater return potential. However, these investments often involve greater risks and volatility. There is no guarantee that the portfolios can achieve their objectives. |
The Russell 2000 Index measures the performance of 2000 companies with small-market capitalizations. The Russell 2500 Growth Index measures the performance of Russell 2500 companies with lower price-to-book ratios and lower forecasted growth values. The Russell indices are unmanaged and are not available for investment.
(2) | Expense ratio is the total annual fund operating expense ratio gross of any fee waivers or expense reimbursement. |
10
THE OBERWEIS FUNDS
MANAGEMENT DISCUSSION
ON FUND PERFORMANCE (continued)
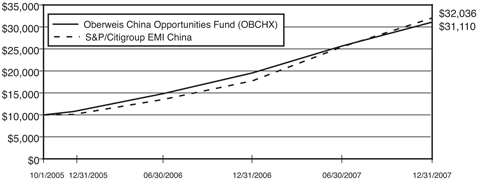
Average Annual Total Returns (1)
Periods ended 12/31/07
| | | | | | | | | |
| | | One
Year | | | Since
Inception
10/1/05 | | | Expense
Ratio (2) | |
OBCHX | | +59.29 | % | | +65.64 | % | | 1.78 | % |
S&P/Citigroup EMI China | | +78.36 | % | | +67.81 | % | | | |
Growth of an Assumed $10,000 Investment
from October 1, 2005 to December 31, 2007
(1) | Performance data represents past performance, which is no guarantee of future results. Returns are historical and include changes in share price and reinvestment of dividends and capital gains. Current performance may be higher or lower than the performance shown. You can obtain performance data current to the most recent month by visiting www.oberweisfunds.com. The principal value and investment return of an investment will fluctuate so that your shares, when redeemed, may be worth more or less than their original cost. The Oberweis Funds invest in rapidly growing smaller and medium sized companies, which may offer greater return potential. However, these investments often involve greater risks and volatility. Foreign and emerging market investing involves special risks such as currency fluctuation and less public disclosure, as well as economic and political risk. There is no guarantee that the portfolios can achieve their objectives. |
The S&P/Citigroup EMI China Index represents the smallest 20% of companies, ranked by total market capitalization, which qualify for inclusion in the S&P/Citigroup BMI China Index, which is an unmanaged broad market index of the universe of institutionally investable securities in China.
(2) | Expense ratio is the total annual fund operating expense ratio gross of any fee waivers or expense reimbursement. |
11
THE OBERWEIS FUNDS
MANAGEMENT DISCUSSION
ON FUND PERFORMANCE (continued)
Average Annual Total Returns (1)
Periods ended 12/31/07
| | | | | | |
| | | Since
Inception
2/1/07 | | | Expense
Ratio (2) | |
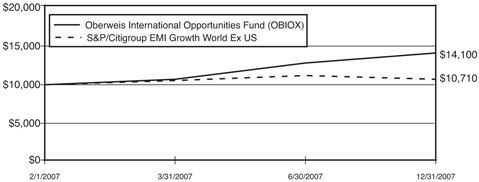
OBIOX | | +41.00 | % | | 2.00 | % (3) |
S&P/Citigroup EMI Growth World EX US | | +7.10 | % | | | |
Growth of an Assumed $10,000 Investment
from February 1, 2007 to December 31, 2007
(1) | Performance data represents past performance, which is no guarantee of future results. Returns are historical and include changes in share price and reinvestment of dividends and capital gains. Current performance may be higher or lower than the performance shown. You can obtain performance data current to the most recent month by visiting www.oberweisfunds.com. The principal value and investment return of an investment will fluctuate so that your shares, when redeemed, may be worth more or less than their original cost. The Oberweis Funds invest in rapidly growing smaller and medium sized companies, which may offer greater return potential. However, these investments often involve greater risks and volatility. Foreign and emerging market investing involves special risks such as currency fluctuation and less public disclosure, as well as economic and political risk. There is no guarantee that the portfolios can achieve their objectives. |
The S&P/Citigroup EMI Growth World Ex-US Index captures the bottom 20% of institutionally investable capital of developed countries selected by the index sponsor, outside the United States.
(2) | Expense ratio is the total annual fund operating expense ratio gross of any fee waivers or expense reimbursement. |
12
OBERWEIS EMERGING GROWTH FUND
Schedule of Investments
December 31, 2007
| | | | | |
| | | Shares | | Value |
EQUITIES - 95.9% | | | | | |
Advertising Agency - 5.5% | | | | | |
Focus Media Hldg. Ltd. ADR * | | 149,978 | | $ | 8,520,250 |
inVentiv Health, Inc.* | | 40,750 | | | 1,261,620 |
ValueClick, Inc.* | | 101,500 | | | 2,222,850 |
| | | | | |
| | | | | 12,004,720 |
| | | | | |
Auto Trucks & Parts - 0.8% | | | | | |
Spartan Motors, Inc. | | 234,400 | | | 1,790,816 |
| | | | | |
Banks - 0.4% | | | | | |
Pinnacle Financial Partners, Inc.* | | 33,300 | | | 846,486 |
| | | | | |
Biotechnology - 2.1% | | | | | |
Omrix Biopharmaceuticals, Inc.* | | 130,100 | | | 4,519,674 |
| | | | | |
Building Materials - 2.0% | | | | | |
Zoltek Companies, Inc.* | | 100,000 | | | 4,287,000 |
| | | | | |
Commercial Information Service - 0.6% | | | | | |
LoopNet, Inc.* | | 93,500 | | | 1,313,675 |
| | | | | |
Communication Technology - 7.9% | | | | | |
Acme Packet, Inc.* | | 152,864 | | | 1,924,558 |
Atheros Communications, Inc.* | | 127,300 | | | 3,887,742 |
Geoeye, Inc.* | | 21,297 | | | 716,644 |
Globecom Systems, Inc.* | | 134,600 | | | 1,574,820 |
Novatel Wireless, Inc.* | | 154,700 | | | 2,506,140 |
Shoretel, Inc.* | | 319,650 | | | 4,465,510 |
Sierra Wireless, Inc.* | | 145,600 | | | 2,162,160 |
| | | | | |
| | | | | 17,237,574 |
| | | | | |
Computer Services Software & Systems - 19.4% | | | | | |
Chordiant Software, Inc.* | | 214,500 | | | 1,833,975 |
Concur Technologies, Inc.* | | 81,600 | | | 2,954,736 |
DealerTrack Hldgs., Inc.* | | 102,200 | | | 3,420,634 |
Double-Take Software Inc.* | | 149,800 | | | 3,253,656 |
Interactive Intelligence, Inc.* | | 154,100 | | | 4,060,535 |
Kenexa Corp.* | | 68,600 | | | 1,332,212 |
PROS Hldgs., Inc.* | | 128,600 | | | 2,523,132 |
Sapient Corp.* | | 180,100 | | | 1,586,681 |
Sigma Designs, Inc.* | | 128,508 | | | 7,093,642 |
Stanley, Inc.* | | 120,500 | | | 3,858,410 |
Synchronoss Technologies, Inc.* | | 141,000 | | | 4,997,040 |
Vasco Data Security International, Inc.* | | 201,600 | | | 5,628,672 |
| | | | | |
| | | | | 42,543,325 |
| | | | | |
See accompanying notes to the financial statements.
13
OBERWEIS EMERGING GROWTH FUND
Schedule of Investments (continued)
December 31, 2007
| | | | | |
| | | Shares | | Value |
Computer Technology - 5.2% | | | | | |
Advanced Analogic Technologies, Inc.* | | 146,800 | | $ | 1,655,904 |
Falconstor Software, Inc.* | | 258,900 | | | 2,915,214 |
Phoenix Technologies Ltd.* | | 112,000 | | | 1,442,560 |
Synaptics, Inc.* | | 129,400 | | | 5,326,104 |
| | | | | |
| | | | | 11,339,782 |
| | | | | |
Drugs & Pharmaceuticals- 3.6% | | | | | |
Caraco Pharmaceutical Laboratories, Ltd. * | | 46,800 | | | 802,620 |
Obagi Medical Products, Inc.* | | 231,400 | | | 4,232,306 |
Salix Pharmaceuticals Ltd.* | | 5,766 | | | 45,436 |
Sciele Pharma, Inc.* | | 137,467 | | | 2,811,200 |
| | | | | |
| | | | | 7,891,562 |
| | | | | |
Electrical - 0.6% | | | | | |
Axsys Technologies, Inc.* | | 11,990 | | | 439,434 |
Orion Energy Systems, Inc.* | | 42,100 | | | 785,586 |
| | | | | |
| | | | | 1,225,020 |
| | | | | |
Electronics - Instruments - 0.4% | | | | | |
Virtual Radiologic Corp.* | | 39,000 | | | 790,920 |
| | | | | |
Electronic Medical Systems - 3.6% | | | | | |
Accuray, Inc.* | | 276,800 | | | 4,212,896 |
Cynosure, Inc.* | | 86,600 | | | 2,291,436 |
Natus Medical, Inc.* | | 66,800 | | | 1,292,580 |
| | | | | |
| | | | | 7,796,912 |
| | | | | |
Electronics Semi-Conductors - 5.8% | | | | | |
Anadigics, Inc.* | | 133,300 | | | 1,542,281 |
AuthenTec, Inc.* | | 24,800 | | | 360,344 |
IPG Photonics Corp.* | | 128,400 | | | 2,566,716 |
Mellanox Technologies Ltd.* | | 83,500 | | | 1,521,370 |
O2Micro International Ltd. ADR * | | 241,600 | | | 2,788,064 |
Tessera Technologies, Inc.* | | 97,103 | | | 4,039,485 |
| | | | | |
| | | | | 12,818,260 |
| | | | | |
Energy Misc. - 0.8% | | | | | |
Dawson Geophysical Co.* | | 25,200 | | | 1,800,792 |
| | | | | |
Finance Companies - 0.8% | | | | | |
Life Partners Hldgs., Inc | | 67,200 | | | 1,861,440 |
| | | | | |
Financial Data Product Services - 2.7% | | | | | |
CyberSource Corp.* | | 148,000 | | | 2,629,960 |
Exlservice Hldgs., Inc.* | | 145,500 | | | 3,358,140 |
| | | | | |
| | | | | 5,988,100 |
| | | | | |
See accompanying notes to the financial statements.
14
OBERWEIS EMERGING GROWTH FUND
Schedule of Investments (continued)
December 31, 2007
| | | | | |
| | | Shares | | Value |
Foods - 0.5% | | | | | |
Sunopta, Inc.* | | 90,000 | | $ | 1,201,500 |
| | | | | |
Forms & Bulk Print - 1.9% | | | | | |
InnerWorkings, Inc.* | | 240,600 | | | 4,152,756 |
| | | | | |
Health Care Management Services - 3.8% | | | | | |
Allscripts Healthcare, Inc.* | | 185,518 | | | 3,602,759 |
HealthExtras, Inc.* | | 93,000 | | | 2,425,440 |
Omnicell, Inc.* | | 90,300 | | | 2,431,779 |
| | | | | |
| | | | | 8,459,978 |
| | | | | |
Health Care Services - 2.5% | | | | | |
Healthways, Inc.* | | 42,766 | | | 2,499,245 |
Nighthawk Radiology Hldgs., Inc.* | | 146,800 | | | 3,090,140 |
| | | | | |
| | | | | 5,589,385 |
| | | | | |
Insurance - 2.5% | | | | | |
eHealth, Inc.* | | 173,100 | | | 5,558,241 |
| | | | | |
Machine Oilwell Equipment - 2.0% | | | | | |
Dril-Quip, Inc.* | | 42,600 | | | 2,371,116 |
Flotek Industries Inc.* | | 34,100 | | | 1,228,964 |
T-3 Energy Services, Inc.* | | 19,400 | | | 911,994 |
| | | | | |
| | | | | 4,512,074 |
| | | | | |
Machinery Specialty - 0.2% | | | | | |
TurboChef Technologies, Inc.* | | 30,900 | | | 509,850 |
| | | | | |
Materials & Commodities Misc. - 0.3% | | | | | |
Ceradyne, Inc.* | | 13,102 | | | 614,877 |
| | | | | |
Medical &Dental Services - 0.9% | | | | | |
Genoptix, Inc.* | | 9,600 | | | 294,720 |
Lifecell Corp.* | | 37,100 | | | 1,599,381 |
| | | | | |
| | | | | 1,894,101 |
| | | | | |
Metal Fabricating - 1.5% | | | | | |
Dynamic Materials Corp | | 57,600 | | | 3,392,640 |
| | | | | |
Oil Crude Producer - 6.0% | | | | | |
Arena Resources, Inc.* | | 91,200 | | | 3,803,952 |
Carrizo Oil & Gas, Inc.* | | 97,001 | | | 5,310,805 |
Gulfport Energy Corp.* | | 96,400 | | | 1,760,264 |
Warren Resources, Inc.* | | 164,500 | | | 2,324,385 |
| | | | | |
| | | | | 13,199,406 |
| | | | | |
Production Technology Equipment - 0.5% | | | | | |
Fei Co.* | | 42,800 | | | 1,062,724 |
| | | | | |
See accompanying notes to the financial statements.
15
OBERWEIS EMERGING GROWTH FUND
Schedule of Investments (continued)
December 31, 2007
| | | | | |
| | | Shares | | Value |
Restaurants - 0.9% | | | | | |
BJ’s Restaurants, Inc.* | | 118,500 | | $ | 1,926,810 |
| | | | | |
Retail - 1.6% | | | | | |
Volcom, Inc.* | | 75,003 | | | 1,652,316 |
Zumiez, Inc.* | | 76,600 | | | 1,865,976 |
| | | | | |
| | | | | 3,518,292 |
| | | | | |
Service Commercial- 4.0% | | | | | |
G-Market, Inc. ADR * | | 123,200 | | | 3,067,680 |
Liquidity Services, Inc.* | | 164,800 | | | 2,125,920 |
Perficient, Inc.* | | 120,800 | | | 1,901,392 |
The Knot, Inc.* | | 104,900 | | | 1,672,106 |
| | | | | |
| | | | | 8,767,098 |
| | | | | |
Shoes - 1.2% | | | | | |
Iconix Brand Group, Inc.* | | 130,200 | | | 2,559,732 |
| | | | | |
Technology Misc.- 0.4% | | | | | |
Dice Hldgs., Inc.* | | 97,100 | | | 775,829 |
| | | | | |
Telecommunications - 0.8% | | | | | |
Opnext, Inc.* | | 208,800 | | | 1,847,880 |
| | | | | |
Textile-Apparel Manufacturer - 0.3% | | | | | |
Lululemon Athletica * | | 11,900 | | | 563,703 |
| | | | | |
Wholesale & International Trade - 1.9% | | | | | |
Central European Distribution Corp.* | | 73,350 | | | 4,260,168 |
| | | | | |
Total Equities
(Cost: $169,122,792) | | | | $ | 210,423,102 |
| | | | | |
| | |
| | | Face Amount | | Value |
Commercial Paper - 3.1% | | | | | |
HSBC Financial Corp | | 4,500,000 | | | |
4.45%, due 01/03/2008 | | | | $ | 4,500,000 |
Toyota Motor Credit Corp | | 400,000 | | | |
4.18%, due 01/03/2008 | | | | | 400,000 |
Toyota Motor Credit Corp | | 2,000,000 | | | |
3.50%, due 01/03/2008 | | | | | 2,000,000 |
| | | | | |
Total Commercial Paper -
(Cost: $6,900,000) | | | | $ | 6,900,000 |
| | | | | |
See accompanying notes to the financial statements.
16
OBERWEIS EMERGING GROWTH FUND
Schedule of Investments (continued)
December 31, 2007
| | | | | |
| | | Units | | Value |
Warrants - 0.3% | | | | | |
Internet Software & Systems | | | | | |
Think Partnership, Inc. ($2.50, expires 04/03/11)† | | 540,000 | | $ | 374,946 |
Think Partnership, Inc. ($3.05, expires 12/05/11)† | | 170,043 | | | 122,127 |
Think Partnership, Inc. ($4.00, expires 12/05/11)† | | 85,022 | | | 53,899 |
| | | | | |
Total Warrants
(Cost: $0) | | | | $ | 550,972 |
| | | | | |
Total Investments - 99.3%
(Cost: $176,022,792) | | | | $ | 217,874,074 |
Other Assets less Liabilities 0.7% | | | | | 1,449,196 |
| | | | | |
Net Assets - 100% | | | | $ | 219,323,270 |
| | | | | |
Based on the cost of investments of $176,279,086 for federal income tax purposes at December 31, 2007, the aggregate gross unrealized appreciation was $56,791,839 the aggregate gross unrealized depreciation was $15,196,851 and the net unrealized appreciation of investments was $41,594,988.
| * | Non-Income producing security during the year ended December 31, 2007. |
ADR American Depositary Receipt
See accompanying notes to the financial statements.
17
OBERWEIS MICRO-CAP FUND
Schedule of Investments
December 31, 2007
| | | | | |
| | | Shares | | Value |
EQUITIES - 98.9% | | | | | |
Air Transport - 0.7% | | | | | |
Edac Technologies Co.* | | 35,000 | | $ | 342,300 |
| | | | | |
Banks - 1.1% | | | | | |
Alliance Bankshares Corp.* | | 11,800 | | | 77,762 |
Silver State Bancorp * | | 34,450 | | | 485,745 |
| | | | | |
| | | | | 563,507 |
| | | | | |
Biotechnology - 4.9% | | | | | |
Omrix Biopharmaceuticals, Inc.* | | 46,300 | | | 1,608,462 |
Repligen Corp.* | | 137,400 | | | 899,970 |
| | | | | |
| | | | | 2,508,432 |
| | | | | |
Casinos & Gambling - 0.3% | | | | | |
Century Casinos, Inc.* | | 21,400 | | | 137,816 |
| | | | | |
Chemicals - 5.8% | | | | | |
KMG Chemicals, Inc | | 16,300 | | | 235,698 |
LSB Industries, Inc.* | | 51,700 | | | 1,458,974 |
Ultralife Batteries, Inc.* | | 61,900 | | | 1,247,285 |
| | | | | |
| | | | | 2,941,957 |
| | | | | |
Commercial Information System - 1.1% | | | | | |
Internet Gold-Golden Lines Ltd.* | | 48,000 | | | 571,200 |
| | | | | |
Communication Technology - 3.7% | | | | | |
Ceragon Networks Ltd.* | | 94,500 | | | 934,605 |
Chyron Corp.* | | 20,300 | | | 110,635 |
Network Equipment Technologies, Inc. * | | 59,200 | | | 498,464 |
Telular Corp.* | | 50,275 | | | 344,384 |
| | | | | |
| | | | | 1,888,088 |
| | | | | |
Computer Services Software & Systems - 23.4% | | | | | |
Bitstream, Inc.* | | 41,300 | | | 264,320 |
ClickSoftware Technologies Ltd.* | | 203,600 | | | 822,544 |
Document Sciences Co.* | | 21,000 | | | 304,290 |
Double-Take Software, Inc.* | | 82,500 | | | 1,791,900 |
Ebix, Inc.* | | 8,800 | | | 636,680 |
Edgewater Technology, Inc.* | | 24,800 | | | 181,040 |
Global Med Technologies, Inc.* | | 68,300 | | | 73,764 |
GlobalScape, Inc.* | | 110,200 | | | 608,304 |
GSE Systems, Inc.* | | 62,800 | | | 643,072 |
Guidance Software Inc.* | | 23,000 | | | 320,620 |
Innodata Isogen, Inc.* | | 51,300 | | | 274,455 |
Kenexa Corp.* | | 63,532 | | | 1,233,792 |
NetSol Technologies, Inc.* | | 155,900 | | | 375,719 |
Sigma Designs, Inc.* | | 23,400 | | | 1,291,680 |
See accompanying notes to the financial statements.
18
OBERWEIS MICRO-CAP FUND
Schedule of Investments (continued)
December 31, 2007
| | | | | |
| | | Shares | | Value |
Silverstar Hldgs. Ltd.* | | 274,300 | | $ | 485,511 |
Simulations Plus, Inc.* | | 200,000 | | | 766,020 |
Unica Corp.* | | 10,700 | | | 98,975 |
Vasco Data Security International, Inc.* | | 48,008 | | | 1,340,383 |
Website Pros, Inc.* | | 34,900 | | | 405,189 |
| | | | | |
| | | | | 11,918,258 |
| | | | | |
Computer Technology - 2.7% | | | | | |
NCI, Inc.* | | 37,000 | | | 633,070 |
Silicom Ltd.* | | 51,600 | | | 720,852 |
| | | | | |
| | | | | 1,353,922 |
| | | | | |
Control & Filter Devices - 0.6% | | | | | |
K-Tron International, Inc.* | | 2,500 | | | 298,125 |
| | | | | |
Diversified Production - 2.6% | | | | | |
Astronics Corp.* | | 31,500 | | | 1,338,750 |
| | | | | |
Drugs & Pharmaceuticals - 0.8% | | | | | |
Questcor Pharmaceuticals, Inc.* | | 68,700 | | | 396,399 |
| | | | | |
Education Services - 1.1% | | | | | |
GP Strategies Corp.* | | 51,800 | | | 551,670 |
| | | | | |
Electronic Instruments - 1.1% | | | | | |
Perceptron, Inc.* | | 55,900 | | | 590,863 |
| | | | | |
Electronic Medical Systems - 3.4% | | | | | |
Somanetics Corp.* | | 41,722 | | | 986,725 |
Visicu, Inc.* | | 65,100 | | | 772,737 |
| | | | | |
| | | | | 1,759,462 |
| | | | | |
Electronics Semi-Conductors - 4.2% | | | | | |
Alliance Fiber Optic Products, Inc.* | | 57,300 | | | 114,600 |
AXT, Inc.* | | 149,700 | | | 928,140 |
Catalyst Semiconductor, Inc.* | | 97,600 | | | 453,840 |
NVE Corp.* | | 23,900 | | | 587,940 |
Simtek Corp.* | | 14,708 | | | 33,975 |
| | | | | |
| | | | | 2,118,495 |
| | | | | |
Engineering & Construction Services - 1.8% | | | | | |
Versar, Inc.* | | 49,100 | | | 318,168 |
VSE Corp | | 11,900 | | | 581,196 |
| | | | | |
| | | | | 899,364 |
| | | | | |
Equipment Misc. - 0.2% | | | | | |
MFRI, Inc.* | | 7,900 | | | 84,293 |
| | | | | |
See accompanying notes to the financial statements.
19
OBERWEIS MICRO-CAP FUND
Schedule of Investments (continued)
December 31, 2007
| | | | | |
| | | Shares | | Value |
Financial Data Product Services - 2.6% | | | | | |
Cybersource Corp.* | | 73,929 | | $ | 1,313,718 |
| | | | | |
Financial Information Services - 0.7% | | | | | |
TheStreet.com, Inc. | | 22,500 | | | 358,200 |
| | | | | |
Health Care Facilities - 1.2% | | | | | |
Almost Family, Inc.* | | 31,700 | | | 613,712 |
| | | | | |
Health Care Misc. - 0.3% | | | | | |
American Caresource Hldgs., Inc.* | | 50,100 | | | 160,320 |
| | | | | |
Machine Oilwell Equipment - 8.2% | | | | | |
Allis-Chalmers Energy, Inc.* | | 41,600 | | | 613,600 |
Bolt Technology Corp.* | | 25,200 | | | 957,096 |
Flotek Industries, Inc.* | | 35,000 | | | 1,261,400 |
T-3 Energy Services, Inc.* | | 28,900 | | | 1,358,589 |
| | | | | |
| | | | | 4,190,685 |
| | | | | |
Machinery - Construction - 0.1% | | | | | |
Paragon Technologies, Inc.* | | 9,900 | | | 67,815 |
| | | | | |
Machinery & Engineering - 0.4% | | | | | |
Peerless Mfg. Co.* | | 4,500 | | | 185,355 |
| | | | | |
Machine Tools - 0.9% | | | | | |
Hurco Companies, Inc.* | | 10,378 | | | 453,000 |
| | | | | |
Medical & Dental Instruments & Supply - 2.7% | | | | | |
Rochester Medical Corp.* | | 19,299 | | | 214,991 |
Span-America Medical Systems, Inc | | 2,900 | | | 32,799 |
Synovis Life Technologies, Inc.* | | 32,100 | | | 627,555 |
Transcend Services, Inc.* | | 31,000 | | | 503,750 |
| | | | | |
| | | | | 1,379,095 |
| | | | | |
Medical & Dental Services - 0.6% | | | | | |
Tutogen Medical, Inc.* | | 31,900 | | | 329,208 |
| | | | | |
Metal Fabricating - 3.1% | | | | | |
Dynamic Materials Corp | | 21,202 | | | 1,248,798 |
Graham Corp | | 6,300 | | | 330,120 |
| | | | | |
| | | | | 1,578,918 |
| | | | | |
Oil Crude Producer - 1.4% | | | | | |
Geokinetics, Inc.* | | 35,700 | | | 694,365 |
| | | | | |
Oil Integrated Domestic - 1.0% | | | | | |
GMX Resources, Inc.* | | 16,000 | | | 516,480 |
| | | | | |
See accompanying notes to the financial statements.
20
OBERWEIS MICRO-CAP FUND
Schedule of Investments (continued)
December 31, 2007
| | | | | |
| | | Shares | | Value |
Pollution & Environmental Service - 1.7% | | | | | |
Fuel - Tech N.V.* | | 38,600 | | $ | 874,290 |
| | | | | |
Retail - 0.5% | | | | | |
Appliance Recycling Centers of America, Inc.* | | 26,400 | | | 236,280 |
| | | | | |
Service Commercial - 7.9% | | | | | |
Bidz.com, Inc.* | | 72,300 | | | 648,531 |
CRM Hldgs. Ltd.* | | 93,800 | | | 735,392 |
ICF International, Inc.* | | 26,500 | | | 669,390 |
Inx, Inc.* | | 15,500 | | | 161,975 |
Perficient, Inc.* | | 80,618 | | | 1,268,927 |
Rainmaker Systems, Inc.* | | 88,134 | | | 569,346 |
| | | | | |
| | | | | 4,053,561 |
| | | | | |
Technology Misc. - 2.8% | | | | | |
Vocus, Inc.* | | 41,700 | | | 1,439,901 |
| | | | | |
Telecommunications - 0.9% | | | | | |
Numerex Corp.* | | 27,700 | | | 228,525 |
Vicon Industries, Inc.* | | 25,700 | | | 246,720 |
| | | | | |
| | | | | 475,245 |
| | | | | |
Tires & Rubber - 0.4% | | | | | |
Female Health Co.* | | 88,700 | | | 226,185 |
| | | | | |
Utilities Telecommunication - 1.9% | | | | | |
Commtouch Software Ltd.* | | 264,200 | | | 533,684 |
RRSAT Global Communication Network Ltd.* | | 22,500 | | | 443,025 |
| | | | | |
| | | | | 976,709 |
| | | | | |
Wholesalers - 0.1% | | | | | |
Clean Diesel Technologies, Inc.* | | 1,700 | | | 38,981 |
| | | | | |
Total Equities
(Cost: $ 39,313,748) | | | | $ | 50,424,924 |
| | | | | |
| | |
| | | Face Amount | | Value |
Commercial Paper - 1.7% | | | | | |
HSBC Financial Corp | | 900,000 | | | |
4.45%, due 01/03/2008 | | | | $ | 900,000 |
| | | | | |
Total Commercial Paper -
(Cost: $ 900,000) | | | | $ | 900,000 |
| | | | | |
See accompanying notes to the financial statements.
21
OBERWEIS MICRO-CAP FUND
Schedule of Investments (continued)
December 31, 2007
| | | | | | |
| | | Units | | Value | |
Warrants - 0.5% | | | | | | |
Internet Software & Systems | | | | | | |
Think Partnership, Inc. ($2.50, expires 04/03/11)† | | 260,000 | | $ | 180,529 | |
Think Partnership, Inc. ($3.05, expires 12/05/11)† | | 81,873 | | | 58,802 | |
Think Partnership, Inc. ($4.00, expires 12/05/11)† | | 40,937 | | | 25,952 | |
| | | | | | |
Total Warrants
(Cost: $0) | | | | $ | 265,283 | |
| | | | | | |
Total Investments - 101.1%
(Cost: $40,213,748) | | | | $ | 51,590,207 | |
Other Liabilities less Assets - (1.1%) | | | | | (586,103 | ) |
| | | | | | |
Net Assets - 100% | | | | $ | 51,004,104 | |
| | | | | | |
Based on the cost of investments of $40,272,832 for federal income tax purposes at December 31, 2007, the aggregate gross unrealized appreciation was $14,510,512 the aggregate gross unrealized depreciation was $3,193,137 and the net unrealized appreciation of investments was $11,317,375.
| * | Non-Income producing security during the year ended December 31, 2007. |
See accompanying notes to the financial statements.
22
OBERWEIS MID-CAP FUND
Schedule of Investments
December 31, 2007
| | | | | |
| | | Shares | | Value |
EQUITIES - 99.0% | | | | | |
Advertising Agency - 1.9% | | | | | |
Focus Media Hldg. Ltd. ADR * | | 3,800 | | $ | 215,878 |
| | | | | |
Auto Trucks & Parts - 0.8% | | | | | |
Spartan Motors, Inc | | 12,100 | | | 92,444 |
| | | | | |
Beverage - Brewers Wine - 0.9% | | | | | |
Vina Concha y Toro S.A. ADR | | 2,400 | | | 101,952 |
| | | | | |
Biotech Research & Production - 8.4% | | | | | |
Cubist Pharmaceuticals, Inc.* | | 14,200 | | | 291,242 |
Icon Plc. ADR * | | 3,600 | | | 222,696 |
Omrix Biopharmaceutical, Inc.* | | 12,900 | | | 448,146 |
| | | | | |
| | | | | 962,084 |
| | | | | |
Building Materials - 1.9% | | | | | |
Zoltek Companies Inc.* | | 5,100 | | | 218,637 |
| | | | | |
Business & Consumers Discretionary Misc. - 0.4% | | | | | |
Ulta Salon, Cosmetics, and Fragrance, Inc.* | | 2,500 | | | 42,875 |
| | | | | |
Commercial Information Service - 1.7% | | | | | |
Baidu.com, Inc. ADR * | | 500 | | | 194,900 |
| | | | | |
Communication Technology - 4.0% | | | | | |
Aruba Networks, Inc.* | | 1,800 | | | 26,838 |
Atheros Communications, Inc.* | | 3,800 | | | 116,052 |
Ciena Corp.* | | 3,600 | | | 122,796 |
Netgear, Inc.* | | 5,200 | | | 185,484 |
| | | | | |
| | | | | 451,170 |
| | | | | |
Computer Services Software & Systems - 16.7% | | | | | |
Chordiant Software, Inc.* | | 13,100 | | | 112,005 |
Commvault Systems, Inc.* | | 9,400 | | | 199,092 |
Dealertrack Hldgs., Inc.* | | 6,000 | | | 200,820 |
Kenxa Corp.* | | 5,200 | | | 100,984 |
Nuance Communications, Inc.* | | 19,900 | | | 371,732 |
Omniture, Inc.* | | 8,000 | | | 266,320 |
Sapient Corp.* | | 17,500 | | | 154,175 |
Synchronoss Technologies, Inc.* | | 6,800 | | | 240,992 |
Vasco Data Security International, Inc.* | | 9,800 | | | 273,616 |
| | | | | |
| | | | | 1,919,736 |
| | | | | |
Computer Technology - 2.8% | | | | | |
Riverbed Technology, Inc.* | | 2,500 | | | 66,850 |
Synaptics, Inc.* | | 6,200 | | | 255,192 |
| | | | | |
| | | | | 322,042 |
| | | | | |
See accompanying notes to the financial statements.
23
OBERWEIS MID-CAP FUND
Schedule of Investments (continued)
December 31, 2007
| | | | | |
| | | Shares | | Value |
Diverse Financial Services - 2.8% | | | | | |
Euronet Worldwide, Inc.* | | 5,600 | | $ | 168,000 |
NASDAQ Stock Market, Inc.* | | 3,200 | | | 158,368 |
| | | | | |
| | | | | 326,368 |
| | | | | |
Drugs & Pharmaceuticals - 2.8% | | | | | |
Adams Respiratory Therapeutics, Inc.* | | 900 | | | 53,766 |
Sciele Pharmaceutical, Inc.* | | 7,000 | | | 143,150 |
United Therapeutics Corp.* | | 1,300 | | | 126,945 |
| | | | | |
| | | | | 323,861 |
| | | | | |
Electronic Medical Systems - 13.9% | | | | | |
Accuray, Inc.* | | 13,700 | | | 208,514 |
Hologic, Inc.* | | 5,300 | | | 363,792 |
Illumina, Inc.* | | 8,700 | | | 515,562 |
Intuitive Surgical, Inc.* | | 1,591 | | | 513,893 |
| | | | | |
| | | | | 1,601,761 |
| | | | | |
Electronics - 3.7% | | | | | |
FLIR Systems, Inc.* | | 13,400 | | | 419,420 |
| | | | | |
Electronics Semi-Conductors - 3.2% | | | | | |
SunTech Power Hldgs. Co. Ltd. ADR * | | 2,200 | | | 181,104 |
Tessera Technologies, Inc.* | | 4,400 | | | 183,040 |
| | | | | |
| | | | | 364,144 |
| | | | | |
Forms & Bulk Print - 1.6% | | | | | |
InnerWorkings, Inc.* | | 10,800 | | | 186,408 |
| | | | | |
Health Care Management Services - 4.7% | | | | | |
Allscripts Healthcare Solutions, Inc.* | | 6,400 | | | 124,288 |
Amerigroup Corp.* | | 5,000 | | | 182,250 |
HealthExtras, Inc.* | | 4,100 | | | 106,928 |
Phase Forward, Inc.* | | 5,900 | | | 128,325 |
| | | | | |
| | | | | 541,791 |
| | | | | |
Leisure Time - 1.4% | | | | | |
Life Time Fitness, Inc.* | | 3,200 | | | 158,976 |
| | | | | |
Machine Oilwell - 6.9% | | | | | |
Flotek Industries, Inc.* | | 7,100 | | | 255,884 |
Oceaneering International, Inc.* | | 4,000 | | | 269,400 |
W-H Energy Services, Inc.* | | 2,800 | | | 157,388 |
Willbros Group, Inc.* | | 3,000 | | | 114,870 |
| | | | | |
| | | | | 797,542 |
| | | | | |
See accompanying notes to the financial statements.
24
OBERWEIS MID-CAP FUND
Schedule of Investments (continued)
December 31, 2007
| | | | | |
| | | Shares | | Value |
Oil Crude Producer - 2.9% | | | | | |
ATP Oil & Gas Corp.* | | 3,500 | | $ | 176,890 |
Gulfport Energy Corp.* | | 8,500 | | | 155,210 |
| | | | | |
| | | | | 332,100 |
| | | | | |
Producer Durables Misc. - 2.9% | | | | | |
BE Aerospace, Inc.* | | 6,200 | | | 327,980 |
| | | | | |
Restaurants - 2.4% | | | | | |
Chipotle Mexican Grill, Inc.* | | 1,900 | | | 279,433 |
| | | | | |
Retail - 4.5% | | | | | |
Gamestop Corp.* | | 3,000 | | | 186,330 |
Priceline.com, Inc.* | | 1,800 | | | 206,748 |
Zumiez, Inc.* | | 5,200 | | | 126,672 |
| | | | | |
| | | | | 519,750 |
| | | | | |
Textile - Apparel Manufacturer - 3.6% | | | | | |
Guess?, Inc* | | 6,300 | | | 238,707 |
Under Armour, Inc.* | | 4,000 | | | 174,680 |
| | | | | |
| | | | | 413,387 |
| | | | | |
Wholesale and International Trade - 2.2% | | | | | |
Central European Distribution Corp.* | | 4,352 | | | 252,764 |
| | | | | |
Total Equities
(Cost: $9,491,852) | | | | $ | 11,367,403 |
| | | | | |
Total Investments - 99.0%
(Cost: $9,491,852) | | | | $ | 11,367,403 |
Other Assets less Liabilities - 1.0% | | | | | 116,414 |
| | | | | |
Net Assets - 100% | | | | $ | 11,483,817 |
| | | | | |
Based on the cost of investments of $9,551,254 for federal income tax purposes at December 31, 2007, the aggregate gross unrealized appreciation was $2,504,703 the aggregate gross unrealized depreciation was $688,554 and the net unrealized appreciation of investments was $1,816,149.
| * | Non-Income producing security during the year ended December 31, 2007. |
ADR American Depositary Receipt
See accompanying notes to the financial statements.
25
OBERWEIS CHINA OPPORTUNITIES FUND
Schedule of Investments
December 31, 2007
| | | | | |
| | | Shares | | Value |
EQUITIES - 98.8% | | | | | |
Auto Components - 3.1% | | | | | |
Minth Group Ltd.† | | 7,949,100 | | $ | 11,663,791 |
Xinyi Glass Hldg. Co. Ltd.† | | 10,866,900 | | | 10,433,333 |
Zhejiang Glass Co.†* | | 7,705,400 | | | 7,157,443 |
| | | | | |
| | | | | 29,254,567 |
| | | | | |
Chemicals - 0.7% | | | | | |
Jiutian Chemical Group Ltd† | | 20,909,600 | | | 6,795,311 |
| | | | | |
Commercial Service & Supply - 0.3% | | | | | |
Asia Environment Hldgs. Ltd.† | | 5,341,900 | | | 3,039,738 |
| | | | | |
Communications Equipment - 0.9% | | | | | |
China Auto Electronics Group†* | | 8,336,600 | | | 3,433,212 |
Comtech Group, Inc.* | | 292,800 | | | 4,717,008 |
| | | | | |
| | | | | 8,150,220 |
| | | | | |
Computers & Peripherals - 0.8% | | | | | |
China Digital TV Hldg. ADR* | | 268,600 | | | 7,246,828 |
| | | | | |
Construction & Engineering - 1.0% | | | | | |
China Communications Construction Co.† | | 3,497,800 | | | 9,042,764 |
| | | | | |
Construction Materials - 3.0% | | | | | |
China National Building Material Co. Ltd.† | | 6,859,700 | | | 25,987,226 |
China National Materials Co.* | | 1,527,600 | | | 1,861,159 |
| | | | | |
| | | | | 27,848,385 |
| | | | | |
Containers & Packaging - 0.7% | | | | | |
AMVIG Hldgs. Ltd.† | | 5,020,200 | | | 7,019,807 |
| | | | | |
Distributors - 2.4% | | | | | |
Huabao International Hldgs. Ltd.† | | 12,573,000 | | | 12,449,486 |
Li & Fung Ltd.† | | 2,528,800 | | | 10,081,601 |
| | | | | |
| | | | | 22,531,087 |
| | | | | |
Diversified Consumer Services - 4.1% | | | | | |
Hartford Education Corp | | 2,567,050 | | | 312,087 |
New Oriental Education & Technology Group, Inc ADR* | | 205,700 | | | 16,577,363 |
Raffles Education Corp. Ltd.† | | 10,444,900 | | | 21,917,274 |
| | | | | |
| | | | | 38,806,724 |
| | | | | |
Diversified Financial Services - 1.6% | | | | | |
Hong Kong Exchanges & Clearing† | | 541,700 | | | 15,185,899 |
| | | | | |
See accompanying notes to the financial statements.
26
OBERWEIS CHINA OPPORTUNITIES FUND
Schedule of Investments (continued)
December 31, 2007
| | | | | |
| | | Shares | | Value |
Electrical Equipment - 6.7% | | | | | |
China High Speed Transmission†* | | 6,115,700 | | $ | 16,034,595 |
Dongfang Electrical Machinery Ltd.† | | 1,518,100 | | | 12,686,397 |
Neo-Neon Hldgs. Ltd.†* | | 3,858,500 | | | 3,809,807 |
Suntech Power Hldgs. Co., Ltd ADR * | | 376,300 | | | 30,977,016 |
| | | | | |
| | | | | 63,507,815 |
| | | | | |
Electronic Equipment & Instruments - 1.3% | | | | | |
Kingboard Chemicals Hldgs. Ltd.† | | 2,085,600 | | | 12,321,126 |
| | | | | |
Energy Equipment & Services - 4.9% | | | | | |
China Oilfield Services Ltd.† | | 7,533,100 | | | 16,823,640 |
Emer International Group Ltd.†* | | 6,611,800 | | | 4,531,356 |
Ezra Hldgs. Ltd.† | | 9,890,800 | | | 22,584,377 |
Shandong Molong Petroleum Co., Ltd.† | | 13,581,500 | | | 2,629,593 |
| | | | | |
| | | | | 46,568,966 |
| | | | | |
Food Products - 2.0% | | | | | |
China Mengniu Dairy Co.† | | 3,581,900 | | | 12,995,378 |
Synear Food Hldgs. Ltd.† | | 5,429,200 | | | 6,276,894 |
| | | | | |
| | | | | 19,272,272 |
| | | | | |
Food & Staples Retailing - 0.4% | | | | | |
Olam International Ltd.† | | 2,162,000 | | | 4,252,807 |
| | | | | |
Gas Utilities - 1.2% | | | | | |
China Gas Hldgs. Ltd.† | | 7,744,500 | | | 3,328,862 |
Xinao Gas Hldgs. Ltd.† | | 4,185,400 | | | 8,275,363 |
| | | | | |
| | | | | 11,604,225 |
| | | | | |
Health Care Equipment Supplies - 3.1% | | | | | |
Mindray Medical International Ltd. ADR* | | 345,300 | | | 14,837,541 |
Shandong Weigao Group† | | 6,141,600 | | | 14,065,488 |
| | | | | |
| | | | | 28,903,029 |
| | | | | |
Hotels Restaurants & Leisure - 5.5% | | | | | |
Ajisen China Hldgs. Ltd.†* | | 3,716,900 | | | 6,590,497 |
Banyan Tree Hldgs. Ltd.† | | 3,876,600 | | | 5,477,251 |
Ctrip.com International Ltd. ADR* | | 316,300 | | | 18,177,761 |
Fu Ji Food & Catering Services Hldgs. Ltd.† | | 3,581,600 | | | 8,193,759 |
Home Inns & Hotels Mgmt. Inc. ADR * | | 369,800 | | | 13,179,672 |
| | | | | |
| | | | | 51,618,940 |
| | | | | |
Household Durables - 0.4% | | | | | |
China Water Affairs Group.†* | | 5,682,000 | | | 3,448,594 |
| | | | | |
See accompanying notes to the financial statements.
27
OBERWEIS CHINA OPPORTUNITIES FUND
Schedule of Investments (continued)
December 31, 2007
| | | | | |
| | | Shares | | Value |
Industrial Power Production/Energy Trade - 2.0% | | | | | |
China Resources Power Hldgs.Co.† | | 5,686,900 | | $ | 19,332,426 |
| | | | | |
Internet Software & Services - 7.5% | | | | | |
Alibaba.com Ltd.* | | 2,124,900 | | | 7,535,010 |
Baidu.com, Inc. ADR * | | 71,300 | | | 27,792,740 |
Sohu.com, Inc.* | | 335,700 | | | 18,302,364 |
Tencent Hldgs. Ltd.† | | 2,237,000 | | | 16,707,843 |
| | | | | |
| | | | | 70,337,957 |
| | | | | |
Leisure Equipment & Products - 2.2% | | | | | |
Li Ning Co. Ltd.† | | 5,589,100 | | | 20,580,194 |
| | | | | |
Life Sciences Tools & Services - 0.7% | | | | | |
Wuxi Pharmatech, Inc. ADR * | | 230,100 | | | 6,728,124 |
| | | | | |
Machinery - 4.5% | | | | | |
China Infrastructure Machinery Hldg.† | | 7,270,300 | | | 11,385,729 |
Enric Energy Equipment†* | | 3,215,300 | | | 3,715,322 |
Eva Precision Industrial Hldg.† | | 9,946,500 | | | 3,771,236 |
Guangzhou Shipyard International Co.†* | | 1,988,500 | | | 11,026,593 |
Yangzijiang Ship Building†* | | 9,062,200 | | | 12,405,478 |
| | | | | |
| | | | | 42,304,358 |
| | | | | |
Marine - 1.0% | | | | | |
China Shipping Development† | | 3,845,300 | | | 9,985,037 |
| | | | | |
Media - 4.8% | | | | | |
Air Media Group, Inc. ADR.* | | 560,400 | | | 12,541,752 |
Focus Media Hldgs. Ltd ADR.* | | 464,000 | | | 26,359,840 |
VisionChina Media, Inc. ADR.* | | 708,940 | | | 6,025,990 |
| | | | | |
| | | | | 44,927,582 |
| | | | | |
Metals & Mining - 1.8% | | | | | |
China Molybdenum Co.†* | | 4,269,100 | | | 7,684,150 |
Zijin Mining Group Co., Ltd.† | | 6,036,975 | | | 9,143,028 |
| | | | | |
| | | | | 16,827,178 |
| | | | | |
Multiline Retail - 4.1% | | | | | |
Golden Eagle Retail Group Ltd.† | | 6,861,464 | | | 7,106,447 |
Lifestyle, International Hldgs. Ltd.† | | 4,634,700 | | | 12,397,380 |
Parkson Retail Group Ltd.† | | 1,619,700 | | | 19,328,945 |
| | | | | |
| | | | | 38,832,772 |
| | | | | |
See accompanying notes to the financial statements.
28
OBERWEIS CHINA OPPORTUNITIES FUND
Schedule of Investments (continued)
December 31, 2007
| | | | | |
| | | Shares | | Value |
Paper & Forest Products - 6.6% | | | | | |
China Grand Forestry†* | | 64,177,200 | | $ | 13,409,277 |
Lee Man Paper Manufacturing Ltd.† | | 6,872,900 | | | 29,963,231 |
Nine Dragons Paper Hldgs. Ltd.† | | 7,705,000 | | | 19,257,954 |
| | | | | |
| | | | | 62,630,462 |
| | | | | |
Personal Products - 2.6% | | | | | |
China Flavors & Fragrances† | | 9,469,348 | | | 3,784,266 |
Ecogreen Fine Chemicals Group† | | 2,707,200 | | | 1,172,400 |
Hengan International Groups Co., Ltd.† | | 4,327,500 | | | 19,234,604 |
| | | | | |
| | | | | 24,191,270 |
| | | | | |
Real Estate Management & Development - 3.9% | | | | | |
E House China Hldgs. ADS | | 420,900 | | | 10,030,047 |
Guangzhou R&F Properties Co., Ltd.† | | 3,062,600 | | | 10,741,684 |
Hopson Develpment Hldgs. Ltd.† | | 1,572,200 | | | 4,287,992 |
Sino-Ocean Land Hldgs.* | | 2,258,500 | | | 2,797,998 |
Yanlord Land Group Ltd.† | | 3,863,300 | | | 8,827,793 |
| | | | | |
| | | | | 36,685,514 |
| | | | | |
Software - 1.0% | | | | | |
Longtop Financial Technologies Ltd. ADR * | | 330,525 | | | 7,826,832 |
VanceInfo Technologies, Inc. ADR * | | 218,130 | | | 1,963,170 |
| | | | | |
| | | | | 9,790,002 |
| | | | | |
Specialty Retail - 1.2% | | | | | |
Belle International Hldgs.† | | 7,533,700 | | | 11,270,695 |
| | | | | |
Semiconductors & Semi Equipment - 0.5% | | | | | |
Trina Solar Ltd. ADR * | | 95,200 | | | 5,121,760 |
| | | | | |
Textile, Apparel & Luxury Goods - 7.0% | | | | | |
Anta Sports Products Co. Ltd.†* | | 10,120,700 | | | 13,922,809 |
China Hongxing Sports Ltd.† | | 14,964,300 | | | 9,819,916 |
China Sky Chemical Fibre Co.† | | 9,766,300 | | | 14,861,304 |
Peace Mark Hldgs. Ltd.† | | 9,182,400 | | | 14,584,158 |
Ports Design Ltd.† | | 3,653,195 | | | 12,529,483 |
| | | | | |
| | | | | 65,717,670 |
| | | | | |
Trading Co. & Distribution - 1.4% | | | | | |
KS Energy Services Ltd.† | | 5,918,200 | | | 13,097,376 |
| | | | | |
Transport Infrastructure - 1.2% | | | | | |
Hong Kong Aircraft Engineering† | | 412,600 | | | 11,136,422 |
| | | | | |
See accompanying notes to the financial statements.
29
OBERWEIS CHINA OPPORTUNITIES FUND
Schedule of Investments (continued)
December 31, 2007
| | | | | | |
| | | Shares | | Value | |
Water Utilities - 0.7% | | | | | | |
Epure International Ltd†* | | 4,839,500 | | $ | 7,004,827 | |
| | | | | | |
Total Equities (Cost: $596,075,047) | | | | $ | 932,920,730 | |
| | | | | | |
| | |
| | | Face
Amount | | Value | |
Commercial Paper - 1.7% | | | | | | |
Toyota Motor Credit | | 16,000,000 | | | | |
4.18%, due 01/03/2008 | | | | $ | 16,000,000 | |
| | | | | | |
Total Commercial Paper
(Cost: $16,000,000) | | | | $ | 16,000,000 | |
| | | | | | |
| | |
| | | Units | | Value | |
Warrants - 0.1% | | | | | | |
Chemicals | | | | | | |
Jiutian Chemical Group Ltd. ($0.80, expires 10/15/10) | | 4,587,700 | | $ | 478,068 | |
| | | | | | |
Total Warrants
(Cost: $0) | | | | $ | 478,068 | |
| | | | | | |
Total Investments - 100.6%
(Cost: $612,075,047) | | | | $ | 949,398,798 | |
Other Liabilities less Assets - (0.6%) | | | | | (5,574,024 | ) |
| | | | | | |
Net Assets - 100% | | | | $ | 943,824,774 | |
| | | | | | |
Based on the cost of investments of $615,633,764 for federal income tax purposes at December 31, 2007, the aggregate gross unrealized appreciation was $349,713,335, the aggregate gross unrealized depreciation was $15,948,301 and the net unrealized appreciation of investments was $333,765,034.
| * | Non-Income producing security during the year ended December 31, 2007. |
| | | |
ADR American Depositary Receipt | | | |
COUNTRY ALLOCATION (as a percentage of Net Assets) | | | |
China (Includes the People’s Republic of China and Hong Kong) | | 87.0 | % |
Taiwan | | 0.4 | % |
Singapore | | 11.4 | % |
See accompanying notes to the financial statements.
30
OBERWEIS INTERNATIONAL OPPORTUNITES FUND
Schedule of Investments
December 31, 2007
| | | | | |
| | | Shares | | Value |
EQUITIES - 92.2% | | | | | |
Australia - 8.8% | | | | | |
Ausenco Ltd. | | 100,000 | | $ | 1,336,389 |
Computershare Ltd. | | 105,000 | | | 910,887 |
JB HI-FI Ltd. | | 160,000 | | | 2,191,608 |
Leighton Hldgs. Ltd. | | 44,000 | | | 2,364,407 |
Monadelphous Group Ltd. | | 108,000 | | | 1,307,694 |
Tassal Group Ltd. | | 490,883 | | | 1,810,279 |
| | | | | |
| | | | | 9,921,264 |
| | | | | |
Austria - 2.4% | | | | | |
Schoeller-Bleckmann Oilfield† | | 30,000 | | | 2,691,188 |
| | | | | |
Canada - 2.0% | | | | | |
Absolute Software Corp.* | | 60,000 | | | 2,229,900 |
| | | | | |
Denmark - 3.5% | | | | | |
Flsmidth & Co. AS† | | 39,000 | | | 3,976,874 |
| | | | | |
Finland - 4.2% | | | | | |
Elisa Corp.† | | 21,000 | | | 642,220 |
Konecranes OYJ† | | 26,000 | | | 885,673 |
Outokumpu Technology† | | 28,000 | | | 1,518,141 |
Poyry OYJ† | | 64,000 | | | 1,622,237 |
| | | | | |
| | | | | 4,668,271 |
| | | | | |
France - 1.8% | | | | | |
Seloger.com * | | 35,000 | | | 2,057,108 |
| | | | | |
Germany - 6.6% | | | | | |
Aixtron AG†* | | 200,000 | | | 2,779,157 |
Roth & Rau AG†* | | 9,200 | | | 3,428,291 |
SGL Carbon AG†* | | 23,000 | | | 1,244,526 |
| | | | | |
| | | | | 7,451,974 |
| | | | | |
Greece - 6.4% | | | | | |
Hellenic Exchanges | | 90,000 | | | 3,158,033 |
Jumbo S.A | | 49,000 | | | 1,776,686 |
Sprider Stores S.A | | 300,000 | | | 2,280,802 |
| | | | | |
| | | | | 7,215,521 |
| | | | | |
HongKong - 3.9% | | | | | |
Pacific Basin Shipping Ltd. | | 100,000 | | | 161,336 |
Shandong Weigao Group Medical | | 671,900 | | | 1,551,055 |
Weichai Power Co. Ltd. | | 190,000 | | | 1,386,488 |
Xinyi Glass Hldg. Co. Ltd. | | 1,377,400 | | | 1,338,997 |
| | | | | |
| | | | | 4,437,876 |
| | | | | |
See accompanying notes to the financial statements.
31
OBERWEIS INTERNATIONAL OPPORTUNITIES FUND
Schedule of Investments (continued)
December 31, 2007
| | | | | |
| | | Shares | | Value |
Italy - 2.1% | | | | | |
Ducati Motor Hldg.†* | | 1,100,000 | | $ | 2,313,800 |
| | | | | |
Japan - 5.1% | | | | | |
Hitachi Construction Machinery† | | 25,000 | | | 742,124 |
NGK Insulators Ltd.† | | 62,000 | | | 1,662,301 |
O-M Ltd.† | | 120,000 | | | 1,015,103 |
Shima Seiki Mfg. Ltd.† | | 38,000 | | | 1,742,729 |
Works Applications Co. Ltd.† | | 500 | | | 544,012 |
| | | | | |
| | | | | 5,706,269 |
| | | | | |
Netherlands - 4.3% | | | | | |
Boskalis Westminster | | 49,000 | | | 2,984,546 |
Smit International NV | | 18,000 | | | 1,842,186 |
| | | | | |
| | | | | 4,826,732 |
| | | | | |
Norway - 2.8% | | | | | |
Odim ASA†* | | 150,000 | | | 2,325,573 |
Tandberg ASA† | | 40,900 | | | 844,486 |
| | | | | |
| | | | | 3,170,059 |
| | | | | |
Russia- 0.5% | | | | | |
Wimm-Bill-Dann Foods OJSC ADR | | 4,500 | | | 589,680 |
| | | | | |
Singpore- 2.0% | | | | | |
China Hongxing Sports Ltd. | | 1,300,000 | | | 866,998 |
Tat Hong Hldgs. Ltd. | | 600,000 | | | 1,425,544 |
| | | | | |
| | | | | 2,292,542 |
| | | | | |
South Korea - 2.4% | | | | | |
Hyundai Mipo Dockyard† | | 3,500 | | | 1,062,457 |
Korea Line Corp.† | | 1,500 | | | 260,858 |
Taewoong Co. Ltd.† | | 15,000 | | | 1,415,680 |
| | | | | |
| | | | | 2,738,995 |
| | | | | |
Spain- 1.2% | | | | | |
Grifols SA† | | 54,000 | | | 1,212,179 |
| | | | | |
Sweden - 5.5% | | | | | |
Axis Communications AB† | | 77,100 | | | 1,886,481 |
Betsson AB† | | 160,000 | | | 2,020,842 |
Hagstromer & Qviberg AB† | | 58,000 | | | 1,558,445 |
Odd Molly International AB†* | | 25,000 | | | 678,811 |
| | | | | |
| | | | | 6,144,579 |
| | | | | |
See accompanying notes to the financial statements.
32
OBERWEIS INTERNATIONAL OPPORTUNITIES FUND
Schedule of Investments (continued)
December 31, 2007
| | | | | |
| | | Shares | | Value |
Switzerland - 6.4% | | | | | |
Burckhardt Compression Hldg.† | | 7,000 | | $ | 2,271,281 |
Meyer Burger Technology AG†* | | 8,200 | | | 3,018,767 |
Swissquote Group Hldgs† | | 35,000 | | | 1,944,564 |
| | | | | |
| | | | | 7,234,612 |
| | | | | |
United Kingdom - 20.3% | | | | | |
Aggreko | | 135,000 | | | 1,432,339 |
Aquarius Platinum | | 120,000 | | | 1,373,517 |
Aveva Group | | 100,000 | | | 1,921,929 |
Game Group | | 870,000 | | | 4,329,564 |
Lamprell PLC | | 200,000 | | | 1,711,920 |
MoneySupermarket.com * | | 30,000 | | | 83,605 |
Senior PLC | | 500,000 | | | 1,171,968 |
Severfield-Rowen | | 20,000 | | | 183,136 |
Tradus PLC * | | 69,679 | | | 2,486,951 |
Weir Group | | 125,000 | | | 2,014,243 |
Wellstream Hldgs. PLC * | | 190,000 | | | 4,096,067 |
Wood Group (John) PLC | | 240,000 | | | 2,068,636 |
| | | | | |
| | | | | 22,873,875 |
| | | | | |
Total Equities
(Cost: $81,958,559) | | | | $ | 103,753,298 |
| | | | | |
| | |
| | | Face Amount | | Value |
Commercial Paper - 5.7% | | | | | |
HSBC Financial Corp | | 1,900,000 | | | |
4.45%, due 01/03/2008 | | | | $ | 1,900,000 |
Toyota Motor Credit | | 4,500,000 | | | |
3.50%, due 01/03/2008 | | | | | 4,500,000 |
| | | | | |
Total Commercial Paper
(Cost: $6,400,000) | | | | $ | 6,400,000 |
| | | | | |
Total Investments - 97.9%
(Cost: $88,358,559) | | | | $ | 110,153,298 |
Other Assets less Liabilities - 2.1% | | | | | 2,316,674 |
| | | | | |
Net Assets - 100% | | | | $ | 112,469,972 |
| | | | | |
Based on the cost of investments of $89,040,277 for federal income tax purposes at December 31, 2007, the aggregate gross unrealized appreciation was $21,969,299 the aggregate gross unrealized depreciation was $856,278 and the net unrealized appreciation of investments was $21,113,021.
| * | Non-Income producing security during the year ended December 31, 2007. |
ADR American Depositary Receipt
See accompanying notes to the financial statements.
33
THE OBERWEIS FUNDS
Statement of Assets and Liabilities
December 31, 2007
| | | | | | | | | |
| | | Emerging
Growth Fund | | Micro-Cap
Fund | | Mid-Cap
Fund |
Assets: | | | | | | | | | |
Investment securities at value | | $ | 217,874,074 | | $ | 51,590,207 | | $ | 11,367,403 |
(Cost: $176,022,792, $40,213,748 and $9,491,852 respectively) | | | | | | | | | |
Cash | | | 249,817 | | | — | | | 95,899 |
Receivable from fund shares sold | | | 594,306 | | | 58,770 | | | 18,853 |
Receivable from securities sold | | | 2,396,014 | | | 43,908 | | | 15,414 |
Dividends and interest receivable | | | 3,792 | | | 875 | | | 661 |
Prepaid expenses | | | 14,131 | | | 12,602 | | | 5,842 |
| | | | | | | | | |
Total Assets | | | 221,132,134 | | | 51,706,362 | | | 11,504,072 |
| | | | | | | | | |
Liabilities: | | | | | | | | | |
Payable to custodian bank | | | — | | | 458,506 | | | — |
Payable for fund shares redeemed | | | 278,908 | | | 26,088 | | | 639 |
Payable for securities purchased | | | 1,266,018 | | | 138,480 | | | — |
Payable to advisor (see note 2) | | | 153,028 | | | 43,731 | | | 7,852 |
Payable to distributor | | | 47,158 | | | 10,933 | | | 2,454 |
Accrued expenses | | | 63,752 | | | 24,520 | | | 9,310 |
| | | | | | | | | |
Total Liabilities | | | 1,808,864 | | | 702,258 | | | 20,255 |
| | | | | | | | | |
Net Assets | | $ | 219,323,270 | | $ | 51,004,104 | | $ | 11,483,817 |
| | | | | | | | | |
Analysis of net assets: | | | | | | | | | |
Capital | | $ | 174,951,860 | | $ | 38,681,014 | | $ | 9,018,395 |
Undistributed net realized gains (losses) on investment and foreign currency transactions | | | 2,520,128 | | | 946,631 | | | 589,871 |
Net unrealized appreciation of investments and translation of assets and liabilities denominated in foreign currencies | | | 41,851,282 | | | 11,376,459 | | | 1,875,551 |
| | | | | | | | | |
Net Assets | | $ | 219,323,270 | | $ | 51,004,104 | | $ | 11,483,817 |
| | | | | | | | | |
The Pricing of Shares: | | | | | | | | | |
Net asset value and offering price per share | | | | | | | | | |
Emerging Growth Fund: | | | | | | | | | |
($219,323,270 divided by 8,501,501 shares outstanding) | | $ | 25.80 | | | | | | |
| | | | | | | | | |
Micro-Cap Fund: | | | | | | | | | |
($51,004,104 divided by 3,278,648 shares outstanding) | | | | | $ | 15.56 | | | |
| | | | | | | | | |
Mid-Cap Fund: | | | | | | | | | |
($11,483,817 divided by 738,419 shares outstanding) | | | | | | | | $ | 15.55 |
| | | | | | | | | |
See accompanying notes to the financial statements.
34
THE OBERWEIS FUNDS
Statement of Assets and Liabilities
December 31, 2007
| | | | | | | |
| | | China
Opportunities
Fund | | International
Opportunities
Fund | |
Assets: | | | | | | | |
Investment securities at value | | $ | 949,398,798 | | $ | 110,153,298 | |
(Cost: $612,075,047 and $88,358,559 respectively) | | | | | | | |
Cash | | | — | | | 570,348 | |
Receivable from fund shares sold | | | 1,334,077 | | | 241,776 | |
Receivable from securities sold | | | 6,596,445 | | | 6,487,783 | |
Receivable from foreign tax reclaims | | | — | | | 14,897 | |
Dividends and interest receivable | | | 304,189 | | | 24,539 | |
Prepaid expenses | | | 103,023 | | | 36,892 | |
| | | | | | | |
Total Assets | | | 957,736,532 | | | 117,529,533 | |
| | | | | | | |
Liabilities: | | | | | | | |
Payable to custodian bank | | | 5,294,457 | | | — | |
Payable for fund shares redeemed | | | 4,482,498 | | | 116,891 | |
Payable for securities purchased | | | 2,586,313 | | | 4,739,470 | |
Payable to advisor (see note 2) | | | 1,034,535 | | | 129,151 | |
Payable to distributor | | | 206,907 | | | 24,490 | |
Accrued expenses | | | 307,048 | | | 49,559 | |
| | | | | | | |
Total Liabilities | | | 13,911,758 | | | 5,059,561 | |
| | | | | | | |
Net Assets | | $ | 943,824,774 | | $ | 112,469,972 | |
| | | | | | | |
Analysis of net assets: | | | | | | | |
Capital | | $ | 577,026,147 | | $ | 91,453,067 | |
Undistributed net realized gains (losses) on investment and foreign currency transactions | | | 29,473,720 | | | (778,245 | ) |
Net unrealized appreciation of investments and translation of assets and liabilities denominated in foreign currencies | | | 337,324,907 | | | 21,795,150 | |
| | | | | | | |
Net Assets | | $ | 943,824,774 | | $ | 112,469,972 | |
| | | | | | | |
The Pricing of Shares: | | | | | | | |
Net asset value and offering price per share | | | | | | | |
China Opportunities Fund: | | | | | | | |
($943,824,774 divided by 32,481,592 shares outstanding) | | $ | 29.06 | | | | |
| | | | | | | |
International Opportunities Fund: | | | | | | | |
($112,469,972 divided by 7,974,512 shares outstanding) | | | | | $ | 14.10 | |
| | | | | | | |
See accompanying notes to the financial statements.
35
THE OBERWEIS FUNDS
Statement of Operations
Year Ended December 31, 2007
| | | | | | | | | | | | |
| | | Emerging
Growth
Fund | | | Micro-Cap
Fund | | | Mid-Cap
Fund | |
Investment Income: | | | | | | | | | | | | |
Interest | | $ | 255,086 | | | $ | 45,310 | | | $ | 7,417 | |
Dividends | | | 50,255 | | | | 102,615 | | | | 2,237 | |
| | | | | | | | | | | | |
Total Income | | | 305,341 | | | | 147,925 | | | | 9,654 | |
| | | | | | | | | | | | |
Expenses: | | | | | | | | | | | | |
Investment advisory fees (see note 2) | | | 884,681 | | | | 321,493 | | | | 45,304 | |
Management fees (see note 2) | | | 859,681 | | | | 214,329 | | | | 45,304 | |
Distribution and shareholder services fees (see note 2) | | | 537,301 | | | | 133,955 | | | | 28,315 | |
Transfer agent fees and expenses | | | 208,604 | | | | 63,689 | | | | 27,112 | |
Custodian fees and expenses | | | 138,340 | | | | 70,102 | | | | 42,640 | |
Federal and state registration fees | | | 37,380 | | | | 19,682 | | | | 14,311 | |
Other | | | 97,561 | | | | 27,785 | | | | 4,713 | |
| | | | | | | | | | | | |
Total expenses before earnings credits | | | 2,763,548 | | | | 851,035 | | | | 207,699 | |
Earnings credit (see note 5) | | | 8,983 | | | | 3,630 | | | | 3,998 | |
| | | | | | | | | | | | |
Total Expenses | | | 2,754,565 | | | | 847,405 | | | | 203,701 | |
| | | | | | | | | | | | |
Net Investment Income (Loss) | | | (2,449,224 | ) | | | (699,480 | ) | | | (194,047 | ) |
Net Realized and Unrealized Gains (Losses) from Investments: | | | | | | | | | | | | |
Net realized gains on investment transactions | | | 23,296,686 | | | | 6,908,739 | | | | 1,235,895 | |
Increase (decrease) in unrealized appreciation on investments and translation of assets and liabilities denominated in foreign currencies | | | (7,420,577 | ) | | | (1,034,526 | ) | | | 383,101 | |
| | | | | | | | | | | | |
Net realized /unrealized gains on investments and foreign currencies | | | 15,876,109 | | | | 5,874,213 | | | | 1,618,996 | |
| | | | | | | | | | | | |
Net increase in net assets resulting from operations | | $ | 13,426,885 | | | $ | 5,174,733 | | | $ | 1,424,949 | |
| | | | | | | | | | | | |
See accompanying notes to the financial statements.
36
THE OBERWEIS FUNDS
Statement of Operations
Year Ended December 31, 2007
| | | | | | | | |
| | | China
Opportunities
Fund | | | International
Opportunities
Fund* | |
Investment Income: | | | | | | | | |
Interest | | $ | 3,291,626 | | | $ | 124,273 | |
Dividends(a) | | | 7,214,209 | | | | 840,695 | |
| | | | | | | | |
Total Income | | | 10,505,835 | | | | 964,968 | |
| | | | | | | | |
Expenses: | | | | | | | | |
Investment advisory and management fees | | | 10,518,280 | | | | 1,014,441 | |
Distribution and shareholder services fees (see note 2) | | | 2,103,656 | | | | 202,888 | |
Transfer agent fees and expenses | | | 929,610 | | | | 101,182 | |
Custodian fees and expenses | | | 915,226 | | | | 235,307 | |
Other | | | 515,575 | | | | 68,299 | |
| | | | | | | | |
Total expenses before earnings credits | | | 14,982,347 | | | | 1,622,117 | |
Earnings credit (see note 5) | | | 10,151 | | | | 4,885 | |
| | | | | | | | |
Total Expenses | | | 14,972,196 | | | | 1,617,232 | |
| | | | | | | | |
Net Investment Income (Loss) | | | (4,466,361 | ) | | | (652,264 | ) |
Net Realized and Unrealized Gains (Losses) from Investments: | | | | | | | | |
Net realized gains (losses) on investment transactions | | | 107,343,695 | | | | (778,245 | ) |
Net realized gains on foreign currency transactions | | | (47,175 | ) | | | (33,368 | ) |
| | | | | | | | |
Net realized gains (losses) on investment and foreign currency transactions | | | 107,296,520 | | | | (811,613 | ) |
Increase in unrealized appreciation on investments and translation of assets and liabilities denominated in foreign currencies | | | 245,822,121 | | | | 21,795,150 | |
| | | | | | | | |
Net realized /unrealized gains on investments and foreign currencies | | | 353,118,641 | | | | 20,983,537 | |
| | | | | | | | |
Net increase in net assets resulting from operations | | $ | 348,652,280 | | | $ | 20,331,273 | |
| | | | | | | | |
| * | For the period from February 1, 2007 (commencement of operations) through December 31, 2007. |
(a) | Dividends are net of foreign withholding tax of $8,890 and $68,711 for the China Opportunities Fund and the International Opportunities Fund, respectively. |
See accompanying notes to the financial statements.
37
THE OBERWEIS FUNDS
Statements of Changes in Net Assets
| | | | | | | | |
| | | Emerging Growth Fund | |
| | | Year Ended
December 31, 2007 | | | Year Ended
December 31, 2006 | |
From Operations: | | | | | | | | |
Net investment loss | | $ | (2,449,224 | ) | | $ | (2,205,740 | ) |
Net realized gains on investments | | | 23,296,686 | | | | 7,613,371 | |
Increase (decrease) in net unrealized appreciation of investments | | | (7,420,577 | ) | | | 1,973,910 | |
| | | | | | | | |
Net increase in net assets resulting from operations | | | 13,426,885 | | | | 7,381,541 | |
| | | | | | | | |
From Distributions: | | | | | | | | |
Distributions from net realized gains on investments | | | (25,010,586 | ) | | | (6,977,001 | ) |
| | | | | | | | |
From Capital Share Transactions: | | | | | | | | |
Proceeds from sale of shares | | | 84,891,558 | | | | 81,658,413 | |
Proceeds from reinvestment of distributions | | | 23,734,410 | | | | 6,380,186 | |
Redemption of shares | | | (76,764,286 | ) | | | (73,376,518 | ) |
| | | | | | | | |
Net increase from capital share transactions | | | 31,861,682 | | | | 14,662,081 | |
| | | | | | | | |
Total increase in net assets | | | 20,277,981 | | | | 15,066,621 | |
Net Assets: | | | | | | | | |
Beginning of year | | | 199,045,289 | | | | 183,978,668 | |
| | | | | | | | |
End of year | | $ | 219,323,270 | | | $ | 199,045,289 | |
| | | | | | | | |
Transactions in Shares: | | | | | | | | |
Shares sold | | | 2,978,611 | | | | 2,935,204 | |
Shares issued in reinvestment of dividends | | | 913,213 | | | | 247,486 | |
Less shares redeemed | | | (2,703,835 | ) | | | (2,694,828 | ) |
| | | | | | | | |
Net increase from capital share transactions | | | 1,187,989 | | | | 487,862 | |
| | | | | | | | |
See accompanying notes to the financial statements.
38
THE OBERWEIS FUNDS
Statements of Changes in Net Assets
| | | | | | | | |
| | | Micro-Cap Fund | |
| | | Year Ended
December 31, 2007 | | | Year Ended
December 31, 2006 | |
From Operations: | | | | | | | | |
Net investment loss | | $ | (699,480 | ) | | $ | (849,755 | ) |
Net realized gains on investments | | | 6,908,739 | | | | 5,995,915 | |
Decrease in net unrealized appreciation of investments | | | (1,034,526 | ) | | | (5,702,474 | ) |
| | | | | | | | |
Net increase (decrease) in net assets resulting from operations | | | 5,174,733 | | | | (556,314 | ) |
| | | | | | | | |
From Distributions: | | | | | | | | |
Distributions from net realized gains on investments | | | (6,199,169 | ) | | | (4,914,691 | ) |
| | | | | | | | |
From Capital Share Transactions: | | | | | | | | |
Proceeds from sale of shares | | | 5,769,071 | | | | 22,780,129 | |
Proceeds from reinvestment of distributions | | | 5,898,482 | | | | 4,773,092 | |
Redemption of shares | | | (15,426,931 | ) | | | (34,649,521 | ) |
| | | | | | | | |
Net decrease from capital share transactions | | | (3,759,378 | ) | | | (7,096,300 | ) |
| | | | | | | | |
Total decrease in net assets | | | (4,783,814 | ) | | | (12,567,305 | ) |
Net Assets: | | | | | | | | |
Beginning of year | | | 55,787,918 | | | | 68,355,223 | |
| | | | | | | | |
End of year | | $ | 51,004,104 | | | $ | 55,787,918 | |
| | | | | | | | |
Transactions in Shares: | | | | | | | | |
Shares sold | | | 324,990 | | | | 1,260,834 | |
Shares issued in reinvestment of dividends | | | 379,568 | | | | 311,967 | |
Less shares redeemed | | | (900,156 | ) | | | (2,048,433 | ) |
| | | | | | | | |
Net decrease from capital share transactions | | | (195,598 | ) | | | (475,632 | ) |
| | | | | | | | |
See accompanying notes to the financial statements.
39
THE OBERWEIS FUNDS
Statements of Changes in Net Assets
| | | | | | | | |
| | | Mid-Cap Fund | |
| | | Year Ended
December 31, 2007 | | | Year Ended
December 31, 2006 | |
From Operations: | | | | | | | | |
Net investment loss | | $ | (194,047 | ) | | $ | (189,303 | ) |
Net realized gains on investments | | | 1,235,895 | | | | 1,136,078 | |
Increase (decrease) in net unrealized appreciation of investments | | | 383,101 | | | | (68,290 | ) |
| | | | | | | | |
Net increase in net assets resulting from operations | | | 1,424,949 | | | | 878,485 | |
| | | | | | | | |
From Distributions: | | | | | | | | |
Distributions from net realized gains on investments | | | (414,988 | ) | | | — | |
| | | | | | | | |
From Capital Share Transactions: | | | | | | | | |
Proceeds from sale of shares | | | 3,307,068 | | | | 5,134,641 | |
Proceeds from reinvestment of distributions | | | 338,782 | | | | — | |
Redemption of shares | | | (3,846,947 | ) | | | (4,110,868 | ) |
| | | | | | | | |
Net increase (decrease) from capital share transactions | | | (201,097 | ) | | | 1,023,773 | |
| | | | | | | | |
Total increase in net assets | | | 808,864 | | | | 1,902,258 | |
Net Assets: | | | | | | | | |
Beginning of year | | | 10,674,953 | | | | 8,772,695 | |
| | | | | | | | |
End of year | | $ | 11,483,817 | | | $ | 10,674,953 | |
| | | | | | | | |
Transactions in Shares: | | | | | | | | |
Shares sold | | | 210,477 | | | | 374,822 | |
Shares issued in reinvestment of dividends | | | 21,469 | | | | — | |
Less shares redeemed | | | (254,706 | ) | | | (313,945 | ) |
| | | | | | | | |
Net increase (decrease)from capital share transactions | | | (22,760 | ) | | | 60,877 | |
| | | | | | | | |
See accompanying notes to the financial statements.
40
THE OBERWEIS FUNDS
Statements of Changes in Net Assets
| | | | | | | | |
| | | China Opportunities Fund | |
| | | Year Ended
December 31, 2007 | | | Year Ended
December 31, 2006 | |
From Operations: | | | | | | | | |
Net investment loss | | $ | (4,466,361 | ) | | $ | (266,886 | ) |
Net realized gains (losses) on investment and foreign currency transactions | | | 107,296,520 | | | | (15,167,592 | ) |
Increase in net unrealized appreciation of investments and translation of assets and liablities denominated in foreign currencies | | | 245,822,121 | | | | 90,948,105 | |
| | | | | | | | |
Net increase in net assets resulting from operations | | | 348,652,280 | | | | 75,513,627 | |
| | | | | | | | |
From Distributions: | | | | | | | | |
Distributions from net realized gains on investments | | | (62,697,147 | ) | | | — | |
| | | | | | | | |
From Capital Share Transactions: | | | | | | | | |
Proceeds from sale of shares | | | 920,633,110 | | | | 513,892,921 | |
Proceeds from reinvestment of distributions | | | 58,156,256 | | | | — | |
Redemption of shares | | | (767,003,200 | ) | | | (150,793,806 | ) |
| | | | | | | | |
Net increase from capital share transactions | | | 211,786,166 | | | | 363,099,115 | |
| | | | | | | | |
Total increase net assets | | | 497,741,299 | | | | 438,612,742 | |
Net Assets: | | | | | | | | |
Beginning of year | | | 446,083,475 | | | | 7,470,733 | |
| | | | | | | | |
End of year | | $ | 943,824,774 | | | $ | 446,083,475 | |
| | | | | | | | |
Transactions in Shares: | | | | | | | | |
Shares sold | | | 38,416,604 | | | | 32,056,485 | |
Shares issued in reinvestment of dividends | | | 2,010,936 | | | | — | |
Less shares redeemed | | | (30,787,332 | ) | | | (9,908,000 | ) |
| | | | | | | | |
Net increase from capital share transactions | | | 9,640,208 | | | | 22,148,485 | |
| | | | | | | | |
See accompanying notes to the financial statements.
41
THE OBERWEIS FUNDS
Statements of Changes in Net Assets
| | | | |
| | | International Opportunities Fund | |
| | | Period Ended
December 31, 2007 * | |
From Operations: | | | | |
Net investment loss | | $ | (652,264 | ) |
Net realized loss on investment and foreign currency transactions | | | (811,613 | ) |
Increase in net unrealized appreciation of investments and translation of assets and liablities denominated in foreign currencies | | | 21,795,150 | |
| | | | |
Net increase in net assets resulting from operations | | | 20,331,273 | |
| | | | |
From Capital Share Transactions: | | | | |
Proceeds from sale of shares | | | 145,940,269 | |
Redemption of shares | | | (53,801,570 | ) |
| | | | |
Net increase from capital share transactions | | | 92,138,699 | |
| | | | |
Total increase net assets | | | 112,469,972 | |
Net Assets: | | | | |
Beginning of year | | | — | |
| | | | |
End of year | | $ | 112,469,972 | |
| | | | |
Transactions in Shares: | | | | |
Shares sold | | | 12,002,336 | |
Less shares redeemed | | | (4,027,824 | ) |
| | | | |
Net increase from capital share transactions | | | 7,974,512 | |
| | | | |
| * | For the period from February 1, 2007 (commencement of operations) through December 31, 2007. |
See accompanying notes to the financial statements.
42
THE OBERWEIS FUNDS
Notes to Financial Statements
December 31, 2007
1. Significant Accounting Policies
Description of business. The Oberweis Funds (the “Trust”) is registered under the Investment Company Act of 1940 as a diversified open-end management investment company. The Trust is authorized to operate numerous Funds under various trading strategies. The Trust consists of five Funds: the Oberweis Emerging Growth Fund, the Oberweis Micro-Cap Fund, the Oberweis Mid-Cap Fund, the Oberweis China Opportunities Fund, and the Oberweis International Opportunities Fund(collectively, the Funds).
Investment valuation. Investments in securities are stated at value as of the close of the regular trading session on the New York Stock Exchange (NYSE) (generally 3 p.m., Central Standard Time). Each listed and unlisted security for which last sale information is regularly reported is valued at the last reported sales price on that day. If there has been no sale on such day, then such security is valued at the current day’s bid price. Any unlisted security for which last sale information is not regularly reported and any listed debt security which has an inactive listed market for which over-the-counter market quotations are readily available is valued at the closing bid price determined on the basis of reasonable inquiry. Options are valued at the last reported bid price on the primary exchange as of the close of the regular trading session of the Chicago Board Options Exchange (CBOE). Restricted securities and any other securities or other assets for which market quotations are not readily available are valued by appraisal at their fair value as determined in good faith under procedures established by and under the general supervision and responsibility of the Board of Trustees. Short-term debt instruments maturing within 60 days are valued by the amortized cost method, which approximates fair value.
The Oberweis China Opportunities Fund and the Oberweis International Opportunities Fund hold foreign equity securities. Foreign securities at fair value are described in the circumstances below. Generally, trading in foreign securities markets is completed each day at various times prior to the close of the regular trading session of the NYSE. Due to the time differences between the closings of the relevant foreign securities exchanges and the close of the regular trading session of the NYSE for the Funds, the Funds will fair value their foreign investments when it is determined that the market quotations for the foreign investments either are not readily available or are unreliable and, therefore, do not represent fair value. When the fair value prices are utilized, these prices will attempt to reflect the impact of the U.S. financial markets’ perceptions and trading activities on the Funds’ foreign investments since the last closing prices of the foreign investments were calculated on their primary foreign securities markets or exchanges. For these purposes, the Board of Trustees of the Trust has determined that movements in relevant indices, after the close of the foreign securities exchanges, may demonstrate that market quotations are unreliable, and may trigger fair value pricing for certain securities. Consequently, fair valuation of portfolio securities may occur on a daily basis. In determining fair value prices, the Trust utilizes data furnished by an independent pricing service (and that data draws upon, among other information, the market values of foreign investments). When a Fund uses fair value pricing, the values assigned to the Fund’s foreign investments may not be the quoted or published prices of the investments on their primary markets or exchanges.
Foreign Currency Transactions. The accounting records of the Funds are maintained in U.S. dollars. Foreign currency amounts are translated into U.S. dollars at the current rate of exchange to determine the value of investments, assets and liabilities. Purchases and sales of securities, and income and expenses are translated at the prevailing rate of exchange on the respective date
43
of these transactions. The Funds do not isolate that portion of the results of operations resulting from changes in foreign exchange rates on investments from fluctuations arising from changes in market prices of securities held. These fluctuations are included with the net realized and unrealized gains or losses from investments and foreign currencies.
Risks Associated with Foreign Securities and Currencies. Investments in securities of foreign issuers carry certain risks not ordinarily associated with investments in securities of U.S. issuers. These risks include future political and economic developments, and the possible imposition of exchange controls or other foreign governmental laws and restrictions. In addition, with respect to certain countries, there is the possibility of expropriation of assets, confiscatory taxation, political or social instability or diplomatic developments, which could adversely affect investments in those countries.
Certain countries also may impose substantial restrictions on investments in their capital markets by foreign entities, including restrictions on investments in issuers of industries deemed sensitive to relevant national interests. These factors may limit the investment opportunities available and result in a lack of liquidity and a high price volatility with respect to securities of issuers from developing countries.
Fund share valuation. Fund shares are sold and redeemed on a continuous basis at net asset value. On each day the New York Stock Exchange is open for trading, the net asset value per share is determined as of the later of the close of the New York Stock Exchange or the Chicago Board of Options Exchange (CBOE) by dividing the total value of each Fund’s investments and other assets, less liabilities, by the number of each Fund’s shares outstanding.
Investment transactions and investment income. Investment transactions are accounted for on the trade date (date the order to buy or sell is executed). Dividend income is recorded on the ex-dividend date, and interest income is recorded on the accrual basis and includes amortization of premium and discount. Realized gains and losses from investment transactions are reported on an identified cost basis. Gains and losses on premiums from expired options are recognized on the date of expiration.
Federal income taxes and dividends to shareholders. It is each Fund’s policy and intention to comply with the provisions of the Internal Revenue Code available to investment companies and therefore no federal income tax provision is required. Dividends payable to its shareholders are recorded by each Fund on the ex-dividend date. Dividends are determined in accordance with income tax principles which may treat certain transactions differently from generally accepted accounting principles. These “book/tax” differences are either considered temporary or permanent in nature. To the extent these differences are considered permanent in nature, such amounts are reclassified within the composition of net assets based on their federal tax basis treatment; temporary differences do not require reclassification. The tax character of distributions paid during the fiscal year ended December 31, 2007, to shareholders of record on December 27, 2007 were as follows:
| | | | | | | | | |
| | | Distributions Paid From
Ordinary Income | | Distributions Paid From
Net Long-Term Capital Gains | | Total
Distributions Paid |
Emerging Growth Fund | | $ | — | | $ | 25,010,586 | | $ | 25,010,586 |
Micro-Cap Fund | | | — | | | 6,199,169 | | | 6,199,169 |
Mid-Cap Fund | | | — | | | 414,988 | | | 414,988 |
China Opportunities Fund | | | — | | | 62,697,147 | | | 62,697,147 |
44
No distributions were required for the International Opportunities Fund. The Funds designated the following amounts as long term capital gain distributions:
| | | |
| | | Amount |
Emerging Growth Fund | | $ | 25,010,586 |
Micro-Cap Fund | | | 6,199,169 |
Mid-Cap Fund | | | 414,988 |
China Opportunities Fund | | | 62,697,147 |
The tax character of distributions paid during the fiscal year ended December 31, 2006, to shareholders of record on November 6, 2006, were as follows:
| | | | | | | | | |
| | | Distributions Paid From
Ordinary Income | | Distributions Paid From
Net Long-Term Capital Gains | | Total
Distributions Paid |
Emerging Growth Fund | | $ | — | | $ | 6,977,001 | | $ | 6,977,001 |
Micro-Cap Fund | | | — | | | 4,914,691 | | | 4,914,691 |
No distributions were made for the Mid-Cap Fund and China Opportunities Fund. The Micro-Cap Fund includes $1,849,015 of earnings and profit distributed to shareholders on redemptions of their shares:
| | | |
| | | Amount |
Emerging Growth Fund | | $ | 6,977,001 |
Micro-Cap Fund | | | 6,763,706 |
The tax components of undistributed net investment income and net realized gains at December 31, 2007 were as follows:
| | | | | | |
| | | Undistributed
Ordinary Income | | Undistributed
Net Long-Term Capital Gains |
Emerging Growth Fund | | $ | — | | $ | 2,776,422 |
Micro-Cap Fund | | | — | | | 1,005,717 |
Mid-Cap Fund | | | — | | | 649,787 |
China Opportunities Fund | | | — | | | 33,031,987 |
As of December 31, 2007, the following Funds had net capital loss carryforwards to offset future net capital gains, if any, to the extent provided by treasury regulations:
| | | | | | | | | | | | |
| | | 2012 | | 2013 | | 2014 | | 2015 |
International Opportunities Fund | | $ | — | | $ | — | | $ | — | | $ | 96,526 |
Net capital losses incurred after October 31 and within the taxable year are deemed to arise on the first business day of the Fund’s next taxable year. For the year ended December 31, 2007, the International Opportunities Fund deferred to January 1, 2008 post-October capital losses of $18,903.
The Funds adopted Financial Accounting Standards Board (“FASB”) Interpretation No. 48, Accounting for Uncertainty in Income Taxes - an Interpretation of FASB Statement No. 109 (“FIN 48”) effective June 29, 2007. FIN 48 requires management to determine whether a tax position of the Fund is more likely than not to be sustained upon examination by the applicable taxing authority, including resolution of any related appeals or litigation processes, based
45
on the technical merits of the position. The tax benefit to be recognized is measured as the largest amount of benefit that is greater than fifty percent likely of being realized upon ultimate settlement. FIN 48 must be applied to all existing tax positions upon initial adoption and the cumulative effect, if any, is to be reported as an adjustment to net assets.
As of December 31, 2007, Management has evaluated the known implications of FIN 48 on its computation of net assets for the Funds. As a result of this evaluation, management believes that FIN 48 does not have any effect on the Fund’s Financial Statements. However, management’s conclusions regarding FIN 48 may be subject to review and adjustment at a later date based on factors including, but not limited to, further implementation guidance from the FASB, new tax laws, regulations, and administrative interpretations (including relevant court decisions). Each Fund’s federal tax returns for the prior three fiscal years remain subject to examination by the Internal Revenue Service. The Funds are not aware of any tax positions for which it is reasonably possible that the total amounts of unrecognized tax benefits will significantly change in the next twelve months.
Use of estimates. The preparation of financial statements in conformity with generally accepted accounting principles requires management to make estimates and assumptions that affect the amounts reported in the financial statements and accompanying notes. Actual results may differ from those estimates.
Indemnifications. Under the Trusts’ organizational documents, its present and former Officers and Trustees are indemnified against certain liabilities arising out of the performance of their duties to the Trust. In addition, in the normal course of business, the Trust enters into contracts that provide general indemnifications to other parties. The Trusts’ maximum exposure under these arrangements is unknown as this would involve future claims that may be made against the Trust that have not yet occurred. However, the Trust has not had prior claims or losses pursuant to these contracts and expects the risk of loss to be remote.
2. Transactions with affiliates
The Funds have written agreements with Oberweis Asset Management, Inc. (“OAM”) as the Funds’ investment adviser and manager. Oberweis Securities, Inc. (“Oberweis Securities”), the Funds’ principal distributor, is an affiliate of OAM.
Investment advisory agreement. Under the Advisory Agreement, OAM provides investment advisory services to the Emerging Growth, Micro-Cap and Mid-Cap Funds and pursuant to a separate Management Agreement, OAM provides non-investment advisory management services such as adminstrative, compliance and accounting services to these Funds. For investment advisory services, the Emerging Growth Fund paid monthly investment advisory fees at an annual rate equal to .45% of the first $50 million of average daily net assets and .40% of average daily net assets in excess of $50 million. The Micro-Cap Fund paid monthly investment advisory fees at an annual rate equal to .60% of average daily net assets. The Mid-Cap Fund paid monthly investment advisory fees at an annual rate equal to .40% of average daily net assets. For investment advisory and management services, the China Opportunities Fund paid monthly investment advisory and management fees at an annual rate equal to 1.25% of average daily net assets. The Oberweis International Opportunities Fund paid monthly investment advisory and management fees at an annual rate equal to 1.25% of average daily net assets. For the year ended December 31, 2007, the Emerging Growth Fund, Micro-Cap Fund, and Mid-Cap Fund, incurred investment advisory fees totaling $884,681, $321,493, and $45,304, respectively. For the year ended December 31, 2007, the China Opportunities Fund and International Opportunities Fund incurred investment advisory and management fees totaling $10,518,280 and $1,014,441, respectively.
46
Management agreement. For management services and facilities furnished, the Emerging Growth Fund, Micro-Cap Fund, and Mid-Cap Fund each paid a monthly fee at an annual rate equal to .40% of average daily net assets. For the year ended December 31, 2007, the Emerging Growth Fund, Micro-Cap Fund, and Mid-Cap Fund incurred management fees totaling $859,681, $214,329 and $45,304, respectively.
Expense reimbursement. OAM is contractually obligated to reduce its management fees or reimburse the Emerging Growth Fund, Micro-Cap Fund, and Mid-Cap Fund to the extent that total ordinary operating expenses, as defined, exceed in any one year the following amounts expressed as a percentage of each Fund’s average daily net assets: 2% of the first $25,000,000; plus 1.8% of the next $25,000,000; plus 1.6% of average daily net assets in excess of $50,000,000. OAM is also contractually obligated to reduce its investment and management fees or reimburse the China Opportunities Fund and the International Opportunities Fund to the extent that total ordinary operating expenses, as defined, exceed in any one year 2.49% expressed as a percentage of the Funds’ average daily net assets. For the year ended December 31, 2007 OAM has not reimbursed the Funds.
Officers and trustees. Certain officers or trustees of the Trust are also officers or directors of OAM and Oberweis Securities. For the year ended December 31, 2007, the Trust made no direct payments to its officers and paid $40,000 to its unaffiliated trustees.
Distribution and shareholder service agreement. The Funds have a distribution and shareholder services agreement with Oberweis Securities. For services under the distribution and shareholder services agreement, the Funds pay Oberweis Securities a fee at the annual rate of .25% of the average daily net assets as compensation for services. For the year ended December 31, 2007, the Emerging Growth Fund, Micro-Cap Fund, Mid-Cap Fund, China Opportunities Fund, and International Opportunites Fund incurred distribution fees totaling $537,301, $133,955, $28,315, $2,103,656, and $202,888, respectively.
3. Investment transactions
The cost of securities purchased and proceeds from securities sold during the year ended December 31, 2007, other than commercial paper, aggregated $179,835,655 and $176,905,351, respectively, for the Emerging Growth Fund, $34,655,456 and $46,596,244, respectively, for the Micro-Cap Fund, $12,231,633 and $13,011,259, respectively, for the Mid-Cap Fund, and $680,305,158 and $521,098,201, respectively, for the China Opportunities Fund and $187,480,458 and $104,704,594, respectively for the International Opportunities Fund. The Funds did not hold government securities during the year ended December 31, 2007.
The Funds may write covered call options. The premiums received provide a partial hedge (protection) against declining prices and enables each Fund to generate a higher return during periods when OAM does not expect the underlying security to make any major price moves in the near future but still deems the underlying security to be, over the long term, an attractive investment for each Fund. The Funds write covered call options for which premiums received are recorded as liabilities and are subsequently adjusted to the current value of the options written. Premiums received from writing options that expire are treated as realized gains. Premiums received from writing options, which are either exercised or closed, are offset against the proceeds received or amount paid on the transaction to determine realized gains or losses. Amounts recovered for securities litigation are included in the realized gains of the Fund and are recorded when received. The Funds did not write covered call options for the year ended December 31, 2007.
47
4. Redemption fee
The Oberweis Funds are designed for long-term investors. To discourage market timers redemptions of shares of the Emerging Growth Fund, Micro-Cap Fund, and Mid-Cap Fund within 90 days of purchase are subject to a 1% redemption fee of the total redemption amount and 2% for the China Opportunities Fund, and the International Opportunities Fund. The redemption fee is deducted from the redemption proceeds and is retained by the Fund.
The redemption fee is retained by the Funds for the expense they incur in connection with shareholder redemptions. Redemption fees received by the Emerging Growth Fund, Micro-Cap Fund, Mid-Cap Fund, China Opportunities Fund, and International Opportunities Fund were $29,211, $6,188, $15,677, $4,251,465, and $251,375, respectively, for the year ended December 31, 2007, and were recorded as a reduction of the cost of shares redeemed in the statements of changes in net assets.
5. Earnings credits and interest charges
The Trust, as part of the agreement with the Custodian, receives credits against its custodian fees on its uninvested cash balances and is allowed to borrow for temporary purposes. Borrowings are not to exceed 5% of the value of each Fund’s total assets at the time of any such borrowing. Interest on amounts borrowed is calculated at the prime rate and is payable monthly. During the year ended December 31, 2007, the Emerging Growth Fund, Micro-Cap Fund, Mid-Cap Fund, China Opportunities Fund, and International Opportunities received credits of $8,983, $3,630, $3,998, $10, 151, and $4,885, respectively. During the year ended December 31, 2007, the Emerging Growth Fund, Micro-Cap Fund, Mid-Cap Fund, China Opportunities Fund, and International Opportunities Fund incurred interest charges of $13,397, $17,276, $2,401, $55,600, and $12,610, respectively, which is included in custodian fees and expenses in the statement of operations.
6. New Accounting Pronouncement
SFAS No. 157 was issued by the Financial Standards Accounting Board in September, 2006. This standard is effective for financial statements issued for fiscal years beginning after November 15, 2007 and interim periods within those fiscal years. This standard establishes a single authoritative definition of fair value, sets out a framework for measuring fair value and requires additional disclosures about fair value measurements. SFAS No. 157 applies to fair value measurements already required or permitted by existing standards. Management of the Funds is currently evaluating the impact that SFAS No. 157 will have on the Funds’ financial statements.
48
THE OBERWEIS FUNDS
Financial Highlights
Per share income and capital for a share outstanding throughout each period is as follows:
| | | | | | | | | | | | | | | | | | | | |
| | | Emerging Growth Fund | |
| | | Years ended December 31, | |
| | | 2007 | | | 2006 | | | 2005 | | | 2004 | | | 2003 | |
Net asset value at beginning of year | | $ | 27.22 | | | $ | 26.95 | | | $ | 27.93 | | | $ | 27.05 | | | $ | 16.13 | |
Income (loss) from investment operations: | | | | | | | | | | | | | | | | | | | | |
Net investment loss(a) | | | (.33 | ) | | | (.30 | ) | | | (.33 | ) | | | (.36 | ) | | | (.27 | ) |
Net realized and unrealized gain on investments | | | 2.21 | | | | 1.56 | | | | 1.09 | | | | 1.99 | | | | 11.19 | |
| | | | | | | | | | | | | | | | | | | | |
Total from investment operations | | | 1.88 | | | | 1.26 | | | | .76 | | | | 1.63 | | | | 10.92 | |
Redemption Fees(a) | | | — | | | | — | | | | — | | | | .01 | | | | — | |
Less distributions: | | | | | | | | | | | | | | | | | | | | |
Distribution from net realized gains on investments | | | (3.30 | ) | | | (.99 | ) | | | (1.74 | ) | | | (.76 | ) | | | — | |
| | | | | | | | | | | | | | | | | | | | |
Net asset value at end of year | | $ | 25.80 | | | $ | 27.22 | | | $ | 26.95 | | | $ | 27.93 | | | $ | 27.05 | |
| | | | | | | | | | | | | | | | | | | | |
Total Return (%) | | | 6.82 | | | | 4.87 | | | | 2.74 | | | | 6.29 | | | | 67.70 | |
Ratio/Supplemental Data | | | | | | | | | | | | | | | | | | | | |
Net Assets at end of year (in thousands) | | $ | 219,323 | | | $ | 199,045 | | | $ | 183,979 | | | $ | 175,614 | | | $ | 242,695 | |
Ratio of gross expenses to average net assets (%) | | | 1.29 | | | | 1.35 | | | | 1.42 | | | | 1.44 | | | | 1.37 | |
Ratio of net expenses to average net assets (%)(b) | | | 1.28 | | | | 1.35 | | | | 1.41 | | | | 1.44 | | | | 1.37 | |
Ratio of net investment loss to average net assets (%) | | | (1.14 | ) | | | (1.11 | ) | | | (1.26 | ) | | | (1.38 | ) | | | (1.18 | ) |
Portfolio turnover rate (%) | | | 85 | | | | 74 | | | | 75 | | | | 55 | | | | 56 | |
Average commission rate paid(c) | | $ | .0194 | | | $ | .0178 | | | $ | .0176 | | | $ | .0199 | | | $ | .0206 | |
Notes:
(a) | The net investment loss per share data was determined using average shares outstanding during the period. |
(b) | The ratios in this column reflect the impact, if any, of expense offset arrangements. |
49
THE OBERWEIS FUNDS
Financial Highlights
Per share income and capital for a share outstanding throughout each period is as follows:
| | | | | | | | | | | | | | | | | | | | |
| | | Micro-Cap Fund | |
| | | Years ended December 31, | |
| | | 2007 | | | 2006 | | | 2005 | | | 2004 | | | 2003 | |
Net asset value at beginning of year | | $ | 16.06 | | | $ | 17.31 | | | $ | 17.50 | | | $ | 26.26 | | | $ | 13.86 | |
Income (loss) from investment operations: | | | | | | | | | | | | | | | | | | | | |
Net investment loss(a) | | | (.23 | ) | | | (.21 | ) | | | (.18 | ) | | | (.36 | ) | | | (.31 | ) |
Net realized and unrealized gain on investments | | | 1.86 | | | | .42 | | | | 2.29 | | | | (.54 | ) | | | 15.36 | |
| | | | | | | | | | | | | | | | | | | | |
Total from investment operations | | | 1.63 | | | | .21 | | | | 2.11 | | | | (.90 | ) | | | 15.05 | |
Redemption Fees(a) | | | — | | | | .01 | | | | .01 | | | | .04 | | | | .05 | |
Less distributions: | | | | | | | | | | | | | | | | | | | | |
Distribution from net realized gains on investments | | | (2.13 | ) | | | (1.47 | ) | | | (2.31 | ) | | | (7.90 | ) | | | (2.70 | ) |
| | | | | | | | | | | | | | | | | | | | |
Net asset value at end of year | | $ | 15.56 | | | $ | 16.06 | | | $ | 17.31 | | | $ | 17.50 | | | $ | 26.26 | |
| | | | | | | | | | | | | | | | | | | | |
Total Return (%) | | | 10.17 | | | | 1.66 | | | | 12.72 | | | | 2.19 | | | | 108.93 | |
Ratio/Supplemental Data | | | | | | | | | | | | | | | | | | | | |
Net Assets at end of year (in thousands) | | $ | 51,004 | | | $ | 55,788 | | | $ | 68,355 | | | $ | 46,676 | | | $ | 99,546 | |
Ratio of gross expenses to average net assets (%) | | | 1.59 | | | | 1.63 | | | | 1.70 | | | | 1.69 | | | | 1.60 | |
Ratio of net expenses to average net assets (%)(b) | | | 1.58 | | | | 1.62 | | | | 1.68 | | | | 1.69 | | | | 1.60 | |
Ratio of net investment loss to average net assets (%) | | | (1.31 | ) | | | (1.23 | ) | | | (1.08 | ) | | | (1.54 | ) | | | (1.47 | ) |
Portfolio turnover rate (%) | | | 65 | | | | 108 | | | | 76 | | | | 58 | | | | 87 | |
Average commission rate paid(c) | | $ | .0198 | | | $ | .0172 | | | $ | .0171 | | | $ | .0195 | | | $ | .0200 | |
Notes:
(a) | The net investment loss per share data was determined using average shares outstanding during the period. |
(b) | The ratios in this column reflect the impact, if any, of expense offset arrangements. |
50
THE OBERWEIS FUNDS
Financial Highlights
Per share income and capital for a share outstanding throughout each period is as follows:
| | | | | | | | | | | | | | | | | | | | |
| | | Mid-Cap Fund | |
| | | Years ended December 31, | |
| | | 2007 | | | 2006 | | | 2005 | | | 2004 | | | 2003 | |
Net asset value at beginning of year | | $ | 14.02 | | | $ | 12.53 | | | $ | 11.95 | | | $ | 11.37 | | | $ | 7.29 | |
Income (loss) from investment operations: | | | | | | | | | | | | | | | | | | | | |
Net investment loss(a) | | | (.27 | ) | | | (.24 | ) | | | (.22 | ) | | | (.17 | ) | | | (.18 | ) |
Net realized and unrealized gain on investments | | | 2.36 | | | | 1.72 | | | | .80 | | | | .74 | | | | 4.25 | |
| | | | | | | | | | | | | | | | | | | | |
Total from investment operations | | | 2.09 | | | | 1.48 | | | | .58 | | | | .57 | | | | 4.07 | |
Redemption Fees(a) | | | .02 | | | | .01 | | | | — | | | | .01 | | | | .01 | |
Less distributions: | | | | | | | | | | | | | | | | | | | | |
Distribution from net realized gains on investments | | | (.58 | ) | | | — | | | | — | | | | — | | | | — | |
| | | | | | | | | | | | | | | | | | | | |
Net asset value at end of year | | $ | 15.55 | | | $ | 14.02 | | | $ | 12.53 | | | $ | 11.95 | | | $ | 11.37 | |
| | | | | | | | | | | | | | | | | | | | |
Total Return (%) | | | 14.99 | | | | 11.89 | | | | 4.85 | | | | 5.10 | | | | 55.97 | |
Ratio/Supplemental Data | | | | | | | | | | | | | | | | | | | | |
Net Assets at end of year (in thousands) | | $ | 11,484 | | | $ | 10,675 | | | $ | 8,773 | | | $ | 10,426 | | | $ | 10,820 | |
Ratio of gross expenses to average net assets (%) | | | 1.83 | | | | 1.90 | | | | 2.14 | | | | 1.96 | | | | 2.31 | |
Ratio of net expenses to average net assets (%)(b) | | | 1.80 | | | | 1.83 | | | | 2.00 | | | | 1.95 | | | | 2.00 | |
Ratio of net investment loss to average net assets (%) | | | (1.71 | ) | | | (1.76 | ) | | | (1.90 | ) | | | (1.52 | ) | | | (1.91 | ) |
Portfolio turnover rate (%) | | | 110 | | | | 112 | | | | 119 | | | | 86 | | | | 29 | |
Average commission rate paid(c) | | $ | .0183 | | | $ | .0175 | | | $ | .0168 | | | $ | .0196 | | | $ | .0200 | |
Notes:
(a) | The net investment loss per share data was determined using average shares outstanding during the period. |
(b) | The ratios in this column reflect the impact, if any, of expense offset arrangements and expense reimbursement from the adviser. |
51
THE OBERWEIS FUNDS
Financial Highlights
Per share income and capital for a share outstanding throughout each period is as follows:
| | | | | | | | | | | | |
| | | China Opportunities Fund | |
| | | Years Ended December 31, | | | Period Ended
December 31, | |
| | | 2007 | | | 2006 | | | 2005(a) | |
Net asset value at beginning of year | | $ | 19.53 | | | $ | 10.78 | | | $ | 10.00 | |
Income (loss) from investment operations: | | | | | | | | | | | | |
Net investment loss(b) | | | (.14 | ) | | | (.02 | ) | | | (.03 | ) |
Net realized and unrealized gain on investments and translation of assets and liabilities denominated in foreign currencies | | | 11.58 | | | | 8.70 | | | | .81 | |
| | | | | | | | | | | | |
Total from investment operations | | | 11.44 | | | | 8.68 | | | | .78 | |
Redemption Fees(b) | | | .13 | | | | .07 | | | | — | |
Less distributions: | | | | | | | | | | | | |
Distribution from net realized gains on investments | | | (2.04 | ) | | | — | | | | — | |
| | | | | | | | | | | | |
Net asset value at end of year | | $ | 29.06 | | | $ | 19.53 | | | $ | 10.78 | |
| | | | | | | | | | | | |
Total Return (%) | | | 59.29 | | | | 81.17 | | | | 7.80 | |
Ratio/Supplemental Data | | | | | | | | | | | | |
Net Assets at end of year (in thousands) | | $ | 943,825 | | | $ | 446,083 | | | $ | 7,471 | |
Ratio of gross expenses to average net assets (%) | | | 1.78 | | | | 1.91 | | | | 4.57 | |
Ratio of net expenses to average net assets (%)(c) | | | 1.78 | | | | 1.91 | | | | 2.49 | |
Ratio of net investment loss to average net assets (%) | | | (.53 | ) | | | (.15 | ) | | | (1.34 | ) |
Portfolio turnover rate (%) | | | 68 | | | | 53 | | | | 14 | |
Average commission rate paid(d) | | $ | .0024 | | | $ | .0021 | | | $ | .0011 | |
Notes:
(a) | For the period from October 1, 2005 (commencement of operations) through December 31, 2005. |
(b) | The net investment loss per share data was determined using average shares oustanding during the period. |
(c) | The ratios in this column reflect the impact, if any, of expense offset arrangements and expense reimbursement from the adviser. |
52
THE OBERWEIS FUNDS
Financial Highlights
Per share income and capital for a share outstanding throughout each period is as follows:
| | | | |
| | | International Opportunities Fund | |
| | | Period Ended
December 31,
2007(a) | |
Net asset value at beginning of year | | $ | 10.00 | |
Income (loss) from investment operations: | | | | |
Net investment loss(b) | | | (.10 | ) |
Net realized and unrealized gain on investments | | | 4.16 | |
| | | | |
Total from investment operations | | | 4.06 | |
Redemption Fees(b) | | | .04 | |
Less distributions: | | | | |
Distribution from net realized gains on investments | | | — | |
| | | | |
Net asset value at end of year | | $ | 14.10 | |
| | | | |
Total Return (%) | | | 41.00 | |
Ratio/Supplemental Data | | | | |
Net Assets at end of year (in thousands) | | $ | 112,470 | |
Ratio of gross expenses to average net assets (%)(c) | | | 2.00 | |
Ratio of net expenses to average net assets (%)(c) (d) | | | 1.99 | |
Ratio of net investment loss to average net assets (%)(c) | | | (.80 | ) |
Portfolio turnover rate (%) | | | 126 | |
Average commission rate paid(e) | | $ | .0173 | |
Notes:
(a) | For the period from February 1, 2007 (commencement of operations) through December 31, 2007. |
(b) | The net investment loss per share data was determined using average shares outstanding during the period. |
(d) | The ratios in this column reflect the impact, if any, of expense offset arrangements. |
53
REPORT OF INDEPENDENT REGISTERED PUBLIC
ACCOUNTING FIRM
To the Board of Trustees and Shareholders of
The Oberweis Funds
In our opinion, the accompanying statement of assets and liabilities, including the schedule of investments, and the related statements of operations and of changes in net assets and the financial highlights present fairly, in all material respects, the financial position of the Oberweis Emerging Growth Fund, Oberweis Micro-Cap Fund, Oberweis Mid-Cap Fund, Oberweis China Opportunities Fund, and Oberweis International Opportunities Fund (five funds constituting The Oberweis Funds, hereafter referred to as the “Funds”) at December 31, 2007, the results of each of their operations for year then ended or the period from February 1, 2007 through December 31, 2007 for the Oberweis International Opportunities Fund, the changes in each of their net assets for the two years then ended or period indicated and the financial highlights for each of the years or periods indicated, in conformity with accounting principles generally accepted in the United States of America. These financial statements and financial highlights (hereafter referred to as “financial statements”) are the responsibility of the Funds’ management; our responsibility is to express an opinion on these financial statements based on our audits. We conducted our audits of these financial statements in accordance with the standards of the Public Company Accounting Oversight Board (United States). Those standards require that we plan and perform the audit to obtain reasonable assurance about whether the financial statements are free from material misstatement. An audit includes examining, on a test basis, evidence supporting the amounts and disclosures in the financial statements, assessing the accounting principles used and significant estimates made by management, and evaluating the overall financial statement presentation. We believe that our audits, which included confirmation of securities at December 31, 2007 by correspondence with the custodian and brokers, provide a reasonable basis for our opinion.
|
|
 |
February 25, 2008 |
Chicago, Illinois |
54
Trustees and Officers of The Oberweis Funds
| | | | |
Name, Address
and Age | | Position Held
with Fund | | Term of Office
and Length of
Time Served |
| | |
Noninterested Trustees | | | | |
Katherine Smith Dedrick (50) 3333 Warrenville Road, Suite 500 Lisle, IL 60532 | | Trustee | | Trustee since November, 2004(1) |
| | |
Gary D. McDaniel (59) 3333 Warrenville Road, Suite 500 Lisle, IL 60532 | | Trustee | | Trustee since May, 2004(1) |
| | |
James G. Schmidt (60) 3333 Warrenville Road, Suite 500 Lisle, IL 60532 | | Trustee | | Trustee since November, 2003(1) |
| | |
Interested Trustees | | | | |
James D. Oberweis (61) 3333 Warrenville Road, Suite 500 Lisle, IL 60532 | | Trustee(2) | | Trustee and Officer since July, 1986(1) |
| | |
Interested Trustees | | | | |
James W. Oberweis (33) 3333 Warrenville Road, Suite 500 Lisle, IL 60532 | | President | | Officer since August, 1996(3) |
| | |
Patrick B. Joyce (48) 3333 Warrenville Road, Suite 500 Lisle, IL 60532 | | Executive Vice
President and
Treasurer | | Officer since October, 1994(3) |
| | |
Martin L. Yokosawa (47) 3333 Warrenville Road, Suite 500 Lisle, IL 60532 | | Senior Vice President | | Officer since October, 1994(3) |
| | |
David I. Covas (32) 3333 Warrenville Road, Suite 500 Lisle, IL 60532 | | Vice President | | Officer since August, 2004(3) |
| | |
Eric V. Hannemann (34) 3333 Warrenville Road, Suite 500 Lisle, IL 60532 | | Secretary | | Officer since August, 2005(3) |
(1) | Unless otherwise noted, each trustee shall serve as a trustee of the Fund until the next meeting of shareholders, if any, called for the purpose of considering the election or re-election of such trustee or of a successor to such trustee, and until the election and qualification of his successor, if any, elected at such meeting, or until such trustee sooner dies, resigns, retires or is removed. |
(2) | James D. Oberweis is an interested trustee of the Fund by reason of his position as the former Chairman of Oberweis Asset Management, Inc., the Fund’s investment advisor. |
(3) | Elected annually by board of trustees. |
The Statement of Additional Information includes additional information about Fund officers and trustees and is available upon request without charge, by calling the Fund at 1-800-323-6166.
55
Trustees and Officers of The Oberweis Funds
| | | | |
Principal Occupation Last Five Years | | Number of Portfolios Overseen by Trustee | | Other Directorships |
| | |
Partner - Childress Duffy Goldblatt, Ltd, April 1, 2007 to present; Partner - Levenfeld Pearlstein, LLC, January 2005 to April 1, 2007; Partner - Hinshaw & Culbertson, 1985 to January 2005. | | 5 | | None |
| | |
Vice President/General Manager of the Flexible Packaging Group - Smurfit Stone Container, March 1988 to 2007. | | 5 | | None |
| | |
Senior Vice President and Chief Financial Officer - Federal Heath Sign Co., May 2003 to present; Vice President - Finance Federal Sign division of Federal Signal Corp. October, 1991 to April, 2003. | | 5 | | None |
| | |
Director - Oberweis Asset Management, Inc. September, 1994 to present. Chairman - September 2001 to present. President - September, 1989 to August, 2001. | | 5 | | None |
| | |
President - Oberweis Asset Management, Inc., September, 2001 to present; Senior Vice President May, 1996 to August, 2001; Portfolio Manager from December, 1995 to present; President and Director - Oberweis Securities, Inc., September, 1996 to present. | | Not Applicable | | None |
| | |
Executive Vice President, Secretary and Director - Oberweis Asset Management, Inc., September, 1994 to present; Executive Vice President and Director - Oberweis Securities, Inc. September, 1996 to present. | | Not Applicable | | None |
| | |
Senior Vice President - Oberweis Asset Management, Inc., September, 1994 to Present; Senior Vice President - Oberweis Securities, Inc., January, 1997 to present. | | Not Applicable | | None |
| | |
Vice President - Oberweis Asset Management, Inc., September, 2003 to present; Research Analyst June, 1997 to August, 2003. | | Not Applicable | | None |
| | |
Vice President of Accounting - Oberweis Asset Management and Oberweis Securities, Inc., June, 2004 to present; Portfolio and Staff Accountant - Vestor Capital Corp. April, 2003 to June, 2004; Staff Accountant - Green, Plage & Associates, Inc., November, 1999 to April, 2003 | | Not Applicable | | None |
56
THE OBERWEIS FUNDS
Supplemental Information
Proxy Voting:
The Oberweis Funds has delegated authority to vote proxies related to the Funds’ (Emerging Growth Fund, Micro-Cap Fund, Mid-Cap Fund, China Opportunities Fund and Oberweis International Opportunities Fund) Portfolio securities to the Funds’ investment adviser, Oberweis Asset Management, Inc. (“OAM”). A description of the policies and procedures that OAM uses in fulfilling this responsibility is available, without charge upon request, by calling 1-800-323-6166. It also appears on www.oberweisfunds.com and in the Funds’ Statement of Additional Information, which can be found on the Securities and Exchange Commission’s (“SEC”) website at http://www.sec.gov. Information on how the Funds voted proxies relating to portfolio securities during the most recent 12 month period ended June 30 is available (1) without charge, upon request, by calling 1-800-323-6166, and (2) on the SEC’s website at http://www.sec.gov.
Availability of Schedules of Portfolio Investments:
The Funds file their complete schedule of portfolio investments with the SEC for the first and third quarter of each fiscal year (March 31 and September 30) on Form NQ. The Funds’ Forms NQ are available, without charge, on the SEC’s website at http://www.sec.gov and may be reviewed and copied at the SEC’s Public Reference Room in Washington, D.C. Information on the operation of the Public Reference Room may be obtained by calling 1-800-SEC-0330.
Approval of Investment Advisory Contracts:
The Investment Advisory Agreement with respect to the Emerging Growth, Micro-Cap, and Mid-Cap Funds and the Investment Advisory and Management Agreement for the China Opportunities Fund was last approved by the Board of Trustees, including all of the trustees who are not parties to such agreements or interested persons of any such party, (the “independent trustees”) on August 23, 2007. The Investment Advisory and Management Agreement for the International Opportunities Fund was initially approved by the Board of Trustees on November 9, 2006 and the initial term of such agreement is two years. Accordingly, the approval of such agreement was not considered during the period covered by this report. The Investment Advisory and Management Agreement for the Asia Opportunities Fund was initially approved by the Board of Trustees, including all of the independent trustees, on November 8, 2007. The Board of Trustees, including a majority of the independent trustees, determined that approval of the agreements was in the best interests of each Fund. The independent trustees were assisted by independent legal counsel in making their determination.
The Board noted that OAM has a long association with The Oberweis Funds, in each case since the inception of each of the Funds. The Board recognizes that a long-term relationship with a capable, conscientious investment adviser is in the best interests of shareholders and that shareholders have invested in the Funds knowing that OAM managed the Funds and knowing the investment advisory fee schedule.
Nature, Quality and Extent of Services. With respect to the nature, quality and extent of the services provided by OAM to the Emerging Growth, Micro-Cap, Mid-Cap and China Opportunities Funds and of the services to be provided by OAM to the Asia Opportunities
57
THE OBERWEIS FUNDS
Supplemental Information
Fund, the Board considered the functions performed by OAM and the personnel providing such services, OAM’s financial condition, the compliance regime created by OAM, including the competency of the Trust’s chief compliance officer and the fact that neither the Trust nor OAM has had any material compliance issues, and OAM’s anticipated financial support of the Asia Opportunities Fund. The Board considered the educational and professional background and qualifications for the portfolio manager for the Asia Opportunities Fund, the OAM trading, research and portfolio management support team and the investment strategy and process for the Asia Opportunities Fund. Based on the information provided, the Board concluded that the nature and extent of services to be provided to the Asia Opportunities Fund was appropriate and that the quality would be good. The Board also considered the honesty and integrity of OAM and the portfolio management team and that OAM personnel act with the highest ethical standards. The Board noted that OAM personnel are very forthright with the Board. Based on information provided, the Board concluded that the nature and extent of services provided to each Fund were appropriate and that the quality was good.
The Board also reviewed and discussed reports prepared by OAM containing information on total returns and average annual total returns over various periods of time of the Emerging Growth, Micro-Cap, Mid-Cap and China Opportunities Funds as compared to relevant market indices and other mutual funds pursuing broadly similar strategies. The Board concluded that (i) as to the Emerging Growth, Micro-Cap, and Mid-Cap Funds, the investment performance was satisfactory, and in some cases, good versus relevant market indices, and was in line with the other mutual funds included in the reports and (ii) as to the China Opportunities Fund, the investment performance, though for a relatively short period of time, was satisfactory versus relevant market indices and good to very good versus other funds included in the report. With respect to the Asia Opportunities Fund, the Board reviewed the performance of the existing funds, in particular the China Opportunities and International Opportunities Funds, and concluded that the performance of existing funds was satisfactory, noting the strong performance of the China Opportunities and International Opportunities Funds since their inception.
Fees and Expenses. For each Fund, the Board compared the amounts paid to OAM for advisory services (for advisory and management services for the China Opportunities and Asia Opportunities Funds) and each Fund’s expense ratio (or expense cap for the China Opportunities and Asia Opportunities Funds) with other mutual funds pursuing broadly similar strategies as included in reports prepared by OAM (and with the China Opportunities and International Opportunities Funds for the Asia Opportunities Fund). This information showed that each of the Emerging Growth, Micro-Cap, Mid Cap, and China Opportunities Fund’s advisory fee was either comparable or in a mid-range compared to other mutual funds, and that the Asia Opportunities Fund’s advisory and management fee is reasonable. The information also showed that the expense ratios of the Emerging Growth, Micro-Cap, Mid-Cap and China Opportunities Funds and the projected expense ratio of the Asia Opportunities Fund were in line with those of similar mutual funds. In addition, the Board considered amounts paid to OAM by other registered funds, for which
58
THE OBERWEIS FUNDS
Supplemental Information
OAM acts as a subadviser. For each Fund (except for the Asia Opportunities Fund because OAM does not manage other regional accounts), the Board considered amounts paid to OAM by OAM’s other clients. With respect to OAM’s other clients, including funds for which it acts as a subadvisor, the Board noted that the mix of services provided and the level of responsibility required under the agreements with the Funds were greater than OAM’s obligations for similar client accounts and that the advisory fees of such accounts are less relevant to the Board’s consideration because they reflect different competitive forces than those in the mutual fund marketplace. The Board also considered that OAM has agreed to bear organizational expenses of the Asia Opportunities Fund and has proposed an expense cap for the Asia Opportunities Fund. Based on the information considered, the Board concluded that each Fund’s advisory fee (advisory and management fee for the China Opportunities and Asia Opportunities Funds, coupled with the expense cap) was reasonable and appropriate in amount given the quality of services provided or expected to be provided.
Profitability. With respect to the costs of services provided and profits realized by OAM, the Board considered the advisory fees received by OAM from each of the Emerging Growth, Micro-Cap, Mid-Cap and China Opportunities Funds and the proposed advisory and management fee rate for the Asia Opportunities Fund. The Board also considered the fact that OAM has agreed to bear the organizational expenses and to cap expenses for the Asia Opportunities Fund. Based on this information, the Board concluded for each Fund that OAM’s profitability was not unreasonable.
Economies of Scale. The Board considered the extent to which economies of scale would be realized as each Fund grows and whether fee levels reflect economies of scale for the benefit of Fund shareholders. The Board reviewed each of the Emerging Growth, Micro-Cap, Mid-Cap and China Opportunities Fund’s asset size and expense ratio. The Board noted OAM’s comments that the Funds may have some capacity constraints which limit economies of scale and that, with respect to the Asia Opportunities Fund, economies of scale are expected during the start-up process. The Board concluded, with respect to each of the Funds, that the total expense ratio, (after giving effect to the expense caps proposed by OAM for the Asia Opportunities Fund) was reasonable.
Other Benefits to OAM and its Affiliates. The Board considered the character and amount of other incidental benefits received by OAM and its affiliates from their relationship with the Funds, including fees received or expected to be received by an affiliate of OAM for distribution services and benefits to OAM related to soft dollars. The Board concluded that, taking into account these benefits, the Emerging Growth, Micro-Cap and Mid-Cap Funds’ advisory fees (advisory and management fees for the China Opportunities and Asia Opportunities Funds) were reasonable.
Based on all of the information considered and the conclusions reached, the Board determined to approve the agreements. The Board of Trustees, including the independent trustees, did not identify any single factor or group of factors as all important or controlling and considered all factors together.
59
THE OBERWEIS FUNDS
Supplemental Information
Expense Examples:
As a shareholder of The Oberweis Funds, you may incur two types of costs: (1) transaction costs, including redemption fees and (2) ongoing costs, including management fees; distribution (and/or service) 12b-1 fees; and other Fund expenses. This example is intended to help you understand your ongoing costs (in dollars) of investing in The Oberweis Funds and to compare these costs with the ongoing costs of investing in other mutual funds.
The Example is based on an investment of $1,000 investment at the beginning of the period and held for the entire period from July 1, 2007 through December 31, 2007.
Actual Expenses:
The first line for each Fund in the table below provides information about actual account values and actual expenses. You may use the information below, together with the amount you invested, to estimate the expenses that you paid over the period. Simply divide your account value by $1,000 (for example, an $8,600 account value divided by $1,000=8.6), then multiply the result by the number in the table under the heading entitled “Expenses Paid During Period” to estimate the expenses you paid on your account during this period.
60
THE OBERWEIS FUNDS
Supplemental Information
Hypothetical Example for Comparison Purposes:
The second line for each Fund in the table below provides information about hypothetical account values and hypothetical expenses based on each Fund’s actual expense ratio and an assumed rate of return of 5% per year before expenses, which is not the Fund’s actual return. The hypothetical account values and expenses may not be used to estimate the actual ending account balance or expenses you paid for the period. You may use this information to compare this 5% hypothetical example with the 5% hypothetical examples that appear in the shareholder reports of other funds.
Please note that the expenses shown in the table are meant to highlight your ongoing costs only and do not reflect any transactional costs, such as redemption fees. Therefore, the second line for each Fund in the table is useful in comparing ongoing costs only, and will not help you determine the relative total costs of owning different funds. In addition, if these transactional costs were included, your costs would have been higher.
| | | | | | | | | | | | |
| | | Beginning
Account Value
7/1/07 | | Ending
Account Value
12/31/07 | | Expense Paid
During Period*
7/1/07-12/31/07 | | Expense Ratio
During Period
7/1/07-12/31/07 | |
Emerging Growth Fund | | | | | | | | | | | | |
Actual | | $ | 1,000.00 | | $ | 1,034.38 | | $ | 6.46 | | 1.26 | % |
Hypothetical (5% return before expenses) | | $ | 1,000.00 | | $ | 1,018.85 | | $ | 6.41 | | 1.26 | % |
Micro-Cap Fund | | | | | | | | | | | | |
Actual | | $ | 1,000.00 | | $ | 1,051.27 | | $ | 7.76 | | 1.50 | % |
Hypothetical (5% return before expenses) | | $ | 1,000.00 | | $ | 1,017.64 | | $ | 7.63 | | 1.50 | % |
Mid-Cap Fund | | | | | | | | | | | | |
Actual | | $ | 1,000.00 | | $ | 1,075.57 | | $ | 9.26 | | 1.77 | % |
Hypothetical (5% return before expenses) | | $ | 1,000.00 | | $ | 1,016.28 | | $ | 9.00 | | 1.77 | % |
China Opportunities Fund | | | | | | | | | | | | |
Actual | | $ | 1,000.00 | | $ | 1,298.89 | | $ | 10.37 | | 1.79 | % |
Hypothetical (5% return before expenses) | | $ | 1,000.00 | | $ | 1,016.18 | | $ | 9.10 | | 1.79 | % |
International | | | | | | | | | | | | |
Opportunities Fund | | | | | | | | | | | | |
Actual | | $ | 1,000.00 | | $ | 1,206.68 | | $ | 10.68 | | 1.92 | % |
Hypothetical (5% return before expenses) | | $ | 1,000.00 | | $ | 1,015.53 | | $ | 9.75 | | 1.92 | % |
| * | Expenses are equal to the average account value times the Fund’s annualized expense ratio multiplied by the number of days in the most recent fiscal half-year divided by the number of days in the fiscal year. |
| | | | |
| | Trustees and Officers | | |
| | James D. Oberweis | | Katherine Smith Dedrick |
| | Trustee | | Trustee |
| | |
| | Gary D. McDaniel | | James G. Schmidt |
| | Trustee | | Trustee |
| | |
| | James W. Oberweis | | Patrick B. Joyce |
| | President | | Executive Vice President |
| | | | Treasurer |
| | |
| | David I. Covas | | Martin L. Yokosawa |
| | Vice President | | Senior Vice President |
| | |
| | Eric V. Hannemann | | |
| | Secretary | | |
| |
| | Manager and Investment Advisor Oberweis Asset Management, Inc. |
| | 3333 Warrenville Road, Suite 500, Lisle, IL 60532 1-800-323-6166 www.oberweisfunds.com |
| |
| | Distributor Oberweis Securities, Inc. 3333 Warrenville Road, Suite 500, Lisle, IL 60532 1-630-577-2300 www.oberweisfunds.com |
| |
| | Custodian UMB Bank, n.a. 928 Grand Blvd., Kansas City, MO 64106 |
| |
| | Transfer Agent UMB Fund Services, Inc. P.O. Box 711 Milwaukee, WI 53201-0711 1-800-245-7311 |
| | Counsel Vedder Price P.C. 222 North LaSalle Street, Chicago, IL 60601 Independent Registered Public Accounting Firm PricewaterhouseCoopers LLP One North Wacker Drive, Chicago, IL 60606 |
 | | |
| | The Oberweis Funds |
| | Emerging Growth Fund Micro-Cap Fund Mid-Cap Fund China Opportunities Fund International Opportunities Fund |
1-800-245-7311
www.oberweisfunds.com
| | (a) | As of December 31, 2007, the registrant has adopted a code of ethics that applies to the registrant’s principal executive officer, principal financial officer, principal accounting officer, or persons performing similar functions. |
| | (b) | A copy of the code of ethics may be obtained upon request, without charge, by contacting the registrant in writing at its principal executive office. |
| ITEM 3. | AUDIT COMMITTEE FINANCIAL EXPERT |
| | (a) | (1) The registrant’s board of trustees has determined that the registrant has at least one audit committee financial expert serving on the audit committee. |
| | (b) | The audit committee financial expert is James G. Schmidt. Mr. Schmidt is independent as defined in Form N-CSR Item 3 (a) (2). |
| ITEM 4. | PRINCIPAL ACCOUNTANT FEES AND SERVICES. |
(a)-(d)
| | | | |
| | | 2006 | | 2007 |
Audit fees | | 54,000 | | 70,000 |
Audit-Related Fees | | N/A | | N/A |
Tax Fees | | 14,000 | | 20,500 |
All Other Fees | | N/A | | N/A |
Audit Fees include amounts related to the audit of the registrant’s annual financial statements and services normally provided by the principal accountant in connection with statutory and regulatory filings. Tax Fees principally include tax compliance, tax advice, tax planning and preparation of tax returns.
(e)(1) The registrant’s audit committee pre-approves all audit services provided by the registrant’s principal accountant for the registrant and all non-audit services provided by the registrant’s principal accountant for the registrant, its investment adviser and any entity controlling, controlled by, or under common
control with the investment adviser (“Adviser Affiliate”) that provides ongoing services to the registrant, if the engagement by the investment adviser or Adviser Affiliate relates directly to the operations and financial reporting of the registrant.
(e)(2) No services included in (b) – (d) above were approved pursuant to paragraph (c)(7)(i)(C) of Rule 2-01 of Regulation S-X.
(f) Not Applicable.
(g) The aggregate fees billed for the most recent fiscal year and the preceding fiscal year by the registrant’s principal accountant for non-audit services rendered to the registrant, its investment, and Adviser Affiliate that provides ongoing services to the registrant for 2007 and 2006 were $17,000, and 16,100, respectively.
(h) Non-audit services rendered to the registrant’s investment adviser and any Adviser Affiliate that were not pre-approved pursuant to Paragraph (c) (7) (ii) of Rule 2-01 of Regulation S-X were considered by the registrant’s audit committee as to whether they were compatible with maintaining the principal account’s independence.
| ITEM 5. | AUDIT COMMITTEE OF LISTED REGISTRANTS. |
Not Applicable to the registrant.
| ITEM 6. | SCHEDULE OF INVESTMENTS. |
See Schedule I in Item 1.
| ITEM 7. | DISCLOSURE OF PROXY VOTING POLICIES AND PROCEDURES FOR CLOSED-END MANAGEMENT INVESTMENT COMPANIES. |
Not Applicable to the registrant.
| ITEM 8. | PORTFOLIO MANAGERS OF CLOSED-END MANAGEMENT INVESTMENT COMPANIES. |
Not Applicable to the registrant.
| ITEM 9. | PURCHASES OF EQUITY SECURITIES BY CLOSED-END MANAGEMENT INVESTMENT COMPANY AND AFFILIATED PURCHASERS. |
Not Applicable to the registrant.
| ITEM 10. | SUBMISSION OF MATTERS TO A VOTE OF SECURITY HOLDERS. |
There have been no material changes to the procedures by which shareholders may recommend nominees to the registrant’s board of trustees since registrant last disclosed such procedures in its proxy statement dated April 16, 2004.
| ITEM 11. | CONTROLS AND PROCEDURES. |
| | (a) | The registrant’s principal executive and principal financial officers, or persons performing similar functions, have concluded that the registrant’s disclosure controls and procedures (as defined in Rule 30a-3 (c) under the Investment Company Act of 1940, as amended (the “1940 Act”) (17CFR 270.30a-3(c))) are effective, as of a date within 90 days of the filing date of the report that includes the disclosure required by this paragraph, based on their evaluation of these controls and procedures required by Rule 30a-3(b) under the 1940 Act (17 CFR 270.30a-3(b)) and Rules 13a-15(b) or 15d-15(b) under the Exchange Act (17 CFR 240.13a-15(b) or 240.15d-15(b)). |
| | (b) | There has been no change to the registrant’s internal control over financial reporting (as defined in Rule 30a-3(d) under the 1940 Act (17 CFR 270.30a-3(d)) that occurred during the second fiscal quarter of the period covered by this report that has materially affected, or is reasonably likely to materially affect, the registrant’s internal control over financial reporting. |
| | |
| (a) (1) | | Code of Ethics applicable to its Principal Executive and Principal Accounting Officers pursuant to Section 406 of the Sarbanes-Oxley Act of 2002 attached hereto as Exhibit 99.406. Code of Ethics. |
| |
| (a) (2) | | Certifications pursuant to Rule 30a-2 under the Investment Company Act of 1940 (17CFR 270.30a-2) in the exact form set forth below: EX-99.CERT attached hereto. |
| |
| (a) (3) | | Any written solicitation to purchase securities under Rule 23 c-1 under the Investment Company Act of 1940 (17 CFR 270.23c-1) sent or given during the period covered by the report by or on behalf of the registrant to 10 or more persons. Not Applicable to the registrant. |
| | |
| |
| (b) | | If the report is filed under Section 13(a) or 15(d) of the Exchange Act, provide the certifications required by Rule 30a-2(b) under the 1940 Act (17 CFR 270.30a-2(b)), Rule 13a-14(b) or Rule 15d-14(b) under the Exchange Act (17 CFR 240.13a-14(b) or 240.15d-14(b)), and Section 1350 of Chapter 63 of Title 18 of the United States Code (18 U.S.C. 1350) as an exhibit. A certification furnished pursuant to this paragraph will not be deemed “filed” for purposes of Section 18 of the Exchange Act (15 U.S. C. 78r), or otherwise subject to the liability of that section. Such certification will not be deemed to be incorporated by reference into any filing under the Securities Act of 1933 or the Exchange Act, except to the extent that the registrant specifically incorporates it by reference. EX-99.906 CERT attached hereto. |
SIGNATURES
Pursuant to the requirements of the Securities Exchange Act of 1934 and the Investment Company Act of 1940, the registrant has duly caused this report to be signed on its behalf by the undersigned, thereunto duly authorized.
| | |
| (Registrant) The Oberweis Funds |
| |
| By (Signature and Title*) | | /s/ James W. Oberweis |
| | James W. Oberweis |
| | President, The Oberweis Funds |
Date 03/03/2008
Pursuant to the requirements of the Securities Exchange Act of 1934 and the Investment Company Act of 1940, this report has been signed below by the following persons on behalf of the registrant and in the capacities and on the dates indicated.
| | |
| By (Signature and Title*) | | /s/ James W. Oberweis |
| | James W. Oberweis |
| | President, The Oberweis Funds |
Date 03/03/2008
| | |
| By (Signature and Title*) | | /s/ Patrick B. Joyce |
| | Patrick B. Joyce |
| | Executive Vice President and Treasurer, |
| | The Oberweis Funds |
Date 03/03/2008
| /*/ | Print the name and title of each signing officer under his or her signature. |