| | |
OMB APPROVAL |
OMB Number: | | 3235-0570 |
Expires: | | September 30, 2007 |
Estimated average burden |
hours per response | | 19.4 |
UNITED STATES
SECURITIES AND EXCHANGE COMMISSION
Washington, D.C. 20549
FORM N-CSR
CERTIFIED SHAREHOLDER REPORT OF REGISTERED
MANAGEMENT INVESTMENT COMPANIES
Investment Company Act file number 811-4854
The Oberweis Funds
(Exact name of registrant as specified in charter)
3333 Warrenville Road, Suite 500, Lisle, IL 60532
(Address of principal executive offices) (Zip code)
| | |
| | Copy to: |
| |
| James W. Oberweis | | James A. Arpaia |
| The Oberweis Funds | | Vedder, Price, Kaufman, & Kammholz, P.C. |
| 3333 Warrenville Road, Suite 500 | | 222 North LaSalle Street, Suite 2600 |
| Lisle, IL 60532 | | Chicago, IL 60601 |
| (Name and address of agent for service) |
Registrant’s telephone number, including area code: (800) 323-6166
Date of fiscal year end: December 31
Date of reporting period: December 31, 2006
Form N-CSR is to be used by management investment companies to file reports with the Commission not later than 10 days after the transmission to stockholders of any report that is required to be transmitted to stockholders under Rule 30e-1 under the Investment Company Act of 1940 (17 CFR 270.30e-1). The Commission may use the information provided on Form N-CSR in its regulatory, disclosure review, inspection, and policymaking roles.
A registrant is required to disclose the information specified by Form N-CSR, and the Commission will make this information public. A registrant is not required to respond to the collection of information contained in Form N-CSR unless the Form displays a currently valid Office of Management and Budget (“OMB”) control number. Please direct comments concerning the accuracy of the information collection burden estimate and any suggestions for reducing the burden to Secretary, Securities and Exchange Commission, 450 Fifth Street, NW, Washington, DC 20549-0609. The OMB has reviewed this collection of information under the clearance requirements of 44 U.S.C. § 3507.
| ITEM 1. | REPORTS TO STOCKHOLDERS. |
The Annual Report to Stockholders Follows.
PRESIDENT’S LETTER
Dear Fellow Oberweis Funds Shareholder:
I am pleased to report positive returns for each of The Oberweis Funds in 2006. The China Opportunities Fund performed extraordinarily well, appreciating +81.17%. Among our U.S.-focused funds, the Micro-Cap Fund returned +1.66%, the Emerging Growth Fund returned +4.87%, and the Mid-Cap Fund returned +11.89%.
Stocks took investors on a bit of a roller-coaster ride in 2006, rising steadily into May before getting the summer doldrums. The summer slide was snapped by two factors that suggested inflation was under control: one, after peaking at nearly $80 per barrel in July, crude oil began a precipitous slide and fell roughly 25% by Halloween; and two, the Federal Reserve’s decision on August 8th not to raise interest rates after 17 consecutive rate hikes implied that tighter monetary policy had slowed the economy and lessened the threat of sustained inflation. With inflation fears quelled, equity markets responded strongly. From the lows reached during the summer, the S&P 500 Index appreciated approximately 17% and the Russell 2000 Index gained over 18% by year-end.
While these and other macro events drove the market up and down throughout the year, our approach remains focused at the micro level, seeking individual companies whose growth prospects are strong and whose valuations appear low in relation to the company’s forecasted rate of growth. While the funds’ returns over short periods of time will invariably be influenced by unpredictable events, over time the cyclical nature of the market permits residual stock picking ability to shine through.
Our first international fund, the China Opportunities Fund, finished its first full year with terrific results. Strong economic growth in China paired with increased international investment, led equity markets in the greater China region to post remarkable gains. The Micro-Cap and Emerging Growth Funds experienced more modest gains for the year. These two funds invest in very high growth small-cap companies and faced headwinds in 2006. American small-cap companies with high rates of earnings growth, which are targeted by our investment strategies for these two funds, did not perform as well as small-cap companies with lower rates of earnings growth. Over longer periods of time, however, these style cycles have historically tended to average out and the longer term returns to shareholders have been quite favorable. Indeed, you will be pleased to learn that over the past ten years both the Micro-Cap and Emerging Growth Funds have outperformed the benchmark Russell 2000® Growth Index. Not surprisingly, some of the best historical buying opportunities for the Emerging Growth and Micro-Cap Funds were after periods in which our investment style was out of favor in the market.
The average forward P/E ratio at the end of 2006 was 23.7 times for the Micro-Cap Fund, 23.9 times for the Emerging Growth Fund, 23.6 times for the Mid-Cap Fund, and 20.9 times for the China Opportunities Fund. As of 12/31/06, the weighted average market capitalization for the Micro-Cap, Emerging Growth, Mid-Cap and China Opportunities Funds, respectively, was $275 million, $1.13 billion, $2.03 billion, and $4.5 billion. Note that the average market capitalization for the China Opportunities Fund was skewed upward by a few holdings with large market capitalizations. The median issue in the fund had a market capitalization of $1.19 billion.
We are also proud to announce the launch of our fifth fund, the Oberweis International Opportunities Fund (OBIOX), on Feb 1, 2007. Interested investors may obtain a prospectus at www.ober-weisfunds.com. In addition, the Micro-Cap Fund has reopened to investors. At present, all of The Oberweis Funds are open to new investors. If you have any questions about your account, please contact shareholder services at (800) 245-7311. Thank you for investing with us in The Oberweis Funds.
Sincerely,

James W. Oberweis
President & Portfolio Manager
1
THE OBERWEIS FUNDS
MANAGEMENT DISCUSSION ON FUND PERFORMANCE
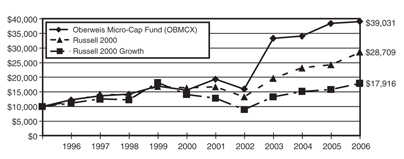
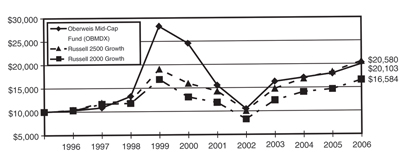
For the annual period ended December 31, 2006, the Oberweis Micro-Cap Fund appreciated +1.66% and the Emerging Growth Fund appreciated +4.87%. For comparison, the benchmark Russell 2000 Growth Index appreciated +13.35%. The Oberweis Mid-Cap Fund appreciated +11.89%. The Russell 2500 Growth Index appreciated +12.26%. The Oberweis China Opportunities Fund returned +81.17% for the year ended December 31, 2006 versus +78.36% for its benchmark, the S&P/Citigroup EMI China Index.
Three of the four Oberweis Funds invest primarily in United States stocks, namely Micro-Cap, Emerging Growth, and Mid-Cap. These three funds are positioned to take advantage of the long-term price appreciation that occurs when the market places an appropriately high value on fast growing, profitable companies primarily located in the United States. The China Opportunities Fund is positioned to take advantage of the long-term price appreciation that occurs when the market places an appropriately high value on China-related fast-growing, profitable companies.
In 2006, the U.S. small-cap equity market performed well, rising 18.37% as measured by the Russell 2000 Index. Within the small-cap marketplace, value outperformed growth by 1,013 basis points for the year. The Russell 2000 Growth Index returned 13.35% while the Russell 2000 Value Index returned 23.48%. Energy and interest rates were two of the important variables driving U.S. equity returns. The Federal Reserve’s decision on August 8th not to raise interest rates after 17 consecutive rate hikes implied that tighter monetary policy had slowed the economy and lessened the threat of sustained inflation. After peaking in July, crude oil experienced a significant decline in the second half of the year. With inflation fears quelled, U.S. equity markets responded positively in the second half of the year. Strong economic growth in China, paired with increased international investment into China, led equity markets in the greater China region to post remarkable gains.
The China Opportunities Fund returned exceptionally high absolute returns and exceeded its benchmark, the S&P/Citigroup EMI China Index. The Mid-Cap Fund trailed its benchmark, the Russell 2500 Index, by 37 basis points. The Micro-Cap and Emerging Growth Funds trailed the Russell 2000 Growth Index in 2006. These two funds invest in very high growth small-cap companies. Within the benchmark, companies with high rates of growth underperformed companies with lower rates of earnings growth. Although they experienced a challenging year in 2006, both the Micro-Cap and Emerging Growth Funds have outperformed the benchmark Russell 2000 Growth Index over the last 10 years.
The Micro-Cap Fund particularly benefited from investments in Fuel Tech Inc., Perficient Inc., Kenexa Corp., Omrix Biopharmaceuticals Inc., and Allis-Chalmers Energy Inc. The Emerging Growth Fund derived significant gains from investments in Focus Media Holding Ltd., Veritas DGC Inc., Rackable Systems Inc., Desarrolladora Homex S.A. de C.V., and Redback Networks Inc. The Mid-Cap Fund particularly benefited from investments in Focus Media Holding Ltd., Akamai Technologies Inc., Wellcare Health Plans Inc., Redback Networks Inc., and Joy Global Inc. The China Opportunities Fund benefited from investments in China Infrastructure Machinery, Century Sunshine Ecological, Nine Dragons Paper, Ezra Holdings, and Focus Media Holding Ltd. The portfolio turnover rates were 108% for the Micro-Cap Fund, 74% for the Emerging Growth Fund, 112% for the Mid-Cap Fund, and 53% for the China Opportunities Fund. The net expense ratios of the four funds were 1.62% for Micro-Cap, 1.35% for Emerging Growth, 1.83% for Mid-Cap, and 1.91% for China Opportunities.
2
THE OBERWEIS FUNDS
MANAGEMENT DISCUSSION ON FUND PERFORMANCE
(cont’d.)
The SEC adopted a requirement that Funds present their portfolio holdings in a table, chart or graph format in their annual and semi-annual reports to shareholders, whether or not a schedule of investments is utilized. The following tables, which present portfolio holdings as a percentage of net assets, are provided in compliance with this requirement.
Oberweis Emerging Growth Fund
| | | |
Asset Allocation | | | |
Common Stocks | | 96.4 | % |
Warrants | | 0.2 | % |
Other Assets in excess of Liabilities | | 3.4 | % |
| | | |
| | 100.0 | % |
| | | |
Top Holdings | | | |
Focus Media Hldg. Ltd. | | 2.8 | % |
Ceradyne, Inc. | | 2.6 | % |
Redback Networks, Inc. | | 2.5 | % |
Veritas DGC, Inc. | | 2.3 | % |
aQuantive, Inc. | | 2.3 | % |
Think Partnership, Inc. | | 2.2 | % |
Carrizo Oil & Gas, Inc. | | 2.1 | % |
Trident Microsystems, Inc. | | 1.9 | % |
G-Market, Inc. | | 1.9 | % |
Valueclick, Inc. | | 1.9 | % |
Other Holdings | | 77.5 | % |
| | | |
| | 100.0 | % |
| | | |
Top Industries | | | |
Technology - Computer Services Software & Systems | | 9.6 | % |
Technology - Communication Technology | | 8.7 | % |
Consumer Discretionary - Advertising Agency | | 7.8 | % |
Consumer Discretionary - Service Commercial | | 5.8 | % |
Other Energy - Oil Crude Producer | | 5.0 | % |
Technology - Computer Technology | | 4.7 | % |
Health Care - Medical & Dental Services | | 4.6 | % |
Health Care - Drugs & Pharmaceuticals | | 3.8 | % |
Health Care Management Services | | 3.7 | % |
Technology Electronics Semi-Conductors | | 3.0 | % |
Other Industries | | 43.3 | % |
| | | |
| | 100.0 | % |
Oberweis Micro-Cap Fund
| | | |
Asset Allocation | | | |
Common Stocks | | 101.4 | % |
Warrants | | 0.4 | % |
Other Liabilities in excess of Assets | | (1.8 | %) |
| | | |
| | 100.0 | % |
| | | |
Top Holdings | | | |
Kenexa Corp. | | 4.7 | % |
Think Partnership, Inc. | | 3.8 | % |
Fuel - Tech, Inc. | | 3.6 | % |
Perficient, Inc. | | 3.5 | % |
Vasco Data Security International, Inc. | | 3.4 | % |
I.D. Systems, Inc. | | 3.1 | % |
Allis-Chalmers Energy, Inc. | | 2.8 | % |
Vital Images, Inc. | | 2.7 | % |
Saba Software, Inc. | | 2.0 | % |
GMX Resources, Inc. | | 1.9 | % |
Other Holdings | | 68.5 | % |
| | | |
| | 100.0 | % |
| | | |
Top Industries | | | |
Technology - Computer Service Software & System | | 21.1 | % |
Consumer Discretionary - Service Commercial | | 5.8 | % |
Technology - Computer Technology | | 5.7 | % |
Producer Durables - Misc. | | 5.6 | % |
Technology - Electronics Semi-Conductors | | 5.4 | % |
Consumer Discretionary - Misc. | | 4.7 | % |
Other Energy - Oil Crude Producer | | 4.3 | % |
Technology - Internet Software & Systems | | 3.8 | % |
Other Energy - Machine Oilwell Equipment | | 3.8 | % |
Producer Durables - Electronics | | 3.5 | % |
Other Industries | | 36.3 | % |
| | | |
| | 100.0 | % |
3
THE OBERWEIS FUNDS
MANAGEMENT DISCUSSION ON FUND PERFORMANCE
(cont’d.)
Oberweis Mid-Cap Fund
| | | |
Asset Allocation | | | |
Common Stocks | | 98.6 | % |
Other Assets in excess of Liabilities | | 1.4 | % |
| | | |
| | 100.0 | % |
| | | |
Top Holdings | | | |
Wellcare Health Plans, Inc. | | 4.6 | % |
Illumina, Inc. | | 3.8 | % |
Tessera Technologies, Inc. | | 3.3 | % |
Redback Networks | | 3.3 | % |
Focus Media Hldg. Ltd. | | 3.3 | % |
Allscripts Healthcare Solutions, Inc. | | 3.3 | % |
SunTech Power Holdings Co. Ltd. | | 3.0 | % |
Nutri/System, Inc. | | 3.0 | % |
Hologic, Inc. | | 2.8 | % |
Daktronics, Inc. | | 2.6 | % |
Other Holdings | | 67.0 | % |
| | | |
| | 100.0 | % |
| | | |
Top Industries | | | |
Technology - Communication Technology | | 11.1 | % |
Health Care - Management Services | | 9.3 | % |
Health Care - Electrical Medical Systems | | 8.3 | % |
Consumer Discretionary - Advertising Agency | | 7.9 | % |
Technology - Electronics Semi-Conductors | | 7.8 | % |
Other Energy-Machine Oilwell | | 5.2 | % |
Consumer Discretionary-Retail | | 5.0 | % |
Technology - Computer Service Software & Systems | | 5.0 | % |
Health Care - Medical & Dental Instruments / Supplies | | 4.0 | % |
Consumer Discretionary-Service Commerical | | 4.0 | % |
Other Industries | | 32.4 | % |
| | | |
| | 100.0 | % |
Oberweis China Opportunities Fund
| | | |
Asset Allocation | | | |
Common Stocks | | 94.4 | % |
Commerical Paper | | 7.4 | % |
Other Liabilities in excess of Assets | | (1.8 | %) |
| | | |
| | 100.0 | % |
| | | |
Top Holdings | | | |
Century Sunshine Ecological Technology Ltd. | | 3.4 | % |
Baidu.com, Inc. | | 3.3 | % |
Nine Dragons Paper Holdings Ltd. | | 3.2 | % |
Ezra Holdings, Ltd. | | 2.7 | % |
Focus Media Hldg. Ltd. ADR | | 2.6 | % |
China Infrastructure | | 2.5 | % |
Fu Ji Food & Catering Services Holding Ltd. | | 2.5 | % |
Lee & Man Paper Manufacturing Ltd. | | 2.5 | % |
Raffles Education Corp. Ltd. | | 2.2 | % |
Suntech Power Holdings Co., Ltd. | | 2.1 | % |
Other Holdings | | 73.0 | % |
| | | |
| | 100.0 | % |
| | | |
Top Industries | | | |
Basic Materials - Paper & Related Products | | 5.7 | % |
Industrial - Transport - Marine | | 4.8 | % |
Consumer Non-Cyclical - Food Misc/ Diversified | | 4.4 | % |
Energy Alternative Sources | | 3.9 | % |
Financials - Real Estate Operations / Development | | 3.4 | % |
Basic Materials - Agriculture Chemicals | | 3.4 | % |
Communications - Internet Content Information | | 3.3 | % |
Communications - Advertising Sales | | 2.6 | % |
Consumer Non-Cyclical Schools | | 2.6 | % |
Industrial - Machinery Construction & Mining | | 2.5 | % |
Other Industries | | 63.4 | % |
| | | |
| | 100.0 | % |
4
THE OBERWEIS FUNDS
MANAGEMENT DISCUSSION ON FUND PERFORMANCE
(cont’d.)
| | | | | | | | | | | | | | |
| | | Average Annual Total Returns(1) | | | | | | Growth of an Assumed $10,000 Investment |
| | | Periods ended 12/31/06 | | | | | | from January 7, 1987 to December 31, 2006 |
| | | | | | | | | | | | | | |
| | | One
Year | | | Five
Years | | | Ten
Years | | | Since
Inception
1/7/87 | | | 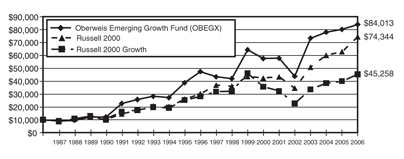
|
OBEGX | | +4.87 | % | | +7.79 | % | | +5.89 | % | | +11.23 | % | |
Russell 2000 Growth | | +13.35 | % | | +6.93 | % | | +4.88 | % | | +7.85 | % | |
Russell 2000 | | +18.37 | % | | +11.39 | % | | +9.44 | % | | +10.56 | % | |
| | | | | | | | | | | | | |
| | | | | | | | | | | | | | |
| | | Average Annual Total Returns(1) | | | | | | Growth of an Assumed $10,000 Investment |
| | | Periods ended 12/31/06 | | | | | | from January 1, 1996 to December 31, 2006 |
| | | | | | | | | | | | | | 
|
| | | One
Year | | | Five
Years | | | Ten
Years | | | Since
Inception
1/1/96 | | |
OBMCX | | +1.66 | % | | +15.12 | % | | +12.26 | % | | +13.18 | % | |
Russell 2000 Growth | | +13.35 | % | | +6.93 | % | | +4.88 | % | | +5.44 | % | |
Russell 2000 | | +18.37 | % | | +11.39 | % | | +9.44 | % | | +10.06 | % | |
| | | | | | | | | | | | | |
| | | | | | | | | | | | | | |
| | | Average Annual Total Returns(1) | | | | | | Growth of an Assumed $10,000 Investment |
| | | Periods ended 12/31/06 | | | | | | from September 15, 1996 to December 31, 2006 |
| | | | | | | | | | | | | | 
|
| | | One
Year | | | Five
Years | | | Ten
Years | | | Since
Inception
1/1/96 | | |
OBMDX | | +11.89 | % | | +5.30 | % | | +6.93 | % | | +7.02 | % | |
Russell 2500 Growth | | +12.26 | % | | +7.62 | % | | +7.11 | % | | +7.26 | % | |
Russell 2000 | | +18.37 | % | | +11.39 | % | | +9.44 | % | | +5.04 | % | |
| | | | | | | | | | | | | |
(1) | Performance data represents past performance, which is no guarantee of future results. Current performance may be higher or lower than the performance shown. You can obtain performance data current to the most recent month by visiting www.oberweisfunds.com. Returns are historical and include changes in share price and reinvestment of dividends and capital gains. Investment return and principal value will fluctuate so that shares, when redeemed, may be worth more or less than their original cost. The Oberweis Funds invest in rapidly growing smaller and medium sized companies, which may offer greater return potential. However, these investments often involve greater risks and volatility. There is no guarantee that the funds can achieve their objectives. The Russell 2000 Growth Index measures the performance of those Russell 2000 companies with higher price-to-book ratios and higher forecasted earnings growth rates. The Russell 2000 Index measures the performance of 2000 companies with small-market capitalizations. The Russell 2500 Growth Index measures the performance of Russell 2500 companies with lower price-to-book ratios and lower forecasted growth values. The Russell indices are unmanaged and are not available for investment. A sales load of 4% was charged on the Oberweis Emerging Growth Fund until December 31, 1991 and is not reflected in the total return figures or graph above. |
5
THE OBERWEIS FUNDS
MANAGEMENT DISCUSSION ON FUND PERFORMANCE
(cont’d.)
| | | | | | | | |
Average Annual Total Returns(1) Periods ended 12/31/06 | | | Growth of an Assumed $10,000 Investment
from October 1, 2005 to December 31, 2006 |
| | | One
Year | | | Since
Inception
10/1/05 | | | 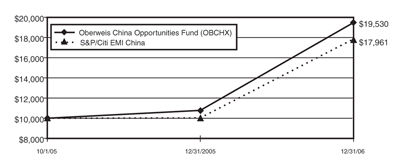
|
OBCHX | | +81.17 | % | | +71.35 | % | |
S&P/Citi EMI China | | +78.36 | % | | +60.18 | % | |
| | | | | | | |
(1) | Performance data represents past performance, which is no guarantee of future results. Returns are historical and include changes in share price and reinvestment of dividends and capital gains. Current performance may be higher or lower than the performance shown. You can obtain performance data current to the most recent month by visiting www.oberweisfunds.com. The principal value and investment return of an investment will fluctuate so that your shares, when redeemed, may be worth more or less than their original cost. The Oberweis Funds invest in rapidly growing smaller and medium sized companies, which may offer greater return potential. However, these investments often involve greater risks and volatility. Foreign and emerging market investing involves special risks such as currency fluctuation and less public disclosure, as well as economic and political risk. There is no guarantee that the funds can achieve their objectives. |
The S&P/Citigroup EMI China Index represents the smallest 20% of companies, ranked by total market capitalization, which qualify for inclusion in the S&P/Citigroup BMI China Index, which is an unmanaged broad market index of the universe of institutionally investable securities in China.
6
OBERWEIS EMERGING GROWTH FUND
Portfolio of Investments
December 31, 2006 (value in thousands)
| | | | | |
| Shares | | Company (Closing Price) | | Value |
| | | EQUITIES - 96.4% | | |
| | |
| | | Auto & Transportation - Air
Transportation - 1.1% | | |
| 60,500 | | Ladish Co., Inc.@ 37.08 | | $ | 2,243 |
| | | | | |
| | |
| | Consumer Discretionary - Advertising Agency - 7.8% | | | |
| 183,874 | | aQuantive, Inc. @ 24.66 | | | 4,534 |
| 84,889 | | Focus Media Hldg. Ltd. @ 66.39 | | | 5,636 |
| 49,750 | | inVentiv Health, Inc. @ 35.35 | | | 1,759 |
| 156,500 | | ValueClick, Inc. @ 23.63 | | | 3,698 |
| | | | | |
| | | | | 15,627 |
| | | | | |
| | |
| | Consumer Disretionary - Casinos & Gambling - 0.8% | | | |
| 60,300 | | Shuffle Master, Inc.@ 26.20 | | | 1,580 |
| | | | | |
| | |
| | Consumer Discretionary - Commercial Information Service - 0.9% | | | |
| 97,994 | | Lecg Corp. @ 18.48 | | | 1,811 |
| | | | | |
| | |
| | Consumer Discretionary - Consumer Products - 1.1% | | | |
| 55,900 | | Citi Trends, Inc.@ 39.64 | | | 2,216 |
| | | | | |
| | |
| | Consumer Discretionary - Retail - 2.1% | | | |
| 70,767 | | Volcom, Inc. @ 29.57 | | | 2,093 |
| 72,300 | | Zumiez, Inc. @ 29.54 | | | 2,136 |
| | | | | |
| | | | | 4,229 |
| | | | | |
| | |
| | Consumer Discretionary - Service Commercial - 5.8% | | | |
| 41,465 | | CRA International, Inc. @ 52.40 | | | 2,173 |
| 28,192 | | *Ctrip.com International Ltd. @ 62.37 | | | 1,758 |
| 159,300 | | G-Market, Inc.@ 23.96 | | | 3,817 |
| 71,600 | | Kenexa Corp. @ 33.26 | | | 2,381 |
| 49,500 | | Travelzoo, Inc.@ 29.95 | | | 1,483 |
| | | | | |
| | | | | 11,612 |
| | | | | |
| | |
| | Consumer Discretionary - Shoes - 2.2% | | | |
| 26,700 | | Heelys, Inc.@ 32.11 | | | 857 |
| 122,900 | | Iconix Brand Group, Inc. @ 19.39 | | | 2,383 |
| 35,050 | | *Steven Madden Ltd.@ 35.09 | | | 1,230 |
| | | | | |
| | | | | 4,470 |
| | | | | |
| | |
| | Consumer Discretionary - Wholesale - 1.7% | | | |
| 116,950 | | Central European Distribution Corp. @ 29.70 | | | 3,473 |
| | | | | |
| | |
| | Consumer Staples - Foods - 0.4% | | | |
| 85,000 | | Sunopta, Inc. @ 8.80 | | | 748 |
| | | | | |
See accompanying notes to financial statements.
| | | | | |
| Shares | | Company (Closing Price) | | Value |
| | Financial Services - Financial Data Product Services - 1.8% | | | |
| 86,000 | | Exlservice Holdings, Inc. @ 21.04 | | $ | 1,809 |
| 132,100 | | Tradestation Group, Inc. @ 13.75 | | | 1,816 |
| | | | | |
| | | | | 3,625 |
| | | | | |
| | |
| | Financial Services - Insurance - 1.4% | | | |
| 25,100 | | eHealth, Inc. @ 20.11 | | | 505 |
| 92,100 | | HealthExtras, Inc. @ 24.10 | | | 2,220 |
| | | | | |
| | | | | 2,725 |
| | | | | |
| | |
| | Health Care - Biotechnology - 2.3% | | | |
| 54,181 | | ArthroCare Corp. @ 39.92 | | | 2,163 |
| 77,700 | | Omrix Biopharmaceuticals, Inc. @ 30.26 | | | 2,351 |
| | | | | |
| | | | | 4,514 |
| | | | | |
| | |
| | Health Care - Drugs & Pharmaceuticals - 3.8% | | | |
| 84,800 | | Adams Respiratory Therapeutics, Inc. @ 40.81 | | | 3,461 |
| 145,269 | | Salix Pharmaceuticals Ltd. @ 12.17 | | | 1,768 |
| 96,467 | | Sciele Pharma, Inc. @ 24.00 | | | 2,315 |
| | | | | |
| | | | | 7,544 |
| | | | | |
| | |
| | Health Care - Electronic Medical Systems - 1.1% | | | |
| 100,700 | | Natus Medical, Inc.@ 16.61 | | | 1,673 |
| 20,895 | | Syneron Medical Ltd. @ 27.13 | | | 567 |
| | | | | |
| | | | | 2,240 |
| | | | | |
| | |
| | Health Care - Facilities - 1.0% | | | |
| 40,466 | | Healthways, Inc. @ 47.71 | | | 1,931 |
| | | | | |
| | |
| | Health Care - Management Services - 3.7% | | | |
| 117,518 | | Allscripts Healthcare, Inc.@ 26.99 | | | 3,172 |
| 128,200 | | Healthspring, Inc. @ 20.35 | | | 2,609 |
| 47,900 | | Vital Images, Inc.@ 34.80 | | | 1,667 |
| | | | | |
| | | | | 7,448 |
| | | | | |
| | |
| | Health Care - Medical & Dental Services - 4.6% | | | |
| 58,600 | | Abaxis, Inc. @ 19.25 | | | 1,128 |
| 52,000 | | Foxhollow Technologies, Inc. @ 21.58 | | | 1,122 |
| 86,100 | | Kyphon, Inc. @ 40.40 | | | 3,478 |
| 35,100 | | Lifecell Corp. @ 24.14 | | | 847 |
| 27,575 | | Palomar Medical Technologies, Inc. @ 50.67 | | | 1,397 |
| 96,700 | | Spectranetics Corp. @ 11.29 | | | 1,092 |
| | | | | |
| | | | | 9,064 |
| | | | | |
7
OBERWEIS EMERGING GROWTH FUND
Portfolio of Investments (cont’d.)
| | | | | |
Shares | | Company (Closing Price) | | Value |
| | Health Care - Services - 1.9% | | | |
35,000 | | LHC Group, Inc. @ 28.51 | | $ | 998 |
110,200 | | Nighthawk Radiology Holdings, Inc. @ 25.50 | | | 2,810 |
| | | | | |
| | | | | 3,808 |
| | | | | |
| | |
| | Materials & Production - Building Materials - 0.9% | | | |
86,600 | | Zoltek Companies, Inc.@ 19.67 | | | 1,703 |
| | | | | |
| | |
| | Materials & Production - Metal Fabricating - 0.8% | | | |
54,400 | | Dynamic Materials Corp. @ 28.10 | | | 1,529 |
| | | | | |
| | |
| | Materials & Production - Misc. Materials &Commodities - 2.6% | | | |
90,450 | | Ceradyne, Inc. @ 56.50 | | | 5,110 |
| | | | | |
| | |
| | Other Energy - Machine Oilwell Equipment - 2.4% | | | |
71,300 | | Allis-Chalmers Energy, Inc. @ 23.04 | | | 1,643 |
44,500 | | Dril Quip, Inc. @ 39.16 | | | 1,743 |
25,200 | | *Lufkin Industries, Inc. @ 58.08 | | | 1,464 |
| | | | | |
| | | | | 4,850 |
| | | | | |
| | |
| | Other Energy - Misc. - 2.3% | | | |
54,575 | | Veritas DGC, Inc. @ 85.63 | | | 4,673 |
| | | | | |
| | |
| | Other Energy - Offshore Drilling - 1.0% | | | |
66,025 | | Hercules Offshore, Inc. @ 28.90 | | | 1,908 |
| | | | | |
| | |
| | Other Energy - Oil Crude Producer - 5.0% | | | |
46,791 | | ATP Oil & Gas Corp. @ 39.57 | | | 1,851 |
48,900 | | Bronco Drilling Company, Inc. @ 17.19 | | | 841 |
142,901 | | Carrizo Oil & Gas, Inc. @ 29.02 | | | 4,147 |
23,900 | | Goodrich Petroleum Corp. @ 36.18 | | | 865 |
155,000 | | Petrohawk Energy Corp. @ 11.50 | | | 1,782 |
33,400 | | Pioneer Drilling Co. @ 13.28 | | | 444 |
| | | | | |
| | | | | 9,930 |
| | | | | |
| | |
| | Producer Durables - Homebuilding - 1.3% | | | |
44,855 | | Desarrolladora Homex S.A. Development Corp. @ 59.07 | | | 2,650 |
| | | | | |
| | |
| | Producer Durables - Machinery Industrial - 0.7% | | | |
54,000 | | Kadant, Inc. @ 24.38 | | | 1,317 |
| | | | | |
| | |
| | Producer Durables - Misc. - 1.3% | | | |
30,950 | | *Bucyrus International, Inc. @ 51.76 | | | 1,602 |
59,845 | | Turbochef Technologies, Inc. @ 17.02 | | | 1,019 |
| | | | | |
| | | | | 2,621 |
| | | | | |
| | |
| | Producer Durables Pollution & Environment - 0.6% | | | |
59,577 | | *American Ecology Corp.@ 18.51 | | | 1,103 |
| | | | | |
See accompanying notes to financial statements.
| | | | | |
Shares | | Company (Closing Price`) | | Value |
| | Technology - Communication Technology - 8.7% | | | |
148,464 | | Acme Packet, Inc. @ 20.64 | | $ | 3,064 |
103,100 | | Atheros Communications, Inc. @ 21.32 | | | 2,198 |
134,400 | | Oplink Communications, Inc. @ 20.56 | | | 2,763 |
83,300 | | Optium Corp. @ 24.94 | | | 2,077 |
198,000 | | Redback Networks, Inc.@ 24.94 | | | 4,938 |
152,000 | | Sierra Wireless, Inc. @ 14.06 | | | 2,137 |
| | | | | |
| | | | | 17,177 |
| | | | | |
| | |
| | Technology - Computer Services Software & Systems - 9.6% | | | |
143,900 | | Concur Technologies, Inc. @ 16.04 | | | 2,308 |
110,200 | | DealerTrack Holdings, Inc.@ 29.42 | | | 3,242 |
77,300 | | DivX, Inc.@ 23.07 | | | 1,783 |
93,800 | | Emageon, Inc. @ 15.36 | | | 1,441 |
48,892 | | Infocrossing Inc, @ 16.30 | | | 797 |
54,500 | | Interactive Intelligence, Inc. @ 22.42 | | | 1,222 |
148,635 | | Online Resources, Inc. @ 10.21 | | | 1,518 |
99,555 | | Rightnow Technologies, Inc. @ 17.22 | | | 1,714 |
66,600 | | Sigma Designs, Inc. @ 25.45 | | | 1,695 |
38,373 | | Systems Xcellence, Inc. @ 20.17 | | | 774 |
212,500 | | VASCO Data Security International, Inc. @ 11.85 | | | 2,518 |
| | | | | |
| | | | | 19,012 |
| | | | | |
| | |
| | Technology - Computer Technology - 4.7% | | | |
133,400 | | Falconstor Software, Inc. @ 8.65 | | | 1,154 |
59,400 | | Occam Networks, Inc. @ 16.50 | | | 980 |
65,300 | | Rackable Systems, Inc. @ 30.97 | | | 2,022 |
107,500 | | SimpleTech, Inc. @ 12.68 | | | 1,363 |
213,100 | | Trident Microsystems, Inc. @ 18.18 | | | 3,874 |
| | | | | |
| | | | | 9,393 |
| | | | | |
| | |
| | Technology - Electronics - 2.7% | | | |
88,700 | | *Daktronics, Inc. @ 36.85 | | | 3,269 |
55,700 | | Supertex, Inc. @ 39.25 | | | 2,186 |
| | | | | |
| | | | | 5,455 |
| | | | | |
| | |
| | Technology - Electronics Semi-Conductors - 3.0% | | | |
83,300 | | Canadian Solar, Inc. @ 10.48 | | | 873 |
29,600 | | IPG Photonics Corp. @ 24.00 | | | 710 |
105,713 | | PLX Technology, Inc. @ 13.04 | | | 1,378 |
75,303 | | Tessera Technologies, Inc. @ 40.34 | | | 3,038 |
| | | | | |
| | | | | 5,999 |
| | | | | |
| | Technology - Electronics Technology - 0.4% | | | |
30,100 | | Essex Corp. @ 23.91 | | | 720 |
| | | | | |
8
OBERWEIS EMERGING GROWTH FUND
Portfolio of Investments (cont’d.)
| | | | | |
| Shares | | Company (Closing Price) | | Value |
| | | Technology - Internet
Software & Systems - 2.2% | | |
| 1,350,000 | | Think Partnership, Inc. @ 3.26 | | $ | 4,401 |
| | | | | |
| | |
| | Utilities - Utilities Telecommunications - 0.7% | | | |
| 44,743 | | *Atlantic Tele-Network, Inc. @ 29.30 | | | 1,311 |
| | | | | |
| | Total Equities | | | |
| | (Cost: $ 142,944,000) | | $ | 191,770 |
| | | | | |
| | |
| Units | | Company (Closing Price) | | Value |
| | WARRANTS - 0.2% | | | |
| | |
| | Technology - Internet Software & Systems | | | |
| 540,000(a) | | Think Partnership, Inc. ($2.50 expires 4-3-11) | | $ | 410 |
| 170,043(a) | | Think Partnership, Inc. ($3.05 expires 12-5-11) | | | 36 |
| 85,022(a) | | Think Partnership, Inc. ($4.00 expires 12-5-11) | | | 0 |
| | | | | |
| | Total Warrants | | | |
| | (Cost: $0) | | $ | 446 |
| | | | | |
| | Total Investments - 96.6% | | | |
| | (Cost: $ 142,944,000) | | | 192,216 |
| | Other Assets less Liabilities 3.4% | | | 6,829 |
| | | | | |
| | NET ASSETS – 100% | | $ | 199,045 |
| | | | | |
See accompanying notes to financial statements.
Notes to Portfolio of Investments
Based on the cost of investments of $143,076,000 for federal income tax purposes at December 31, 2006, the aggregate gross unrealized appreciation was $56,258,000, the aggregate gross unrealized depreciation was $7,118,000 and the net unrealized appreciation of investments was $49,140,000.
| * | Income producing security during the year ended December 31, 2006. |
| (a) | The securities are subject to legal or contractual restrictions on sale. They are valued at fair value in accordance with procedures adopted by the board of trustees of the Trust as of December 31, 2006. The aggregate value of restricted securities was $446,000 or 0.2% of net assets at December 31, 2006. |
9
OBERWEIS MICRO-CAP FUND
Portfolio of Investments
December 31, 2006 (value in thousands)
| | | | | |
| Shares | | Company (Closing Price) | | Value |
| | EQUITIES - 101.4% | | | |
| | |
| | Auto & Transport - Air Transportation - 0.8% | | | |
| 27,900 | | LMI Aerospace, Inc. @ 15.48 | | $ | 432 |
| | | | | |
| | |
| | Consumer Discretionary - Commercial Information Service - 0.8% | | | |
| 35,447 | | Internet Gold Golden Lines Ltd. @ 12.46 | | | 442 |
| | | | | |
| | |
| | Consumer Discretionary - Misc. - 4.7% | | | |
| 78,232 | | Kenexa Corp. @ 33.26 | | | 2,602 |
| | | | | |
| | |
| | Consumer Discretionary - Retail - 1.9% | | | |
| 34,300 | | Gaiam, Inc. @ 13.68 | | | 469 |
| 52,800 | | US Home System, Inc. @ 11.36 | | | 600 |
| | | | | |
| | | | | 1,069 |
| | | | | |
| | |
| | Consumer Discretionary - Service Commercial - 5.8% | | | |
| 39,900 | | CRM Holdings Ltd. @ 8.90 | | | 355 |
| 31,100 | | ICF International, Inc. @ 14.52 | | | 452 |
| 4,400 | | Peoplesupport, Inc. @ 21.05 | | | 93 |
| 86,934 | | Rainmaker Systems, Inc. @ 7.47 | | | 649 |
| 76,000 | | Metretek Technologies, Inc. @ 12.32 | | | 936 |
| 51,000 | | *Thomas Group, Inc. @ 15.04 | | | 767 |
| | | | | |
| | | | | 3,252 |
| | | | | |
| | |
| | Consumer Discretionary - Wholesale - 1.5% | | | |
| 35,600 | | ACR Group, Inc. @ 5.90 | | | 210 |
| 18,500 | | DXP Enterprises, Inc. @ 35.04 | | | 648 |
| | | | | |
| | | | | 858 |
| | | | | |
| | |
| | Consumer Staples - Foods - 3.0% | | | |
| 72,200 | | Jamba, Inc. @ 10.07 | | | 727 |
| 76,400 | | Medifast, Inc. @ 12.58 | | | 961 |
| | | | | |
| | | | | 1,688 |
| | | | | |
| | |
| | Financial Services - Banks - 1.7% | | | |
| 16,700 | | Alliance Bankshares Corp. @ 15.65 | | | 261 |
| 25,950 | | Silver State Bancorp @ 26.00 | | | 675 |
| | | | | |
| | | | | 936 |
| | | | | |
| | |
| | Financial Services - Financial Data Product Services - 1.6% | | | |
| 78,829 | | Cybersource Corp. @ 11.02 | | | 869 |
| | | | | |
| | |
| | Financial Services – Information Services 1.0% | | | |
| 59,700 | | *Thestreet.com, Inc. @ 8.90 | | | 531 |
| | | | | |
| | |
| | Financial Services - Misc - 1.6% | | | |
| 48,400 | | Electronic Clearing House, Inc. @ 18.40 | | | 891 |
| | | | | |
See accompanying notes to financial statements.
| | | | | |
| Shares | | Company (Closing Price) | | Value |
| | Health Care - Biotechnology - 3.0% | | | |
| 34,000 | | Omrix Biopharmaceuticals, Inc. @ 30.26 | | $ | 1,029 |
| 54,700 | | Trimeris, Inc. @ 12.71 | | | 695 |
| �� | | | | |
| | | | | 1,724 |
| | | | | |
| | |
| | Health Care - Electronic Medical Systems - 2.8% | | | |
| 34,300 | | Cynosure, Inc. @ 15.83 | | | 543 |
| 36,322 | | Somanetics Corp. @ 22.83 | | | 829 |
| 16,600 | | Visicu, Inc. @ 11.20 | | | 186 |
| | | | | |
| | | | | 1,558 |
| | | | | |
| | |
| | Health Care - Facilities - 0.5% | | | |
| 59,000 | | Health Grades, Inc. @ 4.49 | | | 265 |
| | | | | |
| | |
| | Health Care - Management Services - 2.7% | | | |
| 42,489 | | Vital Images, Inc. @ 34.80 | | | 1,479 |
| | | | | |
| | |
| | Health Care - Medical & Dental - 5.4% | | | |
| 44,900 | | Angeion Corp. @ 12.23 | | | 549 |
| 28,154 | | Arrhythmia Research Technology, Inc. @ 24.33 | | | 685 |
| 78,419 | | Bio-Imaging Technologies, Inc. @ 8.06 | | | 632 |
| 55,700 | | Bovie Medical Corp. @ 9.07 | | | 505 |
| 14,100 | | Enpath Medical, Inc. @ 14.55 | | | 205 |
| 565 | | Intricon Corp. @ 4.97 | | | 3 |
| 37,199 | | Rochester Medical Corp. @ 12.05 | | | 448 |
| | | | | |
| | | | | 3,027 |
| | | | | |
| | |
| | Industrial - Construction & Mine - 0.5% | | | |
| 15,189 | | Force Protection, Inc. @ 17.41 | | | 264 |
| | | | | |
| | |
| | Other Energy - Oil Crude Producer - 4.3% | | | |
| 13,000 | | Arena Resources, Inc. @ 42.71 | | | 555 |
| 7,290 | | Dawson Geophysical Co. @ 36.43 | | | 266 |
| 29,500 | | GMX Resources, Inc. @ 35.50 | | | 1,047 |
| 62,490 | | TGC Industries, Inc. @ 8.40 | | | 525 |
| | | | | |
| | | | | 2,393 |
| | | | | |
| | |
| | Other Energy - Machine Oilwell Equipment - 3.8% | | | |
| 67,500 | | Allis Chalmers Energy, Inc. @ 23.04 | | | 1,555 |
| 24,300 | | T-3 Energy Services, Inc. @ 22.05 | | | 536 |
| | | | | |
| | | | | 2,091 |
| | | | | |
| | |
| | Other Energy - Misc. - 3.1% | | | |
| 101,600 | | ENGlobal Corp. @ 6.43 | | | 653 |
| 37,900 | | Flotek Industries, Inc. @ 28.05 | | | 1,063 |
| | | | | |
| | | | | 1,716 |
| | | | | |
| | |
| | Producer Durables - Control & Filter Devices - 0.7% | | | |
| 11,578 | | Hurco Companies, Inc. @ 31.71 | | | 367 |
| | | | | |
10
OBERWEIS MICRO-CAP FUND
Portfolio of Investments (cont’d.)
| | | | | |
Shares | | Company (Closing Price) | | Value |
| | Producer Durables - Diversified Production - 1.0% | | | |
33,700 | | Astronics Corp. @ 17.11 | | $ | 577 |
| | |
| | Producer Durables - Electronics - 3.5% | | | |
29,973 | | Aehr Test Systems @ 4.98 | | | 149 |
7,206 | | Aetrium, Inc. @ 3.56 | | | 26 |
16,900 | | Camtek Ltd.@ 4.26 | | | 72 |
90,494 | | I.D. Systems, Inc. @ 18.82 | | | 1,703 |
| | | | | 1,950 |
| | |
| | Producer Durables - Machinery Industrial - 0.3% | | | |
16,600 | | *Trio-Tech International @ 11.25 | | | 187 |
| | |
| | Producer Durables - Misc. - 5.6% | | | |
19,802 | | *Dynamic Materials Corp. @ 28.10 | | | 556 |
82,200 | | Fuel Tech N.V. @ 24.64 | | | 2,025 |
27,500 | | MFRI, Inc. @ 19.70 | | | 542 |
| | | | | |
| | | | | 3,123 |
| | | | | |
| | |
| | Producer Durables - Telecommunications - 1.9% | | | |
52,522 | | Numerex Corp.@ 9.41 | | | 494 |
59,100 | | Silicom Ltd. @ 9.27 | | | 548 |
| | | | | |
| | | | | 1,042 |
| | | | | |
| | |
| | Technology - Communication - 0.8% | | | |
14,400 | | Alliance Fiber Optic Products, Inc. @ 2.02 | | | 29 |
76,000 | | Ceragon Networks Ltd. @ 5.47 | | | 416 |
| | | | | |
| | | | | 445 |
| | | | | |
| | |
| | Technology - Computer Service Software & System - 21.1% | | | |
65,400 | | *American Software, Inc. @ 6.93 | | | 453 |
82,000 | | Bitstream, Inc. @ 8.70 | | | 713 |
241,200 | | ClickSoftware Technologies Ltd. @ 2.96 | | | 714 |
46,100 | | Double - Take Software, Inc. @ 12.88 | | | 594 |
114,500 | | Edgewater Technology, Inc. @ 6.11 | | | 700 |
28,000 | | GSE Systems, Inc. @ 6.65 | | | 186 |
7,100 | | Logility, Inc. @ 7.93 | | | 56 |
19,200 | | Opnet Technologies, Inc. @ 14.45 | | | 277 |
54,731 | | Pacificnet, Inc. @ 6.18 | | | 338 |
120,518 | | Perficient, Inc. @ 16.41 | | | 1,978 |
177,260 | | Saba Software, Inc. @ 6.23 | | | 1,104 |
19,700 | | Sigma Designs, Inc. @ 25.45 | | | 501 |
141,600 | | Sonic Foundry, Inc. @ 4.70 | | | 666 |
114,000 | | Sumtotal Systems, Inc. @ 6.05 | | | 690 |
158,508 | | Vasco Data Security International, Inc. @ 11.85 | | | 1,878 |
56,400 | | Vocus, Inc.@ 16.80 | | | 948 |
| | | | | |
| | | | | 11,796 |
| | | | | |
See accompanying notes to financial statements.
| | | | | |
Shares | | Company (Closing Price) | | Value |
| | Technology - Computer Technology - 5.7% | | | |
38,050 | | Allot Communications Ltd. @ 11.71 | | $ | 445 |
82,300 | | Avici Systems, Inc. @ 7.75 | | | 638 |
113,000 | | Aware, Inc. @ 5.33 | | | 602 |
41,100 | | Datalink Corp. @ 7.52 | | | 309 |
2,200 | | Netsmart Technologies, Inc. @ 16.24 | | | 36 |
68,900 | | Streamline Health Solutions, Inc.@ 5.70 | | | 393 |
155,700 | | VA Software Corp. @ 5.03 | | | 783 |
| | | | | |
| | | | | 3,206 |
| | | | | |
| | |
| | Technology – Electronics Semi-Conductors - 5.4% | | | |
65,300 | | Netlist, Inc. @ 9.72 | | | 635 |
10,400 | | NVE Corp. @ 30.72 | | | 320 |
86,400 | | Sirenza Microdevices, Inc. @ 7.86 | | | 679 |
60,700 | | SRS Labs, Inc. @ 10.82 | | | 657 |
46,300 | | Techwell, Inc. @ 16.06 | | | 744 |
| | | | | |
| | | | | 3,035 |
| | | | | |
| | |
| | Technology - Internet Software & Systems - 3.8% | | | |
650,000 | | Think Partnership, Inc. @ 3.26 | | | 2,119 |
| | | | | |
| | |
| | Utilities - Utilites Telecommunications - 1.1% | | | |
47,000 | | RRSAT Global Communication Network Ltd. @ 12.98 | | | 610 |
| | | | | |
| | Total Equities | | | |
| | (Cost $44,348,000) | | $ | 56,544 |
| | | | | |
| | | | | |
Units | | Company (Closing Price) | | Value |
| | WARRANTS 0.4% | | | |
| | Technology - Internet Software & Systems | | | |
260,000(a) | | Think Partnership, Inc. ($2.50, expires 04-03-11) | | $ | 198 |
81,873(a) | | Think Partnership, Inc. ($3.05, expires 12-05-11) | | | 17 |
40,937(a) | | Think Partnership, Inc. ($4.00, expires 12-05-11) | | | 0 |
| | | | | |
| | Total Warrants | | | |
| | (Cost: $0) | | | $215 |
| | | | | |
| | Total Investments - 101.8% | | | |
| | (Cost: $44,348,000) | | | 56,759 |
| | Other Liablities less Assets (1.8%) | | | (971) |
| | | | | |
| | NET ASSETS - 100% | | | $55,788 |
| | | | | |
11
OBERWEIS MICRO-CAP FUND
Portfolio of Investments (cont’d.)
Notes to Portfolio of Investments
Based on the cost of investments of $44,394,000 for federal income tax purposes at December 31, 2006, the aggregate gross unrealized appreciation was $13,777,000, the aggregate gross unrealized depreciation was $1,412,000 and the net unrealized appreciation of investments was $12,365,000.
| * | Income producing security during the year ended December 31, 2006. |
(a) | The securities are subject to legal or contractual restrictions on sale. They are valued at fair value in accordance with procedures adopted by the board of trustees of the Trust as of December 31, 2006. The aggregate value of restricted securities was $215,000 or 0.4% of net assets at December 31, 2006. |
See accompanying notes to financial statements.
12
OBERWEIS MID-CAP FUND
Portfolio of Investments
December 31, 2006 (value in thousands)
| | | | | |
| Shares | | Company (Closing Price) | | Value |
| | EQUITIES - 98.6% | | | |
| | |
| | Auto & Transportation - Air Transportation - 1.0% | | | |
| 3,600 | | AAR Corp.@ 29.19 | | $ | 105 |
| | | | | |
| | |
| | Consumer Discretionary - Advertising Agency - 7.9% | | | |
| 8,731 | | aQuantive, Inc. @ 24.66 | | | 215 |
| 5,300 | | Focus Media Hldg. Ltd. @ 66.39 | | | 352 |
| 11,681 | | ValueClick, Inc. @ 23.63 | | | 276 |
| | | | | |
| | | | | 843 |
| | | | | |
| | |
| | Consumer Discretionary - Casinos & Gambling - 0.8% | | | |
| 3,200 | | Shuffle Master, Inc. @ 26.20 | | | 84 |
| | | | | |
| | |
| | Consumer Discretionary - Commerical Information Service - 2.4% | | | |
| 2,300 | | Baidu.com, Inc. @ 112.72 | | | 259 |
| | | | | |
| | |
| | Consumer Discretionary - Leisure Time - 1.0% | | | |
| 2,700 | | Penn National Gaming, Inc. @ 41.62 | | | 112 |
| | | | | |
| | |
| | Consumer Discretionary - Restaurants - 3.5% | | | |
| 2,100 | | Chipotle Mexican Grill, Inc. 57.00 @ | | | 120 |
| 4,548 | | Panera Bread Co. @ 55.91 | | | 254 |
| | | | | |
| | | | | 374 |
| | | | | |
| | |
| | Consumer Discretionary - Retail - 5.0% | | | |
| 4,500 | | *Bebe Stores, Inc. @ 19.79 | | | 89 |
| 3,300 | | Coldwater Creek, Inc. @ 24.52 | | | 81 |
| 1,900 | | GameStop Corp. @ 55.11 | | | 105 |
| 5,300 | | Volcom, Inc. @ 29.57 | | | 157 |
| 3,400 | | Zumiez, Inc. @ 29.54 | | | 100 |
| | | | | |
| | | | | 532 |
| | | | | |
| | |
| | Consumer Discretionary - Service Commercial - 4.0% | | | |
| 2,072 | | CRA International, Inc. @ 52.40 | | | 109 |
| 5,000 | | Nutri/System, Inc. @ 63.39 | | | 317 |
| | | | | |
| | | | | 426 |
| | | | | |
| | |
| | Consumer Discretionary - Wholesale - 1.7% | | | |
| 6,152 | | Central European Distribution Corp. @ 29.70 | | | 183 |
| | | | | |
| | |
| | Financial Services - Insurance - 1.0% | | | |
| 4,700 | | HealthExtras, Inc. @ 24.10 | | | 113 |
| | | | | |
| | |
| | Fiancial Services - Sec. Brokerage Services - 1.7% | | | |
| 7,948 | | *OptionsXpress Holdings, Inc. @ 22.69 | | | 180 |
| | | | | |
| | |
| | Health Care - Biotech Research & Production - 1.1% | | | |
| 3,074 | | Arthrocare Corp. @ 39.92 | | | 123 |
| | | | | |
See accompanying notes to financial statements.
| | | | | |
| Shares | | Company (Closing Price) | | Value |
| | Health Care - Drugs & Pharmaceuticals - 4.0% | | | |
| 4,256 | | Adams Respiratory Therapeutics, Inc. @ 40.81 | | $ | 174 |
| 7,900 | | Medicines Co. @ 31.72 | | | 251 |
| | | | | |
| | | | | 425 |
| | | | | |
| | |
| | Health Care - Electrical Medical Systems - 8.3% | | | |
| 6,300 | | Hologic, Inc. @ 47.28 | | | 298 |
| 10,200 | | Illumina, Inc. @ 39.31 | | | 401 |
| 1,991 | | Intuitive Surgical, Inc. @ 95.90 | | | 191 |
| | | | | |
| | | | | 890 |
| | | | | |
| | |
| | Health Care - Management Services - 9.3% | | | |
| 12,900 | | Allscripts Healthcare Solutions, Inc. @ 26.99 | | | 348 |
| 7,300 | | Healthspring, Inc. @ 20.35 | | | 149 |
| 7,200 | | Wellcare Health Plans, Inc.@ 68.90 | | | 496 |
| | | | | |
| | | | | 993 |
| | | | | |
| | |
| | Health Care - Medical & Dental Instruments / Supplies - 4.0% | | | |
| 5,950 | | Immucor, Inc. @ 29.23 | | | 174 |
| 3,681 | | Kyphon, Inc. @ 40.40 | | | 149 |
| 2,136 | | Resmed, Inc. @ 49.22 | | | 105 |
| | | | | |
| | | | | 428 |
| | | | | |
| | |
| | Materials & Producers - Misc. Materials & Products - 0.8% | | | |
| 1,400 | | Rogers Corp. @ 59.15 | | | 83 |
| | | | | |
| | |
| | Material Producer - Misc. Materials & Commodities - 2.3% | | | |
| 4,287 | | Ceradyne, Inc. @ 56.50 | | | 242 |
| | | | | |
| | |
| | Other Energy - Machine Oilwell - 5.2% | | | |
| 2,400 | | Dril-Quip, Inc. @ 39.16 | | | 94 |
| 3,900 | | *Helmerich & Payne, Inc. @ 24.47 | | | 95 |
| 6,900 | | Oceaneering International, Inc. @ 39.70 | | | 274 |
| 2,800 | | *Rowan Companies, Inc. @ 33.20 | | | 93 |
| | | | | |
| | | | | 556 |
| | | | | |
| | |
| | Other Energy - Misc. - 1.4% | | | |
| 5,800 | | Tetra Technologies, Inc. @ 25.58 | | | 148 |
| | | | | |
| | |
| | Other Energy - Offshore Drilling - 1.2% | | | |
| 4,500 | | Hercules Offshore, Inc. @ 28.90 | | | 130 |
| | | | | |
| | |
| | Producer Durables - Misc. - 2.0% | | | |
| 8,200 | | BE Areospace, Inc. @ 25.68 | | | 211 |
| | | | | |
13
OBERWEIS MID-CAP FUND
Portfolio of Investments (cont’d.)
| | | | | |
Shares | | Company (Closing Price) | | Value |
| | Technology - Communication Technology - 11.1% | | | |
| 7,800 | | Acme Packet, Inc. @ 20.64 | | $ | 161 |
| 4,400 | | Atheros Communications, Inc.@ 21.32 | | | 94 |
| 3,300 | | Avocent Corp. @ 33.85 | | | 112 |
| 3,800 | | Ciena Corp. @ 27.71 | | | 105 |
| 3,310 | | J2 Global Communications, Inc. @ 27.25 | | | 90 |
| 14,200 | | Redback Networks, Inc.@ 24.94 | | | 354 |
| 7,800 | | Sierra Wireless, Inc. @ 14.06 | | | 110 |
| 24,500 | | Sonus Networks, Inc. @ 6.59 | | | 161 |
| | | | | |
| | | | | 1,187 |
| | | | | |
| | |
| | Technology - Computer Service Software & Systems - 5.0% | | | |
| 8,500 | | Dealertrack, Inc. @ 29.42 | | | 250 |
| 24,100 | | Nuance, Inc. @ 11.46 | | | 276 |
| | | | | |
| | | | | 526 |
| | | | | |
| | |
| | Technology - Computer Technology - 1.5% | | | |
| 9,028 | | Trident Microsystems, Inc. @ 18.18 | | | 164 |
| | | | | |
| | |
| | Technology - Electronics - 2.6% | | | |
| 7,500 | | Daktronics, Inc. @ 36.85 | | | 276 |
| | | | | |
| | |
| | Technology - Electronics Semi-Conductors - 7.8% | | | |
| 4,200 | | FormFactor, Inc. @ 37.25 | | | 156 |
| 9,400 | | SunTech Power Holdings Co. Ltd.@ 34.01 | | | 320 |
| 8,800 | | Tessera Technologies, Inc. @ 40.34 | | | 355 |
| | | | | |
| | | | | 831 |
| | | | | |
| | |
| | Utilities – Utilities Telecommunications 1.0% | | | |
| 3,200 | | NeuStar, Inc. @ 32.44 | | | 104 |
| | | | | |
| | Total Equities | | | |
| | (Cost $9,036,000) | | $ | 10,528 |
| | | | | |
| | Total Investments - 98.6% | | | |
| | (Cost: $9,036,000) | | | 10,528 |
| | Other Assets less Liabilities - 1.4% | | | 147 |
| | | | | |
| | NET ASSETS - 100.0% | | $ | 10,675 |
| | | | | |
See accompanying notes to financial statements.
Notes to Portfolio of Investments
Based on the cost of investments of $9,050,000 for federal income tax purposes at December 31, 2006, the aggregate gross unrealized appreciation was $1,820,000, the aggregate gross unrealized depreciation was $342,000 and the net unrealized appreciation of investments was $1,478,000.
| * | Income producing security during the year ended December 31, 2006. |
14
OBERWEIS CHINA OPPORTUNITIES FUND
Portfolio of Investments
December 31, 2006 (value in thousands)
| | | | | |
Shares | | Company (Closing Price) | | Value |
| | EQUITIES: CHINA/HONG KONG- 77.2% | | | |
| | |
| | Basic Materials - Agriculture Chemicals - 3.4% | | | |
80,922,000 | | †*Century Sunshine Ecological Technology | | | |
| | Holdings Ltd. @ 0.1900 | | $ | 15,378 |
| | | | | |
| | |
| | Basic Materials - Chemicals - Others - 2.5% | | | |
11,960,748 | | †China Flavors & Fragrances @ 0.3857 | | | 4,613 |
1,663,900 | | †*Kingboard Chemicals Holdings Ltd. @ 3.9271 | | | 6,534 |
| | | | | |
| | | | | 11,147 |
| | | | | |
| | |
| | Basic Materials - Electronic Components - 1.9% | | | |
7,779,981 | | Kingboard Laminates @ 1.0697 | | | 8,322 |
| | | | | |
| | |
| | Basic Materials - Gold Mining - 0.4% | | | |
2,767,600 | | †*Zijin Mining Group Co., Ltd. @ 0.6955 | | | 1,925 |
| | | | | |
| | |
| | Basic Materials - Paper & Related Products - 5.7% | | | |
4,510,000 | | †*Lee & Man Paper Manufacturing Ltd. | | | |
| | @ 2.4517 | | | 11,057 |
8,312,200 | | †*Nine Dragons Paper Holdings Ltd.@ 1.7183 | | | 14,283 |
| | | | | |
| | | | | 25,340 |
| | | | | |
| | |
| | Communications - Advertising Sales - 2.6% | | | |
172,000 | | Focus Media Holdings Ltd. | | | |
| | ADR @ 66.3900 | | | 11,419 |
| | |
| | Communications - E-Commerce / Services - 0.7% | | | |
49,800 | | *Ctrip.com International Ltd. ADR @ 62.3700 | | | 3,106 |
| | |
| | Communications - Internet Content Information - 3.3% | | | |
132,200 | | Baidu.com, Inc. ADR @ 112.72 | | | 14,902 |
| | | | | |
| | |
| | Communications - Machinery - Gerneral Industry - 1.1% | | | |
1,356,800 | | †Tencent Holdings Ltd. @ 3.5514 | | | 4,818 |
| | | | | |
| | |
| | Communications - Wireless Equipment - 0.7% | | | |
3,976,700 | | †*Longcheer Holdings Ltd. @ 0.8177 | | | 3,252 |
| | | | | |
| | |
| | Consumer Cyclical - Apparel Manufactures - 1.9% | | | |
3,801,395 | | †*Ports Design Ltd. @ 2.1847 | | | 8,305 |
| | | | | |
| | |
| | Consumer Cyclical - Auto/Truck Parts & Equipment -Orig - 1.1% | | | |
5,838,200 | | †*Minth Group Ltd. @ 0.8209 | | | 4,792 |
| | | | | |
| | |
| | Consumer Cyclical - Diversified Operations 0.3% | | | |
2,692,000 | | Huabao International Holdings Ltd. @ 0.5426 | | | 1,461 |
| | | | | |
| | |
| | Consumer Cyclical - Distribution / Wholesale - 1.7% | | | |
2,443,100 | | †*Li & Fung Ltd. @ 3.1051 | | | 7,586 |
| | | | | |
See accompanying notes to financial statements.
| | | | | |
Shares | | Company (Closing Price) | | Value |
| | Consumer Cyclical - Footwear & Related Apparel - 1.4% | | | |
6,725,900 | | †* Prime Success International Group Ltd. | | | |
| | @ 0.9279 | | $ | 6,241 |
| | | | | |
| | |
| | Consumer Cyclical - Hotels/Motels - 0.9% | | | |
1,230,700 | | †*Shangrai-La Asia Ltd.@ 2.5726 | | | 3,166 |
17,000 | | Home Inns & Hotels Mgmt, Inc. ADR | | | |
| | @ 37.5400 | | | 638 |
| | | | | 3,804 |
| | |
| | Consumer Cyclical - Leisure & Recreational Products - 1.8% | | | |
5,147,400 | | †*Li Ning Co., Ltd. @ 1.5990 | | | 8,231 |
| | | | | |
| | |
| | Consumer Cyclical - Misc Manufacturer - 1.9% | | | |
9,388,700 | | †*Peace Mark Holdings Ltd. @ 0.8940 | | | 8,393 |
| | | | | |
| | |
| | Consumer Cyclical - Retail-Apparel/ Shoes - 0.9% | | | |
6,423,300 | | †Hongguo International Holdings | | | |
| | Ltd. @ 0.5999 | | | 3,854 |
| | | | | |
| | |
| | Consumer Cyclical - Retail - Hypermarkets - 0.4% | | | |
2,043,600 | | †*Wumart Stores, Inc. @ 0.8846 | | | 1,808 |
| | | | | |
| | |
| | Consumer Cyclical - Retail - Major Department Stores – 1.4% | | | |
2,476,400 | | †*Lifestlye International Holdings Ltd. @ 2.5655 | | | 6,353 |
| | | | | |
| | |
| | Consumer Cyclical - Retail - Regional Department Stores - 1.9% | | | |
9,441,964 | | †*Golden Eagle Retail Group Ltd. @ 0.8880 | | | 8,384 |
| | | | | |
| | |
| | Consumer Cyclical - Textile Products - 0.8% | | | |
2,512,400 | | †*Weiqiao Textile Co., Ltd. @ 1.3473 | | | 3,385 |
| | | | | |
| | |
| | Consumer Discretionary - Consumer Products - 0.7% | | | |
137,200 | | Sohu.com, Inc. @ 24.0000 | | | 3,295 |
| | | | | |
| | |
| | Consumer Non-Cyclical - Agriculture Bio-Tech - 0.8% | | | |
7,761,700 | | †*China Sun Bio-Chem Technology Group | | | |
| | Co.@ 0.4344 | | | 3,372 |
| | | | | |
| | |
| | Consumer Non-Cyclical - Dispose Medical Products - 0.4% | | | |
1,727,800 | | *Shandong Weigao Group @ 1.0646 | | | 1,839 |
| | | | | |
| | |
| | Consumer Non- Cyclical - Flour & Grain - 0.5% | | | |
2,364,900 | | †Celestial Nutrifoods Ltd. @ 0.9774 | | | 2,311 |
| | | | | |
15
OBERWEIS CHINA OPPORTUNITIES FUND
Portfolio of Investments (cont’d)
| | | | | |
| Shares | | | Company (Closing Price) | | Value |
| | | Consumer Non-Cyclical - Feminine Health Care Products - 1.5% | | |
| 2,693,900 | | | †*Hengan International Group @ 2.4759 $ | | 6,670 |
| | | | | |
| | |
| | | Consumer Non-Cyclical - Food -Dairy Products - 1.6% | | |
| 1,567,600 | | | †*China Mengniu Dairy Co. @ 2.6206 | | 4,108 |
| 3,305,300 | | | †China Milk Product @ 0.9019 | | 2,981 |
| | | | | |
| | | | | 7,089 |
| | | | | |
| | |
| | | Consumer Non-Cyclical - Food- Misc / Diversified - 3.8% | | |
| 7,013,900 | | | China Kangda Co., Ltd. @ 0.2966 | | 2,081 |
| 4,179,000 | | | †*China Yurun Food Group Ltd. @ 0.9196 | | 3,843 |
| 4,291,500 | | | †*Fu Ji Food & Catering Services Holdings Ltd. @ 2.5792 | | 11,068 |
| | | | | |
| | | | | 16,992 |
| | | | | |
| | |
| | | Consumer Non-Cyclical Medical Biomedical/ Genetic - 0.9% | | |
| 362,000 | | | American Oriental Bioengineering, Inc. @ 11.6700 | | 4,224 |
| | | | | |
| | |
| | | Consumer Non-Cyclical-Patient Monitoring Equipment - 0.4% | | |
| 80,600 | | | Mindray Medical Intl Ltd. @ 23.9200 | | 1,928 |
| | | | | |
| | |
| | | Consumer Non-Cyclical- Printing Commercial - 0.7% | | |
| 4,546,000 | | | *AMVIG Holdings Ltd. @ 0.6814 | | 3,098 |
| | | | | |
| | |
| | | Consumer Non-Cyclical - Protection Safety - 0.7% | | |
| 8,604,800 | | | †*GST Holdings Ltd. @ 0.3606 | | 3,103 |
| | | | | |
| | |
| | | Consumer Non-Cyclical - Schools- 0.2% | | |
| 21,600 | | | New Oriental Education & Technology Group, Inc. ADR @ 33.5400 | | 724 |
| | | | | |
| | |
| | | Consumer Non-Cyclical - Sugar - 0.9% | | |
| 7,540,300 | | | †Xiwang Sugar Holdings Company Ltd. @ 0.5143 | | 3,878 |
| | | | | |
| | |
| | | Energy - Alternative Sources - 3.9% | | |
| 357,000 | | | Canadian Solar, Inc. @ 10.4800 | | 3,741 |
| 209,300 | | | Trina Solar Ltd. ADR @ 18.90 | | 3,956 |
| 280,600 | | | Suntech Power Holdings Co., Ltd. ADR @ 34.0100 | | 9,543 |
| | | | | |
| | | | | 17,240 |
| | | | | |
| | |
| | | Energy - Oil Field Services - 1.1% | | |
| 7,116,300 | | | †*China Oilfield Services Ltd. @ 0.6929 | | 4,931 |
| | | | | |
See accompanying notes to financial statements.
| | | | | |
| Shares | | | Company (Closing Price) | | Value |
| | | Energy - Oil Machinery & Equipment - 0.3% | | |
| 2,034,700 | | | †Enric Energy Equipment @ 0.6147 $ | | 1,251 |
| | | | | |
| | |
| | | Energy - Pipelines - 0.4% | | |
| 9,789,000 | | | †*China Gas Holdings Ltd. @ 0.1990 | | 1,948 |
| | | | | |
| | |
| | | Financials - Finance – Other Services - 0.8% | | |
| 333,100 | | | †*Hong Kong Exchanges & Clearing @ 10.9480 | | 3,647 |
| | | | | |
| | |
| | | Financials - Life/Health Insurance - 1.8% | | |
| 2,300,000 | | | China Life Insurance @ 3.4136 | | 7,851 |
| | | | | |
| | |
| | | Financials - Real Estate Operations / Development - 1.8% | | |
| 1,520,000 | | | †*Guangzhou R&F Properties Co., Ltd. @ 2.1564 | | 3,278 |
| 1,713,700 | | | †*Hopson Development Holdings Ltd. @ 2.8269 | | 4,844 |
| | | | | |
| | | | | 8,122 |
| | | | | |
| | |
| | | Industrial - Building & Construction Products-Misc. - 1.1% | | |
| 1,887,700 | | | China Communications @ 0.9887 | | 1,866 |
| 4,512,000 | | | †*China National Building Material Co. @ 0.6476 | | 2,922 |
| | | | | |
| | | | | 4,788 |
| | | | | |
| | |
| | | Industrial -Building Products - Wood - 0.6% | | |
| 19,107,800 | | | †Good Fellow Group Ltd. @ 0.1368 | | 2,614 |
| | | | | |
| | |
| | | Industrial - Electronic Components- Misc. - 1.5% | | |
| 7,231,100 | | | †AAC Acoustic Technology Hldgs, Inc. @ 0.9487 | | 6,860 |
| | | | | |
| | |
| | | Industrial - Engineering/R&D Serv - 1.5% | | |
| 498,000 | | | †Hong Kong Aircraft @ 13.6198 | | 6,783 |
| | | | | |
| | |
| | | Industrial - Lighting Products & Systems - 1.0% | | |
| 4,570,400 | | | *Neo-Neon Holdings Ltd. @ 0.9553 | | 4,366 |
| | | | | |
| | |
| | | Industrial - Machinery - Construction & Mining - 2.5% | | |
| 9,471,700 | | | China Infrastructure Machinery Hldgs @ 1.1829 | | 11,204 |
| | | | | |
| | |
| | | Industrial - Machinery General Industry - 0.1% | | |
| 932,000 | | | Shandong Molong Petroleum Co., Ltd. @ 0.3677 | | 343 |
| | | | | |
| | |
| | | Industrial - Marine Transportation - 1.0% | | |
| 2,868,000 | | | †*China Shipping Development @ 1.5295 | | 4,387 |
| | | | | |
16
OBERWEIS CHINA OPPORTUNITIES FUND
Portfolio of Investments (cont’d)
| | | | | | |
| Shares | | | Company (Closing Price) | | Value |
| | | Industial Metal Processors & Fabrication - 0.9% | | | |
| 3,207,700 | | | †Eva Precision Industrial Hldg. @ 0.2565 | | $ | 823 |
| 3,037,600 | | | †*Jiangxi Copper Co., Ltd. @ 1.0152 | | | 3,084 |
| | | | | | |
| | | | | | 3,907 |
| | | | | | |
| | |
| | | Industrial - Power Conversion / Supply Equipment - 1.3% | | | |
| 1,512,800 | | | †*Dongfang Electrical Machinery Ltd. @ 2.6743 | | | 4,046 |
| 1,747,000 | | | †*Harbin Power Equipment Co., Ltd. @ 1.1438 | | | 1,998 |
| | | | | | |
| | | | | | 6,044 |
| | | | | | |
| | |
| | | Technology - Electronic Design Automation - 1.3% | | | |
| 318,200 | | | Comtech Group, Inc. @ 18.1900 | | | 5,788 |
| | | | | | |
| | |
| | | Utilities - Electric Generation - 1.5% | | | |
| 4,377,500 | | | †China Resources Power Holdings Co. @ 1.5077 | | | 6,600 |
| | | | | | |
| | |
| | | Utilities - Gas-Distribution - 1.0% | | | |
| 3,914,500 | | | *Xinao Gas Holdings Ltd. @ 1.1314 | | | 4,429 |
| | | | | | |
| | |
| | | EQUITIES: SINGAPORE - 10.9% | | | |
| | |
| | | Consumer Cyclical - Hotels/Motels - 1.0% | | | |
| 4,273,100 | | | †Banyon Tree Holdings Ltd. @ 1.0119 | | | 4,324 |
| | | | | | |
| | |
| | | Consumer Non-Cyclical - Schools - 2.4% | | | |
| 1,631,275 | | | Hartford Education Corp. @ 0.5085 | | | 830 |
| 8,578,200 | | | †*Raffles Education Corp. Ltd. @ 1.1532 | | | 9,892 |
| | | | | | |
| | | | | | 10,722 |
| | | | | | |
| | |
| | | Consumer Non-Cyclical Wholesale/Distribution - 0.4% | | | |
| 1,358,000 | | | †Olam International Ltd. @ 1.3819 | | | 1,877 |
| | | | | | |
| | |
| | | Energy Oil Machinery & Equipment - 1.6% | | | |
| 4,536,400 | | | †*KS Energy Services Ltd. @ 1.6239 | | | 7,366 |
| | | | | | |
| | |
| | | Financials - Real Estate Operations / Development - 1.6% | | | |
| 4,401,200 | | | †Yanlord Land Group Ltd. @ 1.6525 | | | 7,273 |
| | | | | | |
| | |
| | | Industrial - Transport-Marine - 3.8% | | | |
| 4,658,600 | | | †*Ezra Holdings Ltd. @ 2.5891 | | | 12,062 |
| 3,991,400 | | | †Labroy Marine Ltd. @ 1.2233 | | | 4,883 |
| | | | | | |
| | | | | | 16,945 |
| | | | | | |
See accompanying notes to financial statements.
| | | | | | |
| Shares | | | Company (Closing Price) | | Value |
| | | Industrial - Water Treatment Systems - 0.1% | | | |
| 2,445,000 | | | †Asia Enironment Hldgs Ltd. @ 0.2470 | | $ | 604 |
| | | | | | |
| | |
| | | EQUITIES: TAIWAN - 2.6% | | | |
| | |
| | | Consumer Cyclical - Athletic Equipment - 0.4% | | | |
| 227,000 | | | †Johnson Health Tech Co., Ltd. @ 7.3158 | | | 1,661 |
| | | | | | |
| | |
| | | Consumer Non-Cyclical - Flour & Grain - 0.9% | | | |
| 9,849,900 | | | †*Pine Agritech Ltd. @ .4000 | | | 3,940 |
| | | | | | |
| | |
| | | Consumer Cyclical - Athletic Footwear - 0.6% | | | |
| 2,022,700 | | | †China Hongxing Sport @ 1.3755 | | | 2,782 |
| | | | | | |
| | |
| | | Technology - Semiconductors Compo-Intg. Circ. 0.7% | | | |
| 206,448 | | | *Siliconware Precision Industries Co. ADR @ 15.87 | | | 3,276 |
| | | | | | |
| | |
| | | EQUITIES: UNITED STATES - 1.7% | | | |
| | |
| | | Consumer Non-Cyclical Agriculture Bio-Tech - 0.6% | | | |
| 233,200 | | | Origin Agritech Ltd. @ 10.9400 | | | 2,551 |
| | | | | | |
| | |
| | | Technology - Computer Graphics - 1.1% | | | |
| 269,200 | | | Trident Microsystems, Inc. @ 18.18 | | | 4,894 |
| | | | | | |
| | |
| | | EQUITIES: KOREA - 0.8% | | | |
| | |
| | | Communications - E-Commerce / Services - 0.8% | | | |
| 145,200 | | | GMarket, Inc. ADR @ 23.96 | | | 3,479 |
| | | | | | |
| | |
| | | EQUITIES: BRITISH VIRGIN ISLANDS- 0.6% | | | |
| | |
| | | Technology - Electronic Component Semiconductor - 0.6% | | | |
| 324,605 | | | Renesola Ltd. @ 8.3227 | | | 2,702 |
| | | | | | |
| | |
| | | EQUITIES: GRAND CAYMAN ISLANDS- 0.6% | | | |
| | |
| | | Consumer Non-Cyclical - Food - Misc / Diversified - 0.6% | | | |
| 1,353,200 | | | †China Fishery Group Ltd. @ 2.0683 | | | 2,799 |
| | | | | | |
| | | Total Equities | | | |
| | | (Cost: $329,524,000) | | $ | 421,027 |
| | | | | | |
17
OBERWEIS CHINA OPPORTUNITIES FUND
Portfolio of Investments (cont’d)
| | | | | | |
Face
Amount | | Company (Closing Price) | | Value | |
| | COMMERICAL PAPER - 7.4% | | | | |
| | |
| $6,900,000 | | American Express | | | | |
| | 5.25%, due 01/03/07 | | $ | 20,700 | |
| | |
| 3,300,000 | | Americal General Finance | | | | |
| | 5.22%, due 01/02/07 | | | 12,300 | |
| | | | | | |
| | Total Commerical Paper | | | | |
| | (Cost: $33,000,000) | | $ | 33,000 | |
| | | | | | |
| | Total Investments - 101.8% | | | | |
| | (Cost: $362,524,000) | | | 454,027 | |
| | Other Liabilities less Assets - (1.8%) | | | (7,944 | ) |
| | | | | | |
| | NET ASSETS – 100% | | $ | 446,083 | |
| | | | | | |
Notes to Portfolio of Investments
Based on the cost of investments of $362,643,000 for federal income tax purposes at December 31, 2006, the aggregate gross unrealized appreciation was $101,238,000, the aggregate gross unrealized depreciation was $9,854,000 and the net unrealized appreciation of investments was $91,384,000.
| * | Income producing security during the year ended December 31, 2006. |
ADR American Depositary Receipt
See accompanying notes to financial statements.
18
THE OBERWEIS FUNDS
Statement of Assets and Liabilities
December 31, 2006 (in thousands, except pricing of shares)
| | | | | | | | | | | | | | |
| | | Emerging
Growth
Fund | | Micro-Cap
Fund | | Mid-Cap
Fund | | | China
Opportunities
Fund | |
Assets: | | | | | | | | | | | | | | |
Investment securities at value (Cost: $142,944, $44,348, $ 9,036 and $362,524 respectively) | | $ | 192,216 | | $ | 56,759 | | $ | 10,528 | | | $ | 454,027 | |
Cash | | | — | | | — | | | 201 | | | | — | |
Receivable from fund shares sold | | | 10,889 | | | 3 | | | 20 | | | | 9,278 | |
Receivable from securities sold | | | 410 | | | 158 | | | — | | | | — | |
Dividends and interest receivable | | | 36 | | | 21 | | | — | | | | 200 | |
Prepaid expenses | | | 116 | | | 15 | | | 8 | | | | 60 | |
| | | | | | | | | | | | | | |
Total Assets | | | 203,667 | | | 56,956 | | | 10,757 | | | | 463,565 | |
| | | | | | | | | | | | | | |
Liabilities: | | | | | | | | | | | | | | |
Payable to custodian bank | | | 3,407 | | | 764 | | | — | | | | 4 | |
Payable for fund shares redeemed | | | 344 | | | 193 | | | 60 | | | | 328 | |
Payable for securities purchased | | | 618 | | | 108 | | | — | | | | 16,535 | |
Payable to advisor (see note 2) | | | 134 | | | 48 | | | 8 | | | | 415 | |
Payable to distributor | | | 41 | | | 12 | | | 2 | | | | 83 | |
Accrued expenses | | | 78 | | | 43 | | | 12 | | | | 117 | |
| | | | | | | | | | | | | | |
Total Liabilities | | | 4,622 | | | 1,168 | | | 82 | | | | 17,482 | |
| | | | | | | | | | | | | | |
Net Assets | | $ | 199,045 | | $ | 55,788 | | $ | 10,675 | | | $ | 446,083 | |
| | | | | | | | | | | | | | |
Analysis of net assets: | | | | | | | | | | | | | | |
Capital | | $ | 145,321 | | $ | 41,291 | | $ | 9,414 | | | $ | 369,754 | |
Undistributed net realized gains (losses) on investment and foreign currency transactions | | | 4,452 | | | 2,086 | | | (231 | ) | | | (15,174 | ) |
Net unrealized appreciation of investments and translation of assets and liabilities denominated in foreign currencies. | | | 49,272 | | | 12,411 | | | 1,492 | | | | 91,503 | |
| | | | | | | | | | | | | | |
Net Assets | | $ | 199,045 | | $ | 55,788 | | $ | 10,675 | | | $ | 446,083 | |
| | | | | | | | | | | | | | |
The Pricing of Shares: | | | | | | | | | | | | | | |
Net asset value and offering price per share | | | | | | | | | | | | | | |
Emerging Growth Fund: | | | | | | | | | | | | | | |
($199,045,289 divided by 7,313,512 shares outstanding) | | $ | 27.22 | | | | | | | | | | | |
| | | | | | | | | | | | | | |
Micro-Cap Fund: | | | | | | | | | | | | | | |
($55,787,918 divided by 3,474,245 shares outstanding) | | | | | $ | 16.06 | | | | | | | | |
| | | | | | | | | | | | | | |
Mid-Cap Fund: | | | | | | | | | | | | | | |
($10,674,953 divided by 761,179 shares outstanding) | | | | | | | | $ | 14.02 | | | | | |
| | | | | | | | | | | | | | |
China Opportunities Fund: | | | | | | | | | | | | | | |
($446,083,475 divided by 22,841,384 shares outstanding) | | | | | | | | | | | | $ | 19.53 | |
| | | | | | | | | | | | | | |
See accompanying notes to financial statements.
19
THE OBERWEIS FUNDS
Statement of Operations
Year Ended December 31, 2006 (in thousands)
| | | | | | | | | | | | | | | | |
| | | Emerging
Growth
Fund | | | Micro-Cap
Fund | | | Mid-Cap
Fund | | | China
Opportunities
Fund | |
Investment Income: | | | | | | | | | | | | | | | | |
Interest | | $ | 166 | | | $ | 63 | | | $ | — | | | $ | 662 | |
Dividends | | | 299 | | | | 209 | | | | 8 | | | | 2,5751 | |
| | | | | | | | | | | | | | | | |
Total Income | | | 465 | | | | 272 | | | | 8 | | | | 3,237 | |
| | | | | | | | | | | | | | | | |
Expenses: | | | | | | | | | | | | | | | | |
Investment advisory fees | | | 818 | | | | 415 | | | | 43 | | | | 2,296 | |
Management fees | | | 794 | | | | 277 | | | | 43 | | | | — | |
Distribution fees and shareholder services (see note 2) | | | 496 | | | | 173 | | | | 27 | | | | 459 | |
Transfer agent fees and expenses | | | 203 | | | | 93 | | | | 28 | | | | 237 | |
Custodian fees and expenses | | | 135 | | | | 102 | | | | 42 | | | | 320 | |
Professional fees | | | 70 | | | | 7 | | | | 2 | | | | 63 | |
Shareholder reports | | | 59 | | | | 19 | | | | 1 | | | | 63 | |
Federal and state registration fees | | | 48 | | | | 24 | | | | 16 | | | | 64 | |
Insurance | | | 30 | | | | 9 | | | | 2 | | | | 2 | |
Trustees’ fees | | | 21 | | | | 6 | | | | 1 | | | | 10 | |
Other | | | 6 | | | | 1 | | | | — | | | | 1 | |
| | | | | | | | | | | | | | | | |
Total expenses before reimbursed expenses | | | 2,680 | | | | 1,126 | | | | 205 | | | | 3,515 | |
Earnings credit (see note 5) | | | 9 | | | | 4 | | | | 7 | | | | 11 | |
| | | | | | | | | | | | | | | | |
Total Expenses | | | 2,671 | | | | 1,122 | | | | 198 | | | | 3,504 | |
| | | | | | | | | | | | | | | | |
Net Investment Income (Loss) | | | (2,206 | ) | | | (850 | ) | | | (190 | ) | | | (267 | ) |
Net Realized and Unrealized Gains (Losses) from Investments: | | | | | | | | | | | | | | | | |
Net realized gains (losses) on investment transactions | | | 7,613 | | | | 5,996 | | | | 1,136 | | | | (15,323 | ) |
Net realized gains (losses) on foreign currency transactions | | | — | | | | — | | | | — | | | | 155 | |
| | | | | | | | | | | | | | | | |
Net realized gains (losses) on investment and foreign currency transactions | | | 7,613 | | | | 5,996 | | | | 1,136 | | | | (15,168 | ) |
Increase (decrease) in unrealized appreciation on investments and translation of assets and liabilities denominated in foreign currencies | | | 1,974 | | | | (5,702 | ) | | | (68 | ) | | | 90,948 | |
| | | | | | | | | | | | | | | | |
Net realized/unrealized gains (losses) on investments and foreign currencies | | | 9,587 | | | | 294 | | | | 1,068 | | | | 75,780 | |
| | | | | | | | | | | | | | | | |
Net increase (decrease) in net assets resulting from operations | | $ | 7,381 | | | $ | (556 | ) | | $ | 878 | | | $ | 75,513 | |
| | | | | | | | | | | | | | | | |
1 | Net of foreign taxes withheld of $11,339. |
See accompanying notes to financial statements.
20
THE OBERWEIS FUNDS
Statements of Changes in Net Assets (in thousands)
| | | | | | | | |
| | | Emerging Growth Fund | |
| | | Year Ended
December 31,
2006 | | | Year Ended
December 31,
2005 | |
From Operations: | | | | | | | | |
Net investment loss | | $ | (2,206 | ) | | $ | (2,084 | ) |
Net realized gains on investments | | | 7,613 | | | | 11,809 | |
Increase (decrease) in net unrealized appreciation of investments | | | 1,974 | | | | (5,371 | ) |
| | | | | | | | |
Net increase in net assets resulting from operations | | | 7,381 | | | | 4,354 | |
| | | | | | | | |
| | |
From Distributions: | | | | | | | | |
Distributions from net realized gains on investments | | | (6,977 | ) | | | (11,084 | ) |
| | | | | | | | |
| | |
From Capital Share Transactions: | | | | | | | | |
Proceeds from sale of shares | | | 81,658 | | | | 55,337 | |
Proceeds from reinvestment of distributions | | | 6,380 | | | | 10,521 | |
Redemption of shares | | | (73,376 | ) | | | (50,763 | ) |
| | | | | | | | |
Net increase from capital share transactions | | | 14,662 | | | | 15,095 | |
| | | | | | | | |
Total increase in net assets | | | 15,066 | | | | 8,365 | |
| | |
Net Assets: | | | | | | | | |
Beginning of year | | | 183,979 | | | | 175,614 | |
| | | | | | | | |
End of year | | $ | 199,045 | | | $ | 183,979 | |
| | | | | | | | |
| | |
Accumulated Net Investment Gain | | $ | 4,452 | | | $ | 3,816 | |
| | | | | | | | |
| | |
Transactions in Shares: | | | | | | | | |
Shares sold | | | 2,936 | | | | 2,071 | |
Shares issued in reinvestment of dividends | | | 247 | | | | 392 | |
Less shares redeemed | | | (2,695 | ) | | | (1,924 | ) |
| | | | | | | | |
Net increase from capital share transactions | | | 488 | | | | 539 | |
| | | | | | | | |
See accompanying notes to financial statements.
21
THE OBERWEIS FUNDS
Statements of Changes in Net Assets (in thousands)
| | | | | | | | |
| | | Micro-Cap Fund | |
| | | Year Ended
December 31, 2006 | | | Year Ended
December 31, 2005 | |
From Operations: | | | | | | | | |
Net investment loss | | $ | (850 | ) | | $ | (500 | ) |
Net realized gains on investments | | | 5,996 | | | | 4,865 | |
Increase (decrease) in net unrealized appreciation of investments | | | (5,702 | ) | | | 1,558 | |
| | | | | | | | |
Net increase (decrease) in net assets resulting from operations | | | (556 | ) | | | 5,923 | |
| | | | | | | | |
| | |
From Distributions: | | | | | | | | |
Distributions from net realized gains on investments | | | (4,915 | ) | | | (6,356 | ) |
| | | | | | | | |
| | |
From Capital Share Transactions: | | | | | | | | |
Proceeds from sale of shares | | | 22,780 | | | | 27,620 | |
Proceeds from reinvestment of distributions | | | 4,773 | | | | 6,110 | |
Redemption of shares | | | (34,649 | ) | | | (11,618 | ) |
| | | | | | | | |
Net increase (decrease) from capital share transactions | | | (7,096 | ) | | | 22,112 | |
| | | | | | | | |
Total increase (decrease) in net assets | | | (12,567 | ) | | | 21,679 | |
| | |
Net Assets: | | | | | | | | |
Beginning of Year | | | 68,355 | | | | 46,676 | |
| | | | | | | | |
End of Year | | $ | 55,788 | | | $ | 68,355 | |
| | | | | | | | |
Accumulated Net Investment Gain | | $ | 2,086 | | | $ | 1,005 | |
| | | | | | | | |
| | |
Transactions in Shares: | | | | | | | | |
Shares sold | | | 1,260 | | | | 1,598 | |
Shares issued in reinvestment of dividends | | | 312 | | | | 370 | |
Less shares redeemed | | | (2,048 | ) | | | (686 | ) |
| | | | | | | | |
Net increase (decrease) from capital share transactions | | | (476 | ) | | | 1,282 | |
| | | | | | | | |
See accompanying notes to financial statements.
22
THE OBERWEIS FUNDS
Statements of Changes in Net Assets (in thousands)
| | | | | | | | |
| | | Mid-Cap Fund | |
| | | Year Ended
December 31,
2006 | | | Year Ended
December 31,
2005 | |
From Operations: | | | | | | | | |
Net investment loss | | $ | (190 | ) | | $ | (169 | ) |
Net realized gains on investments | | | 1,136 | | | | 998 | |
Decrease in net unrealized appreciation of investments | | | (68 | ) | | | (487 | ) |
| | | | | | | | |
Net increase in net assets resulting from operations | | | 878 | | | | 342 | |
| | | | | | | | |
| | |
From Capital Share Transactions: | | | | | | | | |
Proceeds from sale of shares | | | 5,135 | | | | 776 | |
Redemption of shares | | | (4,111 | ) | | | (2,771 | ) |
| | | | | | | | |
Net increase (decrease) from capital share transactions | | | 1,024 | | | | (1,995 | ) |
| | | | | | | | |
Total increase (decrease) in net assets | | | 1,902 | | | | (1,653 | ) |
| | |
Net Assets: | | | | | | | | |
Beginning of year | | | 8,773 | | | | 10,426 | |
| | | | | | | | |
End of year | | $ | 10,675 | | | $ | 8,773 | |
| | | | | | | | |
Accumulated Net Investment Loss | | $ | (231 | ) | | $ | (1,367 | ) |
| | | | | | | | |
| | |
Transactions in Shares: | | | | | | | | |
Shares sold | | | 375 | | | | 67 | |
Less shares redeemed | | | (314 | ) | | | (239 | ) |
| | | | | | | | |
Net increase (decrease) from capital share transactions | | | 61 | | | | (172 | ) |
| | | | | | | | |
See accompanying notes to financial statements.
23
THE OBERWEIS FUNDS
Statements of Changes in Net Assets (in thousands)
| | | | | | | | |
| | | China Opportunities Fund | |
| | | Year Ended
December 31, 2006 | | | Period Ended
December 31, 2005* | |
From Operations: | | | | | | | | |
Net investment loss | | $ | (267 | ) | | $ | (17 | ) |
Net realized losses on investment and foreign currency transactions | | | (15,168 | ) | | | (14 | ) |
Increase in net unrealized appreciation of investments and translation of assets and liabilities denominated in foreign currencies | | | 90,948 | | | | 555 | |
| | | | | | | | |
Net increase in net assets resulting from operations | | | 75,513 | | | | 524 | |
| | | | | | | | |
| | |
From Capital Share Transactions: | | | | | | | | |
Proceeds from sale of shares | | | 513,893 | | | | 6,977 | |
Redemption of shares | | | (150,794 | ) | | | (30 | ) |
| | | | | | | | |
Net increase from capital share transactions | | | 363,099 | | | | 6,947 | |
| | | | | | | | |
Total increase in net assets | | | 438,612 | | | | 7,471 | |
| | |
Net Assets: | | | | | | | | |
Beginning of year | | | 7,471 | | | | — | |
| | | | | | | | |
End of year | | $ | 446,083 | | | $ | 7,471 | |
| | | | | | | | |
Accumulated Net Investment Loss | | $ | (15,174 | ) | | $ | (14 | ) |
| | | | | | | | |
| | |
Transactions in Shares: | | | | | | | | |
Shares sold | | | 32,056 | | | | 696 | |
Less shares redeemed | | | (9,908 | ) | | | (3 | ) |
| | | | | | | | |
Net increase from capital share transactions | | | 22,148 | | | | 693 | |
| | | | | | | | |
| * | For the period from October 1, 2005 (commencement of operations) through December 31, 2005. |
See accompanying notes to financial statements.
24
THE OBERWEIS FUNDS
Notes to Financial Statements
December 31, 2006
1. Significant Accounting Policies
Description of business. The Oberweis Funds (the “Trust”) is registered under the Investment Company Act of 1940 as a diversified open-end management investment company. The Trust is authorized to operate numerous funds under various trading strategies. The Trust consists of four funds: the Oberweis Emerging Growth Fund, the Oberweis Micro-Cap Fund, the Oberweis Mid-Cap Fund, and the Oberweis China Opportunities Fund (collectively, the “Funds”).
Investment valuation. Investments in securities are stated at value as of the close of the regular trading session on the New York Stock Exchange (NYSE) (generally 3 p.m., Central Standard Time). Each listed and unlisted security for which last sale information is regularly reported is valued at the last reported sales price on that day. If there has been no sale on such day, then such security is valued at the current day’s bid price. Any unlisted security for which last sale information is not regularly reported and any listed debt security which has an inactive listed market for which over-the-counter market quotations are readily available is valued at the closing bid price determined on the basis of reasonable inquiry. Options are valued at the last reported bid price on the primary exchange as of the close of the regular trading session of the Chicago Board Options Exchange (CBOE). Restricted securities and any other securities or other assets for which market quotations are not readily available are valued by appraisal at their fair value as determined in good faith under procedures established by and under the general supervision and responsibility of the Board of Trustees. Short-term debt instruments maturing within 60 days are valued by the amortized cost method, which approximates fair value.
Foreign securities are valued as of the close of trading on the primary exchange on which they trade. The value is then converted to U.S. dollars using current exchange rates and in accordance with the Funds’ pricing policies. The China Opportunities Fund may use a fair valuation model provided by an independent pricing service, which is intended to reflect fair value when a security’s value or a meaningful portion of the Fund’s portfolio is believed to have been materially affected by a significant event that has occurred between the close of the exchange or market on which the security is principally traded and the close of the NYSE. The Funds’ valuation policies set forth certain triggers which instruct when to use the valuation model. The value assigned to a security by the fair valuation model is a determination of fair value made under the Funds’ valuation policies and under the supervision of the Board of Trustees. In such a case, the Fund’s value for a security is likely to be different from the last quoted price.
Foreign Currency Transactions. The accounting records of the Funds are maintained in U.S. dollars. Foreign currency amounts are translated into U.S. dollars at the current rate of exchange to determine the value of investments, assets and liabilities. Purchases and sales of securities, and income and expenses are translated at the prevailing rate of exchange on the respective date of these transactions. The Funds do not isolate that portion of the results of operations resulting from changes in foreign exchange rates on investments from fluctuations arising from changes in market prices of securities held. These fluctuations are included with the net realized and unrealized gains or losses from investments and foreign currencies.
Risks Associated with Foreign Securities and Currencies. Investments in securities of foreign issuers carry certain risks not ordinarily associated with investments in securities of U.S. issuers. These risks include future political and economic developments, and the possible imposition of exchange controls or other foreign governmental laws and restrictions. In addition, with respect to certain countries, there is the possibility of expropriation of assets, confiscatory taxation, political or social instability or diplomatic developments, which could adversely affect investments in those countries.
Certain countries also may impose substantial restrictions on investments in their capital markets by foreign entities, including restrictions on investments in issuers of industries deemed sensitive to relevant national interests. These factors may limit the investment opportunities available and result in a lack of liquidity and a high price volatility with respect to securities of issuers from developing countries.
Fund share valuation. Fund shares are sold and redeemed on a continuous basis at net asset value. On each day the NYSE is open for trading, the net asset value per share is determined as of the later of the close of the NYSE or the CBOE by dividing the total value of each Fund’s investments and other assets, less liabilities, by the number of each Fund’s shares outstanding.
Investment transactions and investment income. Investment transactions are accounted for on the trade date (date the order to buy or sell is executed). Dividend income is recorded on the ex-dividend date, and interest income is recorded on the accrual basis and includes amortization of premium and discount. Realized gains and losses from investment transactions are reported on an identified cost basis. Gains and losses on premiums from expired options are recognized on the date of expiration.
25
Federal income taxes and dividends to shareholders. It is each Fund’s policy and intention to comply with the provisions of the Internal Revenue Code available to investment companies and therefore no federal income tax provision is required. Dividends payable to its shareholders are recorded by each Fund on the ex-dividend date. Dividends are determined in accordance with income tax principles which may treat certain transactions differently from generally accepted accounting principles. These “book/tax” differences are either considered temporary or permanent in nature. To the extent these differences are considered permanent in nature, such amounts are reclassified within the composition of net assets based on their federal tax basis treatment; temporary differences do not require reclassification. The tax character of distributions paid during the fiscal year ended December 31, 2006, to shareholders of record on November 9, 2006, were as follows (amounts in thousands):
| | | | | | | | | |
| | | Distributions
Paid From
Ordinary
Income | | Distributions
Paid From
Net Long-Term
Capital Gains | | Total
Distributions
Paid |
Emerging Growth Fund | | $ | — | | $ | 6,977 | | $ | 6,977 |
Micro-Cap Fund | | | — | | | 4,915 | | | 4,915 |
No distributions were required for the Mid-Cap Fund and China Opportunities Fund. The Funds designated the following amounts as long-term capital gain distributions. The Micro-Cap Fund includes $1,849 of earnings and profit distributed to shareholders on redemptions of their shares (amount in thousands);
| | | |
| | | Amount |
Emerging Growth Fund | | $ | 6,977 |
Micro-Cap Fund | | | 6,764 |
The tax character of distributions paid during the fiscal year ended December 31, 2005, to shareholders of record on November 10, 2005, were as follows (amounts in thousands):
| | | | | | | | | |
| | | Distributions
Paid From
Ordinary
Income | | Distributions
Paid From
Net Long-Term
Capital Gains | | Total
Distributions
Paid |
Emerging Growth Fund | | $ | — | | $ | 11,084 | | $ | 11,084 |
Micro-Cap Fund | | | — | | | 6,356 | | | 6,356 |
No distributions were required for the Mid-Cap Fund and China Opportunities Fund.
The tax components of undistributed net investment income and net realized gains at December 31, 2006 were as follows (amounts in thousands):
| | | | | | |
| | | Undistributed
Ordinary
Income | | Undistributed
Net Long-Term
Capital Gains |
Emerging Growth Fund | | $ | — | | $ | 4,583 |
Micro-Cap Fund | | $ | — | | $ | 2,131 |
As of December 31, 2006, the following Funds had net capital loss carryforwards to offset future net capital gains, if any, to the extent provided by treasury regulations (amounts in thousands):
| | | | | | | | | | | | |
| | | 2010 | | 2011 | | 2013 | | 2014 |
Mid-Cap Fund | | $ | — | | $ | 217 | | $ | — | | $ | — |
China Opportunities Fund | | $ | — | | $ | — | | $ | 3 | | $ | 12,411 |
Net capital losses incurred after October 31 and within the taxable year are deemed to arise on the first business day of the Fund’s next taxable year. For the year ended December 31, 2006, the China Opportunities Fund deferred to January 1, 2007 post-October capital losses of $2,641,000.
26
Use of estimates. The preparation of financial statements in conformity with generally accepted accounting principles requires management to make estimates and assumptions that affect the amounts reported in the financial statements and accompanying notes. Actual results may differ from those estimates.
Indemnifications. Under the Trust’s organizational documents, its present and former Officers and Trustees are indemnified against certain liabilities arising out of the performance of their duties to the Trust’s. In addition, in the normal course of business, the Trust enters into contracts that provide general indemnifications to other parties. The Trust’s maximum exposure under these arrangements is unknown as this would involve future claims that may be made against the Trust that have not yet occurred. However, the Trust has not had prior claims or losses pursuant to these contracts and expects the risk of loss to be remote.
2. Transactions with affiliates
The Funds have written agreements with Oberweis Asset Management, Inc. (“OAM”) as the Funds’ investment adviser and manager. Oberweis Securities, Inc. (“Oberweis Securities”), the Funds’ principal distributor, is an affiliate of OAM.
Investment advisory agreement. For investment advisory services, the Emerging Growth Fund paid monthly investment advisory fees at an annual rate equal to .45% of the first $50 million of average daily net assets and .40% of average daily net assets in excess of $50 million. The Micro-Cap Fund paid monthly investment advisory fees at an annual rate equal to .60% of average daily net assets. The Mid-Cap Fund paid monthly investment advisory fees at an annual rate equal to .40% of average daily net assets. For investment advisory and management services, the China Opportunities Fund paid monthly investment advisory and management fees at an annual rate equal to 1.25% of average daily net assets. For the year ended December 31, 2006, the Emerging Growth Fund, Micro-Cap Fund, and Mid-Cap Fund, incurred investment advisory fees totaling $818,000, $415,000, and $43,000, respectively. For the year ended December 31, 2006, the China Opportunities Fund incurred investment advisory and management fees totaling $2,296,000.
Management agreement. For management services and facilities furnished, the Emerging Growth Fund, Micro-Cap Fund, and Mid-Cap Fund each paid a monthly fee at an annual rate equal to .40% of average daily net assets. For the year ended December 31, 2006, the Emerging Growth Fund, Micro-Cap Fund, and Mid-Cap Fund incurred management fees totaling $794,000, $277,000 and $43,000, respectively.
Expense reimbursement. OAM is contractually obligated to reduce its management fees or reimburse the Emerging Growth Fund, Micro-Cap Fund, and Mid-Cap Fund to the extent that total ordinary operating expenses, as defined, exceed in any one year the following amounts expressed as a percentage of each Fund’s average daily net assets: 2% of the first $25,000,000; plus 1.8% of the next $25,000,000; plus 1.6% of average daily net assets in excess of $50,000,000. OAM is also contractually obligated to reduce its investment and management fees or reimburse the China Opportunities Fund to the extent that total ordinary operating expenses, as defined, exceed in any one year 2.49% expressed as a percentage of the Fund’s average daily net assets. For the year ended December 31, 2006 OAM did not reimburse the Funds.
Officers and trustees. Certain officers or trustees of the Trust are also officers or directors of OAM and Oberweis Securities. During the year ended December 31, 2006, the Trust made no direct payments to its officers and paid $40,000 to its noninterested trustees.
Distribution and shareholder service agreement. The Funds have a distribution and shareholder services agreement with Oberweis Securities. For services under the distribution and shareholder services agreement, the Funds pay Oberweis Securities a fee at the annual rate of .25% of the average daily net assets as compensation for services. For the year ended December 31, 2006, the Emerging Growth Fund, Micro-Cap Fund, Mid-Cap Fund and China Opportunities Fund incurred distribution fees totaling $496,000, $173,000, $27,000, and $459,000, respectively.
Affiliated Commissions. For the year ended December 31, 2006, the Emerging Growth Fund, Micro-Cap Fund, Mid-Cap Fund and China Opportunities Fund did not execute any security transactions through Oberweis Securities and therefore did not pay commissions to Oberweis Securities.
3. Investment transactions
The cost of securities purchased and proceeds from securities sold during the year ended December 31, 2006, other than options written and money market investments, aggregated $144,026,000 and $145,070,000, respectively, for the Emerging Growth Fund, $73,074,000 and $80,700,000, respectively, for the Micro-Cap Fund, $12,586,000 and $11,796,000, respectively, for the Mid-Cap Fund, and $425,087,000 and $91,727,000, respectively, for the China Opportunities Fund. The Funds did not hold government securities during the year ended December 31, 2006.
The Funds may write covered call options. The premiums received provide a partial hedge (protection) against declining prices and enables each Fund to generate a higher return during periods when OAM does not expect the underlying security to make any major price moves in the near future but still deems the underlying security to be, over the long term, an attractive investment for each Fund. The Funds write covered call options for which premiums received are recorded as liabilities and are subsequently adjusted to the current value of the options written. Premiums received from writing options that expire are treated as realized gains. Premiums received from writing options, which are either exercised or closed, are offset against the proceeds received or amount paid on the transaction to determine realized gains or losses. Amounts recovered for securities litigation are included in the realized gains of the Fund and are recorded when received. The Funds did not write covered call options for the year ended December 31, 2006.
27
4. Redemption fee
The Oberweis Funds are designed for long-term investors. To discourage market timers, redemptions of shares of the Emerging Growth Fund, Micro-Cap Fund, and Mid-Cap Fund within 90 days of purchase are subject to a 1% redemption fee of the total redemption amount and 2% for the China Opportunities Fund. The redemption fee applies only to shares acquired on or after January 1, 2004 and does not currently apply to exchanges. The redemption fee is deducted from the redemption proceeds and is retained by the Fund.
The redemption fee is retained by the Funds for the expense they incur in connection with shareholder redemptions. Redemption fees received by the Emerging Growth Fund, Micro-Cap Fund, Mid-Cap Fund and China Opportunities Fund were $19,000, $42,000, $5,000 and $1,671,000, respectively, for the year ended December 31, 2006, and were recorded as a reduction of the cost of shares redeemed in the statements of changes in net assets.
5. Earnings credits and interest charges
The Trust, as part of the agreement with the Custodian, receives credits against its custodian fees on its uninvested cash balances and is allowed to borrow for temporary purposes. Interest on amounts borrowed is calculated at the prime rate and is payable monthly. During the year ended December 31, 2006, the Emerging Growth Fund, Micro-Cap Fund, Mid-Cap Fund, and China Opportunities Fund received credits of $9,000, $4,000, $7,000 and $11,000, respectively. During the year ended December 31, 2006, the Emerging Growth Fund, Micro-Cap Fund, Mid-Cap Fund and the China Opportunities Fund incurred interest charges of $21,000, $32,000, $3,000 and $11,000, respectively, which is included in custodian fees and expenses in the statement of operations.
6. New Accounting Pronouncements
On July 13, 2006, the Financial Accounting Standards Board (FASB) released FASB Interpretation No. 48 Accounting for Uncertainty in Income Taxes [FIN 48]. FIN 48 provides guidance for how uncertain tax positions should be recognized, measured, presented and disclosed in the financial statements. FIN 48 requires the evaluation of tax positions taken or expected to be taken in the course of preparing the Fund’s tax returns to determine whether the tax positions are “more-likely-than-not” of being sustained by the applicable tax authority. Tax positions not deemed to meet the more-likely-than-not threshold would be recorded as a tax benefit or expense in the current year. Adoption of FIN 48 is required for fiscal years beginning after December 15, 2006 and is to be applied to all open tax years as of the effective date. The Securities and Exchange Commission has granted a six month delay for mutual funds. At this time, management is evaluating the implications of FIN 48 and does not expect the adoption of FIN 48 will have a significant impact on the net assets or results of operations of the Funds.
SFAS No. 157 was issued by the Financial Standards Accounting Board in September, 2006. This standard is effective for financial statements issued for fiscal years beginning after November 15, 2007 and interim periods within those fiscal years. This standard establishes a single authoritative definition of fair value, sets out a framework for measuring fair value and requires additional disclosures about fair value measurements. SFAS No. 157 applies to fair value measurements already required or permitted by existing standards. Fund management does not believe the adoption of SFAS No. 157 will impact the financial statement amounts; however additional disclosures may be required about the inputs used to develop the measurements and the effect of certain of the measurements included within the Statement of Operations for the period.
28
FINANCIAL HIGHLIGHTS
Per share income and capital changes for a share outstanding throughout each period is as follows:
| | | | | | | | | | | | | | | | | | | | |
| | | Emerging Growth Fund | |
| | | Years ended December 31, | |
| | | 2006 | | | 2005 | | | 2004 | | | 2003 | | | 2002 | |
Net asset value at beginning of year | | $ | 26.95 | | | $ | 27.93 | | | $ | 27.05 | | | $ | 16.13 | | | $ | 21.29 | |
Income (loss) from investment operations: | | | | | | | | | | | | | | | | | | | | |
Net investment loss(a) | | | (.30 | ) | | | (.33 | ) | | | (.36 | ) | | | (.27 | ) | | | (.26 | ) |
Net realized and unrealized gain (loss) on investments | | | 1.56 | | | | 1.09 | | | | 1.99 | | | | 11.19 | | | | (4.90 | ) |
| | | | | | | | | | | | | | | | | | | | |
| | | | | |
Total from investment operations | | | 1.26 | | | | .76 | | | | 1.63 | | | | 10.92 | | | | (5.16 | ) |
Redemption Fees | | | — | | | | — | | | | .01 | | | | — | | | | — | |
Less distributions: | | | | | | | | | | | | | | | | | | | | |
Distribution from net realized gains on investments | | | (.99 | ) | | | (1.74 | ) | | | (.76 | ) | | | — | | | | — | |
| | | | | | | | | | | | | | | | | | | | |
Net asset value at end of year | | $ | 27.22 | | | $ | 26.95 | | | $ | 27.93 | | | $ | 27.05 | | | $ | 16.13 | |
| | | | | | | | | | | | | | | | | | | | |
| | | | | |
Total Return (%) | | | 4.87 | | | | 2.74 | | | | 6.3 | | | | 67.7 | | | | (24.2 | ) |
Ratio/Supplemental Data | | | | | | | | | | | | | | | | | | | | |
Net Assets at end of year (in thousands) | | $ | 199,045 | | | $ | 183,979 | | | $ | 175,614 | | | $ | 242,695 | | | $ | 61,292 | |
Ratio of expenses to average net assets (%) | | | 1.35 | | | | 1.42 | | | | 1.44 | | | | 1.37 | | | | 1.57 | |
Ratio of net investment loss to average net assets (%) | | | (1.11 | ) | | | (1.26 | ) | | | (1.38 | ) | | | (1.18 | ) | | | (1.48 | ) |
Portfolio turnover rate (%) | | | 74 | | | | 75 | | | | 55 | | | | 56 | | | | 66 | |
Average commission rate paid(b) | | $ | .0178 | | | $ | .0176 | | | $ | .0199 | | | $ | .0206 | | | $ | .0265 | |
Notes:
(a) | The net investment loss per share data was determined using average shares outstanding during the year. |
29
FINANCIAL HIGHLIGHTS
Per share income and capital changes for a share outstanding throughout the period is as follows:
| | | | | | | | | | | | | | | | | | | | |
| | | Micro-Cap Fund | |
| | | Years ended December 31, | |
| | | 2006 | | | 2005 | | | 2004 | | | 2003 | | | 2002 | |
Net asset value at beginning of year | | $ | 17.31 | | | $ | 17.50 | | | $ | 26.26 | | | $ | 13.86 | | | $ | 16.77 | |
Income (loss) from investment operations: | | | | | | | | | | | | | | | | | | | | |
Net investment loss(a) | | | (.21 | ) | | | (.18 | ) | | | (.36 | ) | | | (.31 | ) | | | (.24 | ) |
Net realized and unrealized gain (loss) on investments | | | .42 | | | | 2.29 | | | | (.54 | ) | | | 15.36 | | | | (2.67 | ) |
| | | | | | | | | | | | | | | | | | | | |
| | | | | |
Total from investment operations | | | .21 | | | | 2.11 | | | | (.90 | ) | | | 15.05 | | | | (2.91 | ) |
Redemption Fees | | | .01 | | | | .01 | | | | .04 | | | | .05 | | | | — | |
Less distributions: | | | | | | | | | | | | | | | | | | | | |
Distribution from net realized gains on investments | | | (1.47 | ) | | | (2.31 | ) | | | (7.90 | ) | | | (2.70 | ) | | | — | |
| | | | | | | | | | | | | | | | | | | | |
Net asset value at end of year | | $ | 16.06 | | | $ | 17.31 | | | $ | 17.50 | | | $ | 26.26 | | | $ | 13.86 | |
| | | | | | | | | | | | | | | | | | | | |
| | | | | |
Total Return (%) | | | 1.66 | | | | 12.72 | | | | 2.2 | | | | 108.9 | | | | (17.3 | ) |
Ratio/Supplemental Data | | | | | | | | | | | | | | | | | | | | |
Net Assets at end of year (in thousands) | | $ | 55,788 | | | $ | 68,355 | | | $ | 46,676 | | | $ | 99,546 | | | $ | 21,978 | |
Ratio of expenses to average net assets (%) | | | 1.62 | (b) | | | 1.70 | | | | 1.70 | | | | 1.60 | | | | 1.93 | |
Ratio of net investment loss to average net assets (%) | | | (1.23 | ) | | | (1.08 | ) | | | (1.54 | ) | | | (1.47 | ) | | | (1.64 | ) |
Portfolio turnover rate (%) | | | 108 | | | | 76 | | | | 58 | | | | 87 | | | | 81 | |
Average commission rate paid(c) | | $ | .0172 | | | $ | .0171 | | | $ | .0195 | | | $ | .0200 | | | $ | .0256 | |
Notes:
(a) | The net investment loss per share data was determined using average shares outstanding during the year. |
(b) | The expense ratio would have been 1.63% for 2006 before earnings credits. |
30
FINANCIAL HIGHLIGHTS
Per share income and capital changes for a share outstanding throughout the period is as follows:
| | | | | | | | | | | | | | | | | | | | |
| | | Mid-Cap Fund | |
| | | Years ended December 31, | |
| | | 2006 | | | 2005 | | | 2004 | | | 2003 | | | 2002 | |
Net asset value at beginning of year | | $ | 12.53 | | | $ | 11.95 | | | $ | 11.37 | | | $ | 7.29 | | | $ | 10.83 | |
Income (loss) from investment operations: | | | | | | | | | | | | | | | | | | | | |
Net investment loss(a) | | | (.24 | ) | | | (.22 | ) | | | (.17 | ) | | | (.18 | ) | | | (.17 | ) |
Net realized and unrealized gain (loss) on investments | | | 1.72 | | | | .80 | | | | .74 | | | | 4.25 | | | | (3.37 | ) |
| | | | | | | | | | | | | | | | | | | | |
| | | | | |
Total from investment operations | | | 1.48 | | | | .58 | | | | .57 | | | | 4.07 | | | | (3.54 | ) |
Redemption Fees | | | .01 | | | | — | | | | .01 | | | | .01 | | | | — | |
Less distributions: | | | | | | | | | | | | | | | | | | | | |
Distribution from net realized gains on investments | | | — | | | | — | | | | — | | | | — | | | | — | |
| | | | | | | | | | | | | | | | | | | | |
Net asset value at end of year | | $ | 14.02 | | | $ | 12.53 | | | $ | 11.95 | | | $ | 11.37 | | | $ | 7.29 | |
| | | | | | | | | | | | | | | | | | | | |
| | | | | |
Total Return (%) | | | 11.89 | | | | 4.85 | | | | 5.1 | | | | 56.0 | | | | (32.7 | ) |
Ratio/Supplemental Data | | | | | | | | | | | | | | | | | | | | |
Net Assets at end of year (in thousands) | | $ | 10,675 | | | $ | 8,773 | | | $ | 10,426 | | | $ | 10,820 | | | $ | 4,370 | |
Ratio of expenses to average net assets (%) | | | 1.83 | | | | 2.00 | (b) | | | 1.96 | | | | 2.00 | (b) | | | 2.00 | (b) |
Ratio of net investment loss to average net assets (%) | | | (1.76 | ) | | | (1.90 | ) | | | (1.52 | ) | | | (1.91 | ) | | | (1.91 | ) |
Portfolio turnover rate (%) | | | 112 | | | | 119 | | | | 86 | | | | 29 | | | | 66 | |
Average commission rate paid(c) | | $ | .0175 | | | $ | .0168 | | | $ | .0196 | | | $ | .0200 | | | $ | .0256 | |
Notes:
(a) | The net investment loss per share data was determined using average shares outstanding during the year. |
(b) | Net of expense reimbursement from related parties. The expense ratios would have been 1.90%, 2.14%, 2.31%, and 2.66%, for 2006, 2005, 2003, and 2002 respectively, before expense reimbursement and earnings credits. |
31
FINANCIAL HIGHLIGHTS
Per share income and capital changes for a share outstanding throughout the period is as follows:
| | | | | | | | |
| | | China Opportunities Fund | |
| | | Year Ended
December 31, 2006 | | | Period ended
December 31, 2005(a) | |
Net asset value at beginning of year | | $ | 10.78 | | | $ | 10.00 | |
Income (loss) from investment operations: | | | | | | | | |
Net investment income (loss)(b) | | | (.02 | ) | | | (.03 | ) |
Net realized and unrealized gains (losses) on investments and translation of assets and liabilities denominated in foreign currencies | | | 8.70 | | | | .81 | |
| | | | | | | | |
| | |
Total from investment operations | | | 8.68 | | | | .78 | |
Redemption Fees | | | .07 | | | | — | |
Less distributions: | | | | | | | | |
Distribution from net realized gains on investments | | | — | | | | — | |
| | | | | | | | |
Net asset value at end of year | | $ | 19.53 | | | $ | 10.78 | |
| | | | | | | | |
| | |
Total Return (%) | | | 81.17 | | | | 7.80 | |
Ratio/Supplemental Data | | | | | | | | |
Net Assets at end of year (in thousands) | | $ | 446,083 | | | $ | 7,471 | |
Ratio of expenses to average net assets (%) | | | 1.91 | | | | 2.49 | (c) |
Ratio of net investment loss to average net assets (%) | | | (.15 | ) | | | (1.34 | ) |
Portfolio turnover rate (%) | | | 53 | | | | 14 | |
Average commission rate paid(d) | | $ | .0021 | | | $ | .0011 | |
Notes:
(a) | For the period from October 1, 2005 (commencement of operations) through December 31, 2005. |
(b) | The net investment income (loss) per share data was determined using average shares outstanding during the year. |
(c) | Net of expense reimbursement from related parties. The expense ratio would have been 4.57%, for 2005, before expense reimbursement and earnings credits. |
32
REPORT OF INDEPENDENT REGISTERED PUBLIC ACCOUNTING FIRM
To the Board of Trustees and Shareholders of
The Oberweis Funds
In our opinion, the accompanying statements of assets and liabilities, including the portfolios of investments, and the related statements of operations and of changes in net assets and the financial highlights present fairly, in all material respects, the financial position of the Oberweis Emerging Growth Fund, Oberweis Micro-Cap Fund, Oberweis Mid-Cap Fund and Oberweis China Opportunities Fund (four funds constituting The Oberweis Funds, hereafter referred to as the “Funds”) at December 31, 2006, the results of each of their operations for year then ended, the changes in each of their net assets for the two years or periods then ended and the financial highlights for each of the periods indicated, in conformity with accounting principles generally accepted in the United States of America. These financial statements and financial highlights (hereafter referred to as “financial statements”) are the responsibility of the Funds’ management; our responsibility is to express an opinion on these financial statements based on our audits. We conducted our audits of these financial statements in accordance with the standards of the Public Company Accounting Oversight Board (United States). Those standards require that we plan and perform the audit to obtain reasonable assurance about whether the financial statements are free of material misstatement. An audit includes examining, on a test basis, evidence supporting the amounts and disclosures in the financial statements, assessing the accounting principles used and significant estimates made by management, and evaluating the overall financial statement presentation. We believe that our audits, which included confirmation of securities at December 31, 2006 by correspondence with the custodian and brokers, provide a reasonable basis for our opinion.
February 21, 2007
Chicago, Illinois
33
Trustees and Officers of The Oberweis Funds
| | | | | | | | | | |
Name, Address and Age | | Position Held with Fund | | Term of Office and Length of Time Served | | Principal Occupation Last Five Years | | Number of Portfolios Overseen by Trustee | | Other Directorships |
| Noninterested Trustees | | | | | | | | | | |
Katherine Smith Dedrick (49) 3333 Warrenville Road, Suite 500 Lisle, IL 60532 | | Trustee | | Trustee since November,2004(1) | | Partner - Levenfeld Pearlstein, LLC, January 2005 to present; Partner - Hinshaw & Culbertson 1985 to January 2005. | | 4 | | None |
| | | | | |
Gary D. McDaniel (58) 3333 Warrenville Road, Suite 500 Lisle, IL 60532 | | Trustee | | Trustee since May, 2004(1) | | Vice President/General Manager of the Flexible Packaging Group - Altivity Packaging, LLC (formerly Smurfit Stone Container), March 1988 to present. | | 4 | | None |
| | | | | |
James G. Schmidt (59) 3333 Warrenville Road, Suite 500 Lisle, IL 60532 | | Trustee | | Trustee since November, 2003(1) | | Senior Vice President and Chief Financial Officer - Federal Heath Sign Co., May 2003 to present; Vice President - Finance, Federal Sign division of Federal Signal Corp. October, 1991 to April, 2003. | | 4 | | None |
| | | | | |
| Interested Trustee | | | | | | | | | | |
James D. Oberweis (60) 3333 Warrenville Road, Suite 500 Lisle, IL 60532 | | Trustee(2) | | Trustee since July, 1986(1) | | Chairman of the Board and Director—Oberweis Asset Management, Inc.; Chairman of the Board—Oberweis Dairy, Inc.; President—The Oberweis Funds, July, 1986 to February, 2004. | | 4 | | None |
| | | | | |
| Officers | | | | | | | | | | |
James W. Oberweis (32) 3333 Warrenville Road, Suite 500 Lisle, IL 60532 | | President | | Officer since August, 1996(3) | | President - Oberweis Asset Management, Inc., September, 2001 to present; Senior Vice President May, 1996 to August, 2001; Portfolio Manager from December, 1995 to present; President and Director - Oberweis Securities, Inc., September, 1996 to present. | | Not Applicable | | None |
| | | | | |
Patrick B. Joyce (47) 3333 Warrenville Road, Suite 500 Lisle, IL 60532 | | Executive Vice President and Treasurer | | Officer since October, 1994(3) | | Executive Vice President, Secretary and Director - Oberweis Asset Management, Inc., September, 1994 to present; Executive Vice President and Director - Oberweis Securities, Inc. September, 1996 to present. | | Not Applicable | | None |
| | | | | |
Martin L. Yokosawa (46) 3333 Warrenville Road, Suite 500 Lisle, IL 60532 | | Senior Vice President | | Officer since October, 1994(3) | | Senior Vice President - Oberweis Asset Management, Inc., September, 1994 to Present; Senior Vice President - Oberweis Securities, Inc., January, 1997 to present. | | Not Applicable | | None |
| | | | | |
David I. Covas (31) 3333 Warrenville Road, Suite 500 Lisle, IL 60532 | | Vice President | | Officer since August, 2004(3) | | Vice President - Oberweis Asset Management, Inc., September, 2003 to present; Research Analyst June, 1997 to August, 2003. | | Not Applicable | | None |
| | | | | |
Eric V. Hannemann (33) 3333 Warrenville Road, Suite 500 Lisle, IL 60532 | | Secretary | | Officer since August, 2005(3) | | Vice President of Accounting - Oberweis Asset Management and Oberweis Securities, Inc., June, 2004 to present; Portfolio and Staff Accountant - Vestor Capital Corp. April, 2003 to June, 2004; Staff Accountant - Green, Plage & Associates, Inc., November, 1999 to April, 2003 | | Not Applicable | | None |
| (1) | Unless otherwise noted, each trustee shall serve as a trustee of the Trust until the next meeting of shareholders, if any, called for the purpose of considering the election or re-election of such trustee or of a successor to such trustee, and until the election and qualification of his successor, if any, elected at such meeting, or until such trustee sooner dies, resigns, retires or is removed. |
| (2) | James D. Oberweis is an interested trustee of the Trust by reason of his position as the Chairman of Oberweis Asset Management, Inc., the Trust’s investment advisor. |
| (3) | Elected annually by board of trustees. |
The Statement of Additional Information includes additional information about Trust officers and trustees and is available upon request without charge, by calling the Trust at 1-800-323-6166.
34
THE OBERWEIS FUNDS
Supplemental Information
Proxy Voting:
The Oberweis Funds has delegated authority to vote proxies related to the Funds’ (Emerging Growth Fund, Micro-Cap Fund, Mid-Cap Fund, and China Opportunities Fund) portfolio securities to the Funds’ investment adviser, Oberweis Asset Management, Inc. (“OAM”). A description of the policies and procedures that OAM uses in fulfilling this responsibility is available, without charge upon request, by calling 1-800-323-6166. It also appears on www.oberweisfunds.com and in the Funds’ Statement of Additional Information, which can be found on the Securities and Exchange Commission’s (“SEC”) website at http://www.sec.gov. Information on how the Funds voted proxies relating to portfolio securities during the most recent 12 month period ended June 30 is available (1) without charge, upon request, by calling 1-800-323-6166, and (2) on the SEC’s website at http://www.sec.gov.
Availability of Schedules of Portfolio Investments:
The Funds file their complete schedule of portfolio investments with the SEC for the first and third quarters of each fiscal year (March 31 and September 30) on Form N-Q. The Funds’ Forms N-Q are available, without charge, on the SEC’s website at http://www.sec.gov and may be reviewed and copied at the SEC’s Public Reference Room in Washington, D.C. Information on the operation of the Public Reference Room may be obtained by calling 1-800-SEC-0330.
Approval of Investment Advisory Contracts:
The Investment Advisory Agreement with respect to the Emerging Growth, Micro-Cap and Mid-Cap Funds was last approved by the Board of Trustees, including all of the trustees who are not parties to such agreements or interested persons of any such party (the “independent trustees”), on August 10, 2006. The Investment Advisory and Management Agreement for the China Opportunities Fund was initially approved by the Board of Trustees on August 10, 2005 and the initial term of such agreement is two years. Accordingly, the approval of such agreement was not considered during the period covered by this report. The Investment Advisory and Management Agreement for the International Opportunities Fund was initially approved by the Board of Trustees, including all of the independent trustees, on November 9, 2006. The Board of Trustees, including a majority of the independent trustees, determined that approval of the agreements was in the best interests of each Fund. The independent trustees were assisted by independent legal counsel in making their determination.
The Board noted that OAM has a long association with the Emerging Growth, Micro-Cap and Mid-Cap Funds, in each case since the inception of the Funds. The Board recognizes that a long-term relationship with a capable, conscientious investment adviser is in the best interests of shareholders and that shareholders have invested in the Funds knowing that OAM managed the Funds and knowing the investment advisory fee schedule.
Nature, Quality and Extent of Services. With respect to the nature, quality and extent of the services provided by OAM to the Emerging Growth, Micro-Cap and Mid-Cap Funds and of the services to be provided by OAM to the International Opportunities Fund, the Board considered the functions performed by OAM and the personnel providing such services, OAM’s financial condition, and the compliance regime created by OAM, including the competency of the Trust’s chief compliance officer and the fact that neither the Trust nor OAM has had any material compliance issues, and OAM’s anticipated financial support of the International Opportunities Fund. The Board considered the educational and professional background and qualifications for the portfolio manager and research analyst for the International Opportunities Fund, the OAM trading, research and portfolio management support team and the investment strategy and process for the International Opportunities Fund. Based on the information provided, the Board concluded that the nature and extent of services to be provided to the International Opportunities Fund was appropriate and that the quality would be good. The Board also considered the honesty and integrity of OAM and the portfolio management team and that OAM personnel act with the highest of ethical standards. The Board noted that OAM personnel are very forthright with the Board. Based on the information provided, the Board concluded that the nature and extent of services provided to each Fund were appropriate and that the quality was good.
The Board also reviewed and discussed reports prepared by OAM containing information on total returns and average annual total returns over various periods of time of the Emerging Growth, Micro-Cap and Mid-Cap Funds as compared to relevant market indices and other mutual funds pursuing broadly similar strategies. The Board concluded that as to each Fund, the investment performance was satisfactory, and in some cases, good versus relevant market indices, and was in the line with the other mutual funds
35
THE OBERWEIS FUNDS
Supplemental Information (cont’d.)
included in the reports. With respect to the International Opportunities Fund, the Board reviewed the performance of the existing funds, in particular, the China Opportunities Fund, and concluded that the performance of the existing funds was satisfactory, noting the strong performance of the China Opportunities Fund since its inception.
Fees and Expenses. For each Fund, the Board compared the amounts paid to OAM for advisory services (for advisory and management services for the International Opportunities Fund) and each Fund’s expense ratio (or expense cap for the International Opportunities Fund) with other mutual funds pursuing broadly similar strategies as included in reports prepared by OAM (and with the China Opportunities Fund for the International Opportunities Fund). This information showed that each of the Emerging Growth, Micro-Cap and Mid-Cap Fund’s advisory fee was in the mid-range compared to the other mutual funds, and that the International Opportunities Fund’s advisory and management fee is reasonable. The information also showed that the expense ratios of the Emerging Growth, Micro-Cap and Mid-Cap Funds and the projected expense ratio of the International Opportunities Fund were in line with those of similar mutual funds. In addition, the Board considered amounts paid to OAM by other registered funds, for which OAM acts as a subadviser. For each Fund (expect for the International Opportunities Fund because OAM does not manage other international accounts), the Board considered amounts paid to OAM by OAM’s other clients. With respect to OAM’s other clients, including funds for which it acts as a subadviser, the Board noted that the mix of services provided and the level of responsibility required under the agreements with the Funds were greater than OAM’s obligations for similar client accounts and that the advisory fees of such accounts are less relevant to the Board’s consideration because they reflect different competitive forces than those in the mutual fund marketplace. The Board also considered that OAM has agreed to bear organizational expenses of the International Opportunities Fund and has proposed an expense cap for the International Opportunities Fund. Based on the information considered, the Board concluded that each Fund’s advisory fee (advisory and management fee for the International Opportunities Fund, coupled with the expense cap) was reasonable and appropriate in amount given the quality of services provided or expected to be provided.
Profitability. With respect to the costs of services provided and profits realized or to be by OAM, the Board considered the advisory fees received by OAM from each of the Emerging Growth, Micro-Cap and Mid-Cap Funds and the proposed advisory and management fee rate for the International Opportunities Fund. The Board also considered the fact that OAM has agreed to bear the organizational expenses and to cap expenses for the International Opportunities Fund. Based on this information, the Board concluded for each Fund that OAM’s profitability was not unreasonable.
Economies of Scale. The Board considered the extent to which economies of scale would be realized as each Fund grows and whether fee levels reflect economies of scale for the benefit of Fund Shareholders. The Board reviewed each of the Emerging Growth, Micro-Cap and Mid-Cap Fund’s asset size and expense ratio. The Board noted OAM’s comments that the Funds may have some capacity constraints which limit economies of scale and that, with respect to the International Opportunities Fund, economies of scale are unexpected during the start-up process. The Board concluded, with respect to each of the Funds, that the total expense ratio (after giving effect to the expense cap proposed by OAM for the International Opportunities Fund) was reasonable.
Other Benefits of OAM and its Affiliates. The Board considered the character and amount of other incidental benefits received by OAM and its affiliates from their relationship with the Funds, including fees received or expected to be received by an affiliate of OAM for distribution services and benefits to OAM related to soft dollars. The Board concluded that, taking into account these benefits, the Emerging Growth, Micro-Cap and Mid-Cap Funds’ advisory fees (advisory and management fee for the International Opportunities Fund) were reasonable.
Based on all of the information considered and the conclusions reached, the Board determined to approve the agreements. The Board of Trustees, including the independent trustees, did not identify any single factor or group of factors as all important or controlling and considered all factors together.
36
THE OBERWEIS FUNDS
Supplemental Information (cont’d.)
Expense Examples:
As a shareholder of The Oberweis Funds, you may incur two types of costs: (1) transaction costs, including redemption fees and (2) ongoing costs, including management fees; distribution (and/or service) 12b-1 fees; and other Fund expenses. This example is intended to help you understand your ongoing costs (in dollars) of investing in The Oberweis Funds and to compare these costs with the ongoing costs of investing in other mutual funds.
The Example is based on an investment of $1,000 investment at the beginning of the period and held for the entire period from July 1, 2006 through December 31, 2006.
Actual Expenses:
The first line for each Fund in the table below provides information about actual account values and actual expenses. You may use the information below, together with the amount you invested, to estimate the expenses that you paid over the period. Simply divide your account value by $1,000 (for example, an $8,600 account value divided by $1,000=8.6), then multiply the result by the number in the table under the heading entitled “Expenses Paid During Period” to estimate the expenses you paid on your account during this period.
Hypothetical Example for Comparison Purposes:
The second line for each Fund in the table below provides information about hypothetical account values and hypothetical expenses based on each Fund’s actual expense ratio and an assumed rate of return of 5% per year before expenses, which is not the Fund’s actual return. The hypothetical account values and expenses may not be used to estimate the actual ending account balance or expenses you paid for the period. You may use this information to compare this 5% hypothetical example with the 5% hypothetical examples that appear in the shareholder reports of other funds.
Please note that the expenses shown in the table are meant to highlight your ongoing costs only and do not reflect any transactional costs, such as redemption fees. Therefore, the second line for each Fund in the table is useful in comparing ongoing costs only, and will not help you determine the relative total costs of owning different funds. In addition, if these transactional costs were included, your costs would have been higher.
| | | | | | | | | | | | |
| | | Beginning Account Value 7/1/06 | | Ending Account Value 12/31/06 | | Expense Paid During Period* 7/1/06-12/31/06 | | Expense Ratio During Period 7/1/06-12/31/06 | |
Emerging Growth Fund | | | | | | | | | | | | |
Actual | | $ | 1,000 | | $ | 1,025 | | $ | 7 | | 1.35 | % |
Hypothetical (5% return before expenses) | | $ | 1,000 | | $ | 1,018 | | $ | 7 | | 1.35 | % |
| | | | |
Micro-Cap Fund | | | | | | | | | | | | |
Actual | | $ | 1,000 | | $ | 1,008 | | $ | 8 | | 1.62 | % |
Hypothetical (5% return before expenses) | | $ | 1,000 | | $ | 1,017 | | $ | 8 | | 1.62 | % |
| | | | |
Mid-Cap Fund | | | | | | | | | | | | |
Actual | | $ | 1,000 | | $ | 1,060 | | $ | 10 | | 1.83 | % |
Hypothetical (5% return before expenses) | | $ | 1,000 | | $ | 1,016 | | $ | 9 | | 1.83 | % |
| | | | |
China Opportunities Fund | | | | | | | | | | | | |
Actual | | $ | 1,000 | | $ | 1,409 | | $ | 12 | | 1.91 | % |
Hypothetical (5% return before expenses) | | $ | 1,000 | | $ | 1,016 | | $ | 10 | | 1.91 | % |
| * | Expenses are equal to the average account value times the Fund’s annualized expense ratio multiplied by the number of days in the most recent fiscal half-year divided by the number of days in the fiscal year. |
37
| | (a) | As of December 31, 2006, the registrant has adopted a code of ethics that applies to the registrant’s principal executive officer, principal financial officer, principal accounting officer, or persons performing similar functions. |
| | (b) | A copy of the code of ethics may be obtained upon request, without charge, by contacting the registrant in writing at its principal executive office. |
| ITEM 3. | AUDIT COMMITTEE FINANCIAL EXPERT |
| | (a) | (1) The registrant’s board of trustees has determined that the registrant has at least one audit committee financial expert serving on the audit committee. |
| | (b) | The audit committee financial expert is James G. Schmidt. Mr. Schmidt is independent as defined in Form N-CSR Item 3 (a) (2). |
| ITEM 4. | PRINCIPAL ACCOUNTANT FEES AND SERVICES. |
(a)-(d)
| | | | |
| | | 2005 | | 2006 |
Audit fees | | 50,000 | | 54,000 |
Audit-Related Fees | | N/A | | N/A |
Tax Fees | | 12,000 | | 14,000 |
All Other Fees | | N/A | | N/A |
Audit Fees include amounts related to the audit of the registrant’s annual financial statements and services normally provided by the principal accountant in connection with statutory and regulatory filings. Tax Fees principally include tax compliance, tax advice, tax planning and preparation of tax returns.
(e)(1) The registrant’s audit committee pre-approves all audit services provided by the registrant’s principal accountant for the registrant and all non-audit services provided by the registrant’s principal accountant for the registrant, its investment adviser and any entity controlling, controlled by, or under common
control with the investment adviser (“Adviser Affiliate”) that provides ongoing services to the registrant, if the engagement by the investment adviser or Adviser Affiliate relates directly to the operations and financial reporting of the registrant.
(e)(2) No services included in (b) – (d) above were approved pursuant to paragraph (c)(7)(i)(C) of Rule 2-01 of Regulation S-X.
(f) Not Applicable.
(g) The aggregate fees billed for the most recent fiscal year and the preceding fiscal year by the registrant’s principal accountant for non-audit services rendered to the registrant, its investment, and Adviser Affiliate that provides ongoing services to the registrant for 2006 and 2005 were $16,100, and 15,052, respectively.
(h) Non-audit services rendered to the registrant’s investment adviser and any Adviser Affiliate that were not pre-approved pursuant to Paragraph (c) (7) (ii) of Rule 2-01 of Regulation S-X were considered by the registrant’s audit committee as to whether they were compatible with maintaining the principal account’s independence.
| ITEM 5. | AUDIT COMMITTEE OF LISTED REGISTRANTS. |
Not Applicable to the registrant.
| ITEM 6. | SCHEDULE OF INVESTMENTS. |
See Schedule I in Item 1.
| ITEM 7. | DISCLOSURE OF PROXY VOTING POLICIES AND PROCEDURES FOR CLOSED-END MANAGEMENT INVESTMENT COMPANIES. |
Not Applicable to the registrant.
| ITEM 8. | PORTFOLIO MANAGERS OF CLOSED-END MANAGEMENT INVESTMENT COMPANIES. |
Not Applicable to the registrant.
| ITEM 9. | PURCHASES OF EQUITY SECURITIES BY CLOSED-END MANAGEMENT INVESTMENT COMPANY AND AFFILIATED PURCHASERS. |
Not Applicable to the registrant.
| ITEM 10. | SUBMISSION OF MATTERS TO A VOTE OF SECURITY HOLDERS. |
There have been no material changes to the procedures by which shareholders may recommend nominees to the registrant’s board of trustees since registrant last disclosed such procedures in its proxy statement dated April 16, 2004.
| ITEM 11. | CONTROLS AND PROCEDURES. |
| | (a) | The registrant’s principal executive and principal financial officers, or persons performing similar functions, have concluded that the registrant’s disclosure controls and procedures (as defined in Rule 30a-3 (c) under the Investment Company Act of 1940, as amended (the “1940 Act”) (17CFR 270.30a-3(c))) are effective, as of a date within 90 days of the filing date of the report that includes the disclosure required by this paragraph, based on their evaluation of these controls and procedures required by Rule 30a-3(b) under the 1940 Act (17 CFR 270.30a-3(b)) and Rules 13a-15(b) or 15d-15(b) under the Exchange Act (17 CFR 240.13a-15(b) or 240.15d-15(b)). |
| | (b) | There has been no change to the registrant’s internal control over financial reporting (as defined in Rule 30a-3(d) under the 1940 Act (17 CFR 270.30a-3(d)) that occurred during the second fiscal quarter of the period covered by this report that has materially affected, or is reasonably likely to materially affect, the registrant’s internal control over financial reporting. |
| | |
| (a) (1) | | Code of Ethics applicable to its Principal Executive and Principal Accounting Officers pursuant to Section 406 of the Sarbanes-Oxley Act of 2002 attached hereto as Exhibit 99.406. Code of Ethics. |
| |
| (a) (2) | | Certifications pursuant to Rule 30a-2 under the Investment Company Act of 1940 (17CFR 270.30a-2) in the exact form set forth below: EX-99.CERT attached hereto. |
| |
| (a) (3) | | Any written solicitation to purchase securities under Rule 23 c-1 under the Investment Company Act of 1940 (17 CFR 270.23c-1) sent or given during the period covered by the report by or on behalf of the registrant to 10 or more persons. Not Applicable to the registrant. |
| | |
| |
| (b) | | If the report is filed under Section 13(a) or 15(d) of the Exchange Act, provide the certifications required by Rule 30a-2(b) under the 1940 Act (17 CFR 270.30a-2(b)), Rule 13a-14(b) or Rule 15d-14(b) under the Exchange Act (17 CFR 240.13a-14(b) or 240.15d-14(b)), and Section 1350 of Chapter 63 of Title 18 of the United States Code (18 U.S.C. 1350) as an exhibit. A certification furnished pursuant to this paragraph will not be deemed “filed” for purposes of Section 18 of the Exchange Act (15 U.S. C. 78r), or otherwise subject to the liability of that section. Such certification will not be deemed to be incorporated by reference into any filing under the Securities Act of 1933 or the Exchange Act, except to the extent that the registrant specifically incorporates it by reference. EX-99.906 CERT attached hereto. |
SIGNATURES
Pursuant to the requirements of the Securities Exchange Act of 1934 and the Investment Company Act of 1940, the registrant has duly caused this report to be signed on its behalf by the undersigned, thereunto duly authorized.
| | |
| (Registrant) The Oberweis Funds |
| |
| By (Signature and Title*) | | /s/ James W. Oberweis |
| | James W. Oberweis |
| | President, The Oberweis Funds |
Date 03/09/2007
Pursuant to the requirements of the Securities Exchange Act of 1934 and the Investment Company Act of 1940, this report has been signed below by the following persons on behalf of the registrant and in the capacities and on the dates indicated.
| | |
| By (Signature and Title*) | | /s/ James W. Oberweis |
| | James W. Oberweis |
| | President, The Oberweis Funds |
Date 03/09/2007
| | |
| By (Signature and Title*) | | /s/ Patrick B. Joyce |
| | Patrick B. Joyce |
| | Executive Vice President and Treasurer, |
| | The Oberweis Funds |
Date 03/09/2007
| /*/ | Print the name and title of each signing officer under his or her signature. |