Form N-CSR is to be used by management investment companies to file reports with the Commission not later than 10 days after the transmission to stockholders of any report that is required to be transmitted to stockholders under Rule 30e-1 under the Investment Company Act of 1940 (17 CFR 270.30e-1). The Commission may use the information provided on Form N-CSR in its regulatory, disclosure review, inspection, and policymaking roles.
A registrant is required to disclose the information specified by Form N-CSR, and the Commission will make this information public. A registrant is not required to respond to the collection of information contained in Form N-CSR unless the Form displays a currently valid Office of Management and Budget (“OMB”) control number. Please direct comments concerning the accuracy of the information collection burden estimate and any suggestions for reducing the burden to Secretary, Securities and Exchange Commission, 450 Fifth Street, NW, Washington, DC 20549-0609. The OMB has reviewed this collection of information under the clearance requirements of 44 U.S.C. § 3507.
Beginning on January 1, 2021, as permitted by regulations adopted by the Securities and Exchange Commission, paper copies of the Funds’ shareholder reports will no longer be sent by mail, unless you specifically request paper copies of the reports from the Funds or from your financial intermediary, such as a broker-dealer or bank. Instead, the reports will be made available on www.oberweisfunds.com and you will be notified by mail each time a report is posted and provided with a website link to access the report.
If you already elected to receive shareholder reports electronically, you will not be affected by this change and you need not take any action. You may elect to receive shareholder reports and other communications from the Funds or your financial intermediary electronically by contacting us at 1-800-245-7311.
You may elect to receive all future reports in paper free of charge. You can inform the Funds or your financial intermediary that you wish to continue receiving paper copies of your shareholder reports by contacting us at 1-800-245-7311. Your election to receive reports in paper will apply to all funds held with the fund complex.
PRESIDENT’S Letter (unaudited)
Dear Fellow Oberweis Funds Shareholder,
2021 IN REVIEW
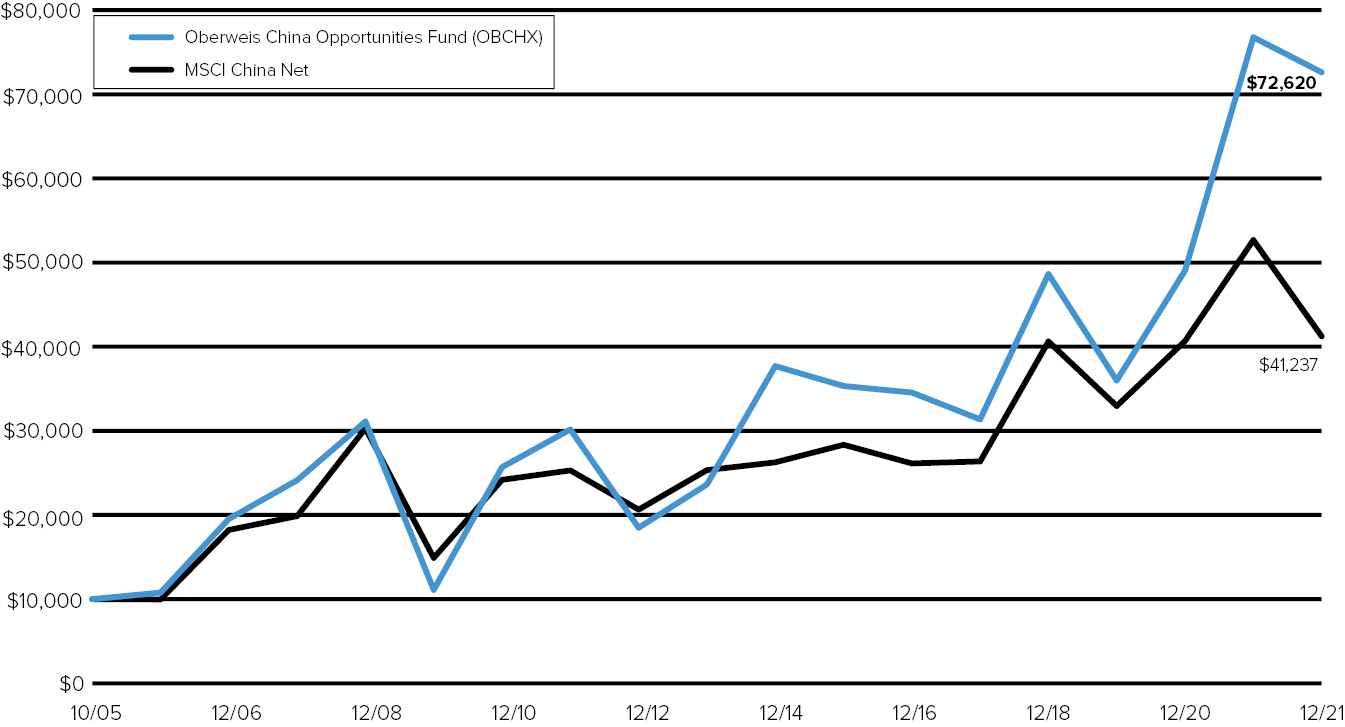
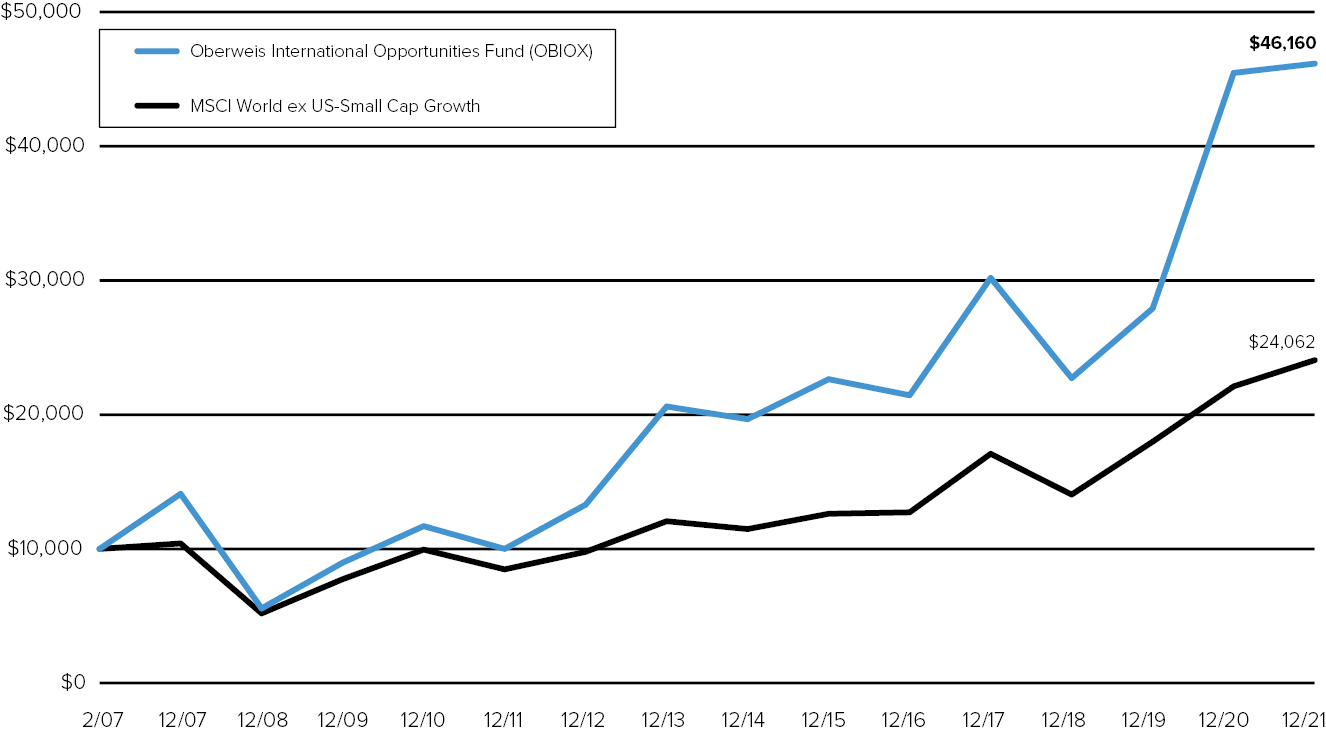
I’m pleased to report truly exceptional results for the domestic funds. The Micro-Cap Fund and Small-Cap Opportunities Fund returned 53.38% and 43.57%, respectively (compared to 0.88% and 2.83% for the Russell Micro-Cap Growth and Russell 2000 Growth indices). Among the international funds, the International Opportunities Fund returned 1.52% (versus 8.83% for the MSCI World ex-US SCG Index). The Emerging Markets Fund returned 13.24% (versus 18.75% for the MSCI EM Small Cap Index). While these two funds underperformed their benchmarks in 2021, they outperformed by a much wider margin in 2020, resulting in aggregate returns well ahead of the benchmark over the combined two years. Government policy shifts in 2021 made for a difficult year for investors in China, although our China Opportunities Fund fared far better than the benchmark, returning -5.41% (compared to -21.72% for the MSCI China Index). The Global Opportunities Fund, which invests in many of our team’s top ideas around the world, returned 20.92% (compared to 16.10% for the MSCI ACWI Small-Cap Index).
It is the dream of every mutual fund company president to look back at the returns of the fund family and see that every single fund significantly outperformed its benchmark over trailing three-year, five-year, and ten-year periods. This is indeed the case for every fund in the family today with a qualifying track record (which includes all but our new fund). Even our newest fund, Emerging Markets, has crushed its benchmark over the trailing three-years. We believe that these results provide some indication of the effectiveness of our time-tested investment process and the discipline that our team employs in its implementation. While no one can predict the future, we believe that the behavioral biases that underlie our investment processes are unlikely to change. Clearly, not every period will look as good as this one, but in our view the outperformance generated across the six funds demonstrates the potential to add significant alpha over time.
THE YEAR AHEAD
Our funds seek to find undervalued firms that are capitalizing on change, typically from new products, markets, management teams, or regulations. Covid-19 caused a devastating loss for humanity, but also a period of accelerated societal change, such as an explosion in ecommerce, mass adoption of food delivery, an accelerated shift from business to casual apparel, and business acceptance of virtual meetings and working remotely. Periods of significant change tend to increase the potential for the smaller, innovative firms such as those held in the Oberweis Funds. It is easier for businesses to find new niches, unsettle incumbents and take market share during periods of rapid change.
It is now clear that stimulus from the American Rescue Plan Act of 2021, labor market shortages, and supply chain disruptions have ignited inflation, and interest rates will move higher in response in 2022. On November 10th, the US Labor Department issued a report showing that the US Consumer Price Index jumped 6.8% year-over-year, its highest reading in 39 years. Meanwhile, the unemployment rate had fallen to 4.2%. In the weeks that followed that report, several Federal Reserve officials retreated from previous statements that “inflation is transitory” and called instead for faster and sharper monetary tightening to fight inflation.
We put as much stock in pronouncements that inflation is sticky as we did in prior assertions that inflation is transitory. To be clear, that’s very little stock. When it comes to macroeconomic forecasts, a lot of people have a lot of opinions, but nobody knows anything. Instead, we choose to spend our time looking for less-followed investment opportunities in companies whose ability to create substantial long-term shareholder value isn’t materially predicated
1
PRESIDENT’S Letter (unaudited) (continued)
on near-term monetary expectations. Over time, the success of most of our investments is primarily determined by their ability to drive sales and earnings growth by taking market share from competitors or creating new markets. We do recognize that shifting macroeconomic expectations can lead to volatility. For us, however, volatility often equals opportunity when it causes the growing, durable enterprises we favor to trade at prices that do not reflect their long-term potential.
Even if inflation does prove to be structural and interest rates rise more-than-expected to fight it, it is not obvious to us how different classes of equities will fare. Traditional logic holds that small growth stocks–with earnings predicated on profits years into the future–would be disproportionately punished. However, that also assumes that valuations of all asset classes are similar at the starting point. And they are not. U.S. large-cap stocks are much more expensive than international equities or small-caps. The relationship is particularly acute for emerging markets, where valuations appear to us to be unusually cheap. Similarly, the spread between U.S. small-cap and micro-cap cash flow yields and their large-cap brethren is tighter than historical averages, implying that small stocks may be more attractive than average compared to large-caps. Even if interest rates rise by more than already anticipated, we believe that the relatively cheap valuations of international and small/micro-cap equities will play at least as important a role in determining future returns as rising interest rates themselves.
VALUATION RECAP
As of December 31, 2021, the price/earnings (P/E) ratio was 21.1 times for the Global Opportunities Fund (versus 19.0 last quarter), 17.0 times for the Small-Cap Opportunities Fund (versus 14.1 last quarter), 16.2 times for the Micro-Cap Fund (versus 14.2 last quarter), 26.1 times for the International Opportunities Fund (versus 24.7 last quarter), 29.0 times for the China Opportunities Fund (versus 28.5 last quarter), and 26.1 times for the Emerging Markets Fund (versus 26.3 times last quarter). Each of these funds invests in companies with expected earnings growth rates that are higher than that of the broader market, and in companies expected to grow faster than current market expectations. As of December 31, 2021, the weighted-average market capitalization was $6.1 billion for the Global Opportunities Fund, $4.3 billion for the Small-Cap Opportunities Fund, $1.4 billion for the Micro-Cap Fund, $5.2 billion for the International Opportunities Fund, $4.2 billion for the Emerging Markets Fund, and $18.0 billion for the China Opportunities Fund.
We appreciate your investment in The Oberweis Funds and are grateful for the trust you have shown us with your valuable investments. If you have any questions about your account, please contact shareholder services at (800) 245-7311. Thank you for investing with us in The Oberweis Funds.
Sincerely,

James W. Oberweis, CFA
President & Portfolio Manager
2
Management discussion on fund performance
(unaudited)
Market environment
Global equities returned 21.82% in 2021, as measured by the MSCI World Index. Global small-caps, as measured by the MSCI World Small-Cap Index, returned 15.75%, underperforming large-capitalization stocks. International small-caps underperformed versus U.S. small-caps, as evidenced by the 11.14% return on the MSCI World ex-USA Small-Cap Index. Within the United States, large-cap growth stocks outperformed small-cap growth stocks by 2477 basis points, as measured by the respective returns of the Russell 1000 Growth (27.60%) and Russell 2000 Growth (2.83%) indices. Within domestic small-cap, value sharply outperformed growth, with the Russell 2000 Value Index (28.27%) outperforming the Russell 2000 Growth Index (2.83%) by 2544 basis points for the year.
Discussion of The Oberweis funds
The International Opportunities Fund returned 1.52% versus 8.83% for the MSCI World ex-US Small Cap Growth Index. At the country level, Switzerland, Sweden, and Japan detracted from portfolio return, partially offset by favorable performance in the United Kingdom and Norway. At the sector level, the portfolio was negatively impacted by stock selection in communication services and healthcare, partially offset by positive stock selection in information technology. At the stock level, Baycurrent Consulting (6532 JP), Nordic Semiconductor (NOD NO), and Endava (DAVA US) were among the top contributors to performance; IR Japan Holdings (6035 JP), BASE (4477 JP), Medpeer (6095 JP) were among the top detractors
The Global Opportunities Fund returned 20.92% versus 16.10% for the MSCI AWCI Small-Cap Index. At the country level, stock selection in the United States, Israel, Finland and the United Kingdom added to portfolio return, while Japan and China detracted from portfolio return. At the sector level, information technology, consumer discretionary, and healthcare added to return, while financials and industrials detracted. At the stock level, Synaptics (SYNA US), Inmode (INMD US), and Upwork (UPWK US) were among the top contributors to performance; IR Japan Holdings (6035 JP), Alphatec (ATEC US) and Medpeer (6095 JP) were among the top detractors.
The China Opportunities Fund returned -5.41% versus -21.72% for the MSCI China Index. At the sector level, information technology, consumer discretionary, and materials were the largest contributors to the portfolio’s outperformance, partially offset by a negative contribution from financials. At the stock level, Li Ning (2331 HK), Ecovacs Robotics (603486 C1), and Jiangsu Eastern Shenghong (000301 C2), were among the top contributors to performance; Alibaba (9988 HK), New Oriental Education & Technology (EDU US), 360 DigiTech (QFIN US), and Vnet Group (VNET) were among the top detractors.
The Emerging Markets Fund returned 13.24% versus 18.75% for the MSCI EM Small-Cap Index. At the country level, China and India were the primary detractors while Cyprus was the top contributor. At the sector level, the fund was positively impacted by stock selection in communication services, financials, and consumer staples, while performance was adversely impacted by stock selection in information technology. At the stock level, AfreecaTV (067160 KS), TCS Group Holding (TCS LI), and Aspeed Technology (5274 TT) were among the top contributors to performance; Dada Nexus (DADA US), Venus MedTech Hangzhou (2500 HK), and Bukalapak.com (BUKA IJ) were among the top detractors.
3
Management discussion on fund performance
(unaudited) (continued)
The Micro-Cap Fund returned 53.38% versus 0.88% for the Russell Micro-Cap Growth Index. The portfolio benefitted from favorable stock selection in technology, producer durables and healthcare. At the stock level, Inmode (INMD), Magnite (MGNI), and Axcelis Technologies (ACLS) were among the top contributors to performance. Lands’ End (LE), Red Robin Gourmet Burgers (RRGB), and Neuronetics (STIM) were among the top detractors.
The Small-Cap Opportunities Fund returned 43.57% versus 2.83% for the Russell 2000 Growth Index. The portfolio benefitted from favorable stock selection in technology, healthcare, and producer durables. Synaptics (SYNA), Inmode (INMD), and Axcelis Technologies (ACLS) were among the top contributors to performance. Red Robin Gourmet Burgers (RRGB), Golden Nugget Online Gaming (GNOG), and Alphatec Holdings (ATEC) were among the top detractors.
For current performance information, please visit www.oberweisfunds.com.
4
Management discussion on fund performance
(unaudited) (continued)
Oberweis Micro-Cap Fund
At December 31, 2021
Asset Allocation (% of Net Assets) | | |
Equities | | 101.1 |
Other Liabilities less Assets | | (1.1) |
| | | |
Top Ten Holdings (% of Net Assets) |
Axcelis Technologies, Inc. | | 4.5 |
Alpha and Omega Semiconductor Ltd. | | 3.3 |
Veritiv Corp. | | 3.2 |
Vocera Communications, Inc. | | 2.6 |
Clearfield, Inc. | | 2.5 |
Guess’, Inc. | | 2.4 |
Boot Barn Hldgs., Inc. | | 2.4 |
AngioDynamics, Inc. | | 2.2 |
Ultra Clean Hldgs., Inc. | | 2.1 |
ChannelAdvisor Corp. | | 1.9 |
| | | |
Top Ten Industries (% of Net Assets) |
Production Technology Equipment | | 10.4 |
Back Office Support, Human Resources & Consulting | | 8.9 |
Specialty Retail | | 7.3 |
Communications Technology | | 6.8 |
Semiconductors & Components | | 5.6 |
Medical & Dental Insturments & Supplies | | 5.1 |
Telecommunications Equipment | | 5.0 |
Computer Services Software & Systems | | 4.4 |
Medical Equipment | | 3.7 |
Containers & Packaging | | 3.2 |
Oberweis Small-Cap Opportunities Fund
At December 31, 2021
Asset Allocation (% of Net Assets) | | |
Equities | | 99.7 |
Other Assets less Liabilities | | 0.3 |
| | | |
Top Ten Holdings (% of Net Assets) |
Synaptics, Inc. | | 5.3 |
Axcelis Technologies, Inc. | | 3.9 |
Crocs, Inc. | | 3.0 |
Veritiv Corp. | | 2.6 |
Ultra Clean Hldgs., Inc. | | 2.4 |
Shutterstock, Inc. | | 2.4 |
MaxLinear. Inc. | | 2.1 |
AngioDynamics, Inc. | | 2.1 |
Builders FirstSource, Inc. | | 2.1 |
Inter Parfums, Inc. | | 2.0 |
| | | |
Top Ten Industries (% of Net Assets) |
Computer Services Software & Systems | | 8.9 |
Production Technology Equipment | | 6.3 |
Building Materials | | 5.9 |
Computer Technology | | 5.3 |
Semiconductors & Components | | 5.1 |
Medical & Dental Insturments & Supplies | | 4.5 |
Textiles Apparel & Shoes | | 4.4 |
Back Office Support, Human Resources, & Consulting | | 4.0 |
Medical Equipment | | 3.6 |
Specialty Retail | | 3.1 |
5
Management discussion on fund performance
(unaudited) (continued)
Oberweis Global Opportunities Fund
At December 31, 2021
Asset Allocation (% of Net Assets) |
Equities | | 97.0 |
Other Assets less Liabilities | | 3.0 |
| | | |
Top Ten Holdings (% of Net Assets) |
Synaptics, Inc. | | 6.1 |
Alphatec Hldgs, Inc. | | 4.4 |
Ultra Clean Hldgs., Inc. | | 4.2 |
Deckers Outdoor Corp. | | 4.1 |
Intermediate Capital Group PLC | | 4.1 |
Crocs, Inc. | | 3.8 |
M31 Technology Corp. | | 3.7 |
Halozyme Therapeutics, Inc. | | 3.5 |
Taylor Wimpey PLC | | 3.2 |
ChannelAdvisor Corp. | | 3.2 |
| | | |
Top Ten Industries (% of Net Assets) |
Semiconductor & Semiconductor Equipment | | 24.2 |
Textiles, Apparel & Luxury Goods | | 9.8 |
Healthcare Equipment & Supplies | | 8.0 |
Software | | 7.1 |
Household Durables | | 4.8 |
Capital Markets | | 4.1 |
Leisure Products | | 3.7 |
Metals & Mining | | 3.6 |
Biotechnology | | 3.5 |
Electronic Equipment, Instruments & Components | | 3.5 |
Oberweis China Opportunities Fund
At December 31, 2021
Asset Allocation (% of Net Assets) |
Equities | | 98.5 |
Other Assets less Liabilities | | 1.5 |
| | | |
Top Ten Holdings (% of Net Assets) |
Li Ning Co. Ltd. | | 2.8 |
Luzhou Laojiao Co. Ltd. | | 2.5 |
Contemporary Amperex Technology Co. Ltd. | | 2.0 |
Universal Microwave Technology, Inc. | | 2.0 |
Unimicron Technology Corp. | | 1.8 |
East Money Information Co. Ltd. | | 1.8 |
Yongxing Special Materials Technology Co. Ltd. | | 1.8 |
YTO Express Group Co. Ltd. | | 1.8 |
Longfor Group Hldgs. Ltd. | | 1.8 |
China Longyuan Power Group Corp. Ltd. | | 1.7 |
| | | |
Top Ten Industries (% of Net Assets) |
Semiconductors & Semiconductor Equipment | | 16.7 |
Electronic Equipment, Instruments & Components | | 16.4 |
Electrical Equipment | | 13.5 |
Machinery | | 8.2 |
Auto Components | | 7.0 |
Real Estate Management & Development | | 5.3 |
Chemicals | | 4.5 |
Metals & Mining | | 3.3 |
Textiles, Apparel & Luxury Goods | | 2.9 |
Beverages | | 2.5 |
6
Management discussion on fund performance
(unaudited) (continued)
Oberweis International Opportunities Fund
At December 31, 2021
Asset Allocation (% of Net Assets) | | |
Equities | | 98.9 |
Other Assets less Liabilities | | 1.1 |
| | | |
Top Ten Holdings (% of Net Assets) |
Nordic Semiconductor ASA | | 4.9 |
BayCurrent Consulting, Inc. | | 4.4 |
Food & Life Co. Ltd. | | 4.3 |
Future PLC | | 3.1 |
Constellium SE | | 2.9 |
Intermediate Capital Group PLC | | 2.8 |
Uniti Group Ltd. | | 2.4 |
IDP Education Ltd. | | 2.3 |
Nova Ltd. | | 2.3 |
Aritzia, Inc. | | 2.1 |
| | | |
Top Ten Industries (% of Net Assets) |
Semiconductors & Semiconductor Equipment | | 11.5 |
Capital Markets | | 9.2 |
Professional Services | | 7.9 |
Leisure Products | | 5.9 |
Metals & Mining | | 5.7 |
Household Durables | | 5.1 |
Machinery | | 4.7 |
Information Technology Services | | 4.7 |
Hotels, Restaurants & Leisure | | 4.3 |
Specialty Retail | | 4.1 |
Oberweis Emerging Markets Fund
At December 31, 2021
Asset Allocation (% of Net Assets) |
Equities | | 94.0 |
Other Assets less Liabilities | | 6.0 |
| | | |
Top Ten Holdings (% of Net Assets) |
Dada Nexus Ltd. | | 3.8 |
ASPEED Technology, Inc. | | 3.8 |
HeadHunter Group PLC ADS | | 2.6 |
AfreecaTV Co. Ltd. | | 2.5 |
M31 Technology Corp. | | 2.4 |
IDP Education Ltd. | | 2.4 |
Thunder Software Technology
Co. Ltd. | | 2.3 |
Pan Jit International, Inc. | | 2.3 |
LEENO Industrial, Inc. | | 2.2 |
Wilcon Depot, Inc. | | 2.1 |
| | | |
Top Ten Industries (% of Net Assets) |
Semiconductors & Semiconductor Equipment | | 10.7 |
Software | | 9.5 |
Internet & Direct Marketing Retail | | 6.9 |
Professional Services | | 5.3 |
Diversified Consumer Services | | 4.3 |
Healthcare Equipment & Supplies | | 4.0 |
Multiline Retail | | 3.7 |
Beverages | | 3.2 |
Oil, Gas & Consumable Fuels | | 3.2 |
Household Durables | | 3.0 |
7
Management discussion on fund performance
(unaudited) (continued)
Average Annual Total Returns1 (for the Periods Ended December 31, 2021)
| | 1 YR
(%) | | 5 YR (%) | | 10 YR (%) | | SINCE
INCEPTION2
(%) | | EXPENSE
RATIO3
(%) |
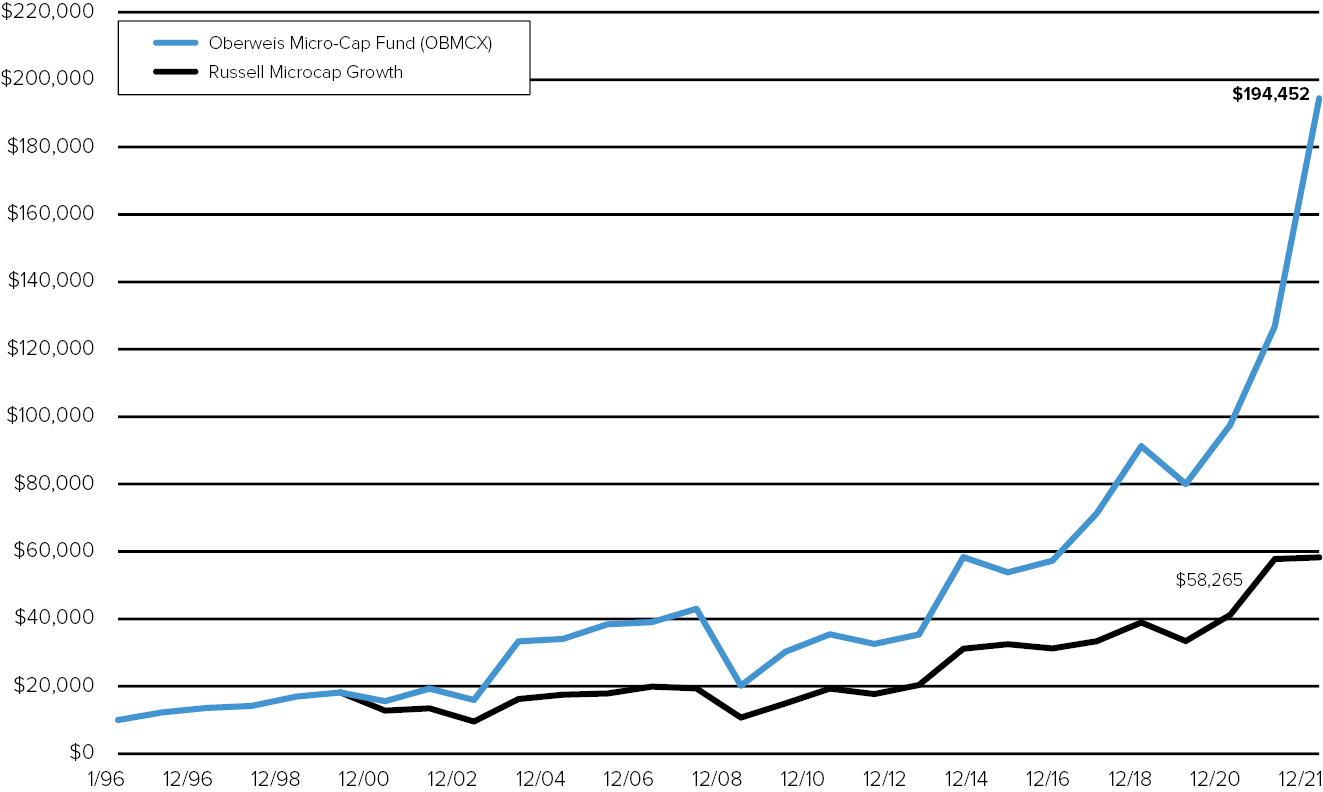
OBMCX | | 53.38 | | 22.20 | | 19.56 | | 12.09 | | 1.48 |
OMCIX4 | | 53.90 | | 22.50 | | 19.85 | | 12.37 | | 1.23 |
Russell Microcap Growth | | 0.88 | | 11.78 | | 12.66 | | N/A5 | | |
Growth of a $10,000 Investment (from January 1, 1996 to December 31, 2021)
8
Management discussion on fund performance
(unaudited) (continued)
Average Annual Total Returns1 (for the Periods Ended December 31, 2021)
| | 1 YR
(%) | | 5 YR (%) | | 10 YR (%) | | SINCE
INCEPTION2
(%) | | EXPENSE
RATIO3
(%) |
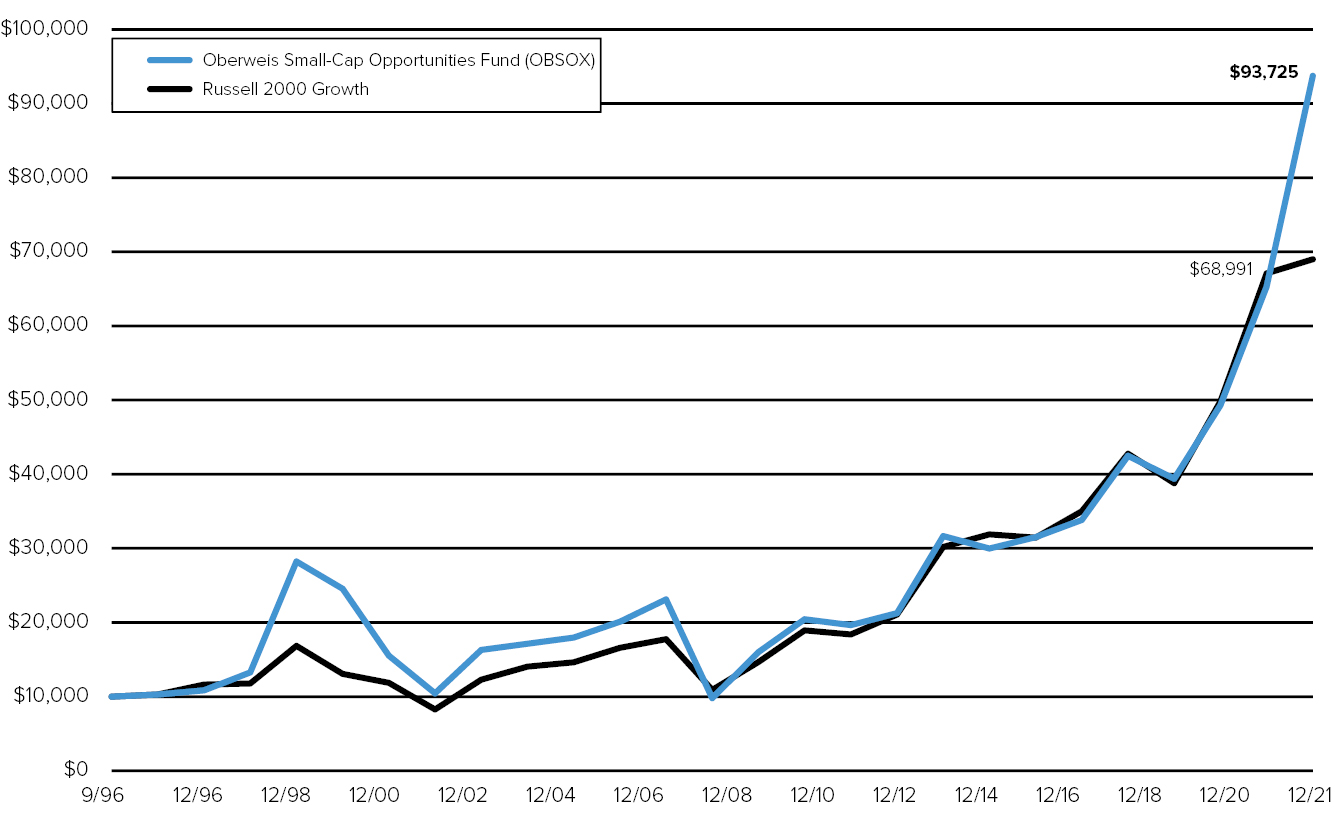
OBSOX | | 43.57 | | 22.61 | | 16.91 | | 9.25 | | 1.55 |
OBSIX4 | | 43.92 | | 22.92 | | 17.21 | | 9.53 | | 1.30 |
Russell 2000 Growth | | 2.83 | | 14.53 | | 14.14 | | 7.93 | | |
Growth of a $10,000 Investment (from September 15, 1996 to December 31, 2021)
9
Management discussion on fund performance
(unaudited) (continued)
Average Annual Total Returns1 (for the Periods Ended December 31, 2021)
| | 1 YR
(%) | | 5 YR (%) | | 10 YR (%) | | SINCE
INCEPTION2
(%) | | EXPENSE
RATIO3
(%) |
OBEGX | | 20.92 | | 18.56 | | 14.64 | | 9.73 | | 1.38 |
OBGIX4 | | 21.23 | | 18.85 | | 14.92 | | 10.01 | | 1.13 |
MSCI ACWI Small-Cap | | 16.10 | | 12.28 | | 11.78 | | N/A5 | | |
Growth of a $10,000 Investment (from January 7, 1987 to December 31, 2021)

10
Management discussion on fund performance
(unaudited) (continued)
Average Annual Total Returns1 (for the Periods Ended December 31, 2021)
| | 1 YR
(%) | | 5 YR (%) | | 10 YR (%) | | SINCE
INCEPTION2
(%) | | EXPENSE
RATIO3
(%) |
OBCHX | | (5.41) | | 18.28 | | 14.66 | | 12.98 | | 1.87 |
OCHIX4 | | (5.23) | | 18.55 | | 14.94 | | 13.26 | | 1.62 |
MSCI China Net | | (21.72) | | 9.36 | | 7.17 | | 9.11 | | |
Growth of a $10,000 Investment (from October 1, 2005 to December 31, 2021)
11
Management discussion on fund performance
(unaudited) (continued)
Average Annual Total Returns1 (for the Periods Ended December 31, 2021)
| | 1 YR
(%) | | 5 YR (%) | | 10 YR (%) | | SINCE
INCEPTION2
(%) | | EXPENSE
RATIO3
(%) |
OBIOX | | 1.52 | | 16.57 | | 16.53 | | 10.80 | | 1.60 |
MSCI World ex-US Small Cap Growth | | 8.83 | | 13.59 | | 11.00 | | 6.15 | | |
Growth of a $10,000 Investment (from February 1, 2007 to December 31, 2021)
12
Management discussion on fund performance
(unaudited) (continued)
Average Annual Total Returns1 (for the Periods Ended December 31, 2021)
| | 1 YR
(%) | | SINCE
INCEPTION2
(%) | | EXPENSE
RATIO3
(%) |
OBEMX | | 13.24 | | 12.96 | | 1.75 |
OIEMX | | 13.50 | | 13.23 | | 1.50 |
MSCI EM Small-Cap | | 18.75 | | 7.08 | | |
Growth of a $10,000 Investment (from May 1, 2018 to December 31, 2021)

13
OBERWEIS MICRO-CAP FUND
Schedule of Investments December 31, 2021
| | SHARES | | VALUE |
Equities – 101.1% | | | | | |
| | | | | | |
BACK OFFICE SUPPORT, HUMAN RESOURCES & CONSULTING – 8.9% | | | | | |
Cross Country Healthcare, Inc.* | | 77,900 | | $ | 2,162,504 |
Forrester Research, Inc.* | | 23,400 | | | 1,374,282 |
Heidrick & Struggles International, Inc. | | 37,400 | | | 1,635,502 |
ICF International, Inc. | | 13,500 | | | 1,384,425 |
Information Services Group, Inc. | | 199,800 | | | 1,522,476 |
Kforce, Inc. | | 13,600 | | | 1,022,992 |
Resources Connection, Inc. | | 106,800 | | | 1,905,312 |
The Hackett Group, Inc. | | 57,500 | | | 1,180,475 |
| | | | | | 12,187,968 |
| | | | | | |
BANKS — DIVERSIFIED – 1.0% | | | | | |
First Foundation, Inc. | | 26,300 | | | 653,818 |
Mercantile Bank Corp. | | 19,500 | | | 683,085 |
| | | | | | 1,336,903 |
| | | | | | |
BIOTECHNOLOGY – 0.8% | | | | | |
Dynavax Technologies Corp.* | | 79,300 | | | 1,115,751 |
| | | | | | |
BUILDING MATERIALS – 1.2% | | | | | |
Masonite International Corp.* | | 13,800 | | | 1,627,710 |
| | | | | | |
CASINOS & GAMBLING – 2.7% | | | | | |
Full House Resorts, Inc.* | | 190,543 | | | 2,307,476 |
Monarch Casino & Resort, Inc.* | | 19,800 | | | 1,464,210 |
| | | | | | 3,771,686 |
| | | | | | |
COMMERCIAL VEHICLES & PARTS – 1.0% | | | | | |
The Shyft Group, Inc. | | 27,400 | | | 1,346,162 |
| | | | | | |
COMMUNICATIONS TECHNOLOGY – 6.8% | | | | | |
ADTRAN, Inc. | | 59,400 | | | 1,356,102 |
Aviat Networks, Inc.* | | 73,207 | | | 2,348,481 |
DZS, Inc.* | | 119,800 | | | 1,943,156 |
Extreme Networks, Inc.* | | 160,400 | | | 2,518,280 |
Ooma, Inc.* | | 58,300 | | | 1,191,652 |
| | | | | | 9,357,671 |
| | | | | | |
COMPUTER SERVICES SOFTWARE & SYSTEMS – 4.4% | | | | | |
Avid Technology, Inc.* | | 37,100 | | | 1,208,347 |
ChannelAdvisor Corp.* | | 104,700 | | | 2,583,996 |
Model N, Inc.* | | 39,200 | | | 1,177,176 |
Perficient, Inc.* | | 8,200 | | | 1,060,178 |
| | | | | | 6,029,697 |
See accompanying notes to the financial statements.
14
OBERWEIS MICRO-CAP FUND (continued)
Schedule of Investments December 31, 2021
| | SHARES | | VALUE |
COMPUTER TECHNOLOGY – 2.3% | | | | | |
Identiv, Inc.* | | 64,200 | | $ | 1,806,588 |
ScanSource, Inc.* | | 40,400 | | | 1,417,232 |
| | | | | | 3,223,820 |
| | | | | | |
CONSUMER SERVICES – MISCELLANEOUS – 2.3% | | | | | |
Perion Network Ltd.* | | 85,600 | | | 2,058,680 |
SP Plus Corp.* | | 37,600 | | | 1,061,072 |
| | | | | | 3,119,752 |
| | | | | | |
CONTAINERS & PACKAGING – 3.2% | | | | | |
Veritiv Corp.* | | 36,000 | | | 4,412,520 |
| | | | | | |
CONSTRUCTION – 1.3% | | | | | |
Sterling Construction Co. Inc.* | | 67,900 | | | 1,785,770 |
| | | | | | |
DIVERSIFIED MANUFACTURING OPERATIONS – 1.0% | | | | | |
a.k.a. Brands Hldgs. Corp.* | | 151,000 | | | 1,396,750 |
| | | | | | |
EDUCATION SERVICES – 1.3% | | | | | |
Houghton Mifflin Harcourt Co.* | | 110,700 | | | 1,782,270 |
| | | | | | |
ELECTRONIC ENTERTAINMENT – 1.5% | | | | | |
Everi Hldgs. Inc.* | | 94,200 | | | 2,011,170 |
| | | | | | |
ENERGY EQUIPMENT – 1.7% | | | | | |
Ameresco, Inc.* | | 28,608 | | | 2,329,836 |
| | | | | | |
FINANCIAL DATA & SYSTEMS – 0.8% | | | | | |
International Money Express, Inc.* | | 68,900 | | | 1,099,644 |
| | | | | | |
HEALTHCARE SERVICES – 2.3% | | | | | |
HealthStream, Inc.* | | 56,700 | | | 1,494,612 |
RadNet, Inc.* | | 53,600 | | | 1,613,896 |
| | | | | | 3,108,508 |
| | | | | | |
HOME BUILDING – 1.3% | | | | | |
M/I Homes, Inc.* | | 28,900 | | | 1,797,002 |
| | | | | | |
HOUSEHOLD FURNISHINGS – 1.3% | | | | | |
Flexsteel Industries, Inc. | | 30,000 | | | 805,800 |
Lifetime Brands, Inc. | | 60,400 | | | 964,588 |
| | | | | | 1,770,388 |
| | | | | | |
INSURANCE — PROPERTY CASUALTY – 0.8% | | | | | |
Employers Hldgs., Inc. | | 25,100 | | | 1,038,638 |
| | | | | | |
LEISURE – 1.0% | | | | | |
Johnson Outdoors, Inc. | | 14,100 | | | 1,321,029 |
| | | | | | |
LUXURY ITEMS – 1.5% | | | | | |
Movado Group, Inc. | | 48,200 | | | 2,016,206 |
See accompanying notes to the financial statements.
15
OBERWEIS MICRO-CAP FUND (continued)
Schedule of Investments December 31, 2021
| | SHARES | | VALUE |
MACHINERY — AGRICULTURE – 1.0% | | | | | |
Titan Machinery, Inc.* | | 39,500 | | $ | 1,330,755 |
| | | | | | |
MACHINERY — INDUSTRIAL – 1.3% | | | | | |
EnPro Industries, Inc. | | 15,900 | | | 1,750,113 |
| | | | | | |
MEDICAL & DENTAL INSTRUMENTS & SUPPLIES – 5.1% | | | | | |
Alphatec Hldgs. Inc.* | | 195,500 | | | 2,234,565 |
AngioDynamics, Inc.* | | 107,900 | | | 2,975,882 |
Antares Pharma, Inc.* | | 251,200 | | | 896,784 |
Cerus Corp.* | | 143,100 | | | 974,511 |
| | | | | | 7,081,742 |
| | | | | | |
MEDICAL EQUIPMENT – 3.7% | | | | | |
Lantheus Hldgs., Inc.* | | 88,700 | | | 2,562,543 |
Varex Imaging Corp.* | | 81,000 | | | 2,555,550 |
| | | | | | 5,118,093 |
| | | | | | |
MEDICAL SERVICES – 0.7% | | | | | |
Inotiv, Inc.* | | 23,457 | | | 986,836 |
| | | | | | |
OIL CRUDE PRODUCER – 0.7% | | | | | |
Earthstone Energy, Inc.* | | 85,200 | | | 932,088 |
| | | | | | |
OIL WELL EQUIPMENT & SERVICES – 1.4% | | | | | |
Patterson-UTI Energy, Inc. | | 125,200 | | | 1,057,940 |
RPC, Inc.* | | 189,400 | | | 859,876 |
| | | | | | 1,917,816 |
| | | | | | |
PRODUCTION TECHNOLOGY EQUIPMENT – 10.4% | | | | | |
Aehr Test Systems* | | 91,800 | | | 2,219,724 |
Axcelis Technologies, Inc.* | | 83,600 | | | 6,233,216 |
Cohu, Inc.* | | 28,576 | | | 1,088,460 |
CyberOptics Corp.* | | 38,700 | | | 1,799,550 |
Ultra Clean Hldgs., Inc.* | | 50,800 | | | 2,913,888 |
| | | | | | 14,254,838 |
| | | | | | |
RADIO & TV BROADCASTERS – 1.3% | | | | | |
Entravision Communications Corp. | | 270,100 | | | 1,831,278 |
| | | | | | |
RECREATIONAL VEHICLES & BOATS – 0.9% | | | | | |
Malibu Boats, Inc.* | | 18,100 | | | 1,244,013 |
| | | | | | |
SCIENTIFIC INSTRUMENTS – ELECTRICAL – 1.6% | | | | | |
Allied Motion Technologies, Inc. | | 34,100 | | | 1,244,309 |
Preformed Line Products Co. | | 7,000 | | | 452,900 |
RF Industries Ltd.* | | 65,000 | | | 520,000 |
| | | | | | 2,217,209 |
See accompanying notes to the financial statements.
16
OBERWEIS MICRO-CAP FUND (continued)
Schedule of Investments December 31, 2021
| | SHARES | | VALUE |
SCIENTIFIC INSTRUMENTS — GAUGES & METERS – 1.0% | | | | | |
Vishay Precision Group, Inc.* | | 37,800 | | $ | 1,403,136 |
| | | | | | |
SEMICONDUCTORS & COMPONENTS – 5.6% | | | | | |
Alpha and Omega Semiconductor Ltd.* | | 74,000 | | | 4,481,440 |
Amtech Systems, Inc.* | | 102,500 | | | 1,012,700 |
SMART Global Hldgs., Inc.* | | 30,400 | | | 2,158,096 |
| | | | | | 7,652,236 |
| | | | | | |
SPECIALTY RETAIL – 7.3% | | | | | |
Boot Barn Hldgs., Inc.* | | 26,600 | | | 3,273,130 |
Guess’, Inc. | | 139,000 | | | 3,291,520 |
Tilly’s, Inc. | | 69,700 | | | 1,122,867 |
Zumiez, Inc.* | | 51,300 | | | 2,461,887 |
| | | | | | 10,149,404 |
| | | | | | |
TECHNOLOGY – MISCELLANEOUS – 2.8% | | | | | |
Camtek Ltd.* | | 48,380 | | | 2,227,415 |
CTS Corp. | | 46,200 | | | 1,696,464 |
| | | | | | 3,923,879 |
| | | | | | |
TELECOMMUNICATIONS EQUIPMENT – 5.0% | | | | | |
Clearfield, Inc.* | | 40,000 | | | 3,376,800 |
Vocera Communications, Inc.* | | 55,226 | | | 3,580,854 |
| | | | | | 6,957,654 |
| | | | | | |
TOYS – 0.9% | | | | | |
Funko, Inc.* | | 71,100 | | | 1,336,679 |
| | | | | | |
Total Equities | | | | | |
(Cost: $97,929,207) | | | | $ | 139,074,620 |
| | | | | | |
Total Investments – 101.1% | | | | | |
(Cost: $97,929,207) | | | | $ | 139,074,620 |
Other Liabilities Less Assets – (1.1)% | | | | | (1,456,700) |
Net Assets – 100% | | | | $ | 137,617,920 |
See accompanying notes to the financial statements.
17
OBERWEIS SMALL-CAP OPPORTUNITIES FUND
Schedule of Investments December 31, 2021
| | SHARES | | VALUE |
Equities – 99.7% | | | | | |
| | | | | | |
ALUMINUM – 1.0% | | | | | |
Arconic Corp.* | | 9,000 | | $ | 297,090 |
| | | | | | |
ASSET MANAGEMENT & CUSTODIAN – 0.8% | | | | | |
Focus Financial Partners, Inc.* | | 3,800 | | | 226,936 |
| | | | | | |
BACK OFFICE SUPPORT, HUMAN RESOURCES & CONSULTING – 4.0% | | | | | |
Forrester Research, Inc.* | | 6,300 | | | 369,999 |
ICF International, Inc. | | 2,800 | | | 287,140 |
Korn Ferry | | 6,500 | | | 492,245 |
| | | | | | 1,149,384 |
| | | | | | |
BANKS — DIVERSIFIED – 0.6% | | | | | |
First Foundation, Inc. | | 7,400 | | | 183,964 |
| | | | | | |
BANKS — SAVINGS, THRIFTS & MORTGAGE LENDING – 0.7% | | | | | |
Flushing Financial Corp. | | 7,900 | | | 191,970 |
| | | | | | |
BIOTECHNOLOGY – 1.1% | | | | | |
Halozyme Therapeutics, Inc.* | | 7,700 | | | 309,617 |
| | | | | | |
BUILDING MATERIALS – 5.9% | | | | | |
Builders FirstSource, Inc.* | | 7,000 | | | 599,970 |
Masonite International Corp.* | | 2,800 | | | 330,260 |
Patrick Industries, Inc. | | 4,800 | | | 387,312 |
Summit Materials, Inc.* | | 9,700 | | | 389,358 |
| | | | | | 1,706,900 |
| | | | | | |
CASINOS & GAMBLING – 1.2% | | | | | |
Monarch Casino and Resort, Inc.* | | 4,600 | | | 340,170 |
| | | | | | |
CHEMICALS — DIVERSIFIED – 2.0% | | | | | |
Cabot Corp. | | 5,100 | | | 286,620 |
Univar Solutions, Inc.* | | 10,300 | | | 292,005 |
| | | | | | 578,625 |
| | | | | | |
COMMUNICATIONS TECHNOLOGY – 1.0% | | | | | |
Aviat Networks, Inc.* | | 8,900 | | | 285,512 |
| | | | | | |
COMPUTER SERVICES SOFTWARE & SYSTEMS – 8.9% | | | | | |
Cargurus, Inc.* | | 14,000 | | | 470,960 |
ChannelAdvisor Corp.* | | 12,200 | | | 301,096 |
LiveRamp Hldgs., Inc.* | | 5,900 | | | 282,905 |
Rapid7, Inc.* | | 1,800 | | | 211,842 |
Shutterstock, Inc. | | 6,308 | | | 699,431 |
TechTarget, Inc.* | | 3,400 | | | 325,244 |
Teradata Corp.* | | 6,600 | | | 280,302 |
| | | | | | 2,571,780 |
See accompanying notes to the financial statements.
18
OBERWEIS SMALL-CAP OPPORTUNITIES FUND (continued)
Schedule of Investments December 31, 2021
| | SHARES | | VALUE |
COMPUTER TECHNOLOGY – 5.3% | | | | | |
Synaptics, Inc.* | | 5,300 | | $ | 1,534,403 |
| | | | | | |
CONTAINERS & PACKAGING – 2.6% | | | | | |
Veritiv Corp.* | | 6,242 | | | 765,082 |
| | | | | | |
COSMETICS – 2.0% | | | | | |
Inter Parfums, Inc. | | 5,500 | | | 587,950 |
| | | | | | |
DIVERSIFIED MANUFACTURING OPERATIONS – 1.8% | | | | | |
Inmode Ltd.* | | 2,600 | | | 183,508 |
Revolve Group, Inc.* | | 6,300 | | | 353,052 |
| | | | | | 536,560 |
| | | | | | |
DIVERSIFIED METALS & MINERALS – 1.8% | | | | | |
Materion Corp. | | 5,800 | | | 533,252 |
| | | | | | |
DIVERSIFIED RETAIL – 2.2% | | | | | |
BJ’s Wholesale Club Hldgs., Inc.* | | 6,700 | | | 448,699 |
PROG Hldgs., Inc.* | | 4,500 | | | 202,995 |
| | | | | | 651,694 |
| | | | | | |
EDUCATION SERVICES – 2.1% | | | | | |
Houghton Mifflin Harcourt Co.* | | 14,000 | | | 225,400 |
Stride, Inc.* | | 11,200 | | | 373,296 |
| | | | | | 598,696 |
| | | | | | |
ELECTRONIC ENTERTAINMENT – 1.4% | | | | | |
Everi Hldgs., Inc.* | | 19,600 | | | 418,460 |
| | | | | | |
ENERGY EQUIPMENT – 1.7% | | | | | |
Ameresco, Inc.* | | 6,000 | | | 488,640 |
| | | | | | |
ENTERTAINMENT – 0.8% | | | | | |
ZipRecruiter, Inc.* | | 9,500 | | | 236,930 |
| | | | | | |
FOREST PRODUCTS – 1.1% | | | | | |
UFP Industries, Inc. | | 3,400 | | | 312,834 |
| | | | | | |
HEALTHCARE MANAGEMENT SERVICES – 1.1% | | | | | |
Option Care Health, Inc.* | | 10,800 | | | 307,152 |
| | | | | | |
HEALTHCARE SERVICES – 2.7% | | | | | |
Acadia Healthcare Co., Inc.* | | 8,400 | | | 509,880 |
HealthStream, Inc.* | | 10,800 | | | 284,688 |
| | | | | | 794,568 |
See accompanying notes to the financial statements.
19
OBERWEIS SMALL-CAP OPPORTUNITIES FUND (continued)
Schedule of Investments December 31, 2021
| | SHARES | | VALUE |
HOME BUILDING – 2.1% | | | | | |
M/I Homes, Inc.* | | 6,000 | | $ | 373,080 |
Tri Pointe Homes, Inc.* | | 8,500 | | | 237,065 |
| | | | | | 610,145 |
| | | | | | |
HOUSEHOLD FURNISHINGS – 1.6% | | | | | |
Tempur Sealy International, Inc. | | 10,100 | | | 475,003 |
| | | | | | |
INSURANCE — MULTI — LINE – 0.9% | | | | | |
BRP Group, Inc.* | | 7,400 | | | 267,214 |
| | | | | | |
INSURANCE — PROPERTY CASUALTY – 1.3% | | | | | |
Stewart Information Services Corp. | | 4,600 | | | 366,758 |
| | | | | | |
LEISURE TIME — 1.9% | | | | | |
SeaWorld Entertainment, Inc.* | | 8,600 | | | 557,796 |
| | | | | | |
MACHINERY — INDUSTRIAL – 1.0% | | | | | |
Kennametal, Inc. | | 8,100 | | | 290,871 |
| | | | | | |
MANUFACTURED HOUSING – 1.8% | | | | | |
Skyline Champion Corp.* | | 6,800 | | | 537,064 |
| | | | | | |
MEDICAL & DENTAL INSTRUMENTS & SUPPLIES – 4.5% | | | | | |
Alphatec Hldgs., Inc.* | | 37,000 | | | 422,910 |
AngioDynamics, Inc.* | | 22,400 | | | 617,792 |
Merit Medical Systems, Inc.* | | 4,200 | | | 261,660 |
| | | | | | 1,302,362 |
| | | | | | |
MEDICAL EQUIPMENT – 3.6% | | | | | |
Lantheus Hldgs., Inc.* | | 18,400 | | | 531,576 |
Varex Imaging Corp.* | | 16,600 | | | 523,730 |
| | | | | | 1,055,306 |
| | | | | | |
OIL CRUDE PRODUCER – 1.5% | | | | | |
Magnolia Oil & Gas Corp. | | 12,000 | | | 226,440 |
PDC Energy, Inc. | | 4,400 | | | 214,632 |
| | | | | | 441,072 |
| | | | | | |
OIL WELL EQUIPMENT & SERVICES – 0.6% | | | | | |
NOV, Inc. | | 13,400 | | | 181,570 |
| | | | | | |
PHARMACEUTICALS – 1.1% | | | | | |
Amphastar Pharmaceuticals, Inc.* | | 13,500 | | | 314,415 |
| | | | | | |
POWER TRANSMISSION EQUIPMENT – 1.7% | | | | | |
Belden, Inc. | | 7,500 | | | 492,975 |
See accompanying notes to the financial statements.
20
OBERWEIS SMALL-CAP OPPORTUNITIES FUND (continued)
Schedule of Investments December 31, 2021
| | SHARES | | VALUE |
PRODUCTION TECHNOLOGY EQUIPMENT – 6.3% | | | | | |
Axcelis Technologies, Inc.* | | 15,000 | | $ | 1,118,400 |
Ultra Clean Hldgs., Inc.* | | 12,200 | | | 699,792 |
| | | | | | 1,818,192 |
| | | | | | |
SCIENTIFIC INSTRUMENTS – POLLUTION
CONTROL – 1.0% | | | | | |
Clean Harbors, Inc.* | | 2,900 | | | 289,333 |
| | | | | | |
SEMICONDUCTORS & COMPONENTS – 5.1% | | | | | |
Diodes, Inc.* | | 3,400 | | | 373,354 |
MACOM Technology Solutions Hldgs. Inc.* | | 6,100 | | | 477,630 |
MaxLinear. Inc.* | | 8,200 | | | 618,198 |
| | | | | | 1,469,182 |
| | | | | | |
SPECIALTY RETAIL – 3.1% | | | | | |
Boot Barn Hldgs., Inc.* | | 3,900 | | | 479,895 |
Guess’, Inc. | | 17,900 | | | 423,872 |
| | | | | | 903,767 |
| | | | | | |
TELECOMMUNICATIONS EQUIPMENT – 2.4% | | | | | |
Knowles Corp.* | | 12,500 | | | 291,875 |
Vocera Communications, Inc.* | | 6,100 | | | 395,524 |
| | | | | | 687,399 |
| | | | | | |
TEXTILES, APPAREL & SHOES – 4.4% | | | | | |
Crocs, Inc.* | | 6,900 | | | 884,718 |
Deckers Outdoor Corp.* | | 1,140 | | | 417,593 |
| | | | | | 1,302,311 |
| | | | | | |
Total Equities | | | | | |
(Cost: $22,009,106) | | | | $ | 28,970,904 |
| | | | | | |
Total Investments – 99.7% | | | | | |
(Cost: $22,009,106) | | | | $ | 28,970,904 |
Other Assets Less Liabilities – 0.3% | | | | | 77,952 |
Net Assets – 100% | | | | $ | 29,048,856 |
* Non–income producing security during the year ended December 31, 2021
See accompanying notes to the financial statements.
21
OBERWEIS GLOBAL OPPORTUNITIES FUND
Schedule of Investments December 31, 2021
| | SHARES | | VALUE |
Equities – 97.0% | | | | | |
| | | | | | |
AUSTRALIA – 1.1% | | | | | |
IDP Education Ltd.* | | 35,000 | | $ | 882,321 |
| | | | | | |
CANADA – 2.5% | | | | | |
Aritzia, Inc.* | | 26,100 | | | 1,080,107 |
BRP, Inc. | | 9,600 | | | 840,854 |
| | | | | | 1,920,961 |
| | | | | | |
CHINA – 7.5% | | | | | |
Foryou Corp.* | | 132,800 | | | 1,145,180 |
Guangzhou Tinci Materials Technology Co. Ltd.* | | 30,000 | | | 539,665 |
Han’s Laser Technology Industry Group Co. Ltd.* | | 120,000 | | | 1,016,726 |
Li Ning Co. Ltd. | | 130,000 | | | 1,422,938 |
Shanghai Weaver Network Co. Ltd.* | | 75,000 | | | 821,030 |
Sino Wealth Electronic Ltd.* | | 80,050 | | | 852,825 |
| | | | | | 5,798,364 |
| | | | | | |
DENMARK – 1.3% | | | | | |
ALK-Abello AS* | | 1,900 | | | 997,688 |
| | | | | | |
FRANCE – 1.0% | | | | | |
Soitec SA* | | 3,000 | | | 734,973 |
| | | | | | |
ISRAEL – 2.6% | | | | | |
Inmode Ltd.* | | 28,200 | | | 1,990,356 |
| | | | | | |
JAPAN – 5.6% | | | | | |
Food & Life Co. Ltd. | | 23,500 | | | 887,329 |
Future Corp. | | 44,400 | | | 675,192 |
JMDC, Inc.* | | 27,300 | | | 2,032,426 |
Persol Hldgs. Co. Ltd.* | | 25,000 | | | 726,831 |
| | | | | | 4,321,778 |
| | | | | | |
NETHERLANDS – 1.7% | | | | | |
BE Semiconductor Industries NV | | 15,700 | | | 1,340,863 |
| | | | | | |
NORWAY – 2.9% | | | | | |
Nordic Semiconductor ASA* | | 66,900 | | | 2,243,593 |
| | | | | | |
SOUTH KOREA – 1.1% | | | | | |
LEENO Industrial, Inc. | | 5,000 | | | 832,664 |
| | | | | | |
SWEDEN – 3.6% | | | | | |
AddLife AB | | 17,000 | | | 714,582 |
MIPS AB | | 15,400 | | | 2,015,040 |
| | | | | | 2,729,622 |
See accompanying notes to the financial statements.
22
OBERWEIS GLOBAL OPPORTUNITIES FUND (continued)
Schedule of Investments December 31, 2021
| | SHARES | | VALUE |
TAIWAN – 5.0% | | | | | |
M31 Technology Corp. | | 201,000 | | $ | 2,880,664 |
Unimicron Technology Corp.* | | 120,000 | | | 998,637 |
| | | | | | 3,879,301 |
| | | | | | |
UNITED KINGDOM – 10.5% | | | | | |
Endava PLC ADS* | | 9,600 | | | 1,612,032 |
Intermediate Capital Group PLC | | 105,100 | | | 3,121,134 |
Oxford Instruments PLC | | 24,400 | | | 868,598 |
Taylor Wimpey PLC | | 1,046,900 | | | 2,486,883 |
| | | | | | 8,088,647 |
| | | | | | |
UNITED STATES OF AMERICA – 50.6% | | | | | |
Acadia Healthcare Co., Inc.* | | 15,500 | | | 940,850 |
Alphatec Hldgs., Inc.* | | 294,500 | | | 3,366,135 |
AngioDynamics, Inc.* | | 27,600 | | | 761,208 |
Arconic Corp.* | | 21,800 | | | 719,618 |
Axcelis Technologies, Inc.* | | 25,000 | | | 1,864,000 |
Belden, Inc. | | 12,900 | | | 847,917 |
Builders FirstSource, Inc.* | | 17,700 | | | 1,517,067 |
Castle Biosciences, Inc.* | | 23,000 | | | 986,010 |
ChannelAdvisor Corp.* | | 100,600 | | | 2,482,808 |
Crocs, Inc.* | | 23,000 | | | 2,949,060 |
Deckers Outdoor Corp.* | | 8,600 | | | 3,150,266 |
Halozyme Therapeutics, Inc.* | | 67,800 | | | 2,726,238 |
Materion Corp. | | 22,100 | | | 2,031,874 |
Model N, Inc.* | | 21,200 | | | 636,636 |
Patrick Industries, Inc. | | 10,000 | | | 806,900 |
Rapid7, Inc.* | | 8,200 | | | 965,058 |
Shutterstock, Inc. | | 22,100 | | | 2,450,448 |
Synaptics, Inc.* | | 16,100 | | | 4,661,111 |
Tempur Sealy International, Inc. | | 25,500 | | | 1,199,265 |
Teradata Corp.* | | 13,300 | | | 564,851 |
Ultra Clean Hldgs., Inc.* | | 55,800 | | | 3,200,689 |
| | | | | | 38,828,009 |
| | | | | | |
Total Equities | | | | | |
(Cost: $55,418,036) | | | | $ | 74,589,140 |
| | | | | | |
Total Investments – 97.0% | | | | | |
(Cost: $55,418,036) | | | | $ | 74,589,140 |
Other Assets Less Liabilities – 3.0% | | | | | 2,271,228 |
Net Assets – 100% | | | | $ | 76,860,368 |
* Non-income producing security during the year ended December 31, 2021
ADS—American depositary share
See accompanying notes to the financial statements.
23
OBERWEIS GLOBAL OPPORTUNITIES FUND (continued)
Schedule of Investments December 31, 2021
SECTOR ALLOCATIONS (As A Percentage of Net Assets) (unaudited) | | |
Consumer Discretionary | | 27.7 | % |
Financials | | 4.1 | % |
Health Care | | 18.9 | % |
Industrials | | 4.2 | % |
Information Technology | | 37.8 | % |
Materials | | 4.3 | % |
See accompanying notes to the financial statements.
24
OBERWEIS CHINA OPPORTUNITIES FUND
Schedule of Investments December 31, 2021
| | SHARES | | VALUE |
Equities – 98.5% | | | | | |
| | | | | | |
AIR FREIGHT & LOGISTICS – 2.2% | | | | | |
Milkyway Chemical Supply Chain Service Co. Ltd.* | | 20,000 | | $ | 422,945 |
YTO Express Group Co. Ltd.* | | 650,032 | | | 1,701,217 |
| | | | | | 2,124,162 |
AUTO COMPONENTS – 7.0% | | | | | |
Foryou Corp.* | | 120,000 | | | 1,034,801 |
Huizhou Desay SV Automotive Co. Ltd. | | 15,000 | | | 333,048 |
IKD Co. Ltd.* | | 400,039 | | | 1,210,147 |
Ningbo Jifeng Auto Parts Co. Ltd.* | | 350,000 | | | 883,045 |
Sailun Group Co. Ltd.* | | 450,000 | | | 1,044,262 |
Shanghai Baolong Automotive Corp.* | | 120,000 | | | 1,099,570 |
Shenzhen Kedali Industry Co. Ltd.* | | 45,000 | | | 1,132,096 |
| | | | | | 6,736,969 |
| | | | | | |
AUTOMOBILES – 1.5% | | | | | |
Xpeng, Inc.* | | 60,000 | | | 1,433,518 |
| | | | | | |
BEVERAGES – 2.5% | | | | | |
Luzhou Laojiao Co. Ltd. | | 60,000 | | | 2,389,965 |
| | | | | | |
CAPITAL MARKETS – 1.8% | | | | | |
East Money Information Co. Ltd.* | | 300,000 | | | 1,746,791 |
| | | | | | |
CHEMICALS – 4.5% | | | | | |
Anhui Jinhe Industrial Co. Ltd.* | | 130,000 | | | 1,047,400 |
Guangzhou Tinci Materials Technology Co. Ltd. | | 43,500 | | | 782,514 |
Shenzhen Senior Technology Material Co. Ltd.* | | 100,117 | | | 576,976 |
Sinoma Science & Technology Co. Ltd.* | | 160,000 | | | 854,050 |
Skshu Paint Co. Ltd. | | 50,014 | | | 1,091,952 |
| | | | | | 4,352,892 |
| | | | | | |
CONSTRUCTION & ENGINEER – 1.5% | | | | | |
China State Construction International Hldgs. Co. Ltd.* | | 1,200,000 | | | 1,491,228 |
| | | | | | |
CONTAINERS & PACKAGING – 1.3% | | | | | |
Jiangsu Shuangxing Color Plastic New Materials Co. Ltd.* | | 300,030 | | | 1,274,800 |
| | | | | | |
ELECTRICAL EQUIPMENT – 13.5% | | | | | |
Contemporary Amperex Technology Co. Ltd. | | 21,002 | | | 1,937,612 |
Eve Energy Co. Ltd.* | | 60,000 | | | 1,112,562 |
Ming Yang Smart Energy Group Ltd.* | | 250,000 | | | 1,023,786 |
NARI Technology Co. Ltd.* | | 50,000 | | | 314,040 |
Ningbo Orient Wires & Cables Co. Ltd.* | | 160,000 | | | 1,284,338 |
Sieyuan Electric Co. Ltd.* | | 199,965 | | | 1,543,960 |
Sungrow Power Supply Co. Ltd.* | | 50,097 | | | 1,146,035 |
See accompanying notes to the financial statements.
25
OBERWEIS CHINA OPPORTUNITIES FUND (continued)
Schedule of Investments December 31, 2021
| | SHARES | | VALUE |
Suzhou Maxwell Technologies Co. Ltd.* | | 16,055 | | $ | 1,617,995 |
Wolong Electric Drive Group Co. Ltd.* | | 250,000 | | | 717,435 |
Zhejiang HangKe Technology, Inc. Co.* | | 60,005 | | | 1,012,856 |
Zhuzhou CRRC Times Electric Co. Ltd. | | 230,000 | | | 1,331,756 |
| | | | | | 13,042,375 |
| | | | | | |
ELECTRONIC EQUIPMENT, INSTRUMENTS & COMPONENTS – 16.4% | | | | | |
Cowell e Hldgs., Inc.* | | 900,000 | | | 1,516,621 |
GoerTek, Inc. | | 180,027 | | | 1,528,142 |
Huagong Tech Co. Ltd.* | | 200,000 | | | 874,259 |
Luxshare Precision Industry Co. Ltd. | | 150,000 | | | 1,157,938 |
Shennan Circuits Co. Ltd.* | | 55,000 | | | 1,051,260 |
Shenzhen Topband Co. Ltd.* | | 200,000 | | | 586,500 |
Sunny Optical Technology Group Co. Ltd. | | 45,000 | | | 1,423,130 |
Unimicron Technology Corp.* | | 210,000 | | | 1,747,614 |
Universal Microwave Technology, Inc.* | | 250,000 | | | 1,931,606 |
Wuhan DR Laser Technology Corp. Ltd.* | | 20,010 | | | 803,427 |
Wuhu Token Sciences Co. Ltd.* | | 400,070 | | | 833,610 |
Wuxi Lead Intelligent Equipment Co. Ltd.* | | 110,093 | | | 1,284,654 |
Xiamen Faratronic Co. Ltd.* | | 30,000 | | | 1,093,922 |
| | | | | | 15,832,683 |
| | | | | | |
ENTERTAINMENT – 1.5% | | | | | |
Wuhu Sanqi Interactive Entertainment Network Technology Group Co. Ltd. | | 350,000 | | | 1,483,823 |
| | | | | | |
FOOD PRODUCTS – 0.7% | | | | | |
Sanquan Food Co. Ltd.* | | 200,023 | | | 634,271 |
| | | | | | |
HEALTHCARE EQUIPMENT & SUPPLIES – 1.2% | | | | | |
Shandong Pharmaceutical Glass Co. Ltd.* | | 170,000 | | | 1,170,961 |
| | | | | | |
HOTELS, RESTAURANTS & LEISURE – 0.2% | | | | | |
Huazhu Group Ltd.* | | 50,000 | | | 186,916 |
| | | | | | |
INDEPENDENT POWER & RENEWABLE ELECTRICITY PRODUCERS – 1.7% | | | | | |
China Longyuan Power Group Corp. Ltd. | | 700,000 | | | 1,633,836 |
| | | | | | |
INTERNET & DIRECT MARKETING RETAIL – 0.3% | | | | | |
Meituan* | | 10,000 | | | 289,063 |
| | | | | | |
MACHINERY – 8.2% | | | | | |
Chervon Hldgs. Ltd.* | | 50,000 | | | 371,268 |
Han’s Laser Technology Industry Group Co. Ltd. | | 160,000 | | | 1,355,634 |
Hangzhou Boiler Group Co. Ltd.* | | 250,049 | | | 1,243,301 |
Moon Environment Technology Co. Ltd.* | | 100,000 | | | 241,472 |
See accompanying notes to the financial statements.
26
OBERWEIS CHINA OPPORTUNITIES FUND (continued)
Schedule of Investments December 31, 2021
| | SHARES | | VALUE |
North Industries Group Red Arrow Co. Ltd.* | | 200,000 | | $ | 836,916 |
Riyue Heavy Industry Co. Ltd. | | 170,058 | | | 879,187 |
Shanghai Kelai Mechatronics Engineering Co. Ltd.* | | 130,000 | | | 742,053 |
Yijiahe Technology Co. Ltd.* | | 99,980 | | | 1,178,413 |
Zhejiang Wanliyang Co. Ltd.* | | 450,000 | | | 1,040,732 |
| | | | | | 7,888,976 |
| | | | | | |
METALS & MINING – 3.3% | | | | | |
Ganfeng Lithium Co. Ltd. | | 90,000 | | | 1,416,205 |
Yongxing Special Materials Technology Co. Ltd.* | | 75,082 | | | 1,743,753 |
| | | | | | 3,159,958 |
| | | | | | |
PHARMACEUTICALS – 1.1% | | | | | |
Shenyang Xingqi Pharmaceutical Co. Ltd. | | 50,000 | | | 1,073,211 |
| | | | | | |
PROFESSIONAL SERVICES – 0.2% | | | | | |
Centre Testing International Group Co. Ltd. | | 50,050 | | | 211,009 |
| | | | | | |
REAL ESTATE MANAGEMENT & DEVELOPMENT – 5.3% | | | | | |
China Resources Mixc Lifestyle Services Ltd. | | 201,538 | | | 939,508 |
Ever Sunshine Lifestyle Services Group Ltd. | | 760,000 | | | 1,177,388 |
Longfor Group Hldgs. Ltd. | | 360,000 | | | 1,694,368 |
Shanghai Wanye Enterprises Co. Ltd.* | | 200,000 | | | 1,044,027 |
Sunac China Hldgs. Ltd.* | | 150,000 | | | 226,608 |
| | | | | | 5,081,899 |
| | | | | | |
SEMICONDUCTORS & SEMICONDUCTOR
EQUIPMENT – 16.7% | | | | | |
Amazing Microelectronic Corp.* | | 150,000 | | | 1,325,720 |
Anpec Electronics Corp.* | | 115,000 | | | 1,152,599 |
AP Memory Technology Corp.* | | 65,000 | | | 1,168,368 |
eMemory Technology, Inc.* | | 14,000 | | | 1,104,946 |
Episil Technologies, Inc.* | | 200,000 | | | 1,029,969 |
Eris Technology Corp.* | | 30,000 | | | 311,656 |
Faraday Technology Corp.* | | 160,000 | | | 1,378,411 |
Hangzhou First Applied Material Co. Ltd. | | 42,080 | | | 861,949 |
Hangzhou Silan Microelectronics Co. Ltd. | | 100,000 | | | 850,410 |
JA Solar Technology Corp. Ltd.* | | 80,000 | | | 1,163,586 |
Silergy Corp.* | | 4,000 | | | 723,985 |
Sino Wealth Electronic Ltd.* | | 110,083 | | | 1,172,786 |
Wafer Works Corp.* | | 400,000 | | | 1,232,427 |
Will Semiconductor Ltd.* | | 25,000 | | | 1,219,012 |
Zhejiang Jingsheng Mechanical & Electrical Co. Ltd.* | | 130,000 | | | 1,417,611 |
| | | | | | 16,113,435 |
SOFTWARE – 1.2% | | | | | |
Longshine Technology Group Co. Ltd.* | | 200,000 | | | 1,162,017 |
See accompanying notes to the financial statements.
27
OBERWEIS CHINA OPPORTUNITIES FUND (continued)
Schedule of Investments December 31, 2021
| | SHARES | | VALUE |
TECHNOLOGY HARDWARE, STORAGE & PERIPHERALS – 1.4% | | | | | |
Ninestar Corp.* | | 180,000 | | $ | 1,348,856 |
| | | | | | |
TEXTILES, APPAREL & LUXURY GOODS – 2.9% | | | | | |
Li Ning Co. Ltd. | | 245,000 | | | 2,681,691 |
| | | | | | |
TOBACCO – 0.4% | | | | | |
Smoore International Hldgs. Ltd.* | | 50,000 | | | 254,886 |
| | | | | | |
Total Equities | | | | | |
(Cost: $79,352,795) | | | | $ | 94,800,191 |
| | | | | | |
Total Investments – 98.5% | | | | | |
(Cost: $79,352,795) | | | | $ | 94,800,191 |
Other Assets Less Liabilities – 1.5% | | | | | 1,464,695 |
Net Assets – 100% | | | | $ | 96,264,886 |
* Non-income producing security during the year ended December 31, 2021
COUNTRY ALLOCATION (As a Percentage of Net Assets) (unaudited) | | |
China ( Includes the People’s Republic of China, Taiwan and Hong Kong) | | 98.5 | % |
See accompanying notes to the financial statements.
28
OBERWEIS INTERNATIONAL OPPORTUNITIES FUND
Schedule of Investments December 31, 2021
| | SHARES | | VALUE |
Equities – 98.9% | | | | | |
AUSTRALIA – 6.7% | | | | | |
Charter Hall Group. | | 98,500 | | $ | 1,474,813 |
Evolution Mining Ltd. | | 1,624,100 | | | 4,797,269 |
IDP Education Ltd. | | 281,300 | | | 7,091,339 |
Uniti Group Ltd.* | | 2,276,700 | | | 7,370,909 |
| | | | | | 20,734,330 |
| | | | | | |
BELGIUM – 1.3% | | | | | |
VGP NV* | | 6,900 | | | 2,010,929 |
Warehouses de Pauw NV* | | 42,800 | | | 2,055,219 |
| | | | | | 4,066,148 |
| | | | | | |
CANADA – 11.5% | | | | | |
Aritzia, Inc.* | | 159,500 | | | 6,600,652 |
ATS Automation Tooling Systems, Inc.* | | 149,100 | | | 5,921,568 |
BRP, Inc. | | 63,800 | | | 5,588,174 |
Colliers International Group, Inc. | | 13,200 | | | 1,965,704 |
Gildan Activewear, Inc. | | 101,200 | | | 4,290,400 |
Parex Resources, Inc. | | 271,724 | | | 4,641,862 |
Sleep Country Canada Hldgs., Inc. | | 113,600 | | | 3,370,283 |
Trisura Group Ltd.* | | 87,800 | | | 3,310,025 |
| | | | | | 35,688,668 |
| | | | | | |
DENMARK – 0.8% | | | | | |
ALK-Abello A/S* | | 4,988 | | | 2,619,194 |
| | | | | | |
FINLAND – 2.8% | | | | | |
Outokumpu Oyj | | 625,300 | | | 3,921,081 |
QT Group Oyj* | | 32,200 | | | 4,876,790 |
| | | | | | 8,797,871 |
| | | | | | |
FRANCE – 2.6% | | | | | |
Alten SA* | | 7,100 | | | 1,281,136 |
Rexel SA* | | 150,000 | | | 3,044,740 |
Soitec SA* | | 15,600 | | | 3,821,858 |
| | | | | | 8,147,734 |
| | | | | | |
GERMANY – 2.3% | | | | | |
AIXTRON SE | | 156,600 | | | 3,171,810 |
Aurelius Equity Opportunities SE | | 57,323 | | | 1,753,265 |
Sixt SE* | | 11,900 | | | 2,099,185 |
| | | | | | 7,024,260 |
| | | | | | |
ISRAEL – 2.3% | | | | | |
Nova Ltd.* | | 47,900 | | | 7,017,350 |
See accompanying notes to the financial statements.
29
OBERWEIS INTERNATIONAL OPPORTUNITIES FUND (continued)
Schedule of Investments December 31, 2021
| | SHARES | | VALUE |
JAPAN – 22.1% | | | | | |
BayCurrent Consulting, Inc. | | 35,300 | | $ | 13,605,713 |
Food & Life Co. Ltd. | | 350,100 | | | 13,219,319 |
Future Corp. | | 179,600 | | | 2,731,184 |
IR Japan Hldgs. Ltd. | | 43,500 | | | 2,594,566 |
JMDC, Inc.* | | 76,500 | | | 5,695,260 |
Ki-Star Real Estate Co. Ltd.* | | 55,200 | | | 4,281,683 |
Koei Tecmo Hldgs. Co. Ltd. | | 74,240 | | | 2,915,010 |
M&A Capital Partners Co. Ltd.* | | 107,600 | | | 4,929,919 |
Open House Co. Ltd. | | 76,700 | | | 4,008,077 |
Persol Hldgs. Co. Ltd.* | | 174,000 | | | 5,058,746 |
TIS, Inc.* | | 149,400 | | | 4,442,567 |
Tsubaki Nakashima Co. Ltd. | | 149,600 | | | 1,911,282 |
Visional, Inc.* | | 38,000 | | | 3,212,339 |
| | | | | | 68,605,665 |
| | | | | | |
NETHERLANDS – 6.4% | | | | | |
Aalberts NV* | | 48,600 | | | 3,223,402 |
Alfen NV* | | 16,600 | | | 1,667,748 |
BE Semiconductor Industries NV | | 72,266 | | | 6,171,898 |
Constellium SE* | | 494,400 | | | 8,854,704 |
| | | | | | 19,917,752 |
| | | | | | |
NORWAY – 4.9% | | | | | |
Nordic Semiconductor ASA* | | 457,800 | | | 15,353,018 |
| | | | | | |
SPAIN – 1.3% | | | | | |
Laboratorios Farmaceuticos Rovi SA* | | 46,600 | | | 3,915,164 |
| | | | | | |
SWEDEN – 8.7% | | | | | |
Addtech AB* | | 54,300 | | | 1,291,543 |
Arjo AB* | | 62,800 | | | 768,448 |
Avanza Bank Hldg. AB | | 135,400 | | | 4,959,618 |
Cint Group AB* | | 244,800 | | | 3,883,622 |
Getinge AB* | | 87,700 | | | 3,822,156 |
MIPS AB | | 43,000 | | | 5,626,411 |
Nordnet AB | | 169,500 | | | 3,251,829 |
Thule Group AB | | 56,900 | | | 3,436,329 |
| | | | | | 27,039,956 |
| | | | | | |
SWITZERLAND – 1.1% | | | | | |
Tecan Group AG* | | 5,699 | | | 3,461,379 |
| | | | | | |
UNITED KINGDOM – 24.1% | | | | | |
CVS Group PLC | | 85,400 | | | 2,589,280 |
Endava PLC ADS* | | 35,800 | | | 6,011,536 |
Future PLC* | | 183,000 | | | 9,486,871 |
Games Workshop Group PLC | | 27,900 | | | 3,765,065 |
See accompanying notes to the financial statements.
30
OBERWEIS INTERNATIONAL OPPORTUNITIES FUND (continued)
Schedule of Investments December 31, 2021
| | SHARES | | VALUE |
Grafton Group PLC | | 88,400 | | $ | 1,475,328 |
Howden Joinery Group PLC | | 320,200 | | | 3,905,851 |
IMI PLC | | 145,300 | | | 3,414,196 |
Intermediate Capital Group PLC | | 295,900 | | | 8,787,285 |
LondonMetric Property PLC | | 509,300 | | | 1,953,649 |
Man Group PLC* | | 1,550,400 | | | 4,772,076 |
Marks & Spencer Group PLC* | | 1,973,800 | | | 6,182,151 |
Morgan Sindall Group PLC | | 53,500 | | | 1,824,851 |
Pets at Home Group PLC | | 422,163 | | | 2,657,090 |
Reach PLC | | 667,900 | | | 2,553,895 |
Redrow PLC | | 343,100 | | | 3,254,527 |
Safestore Hldgs. PLC* | | 45,400 | | | 865,845 |
Taylor Wimpey PLC | | 1,814,200 | | | 4,309,584 |
The Sage Group PLC* | | 280,500 | | | 3,237,065 |
Trustpilot Group PLC* | | 825,800 | | | 3,659,542 |
| | | | | | 74,705,687 |
| | | | | | |
Total Equities | | | | | |
(Cost: $233,580,024) | | | | $ | 307,094,176 |
| | | | | | |
Total Investments – 98.9% | | | | | |
(Cost: $233,580,024) | | | | $ | 307,094,176 |
Other Assets Less Liabilities – 1.1% | | | | | 3,262,089 |
Net Assets – 100% | | | | $ | 310,356,265 |
* Non-income producing security during the year ended December 31, 2021
ADS—American depositary share
SECTOR ALLOCATIONS (As A Percentage of Net Assets) (unaudited) | | |
Communication Services | | 8.4 | % |
Consumer Discretionary | | 25.0 | % |
Energy | | 1.5 | % |
Financials | | 10.2 | % |
Healthcare | | 7.4 | % |
Industrials | | 17.5 | % |
Information Technology | | 20.0 | % |
Materials | | 5.7 | % |
Real Estate | | 3.2 | % |
See accompanying notes to the financial statements.
31
OBERWEIS EMERGING MARKETS FUND
Schedule of Investments December 31, 2021
| | SHARES | | VALUE |
Equities – 94.0% | | | | | |
| | | | | | |
ARGENTINA – 0.7% | | | | | |
Despegar.com Corp.* | | 9,800 | | $ | 95,942 |
| | | | | | |
AUSTRALIA – 2.4% | | | | | |
IDP Education Ltd. | | 13,000 | | | 327,719 |
| | | | | | |
BRAZIL – 3.7% | | | | | |
Arco Platform Ltd.* | | 12,500 | | | 261,125 |
TOTVS SA | | 47,100 | | | 242,180 |
| | | | | | 503,305 |
| | | | | | |
CANADA – 1.1% | | | | | |
Parex Resources, Inc. | | 8,400 | | | 143,497 |
| | | | | | |
CHILE – 2.1% | | | | | |
Falabella SA | | 87,800 | | | 286,381 |
| | | | | | |
CHINA – 23.0% | | | | | |
China Isotope & Radiation Corp. | | 48,200 | | | 135,991 |
Chongqing Brewery Co. Ltd.* | | 11,100 | | | 263,541 |
Dada Nexus Ltd. ADS* | | 39,600 | | | 521,136 |
Frontage Hldgs. Corp.* | | 270,000 | | | 136,773 |
Hangzhou Robam Appliances Co. Ltd.* | | 49,000 | | | 276,929 |
Shanghai Weaver Network Co. Ltd. | | 25,235 | | | 276,249 |
Thunder Software Technology Co. Ltd. | | 14,600 | | | 317,089 |
Venus MedTech Hangzhou, Inc.* | | 61,500 | | | 233,456 |
Weimob, Inc.* | | 127,000 | | | 128,505 |
Winning Health Technology Group Co. Ltd. | | 63,260 | | | 166,354 |
Wolong Electric Group Co. Ltd. | | 64,500 | | | 185,098 |
Yantai Jereh Oilfield Services Group Co. Ltd. | | 42,700 | | | 267,989 |
Yijiahe Technology Co. Ltd. | | 17,248 | | | 203,293 |
| | | | | | 3,112,403 |
| | | | | | |
CZECH REPUBLIC – 1.6% | | | | | |
TCS Group Hldg. PLC | | 2,500 | | | 210,800 |
| | | | | | |
FRANCE – 2.1% | | | | | |
Gaztransport & Technigaz SA | | 3,050 | | | 285,590 |
| | | | | | |
GREECE – 1.1% | | | | | |
Greek Organization of Football Prognostics SA | | 10,400 | | | 147,641 |
| | | | | | |
INDIA – 11.1% | | | | | |
Affle India Ltd.* | | 14,100 | | | 213,855 |
Amber Enterprises India Ltd.* | | 2,800 | | | 124,911 |
Bukalapak.com PT Tbk* | | 5,600,000 | | | 169,501 |
Container Corp. of India Ltd. | | 13,900 | | | 114,914 |
See accompanying notes to the financial statements.
32
OBERWEIS EMERGING MARKETS FUND (continued)
Schedule of Investments December 31, 2021
| | SHARES | | VALUE |
L&T Technology Services Ltd. | | 3,100 | | $ | 233,491 |
Linde India Ltd.* | | 4,200 | | | 140,536 |
Route Mobile Ltd. | | 7,300 | | | 175,136 |
Varun Beverages Ltd. | | 14,612 | | | 174,611 |
Vinati Organics Ltd.* | | 6,000 | | | 160,469 |
| | | | | | 1,507,424 |
INDONESIA – 5.2% | | | | | |
PT Bank Jago Tbk* | | 136,700 | | | 153,329 |
PT Industri Jamu dan Farmasi Sido Muncul Tbk | | 2,390,711 | | | 145,095 |
PT Mitra Adiperkasa Tbk* | | 4,312,900 | | | 214,829 |
PT Prodia Widyahusada Tbk* | | 292,000 | | | 188,486 |
| | | | | | 701,739 |
| | | | | | |
MALAYSIA – 1.1% | | | | | |
My E.G. Services Bhd | | 600,000 | | | 154,105 |
| | | | | | |
MEXICO – 1.3% | | | | | |
Prologis Property Mexico SA de CV | | 65,044 | | | 180,530 |
| | | | | | |
PHILIPPINES – 2.1% | | | | | |
Wilcon Depot, Inc. | | 485,000 | | | 290,226 |
| | | | | | |
POLAND – 1.1% | | | | | |
Dino Polska SA* | | 1,600 | | | 145,855 |
| | | | | | |
RUSSIA – 2.6% | | | | | |
HeadHunter Group PLC ADS | | 6,800 | | | 347,412 |
| | | | | | |
SOUTH AFRICA – 1.8% | | | | | |
Clicks Group Ltd. | | 4,980 | | | 98,609 |
Karooooo Ltd.* | | 3,700 | | | 150,886 |
| | | | | | 249,495 |
| | | | | | |
SOUTH KOREA – 9.5% | | | | | |
AfreecaTV Co. Ltd. | | 2,000 | | | 339,815 |
Classys, Inc. | | 10,900 | | | 171,916 |
Cosmax, Inc.* | | 3,000 | | | 220,036 |
Korea Investment Hldgs. Co. Ltd. | | 1,802 | | | 122,086 |
LEENO Industrial, Inc. | | 1,809 | | | 301,258 |
Nice Information Service Co. Ltd. | | 8,692 | | | 131,427 |
| | | | | | 1,286,538 |
| | | | | | |
SWEDEN – 1.5% | | | | | |
Medicover AB | | 5,000 | | | 204,153 |
| | | | | | |
SWITZERLAND – 1.0% | | | | | |
Wizz Air Hldgs. PLC* | | 2,409 | | | 136,558 |
See accompanying notes to the financial statements.
33
OBERWEIS EMERGING MARKETS FUND (continued)
Schedule of Investments December 31, 2021
| | SHARES | | VALUE |
TAIWAN – 15.5% | | | | | |
ASPEED Technology, Inc. | | 4,000 | | $ | 515,775 |
Chailease Hldg. Co. Ltd. | | 16,666 | | | 158,524 |
Chief Telecom, Inc. | | 11,000 | | | 111,043 |
Innodisk Corp. | | 18,340 | | | 135,115 |
M31 Technology Corp. | | 23,000 | | | 329,628 |
momo.com, Inc. | | 4,200 | | | 245,892 |
Pan Jit International, Inc.* | | 80,000 | | | 308,327 |
Sinbon Electronics Co. Ltd. | | 18,000 | | | 184,387 |
Taiwan FamilyMart Co. Ltd. | | 12,000 | | | 107,349 |
| | | | | | 2,096,040 |
| | | | | | |
THAILAND – 1.2% | | | | | |
Mega Lifesciences PCL | | 106,000 | | | 159,882 |
| | | | | | |
VIETNAM – 1.2% | | | | | |
Viettel Construction | | 44,015 | | | 169,185 |
| | | | | | |
Total Equities | | | | | |
(Cost: $9,744,778) | | | | $ | 12,742,420 |
| | | | | | |
Total Investments – 94.0% | | | | | |
(Cost: $9,744,778) | | | | $ | 12,742,420 |
Other Assets Less Liabilities – 6.0% | | | | | 814,202 |
Net Assets – 100% | | | | $ | 13,556,622 |
* Non-income producing security during the year ended December 31, 2021
ADS—American depositary share
SECTOR ALLOCATIONS (As A Percentage of Net Assets) (unaudited) | | |
Communication Services | | 6.2 | % |
Consumer Discretionary | | 21.9 | % |
Consumer Staples | | 8.5 | % |
Energy | | 5.1 | % |
Financials | | 4.8 | % |
Healthcare | | 10.3 | % |
Industrials | | 10.0 | % |
Information Technology | | 23.7 | % |
Materials | | 2.2 | % |
Real Estate | | 1.3 | % |
See accompanying notes to the financial statements.
34
THE OBERWEIS FUNDS
Statements of Assets and Liabilities December 31, 2021
| | | MICRO-CAP
FUND | | SMALL-CAP
OPPORTUNITIES
FUND | | GLOBAL
OPPORTUNITIES
FUND | |
| | | ASSETS | | | | | | | | | |
| | | Investment securities at valuea | $ | 139,074,620 | | $ | 28,970,904 | | $ | 74,589,140 | |
| | | Cash | | — | | | 969,781 | | | 2,317,117 | |
| | | Receivable from fund shares sold | | 1,211,419 | | | 54,600 | | | 41,425 | |
| | | Dividends and interest receivable | | 9,470 | | | 1,533 | | | 38,886 | |
| | | Prepaid expenses | | 23,192 | | | 11,577 | | | 15,288 | |
| | | Total Assets | | 140,318,701 | | | 30,008,395 | | | 77,001,856 | |
| | | | | | | | | | | | |
| | | LIABILITIES | | | | | | | | | |
| | | Payable to custodian bank | | 2,088,719 | | | — | | | — | |
| | | Payable for fund shares redeemed | | 431,616 | | | 838,355 | | | 30,036 | |
| | | Payable for securities purchased | | — | | | 67,121 | | | — | |
| | | Payable to advisor (see note 3) | | 116,913 | | | 23,462 | | | 54,670 | |
| | | Payable to distributor | | 17,521 | | | 3,264 | | | 11,285 | |
| | | Accrued expenses | | 46,012 | | | 27,337 | | | 45,497 | |
| | | Total Liabilities | | 2,700,781 | | | 959,539 | | | 141,488 | |
| | | NET ASSETS | $ | 137,617,920 | | $ | 29,048,856 | | $ | 76,860,368 | |
| | | | | | | | | | | | |
| | | NET ASSETS | | | | | | | | | |
| | | Investor Class | $ | 87,602,940 | | $ | 16,321,755 | | $ | 53,342,075 | |
| | | Institutional Class | | 50,014,980 | | | 12,727,101 | | | 23,518,293 | |
| | | Total | $ | 137,617,920 | | $ | 29,048,856 | | $ | 76,860,368 | |
| | | | | | | | | | | | |
| | | SHARES OUTSTANDING | | | | | | | | | |
| | | (shares of beneficial interest issued and outstanding, respectively, unlimited number of shares authorized with no par value) | | | | | | | | | |
| | | Investor Class | | 2,441,820 | | | 757,678 | | | 1,511,571 | |
| | | Institutional Class | | 1,372,953 | | | 580,509 | | | 656,133 | |
| | | Total | | 3,814,773 | | | 1,338,187 | | | 2,167,704 | |
| | | | | | | | | | | | |
| | | NET ASSET VALUE | | | | | | | | | |
| | | Investor Class, offering price and redemption price | $ | 35.88 | | $ | 21.54 | | $ | 35.29 | |
| | | Institutional Class, offering price and redemption price | $ | 36.43 | | $ | 21.92 | | $ | 35.84 | |
| | | | | | | | | | | | |
| | | ANALYSIS OF NET ASSETS | | | | | | | | | |
| | | Capital | $ | 96,518,949 | | $ | 21,854,275 | | $ | 56,786,739 | |
| | | Accumulated earnings | | 41,098,971 | | | 7,194,581 | | | 20,073,629 | |
| | | Net assets | $ | 137,617,920 | | $ | 29,048,856 | | $ | 76,860,368 | |
| | | | | | | | | | | | |
| | | a Investment securities at cost | $ | 97,929,207 | | $ | 22,009,106 | | $ | 55,418,036 | |
See accompanying notes to the financial statements.
35
THE OBERWEIS FUNDS
Statements of Assets and Liabilities December 31, 2021 (continued)
| | | CHINA
OPPORTUNITIES
FUND | | INTERNATIONAL
OPPORTUNITIES
FUND | | EMERGING
MARKETS
FUND | |
| | | ASSETS | | | | | | | | | |
| | | Investment securities at valuea | $ | 94,800,191 | | $ | 307,094,176 | | $ | 12,742,420 | |
| | | Cash | | 541,952 | | | 1,370,081 | | | 836,383 | |
| | | Foreign Currencyb | | — | | | 53,256 | | | 647 | |
| | | Receivable from fund shares sold | | 863,445 | | | 356,024 | | | 70,000 | |
| | | Receivable from securities sold | | 853,061 | | | 1,442,443 | | | — | |
| | | Dividends and interest receivable | | 26,589 | | | 847,030 | | | 12,290 | |
| | | Prepaid expenses | | 20,435 | | | 39,487 | | | 7,798 | |
| | | Total Assets | | 97,105,673 | | | 311,202,497 | | | 13,669,538 | |
| | | | | | | | | | | | |
| | | LIABILITIES | | | | | | | | | |
| | | Payable for fund shares redeemed | | 284,080 | | | 240,398 | | | — | |
| | | Payable for securities purchased | | 360,906 | | | 129,785 | | | — | |
| | | Deferred foreign capital gains tax liability (see note 2) | | — | | | — | | | 70,326 | |
| | | Payable to advisor (see note 3) | | 104,664 | | | 265,568 | | | 3,142 | |
| | | Payable to distributor | | 17,552 | | | 66,310 | | | 335 | |
| | | Accrued expenses | | 73,585 | | | 144,171 | | | 39,113 | |
| | | Total Liabilities | | 840,787 | | | 846,232 | | | 112,916 | |
| | | NET ASSETS | $ | 96,264,886 | | $ | 310,356,265 | | $ | 13,556,622 | |
| | | | | | | | | | | | |
| | | NET ASSETS | | | | | | | | | |
| | | Investor Class | $ | 81,018,357 | | $ | 310,356,265 | | $ | 1,646,314 | |
| | | Institutional Class | | 15,246,529 | | | — | | | 11,910,308 | |
| | | Total | $ | 96,264,886 | | $ | 310,356,265 | | $ | 13,556,622 | |
| | | | | | | | | | | | |
| | | SHARES OUTSTANDING | | | | | | | | | |
| | | (shares of beneficial interest issued and outstanding, respectively, unlimited number of shares authorized with no par value) | | | | | | | | | |
| | | Investor Class | | 7,041,815 | | | 11,711,841 | | | 120,781 | |
| | | Institutional Class | | 1,306,030 | | | — | | | 866,068 | |
| | | Total | | 8,347,845 | | | 11,711,841 | | | 986,849 | |
| | | | | | | | | | | | |
| | | NET ASSET VALUE | | | | | | | | | |
| | | Investor Class, offering price and redemption price | $ | 11.51 | | $ | 26.50 | | $ | 13.63 | |
| | | Institutional Class, offering price and redemption price | $ | 11.67 | | $ | — | | $ | 13.75 | |
| | | | | | | | | | | | |
| | | ANALYSIS OF NET ASSETS | | | | | | | | | |
| | | Capital | $ | 80,826,563 | | $ | 244,127,312 | | $ | 10,324,606 | |
| | | Accumulated earnings | | 15,438,323 | | | 66,228,953 | | | 3,232,016 | |
| | | Net assets | $ | 96,264,886 | | $ | 310,356,265 | | $ | 13,556,622 | |
| | | | | | | | | | | | |
| | | a Investment securities at cost | $ | 79,352,795 | | $ | 233,580,024 | | $ | 9,744,778 | |
| | | b Foreign currency at cost | $ | — | | $ | 52,983 | | $ | 640 | |
See accompanying notes to the financial statements.
36
THE OBERWEIS FUNDS
Statements of Operations Year Ended December 31, 2021
| | | MICRO-CAP
FUND | SMALL-CAP
OPPORTUNITIES
FUND | |
| | | INVESTMENT INCOME | | | | | | | |
| | | Dividendsa | $ | 435,247 | | $ | 72,463 | | |
| | | Total investment income | | 435,247 | | | 72,463 | | |
| | | | | | | | | | |
| | EXPENSES | | | | | | | |
| | | Investment advisory fees (see note 3) | | 665,226 | | | 87,761 | | |
| | | Management fees (see note 3) | | 443,484 | | | 87,761 | | |
| | | Distribution fees and shareholder services
(see note 3) | | 165,848 | | | 25,869 | | |
| | | Transfer agent fees and expenses | | 97,876 | | | 28,354 | | |
| | | Custodian fees and expenses | | 12,787 | | | 5,670 | | |
| | | Accounting services fees | | 45,896 | | | 20,635 | | |
| | | Federal and state registration fees | | 36,960 | | | 32,390 | | |
| | | Audit fees | | 16,519 | | | 16,519 | | |
| | | Other | | 47,612 | | | 15,912 | | |
| | | Total expenses before reimbursed expenses | | 1,532,208 | | | 320,871 | | |
| | | Earnings credit (see note 6) | | (855 | ) | | (153 | ) | |
| | | Expense reimbursement (see note 3) | | — | | | (9,626 | ) | |
| | | Total expenses | | 1,531,353 | | | 311,092 | | |
| | | NET INVESTMENT LOSS | | (1,096,106 | ) | | (238,629 | ) | |
| | | | | |
| | | NET REALIZED AND UNREALIZED GAINS (LOSSES) FROM INVESTMENTS | | |
| | | Net realized gains on investment transactions | | 31,544,351 | | | 5,904,644 | | |
| | | Change in net unrealized appreciation/depreciation on investments | | 12,706,177 | | | 1,849,942 | | |
| | | Net realized/unrealized gains on investments | | 44,250,528 | | | 7,754,586 | | |
| | | NET INCREASE IN NET ASSETS RESULTING FROM OPERATIONS | $ | 43,154,422 | | $ | 7,515,957 | | |
a Dividends are net of foreign withholding tax of $2,890 for the Micro-Cap Fund
See accompanying notes to the financial statements.
37
THE OBERWEIS FUNDS
Statements of Operations Year Ended December 31, 2021 (continued)
| | | GLOBAL
OPPORTUNITIES
FUND | CHINA
OPPORTUNITIES
FUND | INTERNATIONAL
OPPORTUNITIES
FUND | EMERGING
MARKETS
FUND | |
| | | INVESTMENT INCOME | | | | | | | | | | | | | |
| | | Dividendsa | $ | 393,119 | | $ | 1,416,041 | | $ | 2,736,912 | | $ | 111,075 | | |
| | | Total investment income | | 393,119 | | | 1,416,041 | | | 2,736,912 | | | 111,075 | | |
| | | | | | | | | | | | | | | | |
| | | EXPENSES | | | | | | | | | | | | | |
| | | Investment advisory fees (see note 3) | | 325,777 | | | 1,428,174 | | | 4,242,805 | | | 157,654 | | |
| | | Management fees (see note 3) | | 300,777 | | | — | | | — | | | — | | |
| | | Distribution fees and shareholder services (see note 3) | | 133,936 | | | 237,379 | | | 848,561 | | | 3,131 | | |
| | | Transfer agent fees and expenses | | 65,016 | | | 139,459 | | | 513,716 | | | 27,468 | | |
| | | Custodian fees and expenses | | 33,256 | | | 116,378 | | | 100,890 | | | 46,182 | | |
| | | Accounting services fees | | 39,060 | | | 56,583 | | | 114,983 | | | 24,503 | | |
| | | Federal and state registration fees | | 33,553 | | | 36,491 | | | 29,101 | | | 32,334 | | |
| | | Audit fees | | 21,017 | | | 21,017 | | | 21,017 | | | 21,017 | | |
| | | Other | | 34,580 | | | 53,371 | | | 146,323 | | | 13,006 | | |
| | | Total expenses before reimbursed expenses | | 986,972 | | | 2,088,852 | | | 6,017,396 | | | 325,295 | | |
| | | Earnings credit (see note 6) | | (872 | ) | | (319 | ) | | (1,213 | ) | | (165 | ) | |
| | | Expense reimbursement (see note 3) | | — | | | — | | | (585,449 | ) | | (132,812 | ) | |
| | | Total Expenses | | 986,100 | | | 2,088,533 | | | 5,430,734 | | | 192,318 | | |
| | | NET INVESTMENT LOSS | | (592,981 | ) | | (672,492 | ) | | (2,693,822 | ) | | (81,243 | ) | |
| | | | | | | | | | | | | | | | |
| | | NET REALIZED AND UNREALIZED GAINS (LOSSES) FROM INVESTMENTS | | |
| | | Net realized gains on investment transactions | | 18,507,322 | | | 28,874,954 | | | 68,282,334 | | | 1,797,619 | | |
| | | Net realized foreign capital gains tax | | — | | | — | | | — | | | (65,290 | ) | |
| | | Net realized losses on foreign currency transactions | | (3,208 | ) | | (24,602 | ) | | (7,481 | ) | | (3,394 | ) | |
| | | Net realized gains on investments and foreign currency transactions | | 18,504,114 | | | 28,850,352 | | | 68,274,853 | | | 1,728,935 | | |
| | | Change in net deferred foreign capital gains taxes on unrealized appreciation/depreciation | | — | | | — | | | — | | | (2,540 | ) | |
| | | Change in net unrealized appreciation/depreciation on investments and translation of assets and liabilities denominated in foreign currencies | | (4,663,916 | ) | | (34,074,056 | ) | | (60,205,704 | ) | | (203,006 | ) | |
| | | Net realized/unrealized gains (losses) on investments and foreign currencies | | 13,840,198 | | | (5,223,704 | ) | | 8,069,149 | | | 1,523,389 | | |
| | | NET INCREASE (DECREASE) IN NET ASSETS RESULTING FROM OPERATIONS | $ | 13,247,217 | | $ | (5,896,196 | ) | $ | 5,375,327 | | $ | 1,442,146 | | |
See accompanying notes to the financial statements.
38
THE OBERWEIS FUNDS
Statements of Changes in Net Assets
| | | MICRO-CAP FUND | |
| | | | Year Ended
December 31,
2021 | Year Ended
December 31,
2020 | |
| | FROM OPERATIONS | | | | | | | |
| | | Net investment loss | $ | (1,096,106 | ) | $ | (689,507 | ) | |
| | | Net realized gains on investment transactions | | 31,544,351 | | | 196,695 | | |
| | | Change in net unrealized appreciation/depreciation on investments | | 12,706,177 | | | 16,794,544 | | |
| | | Net increase in net assets resulting from operations | | 43,154,422 | | | 16,301,732 | | |
| | | | | | | | | | |
| | FROM DISTRIBUTIONS | | | | | | | |
| | | Distributions to shareholders | | | | | | | |
| | | Investor Class | | (17,266,714 | ) | | — | | |
| | | Institutional Class | | (11,065,037 | ) | | — | | |
| | | Net decrease in net assets from distributions | | (28,331,751 | ) | | — | | |
| | | | | | | | | | |
| | FROM CAPITAL SHARE TRANSACTIONS | | | | | | | |
| | | Investor Class | | | | | | | |
| | | Proceeds from sale of shares | | 36,156,710 | | | 3,637,401 | | |
| | | Proceeds from reinvestment of distributions | | 16,519,001 | | | — | | |
| | | Redemption of shares (see note 5) | | (18,912,822 | ) | | (14,654,234 | ) | |
| | | Net increase (decrease) from investor class share transactions | | 33,762,889 | | | (11,016,833 | ) | |
| | | Institutional Class | | | | | | | |
| | | Proceeds from sale of shares | | 13,443,503 | | | 919,305 | | |
| | | Proceeds from reinvestment of distributions | | 4,327,680 | | | — | | |
| | | Redemption of shares (see note 5) | | (5,332,751 | ) | | (7,199,994 | ) | |
| | | Net increase (decrease) from institutional class share transactions | | 12,438,432 | | | (6,280,689 | ) | |
| | | Redemption fees (see note 5) | | 46,967 | | | 2,917 | | |
| | | Net increase (decrease) in net assets resulting from capital share transactions | | 46,248,288 | | | (17,294,605 | ) | |
| | | Total increase (decrease) in net assets | | 61,070,959 | | | (992,873 | ) | |
| | | | | | | | | | |
| | NET ASSETS | | | | | | | |
| | | Beginning of year | | 76,546,961 | | | 77,539,834 | | |
| | | End of year | $ | 137,617,920 | | $ | 76,546,961 | | |
| | | | | | | | | | |
| | TRANSACTIONS IN SHARES | | | | | | | |
| | | Investor Class | | | | | | | |
| | | Shares sold | | 906,972 | | | 179,585 | | |
| | | Shares issued in reinvestment of distributions | | 461,296 | | | — | | |
| | | Less shares redeemed | | (484,941 | ) | | (698,871 | ) | |
| | | Net increase (decrease) from investor class share transactions | | 883,327 | | | (519,286 | ) | |
| | | Institutional Class | | | | | | | |
| | | Shares sold | | 320,473 | | | 43,937 | | |
| | | Shares issued in reinvestment of distributions | | 119,023 | | | — | | |
| | | Less shares redeemed | | (129,108 | ) | | (355,588 | ) | |
| | | Net increase (decrease) from institutional class share transactions | | 310,388 | | | (311,651 | ) | |
| | | Net increase (decrease) from capital share transactions | | 1,193,715 | | | (830,937 | ) | |
See accompanying notes to the financial statements.
39
THE OBERWEIS FUNDS
Statements of Changes in Net Assets (continued)
| | | SMALL-CAP OPPORTUNITIES FUND | |
| | | | Year Ended
December 31,
2021 | Year Ended
December 31,
2020 | |
| | FROM OPERATIONS | | | | | | | |
| | | Net investment loss | $ | (238,629 | ) | $ | (127,827 | ) | |
| | | Net realized gains on investment transactions | | 5,904,644 | | | 1,129,773 | | |
| | | Change in net unrealized appreciation/depreciation on investments | | 1,849,942 | | | 3,466,685 | | |
| | | Net increase in net assets resulting from operations | | 7,515,957 | | | 4,468,631 | | |
| | | | | | | | | | |
| | FROM DISTRIBUTIONS | | | | | | | |
| | | Distributions to shareholders | | | | | | | |
| | | Investor Class | | (3,123,678 | ) | | (303,928 | ) | |
| | | Institutional Class | | (2,406,568 | ) | | (345,259 | ) | |
| | | Net decrease in net assets from distributions | | (5,530,246 | ) | | (649,187 | ) | |
| | | | | | | | | | |
| | FROM CAPITAL SHARE TRANSACTIONS | | | | | | | |
| | | Investor Class | | | | | | | |
| | | Proceeds from sale of shares | | 7,952,725 | | | 300,236 | | |
| | | Proceeds from reinvestment of distributions | | 2,713,282 | | | 253,557 | | |
| | | Redemption of shares (see note 5) | | (2,502,149 | ) | | (565,249 | ) | |
| | | Net increase (decrease) from investor class share
transactions | | 8,163,858 | | | (11,456 | ) | |
| | | Institutional Class | | | | | | | |
| | | Proceeds from sale of shares | | 1,774,000 | | | 1,144,055 | | |
| | | Proceeds from reinvestment of distributions | | 1,540,672 | | | 233,987 | | |
| | | Redemption of shares (see note 5) | | (1,053,050 | ) | | (285,226 | ) | |
| | | Net increase from institutional class share transactions | | 2,261,622 | | | 1,092,816 | | |
| | | Redemption fees (see note 5) | | 4,859 | | | 475 | | |
| | | Net increase in net assets resulting from capital share transactions | | 10,430,339 | | | 1,081,835 | | |
| | | Total increase in net assets | | 12,416,050 | | | 4,901,279 | | |
| | | | | | | | | | |
| | NET ASSETS | | | | | | | |
| | | Beginning of year | | 16,632,806 | | | 11,731,527 | | |
| | | End of year | $ | 29,048,856 | | $ | 16,632,806 | | |
| | | | | | | | | | |
| | TRANSACTIONS IN SHARES | | | | | | | |
| | | Investor Class | | | | | | | |
| | | Shares sold | | 317,889 | | | 22,282 | | |
| | | Shares issued in reinvestment of distributions | | 126,140 | | | 13,728 | | |
| | | Less shares redeemed | | (111,005 | ) | | (36,849 | ) | |
| | | Net increase (decrease) from investor class share transactions | | 333,024 | | | (839 | ) | |
| | | Institutional Class | | | | | | | |
| | | Shares sold | | 76,279 | | | 98,477 | | |
| | | Shares issued in reinvestment of distributions | | 70,382 | | | 12,519 | | |
| | | Less shares redeemed | | (45,184 | ) | | (19,982 | ) | |
| | | Net increase from institutional class share transactions | | 101,477 | | | 91,014 | | |
| | | Net increase from capital share transactions | | 434,501 | | | 90,175 | | |
See accompanying notes to the financial statements.
40
THE OBERWEIS FUNDS
Statements of Changes in Net Assets (continued)
| | | GLOBAL OPPORTUNITIES FUND | |
| | | | Year Ended
December 31,
2021 | Year Ended
December 31,
2020 | |
| | FROM OPERATIONS | | | | | | | |
| | | Net investment loss | $ | (592,981 | ) | $ | (493,547 | ) | |
| | | Net realized gains on investment and foreign currency transactions | | 18,504,114 | | | 5,911,870 | | |
| | | Change in net unrealized appreciation/depreciation on investments and foreign currencies | | (4,663,916 | ) | | 17,113,209 | | |
| | | Net increase in net assets resulting from operations | | 13,247,217 | | | 22,531,532 | | |
| | | | | | | | | | |
| | FROM DISTRIBUTIONS | | | | | | | |
| | | Distributions to shareholders | | | | | | | |
| | | Investor Class | | (10,952,215 | ) | | (2,513,432 | ) | |
| | | Institutional Class | | (4,909,922 | ) | | (932,307 | ) | |
| | | Net decrease in net assets from distributions | | (15,862,137 | ) | | (3,445,739 | ) | |
| | | | | | | | | | |
| | FROM CAPITAL SHARE TRANSACTIONS | | | | | | | |
| | | Investor Class | | | | | | | |
| | | Proceeds from sale of shares | | 7,705,053 | | | 1,186,951 | | |
| | | Proceeds from reinvestment of distributions | | 9,853,010 | | | 2,288,838 | | |
| | | Redemption of shares (see note 5) | | (8,274,566 | ) | | (3,756,924 | ) | |
| | | Net increase (decrease) from investor class share transactions | | 9,283,497 | | | (281,135 | ) | |
| | | Institutional Class | | | | | | | |
| | | Proceeds from sale of shares | | 6,574,138 | | | 2,240,433 | | |
| | | Proceeds from reinvestment of distributions | | 3,645,759 | | | 692,252 | | |
| | | Redemption of shares (see note 5) | | (2,714,588 | ) | | (1,711,663 | ) | |
| | | Net increase from institutional class share transactions | | 7,505,309 | | | 1,221,022 | | |
| | | Redemption fees (see note 5) | | 11,495 | | | 1,244 | | |
| | | Net increase in net assets resulting from capital share transactions | | 16,800,301 | | | 941,131 | | |
| | | Total increase in net assets | | 14,185,381 | | | 20,026,924 | | |
| | | | | | | | | | |
| | NET ASSETS | | | | | | | |
| | | Beginning of year | | 62,674,987 | | | 42,648,063 | | |
| | | End of year | $ | 76,860,368 | | $ | 62,674,987 | | |
| | | | | | | | | | |
| | TRANSACTIONS IN SHARES | | | | | | | |
| | | Investor Class | | | | | | | |
| | | Shares sold | | 179,412 | | | 40,019 | | |
| | | Shares issued in reinvestment of distributions | | 279,360 | | | 62,112 | | |
| | | Less shares redeemed | | (195,351 | ) | | (143,339 | ) | |
| | | Net increase (decrease) from investor class share transactions | | 263,421 | | | (41,208 | ) | |
| | | Institutional Class | | | | | | | |
| | | Shares sold | | 153,008 | | | 81,566 | | |
| | | Shares issued in reinvestment of distributions | | 101,780 | | | 18,604 | | |
| | | Less shares redeemed | | (62,733 | ) | | (61,981 | ) | |
| | | Net increase from institutional class share transactions | | 192,055 | | | 38,189 | | |
| | | Net increase (decrease) from capital share transactions | | 455,476 | | | (3,019 | ) | |
See accompanying notes to the financial statements.
41
THE OBERWEIS FUNDS
Statements of Changes in Net Assets (continued)
| | | CHINA OPPORTUNITIES FUND | |
| | | | Year Ended
December 31,
2021 | Year Ended
December 31,
2020 | |
| | FROM OPERATIONS | | | | | | | |
| | | Net investment loss | $ | (672,492 | ) | $ | (1,033,955 | ) | |
| | | Net realized gains on investment and foreign currency transactions | | 28,850,352 | | | 17,259,973 | | |
| | | Change in net unrealized appreciation/depreciation on investments and foreign currencies | | (34,074,056 | ) | | 28,837,044 | | |
| | | Net increase (decrease) in net assets resulting from operations | | (5,896,196 | ) | | 45,063,062 | | |
| | | | | | | | | | |
| | FROM DISTRIBUTIONS | | | | | | | |
| | | Distributions to shareholders | | | | | | | |
| | | Investor Class | | (24,499,105 | ) | | (10,311,587 | ) | |
| | | Institutional Class | | (4,324,663 | ) | | (2,129,840 | ) | |
| | | Net decrease in net assets from distributions | | (28,823,768 | ) | | (12,441,427 | ) | |
| | | | | | | | | | |
| | FROM CAPITAL SHARE TRANSACTIONS | | | | | | | |
| | | Investor Class | | | | | | | |
| | | Proceeds from sale of shares | | 10,556,082 | | | 8,261,354 | | |
| | | Proceeds from reinvestment of distributions | | 22,926,946 | | | 9,606,661 | | |
| | | Redemption of shares (see note 5) | | (21,557,737 | ) | | (21,732,415 | ) | |
| | | Net increase (decrease) from investor class share transactions | | 11,925,291 | | | (3,864,400 | ) | |
| | | Institutional Class | | | | | | | |
| | | Proceeds from sale of shares | | 2,825,562 | | | 3,446,890 | | |
| | | Proceeds from reinvestment of distributions | | 3,592,224 | | | 1,876,619 | | |
| | | Redemption of shares (see note 5) | | (7,413,774 | ) | | (3,867,154 | ) | |
| | | Net increase (decrease) from institutional class share transactions | | (995,988 | ) | | 1,456,355 | | |
| | | Redemption fees (see note 5) | | 30,950 | | | 23,467 | | |
| | | Net increase (decrease) in net assets resulting from capital share transactions | | 10,960,253 | | | (2,384,578 | ) | |
| | | Total increase (decrease) in net assets | | (23,759,711 | ) | | 30,237,057 | | |
| | | | | | | | | | |
| | NET ASSETS | | | | | | | |
| | | Beginning of year | | 120,024,597 | | | 89,787,540 | | |
| | | End of year | $ | 96,264,886 | | $ | 120,024,597 | | |
| | | | | | | | | | |
| | TRANSACTIONS IN SHARES | | | | | | | |
| | | Investor Class | | | | | | | |
| | | Shares sold | | 641,145 | | | 553,521 | | |
| | | Shares issued in reinvestment of distributions | | 2,012,901 | | | 561,137 | | |
| | | Less shares redeemed | | (1,312,152 | ) | | (1,539,155 | ) | |
| | | Net increase (decrease) from investor class share transactions | | 1,341,894 | | | (424,497 | ) | |
| | | Institutional Class | | | | | | | |
| | | Shares sold | | 191,107 | | | 221,745 | | |
| | | Shares issued in reinvestment of distributions | | 310,746 | | | 108,726 | | |
| | | Less shares redeemed | | (429,627 | ) | | (251,302 | ) | |
| | | Net increase from institutional class share transactions | | 72,226 | | | 79,169 | | |
| | | Net increase (decrease) from capital share transactions | | 1,414,120 | | | (345,328 | ) | |
See accompanying notes to the financial statements.
42
THE OBERWEIS FUNDS
Statements of Changes in Net Assets (continued)
| | | INTERNATIONAL OPPORTUNITIES FUND | |
| | | | Year Ended
December 31,
2021 | Year Ended
December 31,
2020 | |
| | FROM OPERATIONS | | | | | | | |
| | | Net investment loss | $ | (2,693,822 | ) | $ | (2,008,348 | ) | |
| | | Net realized gains on investments and foreign currency transactions | | 68,274,853 | | | 54,285,535 | | |
| | | Change in net unrealized appreciation/depreciation on investments and foreign currencies | | (60,205,704 | ) | | 68,435,586 | | |
| | | Net increase in net assets resulting from operations | | 5,375,327 | | | 120,712,773 | | |
| | | | | | | | | | |
| | FROM DISTRIBUTIONS | | | | | | | |
| | | Distributions to shareholders | | (54,761,352 | ) | | (1,290,124 | ) | |
| | | Net decrease in net assets from distributions | | (54,761,352 | ) | | (1,290,124 | ) | |
| | | | | | | | | | |
| | FROM CAPITAL SHARE TRANSACTIONS | | | | | | | |
| | | Proceeds from sale of shares | | 55,352,019 | | | 38,437,961 | | |
| | | Proceeds from reinvestment of distributions | | 48,423,319 | | | 1,140,249 | | |
| | | Redemption of shares (see note 5) | | (71,434,390 | ) | | (155,930,992 | ) | |
| | | Redemption fees (see note 5) | | 46,955 | | | 31,009 | | |
| | | Net increase (decrease) from capital share transactions | | 32,387,903 | | | (116,321,773 | ) | |
| | | Total increase (decrease) in net assets | | (16,998,122 | ) | | 3,100,876 | | |
| | | | | | | | | | |
| | NET ASSETS | | | | | | | |
| | | Beginning of year | | 327,354,387 | | | 324,253,511 | | |
| | | End of year | $ | 310,356,265 | | $ | 327,354,387 | | |
| | | | | | | | | | |
| | | | | | | | | | |
| | TRANSACTIONS IN SHARES | | | | | | | |
| | | Shares sold | | 1,709,411 | | | 1,743,571 | | |
| | | Shares issued in reinvestment of distributions | | 1,832,828 | | | 36,095 | | |
| | | Less shares redeemed | | (2,214,866 | ) | | (8,080,663 | ) | |
| | | Net increase (decrease) from capital share transactions | | 1,327,373 | | | (6,300,997 | ) | |
See accompanying notes to the financial statements.
43
THE OBERWEIS FUNDS
Statements of Changes in Net Assets (continued)
| | | EMERGING MARKETS FUND | |
| | | | Year Ended
December 31,
2021 | Year Ended
December 31,
2020 | |
| | FROM OPERATIONS | | | | | | | |
| | | Net investment loss | $ | (81,243 | ) | $ | (23,948 | ) | |
| | | Net realized gains on investments and foreign currency transactions | | 1,728,935 | | | 1,209,834 | | |
| | | Change in net unrealized appreciation/depreciation on investments and foeign currencies | | (205,546 | ) | | 1,997,255 | | |
| | | Net increase in net assets resulting from operations | | 1,442,146 | | | 3,183,141 | | |
| | | | | | | | | | |
| | FROM DISTRIBUTIONS | | | | | | | |
| | | Distributions to shareholders | | | | | | | |
| | | Investor Class | | (203,953 | ) | | — | | |
| | | Institutional Class | | (1,523,671 | ) | | — | | |
| | | Net decrease in net assets from distributions | | (1,727,624 | ) | | — | | |
| | | | | | | | | | |
| | FROM CAPITAL SHARE TRANSACTIONS | | | | | | | |
| | | Investor Class | | | | | | | |
| | | Proceeds from sale of shares | | 1,259,242 | | | 175,609 | | |
| | | Proceeds from reinvestment of distributions | | 186,395 | | | — | | |
| | | Redemption of shares (see note 5) | | (481,241 | ) | | (182,826 | ) | |
| | | Net increase (decrease) from investor class share transactions | | 964,396 | | | (7,217 | ) | |
| | | Institutional Class | | | | | | | |
| | | Proceeds from sale of shares | | 1,312,840 | | | 540,546 | | |
| | | Proceeds from reinvestment of distributions | | 1,143,509 | | | — | | |
| | | Redemption of shares (see note 5) | | (309,129 | ) | | (957,720 | ) | |
| | | Net increase (decrease) from institutional class share transactions | | 2,147,220 | | | (417,174 | ) | |
| | | Redemption fees (see note 5) | | 2,746 | | | 522 | | |
| | | Net increase (decrease) in net assets resulting from capital share transactions | | 3,114,362 | | | (423,869 | ) | |
| | | Total increase in net assets | | 2,828,884 | | | 2,759,272 | | |
| | | | | | | | | | |
| | NET ASSETS | | | | | | | |
| | | Beginning of year | | 10,727,738 | | | 7,968,466 | | |
| | | End of year | $ | 13,556,622 | | $ | 10,727,738 | | |
| | | | | | | | | | |
| | TRANSACTIONS IN SHARES | | | | | | | |
| | | Investor Class | | | | | | | |
| | | Shares sold | | 81,184 | | | 15,758 | | |
| | | Shares issued in reinvestment of distributions | | 13,726 | | | — | | |
| | | Less shares redeemed | | (31,287 | ) | | (19,250 | ) | |
| | | Net increase (decrease) from investor class share transactions | | 63,623 | | | (3,492 | ) | |
| | | Institutional Class | | | | | | | |
| | | Shares sold | | 88,151 | | | 48,846 | | |
| | | Shares issued in reinvestment of distributions | | 83,407 | | | — | | |
| | | Less shares redeemed | | (20,438 | ) | | (93,794 | ) | |
| | | Net increase (decrease) from institutional class share transactions | | 151,120 | | | (44,948 | ) | |
| | | Net increase (decrease) from capital share transactions | | 214,743 | | | (48,440 | ) | |
See accompanying notes to the financial statements.
44
THE OBERWEIS FUNDS
Notes to Financial Statements December 31, 2021
1. Description of Organization
Description of business. The Oberweis Funds (the ‘‘Trust’’) is registered under the Investment Company Act of 1940 as a diversified open-end management investment company. The Trust is authorized to operate numerous Funds under various trading strategies. The Trust consists of seven Funds of which six are in this report: the Oberweis Micro-Cap Fund, the Oberweis Small-Cap Opportunities Fund, the Oberweis Global Opportunities Fund, the Oberweis China Opportunities Fund, the Oberweis International Opportunities Fund, and the Oberweis Emerging Markets Fund (collectively, ‘‘the Funds’’) are each a series of the Trust. Each Fund in this report except for Oberweis International Opportunities Fund currently offers two classes of shares: Investor Class and Institutional Class. Oberweis International Opportunities Fund offers only Investor Class shares. Each class of shares has identical voting, dividend, liquidation and other rights and the same terms and conditions, except each class may be subject to different class expenses as outlined in the relevant prospectus and each class has exclusive voting rights with respect to matters solely affecting such class.
2. Significant Accounting Policies
The following is a summary of significant accounting policies consistently followed by the Funds. These policies are in conformity with accounting principles generally accepted in the United States of America (“GAAP”). The Funds are each an investment company and follow accounting and reporting guidance under the Financial Accounting Standards Board (“FASB”) Accounting Standards Codification (“ASC”) Topic 946, “Financial Services—Investment Companies.”
Investment valuation. Investments in securities are stated at value as of the close of the regular trading session on the New York Stock Exchange (‘‘NYSE’’) (generally 3 p.m., Central Standard Time). Each listed and unlisted security for which last sale information is regularly reported is valued at the last reported sales price on that day. If there has been no sale on such day, then such security is valued at the current day’s bid price. Any unlisted security for which last sale information is not regularly reported and any listed debt security which has an inactive listed market for which over-the-counter market quotations are readily available is valued at the closing bid price determined on the basis of reasonable inquiry. Restricted securities and any other securities or other assets for which market quotations are not readily available are valued by appraisal at their fair value as determined in good faith under procedures established by and under the general supervision and responsibility of the Board of Trustees. Short-term debt obligations, commercial paper and repurchase agreements are valued on the basis of quoted yields for securities of comparable maturity, quality and type or on the basis of amortized cost.
The Oberweis Global Opportunities Fund, the Oberweis China Opportunities Fund, the Oberweis Emerging Markets Fund and the Oberweis International Opportunities Fund hold foreign equity securities. Foreign securities are fair valued as described in the following circumstances. Generally, trading in foreign securities markets is completed each day at various times prior to the close of the regular trading session of the NYSE. Due to the time differences between the closings of the relevant foreign securities exchanges and the close of the regular trading session of the NYSE for the Funds, the Funds will fair value their foreign investments when it is determined that the market quotations for the foreign investments either are not readily available or are unreliable and, therefore, do not represent fair value. When the fair value prices are utilized, these prices will attempt to reflect the impact of the U.S. financial
45
THE OBERWEIS FUNDS
Notes to Financial Statements December 31, 2021 (continued)
markets’ perceptions and trading activities on the Funds’ foreign investments since the last closing prices of the foreign investments were calculated on their primary foreign securities markets or exchanges. For these purposes, the Board of Trustees of the Trust has determined that movements in relevant indices, after the close of the foreign securities exchanges, may demonstrate that market quotations are unreliable, and may trigger fair value pricing for certain securities. Consequently, fair valuation of portfolio securities may occur on a daily basis. In determining fair value prices, the Trust utilizes data furnished by an independent pricing service (and that data draws upon, among other information, the market values of foreign investments). When a Fund uses fair value pricing, the values assigned to the Fund’s foreign investments may not be the quoted or published prices of the investments on their primary markets or exchanges.
Fair Value Measurements. In accordance with Financial Accounting Standards Board (‘‘FASB’’) guidance, the Funds utilize the ‘‘Fair Value Measurements and Disclosures’’ to define fair value, set out a framework for measuring fair value, and expand disclosures regarding fair value measurements.
Various inputs are used in determining the value of the Fund’s investments. These inputs are summarized in the three levels listed below:
• Level 1 – Quoted prices in active markets for identical securities.
• Level 2 – Other significant observable inputs (including quoted prices for similar securities, interest rates, prepayment speeds, credit risk, etc).
• Level 3 – Significant unobservable inputs (including the Fund’s own assumptions in determining the fair value of investments).
The inputs or methodology used for valuing securities are not necessarily an indication of the risk associated with investing in those securities. The following is a summary of the inputs used to value the Funds’ net assets as of December 31, 2021:
| | Micro-Cap
Fund | | Small-Cap
Opportunities
Fund | |
| | | Level 1 – Equities | $ | 139,074,620 | | $ | 28,970,904 | |
| | | Total Level 1 | | 139,074,620 | | | 28,970,904 | |
| | | Level 2 | | — | | | — | |
| | | Level 3 | | — | | | — | |
| | | Total Investments | $ | 139,074,620 | | $ | 28,970,904 | |
| | Global
Opportunities
Fund | | China
Opportunities
Fund | | International
Opportunities
Fund | |
| | | Level 1 – Equities | | | | | | | | | |
| | | Total Asia | $ | 7,788,720 | | $ | 81,692,890 | | $ | 7,017,350 | |
| | | Total Australia | | 882,321 | | | — | | | 20,734,330 | |
| | | Total Europe | | 11,162,171 | | | — | | | 113,371,679 | |
| | | Total North America | | 40,748,970 | | | — | | | 35,688,668 | |
| | | Total South America | | — | | | — | | | — | |
| | | Total Level 1 | | 60,582,182 | | | 81,692,890 | | | 176,812,027 | |
| | | Level 2 – Equities | | | | | | | | | |
| | | Total Asia | | 9,033,743 | | | 13,107,301 | | | 68,605,665 | |
| | | Total Europe | | 4,973,215 | | | — | | | 61,676,484 | |
| | | Total Level 2 | | 14,006,958 | | | 13,107,301 | | | 130,282,149 | |
| | | Level 3 | | — | | | — | | | — | |
| | | Total Investments | $ | 74,589,140 | | $ | 94,800,191 | | $ | 307,094,176 | |
46
THE OBERWEIS FUNDS
Notes to Financial Statements December 31, 2021 (continued)
| | Emerging Markets
Fund | |
| | | Level 1 – Equities | | | |
| | | Total Asia | $ | 5,214,546 | |
| | | Total Africa | | 249,495 | |
| | | Total Australia | | 327,719 | |
| | | Total Europe | | 1,273,856 | |
| | | Total North America | | 324,027 | |
| | | Total South America | | 885,628 | |
| | | Total Level 1 | | 8,275,271 | |
| | | Level 2 – Equities | | | |
| | | Total Asia | | 4,262,996 | |
| | | Total Europe | | 204,153 | |
| | | Total Level 2 | | 4,467,149 | |
| | | Level 3 | | — | |
| | | Total Investments | $ | 12,742,420 | |
The Funds’ assets include certain foreign securities for which a third party statistical pricing service may be employed for purposes of fair market valuation. The pricing service provides fair market valuation on days when the movement in relevant indices exceeds a predetermined threshold.
Foreign Currency Transactions. The accounting records of the Funds are maintained in U.S. dollars. Foreign currency amounts are translated into U.S. dollars at the current rate of exchange to determine the value of investments, assets and liabilities. Purchases and sales of securities, and income and expenses are translated at the prevailing rate of exchange on the respective date of these transactions. The Funds do not isolate that portion of the results of operations resulting from changes in foreign exchange rates on investments from fluctuations arising from changes in market prices of securities held. These fluctuations are included with the net realized and unrealized gains or losses from investments and foreign currencies.
Risks Associated with Foreign Securities and Currencies. Investments in securities of foreign issuers carry certain risks not ordinarily associated with investments in securities of U.S. issuers. These risks include future political and economic developments, and the possible imposition of exchange controls or other foreign governmental laws and restrictions. In addition, with respect to certain countries, there is the possibility of expropriation of assets, confiscatory taxation, political or social instability or diplomatic developments, which could adversely affect investments in those countries.
Certain countries also may impose substantial restrictions on investments in their capital markets by foreign entities, including restrictions on investments in issuers of industries deemed sensitive to relevant national interests. These factors may limit the investment opportunities available and result in a lack of liquidity and a high price volatility with respect to securities of issuers from developing countries.
Fund Share Valuation. Fund shares are sold and redeemed on a continuous basis at net asset value. On each day the NYSE is open for trading, the net asset value per share is determined as of the later of the close of the NYSE or the CBOE by dividing the total value of each Fund’s investments and other assets, less liabilities, by the number of each Fund’s shares outstanding.
47
THE OBERWEIS FUNDS
Notes to Financial Statements December 31, 2021 (continued)
Investment Transactions and Investment Income. Investment transactions are accounted for on the trade date (date the order to buy or sell is executed). Dividend income is recorded on the ex-dividend date, except that certain dividends from foreign securities are recorded as soon as the information is available to the Fund, and interest income is recorded on the accrual basis and includes amortization of premium and discount. Realized gains and losses from investment transactions are reported on an identified cost basis. Income and realized and unrealized gains or losses on investments are allocated to each class of shares based on its relative net assets.
The Funds may be subject to foreign taxation related to income received, capital gains on the sale of securities and certain foreign currency transactions in the foreign jurisdictions in which they invest. Foreign taxes, if any, are recorded based on the tax regulations and rates that exist in the foreign markets in which the Funds invest. When a capital gain tax is determined to apply, the Funds record an estimated deferred tax liability in an amount that may be payable if the securities were disposed of on the valuation date.
Fund Expense Allocations. The Funds account separately for the assets, liabilities and operations of each Fund. Direct expenses of each Fund or class are charged to that Fund or class while general expenses are allocated pro-rata among the Funds based on net assets or other appropriate methods.
Federal Income Taxes and Dividends to Shareholders. It is the policy of the Funds to continue to comply with all requirements of the Internal Revenue Code of 1986, as amended (‘‘the Code’’), applicable to regulated investment companies and to distribute substantially all of their taxable income to their shareholders. The Funds have met the requirements of the Code applicable to regulated investment companies for the year ended December 31, 2021. Therefore, no federal income tax provision is required. Income and capital gains of the Funds are determined in accordance with both tax regulations and accounting principles generally accepted in the U.S. (‘‘GAAP’’). Such treatment may result in temporary and permanent differences between tax basis earnings and earnings reported for financial statement purposes. These reclassifications, which have no impact on the net asset value of the Funds, are primarily attributable to certain differences in computation of distributable income and capital gains under federal tax rules versus GAAP.
Certain Funds may utilize earnings and profits on redemption of shares as part of the dividends paid deduction.
For the year ended December 31, 2021, permanent book and tax basis differences resulting primarily from differing treatments for net operating losses, foreign currency transactions, passive foreign investment company (‘‘PFIC’’) adjustments and the tax practice known as equalization, were identified and reclassified among the components of the Funds’ net assets.
GAAP requires that certain components of net assets be reclassified between financial and tax reporting. These reclassifications have no effect on net assets or net asset value per share. For the year ended December 31, 2021, permanent differences in book and tax accounting have been reclassified to paid in capital, accumulated net investment income/loss and accumulated net realized gain/loss as follows:
| | | Increases/(Decrease) | |
| | | Capital | | Accumulated
Earnings
(Loss) | |
| | | Micro-Cap Fund | $ | 2,115,141 | | | $ | (2,115,141) | | |
| | | Global Opportunities Fund | | 1,552,718 | | | | (1,552,718 | ) | |
| | | Small-Cap Opportunities Fund | | 498,909 | | | | (498,909 | ) | |
| | | China Opportunities Fund | | 5,052,339 | | | | (5,052,339 | ) | |
| | | International Opportunities Fund | | 1,632,358 | | | | (1,632,358 | ) | |
| | | Emerging Markets Fund | | (83,369 | ) | | | 83,369 | | |
48
THE OBERWEIS FUNDS
Notes to Financial Statements December 31, 2021 (continued)
The tax character of distributions paid during the fiscal year ended December 31, 2021 was as follows:
| | Distributions
Paid from
Ordinary
Income | | Distributions
Paid from
Net Long-Term
Capital Gains | | Total
Distributions
Paid | |
| | | Micro-Cap Fund | $ | 6,601,079 | | $ | 21,730,672 | | $ | 28,331,751 | |
| | | Global Opportunities Fund | | 2,861,842 | | | 13,000,295 | | | 15,862,137 | |
| | | Small-Cap Opportunities Fund | | 2,861,415 | | | 2,668,831 | | | 5,530,246 | |
| | | China Opportunities Fund | | 4,018,595 | | | 24,805,173 | | | 28,823,768 | |
| | | International Opportunities Fund | | — | | | 54,761,352 | | | 54,761,352 | |
| | | Emerging Markets Fund | | 15,223 | | | 1,712,401 | | | 1,727,624 | |
The tax character of distributions paid during the fiscal year ended December 31, 2020 was as follows:
| | Distributions
Paid from
Ordinary
Income | | Distributions
Paid from
Net Long-Term
Capital Gains | | Total
Distributions
Paid | |
| | | Micro-Cap Fund | $ | — | | $ | — | | $ | — | |
| | | Global Opportunities Fund | | — | | | 3,445,739 | | | 3,445,739 | |
| | | Small-Cap Opportunities Fund | | — | | | 649,187 | | | 649,187 | |
| | | China Opportunities Fund | | 3,116,458 | | | 9,324,969 | | | 12,441,427 | |
| | | International Opportunities Fund | | 1,290,124 | | | — | | | 1,290,124 | |
| | | Emerging Markets Fund | | — | | | — | | | — | |
The International Opportunities Fund utilized $8,525,215, respectively, of its capial loss carryforwards during the year ended December 31, 2021.
As of December 31, 2021 the components of accumulated earnings (deficit) on a tax basis were as follows:
| | Undistributed
ordinary
income (deficit) | | Undistributed
long-term
capital gains | | Accumulated
capital and
other losses | | Unrealized
Appreciation
on investments | | Unrealized
Appreciation/
(Depreciation)
foreign currency translations
and India sales tax | |
| | | Micro-Cap Fund | $ | — | | $ | — | | $ | — | | $ | 41,098,971 | | $ | — | | |
| | | Global Opportunities Fund | | — | | | 1,327,220 | | | — | | | 18,746,003 | | | 406 | | |
| | | Small-Cap Opportunities Fund | | — | | | 263,165 | | | — | | | 6,931,416 | | | — | | |
| | | China Opportunities Fund | | — | | | 670,331 | | | — | | | 14,767,974 | | | 18 | | |
| | | International Opportunities Fund | | — | | | — | | | — | | | 66,225,392 | | | 3,561 | | |
| | | Emerging Markets Fund | | — | | | 336,985 | | | — | | | 2,965,453 | | | (70,422 | ) | |
49
THE OBERWEIS FUNDS
Notes to Financial Statements December 31, 2021 (continued)
Accumulated capital and other losses consists of timing differences related to wash sales and capital loss carryforwards.
As of December 31, 2021 the cost of investments for federal income tax purposes are as follows:
| | Cost of
Investments
for Federal
Tax Purposes | | Gross
Unrealized
Appreciation | | Gross
Unrealized
Gross
Unrealized
(Depreciation) | | Unrealized
Appreciation | |
| | | Micro-Cap Fund | $ | 97,975,649 | | $ | 43,780,107 | | $ | (2,681,136) | | | $ | 41,098,971 | |
| | | Global Opportunities Fund | | 55,843,137 | | | 20,352,799 | | | (1,606,796 | ) | | | 18,746,003 | |
| | | Small-Cap Opportunities Fund | | 22,039,488 | | | 7,391,236 | | | (459,820 | ) | | | 6,931,416 | |
| | | China Opportunities Fund | | 80,032,217 | | | 17,301,320 | | | (2,533,346 | ) | | | 14,767,974 | |
| | | International Opportunities Fund | | 240,868,784 | | | 72,131,475 | | | (5,906,083 | ) | | | 66,225,392 | |
| | | Emerging Markets Fund | | 9,776,967 | | | 3,815,023 | | | (849,570 | ) | | | 2,965,453 | |
The Funds have reviewed all open tax years and major jurisdictions and concluded that there are no significant uncertain tax positions that would require recognition in the financial statements. Open tax years are those that are open for exam by taxing authorities and, as of December 31, 2021, open Federal tax years include the tax years ended 2018 through 2021. The Funds have no examinations in progress and are also not aware of any tax positions for which it is reasonably possible that the total amounts of unrecognized tax benefits will significantly change in the next twelve months.
Use of estimates. The preparation of financial statements in conformity with generally accepted accounting principles requires management to make estimates and assumptions that affect the amounts reported in the financial statements and accompanying notes. Actual results may differ from those estimates.
Indemnifications. Under the Trust’s organizational documents, its present and former Officers and Trustees are indemnified against certain liabilities arising out of the performance of their duties to the Trust. In addition, in the normal course of business, the Trust enters into contracts that provide general indemnifications to other parties. The Trust’s maximum exposure under these arrangements is unknown as this would involve future claims that may be made against the Trust that have not yet occurred. However, the Trust has not had prior claims or losses pursuant to these contracts and expects the risk of loss to be remote.
3. Transactions with affiliates
The Funds have written agreements with Oberweis Asset Management, Inc. (‘‘OAM’’) as the Funds’ investment advisor and manager. Oberweis Securities, Inc. (‘‘OSI’’), the Funds’ principal distributor, is an affiliate of OAM.
Investment advisory agreement. Under the Advisory Agreement, OAM provides investment advisory services to the Micro-Cap, Global Opportunities, and Small-Cap Opportunities Funds and pursuant to a separate Management Agreement, OAM provides non-investment advisory management services such as administrative, compliance and accounting services to these Funds. For investment advisory services, the Micro-Cap Fund paid monthly investment advisory
50
THE OBERWEIS FUNDS
Notes to Financial Statements December 31, 2021 (continued)
fees at an annual rate equal to .60% of average daily net assets. The Global Opportunities Fund paid monthly investment advisory fees at an annual rate equal to .45% of the first $50 million of average daily net assets and .40% of average daily net assets in excess of $50 million. The Small-Cap Opportunities Fund paid monthly investment advisory fees at an annual rate equal to .40% of average daily net assets. For investment advisory and management services, the China Opportunities Fund, the International Opportunities Fund and the Emerging Markets Fund paid monthly investment advisory and management fees at an annual rate equal to 1.25%, 1.25% and 1.25% of average daily net assets, respectively. For the year ended December 31, 2021, the Micro-Cap Fund, Small-Cap Opportunities Fund and Global Opportunities Fund incurred investment advisory fees totaling $665,226, $87,761 and $325,777, respectively. For the year ended December 31, 2021, the China Opportunities Fund, International Opportunities Fund, and Emerging Market Fund incurred investment advisory fees totaling $1,428,174, $4,242,805 and $157,654, respectively.
Management agreement. For management services and facilities furnished, the Micro-Cap Fund, Global Opportunities Fund, and Small-Cap Opportunities Fund each paid a monthly fee at an annual rate equal to .40% of average daily net assets. For the year ended December 31, 2021, the Micro-Cap Fund, Small-Cap Opportunities Fund, and Global Opportunities Fund incurred management fees totaling $443,484, $87,761, and $300,777, respectively.
Expense reimbursement. OAM is contractually obligated to reduce its investment and management fees or reimburse the Micro-Cap Fund and Global Opportunities Fund Investor Class Shares to the extent that total ordinary operating expenses, as defined, exceed in any one year the following amounts expressed as a percentage of each Fund’s average daily net assets: 1.80% of the first $50 million; plus 1.60% of average daily net assets in excess of $50 million. OAM is contractually obligated to reduce its investment and management fees or reimburse Small-Cap Opportunities Fund, China Opportunities Fund, International Opportunities Fund and Emerging Markets Fund Investor Class Shares to the extent that total ordinary operating expenses, as defined, exceed in any one year 1.55%, 2.24%, 1.60% and 1.75% expressed as a percentage of the Fund’s average daily net assets, respectively. OAM is contractually obligated to reduce its investment and management fees or reimburse the Global Opportunities Fund and Micro-Cap Fund Institutional Class Shares to the extent that total ordinary operating expenses, as defined, exceed in any one year the following amounts expressed as a percentage of each Fund’s average daily net assets: 1.55% of the first $50 million; plus 1.35% of average daily net assets in excess of $50 million. OAM is contractually obligated to reduce its investment and management fees or reimburse the Small-Cap Opportunities Fund, China Opportunities Fund and Emerging Markets Fund Institutional Class Shares to the extent that total ordinary operating expenses, as defined, exceed in any one year 1.30%, 1.99% and 1.50% expressed as a percentage of the Funds’ average daily net assets, respectively. For the year ended December 31, 2021 OAM reimbursed the Small-Cap Opportunities Fund, the Emerging Markets Fund, and the International Opportunities Fund in the amount of $9,626, $132,812, and $585,449, respectively.
Officers and trustees. Certain officers and trustees of the Trust are also officers and/or directors of OAM and OSI. During the year ended December 31, 2021, the Trust made no direct payments to its officers and paid $137,000 to its unaffiliated trustees.
Distribution and shareholder service agreement. The Funds have a distribution and shareholder services agreement with OSI. For services under the distribution and shareholder services agreement, the Funds pay OSI a fee at the annual rate of .25% of the average daily net assets of Investor Class Shares as compensation for services. For the year ended
51
THE OBERWEIS FUNDS
Notes to Financial Statements December 31, 2021 (continued)
December 31, 2021, the Micro-Cap Fund, Small-Cap Opportunities Fund, Global Opportunities
Fund, China Opportunities Fund, International Opportunities Fund, and Emerging Markets Fund incurred distribution fees totaling $165,848, $25,869, $133,936, $237,379, $848,561, and $3,131, respectively.
Affiliated Commissions. For the year ended December 31, 2021, the Micro-Cap Fund, Global Opportunities Fund, Small-Cap Opportunities Fund, China Opportunities Fund, Emerging Markets Fund and International Opportunities Fund did not execute any security transactions through OSI and therefore did not pay commissions to OSI.
4. Investment transactions
The cost of securities purchased and proceeds from securities sold during the year ended December 31, 2021, other than money market investments, aggregated $106,098,808 and $86,985,931, respectively, for the Micro-Cap Fund, $27,045,352 and $22,544,079, respectively, for the Small-Cap Opportunities Fund, $78,551,325 and $81,077,996, respectively, for the Global Opportunities Fund, $272,296,096 and $294,011,120, respectively, for the China Opportunities Fund, $304,818,227,and $325,536,298, respectively, for the International Opportunities Fund, $8,550,666 and $8,009,905, respectively, for the Emerging Markets Fund. The Funds did not hold government securities during the year ended December 31, 2021.
The Funds may write covered call options. The premiums received provide a partial hedge (protection) against declining prices and enables each Fund to generate a higher return during periods when OAM does not expect the underlying security to make any major price moves in the near future but still deems the underlying security to be, over the long term, an attractive investment for each Fund. The Funds write covered call options for which premiums received are recorded as liabilities and are subsequently adjusted to the current value of the options written. Premiums received from writing options that expire are treated as realized gains. Premiums received from writing options, which are either exercised or closed, are offset against the proceeds received or amount paid on the transaction to determine realized gains or losses. Amounts recovered for securities litigation are included in the realized gains of the Fund and are recorded when received. The Funds did not write covered call options during the year ended December 31, 2021.
5. Redemption fee
The Oberweis Funds are designed for long-term investors. To discourage market timers, redemptions of shares of the Micro-Cap Fund, Global Opportunities Fund, and Small-Cap Opportunities Fund within 90 days of purchase are subject to a 1% redemption fee of the total redemption amount and 2% for the China Opportunities Fund, the Emerging Markets Fund and the International Opportunities Fund. The redemption fee is deducted from the redemption proceeds and is retained by the Fund.
The redemption fee is retained by the Funds for the expense they incur in connection with shareholder redemptions. Redemption fees received by the Micro-Cap Fund, Small-Cap Opportunities Fund, Global Opportunities Fund, China Opportunities Fund, International Opportunities Fund, and Emerging Markets Fund were $46,967, $4,859, $11,495, $30,950, $46,955 and $2,746, respectively, for the year ended December 31, 2021, and were recorded as a reduction of the redemption of shares in the Statements of Changes in Net Assets.
52
THE OBERWEIS FUNDS
Notes to Financial Statements December 31, 2021 (continued)
6. Earnings credits and interest charges
The Trust, as part of the agreement with the Custodian, receives credits against its custodian fees on its uninvested cash balances and is allowed to borrow for temporary purposes. Borrowings are not to exceed 5% of the value of each Fund’s total assets at the time of any such borrowing. Interest on amounts borrowed is calculated at the prime rate and is payable monthly. During the year ended December 31, 2021, the Micro-Cap Fund, Small-Cap Opportunities Fund, Global Opportunities Fund, China Opportunities Fund, International Opportunities Fund, and Emerging Markets Fund received credits of $855, $153, $872, $319, $1,213, and $165, respectively. During the year ended December 31, 2021, the Micro-Cap Fund, the Small Cap Opportunities Fund, the Global Opportunities Fund, the China Opportunities Fund, the International Opportunities Fund and the Emerging Markets Fund incurred interest charges of $601, $471, $220, $2,413, $678, and $4 respectively, which is included in custodian fees and expenses in the Statements of Operations.
7. Coronavirus (COVID-19) pandemic
In early 2020, an outbreak of a novel strain of coronavirus (COVID-19) emerged globally. This coronavirus has resulted in closing international borders, enhanced health screenings, healthcare service preparation and delivery, quarantines, cancellations, disruptions to supply chains and customer activity, as well as general public concern and uncertainty. The impact of this outbreak has negatively affected the worldwide economy, as well as the economies of individual countries, the financial health of individual companies and the market in general in significant and unforeseen ways. The future impact of COVID-19 is currently unknown, and it may exacerbate other risks that apply to the Funds, including political, social and economic risks. Any such impact could adversely affect the Funds’ performance, the performance of the securities in which the Funds invest and may lead to losses on your investment in each Fund. The ultimate impact of COVID-19 on the financial performance of the Funds’ investments is not reasonably estimable at this time.
8. Subsequent events
The Funds have evaluated subsequent events through the issuance of the financial statements and determined that no events have occurred that require disclosure.
53
THE OBERWEIS FUNDS
Financial Highlights
Per share income and capital for a share outstanding throughout each period is as follows:
| Investor Class | | | MICRO-CAP FUND | | |
| | | | | Years Ended December 31, | | |
| | | | 2021 | | | | 2020 | | | | 2019 | | | | 2018 | | | | 2017 | | |
| | Net asset value at beginning of year | | $ | 29.10 | | | $ | 22.40 | | | $ | 18.37 | | | $ | 25.12 | | | $ | 22.02 | | |
| | | | |
| INCOME (LOSS) FROM INVESTMENT OPERATIONS: | | |
| | Net investment lossa | | | (.43 | ) | | | (.26 | ) | | | (.22 | ) | | | (.35 | ) | | | (.32 | ) | |
| | Net realized and unrealized gains (losses) on investments | | | 15.93 | | | | 6.96 | | | | 4.25 | | | | (2.82 | ) | | | 6.37 | | |
| | Total from investment operations | | | 15.50 | | | | 6.70 | | | | 4.03 | | | | (3.17 | ) | | | 6.05 | | |
| | Redemption Feesa | | | .02 | | | | — | | | | — | | | | .03 | | | | — | | |
| | Less distributions: | | | | | | | | | | | | | | | | | | | | | |
| | Distribution from net realized gains on investments | | | (8.74 | ) | | | — | | | | — | | | | (3.61 | ) | | | (2.95 | ) | |
| | Net asset value at end of year | | $ | 35.88 | | | $ | 29.10 | | | $ | 22.40 | | | $ | 18.37 | | | $ | 25.12 | | |
| | Total Return (%) | | | 53.38 | | | | 29.91 | | | | 21.94 | | | | (12.30 | ) | | | 27.90 | | |
| | | | |
| RATIO/SUPPLEMENTAL DATA: | | |
| | Net Assets at end of year (in thousands) | | $ | 87,603 | | | $ | 45,345 | | | $ | 46,546 | | | $ | 53,094 | | | $ | 92,249 | | |
| | Ratio of gross expenses to average net assets (%) | | | 1.48 | | | | 1.59 | | | | 1.60 | | | | 1.57 | | | | 1.58 | | |
| | Ratio of net expenses to average net assets (%)b | | | 1.48 | | | | 1.58 | | | | 1.58 | | | | 1.55 | | | | 1.54 | | |
| | Ratio of net investment loss to average net assets (%) | | | (1.08 | ) | | | (1.22 | ) | | | (1.03 | ) | | | (1.30 | ) | | | (1.32 | ) | |
| | Portfolio turnover rate (%) | | | 81 | | | | 92 | | | | 112 | | | | 119 | | | | 91 | | |
Notes:
54
THE OBERWEIS FUNDS
Financial Highlights (continued)
Per share income and capital for a share outstanding throughout each period is as follows:
| Institutional Class | | MICRO-CAP FUND | | |
| | | |
Years Ended December 31,
| | | Period Ended
December 31,
2017a | | |
| | | | 2021 | | | | 2020 | | | | 2019 | | | | 2018 | | |
| | Net asset value at beginning of period | | $ | 29.36 | | | $ | 22.55 | | | $ | 18.47 | | | $ | 25.17 | | | | $ | 23.52 | | |
| | | | |
| INCOME (LOSS) FROM INVESTMENT OPERATIONS: | | |
| | Net investment lossb | | | (.33 | ) | | | (.21 | ) | | | (.13 | ) | | | (.28 | ) | | | | (.18 | ) | |
| | Net realized and unrealized gains (losses) on investments | | | 16.12 | | | | 7.02 | | | | 4.21 | | | | (2.84 | ) | | | | 4.18 | | |
| | Total from investment operations | | | 15.79 | | | | 6.81 | | | | 4.08 | | | | (3.12 | ) | | | | 4.00 | | |
| | Redemption Feesb | | | .02 | | | | — | | | | — | | | | .03 | | | | | — | | |
| | Less distributions: | | | | | | | | | | | | | | | | | | | | | | |
| | Distribution from net realized gains on investments | | | (8.74 | ) | | | — | | | | — | | | | (3.61 | ) | | | | (2.35 | ) | |
| | Net asset value at end of period | | $ | 36.43 | | | $ | 29.36 | | | $ | 22.55 | | | $ | 18.47 | | | | $ | 25.17 | | |
| | Total Return (%) | | | 53.90 | | | | 30.20 | | | | 22.09 | | | | (12.07 | ) | | | | 16.92 | d | |
| | | | |
| RATIO/SUPPLEMENTAL DATA: | | |
| | Net Assets at end of period (in thousands) | | $ | 50,015 | | | $ | 31,202 | | | $ | 30,994 | | | $ | 14,445 | | | | $ | 9,346 | | |
| | Ratio of gross expenses to average net assets (%) | | | 1.23 | | | | 1.34 | | | | 1.34 | | | | 1.33 | | | | | 1.32 | e | |
| | Ratio of net expenses to average net assets (%)c | | | 1.23 | | | | 1.33 | | | | 1.32 | | | | 1.32 | | | | | 1.28 | e | |
| | Ratio of net investment loss to average net assets (%) | | | (.85 | ) | | | (.97 | ) | | | (.61 | ) | | | (1.05 | ) | | | | (1.04 | )e | |
| | Portfolio turnover rate (%) | | | 81 | | | | 92 | | | | 112 | | | | 119 | | | | | 91 | | |
Notes:
55
THE OBERWEIS FUNDS
Financial Highlights (continued)
Per share income and capital for a share outstanding throughout each period is as follows:
| Investor Class | | | SMALL-CAP OPPORTUNITIES FUND | | |
| | | | | Years Ended December 31, | | |
| | | | 2021 | | | | 2020 | | | | 2019 | | | | 2018 | | | | 2017 | | |
| | Net asset value at beginning of year | | $ | 18.29 | | | $ | 14.36 | | | $ | 11.83 | | | $ | 16.40 | | | $ | 13.89 | | |
| | | | |
| INCOME (LOSS) FROM INVESTMENT OPERATIONS: | | |
| | Net investment lossa | | | (.28 | ) | | | (.17 | ) | | | (.13 | ) | | | (.18 | ) | | | (.22 | ) | |
| | Net realized and unrealized gains (losses) on investments | | | 8.23 | | | | 4.84 | | | | 3.10 | | | | (1.05 | ) | | | 3.77 | | |
| | Total from investment operations | | | 7.95 | | | | 4.67 | | | | 2.97 | | | | (1.23 | ) | | | 3.55 | | |
| | Redemption Feesa | | | .01 | | | | — | | | | — | | | | — | | | | — | | |
| | Less distributions: | | | | | | | | | | | | | | | | | | | | | |
| | Distribution from net realized gains on investments | | | (4.71 | ) | | | (.74 | ) | | | (.44 | ) | | | (3.34 | ) | | | (1.04 | ) | |
| | Net asset value at end of year | | $ | 21.54 | | | $ | 18.29 | | | $ | 14.36 | | | $ | 11.83 | | | $ | 16.40 | | |
| | Total Return (%) | | | 43.57 | | | | 32.47 | | | | 25.07 | | | | (7.23 | ) | | | 25.54 | | |
| | | | | | | | | | | | | | | | | | | | | | | |
| RATIO/SUPPLEMENTAL DATA: | | |
| | Net Assets at end of year (in thousands) | | $ | 16,322 | | | $ | 7,767 | | | $ | 6,110 | | | $ | 5,299 | | | $ | 7,533 | | |
| | Ratio of gross expenses to average net assets (%) | | | 1.59 | | | | 2.03 | | | | 2.21 | | | | 2.13 | | | | 2.29 | | |
| | Ratio of net expenses to average net assets (%)b | | | 1.55 | | | | 1.55 | | | | 1.55 | | | | 1.55 | | | | 1.72 | | |
| | Ratio of net investment loss to average net assets (%) | | | (1.22 | ) | | | (1.14 | ) | | | (.95 | ) | | | (1.06 | ) | | | (1.42 | ) | |
| | Portfolio turnover rate (%) | | | 106 | | | | 147 | | | | 142 | | | | 160 | | | | 142 | | |
Notes:
56
THE OBERWEIS FUNDS
Financial Highlights (continued)
Per share income and capital for a share outstanding throughout each period is as follows:
| | Institutional Class | | | SMALL-CAP OPPORTUNITIES FUND | | |
| | | | | |
Years Ended December 31,
| | | Period Ended
December 31,
2017a | | |
| | 2021 | 2020 | 2019 | 2018 | | | |
| | | Net asset value at beginning of period | | $ | 18.51 | | | $ | 14.49 | | | $ | 11.90 | | | $ | 16.44 | | | | $ | 15.20 | | |
| | | | | | | | | | | | | | | | | | | | | | | | | |
| | INCOME (LOSS) FROM INVESTMENT OPERATIONS: | | |
| | | Net investment lossb | | | (.23 | ) | | | (.13 | ) | | | (.10 | ) | | | (.14 | ) | | | | (.11 | ) | |
| | | Net realized and unrealized gains (losses) on investments | | | 8.34 | | | | 4.89 | | | | 3.13 | | | | (1.06 | ) | | | | 2.39 | | |
| | | Total from investment operations | | | 8.11 | | | | 4.76 | | | | 3.03 | | | | (1.20 | ) | | | | 2.28 | | |
| | | Redemption Feesb | | | .01 | | | | — | | | | — | | | | — | | | | | — | | |
| | | Less distributions: | | | | | | | | | | | | | | | | | | | | | | |
| | | Distribution from net realized gains on investments | | | (4.71 | ) | | | (.74 | ) | | | (.44 | ) | | | (3.34 | ) | | | | (1.04 | ) | |
| | | Net asset value at end of period | | $ | 21.92 | | | $ | 18.51 | | | $ | 14.49 | | | $ | 11.90 | | | | $ | 16.44 | | |
| | | Total Return (%) | | | 43.92 | | | | 32.80 | | | | 25.43 | | | | (7.05 | ) | | | | 14.99 | d | |
| | | | | | | | | | | | | | | | | | | | | | | | | |
| | RATIO/SUPPLEMENTAL DATA: | | |
| | | Net Assets at end of period (in thousands) | | $ | 12,727 | | | $ | 8,866 | | | $ | 5,622 | | | $ | 4,538 | | | | $ | 3,564 | | |
| | | Ratio of gross expenses to average net assets (%) | | | 1.34 | | | | 1.78 | | | | 1.96 | | | | 1.88 | | | | | 1.86 | e | |
| | | Ratio of net expenses to average net assets (%)c | | | 1.30 | | | | 1.30 | | | | 1.30 | | | | 1.30 | | | | | 1.30 | e | |
| | | Ratio of net investment loss to average net assets (%) | | | (.97 | ) | | | (.89 | ) | | | (.69 | ) | | | (.80 | ) | | | | (.97 | )e | |
| | | Portfolio turnover rate (%) | | | 106 | | | | 147 | | | | 142 | | | | 160 | | | | | 142 | | |
Notes:
57
THE OBERWEIS FUNDS
Financial Highlights (continued)
Per share income and capital for a share outstanding throughout each period is as follows:
| Investor Class | | | GLOBAL OPPORTUNITIES FUND | | |
| | | | | Years Ended December 31, | | |
| | | | 2021 | | | | 2020 | | | | 2019 | | | | 2018 | | | | 2017 | | |
| | Net asset value at beginning of year | | $ | 36.51 | | | $ | 24.82 | | | $ | 19.75 | | | $ | 28.36 | | | $ | 24.13 | | |
| | | | | | | | | | | | | | | | | | | | | | | |
| INCOME (LOSS) FROM INVESTMENT OPERATIONS: | | |
| | Net investment lossa | | | (.37 | ) | | | (.32 | ) | | | (.24 | ) | | | (.20 | ) | | | (.19 | ) | |
| | Net realized and unrealized gains (losses) on investments and translation of assets and liabilities denominated in foreign currency | | | 7.99 | | | | 14.13 | | | | 5.31 | | | | (7.09 | ) | | | 8.21 | | |
| | Total from investment operations | | | 7.62 | | | | 13.81 | | | | 5.07 | | | | (7.29 | ) | | | 8.02 | | |
| | Redemption feesa | | | .01 | | | | — | | | | — | | | | — | | | | — | | |
| | Less distributions: | | | | | | | | | | | | | | | | | | | | | |
| | Distribution from net realized gains on investments | | | (8.85 | ) | | | (2.12 | ) | | | — | | | | (1.32 | ) | | | (3.79 | ) | |
| | Net asset value at end of year | | $ | 35.29 | | | $ | 36.51 | | | $ | 24.82 | | | $ | 19.75 | | | $ | 28.36 | | |
| | Total Return (%) | | | 20.92 | | | | 55.55 | | | | 25.67 | | | | (25.66 | ) | | | 33.30 | | |
| | | | | | | | | | | | | | | | | | | | | | | |
| RATIO/SUPPLEMENTAL DATA: | | |
| | Net Assets at end of year (in thousands) | | $ | 53,342 | | | $ | 45,566 | | | $ | 32,004 | | | $ | 28,847 | | | $ | 47,856 | | |
| | Ratio of gross expenses to average net assets (%) | | | 1.38 | | | | 1.53 | | | | 1.58 | | | | 1.52 | | | | 1.52 | | |
| | Ratio of net expenses to average net assets (%)b | | | 1.38 | | | | 1.53 | | | | 1.55 | | | | 1.50 | | | | 1.50 | | |
| | Ratio of net investment loss to average net assets (%) | | | (.86 | ) | | | (1.14 | ) | | | (1.07 | ) | | | (.72 | ) | | | (.67 | ) | |
| | Portfolio turnover rate (%) | | | 111 | | | | 129 | | | | 120 | | | | 155 | | | | 137 | | |
Notes:
58
THE OBERWEIS FUNDS
Financial Highlights (continued)
Per share income and capital for a share outstanding throughout each period is as follows:
| Institutional Class | | | GLOBAL OPPORTUNITIES FUND | | |
| | | | |
Years Ended December 31,
| | | Period Ended
December 31,
2017a | | |
| | | | 2021 | | | | 2020 | | | | 2019 | | | | 2018 | | |
| | Net asset value at beginning of year | | $ | 36.87 | | | $ | 24.99 | | | $ | 19.84 | | | $ | 28.41 | | | | $ | 27.42 | | |
| | | | | | | | | | | | | | | | | | | | | | | | |
| INCOME (LOSS) FROM INVESTMENT OPERATIONS: | | |
| | Net investment lossb | | | (.26 | ) | | | (.25 | ) | | | (.18 | ) | | | (.13 | ) | | | | (.12 | ) | |
| | Net realized and unrealized gains (losses) on investments and translation of assets and liabilities denominated in foreign currency | | | 8.07 | | | | 14.25 | | | | 5.33 | | | | (7.12 | ) | | | | 4.90 | | |
| | Total from investment operations | | | 7.81 | | | | 14 | | | | 5.15 | | | | (7.25 | ) | | | | 4.78 | | |
| | Redemption Feesb | | | .01 | | | | — | | | | — | | | | — | | | | | — | | |
| | Less distributions: | | | | | | | | | | | | | | | | | | | | | | |
| | Distribution from net realized gains on investments | | | (8.85 | ) | | | (2.12 | ) | | | — | | | | (1.32 | ) | | | | (3.79 | ) | |
| | Net asset value at end of year | | $ | 35.84 | | | $ | 36.87 | | | $ | 24.99 | | | $ | 19.84 | | | | $ | 28.41 | | |
| | Total Return (%) | | | 21.23 | | | | 55.94 | | | | 25.96 | | | | (25.48 | ) | | | | 17.49 | e | |
| | | | | | | | | | | | | | | | | | | | | | | | |
| RATIO/SUPPLEMENTAL DATA: | | |
| | Net Assets at end of year (in thousands) | | $ | 23,518 | | | $ | 17,109 | | | $ | 10,644 | | | $ | 8,937 | | | | $ | 7,919 | | |
| | Ratio of gross expenses to average net assets (%) | | | 1.14 | | | | 1.28 | | | | 1.33 | | | | 1.28 | | | | | 1.20 | d | |
| | Ratio of net expenses to average net assets (%)c | | | 1.13 | | | | 1.27 | | | | 1.30 | | | | 1.25 | | | | | 1.18 | d | |
| | Ratio of net investment loss to average net assets (%) | | | (.61 | ) | | | (.88 | ) | | | (.78 | ) | | | (.49 | ) | | | | (.59 | )d | |
| | Portfolio turnover rate (%) | | | 111 | | | | 129 | | | | 120 | | | | 155 | | | | | 137 | e | |
Notes:
59
THE OBERWEIS FUNDS
Financial Highlights (continued)
Per share income and capital for a share outstanding throughout each period is as follows:
| Investor Class | | | CHINA OPPORTUNITIES FUND | | |
| | | | | Years Ended December 31, | | |
| | | 2021 | | | 2020 | | | 2019 | | | 2018 | | | 2017 | | |
| | Net asset value at beginning of year | | $ | 17.29 | | | $ | 12.33 | | | $ | 9.35 | | | $ | 15.95 | | | $ | 10.94 | | |
| | | | | | | | | | | | | | | | | | | | | | | |
| | INCOME (LOSS) FROM INVESTMENT OPERATIONS: | | |
| | Net investment lossa | | | (.11 | ) | | | (.16 | ) | | | (.09 | ) | | | (.10 | ) | | | (.06 | ) | |
| | Net realized and unrealized gains (losses) on investments and translation of assets and liabilities denominated in foreign currencies | | | (.88 | ) | | | 7.11 | | | | 3.47 | | | | (4.06 | ) | | | 6.07 | | |
| | Total from investment operations | | | (.99 | ) | | | 6.95 | | | | 3.38 | | | | (4.16 | ) | | | 6.01 | | |
| | Redemption Feesa | | | — | | | | — | | | | .02 | | | | — | | | | — | | |
| | Less dividends and distributions: | | | | | | | | | | | | | | | | | | | | | |
| | Distribution from net realized gains on investments | | | (4.79 | ) | | | (1.99 | ) | | | (.42 | ) | | | (2.44 | ) | | | (.98 | ) | |
| | Dividends from net investment income | | | — | | | | — | | | | — | | | | — | | | | (.02 | ) | |
| | Total dividends and distributions | | | (4.79 | ) | | | (1.99 | ) | | | (.42 | ) | | | (2.44 | ) | | | (1.00 | ) | |
| | Net asset value at end of year | | $ | 11.51 | | | $ | 17.29 | | | $ | 12.33 | | | $ | 9.35 | | | $ | 15.95 | | |
| | Total Return (%) | | | (5.41 | ) | | | 56.51 | | | | 36.33 | | | | (26.01 | ) | | | 55.05 | | |
| | | | | | | | | | | | | | | | | | | | | | | |
| RATIO/SUPPLEMENTAL DATA: | | | |
| | Net Assets at end of year (in thousands) | | $ | 81,018 | | | $ | 98,527 | | | $ | 75,487 | | | $ | 60,844 | | | $ | 107,190 | | |
| | Ratio of gross expenses to average net assets (%) | | | 1.87 | | | | 1.95 | | | | 1.95 | | | | 1.91 | | | | 1.92 | | |
| | Ratio of net expenses to average net assets (%)b | | | 1.87 | | | | 1.95 | | | | 1.84 | | | | 1.86 | | | | 1.91 | | |
| | Ratio of net investment loss to average net assets (%) | | | (.63 | ) | | | (1.11 | ) | | | (.77 | ) | | | (.68 | ) | | | (.38 | ) | |
| | Portfolio turnover rate (%) | | | 241 | | | | 192 | | | | 184 | | | | 85 | | | | 97 | | |
Notes:
60
THE OBERWEIS FUNDS
Financial Highlights (continued)
Per share income and capital for a share outstanding throughout each period is as follows:
| Institutional Class | | | CHINA OPPORTUNITIES FUND | | |
| | | | |
Years Ended December 31,
| | | Period Ended
December 31,
2017a | | |
| | | 2021 | | | 2020 | | | 2019 | | | 2018 | | | | |
| | Net asset value at beginning of year | | $ | 17.42 | | | $ | 12.39 | | | $ | 9.36 | | | $ | 15.93 | | | | $ | 12.78 | | |
| | | | | | | | | | | | | | | | | | | | | | | | |
| INCOME (LOSS) FROM INVESTMENT OPERATIONS: | | |
| | Net investment lossb | | | (.07 | ) | | | (.13 | ) | | | (.07 | ) | | | (.06 | ) | | | | (.01 | ) | |
| | Net realized and unrealized gains (losses) on investments and translation of assets and liabilities denominated in foreign currencies | | | (.89 | ) | | | 7.15 | | | | 3.50 | | | | (4.07 | ) | | | | 4.19 | | |
| | Total from investment operations | | | (.96 | ) | | | 7.02 | | | | 3.43 | | | | (4.13 | ) | | | | 4.18 | | |
| | Redemption feesb | | | — | | | | — | | | | .02 | | | | — | | | | | — | | |
| | Less dividends and distributions: | | | | | | | | | | | | | | | | | | | | | | |
| | Distribution from net realized gains on investments | | | (4.79 | ) | | | (1.99 | ) | | | (.42 | ) | | | (2.44 | ) | | | | (.98 | ) | |
| | Dividends from net investment income | | | — | | | | — | | | | — | | | | — | | | | | (.05 | ) | |
| | Total dividends and distributions | | | (4.79 | ) | | | (1.99 | ) | | | (.42 | ) | | | (2.44 | ) | | | | (1.03 | ) | |
| | Net asset value at end of year | | $ | 11.67 | | | $ | 17.42 | | | $ | 12.39 | | | $ | 9.36 | | | | $ | 15.93 | | |
| | Total return (%) | | | (5.23 | ) | | | 56.79 | | | | 36.82 | | | | (25.85 | ) | | | | 32.87 | e | |
| | | | | | | | | | | | | | | | | | | | | | | | |
| RATIO/SUPPLEMENTAL DATA: | | |
| | Net Assets at end of year (in thousands) | | $ | 15,247 | | | $ | 21,497 | | | $ | 14,301 | | | $ | 10,998 | | | | $ | 14,087 | | |
| | Ratio of gross expenses to average net assets (%) | | | 1.62 | | | | 1.69 | | | | 1.70 | | | | 1.65 | | | | | 1.60 | d | |
| | Ratio of net expenses to average net assets (%)c | | | 1.62 | | | | 1.69 | | | | 1.59 | | | | 1.61 | | | | | 1.59 | d | |
| | Ratio of net investment loss to average net assets (%) | | | (.38 | ) | | | (.85 | ) | | | (.55 | ) | | | (.42 | ) | | | | (.12 | )d | |
| | Portfolio turnover rate (%) | | | 241 | | | | 192 | | | | 184 | | | | 85 | | | | | 97 | | |
Notes:
61
THE OBERWEIS FUNDS
Financial Highlights (continued)
Per share income and capital for a share outstanding throughout each period is as follows:
| Investor Class | | | INTERNATIONAL OPPORTUNITIES FUND | | |
| | | | | Years Ended December 31, | | |
| | | 2021 | | | 2020 | | | 2019 | | | 2018 | | | 2017 | | |
| | Net asset value at beginning of year | | $ | 31.52 | | | $ | 19.43 | | | $ | 16.01 | | | $ | 25.49 | | | $ | 20.19 | | |
| | | | | | | | | | | | | | | | | | | | | | | |
| INCOME (LOSS) FROM INVESTMENT OPERATIONS: | | |
| | Net investment income (loss)a | | | (.26 | ) | | | (.16 | ) | | | (.03 | ) | | | (.04 | ) | | | (.04 | ) | |
| | Net realized and unrealized gains (losses) on investments and translation of assets and liabilities denominated in foreign currencies | | | .72 | | | | 12.37 | | | | 3.69 | | | | (6.30 | ) | | | 8.26 | | |
| | Total from investment operations | | | .46 | | | | 12.21 | | | | 3.66 | | | | (6.34 | ) | | | 8.22 | | |
| | Redemption Feesa | | | — | | | | — | | | | — | | | | — | | | | — | | |
| | Less dividends and distributions: | | | | | | | | | | | | | | | | | | | | | |
| | Distribution from net realized gains on investments | | | (5.48 | ) | | | — | | | | — | | | | (3.10 | ) | | | (2.85 | ) | |
| | Dividends from net investment income | | | — | | | | (.12 | ) | | | (.24 | ) | | | (.04 | ) | | | (.07 | ) | |
| | Total dividends and distributions | | | (5.48 | ) | | | (.12 | ) | | | (.24 | ) | | | (3.14 | ) | | | (2.92 | ) | |
| | Net asset value at end of year | | $ | 26.50 | | | $ | 31.52 | | | $ | 19.43 | | | $ | 16.01 | | | $ | 25.49 | | |
| | Total return (%) | | | 1.52 | | | | 62.86 | | | | 22.85 | | | | (24.73 | ) | | | 40.77 | | |
| | | | | | | | | | | | | | | | | | | | | | | |
| RATIO/SUPPLEMENTAL DATA: | | |
| | Net Assets at end of year (in thousands) | | $ | 310,356 | | | $ | 327,354 | | | $ | 324,254 | | | $ | 498,164 | | | $ | 905,392 | | |
| | Ratio of gross expenses to average net assets (%) | | | 1.77 | | | | 1.87 | | | | 1.82 | | | | 1.77 | | | | 1.79 | | |
| | Ratio of net expenses to average net assets (%)b | | | 1.60 | | | | 1.60 | | | | 1.60 | | | | 1.60 | | | | 1.60 | | |
| | Ratio of net investment income (loss) to average net assets (%) | | | (.79 | ) | | | (.75 | ) | | | (.19 | ) | | | (.16 | ) | | | (.18 | ) | |
| | Portfolio turnover rate (%) | | | 93 | | | | 130 | | | | 142 | | | | 145 | | | | 153 | | |
Notes:
62
THE OBERWEIS FUNDS
Financial Highlights (continued)
Per share income and capital for a share outstanding throughout each period is as follows:
| Investor Class | | Emerging Markets Fund | | |
| | | |
Years Ended December 31,
| | | Period Ended
December 31,
2018a | | |
| | | 2021 | | | 2020 | | | 2019 | | | | |
| | Net asset value at beginning of period | | $ | 13.81 | | | $ | 9.67 | | | $ | 7.89 | | | | $ | 10.00 | | |
| | | | |
| INCOME (LOSS) FROM INVESTMENT OPERATIONS: | | |
| | Net investment lossb | | | (.13 | ) | | | (.06 | ) | | | (.02 | ) | | | | (.01 | ) | |
| | Net realized and unrealized gains (losses) on investments and translation of assets and liabilities denominated in foreign currencies | | | 1.95 | | | | 4.20 | | | | 1.80 | | | | | (2.10 | ) | |
| | Total from investment operations | | | 1.82 | | | | 4.14 | | | | 1.78 | | | | | (2.11 | ) | |
| | Redemption Feesb | | | — | | | | — | | | | — | | | | | — | | |
| | Less dividends and distributions: | | | | | | | | | | | | | | | | | | |
| | Distribution from net realized gains on investments | | | (2.00 | ) | | | — | | | | — | | | | | — | | |
| | Dividends from net investment income | | | — | | | | — | | | | — | | | | | — | | |
| | Total dividends and distributions | | | (2.00 | ) | | | — | | | | — | | | | | — | | |
| | Net asset value at end of year | | $ | 13.63 | | | $ | 13.81 | | | $ | 9.67 | | | | $ | 7.89 | | |
| | Total Return (%) | | | 13.24 | | | | 42.81 | | | | 22.56 | | | | | (21.10 | )e | |
| | | | |
| RATIO/SUPPLEMENTAL DATA: | | |
| | Net Assets at end of year (in thousands) | | $ | 1,646 | | | $ | 789 | | | $ | 587 | | | | $ | 426 | | |
| | Ratio of gross expenses to average net assets (%) | | | 2.80 | | | | 3.79 | | | | 3.86 | | | | | 3.99 | d | |
| | Ratio of net expenses to average net assets (%)c | | | 1.75 | | | | 1.75 | | | | 1.75 | | | | | 1.75 | d | |
| | Ratio of net investment loss to average net assets (%) | | | (.87 | ) | | | (.54 | ) | | | (.21 | ) | | | | (.15 | )d | |
| | Portfolio turnover rate (%) | | | 67 | | | | 131 | | | | 153 | | | | | 111 | e | |
Notes:
63
THE OBERWEIS FUNDS
Financial Highlights (continued)
Per share income and capital for a share outstanding throughout each period is as follows:
| Institutional Class | | | Emerging Markets Fund | | |
| | | | |
Years Ended December 31,
| | Period Ended
December 31,
2018a | | |
| | | | 2021 | | | | 2020 | | | | 2019 | |
| | Net asset value at beginning of period | | $ | 13.90 | | | $ | 9.71 | | | $ | 7.90 | | | $ | 10.00 | | |
| | | | |
| INCOME (LOSS) FROM INVESTMENT OPERATIONS: | | |
| | Net investment income (loss)b | | | (.10 | ) | | | (.03 | ) | | | — | | | | .01 | | |
| | Net realized and unrealized gains (losses) on investments and translation of assets and liabilities denominated in foreign currencies | | | 1.97 | | | | 4.22 | | | | 1.81 | | | | (2.11 | ) | |
| | Total from investment
operations | | | 1.87 | | | | 4.19 | | | | 1.81 | | | | (2.10 | ) | |
| | Redemption Feesb | | | — | | | | — | | | | — | | | | — | | |
| | Less dividends and distributions: | | | | | | | | | | | | | | | | | |
| | Distribution from net realized gains on investments | | | (2.00 | ) | | | — | | | | — | | | | — | | |
| | Dividends from net investment income | | | (.02 | ) | | | — | | | | — | | | | — | | |
| | Total dividends and distributions | | | (2.02 | ) | | | — | | | | — | | | | — | | |
| | Net asset value at end of year | | $ | 13.75 | | | $ | 13.90 | | | $ | 9.71 | | | $ | 7.90 | | |
| | Total Return (%) | | | 13.50 | | | | 43.15 | | | | 22.91 | | | | (21.00 | )e | |
| | | | |
| RATIO/SUPPLEMENTAL DATA: | | |
| | Net Assets at end of year (in thousands) | | $ | 11,910 | | | $ | 9,938 | | | $ | 7,382 | | | $ | 6,012 | | |
| | Ratio of gross expenses to average net assets (%) | | | 2.55 | | | | 3.54 | | | | 3.61 | | | | 3.74 | d | |
| | Ratio of net expenses to average net assets (%)c | | | 1.50 | | | | 1.50 | | | | 1.50 | | | | 1.50 | d | |
| | Ratio of net investment income (loss) to average net assets (%) | | | (.62 | ) | | | (.26 | ) | | | — | | | | .10 | d | |
| | Portfolio turnover rate (%) | | | 67 | | | | 131 | | | | 153 | | | | 111 | e | |
Notes:
64
REPORT OF INDEPENDENT REGISTERED PUBLIC ACCOUNTING FIRM

To the Board of Trustees of The Oberweis Funds
and the Shareholders of Oberweis Micro-Cap Fund, Oberweis Small-Cap Opportunities Fund, Oberweis Global Opportunities Fund, Oberweis China Opportunities Fund, Oberweis International Opportunities Fund, and Oberweis Emerging Markets Fund
Opinion on the Financial Statements
We have audited the accompanying statements of assets and liabilities of Oberweis Micro-Cap Fund, Oberweis Small-Cap Opportunities Fund, Oberweis Global Opportunities Fund, Oberweis China Opportunities Fund, Oberweis International Opportunities Fund, and Oberweis Emerging Markets Fund, each a series of shares of beneficial interest in The Oberweis Funds, (the “Funds”), including the schedules of investments, as of December 31, 2021, and the related statements of operations for the year then ended, the statements of changes in net assets for each of the years in the two-year period then ended and the financial highlights as noted in the table below, and the related notes (collectively referred to as the “financial statements”).
| | Financial Highlights |
Investor Class:
Micro-Cap Fund
Small-Cap Opportunities Fund
Global Opportunities Fund
China Opportunities Fund
International Opportunities Fund | | For each of the years in the five-year period ended December 31, 2021 |
Investor Class:
Emerging Markets Fund | | For each of the years in the three-year period ended December 31, 2021 and for the period May 1, 2018 (commencement of operations) to December 31, 2018 |
Institutional Class:
Micro-Cap Fund
Small-Cap Opportunities Fund
Global Opportunities Fund
China Opportunities Fund | | For each of the years in the four-year period ended December 31, 2021 and for the period May 1, 2017 (commencement of operations) to December 31, 2017 |
Institutional Class:
Emerging Markets Fund | | For each of the years In the three-year period ended December 31, 2021 and for the period May 1, 2018 (commencement of operations) to December 31, 2018 |
In our opinion, the financial statements present fairly, in all material respects, the financial position of the Funds as of December 31, 2021, and the results of their operations for the year then ended, the changes in their net assets for each of the years in the two-year period then ended and their financial highlights as detailed above, in conformity with accounting principles generally accepted in the United States of America.
65
REPORT OF INDEPENDENT REGISTERED PUBLIC ACCOUNTING FIRM (continued)
Basis for Opinion
These financial statements are the responsibility of the Funds’ management. Our responsibility is to express an opinion on the Funds’ financial statements based on our audits. We are a public accounting firm registered with the Public Company Accounting Oversight Board (United States) (“PCAOB”) and are required to be independent with respect to the Funds in accordance with the U.S. federal securities law and the applicable rules and regulations of the Securities and Exchange Commission and the PCAOB.
We conducted our audits in accordance with the standards of the PCAOB. Those standards require that we plan and perform the audits to obtain reasonable assurance about whether the financial statements are free of material misstatement, whether due to error or fraud. The Funds are not required to have, nor were we engaged to perform, an audit of their internal control over financial reporting. As part of our audits we are required to obtain an understanding of internal control over financial reporting but not for the purpose of expressing an opinion on the effectiveness of the Funds’ internal control over financial reporting. Accordingly, we express no such opinion.
Our audits included performing procedures to assess the risk of material misstatement of the financial statements, whether due to error or fraud, and performing procedures that respond to those risks. Such procedures included examining, on a test basis, evidence regarding the amounts and disclosures in the financial statements. Our procedures included confirmation of securities owned as of December 31, 2021 by correspondence with the custodian, brokers, or by other appropriate auditing procedures where replies from brokers were not received. Our audits also included evaluating the accounting principles used and significant estimates made by management, as well as evaluating the overall presentation of the financial statements. We believe that our audits provide a reasonable basis for our opinion.

BBD, LLP
We have served as the auditor of one or more of the Funds in The Oberweis Funds since 2016.
Philadelphia, Pennsylvania
February 23, 2022
66
TRUSTEES AND OFFICERS OF THE OBERWEIS FUNDS (unaudited)
Name, Address and Age |
Position Held with Fund
|
Term of Office and
Length of Time Served
|
NONINTERESTED TRUSTEES |
Katherine Smith Dedrick (64)
3333 Warrenville Road,
Suite 500 Lisle, IL 60532 | Trustee | Trustee since
November, 20041 |
| | |
Gary D. McDaniel (73)
3333 Warrenville Road,
Suite 500 Lisle, IL 60532 | Trustee | Trustee since
April, 20041 |
James G. Schmidt (74)
3333 Warrenville Road,
Suite 500 Lisle, IL 60532 | Trustee | Trustee since
December, 20031 |
INTERESTED TRUSTEES |
James D. Oberweis (75)
3333 Warrenville Road,
Suite 500 Lisle, IL 60532 | Trustee2 | Trustee since
July, 19861 |
James W. Oberweis (47)
3333 Warrenville Road,
Suite 500 Lisle, IL 60532 | President | Officer since
August, 19963 |
Patrick B. Joyce (62)
3333 Warrenville Road,
Suite 500 Lisle, IL 60532 | Executive Vice President Chief Compliance Officer | Officer since
October, 19943 |
David I. Covas (46)
3333 Warrenville Road,
Suite 500 Lisle, IL 60532 | Vice President | Officer since
August, 20043 |
Kenneth S. Farsalas (51)
3333 Warrenville Road,
Suite 500 Lisle, IL 60532 | Vice President | Officer since
August, 20093 |
Eric V. Hannemann (48)
3333 Warrenville Road,
Suite 500 Lisle, IL 60532 | Treasurer | Officer since
August, 20053 |
Thomas P. Joyce (36)
3333 Warrenville Road,
Suite 500 Lisle, IL 60532 | Secretary | Officer since
July, 20213 |
The Statement of Additional Information includes additional information about Fund officers and trustees and is available upon request without charge, by calling the Fund at 800-323-6166.
67
TRUSTEES AND OFFICERS OF THE OBERWEIS FUNDS
(unaudited) (continued)
Principal Occupation Last Five Years | Number of
Portfolios
Overseen by
Trustee | Other
Directorships |
| |
President – Smith Dedrick Properties, Inc., 2016 to present; President – KSD Law P.C., 2015 to present; President – KSD Global Consulting, Inc., 2015 to present; Executive Committee Member, Risk Worldwide NZ Ltd., 2011 to 2016; President – Aggressive Publishing, Inc., 2010 to present; Member – Risk Worldwide LLC, 2007 to 2016. | 7 | None |
| | 7 | None |
Senior Vice President and Chief Financial Officer – Federal Heath Sign Co., May 2003 to December 2019. | 7 | None |
|
Illinois State Senator, January 2013 to January 2021; Chairman – Oberweis Dairy, Inc. December, 1986 to present. | 7 | None |
President – Oberweis Asset Management, Inc., September, 2001 to present; Portfolio Manager from December, 1995 to present; President and Director – Oberweis Securities, Inc., September, 1996 to present. | Not Applicable | None |
Executive Vice President, Secretary and Director – Oberweis Asset Management, Inc., September, 1994 to present; Executive Vice President and Director – Oberweis Securities, Inc. September, 1996 to present. | Not Applicable | None |
Vice President – Oberweis Asset Management, Inc., September, 2003 to present. | Not Applicable | None |
Vice President – Oberweis Asset Management, Inc., November 2004 to present. | Not Applicable | None |
Vice President of Accounting – Oberweis Asset Management, Inc. and Oberweis Securities, Inc., June, 2004 to present. | Not Applicable | None |
Vice president of Compliance December, 2021 to present, Senior Compliance Analyst July, 2013 to November, 2021, Compliance Associate April, 2010 to June, 2013 – Oberweis Asset Management, Inc. | Not Applicable | None |
68
THE OBERWEIS FUNDS
Supplemental Information (unaudited)
Long-Term Capital Gains
As of December 31, 2021, the following Funds designate long-term capital distribution as follows:
Micro-Cap Fund | | $ | 21,730,672 |
Global Opportunites Fund | | | 13,000,295 |
Small-Cap Opportunities Fund | | | 2,668,831 |
China Opportunities Fund | | | 24,805,173 |
International Opportunities Fund | | | 54,762,352 |
Emerging Markets Fund | | | 1,712,392 |
Qualified Dividend Income
For the year ended December 31, 2021, the dividends paid from net investment income, including short-term capital gains are designated as qualified dividend income.
Micro-Cap Fund | | 5.03 | % |
Global Opportunites Fund | | 6.38 | % |
Small-Cap Opportunities Fund | | 2.16 | % |
China Opportunities Fund | | 100.00 | % |
International Opportunities Fund | | 100.00 | % |
Emerging Markets Fund | | 100.00 | % |
For the year ended December 31, 2021, the dividends paid from net investment income, including short-term capital gains are designated as dividends received deduction available to corporate shareholders.
Micro-Cap Fund | | 4.82 | % |
Global Opportunites Fund | | 1.32 | % |
Small-Cap Opportunities Fund | | 2.17 | % |
China Opportunities Fund | | 0.00 | % |
International Opportunities Fund | | 0.00 | % |
Emerging Markets Fund | | 0.00 | % |
Foreign Taxes Paid
Pursuant to Section 853 of the Internal Revenue Code of 1986, as amended, the China Opportunities Fund, Emerging Markets Fund, International Opportunities Fund and Global Opportunities Fund, respectively, designate $1,507,387, $80,346, $2,914,073 and $0 of income derived from foreign sources and $88,376, $130,613, $177,131 and $0 of foreign taxes paid for the period ended December 31, 2021.
69
THE OBERWEIS FUNDS
Supplemental Information (unaudited) (continued)
Of the ordinary income (including short-term capital gain) distributions made (or to be made) for the year ended December 31, 2021, the proportionate share of income derived from foreign sources and foreign taxes paid attributable to one share of stock are:
| | Foreign
Source
Income | | Foreign
Taxes
Paid |
China Opportunities Fund | | $ | 0.1806 | | $ | 0.0106 |
Emerging Markets Fund | | | 0.1324 | | | 0.0814 |
International Opportunities Fund | | | 0.2488 | | | 0.0151 |
Proxy Voting:
The Oberweis Funds has delegated authority to vote proxies related to the Funds’ (Micro-Cap Fund, Small-Cap Opportunities Fund, Global Opportunities Fund, China Opportunities Fund, International Opportunities Fund and Emerging Markets Fund) Portfolio securities to the Funds’ investment advisor, Oberweis Asset Management, Inc. (“OAM”). A description of the policies and procedures that OAM uses in fulfilling this responsibility is available, without charge upon request, by calling 1-800-323-6166. It also appears on www.oberweisfunds.com and in the Funds’ Statement of Additional Information, which can be found on the Securities and Exchange Commission’s (“SEC”) website at http://www.sec.gov. Information on how the Funds voted proxies relating to portfolio securities during the most recent 12 month period ended December 31 is available (1) without charge, upon request, by calling 1-800-323-6166, and (2) on the SEC’s website at http://www.sec.gov.
Availability of Schedules of Portfolio Investments:
The Funds file their complete schedule of portfolio investments with the SEC for the first and third quarter of each fiscal year (March 31 and September 30) on Form NPORT. The Funds’ Forms NPORT are available, without charge, on the SEC’s website at http://www.sec.gov and may be reviewed and copied at the SEC’s Public Reference Room in Washington, D.C. Information on the operation of the Public Reference Room may be obtained by calling 1-800-SEC-0330.
Approval of Investment Advisory Agreements and Investment Sub-Advisory Agreement
The Investment Advisory Agreement between The Oberweis Funds (the “Trust”) and Oberweis Asset Management, Inc. (“OAM”) with respect to the Micro-Cap Fund, the Global Opportunities Fund and the Small-Cap Opportunities Fund and the Investment Advisory and Management Agreements between the Trust and OAM with respect to the International Opportunities Fund, the China Opportunities Fund and the Emerging Markets Fund (collectively, the “Advisory Agreements”) (the above-noted funds of the Trust are collectively referred to as the “Funds”), and the Investment Sub-Advisory Agreement between OAM and Oberweis Asset Management (Hong Kong) Limited (“OAMHK”), a wholly owned subsidiary of OAM, with respect to the China Opportunities Fund (the “Sub-Advisory Agreement” and together with the Advisory Agreements, the “Agreements”) were last approved by the Board of Trustees of the Trust (the “Board”), including all of the trustees who are not parties to the Agreements or interested persons of any such party (the “independent trustees”), at a meeting on August 18, 2021. The Board, including a majority of the independent trustees, determined that the continuation of the applicable Agreements was in the best interests of each of the Funds.
70
THE OBERWEIS FUNDS
Supplemental Information (unaudited) (continued)
The Board noted that OAM has been associated with each of the Funds since its inception. The Board recognized that a long-term relationship with a capable, conscientious investment adviser is in the best interests of each Fund, and that shareholders have invested in the Funds knowing that OAM manages the Funds and knowing the investment advisory and management fee schedules.
Nature, Quality and Extent of Services. With respect to the nature, quality and extent of the services provided (i) to the Funds by OAM pursuant to the Advisory Agreements and (ii) to the China Opportunities Fund by OAMHK pursuant to the Sub-Advisory Agreement, the Board considered the background and experience of OAM and OAMHK, the functions performed by OAM and OAMHK and the personnel providing such services, the management capabilities of OAM and OAMHK, the information contained in OAM’s and OAMHK’s Forms ADV, OAM’s financial condition and the compliance reports provided to the Board, and the culture of compliance created by OAM and OAMHK, including the competency of the Trust, OAM and OAMHK’s chief compliance officer. The Board also considered the experience, academic background, long tenure, structure, size and geographic locations of the portfolio management/strategy investment teams and their respective roles, the investment process with respect to the types of investments held by the Funds, as well as the honesty and integrity of OAM and OAMHK, and that, in the Board’s experience, OAM and OAMHK personnel are open and forthright with the Board. In addition, the Board considered that OAM and OAMHK are research-oriented firms that conduct extensive research in connection with managing the Funds and also considered the competitive pressure on active management.
The Board reviewed the investment performance of each Fund as compared to a peer universe of funds provided by Broadridge Financial Solutions, Inc. (“Broadridge”), an independent provider of investment company data (the “Performance Universe”), and as compared to the performance of a relevant market benchmark index. With respect to Fund performance, the Board considered each Fund’s performance over the one-, three-, five- and ten-year periods ended June 30, 2021, as applicable, including any periods of outperformance or underperformance as compared to the performance of the relevant market benchmark index and the Fund’s Performance Universe Average. The Board noted that each Fund, except the Emerging Markets Fund, outperformed its relevant market benchmark index and Performance Universe Average for all periods reviewed. The Board also noted that the Emerging Markets Fund outperformed its relevant market benchmark index and Performance Universe for the three-year period and outperformed its Performance Universe but underperformed its market benchmark index for the one-year period. In light of the information provided and the considerations made, the Board concluded that the nature, quality and extent of the services provided to each Fund by OAM and to the China Opportunities Fund by OAMHK have been and are expected to remain satisfactory.
Fees and Expenses. The Board considered the combined investment advisory and management fees charged to each Fund by OAM (the “management fees”) as compared to the management fees of a peer group of funds provided by Broadridge (the “Expense Group”) and the expense ratio(s) of each Fund as compared to the expense ratios of the Expense Group. The Board considered information provided by Broadridge on how it selected the peer funds included in the Expense Group for each Fund and considered certain limitations as to the comparability of the data provided. Based on the information provided, the Board noted that the management fees charged to each Fund, except the China Opportunities Fund and the International Opportunities Fund, were the same as, below or near the median management fee of its Expense Group. With respect to the investment sub-advisory fees paid to OAMHK relating to the China Opportunities Fund, the Board noted that such fees are paid by OAM and not the China Opportunities Fund.
71
THE OBERWEIS FUNDS
Supplemental Information (unaudited) (continued)
The Board noted that the expense ratio for each Fund’s Institutional Class (with the exception of the Small-Cap Opportunities Fund), as applicable, was the same as, below or near the median of the expense ratio of its applicable Expense Group. The Board also noted that the expense ratio of each Fund’s Investor Class and for the International Opportunities Fund was above the median expense ratio of its applicable Expense Group. The Board further noted that with the exception of the China Opportunities Fund, each Fund’s asset size was below the median asset size of its applicable Expense Group.
In addition, the Board considered management fees paid to OAM by other clients. With respect to OAM’s other clients, the Board recognized that the mix of services provided to the Funds, the level of responsibility required under the Advisory Agreements with the Funds, and the regulatory and operational requirements with respect to the Funds are greater than OAM’s obligations for similar client accounts, and that the management fees for such accounts are less relevant to the Board’s consideration of the management fees for the Funds because they reflect different competitive forces than those in the mutual fund marketplace. Based on the information provided, the Board concluded that each Fund’s management fees were reasonable and appropriate in amount, given the nature, quality and extent of the services provided and taking into consideration relevant circumstances.
Profitability. With respect to the costs of services provided and profits realized by OAM, the Board considered the management fees received by OAM from each of the Funds as well as the level, quality and expense of OAM’s staff and the services that OAM provides. The Board also considered the explanation from OAM that the profits realized by OAM specifically from the relationship with the Funds could not be identified due to the impracticality of expense allocation, noting the difficulty of breaking down profitability related to each Fund versus the other Oberweis Funds and other client accounts because management and personnel time and services are not allocated between the various types of accounts. The Board noted OAM’s belief that, while the profits could not be itemized, the overall profitability of OAM was average and within a reasonable range relative to other investment advisory firms, and considered that OAM has contractually agreed to reimburse the Funds for expenses if their respective expense ratios exceed certain limits. The Board did not consider the profits realized by OAMHK with respect to the China Opportunities Fund, noting that OAM compensates OAMHK from its management fees and that the revenue to OAMHK was limited due to the size of the China Opportunities Fund. Based on this information, the Board concluded for each Fund that OAM’s profitability was not unreasonable.
Economies of Scale. The Board considered the extent to which economies of scale would be realized as each Fund grows, and whether management fee levels reflect economies of scale for the benefit of Fund shareholders. The Board noted asset capacity constraints for each of the Funds which limit economies of scale and the expense reimbursements made by OAM to certain of the Funds. The Board also noted that the investment advisory fee schedule for the Global Opportunities Fund includes a breakpoint designed to share economies of scale with shareholders. The Board concluded that each Fund’s management fees reflect an appropriate recognition of any economies of scale.
Other Benefits to OAM and Its Affiliates. The Board considered the character and amount of other incidental benefits received by OAM and its affiliates (including OAMHK) from their relationship with the Funds, including the fees received by Oberweis Securities, Inc. (“OSI”), an affiliate of OAM and OAMHK, for distribution services, as applicable, and benefits to OAM and other OAM client accounts related to soft dollars generated by the Funds’ brokerage transactions. The Board also noted that during the past year none of the Funds’ brokerage transactions had been placed through OSI.
72
THE OBERWEIS FUNDS
Supplemental Information (unaudited) (continued)
After due consideration of all of the information and factors deemed relevant by the Board and based upon its own business judgment and the conclusions reached, the Board determined to approve the continuance of the Agreements. The Board, including the independent trustees, did not identify any single factor or group of factors as all-important or controlling, and considered all factors together.
Expense Examples:
As a shareholder of The Oberweis Funds, you may incur two types of costs: (1) transaction costs, including redemption fees and (2) ongoing costs, including management fees; distribution (and/or service) 12b-1 fees; and other Fund expenses. This example is intended to help you understand your ongoing costs (in dollars) of investing in The Oberweis Funds and to compare these costs with the ongoing costs of investing in other mutual funds.
The Example is based on an investment of $1,000 investment at the beginning of the period and held for the entire period.
Actual Expenses:
The first line for each Fund in the table below provides information about actual account values and actual expenses. You may use the information below; together with the amount you invested, to estimate the expenses that you paid over the period. Simply divide your account value by $1,000 (for example, an $8,600 account value divided by $1,000=8.6), then multiply the result by the number in the table under the heading entitled “Expenses Paid During Period” to estimate the expenses you paid on your account during this period.
Hypothetical Example for Comparison Purposes:
The second line for each Fund in the table below provides information about hypothetical account values and hypothetical expenses based on each Fund’s actual expense ratio and an assumed rate of return of 5% per year before expenses, which is not the Fund’s actual return.
The hypothetical account values and expenses may not be used to estimate the actual ending account balance or expenses you paid for the period. You may use this information to compare this 5% hypothetical example with the 5% hypothetical examples that appear in the shareholder reports of other funds.
Please note that the expenses shown in the table are meant to highlight your ongoing costs only and do not reflect any transactional costs, such as redemption fees. Therefore, the second line for each Fund in the table is useful in comparing ongoing costs only, and will not help you determine the relative total costs of owning different funds. In addition, if these transactional costs were included, your costs would have been higher.
73
THE OBERWEIS FUNDS
Supplemental Information (unaudited) (continued)
| | Beginning
Account
Value
7/1/21 | | Ending
Account
Value
12/31/21 | | Expenses Paid
During Period
7/1/21 – 12/31/21 | | Expense Ratio
During Period
7/1/21 – 12/31/21 |
MICRO-CAP FUND | |
Investor Class | | | | | | | | | | | | |
Actual | | $ | 1,000.00 | | $ | 886.15 | | $ | 7.04 | | 1.48 | % |
Hypothetical | | $ | 1,000.00 | | $ | 1,017.74 | | $ | 7.53 | | 1.48 | % |
Institutional Class | | | | | | | | | | | | |
Actual | | $ | 1,000.00 | | $ | 890.27 | | $ | 5.86 | | 1.23 | % |
Hypothetical | | $ | 1,000.00 | | $ | 1,019.00 | | $ | 6.26 | | 1.23 | % |
| | | | | | | | | | | | | |
SMALL-CAP OPPORTUNITIES FUND | |
Investor Class | | | | | | | | | | | | |
Actual | | $ | 1,000.00 | | $ | 1,143.18 | | $ | 8.37 | | 1.55 | % |
Hypothetical | | $ | 1,000.00 | | $ | 1,017.39 | | $ | 7.88 | | 1.55 | % |
Institutional Class | | | | | | | | | | | | |
Actual | | $ | 1,000.00 | | $ | 1,144.77 | | $ | 7.03 | | 1.30 | % |
Hypothetical | | $ | 1,000.00 | | $ | 1,018.65 | | $ | 6.61 | | 1.30 | % |
| | | | | | | | | | | | | |
GLOBAL OPPORTUNITIES FUND | |
Investor Class | | | | | | | | | | | | |
Actual | | $ | 1,000.00 | | $ | 1,005.67 | | $ | 6.98 | | 1.38 | % |
Hypothetical | | $ | 1,000.00 | | $ | 1,018.25 | | $ | 7.02 | | 1.38 | % |
Institutional Class | | | | | | | | | | | | |
Actual | | $ | 1,000.00 | | $ | 1,006.96 | | $ | 5.72 | | 1.13 | % |
Hypothetical | | $ | 1,000.00 | | $ | 1,019.51 | | $ | 5.75 | | 1.13 | % |
| | | | | | | | | | | | | |
CHINA OPPORTUNITIES FUND | |
Investor Class | | | | | | | | | | | | |
Actual | | $ | 1,000.00 | | $ | 895.61 | | $ | 8.93 | | 1.87 | % |
Hypothetical | | $ | 1,000.00 | | $ | 1,015.78 | | $ | 9.50 | | 1.87 | % |
Institutional Class | | | | | | | | | | | | |
Actual | | $ | 1,000.00 | | $ | 895.77 | | $ | 7.74 | | 1.62 | % |
Hypothetical | | $ | 1,000.00 | | $ | 1,017.04 | | $ | 8.24 | | 1.62 | % |
| | | | | | | | | | | | | |
INTERNATIONAL OPPORTUNITIES FUND | |
Investor Class | | | | | | | | | | | | |
Actual | | $ | 1,000.00 | | $ | 956.37 | | $ | 7.89 | | 1.60 | % |
Hypothetical | | $ | 1,000.00 | | $ | 1,017.14 | | $ | 8.13 | | 1.60 | % |
| | | | | | | | | | | | | |
EMERGING MARKETS FUND | |
Investor Class | | | | | | | | | | | | |
Actual | | $ | 1,000.00 | | $ | 850.28 | | $ | 8.16 | | 1.75 | % |
Hypothetical | | $ | 1,000.00 | | $ | 1,016.38 | | $ | 8.89 | | 1.75 | % |
Institutional Class | | | | | | | | | | | | |
Actual | | $ | 1,000.00 | | $ | 850.87 | | $ | 7.00 | | 1.50 | % |
Hypothetical | | $ | 1,000.00 | | $ | 1,017.64 | | $ | 7.63 | | 1.50 | % |
74
Trustees and Officers | | |
James D. Oberweis
Trustee Gary D. McDaniel
Trustee James W. Oberweis
President David I. Covas
Vice President Kenneth S. Farsalas
Vice President | | Katherine Smith Dedrick
Trustee James G. Schmidt
Trustee Patrick B. Joyce
Executive Vice President
Chief Compliance Officer Eric V. Hannemann
Treasurer Thomas P. Joyce
Secretary |
Manager and Investment Advisor
Oberweis Asset Management, Inc.
3333 Warrenville Road, Suite 500, Lisle, IL 60532
800-323-6166
oberweisfunds.com
Distributor
Oberweis Securities, Inc.
3333 Warrenville Road, Suite 500, Lisle, IL 60532
630-577-2300
oberweisfunds.com
Custodian
UMB Bank, n.a.
928 Grand Blvd., Kansas City, MO 64106
Transfer Agent
UMB Fund Services, Inc.
P.O. Box 711, Milwaukee, WI 53201-0711
800-245-7311
Counsel
Vedder Price P.C.
222 North LaSalle Street, Chicago, IL 60601
Independent Registered Public Accounting Firm
BBD LLP
1835 Market Street, 3rd Floor, Philadelphia, PA 19103
The Oberweis Funds
Micro-Cap Fund
Small-Cap Opportunities Fund
Global Opportunities Fund
China Opportunities Fund
International Opportunities Fund
Emerging Markets Fund
800-245-7311
oberweisfunds.com

3333 Warrenville Road
Suite 500
Lisle, IL 60532

Beginning on January 1, 2021, as permitted by regulations adopted by the Securities and Exchange Commission, paper copies of the Fund’s shareholder reports will no longer be sent by mail, unless you specifically request paper copies of the reports from the Fund or from your financial intermediary, such as a broker-dealer or bank. Instead, the reports will be made available on www.oberweisfunds.com and you will be notified by mail each time a report is posted and provided with a website link to access the report.
If you already elected to receive shareholder reports electronically, you will not be affected by this change and you need not take any action. You may elect to receive shareholder reports and other communications from the Fund or your financial intermediary electronically by contacting us at 1-800-245-7311.
You may elect to receive all future reports in paper free of charge. You can inform the Fund or your financial intermediary that you wish to continue receiving paper copies of your shareholder reports by contacting us at 1-800-245-7311. Your election to receive reports in paper will apply to all funds held with the fund complex.
PRESIDENT AND PORTFOLIO MANAGER’S LETTER (unaudited)
Dear Shareholder:
THE YEAR IN REVIEW
Performance within the international equity market continued to be sensitive to expectations around the pandemic, inflation and interest rates. Generally speaking, our portfolio companies continued to have strong underlying fundamentals and healthy earnings growth, just as they did in 2020. Unlike 2020, however, when many of our investment holdings witnessed price/earnings multiple expansion, in 2021 many experienced multiple compression. This multiple contraction outweighed the underlying positive earnings growth, leading to a positive return for the year that trailed the benchmark. The Oberweis International Opportunities Institutional Fund returned 2.1% vs. 8.83% for the MSCI World Ex-USA Small Cap Growth Index.
A two-year perspective, which helps to average out the effects of the multiple expansion and contraction, gives us a better estimate of how the actual, underlying fundamentals and earnings drove returns during the overall 2020-2021 period. During that period, the fund returned a strong +67.09% vs. +33.78% for the benchmark.
While the rise of Omicron towards the end of the year muddied the picture of a post-pandemic rebound, the markets now seem to be looking beyond its threat. A return to pre-pandemic activity took place over the course of the year and the market narrative shifted from one focused on daily Covid-19 cases, toward fears of inflation and interest rates. As a result, the fund was hurt from a stylistic rotation toward names that are hedges against inflation and higher interest rates. Within our benchmark, the MSCI World Ex-USA Small-Cap Growth Index, the best returning sectors were energy, financials, industrials, real estate and materials. Within energy, financials and materials, equities tied directly to an underlying price index, such as oil, interest rates, lithium and steel did well. We usually tend to be underweight names within these areas given our long-standing belief that commodity prices are difficult to forecast. For example, even though we believe lithium prices are likely to rise over the coming years, this thesis alone is not usually enough for us to make an investment. We choose instead to spend the majority of our time examining companies’ underlying idiosyncratic fundamentals and thus their ability to create substantial long-term shareholder value based on their long-term cash flow generation. We do recognize that shifting macroeconomic expectations and investor positioning can lead to short-term volatility. For us, however, volatility often equals opportunity when it causes the growing, durable enterprises in which we invest to trade at prices that do not reflect their long-term potential. While some of the names may respond to short-term sentiment and therefore near-term multiple compression, in due course superior fundamentals and high earnings growth tend to drive long-term returns.
OUTLOOK
We remain positive on our long-term opportunity set as we are confident that changes in business and consumption are still being underestimated. Long-term and exponential improvements in computing technologies are trends that in our view are well set to continue with very significant implications for investment outcomes. Their impact appears to be broadening in application beyond the narrow parameters of consumer internet to a diverse range of industries from healthcare to food and farming to logistics. Nonetheless they are unlikely to shape the financial headlines in a single period or quarter.
On a shorter timeframe we consider it likely that the market’s earnings expectations for the year ahead are too low. Generally speaking, margins have increased through a combination of gross margin expansion and fixed cost absorption. Looked at in aggregate, we believe cost increases in raw materials and components are likely to continue to be passed on to customers. Furthermore, we expect the market’s operating leverage to continue to expand,
1
PRESIDENT AND PORTFOLIO MANAGER’S LETTER (unaudited) (continued)
with operationally geared sectors such as technology and industrials continuing to increase their contribution to base earnings. At the same time, we remain wary of investing in businesses such as restaurants, hotels or physical retail, where labor is either a material component of the cost structure or where second and part-time jobs are prevalent.
From a geographical perspective, international valuations look cheaper than US valuations and continue to represent an opportunity for investors. The chart below from JP Morgan shows that the US forward twelve-month P/E valuations, relative to the rest of the developed world, are close to a 25-year high.
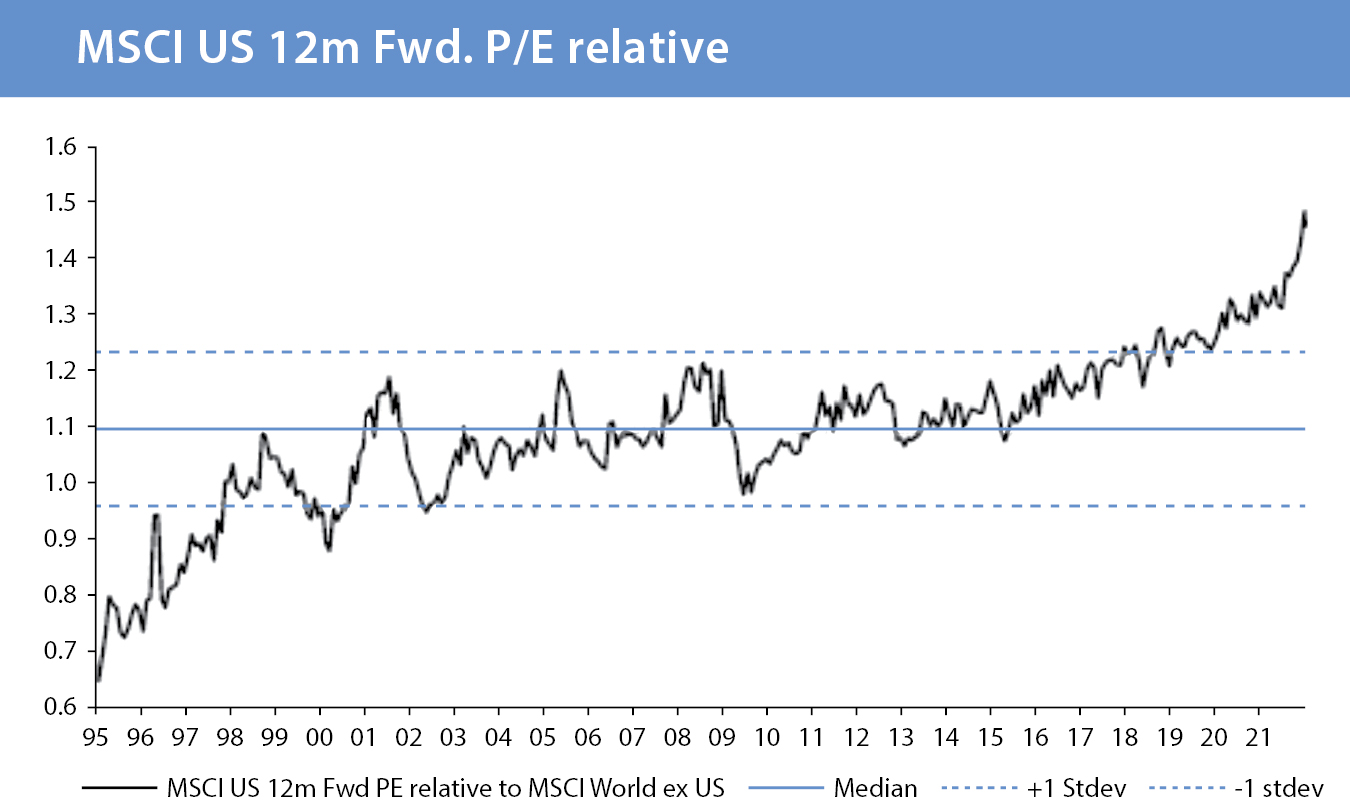
2
PRESIDENT AND PORTFOLIO MANAGER’S LETTER (unaudited) (continued)
Additionally, free cash flow yields for small cap stocks in developed markets are near historical highs:
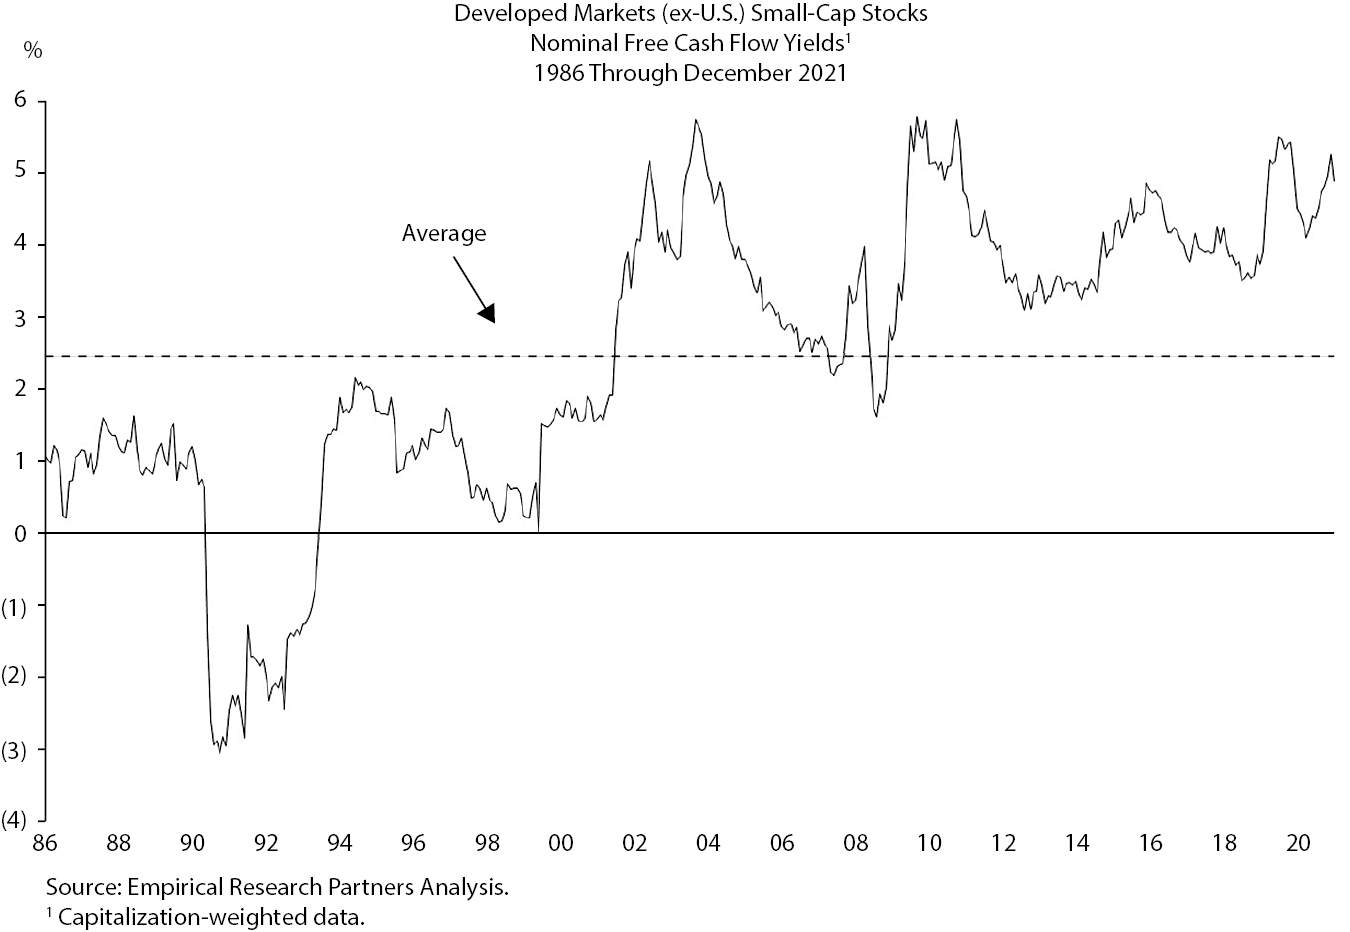
As shown in the chart, the few other times when free cash flow yields were around such attractively high levels included the period right after the global financial crisis and in March 2020. Both times transpired to be significant opportunities that provided investors with excellent returns.
3
PRESIDENT AND PORTFOLIO MANAGER’S LETTER (unaudited) (continued)
PORTFOLIO HIGHLIGHTS
At year end, the fund was invested in 71 stocks in 15 countries. Our top five country weightings (portfolio weighting versus the MSCI World Ex USA Small Cap Growth Index) were the United Kingdom (23.8% vs. 16%), Japan (21.7% vs. 24.4%), Canada (11.3% vs. 8.6%), Sweden (8.6% vs. 9.1%), and Australia (6.6% vs. 9.1%). On a sector basis, the portfolio was overweight consumer discretionary (24.6% vs. 12.7%) and underweight consumer staples (0.0% vs. 6.8%) and industrials (17.3% vs. 24.1%).
Top contributors for the year include Baycurrent Consulting (6532 JP), which returned 122.1% and contributed 534 bps; Nordic Semiconductor (NOD NO) which returned 109.4% and contributed 261 bps; and Endava (DAVA US) which returned 118.8% and contributed 137 bps. The largest detractors in 2021 include IR Japan (6035 JP), which returned -62.4% and detracted 175 bps. Base (4477 JP) which returned -57.3% and detracted 164 bps; and MedPeer (6095 JP) which returned -64.1% and detracted 158 bps.
On behalf of the entire team at Oberweis, thank you for investing in the Oberweis International Opportunities Institutional Fund. If you have any questions about your account, please contact shareholder services at (800) 245-7311.
Sincerely,

| | 
|
James W. Oberweis, CFA
President | | Ralf Scherschmidt
Portfolio Manager |
4
MANAGEMENT DISCUSSION ON FUND PERFORMANCE (unaudited)
MARKET ENVIRONMENT
Global equities returned 21.82% in 2021, as measured by the MSCI World Index. Global small-caps, as measured by the MSCI World Small-Cap Index, underperformed larger caps but still performed strongly in absolute terms, returning 15.75%. Foreign small-caps underperformed U.S. small-caps, as evidenced by the 11.14% return on the MSCI World Ex-USA Small-Cap Index compared to the 19.11% for the MSCI USA Small-Cap Index. Internationally, small-cap value equities outperformed small-cap growth by 444 basis points, with the MSCI World Ex-USA Small Growth Index returning 8.83% versus 13.27% for the MSCI World Ex-USA Small-Cap Value Index.
DISCUSSION OF THE INTERNATIONAL OPPORTUNITIES INSTITUTIONAL FUND
The International Opportunities Institutional Fund underperformed its benchmark in 2021, returning 2.1% versus 8.83% for the MSCI World Ex-USA Small-Cap Growth Index. The portfolio benefitted from stock selection in the United Kingdom and Norway while stock selection in Sweden and Switzerland detracted from performance. On a sector level, the portfolio benefitted from stock selection in Information Technology while performance was negatively impacted by stock selection in Health Care and Communication Services. At the stock level, Baycurrent Consulting (6532 JP), Nordic Semiconductor (NOD NO) and Endava (DAVA) were among the top contributors to performance; IR Japan (6035 JP), Base (4477 JP) and MedPeer (6095 JP) were among the top detractors.
For current performance information, please visit www.oberweisfunds.com.
5
Management discussion on fund performance
(unaudited) (continued)
Oberweis International Opportunities Institutional Fund
At December 31, 2021
Asset Allocation (% of Net Assets) |
Equities | | 97.4 |
Other Assets less Liabilities | | 2.6 |
| | | |
Top Ten Holdings (% of Net Assets) |
Nordic Semiconductor ASA | | 4.8 |
BayCurrent Consulting, Inc. | | 4.3 |
Food & Life Co. Ltd. | | 4.2 |
Future PLC | | 3.0 |
Constellium SE | | 2.8 |
Intermediate Capital Group PLC | | 2.8 |
Uniti Group Ltd. | | 2.4 |
Nova Ltd. | | 2.3 |
IDP Education Ltd. | | 2.2 |
Aritzia, Inc. | | 2.1 |
| | | |
Top Ten Industries (% of Net Assets) |
Semiconductors & Semiconductor Equipment | | 11.3 |
Capital Markets | | 9.0 |
Professional Services | | 7.7 |
Leisure Products | | 5.8 |
Metals & Mining | | 5.6 |
Household Durables | | 5.0 |
Machinery | | 4.6 |
Information Technology Services | | 4.6 |
Hotels, Restaurants & Leisure | | 4.2 |
Specialty Retail | | 4.0 |
6
Management discussion on fund performance
(unaudited) (continued)
Average Annual Total Returns1 (for the Periods Ended December 31, 2021)
| | 1 YR
(%) | | 5 YR
(%) | | SINCE
INCEPTION2
(%) | | EXPENSE
RATIO3
(%) |
OBIIX | | 2.10 | | 17.23 | | 10.47 | | 1.09 |
MSCI World Ex-US Small Cap Growth Index | | 8.83 | | 13.59 | | 8.75 | | |
Growth of a $10,000 Investment (from March 10, 2014 to December 31, 2021)
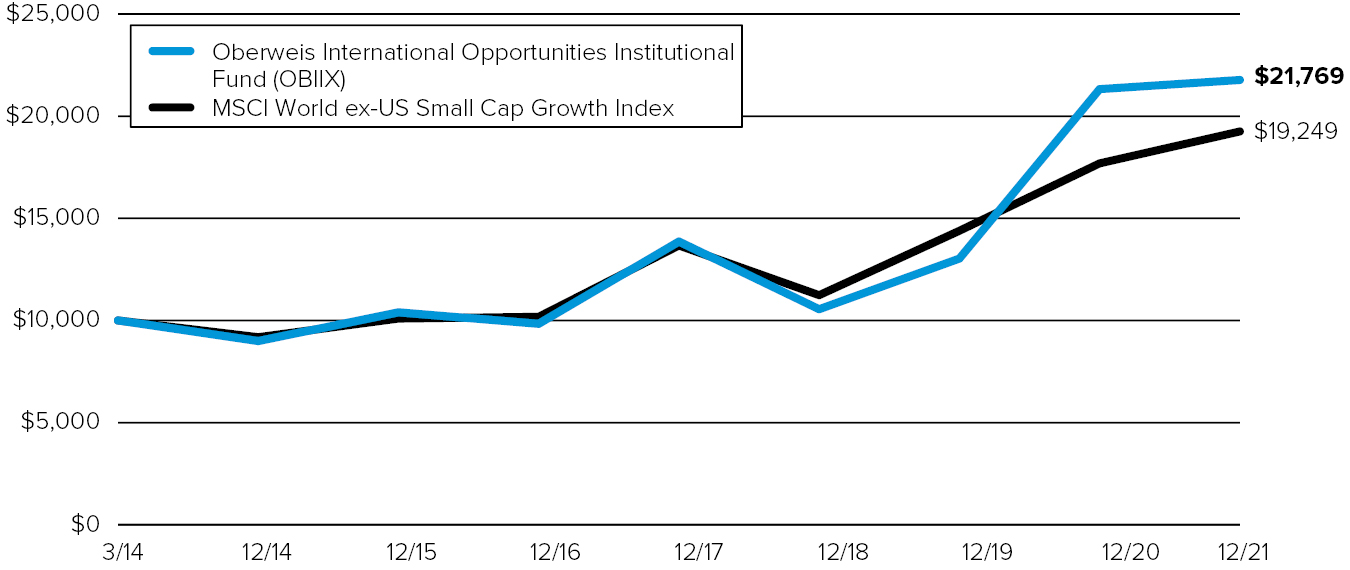
7
OBERWEIS INTERNATIONAL OPPORTUNITIES INSTITUTIONAL FUND
Schedule of Investments December 31, 2021
| | SHARES | | VALUE |
Equities – 97.4% | | | | | |
| | | | | | |
AUSTRALIA – 6.6% | | | | | |
Charter Hall Group. | | 340,229 | | $ | 5,094,153 |
Evolution Mining Ltd. | | 5,563,240 | | | 16,432,706 |
IDP Education Ltd. | | 957,949 | | | 24,149,096 |
Uniti Group Ltd.* | | 7,880,255 | | | 25,512,648 |
| | | | | | 71,188,603 |
| | | | | | |
BELGIUM – 1.3% | | | | | |
VGP NV* | | 24,100 | | | 7,023,679 |
Warehouses de Pauw NV* | | 148,700 | | | 7,140,444 |
| | | | | | 14,164,123 |
| | | | | | |
CANADA – 11.3% | | | | | |
Aritzia, Inc.* | | 544,900 | | | 22,549,814 |
ATS Automation Tooling Systems, Inc.* | | 517,375 | | | 20,547,763 |
BRP, Inc. | | 216,541 | | | 18,966,595 |
Colliers International Group, Inc. | | 45,800 | | | 6,820,398 |
Gildan Activewear, Inc. | | 344,839 | | | 14,619,538 |
Parex Resources, Inc. | | 924,591 | | | 15,794,792 |
Sleep Country Canada Hldgs., Inc. | | 389,200 | | | 11,546,779 |
Trisura Group Ltd.* | | 293,000 | | | 11,045,984 |
| | | | | | 121,891,663 |
| | | | | | |
DENMARK – 0.8% | | | | | |
ALK-Abello A/S* | | 17,008 | | | 8,930,886 |
| | | | | | |
FINLAND – 2.8% | | | | | |
Outokumpu Oyj | | 2,124,976 | | | 13,325,128 |
QT Group Oyj* | | 109,897 | | | 16,644,241 |
| | | | | | 29,969,369 |
| | | | | | |
FRANCE – 2.6% | | | | | |
Alten SA* | | 24,700 | | | 4,456,910 |
Rexel SA* | | 513,905 | | | 10,431,382 |
Soitec SA* | | 53,000 | | | 12,984,517 |
| | | | | | 27,872,809 |
| | | | | | |
GERMANY – 2.2% | | | | | |
AIXTRON SE | | 531,980 | | | 10,774,836 |
Aurelius Equity Opportunities SE | | 195,265 | | | 5,972,321 |
Sixt SE* | | 41,217 | | | 7,270,765 |
| | | | | | 24,017,922 |
| | | | | | |
ISRAEL – 2.3% | | | | | |
Nova Ltd.* | | 166,300 | | | 24,362,950 |
| | | | | | |
See accompanying notes to the financial statements.
8
OBERWEIS INTERNATIONAL OPPORTUNITIES INSTITUTIONAL FUND
Schedule of Investments December 31, 2021 (continued)
| | SHARES | | VALUE |
JAPAN – 21.7% | | | | | |
BayCurrent Consulting, Inc. | | 120,400 | | $ | 46,405,889 |
Food & Life Co. Ltd. | | 1,191,500 | | | 44,989,486 |
Future Corp. | | 617,300 | | | 9,387,305 |
IR Japan Hldgs. Ltd. | | 148,500 | | | 8,857,311 |
JMDC, Inc.* | | 261,000 | | | 19,430,886 |
Ki-Star Real Estate Co. Ltd.* | | 188,200 | | | 14,598,057 |
Koei Tecmo Hldgs. Co. Ltd. | | 257,670 | | | 10,117,331 |
M&A Capital Partners Co. Ltd.* | | 368,100 | | | 16,865,271 |
Open House Co. Ltd. | | 260,500 | | | 13,612,829 |
Persol Hldgs. Co. Ltd.* | | 591,200 | | | 17,188,109 |
TIS, Inc.* | | 511,300 | | | 15,204,046 |
Tsubaki Nakashima Co. Ltd. | | 509,400 | | | 6,508,070 |
Visional, Inc.* | | 128,700 | | | 10,879,685 |
| | | | | | 234,044,275 |
| | | | | | |
NETHERLANDS – 6.3% | | | | | |
Aalberts NV* | | 168,657 | | | 11,186,199 |
Alfen NV* | | 55,961 | | | 5,622,220 |
BE Semiconductor Industries NV | | 245,769 | | | 20,989,971 |
Constellium SE* | | 1,680,939 | | | 30,105,617 |
| | | | | | 67,904,007 |
| | | | | | |
NORWAY – 4.8% | | | | | |
Nordic Semiconductor ASA* | | 1,558,744 | | | 52,274,846 |
| | | | | | |
SPAIN – 1.2% | | | | | |
Laboratorios Farmaceuticos Rovi SA* | | 158,874 | | | 13,348,020 |
| | | | | | |
SWEDEN – 8.6% | | | | | |
Addtech AB* | | 188,636 | | | 4,486,770 |
Arjo AB* | | 218,323 | | | 2,671,493 |
Avanza Bank Hldg. AB | | 458,900 | | | 16,809,222 |
Cint Group AB* | | 833,879 | | | 13,229,046 |
Getinge AB* | | 298,211 | | | 12,996,682 |
MIPS AB | | 146,600 | | | 19,182,137 |
Nordnet AB | | 582,000 | | | 11,165,574 |
Thule Group AB | | 196,500 | | | 11,867,113 |
| | | | | | 92,408,037 |
| | | | | | |
SWITZERLAND – 1.1% | | | | | |
Tecan Group AG* | | 19,797 | | | 12,024,027 |
See accompanying notes to the financial statements.
9
OBERWEIS INTERNATIONAL OPPORTUNITIES INSTITUTIONAL FUND
Schedule of Investments December 31, 2021 (continued)
| | SHARES | | VALUE |
UNITED KINGDOM – 23.8% | | | | | |
CVS Group PLC | | 296,633 | | $ | 8,993,746 |
Endava PLC ADS* | | 121,748 | | | 20,443,924 |
Future PLC* | | 622,431 | | | 32,267,335 |
Games Workshop Group PLC | | 96,700 | | | 13,049,526 |
Grafton Group PLC | | 306,395 | | | 5,113,495 |
Howden Joinery Group PLC | | 1,111,999 | | | 13,564,341 |
IMI PLC | | 504,716 | | | 11,859,596 |
Intermediate Capital Group PLC | | 1,005,835 | | | 29,870,086 |
LondonMetric Property PLC | | 1,770,500 | | | 6,791,550 |
Man Group PLC* | | 5,246,000 | | | 16,147,001 |
Marks & Spencer Group PLC* | | 6,737,000 | | | 21,100,999 |
Morgan Sindall Group PLC | | 181,945 | | | 6,206,029 |
Pets at Home Group PLC | | 1,463,362 | | | 9,210,386 |
Reach PLC | | 2,320,005 | | | 8,871,162 |
Redrow PLC | | 1,179,083 | | | 11,184,372 |
Safestore Hldgs. PLC* | | 157,700 | | | 3,007,570 |
Taylor Wimpey PLC | | 6,213,700 | | | 14,760,481 |
The Sage Group PLC* | | 975,070 | | | 11,252,636 |
Trustpilot Group PLC* | | 2,824,526 | | | 12,516,918 |
| | | | | | 256,211,153 |
| | | | | | |
Total Equities | | | | | |
(Cost: $797,725,099) | | | | $ | 1,050,612,690 |
| | | | | | |
Total Investments – 97.4% | | | | | |
(Cost: $797,725,099) | | | | $ | 1,050,612,690 |
Other Assets Less Liabilities – 2.6% | | | | | 27,814,973 |
Net Assets – 100% | | | | $ | 1,078,427,663 |
* Non-income producing security during the year ended December 31, 2021
ADS — American depositary share
See accompanying notes to the financial statements.
10
OBERWEIS INTERNATIONAL OPPORTUNITIES INSTITUTIONAL FUND
Schedule of Investments December 31, 2021 (continued)
SECTOR ALLOCATIONS (As A Percentage of Net Assets) (unaudited) | | |
Communication Services | | 8.3 | % |
Consumer Discretionary | | 24.6 | % |
Energy | | 1.5 | % |
Financials | | 10.0 | % |
Healthcare | | 7.3 | % |
Industrials | | 17.3 | % |
Information Technology | | 19.7 | % |
Materials | | 5.5 | % |
Real Estate | | 3.2 | % |
See accompanying notes to the financial statements.
11
OBERWEIS INTERNATIONAL OPPORTUNITIES INSTITUTIONAL FUND
Statement of Assets and Liabilities December 31, 2021
| | ASSETS | | | |
| | | Investment securities at valuea | $ | 1,050,612,690 | |
| | | Cash | | 6,448,176 | |
| | | Foreign currencyb | | 189,187 | |
| | | Receivable from securities sold | | 20,627,577 | |
| | | Receivable from fund shares sold | | 755,913 | |
| | | Dividends and interest receivable | | 1,564,916 | |
| | | Prepaid expenses | | 86,889 | |
| | | Total Assets | | 1,080,285,348 | |
| | | | | | |
| | | LIABILITIES | | | |
| | | Payable for fund shares redeemed | | 270,207 | |
| | | Payable for securities purchased | | 525,823 | |
| | | Payable to advisor (see note 3) | | 919,291 | |
| | | Accrued expenses | | 142,364 | |
| | | Total Liabilities | | 1,857,685 | |
| | | NET ASSETS | $ | 1,078,427,663 | |
| | | | | | |
| | | SHARES OUTSTANDING | | | |
| | | (shares of beneficial interest issued and outstanding, respectively, unlimited number of shares authorized with no par value) | | 82,265,284 | |
| | | Net asset value, offering price and redemption price | $ | 13.11 | |
| | | | | | |
| | | ANALYSIS OF NET ASSETS | | | |
| | | Capital | $ | 850,065,080 | |
| | | Accumulated earnings | | 228,362,583 | |
| | | Net Assets | $ | 1,078,427,663 | |
| | | | | | |
| | | a Investment securities at cost | $ | 797,725,099 | |
| | | b Foreign currency at cost | $ | 189,095 | |
See accompanying notes to the financial statements.
12
OBERWEIS INTERNATIONAL OPPORTUNITIES INSTITUTIONAL FUND
Statement of Operations Year Ended December 31, 2021
| | INVESTMENT INCOME | | | | |
| | | Dividendsa | $ | 9,302,893 | | |
| | | Total Investment Income | | 9,302,893 | | |
| | | | | | | |
| | | EXPENSES | | | | |
| | Investment advisory fees (see note 3) | | 12,077,500 | | |
| | | Transfer agent fees and expenses | | 75,791 | | |
| | | Custodian fees and expenses | | 210,649 | | |
| | | Accounting services fees | | 357,825 | | |
| | | Other | | 424,222 | | |
| | | Total expenses before reimbursed expenses | | 13,145,987 | | |
| | | Earnings credit (see note 6) | | (4,484 | ) | |
| | | Total Expenses | | 13,141,503 | | |
| | | NET INVESTMENT LOSS | | (3,838,610 | ) | |
| | | | | |
| | | NET REALIZED AND UREALIZED GAINS (LOSSES) FROM INVESTMENTS | | |
| | | Net realized gains on investment transactions | | 264,598,582 | | |
| | | Net realized losses on foreign currency transactions | | (23,914 | ) | |
| | | Net realized gains on investment and foreign currency transactions | | 264,574,668 | | |
| | | Change in net unrealized appreciation/depreciation on investments and translation of assets and liabilities denominated in foreign currencies | | (233,269,721 | ) | |
| | | Net realized/unrealized gains on investments and foreign currencies | | 31,304,947 | | |
| | | NET INCREASE IN NET ASSETS RESULTING FROM OPERATIONS | $ | 27,466,337 | | |
See accompanying notes to the financial statements.
13
OBERWEIS INTERNATIONAL OPPORTUNITIES INSTITUTIONAL FUND
Statement of Changes in Net Assets
| | | Year Ended
December 31,
2021 | Year Ended
December 31,
2020 | |
| | FROM OPERATIONS | | | | | | | |
| | | Net investment loss | $ | (3,838,610 | ) | $ | (2,456,608 | ) | |
| | | Net realized gains on investments and foreign currency transactions | | 264,574,668 | | | 148,040,148 | | |
| | | Change in net unrealized appreciation\depreciation on investments and foreign currencies | | (233,269,721 | ) | | 320,894,249 | | |
| | | Net increase in net assets resulting from operations | | 27,466,337 | | | 466,477,789 | | |
| | | | | | | | | | |
| | FROM DISTRIBUTIONS | | | | | | | |
| | Distributions to shareholders | | (266,497,571 | ) | | (6,167,618 | ) | |
| | | Net decrease in net assets from distributions | | (266,497,571 | ) | | (6,167,618 | ) | |
| | | | | | | | | | |
| | FROM CAPITAL SHARE TRANSACTIONS | | | | | | | |
| | | Proceeds from sale of shares | | 102,744,641 | | | 134,419,225 | | |
| | | Proceeds from reinvestment of distributions | | 246,793,697 | | | 5,771,139 | | |
| | | Redemption of shares (see note 5) | | (229,735,433 | ) | | (369,963,127 | ) | |
| | Net increase (decrease) from capital share
transactions | | 119,802,905 | | | (229,772,763 | ) | |
| | | Total increase (decrease) in net assets | | (119,228,329 | ) | | 230,537,408 | | |
| | | | | | | | | | |
| | | NET ASSETS | | | | | | | |
| | | Beginning of year | | 1,197,655,992 | | | 967,118,584 | | |
| | | End of year | $ | 1,078,427,663 | | $ | 1,197,655,992 | | |
| | | | | | | | | | |
| | | TRANSACTIONS IN SHARES | | | | | | | |
| | | Shares sold | | 5,885,110 | | | 11,605,267 | | |
| | | Shares issued in reinvestment of distributions | | 18,882,456 | | | 339,879 | | |
| | | Less shares redeemed | | (13,179,772 | ) | | (34,201,645 | ) | |
| | | Net increase (decrease) from capital share
transactions | | 11,587,794 | | | (22,256,499 | ) | |
See accompanying notes to the financial statements.
14
OBERWEIS INTERNATIONAL OPPORTUNITIES INSTITUTIONAL FUND
Notes to Financial Statements December 31, 2021
1. Description of Organization
Description of business. The Oberweis Funds (the ‘‘Trust’’) is registered under the Investment Company Act of 1940 as a diversified open-end management investment company. The Trust is authorized to operate numerous Funds under various trading strategies. The Oberweis International Opportunities Institutional Fund (the “Fund”) is one fund in a series issued by the Trust.
2. Significant Accounting Policies
The following is a summary of significant accounting policies consistently followed by the Fund. These policies are in conformity with accounting principles generally accepted in the United States of America (“GAAP”). The Fund is an investment company and follows accounting and reporting guidance under the Financial Accounting Standards Board (“FASB”) Accounting Standards Codification (“ASC”) Topic 946, “Financial Services—Investment Companies.”
Investment valuation. Investments in securities are stated at value as of the close of the regular trading session on the New York Stock Exchange (‘‘NYSE’’) (generally 3 p.m., Central Standard Time). Each listed and unlisted security for which last sale information is regularly reported is valued at the last reported sales price on that day. If there has been no sale on such day, then such security is valued at the current day’s bid price. Any unlisted security for which last sale information is not regularly reported and any listed debt security which has an inactive listed market for which over-the-counter market quotations are readily available are valued at the closing bid price determined on the basis of reasonable inquiry. Options are valued at the last reported bid price on the primary exchange as of the close of the regular trading session of the Chicago Board Options Exchange (‘‘CBOE’’). Restricted securities and any other securities or other assets for which market quotations are not readily available are valued by appraisal at their fair value as determined in good faith under procedures established by and under the general supervision and responsibility of the Board of Trustees. Short-term debt obligations, commercial paper and repurchase agreements are valued on the basis of quoted yields for securities of comparable maturity, quality and type or on the basis of amortized cost.
The Fund holds foreign equity securities. Foreign securities are fair valued as described in the following circumstances. Generally, trading in foreign securities markets is completed each day at various times prior to the close of the regular trading session of the NYSE. Due to the time differences between the closings of the relevant foreign securities exchanges and the close of the regular trading session of the NYSE for the Fund, the Fund will fair value their foreign investments when it is determined that the market quotations for the foreign investments either are not readily available or are unreliable and, therefore, do not represent fair value. When the fair value prices are utilized, these prices will attempt to reflect the impact of the U.S. financial markets’ perceptions and trading activities on the Funds’ foreign investments since the last closing prices of the foreign investments were calculated on their primary foreign securities markets or exchanges. For these purposes, the Board of Trustees of the Trust has determined that movements in relevant indices, after the close of the foreign securities exchanges, may demonstrate that market quotations are unreliable, and may trigger fair value pricing for certain securities. Consequently, fair valuation of portfolio securities may occur on a daily basis. In determining fair value prices, the Trust utilizes data furnished by an independent pricing service (and that data draws upon, among other information, the market values of foreign investments). When a Fund uses fair value pricing, the values assigned to the Fund’s foreign investments may not be the quoted or published prices of the investments on their primary markets or exchanges.
15
OBERWEIS INTERNATIONAL OPPORTUNITIES INSTITUTIONAL FUND
Notes to Financial Statements December 31, 2021 (continued)
Fair Value Measurements. In accordance with Financial Accounting Standards Board (‘‘FASB’’) guidance, the Fund utilizes the ‘‘Fair Value Measurements and Disclosures’’ to define fair value, set out a framework for measuring fair value, and expand disclosures regarding fair value measurements. The Fair Value Measurement Standard applies to fair value measurements already required or permitted by existing standards.
Various inputs are used in determining the value of the Fund’s investments. These inputs are summarized in the three levels listed below:
• Level 1 — Quoted prices in active markets for identical securities.
• Level 2 — Other significant observable inputs (including quoted prices for similar securities, interest rates, prepayment speeds, credit risk, etc).
• Level 3 — Significant unobservable inputs (including the Fund’s own assumptions in determining the fair value of investments).
The inputs or methodology used for valuing securities are not necessarily an indication of the risk associated with investing in those securities. The following is a summary of the inputs used to value the Fund’s net assets as of December 31, 2021:
| | Level 1 | | Level 2 | | Level 3 | |
| | | Investment Securities | | | | | | | | | |
| | | Equities | | | | | | | | | |
| | | Total Asia | $ | 24,362,950 | | $ | 234,044,275 | | $ | — | |
| | | Total Australia | | 71,188,603 | | | — | | | — | |
| | | Total Europe | | 388,430,998 | | | 210,694,201 | | | — | |
| | | Total North America | | 121,891,663 | | | — | | | — | |
| | | Total Investments | $ | 605,874,214 | | $ | 444,738,476 | | $ | — | |
The Fund’s assets may include certain foreign securities for which a third party statistical pricing service may be employed for purposes of fair market valuation. The pricing service provides fair market valuation on days when the movement in relevant indices exceeds a predetermined threshold.
Foreign Currency Transactions. The accounting records of the Fund are maintained in U.S. dollars. Foreign currency amounts are translated into U.S. dollars at the current rate of exchange to determine the value of investments, assets and liabilities. Purchases and sales of securities, and income and expenses are translated at the prevailing rate of exchange on the respective date of these transactions. The Fund does not isolate that portion of the results of operations resulting from changes in foreign exchange rates on investments from fluctuations arising from changes in market prices of securities held. These fluctuations are included with the net realized and unrealized gains or losses from investments and foreign currencies.
Risks Associated with Foreign Securities and Currencies. Investments in securities of foreign issuers carry certain risks not ordinarily associated with investments in securities of U.S. issuers. These risks include future political and economic developments, and the possible imposition of exchange controls or other foreign governmental laws and restrictions. In addition, with respect to certain countries, there is the possibility of expropriation of assets, confiscatory taxation, political or social instability or diplomatic developments, which could adversely affect investments in those countries.
16
OBERWEIS INTERNATIONAL OPPORTUNITIES INSTITUTIONAL FUND
Notes to Financial Statements December 31, 2021 (continued)
Certain countries also may impose substantial restrictions on investments in their capital markets by foreign entities, including restrictions on investments in issuers of industries deemed sensitive to relevant national interests. These factors may limit the investment opportunities available and result in a lack of liquidity and a high price volatility with respect to securities of issuers from developing countries.
Fund share valuation. Fund shares are sold and redeemed on a continuous basis at net asset value. On each day the NYSE is open for trading, the net asset value per share is determined as of the later of the close of the NYSE or the CBOE by dividing the total value of investments and other assets, less liabilities, by the number of shares outstanding.
Investment transactions and investment income. Investment transactions are accounted for on the trade date (date the order to buy or sell is executed). Dividend income is recorded on the ex-dividend date, except that certain dividends from foreign securities are recorded as soon as the information is available to the Fund, and interest income is recorded on the accrual basis and includes amortization of premium and discount. Realized gains and losses from investment transactions are reported on an identified cost basis. Gains and losses on premiums from expired options are recognized on the date of expiration.
Federal income taxes and dividends to shareholders. It is the policy of the Fund to continue to comply with all requirements of the Internal Revenue Code of 1986, as amended (‘‘the Code’’), applicable to regulated investment companies and to distribute substantially all of their taxable income to their shareholders. The Fund has met the requirements of the Code applicable to regulated investment companies for the year ended December 31, 2021. Therefore, no federal income tax provision is required. Income and capital gains of the Fund are determined in accordance with both tax regulations and accounting principles generally accepted in the U.S. (‘‘GAAP’’). Such treatment may result in temporary and permanent differences between tax basis earnings and earnings reported for financial statement purposes. These reclassifications, which have no impact on the net asset value of the Fund, are primarily attributable to certain differences in computation of distributable income and capital gains under federal tax rules versus GAAP.
The Fund may utilize earnings and profits on redemption of shares as part of the dividends paid deduction.
For the year ended December 31, 2021, permanent book and tax differences resulting primarily from differing treatments for foreign currency transactions, and passive foreign investment company (“PFIC”) adjustments were identified and reclassified among the components of the Fund’s net assets.
GAAP requires that certain components of net assets be reclassified between financial and tax retporting. These reclassifications have no effect on net assets or net asset value per share. For the year ended December 31, 2021, permanent differences in book and tax accounting have been reclassified to paid in capital, accumulated net investment loss and accumulated net realized gain as follows:
| | | Increases/(Decrease) | |
| | | Capital | | Accumulated
Losses | |
| | | International Opportunities Institutional Fund | $ | 19,387,729 | | $ | (19,387,729) | |
17
OBERWEIS INTERNATIONAL OPPORTUNITIES INSTITUTIONAL FUND
Notes to Financial Statements December 31, 2021 (continued)
The tax character of distributions paid during the fiscal year ended December 31, 2021 was as follows:
| | Distributions
Paid from
Ordinary
Income | | Distributions
Paid from
Net Long-Term
Capital Gains | | Total
Distributions
Paid | |
| | | International Opportunities Institutional Fund | $ | — | | $ | 266,497,571 | | $ | 266,497,571 | |
The tax character of distributions paid during the fiscal year ended December 31, 2020 was as follows:
| | Distributions
Paid from
Ordinary
Income | | Distributions
Paid from
Net Long-Term
Capital Gains | | Total
Distributions
Paid | |
| | | International Opportunities Institutional Fund | $ | 3,566,427 | | $ | 2,601,191 | | $ | 6,167,618 | |
As of December 31, 2021 the components of accumulated earnings on a tax basis were as follows:
| | Undistributed
ordinary
income | | Undistributed
long-term
capital gains | | Accumulated
capital and
other losses | | Unrealized
Appreciation
on investments | | Unrealized
foreign
currency
translations | |
| | | International Opportunities Institutional Fund | $ | — | | $ | — | | $ | — | | $ | 228,354,464 | | $ | 8,119 | |
Accumulated capital and other losses consists of timing differences related to wash sales and mark to market on PFICs.
As of December 31, 2021 the cost of investments for federal income tax purposes are as follows:
| | Cost of
Investments
for Federal
Tax Purposes | | Gross
Unrealized
Appreciation | | Gross
Unrealized
(Depreciation) | | Unrealized
Appreciation | |
| | | International Opportunities Institutional Fund | $ | 822,258,226 | | $ | 248,213,504 | | $ | (19,859,040) | | $ | 228,354,464 | |
The Fund has reviewed all open tax years and major jurisdictions and concluded that there are no significant uncertain tax positions that would require recognition in the financial statements. Open tax years are those that are open for exam by taxing authorities and, as of December 31, 2021, open Federal tax years include the tax years ended 2018 through 2021. The Fund has no examinations in progress and is also not aware of any tax positions for which it is reasonably possible that the total amounts of unrecognized tax benefits will significantly change in the next twelve months.
Use of estimates. The preparation of financial statements in conformity with generally accepted accounting principles requires management to make estimates and assumptions that affect the amounts reported in the financial statements and accompanying notes. Actual results may differ from those estimates.
18
OBERWEIS INTERNATIONAL OPPORTUNITIES INSTITUTIONAL FUND
Notes to Financial Statements December 31, 2021 (continued)
Indemnifications. Under the Trusts’ organizational documents, its present and former Officers and Trustees are indemnified against certain liabilities arising out of the performance of their duties to the Trust. In addition, in the normal course of business, the Trust enters into contracts that provide general indemnifications to other parties. The Trusts’ maximum exposure under these arrangements is unknown as this would involve future claims that may be made against the Trust that have not yet occurred. However, the Trust has not had prior claims or losses pursuant to these contracts and expects the risk of loss to be remote.
3. Transactions with affiliates
The Fund has written agreements with Oberweis Asset Management, Inc. (‘‘OAM’’) as the Fund’s investment adviser and manager. Oberweis Securities, Inc. (‘‘OSI’’), the Fund’s principal distributor, is an affiliate of OAM.
Investment advisory agreement. Under the Advisory Agreement, OAM provides investment advisory and management services to the Fund. The Fund paid monthly investment advisory fees at an annual rate equal to 1.00% of average daily net assets. For the year ended December 31, 2021, the International Opportunities Institutional Fund incurred investment advisory fees totaling $12,077,500.
Expense reimbursement. OAM is contractually obligated to reduce its investment fees or reimburse the International Opportunities Institutional Fund to the extent that total ordinary operating expenses, as defined, exceed in any one year 1.10% expressed as a percentage of the Funds’ average daily net assets. For the year ended December 31, 2021 OAM reimbursed the Fund in the amount of $0.
Officers and trustees. Certain officers and trustees of the Trust are also officers and/or directors of OAM and OSI. During the year ended December 31, 2021, the Trust made no direct payments to its officers and paid $137,000 to its unaffiliated trustees.
Affiliated commissions. For the year ended December 31, 2021, the Fund did not execute any security transactions through OSI and therefore did not pay commissions to OSI.
4. Investment transactions
The cost of securities purchased and proceeds from securities sold during the year ended December 31, 2021, other than options written and money market investments, aggregated $1,068,679,034 and $1,236,525,890, respectively. The Fund did not hold government securities during the year ended December 31, 2021.
The Fund may write covered call options. The premiums received provide a partial hedge (protection) against declining prices and enables the Fund to generate a higher return during years when OAM does not expect the underlying security to make any major price moves in the near future but still deems the underlying security to be, over the long term, an attractive investment for the Fund. The Fund may write covered call options for which premiums received are recorded as liabilities and are subsequently adjusted to the current value of the options written. Premiums received from writing options that expire are treated as realized gains. Premiums received from writing options, which are either exercised or closed, are offset against the proceeds received or amount paid on the transaction to determine realized gains or losses. Amounts recovered for securities litigation are included in the realized gains of the Fund and are recorded when received. The Fund did not write covered call options during the year ended December 31, 2021.
19
OBERWEIS INTERNATIONAL OPPORTUNITIES INSTITUTIONAL FUND
Notes to Financial Statements December 31, 2021 (continued)
5. Redemption fee
The Fund is designed for long-term investors. To discourage market timers, redemptions of shares within 90 days of purchase are subject to a 2% redemption fee of the total redemption amount. The redemption fee is deducted from the redemption proceeds and is retained by the Fund.
The redemption fee is retained by the Fund for the expense they incur in connection with shareholder redemptions. Redemption fees received by the Fund were $5,957 for the year ended December 31, 2021 and were recorded as a reduction of the redemption of shares in the Statement of Changes in Net Assets.
6. Earnings credits and interest charges
The Trust, as part of the agreement with the Custodian, receives credits against its custodian fees on its uninvested cash balances and is allowed to borrow for temporary purposes. Borrowings are not to exceed 5% of the value of each Fund’s total assets at the time of any such borrowing. Interest on amounts borrowed is calculated at the prime rate and is payable monthly. During the year ended December 31, 2021, the Fund received credits of $4,484. The Fund incurred interest charges of $10,400, which is included in custodian fees and expenses in the Statement of Operations.
7. Coronavirus (COVID-19) pandemic
In early 2020, an outbreak of a novel strain of coronavirus (COVID-19) emerged globally. This coronavirus has resulted in closing international borders, enhanced health screenings, healthcare service preparation and delivery, quarantines, cancellations, disruptions to supply chains and customer activity, as well as general public concern and uncertainty. The impact of this outbreak has negatively affected the worldwide economy, as well as the economies of individual countries, the financial health of individual companies and the market in general in significant and unforeseen ways. The future impact of COVID-19 is currently unknown, and it may exacerbate other risks that apply to the Funds, including political, social and economic risks. Any such impact could adversely affect the Funds’ performance, the performance of the securities in which the Funds invest and may lead to losses on your investment in each Fund. The ultimate impact of COVID-19 on the financial performance of the Funds’ investments is not reasonably estimable at this time.
8. Subsequent events
The Funds have evaluated subsequent events through the issuance of the financial statements and determined that no events have occurred that require disclosure.
20
OBERWEIS INTERNATIONAL OPPORTUNITIES INSTITUTIONAL FUND
Financial Highlights
Per share income and capital for a share outstanding throughout each year is as follows:
| | | Years Ended December 31, | | |
| | | | | 2021 | | | | 2020 | | | | 2019 | | | | 2018 | | | | 2017 | | |
| | Net asset value at
beginning of year | | $ | 16.95 | | | $ | 10.41 | | | $ | 8.54 | | | $ | 12.77 | | | $ | 9.72 | | |
| | | |
| | INCOME (LOSS) FROM INVESTMENT OPERATIONS: | |
| | Net investment income
(loss)a | | | (.06 | ) | | | (.03 | ) | | | .04 | | | | .04 | | | | .03 | | |
| | Net realized and unrealized gains (losses) on investments and foreign currency transactions | | | .40 | | | | 6.66 | | | | 1.97 | | | | (3.11 | ) | | | 3.95 | | |
| | Total from investment operations | | | .34 | | | | 6.63 | | | | 2.01 | | | | (3.07 | ) | | | 3.98 | | |
| | Redemption feesa | | | — | c | | | — | c | | | — | c | | | — | c | | | — | c | |
| | Less dividends and distributions: | | | | | | | | | | | | | | | | | | | | | |
| | Dividends from net realized gains on investments and foreign currency transactions | | | (4.18 | ) | | | (.04 | ) | | | — | | | | (1.15 | ) | | | (.85 | ) | |
| | Dividends from net investment income | | | — | | | | (.05 | ) | | | (.14 | ) | | | (.01 | ) | | | (.08 | ) | |
| | Total dividends and distributions | | | (4.18 | ) | | | (.09 | ) | | | (.14 | ) | | | (1.16 | ) | | | (.93 | ) | |
| | Net asset value at end of year | | $ | 13.11 | | | $ | 16.95 | | | $ | 10.41 | | | $ | 8.54 | | | $ | 12.77 | | |
| | Total Return (%) | | | 2.10 | | | | 63.65 | | | | 23.50 | | | | (23.91 | ) | | | 40.99 | | |
| | | |
| | RATIO/SUPPLEMENTAL DATA: | |
| | Net Assets at end of year
(in thousands) | | $ | 1,078,428 | | | $ | 1,197,656 | | | $ | 967,119 | | | $ | 753,138 | | | $ | 1,041,117 | | |
| | Ratio of gross expenses to average net assets (%) | | | 1.09 | | | | 1.13 | | | | 1.12 | | | | 1.11 | | | | 1.15 | | |
| | Ratio of net expenses to average net assets (%)b | | | 1.09 | | | | 1.10 | | | | 1.08 | | | | 1.08 | | | | 1.10 | | |
| | Ratio of net investment income (loss) to average net assets (%) | | | (.32 | ) | | | (.27 | ) | | | .37 | | | | .35 | | | | .29 | | |
| | Portfolio turnover rate (%) | | | 91 | | | | 134 | | | | 153 | | | | 145 | | | | 168 | | |
Notes:
21
Report of Independent Registered Public Accounting FirM

To the Board of Trustees of The Oberweis Funds and the Shareholders of Oberweis International Opportunities Institutional Fund
Opinion on the Financial Statements
We have audited the accompanying statement of assets and liabilities of Oberweis International Opportunities Institutional Fund, a series of shares of beneficial interest in The Oberweis Funds (the “Fund”), including the schedule of investments, as of December 31, 2021, and the related statement of operations for the year then ended, the statements of changes in net assets for each of the years in the two-year period then ended and the financial highlights for each of the years in the five-year period then ended, and the related notes (collectively referred to as the “financial statements”). In our opinion, the financial statements present fairly, in all material respects, the financial position of the Fund as of December 31, 2021, and the results of its operations for the year then ended, the changes in its net assets for each of the years in the two-year period then ended and its financial highlights for each of the years in the five-year period then ended, in conformity with accounting principles generally accepted in the United States of America.
Basis for Opinion
These financial statements are the responsibility of the Fund’s management. Our responsibility is to express an opinion on the Fund’s financial statements based on our audits. We are a public accounting firm registered with the Public Company Accounting Oversight Board (United States) (“PCAOB”) and are required to be independent with respect to the Fund in accordance with the U.S. federal securities law and the applicable rules and regulations of the Securities and Exchange Commission and the PCAOB.
We conducted our audits in accordance with the standards of the PCAOB. Those standards require that we plan and perform the audit to obtain reasonable assurance about whether the financial statements are free of material misstatement, whether due to error or fraud. The Fund is not required to have, nor were we engaged to perform, an audit of its internal control over financial reporting. As part of our audit we are required to obtain an understanding of internal control over financial reporting but not for the purpose of expressing an opinion on the effectiveness of the Fund’s internal control over financial reporting. Accordingly, we express no such opinion.
Our audits included performing procedures to assess the risk of material misstatement of the financial statements, whether due to error or fraud, and performing procedures that respond to those risks. Such procedures included examining, on a test basis, evidence regarding the amounts and disclosures in the financial statements. Our procedures included confirmation of securities owned as of December 31, 2021 by correspondence with the custodian, brokers, or by other appropriate auditing procedures where replies from brokers were not received. Our audits also included evaluating the accounting principles used and significant estimates made by management, as well as evaluating the overall presentation of the financial statements. We believe that our audits provide a reasonable basis for our opinion.

BBD, LLP
We have served as the auditor of one or more of the Funds in The Oberweis Funds since 2016.
Philadelphia, Pennsylvania
February 23, 2022
22
TRUSTEES AND OFFICERS OF THE OBERWEIS FUNDS (unaudited)
Name, Address and Age |
Position Held with Fund
|
Term of Office and
Length of Time Served
|
NONINTERESTED TRUSTEES |
Katherine Smith Dedrick (64)
3333 Warrenville Road,
Suite 500 Lisle, IL 60532 | Trustee | Trustee since
November, 20041 |
| | |
Gary D. McDaniel (73)
3333 Warrenville Road,
Suite 500 Lisle, IL 60532 | Trustee | Trustee since
April, 20041 |
James G. Schmidt (74)
3333 Warrenville Road,
Suite 500 Lisle, IL 60532 | Trustee | Trustee since
December, 20031 |
INTERESTED TRUSTEES |
James D. Oberweis (75)
3333 Warrenville Road,
Suite 500 Lisle, IL 60532 | Trustee2 | Trustee since
July, 19861 |
James W. Oberweis (47)
3333 Warrenville Road,
Suite 500 Lisle, IL 60532 | President | Officer since
August, 19963 |
Patrick B. Joyce (62)
3333 Warrenville Road,
Suite 500 Lisle, IL 60532 | Executive Vice President Chief Compliance Officer | Officer since
October, 19943 |
David I. Covas (46)
3333 Warrenville Road,
Suite 500 Lisle, IL 60532 | Vice President | Officer since
August, 20043 |
Kenneth S. Farsalas (51)
3333 Warrenville Road,
Suite 500 Lisle, IL 60532 | Vice President | Officer since
August, 20093 |
Eric V. Hannemann (48)
3333 Warrenville Road,
Suite 500 Lisle, IL 60532 | Treasurer | Officer since
August, 20053 |
Thomas P. Joyce (36)
3333 Warrenville Road,
Suite 500 Lisle, IL 60532 | Secretary | Officer since
July, 20213 |
The Statement of Additional Information includes additional information about Fund officers and trustees and is available upon request without charge, by calling the Fund at 800-323-6166.
23
TRUSTEES AND OFFICERS OF THE OBERWEIS FUNDS
(unaudited) (continued)
Principal Occupation Last Five Years | Number of
Portfolios
Overseen by
Trustee | Other
Directorships |
| |
President – Smith Dedrick Properties, Inc., 2016 to present; President – KSD Law P.C., 2015 to present; President – KSD Global Consulting, Inc., 2015 to present; Executive Committee Member, Risk Worldwide NZ Ltd., 2011 to 2016; President – Aggressive Publishing, Inc., 2010 to present; Member – Risk Worldwide LLC, 2007 to 2016. | 7 | None |
| | 7 | None |
Senior Vice President and Chief Financial Officer – Federal Heath Sign Co., May 2003 to December 2019. | 7 | None |
|
Illinois State Senator, January 2013 to January 2021; Chairman – Oberweis Dairy, Inc. December, 1986 to present. | 7 | None |
President – Oberweis Asset Management, Inc., September, 2001 to present; Portfolio Manager from December, 1995 to present; President and Director – Oberweis Securities, Inc., September, 1996 to present. | Not Applicable | None |
Executive Vice President, Secretary and Director – Oberweis Asset Management, Inc., September, 1994 to present; Executive Vice President and Director – Oberweis Securities, Inc. September, 1996 to present. | Not Applicable | None |
Vice President – Oberweis Asset Management, Inc., September, 2003 to present. | Not Applicable | None |
Vice President – Oberweis Asset Management, Inc., November 2004 to present. | Not Applicable | None |
Vice President of Accounting – Oberweis Asset Management, Inc. and Oberweis Securities, Inc., June, 2004 to present. | Not Applicable | None |
Vice President of Compliance December, 2021 to present, Senior Compliance Analyst July, 2013 to November, 2021, Compliance Associate April, 2010 to June, 2013 – Oberweis Asset Management, Inc. | Not Applicable | None |
24
OBERWEIS INTERNATIONAL OPPORTUNITIES INSTITUTIONAL FUND
Supplemental Information (unaudited)
Long-term Capital Gain
The International Opportunities Institutional Fund designate $266,497,571, respectively, as long-term capital gain distribution.
Qualified Dividend Income
For the year ended December 31, 2021, 100% of the dividends paid from net investment income for the International Opportunities Institutional Fund is designated as qualified dividend income.
Foreign Taxes Paid
Pursuant to Section 853 of the Internal Revenue Code of 1986, as amended, the International Opportunities Institutional Fund designates $9,932,590 of income derived from foreign sources and $629,697 of foreign taxes paid for the period ended December 31, 2021.
Of the ordinary income (including short-term capital gain) distributions made (or to be made) for the year ended December 31, 2021, the proportionate share of income derived from foreign sources and foreign taxes paid attributable to one share of stock are:
| | Foreign
Source Income | | Foreign
Taxes Paid | |
| | | International Opportunities Institutional Fund | $ | 0.1207 | | $ | 0.0077 | |
Proxy Voting:
The Oberweis Fund has delegated authority to vote proxies related to the Oberweis International Opportunities Institutional Fund Portfolio securities to the Fund’s investment adviser, Oberweis Asset Management, Inc. (“OAM”). A description of the policies and procedures that OAM uses in fulfilling this responsibility is available, without charge upon request, by calling 1-800-323-6166. It also appears on www.oberweisfunds.com and in the Fund’s Statement of Additional Information, which can be found on the Securities and Exchange Commission’s (“SEC”) website at http://www.sec.gov. Information on how the Funds voted proxies relating to portfolio securities during the most recent 12 month period ended December 31 is available (1) without charge, upon request, by calling 1-800-323-6166, and (2) on the SEC’s website at http://www.sec.gov.
Availability of Schedules of Portfolio Investments:
The Fund files its complete schedule of portfolio investments with the SEC for the first and third quarter of each fiscal year (March 31 and September 30) on Form NPORT. The Fund’s Form NPORT are available, without charge, on the SEC’s website at http://www.sec.gov and may be reviewed and copied at the SEC’s Public Reference Room in Washington, D.C. Information on the operation of the Public Reference Room may be obtained by calling 1-800-SEC-0330.
Approval of Investment Advisory Agreement:
The Investment Advisory and Management Agreement between The Oberweis Funds (the “Trust”) and Oberweis Asset Management, Inc. (“OAM”) (the “Advisory Agreement”) with respect to the International Opportunities Institutional Fund (the “Fund”) was last approved by the Board of Trustees of the Trust (the “Board”), including all of the trustees who are not parties to the Advisory Agreement or interested persons of any such party (the “independent trustees”), at a meeting on August 18, 2021. The Board, including a majority of the independent trustees, determined that the continuation of the Advisory Agreement was in the best interests of the Fund.
25
OBERWEIS INTERNATIONAL OPPORTUNITIES INSTITUTIONAL FUND
Supplemental Information (unaudited) (continued)
The Board noted that OAM has been associated with the Fund since its inception. The Board recognized that a long-term relationship with a capable, conscientious investment adviser is in the best interests of the Fund, and that shareholders have invested in the Fund knowing that OAM manages the Fund and knowing the investment advisory and management fee schedule.
Nature, Quality and Extent of Services. With respect to the nature, quality and extent of the services provided to the Fund by OAM pursuant to the Advisory Agreement, the Board considered the background and experience of OAM, the functions performed by OAM and the personnel providing such services, the management capabilities of OAM, the information contained in OAM’s Form ADV, OAM’s financial condition and the compliance reports provided to the Board, and the culture of compliance created by OAM, including the competency of the Trust and OAM’s chief compliance officer. The Board also considered the experience, academic background, long tenure, structure, size and geographic locations of the portfolio management/strategy investment team and its role, the investment process with respect to the types of investments held by the Fund, as well as the honesty and integrity of OAM, and that, in the Board’s experience, OAM personnel are open and forthright with the Board. In addition, the Board considered that OAM is a research-oriented firm that conducts extensive research in connection with managing the Fund and also considered the competitive pressure on active management.
The Board reviewed the investment performance of the Fund as compared to a peer universe of funds provided by Broadridge Financial Solutions, Inc. (“Broadridge”), an independent provider of investment company data (the “Performance Universe”), and as compared to the performance of a relevant market benchmark index. With respect to Fund performance, the Board considered the Fund’s performance over the one-, three- and five-year periods ended June 30, 2021, as compared to the performance of the relevant market benchmark index and the Fund’s Performance Universe Average. The Board noted that the Fund outperformed its market benchmark index and Performance Universe Average for all periods reviewed. In light of the information provided and the considerations made, the Board concluded that the nature, quality and extent of the services provided to the Fund by OAM have been and are expected to remain satisfactory.
Fees and Expenses. The Board considered the combined investment advisory and management fees charged to the Fund by OAM (the “management fees”) as compared to the management fees of a peer group of funds provided by Broadridge (the “Expense Group”) and the expense ratio of the Fund as compared to the expense ratios of the Expense Group. The Board considered information provided by Broadridge on how it selected the peer funds included in the Expense Group for the Fund and considered certain limitations as to the comparability of the data provided. Based on the information provided, the Board noted that the management fees charged to the Fund were the same as the median management fee of its Expense Group. The Board also noted that the expense ratio for the Fund was below the median of the expense ratio of the Expense Group.
In addition, the Board considered management fees paid to OAM by other clients. With respect to OAM’s other clients, the Board recognized that the mix of services provided to the Fund, the level of responsibility required under the Advisory Agreement with the Fund, and the regulatory, compliance and operational requirements with respect to the Fund are greater than OAM’s obligations for similar client accounts, and that the management fees for such accounts are less relevant to the Board’s consideration of the management fees for the Fund because they reflect different competitive forces than those in the mutual fund marketplace. Based on the information provided, the Board concluded that the Fund’s management fees were reasonable and appropriate in amount, given the nature, quality and extent of the services provided and taking into consideration relevant circumstances.
26
OBERWEIS INTERNATIONAL OPPORTUNITIES INSTITUTIONAL FUND
Supplemental Information (unaudited) (continued)
Profitability. With respect to the costs of services provided and profits realized by OAM, the Board considered the management fees received by OAM from the Fund as well as the level, quality and expense of OAM’s staff and the services that OAM provides. The Board also considered the explanation from OAM that the profits realized by OAM specifically from the relationship with the Fund could not be identified due to the impracticality of expense allocation, noting the difficulty of breaking down profitability related to the Fund versus the other Oberweis Funds and other client accounts because management and personnel time and services are not allocated between the various types of accounts. The Board noted OAM’s belief that, while the profits could not be itemized, the overall profitability of OAM was average and within a reasonable range relative to other investment advisory firms, and considered that OAM has contractually agreed to reimburse the Fund for expenses if its expense ratio exceeds a certain limit. Based on this information, the Board concluded for the Fund that OAM’s profitability was not unreasonable.
Economies of Scale. The Board considered the extent to which economies of scale would be realized as the Fund grows, and whether management fee levels reflect economies of scale for the benefit of Fund shareholders. The Board noted asset capacity constraints for the Fund which limit economies of scale and the expense reimbursement made by OAM to the Fund. The Board concluded that the Fund’s management fees reflect an appropriate recognition of any economies of scale.
Other Benefits to OAM and Its Affiliates. The Board considered the character and amount of other incidental benefits received by OAM and its affiliates from their relationship with the Fund, including benefits to OAM and other OAM client accounts related to soft dollars generated by the Fund’s brokerage transactions. The Board also noted that during the past year none of the Fund’s brokerage transactions had been placed through the affiliated broker-dealer of OAM.
After due consideration of all of the information and factors deemed relevant by the Board and based upon its own business judgment and the conclusions reached, the Board determined to approve the continuance of the Advisory Agreement. The Board, including the independent trustees, did not identify any single factor or group of factors as all-important or controlling, and considered all factors together.
Expense Examples:
As a shareholder of The Oberweis International Opportunities Institutional Fund, you may incur two types of costs: (1) transaction costs, including redemption fees and (2) ongoing costs, including management fees; distribution (and/or service) 12b-1 fees; and other Fund expenses. This example is intended to help you understand your ongoing costs (in dollars) of investing in The Oberweis International Opportunities Institutional Fund and to compare these costs with the ongoing costs of investing in other mutual funds.
The Example is based on an investment of $1,000 investment at the beginning of the period and held for the entire period.
Actual Expenses:
The first line for each Fund in the table below provides information about actual account values and actual expenses. You may use the information below; together with the amount you invested, to estimate the expenses that you paid over the period. Simply divide your account value by $1,000 (for example, an $8,600 account value divided by $1,000=8.6), then multiply the result by the number in the table under the heading entitled “Expenses Paid During Period” to estimate the expenses you paid on your account during this period.
27
OBERWEIS INTERNATIONAL OPPORTUNITIES INSTITUTIONAL FUND
Supplemental Information (unaudited) (continued)
Hypothetical Example for Comparison Purposes:
The second line for each Fund in the table below provides information about hypothetical account values and hypothetical expenses based on each Fund’s actual expense ratio and an assumed rate of return of 5% per year before expenses, which is not the Fund’s actual return.
The hypothetical account values and expenses may not be used to estimate the actual ending account balance or expenses you paid for the period. You may use this information to compare this 5% hypothetical example with the 5% hypothetical examples that appear in the shareholder reports of other funds.
Please note that the expenses shown in the table are meant to highlight your ongoing costs only and do not reflect any transactional costs, such as redemption fees. Therefore, the second line for each Fund in the table is useful in comparing ongoing costs only, and will not help you determine the relative total costs of owning different funds. In addition, if these transactional costs were included, your costs would have been higher.
| | Beginning
Account
Value
7/1/21 | Ending
Account
Value
12/31/21 | Expenses
Paid
During
Period
7/1/21 –
12/31/21 | Expense
Ratio
During
Period
7/1/21 –
12/31/21 | |
| | | Actual | $ | 1,000.00 | $ | 959.86 | $ | 5.38 | 1.09 | % | |
| | | Hypothetical | $ | 1,000.00 | $ | 1,019.71 | $ | 5.55 | 1.09 | % | |
* Expenses are equal to the average account value times the Fund’s annualized expense ratio multiplied by the number of days in the most recent fiscal half-year divided by the number of days in the fiscal year.
28
Trustees and Officers | | |
James D. Oberweis
Trustee Gary D. McDaniel
Trustee James W. Oberweis
President David I. Covas
Vice President Kenneth S. Farsalas
Vice President | | Katherine Smith Dedrick
Trustee James G. Schmidt
Trustee Patrick B. Joyce
Executive Vice President
Chief Compliance Officer Eric V. Hannemann
Treasurer Thomas P. Joyce
Secretary |
Manager and Investment Advisor
Oberweis Asset Management, Inc.
3333 Warrenville Road, Suite 500, Lisle, IL 60532
800-323-6166
oberweisfunds.com
Distributor
Oberweis Securities, Inc.
3333 Warrenville Road, Suite 500, Lisle, IL 60532
630-577-2300
oberweisfunds.com
Custodian
UMB Bank, n.a.
928 Grand Blvd., Kansas City, MO 64106
Transfer Agent
UMB Fund Services, Inc.
P.O. Box 711, Milwaukee, WI 53201-0711
800-245-7311
Counsel
Vedder Price P.C.
222 North LaSalle Street, Chicago, IL 60601
Independent Registered Public Accounting Firm
BBD, LLP
1835 Market Street, 3rd Floor, Philadelphia, PA 19103
International Opportunities Institutional Fund
800-245-7311
oberweisfunds.com

3333 Warrenville Road
Suite 500
Lisle, IL 60532
Audit Fees include amounts related to the audit of the registrant’s annual financial statements and services normally provided by the principal accountant in connection with statutory and regulatory filings. Tax Fees principally include tax compliance, tax advice, tax planning and preparation of tax returns.
(e)(1) The registrant’s audit committee pre-approves all audit services provided by the registrant’s principal accountant for the registrant and all non-audit services provided by the registrant’s principal accountant for the registrant, its investment adviser and any entity controlling, controlled by, or under common control with the investment adviser (“Adviser Affiliate”) that provides ongoing services to the registrant, if the engagement by the investment adviser or Adviser Affiliate relates directly to the operations and financial reporting of the registrant.
(e)(2) No services included in (b) – (d) above were approved pursuant to paragraph (c)(7)(i)(C) of Rule 2-01 of Regulation S-X.
(f) Not Applicable.
(g) The aggregate fees billed for the most recent fiscal year and the preceding fiscal year by the registrant’s principal accountant for non-audit services rendered to the registrant, its investment, and Adviser Affiliate that provides ongoing services to the registrant for 2021 and 2020 were $26,000 and $29,000, respectively.
(h) Non-audit services rendered to the registrant’s investment adviser and any Adviser Affiliate that were not pre-approved pursuant to Paragraph (c) (7) (ii) of Rule 2-01 of Regulation S-X were considered by the registrant’s audit committee as to whether they were compatible with maintaining the principal account’s independence.
Not Applicable to the registrant.
See Schedule in Item 1.
Not Applicable to the registrant.
Not Applicable to the registrant.
Not Applicable to the registrant.
There have been no material changes to the procedures by which shareholders may recommend nominees to the registrant’s board of trustees since registrant last disclosed such procedures in its proxy statement dated April 16, 2004.
Pursuant to the requirements of the Securities Exchange Act of 1934 and the Investment Company Act of 1940, the registrant has duly caused this report to be signed on its behalf by the undersigned, thereunto duly authorized.
Pursuant to the requirements of the Securities Exchange Act of 1934 and the Investment Company Act of 1940, this report has been signed below by the following persons on behalf of the registrant and in the capacities and on the dates indicated.