UNITED STATES
SECURITIES AND EXCHANGE COMMISSION
Washington, D.C. 20549
FORM N-CSR
CERTIFIED SHAREHOLDER REPORT OF REGISTERED
MANAGEMENT INVESTMENT COMPANIES
Investment Company Act file number 811-4854
The Oberweis Funds
(Exact name of registrant as specified in charter)
3333 Warrenville Road, Suite 500, Lisle, IL 60532
(Address of principal executive offices) (Zip code)
James W. Oberweis | Copy to: James A. Arpaia |
(Name and address of agent for service)
Registrant’s telephone number, including area code: (800) 323-6166
Date of fiscal year end: December 31
Date of reporting period: December 31, 2023
Form N-CSR is to be used by management investment companies to file reports with the Commission not later than 10 days after the transmission to stockholders of any report that is required to be transmitted to stockholders under Rule 30e-1 under the Investment Company Act of 1940 (17 CFR 270.30e-1). The Commission may use the information provided on Form N-CSR in its regulatory, disclosure review, inspection, and policymaking roles.
A registrant is required to disclose the information specified by Form N-CSR, and the Commission will make this information public. A registrant is not required to respond to the collection of information contained in Form N-CSR unless the Form displays a currently valid Office of Management and Budget (“OMB”) control number. Please direct comments concerning the accuracy of the information collection burden estimate and any suggestions for reducing the burden to Secretary, Securities and Exchange Commission, 450 Fifth Street, NW, Washington, DC 20549-0609. The OMB has reviewed this collection of information under the clearance requirements of 44 U.S.C. § 3507.
ITEM 1. REPORTS TO STOCKHOLDERS.
Annual Reports for the period 01/01/23 through 12/31/23 is filed herewith

ANNUAL REPORT | ||||||||
INVESTOR | INSTITUTIONAL | |||||||
Oberweis Micro-Cap Fund | OBMCX | OMCIX | ||||||
Oberweis Small-Cap Opportunities Fund | OBSOX | OBSIX | ||||||
Oberweis Global Opportunities Fund | OBEGX | OBGIX | ||||||
Oberweis China Opportunities Fund | OBCHX | OCHIX | ||||||
Oberweis Emerging Markets Fund | OBEMX | OIEMX | ||||||
Oberweis International Opportunities Fund | OBIOX | OBIIX | ||||||
Oberweis Focused International Growth Fund | — | OFIGX | ||||||
December 31, 2023 | ||||||||
oberweisfunds.com | ||||||||
TABLE OF CONTENTS
1 | ||
4 | ||
Schedule of Investments | ||
17 | ||
21 | ||
25 | ||
28 | ||
31 | ||
35 | ||
38 | ||
Statements of Assets and Liabilities | ||
40 | ||
40 | ||
40 | ||
41 | ||
41 | ||
42 | ||
42 | ||
Statements of Operations | ||
43 | ||
43 | ||
44 | ||
44 | ||
44 | ||
45 | ||
45 | ||
Statements of Changes in Net Assets | ||
46 | ||
47 | ||
48 | ||
49 | ||
50 | ||
51 | ||
52 | ||
53 | ||
Financial Highlights | ||
64 | ||
66 | ||
68 | ||
70 | ||
72 | ||
74 | ||
76 | ||
77 | ||
78 | ||
80 |
PRESIDENT’S LETTER (unaudited)
Dear Fellow Oberweis Funds Shareholder,
2023 Performance in REVIEW
2023 was a mixed year for our funds. The Micro-Cap Fund performed very well, with an 18.87% (based on investor-class returns) compared to 9.11% for the Russell Micro-Cap Growth Index. The Small-Cap Opportunities Fund returned 15.81% versus 18.66% for the Russell 2000 Growth Index. These two U.S.-focused funds have performed exceptionally well over multi-year periods, outperforming their benchmark returns by a wide margin over the trailing 3-, 5-, 10-, and 15-year measurement periods.
The year was more difficult for our international-focused funds. The China Opportunities Fund returned -7.70% compared to -11.20% for the MSCI China Index. Although the China Opportunities Fund has exceeded its benchmark over the trailing 1-,3-,5-, 10- and 15-year periods, the broader decline in Chinese equities has yielded unfavorable absolute returns in recent years. International Opportunities returned 4.89% compared to 10.57% for the MSCI World ex-US SCG Net Index. Global Opportunities gained 6.40% versus 16.84% for the MSCI ACWI Small-Cap Index. The Emerging Markets Fund returned 15.02% versus 23.92% for the MSCI EM Small-Cap Index. The Focused International Growth Fund returned 16.60% versus 18.24% for the MSCI EAFE Index.
The macro environment last year posed challenges for our investment style. First, our strategies generally focus on smaller companies with misunderstood growth potential. To find them, most of our funds begin with the universe of firms reporting positive earnings surprises and/or positive earnings revisions. On average, these types of companies tend to outperform the market, but in 2023 small-caps with the largest negative earnings surprises broadly beat those with the largest positive surprises. Additionally, tighter monetary policy, particularly by the U.S. Federal Reserve, was another headwind and rising rates tend to adversely affect valuations of small-cap growth stocks. Further, since the average growth rate of companies in our funds tends to be higher than those of their respective benchmarks, our funds tend to underperform in a rising interest rate environment. Lastly, rising international risks and slower growth abroad relative to the U.S. made investing outside of the U.S. particularly challenging.
Of course, we aim to deliver long-term results for our shareholders, and over the long-term, the funds have fared well. Over the trailing fifteen years, the Micro-Cap, Small-Cap Opportunities, Global Opportunities, and International Opportunities funds have all beaten their benchmark returns (net of fees). Results have been exceptional for the U.S. funds. The Emerging Markets Fund, which eclipsed its 5-year anniversary in 2023, is well ahead of its benchmark since its inception in 2018.
With respect to the International Opportunities Fund, despite a strong 15-year track record, the fund has underperformed more recently. In our experience, some of the best buying opportunities have occurred after such periods, when valuations tend to be attractive. For example, the International Opportunities Fund lagged in 2018-2019, but then rocketed back with a 63% gain in 2020. Similarly, following a tough year in 2008, the fund rebounded 110% from 2009-2010, well ahead of its benchmark. Although no one can predict the future, we believe it’s worth studying patterns of the past.
Globally, the U.S. economy continues to lead the developed world in terms of economic growth, though valuations of its large-cap stocks are also the highest in the world. Developed markets outside of America face more difficult challenges, but slower growth and geopolitical risks appear to be already factored into less expensive equity valuations. Emerging markets, which one might expect to lag in a year in which rates soared, have outperformed. We attribute this both to greater economic resiliency than in past cycles as well as lower valuations going
1
PRESIDENT’S Letter (unaudited) (continued)
into 2023. Emerging markets, particularly China, continue to trade at a steep discount to the developed world. A shift in political posture, such as a significant stimulus program in China, has the potential to catalyze emerging market stocks.
THE YEAR AHEAD
We believe that the current environment presents a significantly better-than-average risk/reward opportunity for our small-cap strategies. Small-cap companies are trading for some of the cheapest valuations in recent history, both in the U.S. and in international markets. Also, the valuation gap between U.S. small- and large-cap stocks ranks among the widest in nearly 30 years. This comes after a prolonged multi-year cycle of small-cap underperformance, accentuated by one of the fastest and sharpest cycles of rising interest rates in history. It’s easy to forget that longer cycles favoring large- or small-caps have occurred regularly throughout history. Rising interest rate expectations and increasing recession fears have been two of the classic signposts of a cycle favoring large-cap stocks, but that cycle may have already concluded.
Those with long investment tenure or an affinity for market history will recognize that leadership changes invariably occur when a rising interest rate cycle is expected to conclude, which seems to match the present time. While we cannot pinpoint such a shift to a specific quarter or even a year, the pivot from a rising interest rate environment to a declining one has historically favored small-caps. Generally, after a period of rising interest rates, the market discounts both a higher cost of capital and a likelihood for slower economic conditions. When the cycle comes to an end, the bursts for small-caps can be quite dramatic. In fact, if asked for the ideal conditions to buy our strategies, our answer would be the inflection point of change when the small-caps shift course from depressed valuations, which is typically around the emergence from recession and/or the end of an interest rate cycle. We have not had a recession, and may not have one, but the interest rate cycle has seemingly already shifted. Other variables matter as well, such as investor risk-tolerance, economic growth and global military conflicts. But our experience lends one clear lesson: return potential for small-caps tends to be skewed to the upside when valuations are very low and marginal confidence in the asset class begins to improve. We believe this environment is likely to drive mean reversion of valuation multiples for small-cap stocks over the next few years, though the precise timing is hard to predict.
VALUATION RECAP
As of December 31, 2023, the price/earnings (P/E) ratio was 13.8 times for the Global Opportunities Fund (versus 11.8 last quarter), 17.7 times for the Small-Cap Opportunities Fund (versus 17.0 last quarter), 14.1 times for the Micro-Cap Fund (versus 14.4 last quarter), 16.5 times for the International Opportunities Fund (versus 15.6 last quarter), 14.9 times for the China Opportunities Fund (versus 13.5 last quarter), 21.3 times for the Emerging Markets Fund (versus 16.4 times last quarter), and 14.6 times for the Focused International Growth Fund (versus 14.3 last quarter). Each of these funds invests in companies with expected earnings growth rates that are higher than that of the broader market, and in companies expected to grow faster than current market expectations. As of December 31, 2023, the weighted-average market capitalization was $5.2 billion for the Global Opportunities Fund, $5.0 billion for the Small-Cap Opportunities Fund, $1.5 billion for the Micro-Cap Fund, $6.8 billion for the International Opportunities Fund, $3.6 billion for the Emerging Markets Fund, $79.4 billion for the China Opportunities Fund, and $136.0 billion for the Focused International Growth Fund.
2
PRESIDENT’S Letter (unaudited) (continued)
We appreciate your investment in The Oberweis Funds and are grateful for the trust you have shown us with your valuable investments. If you have any questions about your account, please contact shareholder services at (800) 245-7311. Thank you for investing with us in The Oberweis Funds.
Sincerely,

James W. Oberweis, CFA
President & Portfolio Manager
3
Management discussion on fund performance
(unaudited)
Market environment
Global equities returned 24.39% in 2023, as measured by the MSCI World Index. Global small-caps, as measured by the MSCI World Small-Cap Index, returned 16.32%, underperforming large-capitalization stocks. International small-caps underperformed U.S. small-caps for the third year, as evidenced by the 10.57% return on the MSCI World ex-USA Small-Cap Index. Within the United States, small-cap growth stocks underperformed large-cap growth stocks by 2,404 basis points, as measured by the respective returns of the Russell 2000 Growth (18.66%) and Russell 1000 Growth (42.67%) indices. Growth stocks significantly outperformed value stocks globally in 2023, with the MSCI World Growth Index (37.31%) returning 2,494 basis points more than the MSCI World Value Index (12.37%). Similarly, small-cap growth stocks outperformed small-cap value stocks, with the MSCI World Small-Cap Growth Index returning 16.45% versus 11.14% for the MSCI World Small-Cap Value Index. Within domestic small-cap, the Russell 2000 Growth Index (18.66%) outperformed the Russell 2000 Value Index (14.58%) by 408 basis points for the year.
Discussion of The Oberweis funds
The Micro-Cap Fund returned 18.87% versus 9.11% for the Russell Micro-Cap Growth Index. The portfolio benefitted from favorable stock selection in technology, industrials, and consumer discretionary while healthcare detracted from relative performance, primarily due to our underweight position in the sector. At the stock level, Axcelis (ACLS), Camtek (CAMT), and Applied Optoelectronics (AAOI) were among the top contributors to performance. Treace Medical Concepts (TMCI), Model N (MODN), and Nine Energy Service (NINE) were among the top detractors.
The Small-Cap Opportunities Fund returned 15.81% versus 18.66% for the Russell 2000 Growth Index. The portfolio benefitted from favorable stock selection in industrials, energy, and materials. Axcelis (ACLS), Aehr Test Systems (AEHR), and Vertiv (VRT) were among the top contributors to performance. Halozyme (HALO), Amylyx (AMLX), and 2U (TWOU) were among the top detractors.
The International Opportunities Fund returned 4.89% versus 10.57% for the MSCI World ex-US Small Cap Growth Index. At the country level, the Netherlands, Hong Kong, and Israel were the leading contributors to portfolio performance while Japan, the U.K., and Norway were the leading detractors. At the sector level, the portfolio was negatively impacted by stock selection in information technology and industrials, partially offset by positive stock selection in materials and healthcare. At the stock level, Be Semiconductor (BESI NA), Sage Group (SGE LN), and Daiwa Securities (8601 JP) were among the top contributors to performance; M&A Capital Partners (6080 JP), Oxford Instruments (OXIG LN), and Verallia (VRLA FP) were among the top detractors.
The Global Opportunities Fund returned 6.40% versus 16.84% for the MSCI AWCI Small-Cap Index. At the country level, stock selection in the United Kingdom, Taiwan, and China added to portfolio return, while the United States, Japan, and Brazil detracted from portfolio return. At the sector level, industrials, real estate, and financials added to return, while information technology, healthcare, and consumer staples detracted. At the stock level, Ashtead (AHT LN), Axcelis (ACLS US), M31 Technology (6643 TT) were among the top contributors to performance; Halozyme Therapeutics (HALO US), Extreme Networks (EXTR US), and Impinj (PI US) were among the top detractors.
4
Management discussion on fund performance
(unaudited) (continued)
The China Opportunities Fund returned -7.70% versus -11.20% for the MSCI China Index. At the sector level, technology and consumer discretionary contributed to performance while healthcare, communication services, and financials were top detractors. At the stock level, Pinduoduo (PDD US), Wistron (3231 TT), and Alchip Technologies (3661 TT), were among the top contributors to performance; Meituan (3690 HK), Wuxi Biologics (2269 HK), and Longfor (960 HK) were among the top detractors.
The Emerging Markets Fund returned 15.02% versus 23.92% for the MSCI EM Small-Cap Index. At the country level, China, Brazil, and Indonesia were the primary detractors while Thailand, South Korea, and South Africa were the top contributors. At the sector level, the fund was positively impacted by stock selection in consumer discretionary and real estate, while performance was adversely impacted by stock selection in consumer staples and materials. At the stock level, Alchip Technologies (3661 TT), M31 Technology (6643 HK), and KPIT Technologies (KPITTECH IN) were among the top contributors to performance; Chongqing Brewery (600132 CH), OPT Machine Vision (688686 CH), and Hangzhou Robam Appliances (002508 CH) were among the top detractors.
The Focused International Growth Fund returned 16.60% versus 18.24% for the MSCI EAFE Index. At the country level, the U.S., China, and Italy were the top contributors, while the Netherlands, Switzerland, and the U.K. detracted from portfolio return. At the sector level, technology, financials, and healthcare added to return, while materials, consumer staples, and industrials detracted. At the stock level, Cadence Design (CDNS US), Schneider Electric (SU FP), and Sony (6758 JP) were among the top contributors to performance; Adyen (ADYEN NA), Anglo American (AAL LN) and Alcon (ALC SW) were among the top detractors.
For current performance information, please visit www.oberweisfunds.com.
5
Management discussion on fund performance
(unaudited) (continued)
Oberweis Micro-Cap Fund
At December 31, 2023
Asset Allocation (% of Net Assets) | ||
Equities | 97.3 | |
Other Assets less Liabilities | 2.7 | |
Top Ten Holdings (% of Net Assets) | ||
Applied Optoelectronics, Inc. | 3.6 | |
Aehr Test Systems | 3.1 | |
ADMA Biologics, Inc. | 2.7 | |
Camtek Ltd. | 2.7 | |
CECO Environmental Corp. | 1.9 | |
Amphastar Pharmaceuticals, Inc. | 1.9 | |
Ultra Clean Hldgs., Inc. | 1.9 | |
TransMedics Group, Inc. | 1.7 | |
Photronics, Inc. | 1.7 | |
Navitas Semiconductor Corp. | 1.7 | |
Top Ten Industries (% of Net Assets) | ||
Semiconductors & Semiconductor Equipment | 17.0 | |
Biotechnology | 7.9 | |
Healthcare Equipment & | 7.2 | |
Communications Equipment | 4.5 | |
Machinery | 4.3 | |
Commercial Services & Supplies | 4.3 | |
Construction & Engineering | 4.2 | |
Hotels, Restaurants & Leisure | 3.8 | |
Banks | 3.4 | |
Pharmaceuticals | 3.2 | |
Oberweis Small-Cap Opportunities Fund
At December 31, 2023
Asset Allocation (% of Net Assets) | ||
Equities | 95.9 | |
Other Assets less Liabilities | 4.1 | |
Top Ten Holdings (% of Net Assets) | ||
Axcelis Technologies, Inc. | 2.7 | |
Weatherford International PLC | 2.7 | |
Aehr Test Systems | 2.7 | |
Universal Display Corp. | 2.1 | |
Amphastar Pharmaceuticals, Inc. | 2.0 | |
Frontdoor, Inc. | 1.8 | |
TransMedics Group, Inc. | 1.7 | |
Oshkosh Corp. | 1.7 | |
Encompass Health Corp. | 1.7 | |
AeroVironment, Inc. | 1.7 | |
Top Ten Industries (% of Net Assets) | ||
Semiconductors & Semiconductor Equipment | 12.2 | |
Healthcare Equipment & | 10.4 | |
Machinery | 7.6 | |
Software | 7.1 | |
Healthcare Providers & Services | 5.4 | |
Energy Equipment & Services | 3.8 | |
Building Products | 3.8 | |
Professional Services | 3.6 | |
Aerospace & Defense | 3.1 | |
Diversified Consumer Services | 3.0 | |
6
Management discussion on fund performance
(unaudited) (continued)
Oberweis Global Opportunities Fund
At December 31, 2023
Asset Allocation (% of Net Assets) | ||
Equities | 94.7 | |
Other Assets less Liabilities | 5.3 | |
Top Ten Holdings (% of Net Assets) | ||
Ashtead Technology Hldgs. PLC | 6.8 | |
Alphatec Hldgs., Inc. | 5.0 | |
Weatherford International PLC | 4.8 | |
Axcelis Technologies, Inc. | 4.2 | |
Veracyte, Inc. | 3.5 | |
Vertiv Hldgs. Co. | 3.3 | |
Fuji Electric Co. Ltd. | 3.3 | |
Whitbread PLC | 3.2 | |
Bel Fuse, Inc. | 3.1 | |
Clean Harbors, Inc. | 2.6 | |
Top Ten Industries (% of Net Assets) | ||
Semiconductors & Semiconductor Equipment | 14.6 | |
Healthcare Equipment & Supplies | 8.6 | |
Electrical Equipment | 8.5 | |
Trading Co. & Distribution | 8.3 | |
Energy Equipment & Services | 6.9 | |
Commercial Services & Supplies | 4.7 | |
Electronic Equipment, Instruments & Components | 4.2 | |
Biotechnology | 3.5 | |
Machinery | 3.3 | |
Hotels, Restaurants & Leisure | 3.2 | |
Oberweis China Opportunities Fund
At December 31, 2023
Asset Allocation (% of Net Assets) | ||
Equities | 99.9 | |
Rights | 0.0 | |
Other Assets less Liabilities | 0.1 | |
Top Ten Holdings (% of Net Assets) | ||
PDD Hldgs. ADS | 8.1 | |
Alibaba Group Hldg. Ltd. | 4.9 | |
Tencent Hldgs. Ltd. | 4.6 | |
New Oriental Education & Technology Group, Inc. | 4.5 | |
Alchip Technologies Ltd. | 4.2 | |
Taiwan Semiconductor Manufacturing Co. Ltd. ADS | 3.9 | |
NetEase, Inc. | 3.6 | |
Baidu, Inc. | 3.0 | |
Trip.com Group Ltd. | 2.7 | |
Li Auto, Inc. ADS | 2.7 | |
Top Ten Industries (% of Net Assets) | ||
Semiconductors & Semiconductor Equipment | 18.6 | |
Broadline Retail | 14.8 | |
Interactive Media & Services | 7.5 | |
Electronic Equipment, Instruments & Components | 6.8 | |
Hotels, Restaurants & Leisure | 6.3 | |
Diversified Consumer Services | 6.0 | |
Automobile Components | 4.7 | |
Machinery | 4.2 | |
Entertainment | 3.8 | |
Technology Hardware, Storage & Peripherals | 3.7 | |
7
Management discussion on fund performance
(unaudited) (continued)
Oberweis Emerging Markets Fund
At December 31, 2023
Asset Allocation (% of Net Assets) | ||
Equities | 89.8 | |
Short-Term Investments | 0.1 | |
Other Assets less Liabilities | 10.1 | |
Top Ten Holdings (% of Net Assets) | ||
eMemory Technology, Inc. | 2.2 | |
Arcos Dorados Hldgs., Inc. | 2.1 | |
Arabian Contracting Services Co. | 1.9 | |
Control Print Ltd. | 1.9 | |
Alsea, S.A.B. de CV | 1.8 | |
Park Systems Corp. | 1.8 | |
PT Sumber Alfaria Trijaya Tbk | 1.8 | |
VTEX | 1.8 | |
Unimicron Technology Corp. | 1.8 | |
Alchip Technologies Ltd. | 1.8 | |
Top Ten Industries (% of Net Assets) | ||
Semiconductors & Semiconductor Equipment | 11.1 | |
Electronic Equipment, Instruments & Components | 7.6 | |
Software | 6.7 | |
Hotels, Restaurants & Leisure | 6.3 | |
Consumer Staples Distribution & Retail | 4.9 | |
Oil, Gas & Consumable Fuels | 3.6 | |
Banks | 3.3 | |
Beverages | 3.3 | |
Media | 3.2 | |
Pharmaceuticals | 3.1 | |
Oberweis International Opportunities Fund
At December 31, 2023
Asset Allocation (% of Net Assets) | ||
Equities | 98.6 | |
Other Assets less Liabilities | 1.4 | |
Top Ten Holdings (% of Net Assets) | ||
BE Semiconductor Industries NV | 3.4 | |
James Hardie Industries PLC | 3.4 | |
Daiwa Securities Group, Inc. | 3.2 | |
ASM International NV | 3.0 | |
Marks and Spencer Group PLC | 3.0 | |
The Sage Group PLC | 2.9 | |
Element Fleet Management Corp. | 2.8 | |
Stantec, Inc. | 2.6 | |
Fuji Electric Co. Ltd. | 2.4 | |
CTS Eventim AG & Co. | 2.3 | |
Top Ten Industries (% of Net Assets) | ||
Food Products | 8.3 | |
Trading Co. & Distribution | 7.2 | |
Machinery | 7.1 | |
Semiconductors & Semiconductor Equipment | 6.4 | |
Electrical Equipment | 5.4 | |
Consumer Staples Distribution & Retail | 5.1 | |
Capital Markets | 5.1 | |
Specialty Retail | 4.4 | |
Commercial Services & Supplies | 3.8 | |
Pharmaceuticals | 3.7 | |
8
Management discussion on fund performance
(unaudited) (continued)
Oberweis Focused International Growth Fund
At December 31, 2023
Asset Allocation (% of Net Assets) | ||
Equities | 98.7 | |
Short-Term Investments | 1.5 | |
Other Liabilities less Assets | (0.2) | |
Top Ten Holdings (% of Net Assets) | ||
Sony Group Corp. | 8.7 | |
Schneider Electric SE | 5.7 | |
Zurich Insurance Group AG | 5.2 | |
LVMH Moet Hennessy Louis Vuitton SE | 4.6 | |
Cadence Design Systems, Inc. | 4.5 | |
Novo Nordisk A/S | 3.9 | |
Partners Group Hldg. AG | 3.6 | |
Dollarama, Inc. | 3.5 | |
Hitachi Ltd. | 3.3 | |
SAP SE | 3.3 | |
Top Ten Industries (% of Net Assets) | ||
Pharmaceuticals | 9.6 | |
Capital Markets | 9.3 | |
Household Durables | 8.7 | |
Banks | 8.3 | |
Software | 7.8 | |
Electrical Equipment | 5.7 | |
Insurance | 5.2 | |
Oil, Gas & Consumable Fuels | 4.7 | |
Textiles, Apparel & Luxury Goods | 4.6 | |
Automobiles | 4.5 | |
9
MANAGEMENT DISCUSSION ON FUND PERFORMANCE
(unaudited) (continued)
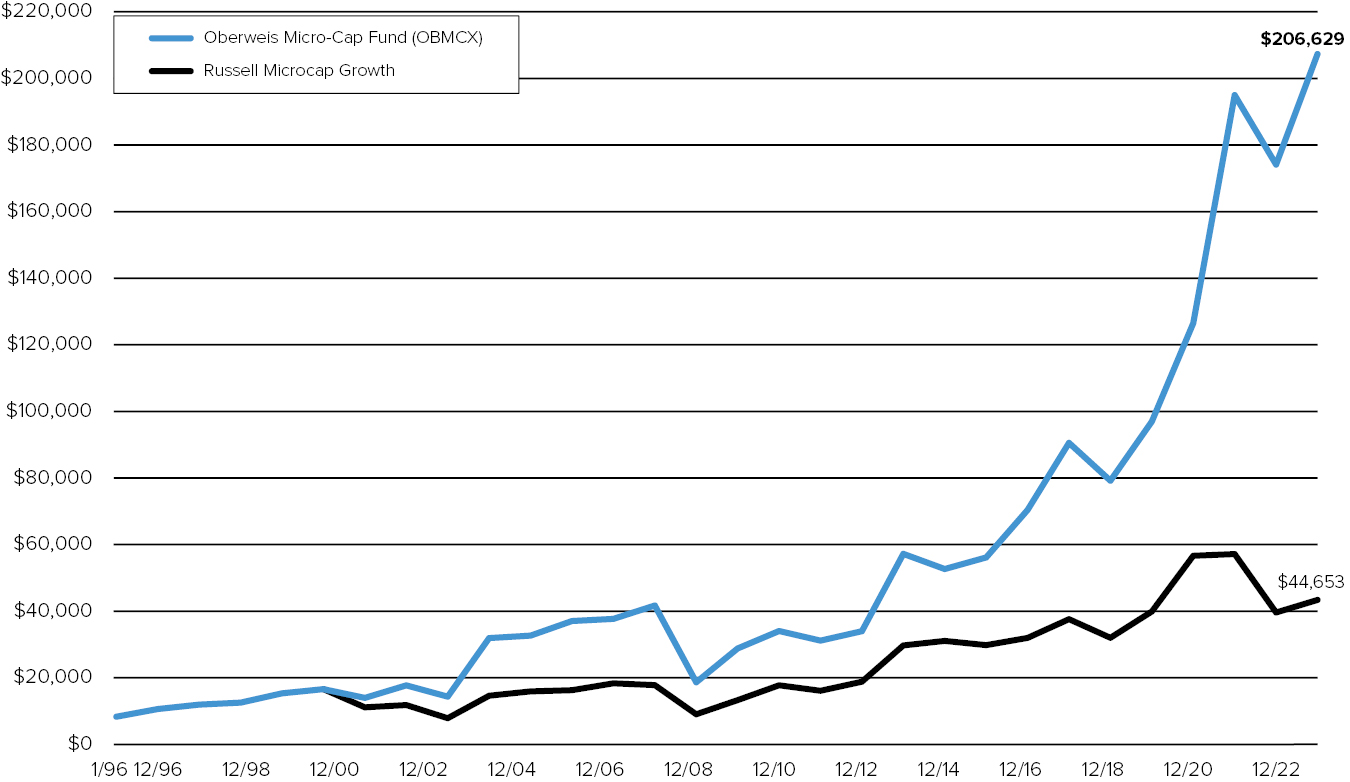
Average Annual Total Returns1 (for the Periods Ended December 31, 2023)
1 YR (%) | 5 YR (%) | 10 YR (%) | SINCE | EXPENSE (%) | |
OBMCX | 18.87 | 20.89 | 13.48 | 11.42 | 1.53 |
OMCIX4 | 19.19 | 21.18 | 13.76 | 11.70 | 1.28 |
Russell Microcap Growth | 9.11 | 5.97 | 3.67 | N/A5 |
Growth of a $10,000 Investment (from January 1, 1996 to December 31, 2023)
1 Performance data represents past performance, which is no guarantee of future results. Current performance may be higher or lower than the performance shown. You can obtain performance data current to the most recent month by visiting oberweisfunds.com. Returns are historical and include changes in share price and reinvestment of dividends and capital gains. Investment return and principal value will fluctuate so that shares, when redeemed, may be worth more or less than their original cost. The Fund’s total returns do not reflect the deduction of income taxes on an individual’s investment. Taxes may reduce your actual investment returns on income or gains paid by the Fund or any gains you may realize if you sell your shares. The Oberweis Funds invest in rapidly growing smaller and medium sized companies, which may offer greater return potential. However, these investments often involve greater risks and volatility. There is no guarantee that the portfolios can achieve their objectives.
The Russell Microcap Growth Index measures the performance of those Russell microcap companies with higher price-to-book ratios and higher forecasted growth values. The Russell Microcap Growth Index is represented by the smallest 1,000 securities in the small cap Russell 2000 Index plus the next 1,000 securities. The Russell Index is unmanaged and is not available for investment.
2 Since Inception returns are from commencement of operations on 01/01/96 for the Fund.
3 Expense ratio is the total annual net fund operating expense ratio as of 12/31/23. The expense ratio gross of any fee waivers or expense reimbursement was 1.53% and 1.28% for the Investor Class and Institutional Class, respectively.
4 The Institutional share class (OMCIX) began on May 1, 2017, returns for prior periods represent synthetic returns.
5 The Russell Microcap Growth Index began on July 3, 2000, and the line graph for the Index begins at the same value as the Fund on that date.
10
Management discussion on fund performance
(unaudited) (continued)
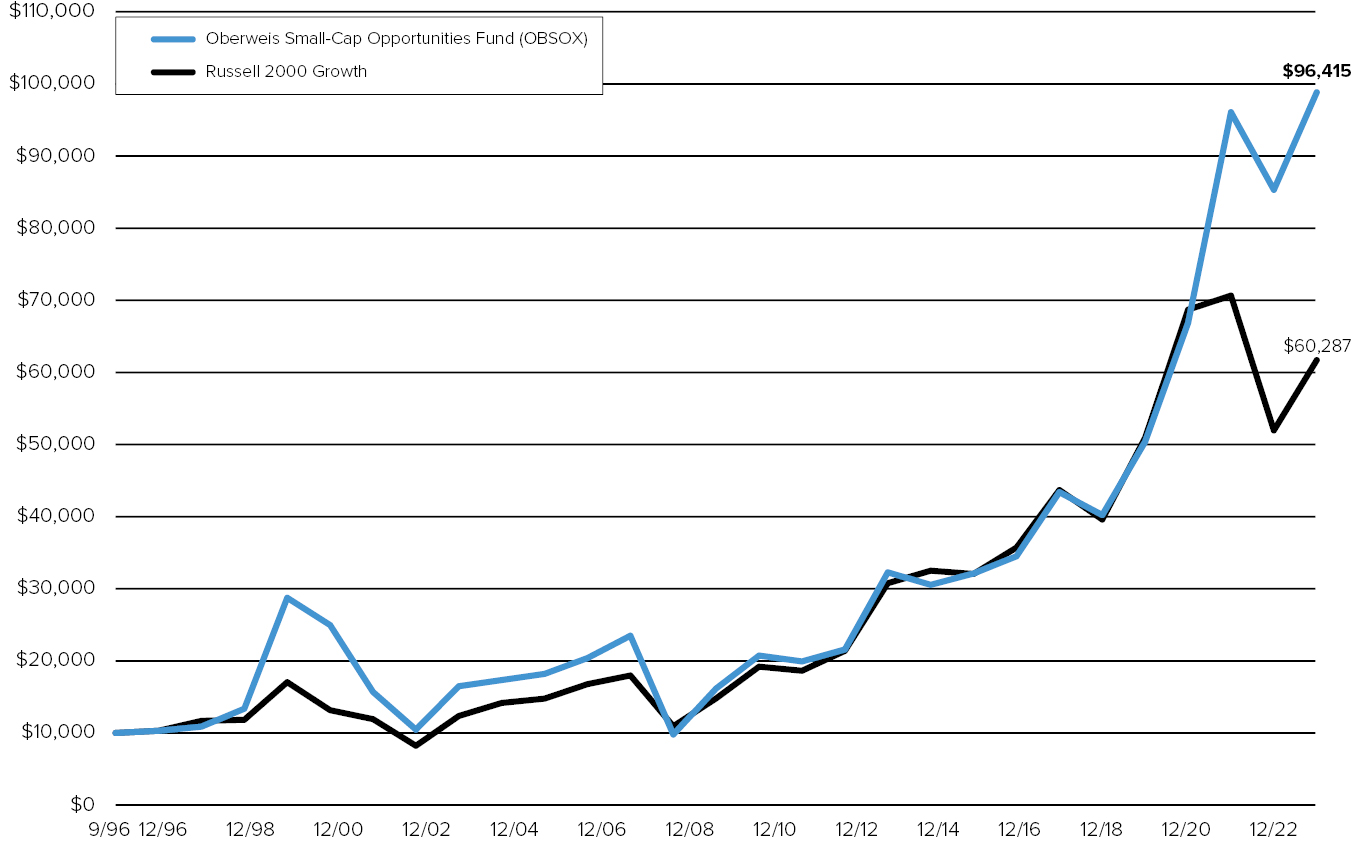
Average Annual Total Returns1 (for the Periods Ended December 31, 2023)
1 YR | 5 YR | 10 YR | SINCE | EXPENSE | ||||||
OBSOX | 15.81 | 19.60 | 11.78 | 8.66 | 1.25 | |||||
OBSIX4 | 16.06 | 19.90 | 12.06 | 8.93 | 1.00 | |||||
Russell 2000 Growth | 18.66 | 9.22 | 7.16 | 6.80 |
Growth of a $10,000 Investment (from September 15, 1996 to December 31, 2023)
1 Performance data represents past performance, which is no guarantee of future results. Current performance may be higher or lower than the performance shown. You can obtain performance data current to the most recent month by visiting oberweisfunds.com. Returns are historical and include changes in share price and reinvestment of dividends and capital gains. Investment return and principal value will fluctuate so that shares, when redeemed, may be worth more or less than their original cost. The Fund’s total returns do not reflect the deduction of income taxes on an individual’s investment. Taxes may reduce your actual investment returns on income or gains paid by the Fund or any gains you may realize if you sell your shares. The Oberweis Funds invest in rapidly growing smaller and medium sized companies, which may offer greater return potential. However, these investments often involve greater risks and volatility. There is no guarantee that the portfolios can achieve their objectives.
The Russell 2000 Growth Index measures the performance of those Russell 2000 companies with higher price-to-book ratios and higher forecasted earnings growth rates. The Russell Index is unmanaged and is not available for investment.
2 Since Inception returns are from commencement of operations on 09/15/96 for the Fund.
3 Expense ratio is the total annual net fund operating expense ratio as of 12/31/23. The expense ratio gross of any fee waivers or expense reimbursement was 1.32% and 1.07% for the Investor Class and Institutional Class, respectively.
4 The Institutional share class (OBSIX) began on May 1, 2017, returns for prior periods represent synthetic returns.
11
Management discussion on fund performance
(unaudited) (continued)
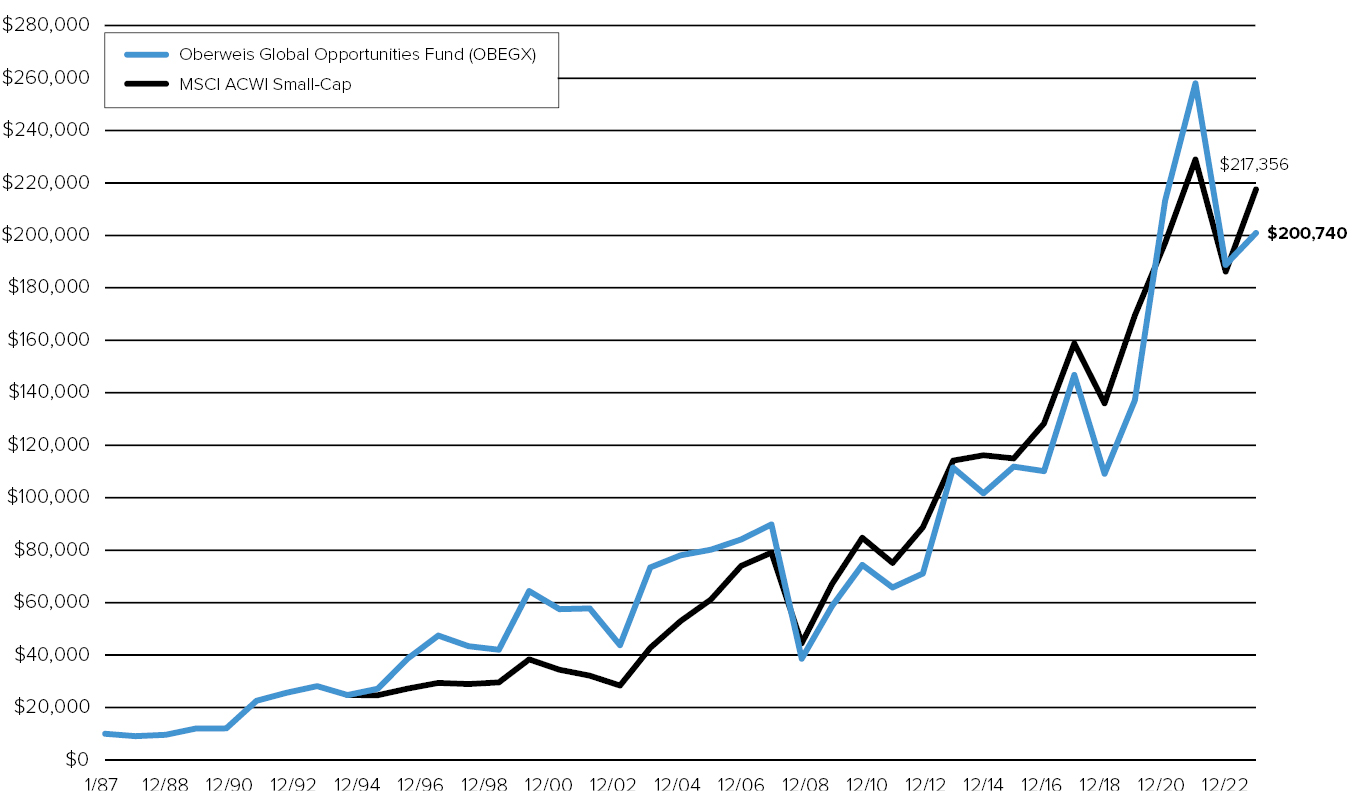
Average Annual Total Returns1 (for the Periods Ended December 31, 2023)
1 YR | 5 YR | 10 YR | SINCE | EXPENSE | ||||||
OBEGX | 6.40 | 12.98 | 6.07 | 8.45 | 1.50 | |||||
OBGIX4 | 6.67 | 13.26 | 6.34 | 8.72 | 1.25 | |||||
MSCI ACWI Small-Cap | 16.84 | 9.85 | 6.66 | N/A5 |
Growth of a $10,000 Investment (from January 7, 1987 to December 31, 2023)
1 Performance data represents past performance, which is no guarantee of future results. Current performance may be higher or lower than the performance shown. You can obtain performance data current to the most recent month by visiting oberweisfunds.com. Returns are historical and include changes in share price and reinvestment of dividends and capital gains. Investment return and principal value will fluctuate so that shares, when redeemed, may be worth more or less than their original cost. The Fund’s total returns do not reflect the deduction of income taxes on an individual’s investment. Taxes may reduce your actual investment returns on income or gains paid by the Fund or any gains you may realize if you sell your shares. The Oberweis Funds invest in rapidly growing smaller and medium sized companies, which may offer greater return potential. However, these investments often involve greater risks and volatility. There is no guarantee that the portfolios can achieve their objectives.
The MSCI ACWI Small-Cap Index (Net) is a free float-adjusted market capitalization weighted index that is designed to measure the equity market performance of small cap developed and emerging markets with dividends reinvested net of withholding tax. A sales load of 4% was charged on the Oberweis Global Opportunities Fund until 12/31/91 and is not reflected in the total return figures or graph above.
2 Since Inception returns are from commencement of operations on 01/07/87 for the Fund.
3 Expense ratio is the total annual net fund operating expense ratio as of 12/31/23. The expense ratio gross of any fee waivers or expense reimbursement was 1.51% and 1.25% for Investor Class and Institutional Class, respectively.
4 The Institutional share class (OBGIX) began on May 1, 2017, returns for prior periods represent synthetic returns.
5 The MSCI ACWI Small-Cap Index began on May 31, 1994, and the line graph for the index begins at the same value as the Fund on that date.
12
Management discussion on fund performance
(unaudited) (continued)
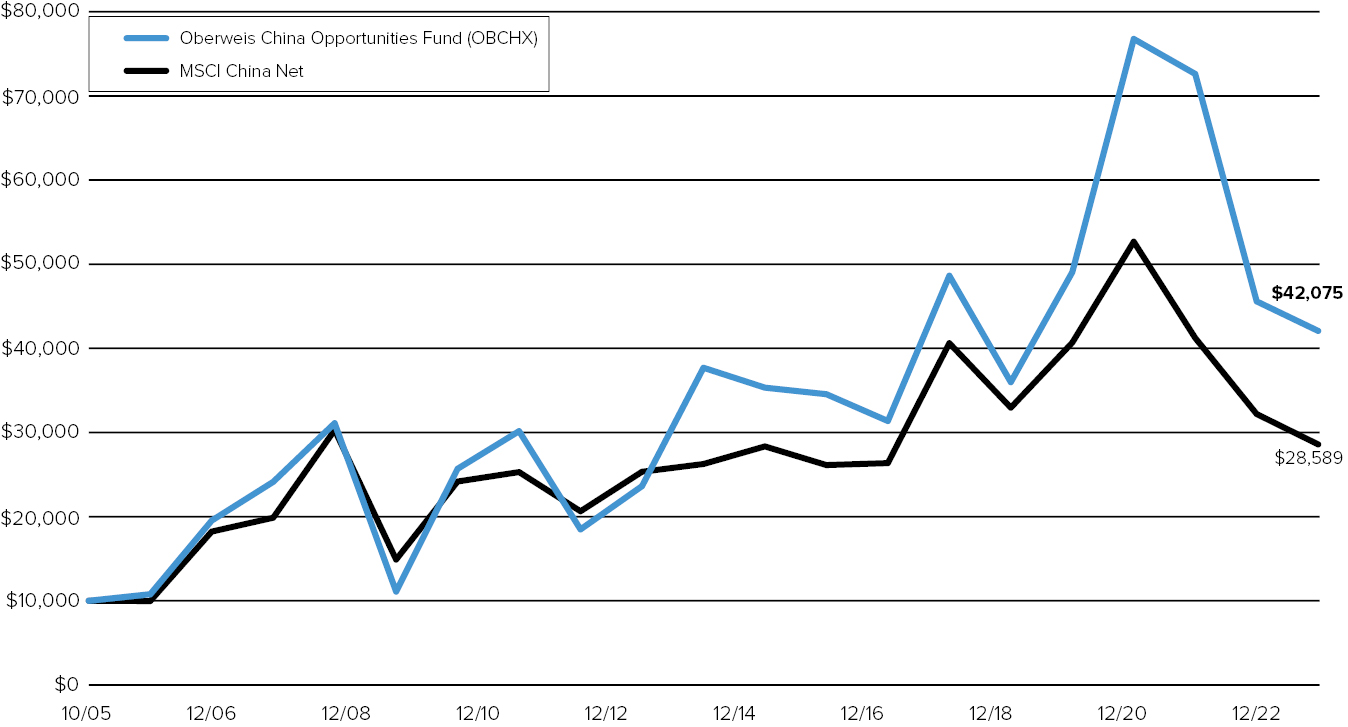
Average Annual Total Returns1 (for the Periods Ended December 31, 2023)
1 YR | 5 YR | 10 YR | SINCE | EXPENSE | ||||||
OBCHX | (7.70) | 3.18 | 1.11 | 8.19 | 2.15 | |||||
OCHIX4 | (7.58) | 3.44 | 1.35 | 8.46 | 1.90 | |||||
MSCI China Net | (11.20) | (2.80) | 0.85 | 5.92 |
Growth of a $10,000 Investment (from October 1, 2005 to December 31, 2023)
1 Performance data represents past performance, which is no guarantee of future results. Returns are historical and include changes in share price and reinvestment of dividends and capital gains. Current performance may be higher or lower than the performance shown. You can obtain performance data current to the most recent month by visiting oberweisfunds.com. The principal value and investment return of an investment will fluctuate so that your shares, when redeemed, may be worth more or less than their original cost. The Fund’s total returns do not reflect the deduction of income taxes on an individual’s investment. Taxes may reduce your actual investment returns on income or gains paid by the Fund or any gains you may realize if you sell your shares. The Oberweis Funds invest in rapidly growing smaller and medium sized companies, which may offer greater return potential. However, these investments often involve greater risks and volatility. Foreign and emerging market investing involves special risks such as currency fluctuation and less public disclosure, as well as economic and political risk. There is no guarantee that the portfolios can achieve their objectives.
The MSCI China Net Index is a free float-adjusted market capitalization-weighted Index of Chinese equities that include China-affiliated corporations and H shares listed on the Hong Kong Exchange, and B shares listed on the Shanghai and Shenzhen exchanges and P chips and foreign listings with minimum dividends reinvested net of withholding tax. The MSCI China net index is unmanaged and is not available for investment.
2 Since Inception returns are from commencement of operations on 10/01/05 for the Fund.
3 Expense ratio is the total annual net fund operating expense ratio as of 12/31/23. The expense ratio gross of any fee waivers or expense reimbursement was 2.16% and 1.90% for Investor Class and Institutional Class, respectively.
4 The Institutional share class (OCHIX) began on May 1, 2017, returns for prior periods represent synthetic returns.
13
Management discussion on fund performance
(unaudited) (continued)
Average Annual Total Returns1 (for the Periods Ended December 31, 2023)
1 YR | 5 YR | SINCE | EXPENSE | |||||
OBEMX | 15.02 | 11.53 | 5.59 | 1.75 | ||||
OIEMX | 15.29 | 11.81 | 5.85 | 1.50 | ||||
MSCI EM Small-Cap | 23.92 | 9.92 | 4.82 |
Growth of a $10,000 Investment (from May 1, 2018 to December 31, 2023)

1 Performance data represents past performance, which is no guarantee of future results. Current performance may be higher or lower than the performance shown. You can obtain performance data current to the most recent month by visiting oberweisfunds.com. Returns are historical and include changes in share price and reinvestment of dividends and capital gains. Investment return and principal value will fluctuate so that shares, when redeemed, may be worth more or less than their original cost. The Fund’s total returns do not reflect the deduction of income taxes on an individual’s investment. Taxes may reduce your actual investment returns on income or gains paid by the Fund or any gains you may realize if you sell your shares. The Oberweis Funds invest in rapidly growing smaller and medium sized companies, which may offer greater return potential. However, these investments often involve greater risks and volatility. There is no guarantee that the portfolios can achieve their objectives.
The MSCI EM Small-Cap Index (Net) is a free float-adjusted market capitalization weighted index that measures the performance of Small-Cap stocks in 24 emerging markets.
2 Since Inception returns are from commencement of operations on 05/01/2018 for the Fund.
3 Expense ratio is the total annual net fund operating expense ratio as of 12/31/23. The expense ratio gross of any fee waivers or expense reimbursement was 2.71% and 2.46% for Investor Class and Institutional Class, respectively.
14
Management discussion on fund performance
(unaudited) (continued)
Average Annual Total Returns1 (for the Periods Ended December 31, 2023)
1 YR | 5 YR | 10 YR | SINCE | EXPENSE | ||||||
OBIOX | 4.89 | 6.05 | 3.99 | 6.81 | 1.59 | |||||
OBIIX4 | 5.23 | 6.33 | 4.26 | 7.08 | 1.09 | |||||
MSCI World ex-US Small Cap Growth | 10.57 | 6.69 | 4.88 | 4.07 |
Growth of a $10,000 Investment (from February 1, 2007 to December 31, 2023)
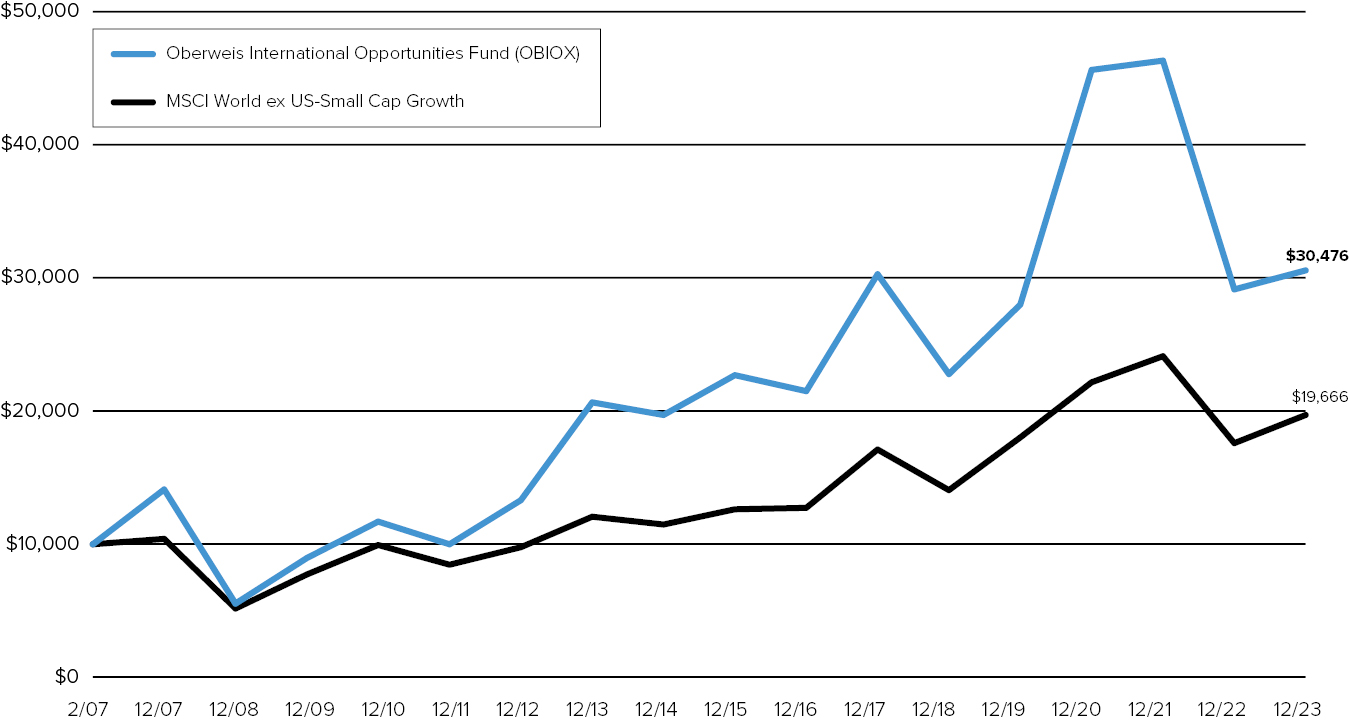
1 Performance data represents past performance, which is no guarantee of future results. Returns are historical and include changes in share price and reinvestment of dividends and capital gains. Current performance may be higher or lower than the performance shown. You can obtain performance data current to the most recent month by visiting oberweisfunds.com. The principal value and investment return of an investment will fluctuate so that your shares, when redeemed, may be worth more or less than their original cost. The Fund’s total returns do not reflect the deduction of income taxes on an individual’s investment. Taxes may reduce your actual investment returns on income or gains paid by the Fund or any gains you may realize if you sell your shares. The Oberweis Funds invest in rapidly growing smaller and medium sized companies, which may offer greater return potential. However, these investments often involve greater risks and volatility. Foreign and emerging market investing involves special risks such as currency fluctuation and less public disclosure, as well as economic and political risk. There is no guarantee that the portfolios can achieve their objectives.
The MSCI World ex-US Small Cap Growth Index is a free float-adjusted market capitalization weighted index that is designed to measure the equity market performance of small cap growth developed and emerging markets excluding the U.S., with minimum dividends reinvested net of withholding tax.
2 Since Inception returns are from commencement of operations on 02/01/07 for the Fund.
3 Expense ratio is the total annual net fund operating expense ratio as of 12/31/23. The expense ratio gross of any fee waivers or expense reimbursement was 1.92% and 1.10% for Investor Class and Institutional Class, respectively.
4 The Institutional share class (OBIIX) began on December 23, 2023, returns for prior periods represent synthetic returns.
15
Management discussion on fund performance
(unaudited) (continued)
Average Annual Total Returns1 (for the Periods Ended December 31, 2023)
1 YR | SINCE | EXPENSE | ||||
OFIGX | 16.60 | (5.80) | 0.95 | |||
MSCI EAFE | 18.24 | 4.22 |
Growth of a $10,000 Investment (from April 1, 2022 to December 31, 2023)
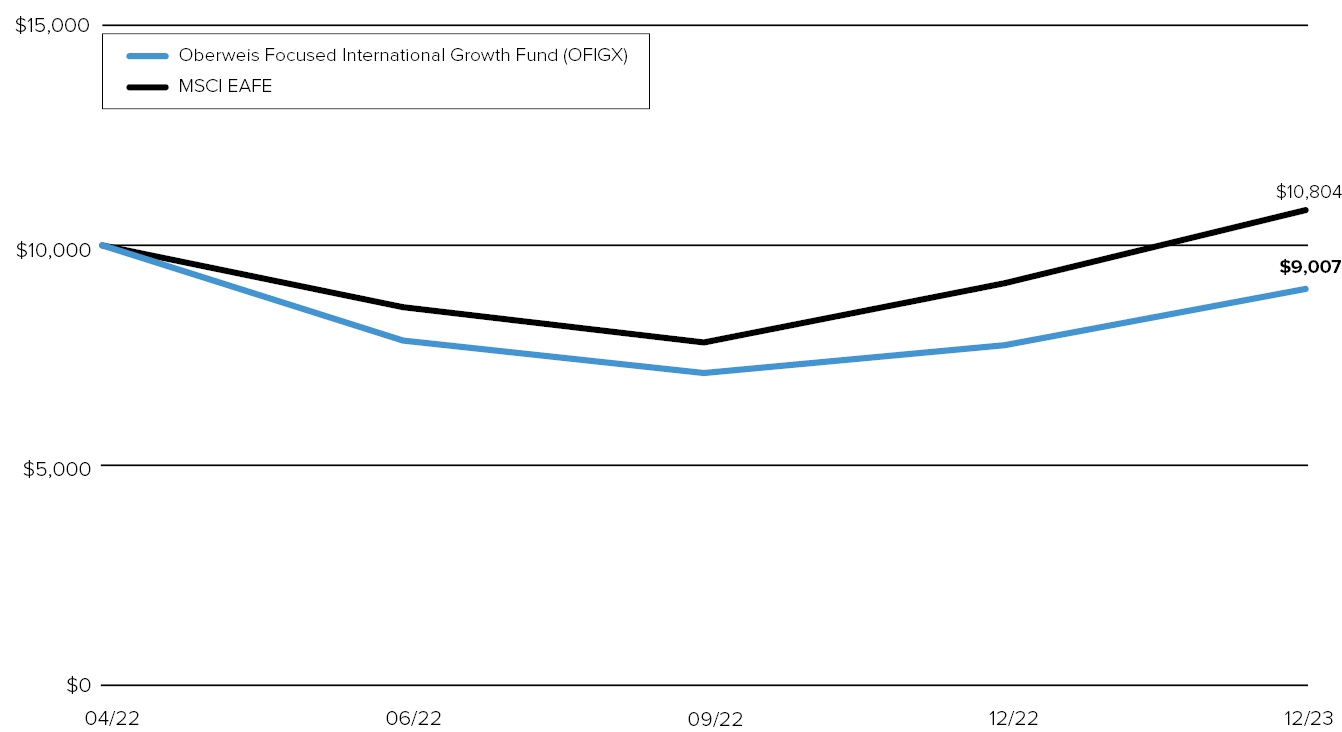
1 Performance data represents past performance, which is no guarantee of future results. Returns are historical and include changes in share price and reinvestment of dividends and capital gains. Current performance may be higher or lower than the performance shown. You can obtain performance data current to the most recent month by visiting oberweisfunds.com. The principal value and investment return of an investment will fluctuate so that your shares, when redeemed, may be worth more or less than their original cost. The Fund’s total returns do not reflect the deduction of income taxes on an individual’s investment. Taxes may reduce your actual investment returns on income or gains paid by the Fund or any gains you may realize if you sell your shares. The Oberweis Funds invest in rapidly growing smaller and medium sized companies, which may offer greater return potential. However, these investments often involve greater risks and volatility. Foreign and emerging market investing involves special risks such as currency fluctuation and less public disclosure, as well as economic and political risk. There is no guarantee that the portfolios can achieve their objectives.
The MSCI EAFE Index is an equity index that captures large and mid-cap representation across 21 developed markets countries around the world, excluding the U.S. and Canada. The index is comprehensive, covering approximately 85% of the free-float-adjusted market capitalization in each country with minimum dividends reinvested net of withholding tax.
2 Since Inception returns are from commencement of operations on 04/01/22 for the Fund.
3 Expense ratio is the total annual net fund operating expense ratio as of 12/31/23. The expense ratio gross of any fee waivers, earnings credit or expense reimbursement was 2.51%.
16
Schedule of Investments December 31, 2023
SHARES | VALUE | ||||
Equities – 97.3% |
| ||||
| |||||
Aerospace & Defense – 1.8% |
| ||||
Cadre Hldgs., Inc. | 102,400 | $ | 3,367,936 | ||
V2X, Inc.* | 100,700 |
| 4,676,508 | ||
| 8,044,444 | ||||
| |||||
Automobile Components – 1.1% |
| ||||
Modine Manufacturing Co.* | 86,500 |
| 5,164,050 | ||
| |||||
Banks – 3.4% |
| ||||
1st Source Corp. | 60,000 |
| 3,297,000 | ||
Heritage Financial Corp. | 140,400 |
| 3,003,156 | ||
Mercantile Bank Corp. | 61,800 |
| 2,495,484 | ||
Preferred Bank | 89,600 |
| 6,545,280 | ||
| 15,340,920 | ||||
| |||||
Beverages – 0.6% |
| ||||
The Vita Coco Co., Inc.* | 106,600 |
| 2,734,290 | ||
| |||||
Biotechnology – 7.9% |
| ||||
ADMA Biologics, Inc.* | 2,710,700 |
| 12,252,364 | ||
Catalyst Pharmaceuticals, Inc.* | 348,600 |
| 5,859,966 | ||
Dynavax Technologies Corp.* | 417,400 |
| 5,835,252 | ||
MannKind Corp.* | 722,800 |
| 2,630,992 | ||
Mirum Pharmaceuticals, Inc.* | 77,400 |
| 2,284,848 | ||
Veracyte, Inc.* | 264,400 |
| 7,273,644 | ||
| 36,137,066 | ||||
| |||||
Building Products – 1.1% |
| ||||
JELD WEN Hldg., Inc.* | 260,200 |
| 4,912,576 | ||
| |||||
Chemicals – 0.6% |
| ||||
Hawkins, Inc. | 37,500 |
| 2,640,750 | ||
| |||||
Commercial Services & Supplies – 4.3% |
| ||||
CECO Environmental Corp.* | 426,700 |
| 8,653,476 | ||
HNI Corp. | 154,800 |
| 6,475,284 | ||
VSE Corp. | 66,300 |
| 4,283,643 | ||
| 19,412,403 | ||||
| |||||
Communications Equipment – 4.5% |
| ||||
Applied Optoelectronics, Inc.* | 849,615 |
| 16,414,562 | ||
Aviat Networks, Inc.* | 129,207 |
| 4,219,901 | ||
| 20,634,463 | ||||
| |||||
Construction & Engineering – 4.2% |
| ||||
Limbach Hldgs., Inc.* | 99,494 |
| 4,523,992 | ||
Primoris Services Corp. | 209,900 |
| 6,970,779 | ||
Sterling Construction Co. Inc.* | 88,000 |
| 7,737,840 | ||
| 19,232,611 | ||||
See accompanying notes to the financial statements.
17
OBERWEIS MICRO-CAP FUND (continued)
Schedule of Investments December 31, 2023
SHARES | VALUE | ||||
Consumer Finance – 1.3% |
| ||||
EZCORP, Inc.* | 655,500 | $ | 5,729,070 | ||
| |||||
Diversified Consumer Services – 3.0% |
| ||||
Adtalem Global Education, Inc.* | 86,500 |
| 5,099,175 | ||
OneSpaWorld Hldgs. Ltd.* | 248,400 |
| 3,502,440 | ||
Rover Group, Inc.* | 466,200 |
| 5,072,256 | ||
| 13,673,871 | ||||
| |||||
Electrical Equipment – 2.8% |
| ||||
American Superconductor Corp.* | 375,800 |
| 4,186,412 | ||
Powell Industries, Inc. | 28,600 |
| 2,528,240 | ||
Thermon Group Hldgs., Inc.* | 190,700 |
| 6,211,099 | ||
| 12,925,751 | ||||
| |||||
Electronic Equipment, Instruments & Components – 2.0% |
| ||||
Bel Fuse, Inc. | 99,300 |
| 6,630,261 | ||
ePlus, Inc.* | 33,300 |
| 2,658,672 | ||
| 9,288,933 | ||||
| |||||
Energy Equipment & Services – 2.5% |
| ||||
Helix Energy Solutions Group, Inc.* | 357,400 |
| 3,674,072 | ||
Precision Drilling Corp.* | 59,700 |
| 3,241,113 | ||
RPC, Inc. | 627,700 |
| 4,569,656 | ||
| 11,484,841 | ||||
| |||||
Healthcare Equipment & Supplies – 7.2% |
| ||||
Alphatec Hldgs., Inc.* | 494,200 |
| 7,467,362 | ||
Artivion, Inc.* | 258,000 |
| 4,613,040 | ||
LeMaitre Vascular, Inc. | 65,300 |
| 3,706,428 | ||
RxSight, Inc.* | 83,100 |
| 3,350,592 | ||
SI BONE, Inc.* | 287,100 |
| 6,026,229 | ||
TransMedics Group, Inc.* | 99,000 |
| 7,814,070 | ||
| 32,977,721 | ||||
| |||||
Healthcare Providers & Services – 1.3% |
| ||||
PetIQ, Inc.* | 304,400 |
| 6,011,900 | ||
| |||||
Hotels, Restaurants & Leisure – 3.8% |
| ||||
BJ’s Restaurants, Inc.* | 148,600 |
| 5,351,086 | ||
Carrols Restaurant Group, Inc. | 623,500 |
| 4,913,180 | ||
Full House Resorts, Inc.* | 223,143 |
| 1,198,278 | ||
Playa Hotels & Resorts NV* | 701,500 |
| 6,067,975 | ||
| 17,530,519 | ||||
| |||||
Household Durables – 1.5% |
| ||||
M/I Homes, Inc.* | 48,800 |
| 6,721,712 | ||
See accompanying notes to the financial statements.
18
OBERWEIS MICRO-CAP FUND (continued)
Schedule of Investments December 31, 2023
SHARES | VALUE | ||||
Insurance – 1.3% |
| ||||
Employers Hldgs., Inc. | 82,500 | $ | 3,250,500 | ||
Skyward Specialty Insurance Group, Inc.* | 81,800 |
| 2,771,384 | ||
| 6,021,884 | ||||
| |||||
Life Sciences Tools & Services – 0.5% |
| ||||
Quanterix Corp.* | 87,800 |
| 2,400,452 | ||
| |||||
Machinery – 4.3% |
| ||||
Blue Bird Corp.* | 286,700 |
| 7,729,432 | ||
Enerpac Tool Group Corp.* | 71,300 |
| 2,216,717 | ||
Proto Labs, Inc.* | 117,400 |
| 4,573,904 | ||
REV Group, Inc. | 151,700 |
| 2,756,389 | ||
The Gorman-Rupp Corp. | 68,900 |
| 2,448,017 | ||
| 19,724,459 | ||||
| |||||
Media – 1.4% |
| ||||
Perion Network Ltd.* | 205,400 |
| 6,340,698 | ||
| |||||
Oil, Gas & Consumable Fuels 1.6% |
| ||||
Dorian LPG Ltd.* | 65,500 |
| 2,873,485 | ||
Vital Energy, Inc.* | 99,700 |
| 4,535,353 | ||
| 7,408,838 | ||||
| |||||
Paper & Forest Products – 0.8% |
| ||||
Clearwater Paper Corp.* | 103,900 |
| 3,752,868 | ||
| |||||
Passenger Airlines – 1.0% |
| ||||
Sun Country Airlines Hldgs., Inc.* | 297,700 |
| 4,682,821 | ||
| |||||
Pharmaceuticals – 3.2% |
| ||||
Amphastar Pharmaceuticals, Inc.* | 136,400 |
| 8,436,340 | ||
ANI Pharmaceuticals, Inc.* | 43,500 |
| 2,398,590 | ||
Evolus, Inc.* | 371,400 |
| 3,910,842 | ||
| 14,745,772 | ||||
| |||||
Professional Services – 3.2% |
| ||||
Huron Consulting Group, Inc.* | 47,500 |
| 4,883,000 | ||
ICF International, Inc. | 27,800 |
| 3,727,702 | ||
Upwork, Inc.* | 396,900 |
| 5,901,903 | ||
| 14,512,605 | ||||
| |||||
See accompanying notes to the financial statements.
19
OBERWEIS MICRO-CAP FUND (continued)
Schedule of Investments December 31, 2023
SHARES | VALUE | ||||
Semiconductors & Semiconductor Equipment – 17.0% |
| ||||
ACM Research, Inc.* | 393,400 | $ | 7,687,036 | ||
Aehr Test Systems* | 534,400 |
| 14,177,632 | ||
Axcelis Technologies, Inc.* | 41,400 |
| 5,369,166 | ||
Camtek Ltd.* | 174,480 |
| 12,105,422 | ||
Navitas Semiconductor Corp.* | 959,100 |
| 7,739,937 | ||
PDF Solutions, Inc.* | 69,500 |
| 2,233,730 | ||
Photronics, Inc.* | 247,500 |
| 7,764,075 | ||
Silicon Motion Technology Corp. ADS | 76,400 |
| 4,681,028 | ||
Ultra Clean Hldgs., Inc.* | 247,100 |
| 8,435,994 | ||
Veeco Instruments, Inc.* | 240,000 |
| 7,447,200 | ||
| 77,641,220 | ||||
| |||||
Software – 2.0% |
| ||||
AvePoint, Inc.* | 241,100 |
| 1,979,431 | ||
Weave Communications, Inc.* | 609,400 |
| 6,989,818 | ||
| 8,969,249 | ||||
| |||||
Specialty Retail – 2.0% |
| ||||
Boot Barn Hldgs., Inc.* | 51,600 |
| 3,960,816 | ||
Caleres, Inc. | 88,400 |
| 2,716,532 | ||
Hibbett, Inc. | 34,100 |
| 2,455,882 | ||
| 9,133,230 | ||||
| |||||
Textiles, Apparel & Luxury Goods – 2.3% |
| ||||
G-III Apparel Group Ltd.* | 196,600 |
| 6,680,468 | ||
Oxford Industries, Inc. | 31,500 |
| 3,150,000 | ||
| 9,830,468 | ||||
| |||||
Trading Co. & Distribution – 1.8% |
| ||||
H&E Equipment Services, Inc. | 98,900 |
| 5,174,448 | ||
Transcat, Inc.* | 21,800 |
| 2,383,394 | ||
| 7,557,842 | ||||
| |||||
Total Equities |
| ||||
(Cost: $363,327,334) | $ | 443,320,297 | |||
| |||||
Total Investments – 97.3% |
| ||||
(Cost: $363,327,334) | $ | 443,320,297 | |||
| |||||
Other Assets Less Liabilities 2.7% |
| 12,346,663 | |||
| |||||
Net Assets – 100% | $ | 455,666,960 | |||
* Non-income producing security during the period ended December 31, 2023
ADS—American depositary share
See accompanying notes to the financial statements.
20
OBERWEIS SMALL-CAP OPPORTUNITIES FUND
Schedule of Investments December 31, 2023
SHARES | VALUE | ||||
Equities – 95.9% |
| ||||
| |||||
Aerospace & Defense – 3.1% |
| ||||
AeroVironment, Inc.* | 69,800 | $ | 8,797,592 | ||
Woodward, Inc. | 52,000 |
| 7,078,760 | ||
| 15,876,352 | ||||
| |||||
Automobile Components – 1.0% |
| ||||
Visteon Corp.* | 39,800 |
| 4,971,020 | ||
| |||||
Banks – 0.6% |
| ||||
First Merchants Corp. | 79,200 |
| 2,936,736 | ||
| |||||
Beverages – 1.9% |
| ||||
MGP Ingredients, Inc. | 64,300 |
| 6,334,836 | ||
Primo Water Corp. | 240,800 |
| 3,624,040 | ||
| 9,958,876 | ||||
| |||||
Biotechnology – 2.2% |
| ||||
Halozyme Therapeutics, Inc.* | 96,300 |
| 3,559,248 | ||
Veracyte, Inc.* | 280,600 |
| 7,719,306 | ||
| 11,278,554 | ||||
| |||||
Building Products – 3.8% |
| ||||
AAON, Inc. | 36,300 |
| 2,681,481 | ||
Gibraltar Industries, Inc.* | 43,300 |
| 3,419,834 | ||
Janus International Group, Inc.* | 528,400 |
| 6,895,620 | ||
Simpson Manufacturing Co., Inc. | 16,800 |
| 3,326,064 | ||
Trex Co., Inc.* | 40,100 |
| 3,319,879 | ||
| 19,642,878 | ||||
| |||||
Chemicals – 1.1% |
| ||||
Quaker Chemical Corp. | 27,000 |
| 5,762,340 | ||
| |||||
Commercial Services & Supplies – 2.2% |
| ||||
Clean Harbors, Inc.* | 39,000 |
| 6,805,890 | ||
MSA Safety, Inc. | 28,100 |
| 4,744,123 | ||
| 11,550,013 | ||||
| |||||
Construction & Engineering – 1.2% |
| ||||
Comfort Systems USA, Inc. | 17,700 |
| 3,640,359 | ||
Dycom Industries, Inc.* | 23,000 |
| 2,647,070 | ||
| 6,287,429 | ||||
| |||||
Consumer Finance – 1.6% |
| ||||
FirstCash Hldgs., Inc. | 74,200 |
| 8,042,538 | ||
| |||||
Consumer Staples Distribution & Retail – 0.7% |
| ||||
Grocery Outlet Hldg. Corp.* | 139,200 |
| 3,752,832 | ||
See accompanying notes to the financial statements.
21
OBERWEIS SMALL-CAP OPPORTUNITIES FUND (continued)
Schedule of Investments December 31, 2023
SHARES | VALUE | ||||
Diversified Consumer Services – 3.0% |
| ||||
Frontdoor, Inc.* | 268,000 | $ | 9,438,960 | ||
Grand Canyon Education, Inc.* | 26,800 |
| 3,538,672 | ||
Stride, Inc.* | 42,500 |
| 2,523,225 | ||
| 15,500,857 | ||||
| |||||
Electrical Equipment – 2.5% |
| ||||
NEXTracker, Inc.* | 103,200 |
| 4,834,920 | ||
Vertiv Hldgs. Co. | 173,900 |
| 8,352,417 | ||
| 13,187,337 | ||||
| |||||
Electronic Equipment, Instruments & Components – 2.1% |
| ||||
Fabrinet* | 33,200 |
| 6,318,956 | ||
OSI Systems, Inc.* | 35,300 |
| 4,555,465 | ||
| 10,874,421 | ||||
| |||||
Energy Equipment & Services – 3.8% |
| ||||
Liberty Energy, Inc. | 137,400 |
| 2,492,436 | ||
NOV, Inc. | 156,900 |
| 3,181,932 | ||
Weatherford International PLC* | 143,700 |
| 14,058,171 | ||
| 19,732,539 | ||||
| |||||
Healthcare Equipment & Supplies – 10.4% |
| ||||
Alphatec Hldgs., Inc.* | 515,500 |
| 7,789,205 | ||
AtriCure, Inc.* | 69,100 |
| 2,466,179 | ||
Axonics, Inc.* | 133,300 |
| 8,295,259 | ||
Haemonetics Corp.* | 96,700 |
| 8,268,817 | ||
Integer Hldgs. Corp.* | 71,000 |
| 7,034,680 | ||
LivaNova PLC* | 74,200 |
| 3,839,108 | ||
Merit Medical Systems, Inc.* | 90,800 |
| 6,897,168 | ||
TransMedics Group, Inc.* | 113,900 |
| 8,990,127 | ||
| 53,580,543 | ||||
| |||||
Healthcare Providers & Services – 5.4% |
| ||||
Acadia Healthcare Co., Inc.* | 82,600 |
| 6,422,976 | ||
Encompass Health Corp. | 133,900 |
| 8,933,808 | ||
HealthEquity, Inc.* | 38,700 |
| 2,565,810 | ||
NeoGenomics, Inc.* | 392,700 |
| 6,353,886 | ||
Option Care Health, Inc.* | 113,700 |
| 3,830,553 | ||
| 28,107,033 | ||||
| |||||
Healthcare Technology – 1.0% |
| ||||
Evolent Health, Inc.* | 159,000 |
| 5,251,770 | ||
| |||||
See accompanying notes to the financial statements.
22
OBERWEIS SMALL-CAP OPPORTUNITIES FUND (continued)
Schedule of Investments December 31, 2023
SHARES | VALUE | ||||
Hotels, Restaurants & Leisure – 2.0% |
| ||||
Light & Wonder, Inc.* | 30,100 | $ | 2,471,511 | ||
Monarch Casino and Resort, Inc. | 58,500 |
| 4,045,275 | ||
Wingstop, Inc. | 15,900 |
| 4,079,622 | ||
| 10,596,408 | ||||
| |||||
Information Technology Services – 0.9% |
| ||||
Fastly, Inc.* | 249,800 |
| 4,446,440 | ||
| |||||
Insurance – 1.0% |
| ||||
Assurant, Inc. | 30,700 |
| 5,172,643 | ||
| |||||
Machinery – 7.6% |
| ||||
Esab Corp. | 79,100 |
| 6,851,642 | ||
Federal Signal Corp. | 98,700 |
| 7,574,238 | ||
Flowserve Corp. | 209,800 |
| 8,647,956 | ||
Oshkosh Corp. | 82,800 |
| 8,976,348 | ||
SPX Technologies, Inc.* | 73,000 |
| 7,373,730 | ||
| 39,423,914 | ||||
| |||||
Media – 1.0% |
| ||||
Perion Network Ltd.* | 169,600 |
| 5,235,552 | ||
| |||||
Metals & Mining – 1.4% |
| ||||
ATI, Inc.* | 102,500 |
| 4,660,675 | ||
Carpenter Technology Corp.* | 35,700 |
| 2,527,560 | ||
| 7,188,235 | ||||
| |||||
Oil, Gas & Consumable Fuels – 1.9% |
| ||||
International Seaways, Inc. | 94,600 |
| 4,302,408 | ||
Magnolia Oil & Gas Corp. | 117,200 |
| 2,495,188 | ||
Matador Resources Co. | 52,800 |
| 3,002,208 | ||
| 9,799,804 | ||||
| |||||
Passenger Airlines – 1.3% |
| ||||
SkyWest, Inc.* | 133,700 |
| 6,979,140 | ||
| |||||
Personal Care Products – 2.1% |
| ||||
elf Beauty, Inc.* | 28,500 |
| 4,113,690 | ||
Inter Parfums, Inc. | 48,400 |
| 6,970,084 | ||
| 11,083,774 | ||||
| |||||
Pharmaceuticals – 2.0% |
| ||||
Amphastar Pharmaceuticals, Inc.* | 168,700 |
| 10,434,095 | ||
| |||||
Professional Services – 3.6% |
| ||||
ICF International, Inc. | 38,300 |
| 5,135,647 | ||
Maximus, Inc. | 60,400 |
| 5,065,144 | ||
Parsons Corp.* | 133,000 |
| 8,340,430 | ||
| 18,541,221 | ||||
See accompanying notes to the financial statements.
23
OBERWEIS SMALL-CAP OPPORTUNITIES FUND (continued)
Schedule of Investments December 31, 2023
SHARES | VALUE | ||||
Semiconductors & Semiconductor Equipment – 12.2% |
| ||||
Aehr Test Systems* | 522,042 | $ | 13,849,774 | ||
Allegro MicroSystems, Inc.* | 148,600 |
| 4,498,122 | ||
Axcelis Technologies, Inc.* | 109,400 |
| 14,188,086 | ||
FormFactor, Inc.* | 159,200 |
| 6,640,232 | ||
Onto Innovation, Inc.* | 44,600 |
| 6,819,340 | ||
Power Integrations, Inc. | 77,300 |
| 6,347,103 | ||
Universal Display Corp. | 56,200 |
| 10,748,812 | ||
| 63,091,469 | ||||
| |||||
Software – 7.1% |
| ||||
ACI Worldwide, Inc.* | 144,262 |
| 4,414,417 | ||
Blackbaud, Inc.* | 30,100 |
| 2,609,670 | ||
Clear Secure, Inc. | 303,500 |
| 6,267,275 | ||
Informatica, Inc.* | 182,100 |
| 5,169,819 | ||
LiveRamp Hldgs., Inc.* | 139,000 |
| 5,265,320 | ||
Qualys, Inc.* | 17,600 |
| 3,454,528 | ||
Rapid7, Inc.* | 48,200 |
| 2,752,220 | ||
Zeta Global Hldgs. Corp.* | 778,800 |
| 6,869,016 | ||
| 36,802,265 | ||||
| |||||
Specialty Retail – 0.9% |
| ||||
Abercrombie & Fitch Co.* | 55,000 |
| 4,852,100 | ||
| |||||
Technology Hardware, Storage & Peripherals – 1.0% |
| ||||
Super Micro Computer, Inc.* | 19,100 |
| 5,429,366 | ||
| |||||
Textiles, Apparel & Luxury Goods – 1.6% |
| ||||
Crocs, Inc.* | 38,800 |
| 3,624,308 | ||
Deckers Outdoor Corp.* | 6,000 |
| 4,010,580 | ||
| 7,634,888 | ||||
| |||||
Trading Co. & Distribution – 0.7% |
| ||||
McGrath RentCorp. | 26,100 |
| 3,122,082 | ||
| |||||
Total Equities |
| ||||
(Cost: $436,956,368) | $ | 496,127,464 | |||
| |||||
Total Investments – 95.9% |
| ||||
(Cost: $436,956,368) | $ | 496,127,464 | |||
| |||||
Other Assets Less Liabilities 4.1% |
| 21,203,072 | |||
| |||||
Net Assets – 100% | $ | 517,330,536 | |||
* Non-income producing security during the period ended December 31, 2023
See accompanying notes to the financial statements.
24
OBERWEIS GLOBAL OPPORTUNITIES FUND
Schedule of Investments December 31, 2023
SHARES | VALUE | ||||
Equities – 94.7% |
| ||||
| |||||
Australia – 1.7% |
| ||||
James Hardie Industries PLC* | 24,100 | $ | 927,706 | ||
| |||||
Canada – 4.4% |
| ||||
ATS Corp.* | 13,100 |
| 564,592 | ||
Element Fleet Management Corp. | 68,600 |
| 1,116,154 | ||
Stantec, Inc. | 8,500 |
| 682,386 | ||
| 2,363,132 | ||||
| |||||
China – 3.5% |
| ||||
MINISO Group Hldg. Ltd. ADS | 38,600 |
| 787,440 | ||
New Oriental Education & Technology Group, Inc.* | 100,000 |
| 707,562 | ||
Zhejiang Shuanghuan Driveline Co. Ltd.* | 100,000 |
| 366,882 | ||
| 1,861,884 | ||||
| |||||
Finland – 1.3% |
| ||||
Kemira Oyj | 38,000 |
| 704,372 | ||
| |||||
France – 2.6% |
| ||||
Rexel SA | 29,700 |
| 812,176 | ||
Sopra Steria Group SA | 2,600 |
| 567,763 | ||
| 1,379,939 | ||||
| |||||
Germany – 1.0% |
| ||||
Gerresheimer AG | 5,000 |
| 520,810 | ||
| |||||
Indonesia – 0.9% |
| ||||
PT Sumber Alfaria Trijaya Tbk* | 2,600,000 |
| 494,772 | ||
| |||||
Israel – 2.5% |
| ||||
Perion Network Ltd.* | 43,200 |
| 1,333,584 | ||
| |||||
Japan – 5.0% |
| ||||
Asics Corp. | 14,100 |
| 441,800 | ||
Fuji Electric Co. Ltd. | 40,700 |
| 1,751,832 | ||
Yamazaki Baking Co. Ltd. | 21,000 |
| 478,979 | ||
| 2,672,611 | ||||
Netherlands – 2.0% |
| ||||
BE Semiconductor Industries NV* | 7,200 |
| 1,084,610 | ||
| |||||
Sweden – 1.1% |
| ||||
Saab AB | 10,000 |
| 602,413 | ||
| |||||
Switzerland – 1.9% |
| ||||
Accelleron Industries AG* | 31,600 |
| 986,584 | ||
| |||||
Taiwan – 3.7% |
| ||||
Alchip Technologies Ltd.* | 6,000 |
| 640,263 | ||
M31 Technology Corp. | 38,800 |
| 1,340,089 | ||
| 1,980,352 | ||||
See accompanying notes to the financial statements.
25
OBERWEIS GLOBAL OPPORTUNITIES FUND (continued)
Schedule of Investments December 31, 2023
SHARES | VALUE | ||||
United Kingdom – 13.6% |
| ||||
Ashtead Technology Hldgs. PLC | 459,400 | $ | 3,595,559 | ||
Cranswick PLC | 8,300 |
| 402,886 | ||
Games Workshop Group PLC* | 3,000 |
| 377,438 | ||
Marks & Spencer Group PLC* | 155,000 |
| 538,203 | ||
Oxford Instruments PLC | 19,200 |
| 561,683 | ||
Whitbread PLC | 36,200 |
| 1,687,026 | ||
| 7,162,795 | ||||
| |||||
United States of America – 49.5% |
| ||||
Acadia Healthcare Co., Inc.* | 7,600 |
| 590,976 | ||
Aehr Test Systems* | 12,900 |
| 342,238 | ||
Allegro MicroSystems, Inc.* | 25,000 |
| 756,750 | ||
Alphatec Hldgs., Inc.* | 175,800 |
| 2,656,338 | ||
Amphastar Pharmaceuticals, Inc.* | 13,400 |
| 828,790 | ||
Applied Optoelectronics, Inc.* | 38,100 |
| 736,092 | ||
Axcelis Technologies, Inc.* | 17,029 |
| 2,208,491 | ||
Axonics, Inc.* | 21,500 |
| 1,337,945 | ||
Bel Fuse, Inc. | 25,000 |
| 1,669,250 | ||
Clean Harbors, Inc.* | 7,900 |
| 1,378,629 | ||
Comstock Resources, Inc. | 64,900 |
| 574,365 | ||
Deckers Outdoor Corp.* | 1,200 |
| 802,116 | ||
Evolent Health, Inc.* | 29,600 |
| 977,688 | ||
Flowserve Corp. | 15,100 |
| 622,422 | ||
Merit Medical Systems, Inc.* | 7,500 |
| 569,700 | ||
Oshkosh Corp. | 5,100 |
| 552,891 | ||
Power Integrations, Inc. | 10,000 |
| 821,100 | ||
RPC, Inc. | 159,000 |
| 1,157,520 | ||
Universal Display Corp. | 3,100 |
| 592,906 | ||
Veracyte, Inc.* | 67,100 |
| 1,845,921 | ||
Vertiv Hldgs. Co. | 37,000 |
| 1,777,110 | ||
Visteon Corp.* | 3,600 |
| 449,640 | ||
Weatherford International PLC* | 25,900 |
| 2,533,797 | ||
Zeta Global Hldgs. Corp.* | 57,000 |
| 502,740 | ||
| 26,285,415 | ||||
| |||||
Total Equities |
| ||||
(Cost: $40,041,962) | $ | 50,360,979 | |||
| |||||
Total Investments – 94.7% |
| ||||
(Cost: $40,041,962) | $ | 50,360,979 | |||
| |||||
Other Assets Less Liabilities – 5.3% |
| 2,824,658 | |||
| |||||
Net Assets – 100% | $ | 53,185,637 | |||
* Non-income producing security during the period ended December 31, 2023
ADS—American depositary share
See accompanying notes to the financial statements.
26
OBERWEIS GLOBAL OPPORTUNITIES FUND (continued)
Schedule of Investments December 31, 2023
SECTOR ALLOCATIONS (As a Percentage of Net Assets) (unaudited) | |||
Communication Services | 2.5 | % | |
Consumer Discretionary | 10.6 | % | |
Consumer Staples | 3.6 | % | |
Energy | 8.0 | % | |
Healthcare | 17.5 | % | |
Industrials | 27.2 | % | |
Information Technology | 22.2 | % | |
Materials | 3.1 | % | |
See accompanying notes to the financial statements.
27
Oberweis China Opportunities Fund
Schedule of Investmentsa December 31, 2023
SHARES | VALUE | ||||
Equities – 99.9% |
| ||||
| |||||
Automobile Components – 4.7% |
| ||||
Cheng Shin Rubber Industry Co. Ltd.* | 350,000 | $ | 512,048 | ||
Shanghai Baolong Automotive Corp.* | 110,000 |
| 874,764 | ||
Tong Yang Industry Co. Ltd.* | 300,000 |
| 742,901 | ||
| 2,129,713 | ||||
| |||||
Automobiles – 2.7% |
| ||||
Li Auto, Inc. ADS* | 33,000 |
| 1,235,190 | ||
| |||||
Biotechnology – 2.1% |
| ||||
Legend Biotech Corp. ADS* | 16,000 |
| 962,720 | ||
| |||||
Broadline Retail – 14.8% |
| ||||
Alibaba Group Hldg. Ltd | 230,000 |
| 2,226,804 | ||
MINISO Group Hldg. Ltd. ADS | 40,000 |
| 816,000 | ||
PDD Hldgs. ADS* | 25,000 |
| 3,657,750 | ||
| 6,700,554 | ||||
| |||||
Capital Markets – 0.8% |
| ||||
Hong Kong Exchanges & Clearing Ltd.* | 10,000 |
| 343,216 | ||
| |||||
Chemicals – 1.8% |
| ||||
Nan Pao Resins Chemical Co. Ltd.* | 90,000 |
| 824,034 | ||
| |||||
Communications Equipment – 1.7% |
| ||||
BYD Electronic International Co. Ltd.* | 160,000 |
| 749,952 | ||
| |||||
Diversified Consumer Services – 6.0% |
| ||||
New Oriental Education & Technology Group, Inc.* | 285,000 |
| 2,016,552 | ||
TAL Education Group ADS* | 55,000 |
| 694,650 | ||
| 2,711,202 | ||||
| |||||
Electronic Equipment, Instruments & Components – 6.8% |
| ||||
Cowell e Hldgs., Inc.* | 280,000 |
| 826,535 | ||
Global Brands Manufacture Ltd | 240,000 |
| 504,391 | ||
Gold Circuit Electronics Ltd.* | 75,000 |
| 532,738 | ||
WT Microelectronics Co. Ltd.* | 140,000 |
| 513,188 | ||
Yageo Corp.* | 35,000 |
| 680,830 | ||
| 3,057,682 | ||||
| |||||
Entertainment – 3.8% |
| ||||
iQIYI, Inc. ADS* | 20,000 |
| 97,600 | ||
NetEase, Inc | 90,000 |
| 1,620,542 | ||
| 1,718,142 | ||||
See accompanying notes to the financial statements.
28
Oberweis China Opportunities Fund (continued)
Schedule of Investmentsa December 31, 2023
SHARES | VALUE | ||||
Healthcare Equipment & Supplies – 1.3% |
| ||||
Gan & Lee Pharmaceuticals Co. Ltd.* | 40,000 | $ | 296,946 | ||
Xiangyu Medical Co. Ltd.* | 40,000 |
| 300,556 | ||
| 597,502 | ||||
| |||||
Hotels, Restaurants & Leisure – 6.3% |
| ||||
H World Group Ltd | 240,000 |
| 806,813 | ||
Meituan* | 50,000 |
| 524,429 | ||
Sands China Ltd.* | 100,000 |
| 292,630 | ||
Trip.com Group Ltd.* | 35,000 |
| 1,244,285 | ||
| 2,868,157 | ||||
| |||||
Household Durables – 2.1% |
| ||||
Beijing Roborock Technology Co. Ltd | 13,060 |
| 521,041 | ||
Hisense Home Appliances Group Co. Ltd | 200,000 |
| 431,837 | ||
| 952,878 | ||||
| |||||
Interactive Media & Services – 7.5% |
| ||||
Baidu, Inc.* | 90,000 |
| 1,338,157 | ||
Tencent Hldgs. Ltd | 55,000 |
| 2,068,003 | ||
| 3,406,160 | ||||
| |||||
Machinery – 4.2% |
| ||||
Sinotruk Hong Kong Ltd.* | 250,000 |
| 490,491 | ||
Suzhou Secote Precision Electronic Co. Ltd.* | 65,000 |
| 665,012 | ||
Yangzijiang Shipbuilding Hldgs. Ltd.* | 650,000 |
| 733,823 | ||
| 1,889,326 | ||||
| |||||
Metals & Mining – 1.6% |
| ||||
Zijin Mining Group Co. Ltd | 450,000 |
| 733,046 | ||
| |||||
Oil, Gas & Consumable Fuels – 3.5% |
| ||||
China Shenhua Energy Co. Ltd.* | 170,000 |
| 582,378 | ||
PetroChina Co. Ltd | 1,500,000 |
| 991,228 | ||
| 1,573,606 | ||||
| |||||
Pharmaceuticlas – 1.1% |
| ||||
Hansoh Pharmaceutical Group Co. Ltd.* | 250,000 |
| 504,578 | ||
| |||||
Real Estate Management & Development – 2.9% |
| ||||
China Resources Mixc Lifestyle Services Ltd | 221,538 |
| 790,143 | ||
Longfor Group Hldgs. Ltd | 320,000 |
| 512,262 | ||
| 1,302,405 | ||||
| |||||
Retail REITs – 0.4% |
| ||||
Link REIT* | 35,000 |
| 196,549 | ||
See accompanying notes to the financial statements.
29
Oberweis China Opportunities Fund (continued)
Schedule of Investmentsa December 31, 2023
SHARES | VALUE | ||||
Semiconductors & Semiconductor Equipment – 18.6% |
| ||||
Alchip Technologies Ltd | 18,000 | $ | 1,920,790 | ||
AP Memory Technology Corp.* | 35,000 |
| 534,856 | ||
Elan Microelectronics Corp | 140,000 |
| 741,272 | ||
ITE Technology, Inc.* | 30,000 |
| 147,114 | ||
King Yuan Electronics Co. Ltd | 380,000 |
| 1,051,205 | ||
M31 Technology Corp | 29,500 |
| 1,018,882 | ||
MediaTek, Inc.* | 31,000 |
| 1,025,236 | ||
Powertech Technology, Inc.* | 50,000 |
| 229,713 | ||
Taiwan Semiconductor Manufacturing Co. Ltd. ADS | 17,000 |
| 1,768,000 | ||
| 8,437,068 | ||||
| |||||
Technology Hardware, Storage & Peripherals – 3.7% |
| ||||
Chicony Electronics Co. Ltd.* | 160,000 |
| 912,334 | ||
Xiaomi Corp.* | 370,000 |
| 739,194 | ||
| 1,651,528 | ||||
| |||||
Textiles, Apparel & Luxury Goods – 1.5% |
| ||||
ANTA Sports Products Ltd.* | 20,000 |
| 194,019 | ||
Makalot Industrial Co. Ltd.* | 40,000 |
| 462,032 | ||
| 656,051 | ||||
| |||||
Total Equities |
| ||||
(Cost: $40,473,099) | $ | 45,201,259 | |||
| |||||
Rights – 0.0% |
| ||||
| |||||
Electronic Equipment, Instruments & Components – 0.0% |
| ||||
WT Microelectronics Co. Ltd.* | 18,809 |
| 10,725 | ||
| |||||
Total Rights |
| ||||
(Cost: $0) | $ | 10,725 | |||
| |||||
Total Investments – 99.9% |
| ||||
(Cost: $40,473,099) | $ | 45,211,984 | |||
| |||||
Other Assets Less Liabilities – 0.1% |
| 61,474 | |||
| |||||
Net Assets – 100% | $ | 45,273,458 | |||
a Certain securities were fair valued under the discretion of the Board of Trustees
* Non-income producing security during the period ended December 31, 2023
ADS—American depositary share
COUNTRY ALLOCATION (As a Percentage of Net Assets) (unaudited) | |||
China ( Includes the People’s Republic of China, | 98.3 | % | |
Singapore | 1.6 | % | |
See accompanying notes to the financial statements.
30
SHARES | VALUE | ||||
Equities – 89.8% |
| ||||
| |||||
Argentina – 3.3% |
| ||||
Arcos Dorados Hldgs., Inc | 30,000 | $ | 380,700 | ||
Despegar.com Corp.* | 22,500 |
| 212,850 | ||
| 593,550 | ||||
| |||||
Brazil – 8.1% |
| ||||
GPS Participacoes e Empreendimentos SA* | 78,600 |
| 305,009 | ||
Hypera SA | 21,200 |
| 156,024 | ||
Petro Rio SA | 27,200 |
| 257,856 | ||
Santos Brasil Participacoes SA | 100,000 |
| 192,894 | ||
TOTVS SA | 34,200 |
| 237,195 | ||
VTEX* | 46,900 |
| 322,672 | ||
| 1,471,650 | ||||
| |||||
Chile – 0.9% |
| ||||
Embotelladora Andina SA | 66,700 |
| 165,802 | ||
| |||||
China – 7.8% |
| ||||
Chongqing Brewery Co. Ltd | 24,000 |
| 224,867 | ||
Dada Nexus Ltd. ADS* | 22,800 |
| 75,696 | ||
Haitian International Hldgs. Ltd.* | 84,000 |
| 207,835 | ||
Hangzhou Robam Appliances Co. Ltd | 95,400 |
| 292,971 | ||
Jiangsu Hengli Hydraulic Co. Ltd | 19,600 |
| 151,114 | ||
Kingdee International Software Group Co. Ltd.* | 117,000 |
| 170,514 | ||
Zhejiang Shuanghuan Driveline Co. Ltd | 80,516 |
| 295,399 | ||
| 1,418,396 | ||||
| |||||
France – 1.3% |
| ||||
Gaztransport & Technigaz SA | 1,750 |
| 231,646 | ||
| |||||
Greece – 1.2% |
| ||||
Greek Organization of Football Prognostics SA | 12,500 |
| 212,105 | ||
| |||||
Hungary – 1.3% |
| ||||
Richter Gedeon Nyrt | 9,200 |
| 232,046 | ||
| |||||
India – 19.5% |
| ||||
Affle India Ltd.* | 15,800 |
| 247,992 | ||
Angel One Ltd.* | 6,200 |
| 259,865 | ||
C.E. Info Systems Ltd | 9,200 |
| 215,059 | ||
Cera Sanitaryware Ltd | 1,463 |
| 137,965 | ||
Control Print Ltd.* | 28,000 |
| 337,105 | ||
CreditAccess Grameen Ltd.* | 7,500 |
| 143,896 | ||
Emudhra Ltd | 42,000 |
| 227,883 | ||
Federal Bank Ltd | 168,700 |
| 316,564 | ||
See accompanying notes to the financial statements.
31
Oberweis Emerging Markets Fund (continued)
Schedule of Investments December 31, 2023
SHARES | VALUE | ||||
Kaynes Technology India Ltd.* | 7,800 | $ | 244,698 | ||
KEI Industries Ltd.* | 6,698 |
| 261,553 | ||
KPIT Technologies Ltd | 11,500 |
| 209,211 | ||
Oracle Financial Services Software Ltd* | 4,600 |
| 232,881 | ||
Senco Gold Ltd.* | 26,500 |
| 221,853 | ||
TVS Motor Co. Ltd.* | 12,000 |
| 292,134 | ||
Varun Beverages Ltd | 13,736 |
| 204,174 | ||
| 3,552,833 | ||||
| |||||
Indonesia – 6.1% |
| ||||
PT Indofood CBP Sukses Makmur Tbk | 340,700 |
| 234,000 | ||
PT Mitra Adiperkasa Tbk | 2,158,900 |
| 250,986 | ||
PT Sumber Alfaria Trijaya Tbk | 1,724,300 |
| 328,129 | ||
PT Samator Indo Gas Tbk | 1,292,700 |
| 127,616 | ||
PT United Tractors Tbk | 112,000 |
| 164,578 | ||
| 1,105,309 | ||||
| |||||
Japan – 1.1% |
| ||||
RS Technologies Co. Ltd | 9,100 |
| 192,907 | ||
| |||||
Malaysia – 1.6% |
| ||||
CTOS Digital Bhd | 970,800 |
| 297,895 | ||
| |||||
Mexico – 5.0% |
| ||||
Alsea, S.A.B. de CV* | 88,300 |
| 333,627 | ||
Prologis Property Mexico SA de CV | 60,400 |
| 287,221 | ||
Regional SAB de CV | 30,200 |
| 288,590 | ||
| 909,438 | ||||
| |||||
Philippines – 1.4% |
| ||||
Wilcon Depot, Inc | 668,800 |
| 252,423 | ||
| |||||
Poland – 1.4% |
| ||||
Dino Polska SA* | 2,100 |
| 245,875 | ||
| |||||
Saudi Arabia – 1.9% |
| ||||
Arabian Contracting Services Co.* | 5,400 |
| 341,280 | ||
| |||||
South Africa – 1.4% |
| ||||
Clicks Group Ltd | 14,080 |
| 250,704 | ||
| |||||
South Korea – 11.9% |
| ||||
AfreecaTV Co. Ltd | 2,600 |
| 171,997 | ||
Chips & Media, Inc | 6,850 |
| 167,948 | ||
Classys, Inc | 9,627 |
| 280,879 | ||
Cosmax, Inc | 2,500 |
| 244,814 | ||
KINX, Inc | 3,100 |
| 239,310 | ||
See accompanying notes to the financial statements.
32
Oberweis Emerging Markets Fund (continued)
Schedule of Investments December 31, 2023
SHARES | VALUE | ||||
LEENO Industrial, Inc | 2,038 | $ | 318,957 | ||
Lunit, Inc.* | 2,800 |
| 177,067 | ||
Park Systems Corp | 2,456 |
| 329,527 | ||
Tokai Carbon Korea Co. Ltd | 2,850 |
| 245,356 | ||
| 2,175,855 | ||||
| |||||
Taiwan – 12.8% |
| ||||
91APP, Inc | 44,000 |
| 150,535 | ||
Alchip Technologies Ltd | 3,000 |
| 320,132 | ||
ASPEED Technology, Inc | 2,400 |
| 243,984 | ||
eMemory Technology, Inc.* | 5,000 |
| 399,146 | ||
Ennoconn Corp | 23,000 |
| 200,844 | ||
Innodisk Corp | 23,218 |
| 236,034 | ||
M31 Technology Corp | 8,800 |
| 303,938 | ||
Sinbon Electronics Co. Ltd | 16,000 |
| 155,879 | ||
Unimicron Technology Corp | 56,000 |
| 321,142 | ||
| 2,331,634 | ||||
| |||||
Thailand – 0.8% |
| ||||
Mega Lifesciences PCL | 145,300 |
| 171,174 | ||
| |||||
United Kingdom – 1.0% | �� | ||||
WAG Payment Solutions PLC* | 173,000 |
| 198,470 | ||
| |||||
Total Equities |
| ||||
(Cost: $13,931,393) | $ | 16,350,992 | |||
| |||||
Short-Term Investments – 0.1% |
| ||||
Fidelity Investments Money Market Government Portfolio Class I 5.25%a | 12,520 |
| 12,520 | ||
| |||||
Total Short-Term Investments |
| ||||
(Cost: $12,520) | $ | 12,520 | |||
| |||||
Total Investments – 89.9% |
| ||||
(Cost: $13,943,913) | $ | 16,363,512 | |||
| |||||
Other Assets Less Liabilities – 10.1% |
| 1,844,708 | |||
| |||||
Net Assets – 100% | $ | 18,208,220 | |||
a Annualized seven-day effective yield as of December 31, 2023
* Non-income producing security during the period ended December 31, 2023
ADS—American depositary share
See accompanying notes to the financial statements.
33
Oberweis Emerging Markets Fund (continued)
Schedule of Investments December 31, 2023
SECTOR ALLOCATIONS (As a Percentage of Net Assets) (unaudited) | |||
Communication Services | 7.3 | % | |
Consumer Discretionary | 15.1 | % | |
Consumer Staples | 10.8 | % | |
Energy | 3.6 | % | |
Financials | 6.6 | % | |
Healthcare | 5.6 | % | |
Industrials | 9.8 | % | |
Information Technology | 28.7 | % | |
Materials | 0.7 | % | |
Real Estate | 1.6 | % | |
See accompanying notes to the financial statements.
34
SHARES | VALUE | ||||
Equities – 98.6% |
| ||||
| |||||
Australia – 8.6% |
| ||||
GrainCorp Ltd. | 819,923 | $ | 4,073,076 | ||
Inghams Group Ltd.* | 1,876,900 |
| 5,064,752 | ||
James Hardie Industries PLC* | 344,700 |
| 13,268,895 | ||
JB Hi-Fi Ltd. | 163,912 |
| 5,923,171 | ||
Super Retail Group Ltd. | 528,148 |
| 5,675,567 | ||
| 34,005,461 | ||||
| |||||
Canada – 13.8% |
| ||||
Ag Growth International, Inc. | 141,300 |
| 5,387,122 | ||
ATS Corp.* | 160,575 |
| 6,920,563 | ||
Element Fleet Management Corp. | 669,500 |
| 10,893,080 | ||
Finning International, Inc. | 171,600 |
| 4,962,427 | ||
Hammond Power Solutions, Inc. | 84,000 |
| 5,179,081 | ||
Parex Resources, Inc. | 341,215 |
| 6,424,658 | ||
Stantec, Inc. | 125,200 |
| 10,051,148 | ||
Stella-Jones, Inc. | 75,200 |
| 4,376,593 | ||
| 54,194,672 | ||||
| |||||
Finland – 1.6% |
| ||||
Metso Corp. | 378,668 |
| 3,833,501 | ||
Outokumpu Oyj | 463,543 |
| 2,294,686 | ||
| 6,128,187 | ||||
| |||||
France – 7.1% |
| ||||
Edenred SA | 150,400 |
| 8,989,463 | ||
Rexel SA | 306,419 |
| 8,379,332 | ||
Sopra Steria Group SACA | 30,200 |
| 6,594,789 | ||
Spie SA | 127,800 |
| 3,992,868 | ||
| 27,956,452 | ||||
| |||||
Germany – 2.3% |
| ||||
CTS Eventim AG & Co.* | 132,851 |
| 9,181,356 | ||
| |||||
Ireland – 1.2% |
| ||||
Glanbia PLC* | 281,900 |
| 4,640,240 | ||
| |||||
Italy – 3.6% |
| ||||
Brunello Cucinelli SpA | 65,100 |
| 6,367,697 | ||
De’ Longhi SpA* | 231,100 |
| 7,786,677 | ||
| 14,154,374 | ||||
| |||||
Japan – 19.9% |
| ||||
ABC-Mart, Inc. | 317,300 |
| 5,547,124 | ||
Asics Corp. | 123,200 |
| 3,860,267 | ||
BayCurrent Consulting, Inc. | 162,400 |
| 5,702,428 | ||
Daiwa Securities Group, Inc. | 1,885,000 |
| 12,688,323 | ||
Fuji Electric Co. Ltd. | 217,200 |
| 9,348,843 | ||
See accompanying notes to the financial statements.
35
Oberweis International Opportunities Fund (continued)
Schedule of Investments December 31, 2023
SHARES | VALUE | ||||
Nissin Foods Hldgs. Co. Ltd. | 191,100 | $ | 6,669,526 | ||
Organo Corp.* | 123,300 |
| 5,106,894 | ||
Ryohin Keikaku Co. Ltd.* | 374,000 |
| 6,258,532 | ||
Santen Pharmaceutical Co. Ltd. | 776,900 |
| 7,741,450 | ||
Sumitomo Bakelite Co. Ltd. | 57,400 |
| 3,013,704 | ||
Sundrug Co. Ltd. | 133,900 |
| 4,303,793 | ||
Toyo Suisan Kaisha Ltd. | 39,100 |
| 2,018,781 | ||
Yamazaki Baking Co. Ltd. | 259,100 |
| 5,909,685 | ||
| 78,169,350 | ||||
| |||||
Netherlands – 10.2% |
| ||||
Arcadis NV* | 121,600 |
| 6,556,573 | ||
ASM International NV* | 22,740 |
| 11,798,038 | ||
BE Semiconductor Industries NV | 88,900 |
| 13,391,924 | ||
Constellium SE* | 412,539 |
| 8,234,278 | ||
| 39,980,813 | ||||
| |||||
Norway – 1.5% |
| ||||
Aker Solutions ASA | 897,700 |
| 3,712,768 | ||
Subsea 7 SA | 143,600 |
| 2,094,659 | ||
| 5,807,427 | ||||
| |||||
Sweden – 3.9% |
| ||||
AAK AB* | 181,120 |
| 4,036,821 | ||
Camurus AB* | 130,600 |
| 6,966,300 | ||
Saab AB | 72,600 |
| 4,373,520 | ||
| 15,376,641 | ||||
| |||||
Switzerland – 1.7% |
| ||||
Accelleron Industries AG* | 221,000 |
| 6,899,845 | ||
| |||||
United Kingdom – 23.2% |
| ||||
Ashtead Technology Hldgs. PLC* | 744,500 |
| 5,826,934 | ||
B&M European Value Retail SA | 656,300 |
| 4,686,543 | ||
Cranswick PLC | 85,800 |
| 4,164,772 | ||
Diploma PLC* | 101,400 |
| 4,629,889 | ||
Domino’s Pizza Group PLC | 850,200 |
| 4,083,561 | ||
Games Workshop Group PLC | 47,650 |
| 5,994,971 | ||
IMI PLC | 306,916 |
| 6,588,229 | ||
Informa PLC | 568,300 |
| 5,659,094 | ||
Intermediate Capital Group PLC | 344,000 |
| 7,368,923 | ||
Keywords Studios PLC | 255,546 |
| 5,413,862 | ||
Marks and Spencer Group PLC | 3,387,300 |
| 11,761,638 | ||
Morgan Sindall Group PLC | 87,071 |
| 2,458,410 | ||
RS GROUP PLC | 450,600 |
| 4,707,607 | ||
See accompanying notes to the financial statements.
36
Oberweis International Opportunities Fund (continued)
Schedule of Investments December 31, 2023
SHARES | VALUE | ||||
Telecom Plus PLC | 188,400 | $ | 3,871,266 | ||
The Sage Group PLC | 775,470 |
| 11,590,039 | ||
Whitbread PLC | 60,300 |
| 2,810,157 | ||
| 91,615,895 | ||||
| |||||
Total Equities |
| ||||
(Cost: $330,530,138) | $ | 388,110,713 | |||
| |||||
Total Investments – 98.6% |
| ||||
(Cost: $330,530,138) | $ | 388,110,713 | |||
| |||||
Other Assets Less Liabilities – 1.4% |
| 5,409,742 | |||
| |||||
Net Assets – 100% | $ | 393,520,455 | |||
* Non-income producing security during the period ended December 31, 2023
SECTOR ALLOCATIONS (As A Percentage of Net Assets) (unaudited) | |||
Communication Services | 3.8 | % | |
Consumer Discretionary | 15.0 | % | |
Consumer Staples | 13.4 | % | |
Energy | 3.1 | % | |
Financials | 7.4 | % | |
Healthcare | 3.7 | % | |
Industrials | 31.0 | % | |
Information Technology | 12.4 | % | |
Materials | 7.8 | % | |
Utilities | 1.0 | % | |
See accompanying notes to the financial statements.
37
SHARES | VALUE | ||||
Equities – 98.7% |
| ||||
| |||||
Australia – 2.6% |
| ||||
BHP Group Ltd | 4,500 | $ | 154,579 | ||
| |||||
Canada – 6.5% |
| ||||
Dollarama, Inc | 2,900 |
| 208,981 | ||
WSP Global, Inc | 1,300 |
| 182,222 | ||
| 391,203 | ||||
| |||||
Denmark – 5.5% |
| ||||
Danske Bank A/S* | 3,600 |
| 96,175 | ||
Novo Nordisk A/S | 2,300 |
| 237,776 | ||
| 333,951 | ||||
| |||||
France – 10.2% |
| ||||
LVMH Moet Hennessy Louis Vuitton SE | 340 |
| 275,363 | ||
Schneider Electric SE | 1,700 |
| 341,164 | ||
| 616,527 | ||||
| |||||
Germany – 3.3% |
| ||||
SAP SE* | 1,300 |
| 200,181 | ||
| |||||
Italy – 4.2% |
| ||||
Ferrari NV* | 230 |
| 77,496 | ||
UniCredit SpA | 6,400 |
| 173,566 | ||
| 251,062 | ||||
| |||||
Japan – 21.7% |
| ||||
Bridgestone Corp | 3,700 |
| 153,248 | ||
Hitachi Ltd.* | 2,800 |
| 201,957 | ||
Mitsubishi UFJ Financial Group, Inc.* | 12,000 |
| 103,106 | ||
Sony Group Corp | 5,500 |
| 523,085 | ||
Sumitomo Corp.* | 5,900 |
| 128,712 | ||
Toyota Motor Corp | 10,700 |
| 196,584 | ||
| 1,306,692 | ||||
| |||||
Netherlands – 2.1% |
| ||||
ASML Hldg. NV | 165 |
| 124,178 | ||
| |||||
Sweden – 6.0% |
| ||||
EQT AB | 6,300 |
| 178,017 | ||
Volvo AB* | 7,100 |
| 184,221 | ||
| 362,238 | ||||
| |||||
Switzerland – 17.4% |
| ||||
Nestle SA | 1,600 |
| 185,490 | ||
Novartis AG* | 800 |
| 80,723 | ||
See accompanying notes to the financial statements.
38
Oberweis Focused International Growth Fund (continued)
Schedule of Investments December 31, 2023
SHARES | VALUE | ||||
Partners Group Hldg. AG* | 150 | $ | 216,324 | ||
Roche Hldg. AG | 300 |
| 87,207 | ||
UBS Group AG* | 5,400 |
| 167,566 | ||
Zurich Insurance Group AG | 600 |
| 313,589 | ||
| 1,050,899 | ||||
| |||||
United Kingdom – 14.7% |
| ||||
Anglo American PLC | 3,100 |
| 77,869 | ||
AstraZeneca PLC | 1,300 |
| 175,653 | ||
BAE Systems PLC | 7,600 |
| 107,582 | ||
BP PLC | 19,700 |
| 117,057 | ||
HSBC Hldgs. PLC | 15,500 |
| 125,561 | ||
Shell PLC | 5,000 |
| 163,894 | ||
Unilever PLC | 2,500 |
| 121,096 | ||
| 888,712 | ||||
| |||||
United States of America – 4.5% |
| ||||
Cadence Design Systems, Inc.* | 1,000 |
| 272,370 | ||
| |||||
Total Equities |
| ||||
(Cost: $5,545,976) | $ | 5,952,592 | |||
| |||||
Short-Term Investments – 1.5% |
| ||||
Fidelity Investments Money Market Government Portfolio Class I 5.25%a | 90,447 |
| 90,447 | ||
| |||||
Total Short-Term Investments |
| ||||
(Cost: $90,447) | $ | 90,447 | |||
| |||||
Total Investments – 100.2% |
| ||||
(Cost: $5,636,423) | $ | 6,043,039 | |||
| |||||
Other Liabilities Less Assets (0.2)% |
| (11,093) | |||
| |||||
Net Assets – 100% | $ | 6,031,946 | |||
a Annualized seven-day effective yield as of December 31, 2023
* Non-income producing security during the period ended December 31, 2023
SECTOR ALLOCATIONS (As a Percentage of Net Assets) (unaudited) | |||
Consumer Discretionary | 23.8 | % | |
Consumer Staples | 5.1 | % | |
Energy | 4.7 | % | |
Financials | 22.8 | % | |
Healthcare | 9.6 | % | |
Industrials | 19.0 | % | |
Information Technology | 9.8 | % | |
Materials | 3.9 | % | |
See accompanying notes to the financial statements.
39
Statements of Assets and Liabilities December 31, 2023
Micro-Cap | Small-Cap | Global | |||||||||
| ASSETS |
|
|
|
| ||||||
Investment securities at valuea | $ | 443,320,297 | $ | 496,127,464 | $ | 50,360,979 | |||||
Cash |
| 18,983,739 |
| 19,010,312 |
| 2,826,581 | |||||
Receivable from securities sold |
| — |
| — |
| 33,507 | |||||
Receivable from fund shares sold |
| 4,090,128 |
| 3,288,986 |
| 100 | |||||
Dividends and interest receivable |
| 109,411 |
| 206,929 |
| 42,043 | |||||
Prepaid expenses |
| 84,590 |
| 94,926 |
| 15,155 | |||||
Total Assets |
| 466,588,165 |
| 518,728,617 |
| 53,278,365 | |||||
|
|
| |||||||||
| LIABILITIES |
|
|
|
| ||||||
Payable to custodian |
| 8,510,220 |
| — |
| — | |||||
Payable for fund shares redeemed |
| 227,747 |
| 874,006 |
| — | |||||
Payable for securities purchased |
| 1,612,180 |
| — |
| — | |||||
Payable to advisor (see note 3) |
| 364,491 |
| 297,007 |
| 37,438 | |||||
Payable to distributor |
| 47,166 |
| 59,361 |
| 7,164 | |||||
Accrued expenses |
| 159,401 |
| 167,707 |
| 48,126 | |||||
Total Liabilities |
| 10,921,205 |
| 1,398,081 |
| 92,728 | |||||
NET ASSETS | $ | 455,666,960 | $ | 517,330,536 | $ | 53,185,637 | |||||
|
|
| |||||||||
| NET ASSETS |
|
|
|
| ||||||
Investor Class | $ | 236,229,754 | $ | 286,616,007 | $ | 34,431,235 | |||||
Institutional Class |
| 219,437,206 |
| 230,714,529 |
| 18,754,402 | |||||
Total | $ | 455,666,960 | $ | 517,330,536 | $ | 53,185,637 | |||||
|
|
| |||||||||
| SHARES OUTSTANDING |
|
|
|
| ||||||
(shares of beneficial interest issued and outstanding, respectively, unlimited number of shares authorized with no par value) |
|
|
| ||||||||
Investor Class |
| 6,280,699 |
| 12,957,749 |
| 1,285,600 | |||||
Institutional Class |
| 5,716,255 |
| 10,198,875 |
| 685,726 | |||||
Total |
| 11,996,954 |
| 23,156,624 |
| 1,971,326 | |||||
|
|
| |||||||||
| NET ASSET VALUE |
|
|
|
| ||||||
Investor Class, offering price and redemption price | $ | 37.61 | $ | 22.12 | $ | 26.78 | |||||
Institutional Class, offering price and redemption price | $ | 38.39 | $ | 22.62 | $ | 27.35 | |||||
|
|
| |||||||||
| ANALYSIS OF NET ASSETS |
|
|
|
| ||||||
Capital | $ | 388,034,815 | $ | 473,272,648 | $ | 50,294,262 | |||||
Accumulated earnings |
| 67,632,145 |
| 44,057,888 |
| 2,891,375 | |||||
Net assets | $ | 455,666,960 | $ | 517,330,536 | $ | 53,185,637 | |||||
|
|
| |||||||||
a Investment securities at cost | $ | 363,327,334 | $ | 436,956,368 | $ | 40,041,962 | |||||
See accompanying notes to the financial statements.
40
Statements of Assets and Liabilities December 31, 2023 (continued)
China | Emerging | ||||||||
| ASSETS |
|
|
|
| ||||
Investment securities at valuea | $ | 45,211,984 |
| $ | 16,363,512 | ||||
Foreign Currencyb |
| 58,420 |
|
| 1,668 | ||||
Receivable from securities sold |
| 431,285 |
|
| — | ||||
Receivable from fund shares sold |
| 20,850 |
|
| 2,000,000 | ||||
Dividends and interest receivable |
| 74,462 |
|
| 22,987 | ||||
Prepaid expenses |
| 16,592 |
|
| 8,143 | ||||
Other Assets |
| 1,055 |
|
| — | ||||
Total Assets |
| 45,814,648 |
|
| 18,396,310 | ||||
|
|
| |||||||
| LIABILITIES |
|
|
|
| ||||
Payable to custodian |
| 349,959 |
|
| — | ||||
Payable for fund shares redeemed |
| 69,812 |
|
| — | ||||
Deferred foreign capital gains tax liability (see note 2) |
| — |
|
| 138,750 | ||||
Payable to advisor (see note 3) |
| 48,361 |
|
| 4,324 | ||||
Payable to distributor |
| 7,784 |
|
| 675 | ||||
Accrued expenses |
| 65,274 |
|
| 44,341 | ||||
Total Liabilities |
| 541,190 |
|
| 188,090 | ||||
NET ASSETS | $ | 45,273,458 |
| $ | 18,208,220 | ||||
|
|
| |||||||
| NET ASSETS |
|
|
|
| ||||
Investor Class | $ | 36,390,395 |
| $ | 5,346,875 | ||||
Institutional Class |
| 8,883,063 |
|
| 12,861,345 | ||||
Total | $ | 45,273,458 |
| $ | 18,208,220 | ||||
|
|
| |||||||
| SHARES OUTSTANDING |
|
|
|
| ||||
(shares of beneficial interest issued and outstanding, respectively, unlimited number of shares authorized with no par value) |
|
|
| ||||||
Investor Class |
| 5,548,821 |
|
| 465,442 | ||||
Institutional Class |
| 1,331,861 |
|
| 1,106,269 | ||||
Total |
| 6,880,682 |
|
| 1,571,711 | ||||
|
|
| |||||||
| NET ASSET VALUE |
|
|
|
| ||||
Investor Class, offering price and redemption price | $ | 6.56 |
| $ | 11.49 | ||||
Institutional Class, offering price and redemption price | $ | 6.67 |
| $ | 11.63 | ||||
|
|
| |||||||
| ANALYSIS OF NET ASSETS |
|
|
|
| ||||
Capital | $ | 71,071,124 |
| $ | 17,100,834 | ||||
Accumulated earnings (losses) |
| (25,797,666 | ) |
| 1,107,386 | ||||
Net assets | $ | 45,273,458 |
| $ | 18,208,220 | ||||
|
|
| |||||||
a Investment securities at cost | $ | 40,473,099 |
| $ | 13,943,913 | ||||
b Foreign currency at cost | $ | 58,459 |
| $ | 1,627 | ||||
See accompanying notes to the financial statements.
41
Statements of Assets and Liabilities December 31, 2023 (continued)
International | Focused | |||||||||
| ASSETS |
|
|
|
|
| ||||
Investment securities at valuea | $ | 388,110,713 |
| $ | 6,043,039 |
| ||||
Cash |
| 3,159,447 |
|
| — |
| ||||
Foreign Currencyb |
| 83,810 |
|
| — |
| ||||
Receivable from securities sold |
| 1,494,569 |
|
| — |
| ||||
Receivable from fund shares sold |
| 38,275 |
|
| — |
| ||||
Dividends and interest receivable |
| 2,635,462 |
|
| 11,469 |
| ||||
Due from Advisor |
| — |
|
| 3,142 |
| ||||
Prepaid expenses |
| 52,400 |
|
| 3,495 |
| ||||
Total Assets |
| 395,574,676 |
|
| 6,061,145 |
| ||||
|
|
|
| |||||||
| LIABILITIES |
|
|
|
|
| ||||
Payable for fund shares redeemed |
| 484,886 |
|
| — |
| ||||
Payable for securities purchased |
| 1,044,802 |
|
| — |
| ||||
Payable to advisor (see note 3) |
| 337,067 |
|
| — |
| ||||
Payable to distributor |
| 24,124 |
|
| — |
| ||||
Accrued expenses |
| 163,342 |
|
| 29,199 |
| ||||
Total Liabilities |
| 2,054,221 |
|
| 29,199 |
| ||||
NET ASSETS | $ | 393,520,455 |
| $ | 6,031,946 |
| ||||
|
|
|
| |||||||
| NET ASSETS |
|
|
|
|
| ||||
Investor Class | $ | 114,698,271 |
| $ | — |
| ||||
Institutional Class |
| 278,822,184 |
|
| 6,031,946 |
| ||||
Total | $ | 393,520,455 |
| $ | 6,031,946 |
| ||||
|
|
|
| |||||||
| SHARES OUTSTANDING |
|
|
|
|
| ||||
(shares of beneficial interest issued and outstanding, respectively, unlimited number of shares authorized with no par value) |
|
|
|
| ||||||
Investor Class |
| 6,583,784 |
|
| — |
| ||||
Institutional Class |
| 32,819,273 |
|
| 688,152 |
| ||||
Total |
| 39,403,057 |
|
| 688,152 |
| ||||
|
|
|
| |||||||
| NET ASSET VALUE |
|
|
|
|
| ||||
Investor Class, offering price and redemption price | $ | 17.42 |
| $ | — |
| ||||
Institutional Class, offering price and redemption price | $ | 8.50 |
| $ | 8.77 |
| ||||
|
|
|
| |||||||
| ANALYSIS OF NET ASSETS |
|
|
|
|
| ||||
Capital | $ | 580,110,658 |
| $ | 7,245,932 |
| ||||
Accumulated earnings (losses) |
| (186,590,203 | ) |
| (1,213,986 | ) | ||||
Net assets | $ | 393,520,455 |
| $ | 6,031,946 |
| ||||
|
|
|
| |||||||
a Investment securities at cost | $ | 330,530,138 |
| $ | 5,636,423 |
| ||||
b Foreign currency at cost | $ | 83,950 |
| $ | — |
| ||||
See accompanying notes to the financial statements.
42
Statements of Operations Year Ended December 31, 2023
Micro-Cap | Small-Cap | |||||||||
| INVESTMENT INCOME |
|
|
|
| |||||
Dividends | $ | 1,364,261 |
| $ | 2,193,999 |
| ||||
Interest |
| 854,032 |
|
| 675,609 |
| ||||
Total investment income |
| 2,218,293 |
|
| 2,869,608 |
| ||||
|
|
|
| |||||||
EXPENSES |
|
|
|
| ||||||
Investment advisory fees (see note 3) |
| 1,904,505 |
|
| 1,329,587 |
| ||||
Management fees (see note 3) |
| 1,269,670 |
|
| 1,329,587 |
| ||||
Distribution fees and shareholder services |
| 444,167 |
|
| 488,065 |
| ||||
Transfer agent fees and expenses |
| 486,799 |
|
| 480,198 |
| ||||
Custodian fees and expenses |
| 28,846 |
|
| 29,372 |
| ||||
Accounting services fees |
| 117,073 |
|
| 121,511 |
| ||||
Other |
| 258,067 |
|
| 263,747 |
| ||||
Total expenses before reimbursed expenses |
| 4,509,127 |
|
| 4,042,067 |
| ||||
Earnings credit (see note 6) |
| (5,627 | ) |
| (5,847 | ) | ||||
Expense reimbursement (see note 3) |
| — |
|
| (224,187 | ) | ||||
Total expenses |
| 4,503,500 |
|
| 3,812,033 |
| ||||
NET INVESTMENT LOSS |
| (2,285,207 | ) |
| (942,425 | ) | ||||
|
|
|
| |||||||
NET REALIZED AND UNREALIZED GAINS (LOSSES) FROM INVESTMENTS | ||||||||||
Net realized losses on investment transactions |
| (9,801,366 | ) |
| (11,253,721 | ) | ||||
Change in net unrealized appreciation/depreciation |
| 54,974,894 |
|
| 51,758,863 |
| ||||
Net realized /unrealized gains on investments |
| 45,173,528 |
|
| 40,505,142 |
| ||||
NET INCREASE IN NET ASSETS RESULTING FROM OPERATIONS | $ | 42,888,321 |
| $ | 39,562,717 |
| ||||
See accompanying notes to the financial statements.
43
Statements of Operations Year Ended December 31, 2023 (continued)
Global | China | Emerging | ||||||||||
INVESTMENT INCOME |
|
|
|
|
|
| ||||||
Dividendsa | $ | 355,806 |
| $ | 909,215 |
| $ | 257,322 |
| |||
Interest |
| 75,526 |
|
| 15,871 |
|
| 45,367 |
| |||
Total investment income |
| 431,332 |
|
| 925,086 |
|
| 302,689 |
| |||
|
|
|
|
|
| |||||||
EXPENSES |
|
|
|
|
|
| ||||||
Investment advisory fees (see note 3) |
| 235,296 |
|
| 654,445 |
|
| 196,061 |
| |||
Management fees (see note 3) |
| 210,296 |
|
| — |
|
| — |
| |||
Distribution fees and shareholder |
| 88,357 |
|
| 104,570 |
|
| 7,189 |
| |||
Transfer agent fees and expenses |
| 61,443 |
|
| 106,731 |
|
| 32,943 |
| |||
Custodian fees and expenses |
| 27,029 |
|
| 99,936 |
|
| 61,121 |
| |||
Accounting services fees |
| 34,064 |
|
| 37,512 |
|
| 26,445 |
| |||
Federal and state registration fees |
| 32,938 |
|
| 36,917 |
|
| 31,631 |
| |||
Audit fees |
| 22,160 |
|
| 22,160 |
|
| 22,160 |
| |||
Other |
| 36,799 |
|
| 40,245 |
|
| 16,237 |
| |||
Total expenses before reimbursed expenses |
| 748,382 |
|
| 1,102,516 |
|
| 393,787 |
| |||
Earnings credit (see note 6) |
| (3,522 | ) |
| (3,966 | ) |
| (7,377 | ) | |||
Expense reimbursement (see note 3) |
| — |
|
| — |
|
| (143,948 | ) | |||
Total Expenses |
| 744,860 |
|
| 1,098,550 |
|
| 242,462 |
| |||
NET INVESTMENT INCOME (LOSS) |
| (313,528 | ) |
| (173,464 | ) |
| 60,227 |
| |||
|
|
|
|
|
| |||||||
NET REALIZED AND UNREALIZED GAINS (LOSSES) FROM INVESTMENTS |
|
|
| |||||||||
Net realized gains (losses) on investment transactions |
| (1,627,287 | ) |
| (4,820,052 | ) |
| 55,786 |
| |||
Net realized foreign capital gains tax |
| — |
|
| — |
|
| (84,386 | ) | |||
Net realized gains (losses) on foreign currency transactions |
| 4,575 |
|
| 2,929 |
|
| (8,376 | ) | |||
Net realized gains (losses) on |
| (1,622,712 | ) |
| (4,817,123 | ) |
| (36,976 | ) | |||
Change in net deferred foreign capital gains taxes on unrealized appreciation/depreciation |
| — |
|
| — |
|
| (94,539 | ) | |||
Change in net unrealized appreciation/depreciation on investments and translation of assets and liabilities denominated in foreign currencies |
| 5,401,625 |
|
| 244,532 |
|
| 2,041,335 |
| |||
Net realized/unrealized gains (losses) on investments and foreign currencies |
| 3,778,913 |
|
| (4,572,591 | ) |
| 1,909,820 |
| |||
NET INCREASE (DECREASE) IN NET ASSETS RESULTING FROM OPERATIONS | $ | 3,465,385 |
| $ | (4,746,055 | ) | $ | 1,970,047 |
| |||
a Dividends are net of foreign withholding tax of $40,384, $113,755, and $38,422 for the Global Opportunities Fund, China Opportunities Fund, and Emerging Markets Fund respectively.
See accompanying notes to the financial statements.
44
Statements of Operations Year Ended December 31, 2023 (continued)
International | Focused | |||||||||
INVESTMENT INCOME |
|
|
|
| ||||||
Dividendsa | $ | 2,991,862 |
| $ | 131,481 |
| ||||
Interest |
| 77,643 |
|
| 9,389 |
| ||||
Total investment income |
| 3,069,505 |
|
| 140,870 |
| ||||
|
|
|
| |||||||
EXPENSES |
|
|
|
| ||||||
Investment advisory fees (see note 3) |
| 1,711,314 |
|
| 46,607 |
| ||||
Distribution fees and shareholder services |
| 329,937 |
|
| — |
| ||||
Transfer agent fees and expenses |
| 261,372 |
|
| 15,185 |
| ||||
Custodian fees and expenses |
| 93,701 |
|
| 15,383 |
| ||||
Accounting services fees |
| 65,628 |
|
| 18,617 |
| ||||
Federal and state registration fees |
| 28,653 |
|
| 19,074 |
| ||||
Audit fees |
| 21,865 |
|
| 20,962 |
| ||||
Shareholder Reporting Fees |
| 27,604 |
|
| 7,818 |
| ||||
Other |
| 65,421 |
|
| 2,620 |
| ||||
Total expenses before reimbursed expenses |
| 2,605,495 |
|
| 146,266 |
| ||||
Earnings credit (see note 6) |
| (15,065 | ) |
| (1,943 | ) | ||||
Expense reimbursement (see note 3) |
| (409,576 | ) |
| (88,978 | ) | ||||
Total Expenses |
| 2,180,854 |
|
| 55,345 |
| ||||
NET INVESTMENT INCOME |
| 888,651 |
|
| 85,525 |
| ||||
NET REALIZED AND UNREALIZED GAINS (LOSSES) FROM INVESTMENTS | ||||||||||
Net realized losses on investment transactions |
| (7,213,662 | ) |
| (237,136 | ) | ||||
Net realized gains on foreign currency transactions |
| 30 |
|
| 1,050 |
| ||||
Net realized losses on investments and foreign |
| (7,213,632 | ) |
| (236,086 | ) | ||||
Change in net unrealized appreciation/depreciation on investments and translation of assets and liabilities denominated in foreign currencies |
| 14,163,705 |
|
| 985,831 |
| ||||
Net realized/unrealized gains on investments and foreign currencies |
| 6,950,073 |
|
| 749,745 |
| ||||
NET INCREASE IN NET ASSETS RESULTING FROM OPERATIONS | $ | 7,838,724 |
| $ | 835,270 |
| ||||
a Dividends are net of foreign withholding tax of $338,873 and $11,287 for the International Opportunities Fund and Focused International Growth Fund respectively.
See accompanying notes to the financial statements.
45
Statements of Changes in Net Assets
MICRO-CAP FUND | |||||||||
Year Ended | Year Ended | ||||||||
| FROM OPERATIONS |
|
|
|
|
|
|
| |
Net investment loss | $ | (2,285,207 | ) | $ | (1,252,328 | ) | |||
Net realized gains (losses) on investment transactions |
| (9,801,366 | ) |
| 440,411 |
| |||
Change in net unrealized appreciation/depreciation on investments |
| 54,974,894 |
|
| (16,127,343 | ) | |||
Net increase (decrease) in net assets resulting from operations |
| 42,888,321 |
|
| (16,939,260 | ) | |||
|
|
|
| ||||||
| FROM DISTRIBUTIONS: |
|
|
|
|
| |||
Distributions to shareholders |
|
|
|
| |||||
Investor Class |
| — |
|
| (1,309,953 | ) | |||
Institutional Class |
| — |
|
| (970,504 | ) | |||
Net decrease in net assets from distributions |
| — |
|
| (2,280,457 | ) | |||
|
|
|
| ||||||
| FROM CAPITAL SHARE TRANSACTIONS |
|
|
|
|
| |||
Investor Class |
|
|
|
| |||||
Proceeds from sale of shares |
| 207,644,309 |
|
| 56,866,010 |
| |||
Proceeds from reinvestment of distributions |
| — |
|
| 1,148,717 |
| |||
Redemption of shares (see note 5) |
| (90,293,510 | ) |
| (37,721,248 | ) | |||
Net increase from investor class share transactions |
| 117,350,799 |
|
| 20,293,479 |
| |||
Institutional Class |
|
|
|
| |||||
Proceeds from sale of shares |
| 157,187,271 |
|
| 48,191,773 |
| |||
Proceeds from reinvestment of distributions |
| — |
|
| 535,090 |
| |||
Redemption of shares (see note 5) |
| (30,799,949 | ) |
| (18,739,798 | ) | |||
Net increase from institutional class share transactions |
| 126,387,322 |
|
| 29,987,065 |
| |||
Redemption fees (see note 5) |
| 252,670 |
|
| 109,101 |
| |||
Net increase in net assets resulting from capital share transactions |
| 243,990,791 |
|
| 50,389,645 |
| |||
Total increase in net assets |
| 286,879,112 |
|
| 31,169,928 |
| |||
|
|
|
| ||||||
| NET ASSETS |
|
|
|
|
| |||
Beginning of year |
| 168,787,848 |
|
| 137,617,920 |
| |||
End of year | $ | 455,666,960 |
| $ | 168,787,848 |
| |||
|
|
|
| ||||||
| TRANSACTIONS IN SHARES |
|
|
|
|
| |||
Investor Class |
|
|
|
| |||||
Shares sold |
| 5,864,271 |
|
| 1,782,331 |
| |||
Shares issued in reinvestment of distributions |
| — |
|
| 36,306 |
| |||
Less shares redeemed |
| (2,626,967 | ) |
| (1,217,062 | ) | |||
Net increase from investor class share transactions |
| 3,237,304 |
|
| 601,575 |
| |||
Institutional Class |
|
|
|
| |||||
Shares sold |
| 4,352,900 |
|
| 1,471,975 |
| |||
Shares issued in reinvestment of distributions |
| — |
|
| 16,613 |
| |||
Less shares redeemed |
| (887,721 | ) |
| (610,465 | ) | |||
Net increase from institutional class share transactions |
| 3,465,179 |
|
| 878,123 |
| |||
Net increase from capital share transactions |
| 6,702,483 |
|
| 1,479,698 |
| |||
See accompanying notes to the financial statements.
46
Statements of Changes in Net Assets (continued)
SMALL-CAP OPPORTUNITIES FUND | |||||||||
Year Ended | Year Ended | ||||||||
| FROM OPERATIONS |
|
|
|
|
|
|
| |
Net investment loss | $ | (942,425 | ) | $ | (499,133 | ) |
| ||
Net realized losses on investment transactions |
| (11,253,721 | ) |
| (3,923,184) |
| |||
Change in net unrealized appreciation/depreciation on investments |
| 51,758,863 |
|
| 450,435 |
| |||
Net increase (decrease) in net assets resulting from operations |
| 39,562,717 |
|
| (3,971,882 | ) | |||
|
|
|
| ||||||
| FROM DISTRIBUTIONS |
|
|
|
|
| |||
Distributions to shareholders |
|
|
|
| |||||
Investor Class |
| — |
|
| (161,156 | ) | |||
Institutional Class |
| — |
|
| (103,813 | ) | |||
Net decrease in net assets from distributions |
| — |
|
| (264,969 | ) | |||
|
|
|
| ||||||
| FROM CAPITAL SHARE TRANSACTIONS |
|
|
|
|
| |||
Investor Class |
|
|
|
| |||||
Proceeds from sale of shares |
| 229,643,648 |
|
| 93,036,426 |
| |||
Proceeds from reinvestment of distributions |
| — |
|
| 147,510 |
| |||
Redemption of shares (see note 5) |
| (60,406,159 | ) |
| (13,146,967 | ) | |||
Net increase from investor class share transactions |
| 169,237,489 |
|
| 80,036,969 |
| |||
Institutional Class |
|
|
|
| |||||
Proceeds from sale of shares |
| 210,847,049 |
|
| 55,903,334 |
| |||
Proceeds from reinvestment of distributions |
| — |
|
| 95,053 |
| |||
Redemption of shares (see note 5) |
| (59,315,051 | ) |
| (4,007,340 | ) | |||
Net increase from institutional class share transactions |
| 151,531,998 |
|
| 51,991,047 |
| |||
Redemption fees (see note 5) |
| 111,978 |
|
| 46,333 |
| |||
Net increase in net assets resulting from capital share transactions |
| 320,881,465 |
|
| 132,074,349 |
| |||
Total increase in net assets |
| 360,444,182 |
|
| 127,837,498 |
| |||
|
|
|
| ||||||
| NET ASSETS |
|
|
|
|
| |||
Beginning of year |
| 156,886,354 |
|
| 29,048,856 |
| |||
End of year | $ | 517,330,536 |
| $ | 156,886,354 |
| |||
|
|
|
| ||||||
| TRANSACTIONS IN SHARES |
|
|
|
|
| |||
Investor Class |
|
|
|
| |||||
Shares sold |
| 10,943,015 |
|
| 4,858,138 |
| |||
Shares issued in reinvestment of distributions |
| — |
|
| 7,699 |
| |||
Less shares redeemed |
| (2,912,130 | ) |
| (696,651 | ) | |||
Net increase from investor class share transactions |
| 8,030,885 |
|
| 4,169,186 |
| |||
Institutional Class |
|
|
|
| |||||
Shares sold |
| 9,826,318 |
|
| 2,843,183 |
| |||
Shares issued in reinvestment of distributions |
| — |
|
| 4,865 |
| |||
Less shares redeemed |
| (2,849,065 | ) |
| (206,936 | ) | |||
Net increase from institutional class share transactions |
| 6,977,253 |
|
| 2,641,112 |
| |||
Net increase from capital share transactions |
| 15,008,138 |
|
| 6,810,298 |
| |||
See accompanying notes to the financial statements.
47
Statements of Changes in Net Assets (continued)
GLOBAL OPPORTUNITIES FUND | |||||||||
Year Ended | Year Ended | ||||||||
| FROM OPERATIONS |
|
|
|
|
|
|
| |
Net investment loss | $ | (313,528 | ) | $ | (353,269 | ) | |||
Net realized losses on investment and foreign currency transactions |
| (1,622,712 | ) |
| (5,696,680 | ) | |||
Change in net unrealized appreciation/depreciation on investments and foreign currencies |
| 5,401,625 |
|
| (14,254,269 | ) | |||
Net increase (decrease) in net assets resulting from operations |
| 3,465,385 |
|
| (20,304,218 | ) | |||
|
|
|
| ||||||
| FROM DISTRIBUTIONS |
|
|
|
|
| |||
Distributions to shareholders |
|
|
|
| |||||
Investor Class |
| — |
|
| (900,921 | ) | |||
Institutional Class |
| — |
|
| (426,487 | ) | |||
Net decrease in net assets from distributions |
| — |
|
| (1,327,408 | ) | |||
|
|
|
| ||||||
| FROM CAPITAL SHARE TRANSACTIONS |
|
|
|
|
| |||
Investor Class |
|
|
|
| |||||
Proceeds from sale of shares |
| 3,004,980 |
|
| 2,803,731 |
| |||
Proceeds from reinvestment of distributions |
| — |
|
| 817,261 |
| |||
Redemption of shares (see note 5) |
| (5,687,410 | ) |
| (6,856,467 | ) | |||
Net decrease from investor class share |
| (2,682,430 | ) |
| (3,235,475 | ) | |||
Institutional Class |
|
|
|
| |||||
Proceeds from sale of shares |
| 2,756,431 |
|
| 7,322,246 |
| |||
Proceeds from reinvestment of distributions |
| — |
|
| 357,317 |
| |||
Redemption of shares (see note 5) |
| (2,161,143 | ) |
| (7,869,826 | ) | |||
Net increase (decrease) from institutional class share transactions |
| 595,288 |
|
| (190,263) |
| |||
Redemption fees (see note 5) |
| 2,774 |
|
| 1,616 |
| |||
Net decrease in net assets resulting from capital share transactions |
| (2,084,368 | ) |
| (3,424,122 | ) | |||
Total increase (decrease) in net assets |
| 1,381,017 |
|
| (25,055,748) |
| |||
|
|
|
| ||||||
| NET ASSETS |
|
|
|
|
| |||
Beginning of year |
| 51,804,620 |
|
| 76,860,368 |
| |||
End of year | $ | 53,185,637 |
| $ | 51,804,620 |
| |||
|
|
|
| ||||||
| TRANSACTIONS IN SHARES |
|
|
|
|
| |||
Investor Class |
|
|
|
| |||||
Shares sold |
| 114,054 |
|
| 102,805 |
| |||
Shares issued in reinvestment of distributions |
| — |
|
| 32,431 |
| |||
Less shares redeemed |
| (217,693 | ) |
| (257,569 | ) | |||
Net decrease from investor class share |
| (103,639 | ) |
| (122,333 | ) | |||
Institutional Class |
|
|
|
| |||||
Shares sold |
| 107,429 |
|
| 275,023 |
| |||
Shares issued in reinvestment of distributions |
| — |
|
| 13,920 |
| |||
Less shares redeemed |
| (78,385 | ) |
| (288,395 | ) | |||
Net increase from institutional class share transactions |
| 29,044 |
|
| 548 |
| |||
Net decrease from capital share transactions |
| (74,595 | ) |
| (121,785 | ) | |||
See accompanying notes to the financial statements.
48
Statements of Changes in Net Assets (continued)
CHINA OPPORTUNITIES FUND | |||||||||
Year Ended | Year Ended | ||||||||
| FROM OPERATIONS |
|
|
|
|
|
|
| |
Net investment loss | $ | (173,464 | ) | $ | (612,274 | ) | |||
Net realized losses on investment and foreign currency transactions |
| (4,817,123 | ) |
| (24,276,628 | ) | |||
Change in net unrealized appreciation/depreciation on investments and foreign currencies |
| 244,532 |
|
| (10,954,305 | ) | |||
Net decrease in net assets resulting from operations |
| (4,746,055 | ) |
| (35,843,207 | ) | |||
|
|
|
| ||||||
| FROM DISTRIBUTIONS |
|
|
|
|
| |||
Distributions to shareholders |
|
|
|
| |||||
Investor Class |
| (166,696 | ) |
| (549,877 | ) | |||
Institutional Class |
| (65,061 | ) |
| (120,710 | ) | |||
Net decrease in net assets from distributions |
| (231,757 | ) |
| (670,587 | ) | |||
|
|
|
| ||||||
| FROM CAPITAL SHARE TRANSACTIONS |
|
|
|
|
| |||
Investor Class |
|
|
|
| |||||
Proceeds from sale of shares |
| 1,955,345 |
|
| 4,872,214 |
| |||
Proceeds from reinvestment of distributions |
| 157,108 |
|
| 520,397 |
| |||
Redemption of shares (see note 5) |
| (7,854,130 | ) |
| (10,629,431 | ) | |||
Net decrease from investor class share transactions |
| (5,741,677 | ) |
| (5,236,820 | ) | |||
Institutional Class |
|
|
|
| |||||
Proceeds from sale of shares |
| 3,541,034 |
|
| 7,464,227 |
| |||
Proceeds from reinvestment of distributions |
| 56,328 |
|
| 109,388 |
| |||
Redemption of shares (see note 5) |
| (3,974,020 | ) |
| (5,794,362 | ) | |||
Net increase (decrease) from institutional class share transactions |
| (376,658 | ) |
| 1,779,253 |
| |||
Redemption fees (see note 5) |
| 53,383 |
|
| 22,697 |
| |||
Net decrease from capital share transactions |
| (6,064,952 | ) |
| (3,434,870 | ) | |||
Total decrease in net assets |
| (11,042,764 | ) |
| (39,948,664 | ) | |||
|
|
|
| ||||||
| NET ASSETS |
|
|
|
|
| |||
Beginning of year |
| 56,316,222 |
|
| 96,264,886 |
| |||
End of year | $ | 45,273,458 |
| $ | 56,316,222 |
| |||
|
|
|
| ||||||
| TRANSACTIONS IN SHARES |
|
|
|
|
| |||
Investor Class |
|
|
|
| |||||
Shares sold |
| 269,114 |
|
| 567,266 |
| |||
Shares issued in reinvestment of distributions |
| 24,096 |
|
| 71,680 |
| |||
Less shares redeemed |
| (1,155,338 | ) |
| (1,269,813 | ) | |||
Net decrease from investor class share transactions |
| (862,128 | ) |
| (630,867 | ) | |||
Institutional Class |
|
|
|
| |||||
Shares sold |
| 464,835 |
|
| 897,133 |
| |||
Shares issued in reinvestment of distributions |
| 8,483 |
|
| 14,822 |
| |||
Less shares redeemed |
| (588,147 | ) |
| (771,295 | ) | |||
Net increase (decrease) from institutional class share transactions |
| (114,829 | ) |
| 140,660 |
| |||
Net decrease from capital share transactions |
| (976,957 | ) |
| (490,207 | ) | |||
See accompanying notes to the financial statements.
49
Statements of Changes in Net Assets (continued)
EMERGING MARKETS FUND | |||||||||
Year Ended | Year Ended | ||||||||
| FROM OPERATIONS |
|
|
|
|
|
|
| |
Net investment income (loss) | $ | 60,227 |
| $ | (28,674 | ) | |||
Net realized gains losses on investments and foreign currency transactions |
| (36,976 | ) |
| (1,160,556 | ) | |||
Change in net unrealized appreciation/depreciation on investments and foreign currencies |
| 1,946,796 |
|
| (2,592,625 | ) | |||
Net increase (decrease) in net assets resulting from operations |
| 1,970,047 |
|
| (3,781,855 | ) | |||
|
|
|
| ||||||
| FROM DISTRIBUTIONS |
|
|
|
|
| |||
Distributions to shareholders |
|
|
|
| |||||
Investor Class |
| (16,879 | ) |
| (42,452 | ) | |||
Institutional Class |
| (91,113 | ) |
| (294,995 | ) | |||
Net decrease in net assets from distributions |
| (107,992 | ) |
| (337,447 | ) | |||
|
|
|
| ||||||
| FROM CAPITAL SHARE TRANSACTIONS |
|
|
|
|
| |||
Investor Class |
|
|
|
| |||||
Proceeds from sale of shares |
| 4,572,037 |
|
| 1,197,372 |
| |||
Proceeds from reinvestment of distributions |
| 16,296 |
|
| 38,456 |
| |||
Redemption of shares (see note 5) |
| (1,093,083 | ) |
| (743,874 | ) | |||
Net increase from investor class share transactions |
| 3,495,250 |
|
| 491,954 |
| |||
Institutional Class |
|
|
|
| |||||
Proceeds from sale of shares |
| 2,865,406 |
|
| 3,351,358 |
| |||
Proceeds from reinvestment of distributions |
| 73,686 |
|
| 255,307 |
| |||
Redemption of shares (see note 5) |
| (2,683,559 | ) |
| (948,787 | ) | |||
Net increase from institutional class share transactions |
| 255,533 |
|
| 2,657,878 |
| |||
Redemption fees (see note 5) |
| 4,906 |
|
| 3,324 |
| |||
Net increase in net assets resulting from capital share transactions |
| 3,755,689 |
|
| 3,153,156 |
| |||
Total increase (decrease) in net assets |
| 5,617,744 |
|
| (966,146 | ) | |||
|
|
|
| ||||||
| NET ASSETS |
|
|
|
|
| |||
Beginning of year |
| 12,590,476 |
|
| 13,556,622 |
| |||
End of year | $ | 18,208,220 |
| $ | 12,590,476 |
| |||
|
|
|
| ||||||
| TRANSACTIONS IN SHARES |
|
|
|
|
| |||
Investor Class |
|
|
|
| |||||
Shares sold |
| 408,051 |
|
| 105,005 |
| |||
Shares issued in reinvestment of distributions |
| 1,421 |
|
| 3,800 |
| |||
Less shares redeemed |
| (101,156 | ) |
| (72,461 | ) | |||
Net increase from investor class share transactions |
| 308,316 |
|
| 36,344 |
| |||
Institutional Class |
|
|
|
| |||||
Shares sold |
| 257,783 |
|
| 283,306 |
| |||
Shares issued in reinvestment of distributions |
| 6,347 |
|
| 24,957 |
| |||
Less shares redeemed |
| (241,790 | ) |
| (90,401 | ) | |||
Net increase from investor class share transactions |
| 22,340 |
|
| 217,862 |
| |||
Net increase from capital share transactions |
| 330,656 |
|
| 254,206 |
| |||
See accompanying notes to the financial statements.
50
Statements of Changes in Net Assets (continued)
INTERNATIONAL | |||||||||
Year Ended | Year Ended | ||||||||
| FROM OPERATIONS |
|
|
|
|
|
|
| |
Net investment income | $ | 888,651 |
| $ | 1,162,475 |
| |||
Net realized losses on investments and foreign currency transactions |
| (7,213,632 | ) |
| (40,116,589 | ) | |||
Change in net unrealized appreciation/depreciation on investments and foreign currencies |
| 14,163,705 |
|
| (68,979,632 | ) | |||
Net increase (decrease) in net assets resulting from operations |
| 7,838,724 |
|
| (107,933,746 | ) | |||
|
|
|
| ||||||
| FROM DISTRIBUTIONS |
|
|
|
|
| |||
Distributions to shareholders |
|
|
|
| |||||
Investor Class |
| (498,938 | ) |
| — |
| |||
Institutional Class |
| — |
|
| — |
| |||
Net decrease in net assets from distributions |
| (498,938 | ) |
| — |
| |||
|
|
|
| ||||||
| FROM CAPITAL SHARE TRANSACTIONS |
|
|
|
|
| |||
Investor Class |
|
|
|
| |||||
Proceeds from sale of shares |
| 8,485,120 |
|
| 22,084,380 |
| |||
Proceeds from reinvestment of distributions |
| 462,812 |
|
| — |
| |||
Redemption of shares (see note 5) |
| (44,489,802 | ) |
| (79,575,084 | ) | |||
Net decrease from investor class share transactions |
| (35,541,870 | ) |
| (57,490,704 | ) | |||
Institutional Class |
|
|
|
| |||||
Proceeds from sale of shares |
| 93,803 |
|
| — |
| |||
Capital from merger (see note 7) |
| 277,163,154 |
|
| — |
| |||
Proceeds from reinvestment of distributions |
| — |
|
| — |
| |||
Redemption of shares (see note 5) |
| (518,947 | ) |
| — |
| |||
Net increase from institutional class share transactions |
| 276,738,010 |
|
| — |
| |||
Redemption fees (see note 5) |
| 14,585 |
|
| 38,129 |
| |||
Net increase in net assets resulting from capital share transactions |
| 241,210,725 |
|
| (57,452,575 | ) | |||
Total increase (decrease) in net assets |
| 248,550,511 |
|
| (165,386,321 | ) | |||
|
|
|
| ||||||
| NET ASSETS |
|
|
|
|
| |||
Beginning of year |
| 144,969,944 |
|
| 310,356,265 |
| |||
End of year | $ | 393,520,455 |
| $ | 144,969,944 |
| |||
|
|
|
| ||||||
| TRANSACTIONS IN SHARES |
|
|
|
|
| |||
Investor Class |
|
|
|
| |||||
Shares sold |
| 495,626 |
|
| 1,103,401 |
| |||
Shares issued in reinvestment of distributions |
| 27,033 |
|
| — |
| |||
Less shares redeemed |
| (2,631,001 | ) |
| (4,123,116 | ) | |||
Net decrease from investor class share transactions |
| (2,108,342 | ) |
| (3,019,715 | ) | |||
Institutional Class |
|
|
|
| |||||
Shares sold |
| 11,074 |
|
| — |
| |||
Shares issued in connection with merger |
| 32,868,556 |
|
| — |
| |||
Less shares redeemed |
| (60,357 | ) |
| — |
| |||
Net increase from investor class share transactions |
| 32,819,273 |
|
| — |
| |||
Net increase (decrease) from capital share transactions |
| 30,710,931 |
|
| (3,019,715 | ) | |||
See accompanying notes to the financial statements.
51
Statements of Changes in Net Assets (continued)
Focused International | |||||||||
Year Ended | Year Ended | ||||||||
| FROM OPERATIONS |
|
|
|
|
|
|
| |
Net investment income | $ | 85,525 |
| $ | 57,383 |
| |||
Net realized losses on investments and foreign currency transactions |
| (236,086 | ) |
| (1,381,459 | ) | |||
Change in net unrealized appreciation/depreciation on investments and foreign currencies |
| 985,831 |
|
| (578,751 | ) | |||
Net increase (decrease) in net assets resulting from operations |
| 835,270 |
|
| (1,902,827) |
| |||
|
|
|
| ||||||
| FROM DISTRIBUTIONS |
|
|
|
|
| |||
Distributions to shareholders |
| (85,865 | ) |
| (63,069 | ) | |||
Net decrease in net assets from distributions |
| (85,865 | ) |
| (63,069 | ) | |||
|
|
|
| ||||||
| FROM CAPITAL SHARE TRANSACTIONS |
|
|
|
|
| |||
Proceeds from sale of shares |
| 466,240 |
|
| 11,665,393 |
| |||
Proceeds from reinvestment of distributions |
| 53,291 |
|
| 37,596 |
| |||
Redemption of shares (see note 5) |
| (314,106 | ) |
| (4,659,977 | ) | |||
Redemption fees (see note 5) |
| — |
|
| — |
| |||
Net increase from capital share transactions |
| 205,425 |
|
| 7,043,012 |
| |||
Total increase in net assets |
| 954,830 |
|
| 5,077,116 |
| |||
|
|
|
| ||||||
| NET ASSETS |
|
|
|
|
| |||
Beginning of year |
| 5,077,116 |
|
| — |
| |||
End of year | $ | 6,031,946 |
| $ | 5,077,116 |
| |||
|
|
|
| ||||||
| TRANSACTIONS IN SHARES |
|
|
|
|
| |||
Shares sold |
| 54,078 |
|
| 1,278,827 |
| |||
Shares issued in reinvestment of distributions |
| 6,098 |
|
| 4,889 |
| |||
Less shares redeemed |
| (37,419 | ) |
| (618,321 | ) | |||
Net increase from capital share transactions |
| 22,757 |
|
| 665,395 |
| |||
a For the period from April 1, 2022 (commencement of operations) through December 31, 2022.
See accompanying notes to the financial statements.
52
Notes to Financial Statements December 31, 2023
1. Description of Organization
Description of business. The Oberweis Funds (the ‘‘Trust’’) is registered under the Investment Company Act of 1940 as an open-end management investment company. The Trust is authorized to operate numerous Funds under various trading strategies. The Trust consists of seven Funds: the Oberweis Micro-Cap Fund, the Oberweis Small-Cap Opportunities Fund, the Oberweis Global Opportunities Fund, the Oberweis China Opportunities Fund, the Oberweis International Opportunities Fund, the Oberweis Emerging Markets Fund and the Oberweis Focused International Growth Fund (collectively, ‘‘the Funds’’) are each a series of the Trust. Each class of shares has identical voting, dividend, liquidation and other rights and the same terms and conditions, except each class may be subject to different class expenses as outlined in the relevant prospectus and each class has exclusive voting rights with respect to matters solely affecting such class.
2. Significant Accounting Policies
The following is a summary of significant accounting policies consistently followed by the Funds. These policies are in conformity with accounting principles generally accepted in the United States of America (“GAAP”). The Funds are each an investment company and follow accounting and reporting guidance under the Financial Accounting Standards Board (“FASB”) Accounting Standards Codification (“ASC”) Topic 946, “Financial Services — Investment Companies.”
Investment valuation. Investments in securities are stated at value as of the close of the regular trading session on the New York Stock Exchange (‘‘NYSE’’) (generally 3 p.m., Central Standard Time). Each listed and unlisted security for which last sale information is regularly reported is valued at the last reported sales price on that day. If there has been no sale on such day, then such security is valued at the current day’s bid price. Any unlisted security for which last sale information is not regularly reported and any listed debt security which has an inactive listed market for which over-the-counter market quotations are readily available is valued at the closing bid price determined on the basis of reasonable inquiry. Restricted securities and any other securities or other assets for which market quotations are not readily available are valued by appraisal at their fair value as determined in good faith under procedures established by and under the general supervision and responsibility of the Board of Trustees. Short-term debt obligations, commercial paper and repurchase agreements are valued on the basis of quoted yields for securities of comparable maturity, quality and type or on the basis of amortized cost.
The Oberweis Global Opportunities Fund, the Oberweis China Opportunities Fund, the Oberweis International Opportunities Fund, the Oberweis Emerging Markets Fund and the Oberweis Focused International Growth Fund hold foreign equity securities. Foreign securities are fair valued as described in the following circumstances. Generally, trading in foreign securities markets is completed each day at various times prior to the close of the regular trading session of the NYSE. Due to the time differences between the closings of the relevant foreign securities exchanges and the close of the regular trading session of the NYSE for the Funds, the Funds will fair value their foreign investments when it is determined that the market quotations for the foreign investments either are not readily available or are unreliable and, therefore, do not represent fair value. When the fair value prices are utilized, these prices will attempt to reflect the impact of the U.S. financial markets’ perceptions and trading activities on the Funds’ foreign investments since the last closing prices of the foreign investments were calculated on their primary foreign securities markets or exchanges. For these purposes, the Board of Trustees of the Trust has determined that movements in relevant indices, after the close of the foreign securities exchanges, may demonstrate that market quotations are unreliable, and may trigger fair value pricing for certain securities. Consequently, fair valuation of portfolio securities may
53
THE OBERWEIS FUNDS |
Notes to Financial Statements December 31, 2023 (continued) |
occur on a daily basis. In determining fair value prices, the Trust utilizes data furnished by an independent pricing service (and that data draws upon, among other information, the market values of foreign investments). When a Fund uses fair value pricing, the values assigned to the Fund’s foreign investments may not be the quoted or published prices of the investments on their primary markets or exchanges.
Fair value measurements. In accordance with Financial Accounting Standards Board (‘‘FASB’’) guidance, the Funds utilize the ‘‘Fair Value Measurements and Disclosures’’ to define fair value, set out a framework for measuring fair value, and expand disclosures regarding fair value measurements.
Various inputs are used in determining the value of the Fund’s investments. These inputs are summarized in the three levels listed below:
• Level 1 – Quoted prices in active markets for identical securities.
• Level 2 – Other significant observable inputs (including quoted prices for similar securities, interest rates, prepayment speeds, credit risk, etc).
• Level 3 – Significant unobservable inputs (including the Fund’s own assumptions in determining the fair value of investments).
The inputs or methodology used for valuing securities are not necessarily an indication of the risk associated with investing in those securities. The following is a summary of the inputs used to value the Funds’ net assets as of December 31, 2023:
| Micro-Cap | Small-Cap | ||||||
Level 1 – Equities | $ | 443,320,297 | $ | 496,127,464 | ||||
Total Level 1 |
| 443,320,297 |
| 496,127,464 | ||||
Level 2 |
| — |
| — | ||||
Level 3 |
| — |
| — | ||||
Total Investments | $ | 443,320,297 | $ | 496,127,464 | ||||
| Global | China | International | ||||||||
Level 1 – Equities |
|
|
| ||||||||
Total Asia | $ | 8,343,203 | $ | 45,201,259 | $ | 78,169,350 | |||||
Total Australia |
| 927,706 |
| — |
| 34,005,461 | |||||
Total Europe |
| 12,441,523 |
| — |
| 221,741,230 | |||||
Total North America |
| 28,648,547 |
| — |
| 54,194,672 | |||||
Total Level 1 |
| 50,360,979 |
| 45,201,259 |
| 388,110,713 | |||||
Level 2 – Equities/Rights |
|
|
| ||||||||
Total Asia |
| — |
| 10,725 |
| — | |||||
Total Level 2 |
| — |
| 10,725 |
| — | |||||
Level 3 |
| — |
| — |
| — | |||||
Total Investments | $ | 50,360,979 | $ | 45,211,984 | $ | 388,110,713 | |||||
54
THE OBERWEIS FUNDS |
Notes to Financial Statements December 31, 2023 (continued) |
| Emerging | Focused | ||||||
Level 1 – Equities |
|
| ||||||
Total Asia | $ | 11,839,706 | $ | 1,306,692 | ||||
Total Africa |
| 250,704 |
| — | ||||
Total Australia |
| — |
| 154,579 | ||||
Total Europe |
| 1,120,142 |
| 3,827,748 | ||||
Total North America |
| 909,438 |
| 663,573 | ||||
Total South America |
| 2,231,002 |
| — | ||||
Total Short-Term Investments |
| 12,520 |
| 90,447 | ||||
Total Level 1 |
| 16,363,512 |
| 6,043,039 | ||||
Level 2 |
| — |
| — | ||||
Level 3 |
| — |
| — | ||||
Total Investments | $ | 16,363,512 | $ | 6,043,039 | ||||
The Funds’ assets include certain foreign securities for which a third-party statistical pricing service may be employed for purposes of fair market valuation. The pricing service provides fair market valuation on days when the movement in relevant indices exceeds a predetermined threshold.
Foreign currency transactions. The accounting records of the Funds are maintained in U.S. dollars. Foreign currency amounts are translated into U.S. dollars at the current rate of exchange to determine the value of investments, assets and liabilities. Purchases and sales of securities, and income and expenses are translated at the prevailing rate of exchange on the respective date of these transactions. The Funds do not isolate that portion of the results of operations resulting from changes in foreign exchange rates on investments from fluctuations arising from changes in market prices of securities held. These fluctuations are included with the net realized and unrealized gains or losses from investments and foreign currencies.
Risks associated with foreign securities and currencies. Investments in securities of foreign issuers carry certain risks not ordinarily associated with investments in securities of U.S. issuers. These risks include future political and economic developments, and the possible imposition of exchange controls or other foreign governmental laws and restrictions. In addition, with respect to certain countries, there is the possibility of expropriation of assets, confiscatory taxation, political or social instability or diplomatic developments, which could adversely affect investments in those countries.
Certain countries also may impose substantial restrictions on investments in their capital markets by foreign entities, including restrictions on investments in issuers of industries deemed sensitive to relevant national interests. These factors may limit the investment opportunities available and result in a lack of liquidity and a high price volatility with respect to securities of issuers from developing countries.
Fund share valuation. Fund shares are sold and redeemed on a continuous basis at net asset value. On each day the NYSE is open for trading, the net asset value per share is determined as of the later of the close of the NYSE or the CBOE by dividing the total value of each Fund’s investments and other assets, less liabilities, by the number of each Fund’s shares outstanding.
55
THE OBERWEIS FUNDS |
Notes to Financial Statements December 31, 2023 (continued) |
Investment transactions and investment income. Investment transactions are accounted for on the trade date (date the order to buy or sell is executed). Dividend income is recorded on the ex-dividend date, except that certain dividends from foreign securities are recorded as soon as the information is available to the Fund, and interest income is recorded on the accrual basis and includes amortization of premium and discount. Realized gains and losses from investment transactions are reported on an identified cost basis. Income and realized and unrealized gains or losses on investments are allocated to each class of shares based on its relative net assets.
Fund Foreign Taxation. The Funds may be subject to foreign taxation related to income received, capital gains on the sale of securities and certain foreign currency transactions in the foreign jurisdictions in which they invest. Foreign taxes, if any, are recorded based on the tax regulations and rates that exist in the foreign markets in which the Funds invest. When a capital gain tax is determined to apply, the Funds record an estimated deferred tax liability in an amount that may be payable if the securities were disposed of on the valuation date.
Fund expense allocations. The Funds account separately for the assets, liabilities and operations of each Fund. Direct expenses of each Fund or class are charged to that Fund or class while general expenses are allocated pro-rata among the Funds based on net assets or other appropriate methods.
Federal income taxes and dividends to shareholders. It is the policy of the Funds to continue to comply with all requirements of the Internal Revenue Code of 1986, as amended (‘‘the Code’’), applicable to regulated investment companies and to distribute substantially all of their taxable income to their shareholders. The Funds have met the requirements of the Code applicable to regulated investment companies for the year ended December 31, 2023. Therefore, no federal income tax provision is required. Income and capital gains of the Funds are determined in accordance with both tax regulations and accounting principles generally accepted in the U.S. (‘‘GAAP’’). Such treatment may result in temporary and permanent differences between tax basis earnings and earnings reported for financial statement purposes. These reclassifications, which have no impact on the net asset value of the Funds, are primarily attributable to certain differences in computation of distributable income and capital gains under federal tax rules versus GAAP.
Dividends and Distributions to Shareholders — The Funds will distribute substantially all of their net investment income and net realized capital gains, if any, at least annually. All distributions are recorded on ex-dividend date.
Certain Funds may utilize earnings and profits on redemption of shares as part of the dividends paid deduction.
As of December 31, 2023, the Funds did not have a liability for any unrecognized tax benefits. The Funds recognize interest and penalties, if any, related to unrecognized tax benefits as income tax expense in the Statements of Operations. During the year ended December 31, 2023, the Funds did not incur any interest or penalties.
For the year ended December 31, 2023, permanent book and tax basis differences resulting primarily from differing treatments for net operating losses, foreign currency transactions, passive foreign investment company (‘‘PFIC’’) adjustments and the tax practice known as equalization, were identified and reclassified among the components of the Funds’ net assets.
56
THE OBERWEIS FUNDS |
Notes to Financial Statements December 31, 2023 (continued) |
GAAP requires that certain components of net assets be reclassified between financial and tax reporting. These reclassifications have no effect on net assets or net asset value per share. For the year ended December 31, 2023, permanent differences in book and tax accounting have been reclassified to paid in capital and accumulated earnings (loss) as follows:
Increases/(Decreases) | ||||||||||
Capital | Accumulated | |||||||||
Micro-Cap Fund | $ | (2,285,206 | ) | $ | 2,285,206 |
| ||||
Small-Cap Opportunities Fund |
| (1,036,505 | ) |
| 1,036,505 |
| ||||
Global Opportunities Fund |
| (202,027 | ) |
| 202,027 |
| ||||
China Opportunities Fund |
| (2 | ) |
| 2 |
| ||||
Emerging Markets Fund |
| (125,895 | ) |
| 125,895 |
| ||||
International Opportunities Fund |
| 193,540,270 |
|
| (193,540,270 | ) | ||||
Focused International Growth Fund |
| — |
|
| — |
| ||||
The tax character of distributions paid during the fiscal year ended December 31, 2023 was as follows:
Distributions | Distributions | Total | |||||||||
Micro-Cap Fund | $ | — | $ | — | $ | — | |||||
Small-Cap Opportunities Fund |
| — |
| — |
| — | |||||
Global Opportunities Fund |
| — |
| — |
| — | |||||
China Opportunities Fund |
| 231,757 |
| — |
| 231,757 | |||||
Emerging Markets Fund |
| 107,992 |
| — |
| 107,992 | |||||
International Opportunities Fund |
| 498,938 |
| — |
| 498,938 | |||||
Focused International Growth |
| 85,865 |
| — |
| 85,865 | |||||
The tax character of distributions paid during the fiscal year ended December 31, 2022 was as follows:
Distributions | Distributions | Total | |||||||||
Micro-Cap Fund | $ | — | $ | 2,280,457 | $ | 2,280,457 | |||||
Small-Cap Opportunities Fund |
| — |
| 264,969 |
| 264,969 | |||||
Global Opportunities Fund |
| — |
| 1,327,408 |
| 1,327,408 | |||||
China Opportunities Fund |
| — |
| 670,587 |
| 670,587 | |||||
Emerging Markets Fund |
| — |
| 337,447 |
| 337,447 | |||||
International Opportunities Fund |
| — |
| — |
| — | |||||
Focused International Growth |
| 63,069 |
| — |
| 63,069 | |||||
57
THE OBERWEIS FUNDS |
Notes to Financial Statements December 31, 2023 (continued) |
As of December 31, 2023, the following Funds had net capital loss carryforwards to offset future net capital gains, if any, to the extent provided by treasury regulations:
Not Subject to Expiration | |||||||||||
Short-Term | Long-Term | Total | |||||||||
Micro-Cap Fund | $ | 11,637,484 | $ | — | $ | 11,637,484 | |||||
Small-Cap Opportunities Fund |
| 14,718,772 |
| — |
| 14,718,772 | |||||
Global Opportunities Fund |
| 7,320,584 |
| — |
| 7,320,584 | |||||
China Opportunities Fund |
| 28,587,727 |
| 817,627 |
| 29,405,354 | |||||
Emerging Markets Fund |
| 777,781 |
| 318,491 |
| 1,096,272 | |||||
International Opportunities Fund |
| 227,694,842 |
| 11,658,325 |
| 239,353,167 | |||||
Focused International Growth |
| 1,535,961 |
| 59,304 |
| 1,595,265 | |||||
Capital loss carryovers are available to offset future realized capital gains and thereby reduce further taxable gain distributions. Some of the capital loss carryovers from merger may have limitations in the future years. During the year ended December 31, 2023, the Emerging Markets Fund utilized $72,724 of capital loss carryover.
Post-October capital losses incurred after October 31 and within the taxable year are deemed to arise on the first business day of the Funds’ next taxable year. For the year ended December 31, 2023, Post October capital losses treated arising on January 1, 2024 was as follows:
Short-Term | Long-Term | |||||||
Micro-Cap Fund | $ | — | $ | — | ||||
Small-Cap Opportunities Fund |
| — |
| — | ||||
Global Opportunities Fund |
| — |
| — | ||||
China Opportunities Fund |
| — |
| — | ||||
Emerging Markets Fund |
| — |
| — | ||||
International Opportunities Fund |
| — |
| — | ||||
Focused International Growth |
| — |
| — | ||||
58
THE OBERWEIS FUNDS |
Notes to Financial Statements December 31, 2023 (continued) |
As of December 31, 2023 the components of accumulated earnings (deficit) on a tax basis were as follows:
Undistributed | Undistributed | Accumulated | Unrealized | Unrealized | |||||||||||||||
Micro-Cap Fund | $ | — | $ | — | $ | (11,637,484 | ) | $ | 79,269,629 | $ | — |
| |||||||
Small-Cap Opportunities Fund |
| — |
| — |
| (14,718,772 | ) |
| 58,776,660 |
| — |
| |||||||
Global Opportunities Fund |
| — |
| — |
| (7,320,584 | ) |
| 10,212,109 |
| (150 | ) | |||||||
China Opportunities Fund |
| 466,784 |
| — |
| (29,405,354 | ) |
| 3,142,149 |
| (1,245 | ) | |||||||
Emerging Markets Fund |
| — |
| — |
| (1,096,272 | ) |
| 2,341,862 |
| (138,204 | ) | |||||||
International Opportunities Fund |
| 1,886,552 |
| — |
| (239,353,167 | ) |
| 50,869,021 |
| 7,391 |
| |||||||
Focused International Growth |
| 709 |
| — |
| (1,595,265 | ) |
| 380,106 |
| 464 |
| |||||||
Accumulated capital and other losses consists of timing differences related to wash sales and capital loss carryforwards.
As of December 31, 2023 the cost of investments for federal income tax purposes are as follows:
Cost of | Gross | Gross | Net | ||||||||||||
Micro-Cap Fund | $ | 364,050,668 | $ | 91,062,827 | $ | (11,793,198 | ) | $ | 79,269,629 | ||||||
Small-Cap Opportunities Fund |
| 437,350,804 |
| 69,652,117 |
| (10,875,457 | ) |
| 58,776,660 | ||||||
Global Opportunities Fund |
| 40,148,870 |
| 11,870,983 |
| (1,658,874 | ) |
| 10,212,109 | ||||||
China Opportunities Fund |
| 42,069,835 |
| 6,694,018 |
| (3,551,869 | ) |
| 3,142,149 | ||||||
Emerging Markets Fund |
| 14,021,650 |
| 3,161,096 |
| (819,234 | ) |
| 2,341,862 | ||||||
International Opportunities Fund |
| 337,241,692 |
| 60,959,711 |
| (10,090,690 | ) |
| 50,869,021 | ||||||
Focused International Growth |
| 5,662,933 |
| 584,173 |
| (204,067 | ) |
| 380,106 | ||||||
59
THE OBERWEIS FUNDS |
Notes to Financial Statements December 31, 2023 (continued) |
The Funds have reviewed all open tax years and major jurisdictions and concluded that there are no significant uncertain tax positions that would require recognition in the financial statements. Open tax years are those that are open for exam by taxing authorities and, as of December 31, 2023, open Federal tax years include the tax years ended 2020 through 2023. The Funds have no examinations in progress and are also not aware of any tax positions for which it is reasonably possible that the total amounts of unrecognized tax benefits will significantly change in the next twelve months.
Use of estimates. The preparation of financial statements in conformity with generally accepted accounting principles requires management to make estimates and assumptions that affect the amounts reported in the financial statements and accompanying notes. Actual results may differ from those estimates.
Indemnifications. Under the Trust’s organizational documents, its present and former Officers and Trustees are indemnified against certain liabilities arising out of the performance of their duties to the Trust. In addition, in the normal course of business, the Trust enters into contracts that provide general indemnifications to other parties. The Trust’s maximum exposure under these arrangements is unknown as this would involve future claims that may be made against the Trust that have not yet occurred. However, the Trust has not had prior claims or losses pursuant to these contracts and expects the risk of loss to be remote.
3. Transactions with affiliates
The Funds have written agreements with Oberweis Asset Management, Inc. (‘‘OAM’’) as the Funds’ investment advisor and manager. Oberweis Securities, Inc. (‘‘OSI’’), the Funds’ principal distributor, is an affiliate of OAM.
Investment advisory agreement. Under the Advisory Agreement, OAM provides investment advisory services to the Micro-Cap, Global Opportunities, and Small-Cap Opportunities Funds and pursuant to a separate Management Agreement, OAM provides non-investment advisory management services such as administrative, compliance and accounting services to these Funds. For investment advisory services, the Micro-Cap Fund paid monthly investment advisory fees at an annual rate equal to .60% of average daily net assets. The Global Opportunities Fund paid monthly investment advisory fees at an annual rate equal to .45% of the first $50 million of average daily net assets and .40% of average daily net assets in excess of $50 million. The Small-Cap Opportunities Fund paid monthly investment advisory fees at an annual rate equal to .40% of average daily net assets. For investment advisory and management services, the China Opportunities Fund, the International Opportunities Fund, the Emerging Markets Fund and the Focused International Growth Fund paid monthly investment advisory and management fees at an annual rate equal to 1.25%, 1.00%, 1.25% and .95% of average daily net assets, respectively. For the year ended December 31, 2023, the Micro-Cap Fund, Small-Cap Opportunities Fund and Global Opportunities Fund incurred investment advisory fees totaling $1,904,505, $1,329,587 and $235,296, respectively. For the year ended December 31, 2023, the China Opportunities Fund, The International Opportunities Fund, the Emerging Markets Fund and the Focused International Growth Fund incurred investment advisory fees totaling $654,445, $1,711,314, $196,061 and $46,607, respectively.
Management agreement. For management services and facilities furnished, the Micro-Cap Fund, Global Opportunities Fund, and Small-Cap Opportunities Fund each paid a monthly fee at an annual rate equal to .40% of average daily net assets. For the year ended December 31, 2023, the Micro-Cap Fund, Small-Cap Opportunities Fund, and Global Opportunities Fund incurred management fees totaling $1,269,670, $1,329,587, and $210,296, respectively.
60
THE OBERWEIS FUNDS |
Notes to Financial Statements December 31, 2023 (continued) |
Expense reimbursement. OAM is contractually obligated to reduce its investment and management fees or reimburse the Micro-Cap Fund and Global Opportunities Fund Investor Class Shares to the extent that total ordinary operating expenses, as defined, exceed in any one year the following amounts expressed as a percentage of each Fund’s average daily net assets: 1.80% of the first $50 million; plus 1.60% of average daily net assets in excess of $50 million. OAM is contractually obligated to reduce its investment and management fees or reimburse Small-Cap Opportunities Fund, China Opportunities Fund, International Opportunities Fund and Emerging Markets Fund Investor Class Shares to the extent that total ordinary operating expenses, as defined, exceed in any one year 1.25%, 2.24%, 1.35% and 1.75% expressed as a percentage of the Fund’s average daily net assets, respectively. OAM is contractually obligated to reduce its investment and management fees or reimburse the Micro-Cap Fund and the Global Opportunities Fund Institutional Class Shares to the extent that total ordinary operating expenses, as defined, exceed in any one year the following amounts expressed as a percentage of each Fund’s average daily net assets: 1.55% of the first $50 million; plus 1.35% of average daily net assets in excess of $50 million. OAM is contractually obligated to reduce its investment and management fees or reimburse the Small-Cap Opportunities Fund, China Opportunities Fund, International Opportunities Fund, Emerging Markets Fund and Focused International Growth Fund Institutional Class Shares to the extent that total ordinary operating expenses, as defined, exceed in any one year 1.00%, 1.99%, 1.10%, 1.50% and 0.95% expressed as a percentage of the Funds’ average daily net assets, respectively. For the year ended December 31, 2023 OAM reimbursed the Small-Cap Opportunities Fund, the International Opportunities Fund, the Emerging Markets Fund and the Focused International Growth Fund in the amount of $224,188, $409,576, $143,948, and $88,978, respectively.
Officers and trustees. Certain officers and trustees of the Trust are also officers and/or directors of OAM and OSI. During the year ended December 31, 2023, the Trust made no direct payments to its officers and paid $149,750 to its unaffiliated trustees.
Distribution and shareholder service agreement. The Funds have a distribution and shareholder services agreement with OSI. For services under the distribution and shareholder services agreement, the Funds pay OSI a fee at the annual rate of .25% of the average daily net assets of Investor Class Shares as compensation for services. For the year ended December 31, 2023, the Micro-Cap Fund, Small-Cap Opportunities Fund, Global Opportunities Fund, China Opportunities Fund, International Opportunities Fund, and Emerging Markets Fund incurred distribution fees totaling $444,167, $488,065, $88,357, $104,570, $329,937, and $7,189, respectively.
Affiliated Commissions. For the year ended December 31, 2023, the Micro-Cap Fund, Small-Cap Opportunities Fund, Global Opportunities Fund, China Opportunities Fund, International Opportunities Fund, and Emerging Markets Fund did not execute any security transactions through OSI and therefore did not pay commissions to OSI.
4. Investment transactions
The cost of securities purchased and proceeds from securities sold during the year ended December 31, 2023, other than money market investments, aggregated $408,258,803 and $172,933,112, respectively, for the Micro-Cap Fund, $527,699,778 and $222,560,080, respectively, for the Small-Cap Opportunities Fund, $48,341,267 and $53,550,498, respectively, for the Global Opportunities Fund, $97,465,298 and $103,562,437, respectively, for the China Opportunities Fund, $155,094,873,and $192,190,191, respectively, for the International Opportunities Fund, $18,971,851 and $16,807,596, respectively, for the Emerging Markets Fund,
61
THE OBERWEIS FUNDS |
Notes to Financial Statements December 31, 2023 (continued) |
$4,998,501 and $4,865,483, respectively for the Focused International Growth Fund, The China Opportunities Fund, International Opportunities Fund, Emerging Markets Fund, and Focused International Growth Fund did hold a money market fund that held government securities during the year ended December 31, 2023.
The Funds may write covered call options. The premiums received provide a partial hedge (protection) against declining prices and enables each Fund to generate a higher return during years when OAM does not expect the underlying security to make any major price moves in the near future but still deems the underlying security to be, over the long term, an attractive investment for each Fund. The Funds write covered call options for which premiums received are recorded as liabilities and are subsequently adjusted to the current value of the options written. Premiums received from writing options that expire are treated as realized gains. Premiums received from writing options, which are either exercised or closed, are offset against the proceeds received or amount paid on the transaction to determine realized gains or losses. Amounts recovered for securities litigation are included in the realized gains of the Fund and are recorded when received. The Funds did not write covered call options during the year ended December 31, 2023.
5. Redemption fee
The Oberweis Funds are designed for long-term investors. To discourage market timers, redemptions of shares of the Micro-Cap Fund, Global Opportunities Fund, and Small-Cap Opportunities Fund within 90 days of purchase are subject to a 1% redemption fee of the total redemption amount and 2% for the China Opportunities Fund, the International Opportunities Fund, the Emerging Markets Fund and the Focused International Growth Fund. The redemption fee is deducted from the redemption proceeds and is retained by the Fund.
The redemption fee is retained by the Funds for the expense they incur in connection with shareholder redemptions. Redemption fees received by the Micro-Cap Fund, Small-Cap Opportunities Fund, Global Opportunities Fund, China Opportunities Fund, International Opportunities Fund, Emerging Markets Fund and Focused International Growth Fund were $252,670, $111,978, $2,774, $53,383, $14,585, 4,906, and $0, respectively, for the year ended December 31, 2023, and were recorded as a reduction of the redemption of shares in the Statements of Changes in Net Assets.
6. Earnings credits and interest charges
The Trust, as part of the agreement with the Custodian, receives credits against its custodian fees on its uninvested cash balances and is allowed to borrow for temporary purposes. Borrowings are not to exceed 5% of the value of each Fund’s total assets at the time of any such borrowing. Interest on amounts borrowed is calculated at the prime rate and is payable monthly. During the year ended December 31, 2023, the Micro-Cap Fund, Small-Cap Opportunities Fund, Global Opportunities Fund, China Opportunities Fund, International Opportunities Fund, Emerging Markets Fund, and Focused International Growth Fund received credits of $5,627, $5,847, $3,522, $3,966, $15,065, 7,377, and $1,943, respectively. During the year ended December 31, 2023, the Micro-Cap Fund, Small Cap Opportunities Fund, Global Opportunities Fund, China Opportunities Fund, International Opportunities Fund, Emerging Markets Fund, and Focused International Growth Fund incurred interest charges of $6, $960, $458, $8,457, $6,521, 879, and $166 respectively, which is included in custodian fees and expenses in the Statements of Operations.
62
THE OBERWEIS FUNDS |
Notes to Financial Statements December 31, 2023 (continued) |
7. Fund Merger
At a meeting held on October 2, 2023, the Oberweis Funds’ Board of Trustees considered a proposal for the reorganization of the Oberweis International Opportunities Fund (the “Acquiring Fund”) and the Oberweis International Institutional Fund (the “Acquired Fund”) into one Fund “ The Oberweis International Opportunites Fund” with two share classes, Investor and Institutional.
The Board of Trustees of the Oberweis Funds determined that the reorganization was in the best interest of the Oberweis International Opportunities Institutional Fund shareholders and approved an Agreement and Plan of Reorganization, which was subsequently approved by the Oberweis Funds’ Board of Trustees on October 2, 2023. The transfer of shareholder assets under the reorganization was tax-free, meaning that neither the shareholders of the Oberweis International Opportunities Fund nor the Oberweis International Opportunities Institutional Fund realized any gains or losses for federal income tax purposes as a result of the transaction. The Reorganization occurred following the close of business on December 22, 2023, whereby the assets and the stated liabilities were transferred to the corresponding Acquiring Fund.
| Acquired Fund | Security | Unrealized | Market Value of | Net | ||||||||||
OBIIX | $ | 237,509,318 | $ | 38,886,089 | $ | 276,395,407 | $ | 277,163,154 | |||||||
| Acquiring Fund | Shares | Net Assets | Net Assets | ||||||
OBIOX | 32,868,556 | $ | 115,226,896 | $ | 392,390,050 | |||||
For financial reporting purposes, the Acquiring Fund is deemed to be the accounting survivor and as a result, the Statement of Operations and Financial Highlights reflect the operations of the Acquiring Fund only. The assets received and shares issued by the Acquiring Fund were recorded at fair value; however, the cost basis of the investments received from the Acquired Fund was carried forward to align ongoing reporting of the Acquiring Fund’s realized and unrealized gains and losses with amounts distributable to shareholders for tax purposes. Because the Acquiring Fund has been managed as a single integrated portfolio since the Reorganization was completed, it is not practicable to separate the amounts of revenue and earnings of the Acquired Fund and the Acquiring Fund that have been included in the Acquiring Fund’s Statement of Operations since the Merger Date.
In connection with the Reorganization, the Acquiring Fund was renamed The Oberweis International Opportunities Fund.
Assuming the Reorganization had been completed on January 1, 2023, the beginning of the reporting period, the unaudited pro forma results of operations for the year ended December 31, 2023 would have been as follows:
| (Unaudited) | ||
Net investment income | $ | 4,616,342 | |
Net realized and unrealized gain on investments |
| 19,163,772 | |
Net increase in net assets resulting from operations | $ | 23,780,114 | |
8. Subsequent events
The Funds have evaluated subsequent events through the issuance of the financial statements and determined that no events have occurred that require disclosure.
63
Financial Highlights
Per share income and capital for a share outstanding throughout each year is as follows:
Investor Class | MICRO-CAP FUND | |||||||||||||||||||||
Years Ended December 31, | ||||||||||||||||||||||
|
|
|
| 2023 |
|
|
| 2022 |
|
|
| 2021 |
|
|
| 2020 |
|
|
| 2019 |
|
|
Net asset value at beginning of year | $ | 31.64 | $ | 35.88 | $ | 29.10 | $ | 22.40 | $ | 18.37 | ||||||||||||
| INCOME (LOSS) FROM INVESTMENT OPERATIONS: |
|
| |||||||||||||||||||
Net investment lossa | (.29 | ) | (.32 | ) | (.43 | ) | (.26 | ) | (.22 | ) | ||||||||||||
Net realized and unrealized gains (losses) on investments |
| 6.23 |
| (3.52 | ) |
| 15.93 |
| 6.96 |
| 4.25 | |||||||||||
Total from investment operations | 5.94 | (3.84 | ) | 15.50 | 6.70 | 4.03 | ||||||||||||||||
Redemption feesa | .03 | .03 | .02 | — | — | |||||||||||||||||
Less distributions: | ||||||||||||||||||||||
Distribution from net realized gains on investments |
| — |
| (.43 | ) |
| (8.74 | ) |
| — |
| — | ||||||||||
Net asset value at end of year | $ | 37.61 | $ | 31.64 | $ | 35.88 | $ | 29.10 | $ | 22.40 | ||||||||||||
Total return (%) | 18.87 | (10.60 | ) | 53.38 | 29.91 | 21.94 | ||||||||||||||||
| RATIO/SUPPLEMENTAL DATA: |
|
| |||||||||||||||||||
Net Assets at end of year (in thousands) | $ | 236,230 | $ | 96,281 | $ | 87,603 | $ | 45,345 | $ | 46,546 | ||||||||||||
Ratio of gross expenses to average net assets (%) | 1.53 | 1.53 | 1.48 | 1.59 | 1.60 | |||||||||||||||||
Ratio of net expenses | 1.53 | 1.52 | 1.48 | 1.58 | 1.58 | |||||||||||||||||
Ratio of net investment loss to average net assets (%) | (.82 | ) | (1.02 | ) | (1.08 | ) | (1.22 | ) | (1.03 | ) | ||||||||||||
Portfolio turnover rate (%) | 58 | 61 | 81 | 92 | 112 | |||||||||||||||||
Notes:
a The net investment loss per share data and the redemption fee data were determined using average shares outstanding during the year.
b The ratios in this row reflect the impact, if any, of expense offset arrangements with the custodian and expense reimbursement from the advisor.
64
THE OBERWEIS FUNDS
Financial Highlights (continued)
Per share income and capital for a share outstanding throughout each year is as follows:
Institutional Class | MICRO-CAP FUND | |||||||||||||||||||||
Years Ended December 31, | ||||||||||||||||||||||
|
|
|
| 2023 |
|
|
| 2022 |
|
|
| 2021 |
|
|
| 2020 |
|
|
| 2019 |
|
|
Net asset value at beginning of year | $ | 32.21 | $ | 36.43 | $ | 29.36 | $ | 22.55 | $ | 18.47 | ||||||||||||
| INCOME (LOSS) FROM INVESTMENT OPERATIONS: |
|
| |||||||||||||||||||
Net investment lossa | (.21 | ) | (.24 | ) | (.33 | ) | (.21 | ) | (.13 | ) | ||||||||||||
Net realized and unrealized gains (losses) on investments |
| 6.36 |
| (3.58 | ) |
| 16.12 |
| 7.02 |
| 4.21 | |||||||||||
Total from investment operations | 6.15 | (3.82 | ) | 15.79 | 6.81 | 4.08 | ||||||||||||||||
Redemption feesa | .03 | .03 | .02 | — | — | |||||||||||||||||
Less distributions: | ||||||||||||||||||||||
Distribution from net realized gains on investments |
| — |
| (.43 | ) |
| (8.74 | ) |
| — |
| — | ||||||||||
Net asset value at end of year | $ | 38.39 | $ | 32.21 | $ | 36.43 | $ | 29.36 | $ | 22.55 | ||||||||||||
Total return (%) | 19.19 | (10.39 | ) | 53.90 | 30.20 | 22.09 | ||||||||||||||||
| RATIO/SUPPLEMENTAL DATA: |
|
| |||||||||||||||||||
Net Assets at end of year (in thousands) | $ | 219,437 | $ | 72,507 | $ | 50,015 | $ | 31,202 | $ | 30,994 | ||||||||||||
Ratio of gross expenses to average net assets (%) | 1.28 | 1.28 | 1.23 | 1.34 | 1.34 | |||||||||||||||||
Ratio of net expenses | 1.28 | 1.27 | 1.23 | 1.33 | 1.32 | |||||||||||||||||
Ratio of net investment loss to average net assets (%) | (.59 | ) | (.76 | ) | (.85 | ) | (.97 | ) | (.61 | ) | ||||||||||||
Portfolio turnover rate (%) | 58 | 61 | 81 | 92 | 112 | |||||||||||||||||
Notes:
a The net investment loss per share data and the redemption fee data were determined using average shares outstanding during the year.
b The ratios in this row reflect the impact, if any, of expense offset arrangements with the custodian and expense reimbursement from the advisor.
65
Financial Highlights (continued)
Per share income and capital for a share outstanding throughout each year is as follows:
Investor Class | SMALL-CAP OPPORTUNITIES FUND | |||||||||||||||||||||
Years Ended December 31, | ||||||||||||||||||||||
|
|
|
| 2023 |
|
|
| 2022 |
|
|
| 2021 |
|
|
| 2020 |
|
|
| 2019 |
|
|
Net asset value at beginning of year | $ | 19.10 | $ | 21.54 | $ | 18.29 | $ | 14.36 | $ | 11.83 | ||||||||||||
| INCOME (LOSS) FROM INVESTMENT OPERATIONS: |
|
| |||||||||||||||||||
Net investment lossa | (.08 | ) | (.16 | ) | (.28 | ) | (.17 | ) | (.13 | ) | ||||||||||||
Net realized and unrealized gains (losses) on investments |
| 3.09 |
| (2.26 | ) |
| 8.23 |
| 4.84 | 3.10 | ||||||||||||
Total from investment | 3.01 | (2.42 | ) | 7.95 | 4.67 | 2.97 | ||||||||||||||||
Redemption feesa | .01 | .01 | .01 | — | — | |||||||||||||||||
Less distributions: | ||||||||||||||||||||||
Distribution from net realized gains on investments |
| — |
| (.03 | ) |
| (4.71 | ) |
| (.74 | ) |
| (.44 | ) | ||||||||
Net asset value at end of year | $ | 22.12 | $ | 19.10 | $ | 21.54 | $ | 18.29 | $ | 14.36 | ||||||||||||
Total return (%) | 15.81 | (11.17 | ) | 43.57 | 32.47 | 25.07 | ||||||||||||||||
| RATIO/SUPPLEMENTAL DATA: |
|
| |||||||||||||||||||
Net Assets at end of year (in thousands) | $ | 286,616 | $ | 94,110 | $ | 16,322 | $ | 7,767 | $ | 6,110 | ||||||||||||
Ratio of gross expenses to average net assets (%) | 1.32 | 1.45 | 1.59 | 2.03 | 2.21 | |||||||||||||||||
Ratio of net expenses to average net assets (%)b | 1.25 | 1.25 | 1.55 | 1.55 | 1.55 | |||||||||||||||||
Ratio of net investment loss to average net assets (%) | (.38 | ) | (.82 | ) | (1.22 | ) | (1.14 | ) | (.95 | ) | ||||||||||||
Portfolio turnover rate (%) | 71 | 45 | 106 | 147 | 142 | |||||||||||||||||
Notes:
a The net investment loss per share data and the redemption fee data were determined using average shares outstanding during the year.
b The ratios in this row reflect the impact, if any, of expense offset arrangements with the custodian and expense reimbursement from the advisor.
66
THE OBERWEIS FUNDS
Financial Highlights (continued)
Per share income and capital for a share outstanding throughout each year is as follows:
Institutional Class | SMALL-CAP OPPORTUNITIES FUND | |||||||||||||||||||||
Years Ended December 31, | ||||||||||||||||||||||
|
|
|
| 2023 |
|
|
| 2022 |
|
|
| 2021 |
|
|
| 2020 |
|
|
| 2019 |
|
|
Net asset value at beginning of year | $ | 19.49 | $ | 21.92 | $ | 18.51 | $ | 14.49 | $ | 11.90 | ||||||||||||
| INCOME (LOSS) FROM INVESTMENT OPERATIONS: |
|
| |||||||||||||||||||
Net investment lossa | (.03 | ) | (.11 | ) | (.23 | ) | (.13 | ) | (.10 | ) | ||||||||||||
Net realized and unrealized gains (losses) on investments |
| 3.15 |
| (2.30 | ) |
| 8.34 |
| 4.89 |
| 3.13 | |||||||||||
Total from investment | 3.12 | (2.41 | ) | 8.11 | 4.76 | 3.03 | ||||||||||||||||
Redemption feesa | .01 | .01 | .01 | — | — | |||||||||||||||||
Less distributions: | ||||||||||||||||||||||
Distribution from net realized gains on investments |
| — |
| (.03 | ) |
| (4.71 | ) |
| (.74 | ) |
| (.44 | ) | ||||||||
Net asset value at end of year | $ | 22.62 | $ | 19.49 | $ | 21.92 | $ | 18.51 | $ | 14.49 | ||||||||||||
Total return (%) | 16.06 | (10.93 | ) | 43.92 | 32.80 | 25.43 | ||||||||||||||||
| RATIO/SUPPLEMENTAL DATA: |
|
| |||||||||||||||||||
Net Assets at end of year (in thousands) | $ | 230,715 | $ | 62,776 | $ | 12,727 | $ | 8,866 | $ | 5,622 | ||||||||||||
Ratio of gross expenses to | 1.07 | 1.20 | 1.34 | 1.78 | 1.96 | |||||||||||||||||
Ratio of net expenses to | 1.00 | 1.00 | 1.30 | 1.30 | 1.30 | |||||||||||||||||
Ratio of net investment loss to average net assets (%) | (.15 | ) | (.59 | ) | (.97 | ) | (.89 | ) | (.69 | ) | ||||||||||||
Portfolio turnover rate (%) | 71 | 45 | 106 | 147 | 142 | |||||||||||||||||
Notes:
a The net investment loss per share data and the redemption fee data were determined using average shares outstanding during the year.
b The ratios in this row reflect the impact, if any, of expense offset arrangements with the custodian and expense reimbursement from the advisor.
67
Financial Highlights (continued)
Per share income and capital for a share outstanding throughout each year is as follows:
Investor Class | GLOBAL OPPORTUNITIES FUND | |||||||||||||||||||||
Years Ended December 31, | ||||||||||||||||||||||
|
|
|
| 2023 |
|
|
| 2022 |
|
|
| 2021 |
|
|
| 2020 |
|
|
| 2019 |
|
|
Net asset value at beginning of year | $ | 25.17 | $ | 35.29 | $ | 36.51 | $ | 24.82 | $ | 19.75 | ||||||||||||
| INCOME (LOSS) FROM INVESTMENT OPERATIONS: |
|
| |||||||||||||||||||
Net investment lossa | (.18 | ) | (.19 | ) | (.37 | ) | (.32 | ) | (.24 | ) | ||||||||||||
Net realized and unrealized gains (losses) on investments and translation of assets and liabilities denominated in foreign currency |
| 1.79 |
| (9.27 | ) |
| 7.99 |
| 14.13 |
| 5.31 | |||||||||||
Total from investment | 1.61 | (9.46 | ) | 7.62 | 13.81 | 5.07 | ||||||||||||||||
Redemption feesa | — | — | .01 | — | — | |||||||||||||||||
| Less distributions: | |||||||||||||||||||||
Distribution from net realized gains on investments |
| — |
| (.66 | ) |
| (8.85 | ) |
| (2.12 | ) |
| — | |||||||||
Net asset value at end of year | $ | 26.78 | $ | 25.17 | $ | 35.29 | $ | 36.51 | $ | 24.82 | ||||||||||||
Total return (%) | 6.40 | (26.80 | ) | 20.92 | 55.55 | 25.67 | ||||||||||||||||
| RATIO/SUPPLEMENTAL DATA: |
|
| |||||||||||||||||||
Net Assets at end of year (in thousands) | $ | 34,431 | $ | 34,968 | $ | 53,342 | $ | 45,566 | $ | 32,004 | ||||||||||||
Ratio of gross expenses to average net assets (%) | 1.51 | 1.52 | 1.38 | 1.53 | 1.58 | |||||||||||||||||
Ratio of net expenses to average net assets (%)b | 1.50 | 1.51 | 1.38 | 1.53 | 1.55 | |||||||||||||||||
Ratio of net investment loss to average net assets (%) | (.67 | ) | (.73 | ) | (.86 | ) | (1.14 | ) | (1.07 | ) | ||||||||||||
Portfolio turnover rate (%) | 95 | 73 | 111 | 129 | 120 | |||||||||||||||||
Notes:
a The net investment loss per share data and the redemption fee data were determined using average shares outstanding during the year.
b The ratios in this row reflect the impact, if any, of expense offset arrangements with the custodian and expense reimbursement from the advisor.
68
THE OBERWEIS FUNDS
Financial Highlights (continued)
Per share income and capital for a share outstanding throughout each year is as follows:
Institutional Class | GLOBAL OPPORTUNITIES FUND | |||||||||||||||||||||
Years Ended December 31, | ||||||||||||||||||||||
|
|
|
| 2023 |
|
|
| 2022 |
|
|
| 2021 |
|
|
| 2020 |
|
|
| 2019 |
|
|
Net asset value at beginning of year | $ | 25.64 | $ | 35.84 | $ | 36.87 | $ | 24.99 | $ | 19.84 | ||||||||||||
| INCOME (LOSS) FROM INVESTMENT OPERATIONS: |
|
| |||||||||||||||||||
Net investment lossa | (.12 | ) | (.12 | ) | (.26 | ) | (.25 | ) | (.18 | ) | ||||||||||||
Net realized and unrealized gains (losses) on investments and translation of assets and liabilities denominated in foreign currency |
| 1.83 |
| (9.42 | ) |
| 8.07 |
| 14.25 |
| 5.33 | |||||||||||
Total from investment | 1.71 | (9.54 | ) | 7.81 | 14.00 | 5.15 | ||||||||||||||||
Redemption feesa | — | — | .01 | — | — | |||||||||||||||||
Less distributions: | ||||||||||||||||||||||
Distribution from net realized gains on investments |
| — |
| (.66 | ) |
| (8.85 | ) |
| (2.12 | ) |
| — | |||||||||
Net asset value at end of year | $ | 27.35 | $ | 25.64 | $ | 35.84 | $ | 36.87 | $ | 24.99 | ||||||||||||
Total return (%) | 6.67 | (26.61 | ) | 21.23 | 55.94 | 25.96 | ||||||||||||||||
| RATIO/SUPPLEMENTAL DATA: |
|
| |||||||||||||||||||
Net Assets at end of year (in thousands) | $ | 18,754 | $ | 16,837 | $ | 23,518 | $ | 17,109 | $ | 10,644 | ||||||||||||
Ratio of gross expenses to average net assets (%) | 1.25 | 1.28 | 1.14 | 1.28 | 1.33 | |||||||||||||||||
Ratio of net expenses to average net assets (%)b | 1.25 | 1.27 | 1.13 | 1.27 | 1.30 | |||||||||||||||||
Ratio of net investment loss to average net assets (%) | (.44 | ) | (.44 | ) | (.61 | ) | (.88 | ) | (.78 | ) | ||||||||||||
Portfolio turnover rate (%) | 95 | 73 | 111 | 129 | 120 | |||||||||||||||||
Notes:
a The net investment loss per share data and the redemption fee data were determined using average shares outstanding during the year.
b The ratios in this row reflect the impact, if any, of expense offset arrangements with the custodian and expense reimbursement from the advisor.
69
Financial Highlights (continued)
Per share income and capital for a share outstanding throughout each year is as follows:
Investor Class | China Opportunities Fund | |||||||||||||||||||||
Years Ended December 31, | ||||||||||||||||||||||
2023 | 2022 | 2021 | 2020 | 2019 | ||||||||||||||||||
Net asset value at beginning of year | $ | 7.14 | $ | 11.51 | $ | 17.29 | $ | 12.33 | $ | 9.35 | ||||||||||||
INCOME (LOSS) FROM INVESTMENT OPERATIONS: | ||||||||||||||||||||||
Net investment lossa | (.03 | ) | (.08 | ) | (.11 | ) | (.16 | ) | (.09 | ) | ||||||||||||
Net realized and unrealized gains (losses) on investments and translation of assets and liabilities denominated in foreign currencies |
| (.53 | ) |
| (4.20 | ) |
| (.88 | ) |
| 7.11 |
| 3.47 | |||||||||
Total from investment operations | (.56 | ) | (4.28 | ) | (.99 | ) | 6.95 | 3.38 | ||||||||||||||
Redemption feesa | .01 | — | — | — | .02 | |||||||||||||||||
Less dividends and distributions: | ||||||||||||||||||||||
Distribution from net realized gains on investments | — | (.09 | ) | (4.79 | ) | (1.99 | ) | (.42 | ) | |||||||||||||
Dividends from net investment income |
| (.03 | ) |
| — |
| — |
| — |
| — | |||||||||||
Total dividends and |
| (.03 | ) |
| (.09 | ) |
| (4.79 | ) |
| (1.99 | ) |
| (.42 | ) | |||||||
Net asset value at end of year | $ | 6.56 | $ | 7.14 | $ | 11.51 | $ | 17.29 | $ | 12.33 | ||||||||||||
Total return (%) | (7.70 | ) | (37.23 | ) | (5.41 | ) | 56.51 | 36.33 | ||||||||||||||
RATIO/SUPPLEMENTAL DATA: | ||||||||||||||||||||||
Net Assets at end of year (in thousands) | $ | 36,390 | $ | 45,803 | $ | 81,018 | $ | 98,527 | $ | 75,487 | ||||||||||||
Ratio of gross expenses to average net assets (%) | 2.16 | 2.05 | 1.87 | 1.95 | 1.95 | |||||||||||||||||
Ratio of net expenses to average net assets (%)b | 2.15 | 2.03 | 1.87 | 1.95 | 1.84 | |||||||||||||||||
Ratio of net investment loss to average net assets (%) | (.39 | ) | (.97 | ) | (.63 | ) | (1.11 | ) | (.77 | ) | ||||||||||||
Portfolio turnover rate (%) | 189 | 254 | 241 | 192 | 184 | |||||||||||||||||
Notes:
a The net investment loss per share data and the redemption fee data were determined using average shares outstanding during the year.
b The ratios in this row reflect the impact, if any, of expense offset arrangements with the custodian and expense reimbursement from the advisor.
70
THE OBERWEIS FUNDS
Financial Highlights (continued)
Per share income and capital for a share outstanding throughout each year is as follows:
Institutional Class | China Opportunities Fund | |||||||||||||||||||||
Years Ended December 31, | ||||||||||||||||||||||
2023 | 2022 | 2021 | 2020 | 2019 | ||||||||||||||||||
Net asset value at beginning of year | $ | 7.27 | $ | 11.67 | $ | 17.42 | $ | 12.39 | $ | 9.36 | ||||||||||||
INCOME (LOSS) FROM INVESTMENT OPERATIONS: | ||||||||||||||||||||||
Net investment lossa | (.01 | ) | (.05 | ) | (.07 | ) | (.13 | ) | (.07 | ) | ||||||||||||
Net realized and unrealized gains (losses) on investments and translation of assets and liabilities denominated in foreign currencies |
| (.55 | ) |
| (4.26 | ) |
| (.89 | ) |
| 7.15 |
| 3.50 | |||||||||
Total from investment operations | (.56 | ) | (4.31 | ) | (.96 | ) | 7.02 | 3.43 | ||||||||||||||
Redemption feesa | .01 | — | — | — | .02 | |||||||||||||||||
Less dividends and distributions: | ||||||||||||||||||||||
Distribution from net realized gains on investments | — | (.09 | ) | (4.79 | ) | (1.99 | ) | (.42 | ) | |||||||||||||
Dividends from net investment income |
| (.05 | ) |
| — |
| — |
| — |
| — | |||||||||||
Total dividends and distributions |
| (.05 | ) |
| (.09 | ) |
| (4.79 | ) |
| (1.99 | ) |
| (.42 | ) | |||||||
Net asset value at end of | $ | 6.67 | $ | 7.27 | $ | 11.67 | $ | 17.42 | $ | 12.39 | ||||||||||||
Total return (%) | (7.58 | ) | (36.97 | ) | (5.23 | ) | 56.79 | 36.82 | ||||||||||||||
RATIO/SUPPLEMENTAL DATA: | ||||||||||||||||||||||
Net Assets at end of year (in thousands) | $ | 8,883 | $ | 10,513 | $ | 15,247 | $ | 21,497 | $ | 14,301 | ||||||||||||
Ratio of gross expenses to average net assets (%) | 1.90 | 1.80 | 1.62 | 1.69 | 1.70 | |||||||||||||||||
Ratio of net expenses to average net assets (%)b | 1.90 | 1.78 | 1.62 | 1.69 | 1.59 | |||||||||||||||||
Ratio of net investment loss to average net assets (%) | (.10 | ) | (.62 | ) | (.38 | ) | (.85 | ) | (.55 | ) | ||||||||||||
Portfolio turnover rate (%) | 189 | 254 | 241 | 192 | 184 | |||||||||||||||||
Notes:
a The net investment loss per share data and the redemption fee data were determined using average shares outstanding during the year.
b The ratios in this row reflect the impact, if any, of expense offset arrangements with the custodian and expense reimbursement from the advisor.
71
Financial Highlights (continued)
Per share income and capital for a share outstanding throughout each year is as follows:
Investor Class | Emerging Markets Fund | |||||||||||||||||||||
Years Ended December 31, | ||||||||||||||||||||||
2023 | 2022 | 2021 | 2020 | 2019 | ||||||||||||||||||
Net asset value at beginning of year | $ | 10.04 | $ | 13.63 | $ | 13.81 | $ | 9.67 | $ | 7.89 | ||||||||||||
INCOME (LOSS) FROM INVESTMENT OPERATIONS: | ||||||||||||||||||||||
Net investment income | .02 | (.07 | ) | (.13 | ) | (.06 | ) | (.02 | ) | |||||||||||||
Net realized and unrealized gains (losses) on investments and translation of assets and liabilities denominated in foreign currencies |
| 1.49 |
| (3.24 | ) |
| 1.95 |
| 4.20 |
| 1.80 | |||||||||||
Total from investment operations | 1.51 | (3.31 | ) | 1.82 | 4.14 | 1.78 | ||||||||||||||||
Redemption feesa | — | — | — | — | — | |||||||||||||||||
Less dividends and distributions: | ||||||||||||||||||||||
Distribution from net realized gains on investments | — | (.28 | ) | (2.00 | ) | — | — | |||||||||||||||
Dividends from net investment income |
| (.06 | ) |
| — |
| — |
| — |
| — | |||||||||||
Total dividends and |
| (.06 | ) |
| (.28 | ) |
| (2.00 | ) |
| — |
| — | |||||||||
Net asset value at end of year | $ | 11.49 | $ | 10.04 | $ | 13.63 | $ | 13.81 | $ | 9.67 | ||||||||||||
Total return (%) | 15.02 | (24.31 | ) | 13.24 | 42.81 | 22.56 | ||||||||||||||||
RATIO/SUPPLEMENTAL DATA: | ||||||||||||||||||||||
Net Assets at end of year | $ | 5,347 | $ | 1,578 | $ | 1,646 | $ | 789 | $ | 587 | ||||||||||||
Ratio of gross expenses to average net assets (%) | 2.71 | 2.90 | 2.80 | 3.79 | 3.86 | |||||||||||||||||
Ratio of net expenses to average net assets (%)b | 1.75 | 1.75 | 1.75 | 1.75 | 1.75 | |||||||||||||||||
Ratio of net investment income (loss) to average net assets (%) | .17 | (.65 | ) | (.87 | ) | (.54 | ) | (.21 | ) | |||||||||||||
Portfolio turnover rate (%) | 115 | 70 | 67 | 131 | 153 | |||||||||||||||||
Notes:
a The net investment loss per share data and the redemption fee data were determined using average shares outstanding during the year.
b The ratios in this row reflect the impact, if any, of expense offset arrangements with the custodian and expense reimbursement from the advisor.
72
THE OBERWEIS FUNDS
Financial Highlights (continued)
Per share income and capital for a share outstanding throughout each year is as follows:
Institutional Class | Emerging Markets Fund | |||||||||||||||||||||
Years Ended December 31, | ||||||||||||||||||||||
2023 | 2022 | 2021 | 2020 | 2019 | ||||||||||||||||||
Net asset value at beginning of year | $ | 10.16 | $ | 13.75 | $ | 13.90 | $ | 9.71 | $ | 7.90 | ||||||||||||
INCOME (LOSS) FROM INVESTMENT OPERATIONS: | ||||||||||||||||||||||
Net investment income | .05 | (.02 | ) | (.10 | ) | (.03 | ) | — | ||||||||||||||
Net realized and unrealized gains (losses) on investments and translation of assets and liabilities denominated in foreign currencies |
| 1.50 |
| (3.29 | ) |
| 1.97 |
| 4.22 |
| 1.81 | |||||||||||
Total from investment operations | 1.55 | (3.31 | ) | 1.87 | 4.19 | 1.81 | ||||||||||||||||
Redemption feesa | — | — | — | — | — | |||||||||||||||||
Less dividends and distributions: | ||||||||||||||||||||||
Distribution from net realized gains on investments | — | (.28 | ) | (2.00 | ) | — | — | |||||||||||||||
Dividends from net investment income |
| (.08 | ) |
| — |
| (.02 | ) |
| — |
| — | ||||||||||
Total dividends and distributions |
| (.08 | ) |
| (.28 | ) |
| (2.02 | ) |
| — |
| — | |||||||||
Net asset value at end of | $ | 11.63 | $ | 10.16 | $ | 13.75 | $ | 13.90 | $ | 9.71 | ||||||||||||
Total return (%) | 15.29 | (24.10 | ) | 13.50 | 43.15 | 22.91 | ||||||||||||||||
RATIO/SUPPLEMENTAL DATA: | ||||||||||||||||||||||
Net Assets at end of year | $ | 12,861 | $ | 11,012 | $ | 11,910 | $ | 9,938 | $ | 7,382 | ||||||||||||
Ratio of gross expenses to average net assets (%) | 2.46 | 2.65 | 2.55 | 3.54 | 3.61 | |||||||||||||||||
Ratio of net expenses to average net | 1.50 | 1.50 | 1.50 | 1.50 | 1.50 | |||||||||||||||||
Ratio of net investment income (loss) to average net assets (%) | .43 | (.16 | ) | (.62 | ) | (.26 | ) | — | ||||||||||||||
Portfolio turnover rate (%) | 115 | 70 | 67 | 131 | 153 | |||||||||||||||||
Notes:
a The net investment loss per share data and the redemption fee data were determined using average shares outstanding during the year.
b The ratios in this row reflect the impact, if any, of expense offset arrangements with the custodian and expense reimbursement from the advisor.
73
Financial Highlights (continued)
Per share income and capital for a share outstanding throughout each year is as follows:
Investor Class | International Opportunities Fund | |||||||||||||||||||||
Years Ended December 31, | ||||||||||||||||||||||
2023 | 2022 | 2021 | 2020 | 2019 | ||||||||||||||||||
Net asset value at beginning of year | $ | 16.68 | $ | 26.50 | $ | 31.52 | $ | 19.43 | $ | 16.01 | ||||||||||||
INCOME (LOSS) FROM INVESTMENT OPERATIONS: | ||||||||||||||||||||||
Net investment income | .11 | .11 | (.26 | ) | (.16 | ) | (.03 | ) | ||||||||||||||
Net realized and unrealized gains (losses) on investments and translation of assets and liabilities denominated in foreign currencies |
| .70 |
| (9.93 | ) |
| .72 |
| 12.37 |
| 3.69 | |||||||||||
Total from investment operations | .81 | (9.82 | ) | �� | .46 | 12.21 | 3.66 | |||||||||||||||
Redemption feesa | — | — | — | — | — | |||||||||||||||||
Less dividends and distributions: | ||||||||||||||||||||||
Distribution from net realized gains on investments | — | — | (5.48 | ) | — | — | ||||||||||||||||
Dividends from net investment income |
| (.07 | ) |
| — |
| — |
| (.12 | ) |
| (.24 | ) | |||||||||
Total dividends and distributions |
| (.07 | ) |
| — |
| (5.48 | ) |
| (.12 | ) |
| (.24 | ) | ||||||||
Net asset value at end of | $ | 17.42 | $ | 16.68 | $ | 26.50 | $ | 31.52 | $ | 19.43 | ||||||||||||
Total return (%) | 4.89 | (37.06 | ) | 1.52 | 62.86 | 22.85 | ||||||||||||||||
RATIO/SUPPLEMENTAL DATA: | ||||||||||||||||||||||
Net Assets at end of year | $ | 114,698 | $ | 144,970 | $ | 310,356 | $ | 327,354 | $ | 324,254 | ||||||||||||
Ratio of gross expenses to average net assets (%) | 1.92 | 1.87 | 1.77 | 1.87 | 1.82 | |||||||||||||||||
Ratio of net expenses to average net | 1.59 | 1.60 | 1.60 | 1.60 | 1.60 | |||||||||||||||||
Ratio of net investment income (loss) to average net assets (%) | .66 | .60 | (.79 | ) | (.75 | ) | (.19 | ) | ||||||||||||||
Portfolio turnover rate (%) | 103 | 74 | 93 | 130 | 142 | |||||||||||||||||
Notes:
a The net investment loss per share data and the redemption fee data were determined using average shares outstanding during the year.
b The ratios in this row reflect the impact, if any, of expense offset arrangements with the custodian and expense reimbursement from the advisor.
74
THE OBERWEIS FUNDS
Financial Highlights (continued)
Per share income and capital for a share outstanding throughout each period is as follows:
Institutional Class | International Opportunities Fund | ||||||
Period Ended | c | ||||||
Net asset value at beginning of period | $ | 8.43 | |||||
INCOME (LOSS) FROM INVESTMENT OPERATIONS: | |||||||
Net investment income (loss)a | — | ||||||
Net realized and unrealized gains (losses) on investments and foreign currency transactions |
| .07 | |||||
Total from investment operations | .07 | ||||||
Redemption feesa |
| — | |||||
Net asset value at end of period | $ | 8.50 | |||||
Total return (%) | .83 | d | |||||
RATIO/SUPPLEMENTAL DATA: | |||||||
Net Assets at end of year (in thousands) | $ | 278,822 | |||||
Ratio of gross expenses to average net assets (%) | 1.10 | e | |||||
Ratio of net expenses to average net assets (%)b | 1.09 | e | |||||
Ratio of net investment income (loss) to average net assets (%) | .28 | e | |||||
Portfolio turnover rate (%) | 103 | ||||||
Notes:
a The net investment income (loss) per share data and the redemption fee data were determined using average shares outstanding during the period.
b The ratios in this row reflect the impact, if any, of expense offset arrangements with the custodian and expense reimbursement from the advisor.
c For the period from December 23, 2023 (commencement of operations) through December 31, 2023.
d Not Annualized.
e Annualized.
75
Financial Highlights (continued)
Per share income and capital for a share outstanding throughout each period is as follows:
Institutional Class | Focused International Growth Fund | |||||||||||
Year Ended | Period Ended | a | ||||||||||
Net asset value at beginning of period | $ | 7.63 | $ | 10.00 | ||||||||
INCOME (LOSS) FROM INVESTMENT OPERATIONS: | ||||||||||||
Net investment incomeb | .12 | .07 | ||||||||||
Net realized and unrealized gains (losses) on investments and translation of assets and liabilities denominated in foreign currencies |
| 1.15 |
| (2.34 | ) | |||||||
Total from investment operations | 1.27 | (2.27 | ) | |||||||||
Redemption feesb | — | — | ||||||||||
Less dividends and distributions: | ||||||||||||
Dividends from net investment income |
| (.13 | ) |
| (.10 | ) | ||||||
Total dividends and distributions |
| (.13 | ) |
| (.10 | ) | ||||||
Net asset value at end of period | $ | 8.77 | $ | 7.63 | ||||||||
Total return (%) | 16.60 | (22.75 | )e | |||||||||
RATIO/SUPPLEMENTAL DATA: | ||||||||||||
Net Assets at end of year (in thousands) | $ | 6,032 | $ | 5,077 | ||||||||
Ratio of gross expenses to average net assets (%) | 2.51 | 1.97 | d | |||||||||
Ratio of net expenses to average net assets (%)c | .95 | .95 | d | |||||||||
Ratio of net investment income to average net assets (%) | 1.47 | 1.18 | d | |||||||||
Portfolio turnover rate (%) | 88 | 54 | e | |||||||||
Notes:
a For the period from April 1, 2022 (commencement of operations) through December 31, 2022.
b The net investment income per share data and the redemption fee data were determined using average shares outstanding during the period.
c The ratios in this row reflect the impact, if any, of expense offset arrangements.
d Annualized.
e Not Annualized
76
![]()
REPORT OF INDEPENDENT REGISTERED PUBLIC ACCOUNTING FIRM
To the Shareholders and Board of Trustees of
The Oberweis Funds
Opinion on the Financial Statements
We have audited the accompanying statements of assets and liabilities, including the schedules of investments, of The Oberweis Funds, comprising of the Oberweis Micro-Cap Fund, Oberweis Small-Cap Opportunities Fund, Oberweis Global Opportunities Fund, Oberweis China Opportunities Fund, Oberweis International Opportunities Fund, Oberweis Emerging Markets Fund, and Oberweis Focused International Growth Fund (the “Funds”) as of December 31, 2023, the related statements of operations and changes in net assets, the related notes, and the financial highlights for the year then ended, (collectively referred to as the “financial statements”). In our opinion, the financial statements present fairly, in all material respects, the financial position of each of the Funds as of December 31, 2023, the results of their operations, the changes in net assets, and the financial highlights for the year then ended, in conformity with accounting principles generally accepted in the United States of America.
The Funds’ financial statements and financial highlights for the year or period ended December 31, 2022, and prior, were audited by other auditors whose report dated February 27, 2023, expressed an unqualified opinion on those financial statements and financial highlights.
Basis for Opinion
These financial statements are the responsibility of the Funds’ management. Our responsibility is to express an opinion on the Funds’ financial statements based on our audits. We are a public accounting firm registered with the Public Company Accounting Oversight Board (United States) (“PCAOB”) and are required to be independent with respect to the Funds in accordance with the U.S. federal securities laws and the applicable rules and regulations of the Securities and Exchange Commission and the PCAOB.
We conducted our audits in accordance with the standards of the PCAOB. Those standards require that we plan and perform the audit to obtain reasonable assurance about whether the financial statements are free of material misstatement whether due to error or fraud.
Our audits included performing procedures to assess the risks of material misstatement of the financial statements, whether due to error or fraud, and performing procedures that respond to those risks. Such procedures included examining, on a test basis, evidence regarding the amounts and disclosures in the financial statements. Our procedures included confirmation of securities owned as of December 31, 2023, by correspondence with the custodian and brokers. Our audits also included evaluating the accounting principles used and significant estimates made by management, as well as evaluating the overall presentation of the financial statements. We believe that our audits provide a reasonable basis for our opinion.
We have served as the Funds’ auditor since 2023.

COHEN & COMPANY, LTD.
Philadelphia, Pennsylvania
February 29, 2024

77
TRUSTEES AND OFFICERS OF THE OBERWEIS FUNDS (unaudited)
Name, Address and Age |
|
|
NONINTERESTED TRUSTEES | ||
Alix Charles (49) | Trustee | Trustee since |
Katherine Smith Dedrick (66) | Trustee | Trustee since |
Michael Simon (57) | Trustee | Trustee since |
INTERESTED TRUSTEES | ||
James W. Oberweis (49) | President | Officer since |
David I. Covas (48) | Vice President | Officer since |
Kenneth S. Farsalas (53) | Vice President | Officer since |
Eric V. Hannemann (50) | Treasurer | Officer since |
Thomas P. Joyce (38) | Secretary and | Officer since |
1 Unless otherwise noted, each trustee shall serve as a trustee of the Funds until the next meeting of shareholders, if any, called for the purpose of considering the election or re-election of such trustee or of a successor to such trustee, and until the election and qualification of his successor, if any, elected at such meeting, or until such trustee sooner dies, resigns, retires or is removed.
2 Elected annually by Board of Trustees.
The Statement of Additional Information includes additional information about Fund officers and trustees and is available upon request without charge, by calling the Fund at 800-323-6166.
78
TRUSTEES AND OFFICERS OF THE OBERWEIS FUNDS
(unaudited) (continued)
Principal Occupation Last Five Years | Number of | Other |
Physician – Duly Health and Care – January, 2008 to present. | 7 | None |
Partner – Walberg Law PLLC, January, 2020 to present; Senior Counsel – Tyson & Mendes, May, 2018 to July, 2021; President – Smith-Dedrick Properties, Inc., December, 2016 to December, 2019; President – KSD Law PC, September, 2015 to December, 2021; President – KSD Global Consulting Inc., August, 2015 to present; President – Aggressive Publishing, Inc., 2010 to present. | 7 | None |
Principal, Simon Venture Development, September, 2010 to present; Partner, Holt Capital Partners, August, 2016 to present. | 7 | Southwestern |
| ||
Chairman, February, 2008 to present, President and Director – Oberweis Asset Management, Inc., September, 2001 to present and Portfolio Manager from December, 1995 to present (held other officer positions from 1995 – September, 2001); President and Director – Oberweis Securities, Inc., September, 1996 to present; Chairman – Oberweis Asset Management (Hong Kong) Limited, March, 2007 to present; Chairman – Oberweis Asset Management UK Limited, July, 2014 to present. | Not Applicable | None |
Vice President – Oberweis Asset Management, Inc., September, 2003 to present; Vice-President – Oberweis Securities, Inc., January, 2004 to present; Registered Representative, July, 1997 to present. | Not Applicable | None |
Director of US Equities, January 2008 to present, Vice President and Portfolio Manager, November 2004 to present – Oberweis Asset Management, Inc. | Not Applicable | None |
Chief Financial Officer, September, 2022 to present, Vice President of Accounting, June, 2004 to August, 2022, Oberweis Asset Management, Inc., and Oberweis Securities, Inc. | Not Applicable | None |
Chief Compliance Officer, September, 2022 to present, Vice President of Compliance, December, 2021 to August, 2022, Senior Compliance Analyst, July, 2013 to November, 2021, Compliance Associate, April, 2010 to June, 2013 – Oberweis Asset Management, Inc., and Oberweis Securities, Inc. | Not Applicable | None |
79
Supplemental Information (unaudited)
For the year ended December 31, 2023, the dividends paid from net investment income, including short-term capital gains are designated as qualified dividend income.
Micro-Cap Fund | 0.00% | |||
Global Opportunities Fund | 0.00% | |||
Small-Cap Opportunities Fund | 0.00% | |||
China Opportunities Fund | 100.00% | |||
International Opportunities Fund | 100.00% | |||
Emerging Markets Fund | 100.00% | |||
Focused International Growth | 100.00% |
Foreign Taxes Paid
Pursuant to Section 853 of the Internal Revenue Code of 1986, as amended, the China Opportunities Fund, Emerging Markets Fund, International Opportunities Fund and Focused International Fund, respectively, designate $1,024,269, $296,164, $3,553,127 and $87,440 of income derived from foreign sources and $113,712, $121,908, $290,740 and $9,580 of foreign taxes paid for the period ended December 31, 2023.
Of the ordinary income (including short-term capital gain) distributions made (or to be made) for the year ended December 31, 2023, the proportionate share of income derived from foreign sources and foreign taxes paid attributable to one share of stock are:
Foreign | Foreign | ||||
China Opportunities Fund | $ 0.1487 | $ 0.0165 | |||
Emerging Markets Fund | 0.1884 | 0.0776 | |||
International Opportunities Fund | 0.0902 | 0.0074 | |||
Focused International Growth | 0.1271 | 0.0139 |
Proxy Voting:
The Oberweis Funds has delegated authority to vote proxies related to the Funds’ (Micro-Cap Fund, Small-Cap Opportunities Fund, Global Opportunities Fund, China Opportunities Fund, International Opportunities Fund, Emerging Markets Fund and Focused International Growth Fund) Portfolio securities to the Funds’ investment advisor, Oberweis Asset Management, Inc. (“OAM”). A description of the policies and procedures that OAM uses in fulfilling this responsibility is available, without charge upon request, by calling 1-800-323-6166. It also appears on www.oberweisfunds.com and in the Funds’ Statement of Additional Information, which can be found on the Securities and Exchange Commission’s (“SEC”) website at http://www.sec.gov. Information on how the Funds voted proxies relating to portfolio securities during the most recent 12 month period ended June 30 is available (1) without charge, upon request, by calling 1-800-323-6166, and (2) on the SEC’s website at http://www.sec.gov.
80
THE OBERWEIS FUNDS
Supplemental Information (unaudited) (continued)
Availability of Schedules of Portfolio Investments:
The Funds file their complete schedule of portfolio investments with the SEC for the first and third quarter of each fiscal year (March 31 and September 30) on Form NPORT. The Funds’ Forms NPORT are available, without charge, on the SEC’s website at http://www.sec.gov and may be reviewed and copied at the SEC’s Public Reference Room in Washington, D.C. Information on the operation of the Public Reference Room may be obtained by calling 1-800-SEC-0330.
Approval of Investment Advisory Agreements and Investment Sub-Advisory Agreement
The Investment Advisory Agreement between The Oberweis Funds (the “Trust”) and Oberweis Asset Management, Inc. (“OAM”) with respect to the Micro-Cap Fund, the Global Opportunities Fund and the Small-Cap Opportunities Fund and the Investment Advisory and Management Agreements between the Trust and OAM with respect to the International Opportunities Fund, the China Opportunities Fund, the Emerging Markets Fund and the Focused International Growth Fund (collectively, the “Advisory Agreements”) (the above-noted funds of the Trust are collectively referred to as the “Funds”), and the Investment Sub-Advisory Agreement between OAM and Oberweis Asset Management (Hong Kong) Limited (“OAMHK”), a wholly owned subsidiary of OAM, with respect to the China Opportunities Fund (the “Sub-Advisory Agreement” and together with the Advisory Agreements, the “Agreements”) were last approved by the Board of Trustees of the Trust (the “Board”), including all of the trustees who are not parties to the Agreements or interested persons of any such party (the “Independent Trustees”), at a meeting on August 16, 2023. The Board, including a majority of the Independent Trustees, determined that the continuation of the applicable Agreements was in the best interests of each of the Funds.
The Board noted that OAM has been associated with each of the Funds since its inception. The Board recognized that a long-term relationship with a capable, conscientious investment adviser is in the best interests of each Fund, and that shareholders have invested in the Funds knowing that OAM manages the Funds and knowing the investment advisory and management fee schedules.
Nature, Quality and Extent of Services. With respect to the nature, quality and extent of the services provided (i) to the Funds by OAM pursuant to the Advisory Agreements and (ii) to the China Opportunities Fund by OAMHK pursuant to the Sub-Advisory Agreement, the Board considered the background and experience of OAM and OAMHK, the functions performed by OAM and OAMHK and the personnel providing such services, the management capabilities of OAM and OAMHK, the information contained in OAM’s and OAMHK’s Forms ADV, OAM’s financial condition and the compliance reports provided to the Board, and the culture of compliance created by OAM and OAMHK, including the competency of the Chief Compliance Officer of the Trust, OAM and OAMHK. The Board also considered the experience, academic background, long tenure, structure, size, low turnover and geographic locations of the portfolio management/strategy investment teams and their respective roles, the investment process with respect to the types of investments held by the Funds, as well as the honesty and integrity of OAM and OAMHK, and that, in the Board’s experience, OAM and OAMHK personnel are open and forthright with the Board. In addition, the Board considered that OAM and OAMHK are research-oriented firms that conduct extensive research in connection with managing the Funds, and also considered the competitive pressure on active investment management.
81
THE OBERWEIS FUNDS
Supplemental Information (unaudited) (continued)
The Board reviewed the investment performance of each Fund as compared to a peer universe of funds provided by Broadridge Financial Solutions, Inc. (“Broadridge”), an independent provider of investment company data (the “Performance Universe Average”), and as compared to the performance of a relevant market benchmark index. With respect to Fund performance, the Board considered each Fund’s performance over the one-, three-, five- and 10-year periods ended June 30, 2023, as applicable, including any periods of outperformance or underperformance as compared to the performance of the relevant market benchmark index and the Fund’s Performance Universe Average. The Board noted (i) each of the Micro-Cap Fund and the Small-Cap Opportunities Fund outperformed its respective relevant market benchmark index and the Performance Universe Average for all periods reviewed, (ii) the International Opportunities Fund outperformed its relevant market benchmark index and the Performance Universe Average for the 10-year period and underperformed for all other periods reviewed, (iii) the Global Opportunities Fund outperformed its relevant market benchmark index and the Performance Universe Average for all periods reviewed except for the three-year period performance that underperformed that of its benchmark index, (iv) the China Opportunities Fund outperformed its benchmark index and the Performance Universe Average for the 10-year period, outperformed its benchmark index and underperformed the Performance Universe Average for the five-year period, underperformed the Performance Universe Average and approximated its benchmark index for the three-year period and underperformed its benchmark index and the Performance Universe Average for the one-year period, (v) the Emerging Markets Fund outperformed the Performance Universe Average for all periods reviewed and its benchmark index for the five-year period and underperformed its benchmark index for the one-year and three-year periods and (vi) the Focused International Growth Fund underperformed its benchmark index and the Performance Universe Average for the one-year period reviewed. In light of the information provided and the considerations made, the Board concluded that the nature, quality and extent of the services provided to each Fund by OAM and to the China Opportunities Fund by OAMHK have been and are expected to remain satisfactory.
Fees and Expenses. The Board considered the combined investment advisory and management fees charged to each Fund by OAM (the “management fees”) as compared to the management fees of a peer group of funds provided by Broadridge (the “Expense Group”) and the expense ratio(s) of each Fund as compared to the expense ratios of the Expense Group. The Board considered information provided by Broadridge on how it selected the peer funds included in the Expense Group for each Fund and considered certain limitations as to the comparability of the data provided. Based on the information provided, the Board noted that, although the contractual management fees for each Fund (except the Small-Cap Opportunities Fund, the Global Opportunities Fund and the Focused International Growth Fund) were above the median management fee of its respective Expense Group, they were within a reasonable range of the applicable median and that the contractual management fees for the Small-Cap Opportunities Fund, the Global Opportunities Fund and the Focused International Growth Fund were below or at the median management fee of the applicable Expense Group. The Board also noted, among other things, that it believed that each Fund’s management fees were reasonable in light of the levels of investment performance historically and over the time periods reviewed, and as compared to the performance of the applicable relevant market benchmark index and the Performance Universe Average. With respect to the investment sub-advisory fees paid to OAMHK relating to the China Opportunities Fund, the Board noted that such fees are paid by OAM and not the China Opportunities Fund.
82
THE OBERWEIS FUNDS
Supplemental Information (unaudited) (continued)
The Board noted that the expense ratio for each Fund’s Institutional Class (with the exception of the Small-Cap Opportunities Fund and the Global Opportunities Fund), as applicable, was above the median of the expense ratio of its applicable Expense Group and that the expense ratio for the Focused International Growth Fund was below the median of the expense ratio of its Expense Group. The Board also noted that the expense ratio of each Fund’s Investor Class and for the International Opportunities Fund was above the median expense ratio of its applicable Expense Group.
In addition, the Board considered management fees paid to OAM by other clients. With respect to OAM’s other clients, the Board recognized that the mix of services provided to the Funds, the level of responsibility required under the Advisory Agreements with the Funds, and the regulatory, compliance and operational requirements with respect to the Funds are greater than OAM’s obligations for similar client accounts, and that the management fees for such accounts are less relevant to the Board’s consideration of the management fees for the Funds because they reflect different competitive forces than those in the mutual fund marketplace. Based on the information provided, the Board concluded that each Fund’s management fees were reasonable and appropriate in amount, given the nature, quality and extent of the services provided and taking into consideration relevant circumstances.
Profitability. With respect to the costs of services provided and profits realized by OAM, the Board considered the management fees received by OAM from each of the Funds as well as the level, quality and expense of OAM’s staff and the services that OAM provides. The Board also considered the explanation from OAM that the profits realized by OAM specifically from the relationship with the Funds could not be identified due to the impracticality of expense allocation, noting the difficulty of breaking down profitability related to each Fund versus the other Oberweis Funds and other client accounts because management and personnel time and services are not allocated between the various types of accounts. The Board noted OAM’s belief that, while the profits could not be itemized, the overall profitability of OAM was below industry average but within a reasonable range relative to other investment advisory firms, and considered that OAM has contractually agreed to reimburse the Funds for expenses if their respective expense ratios exceed certain limits. The Board did not consider the profits realized by OAMHK with respect to the China Opportunities Fund, noting that OAM compensates OAMHK from its management fees and that the revenue to OAMHK was limited due to the size of the China Opportunities Fund. Based on this information, the Board concluded for each Fund that OAM’s profitability was not unreasonable.
Economies of Scale. The Board considered the extent to which economies of scale would be realized as each Fund grows, and whether management fee levels reflect economies of scale for the benefit of Fund shareholders. The Board noted asset capacity constraints for each of the Funds which limit economies of scale and the expense reimbursements made by OAM to certain of the Funds. The Board also noted that the investment advisory fee schedule for the Global Opportunities Fund includes a breakpoint designed to share economies of scale with shareholders. The Board concluded that each Fund’s management fees reflect an appropriate recognition of any economies of scale.
Other Benefits to OAM and Its Affiliates. The Board considered the character and amount of other incidental benefits received by OAM and its affiliates (including OAMHK) from their relationship with the Funds, including the fees received by Oberweis Securities, Inc. (“OSI”), an affiliate of OAM and OAMHK, for distribution services, as applicable, and benefits to OAM and other OAM client accounts related to soft dollars generated by the Funds’ brokerage transactions. The Board also noted that during the past year none of the Funds’ brokerage transactions had been placed through OSI.
83
THE OBERWEIS FUNDS
Supplemental Information (unaudited) (continued)
After due consideration of all of the information and factors deemed relevant by the Board and based upon their own business judgment and the conclusions reached, the Board determined to approve the continuance of the Agreements. The Board, including the Independent Trustees, did not identify any single factor or group of factors as all-important or controlling, and considered all factors together.
Expense Examples:
As a shareholder of The Oberweis Funds, you may incur two types of costs: (1) transaction costs, including redemption fees and (2) ongoing costs, including management fees; distribution (and/or service) 12b-1 fees; and other Fund expenses. This example is intended to help you understand your ongoing costs (in dollars) of investing in The Oberweis Funds and to compare these costs with the ongoing costs of investing in other mutual funds.
The Example is based on an investment of $1,000 investment at the beginning of the period and held for the entire period.
Actual Expenses:
The first line for each Fund in the table below provides information about actual account values and actual expenses. You may use the information below; together with the amount you invested, to estimate the expenses that you paid over the period. Simply divide your account value by $1,000 (for example, an $8,600 account value divided by $1,000=8.6), then multiply the result by the number in the table under the heading entitled “Expenses Paid During Period” to estimate the expenses you paid on your account during this period.
Hypothetical Example for Comparison Purposes:
The second line for each Fund in the table below provides information about hypothetical account values and hypothetical expenses based on each Fund’s actual expense ratio and an assumed rate of return of 5% per year before expenses, which is not the Fund’s actual return.
The hypothetical account values and expenses may not be used to estimate the actual ending account balance or expenses you paid for the period. You may use this information to compare this 5% hypothetical example with the 5% hypothetical examples that appear in the shareholder reports of other funds.
Please note that the expenses shown in the table are meant to highlight your ongoing costs only and do not reflect any transactional costs, such as redemption fees. Therefore, the second line for each Fund in the table is useful in comparing ongoing costs only, and will not help you determine the relative total costs of owning different funds. In addition, if these transactional costs were included, your costs would have been higher.
84
THE OBERWEIS FUNDS
Supplemental Information (unaudited) (continued)
Beginning | Ending | Expenses Paid | Expense Ratio | |||||||||
MICRO-CAP FUND |
| |||||||||||
Investor Class |
|
|
|
| ||||||||
Actual | $ | 1,000.00 | $ | 1,002.67 | $ | 7.72 | 1.53 | % | ||||
Hypothetical | $ | 1,000.00 | $ | 1,017.49 | $ | 7.78 | 1.53 | % | ||||
Institutional Class |
|
|
|
| ||||||||
Actual | $ | 1,000.00 | $ | 1,003.92 | $ | 6.47 | 1.28 | % | ||||
Hypothetical | $ | 1,000.00 | $ | 1,018.75 | $ | 6.51 | 1.28 | % | ||||
|
|
|
| |||||||||
SMALL-CAP OPPORTUNITIES FUND |
| |||||||||||
Investor Class |
|
|
|
| ||||||||
Actual | $ | 1,000.00 | $ | 1,014.21 | $ | 6.35 | 1.25 | % | ||||
Hypothetical | $ | 1,000.00 | $ | 1,018.90 | $ | 6.36 | 1.25 | % | ||||
Institutional Class |
|
|
|
| ||||||||
Actual | $ | 1,000.00 | $ | 1,015.26 | $ | 5.08 | 1.00 | % | ||||
Hypothetical | $ | 1,000.00 | $ | 1,020.16 | $ | 5.09 | 1.00 | % | ||||
|
|
|
| |||||||||
GLOBAL OPPORTUNITIES FUND |
| |||||||||||
Investor Class |
|
|
|
| ||||||||
Actual | $ | 1,000.00 | $ | 983.11 | $ | 7.50 | 1.50 | % | ||||
Hypothetical | $ | 1,000.00 | $ | 1,017.64 | $ | 7.63 | 1.50 | % | ||||
Institutional Class |
|
|
|
| ||||||||
Actual | $ | 1,000.00 | $ | 984.52 | $ | 6.25 | 1.25 | % | ||||
Hypothetical | $ | 1,000.00 | $ | 1,018.90 | $ | 6.36 | 1.25 | % | ||||
|
|
|
| |||||||||
CHINA OPPORTUNITIES FUND |
| |||||||||||
Investor Class |
|
|
|
| ||||||||
Actual | $ | 1,000.00 | $ | 1,013.87 | $ | 10.91 | 2.15 | % | ||||
Hypothetical | $ | 1,000.00 | $ | 1,014.37 | $ | 10.92 | 2.15 | % | ||||
Institutional Class |
|
|
|
| ||||||||
Actual | $ | 1,000.00 | $ | 1,014.97 | $ | 9.65 | 1.90 | % | ||||
Hypothetical | $ | 1,000.00 | $ | 1,015.63 | $ | 9.65 | 1.90 | % | ||||
|
|
|
| |||||||||
EMERGING MARKETS FUND |
| |||||||||||
Investor Class |
|
|
|
| ||||||||
Actual | $ | 1,000.00 | $ | 1,036.64 | $ | 8.98 | 1.75 | % | ||||
Hypothetical | $ | 1,000.00 | $ | 1,016.38 | $ | 8.89 | 1.75 | % | ||||
Institutional Class |
|
|
|
| ||||||||
Actual | $ | 1,000.00 | $ | 1,038.39 | $ | 7.71 | 1.50 | % | ||||
Hypothetical | $ | 1,000.00 | $ | 1,017.64 | $ | 7.63 | 1.50 | % | ||||
85
THE OBERWEIS FUNDS
Supplemental Information (unaudited) (continued)
Beginning | Ending | Expenses Paid | Expense Ratio | |||||||||
INTERNATIONAL OPPORTUNITIES FUND |
| |||||||||||
Investor Class |
|
|
|
| ||||||||
Actual | $ | 1,000.00 | $ | 1,013.08 | $ | 8.07 | 1.59 | % | ||||
Hypothetical | $ | 1,000.00 | $ | 1,017.19 | $ | 8.08 | 1.59 | % | ||||
Institutional Class |
|
|
|
| ||||||||
Actual | $ | 1,000.00 | $ | 1,008.30 | $ | 5.52 | 1.09 | % | ||||
Hypothetical | $ | 1,000.00 | $ | 1,019.71 | $ | 5.55 | 1.09 | % | ||||
|
|
|
| |||||||||
FOCUSED INTERNATIONAL GROWTH FUND |
| |||||||||||
Institutional Class |
|
|
|
| ||||||||
Actual | $ | 1,000.00 | $ | 1,029.69 | $ | 4.86 | 0.95 | % | ||||
Hypothetical | $ | 1,000.00 | $ | 1,020.42 | $ | 4.84 | 0.95 | % | ||||
____________
* Expenses are equal to the average account value times the Fund’s annualized expense ratio multiplied by the number of days in the most recent fiscal half-year divided by the number of days in the fiscal year.
86
Trustees and Officers | ||
Katherine Smith Dedrick Michael J. Simon James W. Oberweis David I. Covas Kenneth S. Farsalas | Alix J. Charles Eric V. Hannemann Thomas P. Joyce |
Manager and Investment Advisor
Oberweis Asset Management, Inc.
3333 Warrenville Road, Suite 500, Lisle, IL 60532
800-323-6166
oberweisfunds.com
Distributor
Oberweis Securities, Inc.
3333 Warrenville Road, Suite 500, Lisle, IL 60532
630-577-2300
oberweisfunds.com
Custodian
UMB Bank, n.a.
928 Grand Blvd., Kansas City, MO 64106
Transfer Agent
UMB Fund Services, Inc.
P.O. Box 711, Milwaukee, WI 53201-0711
800-245-7311
Counsel
Vedder Price P.C.
222 North LaSalle Street, Chicago, IL 60601
Independent Registered Public Accounting Firm
Cohen & Co.
1835 Market Street, Philadelphia, PA 19103
The Oberweis Funds
Micro-Cap Fund
Small-Cap Opportunities Fund
Global Opportunities Fund
China Opportunities Fund
Emerging Markets Fund
International Opportunities Fund
Focused International Growth Fund
800-245-7311
oberweisfunds.com
![]()
3333 Warrenville Road
Suite 500
Lisle, IL 60532
ITEM 2. CODE OF ETHICS.
(a) As of December 31, 2023, the registrant has adopted a code of ethics that applies to the registrant’s principal executive officer, principal financial officer, principal accounting officer, or persons performing similar functions.
(b) During the period covered by this report, there were not any amendments to a provision of the Code of Ethics adopted in 2(a) above.
(c) During the period covered by this report, there were no waivers, including any implicit waivers, from a provision of the Code of Ethics described in 2(a) above that relates to one or more of the items set forth in paragraph (b) of this item’s instructions.
(d) A copy of the code of ethics may be obtained upon request, without charge, by contacting the registrant in writing at its principal executive office.
ITEM 3. AUDIT COMMITTEE FINANCIAL EXPERT
(a) The registrant’s board of trustees has determined that the registrant has at least one audit committee financial expert serving on the audit committee.
(b) The audit committee financial expert is Michael J. Simon. Mr. Simon is independent as defined in Form N-CSR Item 3 (a) (2).
ITEM 4. PRINCIPAL ACCOUNTANT FEES AND SERVICES.
(a)-(d)
2022 | 2023 | |||
Audit fees | 129,500 | 117,500 | ||
Audit-Related Fees | N/A | N/A | ||
Tax Fees | 29,950 | 31,300 | ||
All Other Fees | N/A | N/A |
Audit Fees include amounts related to the audit of the registrant’s annual financial statements and services normally provided by the principal accountant in connection with statutory and regulatory filings. Tax Fees principally include tax compliance, tax advice, tax planning and preparation of tax returns.
(e)(1) The registrant’s audit committee pre-approves all audit services provided by the registrant’s principal accountant for the registrant and all non-audit services provided by the registrant’s principal accountant for the registrant, its investment adviser and any entity controlling, controlled by, or under common control with the investment adviser (“Adviser Affiliate”) that provides ongoing services to the registrant, if the engagement by the investment adviser or Adviser Affiliate relates directly to the operations and financial reporting of the registrant.
(e)(2) No services included in (b) – (d) above were approved pursuant to paragraph (c)(7)(i)(C) of Rule 2-01 of Regulation S-X.
(f) Not Applicable.
(g) The aggregate fees billed for the most recent fiscal year and the preceding fiscal year by the registrant’s principal accountant for non-audit services rendered to the registrant, its investment, and Adviser Affiliate that provides ongoing services to the registrant for 2023 and 2022 were $31,300 and $29,950, respectively.
(h) Non-audit services rendered to the registrant’s investment adviser and any Adviser Affiliate that were not pre-approved pursuant to Paragraph (c) (7) (ii) of Rule 2-01 of Regulation S-X were considered by the registrant’s audit committee as to whether they were compatible with maintaining the principal account’s independence.
ITEM 5. AUDIT COMMITTEE OF LISTED REGISTRANTS.
Not Applicable to the registrant.
ITEM 6. SCHEDULE OF INVESTMENTS.
See Schedule in Item 1.
ITEM 7. DISCLOSURE OF PROXY VOTING POLICIES AND PROCEDURES FOR CLOSED-END MANAGEMENT INVESTMENT COMPANIES.
Not Applicable to the registrant.
ITEM 8. PORTFOLIO MANAGERS OF CLOSED-END MANAGEMENT INVESTMENT COMPANIES.
Not Applicable to the registrant.
ITEM 9. PURCHASES OF EQUITY SECURITIES BY CLOSED-END MANAGEMENT INVESTMENT COMPANY AND AFFILIATED PURCHASERS.
Not Applicable to the registrant.
ITEM 10. SUBMISSION OF MATTERS TO A VOTE OF SECURITY HOLDERS.
There have been no material changes to the procedures by which shareholders may recommend nominees to the registrant’s board of trustees since registrant last disclosed such procedures in its proxy statement dated April 16, 2004.
ITEM 11. CONTROLS AND PROCEDURES.
(a) The registrant’s principal executive and principal financial officers, or persons performing similar functions, have concluded that the registrant’s disclosure controls and procedures (as defined in Rule 30a-3 (c) under the Investment Company Act of 1940, as amended (the “1940 Act”) (17CFR 270.30a-3(c)) are effective, as of a date within 90 days of the filing date of the report that includes the disclosure required by this paragraph, based on their evaluation of these controls and procedures required by Rule 30a-3(b) under the 1940 Act (17 CFR 270.30a-3(b)) and Rules 13a-15(b) or 15d-15(b) under the Exchange Act (17 CFR 240.13a-15(b) or 240.15d-15(b)).
(b) There has been no change to the registrant’s internal control over financial reporting (as defined in Rule 30a-3(d) under the 1940 Act (17 CFR 270.30a-3(d)) that occurred during the period covered by this report that has materially affected, or is reasonably likely to materially affect, the registrant’s internal control over financial reporting.
ITEM 12. EXHIBITS.
(a)(1) | ||
(a)(2) | ||
(a)(3) | Any written solicitation to purchase securities under Rule 23 c-1 under the Investment Company Act of 1940 (17 CFR 270.23c-1) sent or given during the period covered by the report by or on behalf of the registrant to 10 or more persons. Not Applicable to the registrant. | |
(b) |
SIGNATURES
Pursuant to the requirements of the Securities Exchange Act of 1934 and the Investment Company Act of 1940, the registrant has duly caused this report to be signed on its behalf by the undersigned, thereunto duly authorized.
(Registrant) The Oberweis Funds | ||
By (Signature and Title*) | /s/ James W. Oberweis | |
James W. Oberweis | ||
President, The Oberweis Funds | ||
Date 03/07/2024 |
Pursuant to the requirements of the Securities Exchange Act of 1934 and the Investment Company Act of 1940, this report has been signed below by the following persons on behalf of the registrant and in the capacities and on the dates indicated.
By (Signature and Title*) | /s/ James W. Oberweis | |
James W. Oberweis | ||
President, The Oberweis Funds | ||
Date 03/07/2024 |
By (Signature and Title*) | /s/ Eric V. Hannemann | |
Eric V. Hannemann | ||
Treasurer, The Oberweis Funds | ||
Date 03/07/2024 |
/*/ Print the name and title of each signing officer under his or her signature.