UNITED STATES
SECURITIES AND EXCHANGE COMMISSION
Washington, D.C. 20549
FORM N-CSR
CERTIFIED SHAREHOLDER REPORT OF REGISTERED
MANAGEMENT INVESTMENT COMPANIES
| | Investment Company Act file number | 811-4854 |
The Oberweis Funds
(Exact name of registrant as specified in charter)
3333 Warrenville Road, Suite 500, Lisle, IL 60532
(Address of principal executive offices) (Zip code)
James W. Oberweis
The Oberweis Funds
3333 Warrenville Road, Suite 500
Lisle, IL 60532 | | Copy to: James A. Arpaia
Vedder Price P.C.
222 North LaSalle Street, Suite 2600
Chicago, IL 60601 |
(Name and address of agent for service)
Registrant’s telephone number, including area code: (800) 323-6166
Date of fiscal year end: December 31
Date of reporting period: December 31, 2022
Form N-CSR is to be used by management investment companies to file reports with the Commission not later than 10 days after the transmission to stockholders of any report that is required to be transmitted to stockholders under Rule 30e-1 under the Investment Company Act of 1940 (17 CFR 270.30e-1). The Commission may use the information provided on Form N-CSR in its regulatory, disclosure review, inspection, and policymaking roles.
A registrant is required to disclose the information specified by Form N-CSR, and the Commission will make this information public. A registrant is not required to respond to the collection of information contained in Form N-CSR unless the Form displays a currently valid Office of Management and Budget (“OMB”) control number. Please direct comments concerning the accuracy of the information collection burden estimate and any suggestions for reducing the burden to Secretary, Securities and Exchange Commission, 450 Fifth Street, NW, Washington, DC 20549-0609. The OMB has reviewed this collection of information under the clearance requirements of 44 U.S.C. § 3507.
| ITEM 1. | REPORTS TO STOCKHOLDERS. |
Annual Reports for the period 01/01/22 through 12/31/22 is filed herewith
| | ANNUAL REPORT | | | | |
| | | | | INVESTOR
CLASS | | INSTITUTIONAL
CLASS | | |
| | | Oberweis Micro-Cap Fund | | OBMCX | | OMCIX | | |
| | | Oberweis Small-Cap Opportunities Fund | | OBSOX | | OBSIX | | |
| | | Oberweis Global Opportunities Fund | | OBEGX | | OBGIX | | |
| | | Oberweis China Opportunities Fund | | OBCHX | | OCHIX | | |
| | | Oberweis International Opportunities Fund | | OBIOX | | — | | |
| | | Oberweis Emerging Markets Fund | | OBEMX | | OIEMX | | |
| | | December 31, 2022 | | | | | | |
| | | oberweisfunds.com | | | | | | |
PRESIDENT’S LETTER (unaudited)
Dear Fellow Shareholder,
2022 was an unusually rough year for investors. The Fed’s fight against inflation and Russia’s war in Ukraine were mostly to blame. Both stocks and bonds felt the scourge of rising interest rates. The US Fed, in an attempt to fight inflation, increased its target rate for Fed Funds by 400 bps from March to December, going from a target range of 0.25-0.5% to 4.25-4.50%. Except for China, major central banks around the world followed suit. The magnitude of this year’s increase in rates materially exceeded investor expectations.
Unanticipated large increases in interest rates are a double whammy for growth stock investors. Higher interest rates tend to slow economic growth and depress future earnings. Additionally, they also tend to compress valuation multiples for growth stocks, as a higher discount factor reduces the present value of future earnings. When viewed in that light, it’s not terribly surprising to see a sharp decline in stock prices, particularly for growth stocks.
The Fed’s quest to quell inflation was complicated by supply-side disruptions and an incredibly tight labor market. The war in Ukraine and China’s COVID-related production problems increased commodity prices and pressured global supply chains, which fueled price increases and exacerbated inflation. Further, a labor shortage put upward pressure on wages, further complicating the Fed’s anti-inflation campaign.
In terms of economic growth, the US economy fared better than Europe. Europe suffered through a period of sky-high natural gas prices, largely from its dependence on Russian supply. Non-US small caps lagged their US counterparts for the second year in a row. Japanese equities fared relatively well in local currency terms, but not in USD terms, which include the effect of the Yen’s decline versus the US dollar.
China was the most challenging geography. Between President Xi Jinping’s “Covid zero” and “shared prosperity” policies, the investment climate could only be described as decidedly unfriendly and highly unpredictable. This occurred amid a strengthening US dollar and weakening Chinese property market, typically not great signs for Chinese asset prices. Chinese markets crashed into the October National Congress of the Communist Party, when Xi doubled down on the same adverse policy rhetoric.
However, in recent months and into 2023, Chinese equities have rallied strongly. After his successful consolidation of power, Xi dramatically changed policy direction, essentially abandoning “Covid Zero” entirely. While a massive wave of Covid promptly ensued, cases in urban areas may already have peaked and we expect a return to more open times soon. Xi also showed signs of softening his stance on property market regulation and anti-monopoly investigations against Internet firms. This drove a 30% rally in China over the two months that followed the National Congress, but it was not enough to recover from the heavy losses earlier in the year.
2022 Performance in REVIEW
While nobody is happy with a negative return, the domestic funds fared exceptionally well relative to their benchmark indices and peers. The Micro-Cap Fund and Small-Cap Opportunities Fund returned -10.60% and -11.17%, respectively (compared to -29.76% and -26.36% for the Russell Micro-Cap Growth and Russell 2000 Growth indices). Among the international funds, the International Opportunities Fund returned -37.06% (versus -27.02% for the MSCI World ex-US SCG Index). The China Opportunities Fund returned -37.23% (compared to -21.93% for the MSCI China Index). The Global Opportunities Fund returned -26.80% (compared to -18.67% for the MSCI ACWI Small-Cap Index).
1
PRESIDENT’S Letter (unaudited) (continued)
It is entirely normal to have individual years deviate positively and negatively from the benchmark. Over the trailing ten years, the average annual returns of the Micro-Cap, Small-Cap, Global, International, and China Funds have all handily beaten their benchmarks. Similarly, although the Emerging Markets Fund underperformed this year, returning -24.31% (versus -18.02% for the MSCI EM Small Cap Index), the fund has markedly outperformed since its inception. In fact, the Emerging Markets Fund has generated 1,800 basis points of excess cumulative return, net of fees, since its inception on May 1, 2018.
When you measure our skill, we find the long-term track record to be far more indicative than any individual year. In fact, our experience has shown that some of the most attractive entry points often occur following periods of short-term underperformance.
THE YEAR AHEAD
A reader of the first page of this seemingly dreary commentary might conclude our outlook to be bearish. It is, in reality, quite the opposite. We believe that at current prices, the return potential for our funds is significantly above-average, particularly relative to the risks. Our research shows that valuations for global small-caps rival the incredible bargains last seen in the depths of the global financial crisis. That might seem surprising, as stock prices have not declined as much as they did in 2008-2009. However, price/earnings ratios for small-caps were not as expensive at the beginning of 2021 as they were in 2007 and earnings have not similarly declined.
Of course, earnings for our portfolios could be curtailed in 2023, but we don’t see that as the most likely outcome. First, while we expect recession as a base case in 2023, we believe a modest GDP contraction is unlikely to lead to an unhealthy level of unemployment. That is, with less leverage on both corporate and individual balance sheets and a tight labor market, we believe that the coming economic slowdown is likely to be less severe than that of 2008.
Second, and more importantly, our funds are less correlated to the broader economy than you might think. We tend to own “disruptive” niche-oriented companies growing much faster than the broader economy. Long-term growth for these companies tends to be much more correlated with product acceptance and market share gains than oscillations in GDP. While broad economic growth or contraction will influence many holdings to some degree, the real driver, especially over the long-term, tends to be company-specific product growth.
That said, during periods of rising risk-aversion, investors seek current cash flow versus the potential for future earnings growth. That’s why multiples compressed last year. But that has already happened, and buyers today are paying much lower multiples than historical averages. Multiple compression could continue in 2023 but multiples for small-cap growth stocks have already dropped to among the cheapest levels of the past two decades. It could get worse, but we doubt any further contraction will be persistent or material.
At some point, the recession will pass and valuation multiples are likely to revert back to more normal levels. We cannot predict when this will occur, but post-recessionary multiple expansion (which typically happens well before the economy reaches the end of a recession) have been the single best periods for the performance of our funds. Don’t miss it.
VALUATION RECAP
As of December 31, 2022, the price/earnings (P/E) ratio was 14.9 times for the Global Opportunities Fund (versus 13.0 last quarter), 13.0 times for the Small-Cap Opportunities Fund (versus 11.5 last quarter), 11.6 times for the Micro-Cap Fund (versus 10.5 last quarter), 15.2 times for the International Opportunities Fund (versus 12.9 last quarter), 18.9 times for the China Opportunities Fund (versus 18.6 last quarter), 18.2 times for the Emerging Markets
2
PRESIDENT’S Letter (unaudited) (continued)
Fund (versus 17.4 times last quarter). Each of these funds invests in companies with expected earnings growth rates that are higher than that of the broader market, and in companies expected to grow faster than current market expectations. As of December 31, 2022, the weighted-average market capitalization was $4.3 billion for the Global Opportunities Fund, $3.8 billion for the Small-Cap Opportunities Fund, $1.3 billion for the Micro-Cap Fund, $4.3 billion for the International Opportunities Fund, $3.9 billion for the Emerging Markets Fund, and $33.1 billion for the China Opportunities Fund.
We appreciate your investment in The Oberweis Funds and are grateful for the trust you have shown us with your valuable investments. If you have any questions about your account, please contact shareholder services at (800) 245-7311. Thank you for investing with us in The Oberweis Funds.
Sincerely,

James W. Oberweis, CFA
President & Portfolio Manager
3
Management discussion on fund performance
(unaudited)
MARKET ENVIRONMENT
Global equities returned -17.74% in 2022, as measured by the MSCI World Index. Global small-caps, as measured by the MSCI World Small-Cap Index, returned -18.41%, slightly underperforming large-capitalization stocks. International small-caps underperformed U.S. small-caps for the second year, as evidenced by the -20.59% return on the MSCI World ex-USA Small-Cap Index. Within the United States, small-cap growth stocks outperformed large-cap growth stocks by 278 basis points, as measured by the respective returns of the Russell 2000 Growth (-26.36%) and Russell 1000 Growth (-29.14%) indices. Value stocks sharply outperformed growth stocks in 2022. Within domestic small-cap, the Russell 2000 Value Index (-14.50%) outperforming the Russell 2000 Growth Index (-26.36%) by 1186 basis points for the year.
DISCUSSION OF THE OBERWEIS FUNDS
The International Opportunities Fund returned -37.06% versus -27.02% for the MSCI World ex-US Small Cap Growth Index. At the country level, the United Kingdom, Japan, and Canada detracted from portfolio return, partially offset by favorable performance in Denmark. At the sector level, the portfolio was negatively impacted by stock selection in consumer staples and consumer discretionary, partially offset by positive stock selection in industrials. At the stock level, Hexatronic (HTRO SS), D/S Norden (DNORD DC), and Aixtron (AIXA GY) were among the top contributors to performance; Future (FUTR LN), Nordic Semiconductor (NOD NO), and Food & Life Companies (3563 JP) were among the top detractors.
The Global Opportunities Fund returned -26.80% versus -18.67% for the MSCI AWCI Small-Cap Index. At the country level, stock selection in the United States, Taiwan, and Germany added to portfolio return, while Japan, the U.K., and China detracted from portfolio return. At the sector level, healthcare added to return, while information technology, consumer discretionary and financials detracted. At the stock level, Halozyme Therapeutics (HALO US), Acadia Healthcare (ACHC US), and Super Micro Computer (SMCI US) were among the top contributors to performance; Synaptics (SYNA US), Intermediate Capital Group (ICP LN) and Ultra Clean Holdings (UCTT US) were among the top detractors.
The China Opportunities Fund returned -37.23% versus -21.93% for the MSCI China Index. At the sector level, consumer discretionary added to return, while information technology, financials, and materials were top detractors. At the stock level, Pinduoduo (PDD US), Hygeia Healthcare (6078 HK), and Trip.com (9961 HK), were among the top contributors to performance; ACM Research (688082) and Longfor Group (960 HK) were among the top detractors.
The Emerging Markets Fund returned -24.31% versus -18.02% for the MSCI EM Small-Cap Index. At the country level, China, Mexico, and Turkey were the primary detractors while Indonesia was the top contributor. At the sector level, the fund was positively impacted by stock selection in consumer staples, while performance was adversely impacted by stock selection in industrials and information technology. At the stock level, Mitra Adiperkasa (MAPI IJ), Xiabuxiabu Catering Management (520 HK), and PT Sumber Alfaria Trijaya (AMRT IJ) were among the top contributors to performance; Aspeed Technology (5274 TT), Weimob (2013 HK), and Pan Jit International (2481 TT) were among the top detractors.
4
Management discussion on fund performance
(unaudited) (continued)
The Micro-Cap Fund returned -10.60% versus -29.76% for the Russell Micro-Cap Growth Index. The portfolio benefitted from favorable stock selection in technology, producer durables and healthcare. At the stock level, Lantheus (LNTH), Sierra Wireless (SWIR), and Bel Fuse (BELFB) were among the top contributors to performance. Alpha & Omega Semiconductor (AOSL), Boot Barn (BOOT), and Ultra Clean (UCTT) were among the top detractors.
The Small-Cap Opportunities Fund returned -11.17% versus -26.36% for the Russell 2000 Growth Index. The portfolio benefitted from favorable stock selection in healthcare, technology, and producer durables. Lantheus (LNTH), Clearfield (CLFD), and Sierra Wireless (SWIR) were among the top contributors to performance. Synaptics (SYNA), Crocs (CROX), and Ultra Clean (UCTT) were among the top detractors.
For current performance information, please visit www.oberweisfunds.com.
5
MANAGEMENT DISCUSSION ON FUND PERFORMANCE
(unaudited) (continued)
Oberweis Micro-Cap Fund
At December 31, 2022
Asset Allocation (% of Net Assets) | | |
Equities | | 96.5 |
Other Assets less Liabilities | | 3.5 |
| | | |
Top Ten Holdings (% of Net Assets) |
Axcelis Technologies, Inc. | | 4.1 |
Aehr Test Systems | | 3.8 |
Veritiv Corp. | | 2.8 |
Lantheus Hldgs., Inc. | | 2.2 |
Clearfield, Inc. | | 2.1 |
Perion Network Ltd. | | 2.0 |
Model N, Inc. | | 2.0 |
Bel Fuse, Inc. | | 1.8 |
Impinj, Inc. | | 1.7 |
Extreme Networks, Inc. | | 1.6 |
| | | |
Top Ten Industries (% of Net Assets) |
Production Technology
Equipment | | 12.1 |
Communications Technology | | 8.0 |
Computer Services Software & Systems | | 6.0 |
Biotechnology | | 4.8 |
Specialty Retail | | 4.7 |
Medical & Dental Instruments & Supplies | | 4.3 |
Oil Well Equipment & Services | | 4.3 |
Medical Equipment | | 3.6 |
Back Office Support, Human Resources & Consulting | | 3.6 |
Consumer
Services – Miscellaneous | | 3.4 |
Oberweis Small-Cap Opportunities Fund
At December 31, 2022
Asset Allocation (% of Net Assets) | | |
Equities | | 95.9 |
Other Assets less Liabilities | | 4.1 |
| | | |
Top Ten Holdings (% of Net Assets) |
Axcelis Technologies, Inc. | | 4.0 |
Aehr Test Systems | | 3.7 |
Clean Harbors, Inc. | | 2.3 |
Crocs, Inc. | | 2.2 |
Impinj, Inc. | | 2.2 |
Allegro MicroSystems, Inc. | | 2.2 |
Clearfield, Inc. | | 2.1 |
Belden, Inc. | | 2.0 |
Fabrinet | | 1.9 |
Deckers Outdoor Corp. | | 1.9 |
| | | |
Top Ten Industries (% of Net Assets) |
Production Technology
Equipment | | 10.3 |
Diversified Manufacturing Operations | | 5.1 |
Medical & Dental Instruments & Supplies | | 4.7 |
Textiles Apparel & Shoes | | 4.1 |
Oil Crude Producer | | 4.0 |
Medical Equipment | | 3.9 |
Semiconductors & Components | | 3.8 |
Leisure Time | | 3.6 |
Healthcare Services | | 3.5 |
Back Office Support, Human Resources, & Consulting | | 3.2 |
6
Management discussion on fund performance
(unaudited) (continued)
Oberweis Global Opportunities Fund
At December 31, 2022
Asset Allocation (% of Net Assets) | | |
Equities | | 100.0 |
Other Liabilities less Assets | | 0.0 |
| | | |
Top Ten Holdings (% of Net Assets) |
Halozyme Therapeutics, Inc. | | 6.3 |
Impinj, Inc. | | 4.6 |
Crocs, Inc. | | 4.0 |
Axcelis Technologies, Inc. | | 3.9 |
Belden, Inc. | | 3.4 |
Ashtead Technology Hldgs. PLC | | 3.4 |
Super Micro Computer, Inc. | | 3.4 |
Deckers Outdoor Corp. | | 3.3 |
Intermediate Capital Group PLC | | 2.8 |
BayCurrent Consulting, Inc. | | 2.8 |
| | | |
Top Ten Industries (% of Net Assets) |
Semiconductors & Semiconductor Equipment | | 21.9 |
Textiles, Apparel & Luxury
Goods | | 8.3 |
Electronic Equipment, Instruments & Components | | 7.1 |
Biotechnology | | 6.3 |
Trading Co. & Distribution | | 5.4 |
Healthcare Equipment &
Supplies | | 5.4 |
Software | | 4.6 |
Professional Services | | 4.0 |
Communications Equipment | | 3.6 |
Healthcare Providers & Services | | 3.6 |
Oberweis China Opportunities Fund
At December 31, 2022
Asset Allocation (% of Net Assets) | | |
Equities | | 99.2 |
Other Assets less Liabilities | | 0.8 |
| | | |
Top Ten Holdings (% of Net Assets) |
Pinduoduo, Inc. ADS | | 5.1 |
Alibaba Group Hldg. Ltd. | | 3.7 |
Trip.com Group Ltd. | | 3.4 |
JD.com, Inc. | | 3.3 |
Meituan | | 3.2 |
New Oriental Education & Technology Group, Inc. | | 3.0 |
Hygeia Healthcare Hldgs. Co. Ltd. | | 2.7 |
Tencent Music Entertainment
Group ADS | | 2.6 |
Li Ning Co. Ltd. | | 2.5 |
Wuxi Biologics (Cayman), Inc. | | 2.5 |
| | | |
Top Ten Industries (% of Net Assets) |
Internet & Direct Marketing
Retail | | 19.9 |
Hotels, Restaurants & Leisure | | 12.0 |
Entertainment | | 7.0 |
Real Estate Management & Development | | 6.2 |
Healthcare Equipment &
Supplies | | 5.6 |
Diversified Consumer Services | | 4.1 |
Semiconductors & Semiconductor Equipment | | 3.1 |
Healthcare Providers & Services | | 2.7 |
Beverages | | 2.7 |
Textiles, Apparel & Luxury
Goods | | 2.5 |
7
MANAGEMENT DISCUSSION ON FUND PERFORMANCE
(unaudited) (continued)
Oberweis International Opportunities Fund
At December 31, 2022
Asset Allocation (% of Net Assets) | | |
Equities | | 99.7 |
Other Assets less Liabilities | | 0.3 |
| | | |
Top Ten Holdings (% of Net Assets) |
BayCurrent Consulting, Inc. | | 4.4 |
Nordic Semiconductor ASA | | 3.9 |
Rexel SA | | 3.7 |
Hexatronic Group AB | | 3.6 |
AIXTRON SE | | 3.2 |
Constellium SE | | 3.0 |
Edenred SA | | 2.7 |
ATS Corp. | | 2.7 |
Daiwa Securities Group, Inc. | | 2.4 |
Aritzia, Inc. | | 2.3 |
| | | |
Top Ten Industries (% of Net Assets) |
Machinery | | 12.0 |
Information Technology Services | | 8.9 |
Electrical Equipment | | 8.2 |
Semiconductors & Semiconductor Equipment | | 8.1 |
Capital Markets | | 7.6 |
Trading Co. & Distribution | | 7.4 |
Professional Services | | 6.0 |
Specialty Retail | | 4.4 |
Metals & Mining | | 4.3 |
Insurance | | 3.7 |
Oberweis Emerging Markets Fund
At December 31, 2022
Asset Allocation (% of Net Assets) | | |
Equities | | 96.1 |
Other Assets less Liabilities | | 3.9 |
| | | |
Top Ten Holdings (% of Net Assets) |
Dada Nexus Ltd. ADS | | 5.1 |
LEENO Industrial, Inc. | | 2.5 |
Kingdee International Software Group Co. Ltd. | | 2.5 |
Classys, Inc. | | 2.5 |
Chongqing Brewery Co. Ltd. | | 2.3 |
Petro Rio SA | | 2.3 |
Afya Ltd. | | 2.1 |
PT Sumber Alfaria Trijaya Tbk | | 2.0 |
Chailease Hldg. Co. Ltd. | | 2.0 |
POSCO Chemical Co. Ltd. | | 2.0 |
| | | |
Top Ten Industries (% of Net Assets) |
Electronic Equipment, Instruments & Components | | 9.6 |
Software | | 9.3 |
Internet & Direct Marketing
Retail | | 6.7 |
Beverages | | 6.4 |
Semiconductors & Semiconductor Equipment | | 5.9 |
Hotels, Restaurants & Leisure | | 5.2 |
Pharmaceuticals | | 4.7 |
Food & Staples Retailing | | 4.4 |
Healthcare Equipment &
Supplies | | 4.3 |
Diversified Consumer Services | | 4.1 |
8
Management discussion on fund performance
(unaudited) (continued)
Average Annual Total Returns1 (for the Periods Ended December 31, 2022)
| | 1 YR
(%) | | 5 YR (%) | | 10 YR (%) | | SINCE
INCEPTION2
(%) | | EXPENSE
RATIO3
(%) |
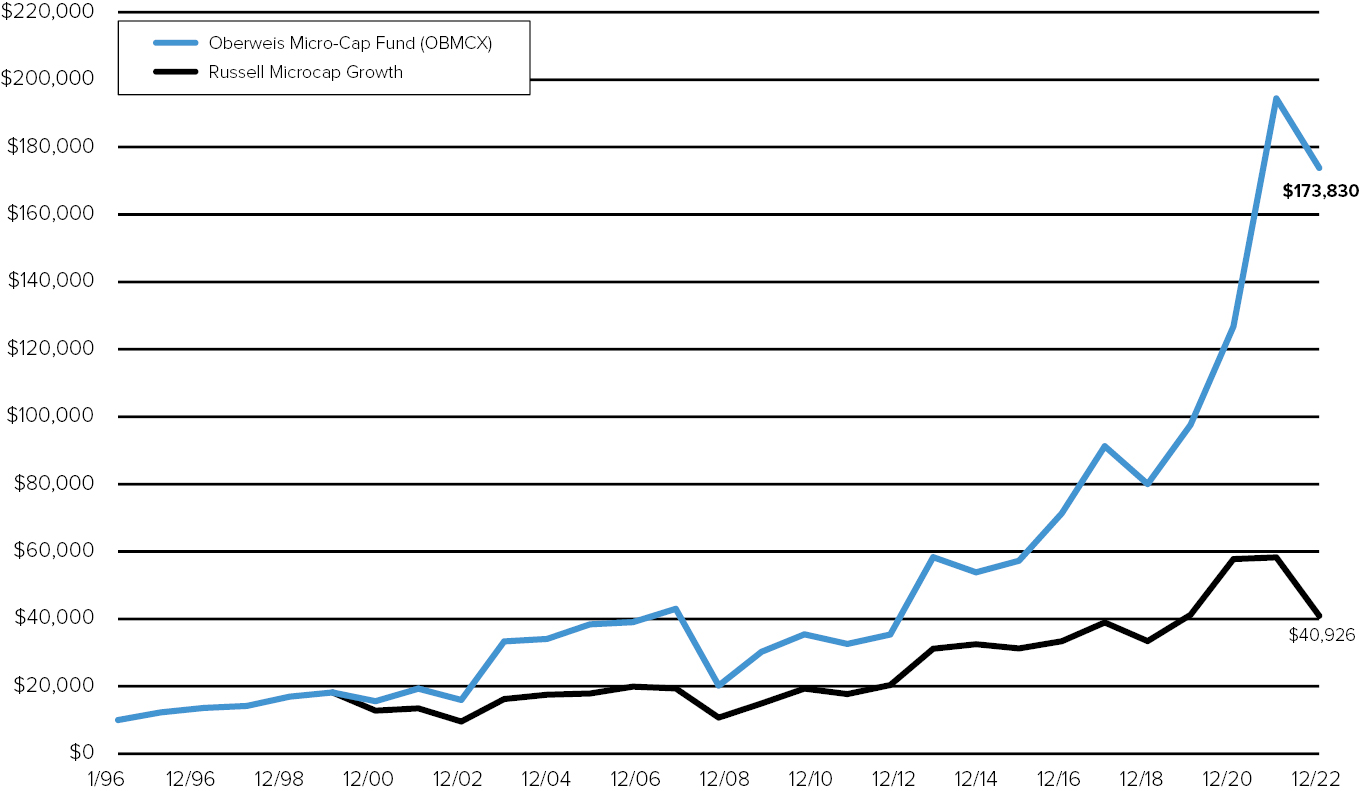
OBMCX | | (10.60) | | 13.76 | | 17.26 | | 11.16 | | 1.52 |
OMCIX4 | | (10.39) | | 14.03 | | 17.55 | | 11.43 | | 1.27 |
Russell Microcap Growth | | (29.76) | | 1.00 | | 7.22 | | N/A5 | | |
Growth of a $10,000 Investment (from January 1, 1996 to December 31, 2022)
9
Management discussion on fund performance
(unaudited) (continued)
Average Annual Total Returns1 (for the Periods Ended December 31, 2022)
| | 1 YR
(%) | | 5 YR (%) | | 10 YR (%) | | SINCE
INCEPTION2
(%) | | EXPENSE
RATIO3
(%) |
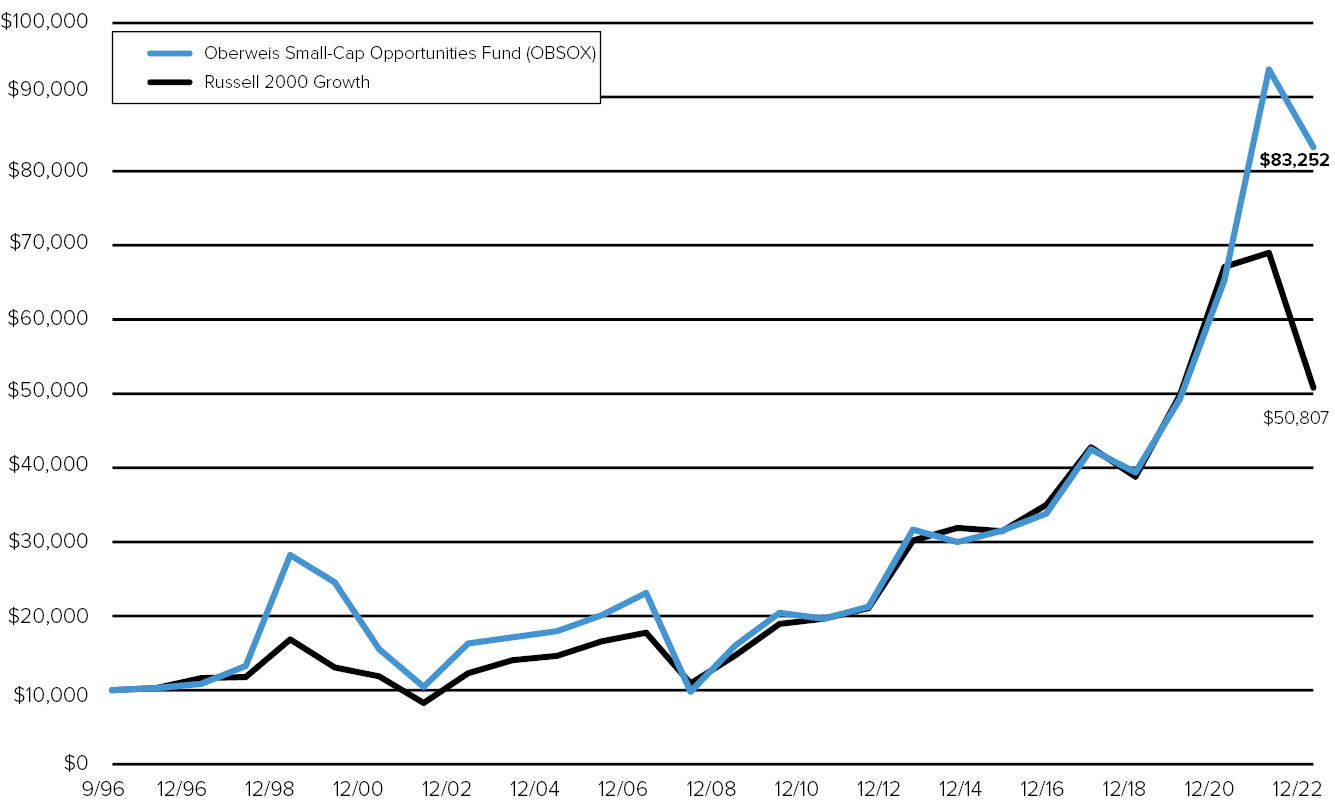
OBSOX | | (11.17) | | 14.41 | | 14.62 | | 8.39 | | 1.25 |
OBSIX4 | | (10.93) | | 14.69 | | 14.92 | | 8.67 | | 1.00 |
Russell 2000 Growth | | (26.36) | | 3.51 | | 9.20 | | 6.38 | | |
Growth of a $10,000 Investment (from September 15, 1996 to December 31, 2022)
10
Management discussion on fund performance
(unaudited) (continued)
Average Annual Total Returns1 (for the Periods Ended December 31, 2022)
| | 1 YR
(%) | | 5 YR (%) | | 10 YR (%) | | SINCE
INCEPTION2
(%) | | EXPENSE
RATIO3
(%) |
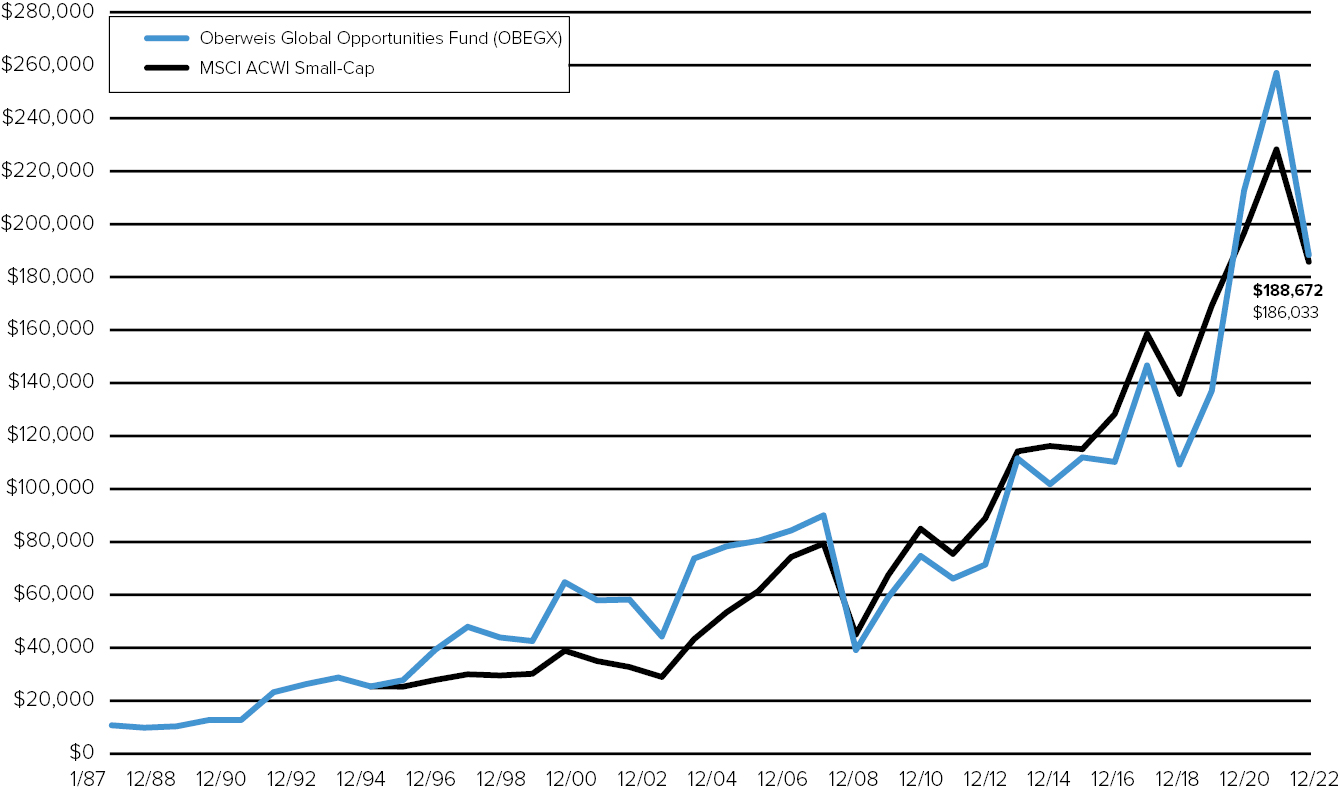
OBEGX | | (26.80) | | 5.16 | | 10.26 | | 8.51 | | 1.51 |
OBGIX4 | | (26.61) | | 5.43 | | 10.53 | | 8.78 | | 1.27 |
MSCI ACWI Small-Cap | | (18.67) | | 3.23 | | 7.69 | | N/A5 | | |
Growth of a $10,000 Investment (from January 7, 1987 to December 31, 2022)
11
Management discussion on fund performance
(unaudited) (continued)
Average Annual Total Returns1 (for the Periods Ended December 31, 2022)
| | 1 YR
(%) | | 5 YR (%) | | 10 YR (%) | | SINCE
INCEPTION2
(%) | | EXPENSE
RATIO3
(%) |
OBCHX | | (37.23) | | (1.29) | | 6.79 | | 9.20 | | 2.03 |
OCHIX4 | | (36.97) | | (1.02) | | 7.07 | | 9.47 | | 1.78 |
MSCI China Net | | (21.93) | | (4.54) | | 2.43 | | 7.01 | | |
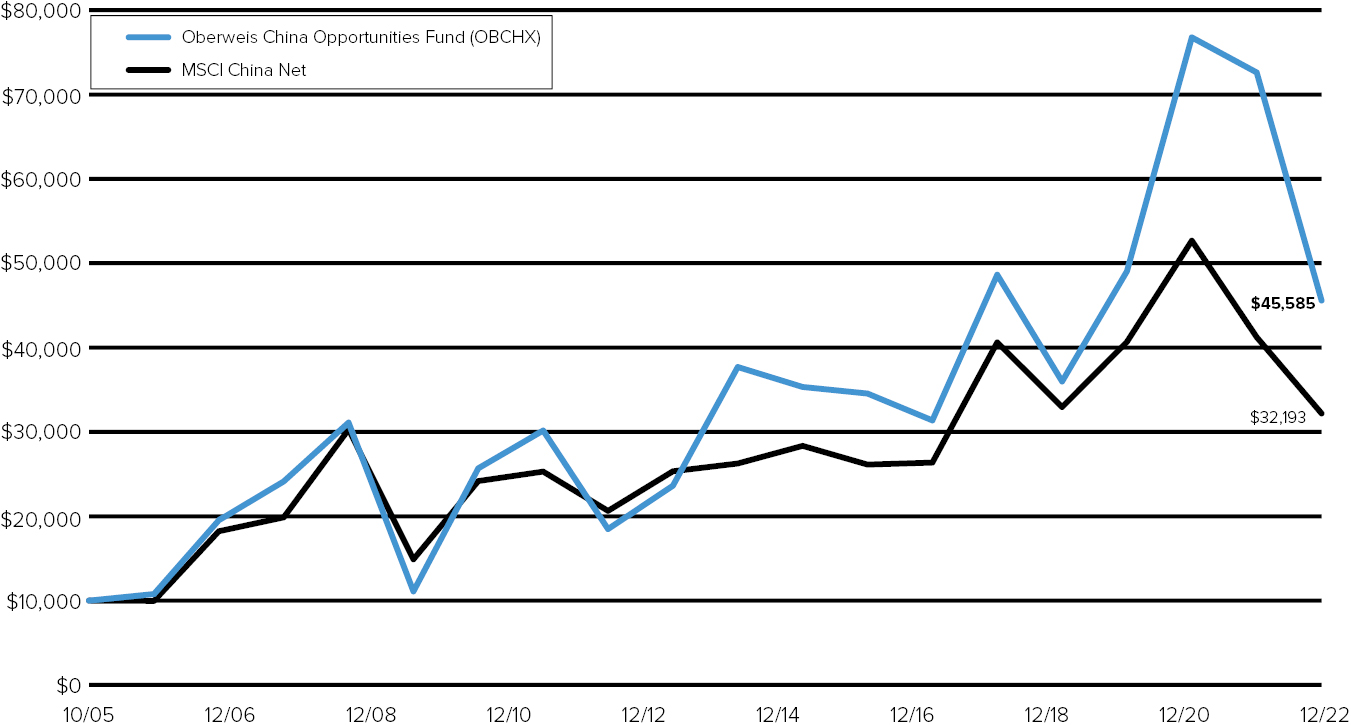
Growth of a $10,000 Investment (from October 1, 2005 to December 31, 2022)
12
Management discussion on fund performance
(unaudited) (continued)
Average Annual Total Returns1 (for the Periods Ended December 31, 2022)
| | 1 YR
(%) | | 5 YR (%) | | 10 YR (%) | | SINCE
INCEPTION2
(%) | | EXPENSE
RATIO3
(%) |
OBIOX | | (37.06) | | (0.76) | | 8.13 | | 6.93 | | 1.60 |
MSCI World ex-US Small Cap Growth | | (27.02) | | 0.55 | | 6.03 | | 3.68 | | |
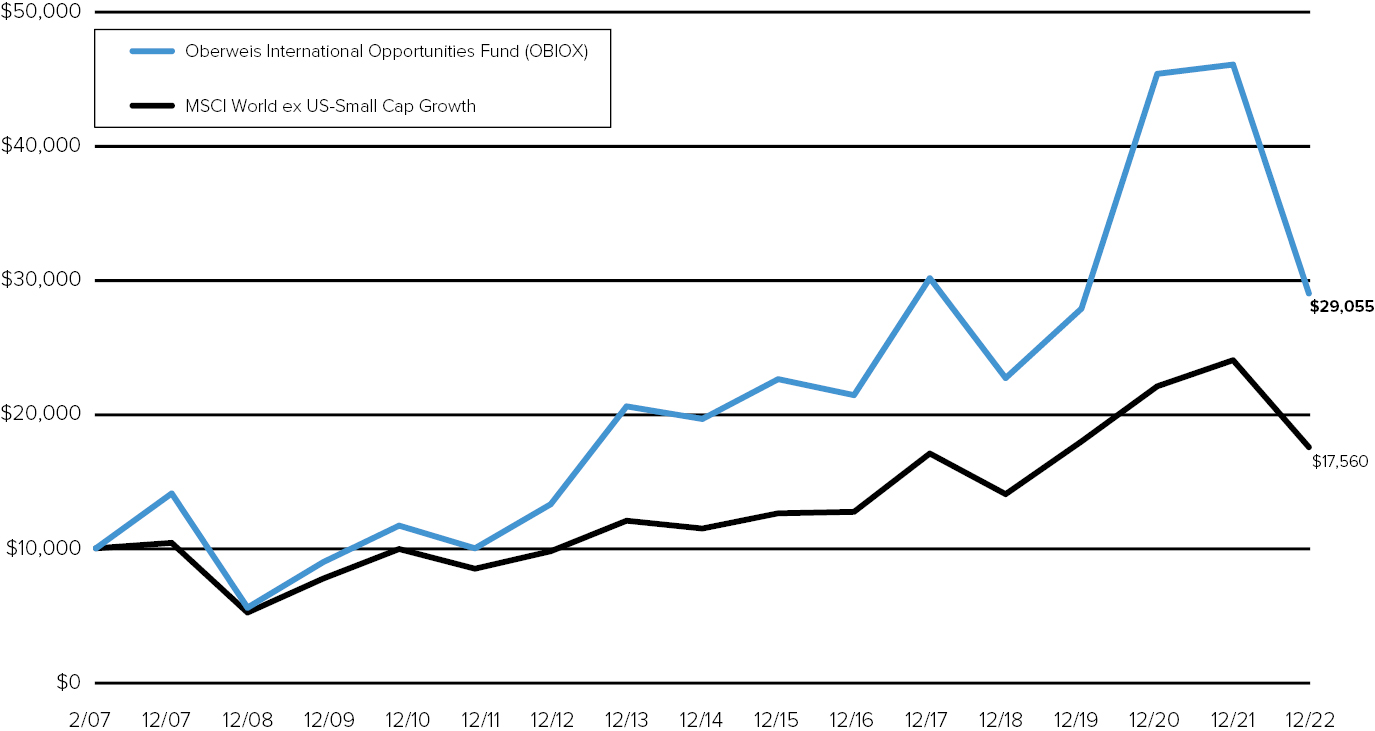
Growth of a $10,000 Investment (from February 1, 2007 to December 31, 2022)
13
Management discussion on fund performance
(unaudited) (continued)
Average Annual Total Returns1 (for the Periods Ended December 31, 2022)
| | 1 YR
(%) | | SINCE
INCEPTION2
(%) | | EXPENSE
RATIO3
(%) |
OBEMX | | (24.31) | | 3.68 | | 1.75 |
OIEMX | | (24.10) | | 3.94 | | 1.50 |
MSCI EM Small-Cap | | (18.02) | | 1.12 | | |
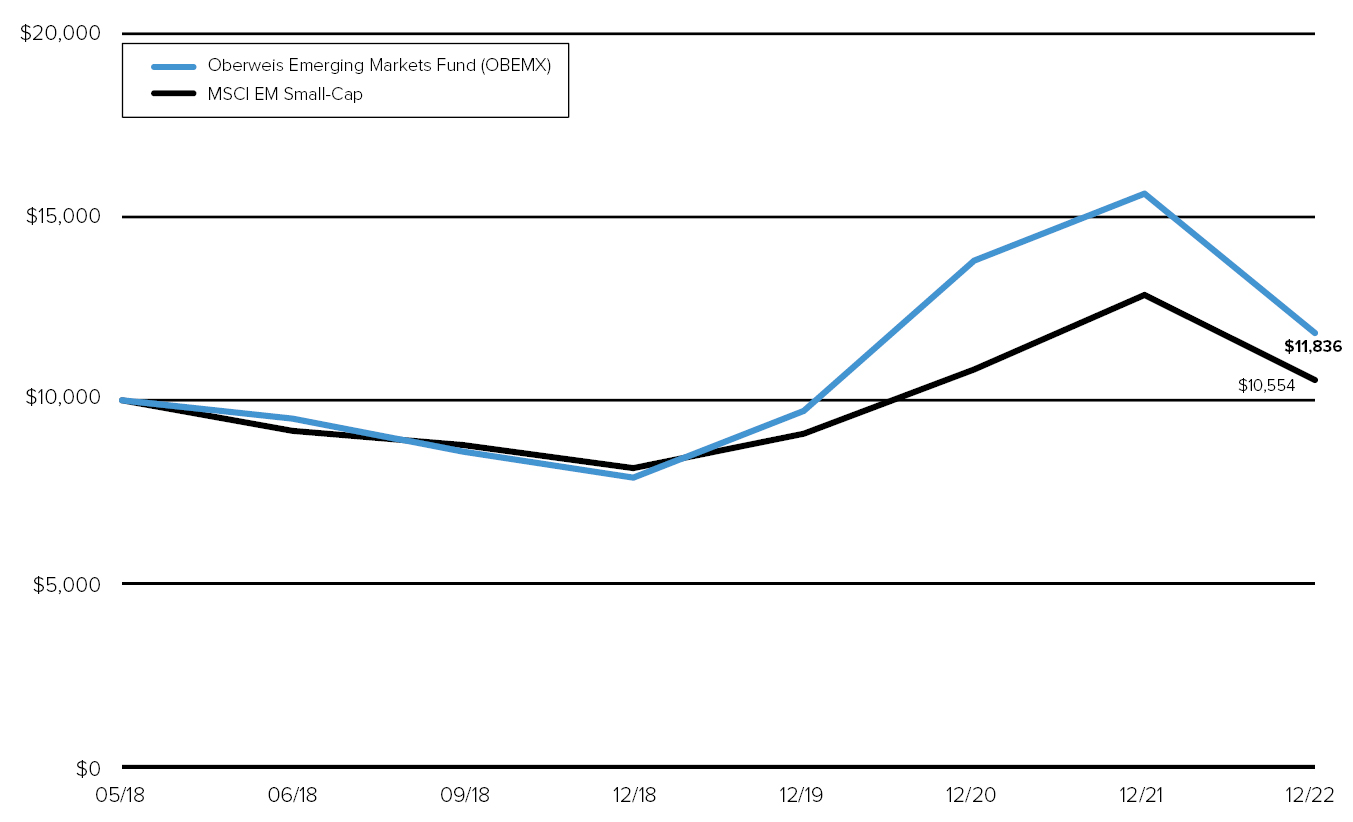
Growth of a $10,000 Investment (from May 1, 2018 to December 31, 2022)
14
OBERWEIS MICRO-CAP FUND
Schedule of Investments December 31, 2022
| | SHARES | | VALUE |
Equities – 96.5% | | | | | |
| | | | | | |
Advertising Agencies – 0.7% | | | | | |
Viad Corp.* | | 51,100 | | $ | 1,246,329 |
| | | | | | |
Aerospace – 2.0% | | | | | |
V2X, Inc.* | | 50,100 | | | 2,068,629 |
VSE Corp. | | 26,100 | | | 1,223,569 |
| | | | | | 3,292,198 |
| | | | | | |
Back Office Support, Human Resources & Consulting – 3.6% | | | | | |
Cross Country Healthcare, Inc.* | | 60,600 | | | 1,610,142 |
Franklin Covey Co.* | | 46,300 | | | 2,165,451 |
ICF International, Inc. | | 23,600 | | | 2,337,580 |
| | | | | | 6,113,173 |
| | | | | | |
Banks – Diversified – 1.8% | | | | | |
Mercantile Bank Corp. | | 25,700 | | | 860,436 |
Preferred Bank* | | 30,200 | | | 2,253,524 |
| | | | | | 3,113,960 |
| | | | | | |
Banks – Savings, Thrifts & Mortgage Lending – 2.0% | | | | | |
Brookline Bancorp, Inc.* | | 121,700 | | | 1,722,055 |
Heritage Financial Corp.* | | 55,400 | | | 1,697,456 |
| | | | | | 3,419,511 |
| | | | | | |
Biotechnology – 4.8% | | | | | |
ADMA Biologics, Inc.* | | 536,900 | | | 2,083,172 |
Catalyst Pharmaceuticals, Inc.* | | 96,600 | | | 1,796,760 |
Dynavax Technologies Corp.* | | 183,700 | | | 1,954,568 |
Veracyte, Inc.* | | 92,400 | | | 2,192,652 |
| | | | | | 8,027,152 |
| | | | | | |
Casinos & Gambling – 1.0% | | | | | |
Full House Resorts, Inc.* | | 221,743 | | | 1,667,507 |
| | | | | | |
Commercial Services – Rental & Leasing – 1.3% | | | | | |
H&E Equipment Services, Inc. | | 50,100 | | | 2,274,540 |
| | | | | | |
Commercial Vehicles & Parts – 1.0% | | | | | |
Modine Manufacturing Co.* | | 86,500 | | | 1,717,890 |
| | | | | | |
See accompanying notes to the financial statements.
15
OBERWEIS MICRO-CAP FUND (continued)
Schedule of Investments December 31, 2022
| | SHARES | | VALUE |
Communications Technology – 8.0% | | | | | |
ADTRAN, Inc. | | 116,400 | | $ | 2,187,156 |
Aviat Networks, Inc.* | | 83,307 | | | 2,598,345 |
Bel Fuse, Inc. | | 89,800 | | | 2,956,216 |
Extreme Networks, Inc.* | | 150,100 | | | 2,748,331 |
Harmonic, Inc.* | | 99,800 | | | 1,307,380 |
KVH Industries, Inc.* | | 88,000 | | | 899,360 |
Ooma, Inc.* | | 61,000 | | | 830,820 |
| | | | | | 13,527,608 |
| | | | | | |
COMPUTER SERVICES SOFTWARE & SYSTEMS – 6.0% | | | | | |
A10 Networks, Inc. | | 131,200 | | | 2,181,856 |
Avid Technology, Inc.* | | 52,200 | | | 1,387,998 |
Model N, Inc.* | | 82,400 | | | 3,342,144 |
OneSpan, Inc.* | | 216,900 | | | 2,427,111 |
PDF Solutions, Inc.* | | 30,100 | | | 858,452 |
| | | | | | 10,197,561 |
| | | | | | |
Computer Technology – 0.8% | | | | | |
ScanSource, Inc.* | | 46,800 | | | 1,367,496 |
| | | | | | |
Consumer Lending – 1.3% | | | | | |
EZCORP, Inc.* | | 262,000 | | | 2,135,300 |
| | | | | | |
Consumer Services – Miscellaneous – 3.4% | | | | | |
Perion Network Ltd.* | | 136,500 | | | 3,453,450 |
SP Plus Corp.* | | 67,600 | | | 2,347,072 |
| | | | | | 5,800,522 |
| | | | | | |
Containers & Packaging – 2.8% | | | | | |
Veritiv Corp. | | 39,400 | | | 4,795,374 |
| | | | | | |
Construction – 1.6% | | | | | |
Sterling Construction Co. Inc.* | | 80,600 | | | 2,643,680 |
| | | | | | |
Diversified Manufacturing Operations – 2.1% | | | | | |
NerdWallet, Inc.* | | 175,900 | | | 1,688,640 |
Playa Hotels & Resorts NV* | | 284,100 | | | 1,855,173 |
| | | | | | 3,543,813 |
| | | | | | |
Electronic Entertainment – 1.2% | | | | | |
Everi Hldgs. Inc.* | | 135,900 | | | 1,950,165 |
| | | | | | |
Energy Equipment – 1.5% | | | | | |
Ameresco, Inc.* | | 45,508 | | | 2,600,327 |
| | | | | | |
Financial Data & Systems – 0.9% | | | | | |
International Money Express, Inc.* | | 63,500 | | | 1,547,495 |
See accompanying notes to the financial statements.
16
OBERWEIS MICRO-CAP FUND (continued)
Schedule of Investments December 31, 2022
| | SHARES | | VALUE |
Food – 2.6% | | | | | |
SunOpta, Inc.* | | 262,600 | | $ | 2,216,344 |
The Chefs’ Warehouse, Inc.* | | 66,900 | | | 2,226,432 |
| | | | | | 4,442,776 |
| | | | | | |
Home Building – 0.8% | | | | | |
M/I Homes, Inc.* | | 30,000 | | | 1,385,400 |
| | | | | | |
Insurance – Property Casualty – 1.0% | | | | | |
Employers Hldgs., Inc. | | 38,500 | | | 1,660,505 |
| | | | | | |
Machinery – Agriculture – 2.2% | | | | | |
Titan International, Inc.* | | 145,100 | | | 2,222,932 |
Titan Machinery, Inc.* | | 39,600 | | | 1,573,308 |
| | | | | | 3,796,240 |
| | | | | | |
Machinery – Industrial – 1.2% | | | | | |
EnPro Industries, Inc. | | 19,300 | | | 2,097,717 |
| | | | | | |
Medical & Dental Instruments & Supplies – 4.3% | | | | | |
Alphatec Hldgs., Inc.* | | 212,900 | | | 2,629,315 |
Cerus Corp.* | | 283,900 | | | 1,036,235 |
LeMaitre Vascular, Inc. | | 21,600 | | | 994,032 |
TransMedics Group, Inc.* | | 42,400 | | | 2,616,928 |
| | | | | | 7,276,510 |
| | | | | | |
Medical Equipment – 3.6% | | | | | |
Lantheus Hldgs., Inc.* | | 74,000 | | | 3,771,040 |
Tactile Systems Technology, Inc.* | | 204,200 | | | 2,344,216 |
| | | | | | 6,115,256 |
| | | | | | |
Metal Fabricating – 0.9% | | | | | |
Haynes International, Inc. | | 33,500 | | | 1,530,615 |
| | | | | | |
Oil Crude Producer – 1.1% | | | | | |
Earthstone Energy, Inc.* | | 128,800 | | | 1,832,824 |
| | | | | | |
Oil Well Equipment & Services – 4.3% | | | | | |
MRC Global, Inc.* | | 119,900 | | | 1,388,442 |
Nine Energy Service, Inc.* | | 99,100 | | | 1,439,923 |
Patterson-UTI Energy, Inc. | | 139,100 | | | 2,342,444 |
RPC, Inc. | | 233,600 | | | 2,076,704 |
| | | | | | 7,247,513 |
| | | | | | |
Pharmaceuticals – 1.3% | | | | | |
Amphastar Pharmaceuticals, Inc.* | | 77,100 | | | 2,160,342 |
See accompanying notes to the financial statements.
17
OBERWEIS MICRO-CAP FUND (continued)
Schedule of Investments December 31, 2022
| | SHARES | | VALUE |
Production Technology Equipment – 12.1% | | | | | |
Aehr Test Systems* | | 318,400 | | $ | 6,399,840 |
Axcelis Technologies, Inc.* | | 87,100 | | | 6,912,256 |
Impinj, Inc.* | | 26,800 | | | 2,926,024 |
Photronics, Inc.* | | 116,800 | | | 1,965,744 |
Ultra Clean Hldgs., Inc.* | | 67,900 | | | 2,250,885 |
| | | | | | 20,454,749 |
| | | | | | |
Scientific Instruments – Electrical – 1.1% | | | | | |
Allied Motion Technologies, Inc. | | 46,400 | | | 1,615,184 |
RF Industries Ltd.* | | 63,100 | | | 321,810 |
| | | | | | 1,936,994 |
| | | | | | |
Scientific Instruments – Gauges & Meters – 1.0% | | | |
Vishay Precision Group, Inc.* | | 43,600 | | | 1,685,140 |
| | | | | | |
Scientific Instruments – Pollution Control – 1.3% | | | |
CECO Environmental Corp.* | | 182,100 | | | 2,126,928 |
| | | | | | |
Semiconductors & Components – 0.5% | | | | | |
Amtech Systems, Inc.* | | 113,900 | | | 865,640 |
| | | | | | |
Specialty Retail – 4.7% | | | | | |
Alta Equipment Group, Inc. | | 93,600 | | | 1,234,584 |
Boot Barn Hldgs., Inc.* | | 27,900 | | | 1,744,308 |
Caleres, Inc. | | 37,600 | | | 837,728 |
Destination XL Group, Inc.* | | 338,100 | | | 2,282,175 |
Guess’, Inc. | | 86,800 | | | 1,795,892 |
| | | | | | 7,894,687 |
| | | | | | |
Technology – Miscellaneous – 0.9% | | | | | |
Camtek Ltd.* | | 59,180 | | | 1,299,593 |
| | | | | | |
Telecommunications Equipment – 2.2% | | | | | |
Clearfield, Inc.* | | 37,700 | | | 3,549,078 |
| | | | | | |
Textiles Apparel & Shoes – 1.6% | | | | | |
Oxford Industries, Inc. | | 17,500 | | | 1,630,650 |
Rocky Brands, Inc. | | 36,000 | | | 850,320 |
| | | | | | 2,480,970 |
| | | | | | |
Total Equities | | | | | |
(Cost: $137,803,008) | | | | $ | 162,821,078 |
| | | | | | |
Total Investments – 96.5% | | | | | |
(Cost: $137,803,008) | | | | $ | 162,821,078 |
| | | | | | |
Other Assets Less Liabilities – 3.5% | | | | | 5,966,770 |
| | | | | | |
Net Assets – 100% | | | | $ | 168,787,848 |
See accompanying notes to the financial statements.
18
OBERWEIS SMALL-CAP OPPORTUNITIES FUND
Schedule of Investments December 31, 2022
| | SHARES | | VALUE |
Equities – 95.9% | | | | | |
| | | | | | |
AEROSPACE – 1.1% | | | | | |
ATI, Inc.* | | 57,200 | | $ | 1,707,992 |
| | | | | | |
AUTO PARTS – 1.5% | | | | | |
Visteon Corp.* | | 17,800 | | | 2,328,774 |
| | | | | | |
BACK OFFICE SUPPORT, HUMAN RESOURCES & CONSULTING – 3.2% | | | | | |
ICF International, Inc. | | 19,800 | | | 1,961,190 |
Insperity, Inc. | | 13,700 | | | 1,556,320 |
NV5 Global, Inc.* | | 11,800 | | | 1,561,376 |
| | | | | | 5,078,886 |
| | | | | | |
BANKS – DIVERSIFIED – 1.6% | | | | | |
First Merchants Corp. | | 25,300 | | | 1,040,083 |
Washington Federal, Inc. | | 43,200 | | | 1,449,359 |
| | | | | | 2,489,442 |
| | | | | | |
BEVERAGE – BREWERS & DISTILLERS – 1.2% | | | | | |
MGP Ingredients, Inc. | | 18,100 | | | 1,925,478 |
| | | | | | |
BIOTECHNOLOGY – 1.9% | | | | | |
Halozyme Therapeutics, Inc.* | | 52,200 | | | 2,970,180 |
| | | | | | |
CASINOS & GAMBLING – 1.0% | | | | | |
Monarch Casino and Resort, Inc.* | | 20,100 | | | 1,545,489 |
| | | | | | |
CHEMICALS – DIVERSIFIED – 2.1% | | | | | |
Cabot Corp. | | 24,200 | | | 1,617,528 |
Univar Solutions, Inc.* | | 54,300 | | | 1,726,740 |
| | | | | | 3,344,268 |
| | | | | | |
CHEMICALS – SPECIALTY – 1.2% | | | | | |
Quaker Chemical Corp. | | 11,600 | | | 1,936,040 |
| | | | | | |
COMMERCIAL VEHICLES & PARTS – 1.7% | | | | | |
Federal Signal Corp. | | 57,100 | | | 2,653,437 |
| | | | | | |
COMMUNICATIONS TECHNOLOGY – 3.0% | | | | | |
Calix, Inc.* | | 37,900 | | | 2,593,497 |
Ciena Corp.* | | 42,800 | | | 2,181,944 |
| | | | | | 4,775,441 |
| | | | | | |
COMPUTER TECHNOLOGY – 2.5% | | | | | |
Super Micro Computer, Inc.* | | 25,700 | | | 2,109,970 |
Synaptics, Inc.* | | 19,400 | | | 1,846,104 |
| | | | | | 3,956,074 |
See accompanying notes to the financial statements.
19
OBERWEIS SMALL-CAP OPPORTUNITIES FUND (continued)
Schedule of Investments December 31, 2022
| | SHARES | | VALUE |
CONSUMER LENDING – 1.0% | | | | | |
FirstCash Hldgs., Inc. | | 17,900 | | $ | 1,555,689 |
| | | | | | |
CONSUMER SERVICES – MISCELLANEOUS – 1.8% | | | | | |
Perion Network Ltd.* | | 110,900 | | | 2,805,770 |
| | | | | | |
CONTAINERS & PACKAGING – 2.9% | | | | | |
O-I Glass, Inc.* | | 103,400 | | | 1,713,338 |
Veritiv Corp. | | 22,742 | | | 2,767,929 |
| | | | | | 4,481,267 |
| | | | | | |
COSMETICS – 1.4% | | | | | |
Inter Parfums, Inc. | | 22,100 | | | 2,133,092 |
| | | | | | |
DIVERSIFIED MANUFACTURING OPERATIONS – 5.1% | | | | | |
Allegro MicroSystems, Inc.* | | 115,200 | | | 3,458,304 |
Inmode Ltd.* | | 59,500 | | | 2,124,150 |
Janus International Group, Inc.* | | 130,300 | | | 1,240,456 |
MP Materials Corp.* | | 48,000 | | | 1,165,440 |
| | | | | | 7,988,350 |
| | | | | | |
ELECTRONIC ENTERTAINMENT – 0.8% | | | | | |
Everi Hldgs., Inc.* | | 88,900 | | | 1,275,715 |
| | | | | | |
ENERGY EQUIPMENT – 1.5% | | | | | |
Ameresco, Inc.* | | 40,700 | | | 2,325,598 |
| | | | | | |
ENVIRONMENTAL, MAINTENANCE & SECURITY SERVICES – 1.3% | | | | | |
ABM Industries, Inc. | | 44,500 | | | 1,976,690 |
| | | | | | |
FOREST PRODUCTS – 0.7% | | | | | |
UFP Industries, Inc. | | 14,700 | | | 1,164,975 |
| | | | | | |
HEALTHCARE MANAGEMENT SERVICES – 1.3% | | | | | |
Option Care Health, Inc.* | | 65,500 | | | 1,970,895 |
| | | | | | |
HEALTHCARE SERVICES – 3.5% | | | | | |
Acadia Healthcare Co., Inc.* | | 18,900 | | | 1,555,848 |
AMN Healthcare Services, Inc.* | | 15,200 | | | 1,562,864 |
Evolent Health, Inc.* | | 81,900 | | | 2,299,752 |
| | | | | | 5,418,464 |
| | | | | | |
INSURANCE – LIFE – 0.8% | | | | | |
Unum Group | | 29,000 | | | 1,189,870 |
| | | | | | |
LEISURE TIME – 3.6% | | | | | |
Fox Factory Hldg. Corp.* | | 21,100 | | | 1,924,953 |
SeaWorld Entertainment, Inc.* | | 39,500 | | | 2,113,645 |
Topgolf Callaway Brands Corp.* | | 83,800 | | | 1,655,050 |
| | | | | | 5,693,648 |
See accompanying notes to the financial statements.
20
OBERWEIS SMALL-CAP OPPORTUNITIES FUND (continued)
Schedule of Investments December 31, 2022
| | SHARES | | VALUE |
MACHINERY – AGRICULTURE – 0.8% | | | | | |
Titan International, Inc.* | | 80,100 | | $ | 1,227,132 |
| | | | | | |
MACHINERY – INDUSTRIAL – 2.7% | | | | | |
Applied Industrial Technologies, Inc. | | 16,600 | | | 2,092,098 |
Franklin Electric Co., Inc. | | 26,600 | | | 2,121,350 |
| | | | | | 4,213,448 |
| | | | | | |
MEDICAL & DENTAL INSTRUMENTS & SUPPLIES – 4.7% | | | | | |
Alphatec Hldgs., Inc.* | | 188,700 | | | 2,330,445 |
Merit Medical Systems, Inc.* | | 35,600 | | | 2,514,072 |
TransMedics Group, Inc.* | | 40,000 | | | 2,468,800 |
| | | | | | 7,313,317 |
| | | | | | |
MEDICAL EQUIPMENT – 3.9% | | | | | |
Haemonetics Corp.* | | 19,700 | | | 1,549,405 |
Inspire Medical Systems, Inc.* | | 3,850 | | | 969,738 |
Lantheus Hldgs., Inc.* | | 50,800 | | | 2,588,768 |
Shockwave Medical, Inc.* | | 5,150 | | | 1,058,892 |
| | | | | | 6,166,803 |
| | | | | | |
OIL CRUDE PRODUCER – 4.0% | | | | | |
Comstock Resources, Inc. | | 114,000 | | | 1,562,940 |
Magnolia Oil & Gas Corp. | | 67,100 | | | 1,573,495 |
Matador Resources Co. | | 30,300 | | | 1,734,372 |
PDC Energy, Inc. | | 22,200 | | | 1,409,256 |
| | | | | | 6,280,063 |
| | | | | | |
OIL WELL EQUIPMENT & SERVICES – 1.9% | | | | | |
Liberty Energy, Inc. | | 84,100 | | | 1,346,441 |
NOV, Inc. | | 80,800 | | | 1,687,912 |
| | | | | | 3,034,353 |
| | | | | | |
PAPER – 1.0% | | | | | |
Clearwater Paper Corp.* | | 41,800 | | | 1,580,458 |
| | | | | | |
PHARMACEUTICALS – 1.0% | | | | | |
Amphastar Pharmaceuticals, Inc.* | | 56,900 | | | 1,594,338 |
| | | | | | |
POWER TRANSMISSION EQUIPMENT – 2.0% | | | | | |
Belden, Inc. | | 42,900 | | | 3,084,510 |
| | | | | | |
PRODUCTION TECHNOLOGY EQUIPMENT – 10.3% | | | | | |
Aehr Test Systems* | | 289,208 | | | 5,813,081 |
Axcelis Technologies, Inc.* | | 78,800 | | | 6,253,568 |
Impinj, Inc.* | | 32,000 | | | 3,493,760 |
Novanta, Inc.* | | 4,900 | | | 665,763 |
| | | | | | 16,226,172 |
See accompanying notes to the financial statements.
21
OBERWEIS SMALL-CAP OPPORTUNITIES FUND (continued)
Schedule of Investments December 31, 2022
| | SHARES | | VALUE |
RESTAURANTS – 0.6% | | | | | |
Texas Roadhouse, Inc. | | 9,500 | | $ | 864,025 |
| | | | | | |
SCIENTIFIC INSTRUMENTS – POLLUTION CONTROL – 2.3% | | | | | |
Clean Harbors, Inc.* | | 31,300 | | | 3,571,956 |
| | | | | | |
SEMICONDUCTORS & COMPONENTS – 3.8% | | | | | |
MACOM Technology Solutions Hldgs., Inc.* | | 38,400 | | | 2,418,432 |
MaxLinear, Inc.* | | 58,500 | | | 1,986,075 |
Silicon Laboratories, Inc.* | | 11,650 | | | 1,580,556 |
| | | | | | 5,985,063 |
| | | | | | |
SPECIALTY RETAIL – 0.5% | | | | | |
Murphy USA, Inc. | | 2,900 | | | 810,666 |
| | | | | | |
TECHNOLOGY – MISCELLANEOUS – 1.9% | | | | | |
Fabrinet* | | 23,700 | | | 3,038,814 |
| | | | | | |
TELECOMMUNICATIONS EQUIPMENT – 2.1% | | | | | |
Clearfield, Inc.* | | 34,800 | | | 3,276,072 |
| | | | | | |
TEXTILES, APPAREL & SHOES – 4.1% | | | | | |
Crocs, Inc.* | | 32,300 | | | 3,502,289 |
Deckers Outdoor Corp.* | | 7,500 | | | 2,993,700 |
| | | | | | 6,495,989 |
| | | | | | |
TRUCKERS – 0.6% | | | | | |
Forward Air Corp. | | 9,800 | | | 1,027,922 |
| | | | | | |
Total Equities | | | | | |
(Cost: $143,070,392) | | | | $ | 150,482,625 |
| | | | | | |
Total Investments – 95.9% | | | | | |
(Cost: $143,070,392) | | | | $ | 150,482,625 |
Other Assets Less Liabilities – 4.1% | | | | | 6,403,729 |
Net Assets – 100% | | | | $ | 156,886,354 |
* Non-income producing security during the period ended December 31, 2022
See accompanying notes to the financial statements.
22
OBERWEIS GLOBAL OPPORTUNITIES FUND
Schedule of Investmentsa December 31, 2022
| | SHARES | | VALUE |
Equities – 100.0% | | | | | |
| | | | | | |
AUSTRALIA – 1.2% | | | | | |
IDP Education Ltd. | | 35,000 | | $ | 645,003 |
| | | | | | |
BRAZIL – 1.1% | | | | | |
TOTVS SA | | 110,000 | | | 575,438 |
| | | | | | |
CANADA – 5.2% | | | | | |
Aritzia, Inc.* | | 32,600 | | | 1,140,037 |
ATS Corp.* | | 25,000 | | | 777,142 |
TFI International, Inc. | | 7,800 | | | 781,210 |
| | | | | | 2,698,389 |
| | | | | | |
CHINA – 5.7% | | | | | |
Dada Nexus Ltd. ADS* | | 173,342 | | | 1,208,194 |
Li Ning Co. Ltd. | | 61,500 | | | 528,835 |
Shanghai Weaver Network Co. Ltd. | | 75,000 | | | 541,690 |
YTO Express Group Co. Ltd. | | 225,000 | | | 649,188 |
| | | | | | 2,927,907 |
| | | | | | |
FRANCE – 2.1% | | | | | |
Rexel SA | | 29,700 | | | 587,413 |
Soitec SA* | | 3,000 | | | 492,403 |
| | | | | | 1,079,816 |
| | | | | | |
GERMANY – 1.7% | | | | | |
AIXTRON SE | | 30,000 | | | 863,186 |
| | | | | | |
ISRAEL – 1.3% | | | | | |
Inmode Ltd.* | | 19,400 | | | 692,580 |
| | | | | | |
JAPAN – 7.4% | | | | | |
BayCurrent Consulting, Inc. | | 46,000 | | | 1,431,980 |
Fuji Electric Co. Ltd. | | 31,000 | | | 1,169,918 |
Future Corp. | | 44,400 | | | 552,340 |
Visional, Inc.* | | 10,000 | | | 662,384 |
| | | | | | 3,816,622 |
| | | | | | |
NORWAY – 2.2% | | | | | |
Nordic Semiconductor ASA* | | 66,900 | | | 1,121,392 |
| | | | | | |
SOUTH KOREA – 1.2% | | | | | |
LEENO Industrial, Inc. | | 5,000 | | | 617,851 |
| | | | | | |
SWITZERLAND – 2.5% | | | | | |
u-blox Hldg. AG | | 11,000 | | | 1,313,010 |
| | | | | | |
TAIWAN – 2.2% | | | | | |
M31 Technology Corp. | | 72,000 | | | 1,067,006 |
See accompanying notes to the financial statements.
23
OBERWEIS GLOBAL OPPORTUNITIES FUND (continued)
Schedule of Investmentsa December 31, 2022
| | | SHARES | | | VALUE | |
UNITED KINGDOM – 10.9% | | | | | | |
Ashtead Technology Hldgs. PLC* | | 459,400 | | $ | 1,749,408 | |
Intermediate Capital Group PLC | | 105,100 | | | 1,451,071 | |
Oxford Instruments PLC | | 19,200 | | | 524,565 | |
RS GROUP PLC | | 41,900 | | | 451,124 | |
VIDENDUM PLC | | 31,800 | | | 414,698 | |
Wise PLC* | | 158,800 | | | 1,075,797 | |
| | | | | | 5,666,663 | |
| | | | | | | |
UNITED STATES OF AMERICA – 55.3% | | | | | | |
Acadia Healthcare Co., Inc.* | | 16,900 | | | 1,391,208 | |
Alphatec Hldgs., Inc.* | | 85,300 | | | 1,053,455 | |
Axcelis Technologies, Inc.* | | 25,149 | | | 1,995,825 | |
Bel Fuse, Inc. | | 25,000 | | | 823,000 | |
Belden, Inc. | | 24,500 | | | 1,761,550 | |
Cabot Corp. | | 8,400 | | | 561,456 | |
Ciena Corp.* | | 15,000 | | | 764,700 | |
Clean Harbors, Inc.* | | 7,900 | | | 901,548 | |
Clearfield, Inc.* | | 11,700 | | | 1,101,438 | |
Comstock Resources, Inc. | | 28,800 | | | 394,847 | |
Crocs, Inc.* | | 18,900 | | | 2,049,327 | |
Cross Country Healthcare, Inc.* | | 17,100 | | | 454,347 | |
Deckers Outdoor Corp.* | | 4,300 | | | 1,716,388 | |
Evolent Health, Inc.* | | 29,600 | | | 831,168 | |
Fabrinet* | | 4,300 | | | 551,346 | |
Halozyme Therapeutics, Inc.* | | 57,200 | | | 3,254,680 | |
Impinj, Inc.* | | 21,700 | | | 2,369,206 | |
Lantheus Hldgs., Inc.* | | 20,300 | | | 1,034,488 | |
MaxLinear, Inc.* | | 20,100 | | | 682,395 | |
MGP Ingredients, Inc. | | 5,600 | | | 595,728 | |
Model N, Inc.* | | 31,200 | | | 1,265,472 | |
Super Micro Computer, Inc.* | | 21,300 | | | 1,748,730 | |
Synaptics, Inc.* | | 8,600 | | | 818,376 | |
Visteon Corp.* | | 4,600 | | | 601,818 | |
| | | | | | 28,722,496 | |
| | | | | | | |
Total Equities | | | | | | |
(Cost: $46,889,562) | | | | $ | 51,807,359 | |
| | | | | | | |
Total Investments 100.0% | | | | | | |
(Cost: $46,889,562) | | | | $ | 51,807,359 | |
Other Liabilities Less Assets – 0.0% | | | | | (2,739 | ) |
Net Assets – 100% | | | | $ | 51,804,620 | |
a Certain securities were fair valued under the discretion of the Board of Trustees
* Non-income producing security during the period ended December 31, 2022
ADS—American depositary share
See accompanying notes to the financial statements.
24
OBERWEIS GLOBAL OPPORTUNITIES FUND (continued)
Schedule of Investmentsa December 31, 2022
SECTOR ALLOCATIONS (As A Percentage of Net Assets) (unaudited) | | |
Consumer Discretionary | | 16.0 | % |
Consumer Staples | | 1.1 | % |
Energy | | 0.8 | % |
Financials | | 2.8 | % |
Healthcare | | 16.8 | % |
Industrials | | 17.7 | % |
Information Technology | | 43.7 | % |
Materials | | 1.1 | % |
See accompanying notes to the financial statements.
25
OBERWEIS CHINA OPPORTUNITIES FUND
Schedule of Investments December 31, 2022
| | SHARES | | VALUE |
Equities – 99.2% | | | | | |
| | | | | | |
AIR FREIGHT & LOGISTICS – 2.3% | | | | | |
Milkyway Chemical Supply Chain Service Co. Ltd. | | 25,000 | | $ | 419,538 |
YTO Express Group Co. Ltd. | | 300,032 | | | 867,076 |
| | | | | | 1,286,614 |
| | | | | | |
AIRLINES – 1.1% | | | | | |
Cathay Pacific Airways Ltd.* | | 550,000 | | | 600,346 |
| | | | | | |
BEVERAGES – 2.7% | | | | | |
China Resources Beer Hldgs. Co. Ltd. | | 100,000 | | | 698,866 |
Luzhou Laojiao Co. Ltd. | | 25,000 | | | 806,565 |
| | | | | | 1,505,431 |
| | | | | | |
BIOTECHNOLOGY – 2.4% | | | | | |
BeiGene Ltd.* | | 80,000 | | | 1,375,440 |
| | | | | | |
CAPITAL MARKETS – 1.4% | | | | | |
Futu Hldgs. Ltd. ADS* | | 20,000 | | | 813,000 |
| | | | | | |
CHEMICALS – 2.5% | | | | | |
Nanjing Cosmos Chemical Co. Ltd.* | | 85,000 | | | 637,650 |
Rianlon Corp.* | | 94,929 | | | 745,181 |
| | | | | | 1,382,831 |
| | | | | | |
DIVERSIFIED CONSUMER SERVICES – 4.1% | | | | | |
New Oriental Education & Technology Group, Inc.* | | 455,000 | | | 1,661,329 |
TAL Education Group ADS* | | 95,000 | | | 669,750 |
| | | | | | 2,331,079 |
| | | | | | |
ELECTRICAL EQUIPMENT – 1.8% | | | | | |
Shenzhen Kstar Science And Technology Co. Ltd.* | | 120,000 | | | 994,289 |
| | | | | | |
ELECTRONIC EQUIPMENT, INSTRUMENTS & COMPONENTS – 2.3% | | | | | |
BOE Varitronix Ltd. | | 50,000 | | | 95,061 |
Cowell e Hldgs., Inc.* | | 350,000 | | | 486,964 |
Suzhou Dongshan Precision Manufacturing Co. Ltd.* | | 200,000 | | | 711,481 |
| | | | | | 1,293,506 |
| | | | | | |
ENTERTAINMENT – 7.0% | | | | | |
Bilibili, Inc.* | | 50,000 | | | 1,196,592 |
NetEase, Inc. | | 90,000 | | | 1,320,223 |
Tencent Music Entertainment Group ADS* | | 175,000 | | | 1,449,000 |
| | | | | | 3,965,815 |
See accompanying notes to the financial statements.
26
OBERWEIS CHINA OPPORTUNITIES FUND (continued)
Schedule of Investments December 31, 2022
| | SHARES | | VALUE |
HEALTHCARE EQUIPMENT & SUPPLIES – 5.6% | | | | | |
Acotec Scientific Hldgs. Ltd.* | | 400,000 | | $ | 880,405 |
AK Medical Hldgs. Ltd.* | | 1,000,000 | | | 1,254,244 |
Angelalign Technology, Inc.* | | 25,000 | | | 393,953 |
Sonoscape Medical Corp.* | | 80,000 | | | 630,982 |
| | | | | | 3,159,584 |
| | | | | | |
HEALTHCARE PROVIDERS & SERVICES – 2.7% | | | | | |
Hygeia Healthcare Hldgs. Co. Ltd.* | | 210,000 | | | 1,506,630 |
| | | | | | |
HOTELS, RESTAURANTS & LEISURE – 12.0% | | | | | |
H World Group Ltd. | | 300,000 | | | 1,293,319 |
Helens International Hldgs. Co. Ltd.* | | 350,000 | | | 664,531 |
Jiumaojiu International Hldgs. Ltd. | | 430,000 | | | 1,148,613 |
Sands China Ltd.* | | 350,000 | | | 1,161,361 |
Trip.com Group Ltd.* | | 55,000 | | | 1,927,871 |
Yum China Hldgs., Inc. | | 10,500 | | | 573,825 |
| | | | | | 6,769,520 |
| | | | | | |
INSURANCE – 1.8% | | | | | |
China Life Insurance Co. Ltd.* | | 600,000 | | | 1,030,043 |
| | | | | | |
INTERACTIVE MEDIA & SERVICES – 1.4% | | | | | |
Kuaishou Technology* | | 85,000 | | | 773,717 |
| | | | | | |
INTERNET & DIRECT MARKETING RETAIL – 19.9% | | | | | |
Alibaba Group Hldg. Ltd.* | | 190,000 | | | 2,099,481 |
Alibaba Health Information Technology Ltd.* | | 1,000,000 | | | 851,963 |
Dada Nexus Ltd. ADS* | | 150,000 | | | 1,045,500 |
JD.com, Inc. | | 65,000 | | | 1,833,707 |
Maoyan Entertainment* | | 650,000 | | | 750,304 |
Meituan* | | 80,000 | | | 1,790,532 |
Pinduoduo, Inc. ADS* | | 35,000 | | | 2,854,250 |
| | | | | | 11,225,737 |
| | | | | | |
LIFE SCIENCES TOOLS & SERVICES – 2.5% | | | | | |
Wuxi Biologics (Cayman), Inc.* | | 185,000 | | | 1,418,519 |
| | | | | | |
MACHINERY – 2.0% | | | | | |
Morimatsu International Hldgs. Co. Ltd.* | | 500,000 | | | 555,378 |
Ningbo Haitian Precision Machinery Co. Ltd.* | | 150,000 | | | 565,329 |
| | | | | | 1,120,707 |
| | | | | | |
MULTILINE RETAIL – 1.7% | | | | | |
MINISO Group Hldg. Ltd. ADS* | | 90,000 | | | 965,700 |
| | | | | | |
PAPER & FOREST PRODUCTS – 0.6% | | | | | |
Nine Dragons Paper Hldgs. Ltd.* | | 400,000 | | | 364,871 |
| | | | | | |
PHARMACEUTICALS – 1.4% | | | | | |
Lotus Pharmaceutical Co. Ltd.* | | 100,000.00 | | | 800,377 |
See accompanying notes to the financial statements.
27
OBERWEIS CHINA OPPORTUNITIES FUND (continued)
Schedule of Investments December 31, 2022
| | SHARES | | VALUE |
PROFESSIONAL SERVICES – 0.3% | | | | | |
Centre Testing International Group Co. Ltd. | | 50,050 | | $ | 160,553 |
| | | | | | |
REAL ESTATE MANAGEMENT & DEVELOPMENT 6.2% | | | | | |
China Resources Mixc Lifestyle Services Ltd. | | 251,538 | | | 1,277,751 |
Country Garden Services Hldgs. Co. Ltd.* | | 450,000 | | | 1,120,748 |
Longfor Group Hldgs. Ltd. | | 350,000 | | | 1,089,616 |
| | | | | | 3,488,115 |
| | | | | | |
SEMICONDUCTORS & SEMICONDUCTOR EQUIPMENT – 3.1% | | | | | |
Jentech Precision Industrial Co. Ltd.* | | 75,000 | | | 918,726 |
M31 Technology Corp.* | | 55,000 | | | 817,784 |
| | | | | | 1,736,510 |
| | | | | | |
SPECIALTY RETAIL – 1.4% | | | | | |
China Tourism Group Duty Free Corp. Ltd. | | 25,000 | | | 776,896 |
| | | | | | |
TECHNOLOGY HARDWARE, STORAGE & PERIPHERALS – 1.3% | | | | | |
Ninestar Corp. | | 100,016 | | | 746,556 |
| | | | | | |
TEXTILES, APPAREL & LUXURY GOODS – 2.5% | | | | | |
Li Ning Co. Ltd. | | 165,000 | | | 1,432,163 |
| | | | | | |
TOBACCO – 1.7% | | | | | |
Smoore International Hldgs. Ltd.* | | 600,000 | | | 931,651 |
| | | | | | |
TRANSPORTATION INFRASTRUCTURE – 2.1% | | | | | |
Shanghai International Airport Co. Ltd.* | | 140,000 | | | 1,162,219 |
| | | | | | |
UTILITIES – GAS – 1.4% | | | | | |
China Resources Gas Group Ltd. | | 200,000 | | | 750,753 |
| | | | | | |
Total Equities | | | | | |
(Cost: $51,390,311) | | | | $ | 55,869,172 |
| | | | | | |
Total Investments – 99.2% | | | | | |
(Cost: $51,390,311) | | | | $ | 55,869,172 |
Other Assets Less Liabilities – 0.8% | | | | | 447,050 |
Net Assets – 100% | | | | $ | 56,316,222 |
* Non-income producing security during the period ended December 31, 2022
ADS—American depositary share
COUNTRY ALLOCATION (As a Percentage of Net Assets) (unaudited) | | |
China (Includes the People’s Republic of China,
Taiwan and Hong Kong) | | 99.2 | % |
See accompanying notes to the financial statements.
28
OBERWEIS INTERNATIONAL OPPORTUNITIES FUND
Schedule of Investmentsa December 31, 2022
| | SHARES | | VALUE |
Equities – 99.7% | | | | | |
| | | | | | |
AUSTRALIA – 8.9% | | | | | |
Computershare Ltd. | | 166,100 | | $ | 2,925,929 |
Elders Ltd. | | 320,600 | | | 2,200,611 |
GrainCorp Ltd. | | 479,100 | | | 2,415,332 |
IDP Education Ltd. | | 161,000 | | | 2,967,013 |
JB Hi-Fi Ltd. | | 81,600 | | | 2,325,667 |
| | | | | | 12,834,552 |
| | | | | | |
AUSTRIA – 2.4% | | | | | |
ANDRITZ AG* | | 53,400 | | | 3,056,684 |
AT & S Austria Technologie & Systemtechnik AG | | 14,300 | | | 490,476 |
| | | | | | 3,547,160 |
| | | | | | |
BELGIUM – 1.1% | | | | | |
Barco NV* | | 66,200 | | | 1,640,005 |
| | | | | | |
CANADA – 18.0% | | | | | |
Aritzia, Inc.* | | 95,500 | | | 3,339,679 |
ATS Corp.* | | 127,700 | | | 3,969,640 |
BRP, Inc. | | 24,600 | | | 1,875,523 |
Element Fleet Management Corp. | | 241,800 | | | 3,294,838 |
Finning International, Inc. | | 98,400 | | | 2,446,192 |
Gildan Activewear, Inc. | | 26,000 | | | 712,024 |
International Petroleum Corp.* | | 200,900 | | | 2,256,853 |
Parex Resources, Inc. | | 120,724 | | | 1,796,594 |
Sleep Country Canada Hldgs., Inc. | | 39,400 | | | 668,694 |
TFI International, Inc. | | 16,000 | | | 1,602,482 |
Toromont Industries Ltd. | | 20,800 | | | 1,501,010 |
Trisura Group Ltd.* | | 77,900 | | | 2,605,680 |
| | | | | | 26,069,209 |
| | | | | | |
DENMARK – 1.5% | | | | | |
D/S Norden A/S | | 36,600 | | | 2,205,692 |
| | | | | | |
FINLAND – 5.2% | | | | | |
Cargotec Oyj* | | 58,100 | | | 2,577,060 |
Metso Outotec Oyj | | 297,100 | | | 3,059,348 |
Outokumpu Oyj | | 385,000 | | | 1,953,931 |
| | | | | | 7,590,339 |
| | | | | | |
FRANCE – 7.4% | | | | | |
Edenred SA* | | 73,100 | | | 3,978,441 |
Nexans SA* | | 15,350 | | | 1,389,298 |
Rexel SA | | 271,000 | | | 5,359,894 |
| | | | | | 10,727,633 |
See accompanying notes to the financial statements.
29
OBERWEIS INTERNATIONAL OPPORTUNITIES FUND (continued)
Schedule of Investmentsa December 31, 2022
| | SHARES | | VALUE |
GERMANY – 5.1% | | | | | |
AIXTRON SE | | 160,600 | | $ | 4,620,920 |
Aurelius Equity Opportunities SE | | 37,923 | | | 739,401 |
Krones AG* | | 14,200 | | | 1,586,732 |
Sixt SE | | 5,372 | | | 491,813 |
| | | | | | 7,438,866 |
| | | | | | |
ITALY – 1.0% | | | | | |
Brunello Cucinelli SpA* | | 20,400 | | | 1,509,395 |
| | | | | | |
JAPAN – 15.9% | | | | | |
BayCurrent Consulting, Inc. | | 205,200 | | | 6,387,876 |
Daiwa Securities Group, Inc. | | 779,400 | | | 3,444,017 |
Fuji Electric Co. Ltd. | | 81,100 | | | 3,060,656 |
Future Corp. | | 198,800 | | | 2,473,092 |
M&A Capital Partners Co. Ltd.* | | 72,900 | | | 2,543,563 |
Toyo Suisan Kaisha Ltd.* | | 73,600 | | | 2,835,511 |
Visional, Inc.* | | 35,100 | | | 2,324,968 |
| | | | | | 23,069,683 |
| | | | | | |
NETHERLANDS – 7.1% | | | | | |
Aalberts NV | | 59,000 | | | 2,298,158 |
Alfen NV* | | 24,000 | | | 2,172,881 |
ASM International NV* | | 5,700 | | | 1,446,267 |
Constellium SE* | | 366,300 | | | 4,333,329 |
| | | | | | 10,250,635 |
| | | | | | |
NORWAY – 5.9% | | | | | |
Aker Solutions ASA | | 450,300 | | | 1,734,322 |
Nordic Semiconductor ASA* | | 334,800 | | | 5,611,987 |
Wallenius Wilhelmsen ASA | | 124,900 | | | 1,230,093 |
| | | | | | 8,576,402 |
| | | | | | |
SWEDEN – 4.5% | | | | | |
Hexatronic Group AB | | 383,600 | | | 5,225,847 |
Munters Group AB* | | 120,700 | | | 1,189,945 |
| | | | | | 6,415,792 |
See accompanying notes to the financial statements.
30
OBERWEIS INTERNATIONAL OPPORTUNITIES FUND (continued)
Schedule of Investmentsa December 31, 2022
| | SHARES | | VALUE |
UNITED KINGDOM – 15.7% | | | | | |
Beazley PLC* | | 333,000 | | $ | 2,723,298 |
Future PLC | | 82,800 | | | 1,262,009 |
IMI PLC | | 54,200 | | | 846,449 |
Indivior PLC* | | 69,600 | | | 1,557,468 |
Intermediate Capital Group PLC | | 162,500 | | | 2,243,569 |
Keywords Studios PLC* | | 45,300 | | | 1,486,521 |
Man Group PLC | | 786,300 | | | 2,022,973 |
Morgan Sindall Group PLC | | 35,400 | | | 658,157 |
Redrow PLC | | 129,500 | | | 709,620 |
RS GROUP PLC | | 125,900 | | | 1,355,525 |
Taylor Wimpey PLC | | 546,700 | | | 669,496 |
Telecom Plus PLC | | 119,700 | | | 3,168,389 |
The Sage Group PLC | | 208,400 | | | 1,876,507 |
Wise PLC* | | 309,600 | | | 2,097,398 |
| | | | | | 22,677,379 |
| | | | | | |
Total Equities | | | | | |
(Cost: $139,985,092) | | | | $ | 144,552,742 |
| | | | | | |
Total Investments – 99.7% | | | | | |
(Cost: $139,985,092) | | | | $ | 144,552,742 |
| | | | | | |
Other Assets Less Liabilities – 0.3% | | | | | 417,202 |
Net Assets – 100% | | | | $ | 144,969,944 |
SECTOR ALLOCATIONS (As a Percentage of Net Assets) (unaudited) | | |
Communication Services | | 0.9 | % |
Consumer Discretionary | | 10.2 | % |
Consumer Staples | | 5.1 | % |
Energy | | 4.0 | % |
Financials | | 13.5 | % |
Healthcare | | 1.1 | % |
Industrials | | 38.6 | % |
Information Technology | | 19.8 | % |
Materials | | 4.3 | % |
Utilities | | 2.2 | % |
See accompanying notes to the financial statements.
31
OBERWEIS EMERGING MARKETS FUND
Schedule of Investmentsa December 31, 2022
| | SHARES | | VALUE |
Equities – 96.1% | | | | | |
| | | | | | |
ARGENTINA – 0.5% | | | | | |
Despegar.com Corp.* | | 11,600 | | $ | 59,508 |
| | | | | | |
AUSTRALIA – 2.0% | | | | | |
IDP Education Ltd. | | 13,300 | | | 246,115 |
| | | | | | |
BRAZIL – 6.8% | | | | | |
Afya Ltd.* | | 17,000 | | | 265,540 |
LOG Commercial Properties e Participacoes SA | | 25,000 | | | 76,329 |
Petro Rio SA* | | 40,400 | | | 284,724 |
TOTVS SA | | 44,200 | | | 231,222 |
| | | | | | 857,815 |
| | | | | | |
CHINA – 23.3% | | | | | |
AK Medical Hldgs. Ltd.* | | 182,000 | | | 228,272 |
Chongqing Brewery Co. Ltd. | | 16,100 | | | 295,010 |
Dada Nexus Ltd. ADS* | | 92,600 | | | 645,422 |
Glodon Co. Ltd.* | | 12,000 | | | 103,485 |
Hangzhou Robam Appliances Co. Ltd. | | 50,500 | | | 201,660 |
Kingdee International Software Group Co. Ltd.* | | 149,000 | | | 319,552 |
Sichuan Swellfun Co. Ltd.* | | 14,000 | | | 170,013 |
Thunder Software Technology Co. Ltd.* | | 7,000 | | | 100,997 |
Weimob, Inc.* | | 204,000 | | | 174,062 |
Wolong Electric Group Co. Ltd. | | 64,500 | | | 115,608 |
Xiabuxiabu Catering Management China Hldgs. Co. Ltd. | | 194,000 | | | 220,706 |
Yantai Jereh Oilfield Services Group Co. Ltd. | | 42,700 | | | 171,434 |
Zhejiang Shuanghuan Driveline Co. Ltd.* | | 52,016 | | | 190,429 |
| | | | | | 2,936,650 |
| | | | | | |
FRANCE – 1.3% | | | | | |
Gaztransport & Technigaz SA | | 1,550 | | | 165,586 |
| | | | | | |
GREECE – 1.6% | | | | | |
Greek Organization of Football Prognostics SA | | 14,500 | | | 205,347 |
| | | | | | |
HUNGARY – 1.3% | | | | | |
Richter Gedeon Nyrt | | 7,200 | | | 160,216 |
| | | | | | |
INDIA – 13.7% | | | | | |
Affle India Ltd.* | | 12,100 | | | 158,362 |
AMI Organics Ltd.* | | 10,300 | | | 120,187 |
Cera Sanitaryware Ltd.* | | 2,200 | | | 138,475 |
Computer Age Management Services Ltd. | | 4,100 | | | 110,102 |
Container Corp. of India Ltd. | | 12,300 | | | 109,842 |
Federal Bank Ltd.* | | 146,000 | | | 245,392 |
See accompanying notes to the financial statements.
32
OBERWEIS EMERGING MARKETS FUND (continued)
Schedule of Investmentsa December 31, 2022
| | SHARES | | VALUE |
KPIT Technologies Ltd. | | 18,500 | | $ | 157,484 |
L&T Technology Services Ltd. | | 2,700 | | | 120,217 |
Linde India Ltd. | | 3,000 | | | 124,553 |
Tube Investments of India Ltd.* | | 3,500 | | | 117,423 |
Varun Beverages Ltd. | | 13,018 | | | 208,110 |
Vinati Organics Ltd. | | 4,700 | | | 113,333 |
| | | | | | 1,723,480 |
| | | | | | |
INDONESIA – 6.2% | | | | | |
PT Indofood CBP Sukses Makmur Tbk | | 200,000 | | | 128,473 |
PT Kalbe Farma Tbk* | | 1,453,000 | | | 195,071 |
PT Mitra Adiperkasa Tbk* | | 2,282,900 | | | 211,902 |
PT Sumber Alfaria Trijaya Tbk | | 1,476,500 | | | 251,339 |
| | | | | | 786,785 |
| | | | | | |
MALAYSIA – 4.2% | | | | | |
Carlsberg Brewery Malaysia Bhd | | 25,000 | | | 129,852 |
My E.G. Services Bhd | | 1,032,000 | | | 203,823 |
Telekom Malaysia Bhd* | | 158,000 | | | 193,689 |
| | | | | | 527,364 |
| | | | | | |
MEXICO – 2.3% | | | | | |
Alsea, S.A.B. de CV* | | 88,300 | | | 167,025 |
Controladora Vuela Compania de Aviacion, S.A.B de CV ADS* | | 14,000 | | | 117,040 |
| | | | | | 284,065 |
| | | | | | |
PHILIPPINES – 1.5% | | | | | |
Wilcon Depot, Inc. | | 360,800 | | | 191,269 |
| | | | | | |
POLAND – 1.4% | | | | | |
Dino Polska SA* | | 2,100 | | | 179,881 |
| | | | | | |
SOUTH AFRICA – 1.7% | | | | | |
Clicks Group Ltd. | | 7,680 | | | 122,075 |
Karooooo Ltd. | | 3,700 | | | 87,801 |
| | | | | | 209,876 |
| | | | | | |
SOUTH KOREA – 10.5% | | | | | |
Classys, Inc. | | 21,727 | | | 316,776 |
LEENO Industrial, Inc. | | 2,588 | | | 319,799 |
LG Innotek Co. Ltd. | | 949 | | | 191,393 |
Park Systems Corp. | | 1,500 | | | 135,917 |
POSCO Chemical Co. Ltd. | | 1,730 | | | 247,144 |
SaraminHR Co. Ltd. | | 5,500 | | | 115,114 |
| | | | | | 1,326,143 |
| | | | | | |
SWITZERLAND – 0.9% | | | | | |
Wizz Air Hldgs. PLC* | | 4,809 | | | 110,720 |
See accompanying notes to the financial statements.
33
OBERWEIS EMERGING MARKETS FUND (continued)
Schedule of Investmentsa December 31, 2022
| | SHARES | | VALUE |
TAIWAN – 15.0% | | | | | |
ASPEED Technology, Inc. | | 4,400 | | $ | 241,219 |
Chailease Hldg. Co. Ltd. | | 35,499 | | | 250,631 |
Chroma ATE, Inc.* | | 30,000 | | | 176,669 |
Genius Electronic Optical Co. Ltd.* | | 16,000 | | | 174,651 |
Innodisk Corp. | | 23,881 | | | 144,131 |
momo.com, Inc. | | 9,440 | | | 197,182 |
Pan Jit International, Inc. | | 98,000 | | | 184,614 |
Sinbon Electronics Co. Ltd. | | 21,000 | | | 187,893 |
Unimicron Technology Corp.* | | 24,000 | | | 93,703 |
Yageo Corp. | | 16,551 | | | 242,863 |
| | | | | | 1,893,556 |
| | | | | | |
THAILAND – 0.9% | | | | | |
Mega Lifesciences PCL | | 87,000 | | | 117,432 |
| | | | | | |
VIETNAM – 1.0% | | | | | |
Masan Group Corp. | | 28,800 | | | 113,612 |
| | | | | | |
Total Equities | | | | | |
(Cost: $11,717,517) | | | | $ | 12,095,420 |
| | | | | | |
Total Investments – 96.1% | | | | | |
(Cost: $11,717,517) | | | | $ | 12,095,420 |
| | | | | | |
Other Assets Less Liabilities – 3.9% | | | | | 495,056 |
Net Assets – 100% | | | | $ | 12,590,476 |
SECTOR ALLOCATIONS (As a Percentage of Net Assets) (unaudited) | | |
Communication Services | | 2.8 | % |
Consumer Discretionary | | 23.2 | % |
Consumer Staples | | 12.7 | % |
Energy | | 4.9 | % |
Financials | | 3.9 | % |
Healthcare | | 9.0 | % |
Industrials | | 6.6 | % |
Information Technology | | 28.4 | % |
Materials | | 3.9 | % |
Real Estate | | 0.7 | % |
See accompanying notes to the financial statements.
34
THE OBERWEIS FUNDS
Statements of Assets and Liabilities December 31, 2022
| | | Micro-Cap
Fund | | Small-Cap
Opportunities
Fund | | Global
Opportunities
Fund | |
| | | ASSETS | | | | | | | | | | |
| | | Investment securities at valuea | $ | 162,821,078 | | $ | 150,482,625 | | $ | 51,807,359 | | |
| | | Cash | | 5,989,381 | | | 7,041,412 | | | 7,575 | | |
| | | Receivable from fund shares sold | | 220,476 | | | 2,153,497 | | | 5,500 | | |
| | | Dividends and interest receivable | | 5,474 | | | 4,076 | | | 63,901 | | |
| | | Prepaid expenses | | 36,019 | | | 35,677 | | | 16,429 | | |
| | | Total Assets | | 169,072,428 | | | 159,717,287 | | | 51,900,764 | | |
| | | | | | | | | | | | | |
| | | LIABILITIES | | | | | | | | | | |
| | | Payable for fund shares redeemed | | 57,329 | | | 161,681 | | | — | | |
| | | Payable for securities purchased | | — | | | 2,507,811 | | | — | | |
| | | Payable to advisor (see note 3) | | 140,458 | | | 79,686 | | | 38,709 | | |
| | | Payable to distributor | | 19,575 | | | 19,915 | | | 7,604 | | |
| | | Accrued expenses | | 67,218 | | | 61,840 | | | 49,831 | | |
| | | Total Liabilities | | 284,580 | | | 2,830,933 | | | 96,144 | | |
| | | NET ASSETS | $ | 168,787,848 | | $ | 156,886,354 | | $ | 51,804,620 | | |
| | | | | | | | | | | | | |
| | | NET ASSETS | | | | | | | | | | |
| | | Investor Class | $ | 96,280,538 | | $ | 94,109,831 | | $ | 34,967,751 | | |
| | | Institutional Class | | 72,507,310 | | | 62,776,523 | | | 16,836,869 | | |
| | | Total | $ | 168,787,848 | | $ | 156,886,354 | | $ | 51,804,620 | | |
| | | | | | | | | | | | | |
| | | SHARES OUTSTANDING | | | | | | | | | | |
| | | (shares of beneficial interest issued and outstanding, respectively, unlimited number of shares authorized with no par value) | | | | | | | | | | |
| | | Investor Class | | 3,043,395 | | | 4,926,864 | | | 1,389,238 | | |
| | | Institutional Class | | 2,251,076 | | | 3,221,622 | | | 656,682 | | |
| | | Total | | 5,294,471 | | | 8,148,486 | | | 2,045,920 | | |
| | | | | | | | | | | | | |
| | | NET ASSET VALUE | | | | | | | | | | |
| | | Investor Class, offering price and redemption price | $ | 31.64 | | $ | 19.10 | | $ | 25.17 | | |
| | | Institutional Class, offering price and redemption price | $ | 32.21 | | $ | 19.49 | | $ | 25.64 | | |
| | | | | | | | | | | | | |
| | | ANALYSIS OF NET ASSETS | | | | | | | | | | |
| | | Capital | $ | 146,329,230 | | $ | 153,427,688 | | $ | 52,580,657 | | |
| | | Accumulated earnings (losses) | | 22,458,618 | | | 3,458,666 | | | (776,037 | ) | |
| | | Net assets | $ | 168,787,848 | | $ | 156,886,354 | | $ | 51,804,620 | | |
| | | | | | | | | | | | | |
| | | a Investment securities at cost | $ | 137,803,008 | | $ | 143,070,392 | | $ | 46,889,562 | | |
See accompanying notes to the financial statements.
35
THE OBERWEIS FUNDS
Statements of Assets and Liabilities December 31, 2022 (continued)
| | | China
Opportunities
Fund | | International
Opportunities
Fund | | Emerging
Markets
Fund | |
| | | ASSETS | | | | | | | | | | | | |
| | | Investment securities at valuea | $ | 55,869,172 | | | $ | 144,552,742 | | | $ | 12,095,420 | | |
| | | Cash | | 34,047 | | | | 107,140 | | | | 556,508 | | |
| | | Foreign Currencyb | | 889,200 | | | | 19,276 | | | | 1,717 | | |
| | | Receivable from fund shares sold | | 105,650 | | | | 120,772 | | | | 9,000 | | |
| | | Dividends and interest receivable | | 11,538 | | | | 874,074 | | | | 12,455 | | |
| | | Prepaid expenses | | 18,385 | | | | 33,755 | | | | 7,392 | | |
| | | Other Assets | | 2,036 | | | | — | | | | — | | |
| | | Total Assets | | 56,930,028 | | | | 145,707,759 | | | | 12,682,492 | | |
| | | | | | | | | | | | | | | |
| | | LIABILITIES | | | | | | | | | | | | |
| | | Payable for fund shares redeemed | | 107,193 | | | | 477,673 | | | | — | | |
| | | Payable for securities purchased | | 372,107 | | | | — | | | | — | | |
| | | Payable to advisor (see note 3) | | 59,697 | | | | 136,619 | | | | 3,532 | | |
| | | Deferred foreign capital gains tax liability (see note 2) | | — | | | | — | | | | 44,211 | | |
| | | Payable to distributor | | 9,752 | | | | 31,776 | | | | 324 | | |
| | | Accrued expenses | | 65,057 | | | | 91,747 | | | | 43,949 | | |
| | | Total Liabilities | | 613,806 | | | | 737,815 | | | | 92,016 | | |
| | | NET ASSETS | $ | 56,316,222 | | | $ | 144,969,944 | | | $ | 12,590,476 | | |
| | | | | | | | | | | | | | | |
| | | NET ASSETS | | | | | | | | | | | | |
| | | Investor Class | $ | 45,803,317 | | | $ | 144,969,944 | | | $ | 1,578,092 | | |
| | | Institutional Class | | 10,512,905 | | | | — | | | | 11,012,384 | | |
| | | Total | $ | 56,316,222 | | | $ | 144,969,944 | | | $ | 12,590,476 | | |
| | | | | | | | | | | | | | | |
| | | SHARES OUTSTANDING | | | | | | | | | | | | |
| | | (shares of beneficial interest issued and outstanding, respectively, unlimited number of shares authorized with no par value) | | | | | | | | | | | | |
| | | Investor Class | | 6,410,949 | | | | 8,692,126 | | | | 157,125 | | |
| | | Institutional Class | | 1,446,690 | | | | — | | | | 1,083,930 | | |
| | | Total | | 7,857,639 | | | | 8,692,126 | | | | 1,241,055 | | |
| | | | | | | | | | | | | | | |
| | | NET ASSET VALUE | | | | | | | | | | | | |
| | | Investor Class, offering price and redemption price | $ | 7.14 | | | $ | 16.68 | | | $ | 10.04 | | |
| | | Institutional Class, offering price and redemption price | $ | 7.27 | | | $ | — | | | $ | 10.16 | | |
| | | | | | | | | | | | | | | |
| | | ANALYSIS OF NET ASSETS | | | | | | | | | | | | |
| | | Capital | $ | 77,136,077 | | | $ | 184,245,844 | | | $ | 13,471,040 | | |
| | | Accumulated losses | | (20,819,855 | ) | | | (39,275,900 | ) | | | (880,564 | ) | |
| | | Net assets | $ | 56,316,222 | | | $ | 144,969,944 | | | $ | 12,590,476 | | |
| | | | | | | | | | | | | | | |
| | | a Investment securities at cost | $ | 51,390,311 | | | $ | 139,985,092 | | | $ | 11,717,517 | | |
| | | b Foreign currency at cost | $ | 874,971 | | | $ | 19,274 | | | $ | 1,627 | | |
See accompanying notes to the financial statements.
36
THE OBERWEIS FUNDS
Statements of Operations Year Ended December 31, 2022
| | | Micro-Cap
Fund | | Small-Cap
Opportunities
Fund | |
| | | INVESTMENT INCOME | | | | | | | | |
| | | Dividends | $ | 691,911 | | | $ | 282,600 | | |
| | | Total investment income | | 691,911 | | | | 282,600 | | |
| | | | | | | | | | | |
| | | EXPENSES | | | | | | | | |
| | | Investment advisory fees (see note 3) | | 824,982 | | | | 267,948 | | |
| | | Management fees (see note 3) | | 549,988 | | | | 267,948 | | |
| | | Distribution fees and shareholder services
(see note 3) | | 199,062 | | | | 111,863 | | |
| | | Transfer agent fees and expenses | | 153,307 | | | | 115,703 | | |
| | | Custodian fees and expenses | | 23,908 | | | | 14,423 | | |
| | | Accounting services fees | | 60,112 | | | | 37,368 | | |
| | | Other | | 142,710 | | | | 97,713 | | |
| | | Total expenses before reimbursed expenses | | 1,954,069 | | | | 912,966 | | |
| | | Earnings credit (see note 6) | | (9,830 | ) | | | (14,355 | ) | |
| | | Expense reimbursement (see note 3) | | — | | | | (116,878 | ) | |
| | | Total expenses | | 1,944,239 | | | | 781,733 | | |
| | | NET INVESTMENT LOSS | | (1,252,328 | ) | | | (499,133 | ) | |
| | | | | | | | | | | |
| | | NET REALIZED AND UNREALIZED GAINS (LOSSES) FROM INVESTMENTS | | |
| | | Net realized gains (losses) on investment
transactions | | 440,411 | | | | (3,923,184 | ) | |
| | | Change in net unrealized appreciation/depreciation
on investments | | (16,127,343 | ) | | | 450,435 | | |
| | | Net realized/unrealized losses on investments | | (15,686,932 | ) | | | (3,472,749 | ) | |
| | | NET DECREASE IN NET ASSETS RESULTING FROM OPERATIONS | $ | (16,939,260 | ) | | $ | (3,971,882 | ) | |
See accompanying notes to the financial statements.
37
THE OBERWEIS FUNDS
Statements of Operations Year Ended December 31, 2022 (continued)
| | | Global
Opportunities
Fund | China
Opportunities
Fund | International
Opportunities
Fund | Emerging
Markets
Fund | |
| | | INVESTMENT INCOME | | | | | | | | | | | | | |
| | | Dividendsa | $ | 446,853 | | $ | 724,787 | | $ | 4,248,957 | | $ | 170,210 | | |
| | | Interest | | — | | | 58 | | | — | | | — | | |
| | | Total investment income | | 446,853 | | | 724,845 | | | 4,248,957 | | | 170,210 | | |
| | | | | | | | | | | | | | | | |
| | | EXPENSES | | | | | | | | | | | | | |
| | | Investment advisory fees (see note 3) | | 248,998 | | | 845,056 | | | 2,411,314 | | | 162,225 | | |
| | | Management fees (see note 3) | | 223,998 | | | — | | | — | | | — | | |
| | | Distribution fees and shareholder services (see note 3) | | 92,818 | | | 136,592 | | | 482,263 | | | 4,214 | | |
| | | Transfer agent fees and expenses | | 62,311 | | | 109,746 | | | 333,403 | | | 32,593 | | |
| | | Custodian fees and expenses | | 48,535 | | | 111,425 | | | 118,247 | | | 52,532 | | |
| | | Accounting services fees | | 35,634 | | | 44,491 | | | 83,382 | | | 24,964 | | |
| | | Federal and state registration fees | | 32,101 | | | 36,538 | | | 36,120 | | | 33,864 | | |
| | | Audit fees | | 21,792 | | | 21,792 | | | 21,794 | | | 21,792 | | |
| | | Other | | 40,486 | | | 48,827 | | | 123,277 | | | 16,000 | | |
| | | Total expenses before reimbursed expenses | | 806,673 | | | 1,354,467 | | | 3,609,800 | | | 348,184 | | |
| | | Earnings credit (see note 6) | | (6,551 | ) | | (17,348 | ) | | (24,474 | ) | | (8,598 | ) | |
| | | Expense reimbursement (see note 3) | | — | | | — | | | (498,844 | ) | | (140,702 | ) | |
| | | Total Expenses | | 800,122 | | | 1,337,119 | | | 3,086,482 | | | 198,884 | | |
| | | NET INVESTMENT INCOME (LOSS) | | (353,269 | ) | | (612,274 | ) | | 1,162,475 | | | (28,674 | ) | |
| | | | | | | | |
| | | NET REALIZED AND UNREALIZED LOSSES FROM INVESTMENTS | | | | | |
| | | Net realized losses on investment transactions | | (5,693,279 | ) | | (24,256,241 | ) | | (40,072,974 | ) | | (1,092,227 | ) | |
| | | Net realized foreign capital gains tax | | — | | | — | | | — | | | (39,291 | ) | |
| | | Net realized losses on foreign currency transactions | | (3,401 | ) | | (20,387 | ) | | (43,615 | ) | | (29,038 | ) | |
| | | Net realized losses on investments and foreign currency transactions | | (5,696,680 | ) | | (24,276,628 | ) | | (40,116,589 | ) | | (1,160,556 | ) | |
| | | Change in net deferred foreign capital gains taxes on unrealized appreciation/depreciation | | — | | | — | | | — | | | 26,116 | | |
| | | Change in net unrealized appreciation/depreciation on investments and translation of assets and liabilities denominated in foreign currencies | | (14,254,269 | ) | | (10,954,305 | ) | | (68,979,632 | ) | | (2,618,741 | ) | |
| | | Net realized/unrealized losses on investments and foreign currencies | | (19,950,949 | ) | | (35,230,933 | ) | | (109,096,221 | ) | | (3,753,181 | ) | |
| | | NET DECREASE IN NET ASSETS RESULTING FROM OPERATIONS | $ | (20,304,218 | ) | $ | (35,843,207 | ) | $ | (107,933,746 | ) | $ | (3,781,855 | ) | |
See accompanying notes to the financial statements.
38
THE OBERWEIS FUNDS
Statements of Changes in Net Assets
| | | MICRO-CAP FUND | |
| | | | Year Ended
December 31,
2022 | Year Ended
December 31,
2021 | |
| | FROM OPERATIONS | | | | | | | |
| | | Net investment loss | $ | (1,252,328 | ) | $ | (1,096,106 | ) | |
| | | Net realized gains on investment transactions | | 440,411 | | | 31,544,351 | | |
| | | Change in net unrealized appreciation/depreciation on investments | | (16,127,343 | ) | | 12,706,177 | | |
| | | Net increase (decrease) in net assets resulting from operations | | (16,939,260 | ) | | 43,154,422 | | |
| | | | | | | | | | |
| | FROM DISTRIBUTIONS | | | | | | | |
| | | Distributions to shareholders | | | | | | | |
| | | Investor Class | | (1,309,953 | ) | | (17,266,714 | ) | |
| | | Institutional Class | | (970,504 | ) | | (11,065,037 | ) | |
| | | Net decrease in net assets from distributions | | (2,280,457 | ) | | (28,331,751 | ) | |
| | | | | | | | | | |
| | FROM CAPITAL SHARE TRANSACTIONS | | | | | | | |
| | | Investor Class | | | | | | | |
| | | Proceeds from sale of shares | | 56,866,010 | | | 36,156,710 | | |
| | | Proceeds from reinvestment of distributions | | 1,148,717 | | | 16,519,001 | | |
| | | Redemption of shares (see note 5) | | (37,721,248 | ) | | (18,912,822 | ) | |
| | | Net increase from investor class share transactions | | 20,293,479 | | | 33,762,889 | | |
| | | Institutional Class | | | | | | | |
| | | Proceeds from sale of shares | | 48,191,773 | | | 13,443,503 | | |
| | | Proceeds from reinvestment of distributions | | 535,090 | | | 4,327,680 | | |
| | | Redemption of shares (see note 5) | | (18,739,798 | ) | | (5,332,751 | ) | |
| | | Net increase from institutional class share transactions | | 29,987,065 | | | 12,438,432 | | |
| | | Redemption fees (see note 5) | | 109,101 | | | 46,967 | | |
| | | Net increase in net assets resulting from capital share transactions | | 50,389,645 | | | 46,248,288 | | |
| | | Total increase in net assets | | 31,169,928 | | | 61,070,959 | | |
| | | | | | | | | | |
| | NET ASSETS | | | | | | | |
| | | Beginning of year | | 137,617,920 | | | 76,546,961 | | |
| | | End of year | $ | 168,787,848 | | $ | 137,617,920 | | |
| | | | | | | | | | |
| | TRANSACTIONS IN SHARES | | | | | | | |
| | | Investor Class | | | | | | | |
| | | Shares sold | | 1,782,331 | | | 906,972 | | |
| | | Shares issued in reinvestment of distributions | | 36,306 | | | 461,296 | | |
| | | Less shares redeemed | | (1,217,062 | ) | | (484,941 | ) | |
| | | Net increase from investor class share transactions | | 601,575 | | | 883,327 | | |
| | | Institutional Class | | | | | | | |
| | | Shares sold | | 1,471,975 | | | 320,473 | | |
| | | Shares issued in reinvestment of distributions | | 16,613 | | | 119,023 | | |
| | | Less shares redeemed | | (610,465 | ) | | (129,108 | ) | |
| | | Net increase from institutional class share transactions | | 878,123 | | | 310,388 | | |
| | | Net increase from capital share transactions | | 1,479,698 | | | 1,193,715 | | |
See accompanying notes to the financial statements.
39
THE OBERWEIS FUNDS
Statements of Changes in Net Assets (continued)
| | | SMALL-CAP OPPORTUNITIES FUND | |
| | | | Year Ended
December 31,
2022 | Year Ended
December 31,
2021 | |
| | FROM OPERATIONS | | | | | | | |
| | | Net investment loss | $ | (499,133 | ) | $ | (238,629 | ) | |
| | | Net realized gains (losses) on investment transactions | | (3,923,184 | ) | | 5,904,644 | | |
| | | Change in net unrealized appreciation/depreciation on investments | | 450,435 | | | 1,849,942 | | |
| | | Net increase (decrease) in net assets resulting from operations | | (3,971,882 | ) | | 7,515,957 | | |
| | | | | | | | | | |
| | FROM DISTRIBUTIONS | | | | | | | |
| | | Distributions to shareholders | | | | | | | |
| | | Investor Class | | (161,156 | ) | | (3,123,678 | ) | |
| | | Institutional Class | | (103,813 | ) | | (2,406,568 | ) | |
| | | Net decrease in net assets from distributions | | (264,969 | ) | | (5,530,246 | ) | |
| | | | | | | | | | |
| | FROM CAPITAL SHARE TRANSACTIONS | | | | | | | |
| | | Investor Class | | | | | | | |
| | | Proceeds from sale of shares | | 93,036,426 | | | 7,952,725 | | |
| | | Proceeds from reinvestment of distributions | | 147,510 | | | 2,713,282 | | |
| | | Redemption of shares (see note 5) | | (13,146,967 | ) | | (2,502,149 | ) | |
| | | Net increase from investor class share transactions | | 80,036,969 | | | 8,163,858 | | |
| | | Institutional Class | | | | | | | |
| | | Proceeds from sale of shares | | 55,903,334 | | | 1,774,000 | | |
| | | Proceeds from reinvestment of distributions | | 95,053 | | | 1,540,672 | | |
| | | Redemption of shares (see note 5) | | (4,007,340 | ) | | (1,053,050 | ) | |
| | | Net increase from institutional class share transactions | | 51,991,047 | | | 2,261,622 | | |
| | | Redemption fees (see note 5) | | 46,333 | | | 4,859 | | |
| | | Net increase in net assets resulting from capital share transactions | | 132,074,349 | | | 10,430,339 | | |
| | | Total increase in net assets | | 127,837,498 | | | 12,416,050 | | |
| | | | | | | | | | |
| | NET ASSETS | | | | | | | |
| | | Beginning of year | | 29,048,856 | | | 16,632,806 | | |
| | | End of year | $ | 156,886,354 | | $ | 29,048,856 | | |
| | | | | | | | | | |
| | TRANSACTIONS IN SHARES | | | | | | | |
| | | Investor Class | | | | | | | |
| | | Shares sold | | 4,858,138 | | | 317,889 | | |
| | | Shares issued in reinvestment of distributions | | 7,699 | | | 126,140 | | |
| | | Less shares redeemed | | (696,651 | ) | | (111,005 | ) | |
| | | Net increase from investor class share transactions | | 4,169,186 | | | 333,024 | | |
| | | Institutional Class | | | | | | | |
| | | Shares sold | | 2,843,183 | | | 76,279 | | |
| | | Shares issued in reinvestment of distributions | | 4,865 | | | 70,382 | | |
| | | Less shares redeemed | | (206,936 | ) | | (45,184 | ) | |
| | | Net increase from institutional class share transactions | | 2,641,112 | | | 101,477 | | |
| | | Net increase from capital share transactions | | 6,810,298 | | | 434,501 | | |
See accompanying notes to the financial statements.
40
THE OBERWEIS FUNDS
Statements of Changes in Net Assets (continued)
| | | GLOBAL OPPORTUNITIES FUND | |
| | | | Year Ended
December 31,
2022 | Year Ended
December 31,
2021 | |
| | FROM OPERATIONS | | | | | | | |
| | | Net investment loss | $ | (353,269 | ) | $ | (592,981 | ) | |
| | | Net realized gains (losses) on investment and foreign currency transactions | | (5,696,680 | ) | | 18,504,114 | | |
| | | Change in net unrealized appreciation/depreciation on investments and foreign currencies | | (14,254,269 | ) | | (4,663,916 | ) | |
| | | Net increase (decrease) in net assets resulting from operations | | (20,304,218 | ) | | 13,247,217 | | |
| | | | | | | | | | |
| | FROM DISTRIBUTIONS | | | | | | | |
| | | Distributions to shareholders | | | | | | | |
| | | Investor Class | | (900,921 | ) | | (10,952,215 | ) | |
| | | Institutional Class | | (426,487 | ) | | (4,909,922 | ) | |
| | | Net decrease in net assets from distributions | | (1,327,408 | ) | | (15,862,137 | ) | |
| | | | | | | | | | |
| | FROM CAPITAL SHARE TRANSACTIONS | | | | | | | |
| | | Investor Class | | | | | | | |
| | | Proceeds from sale of shares | | 2,803,731 | | | 7,705,053 | | |
| | | Proceeds from reinvestment of distributions | | 817,261 | | | 9,853,010 | | |
| | | Redemption of shares (see note 5) | | (6,856,467 | ) | | (8,274,566 | ) | |
| | | Net increase (decrease) from investor class share transactions | | (3,235,475 | ) | | 9,283,497 | | |
| | | Institutional Class | | | | | | | |
| | | Proceeds from sale of shares | | 7,322,246 | | | 6,574,138 | | |
| | | Proceeds from reinvestment of distributions | | 357,317 | | | 3,645,759 | | |
| | | Redemption of shares (see note 5) | | (7,869,826 | ) | | (2,714,588 | ) | |
| | | Net increase (decrease) from institutional class share transactions | | (190,263 | ) | | 7,505,309 | | |
| | | Redemption fees (see note 5) | | 1,616 | | | 11,495 | | |
| | | Net increase (decrease) in net assets resulting from capital share transactions | | (3,424,122 | ) | | 16,800,301 | | |
| | | Total increase (decrease) in net assets | | (25,055,748 | ) | | 14,185,381 | | |
| | | | | | | | | | |
| | NET ASSETS | | | | | | | |
| | | Beginning of year | | 76,860,368 | | | 62,674,987 | | |
| | | End of year | $ | 51,804,620 | | $ | 76,860,368 | | |
| | | | | | | | | | |
| | TRANSACTIONS IN SHARES | | | | | | | |
| | | Investor Class | | | | | | | |
| | | Shares sold | | 102,805 | | | 179,412 | | |
| | | Shares issued in reinvestment of distributions | | 32,431 | | | 279,360 | | |
| | | Less shares redeemed | | (257,569 | ) | | (195,351 | ) | |
| | | Net increase (decrease) from investor class share transactions | | (122,333 | ) | | 263,421 | | |
| | | Institutional Class | | | | | | | |
| | | Shares sold | | 275,023 | | | 153,008 | | |
| | | Shares issued in reinvestment of distributions | | 13,920 | | | 101,780 | | |
| | | Less shares redeemed | | (288,395 | ) | | (62,733 | ) | |
| | | Net increase from institutional class share transactions | | 548 | | | 192,055 | | |
| | | Net increase (decrease) from capital share transactions | | (121,785) | | | 455,476 | | |
See accompanying notes to the financial statements.
41
THE OBERWEIS FUNDS
Statements of Changes in Net Assets (continued)
| | | CHINA OPPORTUNITIES FUND | |
| | | | Year Ended
December 31,
2022 | Year Ended
December 31,
2021 | |
| | FROM OPERATIONS | | | | | | | |
| | | Net investment loss | $ | (612,274 | ) | $ | (672,492 | ) | |
| | | Net realized gains (losses) on investment and foreign currency transactions | | (24,276,628 | ) | | 28,850,352 | | |
| | | Change in net unrealized appreciation/depreciation on investments and foreign currencies | | (10,954,305 | ) | | (34,074,056 | ) | |
| | | Net decrease in net assets resulting from operations | | (35,843,207 | ) | | (5,896,196 | ) | |
| | | | | | | | | | |
| | FROM DISTRIBUTIONS | | | | | | | |
| | | Distributions to shareholders | | | | | | | |
| | | Investor Class | | (549,877 | ) | | (24,499,105 | ) | |
| | | Institutional Class | | (120,710 | ) | | (4,324,663 | ) | |
| | | Net decrease in net assets from distributions | | (670,587 | ) | | (28,823,768 | ) | |
| | | | | | | | | | |
| | FROM CAPITAL SHARE TRANSACTIONS | | | | | | | |
| | | Investor Class | | | | | | | |
| | | Proceeds from sale of shares | | 4,872,214 | | | 10,556,082 | | |
| | | Proceeds from reinvestment of distributions | | 520,397 | | | 22,926,946 | | |
| | | Redemption of shares (see note 5) | | (10,629,431 | ) | | (21,557,737 | ) | |
| | | Net increase (decrease) from investor class share transactions | | (5,236,820 | ) | | 11,925,291 | | |
| | | Institutional Class | | | | | | | |
| | | Proceeds from sale of shares | | 7,464,227 | | | 2,825,562 | | |
| | | Proceeds from reinvestment of distributions | | 109,388 | | | 3,592,224 | | |
| | | Redemption of shares (see note 5) | | (5,794,362 | ) | | (7,413,774 | ) | |
| | | Net increase (decrease) from institutional class share transactions | | 1,779,253 | | | (995,988 | ) | |
| | | Redemption fees (see note 5) | | 22,697 | | | 30,950 | | |
| | | Net increase (decrease) from capital share transactions | | (3,434,870 | ) | | 10,960,253 | | |
| | | Total decrease in net assets | | (39,948,664 | ) | | (23,759,711 | ) | |
| | | | | | | | | | |
| | NET ASSETS | | | | | | | |
| | | Beginning of year | | 96,264,886 | | | 120,024,597 | | |
| | | End of year | $ | 56,316,222 | | $ | 96,264,886 | | |
| | | | | | | | | | |
| | TRANSACTIONS IN SHARES | | | | | | | |
| | | Investor Class | | | | | | | |
| | | Shares sold | | 567,266 | | | 641,145 | | |
| | | Shares issued in reinvestment of distributions | | 71,680 | | | 2,012,901 | | |
| | | Less shares redeemed | | (1,269,813 | ) | | (1,312,152 | ) | |
| | | Net increase (decrease) from investor class share transactions | | (630,867 | ) | | 1,341,894 | | |
| | | Institutional Class | | | | | | | |
| | | Shares sold | | 897,133 | | | 191,107 | | |
| | | Shares issued in reinvestment of distributions | | 14,822 | | | 310,746 | | |
| | | Less shares redeemed | | (771,295 | ) | | (429,627 | ) | |
| | | Net increase from institutional class share transactions | | 140,660 | | | 72,226 | | |
| | | Net increase (decrease) from capital share transactions | | (490,207) | | | 1,414,120 | | |
See accompanying notes to the financial statements.
42
THE OBERWEIS FUNDS
Statements of Changes in Net Assets (continued)
| | | INTERNATIONAL OPPORTUNITIES FUND | |
| | | | Year Ended
December 31,
2022 | Year Ended
December 31,
2021 | |
| | FROM OPERATIONS | | | | | | | |
| | | Net investment income (loss) | $ | 1,162,475 | | $ | (2,693,822 | ) | |
| | | Net realized gains (losses) on investments and foreign currency transactions | | (40,116,589 | ) | | 68,274,853 | | |
| | | Change in net unrealized appreciation/depreciation on investments and foreign currencies | | (68,979,632 | ) | | (60,205,704 | ) | |
| | | Net increase (decrease) in net assets resulting from operations | | (107,933,746 | ) | | 5,375,327 | | |
| | | | | | | | | | |
| | FROM DISTRIBUTIONS | | | | | | | |
| | | Distributions to shareholders | | — | | | (54,761,352 | ) | |
| | | Net decrease in net assets from distributions | | — | | | (54,761,352 | ) | |
| | | | | | | | | | |
| | FROM CAPITAL SHARE TRANSACTIONS | | | | | | | |
| | | Proceeds from sale of shares | | 22,084,380 | | | 55,352,019 | | |
| | | Proceeds from reinvestment of distributions | | — | | | 48,423,319 | | |
| | | Redemption of shares (see note 5) | | (79,575,084 | ) | | (71,434,390 | ) | |
| | | Redemption fees (see note 5) | | 38,129 | | | 46,955 | | |
| | | Net increase (decrease) from capital share transactions | | (57,452,575 | ) | | 32,387,903 | | |
| | | Total decrease in net assets | | (165,386,321 | ) | | (16,998,122 | ) | |
| | | | | | | | | | |
| | NET ASSETS | | | | | | | |
| | | Beginning of year | | 310,356,265 | | | 327,354,387 | | |
| | | End of year | $ | 144,969,944 | | $ | 310,356,265 | | |
| | | | | | | | | | |
| | TRANSACTIONS IN SHARES | | | | | | | |
| | | Shares sold | | 1,103,401 | | | 1,709,411 | | |
| | | Shares issued in reinvestment of distributions | | — | | | 1,832,828 | | |
| | | Less shares redeemed | | (4,123,116 | ) | | (2,214,866 | ) | |
| | | Net increase (decrease) from capital share transactions | | (3,019,715 | ) | | 1,327,373 | | |
See accompanying notes to the financial statements.
43
THE OBERWEIS FUNDS
Statements of Changes in Net Assets (continued)
| | | EMERGING MARKETS FUND | |
| | | | Year Ended
December 31,
2022 | Year Ended
December 31,
2021 | |
| | FROM OPERATIONS | | | | | | | |
| | | Net investment loss | $ | (28,674 | ) | $ | (81,243 | ) | |
| | | Net realized gains (losses) on investments and foreign currency transactions | | (1,160,556 | ) | | 1,728,935 | | |
| | | Change in net unrealized appreciation/depreciation on investments and foreign currencies | | (2,592,626 | ) | | (205,546 | ) | |
| | | Net increase (decrease) in net assets resulting from operations | | (3,781,855 | ) | | 1,442,146 | | |
| | | | | | | | | | |
| | FROM DISTRIBUTIONS | | | | | | | |
| | | Distributions to shareholders | | | | | | | |
| | | Investor Class | | (42,452 | ) | | (203,953 | ) | |
| | | Institutional Class | | (294,995 | ) | | (1,523,671 | ) | |
| | | Net decrease in net assets from distributions | | (337,447 | ) | | (1,727,624 | ) | |
| | | | | | | | | | |
| | FROM CAPITAL SHARE TRANSACTIONS | | | | | | | |
| | | Investor Class | | | | | | | |
| | | Proceeds from sale of shares | | 1,197,372 | | | 1,259,242 | | |
| | | Proceeds from reinvestment of distributions | | 38,456 | | | 186,395 | | |
| | | Redemption of shares (see note 5) | | (743,874 | ) | | (481,241 | ) | |
| | | Net increase from investor class share transactions | | 491,954 | | | 964,396 | | |
| | | Institutional Class | | | | | | | |
| | | Proceeds from sale of shares | | 3,351,358 | | | 1,312,840 | | |
| | | Proceeds from reinvestment of distributions | | 255,307 | | | 1,143,509 | | |
| | | Redemption of shares (see note 5) | | (948,787 | ) | | (309,129 | ) | |
| | | Net increase from institutional class share transactions | | 2,657,878 | | | 2,147,220 | | |
| | | Redemption fees (see note 5) | | 3,324 | | | 2,746 | | |
| | | Net increase in net assets resulting from capital share transactions | | 3,153,156 | | | 3,114,362 | | |
| | | Total increase (decrease) in net assets | | (966,146 | ) | | 2,828,884 | | |
| | | | | | | | | | |
| | NET ASSETS | | | | | | | |
| | | Beginning of year | | 13,556,622 | | | 10,727,738 | | |
| | | End of year | $ | 12,590,476 | | $ | 13,556,622 | | |
| | | | | | | | | | |
| | TRANSACTIONS IN SHARES | | | | | | | |
| | | Investor Class | | | | | | | |
| | | Shares sold | | 105,005 | | | 81,184 | | |
| | | Shares issued in reinvestment of distributions | | 3,800 | | | 13,726 | | |
| | | Less shares redeemed | | (72,461 | ) | | (31,287 | ) | |
| | | Net increase from investor class share transactions | | 36,344 | | | 63,623 | | |
| | | Institutional Class | | | | | | | |
| | | Shares sold | | 283,306 | | | 88,151 | | |
| | | Shares issued in reinvestment of distributions | | 24,957 | | | 83,407 | | |
| | | Less shares redeemed | | (90,401 | ) | | (20,438 | ) | |
| | | Net increase from investor class share transactions | | 217,862 | | | 151,120 | | |
| | | Net increase from capital share transactions | | 254,206 | | | 214,743 | | |
See accompanying notes to the financial statements.
44
THE OBERWEIS FUNDS
Notes to Financial Statements December 31, 2022
1. Description of Organization
Description of business. The Oberweis Funds (the ‘‘Trust’’) is registered under the Investment Company Act of 1940 as an open-end management investment company. The Trust is authorized to operate numerous Funds under various trading strategies. The Trust consists of eight Funds of which six are in this report: the Oberweis Micro-Cap Fund, the Oberweis Small-Cap Opportunities Fund, the Oberweis Global Opportunities Fund, the Oberweis China Opportunities Fund, the Oberweis International Opportunities Fund, and the Oberweis Emerging Markets Fund (collectively, ‘‘the Funds’’) are each a series of the Trust. Each Fund in this report except for Oberweis International Opportunities Fund currently offers two classes of shares: Investor Class and Institutional Class. Oberweis International Opportunities Fund offers only Investor Class shares. Each class of shares has identical voting, dividend, liquidation and other rights and the same terms and conditions, except each class may be subject to different class expenses as outlined in the relevant prospectus and each class has exclusive voting rights with respect to matters solely affecting such class.
2. Significant Accounting Policies
The following is a summary of significant accounting policies consistently followed by the Funds. These policies are in conformity with accounting principles generally accepted in the United States of America (“GAAP”). The Funds are each an investment company and follow accounting and reporting guidance under the Financial Accounting Standards Board (“FASB”) Accounting Standards Codification (“ASC”) Topic 946, “Financial Services — Investment Companies.”
Investment valuation. Investments in securities are stated at value as of the close of the regular trading session on the New York Stock Exchange (‘‘NYSE’’) (generally 3 p.m., Central Standard Time). Each listed and unlisted security for which last sale information is regularly reported is valued at the last reported sales price on that day. If there has been no sale on such day, then such security is valued at the current day’s bid price. Any unlisted security for which last sale information is not regularly reported and any listed debt security which has an inactive listed market for which over-the-counter market quotations are readily available is valued at the closing bid price determined on the basis of reasonable inquiry. Restricted securities and any other securities or other assets for which market quotations are not readily available are valued by appraisal at their fair value as determined in good faith under procedures established by and under the general supervision and responsibility of the Board of Trustees. Short-term debt obligations, commercial paper and repurchase agreements are valued on the basis of quoted yields for securities of comparable maturity, quality and type or on the basis of amortized cost.
The Oberweis Global Opportunities Fund, the Oberweis China Opportunities Fund, the Oberweis International Opportunities Fund and the Oberweis Emerging Markets Fund hold foreign equity securities. Foreign securities are fair valued as described in the following circumstances. Generally, trading in foreign securities markets is completed each day at various times prior to the close of the regular trading session of the NYSE. Due to the time differences between the closings of the relevant foreign securities exchanges and the close of the regular trading session of the NYSE for the Funds, the Funds will fair value their foreign investments when it is determined that the market quotations for the foreign investments either are not readily available or are unreliable and, therefore, do not represent fair value. When the fair value prices are utilized, these prices will attempt to reflect the impact of the U.S. financial markets’ perceptions and trading activities on the Funds’ foreign investments since the last
45
THE OBERWEIS FUNDS
Notes to Financial Statements December 31, 2022 (continued)
closing prices of the foreign investments were calculated on their primary foreign securities markets or exchanges. For these purposes, the Board of Trustees of the Trust has determined that movements in relevant indices, after the close of the foreign securities exchanges, may demonstrate that market quotations are unreliable, and may trigger fair value pricing for certain securities. Consequently, fair valuation of portfolio securities may occur on a daily basis. In determining fair value prices, the Trust utilizes data furnished by an independent pricing service (and that data draws upon, among other information, the market values of foreign investments). When a Fund uses fair value pricing, the values assigned to the Fund’s foreign investments may not be the quoted or published prices of the investments on their primary markets or exchanges.
Fair value measurements. In accordance with Financial Accounting Standards Board (‘‘FASB’’) guidance, the Funds utilize the ‘‘Fair Value Measurements and Disclosures’’ to define fair value, set out a framework for measuring fair value, and expand disclosures regarding fair value measurements.
Various inputs are used in determining the value of the Fund’s investments. These inputs are summarized in the three levels listed below:
• Level 1 – Quoted prices in active markets for identical securities.
• Level 2 – Other significant observable inputs (including quoted prices for similar securities, interest rates, prepayment speeds, credit risk, etc).
• Level 3 – Significant unobservable inputs (including the Fund’s own assumptions in determining the fair value of investments).
The inputs or methodology used for valuing securities are not necessarily an indication of the risk associated with investing in those securities. The following is a summary of the inputs used to value the Funds’ net assets as of December 31, 2022:
| | Micro-Cap
Fund | | Small-Cap
Opportunities
Fund | |
| | | Level 1 – Equities | $ | 162,821,078 | | $ | 150,482,625 | |
| | | Total Level 1 | | 162,821,078 | | | 150,482,625 | |
| | | Level 2 | | — | | | — | |
| | | Level 3 | | — | | | — | |
| | | Total Investments | $ | 162,821,078 | | $ | 150,482,625 | |
| | Global
Opportunities
Fund | | China
Opportunities
Fund | | International
Opportunities
Fund | |
| | | Level 1 – Equities | | | | | | | | | |
| | | Total Asia | $ | 1,900,774 | | $ | 55,869,172 | | $ | — | |
| | | Total Europe | | 2,273,973 | | | — | | | 4,333,329 | |
| | | Total North America | | 31,420,885 | | | — | | | 23,812,356 | |
| | | Total Level 1 | | 35,595,632 | | | 55,869,172 | | | 28,145,685 | |
| | | Level 2 – Equities | | | | | | | | | |
| | | Total Asia | | 7,221,192 | | | — | | | 23,069,683 | |
| | | Total Australia | | 645,003 | | | — | | | 12,834,552 | |
| | | Total Europe | | 7,770,094 | | | — | | | 78,245,969 | |
| | | Total North America | | — | | | — | | | 2,256,853 | |
| | | Total South America | | 575,438 | | | — | | | — | |
| | | Total Level 2 | | 16,211,727 | | | — | | | 116,407,057 | |
| | | Level 3 | | — | | | — | | | — | |
| | | Total Investments | $ | 51,807,359 | | $ | 55,869,172 | | $ | 144,552,742 | |
46
THE OBERWEIS FUNDS
Notes to Financial Statements December 31, 2022 (continued)
| | Emerging Markets
Fund | |
| | | Level 1 – Equities | | | |
| | | Total Asia | $ | 8,098,879 | |
| | | Total Australia | | 246,115 | |
| | | Total Africa | | 209,876 | |
| | | Total Europe | | 821,750 | |
| | | Total North America | | 284,065 | |
| | | Total South America | | 59,508 | |
| | | Total Level 1 | | 9,720,193 | |
| | | Level 2 – Equities | | | |
| | | Total Asia | | 1,517,412 | |
| | | Total South America | | 857,815 | |
| | | Total Level 2 | | 2,375,227 | |
| | | Level 3 | | — | |
| | | Total Investments | $ | 12,095,420 | |
The Funds’ assets include certain foreign securities for which a third party statistical pricing service may be employed for purposes of fair market valuation. The pricing service provides fair market valuation on days when the movement in relevant indices exceeds a predetermined threshold.
Foreign currency transactions. The accounting records of the Funds are maintained in U.S. dollars. Foreign currency amounts are translated into U.S. dollars at the current rate of exchange to determine the value of investments, assets and liabilities. Purchases and sales of securities, and income and expenses are translated at the prevailing rate of exchange on the respective date of these transactions. The Funds do not isolate that portion of the results of operations resulting from changes in foreign exchange rates on investments from fluctuations arising from changes in market prices of securities held. These fluctuations are included with the net realized and unrealized gains or losses from investments and foreign currencies.
Risks associated with foreign securities and currencies. Investments in securities of foreign issuers carry certain risks not ordinarily associated with investments in securities of U.S. issuers. These risks include future political and economic developments, and the possible imposition of exchange controls or other foreign governmental laws and restrictions. In addition, with respect to certain countries, there is the possibility of expropriation of assets, confiscatory taxation, political or social instability or diplomatic developments, which could adversely affect investments in those countries.
Certain countries also may impose substantial restrictions on investments in their capital markets by foreign entities, including restrictions on investments in issuers of industries deemed sensitive to relevant national interests. These factors may limit the investment opportunities available and result in a lack of liquidity and a high price volatility with respect to securities of issuers from developing countries.
Fund share valuation. Fund shares are sold and redeemed on a continuous basis at net asset value. On each day the NYSE is open for trading, the net asset value per share is determined as of the later of the close of the NYSE or the CBOE by dividing the total value of each Fund’s investments and other assets, less liabilities, by the number of each Fund’s shares outstanding.
47
THE OBERWEIS FUNDS
Notes to Financial Statements December 31, 2022 (continued)
Investment transactions and investment income. Investment transactions are accounted for on the trade date (date the order to buy or sell is executed). Dividend income is recorded on the ex-dividend date, except that certain dividends from foreign securities are recorded as soon as the information is available to the Fund, and interest income is recorded on the accrual basis and includes amortization of premium and discount. Realized gains and losses from investment transactions are reported on an identified cost basis. Income and realized and unrealized gains or losses on investments are allocated to each class of shares based on its relative net assets.
Fund foreign taxation. The Funds may be subject to foreign taxation related to income received, capital gains on the sale of securities and certain foreign currency transactions in the foreign jurisdictions in which they invest. Foreign taxes, if any, are recorded based on the tax regulations and rates that exist in the foreign markets in which the Funds invest. When a capital gain tax is determined to apply, the Funds record an estimated deferred tax liability in an amount that may be payable if the securities were disposed of on the valuation date.
Fund expense allocations. The Funds account separately for the assets, liabilities and operations of each Fund. Direct expenses of each Fund or class are charged to that Fund or class while general expenses are allocated pro-rata among the Funds based on net assets or other appropriate methods.
Federal income taxes and dividends to shareholders. It is the policy of the Funds to continue to comply with all requirements of the Internal Revenue Code of 1986, as amended (‘‘the Code’’), applicable to regulated investment companies and to distribute substantially all of their taxable income to their shareholders. The Funds have met the requirements of the Code applicable to regulated investment companies for the year ended December 31, 2022. Therefore, no federal income tax provision is required. Income and capital gains of the Funds are determined in accordance with both tax regulations and accounting principles generally accepted in the U.S. (‘‘GAAP’’). Such treatment may result in temporary and permanent differences between tax basis earnings and earnings reported for financial statement purposes. These reclassifications, which have no impact on the net asset value of the Funds, are primarily attributable to certain differences in computation of distributable income and capital gains under federal tax rules versus GAAP.
Certain Funds may utilize earnings and profits on redemption of shares as part of the dividends paid deduction.
For the year ended December 31, 2022, permanent book and tax basis differences resulting primarily from differing treatments for net operating losses, foreign currency transactions, passive foreign investment company (‘‘PFIC’’) adjustments and the tax practice known as equalization, were identified and reclassified among the components of the Funds’ net assets.
48
THE OBERWEIS FUNDS
Notes to Financial Statements December 31, 2022 (continued)
GAAP requires that certain components of net assets be reclassified between financial and tax retporting. These reclassifications have no effect on net assets or net asset value per share. For the year ended December 31, 2022, permanent differences in book and tax accounting have been reclassified to paid in capital, accumulated net investment income/loss and accumulated net realized gain/loss as follows:
| | | Increases/(Decrease) | |
| | | Capital | | Accumulated
Earnings (Loss) | |
| | | Micro-Cap Fund | $ | (579,362) | | $ | 579,362 | |
| | | Small-Cap Opportunities Fund | | (500,936) | | | 500,936 | |
| | | Global Opportunities Fund | | (781,959) | | | 781,959 | |
| | | China Opportunities Fund | | (255,615) | | | 255,615 | |
| | | International Opportunities Fund | | (2,428,938) | | | 2,428,938 | |
| | | Emerging Markets Fund | | (6,723) | | | 6,723 | |
The tax character of distributions paid during the fiscal year ended December 31, 2022 was as follows:
| | Distributions
Paid from
Ordinary
Income | | Distributions
Paid from
Net Long-Term
Capital Gains | | Total
Distributions
Paid | |
| | | Micro-Cap Fund | $ | — | | $ | 2,280,457 | | $ | 2,280,457 | |
| | | Small-Cap Opportunities Fund | | — | | | 264,969 | | | 264,969 | |
| | | Global Opportunities Fund | | — | | | 1,327,408 | | | 1,327,408 | |
| | | China Opportunities Fund | | — | | | 670,587 | | | 670,587 | |
| | | International Opportunities Fund | | — | | | — | | | — | |
| | | Emerging Markets Fund | | — | | | 337,447 | | | 337,447 | |
The tax character of distributions paid during the fiscal year ended December 31, 2021 was as follows:
| | Distributions
Paid from
Ordinary
Income | | Distributions
Paid from
Net Long-Term
Capital Gains | | Total
Distributions
Paid | |
| | | Micro-Cap Fund | $ | 6,601,079 | | $ | 21,730,672 | | $ | 28,331,751 | |
| | | Small-Cap Opportunities Fund | | 2,861,415 | | | 2,668,831 | | | 5,530,246 | |
| | | Global Opportunities Fund | | 2,861,842 | | | 13,000,295 | | | 15,862,137 | |
| | | China Opportunities Fund | | 4,018,595 | | | 24,805,173 | | | 28,823,768 | |
| | | International Opportunities Fund | | — | | | 54,761,352 | | | 54,761,352 | |
| | | Emerging Markets Fund | | 15,223 | | | 1,712,401 | | | 1,727,624 | |
As of December 31, 2022, the following Funds had net capital loss carryforwards to offset future net capital gains, if any, to the extent provided by treasury regulations:
| | | Not Subject to Expiration | |
| | | Short-Term | | Long-Term | |
| | | Micro-Cap Fund | $ | — | | $ | — | |
| | | Small-Cap Opportunities Fund | | 3,875,560 | | | — | |
| | | Global Opportunities Fund | | 5,328,265 | | | — | |
| | | China Opportunities Fund | | 23,446,626 | | | — | |
| | | International Opportunities Fund | | 39,322,654 | | | 823,206 | |
| | | Emerging Markets Fund | | 849,768 | | | — | |
49
THE OBERWEIS FUNDS
Notes to Financial Statements December 31, 2022 (continued)
Post-October capital losses incurred after October 31 and within the taxable year are deemed to arise on the first business day of the Funds’ next taxable year. For the year ended December 31, 2022, Post October capital losses treated arising on January 1, 2023 was as follows:
| | Short-Term | | Long-Term | |
| | | Micro-Cap Fund | $ | 2,369,475 | | $ | — | |
| | | Small-Cap Opportunities Fund | | — | | | — | |
| | | Global Opportunities Fund | | — | | | — | |
| | | China Opportunities Fund | | — | | | — | |
| | | International Opportunities Fund | | — | | | — | |
| | | Emerging Markets Fund | | — | | | — | |
As of December 31, 2022 the components of accumulated earnings (deficit) on a tax basis were as follows:
| | Undistributed
ordinary
income
(deficit) | | Undistributed
long-term
capital gains | | Accumulated
capital and
other losses | | Unrealized
Appreciation on
investments | | Unrealized
Appreciation/
(Depreciation)
foreign currency
translations and
India sales tax | |
| | | Micro-Cap Fund | $ | — | | $ | — | | $ | (2,369,475 | ) | | $ | 24,828,093 | | $ | — | |
| | | Small-Cap Opportunities Fund | | — | | | — | | | (3,875,560 | ) | | | 7,334,226 | | | — | |
| | | Global Opportunites Fund | | | | | | | | (5,328,265 | ) | | | 4,552,784 | | | (556) | |
| | | China Opportunities Fund | | — | | | — | | | (23,446,626 | ) | | | 2,612,522 | | | 14,249 | |
| | | International Opportunities Fund | | — | | | — | | | (40,145,860 | ) | | | 899,530 | | | (29,570) | |
| | | Emerging Markets Fund | | — | | | — | | | (849,768 | ) | | | 12,511 | | | (43,307) | |
Accumulated capital and other losses consists of timing differences related to wash sales and capital loss carryforwards.
As of December 31, 2022 the cost of investments for federal income tax purposes are as follows:
| | Cost of
Investments
for Federal
Tax Purposes | | Gross
Unrealized
Appreciation | | Gross
Unrealized
(Depreciation) | | Unrealized
Appreciation | |
| | | Micro-Cap Fund | $ | 137,992,985 | | $ | 34,093,660 | | $ | (9,265,567 | ) | | $ | 24,828,093 | |
| | | Small-Cap Opportunities Fund | | 143,148,399 | | | 14,056,265 | | | (6,722,039 | ) | | | 7,334,226 | |
| | | Global Opportunities Fund | | 47,254,575 | | | 8,713,446 | | | (4,160,662 | ) | | | 4,552,784 | |
| | | China Opportunities Fund | | 53,256,649 | | | 6,412,523 | | | (3,800,001 | ) | | | 2,612,522 | |
| | | International Opportunities Fund | | 143,653,212 | | | 18,828,362 | | | (17,928,832 | ) | | | 899,530 | |
| | | Emerging Markets Fund | | 12,082,909 | | | 1,666,974 | | | (1,654,463 | ) | | | 12,511 | |
50
THE OBERWEIS FUNDS
Notes to Financial Statements December 31, 2022 (continued)
The Funds have reviewed all open tax years and major jurisdictions and concluded that there are no significant uncertain tax positions that would require recognition in the financial statements. Open tax years are those that are open for exam by taxing authorities and as of December 31, 2022, open federal tax years included the tax years ended 2019 through 2022. The Funds have no examinations in progress and is also not aware of any tax positions for which it is reasonably possible that the total amounts of unrecognized tax benefits will significantly change in the next twelve months.
Use of estimates. The preparation of financial statements in conformity with generally accepted accounting principles requires management to make estimates and assumptions that affect the amounts reported in the financial statements and accompanying notes. Actual results may differ from those estimates.
Indemnifications. Under the Trust’s organizational documents, its present and former Officers and Trustees are indemnified against certain liabilities arising out of the performance of their duties to the Trust. In addition, in the normal course of business, the Trust enters into contracts that provide general indemnifications to other parties. The Trust’s maximum exposure under these arrangements is unknown as this would involve future claims that may be made against the Trust that have not yet occurred. However, the Trust has not had prior claims or losses pursuant to these contracts and expects the risk of loss to be remote.
3. Transactions with affiliates
The Funds have written agreements with Oberweis Asset Management, Inc. (‘‘OAM’’) as the Funds’ investment advisor and manager. Oberweis Securities, Inc. (‘‘OSI’’), the Funds’ principal distributor, is an affiliate of OAM.
Investment advisory agreement. Under the Advisory Agreement, OAM provides investment advisory services to the Micro-Cap, Global Opportunities, and Small-Cap Opportunities Funds and pursuant to a separate Management Agreement, OAM provides non-investment advisory management services such as administrative, compliance and accounting services to these Funds. For investment advisory services, the Micro-Cap Fund paid monthly investment advisory fees at an annual rate equal to .60% of average daily net assets. The Global Opportunities Fund paid monthly investment advisory fees at an annual rate equal to .45% of the first $50 million of average daily net assets and .40% of average daily net assets in excess of $50 million. The Small-Cap Opportunities Fund paid monthly investment advisory fees at an annual rate equal to .40% of average daily net assets. For investment advisory and management services, the China Opportunities Fund, the International Opportunities Fund and the Emerging Markets Fund paid monthly investment advisory and management fees at an annual rate equal to 1.25%, 1.25% and 1.25% of average daily net assets, respectively. For the year ended December 31, 2022, the Micro-Cap Fund, Small-Cap Opportunities Fund and Global Opportunities Fund incurred investment advisory fees totaling $824,982, $267,948 and $248,998, respectively. For the year ended December 31, 2022, the China Opportunities Fund, International Opportunities Fund, and Emerging Market Fund incurred investment advisory fees totaling $845,056, $2,411,314 and $162,225, respectively.
Management agreement. For management services and facilities furnished, the Micro-Cap Fund, Global Opportunities Fund, and Small-Cap Opportunities Fund each paid a monthly fee at an annual rate equal to .40% of average daily net assets. For the year ended December 31, 2022, the Micro-Cap Fund, Small-Cap Opportunities Fund, and Global Opportunities Fund incurred management fees totaling $549,988, $267,948, and $223,998, respectively.
Expense reimbursement. OAM is contractually obligated to reduce its investment and management fees or reimburse the Micro-Cap Fund and Global Opportunities Fund Investor Class Shares to the extent that total ordinary operating expenses, as defined, exceed in any one year the following amounts expressed as a percentage of each Fund’s average daily net assets: 1.80% of the first $50 million; plus 1.60% of average daily net assets in excess of $50 million.
51
THE OBERWEIS FUNDS
Notes to Financial Statements December 31, 2022 (continued)
OAM is contractually obligated to reduce its investment and management fees or reimburse Small-Cap Opportunities Fund, China Opportunities Fund, International Opportunities Fund and Emerging Markets Fund Investor Class Shares to the extent that total ordinary operating expenses, as defined, exceed in any one year 1.25%, 2.24%, 1.60% and 1.75% expressed as a percentage of the Fund’s average daily net assets, respectively. OAM is contractually obligated to reduce its investment and management fees or reimburse the Micro-Cap Fund Institutional and the Global Opportunities Fund Class Shares to the extent that total ordinary operating expenses, as defined, exceed in any one year the following amounts expressed as a percentage of each Fund’s average daily net assets: 1.55% of the first $50 million; plus 1.35% of average daily net assets in excess of $50 million. OAM is contractually obligated to reduce its investment and management fees or reimburse the Small-Cap Opportunities Fund, China Opportunities Fund and Emerging Markets Fund Institutional Class Shares to the extent that total ordinary operating expenses, as defined, exceed in any one year 1.00%, 1.99% and 1.50% expressed as a percentage of the Funds’ average daily net assets, respectively. For the year ended December 31, 2022 OAM reimbursed the Small-Cap Opportunities Fund, the International Opportunities Fund, and the Emerging Markets Fund in the amount of $116,878, $498,844, and $140,702, respectively.
The expense limitation agreements have one-year terms and are approved annually. The Adviser may recoup the amount of any expense reimbursed during the term of the expense limitation agreement if the recoupment does not cause the Fund’s expenses to exceed the expense limitation in place at the time of reimbursement.
Officers and trustees. Certain officers and trustees of the Trust are also officers and/or directors of OAM and OSI. During the year ended December 31, 2022, the Trust made no direct payments to its officers and paid $171,167 to its unaffiliated trustees.
Distribution and shareholder service agreement. The Funds have a distribution and shareholder services agreement with OSI. For services under the distribution and shareholder services agreement, the Funds pay OSI a fee at the annual rate of .25% of the average daily net assets of Investor Class Shares as compensation for services. For the year ended December 31, 2022, the Micro-Cap Fund, Small-Cap Opportunities Fund, Global Opportunities Fund, China Opportunities Fund, International Opportunities Fund, and Emerging Markets Fund incurred distribution fees totaling $199,062, $111,863, $92,818, $136,592, $482,263, and $4,214, respectively.
Affiliated Commissions. For the year ended December 31, 2022, the Micro-Cap Fund, Small-Cap Opportunities Fund, Global Opportunities Fund, China Opportunities Fund, International Opportunities Fund, and Emerging Markets Fund did not execute any security transactions through OSI and therefore did not pay commissions to OSI.
4. Investment transactions
The cost of securities purchased and proceeds from securities sold during the year ended December 31, 2022, other than money market investments, aggregated $122,170,019 and $82,694,636, respectively, for the Micro-Cap Fund, $154,026,544 and $29,042,042, respectively, for the Small-Cap Opportunities Fund, $41,061,769 and $43,859,543, respectively, for the Global Opportunities Fund, $169,761,938 and $173,462,988, respectively, for the China Opportunities Fund, $143,800,635,and $197,322,594, respectively, for the International Opportunities Fund, $11,688,492 and $8,623,527, respectively, for the Emerging Markets Fund. The Funds did not hold government securities during the year ended December 31, 2022.
The Funds may write covered call options. The premiums received provide a partial hedge (protection) against declining prices and enables each Fund to generate a higher return during periods when OAM does not expect the underlying security to make any major price moves in the near future but still deems the underlying security to be, over the long term, an attractive investment for each Fund. The Funds write covered call options for which premiums received are recorded as liabilities and are subsequently adjusted to the current value of the options written. Premiums received from writing options that expire are treated as realized gains. Premiums received from writing options, which are either exercised or closed, are offset against the proceeds received or amount paid on the transaction to determine realized gains or losses.
52
THE OBERWEIS FUNDS
Notes to Financial Statements December 31, 2022 (continued)
Amounts recovered for securities litigation are included in the realized gains of the Fund and are recorded when received. The Funds did not write covered call options during the year ended December 31, 2022.
5. Redemption fee
The Oberweis Funds are designed for long-term investors. To discourage market timers, redemptions of shares of the Micro-Cap Fund, Global Opportunities Fund, and Small-Cap Opportunities Fund within 90 days of purchase are subject to a 1% redemption fee of the total redemption amount and 2% for the China Opportunities Fund, the Emerging Markets Fund and the International Opportunities Fund. The redemption fee is deducted from the redemption proceeds and is retained by the Fund.
The redemption fee is retained by the Funds for the expense they incur in connection with shareholder redemptions. Redemption fees received by the Micro-Cap Fund, Small-Cap Opportunities Fund, Global Opportunities Fund, China Opportunities Fund, International Opportunities Fund, and Emerging Markets Fund were $109,101, $46,333, $1,616, $22,697, $38,129 and $3,324, respectively, for the year ended December 31, 2022, and were recorded as a reduction of the redemption of shares in the Statements of Changes in Net Assets.
6. Earnings credits and interest charges
The Trust, as part of the agreement with the Custodian, receives credits against its custodian fees on its uninvested cash balances and is allowed to borrow for temporary purposes. Borrowings are not to exceed 5% of the value of each Fund’s total assets at the time of any such borrowing. Interest on amounts borrowed is calculated at the prime rate and is payable monthly. During the year ended December 31, 2022, the Micro-Cap Fund, Small-Cap Opportunities Fund, Global Opportunities Fund, China Opportunities Fund, International Opportunities Fund, and Emerging Markets Fund received credits of $9,830, $14,355, $6,551, $17,348, $24,474, and $8,598, respectively. During the year ended December 31, 2022, the Micro-Cap Fund, the Small Cap Opportunities Fund, the Global Opportunities Fund, the China Opportunities Fund, the International Opportunities Fund and the Emerging Markets Fund incurred interest charges of $8,880, $579, $735, $665, $8,186, and $82 respectively, which is included in custodian fees and expenses in the Statements of Operations.
7. Coronavirus (COVID-19) pandemic
In early 2020, an outbreak of a novel strain of coronavirus (COVID-19) emerged globally. This coronavirus has resulted in closing international borders, enhanced health screenings, healthcare service preparation and delivery, quarantines, cancellations, disruptions to supply chains and customer activity, as well as general public concern and uncertainty. The impact of this outbreak has negatively affected the worldwide economy, as well as the economies of individual countries, the financial health of individual companies and the market in general in significant and unforeseen ways. The future impact of COVID-19 is currently unknown, and it may exacerbate other risks that apply to the Funds, including political, social and economic risks. Any such impact could adversely affect the Funds’ performance, the performance of the securities in which the Funds invest and may lead to losses on your investment in each Fund. The ultimate impact of COVID-19 on the financial performance of the Funds’ investments is not reasonably estimable at this time.
8. Subsequent events
The Funds have evaluated subsequent events through the issuance of the financial statements and determined that no events have occurred that require disclosure.
53
THE OBERWEIS FUNDS
Financial Highlights
Per share income and capital for a share outstanding throughout each year is as follows:
| Investor Class | | | MICRO-CAP FUND | | |
| | | | | Years Ended December 31, | | |
| | | | 2022 | | | | 2021 | | | | 2020 | | | | 2019 | | | | 2018 | | |
| | Net asset value at beginning of year | | $ | 35.88 | | | $ | 29.10 | | | $ | 22.40 | | | $ | 18.37 | | | $ | 25.12 | | |
| | | | |
| INCOME (LOSS) FROM INVESTMENT OPERATIONS: | | |
| | Net investment lossa | | | (.32 | ) | | | (.43 | ) | | | (.26 | ) | | | (.22 | ) | | | (.35 | ) | |
| | Net realized and unrealized gains (losses) on investments | | | (3.52 | ) | | | 15.93 | | | | 6.96 | | | | 4.25 | | | | (2.82 | ) | |
| | Total from investment operations | | | (3.84 | ) | | | 15.50 | | | | 6.70 | | | | 4.03 | | | | (3.17 | ) | |
| | Redemption Feesa | | | .03 | | | | .02 | | | | — | | | | — | | | | .03 | | |
| | Less distributions: | | | | | | | | | | | | | | | | | | | | | |
| | Distribution from net realized gains on investments | | | (.43 | ) | | | (8.74 | ) | | | — | | | | — | | | | (3.61 | ) | |
| | Net asset value at end of year | | $ | 31.64 | | | $ | 35.88 | | | $ | 29.10 | | | $ | 22.40 | | | $ | 18.37 | | |
| | Total Return (%) | | | (10.60 | ) | | | 53.38 | | | | 29.91 | | | | 21.94 | | | | (12.30 | ) | |
| | | | |
| RATIO/SUPPLEMENTAL DATA: | | |
| | Net Assets at end of year (in thousands) | | $ | 96,281 | | | $ | 87,603 | | | $ | 45,345 | | | $ | 46,546 | | | $ | 53,094 | | |
| | Ratio of gross expenses to average net assets (%) | | | 1.53 | | | | 1.48 | | | | 1.59 | | | | 1.60 | | | | 1.57 | | |
| | Ratio of net expenses to average net assets (%)b | | | 1.52 | | | | 1.48 | | | | 1.58 | | | | 1.58 | | | | 1.55 | | |
| | Ratio of net investment loss to average net assets (%) | | | (1.02 | ) | | | (1.08 | ) | | | (1.22 | ) | | | (1.03 | ) | | | (1.30 | ) | |
| | Portfolio turnover rate (%) | | | 61 | | | | 81 | | | | 92 | | | | 112 | | | | 119 | | |
Notes:
54
THE OBERWEIS FUNDS
Financial Highlights (continued)
Per share income and capital for a share outstanding throughout each year is as follows:
| Institutional Class | | | MICRO-CAP FUND | | |
| | | | | Years Ended December 31, | | |
| | | | 2022 | | | | 2021 | | | | 2020 | | | | 2019 | | | | 2018 | | |
| | Net asset value at beginning of year | | $ | 36.43 | | | $ | 29.36 | | | $ | 22.55 | | | $ | 18.47 | | | $ | 25.17 | | |
| | | | |
| INCOME (LOSS) FROM INVESTMENT OPERATIONS: | | |
| | Net investment lossa | | | (.24 | ) | | | (.33 | ) | | | (.21 | ) | | | (.13 | ) | | | (.28 | ) | |
| | Net realized and unrealized gains (losses) on investments | | | (3.58 | ) | | | 16.12 | | | | 7.02 | | | | 4.21 | | | | (2.84 | ) | |
| | Total from investment operations | | | (3.82 | ) | | | 15.79 | | | | 6.81 | | | | 4.08 | | | | (3.12 | ) | |
| | Redemption Feesa | | | .03 | | | | .02 | | | | — | | | | — | | | | .03 | | |
| | Less distributions: | | | | | | | | | | | | | | | | | | | | | |
| | Distribution from net realized gains on investments | | | (.43 | ) | | | (8.74 | ) | | | — | | | | — | | | | (3.61 | ) | |
| | Net asset value at end of year | | $ | 32.21 | | | $ | 36.43 | | | $ | 29.36 | | | $ | 22.55 | | | $ | 18.47 | | |
| | Total Return (%) | | | (10.39 | ) | | | 53.90 | | | | 30.20 | | | | 22.09 | | | | (12.07 | ) | |
| | | | |
| RATIO/SUPPLEMENTAL DATA: | | |
| | Net Assets at end of year (in thousands) | | $ | 72,507 | | | $ | 50,015 | | | $ | 31,202 | | | $ | 30,994 | | | $ | 14,445 | | |
| | Ratio of gross expenses to average net assets (%) | | | 1.28 | | | | 1.23 | | | | 1.34 | | | | 1.34 | | | | 1.33 | | |
| | Ratio of net expenses to average net assets (%)b | | | 1.27 | | | | 1.23 | | | | 1.33 | | | | 1.32 | | | | 1.32 | | |
| | Ratio of net investment loss to average net assets (%) | | | (.76 | ) | | | (.85 | ) | | | (.97 | ) | | | (.61 | ) | | | (1.05 | ) | |
| | Portfolio turnover rate (%) | | | 61 | | | | 81 | | | | 92 | | | | 112 | | | | 119 | | |
Notes:
55
THE OBERWEIS FUNDS
Financial Highlights (continued)
Per share income and capital for a share outstanding throughout each year is as follows:
| Investor Class | | | SMALL-CAP OPPORTUNITIES FUND | | |
| | | | | Years Ended December 31, | | |
| | | | 2022 | | | | 2021 | | | | 2020 | | | | 2019 | | | | 2018 | | |
| | Net asset value at beginning of year | | $ | 21.54 | | | $ | 18.29 | | | $ | 14.36 | | | $ | 11.83 | | | $ | 16.40 | | |
| | | | |
| INCOME (LOSS) FROM INVESTMENT OPERATIONS: | | |
| | Net investment lossa | | | (.16 | ) | | | (.28 | ) | | | (.17 | ) | | | (.13 | ) | | | (.18 | ) | |
| | Net realized and unrealized gains (losses) on investments | | | (2.26 | ) | | | 8.23 | | | | 4.84 | | | | 3.10 | | | | (1.05 | ) | |
| | Total from investment operations | | | (2.42 | ) | | | 7.95 | | | | 4.67 | | | | 2.97 | | | | (1.23 | ) | |
| | Redemption Feesa | | | .01 | | | | .01 | | | | — | | | | — | | | | — | | |
| | Less distributions: | | | | | | | | | | | | | | | | | | | | | |
| | Distribution from net realized gains on investments | | | (.03 | ) | | | (4.71 | ) | | | (.74 | ) | | | (.44 | ) | | | (3.34 | ) | |
| | Net asset value at end of year | | $ | 19.10 | | | $ | 21.54 | | | $ | 18.29 | | | $ | 14.36 | | | $ | 11.83 | | |
| | Total Return (%) | | | (11.17 | ) | | | 43.57 | | | | 32.47 | | | | 25.07 | | | | (7.23 | ) | |
| | | | | | | | | | | | | | | | | | | | | | | |
| RATIO/SUPPLEMENTAL DATA: | | |
| | Net Assets at end of year (in thousands) | | $ | 94,110 | | | $ | 16,322 | | | $ | 7,767 | | | $ | 6,110 | | | $ | 5,299 | | |
| | Ratio of gross expenses to average net assets (%) | | | 1.45 | | | | 1.59 | | | | 2.03 | | | | 2.21 | | | | 2.13 | | |
| | Ratio of net expenses to average net assets (%)b | | | 1.25 | | | | 1.55 | | | | 1.55 | | | | 1.55 | | | | 1.55 | | |
| | Ratio of net investment loss to average net assets (%) | | | (.82 | ) | | | (1.22 | ) | | | (1.14 | ) | | | (.95 | ) | | | (1.06 | ) | |
| | Portfolio turnover rate (%) | | | 45 | | | | 106 | | | | 147 | | | | 142 | | | | 160 | | |
Notes:
56
THE OBERWEIS FUNDS
Financial Highlights (continued)
Per share income and capital for a share outstanding throughout each year is as follows:
| Institutional Class | | | SMALL-CAP OPPORTUNITIES FUND | | |
| | | | | Years Ended December 31, | | |
| | | | 2022 | | | | 2021 | | | | 2020 | | | | 2019 | | | | 2018 | | |
| | Net asset value at beginning of year | | $ | 21.92 | | | $ | 18.51 | | | $ | 14.49 | | | $ | 11.90 | | | $ | 16.44 | | |
| | | | | | | | | | | | | | | | | | | | | | | |
| INCOME (LOSS) FROM INVESTMENT OPERATIONS: | | |
| | Net investment lossa | | | (.11 | ) | | | (.23 | ) | | | (.13 | ) | | | (.10 | ) | | | (.14 | ) | |
| | Net realized and unrealized gains (losses) on investments | | | (2.30 | ) | | | 8.34 | | | | 4.89 | | | | 3.13 | | | | (1.06 | ) | |
| | Total from investment operations | | | (2.41 | ) | | | 8.11 | | | | 4.76 | | | | 3.03 | | | | (1.20 | ) | |
| | Redemption Feesa | | | .01 | | | | .01 | | | | — | | | | — | | | | — | | |
| | Less distributions: | | | | | | | | | | | | | | | | | | | | | |
| | Distribution from net realized gains on investments | | | (.03 | ) | | | (4.71 | ) | | | (.74 | ) | | | (.44 | ) | | | (3.34 | ) | |
| | Net asset value at end of year | | $ | 19.49 | | | $ | 21.92 | | | $ | 18.51 | | | $ | 14.49 | | | $ | 11.90 | | |
| | Total Return (%) | | | (10.93 | ) | | | 43.92 | | | | 32.80 | | | | 25.43 | | | | (7.05 | ) | |
| | | | | | | | | | | | | | | | | | | | | | | |
| RATIO/SUPPLEMENTAL DATA: | | |
| | Net Assets at end of year (in thousands) | | $ | 62,776 | | | $ | 12,727 | | | $ | 8,866 | | | $ | 5,622 | | | $ | 4,538 | | |
| | Ratio of gross expenses to average net assets (%) | | | 1.20 | | | | 1.34 | | | | 1.78 | | | | 1.96 | | | | 1.88 | | |
| | Ratio of net expenses to average net
assets (%)b | | | 1.00 | | | | 1.30 | | | | 1.30 | | | | 1.30 | | | | 1.30 | | |
| | Ratio of net investment loss to average net assets (%) | | | (.59 | ) | | | (.97 | ) | | | (.89 | ) | | | (.69 | ) | | | (.80 | ) | |
| | Portfolio turnover rate (%) | | | 45 | | | | 106 | | | | 147 | | | | 142 | | | | 160 | | |
Notes:
57
THE OBERWEIS FUNDS
Financial Highlights (continued)
Per share income and capital for a share outstanding throughout each year is as follows:
| Investor Class | | | GLOBAL OPPORTUNITIES FUND | | |
| | | | | Years Ended December 31, | | |
| | | | 2022 | | | | 2021 | | | | 2020 | | | | 2019 | | | | 2018 | | |
| | Net asset value at beginning of year | | $ | 35.29 | | | $ | 36.51 | | | $ | 24.82 | | | $ | 19.75 | | | $ | 28.36 | | |
| | | | |
| INCOME (LOSS) FROM INVESTMENT OPERATIONS: | | |
| | Net investment lossa | | | (.19 | ) | | | (.37 | ) | | | (.32 | ) | | | (.24 | ) | | | (.20 | ) | |
| | Net realized and unrealized gains (losses) on investments and translation of assets and liabilities denominated in foreign currency | | | (9.27 | ) | | | 7.99 | | | | 14.13 | | | | 5.31 | | | | (7.09 | ) | |
| | Total from investment operations | | | (9.46 | ) | | | 7.62 | | | | 13.81 | | | | 5.07 | | | | (7.29 | ) | |
| | Redemption feesa | | | — | | | | .01 | | | | — | | | | — | | | | — | | |
| Less distributions: | | | | | | | | | | | | | | | | | | | | | |
| | Distribution from net realized gains on investments | | | (.66 | ) | | | (8.85 | ) | | | (2.12 | ) | | | — | | | | (1.32 | ) | |
| | Net asset value at end of year | | $ | 25.17 | | | $ | 35.29 | | | $ | 36.51 | | | $ | 24.82 | | | $ | 19.75 | | |
| | Total Return (%) | | | (26.80 | ) | | | 20.92 | | | | 55.55 | | | | 25.67 | | | | (25.66 | ) | |
| | | | |
| RATIO/SUPPLEMENTAL DATA: | | |
| | Net Assets at end of year (in thousands) | | $ | 34,968 | | | $ | 53,342 | | | $ | 45,566 | | | $ | 32,004 | | | $ | 28,847 | | |
| | Ratio of gross expenses to average net assets (%) | | | 1.52 | | | | 1.38 | | | | 1.53 | | | | 1.58 | | | | 1.52 | | |
| | Ratio of net expenses to average net assets (%)b | | | 1.51 | | | | 1.38 | | | | 1.53 | | | | 1.55 | | | | 1.50 | | |
| | Ratio of net investment loss to average net assets (%) | | | (.73 | ) | | | (.86 | ) | | | (1.14 | ) | | | (1.07 | ) | | | (.72 | ) | |
| | Portfolio turnover rate (%) | | | 73 | | | | 111 | | | | 129 | | | | 120 | | | | 155 | | |
Notes:
58
THE OBERWEIS FUNDS
Financial Highlights (continued)
Per share income and capital for a share outstanding throughout each year is as follows:
| Institutional Class | | | GLOBAL OPPORTUNITIES FUND | | |
| | | | | Years Ended December 31, | | |
| | | | 2022 | | | | 2021 | | | | 2020 | | | | 2019 | | | | 2018 | | |
| | Net asset value at beginning of year | | $ | 35.84 | | | $ | 36.87 | | | $ | 24.99 | | | $ | 19.84 | | | $ | 28.41 | | |
| | | | |
| INCOME (LOSS) FROM INVESTMENT OPERATIONS: | | |
| | Net investment lossa | | | (.12 | ) | | | (.26 | ) | | | (.25 | ) | | | (.18 | ) | | | (.13 | ) | |
| | Net realized and unrealized gains (losses) on investments and translation of assets and liabilities denominated in foreign currency | | | (9.42 | ) | | | 8.07 | | | | 14.25 | | | | 5.33 | | | | (7.12 | ) | |
| | Total from investment operations | | | (9.54 | ) | | | 7.81 | | | | 14.00 | | | | 5.15 | | | | (7.25 | ) | |
| | Redemption Feesa | | | — | | | | .01 | | | | — | | | | — | | | | — | | |
| | Less distributions: | | | | | | | | | | | | | | | | | | | | | |
| | Distribution from net realized gains on investments | | | (.66 | ) | | | (8.85 | ) | | | (2.12 | ) | | | — | | | | (1.32 | ) | |
| | Net asset value at end of year | | $ | 25.64 | | | $ | 35.84 | | | $ | 36.87 | | | $ | 24.99 | | | $ | 19.84 | | |
| | Total Return (%) | | | (26.61 | ) | | | 21.23 | | | | 55.94 | | | | 25.96 | | | | (25.48 | ) | |
| | | | |
| RATIO/SUPPLEMENTAL DATA: | | |
| | Net Assets at end of year (in thousands) | | $ | 16,837 | | | $ | 23,518 | | | $ | 17,109 | | | $ | 10,644 | | | $ | 8,937 | | |
| | Ratio of gross expenses to average net assets (%) | | | 1.28 | | | | 1.14 | | | | 1.28 | | | | 1.33 | | | | 1.28 | | |
| | Ratio of net expenses to average net assets (%)b | | | 1.27 | | | | 1.13 | | | | 1.27 | | | | 1.30 | | | | 1.25 | | |
| | Ratio of net investment loss to average net assets (%) | | | (.44 | ) | | | (.61 | ) | | | (.88 | ) | | | (.78 | ) | | | (.49 | ) | |
| | Portfolio turnover rate (%) | | | 73 | | | | 111 | | | | 129 | | | | 120 | | | | 155 | | |
Notes:
59
THE OBERWEIS FUNDS
Financial Highlights (continued)
Per share income and capital for a share outstanding throughout each year is as follows:
| Investor Class | | | China Opportunities Fund | | |
| | | | | Years Ended December 31, | | |
| | | | | 2022 | | | | 2021 | | | | 2020 | | | | 2019 | | | | 2018 | | |
| | Net asset value at beginning of year | | $ | 11.51 | | | $ | 17.29 | | | $ | 12.33 | | | $ | 9.35 | | | $ | 15.95 | | |
| | | | |
| | INCOME (LOSS) FROM INVESTMENT OPERATIONS: | | |
| | Net investment lossa | | | (.08 | ) | | | (.11 | ) | | | (.16 | ) | | | (.09 | ) | | | (.10 | ) | |
| | Net realized and unrealized gains (losses) on investments and translation of assets and liabilities denominated in foreign currencies | | | (4.20 | ) | | | (.88 | ) | | | 7.11 | | | | 3.47 | | | | (4.06 | ) | |
| | Total from investment operations | | | (4.28 | ) | | | (.99 | ) | | | 6.95 | | | | 3.38 | | | | (4.16 | ) | |
| | Redemption Feesa | | | — | | | | — | | | | — | | | | .02 | | | | — | | |
| | | | |
| | Less dividends and distributions: | | | | | | | | | | | | | | | | | | | | | |
| | Distribution from net realized gains on investments | | | (.09 | ) | | | (4.79 | ) | | | (1.99 | ) | | | (.42 | ) | | | (2.44 | ) | |
| | Dividends from net investment income | | | — | | | | — | | | | — | | | | — | | | | — | | |
| | Total dividends and distributions | | | (.09 | ) | | | (4.79 | ) | | | (1.99 | ) | | | (.42 | ) | | | (2.44 | ) | |
| | Net asset value at end of year | | $ | 7.14 | | | $ | 11.51 | | | $ | 17.29 | | | $ | 12.33 | | | $ | 9.35 | | |
| | Total Return (%) | | | (37.23 | ) | | | (5.41 | ) | | | 56.51 | | | | 36.33 | | | | (26.01 | ) | |
| | | | |
| | RATIO/SUPPLEMENTAL DATA: | | | | | | | | | | | | | | | | | | | | | |
| | Net Assets at end of year (in thousands) | | $ | 45,803 | | | $ | 81,018 | | | $ | 98,527 | | | $ | 75,487 | | | $ | 60,844 | | |
| | Ratio of gross expenses to average net assets (%) | | | 2.05 | | | | 1.87 | | | | 1.95 | | | | 1.95 | | | | 1.91 | | |
| | Ratio of net expenses to average net assets (%)b | | | 2.03 | | | | 1.87 | | | | 1.95 | | | | 1.84 | | | | 1.86 | | |
| | Ratio of net investment loss to average net assets (%) | | | (0.97 | ) | | | (.63 | ) | | | (1.11 | ) | | | (.77 | ) | | | (.68 | ) | |
| | Portfolio turnover rate (%) | | | 254 | | | | 241 | | | | 192 | | | | 184 | | | | 85 | | |
Notes:
60
THE OBERWEIS FUNDS
Financial Highlights (continued)
Per share income and capital for a share outstanding throughout each year is as follows:
| Institutional Class | | China Opportunities Fund | | |
| | | | Years Ended December 31, | | |
| | | | | 2022 | | | | 2021 | | | | 2020 | | | | 2019 | | | | 2018 | �� | |
| | Net asset value at beginning of year | | $ | 11.67 | | | $ | 17.42 | | | $ | 12.39 | | | $ | 9.36 | | | $ | 15.93 | | |
| | | | | | | | | | | | | | | | | | | | | | | |
| | INCOME (LOSS) FROM INVESTMENT OPERATIONS: | | |
| | Net investment lossa | | | (0.05 | ) | | | (.07 | ) | | | (.13 | ) | | | (.07 | ) | | | (.06 | ) | |
| | Net realized and unrealized gains (losses) on investments and translation of assets and liabilities denominated in foreign currencies | | | (4.26 | ) | | | (.89 | ) | | | 7.15 | | | | 3.50 | | | | (4.07 | ) | |
| | Total from investment operations | | | (4.31 | ) | | | (.96 | ) | | | 7.02 | | | | 3.43 | | | | (4.13 | ) | |
| | Redemption Feesa | | | — | | | | — | | | | — | | | | .02 | | | | — | | |
| | | | | | | | | | | | | | | | | | | | | | | |
| | Less dividends and distributions: | | | | | | | | | | | | | | | | | | | | | |
| | Distribution from net realized gains on investments | | | (.09 | ) | | | (4.79 | ) | | | (1.99 | ) | | | (.42 | ) | | | (2.44 | ) | |
| | Dividends from net investment income | | | — | | | | — | | | | — | | | | — | | | | — | | |
| | Total dividends and distributions | | | (.09 | ) | | | (4.79 | ) | | | (1.99 | ) | | | (.42 | ) | | | (2.44 | ) | |
| | Net asset value at end of year | | $ | 7.27 | | | $ | 11.67 | | | $ | 17.42 | | | $ | 12.39 | | | $ | 9.36 | | |
| | Total return (%) | | | (36.97 | ) | | | (5.23 | ) | | | 56.79 | | | | 36.82 | | | | (25.85 | ) | |
| | | | | | | | | | | | | | | | | | | | | | | |
| | RATIO/SUPPLEMENTAL DATA: | | |
| | Net Assets at end of year (in thousands) | | $ | 10,513 | | | $ | 15,247 | | | $ | 21,497 | | | $ | 14,301 | | | $ | 10,998 | | |
| | Ratio of gross expenses to average net assets (%) | | | 1.80 | | | | 1.62 | | | | 1.69 | | | | 1.70 | | | | 1.65 | | |
| | Ratio of net expenses to average net assets (%)b | | | 1.78 | | | | 1.62 | | | | 1.69 | | | | 1.59 | | | | 1.61 | | |
| | Ratio of net investment loss to average net assets (%) | | | (.62 | ) | | | (.38 | ) | | | (.85 | ) | | | (.55 | ) | | | (.42 | ) | |
| | Portfolio turnover rate (%) | | | 254 | | | | 241 | | | | 192 | | | | 184 | | | | 85 | | |
Notes:
61
THE OBERWEIS FUNDS
Financial Highlights (continued)
Per share income and capital for a share outstanding throughout each year is as follows:
| Investor Class | | | International Opportunities Fund | | |
| | | | | Years Ended December 31, | | |
| | | | | 2022 | | | | 2021 | | | | 2020 | | | | 2019 | | | | 2018 | | |
| | Net asset value at beginning of year | | $ | 26.50 | | | $ | 31.52 | | | $ | 19.43 | | | $ | 16.01 | | | $ | 25.49 | | |
| | | | |
| | INCOME (LOSS) FROM INVESTMENT OPERATIONS: | | |
| | Net investment income
(loss)a | | | .11 | | | | (.26 | ) | | | (.16 | ) | | | (.03 | ) | | | (.04 | ) | |
| | Net realized and unrealized gains (losses) on investments and translation of assets and liabilities denominated in foreign currencies | | | (9.93 | ) | | | .72 | | | | 12.37 | | | | 3.69 | | | | (6.30 | ) | |
| | Total from investment operations | | | (9.82 | ) | | | .46 | | | | 12.21 | | | | 3.66 | | | | (6.34 | ) | |
| | Redemption Feesa | | | — | | | | — | | | | — | | | | — | | | | — | | |
| | | | |
| | Less dividends and distributions: | | | | | | | | | | | | | | | | | | | | | |
| | Distribution from net realized gains on investments | | | — | | | | (5.48 | ) | | | — | | | | — | | | | (3.10 | ) | |
| | Dividends from net investment income | | | — | | | | — | | | | (.12 | ) | | | (.24 | ) | | | (.04 | ) | |
| | Total dividends and distributions | | $ | — | | | | (5.48 | ) | | | (.12 | ) | | | (.24 | ) | | | (3.14 | ) | |
| | Net asset value at end of year | | $ | 16.68 | | | $ | 26.50 | | | $ | 31.52 | | | $ | 19.43 | | | $ | 16.01 | | |
| | Total return (%) | | | (37.06 | ) | | | 1.52 | | | | 62.86 | | | | 22.85 | | | | (24.73 | ) | |
| | | | |
| | RATIO/SUPPLEMENTAL DATA: | | |
| | Net Assets at end of year
(in thousands) | | $ | 144,970 | | | $ | 310,356 | | | $ | 327,354 | | | $ | 324,254 | | | $ | 498,164 | | |
| | Ratio of gross expenses to average net assets (%) | | | 1.87 | | | | 1.77 | | | | 1.87 | | | | 1.82 | | | | 1.77 | | |
| | Ratio of net expenses to average net
assets (%)(b) | | | 1.60 | | | | 1.60 | | | | 1.60 | | | | 1.60 | | | | 1.60 | | |
| | Ratio of net investment income (loss) to average net assets (%) | | | .60 | | | | (.79 | ) | | | (.75 | ) | | | (.19 | ) | | | (.16 | ) | |
| | Portfolio turnover rate (%) | | | 74 | | | | 93 | | | | 130 | | | | 142 | | | | 145 | | |
Notes:
62
THE OBERWEIS FUNDS
Financial Highlights (continued)
Per share income and capital for a share outstanding throughout each period is as follows:
| Investor Class | | | Emerging Markets Fund | | |
| | | | | Years Ended December 31, | | | Period Ended
December 31, | | |
| | | | | 2022 | | | | 2021 | | | | 2020 | | | | 2019 | | | | | 2018a | | |
| | Net asset value at beginning of period | | $ | 13.63 | | | $ | 13.81 | | | $ | 9.67 | | | $ | 7.89 | | | | $ | 10.00 | | |
| | | | |
| | INCOME (LOSS) FROM INVESTMENT OPERATIONS: | | |
| | Net investment lossb | | | (.07 | ) | | | (.13) | | | | (.06 | ) | | | (.02 | ) | | | | (.01 | ) | |
| | Net realized and unrealized gains (losses) on investments and translation of assets and liabilities denominated in foreign currencies | | | (3.24 | ) | | | 1.95 | | | | 4.20 | | | | 1.80 | | | | | (2.10 | ) | |
| | Total from investment operations | | | (3.31 | ) | | | 1.82 | | | | 4.14 | | | | 1.78 | | | | | (2.11 | ) | |
| | Redemption Feesb | | | — | | | | — | | | | — | | | | — | | | | | — | | |
| | | | |
| | Less dividends and distributions: | | | | | | | | | | | | | | | | | | | | | | |
| | Distribution from net realized gains on investments | | | (.28 | ) | | | (2.00 | ) | | | — | | | | — | | | | | — | | |
| | Dividends from net investment income | | | — | | | | — | | | | — | | | | — | | | | | — | | |
| | Total dividends and distributions | | | (.28 | ) | | | (2.00 | ) | | | — | | | | — | | | | | — | | |
| | Net asset value at end of year | | $ | 10.04 | | | $ | 13.63 | | | $ | 13.81 | | | $ | 9.67 | | | | $ | 7.89 | | |
| | Total Return (%) | | | (24.31 | ) | | | 13.24 | | | | 42.81 | | | | 22.56 | | | | | (21.10 | )e | |
| | | | |
| | RATIO/SUPPLEMENTAL DATA: | | |
| | Net Assets at end of year (in thousands) | | | $1,578 | | | | $1,646 | | | | $789 | | | | $587 | | | | | $426 | | |
| | Ratio of gross expenses to average net assets (%) | | | 2.90 | | | | 2.80 | | | | 3.79 | | | | 3.86 | | | | | 3.99 | d | |
| | Ratio of net expenses to average net assets (%)c | | | 1.75 | | | | 1.75 | | | | 1.75 | | | | 1.75 | | | | | 1.75 | d | |
| | Ratio of net investment loss to average net assets (%) | | | (.65 | ) | | | (.87 | ) | | | (.54 | ) | | | (.21 | ) | | | | (.15 | )d | |
| | Portfolio turnover rate (%) | | | 70 | | | | 67 | | | | 131 | | | | 153 | | | | | 111 | e | |
Notes:
63
THE OBERWEIS FUNDS
Financial Highlights (continued)
Per share income and capital for a share outstanding throughout each period is as follows:
| Institutional Class | | | Emerging Markets Fund | | |
| | | | | Years Ended December 31, | | | Period Ended
December 31, | | |
| | | | | 2022 | | | | 2021 | | | | 2020 | | | | 2019 | | | | | 2018a | | |
| | Net asset value at beginning of period | | $ | 13.75 | | | $ | 13.90 | | | $ | 9.71 | | | $ | 7.90 | | | | $ | 10.00 | | |
| | | | |
| | INCOME (LOSS) FROM INVESTMENT OPERATIONS: | | |
| | Net investment income
(loss)b | | | (.02 | ) | | | (.10 | ) | | | (.03 | ) | | | — | | | | | .01 | | |
| | Net realized and unrealized gains (losses) on investments and translation of assets and liabilities denominated in foreign currencies | | | (3.29 | ) | | | 1.97 | | | | 4.22 | | | | 1.81 | | | | | (2.11 | ) | |
| | Total from investment operations | | | (3.31 | ) | | | 1.87 | | | | 4.19 | | | | 1.81 | | | | | (2.10 | ) | |
| | Redemption Feesb | | | — | | | | — | | | | — | | | | — | | | | | — | | |
| | | | |
| | Less dividends and distributions: | | | | | | | | | | | | | | | | | | | | | | |
| | Distribution from net realized gains on investments | | | (.28 | ) | | | (2.00 | ) | | | — | | | | — | | | | | — | | |
| | Dividends from net investment income | | | — | | | | (.02 | ) | | | — | | | | — | | | | | — | | |
| | Total dividends and distributions | | | (.28 | ) | | | (2.02 | ) | | | — | | | | — | | | | | — | | |
| | Net asset value at end of year | | $ | 10.16 | | | $ | 13.75 | | | $ | 13.90 | | | $ | 9.71 | | | | $ | 7.90 | | |
| | Total Return (%) | | | (24.10 | ) | | | 13.50 | | | | 43.15 | | | | 22.91 | | | | | (21.00 | )e | |
| | | | |
| | RATIO/SUPPLEMENTAL DATA: | | |
| | Net Assets at end of year
(in thousands) | | $ | 11,012 | | | $ | 11,910 | | | $ | 9,938 | | | $ | 7,382 | | | | $ | 6,012 | | |
| | Ratio of gross expenses to average net assets (%) | | | 2.65 | | | | 2.55 | | | | 3.54 | | | | 3.61 | | | | | 3.74 | d | |
| | Ratio of net expenses to average net assets (%)c | | | 1.50 | | | | 1.50 | | | | 1.50 | | | | 1.50 | | | | | 1.50 | d | |
| | Ratio of net investment income (loss) to average net assets (%) | | | (.16 | ) | | | (.62 | ) | | | (.26 | ) | | | — | | | | | .10 | d | |
| | Portfolio turnover rate (%) | | | 70 | | | | 67 | | | | 131 | | | | 153 | | | | | 111 | e | |
Notes:
64
REPORT OF INDEPENDENT REGISTERED PUBLIC ACCOUNTING FIRM

To the Board of Trustees of The Oberweis Funds
and the Shareholders of Oberweis Micro-Cap Fund, Oberweis Small-Cap Opportunities Fund, Oberweis Global Opportunities Fund, Oberweis China Opportunities Fund, Oberweis International Opportunities Fund, and Oberweis Emerging Markets Fund
Opinion on the Financial Statements
We have audited the accompanying statements of assets and liabilities of Oberweis Micro-Cap Fund, Oberweis Small-Cap Opportunities Fund, Oberweis Global Opportunities Fund, Oberweis China Opportunities Fund, Oberweis International Opportunities Fund, and Oberweis Emerging Markets Fund, each a series of shares of beneficial interest in The Oberweis Funds (the “Funds”), as of December 31, 2022, and the related statements of operations for the year then ended, the statements of changes in net assets for each of the years in the two-year period then ended, the financial highlights for each of the periods noted in the table below, and the related notes (collectively referred to as the “financial statements”). In our opinion, the financial statements present fairly, in all material respects, the financial position of the Funds as of December 31, 2022, and the results of their operations for the year then ended, the changes in their net assets for each of the years in the two-year period then ended and their financial highlights for each of the periods noted in the table below, in conformity with accounting principles generally accepted in the United States of America.
Class | | Financial Highlights |
Investor Class:
Micro-Cap Fund
Small-Cap Opportunities Fund
Global Opportunities Fund
China Opportunities Fund
International Opportunities Fund | | For each of the years in the five-year period ended December 31, 2022 |
Investor Class:
Emerging Markets Fund | | For each of the years in the four-year period ended December 31, 2022 and for the period May 1, 2018 (commencement of operations) to December 31, 2018 |
Institutional Class:
Micro-Cap Fund
Small-Cap Opportunities Fund
Global Opportunities Fund
China Opportunities Fund | | For each of the years in the five-year period ended December 31, 2022 |
Institutional Class:
Emerging Markets Fund | | For each of the years in the four-year period ended December 31, 2022 and for the period May 1, 2018 (commencement of operations) to December 31, 2018 |
65
REPORT OF INDEPENDENT REGISTERED PUBLIC ACCOUNTING FIRM (continued)
Basis for Opinion
These financial statements are the responsibility of the Funds’ management. Our responsibility is to express an opinion on the Funds’ financial statements based on our audits. We are a public accounting firm registered with the Public Company Accounting Oversight Board (United States) (“PCAOB”) and are required to be independent with respect to the Funds in accordance with the U.S. federal securities law and the applicable rules and regulations of the Securities and Exchange Commission and the PCAOB.
We conducted our audits in accordance with the standards of the PCAOB. Those standards require that we plan and perform the audits to obtain reasonable assurance about whether the financial statements are free of material misstatement, whether due to error or fraud. The Funds are not required to have, nor were we engaged to perform, an audit of their internal control over financial reporting. As part of our audits we are required to obtain an understanding of internal control over financial reporting but not for the purpose of expressing an opinion on the effectiveness of the Funds’ internal control over financial reporting. Accordingly, we express no such opinion.
Our audits included performing procedures to assess the risk of material misstatement of the financial statements, whether due to error or fraud, and performing procedures that respond to those risks. Such procedures included examining, on a test basis, evidence regarding the amounts and disclosures in the financial statements. Our procedures included confirmation of securities owned as of December 31, 2022 by correspondence with the custodian, brokers, or by other appropriate auditing procedures where replies from brokers were not received. Our audits also included evaluating the accounting principles used and significant estimates made by management, as well as evaluating the overall presentation of the financial statements. We believe that our audits provide a reasonable basis for our opinion.

BBD, LLP
We have served as the auditor of one or more of the Funds in The Oberweis Funds since 2016.
Philadelphia, Pennsylvania
February 27, 2023
66
TRUSTEES AND OFFICERS OF THE OBERWEIS FUNDS (unaudited)
Name, Address and Age |
Position Held with Fund
|
Term of Office and
Length of Time Served
|
NONINTERESTED TRUSTEES |
Alix Charles (47)
3333 Warrenville Road,
Suite 500 Lisle, IL 60532 | Trustee | Trustee since
May, 20221 |
Katherine Smith Dedrick (65)
3333 Warrenville Road,
Suite 500 Lisle, IL 60532 | Trustee | Trustee since
November, 20041 |
Gary D. McDaniel (74)
3333 Warrenville Road,
Suite 500 Lisle, IL 60532 | Trustee | Trustee since
April, 20041 |
Michael Simon (56)
3333 Warrenville Road,
Suite 500 Lisle, IL 60532 | Trustee | Trustee since
May, 20221 |
INTERESTED TRUSTEES |
James W. Oberweis (48)
3333 Warrenville Road,
Suite 500 Lisle, IL 60532 | President | Officer since
August, 19962 |
Patrick B. Joyce (63)
3333 Warrenville Road,
Suite 500 Lisle, IL 60532 | Executive Vice President | Officer since
October, 19942 |
David I. Covas (47)
3333 Warrenville Road,
Suite 500 Lisle, IL 60532 | Vice President | Officer since
August, 20042 |
Kenneth S. Farsalas (52)
3333 Warrenville Road,
Suite 500 Lisle, IL 60532 | Vice President | Officer since
August, 20092 |
Eric V. Hannemann (49)
3333 Warrenville Road,
Suite 500 Lisle, IL 60532 | Treasurer | Officer since
August, 20052 |
Thomas P. Joyce (37)
3333 Warrenville Road,
Suite 500 Lisle, IL 60532 | Secretary and
Chief Compliance Officer | Officer since
July, 20212 |
The Statement of Additional Information includes additional information about Fund officers and trustees and is available upon request without charge, by calling the Fund at 800-323-6166.
67
TRUSTEES AND OFFICERS OF THE OBERWEIS FUNDS
(unaudited) (continued)
Principal Occupation Last Five Years | Number of
Portfolios
Overseen by
Trustee | Other
Directorships |
| |
Physician – Duly Health and Care – January, 2008 to present. | 8 | None |
Partner – Walberg Law PLLC, January, 2020 to present; Senior Counsel – Tyson & Mendes, May, 2018 to July, 2021; President – Smith-Dedrick Properties, Inc., December, 2016 to December, 2019; President – KSD Law PC, September, 2015 to December, 2021; President – KSD Global Consulting Inc., August, 2015 to present; President – Aggressive Publishing, Inc., 2010 to present. | 8 | None |
Independent Consultant. | 8 | None |
Principal, Simon Venture Development, September, 2010 to present; Partner, Holt Capital Partners, August, 2016 to present. | 8 | Southwestern
National Bank |
|
Chairman, February, 2008 to present, President and Director – Oberweis Asset Management, Inc., September, 2001 to present and Portfolio Manager from December, 1995 to present (held other officer positions from 1995 – September, 2001); President and Director – Oberweis Securities, Inc., September, 1996 to present; Chairman – Oberweis Asset Management (Hong Kong) Limited, March, 2007 to present; Chairman – Oberweis Asset Management UK Limited, July, 2014 to present. | Not Applicable | None |
Executive Vice President and Director – Oberweis Asset Management, Inc., September, 1994 to December 31, 2022; Executive Vice President and Director – Oberweis Securities, lnc., September, 1996 to December 31, 2022; Director – Oberweis Asset Management (Hong Kong) Limited, March, 2007 to December 31, 2022; Director – Oberweis Asset Management UK Limited, July, 2014 to December 31, 2022. | Not Applicable | None |
Vice President – Oberweis Asset Management, Inc., September, 2003 to present; Vice-President – Oberweis Securities, Inc., January, 2004 to present; Registered Representative, July, 1997 to present. | Not Applicable | None |
Director of US Equities, January 2008 to present, Vice President and Portfolio Manager, November 2004 to present – Oberweis Asset Management, Inc. | Not Applicable | None |
Chief Financial Officer, October, 2022 to present, Vice President of Accounting, June, 2004 to October, 2022, Oberweis Asset Management, Inc., and Oberweis Securities, Inc. | Not Applicable | None |
Chief Compliance Officer, October, 2022 to present, Vice President of Compliance, December, 2021 to October, 2022, Senior Compliance Analyst, July, 2013 to November, 2021, Compliance Associate, April, 2010 to June, 2013 – Oberweis Asset Management, Inc., and Oberweis Securities, Inc. | Not Applicable | None |
68
THE OBERWEIS FUNDS
Supplemental Information (unaudited)
Long-Term Capital Gains
As of December 31, 2022, the following Funds designate long-term capital distribution as follows:
| | Micro-Cap Fund | | $ 2,953,421 | |
| | | Small-Cap Opportunities Fund | | 264,899 | |
| | | Global Opportunities Fund | | 1,327,408 | |
| | | China Opportunities Fund | | 670,331 | |
| | | International Opportunities Fund | | — | |
| | | Emerging Markets Fund | | 337,382 | |
Foreign Taxes Paid
Pursuant to Section 853 of the Internal Revenue Code of 1986, as amended, the China Opportunities Fund, Emerging Markets Fund and International Opportunities Fund, respectively, designate $754,659, $189.469 and $1,300,237 of income derived from foreign sources and $29.862, $66.948 and $408.289 of foreign taxes paid for the period ended December 31, 2022.
Of the ordinary income (including short-term capital gain) distributions made (or to be made) for the year ended December 31, 2022, the proportionate share of income derived from foreign sources and foreign taxes paid attributable to one share of stock are:
| | Foreign
Source Income | | Foreign
Taxes Paid | |
| | China Opportunities Fund | $ 0.0960 | | $ 0.0038 | |
| | International Opportunities Fund | 0.1492 | | 0.0469 | |
| | Emerging Markets Fund | 0.1528 | | 0.0540 | |
Proxy Voting:
The Oberweis Funds has delegated authority to vote proxies related to the Funds’ (Micro-Cap Fund, Small-Cap Opportunities Fund, Global Opportunities Fund, China Opportunities Fund, International Opportunities Fund and Emerging Markets Fund) Portfolio securities to the Funds’ investment advisor, Oberweis Asset Management, Inc. (“OAM”). A description of the policies and procedures that OAM uses in fulfilling this responsibility is available, without charge upon request, by calling 1-800-323-6166. It also appears on www.oberweisfunds.com and in the Funds’ Statement of Additional Information, which can be found on the Securities and Exchange Commission’s (“SEC”) website at http://www.sec.gov. Information on how the Funds voted proxies relating to portfolio securities during the most recent 12 month period ended June 30 is available (1) without charge, upon request, by calling 1-800-323-6166, and (2) on the SEC’s website at http://www.sec.gov.
69
THE OBERWEIS FUNDS
Supplemental Information (unaudited) (continued)
Availability of Schedules of Portfolio Investments:
The Funds file their complete schedule of portfolio investments with the SEC for the first and third quarter of each fiscal year (March 31 and September 30) on Form NPORT. The Funds’ Forms NPORT are available, without charge, on the SEC’s website at http://www.sec.gov and may be reviewed and copied at the SEC’s Public Reference Room in Washington, D.C. Information on the operation of the Public Reference Room may be obtained by calling 1-800-SEC-0330.
Approval of Investment Advisory Agreements and Investment Sub-Advisory Agreement
The Investment Advisory Agreement between The Oberweis Funds (the “Trust”) and Oberweis Asset Management, Inc. (“OAM”) with respect to the Micro-Cap Fund, the Global Opportunities Fund and the Small-Cap Opportunities Fund and the Investment Advisory and Management Agreement between the Trust and OAM with respect to the International Opportunities Fund, the China Opportunities Fund and the Emerging Markets Fund (collectively, the “Advisory Agreements”) (the above-noted funds of the Trust are collectively referred to as the “Funds”), and the Investment Sub-Advisory Agreement between OAM and Oberweis Asset Management (Hong Kong) Limited (“OAMHK”), a wholly owned subsidiary of OAM, with respect to the China Opportunities Fund (the “Sub-Advisory Agreement” and together with the Advisory Agreements, the “Agreements”) were last approved by the Board of Trustees of the Trust (the “Board”), including all of the trustees who are not parties to the Agreements or interested persons of any such party (the “Independent Trustees”), at a meeting on August 17, 2022. The Board, including a majority of the Independent Trustees, determined that the continuation of the applicable Agreements was in the best interests of each of the Funds.
The Board noted that OAM has been associated with each of the Funds since its inception. The Board recognized that a long-term relationship with a capable, conscientious investment adviser is in the best interests of each Fund, and that shareholders have invested in the Funds knowing that OAM manages the Funds and knowing the investment advisory and management fee schedules.
Nature, Quality and Extent of Services. With respect to the nature, extent and quality of the services provided (i) to the Funds by OAM pursuant to the Advisory Agreements and (ii) to the China Opportunities Fund by OAMHK pursuant to the Sub-Advisory Agreement, the Board considered the background and experience of OAM and OAMHK, the functions performed by OAM and OAMHK and the personnel providing such services, the management capabilities of OAM and OAMHK, the information contained in OAM’s and OAMHK’s Forms ADV, OAM’s financial condition and the compliance reports provided to the Board, and the culture of compliance created by OAM and OAMHK, including the competency of the Chief Compliance Officer of the Trust, OAM and OAMHK. The Board also considered the experience, academic background, long tenure, structure, size and geographic locations of the portfolio management/strategy investment teams and their respective roles, the investment process with respect to the types of investments held by the Funds, as well as the honesty and integrity of OAM and OAMHK, and that, in the Board’s experience, OAM and OAMHK personnel are open and forthright with the Board. In addition, the Board considered that OAM and OAMHK are research-oriented firms that conduct extensive research in connection with managing the Funds, and also considered the competitive pressure on active management.
70
THE OBERWEIS FUNDS
Supplemental Information (unaudited) (continued)
The Board reviewed the investment performance of each Fund as compared to a peer universe of funds provided by Broadridge Financial Solutions, Inc. (“Broadridge”), an independent provider of investment company data (the “Performance Universe”), and as compared to the performance of a relevant market benchmark index. With respect to Fund performance, the Board considered each Fund’s performance over the one-, three-, five- and ten-year periods ended June 30, 2022, as applicable, including any periods of outperformance or underperformance as compared to the performance of the relevant market benchmark index and the Fund’s Performance Universe average. The Board noted (i) each of the Micro-Cap Fund and the Small-Cap Opportunities Fund outperformed its respective relevant market benchmark index and Performance Universe average for all periods reviewed, (ii) the International Opportunities Fund outperformed its relevant market benchmark index and Performance Universe average for all periods reviewed except the one-year period, (iii) the Global Opportunities Fund outperformed its relevant market benchmark index and Performance Universe average for all periods reviewed except for the one-year period, and for the five-year period the Global Opportunities Fund’s performance approximated that of its Performance Universe average, (iv) the China Opportunities Fund outperformed its relevant market benchmark index for all periods reviewed and outperformed the Performance Universe average for all periods reviewed except the one-year period, and (v) the Emerging Markets Fund underperformed the relevant market benchmark index for the one-year period but outperformed the Performance Universe average for the one-year period and outperformed the relevant market benchmark index and Performance Universe average for the three-year period. In light of the information provided and the considerations made, the Board concluded that the nature, quality and extent of the services provided to each Fund by OAM and to the China Opportunities Fund by OAMHK have been and are expected to remain satisfactory.
Fees and Expenses. The Board considered the combined investment advisory and management fees charged to each Fund by OAM (the “management fees”) as compared to the management fees of a peer group of funds provided by Broadridge (the “Expense Group”) and the expense ratio(s) of each Fund as compared to the expense ratios of the Expense Group. The Board considered information provided by Broadridge on how it selected the peer funds included in the Expense Group for each Fund and considered certain limitations as to the comparability of the data provided. Based on the information provided, the Board noted that, although the contractual management fees for each Fund (except the Small-Cap Opportunities Fund and the Global Opportunities Fund) were above the median management fee of its respective Expense Group, they were within a reasonable range of the applicable median and that the contractual management fees for the Small-Cap Opportunities Fund and the Global Opportunities Fund were below the median management fee of the applicable Expense Group. The Board also noted, among other things, that it believed that each Fund’s management fees were reasonable in light of the levels of investment performance over the time periods reviewed, and as compared to the performance of the applicable relevant market benchmark index and Performance Universe. With respect to the investment sub-advisory fees paid to OAMHK relating to the China Opportunities Fund, the Board noted that such fees are paid by OAM and not the China Opportunities Fund.
The Board noted that the expense ratio for each Fund’s Institutional Class (with the exception of the Micro-Cap Fund and the Global Opportunities Fund), as applicable, was above the median of the expense ratio of its applicable Expense Group. The Board also noted that the expense ratio of each Fund’s Investor Class and for the International Opportunities Fund was above the median expense ratio of its applicable Expense Group.
71
THE OBERWEIS FUNDS
Supplemental Information (unaudited) (continued)
In addition, the Board considered management fees paid to OAM by other clients. With respect to OAM’s other clients, the Board recognized that the mix of services provided to the Funds, the level of responsibility required under the Advisory Agreements with the Funds, and the regulatory, compliance and operational requirements with respect to the Funds are greater than OAM’s obligations for similar client accounts, and that the management fees for such accounts are less relevant to the Board’s consideration of the management fees for the Funds because they reflect different competitive forces than those in the mutual fund marketplace. Based on the information provided, the Board concluded that each Fund’s management fees were reasonable and appropriate in amount, given the nature, quality and extent of the services provided and taking into consideration relevant circumstances.
Profitability. With respect to the costs of services provided and profits realized by OAM, the Board considered the management fees received by OAM from each of the Funds as well as the level, quality and expense of OAM’s staff and the services that OAM provides. The Board also considered the explanation from OAM that the profits realized by OAM specifically from the relationship with the Funds could not be identified due to the impracticality of expense allocation, noting the difficulty of breaking down profitability related to each Fund versus the other Oberweis Funds and other client accounts because management and personnel time and services are not allocated between the various types of accounts. The Board noted OAM’s belief that, while the profits could not be itemized, the overall profitability of OAM was average and within a reasonable range relative to other investment advisory firms, and considered that OAM has contractually agreed to reimburse the Funds for expenses if their respective expense ratios exceed certain limits. The Board did not consider the profits realized by OAMHK with respect to the China Opportunities Fund, noting that OAM compensates OAMHK from its management fees and that the revenue to OAMHK was limited due to the size of the China Opportunities Fund. Based on this information, the Board concluded for each Fund that OAM’s profitability was not unreasonable.
Economies of Scale. The Board considered the extent to which economies of scale would be realized as each Fund grows, and whether management fee levels reflect economies of scale for the benefit of Fund shareholders. The Board noted asset capacity constraints for each of the Funds which limit economies of scale and the expense reimbursements made by OAM to certain of the Funds. The Board also noted that the investment advisory fee schedule for the Global Opportunities Fund includes a breakpoint designed to share economies of scale with shareholders. The Board concluded that each Fund’s management fees reflect an appropriate recognition of any economies of scale.
Other Benefits to OAM and Its Affiliates. The Board considered the character and amount of other incidental benefits received by OAM and its affiliates (including OAMHK) from their relationship with the Funds, including the fees received by Oberweis Securities, Inc. (“OSI”), an affiliate of OAM and OAMHK, for distribution services, as applicable, and benefits to OAM and other OAM client accounts related to soft dollars generated by the Funds’ brokerage transactions. The Board also noted that during the past year none of the Funds’ brokerage transactions had been placed through OSI.
After due consideration of all of the information and factors deemed relevant by the Board and based upon their own business judgment and the conclusions reached, the Board determined to approve the continuance of the Agreements. The Board, including the Independent Trustees, did not identify any single factor or group of factors as all-important or controlling, and considered all factors together.
72
THE OBERWEIS FUNDS
Supplemental Information (unaudited) (continued)
Expense Examples:
As a shareholder of The Oberweis Funds, you may incur two types of costs: (1) transaction costs, including redemption fees and (2) ongoing costs, including management fees; distribution (and/or service) 12b-1 fees; and other Fund expenses. This example is intended to help you understand your ongoing costs (in dollars) of investing in The Oberweis Funds and to compare these costs with the ongoing costs of investing in other mutual funds.
The Example is based on an investment of $1,000 investment at the beginning of the period and held for the entire period.
Actual Expenses:
The first line for each Fund in the table below provides information about actual account values and actual expenses. You may use the information below; together with the amount you invested, to estimate the expenses that you paid over the period. Simply divide your account value by $1,000 (for example, an $8,600 account value divided by $1,000=8.6), then multiply the result by the number in the table under the heading entitled “Expenses Paid During Period” to estimate the expenses you paid on your account during this period.
Hypothetical Example for Comparison Purposes:
The second line for each Fund in the table below provides information about hypothetical account values and hypothetical expenses based on each Fund’s actual expense ratio and an assumed rate of return of 5% per year before expenses, which is not the Fund’s actual return.
The hypothetical account values and expenses may not be used to estimate the actual ending account balance or expenses you paid for the period. You may use this information to compare this 5% hypothetical example with the 5% hypothetical examples that appear in the shareholder reports of other funds.
Please note that the expenses shown in the table are meant to highlight your ongoing costs only and do not reflect any transactional costs, such as redemption fees. Therefore, the second line for each Fund in the table is useful in comparing ongoing costs only, and will not help you determine the relative total costs of owning different funds. In addition, if these transactional costs were included, your costs would have been higher.
73
THE OBERWEIS FUNDS
Supplemental Information (unaudited) (continued)
| | Beginning
Account
Value
7/1/22 | | Ending
Account
Value
12/31/22 | | Expenses Paid
During Period
7/1/22 – 12/31/22 | | Expense Ratio
During Period
7/1/22 – 12/31/22 |
MICRO-CAP FUND | |
Investor Class | | | | | | | | | | | | |
Actual | | $ | 1,000.00 | | $ | 1,129.19 | | $ | 8.16 | | 1.52 | % |
Hypothetical | | $ | 1,000.00 | | $ | 1,017.54 | | $ | 7.73 | | 1.52 | % |
Institutional Class | | | | | | | | | | | | |
Actual | | $ | 1,000.00 | | $ | 1,130.57 | | $ | 6.82 | | 1.27 | % |
Hypothetical | | $ | 1,000.00 | | $ | 1,018.80 | | $ | 6.46 | | 1.27 | % |
| | | | | | | | | | | | | |
SMALL-CAP OPPORTUNITIES FUND | |
Investor Class | | | | | | | | | | | | |
Actual | | $ | 1,000.00 | | $ | 1,145.01 | | $ | 6.76 | | 1.25 | % |
Hypothetical | | $ | 1,000.00 | | $ | 1,018.90 | | $ | 6.36 | | 1.25 | % |
Institutional Class | | | | | | | | | | | | |
Actual | | $ | 1,000.00 | | $ | 1,146.40 | | $ | 5.41 | | 1.00 | % |
Hypothetical | | $ | 1,000.00 | | $ | 1,020.16 | | $ | 5.09 | | 1.00 | % |
| | | | | | | | | | | | | |
GLOBAL OPPORTUNITIES FUND | |
Investor Class | | | | | | | | | | | | |
Actual | | $ | 1,000.00 | | $ | 1,124.15 | | $ | 8.08 | | 1.51 | % |
Hypothetical | | $ | 1,000.00 | | $ | 1,017.59 | | $ | 7.68 | | 1.51 | % |
Institutional Class | | | | | | | | | | | | |
Actual | | $ | 1,000.00 | | $ | 1,125.50 | | $ | 6.80 | | 1.27 | % |
Hypothetical | | $ | 1,000.00 | | $ | 1,018.80 | | $ | 6.46 | | 1.27 | % |
| | | | | | | | | | | | | |
CHINA OPPORTUNITIES FUND | |
Investor Class | | | | | | | | | | | | |
Actual | | $ | 1,000.00 | | $ | 801.89 | | $ | 9.22 | | 2.03 | % |
Hypothetical | | $ | 1,000.00 | | $ | 1,014.97 | | $ | 10.31 | | 2.03 | % |
Institutional Class | | | | | | | | | | | | |
Actual | | $ | 1,000.00 | | $ | 803.85 | | $ | 8.09 | | 1.78 | % |
Hypothetical | | $ | 1,000.00 | | $ | 1,016.23 | | $ | 9.05 | | 1.78 | % |
| | | | | | | | | | | | | |
INTERNATIONAL OPPORTUNITIES FUND | |
Investor Class | | | | | | | | | | | | |
Actual | | $ | 1,000.00 | | $ | 994.04 | | $ | 8.04 | | 1.60 | % |
Hypothetical | | $ | 1,000.00 | | $ | 1,017.14 | | $ | 8.13 | | 1.60 | % |
| | | | | | | | | | | | | |
EMERGING MARKETS FUND | |
Investor Class | | | | | | | | | | | | |
Actual | | $ | 1,000.00 | | $ | 984.41 | | $ | 8.75 | | 1.75 | % |
Hypothetical | | $ | 1,000.00 | | $ | 1,016.38 | | $ | 8.89 | | 1.75 | % |
Institutional Class | | | | | | | | | | | | |
Actual | | $ | 1,000.00 | | $ | 985.54 | | $ | 7.51 | | 1.50 | % |
Hypothetical | | $ | 1,000.00 | | $ | 1,017.64 | | $ | 7.63 | | 1.50 | % |
74
Trustees and Officers | | |
Michael J. Simon
Trustee Gary D. McDaniel
Trustee James W. Oberweis
President, Trustee David I. Covas
Vice President Kenneth S. Farsalas
Vice President | | Katherine Smith Dedrick
Trustee Alix J. Charles
Trustee Patrick B. Joyce
Executive Vice President Eric V. Hannemann
Treasurer Thomas P. Joyce
Secretary
Chief Compliance Officer |
Manager and Investment Advisor
Oberweis Asset Management, Inc.
3333 Warrenville Road, Suite 500, Lisle, IL 60532
800-323-6166
oberweisfunds.com
Distributor
Oberweis Securities, Inc.
3333 Warrenville Road, Suite 500, Lisle, IL 60532
630-577-2300
oberweisfunds.com
Custodian
UMB Bank, n.a.
928 Grand Blvd., Kansas City, MO 64106
Transfer Agent
UMB Fund Services, Inc.
P.O. Box 711, Milwaukee, WI 53201-0711
800-245-7311
Counsel
Vedder Price P.C.
222 North LaSalle Street, Chicago, IL 60601
Independent Registered Public Accounting Firm
BBD LLP
1835 Market Street, Philadelphia, PA 19103
The Oberweis Funds
Micro-Cap Fund
Small-Cap Opportunities Fund
Global Opportunities Fund
China Opportunities Fund
International Opportunities Fund
Emerging Markets Fund
800-245-7311
oberweisfunds.com

3333 Warrenville Road
Suite 500
Lisle, IL 60532
| | ANNUAL REPORT |
| | | Oberweis International Opportunities Institutional Fund (OBIIX) |
| | | Oberweis Focused International Growth Fund (OFIGX) |
| | | December 31, 2022 |
| | | oberweisfunds.com | | |
| | | | |
PRESIDENT AND PORTFOLIO MANAGER’S LETTER (unaudited)
Dear Fellow Shareholder:
THE Year in Review
In 2022 global equity markets continued to be materially influenced by inflation developments in the US and the Federal Reserve’s response to them. Where the Fed has led, other central banks in the developed world have followed. With the exception of China, the key central banks across the world have pursued a synchronous tightening of monetary policy over the last twelve months. Consequently, the multiple compression we saw in 2021 for many of our investment holdings became even more pronounced in 2022, to such a degree that it outweighed generally strong underlying fundamentals and earnings growth within the portfolios. The Oberweis International Opportunities Institutional Fund returned -37.45% vs. -27.02% for the MSCI World Ex-USA Small Cap Growth Index. On a cumulative 3-year basis, the fund outperformed its benchmark by almost 700bps, with a positive return of +4.51% vs. a negative return of -2.38% for the benchmark. For the nine months from inception at the beginning of April to year-end, the Oberweis Focused International Growth Fund returned -22.75% vs -9.07% for the MSCI EAFE Index.
As we have written previously, we view quarterly and yearly results as “merely short-term data points along the road.” An evaluation of stock-picking skill is only statistically relevant over a long-term horizon. We seek to generate favorable absolute and relative returns over an entire market cycle rather than just quarterly or annual periods. As we have previously noted, even with effective application of our process, we do not expect to outperform in every period. Instead, we invest with an eye on long-term high alpha generation and try to avoid giving undue attention to short-term results, whether favorable or unfavorable. The strategies are not benchmark-hugging strategies and thus may, unsurprisingly, deviate from their benchmarks over the short-term, such as a couple of quarters or years. Only strategies that do not hug their benchmarks have the potential to deliver excellent long-term results that meaningfully beat their benchmarks over time. Short-term fluctuations are expected, and, in fact, our experience has shown that times of short-term underperformance tend to be the best times to add to strategies with high long-term alpha.
Towards the end of the year, inflation data started to respond to tighter monetary policy, looking less threatening with goods inflation coming down as supply chain constraints have eased. Furthermore, the shelter component of US CPI, which constitutes more than 40% of the core measure, should soon start to reflect the loosening of the rental market for residential real estate, thus exerting further downward pressure. The Core PCE index (the Fed’s favored inflation indicator) rose 3.6% in November on an annualized basis over the previous three months, the smallest rise in 3-month core PCE inflation since February 2021. On a year-over-year basis it rose +4.7% and month-on-month by +0.2%. If, hypothetically, it rose by a similar month-on-month amount in the next six months, core PCE inflation would be approximately +3.4% year-on-year in May.
However, the trip back to the Fed’s stated 2% target looks to be a difficult one, due in large part to services. They constitute almost a third of core CPI and this broad category was up by +7.25% on a year-over-year basis in November, driven by strong wage growth. With the job fill rate in these industries low, and almost a year of tighter monetary policy unable to meaningfully impact the labor market, the implication is that the quest to lower inflation to 2% is not going to be easy. The great majority of yield curve spreads have remained inverted, often considered to be a leading indicator of an economic slowdown, while the latest Philadelphia Federal Reserve survey of professional forecasters shows the probability of recession in the next year to be the highest in the 50+ years the survey has been conducted.
1
PRESIDENT AND PORTFOLIO MANAGER’S LETTER (unaudited) (continued)
Also of importance, towards the end of the quarter, China formally relaxed many of the severe Covid-related restrictions it had placed upon its population, and is now enacting a policy that looks increasingly like the out-and-out pursuit of herd immunity. Such a dramatic U-turn is likely to have considerable implications. The lockdowns meant that retail sales in China were about US$400bn below trend this year, representing significant pent-up demand, so a reopening has the potential to be a stimulative event of material proportions as well as an inflationary tailwind.
OUTLOOK
After a year when global bonds and equities have seen their biggest ever loss in market value, and with more forecasters expecting a recession than at any point in recent history, pessimism is not hard to find amongst developed market investors. Evidently the Federal Reserve has a challenging task in front of it. The diminished rate sensitivity of the consumer has affected its ability to push the underlying inflation rate down to 2%. Without the tools to micromanage the economy, investors fear a policy misstep is growing in likelihood.
The central puzzle to solve remains the tight labor market in the US, which appears to be a structural biproduct of demographics and is also, to a greater or lesser degree, replicated across developed markets. Consensus estimates have consistently been too bearish on jobs with payrolls data in the US beating Bloomberg’s median estimate in 11 of the last 12 months. Some labor market indicators have weakened: layoffs are up from a low base, primarily at technology or mortgage-related companies, and the use of temporary workers appears to have peaked in September. However, job openings per unemployed person are still elevated at 1.7:1, and the most critical measure, initial unemployment claims, have not risen in a marked way. Until we see unmistakable signs of weakening, it seems unlikely that the Fed will drastically change course. Chairman Powell indicated as much in his December press conference, pointing to a restrictive policy stance “for some time”.
It seems clear that while the Fed (and by extension other global central banks) may slow the pace of its interest rate increases, it is unlikely to return to stimulative policies any time soon, barring a serious recession. Ten-year inflation expectations, as derived from capital markets and surveys, currently sit at around +2.2%, just below where they were in 2002-2008. The associated real ten-year yield is almost +1.5%, a bit below the average for this period. The retirement of the Baby Boomers and global budget deficits both argue for real rates to be similar to the pre-GFC period, which is to say higher than what we have seen over the past decade. In short, the idea that economies weaken, central banks pivot, and markets soar, to our mind is a less likely scenario when the disinflationary force of excess labor supply is no longer present.
While the above may read bearishly, this is not necessarily so. The drop in consumers’ rate sensitivity and the tight labor supply are arguably providing a roadmap to avoiding recession. The differential between wage gains and core inflation, which was -2% a year ago, over the last four months has been +4%. It seems likely that wage growth will continue to outstrip inflation in the coming months which, together with central banks slowing monetary tightening, would be a bullish combination for spending growth next year.
In a soft-landing scenario, current earnings forecasts for 2023 would likely be too low. And, perhaps most importantly, it does now appear that the outlook for inflation has improved with the easing of supply chain bottlenecks and residential rental market. Moreover, rarely has the consensus opinion been as negative on the economic outlook as it is today. Given the unprecedented path to the current point, we approach any confident macro forecasts with a great deal of humility and skepticism. The implications of this uncertainty for portfolio allocation are clear: remain diversified, tilt towards free cashflow generators, be careful of stretched balance sheets.
2
PRESIDENT AND PORTFOLIO MANAGER’S LETTER (unaudited) (continued)
With respect to valuation, free cash flow yields for both small and large cap stocks in developed markets remain near historical highs, even after the strong fourth quarter. Further, expectations for forward returns are among the lowest they have ever been. Rarely ever has the consensus opinion been as pessimistic. Historically, attractive valuations and trough expectations have made an excellent set-up for forward-looking returns.
Portfolio Highlights
At year end, the Oberweis International Opportunities Institutional Fund was invested in 62 stocks in 14 countries. Its top five country weightings (portfolio weighting versus the MSCI World Ex USA Small Cap Growth Index) at the end of the quarter were Canada (17.9% vs. 9.9%), Japan (15.9% vs. 28.6%), United Kingdom (15.5% vs. 13.4%), Australia (8.8% vs. 9.2%), and France (7.4% vs. 2.7%). On a sector basis, the fund was overweight industrials (38.4% vs. 23.6%) and underweight health care (1.0% vs. 11.2%).
Top contributors for the year include Hexatronic Group AB (HTRO SS), which returned 44.2% and contributed 99bps; D/S Norden A/S (DNORD DC), which returned 158.4% and contributed 72bps; and Aixtron SE (AIXA GY), which returned 43.3% and contributed 64bps. The largest detractors in 2022 include Future plc (FUTR LN), which returned -70.6% and contributed -228bps; Nordic Semiconductor ASA (NOD NO), which returned -50.7% and contributed -227bps; and Food & Life Companies Limited (3563 JP), which returned -57.3% and contributed -156bps.
At year end, the Oberweis Focused International Growth Fund was invested in 28 stocks in 10 countries. Its top five country weightings (portfolio weighting versus the MSCI EAFE Index) at the end of the year were United Kingdom (20.3% vs. 15.3%), Japan (18.5% vs. 21.9%), France (16.0% vs. 11.9%), Switzerland (13.6% vs. 10.1%), and Netherlands (10.2% vs. 4.3%). On a sector basis, the portfolio was overweight information technology (20.4% vs. 7.8%) and underweight communication services (0.0% vs. 4.5%).
Top contributors for the nine months from April 1 to December 31 include Novo Nordisk A/S (NOVOB DC), which returned 20.1% and contributed 72bps; BP P.L.C. (BP/ LN), which returned 18.9% and contributed 37bps; and Edenred (EDEN FP), which returned 6.2% and contributed 20bps. The largest detractors include Future plc (FUTR LN), which returned -53.8% and contributed -290bps; Datadog, Inc. (DDOG US), which returned -46.5% and contributed -236bps; and Adyen N.V. (ADYEN NA), which returned -30.6% and contributed -198bps.
3
PRESIDENT AND PORTFOLIO MANAGER’S LETTER (unaudited) (continued)
We appreciate your investment in The Oberweis Funds and are grateful for the trust you have shown in us. If you have any questions about your account, please contact shareholder services at (800) 245-7311. Thank you for investing with us in The Oberweis Funds.
Sincerely,
| | 
|
James W. Oberweis, CFA
President | | Ralf Scherschmidt
Portfolio Manager |
4
MANAGEMENT DISCUSSION ON FUND PERFORMANCE (unaudited)
MARKET ENVIRONMENT
Developed markets ex-US equities returned -14.45% in 2022, as measured by the MSCI EAFE Index. Global small-caps ex-US, as measured by the MSCI World Ex-USA Small Cap Index, returned -20.59%, underperforming large-capitalization stocks. Value stocks in developed markets ex-US outperformed growth stocks in 2022. The MSCI EAFE Value Index returned -5.18%, outperforming the MSCI EAFE Growth Index by 1792 basis points for the year.
Discussion of The Oberweis funds
The Oberweis International Opportunities Institutional Fund underperformed its benchmark in 2022, returning -37.45% versus -27.02% for the MSCI World Ex-USA Small-Cap Growth Index. The portfolio benefited from stock selection in Germany and France while stock selection in Japan and United Kingdom detracted from performance. On a sector level, the portfolio benefited from stock selection in Industrials while performance was negatively impacted by stock selection in Consumer Discretionary. At the stock level, Hexatronic Group AB (HTRO SS), D/S Norden A/S (DNORD DC) and Aixtron SE (AIXA GY) were among the top contributors to performance. Future plc (FUTR LN), Nordic Semiconductor ASA (NOD NO) and Food & Life Companies Limited (3563 JP) were among the top detractors.
The Oberweis Focused International Growth Fund underperformed its benchmark for the nine months from April 1 to December 31, returning -22.75% vs -9.07% for the MSCI EAFE Index. The portfolio benefited from stock selection in Denmark while stock selection in the United Kingdom and France detracted from performance. On a sector level, the portfolio benefited from stock selection in Energy while performance was negatively impacted by stock selection in Information Technology. At the stock level, Novo Nordisk A/S (NOVOB DC), BP P.L.C. (BP/ LN) and Edenred (EDEN FP) were among the top contributors to performance. Future plc (FUTR LN), Datadog, Inc. (DDOG US) and Adyen N.V. (ADYEN NA) were among the top detractors.
For current performance information, please visit www.oberweisfunds.com.
5
Management discussion on fund performance
(unaudited) (continued)
Oberweis International Opportunities Institutional Fund
At December 31, 2022
Asset Allocation (% of Net Assets) | |
Equities | 98.8 |
Other Assets less Liabilities | 1.2 |
| | |
Top Ten Holdings (% of Net Assets) |
BayCurrent Consulting, Inc. | 4.4 |
Nordic Semiconductor ASA | 3.8 |
Rexel SA | 3.7 |
Hexatronic Group AB | 3.6 |
AIXTRON SE | 3.2 |
Constellium SE | 3.0 |
Edenred SA | 2.7 |
ATS Corp. | 2.7 |
Daiwa Securities Group, Inc. | 2.4 |
Aritzia, Inc. | 2.3 |
| | |
Top Ten Industries (% of Net Assets) |
Machinery | 11.9 |
Information Technology Services | 8.9 |
Electrical Equipment | 8.1 |
Semiconductors & Semiconductor Equipment | 8.0 |
Capital Markets | 7.5 |
Trading Co. & Distribution | 7.3 |
Professional Services | 6.0 |
Specialty Retail | 4.3 |
Metals & Mining | 4.3 |
Insurance | 3.6 |
Oberweis Focused International Growth Fund
At December 31, 2022
Asset Allocation (% of Net Assets) | |
Equities | 99.9 |
Other Assets less Liabilities | 0.1 |
| | |
Top Ten Holdings (% of Net Assets) |
Adyen NV | 8.2 |
Sony Group Corp. | 7.7 |
Zurich Insurance Group AG | 5.6 |
Schneider Electric SE | 5.0 |
Novo Nordisk A/S | 4.8 |
LVMH Moet Hennessy Louis
Vuitton SE | 4.7 |
Sartorius AG | 4.7 |
Cadence Design Systems, Inc. | 4.4 |
Roche Hldg. AG | 4.3 |
Edenred | 3.9 |
| | |
Top Ten Industries (% of Net Assets) |
Information Technology Services | 13.9 |
Pharmaceuticals | 9.1 |
Household Durables | 7.7 |
Banks | 7.0 |
Oil, Gas & Consumable Fuels | 6.9 |
Food Products | 6.0 |
Insurance | 5.6 |
Electrical Equipment | 5.0 |
Textiles, Apparel & Luxury Goods | 4.7 |
Life Sciences Tools & Services | 4.7 |
6
Management discussion on fund performance
(unaudited) (continued)
Average Annual Total Returns1 (for the Periods Ended December 31, 2022)
| | 1 YR
(%) | | 5 YR
(%) | | SINCE
INCEPTION2
(%) | | EXPENSE
RATIO3
(%) |
OBIIX | | (37.45) | | (0.36) | | 3.57 | | 1.10 |
MSCI World Ex-US Small Cap Growth Index | | (27.02) | | 0.55 | | 3.93 | | |
Growth of a $10,000 Investment (from March 10, 2014 to December 31, 2022)
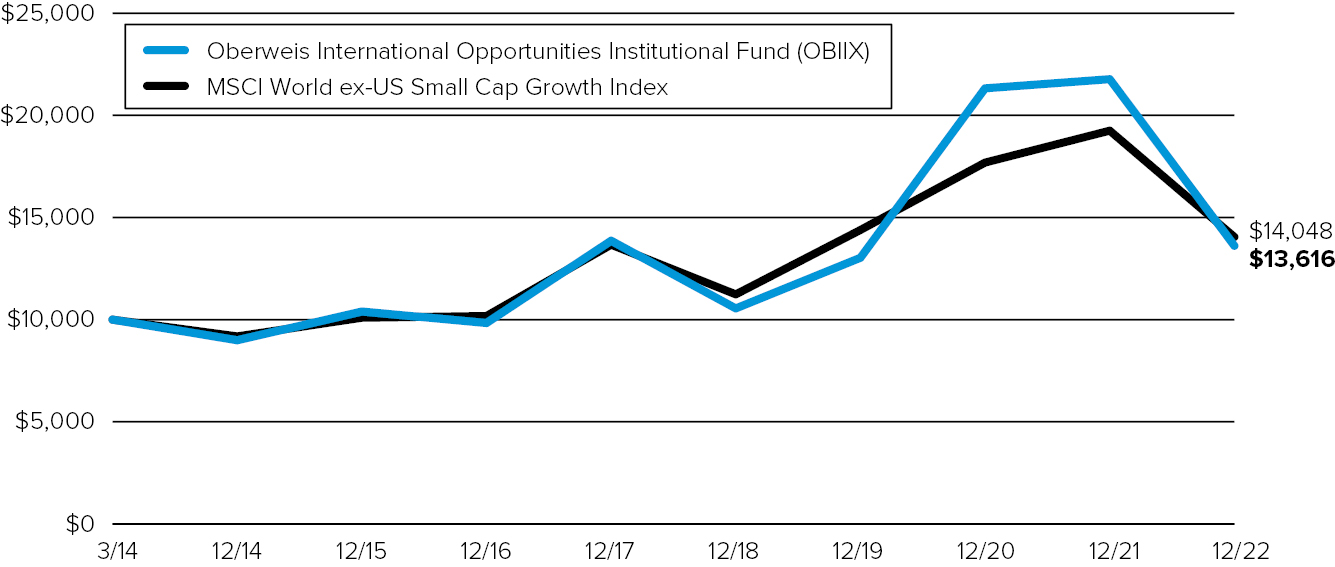
1 Performance data represents past performance, which is no guarantee of future results. Returns are historical and include changes in share price and reinvestment of dividends and capital gains. Current performance may be higher or lower than the performance shown. You can obtain performance data current to the most recent month by visiting oberweisfunds.com. The principal value and investment return of an investment will fluctuate so that your shares, when redeemed, may be worth more or less than their original cost. The Fund’s total returns do not reflect the deduction of income taxes on an individual’s investment. Taxes may reduce your actual investment returns on income or gains paid by the Fund or any gains you may realize if you sell your shares. The Oberweis Funds invest in rapidly growing smaller and medium sized companies, which may offer greater return potential. However, these investments often involve greater risks and volatility. Foreign and emerging market investing involves special risks such as currency fluctuation and less public disclosure, as well as economic and political risk. There is no guarantee that the portfolios can achieve their objectives.
The MSCI World ex-US Small Cap Growth Index is a free float-adjusted market capitalization weighted index that is designed to measure the equity market performance of small cap growth developed and emerging markets excluding the U.S., with minimum dividends reinvested net of withholding tax.
2 Since Inception returns are from commencement of operations on 03/10/14 for the Fund.
3 Expense ratio is the total annual net fund operating expense ratio as of 12/31/22. The expense ratio gross of any fee waivers, earnings credit or expense reimbursement was 1.14%.
7
Management discussion on fund performance
(unaudited) (continued)
Average Annual Total Returns1 (for the Periods Ended December 31, 2022)
| | SINCE
INCEPTION2
(%) | | EXPENSE
RATIO3
(%) |
OFIGX | | (22.75) | | 0.95 |
MSCI EAFE | | (9.07) | | |
Growth of a $10,000 Investment (from April 01, 2022 to December 31, 2022)
1 Performance data represents past performance, which is no guarantee of future results. Returns are historical and include changes in share price and reinvestment of dividends and capital gains. Current performance may be higher or lower than the performance shown. You can obtain performance data current to the most recent month by visiting oberweisfunds.com. The principal value and investment return of an investment will fluctuate so that your shares, when redeemed, may be worth more or less than their original cost. The Fund’s total returns do not reflect the deduction of income taxes on an individual’s investment. Taxes may reduce your actual investment returns on income or gains paid by the Fund or any gains you may realize if you sell your shares. The Oberweis Funds invest in rapidly growing smaller and medium sized companies, which may offer greater return potential. However, these investments often involve greater risks and volatility. Foreign and emerging market investing involves special risks such as currency fluctuation and less public disclosure, as well as economic and political risk. There is no guarantee that the portfolios can achieve their objectives.
The MSCI EAFE Index is an equity index that captures large and mid-cap representation across 21 developed markets countries around the world, excluding the U.S. and Canada. The index is comprehensive, covering approximately 85% of the free-float-adjusted market capitalization in each country with minimum dividends reinvested net of withholding tax.
2 Since Inception returns are from commencement of operations on 04/01/22 for the Fund.
3 Expense ratio is the total annual net fund operating expense ratio as of 12/31/22. The expense ratio gross of any fee waivers, earnings credit or expense reimbursement was 1.97%.
8
OBERWEIS INTERNATIONAL OPPORTUNITIES INSTITUTIONAL FUND
Schedule of Investmentsa December 31, 2022
| | SHARES | | VALUE |
Equities – 98.8% | | | | | |
| | | | | | |
AUSTRALIA – 8.8% | | | | | |
Computershare Ltd. | | 445,200 | | $ | 7,842,407 |
Elders Ltd. | | 859,900 | | | 5,902,387 |
GrainCorp Ltd. | | 1,284,923 | | | 6,477,804 |
IDP Education Ltd. | | 431,752 | | | 7,956,606 |
JB Hi-Fi Ltd. | | 218,839 | | | 6,237,090 |
| | | | | | 34,416,294 |
| | | | | | |
AUSTRIA – 2.4% | | | | | |
ANDRITZ AG* | | 143,100 | | | 8,191,227 |
AT & S Austria Technologie & Systemtechnik AG | | 38,412 | | | 1,317,491 |
| | | | | | 9,508,718 |
| | | | | | |
BELGIUM – 1.1% | | | | | |
Barco NV* | | 177,485 | | | 4,396,924 |
| | | | | | |
CANADA – 17.8% | | | | | |
Aritzia, Inc.* | | 256,000 | | | 8,952,437 |
ATS Corp.* | | 342,875 | | | 10,658,500 |
BRP, Inc. | | 65,973 | | | 5,029,832 |
Element Fleet Management Corp. | | 648,200 | | | 8,832,563 |
Finning International, Inc. | | 263,700 | | | 6,555,496 |
Gildan Activewear, Inc. | | 69,539 | | | 1,904,362 |
International Petroleum Corp.* | | 538,600 | | | 6,050,479 |
Parex Resources, Inc. | | 323,691 | | | 4,817,115 |
Sleep Country Canada Hldgs., Inc. | | 105,500 | | | 1,790,539 |
TFI International, Inc. | | 42,900 | | | 4,296,654 |
Toromont Industries Ltd. | | 55,700 | | | 4,019,533 |
Trisura Group Ltd.* | | 208,900 | | | 6,987,504 |
| | | | | | 69,895,014 |
| | | | | | |
DENMARK – 1.5% | | | | | |
D/S Norden A/S | | 98,200 | | | 5,918,005 |
| | | | | | |
FINLAND – 5.2% | | | | | |
Cargotec Oyj* | | 155,672 | | | 6,904,925 |
Metso Outotec Oyj | | 796,268 | | | 8,199,464 |
Outokumpu Oyj | | 1,031,949 | | | 5,237,290 |
| | | | | | 20,341,679 |
| | | | | | |
FRANCE – 7.3% | | | | | |
Edenred SA* | | 196,100 | | | 10,672,672 |
Nexans SA* | | 41,198 | | | 3,728,750 |
Rexel SA | | 726,419 | | | 14,367,265 |
| | | | | | 28,768,687 |
See accompanying notes to the financial statements.
9
OBERWEIS INTERNATIONAL OPPORTUNITIES INSTITUTIONAL FUND
Schedule of Investmentsa December 31, 2022 (continued)
| | SHARES | | VALUE |
GERMANY – 5.1% | | | | | |
AIXTRON SE | | 430,580 | | $ | 12,389,015 |
Aurelius Equity Opportunities SE | | 101,646 | | | 1,981,836 |
Krones AG* | | 38,200 | | | 4,268,533 |
Sixt SE | | 13,147 | | | 1,203,624 |
| | | | | | 19,843,008 |
| | | | | | |
ITALY – 1.0% | | | | | |
Brunello Cucinelli SpA* | | 54,700 | | | 4,047,250 |
| | | | | | |
JAPAN – 15.8% | | | | | |
BayCurrent Consulting, Inc. | | 550,400 | | | 17,133,952 |
Daiwa Securities Group, Inc. | | 2,090,600 | | | 9,237,954 |
Fuji Electric Co. Ltd. | | 217,600 | | | 8,212,067 |
Future Corp. | | 533,100 | | | 6,631,816 |
M&A Capital Partners Co. Ltd.* | | 195,400 | | | 6,817,725 |
Toyo Suisan Kaisha Ltd.* | | 197,500 | | | 7,608,879 |
Visional, Inc.* | | 94,100 | | | 6,233,033 |
| | | | | | 61,875,426 |
| | | | | | |
NETHERLANDS – 7.0% | | | | | |
Aalberts NV | | 156,157 | | | 6,082,601 |
Alfen NV* | | 64,300 | | | 5,821,511 |
ASM International NV* | | 15,000 | | | 3,805,967 |
Constellium SE* | | 981,754 | | | 11,614,150 |
| | | | | | 27,324,229 |
| | | | | | |
NORWAY – 5.9% | | | | | |
Aker Solutions ASA | | 1,207,000 | | | 4,648,739 |
Nordic Semiconductor ASA* | | 897,344 | | | 15,041,467 |
Wallenius Wilhelmsen ASA | | 334,802 | | | 3,297,339 |
| | | | | | 22,987,545 |
| | | | | | |
SWEDEN – 4.4% | | | | | |
Hexatronic Group AB | | 1,028,122 | | | 14,006,279 |
Munters Group AB* | | 323,600 | | | 3,190,274 |
| | | | | | 17,196,553 |
| | | | | | |
UNITED KINGDOM – 15.5% | | | | | |
Beazley PLC* | | 883,704 | | | 7,226,994 |
Future PLC | | 222,225 | | | 3,387,078 |
IMI PLC | | 142,316 | | | 2,222,569 |
Indivior PLC* | | 186,300 | | | 4,168,913 |
Intermediate Capital Group PLC | | 435,735 | | | 6,016,009 |
Keywords Studios PLC* | | 120,500 | | | 3,954,212 |
See accompanying notes to the financial statements.
10
OBERWEIS INTERNATIONAL OPPORTUNITIES INSTITUTIONAL FUND
Schedule of Investmentsa December 31, 2022 (continued)
| | SHARES | | VALUE |
Man Group PLC | | 2,088,977 | | $ | 5,374,469 |
Morgan Sindall Group PLC | | 93,371 | | | 1,735,953 |
Redrow PLC | | 347,451 | | | 1,903,924 |
RS GROUP PLC | | 337,800 | | | 3,636,985 |
Taylor Wimpey PLC | | 1,457,602 | | | 1,784,999 |
Telecom Plus PLC | | 319,300 | | | 8,451,684 |
The Sage Group PLC | | 559,070 | | | 5,034,063 |
Wise PLC* | | 829,700 | | | 5,620,836 |
| | | | | | 60,518,688 |
| | | | | | |
Total Equities | | | | | |
(Cost: $367,533,281) | | | | $ | 387,038,020 |
| | | | | | |
Total Investments – 98.8% | | | | | |
(Cost: $367,533,281) | | | | $ | 387,038,020 |
| | | | | | |
Other Assets Less Liabilities – 1.2% | | | | | 4,806,140 |
Net Assets – 100% | | | | $ | 391,844,160 |
SECTOR ALLOCATIONS (As a Percentage of Net Assets) (unaudited) | | |
Communication Services | | 0.9 | % |
Consumer Discretionary | | 10.1 | % |
Consumer Staples | | 5.1 | % |
Energy | | 4.0 | % |
Financials | | 13.4 | % |
Healthcare | | 1.1 | % |
Industrials | | 38.3 | % |
Information Technology | | 19.6 | % |
Materials | | 4.2 | % |
Utilities | | 2.1 | % |
See accompanying notes to the financial statements.
11
OBERWEIS FOCUSED INTERNATIONAL GROWTH FUND
Schedule of Investmentsa December 31, 2022
| | SHARES | | VALUE |
Equities – 99.9% | | | | | |
AUSTRALIA – 5.0% | | | | | |
BHP Group Ltd. | | 4,300 | | $ | 133,197 |
Woodside Energy Group Ltd. | | 4,900 | | | 118,665 |
| | | | | | 251,862 |
| | | | | | |
DENMARK – 4.8% | | | | | |
Novo Nordisk A/S | | 1,800 | | | 244,468 |
| | | | | | |
FRANCE – 16.0% | | | | | |
Edenred* | | 3,600 | | | 195,929 |
LVMH Moet Hennessy Louis Vuitton SE | | 330 | | | 240,135 |
Rexel SA | | 6,300 | | | 124,603 |
Schneider Electric SE | | 1,800 | | | 252,779 |
| | | | | | 813,446 |
| | | | | | |
GERMANY – 4.7% | | | | | |
Sartorius AG* | | 600 | | | 236,922 |
| | | | | | |
JAPAN – 18.5% | | | | | |
BayCurrent Consulting, Inc. | | 6,100 | | | 189,893 |
Bridgestone Corp. | | 3,100 | | | 109,762 |
Sony Group Corp. | | 5,100 | | | 388,730 |
Toyo Kaisha Ltd.* | | 3,100 | | | 119,431 |
Toyota Motor Corp. | | 9,500 | | | 129,604 |
| | | | | | 937,420 |
| | | | | | |
NETHERLANDS – 10.4% | | | | | |
Adyen NV* | | 300 | | | 416,469 |
ASML Hldg. NV | | 200 | | | 109,049 |
| | | | | | 525,518 |
| | | | | | |
SWEDEN – 2.2% | | | | | |
EQT AB | | 5,200 | | | 110,475 |
| | | | | | |
SWITZERLAND – 13.6% | | | | | |
Nestle SA | | 1,600 | | | 184,805 |
Roche Hldg. AG* | | 700 | | | 219,954 |
Zurich Insurance Group AG* | | 600 | | | 286,831 |
| | | | | | 691,590 |
| | | | | | |
UNITED KINGDOM – 20.4% | | | | | |
Anglo American PLC | | 2,500 | | | 97,896 |
BP PLC | | 20,000 | | | 115,394 |
Diageo PLC | | 3,100 | | | 135,687 |
HSBC Hldgs. PLC | | 28,900 | | | 179,102 |
See accompanying notes to the financial statements.
12
OBERWEIS FOCUSED INTERNATIONAL GROWTH FUND
Schedule of Investmentsa December 31, 2022 (continued)
| | SHARES | | VALUE |
Natwest Group PLC* | | 55,300 | | $ | 176,356 |
Shell PLC | | 4,100 | | | 115,577 |
Unilever PLC | | 2,400 | | | 121,165 |
Wise PLC* | | 13,800 | | | 93,488 |
| | | | | | 1,034,665 |
| | | | | | |
UNITED STATES OF AMERICA – 4.3% | | | | | |
Cadence Design Systems, Inc.* | | 1,400 | | | 224,896 |
| | | | | | |
Total Equities | | | | | |
(Cost: $5,650,097) | | | | $ | 5,071,262 |
| | | | | | |
Total Investments – 99.9% | | | | | |
(Cost: $5,650,097) | | | | $ | 5,071,262 |
| | | | | | |
Other Assets Less Liabilities – 0.1% | | | | | 5,854 |
Net Assets – 100% | | | | $ | 5,077,116 |
a Certain securities were fair valued under the discretion of the Board of Trustees
* Non-income producing security during the period ended December 31, 2022
SECTOR ALLOCATIONS (As a Percentage of Net Assets) (unaudited) | | |
Consumer Discretionary | | 17.1 | % |
Consumer Staples | | 11.1 | % |
Energy | | 6.9 | % |
Financials | | 14.8 | % |
Healthcare | | 13.8 | % |
Industrials | | 11.2 | % |
Information Technology | | 20.5 | % |
Materials | | 4.5 | % |
See accompanying notes to the financial statements.
13
THE OBERWEIS FUNDS
Statements of Assets and Liabilities December 31, 2022
| | | International
Opportunities
Institutional Fund | Focused
International
Growth Fund | |
| | | ASSETS | | | | | | | |
| | | Investment securities at valuea | $ | 387,038,020 | | $ | 5,071,262 | | |
| | | Cash | | 3,229,244 | | | 12,157 | | |
| | | Foreign Currencyb | | 51,664 | | | — | | |
| | | Receivable from fund shares sold | | 228,188 | | | 6,000 | | |
| | | Dividends and interest receivable | | 1,701,546 | | | 4,650 | | |
| | | Receivable due from advisor (see note 3) | | — | | | 3,666 | | |
| | | Prepaid expenses | | 59,770 | | | 3,111 | | |
| | | Total Assets | | 392,308,432 | | | 5,100,846 | | |
| | | | | | | | | | |
| | | LIABILITIES | | | | | | | |
| | | Payable for fund shares redeemed | | 52,250 | | | — | | |
| | | Payable to advisor (see note 3) | | 319,391 | | | — | | |
| | | Accrued expenses | | 92,631 | | | 23,730 | | |
| | | Total Liabilities | | 464,272 | | | 23,730 | | |
| | | NET ASSETS | $ | 391,844,160 | | $ | 5,077,116 | | |
| | | | | | | | | | |
| | | SHARES OUTSTANDING | | | | | | | |
| | | (shares of beneficial interest issued and outstanding, respectively, unlimited number of shares authorized with no par value) | | 47,766,133 | | | 665,395 | | |
| | | Net asset value, offering price and redemption price | $ | 8.20 | | $ | 7.63 | | |
| | | | | | | | | | |
| | | ANALYSIS OF NET ASSETS | | | | | | | |
| | | Capital | $ | 547,012,086 | | $ | 7,040,506 | | |
| | | Accumulated losses | | (155,167,926 | ) | | (1,963,390 | ) | |
| | | Net Assets | $ | 391,844,160 | | $ | 5,077,116 | | |
| | | | | | | | | | |
| | | a Investment securities at cost | $ | 367,533,281 | | $ | 5,650,097 | | |
| | | b Foreign currency at cost | $ | 51,656 | | $ | — | | |
See accompanying notes to the financial statements.
14
THE OBERWEIS FUNDS
Statements of Operations Year Ended December 31, 2022
| | | International
Opportunities
Institutional Fund | Focused
International
Growth Fundb | |
| | | INVESTMENT INCOME | | | | | | | |
| | | Dividendsa | $ | 14,220,871 | | $ | 103,404 | | |
| | | Total Investment Income | | 14,220,871 | | | 103,404 | | |
| | | | | | | | | | |
| | | EXPENSES | | | | | | | |
| | | Investment advisory fees (see note 3) | | 6,809,875 | | | 38,754 | | |
| | | Transfer agent fees and expenses | | 83,912 | | | 10,757 | | |
| | | Custodian fees and expenses | | 206,948 | | | 8,314 | | |
| | | Accounting services fees | | 240,042 | | | 12,799 | | |
| | | Shareholder Fees | | 28,761 | | | 4,143 | | |
| | | Audit Fees | | 21,793 | | | 16,568 | | |
| | | Other | | 347,026 | | | 4,203 | | |
| | | Total expenses before reimbursed expenses | | 7,738,357 | | | 95,538 | | |
| | | Earnings credit (see note 6) | | (73,713 | ) | | (2,079 | ) | |
| | | Expense reimbursement (see note 3) | | (173,781 | ) | | (47,438 | ) | |
| | | Total Expenses | | 7,490,863 | | | 46,021 | | |
| | | NET INVESTMENT INCOME | | 6,730,008 | | | 57,383 | | |
| | | | | | | | | | |
| | | NET REALIZED AND UNREALIZED GAINS (LOSSES) FROM INVESTMENTS | | |
| | | Net realized losses on investment transactions | | (163,046,219 | ) | | (1,384,639 | ) | |
| | | Net realized gains (losses) on foreign currency transactions | | (115,713 | ) | | 3,180 | | |
| | | Net realized losses on investment and foreign currency transactions | | (163,161,932 | ) | | (1,381,459 | ) | |
| | | Change in net unrealized appreciation/depreciation on investments and translation of assets and liabilities denominated in foreign currencies | | (233,434,243 | ) | | (578,751 | ) | |
| | | Net realized/unrealized losses on investments and foreign currencies | | (396,596,175 | ) | | (1,960,210 | ) | |
| | | NET DECREASE IN NET ASSETS RESULTING FROM OPERATIONS | $ | (389,866,167 | ) | $ | (1,902,827 | ) | |
See accompanying notes to the financial statements.
15
THE OBERWEIS FUNDS
Statements of Changes in Net Assets
| | | International Opportunities
Institutional Fund | |
| | | | Year Ended
December 31,
2022 | Year Ended
December 31,
2021 | |
| | | FROM OPERATIONS | | | | | | | |
| | | Net investment income (loss) | $ | 6,730,008 | | $ | (3,838,610 | ) | |
| | | Net realized gains (losses) on investments and foreign currency transactions | | (163,161,932 | ) | | 264,574,668 | | |
| | | Change in net unrealized appreciation\depreciation on investments and foreign currencies | | (233,434,243 | ) | | (233,269,721 | ) | |
| | | Net increase (decrease) in net assets resulting from operations | | (389,866,167 | ) | | 27,466,337 | | |
| | | | | | | | | | |
| | | FROM DISTRIBUTIONS | | | | | | | |
| | | Distributions to shareholders | | — | | | (266,497,571 | ) | |
| | | Net decrease in net assets from distributions | | — | | | (266,497,571 | ) | |
| | | | | | | | | | |
| | | FROM CAPITAL SHARE TRANSACTIONS | | | | | | | |
| | | Proceeds from sale of shares | | 43,941,613 | | | 102,744,641 | | |
| | | Proceeds from reinvestment of distributions | | — | | | 246,793,697 | | |
| | | Redemption of shares (see note 5) | | (340,658,949 | ) | | (229,735,433 | ) | |
| | | Net increase (decrease) from capital share transactions | | (296,717,336 | ) | | 119,802,905 | | |
| | | Total decrease in net assets | | (686,583,503 | ) | | (119,228,329 | ) | |
| | | | | | | | | | |
| | | NET ASSETS | | | | | | | |
| | | Beginning of year | | 1,078,427,663 | | | 1,197,655,992 | | |
| | | End of year | $ | 391,844,160 | | $ | 1,078,427,663 | | |
| | | | | | | | | | |
| | | TRANSACTIONS IN SHARES | | | | | | | |
| | | Shares sold | | 4,483,001 | | | 5,885,110 | | |
| | | Shares issued in reinvestment of distributions | | — | | | 18,882,456 | | |
| | | Less shares redeemed | | (38,982,152 | ) | | (13,179,772 | ) | |
| | | Net increase (decrease) from capital share transactions | | (34,499,151 | ) | | 11,587,794 | | |
See accompanying notes to the financial statements.
16
THE OBERWEIS FUNDS
Statements of Changes in Net Assets (continued)
| | | Focused International
Growth Funda | |
| | | | Period Ended
December 31,
2022 | |
| | | FROM OPERATIONS | | | | |
| | | Net investment income | $ | 57,383 | | |
| | | Net realized losses on investments and foreign currency transactions | | (1,381,459 | ) | |
| | | Change in net unrealized appreciation\depreciation on investments and foreign currencies | | (578,751 | ) | |
| | | Net decrease in net assets resulting from operations | | (1,902,827 | ) | |
| | | | | | | |
| | | FROM DISTRIBUTIONS | | | | |
| | | Distributions to shareholders | | (63,069 | ) | |
| | | Net decrease in net assets from distributions | | (63,069 | ) | |
| | | | | | | |
| | | FROM CAPITAL SHARE TRANSACTIONS | | | | |
| | | Proceeds from sale of shares | | 11,665,393 | | |
| | | Proceeds from reinvestment of distributions | | 37,596 | | |
| | | Redemption of shares (see note 5) | | (4,659,977 | ) | |
| | | Net increase from capital share transactions | | 7,043,012 | | |
| | | Total increase in net assets | | 5,077,116 | | |
| | | | | | | |
| | | NET ASSETS | | | | |
| | | Beginning of period | | — | | |
| | | End of period | $ | 5,077,116 | | |
| | | | | | | |
| | | TRANSACTIONS IN SHARES | | | | |
| | | Shares sold | | 1,278,827 | | |
| | | Shares issued in reinvestment of distributions | | 4,889 | | |
| | | Less shares redeemed | | (618,321 | ) | |
| | | Net increase from capital share transactions | | 665,395 | | |
a For the period from April 1, 2022 (commencement of operations) through December 31, 2022.
See accompanying notes to the financial statements.
17
THE OBERWEIS FUNDS
Notes to Financial Statements December 31, 2022
1. Description of Organization
Description of business. The Oberweis Funds (the ‘‘Trust’’) is registered under the Investment Company Act of 1940 as an open-end management investment company. The Trust is authorized to operate numerous Funds under various trading strategies. The Oberweis International Opportunities Institutional Fund and the Oberweis Focused International Growth Fund (collectively, the “Funds”) are each Funds in a series issued by the Trust.
2. Significant Accounting Policies
The following is a summary of significant accounting policies consistently followed by the Funds. These policies are in conformity with accounting principles generally accepted in the United States of America (“GAAP”). The Funds are each an investment company and follow accounting and reporting guidance under the Financial Accounting Standards Board (“FASB”) Accounting Standards Codification (“ASC”) Topic 946, “Financial Services — Investment Companies.”
Investment valuation. Investments in securities are stated at value as of the close of the regular trading session on the New York Stock Exchange (‘‘NYSE’’) (generally 3 p.m., Central Standard Time). Each listed and unlisted security for which last sale information is regularly reported is valued at the last reported sales price on that day. If there has been no sale on such day, then such security is valued at the current day’s bid price. Any unlisted security for which last sale information is not regularly reported and any listed debt security which has an inactive listed market for which over-the-counter market quotations are readily available are valued at the closing bid price determined on the basis of reasonable inquiry. Options are valued at the last reported bid price on the primary exchange as of the close of the regular trading session of the Chicago Board Options Exchange (‘‘CBOE’’). Restricted securities and any other securities or other assets for which market quotations are not readily available are valued by appraisal at their fair value as determined in good faith under procedures established by and under the general supervision and responsibility of the Board of Trustees. Short-term debt obligations, commercial paper and repurchase agreements are valued on the basis of quoted yields for securities of comparable maturity, quality and type or on the basis of amortized cost.
The Funds hold foreign equity securities. Foreign securities are fair valued as described in the following circumstances. Generally, trading in foreign securities markets is completed each day at various times prior to the close of the regular trading session of the NYSE. Due to the time differences between the closings of the relevant foreign securities exchanges and the close of the regular trading session of the NYSE for the Funds, the Funds will fair value their foreign investments when it is determined that the market quotations for the foreign investments either are not readily available or are unreliable and, therefore, do not represent fair value. When the fair value prices are utilized, these prices will attempt to reflect the impact of the U.S. financial markets’ perceptions and trading activities on the Funds’ foreign investments since the last closing prices of the foreign investments were calculated on their primary foreign securities markets or exchanges. For these purposes, the Board of Trustees of the Trust has determined that movements in relevant indices, after the close of the foreign securities exchanges, may demonstrate that market quotations are unreliable, and may trigger fair value pricing for certain securities. Consequently, fair valuation of portfolio securities may occur on a daily basis. In determining fair value prices, the Trust utilizes data furnished by an independent pricing service (and that data draws upon, among other information, the market values of foreign investments). When a Fund uses fair value pricing, the values assigned to the Fund’s foreign investments may not be the quoted or published prices of the investments on their primary markets or exchanges.
18
THE OBERWEIS FUNDS
Notes to Financial Statements December 31, 2022 (continued)
Fair value measurements. In accordance with Financial Accounting Standards Board (‘‘FASB’’) guidance, the Funds utilize the ‘‘Fair Value Measurements and Disclosures’’ to define fair value, set out a framework for measuring fair value, and expand disclosures regarding fair value measurements. The Fair Value Measurement Standard applies to fair value measurements already required or permitted by existing standards.
Various inputs are used in determining the value of the Funds’ investments. These inputs are summarized in the three levels listed below:
• Level 1 — Quoted prices in active markets for identical securities.
• Level 2 — Other significant observable inputs (including quoted prices for similar securities, interest rates, prepayment speeds, credit risk, etc).
• Level 3 — Significant unobservable inputs (including the Funds’ own assumptions in determining the fair value of investments).
The inputs or methodology used for valuing securities are not necessarily an indication of the risk associated with investing in those securities. The following is a summary of the inputs used to value the Funds net assets as of December 31, 2022:
| | International
Opportunities
Institutional
Fund | | Focused
International
Growth
Fund | |
| | | Level 1 – Equities | | | | | | |
| | | Total Europe | $ | 11,614,150 | | $ | — | |
| | | Total North America | | 63,844,535 | | | 224,896 | |
| | | Total Level 1 | | 75,458,685 | | | 224,896 | |
| | | | | | | | | |
| | | Level 2 – Equities | | | | | | |
| | | Total Asia | | 61,875,426 | | | 937,420 | |
| | | Total Australia | | 34,416,294 | | | 251,862 | |
| | | Total Europe | | 209,237,136 | | | 3,657,084 | |
| | | Total North America | | 6,050,479 | | | — | |
| | | Total Level 2 | | 311,579,335 | | | 4,846,366 | |
| | | | | | | | | |
| | | Level 3 | | — | | | — | |
| | | Total Investments | $ | 387,038,020 | | $ | 5,071,262 | |
The Funds’ assets may include certain foreign securities for which a third party statistical pricing service may be employed for purposes of fair market valuation. The pricing service provides fair market valuation on days when the movement in relevant indices exceeds a predetermined threshold.
Foreign currency transactions. The accounting records of the Funds are maintained in U.S. dollars. Foreign currency amounts are translated into U.S. dollars at the current rate of exchange to determine the value of investments, assets and liabilities. Purchases and sales of securities, and income and expenses are translated at the prevailing rate of exchange on the respective date of these transactions. The Funds do not isolate that portion of the results of operations resulting from changes in foreign exchange rates on investments from fluctuations arising from changes in market prices of securities held. These fluctuations are included with the net realized and unrealized gains or losses from investments and foreign currencies.
19
THE OBERWEIS FUNDS
Notes to Financial Statements December 31, 2022 (continued)
Risks associated with foreign securities and currencies. Investments in securities of foreign issuers carry certain risks not ordinarily associated with investments in securities of U.S. issuers. These risks include future political and economic developments, and the possible imposition of exchange controls or other foreign governmental laws and restrictions. In addition, with respect to certain countries, there is the possibility of expropriation of assets, confiscatory taxation, political or social instability or diplomatic developments, which could adversely affect investments in those countries.
Certain countries also may impose substantial restrictions on investments in their capital markets by foreign entities, including restrictions on investments in issuers of industries deemed sensitive to relevant national interests. These factors may limit the investment opportunities available and result in a lack of liquidity and a high price volatility with respect to securities of issuers from developing countries.
Fund share valuation. Fund shares are sold and redeemed on a continuous basis at net asset value. On each day the NYSE is open for trading, the net asset value per share is determined as of the later of the close of the NYSE or the CBOE by dividing the total value of investments and other assets, less liabilities, by the number of shares outstanding.
Investment transactions and investment income. Investment transactions are accounted for on the trade date (date the order to buy or sell is executed). Dividend income is recorded on the ex-dividend date, except that certain dividends from foreign securities are recorded as soon as the information is available to the Fund, and interest income is recorded on the accrual basis and includes amortization of premium and discount. Realized gains and losses from investment transactions are reported on an identified cost basis. Gains and losses on premiums from expired options are recognized on the date of expiration.
Federal income taxes and dividends to shareholders. It is the policy of the Funds to continue to comply with all requirements of the Internal Revenue Code of 1986, as amended (‘‘the Code’’), applicable to regulated investment companies and to distribute substantially all of their taxable income to their shareholders. The Funds have met the requirements of the Code applicable to regulated investment companies for the year ended December 31, 2022. Therefore, no federal income tax provision is required. Income and capital gains of the Funds are determined in accordance with both tax regulations and accounting principles generally accepted in the U.S. (‘‘GAAP’’). Such treatment may result in temporary and permanent differences between tax basis earnings and earnings reported for financial statement purposes. These reclassifications, which have no impact on the net asset value of the Funds, are primarily attributable to certain differences in computation of distributable income and capital gains under federal tax rules versus GAAP.
The Funds may utilize earnings and profits on redemption of shares as part of the dividends paid deduction.
For the year ended December 31, 2022, permanent book and tax differences resulting primarily from differing treatments for foreign currency transactions, and passive foreign investment company (“PFIC”) adjustments were identified and reclassified among the components of the Fund’s net assets.
20
THE OBERWEIS FUNDS
Notes to Financial Statements December 31, 2022 (continued)
GAAP requires that certain components of net assets be reclassified between financial and tax reporting. These reclassifications have no effect on net assets or net asset value per share. For the year ended December 31, 2022, permanent differences in book and tax accounting have been reclassified to paid in capital, accumulated net investment loss and accumulated net realized gain as follows:
| | | Increases/(Decrease) | |
| | | Capital | | Accumulated
Earnings | |
| | | International Opportunities Institutional Fund | $ | (6,335,656 | ) | | $ | 6,335,656 | |
| | | Focused International Growth Fund | | (2,505 | ) | | | 2,505 | |
The tax character of distributions paid during the fiscal year ended December 31, 2022 was as follows:
| | Distributions
Paid from
Ordinary
Income | | Distributions
Paid from
Net Long-Term
Capital Gains | | Total
Distributions
Paid | |
| | | International Opportunities Institutional Fund | $ | — | | $ | — | | $ | — | |
| | | Focused International Growth Fund | | 63,069 | | | — | | | 63,069 | |
The tax character of distributions paid during the fiscal year ended December 31, 2021 was as follows:
| | Distributions
Paid from
Ordinary
Income | | Distributions
Paid from
Net Long-Term
Capital Gains | | Total
Distributions
Paid | |
| | | International Opportunities Institutional Fund | $ | — | | $ | 266,497,571 | | $ | 266,497,571 | |
| | | Focused International Growth Fund | | — | | | — | | | — | |
As of December 31, 2022, the following Funds had net capital loss carryforwards to offset future net capital gains, if any, to the extent provided by treasury regulations:
| | | Not Subject to Expiration | |
| | | Short-Term | | Long-Term | |
| | | International Opportunities Institutional Fund | $ | 152,972,176 | | $ | 9,407,340 | |
| | | Focused International Growth Fund | | 1,288,355 | | | — | |
The International Institutional and Focused International Growth Fund utilized $0 and $0 of capital loss carryforward during the year ended December 31, 2022.
21
THE OBERWEIS FUNDS
Notes to Financial Statements December 31, 2022 (continued)
As of December 31, 2022 the components of accumulated earnings on a tax basis were as follows:
| | Undistributed
ordinary
income | | Undistributed
long-term
capital gains | | Accumulated
capital and
other losses | | Unrealized Appreciation
on investments | | Unrealized
Depreciation
foreign
currency
translations | |
| | | International Opportunities Institutional Fund | $ | — | | $ | — | | $ | (162,379,516) | | $ | 7,254,861 | | $ | (43,271) | |
| | | Focused International Growth Fund | | — | | | — | | | (1,288,355) | | | (675,120) | | | 85 | |
Accumulated capital and other losses consists of timing differences related to wash sales.
As of December 31, 2022 the cost of investments for federal income tax purposes are as follows:
| | Cost of
Investments
for Federal
Tax Purposes | | Gross
Unrealized
Appreciation | | Gross
Unrealized
(Depreciation) | | Unrealized
Appreciation | |
| | | International Opportunities Institutional Fund | $ | 379,783,159 | | $ | 52,564,366 | | $ | (45,309,505 | ) | $ | 7,254,861 | | |
| | | Focused International Growth Fund | | 5,746,382 | | | 98,631 | | | (773,751 | ) | | (675,120 | ) | |
The Funds have reviewed all open tax years and major jurisdictions and concluded that there are no significant uncertain tax positions that would require recognition in the financial statements. Open tax years are those that are open for exam by taxing authorities and, as of December 31, 2022, open Federal tax years include the tax years ended 2019 through 2022 for the Oberweis International Opportunities Institutional Fund and the tax year 2022 for the Oberweis Focused International Growth Fund. The Funds have no examinations in progress and are also not aware of any tax positions for which it is reasonably possible that the total amounts of unrecognized tax benefits will significantly change in the next twelve months.
Use of estimates. The preparation of financial statements in conformity with generally accepted accounting principles requires management to make estimates and assumptions that affect the amounts reported in the financial statements and accompanying notes. Actual results may differ from those estimates.
Indemnifications. Under the Trust’s organizational documents, its present and former Officers and Trustees are indemnified against certain liabilities arising out of the performance of their duties to the Trust. In addition, in the normal course of business, the Trust enters into contracts that provide general indemnifications to other parties. The Trusts’ maximum exposure under these arrangements is unknown as this would involve future claims that may be made against the Trust that have not yet occurred. However, the Trust has not had prior claims or losses pursuant to these contracts and expects the risk of loss to be remote.
22
THE OBERWEIS FUNDS
Notes to Financial Statements December 31, 2022 (continued)
3. Transactions with Affiliates
The Funds have written agreements with Oberweis Asset Management, Inc. (‘‘OAM’’) as the Fund’s investment adviser and manager. Oberweis Securities, Inc. (‘‘OSI’’), the Fund’s principal distributor, is an affiliate of OAM.
Investment advisory agreement. Under the Advisory Agreement, OAM provides investment advisory and management services to the Funds. The Oberweis International Opportunities Institutional Fund paid monthly investment advisory and management fees at an annual rate equal to 1.00% of average daily net assets and the Focused International Growth Fund paid investment advisory and management fees at an annual rate equal to 0.80% of average daily net assets. For the year ended December 31, 2022, the International Opportunities Institutional Fund incurred investment advisory and management fees totaling $6,809,875 and the Focused International Growth Fund incurred investment advisory and management fees totaling $38,754.
Expense reimbursement. OAM is contractually obligated to reduce its investment and management fees or reimburse the International Opportunities Institutional Fund and the Focused International Growth Fund to the extent that total ordinary operating expenses, as defined, exceed in any one year 1.10% and 0.95%, respectively, expressed as a percentage of each Fund’s average daily net assets. For the year ended December 31, 2022 OAM reimbursed the International Opportunities Institutional Fund and the Focused International Growth Fund in the amount of $173,781 and $47,438, respectively.
The expense limitation agreements have one-year terms and are approved annually. The Adviser may recoup the amount of any expense reimbursed during the term of the expense limitation agreement if the recoupment does not cause the Fund’s expenses to exceed the expense limitation in place at the time of reimbursement.
Officers and trustees. Certain officers and trustees of the Trust are also officers and/or directors of OAM and OSI. During the year ended December 31, 2022, the Trust made no direct payments to its officers and paid $171,167 to its unaffiliated trustees.
Affiliated commissions. For the year ended December 31, 2022, the International Opportunities Institutional Fund and the Focused International Growth Fund did not execute any security transactions through OSI and therefore did not pay commissions to OSI.
4. Investment Transactions
The cost of securities purchased and proceeds from securities sold during the year ended December 31, 2022, other than options written and money market investments, aggregated $520,934,431 and $788,080,030, respectively for the International Opportunities Institutional Fund, and $10,285,921 and $3,251,185 respectively for the Focused International Growth Fund. The Funds did not hold government securities during the year ended December 31, 2022.
The Funds may write covered call options. The premiums received provide a partial hedge (protection) against declining prices and enables the Fund to generate a higher return during years when OAM does not expect the underlying security to make any major price moves in the near future but still deems the underlying security to be, over the long term, an attractive investment for the Fund. The Fund may write covered call options for which premiums received are recorded as liabilities and are subsequently adjusted to the current value of the options written. Premiums received from writing options that expire are treated as realized gains. Premiums received from writing options, which are either exercised or closed, are offset
23
THE OBERWEIS FUNDS
Notes to Financial Statements December 31, 2022 (continued)
against the proceeds received or amount paid on the transaction to determine realized gains or losses. Amounts recovered for securities litigation are included in the realized gains of the Fund and are recorded when received. The Fund did not write covered call options during the year ended December 31, 2022.
5. Redemption Fee
The Fund is designed for long-term investors. To discourage market timers, redemptions of shares within 90 days of purchase are subject to a 2% redemption fee of the total redemption amount. The redemption fee is deducted from the redemption proceeds and is retained by the Fund.
The redemption fee is retained by the Funds for the expense they incur in connection with shareholder redemptions. Redemption fees received by the International Opportunities International Fund and Focused International Growth Fund were $106,897 and $0 respectively for the year ended December 31, 2022 and were recorded as a reduction of the redemption of shares in the Statement of Changes in Net Assets.
6. Earnings Credits and Interest Charges
The Trust, as part of the agreement with the Custodian, receives credits against its custodian fees on its uninvested cash balances and is allowed to borrow for temporary purposes. Borrowings are not to exceed 5% of the value of each Fund’s total assets at the time of any such borrowing. Interest on amounts borrowed is calculated at the prime rate and is payable monthly. During the year ended December 31, 2022, the International Opportunities Institutional Fund and the Focused International Growth Fund received credits of $73,713 and $2,079 respectively. The International Opportunities Institutional Fund and the Focused International Growth Fund incurred interest charges of $26,792 and $149 respectively, which is included in custodian fees and expenses in the Statement of Operations.
7. Coronavirus (COVID-19) Pandemic
In early 2020, an outbreak of a novel strain of coronavirus (COVID-19) emerged globally. This coronavirus has resulted in closing international borders, enhanced health screenings, healthcare service preparation and delivery, quarantines, cancellations, disruptions to supply chains and customer activity, as well as general public concern and uncertainty. The impact of this outbreak has negatively affected the worldwide economy, as well as the economies of individual countries, the financial health of individual companies and the market in general in significant and unforeseen ways. The future impact of COVID-19 is currently unknown, and it may exacerbate other risks that apply to the Funds, including political, social and economic risks. Any such impact could adversely affect the Funds’ performance, the performance of the securities in which the Funds invest and may lead to losses on your investment in each Fund. The ultimate impact of COVID-19 on the financial performance of the Funds’ investments is not reasonably estimable at this time.
8. Subsequent Events
The Funds have evaluated subsequent events through the issuance of the financial statements and determined that no events have occurred that require disclosure.
24
THE OBERWEIS FUNDS
Financial Highlights
Per share income and capital for a share outstanding throughout each year is as follows:
| | | International Opportunities Institutional Fund | | |
| | | | Years Ended December 31, | | |
| | | | | 2022 | | | | 2021 | | | | 2020 | | | | 2019 | | | | 2018 | | |
| | Net asset value at beginning of year | | $ | 13.11 | | | $ | 16.95 | | | $ | 10.41 | | | $ | 8.54 | | | $ | 12.77 | | |
| | | | | | | | | | | | | | | | | | | | | | | |
| | INCOME (LOSS) FROM INVESTMENT OPERATIONS: | |
| | Net investment income
(loss)a | | | .09 | | | | (.06 | ) | | | (.03 | ) | | | .04 | | | | .04 | | |
| | Net realized and unrealized gains (losses) on investments and foreign currency transactions | | | (5.00 | ) | | | .40 | | | | 6.66 | | | | 1.97 | | | | (3.11 | ) | |
| | Total from investment operations | | | (4.91 | ) | | | .34 | | | | 6.63 | | | | 2.01 | | | | (3.07 | ) | |
| | Redemption feesa | | | — | c | | | — | c | | | — | c | | | — | c | | | — | c | |
| | Less dividends and distributions: | | | | | | | | | | | | | | | | | | | | | |
| | Dividends from net realized gains on investments and foreign currency transactions | | | — | | | | (4.18 | ) | | | (.04 | ) | | | — | | | | (1.15 | ) | |
| | Dividends from net investment income | | | — | | | | — | | | | (.05 | ) | | | (.14 | ) | | | (.01 | ) | |
| | Total dividends and distributions | | | — | | | | (4.18 | ) | | | (.09 | ) | | | (.14 | ) | | | (1.16 | ) | |
| | Net asset value at end of year | | $ | 8.20 | | | $ | 13.11 | | | $ | 16.95 | | | $ | 10.41 | | | $ | 8.54 | | |
| | Total return (%) | | | (37.45 | ) | | | 2.10 | | | | 63.65 | | | | 23.50 | | | | (23.91 | ) | |
| | | | | | | | | | | | | | | | | | | | | | | |
| | RATIO/SUPPLEMENTAL DATA: | |
| | Net Assets at end of year
(in thousands) | | $ | 391,844 | | | $ | 1,078,428 | | | $ | 1,197,656 | | | $ | 967,119 | | | $ | 753,138 | | |
| | Ratio of gross expenses to average net assets (%) | | | 1.14 | | | | 1.09 | | | | 1.13 | | | | 1.12 | | | | 1.11 | | |
| | Ratio of net expenses to average net assets (%)b | | | 1.10 | | | | 1.09 | | | | 1.10 | | | | 1.08 | | | | 1.08 | | |
| | Ratio of net investment income (loss) to average net assets (%) | | | .99 | | | | (.32 | ) | | | (.27 | ) | | | .37 | | | | .35 | | |
| | Portfolio turnover rate (%) | | | 77 | | | | 91 | | | | 134 | | | | 153 | | | | 145 | | |
Notes:
25
THE OBERWEIS FUNDS
Financial Highlights (continued)
Per share income and capital for a share outstanding throughout the period is as follows:
| | | Focused International Growth Fund | |
| | | | Period Ended
December 31,
2022a | |
| | Net asset value at beginning of period | | $ | 10.00 | | |
| | | | | | | |
| | Income (loss) from investment operations: | |
| | Net investment incomeb | | | .07 | | |
| | Net realized and unrealized losses on investments | | | (2.34 | ) | |
| | Total from investment operations | | | (2.27 | ) | |
| | Redemption Feesb | | | — | | |
| | Less dividends and distributions: | | | | | |
| | Dividends from net investment income | | | (.10 | ) | |
| | Total dividends and distributions | | | (.10 | ) | |
| | Net asset value at end of period | | $ | 7.63 | | |
| | Total Return (%) | | | (22.75 | )d | |
| | | | | | | |
| | Ratio/Supplemental Data | |
| | Net Assets at end of year (in thousands) | | $ | 5,077 | | |
| | Ratio of gross expenses to average net assets (%) | | | 1.97 | d | |
| | Ratio of net expenses to average net assets (%)c | | | .95 | d | |
| | Ratio of net investment income to average net assets (%) | | | 1.18 | d | |
| | Portfolio turnover rate (%) | | | 54 | e | |
Notes:
26
Report of Independent Registered Public Accounting FirM
To the Board of Trustees of The Oberweis Funds and the Shareholders of Oberweis International Opportunities Institutional Fund and Oberweis Focused International Growth Fund
Opinion on the Financial Statements
We have audited the accompanying statements of assets and liabilities of Oberweis International Opportunities Institutional Fund and Oberweis Focused International Growth Fund, each a series of shares of beneficial interest in The Oberweis Funds (the “Funds”), including the schedules of investments, as of December 31, 2022, for the Oberweis International Opportunities Institutional Fund the related statements of operations for the year then ended, the statements of changes in net assets for each of the years in the two-year period then ended, the financial highlights for each of the five years in the period then ended, and for the Oberweis Focused International Growth Fund the related statements of operations, changes in net assets, and the financial highlights for the period April 1, 2022 (commencement of operations) through December 31, 2022, and the related notes (collectively referred to as the “financial statements”). In our opinion, the financial statements present fairly, in all material respects, the financial position of the Funds as of December 31, 2022, the results of their operations, the changes in their net assets and their financial highlights for each of the periods noted above, in conformity with accounting principles generally accepted in the United States of America.
Basis for Opinion
These financial statements are the responsibility of the Funds’ management. Our responsibility is to express an opinion on the Funds’ financial statements based on our audits. We are a public accounting firm registered with the Public Company Accounting Oversight Board (United States) (“PCAOB”) and are required to be independent with respect to the Funds in accordance with the U.S. federal securities law and the applicable rules and regulations of the Securities and Exchange Commission and the PCAOB.
We conducted our audits in accordance with the standards of the PCAOB. Those standards require that we plan and perform the audits to obtain reasonable assurance about whether the financial statements are free of material misstatement, whether due to error or fraud. The Funds are not required to have, nor were we engaged to perform, an audit of their internal control over financial reporting. As part of our audits we are required to obtain an understanding of internal control over financial reporting but not for the purpose of expressing an opinion on the effectiveness of the Funds’ internal control over financial reporting. Accordingly, we express no such opinion.
Our audits included performing procedures to assess the risk of material misstatement of the financial statements, whether due to error or fraud, and performing procedures that respond to those risks. Such procedures included examining, on a test basis, evidence regarding the amounts and disclosures in the financial statements. Our procedures included confirmation of securities owned as of December 31, 2022 by correspondence with the custodian. Our audits also included evaluating the accounting principles used and significant estimates made by management, as well as evaluating the overall presentation of the financial statements. We believe that our audits provide a reasonable basis for our opinion.
BBD, LLP
We have served as the auditor of one or more of the Funds in The Oberweis Funds since 2016.
Philadelphia, Pennsylvania
February 27, 2023
27
TRUSTEES AND OFFICERS OF THE OBERWEIS FUNDS (unaudited)
Name, Address and Age |
Position Held with Fund
|
Term of Office and
Length of Time Served
|
NONINTERESTED TRUSTEES |
Alix Charles (47)
3333 Warrenville Road,
Suite 500 Lisle, IL 60532 | Trustee | Trustee since
May, 20221 |
Katherine Smith Dedrick (65)
3333 Warrenville Road,
Suite 500 Lisle, IL 60532 | Trustee | Trustee since
November, 20041 |
Gary D. McDaniel (74)
3333 Warrenville Road,
Suite 500 Lisle, IL 60532 | Trustee | Trustee since
April, 20041 |
Michael Simon (56)
3333 Warrenville Road,
Suite 500 Lisle, IL 60532 | Trustee | Trustee since
May, 20221 |
INTERESTED TRUSTEES |
James W. Oberweis (48)
3333 Warrenville Road,
Suite 500 Lisle, IL 60532 | President | Officer since
August, 19962 |
Patrick B. Joyce (63)
3333 Warrenville Road,
Suite 500 Lisle, IL 60532 | Executive Vice President | Officer since
October, 19942 |
David I. Covas (47)
3333 Warrenville Road,
Suite 500 Lisle, IL 60532 | Vice President | Officer since
August, 20042 |
Kenneth S. Farsalas (52)
3333 Warrenville Road,
Suite 500 Lisle, IL 60532 | Vice President | Officer since
August, 20092 |
Eric V. Hannemann (49)
3333 Warrenville Road,
Suite 500 Lisle, IL 60532 | Treasurer | Officer since
August, 20052 |
Thomas P. Joyce (37)
3333 Warrenville Road,
Suite 500 Lisle, IL 60532 | Secretary and
Chief Compliance Officer | Officer since
July, 20212 |
The Statement of Additional Information includes additional information about Fund officers and trustees and is available upon request without charge, by calling the Fund at 800-323-6166.
28
TRUSTEES AND OFFICERS OF THE OBERWEIS FUNDS
(unaudited) (continued)
Principal Occupation Last Five Years | Number of
Portfolios
Overseen by
Trustee | Other
Directorships |
| |
Physician – Duly Health and Care – January, 2008 to present. | 8 | None |
Partner – Walberg Law PLLC, January, 2020 to present; Senior Counsel – Tyson & Mendes, May, 2018 to July, 2021; President – Smith-Dedrick Properties, Inc., December, 2016 to December, 2019; President – KSD Law PC, September, 2015 to December, 2021; President – KSD Global Consulting Inc., August, 2015 to present; President – Aggressive Publishing, Inc., 2010 to present. | 8 | None |
Independent Consultant.
| 8 | None |
Principal, Simon Venture Development, September, 2010 to present; Partner, Holt Capital Partners, August, 2016 to present. | 8 | Southwestern National Bank |
|
Chairman, February, 2008 to present, President and Director – Oberweis Asset Management, Inc., September, 2001 to present and Portfolio Manager from December, 1995 to present (held other officer positions from 1995 – September, 2001); President and Director – Oberweis Securities, Inc., September, 1996 to present; Chairman – Oberweis Asset Management (Hong Kong) Limited, March, 2007 to present; Chairman – Oberweis Asset Management UK Limited, July, 2014 to present. | Not Applicable | None |
Executive Vice President, Secretary and Director – Oberweis Asset Management, Inc., September, 1994 to December 31, 2022; Executive Vice President and Director – Oberweis Securities, lnc., September, 1996 to December 31, 2022; Director – Oberweis Asset Management (Hong Kong) Limited, March, 2007 to December 31, 2022; Director – Oberweis Asset Management UK Limited, July, 2014 to December 31, 2022. | Not Applicable | None |
Vice President – Oberweis Asset Management, Inc., September, 2003 to present; Vice-President – Oberweis Securities, Inc., January, 2004 to present; Registered Representative, July, 1997 to present. | Not Applicable | None |
Director of US Equities, January 2008 to present, Vice President and Portfolio Manager, November 2004 to present – Oberweis Asset Management, Inc. | Not Applicable | None |
Chief Financial Officer, October, 2022 to present, Vice President of Accounting, June, 2004 to October, 2022, Oberweis Asset Management, Inc., and Oberweis Securities, Inc. | Not Applicable | None |
Chief Compliance Officer, October, 2022 to present, Vice President of Compliance, December, 2021 to October, 2022, Senior Compliance Analyst, July, 2013 to November, 2021, Compliance Associate, April, 2010 to June, 2013 – Oberweis Asset Management, Inc., and Oberweis Securities, Inc. | Not Applicable | None |
29
THE OBERWEIS FUNDS
Supplemental Information (unaudited)
Qualified Dividend Income
For the year ended December 31, 2022, 100% of the dividends paid from net investment income for the Focused International Growth Fund is designated as qualified dividend income.
Foreign Taxes Paid
Pursuant to Section 853 of the Internal Revenue Code of 1986, as amended, the International Opportunities Institutional Fund and the Focused International Growth Fund designates $7,182,580 and $33,314 respectively of income derived from foreign sources and $1,394,983 and $2,810 respectively of foreign taxes paid for the period ended December 31, 2022.
Of the ordinary income (including short-term capital gain) distributions made (or to be made) for the year ended December 31, 2022, the proportionate share of income derived from foreign sources and foreign taxes paid attributable to one share of stock are:
| | Foreign
Source Income | | Foreign
Taxes Paid | |
| | | International Opportunities Institutional Fund | $ | 0.1504 | | $ | 0.0292 | |
| | | Focused International Growth Fund | $ | 0.0501 | | $ | 0.0042 | |
Proxy Voting:
The Oberweis Funds have delegated authority to vote proxies related to the Funds’ (International Opportunities Institutional Fund and Focused International Growth Fund) portfolio securities to the Funds’ investment advisor, Oberweis Asset Management, Inc. (“OAM”). A description of the policies and procedures that OAM uses in fulfilling this responsibility is available, without charge upon request, by calling 1-800-323-6166. It also appears on www.oberweisfunds.com and in the Funds’ Statement of Additional Information, which can be found on the Securities and Exchange Commission’s (“SEC”) website at http://www.sec.gov. Information on how the Funds voted proxies relating to portfolio securities during the most recent 12-month period ended June 30 is available (1) without charge, upon request, by calling 1-800-323-6166, and (2) on the SEC’s website at http://www.sec.gov.
Availability of Schedules of Portfolio Investments:
The Funds file their complete schedule of portfolio investments with the SEC for the first and third quarter of each fiscal year (March 31 and September 30) on Form NPORT. The Funds Form NPORT are available, without charge, on the SEC’s website at http://www.sec.gov and may be reviewed and copied at the SEC’s Public Reference Room in Washington, D.C. Information on the operation of the Public Reference Room may be obtained by calling 1-800-SEC-0330.
Approval of Investment Advisory Agreement:
The Investment Advisory and Management Agreement between The Oberweis Funds (the “Trust”) and Oberweis Asset Management, Inc. (“OAM”) (the “Advisory Agreement”) with respect to the International Opportunities Institutional Fund (the “Fund”) was last approved by the Board of Trustees of the Trust (the “Board”), including all of the trustees who are not parties to the Advisory Agreement or interested persons of any such party (the “Independent Trustees”), at
30
THE OBERWEIS FUNDS
Supplemental Information (unaudited) (continued)
a meeting on August 17, 2022. The Board, including a majority of the Independent Trustees, determined that the continuation of the Advisory Agreement was in the best interests of the Fund.
The Board noted that OAM has been associated with the Fund since its inception. The Board recognized that a long-term relationship with a capable, conscientious investment adviser is in the best interests of the Fund, and that shareholders have invested in the Fund knowing that OAM manages the Fund and knowing the investment advisory and management fee schedule.
Nature, Quality and Extent of Services. With respect to the nature, extent and quality of the services provided to the Fund by OAM pursuant to the Advisory Agreement, the Board considered the background and experience of OAM, the functions performed by OAM and the personnel providing such services, the management capabilities of OAM, the information contained in OAM’s Form ADV, OAM’s financial condition and the compliance reports provided to the Board, and the culture of compliance created by OAM, including the competency of the Chief Compliance Officer of the Trust and OAM. The Board also considered the experience, academic background, long tenure, structure, size and geographic locations of the portfolio management/strategy investment team and its role, the investment process with respect to the types of investments held by the Fund, as well as the honesty and integrity of OAM, and that, in the Board’s experience, OAM personnel are open and forthright with the Board. In addition, the Board considered that OAM is a research-oriented firm that conducts extensive research in connection with managing the Fund, and also considered the competitive pressure on active management.
The Board reviewed the investment performance of the Fund as compared to a peer universe of funds provided by Broadridge Financial Solutions, Inc. (“Broadridge”), an independent provider of investment company data (the “Performance Universe”), and as compared to the performance of a relevant market benchmark index. With respect to Fund performance, the Board considered the Fund’s performance over the one-, three- and five-year periods ended June 30, 2022, including any periods of outperformance or underperformance as compared to the performance of the relevant market benchmark index and the Fund’s Performance Universe average. The Board noted that the Fund outperformed its relevant market benchmark index and Performance Universe average for all periods reviewed except for the one-year period, and for the five-year period the Fund’s performance approximated that of its relevant market benchmark index. In light of the information provided and the considerations made, the Board concluded that the nature, quality and extent of the services provided to the Fund by OAM have been and are expected to remain satisfactory.
Fees and Expenses. The Board considered the combined investment advisory and management fees charged to the Fund by OAM (the “management fees”) as compared to the management fees of a peer group of funds provided by Broadridge (the “Expense Group”) and the expense ratio of the Fund as compared to the expense ratios of the Expense Group. The Board considered information provided by Broadridge on how it selected the peer funds included in the Expense Group for the Fund and considered certain limitations as to the comparability of the data provided. Based on the information provided, the Board noted that although the contractual management fees charged to the Fund were above the median management fee of its Expense Group they were within a reasonable range of the applicable median. The Board also noted, among other things, that it believed the Fund’s management fees were reasonable in light of the levels of investment performance over the time periods reviewed, and as compared to the performance of the relevant market benchmark index and Performance Universe. The Board further noted that the expense ratio for the Fund was above the median of the expense ratio of the Expense Group.
31
THE OBERWEIS FUNDS
Supplemental Information (unaudited) (continued)
In addition, the Board considered management fees paid to OAM by other clients. With respect to OAM’s other clients, the Board recognized that the mix of services provided to the Fund, the level of responsibility required under the Advisory Agreement with the Fund, and the regulatory, compliance and operational requirements with respect to the Fund are greater than OAM’s obligations for similar client accounts, and that the management fees for such accounts are less relevant to the Board’s consideration of the management fees for the Fund because they reflect different competitive forces than those in the mutual fund marketplace. Based on the information provided, the Board concluded that the Fund’s management fees were reasonable and appropriate in amount, given the nature, quality and extent of the services provided and taking into consideration relevant circumstances.
Profitability. With respect to the costs of services provided and profits realized by OAM, the Board considered the management fees received by OAM from the Fund as well as the level, quality and expense of OAM’s staff and the services that OAM provides. The Board also considered the explanation from OAM that the profits realized by OAM specifically from the relationship with the Fund could not be identified due to the impracticality of expense allocation, noting the difficulty of breaking down profitability related to the Fund versus the other Oberweis Funds and other client accounts because management and personnel time and services are not allocated between the various types of accounts. The Board noted OAM’s belief that, while the profits could not be itemized, the overall profitability of OAM was average and within a reasonable range relative to other investment advisory firms, and considered that OAM has contractually agreed to reimburse the Fund for expenses if its expense ratio exceeds a certain limit. Based on this information, the Board concluded for the Fund that OAM’s profitability was not unreasonable.
Economies of Scale. The Board considered the extent to which economies of scale would be realized as the Fund grows, and whether management fee levels reflect economies of scale for the benefit of Fund shareholders. The Board noted asset capacity constraints for the Fund which limit economies of scale and the expense reimbursement made by OAM to the Fund. The Board concluded that the Fund’s management fees reflect an appropriate recognition of any economies of scale.
Other Benefits to OAM and Its Affiliates. The Board considered the character and amount of other incidental benefits received by OAM and its affiliates from their relationship with the Fund, including benefits to OAM and other OAM client accounts related to soft dollars generated by the Fund’s brokerage transactions. The Board also noted that during the past year none of the Fund’s brokerage transactions had been placed through the affiliated broker-dealer of OAM.
After due consideration of all of the information and factors deemed relevant by the Board and based upon their own business judgment and the conclusions reached, the Board determined to approve the continuance of the Advisory Agreement. The Board, including the Independent Trustees, did not identify any single factor or group of factors as all-important or controlling, and considered all factors together.
Expense Examples:
As a shareholder of The Fund, you may incur two types of costs: (1) transaction costs, including redemption fees and (2) ongoing costs, including management fees; distribution (and/or service) 12b-1 fees; and other Fund expenses. This example is intended to help you understand your ongoing costs (in dollars) of investing in The Fund and to compare these costs with the ongoing costs of investing in other mutual funds.
32
THE OBERWEIS FUNDS
Supplemental Information (unaudited) (continued)
The Example is based on an investment of $1,000 investment at the beginning of the period and held for the entire period.
Actual Expenses:
The first line for each Fund in the table below provides information about actual account values and actual expenses. You may use the information below; together with the amount you invested, to estimate the expenses that you paid over the period. Simply divide your account value by $1,000 (for example, an $8,600 account value divided by $1,000=8.6), then multiply the result by the number in the table under the heading entitled “Expenses Paid During Period” to estimate the expenses you paid on your account during this period.
Hypothetical Example for Comparison Purposes:
The second line for each Fund in the table below provides information about hypothetical account values and hypothetical expenses based on the Fund’s actual expense ratio and an assumed rate of return of 5% per year before expenses, which is not the Fund’s actual return.
The hypothetical account values and expenses may not be used to estimate the actual ending account balance or expenses you paid for the period. You may use this information to compare this 5% hypothetical example with the 5% hypothetical examples that appear in the shareholder reports of other funds.
Please note that the expenses shown in the table are meant to highlight your ongoing costs only and do not reflect any transactional costs, such as redemption fees. Therefore, the second line for each Fund in the table is useful in comparing ongoing costs only, and will not help you determine the relative total costs of owning different funds. In addition, if these transactional costs were included, your costs would have been higher.
| Beginning
Account
Value
7/1/22 | Ending
Account
Value
12/31/22 | Expenses Paid
During Period
7/1/22 – 12/31/22 | Expense Ratio
During Period
7/1/22 – 12/31/22 |
INTERNATIONAL OPPORTUNITIES Institutional FUND |
Actual | $ 1,000.00 | $ 983.21 | $ 5.50 | 1.10% |
Hypothetical | $ 1,000.00 | $ 1,019.66 | $ 5.60 | 1.10% |
| | | | | |
FOCUSED INTERNATIONAL GROWTH FUND |
Actual | $ 1,000.00 | $ 986.57 | $ 4.76 | 0.95% |
Hypothetical | $ 1,000.00 | $ 1,020.42 | $ 4.84 | 0.95% |
33
Trustees and Officers | | |
Michael J. Simon
Trustee Gary D. McDaniel
Trustee James W. Oberweis
President, Trustee David I. Covas
Vice President Kenneth S. Farsalas
Vice President | | Katherine Smith Dedrick
Trustee Alix J. Charles
Trustee Patrick B. Joyce
Executive Vice President Eric V. Hannemann
Treasurer Thomas P. Joyce
Secretary
Chief Compliance Officer |
Manager and Investment Advisor
Oberweis Asset Management, Inc.
3333 Warrenville Road, Suite 500, Lisle, IL 60532
800-323-6166
oberweisfunds.com
Distributor
Oberweis Securities, Inc.
3333 Warrenville Road, Suite 500, Lisle, IL 60532
630-577-2300
oberweisfunds.com
Custodian
UMB Bank, n.a.
928 Grand Blvd., Kansas City, MO 64106
Transfer Agent
UMB Fund Services, Inc.
P.O. Box 711, Milwaukee, WI 53201-0711
800-245-7311
Counsel
Vedder Price P.C.
222 North LaSalle Street, Chicago, IL 60601
Independent Registered Public Accounting Firm
BBD, LLP
1835 Market Street, 3rd Floor, Philadelphia, PA 19103
International Opportunities Institutional Fund
Focused International Growth Fund
800-245-7311
oberweisfunds.com
3333 Warrenville Road
Suite 500
Lisle, IL 60532
| | (a) | As of December 31, 2022, the registrant has adopted a code of ethics that applies to the registrant’s principal executive officer, principal financial officer, principal accounting officer, or persons performing similar functions. |
| | | |
| | (b) | During the period covered by this report, there were not any amendments to a provision of the Code of Ethics adopted in 2(a) above. |
| | | |
| | (c) | During the period covered by this report, there were no waivers, including any implicit waivers, from a provision of the Code of Ethics described in 2(a) above that relates to one or more of the items set forth in paragraph (b) of this item’s instructions. |
| | (d) | A copy of the code of ethics may be obtained upon request, without charge, by contacting the registrant in writing at its principal executive office. |
| ITEM 3. | AUDIT COMMITTEE FINANCIAL EXPERT |
| | (a) | The registrant’s board of trustees has determined that the registrant has at least one audit committee financial expert serving on the audit committee. |
| | (b) | The audit committee financial expert is Michael J. Simon. Mr. Simon is independent as defined in Form N-CSR Item 3 (a) (2). |
| ITEM 4. | PRINCIPAL ACCOUNTANT FEES AND SERVICES. |
(a)-(d)
| | | | | |
| | | 2021 | | 2022 |
| Audit fees | | 112,000 | | 129,500 |
| Audit-Related Fees | | N/A | | N/A |
| Tax Fees | | 26,000 | | 29,950 |
| All Other Fees | | N/A | | N/A |
Audit Fees include amounts related to the audit of the registrant’s annual financial statements and services normally provided by the principal accountant in connection with statutory and regulatory filings. Tax Fees principally include tax compliance, tax advice, tax planning and preparation of tax returns.
(e)(1) The registrant’s audit committee pre-approves all audit services provided by the registrant’s principal accountant for the registrant and all non-audit services provided by the registrant’s principal accountant for the registrant, its investment adviser and any entity controlling, controlled by, or under common control with the investment adviser (“Adviser Affiliate”) that provides ongoing services to the registrant, if the engagement by the investment adviser or Adviser Affiliate relates directly to the operations and financial reporting of the registrant.
(e)(2) No services included in (b) – (d) above were approved pursuant to paragraph (c)(7)(i)(C) of Rule 2-01 of Regulation S-X.
(f) Not Applicable.
(g) The aggregate fees billed for the most recent fiscal year and the preceding fiscal year by the registrant’s principal accountant for non-audit services rendered to the registrant, its investment, and Adviser Affiliate that provides ongoing services to the registrant for 2022 and 2021 were $29,950 and $26,000, respectively.
(h) Non-audit services rendered to the registrant’s investment adviser and any Adviser Affiliate that were not pre-approved pursuant to Paragraph (c) (7) (ii) of Rule 2-01 of Regulation S-X were considered by the registrant’s audit committee as to whether they were compatible with maintaining the principal account’s independence.
| ITEM 5. | AUDIT COMMITTEE OF LISTED REGISTRANTS. |
Not Applicable to the registrant.
| ITEM 6. | SCHEDULE OF INVESTMENTS. |
See Schedule in Item 1.
| ITEM 7. | DISCLOSURE OF PROXY VOTING POLICIES AND PROCEDURES FOR CLOSED-END MANAGEMENT INVESTMENT COMPANIES. |
Not Applicable to the registrant.
| ITEM 8. | PORTFOLIO MANAGERS OF CLOSED-END MANAGEMENT INVESTMENT COMPANIES. |
Not Applicable to the registrant.
| ITEM 9. | PURCHASES OF EQUITY SECURITIES BY CLOSED-END MANAGEMENT INVESTMENT COMPANY AND AFFILIATED PURCHASERS. |
Not Applicable to the registrant.
| ITEM 10. | SUBMISSION OF MATTERS TO A VOTE OF SECURITY HOLDERS. |
There have been no material changes to the procedures by which shareholders may recommend nominees to the registrant’s board of trustees since registrant last disclosed such procedures in its proxy statement dated April 16, 2004.
| ITEM 11. | CONTROLS AND PROCEDURES. |
| | (a) | The registrant’s principal executive and principal financial officers, or persons performing similar functions, have concluded that the registrant’s disclosure controls and procedures (as defined in Rule 30a-3 (c) under the Investment Company Act of 1940, as amended (the “1940 Act”) (17CFR 270.30a-3(c)) are effective, as of a date within 90 days of the filing date of the report that includes the disclosure required by this paragraph, based on their evaluation of these controls and procedures required by Rule 30a-3(b) under the 1940 Act (17 CFR 270.30a-3(b)) and Rules 13a-15(b) or 15d-15(b) under the Exchange Act (17 CFR 240.13a-15(b) or 240.15d-15(b)). |
| | (b) | There has been no change to the registrant’s internal control over financial reporting (as defined in Rule 30a-3(d) under the 1940 Act (17 CFR 270.30a-3(d)) that occurred during the period covered by this report that has materially affected, or is reasonably likely to materially affect, the registrant’s internal control over financial reporting. |
SIGNATURES
Pursuant to the requirements of the Securities Exchange Act of 1934 and the Investment Company Act of 1940, the registrant has duly caused this report to be signed on its behalf by the undersigned, thereunto duly authorized.
| | | |
| (Registrant) The Oberweis Funds |
| | |
| By (Signature and Title*) | | /s/ James W. Oberweis |
| | | James W. Oberweis |
| | | President, The Oberweis Funds |
Date 03/07/2023
Pursuant to the requirements of the Securities Exchange Act of 1934 and the Investment Company Act of 1940, this report has been signed below by the following persons on behalf of the registrant and in the capacities and on the dates indicated.
| | | |
| By (Signature and Title*) | | /s/ James W. Oberweis |
| | | James W. Oberweis |
| | | President, The Oberweis Funds |
Date 03/07/2023
| | | |
| By (Signature and Title*) | | /s/ Eric V. Hannemann |
| | | Eric V. Hannemann |
| | | Treasurer, The Oberweis Funds |
Date 03/07/2023
| /*/ | Print the name and title of each signing officer under his or her signature. |