UNITED STATES
SECURITIES AND EXCHANGE COMMISSION
Washington, D.C. 20549
FORM N-CSR
CERTIFIED SHAREHOLDER REPORT OF REGISTERED
MANAGEMENT INVESTMENT COMPANIES
Investment Company Act file number: 811-04920
WASATCH FUNDS TRUST
(Exact name of registrant as specified in charter)
505 Wakara Way, 3rd Floor
Salt Lake City, UT 84108
(Address of principal executive offices) (Zip code)
| | | | | | |
| | (Name and Address of Agent for Service) | | Copy to: | | |
| | | |
| | | Eric S. Bergeson Wasatch Advisors, Inc. 505 Wakara Way, 3rd Floor Salt Lake City, UT 84108 | | Eric F. Fess, Esq. Chapman & Cutler LLP 320 S. Canal Street Chicago, IL 60606 | | |
Registrant’s telephone number, including area code: (801) 533-0777
Date of fiscal year end: September 30
Date of reporting period: March 31, 2023
Item 1. Report to Shareholders.
| (a) | A copy of the report transmitted to shareholders pursuant to Rule 30e-1 under the Investment Company Act of 1940 (the “1940 Act”) is filed herewith. |
WASATCHGLOBAL.COM MARCH 31, 2023 2023 Semi-Annual Report Fund Investor Institutional Fund Investor Institutional Name Class Class Name Class Class Wasatch Core Growth Fund WGROX WIGRX Wasatch International Opportunities Fund WAIOX WIIOX Wasatch Emerging India Fund WAINX WIINX Wasatch International Select Fund WAISX WGISX Wasatch Emerging Markets Select Fund WAESX WIESX Wasatch Long/Short Alpha Fund WALSX WGLSX Wasatch Emerging Markets Small Cap Fund WAEMX WIEMX Wasatch Micro Cap Fund WMICX WGICX Wasatch Frontier Emerging Small Wasatch Micro Cap Value Fund WAMVX WGMVX WAFMX WIFMX Countries Fund Wasatch Small Cap Growth Fund WAAEX WIAEX Wasatch Global Opportunities Fund WAGOX WIGOX Wasatch Small Cap Value Fund WMCVX WICVX Wasatch Global Select Fund WAGSX WGGSX Wasatch Ultra Growth Fund WAMCX WGMCX Wasatch Global Value Fund FMIEX WILCX Wasatch U.S. Select Fund WAUSX WGUSX Wasatch Greater China Fund WAGCX WGGCX Wasatch-Hoisington U.S. Treasury Fund WHOSX Ë‘ Wasatch International Growth Fund WAIGX WIIGX
Wasatch Funds
Salt Lake City, Utah
wasatchglobal.com
800.551.1700
This material must be accompanied or preceded by a prospectus.
Please read the prospectus carefully before you invest.
Wasatch Funds are distributed by ALPS Distributors, Inc.
1
| | |
Letter to Shareholders —While Stocks Have Been Volatile, High Quality is Back in Favor | | |
| | |

Mick Rasmussen, CFA Lead Portfolio Manager | | DEAR FELLOW SHAREHOLDERS: After a poor showing in 2022, high-quality growth stocks got off to a strong start in January 2023. Then, in February, stocks sold off based on concerns regarding overheated economic activity, stubbornly elevated inflation, and persistent interest-rate hikes by the U.S. Federal Reserve (Fed) and counterparts around the world. In March, a few well-publicized bank failures worsened market sentiment — causing stocks to slip further. Nevertheless, investor sentiment improved toward the end of March and U.S. small-cap growth stocks, as measured by the Russell 2000® Growth Index, finished the first quarter of 2023 in positive territory. Small-cap growth stocks also generally performed well internationally in both developed and emerging |
markets. Moreover, the Wasatch-specific approach to high-quality growth investing was generally favored.
In a broad sense, Wasatch defines high-quality growth companies as those having innovative products, services and business models, increasing market share, great management teams, significant returns on capital, relatively low debt and the ability to self-fund expansion. Another element of our approach to quality-oriented investing is that we often attempt to identify excellent companies before high quality is evident in their financial results. If we do this well, stock-price appreciation can be particularly strong.
PERSPECTIVE ON RECENT BANK FAILURES
While elevated inflation and interest-rate hikes have impacted markets for over a year, the failures of three U.S. banks in March sparked stock-price volatility around the world. In the span of less than a week, Silvergate Bank announced it would wind down operations due to losses suffered in its loan portfolio, Silicon Valley Bank (SVB) was placed under receivership of the Federal Deposit Insurance Corporation (FDIC) and regulators closed Signature Bank. The downfalls of SVB and Signature were the second- and third-largest bank failures in U.S. history.
None of the Wasatch funds owned any banks that failed in March. Furthermore, we believe the few banks that we do hold are structurally quite different from the banks that failed.
WHY OUR BANKS ARE DIFFERENT
The banks that failed had concentrated customer bases. Silvergate and Signature focused on the cryptocurrency industry, and the bulk of SVB’s customers were early-stage technology companies. Moreover, SVB and Silvergate had low loan-to-deposit ratios and depended on sizable long-term securities portfolios to support short-term deposits — which created a timing mismatch. These factors played large roles in the banks’ failures.
The banks held in the Wasatch funds are quite different, with reasonable loan-to-deposit ratios and relatively small securities portfolios. Additionally, our banks either focus on retail customers or serve a diversified group of commercial clients. So far, the management teams of the banks we own have reported that operations have remained normal or have actually improved.
BANKING’S EFFECTS ON THE TECHNOLOGY SPACE
Outside of banking, the failures will surely affect the technology space. Many technology companies hold cash and lines of credit at banks like SVB. The government’s decision to protect SVB’s depositors means businesses still have access to working capital in the near term. But we expect to see a somewhat more difficult environment for early-stage technology companies as they seek new banking relationships.
Regarding our own technology holdings, we don’t think we’ll see much friction. We have very few holdings that had any exposure to SVB. We tend to invest in companies that have control over their destinies because they’re self-funded through their ability to generate positive free cash flows.
SUMMARIZING INVESTMENT CONDITIONS DURING THE PAST THREE YEARS
For much of 2020 and 2021, the Covid-19 pandemic accelerated the digitalization of daily activities — working, banking, studying, shopping and accessing entertainment from home. In general, the stocks of companies tied to these themes performed well. For the most part, Wasatch benefited as investors extrapolated rapid rates of growth and market penetration far into the future. A backdrop of very low interest rates magnified the positive effects on Wasatch’s performance in areas like software as a service (SaaS), technology consulting, semiconductor chips, digital banking and e-commerce.
During most of 2022, by contrast, rising inflation and interest rates — and a shift in market leadership — proved quite hostile to Wasatch’s investing approach. Because the long-duration growth companies we favor generate cash flows further into the future, higher interest rates make the income streams of these companies less valuable in the present.
With fallout from the Omicron variant of Covid-19 less severe than initially expected, the stocks of companies tied to digitalization and other areas that had benefited from the pandemic and helped Wasatch’s performance in 2020 and 2021 tended to be hurt the most in 2022. Even so, we believe these themes are enduring and will continue to offer attractive opportunities for long-term investors.
2
| | |
| | | MARCH 31, 2023 (Unaudited) |
While inflation was already set to rise in 2022 due to pandemic-induced supply-chain challenges and increased consumer demand, the war in Ukraine exacerbated inflationary pressures. These pressures supported cyclical, value-oriented areas of the market such as energy and some segments of materials and utilities, where Wasatch was structurally underweighted. We believe these sectors are mostly comprised of capital-intensive and undifferentiated businesses that typically don’t fit well with our preference for dynamic, high-quality companies. Also, energy and materials firms tend to carry significant debt and are often highly cyclical — with success generally linked to a single commodity that’s beyond management’s control.
Worsening inflation also forced central banks to raise interest rates aggressively in 2022, posing stronger headwinds for our long-duration growth stocks. Late in the first quarter of 2023, however, these headwinds showed signs of reversing.
THOUGHTS AND POSITIONING FOR 2023 AND BEYOND
Before discussing our thoughts and positioning, we must first acknowledge that macro predictions are inherently unreliable. To understand why, investors may want to consider a few of the high-profile misjudgments over the past three years. Mainstream experts on Russia failed to foresee the invasion of Ukraine. The Fed incorrectly assumed that inflation was “transitory.” Banks loaded up on long-term bonds based on the wrongheaded belief that interest rates wouldn’t rise sharply in such a short period of time.
Regarding these macro issues, we admit that our early judgments may have been equally incorrect. However, we didn’t make major decisions based on these judgments. Instead, we try to invest in companies we think can perform well under a variety of scenarios. Over the long term, we think this approach will deliver attractive risk-adjusted returns.
Now we come to our thoughts and positioning for 2023 and beyond. As mentioned above, despite continued volatility, high-quality growth stocks reasserted their attractiveness and performed well during the first quarter. While we don’t know what’s in store for us in terms of geopolitics and market conditions, we like our companies regardless of the macro environment.
If the economy enters a significant recession and interest rates fall dramatically, we think we’ll be well-positioned with the likes of profitable technology companies, recession-resistant health-care providers and recurring-revenue businesses that can self-fund their expansion. Additionally, in a lower interest-rate environment, investors tend to prize high-quality growth companies.
But if the economy stays strong or gains momentum, we believe we’ll benefit from generally less expensive investments in the consumer-discretionary and industrials sectors. These sectors tend to be more sensitive to economic development. Having said that, our individual companies aren’t “make or break” economically cyclical businesses.
WE THINK OUR COMPANIES ARE ATTRACTIVELY PRICED
Across all of our investments, we��re paying particular attention to operating margins because companies are seeing rising input costs. By investing in companies with pricing power, we think we’re less vulnerable to margin pressures.
After 2022’s market selloff, which was especially hard on growth stocks, we think our companies are attractively priced for the next five years. And it’s evident that businesses are delivering increasingly normal results, which are being more appropriately reflected in the price of their stocks.
We’re particularly optimistic about our technology companies, whose management teams have realized that profitability must be a top priority. The mantra of “growth at all costs” from the past several years is no longer acceptable. We believe this greater fiscal discipline should lessen the risk and improve the consistency of returns in tech investing.
Still, other factors may increase general market volatility. These factors include a possible recession, rising costs of doing business, uncertainty surrounding interest rates and inflation, heightened geopolitical tensions and central banks balancing various — often conflicting — priorities.
With sincere thanks for your continuing investment and for your trust,
Mick Rasmussen, Lead Portfolio Manager, Wasatch Long/Short Alpha Fund
Information in this report regarding market or economic trends, or the factors influencing historical or future performance, reflects the opinions of management as of the date of this report. These statements should not be relied upon for any other purpose. Past performance is no guarantee of future results, and there is no guarantee that the market forecasts discussed will be realized.
Wasatch Advisors LP, doing business as Wasatch Global Investors, is the investment advisor to Wasatch Funds.
Wasatch Funds are distributed by ALPS Distributors, Inc. (ADI). ADI is not affiliated with Wasatch Global Investors.
Definitions of financial terms and index descriptions and disclosures begin on page 44.
3
| | |
| Wasatch Core Growth Fund (WGROX / WIGRX) | | MARCH 31, 2023 (Unaudited) |
Management Discussion
The Wasatch Core Growth Fund is managed by a team of Wasatch portfolio managers led by JB Taylor, Paul Lambert and Mike Valentine.
| | | | |

JB Taylor Lead Portfolio Manager | | 
Paul Lambert Portfolio Manager | | 
Mike Valentine Portfolio Manager |
OVERVIEW
The first quarter of 2023 was positive for stocks of small U.S. growth companies. The Wasatch Core Growth Fund —Investor Class returned 8.89%, outgaining the benchmark Russell 2000® Growth Index, which rose 6.07%. The broader Russell 2000 Index of small-cap stocks added 2.74%. Our companies posted strong operating results in 2022 and entered 2023 with their stocks trading at some of the most attractive valuations we’ve seen in several years.
Energy and banking, areas where the Fund is not heavily exposed, were the main laggards within the benchmark during the first quarter. The failures of three U.S. regional banks and the government-brokered sale of troubled Swiss firm Credit Suisse Group AG dragged down bank stocks and rattled investors.
The broad U.S. equity market weathered the turmoil well, with investors seemingly optimistic that the banking crisis was contained and that the events may push the Federal Reserve closer to the end of its tightening cycle.
DETAILS OF THE QUARTER
The consumer-discretionary sector was the Fund’s biggest source of outperformance relative to the benchmark in the quarter. Our retailers tend to have strong brand names and typically operate in well-established niches. We believe the Fund’s retail companies are positioned better than most of their peers to navigate inflationary and recessionary environments.
Other significant sources of outperformance included industrials, health care and the Fund’s lack of investments in energy. Information technology was the Fund’s primary source of weakness relative to the benchmark.
A top contributor to Fund performance during the quarter was Floor & Decor Holdings, Inc. A multi-channel specialty retailer of hard-surface flooring, Floor & Decor has become a “category killer” among big-box home centers. Because the company cuts out middlemen and buys in large quantities, it can offer customers a wider selection of flooring at lower prices than most competitors. Floor & Decor’s expanding retail footprint, strong cash flows and solid balance sheet provide what we consider a built-in engine for self-funded growth.
Focus Financial Partners, Inc. was also a contributor. Focus is a leading partnership of independent, fiduciary wealth-management firms. The company’s stock price jumped in February after Focus announced it was in talks to sell itself to a private-equity firm. Later that month, Focus entered into a definitive agreement to be acquired in an all-cash deal expected to close in the third quarter of 2023. We liquidated our position to lock in gains.
Banks were the Fund’s two biggest detractors during the quarter — Bank OZK and Webster Financial Corp., respectively. Although their stock prices declined in sympathy with other bank stocks during March, we believe the strong fundamentals of these two banks set them apart from the ones making headlines.
Bank OZK and Webster follow conventional banking models, with well-diversified customer bases, appropriate levels of loans and deposits and small securities portfolios. Despite liquidity pressures at a number of other banks, our research found no significant uptick in withdrawals at either Bank OZK or Webster. We believe these are well-managed banks serving geographical areas with healthy real-estate markets, favorable demographics and above-average economic growth.
OUTLOOK
According to an old English proverb, “It’s an ill wind that blows no one any good.” As dark clouds gathered over Silicon Valley Bank and the wind blew it down, it wasn’t clear what good might be blown our way. With the clouds now parted, we’re beginning to see some silver linings.
Silicon Valley Bank’s failure is likely to make it more difficult for small firms in biotechnology, software, and other tech-driven industries to get funding to launch and grow businesses. What does this mean for the companies owned in the Fund? Weaker competition and fewer rivals, mostly.
The Wasatch investment approach seeks high-quality companies with solid business models, strong cash flows and healthy balance sheets. Therefore, our companies are unlikely to run out of money when business conditions get tough. This is a key advantage in the current environment, with stock prices down and interest rates elevated. While their competitors scramble, our companies can use their cash to make acquisitions, hire talent, invest in their businesses and take market share. The long-term competitive advantages gained from these actions can be substantial.
In short, we think our focus on businesses with strong fundamentals may be as important now as ever. While no one wants to see bank runs, financial instability or economic turmoil, we believe the Fund’s portfolio of high-quality companies is well-positioned to weather potential storms.
Thank you for the opportunity to manage your assets.
Current and future holdings are subject to risk.
4
| | |
| Wasatch Core Growth Fund (WGROX / WIGRX) | | MARCH 31, 2023 (Unaudited) |
Portfolio Summary
AVERAGE ANNUAL TOTAL RETURNS
| | | | | | | | | | | | | | | | | | | | |
| | | | |
| | | Six Months
(Not annualized) | | 1 Year | | 5 Years | | 10 Years |
| | | | |
Core Growth (WGROX) — Investor | | | | 16.17% | | | | | -10.43% | | | | | 8.96% | | | | | 11.36% | |
| | | | |
Core Growth (WIGRX) — Institutional | | | | 16.24% | | | | | -10.30% | | | | | 9.10% | | | | | 11.49% | |
| | | | |
Russell 2000® Growth Index | | | | 10.46% | | | | | -10.60% | | | | | 4.26% | | | | | 8.49% | |
| | | | |
Russell 2000® Index | | | | 9.14% | | | | | -11.61% | | | | | 4.71% | | | | | 8.04% | |
Data show past performance, which is not indicative of future performance. Current performance may be lower or higher than the performance quoted. To obtain the most recent month-end performance data available, please visit wasatchglobal.com. The Advisor may absorb certain Fund expenses, without which total returns would have been lower. Investment returns and principal value will fluctuate and shares, when redeemed, may be worth more or less than their original cost.
As of the January 31, 2023 prospectus, the Total Annual Fund Operating Expenses for the Wasatch Core Growth Fund are Investor Class: 1.19% / Institutional Class — Gross: 1.06%, Net: 1.05%. The expense ratio shown elsewhere in this report may be different. Net expenses are based on Fund expenses, net of waivers and reimbursements. See the prospectus for additional information regarding Fund expenses.
Wasatch will deduct a 2.00% redemption fee on Fund shares held 60 days or less. Performance data do not reflect the deduction of fees, including sales charges, or the taxes you would pay on fund distributions or the redemption of fund shares. Fees and taxes, if reflected, would reduce the performance quoted. Wasatch does not charge any sales fees. For more complete information including charges, risks and expenses, read the prospectus carefully.
Investing in small cap funds will be more volatile and loss of principal could be greater than investing in large cap or more diversified funds. Investing in foreign securities, especially in emerging markets, entails special risks, such as currency fluctuations and political uncertainties, which are described in more detail in the prospectus.
TOP 10 EQUITY HOLDINGS*
| | | | |
| |
| Company | | % of Net Assets | |
| |
Ensign Group, Inc. | | | 3.4% | |
| |
Kadant, Inc. | | | 3.4% | |
| |
HealthEquity, Inc. | | | 3.2% | |
| |
RBC Bearings, Inc. | | | 3.1% | |
| |
Guidewire Software, Inc. | | | 3.1% | |
| | | | |
| |
| Company | | % of Net Assets | |
| |
Balchem Corp. | | | 3.0% | |
| |
Hamilton Lane, Inc., Class A | | | 2.9% | |
| |
Novanta, Inc. | | | 2.9% | |
| |
Trex Co., Inc. | | | 2.8% | |
| |
ICON PLC | | | 2.7% | |
| *As | of March 31, 2023, there were 53 holdings in the Fund. Foreign currency contracts, written options and repurchase agreements, if any, are not included in the number of holdings. Portfolio holdings are subject to change at any time. References to specific securities should not be construed as recommendations by the Funds or their Advisor. Current and future holdings are subject to risk. |
SECTOR BREAKDOWN**
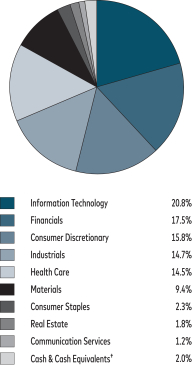
| ** | Excludes securities sold short, if any. |
| † | Also includes Other Assets & Liabilities. |
GROWTH OF A HYPOTHETICAL $10,000 INVESTMENT
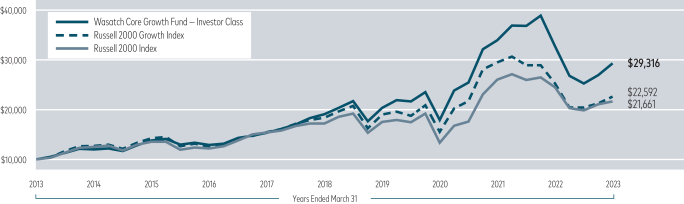
Past performance does not predict future performance. The graph above does not reflect the deduction of fees, sales charges, or taxes that you would pay on fund distributions or the redemption of fund shares. Wasatch does not charge any sales fees.
5
| | |
| Wasatch Emerging India Fund (WAINX / WIINX) | | MARCH 31, 2023 (Unaudited) |
Management Discussion
The Wasatch Emerging India Fund is managed by a team of Wasatch portfolio managers led by Ajay Krishnan and Matthew Dreith.
| | | | |

Ajay Krishnan, CFA Lead Portfolio Manager | | 
Matthew Dreith, CFA Portfolio Manager | | OVERVIEW During the first quarter of 2023, India’s major stock averages continued their slow retreat from all-time highs reached in December. The benchmark MSCI |
India Investable Market Index (IMI) was down -5.94% for the quarter. The Wasatch Emerging India Fund — Investor Class outperformed its benchmark with a smaller decline of -5.03%.
Rebounding from steeper losses during the quarter’s final trading sessions, Indian equities showed resilience amid a slew of negative headlines. A short-seller report attacking companies linked to Indian billionaire Gautam Adani shook investor confidence in January as worries about exposure to the sprawling Adani conglomerate sparked fears of contagion to the banking system.
Inflation and rising interest rates also created headwinds for stocks. Consumer prices in India rose faster than had been expected. Rising prices and higher borrowing costs have pinched household budgets and dented consumption, which accounts for about 60% of India’s gross domestic product (GDP).
DETAILS OF THE QUARTER
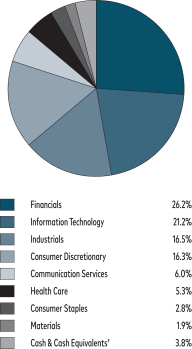
The benchmark’s worst-performing sector during the first quarter was utilities. Several Adani Group constituents detracted from performance among utilities. Because no utilities are owned in the Fund, this sector was the Fund’s biggest source of outperformance relative to the benchmark. Other outperforming sectors in the Fund included information technology (IT) and industrials. Holdings in the health-care, consumer-staples and financials sectors were the Fund’s primary sources of weakness against the benchmark.
The IT-services industry accounted for the two strongest contributors to Fund performance for the quarter: Persistent Systems Ltd. and LTIMindtree Ltd., respectively. Because these companies serve customers world-wide, their stock prices can at times be sensitive to global economic conditions. As a result, both stocks benefited from expectations that the U.S. Federal Reserve and other central banks were nearing the end of their interest-rate increases. Investors hoped looser monetary conditions might encourage corporations to free up spending on IT projects that have been placed on hold.
Persistent Systems provides outsourced software development to clients across a range of industries. In the company’s most recent quarter, after-tax profit rose 35% on
revenue growth of 45% compared to the same quarter a year ago. Bookings increased 20% in terms of total contract value, boosted by several large deals across industries and service lines.
LTIMindtree provides a wide array of IT services and solutions. The company reported a 25% year-over-year increase in quarterly revenues, but profit after tax was down -4.7%. Investors appeared to look past the earnings setback because it was largely attributable to costs and temporary inefficiencies stemming from the merger between L&T Infotech and Mindtree, which was completed in November 2022.
The greatest detractor from Fund performance during the quarter was Bajaj Finance Ltd. A non-bank financial company, Bajaj offers a broad spectrum of lending services. Shares of Bajaj declined in sympathy with other Indian equities as a selloff in the shares of Adani Group spilled over to the broader market and weighed especially heavily on the financials sector. The stock moved lower again in March when investors reacted negatively to reports that Bajaj was working on an offer to purchase a banking business in Indonesia in a deal potentially valued in the hundreds of millions of dollars.
Dr. Lal PathLabs Ltd. was also a detractor. The company operates one of the largest chains of diagnostic pathology labs in India. Robust demand for Covid-19 testing during previous phases of the pandemic had driven increased volumes and margin expansion at Dr. Lal’s. Those effects are now reversing, resulting in difficult year-over-year comparisons to early 2022 — the time of India’s peak in Omicron infections. We expect growth to normalize over the next quarter or two, and we believe Dr. Lal’s has the ultimate potential to become India’s dominant consumer brand in diagnostics as the company continues to consolidate and formalize the market.
OUTLOOK
IT-services firms like Persistent Systems and LTIMindtree have been mainstays of India’s services exports for decades. Now, global capability centers (GCCs) have moved up the value chain from providers of low-cost routine services to centers of excellence for automation, innovation, analytics and other functions. Around 40% of the world’s GCCs are currently based in India. We think this number is likely to increase going forward.
Although economic growth in India has come down in recent quarters, the country is expected to remain one of the world’s fastest-growing major economies. Recent upward revisions in India’s real GDP growth reflect increased capital expenditures in the budget released by the Modi government in February. With risks in the U.S. on the rise, we believe well-situated businesses in consumer-driven economies such as India’s offer potentially attractive opportunities for long-term investment.
Thank you for the opportunity to manage your assets.
Current and future holdings are subject to risk.
6
| | |
| Wasatch Emerging India Fund (WAINX / WIINX) | | MARCH 31, 2023 (Unaudited) |
Portfolio Summary
AVERAGE ANNUAL TOTAL RETURNS
| | | | | | | | | | | | | | | | | | | | |
| | | | |
| | | Six Months
(Not annualized) | | 1 Year | | 5 Years | | 10 Years |
| | | | |
Emerging India (WAINX) — Investor | | | | -9.04% | | | | | -19.79% | | | | | 6.29% | | | | | 12.03% | |
| | | | |
Emerging India (WIINX) — Institutional | | | | -8.93% | | | | | -19.58% | | | | | 6.45% | | | | | 12.16% | |
| | | | |
MSCI India IMI Index | | | | -4.81% | | | | | -12.02% | | | | | 5.66% | | | | | 7.54% | |
Data show past performance, which is not indicative of future performance. Current performance may be lower or higher than the performance quoted. To obtain the most recent month-end performance data available, please visit wasatchglobal.com. The Advisor may absorb certain Fund expenses, without which total returns would have been lower. Investment returns and principal value will fluctuate and shares, when redeemed, may be worth more or less than their original cost.
As of the January 31, 2023 prospectus, the Total Annual Fund Operating Expenses for the Wasatch Emerging India Fund are Investor Class: 1.51% / Institutional Class: 1.38%. The expense ratio shown elsewhere in this report may be different. Net expenses are based on Fund expenses, net of waivers and reimbursements. See the prospectus for additional information regarding Fund expenses.
Wasatch will deduct a 2.00% redemption fee on Fund shares held 60 days or less. Performance data do not reflect the deduction of fees, including sales charges, or the taxes you would pay on fund distributions or the redemption of fund shares. Fees and taxes, if reflected, would reduce the performance quoted. Wasatch does not charge any sales fees. For more complete information including charges, risks and expenses, read the prospectus carefully.
Performance for the Institutional Class prior to 2/1/2016 is based on the performance of the Investor Class. Performance of the Fund’s Institutional Class prior to 2/1/2016 uses the actual expenses of the Fund’s Investor Class without any adjustments. For any such period of time, the performance of the Fund’s Institutional Class would have been substantially similar to, yet higher than, the performance of the Fund’s Investor Class, because the shares of both classes are invested in the same portfolio of securities, but the classes bear different expenses.
Investing in small cap funds will be more volatile and loss of principal could be greater than investing in large cap or more diversified funds. Investing in foreign securities, especially in emerging markets, entails special risks, such as unstable currencies, highly volatile securities markets and political and social instability, which are described in more detail in the prospectus. Being non-diversified, the Fund can invest a larger portion of its assets in the stocks of a limited number of companies than a diversified fund. Non-diversification increases the risk of loss to the Fund if the values of these securities decline.
TOP 10 EQUITY HOLDINGS*
| | | | |
| |
| Company | | % of Net Assets | |
| |
HDFC Bank Ltd. | | | 9.7% | |
| |
Bajaj Finance Ltd. | | | 9.5% | |
| |
Elgi Equipments Ltd. | | | 8.1% | |
| |
AU Small Finance Bank Ltd. | | | 7.6% | |
| |
Persistent Systems Ltd. | | | 5.4% | |
| | | | |
| |
| Company | | % of Net Assets | |
| |
LTIMindtree Ltd. | | | 5.3% | |
| |
Trent Ltd. | | | 5.1% | |
| |
L&T Technology Services Ltd. | | | 4.4% | |
| |
Avenue Supermarts Ltd. | | | 4.3% | |
| |
Dr. Lal PathLabs Ltd. | | | 4.2% | |
| *As | of March 31, 2023, there were 27 holdings in the Fund. Foreign currency contracts, written options and repurchase agreements, if any, are not included in the number of holdings. Portfolio holdings are subject to change at any time. References to specific securities should not be construed as recommendations by the Funds or their Advisor. Current and future holdings are subject to risk. |
SECTOR BREAKDOWN**
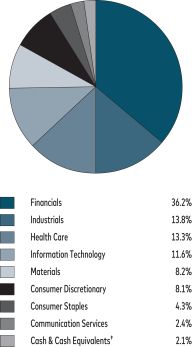
| ** | Excludes securities sold short, if any. |
| † | Also includes Other Assets & Liabilities. |
GROWTH OF A HYPOTHETICAL $10,000 INVESTMENT
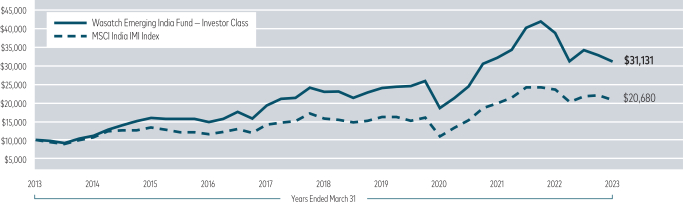
Past performance does not predict future performance. The graph above does not reflect the deduction of fees, sales charges, or taxes that you would pay on fund distributions or the redemption of fund shares. Wasatch does not charge any sales fees.
7
| | |
| Wasatch Emerging Markets Select Fund (WAESX / WIESX) | | MARCH 31, 2023 (Unaudited) |
Management Discussion
The Wasatch Emerging Markets Select Fund is managed by a team of Wasatch portfolio managers led by Ajay Krishnan, Neal Dihora, Scott Thomas and Matthew Dreith.
| | | | |

Ajay Krishnan, CFA Lead Portfolio Manager 
Scott Thomas, CFA Associate Portfolio
Manager | | 
Neal Dihora, CFA Portfolio Manager 
Matthew Dreith, CFA Associate Portfolio
Manager | | OVERVIEW Emerging-market equities pared early gains as worries about the health of financial companies stoked fears of global recession. Failures of three regional banks in the U.S. and the hastily arranged government-brokered sale of troubled Swiss firm Credit Suisse Group AG added complexity to an economic backdrop that was already uncertain, |
clouding the path forward for policymakers who now must also contend with risks to financial stability as they struggle to bring inflation under control.
The benchmark MSCI Emerging Markets Index rose 3.96% for the first quarter of 2023. Surpassing its benchmark, the Wasatch Emerging Markets Select Fund — Investor Class generated a total return of 9.19%.
DETAILS OF THE QUARTER
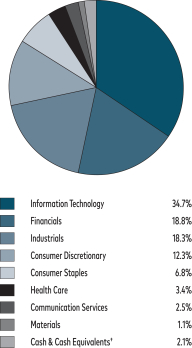
Taiwan and Mexico posted above-average returns relative to the benchmark during the quarter, driven by overweight positioning and outsized gains in our holdings. Early signs that the semiconductor cycle may be bottoming fueled a surge of foreign buying in Taiwan’s tech-heavy stock market. And in Mexico, the peso’s appreciation of more than 8% against the U.S. dollar boosted equity returns as the Bank of Mexico, the country’s central bank, raised its policy interest rate to 11.25%.
Driven largely by MercadoLibre, Inc., which we consider a Brazilian holding for portfolio-management purposes, Brazil was the Fund’s single-biggest source of outperformance relative to the benchmark. MercadoLibre provides e-commerce platforms and payment solutions in Latin America. The company’s stock price rose sharply in January after reports of accounting inconsistencies at rival firm Americanas SA, which later filed for bankruptcy. Already a dominant player in the markets it serves, MercadoLibre is expected to gain additional share as the woes of Americanas hinder its ability to borrow, grow and invest in its business. In February, MercadoLibre’s stock rose further after a solid financial report. For the recent quarter, the company posted greater
than 40% year-over-year revenue growth, helped by robust increases in total payment volume and gross merchandise volume.
Other top contributors to Fund performance during the quarter included ASPEED Technology, Inc. Headquartered in Taiwan, the company is a fabless designer of integrated circuits, specializing in areas that include server management and audio-visual extensions. An upswell of enthusiasm during February about artificial intelligence (AI) helped push ASPEED’s stock price higher. Investors reckoned that the massive data-processing requirements of AI’s large language models may lead to increased demand for the company’s chips.
The greatest detractor from Fund performance for the quarter was Bajaj Finance Ltd. A non-bank financial company, Bajaj offers a broad spectrum of lending services in India. Shares of Bajaj declined in sympathy with other Indian equities, as a selloff in the shares of Gautam Adani’s sprawling conglomerate spilled over to the broader market and weighed especially heavily on financials. The stock moved lower again in March when investors reacted negatively to reports that Bajaj was working on an offer to purchase a banking business in Indonesia in a deal potentially valued in the hundreds of millions of dollars.
Meituan was also a significant detractor from Fund performance. The company operates leading online platforms for consumer products and retail services in China. Stocks in China faced headwinds during the first quarter as optimism about the country’s reopening from zero-Covid gave way to doubts about the ability of consumers to spend. Worries about increased competition in Meituan’s business also impacted the company’s share price.
OUTLOOK
Although emerging markets felt the effects of turmoil at U.S. and European banks, recent stresses in the global financial system didn’t originate in developing nations. Instead, developed markets have been the source of this recent market volatility. Relative to developed countries, emerging markets may not be as risky as investors have been led to believe.
We think emerging markets continue to offer more appealing valuations and better growth prospects. For example, Moody’s Investors Service currently forecasts real gross domestic product growth in India of 5.5% in 2023, up from an earlier forecast of 5%. Growth in 2024 is expected to come in at 6.5%. Recent upward revisions for India reflect increased capital expenditures in the budget released by the Modi government in February. With risks in the U.S. on the rise, we believe well-situated businesses in consumer-driven economies such as India’s offer potentially attractive opportunities for long-term investment.
Thank you for the opportunity to manage your assets.
Current and future holdings are subject to risk.
8
| | |
| Wasatch Emerging Markets Select Fund (WAESX / WIESX) | | MARCH 31, 2023 (Unaudited) |
Portfolio Summary
AVERAGE ANNUAL TOTAL RETURNS
| | | | | | | | | | | | | | | | | | | | |
| | | | |
| | | Six Months
(Not annualized) | | 1 Year | | 5 Years | | 10 Years |
| | | | |
Emerging Markets Select (WAESX) — Investor | | | | 14.92% | | | | | -18.24% | | | | | 6.50% | | | | | 4.05% | |
| | | | |
Emerging Markets Select (WIESX) — Institutional | | | | 15.01% | | | | | -18.05% | | | | | 6.72% | | | | | 4.33% | |
| | | | |
MSCI Emerging Markets Index | | | | 14.04% | | | | | -10.70% | | | | | -0.91% | | | | | 2.00% | |
| | | | |
MSCI Emerging Markets Mid Cap Growth Index | | | | 14.14% | | | | | -12.66% | | | | | -1.14% | | | | | 2.67% | |
Data show past performance, which is not indicative of future performance. Current performance may be lower or higher than the performance quoted. To obtain the most recent month-end performance data available, please visit wasatchglobal.com. The Advisor may absorb certain Fund expenses, without which total returns would have been lower. Investment returns and principal value will fluctuate and shares, when redeemed, may be worth more or less than their original cost.
As of the January 31, 2023 prospectus, the Total Annual Fund Operating Expenses for the Wasatch Emerging Markets Select Fund are Investor Class: 1.32% / Institutional Class: 1.14%. The expense ratio shown elsewhere in this report may be different. Net expenses are based on Fund expenses, net of waivers and reimbursements. See the prospectus for additional information regarding Fund expenses.
Wasatch will deduct a 2.00% redemption fee on Fund shares held 60 days or less. Performance data do not reflect the deduction of fees, including sales charges, or the taxes you would pay on fund distributions or the redemption of fund shares. Fees and taxes, if reflected, would reduce the performance quoted. Wasatch does not charge any sales fees. For more complete information including charges, risks and expenses, read the prospectus carefully.
Investing in foreign securities, especially in emerging markets, entails special risks, such as currency fluctuations and political uncertainties, which are described in more detail in the prospectus. Investing in small cap funds will be more volatile and loss of principal could be greater than investing in large cap or more diversified funds. Being non-diversified, the Fund can invest a larger portion of its assets in the stocks of a limited number of companies than a diversified fund. Non-diversification increases the risk of loss to the Fund if the values of these securities decline.
TOP 10 EQUITY HOLDINGS*
| | | | |
| |
| Company | | % of Net Assets | |
| |
MercadoLibre, Inc. | | | 7.7% | |
| |
HDFC Bank Ltd. | | | 6.7% | |
| |
Voltronic Power Technology Corp. | | | 5.3% | |
| |
Bajaj Finance Ltd. | | | 4.9% | |
| |
Chailease Holding Co. Ltd. | | | 4.8% | |
| | | | |
| |
| Company | | % of Net Assets | |
| |
Lasertec Corp. | | | 4.5% | |
| |
Silergy Corp. | | | 4.4% | |
| |
WEG SA | | | 4.4% | |
| |
Globant SA | | | 4.2% | |
| |
Grupo Aeroportuario del Pacifico SAB de CV | | | 4.0% | |
| * | As of March 31, 2023, there were 36 holdings in the Fund. Foreign currency contracts, written options and repurchase agreements, if any, are not included in the number of holdings. Portfolio holdings are subject to change at any time. References to specific securities should not be construed as recommendations by the Funds or their Advisor. Current and future holdings are subject to risk. |
SECTOR BREAKDOWN**
| ** | Excludes securities sold short, if any. |
| † | Also includes Other Assets & Liabilities. |
GROWTH OF A HYPOTHETICAL $10,000 INVESTMENT
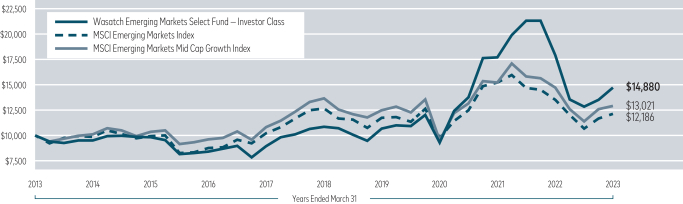
Past performance does not predict future performance. The graph above does not reflect the deduction of fees, sales charges, or taxes that you would pay on fund distributions or the redemption of fund shares. Wasatch does not charge any sales fees.
9
| | |
| Wasatch Emerging Markets Small Cap Fund (WAEMX / WIEMX) | | MARCH 31, 2023 (Unaudited) |
Management Discussion
The Wasatch Emerging Markets Small Cap Fund is managed by a team of Wasatch portfolio managers led by Ajay Krishnan, Dan Chace, Scott Thomas, Kevin Unger and Anh Hoang.
| | | | |

Ajay Krishnan, CFA Lead Portfolio Manager 
Kevin Unger, CFA Associate Portfolio Manager | | 
Dan Chace, CFA Portfolio Manager 
Anh Hoang, CFA Associate Portfolio Manager | | 
Scott Thomas, CFA Portfolio Manager OVERVIEW During the first quarter of 2023, the Wasatch Emerging Markets Small Cap Fund �� Investor Class gained 7.60% and surpassed its benchmark, the |
|
MSCI Emerging Markets Small Cap Index, which rose 3.87%.
Growing optimism that central banks were nearing the end of their interest-rate increases evaporated in February after strong economic data challenged the consensus view that inflationary pressures had peaked. The sudden arrival of a crisis at several banks in the U.S. and one in Europe in March further clouded the path forward for policymakers. In India, stocks declined as a short-seller report attacking companies linked to billionaire Gautam Adani shook investor confidence. India’s economic growth slowed as rising borrowing costs weighed on manufacturing and consumption. Consumer prices exceeded the target of India’s central bank for a second straight month. As a result, the Reserve Bank of India may continue to raise interest rates to rein in stubbornly high inflation.
DETAILS OF THE QUARTER
Taiwan and Mexico were sources of outperformance relative to the benchmark, driven by overweight positioning and outsized gains in our holdings. Early signs that the semiconductor cycle may be bottoming fueled a surge of foreign buying in Taiwan’s tech-heavy stock market. And in Mexico, the peso’s appreciation against the U.S. dollar boosted equity returns as the Bank of Mexico, the country’s central bank, raised its policy interest rate to 11.25%.
China’s reopening from zero-Covid restrictions helped spark an upturn in sentiment throughout the region. Equities in Korea did well, but the Korean stocks in the Fund underperformed the Korean positions in the Index. As a result, Korea was the Fund’s primary source of weakness against the benchmark. In China, the benchmark’s positions posted a negative return. However, the Fund’s Chinese stocks logged a solid double-digit gain that helped performance.
The top contributor to Fund performance for the quarter was Taiwanese holding ASPEED Technology, Inc. The company is a fabless designer of integrated circuits, specializing in areas that include server management and audio-visual extensions. Enthusiasm about artificial intelligence (AI) helped push ASPEED’s stock price higher. Investors reckoned that the massive data-processing requirements of AI’s large language models may lead to increased demand for the company’s chips.
Another top contributor was Grupo Aeroportuario del Centro Norte SAB de CV. Often referred to as “OMA,” the company operates international airports in the northern and central regions of Mexico under contracts with the government. Pent-up demand for travel has raised passenger counts and boosted revenues at the company’s airports.
Although our Indian stocks declined less than the Indian positions in the Index, overweight positioning in India hurt the Fund’s relative performance. As the Fund’s most heavily weighted country, India accounted for the two biggest detractors in the first quarter: AU Small Finance Bank Ltd. and Dr. Lal PathLabs Ltd.
With consumer inflation in India coming in above the central bank’s target, the growing likelihood of additional rate hikes weighed on share prices in the financials sector, including those of AU Small Finance Bank, which primarily targets unbanked and underbanked low- and middle-income borrowers.
Dr. Lal’s operates one of the largest chains of diagnostic pathology labs in India. Robust demand for Covid-19 testing had driven increased volumes and margin expansion for the company. Those effects are now reversing, resulting in difficult year-over-year comparisons to early 2022 — the time of India’s peak in Omicron infections. We expect growth to normalize, and we believe Dr. Lal’s has the potential to become India’s dominant consumer brand in diagnostics.
OUTLOOK
Broadly speaking, we think recent developments could ultimately strengthen, not weaken, the case for investing in emerging markets. Over time, emerging markets may benefit if problems at U.S. banks result in lower global interest rates and a weaker U.S. dollar.
Moreover, we think emerging markets continue to offer more appealing valuations and have better growth prospects than developed markets. For example, India’s economic growth forecasts have recently been revised upward, reflecting increased capital expenditures in the budget released by the Modi government in February. With risks in the U.S. on the rise, we believe well-situated businesses in consumer-driven economies such as India’s offer potentially attractive opportunities for long-term investment.
Thank you for the opportunity to manage your assets.
Current and future holdings are subject to risk.
10
| | |
| Wasatch Emerging Markets Small Cap Fund (WAEMX / WIEMX) | | MARCH 31, 2023 (Unaudited) |
Portfolio Summary
AVERAGE ANNUAL TOTAL RETURNS
| | | | | | | | | | | | | | | | | | | | |
| | | | |
| | | Six Months
(Not annualized) | | 1 Year | | 5 Years | | 10 Years |
| | | | |
Emerging Markets Small Cap (WAEMX) — Investor | | | | 12.39% | | | | | -19.30% | | | | | 3.23% | | | | | 2.80% | |
| | | | |
Emerging Markets Small Cap (WIEMX) — Institutional | | | | 12.24% | | | | | -19.37% | | | | | 3.35% | | | | | 2.90% | |
| | | | |
MSCI Emerging Markets Small Cap Index | | | | 12.38% | | | | | -10.99% | | | | | 1.80% | | | | | 3.18% | |
| | | | |
MSCI Emerging Markets Index | | | | 14.04% | | | | | -10.70% | | | | | -0.91% | | | | | 2.00% | |
Data show past performance, which is not indicative of future performance. Current performance may be lower or higher than the performance quoted. To obtain the most recent month-end performance data available, please visit wasatchglobal.com. The Advisor may absorb certain Fund expenses, without which total returns would have been lower. Investment returns and principal value will fluctuate and shares, when redeemed, may be worth more or less than their original cost.
As of the January 31, 2023 prospectus, the Total Annual Fund Operating Expenses for the Wasatch Emerging Markets Small Cap Fund are Investor Class: 1.91% / Institutional Class: 1.78%. The expense ratio shown elsewhere in this report may be different. Net expenses are based on Fund expenses, net of waivers and reimbursements. See the prospectus for additional information regarding Fund expenses.
Wasatch will deduct a 2.00% redemption fee on Fund shares held 60 days or less. Performance data do not reflect the deduction of fees, including sales charges, or the taxes you would pay on fund distributions or the redemption of fund shares. Fees and taxes, if reflected, would reduce the performance quoted. Wasatch does not charge any sales fees. For more complete information including charges, risks and expenses, read the prospectus carefully.
Performance for the Institutional Class prior to 2/1/2016 is based on the performance of the Investor Class. Performance of the Fund’s Institutional Class prior to 2/1/2016 uses the actual expenses of the Fund’s Investor Class without any adjustments. For any such period of time, the performance of the Fund’s Institutional Class would have been substantially similar to, yet higher than, the performance of the Fund’s Investor Class, because the shares of both classes are invested in the same portfolio of securities, but the classes bear different expenses.
Investing in foreign securities, especially in emerging markets, entails special risks, such as currency fluctuations and political uncertainties, which are described in more detail in the prospectus. Investing in small cap funds will be more volatile and loss of principal could be greater than investing in large cap or more diversified funds. Being non-diversified, the Fund can invest a larger portion of its assets in the stocks of a limited number of companies than a diversified fund. Non-diversification increases the risk of loss to the Fund if the values of these securities decline.
TOP 10 EQUITY HOLDINGS*
| | | | |
| |
| Company | | % of Net Assets | |
| |
Voltronic Power Technology Corp. | | | 6.5% | |
| |
AU Small Finance Bank Ltd. | | | 5.0% | |
| |
Globant SA | | | 4.3% | |
| |
Grupo Aeroportuario del Centro Norte SAB de CV | | | 4.3% | |
| |
Silergy Corp. | | | 4.0% | |
| | | | |
| |
| Company | | % of Net Assets | |
| |
momo.com, Inc. | | | 3.6% | |
| |
LEENO Industrial, Inc. | | | 3.5% | |
| |
Persistent Systems Ltd. | | | 3.5% | |
| |
ASPEED Technology, Inc. | | | 3.4% | |
| |
LTIMindtree Ltd. | | | 3.2% | |
| * | As of March 31, 2023, there were 46 holdings in the Fund. Foreign currency contracts, written options and repurchase agreements, if any, are not included in the number of holdings. Portfolio holdings are subject to change at any time. References to specific securities should not be construed as recommendations by the Funds or their Advisor. Current and future holdings are subject to risk. |
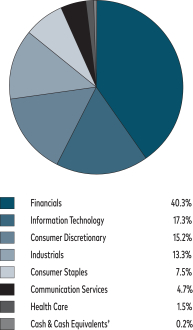
SECTOR BREAKDOWN**
| ** | Excludes securities sold short, if any. |
| † | Also includes Other Assets & Liabilities. |
GROWTH OF A HYPOTHETICAL $10,000 INVESTMENT
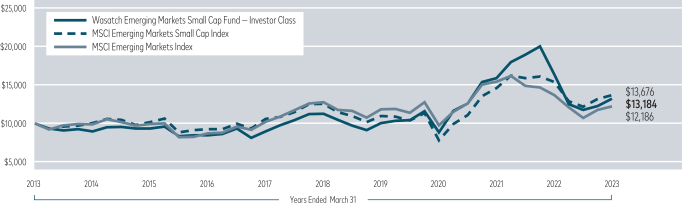
Past performance does not predict future performance. The graph above does not reflect the deduction of fees, sales charges, or taxes that you would pay on fund distributions or the redemption of fund shares. Wasatch does not charge any sales fees.
11
| | |
| Wasatch Frontier Emerging Small Countries Fund (WAFMX / WIFMX) | | MARCH 31, 2023 (Unaudited) |
Management Discussion
The Wasatch Frontier Emerging Small Countries Fund is managed by a team of Wasatch portfolio managers led by Scott Thomas.
| | |
Scott Thomas, CFA Lead Portfolio Manager | | OVERVIEW During 2022, rising rates and inflation sapped investor enthusiasm for growth-oriented stocks. However, as many central banks seemed poised to slow or pause interest-rate increases in 2023, investors have begun to reward the strong results of many of our companies, leading to significant gains for many stocks in the portfolio. |
In this environment, the Wasatch Frontier Emerging Small Countries Fund — Investor Class returned 12.65% in the first quarter, outperforming the benchmark MSCI Frontier Emerging Markets Index, which returned 2.39%.
DETAILS OF THE QUARTER
MercadoLibre, Inc. was the Fund’s top contributor to performance during the quarter. The company operates an online e-commerce, payments, and credit system in 18 countries, and has been called “the Amazon of Latin America” due to its leadership in the region’s fast-growing online marketplace. MercadoLibre experienced considerable growth in 2022, with fourth-quarter revenue up 56.5% from the same period in 2021 and operating income jumping from $24 million to $349 million. MercadoLibre also benefited as an important rival in Brazil was engulfed in an accounting scandal that led to the departure of its CEO and CFO.
Mexico’s Qualitas Controladora SAB de CV was another top performer. The auto insurer is rebounding from a difficult period when mobility trends and accident frequency returned to pre-pandemic levels while inflation increased the cost of parts for vehicle repairs. As the company and industry raise prices and inflation settles down, we think profitability should recover on the back of improving underwriting results and the company’s investment portfolio benefiting from higher interest rates. We continue to like the company’s long-term growth potential and stability as the market leader in an underpenetrated Mexican insurance market. Qualitas is also expanding geographically and diversifying into the relatively nascent Mexican health-insurance business.
The largest detractor from Fund performance was Bajaj Finance Ltd. A non-bank financial company, Bajaj offers a broad spectrum of lending services in India. Shares of Bajaj declined in sympathy with other Indian equities as a selloff in the shares of Gautam Adani’s sprawling conglomerate spilled over to the broader market and weighed especially heavily on financials. The stock moved lower again in March, in part due to investors reacting negatively to reports that Bajaj was planning to purchase an Indonesian bank.
We continue to have confidence in Bajaj’s management team, which has an outstanding track record, and we see significant opportunities ahead for this non-bank lender. Bajaj is outpacing the stodgy traditional banks and their notoriously poor customer service by lending to affluent urban and semi-urban consumers and offering credit cards, mortgages and loans for durable goods. The company is a leader in employing sophisticated data analytics to identify opportunities and reduce credit risk, all while lowering its broader risk profile as it reinvests fee income from higher-risk products into lower-risk areas like mortgage lending.
VEF AB also detracted from performance. The Swedish firm invests in growth-stage financial-technology companies in frontier and emerging markets. The stock was down after a Brazilian company in its investment portfolio tabled its initial public offering and a Mexican holding ran into liquidity issues, raising concerns about whether VEF could sustain its growth. Some setbacks are inevitable with startups, but we continue to believe that VEF is investing in companies with savvy management teams that have structured their businesses to withstand challenges. Importantly, we think these companies represent the future of finance in their target markets.
OUTLOOK
Even as the global banking industry shudders in response to high-profile meltdowns at U.S. and Swiss banks, we continue to see a bright future for the innovative businesses we own within emerging and frontier markets.
To be sure, an extended banking crisis or recession in developed markets could create economic headwinds everywhere. We would note, however, that the worst of the rate-related tumult affecting the developed world has, in many cases, already passed in emerging and frontier markets. Interest rates in these markets remain very high, but some key central banks, including Brazil’s, have already stopped their increases.
Importantly, many of our holdings may not need the strongest economic backdrop to thrive because they’re tied to strong secular tailwinds. The Fund remains focused on companies at the forefront of the longer-term social and technological trends that are transforming the frontier and emerging markets in which they operate.
For example, some of our largest holdings include: IT companies enabling digital transformation for businesses and consumers; financial-service firms facilitating safer and frictionless digital transactions for a growing middle class; hospital chains improving quality of life within local markets; and retail companies and communication-services firms aligned to new purchasing and consumption trends. We believe these companies have a long runway for growth, and we look forward to watching these themes play out in 2023 and beyond.
Thank you for the opportunity to manage your assets.
Current and future holdings are subject to risk.
12
| | |
| Wasatch Frontier Emerging Small Countries Fund (WAFMX / WIFMX) | | MARCH 31, 2023 (Unaudited) |
Portfolio Summary
AVERAGE ANNUAL TOTAL RETURNS
| | | | | | | | | | | | | | | | | | | | |
| | | | |
| | | Six Months
(Not annualized) | | 1 Year | | 5 Years | | 10 Years |
| | | | |
Frontier Emerging Small Countries (WAFMX) — Investor | | | | 12.65% | | | | | -19.06% | | | | | -1.31% | | | | | -0.04% | |
| | | | |
Frontier Emerging Small Countries (WIFMX) — Institutional | | | | 13.31% | | | | | -18.79% | | | | | -1.06% | | | | | 0.15% | |
| | | | |
MSCI Frontier Emerging Markets Index | | | | 11.76% | | | | | -16.63% | | | | | -3.99% | | | | | -0.35% | |
| | | | |
MSCI Frontier Markets Index | | | | 2.24% | | | | | -17.55% | | | | | -2.85% | | | | | 2.73% | |
Data show past performance, which is not indicative of future performance. Current performance may be lower or higher than the performance quoted. To obtain the most recent month-end performance data available, please visit wasatchglobal.com. The Advisor may absorb certain Fund expenses, without which total returns would have been lower. Investment returns and principal value will fluctuate and shares, when redeemed, may be worth more or less than their original cost.
As of the January 31, 2023 prospectus, the Total Annual Fund Operating Expenses for the Wasatch Frontier Emerging Small Countries Fund are Investor Class — Gross: 2.29%, Net: 2.19% / Institutional Class — Gross: 2.08%, Net: 1.99%. The expense ratio shown elsewhere in this report may be different. Net expenses are based on Fund expenses, net of waivers and reimbursements. See the prospectus for additional information regarding Fund expenses.
Wasatch will deduct a 2.00% redemption fee on Fund shares held 60 days or less. Performance data do not reflect the deduction of fees, including sales charges, or the taxes you would pay on fund distributions or the redemption of fund shares. Fees and taxes, if reflected, would reduce the performance quoted. Wasatch does not charge any sales fees. For more complete information including charges, risks and expenses, read the prospectus carefully.
Performance for the Institutional Class prior to 2/1/2016 is based on the performance of the Investor Class. Performance of the Fund’s Institutional Class prior to 2/1/2016 uses the actual expenses of the Fund’s Investor Class without any adjustments. For any such period of time, the performance of the Fund’s Institutional Class would have been substantially similar to, yet higher than, the performance of the Fund’s Investor Class, because the shares of both classes are invested in the same portfolio of securities, but the classes bear different expenses.
Investing in foreign securities, especially in frontier and emerging markets, entails special risks, such as currency fluctuations and political uncertainties, which are described in more detail in the prospectus. Investing in small cap funds will be more volatile and loss of principal could be greater than investing in large cap or more diversified funds. Being non-diversified, the Fund can invest a larger portion of its assets in the stocks of a limited number of companies than a diversified fund. Non-diversification increases the risk of loss to the Fund if the values of these securities decline.
TOP 10 EQUITY HOLDINGS*
| | | | |
| |
| Company | | % of Net Assets | |
| |
MercadoLibre, Inc. | | | 9.9% | |
| |
FPT Corp. | | | 8.2% | |
| |
Bajaj Finance Ltd. | | | 6.6% | |
| |
Bank for Foreign Trade of Vietnam JSC | | | 6.1% | |
| |
Qualitas Controladora SAB de CV | | | 5.2% | |
| | | | |
| |
| Company | | % of Net Assets | |
| |
WEG SA | | | 5.1% | |
| |
Discovery Ltd. | | | 4.9% | |
| |
Wilcon Depot, Inc. | | | 4.5% | |
| |
NU Holdings Ltd. | | | 4.4% | |
| |
Sea Ltd., ADR | | | 4.1% | |
| * | As of March 31, 2023, there were 34 holdings in the Fund. Foreign currency contracts, written options and repurchase agreements, if any, are not included in the number of holdings. Portfolio holdings are subject to change at any time. References to specific securities should not be construed as recommendations by the Funds or their Advisor. Current and future holdings are subject to risk. |
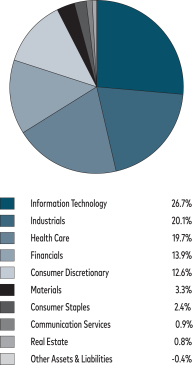
SECTOR BREAKDOWN**
| ** | Excludes securities sold short, if any. |
| † | Also includes Other Assets & Liabilities. |
GROWTH OF A HYPOTHETICAL $10,000 INVESTMENT
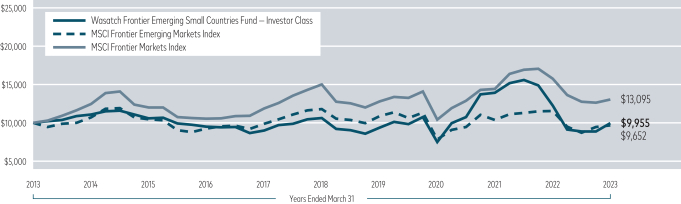
Past performance does not predict future performance. The graph above does not reflect the deduction of fees, sales charges, or taxes that you would pay on fund distributions or the redemption of fund shares. Wasatch does not charge any sales fees.
13
| | |
| Wasatch Global Opportunities Fund (WAGOX / WIGOX) | | MARCH 31, 2023 (Unaudited) |
Management Discussion
The Wasatch Global Opportunities Fund is managed by a team of Wasatch portfolio managers led by JB Taylor, Ajay Krishnan, Ken Applegate and Paul Lambert.
| | | | |

JB Taylor Lead Portfolio Manager 
Ken Applegate, CFA Portfolio Manager | | 
Ajay Krishnan, CFA Lead Portfolio Manager 
Paul Lambert Portfolio Manager | | OVERVIEW Global equities notched gains for the first quarter of 2023 but were volatile. Stocks started the year on an upswing, but signs of persistent inflation weighed on equity markets in February. Volatility continued in March after a few high-profile bank failures led to concerns about the banking industry. In this environment, the Wasatch Global |
|
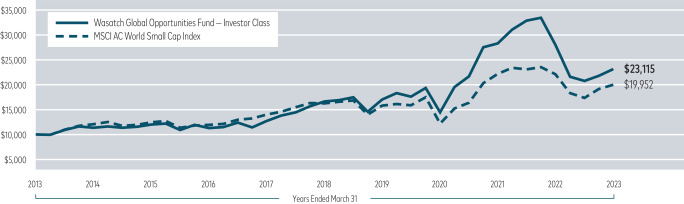
Opportunities Fund — Investor Class gained 6.32%, outperforming its benchmark, the MSCI AC (All Country) World Small Cap Index, which was up 4.24%.
DETAILS OF THE QUARTER
The most significant contributor to the Fund’s performance during the first quarter was BayCurrent Consulting, Inc., a Japan-based business management and information-technology (IT) consultant. Demand for digital transformation projects, a key area of focus for BayCurrent, continues to be strong, which has helped lift the company’s stock in recent months. Recent results indicate that our thesis on the company continues to play out. Japan is behind many countries when it comes to digitalization. The pandemic and work-from-home environment underscored its need to catch up. As Japanese enterprises undertake large-scale digitalization projects, we believe domestic IT consultants such as BayCurrent have a strong home-country advantage relative to global consulting firms.
ASPEED Technology, Inc. was another top contributor. Headquartered in Taiwan, the company is a fabless designer of integrated circuits specializing in areas that include server management and audio-visual extensions. An upswell of enthusiasm during February about artificial intelligence (AI) helped push ASPEED’s stock price higher. Investors reckoned the massive data-processing requirements of AI’s large language models may lead to increased demand for the company’s chips.
Stock-market jitters in India and negative sentiment toward banks in March helped produce one of the Fund’s biggest detractors from performance during the quarter — AU Small Finance Bank Ltd. The company targets unbanked and
underbanked low- and middle-income borrowers in India. While the stocks of many banking companies were down in the first quarter, we think AU Small Finance’s risk profile is quite different from some of the banks that failed. Operating in an emerging market means its management team is used to navigating a volatile interest-rate environment. As such, the bank has an asset-liability management structure well-suited for fluctuating interest rates. Further, AU Small Finance withstood a severe liquidity crisis in India in 2018, which presented a different set of circumstances but was arguably a more challenging crisis than what developed-market banks face today.
Abcam PLC was another detractor. The stock of the British health-care company was down after it reported annual revenue that was below consensus expectations, due in part to the implementation of a new enterprise resource planning (ERP) system, which caused an order backlog. Despite these near-term setbacks, we don’t believe anything has structurally changed for the firm. Abcam provides biological reagents and tools that are essential to a wide range of fields, including drug discovery, diagnostics and basic research. We expect high demand for these products as health-care innovation pushes forward. In addition, we believe profit margins will expand after an extended period of investment for the firm.
OUTLOOK
So far, central banks have ring-fenced banking industry turmoil, limiting the damage to just a few troubled institutions. However, it’s hard to predict whether more bank failures will occur or how severe the fallout from those failures would be. Nevertheless, we feel good about the prospects of the banks we hold. Within our portfolio, we own just two banks, both of which have a risk profile we believe is quite different from the banks that failed.
While we feel good about our bank holdings, we continue to think about the knock-on effects of banking turmoil. Already, at least two things seem certain. First, trouble for banks will be another drag on economic growth. Second, the cost of capital for businesses is poised to increase.
We believe an environment of slower growth and rising capital costs should favor the types of high-quality companies in which Wasatch invests. Our investment process focuses on firms with strong balance sheets, low levels of debt and typically, a steady history of earnings growth and cash flow generation. These self-funded businesses can continue to carry out their growth plans at a time when rising capital costs may force weaker competitors to pare back. We believe this should set our firms up for better growth in the years to come.
Thank you for the opportunity to manage your assets.
Current and future holdings are subject to risk.
14
| | |
| Wasatch Global Opportunities Fund (WAGOX / WIGOX) | | MARCH 31, 2023 (Unaudited) |
Portfolio Summary
AVERAGE ANNUAL TOTAL RETURNS
| | | | | | | | | | | | | | | | | | | | |
| | | | |
| | | Six Months
(Not annualized) | | 1 Year | | 5 Years | | 10 Years |
| | | | |
Global Opportunities (WAGOX) — Investor | | | | 11.56% | | | | | -17.43% | | | | | 6.85% | | | | | 8.74% | |
| | | | |
Global Opportunities (WIGOX) — Institutional | | | | 11.75% | | | | | -17.28% | | | | | 7.06% | | | | | 8.87% | |
| | | | |
MSCI AC World Small Cap Index | | | | 15.14% | | | | | -9.57% | | | | | 4.19% | | | | | 7.15% | |
Data show past performance, which is not indicative of future performance. Current performance may be lower or higher than the performance quoted. To obtain the most recent month-end performance data available, please visit wasatchglobal.com. The Advisor may absorb certain Fund expenses, without which total returns would have been lower. Investment returns and principal value will fluctuate and shares, when redeemed, may be worth more or less than their original cost.
As of the January 31, 2023 prospectus, the Total Annual Fund Operating Expenses for the Wasatch Global Opportunities Fund are Investor Class: 1.50% / Institutional Class — Gross: 1.38%, Net: 1.35%. The expense ratio shown elsewhere in this report may be different. Net expenses are based on Fund expenses, net of waivers and reimbursements. See the prospectus for additional information regarding Fund expenses.
Wasatch will deduct a 2.00% redemption fee on Fund shares held 60 days or less. Performance data do not reflect the deduction of fees, including sales charges, or the taxes you would pay on fund distributions or the redemption of fund shares. Fees and taxes, if reflected, would reduce the performance quoted. Wasatch does not charge any sales fees. For more complete information including charges, risks and expenses, read the prospectus carefully.
Performance for the Institutional Class prior to 2/1/2016 is based on the performance of the Investor Class. Performance of the Fund’s Institutional Class prior to 2/1/2016 uses the actual expenses of the Fund’s Investor Class without any adjustments. For any such period of time, the performance of the Fund’s Institutional Class would have been substantially similar to, yet higher than, the performance of the Fund’s Investor Class, because the shares of both classes are invested in the same portfolio of securities, but the classes bear different expenses.
Investing in small and micro cap funds will be more volatile and loss of principal could be greater than investing in large cap or more diversified funds. Investing in foreign securities, especially in emerging markets, entails special risks, such as currency fluctuations and political uncertainties, which are described in more detail in the prospectus.
TOP 10 EQUITY HOLDINGS*
| | | | |
| |
| Company | | % of Net Assets | |
| |
BayCurrent Consulting, Inc. | | | 5.8% | |
| |
AU Small Finance Bank Ltd. | | | 3.9% | |
| |
Ensign Group, Inc. | | | 3.7% | |
| |
Five Below, Inc. | | | 3.1% | |
| |
HealthEquity, Inc. | | | 3.1% | |
| | | | |
| |
| Company | | % of Net Assets | |
| |
Globant SA | | | 2.9% | |
| |
Abcam PLC | | | 2.8% | |
| |
Voltronic Power Technology Corp. | | | 2.7% | |
| |
Silergy Corp. | | | 2.6% | |
| |
Saia, Inc. | | | 2.4% | |
| * | As of March 31, 2023, there were 64 holdings in the Fund. Foreign currency contracts, written options and repurchase agreements, if any, are not included in the number of holdings. Portfolio holdings are subject to change at any time. References to specific securities should not be construed as recommendations by the Funds or their Advisor. Current and future holdings are subject to risk. |
SECTOR BREAKDOWN**
| ** | Excludes securities sold short, if any. |
GROWTH OF A HYPOTHETICAL $10,000 INVESTMENT
Past performance does not predict future performance. The graph above does not reflect the deduction of fees, sales charges, or taxes that you would pay on fund distributions or the redemption of fund shares. Wasatch does not charge any sales fees.
15
| | |
| Wasatch Global Select Fund (WAGSX / WGGSX) | | MARCH 31, 2023 (Unaudited) |
Management Discussion
The Wasatch Global Select Fund is managed by a team of Wasatch portfolio managers led by Ken Applegate, Paul Lambert, Linda Lasater and Mike Valentine.
| | | | |
Ken Applegate, CFA Portfolio Manager 
Linda Lasater, CFA Portfolio Manager | |
Paul Lambert Portfolio Manager
Mike Valentine Portfolio Manager | | OVERVIEW Global equities notched gains for the quarter but were volatile. Stocks started the year on an upswing, but signs of persistent inflation weighed on equity markets in February. Volatility continued in March after a few high-profile bank failures led to concerns about the banking industry. |
In this environment, the Wasatch Global Select Fund — Investor Class gained 9.68%, outperforming the benchmark MSCI AC (All Country) World Index, which was up 7.31%.
DETAILS OF THE QUARTER
The most significant contributor to the Fund’s performance during the quarter was BayCurrent Consulting, Inc., a Japan-based business management and information-technology (IT) consultant. Demand for digital transformation projects, a key area of focus for BayCurrent, continues to be strong, which has helped lift the company’s stock in recent months. Recent results indicate that our thesis on the company continues to play out. Japan is behind many countries when it comes to digitalization. The pandemic and work-from-home environment underscored its need to catch up. As Japanese enterprises undertake large-scale digitalization projects, we believe domestic IT consultants such as BayCurrent have a strong home-country advantage relative to global consulting firms.
MercadoLibre, Inc. was another large contributor. The company operates an online e-commerce, payments, and credit system in 18 Latin American countries. It has been called “the Amazon of Latin America” due to its leadership in the region’s fast-growing online marketplace. MercadoLibre experienced considerable growth in 2022, with fourth-quarter revenue up 56.5% from the same period in 2021 and operating income jumping from $24 million to $349 million. MercadoLibre also benefited as an important rival in Brazil was engulfed in an accounting scandal that led to the departure of its CEO and CFO.
The largest detractor from Fund performance during the quarter was DiaSorin SpA, an Italian health-diagnostics company. The company benefited from heightened demand for its tests used to detect Covid-19. Now that the world is past the height of the pandemic, DiaSorin needs to offset the decline in Covid-19 tests with other diagnostics. This has weighed on the stock recently, but we still like DiaSorin’s long-term growth potential and recurring-revenue operating model. The company is a leader in specialty disease testing in Europe, and we believe an acquisition it made in 2021 positions DiaSorin to take share in the U.S. disease-testing market.
Abcam PLC was another detractor. The stock of the British health-care company was down after it reported annual revenue that was below consensus expectations, due in part to the implementation of a new enterprise resource planning (ERP) system, an undertaking that caused an order backlog in September and October. While these were near-term setbacks, we don’t believe anything has structurally changed for the firm. Abcam provides biological reagents and tools that are essential to a wide range of fields, including drug discovery, diagnostics and basic research. We expect high demand for these products as health-care innovation pushes forward. In addition, we believe profit margins will expand after an extended period of investment for the firm.
OUTLOOK
So far, central banks have ring-fenced banking industry turmoil, limiting the damage to just a few troubled institutions. However, it’s hard to predict whether more bank failures will occur or how severe the fallout from those failures would be. What we can say, however, is that we feel good about the prospects of the banks we do hold. Within our portfolio, we own just two banks, both of which have a risk profile we believe is quite different from the banks that failed.
While we feel good about our bank holdings, we continue to think about the knock-on effects of banking turmoil. Already, at least two things seem certain. First, trouble for banks will be another drag on economic growth. Second, the cost of capital for businesses is poised to increase.
We believe an environment of slower growth and rising capital costs should favor the types of high-quality companies in which Wasatch invests. Our investment process focuses on firms with strong balance sheets, low levels of debt and typically, a steady history of earnings growth and cash flow generation. These self-funded businesses can continue to carry out their growth plans at a time when rising capital costs may force weaker competitors to pare back. We believe this should set our firms up for better growth in the years to come.
Thank you for the opportunity to manage your assets.
Current and future holdings are subject to risk.
16
| | |
| Wasatch Global Select Fund (WAGSX / WGGSX) | | MARCH 31, 2023 (Unaudited) |
Portfolio Summary
AVERAGE ANNUAL TOTAL RETURNS
| | | | | | | | | | | | | | | |
| | | |
| Name | | Six Months
(Not annualized) | | 1 Year | | Since Inception
10/1/2019 |
| | | |
Global Select (WAGSX) — Investor | | | | 18.37% | | | | | -11.73% | | | | | 4.54% | |
| | | |
Global Select (WGGSX) — Institutional | | | | 18.48% | | | | | -11.44% | | | | | 4.91% | |
| | | |
MSCI AC World Index | | | | 17.78% | | | | | -7.44% | | | | | 8.15% | |
| | | |
MSCI AC World Mid Cap Growth Index | | | | 18.92% | | | | | -9.49% | | | | | 6.49% | |
Data show past performance, which is not indicative of future performance. Current performance may be lower or higher than the performance quoted. To obtain the most recent month-end performance data available, please visit wasatchglobal.com. The Advisor may absorb certain Fund expenses, without which total returns would have been lower. Investment returns and principal value will fluctuate and shares, when redeemed, may be worth more or less than their original cost.
As of the January 31, 2023 prospectus, the Total Annual Fund Operating Expenses for the Wasatch Global Select Fund are Investor Class — Gross: 2.35%, Net: 1.35% / Institutional Class — Gross: 1.53%, Net: 0.95%. The expense ratio shown elsewhere in this report may be different. Net expenses are based on Fund expenses, net of waivers and reimbursements. See the prospectus for additional information regarding Fund expenses.
Wasatch will deduct a 2.00% redemption fee on Fund shares held 60 days or less. Performance data do not reflect the deduction of fees, including sales charges, or the taxes you would pay on fund distributions or the redemption of fund shares. Fees and taxes, if reflected, would reduce the performance quoted. Wasatch does not charge any sales fees. For more complete information including charges, risks and expenses, read the prospectus carefully.
Investing in foreign securities, especially in emerging and frontier markets, entails special risks, such as currency fluctuations and political uncertainties, which are described in more detail in the prospectus. Investing in small cap funds will be more volatile and loss of principal could be greater than investing in large cap or more diversified funds.
TOP 10 EQUITY HOLDINGS*
| | | | |
| |
| Company | | % of Net Assets | |
| |
BayCurrent Consulting, Inc. | | | 5.1% | |
| |
Copart, Inc. | | | 4.9% | |
| |
Amphenol Corp., Class A | | | 4.6% | |
| |
Roper Technologies, Inc. | | | 4.6% | |
| |
Old Dominion Freight Line, Inc. | | | 3.9% | |
| | | | |
| |
| Company | | % of Net Assets | |
| |
MarketAxess Holdings, Inc. | | | 3.9% | |
| |
HDFC Bank Ltd. | | | 3.9% | |
| |
ICON PLC | | | 3.7% | |
| |
Abcam PLC | | | 3.6% | |
| |
Amadeus IT Group SA | | | 3.6% | |
| * | As of March 31, 2023, there were 34 holdings in the Fund. Foreign currency contracts, written options and repurchase agreements, if any, are not included in the number of holdings. Portfolio holdings are subject to change at any time. References to specific securities should not be construed as recommendations by the Funds or their Advisor. Current and future holdings are subject to risk. |
SECTOR BREAKDOWN**
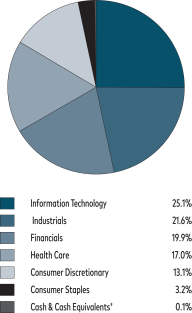
| | ** | Excludes securities sold short, if any. |
| | *Also | includes Other Assets & Liabilities. |
GROWTH OF A HYPOTHETICAL $10,000 INVESTMENT
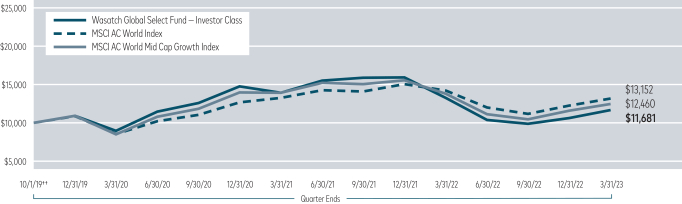
††Inception: October 1, 2019. Past performance does not predict future performance. The graph above does not reflect the deduction of fees, sales charges, or taxes that you would pay on fund distributions or the redemption of fund shares. Wasatch does not charge any sales fees.
17
| | |
| Wasatch Global Value Fund (FMIEX / WILCX) | | MARCH 31, 2023 (Unaudited) |
Management Discussion
The Wasatch Global Value Fund is managed by a team of Wasatch portfolio managers led by David Powers.
| | |

David Powers, CFA Lead Portfolio Manager | | OVERVIEW Global equities finished the first quarter of 2023 in positive territory despite a variety of challenges. March saw the failure of three U.S. banks and the collapse of European financial giant Credit Suisse raise the specter of a banking crisis simi lar to 2008–2009. Equities rallied in the final daysof the quarter as investors |
interpreted the U.S. Federal Reserve’s (Fed’s) quarter-point rate hike on March 23 as a signal that banking-industry issues were manageable. At the same time, investors seemed to believe that these issues would constrain central banks from implementing significant further rate hikes.
In a reversal of the prevailing trend for most of 2022, value stock indexes significantly lagged their growth counterparts during the first quarter of 2023. The Wasatch Global Value Fund — Investor Class returned 0.34%, underperforming the MSCI AC (All Country) World Value Index, which returned 1.24% for the quarter.
DETAILS OF THE QUARTER
During the first quarter, contributors to the Fund’s performance relative to the benchmark were led by selections within financials and health care. Conversely, selections within consumer discretionary and materials, along with an underweight position in information technology, detracted significantly.
The top contributor to performance was Koninklijke Ahold Delhaize NV, an operator of supermarket chains across the U.S. and Europe, including well-known U.S. brands Stop & Shop and Giant. Ahold Delhaize is a high-quality company with strong and stable cash flows, making it an attractive holding in an uncertain environment. In addition, the company reported better-than-expected earnings that were supported by its effective mitigation of high inflation on food prices.
BAE Systems PLC, Europe’s largest defense contractor and Britain’s largest manufacturer, reported strong quarterly sales, earnings and free cash flow. In addition, sentiment with respect to the stock benefited from the mid-March announcement of a trilateral U.S./United Kingdom/Australia submarine-development program. As a leading manufacturer of U.K. nuclear-powered submarines, BAE is expected to be a prime beneficiary of this initiative. More broadly, BAE is positioned to benefit from globally synchronized increases in defense spending for several years to come. Despite the strong stock-price performance in the quarter, we view the company’s valuation as remaining discounted relative to its peers.
On the downside, an overweight position in pharmaceutical company Johnson & Johnson, commonly known as “J&J,” was the biggest detractor from Fund performance during
the quarter. The company posted mixed quarterly results and also provided relatively cautious forward guidance. More importantly, J&J experienced a legal setback with its efforts to contain the financial impact of litigation concerning an asserted connection between its since-discontinued talcum-based baby powder and ovarian cancer. As a result, the range and scope of potential damages related to this litigation remain highly uncertain. In our view, the worst-case scenarios are unlikely, and in any event, compensation will be paid over an extended period and won’t unduly impact J&J’s very substantial free cash flow.
South Korean casino operator Kangwon Land, Inc. underperformed due to a significant revenue and earnings miss. Kangwon operates the only casino in Korea that is open to the country’s citizens. Results were negatively impacted by a slower-than-expected recovery from Covid-19 that weighed on casino traffic, as well as increased labor costs driven by stepped-up dealer hiring in anticipation of a rebound in conditions. An exacerbating factor in the recent weakness is that many high-rolling, VIP Korean gamblers have become accustomed to frequenting Macau, a special administrative region of China referred to as “The Las Vegas of Asia.” Kangwon has a strong balance sheet with virtually no debt, and we added to the position on weakness on the view that the expected recovery is merely delayed.
OUTLOOK
Despite the positive investor sentiment and stock-market performance seen in the first quarter, we have a cautious view of where we are in the economic and market cycle. While hopes of Fed easing have recently been raised by concerns around bank failures, policymakers are facing unprecedented conditions. With a recession looming and inflation well above the Fed’s 2% target, we’re not inclined to assume that we’re on the cusp of Fed rate cuts and the beginning of a new market cycle. As a result, we view the economy as remaining vulnerable to a hard landing and equity valuations as remaining somewhat elevated given the risks to growth.
Based on this assessment, we’re positioned relatively defensively, with overweight allocations to the utilities, health-care, consumer-staples and communication-services sectors, and underweights to consumer discretionary, information technology and industrials. More broadly, the Fund’s holdings are high quality, based on stable earnings and sound balance sheets while also featuring larger market capitalizations, less expensive valuations and above-average dividends relative to the benchmark.
As always, we’ll continue to adhere to our discipline in selecting stocks regardless of the short-term direction of the markets in response to a shifting macroeconomic and geopolitical backdrop.
Thank you for the opportunity to manage your assets.
Current and future holdings are subject to risk.
18
| | |
| Wasatch Global Value Fund (FMIEX / WILCX) | | MARCH 31, 2023 (Unaudited) |
Portfolio Summary
AVERAGE ANNUAL TOTAL RETURNS
| | | | | | | | | | | | | | | | | | | | |
| | | | |
| | | Six Months
(Not annualized) | | 1 Year | | 5 Years | | 10 Years |
| | | | |
Global Value (FMIEX) — Investor | | | | 17.43% | | | | | -1.97% | | | | | 7.61% | | | | | 7.90% | |
| | | | |
Global Value (WILCX) — Institutional | | | | 17.41% | | | | | -1.92% | | | | | 7.76% | | | | | 8.05% | |
| | | | |
MSCI AC World Value Index | | | | 15.63% | | | | | -5.50% | | | | | 4.27% | | | | | 5.89% | |
Data show past performance, which is not indicative of future performance. Current performance may be lower or higher than the performance quoted. To obtain the most recent month-end performance data available, please visit wasatchglobal.com. The Advisor may absorb certain Fund expenses, without which total returns would have been lower. Investment returns and principal value will fluctuate and shares, when redeemed, may be worth more or less than their original cost.
As of the January 31, 2023 prospectus, the Total Annual Fund Operating Expenses for the Wasatch Global Value Fund are Investor Class — Gross: 1.20%, Net: 1.10% / Institutional Class — Gross: 1.14%, Net: 0.95%. The expense ratio shown elsewhere in this report may be different. Net expenses are based on Fund expenses, net of waivers and reimbursements. See the prospectus for additional information regarding Fund expenses.
Wasatch will deduct a 2.00% redemption fee on Fund shares held 60 days or less. Performance data do not reflect the deduction of fees, including sales charges, or the taxes you would pay on fund distributions or the redemption of fund shares. Fees and taxes, if reflected, would reduce the performance quoted. Wasatch does not charge any sales fees. For more complete information including charges, risks and expenses, read the prospectus carefully.
Investments in value stocks can perform differently from the market as a whole and from other types of stocks and can continue to be undervalued by the market for long periods of time. Investing in foreign securities entails special risks, such as currency fluctuations and political uncertainties, which are described in more detail in the prospectus. Loss of principal is a risk of investing.
TOP 10 EQUITY HOLDINGS*
| | | | |
| |
| Company | | % of Net Assets | |
| |
TotalEnergies SE | | | 4.8% | |
| |
Johnson & Johnson | | | 4.8% | |
| |
Duke Energy Corp. | | | 4.2% | |
| |
Novartis AG | | | 4.0% | |
| |
Muenchener Rueckversicherungs- Gesellschaft AG in Muenchen | | | 3.9% | |
| | | | |
| |
| Company | | % of Net Assets | |
| |
Exelon Corp. | | | 3.9% | |
| |
Union Pacific Corp. | | | 3.9% | |
| |
KT&G Corp. | | | 3.4% | |
| |
Koninklijke Ahold Delhaize NV | | | 3.4% | |
| |
Bristol-Myers Squibb Co. | | | 3.3% | |
| * | As of March 31, 2023, there were 37 holdings in the Fund. Foreign currency contracts, written options and repurchase agreements, if any, are not included in the number of holdings. Portfolio holdings are subject to change at any time. References to specific securities should not be construed as recommendations by the Funds or their Advisor. Current and future holdings are subject to risk. |
SECTOR BREAKDOWN**
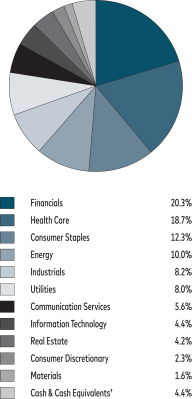
| | ** | Excludes securities sold short, if any. |
| | † | Also includes Other Assets & Liabilities. |
GROWTH OF A HYPOTHETICAL $10,000 INVESTMENT††
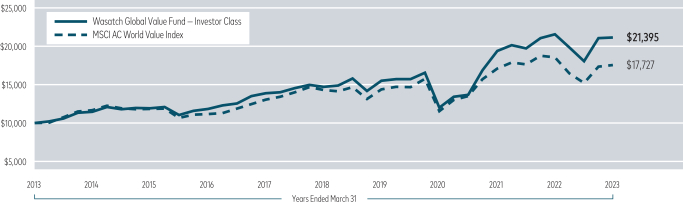
Past performance does not predict future performance. The graph above does not reflect the deduction of fees, sales charges, or taxes that you would pay on fund distributions or the redemption of fund shares. Wasatch does not charge any sales fees.
19
| | |
| Wasatch Greater China Fund (WAGCX / WGGCX) | | MARCH 31, 2023 (Unaudited) |
Management Discussion
The Wasatch Greater China Fund is managed by a team of Wasatch portfolio managers led by Dan Chace, Allison He, Pedro Huerta, Kai Pan and Kevin Unger.
| | | | |
Dan Chace, CFA Lead Portfolio Manager 
Kai Pan, PhD Associate Portfolio Manager | | 
Allison He, CFA Associate Portfolio Manager
Kevin Unger, CFA Associate Portfolio Manager | | 
Pedro Huerta, CFA Associate Portfolio Manager |
OVERVIEW
The Wasatch Greater China Fund — Investor Class was up 1.26% during the first quarter of 2023 but underperformed the benchmark MSCI China Index, which gained 4.71%.
A late-year rally in Chinese equities continued in January, fueled by the government’s decision to lift pandemic-related social restrictions. However, stocks were volatile late in the period due to concerns about geopolitical tensions and banking turmoil in the U.S. and Europe. Despite those concerns, Chinese equities ended the period with moderate gains.
DETAILS OF THE QUARTER
The Fund’s underperformance was largely attributable to its underweight position in the communication-services sector. The sector holds some mega-cap technology companies, which are in a market-capitalization range where we tend to be less exposed. Instead, our Fund skews toward small- and mid-cap stocks, which are less covered by other investors. We believe such stocks provide greater opportunity for active investors to add long-term value.
Wuxi Biologics Cayman, Inc. was the largest detractor from Fund performance during the quarter. A contract research, development and manufacturing firm, Wuxi helps create biological medicines and provides value-added services to other pharmaceutical companies. Wuxi experienced strong revenue and earnings growth in 2022, and we thought management’s execution was stellar. However, the stock was down this quarter after the company pre-released its 2022 results that were slightly below market expectations. We continue to like that Wuxi is an important player in the complex process of researching, developing and manufacturing biologic treatments. We believe demand for its services should continue to be strong as
health-care innovation pushes forward, though geopolitical concerns remain in the background.
Another weak stock was Meituan. Known for its food-delivery platform that links consumers and merchants, Meituan also connects consumers with other local market services. The stock was down due to concerns about Douyin, the Chinese version of TikTok, trying to grow its presence in the local service arena. However, Meituan is still the largest operator in the industry, and it’s taking great efforts — including hiring 10,000 people — to fend off competition. We also think there are differences in the two companies’ advertising models that could allow both competitors to grow.
Airtac International Group was a top contributor for the quarter. Headquartered in Taiwan, the company manufactures pneumatic actuators for industrial automation systems. The stock rose in anticipation of China’s reopening from the pandemic, which should lead to a significant uptick in factory production and increased demand for Airtac’s actuators and their replacement products. While reopening benefits Airtac in the near term, we believe there are opportunities for longer-term growth as Chinese businesses increasingly depend on factory automation to improve efficiency and replace an aging workforce.
Another contributor was Sinbon Electronics Co. Ltd., which manufactures electric cables that power a wide range of products. Sinbon continues to experience strong growth, with 2022 annual revenue up 19.8% from the prior year. Those results, and anticipation of heightened demand for many products as China reopens, led the stock higher this quarter. We continue to believe Sinbon has a long runway for growth. Its management team has established long-term relationships with businesses in many high-growth verticals, including the green energy, medical and automotive industries. We believe the company’s highly variable manufacturing processes are a differentiator for the firm.
OUTLOOK
Global equity markets have been volatile due to concerns about banking industries in the U.S. and Europe. However, we don’t see a direct link between bank failures in those regions and China’s banking system.
While China’s banking system doesn’t face the same risks, banking troubles could lead to a slowdown in the U.S. and European economies, which would impact export-heavy businesses in China. But China’s economy would still be less affected than the countries at the heart of a banking crisis.
As China reopens after pandemic restrictions, we wouldn’t be surprised if the country contributes an outsized portion to global economic growth this year — which could set up a relatively positive backdrop for Chinese equities.
China’s reopening also gives us the opportunity to visit management teams in the country again. In May, our team is planning its first visit back to the country since 2019. We look forward to uncovering new investment opportunities for our shareholders.
Thank you for the opportunity to manage your assets.
Current and future holdings are subject to risk.
20
| | |
| Wasatch Greater China Fund (WAGCX / WGGCX) | | MARCH 31, 2023 (Unaudited) |
Portfolio Summary
AVERAGE ANNUAL TOTAL RETURNS
| | | | | | | | | | | | | | | |
| | | |
| | | Six Months
(Not annualized) | | 1 Year | | Since Inception 11/30/2020 |
| | | |
Greater China (WAGCX) — Investor | | | | 14.47% | | | | | -13.46% | | | | | -15.00% | |
| | | |
Greater China (WGGCX) — Institutional | | | | 14.66% | | | | | -13.28% | | | | | -15.07% | |
| | | |
MSCI China Index | | | | 18.86% | | | | | -4.73% | | | | | -16.46% | |
Data show past performance, which is not indicative of future performance. Current performance may be lower or higher than the performance quoted. To obtain the most recent month-end performance data available, please visit wasatchglobal.com. The Advisor may absorb certain Fund expenses, without which total returns would have been lower. Investment returns and principal value will fluctuate and shares, when redeemed, may be worth more or less than their original cost.
As of the January 31, 2023 prospectus, the Total Annual Fund Operating Expenses for the Wasatch Greater China Fund are Investor Class — Gross: 3.56%, Net: 1.62% / Institutional Class — Gross: 2.61%, Net: 1.36%. The expense ratio shown elsewhere in this report may be different. Net expenses are based on Fund expenses, net of waivers and reimbursements. See the prospectus for additional information regarding Fund expenses.
Wasatch will deduct a 2.00% redemption fee on Fund shares held 60 days or less. Performance data do not reflect the deduction of fees, including sales charges, or the taxes you would pay on fund distributions or the redemption of fund shares. Fees and taxes, if reflected, would reduce the performance quoted. Wasatch does not charge any sales fees. For more complete information including charges, risks and expenses, read the prospectus carefully.
Investing in small cap funds will be more volatile and loss of principal could be greater than investing in large cap or more diversified funds. Investing in foreign securities, especially in emerging markets, entails special risks, such as unstable currencies, highly volatile securities markets and political and social instability, which are described in more detail in the prospectus. Being non-diversified, the Fund can invest a larger portion of its assets in the stocks of a limited number of companies than a diversified fund. Non-diversification increases the risk of loss to the Fund if the values of these securities decline.
The Fund is subject to risks associated with investments in the Greater China Region that could affect the value of your investment. The Fund may invest in securities through the China Stock Connect programs, which subject the Fund to unique accessibility risks affecting the Fund’s ability to efficiently execute its strategy. These risks are described in more detail in the prospectus.
TOP 10 EQUITY HOLDINGS*
| | | | |
| |
| Company | | % of Net Assets | |
| |
H World Group Ltd. | | | 5.7% | |
| |
Chailease Holding Co. Ltd. | | | 5.0% | |
| |
Silergy Corp. | | | 4.6% | |
| |
Glodon Co. Ltd., Class A | | | 4.5% | |
| |
Tencent Holdings Ltd. | | | 4.3% | |
| | | | |
| |
| Company | | % of Net Assets | |
| |
Airtac International Group | | | 4.0% | |
| |
Sino Wealth Electronic Ltd., Class A | | | 3.9% | |
| |
Shenzhen Mindray Bio-Medical Electronics Co. Ltd. | | | 3.8% | |
| |
SG Micro Corp., Class A | | | 3.7% | |
| |
Sinbon Electronics Co. Ltd. | | | 3.6% | |
| *As | of March 31, 2023, there were 36 holdings in the Fund. Foreign currency contracts, written options and repurchase agreements, if any, are not included in the number of holdings. Portfolio holdings are subject to change at any time. References to specific securities should not be construed as recommendations by the Funds or their Advisor. Current and future holdings are subject to risk. |
SECTOR BREAKDOWN**
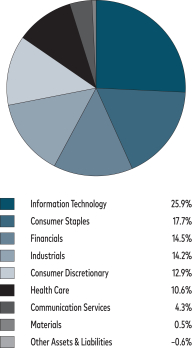
| | ** | Excludes securities sold short, if any. |
GROWTH OF A HYPOTHETICAL $10,000 INVESTMENT
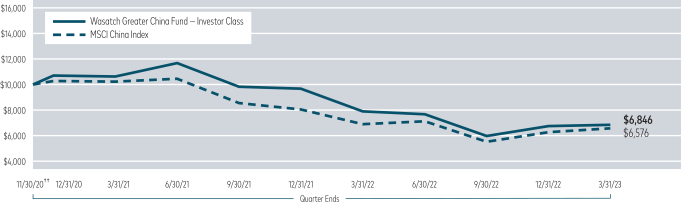
††Inception: November 30, 2020. Past performance does not predict future performance. The graph above does not reflect the deduction of fees, sales charges, or taxes that you would pay on fund distributions or the redemption of fund shares. Wasatch does not charge any sales fees.
21
| | |
| Wasatch International Growth Fund (WAIGX / WIIGX) | | MARCH 31, 2023 (Unaudited) |
Management Discussion
The Wasatch International Growth Fund is managed by a team of Wasatch portfolio managers led by Ken Applegate, Linda Lasater and Derrick Tzau.
| | | | |

Ken Applegate, CFA Lead Portfolio Manager | |
Linda Lasater, CFA Portfolio Manager | | 
Derrick Tzau, CFA Associate Portfolio Manager |
OVERVIEW
International equities notched gains for the period but were volatile. Stocks started 2023 on an upswing, but signs of persistent inflation began to weigh on equity markets in February. Volatility continued in March after a few high-profile bank failures led to concerns about the banking industry.
In this environment, the Wasatch International Growth Fund — Investor Class gained 6.07% and outperformed the benchmark MSCI AC (All Country) World ex USA Small Cap Index, which was up 4.70%.
DETAILS OF THE QUARTER
The most significant contributor to the Fund’s performance during the quarter was BayCurrent Consulting, Inc., a Japan-based business management and information-technology (IT) consultant. Demand for digital transformation projects, a key area of focus for BayCurrent, continues to be strong, which has helped lift the company’s stock in recent months. Margins for the business also remain strong after management successfully pushed through price increases to offset rising wages. Such results indicate that our thesis on the company continues to play out. Japan is behind many countries when it comes to digitalization. The pandemic and work-from-home environment underscored its need to catch up. As Japanese enterprises undertake large-scale digitalization projects, we believe domestic IT consultants such as BayCurrent have a strong home-country advantage relative to global consulting firms.
Another top contributor was Grupo Aeroportuario del Centro Norte SAB de CV, a Mexico-based international airport operator known as “OMA.” The company, which has government contracts to run 13 airports in northern and central Mexico, has benefited from a rebound in travel as the decline in Covid-19 cases and severity has unleashed pent-up demand. In February, OMA reported earnings for the fourth quarter of 2022 that included an 11.8% increase in net income and a 20.7% jump in passenger traffic compared with the prior-year quarter. Traffic has now surpassed pre-pandemic levels, the company said.
The largest detractor during the quarter was Abcam PLC. The stock of the British health-care company was down after
Abcam reported annual revenue that was below consensus expectations, due in part to the implementation of a new enterprise resource planning (ERP) system, an undertaking that caused an order backlog in September and October. Covid-19 restrictions also reduced the company’s revenues from China. While these were near-term setbacks, we don’t believe anything has structurally changed for the firm. Abcam provides biological reagents and tools that are essential to a wide range of fields, including drug discovery, diagnostics and basic research. We expect high demand for these products as health-care innovation pushes forward, and we believe profit margins will expand after an extended period of investment for the firm.
Another weak stock was DiaSorin SpA, an Italian health-diagnostics company. The company benefited from heightened demand for its tests used to detect Covid-19. Now that the world is past the height of the pandemic, DiaSorin needs to offset the decline in Covid-19 tests with other diagnostics. This has weighed on the stock recently, but we still like DiaSorin’s long-term growth potential and recurring-revenue operating model. The company is a leader in specialty disease testing in Europe, and we believe an acquisition it made in 2021 positions DiaSorin to take share in the U.S. disease-testing market.
OUTLOOK
Concern about the banking system has injected a new source of volatility into equity markets. So far, regulators have been able to address each troubled bank before financial contagion occurs, but it’s difficult to predict whether other banks will come under pressure and to what degree. That being said, we believe the banks within our own portfolio have good management teams and are on strong financial footing, which has helped them manage disruptive periods in past crises. And in our view, there are some stark differences between the banks we own and those that have failed.
In thinking beyond the banking system, an important knock-on effect of recent bank troubles is that the cost of capital for firms will continue to become more expensive. As the cost of doing business increases, it could also hamper economic growth, negatively affecting corporate earnings. But the environment may be most detrimental to weaker firms, which have relied on low-cost debt to fund their growth.
We believe this environment underscores the importance of investing in high-quality businesses, which have always been our focus at Wasatch. In our view, such companies are not only better positioned to withstand challenging economic environments, but also to take market share from struggling competitors. We believe this should set these high-quality businesses up for better long-term growth when the economy bounces back.
Thank you for the opportunity to manage your assets.
Current and future holdings are subject to risk.
22
| | |
| Wasatch International Growth Fund (WAIGX / WIIGX) | | MARCH 31, 2023 (Unaudited) |
Portfolio Summary
AVERAGE ANNUAL TOTAL RETURNS
| | | | | | | | | | | | | | | | | | | | |
| | | | |
| | | Six Months
(Not annualized) | | 1 Year | | 5 Years | | 10 Years |
| | | | |
International Growth (WAIGX) — Investor | | | | 16.92% | | | | | -19.10% | | | | | -0.71% | | | | | 4.00% | |
| | | | |
International Growth (WIIGX) — Institutional | | | | 16.98% | | | | | -18.99% | | | | | -0.60% | | | | | 4.08% | |
| | | | |
MSCI AC World ex USA Small Cap Index | | | | 18.63% | | | | | -10.37% | | | | | 1.67% | | | | | 5.06% | |
| | | | |
MSCI World ex USA Small Cap Index | | | | 20.95% | | | | | -10.13% | | | | | 1.54% | | | | | 5.54% | |
Data show past performance, which is not indicative of future performance. Current performance may be lower or higher than the performance quoted. To obtain the most recent month-end performance data available, please visit wasatchglobal.com. The Advisor may absorb certain Fund expenses, without which total returns would have been lower. Investment returns and principal value will fluctuate and shares, when redeemed, may be worth more or less than their original cost.
As of the January 31, 2023 prospectus, the Total Annual Fund Operating Expenses for the Wasatch International Growth Fund are Investor Class: 1.44% / Institutional Class: 1.33%. The expense ratio shown elsewhere in this report may be different. Net expenses are based on Fund expenses, net of waivers and reimbursements. See the prospectus for additional information regarding Fund expenses.
Wasatch will deduct a 2.00% redemption fee on Fund shares held 60 days or less. Performance data do not reflect the deduction of fees, including sales charges, or the taxes you would pay on fund distributions or the redemption of fund shares. Fees and taxes, if reflected, would reduce the performance quoted. Wasatch does not charge any sales fees. For more complete information including charges, risks and expenses, read the prospectus carefully.
Performance for the Institutional Class prior to 2/1/2016 is based on the performance of the Investor Class. Performance of the Fund’s Institutional Class prior to 2/1/2016 uses the actual expenses of the Fund’s Investor Class without any adjustments. For any such period of time, the performance of the Fund’s Institutional Class would have been substantially similar to, yet higher than, the performance of the Fund’s Investor Class, because the shares of both classes are invested in the same portfolio of securities, but the classes bear different expenses.
Investing in foreign securities, especially in frontier and emerging markets, entails special risks, such as currency fluctuations and political uncertainties, which are described in more detail in the prospectus. Investing in small cap funds will be more volatile and loss of principal could be greater than investing in large cap or more diversified funds.
TOP 10 EQUITY HOLDINGS*
| | | | |
| |
| Company | | % of Net Assets | |
| |
BayCurrent Consulting, Inc. | | | 5.0% | |
| |
Descartes Systems Group, Inc. | | | 3.7% | |
| |
Abcam PLC | | | 3.4% | |
| |
Diploma PLC | | | 3.2% | |
| |
Grupo Aeroportuario del Centro Norte SAB de CV | | | 3.0% | |
| | | | |
| |
| Company | | % of Net Assets | |
| |
Kinaxis, Inc. | | | 3.0% | |
| |
Voltronic Power Technology Corp. | | | 2.9% | |
| |
Melexis NV | | | 2.8% | |
| |
Reply SpA | | | 2.6% | |
| |
CTS Eventim AG & Co. KGaA | | | 2.4% | |
| *As | of March 31, 2023, there were 69 holdings in the Fund. Foreign currency contracts, written options and repurchase agreements, if any, are not included in the number of holdings. Portfolio holdings are subject to change at any time. References to specific securities should not be construed as recommendations by the Funds or their Advisor. Current and future holdings are subject to risk. |
SECTOR BREAKDOWN**
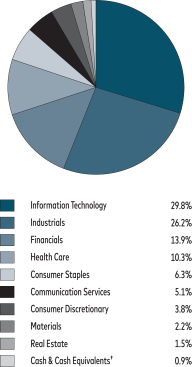
| | ** | Excludes securities sold short, if any. |
| | † | Also includes Other Assets & Liabilities. |
GROWTH OF A HYPOTHETICAL $10,000 INVESTMENT

Past performance does not predict future performance. The graph above does not reflect the deduction of fees, sales charges, or taxes that you would pay on fund distributions or the redemption of fund shares. Wasatch does not charge any sales fees.
23
| | |
| Wasatch International Opportunities Fund (WAIOX / WIIOX) | | MARCH 31, 2023 (Unaudited) |
Management Discussion
The Wasatch International Opportunities Fund is managed by a team of Wasatch portfolio managers led by Linda Lasater, Dan Chace and Allison He.
| | | | |
Linda Lasater, CFA Lead Portfolio Manager | |
Dan Chace, CFA Portfolio Manager | |
Allison He, CFA Associate Portfolio Manager |
OVERVIEW
For the first quarter of 2023, the Wasatch International Opportunities Fund — Investor Class gained 1.77% but trailed the benchmark MSCI AC (All Country) World ex USA Small Cap Index, which was up 4.70%.
International equities notched gains for the period but were volatile. Stocks started the year on an upswing, but signs of persistent inflation began to weigh on equity markets in February. Volatility continued in March after a few high-profile bank failures led to concerns about the banking industry.
DETAILS OF THE QUARTER
The largest detractor from Fund performance during the quarter was Kin and Carta PLC, a trans-Atlantic digital-transformation consultancy. Disappointing earnings results for the first half of its fiscal year weighed on the stock. Management cited worsening economic conditions as a reason for the slowdown in revenue. We’re monitoring the stock. We like the company’s exposure to digital transformation, which is a theme in our portfolio as digital transformation is a key priority for businesses around the world. But Kin and Carta lacks the scale and diversity of some competitors, so it’s been disproportionately hurt by some large project delays and postponements. Going forward, we’ll continue to monitor how Kin and Carta can manage this period and continue to grow scale.
Systena Corp. was another large detractor. The Japan-based information-technology (IT) vendor missed its operating profit target due in part to mid-level employee turnover and slower growth for some of its more profitable business segments. We trimmed the position in light of near-term uncertainty around employee turnover but continue to hold the stock. Many Japanese companies are behind global competitors when it comes to digitalization, but with ample cash on their balance sheets and a history of adapting to market conditions, we believe these companies are poised to spend heavily on IT projects to catch up. We continue to monitor Systena’s ability to hire and retain critical IT staff needed to deliver on the strong trends we’re seeing in IT investment in Japan.
The largest contributor to Fund performance was Fortnox AB. The Swedish company sells cloud-based software for
small and medium-sized companies, with solutions addressing bookkeeping, order handling, invoicing, payroll and other critical business functions. The stock was up after the company reported another quarter of strong growth in an environment where there was concern that small and medium-sized businesses may pare back spending. We view the results as a testament to the value Fortnox provides its customers. Going forward, we believe the company has considerable pricing power; Fortnox’s services are critical to its customers’ business functions but represent a relatively small part of their total operational costs.
Another top contributor was Elmos Semiconductor SE, a Germany-based company that produces semiconductors and sensors primarily for the automotive industry. The stock was up after the company offered much stronger-than-expected earnings guidance in 2023, due in part to a recovery in new-car volumes as supply-chain issues ease. We continue to like the company for its exposure to the auto industry. The electrification of the automobile is a long-term secular growth trend that could make demand for Elmos’ products less cyclical than for other semiconductor manufacturers, in our view.
OUTLOOK
As the quarter closed, the health of the global banking system remained one of investors’ foremost concerns. So far, regulators have been able to address each troubled bank before financial contagion occurs, but it’s difficult to predict whether other banks will come under pressure, and to what degree. Within our portfolio, our direct exposure to the banking industry is limited. We hold only two banks, both of which have a risk profile we believe is quite different from the banks that failed.
In thinking beyond the banking system, an important knock-on effect of recent bank troubles is that the cost of capital for firms will continue to become more expensive. As the cost of doing business increases, it could also hamper economic growth, negatively affecting corporate earnings. But the environment may be most detrimental to weaker firms, which have relied on low-cost debt to fund their growth.
We believe this environment underscores the importance of investing in high-quality businesses. Companies with strong balance sheets, a history of free cash flow generation and a solid, proven operating model can withstand a slowdown and continue funding strategic growth initiatives. In fact, these challenging periods are when we typically see these companies take market share from struggling competitors, setting themselves up for better long-term growth when the economy bounces back.
Thank you for the opportunity to manage your assets.
Current and future holdings are subject to risk.
24
| | |
| Wasatch International Opportunities Fund (WAIOX / WIIOX) | | MARCH 31, 2023 (Unaudited) |
Portfolio Summary
AVERAGE ANNUAL TOTAL RETURNS
| | | | | | | | | | | | | | | | | | | | |
| | | | |
| | | Six Months
(Not annualized) | | 1 Year | | 5 Years | | 10 Years |
| | | | |
International Opportunities (WAIOX) — Investor | | | | 14.34% | | | | | -17.05% | | | | | -0.02% | | | | | 5.04% | |
| | | | |
International Opportunities (WIIOX) — Institutional | | | | 14.51% | | | | | -17.05% | | | | | 0.10% | | | | | 5.19% | |
| | | | |
MSCI AC World ex USA Small Cap Index | | | | 18.63% | | | | | -10.37% | | | | | 1.67% | | | | | 5.06% | |
| | | | |
MSCI World ex USA Small Cap Index | | | | 20.95% | | | | | -10.13% | | | | | 1.54% | | | | | 5.54% | |
Data show past performance, which is not indicative of future performance. Current performance may be lower or higher than the performance quoted. To obtain the most recent month-end performance data available, please visit wasatchglobal.com. The Advisor may absorb certain Fund expenses, without which total returns would have been lower. Investment returns and principal value will fluctuate and shares, when redeemed, may be worth more or less than their original cost.
As of the January 31, 2023 prospectus, the Total Annual Fund Operating Expenses for the Wasatch International Opportunities Fund are Investor Class: 1.96% / Institutional Class: 1.91%. The expense ratio shown elsewhere in this report may be different. Net expenses are based on Fund expenses, net of waivers and reimbursements. See the prospectus for additional information regarding Fund expenses.
Wasatch will deduct a 2.00% redemption fee on Fund shares held 60 days or less. Performance data do not reflect the deduction of fees, including sales charges, or the taxes you would pay on fund distributions or the redemption of fund shares. Fees and taxes, if reflected, would reduce the performance quoted. Wasatch does not charge any sales fees. For more complete information including charges, risks and expenses, read the prospectus carefully.
Performance for the Institutional Class prior to 2/1/2016 is based on the performance of the Investor Class. Performance of the Fund’s Institutional Class prior to 2/1/2016 uses the actual expenses of the Fund’s Investor Class without any adjustments. For any such period of time, the performance of the Fund’s Institutional Class would have been substantially similar to, yet higher than, the performance of the Fund’s Investor Class, because the shares of both classes are invested in the same portfolio of securities, but the classes bear different expenses.
Investing in foreign securities, especially in frontier and emerging markets, entails special risks, such as currency fluctuations and political uncertainties, which are described in more detail in the prospectus. Investing in micro cap funds will be more volatile and loss of principal could be greater than investing in large cap or more diversified funds.
TOP 10 EQUITY HOLDINGS*
| | | | |
| |
| Company | | % of Net Assets | |
| |
Japan Elevator Service Holdings Co. Ltd. | | | 3.0% | |
| |
YouGov PLC | | | 3.0% | |
| |
DiscoverIE Group PLC | | | 2.9% | |
| |
JTC PLC | | | 2.7% | |
| |
Johns Lyng Group Ltd. | | | 2.6% | |
| | | | |
| |
| Company | | % of Net Assets | |
| |
Nexus AG | | | 2.5% | |
| |
Fortnox AB | | | 2.5% | |
| |
Pro Medicus Ltd. | | | 2.5% | |
| |
Premium Group Co. Ltd. | | | 2.3% | |
| |
SIGMAXYZ Holdings, Inc. | | | 2.3% | |
| *As | of March 31, 2023, there were 78 holdings in the Fund. Foreign currency contracts, written options and repurchase agreements, if any, are not included in the number of holdings. Portfolio holdings are subject to change at any time. References to specific securities should not be construed as recommendations by the Funds or their Advisor. Current and future holdings are subject to risk. |
SECTOR BREAKDOWN**
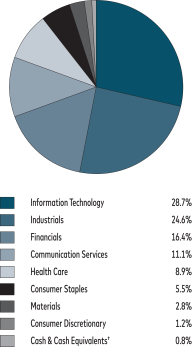
| ** | Excludes securities sold short, if any. |
| † | Also includes Other Assets & Liabilities. |
GROWTH OF A HYPOTHETICAL $10,000 INVESTMENT
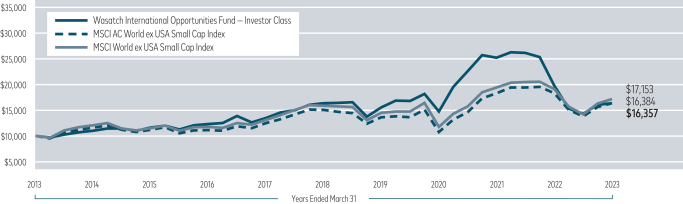
Past performance does not predict future performance. The graph above does not reflect the deduction of fees, sales charges, or taxes that you would pay on fund distributions or the redemption of fund shares. Wasatch does not charge any sales fees.
25
| | |
| Wasatch International Select Fund (WAISX / WGISX) | | MARCH 31, 2023 (Unaudited) |
Management Discussion
The Wasatch International Select Fund is managed by a team of Wasatch portfolio managers led by Ken Applegate, Linda Lasater and Derrick Tzau.
| | | | |
Ken Applegate, CFA Lead Portfolio Manager | |
Linda Lasater, CFA Lead Portfolio Manager | |
Derrick Tzau, CFA Associate Portfolio Manager |
OVERVIEW
International equities notched gains for the quarter but were volatile. Stocks started the year on an upswing, but signs of persistent inflation began to weigh on equity markets in February. Volatility continued in March after a few high-profile bank failures led to concerns about the banking industry.
In this environment, the Wasatch International Select Fund—Investor Class gained 11.20% and outperformed the benchmark MSCI EAFE Index, which was up 8.47%.
DETAILS OF THE QUARTER
The most significant contributor to the Fund’s performance during the quarter was BayCurrent Consulting, Inc., a Japan-based business management and information-technology (IT) consultant. Demand for digital transformation projects, a key area of focus for BayCurrent, continues to be strong, which helped lift the company’s stock. Japan is behind many countries when it comes to digitalization. We believe domestic IT consultants such as BayCurrent will be in high demand as Japanese enterprises undertake large-scale digitalization projects to catch up.
Another top contributor was Hermes International. The French luxury-design house specializes in handbags, leather goods, jewelry, clothing and lifestyle accessories. Strong sales results for the fourth quarter and calendar year in 2022 propelled the stock, as did investor expectations that luxury goods spending will increase as China lifts Covid-19 restrictions and its consumers travel again.
Amadeus IT Group SA was another significant contributor. The company provides IT solutions to the travel and hospitality industries. Its stock has been up as international air-traffic volumes recover after the pandemic. Going forward, we believe both the airline and hospitality industries will be under pressure to increase efficiency, and Amadeus’ technology solutions will play a pivotal role in achieving these aims.
The largest detractor from Fund performance during the quarter was DiaSorin SpA, an Italian health-diagnostics company. Previously the company benefited from heightened demand for its Covid-19 tests. Now that the world is past the height of the pandemic, DiaSorin needs to offset the
decline in Covid-19 tests with other diagnostics. However, we still like DiaSorin’s long-term growth potential. The company is a leader in specialty disease testing in Europe, and we believe an acquisition it made positions DiaSorin to take share in the U.S.
Endava PLC was also a detractor. This British IT company offers software engineering, cloud transformation, test automation, technology consulting and other related services to businesses in a wide range of industries. The company reported quarterly earnings results that met expectations, but the stock was down after management offered weaker guidance for the third and fourth quarters of its fiscal year. The customer sales cycle is becoming more elongated as businesses evaluate budgets more closely in a softening macroeconomic environment. Despite the short-term pause, we believe Endava has a long runway for growth and will continue to benefit from its role as an expert IT outsourcer.
Another weak stock was Abcam PLC. The stock of the British health-care company was down after it reported annual revenue that was below consensus expectations due in part to the implementation of a new enterprise resource planning (ERP) system, which caused an order backlog. Despite the near-term setback, we don’t believe anything has structurally changed for the firm. Abcam provides biological reagents and tools that are essential to a wide range of fields, including drug discovery, diagnostics and basic research. We expect high demand for these products as health-care innovation pushes forward.
OUTLOOK
Concern about the banking system has injected a new source of volatility into equity markets. So far, regulators have been able to address each troubled bank before contagion occurs, but it’s difficult to predict whether other banks will come under pressure, and to what degree.
Within our concentrated portfolio, we don’t own any banks. However, we continue to think about how banking turmoil could have knock-on effects for the broader economy.
One likely effect is that the cost of capital for firms will continue to increase. As the cost of doing business increases, it could also hamper economic growth, negatively affecting corporate earnings. But the environment may be most detrimental to weaker firms, which have relied on low-cost debt to fund their growth.
We believe this environment underscores the importance of investing in high-quality businesses, which have always been our focus at Wasatch. In our view, such companies are not only positioned to withstand challenging economic environments, but to take market share from struggling competitors. We believe this should set these high-quality businesses up for better long-term growth when the economy bounces back.
Thank you for the opportunity to manage your assets.
Current and future holdings are subject to risk.
26
| | |
| Wasatch International Select Fund (WAISX / WGISX) | | MARCH 31, 2023 (Unaudited) |
Portfolio Summary
AVERAGE ANNUAL TOTAL RETURNS
| | | | | | | | | | | | | | | |
| | | |
| Name | | Six Months
(Not annualized) | | 1 Year | | Since Inception 10/1/2019 |
| | | |
International Select (WAISX) — Investor | | | | 21.69% | | | | | -10.06% | | | | | 2.28% | |
| | | |
International Select (WGISX) — Institutional | | | | 21.98% | | | | | -9.62% | | | | | 2.73% | |
| | | |
MSCI EAFE Index | | | | 27.27% | | | | | -1.38% | | | | | 5.45% | |
| | | |
MSCI EAFE Mid Cap Growth Index | | | | 25.60% | | | | | -8.09% | | | | | 2.85% | |
Data show past performance, which is not indicative of future performance. Current performance may be lower or higher than the performance quoted. To obtain the most recent month-end performance data available, please visit wasatchglobal.com. The Advisor may absorb certain Fund expenses, without which total returns would have been lower. Investment returns and principal value will fluctuate and shares, when redeemed, may be worth more or less than their original cost.
As of the January 31, 2023 prospectus, the Total Annual Fund Operating Expenses for the Wasatch International Select Fund are Investor Class — Gross: 3.34%, Net: 1.30% / Institutional Class — Gross: 2.37%, Net: 0.90%. The expense ratio shown elsewhere in this report may be different. Net expenses are based on Fund expenses, net of waivers and reimbursements. See the prospectus for additional information regarding Fund expenses.
Wasatch will deduct a 2.00% redemption fee on Fund shares held 60 days or less. Performance data do not reflect the deduction of fees, including sales charges, or the taxes you would pay on fund distributions or the redemption of fund shares. Fees and taxes, if reflected, would reduce the performance quoted. Wasatch does not charge any sales fees. For more complete information including charges, risks and expenses, read the prospectus carefully.
Investing in foreign securities, especially in frontier and emerging markets, entails special risks, such as currency fluctuations and political uncertainties, which are described in more detail in the prospectus. Investing in small cap funds will be more volatile and loss of principal could be greater than investing in large cap or more diversified funds. Being non-diversified, the Fund can invest a larger portion of its assets in the stocks of a limited number of companies than a diversified fund. Non-diversification increases the risk of loss to the Fund if the values of these securities decline.
TOP 10 EQUITY HOLDINGS*
| | | | |
| |
| Company | | % of Net Assets | |
| |
BayCurrent Consulting, Inc. | | | 6.0% | |
| |
Amadeus IT Group SA, Class A | | | 5.9% | |
| |
Hermes International | | | 5.5% | |
| |
Assa Abloy AB, Class B | | | 4.8% | |
| |
CAE, Inc. | | | 4.7% | |
| | | | |
| |
| Company | | % of Net Assets | |
| |
ICON PLC | | | 4.6% | |
| |
Dassault Systemes SE | | | 4.4% | |
| |
Halma PLC | | | 4.2% | |
| |
Descartes Systems Group, Inc. | | | 3.9% | |
| |
GMO Payment Gateway, Inc. | | | 3.9% | |
| * | As of March 31, 2023, there were 27 holdings in the Fund. Foreign currency contracts, written options and repurchase agreements, if any, are not included in the number of holdings. Portfolio holdings are subject to change at any time. References to specific securities should not be construed as recommendations by the Funds or their Advisor. Current and future holdings are subject to risk. |
SECTOR BREAKDOWN**
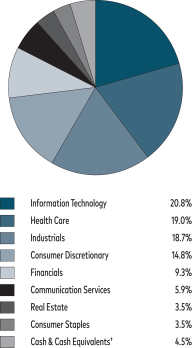
| ** | Excludes securities sold short, if any. |
| † | Also includes Other Assets & Liabilities. |
GROWTH OF A HYPOTHETICAL $10,000 INVESTMENT

††Inception: October 1, 2019. Past performance does not predict future performance. The graph above does not reflect the deduction of fees, sales charges, or taxes that you would pay on fund distributions or the redemption of fund shares. Wasatch does not charge any sales fees.
27
| | |
| Wasatch Long/Short Alpha Fund (WALSX / WGLSX) | | MARCH 31, 2023 (Unaudited) |
Management Discussion
The Wasatch Long/Short Alpha Fund is managed by a team of Wasatch portfolio managers led by Mick Rasmussen.
| | |
Mick Rasmussen, CFA Lead Portfolio Manager
| | OVERVIEW OF THE QUARTER During the first quarter of 2023, the Wasatch Long/Short Alpha Fund — Investor Class gained 4.38% and outperformed the benchmark Russell 2500™ Index, which rose 3.39%. The Fund outpaced the benchmark due to favorable stock selections on the long side, while short positions were drags on relative |
performance. Our bottom-up, fundamental approach to selecting long positions generated positive returns in a volatile quarter for the market, and a sizable portion of the Fund’s alpha came from some of our largest-weight, highest-conviction positions.
The first part of the quarter could be characterized as a risk-on environment. The benchmark delivered strong gains, and some of the best-performing stocks were those with high volatility, heavy short-seller interest and reversing momentum. But the second part of the quarter was very different. The benchmark (which is a long-only index) gave back much of its early-quarter increase as investors worried about an overheated economy, elevated inflation, rising interest rates and bank failures.
LONG POSITIONS DURING THE QUARTER
Among long positions, the top contributor to Fund performance for the first quarter was MarketAxess Holdings, Inc., which operates an electronic trading platform that we believe is pivotal for delivering efficiency, liquidity and cost savings to investors trading in global fixed-income markets. The stock appreciated after the company released fourth-quarter earnings growth that exceeded consensus estimates. Looking ahead, our investment thesis for the company remains on track. MarketAxess continues to gain share of global fixed-income trading, and we like the revenue potential of some of the company’s new offerings that help clients optimize operations and data flow.
A large detractor on the long side was Esperion Therapeutics, Inc., which develops oral therapies for people with elevated low-density lipoprotein cholesterol (LDL-C, or “bad cholesterol”). Shares of the company fell sharply in March as investors reacted negatively to data from a cardiovascular outcomes trial of Esperion’s cholesterol-lowering drug Nexletol® in statin-intolerant patients. The stock fell again on news that Esperion’s partner in the drug was disputing a milestone payment tied to the trial.
We believe investors who failed to look beyond the top-line data may have misinterpreted the results. Our research suggests the trial exceeded clinical expectations of many doctors, who are increasingly prescribing Nexletol to their patients. We expect that the milestone dispute will be settled and that Nexletol’s label will expand in the U.S. and Europe.
SHORT POSITIONS DURING THE QUARTER
Turning to short positions, contributors were those stocks that declined in price. We added the most value during the quarter by shorting Xometry, Inc., which runs an online marketplace that allows customers to purchase custom-manufactured parts in the aerospace, health-care and automotive segments. The company’s financials look unattractive to us, and we don’t have a great deal of confidence in management. Since we initiated the position, Xometry has been a very successful short for the Fund.
Among shorts, detractors were those stocks that rose in price. One of the shorts that hurt us the most was Berkshire Grey, Inc. — which provides artificial-intelligence-enabled robotic solutions that automate supply-chain operations in the United States and Japan. The company is a cash-burning business that had been a successful short for us in the past. But Berkshire Grey announced that it’s being acquired by Softbank, and the stock price shot up as a result. We subsequently closed out our position.
OUTLOOK
Looking forward, we see reasons for both caution and optimism. While we wouldn’t be surprised to see additional problems at banks and tighter credit conditions, we don’t think the economy is headed for a system-wide crisis. The poor management decisions that felled Silvergate Capital, Silicon Valley Bank and Signature Bank were largely bank-specific, so we don’t expect broad contagion. Perhaps more important for the Fund is that we don’t have significant exposure to the banking industry, as we see better opportunities elsewhere.
We’ve noticed an increasing consensus among investors that recession is a foregone conclusion. In response to recession fears and higher interest rates, we’ve recently seen the stocks of economically cyclical and highly indebted companies selling off. The message from the market seems clear: If your business model depends on the economy expanding or on easy access to credit, be prepared for a rough ride.
Fortunately, we believe the current environment is one in which the Fund can thrive — with our long and our short positions working in tandem. On the long side, we’re focused on identifying companies with reasonable valuations, manageable debt loads, defensible market positions, and the ability to generate strong earnings throughout the inevitable ups and downs of the economic cycle. At the other end of the spectrum, our systematic use of quantitative and qualitative methods to uncover short opportunities should provide ballast to the Fund when stock-market conditions become hostile.
Thank you for the opportunity to manage your assets.
Current and future holdings are subject to risk.
28
| | |
| Wasatch Long/Short Alpha Fund (WALSX / WGLSX) | | MARCH 31, 2023 (Unaudited) |
Portfolio Summary
AVERAGE ANNUAL TOTAL RETURNS
| | | | | | | | | | | | | | | |
| | | |
| | | Six Months
(Not annualized) | | 1 Year | | Since Inception 10/1/2021 |
| | | |
Long/Short Alpha (WALSX) — Investor | | | | 19.20% | | | | | 6.87% | | | | | 4.81% | |
| | | |
Long/Short Alpha (WGLSX) — Institutional | | | | 19.27% | | | | | 7.17% | | | | | 5.01% | |
| | | |
Russell 2500™ Index | | | | 11.07% | | | | | -10.39% | | | | | -8.44% | |
| | | |
FTSE U.S. 3-Month Treasury Bill Index | | | | 2.01% | | | | | 2.61% | | | | | 1.76% | |
Data show past performance, which is not indicative of future performance. Current performance may be lower or higher than the performance quoted. To obtain the most recent month-end performance data available, please visit wasatchglobal.com. The Advisor may absorb certain Fund expenses, without which total returns would have been lower. Investment returns and principal value will fluctuate and shares, when redeemed, may be worth more or less than their original cost.
As of the January 31, 2023 prospectus, the Total Annual Fund Operating Expenses for the Wasatch Long/Short Alpha Fund are Investor Class — Gross: 3.14%, Net: 2.41% / Institutional Class — Gross: 3.10%, Net: 2.20%. The expense ratio shown elsewhere in this report may be different. Net expenses are based on Fund expenses, net of waivers and reimbursements. See the prospectus for additional information regarding Fund expenses.
Wasatch will deduct a 2.00% redemption fee on Fund shares held 60 days or less. Performance data do not reflect the deduction of fees, including sales charges, or the taxes you would pay on fund distributions or the redemption of fund shares. Fees and taxes, if reflected, would reduce the performance quoted. Wasatch does not charge any sales fees. For more complete information including charges, risks and expenses, read the prospectus carefully.
Equity investing involves risks, including potential loss of the principal amount invested. Short selling incurs significant unique risks, including potentially unlimited downside risk, high short-sale related expenses, and unavailability of securities to sell short, among others, all of which could negatively impact the performance of the Fund. Additionally, the Fund may not be able to borrow the securities it intends to sell short.
The Fund’s investments in long and short equity positions expose it to changes in the value of securities, which exceed the value of the Fund’s assets. Investment in the Fund will involve market risks associated with different types of investment decisions than those made for a typical “long only” fund. The Fund relies on quantitative models which entail unique risks, including the risk that a model may be limited or incorrect. These risks are described in more detail in the prospectus.
Being non-diversified, the Fund can invest a larger portion of its assets in the stocks of a limited number of companies than a diversified fund. Non-diversification increases the risk of loss to the Fund if the values of these securities decline.
TOP 10 LONG EQUITY HOLDINGS
| | | | |
| |
| Company | | % of Net Assets | |
| |
Roper Technologies, Inc. | | | 4.2% | |
| |
HealthEquity, Inc. | | | 4.0% | |
| |
Hamilton Lane, Inc. Class A | | | 3.5% | |
| |
Ensign Group, Inc. | | | 3.4% | |
| |
MarketAxess Holdings, Inc. | | | 3.4% | |
| | | | |
| |
| Company | | % of Net Assets | |
| |
ICF International, Inc. | | | 3.3% | |
| |
Pool Corp. | | | 3.3% | |
| |
Globant SA | | | 3.2% | |
| |
RBC Bearings, Inc. | | | 3.1% | |
| |
Paylocity Holding Corp. | | | 2.9% | |
| * | As of March 31, 2023, there were 54 long and 48 short holdings in the Fund. Foreign currency contracts, written options and repurchase agreements, if any, are not included in the number of holdings. Portfolio holdings are subject to change at any time. References to specific securities should not be construed as recommendations by the Funds or their Advisor. Current and future holdings are subject to risk. |
SECTOR BREAKDOWN**
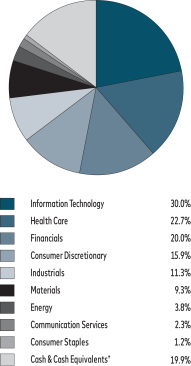
| ** | Excludes securities sold short, if any. |
| † | Also includes Other Assets & Liabilities. |
GROWTH OF A HYPOTHETICAL $10,000 INVESTMENT

††Inception: October 1, 2021. Past performance does not predict future performance. The graph above does not reflect the deduction of fees, sales charges, or taxes that you would pay on fund distributions or the redemption of fund shares. Wasatch does not charge any sales fees.
29
| | |
| Wasatch Micro Cap Fund (WMICX / WGICX) | | MARCH 31, 2023 (Unaudited) |
Management Discussion
The Wasatch Micro Cap Fund is managed by a team of Wasatch portfolio managers led by Ken Korngiebel and Natalie Pesqué.
| | | | | | |

Ken Komgiebel, CFA Lead Portfolio Manager
| | 
Natalie Pesqué, CFA Portfolio Manager | | OVERVIEW The Wasatch Micro Cap Fund — Investor Class gained 10.93% during the first quarter of 2023, handily outperforming its primary benchmark, |
the Russell Microcap® Growth Index, which rose just 0.76%.
Failures of three regional banks in the U.S. and the hastily arranged government-brokered sale of troubled Swiss firm Credit Suisse Group AG added a new layer of complexity to an economic backdrop that was already uncertain. Equities weathered the turmoil well, shrugging off talk about stricter regulation of banks and rallying into the end of the quarter. Hopes that the crisis would push the U.S. Federal Reserve closer to the completion of its tightening cycle appeared to overshadow lingering fears of financial contagion within the banking system and outweigh broader concerns about the fallout to the general economy.
DETAILS OF THE QUARTER
Despite turbulence in the banking industry, the financials sector was a source of outperformance for the Fund during the quarter. We’re underweighted in banks relative to the Index, as we hold just one name — Esquire Financial Holdings, Inc. While the stock traded down in tandem with the industry, Esquire doesn’t share the negative characteristics of the banks that ran into trouble. And we believe in Esquire’s ability to weather the storm.
Holdings in the information-technology, consumer-discretionary and industrials sectors were the Fund’s primary sources of strength, both in absolute terms and relative to the benchmark. Moreover, our holdings performed better than the benchmark’s positions in every sector in which the Fund was invested.
The Fund’s top contributor to performance during the quarter was Napco Security Technologies, Inc. The company makes electronic security devices, fire-detection products, access-control systems, and digital lock equipment for residential, commercial and industrial installations. Napco has been enjoying strong results across its business lines and has been expanding profit margins due to progress in moving its operating model from one based on infrequent hardware purchases (with occasional maintenance and upgrades) to another based on recurring purchases that ensure ongoing functionality. While competitors were hurt by supply-chain difficulties stemming from overreliance on Chinese manufacturing, Napco was able to stay nimble by having less exposure
to China and by maintaining a supply of components from a production base in the Dominican Republic.
Transcat, Inc. also contributed to Fund performance. Transcat provides calibration and laboratory-instrument services. We’ve owned the stock since 2018, and we like the fact that Transcat has posted steady organic growth and has complemented this growth with strategic acquisitions. We also see opportunities for Transcat to improve gross margins.
The biggest detractor from Fund performance for the quarter was Silk Road Medical, Inc., which provides implantable devices to treat blockages in the carotid artery that increase risk of a stroke. Although Silk Road posted a narrower-than-expected loss in its most recently reported quarter, the stock sold off after management offered no guidance as to future earnings. On the plus side, Silk Road’s revenues rose 42% compared to the same quarter a year ago on the back of increased adoption of the company’s Transcarotid Artery Revascularization (TCAR) procedure. In our view, Silk Road’s scalable business model, effective sales force and large cash position should provide the company with an ample runway to profitability.
Purple Innovation, Inc. also detracted from Fund performance. Purple produces and markets mattresses, pillows, sheets and other products. The company’s injection-molded GelFlex Grid is made from a proprietary polymer and provides cushioned comfort while maintaining support. The mattress industry has been facing a poor environment in terms of units shipped, which has weighed on Purple’s stock price. But the company is working on a new merchandising approach and is looking to cut costs where it makes sense to do so. If the new approach is successful, we expect revenues and earnings to improve.
OUTLOOK
With the recent bank failures, we think the scales have now tipped the economy toward recession. Vulnerable consumers and certain segments of the economy are already feeling the initial effects of a broader slowdown.
Uncertainty over inflation and interest rates, the potential for more problems in the banking industry and the increased likelihood of recession may not seem to create a favorable environment for investing. But at Wasatch, we think we do some of our best work amid market volatility. And we’re continuing to vet our current holdings as we search for other high-quality companies in which to invest. As always, we prioritize solid business models, top-tier management teams, increasing market share, significant returns on capital and relatively low debt. When we can find companies with these characteristics and their stock prices are on sale, we’re especially excited about the possibility of outsized returns.
Thank you for the opportunity to manage your assets.
Current and future holdings are subject to risk.
30
| | |
| Wasatch Micro Cap Fund (WMICX / WGICX) | | MARCH 31, 2023 (Unaudited) |
Portfolio Summary
AVERAGE ANNUAL TOTAL RETURNS
| | | | | | | | | | | | | | | | | | | | |
| | | | |
| Name | | Six Months
(Not annualized) | | 1 Year | | 5 Years | | 10 Years |
| | | | |
Micro Cap (WMICX) — Investor | | | | 8.22% | | | | | -18.55% | | | | | 9.59% | | | | | 12.16% | |
| | | | |
Micro Cap (WGICX) — Institutional | | | | 8.22% | | | | | -18.55% | | | | | 9.60% | | | | | 12.16% | |
| | | | |
Russell Microcap® Growth Index | | | | 3.48% | | | | | -17.98% | | | | | 0.95% | | | | | 5.82% | |
| | | | |
Russell Microcap® Index | | | | 1.76% | | | | | -17.93% | | | | | 2.96% | | | | | 7.27% | |
Data show past performance, which is not indicative of future performance. Current performance may be lower or higher than the performance quoted. To obtain the most recent month-end performance data available, please visit wasatchglobal.com. The Advisor may absorb certain Fund expenses, without which total returns would have been lower. Investment returns and principal value will fluctuate and shares, when redeemed, may be worth more or less than their original cost.
As of the January 31, 2023 prospectus, the Total Annual Fund Operating Expenses for the Wasatch Micro Cap Fund are Investor Class: 1.66% / Institutional Class: 1.59%. The expense ratio shown elsewhere in this report may be different. Net expenses are based on Fund expenses, net of waivers and reimbursements. See the prospectus for additional information regarding Fund expenses.
Wasatch will deduct a 2.00% redemption fee on Fund shares held 60 days or less. Performance data do not reflect the deduction of fees, including sales charges, or the taxes you would pay on fund distributions or the redemption of fund shares. Fees and taxes, if reflected, would reduce the performance quoted. Wasatch does not charge any sales fees. For more complete information including charges, risks and expenses, read the prospectus carefully.
Performance for the Institutional Class prior to 1/31/2020 is based on the performance of the Investor Class. Performance of the Fund’s Institutional Class prior to 1/31/2020 uses the actual expenses of the Fund’s Investor Class without any adjustments. For any such period of time, the performance of the Fund’s Institutional Class would have been substantially similar to, yet higher than, the performance of the Fund’s Investor Class, because the shares of both classes are invested in the same portfolio of securities, but the classes bear different expenses.
Investing in micro cap funds will be more volatile and loss of principal could be greater than investing in large cap or more diversified funds. Investing in foreign securities, especially in emerging markets, entails special risks, such as currency fluctuations and political uncertainties, which are described in more detail in the prospectus.
TOP 10 EQUITY HOLDINGS*
| | | | |
| |
| Company | | % of Net Assets | |
| |
Heritage-Crystal Clean, Inc. | | | 3.1% | |
| |
Transcat, Inc. | | | 3.0% | |
| |
Addus HomeCare Corp. | | | 3.0% | |
| |
Kadant, Inc. | | | 2.8% | |
| |
UFP Technologies, Inc. | | | 2.8% | |
| | | | |
| |
| Company | | % of Net Assets | |
| |
Helios Technologies, Inc. | | | 2.6% | |
| |
Napco Security Technologies, Inc. | | | 2.6% | |
| |
Agilysys, Inc. | | | 2.4% | |
| |
Esquire Financial Holdings, Inc. | | | 2.4% | |
| |
ICF International, Inc. | | | 2.4% | |
| * | As of March 31, 2023, there were 75 holdings in the Fund. Foreign currency contracts, written options and repurchase agreements, if any, are not included in the number of holdings. Portfolio holdings are subject to change at any time. References to specific securities should not be construed as recommendations by the Funds or their Advisor. Current and future holdings are subject to risk. |
SECTOR BREAKDOWN**
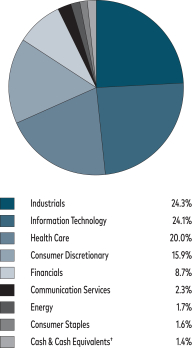
| ** | Excludes securities sold short, if any. |
| † | Also includes Other Assets & Liabilities. |
GROWTH OF A HYPOTHETICAL $10,000 INVESTMENT
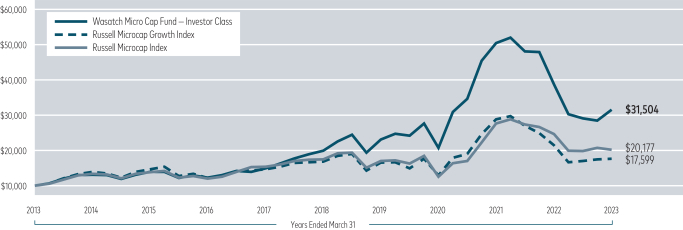
Past performance does not predict future performance. The graph above does not reflect the deduction of fees, sales charges, or taxes that you would pay on fund distributions or the redemption of fund shares. Wasatch does not charge any sales fees.
31
| | |
| Wasatch Micro Cap Value Fund (WAMVX / WGMVX) | | MARCH 31, 2023 (Unaudited) |
Management Discussion
The Wasatch Micro Cap Value Fund is managed by a team of Wasatch portfolio managers led by Brian Bythrow and Thomas Bradley.
| | | | |

Brian Bythrow, CFA Lead Portfolio Manager | | 
Thomas Bradley Associate Portfolio Manager | | OVERVIEW During the first quarter of 2023, the Wasatch Micro Cap Value Fund — Investor Class gained 4.04% and handily outperformed the benchmark |
Russell Microcap® Index, which fell -2.83%.
After strong returns in January, micro-caps sold off in February due to jitters regarding overheated economic activity, stubbornly elevated inflation and persistently rising interest rates. In March, market volatility was exacerbated by failures of three regional banks in the U.S. and troubles at Credit Suisse Group AG, which was forced into a sale by the Swiss government. But by the end of the first quarter, micro-caps had made up some of their lost ground.
DETAILS OF THE QUARTER
The Fund outperformed its benchmark in the first quarter helped by our stock selections in the financials, health-care and consumer-discretionary sectors — and our overweighted allocations to industrials and information technology. From a country perspective, the bulk of the Fund’s outperformance was delivered by our U.S. holdings. Our investments in the United Kingdom, France and Germany were also positive. We continue to like our positions in non-U.S. companies for their attractive valuations, diversification benefits, and status as likely beneficiaries of potentially lower energy prices and a weaker dollar.
Skyline Champion Corp. was the top contributor to Fund performance during the first quarter. The company is one of the largest homebuilders in North America, specializing in modular homes for the single-family, multi-family and hospitality segments as well as accessory dwelling units and park-model recreational vehicles. Skyline delivered earnings and revenues that topped consensus estimates. We think the company looks attractive on a valuation basis. And when the current cycle of hiking interest rates ends, that could mark the beginning of a favorable period for the housing sector. As a result, we’re maintaining our position at a large weight.
Another meaningful contributor was Impinj, Inc. The company, a pioneer in helping develop the “Internet of Things,” provides an infrastructure by which everyday things — such as car parts and even shipping containers — communicate over the internet. Impinj offers a wireless inventory management and tracking platform for customers in retail, manufacturing, health care and other areas. Tiny radio-frequency
identification (RFID) chips are used to connect, count and track individual items. Impinj is heavily reliant on computer chips — which were in short supply during the post-pandemic rebound — and today’s slowing economy helps reduce the former supply-and-demand imbalance, benefiting the company’s profitability. The stock rose after Impinj announced a positive earnings surprise. While we maintain a significant position, we sold some of our shares to reduce our risk in the name.
Aris Water Solutions, Inc. was the greatest detractor from Fund performance during the first quarter. Aris is an oilfield-services company that manages the water supplies used in energy exploration and production (E&P). The company’s recent pipeline investments allow E&P businesses to increase the amount of water that can be recycled, which significantly lowers costs for its customers. In Texas, for example, water use is one of the greatest expenses incurred for drilling activities. We think investors were disappointed by poor operating results stemming from bad weather that prevented crews from making expected pipeline connections. For our part, we don’t think these short-term challenges will materially impact Aris’s long-term results.
Another significant detractor was AgileThought, Inc., which provides end-to-end digital transformation services to Fortune 1000 customers in a diverse group of industries. The company’s services include consulting, data management and automation, custom software development and cloud computing. We think the stock was down due to investors’ nervousness about the company’s plan to raise capital and management’s forecast for growth that was a bit lower than investors — including ourselves — had expected.
OUTLOOK
The economy and stock market continue to face a number of headwinds. As 2023 has unfolded, investors are experiencing significant uncertainty regarding the robustness of economic activity and the direction of inflation and interest rates. Moreover, given the recent banking crisis, there’s concern that credit conditions could become tighter. And investors have been left guessing as to when the federal-funds rate, which is controlled by the Federal Reserve, will peak.
Our expectation is that the U.S. will enter recession before the end of the year. And we believe the Fund is well-positioned for that outcome. But irrespective of how the broad economy performs, we’re optimistic regarding our companies. As always, our focus is on building a diversified portfolio of attractively priced companies that exhibit good visibility into operating performance, strong earnings momentum and the ability to thrive and increase market share across economic cycles. This approach has served shareholders well over time, and we believe it will continue to do so.
Thank you for the opportunity to manage your assets.
Current and future holdings are subject to risk.
32
| | |
| Wasatch Micro Cap Value Fund (WAMVX / WGMVX) | | MARCH 31, 2023 (Unaudited) |
Portfolio Summary
AVERAGE ANNUAL TOTAL RETURNS
| | | | | | | | | | | | | | | | | | | | |
| | | | |
| | | Six Months
(Not annualized) | | 1 Year | | 5 Years | | 10 Years |
| | | | |
Micro Cap Value (WAMVX) — Investor | | | | 10.75% | | | | | -13.45% | | | | | 9.77% | | | | | 11.64% | |
| | | | |
Micro Cap Value (WGMVX) — Institutional | | | | 10.68% | | | | | -13.37% | | | | | 9.88% | | | | | 11.69% | |
| | | | |
Russell Microcap® Index | | | | 1.76% | | | | | -17.93% | | | | | 2.96% | | | | | 7.27% | |
Data show past performance, which is not indicative of future performance. Current performance may be lower or higher than the performance quoted. To obtain the most recent month-end performance data available, please visit wasatchglobal.com. The Advisor may absorb certain Fund expenses, without which total returns would have been lower. Investment returns and principal value will fluctuate and shares, when redeemed, may be worth more or less than their original cost.
As of the January 31, 2023 prospectus, the Total Annual Fund Operating Expenses for the Wasatch Micro Cap Value Fund are Investor Class: 1.70% / Institutional Class — Gross: 1.63%, Net: 1.60%. The expense ratio shown elsewhere in this report may be different. Net expenses are based on Fund expenses, net of waivers and reimbursements. See the prospectus for additional information regarding Fund expenses.
Wasatch will deduct a 2.00% redemption fee on Fund shares held 60 days or less. Performance data do not reflect the deduction of fees, including sales charges, or the taxes you would pay on fund distributions or the redemption of fund shares. Fees and taxes, if reflected, would reduce the performance quoted. Wasatch does not charge any sales fees. For more complete information including charges, risks and expenses, read the prospectus carefully.
Performance for the Institutional Class prior to 1/31/2020 is based on the performance of the Investor Class. Performance of the Fund’s Institutional Class prior to 1/31/2020 uses the actual expenses of the Fund’s Investor Class without any adjustments. For any such period of time, the performance of the Fund’s Institutional Class would have been substantially similar to, yet higher than, the performance of the Fund’s Investor Class, because the shares of both classes are invested in the same portfolio of securities, but the classes bear different expenses.
Investing in micro cap funds will be more volatile and loss of principal could be greater than investing in large cap or more diversified funds. Investments in value stocks can perform differently from the market as a whole and from other types of stocks and can continue to be undervalued by the market for long periods of time. Investing in foreign securities, especially in emerging markets, entails special risks, such as currency fluctuations and political uncertainties, which are described in more detail in the prospectus.
TOP 10 EQUITY HOLDINGS*
| | | | |
| |
| Company | | % of Net Assets | |
| |
Skyline Champion Corp. | | | 3.3% | |
| |
Impinj, Inc. | | | 3.0% | |
| |
Esquire Financial Holdings, Inc. | | | 2.3% | |
| |
Construction Partners, Inc., Class A | | | 2.0% | |
| |
ICF International, Inc. | | | 2.0% | |
| | | | |
| |
| Company | | % of Net Assets | |
| |
Napco Security Technologies, Inc. | | | 2.0% | |
| |
Sterling Infrastructure, Inc. | | | 1.9% | |
| |
Viemed Healthcare, Inc. | | | 1.9% | |
| |
EZCORP, Inc., Class A | | | 1.9% | |
| |
JDC Group AG | | | 1.8% | |
| * | As of March 31, 2023, there were 87 holdings in the Fund. Foreign currency contracts, written options and repurchase agreements, if any, are not included in the number of holdings. Portfolio holdings are subject to change at any time. References to specific securities should not be construed as recommendations by the Funds or their Advisor. Current and future holdings are subject to risk. |
SECTOR BREAKDOWN**
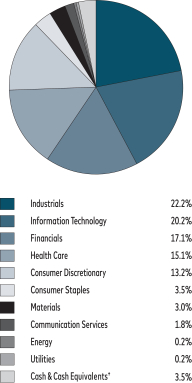
| ** | Excludes securities sold short, if any. |
| † | Also includes Other Assets & Liabilities. |
GROWTH OF A HYPOTHETICAL $10,000 INVESTMENT
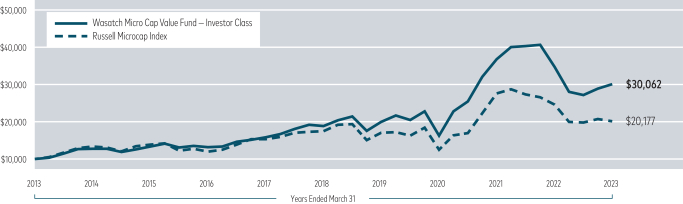
Past performance does not predict future performance. The graph above does not reflect the deduction of fees, sales charges, or taxes that you would pay on fund distributions or the redemption of fund shares. Wasatch does not charge any sales fees.
33
| | |
| Wasatch Small Cap Growth Fund (WAAEX / WIAEX) | | MARCH 31, 2023 (Unaudited) |
Management Discussion
The Wasatch Small Cap Growth Fund is managed by a team of Wasatch portfolio managers led by JB Taylor, Ken Korngiebel and Ryan Snow.
| | | | |

JB Taylor Lead Portfolio Manager | | 
Ken Korngiebel, CFA Portfolio Manager | | 
Ryan Snow Portfolio Manager |
OVERVIEW
The first quarter of 2023 was positive for stocks of small U.S. growth companies. The Wasatch Small Cap Growth Fund — Investor Class increased 7.47%, outgaining the benchmark Russell 2000® Growth Index, which rose 6.07%. The broader Russell 2000 Index of small-cap stocks added 2.74%.
Following 2022’s market weakness, which was driven by macro forces that indiscriminately punished most stocks (excluding energy names), it was a welcome reversal to see company fundamentals drive stock prices during the first quarter. But in March, failures of three regional U.S. banks and the government-brokered sale of troubled Swiss firm Credit Suisse Group AG dragged down bank stocks and rattled investors.
Hopes that the banking crisis would push the Federal Reserve closer to the end of its tightening cycle appeared to outweigh concerns about fallout to the general economy. Investors also seemed to gain confidence that regulators’ efforts to contain the crisis had warded off contagion within the banking system.
DETAILS OF THE QUARTER
The consumer-discretionary sector was the Fund’s biggest source of outperformance during the quarter. Conversely, health care was the Fund’s primary source of weakness.
The strongest contributor to Fund performance was Nova Ltd. The company is a key provider of process-control systems used to manufacture semiconductor chips. Nova’s stock price rose throughout the quarter amid signs that the semiconductor cycle may be bottoming. Rather than try to pinpoint the cycle’s exact turning point, we bought additional shares of Nova for the Fund last year while investors fearful of recession were selling the stock down to attractive valuations. We were more than happy to take the other side of that trade, given our long investment horizon and strong conviction that Nova is a high-quality business. Also, the semiconductor industry is of strategic importance to the U.S., and the need to build additional capacity is a meaningful tailwind for the company in our view.
Focus Financial Partners, Inc. was also a contributor. Focus is a leading partnership of independent, fiduciary
wealth-management firms. The company’s stock price jumped in February after Focus announced it was in talks to sell itself to a private-equity firm. Later that month, Focus entered into a definitive agreement to be acquired in an all-cash deal expected to close in the third quarter of 2023. We liquidated our position to lock in gains.
The greatest detractor from Fund performance was Pinnacle Financial Partners, Inc., the bank holding company for Pinnacle Bank. Although Pinnacle’s stock declined in sympathy with other bank stocks during March, we believe its strong fundamentals set it apart from the failed banks. Pinnacle follows a conventional banking model, with a well-diversified customer base, appropriate levels of loans and deposits, and a small securities portfolio. Despite liquidity pressures at a number of other banks, our research found no significant uptick in withdrawals at Pinnacle. We believe Pinnacle is a well-managed bank serving a geographical area with a healthy real-estate market, favorable demographics and above-average economic growth.
Silk Road Medical, Inc. also detracted. The company provides implantable devices to treat blockages in the carotid artery that put patients at risk of a stroke. Although Silk Road posted a narrower-than-expected loss in its most recently reported quarter, the stock sold off after management offered no guidance as to future earnings. On the plus side, revenues rose 42% on the back of increased adoption of the company’s Transcarotid Artery Revascularization (TCAR) procedure. In our view, Silk Road’s scalable business model, effective sales force and large cash position should give the company an ample runway to profitability.
OUTLOOK
The Wasatch investment approach seeks high-quality companies with solid business models, strong cash flows and healthy balance sheets. As a result, our companies are unlikely to run out of money when business conditions get tough. Their competitors, meanwhile, might scramble to arrange new sources of funding in the wake of Silicon Valley Bank’s collapse and more banking restrictions.
A tighter funding environment means there will likely be fewer start-ups for a while. As investors in technology-driven industries, we’re always concerned about innovations that could get funded and disrupt the business models of the companies we own. It appears some of this risk just got taken off the table, at least for now.
We think our focus on businesses with strong fundamentals may be as important now as ever. While no one wants to see bank runs, financial instability or economic turmoil, we believe the Fund’s portfolio of high-quality companies is well-positioned to weather potential storms.
Thank you for the opportunity to manage your assets.
Current and future holdings are subject to risk.
34
| | |
| Wasatch Small Cap Growth Fund (WAAEX / WIAEX) | | MARCH 31, 2023 (Unaudited) |
Portfolio Summary
AVERAGE ANNUAL TOTAL RETURNS
| | | | | | | | | | | | | | | | | | | | |
| | | | |
| | | Six Months
(Not annualized) | | 1 Year | | 5 Years | | 10 Years |
| | | | |
Small Cap Growth (WAAEX) — Investor | | | | 9.93% | | | | | -21.55% | | | | | 7.63% | | | | | 9.33% | |
| | | | |
Small Cap Growth (WIAEX) — Institutional | | | | 9.97% | | | | | -21.45% | | | | | 7.75% | | | | | 9.43% | |
| | | | |
Russell 2000® Growth Index | | | | 10.46% | | | | | -10.60% | | | | | 4.26% | | | | | 8.49% | |
| | | | |
Russell 2000® Index | | | | 9.14% | | | | | -11.61% | | | | | 4.71% | | | | | 8.04% | |
Data show past performance, which is not indicative of future performance. Current performance may be lower or higher than the performance quoted. To obtain the most recent month-end performance data available, please visit wasatchglobal.com. The Advisor may absorb certain Fund expenses, without which total returns would have been lower. Investment returns and principal value will fluctuate and shares, when redeemed, may be worth more or less than their original cost.
As of the January 31, 2023 prospectus, the Total Annual Fund Operating Expenses for the Wasatch Small Cap Growth Fund are Investor Class: 1.15% / Institutional Class — Gross: 1.06%, Net: 1.05%. The expense ratio shown elsewhere in this report may be different. Net expenses are based on Fund expenses, net of waivers and reimbursements. See the prospectus for additional information regarding Fund expenses.
Wasatch will deduct a 2.00% redemption fee on Fund shares held 60 days or less. Performance data do not reflect the deduction of fees, including sales charges, or the taxes you would pay on fund distributions or the redemption of fund shares. Fees and taxes, if reflected, would reduce the performance quoted. Wasatch does not charge any sales fees. For more complete information including charges, risks and expenses, read the prospectus carefully.
Performance for the Institutional Class prior to 2/1/2016 is based on the performance of the Investor Class. Performance of the Fund’s Institutional Class prior to 2/1/2016 uses the actual expenses of the Fund’s Investor Class without any adjustments. For any such period of time, the performance of the Fund’s Institutional Class would have been substantially similar to, yet higher than, the performance of the Fund’s Investor Class, because the shares of both classes are invested in the same portfolio of securities, but the classes bear different expenses.
Investing in small cap funds will be more volatile and loss of principal could be greater than investing in large cap or more diversified funds. Investing in foreign securities, especially in emerging markets, entails special risks, such as currency fluctuations and political uncertainties, which are described in more detail in the prospectus.
TOP 10 EQUITY HOLDINGS*
| | | | |
| |
| Company | | % of Net Assets | |
| |
Ensign Group, Inc. | | | 4.3% | |
| |
Nova Ltd. | | | 3.9% | |
| |
Medpace Holdings, Inc. | | | 3.5% | |
| |
HealthEquity, Inc. | | | 3.4% | |
| |
RBC Bearings, Inc. | | | 3.3% | |
| | | | |
| |
| Company | | % of Net Assets | |
| |
BellRing Brands, Inc. | | | 3.2% | |
| |
CyberArk Software Ltd. | | | 3.2% | |
| |
Fox Factory Holding Corp. | | | 3.2% | |
| |
Five Below, Inc. | | | 3.1% | |
| |
SiteOne Landscape Supply, Inc. | | | 3.1% | |
| *As | of March 31, 2023, there were 63 holdings in the Fund. Foreign currency contracts, written options and repurchase agreements, if any, are not included in the number of holdings. Portfolio holdings are subject to change at any time. References to specific securities should not be construed as recommendations by the Funds or their Advisor. Current and future holdings are subject to risk. |
SECTOR BREAKDOWN**

| ** | Excludes securities sold short, if any. |
| † | Also includes Other Assets & Liabilities. |
GROWTH OF A HYPOTHETICAL $10,000 INVESTMENT
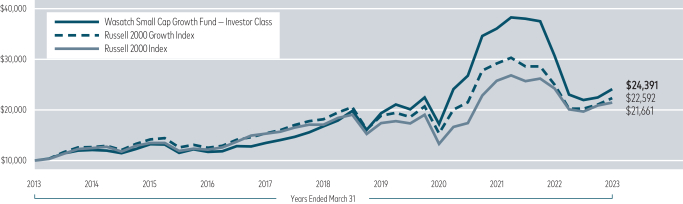
Past performance does not predict future performance. The graph above does not reflect the deduction of fees, sales charges, or taxes that you would pay on fund distributions or the redemption of fund shares. Wasatch does not charge any sales fees.
35
| | |
| Wasatch Small Cap Value Fund (WMCVX / WICVX) | | MARCH 31, 2023 (Unaudited) |
Management Discussion
The Wasatch Small Cap Value Fund is managed by a team of Wasatch portfolio managers led by Jim Larkins and Austin Bone.
| | | | |

Jim Larkins Lead Portfolio Manager | | 
Austin Bone Portfolio Manager | | OVERVIEW The market environment shifted considerably during the first quarter of 2023, weighing on the returns of small-cap stocks. Equities per- formed well in the |
early part of the period on hopes that the U.S. Federal Reserve (Fed) was nearing the end of its long series of interest-rate hikes. Coming at a time in which growth remained positive, the Fed’s apparent shift fostered optimism that the economy would experience a “soft landing.” The outlook changed in March, however, when the failure of some important U.S. banks raised fears about the health of the broader regional-banking group. Small-cap stocks, which are more sensitive to economic trends and more reliant on outside funding than larger companies, fell sharply on the news and finished the quarter behind their large-cap peers.
The Wasatch Small Cap Value Fund — Investor Class gained 5.58% during the quarter and comfortably outpaced the -0.66% loss of its benchmark, the Russell 2000® Value Index. This is consistent with our results over time, which have been highlighted by a tendency to outperform in down markets. We believe our ongoing focus on higher-quality companies — those with solid balance sheets, recurring revenues and healthy competitive positions — has been a key driver of the Fund’s outperformance of its benchmark both in the first quarter and over the longer term, as well.
DETAILS OF THE QUARTER
We steadily upgraded overall portfolio quality throughout 2022 in anticipation of a more challenging investment backdrop. This approach paid off in the first quarter as volatile, uncertain market conditions prompted investors to rotate away from more speculative, momentum-driven stocks toward those with stronger fundamentals.
In terms of individual positions, diversified industrial company Kadant, Inc. was a leading contributor for the quarter. We view the company as a high-quality operator with a strong balance sheet and the ability to outperform through a wide range of economic conditions. These traits held the stock in good stead and enabled it to finish among the many portfolio holdings that produced a double-digit gain.
Housing-related stocks also performed well on positive supply-and-demand trends and hope that interest rates have hit their peak for this cycle. This led to sizable gains for homebuilders Skyline Champion Corp. and LGI Homes, Inc.
On the negative side, our three largest detractors were bank stocks: Bank OZK, Hancock Whitney Corp. and
ServisFirst Bancshares, Inc. Although all continued to exhibit sound fundamentals, their shares were pressured by larger concerns about the industry. We would note, however, that the Fund’s bank stocks were down less than their benchmark counterparts, and our weighting in banks is well below that of the Index. We also benefited from the relatively good performance in our non-bank financials.
Given that bank stocks make up over 18% of the Russell 2000 Value Index, even bottom-up investors like Wasatch are focused on the banking industry. Currently, liquidity and deposit stability are the primary concerns when evaluating individual banks. We’re assessing these risks by looking at the balances our bank holdings have in securities they intend to hold to maturity, and analyzing both the percentage of uninsured deposits and the nature of their deposits. Ultimately, we believe the risk associated with the creditworthiness of borrowers will have the largest influence on the long-run success of our bank investments. This gives us confidence that our investments in this area should be well-positioned for healthy performance relative to the banking industry as a whole. We therefore kept all our current bank holdings and added one additional investment in Pinnacle Financial Partners, Inc., a bank the Fund owned previously. This slightly increased our overall weighting in banks, but we maintained an underweight position in the industry relative to the benchmark.
OUTLOOK
The Fed appeared to be in a challenging position following the events of the first quarter. On one hand, it faced the need to continue raising rates in order to dampen persistently high inflation. On the other, it had to consider the impact tighter policy would have on the overall financial system. In addition, the banking crisis reduced the odds of a soft landing for the economy and increased the likelihood of a recession.
Our approach to this uncertainty is not to attempt to predict the direction of the economy, but rather to position the Fund to perform well in any environment. As always, we seek to achieve this by staying focused on quality, especially at the balance-sheet level, as well as by maintaining a balance between value versus growth, and offense versus defense. We believe this approach will hold the Fund in good stead as the macroeconomic picture sorts itself out in the months ahead.
Thank you for the opportunity to manage your assets.
Current and future holdings are subject to risk.
36
| | |
| Wasatch Small Cap Value Fund (WMCVX / WICVX) | | MARCH 31, 2023 (Unaudited) |
Portfolio Summary
AVERAGE ANNUAL TOTAL RETURNS
| | | | | | | | | | | | | | | | | | | | |
| | | | |
| | | Six Months
(Not annualized) | | 1 Year | | 5 Years | | 10 Years |
| | | | |
Small Cap Value (WMCVX) — Investor | | | | 16.43% | | | | | -8.11% | | | | | 6.00% | | | | | 9.67% | |
| | | | |
Small Cap Value (WICVX) — Institutional | | | | 16.54% | | | | | -8.03% | | | | | 6.13% | | | | | 9.81% | |
| | | | |
Russell 2000® Value Index | | | | 7.70% | | | | | -12.96% | | | | | 4.55% | | | | | 7.22% | |
| | | | |
Russell 2000® Index | | | | 9.14% | | | | | -11.61% | | | | | 4.71% | | | | | 8.04% | |
Data show past performance, which is not indicative of future performance. Current performance may be lower or higher than the performance quoted. To obtain the most recent month-end performance data available, please visit wasatchglobal.com. The Advisor may absorb certain Fund expenses, without which total returns would have been lower. Investment returns and principal value will fluctuate and shares, when redeemed, may be worth more or less than their original cost.
As of the January 31, 2023 prospectus, the Total Annual Fund Operating Expenses for the Wasatch Small Cap Value Fund are Investor Class: 1.16% / Institutional Class — Gross: 1.06%, Net: 1.05%. The expense ratio shown elsewhere in this report may be different. Net expenses are based on Fund expenses, net of waivers and reimbursements. See the prospectus for additional information regarding Fund expenses.
Wasatch will deduct a 2.00% redemption fee on Fund shares held 60 days or less. Performance data do not reflect the deduction of fees, including sales charges, or the taxes you would pay on fund distributions or the redemption of fund shares. Fees and taxes, if reflected, would reduce the performance quoted. Wasatch does not charge any sales fees. For more complete information including charges, risks and expenses, read the prospectus carefully.
Investing in small cap funds will be more volatile and loss of principal could be greater than investing in large cap or more diversified funds. Investments in value stocks can perform differently from the market as a whole and from other types of stocks and can continue to be undervalued by the market for long periods of time. Investing in foreign securities, especially in emerging markets, entails special risks, such as currency fluctuations and political uncertainties, which are described in more detail in the prospectus.
TOP 10 EQUITY HOLDINGS*
| | | | |
| |
| Company | | % of Net Assets | |
| |
Kadant, Inc. | | | 4.2% | |
| |
Ensign Group, Inc. | | | 3.9% | |
| |
Skyline Champion Corp. | | | 3.3% | |
| |
Innospec, Inc. | | | 3.1% | |
| |
Hamilton Lane, Inc., Class A | | | 3.0% | |
| | | | |
| |
| Company | | % of Net Assets | |
| |
Nova Ltd. | | | 2.8% | |
| |
Euronet Worldwide, Inc. | | | 2.7% | |
| |
Valvoline, Inc. | | | 2.7% | |
| |
Moelis & Co., Class A | | | 2.6% | |
| |
Grand Canyon Education, Inc. | | | 2.6% | |
| * | As of March 31, 2023, there were 65 holdings in the Fund. Foreign currency contracts, written options and repurchase agreements, if any, are not included in the number of holdings. Portfolio holdings are subject to change at any time. References to specific securities should not be construed as recommendations by the Funds or their Advisor. Current and future holdings are subject to risk. |
SECTOR BREAKDOWN**
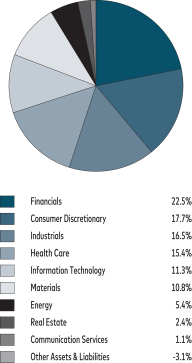
| ** | Excludes securities sold short, if any. |
| † | Also includes Other Assets & Liabilities. |
GROWTH OF A HYPOTHETICAL $10,000 INVESTMENT
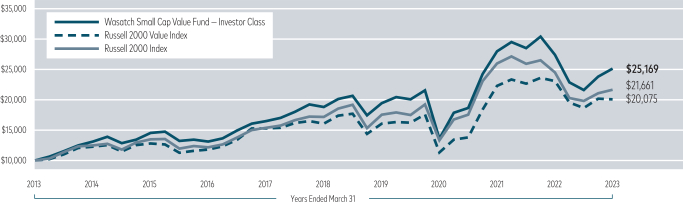
Past performance does not predict future performance. The graph above does not reflect the deduction of fees, sales charges, or taxes that you would pay on fund distributions or the redemption of fund shares. Wasatch does not charge any sales fees.
37
| | |
| Wasatch Ultra Growth Fund (WAMCX / WGMCX) | | MARCH 31, 2023 (Unaudited) |
Management Discussion
The Wasatch Ultra Growth Fund is managed by a team of Wasatch portfolio managers led by John Malooly.
| | |

John Malooly, CFA Lead Portfolio Manager | | OVERVIEW The benchmark Russell 2000® Growth Index rose 6.07% for the first quarter of 2023, trimming early gains amid growing uncertainty about the future paths of interest rates and the U.S. economy. The Wasatch Ultra Growth Fund — Investor Class returned 6.87% and outperformed the benchmark. |
Failures of three regional banks in the U.S. and the hastily arranged government-brokered sale of troubled Swiss firm Credit Suisse Group AG rattled financial markets. Equities weathered the turmoil well, with investors seemingly optimistic that the crisis would push the U.S. Federal Reserve closer to the end of its tightening cycle.
DETAILS OF THE QUARTER
Despite turbulence in the banking industry, financials were a source of outperformance in the Fund during the quarter. We believe the well-diversified deposit bases and healthy balance sheets of the Fund’s two banks set them apart from the ones making headlines. Although our bank stocks declined in sympathy with other banks, they currently represent only about 3% of total Fund assets. Moreover, strong returns from our insurance and capital-markets stocks drove a solid overall gain in the Fund’s financials.
Consumer discretionary and information technology (IT) were the Fund’s other primary sources of strength. We believe our holdings in these sectors are positioned well to navigate inflationary and recessionary environments. In the IT sector, several of our holdings benefited from the recent boom in artificial intelligence (AI), which has triggered an upswell of positive sentiment toward the semiconductor industry.
Health care was the Fund’s largest source of weakness during the quarter. The collapse of Silicon Valley Bank in California bruised sentiment toward biotechnology stocks. Investors worried that the bank’s downfall may hamper funding for biotechs and start-ups in general. Nevertheless, we believe the best science and technology ideas will attract funding.
The Fund’s strongest contributor during the quarter was Floor & Decor Holdings, Inc. A multi-channel specialty retailer of hard-surface flooring, Floor & Decor has become a “category killer” among the big-box home centers. The company cuts out middlemen and buys in large quantities, offering a wider selection of merchandise at lower prices than many competitors. Floor & Decor’s expanding retail footprint, strong cash flows and solid balance sheet enable the company to self-fund its growth.
Another top contributor was PDF Solutions, Inc., which provides technologies for designing and manufacturing
integrated-circuit chips. The company’s stock price soared to record highs in February after quarterly revenues and earnings beat Wall Street estimates. Factors boding well for PDF include its growing backlog and emerging Design-for-Inspection System, a technology that seeks to change the current paradigm of visual chip inspection.
Silk Road Medical, Inc. was the largest individual detractor. The company provides implantable devices to treat carotid-artery blockages. Although Silk Road posted a narrower-than-expected loss in its most recently reported quarter, the stock sold off after management offered no guidance as to future earnings. On the plus side, revenues rose 42% compared to the same quarter a year ago on the back of increased adoption of the company’s Transcarotid Artery Revascularization (TCAR) procedure. In our view, Silk Road’s scalable business model, effective sales force and large cash position should provide the company with an ample runway to profitability.
Esperion Therapeutics, Inc. was another significant detractor. Esperion’s stock fell following data from a cardiovascular outcomes trial of its cholesterol-lowering drug Nexletol®. Shares fell again on news that Esperion’s partner in the drug was disputing a milestone payment tied to the study’s results. However, our research suggests the trial exceeded clinical expectations of many doctors. We expect the dispute to settle out of court and believe the cardiovascular outcomes trial will lead to considerable expansion of Nexletol’s label in the U.S. and Europe.
OUTLOOK
Banking regulations are expected to get tighter. This will almost certainly make borrowing more expensive for companies that can’t self-fund their growth. The banking crisis has already reduced lending activity and has likely increased the probability that the U.S. economy will enter recession.
We don’t see any easy answers — either for banks or for the U.S. economy as a whole. Though we like the banks the Fund currently owns, the banking industry isn’t one in which we’re seeking new candidates for investment.
The Fund remains overweighted in health care, which we believe can do well in just about any macro environment. We’re also overweighted in the semiconductor industry, where we expect machine learning to create unprecedented computing demand. Our software companies largely derive revenues from recurring contracts that consistently generate cash. And we believe depressed valuations in the biotechnology industry offer some attractive opportunities.
Our focus on strong cash flows and healthy balance sheets has taken on added importance as interest rates have risen. We think businesses that can grow or become profitable without borrowing or issuing new stock should enjoy significant competitive advantages.
Thank you for the opportunity to manage your assets.
Current and future holdings are subject to risk.
38
| | |
| Wasatch Ultra Growth Fund (WAMCX / WGMCX) | | MARCH 31, 2023 (Unaudited) |
Portfolio Summary
AVERAGE ANNUAL TOTAL RETURNS
| | | | | | | | | | | | | | | | | | | | |
| | | | |
| | | Six Months
(Not annualized) | | 1 Year | | 5 Years | | 10 Years |
| | | | |
Ultra Growth (WAMCX) — Investor | | | | 8.25% | | | | | -22.66% | | | | | 10.77% | | | | | 12.89% | |
| | | | |
Ultra Growth (WGMCX) — Institutional | | | | 8.34% | | | | | -22.53% | | | | | 10.85% | | | | | 12.93% | |
| | | | |
Russell 2000® Growth Index | | | | 10.46% | | | | | -10.60% | | | | | 4.26% | | | | | 8.49% | |
Data show past performance, which is not indicative of future performance. Current performance may be lower or higher than the performance quoted. To obtain the most recent month-end performance data available, please visit wasatchglobal.com. The Advisor may absorb certain Fund expenses, without which total returns would have been lower. Investment returns and principal value will fluctuate and shares, when redeemed, may be worth more or less than their original cost.
As of the January 31, 2023 prospectus, the Total Annual Fund Operating Expenses for the Wasatch Ultra Growth Fund are Investor Class: 1.18% / Institutional Class — Gross: 1.06%, Net: 1.05%. The expense ratio shown elsewhere in this report may be different. Net expenses are based on Fund expenses, net of waivers and reimbursements. See the prospectus for additional information regarding Fund expenses.
Wasatch will deduct a 2.00% redemption fee on Fund shares held 60 days or less. Performance data do not reflect the deduction of fees, including sales charges, or the taxes you would pay on fund distributions or the redemption of fund shares. Fees and taxes, if reflected, would reduce the performance quoted. Wasatch does not charge any sales fees. For more complete information including charges, risks and expenses, read the prospectus carefully.
Performance for the Institutional Class prior to 1/31/2020 is based on the performance of the Investor Class. Performance of the Fund’s Institutional Class prior to 1/31/2020 uses the actual expenses of the Fund’s Investor Class without any adjustments. For any such period of time, the performance of the Fund’s Institutional Class would have been substantially similar to, yet higher than, the performance of the Fund’s Investor Class, because the shares of both classes are invested in the same portfolio of securities, but the classes bear different expenses.
Investing in small cap funds will be more volatile and loss of principal could be greater than investing in large cap or more diversified funds. Investing in foreign securities, especially in emerging markets, entails special risks, such as currency fluctuations and political uncertainties, which are described in more detail in the prospectus.
TOP 10 EQUITY HOLDINGS*
| | | | |
| |
| Company | | % of Net Assets | |
| |
Freshpet, Inc. | | | 3.7% | |
| |
Intra-Cellular Therapies, Inc. | | | 3.7% | |
| |
Floor & Decor Holdings, Inc., Class A | | | 3.6% | |
| |
Inspire Medical Systems, Inc. | | | 3.5% | |
| |
Five Below, Inc. | | | 3.1% | |
| | | | |
| |
| Company | | % of Net Assets | |
| |
Five9, Inc. | | | 2.9% | |
| |
Paylocity Holding Corp. | | | 2.9% | |
| |
Monolithic Power Systems, Inc. | | | 2.8% | |
| |
Balchem Corp. | | | 2.8% | |
| |
Nova Ltd. | | | 2.7% | |
| * | As of March 31, 2023, there were 71 holdings in the Fund. Foreign currency contracts, written options and repurchase agreements, if any, are not included in the number of holdings. Portfolio holdings are subject to change at any time. References to specific securities should not be construed as recommendations by the Funds or their Advisor. Current and future holdings are subject to risk. |
SECTOR BREAKDOWN**
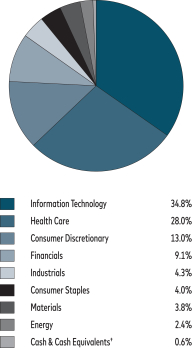
| ** | Excludes securities sold short, if any. |
| † | Also includes Other Assets & Liabilities. |
GROWTH OF A HYPOTHETICAL $10,000 INVESTMENT
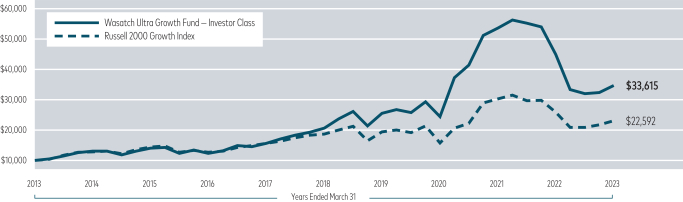
Past performance does not predict future performance. The graph above does not reflect the deduction of fees, sales charges, or taxes that you would pay on fund distributions or the redemption of fund shares. Wasatch does not charge any sales fees.
39
| | |
| Wasatch U.S. Select Fund (WAUSX / WGUSX) | | MARCH 31, 2023 (Unaudited) |
Management Discussion
The Wasatch U.S. Select Fund is managed by a team of Wasatch portfolio managers led by Mike Valentine, Paul Lambert, Austin Bone and Mick Rasmussen.
| | | | |

Mike Valentine Portfolio Manager 
Austin Bone Portfolio Manager | | 
Paul Lambert Portfolio Manager 
Mick Rasmussen Portfolio Manager | | OVERVIEW Stocks started 2023 on an upswing, but in March, failures of three regional banks in the U.S. and the government-brokered sale of troubled Swiss firm Credit Suisse Group AG dragged down bank stocks and rattled investors. The broad U.S. equity market weathered the |
turmoil well as stocks rallied into the end of the first quarter. Hopes that the crisis would push the Federal Reserve closer to the end of its tightening cycle appeared to outweigh concerns about fallout to the general economy.
The Wasatch U.S. Select Fund — Investor Class gained 11.66% in the first quarter but underperformed its benchmark, the Russell 3000® Growth Index, which was up 13.85%.
DETAILS OF THE QUARTER
Bank OZK, colloquially known as “Bank of the Ozarks,” was the largest detractor from Fund performance during the period. The bank saw its stock price decline in sympathy with other bank stocks during March, but we believe the strong fundamentals of Bank OZK set it apart from the ones making headlines in the press.
Bank OZK follows conventional banking models, with a well-diversified customer base, appropriate levels of loans and deposits and a small securities portfolio. Despite liquidity pressures at a number of other banks, our research found no significant uptick in withdrawals at Bank OZK. Moreover, we believe it is a well-managed bank serving geographical areas with healthy real-estate markets, favorable demographics and above-average economic growth.
HealthEquity, Inc. also detracted from Fund performance. The company is the largest U.S. non-bank custodian for health-savings accounts (HSAs). Account holders have online access to their tax-advantaged HSAs and can compare treatment options, pay medical bills, earn wellness incentives, and receive personalized benefit and clinical information. While the stock drifted lower, fundamentals for HealthEquity remain strong. The company continues to experience strong HSA account growth and asset growth for its platform, and we anticipate significant long-term growth for the company as more employers offer HSAs.
The top contributor to Fund performance during the quarter was MarketAxess Holdings, Inc. The company operates an electronic trading platform that we believe is pivotal in delivering efficiency, liquidity and cost savings to investors trading in fixed-income markets. The stock appreciated after the company released fourth-quarter earnings growth that exceeded consensus estimates. Looking ahead, our thesis on the company remains on track. MarketAxess is gaining share in the global fixed-income trading market, and we like the revenue potential of some of its new offerings that help clients optimize trading and market data.
ANSYS, Inc. was another top contributor. The engineering simulator software company reported fourth-quarter 2022 operating results that helped confirm its ability to grow revenue, even as some industrial customers experience a cyclical slowdown. Going forward, we expect increased demand for engineering simulator software. We also believe ANSYS’s scale gives it a competitive advantage, allowing it to continually refine solutions and build new features that add value for customers. We also like that ANSYS’s business model is relatively sticky. The software becomes deeply embedded in clients’ business workflows, making it likely that ANSYS will gain incremental research and development spending from those clients.
OUTLOOK
While the collapse of Silicon Valley Bank was a source of volatility for markets, we’re beginning to see some silver linings as it pertains to our own holdings. The bank’s failure will likely make it more difficult for small firms in biotechnology, software, and other tech-driven industries to get the money they need to launch and grow their businesses. What does this mean for the companies owned in the Fund? Weaker competition and fewer rivals, mostly.
The Wasatch investment approach seeks high-quality companies with solid business models, strong cash flows and healthy balance sheets. Therefore, our companies are unlikely to run out of money when business conditions get tough. This is a key advantage in the current environment when stock prices are down and interest rates are elevated. While their competitors scramble, our companies can use their cash to make acquisitions, hire talent, invest in their businesses and take market share. The long-term competitive advantages gained from these actions can be substantial.
We think our focus on businesses with strong fundamentals may be as important now as ever. While no one wants to see bank runs, financial instability or economic turmoil, we believe the Fund’s portfolio of high-quality companies is well-positioned to weather potential storms.
Thank you for the opportunity to manage your assets.
Current and future holdings are subject to risk.
40
| | |
| Wasatch U.S. Select Fund (WAUSX / WGUSX) | | MARCH 31, 2023 (Unaudited) |
Portfolio Summary
TOTAL RETURNS
| | | | | | | | | | |
| | |
| | | Six Months
(Not annualized) | | Since Inception 6/13/2022 |
| | |
U.S. Select Fund (WAUSX) — Investor | | | | 20.94% | | | | | 17.80% | |
| | |
U.S. Select Fund (WGUSX) — Institutional | | | | 21.17% | | | | | 17.90% | |
| | |
Russell 3000® Growth Index | | | | 16.49% | | | | | 15.47% | |
| | |
Russell Midcap® Growth Index | | | | 16.67% | | | | | 18.41% | |
Data show past performance, which is not indicative of future performance. Current performance may be lower or higher than the performance quoted. To obtain the most recent month-end performance data available, please visit wasatchglobal.com. The Advisor may absorb certain Fund expenses, without which total returns would have been lower. Investment returns and principal value will fluctuate and shares, when redeemed, may be worth more or less than their original cost.
As of the January 31, 2023 prospectus, the Total Annual Fund Operating Expenses for the Wasatch U.S. Select Fund are Investor Class—Gross: 11.81%, Net: 1.01% / Institutional Class — Gross: 10.54%, Net: 0.86%. The expense ratio shown elsewhere in this report may be different. Net expenses are based on Fund expenses, net of waivers and reimbursements. See the prospectus for additional information regarding Fund expenses.
Wasatch will deduct a 2.00% redemption fee on Fund shares held 60 days or less. Performance data do not reflect the deduction of fees, including sales charges, or the taxes you would pay on fund distributions or the redemption of fund shares. Fees and taxes, if reflected, would reduce the performance quoted. Wasatch does not charge any sales fees. For more complete information including charges, risks and expenses, read the prospectus carefully.
Investing in small cap funds will be more volatile and loss of principal could be greater than investing in large cap or more diversified funds. Investing in foreign securities, especially in emerging markets, entails special risks, such as currency fluctuations and political uncertainties, which are described in more detail in the prospectus. Being non-diversified, the Fund can invest a larger portion of its assets in the stocks of a limited number of companies than a diversified fund. Non-diversification increases the risk of loss to the Fund if the values of these securities decline.
TOP 10 EQUITY HOLDINGS*
| | | | |
| |
| Company | | % of Net Assets | |
| |
AMETEK, Inc. | | | 4.5% | |
| |
Roper Technologies, Inc. | | | 4.3% | |
| |
Amphenol Corp., Class A | | | 4.3% | |
| |
Ensign Group, Inc. | | | 4.1% | |
| |
HEICO Corp., Class A | | | 4.1% | |
| | | | |
| |
| Company | | % of Net Assets | |
| |
Copart, Inc. | | | 4.1% | |
| |
Balchem Corp. | | | 3.7% | |
| |
HealthEquity, Inc. | | | 3.6% | |
| |
ANSYS, Inc. | | | 3.6% | |
| |
Valvoline, Inc. | | | 3.3% | |
| * | As of March 31, 2023, there were 35 holdings in the Fund. Foreign currency contracts, written options and repurchase agreements, if any, are not included in the number of holdings. Portfolio holdings are subject to change at any time. References to specific securities should not be construed as recommendations by the Funds or their Advisor. Current and future holdings are subject to risk. |
SECTOR BREAKDOWN**
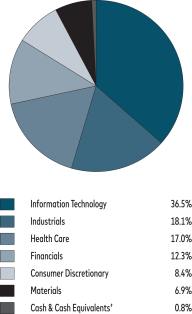
| ** | Excludes securities sold short, if any. |
| † | Also includes Other Assets & Liabilities. |
GROWTH OF A HYPOTHETICAL $10,000 INVESTMENT
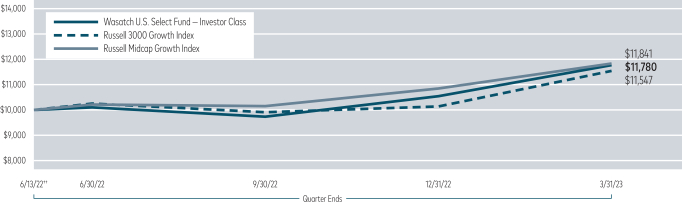
††Inception: June 13, 2022. Past performance does not predict future performance. The graph above does not reflect the deduction of fees, sales charges, or taxes that you would pay on fund distributions or the redemption of fund shares. Wasatch does not charge any sales fees.
41
| | |
| Wasatch-Hoisington U.S. Treasury Fund (WHOSX) | | MARCH 31, 2023 (Unaudited) |
Management Discussion
The Wasatch-Hoisington U.S. Treasury Fund is sub-advised by Hoisington Investment Management Company (HIMCo).
| | | | |

Van Hoisington Lead Portfolio Manager | | 
Van R. Hoisington, Jr. Portfolio Manager | | 
David Hoisington Portfolio Manager |
DETAILS OF THE QUARTER
After reaching a high yield of 4.42% in October of 2022, the long-term U.S. Treasury bond market continued to rally in the first quarter of 2023. The Wasatch-Hoisington U.S. Treasury Fund, which is invested in long-dated U.S. Treasury securities (bonds with maturities longer than 20 years), returned 6.20% for the first quarter versus 2.96% for the Bloomberg US Aggregate Bond Index. Thirty-year Treasury bond yields closed at 3.69% at the end of March, down from 3.95% at the end of 2022.
Volatility was high as the Treasury bond market was buffeted by positive and negative considerations. On the favorable side, all key measures of inflation continued to recede even though the core consumer inflation rate remained above the U.S. Federal Reserve’s (Fed’s) target. Also supportive were signs of recession in both the manufacturing and high-tech sectors, and financial problems in the banking and commercial real-estate sectors, as well as poor economic conditions in most major foreign economies except for China. But even China’s rebound from the end of Covid restrictions appeared to have moderated late in the first quarter. Working against the market were two hikes in the federal-funds rate and continued growth in the service sector.
OVERVIEW
Historically, excessive monetary policies initiate two processes — inflation and excessive risk taking that become an integral part of the financial cycle. This historical pattern is evident in the Fed’s response to the pandemic. In 2020 and 2021, the Fed engineered a monetary acceleration that is unprecedented in modern times. Then, in 2021 and 2022, rampant price increases (inflation) resulted in the worst cost-of-living crisis the U.S. economy had seen in 42 years, heavily damaging the standard of living of modest- and moderate-income households. To subdue inflation running far above its target, Fed actions then caused an unprecedented monetary contraction, which has, in turn, begun to increase the potential for significant failure among the reckless ventures originated from 2020 to early 2022.
The risk of a recession continues to rise, although the economy grew in the first quarter of 2023. The Fed’s interest-rate increases have neutralized the inflationary impact of the fastest modern-era money growth, which
occurred in 2020–2021. Other deposit liabilities (ODL) in real terms registered a double-digit decline in the 12 months ended March 31, 2023, with the 24-month change at a negative -5%. Over the past 12 months, real bank credit had declined even before the recent and highly visible bank failures and is now unchanged for the past 24 months. Although monthly data is not available before World War II, the decline in money in each of the past 12 months is undoubtedly the sharpest since 1934.
Two considerations suggest that the rise in the velocity of money in 2022 and the first quarter of this year, which has thus far interfered with the Fed’s efforts to contain inflation, will reverse. By formula and statistical estimation, velocity lags the business cycle. Since V equals gross domestic product (GDP) (a coincident variable) divided by money (a leading variable), V must definitionally lag. Econometrically, velocity is determined by the marginal revenue product of debt and the loan-to-deposit (LD) ratio, both of which are lagging indicators. The econometrics would be highly questionable if V were determined by leading indicators.
With $10 trillion of total U.S. debt being rolled over this year and an equivalent amount in 2024, the marginal revenue product of debt is set to decline late this year and in 2024. Allocating cash flow from debt-funded projects to interest payments is the least productive use of these resources. While the LD ratio rose in the first quarter and last year as well, this also is a lagging variable with its trough an average of 47 months after its recessionary peak. Under the weight of faltering business conditions, loans will follow and so will the LD ratio. When velocity turns down, monetary policy will have very little capability to stimulate economic activity. The well-known “pushing on a string” predicament will be totally insufficient to describe the situation that lies ahead.
Accordingly, with low or declining economic activity, the inflation rate will most likely continue to recede. Further progress will be made in terms of moving consumer inflation into the Fed’s target zone in 2024. The financial cycle leads the GDP cycle with the price/labor cycle trailing both. This historical pattern indicates that this year’s decline in long-term Treasury bond yields will continue.
Thank you for the opportunity to manage your assets.
Current and future holdings are subject to risk.
42
| | |
| Wasatch-Hoisington U.S. Treasury Fund (WHOSX) | | MARCH 31, 2023 (Unaudited) |
Portfolio Summary
AVERAGE ANNUAL TOTAL RETURNS
| | | | | | | | | | | | | | | | | | | | |
| | | | |
| | | Six Months
(Not annualized) | | 1 Year | | 5 Years | | 10 Years |
| | | | |
U.S. Treasury | | | | 4.10% | | | | | -20.55% | | | | | -1.24% | | | | | 1.08% | |
| | | | |
Bloomberg US Aggregate Bond Index | | | | 4.89% | | | | | -4.78% | | | | | 0.91% | | | | | 1.36% | |
Data show past performance, which is not indicative of future performance. Current performance may be lower or higher than the performance quoted. To obtain the most recent month-end performance data available, please visit wasatchglobal.com. The Advisor may absorb certain Fund expenses, without which total returns would have been lower. Investment returns and principal value will fluctuate and shares, when redeemed, may be worth more or less than their original cost.
As of the January 31, 2023 prospectus, the Total Annual Fund Operating Expenses for the Wasatch-Hoisington U.S. Treasury Fund are 0.67%. The expense ratio shown elsewhere in this report may be different. Net expenses are based on Fund expenses, net of waivers and reimbursements. See the prospectus for additional information regarding Fund expenses.
Wasatch will deduct a 2.00% redemption fee on Fund shares held 60 days or less. Performance data do not reflect the deduction of fees, including sales charges, or the taxes you would pay on fund distributions or the redemption of fund shares. Fees and taxes, if reflected, would reduce the performance quoted. Wasatch does not charge any sales fees. For more complete information including charges, risks and expenses, read the prospectus carefully.
Investments in fixed income funds are subject to the same interest rate, inflation, credit and other risks associated with the underlying bonds. Return of principal is not guaranteed.
TOP U.S. TREASURY HOLDINGS*
| | | | | | | | |
| | |
| Holding | | Maturity
Date | | | % of Net
Assets | |
| | |
U.S. Treasury Bond, 1.250% | | | 5/15/2050 | | | | 23.8% | |
| | |
U.S. Treasury Bond, 1.375% | | | 8/15/2050 | | | | 22.3% | |
| | |
U.S. Treasury Bond, 1.875% | | | 11/15/2051 | | | | 16.7% | |
| | | | | | | | |
| | |
| Holding | | Maturity
Date | | | % of Net
Assets | |
| | |
U.S. Treasury Bond, 2.250% | | | 8/15/2046 | | | | 14.9% | |
| | |
U.S. Treasury Bond, 3.000% | | | 8/15/2048 | | | | 14.3% | |
| | |
U.S. Treasury Bond, 2.500% | | | 2/15/2045 | | | | 6.4% | |
| * | As of March 31, 2023, there were 6 holdings in the Fund. Repurchase agreements, if any, are not included in the number of holdings. Portfolio holdings are subject to change at any time. References to specific securities should not be construed as recommendations by the Funds or their Advisor. Current and future holdings are subject to risk. |
INVESTMENTS & CASH
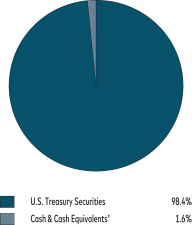
| | † | Also includes Other Assets & Liabilities. |
GROWTH OF A HYPOTHETICAL $10,000 INVESTMENT
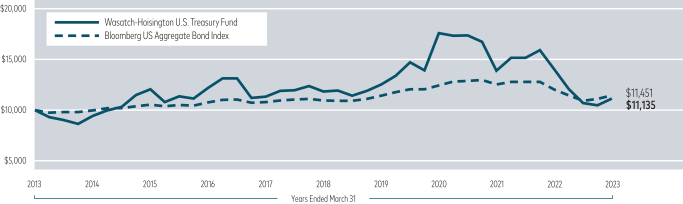
Past performance does not predict future performance. The graph above does not reflect the deduction of fees, sales charges, or taxes that you would pay on fund distributions or the redemption of fund shares. Wasatch does not charge any sales fees.
43
| | |
| Wasatch Funds Management Discussions | | MARCH 31, 2023 (Unaudited) |
DEFINITIONS OF FINANCIAL TERMS
Alpha is a risk-adjusted measure of the so-called “excess return” on an investment. It is a common measure of assessing an active manager’s performance as it is the return in excess of a benchmark index or “risk-free” investment. The difference between the fair and actually expected rates of return on a stock is called the stock’s alpha.
CFA® stands for Chartered Financial Analyst and is a trademark owned by the CFA Institute.
The “cloud” is the internet. Cloud-computing is a model for delivering information-technology services in which resources are retrieved from the internet through web-based tools and applications, rather than from a direct connection to a server.
Diversification is a strategy that mixes a variety of investments within a portfolio in an attempt to reduce risk. Diversification does not eliminate the risk of experiencing investment losses.
Earnings growth is a measure of growth in a company’s net income over a specific period, often one year.
Free cash flow is a measure of a company’s financial performance, calculated as operating cash flow minus capital expenditures. It is the cash a company generates after spending the money required to maintain or expand its asset base.
The federal-funds rate is the interest rate at which private depository institutions (mostly banks) lend balances (federal funds) at the Federal Reserve to other depository institutions, usually overnight. It is the interest rate banks charge each other for loans.
Gross domestic product (GDP) is a basic measure of a country’s economic performance and is the market value of all final goods and services made within the borders of a country in a year.
An initial public offering (IPO) is a company’s first sale of stock to the public.
The loan-to-deposit (LD) ratio is used to assess a bank’s liquidity by comparing the bank’s total loans to its total deposits for the same period. If the ratio is too high, the bank may not have enough liquidity to cover unforeseen fund requirements. If the ratio is too low, the bank may not be earning as much as it could.
The marginal revenue product of debt (MRPD) is the ratio of GDP to debt.
M2 money supply consists of currency and checking accounts, consumer-type time and savings accounts and equivalent near monies, while M3 money supply consists of M2 plus business-type time deposits and less liquid near monies. Both M2 and M3 exclude monies and near monies owned by the Treasury, depository institutions and foreign banks and official institutions and IRA and Keogh balances owned by consumers.
Other deposit liabilities (ODL) equal M2 minus currency in circulation and money market mutual fund shares.
Return on capital is a measure of how effectively a company uses the money, owned or borrowed, that has been invested in its operations.
“Risk-on” is when investors are seeking the potentially higher returns of riskier assets and put money back in the market willing to risk the money, thus risk on.
Valuation is the process of determining the current worth of an asset or company.
The velocity of money (V) is the rate at which money circulates, changes hands or turns over in an economy.
INDEX DESCRIPTIONS AND DISCLOSURES
The Bloomberg US Aggregate Bond Index is a broad-based flagship benchmark that measures the investment grade, U.S. dollar denominated, fixed-rate taxable bond market. The index includes Treasuries, government-related and corporate securities, mortgage-backed securities (MBS) (agency fixed-rate and hybrid adjustable-rate mortgage [ARM] pass-throughs), asset-backed securities (ABS) and commercial mortgage-backed securities (CMBS) (agency and non-agency).
The FTSE U.S. 3-Month Treasury Bill Index measures monthly return equivalents of yield averages not marked to market. The 3-Month Treasury Bill indexes consist of the last three 3-month Treasury bill issues.
The MSCI AC (All Country) World Index captures large- and mid-cap representation across 23 developed-market and 24 emerging-market countries.
The MSCI AC (All Country) World ex USA Small Cap Index is an unmanaged index and includes reinvestment of all dividends of issuers located in countries throughout the world representing developed and emerging markets, excluding securities of U.S. issuers. This index is a free float adjusted market capitalization index designed to measure the performance of small-capitalization securities.
The MSCI AC (All Country) World Mid Cap Growth Index is an unmanaged index capturing mid-cap securities exhibiting growth style characteristics across developed and emerging countries.
The MSCI AC (All Country) World Small Cap Index is an unmanaged index and includes reinvestment of all dividends of issuers located in countries throughout the world representing developed and emerging markets. This index is a free float adjusted market capitalization index designed to measure the performance of small-capitalization securities.
The MSCI AC (All Country) World Value Index captures large- and mid-cap securities exhibiting overall value style characteristics across 23 developed-market countries and 24 emerging-market countries.
The MSCI China Index captures large- and mid-cap representation across China A shares, H shares, B shares, Red chips, P chips and foreign listings (e.g. ADRs). The index covers about 85% of this China equity universe. Currently, the index includes large-cap A and mid-cap A shares represented at 20% of their free float adjusted market capitalization.
The MSCI EAFE Index is an unmanaged index and includes reinvestment of all dividends of issuers located in 21 developed-market countries, excluding the U.S. and Canada.
44
| | |
| Wasatch Funds Management Discussions | | MARCH 31, 2023 (Unaudited) |
INDEX DESCRIPTIONS AND DISCLOSURES (continued)
This index is a free float adjusted market capitalization index designed to measure the performance of mid-cap and large-cap securities.
The MSCI EAFE Mid Cap Growth Index is an unmanaged index capturing mid-cap securities exhibiting growth style characteristics across developed markets around the world, excluding the U.S. and Canada.
The MSCI Emerging Markets Index captures large- and mid-cap representation across 24 emerging-market countries.
The MSCI Emerging Markets Mid Cap Growth Index measures the equity market performance of mid-cap securities exhibiting growth style characteristics in emerging-market countries.
The MSCI Emerging Markets Small Cap Index captures small-cap representation across 24 emerging-market countries.
The MSCI Frontier Emerging Markets and MSCI Frontier Markets indexes are free float adjusted market capitalization indexes designed to measure equity market performance in the global frontier and emerging markets.
The MSCI India Investable Market Index (IMI) covers all investable large-, mid- and small-cap securities across India, targeting approximately 99% of the Indian market’s free float adjusted market capitalization.
The MSCI World ex USA Small Cap Index is a free float adjusted market capitalization weighted index designed to measure the equity market performance of developed markets, excluding the United States.
Pertaining to the use of MSCI information. Source: MSCI. The MSCI information may only be used for your internal use, may not be reproduced or redisseminated in any form and may not be used as a basis for or a component of any financial instruments or products or indices. None of the MSCI information is intended to constitute investment advice or a recommendation to make (or refrain from making) any kind of investment decision and may not be relied on as such. Historical data and analysis should not be taken as an indication or guarantee of any future performance analysis, forecast or prediction. The MSCI information is provided on an “as is” basis and the user of this information assumes the entire risk of any use made of this information. MSCI, each of its affiliates and each other person involved in or related to compiling, computing or creating any MSCI information (collectively, the “MSCI Parties”) expressly disclaims all warranties (including, without limitation, any warranties or originality, accuracy, completeness, timeliness, non-infringement, merchantability and fitness for a particular purpose) with respect to this information. Without limiting any of the foregoing, in no event shall any MSCI Party have any liability for any direct, indirect, special, incidental, punitive, consequential (including, without limitation, lost profits) or any other damages. (www.msci.com)
The Russell 2000 Index is an unmanaged total-return index of the smallest 2,000 companies in the Russell 3000
Index, as ranked by total market capitalization. The Russell 2000 is widely used in the industry to measure the performance of small-company stocks.
The Russell 2000 Growth Index measures the performance of Russell 2000 Index companies with higher price-to-book ratios and higher forecasted growth values.
The Russell 2000 Value Index measures the performance of Russell 2000 Index companies with lower price-to-book ratios and lower forecasted growth values.
The Russell 2500 Index is a market-cap weighted index that includes the smallest 2,500 small- and mid-cap stocks covered in the broad-based Russell 3000 Index of U.S.-based listed equities.
The Russell 3000 Index is an unmanaged total return index of the largest 3,000 U.S. companies based on total market capitalization.
The Russell 3000 Growth Index measures the performance of Russell 3000 Index companies with higher price-to-book ratios and higher forecasted growth values. It is constructed to provide a barometer of the broad growth market.
The Russell Microcap Index is an unmanaged total return index of the smallest 1,000 securities in the small-cap Russell 2000 Index along with the next smallest 1,000 companies, based on a ranking of all U.S. equities by market capitalization.
The Russell Microcap Growth Index is an unmanaged total return index measuring the performance of the micro-cap growth segment of the U.S. equity market.
The Russell Midcap Index is an unmanaged total return index of the 800 smallest companies in the Russell 1000 Index, as ranked by total market capitalization.
The Russell Midcap Growth Index measures the performance of the mid-cap growth segment of the U.S. equity universe. It includes those Russell Midcap Index companies with higher price-to-book ratios and higher forecasted growth values.
Pertaining to the use of Russell information. The Wasatch Funds have been developed solely by Wasatch Global Investors. The Funds are not in any way connected to or sponsored, endorsed, sold or promoted by the London Stock Exchange Group plc and its group undertakings (collectively, the “LSE Group”). FTSE Russell is a trading name of certain of the LSE Group companies. All rights in the Russell Indexes used in these materials vest in the relevant LSE Group company which owns the Index. “Russell ®” is a trade mark of the relevant LSE Group company and is used by any other LSE Group company under license. TMX® is a trademark of TSX, Inc. and used by the LSE Group under license. The Indexes are calculated by or on behalf of FTSE International Limited or its affiliate, agent or partner. The LSE Group does not accept any liability whatsoever to any person arising out of (a) the use of, reliance on or any error in the indexes or (b) investment in or operation of the Wasatch Funds or the suitability of these indexes for the purpose to which they are being put by Wasatch Global Investors.
Indexes are unmanaged. Investors cannot invest directly in these or any indexes.
45
Operating Expenses
| | | | | | | | | | | | | | | | | | | | |
| | | Account Value | | Expenses Paid
During Period* | | Annualized Expense
Ratio* |
| Fund/Class and Return | | Beginning of Period
October 1, 2022 | | End of Period
March 31, 2023 |
Core Growth Fund — Investor Class | | | | | | | | | | | | | | | | | | | | |
Actual | | | $ | 1,000.00 | | | | $ | 1,161.70 | | | | $ | 6.47 | | | | | 1.20% | |
Hypothetical (5% before expenses) | | | $ | 1,000.00 | | | | $ | 1,018.95 | | | | $ | 6.04 | | | | | 1.20% | |
Core Growth Fund — Institutional Class | | | | | | | | | | | | | | | | | | | | |
Actual | | | $ | 1,000.00 | | | | $ | 1,162.40 | | | | $ | 5.71 | | | | | 1.06% | |
Hypothetical (5% before expenses) | | | $ | 1,000.00 | | | | $ | 1,019.65 | | | | $ | 5.34 | | | | | 1.06% | |
Emerging India Fund — Investor Class | | | | | | | | | | | | | | | | | | | | |
Actual | | | $ | 1,000.00 | | | | $ | 909.60 | | | | $ | 7.47 | | | | | 1.57% | |
Hypothetical (5% before expenses) | | | $ | 1,000.00 | | | | $ | 1,017.10 | | | | $ | 7.90 | | | | | 1.57% | |
Emerging India Fund — Institutional Class | | | | | | | | | | | | | | | | | | | | |
Actual | | | $ | 1,000.00 | | | | $ | 910.70 | | | | $ | 6.72 | | | | | 1.41% | |
Hypothetical (5% before expenses) | | | $ | 1,000.00 | | | | $ | 1,017.90 | | | | $ | 7.09 | | | | | 1.41% | |
Emerging Markets Select Fund — Investor Class | | | | | | | | | | | | | | | | |
Actual | | | $ | 1,000.00 | | | | $ | 1,149.20 | | | | $ | 7.45 | | | | | 1.39% | |
Hypothetical (5% before expenses) | | | $ | 1,000.00 | | | | $ | 1,018.00 | | | | $ | 6.99 | | | | | 1.39% | |
Emerging Markets Select Fund — Institutional Class | | | | | | | | | | | | | | | | |
Actual | | | $ | 1,000.00 | | | | $ | 1,150.10 | | | | $ | 6.16 | | | | | 1.15% | |
Hypothetical (5% before expenses) | | | $ | 1,000.00 | | | | $ | 1,019.20 | | | | $ | 5.79 | | | | | 1.15% | |
Emerging Markets Small Cap Fund — Investor Class | | | | | | | | | | | | | | | | |
Actual | | | $ | 1,000.00 | | | | $ | 1,123.90 | | | | $ | 10.48 | | | | | 1.98% | |
Hypothetical (5% before expenses) | | | $ | 1,000.00 | | | | $ | 1,015.06 | | | | $ | 9.95 | | | | | 1.98% | |
Emerging Markets Small Cap Fund — Institutional Class | | | | | | | | | | | | | | | | |
Actual | | | $ | 1,000.00 | | | | $ | 1,122.40 | | | | $ | 9.68 | | | | | 1.83% | |
Hypothetical (5% before expenses) | | | $ | 1,000.00 | | | | $ | 1,015.81 | | | | $ | 9.20 | | | | | 1.83% | |
Frontier Emerging Small Countries Fund — Investor Class | | | | | | | | | | | | | | | | |
Actual | | | $ | 1,000.00 | | | | $ | 1,126.50 | | | | $ | 11.45 | | | | | 2.16% | |
Hypothetical (5% before expenses) | | | $ | 1,000.00 | | | | $ | 1,014.16 | | | | $ | 10.85 | | | | | 2.16% | |
Frontier Emerging Small Countries Fund — Institutional Class | | | | | | | | | | | |
Actual | | | $ | 1,000.00 | | | | $ | 1,133.10 | | | | $ | 10.42 | | | | | 1.96% | |
Hypothetical (5% before expenses) | | | $ | 1,000.00 | | | | $ | 1,015.16 | | | | $ | 9.85 | | | | | 1.96% | |
Global Opportunities Fund — Investor Class | | | | | | | | | | | | | | | | | | | | |
Actual | | | $ | 1,000.00 | | | | $ | 1,115.60 | | | | $ | 8.18 | | | | | 1.55% | |
Hypothetical (5% before expenses) | | | $ | 1,000.00 | | | | $ | 1,017.20 | | | | $ | 7.80 | | | | | 1.55% | |
Global Opportunities Fund — Institutional Class | | | | | | | | | | | | | | | | |
Actual | | | $ | 1,000.00 | | | | $ | 1,117.50 | | | | $ | 7.18 | | | | | 1.36% | |
Hypothetical (5% before expenses) | | | $ | 1,000.00 | | | | $ | 1,018.15 | | | | $ | 6.84 | | | | | 1.36% | |
Global Select Fund — Investor Class | | | | | | | | | | | | | | | | |
Actual | | | $ | 1,000.00 | | | | $ | 1,183.70 | | | | $ | 7.40 | | | | | 1.36% | |
Hypothetical (5% before expenses) | | | $ | 1,000.00 | | | | $ | 1,018.15 | | | | $ | 6.84 | | | | | 1.36% | |
Global Select Fund — Institutional Class | | | | | | | | | | | | | | | | |
Actual | | | $ | 1,000.00 | | | | $ | 1,184.80 | | | | $ | 5.23 | | | | | 0.96% | |
Hypothetical (5% before expenses) | | | $ | 1,000.00 | | | | $ | 1,020.14 | | | | $ | 4.84 | | | | | 0.96% | |
Global Value Fund — Investor Class | | | | | | | | | | | | | | | | | | | | |
Actual | | | $ | 1,000.00 | | | | $ | 1,174.30 | | | | $ | 5.96 | | | | | 1.10% | |
Hypothetical (5% before expenses) | | | $ | 1,000.00 | | | | $ | 1,019.45 | | | | $ | 5.54 | | | | | 1.10% | |
Global Value Fund — Institutional Class | | | | | | | | | | | | | | | | | | | | |
Actual | | | $ | 1,000.00 | | | | $ | 1,174.10 | | | | $ | 5.15 | | | | | 0.95% | |
Hypothetical (5% before expenses) | | | $ | 1,000.00 | | | | $ | 1,020.19 | | | | $ | 4.78 | | | | | 0.95% | |
Greater China Fund — Investor Class | | | | | | | | | | | | | | | | | | | | |
Actual | | | $ | 1,000.00 | | | | $ | 1,144.70 | | | | $ | 8.18 | | | | | 1.53% | |
Hypothetical (5% before expenses) | | | $ | 1,000.00 | | | | $ | 1,017.30 | | | | $ | 7.70 | | | | | 1.53% | |
Greater China Fund — Institutional Class | | | | | | | | | | | | | | | | |
Actual | | | $ | 1,000.00 | | | | $ | 1,146.60 | | | | $ | 6.85 | | | | | 1.28% | |
Hypothetical (5% before expenses) | | | $ | 1,000.00 | | | | $ | 1,018.55 | | | | $ | 6.44 | | | | | 1.28% | |
46
| | |
| | | MARCH 31, 2023 (Unaudited) |
| | | | | | | | | | | | | | | | | | | | |
| | | Account Value | | Expenses Paid
During Period* | | Annualized Expense
Ratio* |
| Fund/Class and Return | | Beginning of Period
October 1, 2022 | | End of Period
March 31, 2023 |
International Growth Fund — Investor Class | | | | | | | | | | | | | | | | | | | | |
Actual | | | $ | 1,000.00 | | | | $ | 1,169.20 | | | | $ | 8.11 | | | | | 1.50% | |
Hypothetical (5% before expenses) | | | $ | 1,000.00 | | | | $ | 1,017.45 | | | | $ | 7.54 | | | | | 1.50% | |
International Growth Fund — Institutional Class | | | | | | | | | | | | | | | | | | | | |
Actual | | | $ | 1,000.00 | | | | $ | 1,169.80 | | | | $ | 7.36 | | | | | 1.36% | |
Hypothetical (5% before expenses) | | | $ | 1,000.00 | | | | $ | 1,018.15 | | | | $ | 6.84 | | | | | 1.36% | |
International Opportunities Fund — Investor Class | | | | | | | | | | | | | | | | | | | | |
Actual | | | $ | 1,000.00 | | | | $ | 1,143.40 | | | | $ | 10.85 | | | | | 2.03% | |
Hypothetical (5% before expenses) | | | $ | 1,000.00 | | | | $ | 1,014.81 | | | | $ | 10.20 | | | | | 2.03% | |
International Opportunities Fund — Institutional Class | | | | | | | | | | | | | | | | | | | | |
Actual | | | $ | 1,000.00 | | | | $ | 1,145.10 | | | | $ | 10.48 | | | | | 1.96% | |
Hypothetical (5% before expenses) | | | $ | 1,000.00 | | | | $ | 1,015.16 | | | | $ | 9.85 | | | | | 1.96% | |
International Select Fund — Investor Class | | | | | | | | | | | | | | | | |
Actual | | | $ | 1,000.00 | | | | $ | 1,216.90 | | | | $ | 7.46 | | | | | 1.35% | |
Hypothetical (5% before expenses) | | | $ | 1,000.00 | | | | $ | 1,018.20 | | | | $ | 6.79 | | | | | 1.35% | |
International Select Fund — Institutional Class | | | | | | | | | | | | | | | | |
Actual | | | $ | 1,000.00 | | | | $ | 1,219.80 | | | | $ | 5.20 | | | | | 0.94% | |
Hypothetical (5% before expenses) | | | $ | 1,000.00 | | | | $ | 1,020.24 | | | | $ | 4.73 | | | | | 0.94% | |
Long/Short Alpha Fund — Investor Class | | | | | | | | | | | | | | | | |
Actual | | | $ | 1,000.00 | | | | $ | 1,192.00 | | | | $ | 13.61 | | | | | 2.49% | |
Hypothetical (5% before expenses) | | | $ | 1,000.00 | | | | $ | 1,012.52 | | | | $ | 12.49 | | | | | 2.49% | |
Long/Short Alpha Fund — Institutional Class | | | | | | | | | | | | | | | | |
Actual | | | $ | 1,000.00 | | | | $ | 1,192.70 | | | | $ | 12.03 | | | | | 2.20% | |
Hypothetical (5% before expenses) | | | $ | 1,000.00 | | | | $ | 1,013.96 | | | | $ | 11.05 | | | | | 2.20% | |
Micro Cap Fund — Investor Class | | | | | | | | | | | | | | | | |
Actual | | | $ | 1,000.00 | | | | $ | 1,082.20 | | | | $ | 8.83 | | | | | 1.70% | |
Hypothetical (5% before expenses) | | | $ | 1,000.00 | | | | $ | 1,016.45 | | | | $ | 8.55 | | | | | 1.70% | |
Micro Cap Fund — Institutional Class | | | | | | | | | | | |
Actual | | | $ | 1,000.00 | | | | $ | 1,082.20 | | | | $ | 8.31 | | | | | 1.60% | |
Hypothetical (5% before expenses) | | | $ | 1,000.00 | | | | $ | 1,016.95 | | | | $ | 8.05 | | | | | 1.60% | |
Micro Cap Value Fund — Investor Class | | | | | | | | | | | | | | | | | | | | |
Actual | | | $ | 1,000.00 | | | | $ | 1,107.50 | | | | $ | 9.14 | | | | | 1.74% | |
Hypothetical (5% before expenses) | | | $ | 1,000.00 | | | | $ | 1,016.26 | | | | $ | 8.75 | | | | | 1.74% | |
Micro Cap Value Fund — Institutional Class | | | | | | | | | | | | | | | | |
Actual | | | $ | 1,000.00 | | | | $ | 1,106.80 | | | | $ | 8.40 | | | | | 1.60% | |
Hypothetical (5% before expenses) | | | $ | 1,000.00 | | | | $ | 1,016.95 | | | | $ | 8.05 | | | | | 1.60% | |
Small Cap Growth Fund — Investor Class | | | | | | | | | | | | | | | | |
Actual | | | $ | 1,000.00 | | | | $ | 1,099.30 | | | | $ | 6.18 | | | | | 1.18% | |
Hypothetical (5% before expenses) | | | $ | 1,000.00 | | | | $ | 1,019.05 | | | | $ | 5.94 | | | | | 1.18% | |
Small Cap Growth Fund — Institutional Class | | | | | | | | | | | | | | | | |
Actual | | | $ | 1,000.00 | | | | $ | 1,099.70 | | | | $ | 5.50 | | | | | 1.05% | |
Hypothetical (5% before expenses) | | | $ | 1,000.00 | | | | $ | 1,019.70 | | | | $ | 5.29 | | | | | 1.05% | |
Small Cap Value Fund — Investor Class | | | | | | | | | | | | | | | | | | | | |
Actual | | | $ | 1,000.00 | | | | $ | 1,164.30 | | | | $ | 6.37 | | | | | 1.18% | |
Hypothetical (5% before expenses) | | | $ | 1,000.00 | | | | $ | 1,019.05 | | | | $ | 5.94 | | | | | 1.18% | |
Small Cap Value Fund — Institutional Class | | | | | | | | | | | | | | | | | | | | |
Actual | | | $ | 1,000.00 | | | | $ | 1,165.40 | | | | $ | 5.67 | | | | | 1.05% | |
Hypothetical (5% before expenses) | | | $ | 1,000.00 | | | | $ | 1,019.70 | | | | $ | 5.29 | | | | | 1.05% | |
Ultra Growth Fund — Investor Class | | | | | | | | | | | | | | | | | | | | |
Actual | | | $ | 1,000.00 | | | | $ | 1,082.50 | | | | $ | 6.49 | | | | | 1.25% | |
Hypothetical (5% before expenses) | | | $ | 1,000.00 | | | | $ | 1,018.70 | | | | $ | 6.29 | | | | | 1.25% | |
Ultra Growth Fund — Institutional Class | | | | | | | | | | | | | | | | |
Actual | | | $ | 1,000.00 | | | | $ | 1,083.40 | | | | $ | 5.45 | | | | | 1.05% | |
Hypothetical (5% before expenses) | | | $ | 1,000.00 | | | | $ | 1,019.70 | | | | $ | 5.29 | | | | | 1.05% | |
47
| | |
| Wasatch Funds | | MARCH 31, 2023 (Unaudited) |
Operating Expenses (continued)
| | | | | | | | | | | | | | | | | | | | |
| | | Account Value | | Expenses Paid
During Period* | | Annualized Expense
Ratio* |
| Fund/Class and Return | | Beginning of Period
October 1, 2022 | | End of Period
March 31, 2023 |
U.S. Select Fund — Investor Class | | | | | | | | | | | | | | | | | | | | |
Actual | | | $ | 1,000.00 | | | | $ | 1,209.40 | | | | $ | 5.62 | | | | | 1.02% | |
Hypothetical (5% before expenses) | | | $ | 1,000.00 | | | | $ | 1,019.85 | | | | $ | 5.14 | | | | | 1.02% | |
U.S. Select Fund — Institutional Class | | | | | | | | | | | | | | | | | | | | |
Actual | | | $ | 1,000.00 | | | | $ | 1,211.70 | | | | $ | 4.80 | | | | | 0.87% | |
Hypothetical (5% before expenses) | | | $ | 1,000.00 | | | | $ | 1,020.59 | | | | $ | 4.38 | | | | | 0.87% | |
U.S. Treasury Fund — Investor Class | | | | | | | | | | | | | | | | | | | | |
Actual | | | $ | 1,000.00 | | | | $ | 1,041.00 | | | | $ | 3.56 | | | | | 0.70% | |
Hypothetical (5% before expenses) | | | $ | 1,000.00 | | | | $ | 1,021.44 | | | | $ | 3.53 | | | | | 0.70% | |
*Expenses are equal to a fund’s annualized expense ratio as indicated above multiplied by the average account value over the period, multiplied by the number of days in the most recent fiscal half-year divided by the number of days in the full fiscal year (182/365).
48
| | |
| Wasatch Core Growth Fund (WGROX / WIGRX) | | MARCH 31, 2023 (Unaudited) |
Schedule of Investments
| | | | | | | | |
| Shares | | | | | Value | |
| | | | | | | |
| |
| | | | COMMON STOCKS 98.0% | |
| | |
| | | | Application Software 9.4% | | | |
| | 3,396,834 | | | Clearwater Analytics Holdings, Inc., Class A* | | $ | 54,213,471 | |
| | 647,776 | | | Five9, Inc.* | | | 46,827,727 | |
| | 1,119,412 | | | Guidewire Software, Inc.* | | | 91,847,754 | |
| | 317,283 | | | Paylocity Holding Corp.* | | | 63,069,515 | |
| | 1,001,115 | | | Q2 Holdings, Inc.* | | | 24,647,451 | |
| | | | | | | | |
| | | | 280,605,918 | |
| | | | | | | | |
| | |
| | | | Asset Management & Custody
Banks 4.8% | | | |
| | 887,409 | | | Cohen & Steers, Inc. | | | 56,758,680 | |
| | 1,178,472 | | | Hamilton Lane, Inc., Class A | | | 87,183,358 | |
| | | | | | | | |
| | | | 143,942,038 | |
| | | | | | | | |
| | |
| | | | Automotive Parts & Equipment 3.7% | | | |
| | 545,642 | | | Fox Factory Holding Corp.* | | | 66,224,570 | |
| | 662,010 | | | XPEL, Inc.* | | | 44,983,579 | |
| | | | | | | | |
| | | | 111,208,149 | |
| | | | | | | | |
| | |
| | | | Broadline Retail 1.6% | | | |
| | 838,743 | | | Ollie’s Bargain Outlet Holdings, Inc.* | | | 48,596,769 | |
| | | | | | | | |
| | |
| | | | Building Products 3.7% | | | |
| | 2,875,607 | | | Janus International Group, Inc.* | | | 28,353,485 | |
| | 1,696,686 | | | Trex Co., Inc.* | | | 82,577,708 | |
| | | | | | | | |
| | | | 110,931,193 | |
| | | | | | | | |
| | |
| | | | Cargo Ground Transportation 2.2% | | | |
| | 245,120 | | | Saia, Inc.* | | | 66,692,250 | |
| | | | | | | | |
| | |
| | | | Commodity Chemicals 2.5% | | | |
| | 2,170,907 | | | Valvoline, Inc. | | | 75,851,491 | |
| | | | | | | | |
| | |
| | | | Distillers & Vintners 0.9% | | | |
| | 1,687,981 | | | Duckhorn Portfolio, Inc.* | | | 26,838,898 | |
| | | | | | | | |
| | |
| | | | Distributors 2.5% | | | |
| | 216,943 | | | Pool Corp. | | | 74,289,961 | |
| | | | | | | | |
| | |
| | | | Electronic Equipment &
Instruments 2.9% | | | |
| | 540,696 | | | Novanta, Inc.* | | | 86,019,327 | |
| | | | | | | | |
| | |
| | | | Electronic Manufacturing
Services 1.8% | | | |
| | 442,037 | | | Fabrinet* | | | 52,496,314 | |
| | | | | | | | |
| | |
| | | | Financial Exchanges & Data 2.8% | | | |
| | 303,637 | | | Morningstar, Inc. | | | 61,647,420 | |
| | 2,891,061 | | | Open Lending Corp., Class A* | | | 20,353,069 | |
| | | | | | | | |
| | | | 82,000,489 | |
| | | | | | | | |
| | |
| | | | Health Care Facilities 3.4% | | | |
| | 1,070,546 | | | Ensign Group, Inc. | | | 102,279,965 | |
| | | | | | | | |
| | |
| | | | Health Care Supplies 1.9% | | | |
| | 3,017,146 | | | Neogen Corp.* | | | 55,877,544 | |
| | | | | | | | |
| | |
| | | | Home Improvement Retail 1.8% | | | |
| | 558,902 | | | Floor & Decor Holdings, Inc., Class A* | | | 54,895,354 | |
| | | | | | | | |
| | | | | | | | |
| Shares | | | | | Value | |
| | | | | | | |
| | |
| | | | Homebuilding 1.3% | | | |
| | 336,558 | | | Installed Building Products, Inc. | | $ | 38,377,709 | |
| | | | | | | | |
| | |
| | | | Industrial Machinery & Supplies &
Components 8.7% | | | |
| | 850,316 | | | Helios Technologies, Inc. | | | 55,610,666 | |
| | 481,124 | | | Kadant, Inc. | | | 100,323,977 | |
| | 599,527 | | | Kornit Digital Ltd.* | | | 11,606,843 | |
| | 395,828 | | | RBC Bearings, Inc.* | | | 92,121,050 | |
| | | | | | | | |
| | | | 259,662,536 | |
| | | | | | | | |
| | |
| | | | Insurance Brokers 1.0% | | | |
| | 594,100 | | | Goosehead Insurance, Inc., Class A* | | | 31,012,020 | |
| | | | | | | | |
| | |
| | | | Interactive Media & Services 1.2% | | | |
| | 2,198,670 | | | ZipRecruiter, Inc., Class A* | | | 35,046,800 | |
| | | | | | | | |
| | |
| | | | Investment Banking & Brokerage 2.1% | | | |
| | 1,642,441 | | | Moelis & Co., Class A | | | 63,135,432 | |
| | | | | | | | |
| | |
| | | | IT Consulting & Other Services 1.9% | | | |
| | 351,449 | | | Globant SA* | | | 57,641,150 | |
| | | | | | | | |
| | |
| | | | Leisure Products 1.4% | | | |
| | 1,026,313 | | | YETI Holdings, Inc.* | | | 41,052,520 | |
| | | | | | | | |
| | |
| | | | Life Sciences Tools & Services 5.0% | | | |
| | 383,540 | | | ICON PLC* | | | 81,920,308 | |
| | 353,854 | | | Medpace Holdings, Inc.* | | | 66,542,245 | |
| | | | | | | | |
| | | | 148,462,553 | |
| | | | | | | | |
| | |
| | | | Managed Health Care 3.2% | | | |
| | 1,624,929 | | | HealthEquity, Inc.* | | | 95,399,582 | |
| | | | | | | | |
| | |
| | | | Metal, Glass & Plastic Containers 1.3% | | | |
| | 1,357,821 | | | TriMas Corp. | | | 37,828,893 | |
| | | | | | | | |
| | |
| | | | Other Specialty Retail 2.6% | | | |
| | 383,591 | | | Five Below, Inc.* | | | 79,008,238 | |
| | | | | | | | |
| | |
| | | | Packaged Foods & Meats 1.1% | | | |
| | 483,515 | | | Freshpet, Inc.* | | | 32,003,858 | |
| | | | | | | | |
| | |
| | | | Personal Care Products 0.4% | | | |
| | 327,909 | | | BellRing Brands, Inc.* | | | 11,148,906 | |
| | | | | | | | |
| | |
| | | | Pharmaceuticals 1.1% | | | |
| | 584,917 | | | Intra-Cellular Therapies, Inc.* | | | 31,673,256 | |
| | | | | | | | |
| | |
| | | | Regional Banks 3.9% | | | |
| | 2,183,998 | | | Bank OZK | | | 74,692,731 | |
| | 1,085,514 | | | Webster Financial Corp. | | | 42,790,962 | |
| | | | | | | | |
| | | | 117,483,693 | |
| | | | | | | | |
| | |
| | | | Self Storage REITs 1.8% | | | |
| | 1,299,148 | | | National Storage Affiliates Trust | | | 54,278,403 | |
| | | | | | | | |
| | |
| | | | Semiconductor Materials &
Equipment 0.9% | | | |
| | 246,675 | | | Nova Ltd.* | | | 25,770,137 | |
| | | | | | | | |
| | |
| | | | Semiconductors 1.9% | | | |
| | 110,566 | | | Monolithic Power Systems, Inc. | | | 55,342,706 | |
| | | | | | | | |
49
| | |
| Wasatch Core Growth Fund (WGROX / WIGRX) | | MARCH 31, 2023 (Unaudited) |
Schedule of Investments (continued)
| | | | | | | | |
| Shares | | | | | Value | |
| | | | | | | |
| | |
| | | | Specialized Consumer
Services 0.8% | | | |
| | 2,856,900 | | | Mister Car Wash, Inc.* | | $ | 24,626,478 | |
| | | | | | | | |
| | |
| | | | Specialty Chemicals 5.6% | | | |
| | 704,538 | | | Balchem Corp. | | | 89,109,966 | |
| | 769,437 | | | Innospec, Inc. | | | 78,998,097 | |
| | | | | | | | |
| | | | 168,108,063 | |
| | | | | | | | |
| | |
| | | | Systems Software 2.1% | | | |
| | 426,016 | | | CyberArk Software Ltd.* | | | 63,041,848 | |
| | | | | | | | |
| | |
| | | | Transaction & Payment Processing
Services 2.8% | | | |
| | 448,226 | | | Euronet Worldwide, Inc.* | | | 50,156,490 | |
| | 427,843 | | | Shift4 Payments, Inc., Class A* | | | 32,430,499 | |
| | | | | | | | |
| | | | 82,586,989 | |
| | | | | | | | |
| | |
| | | | Total Common Stocks
(cost $2,301,241,320) | | | 2,925,217,430 | |
| | | | | | | | |
| | |
| | | | WARRANTS 0.0% | | | | |
| | |
| | | | Insurance Brokers 0.0% | | | |
| | 540,000 | | | Hagerty, Inc., expiring 12/2/2026* *** † | | | 939,600 | |
| | | | | | | | |
| | |
| | | | Total Warrants
(cost $1,859,173) | | | 939,600 | |
| | | | | | | | |
| | |
| | | | Total Investments
(cost $2,303,100,493) 98.0% | | | 2,926,157,030 | |
| | |
| | | | Other Assets less Liabilities 2.0% | | | 59,374,748 | |
| | | | | | | | |
| | |
| | | | Net Assets 100.0% | | $ | 2,985,531,778 | |
| | | | | | | | |
| |
| | | | *Non-income producing. ***Security was fair valued under procedures adopted by the Board of Trustees using unobservable inputs as described in Note 12, as applicable. †Security was purchased in a private placement transaction or under Rule 144A of the Securities Act of 1933 (see Note 9). The aggregate value of securities purchased in a private placement transaction or under Rule 144A of the Securities Act of 1933 at March 31, 2023 amounted to approximately $939,600 and represented 0.03% of net assets. REIT Real Estate Investment Trust. | |
| |
| | | | See Notes to Financial Statements. | |
At March 31, 2023, the Wasatch Core Growth Fund’s investments were in the following countries:
| | | | | |
| Country | | % |
Ireland | | | | 2.8 | |
Israel | | | | 3.4 | |
United States | | | | 93.8 | |
| | | | | |
TOTAL | | | | 100.0 | % |
| | | | | |
50
| | |
| Wasatch Emerging India Fund (WAINX / WIINX) | | MARCH 31, 2023 (Unaudited) |
Schedule of Investments
| | | | | | | | |
| Shares | | | | | Value | |
| | | | | | | |
| |
| | | | COMMON STOCKS 97.9% | |
| | |
| | | | Apparel Retail 5.1% | | | |
| | 1,336,758 | | | Trent Ltd. | | $ | 22,424,899 | |
| | | | | | | | |
| | |
| | | | Apparel, Accessories & Luxury
Goods 1.9% | | | |
| | 17,825 | | | Page Industries Ltd. | | | 8,233,964 | |
| | | | | | | | |
| | |
| | | | Automotive Parts & Equipment 0.8% | | | |
| | 117,695 | | | Tube Investments of India Ltd. | | | 3,656,907 | |
| | | | | | | | |
| | |
| | | | Commercial & Residential Mortgage
Finance 3.7% | | | |
| | 802,305 | | | Aavas Financiers Ltd.* | | | 15,759,368 | |
| | 44,011 | | | IIFL Finance Ltd. | | | 261,996 | |
| | | | | | | | |
| | | | 16,021,364 | |
| | | | | | | | |
| | |
| | | | Commodity Chemicals 4.3% | | | |
| | 2,144,573 | | | Berger Paints India Ltd. | | | 15,209,041 | |
| | 121,761 | | | Supreme Industries Ltd. | | | 3,729,368 | |
| | | | | | | | |
| | | | 18,938,409 | |
| | | | | | | | |
| | |
| | | | Consumer Finance 9.5% | | | |
| | 605,840 | | | Bajaj Finance Ltd. | | | 41,569,510 | |
| | | | | | | | |
| | |
| | | | Diversified Banks 13.4% | | | |
| | 2,152,948 | | | HDFC Bank Ltd. | | | 42,345,979 | |
| | 780,288 | | | Kotak Mahindra Bank Ltd. | | | 16,492,837 | |
| | | | | | | | |
| | | | 58,838,816 | |
| | | | | | | | |
| | |
| | | | Food Retail 4.3% | | | |
| | 449,874 | | | Avenue Supermarts Ltd.* | | | 18,667,942 | |
| | | | | | | | |
| | |
| | | | Footwear 0.3% | | | |
| | 351,318 | | | Campus Activewear Ltd.* | | | 1,427,363 | |
| | | | | | | | |
| | |
| | | | Health Care Facilities 1.1% | | | |
| | 873,331 | | | Max Healthcare Institute Ltd.* | | | 4,697,059 | |
| | | | | | | | |
| | |
| | | | Health Care Services 8.1% | | | |
| | 830,544 | | | Dr. Lal PathLabs Ltd. | | | 18,524,665 | |
| | 3,590,652 | | | Vijaya Diagnostic Centre Pvt. Ltd. | | | 17,136,303 | |
| | | | | | | | |
| | | | 35,660,968 | |
| | | | | | | | |
| | |
| | | | Industrial Machinery & Supplies &
Components 9.4% | | | |
| | 6,659,561 | | | Elgi Equipments Ltd. | | | 35,637,397 | |
| | 306,402 | | | GMM Pfaudler Ltd. | | | 5,472,942 | |
| | | | | | | | |
| | | | 41,110,339 | |
| | | | | | | | |
| | |
| | | | Interactive Media & Services 2.4% | | | |
| | 227,333 | | | Info Edge India Ltd. | | | 10,339,955 | |
| | | | | | | | |
| | | | | | | | |
| Shares | | | | | Value | |
| | | | | | | |
| | |
| | | | IT Consulting & Other Services 10.7% | | | |
| | 400,381 | | | LTIMindtree Ltd. | | $ | 23,315,105 | |
| | 421,538 | | | Persistent Systems Ltd. | | | 23,778,332 | |
| | | | | | | | |
| | | | 47,093,437 | |
| | | | | | | | |
| | |
| | | | Life Sciences Tools & Services 4.1% | | | |
| | 516,982 | | | Divi’s Laboratories Ltd. | | | 17,801,508 | |
| | | | | | | | |
| | |
| | | | Metal, Glass & Plastic
Containers 0.6% | | | |
| | 254,644 | | | Mold-Tek Packaging Ltd. | | | 2,805,775 | |
| | | | | | | | |
| | |
| | | | Property & Casualty Insurance 2.1% | | | |
| | 719,013 | | | ICICI Lombard General Insurance Co. Ltd. | | | 9,370,957 | |
| | | | | | | | |
| | |
| | | | Regional Banks 7.6% | | | |
| | 4,692,444 | | | AU Small Finance Bank Ltd. | | | 33,197,538 | |
| | | | | | | | |
| | |
| | | | Research & Consulting Services 4.4% | | | |
| | 466,106 | | | L&T Technology Services Ltd. | | | 19,281,860 | |
| | | | | | | | |
| | |
| | | | Specialty Chemicals 3.2% | | | |
| | 419,231 | | | Asian Paints Ltd. | | | 14,124,595 | |
| | | | | | | | |
| | |
| | | | Systems Software 0.9% | | | |
| | 54,729 | | | Tata Elxsi Ltd. | | | 3,985,087 | |
| | | | | | | | |
| | |
| | | | Total Common Stocks
(cost $313,198,372) | | | 429,248,252 | |
| | | | | | | | |
| | |
| | | | Total Investments§
(cost $313,198,372) 97.9% | | | 429,248,252 | |
| | |
| | | | Other Assets less Liabilities 2.1% | | | 9,355,386 | |
| | | | | | | | |
| | |
| | | | Net Assets 100.0% | | $ | 438,603,638 | |
| | | | | | | | |
| |
| | | | *Non-income producing. §The aggregate amount of foreign securities fair valued pursuant to a systematic valuation model as a percent of net assets was 97.87%. | |
| |
| | | | See Notes to Financial Statements. | |
At March 31, 2023, the Wasatch Emerging India Fund’s investments were in the following countries:
| | | | | |
| Country | | % |
India | | | | 100.0 | |
| | | | | |
TOTAL | | | | 100.0 | % |
| | | | | |
51
| | |
| Wasatch Emerging Markets Select Fund (WAESX / WIESX) | | MARCH 31, 2023 (Unaudited) |
Schedule of Investments
| | | | | | | | |
| Shares | | | | | Value | |
| | | | | | | |
| |
| | | | COMMON STOCKS 96.2% | |
| | |
| | | | Airport Services 4.0% | | | |
| | 925,040 | | | Grupo Aeroportuario del Pacifico SAB de CV, Class B | | $ | 17,998,239 | |
| | | | | | | | |
| | |
| | | | Apparel Retail 1.1% | | | |
| | 283,041 | | | Trent Ltd. | | | 4,748,179 | |
| | | | | | | | |
| | |
| | | | Apparel, Accessories & Luxury
Goods 1.4% | | | |
| | 13,790 | | | Page Industries Ltd. | | | 6,370,062 | |
| | | | | | | | |
| | |
| | | | Broadline Retail 10.8% | | | |
| | 26,306 | | | MercadoLibre, Inc.* | | | 34,672,886 | |
| | 469,825 | | | momo.com, Inc. | | | 13,996,546 | |
| | | | | | | | |
| | | | 48,669,432 | |
| | | | | | | | |
| | |
| | | | Consumer Finance 4.9% | | | |
| | 318,760 | | | Bajaj Finance Ltd. | | | 21,871,611 | |
| | | | | | | | |
| | |
| | | | Diversified Banks 10.4% | | | |
| | 1,542,394 | | | HDFC Bank Ltd. | | | 30,337,094 | |
| | 3,432,474 | | | NU Holdings Ltd., Class A* | | | 16,338,576 | |
| | | | | | | | |
| | | | 46,675,670 | |
| | | | | | | | |
| | |
| | | | Drug Retail 2.8% | | | |
| | 2,573,730 | | | Raia Drogasil SA | | | 12,415,571 | |
| | | | | | | | |
| | |
| | | | Electrical Components &
Equipment 9.6% | | | |
| | 417,765 | | | Voltronic Power Technology Corp. | | | 23,789,069 | |
| | 2,446,202 | | | WEG SA | | | 19,570,774 | |
| | | | | | | | |
| | | | 43,359,843 | |
| | | | | | | | |
| | |
| | | | Health Care Services 1.3% | | | |
| | 266,675 | | | Dr. Lal PathLabs Ltd. | | | 5,947,987 | |
| | | | | | | | |
| | |
| | | | Hotels, Resorts & Cruise Lines 1.0% | | | |
| | 884,500 | | | H World Group Ltd.* | | | 4,329,592 | |
| | | | | | | | |
| | |
| | | | Industrial Machinery & Supplies &
Components 2.9% | | | |
| | 291,691 | | | Airtac International Group | | | 11,407,854 | |
| | 130,222 | | | Techtronic Industries Co. Ltd. | | | 1,410,969 | |
| | | | | | | | |
| | | | 12,818,823 | |
| | | | | | | | |
| | |
| | | | Interactive Home Entertainment 3.6% | | | |
| | 189,572 | | | Sea Ltd., ADR* | | | 16,407,457 | |
| | | | | | | | |
| | |
| | | | Interactive Media & Services 2.4% | | | |
| | 220,000 | | | Tencent Holdings Ltd. | | | 10,751,245 | |
| | | | | | | | |
| | |
| | | | IT Consulting & Other Services 4.9% | | | |
| | 113,902 | | | Globant SA* | | | 18,681,067 | |
| | 60,641 | | | LTIMindtree Ltd. | | | 3,531,265 | |
| | | | | | | | |
| | | | 22,212,332 | |
| | | | | | | | |
| | |
| | | | Life & Health Insurance 1.8% | | | |
| | 1,040,672 | | | Discovery Ltd.* | | | 8,164,178 | |
| | | | | | | | |
| | |
| | | | Life Sciences Tools & Services 4.0% | | | |
| | 206,053 | | | Divi’s Laboratories Ltd. | | | 7,095,129 | |
| | 330,138 | | | Hangzhou Tigermed Consulting Co. Ltd., Class A | | | 4,600,274 | |
| | 1,040,813 | | | Wuxi Biologics Cayman, Inc.* | | | 6,413,446 | |
| | | | | | | | |
| | | | 18,108,849 | |
| | | | | | | | |
| | | | | | | | |
| Shares | | | | | Value | |
| | | | | | | |
| | |
| | | | Property & Casualty Insurance 0.8% | | | |
| | 593,544 | | | Qualitas Controladora SAB de CV | | $ | 3,797,430 | |
| | | | | | | | |
| | |
| | | | Regional Banks 2.4% | | | |
| | 1,521,110 | | | AU Small Finance Bank Ltd. | | | 10,761,366 | |
| | | | | | | | |
| | |
| | | | Restaurants 2.0% | | | |
| | 501,500 | | | Meituan, Class B* | | | 9,098,320 | |
| | | | | | | | |
| | |
| | | | Semiconductor Equipment 4.5% | | | |
| | 113,000 | | | Lasertec Corp. | | | 20,077,762 | |
| | | | | | | | |
| | |
| | | | Semiconductors 11.6% | | | |
| | 169,894 | | | ASPEED Technology, Inc. | | | 14,827,762 | |
| | 65,158 | | | LEENO Industrial, Inc. | | | 7,226,037 | |
| | 154,297 | | | SG Micro Corp., Class A | | | 3,491,305 | |
| | 1,244,836 | | | Silergy Corp. | | | 19,763,738 | |
| | 1,192,542 | | | Sino Wealth Electronic Ltd., Class A | | | 7,097,176 | |
| | | | | | | | |
| | | | 52,406,018 | |
| | | | | | | | |
| | |
| | | | Specialized Finance 4.8% | | | |
| | 2,959,891 | | | Chailease Holding Co. Ltd. | | | 21,768,091 | |
| | | | | | | | |
| | |
| | | | Specialty Chemicals 1.9% | | | |
| | 250,685 | | | Asian Paints Ltd. | | | 8,445,998 | |
| | | | | | | | |
| | |
| | | | Systems Software 0.2% | | | |
| | 10,520 | | | Tata Elxsi Ltd. | | | 766,013 | |
| | | | | | | | |
| | |
| | | | Transaction & Payment Processing
Services 1.1% | | | |
| | 317,077 | | | Dlocal Ltd.* | | | 5,142,989 | |
| | | | | | | | |
| | |
| | | | Total Common Stocks
(cost $476,625,306) | | | 433,113,057 | |
| | | | | | | | |
| | |
| | | | Total Investments§
(cost $476,625,306) 96.2% | | | 433,113,057 | |
| | |
| | | | Other Assets less Liabilities 3.8% | | | 17,082,051 | |
| | | | | | | | |
| | |
| | | | Net Assets 100.0% | | $ | 450,195,108 | |
| | | | | | | | |
| |
| | | | *Non-income producing. §The aggregate amount of foreign securities fair valued pursuant to a systematic valuation model as a percent of net assets was 63.99% ADR American Depositary Receipt. | |
| |
| | | | See Notes to Financial Statements. | |
At March 31, 2023, the Wasatch Emerging Markets Select Fund’s investments were in the following countries:
| | | | | |
| Country | | % |
Brazil | | | | 11.1 | |
China | | | | 10.6 | |
Hong Kong | | | | 0.3 | |
India | | | | 23.1 | |
Japan | | | | 4.6 | |
Mexico | | | | 5.0 | |
Singapore | | | | 3.8 | |
South Africa | | | | 1.9 | |
South Korea | | | | 1.7 | |
Taiwan | | | | 24.4 | |
United States | | | | 12.3 | |
Uruguay | | | | 1.2 | |
| | | | | |
TOTAL | | | | 100.0 | % |
| | | | | |
52
| | |
| Wasatch Emerging Markets Small Cap Fund (WAEMX / WIEMX) | | MARCH 31, 2023 (Unaudited) |
Schedule of Investments
| | | | | | | | |
| Shares | | | | | Value | |
| | | | | | | |
| | |
| | | | COMMON STOCKS 97.9% | | | | |
| | |
| | | | Airport Services 4.3% | | | |
| | 1,402,925 | | | Grupo Aeroportuario del Centro Norte SAB de CV | | $ | 15,669,629 | |
| | | | | | | | |
| | |
| | | | Apparel Retail 2.9% | | | |
| | 631,245 | | | Trent Ltd. | | | 10,589,505 | |
| | | | | | | | |
| | |
| | | | Application Software 1.0% | | | |
| | 112,001 | | | LiveChat Software SA | | | 3,721,295 | |
| | | | | | | | |
| | |
| | | | Asset Management & Custody
Banks 0.9% | | | |
| | 17,554,351 | | | VEF AB* | | | 3,221,158 | |
| | | | | | | | |
| | |
| | | | Broadline Retail 3.6% | | | |
| | 437,600 | | | momo.com, Inc. | | | 13,036,532 | |
| | | | | | | | |
| | |
| | | | Commercial & Residential Mortgage
Finance 2.6% | | | |
| | 475,366 | | | Aavas Financiers Ltd.* | | | 9,337,431 | |
| | | | | | | | |
| | |
| | | | Commodity Chemicals 1.1% | | | |
| | 567,520 | | | Berger Paints India Ltd. | | | 4,024,780 | |
| | | | | | | | |
| | |
| | | | Communications Equipment 1.8% | | | |
| | 612,000 | | | Accton Technology Corp. | | | 6,432,198 | |
| | | | | | | | |
| | |
| | | | Consumer Finance 1.4% | | | |
| | 7,189,323 | | | Ngern Tid Lor PCL | | | 5,256,122 | |
| | | | | | | | |
| | |
| | | | Drug Retail 4.4% | | | |
| | 503,959 | | | Clicks Group Ltd. | | | 7,249,565 | |
| | 1,792,950 | | | Raia Drogasil SA | | | 8,649,119 | |
| | | | | | | | |
| | | | 15,898,684 | |
| | | | | | | | |
| | |
| | | | Electrical Components & Equipment 6.5% | | | |
| | 417,863 | | | Voltronic Power Technology Corp. | | | 23,794,650 | |
| | | | | | | | |
| | |
| | | | Electronic Components 1.4% | | | |
| | 458,258 | | | Sinbon Electronics Co. Ltd. | | | 5,157,546 | |
| | | | | | | | |
| | |
| | | | Electronic Equipment &
Instruments 2.4% | | | |
| | 761,616 | | | Chroma ATE, Inc. | | | 4,453,162 | |
| | 9,840 | | | Honeywell Automation India Ltd. | | | 4,366,335 | |
| | | | | | | | |
| | | | 8,819,497 | |
| | | | | | | | |
| | |
| | | | Electronic Manufacturing
Services 1.4% | | | |
| | 43,422 | | | Fabrinet* | | | 5,156,797 | |
| | | | | | | | |
| | |
| | | | Health Care Facilities 1.0% | | | |
| | 17,967,300 | | | PT Mitra Keluarga Karyasehat Tbk | | | 3,508,147 | |
| | | | | | | | |
| | |
| | | | Health Care Services 2.4% | | | |
| | 398,779 | | | Dr. Lal PathLabs Ltd. | | | 8,894,468 | |
| | | | | | | | |
| | | | | | | | |
| Shares | | | | | Value | |
| | | | | | | |
| | |
| | | | Home Improvement Retail 2.8% | | | |
| | 8,758,100 | | | MR DIY Group M Bhd | | $ | 3,083,439 | |
| | 13,072,875 | | | Wilcon Depot, Inc. | | | 7,223,852 | |
| | | | | | | | |
| | | | 10,307,291 | |
| | | | | | | | |
| | |
| | | | Hotels, Resorts & Cruise Lines 1.9% | | | |
| | 1,394,570 | | | H World Group Ltd.* | | | 6,826,364 | |
| | | | | | | | |
| | |
| | | | Industrial Machinery & Supplies &
Components 4.0% | | | |
| | 167,500 | | | Airtac International Group | | | 6,550,821 | |
| | 1,523,365 | | | Elgi Equipments Ltd. | | | 8,152,003 | |
| | | | | | | | |
| | | | 14,702,824 | |
| | | | | | | | |
| | |
| | | | Interactive Media & Services 1.9% | | | |
| | 2,219,828 | | | Baltic Classifieds Group PLC | | | 4,254,227 | |
| | 57,878 | | | Info Edge India Ltd. | | | 2,632,508 | |
| | | | | | | | |
| | | | 6,886,735 | |
| | | | | | | | |
| | |
| | | | IT Consulting & Other Services 11.0% | | | |
| | 95,972 | | | Globant SA* | | | 15,740,368 | |
| | 200,282 | | | LTIMindtree Ltd. | | | 11,662,881 | |
| | 225,765 | | | Persistent Systems Ltd. | | | 12,735,068 | |
| | | | | | | | |
| | | | 40,138,317 | |
| | | | | | | | |
| | |
| | | | Life & Health Insurance 2.3% | | | |
| | 1,070,913 | | | Discovery Ltd.* | | | 8,401,422 | |
| | | | | | | | |
| | |
| | | | Movies & Entertainment 0.6% | | | |
| | 39,604 | | | JYP Entertainment Corp. | | | 2,366,878 | |
| | | | | | | | |
| | |
| | | | Other Specialty Retail 1.1% | | | |
| | 3,242,300 | | | Pet Center Comercio e Participacoes SA | | | 3,966,155 | |
| | | | | | | | |
| | |
| | | | Packaged Foods & Meats 0.8% | | | |
| | 9,068,700 | | | PT Cisarua Mountain Dairy Tbk | | | 2,794,184 | |
| | | | | | | | |
| | |
| | | | Personal Care Products 1.7% | | | |
| | 236,505 | | | Proya Cosmetics Co. Ltd., Class A | | | 6,262,689 | |
| | | | | | | | |
| | |
| | | | Property & Casualty Insurance 2.2% | | | |
| | 1,282,184 | | | Qualitas Controladora SAB de CV | | | 8,203,274 | |
| | | | | | | | |
| | |
| | | | Regional Banks 6.5% | | | |
| | 2,572,278 | | | AU Small Finance Bank Ltd. | | | 18,198,043 | |
| | 718,662 | | | Regional SAB de CV | | | 5,490,865 | |
| | | | | | | | |
| | | | 23,688,908 | |
| | | | | | | | |
| | |
| | | | Research & Consulting Services 3.5% | | | |
| | 19,228,728 | | | CTOS Digital Bhd. | | | 5,729,991 | |
| | 170,670 | | | L&T Technology Services Ltd. | | | 7,060,272 | |
| | | | | | | | |
| | | | 12,790,263 | |
| | | | | | | | |
| | |
| | | | Semiconductor Equipment 2.1% | | | |
| | 93,778 | | | Tokai Carbon Korea Co. Ltd. | | | 7,590,189 | |
| | | | | | | | |
53
| | |
| Wasatch Emerging Markets Small Cap Fund (WAEMX / WIEMX) | | MARCH 31, 2023 (Unaudited) |
Schedule of Investments (continued)
| | | | | | | | |
| Shares | | | | | Value | |
| | | | | | | |
| | |
| | | | Semiconductors 13.6% | | | |
| | 142,651 | | | ASPEED Technology, Inc. | | $ | 12,450,087 | |
| | 63,000 | | | Global Unichip Corp. | | | 2,254,172 | |
| | 116,276 | | | LEENO Industrial, Inc. | | | 12,895,035 | |
| | 926,572 | | | Silergy Corp. | | | 14,710,794 | |
| | 1,231,764 | | | Sino Wealth Electronic Ltd., Class A | | | 7,330,598 | |
| | | | | | | | |
| | | | 49,640,686 | |
| | | | | | | | |
| | |
| | | | Specialized Finance 1.5% | | | |
| | 755,000 | | | Chailease Holding Co. Ltd. | | | 5,552,539 | |
| | | | | | | | |
| | |
| | | | Transaction & Payment Processing
Services 1.3% | | | |
| | 296,764 | | | Dlocal Ltd.* | | | 4,813,512 | |
| | | | | | | | |
| | |
| | | | Total Common Stocks
(cost $268,667,053) | | | 357,450,669 | |
| | | | | | | | |
| | |
| | | | Total Investments§
(cost $268,667,053) 97.9% | | | 357,450,669 | |
| | |
| | | | Other Assets less Liabilities 2.1% | | | 7,741,918 | |
| | | | | | | | |
| | |
| | | | Net Assets 100.0% | | $ | 365,192,587 | |
| | | | | | | | |
| |
| | | | *Non-income producing. §The aggregate amount of foreign securities fair valued pursuant to a systematic valuation model as a percent of net assets was 77.14%. | |
| | |
| | | | See Notes to Financial Statements. | | | | |
At March 31, 2023, the Wasatch Emerging Markets Small Cap Fund’s investments were in the following countries:
| | | | | |
| Country | | % |
Brazil | | | | 3.5 | |
China | | | | 5.7 | |
India | | | | 27.3 | |
Indonesia | | | | 1.8 | |
Korea | | | | 0.7 | |
Malaysia | | | | 2.5 | |
Mexico | | | | 8.2 | |
Philippines | | | | 2.0 | |
Poland | | | | 1.0 | |
South Africa | | | | 4.4 | |
South Korea | | | | 5.7 | |
Sweden | | | | 0.9 | |
Taiwan | | | | 26.4 | |
Thailand | | | | 1.5 | |
United Kingdom | | | | 1.2 | |
United States | | | | 5.8 | |
Uruguay | | | | 1.4 | |
| | | | | |
TOTAL | | | | 100.0 | % |
| | | | | |
54
| | |
| Wasatch Frontier Emerging Small Countries Fund (WAFMX / WIFMX) | | MARCH 31, 2023 (Unaudited) |
Schedule of Investments
| | | | | | | | |
| Shares | | | | | Value | |
| | | | | | | |
| |
| | | | COMMON STOCKS 99.7% | |
| | |
| | | | Airport Services 5.7% | | | |
| | 82,300 | | | Grupo Aeroportuario del Centro Norte SAB de CV | | $ | 919,230 | |
| | 57,500 | | | Grupo Aeroportuario del Pacifico SAB de CV, Class B | | | 1,118,761 | |
| | | | | | | | |
| | | | 2,037,991 | |
| | | | | | | | |
| | |
| | | | Application Software 0.9% | | | |
| | 9,910 | | | LiveChat Software SA | | | 329,265 | |
| | | | | | | | |
| | |
| | | | Asset Management & Custody
Banks 3.7% | | | |
| | 1,178,700 | | | DCVFMVN Diamond ETF* | | | 1,132,381 | |
| | 1,077,054 | | | VEF AB* | | | 197,635 | |
| | | | | | | | |
| | | | 1,330,016 | |
| | | | | | | | |
| | |
| | | | Broadline Retail 9.9% | | | |
| | 2,672 | | | MercadoLibre, Inc.* | | | 3,521,856 | |
| | | | | | | | |
| | |
| | | | Commercial & Residential Mortgage
Finance 0.9% | | | |
| | 15,669 | | | Aavas Financiers Ltd.* | | | 307,780 | |
| | | | | | | | |
| | |
| | | | Consumer Finance 8.0% | | | |
| | 34,117 | | | Bajaj Finance Ltd. | | | 2,340,927 | |
| | 672,869 | | | Ngern Tid Lor PCL | | | 491,935 | |
| | | | | | | | |
| | | | 2,832,862 | |
| | | | | | | | |
| | |
| | | | Distillers & Vintners 2.1% | | | |
| | 255,070 | | | Ginebra San Miguel, Inc. | | | 745,997 | |
| | | | | | | | |
| | |
| | | | Diversified Banks 12.4% | | | |
| | 549,271 | | | Bank for Foreign Trade of Vietnam JSC* | | | 2,145,192 | |
| | 2,541 | | | Credicorp Ltd. | | | 336,403 | |
| | 325,656 | | | NU Holdings Ltd., Class A* | | | 1,550,122 | |
| | 624,100 | | | PT Bank Central Asia Tbk | | | 365,126 | |
| | | | | | | | |
| | | | 4,396,843 | |
| | | | | | | | |
| | |
| | | | Drug Retail 3.5% | | | |
| | 24,283 | | | Clicks Group Ltd. | | | 349,316 | |
| | 183,000 | | | Raia Drogasil SA | | | 882,785 | |
| | | | | | | | |
| | | | 1,232,101 | |
| | | | | | | | |
| | |
| | | | Electrical Components & Equipment 5.1% | | | |
| | 225,200 | | | WEG SA | | | 1,801,707 | |
| | | | | | | | |
| | |
| | | | Electronic Manufacturing Services 1.0% | | | |
| | 2,975 | | | Fabrinet* | | | 353,311 | |
| | | | | | | | |
| | |
| | | | Food Retail 1.9% | | | |
| | 7,457 | | | Dino Polska SA* | | | 677,322 | |
| | | | | | | | |
| | |
| | | | Health Care Facilities 1.6% | | | |
| | 2,821,400 | | | PT Mitra Keluarga Karyasehat Tbk | | | 550,883 | |
| | | | | | | | |
| | |
| | | | Home Improvement Retail 4.5% | | | |
| | 2,874,900 | | | Wilcon Depot, Inc. | | | 1,588,622 | |
| | | | | | | | |
| | |
| | | | Interactive Home Entertainment 4.0% | | | |
| | 16,594 | | | Sea Ltd., ADR* | | | 1,436,211 | |
| | | | | | | | |
| | | | | | | | |
| Shares | | | | | Value | |
| | | | | | | |
| | |
| | | | Interactive Media & Services 0.6% | | | |
| | 110,746 | | | Baltic Classifieds Group PLC | | $ | 212,241 | |
| | | | | | | | |
| | |
| | | | IT Consulting & Other Services 11.1% | | | |
| | 865,536 | | | FPT Corp. | | | 2,922,728 | |
| | 6,228 | | | Globant SA* | | | 1,021,454 | |
| | | | | | | | |
| | | | 3,944,182 | |
| | | | | | | | |
| | |
| | | | Life & Health Insurance 4.9% | | | |
| | 220,387 | | | Discovery Ltd.* | | | 1,728,959 | |
| | | | | | | | |
| | |
| | | | Other Specialty Retail 0.8% | | | |
| | 226,165 | | | Pet Center Comercio e Participacoes SA | | | 276,657 | |
| | | | | | | | |
| | |
| | | | Property & Casualty Insurance 5.2% | | | |
| | 286,322 | | | Qualitas Controladora SAB de CV | | | 1,831,857 | |
| | | | | | | | |
| | |
| | | | Regional Banks 2.5% | | | |
| | 117,300 | | | Regional SAB de CV | | | 896,219 | |
| | | | | | | | |
| | |
| | | | Research & Consulting Services 2.5% | | | |
| | 2,973,400 | | | CTOS Digital Bhd. | | | 886,047 | |
| | | | | | | | |
| | |
| | | | Semiconductors 4.2% | | | |
| | 7,800 | | | ASPEED Technology, Inc. | | | 680,757 | |
| | 52,000 | | | Silergy Corp. | | | 825,582 | |
| | | | | | | | |
| | | | 1,506,339 | |
| | | | | | | | |
| | |
| | | | Transaction & Payment Processing
Services 2.7% | | | |
| | 330 | | | Adyen NV* | | | 525,831 | |
| | 25,929 | | | Dlocal Ltd.* | | | 420,569 | |
| | | | | | | | |
| | | | 946,400 | |
| | | | | | | | |
| | |
| | | | Total Common Stocks
(cost $32,434,639) | | | 35,371,668 | |
| | | | | | | | |
| | |
| | | | Total Investments§
(cost $32,434,639) 99.7% | | | 35,371,668 | |
| | |
| | | | Other Assets less Liabilities 0.3% | | | 91,785 | |
| | | | | | | | |
| | |
| | | | Net Assets 100.0% | | $ | 35,463,453 | |
| | | | | | | | |
| |
| | | | *Non-income producing. §The aggregate amount of foreign securities fair valued pursuant to a systematic valuation model as a percent of net assets was 50.10%. ADR American Depositary Receipt. ETF Exchange-Traded Fund. | |
| |
| | | | See Notes to Financial Statements. | |
55
| | |
| Wasatch Frontier Emerging Small Countries Fund (WAFMX / WIFMX) | | MARCH 31, 2023 (Unaudited) |
Schedule of Investments (continued)
At March 31, 2023, the Wasatch Frontier Emerging Small Countries Fund’s investments were in the following countries:
| | | | | |
| Country | | % |
Brazil | | | | 12.7 | |
India | | | | 7.5 | |
Indonesia | | | | 2.6 | |
Malaysia | | | | 2.5 | |
Mexico | | | | 13.5 | |
Netherlands | | | | 1.5 | |
Peru | | | | 0.9 | |
Philippines | | | | 6.6 | |
Poland | | | | 2.8 | |
Singapore | | | | 4.1 | |
South Africa | | | | 5.9 | |
Sweden | | | | 0.6 | |
Taiwan | | | | 4.3 | |
Thailand | | | | 1.4 | |
United Kingdom | | | | 0.6 | |
United States | | | | 13.8 | |
Uruguay | | | | 1.2 | |
Vietnam | | | | 17.5 | |
| | | | | |
TOTAL | | | | 100.0 | % |
| | | | | |
56
| | |
| Wasatch Global Opportunities Fund (WAGOX / WIGOX) | | MARCH 31, 2023 (Unaudited) |
Schedule of Investments
| | | | | | | | |
| Shares | | | | | Value | |
| | | | | | | |
| |
| | | | COMMON STOCKS 100.5% | |
| | |
| | | | Apparel Retail 1.1% | | | |
| | 26,647 | | | Boot Barn Holdings, Inc.* | | $ | 2,042,226 | |
| | | | | | | | |
| | |
| | | | Application Software 6.3% | | | |
| | 41,330 | | | Five9, Inc.* | | | 2,987,746 | |
| | 13,707 | | | Paylocity Holding Corp.* | | | 2,724,677 | |
| | 76,337 | | | Q2 Holdings, Inc.* | | | 1,879,417 | |
| | 61,700 | | | Rakus Co. Ltd. | | | 896,097 | |
| | 388,581 | | | Systena Corp. | | | 854,462 | |
| | 222,898 | | | Technology One Ltd. | | | 2,190,391 | |
| | | | | | | | |
| | | | 11,532,790 | |
| | | | | | | | |
| | |
| | | | Asset Management & Custody Banks 3.5% | | | |
| | 44,804 | | | Focus Financial Partners, Inc., Class A* | | | 2,323,983 | |
| | 43,275 | | | Hamilton Lane, Inc., Class A | | | 3,201,485 | |
| | 94,598 | | | Netwealth Group Ltd. | | | 866,143 | |
| | | | | | | | |
| | | | 6,391,611 | |
| | | | | | | | |
| | |
| | | | Automotive Parts & Equipment 1.6% | | | |
| | 23,184 | | | Fox Factory Holding Corp.* | | | 2,813,842 | |
| | | | | | | | |
| | |
| | | | Biotechnology 3.1% | | | |
| | 383,252 | | | Abcam PLC, ADR* | | | 5,158,572 | |
| | 71,398 | | | C4 Therapeutics, Inc.* | | | 224,189 | |
| | 125,288 | | | Sangamo Therapeutics, Inc.* | | | 220,507 | |
| | | | | | | | |
| | | | 5,603,268 | |
| | | | | | | | |
| | |
| | | | Broadline Retail 1.8% | | | |
| | 56,541 | | | Ollie’s Bargain Outlet Holdings, Inc.* | | | 3,275,986 | |
| | | | | | | | |
| | |
| | | | Building Products 2.4% | | | |
| | 88,873 | | | Trex Co., Inc.* | | | 4,325,449 | |
| | | | | | | | |
| | |
| | | | Cargo Ground Transportation 2.4% | | | |
| | 16,159 | | | Saia, Inc.* | | | 4,396,541 | |
| | | | | | | | |
| | |
| | | | Commercial & Residential Mortgage
Finance 1.5% | | | |
| | 136,611 | | | Aavas Financiers Ltd.* | | | 2,683,397 | |
| | | | | | | | |
| | |
| | | | Commodity Chemicals 1.3% | | | |
| | 67,732 | | | Valvoline, Inc. | | | 2,366,556 | |
| | | | | | | | |
| | |
| | | | Diversified Real Estate Activities 0.8% | | | |
| | 143,221 | | | PATRIZIA SE | | | 1,495,735 | |
| | | | | | | | |
| | |
| | | | Drug Retail 0.7% | | | |
| | 646 | | | Ain Holdings, Inc. | | | 27,084 | |
| | 28,300 | | | Sugi Holdings Co. Ltd. | | | 1,216,446 | |
| | | | | | | | |
| | | | 1,243,530 | |
| | | | | | | | |
| | |
| | | | Electrical Components & Equipment 2.7% | | | |
| | 86,896 | | | Voltronic Power Technology Corp. | | | 4,948,176 | |
| | | | | | | | |
| | |
| | | | Financial Exchanges & Data 1.0% | | | |
| | 260,014 | | | Open Lending Corp., Class A* | | | 1,830,499 | |
| | | | | | | | |
| | | | | | | | |
| Shares | | | | | Value | |
| | | | | | | |
| | |
| | | | Health Care Equipment 0.6% | | | |
| | 10,779 | | | DiaSorin SpA | | $ | 1,135,912 | |
| | | | | | | | |
| | |
| | | | Health Care Facilities 3.7% | | | |
| | 69,453 | | | Ensign Group, Inc. | | | 6,635,540 | |
| | | | | | | | |
| | |
| | | | Health Care Services 1.1% | | | |
| | 86,276 | | | Dr. Lal PathLabs Ltd. | | | 1,924,322 | |
| | | | | | | | |
| | |
| | | | Health Care Supplies 2.6% | | | |
| | 134,939 | | | Neogen Corp.* | | | 2,499,070 | |
| | 58,091 | | | Silk Road Medical, Inc.* | | | 2,273,101 | |
| | | | | | | | |
| | | | 4,772,171 | |
| | | | | | | | |
| | |
| | | | Health Care Technology 1.6% | | | |
| | 85,450 | | | JMDC, Inc. | | | 2,963,204 | |
| | | | | | | | |
| | |
| | | | Home Improvement Retail 1.9% | | | |
| | 35,119 | | | Floor & Decor Holdings, Inc., Class A* | | | 3,449,388 | |
| | | | | | | | |
| | |
| | | | Homebuilding 1.8% | | | |
| | 28,731 | | | LGI Homes, Inc.* | | | 3,276,196 | |
| | | | | | | | |
| | |
| | | | Human Resource & Employment
Services 1.1% | | | |
| | 85,000 | | | SMS Co. Ltd. | | | 2,067,241 | |
| | | | | | | | |
| | |
| | | | Industrial Machinery & Supplies &
Components 2.8% | | | |
| | 32,878 | | | Helios Technologies, Inc. | | | 2,150,221 | |
| | 12,464 | | | RBC Bearings, Inc.* | | | 2,900,747 | |
| | | | | | | | |
| | | | 5,050,968 | |
| | | | | | | | |
| | |
| | | | Interactive Media & Services 0.8% | | | |
| | 96,538 | | | ZipRecruiter, Inc., Class A* | | | 1,538,816 | |
| | | | | | | | |
| | |
| | | | IT Consulting & Other Services 7.7% | | | |
| | 26,918 | | | Endava PLC, ADR* | | | 1,808,351 | |
| | 32,509 | | | Globant SA* | | | 5,331,801 | |
| | 53,967 | | | LTIMindtree Ltd. | | | 3,142,623 | |
| | 64,182 | | | Persistent Systems Ltd. | | | 3,620,411 | |
| | | | | | | | |
| | | | 13,903,186 | |
| | | | | | | | |
| | |
| | | | Leisure Products 0.9% | | | |
| | 41,520 | | | YETI Holdings, Inc.* | | | 1,660,800 | |
| | | | | | | | |
| | |
| | | | Life Sciences Tools & Services 2.3% | | | |
| | 22,591 | | | Medpace Holdings, Inc.* | | | 4,248,238 | |
| | | | | | | | |
| | |
| | | | Managed Health Care 3.1% | | | |
| | 95,315 | | | HealthEquity, Inc.* | | | 5,595,944 | |
| | | | | | | | |
| | |
| | | | Other Specialty Retail 3.1% | | | |
| | 27,541 | | | Five Below, Inc.* | | | 5,672,620 | |
| | | | | | | | |
| | |
| | | | Packaged Foods & Meats 1.7% | | | |
| | 46,740 | | | Freshpet, Inc.* | | | 3,093,721 | |
| | | | | | | | |
57
| | |
| Wasatch Global Opportunities Fund (WAGOX / WIGOX) | | MARCH 31, 2023 (Unaudited) |
Schedule of Investments (continued)
| | | | | | | | |
| Shares | | | | | Value | |
| | | | | | | |
| | |
| | | | Pharmaceuticals 1.7% | | | |
| | 146,161 | | | Esperion Therapeutics, Inc.* | | $ | 232,396 | |
| | 51,129 | | | Intra-Cellular Therapies, Inc.* | | | 2,768,635 | |
| | | | | | | | |
| | | | 3,001,031 | |
| | | | | | | | |
| | |
| | | | Regional Banks 6.0% | | | |
| | 999,455 | | | AU Small Finance Bank Ltd. | | | 7,070,824 | |
| | 109,874 | | | Bank OZK | | | 3,757,691 | |
| | | | | | | | |
| | | | 10,828,515 | |
| | | | | | | | |
| | |
| | | | Research & Consulting Services 6.8% | | | |
| | 252,170 | | | BayCurrent Consulting, Inc. | | | 10,469,620 | |
| | 45,808 | | | L&T Technology Services Ltd. | | | 1,894,984 | |
| | | | | | | | |
| | | | 12,364,604 | |
| | | | | | | | |
| | |
| | | | Restaurants 0.4% | | | |
| | 21,310 | | | Domino’s Pizza Enterprises Ltd. | | | 715,361 | |
| | | | | | | | |
| | |
| | | | Semiconductor Equipment 1.8% | | | |
| | 31,702 | | | Nova Ltd.* | | | 3,311,908 | |
| | | | | | | | |
| | |
| | | | Semiconductors 8.2% | | | |
| | 40,400 | | | ASPEED Technology, Inc. | | | 3,525,972 | |
| | 28,052 | | | Melexis NV | | | 3,248,751 | |
| | 6,626 | | | Monolithic Power Systems, Inc. | | | 3,316,578 | |
| | 300,000 | | | Silergy Corp. | | | 4,762,974 | |
| | | | | | | | |
| | | | 14,854,275 | |
| | | | | | | | |
| | |
| | | | Specialty Chemicals 2.1% | | | |
| | 29,632 | | | Balchem Corp. | | | 3,747,855 | |
| | | | | | | | |
| | |
| | | | Systems Software 2.7% | | | |
| | 21,615 | | | CyberArk Software Ltd.* | | | 3,198,587 | |
| | 23,561 | | | Tata Elxsi Ltd. | | | 1,715,592 | |
| | | | | | | | |
| | | | 4,914,179 | |
| | | | | | | | |
| | |
| | | | Trading Companies & Distributors 1.8% | | | |
| | 70,119 | | | Diploma PLC | | | 2,441,380 | |
| | 69,700 | | | MonotaRO Co. Ltd. | | | 877,915 | |
| | | | | | | | |
| | | | 3,319,295 | |
| | | | | | | | |
| | | | | | | | |
| Shares | | | | | Value | |
| | | | | | | |
| | |
| | | | Transaction & Payment Processing
Services 2.0% | | | |
| | 17,563 | | | Euronet Worldwide, Inc.* | | $ | 1,965,300 | |
| | 18,200 | | | GMO Payment Gateway, Inc. | | | 1,575,708 | |
| | | | | | | | |
| | | | 3,541,008 | |
| | | | | | | | |
| | |
| | | | Total Common Stocks
(cost $151,748,407) | | | 182,535,904 | |
| | | | | | | | |
| | |
| | | | Total Investments§
(cost $151,748,407) 100.5% | | | 182,535,904 | |
| | |
| | | | Liabilities less Other Assets (0.5%) | | | (837,686 | ) |
| | | | | | | | |
| | |
| | | | Net Assets 100.0% | | $ | 181,698,218 | |
| | | | | | | | |
| |
| | | | *Non-income producing. §The aggregate amount of foreign securities fair valued pursuant to a systematic valuation model as a percent of net assets was 37.61%. ADR American Depositary Receipt. | |
| |
| | | | See Notes to Financial Statements. | |
At March 31, 2023, the Wasatch Global Opportunities Fund’s investments were in the following countries:
| | | | | |
| Country | | % |
Australia | | | | 2.1 | |
Belgium | | | | 1.8 | |
Germany | | | | 0.8 | |
India | | | | 12.1 | |
Israel | | | | 3.6 | |
Italy | | | | 0.6 | |
Japan | | | | 11.5 | |
Taiwan | | | | 7.2 | |
United Kingdom | | | | 5.1 | |
United States | | | | 55.2 | |
| | | | | |
TOTAL | | | | 100.0 | % |
| | | | | |
58
| | |
| Wasatch Global Select Fund (WAGSX / WGGSX) | | MARCH 31, 2023 (Unaudited) |
Schedule of Investments
| | | | | | | | |
| Shares | | | | | Value | |
| | | | | | | |
| |
| | | | COMMON STOCKS 99.9% | |
| | |
| | | | Application Software 12.5% | | | |
| | 11,205 | | | Dassault Systemes SE | | $ | 462,218 | |
| | 2,961 | | | Five9, Inc.* | | | 214,050 | |
| | 675 | | | HubSpot, Inc.* | | | 289,406 | |
| | 1,504 | | | Roper Technologies, Inc. | | | 662,798 | |
| | 3,164 | | | Xero Ltd.* | | | 191,901 | |
| | | | | | | | |
| | | | | | | 1,820,373 | |
| | | | | | | | |
| | |
| | | | Biotechnology 3.6% | | | |
| | 38,849 | | | Abcam PLC, ADR* | | | 522,907 | |
| | | | | | | | |
| | |
| | | | Broadline Retail 3.4% | | | |
| | 376 | | | MercadoLibre, Inc.* | | | 495,591 | |
| | | | | | | | |
| | |
| | | | Building Products 5.2% | | | |
| | 19,076 | | | Assa Abloy AB, Class B | | | 456,917 | |
| | 6,156 | | | Trex Co., Inc.* | | | 299,613 | |
| | | | | | | | |
| | | | | | | 756,530 | |
| | | | | | | | |
| | |
| | | | Cargo Ground Transportation 3.9% | | | |
| | 1,667 | | | Old Dominion Freight Line, Inc. | | | 568,180 | |
| | | | | | | | |
| | |
| | | | Consumer Finance 2.7% | | | |
| | 5,811 | | | Bajaj Finance Ltd. | | | 398,720 | |
| | | | | | | | |
| | |
| | | | Distributors 3.0% | | | |
| | 1,257 | | | Pool Corp. | | | 430,447 | |
| | | | | | | | |
| | |
| | | | Diversified Banks 3.9% | | | |
| | 28,522 | | | HDFC Bank Ltd. | | | 560,994 | |
| | | | | | | | |
| | |
| | | | Diversified Support Services 4.9% | | | |
| | 9,533 | | | Copart, Inc.* | | | 716,977 | |
| | | | | | | | |
| | |
| | | | Drug Retail 3.2% | | | |
| | 10,800 | | | Sugi Holdings Co. Ltd. | | | 464,227 | |
| | | | | | | | |
| | |
| | | | Electrical Components & Equipment 2.4% | | | |
| | 43,500 | | | WEG SA | | | 348,021 | |
| | | | | | | | |
| | |
| | | | Electronic Components 4.6% | | | |
| | 8,183 | | | Amphenol Corp., Class A | | | 668,715 | |
| | | | | | | | |
| | |
| | | | Financial Exchanges & Data 6.9% | | | |
| | 1,438 | | | MarketAxess Holdings, Inc. | | | 562,675 | |
| | 2,188 | | | Morningstar, Inc. | | | 444,230 | |
| | | | | | | | |
| | | | | | | 1,006,905 | |
| | | | | | | | |
| | |
| | | | Health Care Equipment 1.7% | | | |
| | 2,422 | | | DiaSorin SpA | | | 255,235 | |
| | | | | | | | |
| | |
| | | | Health Care Supplies 2.6% | | | |
| | 2,881 | | | Coloplast A/S, Class B | | | 379,333 | |
| | | | | | | | |
| | |
| | | | Health Care Technology 2.0% | | | |
| | 8,200 | | | JMDC, Inc.* | | | 284,357 | |
| | | | | | | | |
| | |
| | | | Hotels, Resorts & Cruise Lines 3.6% | | | |
| | 7,727 | | | Amadeus IT Group SA* | | | 518,354 | |
| | | | | | | | |
| | |
| | | | IT Consulting & Other Services 2.0% | | | |
| | 1,755 | | | Globant SA* | | | 287,838 | |
| | | | | | | | |
| | | | | | | | |
| Shares | | | | | Value | |
| | | | | | | |
| | |
| | | | Life Sciences Tools & Services 3.7% | | | |
| | 2,532 | | | ICON PLC* | | $ | 540,810 | |
| | | | | | | | |
| | |
| | | | Managed Health Care 3.4% | | | |
| | 8,358 | | | HealthEquity, Inc.* | | | 490,698 | |
| | | | | | | | |
| | |
| | | | Other Specialty Retail 3.1% | | | |
| | 2,206 | | | Five Below, Inc.* | | | 454,370 | |
| | | | | | | | |
| | |
| | | | Regional Banks 3.1% | | | |
| | 13,011 | | | Bank OZK | | | 444,976 | |
| | | | | | | | |
| | |
| | | | Research & Consulting Services 5.1% | | | |
| | 17,880 | | | BayCurrent Consulting, Inc. | | | 742,344 | |
| | | | | | | | |
| | |
| | | | Semiconductor Equipment 1.7% | | | |
| | 1,400 | | | Lasertec Corp. | | | 248,751 | |
| | | | | | | | |
| | |
| | | | Semiconductors 4.3% | | | |
| | 734 | | | Monolithic Power Systems, Inc. | | | 367,396 | |
| | 16,419 | | | Silergy Corp. | | | 260,678 | |
| | | | | | | | |
| | | | | | | 628,074 | |
| | | | | | | | |
| | |
| | | | Specialized Finance 2.0% | | | |
| | 39,100 | | | Chailease Holding Co. Ltd. | | | 287,555 | |
| | | | | | | | |
| | |
| | | | Transaction & Payment Processing
Services 1.4% | | | |
| | 2,873 | | | Block, Inc.* | | | 197,231 | |
| | | | | | | | |
| | |
| | | | Total Common Stocks
(cost $14,061,222) | | | 14,518,513 | |
| | | | | | | | |
| | |
| | | | Total Investments§
(cost $14,061,222) 99.9% | | | 14,518,513 | |
| | |
| | | | Other Assets less Liabilities 0.1% | | | 10,298 | |
| | | | | | | | |
| | |
| | | | Net Assets 100.0% | | $ | 14,528,811 | |
| | | | | | | | |
| |
| | | | *Non-income producing. §The aggregate amount of foreign securities fair valued pursuant to a systematic valuation model as a percent of net assets was 37.94%. ADR American Depositary Receipt. | |
| |
| | | | See Notes to Financial Statements. | |
At March 31, 2023, the Wasatch Global Select Fund’s investments were in the following countries:
| | | | | |
| Country | | % |
Australia | | | | 1.3 | |
Brazil | | | | 2.4 | |
Denmark | | | | 2.6 | |
France | | | | 3.2 | |
India | | | | 6.6 | |
Ireland | | | | 3.7 | |
Italy | | | | 1.8 | |
Japan | | | | 12.0 | |
Spain | | | | 3.6 | |
Sweden | | | | 3.1 | |
Taiwan | | | | 3.8 | |
United Kingdom | | | | 3.6 | |
United States | | | | 52.3 | |
| | | | | |
TOTAL | | | | 100.0 | % |
| | | | | |
59
| | |
| Wasatch Global Value Fund (FMIEX / WILCX) | | MARCH 31, 2023 (Unaudited) |
Schedule of Investments
| | | | | | | | |
| Shares | | | | | Value | |
| | | | | | | |
| |
| | | | COMMON STOCKS 95.5% | |
| | |
| | | | Aerospace & Defense 1.9% | | | |
| | 240,000 | | | BAE Systems PLC | | $ | 2,903,069 | |
| | | | | | | | |
| | |
| | | | Biotechnology 2.2% | | | |
| | 40,000 | | | Gilead Sciences, Inc. | | | 3,318,800 | |
| | | | | | | | |
| | |
| | | | Brewers 0.8% | | | |
| | 24,000 | | | Molson Coors Beverage Co., Class B | | | 1,240,320 | |
| | | | | | | | |
| | |
| | | | Casinos & Gaming 2.3% | | | |
| | 222,500 | | | Kangwon Land, Inc. | | | 3,412,794 | |
| | | | | | | | |
| | |
| | | | Diversified Banks 11.3% | | | |
| | 65,000 | | | Citigroup, Inc. | | | 3,047,850 | |
| | 225,000 | | | ING Groep NV, ADR | | | 2,670,750 | |
| | 33,000 | | | JPMorgan Chase & Co. | | | 4,300,230 | |
| | 39,000 | | | Toronto-Dominion Bank | | | 2,335,960 | |
| | 210,000 | | | United Overseas Bank Ltd. | | | 4,710,098 | |
| | | | | | | | |
| | | | | | | 17,064,888 | |
| | | | | | | | |
| | |
| | | | Diversified Metals & Mining 1.6% | | | |
| | 75,000 | | | BHP Group Ltd. | | | 2,371,045 | |
| | | | | | | | |
| | |
| | | | Electric Utilities 8.0% | | | |
| | 65,000 | | | Duke Energy Corp. | | | 6,270,550 | |
| | 140,000 | | | Exelon Corp. | | | 5,864,600 | |
| | | | | | | | |
| | | | | | | 12,135,150 | |
| | | | | | | | |
| | |
| | | | Electrical Components &
Equipment 1.5% | | | |
| | 13,000 | | | Eaton Corp. PLC | | | 2,227,420 | |
| | | | | | | | |
| | |
| | | | Electronic Manufacturing Services 2.2% | | | |
| | 975,000 | | | Hon Hai Precision Industry Co. Ltd. | | | 3,337,420 | |
| | | | | | | | |
| | |
| | | | Food Retail 5.3% | | | |
| | 150,000 | | | Koninklijke Ahold Delhaize NV | | | 5,124,766 | |
| | 64,000 | | | Seven & i Holdings Co. Ltd. | | | 2,891,143 | |
| | | | | | | | |
| | | | | | | 8,015,909 | |
| | | | | | | | |
| | |
| | | | Industrial Conglomerates 1.0% | | | |
| | 1,650,000 | | | NWS Holdings Ltd. | | | 1,477,171 | |
| | | | | | | | |
| | |
| | | | Industrial REITs 2.2% | | | |
| | 1,900,000 | | | Mapletree Industrial Trust | | | 3,392,277 | |
| | | | | | | | |
| | |
| | | | Integrated Oil & Gas 6.9% | | | |
| | 102,500 | | | Suncor Energy, Inc. | | | 3,182,316 | |
| | 124,000 | | | TotalEnergies SE | | | 7,311,495 | |
| | | | | | | | |
| | | | | | | 10,493,811 | |
| | | | | | | | |
| | |
| | | | Integrated Telecommunication
Services 5.5% | | | |
| | 225,000 | | | AT&T, Inc. | | | 4,331,250 | |
| | 104,000 | | | Verizon Communications, Inc. | | | 4,044,560 | |
| | | | | | | | |
| | | | | | | 8,375,810 | |
| | | | | | | | |
| | |
| | | | Multi-Line Insurance 2.3% | | | |
| | 115,000 | | | AXA SA | | | 3,509,521 | |
| | | | | | | | |
| | | | | | | | |
| Shares | | | | | Value | |
| | | | | | | |
| | |
| | | | Oil & Gas Drilling 1.8% | | | |
| | 67,000 | | | Noble Corp. PLC* | | $ | 2,644,490 | |
| | | | | | | | |
| | |
| | | | Oil & Gas Exploration &
Production 1.3% | | | |
| | 17,000 | | | EOG Resources, Inc. | | | 1,948,710 | |
| | | | | | | | |
| | |
| | | | Packaged Foods & Meats 2.8% | | | |
| | 110,000 | | | Kraft Heinz Co. | | | 4,253,700 | |
| | | | | | | | |
| | |
| | | | Pharmaceuticals 16.5% | | | |
| | 72,000 | | | Bristol-Myers Squibb Co. | | | 4,990,320 | |
| | 47,000 | | | Johnson & Johnson | | | 7,285,000 | |
| | 66,000 | | | Novartis AG | | | 6,060,022 | |
| | 70,000 | | | Otsuka Holdings Co. Ltd. | | | 2,222,473 | |
| | 40,000 | | | Sanofi | | | 4,339,148 | |
| | | | | | | | |
| | | | | | | 24,896,963 | |
| | | | | | | | |
| | |
| | | | Property & Casualty Insurance 2.8% | | | |
| | 77,000 | | | Axis Capital Holdings Ltd. | | | 4,198,040 | |
| | | | | | | | |
| | |
| | | | Rail Transportation 3.9% | | | |
| | 29,000 | | | Union Pacific Corp. | | | 5,836,540 | |
| | | | | | | | |
| | |
| | | | Reinsurance 3.9% | | | |
| | 17,000 | | | Muenchener Rueckversicherungs-Gesellschaft AG in Muenchen | | | 5,943,802 | |
| | | | | | | | |
| | |
| | | | Retail REITs 2.0% | | | |
| | 155,000 | | | Kimco Realty Corp. | | | 3,027,150 | |
| | | | | | | | |
| | |
| | | | Technology Hardware, Storage &
Peripherals 2.1% | | | |
| | 65,500 | | | Samsung Electronics Co. Ltd. | | | 3,239,038 | |
| | | | | | | | |
| | |
| | | | Tobacco 3.4% | | | |
| | 80,000 | | | KT&G Corp. | | | 5,141,433 | |
| | | | | | | | |
| | |
| | | | Total Common Stocks (cost $124,683,060) | | | 144,405,271 | |
| | | | | | | | |
| | |
| | | | Total Investments§
(cost $124,683,059) 95.5% | | | 144,405,271 | |
| | |
| | | | Other Assets less Liabilities 4.5% | | | 6,763,449 | |
| | | | | | | | |
| | |
| | | | Net Assets 100.0% | | $ | 151,168,720 | |
| | | | | | | | |
| |
| | | | *Non-income producing. §The aggregate amount of foreign securities fair valued pursuant to a systematic valuation model as a percent of net assets was 44.58%. ADR American Depositary Receipt. REIT Real Estate Investment Trust. | |
| |
| | | | See Notes to Financial Statements. | |
60
| | |
| Wasatch Global Value Fund (FMIEX / WILCX) | | MARCH 31, 2023 (Unaudited) |
Schedule of Investments (continued)
At March 31, 2023, the Wasatch Global Value Fund’s investments were in the following countries:
| | | | | |
| Country | | % |
Australia | | | | 1.7 | |
Canada | | | | 3.8 | |
France | | | | 10.5 | |
Germany | | | | 4.1 | |
Hong Kong | | | | 1.0 | |
Japan | | | | 3.5 | |
Netherlands | | | | 5.4 | |
Singapore | | | | 5.6 | |
South Korea | | | | 8.2 | |
Switzerland | | | | 4.2 | |
Taiwan | | | | 2.3 | |
United Kingdom | | | | 2.0 | |
United States | | | | 47.7 | |
| | | | | |
TOTAL | | | | 100.0 | % |
| | | | | |
61
| | |
| Wasatch Greater China Fund (WAGCX / WGGCX) | | MARCH 31, 2023 (Unaudited) |
Schedule of Investments
| | | | | | | | |
| Shares | | | | | Value | |
| | | | | | | |
| |
| | | | COMMON STOCKS 100.6% | |
| | |
| | | | Apparel, Accessories & Luxury Goods 1.3% | | | |
| | 7,300 | | | Shenzhou International Group Holdings Ltd. | | $ | 76,578 | |
| | | | | | | | |
| | |
| | | | Application Software 4.5% | | | |
| | 24,332 | | | Glodon Co. Ltd., Class A | | | 263,093 | |
| | | | | | | | |
| | |
| | | | Construction Materials 0.5% | | | |
| | 6,500 | | | Beijing Oriental Yuhong Waterproof Technology Co. Ltd., Class A | | | 31,618 | |
| | | | | | | | |
| | |
| | | | Distillers & Vintners 6.3% | | | |
| | 800 | | | Kweichow Moutai Co. Ltd., Class A* | | | 211,328 | |
| | 5,500 | | | Wuliangye Yibin Co. Ltd., Class A | | | 157,137 | |
| | | | | | | | |
| | | | | | | 368,465 | |
| | | | | | | | |
| | |
| | | | Diversified Banks 1.0% | | | |
| | 11,500 | | | China Merchants Bank Co. Ltd., Class H | | | 58,397 | |
| | | | | | | | |
| | |
| | | | Drug Retail 3.2% | | | |
| | 22,570 | | | Yifeng Pharmacy Chain Co. Ltd., Class A | | | 190,294 | |
| | | | | | | | |
| | |
| | | | Electrical Components & Equipment 2.8% | | | |
| | 2,800 | | | Contemporary Amperex Technology Co. Ltd., Class A | | | 165,736 | |
| | | | | | | | |
| | |
| | | | Electronic Components 4.6% | | | |
| | 23,300 | | | Shenzhen H&T Intelligent Control Co. Ltd., Class A | | | 57,756 | |
| | 19,000 | | | Sinbon Electronics Co. Ltd. | | | 213,839 | |
| | | | | | | | |
| | | | | | | 271,595 | |
| | | | | | | | |
| | |
| | | | Health Care Equipment 3.8% | | | |
| | 4,900 | | | Shenzhen Mindray Bio-Medical Electronics Co. Ltd., Class A | | | 222,324 | |
| | | | | | | | |
| | |
| | | | Hotels, Resorts & Cruise Lines 5.7% | | | |
| | 68,800 | | | H World Group Ltd.* | | | 336,773 | |
| | | | | | | | |
| | |
| | | | Industrial Machinery & Supplies &
Components 11.4% | | | |
| | 6,000 | | | Airtac International Group | | | 234,656 | |
| | 20,763 | | | Shenzhen Inovance Technology Co. Ltd., Class A | | | 212,709 | |
| | 16,778 | | | Techtronic Industries Co. Ltd. | | | 181,792 | |
| | 6,700 | | | Wuxi Lead Intelligent Equipment Co. Ltd., Class A | | | 39,510 | |
| | | | | | | | |
| | | | | | | 668,667 | |
| | | | | | | | |
| | |
| | | | Interactive Media & Services 4.3% | | | |
| | 5,200 | | | Tencent Holdings Ltd. | | | 254,120 | |
| | | | | | | | |
| | |
| | | | Life & Health Insurance 6.2% | | | |
| | 20,000 | | | AIA Group Ltd. | | | 209,747 | |
| | 23,500 | | | Ping An Insurance Group Co. of China Ltd., Class H | | | 152,027 | |
| | | | | | | | |
| | | | | | | 361,774 | |
| | | | | | | | |
| | |
| | | | Life Sciences Tools & Services 6.8% | | | |
| | 15,300 | | | Hangzhou Tigermed Consulting Co. Ltd., Class A | | | 213,196 | |
| | 30,687 | | | Wuxi Biologics Cayman, Inc.* | | | 189,092 | |
| | | | | | | | |
| | | | | | | 402,288 | |
| | | | | | | | |
| | |
| | | | Other Specialty Retail 2.9% | | | |
| | 6,500 | | | China Tourism Group Duty Free Corp. Ltd., Class A | | | 173,576 | |
| | | | | | | | |
| | | | | | | | |
| Shares | | | | | Value | |
| | | | | | | |
| | |
| | | | Packaged Foods & Meats 4.7% | | | |
| | 11,800 | | | Chongqing Fuling Zhacai Group Co. Ltd., Class A | | $ | 43,494 | |
| | 15,906 | | | Foshan Haitian Flavouring & Food Co. Ltd., Class A | | | 177,143 | |
| | 12,500 | | | Inner Mongolia Yili Industrial Group Co. Ltd., Class A | | | 52,877 | |
| | | | | | | | |
| | | | | | | 273,514 | |
| | | | | | | | |
| | |
| | | | Personal Care Products 3.5% | | | |
| | 5,741 | | | Proya Cosmetics Co. Ltd., Class A | | | 152,023 | |
| | 2,782 | | | Yunnan Botanee Bio-Technology Group Co. Ltd., Class A | | | 51,862 | |
| | | | | | | | |
| | | �� | | | | 203,885 | |
| | | | | | | | |
| | |
| | | | Regional Banks 2.4% | | | |
| | 35,000 | | | Bank of Ningbo Co. Ltd., Class A | | | 139,024 | |
| | | | | | | | |
| | |
| | | | Restaurants 2.9% | | | |
| | 9,300 | | | Meituan, Class B* | | | 168,723 | |
| | | | | | | | |
| | |
| | | | Semiconductors 13.3% | | | |
| | 1,814 | | | 3peak, Inc., Class A | | | 64,256 | |
| | 9,650 | | | SG Micro Corp., Class A | | | 218,352 | |
| | 17,000 | | | Silergy Corp. | | | 269,902 | |
| | 38,256 | | | Sino Wealth Electronic Ltd., Class A | | | 227,673 | |
| | | | | | | | |
| | | | | | | 780,183 | |
| | | | | | | | |
| | |
| | | | Specialized Finance 5.0% | | | |
| | 39,940 | | | Chailease Holding Co. Ltd. | | | 293,733 | |
| | | | | | | | |
| | |
| | | | Systems Software 3.5% | | | |
| | 34,700 | | | Hangzhou Dptech Technologies Co. Ltd., Class A | | | 95,606 | |
| | 5,000 | | | Sangfor Technologies, Inc., Class A | | | 107,818 | |
| | | | | | | | |
| | | | | | | 203,424 | |
| | | | | | | | |
| | |
| | | | Total Common Stocks
(cost $7,379,776) | | | 5,907,784 | |
| | | | | | | | |
| | |
| | | | Total Investments§
(cost $7,379,776) 100.6% | | | 5,907,784 | |
| | |
| | | | Liabilities less Other Assets (0.6%) | | | (35,659 | ) |
| | | | | | | | |
| | |
| | | | Net Assets 100.0% | | $ | 5,872,125 | |
| | | | | | | | |
| |
| | | | *Non-income producing. §The aggregate amount of foreign securities fair valued pursuant to a systematic valuation model as a percent of net assets was 100.61%. | |
| |
| | | | See Notes to Financial Statements. | |
At March 31, 2023, the Wasatch Greater China Fund’s investments were in the following countries:
| | | | | |
| Country | | % |
China | | | | 76.3 | |
Hong Kong | | | | 6.6 | |
Taiwan | | | | 17.1 | |
| | | | | |
TOTAL | | | | 100.0 | % |
| | | | | |
62
| | |
| Wasatch International Growth Fund (WAIGX / WIIGX) | | MARCH 31, 2023 (Unaudited) |
Schedule of Investments
| | | | | | | | |
| Shares | | | | | Value | |
| | | | | | | |
| |
| | | | COMMON STOCKS 99.1% | |
| | |
| | | | Aerospace & Defense 2.2% | | | |
| | 541,448 | | | CAE, Inc.* | | $ | 12,243,175 | |
| | | | | | | | |
| | |
| | | | Airport Services 3.0% | | | |
| | 1,468,360 | | | Grupo Aeroportuario del Centro Norte SAB de CV | | | 16,400,489 | |
| | | | | | | | |
| | |
| | | | Apparel, Accessories & Luxury
Goods 1.5% | | | |
| | 414,818 | | | Canada Goose Holdings, Inc.* | | | 7,977,151 | |
| | | | | | | | |
| | |
| | | | Application Software 11.2% | | | |
| | 250,926 | | | Descartes Systems Group, Inc.* | | | 20,252,318 | |
| | 252,184 | | | Fortnox AB | | | 1,725,527 | |
| | 118,786 | | | Kinaxis, Inc.* | | | 16,309,234 | |
| | 392,900 | | | Rakus Co. Ltd. | | | 5,706,263 | |
| | 2,926,732 | | | Systena Corp. | | | 6,435,681 | |
| | 1,087,340 | | | Technology One Ltd. | | | 10,685,155 | |
| | | | | | | | |
| | | | | | | 61,114,178 | |
| | | | | | | | |
| | |
| | | | Asset Management & Custody
Banks 1.8% | | | |
| | 1,061,230 | | | Netwealth Group Ltd. | | | 9,716,668 | |
| | | | | | | | |
| | |
| | | | Biotechnology 3.4% | | | |
| | 1,394,849 | | | Abcam PLC, ADR* | | | 18,774,668 | |
| | | | | | | | |
| | |
| | | | Brewers 0.6% | | | |
| | 38,661 | | | Royal Unibrew A/S | | | 3,370,130 | |
| | | | | | | | |
| | |
| | | | Broadline Retail 0.5% | | | |
| | 423,543 | | | B&M European Value Retail SA | | | 2,523,373 | |
| | | | | | | | |
| | |
| | | | Commercial & Residential Mortgage
Finance 2.5% | | | |
| | 131,219 | | | Aavas Financiers Ltd.* | | | 2,577,484 | |
| | 1,895,334 | | | OSB Group PLC | | | 11,337,686 | |
| | | | | | | | |
| | | | | | | 13,915,170 | |
| | | | | | | | |
| | |
| | | | Commodity Chemicals 0.4% | | | |
| | 325,710 | | | Berger Paints India Ltd. | | | 2,309,894 | |
| | | | | | | | |
| | |
| | | | Construction & Engineering 1.6% | | | |
| | 2,048,468 | | | Johns Lyng Group Ltd. | | | 8,831,602 | |
| | | | | | | | |
| | |
| | | | Diversified Real Estate Activities 1.5% | | | |
| | 798,719 | | | PATRIZIA SE | | | 8,341,459 | |
| | | | | | | | |
| | |
| | | | Drug Retail 5.3% | | | |
| | 277,886 | | | Ain Holdings, Inc. | | | 11,650,620 | |
| | 165,975 | | | Clicks Group Ltd. | | | 2,387,588 | |
| | 565,000 | | | Raia Drogasil SA | | | 2,725,537 | |
| | 287,600 | | | Sugi Holdings Co. Ltd. | | | 12,362,187 | |
| | | | | | | | |
| | | | | | | 29,125,932 | |
| | | | | | | | |
| | |
| | | | Electrical Components &
Equipment 2.9% | | | |
| | 280,585 | | | Voltronic Power Technology Corp. | | | 15,977,538 | |
| | | | | | | | |
| | |
| | | | Electronic Equipment &
Instruments 2.3% | | | |
| | 457,739 | | | Halma PLC | | | 12,636,561 | |
| | | | | | | | |
| | | | | | | | |
| Shares | | | | | Value | |
| | | | | | | |
| | |
| | | | Health Care Equipment 1.6% | | | |
| | 82,393 | | | DiaSorin SpA | | $ | 8,682,737 | |
| | | | | | | | |
| | |
| | | | Health Care Services 0.8% | | | |
| | 191,159 | | | Dr. Lal PathLabs Ltd. | | | 4,263,659 | |
| | | | | | | | |
| | |
| | | | Health Care Supplies 0.9% | | | |
| | 231,528 | | | Menicon Co. Ltd. | | | 4,933,829 | |
| | | | | | | | |
| | |
| | | | Health Care Technology 2.9% | | | |
| | 360,227 | | | JMDC, Inc.* | | | 12,491,819 | |
| | 73,196 | | | Pro Medicus Ltd. | | | 3,156,908 | |
| | | | | | | | |
| | | | | | | 15,648,727 | |
| | | | | | | | |
| | |
| | | | Human Resource & Employment
Services 3.3% | | | |
| | 388,236 | | | SMS Co. Ltd. | | | 9,442,085 | |
| | 249,900 | | | TechnoPro Holdings, Inc. | | | 6,931,223 | |
| | 27,400 | | | Visional, Inc.* | | | 1,541,408 | |
| | | | | | | | |
| | | | | | | 17,914,716 | |
| | | | | | | | |
| | |
| | | | Industrial Machinery & Supplies &
Components 1.8% | | | |
| | 828,922 | | | Elgi Equipments Ltd. | | | 4,435,821 | |
| | 76,185 | | | Stabilus SE | | | 5,326,122 | |
| | | | | | | | |
| | | | | | | 9,761,943 | |
| | | | | | | | |
| | |
| | | | Interactive Media & Services 1.9% | | | |
| | 121,700 | | | Kakaku.com, Inc. | | | 1,670,614 | |
| | 840,610 | | | Rightmove PLC | | | 5,851,181 | |
| | 50,639 | | | Scout24 SE | | | 3,011,957 | |
| | | | | | | | |
| | | | | | | 10,533,752 | |
| | | | | | | | |
| | |
| | | | Investment Banking & Brokerage 1.0% | | | |
| | 1,249,370 | | | AJ Bell PLC | | | 5,320,298 | |
| | | | | | | | |
| | |
| | | | IT Consulting & Other Services 6.7% | | | |
| | 141,252 | | | Endava PLC, ADR* | | | 9,489,309 | |
| | 26,445 | | | Globant SA* | | | 4,337,245 | |
| | 45,895 | | | LTIMindtree Ltd. | | | 2,672,571 | |
| | 112,754 | | | Reply SpA | | | 14,158,859 | |
| | 350,673 | | | Softcat PLC | | | 5,633,114 | |
| | | | | | | | |
| | | | | | | 36,291,098 | |
| | | | | | | | |
| | |
| | | | Movies & Entertainment 2.4% | | | |
| | 207,149 | | | CTS Eventim AG & Co. KGaA* | | | 12,950,097 | |
| | | | | | | | |
| | |
| | | | Other Specialty Retail 1.5% | | | |
| | 2,224,300 | | | Pet Center Comercio e Participacoes SA | | | 2,720,883 | |
| | 186,726 | | | Pet Valu Holdings Ltd. | | | 5,200,419 | |
| | | | | | | | |
| | | | | | | 7,921,302 | |
| | | | | | | | |
| | |
| | | | Pharmaceuticals 0.7% | | | |
| | 343,171 | | | JCR Pharmaceuticals Co. Ltd. | | | 3,677,714 | |
| | | | | | | | |
| | |
| | | | Property & Casualty Insurance 1.8% | | | |
| | 108,467 | | | Definity Financial Corp. | | | 2,830,656 | |
| | 1,125,605 | | | Qualitas Controladora SAB de CV | | | 7,201,498 | |
| | | | | | | | |
| | | | | | | 10,032,154 | |
| | | | | | | | |
| | |
| | | | Publishing 0.8% | | | |
| | 288,401 | | | Future PLC | | | 4,145,173 | |
| | | | | | | | |
63
| | |
| Wasatch International Growth Fund (WAIGX / WIIGX) | | MARCH 31, 2023 (Unaudited) |
Schedule of Investments (continued)
| | | | | | | | |
| Shares | | | | | Value | |
| | | | | | | |
| | |
| | | | Regional Banks 4.7% | | | |
| | 1,692,455 | | | AU Small Finance Bank Ltd. | | $ | 11,973,577 | |
| | 154,085 | | | Canadian Western Bank | | | 2,822,896 | |
| | 251,029 | | | EQB, Inc. | | | 10,828,702 | |
| | | | | | | | |
| | | | | | | 25,625,175 | |
| | | | | | | | |
| | |
| | | | Research & Consulting Services 5.0% | | | |
| | 658,300 | | | BayCurrent Consulting, Inc. | | | 27,331,367 | |
| | | | | | | | |
| | |
| | | | Restaurants 0.5% | | | |
| | 76,061 | | | Domino’s Pizza Enterprises Ltd. | | | 2,553,311 | |
| | | | | | | | |
| | |
| | | | Semiconductor Materials &
Equipment 0.3% | | | |
| | 21,389 | | | Tokai Carbon Korea Co. Ltd. | | | 1,731,179 | |
| | | | | | | | |
| | |
| | | | Semiconductors 7.1% | | | |
| | 66,500 | | | ASPEED Technology, Inc. | | | 5,803,891 | |
| | 104,920 | | | LEENO Industrial, Inc. | | | 11,635,652 | |
| | 132,206 | | | Melexis NV | | | 15,311,006 | |
| | 373,996 | | | Silergy Corp. | | | 5,937,777 | |
| | | | | | | | |
| | | | | | | 38,688,326 | |
| | | | | | | | |
| | |
| | | | Soft Drinks & Non-Alcoholic
Beverages 0.4% | | | |
| | 131,894 | | | Fevertree Drinks PLC | | | 2,085,583 | |
| | | | | | | | |
| | |
| | | | Specialty Chemicals 1.8% | | | |
| | 791,006 | | | Hexpol AB | | | 9,798,159 | |
| | | | | | | | |
| | |
| | | | Systems Software 2.2% | | | |
| | 80,426 | | | CyberArk Software Ltd.* | | | 11,901,440 | |
| | | | | | | | |
| | |
| | | | Trading Companies & Distributors 6.3% | | | |
| | 494,898 | | | Diploma PLC | | | 17,231,194 | |
| | 552,171 | | | Howden Joinery Group PLC | | | 4,767,727 | |
| | 38,029 | | | IMCD NV | | | 6,218,340 | |
| | 260,848 | | | MonotaRO Co. Ltd. | | | 3,285,542 | |
| | 240,947 | | | RS Group PLC | | | 2,724,221 | |
| | | | | | | | |
| | | | | | | 34,227,024 | |
| | | | | | | | |
| | | | | | | | |
| Shares | | | | | Value | |
| | | | | | | |
| | |
| | | | Transaction & Payment Processing
Services 2.0% | | | |
| | 129,100 | | | GMO Payment Gateway, Inc. | | $ | 11,177,142 | |
| | | | | | | | |
| | |
| | | | Total Common Stocks
(cost $395,319,919) | | | 540,453,893 | |
| | | | | | | | |
| | |
| | | | Total Investments§
(cost $395,319,919) 99.1% | | | 540,453,893 | |
| | |
| | | | Other Assets less Liabilities 0.9% | | | 4,641,111 | |
| | | | | | | | |
| | |
| | | | Net Assets 100.0% | | $ | 545,095,004 | |
| | | | | | | | |
| |
| | | | *Non-income producing. §The aggregate amount of foreign securities fair valued pursuant to a systematic valuation model as a percent of net assets was 70.28%. ADR American Depositary Receipt. | |
| |
| | | | See Notes to Financial Statements. | |
At March 31, 2023, the Wasatch International Growth Fund’s investments were in the following countries:
| | | | | |
| Country | | % |
Australia | | | | 6.5 | |
Belgium | | | | 2.8 | |
Brazil | | | | 1.0 | |
Canada | | | | 14.5 | |
Denmark | | | | 0.6 | |
Germany | | | | 5.5 | |
India | | | | 5.2 | |
Israel | | | | 2.2 | |
Italy | | | | 4.2 | |
Japan | | | | 22.0 | |
Mexico | | | | 4.4 | |
Netherlands | | | | 1.2 | |
South Africa | | | | 0.4 | |
South Korea | | | | 2.5 | |
Sweden | | | | 2.1 | |
Taiwan | | | | 5.1 | |
United Kingdom | | | | 19.0 | |
United States | | | | 0.8 | |
| | | | | |
TOTAL | | | | 100.0 | % |
| | | | | |
64
| | |
| Wasatch International Opportunities Fund (WAIOX / WIIOX) | | MARCH 31, 2023 (Unaudited) |
Schedule of Investments
| | | | | | | | |
| Shares | | | | | Value | |
| | | | | | | |
| |
| | | | COMMON STOCKS 99.2% | |
| | |
| | | | Advertising 3.8% | | | |
| | 286,400 | | | Direct Marketing MiX, Inc. | | $ | 2,943,975 | |
| | 1,030,391 | | | YouGov PLC | | | 11,522,279 | |
| | | | | | | | |
| | | | | | | 14,466,254 | |
| | | | | | | | |
| | |
| | | | Air Freight & Logistics 2.2% | | | |
| | 561,818 | | | AZ-COM MARUWA Holdings, Inc. | | | 8,461,907 | |
| | | | | | | | |
| | |
| | | | Alternative Carriers 2.1% | | | |
| | 627,552 | | | Chief Telecom, Inc. | | | 7,945,041 | |
| | | | | | | | |
| | |
| | | | Application Software 14.7% | | | |
| | 37,947 | | | Atoss Software AG | | | 6,861,764 | |
| | 1,534,861 | | | Bytes Technology Group PLC | | | 7,353,979 | |
| | 26,011 | | | Esker SA | | | 3,707,362 | |
| | 1,383,441 | | | Fortnox AB | | | 9,465,967 | |
| | 170,396 | | | LiveChat Software SA | | | 5,661,501 | |
| | 231,500 | | | m-up Holdings, Inc. | | | 2,004,078 | |
| | 63,209 | | | Mensch und Maschine Software SE | | | 3,508,353 | |
| | 325,532 | | | Rakus Co. Ltd. | | | 4,727,847 | |
| | 2,473,645 | | | Systena Corp. | | | 5,439,374 | |
| | 152,568 | | | Vitec Software Group AB, Class B | | | 7,862,968 | |
| | | | | | | | |
| | | | | | | 56,593,193 | |
| | | | | | | | |
| | |
| | | | Asset Management & Custody
Banks 3.1% | | | |
| | 1,184,764 | | | JTC PLC | | | 10,330,797 | |
| | 8,720,111 | | | VEF AB* | | | 1,600,108 | |
| | | | | | | | |
| | | | | | | 11,930,905 | |
| | | | | | | | |
| | |
| | | | Brewers 0.8% | | | |
| | 33,902 | | | Royal Unibrew A/S | | | 2,955,282 | |
| | | | | | | | |
| | |
| | | | Commercial & Residential Mortgage
Finance 3.4% | | | |
| | 305,439 | | | Aavas Financiers Ltd.* | | | 5,999,620 | |
| | 767,823 | | | Mortgage Advice Bureau Holdings Ltd. | | | 7,028,120 | |
| | | | | | | | |
| | | | | | | 13,027,740 | |
| | | | | | | | |
| | |
| | | | Commodity Chemicals 2.0% | | | |
| | 529,374 | | | Berger Paints India Ltd. | | | 3,754,254 | |
| | 133,301 | | | Supreme Industries Ltd. | | | 4,082,822 | |
| | | | | | | | |
| | | | | | | 7,837,076 | |
| | | | | | | | |
| | |
| | | | Construction & Engineering 2.6% | | | |
| | 2,278,836 | | | Johns Lyng Group Ltd. | | | 9,824,793 | |
| | | | | | | | |
| | |
| | | | Consumer Finance 3.0% | | | |
| | 96,249 | | | Gruppo MutuiOnline SpA | | | 2,724,371 | |
| | 689,150 | | | Premium Group Co. Ltd. | | | 8,848,343 | |
| | | | | | | | |
| | | | | | | 11,572,714 | |
| | | | | | | | |
| | |
| | | | Diversified Banks 1.1% | | | |
| | 2,649,876 | | | City Union Bank Ltd. | | | 4,069,394 | |
| | | | | | | | |
| | |
| | | | Diversified Support Services 5.6% | | | |
| | 715,700 | | | Japan Elevator Service Holdings Co. Ltd. | | | 11,681,332 | |
| | 3,267,580 | | | Johnson Service Group PLC | | | 4,933,802 | |
| | 1,108,937 | | | Prestige International, Inc. | | | 5,007,595 | |
| | | | | | | | |
| | | | | | | 21,622,729 | |
| | | | | | | | |
| | | | | | | | |
| Shares | | | | | Value | |
| | | | | | | |
| | |
| | | | Drug Retail 1.1% | | | |
| | 103,900 | | | Ain Holdings, Inc. | | $ | 4,356,101 | |
| | | | | | | | |
| | |
| | | | Electrical Components &
Equipment 4.5% | | | |
| | 1,184,127 | | | DiscoverIE Group PLC | | | 11,281,122 | |
| | 106,631 | | | Voltronic Power Technology Corp. | | | 6,071,960 | |
| | | | | | | | |
| | | | | | | 17,353,082 | |
| | | | | | | | |
| | |
| | | | Electronic Equipment &
Instruments 0.7% | | | |
| | 155,069 | | | Nayax Ltd.* | | | 2,639,682 | |
| | | | | | | | |
| | |
| | | | Food Retail 2.1% | | | |
| | 56,713 | | | Rami Levy Chain Stores Hashikma Marketing 2006 Ltd. | | | 3,371,562 | |
| | 3,591,800 | | | Sheng Siong Group Ltd. | | | 4,565,176 | |
| | | | | | | | |
| | | | | | | 7,936,738 | |
| | | | | | | | |
| | |
| | | | Health Care Services 2.6% | | | |
| | 203,587 | | | Dr. Lal PathLabs Ltd. | | | 4,540,856 | |
| | 1,131,914 | | | Vijaya Diagnostic Centre Pvt. Ltd. | | | 5,402,034 | |
| | | | | | | | |
| | | | | | | 9,942,890 | |
| | | | | | | | |
| | |
| | | | Health Care Technology 5.0% | | | |
| | 163,168 | | | Nexus AG | | | 9,703,911 | |
| | 218,707 | | | Pro Medicus Ltd. | | | 9,432,726 | |
| | | | | | | | |
| | | | | | | 19,136,637 | |
| | | | | | | | |
| | |
| | | | Hotels, Resorts & Cruise Lines 0.3% | | | |
| | 34,100 | | | Temairazu, Inc. | | | 1,221,921 | |
| | | | | | | | |
| | |
| | | | Human Resource & Employment
Services 1.2% | | | |
| | 195,962 | | | SMS Co. Ltd. | | | 4,765,889 | |
| | | | | | | | |
| | |
| | | | Industrial Machinery & Supplies &
Components 1.6% | | | |
| | 787,523 | | | Elgi Equipments Ltd. | | | 4,214,282 | |
| | 120,268 | | | GMM Pfaudler Ltd. | | | 2,148,223 | |
| | | | | | | | |
| | | | | | | 6,362,505 | |
| | | | | | | | |
| | |
| | | | Interactive Media & Services 3.2% | | | |
| | 2,650,992 | | | Baltic Classifieds Group PLC | | | 5,080,538 | |
| | 425,999 | | | Hemnet Group AB | | | 7,166,339 | |
| | | | | | | | |
| | | | | | | 12,246,877 | |
| | | | | | | | |
| | |
| | | | Investment Banking & Brokerage 1.9% | | | |
| | 536,149 | | | AJ Bell PLC | | | 2,283,129 | |
| | 175,000 | | | Strike Co. Ltd. | | | 5,059,025 | |
| | | | | | | | |
| | | | | | | 7,342,154 | |
| | | | | | | | |
| | |
| | | | IT Consulting & Other Services 7.5% | | | |
| | 29,161 | | | Adesso SE | | | 4,668,466 | |
| | 46,235 | | | Aubay | | | 2,372,630 | |
| | 257,102 | | | Avant Group Corp. | | | 2,785,092 | |
| | 101,489 | | | Base Co. Ltd. | | | 4,431,800 | |
| | 113,073 | | | Digital Value SpA* | | | 8,166,104 | |
| | 3,301,785 | | | Kin & Carta PLC* | | | 3,154,779 | |
| | 31,465 | | | Nagarro SE* | | | 3,206,162 | |
| | | | | | | | |
| | | | | | | 28,785,033 | |
| | | | | | | | |
65
| | |
| Wasatch International Opportunities Fund (WAIOX / WIIOX) | | MARCH 31, 2023 (Unaudited) |
Schedule of Investments (continued)
| | | | | | | | |
| Shares | | | | | Value | |
| | | | | | | |
| | |
| | | | Life Sciences Tools & Services 0.9% | | | |
| | 165,102 | | | Ergomed PLC* | | $ | 2,069,365 | |
| | 207,065 | | | Tarsons Products Ltd.* | | | 1,344,667 | |
| | | | | | | | |
| | | | | | | 3,414,032 | |
| | | | | | | | |
| | |
| | | | Metal, Glass & Plastic Containers 0.8% | | | |
| | 265,448 | | | Mold-Tek Packaging Ltd. | | | 2,924,818 | |
| | | | | | | | |
| | |
| | | | Movies & Entertainment 0.6% | | | |
| | 103,480 | | | NexTone, Inc.* | | | 2,427,473 | |
| | | | | | | | |
| | |
| | | | Other Specialty Retail 0.9% | | | |
| | 91,671 | | | Musti Group Oyj* | | | 1,601,013 | |
| | 1,578,200 | | | Pet Center Comercio e Participacoes SA | | | 1,930,539 | |
| | | | | | | | |
| | | | | | | 3,531,552 | |
| | | | | | | | |
| | |
| | | | Packaged Foods & Meats 0.5% | | | |
| | 873,287 | | | Cloetta AB, Class B | | | 1,841,612 | |
| | | | | | | | |
| | |
| | | | Personal Care Products 1.0% | | | |
| | 523,566 | | | Sarantis SA | | | 3,878,124 | |
| | | | | | | | |
| | |
| | | | Pharmaceuticals 0.5% | | | |
| | 165,129 | | | JCR Pharmaceuticals Co. Ltd. | | | 1,769,664 | |
| | | | | | | | |
| | |
| | | | Property & Casualty Insurance 1.7% | | | |
| | 1,036,698 | | | Qualitas Controladora SAB de CV | | | 6,632,681 | |
| | | | | | | | |
| | |
| | | | Publishing 1.4% | | | |
| | 386,032 | | | Future PLC | | | 5,548,418 | |
| | | | | | | | |
| | |
| | | | Regional Banks 1.5% | | | |
| | 133,234 | | | EQB, Inc. | | | 5,747,349 | |
| | | | | | | | |
| | |
| | | | Research & Consulting Services 6.8% | | | |
| | 9,630,018 | | | CTOS Digital Bhd. | | | 2,869,660 | |
| | 186,615 | | | Funai Soken Holdings, Inc. | | | 3,831,281 | |
| | 142,700 | | | Management Solutions Co. Ltd. | | | 3,580,643 | |
| | 344,117 | | | NICE Information Service Co. Ltd. | | | 3,269,601 | |
| | 1,010,700 | | | SIGMAXYZ Holdings, Inc. | | | 8,706,284 | |
| | 447,604 | | | Talenom Oyj | | | 3,999,914 | |
| | | | | | | | |
| | | | | | | 26,257,383 | |
| | | | | | | | |
| | |
| | | | Restaurants 0.0% | | | |
| | 630,045 | | | Patisserie Holdings PLC* *** §§ | | | 7,772 | |
| | | | | | | | |
| | |
| | | | Semiconductor Equipment 1.7% | | | |
| | 625,000 | | | Materials Analysis Technology, Inc. | | | 3,871,566 | |
| | 31,001 | | | Tokai Carbon Korea Co. Ltd. | | | 2,509,154 | |
| | | | | | | | |
| | | | | | | 6,380,720 | |
| | | | | | | | |
| | |
| | | | Semiconductors 3.9% | | | |
| | 66,890 | | | Elmos Semiconductor SE | | | 6,510,848 | |
| | 77,763 | | | LEENO Industrial, Inc. | | | 8,623,935 | |
| | | | | | | | |
| | | | | | | 15,134,783 | |
| | | | | | | | |
| | |
| | | | Specialized Finance 0.7% | | | |
| | 171,500 | | | eGuarantee, Inc. | | | 2,822,371 | |
| | | | | | | | |
| | | | | | | | |
| Shares | | | | | Value | |
| | | | | | | |
| | |
| | | | Systems Software 0.2% | | | |
| | 45,668 | | | TECSYS, Inc. | | $ | 924,511 | |
| | | | | | | | |
| | |
| | | | Total Common Stocks
(cost $327,379,303) | | | 381,639,800 | |
| | | | | | | | |
| | |
| | | | Total Investments§
(cost $327,379,303) 99.2% | | | 381,639,800 | |
| | |
| | | | Other Assets less Liabilities 0.8% | | | 2,959,243 | |
| | | | | | | | |
| | |
| | | | Net Assets 100.0% | | $ | 384,599,043 | |
| | | | | | | | |
| |
| | | | *Non-income producing. ***Security was fair valued under procedures adopted by the Board of Trustees using unobservable inputs as described in Note 12, as applicable. §The aggregate amount of foreign securities fair valued pursuant to a systematic valuation model as a percent of net assets was 85.03%. §§The aggregate value of illiquid holdings at March 31, 2023 amounted to approximately $7,772 and represented 0.00% of net assets. | |
| |
| | | | See Notes to Financial Statements. | |
At March 31, 2023, the Wasatch International Opportunities Fund’s investments were in the following countries:
| | | | | |
| Country | | % |
Australia | | | | 5.0 | |
Brazil | | | | 0.5 | |
Canada | | | | 1.7 | |
Denmark | | | | 0.8 | |
Finland | | | | 1.5 | |
France | | | | 1.6 | |
Germany | | | | 9.0 | |
Greece | | | | 1.0 | |
India | | | | 10.1 | |
Israel | | | | 1.6 | |
Italy | | | | 2.9 | |
Japan | | | | 24.9 | |
Malaysia | | | | 0.7 | |
Mexico | | | | 1.7 | |
Poland | | | | 1.5 | |
Singapore | | | | 1.2 | |
South Korea | | | | 3.8 | |
Sweden | | | | 7.3 | |
Taiwan | | | | 4.7 | |
United Kingdom | | | | 18.5 | |
| | | | | |
TOTAL | | | | 100.0 | % |
| | | | | |
66
| | |
| Wasatch International Select Fund (WAISX / WGISX) | | MARCH 31, 2023 (Unaudited) |
Schedule of Investments
| | | | | | | | |
| Shares | | | | | Value | |
| | | | | | | |
| |
| | | | COMMON STOCKS 95.5% | |
| | |
| | | | Aerospace & Defense 4.7% | | | |
| | 11,062 | | | CAE, Inc.* | | $ | 250,133 | |
| | | | | | | | |
| | |
| | | | Apparel, Accessories & Luxury Goods 5.5% | | | |
| | 145 | | | Hermes International | | | 293,662 | |
| | | | | | | | |
| | |
| | | | Application Software 11.1% | | | |
| | 5,700 | | | Dassault Systemes SE | | | 235,131 | |
| | 2,592 | | | Descartes Systems Group, Inc.* | | | 209,201 | |
| | 2,479 | | | Xero Ltd.* | | | 150,355 | |
| | | | | | | | |
| | | | | | | 594,687 | |
| | | | | | | | |
| | |
| | | | Asset Management & Custody Banks 2.8% | | | |
| | 159 | | | Partners Group Holding AG | | | 149,734 | |
| | | | | | | | |
| | |
| | | | Biotechnology 3.7% | | | |
| | 14,866 | | | Abcam PLC, ADR* | | | 200,096 | |
| | | | | | | | |
| | |
| | | | Broadline Retail 3.4% | | | |
| | 3,026 | | | Dollarama, Inc. | | | 180,844 | |
| | | | | | | | |
| | |
| | | | Building Products 4.8% | | | |
| | 10,784 | | | Assa Abloy AB, Class B | | | 258,303 | |
| | | | | | | | |
| | |
| | | | Drug Retail 3.4% | | | |
| | 4,300 | | | Sugi Holdings Co. Ltd. | | | 184,831 | |
| | | | | | | | |
| | |
| | | | Electronic Equipment & Instruments 4.1% | | | |
| | 8,059 | | | Halma PLC | | | 222,481 | |
| | | | | | | | |
| | |
| | | | Health Care Equipment 2.7% | | | |
| | 1,383 | | | DiaSorin SpA | | | 145,743 | |
| | | | | | | | |
| | |
| | | | Health Care Supplies 3.6% | | | |
| | 1,449 | | | Coloplast A/S, Class B | | | 190,786 | |
| | | | | | | | |
| | |
| | | | Health Care Technology 3.2% | | | |
| | 4,901 | | | JMDC, Inc.* | | | 169,955 | |
| | | | | | | | |
| | |
| | | | Hotels, Resorts & Cruise Lines 5.9% | | | |
| | 4,711 | | | Amadeus IT Group SA* | | | 316,031 | |
| | | | | | | | |
| | |
| | | | Industrial Machinery & Supplies &
Components 3.2% | | | |
| | 256 | | | Rational AG | | | 172,079 | |
| | | | | | | | |
| | |
| | | | Interactive Media & Services 5.9% | | | |
| | 2,600 | | | Kakaku.com, Inc. | | | 35,691 | |
| | 1,188 | | | REA Group Ltd. | | | 110,773 | |
| | 2,825 | | | Scout24 SE | | | 168,028 | |
| | | | | | | | |
| | | | | | | 314,492 | |
| | | | | | | | |
| | |
| | | | IT Consulting & Other Services 5.6% | | | |
| | 1,850 | | | Endava PLC, ADR* | | | 124,283 | |
| | 1,100 | | | Obic Co. Ltd. | | | 174,233 | |
| | | | | | | | |
| | | | | | | 298,516 | |
| | | | | | | | |
| | | | | | | | |
| Shares | | | | | Value | |
| | | | | | | |
| | |
| | | | Life Sciences Tools & Services 5.8% | | | |
| | 1,151 | | | ICON PLC* | | $ | 245,842 | |
| | 221 | | | Sartorius Stedim Biotech | | | 67,802 | |
| | | | | | | | |
| | | | | | | 313,644 | |
| | | | | | | | |
| | |
| | | | Real Estate Services 3.5% | | | |
| | 1,343 | | | FirstService Corp. | | | 189,232 | |
| | | | | | | | |
| | |
| | | | Research & Consulting Services 6.0% | | | |
| | 7,800 | | | BayCurrent Consulting, Inc. | | | 323,841 | |
| | | | | | | | |
| | |
| | | | Transaction & Payment Processing
Services 6.6% | | | |
| | 90 | | | Adyen NV* | | | 143,408 | |
| | 2,400 | | | GMO Payment Gateway, Inc. | | | 207,786 | |
| | | | | | | | |
| | | | | | | 351,194 | |
| | | | | | | | |
| | |
| | | | Total Common Stocks
(cost $5,001,938) | | | 5,120,284 | |
| | | | | | | | |
| | |
| | | | Total Investments§
(cost $5,001,938) 95.5% | | | 5,120,284 | |
| | |
| | | | Other Assets less Liabilities 4.5% | | | 241,773 | |
| | | | | | | | |
| | |
| | | | Net Assets 100.0% | | $ | 5,362,057 | |
| | | | | | | | |
| |
| | | | *Non-income producing. §The aggregate amount of foreign securities fair valued pursuant to a systematic valuation model as a percent of net assets was 69.39%. ADR American Depositary Receipt. | |
| |
| | | | See Notes to Financial Statements. | |
At March 31, 2023, the Wasatch International Select Fund’s investments were in the following countries:
| | | | | |
| Country | | % |
Australia | | | | 5.1 | |
Canada | | | | 16.2 | |
Denmark | | | | 3.7 | |
France | | | | 11.7 | |
Germany | | | | 6.6 | |
Ireland | | | | 4.8 | |
Italy | | | | 2.9 | |
Japan | | | | 21.4 | |
Netherlands | | | | 2.8 | |
Spain | | | | 6.2 | |
Sweden | | | | 5.0 | |
Switzerland | | | | 2.9 | |
United Kingdom | | | | 10.7 | |
| | | | | |
TOTAL | | | | 100.0 | % |
| | | | | |
67
| | |
| Wasatch Long/Short Alpha Fund (WALSX / WGLSX) | | MARCH 31, 2023 (Unaudited) |
Schedule of Investments
| | | | | | | | |
| Shares | | | | | Value | |
| | | | | | | |
| |
| | | | COMMON STOCKS 116.5% | |
| | |
| | | | Application Software 17.1% | | | |
| | 8,507 | | | Five9, Inc.* †† | | $ | 614,971 | |
| | 8,811 | | | Guidewire Software, Inc.* †† | | | 722,942 | |
| | 1,445 | | | HubSpot, Inc.* †† | | | 619,544 | |
| | 3,907 | | | Paylocity Holding Corp.* †† | | | 776,633 | |
| | 2,559 | | | Roper Technologies, Inc.†† | | | 1,127,726 | |
| | 3,518 | | | Workday, Inc., Class A* †† | | | 726,608 | |
| | | | | | | | |
| | | | | | | 4,588,424 | |
| | | | | | | | |
| | |
| | | | Asset Management & Custody Banks 5.8% | | | |
| | 9,918 | | | Cohen & Steers, Inc. | | | 634,355 | |
| | 12,553 | | | Hamilton Lane, Inc., Class A†† | | | 928,671 | |
| | | | | | | | |
| | | | | | | 1,563,026 | |
| | | | | | | | |
| | |
| | | | Biotechnology 1.5% | | | |
| | 43,624 | | | C4 Therapeutics, Inc.* | | | 136,979 | |
| | 25,418 | | | Nkarta, Inc.* | | | 90,234 | |
| | 99,881 | | | Sangamo Therapeutics, Inc.* | | | 175,791 | |
| | | | | | | | |
| | | | | | | 403,004 | |
| | | | | | | | |
| | |
| | | | Broadcasting 2.3% | | | |
| | 35,960 | | | TEGNA, Inc.†† | | | 608,084 | |
| | | | | | | | |
| | |
| | | | Building Products 2.0% | | | |
| | 10,959 | | | Trex Co., Inc.* †† | | | 533,374 | |
| | | | | | | | |
| | |
| | | | Casinos & Gaming 2.5% | | | |
| | 43,790 | | | NeoGames SA* †† | | | 665,608 | |
| | | | | | | | |
| | |
| | | | Commodity Chemicals 2.5% | | | |
| | 19,122 | | | Valvoline, Inc.†† | | | 668,123 | |
| | | | | | | | |
| | |
| | | | Consumer Finance 2.0% | | | |
| | 63,216 | | | EZCORP, Inc., Class A* | | | 543,658 | |
| | | | | | | | |
| | |
| | | | Distributors 3.3% | | | |
| | 2,566 | | | Pool Corp. | | | 878,701 | |
| | | | | | | | |
| | |
| | | | Education Services 1.3% | | | |
| | 3,130 | | | Grand Canyon Education, Inc.* †† | | | 356,507 | |
| | | | | | | | |
| | |
| | | | Electronic Equipment & Instruments 3.8% | | | |
| | 14,609 | | | Cognex Corp.†† | | | 723,876 | |
| | 1,820 | | | Novanta, Inc.* †† | | | 289,544 | |
| | | | | | | | |
| | | | | | | 1,013,420 | |
| | | | | | | | |
| | |
| | | | Electronic Manufacturing Services 1.9% | | | |
| | 4,282 | | | Fabrinet* | | | 508,530 | |
| | | | | | | | |
| | |
| | | | Financial Exchanges & Data 5.7% | | | |
| | 2,320 | | | MarketAxess Holdings, Inc.†† | | | 907,793 | |
| | 3,094 | | | Morningstar, Inc.†† | | | 628,175 | |
| | | | | | | | |
| | | | | | | 1,535,968 | |
| | | | | | | | |
| | |
| | | | Health Care Equipment 2.5% | | | |
| | 2,907 | | | Inspire Medical Systems, Inc.* †† | | | 680,441 | |
| | | | | | | | |
| | |
| | | | Health Care Facilities 3.4% | | | |
| | 9,544 | | | Ensign Group, Inc.†† | | | 911,834 | |
| | | | | | | | |
| | | | | | | | |
| Shares | | | | | Value | |
| | | | | | | |
| | |
| | | | Health Care Services 1.4% | | | |
| | 3,679 | | | Addus HomeCare Corp.* †† | | $ | 392,770 | |
| | | | | | | | |
| | |
| | | | Health Care Supplies 5.7% | | | |
| | 27,663 | | | Neogen Corp.* †† | | | 512,319 | |
| | 7,850 | | | Silk Road Medical, Inc.* †† | | | 307,170 | |
| | 5,431 | | | UFP Technologies, Inc.* | | | 705,161 | |
| | | | | | | | |
| | | | | | | 1,524,650 | |
| | | | | | | | |
| | |
| | | | Home Improvement Retail 1.6% | | | |
| | 4,446 | | | Floor & Decor Holdings, Inc., Class A* †† | | | 436,686 | |
| | | | | | | | |
| | |
| | | | Homebuilding 2.3% | | | |
| | 8,159 | | | Skyline Champion Corp.* †† | | | 613,802 | |
| | | | | | | | |
| | |
| | | | Industrial Machinery & Supplies &
Components 6.0% | | | |
| | 3,719 | | | Kadant, Inc.†† | | | 775,486 | |
| | 3,567 | | | RBC Bearings, Inc.* †† | | | 830,148 | |
| | | | | | | | |
| | | | | | | 1,605,634 | |
| | | | | | | | |
| | |
| | | | Investment Banking & Brokerage 2.1% | | | |
| | 14,754 | | | Moelis & Co., Class A | | | 567,144 | |
| | | | | | | | |
| | |
| | | | IT Consulting & Other Services 4.5% | | | |
| | 5,295 | | | Globant SA* †† | | | 868,433 | |
| | 29,492 | | | Grid Dynamics Holdings, Inc.* | | | 337,978 | |
| | | | | | | | |
| | | | | | | 1,206,411 | |
| | | | | | | | |
| | |
| | | | Leisure Products 2.9% | | | |
| | 16,469 | | | Vista Outdoor, Inc.* †† | | | 456,356 | |
| | 7,900 | | | YETI Holdings, Inc.* †† | | | 316,000 | |
| | | | | | | | |
| | | | | | | 772,356 | |
| | | | | | | | |
| | |
| | | | Life Sciences Tools & Services 2.3% | | | |
| | 3,293 | | | Medpace Holdings, Inc.* †† | | | 619,249 | |
| | | | | | | | |
| | |
| | | | Managed Health Care 3.9% | | | |
| | 18,071 | | | HealthEquity, Inc.* †† | | | 1,060,948 | |
| | | | | | | | |
| | |
| | | | Multi-Sector Holdings 1.1% | | | |
| | 14,307 | | | Cannae Holdings, Inc.* | | | 288,715 | |
| | | | | | | | |
| | |
| | | | Oil & Gas Equipment & Services 1.8% | | | |
| | 11,773 | | | Cactus, Inc., Class A†† | | | 485,401 | |
| | | | | | | | |
| | |
| | | | Oil & Gas Exploration & Production 2.0% | | | |
| | 24,464 | | | Magnolia Oil & Gas Corp., Class A†† | | | 535,272 | |
| | | | | | | | |
| | |
| | | | Other Specialty Retail 2.0% | | | |
| | 2,673 | | | Five Below, Inc.* †† | | | 550,558 | |
| | | | | | | | |
| | |
| | | | Packaged Foods & Meats 1.2% | | | |
| | 5,062 | | | Freshpet, Inc.* †† | | | 335,054 | |
| | | | | | | | |
| | |
| | | | Paper Products 2.1% | | | |
| | 17,072 | | | Clearwater Paper Corp.* | | | 570,546 | |
| | | | | | | | |
| | |
| | | | Pharmaceuticals 1.9% | | | |
| | 45,116 | | | Esperion Therapeutics, Inc.* | | | 71,735 | |
| | 8,194 | | | Intra-Cellular Therapies, Inc.* †† | | | 443,705 | |
| | | | | | | | |
| | | | | | | 515,440 | |
| | | | | | | | |
68
| | |
| Wasatch Long/Short Alpha Fund (WALSX / WGLSX) | | MARCH 31, 2023 (Unaudited) |
Schedule of Investments (continued)
| | | | | | | | |
| Shares | | | | | Value | |
| | | | | | | |
| | |
| | | | Regional Banks 2.0% | | | |
| | 15,590 | | | Bank OZK†† | | $ | 533,178 | |
| | | | | | | | |
| | |
| | | | Research & Consulting Services 3.3% | | | |
| | 8,088 | | | ICF International, Inc.†† | | | 887,254 | |
| | | | | | | | |
| | |
| | | | Semiconductors 2.8% | | | |
| | 1,509 | | | Monolithic Power Systems, Inc.†† | | | 755,315 | |
| | | | | | | | |
| | |
| | | | Specialty Chemicals 4.7% | | | |
| | 5,364 | | | Balchem Corp.†† | | | 678,439 | |
| | 5,607 | | | Innospec, Inc.†† | | | 575,670 | |
| | | | | | | | |
| | | | 1,254,109 | |
| | | | | | | | |
| | |
| | | | Transaction & Payment Processing
Services 1.3% | | | |
| | 4,990 | | | Block, Inc.* †† | | | 342,563 | |
| | | | | | | | |
| | |
| | | | Total Common Stocks
(cost $32,131,771) | | | 31,311,757 | |
| | | | | | | | |
| |
| | | | COMMON STOCKS SOLD SHORT (36.4%) | |
| | |
| | | | Aerospace & Defense 1.0% | | | |
| | (7,611 | ) | | Spirit AeroSystems Holdings, Inc., Class A | | | (262,808 | ) |
| | | | | | | | |
| | |
| | | | Alternative Carriers 0.8% | | | |
| | (182,549 | ) | | Globalstar, Inc.* | | | (211,757 | ) |
| | | | | | | | |
| | |
| | | | Aluminum 0.8% | | | |
| | (22,445 | ) | | Century Aluminum Co.* | | | (224,450 | ) |
| | | | | | | | |
| | |
| | | | Application Software 4.4% | | | |
| | (4,100 | ) | | Alteryx, Inc., Class A* | | | (241,244 | ) |
| | (4,261 | ) | | Ceridian HCM Holding, Inc.* | | | (311,990 | ) |
| | (15,238 | ) | | Domo, Inc., Class B* | | | (216,227 | ) |
| | (9,538 | ) | | Nutanix, Inc., Class A* | | | (247,893 | ) |
| | (18,368 | ) | | Yext, Inc.* | | | (176,517 | ) |
| | | | | | | | |
| | | | | | | (1,193,871 | ) |
| | | | | | | | |
| | |
| | | | Asset Management & Custody
Banks 0.7% | | | |
| | (2,168 | ) | | Ares Management Corp., Class A | | | (180,898 | ) |
| | | | | | | | |
| | |
| | | | Automobile Manufacturers 0.5% | | | |
| | (91,465 | ) | | Workhorse Group, Inc.* | | | (121,648 | ) |
| | | | | | | | |
| | |
| | | | Automotive Parts & Equipment 0.5% | | | |
| | (22,123 | ) | | Luminar Technologies, Inc.* | | | (143,578 | ) |
| | | | | | | | |
| | |
| | | | Biotechnology 0.6% | | | |
| | (833 | ) | | Karuna Therapeutics, Inc.* | | | (151,306 | ) |
| | | | | | | | |
| | |
| | | | Broadcasting 0.6% | | | |
| | (37,845 | ) | | iHeartMedia, Inc., Class A* | | | (147,596 | ) |
| | | | | | | | |
| | |
| | | | Building Products 1.2% | | | |
| | (26,283 | )�� | | JELD-WEN Holding, Inc.* | | | (332,743 | ) |
| | | | | | | | |
| | |
| | | | Commercial Printing 0.8% | | | |
| | (12,606 | ) | | Deluxe Corp. | | | (201,696 | ) |
| | | | | | | | |
| | | | | | | | |
| Shares | | | | | Value | |
| | | | | | | |
| | |
| | | | Commodity Chemicals 0.6% | | | |
| | (21,353 | ) | | PureCycle Technologies, Inc.* | | $ | (149,471 | ) |
| | | | | | | | |
| | |
| | | | Electrical Components & Equipment 1.2% | | | |
| | (14,007 | ) | | Plug Power, Inc.* | | | (164,162 | ) |
| | (8,374 | ) | | Sunrun, Inc.* | | | (168,736 | ) |
| | | | | | | | |
| | | | | | | (332,898 | ) |
| | | | | | | | |
| | |
| | | | Electronic Equipment & Instruments 1.9% | | | |
| | (22,979 | ) | | Arlo Technologies, Inc.* | | | (139,253 | ) |
| | (147,178 | ) | | SmartRent, Inc.* | | | (375,304 | ) |
| | | | | | | | |
| | | | | | | (514,557 | ) |
| | | | | | | | |
| | |
| | | | Health Care Equipment 2.4% | | | |
| | (8,402 | ) | | Alphatec Holdings, Inc.* | | | (131,072 | ) |
| | (8,508 | ) | | Nevro Corp.* | | | (307,564 | ) |
| | (19,201 | ) | | Pulmonx Corp.* | | | (214,667 | ) |
| | | | | | | | |
| | | | | | | (653,303 | ) |
| | | | | | | | |
| | |
| | | | Health Care Technology 1.6% | | | |
| | (106,887 | ) | | American Well Corp., Class A* | | | (252,253 | ) |
| | (156,822 | ) | | Multiplan Corp.* | | | (166,232 | ) |
| | | | | | | | |
| | | | | | | (418,485 | ) |
| | | | | | | | |
| | |
| | | | Heavy Electrical Equipment 0.7% | | | |
| | (9,537 | ) | | Bloom Energy Corp., Class A* | | | (190,072 | ) |
| | | | | | | | |
| | |
| | | | Hotel & Resort REITs 0.9% | | | |
| | (20,092 | ) | | Park Hotels & Resorts, Inc. | | | (248,337 | ) |
| | | | | | | | |
| | |
| | | | Hotels, Resorts & Cruise Lines 1.6% | | | |
| | (1,725 | ) | | Hyatt Hotels Corp., Class A* | | | (192,838 | ) |
| | (25,419 | ) | | Lindblad Expeditions Holdings, Inc.* | | | (243,005 | ) |
| | | | | | | | |
| | | | | | | (435,843 | ) |
| | | | | | | | |
| | |
| | | | Interactive Home Entertainment 1.1% | | | |
| | (6,863 | ) | | ROBLOX Corp., Class A* | | | (308,698 | ) |
| | | | | | | | |
| | |
| | | | Interactive Media & Services 0.9% | | | |
| | (105,135 | ) | | Angi, Inc.* | | | (238,656 | ) |
| | | | | | | | |
| | |
| | | | Leisure Products 0.5% | | | |
| | (67,217 | ) | | AMMO, Inc.* | | | (132,417 | ) |
| | | | | | | | |
| | |
| | | | Mortgage REITs 0.8% | | | |
| | (26,507 | ) | | Rithm Capital Corp. | | | (212,056 | ) |
| | | | | | | | |
| | |
| | | | Multi-Utilities 0.5% | | | |
| | (4,192 | ) | | CenterPoint Energy, Inc. | | | (123,496 | ) |
| | | | | | | | |
| | |
| | | | Oil & Gas Refining & Marketing 0.5% | | | |
| | (4,356 | ) | | Par Pacific Holdings, Inc.* | | | (127,195 | ) |
| | | | | | | | |
| | |
| | | | Packaged Foods & Meats 0.5% | | | |
| | (801 | ) | | J M Smucker Co. | | | (126,053 | ) |
| | | | | | | | |
| | |
| | | | Passenger Airlines 1.6% | | | |
| | (24,060 | ) | | Hawaiian Holdings, Inc.* | | | (220,390 | ) |
| | (50,066 | ) | | Joby Aviation, Inc.* | | | (217,286 | ) |
| | | | | | | | |
| | | | | | | (437,676 | ) |
| | | | | | | | |
69
| | |
| Wasatch Long/Short Alpha Fund (WALSX / WGLSX) | | MARCH 31, 2023 (Unaudited) |
Schedule of Investments (continued)
| | | | | | | | |
| Shares | | | | | Value | |
| | | | | | | |
| | |
| | | | Personal Care Products 0.8% | | | |
| | (17,823 | ) | | Coty, Inc., Class A* | | $ | (214,945 | ) |
| | | | | | | | |
| | |
| | | | Pharmaceuticals 0.5% | | | |
| | (15,147 | ) | | Viatris, Inc. | | | (145,714 | ) |
| | | | | | | | |
| | |
| | | | Real Estate Development 0.8% | | | |
| | (2,591 | ) | | Howard Hughes Corp.* | | | (207,280 | ) |
| | | | | | | | |
| | |
| | | | Research & Consulting Services 1.2% | | | |
| | (27,834 | ) | | Dun & Bradstreet Holdings, Inc. | | | (326,771 | ) |
| | | | | | | | |
| | |
| | | | Restaurants 0.7% | | | |
| | (24,696 | ) | | Sweetgreen, Inc., Class A* | | | (193,617 | ) |
| | | | | | | | |
| | |
| | | | Semiconductors 0.6% | | | |
| | (2,567 | ) | | Wolfspeed, Inc.* | | | (166,727 | ) |
| | | | | | | | |
| | |
| | | | Soft Drinks & Non-Alcoholic
Beverages 0.6% | | | |
| | (1,788 | ) | | Celsius Holdings, Inc.* | | | (166,177 | ) |
| | | | | | | | |
| | |
| | | | Trading Companies & Distributors 1.4% | | | |
| | (7,700 | ) | | Ftai Aviation Ltd. | | | (215,292 | ) |
| | (10,799 | ) | | Xometry, Inc., Class A* | | | (161,661 | ) |
| | | | | | | | |
| | | | (376,953 | ) |
| | | | | | | | |
| | |
| | | | Transaction & Payment Processing
Services 0.6% | | | |
| | (14,099 | ) | | Affirm Holdings, Inc.* | | | (158,896 | ) |
| | | | | | | | |
| | |
| | | | Total Investments Sold Short
(proceeds $11,869,844) (36.4%) | | | (9,778,644 | ) |
| | | | | | | | |
| | |
| | | | Total Investments, Net of Investments Sold Short
(cost $20,261,927) 80.1% | | | 21,533,113 | |
| | | | | | | | |
| | |
| | | | Other Assets less Liabilities 19.9% | | | 5,341,429 | |
| | | | | | | | |
| | |
| | | | Net Assets 100.0% | | $ | 26,874,542 | |
| | | | | | | | |
| |
| | | | *Non-income producing. ††All or a portion of this security has been designated as collateral for short sales. REIT Real Estate Investment Trust. | |
| |
| | | | See Notes to Financial Statements. | |
At March 31, 2023, the Wasatch Long/Short Alpha Fund ’s investments excluding securities sold short, were in the following countries:
| | | | | |
| Country | | % |
Israel | | | | 2.1 | |
United States | | | | 97.9 | |
| | | | | |
TOTAL | | | | 100.0 | % |
| | | | | |
70
| | |
| Wasatch Micro Cap Fund (WMICX / WGICX) | | MARCH 31, 2023 (Unaudited) |
Schedule of Investments
| | | | | | | | |
| Shares | | | | | Value | |
| | | | | | | |
| |
| | | | COMMON STOCKS 96.9% | |
| | |
| | | | Advertising 1.9% | | | |
| | 506,025 | | | Thryv Holdings, Inc.* | | $ | 11,668,936 | |
| | | | | | | | |
| | |
| | | | Alternative Carriers 0.5% | | | |
| | 194,833 | | | Bandwidth, Inc., Class A* | | | 2,961,462 | |
| | | | | | | | |
| | |
| | | | Apparel Retail 1.9% | | | |
| | 160,096 | | | Boot Barn Holdings, Inc.* | | | 12,269,757 | |
| | | | | | | | |
| | |
| | | | Application Software 7.3% | | | |
| | 187,529 | | | Agilysys, Inc.* | | | 15,473,018 | |
| | 518,757 | | | Asure Software, Inc.* | | | 7,521,977 | |
| | 403,499 | | | CS Disco, Inc.* | | | 2,679,233 | |
| | 548,678 | | | Enfusion, Inc., Class A* | | | 5,761,119 | |
| | 133,730 | | | Sprout Social, Inc., Class A* | | | 8,141,482 | |
| | 1,360,110 | | | Weave Communications, Inc.* | | | 6,759,747 | |
| | | | | | | | |
| | | | | | | 46,336,576 | |
| | | | | | | | |
| | |
| | | | Automotive Parts & Equipment 3.3% | | | |
| | 117,257 | | | Patrick Industries, Inc. | | | 8,068,454 | |
| | 191,396 | | | XPEL, Inc.* | | | 13,005,358 | |
| | | | | | | | |
| | | | | | | 21,073,812 | |
| | | | | | | | |
| | |
| | | | Biotechnology 3.3% | | | |
| | 342,286 | | | Atara Biotherapeutics, Inc.* | | | 992,629 | |
| | 613,968 | | | BriaCell Therapeutics Corp.* | | | 4,574,062 | |
| | 84,125 | | | Denali Therapeutics, Inc.* | | | 1,938,240 | |
| | 203,425 | | | Dyne Therapeutics, Inc.* | | | 2,343,456 | |
| | 77,667 | | | Kymera Therapeutics, Inc.* | | | 2,301,273 | |
| | 281,088 | | | MacroGenics, Inc.* | | | 2,015,401 | |
| | 364,784 | | | Nkarta, Inc.* | | | 1,294,983 | |
| | 159,306 | | | Nurix Therapeutics, Inc.* | | | 1,414,637 | |
| | 997,280 | | | Sangamo Therapeutics, Inc.* | | | 1,755,213 | |
| | 151,393 | | | Viking Therapeutics, Inc.* | | | 2,520,694 | |
| | | | | | | | |
| | | | | | | 21,150,588 | |
| | | | | | | | |
| | |
| | | | Building Products 2.7% | | | |
| | 60,727 | | | CSW Industrials, Inc. | | | 8,436,802 | |
| | 895,488 | | | Janus International Group, Inc.* | | | 8,829,512 | |
| | | | | | | | |
| | | | | | | 17,266,314 | |
| | | | | | | | |
| | |
| | | | Casinos & Gaming 1.0% | | | |
| | 423,766 | | | NeoGames SA* | | | 6,441,243 | |
| | | | | | | | |
| | |
| | | | Construction & Engineering 1.6% | | | |
| | 364,799 | | | Construction Partners, Inc., Class A* | | | 9,827,685 | |
| | | | | | | | |
| | |
| | | | Consumer Finance 1.3% | | | |
| | 985,631 | | | EZCORP, Inc., Class A* | | | 8,476,427 | |
| | | | | | | | |
| | |
| | | | Data Processing & Outsourced
Services 1.2% | | | |
| | 524,649 | | | TaskUS, Inc., Class A* | | | 7,575,932 | |
| | | | | | | | |
| | |
| | | | Distillers & Vintners 0.2% | | | |
| | 843,723 | | | Vintage Wine Estates, Inc.* | | | 902,784 | |
| | | | | | | | |
| | |
| | | | Electrical Components &
Equipment 2.3% | | | |
| | 367,551 | | | Allied Motion Technologies, Inc. | | | 14,205,846 | |
| | | | | | | | |
| | | | | | | | |
| Shares | | | | | Value | |
| | | | | | | |
| | |
| | | | Electronic Equipment &
Instruments 3.2% | | | |
| | 431,494 | | | Napco Security Technologies, Inc.* | | $ | 16,215,544 | |
| | 411,914 | | | nLight, Inc.* | | | 4,193,285 | |
| | | | | | | | |
| | | | | | | 20,408,829 | |
| | | | | | | | |
| | |
| | | | Environmental & Facilities
Services 3.1% | | | |
| | 543,269 | | | Heritage-Crystal Clean, Inc.* | | | 19,345,809 | |
| | | | | | | | |
| | |
| | | | Financial Exchanges & Data 0.7% | | | |
| | 628,434 | | | Open Lending Corp., Class A* | | | 4,424,175 | |
| | | | | | | | |
| | |
| | | | Health Care Equipment 1.2% | | | |
| | 444,208 | | | Paragon 28, Inc.* | | | 7,582,631 | |
| | | | | | | | |
| | |
| | | | Health Care Facilities 1.9% | | | |
| | 820,912 | | | Pennant Group, Inc.* | | | 11,722,623 | |
| | | | | | | | |
| | |
| | | | Health Care Services 4.3% | | | |
| | 174,755 | | | Addus HomeCare Corp.* | | | 18,656,844 | |
| | 387,426 | | | Castle Biosciences, Inc.* | | | 8,802,319 | |
| | | | | | | | |
| | | | | | | 27,459,163 | |
| | | | | | | | |
| | |
| | | | Health Care Supplies 6.0% | | | |
| | 237,991 | | | OrthoPediatrics Corp.* | | | 10,540,621 | |
| | 245,700 | | | Silk Road Medical, Inc.* | | | 9,614,241 | |
| | 134,707 | | | UFP Technologies, Inc.* | | | 17,490,357 | |
| | | | | | | | |
| | | | | | | 37,645,219 | |
| | | | | | | | |
| | |
| | | | Health Care Technology 2.2% | | | |
| | 206,438 | | | Simulations Plus, Inc. | | | 9,070,886 | |
| | 875,284 | | | Tabula Rasa HealthCare, Inc.* | | | 4,892,837 | |
| | | | | | | | |
| | | | | | | 13,963,723 | |
| | | | | | | | |
| | |
| | | | Home Furnishings 0.4% | | | |
| | 860,315 | | | Purple Innovation, Inc.* | | | 2,271,232 | |
| | | | | | | | |
| | |
| | | | Homebuilding 1.7% | | | |
| | 813,629 | | | Dream Finders Homes, Inc., Class A* | | | 10,780,584 | |
| | | | | | | | |
| | |
| | | | Human Resource & Employment
Services 0.9% | | | |
| | 500,929 | | | DLH Holdings Corp.* | | | 5,745,656 | |
| | | | | | | | |
| | |
| | | | Industrial Machinery & Supplies &
Components 7.1% | | | |
| | 255,382 | | | Helios Technologies, Inc. | | | 16,701,983 | |
| | 83,950 | | | Kadant, Inc. | | | 17,505,254 | |
| | 389,052 | | | Kornit Digital Ltd.* | | | 7,532,046 | |
| | 3,316,704 | | | Markforged Holding Corp.* | | | 3,180,056 | |
| | | | | | | | |
| | | | | | | 44,919,339 | |
| | | | | | | | |
| | |
| | | | Insurance Brokers 2.5% | | | |
| | 194,190 | | | Goosehead Insurance, Inc., Class A* | | | 10,136,718 | |
| | 613,024 | | | Hagerty, Inc., Class A* | | | 5,357,830 | |
| | | | | | | | |
| | | | | | | 15,494,548 | |
| | | | | | | | |
| | |
| | | | IT Consulting & Other Services 1.7% | | | |
| | 943,869 | | | Grid Dynamics Holdings, Inc.* | | | 10,816,739 | |
| | | | | | | | |
| | |
| | | | Leisure Facilities 1.5% | | | |
| | 305,119 | | | Xponential Fitness, Inc., Class A* | | | 9,272,566 | |
| | | | | | | | |
71
| | |
| Wasatch Micro Cap Fund (WMICX / WGICX) | | MARCH 31, 2023 (Unaudited) |
Schedule of Investments (continued)
| | | | | | | | |
| Shares | | | | | Value | |
| | | | | | | |
| | |
| | | | Leisure Products 1.9% | | | |
| | 387,449 | | | MasterCraft Boat Holdings, Inc.* | | $ | 11,790,073 | |
| | | | | | | | |
| | |
| | | | Life Sciences Tools & Services 0.3% | | | |
| | 478,068 | | | Inotiv, Inc.* | | | 2,070,034 | |
| | | | | | | | |
| | |
| | | | Oil & Gas Equipment & Services 1.7% | | | |
| | 483,938 | | | DMC Global, Inc.* | | | 10,632,118 | |
| | | | | | | | |
| | |
| | | | Packaged Foods & Meats 1.4% | | | |
| | 135,110 | | | Freshpet, Inc.* | | | 8,942,931 | |
| | | | | | | | |
| | |
| | | | Pharmaceuticals 0.8% | | | |
| | 1,128,227 | | | Esperion Therapeutics, Inc.* | | | 1,793,881 | |
| | 30,560 | | | Intra-Cellular Therapies, Inc.* | | | 1,654,824 | |
| | 7,861,171 | | | PharmaCielo Ltd.* ‡‡ | | | 1,366,907 | |
| | | | | | | | |
| | | | | | | 4,815,612 | |
| | | | | | | | |
| | |
| | | | Regional Banks 2.4% | | | |
| | 395,056 | | | Esquire Financial Holdings, Inc. | | | 15,446,690 | |
| | | | | | | | |
| | |
| | | | Research & Consulting Services 2.4% | | | |
| | 140,738 | | | ICF International, Inc. | | | 15,438,959 | |
| | | | | | | | |
| | |
| | | | Restaurants 2.6% | | | |
| | 317,211 | | | Chuy’s Holdings, Inc.* | | | 11,372,014 | |
| | 79,827 | | | Kura Sushi USA, Inc., Class A* | | | 5,255,810 | |
| | | | | | | | |
| | | | | | | 16,627,824 | |
| | | | | | | | |
| | |
| | | | Semiconductor Materials &
Equipment 6.4% | | | |
| | 146,311 | | | Nova Ltd.* | | | 15,285,110 | |
| | 236,019 | | | PDF Solutions, Inc.* | | | 10,007,205 | |
| | 727,298 | | | Veeco Instruments, Inc.* | | | 15,367,807 | |
| | | | | | | | |
| | | | | | | 40,660,122 | |
| | | | | | | | |
| | |
| | | | Semiconductors 2.8% | | | |
| | 67,796 | | | Impinj, Inc.* | | | 9,187,714 | |
| | 61,711 | | | SiTime Corp.* | | | 8,777,155 | |
| | | | | | | | |
| | | | | | | 17,964,869 | |
| | | | | | | | |
| | |
| | | | Systems Software 2.6% | | | |
| | 71,874 | | | CyberArk Software Ltd.* | | | 10,635,915 | |
| | 128,384 | | | Rapid7, Inc.* | | | 5,894,109 | |
| | | | | | | | |
| | | | | | | 16,530,024 | |
| | | | | | | | |
| | |
| | | | Trading Companies &
Distributors 3.0% | | | |
| | 213,981 | | | Transcat, Inc.* | | | 19,127,762 | |
| | | | | | | | |
| | |
| | | | Transaction & Payment Processing
Services 1.7% | | | |
| | 1,933,333 | | | Cantaloupe, Inc.* | | | 11,019,998 | |
| | | | | | | | |
| | |
| | | | Total Common Stocks
(cost $555,679,174) | | | 613,077,214 | |
| | | | | | | | |
| |
| | | | PREFERRED STOCKS 1.6% | |
| | |
| | | | Textiles 1.6% | | | |
| | 339,559 | | | Johnnie-O Holdings, Inc., Series A Pfd.* *** † | | | 10,183,374 | |
| | | | | | | | |
| | |
| | | | Total Preferred Stocks
(cost $10,000,013) | | | 10,183,374 | |
| | | | | | | | |
| | | | | | | | |
| Shares | | | | | Value | |
| | | | | | | |
| |
| | | | WARRANTS 0.1% | |
| | |
| | | | Pharmaceuticals 0.1% | | | |
| | 1,202,790 | | | Esperion Therapeutics, Inc., expiring 9/22/2026**** † | | $ | 661,535 | |
| | | | | | | | |
| | 45,000 | | | IM Cannabis Corp., expiring
5/7/2026**** † | | | — | |
| | | | | | | | |
| | | | | | | 661,535 | |
| | | | | | | | |
| | |
| | | | Total Warrants
(cost $1,230,197) | | | 661,535 | |
| | | | | | | | |
| | |
| | | | Total Investments
(cost $566,909,384) 98.6% | | | 623,922,123 | |
| | |
| | | | Other Assets less Liabilities 1.4% | | | 8,927,795 | |
| | | | | | | | |
| | |
| | | | Net Assets 100.0% | | $ | 632,849,918 | |
| | | | | | | | |
| |
| | | | *Non-income producing. ***Security was fair valued under procedures adopted by the Board of Trustees using unobservable inputs as described in Note 12, as applicable. †Security was purchased in a private placement transaction or under Rule 144A of the Securities Act of 1933 (see Note 9). The aggregate value of securities purchased in a private placement transaction or under Rule 144A of the Securities Act of 1933 at March 31, 2023 amounted to approximately $10,844,909 and represented 1.71% of net assets. ‡‡Affiliated company (see Note 8). | |
| |
| | | | See Notes to Financial Statements. | |
At March 31, 2023, the Wasatch Micro Cap Fund’s investments were in the following countries:
| | | | | |
| Country | | % |
Canada | | | | 0.9 | |
Israel | | | | 6.4 | |
United States | | | | 92.7 | |
| | | | | |
TOTAL | | | | 100.0 | % |
| | | | | |
72
| | |
| Wasatch Micro Cap Value Fund (WAMVX / WGMVX) | | MARCH 31, 2023 (Unaudited) |
Schedule of Investments
| | | | | | | | |
| Shares | | | | | Value | |
| | | | | | | |
| |
| | | | COMMON STOCKS 96.5% | |
| | |
| | | | Agricultural Products & Services 0.6% | | | |
| | 82,121 | | | Winfarm SAS* | | $ | 1,870,265 | |
| | | | | | | | |
| | |
| | | | Air Freight & Logistics 1.5% | | | |
| | 670,000 | | | Radiant Logistics, Inc.* | | | 4,395,200 | |
| | | | | | | | |
| | |
| | | | Apparel Retail 1.2% | | | |
| | 136,000 | | | Shoe Carnival, Inc. | | | 3,488,400 | |
| | | | | | | | |
| | |
| | | | Application Software 1.1% | | | |
| | 692,400 | | | Weave Communications, Inc.* | | | 3,441,228 | |
| | | | | | | | |
| | |
| | | | Asset Management & Custody
Banks 1.1% | | | |
| | 813,000 | | | Fiducian Group Ltd. | | | 3,255,371 | |
| | | | | | | | |
| | |
| | | | Automotive Parts & Equipment 1.3% | | | |
| | 55,000 | | | Patrick Industries, Inc. | | | 3,784,550 | |
| | | | | | | | |
| | |
| | | | Automotive Retail 0.7% | | | |
| | 373,000 | | | CarParts.com, Inc.* | | | 1,991,820 | |
| | | | | | | | |
| | |
| | | | Biotechnology 0.5% | | | |
| | 163,000 | | | BioAtla, Inc.* | | | 436,840 | |
| | 56,000 | | | Viking Therapeutics, Inc.* | | | 932,400 | |
| | | | | | | | |
| | | | 1,369,240 | |
| | | | | | | | |
| | |
| | | | Casinos & Gaming 2.6% | | | |
| | 576,000 | | | Full House Resorts, Inc.* | | | 4,164,480 | |
| | 249,000 | | | NeoGames SA* | | | 3,784,800 | |
| | | | | | | | |
| | | | 7,949,280 | |
| | | | | | | | |
| | |
| | | | Commercial & Residential Mortgage
Finance 1.8% | | | |
| | 493,000 | | | Mortgage Advice Bureau Holdings Ltd. | | | 4,512,580 | |
| | 85,950 | | | Velocity Financial, Inc.* | | | 776,129 | |
| | | | | | | | |
| | | | 5,288,709 | |
| | | | | | | | |
| | |
| | | | Communications Equipment 3.6% | | | |
| | 124,500 | | | Digi International, Inc.* | | | 4,193,160 | |
| | 275,300 | | | Harmonic, Inc.* | | | 4,016,627 | |
| | 586,000 | | | Lantronix, Inc.* | | | 2,543,240 | |
| | | | | | | | |
| | | | 10,753,027 | |
| | | | | | | | |
| | |
| | | | Construction & Engineering 6.6% | | | |
| | 65,400 | | | Argan, Inc. | | | 2,646,738 | |
| | 187,714 | | | Bowman Consulting Group Ltd.* | | | 5,389,269 | |
| | 228,000 | | | Construction Partners, Inc., Class A* | | | 6,142,320 | |
| | 152,700 | | | Sterling Infrastructure, Inc.* | | | 5,784,276 | |
| | | | | | | | |
| | | | 19,962,603 | |
| | | | | | | | |
| | |
| | | | Consumer Finance 1.9% | | | |
| | 661,000 | | | EZCORP, Inc., Class A* | | | 5,684,600 | |
| | | | | | | | |
| | |
| | | | Diversified Metals & Mining 1.4% | | | |
| | 1,061,000 | | | Critical Elements Lithium Corp.* | | | 2,001,887 | |
| | 8,156,020 | | | Talon Metals Corp.* | | | 2,172,525 | |
| | | | | | | | |
| | | | 4,174,412 | |
| | | | | | | | |
| | |
| | | | Diversified Support Services 1.4% | | | |
| | 2,847,000 | | | Johnson Service Group PLC | | | 4,298,758 | |
| | | | | | | | |
| | | | | | | | |
| Shares | | | | | Value | |
| | | | | | | |
| | |
| | | | Electrical Components &
Equipment 1.3% | | | |
| | 100,000 | | | Allied Motion Technologies, Inc. | | $ | 3,865,000 | |
| | | | | | | | |
| | |
| | | | Electronic Equipment &
Instruments 2.8% | | | |
| | 342,800 | | | Luna Innovations, Inc.* | | | 2,464,732 | |
| | 159,456 | | | Napco Security Technologies, Inc.* | | | 5,992,356 | |
| | | | | | | | |
| | | | 8,457,088 | |
| | | | | | | | |
| | |
| | | | Electronic Manufacturing Services 2.4% | | | |
| | 23,000 | | | Fabrinet* | | | 2,731,480 | |
| | 183,400 | | | Kimball Electronics, Inc.* | | | 4,419,940 | |
| | | | | | | | |
| | | | 7,151,420 | |
| | | | | | | | |
| | |
| | | | Environmental & Facilities Services 0.6% | | | |
| | 239,500 | | | Aris Water Solution, Inc., Class A | | | 1,865,705 | |
| | | | | | | | |
| | |
| | | | Food Distributors 1.5% | | | |
| | 132,700 | | | Chefs’ Warehouse, Inc.* | | | 4,518,435 | |
| | | | | | | | |
| | |
| | | | Health Care Equipment 2.1% | | | |
| | 482,557 | | | Biomerica, Inc.* | | | 902,381 | |
| | 473,927 | | | Brainsway Ltd., ADR* | | | 831,742 | |
| | 143,000 | | | Inmode Ltd.* | | | 4,570,280 | |
| | | | | | | | |
| | | | 6,304,403 | |
| | | | | | | | |
| | |
| | | | Health Care Services 4.2% | | | |
| | 36,000 | | | Addus HomeCare Corp.* | | | 3,843,360 | |
| | 408,000 | | | InfuSystem Holdings, Inc.* | | | 3,162,000 | |
| | 594,139 | | | Viemed Healthcare, Inc.* | | | 5,739,383 | |
| | | | | | | | |
| | | | 12,744,743 | |
| | | | | | | | |
| | |
| | | | Health Care Supplies 1.1% | | | |
| | 73,000 | | | OrthoPediatrics Corp.* | | | 3,233,170 | |
| | | | | | | | |
| | |
| | | | Health Care Technology 3.7% | | | |
| | 597,539 | | | Instem PLC* | | | 4,630,817 | |
| | 55,905 | | | Nexus AG | | | 3,324,776 | |
| | 222,000 | | | OptimizeRx Corp.* | | | 3,247,860 | |
| | | | | | | | |
| | | | 11,203,453 | |
| | | | | | | | |
| | |
| | | | Home Furnishings 0.7% | | | |
| | 71,000 | | | Lovesac Co.* | | | 2,051,900 | |
| | | | | | | | |
| | |
| | | | Homebuilding 3.3% | | | |
| | 132,600 | | | Skyline Champion Corp.* | | | 9,975,498 | |
| | | | | | | | |
| | |
| | | | Industrial Machinery & Supplies
& Components 3.1% | | | |
| | 231,300 | | | Graham Corp.* | | | 3,025,404 | |
| | 29,000 | | | John Bean Technologies Corp. | | | 3,169,410 | |
| | 15,000 | | | Kadant, Inc. | | | 3,127,800 | |
| | | | | | | | |
| | | | 9,322,614 | |
| | | | | | | | |
| | |
| | | | Integrated Telecommunication
Services 0.9% | | | |
| | 213,800 | | | Ooma, Inc.* | | | 2,674,638 | |
| | | | | | | | |
| | |
| | | | Investment Banking & Brokerage 1.8% | | | |
| | 268,000 | | | JDC Group AG* | | | 5,391,483 | |
| | | | | | | | |
73
| | |
| Wasatch Micro Cap Value Fund (WAMVX / WGMVX) | | MARCH 31, 2023 (Unaudited) |
Schedule of Investments (continued)
| | | | | | | | |
| Shares | | | | | Value | |
| | | | | | | |
| | |
| | | | IT Consulting & Other Services 3.7% | | | |
| | 1,046,514 | | | AgileThought, Inc.* | | $ | 3,296,519 | |
| | 376,000 | | | Grid Dynamics Holdings, Inc.* | | | 4,308,960 | |
| | 1,270,300 | | | Pivotree, Inc.* | | | 3,383,707 | |
| | | | | | | | |
| | | | 10,989,186 | |
| | | | | | | | |
| | |
| | | | Leisure Products 1.6% | | | |
| | 199,000 | | | Clarus Corp. | | | 1,880,550 | |
| | 110,000 | | | Vista Outdoor, Inc.* | | | 3,048,100 | |
| | | | | | | | |
| | | | 4,928,650 | |
| | | | | | | | |
| | |
| | | | Life Sciences Tools & Services 1.4% | | | |
| | 199,000 | | | Ergomed PLC* | | | 2,494,238 | |
| | 381,500 | | | Inotiv, Inc.* | | | 1,651,895 | |
| | | | | | | | |
| | | | 4,146,133 | |
| | | | | | | | |
| | |
| | | | Metals & Mining 0.2% | | | |
| | 234,578 | | | Foran Mining Corp.* | | | 685,596 | |
| | | | | | | | |
| | |
| | | | Mortgage REITs 1.0% | | | |
| | 260,000 | | | AFC Gamma, Inc. | | | 3,161,600 | |
| | | | | | | | |
| | |
| | | | Movies & Entertainment 1.0% | | | |
| | 1,169,027 | | | Thunderbird Entertainment Group, Inc.* | | | 2,897,699 | |
| | | | | | | | |
| | |
| | | | Oil & Gas Exploration & Production 0.2% | | | |
| | 2,965,448 | | | New Stratus Energy, Inc.* | | | 669,228 | |
| | | | | | | | |
| | |
| | | | Packaged Foods & Meats 1.4% | | | |
| | 484,000 | | | Hilton Food Group PLC | | | 4,143,308 | |
| | | | | | | | |
| | |
| | | | Pharmaceuticals 2.1% | | | |
| | 469,205 | | | Biote Corp., Class A* | | | 2,904,379 | |
| | 163,000 | | | Harrow Health, Inc.* | | | 3,449,080 | |
| | | | | | | | |
| | | | 6,353,459 | |
| | | | | | | | |
| | |
| | | | Property & Casualty Insurance 1.7% | | | |
| | 74,750 | | | HCI Group, Inc. | | | 4,006,600 | |
| | 51,213 | | | Skyward Specialty Insurance Group, Inc.* | | | 1,120,028 | |
| | | | | | | | |
| | | | 5,126,628 | |
| | | | | | | | |
| | |
| | | | Regional Banks 5.6% | | | |
| | 99,000 | | | Axos Financial, Inc.* | | | 3,655,080 | |
| | 135,158 | | | California BanCorp* | | | 2,636,933 | |
| | 175,300 | | | Esquire Financial Holdings, Inc. | | | 6,854,230 | |
| | 633,000 | | | Sterling Bancorp, Inc.* | | | 3,582,780 | |
| | | | | | | | |
| | | | 16,729,023 | |
| | | | | | | | |
| | |
| | | | Research & Consulting Services 3.7% | | | |
| | 55,115 | | | ICF International, Inc. | | | 6,046,116 | |
| | 2,792,000 | | | Knights Group Holdings PLC | | | 2,245,624 | |
| | 167,000 | | | Red Violet, Inc.* | | | 2,939,200 | |
| | | | | | | | |
| | | | 11,230,940 | |
| | | | | | | | |
| | |
| | | | Restaurants 1.8% | | | |
| | 236,000 | | | El Pollo Loco Holdings, Inc. | | | 2,263,240 | |
| | 673,673 | | | Noodles & Co.* | | | 3,267,314 | |
| | | | | | | | |
| | | | 5,530,554 | |
| | | | | | | | |
| | |
| | | | Semiconductor Materials &
Equipment 1.3% | | | |
| | 189,000 | | | Veeco Instruments, Inc.* | | | 3,993,570 | |
| | | | | | | | |
| | | | | | | | |
| Shares | | | | | Value | |
| | | | | | | |
| | |
| | | | Semiconductors 4.0% | | | |
| | 67,200 | | | Impinj, Inc.* | | $ | 9,106,944 | |
| | 21,000 | | | SiTime Corp.* | | | 2,986,830 | |
| | | | | | | | |
| | | | 12,093,774 | |
| | | | | | | | |
| | |
| | | | Silver Mining 0.3% | | | |
| | 97,000 | | | Aya Gold & Silver, Inc.* | | | 780,881 | |
| | | | | | | | |
| | |
| | | | Specialized Finance 1.0% | | | |
| | 86,000 | | | A-Mark Precious Metals, Inc. | | | 2,979,900 | |
| | | | | | | | |
| |
| | | | Steel 1.3% | |
| | 80,000 | | | Haynes International, Inc. | | | 4,007,200 | |
| | | | | | | | |
| | |
| | | | Systems Software 1.2% | | | |
| | 80,100 | | | Rapid7, Inc.* | | | 3,677,391 | |
| | | | | | | | |
| | |
| | | | Trading Companies &
Distributors 3.9% | | | |
| | 122,000 | | | ADENTRA, Inc. | | | 2,327,162 | |
| | 111,000 | | | Global Industrial Co. | | | 2,979,240 | |
| | 232,724 | | | Karat Packaging, Inc. | | | 3,102,211 | |
| | 25,000 | | | Veritiv Corp. | | | 3,378,500 | |
| | | | | | | | |
| | | | 11,787,113 | |
| | | | | | | | |
| | |
| | | | Transaction & Payment Processing
Services 1.3% | | | |
| | 153,521 | | | i3 Verticals, Inc., Class A* | | | 3,765,870 | |
| | | | | | | | |
| | |
| | | | Water Utilities 0.0% | | | |
| | 2,652 | | | Consolidated Water Co. Ltd. | | | 43,572 | |
| | | | | | | | |
| | |
| | | | Total Common Stocks
(cost $247,953,955) | | | 290,188,288 | |
| | | | | | | | |
| |
| | | | LIMITED LIABILITY COMPANY MEMBERSHIP INTEREST 0.0% | |
| |
| | | | Pharmaceuticals 0.0% | |
| | 50,528 | | | Regenacy Pharmaceuticals LLC* *** † | | | 505 | |
| | | | | | | | |
| | |
| | | | Total Limited Liability Company Membership Interest
(cost $30,001) | | | 505 | |
| | | | | | | | |
| |
| | | | WARRANTS 0.0% | |
| | |
| | | | Trading Companies &
Distributors 0.0% | | | |
| | 14,476 | | | Greenlane Holdings, Inc., expiring 2/24/2026**** † | | | — | |
| | | | | | | | |
| | |
| | | | Total Warrants
(cost $396,902) | | | — | |
| | | | | | | | |
| | |
| | | | Total Investments§
(cost $248,380,858) 96.5% | | | 290,188,793 | |
| | |
| | | | Other Assets less Liabilities 3.5% | | | 10,370,361 | |
| | | | | | | | |
| | |
| | | | Net Assets 100.0% | | $ | 300,559,154 | |
| | | | | | | | |
74
| | |
| Wasatch Micro Cap Value Fund (WAMVX / WGMVX) | | MARCH 31, 2023 (Unaudited) |
Schedule of Investments (continued)
| | | | |
| | | *Non-income producing. ***Security was fair valued under procedures adopted by the Board of Trustees using unobservable inputs as described in Note 12, as applicable. †Security was purchased in a private placement transaction or under Rule 144A of the Securities Act of 1933 (see Note 9). The aggregate value of securities purchased in a private placement transaction or under Rule 144A of the Securities Act of 1933 at March 31, 2023 amounted to approximately $505 and represented 0.00% of net assets. §The aggregate amount of foreign securities fair valued pursuant to a systematic valuation model as a percent of net assets was 5.94%. ADR American Depositary Receipt. REIT Real Estate Investment Trust. |
| |
| | See Notes to Financial Statements. |
At March 31, 2023, the Wasatch Micro Cap Value Fund’s investments were in the following countries:
| | | | | |
| Country | | % |
Australia | | | | 1.1 | |
Canada | | | | 5.1 | |
France | | | | 0.7 | |
Germany | | | | 3.0 | |
Israel | | | | 3.2 | |
United Kingdom | | | | 7.7 | |
United States | | | | 79.2 | |
| | | | | |
TOTAL | | | | 100.0 | % |
| | | | | |
75
| | |
| Wasatch Small Cap Growth Fund (WAAEX / WIAEX) | | MARCH 31, 2023 (Unaudited) |
Schedule of Investments
| | | | | | | | |
| Shares | | | | | Value | |
| | | | | | | |
| |
| | | | COMMON STOCKS 97.6% | |
| | |
| | | | Apparel Retail 2.3% | | | |
| | 628,294 | | | Boot Barn Holdings, Inc.* | | $ | 48,152,452 | |
| | | | | | | | |
| | |
| | | | Application Software 7.2% | | | |
| | 461,848 | | | Five9, Inc.* | | | 33,386,992 | |
| | 1,069,918 | | | nCino, Inc.* | | | 26,512,568 | |
| | 316,420 | | | Paylocity Holding Corp.* | | | 62,897,968 | |
| | 518,763 | | | Sprout Social, Inc., Class A* | | | 31,582,291 | |
| | | | | | | | |
| | | | 154,379,819 | |
| | | | | | | | |
| | |
| | | | Asset Management & Custody
Banks 2.1% | | | |
| | 1,808,043 | | | StepStone Group, Inc., Class A | | | 43,881,204 | |
| | | | | | | | |
| | |
| | | | Automotive Parts & Equipment 5.3% | | | |
| | 555,903 | | | Fox Factory Holding Corp.* | | | 67,469,947 | |
| | 670,618 | | | XPEL, Inc.* | | | 45,568,493 | |
| | | | | | | | |
| | | | 113,038,440 | |
| | | | | | | | |
| | |
| | | | Biotechnology 2.8% | | | |
| | 492,958 | | | Allovir, Inc.* | | | 1,942,255 | |
| | 2,371,687 | | | Atara Biotherapeutics, Inc.* | | | 6,877,892 | |
| | 1,598,658 | | | C4 Therapeutics, Inc.* | | | 5,019,786 | |
| | 145,181 | | | Denali Therapeutics, Inc.* | | | 3,344,970 | |
| | 761,660 | | | Dyne Therapeutics, Inc.* | | | 8,774,323 | |
| | 268,635 | | | Kymera Therapeutics, Inc.* | | | 7,959,655 | |
| | 1,293,397 | | | Nkarta, Inc.* | | | 4,591,559 | |
| | 879,296 | | | Nurix Therapeutics, Inc.* | | | 7,808,149 | |
| | 3,030,155 | | | Sangamo Therapeutics, Inc.* | | | 5,333,073 | |
| | 448,439 | | | Viking Therapeutics, Inc.* | | | 7,466,509 | |
| | | | | | | | |
| | | | 59,118,171 | |
| | | | | | | | |
| | |
| | | | Broadline Retail 3.3% | | | |
| | 865,366 | | | Global-e Online Ltd.* | | | 27,890,746 | |
| | 721,051 | | | Ollie’s Bargain Outlet Holdings, Inc.* | | | 41,777,695 | |
| | | | | | | | |
| | | | 69,668,441 | |
| | | | | | | | |
| | |
| | | | Building Products 3.8% | | | |
| | 505,893 | | | AAON, Inc. | | | 48,914,794 | |
| | 1,373,067 | | | AZEK Co., Inc.* | | | 32,321,997 | |
| | | | | | | | |
| | | | 81,236,791 | |
| | | | | | | | |
| | |
| | | | Data Processing & Outsourced
Services 0.8% | | | |
| | 1,143,382 | | | TaskUS, Inc., Class A* | | | 16,510,436 | |
| | | | | | | | |
| | |
| | | | Distillers & Vintners 0.2% | | | |
| | 4,868,053 | | | Vintage Wine Estates, Inc.* ‡‡ | | | 5,208,817 | |
| | | | | | | | |
| | |
| | | | Financial Exchanges & Data 0.7% | | | |
| | 2,029,469 | | | Open Lending Corp., Class A* | | | 14,287,462 | |
| | | | | | | | |
| | |
| | | | Health Care Equipment 3.3% | | | |
| | 324,152 | | | Axonics, Inc.* | | | 17,685,733 | |
| | 221,358 | | | Inspire Medical Systems, Inc.* | | | 51,813,267 | |
| | | | | | | | |
| | | | 69,499,000 | |
| | | | | | | | |
| | |
| | | | Health Care Facilities 4.2% | | | |
| | 949,848 | | | Ensign Group, Inc. | | | 90,748,478 | |
| | | | | | | | |
| | | | | | | | |
| Shares | | | | | Value | |
| | | | | | | |
| | |
| | | | Health Care Services 0.9% | | | |
| | 824,664 | | | Castle Biosciences, Inc.* | | $ | 18,736,366 | |
| | | | | | | | |
| | |
| | | | Health Care Supplies 4.0% | | | |
| | 2,984,856 | | | Neogen Corp.* | | | 55,279,533 | |
| | 788,059 | | | Silk Road Medical, Inc.* | | | 30,836,749 | |
| | | | | | | | |
| | | | 86,116,282 | |
| | | | | | | | |
| | |
| | | | Home Improvement Retail 2.5% | | | |
| | 540,117 | | | Floor & Decor Holdings, Inc., Class A* | | | 53,050,292 | |
| | | | | | | | |
| |
| | | | Homebuilding 2.4% | |
| | 442,838 | | | LGI Homes, Inc.* | | | 50,496,817 | |
| | | | | | | | |
| | |
| | | | Industrial Machinery & Supplies &
Components 6.6% | | | |
| | 829,124 | | | Helios Technologies, Inc. | | | 54,224,710 | |
| | 821,290 | | | Kornit Digital Ltd.* | | | 15,900,174 | |
| | 302,354 | | | RBC Bearings, Inc.* | | | 70,366,846 | |
| | | | | | | | |
| | | | 140,491,730 | |
| | | | | | | | |
| | |
| | | | Insurance Brokers 1.4% | | | |
| | 592,982 | | | Goosehead Insurance, Inc., Class A* | | | 30,953,660 | |
| | | | | | | | |
| | |
| | | | Interactive Media & Services 1.8% | | | |
| | 2,409,083 | | | ZipRecruiter, Inc., Class A* | | | 38,400,783 | |
| | | | | | | | |
| | |
| | | | IT Consulting & Other Services 3.3% | | | |
| | 253,600 | | | Globant SA* | | | 41,592,936 | |
| | 2,495,825 | | | Grid Dynamics Holdings, Inc.* | | | 28,602,155 | |
| | | | | | | | |
| | | | 70,195,091 | |
| | | | | | | | |
| | |
| | | | Leisure Products 1.9% | | | |
| | 1,019,885 | | | YETI Holdings, Inc.* | | | 40,795,400 | |
| | | | | | | | |
| | |
| | | | Life Sciences Tools & Services 3.5% | | | |
| | 393,764 | | | Medpace Holdings, Inc.* | | | 74,047,320 | |
| | | | | | | | |
| | |
| | | | Managed Health Care 3.4% | | | |
| | 1,241,595 | | | HealthEquity, Inc.* | | | 72,894,042 | |
| | | | | | | | |
| | |
| | | | Other Specialty Retail 3.1% | | | |
| | 318,452 | | | Five Below, Inc.* | | | 65,591,558 | |
| | | | | | | | |
| | |
| | | | Packaged Foods & Meats 1.1% | | | |
| | 357,818 | | | Freshpet, Inc.* | | | 23,683,973 | |
| | | | | | | | |
| | |
| | | | Personal Care Products 3.2% | | | |
| | 2,013,183 | | | BellRing Brands, Inc.* | | | 68,448,222 | |
| | | | | | | | |
| | |
| | | | Pharmaceuticals 2.1% | | | |
| | 86,258 | | | Arvinas, Inc.* | | | 2,356,569 | |
| | 4,060,881 | | | Esperion Therapeutics, Inc.* | | | 6,456,801 | |
| | 682,262 | | | Intra-Cellular Therapies, Inc.* | | | 36,944,487 | |
| | | | | | | | |
| | | | 45,757,857 | |
| | | | | | | | |
| | |
| | | | Regional Banks 2.5% | | | |
| | 975,247 | | | Pinnacle Financial Partners, Inc. | | | 53,794,625 | |
| | | | | | | | |
| | |
| | | | Semiconductor Materials &
Equipment 3.9% | | | |
| | 792,997 | | | Nova Ltd.* | | | 82,844,397 | |
| | | | | | | | |
76
| | |
| Wasatch Small Cap Growth Fund (WAAEX / WIAEX) | | MARCH 31, 2023 (Unaudited) |
Schedule of Investments (continued)
| | | | | | | | |
| Shares | | | | | Value | |
| | | | | | | |
| | |
| | | | Semiconductors 1.3% | | | |
| | 194,624 | | | SiTime Corp.* | | $ | 27,681,372 | |
| | | | | | | | |
| | |
| | | | Specialized Consumer
Services 1.2% | | | |
| | 2,956,334 | | | Mister Car Wash, Inc.* | | | 25,483,599 | |
| | | | | | | | |
| | |
| | | | Systems Software 5.5% | | | |
| | 460,116 | | | CyberArk Software Ltd.* | | | 68,087,966 | |
| | 1,419,968 | | | JFrog Ltd.* | | | 27,973,369 | |
| | 446,376 | | | Rapid7, Inc.* | | | 20,493,122 | |
| | | | | | | | |
| | | | 116,554,457 | |
| | | | | | | | |
| | |
| | | | Trading Companies &
Distributors 3.1% | | | |
| | 477,024 | | | SiteOne Landscape Supply, Inc.* | | | 65,290,275 | |
| | | | | | | | |
| | |
| | | | Transaction & Payment Processing
Services 2.9% | | | |
| | 560,995 | | | Euronet Worldwide, Inc.* | | | 62,775,341 | |
| | | | | | | | |
| | |
| | | | Total Common Stocks
(cost $1,877,527,777) | | | 2,079,812,970 | |
| | | | | | | | |
| |
| | | | PREFERRED STOCKS 1.2% | |
| | |
| | | | Semiconductor Materials &
Equipment 0.0% | | | |
| | 184,939 | | | Nanosys, Inc., Series A-1 Pfd.* *** † | | | 147,951 | |
| | 991,999 | | | Nanosys, Inc., Series A-2 Pfd.* *** † | | | 793,599 | |
| | | | | | | | |
| | | | 941,550 | |
| | | | | | | | |
| | |
| | | | Systems Software 0.3% | | | |
| | 1,114,610 | | | DataStax, Inc., Series E Pfd.* *** † | | | 7,111,212 | |
| | | | | | | | |
| |
| | | | Textiles 0.9% | |
| | 611,205 | | | Johnnie-O Holdings, Inc., Series A Pfd.* *** † ‡‡ | | | 18,330,038 | |
| | | | | | | | |
| | |
| | | | Total Preferred Stocks
(cost $28,184,928) | | | 26,382,800 | |
| | | | | | | | |
| | | | | | | | |
| Shares | | | | | Value | |
| | | | | | | |
| | |
| | | | WARRANTS 0.1% | | | | |
| | |
| | | | Pharmaceuticals 0.1% | | | |
| | 2,908,006 | | | Esperion Therapeutics, Inc., expiring 9/22/2026* *** † | | $ | 1,599,404 | |
| | | | | | | | |
| | |
| | | | Total Warrants
(cost $1,411,160) | | | 1,599,404 | |
| | | | | | | | |
| | |
| | | | Total Investments
(cost $1,907,123,865) 98.9% | | | 2,107,795,174 | |
| | |
| | | | Other Assets less Liabilities 1.1% | | | 24,194,632 | |
| | | | | | | | |
| | |
| | | | Net Assets 100.0% | | $ | 2,131,989,806 | |
| | | | | | | | |
| |
| | | | | *Non-income producing. ***Security was fair valued under procedures adopted by the Board of Trustees using unobservable inputs as described in Note 12, as applicable. †Security was purchased in a private placement transaction or under Rule 144A of the Securities Act of 1933 (see Note 9). The aggregate value of securities purchased in a private placement transaction or under Rule 144A of the Securities Act of 1933 at March 31, 2023 amounted to approximately $27,982,204 and represented 1.31% of net assets. ‡‡Affiliated company (see Note 8). | |
| |
| | | | See Notes to Financial Statements. | |
At March 31, 2023, the Wasatch Small Cap Growth Fund’s investments were in the following countries:
| | | | | |
| Country | | % |
Israel | | | | 9.2 | |
United States | | | | 90.8 | |
| | | | | |
TOTAL | | | | 100.0 | % |
| | | | | |
77
| | |
| Wasatch Small Cap Value Fund (WMCVX / WICVX) | | MARCH 31, 2023 (Unaudited) |
Schedule of Investments
| | | | | | | | |
| Shares | | | | | Value | |
| | | | | | | |
| | |
| | | | COMMON STOCKS 103.1% | | | | |
| | |
| | | | Advertising 0.2% | | | |
| | 83,344 | | | Thryv Holdings, Inc.* | | $ | 1,921,913 | |
| | | | | | | | |
| |
| | | | Aerospace & Defense 0.0% | |
| | 1,000 | | | HEICO Corp., Class A | | | 135,900 | |
| | | | | | | | |
| | |
| | | | Application Software 3.1% | | | |
| | 235,497 | | | Five9, Inc.* | | | 17,024,078 | |
| | 302,930 | | | Guidewire Software, Inc.* | | | 24,855,407 | |
| | | | | | | | |
| | | | 41,879,485 | |
| | | | | | | | |
| | |
| | | | Asset Management & Custody
Banks 5.6% | | | |
| | 1,062,713 | | | Artisan Partners Asset Management, Inc., Class A | | | 33,985,562 | |
| | 545,059 | | | Hamilton Lane, Inc., Class A | | | 40,323,465 | |
| | | | | | | | |
| | | | 74,309,027 | |
| | | | | | | | |
| | |
| | | | Automotive Parts & Equipment 2.0% | | | |
| | 223,626 | | | Fox Factory Holding Corp.* | | | 27,141,488 | |
| | | | | | | | |
| |
| | | | Biotechnology 1.5% | |
| | 1,373,334 | | | Atara Biotherapeutics, Inc.* | | | 3,982,668 | |
| | 500,432 | | | C4 Therapeutics, Inc.* | | | 1,571,356 | |
| | 526,186 | | | Dyne Therapeutics, Inc.* | | | 6,061,663 | |
| | 157,881 | | | Kymera Therapeutics, Inc.* | | | 4,678,014 | |
| | 475,844 | | | Nurix Therapeutics, Inc.* | | | 4,225,495 | |
| | | | | | | | |
| | | | 20,519,196 | |
| | | | | | | | |
| | |
| | | | Broadcasting 1.0% | | | |
| | 76,990 | | | Nexstar Media Group, Inc. | | | 13,293,093 | |
| | | | | | | | |
| | |
| | | | Broadline Retail 2.1% | | | |
| | 474,473 | | | Ollie’s Bargain Outlet Holdings, Inc.* | | | 27,490,966 | |
| | | | | | | | |
| | |
| | | | Building Products 3.5% | | | |
| | 2,439,843 | | | Janus International Group, Inc.* | | | 24,056,852 | |
| | 474,972 | | | Trex Co., Inc.* | | | 23,116,887 | |
| | | | | | | | |
| | | | 47,173,739 | |
| | | | | | | | |
| | |
| | | | Cargo Ground Transportation 2.0% | | | |
| | 96,898 | | | Saia, Inc.* | | | 26,364,008 | |
| | | | | | | | |
| | |
| | | | Commodity Chemicals 3.7% | | | |
| | 350,756 | | | AdvanSix, Inc. | | | 13,423,432 | |
| | 1,015,304 | | | Valvoline, Inc. | | | 35,474,722 | |
| | | | | | | | |
| | | | 48,898,154 | |
| | | | | | | | |
| | |
| | | | Construction & Engineering 1.2% | | | |
| | 588,605 | | | Construction Partners, Inc., Class A* | | | 15,857,019 | |
| | | | | | | | |
| | |
| | | | Data Processing & Outsourced
Services 0.6% | | | |
| | 537,072 | | | TaskUS, Inc., Class A* | | | 7,755,320 | |
| | | | | | | | |
| | |
| | | | Diversified Chemicals 0.8% | | | |
| | 371,294 | | | Huntsman Corp. | | | 10,158,604 | |
| | | | | | | | |
| | |
| | | | Education Services 2.6% | | | |
| | 300,261 | | | Grand Canyon Education, Inc.* | | | 34,199,728 | |
| | | | | | | | |
| | | | | | | | |
| Shares | | | | | Value | |
| | | | | | | |
| | |
| | | | Electronic Components 1.1% | | | |
| | 632,069 | | | Vishay Intertechnology, Inc. | | $ | 14,297,401 | |
| | | | | | | | |
| | |
| | | | Electronic Manufacturing Services 2.4% | | | |
| | 273,849 | | | Fabrinet* | | | 32,522,307 | |
| | | | | | | | |
| | |
| | | | Financial Exchanges & Data 0.7% | | | |
| | 1,393,224 | | | Open Lending Corp., Class A* | | | 9,808,297 | |
| | | | | | | | |
| | |
| | | | Health Care Equipment 1.3% | | | |
| | 561,227 | | | Inmode Ltd.* | | | 17,936,815 | |
| | | | | | | | |
| | |
| | | | Health Care Facilities 3.9% | | | |
| | 541,902 | | | Ensign Group, Inc. | | | 51,773,317 | |
| | | | | | | | |
| | |
| | | | Health Care Supplies 3.1% | | | |
| | 835,165 | | | Neogen Corp.* | | | 15,467,256 | |
| | 199,515 | | | UFP Technologies, Inc.* | | | 25,905,027 | |
| | | | | | | | |
| | | | 41,372,283 | |
| | | | | | | | |
| | |
| | | | Home Furnishings 1.0% | | | |
| | 455,536 | | | Lovesac Co.* | | | 13,164,990 | |
| | | | | | | | |
| | |
| | | | Homebuilding 6.2% | | | |
| | 301,698 | | | Century Communities, Inc. | | | 19,284,536 | |
| | 170,888 | | | LGI Homes, Inc.* | | | 19,486,359 | |
| | 589,339 | | | Skyline Champion Corp.* | | | 44,335,973 | |
| | | | | | | | |
| | | | 83,106,868 | |
| | | | | | | | |
| | |
| | | | Industrial Machinery & Supplies &
Components 7.1% | | | |
| | 155,861 | | | Albany International Corp., Class A | | | 13,927,739 | |
| | 387,201 | | | Helios Technologies, Inc. | | | 25,322,945 | |
| | 267,065 | | | Kadant, Inc. | | | 55,688,394 | |
| | | | | | | | |
| | | | 94,939,078 | |
| | | | | | | | |
| | |
| | | | Investment Banking & Brokerage 2.6% | | | |
| | 910,080 | | | Moelis & Co., Class A | | | 34,983,475 | |
| | | | | | | | |
| | |
| | | | Leisure Products 2.8% | | | |
| | 563,575 | | | Vista Outdoor, Inc.* | | | 15,616,663 | |
| | 544,609 | | | YETI Holdings, Inc.* | | | 21,784,360 | |
| | | | | | | | |
| | | | 37,401,023 | |
| | | | | | | | |
| | |
| | | | Life Sciences Tools & Services 2.3% | | | |
| | 5,000 | | | Inotiv, Inc.* | | | 21,650 | |
| | 162,170 | | | Medpace Holdings, Inc.* | | | 30,496,068 | |
| | | | | | | | |
| | | | 30,517,718 | |
| | | | | | | | |
| | |
| | | | Managed Health Care 2.1% | | | |
| | 482,839 | | | HealthEquity, Inc.* | | | 28,347,478 | |
| | | | | | | | |
| | |
| | | | Mortgage REITs 1.2% | | | |
| | 1,389,731 | | | Arbor Realty Trust, Inc. | | | 15,968,009 | |
| | | | | | | | |
| | |
| | | | Oil & Gas Equipment & Services 1.5% | | | |
| | 470,779 | | | Cactus, Inc., Class A | | | 19,410,218 | |
| | | | | | | | |
| | |
| | | | Oil & Gas Exploration &
Production 4.0% | | | |
| | 1,390,390 | | | Magnolia Oil & Gas Corp., Class A | | | 30,421,733 | |
| | 485,301 | | | Matador Resources Co. | | | 23,124,593 | |
| | | | | | | | |
| | | | 53,546,326 | |
| | | | | | | | |
78
| | |
| Wasatch Small Cap Value Fund (WMCVX / WICVX) | | MARCH 31, 2023 (Unaudited) |
Schedule of Investments (continued)
| | | | | | | | |
| Shares | | | | | Value | |
| | | | | | | |
| | |
| | | | Paper Products 0.9% | | | |
| | 1,201,784 | | | Mercer International, Inc. | | $ | 11,747,439 | |
| | | | | | | | |
| |
| | | | Pharmaceuticals 1.1% | |
| | 273,463 | | | Intra-Cellular Therapies, Inc.* | | | 14,808,021 | |
| | | | | | | | |
| | |
| | | | Regional Banks 9.7% | | | |
| | 803,763 | | | Axos Financial, Inc.* | | | 29,674,930 | |
| | 982,990 | | | Bank OZK | | | 33,618,258 | |
| | 640,991 | | | FB Financial Corp. | | | 19,922,000 | |
| | 368,729 | | | Hancock Whitney Corp. | | | 13,421,736 | |
| | 221,327 | | | Pinnacle Financial Partners, Inc. | | | 12,208,397 | |
| | 380,808 | | | ServisFirst Bancshares, Inc. | | | 20,803,541 | |
| | | | | | | | |
| | | | 129,648,862 | |
| | | | | | | | |
| | |
| | | | Self Storage REITs 2.4% | | | |
| | 776,035 | | | National Storage Affiliates Trust | | | 32,422,742 | |
| | | | | | | | |
| | |
| | | | Semiconductor Materials &
Equipment 4.6% | | | |
| | 355,252 | | | Nova Ltd.* | | | 37,113,177 | |
| | 1,169,878 | | | Veeco Instruments, Inc.* | | | 24,719,522 | |
| | | | | | | | |
| | | | 61,832,699 | |
| | | | | | | | |
| | |
| | | | Specialized Consumer Services 1.0% | | | |
| | 1,552,230 | | | Mister Car Wash, Inc.* | | | 13,380,223 | |
| | | | | | | | |
| | |
| | | | Specialty Chemicals 3.1% | | | |
| | 408,851 | | | Innospec, Inc. | | | 41,976,732 | |
| | | | | | | | |
| | |
| | | | Steel 2.3% | | | |
| | 290,327 | | | Commercial Metals Co. | | | 14,196,990 | |
| | 466,300 | | | Ryerson Holding Corp. | | | 16,963,994 | |
| | | | | | | | |
| | | | 31,160,984 | |
| | | | | | | | |
| | | | | | | | |
| Shares | | | | | Value | |
| | | | | | | |
| | |
| | | | Trading Companies &
Distributors 2.1% | | | |
| | 278,782 | | | Triton International Ltd. | | $ | 17,624,598 | |
| | 81,288 | | | Veritiv Corp. | | | 10,985,260 | |
| | | | | | | | |
| | | | 28,609,858 | |
| | | | | | | | |
| | |
| | | | Transaction & Payment Processing
Services 2.7% | | | |
| | 317,714 | | | Euronet Worldwide, Inc.* | | | 35,552,197 | |
| | | | | | | | |
| | |
| | | | Total Common Stocks
(cost $1,182,628,216) | | | 1,377,333,000 | |
| | | | | | | | |
| | |
| | | | Total Investments
(cost $1,182,628,216) 103.1% | | | 1,377,333,000 | |
| | |
| | | | Liabilities less Other Assets (3.1%) | | | (42,042,144 | ) |
| | | | | | | | |
| | |
| | | | Net Assets 100.0% | | $ | 1,335,290,856 | |
| | | | | | | | |
| |
| | | | *Non-income producing. REIT Real Estate Investment Trust. | |
| |
| | | | See Notes to Financial Statements. | |
At March 31, 2023, the Wasatch Small Cap Value Fund’s investments were in the following countries:
| | | | | |
| Country | | % |
Israel | | | | 4.0 | |
United States | | | | 96.0 | |
| | | | | |
TOTAL | | | | 100.0 | % |
| | | | | |
79
| | |
| Wasatch Ultra Growth Fund (WAMCX / WGMCX) | | MARCH 31, 2023 (Unaudited) |
Schedule of Investments
| | | | | | | | |
| Shares | | | | | Value | |
| | | | | | | |
| | |
| | | | COMMON STOCKS 98.1% | | | | |
| | |
| | | | Application Software 10.9% | | | |
| | 549,354 | | | Five9, Inc.* | | $ | 39,712,801 | |
| | 86,520 | | | HubSpot, Inc.* | | | 37,095,450 | |
| | 199,196 | | | Paylocity Holding Corp.* | | | 39,596,181 | |
| | 639,431 | | | Q2 Holdings, Inc.* | | | 15,742,791 | |
| | 297,060 | | | Sprout Social, Inc., Class A* | | | 18,085,013 | |
| | | | | | | | |
| | | | 150,232,236 | |
| | | | | | | | |
| | |
| | | | Biotechnology 7.1% | | | |
| | 443,243 | | | Allovir, Inc.* | | | 1,746,377 | |
| | 1,881,974 | | | Atara Biotherapeutics, Inc.* | | | 5,457,725 | |
| | 876,668 | | | BioAtla, Inc.* | | | 2,349,470 | |
| | 1,342,841 | | | C4 Therapeutics, Inc.* | | | 4,216,521 | |
| | 226,049 | | | Denali Therapeutics, Inc.* | | | 5,208,169 | |
| | 607,013 | | | Dyne Therapeutics, Inc.* | | | 6,992,790 | |
| | 332,806 | | | Exact Sciences Corp.* | | | 22,567,575 | |
| | 958,607 | | | Exagen, Inc.* ‡‡ | | | 2,329,415 | |
| | 240,479 | | | Kymera Therapeutics, Inc.* | | | 7,125,393 | |
| | 987,112 | | | MacroGenics, Inc.* | | | 7,077,593 | |
| | 1,398,555 | | | Nkarta, Inc.* | | | 4,964,870 | |
| | 781,845 | | | Nurix Therapeutics, Inc.* | | | 6,942,783 | |
| | 5,454,568 | | | Sangamo Therapeutics, Inc.* | | | 9,600,040 | |
| | 695,988 | | | Viking Therapeutics, Inc.* | | | 11,588,200 | |
| | | | | | | | |
| | | | 98,166,921 | |
| | | | | | | | |
| | |
| | | | Broadline Retail 1.4% | | | |
| | 344,100 | | | Ollie’s Bargain Outlet Holdings, Inc.* | | | 19,937,154 | |
| | | | | | | | |
| | |
| | | | Building Products 2.2% | | | |
| | 633,033 | | | Trex Co., Inc.* | | | 30,809,716 | |
| | | | | | | | |
| | |
| | | | Distillers & Vintners 0.3% | | | |
| | 3,834,725 | | | Vintage Wine Estates, Inc.* ‡‡ | | | 4,103,156 | |
| | | | | | | | |
| | |
| | | | Financial Exchanges & Data 4.0% | | | |
| | 57,603 | | | MarketAxess Holdings, Inc. | | | 22,539,478 | |
| | 2,034,145 | | | Open Lending Corp., Class A* | | | 14,320,381 | |
| | 237,543 | | | Tradeweb Markets, Inc., Class A | | | 18,770,648 | |
| | | | | | | | |
| | | | 55,630,507 | |
| | | | | | | | |
| | |
| | | | Health Care Equipment 7.4% | | | |
| | 1,252,204 | | | Artivion, Inc.* | | | 16,403,872 | |
| | 578,771 | | | AtriCure, Inc.* | | | 23,990,058 | |
| | 544,713 | | | Conformis, Inc.* ‡‡ | | | 871,541 | |
| | 204,552 | | | Inspire Medical Systems, Inc.* | | | 47,879,487 | |
| | 769,525 | | | Paragon 28, Inc.* | | | 13,135,792 | |
| | | | | | | | |
| | | | 102,280,750 | |
| | | | | | | | |
| | |
| | | | Health Care Services 2.0% | | | |
| | 1,205,751 | | | Castle Biosciences, Inc.* | | | 27,394,663 | |
| | | | | | | | |
| | |
| | | | Health Care Supplies 3.6% | | | |
| | 4,780,050 | | | Cerus Corp.* | | | 14,196,748 | |
| | 897,138 | | | Silk Road Medical, Inc.* | | | 35,105,010 | |
| | | | | | | | |
| | | | 49,301,758 | |
| | | | | | | | |
| | |
| | | | Health Care Technology 1.5% | | | |
| | 112,190 | | | Veeva Systems, Inc., Class A* | | | 20,619,400 | |
| | | | | | | | |
| | |
| | | | Home Improvement Retail 3.6% | | | |
| | 500,566 | | | Floor & Decor Holdings, Inc., Class A* | | | 49,165,593 | |
| | | | | | | | |
| | | | | | | | |
| Shares | | | | | Value | |
| | | | | | | |
| | |
| | | | Homebuilding 3.3% | | | |
| | 145,587 | | | LGI Homes, Inc.* | | $ | 16,601,286 | |
| | 389,433 | | | Skyline Champion Corp.* | | | 29,297,044 | |
| | | | | | | | |
| | | | 45,898,330 | |
| | | | | | | | |
| | |
| | | | Industrial Machinery & Supplies &
Components 2.0% | | | |
| | 565,195 | | | Kornit Digital Ltd.* | | | 10,942,175 | |
| | 74,185 | | | RBC Bearings, Inc.* | | | 17,265,075 | |
| | | | | | | | |
| | | | 28,207,250 | |
| | | | | | | | |
| | |
| | | | Insurance Brokers 1.1% | | | |
| | 283,599 | | | Goosehead Insurance, Inc., Class A* | | | 14,803,868 | |
| | | | | | | | |
| | |
| | | | Internet Services &
Infrastructure 1.4% | | | |
| | 2,164,818 | | | BigCommerce Holdings, Inc., Series 1* | | | 19,353,473 | |
| | | | | | | | |
| | |
| | | | IT Consulting & Other Services 3.3% | | | |
| | 369,614 | | | Endava PLC, ADR* | | | 24,830,668 | |
| | 130,166 | | | Globant SA* | | | 21,348,526 | |
| | | | | | | | |
| | | | 46,179,194 | |
| | | | | | | | |
| | |
| | | | Leisure Products 0.5% | | | |
| | 944,979 | | | Solo Brands, Inc., Class A* | | | 6,784,949 | |
| | | | | | | | |
| | |
| | | | Managed Health Care 2.1% | | | |
| | 486,124 | | | HealthEquity, Inc.* | | | 28,540,340 | |
| | | | | | | | |
| | |
| | | | Metal, Glass & Plastic Containers 1.1% | | | |
| | 540,590 | | | TriMas Corp. | | | 15,060,837 | |
| | | | | | | | |
| | |
| | | | Oil & Gas Exploration &
Production 2.4% | | | |
| | 1,063,483 | | | Magnolia Oil & Gas Corp., Class A | | | 23,269,008 | |
| | 195,585 | | | Matador Resources Co. | | | 9,319,625 | |
| | | | | | | | |
| | | | 32,588,633 | |
| | | | | | | | |
| | |
| | | | Other Specialty Retail 3.1% | | | |
| | 207,753 | | | Five Below, Inc.* | | | 42,790,885 | |
| | | | | | | | |
| | |
| | | | Packaged Foods & Meats 3.7% | | | |
| | 777,344 | | | Freshpet, Inc.* | | | 51,452,399 | |
| | | | | | | | |
| | |
| | | | Pharmaceuticals 4.3% | | | |
| | 128,656 | | | Arvinas, Inc.* | | | 3,514,882 | |
| | 3,595,975 | | | Esperion Therapeutics, Inc.* | | | 5,717,600 | |
| | 932,935 | | | Intra-Cellular Therapies, Inc.* | | | 50,518,430 | |
| | | | | | | | |
| | | | 59,750,912 | |
| | | | | | | | |
| | |
| | | | Regional Banks 3.0% | | | |
| | 893,415 | | | Bank OZK | | | 30,554,793 | |
| | 189,181 | | | Pinnacle Financial Partners, Inc. | | | 10,435,224 | |
| | | | | | | | |
| | | | 40,990,017 | |
| | | | | | | | |
| | |
| | | | Semiconductor Materials &
Equipment 7.5% | | | |
| | 596,846 | | | Kulicke & Soffa Industries, Inc. | | | 31,447,816 | |
| | 358,634 | | | Nova Ltd.* | | | 37,466,494 | |
| | 827,227 | | | PDF Solutions, Inc.* | | | 35,074,425 | |
| | | | | | | | |
| | | | 103,988,735 | |
| | | | | | | | |
80
| | |
| Wasatch Ultra Growth Fund (WAMCX / WGMCX) | | MARCH 31, 2023 (Unaudited) |
Schedule of Investments (continued)
| | | | | | | | |
| Shares | | | | | Value | |
| | | | | | | |
| | |
| | | | Semiconductors 5.9% | | | |
| | 76,834 | | | Monolithic Power Systems, Inc. | | $ | 38,458,490 | |
| | 289,712 | | | Power Integrations, Inc. | | | 24,521,224 | |
| | 133,380 | | | SiTime Corp.* | | | 18,970,637 | |
| | | | | | | | |
| | | | 81,950,351 | |
| | | | | | | | |
| | |
| | | | Specialty Chemicals 2.7% | | | |
| | 300,517 | | | Balchem Corp. | | | 38,009,390 | |
| | | | | | | | |
| |
| | | | Systems Software 5.7% | |
| | 238,041 | | | CyberArk Software Ltd.* | | | 35,225,307 | |
| | 954,424 | | | JFrog Ltd.* | | | 18,802,153 | |
| | 171,994 | | | Monday.com Ltd.* | | | 24,552,144 | |
| | | | | | | | |
| | | | 78,579,604 | |
| | | | | | | | |
| | |
| | | | Transaction & Payment Processing
Services 1.0% | | | |
| | 196,653 | | | Block, Inc.* | | | 13,500,229 | |
| | | | | | | | |
| | |
| | | | Total Common Stocks
(cost $1,315,012,336) | | | 1,356,071,250 | |
| | | | | | | | |
| |
| | | | PREFERRED STOCKS 1.1% | |
| | |
| | | | Semiconductor Materials &
Equipment 0.0% | | | |
| | 46,235 | | | Nanosys, Inc., Series A-1 Pfd.* *** † | | | 36,988 | |
| | 248,000 | | | Nanosys, Inc., Series A-2 Pfd.* *** † | | | 198,400 | |
| | | | | | | | |
| | | | 235,388 | |
| | | | | | | | |
| | |
| | | | Textiles 1.1% | | | |
| | 509,338 | | | Johnnie-O Holdings, Inc., Series A Pfd.* *** † ‡‡ | | | 15,275,046 | |
| | | | | | | | |
| | |
| | | | Total Preferred Stocks
(cost $15,546,240) | | | 15,510,434 | |
| | | | | | | | |
| | |
| | | | WARRANTS 0.2% | | | | |
| | |
| | | | Insurance Brokers 0.1% | | | |
| | 450,000 | | | Hagerty, Inc., expiring 12/2/2026* *** † | | | 783,000 | |
| | | | | | | | |
| | | | | | | | |
| Shares | | | | | Value | |
| | | | | | | |
| | |
| | | | Pharmaceuticals 0.1% | | | |
| | 2,161,987 | | | Esperion Therapeutics, Inc., expiring 9/22/2026* *** † | | $ | 1,189,093 | |
| | | | | | | | |
| | |
| | | | Total Warrants
(cost $2,624,153) | | | 1,972,093 | |
| | | | | | | | |
| | |
| | | | Total Investments
(cost $1,333,182,728) 99.4% | | | 1,373,553,777 | |
| | |
| | | | Other Assets less Liabilities 0.6% | | | 8,650,074 | |
| | | | | | | | |
| | |
| | | | Net Assets 100.0% | | $ | 1,382,203,851 | |
| | | | | | | | |
| |
| | | | | *Non-income producing. ***Security was fair valued under procedures adopted by the Board of Trustees using unobservable inputs as described in Note 12, as applicable. †Security was purchased in a private placement transaction or under Rule 144A of the Securities Act of 1933 (see Note 9). The aggregate value of securities purchased in a private placement transaction or under Rule 144A of the Securities Act of 1933 at March 31, 2023 amounted to approximately $17,482,527 and represented 1.26% of net assets. ‡‡Affiliated company (see Note 8). ADR American Depositary Receipt. REIT Real Estate Investment Trust. | |
| |
| | | | See Notes to Financial Statements. | |
At March 31, 2023, the Wasatch Ultra Growth Fund’s investments were in the following countries:
| | | | | |
| Country | | % |
Israel | | | | 7.9 | |
United Kingdom | | | | 1.8 | |
United States | | | | 90.3 | |
| | | | | |
TOTAL | | | | 100.0 | % |
| | | | | |
81
| | |
| Wasatch U.S. Select Fund (WAUSX / WGUSX) | | MARCH 31, 2023 (Unaudited) |
Schedule of Investments
| | | | | | | | |
| Shares | | | | | Value | |
| | | | | | | |
| | |
| | | | COMMON STOCKS 99.2% | | | | |
| | |
| | | | Aerospace & Defense 4.1% | | | |
| | 2,915 | | | HEICO Corp., Class A | | $ | 396,148 | |
| | | | | | | | |
| | |
| | | | Application Software 22.8% | | | |
| | 1,033 | | | ANSYS, Inc.* | | | 343,782 | |
| | 2,051 | | | Five9, Inc.* | | | 148,267 | |
| | 3,421 | | | Guidewire Software, Inc.* | | | 280,693 | |
| | 395 | | | HubSpot, Inc.* | | | 169,356 | |
| | 1,099 | | | Paylocity Holding Corp.* | | | 218,459 | |
| | 947 | | | Roper Technologies, Inc. | | | 417,334 | |
| | 875 | | | Tyler Technologies, Inc.* | | | 310,310 | |
| | 1,501 | | | Workday, Inc., Class A* | | | 310,017 | |
| | | | | | | | |
| | | | 2,198,218 | |
| | | | | | | | |
| | |
| | | | Asset Management & Custody Banks 3.1% | | | |
| | 4,049 | | | Hamilton Lane, Inc., Class A | | | 299,545 | |
| | | | | | | | |
| | |
| | | | Automotive Parts & Equipment 2.1% | | | |
| | 1,624 | | | Fox Factory Holding Corp.* | | | 197,105 | |
| | | | | | | | |
| | |
| | | | Building Products 2.5% | | | |
| | 4,950 | | | Trex Co., Inc.* | | | 240,917 | |
| | | | | | | | |
| | |
| | | | Cargo Ground Transportation 2.9% | | | |
| | 832 | | | Old Dominion Freight Line, Inc. | | | 283,579 | |
| | | | | | | | |
| | |
| | | | Commodity Chemicals 3.3% | | | |
| | 9,040 | | | Valvoline, Inc. | | | 315,858 | |
| | | | | | | | |
| | |
| | | | Distributors 2.5% | | | |
| | 695 | | | Pool Corp. | | | 237,996 | |
| | | | | | | | |
| | |
| | | | Diversified Support Services 4.1% | | | |
| | 5,256 | | | Copart, Inc.* | | | 395,304 | |
| | | | | | | | |
| | |
| | | | Electrical Components & Equipment 4.5% | | | |
| | 2,962 | | | AMETEK, Inc. | | | 430,467 | |
| | | | | | | | |
| | |
| | | | Electronic Components 4.3% | | | |
| | 5,033 | | | Amphenol Corp., Class A | | | 411,297 | |
| | | | | | | | |
| | |
| | | | Electronic Equipment & Instruments 5.3% | | | |
| | 4,776 | | | Cognex Corp. | | | 236,651 | |
| | 1,729 | | | Novanta, Inc.* | | | 275,066 | |
| | | | | | | | |
| | | | 511,717 | |
| | | | | | | | |
| | |
| | | | Financial Exchanges & Data 5.4% | | | |
| | 762 | | | MarketAxess Holdings, Inc. | | | 298,163 | |
| | 1,109 | | | Morningstar, Inc. | | | 225,160 | |
| | | | | | | | |
| | | | 523,323 | |
| | | | | | | | |
| | |
| | | | Health Care Equipment 1.7% | | | |
| | 703 | | | Inspire Medical Systems, Inc.* | | | 164,551 | |
| | | | | | | | |
| | |
| | | | Health Care Facilities 4.1% | | | |
| | 4,150 | | | Ensign Group, Inc. | | | 396,491 | |
| | | | | | | | |
| | |
| | | | Health Care Technology 2.6% | | | |
| | 1,359 | | | Veeva Systems, Inc., Class A* | | | 249,771 | |
| | | | | | | | |
| | |
| | | | Home Improvement Retail 1.7% | | | |
| | 1,707 | | | Floor & Decor Holdings, Inc., Class A* | | | 167,662 | |
| | | | | | | | |
| | | | | | | | |
| Shares | | | | | Value | |
| | | | | | | |
| | |
| | | | IT Consulting & Other Services 1.8% | | | |
| | 1,042 | | | Globant SA* | | $ | 170,898 | |
| | | | | | | | |
| | |
| | | | Life Sciences Tools & Services 5.0% | | | |
| | 1,335 | | | ICON PLC* | | | 285,143 | |
| | 1,020 | | | Medpace Holdings, Inc.* | | | 191,811 | |
| | | | | | | | |
| | | | 476,954 | |
| | | | | | | | |
| | |
| | | | Managed Health Care 3.6% | | | |
| | 5,868 | | | HealthEquity, Inc.* | | | 344,510 | |
| | | | | | | | |
| | |
| | | | Other Specialty Retail 2.1% | | | |
| | 1,001 | | | Five Below, Inc.* | | | 206,176 | |
| | | | | | | | |
| | |
| | | | Regional Banks 2.6% | | | |
| | 7,286 | | | Bank OZK | | | 249,181 | |
| | | | | | | | |
| | |
| | | | Semiconductors 2.2% | | | |
| | 430 | | | Monolithic Power Systems, Inc. | | | 215,232 | |
| | | | | | | | |
| | |
| | | | Specialty Chemicals 3.7% | | | |
| | 2,782 | | | Balchem Corp. | | | 351,867 | |
| | | | | | | | |
| | |
| | | | Transaction & Payment Processing
Services 1.2% | | | |
| | 1,611 | | | Block, Inc.* | | | 110,595 | |
| | | | | | | | |
| | |
| | | | Total Common Stocks
(cost $8,850,192) | | | 9,545,362 | |
| | | | | | | | |
| | |
| | | | Total Investments
(cost $8,850,192) 99.2% | | | 9,545,362 | |
| | |
| | | | Other Assets less Liabilities 0.8% | | | 78,559 | |
| | | | | | | | |
| | |
| | | | Net Assets 100.0% | | $ | 9,623,921 | |
| | | | | | | | |
| |
| | | | *Non-income producing. | |
| |
| | | | See Notes to Financial Statements. | |
At March 31, 2023, the Wasatch U.S. Select Fund’s investments were in the following countries:
| | | | | |
| Country | | % |
Ireland | | | | 3.0 | |
United States | | | | 97.0 | |
| | | | | |
TOTAL | | | | 100.0 | % |
| | | | | |
82
| | |
| Wasatch-Hoisington U.S. Treasury Fund (WHOSX) | | MARCH 31, 2023 (Unaudited) |
Schedule of Investments
| | | | | | | | |
Principal
Amount | | | | | Value | |
| | | | | | | |
| |
| | | | U.S. GOVERNMENT
OBLIGATIONS 98.4% | |
| $ | 114,000,000 | | | U.S. Treasury Bond, 1.25%, 5/15/50 | | $ | 65,955,235 | |
| | 103,300,000 | | | U.S. Treasury Bond, 1.375%, 8/15/50 | | | 61,758,066 | |
| | 68,000,000 | | | U.S. Treasury Bond, 1.875%, 11/15/51 | | | 46,088,594 | |
| | 54,900,000 | | | U.S. Treasury Bond, 2.25%, 8/15/46 | | | 41,301,528 | |
| | 45,530,000 | | | U.S. Treasury Bond, 3.00%, 8/15/48 | | | 39,612,878 | |
| | 22,150,000 | | | U.S. Treasury Bond, 2.50%, 2/15/45 | | | 17,632,611 | |
| | | | | | | | |
| | |
| | | | Total U.S. Government
Obligations
(cost $348,060,983) | | | 272,348,912 | |
| | | | | | | | |
| | |
| | | | Total Investments
(cost $348,060,983) 98.4% | | | 272,348,912 | |
| | |
| | | | Other Assets less Liabilities 1.6% | | | 4,506,252 | |
| | | | | | | | |
| | |
| | | | Net Assets 100.0% | | $ | 276,855,164 | |
| | | | | | | | |
| |
| | | | See Notes to Financial Statements. | |
83
Statements of Assets and Liabilities
| | | | | | | | | | | | | | | |
| | | Core
Growth
Fund | | Emerging
India
Fund | | Emerging
Markets
Select
Fund |
| | | | | | | | | | | | | | | |
Assets: | | | | | | | | | | | | | | | |
Investments, at cost | |
Unaffiliated issuers | | | $ | 2,303,100,493 | | | | $ | 313,198,372 | | | | $ | 476,625,306 | |
| | | | | | | | | | | | | | | |
| | | $ | 2,303,100,493 | | | | $ | 313,198,372 | | | | $ | 476,625,306 | |
| | | | | | | | | | | | | | | |
Investments, at market value | |
Unaffiliated issuers | | | $ | 2,926,157,030 | | | | $ | 429,248,252 | | | | $ | 433,113,057 | |
| | | | | | | | | | | | | | | |
| | | | 2,926,157,030 | | | | | 429,248,252 | | | | | 433,113,057 | |
Cash | | | | 60,338,701 | | | | | 17,024,853 | | | | | 19,311,574 | |
Foreign currency on deposit (cost of $9,052, $0, $908,616, $598,134, $2, $562, $5 and $171,043, respectively) | | | | 9,030 | | | | | — | | | | | 908,616 | |
Receivable for investment securities sold | | | | 3,450,272 | | | | | — | | | | | — | |
Capital shares receivable | | | | 2,367,677 | | | | | 89,197 | | | | | 845,342 | |
Interest and dividends receivable | | | | 634,754 | | | | | 275,322 | | | | | 337,089 | |
Prepaid expenses and other assets | | | | 74,042 | | | | | 23,992 | | | | | 62,569 | |
| | | | | | | | | | | | | | | |
Total Assets | | | | 2,993,031,506 | | | | | 446,661,616 | | | | | 454,578,247 | |
| | | | | | | | | | | | | | | |
Liabilities: | |
Payable for securities purchased | | | | 2,311,898 | | | | | — | | | | | 3,602,752 | |
Capital shares payable | | | | 1,557,589 | | | | | 49,092 | | | | | 234,425 | |
Dividends payable to shareholders | | | | — | | | | | — | | | | | — | |
Payable to Advisor | | | | 2,489,563 | | | | | 477,270 | | | | | 369,293 | |
Accrued fund administration fees | | | | 578,626 | | | | | 91,990 | | | | | 37,528 | |
Accrued expenses and other liabilities | | | | 562,052 | | | | | 305,031 | | | | | 139,141 | |
Foreign capital gains taxes payable | | | | — | | | | | 7,134,595 | | | | | — | |
| | | | | | | | | | | | | | | |
Total Liabilities | | | | 7,499,728 | | | | | 8,057,978 | | | | | 4,383,139 | |
| | | | | | | | | | | | | | | |
Net Assets | | | $ | 2,985,531,778 | | | | $ | 438,603,638 | | | | $ | 450,195,108 | |
| | | | | | | | | | | | | | | |
Net Assets Consist of: | |
Capital stock | | | $ | 420,202 | | | | $ | 853,529 | | | | $ | 287,460 | |
Paid-in-capital in excess of par | | | | 2,432,503,783 | | | | | 331,784,195 | | | | | 547,997,050 | |
Distributable earnings (accumulated loss) | | | | 552,607,793 | | | | | 105,965,914 | | | | | (98,089,402 | ) |
| | | | | | | | | | | | | | | |
Net Assets | | | $ | 2,985,531,778 | | | | $ | 438,603,638 | | | | $ | 450,195,108 | |
| | | | | | | | | | | | | | | |
Net Assets | |
Investor Class | | | | 1,533,986,991 | | | | | 203,019,309 | | | | | 60,436,376 | |
Institutional Class | | | | 1,451,544,787 | | | | | 235,584,329 | | | | | 389,758,732 | |
| | | |
Capital Stock Issued and Outstanding (Unlimited number of
shares authorized, $0.01 par value) | | | | | | | | | | | | | | | |
Investor Class | | | | 21,783,154 | | | | | 39,791,643 | | | | | 3,941,857 | |
Institutional Class | | | | 20,237,086 | | | | | 45,561,284 | | | | | 24,804,167 | |
| | | |
Net Asset Value, Redemption Price and Offering Price Per Share | | | | | | | | | | | | | | | |
Investor Class | | | $ | 70.42 | | | | $ | 5.10 | | | | $ | 15.33 | |
| | | | | | | | | | | | | | | |
Institutional Class | | | $ | 71.73 | | | | $ | 5.17 | | | | $ | 15.71 | |
| | | | | | | | | | | | | | | |
See Notes to Financial Statements.
84
| | |
| | | MARCH 31, 2023 (Unaudited) |
| | | | | | | | | | | | | | | | | | | | | | | |
Emerging
Markets
Small Cap
Fund | | Frontier
Emerging
Small Countries
Fund | | Global
Opportunities
Fund | | Global
Select
Fund | | Global
Value
Fund |
| | | | | | | | | | | | | | | | | | | | | | | | |
| | | | | | | | | | | | | | | | | | | | | | | | |
| | | | | | | | | | | | | | | | | | | | | | | | |
| | $ | 268,667,053 | | | | $ | 32,434,639 | | | | $ | 151,748,407 | | | | $ | 14,061,222 | | | | $ | 124,683,059 | |
| | | | | | | | | | | | | | | | | | | | | | | | |
| | $ | 268,667,053 | | | | $ | 32,434,639 | | | | $ | 151,748,407 | | | | $ | 14,061,222 | | | | $ | 124,683,059 | |
| | | | | | | | | | | | | | | | | | | | | | | | |
| | | | | | | | | | | | | | | | | | | | | | | | |
| | $ | 357,450,669 | | | | $ | 35,371,668 | | | | $ | 182,535,904 | | | | $ | 14,518,513 | | | | $ | 144,405,271 | |
| | | | | | | | | | | | | | | | | | | | | | | | |
| | | 357,450,669 | | | | | 35,371,668 | | | | | 182,535,904 | | | | | 14,518,513 | | | | | 144,405,271 | |
| | | 8,574,139 | | | | | 611,603 | | | | | 601,573 | | | | | 33,225 | | | | | 7,131,784 | |
| | | 598,134 | | | | | 1 | | | | | 570 | | | | | 5 | | | | | 171,043 | |
| | | 3,763,137 | | | | | — | | | | | 155,289 | | | | | — | | | | | 152,147 | |
| | | 68,318 | | | | | 17,298 | | | | | 51,003 | | | | | 82 | | | | | 69,092 | |
| | | 714,104 | | | | | 43,449 | | | | | 176,032 | | | | | 14,308 | | | | | 835,592 | |
| | | | | | | | | | | | | | | | | | | | | | | | |
| | | 42,085 | | | | | 23,001 | | | | | 25,072 | | | | | 17,454 | | | | | 23,668 | |
| | | | | | | | | | | | | | | | | | | | | | | | |
| | | 371,210,586 | | | | | 36,067,020 | | | | | 183,545,443 | | | | | 14,583,587 | | | | | 152,788,597 | |
| | | | | | | | | | | | | | | | | | | | | | | | |
| | | | | | | | | | | | | | | | | | | | | | | | |
| | | 2,476,239 | | | | | 84,899 | | | | | 772,063 | | | | | — | | | | | 1,011,149 | |
| | | 344,159 | | | | | 17 | | | | | 142,846 | | | | | 4,471 | | | | | 281,222 | |
| | | — | | | | | — | | | | | — | | | | | — | | | | | 38,954 | |
| | | 511,513 | | | | | 41,422 | | | | | 189,355 | | | | | 809 | | | | | 103,381 | |
| | | 116,295 | | | | | 16,637 | | | | | 43,451 | | | | | 3,524 | | | | | 40,686 | |
| | | 267,115 | | | | | 96,250 | | | | | 96,920 | | | | | 30,252 | | | | | 144,485 | |
| | | 2,302,678 | | | | | 364,342 | | | | | 602,590 | | | | | 15,720 | | | | | — | |
| | | | | | | | | | | | | | | | | | | | | | | | |
| | | 6,017,999 | | | | | 603,567 | | | | | 1,847,225 | | | | | 54,776 | | | | | 1,619,877 | |
| | | | | | | | | | | | | | | | | | | | | | | | |
| | $ | 365,192,587 | | | | $ | 35,463,453 | | | | $ | 181,698,218 | | | | $ | 14,528,811 | | | | $ | 151,168,720 | |
| | | | | | | | | | | | | | | | | | | | | | | | |
| | | | | | | | | | | | | | | | | | | | | | | | |
| | $ | 1,349,871 | | | | $ | 128,145 | | | | $ | 489,058 | | | | $ | 13,961 | | | | $ | 172,847 | |
| | | 284,184,724 | | | | | 138,110,677 | | | | | 155,662,235 | | | | | 16,020,059 | | | | | 293,898,786 | |
| | | 79,657,992 | | | | | (102,775,369 | ) | | | | 25,546,925 | | | | | (1,505,209 | ) | | | | (142,902,913 | ) |
| | | | | | | | | | | | | | | | | | | | | | | | |
| | $ | 365,192,587 | | | | $ | 35,463,453 | | | | $ | 181,698,218 | | | | $ | 14,528,811 | | | | $ | 151,168,720 | |
| | | | | | | | | | | | | | | | | | | | | | | | |
| | | | | | | | | | | | | | | | | | | | | | | | |
| | | 144,587,213 | | | | | 31,510,227 | | | | | 121,009,023 | | | | | 4,497,764 | | | | | 120,476,837 | |
| | | 220,605,374 | | | | | 3,953,226 | | | | | 60,689,195 | | | | | 10,031,047 | | | | | 30,691,883 | |
| | | | |
| | | | | | | | | | | | | | | | | | | | | | | | |
| | | | | | | | | | | | | | | | | | | | | | | | |
| | | 53,845,244 | | | | | 11,407,473 | | | | | 32,684,014 | | | | | 436,346 | | | | | 13,770,218 | |
| | | 81,141,827 | | | | | 1,407,055 | | | | | 16,221,823 | | | | | 959,770 | | | | | 3,514,464 | |
| | | | |
| | | | | | | | | | | | | | | | | | | | | | | | |
| | $ | 2.69 | | | | $ | 2.76 | | | | $ | 3.70 | | | | $ | 10.31 | | | | $ | 8.75 | |
| | | | | | | | | | | | | | | | | | | | | | | | |
| | $ | 2.72 | | | | $ | 2.81 | | | | $ | 3.74 | | | | $ | 10.45 | | | | $ | 8.73 | |
| | | | | | | | | | | | | | | | | | | | | | | | |
85
Statements of Assets and Liabilities (continued)
| | | | | | | | | | | | | | | |
| | | Greater
China
Fund | | International
Growth
Fund | | International
Opportunities
Fund |
| | | | | | | | | | | | | | | |
Assets: | | | | | | | | | | | | | | | |
Investments, at cost | |
Unaffiliated issuers | | | $ | 7,379,776 | | | | $ | 395,319,919 | | | | $ | 327,379,303 | |
Affiliated issuers1 | | | | — | | | | | — | | | | | — | |
| | | | | | | | | | | | | | | |
| | | $ | 7,379,776 | | | | $ | 395,319,919 | | | | $ | 327,379,303 | |
| | | | | | | | | | | | | | | |
Investments, at market value | |
Unaffiliated issuers | | | $ | 5,907,784 | | | | $ | 540,453,893 | | | | $ | 381,639,800 | |
Affiliated issuers1 | | | | — | | | | | — | | | | | — | |
| | | | | | | | | | | | | | | |
| | | | 5,907,784 | | | | | 540,453,893 | | | | | 381,639,800 | |
Cash | | | | — | | | | | 5,919,052 | | | | | 1,985,256 | |
Foreign currency on deposit (cost of $0, $56,992, $35,911, $31, $0, $5, $0 and $0, respectively) | | | | — | | | | | 57,030 | | | | | 35,947 | |
Receivable for investment securities sold | | | | — | | | | | 221,269 | | | | | 1,996,759 | |
Capital shares receivable | | | | — | | | | | 102,739 | | | | | 200,972 | |
Interest and dividends receivable | | | | 2,509 | | | | | 2,218,146 | | | | | 998,251 | |
Receivable from Investment Advisor | | | | 6,243 | | | | | — | | | | | — | |
Prepaid expenses and other assets | | | | 20,060 | | | | | 29,578 | | | | | 30,018 | |
| | | | | | | | | | | | | | | |
Total Assets | | | | 5,936,596 | | | | | 549,001,707 | | | | | 386,887,003 | |
| | | | | | | | | | | | | | | |
Liabilities: | |
Securities sold short, at value (proceeds of $0, $0, $0, $0, $11,869,844, $0, $0, and $0, respectively) | | | | — | | | | | — | | | | | — | |
Bank overdraft | | | | 28,313 | | | | | — | | | | | — | |
Payable for securities purchased | | | | — | | | | | — | | | | | 306,298 | |
Capital shares payable | | | | 11,949 | | | | | 1,441,370 | | | | | 333,939 | |
Payable to Advisor | | | | — | | | | | 586,682 | | | | | 571,319 | |
Accrued fund administration fees | | | | — | | | | | 294,299 | | | | | 152,699 | |
Accrued expenses and other liabilities | | | | 24,209 | | | | | 370,506 | | | | | 253,681 | |
Foreign capital gains taxes payable | | | | — | | | | | 1,213,846 | | | | | 670,024 | |
Dividends payable on securities sold short | | | | — | | | | | — | | | | | — | |
| | | | | | | | | | | | | | | |
Total Liabilities | | | | 64,471 | | | | | 3,906,703 | | | | | 2,287,960 | |
| | | | | | | | | | | | | | | |
Net Assets | | | $ | 5,872,125 | | | | $ | 545,095,004 | | | | $ | 384,599,043 | |
| | | | | | | | | | | | | | | |
Net Assets Consist of: | | | | | | | | | | | | | | | |
Capital stock | | | $ | 9,123 | | | | $ | 231,757 | | | | $ | 1,322,683 | |
Paid-in-capital in excess of par | | | | 11,038,931 | | | | | 428,518,951 | | | | | 382,683,258 | |
Distributable earnings (accumulated loss) | | | | (5,175,929 | ) | | | | 116,344,296 | | | | | 593,102 | |
| | | | | | | | | | | | | | | |
Net Assets | | | $ | 5,872,125 | | | | $ | 545,095,004 | | | | $ | 384,599,043 | |
| | | | | | | | | | | | | | | |
Net Assets | | | | | | | | | | | | | | | |
Investor Class | | | | 2,747,091 | | | | | 290,779,719 | | | | | 65,586,796 | |
Institutional Class | | | | 3,125,034 | | �� | | | 254,315,285 | | | | | 319,012,247 | |
| | | |
Capital Stock Issued and Outstanding (Unlimited number of
shares authorized, $0.01 par value) | | | | | | | | | | | | | | | |
Investor Class | | | | 425,752 | | | | | 12,413,830 | | | | | 22,872,167 | |
Institutional Class | | | | 486,582 | | | | | 10,761,833 | | | | | 109,396,090 | |
| | | |
Net Asset Value, Redemption Price and Offering Price Per Share | | | | | | | | | | | | | | | |
Investor Class | | | $ | 6.45 | | | | $ | 23.42 | | | | $ | 2.87 | |
| | | | | | | | | | | | | | | |
Institutional Class | | | $ | 6.42 | | | | $ | 23.63 | | | | $ | 2.92 | |
| | | | | | | | | | | | | | | |
| 1 | See Note 8 for information on affiliated issuers. |
See Notes to Financial Statements.
86
| | |
| | | MARCH 31, 2023 (Unaudited) |
| | | | | | | | | | | | | | | | | | | | | | | |
International
Select
Fund | | Long/Short
Alpha Fund | | Micro Cap
Fund | | Micro Cap
Value
Fund | | Small Cap
Growth
Fund |
| | | | | | | | | | | | | | | | | | | | | | | | |
| | | | | | | | | | | | | | | | | | | | | | | | |
| | | | | | | | | | | | | | | | | | | | | | | | |
| | $ | 5,001,938 | | | | $ | 32,131,771 | | | | $ | 554,779,131 | | | | $ | 248,380,858 | | | | $ | 1,840,443,349 | |
| | | — | | | | | — | | | | | 12,130,253 | | | | | — | | | | | 66,680,517 | |
| | | | | | | | | | | | | | | | | | | | | | | | |
| | $ | 5,001,938 | | | | $ | 32,131,771 | | | | $ | 566,909,384 | | | | $ | 248,380,858 | | | | $ | 1,907,123,866 | |
| | | | | | | | | | | | | | | | | | | | | | | | |
| | | | | | | | | | | | | | | | | | | | | | | | |
| | $ | 5,120,284 | | | | $ | 31,311,757 | | | | $ | 622,555,216 | | | | $ | 290,188,793 | | | | $ | 2,084,256,319 | |
| | | — | | | | | — | | | | | 1,366,907 | | | | | — | | | | | 23,538,855 | |
| | | | | | | | | | | | | | | | | | | | | | | | |
| | | 5,120,284 | | | | | 31,311,757 | | | | | 623,922,123 | | | | | 290,188,793 | | | | | 2,107,795,174 | |
| | | 236,469 | | | | | 5,765,951 | | | | | 15,131,348 | | | | | 6,845,994 | | | | | 33,111,765 | |
| | | | | | | | | | | | | | | | | | | | | | | | |
| | | 32 | | | | | — | | | | | 5 | | | | | — | | | | | — | |
| | | — | | | | | 120,876 | | | | | — | | | | | 5,234,268 | | | | | — | |
| | | — | | | | | 1,000 | | | | | 78,538 | | | | | 152,046 | | | | | 1,305,858 | |
| | | 9,457 | | | | | 11,628 | | | | | 28,892 | | | | | 171,187 | | | | | 54,616 | |
| | | 6,470 | | | | | — | | | | | — | | | | | — | | | | | — | |
| | | 17,330 | | | | | 17,385 | | | | | 29,829 | | | | | 72,117 | | | | | 71,779 | |
| | | | | | | | | | | | | | | | | | | | | | | | |
| | | 5,390,042 | | | | | 37,228,597 | | | | | 639,190,735 | | | | | 302,664,405 | | | | | 2,142,339,192 | |
| | | | | | | | | | | | | | | | | | | | | | | | |
| | | | | | | | | | | | | | | | | | | | | | | | |
| | | | | | | | | | | | | | | | | | | | | | | | |
| | | — | | | | | 9,778,644 | | | | | — | | | | | — | | | | | — | |
| | | — | | | | | — | | | | | — | | | | | — | | | | | — | |
| | | — | | | | | 513,081 | | | | | 4,759,199 | | | | | 1,471,857 | | | | | 6,577,418 | |
| | | — | | | | | — | | | | | 422,192 | | | | | 81,410 | | | | | 1,236,961 | |
| | | — | | | | | 24,730 | | | | | 799,328 | | | | | 382,466 | | | | | 1,765,072 | |
| | | — | | | | | 1,635 | | | | | 163,938 | | | | | 60,003 | | | | | 509,088 | |
| | | 27,985 | | | | | 26,324 | | | | | 196,160 | | | | | 109,515 | | | | | 260,847 | |
| | | — | | | | | — | | | | | — | | | | | — | | | | | — | |
| | | — | | | | | 9,641 | | | | | — | | | | | — | | | | | — | |
| | | | | | | | | | | | | | | | | | | | | | | | |
| | | 27,985 | | | | | 10,354,055 | | | | | 6,340,817 | | | | | 2,105,251 | | | | | 10,349,386 | |
| | | | | | | | | | | | | | | | | | | | | | | | |
| | $ | 5,362,057 | | | | $ | 26,874,542 | | | | $ | 632,849,918 | | | | $ | 300,559,154 | | | | $ | 2,131,989,806 | |
| | | | | | | | | | | | | | | | | | | | | | | | |
| | | | | | | | | | | | | | | | | | | | | | | | |
| | $ | 4,922 | | | | $ | 25,022 | | | | $ | 1,022,449 | | | | $ | 971,515 | | | | $ | 657,565 | |
| | | 6,256,692 | | | | | 26,410,661 | | | | | 768,612,343 | | | | | 295,114,807 | | | | | 2,119,775,944 | |
| | | (899,557 | ) | | | | 438,859 | | | | | (136,784,874 | ) | | | | 4,472,832 | | | | | 11,556,297 | |
| | | | | | | | | | | | | | | | | | | | | | | | |
| | $ | 5,362,057 | | | | $ | 26,874,542 | | | | $ | 632,849,918 | | | | $ | 300,559,154 | | | | $ | 2,131,989,806 | |
| | | | | | | | | | | | | | | | | | | | | | | | |
| | | | | | | | | | | | | | | | | | | | | | | | |
| | | 3,113,205 | | | | | 16,534,675 | | | | | 554,398,039 | | | | | 256,272,918 | | | | | 879,674,373 | |
| | | 2,248,852 | | | | | 10,339,867 | | | | | 78,451,879 | | | | | 44,286,236 | | | | | 1,252,315,433 | |
| | | | | | | | | | | | | | | | | | | | | | | | |
| | | | |
| | | | | | | | | | | | | | | | | | | | | | | | |
| | | 287,550 | | | | | 1,541,191 | | | | | 89,575,564 | | | | | 82,914,420 | | | | | 27,416,117 | |
| | | 204,628 | | | | | 960,991 | | | | | 12,669,353 | | | | | 14,237,042 | | | | | 38,340,432 | |
| | | | |
| | | | | | | | | | | | | | | | | | | | | | | | |
| | $ | 10.83 | | | | $ | 10.73 | | | | $ | 6.19 | | | | $ | 3.09 | | | | $ | 32.09 | |
| | | | | | | | | | | | | | | | | | | | | | | | |
| | $ | 10.99 | | | | $ | 10.76 | | | | $ | 6.19 | | | | $ | 3.11 | | | | $ | 32.66 | |
| | | | | | | | | | | | | | | | | | | | | | | | |
87
Statements of Assets and Liabilities (continued)
| | | | | | | | | | | | | | | |
| | | Small Cap
Value
Fund | | Ultra
Growth
Fund | | U.S.
Select
Fund |
| | | | | | | | | | | | | | | |
Assets: | | | | | | | | | | | | | | | |
Investments, at cost | |
Unaffiliated issuers | | | $ | 1,182,628,216 | | | | $ | 1,251,998,283 | | | | $ | 8,850,192 | |
Affiliated issuers1 | | | | — | | | | | 81,184,445 | | | | | — | |
| | | | | | | | | | | | | | | |
| | | $ | 1,182,628,216 | | | | $ | 1,333,182,728 | | | | $ | 8,850,192 | |
| | | | | | | | | | | | | | | |
Investments, at market value | |
Unaffiliated issuers | | | $ | 1,377,333,000 | | | | $ | 1,350,974,618 | | | | $ | 9,545,362 | |
Affiliated issuers1 | | | | — | | | | | 22,579,159 | | | | | — | |
| | | | | | | | | | | | | | | |
| | | | 1,377,333,000 | | | | | 1,373,553,777 | | | | | 9,545,362 | |
Cash | | | | 22,140,829 | | | | | 9,792,361 | | | | | 50,652 | |
Receivable for investment securities sold | | | | 14,574,065 | | | | | 8,529,698 | | | | | — | |
Capital shares receivable | | | | 33,326,286 | | | | | 378,331 | | | | | 8,400 | |
Interest and dividends receivable | | | | 531,305 | | | | | 190,235 | | | | | 3,281 | |
Receivable from Investment Advisor | | | | — | | | | | — | | | | | 12,366 | |
Prepaid expenses and other assets | | | | 51,988 | | | | | 48,606 | | | | | 56,786 | |
| | | | | | | | | | | | | | | |
Total Assets | | | | 1,447,957,473 | | | | | 1,392,493,008 | | | | | 9,676,847 | |
| | | | | | | | | | | | | | | |
Liabilities: | |
Payable for securities purchased | | | | 16,386,508 | | | | | 7,082,507 | | | | | 23,453 | |
Capital shares payable | | | | 94,654,464 | | | | | 1,496,315 | | | | | 3,425 | |
Dividends payable to shareholders | | | | — | | | | | — | | | | | — | |
Payable to Advisor | | | | 1,179,412 | | | | | 1,147,088 | | | | | — | |
Accrued fund administration fees | | | | 240,360 | | | | | 238,556 | | | | | — | |
Accrued expenses and other liabilities | | | | 205,873 | | | | | 324,691 | | | | | 26,048 | |
| | | | | | | | | | | | | | | |
Total Liabilities | | | | 112,666,617 | | | | | 10,289,157 | | | | | 52,926 | |
| | | | | | | | | | | | | | | |
Net Assets | | | $ | 1,335,290,856 | | | | $ | 1,382,203,851 | | | | $ | 9,623,921 | |
| | | | | | | | | | | | | | | |
Net Assets Consist of: | |
Capital stock | | | $ | 1,557,235 | | | | $ | 485,349 | | | | $ | 8,165 | |
Paid-in-capital in excess of par | | | | 1,146,505,471 | | | | | 1,471,090,402 | | | | | 9,140,419 | |
Distributable earnings (accumulated loss) | | | | 187,228,150 | | | | | (89,371,900 | ) | | | | 475,337 | |
| | | | | | | | | | | | | | | |
Net Assets | | | $ | 1,335,290,856 | | | | $ | 1,382,203,851 | | | | $ | 9,623,921 | |
| | | | | | | | | | | | | | | |
Net Assets | |
Investor Class | | | | 572,467,613 | | | | | 969,269,063 | | | | | 2,945,539 | |
Institutional Class | | | | 762,823,243 | | | | | 412,934,788 | | | | | 6,678,382 | |
| | | |
Capital Stock Issued and Outstanding (Unlimited number of shares authorized, $0.01 par value) | | | | | | | | | | | | | | | |
Investor Class | | | | 67,160,745 | | | | | 34,061,817 | | | | | 250,007 | |
Institutional Class | | | | 88,562,792 | | | | | 14,473,034 | | | | | 566,503 | |
| | | |
Net Asset Value, Redemption Price and Offering Price Per Share | | | | | | | | | | | | | | | |
Investor Class | | | $ | 8.52 | | | | $ | 28.46 | | | | $ | 11.78 | |
| | | | | | | | | | | | | | | |
Institutional Class | | | $ | 8.61 | | | | $ | 28.53 | | | | $ | 11.79 | |
| | | | | | | | | | | | | | | |
88
| | |
| | | MARCH 31, 2023 (Unaudited) |
| | | | | | | | | | | | | | | | | | | | | | | | | | | | |
U.S.
Treasury
Fund | | | | | | | | | | |
| | | | | | | | | | | | | | | | | | | | | | | | | | | | | |
| | | | | | | | | | | | | | | | | | | | | | | | | | | | | |
| | | | | | | | | | | | | | | | | | | | | | | | | | | | | |
| | $ | 348,060,983 | | | | | | | | | | | | | | | | | | | | | | | | | | |
| | | — | | | | | | | | | | | | | | | | | | | | | | | | | | |
| | | | | | | | | | | | | | | | | | | | | | | | | | | | | |
| | $ | 348,060,983 | | | | | | | | | | | | | | | | | | | | | | | | | | |
| | | | | | | | | | | | | | | | | | | | | | | | | | | | | |
| | | | | | | | | | | | | | | | | | | | | | | | | | | | | |
| | $ | 272,348,912 | | | | | | | | | | | | | | | | | | | | | | | | | | |
| | | — | | | | | | | | | | | | | | | | | | | | | | | | | | |
| | | | | | | | | | | | | | | | | | | | | | | | | | | | | |
| | | 272,348,912 | | | | | | | | | | | | | | | | | | | | | | | | | | |
| | | 3,532,644 | | | | | | | | | | | | | | | | | | | | | | | | | | |
| | | — | | | | | | | | | | | | | | | | | | | | | | | | | | |
| | | 43,084 | | | | | | | | | | | | | | | | | | | | | | | | | | |
| | | 1,590,573 | | | | | | | | | | | | | | | | | | | | | | | | | | |
| | | — | | | | | | | | | | | | | | | | | | | | | | | | | | |
| | | 17,881 | | | | | | | | | | | | | | | | | | | | | | | | | | |
| | | | | | | | | | | | | | | | | | | | | | | | | | | | | |
| | | 277,533,094 | | | | | | | | | | | | | | | | | | | | | | | | | | |
| | | | | | | | | | | | | | | | | | | | | | | | | | | | | |
| | | | | | | | | | | | | | | | | | | | | | | | | | | | | |
| | | — | | | | | | | | | | | | | | | | | | | | | | | | | | |
| | | 363,949 | | | | | | | | | | | | | | | | | | | | | | | | | | |
| | | 79,741 | | | | | | | | | | | | | | | | | | | | | | | | | | |
| | | 122,188 | | | | | | | | | | | | | | | | | | | | | | | | | | |
| | | 47,722 | | | | | | | | | | | | | | | | | | | | | | | | | | |
| | | 64,330 | | | | | | | | | | | | | | | | | | | | | | | | | | |
| | | | | | | | | | | | | | | | | | | | | | | | | | | | | |
| | | 677,930 | | | | | | | | | | | | | | | | | | | | | | | | | | |
| | | | | | | | | | | | | | | | | | | | | | | | | | | | | |
| | $ | 276,855,164 | | | | | | | | | | | | | | | | | | | | | | | | | | |
| | | | | | | | | | | | | | | | | | | | | | | | | | | | | |
| | | | | | | | | | | | | | | | | | | | | | | | | | | | | |
| | $ | 214,870 | | | | | | | | | | | | | | | | | | | | | | | | | | |
| | | 430,703,719 | | | | | | | | | | | | | | | | | | | | | | | | | | |
| | | (154,063,425 | ) | | | | | | | | | | | | | | | | | | | | | | | | | |
| | | | | | | | | | | | | | | | | | | | | | | | | | | | | |
| | $ | 276,855,164 | | | | | | | | | | | | | | | | | | | | | | | | | | |
| | | | | | | | | | | | | | | | | | | | | | | | | | | | | |
| | | 276,855,164 | | | | | | | | | | | | | | | | | | | | | | | | | | |
| | | | | | | | | | | | | | | | | | | | | | | | | | | | | |
| | | | | | | | | | | | | | | | | | | | | | | | | | | | | |
| | | | | |
| |
|
— |
| | | | | | | | | | | | | | | | | | | | | | | | | |
| | | 21,487,034 | | | | | | | | | | | | | | | | | | | | | | | | | | |
| | | — | | | | | | | | | | | | | | | | | | | | | | | | | | |
| | | | | |
| | | | | | | | | | | | | | | | | | | | | | | | | | | | | |
| | $ | 12.88 | | | | | | | | | | | | | | | | | | | | | | | | | | |
| | | | | | | | | | | | | | | | | | | | | | | | | | | | | |
| | $ | — | | | | | | | | | | | | | | | | | | | | | | | | | | |
| | | | | | | | | | | | | | | | | | | | | | | | | | | | | |
89
Statements of Operations
| | | | | | | | | | | | | | | |
| | | Core
Growth
Fund | | Emerging
India
Fund | | Emerging
Markets
Select
Fund |
| | | | | | | | | | | | | | | |
Investment Income: | |
Interest | | | $ | 436,031 | | | | $ | 413,563 | | | | $ | 254,834 | |
Dividends1 | | | | | | | | | | | | | | | |
Unaffiliated issuers | | | | 10,322,934 | | | | | 366,137 | | | | | 954,995 | |
| | | | | | | | | | | | | | | |
Total investment income | | | | 10,758,965 | | | | | 779,700 | | | | | 1,209,829 | |
| | | | | | | | | | | | | | | |
Expenses: | |
Investment advisory fees | | | | 14,251,901 | | | | | 3,070,884 | | | | | 1,974,019 | |
Shareholder servicing fees — Investor Class | | | | 968,970 | | | | | 177,093 | | | | | 58,546 | |
Shareholder servicing fees — Institutional Class | | | | 20,804 | | | | | 12,597 | | | | | 3,963 | |
Fund administration fees | | | | 144,118 | | | | | 28,020 | | | | | 21,601 | |
Fund accounting fees | | | | 124,432 | | | | | 29,815 | | | | | 26,684 | |
Reports to shareholders — Investor Class | | | | 92,679 | | | | | 18,291 | | | | | 6,207 | |
Reports to shareholders — Institutional Class | | | | 69,946 | | | | | 11,421 | | | | | 23,091 | |
Custody fees | | | | 7,725 | | | | | 147,759 | | | | | 65,399 | |
Federal and state registration fees — Investor Class | | | | 33,585 | | | | | 14,847 | | | | | 15,577 | |
Federal and state registration fees — Institutional Class | | | | 34,850 | | | | | 13,874 | | | | | 62,941 | |
Legal fees | | | | 79,216 | | | | | 15,148 | | | | | 10,173 | |
Trustees’ fees | | | | 165,231 | | | | | 31,821 | | | | | 21,226 | |
Interest | | | | 103,548 | | | | | 8,325 | | | | | 6,512 | |
Audit fees | | | | 19,476 | | | | | 19,476 | | | | | 19,476 | |
Other expenses | | | | 68,739 | | | | | 30,478 | | | | | 21,613 | |
| | | | | | | | | | | | | | | |
Total expenses before reimbursement | | | | 16,185,220 | | | | | 3,629,849 | | | | | 2,337,028 | |
Reimbursement of expenses by Advisor | | | | (76,993 | ) | | | | — | | | | | — | |
| | | | | | | | | | | | | | | |
Net Expenses | | | | 16,108,227 | | | | | 3,629,849 | | | | | 2,337,028 | |
| | | | | | | | | | | | | | | |
Net Investment Income (Loss) | | | | (5,349,262 | ) | | | | (2,850,149 | ) | | | | (1,127,199 | ) |
| | | | | | | | | | | | | | | |
Realized Gain (Loss): | |
Investments sold | | | | (39,708,197 | ) | | | | 19,816,258 | | | | | (8,682,967 | ) |
Foreign currency transactions | | | | — | | | | | (499,646 | ) | | | | (42,087 | ) |
Foreign capital gains taxes | | | | 9,052 | | | | | (5,767,424 | ) | | | | (94,873 | ) |
| | | | | | | | | | | | | | | |
Net realized gain (loss) | | | | (39,699,145 | ) | | | | 13,549,188 | | | | | (8,819,927 | ) |
| | | | | | | | | | | | | | | |
Change in Unrealized Appreciation (Depreciation): | |
Investments | | | | 454,555,542 | | | | | (66,317,683 | ) | | | | 62,596,964 | |
Investments in affiliates | | | | — | | | | | — | | | | | — | |
Foreign currency translations | | | | 1,006 | | | | | (1,167 | ) | | | | 2,749 | |
Deferred foreign capital gains taxes | | | | — | | | | | 9,706,172 | | | | | — | |
| | | | | | | | | | | | | | | |
Net change in unrealized appreciation (depreciation) | | | | 454,556,548 | | | | | (56,612,678 | ) | | | | 62,599,713 | |
| | | | | | | | | | | | | | | |
Net gain (loss) on investments | | | | 414,857,403 | | | | | (43,063,490 | ) | | | | 53,779,786 | |
| | | | | | | | | | | | | | | |
Net Increase (Decrease) in Net Assets Resulting from Operations | | | $ | 409,508,141 | | | | $ | (45,913,639 | ) | | | $ | 52,652,587 | |
| | | | | | | | | | | | | | | |
| 1 | Net of $0, $111,108, $92,042, $175,934, $20,483, $22,645, $2,607 and $178,212 in foreign withholding taxes, respectively. |
See Notes to Financial Statements.
90
| | |
| | | SIX MONTHS ENDED MARCH 31, 2023 (Unaudited) |
| | | | | | | | | | | | | | | | | | | | | | | |
Emerging
Markets
Small Cap
Fund | | Frontier
Emerging
Small Countries
Fund | | Global
Opportunities
Fund | | Global
Select
Fund | | Global
Value
Fund |
| | | | | | | | | | | | | | | | | | | | | | | | |
| | | | | | | | | | | | | | | | | | | | | | | | |
| | $ | 105,991 | | | | $ | 9,947 | | | | $ | 22,574 | | | | $ | 2,758 | | | | $ | 124,379 | |
| | | | | | | | | | | | | | | | | | | | | | | | |
| | | 1,396,668 | | | | | 153,129 | | | | | 404,613 | | | | | 42,045 | | | | | 2,414,759 | |
| | | | | | | | | | | | | | | | | | | | | | | | |
| | | 1,502,659 | | | | | 163,076 | | | | | 427,187 | | | | | 44,803 | | | | | 2,539,138 | |
| | | | | | | | | | | | | | | | | | | | | | | | |
| | | | | | | | | | | | | | | | | | | | | | | | |
| | | 3,030,304 | | | | | 289,022 | | | | | 1,093,879 | | | | | 58,706 | | | | | 629,768 | |
| | | 148,759 | | | | | 39,147 | | | | | 88,004 | | | | | 11,222 | | | | | 88,137 | |
| | | 1,795 | | | | | 1,549 | | | | | 1,690 | | | | | 3,549 | | | | | 1,545 | |
| | | 21,783 | | | | | 2,097 | | | | | 9,810 | | | | | 815 | | | | | 7,794 | |
| | | 27,322 | | | | | 9,757 | | | | | 17,595 | | | | | 8,180 | | | | | 14,910 | |
| | | 11,990 | | | | | 7,192 | | | | | 9,162 | | | | | 5,643 | | | | | 12,747 | |
| | | 12,367 | | | | | 2,013 | | | | | 5,638 | | | | | 1,273 | | | | | 1,782 | |
| | | 111,887 | | | | | 33,635 | | | | | 15,974 | | | | | 2,920 | | | | | 7,789 | |
| | | 17,019 | | | | | 7,192 | | | | | 12,305 | | | | | 8,391 | | | | | 8,604 | |
| | | 29,844 | | | | | 8,143 | | | | | 10,635 | | | | | 8,688 | | | | | 8,086 | |
| | | 11,227 | | | | | 1,137 | | | | | 4,930 | | | | | 385 | | | | | 3,635 | |
| | | 23,530 | | | | | 2,419 | | | | | 10,294 | | | | | 804 | | | | | 7,557 | |
| | | 63,130 | | | | | 1,788 | | | | | 9,810 | | | | | 351 | | | | | 1,257 | |
| | | 19,476 | | | | | 19,476 | | | | | 19,476 | | | | | 19,476 | | | | | 19,476 | |
| | | 26,113 | | | | | 8,071 | | | | | 9,728 | | | | | 5,648 | | | | | 7,891 | |
| | | | | | | | | | | | | | | | | | | | | | | | |
| | | 3,556,546 | | | | | 432,638 | | | | | 1,318,930 | | | | | 136,051 | | | | | 820,978 | |
| | | (77,170 | ) | | | | (59,129 | ) | | | | (19,553 | ) | | | | (61,609 | ) | | | | (66,860 | ) |
| | | | | | | | | | | | | | | | | | | | | | | | |
| | | 3,479,376 | | | | | 373,509 | | | | | 1,299,377 | | | | | 74,442 | | | | | 754,118 | |
| | | | | | | | | | | | | | | | | | | | | | | | |
| | | (1,976,717 | ) | | | | (210,433 | ) | | | | (872,190 | ) | | | | (29,639 | ) | | | | 1,785,020 | |
| | | | | | | | | | | | | | | | | | | | | | | | |
| | | | | | | | | | | | | | | | | | | | | | | | |
| | | 7,127,124 | | | | | (1,537,087 | ) | | | | (488,509 | ) | | | | (336,600 | ) | | | | (1,222,007 | ) |
| | | (255,524 | ) | | | | (12,734 | ) | | | | (17,588 | ) | | | | (371 | ) | | | | 984 | |
| | | (1,914,183 | ) | | | | (32,073 | ) | | | | (48,850 | ) | | | | — | | | | | — | |
| | | | | | | | | | | | | | | | | | | | | | | | |
| | | 4,957,417 | | | | | (1,581,894 | ) | | | | (554,947 | ) | | | | (336,971 | ) | | | | (1,221,023 | ) |
| | | | | | | | | | | | | | | | | | | | | | | | |
| | | | | | | | | | | | | | | | | | | | | | | | |
| | | 38,590,327 | | | | | 5,907,693 | | | | | 19,690,095 | | | | | 2,636,583 | | | | | 19,692,437 | |
| | | — | | | | | — | | | | | — | | | | | — | | | | | — | |
| | | (2,701 | ) | | | | 391 | | | | | 4,960 | | | | | 576 | | | | | 14,186 | |
| | | 1,945,659 | | | | | 158,407 | | | | | (14,925 | ) | | | | 913 | | | | | — | |
| | | | | | | | | | | | | | | | | | | | | | | | |
| | | 40,533,285 | | | | | 6,066,491 | | | | | 19,680,130 | | | | | 2,638,072 | | | | | 19,706,623 | |
| | | | | | | | | | | | | | | | | | | | | | | | |
| | | 45,490,702 | | | | | 4,484,597 | | | | | 19,125,183 | | | | | 2,301,101 | | | | | 18,485,600 | |
| | | | | | | | | | | | | | | | | | | | | | | | |
| | $ | 43,513,985 | | | | $ | 4,274,164 | | | | $ | 18,252,993 | | | | $ | 2,271,462 | | | | $ | 20,270,620 | |
| | | | | | | | | | | | | | | | | | | | | | | | |
91
Statements of Operations (continued)
| | | | | | | | | | | | | | | |
| | | Greater
China
Fund | | International
Growth
Fund | | International
Opportunities
Fund |
| | | | | | | | | | | | | | | |
Investment Income: | |
Interest | | | $ | 2,150 | | | | $ | 98,760 | | | | $ | 323,355 | |
Dividends1 | | | | | | | | | | | | | | | |
Unaffiliated issuers | | | | 4,783 | | | | | 3,833,374 | | | | | 2,017,312 | |
| | | | | | | | | | | | | | | |
Total investment income | | | | 6,933 | | | | | 3,932,134 | | | | | 2,340,667 | |
| | | | | | | | | | | | | | | |
Expenses: | |
Investment advisory fees | | | | 29,641 | | | | | 3,654,259 | | | | | 3,559,484 | |
Shareholder servicing fees — Investor Class | | | | 10,413 | | | | | 202,950 | | | | | 47,123 | |
Shareholder servicing fees — Institutional Class | | | | 1,566 | | | | | 3,394 | | | | | 124,519 | |
Fund administration fees | | | | 307 | | | | | 34,595 | | | | | 24,060 | |
Fund accounting fees | | | | 9,997 | | | | | 31,459 | | | | | 28,619 | |
Reports to shareholders — Investor Class | | | | 6,059 | | | | | 16,506 | | | | | 3,806 | |
Reports to shareholders — Institutional Class | | | | 1,300 | | | | | 13,747 | | | | | 29,099 | |
Custody fees | | | | 3,152 | | | | | 80,434 | | | | | 71,588 | |
Federal and state registration fees — Investor Class | | | | 7,910 | | | | | 12,865 | | | | | 8,873 | |
Federal and state registration fees — Institutional Class | | | | 8,017 | | | | | 12,370 | | | | | 14,487 | |
Legal fees | | | | 175 | | | | | 18,421 | | | | | 12,557 | |
Trustees’ fees | | | | 317 | | | | | 38,684 | | | | | 26,290 | |
Dividends on securities sold short | | | | — | | | | | — | | | | | — | |
Interest | | | | 851 | | | | | 32,364 | | | | | 10,806 | |
Audit fees | | | | 19,476 | | | | | 19,476 | | | | | 19,476 | |
Other expenses | | | | 4,640 | | | | | 25,579 | | | | | 23,908 | |
| | | | | | | | | | | | | | | |
Total expenses before reimbursement | | | | 103,821 | | | | | 4,197,103 | | | | | 4,004,695 | |
Reimbursement of expenses by Advisor | | | | (62,284 | ) | | | | (9,394 | ) | | | | (1,274 | ) |
| | | | | | | | | | | | | | | |
Net Expenses | | | | 41,537 | | | | | 4,187,709 | | | | | 4,003,421 | |
| | | | | | | | | | | | | | | |
Net Investment Loss | | | | (34,604 | ) | | | | (255,575 | ) | | | | (1,662,754 | ) |
| | | | | | | | | | | | | | | |
Realized Gain (Loss): | |
Investments sold | | | | (376,969 | ) | | | | (7,794,565 | ) | | | | (7,203,093 | ) |
Investments in affiliates | | | | — | | | | | — | | | | | — | |
Foreign currency transactions | | | | (8,788 | ) | | | | (942 | ) | | | | (214,371 | ) |
Net realized gain on short positions | | | | — | | | | | — | | | | | — | |
Foreign capital gains taxes | | | | — | | | | | (804,865 | ) | | | | (413,027 | ) |
| | | | | | | | | | | | | | | |
Net realized loss | | | | (385,757 | ) | | | | (8,600,372 | ) | | | | (7,830,491 | ) |
| | | | | | | | | | | | | | | |
Change in Unrealized Appreciation (Depreciation): | |
Investments | | | | 959,215 | | | | | 103,252,331 | | | | | 63,347,651 | |
Investments in affiliates | | | | — | | | | | — | | | | | — | |
Foreign currency translations | | | | 46 | | | | | 70,927 | | | | | 16,073 | |
Short positions | | | | — | | | | | — | | | | | — | |
Deferred foreign capital gains taxes | | | | — | | | | | 1,251,377 | | | | | 1,131,970 | |
| | | | | | | | | | | | | | | |
Net change in unrealized appreciation | | | | 959,261 | | | | | 104,574,635 | | | | | 64,495,694 | |
| | | | | | | | | | | | | | | |
Net gain on investments | | | | 573,504 | | | | | 95,974,263 | | | | | 56,665,203 | |
| | | | | | | | | | | | | | | |
Net Increase in Net Assets Resulting from Operations | | | $ | 538,900 | | | | $ | 95,718,688 | | | | $ | 55,002,449 | |
| | | | | | | | | | | | | | | |
| 1 | Net of $252, $250,289, $215,170, $2,505, $0, $0, $20,996 and $0 in foreign withholding taxes, respectively. |
See Notes to Financial Statements.
92
| | |
| | | SIX MONTHS ENDED MARCH 31, 2023 (Unaudited) |
| | | | | | | | | | | | | | | | | | | | | | | |
International
Select
Fund | | Long/Short
Alpha Fund | | Micro Cap
Fund | | Micro Cap
Value
Fund | | Small Cap
Growth
Fund |
| | | | | | | | | | | | | | | | | | | | | | | | |
| | | | | | | | | | | | | | | | | | | | | | | | |
| | $ | 3,081 | | | | $ | 87,365 | | | | $ | 174,199 | | | | $ | 124,620 | | | | $ | 400,450 | |
| | | | | | | | | | | | | | | | | | | | | | | | |
| | | 12,493 | | | | | 102,381 | | | | | 375,983 | | | | | 1,102,835 | | | | | 1,554,749 | |
| | | | | | | | | | | | | | | | | | | | | | | | |
| | | 15,574 | | | | | 189,746 | | | | | 550,182 | | | | | 1,227,455 | | | | | 1,955,199 | |
| | | | | | | | | | | | | | | | | | | | | | | | |
| | | | | | | | | | | | | | | | | | | | | | | | |
| | | 21,520 | | | | | 160,861 | | | | | 4,697,454 | | | | | 2,299,506 | | | | | 10,432,777 | |
| | | 11,450 | | | | | 6,376 | | | | | 332,740 | | | | | 181,801 | | | | | 495,035 | |
| | | 2,694 | | | | | 3,884 | | | | | 1,428 | | | | | 1,455 | | | | | 14,110 | |
| | | 317 | | | | | 1,504 | | | | | 34,538 | | | | | 17,951 | | | | | 115,804 | |
| | | 8,641 | | | | | 9,310 | | | | | 35,552 | | | | | 23,640 | | | | | 101,627 | |
| | | 5,572 | | | | | 1,293 | | | | | 32,389 | | | | | 18,294 | | | | | 41,465 | |
| | | 1,085 | | | | | 4,599 | | | | | 4,568 | | | | | 2,940 | | | | | 79,068 | |
| | | 1,643 | | | | | 980 | | | | | 6,343 | | | | | 11,830 | | | | | 5,771 | |
| | | 8,421 | | | | | 10,755 | | | | | 18,383 | | | | | 17,532 | | | | | 30,162 | |
| | | 8,467 | | | | | 12,274 | | | | | 13,085 | | | | | 11,289 | | | | | 41,923 | |
| | | 163 | | | | | 660 | | | | | 19,177 | | | | | 9,068 | | | | | 60,509 | |
| | | 340 | | | | | 1,372 | | | | | 40,350 | | | | | 18,944 | | | | | 126,554 | |
| | | — | | | | | 45,906 | | | | | — | | | | | — | | | | | — | |
| | | 1,184 | | | | | 46,055 | | | | | 15,281 | | | | | 3,460 | | | | | 41,145 | |
| | | 19,476 | | | | | 19,476 | | | | | 19,476 | | | | | 19,476 | | | | | 19,476 | |
| | | 2,912 | | | | | 2,163 | | | | | 21,999 | | | | | 12,095 | | | | | 55,509 | |
| | | | | | | | | | | | | | | | | | | | | | | | |
| | | 93,885 | | | | | 327,468 | | | | | 5,292,763 | | | | | 2,649,281 | | | | | 11,660,935 | |
| | | (62,807 | ) | | | | (28,076 | ) | | | | (5,185 | ) | | | | (11,597 | ) | | | | (114,410 | ) |
| | | | | | | | | | | | | | | | | | | | | | | | |
| | | 31,078 | | | | | 299,392 | | | | | 5,287,578 | | | | | 2,637,684 | | | | | 11,546,525 | |
| | | | | | | | | | | | | | | | | | | | | | | | |
| | | (15,504 | ) | | | | (109,646 | ) | | | | (4,737,396 | ) | | | | (1,410,229 | ) | | | | (9,591,326 | ) |
| | | | | | | | | | | | | | | | | | | | | | | | |
| | | | | | | | | | | | | | | | | | | | | | | | |
| | | (334,304 | ) | | | | (990,453 | ) | | | | (85,217,328 | ) | | | | (15,238,124 | ) | | | | (133,943,762 | ) |
| | | — | | | | | — | | | | | (209,016 | ) | | | | — | | | | | (4,868,227 | ) |
| | | 482 | | | | | — | | | | | (1,445 | ) | | | | 4,321 | | | | | — | |
| | | — | | | | | 480,398 | | | | | — | | | | | — | | | | | — | |
| | | — | | | | | — | | | | | — | | | | | — | | | | | — | |
| | | | | | | | | | | | | | | | | | | | | | | | |
| | | (333,822 | ) | | | | (510,055 | ) | | | | (85,427,789 | ) | | | | (15,233,803 | ) | | | | (138,811,989 | ) |
| | | | | | | | | | | | | | | | | | | | | | | | |
| | | | | | | | | | | | | | | | | | | | | | | | |
| | | 1,377,177 | | | | | 5,324,972 | | | | | 139,485,768 | | | | | 47,418,423 | | | | | 283,658,675 | |
| | | — | | | | | — | | | | | (949,086 | ) | | | | — | | | | | 59,166,119 | |
| | | 583 | | | | | — | | | | | 116 | | | | | 531 | | | | | — | |
| | | — | | | | | (435,172 | ) | | | | — | | | | | — | | | | | — | |
| | | — | | | | | — | | | | | — | | | | | — | | | | | — | |
| | | | | | | | | | | | | | | | | | | | | | | | |
| | | 1,377,760 | | | | | 4,889,800 | | | | | 138,536,798 | | | | | 47,418,954 | | | | | 342,824,794 | |
| | | | | | | | | | | | | | | | | | | | | | | | |
| | | 1,043,938 | | | | | 4,379,745 | | | | | 53,109,009 | | | | | 32,185,151 | | | | | 204,012,805 | |
| | | | | | | | | | | | | | | | | | | | | | | | |
| | $ | 1,028,434 | | | | $ | 4,270,099 | | | | $ | 48,371,613 | | | | $ | 30,774,922 | | | | $ | 194,421,479 | |
| | | | | | | | | | | | | | | | | | | | | | | | |
93
Statements of Operations (continued)
| | | | | | | | | | | | | | | |
| | | Small Cap
Value
Fund | | Ultra
Growth
Fund | | U.S. Select
Fund |
| | | | | | | | | | | | | | | |
Investment Income: | |
Interest | | | $ | 244,074 | | | | $ | 84,907 | | | | $ | 2,038 | |
Dividends1 | | | | | | | | | | | | | | | |
Unaffiliated issuers | | | | 8,960,698 | | | | | 1,814,014 | | | | | 15,691 | |
| | | | | | | | | | | | | | | |
Total investment income | | | | 9,204,772 | | | | | 1,898,921 | | | | | 17,729 | |
| | | | | | | | | | | | | | | |
Expenses: | |
Investment advisory fees | | | | 6,957,773 | | | | | 6,908,449 | | | | | 25,295 | |
Shareholder servicing fees — Investor Class | | | | 336,076 | | | | | 868,005 | | | | | 9,231 | |
Shareholder servicing fees — Institutional Class | | | | 3,253 | | | | | 2,561 | | | | | 4,735 | |
Fund administration fees | | | | 73,162 | | | | | 71,943 | | | | | 341 | |
Fund accounting fees | | | | 68,274 | | | | | 66,377 | | | | | 7,801 | |
Reports to shareholders — Investor Class | | | | 46,228 | | | | | 63,301 | | | | | 3,724 | |
Reports to shareholders — Institutional Class | | | | 32,013 | | | | | 27,681 | | | | | 2,841 | |
Custody fees | | | | 4,662 | | | | | 6,618 | | | | | 3,235 | |
Federal and state registration fees — Investor Class | | | | 21,101 | | | | | 30,658 | | | | | 10,832 | |
Federal and state registration fees — Institutional Class | | | | 20,004 | | | | | 17,702 | | | | | 10,945 | |
Legal fees | | | | 38,418 | | | | | 41,415 | | | | | 5,191 | |
Trustees’ fees | | | | 80,001 | | | | | 87,373 | | | | | 301 | |
Interest | | | | 18,797 | | | | | 26,591 | | | | | 696 | |
Audit fees | | | | 19,476 | | | | | 19,476 | | | | | 19,476 | |
Other expenses | | | | 34,615 | | | | | 42,004 | | | | | 3,613 | |
| | | | | | | | | | | | | | | |
Total expenses before reimbursement | | | | 7,753,853 | | | | | 8,280,154 | | | | | 108,257 | |
Reimbursement of expenses by Advisor | | | | (40,195 | ) | | | | (46,466 | ) | | | | (77,371 | ) |
| | | | | | | | | | | | | | | |
Net Expenses | | | | 7,713,658 | | | | | 8,233,688 | | | | | 30,886 | |
| | | | | | | | | | | | | | | |
Net Investment Income (Loss) | | | | 1,491,114 | | | | | (6,334,767 | ) | | | | (13,157 | ) |
| | | | | | | | | | | | | | | |
Realized Gain (Loss): | |
Investments sold | | | | 1,915,425 | | | | | (74,706,609 | ) | | | | (201,648 | ) |
Investments in affiliates | | | | — | | | | | (3,286,507 | ) | | | | — | |
| | | | | | | | | | | | | | | |
Net realized gain (loss) | | | | 1,915,425 | | | | | (77,993,116 | ) | | | | (201,648 | ) |
| | | | | | | | | | | | | | | |
Change in Unrealized Appreciation (Depreciation): | |
Investments | | | | 199,887,768 | | | | | 193,464,522 | | | | | 1,258,937 | |
Investments in affiliates | | | | — | | | | | (1,704,347 | ) | | | | — | |
| | | | | | | | | | | | | | | |
Net change in unrealized appreciation | | | | 199,887,768 | | | | | 191,760,175 | | | | | 1,258,937 | |
| | | | | | | | | | | | | | | |
Net gain on investments | | | | 201,803,193 | | | | | 113,767,059 | | | | | 1,057,289 | |
| | | | | | | | | | | | | | | |
Net Increase in Net Assets Resulting from Operations | | | $ | 203,294,307 | | | | $ | 107,432,292 | | | | $ | 1,044,132 | |
| | | | | | | | | | | | | | | |
| 1 | Net of $0, $0, $0 and $0 in foreign withholding taxes, respectively. |
See Notes to Financial Statements.
94
| | |
| | | SIX MONTHS ENDED MARCH 31, 2023 (Unaudited) |
| | | |
U.S.
Treasury
Fund |
| | | | |
| | | | |
| | $ | 4,772,547 | |
| | | | |
| | | — | |
| | | | |
| | | 4,772,547 | |
| | | | |
| | | | |
| | | 730,388 | |
| | | 162,370 | |
| | | — | |
| | | 16,571 | |
| | | 15,189 | |
| | | 19,571 | |
| | | — | |
| | | 1,244 | |
| | | 24,144 | |
| | | — | |
| | | 8,263 | |
| | | 17,285 | |
| | | 3,432 | |
| | | 19,476 | |
| | | 8,694 | |
| | | | |
| | | 1,026,627 | |
| | | — | |
| | | | |
| | | 1,026,627 | |
| | | | |
| | | 3,745,920 | |
| | | | |
| | | | |
| | | (10,103,271 | ) |
| | | — | |
| | | | |
| | | (10,103,271 | ) |
| | | | |
| | | | |
| | | 18,598,911 | |
| | | — | |
| | | | |
| | | 18,598,911 | |
| | | | |
| | | 8,495,640 | |
| | | | |
| | $ | 12,241,560 | |
| | | | |
95
Statements of Changes in Net Assets
| | | | | | | | | | | | | | | | | | | | |
| | | Core Growth
Fund | | Emerging India
Fund |
| | | Six Months Ended
March 31, 2023
(Unaudited) | | Year Ended
September 30, 2022 | | Six Months Ended
March 31, 2023
(Unaudited) | | Year Ended
September 30, 2022 |
| | | | | | | | | | | | | | | | | | | | |
Operations: | | | | | | | | | | | | | | | | | | | | |
Net investment loss | | | $ | (5,349,262 | ) | | | $ | (18,490,609 | ) | | | $ | (2,850,149 | ) | | | $ | (6,490,534 | ) |
Net realized gain (loss) on investments, foreign currency translations and foreign capital gains taxes | | | | (39,699,145 | ) | | | | 31,668,868 | | | | | 13,549,188 | | | | | 3,645,528 | |
Change in unrealized appreciation (depreciation) on investments, foreign currency translations
and deferred foreign capital gains taxes | | | | 454,556,548 | | | | | (1,245,547,699 | ) | | | | (56,612,678 | ) | | | | (102,601,153 | ) |
| | | | | | | | | | | | | | | | | | | | |
Net increase (decrease) in net assets resulting from operations | | | | 409,508,141 | | | | | (1,232,369,440 | ) | | | | (45,913,639 | ) | | | | (105,446,159 | ) |
| | | | | | | | | | | | | | | | | | | | |
|
Distributions to shareholders from distributable earnings | |
Investor Class | | | | (10,015,380 | ) | | | | (326,601,199 | ) | | | | (2,530,535 | ) | | | | (11,748,479 | ) |
Institutional Class | | | | (8,797,567 | ) | | | | (284,274,389 | ) | | | | (3,141,875 | ) | | | | (15,680,233 | ) |
|
Capital share transactions: | |
Investor Class | | | | | | | | | | | | | | | | | | | | |
Shares sold | | | | 97,325,792 | | | | | 248,203,167 | | | | | 26,758,443 | | | | | 95,937,161 | |
Shares issued to holders in reinvestment of dividends | | | | 9,663,297 | | | | | 313,193,819 | | | | | 2,518,483 | | | | | 11,693,871 | |
Shares redeemed | | | | (136,259,566 | ) | | | | (404,340,602 | ) | | | | (30,886,946 | ) | | | | (81,140,243 | ) |
Redemption fees | | | | 12,357 | | | | | 85,040 | | | | | 15,576 | | | | | 156,749 | |
| | | | | | | | | | | | | | | | | | | | |
Net increase (decrease) | | | | (29,258,120 | ) | | | | 157,141,424 | | | | | (1,594,444 | ) | | | | 26,647,538 | |
| | | | | | | | | | | | | | | | | | | | |
Institutional Class | | | | | | | | | | | | | | | | | | | | |
Shares sold | | | | 230,260,817 | | | | | 459,051,536 | | | | | 18,870,378 | | | | | 103,481,526 | |
Shares issued to holders in reinvestment of dividends | | | | 8,404,896 | | | | | 261,121,349 | | | | | 2,783,843 | | | | | 14,141,713 | |
Shares redeemed | | | | (246,702,384 | ) | | | | (441,359,771 | ) | | | | (71,467,416 | ) | | | | (86,825,415 | ) |
Redemption fees | | | | 8,920 | | | | | 34,409 | | | | | 4,874 | | | | | 4,276 | |
| | | | | | | | | | | | | | | | | | | | |
Net increase (decrease) | | | | (8,027,751 | ) | | | | 278,847,523 | | | | | (49,808,321 | ) | | | | 30,802,100 | |
| | | | | | | | | | | | | | | | | | | | |
Total increase (decrease) in net assets | | | | 353,409,323 | | | | | (1,407,256,081 | ) | | | | (102,988,814 | ) | | | | (75,425,233 | ) |
|
Net assets: | |
Beginning of period | | | | 2,632,122,455 | | | | | 4,039,378,536 | | | | | 541,592,452 | | | | | 617,017,685 | |
| | | | | | | | | | | | | | | | | | | | |
End of period | | | $ | 2,985,531,778 | | | | $ | 2,632,122,455 | | | | $ | 438,603,638 | | | | $ | 541,592,452 | |
| | | | | | | | | | | | | | | | | | | | |
|
Capital share transactions — shares: | |
Investor Class | | | | | | | | | | | | | | | | | | | | |
Shares sold | | | | 1,415,409 | | | | | 3,067,009 | | | | | 4,969,693 | | | | | 14,380,076 | |
Shares issued to holders in reinvestment of dividends | | | | 146,814 | | | | | 3,484,190 | | | | | 454,600 | | | | | 1,745,354 | |
Shares redeemed | | | | (2,003,223 | ) | | | | (5,082,081 | ) | | | | (5,804,450 | ) | | | | (13,153,521 | ) |
| | | | | | | | | | | | | | | | | | | | |
Net increase (decrease) in shares outstanding | | | | (441,000 | ) | | | | 1,469,118 | | | | | (380,157 | ) | | | | 2,971,909 | |
| | | | | | | | | | | | | | | | | | | | |
Institutional Class | | | | | | | | | | | | | | | | | | | | |
Shares sold | | | | 3,236,440 | | | | | 5,572,521 | | | | | 3,418,712 | | | | | 15,727,057 | |
Shares issued to holders in reinvestment of dividends | | | | 125,409 | | | | | 2,857,846 | | | | | 496,229 | | | | | 2,085,798 | |
Shares redeemed | | | | (3,655,356 | ) | | | | (5,462,162 | ) | | | | (13,014,092 | ) | | | | (14,125,635 | ) |
| | | | | | | | | | | | | | | | | �� | | | |
Net increase (decrease) in shares outstanding | | | | (293,507 | ) | | | | 2,968,205 | | | | | (9,099,151 | ) | | | | 3,687,220 | |
| | | | | | | | | | | | | | | | | | | | |
96
| | |
| | | MARCH 31, 2023 (Unaudited) |
| | | | | | | | | | | | | | | | | | | | | | | | | | | | |
Emerging Markets Select
Fund | | Emerging Markets Small Cap
Fund | | Frontier Emerging Small Countries
Fund |
Six Months Ended
March 31, 2023
(Unaudited) | | Year Ended
September 30, 2022 | | Six Months Ended
March 31, 2023
(Unaudited) | | Year Ended
September 30, 2022 | | Six Months Ended
March 31, 2023
(Unaudited) | | Year Ended
September 30, 2022 |
| | | | | | | | | | | | | | | | | | | | | | | | | | | | | |
| | | | | | | | | | | | | | | | | | | | | | | | | | | | | |
| | $ | (1,127,199 | ) | | | $ | (1,850,351 | ) | | | $ | (1,976,717 | ) | | | $ | (3,683,664 | ) | | | $ | (210,433 | ) | | | $ | (585,297 | ) |
| | | (8,819,927 | ) | | | | (44,531,178 | ) | | | | 4,957,417 | | | | | 11,618,896 | | | | | (1,581,894 | ) | | | | (4,778,617 | ) |
| | | 62,599,713 | | | | | (162,164,202 | ) | | | | 40,533,285 | | | | | (264,732,578 | ) | | | | 6,066,491 | | | | | (26,870,663 | ) |
| | | | | | | | | | | | | | | | | | | | | | | | | | | | | |
| | | 52,652,587 | | | | | (208,545,731 | ) | | | | 43,513,985 | | | | | (256,797,346 | ) | | | | 4,274,164 | | | | | (32,234,577 | ) |
| | | | | | | | | | | | | | | | | | | | | | | | | | | | | |
| | | | | |
| | | | | | | | | | | | | | | | | | | | | | | | | | | | | |
| | | — | | | | | (578,279 | ) | | | | (4,637,408 | ) | | | | (20,036,368 | ) | | | | — | | | | | (365,738 | ) |
| | | — | | | | | (1,049,729 | ) | | | | (6,561,217 | ) | | | | (19,590,549 | ) | | | | — | | | | | (154,376 | ) |
| | | | | |
| | | | | | | | | | | | | | | | | | | | | | | | | | | | | |
| | | | | | | | | | | | | | | | | | | | | | | | | | | | | |
| | | 15,616,098 | | | | | 103,497,531 | | | | | 7,702,970 | | | | | 105,275,533 | | | | | 1,247,383 | | | | | 8,123,117 | |
| | | — | | | | | 577,642 | | | | | 4,508,533 | | | | | 18,833,390 | | | | | — | | | | | 328,775 | |
| | | (15,456,351 | ) | | | | (99,601,938 | ) | | | | (33,258,370 | ) | | | | (160,261,548 | ) | | | | (3,500,012 | ) | | | | (7,070,629 | ) |
| | | 13,211 | | | | | 146,604 | | | | | 1,748 | | | | | 55,766 | | | | | 18 | | | | | 5,510 | |
| | | | �� | | | | | | | | | | | | | | | | | | | | | | | | | |
| | | 172,958 | | | | | 4,619,839 | | | | | (21,045,119 | ) | | | | (36,096,859 | ) | | | | (2,252,611 | ) | | | | 1,386,773 | |
| | | | | | | | | | | | | | | | | | | | | | | | | | | | | |
| | | | | | | | | | | | | | | | | | | | | | | | | | | | | |
| | | 113,338,443 | | | | | 493,239,547 | | | | | 31,120,005 | | | | | 181,799,296 | | | | | 38,265 | | | | | 5,067,490 | |
| | | — | | | | | 703,049 | | | | | 6,409,243 | | | | | 18,882,311 | | | | | — | | | | | 151,926 | |
| | | (59,462,160 | ) | | | | (209,153,428 | ) | | | | (61,504,062 | ) | | | | (133,630,699 | ) | | | | (7,143,882 | ) | | | | (3,101,280 | ) |
| | | 9,437 | | | | | 22,278 | | | | | 157 | | | | | 8,861 | | | | | — | | | | | 680 | |
| | | | | | | | | | | | | | | | | | | | | | | | | | | | | |
| | | 53,885,720 | | | | | 284,811,446 | | | | | (23,974,657 | ) | | | | 67,059,769 | | | | | (7,105,617 | ) | | | | 2,118,816 | |
| | | | | | | | | | | | | | | | | | | | | | | | | | | | | |
| | | 106,711,265 | | | | | 79,257,546 | | | | | (12,704,416 | ) | | | | (265,461,353 | ) | | | | (5,084,064 | ) | | | | (29,249,102 | ) |
| | | | | |
| | | | | | | | | | | | | | | | | | | | | | | | | | | | | |
| | | 343,483,843 | | | | | 264,226,297 | | | | | 377,897,003 | | | | | 643,358,356 | | | | | 40,547,517 | | | | | 69,796,619 | |
| | | | | | | | | | | | | | | | | | | | | | | | | | | | | |
| | $ | 450,195,108 | | | | $ | 343,483,843 | | | | $ | 365,192,587 | | | | $ | 377,897,003 | | | | $ | 35,463,453 | | | | $ | 40,547,517 | |
| | | | | | | | | | | | | | | | | | | | | | | | | | | | | |
| | | | | |
| | | | | | | | | | | | | | | | | | | | | | | | | | | | | |
| | | | | | | | | | | | | | | | | | | | | | | | | | | | | |
| | | 1,059,830 | | | | | 5,017,233 | | | | | 2,925,082 | | | | | 27,825,702 | | | | | 476,197 | | | | | 2,500,260 | |
| | | — | | | | | 27,069 | | | | | 1,747,493 | | | | | 4,673,298 | | | | | — | | | | | 82,815 | |
| | | (1,058,087 | ) | | | | (5,279,941 | ) | | | | (12,829,361 | ) | | | | (46,719,791 | ) | | | | (1,390,982 | ) | | | | (2,143,065 | ) |
| | | | | | | | | | | | | | | | | | | | | | | | | | | | | |
| | | 1,743 | | | | | (235,639 | ) | | | | (8,156,786 | ) | | | | (14,220,791 | ) | | | | (914,785 | ) | | | | 440,010 | |
| | | | | | | | | | | | | | | | | | | | | | | | | | | | | |
| | | | | | | | | | | | | | | | | | | | | | | | | | | | | |
| | | 7,594,246 | | | | | 25,805,080 | | | | | 11,718,423 | | | | | 50,113,813 | | | | | 14,055 | | | | | 1,341,838 | |
| | | — | | | | | 32,205 | | | | | 2,455,649 | | | | | 4,628,017 | | | | | — | | | | | 37,887 | |
| | | (4,084,973 | ) | | | | (11,943,908 | ) | | | | (22,986,566 | ) | | | | (39,909,264 | ) | | | | (2,812,536 | ) | | | | (1,098,403 | ) |
| | | | | | | | | | | | | | | | | | | | | | | | | | | | | |
| | | 3,509,273 | | | | | 13,893,377 | | | | | (8,812,494 | ) | | | | 14,832,566 | | | | | (2,798,481 | ) | | | | 281,322 | |
| | | | | | | | | | | | | | | | | | | | | | | | | | | | | |
97
Statements of Changes in Net Assets (continued)
| | | | | | | | | | | | | | | | | | | | |
| | | Global Opportunities
Fund | | Global Select
Fund |
| | | Six Months Ended
March 31, 2023
(Unaudited) | | Year Ended
September 30, 2022 | | Six Months Ended
March 31, 2023
(Unaudited) | | Year Ended
September 30, 2022 |
| | | | | | | | | | | | | | | | | | | | |
Operations: | | | | | | | | | | | | | | | | | | | | |
Net investment income (loss) | | | $ | (872,190 | ) | | | $ | (2,165,481 | ) | | | $ | (29,639 | ) | | | $ | (80,784 | ) |
Net realized gain (loss) on investments, foreign currency translations and foreign capital gains taxes | | | | (554,947 | ) | | | | 2,277,633 | | | | | (336,971 | ) | | | | (1,103,900 | ) |
Change in unrealized appreciation (depreciation) on investments, foreign currency translations and deferred foreign capital gains taxes | | | | 19,680,130 | | | | | (103,364,198 | ) | | | | 2,638,072 | | | | | (6,431,292 | ) |
| | | | | | | | | | | | | | | | | | | | |
Net increase (decrease) in net assets resulting from operations | | | | 18,252,993 | | | | | (103,252,046 | ) | | | | 2,271,462 | | | | | (7,615,976 | ) |
| | | | | | | | | | | | | | | | | | | | |
|
Distributions to shareholders from distributable earnings | |
Investor Class | | | | (2,469,318 | ) | | | | (14,804,572 | ) | | | | — | | | | | (813,040 | ) |
Institutional Class | | | | (1,256,428 | ) | | | | (5,997,363 | ) | | | | — | | | | | (1,403,979 | ) |
|
Capital share transactions: | |
Investor Class | | | | | | | | | | | | | | | | | | | | |
Shares sold | | | | 11,988,504 | | | | | 38,979,429 | | | | | 255,110 | | | | | 701,016 | |
Shares issued to holders in reinvestment of dividends | | | | 2,451,806 | | | | | 14,715,236 | | | | | — | | | | | 813,040 | |
Shares redeemed | | | | (9,845,155 | ) | | | | (43,287,302 | ) | | | | (320,969 | ) | | | | (1,370,547 | ) |
Redemption fees | | | | 14,721 | | | | | 28,823 | | | | | 15 | | | | | 553 | |
| | | | | | | | | | | | | | | | | | | | |
Net increase (decrease) | | | | 4,609,876 | | | | | 10,436,186 | | | | | (65,844 | ) | | | | 144,062 | |
| | | | | | | | | | | | | | | | | | | | |
Institutional Class | | | | | | | | | | | | | | | | | | | | |
Shares sold | | | | 4,338,779 | | | | | 42,443,771 | | | | | 1,276,160 | | | | | 1,995,085 | |
Shares issued to holders in reinvestment of dividends | | | | 1,232,291 | | | | | 5,863,776 | | | | | — | | | | | 1,403,979 | |
Shares redeemed | | | | (5,330,689 | ) | | | | (28,092,909 | ) | | | | (1,660,346 | ) | | | | (443,486 | ) |
Redemption fees | | | | 7,148 | | | | | 9,216 | | | | | — | | | | | 1,864 | |
| | | | | | | | | | | | | | | | | | | | |
Net increase (decrease) | | | | 247,529 | | | | | 20,223,854 | | | | | (384,186 | ) | | | | 2,957,442 | |
| | | | | | | | | | | | | | | | | | | | |
Total increase (decrease) in net assets | | | | 19,384,652 | | | | | (93,393,941 | ) | | | | 1,821,432 | | | | | (6,731,491 | ) |
|
Net assets: | |
Beginning of period | | | | 162,313,566 | | | | | 255,707,507 | | | | | 12,707,379 | | | | | 19,438,870 | |
| | | | | | | | | | | | | | | | | | | | |
End of period | | | $ | 181,698,218 | | | | $ | 162,313,566 | | | | $ | 14,528,811 | | | | $ | 12,707,379 | |
| | | | | | | | | | | | | | | | | | | | |
|
Capital share transactions — shares: | |
Investor Class | | | | | | | | | | | | | | | | | | | | |
Shares sold | | | | 3,138,986 | | | | | 7,436,719 | | | | | 25,235 | | | | | 55,182 | |
Shares issued to holders in reinvestment of dividends | | | | 681,057 | | | | | 2,829,853 | | | | | — | | | | | 60,003 | |
Shares redeemed | | | | (2,718,596 | ) | | | | (9,804,570 | ) | | | | (34,096 | ) | | | | (115,462 | ) |
| | | | | | | | | | | | | | | | | | | | |
Net increase (decrease) in shares outstanding | | | | 1,101,447 | | | | | 462,002 | | | | | (8,861 | ) | | | | (277 | ) |
| | | | | | | | | | | | | | | | | | | | |
Institutional Class | | | | | | | | | | | | | | | | | | | | |
Shares sold | | | | 1,191,487 | | | | | 8,859,854 | | | | | 119,704 | | | | | 156,998 | |
Shares issued to holders in reinvestment of dividends | | | | 338,542 | | | | | 1,119,041 | | | | | — | | | | | 102,780 | |
Shares redeemed | | | | (1,463,870 | ) | | | | (6,435,070 | ) | | | | (161,087 | ) | | | | (35,444 | ) |
| | | | | | | | | | | | | | | | | | | | |
Net increase (decrease) in shares outstanding | | | | 66,159 | | | | | 3,543,825 | | | | | (41,383 | ) | | | | 224,334 | |
| | | | | | | | | | | | | | | | | | | | |
98
| | |
| | | MARCH 31, 2023 (Unaudited) |
| | | | | | | | | | | | | | | | | | | | | | | | | | | | |
Global Value
Fund | | Greater China
Fund | | International Growth
Fund |
Six Months Ended
March 31, 2023
(Unaudited) | | Year Ended
September 30, 2022 | | Six Months Ended
March 31, 2023
(Unaudited) | | Year Ended
September 30, 2022 | | Six Months Ended
March 31, 2023
(Unaudited) | | Year Ended
September 30, 2022 |
| | | | | | | | | | | | | | | | | | | | | | | | | | | | | |
| | | | | | | | | | | | | | | | | | | | | | | | | | | | | |
| | $ | 1,785,020 | | | | $ | 3,409,192 | | | | $ | (34,604 | ) | | | $ | (41,487 | ) | | | $ | (255,575 | ) | | | $ | (793,184 | ) |
| | | (1,221,023 | ) | | | | 9,848,363 | | | | | (385,757 | ) | | | | (2,177,886 | ) | | | | (8,600,372 | ) | | | | 9,194,155 | |
| | | 19,706,623 | | | | | (24,676,596 | ) | | | | 959,261 | | | | | (1,896,553 | ) | | | | 104,574,635 | | | | | (522,144,840 | ) |
| | | | | | | | | | | | | | | | | | | | | | | | | | | | | |
| | | 20,270,620 | | | | | (11,419,041 | ) | | | | 538,900 | | | | | (4,115,926 | ) | | | | 95,718,688 | | | | | (513,743,869 | ) |
| | | | | | | | | | | | | | | | | | | | | | | | | | | | | |
| | | | | |
| | | | | | | | | | | | | | | | | | | | | | | | | | | | | |
| | | (8,248,166 | ) | | | | (6,647,351 | ) | | | | (141,340 | ) | | | | — | | | | | — | | | | | (51,916,282 | ) |
| | | (1,485,006 | ) | | | | (588,496 | ) | | | | (182,828 | ) | | | | — | | | | | — | | | | | (63,352,795 | ) |
| | | | | |
| | | | | | | | | | | | | | | | | | | | | | | | | | | | | |
| | | | | | | | | | | | | | | | | | | | | | | | | | | | | |
| | | 8,704,659 | | | | | 12,745,551 | | | | | 2,621,054 | | | | | 2,125,309 | | | | | 11,221,045 | | | | | 36,385,889 | |
| | | 8,026,954 | | | | | 6,472,405 | | | | | 136,465 | | | | | — | | | | | — | | | | | 47,744,025 | |
| | | (8,768,077 | ) | | | | (20,117,303 | ) | | | | (2,130,107 | ) | | | | (2,306,356 | ) | | | | (45,330,750 | ) | | | | (101,922,857 | ) |
| | | 551 | | | | | 4,373 | | | | | 696 | | | | | 12,309 | | | | | 949 | | | | | 6,797 | |
| | | | | | | | | | | | | | | | | | | | | | | | | | | | | |
| | | 7,964,087 | | | | | (894,974 | ) | | | | 628,108 | | | | | (168,738 | ) | | | | (34,108,756 | ) | | | | (17,786,146 | ) |
| | | | | | | | | | | | | | | | | | | | | | | | | | | | | |
| | | | | | | | | | | | | | | | | | | | | | | | | | | | | |
| | | 15,203,304 | | | | | 14,594,609 | | | | | 221,271 | | | | | 3,202,467 | | | | | 17,467,405 | | | | | 85,055,620 | |
| | | 1,483,033 | | | | | 586,805 | | | | | 182,828 | | | | | — | | | | | — | | | | | 58,809,032 | |
| | | (2,584,947 | ) | | | | (4,195,399 | ) | | | | (190,674 | ) | | | | (4,677,922 | ) | | | | (133,525,849 | ) | | | | (176,000,636 | ) |
| | | — | | | | | 941 | | | | | — | | | | | 1,913 | | | | | 288 | | | | | 36 | |
| | | | | | | | | | | | | | | | | | | | | | | | | | | | | |
| | | 14,101,390 | | | | | 10,986,956 | | | | | 213,425 | | | | | (1,473,542 | ) | | | | (116,058,156 | ) | | | | (32,135,948 | ) |
| | | | | | | | | | | | | | | | | | | | | | | | | | | | | |
| | | 32,602,925 | | | | | (8,562,906 | ) | | | | 1,056,265 | | | | | (5,758,206 | ) | | | | (54,448,224 | ) | | | | (678,935,040 | ) |
| | | | | |
| | | | | | | | | | | | | | | | | | | | | | | | | | | | | |
| | | 118,565,795 | | | | | 127,128,701 | | | | | 4,815,860 | | | | | 10,574,066 | | | | | 599,543,228 | | | | | 1,278,478,268 | |
| | | | | | | | | | | | | | | | | | | | | | | | | | | | | |
| | $ | 151,168,720 | | | | $ | 118,565,795 | | | | $ | 5,872,125 | | | | $ | 4,815,860 | | | | $ | 545,095,004 | | | | $ | 599,543,228 | |
| | | | | | | | | | | | | | | | | | | | | | | | | | | | | |
| | | | | |
| | | | | | | | | | | | | | | | | | | | | | | | | | | | | |
| | | | | | | | | | | | | | | | | | | | | | | | | | | | | |
| | | 966,046 | | | | | 1,348,226 | | | | | 370,040 | | | | | 230,759 | | | | | 495,087 | | | | | 1,279,011 | |
| | | 917,366 | | | | | 705,208 | | | | | 21,456 | | | | | — | | | | | — | | | | | 1,409,210 | |
| | | (984,592 | ) | | | | (2,164,178 | ) | | | | (320,510 | ) | | | | (261,868 | ) | | | | (2,037,930 | ) | | | | (3,659,382 | ) |
| | | | | | | | | | | | | | | | | | | | | | | | | | | | | |
| | | 898,820 | | | | | (110,744 | ) | | | | 70,986 | | | | | (31,109 | ) | | | | (1,542,843 | ) | | | | (971,161 | ) |
| | | | | | | | | | | | | | | | | | | | | | | | | | | | | |
| | | | | | | | | | | | | | | | | | | | | | | | | | | | | |
| | | 1,686,829 | | | | | 1,554,788 | | | | | 36,679 | | | | | 332,766 | | | | | 780,057 | | | | | 3,020,035 | |
| | | 169,878 | | | | | 65,481 | | | | | 28,929 | | | | | — | | | | | — | | | | | 1,723,594 | |
| | | (293,114 | ) | | | | (445,783 | ) | | | | (30,751 | ) | | | | (571,578 | ) | | | | (5,859,319 | ) | | | | (6,816,735 | ) |
| | | | | | | | | | | | | | | | | | | | | | | | | | | | | |
| | | 1,563,593 | | | | | 1,174,486 | | | | | 34,857 | | | | | (238,812 | ) | | | | (5,079,262 | ) | | | | (2,073,106 | ) |
| | | | | | | | | | | | | | | | | | | | | | | | | | | | | |
99
Statements of Changes in Net Assets (continued)
| | | | | | | | | | | | | | | | | | | | |
| | | International Opportunities
Fund | | International Select
Fund |
| | | Six Months Ended
March 31, 2023
(Unaudited) | | Year Ended
September 30, 2022 | | Six Months Ended
March 31, 2023
(Unaudited) | | Year Ended
September 30, 2022 |
| | | | | | | | | | | | | | | | | | | | |
Operations: | | | | | | | | | | | | | | | | | | | | |
Net investment loss | | | $ | (1,662,754 | ) | | | $ | (5,978,343 | ) | | | $ | (15,504 | ) | | | $ | (35,905 | ) |
Net realized loss on investments, foreign currency translations and foreign capital gains taxes | | | | (7,830,491 | ) | | | | (23,853,442 | ) | | | | (333,822 | ) | | | | (566,918 | ) |
Net realized gain on short positions | | | | — | | | | | — | | | | | — | | | | | — | |
Change in unrealized appreciation (depreciation) on investments, foreign currency translations and deferred foreign capital gains taxes | | | | 64,495,694 | | | | | (330,844,989 | ) | | | | 1,377,760 | | | | | (3,012,107 | ) |
| | | | | | | | | | | | | | | | | | | | |
Net increase (decrease) in net assets resulting from operations | | | | 55,002,449 | | | | | (360,676,774 | ) | | | | 1,028,434 | | | | | (3,614,930 | ) |
| | | | | | | | | | | | | | | | | | | | |
|
Distributions to shareholders from distributable earnings | |
Investor Class | | | | — | | | | | (16,548,898 | ) | | | | — | | | | | — | |
Institutional Class | | | | — | | | | | (79,947,261 | ) | | | | — | | | | | — | |
|
Capital share transactions: | |
Investor Class | | | | | | | | | | | | | | | | | | | | |
Shares sold | | | | 2,324,780 | | | | | 5,319,580 | | | | | 404,402 | | | | | 750,357 | |
Shares issued to holders in reinvestment of dividends | | | | — | | | | | 15,590,314 | | | | | — | | | | | — | |
Shares redeemed | | | | (10,039,684 | ) | | | | (21,059,497 | ) | | | | (330,130 | ) | | | | (1,279,134 | ) |
Redemption fees | | | | 248 | | | | | 1,397 | | | | | 56 | | | | | 3,030 | |
| | | | | | | | | | | | | | | | | | | | |
Net increase (decrease) | | | | (7,714,656 | ) | | | | (148,206 | ) | | | | 74,328 | | | | | (525,747 | ) |
| | | | | | | | | | | | | | | | | | | | |
Institutional Class | | | | | | | | | | | | | | | | | | | | |
Shares sold | | | | 77,113,178 | | | | | 267,454,540 | | | | | 230,000 | | | | | 172,693 | |
Shares issued to holders in reinvestment of dividends | | | | — | | | | | 54,694,120 | | | | | — | | | | | — | |
Shares redeemed | | | | (158,481,654 | ) | | | | (261,107,430 | ) | | | | (1,271,926 | ) | | | | (239,743 | ) |
Redemption fees | | | | 950 | | | | | 1,997 | | | | | — | | | | | — | |
| | | | | | | | | | | | | | | | | | | | |
Net increase (decrease) | | | | (81,367,526 | ) | | | | 61,043,227 | | | | | (1,041,926 | ) | | | | (67,050 | ) |
| | | | | | | | | | | | | | | | | | | | |
Total increase (decrease) in net assets | | | | (34,079,733 | ) | | | | (396,277,912 | ) | | | | 60,836 | | | | | (4,207,727 | ) |
|
Net assets: | |
Beginning of period | | | | 418,678,776 | | | | | 814,956,688 | | | | | 5,301,221 | | | | | 9,508,948 | |
| | | | | | | | | | | | | | | | | | | | |
End of period | | | $ | 384,599,043 | | | | $ | 418,678,776 | | | | $ | 5,362,057 | | | | $ | 5,301,221 | |
| | | | | | | | | | | | | | | | | | | | |
|
Capital share transactions — shares: | |
Investor Class | | | | | | | | | | | | | | | | | | | | |
Shares sold | | | | 834,269 | | | | | 1,512,692 | | | | | 38,398 | | | | | 62,125 | |
Shares issued to holders in reinvestment of dividends | | | | — | | | | | 3,600,534 | | | | | — | | | | | — | |
Shares redeemed | | | | (3,559,842 | ) | | | | (5,994,663 | ) | | | | (33,330 | ) | | | | (98,010 | ) |
| | | | | | | | | | | | | | | | | | | | |
Net increase (decrease) in shares outstanding | | | | (2,725,573 | ) | | | | (881,437 | ) | | | | 5,068 | | | | | (35,885 | ) |
| | | | | | | | | | | | | | | | | | | | |
Institutional Class | | | | | | | | | | | | | | | | | | | | |
Shares sold | | | | 27,054,972 | | | | | 76,495,700 | | | | | 21,043 | | | | | 13,285 | |
Shares issued to holders in reinvestment of dividends | | | | — | | | | | 12,430,482 | | | | | — | | | | | — | |
Shares redeemed | | | | (56,697,319 | ) | | | | (76,677,983 | ) | | | | (125,736 | ) | | | | (18,239 | ) |
| | | | | | | | | | | | | | | | | | | | |
Net increase (decrease) in shares outstanding | | | | (29,642,347 | ) | | | | 12,248,199 | | | | | (104,693 | ) | | | | (4,954 | ) |
| | | | | | | | | | | | | | | | | | | | |
| 1 | Fund inception date was October 1, 2021. |
See Notes to Financial Statements.
100
| | |
| | | MARCH 31, 2023 (Unaudited) |
| | | | | | | | | | | | | | | | | | | | | | | | | | | | |
Long/Short Alpha
Fund | | Micro Cap
Fund | | Micro Cap Value
Fund |
Six Months Ended
March 31, 2023
(Unaudited) | | Year Ended
September 30, 20221 | | Six Months Ended
March 31, 2023
(Unaudited) | | Year Ended
September 30, 2022 | | Six Months Ended
March 31, 2023
(Unaudited) | | Year Ended
September 30, 2022 |
| | | | | | | | | | | | | | | | | | | | | | | | | | | | | |
| | | | | | | | | | | | | | | | | | | | | | | | | | | | | |
| | $ | (109,646 | ) | | | $ | (337,969 | ) | | | $ | (4,737,396 | ) | | | $ | (14,765,182 | ) | | | $ | (1,410,229 | ) | | | $ | (4,330,858 | ) |
| | | (990,453 | ) | | | | (2,660,151 | ) | | | | (85,427,789 | ) | | | | (86,728,624 | ) | | | | (15,233,803 | ) | | | | (14,266,891 | ) |
| | | 480,398 | | | | | 2,809,512 | | | | | — | | | | | — | | | | | — | | | | | — | |
| | | 4,889,800 | | | | | (3,618,614 | ) | | | | 138,536,798 | | | | | (363,166,568 | ) | | | | 47,418,954 | | | | | (129,242,061 | ) |
| | | | | | | | | | | | | | | | | | | | | | | | | | | | | |
| | | 4,270,099 | | | | | (3,807,222 | ) | | | | 48,371,613 | | | | | (464,660,374 | ) | | | | 30,774,922 | | | | | (147,839,810 | ) |
| | | | | | | | | | | | | | | | | | | | | | | | | | | | | |
| | | | | |
| | | | | | | | | | | | | | | | | | | | | | | | | | | | | |
| | | (8,767 | ) | | | | — | | | | | — | | | | | (257,919,727 | ) | | | | — | | | | | (73,081,163 | ) |
| | | (15,251 | ) | | | | — | | | | | — | | | | | (41,304,544 | ) | | | | — | | | | | (12,549,879 | ) |
| | | | | |
| | | | | | | | | | | | | | | | | | | | | | | | | | | | | |
| | | | | | | | | | | | | | | | | | | | | | | | | | | | | |
| | | 7,242,877 | | | | | 10,437,484 | | | | | 17,264,998 | | | | | 83,326,504 | | | | | 13,624,765 | | | | | 82,141,646 | |
| | | 8,767 | | | | | — | | | | | — | | | | | 243,675,646 | | | | | — | | | | | 71,677,406 | |
| | | (408,039 | ) | | | | (1,076,313 | ) | | | | (64,233,353 | ) | | | | (261,308,270 | ) | | | | (32,908,179 | ) | | | | (91,551,333 | ) |
| | | 1,190 | | | | | 3,329 | | | | | 7,720 | | | | | 33,892 | | | | | 4,751 | | | | | 36,520 | |
| | | | | | | | | | | | | | | | | | | | | | | | | | | | | |
| | | 6,844,795 | | | | | 9,364,500 | | | | | (46,960,635 | ) | | | | 65,727,772 | | | | | (19,278,663 | ) | | | | 62,304,239 | |
| | | | | | | | | | | | | | | | | | | | | | | | | | | | | |
| | | | | | | | | | | | | | | | | | | | | | | | | | | | | |
| | | 1,583,267 | | | | | 19,173,989 | | | | | 21,636,124 | | | | | 67,953,958 | | | | | 4,916,036 | | | | | 29,173,118 | |
| | | 15,251 | | | | | — | | | | | — | | | | | 39,473,070 | | | | | — | | | | | 12,450,069 | |
| | | (7,781,233 | ) | | | | (2,766,684 | ) | | | | (24,858,863 | ) | | | | (128,240,524 | ) | | | | (8,095,608 | ) | | | | (21,836,415 | ) |
| | | 112 | | | | | 1,686 | | | | | 10,658 | | | | | 11,080 | | | | | 19 | | | | | 5,345 | |
| | | | | | | | | | | | | | | | | | | | | | | | | | | | | |
| | | (6,182,603 | ) | | | | 16,408,991 | | | | | (3,212,081 | ) | | | | (20,802,416 | ) | | | | (3,179,553 | ) | | | | 19,792,117 | |
| | | | | | | | | | | | | | | | | | | | | | | | | | | | | |
| | | 4,908,273 | | | | | 21,966,269 | | | | | (1,801,103 | ) | | | | (718,959,289 | ) | | | | 8,316,706 | | | | | (151,374,496 | ) |
| | | | | |
| | | | | | | | | | | | | | | | | | | | | | | | | | | | | |
| | | 21,966,269 | | | | | — | | | | | 634,651,021 | | | | | 1,353,610,310 | | | | | 292,242,448 | | | | | 443,616,944 | |
| | | | | | | | | | | | | | | | | | | | | | | | | | | | | |
| | $ | 26,874,542 | | | | $ | 21,966,269 | | | | $ | 632,849,918 | | | | $ | 634,651,021 | | | | $ | 300,559,154 | | | | $ | 292,242,448 | |
| | | | | | | | | | | | | | | | | | | | | | | | | | | | | |
| | | | | |
| | | | | | | | | | | | | | | | | | | | | | | | | | | | | |
| | | | | | | | | | | | | | | | | | | | | | | | | | | | | |
| | | 671,653 | | | | | 1,015,942 | | | | | 2,899,206 | | | | | 10,095,488 | | | | | 4,488,535 | | | | | 20,799,592 | |
| | | 853 | | | | | — | | | | | — | | | | | 27,690,414 | | | | | — | | | | | 17,964,263 | |
| | | (39,453 | ) | | | | (107,804 | ) | | | | (10,956,382 | ) | | | | (32,162,553 | ) | | | | (10,926,780 | ) | | | | (25,266,275 | ) |
| | | | | | | | | | | | | | | | | | | | | | | | | | | | | |
| | | 633,053 | | | | | 908,138 | | | | | (8,057,176 | ) | | | | 5,623,349 | | | | | (6,438,245 | ) | | | | 13,497,580 | |
| | | | | | | | | | | | | | | | | | | | | | | | | | | | | |
| | | | | | | | | | | | | | | | | | | | | | | | | | | | | |
| | | 154,882 | | | | | 1,806,617 | | | | | 3,563,504 | | | | | 7,928,370 | | | | | 1,592,249 | | | | | 7,138,745 | |
| | | 1,479 | | | | | — | | | | | — | | | | | 4,490,679 | | | | | — | | | | | 3,104,755 | |
| | | (721,734 | ) | | | | (280,253 | ) | | | | (4,287,944 | ) | | | | (14,843,245 | ) | | | | (2,662,450 | ) | | | | (5,938,809 | ) |
| | | | | | | | | | | | | | | | | | | | | | | | | | | | | |
| | | (565,373 | ) | | | | 1,526,364 | | | | | (724,440 | ) | | | | (2,424,196 | ) | | | | (1,070,201 | ) | | | | 4,304,691 | |
| | | | | | | | | | | | | | | | | | | | | | | | | | | | | |
101
Statements of Changes in Net Assets (continued)
| | | | | | | | | | | | | | | | | | | | |
| | | Small Cap Growth
Fund | | Small Cap Value
Fund |
| | | Six Months Ended
March 31, 2023
(Unaudited) | | Year Ended
September 30, 2022 | | Six Months Ended
March 31, 2023
(Unaudited) | | Year Ended
September 30, 2022 |
| | | | | | | | | | | | | | | | | | | | |
Operations: | | | | | | | | | | | | | | | | | | | | |
Net investment income (loss) | | | $ | (9,591,326 | ) | | | $ | (27,936,551 | ) | | | $ | 1,491,114 | | | | $ | 1,462,850 | |
Net realized gain (loss) on investments, foreign currency translations and foreign capital gains taxes | | | | (138,811,989 | ) | | | | 16,878,405 | | | | | 1,915,425 | | | | | 43,619,406 | |
Change in unrealized appreciation (depreciation) on investments, foreign currency translations and deferred foreign capital gains taxes | | | | 342,824,794 | | | | | (1,488,390,413 | ) | | | | 199,887,768 | | | | | (450,637,702 | ) |
| | | | | | | | | | | | | | | | | | | | |
Net increase (decrease) in net assets resulting from operations | | | | 194,421,479 | | | | | (1,499,448,559 | ) | | | | 203,294,307 | | | | | (405,555,446 | ) |
| | | | | | | | | | | | | | | | | | | | |
| | | | |
Distributions to shareholders from distributable earnings | | | | | | | | | | | | | | | | | | | | |
Investor Class | | | | — | | | | | (298,275,007 | ) | | | | (14,251,795 | ) | | | | (63,940,106 | ) |
Institutional Class | | | | — | | | | | (324,759,466 | ) | | | | (16,822,096 | ) | | | | (65,113,713 | ) |
| | | | |
Capital share transactions: | | | | | | | | | | | | | | | | | | | | |
Investor Class | | | | | | | | | | | | | | | | | | | | |
Shares sold | | | | 55,373,274 | | | | | 170,077,569 | | | | | 79,800,279 | | | | | 143,290,709 | |
Shares issued to holders in reinvestment of dividends | | | | — | | | | | 287,667,859 | | | | | 13,955,521 | | | | | 62,945,104 | |
Shares redeemed | | | | (105,995,264 | ) | | | | (365,759,690 | ) | | | | (170,986,806 | ) | | | | (220,687,194 | ) |
Redemption fees | | | | 9,217 | | | | | 58,888 | | | | | 8,216 | | | | | 22,718 | |
| | | | | | | | | | | | | | | | | | | | |
Net increase (decrease) | | | | (50,612,773 | ) | | | | 92,044,626 | | | | | (77,222,790 | ) | | | | (14,428,663 | ) |
| | | | | | | | | | | | | | | | | | | | |
Institutional Class | | | | | | | | | | | | | | | | | | | | |
Shares sold | | | | 176,970,031 | | | | | 491,403,328 | | | | | 71,215,521 | | | | | 264,173,350 | |
Shares issued to holders in reinvestment of dividends | | | | — | | | | | 302,906,157 | | | | | 16,171,156 | | | | | 63,842,825 | |
Shares redeemed | | | | (175,745,574 | ) | | | | (419,314,392 | ) | | | | (80,462,104 | ) | | | | (235,173,800 | ) |
Redemption fees | | | | 22,519 | | | | | 38,065 | | | | | 673 | | | | | 4,480 | |
| | | | | | | | | | | | | | | | | | | | |
Net increase (decrease) | | | | 1,246,976 | | | | | 375,033,158 | | | | | 6,925,246 | | | | | 92,846,855 | |
| | | | | | | | | | | | | | | | | | | | |
Total increase (decrease) in net assets | | | | 145,055,682 | | | | | (1,655,405,248 | ) | | | | 101,922,872 | | | | | (456,191,073 | ) |
| | | | |
Net assets: | | | | | | | | | | | | | | | | | | | | |
Beginning of period | | | | 1,986,934,124 | | | | | 3,642,339,372 | | | | | 1,233,367,984 | | | | | 1,689,559,057 | |
| | | | | | | | | | | | | | | | | | | | |
End of period | | | $ | 2,131,989,806 | | | | $ | 1,986,934,124 | | | | $ | 1,335,290,856 | | | | $ | 1,233,367,984 | |
| | | | | | | | | | | | | | | | | | | | |
| | | | |
Capital share transactions — shares: | | | | | | | | | | | | | | | | | | | | |
Investor Class | | | | | | | | | | | | | | | | | | | | |
Shares sold | | | | 1,787,509 | | | | | 4,006,813 | | | | | 9,462,794 | | | | | 15,186,572 | |
Shares issued to holders in reinvestment of dividends | | | | — | | | | | 6,173,130 | | | | | 1,703,971 | | | | | 6,281,947 | |
Shares redeemed | | | | (3,419,871 | ) | | | | (9,055,389 | ) | | | | (20,141,901 | ) | | | | (23,985,547 | ) |
| | | | | | | | | | | | | | | | | | | | |
Net increase (decrease) in shares outstanding | | | | (1,632,362 | ) | | | | 1,124,554 | | | | | (8,975,136 | ) | | | | (2,517,028 | ) |
| | | | | | | | | | | | | | | | | | | | |
Institutional Class | | | | | | | | | | | | | | | | | | | | |
Shares sold | | | | 5,557,754 | | | | | 12,084,062 | | | | | 8,289,451 | | | | | 27,501,939 | |
Shares issued to holders in reinvestment of dividends | | | | — | | | | | 6,395,822 | | | | | 1,955,400 | | | | | 6,314,820 | |
Shares redeemed | | | | (5,564,341 | ) | | | | (10,126,348 | ) | | | | (9,380,018 | ) | | | | (24,955,438 | ) |
| | | | | | | | | | | | | | | | | | | | |
Net increase (decrease) in shares outstanding | | | | (6,587 | ) | | | | 8,353,536 | | | | | 864,833 | | | | | 8,861,321 | |
| | | | | | | | | | | | | | | | | | | | |
| 1 | Fund inception date was June 13, 2022. |
See Notes to Financial Statements.
102
| | |
| | | MARCH 31, 2023 (Unaudited) |
| | | | | | | | | | | | | | | | | | | | | | | | | | | | |
Ultra Growth
Fund | | U.S. Select
Fund | | U.S. Treasury
Fund |
Six Months Ended
March 31, 2023
(Unaudited) | | Year Ended
September 30, 2022 | | Six Months Ended
March 31, 2023
(Unaudited) | | Period Ended
September 30, 20221 | | Six Months Ended
March 31, 2023
(Unaudited) | | Year Ended
September 30, 2022 |
| | | | | | | | | | | | | | | | | | | | | | | | | | | | | |
| | | | | | | | | | | | | | | | | | | | | | | | | | | | | |
| | $ | (6,334,767 | ) | | | $ | (20,763,778 | ) | | | $ | (13,157 | ) | | | $ | (5,676 | ) | | | $ | 3,745,920 | | | | $ | 6,738,135 | |
| | | (77,993,116 | ) | | | | 3,391,857 | | | | | (201,648 | ) | | | | 648 | | | | | (10,103,271 | ) | | | | (61,233,193 | ) |
| | | 191,760,175 | | | | | (1,105,267,854 | ) | | | | 1,258,937 | | | | | (563,767 | ) | | | | 18,598,911 | | | | | (76,105,948 | ) |
| | | | | | | | | | | | | | | | | | | | | | | | | | | | | |
| | | 107,432,292 | | | | | (1,122,639,775 | ) | | | | 1,044,132 | | | | | (568,795 | ) | | | | 12,241,560 | | | | | (130,601,006 | ) |
| | | | | | | | | | | | | | | | | | | | | | | | | | | | | |
| | | | | |
| | | | | | | | | | | | | | | | | | | | | | | | | | | | | |
| | | — | | | | | (229,039,647 | ) | | | | — | | | | | — | | | | | (3,731,126 | ) | | | | (6,840,922 | ) |
| | | (556,115 | ) | | | | (76,370,747 | ) | | | | — | | | | | — | | | | | — | | | | | — | |
| | | | | |
| | | | | | | | | | | | | | | | | | | | | | | | | | | | | |
| | | | | | | | | | | | | | | | | | | | | | | | | | | | | |
| | | 78,810,758 | | | | | 253,924,593 | | | | | 1,496,827 | | | | | 2,035,197 | | | | | 60,413,646 | | | | | 156,984,468 | |
| | | — | | | | | 218,714,597 | | | | | — | | | | | — | | | | | 3,550,229 | | | | | 6,430,282 | |
| | | (170,182,674 | ) | | | | (686,348,727 | ) | | | | (651,704 | ) | | | | (60,314 | ) | | | | (83,210,685 | ) | | | | (201,642,801 | ) |
| | | 25,427 | | | | | 82,520 | | | | | 11 | | | | | 1,206 | | | | | 68,711 | | | | | 244,125 | |
| | | | | | | | | | | | | | | | | | | | | | | | | | | | | |
| | | (91,346,489 | ) | | | | (213,627,017 | ) | | | | 845,134 | | | | | 1,976,089 | | | | | (19,178,099 | ) | | | | (37,983,926 | ) |
| | | | | | | | | | | | | | | | | | | | | | | | | | | | | |
| | | | | | | | | | | | | | | | | | | | | | | | | | | | | |
| | | 65,692,888 | | | | | 231,569,168 | | | | | 3,191,629 | | | | | 3,960,693 | | | | | — | | | | | — | |
| | | 542,074 | | | | | 74,406,337 | | | | | — | | | | | — | | | | | — | | | | | — | |
| | | (73,435,450 | ) | | | | (263,423,838 | ) | | | | (802,122 | ) | | | | (22,839 | ) | | | | — | | | | | — | |
| | | 1,520 | | | | | 6,041 | | | | | — | | | | | — | | | | | — | | | | | — | |
| | | | | | | | | | | | | | | | | | | | | | | | | | | | | |
| | | (7,198,968 | ) | | | | 42,557,708 | | | | | 2,389,507 | | | | | 3,937,854 | | | | | — | | | | | — | |
| | | | | | | | | | | | | | | | | | | | | | | | | | | | | |
| | | 8,330,720 | | | | | (1,599,119,478 | ) | | | | 4,278,773 | | | | | 5,345,148 | | | | | (10,667,665 | ) | | | | (175,425,854 | ) |
| | | | | |
| | | | | | | | | | | | | | | | | | | | | | | | | | | | | |
| | | 1,373,873,131 | | | | | 2,972,992,609 | | | | | 5,345,148 | | | | | — | | | | | 287,522,829 | | | | | 462,948,683 | |
| | | | | | | | | | | | | | | | | | | | | | | | | | | | | |
| | $ | 1,382,203,851 | | | | $ | 1,373,873,131 | | | | $ | 9,623,921 | | | | $ | 5,345,148 | | | | $ | 276,855,164 | | | | $ | 287,522,829 | |
| | | | | | | | | | | | | | | | | | | | | | | | | | | | | |
| | | | | |
| | | | | | | | | | | | | | | | | | | | | | | | | | | | | |
| | | | | | | | | | | | | | | | | | | | | | | | | | | | | |
| | | 2,812,087 | | | | | 6,764,579 | | | | | 130,753 | | | | | 187,794 | | | | | 4,879,815 | | | | | 9,747,128 | |
| | | — | | | | | 5,346,238 | | | | | — | | | | | — | | | | | 271,472 | | | | | 424,698 | |
| | | (6,211,279 | ) | | | | (18,891,335 | ) | | | | (63,477 | ) | | | | (5,063 | ) | | | | (6,602,838 | ) | | | | (12,805,705 | ) |
| | | | | | | | | | | | | | | | | | | | | | | | | | | | | |
| | | (3,399,192 | ) | | | | (6,780,518 | ) | | | | 67,276 | | | | | 182,731 | | | | | (1,451,551 | ) | | | | (2,633,879 | ) |
| | | | | | | | | | | | | | | | | | | | | | | | | | | | | |
| | | | | | | | | | | | | | | | | | | | | | | | | | | | | |
| | | 2,368,296 | | | | | 6,254,360 | | | | | 276,317 | | | | | 368,377 | | | | | — | | | | | — | |
| | | 19,784 | | | | | 1,815,231 | | | | | — | | | | | — | | | | | — | | | | | — | |
| | | (2,666,471 | ) | | | | (7,374,887 | ) | | | | (76,161 | ) | | | | (2,030 | ) | | | | — | | | | | — | |
| | | | | | | | | | | | | | | | | | | | | | | | | | | | | |
| | | (278,391 | ) | | | | 694,704 | | | | | 200,156 | | | | | 366,347 | | | | | — | | | | | — | |
| | | | | | | | | | | | | | | | | | | | | | | | | | | | | |
103
Statement of Cash Flows
| | | | | |
| | | Long/Short Alpha Fund |
| | | Six Months Ended
March 31, 2023
(Unaudited) |
| | | | | |
Cash flows from operating activities: | | | | | |
Net increase in net assets resulting from operations | | | $ | 4,270,099 | |
Adjustments to reconcile net increase in net assets resulting from operations to net cash from operating activities | | | | | |
Long-term investments purchased | | | | (16,317,405 | ) |
Long-term investments sold | | | | 14,238,500 | |
Short-term investments purchased | | | | (68,066,328 | ) |
Short-term investments sold | | | | 68,066,421 | |
Purchases to cover securities sold short | | | | (3,635,228 | ) |
Securities sold short | | | | 6,127,601 | |
Increase in investment sold receivable | | | | (120,876 | ) |
Increase in dividends and interest receivable | | | | (71 | ) |
Decrease in prepaid expenses and other assets | | | | 12,877 | |
Increase in investment securities purchased payable | | | | 513,081 | |
Increase in dividend payable on securities sold short | | | | 9,477 | |
Decrease in accrued fund administration fees | | | | (1,477 | ) |
Increase in payable to Advisor | | | | 21,159 | |
Decrease in accrued expenses and other liabilities | | | | (24,620 | ) |
Net change in unrealized appreciation on unaffiliated investments | | | | (5,324,972 | ) |
Net realized loss from unaffiliated investments | | | | 990,546 | |
Net realized gain from securities sold short | | | | (480,398 | ) |
Net change in unrealized depreciation on securities sold short | | | | 435,172 | |
Net realized gain from short-term investments | | | | (93 | ) |
| | | | | |
Net cash from operating activities | | | | 713,465 | |
| | | | | |
| |
Cash flows from financing activities: | | | | | |
Proceeds from shares sold | | | | 8,833,149 | |
Payment on shares redeemed | | | | (8,189,272 | ) |
Redemption fees | | | | 1,302 | |
| | | | | |
Net cash from financing activities | | | | 645,179 | |
| | | | | |
| |
Net increase in cash | | | | 1,358,644 | |
Cash at beginning of period | | | | 4,407,307 | |
| | | | | |
Cash at end of period | | | $ | 5,765,951 | |
| | | | | |
| |
Supplemental Disclosure of Cash Flow Information: | | | $ | 45,906 | |
Dividend on securities sold short during the period | | | | 46,055 | |
Interest expense paid during the period | | | | | |
104
(This page intentionally left blank.)
105
Financial Highlights
| | | | | | | | | | | | | | | | | | | | | | | | | | | | | | | | | | | | | | | | |
| | | | | Income (Loss) from
Investment Operations | | | | | | Less Distributions | | |
| | | Net Asset
Value
Beginning
of Period | | Net
Investment
Income (Loss) | | Net Realized
and Unrealized
Gains (Losses)
on Investments | | Total from
Investment
Operations | | Redemption
Fees
(See Note 2) | | Dividends
from Net
Investment
Income | | Distributions
from Net
Realized
Gains | | Total
Distributions |
| Core Growth Fund — Investor Class | | | | | | | | | | | | | | | | | | | | | | | | | | | | | | | |
| Six Months ended 3/31/23 (unaudited) | | | $ | 61.04 | | | | | (0.16 | ) | | | | 10.00 | | | | | 9.84 | | | | | — | 4 | | | | — | | | | | (0.46 | ) | | | | (0.46 | ) |
| Year ended 9/30/22 | | | $ | 104.75 | | | | | (0.48 | ) | | | | (27.40 | ) | | | | (27.88 | ) | | | | — | 4 | | | | — | | | | | (15.83 | ) | | | | (15.83 | ) |
| Year ended 9/30/21 | | | $ | 77.61 | | | | | (0.63 | ) | | | | 34.37 | | | | | 33.74 | | | | | — | 4 | | | | — | | | | | (6.60 | ) | | | | (6.60 | ) |
| Year ended 9/30/20 | | | $ | 73.17 | | | | | (0.32 | ) | | | | 12.47 | | | | | 12.15 | | | | | — | 4 | | | | — | | | | | (7.71 | ) | | | | (7.71 | ) |
| Year ended 9/30/19 | | | $ | 81.04 | | | | | (0.42 | ) | | | | (1.40 | ) | | | | (1.82 | ) | | | | 0.01 | | | | | — | | | | | (6.06 | ) | | | | (6.06 | ) |
| Year ended 9/30/18 | | | $ | 67.44 | | | | | (0.43 | ) | | | | 18.30 | | | | | 17.87 | | | | | — | 4 | | | | — | | | | | (4.27 | ) | | | | (4.27 | ) |
| Core Growth Fund — Institutional Class | | | | | | | | | | | | | | | | | | | | | | | | | | | | | | | |
| Six Months ended 3/31/23 (unaudited) | | | $ | 62.13 | | | | | (0.10 | ) | | | | 10.16 | | | | | 10.06 | | | | | — | 4 | | | | — | | | | | (0.46 | ) | | | | (0.46 | ) |
| Year ended 9/30/22 | | | $ | 106.20 | | | | | (0.41 | ) | | | | (27.83 | ) | | | | (28.24 | ) | | | | — | 4 | | | | — | | | | | (15.83 | ) | | | | (15.83 | ) |
| Year ended 9/30/21 | | | $ | 78.53 | | | | | (0.50 | ) | | | | 34.77 | | | | | 34.27 | | | | | — | 4 | | | | — | | | | | (6.60 | ) | | | | (6.60 | ) |
| Year ended 9/30/20 | | | $ | 73.86 | | | | | (0.29 | ) | | | | 12.67 | | | | | 12.38 | | | | | — | 4 | | | | — | | | | | (7.71 | ) | | | | (7.71 | ) |
| Year ended 9/30/19 | | | $ | 81.62 | | | | | (0.26 | ) | | | | (1.44 | ) | | | | (1.70 | ) | | | | — | 4 | | | | — | | | | | (6.06 | ) | | | | (6.06 | ) |
| Year ended 9/30/18 | | | $ | 67.81 | | | | | (0.21 | ) | | | | 18.29 | | | | | 18.08 | | | | | — | 4 | | | | — | | | | | (4.27 | ) | | | | (4.27 | ) |
| Emerging India Fund — Investor Class | | | | | | | | | | | | | | | | | | | | | | | | | | | | | | | |
| Six Months ended 3/31/23 (unaudited) | | | $ | 5.67 | | | | | (0.04 | ) | | | | (0.47 | ) | | | | (0.51 | ) | | | | — | 4 | | | | — | | | | | (0.06 | ) | | | | (0.06 | ) |
| Year ended 9/30/22 | | | $ | 6.95 | | | | | (0.06 | ) | | | | (0.92 | ) | | | | (0.98 | ) | | | | — | 4 | | | | — | | | | | (0.30 | ) | | | | (0.30 | ) |
| Year ended 9/30/21 | | | $ | 4.22 | | | | | (0.05 | ) | | | | 2.78 | | | | | 2.73 | | | | | — | 4 | | | | — | | | | | — | | | | | — | |
| Year ended 9/30/20 | | | $ | 4.25 | | | | | (0.06 | ) | | | | 0.04 | | | | | (0.02 | ) | | | | — | 4 | | | | — | | | | | (0.01 | ) | | | | (0.01 | ) |
| Year ended 9/30/19 | | | $ | 3.95 | | | | | (0.05 | ) | | | | 0.62 | | | | | 0.57 | | | | | — | 4 | | | | — | | | | | (0.27 | ) | | | | (0.27 | ) |
| Year ended 9/30/18 | | | $ | 4.08 | | | | | (0.06 | ) | | | | 0.06 | | | | | — | | | | | — | 4 | | | | — | | | | | (0.13 | ) | | | | (0.13 | ) |
| Emerging India Fund — Institutional Class | | | | | | | | | | | | | | | | | | | | | | | | | | | | | | | |
| Six Months ended 3/31/23 (unaudited) | | | $ | 5.74 | | | | | (0.05 | ) | | | | (0.46 | ) | | | | (0.51 | ) | | | | — | 4 | | | | — | | | | | (0.06 | ) | | | | (0.06 | ) |
| Year ended 9/30/22 | | | $ | 7.03 | | | | | (0.06 | ) | | | | (0.93 | ) | | | | (0.99 | ) | | | | — | 4 | | | | — | | | | | (0.30 | ) | | | | (0.30 | ) |
| Year ended 9/30/21 | | | $ | 4.26 | | | | | (0.05 | ) | | | | 2.82 | | | | | 2.77 | | | | | — | 4 | | | | — | | | | | — | | | | | — | |
| Year ended 9/30/20 | | | $ | 4.28 | | | | | (0.02 | ) | | | | 0.01 | | | | | (0.01 | ) | | | | — | 4 | | | | — | | | | | (0.01 | ) | | | | (0.01 | ) |
| Year ended 9/30/19 | | | $ | 3.97 | | | | | (0.01 | ) | | | | 0.59 | | | | | 0.58 | | | | | — | 4 | | | | — | | | | | (0.27 | ) | | | | (0.27 | ) |
| Year ended 9/30/18 | | | $ | 4.10 | | | | | — | 4 | | | | — | 4 | | | | — | 4 | | | | — | 4 | | | | — | | | | | (0.13 | ) | | | | (0.13 | ) |
| Emerging Markets Select Fund — Investor Class | | | | | | | | | | | | | | | | | | | | | | | | | | | | | | | |
| Six Months ended 3/31/23 (unaudited) | | | $ | 13.34 | | | | | (0.05 | ) | | | | 2.04 | | | | | 1.99 | | | | | — | 4 | | | | — | | | | | — | | | | | — | |
| Year ended 9/30/22 | | | $ | 22.49 | | | | | (0.17 | ) | | | | (8.93 | ) | | | | (9.10 | ) | | | | 0.04 | | | | | — | | | | | (0.09 | ) | | | | (0.09 | ) |
| Year ended 9/30/21 | | | $ | 14.40 | | | | | 0.11 | | | | | 7.97 | | | | | 8.08 | | | | | 0.01 | | | | | — | | | | | — | | | | | — | |
| Year ended 9/30/20 | | | $ | 11.32 | | | | | (0.04 | ) | | | | 3.12 | | | | | 3.08 | | | | | — | 4 | | | | — | | | | | — | | | | | — | |
| Year ended 9/30/19 | | | $ | 10.40 | | | | | (0.13 | ) | | | | 1.05 | | | | | 0.92 | | | | | — | 4 | | | | — | | | | | — | | | | | — | |
| Year ended 9/30/18 | | | $ | 10.46 | | | | | (0.09 | ) | | | | 0.03 | | | | | (0.06 | ) | | | | — | 4 | | | | — | | | | | — | | | | | — | |
| Emerging Markets Select Fund — Institutional Class | | | | | | | | | | | | | | | | | | | | | | | | | | | | | | | |
| Six Months ended 3/31/23 (unaudited) | | | $ | 13.66 | | | | | (0.03 | ) | | | | 2.08 | | | | | 2.05 | | | | | — | 4 | | | | — | | | | | — | | | | | — | |
| Year ended 9/30/22 | | | $ | 23.01 | | | | | (0.04 | ) | | | | (9.22 | ) | | | | (9.26 | ) | | | | — | 4 | | | | — | | | | | (0.09 | ) | | | | (0.09 | ) |
| Year ended 9/30/21 | | | $ | 14.71 | | | | | (0.03 | ) | | | | 8.33 | | | | | 8.30 | | | | | — | 4 | | | | — | | | | | — | | | | | — | |
| Year ended 9/30/20 | | | $ | 11.53 | | | | | (0.05 | ) | | | | 3.23 | | | | | 3.18 | | | | | — | 4 | | | | — | | | | | — | | | | | — | |
| Year ended 9/30/19 | | | $ | 10.56 | | | | | (0.01 | ) | | | | 0.98 | | | | | 0.97 | | | | | — | 4 | | | | — | | | | | — | | | | | — | |
| Year ended 9/30/18 | | | $ | 10.60 | | | | | (0.04 | ) | | | | — | 4 | | | | (0.04 | ) | | | | — | 4 | | | | — | | | | | — | | | | | — | |
| Emerging Markets Small Cap Fund — Investor Class | | | | | | | | | | | | | | | | | | | | | | | | | | | | | | | |
| Six Months ended 3/31/23 (unaudited) | | | $ | 2.47 | | | | | (0.03 | ) | | | | 0.33 | | | | | 0.30 | | | | | — | 4 | | | | — | | | | | (0.08 | ) | | | | (0.08 | ) |
| Year ended 9/30/22 | | | $ | 4.23 | | | | | (0.05 | ) | | | | (1.46 | ) | | | | (1.51 | ) | | | | — | 4 | | | | (0.01 | ) | | | | (0.24 | ) | | | | (0.25 | ) |
| Year ended 9/30/21 | | | $ | 3.02 | | | | | (0.03 | ) | | | | 1.49 | | | | | 1.46 | | | | | — | 4 | | | | — | | | | | (0.25 | ) | | | | (0.25 | ) |
| Year ended 9/30/20 | | | $ | 2.64 | | | | | (0.04 | ) | | | | 0.58 | | | | | 0.54 | | | | | — | 4 | | | | — | | | | | (0.16 | ) | | | | (0.16 | ) |
| Year ended 9/30/19 | | | $ | 2.78 | | | | | (0.05 | ) | | | | 0.21 | | | | | 0.16 | | | | | — | 4 | | | | — | | | | | (0.30 | ) | | | | (0.30 | ) |
| Year ended 9/30/18 | | | $ | 2.99 | | | | | (0.03 | ) | | | | (0.18 | ) | | | | (0.21 | ) | | | | — | 4 | | | | — | | | | | — | | | | | — | |
| Emerging Markets Small Cap Fund — Institutional Class | | | | | | | | | | | | | | | | | | | | | | | | | | | | | | | |
| Six Months ended 3/31/23 (unaudited) | | | $ | 2.50 | | | | | (0.02 | ) | | | | 0.32 | | | | | 0.30 | | | | | — | 4 | | | | — | | | | | (0.08 | ) | | | | (0.08 | ) |
| Year ended 9/30/22 | | | $ | 4.27 | | | | | (0.02 | ) | | | | (1.49 | ) | | | | (1.51 | ) | | | | — | 4 | | | | (0.01 | ) | | | | (0.25 | ) | | | | (0.26 | ) |
| Year ended 9/30/21 | | | $ | 3.04 | | | | | (0.03 | ) | | | | 1.51 | | | | | 1.48 | | | | | — | 4 | | | | — | | | | | (0.25 | ) | | | | (0.25 | ) |
| Year ended 9/30/20 | | | $ | 2.65 | | | | | (0.02 | ) | | | | 0.57 | | | | | 0.55 | | | | | — | 4 | | | | — | | | | | (0.16 | ) | | | | (0.16 | ) |
| Year ended 9/30/19 | | | $ | 2.79 | | | | | (0.02 | ) | | | | 0.18 | | | | | 0.16 | | | | | — | 4 | | | | — | | | | | (0.30 | ) | | | | (0.30 | ) |
| Year ended 9/30/18 | | | $ | 3.00 | | | | | (0.01 | ) | | | | (0.20 | ) | | | | (0.21 | ) | | | | — | 4 | | | | — | | | | | — | | | | | — | |
See Notes to Financial Highlights and Notes to Financial Statements.
106
| | |
| | | (For a share outstanding throughout each period.) |
| | | | | | | | | | | | | | | | | | | | | | | | | | | | | | |
| | | | | | |
Ratios to Average Net Assets | | | Supplemental Data | |
Net Asset
Value
End of
Period | | | Total Return (%)1 | | | Expenses Net of Waivers and
Reimbursements (%)2 | | | Expenses Before Waivers and
Reimbursements (%)2 | | | Net Investment
Income (Loss)
Net of Waivers and
Reimbursements (%)2 | | | Net Investment
Income (Loss)
Before Waivers and
Reimbursements (%)2 | | | Net Assets End of Period
(000s) | | | Portfolio
Turnover
Rate1 3 | |
| | | | | | | | | | | | | | | | | | | | | | | | | | | | | | |
| $ | 70.42 | | | | 16.17 | | | | 1.20 | 6 7 | | | 1.20 | 6 7 | | | (0.44 | ) | | | (0.44 | ) | | $ | 1,533,987 | | | | 15% | |
| $ | 61.04 | | | | (31.47 | ) | | | 1.19 | 5 8 | | | 1.19 | 5 8 | | | (0.59 | ) | | | (0.59 | ) | | $ | 1,356,653 | | | | 29% | |
| $ | 104.75 | | | | 44.82 | | | | 1.17 | 5 | | | 1.17 | 5 | | | (0.65 | ) | | | (0.65 | ) | | $ | 2,174,178 | | | | 35% | |
| $ | 77.61 | | | | 17.41 | | | | 1.19 | 5 | | | 1.19 | 5 | | | (0.48 | ) | | | (0.48 | ) | | $ | 1,595,920 | | | | 38% | |
| $ | 73.17 | | | | (0.37 | ) | | | 1.19 | 5 | | | 1.19 | 5 | | | (0.59 | ) | | | (0.59 | ) | | $ | 1,435,994 | | | | 31% | |
| $ | 81.04 | | | | 27.66 | | | | 1.18 | 5 8 | | | 1.18 | 5 8 | | | (0.66 | ) | | | (0.66 | ) | | $ | 1,577,554 | | | | 27% | |
| | | | | | | | | | | | | | | | | | | | | | | | | | | | | | |
| $ | 71.73 | | | | 16.24 | | | | 1.06 | 6 7 | | | 1.07 | 6 7 | | | (0.30 | ) | | | (0.31 | ) | | $ | 1,451,545 | | | | 15% | |
| $ | 62.13 | | | | (31.37 | ) | | | 1.05 | 5 8 | | | 1.06 | 5 8 | | | (0.46 | ) | | | (0.46 | ) | | $ | 1,275,470 | | | | 29% | |
| $ | 106.20 | | | | 44.98 | | | | 1.05 | 5 | | | 1.05 | 5 | | | (0.54 | ) | | | (0.55 | ) | | $ | 1,865,201 | | | | 35% | |
| $ | 78.53 | | | | 17.58 | | | | 1.05 | 5 | | | 1.08 | 5 | | | (0.45 | ) | | | (0.48 | ) | | $ | 1,134,229 | | | | 38% | |
| $ | 73.86 | | | | (0.22 | ) | | | 1.05 | 5 | | | 1.09 | 5 | | | (0.45 | ) | | | (0.48 | ) | | $ | 849,787 | | | | 31% | |
| $ | 81.62 | | | | 27.82 | | | | 1.06 | 5 8 | | | 1.08 | 5 8 | | | (0.53 | ) | | | (0.55 | ) | | $ | 722,302 | | | | 27% | |
| | | | | | | | | | | | | | | | | | | | | | | | | | | | | | |
| $ | 5.10 | | | | (9.04 | ) | | | 1.57 | 5 8 | | | 1.57 | 5 8 | | | (1.25 | ) | | | (1.25 | ) | | $ | 203,019 | | | | 13% | |
| $ | 5.67 | | | | (14.79 | ) | | | 1.51 | 5 8 | | | 1.51 | 5 8 | | | (1.13 | ) | | | (1.13 | ) | | $ | 227,767 | | | | 25% | |
| $ | 6.95 | | | | 64.69 | | | | 1.52 | 5 | | | 1.52 | 5 | | | (1.15 | ) | | | (1.15 | ) | | $ | 258,617 | | | | 21% | |
| $ | 4.22 | | | | (0.38 | ) | | | 1.64 | 6 | | | 1.64 | 6 | | | (0.89 | ) | | | (0.89 | ) | | $ | 136,415 | | | | 44% | |
| $ | 4.25 | | | | 15.06 | | | | 1.68 | 6 | | | 1.68 | 6 | | | (0.99 | ) | | | (0.99 | ) | | $ | 187,625 | | | | 21% | |
| $ | 3.95 | | | | (0.33 | ) | | | 1.71 | 6 7 | | | 1.71 | 6 7 | | | (1.22 | ) | | | (1.22 | ) | | $ | 184,733 | | | | 48% | |
| | | | | | | | | | | | | | | | | | | | | | | | | | | | | | |
| $ | 5.17 | | | | (8.93 | ) | | | 1.41 | 5 8 | | | 1.41 | 5 8 | | | (1.09 | ) | | | (1.09 | ) | | $ | 235,584 | | | | 13% | |
| $ | 5.74 | | | | (14.77 | ) | | | 1.38 | 5 8 | | | 1.38 | 5 8 | | | (1.01 | ) | | | (1.01 | ) | | $ | 313,825 | | | | 25% | |
| $ | 7.03 | | | | 65.02 | | | | 1.37 | 5 | | | 1.37 | 5 | | | (0.97 | ) | | | (0.97 | ) | | $ | 358,401 | | | | 21% | |
| $ | 4.26 | | | | (0.15 | ) | | | 1.45 | 6 | | | 1.45 | 6 | | | (0.69 | ) | | | (0.69 | ) | | $ | 145,981 | | | | 44% | |
| $ | 4.28 | | | | 15.23 | | | | 1.49 | 6 | | | 1.49 | 6 | | | (0.75 | ) | | | (0.75 | ) | | $ | 92,214 | | | | 21% | |
| $ | 3.97 | | | | (0.33 | ) | | | 1.51 | 6 8 | | | 1.60 | 6 8 | | | (0.93 | ) | | | (1.02 | ) | | $ | 42,457 | | | | 48% | |
| | | | | | | | | | | | | | | | | | | | | | | | | | | | | | |
| $ | 15.33 | | | | 14.92 | | | | 1.39 | 5 8 | | | 1.39 | 5 8 | | | (0.77 | ) | | | (0.77 | ) | | $ | 60,436 | | | | 8% | |
| $ | 13.34 | | | | (40.42 | ) | | | 1.32 | 5 8 | | | 1.32 | 5 8 | | | (0.73 | ) | | | (0.73 | ) | | $ | 52,571 | | | | 31% | |
| $ | 22.49 | | | | 56.18 | | | | 1.37 | 5 | | | 1.37 | 5 | | | (0.55 | ) | | | (0.55 | ) | | $ | 93,932 | | | | 20% | |
| $ | 14.40 | | | | 27.21 | | | | 1.51 | 6 | | | 1.80 | 6 | | | (0.69 | ) | | | (0.99 | ) | | $ | 14,984 | | | | 35% | |
| $ | 11.32 | | | | 8.85 | 5 | | | 1.51 | 6 | | | 1.97 | 6 | | | (0.51 | ) | | | (0.97 | ) | | $ | 9,771 | | | | 14% | |
| $ | 10.40 | | | | (0.57 | ) | | | 1.51 | 6 8 | | | 1.76 | 6 8 | | | (0.67 | ) | | | (0.92 | ) | | $ | 13,520 | | | | 44% | |
| | | | | | | | | | | | | | | | | | | | | | | | | | | | | | |
| $ | 15.71 | | | | 15.01 | | | | 1.15 | 5 8 | | | 1.15 | 5 8 | | | (0.54 | ) | | | (0.54 | ) | | $ | 389,759 | | | | 8% | |
| $ | 13.66 | | | | (40.40 | ) | | | 1.14 | 5 8 | | | 1.14 | 5 8 | | | (0.40 | ) | | | (0.40 | ) | | $ | 290,912 | | | | 31% | |
| $ | 23.01 | | | | 56.42 | | | | 1.18 | 5 | | | 1.18 | 5 | | | (0.44 | ) | | | (0.44 | ) | | $ | 170,294 | | | | 20% | |
| $ | 14.71 | | | | 27.58 | | | | 1.21 | 6 | | | 1.41 | 6 | | | (0.40 | ) | | | (0.59 | ) | | $ | 43,682 | | | | 35% | |
| $ | 11.53 | | | | 9.19 | | | | 1.21 | 6 | | | 1.43 | 6 | | | (0.14 | ) | | | (0.36 | ) | | $ | 34,375 | | | | 14% | |
| $ | 10.56 | | | | (0.38 | ) | | | 1.21 | 6 8 | | | 1.45 | 6 8 | | | (0.36 | ) | | | (0.60 | ) | | $ | 30,215 | | | | 44% | |
| | | | | | | | | | | | | | | | | | | | | | | | | | | | | | |
| $ | 2.69 | | | | 12.39 | | | | 1.98 | 6 7 | | | 2.06 | 6 7 | | | (1.17 | ) | | | (1.24 | ) | | $ | 144,587 | | | | 8% | |
| $ | 2.47 | | | | (37.93 | ) | | | 1.91 | 6 7 | | | 1.91 | 6 7 | | | (0.74 | ) | | | (0.74 | ) | | $ | 153,161 | | | | 36% | |
| $ | 4.23 | | | | 50.23 | | | | 1.88 | 5 | | | 1.88 | 5 | | | (1.07 | ) | | | (1.07 | ) | | $ | 322,350 | | | | 22% | |
| $ | 3.02 | | | | 21.12 | | | | 1.95 | 6 | | | 1.95 | 6 | | | (1.02 | ) | | | (1.02 | ) | | $ | 197,524 | | | | 20% | |
| $ | 2.64 | | | | 7.29 | | | | 1.97 | 6 | | | 1.99 | 6 | | | (0.83 | ) | | | (0.84 | ) | | $ | 191,405 | | | | 16% | |
| $ | 2.78 | | | | (7.02 | ) | | | 1.96 | 7 | | | 1.98 | 6 7 | | | (0.51 | ) | | | (0.53 | ) | | $ | 285,540 | | | | 40% | |
| | | | | | | | | | | | | | | | | | | | | | | | | | | | | | |
| $ | 2.72 | | | | 12.24 | | | | 1.83 | 6 7 | | | 1.86 | 6 7 | | | (1.02 | ) | | | (1.04 | ) | | $ | 220,605 | | | | 8% | |
| $ | 2.50 | | | | (37.75 | ) | | | 1.78 | 6 7 | | | 1.78 | 6 7 | | | (0.58 | ) | | | (0.58 | ) | | $ | 224,736 | | | | 36% | |
| $ | 4.27 | | | | 50.53 | | | | 1.76 | 5 | | | 1.76 | 5 | | | (0.94 | ) | | | (0.94 | ) | | $ | 321,008 | | | | 22% | |
| $ | 3.04 | | | | 21.41 | | | | 1.81 | 6 | | | 1.81 | 6 | | | (0.88 | ) | | | (0.88 | ) | | $ | 176,548 | | | | 20% | |
| $ | 2.65 | | | | 7.25 | | | | 1.82 | 6 | | | 1.85 | 6 | | | (0.73 | ) | | | (0.76 | ) | | $ | 174,050 | | | | 16% | |
| $ | 2.79 | | | | (7.00 | ) | | | 1.82 | 6 7 | | | 1.84 | 6 7 | | | (0.33 | ) | | | (0.35 | ) | | $ | 240,892 | | | | 40% | |
107
Financial Highlights (continued)
| | | | | | | | | | | | | | | | | | | | | | | | | | | | | | | | | | | | | | | | |
| | | | | Income (Loss) from
Investment Operations | | | | | | Less Distributions | | |
| | | Net Asset
Value
Beginning
of Period | | Net
Investment
Income (Loss) | | Net Realized
and Unrealized
Gains (Losses)
on Investments | | Total from
Investment
Operations | | Redemption
Fees
(See Note 2) | | Dividends
from Net
Investment
Income | | Distributions
from Net
Realized
Gains | | Total
Distributions |
| Frontier Emerging Small Countries Fund — Investor Class | | | | | | | | | | | | | | | | | | | | | |
| Six Months ended 3/31/23 (unaudited) | | | $ | 2.45 | | | | | (0.03 | ) | | | | 0.34 | | | | | 0.31 | | | | | — | 4 | | | | — | | | | | — | | | | | — | |
| Year ended 9/30/22 | | | $ | 4.40 | | | | | (0.03 | ) | | | | (1.89 | ) | | | | (1.92 | ) | | | | — | 4 | | | | (0.03 | ) | | | | — | | | | | (0.03 | ) |
| Year ended 9/30/21 | | | $ | 3.02 | | | | | (0.07 | ) | | | | 1.45 | | | | | 1.38 | | | | | — | 4 | | | | — | | | | | — | | | | | — | |
| Year ended 9/30/20 | | | $ | 2.74 | | | | | (0.07 | ) | | | | 0.35 | | | | | 0.28 | | | | | — | 4 | | | | — | | | | | — | | | | | — | |
| Year ended 9/30/19 | | | $ | 2.51 | | | | | — | 4 | | | | 0.23 | | | | | 0.23 | | | | | — | 4 | | | | — | | | | | — | | | | | — | |
| Year ended 9/30/18 | | | $ | 2.75 | | | | | (0.11 | ) | | | | (0.13 | ) | | | | (0.24 | ) | | | | — | 4 | | | | — | | | | | — | | | | | — | |
| Frontier Emerging Small Countries Fund — Institutional Class | | | | | | | | | | | | | | | | | | | | | |
| Six Months ended 3/31/23 (unaudited) | | | $ | 2.48 | | | | | (0.18 | ) | | | | 0.51 | | | | | 0.33 | | | | | — | | | | | — | | | | | — | | | | | — | |
| Year ended 9/30/22 | | | $ | 4.46 | | | | | (0.03 | ) | | | | (1.91 | ) | | | | (1.94 | ) | | | | — | 4 | | | | (0.04 | ) | | | | — | | | | | (0.04 | ) |
| Year ended 9/30/21 | | | $ | 3.05 | | | | | (0.04 | ) | | | | 1.45 | | | | | 1.41 | | | | | — | 4 | | | | — | | | | | — | | | | | — | |
| Year ended 9/30/20 | | | $ | 2.76 | | | | | (0.08 | ) | | | | 0.37 | | | | | 0.29 | | | | | — | 4 | | | | — | | | | | — | | | | | — | |
| Year ended 9/30/19 | | | $ | 2.53 | | | | | 0.03 | | | | | 0.20 | | | | | 0.23 | | | | | — | 4 | | | | — | | | | | — | | | | | — | |
| Year ended 9/30/18 | | | $ | 2.76 | | | | | (0.04 | ) | | | | (0.19 | ) | | | | (0.23 | ) | | | | — | 4 | | | | — | | | | | — | | | | | — | |
| Global Opportunities Fund — Investor Class | | | | | | | | | | | | | | | | | | | | | |
| Six Months ended 3/31/23 (unaudited) | | | $ | 3.39 | | | | | (0.02 | ) | | | | 0.41 | | | | | 0.39 | | | | | — | 4 | | | | — | | | | | (0.08 | ) | | | | (0.08 | ) |
| Year ended 9/30/22 | | | $ | 5.83 | | | | | (0.04 | ) | | | | (1.96 | ) | | | | (2.00 | ) | | | | — | 4 | | | | (0.01 | ) | | | | (0.43 | ) | | | | (0.44 | ) |
| Year ended 9/30/21 | | | $ | 3.92 | | | | | (0.04 | ) | | | | 2.05 | | | | | 2.01 | | | | | — | 4 | | | | — | | | | | (0.10 | ) | | | | (0.10 | ) |
| Year ended 9/30/20 | | | $ | 3.46 | | | | | (0.05 | ) | | | | 0.81 | | | | | 0.76 | | | | | — | 4 | | | | — | | | | | (0.30 | ) | | | | (0.30 | ) |
| Year ended 9/30/19 | | | $ | 4.09 | | | | | (0.03 | ) | | | | (0.06 | ) | | | | (0.09 | ) | | | | — | 4 | | | | — | | | | | (0.54 | ) | | | | (0.54 | ) |
| Year ended 9/30/18 | | | $ | 3.76 | | | | | (0.03 | ) | | | | 0.77 | | | | | 0.74 | | | | | — | 4 | | | | — | | | | | (0.41 | ) | | | | (0.41 | ) |
| Global Opportunities Fund — Institutional Class | | | | | | | | | | | | | | | | | | | | | |
| Six Months ended 3/31/23 (unaudited) | | | $ | 3.42 | | | | | (0.02 | ) | | | | 0.42 | | | | | 0.40 | | | | | — | 4 | | | | — | | | | | (0.08 | ) | | | | (0.08 | ) |
| Year ended 9/30/22 | | | $ | 5.88 | | | | | (0.03 | ) | | | | (1.99 | ) | | | | (2.02 | ) | | | | — | 4 | | | | (0.01 | ) | | | | (0.43 | ) | | | | (0.44 | ) |
| Year ended 9/30/21 | | | $ | 3.94 | | | | | (0.05 | ) | | | | 2.09 | | | | | 2.04 | | | | | — | 4 | | | | — | | | | | (0.10 | ) | | | | (0.10 | ) |
| Year ended 9/30/20 | | | $ | 3.48 | | | | | (0.03 | ) | | | | 0.79 | | | | | 0.76 | | | | | — | 4 | | | | — | | | | | (0.30 | ) | | | | (0.30 | ) |
| Year ended 9/30/19 | | | $ | 4.10 | | | | | (0.03 | ) | | | | (0.05 | ) | | | | (0.08 | ) | | | | — | | | | | — | | | | | (0.54 | ) | | | | (0.54 | ) |
| Year ended 9/30/18 | | | $ | 3.76 | | | | | (0.02 | ) | | | | 0.77 | | | | | 0.75 | | | | | — | | | | | — | | | | | (0.41 | ) | | | | (0.41 | ) |
| Global Select Fund — Investor Class | | | | | | | | | | | | | | | | | | | | | |
| Six Months ended 3/31/23 (unaudited) | | | $ | 8.71 | | | | | (0.04 | ) | | | | 1.64 | | | | | 1.60 | | | | | — | 4 | | | | — | | | | | — | | | | | — | |
| Year ended 9/30/22 | | | $ | 15.83 | | | | | (0.10 | ) | | | | (5.24 | ) | | | | (5.34 | ) | | | | — | 4 | | | | — | | | | | (1.78 | ) | | | | (1.78 | ) |
| Year ended 9/30/21 | | | $ | 12.60 | | | | | (0.12 | ) | | | | 3.36 | | | | | 3.24 | | | | | 0.01 | | | | | — | | | | | (0.02 | ) | | | | (0.02 | ) |
| Year ended 9/30/2011 | | | $ | 10.00 | | | | | (0.06 | ) | | | | 2.65 | | | | | 2.59 | | | | | 0.01 | | | | | — | | | | | — | | | | | — | |
| Global Select Fund — Institutional Class | | | | | | | | | | | | | | | | | | | | | | | | | | | | | | | | | | | | | | | | |
| Six Months ended 3/31/23 (unaudited) | | | $ | 8.82 | | | | | (0.02 | ) | | | | 1.65 | | | | | 1.63 | | | | | — | | | | | — | | | | | — | | | | | — | |
| Year ended 9/30/22 | | | $ | 15.94 | | | | | (0.05 | ) | | | | (5.29 | ) | | | | (5.34 | ) | | | | — | 4 | | | | — | | | | | (1.78 | ) | | | | (1.78 | ) |
| Year ended 9/30/21 | | | $ | 12.64 | | | | | (0.07 | ) | | | | 3.39 | | | | | 3.32 | | | | | — | 4 | | | | — | | | | | (0.02 | ) | | | | (0.02 | ) |
| Year ended 9/30/2011 | | | $ | 10.00 | | | | | (0.04 | ) | | | | 2.68 | | | | | 2.64 | | | | | — | 4 | | | | — | | | | | — | | | | | — | |
| Global Value Fund — Investor Class | | | | | | | | | | | | | | | | | | | | | |
| Six Months ended 3/31/23 (unaudited) | | | $ | 8.00 | | | | | 0.11 | | | | | 1.28 | | | | | 1.39 | | | | | — | 4 | | | | (0.10 | ) | | | | (0.54 | ) | | | | (0.64 | ) |
| Year ended 9/30/22 | | | $ | 9.24 | | | | | 0.23 | | | | | (0.96 | ) | | | | (0.73 | ) | | | | — | 4 | | | | (0.23 | ) | | | | (0.28 | ) | | | | (0.51 | ) |
| Year ended 9/30/21 | | | $ | 6.56 | | | | | 0.18 | | | | | 2.65 | | | | | 2.83 | | | | | — | 4 | | | | (0.15 | ) | | | | — | | | | | (0.15 | ) |
| Year ended 9/30/20 | | | $ | 7.74 | | | | | 0.16 | | | | | (1.09 | )13 | | | | (0.93 | ) | | | | — | 4 | | | | (0.21 | ) | | | | (0.04 | ) | | | | (0.25 | ) |
| Year ended 9/30/19 | | | $ | 9.29 | | | | | 0.19 | | | | | (0.42 | ) | | | | (0.23 | ) | | | | — | 4 | | | | (0.19 | ) | | | | (1.13 | ) | | | | (1.32 | ) |
| Year ended 9/30/18 | | | $ | 9.93 | | | | | 0.19 | | | | | 0.65 | 10 | | | | 0.84 | | | | | — | 4 | | | | (0.19 | ) | | | | (1.29 | ) | | | | (1.48 | ) |
| Global Value Fund — Institutional Class | | | | | | | | | | | | | | | | | | | | | |
| Six Months ended 3/31/23 (unaudited) | | | $ | 7.99 | | | | | 0.10 | | | | | 1.28 | | | | | 1.38 | | | | | — | | | | | (0.10 | ) | | | | (0.54 | ) | | | | (0.64 | ) |
| Year ended 9/30/22 | | | $ | 9.23 | | | | | 0.25 | | | | | (0.97 | ) | | | | (0.72 | ) | | | | — | 4 | | | | (0.24 | ) | | | | (0.28 | ) | | | | (0.52 | ) |
| Year ended 9/30/21 | | | $ | 6.56 | | | | | 0.19 | | | | | 2.63 | | | | | 2.82 | | | | | 0.01 | | | | | (0.16 | ) | | | | — | | | | | (0.16 | ) |
| Year ended 9/30/20 | | | $ | 7.73 | | | | | 0.16 | | | | | (1.07 | )13 | | | | (0.91 | ) | | | | — | 4 | | | | (0.22 | ) | | | | (0.04 | ) | | | | (0.26 | ) |
| Year ended 9/30/19 | | | $ | 9.28 | | | | | 0.19 | | | | | (0.41 | ) | | | | (0.22 | ) | | | | — | 4 | | | | (0.20 | ) | | | | (1.13 | ) | | | | (1.33 | ) |
| Year ended 9/30/18 | | | $ | 9.92 | | | | | 0.20 | | | | | 0.66 | 10 | | | | 0.86 | | | | | — | 4 | | | | (0.20 | ) | | | | (1.30 | ) | | | | (1.50 | ) |
See Notes to Financial Highlights and Notes to Financial Statements.
108
| | |
| | | (For a share outstanding throughout each period.) |
| | | | | | | | | | | | | | | | | | | | | | | | | | | | | | |
| | | | | | |
Ratios to Average Net Assets | | | Supplemental Data | |
Net Asset
Value
End of
Period | | | Total Return (%)1 | | | Expenses Net of Waivers and
Reimbursements (%)2 | | | Expenses Before Waivers and
Reimbursements (%)2 | | | Net Investment
Income (Loss)
Net of Waivers and
Reimbursements (%)2 | | | Net Investment
Income (Loss)
Before Waivers and
Reimbursements (%)2 | | | Net Assets End of Period
(000s) | | | Portfolio
Turnover
Rate1 3 | |
| | | | | | | | | | | | | | | | | | | | | | | | | | | | | | |
| $ | 2.76 | | | | 12.65 | | | | 2.16 | 6 7 | | | 2.44 | 6 7 | | | (1.20 | ) | | | (1.48 | ) | | $ | 31,510 | | | | 9% | |
| $ | 2.45 | | | | (43.89 | ) | | | 2.15 | 5 8 | | | 2.29 | 5 8 | | | (1.13 | ) | | | (1.26 | ) | | $ | 30,132 | | | | 44% | |
| $ | 4.40 | | | | 45.70 | | | | 2.12 | 5 | | | 2.12 | 5 | | | (1.33 | ) | | | (1.33 | ) | | $ | 52,307 | | | | 39% | |
| $ | 3.02 | | | | 10.22 | | | | 2.15 | 5 | | | 2.38 | 5 | | | (1.12 | ) | | | (1.34 | ) | | $ | 39,899 | | | | 33% | |
| $ | 2.74 | | | | 9.16 | | | | 2.20 | 6 | | | 2.30 | 6 | | | 0.78 | | | | 0.69 | | | $ | 43,789 | | | | 63% | |
| $ | 2.51 | | | | (8.73 | ) | | | 2.22 | 6 7 | | | 2.36 | 6 7 | | | (0.39 | ) | | | (0.53 | ) | | $ | 57,406 | | | | 42% | |
| | | | | | | | | | | | | | | | | | | | | | | | | | | | | | |
| $ | 2.81 | | | | 13.31 | | | | 1.96 | 6 7 | | | 2.65 | 6 7 | | | (1.19 | ) | | | (1.88 | ) | | $ | 3,953 | | | | 9% | |
| $ | 2.48 | | | | (43.89 | ) | | | 1.95 | 5 8 | | | 2.08 | 5 8 | | | (0.88 | ) | | | (1.00 | ) | | $ | 10,416 | | | | 44% | |
| $ | 4.46 | | | | 46.23 | | | | 1.95 | 5 | | | 2.08 | 5 | | | (1.13 | ) | | | (1.26 | ) | | $ | 17,490 | | | | 39% | |
| $ | 3.05 | | | | 10.51 | | | | 1.96 | 5 | | | 2.18 | 5 | | | (0.98 | ) | | | (1.20 | ) | | $ | 10,560 | | | | 33% | |
| $ | 2.76 | | | | 9.09 | | | | 2.00 | 6 | | | 2.15 | 6 | | | 1.04 | | | | 0.90 | | | $ | 16,456 | | | | 63% | |
| $ | 2.53 | | | | (8.33 | ) | | | 2.02 | 6 8 | | | 2.11 | 6 8 | | | (0.30 | ) | | | (0.39 | ) | | $ | 20,586 | | | | 42% | |
| | | | | | | | | | | | | | | | | | | | | | | | | | | | | | |
| $ | 3.70 | | | | 11.56 | | | | 1.55 | 6 7 | | | 1.55 | 6 7 | | | (1.06 | ) | | | (1.06 | ) | | $ | 121,009 | | | | 14% | |
| $ | 3.39 | | | | (36.97 | ) | | | 1.50 | 5 8 | | | 1.50 | 5 8 | | | (1.00 | ) | | | (1.00 | ) | | $ | 107,048 | | | | 33% | |
| $ | 5.83 | | | | 51.70 | | | | 1.46 | 5 | | | 1.46 | 5 | | | (1.08 | ) | | | (1.08 | ) | | $ | 181,563 | | | | 22% | |
| $ | 3.92 | | | | 23.20 | | | | 1.53 | 5 | | | 1.53 | 5 | | | (1.03 | ) | | | (1.03 | ) | | $ | 100,698 | | | | 20% | |
| $ | 3.46 | | | | 0.82 | | | | 1.56 | 5 | | | 1.56 | 5 | | | (0.95 | ) | | | (0.95 | ) | | $ | 103,710 | | | | 24% | |
| $ | 4.09 | | | | 20.75 | | | | 1.55 | 6 8 | | | 1.55 | 6 8 | | | (0.78 | ) | | | (0.78 | ) | | $ | 110,874 | | | | 40% | |
| | | | | | | | | | | | | | | | | | | | | | | | | | | | | | |
| $ | 3.74 | | | | 11.75 | | | | 1.36 | 6 7 | | | 1.43 | 6 7 | | | (0.87 | ) | | | (0.94 | ) | | $ | 60,689 | | | | 14% | |
| $ | 3.42 | | | | (36.94 | ) | | | 1.35 | 5 8 | | | 1.38 | 5 8 | | | (0.85 | ) | | | (0.87 | ) | | $ | 55,266 | | | | 33% | |
| $ | 5.88 | | | | 52.21 | | | | 1.35 | 5 | | | 1.40 | 5 | | | (0.96 | ) | | | (1.01 | ) | | $ | 74,144 | | | | 22% | |
| $ | 3.94 | | | | 23.09 | | | | 1.35 | 5 | | | 1.48 | 5 | | | (0.83 | ) | | | (0.96 | ) | | $ | 38,795 | | | | 20% | |
| $ | 3.48 | | | | 1.09 | | | | 1.35 | 5 | | | 1.57 | 5 | | | (0.74 | ) | | | (0.95 | ) | | $ | 19,060 | | | | 24% | |
| $ | 4.10 | | | | 21.04 | | | | 1.36 | 6 8 | | | 1.66 | 6 8 | | | (0.57 | ) | | | (0.86 | ) | | $ | 15,879 | | | | 40% | |
| | | | | | | | | | | | | | | | | | | | | | | | | | | | | | |
| $ | 10.31 | | | | 18.37 | | | | 1.36 | 6 7 | | | 2.58 | 6 7 | | | (0.71 | ) | | | (1.93 | ) | | $ | 4,498 | | | | 11% | |
| $ | 8.71 | | | | (37.76 | ) | | | 1.35 | 5 8 | | | 2.35 | 5 8 | | | (0.77 | ) | | | (1.77 | ) | | $ | 3,879 | | | | 30% | |
| $ | 15.83 | | | | 25.84 | | | | 1.35 | 5 | | | 2.17 | 5 | | | (0.86 | ) | | | (1.68 | ) | | $ | 7,054 | | | | 58% | |
| $ | 12.60 | | | | 26.00 | | | | 1.36 | 6 | | | 4.70 | 6 | | | (0.81 | ) | | | (4.16 | ) | | $ | 4,306 | | | | 35% | |
| | | | | | | | | | | | | | | | | | | | | | | | | | | | | | |
| $ | 10.45 | | | | 18.48 | | | | 0.96 | 6 7 | | | 1.70 | 6 7 | | | (0.31 | ) | | | (1.05 | ) | | $ | 10,031 | | | | 11% | |
| $ | 8.82 | | | | (37.47 | ) | | | 0.95 | 5 8 | | | 1.53 | 5 8 | | | (0.35 | ) | | | (0.93 | ) | | $ | 8,828 | | | | 30% | |
| $ | 15.94 | | | | 26.31 | | | | 0.95 | 5 | | | 1.56 | 5 | | | (0.46 | ) | | | (1.07 | ) | | $ | 12,385 | | | | 58% | |
| $ | 12.64 | | | | 26.40 | | | | 0.96 | 6 | | | 2.79 | 6 | | | (0.42 | ) | | | (2.25 | ) | | $ | 9,065 | | | | 35% | |
| | | | | | | | | | | | | | | | | | | | | | | | | | | | | | |
| $ | 8.75 | | | | 17.43 | | | | 1.10 | 5 8 | | | 1.18 | 5 8 | | | 2.52 | | | | 2.44 | | | $ | 120,477 | | | | 26% | |
| $ | 8.00 | | | | (8.55 | ) | | | 1.10 | 5 8 | | | 1.20 | 5 8 | | | 2.46 | | | | 2.36 | | | $ | 102,983 | | | | 47% | |
| $ | 9.24 | | | | 43.20 | | | | 1.10 | 5 | | | 1.18 | 5 | | | 1.97 | | | | 1.89 | | | $ | 119,966 | | | | 41% | |
| $ | 6.56 | | | | (12.18 | )13 | | | 1.10 | 5 | | | 1.30 | 5 | | | 2.04 | | | | 1.84 | | | $ | 96,323 | | | | 76% | |
| $ | 7.74 | | | | (0.40 | ) | | | 1.10 | 5 | | | 1.19 | 5 | | | 2.30 | | | | 2.22 | | | $ | 146,704 | | | | 49% | |
| $ | 9.29 | | | | 9.56 | 10 | | | 1.11 | 5 8 | | | 1.19 | 5 8 | | | 2.17 | | | | 2.08 | | | $ | 192,811 | | | | 72% | |
| | | | | | | | | | | | | | | | | | | | | | | | | | | | | | |
| $ | 8.73 | | | | 17.41 | | | | 0.95 | 5 8 | | | 1.12 | 5 8 | | | 2.71 | | | | 2.55 | | | $ | 30,692 | | | | 26% | |
| $ | 7.99 | | | | (8.42 | ) | | | 0.95 | 5 8 | | | 1.14 | 5 8 | | | 2.89 | | | | 2.71 | | | $ | 15,583 | | | | 47% | |
| $ | 9.23 | | | | 43.26 | | | | 0.99 | 5 | | | 1.43 | 5 | | | 2.04 | | | | 1.60 | | | $ | 7,163 | | | | 41% | |
| $ | 6.56 | | | | (11.93 | )13 | | | 0.95 | 5 | | | 1.38 | 5 | | | 2.21 | | | | 1.78 | | | $ | 6,449 | | | | 76% | |
| $ | 7.73 | | | | (0.25 | ) | | | 0.97 | 5 | | | 1.23 | 5 | | | 2.44 | | | | 2.19 | | | $ | 7,978 | | | | 49% | |
| $ | 9.28 | | | | 9.61 | 10 | | | 0.95 | 5 8 | | | 1.58 | 5 8 | | | 2.39 | | | | 1.76 | | | $ | 9,615 | | | | 72% | |
109
Financial Highlights (continued)
| | | | | | | | | | | | | | | | | | | | | | | | | | | | | | | | | | | | | | | | |
| | | | | Income (Loss) from
Investment Operations | | | | | | Less Distributions | | |
| | | Net Asset
Value
Beginning
of Period | | Net
Investment
Income (Loss) | | Net Realized
and Unrealized
Gains (Losses)
on Investments | | Total from
Investment
Operations | | Redemption
Fees
(See Note 2) | | Dividends
from Net
Investment
Income | | Distributions
from Net
Realized
Gains | | Total
Distributions |
| Greater China Fund — Investor Class | | | | | | | | | | | | | | | | | | | | | |
| Six Months ended 3/31/23 (unaudited) | | | $ | 5.98 | | | | | (0.04 | ) | | | | 0.90 | | | | | 0.86 | | | | | — | 4 | | | | (0.39 | ) | | | | — | | | | | (0.39 | ) |
| Year ended 9/30/22 | | | $ | 9.83 | | | | | (0.05 | ) | | | | (3.83 | )9 | | | | (3.88 | ) | | | | 0.03 | | | | | — | | | | | — | | | | | — | |
| Period ended 9/30/2114 | | | $ | 10.00 | | | | | (0.05 | ) | | | | (0.17 | ) | | | | (0.22 | ) | | | | 0.05 | | | | | — | | | | | — | | | | | — | |
| Greater China Fund — Institutional Class | | | | | | | | | | | | | | | | | | | | | | | | | | | | | | | | | | | | | | | | |
| Six Months ended 3/31/23 (unaudited) | | | $ | 5.96 | | | | | (0.03 | ) | | | | 0.90 | | | | | 0.87 | | | | | — | | | | | (0.41 | ) | | | | — | | | | | (0.41 | ) |
| Year ended 9/30/22 | | | $ | 9.82 | | | | | (0.07 | ) | | | | (3.79 | )9 | | | | (3.86 | ) | | | | — | 4 | | | | — | | | | | — | | | | | — | |
| Period ended 9/30/2114 | | | $ | 10.00 | | | | | (0.03 | ) | | | | (0.15 | ) | | | | (0.18 | ) | | | | — | 4 | | | | — | | | | | — | | | | | — | |
| International Growth Fund — Investor Class | | | | | | | | | | | | | | | | | | | | | |
| Six Months ended 3/31/23 (unaudited) | | | $ | 20.03 | | | | | (0.04 | ) | | | | 3.43 | | | | | 3.39 | | | | | — | 4 | | | | — | | | | | — | | | | | — | |
| Year ended 9/30/22 | | | $ | 38.79 | | | | | (0.07 | ) | | | | (15.16 | ) | | | | (15.23 | ) | | | | — | 4 | | | | — | | | | | (3.53 | ) | | | | (3.53 | ) |
| Year ended 9/30/21 | | | $ | 34.07 | | | | | (0.17 | ) | | | | 8.68 | | | | | 8.51 | | | | | — | 4 | | | | — | | | | | (3.79 | ) | | | | (3.79 | ) |
| Year ended 9/30/20 | | | $ | 28.23 | | | | | (0.20 | ) | | | | 6.82 | | | | | 6.62 | | | | | — | 4 | | | | — | | | | | (0.78 | ) | | | | (0.78 | ) |
| Year ended 9/30/19 | | | $ | 36.95 | | | | | (0.08 | ) | | | | (4.26 | ) | | | | (4.34 | ) | | | | — | 4 | | | | — | | | | | (4.38 | ) | | | | (4.38 | ) |
| Year ended 9/30/18 | | | $ | 33.84 | | | | | (- | )4 | | | | 4.04 | | | | | 4.04 | | | | | — | 4 | | | | — | | | | | (0.93 | ) | | | | (0.93 | ) |
| International Growth Fund — Institutional Class | | | | | | | | | | | | | | | | | | | | | |
| Six Months ended 3/31/23 (unaudited) | | | $ | 20.20 | | | | | 0.03 | | | | | 3.40 | | | | | 3.43 | | | | | — | 4 | | | | — | | | | | — | | | | | — | |
| Year ended 9/30/22 | | | $ | 39.04 | | | | | (0.02 | ) | | | | (15.29 | ) | | | | (15.31 | ) | | | | — | 4 | | | | — | | | | | (3.53 | ) | | | | (3.53 | ) |
| Year ended 9/30/21 | | | $ | 34.24 | | | | | (0.13 | ) | | | | 8.72 | | | | | 8.59 | | | | | — | 4 | | | | — | | | | | (3.79 | ) | | | | (3.79 | ) |
| Year ended 9/30/20 | | | $ | 28.33 | | | | | (0.12 | ) | | | | 6.81 | | | | | 6.69 | | | | | — | 4 | | | | — | | | | | (0.78 | ) | | | | (0.78 | ) |
| Year ended 9/30/19 | | | $ | 37.03 | | | | | (0.04 | ) | | | | (4.28 | ) | | | | (4.32 | ) | | | | — | 4 | | | | — | | | | | (4.38 | ) | | | | (4.38 | ) |
| Year ended 9/30/18 | | | $ | 33.88 | | | | | 0.06 | | | | | 4.02 | | | | | 4.08 | | | | | — | 4 | | | | — | | | | | (0.93 | ) | | | | (0.93 | ) |
| International Opportunities Fund — Investor Class | | | | | | | | | | | | | | | | | | | | | |
| Six Months ended 3/31/23 (unaudited) | | | $ | 2.51 | | | | | (0.03 | ) | | | | 0.39 | | | | | 0.36 | | | | | — | 4 | | | | — | | | | | — | | | | | — | |
| Year ended 9/30/22 | | | $ | 5.26 | | | | | (0.05 | ) | | | | (2.06 | ) | | | | (2.11 | ) | | | | — | 4 | | | | — | | | | | (0.64 | ) | | | | (0.64 | ) |
| Year ended 9/30/21 | | | $ | 4.64 | | | | | (0.07 | ) | | | | 0.79 | | | | | 0.72 | | | | | — | 4 | | | | — | | | | | (0.10 | ) | | | | (0.10 | ) |
| Year ended 9/30/20 | | | $ | 3.54 | | | | | (0.09 | ) | | | | 1.28 | | | | | 1.19 | | | | | — | | | | | — | | | | | (0.09 | ) | | | | (0.09 | ) |
| Year ended 9/30/19 | | | $ | 3.58 | | | | | (0.09 | ) | | | | 0.13 | | | | | 0.04 | | | | | — | 4 | | | | — | | | | | (0.08 | ) | | | | (0.08 | ) |
| Year ended 9/30/18 | | | $ | 3.47 | | | | | (0.05 | ) | | | | 0.40 | | | | | 0.35 | | | | | — | 4 | | | | — | | | | | (0.24 | ) | | | | (0.24 | ) |
| International Opportunities Fund — Institutional Class | | | | | | | | | | | | | | | | | | | | | |
| Six Months ended 3/31/23 (unaudited) | | | $ | 2.55 | | | | | (0.01 | ) | | | | 0.38 | | | | | 0.37 | | | | | — | 4 | | | | — | | | | | — | | | | | — | |
| Year ended 9/30/22 | | | $ | 5.33 | | | | | (0.03 | ) | | | | (2.11 | ) | | | | (2.14 | ) | | | | — | 4 | | | | — | | | | | (0.64 | ) | | | | (0.64 | ) |
| Year ended 9/30/21 | | | $ | 4.71 | | | | | (0.05 | ) | | | | 0.77 | | | | | 0.72 | | | | | — | 4 | | | | — | | | | | (0.10 | ) | | | | (0.10 | ) |
| Year ended 9/30/20 | | | $ | 3.58 | | | | | (0.04 | ) | | | | 1.26 | | | | | 1.22 | | | | | — | | | | | — | | | | | (0.09 | ) | | | | (0.09 | ) |
| Year ended 9/30/19 | | | $ | 3.62 | | | | | (0.02 | ) | | | | 0.06 | | | | | 0.04 | | | | | — | 4 | | | | — | | | | | (0.08 | ) | | | | (0.08 | ) |
| Year ended 9/30/18 | | | $ | 3.50 | | | | | (0.03 | ) | | | | 0.39 | | | | | 0.36 | | | | | — | 4 | | | | — | | | | | (0.24 | ) | | | | (0.24 | ) |
| International Select Fund — Investor Class | | | | | | | | | | | | | | | | | | | | | |
| Six Months ended 3/31/23 (unaudited) | | | $ | 8.90 | | | | | (0.04 | ) | | | | 1.97 | | | | | 1.93 | | | | | — | 4 | | | | — | | | | | — | | | | | — | |
| Year ended 9/30/22 | | | $ | 14.96 | | | | | (0.10 | ) | | | | (5.97 | ) | | | | (6.07 | ) | | | | 0.01 | | | | | — | | | | | — | | | | | — | |
| Year ended 9/30/21 | | | $ | 12.61 | | | | | (0.07 | ) | | | | 2.41 | | | | | 2.34 | | | | | 0.01 | | | | | — | | | | | — | | | | | — | |
| Year ended 9/30/2011 | | | $ | 10.00 | | | | | (0.04 | ) | | | | 2.64 | | | | | 2.60 | | | | | 0.01 | | | | | — | | | | | — | | | | | — | |
| International Select Fund — Institutional Class | | | | | | | | | | | | | | | | | | | | | |
| Six Months ended 3/31/23 (unaudited) | | | $ | 9.01 | | | | | (0.01 | ) | | | | 1.99 | | | | | 1.98 | | | | | — | | | | | — | | | | | — | | | | | — | |
| Year ended 9/30/22 | | | $ | 15.10 | | | | | (0.04 | ) | | | | (6.05 | ) | | | | (6.09 | ) | | | | — | | | | | — | | | | | — | | | | | — | |
| Year ended 9/30/21 | | | $ | 12.69 | | | | | — | 4 | | | | 2.41 | | | | | 2.41 | | | | | — | | | | | — | | | | | — | | | | | — | |
| Year ended 9/30/2011 | | | $ | 10.00 | | | | | (0.02 | ) | | | | 2.68 | | | | | 2.66 | | | | | 0.03 | | | | | — | | | | | — | | | | | — | |
| Long/Short Alpha Fund | | | | | | | | | | | | | | | | | | | | | |
| Six Months ended 3/31/23 (unaudited) | | | $ | 9.01 | | | | | (0.03 | ) | | | | 1.76 | | | | | 1.73 | | | | | — | 4 | | | | — | | | | | (0.01 | ) | | | | (0.01 | ) |
| Year ended 9/30/2215 | | | $ | 10.00 | | | | | (0.16 | ) | | | | (0.83 | ) | | | | (0.99 | ) | | | | — | 4 | | | | — | | | | | — | | | | | — | |
| Long/Short Alpha Fund — Institutional Class | | | | | | | | | | | | | | | | | | | | | | | | | | | | | | | | | | | | | | | | |
| Six Months ended 3/31/23 (unaudited) | | | $ | 9.03 | | | | | (0.06 | ) | | | | 1.80 | | | | | 1.74 | | | | | — | 4 | | | | — | | | | | (0.01 | ) | | | | (0.01 | ) |
| Year ended 9/30/2215 | | | $ | 10.00 | | | | | (0.13 | ) | | | | (0.84 | ) | | | | (0.97 | ) | | | | — | 4 | | | | — | | | | | — | | | | | — | |
See Notes to Financial Highlights and Notes to Financial Statements.
110
| | |
| | | (For a share outstanding throughout each period.) |
| | | | | | | | | | | | | | | | | | | | | | | | | | | | | | |
| | | | | | |
Ratios to Average Net Assets | | | Supplemental Data | |
Net Asset
Value
End of
Period | | | Total Return (%)1 | | | Expenses Net of Waivers and
Reimbursements (%)2 | | | Expenses Before Waivers and
Reimbursements (%)2 | | | Net Investment
Income (Loss)
Net of Waivers and
Reimbursements (%)2 | | | Net Investment
Income (Loss)
Before Waivers and
Reimbursements (%)2 | | | Net Assets End of Period
(000s) | | | Portfolio
Turnover
Rate1 3 | |
| | | | | | | | | | | | | | | | | | | | | | | | | | | | | | |
| $ | 6.45 | | | | 14.47 | | | | 1.53 | 6 7 | | | 3.89 | 6 7 | | | (1.29 | ) | | | (3.66 | ) | | $ | 2,747 | | | | 40% | |
| $ | 5.98 | | | | (39.17 | )17 | | | 1.62 | 6 7 19 | | | 3.56 | 6 7 19 | | | (0.56 | ) | | | (2.50 | ) | | $ | 2,122 | | | | 109% | |
| $ | 9.83 | | | | (1.70 | ) | | | 1.51 | 6 | | | 3.76 | 6 | | | (0.60 | ) | | | (2.85 | ) | | $ | 3,795 | | | | 43% | |
| | | | | | | | | | | | | | | | | | | | | | | | | | | | | | |
| $ | 6.42 | | | | 14.66 | | | | 1.28 | 6 7 | | | 3.13 | 6 7 | | | (1.05 | ) | | | (2.89 | ) | | $ | 3,125 | | | | 40% | |
| $ | 5.96 | | | | (39.31 | )17 | | | 1.36 | 6 7 19 | | | 2.61 | 6 7 19 | | | (0.47 | ) | | | (1.72 | ) | | $ | 2,694 | | | | 109% | |
| $ | 9.82 | | | | (1.80 | ) | | | 1.26 | 6 | | | 3.09 | 6 | | | (0.34 | ) | | | (2.17 | ) | | $ | 6,779 | | | | 43% | |
| | | | | | | | | | | | | | | | | | | | | | | | | | | | | | |
| $ | 23.42 | | | | 16.92 | | | | 1.50 | 6 7 | | | 1.50 | 6 7 | | | (0.13 | ) | | | (0.13 | ) | | $ | 290,780 | | | | 10% | |
| $ | 20.03 | | | | (42.98 | ) | | | 1.44 | 5 8 | | | 1.44 | 5 8 | | | (0.14 | ) | | | (0.14 | ) | | $ | 279,608 | | | | 20% | |
| $ | 38.79 | | | | 26.59 | | | | 1.41 | 5 | | | 1.41 | 5 | | | (0.47 | ) | | | (0.47 | ) | | $ | 579,102 | | | | 25% | |
| $ | 34.07 | | | | 23.73 | | | | 1.47 | 5 | | | 1.47 | 5 | | | (0.50 | ) | | | (0.50 | ) | | $ | 497,104 | | | | 45% | |
| $ | 28.23 | | | | (9.76 | ) | | | 1.46 | 5 | | | 1.46 | 5 | | | (0.25 | ) | | | (0.25 | ) | | $ | 543,990 | | | | 40% | |
| $ | 36.95 | | | | 12.13 | | | | 1.45 | 5 8 | | | 1.45 | 5 8 | | | 0.01 | | | | 0.01 | | | $ | 748,847 | | | | 44% | |
| | | | | | | | | | | | | | | | | | | | | | | | | | | | | | |
| $ | 23.63 | | | | 16.98 | | | | 1.36 | 6 7 | | | 1.37 | 6 7 | | | (0.05 | ) | | | (0.05 | ) | | $ | 254,315 | | | | 10% | |
| $ | 20.20 | | | | (42.90 | ) | | | 1.33 | 5 8 | | | 1.33 | 5 8 | | | (0.03 | ) | | | (0.03 | ) | | $ | 319,936 | | | | 20% | |
| $ | 39.04 | | | | 26.70 | | | | 1.32 | 5 | | | 1.32 | 5 | | | (0.38 | ) | | | (0.38 | ) | | $ | 699,377 | | | | 25% | |
| $ | 34.24 | | | | 23.89 | | | | 1.35 | 5 | | | 1.36 | 5 | | | (0.38 | ) | | | (0.38 | ) | | $ | 569,068 | | | | 45% | |
| $ | 28.33 | | | | (9.67 | ) | | | 1.35 | 5 | | | 1.35 | 5 | | | (0.13 | ) | | | (0.13 | ) | | $ | 595,341 | | | | 40% | |
| $ | 37.03 | | | | 12.24 | | | | 1.35 | 5 8 | | | 1.36 | 5 8 | | | 0.16 | | | | 0.16 | | | $ | 816,942 | | | | 44% | |
| | | | | | | | | | | | | | | | | | | | | | | | | | | | | | |
| $ | 2.87 | | | | 14.34 | | | | 2.03 | 6 7 | | | 2.03 | 6 7 | | | (0.87 | ) | | | (0.87 | ) | | $ | 65,587 | | | | 13% | |
| $ | 2.51 | | | | (45.24 | ) | | | 1.96 | 5 8 | | | 1.96 | 5 8 | | | (1.05 | ) | | | (1.05 | ) | | $ | 64,198 | | | | 39% | |
| $ | 5.26 | | | | 15.68 | | | | 1.91 | 5 | | | 1.91 | 5 | | | (1.14 | ) | | | (1.14 | ) | | $ | 139,189 | | | | 35% | |
| $ | 4.64 | | | | 34.24 | | | | 2.02 | 6 | | | 2.02 | 6 | | | (1.20 | ) | | | (1.20 | ) | | $ | 129,071 | | | | 35% | |
| $ | 3.54 | | | | 1.61 | | | | 2.09 | 6 | | | 2.09 | 6 | | | (1.04 | ) | | | (1.04 | ) | | $ | 132,503 | | | | 46% | |
| $ | 3.58 | | | | 10.45 | | | | 2.10 | 5 7 | | | 2.10 | 5 7 | | | (1.07 | ) | | | (1.07 | ) | | $ | 240,489 | | | | 36% | |
| | | | | | | | | | | | | | | | | | | | | | | | | | | | | | |
| $ | 2.92 | | | | 14.51 | | | | 1.96 | 6 7 | | | 1.96 | 6 7 | | | (0.81 | ) | | | (0.81 | ) | | $ | 319,012 | | | | 13% | |
| $ | 2.55 | | | | (45.21 | ) | | | 1.91 | 5 8 | | | 1.91 | 5 8 | | | (0.97 | ) | | | (0.97 | ) | | $ | 354,481 | | | | 39% | |
| $ | 5.33 | | | | 15.44 | | | | 1.89 | 5 | | | 1.89 | 5 | | | (1.10 | ) | | | (1.10 | ) | | $ | 675,768 | | | | 35% | |
| $ | 4.71 | | | | 34.71 | | | | 1.93 | 5 | | | 1.93 | 5 | | | (1.06 | ) | | | (1.06 | ) | | $ | 544,914 | | | | 35% | |
| $ | 3.58 | | | | 1.59 | | | | 1.96 | 6 | | | 1.96 | 6 | | | (0.81 | ) | | | (0.81 | ) | | $ | 376,578 | | | | 46% | |
| $ | 3.62 | | | | 10.66 | | | | 1.96 | 5 7 | | | 1.97 | 5 7 | | | (0.86 | ) | | | (0.87 | ) | | $ | 292,345 | | | | 36% | |
| | | | | | | | | | | | | | | | | | | | | | | | | | | | | | |
| $ | 10.83 | | | | 21.69 | | | | 1.35 | 6 7 | | | 3.82 | 6 7 | | | (0.76 | ) | | | (3.23 | ) | | $ | 3,113 | | | | 8% | |
| $ | 8.90 | | | | (40.51 | ) | | | 1.30 | 5 8 | | | 3.34 | 5 8 | | | (0.72 | ) | | | (2.76 | ) | | $ | 2,514 | | | | 27% | |
| $ | 14.96 | | | | 18.64 | | | | 1.30 | 5 | | | 3.09 | 5 | | | (0.68 | ) | | | (2.46 | ) | | $ | 4,763 | | | | 35% | |
| $ | 12.61 | | | | 26.10 | | | | 1.30 | 5 | | | 6.96 | 5 | | | (0.55 | ) | | | (6.20 | ) | | $ | 2,861 | | | | 36% | |
| | | | | | | | | | | | | | | | | | | | | | | | | | | | | | |
| $ | 10.99 | | | | 21.98 | | | | 0.94 | 6 7 | | | 3.12 | 6 7 | | | (0.37 | ) | | | (2.55 | ) | | $ | 2,249 | | | | 8% | |
| $ | 9.01 | | | | (40.33 | ) | | | 0.90 | 5 8 | | | 2.37 | 5 8 | | | (0.30 | ) | | | (1.76 | ) | | $ | 2,788 | | | | 27% | |
| $ | 15.10 | | | | 18.99 | | | | 0.90 | 5 | | | 3.03 | 5 | | | (0.27 | ) | | | (2.40 | ) | | $ | 4,746 | | | | 35% | |
| $ | 12.69 | | | | 26.90 | | | | 0.90 | 6 | | | 7.68 | 6 | | | (0.19 | ) | | | (6.96 | ) | | $ | 2,069 | | | | 36% | |
| | | | | | | | | | | | | | | | | | | | | | | | | | | | | | |
| $ | 10.73 | | | | 19.20 | | | | 2.49 | 6 7 18 | | | 2.56 | 6 7 18 | | | (0.85 | ) | | | (0.93 | ) | | $ | 16,535 | | | | 48% | |
| $ | 9.01 | | | | (9.90 | ) | | | 2.41 | 6 7 18 | | | 3.14 | 6 7 18 | | | (1.62 | ) | | | (2.35 | ) | | $ | 8,184 | | | | 55% | |
| | | | | | | | | | | | | | | | | | | | | | | | | | | | | | |
| $ | 10.76 | | | | 19.27 | | | | 2.20 | 6 7 18 | | | 2.53 | 6 7 18 | | | (0.85 | ) | | | (1.19 | ) | | $ | 10,340 | | | | 48% | |
| $ | 9.03 | | | | (9.70 | ) | | | 2.20 | 6 7 18 | | | 3.10 | 6 7 18 | | | (1.47 | ) | | | (2.37 | ) | | $ | 13,782 | | | | 55% | |
111
Financial Highlights (continued)
| | | | | | | | | | | | | | | | | | | | | | | | | | | | | | | | | | | | | | | | |
| | | | | Income (Loss) from
Investment Operations | | | | | | Less Distributions | | |
| | | Net Asset
Value
Beginning
of Period | | Net
Investment
Income (Loss) | | Net Realized
and Unrealized
Gains (Losses)
on Investments | | Total from
Investment
Operations | | Redemption
Fees
(See Note 2) | | Dividends
from Net
Investment
Income | | Distributions
from Net
Realized
Gains | | Total
Distributions |
| Micro Cap Fund — Investor Class | | | | | | | | | | | | | | | | | | | | | | | | | | | | | | | | | | | | |
| Six Months ended 3/31/23 (unaudited) | | | $ | 5.72 | | | | | (0.06 | ) | | | | 0.53 | | | | | 0.47 | | | | | — | 4 | | | | — | | | | | — | | | | | — | |
| Year ended 9/30/22 | | | $ | 12.55 | | | | | (0.13 | ) | | | | (3.80 | ) | | | | (3.93 | ) | | | | — | 4 | | | | — | | | | | (2.90 | ) | | | | (2.90 | ) |
| Year ended 9/30/21 | | | $ | 9.56 | | | | | (0.19 | ) | | | | 3.85 | | | | | 3.66 | | | | | — | 4 | | | | — | | | | | (0.67 | ) | | | | (0.67 | ) |
| Year ended 9/30/20 | | | $ | 7.45 | | | | | (0.10 | ) | | | | 3.08 | | | | | 2.98 | | | | | — | | | | | — | | | | | (0.87 | ) | | | | (0.87 | ) |
| Year ended 9/30/19 | | | $ | 9.86 | | | | | (0.08 | ) | | | | (0.55 | ) | | | | (0.63 | ) | | | | — | 4 | | | | — | | | | | (1.78 | ) | | | | (1.78 | ) |
| Year ended 9/30/18 | | | $ | 8.23 | | | | | (0.08 | ) | | | | 2.88 | | | | | 2.80 | | | | | — | 4 | | | | — | | | | | (1.17 | ) | | | | (1.17 | ) |
| Micro Cap Fund — Institutional Class | | | | | | | | | | | | | | | | | | | | | | | | | | | | | | | | | | | | |
| Six Months ended 3/31/23 (unaudited) | | | $ | 5.72 | | | | | (0.04 | ) | | | | 0.51 | | | | | 0.47 | | | | | — | 4 | | | | — | | | | | — | | | | | — | |
| Year ended 9/30/22 | | | $ | 12.55 | | | | | (0.13 | ) | | | | (3.80 | ) | | | | (3.93 | ) | | | | — | 4 | | | | — | | | | | (2.90 | ) | | | | (2.90 | ) |
| Year ended 9/30/21 | | | $ | 9.55 | | | | | (0.19 | ) | | | | 3.86 | | | | | 3.67 | | | | | — | 4 | | | | — | | | | | (0.67 | ) | | | | (0.67 | ) |
| Period ended 9/30/2012 | | | $ | 7.74 | | | | | (0.05 | ) | | | | 1.86 | | | | | 1.81 | | | | | — | | | | | — | | | | | — | | | | | — | |
| Micro Cap Value Fund — Investor Class | | | | | | | | | | | | | | | | | | | | | | | | | | | | | | | | | | | | |
| Six Months ended 3/31/23 (unaudited) | | | $ | 2.79 | | | | | (0.02 | ) | | | | 0.32 | | | | | 0.30 | | | | | — | 4 | | | | — | | | | | — | | | | | — | |
| Year ended 9/30/22 | | | $ | 5.10 | | | | | (0.04 | ) | | | | (1.33 | ) | | | | (1.37 | ) | | | | — | 4 | | | | — | | | | | (0.94 | ) | | | | (0.94 | ) |
| Year ended 9/30/21 | | | $ | 3.65 | | | | | (0.04 | ) | | | | 2.02 | | | | | 1.98 | | | | | — | 4 | | | | — | | | | | (0.53 | ) | | | | (0.53 | ) |
| Year ended 9/30/20 | | | $ | 3.21 | | | | | (0.04 | ) | | | | 0.78 | | | | | 0.74 | | | | | — | | | | | — | | | | | (0.30 | ) | | | | (0.30 | ) |
| Year ended 9/30/19 | | | $ | 3.83 | | | | | (0.03 | ) | | | | (0.20 | ) | | | | (0.23 | ) | | | | — | 4 | | | | (0.02 | ) | | | | (0.37 | ) | | | | (0.39 | ) |
| Year ended 9/30/18 | | | $ | 3.48 | | | | | (0.03 | ) | | | | 0.65 | | | | | 0.62 | | | | | — | 4 | | | | — | | | | | (0.27 | ) | | | | (0.27 | ) |
| Micro Cap Value Fund — Institutional Class | | | | | | | | | | | | | | | | | | | | | | | | | | | | | | | | | | | | |
| Six Months ended 3/31/23 (unaudited) | | | $ | 2.81 | | | | | (0.01 | ) | | | | 0.31 | | | | | 0.30 | | | | | — | 4 | | | | — | | | | | — | | | | | — | |
| Year ended 9/30/22 | | | $ | 5.12 | | | | | (0.04 | ) | | | | (1.33 | ) | | | | (1.37 | ) | | | | — | 4 | | | | — | | | | | (0.94 | ) | | | | (0.94 | ) |
| Year ended 9/30/21 | | | $ | 3.66 | | | | | (0.05 | ) | | | | 2.04 | | | | | 1.99 | | | | | — | 4 | | | | — | | | | | (0.53 | ) | | | | (0.53 | ) |
| Period ended 9/30/2012 | | | $ | 3.26 | | | | | (0.01 | ) | | | | 0.41 | | | | | 0.40 | | | | | — | | | | | — | | | | | — | | | | | — | |
| Small Cap Growth Fund — Investor Class | | | | | | | | | | | | | | | | | | | | | | | | | | | | | | | | | | | | |
| Six Months ended 3/31/23 (unaudited) | | | $ | 29.19 | | | | | (0.19 | ) | | | | 3.09 | | | | | 2.90 | | | | | — | 4 | | | | — | | | | | — | | | | | — | |
| Year ended 9/30/22 | | | $ | 62.46 | | | | | (0.46 | ) | | | | (21.99 | ) | | | | (22.45 | ) | | | | — | 4 | | | | — | | | | | (10.82 | ) | | | | (10.82 | ) |
| Year ended 9/30/21 | | | $ | 46.64 | | | | | (0.57 | ) | | | | 19.94 | | | | | 19.37 | | | | | — | 4 | | | | — | | | | | (3.55 | ) | | | | (3.55 | ) |
| Year ended 9/30/20 | | | $ | 40.23 | | | | | (0.32 | ) | | | | 12.52 | | | | | 12.20 | | | | | — | | | | | — | | | | | (5.79 | ) | | | | (5.79 | ) |
| Year ended 9/30/19 | | | $ | 55.30 | | | | | (0.28 | ) | | | | (2.33 | ) | | | | (2.61 | ) | | | | — | 4 | | | | — | | | | | (12.46 | ) | | | | (12.46 | ) |
| Year ended 9/30/18 | | | $ | 45.72 | | | | | (0.54 | ) | | | | 15.19 | | | | | 14.65 | | | | | — | 4 | | | | — | | | | | (5.07 | ) | | | | (5.07 | ) |
| Small Cap Growth Fund — Institutional Class | | | | | | | | | | | | | | | | | | | | | | | | | | | | | | | | | | | | |
| Six Months ended 3/31/23 (unaudited) | | | $ | 29.70 | | | | | (0.14 | ) | | | | 3.10 | | | | | 2.96 | | | | | — | 4 | | | | — | | | | | — | | | | | — | |
| Year ended 9/30/22 | | | $ | 63.29 | | | | | (0.42 | ) | | | | (22.35 | ) | | | | (22.77 | ) | | | | — | 4 | | | | — | | | | | (10.82 | ) | | | | (10.82 | ) |
| Year ended 9/30/21 | | | $ | 47.18 | | | | | (0.51 | ) | | | | 20.17 | | | | | 19.66 | | | | | — | 4 | | | | — | | | | | (3.55 | ) | | | | (3.55 | ) |
| Year ended 9/30/20 | | | $ | 40.60 | | | | | (0.28 | ) | | | | 12.65 | | | | | 12.37 | | | | | — | | | | | — | | | | | (5.79 | ) | | | | (5.79 | ) |
| Year ended 9/30/19 | | | $ | 55.61 | | | | | (0.24 | ) | | | | (2.31 | ) | | | | (2.55 | ) | | | | — | 4 | | | | — | | | | | (12.46 | ) | | | | (12.46 | ) |
| Year ended 9/30/18 | | | $ | 45.89 | | | | | (0.31 | ) | | | | 15.10 | | | | | 14.79 | | | | | — | 4 | | | | — | | | | | (5.07 | ) | | | | (5.07 | ) |
| Small Cap Value Fund — Investor Class | | | | | | | | | | | | | | | | | | | | | | | | | | | | | | | | | | | | |
| Six Months ended 3/31/23 (unaudited) | | | $ | 7.49 | | | | | 0.01 | | | | | 1.21 | | | | | 1.22 | | | | | — | 4 | | | | — | | | | | (0.19 | ) | | | | (0.19 | ) |
| Year ended 9/30/22 | | | $ | 10.68 | | | | | — | 4 | | | | (2.38 | ) | | | | (2.38 | ) | | | | — | 4 | | | | — | 4 | | | | (0.81 | ) | | | | (0.81 | ) |
| Year ended 9/30/21 | | | $ | 6.99 | | | | | (0.02 | ) | | | | 3.71 | | | | | 3.69 | | | | | — | 4 | | | | — | | | | | — | | | | | — | |
| Year ended 9/30/20 | | | $ | 7.61 | | | | | 0.01 | | | | | (0.54 | ) | | | | (0.53 | ) | | | | — | | | | | (0.04 | ) | | | | (0.05 | ) | | | | (0.09 | ) |
| Year ended 9/30/19 | | | $ | 8.53 | | | | | 0.03 | | | | | (0.36 | ) | | | | (0.33 | ) | | | | — | 4 | | | | — | | | | | (0.59 | ) | | | | (0.59 | ) |
| Year ended 9/30/18 | | | $ | 7.94 | | | | | 0.02 | | | | | 1.10 | | | | | 1.12 | | | | | — | 4 | | | | (0.01 | ) | | | | (0.52 | ) | | | | (0.53 | ) |
| Small Cap Value Fund — Institutional Class | | | | | | | | | | | | | | | | | | | | | | | | | | | | | | | | | | | | |
| Six Months ended 3/31/23 (unaudited) | | | $ | 7.56 | | | | | 0.01 | | | | | 1.23 | | | | | 1.24 | | | | | — | 4 | | | | — | | | | | (0.19 | ) | | | | (0.19 | ) |
| Year ended 9/30/22 | | | $ | 10.78 | | | | | 0.01 | | | | | (2.41 | ) | | | | (2.40 | ) | | | | — | 4 | | | | (0.01 | ) | | | | (0.81 | ) | | | | (0.82 | ) |
| Year ended 9/30/21 | | | $ | 7.05 | | | | | — | 4 | | | | 3.73 | | | | | 3.73 | | | | | — | 4 | | | | — | | | | | — | | | | | — | |
| Year ended 9/30/20 | | | $ | 7.67 | | | | | 0.03 | | | | | (0.55 | ) | | | | (0.52 | ) | | | | — | | | | | (0.05 | ) | | | | (0.05 | ) | | | | (0.10 | ) |
| Year ended 9/30/19 | | | $ | 8.58 | | | | | 0.03 | | | | | (0.35 | ) | | | | (0.32 | ) | | | | — | 4 | | | | — | | | | | (0.59 | ) | | | | (0.59 | ) |
| Year ended 9/30/18 | | | $ | 7.98 | | | | | 0.04 | | | | | 1.10 | | | | | 1.14 | | | | | — | 4 | | | | (0.02 | ) | | | | (0.52 | ) | | | | (0.54 | ) |
See Notes to Financial Highlights and Notes to Financial Statements.
112
| | |
| | | (For a share outstanding throughout each period.) |
| | | | | | | | | | | | | | | | | | | | | | | | | | | | | | |
| | | | | | |
Ratios to Average Net Assets | | | Supplemental Data | |
Net Asset
Value
End of
Period | | | Total Return (%)1 | | | Expenses Net of Waivers and
Reimbursements (%)2 | | | Expenses Before Waivers and
Reimbursements (%)2 | | | Net Investment
Income (Loss)
Net of Waivers and
Reimbursements (%)2 | | | Net Investment
Income (Loss)
Before Waivers and
Reimbursements (%)2 | | | Net Assets End of Period
(000s) | | | Portfolio
Turnover
Rate1 3 | |
| | | | | | | | | | | | | | | | | | | | | | | | | | | | | | |
| $ | 6.19 | | | | 8.22 | | | | 1.70 | 5 8 | | | 1.70 | 5 8 | | | (1.52 | ) | | | (1.52 | ) | | $ | 554,398 | | | | 31% | |
| $ | 5.72 | | | | (39.42 | ) | | | 1.66 | 5 8 | | | 1.66 | 5 8 | | | (1.54 | ) | | | (1.54 | ) | | $ | 558,093 | | | | 59% | |
| $ | 12.55 | | | | 38.81 | | | | 1.63 | 5 | | | 1.63 | 5 | | | (1.52 | ) | | | (1.52 | ) | | $ | 1,155,133 | | | | 63% | |
| $ | 9.56 | | | | 43.47 | | | | 1.66 | 5 | | | 1.66 | 5 | | | (1.48 | ) | | | (1.48 | ) | | $ | 746,749 | | | | 75% | |
| $ | 7.45 | | | | (1.15 | ) | | | 1.66 | 5 | | | 1.66 | 5 | | | (1.31 | ) | | | (1.31 | ) | | $ | 473,505 | | | | 67% | |
| $ | 9.86 | | | | 38.04 | | | | 1.65 | 5 8 | | | 1.65 | 5 8 | | | (1.27 | ) | | | (1.27 | ) | | $ | 496,128 | | | | 54% | |
| | | | | | | | | | | | | | | | | | | | | | | | | | | | | | |
| $ | 6.19 | | | | 8.22 | | | | 1.60 | 5 8 | | | 1.62 | 5 8 | | | (1.43 | ) | | | (1.44 | ) | | $ | 78,452 | | | | 31% | |
| $ | 5.72 | | | | (39.40 | ) | | | 1.59 | 5 8 | | | 1.59 | 5 8 | | | (1.47 | ) | | | (1.47 | ) | | $ | 76,558 | | | | 59% | |
| $ | 12.55 | | | | 38.96 | | | | 1.56 | 5 | | | 1.56 | 5 | | | (1.45 | ) | | | (1.45 | ) | | $ | 198,477 | | | | 63% | |
| $ | 9.55 | | | | 23.39 | | | | 1.60 | 5 | | | 1.62 | 5 | | | (1.43 | ) | | | (1.45 | ) | | $ | 59,124 | | | | 75% | |
| | | | | | | | | | | | | | | | | | | | | | | | | | | | | | |
| $ | 3.09 | | | | 10.75 | | | | 1.74 | 5 8 | | | 1.74 | 5 8 | | | (0.94 | ) | | | (0.94 | ) | | $ | 256,273 | | | | 27% | |
| $ | 2.79 | | | | (32.47 | ) | | | 1.70 | 5 8 | | | 1.70 | 5 8 | | | (1.13 | ) | | | (1.13 | ) | | $ | 249,290 | | | | 50% | |
| $ | 5.10 | | | | 58.11 | | | | 1.66 | 5 | | | 1.66 | 5 | | | (1.15 | ) | | | (1.15 | ) | | $ | 387,236 | | | | 82% | |
| $ | 3.65 | | | | 24.17 | | | | 1.74 | 5 | | | 1.74 | 5 | | | (1.01 | ) | | | (1.01 | ) | | $ | 222,963 | | | | 63% | |
| $ | 3.21 | | | | (4.50 | ) | | | 1.74 | 5 | | | 1.74 | 5 | | | (0.90 | ) | | | (0.90 | ) | | $ | 249,523 | | | | 66% | |
| $ | 3.83 | | | | 18.84 | | | | 1.74 | 5 8 | | | 1.74 | 5 8 | | | (0.89 | ) | | | (0.89 | ) | | $ | 283,623 | | | | 69% | |
| | | | | | | | | | | | | | | | | | | | | | | | | | | | | | |
| $ | 3.11 | | | | 10.68 | | | | 1.60 | 5 8 | | | 1.65 | 5 8 | | | (0.80 | ) | | | (0.85 | ) | | $ | 44,286 | | | | 27% | |
| $ | 2.81 | | | | (32.31 | ) | | | 1.60 | 5 8 | | | 1.63 | 5 8 | | | (1.03 | ) | | | (1.06 | ) | | $ | 42,952 | | | | 50% | |
| $ | 5.12 | | | | 58.25 | | | | 1.60 | 5 | | | 1.61 | 5 | | | (1.10 | ) | | | (1.10 | ) | | $ | 56,381 | | | | 82% | |
| $ | 3.66 | | | | 12.27 | | | | 1.60 | 5 | | | 1.84 | 5 | | | (0.99 | ) | | | (1.23 | ) | | $ | 25,317 | | | | 63% | |
| | | | | | | | | | | | | | | | | | | | | | | | | | | | | | |
| $ | 32.09 | | | | 9.93 | | | | 1.18 | 5 8 | | | 1.18 | 5 8 | | | (0.99 | ) | | | (0.99 | ) | | $ | 879,674 | | | | 16% | |
| $ | 29.19 | | | | (42.42 | ) | | | 1.15 | 5 8 | | | 1.15 | 5 8 | | | (1.05 | ) | | | (1.05 | ) | | $ | 848,033 | | | | 32% | |
| $ | 62.46 | | | | 42.49 | | | | 1.12 | 5 | | | 1.12 | 5 | | | (1.00 | ) | | | (1.00 | ) | | $ | 1,744,187 | | | | 40% | |
| $ | 46.64 | | | | 33.26 | | | | 1.16 | 5 | | | 1.16 | 5 | | | (0.89 | ) | | | (0.89 | ) | | $ | 1,247,871 | | | | 37% | |
| $ | 40.23 | | | | 1.67 | 5 | | | 1.17 | 6 | | | 1.17 | 6 | | | (0.80 | ) | | | (0.80 | ) | | $ | 978,825 | | | | 26% | |
| $ | 55.30 | | | | 35.08 | | | | 1.20 | 5 8 | | | 1.20 | 5 8 | | | (0.84 | ) | | | (0.84 | ) | | $ | 1,170,809 | | | | 36% | |
| | | | | | | | | | | | | | | | | | | | | | | | | | | | | | |
| $ | 32.66 | | | | 9.97 | | | | 1.05 | 5 8 | | | 1.07 | 5 8 | | | (0.87 | ) | | | (0.89 | ) | | $ | 1,252,315 | | | | 16% | |
| $ | 29.70 | | | | (42.35 | ) | | | 1.05 | 5 8 | | | 1.06 | 5 8 | | | (0.94 | ) | | | (0.95 | ) | | $ | 1,138,901 | | | | 32% | |
| $ | 63.29 | | | | 42.62 | | | | 1.05 | 5 | | | 1.06 | 5 | | | (0.92 | ) | | | (0.93 | ) | | $ | 1,898,152 | | | | 40% | |
| $ | 47.18 | | | | 33.39 | | | | 1.05 | 5 | | | 1.08 | 5 | | | (0.78 | ) | | | (0.81 | ) | | $ | 1,233,331 | | | | 37% | |
| $ | 40.60 | | | | 1.80 | | | | 1.06 | 6 | | | 1.09 | 6 | | | (0.68 | ) | | | (0.72 | ) | | $ | 712,833 | | | | 26% | |
| $ | 55.61 | | | | 35.27 | | | | 1.06 | 5 7 | | | 1.10 | 5 7 | | | (0.70 | ) | | | (0.74 | ) | | $ | 714,184 | | | | 36% | |
| | | | | | | | | | | | | | | | | | | | | | | | | | | | | | |
| $ | 8.52 | | | | 16.43 | | | | 1.18 | 5 8 | | | 1.18 | 5 8 | | | 0.15 | | | | 0.15 | | | $ | 572,468 | | | | 32% | |
| $ | 7.49 | | | | (24.18 | ) | | | 1.16 | 5 8 | | | 1.16 | 5 8 | | | 0.04 | | | | 0.04 | | | $ | 570,201 | | | | 61% | |
| $ | 10.68 | | | | 52.79 | | | | 1.16 | 5 | | | 1.16 | 5 | | | (0.16 | ) | | | (0.16 | ) | | $ | 840,022 | | | | 50% | |
| $ | 6.99 | | | | (7.13 | ) | | | 1.21 | 5 | | | 1.21 | 5 | | | 0.22 | | | | 0.22 | | | $ | 525,957 | | | | 58% | |
| $ | 7.61 | | | | (2.69 | ) | | | 1.20 | 5 | | | 1.20 | 5 | | | 0.51 | | | | 0.51 | | | $ | 454,451 | | | | 25% | |
| $ | 8.53 | | | | 14.54 | | | | 1.20 | 5 8 | | | 1.20 | 5 8 | | | 0.29 | | | | 0.29 | | | $ | 347,298 | | | | 46% | |
| | | | | | | | | | | | | | | | | | | | | | | | | | | | | | |
| $ | 8.61 | | | | 16.54 | | | | 1.05 | 5 8 | | | 1.06 | 5 8 | | | 0.27 | | | | 0.26 | | | $ | 762,823 | | | | 32% | |
| $ | 7.56 | | | | (24.15 | ) | | | 1.05 | 5 8 | | | 1.06 | 5 8 | | | 0.14 | | | | 0.14 | | | $ | 663,167 | | | | 61% | |
| $ | 10.78 | | | | 52.91 | | | | 1.05 | 5 | | | 1.06 | 5 | | | (0.05 | ) | | | (0.06 | ) | | $ | 849,537 | | | | 50% | |
| $ | 7.05 | | | | (6.94 | ) | | | 1.05 | 5 | | | 1.08 | 5 | | | 0.38 | | | | 0.34 | | | $ | 472,331 | | | | 58% | |
| $ | 7.67 | | | | (2.55 | ) | | | 1.05 | 5 | | | 1.09 | 5 | | | 0.70 | | | | 0.66 | | | $ | 368,498 | | | | 25% | |
| $ | 8.58 | | | | 14.78 | | | | 1.06 | 5 8 | | | 1.13 | 5 8 | | | 0.43 | | | | 0.35 | | | $ | 91,857 | | | | 46% | |
113
Financial Highlights (continued)
| | | | | | | | | | | | | | | | | | | | | | | | | | | | | | | | | | | | | | | | |
| | | | | Income (Loss) from
Investment Operations | | | | | | Less Distributions | | |
| | | Net Asset
Value
Beginning
of Period | | Net
Investment
Income (Loss) | | Net Realized
and Unrealized
Gains (Losses)
on Investments | | Total from
Investment
Operations | | Redemption
Fees
(See Note 2) | | Dividends
from Net
Investment
Income | | Distributions
from Net
Realized
Gains | | Total
Distributions |
| Ultra Growth Fund — Investor Class | | | | | | | | | | | | | | | | | | | | | | | | | | | | | | | | | | | | |
| Six Months ended 3/31/23 (unaudited) | | | $ | 26.29 | | | | | (0.17 | ) | | | | 2.34 | | | | | 2.17 | | | | | — | 4 | | | | — | | | | | — | | | | | — | |
| Year ended 9/30/22 | | | $ | 50.98 | | | | | (0.43 | ) | | | | (18.93 | ) | | | | (19.36 | ) | | | | — | 4 | | | | — | | | | | (5.33 | ) | | | | (5.33 | ) |
| Year ended 9/30/21 | | | $ | 39.56 | | | | | (0.48 | ) | | | | 13.30 | | | | | 12.82 | | | | | 0.01 | | | | | — | | | | | (1.41 | ) | | | | (1.41 | ) |
| Year ended 9/30/20 | | | $ | 25.30 | | | | | (0.17 | ) | | | | 14.98 | | | | | 14.81 | | | | | 0.01 | | | | | — | | | | | (0.56 | ) | | | | (0.56 | ) |
| Year ended 9/30/19 | | | $ | 27.68 | | | | | (0.18 | ) | | | | (0.60 | ) | | | | (0.78 | ) | | | | 0.01 | | | | | — | | | | | (1.61 | ) | | | | (1.61 | ) |
| Year ended 9/30/18 | | | $ | 21.81 | | | | | — | 4 | | | | 8.31 | | | | | 8.31 | | | | | — | 4 | | | | (0.10 | ) | | | | (2.34 | ) | | | | (2.44 | ) |
| Ultra Growth Fund — Institutional Class | | | | | | | | | | | | | | | | | | | | | | | | | | | | | | | | | | | | |
| Six Months ended 3/31/23 (unaudited) | | | $ | 26.37 | | | | | (0.11 | ) | | | | 2.31 | | | | | 2.20 | | | | | — | 4 | | | | (0.04 | ) | | | | — | | | | | (0.04 | ) |
| Year ended 9/30/22 | | | $ | 51.05 | | | | | (0.34 | ) | | | | (19.01 | ) | | | | (19.35 | ) | | | | — | 4 | | | | — | | | | | (5.33 | ) | | | | (5.33 | ) |
| Year ended 9/30/21 | | | $ | 39.58 | | | | | (0.41 | ) | | | | 13.28 | | | | | 12.87 | | | | | 0.01 | | | | | — | | | | | (1.41 | ) | | | | (1.41 | ) |
| Period ended 9/30/2012 | | | $ | 29.39 | | | | | (0.09 | ) | | | | 10.28 | | | | | 10.19 | | | | | — | 4 | | | | — | | | | | — | | | | | — | |
| U.S. Select Fund — Investor Class | | | | | | | | | | | | | | | | | | | | | | | | | | | | | | | | | | | | |
| Six Months ended 3/31/23 (unaudited) | | | $ | 9.74 | | | | | (0.02 | ) | | | | 2.06 | | | | | 2.04 | | | | | — | 4 | | | | — | | | | | — | | | | | — | |
| Period ended 9/30/2216 | | | $ | 10.00 | | | | | (0.01 | ) | | | | (0.26 | ) | | | | (0.27 | ) | | | | 0.01 | | | | | — | | | | | — | | | | | — | |
| U.S. Select Fund — Institutional Class | | | | | | | | | | | | | | | | | | | | | | | | | | | | | | | | | | | | |
| Six Months ended 3/31/23 (unaudited) | | | $ | 9.73 | | | | | (0.01 | ) | | | | 2.07 | | | | | 2.06 | | | | | — | | | | | — | | | | | — | | | | | — | |
| Period ended 9/30/2216 | | | $ | 10.00 | | | | | (0.01 | ) | | | | (0.26 | ) | | | | (0.27 | ) | | | | — | | | | | — | | | | | — | | | | | — | |
| U.S. Treasury Fund — Investor Class | | | | | | | | | | | | | | | | | | | | | | | | | | | | | | | | | | | | |
| Six Months ended 3/31/23 (unaudited) | | | $ | 12.53 | | | | | 0.17 | | | | | 0.35 | | | | | 0.52 | | | | | — | 4 | | | | (0.17 | ) | | | | — | | | | | (0.17 | ) |
| Year ended 9/30/22 | | | $ | 18.10 | | | | | 0.28 | | | | | (5.57 | ) | | | | (5.29 | ) | | | | 0.01 | | | | | (0.29 | ) | | | | — | | | | | (0.29 | ) |
| Year ended 9/30/21 | | | $ | 22.42 | | | | | 0.25 | | | | | (3.00 | ) | | | | (2.75 | ) | | | | 0.01 | | | | | (0.24 | ) | | | | (1.34 | ) | | | | (1.58 | ) |
| Year ended 9/30/20 | | | $ | 19.26 | | | | | 0.30 | | | | | 3.13 | | | | | 3.43 | | | | | 0.03 | | | | | (0.30 | ) | | | | — | | | | | (0.30 | ) |
| Year ended 9/30/19 | | | $ | 15.26 | | | | | 0.34 | | | | | 3.99 | | | | | 4.33 | | | | | 0.01 | | | | | (0.34 | ) | | | | — | | | | | (0.34 | ) |
| Year ended 9/30/18 | | | $ | 16.32 | | | | | 0.35 | | | | | (1.07 | ) | | | | (0.72 | ) | | | | — | 4 | | | | (0.34 | ) | | | | — | | | | | (0.34 | ) |
See Notes to Financial Highlights and Notes to Financial Statements.
114
| | |
| | | (For a share outstanding throughout each period.) |
| | | | | | | | | | | | | | | | | | | | | | | | | | | | | | |
| | | | | | |
Ratios to Average Net Assets | | | Supplemental Data | |
Net Asset
Value
End of
Period | | | Total Return (%)1 | | | Expenses Net of Waivers and
Reimbursements (%)2 | | | Expenses Before Waivers and
Reimbursements (%)2 | | | Net Investment
Income (Loss)
Net of Waivers and
Reimbursements (%)2 | | | Net Investment
Income (Loss)
Before Waivers and
Reimbursements (%)2 | | | Net Assets End of Period
(000s) | | | Portfolio
Turnover
Rate1 3 | |
| | | | | | | | | | | | | | | | | | | | | | | | | | | | | | |
| $ | 28.46 | | | | 8.25 | | | | 1.25 | 5 8 | | | 1.25 | 5 8 | | | (0.97 | ) | | | (0.97 | ) | | $ | 969,269 | | | | 12% | |
| $ | 26.29 | | | | (41.70 | ) | | | 1.18 | 5 8 | | | 1.18 | 5 8 | | | (1.00 | ) | | | (1.00 | ) | | $ | 984,853 | | | | 34% | |
| $ | 50.98 | | | | 32.78 | | | | 1.16 | 5 | | | 1.16 | 5 | | | (0.96 | ) | | | (0.96 | ) | | $ | 2,255,327 | | | | 35% | |
| $ | 39.56 | | | | 59.54 | | | | 1.19 | 5 | | | 1.19 | 5 | | | (0.95 | ) | | | (0.95 | ) | | $ | 1,733,280 | | | | 37% | |
| $ | 25.30 | | | | (1.35 | ) | | | 1.24 | 5 | | | 1.24 | 5 | | | (0.93 | ) | | | (0.93 | ) | | $ | 623,154 | | | | 17% | |
| $ | 27.68 | | | | 41.97 | | | | 1.24 | 5 8 | | | 1.24 | 5 8 | | | (1.00 | ) | | | (1.00 | ) | | $ | 297,562 | | | | 44% | |
| | | | | | | | | | | | | | | | | | | | | | | | | | | | | | |
| $ | 28.53 | | | | 8.34 | | | | 1.05 | 5 8 | | | 1.08 | 5 8 | | | (0.78 | ) | | | (0.80 | ) | | $ | 412,935 | | | | 12% | |
| $ | 26.37 | | | | (41.62 | ) | | | 1.05 | 5 8 | | | 1.06 | 5 8 | | | (0.87 | ) | | | (0.88 | ) | | $ | 389,020 | | | | 34% | |
| $ | 51.05 | | | | 32.89 | | | | 1.05 | 5 | | | 1.06 | 5 | | | (0.86 | ) | | | (0.87 | ) | | $ | 717,666 | | | | 35% | |
| $ | 39.58 | | | | 34.67 | | | | 1.05 | 5 | | | 1.07 | 5 | | | (0.97 | ) | | | (0.98 | ) | | $ | 348,388 | | | | 37% | |
| | | | | | | | | | | | | | | | | | | | | | | | | | | | | | |
| $ | 11.78 | | | | 20.94 | | | | 1.02 | 6 7 | | | 4.39 | 6 7 | | | (0.49 | ) | | | (3.86 | ) | | $ | 2,946 | | | | 24% | |
| $ | 9.74 | | | | (2.60 | ) | | | 1.01 | 6 7 | | | 11.81 | 6 7 | | | (0.59 | ) | | | (11.39 | ) | | $ | 1,779 | | | | 4% | |
| | | | | | | | | | | | | | | | | | | | | | | | | | | | | | |
| $ | 11.79 | | | | 21.17 | | | | 0.87 | 6 7 | | | 2.70 | 6 7 | | | (0.35 | ) | | | (2.18 | ) | | $ | 6,678 | | | | 24% | |
| $ | 9.73 | | | | (2.70 | ) | | | 0.86 | 6 7 | | | 10.54 | 6 7 | | | (0.43 | ) | | | (10.11 | ) | | $ | 3,566 | | | | 4% | |
| | | | | | | | | | | | | | | | | | | | | | | | | | | | | | |
| $ | 12.88 | | | | 4.10 | | | | 0.70 | 5 8 | | | 0.70 | 5 8 | | | 2.56 | | | | 2.56 | | | $ | 276,855 | | | | 7% | |
| $ | 12.53 | | | | (29.44 | ) | | | 0.67 | 5 8 | | | 0.67 | 5 8 | | | 1.70 | | | | 1.70 | | | $ | 287,523 | | | | 47% | |
| $ | 18.10 | | | | (12.74 | ) | | | 0.66 | 5 | | | 0.66 | 5 | | | 1.30 | | | | 1.30 | | | $ | 462,949 | | | | 50% | |
| $ | 22.42 | | | | 18.06 | | | | 0.66 | 5 | | | 0.66 | 5 | | | 1.41 | | | | 1.41 | | | $ | 545,586 | | | | 13% | |
| $ | 19.26 | | | | 28.73 | | | | 0.69 | 5 | | | 0.69 | 5 | | | 2.05 | | | | 2.05 | | | $ | 379,644 | | | | 29% | |
| $ | 15.26 | | | | (4.47 | ) | | | 0.70 | 5 8 | | | 0.70 | 5 8 | | | 2.13 | | | | 2.13 | | | $ | 303,105 | | | | 6% | |
115
Notes to Financial Highlights
| 1 | Not annualized for periods less than one year. |
| 2 | Annualized for periods less than one year. |
| 3 | Portfolio turnover is calculated on the basis of the Fund as a whole without distinguishing between the classes of shares issued. |
| 4 | Represents amounts less than $0.005 per share. |
| 5 | Includes interest expenses of less than 0.005%. |
| 6 | Includes interest expenses of more than 0.005%. |
| 7 | Includes extraordinary expenses greater than or equal to 0.01% (see Note 7 in “Notes to Financial Statements”). |
| 8 | Includes extraordinary expenses of less than 0.01% (see Note 7 in “Notes to Financial Statements”). |
| 9 | The Advisor reimbursed the Greater China Fund $258,290 for losses from a trade error. The reimbursement reduced the Net Realized and Unrealized Losses on Investments by $0.24 per share. |
| 10 | Net Realized and Unrealized Gains (Losses) on Investments per share reflects a large, non-recurring receivable for security litigation which amounted to $0.06 and $0.06 per share for the Investor Class and Institutional Class, respectively. Excluding this non-recurring receivable, Net Realized and Unrealized Gains (Losses) would have been $0.59 and $0.60 per share for the Investor Class and Institutional Class, respectively. Excluding this non-recurring receivable, Total Return would have been 8.74% and 8.91% for the Investor Class and Institutional Class, respectively. |
| 11 | Fund inception date was October 1, 2019. |
| 12 | Institutional Class inception date was January 31, 2020. |
| 13 | Net Realized and Unrealized Gains (Losses) on Investments per share reflects a large, non-recurring receivable for security litigation which amounted to $0.07 and $0.07 per share for the Investor Class and Institutional Class, respectively. Excluding this non-recurring receivable, Net Realized and Unrealized Gains (Losses) on Investments would have been $(1.16) and $(1.14) per share for the Investor Class and Institutional Class, respectively. Excluding this non-recurring receivable, Total Return would have been (13.11)% and (13.00)% for the Investor Class and Institutional Class, respectively. |
| 14 | Fund inception date was November 30, 2020. |
| 15 | Fund inception date was October 1, 2021. |
| 16 | Fund inception date was June 13, 2022. |
| 17 | The Advisor reimbursed the Greater China Fund $258,290 for losses from a trade error. The reimbursement increased the total return by 3.54%. |
| 18 | Includes interest expense and dividend payments for securities sold short. The ratios excluding such expenses are listed below: |
| | | | | | | | | | | | |
| | | Expenses Net of
Waivers and
Reimbursements (%)2 | | Expenses Before
Waivers and
Reimbursements (%)2 | | |
Long/Short Alpha Fund — Investor Class | | | | | | | | | | | | |
Period ended 3/31/23 | | | | 1.75 | | | | | 1.82 | | | |
Year ended 9/30/22 | | | | 1.75 | | | | | 2.48 | | | |
| | | |
Long/Short Alpha Fund — Institutional Class | | | | | | | | | | | | |
Period ended 3/31/23 | | | | 1.50 | | | | | 1.83 | | | |
Year ended 9/30/22 | | | | 1.50 | | | | | 2.40 | | | |
| 19 | Includes interest expense and dividend payments for securities sold short. The ratios excluding such expenses are listed below: |
| | | | | | | | | | | | |
| | | Expenses Net of
Waivers and
Reimbursements (%)2 | | Expenses Before
Waivers and
Reimbursements (%)2 | | |
Greater China Fund — Investor Class | | | | | | | | | | | | |
Year ended 9/30/22 | | | | 1.51 | | | | | 3.46 | | | |
| | | |
Greater China Fund — Institutional Class | | | | | | | | | | | | |
Year ended 9/30/22 | | | | 1.26 | | | | | 2.51 | | | |
116
| | |
| Wasatch Funds | | MARCH 31, 2023 (Unaudited) |
Notes to Financial Statements
1. ORGANIZATION
Wasatch Funds Trust (the “Trust”) is a Massachusetts business trust registered under the Investment Company Act of 1940, as amended (the “1940 Act”), as an open-end management investment company and consists of 20 series or funds (each a “Fund” and collectively the “Funds”). The Core Growth Fund, Global Opportunities Fund, Global Select Fund, Global Value Fund, International Growth Fund, International Opportunities Fund, Micro Cap Fund, Micro Cap Value Fund, Small Cap Growth Fund, Small Cap Value Fund, Ultra Growth Fund and Wasatch-Hoisington U.S. Treasury Fund (“U.S. Treasury Fund”) (sub-advised) are each classified as a diversified fund. The Emerging India Fund, Emerging Markets Select Fund, Emerging Markets Small Cap Fund, Frontier Emerging Small Countries Fund, Greater China Fund, International Select Fund, Long/Short Alpha Fund and U.S. Select Fund are each classified as a non-diversified fund. Each Fund maintains its own investment objective(s).
On November 9, 2011, the Trust redesignated the shares of the Funds into Investor Class shares effective January 31, 2012, and authorized and designated a new Institutional Class of shares in the Funds. Currently 19 funds offer Institutional Class shares: Core Growth Fund, Global Value Fund and Small Cap Value Fund, which commenced operations on January 31, 2012; Emerging Markets Select Fund, which commenced operations on December 13, 2012; Emerging India Fund, Emerging Markets Small Cap Fund, Frontier Emerging Small Countries Fund, Global Opportunities Fund, International Growth Fund, International Opportunities Fund and Small Cap Growth Fund, which commenced operations on February 1, 2016; Global Select Fund and International Select Fund, which commenced operations on October 1, 2019; Micro Cap Fund, Micro Cap Value Fund and Ultra Growth Fund, which commenced operations on January 31, 2020; Greater China Fund, which commenced operations on November 30, 2020; Long/Short Alpha Fund, which commenced operations on October 1, 2021; and U.S. Select Fund, which commenced operations on June 13, 2022. Each class of shares for each Fund has identical rights and privileges except with respect to purchase minimums, distribution and service charges, shareholder services, voting rights on matters affecting a single class of shares, and the exchange and conversion features. The Funds have entered into an investment advisory agreement with Wasatch Advisors LP, d/b/a Wasatch Global Investors, as investment advisor (the “Advisor” or “Wasatch”).
The Core Growth, Emerging India, Emerging Markets Select, Emerging Markets Small Cap, Frontier Emerging Small Countries, Global Opportunities, Global Select, Global Value, Greater China, International Growth, International Opportunities, International Select, Long/Short Alpha, Micro Cap, Micro Cap Value, Small Cap Growth,
Small Cap Value, Ultra Growth and U.S. Select Funds are referred to herein as the “Equity Funds.”
2. SIGNIFICANT ACCOUNTING POLICIES
The following is a summary of significant policies related to investments of the Funds held at March 31, 2023. These policies are in conformity with accounting principles generally accepted in the United States of America (“U.S. GAAP”).
The Funds are investment companies and accordingly they follow the investment company accounting and reporting guidance in accordance with the Financial Accounting Standards Board Accounting Standards Codification Topic 946, Financial Services — Investment Companies.
Valuation of Securities — All investments in securities are recorded at their estimated fair value as described in Note 12.
Foreign Currency Translations — Values of investments denominated in foreign currencies are converted into U.S. dollars using the current exchange rates each business day (generally 4:00 p.m. Eastern Time). Purchases and sales of investments and dividend income are translated into U.S. dollars using the current prevailing exchange rate on the transaction date. The effect of changes in foreign exchange rates on realized and unrealized gains or losses on securities is reflected as a component of such gains or losses. Transactions in foreign denominated assets may involve greater risks than domestic transactions.
Investment in Securities and Related Investment Income — Security transactions are accounted for on the trade date. Gains or losses on securities sold are determined on the identified cost basis. Dividend income and distributions to shareholders are recorded on the ex-dividend date except that certain dividends from foreign securities may be recorded after the ex-dividend date based on when the Fund is informed of the dividend. Interest income and estimated expenses are accrued daily. Bond discount and premiums are amortized using the interest method. To the extent dividends received include return of capital or capital gain distributions, such distributions are recorded as a reduction to cost of the related security or as a realized gain or loss.
For financial reporting purposes, estimates on all real estate investment trust (REIT) rates are based on prior year average rates made public by the REITs. To obtain these rates Wasatch utilizes a service through Wall Street Concepts, which gathers and disseminates the information. Prior to filing tax returns, REIT rates are trued up for actual rates. The differences between the actual versus the trued-up rates are captured in the next fiscal year’s financial reporting process.
Expenses — The Funds contract for various services on a collective basis. Most expenses are directly attributable to each Fund and therefore are charged accordingly.
117
Notes to Financial Statements (continued)
Expenses not directly attributable to one or more Funds are allocated among applicable Funds on an equitable and consistent basis considering such things as the nature and type of expense and the relative net assets of the Funds.
Use of Management Estimates — The preparation of financial statements in conformity with U.S. GAAP requires management to make estimates and assumptions that affect the reported amounts of assets and liabilities at the date of the financial statements and the reported changes in net assets during the reporting period. Actual results could differ from those estimates.
Guarantees and Indemnifications — In the normal course of business, the Funds enter into contracts that contain a variety of representations and warranties which provide general indemnifications. The maximum exposure under these arrangements is unknown, as this would involve future claims that may be made against the Funds and/or their affiliates that have not yet occurred. Based on experience, however, the risk of loss is expected to be remote.
Redemption Fees — The Funds deduct a fee of 2.00% from redemption proceeds on shares of the Funds held 60 days or less. Redemption fees retained by the Funds are credited to additional paid-in capital.
Other — Income, expenses, and realized and unrealized gains or losses on investments are generally allocated to each class of shares based on its relative net assets, except that each class separately bears expenses related specifically to that class, such as certain shareholder servicing fees.
3. SECURITIES AND OTHER INVESTMENTS
Repurchase Agreements — The Funds may engage in repurchase transactions. Under the terms of a typical repurchase agreement, a fund takes possession of an underlying debt obligation subject to an obligation of the seller to repurchase and the fund to resell the obligation at an agreed upon price and time. The market value of the collateral must be at least equal at all times to the total amount of the repurchase obligation, including interest. Generally, in the event of counterparty default, the fund has the right to use the collateral to offset losses incurred.
Short Sales — The Equity Funds (the Long/Short Alpha Fund in particular) may enter into short sales whereby a fund sells a security it generally does not own (the security is borrowed) in anticipation of a decline in the security’s price. The initial amount of a short sale is recorded as a liability which is marked-to-market daily. Fluctuations in the value of the short liability are recorded as unrealized gains or losses. If a Fund shorts a security when also holding a long position in the security (a “short against the box”), as the security’s price declines, the short position increases in value, offsetting the long position’s decrease in value. The opposite effect occurs if the security’s price rises. A Fund realizes a gain or loss upon closing of the
short sale (returning the security to the counterparty by way of purchase or delivery of a long position owned). Possible losses from short sales may be unlimited, whereas losses from security purchases cannot exceed the total amount invested. The Funds are liable to the lender for any dividends payable on securities while those securities are in a short position. These dividends are an expense of the Funds. The Funds designate collateral consisting of cash, U.S. government securities or other liquid assets sufficient to collateralize the market value of short positions.
Participation Notes — Certain Funds may invest in Participation Notes (P-Notes). P-Notes are promissory notes designed to offer a return linked to the performance of a particular underlying equity security or market. P-Notes are issued by banks or broker-dealers and allow a fund to gain exposure to common stocks in markets in which the fund is currently not approved to directly invest, or in markets that prohibit direct investment by foreign purchasers. While the holder of a P-Note is entitled to receive from the bank or broker-dealer any dividends or other distributions paid on the underlying securities, the holder is not entitled to the same rights as an owner of the underlying securities, such as voting rights. Income received from P-Notes is recorded as dividend income in the Statements of Operations. P-Notes are considered general unsecured contractual obligations of the bank or broker-dealer. Risks associated with P-Notes include the possible failure of a counterparty (i.e., the issuing bank or broker-dealer) to perform in accordance with the terms of the agreement, inability to transfer or liquidate the notes, potential delays or an inability to redeem the notes before maturity under certain market conditions, and limited legal recourse against the issuer of the underlying common stock.
4. FINANCIAL DERIVATIVE INSTRUMENTS
Foreign Currency Contracts — The Funds may enter into foreign currency contracts to settle planned purchases or sales of securities or to protect against a possible loss resulting from an adverse change in the relationship between the U.S. dollar and a foreign currency involved in an underlying transaction. Foreign currency contracts are agreements between two parties to buy and sell a currency at a set price on a future date. The market value of a foreign currency contract fluctuates with changes in currency exchange rates. Foreign currency contracts are marked-to-market daily and the change in market value is recorded by a fund as unrealized appreciation or depreciation. When a foreign currency contract is closed, the fund records a realized gain or loss equal to the difference between the value at the time the contract was opened and the value at the time it was closed. These contracts may involve market risk in excess of the unrealized gain or loss reflected in the Schedule of Investments. In addition, a fund could be exposed to credit risk if a counterparty is unable or unwilling to meet the terms of the contracts or if
118
| | |
| | | MARCH 31, 2023 (Unaudited) |
the value of the currency changes unfavorably. In connection with these contracts, the Funds may segregate cash and/or securities in a sufficient amount as collateral in accordance with the terms of the respective contracts.
None of the Funds entered into foreign currency contracts transactions during the six-month period ended March 31, 2023.
5. PURCHASES AND SALES OF SECURITIES
The cost of investment securities purchased and proceeds from sales of investment securities, excluding U.S. government and short-term securities, for the six months ended March 31, 2023 are summarized below:
| | | | | | | | | | | | | | | | | | | | | | | | | |
| | | Core
Growth
Fund | | Emerging
India
Fund | | Emerging
Markets
Select
Fund | | Emerging
Markets
Small Cap
Fund | | Frontier
Emerging
Small Countries
Fund |
Purchases | | | $ | 415,746,191 | | | | $ | 60,255,441 | | | | $ | 76,484,643 | | | | $ | 30,751,110 | | | | $ | 3,346,217 | |
Sales | | | | 527,506,667 | | | | | 121,671,598 | | | | | 29,213,867 | | | | | 102,751,492 | | | | | 11,575,989 | |
| | | | | |
| | | Global
Opportunities
Fund | | Global
Select
Fund | | Global
Value
Fund | | Greater China Fund | | International
Growth
Fund |
Purchases | | | $ | 24,561,578 | | | | $ | 1,495,318 | | | | $ | 44,870,243 | | | | $ | 2,919,895 | | | | $ | 57,236,796 | |
Sales | | | | 24,640,592 | | | | | 1,993,652 | | | | | 35,122,316 | | | | | 2,378,342 | | | | | 203,773,151 | |
| | | | | |
| | | International
Opportunities
Fund | | International
Select
Fund | | Long/Short Alpha Fund | | Micro
Cap
Fund | | Micro Cap
Value
Fund |
Purchases | | | $ | 50,595,495 | | | | $ | 436,315 | | | | $ | 16,317,403 | | | | $ | 195,449,169 | | | | $ | 81,272,989 | |
Sales | | | | 116,156,884 | | | | | 1,547,260 | | | | | 14,238,500 | | | | | 254,649,202 | | | | | 96,686,393 | |
| | | | | |
| | | Small Cap
Growth
Fund | | Small Cap
Value
Fund | | Ultra
Growth
Fund | | U.S.
Select
Fund | | |
Purchases | | | $ | 328,639,898 | | | | $ | 438,074,398 | | | | $ | 167,886,614 | | | | $ | 4,813,220 | | | | | | |
Sales | | | | 413,192,967 | | | | | 485,809,402 | | | | | 274,450,135 | | | | | 1,650,073 | | | | | | |
Purchases and sales of U.S. government securities in the U.S. Treasury Fund were $20,887,109 and $41,242,988, respectively.
6. FEDERAL INCOME TAX INFORMATION
It is the Funds’ policy to qualify as regulated investment companies and distribute substantially all of their taxable income to shareholders. The Funds’ tax returns are open to examination by the relevant tax authorities until expiration of the applicable statute of limitations, which is generally three years after the filing of the tax return.
Management has analyzed the Funds’ tax positions taken for all open federal and state income tax years, and has concluded that no provision for income tax is required in the Funds’ financial statements.
As of March 31, 2023, the cost and unrealized appreciation (depreciation) of securities on a tax basis were as follows:
| | | | | | | | | | | | | | | | | | | | | | | | | |
| | | Core
Growth
Fund | | Emerging
India
Fund | | Emerging
Markets
Select
Fund | | Emerging
Markets
Small Cap
Fund | | Frontier
Emerging
Small Countries
Fund |
Cost | | | $ | 2,324,085,787 | | | | $ | 316,022,299 | | | | $ | 481,670,402 | | | | $ | 268,926,493 | | | | $ | 33,432,634 | |
| | | | | |
Gross appreciation | | | $ | 866,614,331 | | | | $ | 120,110,157 | | | | $ | 33,505,597 | | | | $ | 130,948,475 | | | | $ | 6,963,720 | |
Gross (depreciation) | | | | (264,543,088 | ) | | | | (6,884,204 | ) | | | | (82,062,942 | ) | | | | (42,424,300 | ) | | | | (5,024,686 | ) |
| | | | | |
Net appreciation (depreciation) | | | $ | 602,071,243 | | | | $ | 113,225,953 | | | | $ | (48,557,345 | ) | | | $ | 88,524,175 | | | | $ | 1,939,034 | |
| | | | | |
119
Notes to Financial Statements (continued)
| | | | | | | | | | | | | | | | | | | | | | | | | |
| | | Global
Opportunities
Fund | | Global Select
Fund | | Global
Value
Fund | | Greater China Fund | | International
Growth
Fund |
Cost | | | $ | 152,348,324 | | | | $ | 14,247,206 | | | | $ | 125,748,625 | | | | $ | 7,456,274 | | | | $ | 402,842,608 | |
| | | | | |
Gross appreciation | | | $ | 48,190,202 | | | | $ | 2,136,754 | | | | $ | 21,608,707 | | | | $ | 308,825 | | | | $ | 168,157,161 | |
Gross (depreciation) | | | | (18,002,623 | ) | | | | (1,865,447 | ) | | | | (2,952,061 | ) | | | | (1,857,315 | ) | | | | (30,545,875 | ) |
| | | | | |
Net appreciation (depreciation) | | | $ | 30,187,579 | | | | $ | 271,307 | | | | $ | 18,656,646 | | | | $ | (1,548,490 | ) | | | $ | 137,611,286 | |
| | | | | |
| | | | | |
| | | International Opportunities Fund | | International Select
Fund | | Long/Short Alpha Fund | | Micro
Cap
Fund | | Micro Cap
Value
Fund |
Cost | | | $ | 331,086,820 | | | | $ | 5,027,379 | | | | $ | 20,359,035 | | | | $ | 596,102,588 | | | | $ | 251,881,520 | |
| | | | | |
Gross appreciation | | | $ | 100,361,893 | | | | $ | 703,391 | | | | $ | 5,022,824 | | | | $ | 112,595,048 | | | | $ | 72,974,750 | |
Gross (depreciation) | | | | (49,808,913 | ) | | | | (610,486 | ) | | | | (3,848,746 | ) | | | | (84,775,513 | ) | | | | (34,667,477 | ) |
| | | | | |
Net appreciation (depreciation) | | | $ | 50,552,980 | | | | $ | 92,905 | | | | $ | 1,174,078 | | | | $ | 27,819,535 | | | | $ | 38,307,273 | |
| | | | | |
| | | | | |
| | | Small Cap
Growth
Fund | | Small Cap
Value
Fund | | Ultra
Growth
Fund | | U.S.
Select
Fund | | U.S.
Treasury
Fund |
Cost | | | $ | 125,748,625 | | | | $ | 1,197,681,512 | | | | $ | 1,341,669,899 | | | | $ | 8,978,082 | | | | $ | 348,352,562 | |
| | | | | |
Gross appreciation | | | $ | 21,608,707 | | | | $ | 263,801,701 | | | | $ | 350,069,901 | | | | $ | 766,511 | | | | $ | — | |
Gross (depreciation) | | | | (2,952,061 | ) | | | | (84,150,213 | ) | | | | (318,186,022 | ) | | | | (199,231 | ) | | | | (76,003,650 | ) |
| | | | | |
Net appreciation (depreciation) | | | $ | 18,656,646 | | | | $ | 179,651,488 | | | | $ | 31,883,879 | | | | $ | 567,280 | | | | $ | (76,003,650 | ) |
| | | | | |
The difference between book-basis and tax-basis unrealized gains (losses) is primarily attributable to the tax deferral of losses on wash sales, unrealized appreciation (depreciation) on passive foreign investment companies (PFICs), and other temporary tax adjustments.
The amount and character of tax-basis distributions and composition of net assets are finalized at fiscal year-end. Accordingly, tax basis balances have not been determined as of the date of this report.
Distributions to shareholders are recorded on the ex-dividend date. Distributions are determined on a tax basis at the fiscal year-end and may differ from ordinary income and realized capital gains for financial reporting purposes. The Funds may utilize earnings and profits
distributed to shareholders on redemption of shares as part of the dividends-paid deduction (tax equalization).
Differences between income and/or capital gains as determined on a book basis and a tax basis are primarily due to passive foreign investment company shares, foreign capital gains taxes, foreign currency transactions, corporate actions, wash sales and investments in REITs. These reclassifications have no effect on net assets or net asset value per share.
The Funds are permitted to carry forward capital losses for an unlimited period. The losses that are carried forward retain their character as either short-term or long-term capital losses.
Capital loss carryforwards as of September 30, 2022 are as follows:
| | | | | | | | | | |
| | | Non-Expiring |
| Fund | | Short Term | | Long Term |
Emerging Markets Select Fund | | | $ | 483,008 | | | | $ | — | |
Frontier Emerging Small Countries Fund | | | | 95,179,079 | | | | | 5,909,129 | |
Global Value Fund* | | | | 23,779,525 | | | | | 136,520,176 | |
Greater China Fund | | | | 2,505,331 | | | | | 650,816 | |
International Select Fund | | | | 413,327 | | | | | 168,922 | |
Micro Cap Fund | | | | 1,463,356 | | | | | — | |
U.S. Treasury Fund | | | | 12,763,207 | | | | | 54,976,373 | |
| * | The Fund’s capital loss carryforward is subject to an annual limitation under the Internal Revenue Code and related regulations. |
120
| | |
| | | MARCH 31, 2023 (Unaudited) |
During the tax year ended September 30, 2022, the Funds used capital loss carryforwards in the following amounts:
| | | | | |
| Fund | | Amount Used |
Global Value Fund | | | $ | 1,027,950 | |
Under current tax law, Post-October Capital Losses and Late-Year Ordinary Losses may be deferred and treated as occurring on the first business day of the following fiscal year for tax purposes. The Funds have elected to defer losses as follows:
| | | | | | | | | | |
| Fund | | Post-October
Capital Losses | | Late-Year
Ordinary Losses |
Core Growth Fund | | | $ | — | | | | $ | (14,008,024 | ) |
Emerging India Fund | | | | — | | | | | (9,879,336 | ) |
Emerging Markets Select Fund | | | | (35,366,380 | ) | | | | (1,746,509 | ) |
Emerging Markets Small Cap Fund | | | | — | | | | | (9,367,362 | ) |
Frontier Emerging Small Countries Fund | | | | — | | | | | (2,711,638 | ) |
Global Opportunities Fund | | | | — | | | | | (2,450,363 | ) |
Global Select Fund | | | | (1,379,361 | ) | | | | (56,024 | ) |
Global Value Fund | | | | — | | | | | (15,776 | ) |
International Growth Fund | | | | (8,843,338 | ) | | | | (1,369,984 | ) |
International Opportunities Fund | | | | (36,751,064 | ) | | | | (4,140,412 | ) |
International Select Fund | | | | — | | | | | (18,159 | ) |
Micro Cap Fund | | | | (57,195,921 | ) | | | | (9,615,531 | ) |
Micro Cap Value Fund | | | | (13,934,191 | ) | | | | (2,830,073 | ) |
Small Cap Growth Fund | | | | (15,243,847 | ) | | | | (18,857,904 | ) |
Small Cap Value Fund | | | | — | | | | | (114,009 | ) |
Ultra Growth Fund | | | | (18,863,740 | ) | | | | (13,725,563 | ) |
U.S. Select Fund | | | | — | | | | | (5,028 | ) |
EU Reclaims — Withholding taxes on foreign dividends and capital gains have been provided for in accordance with the Funds’ understanding of the applicable countries’ tax rules and rates. Several Wasatch Funds have filed tax reclaims for previously withheld taxes on dividends earned in certain European Union countries. These filings are subject to various administrative and judicial proceedings within these countries. Such tax reclaims received during the year, if any, are included in dividend income in the Statements of Operations and any related receivable, if any, is reflected as interest and dividends receivable in the Statements of Assets and Liabilities. When uncertainty exists as to the ultimate resolution of these proceedings, the likelihood of receipt of these EU reclaims, and the potential timing of payment, no amounts are reflected in the financial statements. For U.S. income tax purposes, EU reclaims received by the Funds, if any, reduce the amounts of foreign taxes Fund shareholders can use as tax credits in their individual income tax returns. In the event that EU reclaims received by the Funds during the fiscal year exceed foreign withholding taxes paid, and the Funds had previously passed foreign tax credits on to their shareholders, the Funds may enter into a closing agreement with the Internal Revenue Service (IRS) in order to pay the associated tax liability on behalf of the Funds’ shareholders.
7. RELATED PARTY TRANSACTIONS
Investment Advisory Fees, Expense Limitations — As the Funds’ investment advisor, the Advisor receives a monthly fee calculated on average daily net assets. The Advisor has contractually agreed to waive its fees and/or reimburse the Investor Class shares and the Institutional Class shares of certain Funds should a Fund’s operating expenses exceed a specified annual limitation through at least January 31, 2024. If operating expenses are less than the specified expense limit for the Fund, the Advisor shall be entitled to recoup the fees waived or reduced to the extent that the operating expenses and the amounts reimbursed do not exceed such expense limit for the Fund, under the period of the agreement (currently through January 31, 2024). A Fund may only make a repayment to the Advisor for the amount reimbursed if such repayment does not cause the Fund’s expense ratio, after the repayment is taken into account, to exceed both (i) the expense cap in place at the time such amounts were waived; and (ii) the Fund’s current expense cap. All amounts not recovered at the end of the period expire on January 31, 2024. Shareholder expenses will increase if the Advisor does not renew the contractual expense cap after its expiration date. Ordinary operating expenses exclude any interest, dividend expense on short sales/interest expense, taxes, brokerage commissions, other investment-related costs, acquired fund fees and expenses, and extraordinary expenses, such as litigation and other expenses not
121
Notes to Financial Statements (continued)
incurred in the ordinary course of the Funds’ business in excess of such limitations. Investment advisory fees and fees waived, if any, for the six months ended March 31, 2023 are disclosed in the Statements of Operations. Investment advisory fee and expense limitation annual rates are shown below.
| | | | | | | | | | | | | | | | | | | | | | | | | |
| Fund | | Advisory
Fee | | Expense
Limitation
Investor Class | | Expense
Limitation
Institutional Class | | Contractual Expense
Limitation/
Reimbursement
Recoverable
Expiration Date | | Reimbursement
Recoverable |
Core Growth Fund | | | | 1.00% | | | | | 1.50% | | | | | 1.05% | | | | | 1/31/2024 | | | | $ | 76,993 | |
Emerging India Fund | | | | 1.25% | | | | | 1.75% | | | | | 1.50% | | | | | 1/31/2024 | | | | | — | |
Emerging Markets Select Fund | | | | 1.00% | | | | | 1.50% | | | | | 1.20% | | | | | 1/31/2024 | | | | | — | |
Emerging Markets Small Cap Fund | | | | 1.65% | | | | | 1.95% | | | | | 1.80% | | | | | 1/31/2024 | | | | | 77,170 | |
Frontier Emerging Small Countries Fund | | | | 1.65% | | | | | 2.15% | | | | | 1.95% | | | | | 1/31/2024 | | | | | 59,129 | |
Global Opportunities Fund | | | | 1.25% | | | | | 1.75% | | | | | 1.35% | | | | | 1/31/2024 | | | | | 19,553 | |
Global Select Fund | | | | 0.85% | | | | | 1.35% | | | | | 0.95% | | | | | 1/31/2024 | | | | | 61,609 | |
Global Value Fund | | | | 0.90% | | | | | 1.10% | | | | | 0.95% | | | | | 1/31/2024 | | | | | 66,860 | |
Greater China Fund | | | | 1.00% | | | | | 1.50% | | | | | 1.25% | | | | | 1/31/2024 | | | | | 62,284 | |
International Growth Fund | | | | 1.25% | | | | | 1.75% | | | | | 1.35% | | | | | 1/31/2024 | | | | | 9,394 | |
International Opportunities Fund | | | | 1.75% | | | | | 2.25% | | | | | 1.95% | | | | | 1/31/2024 | | | | | 1,274 | |
International Select Fund | | | | 0.80% | | | | | 1.30% | | | | | 0.90% | | | | | 1/31/2024 | | | | | 62,807 | |
Long/Short Alpha Fund | | | | 1.25% | | | | | 1.75% | | | | | 1.50% | | | | | 1/31/2024 | | | | | 28,076 | |
Micro Cap Fund | | | | 1.50% | | | | | 1.95% | | | | | 1.60% | | | | | 1/31/2024 | | | | | 5,185 | |
Micro Cap Value Fund | | | | 1.50% | | | | | 1.95% | | | | | 1.60% | | | | | 1/31/2024 | | | | | 11,597 | |
Small Cap Growth Fund | | | | 1.00% | | | | | 1.50% | | | | | 1.05% | | | | | 1/31/2024 | | | | | 114,410 | |
Small Cap Value Fund | | | | 1.00% | | | | | 1.50% | | | | | 1.05% | | | | | 1/31/2024 | | | | | 40,195 | |
Ultra Growth Fund | | | | 1.00% | | | | | 1.50% | | | | | 1.05% | | | | | 1/31/2024 | | | | | 46,466 | |
U.S. Select Fund | | | | 0.75% | | | | | 1.00% | | | | | 0.85% | | | | | 1/31/2024 | | | | | 77,371 | |
U.S. Treasury Fund | | | | 0.50% | | | | | 0.75% | | | | | N/A | | | | | 1/31/2024 | | | | | — | |
Affiliated Trades — Certain Funds are permitted to purchase or sell securities from or to certain related affiliated funds under specified conditions outlined in the procedures adopted by the Board of Trustees (the “Board”). The procedures have been designed to ensure that any purchase or sale of securities by the Funds from or to another fund (or funds) that is, or could be, considered an affiliate by virtue of having a common investment advisor (or affiliated investment advisors), common Trustees and/or common officers complies with Rule 17a-7 of the 1940 Act. Further, each transaction is effected at the current market price, as that term is defined under the procedures.
Compensation — Officers serve in that capacity without compensation from the Trust. Beginning in the calendar year of 2022, and unchanged in the calendar year 2023, the Funds’ method of compensating Trustees is to pay each Independent Trustee a retainer of $150,000 per year for services rendered and a fee of $30,000 for each regularly scheduled Board of Trustees meeting, including the executive session held with respect to the investment advisory contract renewal process for the Funds, whether attended in person or telephonically (including any committee meeting attended) (collectively, the “2022 Base Compensation”). Trustees will receive an additional $12,000 for in-person attendance of any special Board meeting or committee meeting (or any combination thereof), and $6,000 for telephonic attendance of any special Board meeting or commit-
tee meeting (or any combination thereof). In addition, the Chair of the Board receives an additional 25% of the 2022 Base Compensation and the Chair of a Committee receives an additional 15% of the 2022 Base Compensation. Accordingly, to implement this additional compensation for services as a Chair, the Chair of the Board receives an additional fee of $75,000 a year as Chair. The Chair of the Audit Committee and the Chair of the Nominating Committee each receive an additional $45,000 per year as Chair.
In the calendar year of 2021, each Independent Trustee was paid a retainer of $126,750 per year for services rendered and a fee of $25,350 for each regularly scheduled Board of Trustees meeting, including the executive session held with respect to the investment advisory contract renewal process for the Funds, whether attended in person or telephonically (including any committee meeting attended) (collectively, the “2021 Base Compensation”). Trustees received an additional $12,000 for in-person attendance at any special Board meeting or committee meeting (or any combination thereof), and $6,000 for telephonic attendance at any special Board meeting or committee meeting (or any combination thereof). In addition, the Chair of the Board received an additional 25% of the 2021 Base Compensation and the Chair of a Committee received an additional 15% of the 2021 Base Compensation. Accordingly, to implement this additional compensation for services as a Chair, the Chair of the Board received
122
| | |
| | | MARCH 31, 2023 (Unaudited) |
an additional fee of $31,687.50 a year as Chair and $7,921.75 for attendance in person or telephonically at each regular Board meeting (four meetings per year) in 2021. The Chair of the Audit Committee and the Chair of the Nominating Committee each received an additional $19,012.50 per year as Chair and $4,753.13 for attendance in person or telephonically at each regular Board meeting (four meetings per year) in 2021.
Payments by Advisor — During 2018, the Advisor paid for a portion of the expenses in connection with the merger of the Long/Short and Global Value Funds. The Advisor will not be reimbursed for these amounts. The impact of the payments is reflected in the net expense ratios in the Financial Highlights.
During 2022, the Advisor reimbursed the Greater China Fund $258,290 for losses from a trade error. The impact of the payment is reflected in the Total Return and Realized and Unrealized Gains (Losses) on Investments sections in the Financial Highlights.
Payments by Sub-Advisor — Pursuant to a sub-advisory agreement entered into between the Advisor and Hoisington Investment Management Company (“HIMCo”), the Sub-Advisor for the U.S. Treasury Fund, (“HIMCo Sub-Advisory Agreement”), and subject to the supervision of the Advisor, HIMCo directs the investment of the U.S. Treasury Fund’s assets and is responsible for the continuing management of the Fund’s assets, including the placement of orders to purchase or sell securities on behalf of the Fund. The HIMCo Sub-Advisory Agreement provides that the Advisor shall pay HIMCo a monthly management fee computed at the annual rate of 0.02% of the Fund’s average daily net assets as long as and whenever the Fund has net assets less than $20 million and one-half (1/2) of the monthly fee the Advisor receives from the Fund under the Advisory and Service Contract as long as and whenever the Fund has net assets of $20 million or more. The Advisor retains the remainder of the advisory fee paid under the Advisory and Service Contract. The Sub-Advisor may reimburse the Advisor for certain expenses.
Transfer Agent Intermediary Fees Reimbursed to the Advisor — Each Fund paid fees to, and reimbursed certain out-of-pocket expenses of, the Funds’ transfer agent during the period. In addition, the Advisor and the Funds’ distributor have entered into selling dealer agreements and service agreements with certain financial services companies, broker-dealers, banks, advisors, retirement service providers or other authorized agents or organizations (each an “Intermediary” — together, “Intermediaries”) to accept purchase, exchange and redemption orders on the Funds’ behalf. For Investor Class shares of the Funds, some Intermediaries do not charge investors a direct transaction fee but instead charge a fee for accounting and shareholder services that the agent provided to Fund shareholders on the Funds’ behalf. Those services typically included recordkeeping, transaction processing for shareholders’ accounts, communication of tax information, income distribution and other services. Generally, the fee was either a per account charge based on the number of accounts to which the Intermediary provided such services, or was a percentage (as of March 31, 2023 up to 0.40% annually) of the average value of the Funds’ Investor Class shares held in such accounts. The Advisor paid the Intermediary fees and the Funds reimbursed the Advisor for the portion of such fees, which are intended to compensate the Intermediary for provision of services of the type that would be provided by the Funds’ transfer agent or other service providers if the shares were registered on the books of the Funds’ transfer agent. Institutional Class shares of the Funds do not reimburse the Advisor for payments to Intermediaries. The Funds’ reimbursement of expenses incurred for services provided by Intermediaries are included in “Shareholder servicing fees — Investor Class” in the Statements of Operations.
123
Notes to Financial Statements (continued)
10% Shareholders — As of March 31, 2023, the Funds had individual shareholder accounts and/or omnibus shareholder accounts (comprised of a group of individual shareholders), which individually amounted to more than 10% of the total shares outstanding of each Fund as detailed below:
| | | | | | | | | | |
| Fund | | Number of
Accounts | | Percent of Shares
Outstanding |
Core Growth Fund | | | | 2 | | | | | 46.62 | % |
Emerging India Fund | | | | 3 | | | | | 67.23 | % |
Emerging Markets Select Fund | | | | 3 | | | | | 67.70 | % |
Emerging Markets Small Cap Fund | | | | 2 | | | | | 58.46 | % |
Frontier Emerging Small Countries Fund | | | | 4 | | | | | 66.29 | % |
Global Opportunities Fund | | | | 3 | | | | | 61.96 | % |
Global Select Fund | | | | 3 | | | | | 68.98 | % |
Global Value Fund | | | | 2 | | | | | 72.91 | % |
Greater China Fund | | | | 3 | | | | | 66.39 | % |
International Growth Fund | | | | 2 | | | | | 47.60 | % |
International Opportunities Fund | | | | 2 | | | | | 36.53 | % |
International Select Fund | | | | 4 | | | | | 76.19 | % |
Long/Short Alpha Fund | | | | 4 | | | | | 91.01 | % |
Micro Cap Fund | | | | 2 | | | | | 40.23 | % |
Micro Cap Value Fund | | | | 3 | | | | | 60.84 | % |
Small Cap Growth Fund | | | | 3 | | | | | 61.57 | % |
Small Cap Value Fund | | | | 4 | | | | | 72.69 | % |
Ultra Growth Fund | | | | 2 | | | | | 59.09 | % |
U.S. Select Fund | | | | 3 | | | | | 89.63 | % |
U.S. Treasury Fund | | | | 5 | | | | | 65.84 | % |
Affiliated Interests — As of March 31, 2023, the Advisor and its affiliates, and the retirement plans of the Advisor and its affiliates, held shares of the Funds, which may be redeemed at any time as detailed below:
| | | | | | | | | | |
| Fund | | Number of
Accounts* | | Percent of Shares
Outstanding |
Core Growth Fund | | | | 25 | | | | | 2.86 | % |
Emerging India Fund | | | | 32 | | | | | 4.90 | % |
Emerging Markets Select Fund | | | | 25 | | | | | 3.44 | % |
Emerging Markets Small Cap Fund | | | | 17 | | | | | 2.23 | % |
Frontier Emerging Small Countries Fund | | | | 14 | | | | | 2.15 | % |
Global Opportunities Fund | | | | 17 | | | | | 5.31 | % |
Global Select Fund | | | | 21 | | | | | 67.63 | % |
Global Value Fund | | | | 12 | | | | | 3.49 | % |
Greater China Fund | | | | 17 | | | | | 59.74 | % |
International Growth Fund | | | | 16 | | | | | 0.52 | % |
International Opportunities Fund | | | | 16 | | | | | 2.39 | % |
International Select Fund | | | | 12 | | | | | 47.97 | % |
Long/Short Alpha Fund | | | | 17 | | | | | 43.29 | % |
Micro Cap Fund | | | | 17 | | | | | 0.89 | % |
Micro Cap Value Fund | | | | 18 | | | | | 2.36 | % |
Small Cap Growth Fund | | | | 23 | | | | | 2.59 | % |
Small Cap Value Fund | | | | 15 | | | | | 1.38 | % |
Ultra Growth Fund | | | | 20 | | | | | 1.50 | % |
U.S. Select Fund | | | | 15 | | | | | 67.20 | % |
U.S. Treasury Fund | | | | 12 | | | | | 1.10 | % |
| * | Multiple accounts with the same beneficial owner are treated as one account. |
124
| | |
| | | MARCH 31, 2023 (Unaudited) |
8. TRANSACTIONS WITH AFFILIATES
If a Fund’s holding represents ownership of 5% or more of the voting securities of a company, the company is deemed to be an affiliate as defined by the 1940 Act. The following Funds conducted transactions during the six months ended March 31, 2023 with an “affiliated company” as so defined:
| | | | | | | | | | | | | | | | | | | | | | | | | | | | | | | | | | | |
| | | Value, Beginning Of the Period | | Purchases At Cost | | Proceeds From Sales | | Value, End Of the Period | | Dividends
Credited to
Income for the Period ended
3/31/2023 | | Gain (Loss)
Realized on
Sale of Shares
For the Period ended
3/31/2023 | | Change in
Unrealized
Appreciation
for The Period ended
3/31/2023 |
Micro Cap Fund | | | | | | | | | | | | | | | | | | | | | | | | | | | | | | | | | | | |
Common Stock | | | | | | | | | | | | | | | | | | | | | | | | | | | | | | | | | | | |
PharmaCielo Ltd. | | | $ | 2,546,853 | | | | $ | — | | | | $ | 21,844 | | | | $ | 1,366,907 | | | | $ | — | | | | $ | (209,016 | ) | | | $ | (949,086 | ) |
| | | | | |
Small Cap Growth Fund | | | | | | | | | | | | | | | | | | | | | | | | | | | | | | | | | | | |
Common Stock | | | | | | | | | | | | | | | | | | | | | | | | | | | | | | | | | | | |
Pennant Group, Inc.* | | | | 20,382,041 | | | | | — | | | | | 20,817,841 | | | | | — | | | | | — | | | | | (15,036,554 | ) | | | | 15,472,354 | |
TaskUS, Inc., Class A* | | | | 23,923,988 | | | | | — | | | | | 6,236,593 | | | | | 16,510,436 | | | | | — | | | | | (9,514,323 | ) | | | | 8,337,364 | |
Vintage Wine Estates, Inc., PIPE Shares | | | | 15,235,000 | | | | | — | | | | | 1,451,243 | | | | | 5,208,817 | | | | | — | | | | | (4,868,227 | ) | | | | (3,706,713 | ) |
Preferred Stock | | | | | | | | | | | | | | | | | | | | | | | | | | | | | | | | | | | |
Johnnie-O Holdings, Inc., Series A Pfd. | | | | 13,770,449 | | | | | — | | | | | — | | | | | 18,330,038 | | | | | — | | | | | — | | | | | 4,559,589 | |
| | | | | |
| | | $ | 73,311,478 | | | | $ | — | | | | $ | 28,505,677 | | | | $ | 40,049,291 | | | | $ | — | | | | $ | (29,419,104 | ) | | | $ | 24,662,594 | |
| | | | | |
Ultra Growth Fund | | | | | | | | | | | | | | | | | | | | | | | | | | | | | | | | | | | |
Common Stock | | | | | | | | | | | | | | | | | | | | | | | | | | | | | | | | | | | |
Conformis, Inc. | | | | 2,631,685 | | | | | — | | | | | 23,756 | | | | | 871,541 | | | | | — | | | | | (129,772 | ) | | | | (1,606,616 | ) |
Exagen, Inc. | | | | 2,625,714 | | | | | — | | | | | 26,421 | | | | | 2,329,415 | | | | | — | | | | | (196,072 | ) | | | | (73,806 | ) |
Vintage Wine Estates, Inc., PIPE Shares | | | | 11,654,883 | | | | | — | | | | | 767,477 | | | | | 4,103,156 | | | | | — | | | | | (2,960,663 | ) | | | | (3,823,587 | ) |
Preferred Stock | | | | | | | | | | | | | | | | | | | | | | | | | | | | | | | | | | | |
Johnnie-O Holdings, Inc., Series A Pfd. | | | | 11,475,385 | | | | | — | | | | | — | | | | | 15,275,047 | | | | | — | | | | | — | | | | | 3,799,662 | |
| | | | | |
| | | $ | 28,387,667 | | | | $ | — | | | | $ | 817,654 | | | | $ | 22,579,159 | | | | $ | — | | | | $ | (3,286,507 | ) | | | $ | (1,704,347 | ) |
| | | | | |
| | | | | | | | | | | | | | | | | | | | | | | | | | | | | | | | | | | |
| | | Share Activity | | Dividends
Credited to
Income for the Period ended
3/31/2023 | | Gain (Loss)
Realized on
Sale of Shares
For the Period ended
3/31/2023 | | Change in
Unrealized
Appreciation
for the Period ended
3/31/2023 |
| | | Balance
9/30/2022 | | Purchases/
Additions | | Sales/
Reductions | | Balance
3/31/2023 |
Micro Cap Fund | | | | | | | | | | | | | | | | | | | | | | | | | | | | | | | | | | | |
Common Stock | | | | | | | | | | | | | | | | | | | | | | | | | | | | | | | | | | | |
PharmaCielo Ltd. | | | | 7,995,671 | | | | | — | | | | | 134,500 | | | | | 7,861,171 | | | | $ | — | | | | $ | (209,016 | ) | | | $ | (949,086 | ) |
| | | | | |
Small Cap Growth Fund | | | | | | | | | | | | | | | | | | | | | | | | | | | | | | | | | | | |
Common Stock | | | | | | | | | | | | | | | | | | | | | | | | | | | | | | | | | | | |
Pennant Group, Inc.* | | | | 1,957,929 | | | | | — | | | | | 1,957,929 | | | | | — | | | | | — | | | | | (15,036,554 | ) | | | | 15,472,354 | |
TaskUS, Inc., Class A* | | | | 1,485,962 | | | | | — | | | | | 342,580 | | | | | 1,143,382 | | | | | — | | | | | (9,514,323 | ) | | | | 8,337,364 | |
Vintage Wine Estates, Inc., PIPE Shares | | | | 5,500,000 | | | | | — | | | | | 631,947 | | | | | 4,868,053 | | | | | — | | | | | (4,868,227 | ) | | | | (3,706,713 | ) |
Preferred Stock | | | | | | | | | | | | | | | | | | | | | | | | | | | | | | | | | | | |
Johnnie-O Holdings, Inc., Series A Pfd. | | | | 611,205 | | | | | — | | | | | — | | | | | 611,205 | | | | | — | | | | | — | | | | | 4,559,589 | |
| | | | | |
| | | | 9,555,096 | | | | | — | | | | | 2,932,456 | | | | | 6,622,640 | | | | $ | — | | | | $ | (29,419,104 | ) | | | $ | 24,662,594 | |
| | | | | |
Ultra Growth Fund | | | | | | | | | | | | | | | | | | | | | | | | | | | | | | | | | | | |
Common Stock | | | | | | | | | | | | | | | | | | | | | | | | | | | | | | | | | | | |
Conformis, Inc. | | | | 13,764,042 | | | | | — | | | | | 13,219,329 | | | | | 544,713 | | | | | — | | | | | (129,772 | ) | | | | (1,606,616 | ) |
Exagen, Inc. | | | | 968,898 | | | | | — | | | | | 10,291 | | | | | 958,607 | | | | | — | | | | | (196,072 | ) | | | | (73,806 | ) |
Vintage Wine Estates, Inc., PIPE Shares | | | | 4,207,539 | | | | | — | | | | | 372,814 | | | | | 3,834,725 | | | | | — | | | | | (2,960,663 | ) | | | | (3,823,587 | ) |
Preferred Stock | | | | | | | | | | | | | | | | | | | | | | | | | | | | | | | | | | | |
Johnnie-O Holdings, Inc., Series A Pfd. | | | | 509,338 | | | | | — | | | | | — | | | | | 509,338 | | | | | — | | | | | — | | | | | 3,799,662 | |
| | | | | |
| | | | 19,449,817 | | | | | — | | | | | 13,602,434 | | | | | 5,847,383 | | | | $ | — | | | | $ | (3,286,507 | ) | | | $ | (1,704,347 | ) |
| | | | | |
| * | This security was deemed to no longer meet the criteria of an affiliated company at the reporting date. For financial statement purposes, the total amount of the gain (loss) realized on sale of shares and the total change in unrealized appreciation for the period ended September 30, 2022 is included in the Statements of Operations even though the security was not deemed an affiliated company as of the end of the year end. |
125
Notes to Financial Statements (continued)
9. RESTRICTED SECURITIES
The Funds may own investments that were purchased through private placement transactions or under Rule 144A of the Securities Act of 1933 (the “Securities Act”) and cannot be sold without prior registration under the Securities Act or may be limited due to certain restrictions. These securities are generally deemed to be illiquid and are valued at fair value as determined by a designated Pricing Committee of the Advisor (“Pricing Committee”), comprised of personnel of the Advisor, with oversight by the Board of Trustees and in accordance with Board-approved Pricing Policies and Procedures. If and when such securities are registered, the costs of registering such securities are paid by the issuer. At March 31, 2023, the Funds held the following restricted securities:
| | | | | | | | | | | | | | | | | | | | | | | | | |
| | | Security Type | | Acquisition
Date | | Cost | | Fair
Value | | Value as a Percent Of Net Assets |
Core Growth Fund | | | | | | | | | | | | | | | | | | | | | | | | | |
Hagerty, Inc., expiring 12/2/2026 | | | | Warrants | | | | | 12/2/2021 | | | | $ | 1,859,173 | | | | $ | 939,600 | | | | | 0.03 | % |
|
| |
Micro Cap Fund | | | | | | | | | | | | | | | | | | | | | | | | | |
Johnnie-O Holdings, Inc., Series A Pfd. | | | | Preferred Stock | | | | | 3/16/2022 | | | | $ | 10,000,013 | | | | $ | 10,183,374 | | | | | 1.61 | % |
Esperion Therapeutics, Inc., expiring 9/22/2026 | | | | Warrants | | | | | 12/3/2021 | | | | | 613,226 | | | | | 661,535 | | | | | 0.10 | % |
IM Cannabis Corp., expiring 5/7/2026 | | | | Warrants | | | | | 5/5/2021 | | | | | 616,971 | | | | | 0 | | | | | 0.00 | % |
| | | | | | | | | | | | | | | | | | | | | | | | | |
| | | | | | | | | | | | | $ | 11,230,210 | | | | $ | 10,844,909 | | | | | 1.71 | % |
|
| |
Micro Cap Value Fund | | | | | | | | | | | | | | | | | | | | | | | | | |
Regenacy Pharmaceuticals LLC | | | | LLC Membership Interest | | | | | 12/21/2016 | | | | $ | 30,001 | | | | $ | 505 | | | | | 0.00 | % |
Greenlane Holdings, Inc., expiring 2/24/2026 | | | | Warrants | | | | | 2/22/2021 | | | | | 396,902 | | | | | 0 | | | | | 0.00 | % |
| | | | | | | | | | | | | | | | | | | | | | | | | |
| | | | | | | | | | | | | $ | 426,903 | | | | $ | 505 | | | | | 0.00 | % |
|
| |
Small Cap Growth Fund | | | | | | | | | | | | | | | | | | | | | | | | | |
DataStax, Inc., Series E Pfd. | | | | Preferred Stock | | | | | 8/12/2014 | | | | $ | 8,000,002 | | | | $ | 7,111,212 | | | | | 0.33 | % |
Johnnie-O Holdings, Inc., Series A Pfd. | | | | Preferred Stock | | | | | 3/16/2022 | | | | | 17,999,987 | | | | | 18,330,038 | | | | | 0.86 | % |
Nanosys, Inc., Series A-1 Pfd. | | | | Preferred Stock | | | | | 8/13/2010 | | | | | 184,939 | | | | | 147,951 | | | | | 0.01 | % |
Nanosys, Inc., Series A-2 Pfd. | | | | Preferred Stock | | | | | 11/8/2005 | | | | | 2,000,000 | | | | | 793,599 | | | | | 0.04 | % |
Esperion Therapeutics, Inc., expiring 9/22/2026 | | | | Warrants | | | | | 12/3/2021 | | | | | 1,411,160 | | | | | 1,599,404 | | | | | 0.07 | % |
| | | | | | | | | | | | | | | | | | | | | | | | | |
| | | | | | | | | | | | | $ | 29,596,088 | | | | $ | 27,982,204 | | | | | 1.31 | % |
|
| |
Ultra Growth Fund | | | | | | | | | | | | | | | | | | | | | | | | | |
Johnnie-O Holdings, Inc., Series A Pfd. | | | | Preferred Stock | | | | | 3/16/2022 | | | | $ | 15,000,004 | | | | $ | 15,275,047 | | | | | 1.10 | % |
Nanosys, Inc., Series A-1 Pfd. | | | | Preferred Stock | | | | | 8/13/2010 | | | | | 46,235 | | | | | 36,988 | | | | | 0.00 | % |
Nanosys, Inc., Series A-2 Pfd. | | | | Preferred Stock | | | | | 11/8/2005 | | | | | 500,001 | | | | | 198,400 | | | | | 0.01 | % |
Esperion Therapeutics, Inc., expiring 9/22/2026 | | | | Warrants | | | | | 12/3/2021 | | | | | 1,074,843 | | | | | 1,189,093 | | | | | 0.09 | % |
Hagerty, Inc., expiring 12/2/2026 | | | | Warrants | | | | | 12/2/2021 | | | | | 1,549,310 | | | | | 783,000 | | | | | 0.06 | % |
| | | | | | | | | | | | | | | |
| | | | | | | | | | | | | $ | 18,170,393 | | | | $ | 17,482,528 | | | | | 1.26 | % |
|
| |
10. LINE OF CREDIT
Effective May 11, 2022, the Trust and each Fund renewed and amended agreements for two open lines of credit totaling $300,000,000, one of which is $100,000,000 committed, and the other of which is $200,000,000 uncommitted, with State Street Bank and Trust Company (together, the “Line”) that mature on May 12, 2023. The agreements, as amended, had no change in the committed, uncommitted and total amounts available on the Line. The Funds incur commitment fees on the undrawn portion of the committed part of the Line, and interest expense to the extent of amounts drawn (borrowed) under the entire Line. Interest is based on the overnight federal-funds rate in effect on the date of borrowing, plus a margin. Commitment fees are pro-rated among the Funds based upon relative average net assets. Interest expense is charged directly to a Fund based upon actual amounts borrowed by that Fund.
126
| | |
| | | MARCH 31, 2023 (Unaudited) |
For the six months ended March 31, 2023, the following Funds had borrowings:
| | | | | | | | | | | | | | | | | | | | | | | | | |
| Funds Utilizing the Line of Credit | | Average Daily
Borrowings | | Number of
Days
Outstanding | | Interest
Expense | | Weighted
Average
Annualized
Interest Rate | | Balance at
3/31/2023 |
Core Growth Fund | | | $ | 14,630,105 | | | | | 28 | | | | $ | 53,015 | | | | | 4.66 | % | | | $ | — | |
Emerging Markets Small Cap Fund | | | | 3,220,157 | | | | | 61 | | | | | 44,274 | | | | | 5.00 | % | | | | — | |
Frontier Emerging Small Countries Fund | | | | 640,118 | | | | | 10 | | | | | 871 | | | | | 4.90 | % | | | | — | |
Global Opportunities Fund | | | | 764,078 | | | | | 46 | | | | | 5,072 | | | | | 5.19 | % | | | | — | |
Global Select Fund | | | | 112,924 | | | | | 12 | | | | | 189 | | | | | 5.01 | % | | | | — | |
Greater China Fund | | | | 1,095,135 | | | | | 3 | | | | | 531 | | | | | 5.82 | % | | | | — | |
International Growth Fund | | | | 4,897,499 | | | | | 29 | | | | | 18,793 | | | | | 4.76 | % | | | | — | |
International Opportunities Fund | | | | 847,389 | | | | | 4 | | | | | 408 | | | | | 4.33 | % | | | | — | |
International Select Fund | | | | 931,100 | | | | | 7 | | | | | 1,010 | | | | | 5.58 | % | | | | — | |
Micro Cap Fund | | | | 2,923,831 | | | | | 14 | | | | | 5,823 | | | | | 5.12 | % | | | | — | |
Micro Cap Value Fund | | | | 112,178 | | | | | 1 | | | | | 17 | | | | | 5.58 | % | | | | — | |
Small Cap Growth Fund | | | | 8,736,622 | | | | | 11 | | | | | 13,427 | | | | | 5.03 | % | | | | — | |
Small Cap Value Fund | | | | 4,569,685 | | | | | 4 | | | | | 2,833 | | | | | 5.58 | % | | | | — | |
Ultra Growth Fund | | | | 2,032,969 | | | | | 11 | | | | | 2,963 | | | | | 4.77 | % | | | | — | |
U.S. Select Fund | | | | 483,271 | | | | | 7 | | | | | 459 | | | | | 4.89 | % | | | | — | |
U.S. Treasury Fund | | | | 286,581 | | | | | 1 | | | | | 44 | | | | | 5.58 | % | | | | — | |
11. PRINCIPAL RISKS
Market Risk — Market risk is the risk that a particular security, or shares of a Fund in general, may fall in value. Securities are subject to market fluctuations caused by such factors as economic, political, regulatory or market developments, changes in interest rates and perceived trends in securities prices. Shares of a Fund could decline in value or underperform other investments due to short-term market movements or any longer periods during more prolonged market downturns. In addition, local, regional or global events such as war, acts of terrorism, spread of infectious diseases or other public health issues, recessions, or other events could have a significant negative impact on a Fund and its investments. Such events may affect certain geographic regions, countries, sectors and industries more significantly than others. Such events could adversely affect the prices and liquidity of a Fund’s portfolio securities or other instruments and could result in disruptions in the trading markets. Any of such circumstances could have a materially negative impact on the value of a Fund’s shares and result in increased market volatility.
Additional Market Disruption Risk — In late February 2022, Russia launched a large scale military attack on Ukraine. The invasion significantly amplified already existing geopolitical tensions among Russia, Ukraine, Europe, NATO and the West, including the U.S. In response to the military action by Russia, various countries, including the U.S., the United Kingdom, and the European Union, issued broad-ranging economic sanctions against Russia. Such sanctions included, among other things, a prohibition on doing business with certain Russian companies, large financial institutions, officials and oligarchs; a commitment by certain
countries and the European Union to remove selected Russian banks from the Society for Worldwide Interbank Financial Telecommunications (“SWIFT”), the electronic banking network that connects banks globally; and restrictive measures to prevent the Russian Central Bank from undermining the impact of the sanctions. Additional sanctions may be imposed in the future. Such sanctions (and any future sanctions) and other actions against Russia may adversely impact, among other things, the Russian economy and various sectors of the economy, including but not limited to, financials, energy, metals and mining, engineering and defense and defense-related materials sectors; may result in a decline in the value and liquidity of Russian securities; may result in boycotts, tariffs, and purchasing and financing restrictions on Russia’s government, companies and certain individuals; may weaken the value of the ruble; downgrade Russia’s credit rating; may freeze Russian securities and/or funds invested in prohibited assets and may impair the ability to trade in Russian securities and/or other assets; and may have other adverse consequences on the Russian government, economy, companies and region. Further, several large corporations and U.S. states have divested interests and curtailed business dealings with certain Russian businesses. Countermeasures or retaliatory actions by Russia may further impair the value and liquidity of Russian securities.
The ramifications of the hostilities and sanctions, however, may not be limited to Russia and Russian companies but may spill over to and negatively impact other regional and global economic markets of the world (including Europe and the United States); companies in other countries (particularly those that have done business with
127
Notes to Financial Statements (continued)
Russia); and various sectors, industries and markets relating to securities and commodities globally, such as oil and natural gas. Accordingly, the actions discussed above and the potential for a wider conflict could increase financial market volatility, cause severe negative effects on regional and global economic markets, industries, and companies, and have a negative effect on a Fund’s investments and performance beyond any direct or indirect exposure to Russian issuers or those of adjoining geographic regions. In addition, Russia may take retaliatory actions and other countermeasures, including cyberattacks and espionage against other countries and companies in the world, which may negatively impact such countries and the companies in which the Funds invest. Accordingly, there may be heightened risk of cyberattacks, which result in, among other things, disruptions in the functioning and operations of industries or companies around the world, including in the United States and Europe.
The extent and duration of the military action or future escalation of such hostilities, the extent and impact of existing and any future sanctions, market disruptions and volatility, and the result of any diplomatic negotiations cannot be predicted. These and any related events could have a significant negative impact on the Funds’ performance and the value of an investment in the Funds, particularly with respect to Russian exposure.
Global Pandemic Risk — The value of a Fund’s investments may be impacted by global health crises or other events. For example, an outbreak of the respiratory disease designated as Covid-19 was first detected in China in December 2019 and subsequently spread internationally. The transmission of Covid-19 and efforts to contain its spread have resulted in international, national and local border closings and other significant travel restrictions and disruptions; significant disruptions to business operations across many industries, to supply chains and to customer activity; and event cancellations and restrictions; service cancellations, reductions and other changes; significant challenges in health-care service preparation and delivery; quarantines; and general concern and uncertainty that have negatively affected the economic environment. These impacts also have caused significant market volatility and disruption, which may continue over extended periods. The ultimate impact of Covid-19 or other health emergencies on the domestic and global economies is impossible to predict accurately. Less developed countries and their health-care systems may be more vulnerable to these impacts. The impact of this Covid-19 pandemic may be short term or may last for an extended period of time, and in either case could result in a substantial economic downturn or recession and may adversely impact the value of an investment in a Fund.
Region Risk — The Funds, except the U.S. Treasury Fund, invest in equity and fixed-income securities of non-U.S.
issuers. Because certain foreign markets are illiquid, market prices may not necessarily represent realizable value. Although the Funds maintain diversified investment portfolios, political or economic developments within a particular country or region may have an adverse effect on the ability of domiciled issuers to meet their obligations. These risks are exaggerated for securities of issuers tied economically to emerging- and frontier-market countries. Additionally, political or economic developments may have an adverse effect on the liquidity and volatility of portfolio securities and currency holdings.
Indian Market and India Region Risk — The Emerging India Fund, the Emerging Markets Select Fund, the Emerging Markets Small Cap Fund, the Frontier Emerging Small Countries Fund, the Global Opportunities Fund, the Global Select Fund, the International Growth Fund, and the International Opportunities Fund may invest a significant amount of their assets in the securities of companies tied economically to India (the “India region”). Companies in the India region with economic ties to India may be located in India, Bangladesh, Pakistan and Sri Lanka. The securities markets in the India region are substantially smaller, less liquid and more volatile than the major securities markets in the United States, and the securities markets in the India region are comparatively underdeveloped. Financial intermediaries may not perform as well as their counterparts in the United States or in other countries with more developed securities markets. In some cases, physical delivery of securities in small lots has been required, and shortages of vault capacity and trained personnel has existed among qualified custodial banks in the India region. A Fund may be unable to sell securities when the registration process is incomplete and may experience delays in receiving dividends. If a market’s trading volume is limited by operational difficulties, the ability of a Fund to invest may be impaired. A Fund’s ability to buy or sell India region securities may be impaired if the Fund’s ability to transact is denied, delayed, suspended or not renewed by local regulators. In previous years, exchange-listed companies in the information-technology sector and related industries (such as software) have grown so as to represent a significant portion of the total capitalization of the Indian market. The value of these companies will generally fluctuate in response to technological and regulatory developments. In addition, governmental actions, including economic and tax reforms, can have a significant effect on economic conditions in the India region, which could adversely affect the value and liquidity of investments. The government in India has exercised and continues to exercise significant influence over many aspects of the economy. Government actions, bureaucratic obstacles and inconsistent economic reform within the Indian government have had a significant effect on its economy and could adversely affect market conditions, economic growth and the profitability of
128
| | |
| | | MARCH 31, 2023 (Unaudited) |
private enterprises in India. Further, any actions or other factors that may impede the flow of foreign capital to India may also inhibit its growth. Although the governments of India, Bangladesh, Pakistan and Sri Lanka have begun to institute economic reform policies, there can be no assurance that they will continue to pursue such policies or, if they do, that such policies will succeed. In addition, large portions of many Indian companies remain in the hands of their founders (including members of their families) and the corporate governance of such family-owned companies may be weaker and less transparent. Religious, cultural and military disputes persist in India and between India and Pakistan (as well as sectarian groups within each country). India’s longstanding border dispute with Pakistan remains unresolved. In recent years, terrorists believed to be based in Pakistan struck Mumbai (India’s financial capital), further damaging relations between the two countries. If the Indian government is unable to control the violence and disruption associated with these tensions (including both domestic and external sources of terrorism), the result may be military conflict, which could destabilize the economy of India. Both India and Pakistan have tested nuclear arms, and the threat of deployment of such weapons could hinder development of the Indian economy. Escalating tensions could impact the broader region, including China.
Liquidity Risk — The trading market for a particular security may be less liquid than it appears and market prices may not represent realizable value. This may be likely when a Fund has a proportionately large investment in securities with small market capitalizations or securities in foreign markets that trade infrequently. Reduced liquidity will have an adverse impact on a Fund’s ability to sell such securities quickly at the currently marked price if necessary to meet redemptions.
Greater China Region Risk — The Greater China Fund is subject to additional risks associated with its investments in the Greater China Region. The Greater China Region includes The People’s Republic of China (“PRC” or “China”), Hong Kong, and Taiwan. The other Equity Funds may also invest in countries in the Asia region, including China, Hong Kong, and Taiwan, and therefore may also be subject to the risks of investing in such countries. China may be subject to considerable degrees of economic, political or social instability. China is an emerging market and demonstrates significantly higher volatility from time to time in comparison to developed markets. Chinese governmental actions can have a significant effect on economic conditions in China, Hong Kong, and Taiwan or on a particular issuer or industry, which could adversely affect the value and liquidity of investments. The Chinese government exercises significant control over China’s economy through, among other things, its industrial policies, monetary policies, management of currency exchange rates, and management of
the payment of foreign currency-denominated obligations. Changes in these policies may adversely impact industries and companies in China. Although over the years the Chinese government has been reforming economic and market practices, the Chinese government could, at any time, alter or discontinue such economic reform programs, adversely affecting industries and companies in China.
Chinese companies are also subject to the risk that Chinese authorities can intervene in their operations and business structure.
The Chinese economy has grown rapidly in recent years and there is no assurance that this growth rate will be maintained. China’s economy may experience a significant slowdown, an economic recession or periods of substantial inflation which may have a negative effect on its securities market. China’s economy, particularly its export-oriented industries, may be adversely impacted by the developments in the economies and governmental actions of their principal trading partners, including the United States, such as a reduction in spending on Chinese products and services, a downturn in the economies of China’s key trading partners, and the imposition of trading restrictions, tariffs or other protectionist trade policies.
The United States and China have been engaged in an ongoing trade war with one another, which has led to trade frictions between their economies and negative repercussions for global markets and other nations closely affiliated with those countries. The current political climate has intensified concerns about the ongoing trade war between China and the United States, as each country has imposed tariffs on the other country’s products. These actions may significantly reduce international trade, substantially reduce the price of goods, cause an oversupply of certain manufactured goods and trigger the possible failure of individual companies and/or large segments of China’s export industry which could have a negative impact on a Fund’s performance. In addition, there is a risk that further capital controls and/or sanctions may be imposed, which could include the prohibition of, or restrictions on, the ability to own or transfer currency, securities, derivatives or other assets and may also include retaliatory action such as the seizure of assets. Further, any perceived actions by China to assist Russia in evading sanctions imposed as a result of the Ukraine invasion may result in new or expanded sanctions against China. Any of these actions could severely impair a Fund’s ability to purchase, sell, transfer, receive, deliver or otherwise obtain exposure to Chinese securities and assets, including the ability to transfer the Fund’s assets and income back into the United States, and could negatively impact the value and/or liquidity of such assets or otherwise adversely affect a Fund’s operations, causing the Fund to decline in value. Events such as these and their consequences are difficult to predict, and it is unclear whether further tariffs or escalating actions may be imposed in the future.
129
Notes to Financial Statements (continued)
In addition, on June 3, 2021, President Biden signed an executive order which, in general terms, prohibits U.S. persons from purchasing or selling publicly traded securities or derivatives of such securities in certain companies with ties to China’s military and related materials sector or surveillance technology industry as listed in the order or as determined by the U.S. Secretary of the Treasury (hereafter, “Chinese Military-Industrial Complex Companies” or “CMICs”). The list of CMICs is subject to change from time to time, which could prevent a Fund from acquiring securities previously deemed suitable investments or result in a forced sale of securities in the portfolio at an inopportune time or price, which may result in losses to the Fund. Such government prohibitions may affect the value of the securities held in the portfolio directly or indirectly as well as negatively impact the market for other China-based issuers, resulting in reduced liquidity and price declines. The government prohibition also could lead to the inability to transact in the securities of other companies within the Greater China Region as a result of trade tensions between the U.S. and China.
On December 2, 2020, the U.S. Congress also passed the Holding Foreign Companies Accountable Act, which could cause the securities of foreign issuers (including Chinese issuers) to be delisted from U.S. stock exchanges if those companies do not permit U.S. oversight of the auditing of their financial information. To the extent a Fund invests in securities of Chinese companies listed in the U.S., delisting could decrease the Fund‘s ability to transact in such securities and could significantly impact their liquidity and market price. In addition, the Fund would have to seek other markets in which to transact in such securities which would also increase the Fund’s costs. It is difficult to predict the consequences of these actions or whether further tariffs and actions will be taken.
Further, China’s domestically oriented industries may be particularly sensitive and adversely affected by changes in government policy and investment cycles as China’s consumer class continues to grow. China has historically managed its currency in a tight range relative to the U.S. dollar but this may be subject to greater uncertainty as Chinese authorities may change the policies that determine the exchange rate mechanism. In addition, the Chinese government may actively attempt to influence the operation of Chinese markets through, among other things, currency controls, direct investments, limitations on specific types of transactions (such as short selling), limitations or prohibitions on investors (including foreign institutional investors) with regard to selling holdings in Chinese companies, limitations or prohibitions on foreign ownership in certain industries, or the repatriation of assets by foreign investors under certain circumstances or similar actions.
Certain securities issued by companies located or operating in China, such as China A-Shares described in the fol-
lowing pages, are subject to trading restrictions, quota limitations, and less market liquidity. Chinese authorities may intervene in the Chinese securities markets and halt or suspend trading of securities for short or even longer periods of time. The Chinese securities markets have experienced considerable volatility, and have been subject to relatively frequent and excessive trading halts and suspensions which, among other things, contribute to uncertainty in the markets, reduce the liquidity of securities subject to a trading halt or suspension and lead to greater market execution and valuation risks. Such actions could adversely impact a Fund’s ability to achieve its investment objective(s), and to trade China shares during such periods and could result in the Fund’s limiting or suspending shareholder redemption privileges as permitted in accordance with applicable law. The Chinese markets generally continue to experience inefficiencies, volatility and pricing anomalies resulting from governmental influence, lack of publicly available information and/or political or social instability. Under current rules of the PRC, there is a limit as to how many shares a single foreign investor is permitted to hold in a PRC-listed company and a limit as to the maximum combined holdings of all foreign investors in a PRC-listed company. As a result, a Fund may have to sell securities at an inopportune time or price or, may not be able to execute its investment strategy, and its performance may be hindered.
Additional risks of loss from investing in China include currency fluctuations, interest rate fluctuations, less liquidity, higher rates of inflation, expropriation (the confiscation of assets and property), confiscatory taxation, nationalization, imposition of tariffs, limitations on repatriation of currency, exchange control regulations (including currency blockage), trading halts, and differing legal, accounting, auditing, financial and reporting standards. Financial reporting by Chinese companies does not have as much regulatory oversight as in the United States. Frequent intervention by the Chinese government, limits on credible corporate governance standards, limited transparency of market and accounting information, and limited oversight of accounting firms increase the risk of insider dealing, market manipulation, improper accounting, and accounting fraud and other corporate misconduct. There may be significant obstacles to obtaining information necessary for investigations into or litigation against Chinese companies.
Internal social unrest or confrontations with neighboring countries, including military conflicts in response to such events, strained international relations and security concerns such as terrorism, may also adversely impact China’s economy, disrupting its economic growth and adversely affecting a Fund’s investments. Any spread of an infectious illness, public health threats or similar issues could reduce consumer demand or economic output, result in market closures, travel restrictions or quarantines, and generally
130
| | |
| | | MARCH 31, 2023 (Unaudited) |
also have a significant impact on the economies of China, Hong Kong, and Taiwan (the Greater China Region), which in turn could adversely affect a Fund’s investments. Additionally, China is alleged to have participated in state-sponsored cyberattacks against foreign companies and foreign governments. Actual and threatened responses to such activity and strained international relations, including purchasing restrictions, sanctions, tariffs or cyberattacks on the Chinese government or Chinese companies, may impact China’s economy and Chinese issuers of securities in which a Fund invests. Incidents involving China’s or the region’s security may cause uncertainty in the Chinese markets and may adversely affect the Chinese economy and a Fund’s investments. Further, China’s strained relationships with certain ethnic groups in China, including Tibetans and Uighurs, have been marked with protests and violence and may adversely affect the Chinese economy.
Risks of Investing in Chinese Securities — The Greater China Fund intends to invest in the securities of Chinese companies through various securities markets and investment vehicles, including China A-Shares through the Stock Connect Programs — the Shanghai-Hong Kong Stock Connect program and the Shenzhen-Hong Kong Stock Connect program, China H-Shares and China B-Shares, shares listed on U.S. exchanges, American Depositary Receipts (ADRs), and Variable Interest Entities (“VIEs”) traded on a stock exchange (as described below) — and investing in these markets and vehicles is therefore considered a principal risk of the Fund. Other Equity Funds may also invest in Asian countries, including China. Such Equity Funds may also invest in Chinese securities, including China A-Shares, and incur Chinese securities risk.
China A-Shares are the stock shares of mainland China- based companies that trade on the two Chinese stock exchanges — the Shanghai Stock Exchange (SSE) and the Shenzhen Stock Exchange (SZSE). Prices on these exchanges are quoted in renminbi. The Stock Connect Programs (mentioned above) are securities trading and clearing links programs with an aim to achieve mutual stock market access between mainland China and Hong Kong. The Stock Connect Programs were developed by The Stock Exchange of Hong Kong Limited (SEHK), the Hong Kong Exchanges and Clearing Limited, the SSE (in the case of the Shanghai Connect) or the SZSE (in the case of the Shenzhen Connect), and the China Securities Depository and Clearing Corporation (CSDC). Investing in China A-Shares is subject to trading, clearance, settlement and other procedures which could pose risks to a Fund, including illiquidity risk, currency risk, legal and regulatory risk, execution risk, operational risk, tax risk and credit risk. China A-Shares markets have a higher propensity for trading suspensions than many other global equity markets. As a result of differing legal standards, a Fund also faces the risk of being unable to enforce its rights with respect to its
China A-Shares holdings. Trading through the Stock Connect Programs is currently subject to a daily quota, which limits the maximum net purchases under the Stock Connect Programs each day and, as such, buy orders for China A-Shares would be rejected once the daily quota is exceeded (although a Fund will be permitted to sell China A-Shares regardless of the daily quota). The daily quota may restrict a Fund’s ability to invest in China A-Shares through Stock Connect Programs on a timely basis and could affect the Fund’s ability to effectively pursue its investment strategy. Further, the Stock Connect Programs, which rely on the connectivity of the Shanghai or Shenzhen markets with the Hong Kong market, are subject to operational risk, regulations that are relatively untested and are subject to change, and extended market closures for holidays or otherwise. During an extended market closure, a Fund’s ability to trade in China A-Shares will be impacted, which may affect the Fund’s performance.
Trading suspensions in certain stocks and extended market closures could lead to greater market execution risks, valuation risks, liquidity risks and costs for a Fund. The Stock Connect Programs will only operate on days when both the Chinese and Hong Kong markets are open for trading and when banking services are available in both markets on the corresponding settlement days. Accordingly, an investment in China A-Shares though the Stock Connect Programs may subject a Fund to the risk of price fluctuations on days when the Chinese markets are open, but the Stock Connect Programs are not trading. Further, if one or both of the Chinese markets and the Hong Kong market are closed on a U.S. trading day, a Fund may not be able to acquire or dispose of China A-Shares in a timely manner.
The Stock Connect Programs do not have an extensive operating history and there is no certainty as to how current regulations or new regulations that may be adopted will be applied or interpreted in connection with the operations, legal enforcement and cross-border trades under the Stock Connect Programs. In addition, there can be no assurance that the Stock Connect Programs will be continued. A Fund may be adversely affected as a result of such changes. Further, different fees, costs and taxes are imposed on foreign investors acquiring China A-Shares through the Stock Connect Programs. These fees, costs and taxes may be higher than those imposed on other Chinese securities providing similar investment exposure.
In addition to the China A-Shares, a Fund may also invest in other classes of shares, including B-Shares and H-Shares. B-Shares are allocated to both international and domestic investors and are denominated in U.S. dollars on the SSE and Hong Kong dollars on the SZSE. The B-Shares market is generally smaller and less liquid and has a smaller issuer base than the China A-Shares market. H-Shares are issued by companies incorporated in the PRC that derive
131
Notes to Financial Statements (continued)
substantial revenues from or allocate substantial assets in the PRC of issuers that also issue China A-Shares. H-Shares may trade at significant discounts or premiums to their China A-Shares counterparts. These classes of shares are subject to the political and economic policies of China.
An Equity Fund may also invest its assets in securities of VIEs. In China, direct ownership of companies in certain sectors by foreign individuals and entities (including U.S. persons and entities such as the Funds) is prohibited. In order to facilitate foreign investment in these businesses, many Chinese companies have created VIEs to facilitate indirect foreign ownership. In such an arrangement, a China-based operating company typically establishes an offshore shell company in another jurisdiction such as the Cayman Islands. That shell company enters into service and other contracts with the China-based operating company, then issues shares on a stock exchange such as the New York Stock Exchange or the Hong Kong Stock Exchange. Foreign investors hold stock in the VIE shell company rather than directly in the China-based operating company. The VIE arrangement allows U.S. investors to obtain economic exposure to the China-based company indirectly through the contractual VIE structure rather than directly through the formal equity ownership structure.
VIEs are a common industry practice and well known to officials and regulators in China. However, VIEs are not formally recognized under Chinese law. Recently, the government of China provided new guidance to and placed restrictions on China-based companies raising capital offshore, including through VIE structures. Investors face uncertainty about future actions by the government of China that could significantly affect an operating company’s financial performance and the enforceability of the VIE shell company’s contractual arrangements. It is uncertain whether Chinese officials or regulators will withdraw their implicit acceptance of the VIE structure, whether any new laws, rules or regulations relating to these structures will be adopted or, if adopted, what impact they would have on the interests of foreign shareholders. Under extreme circumstances, China might prohibit the existence of VIEs or limit a VIE’s ability to pass through economic and governance rights to foreign individuals and entities. If the Chinese government takes action affecting VIEs, the market value of a Fund’s associated portfolio holdings would likely suffer significant, detrimental, and possibly permanent effects, which could result in substantial investment losses.
In addition, Chinese companies, including Chinese companies listed on U.S. exchanges, are not subject to the same degree of regulatory requirements, accounting standards or auditor oversight as companies in more developed countries. As a result, information about Chinese securities and VIEs in which a Fund invests may be less reliable or
complete. As with other Chinese companies with securities listed on U.S. exchanges, U.S.-listed VIEs and ADRs may be delisted if they do not meet U.S. accounting standards and auditor oversight requirements. Delisting would significantly decrease the liquidity and value of the securities, decrease the ability of a Fund to transact in such securities and may increase the costs of a Fund if it is required to seek other markets in which to transact in such securities. There also may be significant obstacles to obtaining information necessary for investigations into or litigation against Chinese companies, and shareholders may have limited legal remedies.
Japan Risk — The Global Opportunities Fund, the Global Select Fund, the International Growth Fund, the International Opportunities Fund, and the International Select Fund invest a significant amount of their assets in securities of companies economically tied to Japan. The Japanese economy has only recently emerged from a prolonged economic downturn. The Japanese economy may be subject to considerable degrees of economic, political and social instability, which could have a negative impact on Japanese securities. Since the year 2000, Japan’s economic growth rate has remained relatively low compared to other advanced economies, and it may remain low in the future. The economy is characterized by an aging demographic, declining population, large government debt and highly regulated labor market. Economic growth is dependent on domestic consumption, deregulation and consistent government policy. International trade, particularly with the U.S., also impacts growth, and adverse economic conditions in the U.S. or other such trade partners may affect Japan. Japan also has a growing economic relationship with China and other Southeast Asian countries, and thus Japan’s economy may also be affected by economic, political or social instability in those countries (whether resulting from local or global events as well as from any deterioration in its relationships with neighboring countries). In addition, Japan is subject to the risk of natural disasters, such as earthquakes, volcanic eruptions, typhoons and tsunamis which could negatively affect a Fund.
Europe and U.K. Risk — The Global Opportunities Fund, the Global Select Fund, the Global Value Fund, the International Fund , the International Opportunities Fund, the International Select Fund, and the Micro Cap Value Fund may invest a significant portion of their assets in securities issued by companies in developed markets, including European countries and the United Kingdom (“U.K.”).
Many countries in Europe are member states of the European Union (“EU”) and will be significantly affected by the fiscal and monetary controls of the EU. Changes in regulations on trade, decreasing imports or exports, changes in the exchange rate of the euro and recessions or defaults or threats of defaults among European countries may have a significant adverse effect on the economies of other
132
| | |
| | | MARCH 31, 2023 (Unaudited) |
European countries. The European financial markets have experienced significant volatility, and several European countries have been adversely affected by unemployment, budget deficits and economic downturns.
Responses to financial problems by European governments, central banks and others, including austerity measures and reforms, may not produce the desired results, may result in social unrest, may limit future growth and economic recovery or may have other unintended consequences. Defaults or restructurings by governments and other entities of their debt could have additional adverse effects on economies, financial markets and asset valuations around the world.
Successionist movements as well as governmental or other response to such movements, may also create instability and uncertainty in the region. In addition, the national politics of countries in the EU have been unpredictable and subject to influence by disruptive political groups and ideologies. The governments in EU countries may be subject to change, and such countries may experience social and political unrest. Unanticipated or sudden political or social development may result in sudden and significant investment losses. The occurrence of terrorist incidents throughout Europe or war in the region could also impact financial markets. The impact of these events is not clear but could be significant and far-reaching and could adversely affect the value and liquidity of a Fund’s investments. Any of these effects could adversely affect any of the companies to which a Fund has exposure and any other assets in which a Fund invests.
Efforts by the member countries of the EU to continue to unify their economic and monetary policies may increase the potential for similarities in movements of European markets and reduce the potential investment benefits of diversification within the region. Further, while many countries in western Europe are considered to have developed markets, many eastern European countries are less developed, and investments in eastern European countries, even if denominated in euros, may involve special risks associated with investments in emerging markets. As the economies of countries in Europe are in different stages of development, the policies adopted by the EU may not address the needs of all European countries.
In addition, one or more countries may abandon the euro and/or withdraw from the EU, creating continuing uncertainty in the currency and financial markets generally. In this regard, on January 31, 2020, the U.K. formally withdrew from the EU (commonly referred to as “Brexit”). Following a transition period, the U.K. and EU entered a trade agreement formally effective on May 1, 2021, but certain post-EU arrangements remain unresolved and subject to further negotiation and agreement. While new trade deals may boost economic growth, such growth may not be able to offset the increased costs of trade with the EU that
resulted from the U.K.’s loss of its membership in the EU single market. There is significant market uncertainty regarding Brexit’s ramifications. The range and potential implications of possible political, regulatory, economic and market outcomes for the U.K. EU and elsewhere cannot be fully known.
As the process unfolds, Brexit may cause greater market volatility and illiquidity, currency fluctuations, interest rate volatility, deterioration in economic activity, economic uncertainties, a decrease in business confidence, a decrease in trade, labor disruptions, political instability, increased likelihood of recession in the U.K. and regulatory uncertainty. Brexit could adversely affect European or worldwide political, regulatory, economic or market conditions and could contribute to instability in global political institutions, regulatory agencies and financial markets. The uncertainty of Brexit could have a significant impact on the business and financial results of companies in the U.K. and other European countries and certain sectors within such countries. The United States and various European countries are substantial trading partners of the U.K. The precise impact on the economy of the U.K. as a result of its departure from the EU depends to a large degree on its ability to conclude favorable trade deals with the EU and other countries, including the United States, China, India and Japan. Brexit has also led to legal uncertainties and could lead to politically divergent national laws and regulations as a new relationship between the U.K. and EU is defined and the U.K. determines which EU laws to replace or replicate. Any of these effects of Brexit could adversely affect the European and U.K. companies in which a Fund may invest. Additionally, increasing commodity prices and rising inflation levels prompted the U.K. government to implement significant policy changes. It is difficult to predict what effects such policies (or the suggestion of such policies) may have and the duration of those effects, which may last for extended periods.
Asia Region Risk — The Emerging Markets Select, Emerging Markets Small Cap, Global Opportunities, Global Select, Global Value, International Growth, International Opportunities and International Select Funds may invest a significant portion of their assets in the securities of companies tied economically to markets in the Asia region, including, among others, Bangladesh, China, Hong Kong, Indonesia, Japan, Malaysia, Philippines, Singapore, South Korea, Taiwan, Thailand and Vietnam. Similarly, the Frontier Emerging Small Countries Fund may invest a significant portion of its assets in the securities of companies tied economically to frontier and emerging market countries in the Asia region including, among others, Bangladesh, Indonesia, Malaysia, Philippines, Singapore, Taiwan, Thailand and Vietnam. The value of a Fund’s assets invested in countries in the Asia region may be adversely affected by, among other things, political,
133
Notes to Financial Statements (continued)
economic, social and religious instability, inadequate investor protection, accounting standards and practices, changes in laws or regulations of countries within the Asia region, international relations with other nations, natural disasters, corruption, civil unrest and military activity. Countries in the Asia region, particularly China, Japan and South Korea, may be adversely affected by political, military, economic and other factors related to North Korea. In addition, China’s long running conflict over Taiwan, border disputes with many of its neighbors and historically strained relations with Japan could adversely impact economies in the region. The governments in many countries have exercised and continue to exercise significant influence over many aspects of their economies, and their actions may significantly impact their economies, sectors, industries and/or companies within the market, which may impact the securities held by a Fund. The economies of many Asian countries differ from the economies of more developed countries in many respects, such as rate of growth, inflation, capital reinvestment, resource self-sufficiency, financial system stability, and sensitivity to changes in global trade. Certain Asian countries are highly dependent upon and may be affected by developments in the United States, Europe and other Asian economies. Global economic conditions, and international trade, affecting Asian economies and companies could deteriorate as a result of political instability and uncertainty, the imposition of tariffs and other protectionist trade policies and similar actions, and increased tensions with other nations.
In addition, the Asian region is comprised of countries in all stages of economic development. Some of these countries may experience overextension of credit, currency devaluation and restrictions, rising unemployment, high inflation, underdeveloped financials sectors, heavy reliance on international trade and prolonged economic recessions. Deflationary factors could also reemerge in certain Asian markets which some countries may not have the capacity to address. Many Asian region countries are dependent on foreign supplies of energy, and competition to claim or develop regional supplies of energy or other natural resources could lead to economic, political or military instability or disruption and adversely impact the performance of a Fund. As some countries in the Asian region are less developed and may be considered emerging or frontier markets, the risk to foreigners that invest in such countries will be magnified and include the risks of emerging or frontier markets, such as increased political and social instability; highly volatile, less mature and less liquid securities markets; less corporate governance standards; limited government oversight and market regulation; differing financial reporting, accounting and auditing standards; capital controls; potential expropriation or nationalization of companies or industries; currency fluctuations; restrictions on
foreign ownership; less legal recourse to enforce a Fund’s rights; less publicly available or inaccurate information regarding companies; high tax rates; less developed or diverse economies, and other political, economic or social developments.
With respect to China, the Chinese government exercises significant control over China’s economy through its industrial policies (e.g., allocation of resources and other preferential treatment), monetary policy, management of currency exchange rates, and management of the payment of foreign currency-denominated obligations. Changes in these policies could adversely impact affected industries or companies. China’s economy, particularly its export-oriented industries, may be adversely impacted by trade or political disputes with China’s major trading partners, including the U.S., as well as its dependence on the economies of other Asian countries, many of which are developing countries. In addition, as its consumer class emerges, China’s domestically oriented industries may be especially sensitive to changes in government policy and investment cycles. China’s currency, which historically has been managed in a tight range relative to the U.S. dollar, may in the future be subject to uncertainty as Chinese authorities change the policies that determine the exchange rate mechanism. Certain securities issued by companies located or operating in China, such as China A-Shares, are subject to trading restrictions, quota limitations and less market liquidity.
Sector and Industry Weightings Risk — The Equity Funds may invest a large percentage of their assets in a few sectors or in industries within a particular sector. A Fund’s investment in a particular sector will fluctuate over time based on the investment opportunities identified by the Advisor. The risks associated with investing in various sectors and industries are considered principal risks of these Funds. These sectors include communication services, consumer discretionary, consumer staples, energy, financials, health care, industrials, information technology, materials, real estate and utilities. Market conditions, interest rates, and economic, political, regulatory, or financial developments could significantly affect a single sector. If an Equity Fund invests in only a few sectors, it will have more exposure to the price movements of securities in those sectors. The Funds may also from time to time make significant investments in an industry or industries within a particular sector. Adverse conditions in such an industry or industries could have correspondingly adverse effects on the financial condition of issuers. These conditions may cause the value of a Fund’s shares to fluctuate more than the values of shares of funds that invest in a greater variety of investments. To the extent an Equity Fund has substantial holdings within a particular sector or industry therein, the risks to the Fund associated with the sector or industry increase.
134
| | |
| | | MARCH 31, 2023 (Unaudited) |
Shareholder Concentration Risk — A significant portion of the net assets of several Wasatch Funds are owned by a group of investors advised by a common investment advisor or have a significant portion of net assets in relatively few related accounts for several Wasatch Funds. In the event of significant redemption activity by these shareholders, these Funds could experience a loss when selling portfolio securities to meet such redemption requests. The Funds could be forced to sell portfolio securities at unfavorable prices in an effort to generate sufficient cash to pay redeeming shareholders. Fund expenses may increase, and performance may be materially affected.
12. FAIR VALUE MEASUREMENTS AND INVESTMENTS
The fair value of a financial instrument is the amount that would be received to sell an asset or paid to transfer a liability in an orderly transaction between market participants at the measurement date. The Funds use various methods to measure the fair value of their investments on a recurring basis. U.S. GAAP established a hierarchy that prioritizes inputs to valuation methods. The three levels of inputs are:
| | • | | Level 1 — Unadjusted quoted prices in active markets for identical assets or liabilities that the Funds have the ability to access. |
| | • | | Level 2 — Observable inputs other than quoted prices included in Level 1 that are observable for the asset or liability, either directly or indirectly. The inputs may include quoted prices for the identical investment on an inactive market, prices for similar investments, interest rates, prepayment speeds, credit risk, yield curves, default rates and similar data. |
| | • | | Level 3 — Unobservable inputs for the asset or liability, to the extent relevant observable inputs are not available, represent the Funds’ own assumptions about the assumptions a market participant would use in valuing the asset or liability, and would be based on the best information available. |
The availability of observable inputs can vary from security to security and is affected by a wide variety of factors, including, for example, the type of security, whether a security is new and not yet established in the marketplace, the liquidity of markets, and other characteristics particular to the security. To the extent that valuation is based on models or inputs that are less observable or unobservable in the market, the determination of fair value requires more judgment. Accordingly, the degree of judgment exercised in determining fair value is greatest for instruments categorized in Level 3.
Equity Securities (common and preferred stock) — Securities are valued as of the close of the New York Stock Exchange (“NYSE”) (generally 4:00 p.m. Eastern Time) on the valuation date. Equity securities and listed warrants are valued using a commercial pricing service at the official close price or last quoted sales price taken from the primary market in which each security trades and, with respect to equity securities traded on the National Association of Securities Dealers Automated Quotations (Nasdaq) system, such securities are valued using the Nasdaq Official Closing Price (“NOCP”) or last sales price if no NOCP is available. If there are no official close or sales on the primary exchange or market on a day, then the security shall be valued at the mean of the last bid and ask price on the primary exchange or market as provided by a pricing service. If the mean cannot be calculated or there is no trade activity on a day, then the security shall be valued at the previous trading day’s price as provided by a pricing service. To the extent that these securities are actively traded and valuation adjustments are not applied, they are categorized in Level 1 of the fair value hierarchy. Additionally, a Fund’s investments are valued at fair value by the Pricing Committee if the Advisor determines that an event impacting the value of an investment occurred between the closing time of a security’s primary market or exchange (for example, a foreign exchange or market) and the time the Fund’s share price is calculated. Significant events include, but are not limited to the following: significant fluctuations in domestic markets, foreign markets or foreign currencies; occurrences not directly tied to the securities markets, such as natural disasters, armed conflicts or significant governmental actions; and major announcements affecting a single issuer or an entire market or market sector. In responding to a significant event, the Pricing Committee determines the fair value of affected securities by considering factors including, but not limited to: index options and futures traded subsequent to the close; American Depositary Receipts (“ADRs”), Global Depositary Receipts (“GDRs”) or other related receipts; currency spot or forward markets that trade after pricing of the foreign exchange; other derivative securities traded after the close such as Standard & Poor’s Depositary Receipts (“SPDRs”) and other exchange-traded funds (“ETFs”); and alternative market quotes on the affected securities. When applicable, the Funds use a systematic fair valuation model provided by an independent third party to assist in adjusting the valuation of foreign securities. When a Fund uses this fair value pricing method, the values assigned to the Fund’s foreign securities may not be the quoted or published prices of the investments on their primary markets or exchanges, and the securities are categorized in Level 2 of the fair value hierarchy. These valuation procedures apply equally to long or short equity positions in a Fund.
135
Notes to Financial Statements (continued)
Participation Notes — Investments are valued at the market price of the underlying security. Counterparty risk is regularly reviewed and considered for valuation. To the extent the inputs are observable and timely, the values would be categorized in Level 2 of the fair value hierarchy.
Corporate Debt Securities — Investments are valued at current market value by a pricing service, or by using the last sale or bid price based on observable inputs. Observable inputs may include benchmark yields, reported trades, broker/dealer quotes, issuer spreads, two-sided markets, benchmark securities, bids, offers and reference data (including market research publications). Although most corporate bonds are categorized in Level 2 of the fair value hierarchy, in instances where observable inputs are not available they are categorized as Level 3.
Short-Term Notes — Investments maturing in 60 days or less at the time of purchase, are generally valued at amortized cost, unless it is determined that the amortized cost method would not represent fair value, in which case the securities are marked-to-market. To the extent the inputs are observable and timely, the values would be categorized in Level 2 of the fair value hierarchy.
Asset-Backed Securities — Investments are priced using the closing bid as supplied by a pricing service based on observable inputs. Observable inputs may include benchmark yields, reported trades, broker/dealer quotes, issuer spreads, two-sided markets, benchmark securities, bids, offers, reference data (including market research publications), new issue data, monthly payment information and collateral performance. Although most asset-backed securities are categorized in Level 2 of the fair value hierarchy, in instances where observable inputs are not available, they are categorized as Level 3.
U.S. Government Issuers — Investments are priced using the closing bid as supplied by a pricing service based on observable inputs. Observable inputs may include benchmark yields, reported trades, broker/dealer quotes, issuer spreads, two-sided markets, benchmark securities, bids, offers and reference data (including market research publications). Although most U.S. government securities are categorized in Level 2 of the fair value hierarchy, in instances where observable inputs are not available, they are categorized as Level 3.
Derivative Instruments — Listed derivatives that are actively traded are valued based on quoted prices from the exchange and categorized in Level 1 of the fair value hierarchy. Exchange-traded options are valued at the last sale price in the market where they are principally traded. If there are no sales on the primary exchange or market on a given day, then the option is valued at the mean of the last bid price and ask price on the primary exchange or market as provided by a pricing service. Forward foreign currency contracts are valued at the market rate provided by the pricing service and categorized as Level 2.
Restricted Securities — If market quotations are not readily available for the Funds’ investments in securities such as restricted securities, private placements, securities for which trading has been halted or other illiquid securities, these investments are valued at fair value in accordance with Board-approved Pricing Policies and Procedures by the Pricing Committee with oversight by the Board of Trustees. Fair value is defined as the price that would be received upon the sale of an asset, or paid to transfer a liability, in an orderly transaction between market participants at the measurement date under current market conditions. For each applicable investment that is fair valued, the Pricing Committee considers, to the extent applicable, various factors including, but not limited to, the financial condition of the company or limited partnership, operating results, prices paid in follow-on rounds, comparable companies in the public market, the nature and duration of the restrictions for holding the securities, a stated net asset value for the partnership, if applicable, and other relevant factors. Depending on the relative significance of valuation inputs, these instruments may be classified in either Level 2 or Level 3 of the fair value hierarchy.
When the last day of the reporting period is a non-business day, certain foreign markets may be open on days when the NYSE is closed, which could result in differences between the value of a Fund’s portfolio securities on the last business day and the last calendar day of the reporting period. Any significant security valuation changes due to an open foreign market are adjusted and reflected by the Fund for financial reporting purposes.
136
| | |
| | | MARCH 31, 2023 (Unaudited) |
The following is a summary of the fair valuations according to the inputs used as of March 31, 2023 in valuing the Funds’ assets and liabilities:
| | | | | | | | | | | | | | | | | | | | | | |
| Fund | | Category | | Quoted Prices
In Active Markets
For Identical
Investments
(Level 1) | | Significant Other
Observable Inputs
(Level 2) | | Significant
Unobservable
Inputs
(Level 3) | | Value at
3/31/2023 |
Core Growth Fund | | | | | | | | | | | | | | | | | | | | | | |
Assets | | | | | | | | | | | | | | | | | | | | | | |
Common Stocks | | | | | $ | 2,925,217,430 | | | | $ | — | | | | $ | — | | | | $ | 2,925,217,430 | |
Warrants | | | | | | — | | | | | — | | | | | 939,600 | | | | | 939,600 | |
| | | | | | | |
| | | | | $ | 2,925,217,430 | | | | $ | — | | | | $ | 939,600 | | | | $ | 2,926,157,030 | |
| | | | | | | |
Emerging India Fund | | | | | | | | | | | | | | | | | | | | | | |
Assets | | | | | | | | | | | | | | | | | | | | | | |
Common Stocks | | | | | | | | | | | | | | | | | | | | | | |
| | Apparel Retail | | | $ | — | | | | $ | 22,424,899 | | | | $ | — | | | | $ | 22,424,899 | |
| | Apparel, Accessories & Luxury Goods | | | | — | | | | | 8,233,964 | | | | | — | | | | | 8,233,964 | |
| | Automotive Parts & Equipment | | | | — | | | | | 3,656,907 | | | | | — | | | | | 3,656,907 | |
| | Commercial & Residential Mortgage Finance | | | | — | | | | | 16,021,364 | | | | | — | | | | | 16,021,364 | |
| | Commodity Chemicals | | | | — | | | | | 18,938,409 | | | | | — | | | | | 18,938,409 | |
| | Consumer Finance | | | | — | | | | | 41,569,510 | | | | | — | | | | | 41,569,510 | |
| | Diversified Banks | | | | — | | | | | 58,838,816 | | | | | — | | | | | 58,838,816 | |
| | Food Retail | | | | — | | | | | 18,667,942 | | | | | — | | | | | 18,667,942 | |
| | Footwear | | | | — | | | | | 1,427,363 | | | | | — | | | | | 1,427,363 | |
| | Health Care Facilities | | | | — | | | | | 4,697,059 | | | | | — | | | | | 4,697,059 | |
| | Health Care Services | | | | — | | | | | 35,660,968 | | | | | — | | | | | 35,660,968 | |
| | Industrial Machinery & Supplies & Components | | | | — | | | | | 41,110,339 | | | | | — | | | | | 41,110,339 | |
| | Interactive Media & Services | | | | — | | | | | 10,339,955 | | | | | — | | | | | 10,339,955 | |
| | IT Consulting & Other Services | | | | — | | | | | 47,093,437 | | | | | — | | | | | 47,093,437 | |
| | Life Sciences Tools & Services | | | | — | | | | | 17,801,508 | | | | | — | | | | | 17,801,508 | |
| | Metal, Glass & Plastic Containers | | | | — | | | | | 2,805,775 | | | | | — | | | | | 2,805,775 | |
| | Property & Casualty Insurance | | | | — | | | | | 9,370,957 | | | | | — | | | | | 9,370,957 | |
| | Regional Banks | | | | — | | | | | 33,197,538 | | | | | — | | | | | 33,197,538 | |
| | Research & Consulting Services | | | | — | | | | | 19,281,860 | | | | | — | | | | | 19,281,860 | |
| | Specialty Chemicals | | | | — | | | | | 14,124,595 | | | | | — | | | | | 14,124,595 | |
| | Systems Software | | | | — | | | | | 3,985,087 | | | | | — | | | | | 3,985,087 | |
| | | | | | | |
| | | $ | — | | | | $ | 429,248,252 | | | | $ | — | | | | $ | 429,248,252 | |
| | | | | | | |
137
Notes to Financial Statements (continued)
| | | | | | | | | | | | | | | | | | | | | | |
| Fund | | Category | | Quoted Prices
In Active
Markets
For Identical
Investments
(Level 1) | | Significant Other
Observable Inputs
(Level 2) | | Significant
Unobservable
Inputs
(Level 3) | | Value at
3/31/2023 |
Emerging Markets Select Fund | | | | | | | | | | | | | | | | | | | | | | |
Assets | | | | | | | | | | | | | | | | | | | | | | |
Common Stocks | | | | | | | | | | | | | | | | | | | | | | |
| | Apparel Retail | | | $ | — | | | | $ | 4,748,179 | | | | $ | — | | | | $ | 4,748,179 | |
| | Apparel, Accessories & Luxury Goods | | | | — | | | | | 6,370,062 | | | | | — | | | | | 6,370,062 | |
| | Broadline Retail | | | | 34,672,886 | | | | | 13,996,546 | | | | | — | | | | | 48,669,432 | |
| | Consumer Finance | | | | — | | | | | 21,871,611 | | | | | — | | | | | 21,871,611 | |
| | Diversified Banks | | | | 16,338,576 | | | | | 30,337,094 | | | | | — | | | | | 46,675,670 | |
| | Electrical Components & Equipment | | | | 19,570,774 | | | | | 23,789,069 | | | | | — | | | | | 43,359,843 | |
| | Health Care Services | | | | — | | | | | 5,947,987 | | | | | — | | | | | 5,947,987 | |
| | Hotels, Resorts & Cruise Lines | | | | — | | | | | 4,329,592 | | | | | — | | | | | 4,329,592 | |
| | Industrial Machinery & Supplies & Components | | | | — | | | | | 12,818,823 | | | | | — | | | | | 12,818,823 | |
| | Interactive Media & Services | | | | — | | | | | 10,751,245 | | | | | — | | | | | 10,751,245 | |
| | IT Consulting & Other Services | | | | 18,681,067 | | | | | 3,531,265 | | | | | — | | | | | 22,212,332 | |
| | Life & Health Insurance | | | | — | | | | | 8,164,178 | | | | | — | | | | | 8,164,178 | |
| | Life Sciences Tools & Services | | | | — | | | | | 18,108,849 | | | | | — | | | | | 18,108,849 | |
| | Regional Banks | | | | — | | | | | 10,761,366 | | | | | — | | | | | 10,761,366 | |
| | Restaurants | | | | — | | | | | 9,098,320 | | | | | — | | | | | 9,098,320 | |
| | Semiconductor Equipment | | | | — | | | | | 20,077,762 | | | | | — | | | | | 20,077,762 | |
| | Semiconductors | | | | — | | | | | 52,406,018 | | | | | — | | | | | 52,406,018 | |
| | Specialized Finance | | | | — | | | | | 21,768,091 | | | | | — | | | | | 21,768,091 | |
| | Specialty Chemicals | | | | — | | | | | 8,445,998 | | | | | — | | | | | 8,445,998 | |
| | Systems Software | | | | — | | | | | 766,013 | | | | | — | | | | | 766,013 | |
| | Other | | | | 55,761,686 | | | | | — | | | | | — | | | | | 55,761,686 | |
| | | | | | | | | | | | | | | | | | | | | | |
| | | | | $ | 145,024,989 | | | | $ | 288,088,068 | | | | $ | — | | | | $ | 433,113,057 | |
| | | | | | | |
Emerging Markets Small Cap Fund | | | | | | | | | | | | | | | | | | | | | | |
Assets | | | | | | | | | | | | | | | | | | | | | | |
Common Stocks | | | | | | | | | | | | | | | | | | | | | | |
| | Apparel Retail | | | $ | — | | | | $ | 10,589,505 | | | | $ | — | | | | $ | 10,589,505 | |
| | Application Software | | | | — | | | | | 3,721,295 | | | | | — | | | | | 3,721,295 | |
| | Asset Management & Custody Banks | | | | — | | | | | 3,221,158 | | | | | — | | | | | 3,221,158 | |
| | Broadline Retail | | | | — | | | | | 13,036,532 | | | | | — | | | | | 13,036,532 | |
| | Commercial & Residential Mortgage Finance | | | | — | | | | | 9,337,431 | | | | | — | | | | | 9,337,431 | |
| | Commodity Chemicals | | | | — | | | | | 4,024,780 | | | | | — | | | | | 4,024,780 | |
| | Communications Equipment | | | | — | | | | | 6,432,198 | | | | | — | | | | | 6,432,198 | |
| | Consumer Finance | | | | — | | | | | 5,256,122 | | | | | — | | | | | 5,256,122 | |
| | Drug Retail | | | | 8,649,119 | | | | | 7,249,565 | | | | | — | | | | | 15,898,684 | |
| | Electrical Components & Equipment | | | | — | | | | | 23,794,650 | | | | | — | | | | | 23,794,650 | |
| | Electronic Components | | | | — | | | | | 5,157,546 | | | | | — | | | | | 5,157,546 | |
| | Electronic Equipment & Instruments | | | | — | | | | | 8,819,497 | | | | | — | | | | | 8,819,497 | |
| | Health Care Facilities | | | | — | | | | | 3,508,147 | | | | | — | | | | | 3,508,147 | |
| | Health Care Services | | | | — | | | | | 8,894,468 | | | | | — | | | | | 8,894,468 | |
| | Home Improvement Retail | | | | — | | | | | 10,307,291 | | | | | — | | | | | 10,307,291 | |
| | Hotels, Resorts & Cruise Lines | | | | — | | | | | 6,826,364 | | | | | — | | | | | 6,826,364 | |
| | Industrial Machinery & Supplies & Components | | | | — | | | | | 14,702,824 | | | | | — | | | | | 14,702,824 | |
| | Interactive Media & Services | | | | — | | | | | 6,886,735 | | | | | — | | | | | 6,886,735 | |
| | IT Consulting & Other Services | | | | 15,740,368 | | | | | 24,397,949 | | | | | — | | | | | 40,138,317 | |
| | Life & Health Insurance | | | | — | | | | | 8,401,422 | | | | | — | | | | | 8,401,422 | |
| | Movies & Entertainment | | | | — | | | | | 2,366,878 | | | | | — | | | | | 2,366,878 | |
| | Personal Care Products | | | | — | | | | | 6,262,689 | | | | | — | | | | | 6,262,689 | |
| | Regional Banks | | | | 5,490,865 | | | | | 18,198,043 | | | | | — | | | | | 23,688,908 | |
| | Research & Consulting Services | | | | — | | | | | 12,790,263 | | | | | — | | | | | 12,790,263 | |
| | Semiconductor Equipment | | | | — | | | | | 7,590,189 | | | | | — | | | | | 7,590,189 | |
| | Semiconductors | | | | — | | | | | 49,640,686 | | | | | — | | | | | 49,640,686 | |
| | Specialized Finance | | | | — | | | | | 5,552,539 | | | | | — | | | | | 5,552,539 | |
| | Other | | | | 40,603,551 | | | | | — | | | | | — | | | | | 40,603,551 | |
| | | | | | | | | | | | | | | | | | | | | | |
| | | | | $ | 70,483,903 | | | | $ | 286,966,766 | | | | $ | — | | | | $ | 357,450,669 | |
| | | | | | | |
138
| | |
| | | MARCH 31, 2023 (Unaudited) |
| | | | | | | | | | | | | | | | | | | | | | |
| Fund | | Category | | Quoted Prices
In Active
Markets
For Identical
Investments
(Level 1) | | Significant Other
Observable Inputs
(Level 2) | | Significant
Unobservable
Inputs
(Level 3) | | Value at
3/31/2023 |
Frontier Emerging Small Countries Fund | | | | | | | | | | | | | | | | | | | | |
Assets | | | | | | | | | | | | | | | | | | | | | | |
Common Stocks | | | | | | | | | | | | | | | | | | | | | | |
| | Application Software | | | $ | — | | | | $ | 329,265 | | | | $ | — | | | | $ | 329,265 | |
| | Asset Management & Custody Banks | | | | — | | | | | 1,330,016 | | | | | — | | | | | 1,330,016 | |
| | Commercial & Residential Mortgage Finance | | | | — | | | | | 307,780 | | | | | — | | | | | 307,780 | |
| | Consumer Finance | | | | — | | | | | 2,832,862 | | | | | — | | | | | 2,832,862 | |
| | Diversified Banks | | | | 1,886,525 | | | | | 2,510,318 | | | | | — | | | | | 4,396,843 | |
| | Drug Retail | | | | 882,785 | | | | | 349,316 | | | | | — | | | | | 1,232,101 | |
| | Food Retail | | | | — | | | | | 677,322 | | | | | — | | | | | 677,322 | |
| | Health Care Facilities | | | | — | | | | | 550,883 | | | | | — | | | | | 550,883 | |
| | Home Improvement Retail | | | | — | | | | | 1,588,622 | | | | | — | | | | | 1,588,622 | |
| | Interactive Media & Services | | | | — | | | | | 212,241 | | | | | — | | | | | 212,241 | |
| | IT Consulting & Other Services | | | | 1,021,454 | | | | | 2,922,728 | | | | | — | | | | | 3,944,182 | |
| | Life & Health Insurance | | | | — | | | | | 1,728,959 | | | | | — | | | | | 1,728,959 | |
| | Research & Consulting Services | | | | — | | | | | 886,047 | | | | | — | | | | | 886,047 | |
| | Semiconductors | | | | — | | | | | 1,506,339 | | | | | — | | | | | 1,506,339 | |
| | Transaction & Payment Processing Services | | | | 420,569 | | | | | 525,831 | | | | | — | | | | | 946,400 | |
| | Other | | | | 12,901,806 | | | | | — | | | | | — | | | | | 12,901,806 | |
| | | | | | | | | | | | | | | | | | | | | | |
| | | | | $ | 17,113,139 | | | | $ | 18,258,529 | | | | $ | — | | | | $ | 35,371,668 | |
| | | | | | | |
Global Opportunities Fund | | | | | | | | | | | | | | | | | | | | | | |
Assets | | | | | | | | | | | | | | | | | | | | | | |
Common Stocks | | | | | | | | | | | | | | | | | | | | | | |
| | Application Software | | | $ | 7,591,840 | | | | $ | 3,940,950 | | | | $ | — | | | | $ | 11,532,790 | |
| | Asset Management & Custody Banks | | | | 5,525,468 | | | | | 866,143 | | | | | — | | | | | 6,391,611 | |
| | Commercial & Residential Mortgage Finance | | | | — | | | | | 2,683,397 | | | | | — | | | | | 2,683,397 | |
| | Diversified Real Estate Activities | | | | — | | | | | 1,495,735 | | | | | — | | | | | 1,495,735 | |
| | Drug Retail | | | | — | | | | | 1,243,530 | | | | | — | | | | | 1,243,530 | |
| | Electrical Components & Equipment | | | | — | | | | | 4,948,176 | | | | | — | | | | | 4,948,176 | |
| | Health Care Equipment | | | | — | | | | | 1,135,912 | | | | | — | | | | | 1,135,912 | |
| | Health Care Services | | | | — | | | | | 1,924,322 | | | | | — | | | | | 1,924,322 | |
| | Health Care Technology | | | | — | | | | | 2,963,204 | | | | | — | | | | | 2,963,204 | |
| | Human Resource & Employment Services | | | | — | | | | | 2,067,241 | | | | | — | | | | | 2,067,241 | |
| | IT Consulting & Other Services | | | | 7,140,152 | | | | | 6,763,034 | | | | | — | | | | | 13,903,186 | |
| | Regional Banks | | | | 3,757,691 | | | | | 7,070,824 | | | | | — | | | | | 10,828,515 | |
| | Research & Consulting Services | | | | — | | | | | 12,364,604 | | | | | — | | | | | 12,364,604 | |
| | Restaurants | | | | — | | | | | 715,361 | | | | | — | | | | | 715,361 | |
| | Semiconductors | | | | 3,316,578 | | | | | 11,537,697 | | | | | — | | | | | 14,854,275 | |
| | Systems Software | | | | 3,198,587 | | | | | 1,715,592 | | | | | — | | | | | 4,914,179 | |
| | Trading Companies & Distributors | | | | — | | | | | 3,319,295 | | | | | — | | | | | 3,319,295 | |
| | Transaction & Payment Processing Services | | | | 1,965,300 | | | | | 1,575,708 | | | | | — | | | | | 3,541,008 | |
| | Other | | | | 81,709,563 | | | | | — | | | | | — | | | | | 81,709,563 | |
| | | | | | | | | | | | | | | | | | | | | | |
| | | | | $ | 114,205,179 | | | | $ | 68,330,725 | | | | $ | — | | | | $ | 182,535,904 | |
| | | | | | | |
139
Notes to Financial Statements (continued)
| | | | | | | | | | | | | | | | | | | | | | |
| Fund | | Category | | Quoted Prices
In Active
Markets
For Identical
Investments
(Level 1) | | Significant Other
Observable Inputs
(Level 2) | | Significant
Unobservable
Inputs
(Level 3) | | Value at
3/31/2023 |
Global Select Fund | | | | | | | | | | | | | | | | | | | | | | |
Assets | | | | | | | | | | | | | | | | | | | | | | |
Common Stocks | | | | | | | | | | | | | | | | | | | | | | |
| | Application Software | | | $ | 1,166,254 | | | | $ | 654,119 | | | | $ | — | | | | $ | 1,820,373 | |
| | Building Products | | | | 299,613 | | | | | 456,917 | | | | | — | | | | | 756,530 | |
| | Consumer Finance | | | | — | | | | | 398,720 | | | | | — | | | | | 398,720 | |
| | Diversified Banks | | | | — | | | | | 560,994 | | | | | — | | | | | 560,994 | |
| | Drug Retail | | | | — | | | | | 464,227 | | | | | — | | | | | 464,227 | |
| | Health Care Equipment | | | | — | | | | | 255,235 | | | | | — | | | | | 255,235 | |
| | Health Care Supplies | | | | — | | | | | 379,333 | | | | | — | | | | | 379,333 | |
| | Health Care Technology | | | | — | | | | | 284,357 | | | | | — | | | | | 284,357 | |
| | Hotels, Resorts & Cruise Lines | | | | — | | | | | 518,354 | | | | | — | | | | | 518,354 | |
| | Research & Consulting Services | | | | — | | | | | 742,344 | | | | | — | | | | | 742,344 | |
| | Semiconductor Equipment | | | | — | | | | | 248,751 | | | | | — | | | | | 248,751 | |
| | Semiconductors | | | | 367,396 | | | | | 260,678 | | | | | — | | | | | 628,074 | |
| | Specialized Finance | | | | — | | | | | 287,555 | | | | | — | | | | | 287,555 | |
| | Other | | | | 7,173,666 | | | | | — | | | | | — | | | | | 7,173,666 | |
| | | | | | | | | | | | | | | | | | | | | | |
| | | | | $ | 9,006,929 | | | | $ | 5,511,584 | | | | $ | — | | | | $ | 14,518,513 | |
| | | | | | | |
Global Value Fund | | | | | | | | | | | | | | | | | | | | | | |
Assets | | | | | | | | | | | | | | | | | | | | | | |
Common Stocks | | | | | | | | | | | | | | | | | | | | | | |
| | Aerospace & Defense | | | $ | — | | | | $ | 2,903,069 | | | | $ | — | | | | $ | 2,903,069 | |
| | Casinos & Gaming | | | | — | | | | | 3,412,794 | | | | | — | | | | | 3,412,794 | |
| | Diversified Banks | | | | 12,354,790 | | | | | 4,710,098 | | | | | — | | | | | 17,064,888 | |
| | Diversified Metals & Mining | | | | — | | | | | 2,371,045 | | | | | — | | | | | 2,371,045 | |
| | Electronic Manufacturing Services | | | | — | | | | | 3,337,420 | | | | | — | | | | | 3,337,420 | |
| | Food Retail | | | | — | | | | | 8,015,909 | | | | | — | | | | | 8,015,909 | |
| | Industrial Conglomerates | | | | — | | | | | 1,477,171 | | | | | — | | | | | 1,477,171 | |
| | Industrial REITs | | | | — | | | | | 3,392,277 | | | | | — | | | | | 3,392,277 | |
| | Integrated Oil & Gas | | | | 3,182,316 | | | | | 7,311,495 | | | | | — | | | | | 10,493,811 | |
| | Multi-Line Insurance | | | | — | | | | | 3,509,521 | | | | | — | | | | | 3,509,521 | |
| | Pharmaceuticals | | | | 12,275,320 | | | | | 12,621,643 | | | | | — | | | | | 24,896,963 | |
| | Reinsurance | | | | — | | | | | 5,943,802 | | | | | — | | | | | 5,943,802 | |
| | Technology Hardware, Storage & Peripherals | | | | — | | | | | 3,239,038 | | | | | — | | | | | 3,239,038 | |
| | Tobacco | | | | — | | | | | 5,141,433 | | | | | — | | | | | 5,141,433 | |
| | Other | | | | 49,206,130 | | | | | — | | | | | — | | | | | 49,206,130 | |
| | | | | | | | | | | | | | | | | | | | | | |
| | | | | $ | 77,018,556 | | | | $ | 67,386,715 | | | | $ | — | | | | $ | 144,405,271 | |
| | | | | | | |
140
| | |
| | | MARCH 31, 2023 (Unaudited) |
| | | | | | | | | | | | | | | | | | | | | | |
| Fund | | Category | | Quoted Prices
In Active
Markets
For Identical
Investments
(Level 1) | | Significant Other
Observable Inputs
(Level 2) | | Significant
Unobservable
Inputs
(Level 3) | | Value at
3/31/2023 |
Greater China Fund | | | | | | | | | | | | | | | | | | | | | | |
Assets | | | | | | | | | | | | | | | | | | | | | | |
Common Stocks | | | | | | | | | | | | | | | | | | | | | | |
| | Apparel, Accessories & Luxury Goods | | | $ | — | | | | $ | 76,578 | | | | $ | — | | | | $ | 76,578 | |
| | Application Software | | | | — | | | | | 263,093 | | | | | — | | | | | 263,093 | |
| | Construction Materials | | | | — | | | | | 31,618 | | | | | — | | | | | 31,618 | |
| | Distillers & Vintners | | | | — | | | | | 368,465 | | | | | — | | | | | 368,465 | |
| | Diversified Banks | | | | — | | | | | 58,397 | | | | | — | | | | | 58,397 | |
| | Drug Retail | | | | — | | | | | 190,294 | | | | | — | | | | | 190,294 | |
| | Electrical Components & Equipment | | | | — | | | | | 165,736 | | | | | — | | | | | 165,736 | |
| | Electronic Components | | | | — | | | | | 271,595 | | | | | — | | | | | 271,595 | |
| | Health Care Equipment | | | | — | | | | | 222,324 | | | | | — | | | | | 222,324 | |
| | Hotels, Resorts & Cruise Lines | | | | — | | | | | 336,773 | | | | | — | | | | | 336,773 | |
| | Industrial Machinery & Supplies & Components | | | | — | | | | | 668,667 | | | | | — | | | | | 668,667 | |
| | Interactive Media & Services | | | | — | | | | | 254,120 | | | | | — | | | | | 254,120 | |
| | Life & Health Insurance | | | | — | | | | | 361,774 | | | | | — | | | | | 361,774 | |
| | Life Sciences Tools & Services | | | | — | | | | | 402,288 | | | | | — | | | | | 402,288 | |
| | Other Specialty Retail | | | | — | | | | | 173,576 | | | | | — | | | | | 173,576 | |
| | Packaged Foods & Meats | | | | — | | | | | 273,514 | | | | | — | | | | | 273,514 | |
| | Personal Care Products | | | | — | | | | | 203,885 | | | | | — | | | | | 203,885 | |
| | Regional Banks | | | | — | | | | | 139,024 | | | | | — | | | | | 139,024 | |
| | Restaurants | | | | — | | | | | 168,723 | | | | | — | | | | | 168,723 | |
| | Semiconductors | | | | — | | | | | 780,183 | | | | | — | | | | | 780,183 | |
| | Specialized Finance | | | | — | | | | | 293,733 | | | | | — | | | | | 293,733 | |
| | Systems Software | | | | — | | | | | 203,424 | | | | | — | | | | | 203,424 | |
| | | | | | | | | | | | | | | | | | | | | | |
| | | | | $ | — | | | | $ | 5,907,784 | | | | $ | — | | | | $ | 5,907,784 | |
| | | | | | | |
International Growth Fund | | | | | | | | | | | | | | | | | | | | | | |
Assets | | | | | | | | | | | | | | | | | | | | | | |
Common Stocks | | | | | | | | | | | | | | | | | | | | | | |
| | Application Software | | | $ | 36,561,552 | | | | $ | 24,552,626 | | | | $ | — | | | | $ | 61,114,178 | |
| | Asset Management & Custody Banks | | | | — | | | | | 9,716,668 | | | | | — | | | | | 9,716,668 | |
| | Brewers | | | | — | | | | | 3,370,130 | | | | | — | | | | | 3,370,130 | |
| | Broadline Retail | | | | — | | | | | 2,523,373 | | | | | — | | | | | 2,523,373 | |
| | Commercial & Residential Mortgage Finance | | | | — | | | | | 13,915,170 | | | | | — | | | | | 13,915,170 | |
| | Commodity Chemicals | | | | — | | | | | 2,309,894 | | | | | — | | | | | 2,309,894 | |
| | Construction & Engineering | | | | — | | | | | 8,831,602 | | | | | — | | | | | 8,831,602 | |
| | Diversified Real Estate Activities | | | | — | | | | | 8,341,459 | | | | | — | | | | | 8,341,459 | |
| | Drug Retail | | | | 2,725,537 | | | | | 26,400,395 | | | | | — | | | | | 29,125,932 | |
| | Electrical Components & Equipment | | | | — | | | | | 15,977,538 | | | | | — | | | | | 15,977,538 | |
| | Electronic Equipment & Instruments | | | | — | | | | | 12,636,561 | | | | | — | | | | | 12,636,561 | |
| | Health Care Equipment | | | | — | | | | | 8,682,737 | | | | | — | | | | | 8,682,737 | |
| | Health Care Services | | | | — | | | | | 4,263,659 | | | | | — | | | | | 4,263,659 | |
| | Health Care Supplies | | | | — | | | | | 4,933,829 | | | | | — | | | | | 4,933,829 | |
| | Health Care Technology | | | | — | | | | | 15,648,727 | | | | | — | | | | | 15,648,727 | |
| | Human Resource & Employment Services | | | | — | | | | | 17,914,716 | | | | | — | | | | | 17,914,716 | |
| | Industrial Machinery & Supplies & Components | | | | — | | | | | 9,761,943 | | | | | — | | | | | 9,761,943 | |
| | Interactive Media & Services | | | | — | | | | | 10,533,752 | | | | | — | | | | | 10,533,752 | |
| | IT Consulting & Other Services | | | | 13,826,554 | | | | | 22,464,544 | | | | | — | | | | | 36,291,098 | |
| | Movies & Entertainment | | | | — | | | | | 12,950,097 | | | | | — | | | | | 12,950,097 | |
| | Pharmaceuticals | | | | — | | | | | 3,677,714 | | | | | — | | | | | 3,677,714 | |
| | Publishing | | | | — | | | | | 4,145,173 | | | | | — | | | | | 4,145,173 | |
| | Regional Banks | | | | 13,651,598 | | | | | 11,973,577 | | | | | — | | | | | 25,625,175 | |
| | Research & Consulting Services | | | | — | | | | | 27,331,367 | | | | | — | | | | | 27,331,367 | |
| | Restaurants | | | | — | | | | | 2,553,311 | | | | | — | | | | | 2,553,311 | |
| | Semiconductor Equipment | | | | — | | | | | 1,731,179 | | | | | — | | | | | 1,731,179 | |
| | Semiconductors | | | | — | | | | | 38,688,326 | | | | | — | | | | | 38,688,326 | |
| | Soft Drinks & Non-Alcoholic Beverages | | | | — | | | | | 2,085,583 | | | | | — | | | | | 2,085,583 | |
| | Specialty Chemicals | | | | — | | | | | 9,798,159 | | | | | — | | | | | 9,798,159 | |
| | Trading Companies & Distributors | | | | — | | | | | 34,227,024 | | | | | — | | | | | 34,227,024 | |
| | Transaction & Payment Processing Services | | | | — | | | | | 11,177,142 | | | | | — | | | | | 11,177,142 | |
| | Other | | | | 90,570,677 | | | | | — | | | | | — | | | | | 90,570,677 | |
| | | | | | | | | | | | | | | | | | | | | | |
| | | | | $ | 157,335,918 | | | | $ | 383,117,975 | | | | $ | — | | | | $ | 540,453,893 | |
| | | | | | | |
141
Notes to Financial Statements (continued)
| | | | | | | | | | | | | | | | | | | | | | |
| Fund | | Category | | Quoted Prices
In Active
Markets
For Identical
Investments
(Level 1) | | Significant Other
Observable Inputs
(Level 2) | | Significant
Unobservable
Inputs
(Level 3) | | Value at
3/31/2023 |
International Opportunities Fund | | | | | | | | | | | | | | | | | | | | | | |
Assets | | | | | | | | | | | | | | | | | | | | | | |
Common Stocks | | | | | | | | | | | | | | | | | | | | | | |
| | Advertising | | | $ | — | | | | $ | 14,466,254 | | | | $ | — | | | | $ | 14,466,254 | |
| | Air Freight & Logistics | | | | — | | | | | 8,461,907 | | | | | — | | | | | 8,461,907 | |
| | Alternative Carriers | | | | — | | | | | 7,945,041 | | | | | — | | | | | 7,945,041 | |
| | Application Software | | | | 7,353,979 | | | | | 49,239,214 | | | | | — | | | | | 56,593,193 | |
| | Asset Management & Custody Banks | | | | — | | | | | 11,930,905 | | | | | — | | | | | 11,930,905 | |
| | Brewers | | | | — | | | | | 2,955,282 | | | | | — | | | | | 2,955,282 | |
| | Commercial & Residential Mortgage Finance | | | | 7,028,120 | | | | | 5,999,620 | | | | | — | | | | | 13,027,740 | |
| | Commodity Chemicals | | | | — | | | | | 7,837,076 | | | | | — | | | | | 7,837,076 | |
| | Construction & Engineering | | | | — | | | | | 9,824,793 | | | | | — | | | | | 9,824,793 | |
| | Consumer Finance | | | | 2,724,371 | | | | | 8,848,343 | | | | | — | | | | | 11,572,714 | |
| | Diversified Banks | | | | — | | | | | 4,069,394 | | | | | — | | | | | 4,069,394 | |
| | Diversified Support Services | | | | 4,933,802 | | | | | 16,688,927 | | | | | — | | | | | 21,622,729 | |
| | Drug Retail | | | | — | | | | | 4,356,101 | | | | | — | | | | | 4,356,101 | |
| | Electrical Components & Equipment | | | | — | | | | | 17,353,082 | | | | | — | | | | | 17,353,082 | |
| | Electronic Equipment & Instruments | | | | — | | | | | 2,639,682 | | | | | — | | | | | 2,639,682 | |
| | Food Retail | | | | — | | | | | 7,936,738 | | | | | — | | | | | 7,936,738 | |
| | Health Care Services | | | | — | | | | | 9,942,890 | | | | | — | | | | | 9,942,890 | |
| | Health Care Technology | | | | — | | | | | 19,136,637 | | | | | — | | | | | 19,136,637 | |
| | Hotels, Resorts & Cruise Lines | | | | — | | | | | 1,221,921 | | | | | — | | | | | 1,221,921 | |
| | Human Resource & Employment Services | | | | — | | | | | 4,765,889 | | | | | — | | | | | 4,765,889 | |
| | Industrial Machinery & Supplies & Components | | | | — | | | | | 6,362,505 | | | | | — | | | | | 6,362,505 | |
| | Interactive Media & Services | | | | 7,166,339 | | | | | 5,080,538 | | | | | — | | | | | 12,246,877 | |
| | Investment Banking & Brokerage | | | | 2,283,129 | | | | | 5,059,025 | | | | | — | | | | | 7,342,154 | |
| | IT Consulting & Other Services | | | | — | | | | | 28,785,033 | | | | | — | | | | | 28,785,033 | |
| | Life Sciences Tools & Services | | | | — | | | | | 3,414,032 | | | | | — | | | | | 3,414,032 | |
| | Metal, Glass & Plastic Containers | | | | — | | | | | 2,924,818 | | | | | — | | | | | 2,924,818 | |
| | Movies & Entertainment | | | | — | | | | | 2,427,473 | | | | | — | | | | | 2,427,473 | |
| | Other Specialty Retail | | | | 1,930,539 | | | | | 1,601,013 | | | | | — | | | | | 3,531,552 | |
| | Packaged Foods & Meats | | | | — | | | | | 1,841,612 | | | | | — | | | | | 1,841,612 | |
| | Pharmaceuticals | | | | — | | | | | 1,769,664 | | | | | — | | | | | 1,769,664 | |
| | Publishing | | | | — | | | | | 5,548,418 | | | | | — | | | | | 5,548,418 | |
| | Research & Consulting Services | | | | 3,999,914 | | | | | 22,257,469 | | | | | — | | | | | 26,257,383 | |
| | Restaurants | | | | — | | | | | — | | | | | 7,772 | | | | | 7,772 | |
| | Semiconductor Equipment | | | | — | | | | | 6,380,720 | | | | | — | | | | | 6,380,720 | |
| | Semiconductors | | | | — | | | | | 15,134,783 | | | | | — | | | | | 15,134,783 | |
| | Specialized Finance | | | | — | | | | | 2,822,371 | | | | | — | | | | | 2,822,371 | |
| | Other | | | | 17,182,665 | | | | | — | | | | | — | | | | | 17,182,665 | |
| | | | | | | | | | | | | | | | | | | | | | |
| | | | | $ | 54,602,858 | | | | $ | 327,029,170 | | | | $ | 7,772 | | | | $ | 381,639,800 | |
| | | | | | | |
International Select Fund | | | | | | | | | | | | | | | | | | | | | | |
Assets | | | | | | | | | | | | | | | | | | | | | | |
Common Stocks | | | | | | | | | | | | | | | | | | | | | | |
| | Apparel, Accessories & Luxury Goods | | | $ | — | | | | $ | 293,662 | | | | $ | — | | | | $ | 293,662 | |
| | Application Software | | | | 209,201 | | | | | 385,486 | | | | | — | | | | | 594,687 | |
| | Asset Management & Custody Banks | | | | — | | | | | 149,734 | | | | | — | | | | | 149,734 | |
| | Building Products | | | | — | | | | | 258,303 | | | | | — | | | | | 258,303 | |
| | Drug Retail | | | | — | | | | | 184,831 | | | | | — | | | | | 184,831 | |
| | Electronic Equipment & Instruments | | | | — | | | | | 222,481 | | | | | — | | | | | 222,481 | |
| | Health Care Equipment | | | | — | | | | | 145,743 | | | | | — | | | | | 145,743 | |
| | Health Care Supplies | | | | — | | | | | 190,786 | | | | | — | | | | | 190,786 | |
| | Health Care Technology | | | | — | | | | | 169,955 | | | | | — | | | | | 169,955 | |
| | Hotels, Resorts & Cruise Lines | | | | — | | | | | 316,031 | | | | | — | | | | | 316,031 | |
| | Industrial Machinery & Supplies & Components | | | | — | | | | | 172,079 | | | | | — | | | | | 172,079 | |
| | Interactive Media & Services | | | | — | | | | | 314,492 | | | | | — | | | | | 314,492 | |
| | IT Consulting & Other Services | | | | 124,283 | | | | | 174,233 | | | | | — | | | | | 298,516 | |
| | Life Sciences Tools & Services | | | | 245,842 | | | | | 67,802 | | | | | — | | | | | 313,644 | |
| | Research & Consulting Services | | | | — | | | | | 323,841 | | | | | — | | | | | 323,841 | |
| | Transaction & Payment Processing Services | | | | — | | | | | 351,194 | | | | | — | | | | | 351,194 | |
| | Other | | | | 820,305 | | | | | — | | | | | — | | | | | 820,305 | |
| | | | | | | | | | | | | | | | | | | | | | |
| | | | | $ | 1,399,631 | | | | $ | 3,720,653 | | | | $ | — | | | | $ | 5,120,284 | |
| | | | | | | |
142
| | |
| | | MARCH 31, 2023 (Unaudited) |
| | | | | | | | | | | | | | | | | | | | | | |
| Fund | | Category | | Quoted Prices
In Active Markets
For Identical
Investments
(Level 1) | | Significant Other
Observable Inputs
(Level 2) | | Significant
Unobservable
Inputs
(Level 3) | | Value at
3/31/2023 |
Long/Short Alpha Fund | | | | | | | | | | | | | | | | | | | | | | |
Assets | | | | | | | | | | | | | | | | | | | | | | |
Common Stocks | | | | | $ | 31,311,757 | | | | $ | — | | | | $ | — | | | | $ | 31,311,757 | |
| | | | | | | | | | | | | | | | | | | | | | |
| | | | | $ | 31,311,757 | | | | $ | — | | | | $ | — | | | | $ | 31,311,757 | |
| | | | | | | |
Liabilities | | | | | | | | | | | | | | | | | | | | | | |
Securities Sold Short | | | | | $ | (9,778,644 | ) | | | $ | — | | | | $ | — | | | | $ | (9,778,644 | ) |
| | | | | | | |
Micro Cap Fund | | | | | | | | | | | | | | | | | | | | | | |
Assets | | | | | | | | | | | | | | | | | | | | | | |
Common Stocks | | | | | $ | 613,077,214 | | | | $ | — | | | | $ | — | | | | $ | 613,077,214 | |
Preferred Stocks | | | | | | — | | | | | — | | | | | 10,183,374 | | | | | 10,183,374 | |
Warrants | | | | | | — | | | | | — | | | | | 661,535 | | | | | 661,535 | |
| | | | | | | | | | | | | | | | | | | | | | |
| | | | | $ | 613,077,214 | | | | $ | — | | | | $ | 10,844,909 | | | | $ | 623,922,123 | |
| | | | | | | |
Micro Cap Value Fund | | | | | | | | | | | | | | | | | | | | | | |
Assets | |
Common Stocks | |
| | Asset Management & Custody Banks | | | $ | — | | | | $ | 3,255,371 | | | | $ | — | | | | $ | 3,255,371 | |
| | Health Care Technology | | | | 3,247,860 | | | | | 7,955,593 | | | | | — | | | | | 11,203,453 | |
| | Life Sciences Tools & Services | | | | 1,651,895 | | | | | 2,494,238 | | | | | — | | | | | 4,146,133 | |
| | Packaged Foods & Meats | | | | — | | | | | 4,143,308 | | | | | — | | | | | 4,143,308 | |
| | Other | | | | 267,440,023 | | | | | — | | | | | — | | | | | 267,440,023 | |
Limited Liability Company Membership Interest | | | | | | — | | | | | — | | | | | 505 | | | | | 505 | |
Warrants | | | | | | — | | | | | — | | | | | — | | | | | — | |
| | | | | | | | | | | | | | | | | | | | | | |
| | | | | $ | 272,339,778 | | | | $ | 17,848,510 | | | | $ | 505 | | | | $ | 290,188,793 | |
| | | | | | | |
Small Cap Growth Fund | | | | | | | | | | | | | | | | | | | | | | |
Assets | |
Common Stocks | | | | | $ | 2,079,812,970 | | | | $ | — | | | | $ | — | | | | $ | 2,079,812,970 | |
Preferred Stocks | | | | | | — | | | | | — | | | | | 26,382,800 | | | | | 26,382,800 | |
Warrants | | | | | | — | | | | | — | | | | | 1,599,404 | | | | | 1,599,404 | |
| | | | | | | | | | | | | | | | | | | | | | |
| | | | | $ | 2,079,812,970 | | | | $ | — | | | | $ | 27,982,204 | | | | $ | 2,107,795,174 | |
| | | | | | | |
Small Cap Value Fund | | | | | | | | | | | | | | | | | | | | | | |
Assets | |
Common Stocks | | | | | $ | 1,377,333,000 | | | | $ | — | | | | $ | — | | | | $ | 1,377,333,000 | |
| | | | | | | | | | | | | | | | | | | | | | |
| | | | | $ | 1,377,333,000 | | | | $ | — | | | | $ | — | | | | $ | 1,377,333,000 | |
| | | | | | | |
Ultra Growth Fund | | | | | | | | | | | | | | | | | | | | | | |
Assets | |
Common Stocks | | | | | $ | 1,356,071,250 | | | | $ | — | | | | $ | — | | | | $ | 1,356,071,250 | |
Preferred Stocks | | | | | | — | | | | | — | | | | | 15,510,434 | | | | | 15,510,434 | |
Warrants | | | | | | — | | | | | — | | | | | 1,972,093 | | | | | 1,972,093 | |
| | | | | | | | | | | | | | | | | | | | | | |
| | | | | $ | 1,356,071,250 | | | | $ | — | | | | $ | 17,482,527 | | | | $ | 1,373,553,777 | |
| | | | | | | |
U.S. Select Fund | | | | | | | | | | | | | | | | | | | | | | |
Assets | |
Common Stocks | | | | | $ | 9,545,362 | | | | $ | — | | | | $ | — | | | | $ | 9,545,362 | |
| | | | | | | | | | | | | | | | | | | | | | |
| | | | | $ | 9,545,362 | | | | $ | — | | | | $ | — | | | | $ | 9,545,362 | |
| | | | | | | |
U.S. Treasury Fund | | | | | | | | | | | | | | | | | | | | | | |
Assets | |
U.S Government Obligations | | | | | $ | — | | | | $ | 272,348,912 | | | | $ | — | | | | $ | 272,348,912 | |
| | | | | | | | | | | | | | | | | | | | | | |
| | | | | $ | — | | | | $ | 272,348,912 | | | | $ | — | | | | $ | 272,348,912 | |
| | | | | | | |
143
Notes to Financial Statements (continued)
If the securities of an Asset Class are all the same level, the asset class is shown in total. If the securities of an Asset Class cross levels, the level with the smallest number of categories and with multiple levels within a category is displayed by category. The remaining categories that do not cross levels are combined into the “Other” category.
The valuation techniques used by the Funds to measure fair value for the six months ended March 31, 2023 maximized the use of observable inputs and minimized the use of unobservable inputs.
The following is a reconciliation of the fair valuations using significant unobservable inputs (Level 3) for the Funds during the six months ended March 31, 2023:
| | | | | | | | | | | | | | | | | | | | | | | | | | | | | | | | | | | | | | | | | | | | | | | | | | |
| Fund | | Market Value
Beginning
Balance
9/30/2022 | | Purchases
At Cost | | Sales
(Proceeds) | | Accrued
Discounts
(Premiums) | | Realized
Gain/
(Loss) | | Change in
Unrealized
Appreciation
(Depreciation) | | Transfers
In at
Market
Value | | Transfers
Out at
Market
Value | | Market Value
Ending
Balance
3/31/2023 | | Net Change
In Unrealized
Appreciation
(Depreciation)
On Investments
Held At
3/31/2023 |
Core Growth Fund | | | | | | | | | | | | | | | | | | | | | | | | | | | | | | | | | | | | | | | | | | | | | | | | | | |
Warrants | | | $ | 1,058,400 | | | | $ | — | | | | $ | — | | | | $ | — | | | | $ | — | | | | $ | (118,800 | ) | | | $ | — | | | | $ | — | | | | $ | 939,600 | | | | $ | (118,800 | ) |
| | | | | |
| | | $ | 1,058,400 | | | | $ | — | | | | $ | — | | | | $ | — | | | | $ | — | | | | $ | (118,800 | ) | | | $ | — | | | | $ | — | | | | $ | 939,600 | | | | $ | (118,800 | ) |
| | | | | |
Emerging Markets Small Cap Fund | | | | | | | | | | | | | | | | | | | | | | | | | | | | | | | | | | | | | | | | | | | | | | | | | | |
Common Stocks | | | $ | 16,583 | | | | $ | — | | | | $ | — | | | | $ | — | | | | $ | (8,933,975 | ) | | | $ | 8,917,392 | | | | $ | — | | | | $ | — | | | | $ | — | | | | $ | — | |
| | | | | |
| | | $ | 16,583 | | | | $ | — | | | | $ | — | | | | $ | — | | | | $ | (8,933,975 | ) | | | $ | 8,917,392 | | | | $ | — | | | | $ | — | | | | $ | — | | | | $ | — | |
| | | | | |
International Opportunities Fund | | | | | | | | | | | | | | | | | | | | | | | | | | | | | | | | | | | | | | | | | | | | | | | | | | |
Common Stocks | | | $ | 7,035 | | | | $ | — | | | | $ | — | | | | $ | — | | | | $ | — | | | | $ | 737 | | | | $ | — | | | | $ | — | | | | $ | 7,772 | | | | $ | 737 | |
| | | | | |
| | | $ | 7,035 | | | | $ | — | | | | $ | — | | | | $ | — | | | | $ | — | | | | $ | 737 | | | | $ | — | | | | $ | — | | | | $ | 7,772 | | | | $ | 737 | |
| | | | | |
Micro Cap Fund | | | | | | | | | | | | | | | | | | | | | | | | | | | | | | | | | | | | | | | | | | | | | | | | | | |
Preferred Stocks | | | $ | 7,650,264 | | | | $ | — | | | | $ | — | | | | $ | — | | | | $ | — | | | | $ | 2,533,110 | | | | $ | — | | | | $ | — | | | | $ | 10,183,374 | | | | $ | 2,533,110 | |
Warrants | | | | 437,502 | | | | | 302,643 | | | | | (9,855 | ) | | | | — | | | | | (269,462 | ) | | | | 200,707 | | | | | — | | | | | — | | | | | 661,535 | | | | | (42,131 | ) |
| | | | | |
| | | $ | 8,087,766 | | | | $ | 302,643 | | | | $ | (9,855 | ) | | | $ | — | | | | $ | (269,462 | ) | | | $ | 2,733,817 | | | | $ | — | | | | $ | — | | | | $ | 10,844,909 | | | | $ | 2,490,979 | |
| | | | | |
Micro Cap Value Fund | | | | | | | | | | | | | | | | | | | | | | | | | | | | | | | | | | | | | | | | | | | | | | | | | | |
Common Stocks | | | $ | 21,222 | | | | $ | — | | | | $ | — | | | | $ | — | | | | $ | — | | | | $ | (20,717 | ) | | | $ | — | | | | $ | — | | | | $ | 505 | | | | $ | (20,717 | ) |
Warrants | | | | — | | | | | — | | | | | — | | | | | — | | | | | — | | | | | — | | | | | — | | | | | — | | | | | — | | | | | — | |
| | | | | |
| | | $ | 21,222 | | | | $ | — | | | | $ | — | | | | $ | — | | | | $ | — | | | | $ | (20,717 | ) | | | $ | — | | | | $ | — | | | | $ | 505 | | | | $ | (20,717 | ) |
| | | | | |
Small Cap Growth Fund | | | | | | | | | | | | | | | | | | | | | | | | | | | | | | | | | | | | | | | | | | | | | | | | | | |
Preferred Stocks | | | $ | 24,067,171 | | | | $ | — | | | | $ | — | | | | $ | — | | | | $ | — | | | | $ | 2,315,629 | | | | $ | — | | | | $ | — | | | | $ | 26,382,800 | | | | $ | 2,315,629 | |
Warrants | | | | 695,813 | | | | | 872,267 | | | | | — | | | | | — | | | | | — | | | | | 31,324 | | | | | — | | | | | — | | | | | 1,599,404 | | | | | 31,324 | |
| | | | | |
| | | $ | 24,762,984 | | | | $ | 872,267 | | | | $ | — | | | | $ | — | | | | $ | — | | | | $ | 2,346,953 | | | | $ | — | | | | $ | — | | | | $ | 27,982,204 | | | | $ | 2,346,953 | |
| | | | | |
Ultra Growth Fund | | | | | | | | | | | | | | | | | | | | | | | | | | | | | | | | | | | | | | | | | | | | | | | | | | |
Preferred Stocks | | | $ | 11,622,503 | | | | $ | — | | | | $ | — | | | | $ | — | | | | $ | — | | | | $ | 3,887,931 | | | | $ | — | | | | $ | — | | | | $ | 15,510,434 | | | | $ | 3,887,931 | |
Warrants | | | | 1,497,779 | | | | | 597,934 | | | | | — | | | | | — | | | | | — | | | | | (123,620 | ) | | | | — | | | | | — | | | | | 1,972,093 | | | | | (123,620 | ) |
| | | | | |
| | | $ | 13,120,282 | | | | $ | 597,934 | | | | $ | — | | | | $ | — | | | | $ | — | | | | $ | 3,764,311 | | | | $ | — | | | | $ | — | | | | $ | 17,482,527 | | | | $ | 3,764,311 | |
| | | | | |
144
| | |
| | | MARCH 31, 2023 (Unaudited) |
QUANTITATIVE INFORMATION ABOUT LEVEL 3 FAIR VALUE MEASUREMENTS
| | | | | | | | | | | | | | |
| Fund | | Description | | Fair Value
At 3/31/2023 | | | Valuation Technique | | Unobservable Input | | Range (Average) | |
| Core Growth Fund | | Warrant: Insurance Brokers | | $939,600 | | | | Discount for lack of marketability | | Discount for lack of marketability | | | 20% | |
| Micro Cap Fund | | Direct Venture Capital Investments: Textiles | | $ | 10,183,374 | | | Market comparable companies | | EV/R* multiple
Discount for lack of marketability | |
| 0.5 - 5.2 (3.1)
46% |
|
| Micro Cap Fund | | Warrant: Pharmaceuticals | | $661,535 | | | | Black Scholes | | Black Scholes | | | 100% | |
| Small Cap Growth Fund | | Direct Venture Capital Investments: Textiles | | $ | 18,330,038 | | | Market comparable companies | | EV/R* multiple
Discount for lack of marketability | |
| 0.5 - 5.2 (3.1)
46% |
|
| Small Cap Growth Fund | | Direct Venture Capital Investments: Semiconductor Equipment | | $941,550 | | | | Market comparable companies | | EV/R* multiple
Discount for lack of marketability | |
| 2.8 - 22.9 (13.2)
21% |
|
| Small Cap Growth Fund | | Direct Venture Capital Investments: Systems Software | | $7,111,212 | | | | Market comparable companies | | EV/R* multiple
Discount for lack of marketability | |
| 3.1 - 14.5 (7.0)
27% |
|
| Small Cap Growth Fund | | Warrant: Pharmaceuticals | | $1,599,404 | | | | Black Scholes | | Black Scholes | | | 100% | |
| Ultra Growth Fund | | Direct Venture Capital Investments: Semiconductor Equipment | | $235,388 | | | | Market comparable companies | | EV/R* multiple
Discount for lack of marketability | |
| 2.8 - 22.9 (13.2)
21% |
|
| Ultra Growth Fund | | Direct Venture Capital Investments: Textiles | | $ | 15,275,046 | | | Market comparable companies | | EV/R* multiple
Discount for lack of marketability | |
| 0.5 - 5.2 (3.1)
46% |
|
| Ultra Growth Fund | | Warrant: Insurance Brokers | | $783,000 | | | | Discount for lack of marketability | | Discount for lack of marketability | | | 20% | |
| Ultra Growth Fund | | Warrant: Pharmaceuticals | | $1,189,093 | | | | Black Scholes | | Black Scholes | | | 100% | |
| * | Enterprise-Value-To-Revenue (“EV/R”) multiple is a measure of the value of a stock that compares a company’s enterprise value to its revenue. |
Changes in EV/R multiples may change the fair value of an investment. Generally, a decrease in this multiple will result in a decrease in the fair value of an investment.
The Funds’ other Level 3 investments have been valued using observable inputs, unadjusted third-party transactions and quotations or unadjusted historical third-party information. No unobservable inputs internally developed by the Funds have been applied to these investments, thus they have been excluded from the above table.
Additional information about the Funds’ fair valuation practices is available in the Funds’ most recent Prospectus, Statement of Additional Information (SAI) and Report to Shareholders. This information is available on the Funds’ website at wasatchglobal.com and on the Securities and Exchange Commission’s website at www.sec.gov.
13. SUBSEQUENT EVENTS
Management has evaluated the possibility of subsequent events and has determined that there are no additional events that would require adjustment to or additional disclosure in the Funds’ financial statements.
145
Supplemental Information
MANAGEMENT OF THE TRUST
Management Information. The business affairs of Wasatch Funds are overseen by its Board of Trustees. The Board consists of four Independent Trustees. Each of the Independent Trustees will serve until their successors are qualified, appointed or elected in accordance with the Trust’s Declaration of Trust and By-Laws. Ms. Allison, Mr. Rinne and Ms. Fletcher were elected by shareholders.
The Trustees and executive officers of Wasatch Funds and their principal occupations for at least the last five years are set forth below. The Advisor retains proprietary rights to the Trust name. The Funds’ Statement of Additional Information includes additional information about the Trustees and is available, without charge, online at wasatchglobal.com or upon request by calling Wasatch Funds at 800.551.1700.
| | | | | | | | | | | | |
Name, Address
And Year of Birth | | Position(s)
Held with
Wasatch Funds | | Term of Office1
And Length of
Time Served | | Principal Occupation(s)
During Past 5 Years | | Number of
Portfolios
In Fund
Complex
Overseen
By Trustee | | | Other Directorships
Held By Trustees
During Past 5 Years2 |
Independent Trustees | | | | | | | | | | | | |
| | | | | |
Miriam M. Allison 505 Wakara Way 3rd Floor Salt Lake City, UT 84108 1947 | | Trustee | | Indefinite Served as Trustee since 2010 | | Rancher since 2004. Chairman of UMB Fund Services, Inc. from 2001 to 2005. | | | 20 | | | Director, Northwestern Mutual Series Fund, Inc. (27 portfolios) from 2006 to 2021. |
| | | | | |
Heikki Rinne 505 Wakara Way 3rd Floor Salt Lake City, UT 84108 1952 | | Trustee and
Chair of the Board | | Indefinite Served as Trustee since 2012 | | Chief Executive Officer of the Halton Group Ltd. (an indoor environmental control manufacturing and technology company) from 2002 to 2016. Director, Halton Foundation since 2010. A Founder and Principal Owner of Sitoumus LLC (a training and consulting firm focusing on empowering organizational and individual engagement as well as general consulting) from January 2017 to present. | | | 20 | | | Director, Halton Group Ltd. from 2016 to 2020. |
| | | | | |
Kristen M. Fletcher 505 Wakara Way 3rd Floor Salt Lake City, UT 84108 1953 | | Trustee and
Chair of the
Audit
Committee | | Indefinite Served as Trustee since 2014 | | Director, Utah Museum of Fine Arts since 2021. Director, Youth Sports Alliance from 2015 to 2021. Trustee, Woodlands Commercial Bank (a/k/a Lehman Brothers Commercial Bank) from 2009 to 2012. Chairman and CEO, ABN AMRO, Inc. and U.S. Country Representative, ABN AMRO Bank, NV from 2002 to 2004. | | | 20 | | | Director, Youth Sports Alliance from 2015 to 2021. Trustee, Woodlands Commercial Bank (a/k/a Lehman Brothers Commercial Bank) from 2009 to 2012. Director Emeritus, Utah Symphony/Utah Opera since September 2017. Director, Utah Symphony/Utah Opera from 2005 to September 2017. |
| | | | | |
Mark Robinson 505 Wakara Way 3rd Floor Salt Lake City, UT 84108 1958 | | Trustee and
Chair of the Governance and Nominating Committee | | Indefinite Served as Trustee since 2020 | | Chief Financial Officer of Truckstop.com LLC from 2016 to 2019. Chief Financial Officer of SABA Software, Inc. from 2013 to 2015. | | | 20 | | | Chairman of Vita Vis Nutrition, Inc. from 2014 to 2016. |
|
|
| 1 | A Trustee may serve until his/her death, resignation, removal or retirement. Each Independent Trustee shall retire as Trustee at the end of the calendar year in which he/she attains the age of 75 years. The Board of Trustees reserves the right to permit continued service after the mandatory retirement age for any individual Trustee in its sole discretion. The Board has approved a one-year waiver from the retirement age requirement for Ms. Allison, effective January 1, 2023. |
| 2 | Directorships are those held by a Trustee in any company with a class of securities registered pursuant to Section 12 of the Securities Exchange Act of 1934 or subject to the requirements of Section 15(d) of the Securities Exchange Act or any company registered as an investment company under the 1940 Act. |
146
| | |
| | | MARCH 31, 2023 (Unaudited) |
| | | | | | |
Name, Address
And Year of Birth | | Position(s)
Held With
Trust | | Term of Office and
Length of Time Served | | Principal Occupation(s)
During Past 5 Years |
Officers | | | | | | |
| | | |
Eric S. Bergeson 505 Wakara Way 3rd Floor Salt Lake City, UT 84108 1966 | | President | | Indefinite Served as President
since May 2018 | | President for Wasatch Funds since May 2018. President of the Advisor since January 2017. Vice President of Institutional Sales for the Advisor since June 1998. |
| | | |
Russell L. Biles 505 Wakara Way 3rd Floor Salt Lake City, UT 84108 1967 | | Chief Compliance Officer, Vice President and Secretary | | Indefinite Served as Chief Compliance Officer and Vice President since February 2007 and Secretary since November 2008 | | Chief Compliance Officer and Vice President for Wasatch Funds since February 2007. Secretary for Wasatch Funds since November 2008. Counsel for the Advisor since October 2006. |
| | | |
Michael K. Yeates 505 Wakara Way 3rd Floor Salt Lake City, UT 84108 1982 | | Treasurer | | Indefinite Served as Treasurer since
May 2018 | | Treasurer for Wasatch Funds since May 2018. Chief Financial Officer of the Advisor since September 2007. |
| | | |
David Corbett 505 Wakara Way 3rd Floor Salt Lake City, UT 84108 1972 | | Assistant Vice President | | Indefinite Served as Assistant Vice President since August 2012 | | Assistant Vice President for Wasatch Funds since August 2012. Director of Mutual Fund Services for the Advisor since June 2007. |
| | | |
Cheryl Reich 505 Wakara Way 3rd Floor Salt Lake City, UT 84108 1983 | | Assistant Secretary | | Indefinite Served as Assistant Secretary since February 2017 | | Assistant Secretary for Wasatch Funds since February 2017. Compliance Associate for the Advisor since September 2012. |
| | | |
Kara H. Becker 505 Wakara Way 3rd Floor Salt Lake City, UT 84108 1983 | | Assistant Treasurer | | Indefinite Served as Assistant Treasurer since May 2018 | | Assistant Treasurer for Wasatch Funds since
May 2018. Controller for the Advisor since
January 2012. |
|
|
PROXY VOTING POLICIES, PROCEDURES AND RECORD
A description of the policies and procedures the Advisor uses to vote proxies related to the Funds’ portfolio securities is set forth in the Funds’ Statement of Additional Information, which is available without charge, upon request by calling 800.551.1700 or visiting the Funds’ website at wasatchglobal.com or the Securities and Exchange Commission’s (SEC) website at www.sec.gov.
Wasatch Funds’ proxy voting record is available without charge on the Funds’ website at wasatchglobal.com and on the SEC’s website at www.sec.gov no later than August 31 for the prior 12 months ended June 30.
QUARTERLY PORTFOLIO HOLDINGS DISCLOSURE ON FORM N-PORT
The Funds file their complete schedules of investments with the SEC for their first and third quarters of each fiscal year on Form N-PORT. The Funds’ Form N-PORT filings are available on the SEC’s website at www.sec.gov.
STATEMENT REGARDING LIQUIDITY RISK MANAGEMENT PROGRAM
Consistent with Rule 22e-4 under the Investment Company Act of 1940, the Wasatch Funds have adopted a Liquidity Risk Management Program to govern the approach to managing liquidity risk within the Wasatch Funds (the “Program”). The Board has approved the designation of the Advisor’s Liquidity Risk Committee to oversee the Program.
The Program’s principal objectives include supporting each Fund’s compliance with limits on investments in illiquid assets and mitigating the risk that a Fund will be unable to meet its redemption obligations timely. The Program also includes a number of elements that support the management and assessment of liquidity risk, including an annual assessment of factors that influence a Fund’s liquidity and the periodic classification and reclassification of a Fund’s investments into groupings that reflect the Liquidity Risk Committee’s assessment of their relative liquidity under current market conditions.
147
Supplemental Information (continued)
Each of the Wasatch Funds maintains a high level of liquidity and is deemed to be a Fund that primarily holds assets that are defined as highly liquid investments. A Highly Liquid Investment is defined as cash and any investment reasonably expected to be convertible into cash in current market conditions in three business days or less without the conversion to cash significantly changing the market value of the investment. A Fund that is deemed to primarily hold assets that are Highly Liquid Investments will have at least 55% of its net assets in Highly Liquid Investments. As a result, each Fund has not adopted a Highly Liquid Investment minimum.
There have been no liquidity events that have materially affected the performance of the Funds or their ability to timely meet redemptions without dilution to existing shareholders. The Liquidity Risk Committee has determined, and reported to the Board, that the Program has operated adequately and effectively to manage the Funds’ liquidity risk since implementation. There can be no assurance that the Program will achieve its objectives in the future. Please refer to your Fund’s prospectus for more information regarding the Fund’s exposure to liquidity risk and other principal risks to which an investment in the Fund may be subject.
Further information on liquidity risks applicable to the Funds can be found within the Prospectus.
BOARD CONSIDERATIONS FOR INVESTMENT ADVISORY AND SUB-ADVISORY AGREEMENTS OF THE WASATCH FUNDS
At a meeting held on November 9, 2022 (the “Meeting”), the Board of Trustees (the “Board”) of Wasatch Funds Trust (the “Trust”) unanimously approved the Advisory and Service Contract (the “Investment Advisory Agreement”) between Wasatch Advisors LP, doing business as Wasatch Global Investors, Inc., (the “Advisor”) and the Trust on behalf of each existing series of the Trust (each a “Fund”) and the sub-advisory agreement (the “Sub-Advisory Agreement”) between the Advisor and Hoisington Investment Management Company (the “Sub-Advisor”) on behalf of the Wasatch-Hoisington U.S. Treasury Fund (the “U.S. Treasury Fund”). As the Board is comprised of all disinterested Trustees (the “Independent Trustees”), the references to Board and/or Independent Trustees shall mean all the Independent Trustees. The Investment Advisory Agreement and Sub-Advisory Agreement are collectively hereafter the “Advisory Agreements” and are each an “Advisory Agreement.”
Following up to an initial two-year period, the Board of each Fund considers the renewal of the Investment Advisory Agreement and the Sub-Advisory Agreement on behalf of the applicable Fund on an annual basis. Throughout the year, the Board meets regularly and, at these meetings, receives regular and/or special reports that cover an extensive array of topics and information relevant
to its annual consideration of the renewal of the Advisory Agreements. Some of these reports and discussions include, among other things, materials that outline the investment performance of the Funds over various periods; internal ratings for each Fund; valuation of securities; compliance with the respective Fund’s investment objectives and investment restrictions; compliance, risk and liquidity management; Fund expenses; the execution of portfolio transactions; cross-holdings of securities among the Funds; and overall economic, market and regulatory developments. The Board also meets periodically with portfolio managers of their assigned Funds and other members of management to discuss, among other things, the investment performance of the respective Funds, portfolio attributes, the manager’s investment approach and any adjustments thereto as well as market conditions or other factors that may impact the Fund’s performance. The Board has also established standing committees that meet regularly throughout the year to review matters within their respective purview.
In addition to the information provided and discussions held throughout the past year, the Board, through its independent legal counsel, requested and received extensive materials and information prepared specifically for its annual consideration of the renewal of the Advisory Agreements provided by the Advisor and Broadridge Financial Solutions, Inc. (“Broadridge”), an independent provider of investment company data. The materials received covered a wide range of topics including, but not limited to, the investment process of the Advisor, including its investment risk management; the organizational structure and culture of the Advisor; the ownership, management and committee structure of the Advisor, including succession planning; the nature, extent and quality of services performed pursuant to the respective Advisory Agreement; the experience of the relevant investment personnel; the performance of each Fund over various periods, including a report prepared by Broadridge comparing the investment performance of each Fund to the performance of certain peers compiled by Broadridge and benchmark(s); a third-party performance ranking of the Funds for various periods comparing a Fund against similarly categorized funds; the management fee and net expense ratios of each class of shares of each Fund, including a report prepared by Broadridge comparing the management fee and total expense ratio of the respective Fund class to those of certain peers compiled by Broadridge; the expense limitation agreement provided by the Advisor on the applicable classes of the Funds; the management fees of certain Funds compared to certain fee data of accounts managed in a similar style to such Funds; the services provided to other types of clients; investment personnel compensation arrangements; the brokerage policies and practices and commission results; and certain financial data of the Advisor and its parent and
148
| | |
| | | MARCH 31, 2023 (Unaudited) |
the profitability of the Advisor as described below. With respect to the Sub-Advisor, the materials also covered, among other things, an evaluation of the Sub-Advisor by the Advisor; the organizational and leadership structure of the Sub-Advisor; the services performed pursuant to the Sub-Advisory Agreement; the experience of the relevant investment personnel; the performance of the U.S. Treasury Fund in absolute terms and as compared to the performance of peers compiled by Broadridge and a benchmark; the management fee rate and total expense ratio of the U.S. Treasury Fund and as compared to peers compiled by Broadridge; and certain financial data regarding the Sub-Advisor.
The information prepared specifically for the annual review of the Advisory Agreements supplemented the information provided to the Board and its committees and the evaluations of the Funds by the Board and its committees throughout the year. The Independent Trustees considered their review of Advisory Agreements to be an ongoing process and employed the accumulated information, knowledge and experience the Trustees had gained during their tenure on the Board and its committees in evaluating the Advisor and Sub-Advisor, including the knowledge gained regarding the scope and quality of the investment management and other capabilities of the Advisor and the Sub-Advisor, and the quality of the Advisor’s administration and other services provided. The Board’s considerations of the Advisory Agreements also reflect the information, negotiations and discussions with management in connection with the Board’s prior reviews of the Funds’ advisory arrangements, and the Independent Trustees’ conclusions may be based, in part, on their consideration of the fee arrangements and other factors developed in prior years.
The Independent Trustees were advised by independent legal counsel during the annual review process as well as throughout the year, including meetings in execution sessions with such counsel at which no representatives from the Advisor or Sub-Advisor were present. In connection with their annual review, the Independent Trustees also received a memorandum from independent legal counsel outlining their fiduciary duties and legal standards in reviewing the Advisory Agreements.
As part of their continuing practice, the Independent Trustees met in executive session on November 2, 2022 (the “November Executive Session”) to continue their considerations for renewing the Advisory Agreements for an additional one-year term. Following the November Executive Session, the Independent Trustees through independent counsel requested and received additional information from management and considered the responses. In addition, prior to and during the Meeting, the Independent Trustees also met in private executive sessions with independent legal counsel. The Independent Trustees invited
members of management of the Advisor to attend a portion of certain executive sessions from time to time to respond to questions and provide additional information. In their review, the Independent Trustees evaluated the advisory arrangements separately on a Fund-by-Fund and per-class basis.
At the Meeting, the Independent Trustees met, including in executive session without management present, to further consider, in relevant part, the renewal of the Advisory Agreements. After the discussions and with the background and knowledge described above, the Independent Trustees approved the renewal of the Advisory Agreements on behalf of the applicable Funds. The Independent Trustees did not identify any single factor as all-important or controlling, but rather the decision reflected the comprehensive consideration of all the information (written and oral) presented during the course of the year and in prior years as well as prepared for the current evaluation process. Each Trustee may have attributed different weights to the various factors and information considered in the approval process. The following summarizes the principal factors, but not all the factors, the Board considered in its review of the Investment Advisory and Sub-Advisory Agreements and its conclusions.
A. Nature, Extent and Quality of Services
In evaluating the renewal of the Advisory Agreements, the Board considered, in relevant part, the nature, extent and quality of the Advisor’s and Sub-Advisor’s services to the applicable Fund(s). With respect to the U.S. Treasury Fund, the Independent Trustees considered the Investment Advisory Agreement and the Sub-Advisory Agreement separately in the course of their review. In this regard, they considered the respective roles of the Advisor and the Sub-Advisor.
The Board considered descriptions of the vast array of management, oversight and administrative services the Advisor provides to manage and operate the Funds. With respect to the Advisor, the Independent Trustees recognized that the Advisor provides portfolio management services for the Funds (other than the U.S. Treasury Fund). In connection with providing these portfolio management services to the applicable Funds, the Board reviewed, among other things, the Advisor’s investment philosophy and investment process; its due diligence in evaluating potential investments; portfolio construction process; sell discipline; investment research and portfolio management capabilities and staffing (including compensation arrangements designed to attract and maintain qualified staff); the experience and credentials of the portfolio managers and the level of skill necessary to manage the Funds; and each Fund’s performance as described in more detail below. In evaluating the portfolio management, the Board also considered the Advisor’s process and principles for
149
Supplemental Information (continued)
managing investment risk, including the functions of the Advisor’s investment risk committee to monitor and identify risks. As part of its review, the Board considered the Advisor’s ability to continue to provide quality services to the Funds and reviewed, among other things, the Advisor’s employee-ownership structure; its management and committee structure and culture; the functions of its business risk committee; its staffing and succession planning for key portfolio and firm employees who service the Funds; the Advisor’s business continuity policies and procedures; and, as described in further detail below, the Advisor’s financial stability and certain financial data of the Advisor, including its profitability and ability to meet its foreseeable compensation obligations. In connection with the Advisor’s portfolio management services, the Board also considered the Advisor’s trading capabilities, including the expertise of its trading team, policies and procedures in executing securities transactions and analytics in assessing the commissions paid.
Beyond the portfolio management services provided, the Board considered the extensive administrative or non-advisory services the Advisor provides to manage and operate the Funds (in addition to those provided by other third parties). In this regard, the Trustees recognized that the Advisor, among other things, coordinates and oversees the Funds’ various service providers (including the Funds’ transfer agent, administrator auditor, custodian, and on behalf of the U.S. Treasury Fund, the Sub-Advisor), assists with the review and negotiation of their fees, and periodically conducts a review of each of the service providers and reports the findings of such reviews to the Board. The Board observed the significant operational support and administrative services the Advisor provides to the Funds to maintain their operations, such as providing employees and officers necessary for the Funds’ overall management and daily operations; preparing and/or assisting with preparing and filing regulatory and tax reports; preparing and/or assisting with preparing and filing registration statements and other regulatory documents; overseeing the preparation of shareholder reports; providing compliance services; valuing portfolio securities and providing daily pricing; proxy voting; cross-trade monitoring; and assisting with insurance renewals. The Advisor further provides Board support services overseeing the organization of Board and/or committee meetings and the timely preparation of materials and preparing presentations or other materials for such meetings. Given the complex regulatory regime applicable to the Funds, the Board recognized the extent and quality of the Advisor’s services with respect to regulatory compliance, including creating, maintaining and updating policies and procedures as new regulatory requirements have been adopted, testing such programs, policies and procedures periodically, and providing compliance training for personnel. The Trustees observed that the scope of the services provided by the Advisor and the
undertakings required of the Advisor have expanded over time as a result of regulatory, market and other developments.
In addition to the services provided by the Advisor, the Independent Trustees also considered the risks borne by the Advisor in sponsoring and managing the Funds in a highly regulated industry, including various material entrepreneurial, operational, reputational, regulatory and litigation risks.
With respect to the U.S. Treasury Fund, the Board recognized that the Fund utilizes a Sub-Advisor, and therefore the Board also evaluated the renewal of the Sub-Advisory Agreement. With respect to such Fund, the Board considered the division of responsibilities between the Advisor and Sub-Advisor and the respective roles of the Advisor and Sub-Advisor in providing services to the Fund. The Board recognized that the Sub-Advisor and its investment personnel are responsible for the portfolio management of the U.S. Treasury Fund but are not expected to provide the other significant administrative or non-advisory services that the Advisor provides to the Fund as described above. The Board noted that the Advisor oversees and evaluates the Sub-Advisor with respect to the latter’s portfolio management of the Fund and considered the Advisor’s evaluation of the Sub-Advisor. The Independent Trustees considered the background and experience of the investment personnel of the Sub-Advisor and the performance history of the U.S. Treasury Fund. Similarly, in seeking to help ensure the continuity of the services of the Sub-Advisor, the Independent Trustees considered, among other things, the stability and organization of the Sub-Advisor; the history, experience and tenure of the investment personnel of the Sub-Advisor to the Fund; the Sub-Advisor’s disaster recovery plans and process; its compliance program, including its regulatory history; and certain financial data of the Sub-Advisor as described in further detail below. The Board noted the Advisor’s favorable assessment of the Sub-Advisor and its recommendation for renewal of the Sub-Advisory Agreement.
Based on their review, the Independent Trustees found that, overall, the nature, extent and quality of services provided under the Investment Advisory Agreement and the Sub-Advisory Agreement were satisfactory on behalf of each applicable Fund.
B. The Investment Performance of the Funds
In evaluating the quality of the services provided by the Advisor and Sub-Advisor, the Board considered Fund investment performance as a relevant factor in assessing whether to approve the Advisory or Sub-Advisory agreements. The Board received and considered a variety of Fund investment performance data. In its review, the Board received and reviewed, among other things, a report (the “Broadridge Report”) prepared by Broadridge which
150
| | |
| | | MARCH 31, 2023 (Unaudited) |
generally provided a Fund’s performance data for the one-, two-, three-, four-, five-, and ten-year periods ended August 31, 2022 (or for the periods available for Funds that did not exist for part of the foregoing time frame) on an absolute basis and as compared to the performance of unaffiliated comparable funds (a “Broadridge Peer Universe”), to a more focused subset of peers (a “Broadridge Peer Group”) and to a benchmark provided by Broadridge for the prescribed periods, subject to certain exceptions. The Board was provided with information describing the independent methodology Broadridge used to create the Broadridge Peer Group and Broadridge Peer Universe. Although the performance data included in the Broadridge Report was based on the performance of the investor class shares of the Funds, the Board recognized that the Funds (other than the U.S. Treasury Fund) offer two classes. The performance of another class of a Fund, however, should be substantially similar on a relative basis because the classes are invested in the same portfolio of securities, and differences in performance between the classes could be principally attributed to the variation in the expenses and the Advisor-agreed expense limitations of each class.
In addition to the Broadridge Report, the Independent Trustees also reviewed materials reflecting, among other things, the respective Fund’s historic performance for the quarter and one-, three-, five-, and ten-year periods ended September 30, 2022 (or for the periods available for Funds that did not exist for part of the foregoing time frame), and annual returns from 2015 through 2021 (or for the calendar years available for Funds that did not exist for part of the foregoing time frame) in absolute terms and as compared to the Fund’s respective benchmark(s) as described below. The Trustees recognized that the performance data reflects a snapshot of a period as of a particular date and that selecting a different performance period could produce significantly different results, particularly during periods of market volatility. To help provide additional context to the significant variation that may occur year-to-year with respect to a Fund’s performance, the Independent Trustees reviewed a Fund’s performance results versus the performance of its benchmark(s) and, to the extent available, certain peer composites and/or Morningstar peer rankings over various periods ended September 30, 2022 and September 30, 2021, respectively, (or for the periods available for Funds that did not exist during the applicable period). The Board therefore considered the broader perspective of performance over a variety of time periods that may include full market cycles. Further, the Board recognized that shareholders may measure their Fund’s performance based on the shareholder’s own particular holding periods, which may differ from the periods reviewed by the Board and lead to significantly differing investment results. In its review, the Board recognized that the Advisor seeks to manage each Fund with a long-
term perspective, and the Board generally placed greater emphasis on investment results over the longer term periods; however, the Board acknowledged that long-term performance could be impacted by even one period of significant outperformance or underperformance. As noted, during the course of the year, the Board met with the portfolio managers periodically to discuss, in part, investment and performance matters.
The Board considered performance on an absolute basis as well as comparative performance results. In addition to reviewing the comparative performance data provided by Broadridge, the Board also considered the performance of certain Funds (i.e., the Core Growth Fund, the Emerging India Fund, the Emerging Markets Select Fund, the Emerging Markets Small Cap Fund, the Frontier Emerging Small Countries Fund, the Global Opportunities Fund, the International Growth Fund, the International Opportunities Fund, the International Select Fund, the Micro Cap Fund, the Micro Cap Value Fund, the Small Cap Growth Fund, the Small Cap Value Fund and the Ultra Growth Fund) compared to the performance of certain composites of funds and/or separate accounts for the one-, three-, five- and ten-year periods ended September 30, 2022 (or for such shorter periods if the Funds or separate account composite did not exist for part of the foregoing time frame). Similarly, the Independent Trustees reviewed certain total return performance of the U.S. Treasury Fund compared to, among other things, certain accounts for a trailing 12-month period ended September 30, 2022 and an annualized five-year period.
In considering comparative performance data, the Board acknowledged some of the limitations of such data that may impact the weight given to particular performance data. The Independent Trustees recognized that the Advisor and Sub-Advisor are responsible for managing the respective Fund in accordance with its particular investment objectives, investment parameters and guidelines, and that peers, benchmarks and/or other client accounts may be following, among other things, different objectives, investment parameters and guidelines, and risk tolerance levels which may lead to differing performance results and limit the value of the comparative performance data in assessing a particular Fund’s performance. Further, an appropriate peer group or benchmark may be difficult to establish for certain Funds given these differences. In this regard, the Independent Trustees have recognized that the respective Broadridge Peer Group for the Micro Cap Fund and Micro Cap Value Fund (collectively, the “Micro Cap Funds”) generally focused on companies with a larger market capitalization than those sought by the Micro Cap Funds and as a result, the Independent Trustees also reviewed each Micro Cap Fund’s performance compared to a supplemental no-load peer group provided by the Advisor for the one-, three-, five- and ten-year periods ended September 30, 2022.
151
Supplemental Information (continued)
The Board also considered information reflecting a Fund’s peer ranking in its respective Morningstar investment category and any Morningstar ratings on the applicable Fund. The Independent Trustees further reviewed analyst reports published by an unaffiliated party for the following Funds: the Core Growth Fund, the International Opportunities Fund, the Small Cap Growth Fund, and the U.S. Treasury Fund.
The performance data prepared for the annual review of the Advisory Agreements supplemented the performance information the Trustees received throughout the year. Accordingly, the Board took into account the discussions with portfolio managers and/or other representatives of the Advisor; such representatives’ analysis regarding the respective Fund’s performance that occurred between Board meetings with particular focus on any Fund experiencing performance challenges; and any recommendations or steps taken to address performance concerns. The Board evaluated performance in light of various factors that may impact performance, including, among other things, general market conditions, issuer-specific information, asset class information and cash flows. In light of changing circumstances in market and economic conditions, among other things, a Trustee may place different emphasis on particular performance data from year to year. In this regard, the Board has recognized within the recent periods in 2022 the considerable general market volatility. The Board considered that the market and economic conditions may significantly impact a Fund’s performance, particularly over shorter periods, and a Fund’s performance may be more indicative of such economic and market events and not necessarily reflective of management skill. Accordingly, depending on the facts and circumstances including differences between the strategies of the respective Fund and its benchmark and/or Broadridge Peer Group, the Board may be satisfied with a Fund’s performance even if its performance was below that of its benchmark or peer group for certain periods. However, given the recent challenged performance of various Funds in the short-term period as described in further detail in the following pages, the Board will continue to monitor Fund performance closely, consider whether any steps are necessary or appropriate to address such issues and review the results of any steps undertaken, if any. Based on their review of the data provided to the Board and in the context of its full deliberations, the Independent Trustees determined the following:
Core Growth Fund
With respect to the Core Growth Fund, although the performance of the Fund’s investor class was below the performance of the median of the Broadridge Peer Group for the one-year period ended August 31, 2022, the Fund’s investor class outperformed the median of the Broadridge
Peer Group for the two-, three-, four-, five- and ten-year periods ended August 31, 2022. Although the average annual total returns of the Fund’s investor and institutional classes were below the performance of the Russell 2000® Index for the one-year period ended September 30, 2022, the average annual total returns of the Fund’s investor class and institutional class outperformed said index for the three-, five- and ten-year periods ended September 30, 2022. Similarly, although the average annual total returns of the Fund’s investor and institutional classes were below the performance of the Russell 2000® Growth Index for the one-year period ended September 30, 2022, the average annual total returns of the Fund’s investor class and institutional class outperformed the Russell 2000® Growth Index for the three-, five- and ten-year periods ended September 30, 2022. Performance for the institutional class prior to January 31, 2012 was based on the performance of the investor class. On the basis of the Board’s ongoing review of investment performance, including considering the relative market conditions during certain reporting periods, the Board determined that the Fund’s overall investment results have been satisfactory and support the renewal of the Advisory Agreement.
Emerging India Fund
With respect to the Emerging India Fund, although the performance of the Fund’s investor class was below the performance of the median of the Broadridge Peer Universe for the one-year period ended August 31, 2022, the Fund’s investor class outperformed the median of the Broadridge Peer Universe for the two-, three-, four-, five- and ten-year periods ended August 31, 2022. A Broadridge Peer Group, however, was not available for the Emerging India Fund given that the limited number of available retail no-load India region funds precluded the creation of a meaningful comparison group. In addition, although the average annual total returns of the Fund’s investor class and institutional class were below the performance of the MSCI India Investable Market Index for the one- and three-year periods ended September 30, 2022, each class outperformed such index for the five- and ten-year periods ended September 30, 2022. Performance for the institutional class prior to February 1, 2016 was based on the performance of the investor class. On the basis of the Board’s ongoing review of investment performance, including considering the relative market conditions during certain reporting periods, the Board determined that the Fund’s overall investment results have been satisfactory and support the renewal of the Advisory Agreement.
Emerging Markets Select Fund
With respect to the Emerging Markets Select Fund, although the performance of the Fund’s investor class was below the performance of the median of the performance
152
| | |
| | | MARCH 31, 2023 (Unaudited) |
of its Broadridge Peer Group for the one-year period ended August 31, 2022, the Independent Trustees noted that the Fund’s investor class outperformed the median of the Broadridge Peer Group for the two-, three-, four- and five-year periods ended August 31, 2022. Similarly, although the average annual total returns of the Fund’s investor class and institutional class were below the performance of the MSCI Emerging Markets Index for the one-year period ended September 30, 2022, the average annual total returns of the Fund’s investor class and institutional class outperformed said index for the three- and five-year periods ended September 30, 2022. On the basis of the Board’s ongoing review of investment performance, including considering the relative market conditions during certain reporting periods, the Board determined that the Fund’s overall investment results have been satisfactory and support the renewal of the Advisory Agreement.
Emerging Markets Small Cap Fund
With respect to the Emerging Markets Small Cap Fund, although the performance of the Fund’s investor class was below the performance of the median of the Broadridge Peer Group for the one-year period ended August 31, 2022, the Independent Trustees noted that the Fund’s investor class outperformed the median of the Broadridge Peer Group for the two-, three-, four-, five- and ten-year periods ended August 31, 2022. Similarly, although the average annual total returns of the Fund’s investor class and institutional class were below the performance of the MSCI Emerging Markets Small Cap Index for the one-, three- and ten-year periods ended September 30, 2022, each class outperformed the MSCI Emerging Markets Small Cap Index for the five-period ended September 30, 2022. In addition, although the performance of each class of the Fund was below the performance of the MSCI Emerging Markets Index for the one-year period ended September 30, 2022, each class of the Fund outperformed said index for the three-, five- and ten-year periods ended September 30, 2022. Performance for the institutional class prior to February 1, 2016 was based on the performance of the investor class. On the basis of the Board’s ongoing review of investment performance, including considering the relative market conditions during certain reporting periods, the Board determined that the Fund’s overall investment results have been satisfactory and support the renewal of the Advisory Agreement.
| Frontier | Emerging Small Countries Fund |
With respect to the Frontier Emerging Small Countries Fund, the Independent Trustees noted that the Fund’s investor class outperformed the median of its Broadridge Peer Group for the one-, two-, three-, four-, five- and ten-year periods ended August 31, 2022. Similarly, the Board noted that although the average annual total returns of the Fund’s investor class and institutional class
were below the performance of the MSCI Frontier Emerging Markets Index for the one-year period ended September 30, 2022, each class outperformed such index for the three-, five- and ten-year periods ended September 30, 2022. The performance of each class, however, was below the performance of the MSCI Frontier Markets Index for the one-, three-, five- and ten-year periods ended September 30, 2022. Performance for the institutional class prior to February 1, 2016 was based on the performance of the investor class. On the basis of the Board’s ongoing review of investment performance, including considering the relative market conditions during certain reporting periods, the Board determined that the Fund’s overall investment results have been satisfactory and support the renewal of the Advisory Agreement.
Global Opportunities Fund
With respect to the Global Opportunities Fund, although the performance of the Fund’s investor class was below the performance of the median of the Broadridge Peer Group for the one- and two-year periods ended August 31, 2022, the Fund’s investor class outperformed the performance of the median of the Broadridge Peer Group for the three-, four-, five- and ten-year periods ended August 31, 2022. Similarly, although the average annual total returns of the Fund’s investor class and institutional class were below the performance of the MSCI AC World Small Cap Index for the one-year period ended September 30, 2022, each class outperformed such index for the three-, five- and ten-year periods ended September 30, 2022. Performance for the institutional class prior to February 1, 2016 was based on the performance of the investor class. On the basis of the Board’s ongoing review of investment performance, including considering the relative market conditions during certain reporting periods, the Board determined that the Fund’s overall investment results have been satisfactory to support renewal of the Advisory Agreement.
Global Select Fund
With respect to the Global Select Fund, the Independent Trustees noted that the performance of the Fund’s investor class was below the performance of the median of the Broadridge Peer Group for the one- and two-year periods ended August 31, 2022. Similarly, the average annual total returns of the Fund’s investor class and institutional class were below the performance of the Fund’s benchmark, the MSCI AC (All Country) World Index, for the one- and three-year periods ended September 30, 2022. The Board recognized that the Fund was relatively new, with only a limited performance time period available. On the basis of the Board’s ongoing review of investment performance, including considering the relative market conditions during certain reporting periods, the Board determined that the Fund’s overall investment results have been satisfactory to support renewal of the Advisory Agreement.
153
Supplemental Information (continued)
Global Value Fund
With respect to the Global Value Fund (formerly, the Large Cap Value Fund), the Independent Trustees noted that the Fund’s investor class outperformed the median of the Broadridge Peer Group for the one-, two-, three-, four-, five- and ten-year periods ended August 31, 2022. Similarly, the Board noted that the average annual total returns of the Fund’s investor class and institutional class outperformed the MSCI AC (All Country) World Value Index and MSCI AC World Index for the one-, three-, five- and ten-year periods ended September 30, 2022. Performance for the institutional class prior to January 31, 2012 was based on the performance of the investor class. In reviewing the performance data, the Independent Trustees also recognized that the Board previously approved a change in the principal investment strategies of the Fund to permit the Fund greater ability to invest in foreign securities, and thus the Fund became a global value fund effective October 31, 2017. Accordingly, the Fund’s past performance prior to such effective date would not reflect the foregoing change. On the basis of the Board’s ongoing review of investment performance, including considering the relative market conditions during certain reporting periods, the Board determined that the Fund’s overall investment results have been satisfactory and support the renewal of the Advisory Agreement.
Greater China Fund
With respect to the Greater China Fund, the Board noted that the performance of the Fund’s investor class shares was below the performance of the median of the Broadridge Peer Group for the one-year period ended August 31, 2022. Similarly, the Board noted that the average annual total returns of the Fund’s investor class and institutional class were below the performance of its benchmark, the MSCI China Index, for the one-year period ended September 30, 2022. However, the Board recognized that the Fund was new, with a performance history too limited to make a meaningful assessment of performance.
International Growth Fund
With respect to the International Growth Fund, the Independent Trustees noted that the performance of the Fund’s investor class was below the median of the Broadridge Peer Group for the one-, two-, three-, four-, five- and ten-year periods ended August 31, 2022. Similarly, the average annual total returns of the Fund’s investor class and institutional class were below the performance of its benchmarks, the MSCI AC (All Country) World ex USA Small Cap Index and MSCI World ex USA Small Cap Index, for the one-, three-, five- and ten-year periods ended September 30, 2022. Based on calendar-year returns beginning with 2015 through 2021, other than calendar years 2016 and 2021, the performance of each class
outperformed its benchmarks, the MSCI AC World ex USA Small Cap Index and MSCI World ex USA Small Cap Index, for the 2015, 2017, 2018, 2019, and 2020 calendar years. Performance for the institutional class prior to February 1, 2016 was based on the performance of the investor class. On the basis of the Board’s ongoing review of investment performance, including considering the relative market conditions during certain reporting periods, the Board determined that the Fund’s overall investment results have been satisfactory to support renewal of the Advisory Agreement.
International Opportunities Fund
With respect to the International Opportunities Fund, the Independent Trustees noted that the performance of the Fund’s investor class was below the performance of the median of the Broadridge Peer Group for the one-, two-, three-, four-, five- and ten-year periods ended August 31, 2022. Similarly, the Independent Trustees noted that the average annual total returns of the Fund’s investor class and institutional class for the one-, three- and five-year periods ended September 30, 2022 were below the performance of its benchmark, the MSCI AC (All Country) World ex USA Small Cap Index, but each class outperformed the performance of such benchmark for the ten-year period ended September 30, 2022. In addition, the average annual total returns of each class were below the performance of the MSCI World ex USA Small Cap Index for the one- and three-year periods ended September 30, 2022, but each class outperformed such index for the five- and ten-year periods ended September 30, 2022. Performance for the institutional class prior to February 1, 2016 was based on the performance of the investor class. Based on calendar-year returns beginning with 2015 through 2021, the Board noted that each class outperformed such benchmarks for the 2015, 2017, 2018, 2019 and 2020 calendar years, and the institutional class outperformed such indexes for 2016; however, the performance of the investor class was above the performance of the MSCI AC World ex USA Small Cap Index and below the performance of the MSCI World ex USA Small Cap Index for calendar year 2016. On the basis of the Board’s ongoing review of investment performance, including considering the relative market conditions during certain reporting periods, the Board determined that the Fund’s overall investment results have been satisfactory to support renewal of the Advisory Agreement.
International Select Fund
With respect to the International Select Fund, the Independent Trustees noted that the performance of the Fund’s investor class was below the performance of the median of the Broadridge Peer Group for the one- and two-year periods ended August 31, 2022. Similarly, the
154
| | |
| | | MARCH 31, 2023 (Unaudited) |
average annual total returns of the Fund’s investor class and institutional class were below the performance of its benchmark, the MSCI EAFE Index, for the one- and three-year periods ended September 30, 2022. Based on calendar-year returns, the Board noted that although the performance of each Fund class was below the performance of the MSCI EAFE Index for 2021, each class outperformed the performance of said index for 2020. The Board recognized that the Fund was relatively new with a limited performance history. On the basis of the Board’s ongoing review of investment performance, including considering the relative market conditions during certain reporting periods, the Board determined that the Fund’s overall investment results have been satisfactory and support the renewal of the Advisory Agreement.
Long/Short Alpha Fund
The Board recognized that the Fund was new with a limited performance history available and therefore the comparative Broadridge performance data was not available. However, the Board noted that the average annual total returns for each class outperformed the performance of its benchmark, the Russell 2500TM Index, for the one-year period ended September 30, 2022 but underperformed the FTSE 3-Month U.S. Treasury Bill Index for such period. The Board further recognized that the Fund’s performance history was too limited to make a meaningful assessment of performance.
Micro Cap Fund
With respect to the Micro Cap Fund, the Independent Trustees noted that although the performance of the Fund’s investor class was below the median of the Broadridge Peer Group for the one- and two-year periods ended August 31, 2022, the Fund’s investor class outperformed the median for the three-, four-, five- and ten-year periods ended August 31, 2022. Similarly, although the average annual total returns of the Fund’s investor class and institutional class were below the performance of its benchmark, the Russell Microcap® Index, for the one- and three-year periods ended September 30, 2022, the Fund’s investor class and institutional class outperformed said benchmark for the five- and ten-year periods ended September 30, 2022. Performance for the institutional class prior to January 31, 2020 was based on the performance of the investor class. In addition to the Broadridge comparative data, the Independent Trustees also reviewed the Fund’s performance compared to a custom peer group provided by the Advisor for the one-, three-, five- and ten-year periods ended September 30, 2022. On the basis of the Board’s ongoing review of investment performance, including considering the relative market conditions during certain reporting periods, the Board determined that the Fund’s overall investment results have been satisfactory and support the renewal of the Advisory Agreement.
Micro Cap Value Fund
With respect to the Micro Cap Value Fund, the Independent Trustees noted that although the performance of the Fund’s investor class was below the median of the Broadridge Peer Group for the one-year period ended August 31, 2022, the Fund’s investor class outperformed the median for the two-, three-, four-, five- and ten-year periods ended August 31, 2022. Similarly, although the average annual total returns of the Fund’s investor class and institutional class were below the performance of its benchmark, the Russell Microcap® Index, for the one-year period ended September 30, 2022, the Fund’s investor class and institutional class outperformed said index for the three-, five- and ten-year periods ended September 30, 2022. Performance for the institutional class prior to January 31, 2020 was based on the performance of the investor class. In addition to the Broadridge comparative data, the Independent Trustees also reviewed the Fund’s performance compared to a custom peer group provided by the Advisor for the one-, three-, five- and ten-year periods ended September 30, 2022. On the basis of the Board’s ongoing review of investment performance, including considering the relative market conditions during certain reporting periods, the Board determined that the Fund’s overall investment results have been satisfactory and support the renewal of the Advisory Agreement.
Small Cap Growth Fund
With respect to the Small Cap Growth Fund, the Independent Trustees noted that although the performance of the Fund’s investor class was below the performance of the median of the Broadridge Peer Group for the one-, two-, three- and ten-year periods ended August 31, 2022, the Fund’s investor class outperformed the performance of the median for the four- and five-year periods ended August 31, 2022. In addition, although the average annual total returns of the Fund’s investor class and institutional class were below the performance of its benchmark, the Russell 2000® Growth Index, for the one-year period ended September 30, 2022, each class outperformed said index for the three-, five and ten-year periods ended September 30, 2022. In addition, although the average annual total returns of the Fund’s investor and institutional classes were below the performance of the Russell 2000® Index for the one- and three-year periods ended September 30, 2022, the Fund’s investor class and institutional class outperformed said index for the five- and ten-year periods ended September 30, 2022. Performance for the institutional class prior to February 1, 2016 was based on the performance of the investor class. On the basis of the Board’s ongoing review of investment performance, including considering the relative market conditions during certain reporting periods, the Board determined that the Fund’s overall investment results have been
155
Supplemental Information (continued)
satisfactory and support the renewal of the Advisory Agreement.
Small Cap Value Fund
With respect to the Small Cap Value Fund, the Independent Trustees noted that although the performance of the Fund’s investor class was below the median of the Broadridge Peer Group for the one-, two-, three- and four-year periods ended August 31, 2022, the Fund’s investor class outperformed the median for the five- and ten-year periods ended August 31, 2022. In addition, the average annual total returns of the Fund’s investor class and institutional class were below the performance of the Russell 2000® Value Index and Russell 2000® Index for the one- and three-year periods ended September 30, 2022, but each class outperformed said indexes for the five- and ten-year periods ended September 30, 2022. Performance for the institutional class prior to January 31, 2012 is based on the performance of the investor class. On the basis of the Board’s ongoing review of investment performance, including considering the relative market conditions during certain reporting periods, the Board determined that the Fund’s overall investment results have been satisfactory to and support the renewal of the Advisory Agreement.
Ultra Growth Fund
With respect to the Ultra Growth Fund, the Independent Trustees noted that although the performance of the Fund’s investor class was below the median of the Broadridge Peer Group for the one- and two-year periods ended August 31, 2022, the Fund’s investor class outperformed the median of the Broadridge Peer Group for the three-, four-, five- and ten-year periods ended August 31, 2022. In addition, the average annual total returns of the Fund’s investor class and institutional class were below the performance of the Russell 2000® Growth Index for the one-year period ended September 30, 2022 but were above the performance of said index for the three-, five- and ten-year periods ended September 30, 2022. Performance for the institutional class prior to January 31, 2020 was based on the performance of the investor class. On the basis of the Board’s ongoing review of investment performance, including considering the relative market conditions during certain reporting periods, the Board determined that the Fund’s overall investment results have been satisfactory and support the renewal of the Advisory Agreement.
U.S. Treasury Fund
With respect to the U.S. Treasury Fund, the Independent Trustees noted that the performance of the Fund’s investor class was below the median of the Broadridge Peer Group for the one-, two-, three-, four-, five- and ten-year periods ended August 31, 2022. Similarly, the average annual total returns of the Fund’s investor class
were below the performance of the Bloomberg US Aggregate Bond Index for the one-, three- five- and ten-year periods ended September 30, 2022. On the basis of the Board’s ongoing review of investment performance, including considering the relative market conditions during certain reporting periods, the Board determined that the Fund’s overall investment results have been satisfactory and support the renewal of the Advisory Agreement.
C. Fees, Expenses and Profitability
1. Fees and Expenses
In evaluating the management fee rates, the Board considered the Advisor’s approach in setting a management fee rate for a Fund and the factors considered in establishing a proposed rate, including, among other elements, the value of the service to shareholders (e.g., the expertise of the Advisor with respect to the proposed strategy and the potential to deliver alpha), the competitive marketplace (e.g., the uniqueness of the Fund and the fees of competitor funds) and the economics to the Advisor (e.g., the costs of operating the Fund and whether potential revenues will be limited by capacity constraints of the Fund). In addition to this framework, the Board also recognized that the Advisor has historically closed certain capacity-constrained Funds (generally those investing in small- and micro-cap companies) from time to time to certain new investors to control the asset levels of such Funds to a level the Advisor considers necessary in order to maintain the integrity of the investment strategies of these Funds. While the Board considered this practice beneficial to shareholders, the Board also recognized that such practice limits the potential revenues the Advisor may earn from such Funds, and this outcome should be factored into the fee. The Board also noted the costs and resources necessary to effectively manage the Funds, particularly given the Advisor’s research-intensive investment approach and its application to investment strategies that pursue small- or micro-cap companies and/or foreign companies. As described in further detail below, the Board reviewed, among other things, the Advisor’s revenues and operating expenses per Fund (existing during the applicable period) for the 2019, 2020 and 2021 calendar years.
As part of its annual review, the Board considered, among other things, the contractual management fee rate and the actual management fee rate (i.e., the management fee after taking into account expense reimbursements and/or fee waivers, if any) paid by a Fund to the Advisor in light of the nature, extent and quality of the services provided as well as the net total expense ratio of each class of each Fund (expressed as a percentage of average net assets), as the expense ratio is more reflective of the shareholder’s costs in investing in the respective Fund. In its review, the Board reviewed both the contractual fee rates for each Fund in prior years from 2011 through 2022 (or
156
| | |
| | | MARCH 31, 2023 (Unaudited) |
for such shorter periods if the respective Fund was not in existence during a portion of this time frame) and any reductions in fee rates for a Fund during this time period. The Board also considered, among other things, the expense limitation and/or fee waiver arrangements proposed by the Advisor. The Board reviewed the gross management fees paid and the amounts the Advisor waived or reimbursed for the years 2020, 2021 and 2022 (which included certain estimates for the last four months of 2022) or for shorter periods for Funds that were not in existence during a portion of this time frame. The Board further considered a Fund’s net management fee and net total expense ratio in light of its performance history.
The Board received and considered comparative fee data, including data provided by Broadridge comparing, among other things, the contractual management fee rate, net management fee rate and actual total net expense ratio of each class of the respective Fund in relation to those of a comparable peer group of funds (the “Broadridge Expense Group”) as well as certain actual management fee and actual total expense ratio data compared to a larger group of funds (the “Broadridge Expense Universe”), each established by Broadridge.
In reviewing the comparative data provided by Broadridge, the Board reviewed information regarding the independent methodology followed to develop the Broadridge Expense Universe and Broadridge Expense Group. The Board recognized some of the limitations of the comparative data given the differences between the applicable Fund and the peers comprising such Fund’s respective Broadridge Expense Universe or Broadridge Expense Group, particularly with respect to the Micro Cap Fund and Micro Cap Value Fund. Given these limitations, the Independent Trustees also reviewed comparisons of the Micro Cap Fund’s and Micro Cap Value Fund’s management fee and total net expense ratio with those of a custom peer group provided by the Advisor. Aside from the comparative data provided by Broadridge, the Independent Trustees also considered comparative data between the fee rates charged by the Advisor and Sub-Advisor to certain Funds compared to other types of clients, as described in further detail below.
In considering the fees of the Sub-Advisor for the U.S. Treasury Fund, the Independent Trustees considered the fee rate paid to the Sub-Advisor with respect to said Fund in absolute terms and as compared to the Sub-Advisor’s pricing schedule for portfolio management services for other clients. The Independent Trustees also noted that the Advisor, not the Fund, pays the Sub-Advisor from the Advisor’s own revenues. Further, the Independent Trustees recognized that the Advisor and Sub-Advisor are not affiliates and the sub-advisory fee was established through arm’s-length negotiations between the Advisor and the Sub-Advisor.
In its evaluation of the advisory and sub-advisory fees of the Funds, the Board observed, among other things, the following:
Core Growth Fund
With respect to the Core Growth Fund, the Independent Trustees recognized that although the contractual management fee rate for the institutional and investor class shares was above the median of the respective Broadridge Expense Group, the total net expense ratio of the investor class shares was slightly above (within 5 basis points) the median of the Broadridge Expense Group and the total net expense ratio of the institutional class shares was lower than the median of the Broadridge Expense Group. The Independent Trustees also considered the Advisor’s analysis of various factors that contributed to setting the fee level, including, among other things, the Fund’s potential to deliver alpha; its comparative ranking in its Morningstar category; the Fund’s capacity constraints which, in turn, limit revenue potential for the Advisor; the expertise of the Advisor with regard to the Fund’s investment strategy; the competitive marketplace; and the costs of the Advisor’s research-intensive approach. Based on its review, the Board determined that the level of the advisory fee for the Core Growth Fund was acceptable in light of its overall considerations, including the nature, extent and quality of services provided.
Emerging India Fund
With respect to the Emerging India Fund, although the Fund’s contractual management fee rate for the investor class and institutional class shares was higher than the median of the Broadridge Expense Group, the total net expense ratio of the investor class shares was slightly higher (approximately 5 basis points) than the median of the Broadridge Expense Group and the total net expense ratio of the institutional class shares was below the median of the Broadridge Expense Group. The Independent Trustees also considered the Advisor’s analysis of various factors that contributed to setting the fee level, including, among other things, the uniqueness of the Fund in the marketplace, the pricing of other peers, the capacity constraints of the Fund and related limits on revenue potential, the expertise of the Advisor in the small-cap asset class and the additional regulatory and other challenges and related costs associated with evaluating and investing in companies in India. Based on its review, the Board determined that the level of the advisory fee for the Emerging India Fund was acceptable in light of its overall considerations, including the nature, extent and quality of services provided.
157
Supplemental Information (continued)
Emerging Markets Select Fund
With respect to the Emerging Markets Select Fund, the Independent Trustees noted that the Fund’s contractual management fee rate for the investor class shares and the institutional class shares was slightly above (within 5 basis points) the median of the Broadridge Expense Group. In addition, the total net expense ratios of the investor class shares and institutional class shares were below the median for the Broadridge Expense Group. The Independent Trustees also considered the Advisor’s analysis of various factors that contributed to setting the fee level, including the uniqueness of the Fund and its focused strategy in the emerging-markets segment and the higher capacity of the Fund compared to other Wasatch funds. Based on its review, the Board determined that the level of the advisory fee for the Emerging Markets Select Fund was acceptable in light of its overall considerations, including the nature, extent and quality of services provided.
Emerging Markets Small Cap Fund
With respect to the Emerging Markets Small Cap Fund, the Independent Trustees noted that the Fund’s contractual management fee rate and the total net expense ratios for the investor class shares and institutional class shares were above the median of the Broadridge Expense Group. The Independent Trustees also considered the Advisor’s analysis of various factors that contributed to setting the fee level, including, among other things, the uniqueness of the Fund in the emerging-markets segment, the potential to deliver alpha, the capacity constraints of the Fund and related limits on revenue potential, and the additional expenses associated with investing in companies dispersed among the various emerging-market countries and the higher trading and operating fees in these countries. Based on its review, the Board determined that the level of the advisory fee for the Emerging Markets Small Cap Fund was acceptable in light of its overall considerations, including the nature, extent and quality of services provided.
Frontier Emerging Small Countries Fund
With respect to the Frontier Emerging Small Countries Fund, the Independent Trustees noted that the Fund’s contractual management fee rate and the total net expense ratios of the institutional and investor class shares were above the median of the Broadridge Expense Group. The Independent Trustees also considered the Advisor’s analysis of various factors that contributed to setting the fee level, including, among other things, the uniqueness of the Fund in the frontier emerging small countries market segment, the capacity constraints of the Fund and related limits on revenue potential, and the additional expenses associated with investing in companies dispersed among the various smaller emerging and frontier countries, including the higher trading and operating fees in these countries. Based
on its review, the Board determined that the level of the advisory fee for the Frontier Emerging Small Countries Fund was acceptable in light of its overall considerations, including the nature, extent and quality of services provided.
Global Opportunities Fund
With respect to the Global Opportunities Fund, the Independent Trustees noted that although the Fund’s contractual management fee rate was above the median of the Broadridge Expense Group for the investor class shares and the institutional class shares, the total net expense ratio of the institutional class shares was below the median of the Broadridge Expense Group and the total net expense ratio of the investor class shares was slightly above (within 5 basis points) the median of the Broadridge Expense Group. The Independent Trustees also considered the Advisor’s analysis of various factors that contributed to setting the fee level, including, among other things, the uniqueness of the Fund in the marketplace, the potential to deliver alpha with the Fund’s strategy and ability to invest across various countries, the competitive environment of its market category and the capacity constraints of the Fund and related limits on revenue potential. Based on its review, the Board determined that the level of the advisory fee for the Global Opportunities Fund was acceptable in light of its overall considerations, including the nature, extent and quality of services provided.
Global Select Fund
With respect to the Global Select Fund, the Board noted that although the Fund’s contractual management fee rate was above the median of the Broadridge Expense Group for the investor class shares and institutional class shares, the total net expense ratio of the investor class shares was above the median of the Broadridge Expense Group and the total net expense ratio of the institutional class shares was below the median of the Broadridge Expense Group. The Independent Trustees also considered the Advisor’s analysis of various factors that contributed to setting the fee level, including, among other things, the uniqueness of the Fund’s focused strategy to invest in securities across various countries, the competitive environment of its market category and the higher capacity of the Fund compared to other Wasatch funds. Based on its review, the Board determined that the level of the advisory fee for the Global Select Fund was acceptable in light of its overall considerations, including the nature, extent and quality of services provided.
Global Value Fund
With respect to the Global Value Fund, the Independent Trustees noted that the contractual management fee rate and the total net expense ratios of the investor class
158
| | |
| | | MARCH 31, 2023 (Unaudited) |
shares and institutional class shares were below the median of the Broadridge Expense Group for both share classes. In addition, the Independent Trustees also considered the Advisor’s analysis of various factors that contributed to setting the fee level, including that the Fund generally had no capacity constraints given its investment strategies and operated in a competitive market segment. Based on its review, the Board determined that the level of the advisory fee for the Global Value Fund was acceptable in light of its overall considerations, including the nature, extent and quality of services provided.
Greater China Fund
With respect to the Greater China Fund, the Independent Trustees noted that the Fund’s contractual management fee rate for the investor class shares and institutional class shares was below the median of the Broadridge Expense Group; the total net expense ratio of the investor class shares was slightly above (within 5 basis points) the median of the Broadridge Expense Group; and the total net expense ratio of the institutional class shares was below the median of the Broadridge Expense Group. In addition, the Independent Trustees also considered the Advisor’s analysis of various factors that contributed to setting the fee level, including the Advisor’s investment process applied to the Greater China region, the higher costs of operating the Fund, and the larger capacity of the Fund compared to other Wasatch funds. Based on its review, the Board determined that the level of the advisory fee for the Greater China Fund was acceptable in light of its overall considerations, including the nature, extent and quality of services provided.
International Growth Fund
With respect to the International Growth Fund, the Independent Trustees noted that although the Fund’s contractual management fee rate for the investor class shares and institutional class shares was above the median of the Broadridge Expense Group, the total net expense ratio of the institutional class shares matched the median of the Broadridge Expense Group and the total net expense ratio of the investor class shares was above the median of the Broadridge Expense Group. In addition, the Independent Trustees also considered the Advisor’s analysis of various factors that contributed to setting the fee level, including the potential to deliver alpha through its investment approach, the uniqueness of the strategy of the Fund in its market category, the higher costs in operating a Fund that invests in foreign markets and the capacity constraints of the Fund and related limits on the revenue potential. Based on its review, the Board determined that the level of the advisory fee for the International Growth Fund was acceptable in light of its overall considerations, including the nature, extent and quality of services provided.
International Opportunities Fund
With respect to the International Opportunities Fund, the Independent Trustees noted that the Fund’s contractual management fee rate and the total net expense ratios for the investor class shares and institutional class shares were above the median of the Broadridge Expense Group. In addition, the Independent Trustees also considered the Advisor’s analysis of various factors that contributed to setting the fee level, including, among other things, the potential to add value through its investment approach, the uniqueness of the strategy of the Fund, the capacity constraints of the Fund and related limits on revenue potential and the higher costs in operating an international fund due, in part, to additional research resources required to screen and research companies across the world. Based on its review, the Board determined that the level of the advisory fee for the International Opportunities Fund was acceptable in light of its overall considerations, including the nature, extent and quality of services provided.
International Select Fund
With respect to the International Select Fund, the Independent Trustees noted that the Fund’s contractual management fee rate was below the median of the Broadridge Expense Group for the investor class shares and institutional class shares, the net expense ratio of the investor class shares was above the median of the Broadridge Expense Group and the total net expense ratio of the institutional class shares was below the median of the Broadridge Expense Group. In addition, the Independent Trustees also considered the Advisor’s analysis of various factors that contributed to setting the fee level. The Independent Trustees recognized the Fund’s higher capacity than certain other Wasatch funds and the uniqueness of the Fund’s focused strategy and the experience of the research team. Based on its review, the Board determined that the level of the advisory fee for the International Select Fund was acceptable in light of its overall considerations, including the nature, extent and quality of services provided.
Long/Short Alpha Fund
With respect to the Long/Short Alpha Fund, the Independent Trustees noted that the Fund’s contractual management fee rate and total net expense ratios for the investor class shares and institutional class shares were above the median of the Broadridge Expense Group. In addition, the Independent Trustees also considered the Advisor’s analysis of various factors that contributed to setting the fee level including, among other things, the research approach utilized by the Advisor, the uniqueness of the Fund, and the wide variation in fees of peer funds. Based on its review, the Board determined that the level of the advisory fee for the Long/Short Alpha Fund was
159
Supplemental Information (continued)
acceptable in light of its overall considerations, including the nature, extent and quality of services provided.
Micro Cap Fund and Micro Cap Value Fund
With respect to the Micro Cap Fund and the Micro Cap Value Fund, the Independent Trustees noted that each Fund’s contractual management fee rate and the total net expense ratios for investor class shares and institutional class shares were above the median of the respective Broadridge Expense Group. In addition, the Independent Trustees also considered the Advisor’s analysis of various factors that contributed to setting the fee level, including, among other things, the capacity constraints of the Funds and related limited revenue potential, the uniqueness of the Funds and their potential to deliver alpha, the Advisor’s expertise in the micro-cap asset category, and the higher expense in managing the Funds due, in part, to the higher costs associated with the due diligence required to screen and research companies in the micro-cap asset class. Based on its review, the Board determined that the level of the advisory fee for each Fund was acceptable in light of its overall considerations, including the nature, extent and quality of services provided.
Small Cap Growth Fund
With respect to the Small Cap Growth Fund, the Independent Trustees noted that although the Fund’s contractual management fee rate was above the median of the Broadridge Expense Group for the investor class shares and institutional class shares, the total net expense ratios of each share class were below the median of the Broadridge Expense Group. In addition, the Independent Trustees also considered the Advisor’s analysis of various factors that contributed to setting the fee level, including, among other things, the potential to deliver alpha, the expertise of the Advisor with regard to this strategy, the competitive market segment, the willingness of the Advisor to close its small-cap funds from time to time, the Fund’s capacity constraints and related limited revenue potential and the higher costs to manage the Fund due, in part, to the costs associated with the Advisor’s research-intensive approach. Based on its review, the Board determined that the level of the advisory fee for the Small Cap Growth Fund was acceptable in light of its overall considerations, including the nature, extent and quality of services provided.
Small Cap Value Fund
With respect to the Small Cap Value Fund, the Independent Trustees noted that although the Fund’s contractual management fee rate was above the median of its Broadridge Expense Group for the investor class shares and institutional class shares, the total net expense ratio of the institutional share class was below the median of the Broadridge Expense Group, and the total net expense ratio
of the investor class matched the median of the Broadridge Expense Group. In addition, the Independent Trustees also considered the Advisor’s analysis of various factors that contributed to setting the fee level, including, among other things, the potential to deliver alpha, the expertise of the Advisor in the small cap asset class, the competitive market segment, the willingness of the Advisor to close its small-cap funds from time to time, the Fund’s capacity constraints and related limited revenue potential and the higher costs to manage the Fund due, in part, to the costs associated with the Advisor’s research-intensive approach applied to the small-cap asset class. Based on its review, the Board determined that the level of the advisory fee for the Small Cap Value Fund was acceptable in light of its overall considerations, including the nature, extent and quality of services provided.
Ultra Growth Fund
With respect to the Ultra Growth Fund, the Independent Trustees noted that the Fund’s contractual management fee rate for its investor class shares and institutional class shares was above the median of the Broadridge Expense Group, but the total net expense ratio of the investor class was slightly higher (within 5 basis points) than the median of the Broadridge Expense Group, and the total net expense ratio of the institutional class was below the median of the Broadridge Expense Group. In addition, the Independent Trustees also considered the Advisor’s analysis of various factors that contributed to setting the fee level, including, among other things, the potential to deliver alpha through its investment approach, the competitive market segment, the willingness of the Advisor to close its small-cap funds from time to time, the Fund’s capacity constraints and related limited revenue potential and the higher cost to manage the Fund due, in part, to the higher costs associated with the Advisor’s research-intensive approach. Based on its review, the Board determined that the level of the advisory fee for the Ultra Growth Fund was acceptable in light of its overall considerations, including the nature, extent and quality of services provided.
U.S. Treasury Fund
With respect to the U.S. Treasury Fund, the Independent Trustees noted that the Fund’s contractual management fee was below the median of the Broadridge Expense Group for the investor class shares, and the total net expense ratio of the investor class shares matched the median of the Broadridge Expense Group. In addition, the Independent Trustees recognized that the Fund did not have any capacity constraints. Based on its review, the Board determined that the level of the advisory fee for the U.S. Treasury Fund was acceptable in light of its overall considerations, including the nature, extent and quality of services provided.
160
| | |
| | | MARCH 31, 2023 (Unaudited) |
The Board recognized that in addition to the advisory fee paid to the Advisor, the U.S. Treasury Fund is sub-advised, and the Board separately considered the sub-advisory fee rate paid to the Sub-Advisor by the Advisor. The Board reviewed, among other things, the Sub-Advisor’s fee rate for services to the Fund compared to the Sub-Advisor’s pricing schedule for portfolio management services to other clients. With respect to the U.S. Treasury Fund, the Independent Trustees noted that the sub-advisory fee rate was in line with the Sub-Advisor’s fee schedule for its other clients in light of the asset size of the Fund. In addition, the Independent Trustees also recognized that the Advisor pays the Sub-Advisor from its own revenues, and that the Advisor and Sub-Advisor were not affiliated persons and therefore the sub-advisory fee had been established through arm’s-length negotiations between the Advisor and the Sub-Advisor. Based on its review, the Board determined that the level of the sub-advisory fee for the U.S. Treasury Fund was acceptable in light of its overall considerations, including the nature, extent and quality of services provided.
2. Fees Charged to Other Advisor and Sub-Advisor Clients
In determining the appropriateness of the fees, the Board considered information regarding the fee rates charged by the Advisor to certain other types of clients that are similarly managed to the respective Fund (if any) and the types of services provided or not provided to these other types of clients. For certain of the Funds’ strategies, such other clients of the Advisor may include: separately managed accounts, model accounts, collective investment trusts and certain domestic and foreign funds outside the Wasatch family of funds for which the Advisor serves as a sub-advisor. The Board reviewed the differences in the scope of services the Advisor provides to the Funds relative to those provided by the Advisor to the other types of clients. The Independent Trustees recognized the Advisor’s representation that, as a general rule, the Advisor seeks to charge higher fees to clients that require a higher degree of service. The Independent Trustees considered the more extensive and complex services the Advisor provides to the Funds, which are unique to the Funds, and the corresponding additional personnel, time and resources necessary to provide these services. Such services included, among other things, certain administrative services, operational expertise, third-party oversight, daily fund share transaction monitoring, Board support services, shareholder communications, tax administration and compliance and regulatory services. Although the Advisor provides varying degrees of portfolio management services or investment advice to these other clients, the Independent Trustees recognized that the level of these services, expertise and resources still may differ significantly due, in part, to the differences in investment objectives, guidelines or parameters of the
accounts, including, but not limited to, the ability to invest in foreign securities and the related functions necessary to establish and trade securities in foreign jurisdictions. In addition to the differences in services provided to the Funds compared to other clients, the Independent Trustees recognized the additional regulatory, entrepreneurial and reputational risks incurred by the Advisor in managing the Funds that the Advisor does not incur in managing strategies for other types of clients.
In addition to the description of the different services provided to these other clients, the Board received certain fee data with respect to the other types of clients that were managed in a similar style to the applicable Fund. Such Funds with comparative fee data included the Core Growth Fund, Emerging India Fund, Emerging Markets Select Fund, Emerging Markets Small Cap Fund, Frontier Emerging Small Countries Fund, Global Opportunities Fund, International Growth Fund, International Opportunities Fund, International Select Fund, Micro Cap Fund, Micro Cap Value Fund, Small Cap Growth Fund, Small Cap Value Fund and Ultra Growth Fund.
The Board determined that the varying levels of fees were justified given, among other things, the inherent differences in the products and level of services provided to the Funds versus other clients, the differing regulatory requirements and the entrepreneurial, reputational, and regulatory risks incurred in sponsoring and advising the Funds.
With respect to the Sub-Advisor of the U.S. Treasury Fund, the Independent Trustees, as noted above, had reviewed the sub-advisory fee rate paid to the Sub-Advisor compared to the Sub-Advisor’s pricing schedule for portfolio management services for other clients. As described above, the Independent Trustees noted that the fee rate paid to the Sub-Advisor for its services was in line with the Sub-Advisor’s respective pricing schedule.
3. Profitability of Fund Advisors
In conjunction with their review of fees, the Independent Trustees reviewed information reflecting the Advisor’s financial condition and profitability. The Independent Trustees reviewed, among other things, the consolidated financial statements of WA Holdings, Inc. (the parent of the Advisor) and its subsidiary (the Advisor) for the years ended December 31, 2021 and 2020. In addition, the Board also reviewed various profitability data of the Advisor. The Independent Trustees received and reviewed, among other things, the Advisor’s revenues, expenses and profit margin (pre-tax and pre- and post-distribution expenses paid by the Advisor out of its own resources) for 2021. Further, the Independent Trustees recognized that compensation expense is a primary expense of the Advisor and that, as a privately held S corporation owned by the employees, the Advisor’s level of profitability could be influenced, in part,
161
Supplemental Information (continued)
by paying employees through compensation expense as opposed to dividends as shareholders. As a result, the Independent Trustees also reviewed the Advisor’s profitability data for 2021 with certain adjustments to the compensation expense to assist in the comparability of the Advisor’s profitability to that of certain industry peers. In this regard, the Independent Trustees received profitability data of certain industry peers of the Advisor, including, among other things, their revenues, expenses and profit margin (pre-tax) compared to the profitability data of the Advisor on an actual and compensation expense adjusted basis. The Independent Trustees, however, recognized the inherent limitations of the comparative data given that the calculation of profitability is rather subjective and that numerous factors (such as the structure of the particular advisor, the types of funds it manages, its business mix, its cost of capital, the methodology used to allocate expenses and other factors) can have a significant impact on the results. In addition to the comparative data, the Independent Trustees also received profitability information for the Advisor for providing services to the Funds (those existing during the applicable periods) on an aggregate and per-Fund basis (on an actual and adjusted compensation basis) for the 2021 calendar year.
In evaluating profitability data, the Independent Trustees recognized the difficulty in calculating profitability at the individual Fund level given that differing but reasonable allocation methodologies could be employed and lead to significantly different results. At the November Executive Session, the Independent Trustees met with certain senior management of the Advisor to discuss, among other things, the nature of Subchapter S corporations, the compensation structure for the Advisor’s investment professionals, the rationale behind the compensation adjustments, the methodology to determine profitability, and projected profitability for 2022.
The Independent Trustees recognized that the Advisor’s revenues and profitability may fluctuate significantly from year to year due to, among other things, fluctuations in assets under management. To provide additional historical context, the Independent Trustees requested and received profitability data for the Advisor for services to the Funds (those existing during the applicable periods) in the aggregate and on a per-Fund basis for the 2019 and 2020 calendar years. The Independent Trustees considered, among other things, the Advisor’s business model, fluctuations in the Advisor’s revenues each calendar year from 2016 through 2021 (and through October 19, 2022), fluctuations in the Advisor’s profit margin from the Funds (those existing during such time) each year from 2019 through 2021, financial stability and the manner in which the Advisor funds its future financial commitments (such as its long-term compensation programs, deferred compensation arrangements and share buyback requirements).
In its review of profitability, the Independent Trustees also considered the indirect benefits (such as soft dollars) the Advisor or Sub-Advisor received that were directly attributable to the management of the applicable Funds as discussed in further detail below. Based on its review, the Board was satisfied that the Advisor’s level of profitability from its relationship with each Fund was not unreasonable over various time frames in light of the nature, extent and quality of services provided.
With respect to the Sub-Advisor, the Independent Trustees reviewed information reflecting the financial condition of the Sub-Advisor. Although profitability on a per-account level was not available, the Trustees reviewed the Sub-Advisor’s financial statements for the years ended December 31, 2021 and 2020. Based on its review, including the Sub-Advisor’s fee schedule and the fact that the sub-advisory fee was established through arm’s-length negotiations, the Board concluded that the Sub-Advisor’s profitability from its relationship with the U.S. Treasury Fund was not unreasonable.
D. Economies of Scale and Whether Fee Levels Reflect These Economies of Scale
In evaluating the reasonableness of the advisory fees, the Board considered the existence of any economies of scale in the provision of services by the Advisor and Sub-Advisor and whether those economies were appropriately shared with the Funds. In the Board’s review, the Independent Trustees recognized that economies of scale are difficult to measure, particularly on a Fund-by-Fund basis, and certain expenses may not decline with a rise in assets. However, the Board recognized that there are several methods to help share the benefits of economies of scale, including breakpoints in the management fee schedule, fee waivers and/or expense limitations, pricing of Funds at scale at inception and other means. Although the management fee schedule for each Fund does not have breakpoints, the Board noted that the Funds have temporary expense limitation arrangements in place pursuant to which the Advisor reimburses expenses and/or waives fees of the respective Fund that exceed the expense limit expressed as a percentage of average daily net assets of the respective class (subject to certain exceptions). The Independent Trustees reviewed, among other things, the Funds’ expense ratios, the expense caps for the investor and institutional class (if any) per Fund, and the amounts the Advisor reimbursed certain Funds per class for the Funds’ fiscal year 2022 as well as the amounts the Advisor reimbursed to Funds, if any, for the 2020, 2021 and 2022 fiscal years (12-month periods ended September 30) of the Funds. The Independent Trustees further reviewed the advisory fee rate the Advisor received after waivers of fees or expenses reimbursed by the Advisor. The Board noted that economies of scale may also be shared through the
162
| | |
| Wasatch Funds | | MARCH 31, 2023 (Unaudited) |
Supplemental Information (continued)
Advisor’s ability to negotiate lower fee arrangements with third-party service providers.
In addition to expense limitations, the Independent Trustees recognized that many of the Funds have capacity constraints, particularly those Funds investing primarily in small- and micro-cap companies, and, as a result, the Advisor periodically closes Funds to new investments as it determines necessary to preserve the integrity of the respective Fund’s investment strategy and to protect performance. Although this practice may limit asset growth and thereby preclude certain economies of scale from being achieved, the Independent Trustees also recognized the benefit of protecting performance for existing shareholders and maintaining assets at a level that the Advisor believes it can effectively manage. As noted, the Independent Trustees further considered that the practice may limit the profit potential of the Advisor. With respect to Funds without capacity constraints, the Independent Trustees recognized that breakpoints would be beneficial if the Fund’s assets were large enough to meet the breakpoints and noted the Advisor’s position that such larger capacity Funds were not at asset levels that would benefit from breakpoints in the fee schedule.
Considering the factors above, the Independent Trustees concluded that the absence of breakpoints in the management fee was acceptable and that any economies of scale that exist are adequately reflected in the Advisor’s fee structure.
E. Indirect Benefits
The Independent Trustees received and considered information regarding indirect benefits the Advisor and Sub-Advisor may receive as a result of their relationship with the respective Fund(s). In this regard, with the exception of the U.S. Treasury Fund, the Independent Trustees recognized that the Advisor received benefits from soft dollar arrangements whereby the Advisor used a portion of the brokerage commissions paid by the Funds to acquire research that may be useful to the Advisor in managing the Funds and similarly managed strategies for other clients. The Board recognized that soft dollar arrangements may result in the applicable Fund bearing costs to purchase research and therefore may reduce the Advisor’s expenses. The Independent Trustees accordingly considered that the Advisor’s profitability would be lower if it paid for such research with its own revenues. With respect to the Sub-Advisor, the Independent Trustees recognized that the Sub-Advisor had not participated in soft dollar arrangements with respect to the U.S. Treasury Fund’s portfolio transactions. The Independent Trustees further considered the reputational and/or marketing benefits the Advisor and Sub-Advisor may receive as a result of their association with the Funds. The Independent Trustees took these indirect benefits into account when assessing the level of
advisory fees paid to the Advisor and sub-advisory fee paid to the Sub-Advisor and concluded that the indirect benefits received were reasonable.
F. Annual Approval of Advisory Agreements
During its review process, the Independent Trustees noted certain instances where clarification or follow-up was appropriate and in other instances where clarification or follow-up was not necessary. In those circumstances where clarification or follow-up was requested, the Board determined that information responsive to its requests (whether oral or written) had been provided. The Independent Trustees did not identify any single factor discussed previously as all-important or controlling. The Board, including a majority of Independent Trustees, concluded that the terms of the Investment Advisory Agreement for each Fund and the Sub-Advisory Agreement with the Sub-Advisor on behalf of the U.S. Treasury Fund were fair and reasonable, that the Advisor’s and Sub-Advisor’s fees were reasonable in light of the services provided to each respective Fund, that the Investment Advisory Agreement should be approved on behalf of each Fund and that the Sub-Advisory Agreement should be approved on behalf of the U.S. Treasury Fund.
G. Other Advisory Agreement Approvals
Subsequent to the Meeting, the Advisor, among other things, converted its corporate structure from a Utah corporation to a Delaware limited partnership and changed its name from Wasatch Advisors, Inc. to Wasatch Advisors LP pursuant to an internal reorganization. At a meeting held on February 22, 2023 (the “February Meeting”), the Board received certain information regarding the internal reorganization. The Board considered, among other things, that there was no change in the advisory fees payable under the Advisory Agreements, the nature or level of services provided to the Funds or to the day-to-day management of the Funds as a result of the reorganization and legal analysis that the internal reorganization would not result in an “assignment” of the Advisory Agreements as that term is defined in the 1940 Act. The Board had approved the renewal of the Advisory Agreements at the recent Meeting and its considerations should continue to apply. At the February Meeting, the Board approved the execution of amended and restated Advisory Agreements reflecting the Advisor’s new name and form of organization.
163
| | |
| Wasatch Funds | | MARCH 31, 2023 |
Service Providers
Investment Advisor
Wasatch Advisors LP, d/b/a Wasatch Global Investors
505 Wakara Way, 3rd Floor
Salt Lake City, UT 84108
Sub-Advisor for the Wasatch-Hoisington U.S. Treasury Fund
Hoisington Investment Management Co. (HIMCo)
6836 Bee Caves Road
Building 2, Suite 100
Austin, TX 78746
Administrator and Fund Accountant
State Street Bank and Trust Company
801 Pennsylvania Avenue
Kansas City, MO 64105
Distributor
ALPS Distributors, Inc.
1290 Broadway, Suite 1100
Denver, CO 80203
Transfer Agent
UMB Fund Services, Inc.
235 West Galena Street
Milwaukee, WI 53212
Custodian
State Street Bank and Trust Company
801 Pennsylvania Avenue
Kansas City, MO 64105
Legal Counsel to Wasatch Funds and Independent Trustees
Chapman and Cutler, LLP
320 S. Canal Street
Chicago, IL 60606
Independent Registered Public Accounting Firm
PricewaterhouseCoopers LLP
1100 Walnut Street, Suite 1300
Kansas City, MO 64106
ONLINE
wasatchglobal.com
or via email
shareholderservice@wasatchfunds.com
TELEPHONE
800.551.1700
M - F, 7:00 a.m. to 7:00 p.m. Central Time
Automated Line, 24 Hours
MAIL
Regular Mail Delivery
Wasatch Funds
P.O. Box 2172
Milwaukee, WI 53201-2172
Overnight Delivery
Wasatch Funds
235 West Galena Street
Milwaukee, WI 53212
164
WASATCHGLOBAL.COM ACTIVE MANAGEMENT FOR INEFFICIENT MARKETS SMALL CAP MICRO CAP INTERNATIONAL EMERGING MARKETS FRONTIER MARKETS GLOBAL
Item 2. Code of Ethics.
Not required.
Item 3. Audit Committee Financial Expert.
Not required.
Item 4. Principal Accountant Fees and Services.
Not required.
Item 5. Audit Committee of Listed Registrants.
Not applicable.
Item 6. Investments.
| (a) | Schedule of Investments is included as a part of the report to shareholders filed under Item 1 of this Form N-CSR. |
Item 7. Disclosure of Proxy Voting Policies and Procedures for Closed-End Management Investment Companies.
Not applicable.
Item 8. Portfolio Managers of Closed-End Investment Companies.
Not applicable.
Item 9. Purchases of Equity Securities by Closed-End Management Investment Company and Affiliated Purchasers.
Not applicable.
Item 10. Submission of Matters to a Vote of Security Holders.
There have been no material changes to the procedures by which shareholders may recommend nominees to the Registrant’s board of trustees, where those changes were implemented after the Registrant last provided disclosure in response to this item.
Item 11. Controls and Procedures.
| (a) | The Registrant’s principal executive and principal financial officers have concluded that the Registrant’s disclosure controls and procedures (as defined in Rule 30a-3(c) under the 1940 Act) are effective, as of a date within 90 days of the filing date of this Form N-CSR based on their evaluation of these controls and procedures required by Rule 30a-3(b) under the 1940 Act) and Rules 13a-15(b) or 15d-15(b) under the Securities Exchange Act of 1934). |
| (b) | There were no changes in the Registrant’s internal control over financial reporting (as defined in Rule 30a-3(d) under the 1940 Act) that occurred during the period covered by this report that has materially affected, or is reasonably likely to materially affect, the Registrant’s internal control over financial reporting. |
Item 12. Disclosure of Securities Lending Activities for Closed-End Management Investment Companies.
Item 13. Exhibits.
SIGNATURES
Pursuant to the requirements of the Securities Exchange Act of 1934 and the Investment Company Act of 1940, the Registrant has duly caused this report to be signed on its behalf by the undersigned, thereunto duly authorized.
| | |
| WASATCH FUNDS TRUST |
| |
| By: | | /s/ Eric S. Bergeson |
| | Eric S. Bergeson |
| | President (principal executive officer) of Wasatch Funds Trust |
| |
| Date: | | June 5, 2023 |
|
Pursuant to the requirements of the Securities Exchange Act of 1934 and the Investment Company Act of 1940, this report has been signed below by the following persons on behalf of the Registrant and in the capacities and on the dates indicated. |
| |
| By: | | /s/ Eric S. Bergeson |
| | Eric S. Bergeson |
| | President (principal executive officer) of Wasatch Funds Trust |
| |
| Date: | | June 5, 2023 |
| |
| By: | | /s/ Michael K. Yeates |
| | Michael K. Yeates |
| | Treasurer (principal financial officer) of Wasatch Funds Trust |
| |
| Date: | | June 5, 2023 |