UNITED STATES
SECURITIES AND EXCHANGE COMMISSION
Washington, D.C. 20549
FORMN-CSR
CERTIFIED SHAREHOLDER REPORT OF REGISTERED
MANAGEMENT INVESTMENT COMPANIES
Investment Company Act file number:811-04920
WASATCH FUNDS TRUST
(Exact name of registrant as specified in charter)
505 Wakara Way, 3rd Floor
Salt Lake City, UT 84108
(Address of principal executive offices)(Zip code)
| | |
| (Name and Address of Agent for Service) | | Copy to: |
| |
Eric S. Bergeson Wasatch Advisors, Inc. 505 Wakara Way, 3rd Floor Salt Lake City, UT 84108 | | Eric F. Fess, Esq. Chapman & Cutler LLP 111 West Monroe Street Chicago, IL 60603 |
Registrant’s telephone number, including area code: (801)533-0777
Date of fiscal year end: September 30
Date of reporting period: March 31, 2020
| Item 1. | Report to Shareholders. |
WASATCHGLOBAL . COM MARCH 31, 2020 2020 Semi-Annual Report Fund Investor Institutional Name Class Class Wasatch Core Growth Fund WGROX WIGRX Wasatch Emerging India Fund WAINX WIINX Wasatch Emerging Markets Select Fund WAESX WIESX Wasatch Emerging Markets Small Cap Fund WAEMX WIEMX Wasatch Frontier Emerging Small Countries Fund WAFMX WIFMX Wasatch Global Opportunities Fund WAGOX WIGOX Wasatch Global Select Fund WAGSX WGGSX Wasatch Global Value Fund FMIEX WILCX Wasatch International Growth Fund WAIGX WIIGX Fund Investor Institutional Name Class Class Wasatch International Opportunities Fund WAIOX WIIOX Wasatch International Select Fund WAISX WGISX Wasatch Micro Cap Fund WMICX WGICX Wasatch Micro Cap Value Fund WAMVX WGMVX Wasatch Small Cap Growth Fund WAAEX WIAEX Wasatch Small Cap Value Fund WMCVX WICVX Wasatch Ultra Growth Fund WAMCX WGMCX Wasatch-Hoisington U.S. Treasury Fund WHOSX Beginning January 31, 2021, as permitted by regulations adopted by the Securities and Exchange Commission, paper copies of Wasatch Funds shareholder reports will no longer be sent by mail, unless you specifically request paper copies of the reports from Wasatch Funds or from your financial intermediary, (such as a broker-dealer or bank). Instead, reports will be made available on Wasatch Funds’ website wasatchglobal.com, and you will be notified by mail each time a report is posted and provided with a website link to access the report. If you already elected to receive shareholder reports electronically, you will not be affected by this change and you need not take any action. You may elect to receive shareholder reports and other communications from Wasatch Funds electronically by contacting your financial intermediary (such as a broker-dealer or bank) or, for Fund shares held directly with Wasatch Funds, by calling 800.551.1700 or by enrolling in “eDelivery” by logging into your account at https://wasatchfunds.olaccess.com. You may elect to receive all future reports in paper free of charge. If you invest through a financial intermediary, you can contact your financial intermediary to request that you continue receiving paper copies of your shareholder reports. If you invest directly with Wasatch Funds, you can call 800.551.1700 to let the Funds know you wish to continue receiving paper copies of your shareholder reports. Your election to receive reports in paper will apply to all Wasatch Funds held in your account if you invest through a financial intermediary or all Wasatch Funds held with the fund complex if you invest directly with Wasatch Funds.
WASATCH FUNDS
Salt Lake City, Utah
wasatchglobal.com
800.551.1700
This material must be accompanied or preceded by a prospectus.
Please read the prospectus carefully before you invest.
Wasatch Funds are distributed by ALPS Distributors, Inc.
1
| | |
| LETTERTO SHAREHOLDERS — TRUSTING OUR INSTRUMENTS | | |
|
|
|
| | | | |

JB Taylor CEO, Portfolio Manager and Head of U.S. Small Cap Investing | | 
Ajay Krishnan, CFA Portfolio Manager and Head of Emerging Markets Investing | | DEAR FELLOW SHAREHOLDERS: If you Google “trust your…,” some of the most-frequent entries you will see are “trust your gut,” “trust your instincts” and “trust your intuition.” While these are important considerations during the current health and economic crisis, we think they must be balanced with the equally important “trust your instruments” — a fundamental principle in the field of aviation. A pilot initially learns to navigate using visual reference points on the ground. But at higher altitude, especially under stormy conditions, reference points outside the cockpit mostly disappear. For these circumstances, a pilot is taught to override the body’s physical senses — and instead pay close attention to the instrument display panel. In fact, a pilot flying when visibility is poor must rely almost exclusively on the display indicators. |
In our investment process, we benefit from both subjective analysis and our version of “trusting our instruments.” As we steer through the current environment characterized by extreme stock-market volatility and a particularly uncertain future, the objectivity of our instruments has become increasingly valuable. Indeed, our instruments indicate that our funds are on course — invested in what we believe are strong companies at appropriate position sizes.
A BATTLEOF EXPONENTIAL FORCES
For stocks, the quarter ended March 31, 2020 included one of the worst periods on record. Stocks of companies — large and small, around the world and across all sectors — fell in a synchronous fashion. What was staggering, beyond the magnitude of the declines, was the speed at which stocks fell. Nearly all equity indexes declined between-30% and-40% over the four-week period between February 20 and March 20.
For a pilot, this would be the equivalent of flying through sunny, cloudless skies in one moment and through a Category 5 hurricane in the next. With unthinkable speed, we dove from record employment numbers in the U.S. to a probable global recession. The sad reality of the attempt to limit the spread of the novel coronavirus is a massive coordinated global slowdown in human interaction and commerce, with most businesses in every sector taking punishment in the storm.
The unprecedented uncertainty is due to the coronavirus’s exponential infection rate among the world’s population. However, we remain hopeful based on global responses. Medical responses include the fast-track development of potential vaccines and antiviral drugs. Economic responses consist of unprecedented monetary and fiscal measures. To paraphraseNew York Times columnist Thomas Friedman, we are in a battle of exponential forces. Globally, citizens are working to counterCovid-19’s negative exponential force with an overwhelmingly positive exponential force.
The current crisis is the equivalent of a massive slowdown in the global “income statement,” figuratively speaking, compared to the2008-09 global financial crisis, which saw a sudden evaporation of the global “balance sheet” due to enormous levels of bad credit. A struggling income statement can recover, provided the balance sheet is strong. It’s encouraging that the monetary and fiscal measures enacted — cash payments for workers, accessiblelow-interest loans for small businesses and massive influxes of banking liquidity — seem properly focused on preventing the current “income statement” problem from becoming a larger “balance sheet” issue.
Once the crisis has abated, we expect that our funds will be well-positioned with investments in companies benefiting from the renewed economic upturn — and not only in the U.S. Other countries have been just as diligent, or even more so, with their own medical and economic responses to the virus. And because world-wide economies had been relatively strong before the outbreak, we believe our companies will pick up not too far from where they had left off — even if there are hiccups along the way.
THE WASATCH RESPONSE
Our response during a typical market correction is generally to hold steady. After all, if we liked our companies going into the selloff, we should still like them afterwards — especially at the resulting less-expensive prices.
Therefore, even though this has not been a typical market correction, we are making very few changes to our growth-oriented funds. We generally invest in companies that we consider high quality. We have found that during market downturns, investors tend to prefer high-quality names — even those considered somewhat expensive.
Many of Wasatch’s long-term, alpha-producing track records have been generated by outperforming in down markets, and true to form, our funds have generally outperformed in the current downturn. During the past few years, it has been especially gratifying to see our growth-oriented funds generate benchmark-beating returns on both the downside and the upside.
Looking forward, it’s impossible to predict short-term performance, especially under the current“anything-but-normal” conditions. But we think our funds are well-situated compared to their benchmarks. Generally speaking, our companies have long records of stronger sales and earnings growth, higher returns on capital, better cash flows and, importantly, much healthier balance sheets.
Sometimes the hardest thing to do in investing is to not do anything. Because we have navigated severe market volatility many times before, we know what tends to work and we understand the value of keeping our emotions in check. These experiences, in turn, have given us the courage to trust the research we have already done. The overwhelming majority of our investments are in companies that we believe are built to withstand harsh economic shocks.
2
| | |
| | MARCH 31, 2020 (UNAUDITED) |
|
|
|
To be prepared for scenarios in which the current crisis becomes longer and deeper than we expect, the Wasatch research team hasre-analyzed and stress-tested every company we own for balance-sheet strength and the ability to endure relatively long-term hits to sales and earnings. We have adjusted weightings in companies for which we see increased or decreased potential, and we have sold a few names where our outlook for their long-term growth prospects has changed (which may not necessarily be due to recent events). As always, we continue to assess new opportunities — especially since many companies on our wish lists have fallen toonce-in-a-decade valuations.
It’s important to emphasize that market cycles consist of two phases. One phase is the downturn, during which Wasatch has performed admirably in the current cycle. The other is the ensuing recovery, the start of which can only be determined in hindsight.
Because the stocks that hold up better during a significant downturn are sometimes the same ones that performed relatively well before the downturn, portfolio adjustments may not be necessary. But a recovery rally off the market bottom can be trickier to navigate. That’s not to say a static portfolio will necessarily perform poorly during a recovery rally. It’s just that moderate alterations to the portfolio can often improve performance.
For example, our historical research and firsthand insights — which are our versions of “flight-control instruments” — indicate that some of our biggest decliners during the downturn may also be some of our largest winners during the recovery. So, rather than selling these positions based on what might look like deteriorating fundamentals, we may prudently add to current weights at lower prices.
The idea is that, unlikerun-of-the-mill market corrections, crisis-induced precipitous declines often warrant increasing weights in what seem like “higher-risk” holdings. To be prepared, we havere-analyzed all our fund holdings and watch-list names. This continues to give us the conviction to increase position sizes and make incremental investments in companies whose stocks get punished particularly unfairly in our view.
MAINTAINING OUR LONG-TERM PERSPECTIVE
We think patience is our most-important asset. We remain steadfast in ourbottom-up research process. Above all, we are long-term investors focused on paying reasonable prices for high-quality companies. We think quality is especially important during a crisis because exceptional companies often increase their competitive advantages in times of stress, even when short-term sales and earnings decline on an absolute basis. After the crisis, these companies are particularly well-positioned to grow and take even more market share over the long term.
In closing, we would like to note that we as a firm believe it’s important to support public-health officials in containingCovid-19. As such, Wasatch has temporarily halted business travel. And members of our team have redoubled their efforts to minimize the impact on our operations.
For example, many of our scheduledin-person research meetings have been converted into technology-enabled “virtual visits.” Moreover, we have been impressed that the companies we own and those that we are considering for investment have been universally accommodative, so we have been able to get the information we need to do our jobs with remarkably few impediments.
Finally, out of an abundance of caution for the safety of our staff and the broader community, most of our employees are working from home. Please note that all business functions are fully operational and all lines of communication with Wasatch remain open.
With sincere thanks for your continuing investment and for your trust,
| | |

| | 
|
JB Taylor | | Ajay Krishnan |
Information in this report regarding market or economic trends, or the factors influencing historical or future performance, reflects the opinions of management as of the date of this report. These statements should not be relied upon for any other purpose. Past performance is no guarantee of future results, and there is no guarantee that the market forecasts discussed will be realized.
CFA® is a trademark owned by the CFA Institute.
Wasatch Global Investors is the investment advisor to Wasatch Funds.
Wasatch Funds are distributed by ALPS Distributors, Inc. (ADI). ADI is not affiliated with Wasatch Global Investors.
Definitions of financial terms and index descriptions and disclosures begin on page 38.
3
| | |
| WASATCH CORE GROWTH FUND(WGROX / WIGRX) | | MARCH 31, 2020 (UNAUDITED) |
|
|
|
Management Discussion
The Wasatch Core Growth Fund is managed by a team of Wasatch portfolio managers led by JB Taylor, Paul Lambert and Mike Valentine.
| | | | |

JB Taylor Lead Portfolio Manager | | 
Paul Lambert Portfolio Manager | | 
Mike Valentine Portfolio Manager |
OVERVIEW
Equity prices of small growth companiessee-sawed from gains to coronavirus-induced losses before partially rebounding near the end of the quarter ended March 31, 2020. Small-company stocks generally declined more than large-company names, and the benchmark Russell 2000 Index dropped-30.61% for the quarter. Meanwhile, the Russell 2000 Growth Index lost-25.76%. Declining less than these indexes, the Wasatch Core Growth Fund — Investor Class fell -23.93%.
Given the magnitude ofCovid-19 repercussions, pundits have drawn comparisons to the 2008-09 global financial crisis (GFC). For our part, we see a distinction in that the current crisis is the equivalent of a massive slowdown in the global “income statement,” whereas the GFC entailed a sudden evaporation of the global “balance sheet” due to enormous levels of bad credit. A struggling income statement can recover, provided the balance sheet is strong. It’s encouraging that the monetary and fiscal measures enacted seem properly focused on preventing the current “income statement” problem from becoming a larger “balance sheet” issue.
DETAILSOFTHE QUARTER
By sector, stock picking in consumer discretionary, information technology and real estate aided the Fund’s performance relative to its Russell 2000 benchmark. We also benefited from not having exposure to energy, by far the weakest area of the market. The industrials sector subtracted the most from the Fund’s return. Our industrial companies held up better than their Index peers, but our overweight position detracted from performance relative to the benchmark.
The top contributor to Fund performance was Five9, Inc., a provider of contact-center software that’s managed and hosted from the cloud. The company offers real-time and historical reporting, quality monitoring, and workforce and customer-relationship-management integrations. The superiority of cloud-based software has become especially evident during the pandemic. On a longer-term basis, Five9 has competitive advantages that make it the dominant growth company in its industry.
Another contributor was DocuSign, Inc. The company’se-signature software enables businesses to digitally prepare and execute agreements. DocuSign has been experiencing rapid sales gains and improved growth prospects. With the pandemic scattering corporate operations to home offices
and curtailing travel, DocuSign is positioned to benefit as more companies sign contracts over the internet.
The largest detractor from performance was Euronet Worldwide, Inc., a provider of electronic solutions for financial transactions in the U.S., Europe and Asia. Euronet’s offerings include financial-payment middleware, financial-network gateways, outsourcing and consulting. The stock fell due to the anticipateddrop-off in financial transactions amid a global economic slowdown. Over the long term, we think Euronet is well-positioned for double-digit annual sales growth and meaningfully improved earnings.
An additional detractor was Monro, Inc., which operates a chain of shops for automotive repairs and tires. These shops provide a broad range of services and parts related to brakes, mufflers, exhaust systems, steering mechanisms, drive trains, suspensions, wheel alignments and routine maintenance. At the current stock price, we like Monro based on our expectations that the company will increase revenues, margins and free cash flows.
OUTLOOK
Wasatch’s core expertise is the fundamental analysis of individual companies. In this regard, we liked our portfolio companies going into the selloff and we still like them now.
Compared to the benchmark, our companies generally have long records of stronger sales and earnings growth, higher returns on capital, better cash flows and, importantly, much healthier balance sheets. The Wasatch research team spent several weeksre-analyzing every company we own and scanning for new opportunities. We’ve adjusted company weightings where we see increased potential or weakness, and we’ve sold a handful of names for which we viewed upside potential as inadequate.
Having outpaced our benchmark during the initial phases of theCovid-19 turmoil, we’re acutely aware that the race is never over. In market panics, extreme risk aversion can cause investors to unfairly punish the stocks of companies whose long-term businesses remain strong — but whose near-term prospects are much less certain, or perhaps even quite poor. Such panics sometimes do not burn themselves out until high-quality stocks with some perceived risk are beaten down to the point that they may actually be the least-risky names. To the extent that we believe risk has become mispriced, we’ll continue to seek opportunities to selectively take it on.
Thank you for the opportunity to manage your assets.
| | Current and future holdings are subject to risk. |
4
| | |
| WASATCH CORE GROWTH FUND(WGROX / WIGRX) | | MARCH 31, 2020 (UNAUDITED) |
|
|
|
Portfolio Summary
AVERAGE ANNUAL TOTAL RETURNS
| | | | | | | | | | | | | | | | | | | | |
| | | SIX MONTHS* | | 1 YEAR | | 5 YEARS | | 10 YEARS |
Core Growth (WGROX) — Investor | | | | -17.26% | | | | | -12.13% | | | | | 5.40% | | | | | 11.12% | |
Core Growth (WIGRX) — Institutional | | | | -17.22% | | | | | -12.02% | | | | | 5.53% | | | | | 11.22% | |
Russell 2000® Index | | | | -23.72% | | | | | -23.99% | | | | | -0.25% | | | | | 6.90% | |
Russell 2000® Growth Index | | | | -17.31% | | | | | -18.58% | | | | | 1.70% | | | | | 8.89% | |
Data show past performance, which is not indicative of future performance. Current performance may be lower or higher than the performance quoted. To obtain the most recentmonth-end performance data available, please visit wasatchglobal.com. The Advisor may absorb certain Fund expenses, without which total returns would have been lower. Investment returns and principal value will fluctuate and shares, when redeemed, may be worth more or less than their original cost.
As of the January 31, 2020 prospectus, the Total Annual Fund Operating Expenses for the Wasatch Core Growth Fund are Investor Class: 1.19% / Institutional Class — Gross: 1.09%, Net: 1.05%. The expense ratio shown elsewhere in this report may be different. Net expenses are based on Fund expenses, net of waivers and reimbursements. See the prospectus for additional information regarding Fund expenses.
Wasatch will deduct a 2.00% redemption fee on Fund shares held 60 days or less. Performance data do not reflect the deduction of fees, including sales charges, or the taxes you would pay on fund distributions or the redemption of fund shares. Fees and taxes, if reflected, would reduce the performance quoted. Wasatch does not charge any sales fees. For more complete information including charges, risks and expenses, read the prospectus carefully.
Performance for the Institutional Class prior to 1/31/2012 is based on the performance of the Investor Class. Performance of the Fund’s Institutional Class prior to 1/31/2012 uses the actual expenses of the Fund’s Investor Class without any adjustments. For any such period of time, the performance of the Fund’s Institutional Class would have been substantially similar to, yet higher than, the performance of the Fund’s Investor Class, because the shares of both classes are invested in the same portfolio of securities, but the classes bear different expenses.
Investing in small cap funds will be more volatile and loss of principal could be greater than investing in large cap or more diversified funds. Investing in foreign securities, especially in emerging markets, entails special risks, such as currency fluctuations and political uncertainties, which are described in more detail in the prospectus.
TOP 10 EQUITY HOLDINGS**
| | | | |
| Company | | % of Net
Assets | |
| |
Trex Co., Inc. | | | 3.5% | |
| |
Tyler Technologies, Inc. | | | 3.4% | |
| |
ICON plc (Ireland) | | | 3.4% | |
| |
Pool Corp. | | | 3.3% | |
| |
Proofpoint, Inc. | | | 2.9% | |
| | | | |
| Company | | % of Net
Assets | |
| |
Five9, Inc. | | | 2.8% | |
| |
Balchem Corp. | | | 2.8% | |
| |
Monolithic Power Systems, Inc. | | | 2.7% | |
| |
RBC Bearings, Inc. | | | 2.7% | |
| |
Euronet Worldwide, Inc. | | | 2.6% | |
| ** | As of March 31, 2020, there were 53 holdings in the Fund. Foreign currency contracts, written options and repurchase agreements, if any, are not included in the number of holdings. Portfolio holdings are subject to change at any time. References to specific securities should not be construed as recommendations by the Funds or their Advisor. Current and future holdings are subject to risk. |
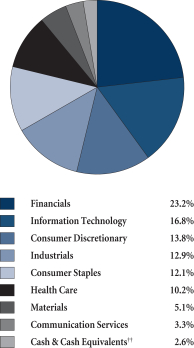
SECTOR BREAKDOWN†
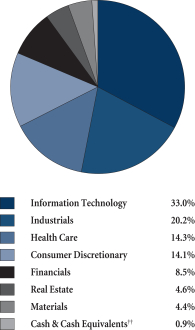
| † | Excludes securities sold short and options written, if any. |
| †† | Also includes Other Assets & Liabilities. |
GROWTHOFA HYPOTHETICAL $10,000 INVESTMENT
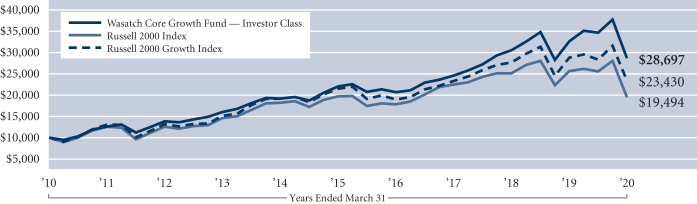
Past performance does not predict future performance. The graph above does not reflect the deduction of fees, sales charges, or taxes that you would pay on fund distributions or the redemption of fund shares. Wasatch does not charge any sales fees.
5
| | |
| WASATCH EMERGING INDIA FUND(WAINX / WIINX) | | MARCH 31, 2020 (UNAUDITED) |
|
|
|
Management Discussion
The Wasatch Emerging India Fund is managed by a team of Wasatch portfolio managers led by Ajay Krishnan and Matthew Dreith.
| | | | |
Ajay Krishnan, CFA Lead Portfolio Manager | | 
Matthew Dreith, CFA Portfolio Manager | | OVERVIEW Stocks in India posted steep losses during the quarter ended March 31, 2020 as the nation went into a lockdown to halt the spread ofCovid-19. |
The Wasatch Emerging India Fund — Investor Class slipped-28.12% for the quarter. The Fund declined less than its benchmark, the MSCI India Investable Market Index (IMI), which fell-31.79%.
Although the spread ofCovid-19 in India appeared to be slow, Prime Minister Narendra Modi announced a three-week lockdown designed to replicate China’s success in containing the outbreak. To cushion the impact on the nation and the economy, the national government announced $22.6 billion in spending aimed primarily at the poor. In addition, state governments implemented relief programs of their own. India’s central bank slashed interest rates and pledged to inject up to $50 billion of cash into the country’s financial system.
DETAILSOFTHE QUARTER
The coronavirus lockdown is likely to hinder the ability of households and businesses to repay debt, which added to the woes of Indian financial stocks during the quarter. Our financials declined less than the financials in the Index, providing a source of strength for the Fund relative to its benchmark. The Fund’s largest sources of outperformance were materials and health care, respectively. In these sectors as well, the Fund’s holdings held up substantially better than the corresponding positions in the benchmark.
During a quarter in which defensive investments tended to perform better, our underweight position in consumer staples was a headwind for the Fund. The consumer-staples sector was the best-performing sector of the Index and one of the few areas in which the Fund’s holdings posted steeper declines than the benchmark’s positions.
The Fund’s position in Divi’s Laboratories Ltd. held up well during the quarter. The company produces active pharmaceutical ingredients and intermediates. Divi’s has benefited as international manufacturers of pharmaceuticals shift supply chains out of China or seek secondary sources of supply.
Trent Ltd. is a relatively new position in the Fund. The company operates a chain of retail stores that sell fashion apparel, cosmetics, perfumes and toiletries. We think Trent has the potential to become the “Zara of India.” (Zara, based in Spain, is an apparel retailer that specializes in fast fashion and is one of the largest international retail companies.) We expect Trent to be a strong beneficiary of the formalization of India’s retail landscape, where close to 90% of the industry is dominated by small informal retailers.
Financial companies accounted for many of the Fund’s greatest detractors for the quarter. Among these were Bajaj Finance Ltd., AU Small Finance Bank Ltd. and Aavas Financiers Ltd. Bajaj is anon-bank financial company (NBFC) offering a broad spectrum of lending services. AU is a small finance bank that primarily targets unbanked and underbankedlow- and middle-income individuals and small businesses. Aavas is an NBFC specializing in housing loans tolow- and middle-income customers in semi-urban and rural areas of India.
After having spoken with the management teams of all three of these companies and making our own analyses based on potential worst-case outcomes, we believe they have ample capital buffers and we expect them to emerge from theCovid-19 crisis even stronger. We have used the sharp declines in their share prices to add selectively to our positions.
OUTLOOK
When the pandemic subsides, India will set about resuming the political and economic progress that has brought steady improvement to the lives of its people since long before the arrival of the coronavirus. Our optimism is based in part on a confluence of factors that have been driving a virtuous circle of progress.
The first such factor is the market-friendly reforms that have been enacted in India. Although the current government tends to receive most of the credit for these reforms, some were in the works before the Modi coalition came into power. Second is India’s young and growing population. Because India is home to one of the youngest populations in the world, a large cohort of Indians will be reaching their peak-productivity, peak-consumption years at roughly the same time. The third key factor is having the world’s lowest prices for mobile-telecommunications data, which have enabled the large-scale digitalization of banking and commerce in India.
Thank you for the opportunity to manage your assets.
| | Current and future holdings are subject to risk. |
6
| | |
| WASATCH EMERGING INDIA FUND(WAINX / WIINX) | | MARCH 31, 2020 (UNAUDITED) |
|
|
|
Portfolio Summary
AVERAGE ANNUAL TOTAL RETURNS
| | | | | | | | | | | | | | | | | | | | |
| | | SIX MONTHS* | | 1 YEAR | | 5 YEARS | | SINCE INCEPTION
4/26/11 |
Emerging India (WAINX) — Investor | | | | -23.99% | | | | | -22.35% | | | | | 3.16% | | | | | 7.07% | |
Emerging India (WIINX) — Institutional | | | | -23.82% | | | | | -22.19% | | | | | 3.34% | | | | | 7.17% | |
MSCI India IMI | | | | -28.20% | | | | | -32.64% | | | | | -3.91% | | | | | -1.72% | |
Data show past performance, which is not indicative of future performance. Current performance may be lower or higher than the performance quoted. To obtain the most recentmonth-end performance data available, please visit wasatchglobal.com. The Advisor may absorb certain Fund expenses, without which total returns would have been lower. Investment returns and principal value will fluctuate and shares, when redeemed, may be worth more or less than their original cost.
As of the January 31, 2020 prospectus, the Total Annual Fund Operating Expenses for the Wasatch Emerging India Fund are Investor Class: 1.68%/ Institutional Class: 1.49%. The expense ratio shown elsewhere in this report may be different. Net expenses are based on Fund expenses, net of waivers and reimbursements. See the prospectus for additional information regarding Fund expenses.
Wasatch will deduct a 2.00% redemption fee on Fund shares held 60 days or less. Performance data do not reflect the deduction of fees, including sales charges, or the taxes you would pay on fund distributions or the redemption of fund shares. Fees and taxes, if reflected, would reduce the performance quoted. Wasatch does not charge any sales fees. For more complete information including charges, risks and expenses, read the prospectus carefully.
Performance for the Institutional Class prior to 2/1/2016 is based on the performance of the Investor Class. Performance of the Fund’s Institutional Class prior to 2/1/2016 uses the actual expenses of the Fund’s Investor Class without any adjustments. For any such period of time, the performance of the Fund’s Institutional Class would have been substantially similar to, yet higher than, the performance of the Fund’s Investor Class, because the shares of both classes are invested in the same portfolio of securities, but the classes bear different expenses.
Investing in small cap funds will be more volatile and loss of principal could be greater than investing in large cap or more diversified funds. Investing in foreign securities, especially in emerging markets, entails special risks, such as unstable currencies, highly volatile securities markets and political and social instability, which are described in more detail in the prospectus.
TOP 10 EQUITY HOLDINGS**
| | | | |
| Company | | % of Net
Assets | |
| |
| Divi’s Laboratories Ltd.(India) | | | 6.5% | |
| |
| Dr. Lal PathLabs Ltd.(India) | | | 6.1% | |
| |
| Bajaj Finance Ltd.(India) | | | 6.1% | |
| |
| Pidilite Industries Ltd.(India) | | | 5.9% | |
| |
| ICICI Lombard General Insurance Co. Ltd. (India) | | | 5.9% | |
| | | | |
| Company | | % of Net
Assets | |
| |
| Berger Paints India Ltd.(India) | | | 5.0% | |
| |
| Britannia Industries Ltd.(India) | | | 5.0% | |
| |
| HDFC Bank Ltd.(India) | | | 4.9% | |
| |
| AU Small Finance Bank Ltd.(India) | | | 4.8% | |
| |
| Mindtree Ltd.(India) | | | 4.7% | |
| ** | As of March 31, 2020, there were 32 holdings in the Fund. Foreign currency contracts, written options and repurchase agreements, if any, are not included in the number of holdings. Portfolio holdings are subject to change at any time. References to specific securities should not be construed as recommendations by the Funds or their Advisor. Current and future holdings are subject to risk. |
SECTOR BREAKDOWN†
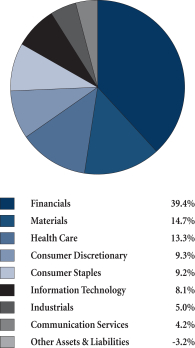
| † | Excludes securities sold short and options written, if any. |
GROWTHOFA HYPOTHETICAL $10,000 INVESTMENT
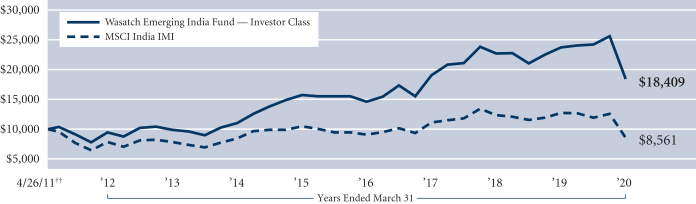
††Inception: April 26, 2011.Past performance does not predict future performance. The graph above does not reflect the deduction of fees, sales charges, or taxes that you would pay on fund distributions or the redemption of fund shares. Wasatch does not charge any sales fees.
7
| | |
| WASATCH EMERGING MARKETS SELECT FUND(WAESX / WIESX) | | MARCH 31, 2020 (UNAUDITED) |
|
|
|
Management Discussion
The Wasatch Emerging Markets Select Fund is managed by a team of Wasatch portfolio managers led by Ajay Krishnan, Scott Thomas and Matthew Dreith.
| | | | |

Ajay Krishnan, CFA Lead Portfolio Manager | | 
Scott Thomas, CFA Associate Portfolio
Manager | | 
Matthew Dreith, CFA Associate Portfolio
Manager |
OVERVIEW
Worries tied to the coronavirus pandemic sent stock prices in emerging markets sharply lower during the quarter ended March 31, 2020. The Wasatch Emerging Markets Select Fund — Investor Class lost-23.42% compared to a decline of-23.60% for its benchmark, the MSCI Emerging Markets Index. Growing fears about the impact ofCovid-19 on global demand, supply chains, corporate profits and economic growth jolted financial markets around the world.
In the wake of this crisis, the Wasatch international team spent several weeksre-analyzing every company we own and scanning our investment universe for new opportunities. As expected, our analysis showed that the Fund’s companies have stronger earnings growth, higher returns on equity and returns on assets, and less debt than the average company in the benchmark. We adjusted company weightings where we saw an improvement in the risk/reward potential and sold a few holdings for which we viewed upside potential as inadequate.
DETAILSOFTHE QUARTER
Taiwan and Brazil were the Fund’s largest sources of outperformance relative to the benchmark. Taiwan was one of thetop-performing emerging markets during the quarter. Its early response and effective containment measures have resulted in fewer cases ofCovid-19 compared to most neighboring countries. Brazil was the worst performer in the Index amid mounting concerns about the government’s handling of the crisis and growing tensions between the president and the Congress.
India was the greatest source of weakness against the benchmark. Although the Indian stocks in the Fund fared only slightly worse than those in the benchmark, our overweight position in India was a headwind to performance.
The strongest contributor to Fund performance was Microport Scientific Corp. Based in Shanghai, China, the company manufactures interventional and minimally invasive devices for keyhole surgery. Reports that a well-respected, Asia-focused private-equity firm had acquired an ownership stake sent Microport’s stock price soaring in late February.
Taiwanese holdings Silergy Corp. and ASPEED Technology, Inc. were the second- and third-largest contributors, respectively. Silergy manufactures high-performance mixed-signal and analog integrated circuits used in a wide array of
electronic devices. The company reported strong revenues, which helped alleviate concerns that weak demand from China might lead to a protracted slowdown in Silergy’s growth. ASPEED is a fabless designer of integrated circuits specializing in areas that include server management and audio-visual extensions. The company has been benefiting as firms globally add capacity to their data centers to accommodate citizens waiting out the coronavirus under home confinement.
Two Indian financial companies — Bajaj Finance Ltd. and HDFC Bank Ltd. — were the largest and second-largest detractors, respectively. Bajaj is anon-bank financial company offering lending services that include vehicle loans, mortgage loans, consumer loans and commercial loans. HDFC is one of India’s leading private-sector banks. The share prices of both companies tumbled on fears that India’s three-week coronavirus lockdown may trigger a wave of loan defaults. While these concerns appear justified, we believe the stocks of Bajaj and HDFC have been unfairly punished, and we don’t think the long-term franchise of either company has been impaired.
Grupo Aeroportuario del Pacifico S.A.B. de C.V. was also a significant detractor. The company operates international airports in Mexico under contracts with the government. The stock fell sharply on concerns that coronavirus-related declines in airport traffic would significantly reduce the amount of tariff revenue the company collects.
OUTLOOK
While the new coronavirus will likely have broad,short- to medium-term earnings impacts on many businesses — particularly those connected to global supply chains — we don’t currently expect major impairments to the long-term competitive positions of the companies we own. We continue to assess the ability of our companies to weather a severe, prolonged downturn. Because our investment approach already emphasizes high-quality companies with little or no debt and strong cash flows, the results thus far have been favorable.
Moreover, our outreach to company management teams has indicated few changes to their secular outlooks for operations and capital investments. Although we have been forced to temporarily suspend international travel, the Wasatch team maintains an extensive network of contacts throughout the world. We feel confident that disruptions stemming from the pandemic won’t fundamentally threaten the long-term revenue and earnings power of companies owned in the Fund.
Thank you for the opportunity to manage your assets.
| | Current and future holdings are subject to risk. |
8
| | |
| WASATCH EMERGING MARKETS SELECT FUND (WAESX / WIESX) | | MARCH 31, 2020 (UNAUDITED) |
|
|
|
Portfolio Summary
AVERAGE ANNUAL TOTAL RETURNS
| | | | | | | | | | | | | | | | | | | | |
| | | SIX MONTHS* | | 1 YEAR | | 5 YEARS | | SINCE INCEPTION 12/13/12 |
Emerging Markets Select (WAESX) — Investor | | | | -15.37% | | | | | -13.38% | | | | | -1.13% | | | | | -0.53% | |
Emerging Markets Select (WIESX) — Institutional | | | | -15.26% | | | | | -13.16% | | | | | -0.88% | | | | | -0.22% | |
MSCI Emerging Markets Index | | | | -14.55% | | | | | -17.69% | | | | | -0.37% | | | | | -0.42% | |
Data show past performance, which is not indicative of future performance. Current performance may be lower or higher than the performance quoted. To obtain the most recentmonth-end performance data available, please visit wasatchglobal.com. The Advisor may absorb certain Fund expenses, without which total returns would have been lower. Investment returns and principal value will fluctuate and shares, when redeemed, may be worth more or less than their original cost.
As of the January 31, 2020 prospectus, the Total Annual Fund Operating Expenses for the Wasatch Emerging Markets Select Fund are Investor Class — Gross: 1.97%, Net: 1.51% / Institutional Class — Gross:1.43%, Net: 1.21%. The expense ratio shown elsewhere in this report may be different. Net expenses are based on Fund expenses, net of waivers and reimbursements. See the prospectus for additional information regarding Fund expenses.
Wasatch will deduct a 2.00% redemption fee on Fund shares held 60 days or less. Performance data do not reflect the deduction of fees, including sales charges, or the taxes you would pay on fund distributions or the redemption of fund shares. Fees and taxes, if reflected, would reduce the performance quoted. Wasatch does not charge any sales fees. For more complete information including charges, risks and expenses, read the prospectus carefully.
Investing in foreign securities, especially in emerging markets, entails special risks, such as currency fluctuations and political uncertainties, which are described in more detail in the prospectus. Investing in small cap funds will be more volatile and loss of principal could be greater than investing in large cap or more diversified funds.
TOP 10 EQUITY HOLDINGS**
| | | | |
| Company | | % of Net
Assets | |
| |
Silergy Corp.(Taiwan) | | | 6.9% | |
| |
MercadoLibre, Inc. | | | 5.6% | |
| |
Bajaj Finance Ltd.(India) | | | 4.5% | |
| |
Raia Drogasil S.A.(Brazil) | | | 4.2% | |
| |
Globant S.A.(Argentina) | | | 3.9% | |
| |
HDFC Bank Ltd.(India) | | | 3.7% | |
| | | | |
| Company | | % of Net
Assets | |
| |
ICICI Lombard General Insurance Co. Ltd. (India) | | | 3.6% | |
| |
Vitasoy International Holdings Ltd.(Hong Kong) | | | 3.6% | |
| |
Voltronic Power Technology Corp.(Taiwan) | | | 3.4% | |
| |
Tencent Holdings Ltd.(China) | | | 3.3% | |
| ** | As of March 31, 2020, there were 39 holdings in the Fund. Foreign currency contracts, written options and repurchase agreements, if any, are not included in the number of holdings. Portfolio holdings are subject to change at any time. References to specific securities should not be construed as recommendations by the Funds or their Advisor. Current and future holdings are subject to risk. |
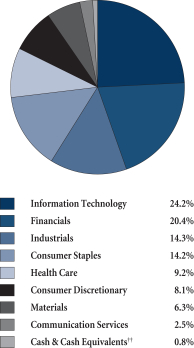
SECTOR BREAKDOWN†
| † | Excludes securities sold short and options written, if any. |
| †† | Also includes Other Assets & Liabilities. |
GROWTHOFA HYPOTHETICAL $10,000 INVESTMENT
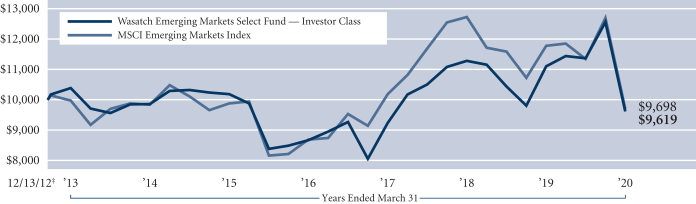
‡Inception: December 13, 2012. Past performance does not predict future performance. The graph above does not reflect the deduction of fees, sales charges, or taxes that you would pay on fund distributions or the redemption of fund shares. Wasatch does not charge any sales fees.
9
| | |
| WASATCH EMERGING MARKETS SMALL CAP FUND(WAEMX / WIEMX) | | MARCH 31, 2020 (UNAUDITED) |
|
|
|
Management Discussion
The Wasatch Emerging Markets Small Cap Fund is managed by a team of Wasatch portfolio managers led by Ajay Krishnan, Dan Chace, Scott Thomas and Kevin Unger.
| | | | |

Ajay Krishnan, CFA Lead Portfolio Manager 
Scott Thomas, CFA Associate Portfolio Manager | | 
Dan Chace, CFA Portfolio Manager 
Kevin Unger, CFA Associate Portfolio Manager | | OVERVIEW Growing fears about the impact of the coronavirus pandemic on global demand, supply chains, corporate profits and economic growth jolted financial markets and sent emerging-market stock prices plunging during the quarter ended March 31, 2020. The Wasatch Emerging Markets Small Cap Fund — Investor Class |
|
fell-23.74%, while the benchmark MSCI Emerging Markets Small Cap Index lost-31.37%.
In most countries, our stocks held up better than those in the Index. On average, our companies have stronger earnings growth, higher returns on equity and returns on assets, and less debt than the average benchmark company. The Wasatch international team spent several weeksre-analyzing every company we own and scanning for new opportunities. We adjusted company weightings where we saw an improvement in the risk/reward potential and sold a few holdings for which we viewed upside potential as inadequate.
DETAILSOFTHE QUARTER
Brazil and Taiwan were the Fund’s largest sources of outperformance relative to the benchmark. Taiwan was atop-performing emerging market during the quarter. Its early response and effective containment measures have resulted in fewer cases ofCovid-19 compared to most neighboring countries. Brazil was one of the Index’s worst performers amid concerns about the government’s handling of the crisis and tensions between the president and the Congress.
Falling oil prices and coronavirus worries weighed on Mexican equities during the quarter. The Fund’s Mexican stocks declined more than their Index counterparts, and our overweight position in Mexico was a headwind to performance.
The strongest contributor to Fund performance for the quarter was Microport Scientific Corp. Based in Shanghai, China, the company manufactures interventional and minimally invasive devices for keyhole surgery. Reports that a well-respected, Asia-focused private-equity firm had acquired an ownership stake sent Microport’s stock price soaring in late February. We trimmed the Fund’s position to maintain its desired weight.
Taiwanese holdings Silergy Corp. and ASPEED Technology, Inc. were the second- and third-largest contributors, respectively.
Silergy manufactures high-performance mixed-signal and analog integrated circuits used in electronic devices. The company reported strong revenues, which helped alleviate concerns that weak demand from China might lead to a protracted slowdown in Silergy’s growth. ASPEED is a fabless designer of integrated circuits specializing in areas that include server management and audio-visual extensions. The company has been benefiting as firms globally add capacity to their data centers to accommodate citizens waiting out the coronavirus under home confinement.
Two Indian financial companies — Bajaj Finance Ltd. and AU Small Finance Bank Ltd. — were the Fund’s largest and second-largest detractors, respectively. Bajaj, anon-bank financial company, offers lending services that include vehicle loans, mortgage loans, consumer loans and commercial loans. AU primarily targets unbanked and underbankedlow- and middle-income individuals and small businesses. Both companies’ share prices tumbled on fears that India’s three-week coronavirus lockdown may trigger a wave of loan defaults. While these concerns appear justified, we believe the stocks of Bajaj and AU have been unfairly punished. In our analysis, both lenders are well-capitalized, and their long-term franchises are not impaired.
Grupo Aeroportuario del Centro Norte S.A.B. de C.V. was the third-largest detractor. The company operates international airports in the northern and central regions of Mexico. Its stock price fell sharply on concerns that coronavirus-related declines in airport traffic would significantly reduce tariff revenue.
OUTLOOK
WhileCovid-19 will likely have broad, short- to medium-term earnings impacts on many businesses — particularly those connected to global supply chains — we don’t currently expect major impairments to the long-term competitive positions of the Fund’s companies. The Wasatch international team continues to stress-test our companies to assess their ability to weather a severe, prolonged downturn. Because we already emphasize high-quality companies with little or no debt and strong cash flows, the results thus far have been favorable.
Moreover, our outreach to company management teams has indicated few changes to their secular outlooks for operations and capital investments. Although we have been forced to temporarily suspend international travel, the Wasatch team maintains an extensive network of contacts throughout the world. We feel confident that disruptions stemming from the pandemic won’t fundamentally threaten the long-term revenue and earnings power of companies owned in the Fund.
Thank you for the opportunity to manage your assets.
| | Current and future holdings are subject to risk. |
10
| | |
| WASATCH EMERGING MARKETS SMALL CAP FUND (WAEMX / WIEMX) | | MARCH 31, 2020 (UNAUDITED) |
|
|
|
Portfolio Summary
AVERAGE ANNUAL TOTAL RETURNS
| | | | | | | | | | | | | | | | | | | | |
| | | SIX MONTHS* | | 1 YEAR | | 5 YEARS | | 10 YEARS |
Emerging Markets Small Cap (WAEMX) — Investor | | | | -14.97% | | | | | -11.97% | | | | | -1.10% | | | | | 2.90% | |
Emerging Markets Small Cap (WIEMX) — Institutional | | | | -14.53% | | | | | -11.87% | | | | | -0.93% | | | | | 2.99% | |
MSCI Emerging Markets Small Cap Index | | | | -24.83% | | | | | -28.98% | | | | | -5.17% | | | | | -1.34% | |
MSCI Emerging Markets Index | | | | -14.55% | | | | | -17.69% | | | | | -0.37% | | | | | 0.68% | |
Data show past performance, which is not indicative of future performance. Current performance may be lower or higher than the performance quoted. To obtain the most recentmonth-end performance data available, please visit wasatchglobal.com. The Advisor may absorb certain Fund expenses, without which total returns would have been lower. Investment returns and principal value will fluctuate and shares, when redeemed, may be worth more or less than their original cost.
As of the January 31, 2020 prospectus, the Total Annual Fund Operating Expenses for the Wasatch Emerging Markets Small Cap Fund are Investor Class — Gross: 1.99%, Net: 1.97%/ Institutional Class — Gross:1.85%, Net: 1.82%. The expense ratio shown elsewhere in this report may be different. Net expenses are based on Fund expenses, net of waivers and reimbursements. See the prospectus for additional information regarding Fund expenses.
Wasatch will deduct a 2.00% redemption fee on Fund shares held 60 days or less. Performance data do not reflect the deduction of fees, including sales charges, or the taxes you would pay on fund distributions or the redemption of fund shares. Fees and taxes, if reflected, would reduce the performance quoted. Wasatch does not charge any sales fees. For more complete information including charges, risks and expenses, read the prospectus carefully.
Performance for the Institutional Class prior to 2/1/2016 is based on the performance of the Investor Class. Performance of the Fund’s Institutional Class prior to 2/1/2016 uses the actual expenses of the Fund’s Investor Class without any adjustments. For any such period of time, the performance of the Fund’s Institutional Class would have been substantially similar to, yet higher than, the performance of the Fund’s Investor Class, because the shares of both classes are invested in the same portfolio of securities, but the classes bear different expenses.
Investing in foreign securities, especially in emerging markets, entails special risks, such as currency fluctuations and political uncertainties, which are described in more detail in the prospectus. Investing in small cap funds will be more volatile and loss of principal could be greater than investing in large cap or more diversified funds.
TOP 10 EQUITY HOLDINGS**
| | | | |
| Company | | % of Net
Assets | |
| |
Silergy Corp.(Taiwan) | | | 5.6% | |
| |
Voltronic Power Technology Corp.(Taiwan) | | | 4.8% | |
| |
Raia Drogasil S.A.(Brazil) | | | 3.9% | |
| |
Berger Paints India Ltd.(India) | | | 3.5% | |
| |
Magazine Luiza S.A.(Brazil) | | | 3.4% | |
| |
Globant S.A.(Argentina) | | | 3.3% | |
| | | | |
| Company | | % of Net
Assets | |
| |
Dr. Lal PathLabs Ltd.(India) | | | 3.3% | |
| |
ICICI Lombard General Insurance Co. Ltd. (India) | | | 3.3% | |
| |
ASPEED Technology, Inc.(Taiwan) | | | 3.1% | |
| |
Vitasoy International Holdings Ltd. (Hong Kong) | | | 2.9% | |
| ** | As of March 31, 2020, there were 51 holdings in the Fund. Foreign currency contracts, written options and repurchase agreements, if any, are not included in the number of holdings. Portfolio holdings are subject to change at any time. References to specific securities should not be construed as recommendations by the Funds or their Advisor. Current and future holdings are subject to risk. |
SECTOR BREAKDOWN†
| † | Excludes securities sold short and options written, if any. |
| †† | Also includes Other Assets & Liabilities. |
GROWTHOFA HYPOTHETICAL $10,000 INVESTMENT
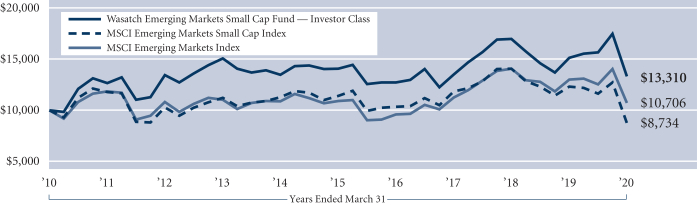
Past performance does not predict future performance. The graph above does not reflect the deduction of fees, sales charges, or taxes that you would pay on fund distributions or the redemption of fund shares. Wasatch does not charge any sales fees.
11
| | |
| WASATCH FRONTIER EMERGING SMALL COUNTRIES FUND (WAFMX / WIFMX) | | MARCH 31, 2020 (UNAUDITED) |
|
|
|
Management Discussion
The Wasatch Frontier Emerging Small Countries Fund is managed by a team of Wasatch portfolio managers led by Scott Thomas.
| | |
Scott Thomas, CFA Lead Portfolio Manager | | OVERVIEW The Wasatch Frontier Emerging Small Countries Fund — Investor Class finished the quarter ended March 31, 2020 down-31.23%, slightly outperforming its primary benchmark, the MSCI Frontier Emerging Markets Index, which finished the period down-31.56%. During the quarter, market panic sur- |
rounding theCovid-19 pandemic took a dramatic toll on global equity markets. Global governments and central banks have taken swift and unprecedented action. Broadly speaking, the overarching theme has been one of unpredictability as the rapid pace of breaking developments has led to historic market volatility, with drawdowns one day followed by historic rallies the next.
DETAILSOFTHE QUARTER
Although currency effects were significant headwinds during the quarter, beneficial stock selection in a number of countries, including Colombia, Peru, Egypt, the Philippines and Argentina, was enough to drive the Fund’s outperformance of its benchmark.
The impact of the coronavirus was broad and spared few markets or companies. Still, some companies weathered the storm relatively well. Among them were Fund holdings TQM Corp. and Delta Brac Housing Finance Corp. We think both companies have bright futures.
TQM is the leading insurance broker in Thailand. We believe the pandemic will have limited impact on TQM’s business. Our research has shown that the company has a pristine balance sheet with ample cash and no debt. We expect TQM to be able to continue gaining market share. Management just set an ambitious insurance-premium target of 50 billion Thai baht by 2026. That’s a compound annual growth rate of more than 21% from 2019.
Our sole holding at the moment in Bangladesh is Delta Brac Housing Finance. We see the company as having a major growth runway, as the penetration of mortgages in Bangladesh is among the lowest in the world. With strong backing from key institutional shareholders, Delta has consistently produced returns on equity of more than 20%. We expect the company to continue to compound earnings as demand for housing remains a long-term constant.
On a country basis, Mexico was the largest detractor from Fund performance versus the Index. Mexico is likely to face numerous challenges stemming from the pandemic. Some estimates project that the Mexican economy could contract by as much as 8%, at least in part due to the impact on the country’s tourism industry and decreased demand for Mexican exports. However, we believe Mexico may also benefit over the longer term, insofar as the crisis motivates organizations to look beyond China as a sole-source manufacturing provider.
The Fund’s largest detractor for the quarter was Qualitas Controladoras S.A.B. de C.V., a Mexican insurance company specializing in automotive insurance and related financial products. In our view, the decline in the company’s share price over the past three months provides a good example of the indiscriminate selling that has been commonplace during this market crisis. Judging from our analysis, Qualitas looks to be capable of weathering the current storm.
Colombia also suffered disproportionally and was one of the worst-performing frontier markets for the three-month period. This was driven in part by the steep decline in oil prices given the importance of oil to the Colombian government’s budget and the economy. Banco Davivienda S.A. detracted from Fund performance for the quarter. The bank, domiciled in Colombia, provides banking services to individuals, families, small andmedium-size enterprises and builders. Banco Davivienda is one of the largest lenders in Colombia. We think recent stock-price weakness presents an interesting buying opportunity, as the bank boasts a strong balance sheet and has little direct exposure to oil.
OUTLOOK
Without mincing words: we believe Wasatch is in good shape, as a firm. And we believe the Frontier Emerging Small Countries Fund is similarly well-positioned. As we assess frontier markets and emerging small countries, one thing is clear: We liked our companies going into the selloff, and we still like them now — especially at the current, less-expensive prices. We have conductedin-depth analyses of how our investments are positioned and feel confident that the majority of the Fund’s portfolio companies have much stronger balance sheets, generate stronger earnings growth and have higher returns on equity than the companies represented in the benchmark.
In many of our recent calls, our companies’ management teams have generally been optimistic, seeing the prospect for growth on the other side of the crisis. We believe these companies arewell-run and better poised to weather this environment than lower-quality competitors, who are less likely to have the organizational means to maintain operations and serve customers in this challenging time.
Thank you for the opportunity to manage your assets.
| | Current and future holdings are subject to risk. |
12
| | |
| WASATCH FRONTIER EMERGING SMALL COUNTRIES FUND (WAFMX / WIFMX) | | MARCH 31, 2020 (UNAUDITED) |
|
|
|
Portfolio Summary
AVERAGE ANNUAL TOTAL RETURNS
| | | | | | | | | | | | | | | | | | | | |
| | | SIX MONTHS* | | 1 YEAR | | 5 YEARS | | SINCE INCEPTION 1/31/12 |
Frontier Emerging Small Countries (WAFMX) — Investor | | | | -24.45% | | | | | -20.69% | | | | | -6.87% | | | | | 0.73% | |
Frontier Emerging Small Countries (WIFMX) — Institutional | | | | -24.28% | | | | | -20.53% | | | | | -6.69% | | | | | 0.84% | |
MSCI Frontier Emerging Markets Index | | | | -26.95% | | | | | -28.65% | | | | | -5.76% | | | | | -0.81% | |
MSCI Frontier Markets Index | | | | -21.73% | | | | | -18.96% | | | | | -2.85% | | | | | 2.52% | |
Data show past performance, which is not indicative of future performance. Current performance may be lower or higher than the performance quoted. To obtain the most recentmonth-end performance data available, please visit wasatchglobal.com. The Advisor may absorb certain Fund expenses, without which total returns would have been lower. Investment returns and principal value will fluctuate and shares, when redeemed, may be worth more or less than their original cost.
As of the January 31, 2020 prospectus, the Total Annual Fund Operating Expenses for the Wasatch Frontier Emerging Small Countries Fund are Investor Class — Gross: 2.30%, Net: 2.20%/ Institutional Class — Gross:2.15%, Net: 2.00%. The expense ratio shown elsewhere in this report may be different. Net expenses are based on Fund expenses, net of waivers and reimbursements. See the prospectus for additional information regarding Fund expenses.
Wasatch will deduct a 2.00% redemption fee on Fund shares held 60 days or less. Performance data do not reflect the deduction of fees, including sales charges, or the taxes you would pay on fund distributions or the redemption of fund shares. Fees and taxes, if reflected, would reduce the performance quoted. Wasatch does not charge any sales fees. For more complete information including charges, risks and expenses, read the prospectus carefully.
Performance for the Institutional Class prior to 2/1/2016 is based on the performance of the Investor Class. Performance of the Fund’s Institutional Class prior to 2/1/2016 uses the actual expenses of the Fund’s Investor Class without any adjustments. For any such period of time, the performance of the Fund’s Institutional Class would have been substantially similar to, yet higher than, the performance of the Fund’s Investor Class, because the shares of both classes are invested in the same portfolio of securities, but the classes bear different expenses.
Investing in small cap funds will be more volatile and loss of principal could be greater than investing in large cap or more diversified funds. Investing in foreign securities, especially in frontier and emerging markets, entails special risks, such as currency fluctuations and political uncertainties, which are described in more detail in the prospectus.
TOP 10 EQUITY HOLDINGS**
| | | | |
| Company | | % of Net
Assets | |
| |
MercadoLibre, Inc. | | | 6.6% | |
| |
Cleopatra Hospital(Egypt) | | | 5.8% | |
| |
Raia Drogasil S.A.(Brazil) | | | 5.6% | |
| |
Philippine Seven Corp.(Philippines) | | | 5.5% | |
| |
Safaricom plc(Kenya) | | | 4.9% | |
| | | | |
| Company | | % of Net
Assets | |
| |
Qualitas Controladora S.A.B. de C.V.(Mexico) | | | 4.5% | |
| |
Globant S.A.(Argentina) | | | 4.3% | |
| |
Naspers Ltd., Class N(South Africa) | | | 3.9% | |
| |
Commercial International Bank S.A.E.(Egypt) | | | 3.9% | |
| |
FPT Corp.(Vietnam) | | | 3.7% | |
| ** | As of March 31, 2020, there were 38 holdings in the Fund. Foreign currency contracts, written options and repurchase agreements, if any, are not included in the number of holdings. Portfolio holdings are subject to change at any time. References to specific securities should not be construed as recommendations by the Funds or their Advisor. Current and future holdings are subject to risk. |
SECTOR BREAKDOWN†

| † | Excludes securities sold short and options written, if any. |
| †† | Also includes Other Assets & Liabilities. |
GROWTHOFA HYPOTHETICAL $10,000 INVESTMENT
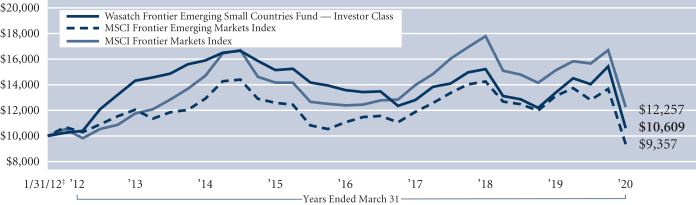
‡Inception: January 31, 2012. Past performance does not predict future performance. The graph above does not reflect the deduction of fees, sales charges, or taxes that you would pay on fund distributions or the redemption of fund shares. Wasatch does not charge any sales fees.
13
| | |
| WASATCH GLOBAL OPPORTUNITIES FUND (WAGOX / WIGOX) | | MARCH 31, 2020 (UNAUDITED) |
|
|
|
Management Discussion
The Wasatch Global Opportunities Fund is managed by a team of Wasatch portfolio managers led by JB Taylor, Ajay Krishnan, Ken Applegate and Paul Lambert.
| | | | |

JB Taylor Lead Portfolio Manager 
Ken Applegate, CFA Portfolio Manager | | 
Ajay Krishnan, CFA Lead Portfolio Manager 
Paul Lambert Portfolio Manager | | OVERVIEW The Wasatch Global Opportunities Fund —
Investor Class finished the quarter ended March 31, 2020 down-25.43% and outperformed the benchmark MSCI AC (All Country) World Small Cap Index, which finished the period down -30.19%. The quarter began on a positive note amid |
|
optimism that the trade conflict between the U.S. and China was finally nearing an end. News of a phase-one agreement, signed on January 15, raised hopes for a period of improving relations between the world’s two largest economies. By mid-February, large-cap U.S. stock indexes had pushed to all-time highs, with small caps not far behind. The joy was short-lived, however, as the outbreak of the novel-coronavirus disease in China began spreading to other countries.
Investor concerns about the potential impact of Covid-19 on economic growth and corporate earnings led to a precipitous drop in global markets. Financial markets rallied near the end of the quarter after the Federal Reserve embarked on an open-ended program of quantitative easing and the U.S. government enacted relief legislation of unprecedented scale.
DETAILSOFTHE QUARTER
Stock selection, particularly in the U.S., Japan, Australia and Taiwan, drove the Fund’s outperformance of the benchmark.
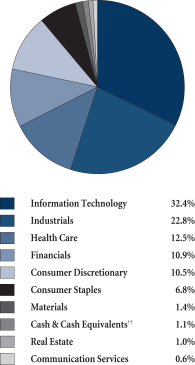
One of the areas that we think might bounce back quickly and for which we see a favorable tailwind is the information-technology (IT) sector, which was already overweight, comprising over 30% of the Fund versus less than 14% for the benchmark.
In keeping with our long-held optimism for the IT space, Five9, Inc. was the largest individual contributor to Fund performance during the quarter. The company is a cloud software provider for contact centers around the world. Five9’s products include a virtual contact center that acts as a hub for engagement between clients and customers. As industries have necessarily shifted toward remote-work arrangements, call centers, many of which run on Five9’s software, have become even more integral to the operations of many organizations. We believe the company’s long-term growth prospects remain strong.
ASPEED Technology, Inc. and Silergy Corp. were two other IT companies that contributed to the Fund’s return during
the quarter. ASPEED produces processors intended for server-management applications. Silergy manufactures integrated circuits for power management. Both companies are based in Taiwan. As the pandemic highlights the business risks inherent in sourcing supply from a single country, an increase in manufacturers seeking to diversify operations away from China may benefit countries like Taiwan and India.
In India, sharp selloffs hit the financials sector. AU Small Finance Bank Ltd. and Bajaj Finance Ltd., the Fund’s two most-significant individual detractors during the quarter, were among those impacted. As its name suggests, AU Small Finance Bank offers banking products focused on low- and middle-income individuals and small businesses, while Bajaj Finance specializes in wealth management, investments, and related financial services and products.
Generally, we continue to like the prospects of the Fund’s Indian holdings and we are overweight versus the benchmark in India. One development that could be favorable for India is diminished global demand for oil, which has led to lower oil prices. Because India imports approximately 80% of the petroleum it uses, cheaper oil typically improves the nation’s current-account balance, supports its currency and helps keep inflation in check. Investors hope this will give India’s central bank additional scope to pursue interest-rate cuts aimed at stimulating the country’s slowing economy.
OUTLOOK
We understand it is an alarming and uncertain time for investors. What we’ve found in times of uncertainty like we’re currently experiencing is that quality companies adapt. For precisely this reason, our commitment to a “bottom-up” approach focused on strong company fundamentals isn’t merely a flowery talking point. Rather, we feel firm conviction that the best places to be invested during difficult periods are in excellent companies whose capable management teams have positioned the businesses to grow for years. Such positioning includes reasonable preparation to weather unpredictable events in the interim between the present and our long-term investment horizon.
We believe the Fund’s demonstrated resilience through the first months of the coronavirus is evidentiary of the effectiveness of our long-term perspective.
Thank you for the opportunity to manage your assets.
| | Current and future holdings are subject to risk. |
14
| | |
| WASATCH GLOBAL OPPORTUNITIES FUND (WAGOX / WIGOX) | | MARCH 31, 2020 (UNAUDITED) |
|
|
|
Portfolio Summary
AVERAGE ANNUAL TOTAL RETURNS
| | | | | | | | | | | | | | | | | | | | |
| | | SIX MONTHS* | | 1 YEAR | | 5 YEARS | | 10 YEARS |
Global Opportunities (WAGOX) — Investor | | | | -17.97% | | | | | -15.03% | | | | | 3.79% | | | | | 7.82% | |
Global Opportunities (WIGOX) — Institutional | | | | -18.15% | | | | | -14.97% | | | | | 3.90% | | | | | 7.88% | |
MSCI AC World Small Cap Index | | | | -23.39% | | | | | -23.06% | | | | | -0.49% | | | | | 5.10% | |
Data show past performance, which is not indicative of future performance. Current performance may be lower or higher than the performance quoted. To obtain the most recent month-end performance data available, please visit wasatchglobal.com. The Advisor may absorb certain Fund expenses, without which total returns would have been lower. Investment returns and principal value will fluctuate and shares, when redeemed, may be worth more or less than their original cost.
As of the January 31, 2020 prospectus, the Total Annual Fund Operating Expenses for the Wasatch Global Opportunities Fund are Investor Class: 1.56% / Institutional Class — Gross: 1.57%, Net: 1.36%. The expense ratio shown elsewhere in this report may be different. Net expenses are based on Fund expenses, net of waivers and reimbursements. See the prospectus for additional information regarding Fund expenses.
Wasatch will deduct a 2.00% redemption fee on Fund shares held 60 days or less. Performance data do not reflect the deduction of fees, including sales charges, or the taxes you would pay on fund distributions or the redemption of fund shares. Fees and taxes, if reflected, would reduce the performance quoted. Wasatch does not charge any sales fees. For more complete information including charges, risks and expenses, read the prospectus carefully.
Performance for the Institutional Class prior to 2/1/2016 is based on the performance of the Investor Class. Performance of the Fund’s Institutional Class prior to 2/1/2016 uses the actual expenses of the Fund’s Investor Class without any adjustments. For any such period of time, the performance of the Fund’s Institutional Class would have been substantially similar to, yet higher than, the performance of the Fund’s Investor Class, because the shares of both classes are invested in the same portfolio of securities, but the classes bear different expenses.
Investing in small and micro cap funds will be more volatile and loss of principal could be greater than investing in large cap or more diversified funds. Investing in foreign securities, especially in emerging markets, entails special risks, such as currency fluctuations and political uncertainties, which are described in more detail in the prospectus.
TOP 10 EQUITY HOLDINGS**
| | | | |
| Company | | % of Net
Assets | |
| |
Trex Co., Inc. | | | 3.1% | |
| |
AU Small Finance Bank Ltd.(India) | | | 2.7% | |
| |
Monolithic Power Systems, Inc. | | | 2.6% | |
| |
Vitasoy International Holdings Ltd.(Hong Kong) | | | 2.6% | |
| |
Globant S.A.(Argentina) | | | 2.6% | |
| | | | |
| Company | | % of Net
Assets | |
| |
Silergy Corp.(Taiwan) | | | 2.5% | |
| |
Tyler Technologies, Inc. | | | 2.4% | |
| |
Five9, Inc. | | | 2.4% | |
| |
MercadoLibre, Inc. | | | 2.2% | |
| |
Ensign Group, Inc. (The) | | | 2.1% | |
| ** | As of March 31, 2020, there were 78 holdings in the Fund. Foreign currency contracts, written options and repurchase agreements, if any, are not included in the number of holdings. Portfolio holdings are subject to change at any time. References to specific securities should not be construed as recommendations by the Funds or their Advisor. Current and future holdings are subject to risk. |
SECTOR BREAKDOWN†
| † | Excludes securities sold short and options written, if any. |
| †† | Also includes Other Assets & Liabilities. |
GROWTHOFA HYPOTHETICAL $10,000 INVESTMENT
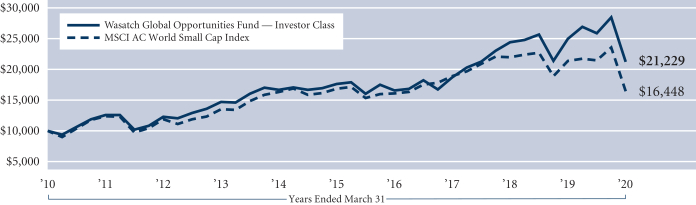
Past performance does not predict future performance. The graph above does not reflect the deduction of fees, sales charges, or taxes that you would pay on fund distributions or the redemption of fund shares. Wasatch does not charge any sales fees.
15
| | |
| WASATCH GLOBAL SELECT FUND(WAGSX / WGGSX) | | MARCH 31, 2020 (UNAUDITED) |
|
|
|
Management Discussion
The Wasatch Global Select Fund is managed by a team of Wasatch portfolio managers led by Ken Applegate, Ken Korngiebel, Paul Lambert, Linda Lasater and Mike Valentine.
| | | | |
Ken Applegate, CFA Portfolio Manager | | 
Ken Korngiebel, CFA Portfolio Manager | |
Paul Lambert Portfolio Manager |
| | |

Linda Lasater, CFA Portfolio Manager | |
Mike Valentine Portfolio Manager |
OVERVIEW
The Wasatch Global Select Fund — Investor Class declined-17.82% for the quarter ended March 31, 2020. The Fund outperformed the benchmark MSCI AC (All Country) World Index, which finished the period down -21.37%.
The quarter began on a positive note amid optimism that the trade conflict between the U.S. and China was finally nearing an end. News of a phase-one agreement, signed on January 15, raised hopes for a period of improving relations between the world’s two largest economies. By mid-February, large-cap U.S. stock indexes had pushed to all-time highs, with small caps not far behind. The joy was short-lived, however, as the outbreak of the novel-coronavirus disease in China began spreading to other countries.
DETAILSOFTHE QUARTER
Not all companies have been negatively impacted by this crisis. One of the areas that we think might bounce back quickly and for which we see a favorable tailwind is the information-technology (IT) sector, in which the Fund was already overweight, comprising over 31% of the portfolio versus approximately 18% for the benchmark.
In keeping with our long-held optimism for the IT space, DocuSign, Inc. was the top contributor to Fund performance for the quarter. The company offers e-signature software that enables businesses to digitally prepare and execute agreements. The company has been experiencing rapid sales gains and improved prospects for growth. With the pandemic scattering corporate operations to home offices and curtailing business travel, we think DocuSign is positioned to benefit as more companies sign contracts electronically over the internet.
Like IT, we have also been able to find companies with attractive quality and growth characteristics in the health-care space. The Fund is overweight in health care at about 22% of its portfolio compared to approximately 12% for the
benchmark. Veeva Systems, Inc. was a top health-care contributor. The company possesses many of the same attributes we see in our IT holdings. Veeva offers cloud solutions, including data and software solutions, targeted at streamlining operations for customers in the life sciences and biotechnology industries.
Tsuruha Holdings, Inc. from the consumer-staples sector also contributed. This Japan-based drugstore chain has continued to generate strong sales by supplying local citizens with daily necessities and pharmaceuticals.
The Fund’s largest individual detractor for the quarter was Bajaj Finance Ltd., a non-bank financial company offering a broad spectrum of lending services that includes vehicle loans, mortgage loans, consumer loans and commercial loans. Shares of Bajaj tumbled on fears that India’s three-week coronavirus lockdown may trigger a wave of loan defaults. While these concerns appear justified in our view, we believe the company’s stock has been unfairly punished. Bajaj focuses on India’s salaried class, whose loan payments are often made through automatic transfers from their bank accounts. We believe the company is well-capitalized and do not foresee impairment to its long-term business prospects from coronavirus effects.
Euronet Worldwide, Inc., a U.S.-based financial transaction processing services provider, was another detractor. The company has faced near-term pressure in its money-transfer business, in addition to market concerns surrounding the coronavirus. However, we continue to like Euronet and believe the company has strong growth potential in all three business segments — electronic funds transfer (EFT) processing, epay and money transfer.
OUTLOOK
While the pandemic will likely have broad, short- to medium-term earnings impacts on many companies, we don’t currently expect major impairments to the long-term competitive positions of the companies we own.
On average, our companies have stronger earnings growth, higher returns on equity and returns on assets, and less debt than the average company in the benchmark. The Wasatch research team spent several weeks re-analyzing every company we own and scanning for new opportunities. We’ve adjusted company weightings where we see increased potential or weakness, and we’ve sold a handful of names for which we viewed upside potential as inadequate. However, we currently do not see many new names that get us more excited than the ones we already own.
Thank you for the opportunity to manage your assets.
| | Current and future holdings are subject to risk. |
16
| | |
| WASATCH GLOBAL SELECT FUND(WAGSX / WGGSX) | | MARCH 31, 2020 (UNAUDITED) |
|
|
|
Portfolio Summary
AVERAGE ANNUAL TOTAL RETURNS
| | | | | | | | | | |
| | | SIX MONTHS* | | SINCE INCEPTION |
Global Select (WAGSX) — Investor | | | | -10.10% | | | | | -10.10% | |
Global Select (WGGSX) — Institutional | | | | -9.90% | | | | | -9.90% | |
MSCI AC World Index | | | | -14.33% | | | | | -14.33% | |
Data show past performance, which is not indicative of future performance. Current performance may be lower or higher than the performance quoted. To obtain the most recent month-end performance data available, please visit wasatchglobal.com. The Advisor may absorb certain Fund expenses, without which total returns would have been lower. Investment returns and principal value will fluctuate and shares, when redeemed, may be worth more or less than their original cost.
As of the January 31, 2020 prospectus, the Total Annual Fund Operating Expenses for the Wasatch Global Select Fund are Investor Class — Gross: 1.86%, Net: 1.35%/ Institutional Class — Gross: 1.55%, Net: 0.95%. The expense ratio shown elsewhere in this report may be different. Net expenses are based on Fund expenses, net of waivers and reimbursements. See the prospectus for additional information regarding Fund expenses.
Wasatch will deduct a 2.00% redemption fee on Fund shares held 60 days or less. Performance data do not reflect the deduction of fees, including sales charges, or the taxes you would pay on fund distributions or the redemption of fund shares. Fees and taxes, if reflected, would reduce the performance quoted. Wasatch does not charge any sales fees. For more complete information including charges, risks and expenses, read the prospectus carefully.
Investing in foreign securities, especially in emerging and frontier markets, entails special risks, such as currency fluctuations and political uncertainties, which are described in more detail in the prospectus. Investing in small cap funds will be more volatile and loss of principal could be greater than investing in large cap or more diversified funds. Being non-diversified, the Fund can invest a larger portion of its assets in the stocks of a limited number of companies than a diversified fund. Non-diversification increases the risk of loss to the Fund if the values of these securities decline.
TOP 10 EQUITY HOLDINGS**
| | | | |
| Company | | % of Net
Assets | |
| |
Coloplast A/S, Class B(Denmark) | | | 4.9% | |
| |
Old Dominion Freight Line, Inc. | | | 4.7% | |
| |
Pool Corp. | | | 4.6% | |
| |
Tsuruha Holdings, Inc.(Japan) | | | 4.5% | |
| |
Tyler Technologies, Inc. | | | 4.5% | |
| | | | |
| Company | | % of Net
Assets | |
| |
Copart, Inc. | | | 4.4% | |
| |
Assa Abloy AB, Class B(Sweden) | | | 4.3% | |
| |
ICON plc(Ireland) | | | 4.0% | |
| |
Roper Technologies, Inc. | | | 3.7% | |
| |
Cochlear Ltd.(Australia) | | | 3.6% | |
| ** | As of March 31, 2020, there were 30 holdings in the Fund. Foreign currency contracts, written options and repurchase agreements, if any, are not included in the number of holdings. Portfolio holdings are subject to change at any time. References to specific securities should not be construed as recommendations by the Funds or their Advisor. Current and future holdings are subject to risk. |
SECTOR BREAKDOWN†
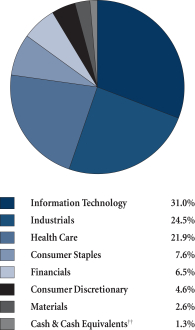
| † | Excludes securities sold short and options written, if any. |
| †† | Also includes Other Assets & Liabilities. |
GROWTHOFA HYPOTHETICAL $10,000 INVESTMENT
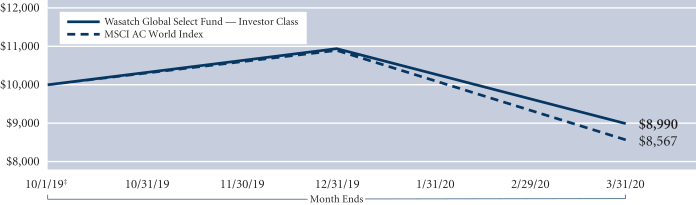
‡Inception: October 1, 2019. Past performance does not predict future performance. The graph above does not reflect the deduction of fees, sales charges, or taxes that you would pay on fund distributions or the redemption of fund shares. Wasatch does not charge any sales fees.
17
| | |
| WASATCH GLOBAL VALUE FUND (FMIEX / WILCX) | | MARCH 31, 2020 (UNAUDITED) |
|
|
|
Management Discussion
The Wasatch Global Value Fund is managed by a team of Wasatch portfolio managers led by David Powers.
| | |

David Powers, CFA Lead Portfolio Manager | | OVERVIEW Global equities finished the quarter ended March 31, 2020 sharply lower as the spread of Covid-19 led to containment efforts that all but brought the global economy to a standstill. The selloff began in mid-February and continued through much of March as investors fled stocks in an attempt to |
reduce risk. Equities recovered some of the lost ground late in the quarter as governments around the world launched extraordinary fiscal and monetary stimulus efforts.
The Wasatch Global Value Fund — Investor Class dropped -27.86% for the quarter, trailing the benchmark MSCI AC (All Country) World Index, which fell -21.37%. Energy stocks posted the largest declines, followed by financials. Meanwhile, health-care, information-technology and consumer-staples stocks held up relatively well.
DETAILSOFTHE QUARTER
The Fund’s performance was constrained by overweight positions and stock selection within financials, real estate and energy. The Fund’s holdings in utilities, consumer staples and health care were down less than their benchmark counterparts.
In geographic terms, there was no place to hide from the pandemic. Stocks in most European countries and Australia were down more than the Index’s overall return, while stocks in China, Hong Kong and Japan were down less. Our companies within the United States and Canada accounted for the bulk of the Fund’s underperformance relative to the benchmark.
The Fund’s defensive consumer-staples positions held up better than their benchmark peers during the quarter. These included low-cost retailer Walmart, Inc. and global grocer Koninklijke Ahold Delhaize N.V. In a similar vein, our stocks within health care also held up relatively well, including managed-care company Centene Corp. and pharmaceutical company Novartis AG. Within communication services, an overweight position in China Mobile Ltd. helped cushion performance relative to the benchmark.
Major detractors for the quarter included Suncor Energy, Inc., BP plc and Schlumberger Ltd., all of which suffered along with the rest of the energy complex as the pandemic suppressed demand while Russia and Saudi Arabia compounded matters by launching an oil price war. We reduced our energy exposure during the quarter to rotate into what we consider more-attractive areas, which are discussed below.
Real estate investment trusts focused on entertainment and leisure activities — EPR Properties and VICI Properties, Inc. — also weighed on performance given the dimmed outlook for casinos, hotels, amusement parks, theaters and the like under near-lockdown conditions. We moved on from VICI but still hold EPR at a smaller weight.
OUTLOOK
There’s no doubt the Covid-19 crisis will have a severe impact on the global economy. This will be reflected in a precipitous decline in aggregate earnings and substantial dividend cuts from companies across a range of sectors. We believe some of this was already reflected in stock price levels as the quarter ended, especially in certain areas. In a hurry to de-risk, investors were quick to sell smaller-capitalization stocks and more-cyclical, deep-value holdings.
How does investor sentiment recover? The first requirement is an easing of the pandemic, of which we’ve begun to see some initial signs. As government stimulus efforts take hold, we should see improvement in the global economy. Once investors get a sense of where corporate earnings may bottom out, they can begin to look forward. All of this will take place against the backdrop of central banks’ unprecedented support of risk-asset valuations through quantitative easing. There will clearly be significant challenges along the way. But looking out a few quarters, there’s the potential for stocks to rebound — perhaps sharply.
In positioning the Fund, we’ve continued to employ a consistent process, adjusting holdings to capitalize on the most-attractive areas within the value universe. Entering 2020, we had already begun to add cyclical exposure as the valuation spread between growth and value stocks had reached historical extremes. This valuation spread was only intensified by the market downturn, during which energy, financials, industrials and materials stocks took the hardest hits. We’ve been looking to take advantage of this weakness to further increase the Fund’s cyclical exposure, focusing on stocks that were crushed in the wake of the pandemic. We also see a range of opportunities in smaller-cap stocks as we seek to tie the Fund to an ultimate recovery in economic conditions and companies’ earnings growth.
It’s worth noting that value stocks have historically led performance in the early stages of an economic recovery, and that the current period of growth outperforming value is the longest in decades.
Thank you for the opportunity to manage your assets.
| | Current and future holdings are subject to risk. |
18
| | |
| WASATCH GLOBAL VALUE FUND (FMIEX / WILCX) | | MARCH 31, 2020 (UNAUDITED) |
|
|
|
Portfolio Summary
AVERAGE ANNUAL TOTAL RETURNS
| | | | | | | | | | | | | | | | | | | | |
| | | SIX MONTHS* | | 1 YEAR | | 5 YEARS | | 10 YEARS |
Global Value (FMIEX) — Investor | | | | -23.93% | | | | | -22.85% | | | | | 0.15% | | | | | 4.22% | |
Global Value (WILCX) — Institutional | | | | -23.91% | | | | | -22.76% | | | | | 0.27% | | | | | 4.33% | |
MSCI AC World Index | | | | -14.33% | | | | | -11.26% | | | | | 2.85% | | | | | 5.88% | |
Data show past performance, which is not indicative of future performance. Current performance may be lower or higher than the performance quoted. To obtain the most recent month-end performance data available, please visit wasatchglobal.com. The Advisor may absorb certain Fund expenses, without which total returns would have been lower. Investment returns and principal value will fluctuate and shares, when redeemed, may be worth more or less than their original cost.
As of the January 31, 2020 prospectus, the Total Annual Fund Operating Expenses for the Wasatch Global Value Fund are Investor Class — Gross: 1.19%, Net: 1.10% / Institutional Class — Gross: 1.23%, Net: 0.97%. The expense ratio shown elsewhere in this report may be different. Net expenses are based on Fund expenses, net of waivers and reimbursements. See the prospectus for additional information regarding Fund expenses.
Wasatch will deduct a 2.00% redemption fee on Fund shares held 60 days or less. Performance data do not reflect the deduction of fees, including sales charges, or the taxes you would pay on fund distributions or the redemption of fund shares. Fees and taxes, if reflected, would reduce the performance quoted. Wasatch does not charge any sales fees. For more complete information including charges, risks and expenses, read the prospectus carefully.
Performance for the Institutional Class prior to 1/31/2012 is based on the performance of the Investor Class. Performance of the Fund’s Institutional Class prior to 1/31/2012 uses the actual expenses of the Fund’s Investor Class without any adjustments. For any such period of time, the performance of the Fund’s Institutional Class would have been substantially similar to, yet higher than, the performance of the Fund’s Investor Class, because the shares of both classes are invested in the same portfolio of securities, but the classes bear different expenses.
Investments in value stocks can perform differently from the market as a whole and from other types of stocks and can continue to be undervalued by the market for long periods of time. Investing in foreign securities entails special risks, such as currency fluctuations and political uncertainties, which are described in more detail in the prospectus. Loss of principal is a risk of investing.
TOP 10 EQUITY HOLDINGS**
| | | | |
| Company | | % of Net
Assets | |
| |
China Mobile Ltd.(China) | | | 6.0% | |
| |
Johnson & Johnson | | | 5.0% | |
| |
Exelon Corp. | | | 4.5% | |
| |
Duke Energy Corp. | | | 4.1% | |
| |
Muenchener Rueckversicherungs-Gesellschaft AG in Muenchen(Germany) | | | 4.1% | |
| | | | |
| Company | | % of Net
Assets | |
| |
Samsung Electronics Co. Ltd.(South Korea) | | | 4.1% | |
| |
Pfizer, Inc. | | | 3.7% | |
| |
BP plc(United Kingdom) | | | 3.7% | |
| |
Eaton Corp. plc | | | 3.5% | |
| |
Suncor Energy, Inc.(Canada) | | | 3.3% | |
| **As | of March 31, 2020, there were 36 holdings in the Fund. Foreign currency contracts, written options and repurchase agreements, if any, are not included in the number of holdings. Portfolio holdings are subject to change at any time. References to specific securities should not be construed as recommendations by the Funds or their Advisor. Current and future holdings are subject to risk. |
SECTOR BREAKDOWN†
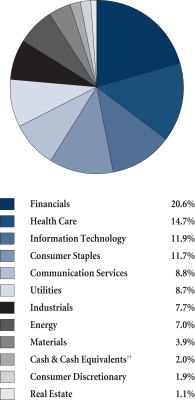
| † | Excludes securities sold short and options written, if any. |
| †† | Also includes Other Assets & Liabilities. |
GROWTHOFA HYPOTHETICAL $10,000 INVESTMENT
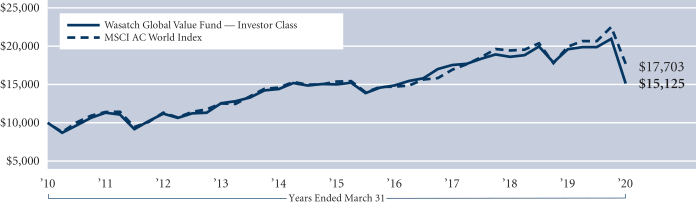
Past performance does not predict future performance. The graph above does not reflect the deduction of fees, sales charges, or taxes that you would pay on fund distributions or the redemption of fund shares. Wasatch does not charge any sales fees.
19
| | |
| WASATCH INTERNATIONAL GROWTH FUND (WAIGX / WIIGX) | | MARCH 31, 2020 (UNAUDITED) |
|
|
|
Management Discussion
The Wasatch International Growth Fund is managed by a team of Wasatch portfolio managers led by Ken Applegate, Linda Lasater and Derrick Tzau.
| | | | |

Ken Applegate, CFA Lead Portfolio Manager | | 
Linda Lasater, CFA Portfolio Manager | | 
Derrick Tzau, CFA Associate Portfolio Manager |
OVERVIEW
The Wasatch International Growth Fund — Investor Class finished the quarter ended March 31, 2020 down -22.18%, outperforming its benchmark, the MSCI AC (All Country) World ex USA Small Cap Index, which finished the quarter down -29.01%.
During the quarter, market panic surrounding theCovid-19 pandemic took a dramatic toll on international equity markets. Around the world, governments and central banks have taken swift and unprecedented action. Broadly speaking, the overarching theme has been one of unpredictability as the rapid pace of breaking developments led to historic market volatility over the three-month period, with drawdowns one day followed by historic rallies the next.
We reopened the Fund to new investors during the quarter. Consistent with Wasatch’s longstanding commitment to shareholders, the Fund previously had been closed to new investors to ensure its disciplined and focused investment approach. The Fund’s reopening reflects Wasatch’s view that current market volatility and dislocations present attractive opportunities for long-term investors, including tremendous opportunities to invest in quality companies at what we consider rarely seen discounts. Wasatch remains committed to thoughtfully managing capacity and will close the Fund, if necessary, when we believe it is in the best interest of existing shareholders.
DETAILSOFTHE QUARTER
Stock selection, particularly in Japan, was the primary driver of the Fund’s outperformance of its benchmark during the quarter. The Fund also benefited from stock selection in the United Kingdom, Australia, Taiwan and Canada.
Not all companies have been negatively impacted by the coronavirus crisis. For example, Kusuri no Aoki Holdings Co. Ltd., Tsuruha Holdings, Inc., Sugi Holdings Co. Ltd. and Ain Holdings, Inc. are drugstore chains based in Japan. These four companies continue to generate strong sales by supplying local citizens with daily necessities and pharmaceuticals. While they have been benefiting during these challenging times, our investment thesis and excitement is based on their ability to capitalize on consolidation within the large and fragmented Japanese drugstore industry. We also received good news on March 20 from DiaSorin S.p.A., a diagnostics company based in Italy. The company received Emergency Use Authorization from the U.S. Food and Drug
Administration for a test that detects the virus that causes Covid-19.
One of the largest individual detractors from Fund performance during the quarter was Trainline plc, the leading online-booking platform for train tickets in the U.K. With most people staying at home, travel in the U.K. has decreased significantly and this will have a material impact on Trainline’s earnings. However, we believe domestic travel will bounce back quickly and our analysis has shown that Trainline has ample cash on its balance sheet and access to capital through a revolving credit facility in the event that the downturn is longer or deeper than expected. We have been taking advantage of significant stock-price weakness and adding to our position in Trainline.
In India, sharp selloffs hit the financials sector. AU Small Finance Bank Ltd. was the largest detractor from Fund performance for the quarter. As its name suggests, AU Small Finance Bank offers banking products focused on low- and middle-income individuals and small businesses. All in all, we continue to like the prospects of the Fund’s Indian holdings. India is the Fund’s most heavily weighted emerging market, and we are overweight versus the benchmark.
OUTLOOK
Without mincing words: we believe Wasatch is in good shape, as a firm. And we believe the International Growth Fund is similarly well-positioned. As we assess international markets, one thing is clear: We liked our companies going into the selloff, and we still like them now — especially at the current less-expensive prices. We have conducted in-depth analyses of how our investments are positioned and feel confident that the majority of the Fund’s portfolio companies have much stronger balance sheets, generate stronger earnings growth and have higher returns on equity than those in the benchmark.
In many of our recent calls, our companies’ management teams have generally been optimistic, seeing the prospect for growth on the other side of the crisis. We believe these companies are well-run and better poised to weather this environment than lower-quality competitors, who are less likely to have the organizational means to maintain operations and serve customers in this challenging time.
Thank you for the opportunity to manage your assets.
| | Current and future holdings are subject to risk. |
20
| | |
| WASATCH INTERNATIONAL GROWTH FUND (WAIGX / WIIGX) | | MARCH 31, 2020 (UNAUDITED) |
|
|
|
Portfolio Summary
AVERAGE ANNUAL TOTAL RETURNS
| | | | | | | | | | | | | | | | | | | | |
| | | SIX MONTHS* | | 1 YEAR | | 5 YEARS | | 10 YEARS |
International Growth (WAIGX) — Investor | | | | -12.33% | | | | | -11.42% | | | | | 2.31% | | | | | 7.51% | |
International Growth (WIIGX) — Institutional | | | | -12.29% | | | | | -11.35% | | | | | 2.41% | | | | | 7.56% | |
MSCI AC World ex USA Small Cap Index | | | | -21.19% | | | | | -21.18% | | | | | -0.81% | | | | | 2.79% | |
MSCI World ex USA Small Cap Index | | | | -20.23% | | | | | -19.04% | | | | | 0.39% | | | | | 3.95% | |
Data show past performance, which is not indicative of future performance. Current performance may be lower or higher than the performance quoted. To obtain the most recent month-end performance data available, please visit wasatchglobal.com. The Advisor may absorb certain Fund expenses, without which total returns would have been lower. Investment returns and principal value will fluctuate and shares, when redeemed, may be worth more or less than their original cost.
As of the January 31, 2020 prospectus, the Total Annual Fund Operating Expenses for the Wasatch International Growth Fund are Investor Class: 1.46% / Institutional Class: 1.35%. The expense ratio shown elsewhere in this report may be different. See the prospectus for additional information regarding Fund expenses.
Wasatch will deduct a 2.00% redemption fee on Fund shares held 60 days or less. Performance data do not reflect the deduction of fees, including sales charges, or the taxes you would pay on fund distributions or the redemption of fund shares. Fees and taxes, if reflected, would reduce the performance quoted. Wasatch does not charge any sales fees. For more complete information including charges, risks and expenses, read the prospectus carefully.
Performance for the Institutional Class prior to 2/1/2016 is based on the performance of the Investor Class. Performance of the Fund’s Institutional Class prior to 2/1/2016 uses the actual expenses of the Fund’s Investor Class without any adjustments. For any such period of time, the performance of the Fund’s Institutional Class would have been substantially similar to, yet higher than, the performance of the Fund’s Investor Class, because the shares of both classes are invested in the same portfolio of securities, but the classes bear different expenses.
Investing in foreign securities, especially in frontier and emerging markets, entails special risks, such as currency fluctuations and political uncertainties, which are described in more detail in the prospectus. Investing in small cap funds will be more volatile and loss of principal could be greater than investing in large cap or more diversified funds.
TOP 10 EQUITY HOLDINGS**
| | | | |
| Company | | % of Net
Assets | |
| |
Cochlear Ltd.(Australia) | | | 2.7% | |
| |
DiaSorin S.p.A.(Italy) | | | 2.4% | |
| |
Halma plc(United Kingdom) | | | 2.2% | |
| |
Trainline plc(United Kingdom) | | | 2.1% | |
| |
Patrizia AG(Germany) | | | 2.1% | |
| | | | |
| Company | | % of Net
Assets | |
| |
Vitasoy International Holdings Ltd.(Hong Kong) | | | 1.9% | |
| |
Sugi Holdings Co. Ltd.(Japan) | | | 1.7% | |
| |
Silergy Corp.(Taiwan) | | | 1.7% | |
| |
Asahi Intecc Co. Ltd.(Japan) | | | 1.7% | |
| |
Diploma plc(United Kingdom) | | | 1.6% | |
| **As | of March 31, 2020, there were 86 holdings in the Fund. Foreign currency contracts, written options and repurchase agreements, if any, are not included in the number of holdings. Portfolio holdings are subject to change at any time. References to specific securities should not be construed as recommendations by the Funds or their Advisor. Current and future holdings are subject to risk. |
SECTOR BREAKDOWN†
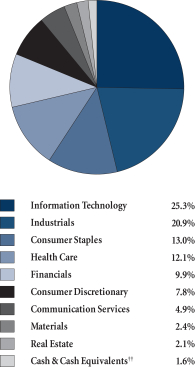
| † | Excludes securities sold short and options written, if any. |
| †† | Also includes Other Assets & Liabilities. |
GROWTHOFA HYPOTHETICAL $10,000 INVESTMENT
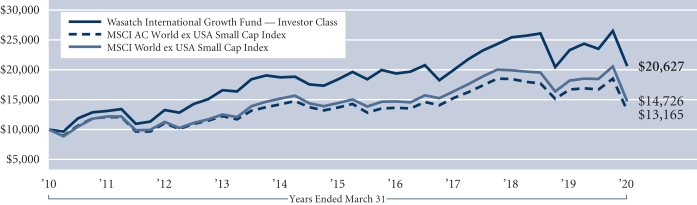
Past performance does not predict future performance. The graph above does not reflect the deduction of fees, sales charges, or taxes that you would pay on fund distributions or the redemption of fund shares. Wasatch does not charge any sales fees.
21
| | |
| WASATCH INTERNATIONAL OPPORTUNITIES FUND (WAIOX / WIIOX) | | MARCH 31, 2020 (UNAUDITED) |
|
|
|
Management Discussion
The Wasatch International Opportunities Fund is managed by a team of Wasatch portfolio managers led by Linda Lasater, Dan Chace and Allison He.
| | | | |
Linda Lasater, CFA Lead Portfolio Manager | |
Dan Chace, CFA Portfolio Manager | | 
Allison He, CFA Associate Portfolio Manager |
OVERVIEW
The Wasatch International Opportunities Fund — Investor Class declined -18.77% for the quarter ended March 31, 2020. The Fund outperformed its benchmark, the MSCI AC (All Country) World ex USA Small Cap Index, which finished the same period down -29.01%.
During the quarter, market panic surrounding theCovid-19 pandemic took a dramatic toll on international equity markets. Around the world, governments and central banks have taken swift and unprecedented action. Broadly speaking, the overarching theme has been one of unpredictability as the rapid pace of breaking developments has led to historic market volatility.
We believe the Fund is well-positioned to withstand the coronavirus crisis given our in-depth analyses of our investments. Our broad assessment is that the Fund holds companies with strong balance sheets that appear capable of surviving the pandemic’s effects and thriving thereafter.
DETAILSOFTHE QUARTER
One area that we think might see favorable tailwinds during the pandemic and beyond is the information-technology (IT) sector. The Fund already had an overweight position in IT at about 28% of the portfolio compared to approximately 11% for its benchmark.
Stock selection, particularly in Japan, was the primary driver of the Fund’s outperformance of its benchmark during the quarter. The Fund also benefited from stock selection in China, Korea, Taiwan, the United Kingdom and France.
Not all companies have been negatively impacted by the coronavirus crisis. For example, Kusuri no Aoki Holdings Co. Ltd.,which was among the top individual contributors to Fund performance for the quarter, is a drugstore and pharmacy chain based in Japan. The company continues to generate strong sales by supplying local citizens with daily necessities and pharmaceuticals.
The Fund’s largest individual contributor was AK Medical Holdings Ltd., a Chinese medical-device manufacturer that produces orthopedic implants, spinal interbody cages and artificial vertebral bodies, among other products.
While Kusuri and AK Medical have been benefiting during these challenging times, our investment thesis is based on their ability to grow over the long term. Indeed, the health-care sector, where the Fund is overweight at about 18% of the portfolio versus less than 8% for the benchmark,
remains an area we like and where we often discover companies with the quality characteristics and growth potential we find attractive. The Fund’s health-care investments have not only been a source of alpha during this uncertain period, but we believe they have the potential to benefit from future tailwinds.
One of the largest individual detractors from Fund performance during the quarter wasClipper Logistics plc. The company offers logistics services, including warehousing, garment handling, e-fulfillment and transport services, and specializes in serving the high-end retail segment. Our long-term conviction in Clipper was weak relative to our excitement for other opportunities, and we fully exited the position subsequent to quarter-end.
The Fund did not hold significant positions in the heavily affected tourism and travel industries — and we adjusted positions where necessary in the few potentially exposed companies we did own. One example is Webjet Ltd., the largest online travel agency in Australia and New Zealand, which was the most-significant detractor from Fund performance for the quarter. The company recently raised capital to shore up its position. We believe Webjet has the potential to take significant market share when the travel industry normalizes.
OUTLOOK
While the coronavirus outbreak will likely have broad, short- to medium-term earnings impacts on many companies, we don’t currently expect major impairments to the long-term competitive positions of the companies we own. Moreover, our outreach to company management teams has helped assure us that they expect few changes to their secular outlooks for operations and capital investments.
Without mincing words: we believe Wasatch is in good shape, as a firm. And we believe the International Opportunities Fund is similarly well-positioned. As we assess international markets, one thing is clear: We liked our companies going into the selloff, and we still like them now — especially at the current, less-expensive prices. We have conducted in-depth analyses of how our investments are positioned and feel confident that the majority of the Fund’s portfolio companies have much stronger balance sheets, generate stronger earnings growth and have higher returns on equity than those in the benchmark.
Thank you for the opportunity to manage your assets.
| Current | and future holdings are subject to risk. |
22
| | |
| WASATCH INTERNATIONAL OPPORTUNITIES FUND (WAIOX / WIIOX) | | MARCH 31, 2020 (UNAUDITED) |
|
|
|
Portfolio Summary
AVERAGE ANNUAL TOTAL RETURNS
| | | | | | | | | | | | | | | | | | | | |
| | | SIX MONTHS* | | 1 YEAR | | 5 YEARS | | 10 YEARS |
International Opportunities (WAIOX) — Investor | | | | -12.34% | | | | | -5.39% | | | | | 4.87% | | | | | 8.01% | |
International Opportunities (WIIOX) — Institutional | | | | -12.20% | | | | | -5.32% | | | | | 5.12% | | | | | 8.13% | |
MSCI AC World ex USA Small Cap Index | | | | -21.19% | | | | | -21.18% | | | | | -0.81% | | | | | 2.79% | |
MSCI World ex USA Small Cap Index | | | | -20.23% | | | | | -19.04% | | | | | 0.39% | | | | | 3.95% | |
Data show past performance, which is not indicative of future performance. Current performance may be lower or higher than the performance quoted. To obtain the most recent month-end performance data available, please visit wasatchglobal.com. The Advisor may absorb certain Fund expenses, without which total returns would have been lower. Investment returns and principal value will fluctuate and shares, when redeemed, may be worth more or less than their original cost.
As of the January 31, 2020 prospectus, the Total Annual Fund Operating Expenses for the Wasatch International Opportunities Fund are Investor Class: 2.09%/ Institutional Class:1.96%. The expense ratio shown elsewhere in this report may be different. See the prospectus for additional information regarding Fund expenses.
Wasatch will deduct a 2.00% redemption fee on Fund shares held 60 days or less. Performance data do not reflect the deduction of fees, including sales charges, or the taxes you would pay on fund distributions or the redemption of fund shares. Fees and taxes, if reflected, would reduce the performance quoted. Wasatch does not charge any sales fees. For more complete information including charges, risks and expenses, read the prospectus carefully.
Performance for the Institutional Class prior to 2/1/2016 is based on the performance of the Investor Class. Performance of the Fund’s Institutional Class prior to 2/1/2016 uses the actual expenses of the Fund’s Investor Class without any adjustments. For any such period of time, the performance of the Fund’s Institutional Class would have been substantially similar to, yet higher than, the performance of the Fund’s Investor Class, because the shares of both classes are invested in the same portfolio of securities, but the classes bear different expenses.
Investing in foreign securities, especially in frontier and emerging markets, entails special risks, such as currency fluctuations and political uncertainties, which are described in more detail in the prospectus. Investing in micro cap funds will be more volatile and loss of principal could be greater than investing in large cap or more diversified funds.
TOP 10 EQUITY HOLDINGS**
| | | | |
| Company | | % of Net
Assets | |
| |
| AK Medical Holdings Ltd.(China) | | | 3.9% | |
| |
| Fortnox AB(Sweden) | | | 2.5% | |
| |
| Prestige International, Inc.(Japan) | | | 2.3% | |
| |
| Esker S.A.(France) | | | 2.3% | |
| |
| Philippine Seven Corp.(Philippines) | | | 2.2% | |
| | | | |
| Company | | % of Net
Assets | |
| |
| Avon Rubber plc(United Kingdom) | | | 2.1% | |
| |
| LEENO Industrial, Inc.(South Korea) | | | 2.1% | |
| |
| Rakus Co. Ltd.(Japan) | | | 2.0% | |
| |
| IR Japan Holdings Ltd. (Japan) | | | 2.0% | |
| |
| Systena Corp.(Japan) | | | 2.0% | |
| **As | of March 31, 2020, there were 94 holdings in the Fund. Foreign currency contracts, written options and repurchase agreements, if any, are not included in the number of holdings. Portfolio holdings are subject to change at any time. References to specific securities should not be construed as recommendations by the Funds or their Advisor. Current and future holdings are subject to risk. |
SECTOR BREAKDOWN†

| † | Excludes securities sold short and options written, if any. |
| †† | Also includes Other Assets & Liabilities. |
GROWTHOFA HYPOTHETICAL $10,000 INVESTMENT
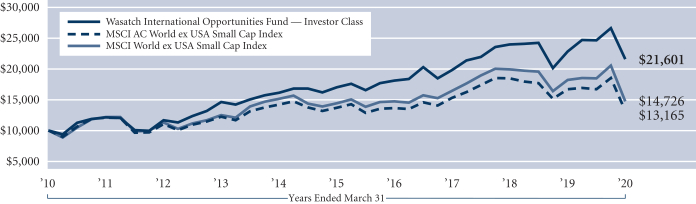
Past performance does not predict future performance. The graph above does not reflect the deduction of fees, sales charges, or taxes that you would pay on fund distributions or the redemption of fund shares. Wasatch does not charge any sales fees.
23
| | |
WASATCH INTERNATIONAL SELECT FUND (WAISX / WGISX) | | MARCH 31, 2020 (UNAUDITED) |
|
|
|
Management Discussion
The Wasatch International Select Fund is managed by a team of Wasatch portfolio managers led by Ken Applegate, Linda Lasater and Derrick Tzau.
| | | | |
Ken Applegate, CFA Lead Portfolio Manager | |
Linda Lasater, CFA Lead Portfolio Manager | |
Derrick Tzau, CFA Associate Portfolio Manager |
OVERVIEW
The Wasatch International Select Fund — Investor Class declined -15.45% for the quarter ended March 31, 2020. The Fund outperformed its benchmark, the MSCI EAFE Index, which finished the same period down -22.83%.
During the quarter, market panic surrounding theCovid-19 pandemic took a dramatic toll on international equity markets. Around the world, governments and central banks have taken swift and unprecedented action. Broadly speaking, the overarching theme has been one of unpredictability as the rapid pace of breaking developments has led to historic market volatility, with drawdowns one day followed by historic rallies the next.
DETAILSOFTHE QUARTER
Not all companies have been negatively affected by this crisis. For example, three health-care companies — Fisher & Paykel Healthcare Corp. Ltd., Coloplast A/S and Sartorius Stedim Biotech S.A. — were the strongest contributors to Fund performance for the quarter.
Health care is the Fund’s most-overweight sector because we have been able to find a multitude of companies with quality and growth characteristics that meet our strict standards. Generally speaking, health-care stocks tend to behave in an idiosyncratic and defensive fashion. The Fund’s health-care investments have not only been a source of alpha during this uncertain period, but we believe they have the potential to benefit from future tailwinds.
Fisher & Paykel (F&P) was the top contributor. The company produces and markets ventilation and oxygen therapy products. As you might imagine, the company’s products have been in high demand during the Covid-19 health crisis and its employees have been working overtime to supply as many products as possible to assist doctors in treating their patients. Looking beyond the pandemic, we believe F&P has significant headroom for growth. We have high confidence that management can capitalize on the company’s opportunities.
Coloplast, headquartered in Denmark, develops and manufactures health-care products for ostomy, incontinence, mastectomy, wound healing and skin care. Customers include health-care professionals, dealers and product users. Coloplast is the market leader in Europe, and the company has been gaining market share in the U.S. in recent years.
Sartorius Stedim is a French manufacturer of products used in biopharmaceutical manufacturing and for life-sciences research.
One of the largest detractors from Fund performance during the quarter was Trainline plc, the leading online-booking platform for train tickets in the U.K. Decreased travel will have a material impact on Trainline’s earnings, but we believe domestic travel in the U.K. will bounce back quickly. Trainline has ample cash on its balance sheet and access to capital through a revolving credit facility in the event that the downturn is longer or deeper than expected. We have been taking advantage of significant stock-price weakness and adding to our position in Trainline.
CAE, Inc. was the largest individual detractor. The company designs, manufactures and sells flight-simulation systems to customers in both the civil and defense markets. CAE also provides aviation training services. This is a newer position in the Fund and, despite the short-term challenges posed by decreased travel, we believe the company has promising long-term growth prospects. CAE is already a global leader in the space and appears poised to continue that growth over the coming years.
OUTLOOK
Without mincing words: we believe Wasatch is in good shape, as a firm. And we believe the International Select Fund is similarly well-positioned. As we assess international markets, one thing is clear: We liked our companies going into the selloff, and we still like them now — especially at the current, less-expensive prices. We have conducted in-depth analyses of how our investments are positioned and feel confident that the majority of the Fund’s portfolio companies have much stronger balance sheets, generate stronger earnings growth and have higher returns on equity than those in the benchmark.
In many of our recent calls, our companies’ management teams have generally been optimistic, seeing the prospect for growth on the other side of the crisis. We believe these companies are well-run and better poised to weather this environment than lower-quality competitors, who are less likely to have the organizational means to maintain operations and serve customers in this challenging time.
Thank you for the opportunity to manage your assets.
| Current | and future holdings are subject to risk. |
24
| | |
| WASATCH INTERNATIONAL SELECT FUND (WAISX / WGISX) | | MARCH 31, 2020 (UNAUDITED) |
|
|
|
Portfolio Summary
AVERAGE ANNUAL TOTAL RETURNS
| | | | | | | | | | |
| | | SIX MONTHS* | | SINCE INCEPTION |
International Select (WAISX) — Investor | | | | -5.30% | | | | | -5.30% | |
International Select (WGISX) — Institutional | | | | -4.80% | | | | | -4.80% | |
MSCI EAFE Index | | | | -16.52% | | | | | -16.52% | |
Data show past performance, which is not indicative of future performance. Current performance may be lower or higher than the performance quoted. To obtain the most recent month-end performance data available, please visit wasatchglobal.com. The Advisor may absorb certain Fund expenses, without which total returns would have been lower. Investment returns and principal value will fluctuate and shares, when redeemed, may be worth more or less than their original cost.
As of the January 31, 2020 prospectus, the Total Annual Fund Operating Expenses for the Wasatch International Select Fund are Investor Class — Gross: 2.03%, Net: 1.30%/ Institutional Class — Gross: 1.79%, Net: 0.90%. The expense ratio shown elsewhere in this report may be different. Net expenses are based on Fund expenses, net of waivers and reimbursements. See the prospectus for additional information regarding Fund expenses.
Wasatch will deduct a 2.00% redemption fee on Fund shares held 60 days or less. Performance data do not reflect the deduction of fees, including sales charges, or the taxes you would pay on fund distributions or the redemption of fund shares. Fees and taxes, if reflected, would reduce the performance quoted. Wasatch does not charge any sales fees. For more complete information including charges, risks and expenses, read the prospectus carefully.
Investing in foreign securities, especially in frontier and emerging markets, entails special risks, such as currency fluctuations and political uncertainties, which are described in more detail in the prospectus. Investing in small cap funds will be more volatile and loss of principal could be greater than investing in large cap or more diversified funds. Being non-diversified, the Fund can invest a larger portion of its assets in the stocks of a limited number of companies than a diversified fund. Non-diversification increases the risk of loss to the Fund if the values of these securities decline.
TOP 10 EQUITY HOLDINGS**
| | | | |
| Company | | % of Net
Assets | |
| |
| Coloplast A/S, Class B(Denmark) | | | 6.3% | |
| |
| Fisher & Paykel Healthcare Corp. Ltd.(New Zealand) | | | 6.2% | |
| |
| Tsuruha Holdings, Inc.(Japan) | | | 5.7% | |
| |
| Assa Abloy AB, Class B(Sweden) | | | 4.8% | |
| |
| Dassault Systemes S.A.(France) | | | 4.5% | |
| | | | |
| Company | | % of Net
Assets | |
| |
| Sartorius Stedim Biotech(France) | | | 4.5% | |
| |
| Halma plc(United Kingdom) | | | 4.4% | |
| |
| Cochlear Ltd.(Australia) | | | 4.0% | |
| |
| Chr. Hansen Holding A/S(Denmark) | | | 4.0% | |
| |
| Sonova Holding AG(Switzerland) | | | 3.8% | |
| **As | of March 31, 2020, there were 29 holdings in the Fund. Foreign currency contracts, written options and repurchase agreements, if any, are not included in the number of holdings. Portfolio holdings are subject to change at any time. References to specific securities should not be construed as recommendations by the Funds or their Advisor. Current and future holdings are subject to risk. |
SECTOR BREAKDOWN†
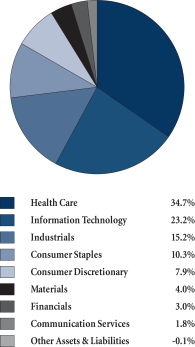
| † | Excludes securities sold short and options written, if any. |
GROWTHOFA HYPOTHETICAL $10,000 INVESTMENT
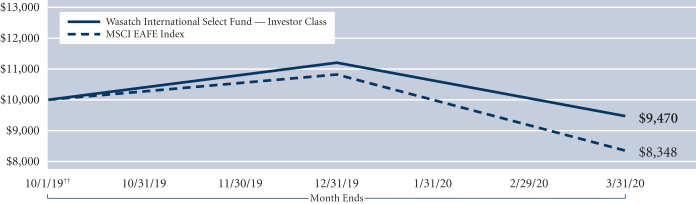
††Inception:October 1, 2019. Past performance does not predict future performance. The graph above does not reflect the deduction of fees, sales charges, or taxes that you would pay on fund distributions or the redemption of fund shares. Wasatch does not charge any sales fees.
25
| | |
| WASATCH MICRO CAP FUND (WMICX / WGICX) | | MARCH 31, 2020 (UNAUDITED) |
|
|
|
Management Discussion
The Wasatch Micro Cap Fund is managed by a team of Wasatch portfolio managers led by Ken Korngiebel and Dan Chace.
| | | | |
Ken Korngiebel, CFA Lead Portfolio Manager | | 
Dan Chace, CFA Portfolio Manager | | OVERVIEW During the Covid-19 turmoil that occurred in the three months ended March 31, 2020, equity prices experienced extreme losses |
before partially rebounding near the end of the quarter on optimism that massive monetary and fiscal stimulus would limit economic fallout. Small-company stocks were generally down more than large-company names, and the benchmark Russell Microcap Index dropped -31.99% for the quarter. Declining less than its benchmark, the Wasatch Micro Cap Fund — Investor Class dropped -24.80%.
The quarter began on a positive note amid optimism that the trade conflict between the U.S. and China was finally nearing an end. News of a phase-one agreement, signed on January 15, raised hopes for a period of improving relations between the world’s two largest economies. By mid-February, large-cap U.S. stock indexes had pushed to all-time highs, with small caps not far behind. The joy was short-lived, however, as the outbreak of Covid-19 in China began spreading to other countries.
DETAILSOFTHE QUARTER
Stock selection in the financials sector contributed the most to the Fund’s outperformance of the Index. Similarly, our industrials held up much better than their benchmark counterparts. Not surprisingly, consumer discretionary was one of the weakest-performing sectors — and our companies were down slightly more than those in the Index. Information technology and health care are the Fund’s most-heavily weighted sectors and, in both, our companies were down less than their Index peers.
The strongest contributor to Fund performance was Inovio Pharmaceuticals, Inc. A biotechnology company, Inovio recently completed preclinical testing for its DNA-based potential coronavirus vaccine, INO-4800. The company plans to launch clinical trials in the U.S., China and Korea, with initial results expected sometime in the fall of 2020. Inovio anticipates having one million doses of the potential vaccine ready for additional clinical trials or emergency use by the end of the calendar year.
Limelight Networks, Inc. was another contributor. The company’s content-delivery network enables businesses to deliver digital content across internet, mobile and social channels. The recent launch of several new over-the-top services — which distribute streaming media as a standalone product directly to consumers — has boosted demand for Limelight’s capabilities. Demand also has surged as billions of people around the globe shelter in place to slow the spread of Covid-19. We think the quality of Limelight’s
technology will enhance the company’s ability to gain market share, particularly in the video space.
Stocks tied to the retail and restaurant industries were among the quarter’s biggest decliners as customers stayed home and public-health concerns disrupted operations. Detractors from Fund performance included Boot Barn Holdings, Inc., Chefs’ Warehouse, Inc. and Chuy’s Holdings, Inc. We added to all three positions to take advantage of their lower market valuations.
Boot Barn is a multi-channel specialty retailer offering western and work-related apparel, footwear and accessories. In addition to general concerns about retailers, exposure to oil-producing regions of Texas appeared to weigh on the company’s stock price during the quarter as oil prices plummeted to multi-year lows. Chefs’ Warehouse distributes specialty-food products primarily to chefs who own or operate restaurants, catering services and fine-dining establishments. Chuy’s operates more than 90 Tex-Mex restaurants across 19 states.
OUTLOOK
Having outpaced our benchmark during the initial phases of the Covid-19 turmoil, we’re acutely aware that the race is never over. In market panics, extreme risk aversion can cause investors to unfairly punish the stocks of companies whose long-term businesses remain strong — but whose near-term prospects are much less certain, or perhaps even quite poor. Such panics sometimes don’t burn themselves out until high-quality stocks with some perceived risk are beaten down to the point that they may actually be the least-risky names. To the extent that we believe risk has become mispriced, we’ll continue to seek opportunities to selectively take it on — in anticipation of a time when market prices better reflect company fundamentals.
In the meantime, patience can be an investor’s most-important asset. Because we generally aren’t concerned about the impact of short-term events on the long-run earnings potential of the businesses we own, we believe our investment approach is well-suited to navigating turbulent markets. Regardless of what the future holds, we’ll continue our process of re-examining the thesis of every holding and scanning our investment universe for opportunities to improve the Fund’s portfolio.
Thank you for the opportunity to manage your assets.
| Current | and future holdings are subject to risk. |
26
| | |
| WASATCH MICRO CAP FUND(WMICX / WGICX) | | MARCH 31, 2020 (UNAUDITED) |
|
|
|
Portfolio Summary
AVERAGE ANNUAL TOTAL RETURNS
| | | | | | | | | | | | | | | | | | | | |
| | | SIX MONTHS* | | 1 YEAR | | 5 YEARS | | 10 YEARS |
Micro Cap (WMICX) — Investor | | | | -14.01% | | | | | -10.02% | | | | | 8.28% | | | | | 11.31% | |
Micro Cap (WGICX) — Institutional | | | | -14.01% | | | | | -10.02% | | | | | 8.28% | | | | | 11.31% | |
Russell Microcap® Index | | | | -22.84% | | | | | -26.38% | | | | | -1.94% | | | | | 6.05% | |
Data show past performance, which is not indicative of future performance. Current performance may be lower or higher than the performance quoted. To obtain the most recent month-end performance data available, please visit wasatchglobal.com. The Advisor may absorb certain Fund expenses, without which total returns would have been lower. Investment returns and principal value will fluctuate and shares, when redeemed, may be worth more or less than their original cost.
As of the January 31, 2020 prospectus, the Total Annual Fund Operating Expenses for the Wasatch Micro Cap Fund are Investor Class: 1.66% / Institutional Class: 1.59%. The expense ratio shown elsewhere in this report may be different. See the prospectus for additional information regarding Fund expenses.
Wasatch will deduct a 2.00% redemption fee on Fund shares held 60 days or less. Performance data do not reflect the deduction of fees, including sales charges, or the taxes you would pay on fund distributions or the redemption of fund shares. Fees and taxes, if reflected, would reduce the performance quoted. Wasatch does not charge any sales fees. For more complete information including charges, risks and expenses, read the prospectus carefully.
Performance for the Institutional Class prior to 1/31/2020 is based on the performance of the Investor Class. Performance of the Fund’s Institutional Class prior to 1/31/2020 uses the actual expenses of the Fund’s Investor Class without any adjustments. For any such period of time, the performance of the Fund’s Institutional Class would have been substantially similar to, yet higher than, the performance of the Fund’s Investor Class, because the shares of both classes are invested in the same portfolio of securities, but the classes bear different expenses.
Investing in micro cap funds will be more volatile and loss of principal could be greater than investing in large cap or more diversified funds. Investing in foreign securities, especially in emerging markets, entails special risks, such as currency fluctuations and political uncertainties, which are described in more detail in the prospectus.
TOP 10 EQUITY HOLDINGS**
| | | | |
| Company | | % of Net
Assets | |
| |
| Limelight Networks, Inc. | | | 3.0% | |
| |
| Kadant, Inc. | | | 3.0% | |
| |
| Freshpet, Inc. | | | 2.8% | |
| |
| Construction Partners, Inc., Class A | | | 2.7% | |
| |
| Transcat, Inc. | | | 2.7% | |
| | | | |
| Company | | % of Net
Assets | |
| |
| Upland Software, Inc. | | | 2.6% | |
| |
| Kornit Digital Ltd.(Israel) | | | 2.5% | |
| |
| Medallia, Inc. | | | 2.5% | |
| |
| Simulations Plus, Inc. | | | 2.5% | |
| |
| ICF International, Inc. | | | 2.5% | |
| ** | As of March 31, 2020, there were 73 holdings in the Fund. Foreign currency contracts, written options and repurchase agreements, if any, are not included in the number of holdings. Portfolio holdings are subject to change at any time. References to specific securities should not be construed as recommendations by the Funds or their Advisor. Current and future holdings are subject to risk. |
SECTOR BREAKDOWN†
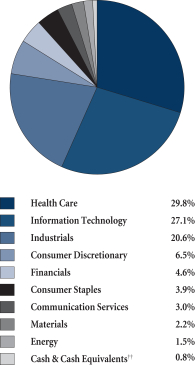
| † | Excludes securities sold short and options written, if any. |
| †† | Also includes Other Assets & Liabilities. |
GROWTHOFA HYPOTHETICAL $10,000 INVESTMENT
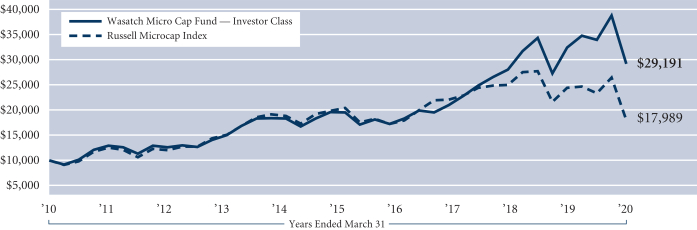
Past performance does not predict future performance. The graph above does not reflect the deduction of fees, sales charges, or taxes that you would pay on fund distributions or the redemption of fund shares. Wasatch does not charge any sales fees.
27
| | |
| WASATCH MICRO CAP VALUE FUND(WAMVX / WGMVX) | | MARCH 31, 2020 (UNAUDITED) |
|
|
|
Management Discussion
The Wasatch Micro Cap Value Fund is managed by a team of Wasatch portfolio managers led by Brian Bythrow.
| | |

Brian Bythrow, CFA Lead Portfolio Manager | | OVERVIEW During the quarter ended March 31, 2020, the broad equity market selloff resulted in the Wasatch Micro Cap Value Fund — Investor Class slipping-28.44%. The Fund outperformed the benchmark Russell Microcap Index, which fell-31.99%. Interestingly, unlike during many |
historical market downturns, value stocks didn’t hold up better than average during the quarter’s rout. We think the reason was that many value companies have asset-heavy operations and/or high debt levels.
Given the Fund’s focus on the “growthier” end of the value spectrum, we’re not surprised that it outperformed its benchmark during the quarter’s downturn. Our companies generally have much less debt than those in the Index, and we think ourlow-debt criterion is also appropriate going forward. In addition, the characteristics we look for include a winning business model, proven management, a track record of increasing market share and an ability to grow at double-digit rates for the next several years. We think companies with these characteristics — bought at stock prices much lower than the prices offered several months ago — are likely to be long-term holdings.
DETAILSOFTHE QUARTER
Concerns about the impact ofCovid-19 overshadowed most other factors driving stock prices during the quarter. Still, we did see some winners.
Inovio Pharmaceuticals, Inc. was the top contributor to Fund performance for the quarter. A biotechnology company, Inovio recently completed preclinical testing for itsDNA-based potential coronavirus vaccine. The company plans to launch clinical trials in the U.S., China and Korea, with initial results expected sometime in the fall of 2020.
Another stock that held up well was SiTime Corp. The company manufactures oscillators, clock generators and embedded resonators used for ethernet switches, computing devices, graphics cards, disk drives, mobile phones and subscriber-identity cards. Apparently, the electronic devices that need SiTime’s components are still considered high-priority purchases. The company ranks exceedingly well in our assessment of its balance sheet, business model, management, market share and growth potential.
Bandwidth, Inc. was also a solid contributor. The company operates a cloud-based software platform that enables enterprises to create, scale and operate voice or text communications. Use of Bandwidth’s platform skyrocketed during the quarter as the coronavirus pandemic scattered corporate operations to home offices.
Stocks tied real estate were among the quarter’s biggest losers, as investors fretted over declining property-related transactions and hardships in paying rents and mortgages. Detractors from Fund performance included Skyline Champion Corp. and Arbor Realty Trust, Inc.
Skyline Champion produces manufactured homes, modular homes and modular buildings. The company focuses on the multi-family, hospitality, senior and workforce-housing segments in the United States and Canada. Because housing is considered “essential” during the pandemic, Skyline’s operations are partially open. We’re optimistic regarding the stock because the company has a healthy balance sheet and provides much-needed affordable housing.
Arbor Realty invests primarily in real estate related bridge and mezzanine loans and preferred equity. While we acknowledge that Arbor has some debt on its balance sheet, we think the company is well-positioned for the long term. In our estimation, Arbor has an excellent management team. And the company is focused on multi-family housing, a necessity in all economic environments.
Another significant detractor was National CineMedia, Inc., which operates the largest cinema-advertising network in the United States. Relative to companies that provide “essential” services, we’re less optimistic about National CineMedia because we think sizable public gatherings for entertainment may be on hold for an extended period.
OUTLOOK
Although we can’t predict when the coronavirus pandemic will subside, we’d note that every major crisis during our careers has producedonce-in-a-decade buying opportunities. And we believe the current crisis will be no different. We’ve already described the characteristics we look for in companies.
Now more than ever, we want to invest in great businesses that we can hold for years on end. We’re looking to concentrate on our most-favored names and reduce the number of stocks we own. We’re also finding more interesting investment opportunities because companies that had previously been out of ourmarket-cap range have fallen into themicro-cap space.
A final point is that stocks are likely to move in fits and starts. We have little doubt that we’ll continue to face days of extreme pessimism and days of unbridled optimism. For our part, we don’t think it’s possible to “time” theday-to-day moves in the markets. Instead, we’re attempting to position the Fund for the next several years. And we’re keeping our emotions in check by focusing on the long-term fundamentals of the companies we hold and those we want to own.
Thank you for the opportunity to manage your assets.
| | Current and future holdings are subject to risk. |
28
| | |
| WASATCH MICRO CAP VALUE FUND(WAMVX / WGMVX) | | MARCH 31, 2020 (UNAUDITED) |
|
|
|
Portfolio Summary
AVERAGE ANNUAL TOTAL RETURNS
| | | | | | | | | | | | | | | | | | | | |
| | | SIX MONTHS* | | 1 YEAR | | 5 YEARS | | 10 YEARS |
Micro Cap Value (WAMVX) — Investor | | | | -20.40% | | | | | -18.36% | | | | | 4.10% | | | | | 8.65% | |
Micro Cap Value (WGMVX) — Institutional | | | | -20.40% | | | | | -18.36% | | | | | 4.10% | | | | | 8.65% | |
Russell Microcap® Index | | | | -22.84% | | | | | -26.38% | | | | | -1.94% | | | | | 6.05% | |
Data show past performance, which is not indicative of future performance. Current performance may be lower or higher than the performance quoted. To obtain the most recentmonth-end performance data available, please visit wasatchglobal.com. The Advisor may absorb certain Fund expenses, without which total returns would have been lower. Investment returns and principal value will fluctuate and shares, when redeemed, may be worth more or less than their original cost.
As of the January 31, 2020 prospectus, the Total Annual Fund Operating Expenses for the Wasatch Micro Cap Value Fund are Investor Class: 1.74% / Institutional Class: 1.59%. The expense ratio shown elsewhere in this report may be different. See the prospectus for additional information regarding Fund expenses.
Wasatch will deduct a 2.00% redemption fee on Fund shares held 60 days or less. Performance data do not reflect the deduction of fees, including sales charges, or the taxes you would pay on fund distributions or the redemption of fund shares. Fees and taxes, if reflected, would reduce the performance quoted. Wasatch does not charge any sales fees. For more complete information including charges, risks and expenses, read the prospectus carefully.
Performance for the Institutional Class prior to 1/31/2020 is based on the performance of the Investor Class. Performance of the Fund’s Institutional Class prior to 1/31/2020 uses the actual expenses of the Fund’s Investor Class without any adjustments. For any such period of time, the performance of the Fund’s Institutional Class would have been substantially similar to, yet higher than, the performance of the Fund’s Investor Class, because the shares of both classes are invested in the same portfolio of securities, but the classes bear different expenses.
Investing in micro cap funds will be more volatile and loss of principal could be greater than investing in large cap or more diversified funds. Investments in value stocks can perform differently from the market as a whole and from other types of stocks and can continue to be undervalued by the market for long periods of time. Investing in foreign securities, especially in emerging markets, entails special risks, such as currency fluctuations and political uncertainties, which are described in more detail in the prospectus.
TOP 10 EQUITY HOLDINGS**
| | | | |
| Company | | % of Net
Assets | |
| |
| Freshpet, Inc. | | | 2.6% | |
| |
| Bandwidth, Inc., Class A | | | 2.4% | |
| |
| Fabrinet | | | 2.3% | |
| |
| Skyline Champion Corp. | | | 2.0% | |
| |
| OptimizeRx Corp. | | | 1.8% | |
| | | | |
| Company | | % of Net
Assets | |
| |
| Esker S.A.(France) | | | 1.8% | |
| |
| PetIQ, Inc. | | | 1.7% | |
| |
| IR Japan Holdings Ltd.(Japan) | | | 1.7% | |
| |
| Nova Measuring Instruments Ltd.(Israel) | | | 1.6% | |
| |
| QAD, Inc., Class A | | | 1.6% | |
| ** | As of March 31, 2020, there were 93 holdings in the Fund. Foreign currency contracts, written options and repurchase agreements, if any, are not included in the number of holdings. Portfolio holdings are subject to change at any time. References to specific securities should not be construed as recommendations by the Funds or their Advisor. Current and future holdings are subject to risk. |
SECTOR BREAKDOWN†
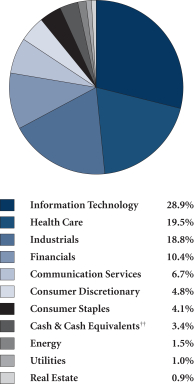
| † | Excludes securities sold short and options written, if any. |
| †† | Also includes Other Assets & Liabilities. |
GROWTHOFA HYPOTHETICAL $10,000 INVESTMENT
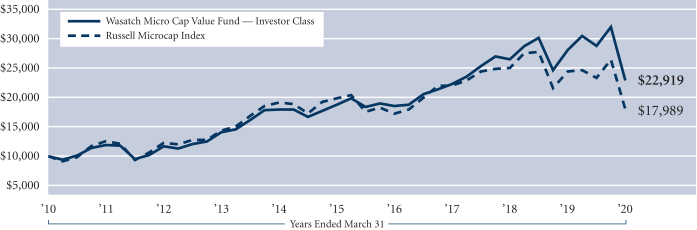
Past performance does not predict future performance. The graph above does not reflect the deduction of fees, sales charges, or taxes that you would pay on fund distributions or the redemption of fund shares. Wasatch does not charge any sales fees.
29
| | |
| WASATCH SMALL CAP GROWTH FUND(WAAEX / WIAEX) | | MARCH 31, 2020 (UNAUDITED) |
|
|
|
Management Discussion
The Wasatch Small Cap Growth Fund is managed by a team of Wasatch portfolio managers led by JB Taylor, Ken Korngiebel and Ryan Snow.
| | | | |

JB Taylor Lead Portfolio Manager | | 
Ken Korngiebel, CFA Portfolio Manager | | 
Ryan Snow Portfolio Manager |
OVERVIEW
During theCovid-19 turmoil of the quarter ended March 31, 2020, equity prices experienced extreme losses before partially rebounding near the end of the quarter on optimism that massive monetary and fiscal stimulus would limit economic fallout. Small-company stocks were generally down more than large-company names, and the benchmark Russell 2000 Growth Index lost-25.76%. Meanwhile, the Russell 2000 Index dropped-30.61%. The Wasatch Small Cap Growth Fund — Investor Class fell-23.55%.
Wasatch portfolios historically have held up better in down markets because we strive to invest in companies with better quality metrics than the average company in their benchmark indexes. This tendency held true during the quarter, with the Fund down less than its benchmark. We didn’t have significant holdings in the heavily affected tourism and travel industries — and we adjusted positions, where necessary, in the few potentially exposed companies we did own.
DETAILSOFTHE QUARTER
By sector, our stock picking in information technology and industrials accounted for most of the Fund’s outperformance relative to the benchmark. We also benefited from not having exposure to some of the worst areas of the market like energy and materials. The Fund’s overweight position in consumer discretionary and weakness in our health care stocks detracted from relative performance.
The top contributor to Fund performance was Five9, Inc., a provider of contact-center software that’s managed and hosted from the cloud. The company offers real-time and historical reporting, quality monitoring, and workforce and customer-relationship-management integrations. The superiority of cloud-based software has become especially evident during the pandemic. On a longer-term basis, Five9 has competitive advantages that make it the dominant growth company in its industry.
Biotechnology firm Inovio Pharmaceuticals, Inc. was also a contributor. Inovio recently completed preclinical testing for itsDNA-based potential coronavirus vaccine. The company plans to launch clinical trials in the U.S., China and Korea. Inovio anticipates having one million doses of the potential vaccine ready for additional clinical trials or emergency use by the end of 2020.
The largest detractor from performance was National Vision Holdings, Inc., a provider of eye exams, eyeglasses
and contact lenses at “value-oriented” prices. Most vision appointments have been postponed during the pandemic and this has impacted National Vision’s sales and earnings. Although the stock has declined substantially, we think the company’s balance sheet is healthy enough to weather a slowdown. When conditions normalize, we expect to see same-store sales accelerate — especially since consumers still hurting from a recession typically gravitate tovalue-oriented brands.
Another detractor was Monro, Inc., which operates a chain of shops for automotive repairs and tires. These shops provide services and parts related to brakes, mufflers, exhaust systems, steering mechanisms, drive trains, suspensions, wheel alignments and routine maintenance. At the current stock price, we like Monro based on our expectations that the company will increase revenues, margins and free cash flows.
OUTLOOK
TheCovid-19 crisis is likely to result in broad changes to society. Existing trends toward telemedicine, video conferencing and online education, for example, are likely to accelerate as technological solutions become accepted as viable replacements forhuman-to-human contact in a wider range of applications. A long-running investment theme in the Fund has been to seek innovative companies using new technologies to do things better, faster and cheaper. As American life is transformed in the wake of the virus, we think the types of innovative, disruptive companies we look for are likely to lead the way.
Beyond keeping up with new innovations, we think an enduring principle is that quality is especially important during a crisis because exceptional companies often increase their competitive advantages in times of stress, even when short-term sales and earnings decline on an absolute basis. After the crisis, these companies are particularly well-positioned to grow and take even more market share over the long term.
Because we generally aren’t concerned about the impact of short-term events on thelong-run earnings potential of the businesses we own, we believe our investment approach is well-suited to navigating turbulent markets. Regardless of what the future holds, we’ll continue our process ofre-examining the thesis of every holding and scanning our investment universe for opportunities to improve the Fund’s portfolio.
Thank you for the opportunity to manage your assets.
| | Current and future holdings are subject to risk. |
30
| | |
| WASATCH SMALL CAP GROWTH FUND (WAAEX / WIAEX) | | MARCH 31, 2020 (UNAUDITED) |
|
|
|
Portfolio Summary
AVERAGE ANNUAL TOTAL RETURNS
| | | | | | | | | | | | | | | | | | | | |
| | | SIX MONTHS* | | 1 YEAR | | 5 YEARS | | 10 YEARS |
Small Cap Growth (WAAEX) — Investor | | | | -14.48% | | | | | -11.08% | | | | | 5.52% | | | | | 10.49% | |
Small Cap Growth (WIAEX) — Institutional | | | | -14.42% | | | | | -10.98% | | | | | 5.66% | | | | | 10.56% | |
Russell 2000® Growth Index | | | | -17.31% | | | | | -18.58% | | | | | 1.70% | | | | | 8.89% | |
Russell 2000® Index | | | | -23.72% | | | | | -23.99% | | | | | -0.25% | | | | | 6.90% | |
Data show past performance, which is not indicative of future performance. Current performance may be lower or higher than the performance quoted. To obtain the most recentmonth-end performance data available, please visit wasatchglobal.com. The Advisor may absorb certain Fund expenses, without which total returns would have been lower. Investment returns and principal value will fluctuate and shares, when redeemed, may be worth more or less than their original cost.
As of the January 31, 2020 prospectus, the Total Annual Fund Operating Expenses for the Wasatch Small Cap Growth Fund are Investor Class: 1.17% / Institutional Class — Gross: 1.09%, Net: 1.06%. The expense ratio shown elsewhere in this report may be different. Net expenses are based on Fund expenses, net of waivers and reimbursements. See the prospectus for additional information regarding Fund expenses.
Wasatch will deduct a 2.00% redemption fee on Fund shares held 60 days or less. Performance data do not reflect the deduction of fees, including sales charges, or the taxes you would pay on fund distributions or the redemption of fund shares. Fees and taxes, if reflected, would reduce the performance quoted. Wasatch does not charge any sales fees. For more complete information including charges, risks and expenses, read the prospectus carefully.
Performance for the Institutional Class prior to 2/1/2016 is based on the performance of the Investor Class. Performance of the Fund’s Institutional Class prior to 2/1/2016 uses the actual expenses of the Fund’s Investor Class without any adjustments. For any such period of time, the performance of the Fund’s Institutional Class would have been substantially similar to, yet higher than, the performance of the Fund’s Investor Class, because the shares of both classes are invested in the same portfolio of securities, but the classes bear different expenses.
Investing in small cap funds will be more volatile and loss of principal could be greater than investing in large cap or more diversified funds. Investing in foreign securities, especially in emerging markets, entails special risks, such as currency fluctuations and political uncertainties, which are described in more detail in the prospectus.
* Not annualized.
TOP 10 EQUITY HOLDINGS**
| | | | |
| Company | | % of Net
Assets | |
| |
| Five9, Inc. | | | 3.7% | |
| |
| Medpace Holdings, Inc. | | | 3.3% | |
| |
| RBC Bearings, Inc. | | | 3.3% | |
| |
| Paylocity Holding Corp. | | | 3.2% | |
| |
| Monolithic Power Systems, Inc. | | | 3.0% | |
| | | | |
| Company | | % of Net
Assets | |
| |
| ICON plc(Ireland) | | | 3.0% | |
| |
| DocuSign, Inc. | | | 2.9% | |
| |
| Barnes Group, Inc. | | | 2.9% | |
| |
| Ollie’s Bargain Outlet Holdings, Inc. | | | 2.7% | |
| |
| Euronet Worldwide, Inc. | | | 2.7% | |
| **As | of March 31, 2020, there were 61 holdings in the Fund. Foreign currency contracts, written options and repurchase agreements, if any, are not included in the number of holdings. Portfolio holdings are subject to change at any time. References to specific securities should not be construed as recommendations by the Funds or their Advisor. Current and future holdings are subject to risk. |
SECTOR BREAKDOWN†
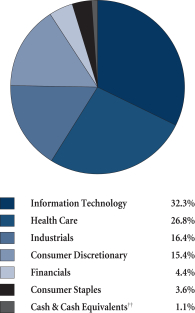
| † | Excludes securities sold short and options written, if any. |
| † | †Also includes Other Assets & Liabilities. |
GROWTHOFA HYPOTHETICAL $10,000 INVESTMENT
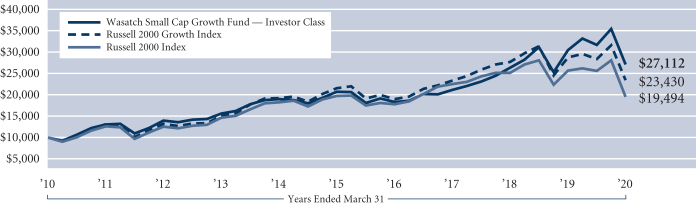
Past performance does not predict future performance. The graph above does not reflect the deduction of fees, sales charges, or taxes that you would pay on fund distributions or the redemption of fund shares. Wasatch does not charge any sales fees.
31
| | |
| WASATCH SMALL CAP VALUE FUND(WMCVX / WICVX) | | MARCH 31, 2020 (UNAUDITED) |
|
|
|
Management Discussion
The Wasatch Small Cap Value Fund is managed by a team of Wasatch portfolio managers led by Jim Larkins and Austin Bone.
| | | | |

Jim Larkins Lead Portfolio Manager | | 
Austin Bone Associate Portfolio Manager | | OVERVIEW U.S. equities experienced a severe downturn in the quarter ended March 31, 2020, as the spread ofCovid-19 led to uncertainty about the outlook for |
economic growth and corporate earnings.Small-cap stocks lagged large caps by a considerable margin, and value stocks significantly underperformed growth. The Wasatch Small Cap Value Fund — Investor Class declined-36.93% and lagged the benchmark Russell 2000 Value Index, which dropped-35.66%. By comparison, the Russell 2000 Growth Index fell -25.76%.
Amid the chaos in the financial markets, we relied on our processes,bottom-up analysis and the input from our experienced team of analysts to adjust the Fund on the margin rather than make large-scale changes. Our20-plus years of experience in managing the Fund has taught us that excessive portfolio activity in response to short-term market movements can have a destructive effect on longer-term returns, so we sought to base our decisions on individual company fundamentals and not on the daily price action of their stocks.
On this front, we continue to have a high degree of confidence in the businesses and management teams in which we have invested your capital. While we were disappointed in the market performance of some of our investments, we believe the underlying businesses have robust outlooks for future returns. We held countless discussions with the management teams of our portfolio companies in recent weeks. We were impressed by their preparation, their relationships with their banks and their plans for the future. We therefore believe that the Fund, despite its recent weakness, remains well-constructed and positioned to capitalize on opportunities among both new and existing investments. It’s important to keep in mind that we’re constantly monitoring the fundamentals of our portfolio companies, and we will not hesitate to make adjustments if facts change.
DETAILSOFTHE QUARTER
The Fund’s performance relative to the Russell 2000 Value Index was hurt by two key factors. First, the Fund’s holdings in the travel and leisure space faced a direct, negative impact from restrictions associated with the coronavirus pandemic. Copa Holdings S.A., an airline that operates mainly in Central and South America, and Allegiant Travel Co., alow-cost U.S. air carrier, were both hit hard. We view Copa as awell-run operator with a strong geographic position and a multi-year growth story. It has a cash balance of nearly $1 billion, and we believe it is well-positioned to weather the stoppage in air travel. Allegiant, for its part, has a history of adapting quickly to reduced schedules. In addition, we think the company stands to benefit from sharply lower fuel costs.
The Fund’s underperformance in financials also weighed on its quarterly return. Across the entire market, stocks of companies that hold either loans or securities derived from loans came under pressure due to increased concerns about liquidity conditions and potential credit losses. Commercial lenders Arbor Realty Trust, Inc. and Ladder Capital Corp. both fell sharply as a result. In addition, our positions in banking stocks were hurt by the compression in net interest margins (i.e., the difference between the rates at which banks borrow and lend). While we sold three holdings in financials due to their above-average leverage, we retained the majority of our investments and are closely evaluating all of them to determine which ones could emerge from the crisis with the best market positions.
OUTLOOK
During times of investor panic and forced selling, stock prices may not necessarily correspond with companies’ profit outlook for the next three to five years. Our goal is to take advantage of these dislocations, instead of jeopardizing longer-term performance by overreacting to erratic market movements. Accordingly, we spent several weeksre-analyzing every company we own and scanning for new opportunities. We adjusted company weightings where we saw increased likelihood of weakness, we sold a handful of stocks where we saw less upside potential, and we took care not to sell stocks that we believe offer the most compelling upside opportunities, even if they were also among the quarter’s largest laggards.
We aren’t attempting to anticipate — or react to —day-to-day headlines. Instead, we are continuing to utilize our disciplined,bottom-up investment process to find high-quality, well-managed companies that our research indicates are well-positioned to withstand the downturn and prosper in an eventual recovery. We have been managing the Fund with an eye toward this outcome, and we believe the benefit will be evident in the Fund’s long-term results.
Thank you for the opportunity to manage your assets.
| | Current and future holdings are subject to risk. |
32
| | |
| WASATCH SMALL CAP VALUE FUND (WMCVX / WICVX) | | MARCH 31, 2020 (UNAUDITED) |
|
|
|
Portfolio Summary
AVERAGE ANNUAL TOTAL RETURNS
| | | | | | | | | | | | | | | | | | | | |
| | | SIX MONTHS* | | 1 YEAR | | 5 YEARS | | 10 YEARS |
Small Cap Value (WMCVX) — Investor | | | | -32.38% | | | | | -30.17% | | | | | -1.34% | | | | | 6.96% | |
Small Cap Value (WICVX) — Institutional | | | | -32.28% | | | | | -30.00% | | | | | -1.19% | | | | | 7.10% | |
Russell 2000® Value Index | | | | -30.20% | | | | | -29.64% | | | | | -2.42% | | | | | 4.79% | |
Russell 2000® Index | | | | -23.72% | | | | | -23.99% | | | | | -0.25% | | | | | 6.90% | |
Data show past performance, which is not indicative of future performance. Current performance may be lower or higher than the performance quoted. To obtain the most recentmonth-end performance data available, please visit wasatchglobal.com. The Advisor may absorb certain Fund expenses, without which total returns would have been lower. Investment returns and principal value will fluctuate and shares, when redeemed, may be worth more or less than their original cost.
As of the January 31, 2020 prospectus, the Total Annual Fund Operating Expenses for the Wasatch Small Cap Value Fund are Investor Class: 1.20% / Institutional Class — Gross: 1.09%, Net: 1.05%. The expense ratio shown elsewhere in this report may be different. Net expenses are based on Fund expenses, net of waivers and reimbursements. See the prospectus for additional information regarding Fund expenses.
Wasatch will deduct a 2.00% redemption fee on Fund shares held 60 days or less. Performance data do not reflect the deduction of fees, including sales charges, or the taxes you would pay on fund distributions or the redemption of fund shares. Fees and taxes, if reflected, would reduce the performance quoted. Wasatch does not charge any sales fees. For more complete information including charges, risks and expenses, read the prospectus carefully.
Performance for the Institutional Class prior to 1/31/2012 is based on the performance of the Investor Class. Performance of the Fund’s Institutional Class prior to 1/31/2012 uses the actual expenses of the Fund’s Investor Class without any adjustments. For any such period of time, the performance of the Fund’s Institutional Class would have been substantially similar to, yet higher than, the performance of the Fund’s Investor Class, because the shares of both classes are invested in the same portfolio of securities, but the classes bear different expenses.
Investing in small cap funds will be more volatile and loss of principal could be greater than investing in large cap or more diversified funds. Investments in value stocks can perform differently from the market as a whole and from other types of stocks and can continue to be undervalued by the market for long periods of time. Investing in foreign securities, especially in emerging markets, entails special risks, such as currency fluctuations and political uncertainties, which are described in more detail in the prospectus.
* Not annualized.
TOP 10 EQUITY HOLDINGS**
| | | | |
| Company | | % of Net
Assets | |
| |
| Kadant, Inc. | | | 4.5% | |
| |
| Fabrinet | | | 4.4% | |
| |
| Hamilton Lane, Inc., Class A | | | 3.2% | |
| |
| Ensign Group, Inc. (The) | | | 3.1% | |
| |
| Euronet Worldwide, Inc. | | | 3.1% | |
| | | | |
| Company | | % of Net
Assets | |
| |
| National Storage Affiliates Trust | | | 3.0% | |
| |
| Valvoline, Inc. | | | 2.9% | |
| |
| Monro, Inc. | | | 2.9% | |
| |
| ICON plc (Ireland) | | | 2.6% | |
| |
| Innospec, Inc. | | | 2.5% | |
| **As | of March 31, 2020, there were 60 holdings in the Fund. Foreign currency contracts, written options and repurchase agreements, if any, are not included in the number of holdings. Portfolio holdings are subject to change at any time. References to specific securities should not be construed as recommendations by the Funds or their Advisor. Current and future holdings are subject to risk. |
SECTOR BREAKDOWN†
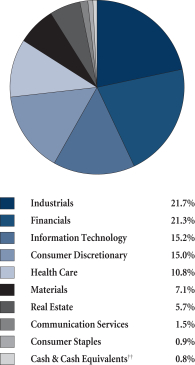
| †Excludes | securities sold short and options written, if any. |
| †† | Also includes Other Assets & Liabilities. |
GROWTHOFA HYPOTHETICAL $10,000 INVESTMENT
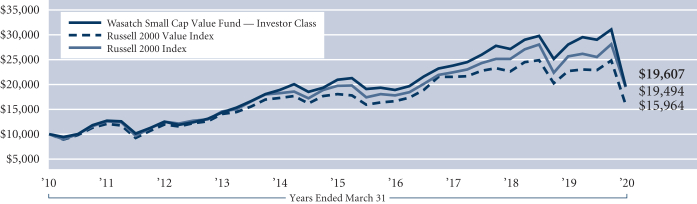
Past performance does not predict future performance. The graph above does not reflect the deduction of fees, sales charges, or taxes that you would pay on fund distributions or the redemption of fund shares. Wasatch does not charge any sales fees.
33
| | |
| WASATCH ULTRA GROWTH FUND(WAMCX / WGMCX) | | MARCH 31, 2020 (UNAUDITED) |
|
|
|
Management Discussion
The Wasatch Ultra Growth Fund is managed by a team of Wasatch portfolio managers led by John Malooly.
| | |

John Malooly, CFA Lead Portfolio Manager | | OVERVIEW Equity prices experienced significant losses amid the Covid-19 crisis during the quarter ended March 31, 2020. Small companies were down more than large companies, and the benchmark Russell 2000 Growth Index declined-25.76%. The Wasatch Ultra Growth Fund — Investor Class held up much |
better than the benchmark but still posted a drop of -17.24%.
Aside from the devastating human toll, Covid-19 poses a range of business and economic threats. With little in the way of recent precedent to guide them, investors began selling risk-oriented assets. As the pandemic largely moved to the U.S. and Europe during March, the selloff evolved into a full-blown panic. Financial markets rallied near the end of the quarter after the Federal Reserve embarked on an open-ended program of quantitative easing and the U.S. government enacted relief legislation of unprecedented scale.
DETAILSOFTHE QUARTER
At the sector level, beneficial stock picking in industrials contributed to the Fund’s outperformance relative to its benchmark. The Fund’s most-heavily weighted sectors are health care and information technology. In both sectors, our stocks outperformed their benchmark counterparts. Stock picking in materials, consumer staples and consumer discretionary also helped relative results. Our underperformance in financials was a headwind.
The strongest contributor to Fund performance was Inovio Pharmaceuticals, Inc. A biotechnology company, Inovio recently completed preclinical testing for its DNA-based potential coronavirus vaccine, INO-4800. The company plans to launch clinical trials in the U.S., China and Korea, with initial results expected sometime in the fall of 2020. Inovio anticipates having one million doses of the potential vaccine ready for additional clinical trials or emergency use by the end of the calendar year.
Other contributors included DocuSign, Inc. and Habit Restaurants, Inc. DocuSign offers e-signature software that enables businesses to digitally prepare and execute agreements. The company has been experiencing rapid sales gains and improved prospects for future growth. With the coronavirus pandemic scattering corporate operations to home offices and curtailing business travel, DocuSign is positioned to benefit as more companies sign contracts electronically over the internet.
Habit operates and franchises fast-casual restaurants specializing in fresh, made-to-order burgers and sandwiches cooked over an open flame. The company’s stock price jumped in early January after Habit agreed to be acquired by a larger competitor. The all-cash deal, which allowed Habit’s shareholders to sidestep the impact of the coronavirus, closed as expected in March.
Retail stocks were among the quarter’s biggest decliners as shoppers stayed home and public-health concerns disrupted
operations. Detractors from Fund performance included Five Below, Inc. and Floor & Decor Holdings, Inc. We added to both positions to take advantage of their lower valuations.
Five Below is a specialty value retailer offering a variety of low-priced merchandise. Although the company made the decision to temporarily close its stores, we think it’s likely to survive. Moreover, Five Below’s debt-free balance sheet, significant free cash flow and attractive long-term prospects continue to make its stock a worthwhile Fund holding in our view.
Floor & Decor is a multi-channel specialty retailer of hard-surface flooring and related accessories. A category-killer within wood and stone floorings, the company is positioned to benefit from housing’s potential to remain a strong contributor to the U.S. economy.
OUTLOOK
The Covid-19 crisis is likely to result in broad changes to society. Existing trends toward telemedicine and online education, for example, are likely to accelerate as technological solutions become accepted as viable replacements for human-to-human contact in a wider range of applications. A long-running investment theme in the Fund has been to seek innovative companies using new technologies to do things better, faster and cheaper. As American life is transformed in the wake of the coronavirus, we think the types of innovative, disruptive companies we look for are likely to lead the way.
Having outpaced our benchmark during the initial phases of the Covid-19 turmoil, we’re acutely aware that the race is never over. In market panics, extreme risk aversion can cause investors to unfairly punish the stocks of companies whose long-term businesses remain strong — but whose near-term prospects are much less certain, or perhaps even quite poor. Such panics sometimes don’t burn themselves out until stocks with some perceived risk are beaten down to the point that they may actually be the least-risky names. To the extent that we believe risk has become mispriced, we’ll continue to seek opportunities to selectively take it on.
Thank you for the opportunity to manage your assets.
| | Current and future holdings are subject to risk. |
34
| | |
| WASATCH ULTRA GROWTH FUND(WAMCX / WGMCX) ) | | MARCH 31, 2020 (UNAUDITED) |
|
|
|
Portfolio Summary
AVERAGE ANNUAL TOTAL RETURNS
| | | | | | | | | | | | | | | | | | | | |
| | | SIX MONTHS* | | 1 YEAR | | 5 YEARS | | 10 YEARS |
Ultra Growth (WAMCX) — Investor | | | | -5.11% | | | | | -3.89% | | | | | 11.49% | | | | | 13.32% | |
Ultra Growth (WGMCX) — Institutional | | | | -5.11% | | | | | -3.89% | | | | | 11.49% | | | | | 13.32% | |
Russell 2000® Growth Index | | | | -17.31% | | | | | -18.58% | | | | | 1.70% | | | | | 8.89% | |
Data show past performance, which is not indicative of future performance. Current performance may be lower or higher than the performance quoted. To obtain the most recent month-end performance data available, please visit wasatchglobal.com. The Advisor may absorb certain Fund expenses, without which total returns would have been lower. Investment returns and principal value will fluctuate and shares, when redeemed, may be worth more or less than their original cost.
As of the January 31, 2020 prospectus, the Total Annual Fund Operating Expenses for the Wasatch Ultra Growth Fund are Investor Class: 1.25% / Institutional Class — Gross: 1.10%, Net: 1.06%. The expense ratio shown elsewhere in this report may be different. Expenses include direct expenses paid to the Advisor as well as indirect expenses incurred by the Fund as a result of its investments in other investment companies (each an “Acquired Fund”), before any expense reimbursements by the Advisor. Net expenses are based on Fund expenses, net of waivers and reimbursements. See the prospectus for additional information regarding Fund expenses.
Wasatch will deduct a 2.00% redemption fee on Fund shares held 60 days or less. Performance data do not reflect the deduction of fees, including sales charges, or the taxes you would pay on fund distributions or the redemption of fund shares. Fees and taxes, if reflected, would reduce the performance quoted. Wasatch does not charge any sales fees. For more complete information including charges, risks and expenses, read the prospectus carefully.
Performance for the Institutional Class prior to 1/31/2020 is based on the performance of the Investor Class. Performance of the Fund’s Institutional Class prior to 1/31/2020 uses the actual expenses of the Fund’s Investor Class without any adjustments. For any such period of time, the performance of the Fund’s Institutional Class would have been substantially similar to, yet higher than, the performance of the Fund’s Investor Class, because the shares of both classes are invested in the same portfolio of securities, but the classes bear different expenses.
Investing in small cap funds will be more volatile and loss of principal could be greater than investing in large cap or more diversified funds. Investing in foreign securities, especially in emerging markets, entails special risks, such as currency fluctuations and political uncertainties, which are described in more detail in the prospectus.
TOP 10 EQUITY HOLDINGS**
| | | | |
| Company | | % of Net
Assets | |
| |
| Freshpet, Inc. | | | 3.3% | |
| |
| Five9, Inc. | | | 2.6% | |
| |
| Paylocity Holding Corp. | | | 2.4% | |
| |
| Tandem Diabetes Care, Inc. | | | 2.4% | |
| |
| Ollie’s Bargain Outlet Holdings, Inc. | | | 2.3% | |
| | | | |
| Company | | % of Net
Assets | |
| |
| Monolithic Power Systems, Inc. | | | 2.3% | |
| |
| HubSpot, Inc. | | | 2.2% | |
| |
| Proofpoint, Inc. | | | 2.2% | |
| |
| Exact Sciences Corp. | | | 2.2% | |
| |
| Grocery Outlet Holding Corp. | | | 2.1% | |
| ** | As of March 31, 2020, there were 79 holdings in the Fund. Foreign currency contracts, written options and repurchase agreements, if any, are not included in the number of holdings. Portfolio holdings are subject to change at any time. References to specific securities should not be construed as recommendations by the Funds or their Advisor. Current and future holdings are subject to risk. |
SECTOR BREAKDOWN†
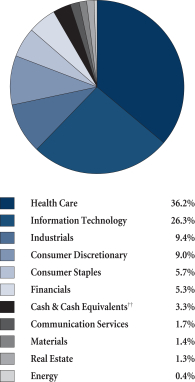
| † | Excludes securities sold short and options written, if any. |
| † | †Also includes Other Assets & Liabilities. |
GROWTHOFA HYPOTHETICAL $10,000 INVESTMENT
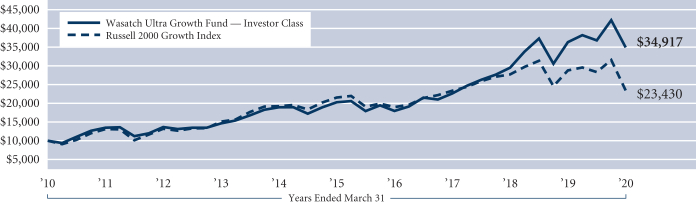
Past performance does not predict future performance. The graph above does not reflect the deduction of fees, sales charges, or taxes that you would pay on fund distributions or the redemption of fund shares. Wasatch does not charge any sales fees.
35
| | |
| WASATCH-HOISINGTON U.S. TREASURY FUND(WHOSX) | | MARCH 31, 2020 (UNAUDITED) |
|
|
|
Management Discussion
The Wasatch-Hoisington U.S. Treasury Fund is sub-advised by Hoisington Investment Management Company.
| | | | |

Van Hoisington Lead Portfolio Manager | | 
Van R. Hoisington, Jr. Portfolio Manager | | 
David Hoisington Portfolio Manager |
OVERVIEW
U.S. Treasury bond yields fell sharply during the quarter ended March 31, 2020 after dropping significantly in 2019. The 30-year Treasury bond yield declined to 1.31%, down from 2.388% at the end of 2019. A supply and demand side shock caused by the coronavirus pandemic hit a global economy that had slowed sharply in 2019. An indication of the fragile conditions, world trade volume declined in 2019, only the third annual decrease since 1980. The earlier times were in the recessions of 1982 and 2009. In the midst of widespread declines in economic activity, inflation fell sharply. The poorer growth, falling inflation and uncertain conditions all contributed to the strong rally in the Treasury bond market.
DETAILSOFTHE QUARTER
For the three months ended March 31, 2020, the Wasatch-Hoisington U.S. Treasury Fund rose 26.16%. The benchmark Bloomberg Barclays US Aggregate Bond Index posted a far more modest gain of 3.15% over the same period.
OUTLOOK
Major secular forces restraining growth over the past two decades are likely to worsen. The debt overhang will become far greater in the U.S. and for foreign economic powers. Demographic trends, already deteriorating in all these areas, will worsen even further. Based on the pattern during the Spanish flu pandemic of 1918 to 1920, population growth rates are likely to decline in all of these economies, as the coronavirus has engulfed each one. The monetary base is being expanded more sharply than during the U.S. Federal Reserve’s quantitative easing after the global financial crisis of 2008-09. But monetary policy is unlikely to be any more effective.
In view of initial conditions when the virus hit and considering the poorer secular factors, the U.S. economy is facing a deflationary recession. Based on the trends at hand, we expect this downturn will be more severe than the three previous worst post-war recessions of 1973-75, 1981-82 and 2008-09.
This may have a noticeable impact on inflation. Measured from the peak before or during the recession until the cyclical trough, the average decline in the core personal consumption expenditures (PCE) deflator, the Fed’s preferred inflation gauge, was 4.32 percentage points, with a range of minus -1.65 percentage points for the 2008-09 recession to minus -6.96 percentage points for the 1981-82 recession.
One reason for the variability in this range is that highly volatile oil prices rose in two of the recessions and, although energy prices are not measured directly in the core PCE deflator, they have a strong indirect influence. From peak to trough, oil prices declined 49.2% for the 1981-82 recession, but in all three recessions the average price was virtually unchanged. From the cyclical peak to the current level, the decline in oil prices is nearly 72%, unprecedented for a major recession. Extrapolating these trends from previous recessions, the core PCE measure could deflate two to three percentage points and possibly more while the broader PCE measure could contract four percentage points. This means that core PCE could recede to a 1% rate of deflation, with the overall PCE measure deflating at 4% or more.
Once the virus is contained, the output gap, a measure of real gross domestic product (GDP) relative to its potential will be massive both domestically and globally. A recovery in business activity will occur and may appear to be V shaped but will be at a much lower GDP level than the 2019 measure of activity. In other words, the economy will stagger, not march, forward. Five to seven years will likely elapse before the output gap returns to the late 2019 level. This suggests that once the cyclical decline in inflation has occurred, the economy will be mired in a protracted period of mild deflation and that firms with the weakest pricing power will need to try to lower nominal wages, something for which modern business managers have no experience.
Thus, the Treasury yield curve will be anchored close to the zero bound for a very lengthy period. Without the legal and structural impediments to crossing the zero bound, both variables in the Fisher equation (the real rate and inflationary expectations) will tend to push yields toward negative territory.
Thank you for the opportunity to manage your assets.
36
| | |
| WASATCH-HOISINGTON U.S. TREASURY FUND (WHOSX) | | MARCH 31, 2020 (UNAUDITED) |
|
|
|
Portfolio Summary
AVERAGE ANNUAL TOTAL RETURNS
| | | | | | | | | | | | | | | | | | | | |
| | | SIX MONTHS* | | 1 YEAR | | 5 YEARS | | 10 YEARS |
U.S. Treasury | | | | 19.58% | | | | | 40.27% | | | | | 7.82% | | | | | 10.45% | |
Bloomberg Barclays US Aggregate Bond Index | | | | 3.33% | | | | | 8.93% | | | | | 3.36% | | | | | 3.88% | |
Data show past performance, which is not indicative of future performance. Current performance may be lower or higher than the performance quoted. To obtain the most recent month-end performance data available, please visit wasatchglobal.com. The Advisor may absorb certain Fund expenses, without which total returns would have been lower. Investment returns and principal value will fluctuate and shares, when redeemed, may be worth more or less than their original cost.
As of the January 31, 2020 prospectus, the Total Annual Fund Operating Expenses for the Wasatch-Hoisington U.S. Treasury Fund are 0.69%. The expense ratio shown elsewhere in this report may be different. See the prospectus for additional information regarding Fund expenses.
Wasatch will deduct a 2.00% redemption fee on Fund shares held 60 days or less. Performance data do not reflect the deduction of fees, including sales charges, or the taxes you would pay on fund distributions or the redemption of fund shares. Fees and taxes, if reflected, would reduce the performance quoted. Wasatch does not charge any sales fees. For more complete information including charges, risks and expenses, read the prospectus carefully.
Investments in fixed income funds are subject to the same interest rate, inflation, credit and other risks associated with the underlying bonds. Return of principal is not guaranteed.
TOP U.S. TREASURY HOLDINGS**
| | | | | | | | |
| Holding | | Maturity
Date | | | % of Net
Assets | |
| | |
| U.S. Treasury Bond, 2.250% | | | 8/15/46 | | | | 25.5% | |
| | |
| U.S. Treasury Strip, principal only | | | 8/15/45 | | | | 23.2% | |
| | |
| U.S. Treasury Strip, principal only | | | 5/15/44 | | | | 16.5% | |
| | |
| U.S. Treasury Bond, 3.000% | | | 8/15/48 | | | | 15.2% | |
| | | | | | | | |
| Holding | | Maturity
Date | | | % of Net
Assets | |
| | |
| U.S. Treasury Bond, 2.500% | | | 2/15/45 | | | | 7.6% | |
| | |
| U.S. Treasury Strip, principal only | | | 8/15/40 | | | | 6.2% | |
| | |
| U.S. Treasury Bond, 2.250% | | | 8/15/49 | | | | 2.8% | |
| | |
| U.S. Treasury Bond, 2.875% | | | 5/15/49 | | | | 1.2% | |
| ** | As of March 31, 2020, there were 8 holdings in the Fund. Repurchase agreements, if any, are not included in the number of holdings. Portfolio holdings are subject to change at any time. References to specific securities should not be construed as recommendations by the Funds or their Advisor. Current and future holdings are subject to risk. |
INVESTMENTS & CASH
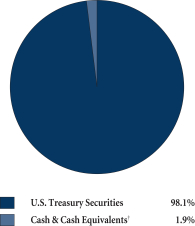
| † | Also includes Other Assets & Liabilities. |
GROWTHOFA HYPOTHETICAL $10,000 INVESTMENT
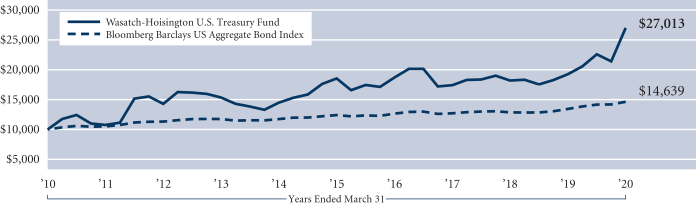
Past performance does not predict future performance. The graph above does not reflect the deduction of fees, sales charges, or taxes that you would pay on fund distributions or the redemption of fund shares. Wasatch does not charge any sales fees.
37
| | |
| WASATCH FUNDS MANAGEMENT DISCUSSIONS | | MARCH 31, 2020 (UNAUDITED) |
|
|
|
Definitions of Financial Terms
Alpha is a risk-adjusted measure of the so-called “excess return” on an investment. It is a common measure of assessing an active manager’s performance as it is the return in excess of a benchmark index or “risk-free” investment. The difference between the fair and actually expected rates of return on a stock is called the stock’s alpha.
CFA® stands for Chartered Financial Analyst and is a trademark owned by the CFA Institute.
The“cloud” is the internet.Cloud-computing is a model for delivering information-technology services in which resources are retrieved from the internet through web-based tools and applications, rather than from a direct connection to a server.
Earnings growth is a measure of growth in a company’s net income over a specific period, often one year.
TheFisher equation in economics estimates the relationship between nominal and real interest rates under inflation. It is named after Irving Fisher, who was renowned for his work on the theory of interest. In economics, this equation is used to predict nominal and real interest rate behavior.
Theglobal financial crisis, also known as thefinancial crisis of 2008-09 and the 2008 financial crisis, is considered by many economists to have been the worst financial crisis since the Great Depression of the 1930s.
Gross domestic product (GDP) is a basic measure of a country’s economic performance and is the market value of all final goods and services made within the borders of a country in a year.
Themonetary base is the total amount of a currency that is either circulated in the hands of the public or in the commercial bank deposits held in the central bank’s reserves. This measure of the money supply typically only includes the most liquid currencies.
ThePersonal Consumption Expenditures (PCE) Deflatoris part of the National Income and Products Accounts developed by the Bureau of Economic Analysis of the U.S. Commerce Department. The PCE Deflator is a variable weighted index and is widely considered to be the most reliable of all the price indexes.
Quantitative easing is a government monetary policy used to increase the money supply by buying government securities or other securities from the market. Quantitative easing increases the money supply by flooding financial institutions with capital in an effort to promote increased lending and liquidity.
Real gross domestic product (GDP) is a macroeconomic measure of the value of economic output adjusted for price changes (i.e., inflation or deflation). This adjustment transforms the money-value measure, nominal GDP, into an index for quantity of total output.
Return on assets (ROA) measures a company’s profitability by showing how many dollars of earnings a company derives from each dollar of assets it controls.
Return on capital is a measure of how effectively a company uses the money, owned or borrowed, that has been invested in its operations.
Return on equity (ROE) measures a company’s efficiency at generating profits from shareholders’ equity.
Sales growth is the increase in sales over a specified period of time, not necessarily one year.
Valuation is the process of determining the current worth of an asset or company.
Theyield curve is a line on a graph that plots the interest rates, at a set point in time, of bonds having equal credit quality, but differing maturity dates. The most frequently reported yield curve compares three-month, two-year, five-year and 30-year U.S. Treasury securities. This yield curve is used as a benchmark for other interest rates, such as mortgage rates or bank lending rates. The curve is also used to predict changes in economic output and growth.
INDEX DESCRIPTIONSAND DISCLOSURES
TheBloomberg Barclays US Aggregate Bond Index is a broad-based flagship benchmark that measures the investment grade, U.S. dollar denominated, fixed-rate taxable bond market. The index includes Treasuries, government-related and corporate securities, mortgage-backed securities (MBS) (agency fixed-rate and hybrid adjustable-rate mortgage [ARM] pass-throughs), asset-backed securities (ABS) and commercial mortgage-backed securities (CMBS) (agency and non-agency).
TheMSCI AC (All Country) World Index captures large- and mid-cap representation across 23 developed-market and 26 emerging-market countries.
TheMSCI AC (All Country) World ex USA Small Cap Index is an unmanaged index and includes reinvestment of all dividends of issuers located in countries throughout the world representing developed and emerging markets, excluding securities of U.S. issuers. This index is a free float-adjusted market capitalization index designed to measure the performance of small-capitalization securities.
TheMSCI AC (All Country) World Small Cap Index is an unmanaged index and includes reinvestment of all dividends of issuers located in countries throughout the world representing developed and emerging markets. This index is a free float-adjusted market capitalization index designed to measure the performance of small-capitalization securities.
TheMSCI EAFE Index is an unmanaged index and includes reinvestment of all dividends of issuers located in 21 developed-market countries, excluding the U.S. and Canada. This index is a free float-adjusted market capitalization index designed to measure the performance of mid-cap and large-cap securities.
TheMSCI Emerging Markets Index captures large- and mid-cap representation across 26 emerging-market countries.
TheMSCI Emerging Markets Small Cap Index captures small-cap representation across 26 emerging-market countries.
TheMSCI Frontier Emerging Markets andMSCI Frontier Marketsindexes are free float-adjusted market capitalization indexes designed to measure equity market performance in the global frontier and emerging markets.
TheMSCI India Investable Market Index (IMI) covers all investable large-, mid- and small-cap securities across India, targeting approximately 99% of the Indian market’s free-float adjusted market capitalization.
TheMSCI World ex USA Index captures large- and mid-cap representation across 22 of 23 developed market countries, excluding the United States.
38
| | |
| | MARCH 31, 2020 (UNAUDITED) |
|
|
|
TheMSCI World ex USA Small Cap Index is a free float-adjusted market capitalization weighted index designed to measure the equity market performance of developed markets, excluding the United States.
Pertaining to the use of MSCI information. Source: MSCI. The MSCI information may only be used for your internal use, may not be reproduced or redisseminated in any form and may not be used as a basis for or a component of any financial instruments or products or indices. None of the MSCI information is intended to constitute investment advice or a recommendation to make (or refrain from making) any kind of investment decision and may not be relied on as such. Historical data and analysis should not be taken as an indication or guarantee of any future performance analysis, forecast or prediction. The MSCI information is provided on an “as is” basis and the user of this information assumes the entire risk of any use made of this information. MSCI, each of its affiliates and each other person involved in or related to compiling, computing or creating any MSCI information (collectively, the “MSCI Parties”) expressly disclaims all warranties (including, without limitation, any warranties or originality, accuracy, completeness, timeliness, non-infringement, merchantability and fitness for a particular purpose) with respect to this information. Without limiting any of the foregoing, in no event shall any MSCI Party have any liability for any direct, indirect, special, incidental, punitive, consequential (including, without limitation, lost profits) or any other damages. (www.msci.com)
TheRussell 2000 Index is an unmanaged total-return index of the smallest 2,000 companies in the Russell 3000 Index, as ranked by total market capitalization. The Russell 2000 is widely used in the industry to measure the performance of small-company stocks.
TheRussell 2000 Growth Index measures the performance of Russell 2000 Index companies with higher price-to-book ratios and higher forecasted growth values.
TheRussell 2000 Value Index measures the performance of Russell 2000 Index companies with lower price-to-book ratios and lower forecasted growth values.
TheRussell Microcap Index is an unmanaged total return index of the smallest 1,000 securities in the small-cap Russell 2000 Index along with the next smallest 1,000 companies, based on a ranking of all U.S. equities by market capitalization.
Pertaining to the use of Russell information. All rights in the Russell 2000, Russell 2000 Growth, Russell 2000 Value and Russell Microcap vest in the relevant London Stock Exchange Group plc (collectively, the “LSE Group”), which owns these indexes. Russell® is a trademark of the relevant LSE Group company and is used by any other LSE Group company under license. These indexes are calculated by or on behalf of FTSE International Limited or its affiliate, agent or partner. The LSE Group does not accept any liability whatsoever to any person arising out of (a) the use of, reliance on or any error in the Index or (b) investment in or operation of any Wasatch portfolio. The LSE Group makes no claim, prediction, warranty or representation either as to the results to be obtained from any Wasatch portfolio or the suitability of these indexes for the purpose to which they are being put by Wasatch Global Investors.
You cannot invest directly in these or any indexes.
39
Operating Expenses(UNAUDITED)
EXPENSE EXAMPLE
As a shareholder of Wasatch Funds, you incur two types of costs: (1) transaction costs, including redemption fees and (2) ongoing costs, including management fees and other fund expenses. This example is intended to help you understand your ongoing costs (in dollars) of investing in a Wasatch Fund and to compare these costs with the ongoing costs of investing in other mutual funds.
The example is based on an investment of $1,000.00 invested at the beginning of the period and held for the entire six-month period ended March 31, 2020.
ACTUAL EXPENSES
The first line of the table on the next page provides information about actual account values and actual expenses, based upon the actual total return of the fund during the most recent six-month period ended March 31, 2020. You may use the information in this line, together with the amount you invested, to estimate the expenses you paid over the period. Simply divide your account value by $1,000.00 (for example, an $8,600.00 account value divided by $1,000.00 = 8.6), then multiply the result by the number in the first line under the heading entitled “Expenses Paid During Period” to estimate the expenses you paid on your account during this period.
In addition, the Funds charge a $12.50 IRA annual maintenance fee and a $15.00 fee for redemptions paid by wire. To the extent these fees apply to your account, your expenses paid during the period would be higher and your ending account value would be lower than the amounts shown in the table on the next page.
HYPOTHETICAL EXAMPLEFOR COMPARISON PURPOSES
The second line of the table on the next page provides information about hypothetical account values and hypothetical expenses based on a fund’s actual expense ratio and
an assumed rate of return of 5% per year before expenses, which is not the fund’s actual return. The hypothetical account values and expenses may not be used to estimate the actual ending account balance or expenses you paid for the period. You may use this information to compare the ongoing costs of investing in a Wasatch Fund and other funds. To do so, compare this 5% hypothetical example with the 5% hypothetical examples that appear in the shareholder reports of other funds.
In addition, the Funds charge a $12.50 IRA annual maintenance fee and a $15.00 fee for redemptions paid by wire. To the extent these fees apply to your account, your expenses paid during the period would be higher and your ending account value would be lower than the amounts shown in the table on the next page. If another fund’s fees differ from those listed above, your expenses paid and your ending account value could be higher or lower than those of other funds.
Please note that the expenses shown in the table are meant to highlight your ongoing costs only and do not reflect any transactional costs, such as redemption fees. Therefore, the second line of the table is useful in comparing ongoing costs only, and will not help you determine the relative total costs of owning different funds. In addition, if these transactional costs were included, your costs would have been higher.
A Fund’s annualized expense ratio may vary as a result of various factors including expenses that are not reimbursable under the contractual agreement between the Fund and the Advisor such as interest, taxes, brokerage commissions, other investment related costs, dividend expense on short sales, and extraordinary expenses.
40
| | |
| | MARCH 31, 2020 (UNAUDITED) |
|
|
|
| | | | | | | | | | | | | | | | | | | | |
| | | Account Value | | Expenses Paid
During Period* | | Annualized Expense
Ratio* |
| Fund/Class and Return | | Beginning of Period
October 1, 2019 | | End of Period
March 31, 2020 |
Core Growth Fund — Investor Class | | | | | | | | | | | | | | | | | | | | |
| | | | |
Actual | | | | $1,000.00 | | | | | $827.40 | | | | | $5.39 | | | | | 1.18% | |
Hypothetical (5% before expenses) | | | | $1,000.00 | | | | | $1,019.10 | | | | | $5.96 | | | | | 1.18% | |
Core Growth Fund — Institutional Class | | | | | | | | | | | | | | | | | | | | |
| | | | |
Actual | | | | $1,000.00 | | | | | $827.80 | | | | | $4.80 | | | | | 1.05% | |
Hypothetical (5% before expenses) | | | | $1,000.00 | | | | | $1,019.75 | | | | | $5.30 | | | | | 1.05% | |
Emerging India Fund — Investor Class | | | | | | | | | | | | | | | | | | | | |
| | | | |
Actual | | | | $1,000.00 | | | | | $760.10 | | | | | $7.08 | | | | | 1.61% | |
Hypothetical (5% before expenses) | | | | $1,000.00 | | | | | $1,016.95 | | | | | $8.12 | | | | | 1.61% | |
Emerging India Fund — Institutional Class | | | | | | | | | | | | | | | | | | | | |
| | | | |
Actual | | | | $1,000.00 | | | | | $761.80 | | | | | $6.34 | | | | | 1.44% | |
Hypothetical (5% before expenses) | | | | $1,000.00 | | | | | $1,017.80 | | | | | $7.26 | | | | | 1.44% | |
Emerging Markets Select Fund — Investor Class | | | | | | | | | | | | | | | | | | | | |
| | | | |
Actual | | | | $1,000.00 | | | | | $846.30 | | | | | $6.97 | | | | | 1.51% | |
Hypothetical (5% before expenses) | | | | $1,000.00 | | | | | $1,017.45 | | | | | $7.62 | | | | | 1.51% | |
Emerging Markets Select Fund — Institutional Class | | | | | | | | | | | | | | | | | | | | |
| | | | |
Actual | | | | $1,000.00 | | | | | $847.40 | | | | | $5.59 | | | | | 1.21% | |
Hypothetical (5% before expenses) | | | | $1,000.00 | | | | | $1,018.95 | | | | | $6.11 | | | | | 1.21% | |
Emerging Markets Small Cap Fund — Investor Class | | | | | | | | | | | | | | | | | | | | |
| | | | |
Actual | | | | $1,000.00 | | | | | $850.30 | | | | | $9.07 | | | | | 1.96% | |
Hypothetical (5% before expenses) | | | | $1,000.00 | | | | | $1,015.20 | | | | | $9.87 | | | | | 1.96% | |
Emerging Markets Small Cap Fund — Institutional Class | | | | | | | | | | | | | | | | | | | | |
| | | | |
Actual | | | | $1,000.00 | | | | | $854.70 | | | | | $8.39 | | | | | 1.81% | |
Hypothetical (5% before expenses) | | | | $1,000.00 | | | | | $1,015.95 | | | | | $9.12 | | | | | 1.81% | |
Frontier Emerging Small Countries Fund — Investor Class | | | | | | | | | | | | | | | | | | | | |
| | | | |
Actual | | | | $1,000.00 | | | | | $755.50 | | | | | $9.44 | | | | | 2.15% | |
Hypothetical (5% before expenses) | | | | $1,000.00 | | | | | $1,014.25 | | | | | $10.83 | | | | | 2.15% | |
Frontier Emerging Small Countries Fund —Institutional Class | | | | | | | | | | | | | | | | | | | | |
| | | | |
Actual | | | | $1,000.00 | | | | | $757.20 | | | | | $8.57 | | | | | 1.95% | |
Hypothetical (5% before expenses) | | | | $1,000.00 | | | | | $1,015.25 | | | | | $9.82 | | | | | 1.95% | |
Global Opportunities Fund — Investor Class | | | | | | | | | | | | | | | | | | | | |
| | | | |
Actual | | | | $1,000.00 | | | | | $820.30 | | | | | $6.96 | | | | | 1.53% | |
Hypothetical (5% before expenses) | | | | $1,000.00 | | | | | $1,017.35 | | | | | $7.72 | | | | | 1.53% | |
Global Opportunities Fund — Institutional Class | | | | | | | | | | | | | | | | | | | | |
| | | | |
Actual | | | | $1,000.00 | | | | | $818.50 | | | | | $6.18 | | | | | 1.36% | |
Hypothetical (5% before expenses) | | | | $1,000.00 | | | | | $1,018.20 | | | | | $6.86 | | | | | 1.36% | |
Global Select Fund — Investor Class | | | | | | | | | | | | | | | | | | | | |
| | | | |
Actual | | | | $1,000.00 | | | | | $899.00 | | | | | $6.41 | | | | | 1.35% | |
Hypothetical (5% before expenses) | | | | $1,000.00 | | | | | $1,018.25 | | | | | $6.81 | | | | | 1.35% | |
Global Select Fund — Institutional Class | | | | | | | | | | | | | | | | | | | | |
| | | | |
Actual | | | | $1,000.00 | | | | | $901.00 | | | | | $4.51 | | | | | 0.95% | |
Hypothetical (5% before expenses) | | | | $1,000.00 | | | | | $1,020.25 | | | | | $4.80 | | | | | 0.95% | |
Global Value Fund — Investor Class | | | | | | | | | | | | | | | | | | | | |
| | | | |
Actual | | | | $1,000.00 | | | | | $760.70 | | | | | $4.84 | | | | | 1.10% | |
Hypothetical (5% before expenses) | | | | $1,000.00 | | | | | $1,019.50 | | | | | $5.55 | | | | | 1.10% | |
Global Value Fund — Institutional Class | | | | | | | | | | | | | | | | | | | | |
| | | | |
Actual | | | | $1,000.00 | | | | | $760.90 | | | | | $4.18 | | | | | 0.95% | |
Hypothetical (5% before expenses) | | | | $1,000.00 | | | | | $1,020.25 | | | | | $4.80 | | | | | 0.95% | |
International Growth Fund — Investor Class | | | | | | | | | | | | | | | | | | | | |
| | | | |
Actual | | | | $1,000.00 | | | | | $876.70 | | | | | $6.85 | | | | | 1.46% | |
Hypothetical (5% before expenses) | | | | $1,000.00 | | | | | $1,017.70 | | | | | $7.36 | | | | | 1.46% | |
International Growth Fund — Institutional Class | | | | | | | | | | | | | | | | | | | | |
| | | | |
Actual | | | | $1,000.00 | | | | | $877.10 | | | | | $6.34 | | | | | 1.35% | |
Hypothetical (5% before expenses) | | | | $1,000.00 | | | | | $1,018.25 | | | | | $6.81 | | | | | 1.35% | |
41
| | |
| WASATCH FUNDS | | MARCH 31, 2020 (UNAUDITED) |
|
|
|
Operating Expenses(continued)
| | | | | | | | | | | | | | | | | | | | |
| | | Account Value | | Expenses Paid
During Period* | | Annualized Expense
Ratio* |
| Fund/Class and Return | | Beginning of Period
October 1, 2019 | | End of Period
March 31, 2020 |
International Opportunities Fund — Investor Class | | | | | | | | | | | | | | | | | | | | |
| | | | |
Actual | | | | $1,000.00 | | | | | $876.60 | | | | | $9.52 | | | | | 2.03% | |
Hypothetical (5% before expenses) | | | | $1,000.00 | | | | | $1,014.85 | | | | | $10.23 | | | | | 2.03% | |
International Opportunities Fund — Institutional Class | | | | | | | | | | | | | | | | | | | | |
| | | | |
Actual | | | | $1,000.00 | | | | | $878.00 | | | | | $9.06 | | | | | 1.93% | |
Hypothetical (5% before expenses) | | | | $1,000.00 | | | | | $1,015.35 | | | | | $9.72 | | | | | 1.93% | |
International Select Fund — Investor Class | | | | | | | | | | | | | | | | | | | | |
| | | | |
Actual | | | | $1,000.00 | | | | | $947.00 | | | | | $6.38 | | | | | 1.31% | |
Hypothetical (5% before expenses) | | | | $1,000.00 | | | | | $1,018.45 | | | | | $6.61 | | | | | 1.31% | |
International Select Fund — Institutional Class | | | | | | | | | | | | | | | | | | | | |
| | | | |
Actual | | | | $1,000.00 | | | | | $952.00 | | | | | $4.49 | | | | | 0.92% | |
Hypothetical (5% before expenses) | | | | $1,000.00 | | | | | $1,020.40 | | | | | $4.65 | | | | | 0.92% | |
Micro Cap Fund — Investor Class | | | | | | | | | | | | | | | | | | | | |
| | | | |
Actual | | | | $1,000.00 | | | | | $859.90 | | | | | $7.63 | | | | | 1.64% | |
Hypothetical (5% before expenses) | | | | $1,000.00 | | | | | $1,016.80 | | | | | $8.27 | | | | | 1.64% | |
Micro Cap Fund — Institutional Class | | | | | | | | | | | | | | | | | | | | |
| | | | |
Actual | | | | $1,000.00 | | | | | $740.30 | | | | | $2.25 | | | | | 1.58% | |
Hypothetical (5% before expenses) | | | | $1,000.00 | | | | | $1,005.61 | | | | | $2.60 | | | | | 1.58% | |
Micro Cap Value Fund — Investor Class | | | | | | | | | | | | | | | | | | | | |
| | | | |
Actual | | | | $1,000.00 | | | | | $796.00 | | | | | $7.77 | | | | | 1.73% | |
Hypothetical (5% before expenses) | | | | $1,000.00 | | | | | $1,016.35 | | | | | $8.72 | | | | | 1.73% | |
Micro Cap Value Fund — Institutional Class | | | | | | | | | | | | | | | | | | | | |
| | | | |
Actual | | | | $1,000.00 | | | | | $717.80 | | | | | $2.25 | | | | | 1.60% | |
Hypothetical (5% before expenses) | | | | $1,000.00 | | | | | $1,005.57 | | | | | $2.63 | | | | | 1.60% | |
Small Cap Growth Fund — Investor Class | | | | | | | | | | | | | | | | | | | | |
| | | | |
Actual | | | | $1,000.00 | | | | | $855.20 | | | | | $5.43 | | | | | 1.17% | |
Hypothetical (5% before expenses) | | | | $1,000.00 | | | | | $1,019.15 | | | | | $5.91 | | | | | 1.17% | |
Small Cap Growth Fund — Institutional Class | | | | | | | | | | | | | | | | | | | | |
| | | | |
Actual | | | | $1,000.00 | | | | | $855.80 | | | | | $4.87 | | | | | 1.05% | |
Hypothetical (5% before expenses) | | | | $1,000.00 | | | | | $1,019.75 | | | | | $5.30 | | | | | 1.05% | |
Small Cap Value Fund — Investor Class | | | | | | | | | | | | | | | | | | | | |
| | | | |
Actual | | | | $1,000.00 | | | | | $676.20 | | | | | $4.99 | | | | | 1.19% | |
Hypothetical (5% before expenses) | | | | $1,000.00 | | | | | $1,019.05 | | | | | $6.01 | | | | | 1.19% | |
Small Cap Value Fund — Institutional Class | | | | | | | | | | | | | | | | | | | | |
| | | | |
Actual | | | | $1,000.00 | | | | | $677.20 | | | | | $4.40 | | | | | 1.05% | |
Hypothetical (5% before expenses) | | | | $1,000.00 | | | | | $1,019.75 | | | | | $5.30 | | | | | 1.05% | |
Ultra Growth Fund — Investor Class | | | | | | | | | | | | | | | | | | | | |
| | | | |
Actual | | | | $1,000.00 | | | | | $948.90 | | | | | $5.85 | | | | | 1.20% | |
Hypothetical (5% before expenses) | | | | $1,000.00 | | | | | $1,019.00 | | | | | $6.06 | | | | | 1.20% | |
Ultra Growth Fund — Institutional Class | | | | | | | | | | | | | | | | | | | | |
| | | | |
Actual | | | | $1,000.00 | | | | | $800.60 | | | | | $1.55 | | | | | 1.05% | |
Hypothetical (5% before expenses) | | | | $1,000.00 | | | | | $1,006.48 | | | | | $1.73 | | | | | 1.05% | |
U.S. Treasury Fund | | | | | | | | | | | | | | | | | | | | |
| | | | |
Actual | | | | $1,000.00 | | | | | $1,195.80 | | | | | $3.62 | | | | | 0.66% | |
Hypothetical (5% before expenses) | | | | $1,000.00 | | | | | $1,025.00 | | | | | $3.34 | | | | | 0.66% | |
*Expenses are equal to a fund’s annualized expense ratio as indicated above multiplied by the average account value over the period, multiplied by the number of days in the most recent fiscal half-year divided by the number of days in the full fiscal year (183/366), except for the Institutional Class of the Micro Cap Fund, Micro Cap Value Fund and Ultra Growth Fund, which have 60 days in the most recent fiscal period due to their inception date of January 31, 2020.
42
| | |
| WASATCH CORE GROWTH FUND(WGROX / WIGRX) | | MARCH 31, 2020 (UNAUDITED) |
|
|
|
Schedule of Investments
| | | | | | | | |
| Shares | | | | | Value | |
| | | | | | | |
| | | | COMMON STOCKS 99.1% | | | | |
| | |
| | | | Airlines 1.3% | | | | |
| | 290,891 | | | Allegiant Travel Co. | | $ | 23,794,884 | |
| | | | | | | | |
| | |
| | | | Application Software 16.4% | | | | |
| | 309,573 | | | Avalara, Inc.* | | | 23,094,146 | |
| | 361,383 | | | DocuSign, Inc.* | | | 33,391,789 | |
| | 681,391 | | | Five9, Inc.* | | | 52,099,156 | |
| | 414,871 | | | Guidewire Software, Inc.* | | | 32,903,419 | |
| | 1,401,108 | | | Medallia, Inc.* | | | 28,078,204 | |
| | 526,548 | | | Paylocity Holding Corp.* | | | 46,504,719 | |
| | 466,850 | | | Q2 Holdings, Inc.* | | | 27,572,161 | |
| | 219,030 | | | Tyler Technologies, Inc.* | | | 64,955,537 | |
| | | | | | | | |
| | | | 308,599,131 | |
| | | | | | | | |
| | |
| | | | Asset Management & Custody Banks 4.7% | | | | |
| | 896,041 | | | Cohen & Steers, Inc. | | | 40,725,063 | |
| | 852,335 | | | Hamilton Lane, Inc., Class A | | | 47,142,649 | |
| | | | | | | | |
| | | | 87,867,712 | |
| | | | | | | | |
| | |
| | | | Automotive Retail 2.6% | | | | |
| | 1,375,149 | | | Camping World Holdings, Inc., Class A | | | 7,824,598 | |
| | 944,095 | | | Monro, Inc. | | | 41,360,802 | |
| | | | | | | | |
| | | | 49,185,400 | |
| | | | | | | | |
| | |
| | | | Biotechnology 0.9% | | | | |
| | 245,875 | | | Ligand Pharmaceuticals, Inc.* | | | 17,880,030 | |
| | | | | | | | |
| | |
| | | | Building Products 3.5% | | | | |
| | 833,330 | | | Trex Co., Inc.* | | | 66,783,066 | |
| | | | | | | | |
| | |
| | | | Commercial Printing 1.2% | | | | |
| | 416,264 | | | Cimpress plc* | | | 22,145,245 | |
| | | | | | | | |
| | |
| | | | Commodity Chemicals 1.6% | | | | |
| | 2,332,692 | | | Valvoline, Inc. | | | 30,534,938 | |
| | | | | | | | |
| | |
| | | | Data Processing & Outsourced Services 2.6% | | | | |
| | 571,161 | | | Euronet Worldwide, Inc.* | | | 48,959,921 | |
| | | | | | | | |
| | |
| | | | Distributors 3.3% | | | | |
| | 313,505 | | | Pool Corp. | | | 61,688,379 | |
| | | | | | | | |
| | |
| | | | Diversified Banks 0.8% | | | | |
| | 9,399,239 | | | City Union Bank Ltd. (India) | | | 16,017,559 | |
| | | | | | | | |
| | |
| | | | Electronic Equipment & Instruments 2.0% | | | | |
| | 464,503 | | | Novanta, Inc.* | | | 37,104,500 | |
| | | | | | | | |
| | |
| | | | Electronic Manufacturing Services 2.6% | | | | |
| | 890,409 | | | Fabrinet* | | | 48,580,715 | |
| | | | | | | | |
| | |
| | | | General Merchandise Stores 2.1% | | | | |
| | 836,832 | | | Ollie’s Bargain Outlet Holdings, Inc.* | | | 38,778,795 | |
| | | | | | | | |
| | |
| | | | Health Care Equipment 0.6% | | | | |
| | 337,951 | | | Cantel Medical Corp. | | | 12,132,441 | |
| | | | | | | | |
| | |
| | | | Health Care Facilities 3.3% | | | | |
| | 1,150,917 | | | Ensign Group, Inc. (The) | | | 43,285,988 | |
| | 646,000 | | | Pennant Group, Inc. (The)* | | | 9,147,360 | |
| | 136,110 | | | U.S. Physical Therapy, Inc. | | | 9,391,590 | |
| | | | | | | | |
| | | | 61,824,938 | |
| | | | | | | | |
| | |
| | | | Health Care Supplies 2.2% | | | | |
| | 619,118 | | | Neogen Corp.* | | | 41,474,715 | |
| | | | | | | | |
| | |
| | | | Home Improvement Retail 1.1% | | | | |
| | 624,656 | | | Floor & Decor Holdings, Inc., Class A* | | | 20,045,211 | |
| | | | | | | | |
| | | | | | | | |
| Shares | | | | | Value | |
| | | | | | | |
| | |
| | | | Industrial Machinery 9.7% | | | | |
| | 1,339,637 | | | Altra Industrial Motion Corp. | | $ | 23,430,251 | |
| | 1,151,994 | | | Barnes Group, Inc. | | | 48,187,909 | |
| | 764,751 | | | Helios Technologies, Inc. | | | 28,999,358 | |
| | 433,822 | | | Kadant, Inc. | | | 32,384,812 | |
| | 443,809 | | | RBC Bearings, Inc.* | | | 50,057,217 | |
| | | | | | | | |
| | | | 183,059,547 | |
| | | | | | | | |
| | |
| | | | Industrial REITs 2.2% | | | | |
| | 3,524,702 | | | Monmouth Real Estate Investment Corp. | | | 42,472,659 | |
| | | | | | | | |
| | |
| | | | IT Consulting & Other Services 2.0% | | | | |
| | 201,365 | | | EPAM Systems, Inc.* | | | 37,385,426 | |
| | | | | | | | |
| | |
| | | | Leisure Facilities 2.0% | | | | |
| | 793,645 | | | Planet Fitness, Inc., Class A* | | | 38,650,512 | |
| | | | | | | | |
| | |
| | | | Life Sciences Tools & Services 5.6% | | | | |
| | 476,331 | | | ICON plc* (Ireland) | | | 64,781,016 | |
| | 554,938 | | | Medpace Holdings, Inc.* | | | 40,721,350 | |
| | | | | | | | |
| | | | 105,502,366 | |
| | | | | | | | |
| | |
| | | | Managed Health Care 1.6% | | | | |
| | 612,041 | | | HealthEquity, Inc.* | | | 30,963,154 | |
| | | | | | | | |
| | |
| | | | Regional Banks 3.0% | | | | |
| | 568,515 | | | Bank OZK | | | 9,494,201 | |
| | 888,762 | | | Eagle Bancorp, Inc. | | | 26,849,500 | |
| | 855,539 | | | Webster Financial Corp. | | | 19,591,843 | |
| | | | | | | | |
| | | | 55,935,544 | |
| | | | | | | | |
| | |
| | | | Research & Consulting Services 1.7% | | | | |
| | 1,567,060 | | | Clarivate Analytics plc* | | | 32,516,495 | |
| | | | | | | | |
| | |
| | | | Semiconductors 2.7% | | | | |
| | 304,138 | | | Monolithic Power Systems, Inc. | | | 50,930,949 | |
| | | | | | | | |
| | |
| | | | Specialized REITs 2.4% | | | | |
| | 1,518,644 | | | National Storage Affiliates Trust | | | 44,951,862 | |
| | | | | | | | |
| | |
| | | | Specialty Chemicals 2.8% | | | | |
| | 526,660 | | | Balchem Corp. | | | 51,991,875 | |
| | | | | | | | |
| | |
| | | | Specialty Stores 3.0% | | | | |
| | 495,790 | | | Five Below, Inc.* | | | 34,893,700 | |
| | 1,113,483 | | | National Vision Holdings, Inc.* | | | 21,623,840 | |
| | | | | | | | |
| | | | 56,517,540 | |
| | | | | | | | |
| | |
| | | | Systems Software 4.8% | | | | |
| | 438,772 | | | CyberArk Software Ltd.* (Israel) | | | 37,541,332 | |
| | 523,240 | | | Proofpoint, Inc.* | | | 53,679,192 | |
| | | | | | | | |
| | | | 91,220,524 | |
| | | | | | | | |
| | |
| | | | Trading Companies & Distributors 1.3% | | | | |
| | 328,403 | | | SiteOne Landscape Supply, Inc.* | | | 24,177,029 | |
| | | | | | | | |
| | |
| | | | Trucking 1.5% | | | | |
| | 222,714 | | | Old Dominion Freight Line, Inc. | | | 29,233,440 | |
| | | | | | | | |
| | |
| | | | Total Common Stocks
(cost $1,714,731,544) | | $ | 1,868,906,502 | |
| | | | | | | | |
43
| | |
| WASATCH CORE GROWTH FUND(WGROX / WIGRX) | | MARCH 31, 2020 (UNAUDITED) |
|
|
|
Schedule of Investments(continued)
| | | | | | | | |
Principal Amount | | | | | Value | |
| | | | | | | |
| | | | SHORT-TERM INVESTMENTS 0.9% | | | | |
| | |
| | | | Repurchase Agreement 0.9% | | | | |
| | $16,332,508 | | | Repurchase Agreement dated 3/31/20,
0.00% due 4/1/20 with Fixed Income
Clearing Corp. collateralized by $16,050,000 of United States Treasury Notes 1.750% due 7/15/22; value: $16,663,608; repurchase proceeds: $16,332,508 (cost $16,332,508) | | $ | 16,332,508 | |
| | | | | | | | |
| | |
| | | | Total Short-Term Investments
(cost $16,332,508) | | | 16,332,508 | |
| | | | | | | | |
| | |
| | | | Total Investments
(cost $1,731,064,052) 100.0%§ | | | 1,885,239,010 | |
| | |
| | | | Other Assets less Liabilities <0.1% | | | 426,456 | |
| | | | | | | | |
| | |
| | | | NET ASSETS 100.0% | | $ | 1,885,665,466 | |
| | | | | | | | |
| |
| | | | *Non-income producing. §The aggregate amount of foreign securities fair valued pursuant to a systematic valuation model as a percent of net assets was 0.85%. REIT Real Estate Investment Trust. See Notes to Financial Statements. | |
At March 31, 2020, Wasatch Core Growth Fund’s investments, excluding short-term investments, were in the following countries:
| | | | | |
| Country | | % |
India | | | | 0.8 | |
Ireland | | | | 3.5 | |
Israel | | | | 2.0 | |
United States | | | | 93.7 | |
| | | | | |
TOTAL | | | | 100.0 | % |
| | | | | |
44
| | |
| WASATCH EMERGING INDIA FUND(WAINX / WIINX) | | MARCH 31, 2020 (UNAUDITED) |
|
|
|
Schedule of Investments
| | | | | | | | |
| Shares | | | | | Value | |
| | | | | | | |
| | | | COMMON STOCKS 103.2% | | | | |
| | |
| | | | Apparel, Accessories & Luxury Goods 3.2% | | | | |
| | 29,042 | | | Page Industries Ltd. (India) | | $ | 6,425,733 | |
| | | | | | | | |
| | |
| | | | Auto Parts & Equipment 1.3% | | | | |
| | 300,000 | | | Endurance Technologies Ltd. (India) | | | 2,391,341 | |
| | 409,520 | | | Minda Corp. Ltd. (India) | | | 312,162 | |
| | | | | | | | |
| | | | 2,703,503 | |
| | | | | | | | |
| | |
| | | | Brewers 2.7% | | | | |
| | 450,196 | | | United Breweries Ltd. (India) | | | 5,447,869 | |
| | | | | | | | |
| | |
| | | | Commodity Chemicals 6.2% | | | | |
| | 1,537,566 | | | Berger Paints India Ltd. (India) | | | 10,045,472 | |
| | 365,334 | | | Gulf Oil Lubricants India Ltd. (India) | | | 2,525,664 | |
| | | | | | | | |
| | | | 12,571,136 | |
| | | | | | | | |
| | |
| | | | Consumer Finance 7.7% | | | | |
| | 418,574 | | | Bajaj Finance Ltd. (India) | | | 12,225,400 | |
| | 394,808 | | | SBI Cards & Payment Services Ltd.* *** †§§ (India) | | | 3,227,300 | |
| | | | | | | | |
| | | | 15,452,700 | |
| | | | | | | | |
| | |
| | | | Department Stores 2.6% | | | | |
| | 807,809 | | | Trent Ltd. (India) | | | 5,157,155 | |
| | | | | | | | |
| | |
| | | | Diversified Banks 10.3% | | | | |
| | 1,518,459 | | | City Union Bank Ltd. (India) | | | 2,587,657 | |
| | 860,384 | | | HDFC Bank Ltd. (India) | | | 9,760,117 | |
| | 493,997 | | | Kotak Mahindra Bank Ltd. (India) | | | 8,372,736 | |
| | | | | | | | |
| | | | 20,720,510 | |
| | | | | | | | |
| | |
| | | | Diversified Chemicals 5.9% | | | | |
| | 659,676 | | | Pidilite Industries Ltd. (India) | | | 11,811,636 | |
| | | | | | | | |
| | |
| | | | Financial Exchanges & Data 2.7% | | | | |
| | 326,231 | | | CRISIL Ltd. (India) | | | 5,404,432 | |
| | | | | | | | |
| | |
| | | | Health Care Services 6.1% | | | | |
| | 669,512 | | | Dr. Lal PathLabs Ltd. (India) | | | 12,325,421 | |
| | | | | | | | |
| | |
| | | | Hotels, Resorts & Cruise Lines 0.4% | | | | |
| | 2,606,139 | | | Lemon Tree Hotels Ltd.* (India) | | | 766,499 | |
| | | | | | | | |
| | |
| | | | Industrial Conglomerates 3.0% | | | | |
| | 23,780 | | | 3M India Ltd.* (India) | | | 5,953,973 | |
| | | | | | | | |
| | |
| | | | Industrial Machinery 2.1% | | | | |
| | 2,843,085 | | | Elgi Equipments Ltd. (India) | | | 4,206,075 | |
| | | | | | | | |
| | |
| | | | Interactive Media & Services 4.2% | | | | |
| | 313,069 | | | Info Edge India Ltd. (India) | | | 8,529,606 | |
| | | | | | | | |
| | |
| | | | Internet & Direct Marketing
Retail 1.8% | | | | |
| | 311,126 | | | MakeMyTrip Ltd.* (India) | | | 3,719,511 | |
| | | | | | | | |
| | |
| | | | IT Consulting & Other Services 8.1% | | | | |
| | 356,238 | | | Larsen & Toubro Infotech Ltd. (India) | | | 6,743,214 | |
| | 885,338 | | | Mindtree Ltd. (India) | | | 9,537,853 | |
| | | | | | | | |
| | | | 16,281,067 | |
| | | | | | | | |
| | |
| | | | Life & Health Insurance 2.4% | | | | |
| | 1,031,715 | | | ICICI Prudential Life Insurance Co. Ltd. (India) | | | 4,812,687 | |
| | | | | | | | |
| | | | | | | | |
| Shares | | | | | Value | |
| | | | | | | |
| | |
| | | | Life Sciences Tools & Services 6.5% | | | | |
| | 501,652 | | | Divi’s Laboratories Ltd. (India) | | $ | 13,016,084 | |
| | | | | | | | |
| | |
| | | | Packaged Foods & Meats 5.0% | | | | |
| | 284,101 | | | Britannia Industries Ltd. (India) | | | 10,041,346 | |
| | | | | | | | |
| | |
| | | | Personal Products 1.5% | | | | |
| | 21,811 | | | Procter & Gamble Hygiene & Health Care Ltd. (India) | | | 2,959,115 | |
| | | | | | | | |
| | |
| | | | Pharmaceuticals 0.7% | | | | |
| | 311,451 | | | Amrutanjan Health Care Ltd. (India) | | | 1,358,229 | |
| | | | | | | | |
| | |
| | | | Property & Casualty Insurance 5.9% | | | | |
| | 812,230 | | | ICICI Lombard General Insurance Co. Ltd. (India) | | | 11,800,329 | |
| | | | | | | | |
| | |
| | | | Regional Banks 4.8% | | | | |
| | 1,425,060 | | | AU Small Finance Bank Ltd. (India) | | | 9,739,514 | |
| | | | | | | | |
| | |
| | | | Specialty Chemicals 2.5% | | | | |
| | 234,115 | | | Asian Paints Ltd. (India) | | | 5,124,508 | |
| | | | | | | | |
| | |
| | | | Thrifts & Mortgage Finance 5.6% | | | | |
| | 416,799 | | | Aavas Financiers Ltd.* (India) | | | 6,736,551 | |
| | 210,471 | | | Housing Development Finance Corp. Ltd. (India) | | | 4,520,347 | |
| | | | | | | | |
| | | | 11,256,898 | |
| | |
| | | | Total Common Stocks
(cost $208,838,307) | | | 207,585,536 | |
| | | | | | | | |
| | |
| | | | Total Investments
(cost $208,838,307) 103.2%§ | | | 207,585,536 | |
| | |
| | | | Liabilities less Other Assets (3.2%) | | | (6,436,412 | ) |
| | | | | | | | |
| | |
| | | | NET ASSETS 100.0% | | $ | 201,149,124 | |
| | | | | | | | |
| |
| | | | *Non-income producing. ***Security was fair valued under procedures adopted by the Board of Trustees (see Note 12). †Security purchased in a private placement transaction or under Rule 144A of the Securities Act of 1933 (see Note 9). The aggregate value of securities purchased in a private placement transaction or under Rule 144A of the Securities Act of 1933 at March 31, 2020, amounted to approximately $3,227,300, and represented 1.60% of net assets. §The aggregate amount of foreign securities fair valued pursuant to a systematic valuation model as a percent of net assets was 93.37%. §§The aggregate value of illiquid holdings at March 31, 2020, amounted to approximately $3,227,300 and represented 1.60% of net assets. See Notes to Financial Statements. | |
At March 31, 2020, Wasatch Emerging India Fund’s investments, were in the following countries:
| | | | | |
| Country | | % |
India | | | | 100.0 | |
| | | | | |
TOTAL | | | | 100.0 | % |
| | | | | |
45
| | |
| WASATCH EMERGING MARKETS SELECT FUND(WAESX / WIESX) | | |
|
|
|
Schedule of Investments
| | | | | | | | |
| Shares | | | | | Value | |
| | | | | | | |
| | | | COMMON STOCKS 95.5% | | | | |
| | |
| | | | Airport Services 1.3% | | | | |
| | 85,926 | | | Grupo Aeroportuario del Pacifico S.A.B. de C.V., Class B (Mexico) | | $ | 464,574 | |
| | | | | | | | |
| | |
| | | | Apparel, Accessories & Luxury Goods 1.7% | | | | |
| | 2,871 | | | Page Industries Ltd. (India) | | | 635,228 | |
| | | | | | | | |
| | |
| | | | Application Software 3.9% | | | | |
| | 16,240 | | | Globant S.A.* (Argentina) | | | 1,427,171 | |
| | | | | | | | |
| | |
| | | | Biotechnology 1.7% | | | | |
| | 3,965 | | | Medytox, Inc. (South Korea) | | | 630,788 | |
| | | | | | | | |
| | |
| | | | Consumer Finance 4.4% | | | | |
| | 55,987 | | | Bajaj Finance Ltd. (India) | | | 1,635,227 | |
| | | | | | | | |
| | |
| | | | Diversified Banks 8.0% | | | | |
| | 120,868 | | | HDFC Bank Ltd. (India) | | | 1,371,115 | |
| | 567,364 | | | PT Bank Central Asia Tbk (Indonesia) | | | 955,962 | |
| | 51,382 | | | TCS Group Holding plc GDR (Russia) | | | 593,976 | |
| | | | | | | | |
| | | | 2,921,053 | |
| | | | | | | | |
| | |
| | | | Diversified Chemicals 1.8% | | | | |
| | 37,930 | | | Pidilite Industries Ltd. (India) | | | 679,144 | |
| | | | | | | | |
| | |
| | | | Drug Retail 4.2% | | | | |
| | 78,766 | | | Raia Drogasil S.A. (Brazil) | | | 1,543,911 | |
| | | | | | | | |
| | |
| | | | Electrical Components & Equipment 6.7% | | | | |
| | 48,056 | | | Amara Raja Batteries Ltd. (India) | | | 301,852 | |
| | 59,661 | | | Voltronic Power Technology Corp. (Taiwan) | | | 1,239,864 | |
| | 139,701 | | | WEG S.A. (Brazil) | | | 902,554 | |
| | | | | | | | |
| | | | 2,444,270 | |
| | | | | | | | |
| | |
| | | | Health Care Equipment 3.2% | | | | |
| | 518,339 | | | Microport Scientific Corp. (Hong Kong) | | | 1,159,472 | |
| | | | | | | | |
| | |
| | | | Human Resource & Employment Services 2.6% | | | | |
| | 15,427 | | | 51job, Inc. ADR* (China) | | | 947,063 | |
| | | | | | | | |
| | |
| | | | Industrial Machinery 2.4% | | | | |
| | 139,000 | | | Techtronic Industries Co. Ltd. (Hong Kong) | | | 882,637 | |
| | | | | | | | |
| | |
| | | | Interactive Media & Services 3.3% | | | | |
| | 24,425 | | | Tencent Holdings Ltd. (China) | | | 1,207,269 | |
| | | | | | | | |
| | |
| | | | Internet & Direct Marketing Retail 12.1% | | | | |
| | 5,304 | | | Alibaba Group Holding Ltd. ADR* (China) | | | 1,031,522 | |
| | 31,797 | | | MakeMyTrip Ltd.* (India) | | | 380,133 | |
| | 4,234 | | | MercadoLibre, Inc.* | | | 2,068,648 | |
| | 40,408 | | | Trip.com Group Ltd. ADR* (China) | | | 947,567 | |
| | | | | | | | |
| | | | 4,427,870 | |
| | | | | | | | |
| | |
| | | | IT Consulting & Other Services 2.8% | | | | |
| | 53,591 | | | Larsen & Toubro Infotech Ltd. (India) | | | 1,014,422 | |
| | | | | | | | |
| | |
| | | | Life & Health Insurance 2.4% | | | | |
| | 110,272 | | | Discovery Ltd. (South Africa) | | | 480,831 | |
| | 85,892 | | | ICICI Prudential Life Insurance Co. Ltd. (India) | | | 400,664 | |
| | | | | | | | |
| | | | 881,495 | |
| | | | | | | | |
| | |
| | | | Life Sciences Tools & Services 2.4% | | | | |
| | 69,500 | | | Wuxi Biologics Cayman, Inc.* (China) | | | 887,295 | |
| | | | | | | | |
| | |
| | | | Managed Health Care 0.8% | | | | |
| | 38,000 | | | Hapvida Participacoes e Investimentos S.A. (Brazil) | | | 310,079 | |
| | | | | | | | |
| | | | | | | | |
| Shares | | | | | Value | |
| | | | | | | |
| | |
| | | | Packaged Foods & Meats 5.9% | | | | |
| | 23,851 | | | Britannia Industries Ltd. (India) | | $ | 842,997 | |
| | 435,393 | | | Vitasoy International Holdings Ltd. (Hong Kong) | | | 1,310,265 | |
| | | | | | | | |
| | | | 2,153,262 | |
| | | | | | | | |
| | |
| | | | Personal Products 2.0% | | | | |
| | 798 | | | LG Household & Health Care Ltd. (South Korea) | | | 730,958 | |
| | | | | | | | |
| | |
| | | | Pharmaceuticals 2.1% | | | | |
| | 59,700 | | | Jiangsu Hengrui Medicine Co. Ltd., Class A* (China) | | | 766,329 | |
| | | | | | | | |
| | |
| | | | Property & Casualty Insurance 3.7% | | | | |
| | 90,201 | | | ICICI Lombard General Insurance Co. Ltd. (India) | | | 1,310,468 | |
| | 21,618 | | | Qualitas Controladora S.A.B. de C.V. (Mexico) | | | 55,260 | |
| | | | | | | | |
| | | | 1,365,728 | |
| | | | | | | | |
| | |
| | | | Regional Banks 0.9% | | | | |
| | 49,022 | | | AU Small Finance Bank Ltd. (India) | | | 335,039 | |
| | | | | | | | |
| | |
| | | | Semiconductors 10.1% | | | | |
| | 34,297 | | | ASPEED Technology, Inc. (Taiwan) | | | 1,168,317 | |
| | 77,959 | | | Silergy Corp. (Taiwan) | | | 2,528,654 | |
| | | | | | | | |
| | | | 3,696,971 | |
| | | | | | | | |
| | |
| | | | Specialized Finance 1.0% | | | | |
| | 117,000 | | | Chailease Holding Co. Ltd. (Taiwan) | | | 352,396 | |
| | | | | | | | |
| | |
| | | | Specialty Chemicals 3.2% | | | | |
| | 53,760 | | | Asian Paints Ltd. (India) | | | 1,176,745 | |
| | | | | | | | |
| | |
| | | | Thrifts & Mortgage Finance 0.9% | | | | |
| | 20,124 | | | Aavas Financiers Ltd.* (India) | | | 325,256 | |
| | | | | | | | |
| | |
| | | | Total Common Stocks
(cost $32,165,015) | | | 35,001,652 | |
| | | | | | | | |
| | |
| | | | PREFERRED STOCKS 1.9% | | | | |
| | |
| | | | Diversified Banks 1.9% | | | | |
| | 94,031 | | | Banco Davivienda S.A., 2.90% (Colombia) | | | 706,043 | |
| | | | | | | | |
| | |
| | | | Total Preferred Stocks
(cost $886,979) | | | 706,043 | |
| | | | | | | | |
| | |
| | | | Total Investments
(cost $33,051,994) 97.4%§ | | | 35,707,695 | |
| | |
| | | | Other Assets less Liabilities 2.6% | | | 965,031 | |
| | | | | | | | |
| | |
| | | | NET ASSETS 100.0% | | $ | 36,672,726 | |
| | | | | | | | |
| |
| | | | *Non-income producing. §The aggregate amount of foreign securities fair valued pursuant to a systematic valuation model as a percent of net assets was 66.34%. ADR American Depositary Receipt. GDR Global Depositary Receipt. See Notes to Financial Statements. | |
46
| | |
| | MARCH 31, 2020 (UNAUDITED) |
|
|
|
At March 31, 2020, Wasatch Emerging Markets Select Fund’s investments, were in the following countries:
| | | | | |
| Country | | % of Net
Assets |
Argentina | | | | 4.0 | |
Brazil | | | | 7.7 | |
China | | | | 16.2 | |
Colombia | | | | 2.0 | |
Hong Kong | | | | 9.4 | |
India | | | | 29.1 | |
Indonesia | | | | 2.7 | |
Mexico | | | | 1.5 | |
Russia | | | | 1.7 | |
South Africa | | | | 1.3 | |
South Korea | | | | 3.8 | |
Taiwan | | | | 14.8 | |
United States | | | | 5.8 | |
| | | | | |
TOTAL | | | | 100.0 | % |
| | | | | |
47
| | |
| WASATCH EMERGING MARKETS SMALL CAP FUND(WAEMX / WIEMX) | | |
|
|
|
Schedule of Investments
| | | | | | | | |
| Shares | | | | | Value | |
| | | | | | | |
| | | | COMMON STOCKS 97.2% | | | | |
| | |
| | | | Airport Services 1.6% | | | | |
| | 1,374,525 | | | Grupo Aeroportuario del Centro Norte S.A.B. de C.V. (Mexico) | | $ | 4,651,570 | |
| | | | | | | | |
| | |
| | | | Application Software 3.3% | | | | |
| | 106,207 | | | Globant S.A.* (Argentina) | | | 9,333,471 | |
| | | | | | | | |
| | |
| | | | Biotechnology 1.6% | | | | |
| | 27,826 | | | Medytox, Inc. (South Korea) | | | 4,426,809 | |
| | | | | | | | |
| | |
| | | | Commodity Chemicals 4.3% | | | | |
| | 1,497,470 | | | Berger Paints India Ltd. (India) | | | 9,783,510 | |
| | 2,339,813 | | | TOA Paint Thailand Public Co. Ltd. (Thailand) | | | 2,245,878 | |
| | | | | | | | |
| | | | 12,029,388 | |
| | | | | | | | |
| | |
| | | | Consumer Finance 6.0% | | | | |
| | 265,148 | | | Bajaj Finance Ltd. (India) | | | 7,744,247 | |
| | 2,110,475 | | | Muangthai Capital Public Co. Ltd. (Thailand) | | | 2,250,830 | |
| | 2,414,829 | | | Srisawad Corp. Public Co. Ltd., Class A (Thailand) | | | 3,127,302 | |
| | 4,601,345 | | | Unifin Financiera S.A.B de C.V. (Mexico) | | | 3,658,188 | |
| | | | | | | | |
| | | | 16,780,567 | |
| | | | | | | | |
| | |
| | | | Department Stores 1.2% | | | | |
| | 233,946 | | | Poya International Co. Ltd. (Taiwan) | | | 3,312,728 | |
| | | | | | | | |
| | |
| | | | Distillers & Vintners 1.3% | | | | |
| | 608,057 | | | Sichuan Swellfun Co. Ltd., Class A (China) | | | 3,664,302 | |
| | | | | | | | |
| | |
| | | | Diversified Banks 2.7% | | | | |
| | 1,704,936 | | | City Union Bank Ltd. (India) | | | 2,905,439 | |
| | 408,104 | | | TCS Group Holding plc GDR (Russia) | | | 4,717,682 | |
| | | | | | | | |
| | | | 7,623,121 | |
| | | | | | | | |
| | |
| | | | Diversified Chemicals 2.1% | | | | |
| | 322,860 | | | Pidilite Industries Ltd. (India) | | | 5,780,875 | |
| | | | | | | | |
| | |
| | | | Drug Retail 6.4% | | | | |
| | 481,648 | | | Clicks Group Ltd. (South Africa) | | | 6,942,230 | |
| | 559,110 | | | Raia Drogasil S.A. (Brazil) | | | 10,959,249 | |
| | | | | | | | |
| | | | 17,901,479 | |
| | | | | | | | |
| | |
| | | | Electrical Components &
Equipment 5.6% | | | | |
| | 395,965 | | | Amara Raja Batteries Ltd. (India) | | | 2,487,155 | |
| | 642,694 | | | Voltronic Power Technology Corp. (Taiwan) | | | 13,356,351 | |
| | | | | | | | |
| | | | 15,843,506 | |
| | | | | | | | |
| | |
| | | | Electronic Equipment &
Instruments 1.6% | | | | |
| | 1,096,616 | | | Chroma ATE, Inc. (Taiwan) | | | 4,470,222 | |
| | | | | | | | |
| | |
| | | | General Merchandise Stores 3.4% | | | | |
| | 1,288,666 | | | Magazine Luiza S.A. (Brazil) | | | 9,669,769 | |
| | | | | | | | |
| | |
| | | | Health Care Equipment 2.6% | | | | |
| | 3,233,076 | | | Microport Scientific Corp. (Hong Kong) | | | 7,232,062 | |
| | | | | | | | |
| | |
| | | | Health Care Facilities 1.7% | | | | |
| | 16,606,200 | | | Cleopatra Hospital* (Egypt) | | | 4,853,146 | |
| | | | | | | | |
| | |
| | | | Health Care Services 3.3% | | | | |
| | 500,992 | | | Dr. Lal PathLabs Ltd. (India) | | | 9,223,042 | |
| | | | | | | | |
| | |
| | | | Highways & Railtracks 1.0% | | | | |
| | 4,537,437 | | | Yuexiu Transport Infrastructure Ltd. (China) | | | 2,746,002 | |
| | | | | | | | |
| | | | Home Improvement Retail 1.2% | | | | |
| | 41,666,224 | | | PT Ace Hardware Indonesia Tbk (Indonesia) | | | 3,314,948 | |
| | | | | | | | |
| | | | | | | | |
| Shares | | | | | Value | |
| | | | | | | |
| | |
| | | | Hotels, Resorts & Cruise Lines 1.5% | | | | |
| | 148,730 | | | Huazhu Group Ltd. ADR (China) | | $ | 4,273,013 | |
| | | | | | | | |
| | |
| | | | Human Resource & Employment
Services 2.6% | | | | |
| | 120,668 | | | 51job, Inc. ADR* (China) | | | 7,407,808 | |
| | | | | | | | |
| | |
| | | | Industrial Conglomerates 2.0% | | | | |
| | 22,180 | | | 3M India Ltd.* (India) | | | 5,553,369 | |
| | | | | | | | |
| | |
| | | | Industrial Machinery 1.4% | | | | |
| | 265,583 | | | Airtac International Group (Taiwan) | | | 3,916,097 | |
| | | | | | | | |
| | |
| | | | Insurance Brokers 1.3% | | | | |
| | 1,773,285 | | | TQM Corp. Public Co. Ltd. (Thailand) | | | 3,633,836 | |
| | | | | | | | |
| | |
| | | | Interactive Media & Services 2.4% | | | | |
| | 250,874 | | | Info Edge India Ltd. (India) | | | 6,835,095 | |
| | | | | | | | |
| | |
| | | | Internet & Direct Marketing
Retail 0.8% | | | | |
| | 183,648 | | | MakeMyTrip Ltd.* (India) | | | 2,195,512 | |
| | | | | | | | |
| | |
| | | | IT Consulting & Other Services 3.8% | | | | |
| | 305,856 | | | Larsen & Toubro Infotech Ltd. (India) | | | 5,789,535 | |
| | 445,179 | | | Mindtree Ltd. (India) | | | 4,795,967 | |
| | | | | | | | |
| | | | 10,585,502 | |
| | | | | | | | |
| | |
| | | | Life & Health Insurance 0.3% | | | | |
| | 191,272 | | | Discovery Ltd. (South Africa) | | | 834,023 | |
| | | | | | | | |
| | |
| | | | Packaged Foods & Meats 4.6% | | | | |
| | 135,161 | | | Britannia Industries Ltd. (India) | | | 4,777,169 | |
| | 2,687,755 | | | Vitasoy International Holdings Ltd. (Hong Kong) | | | 8,088,490 | |
| | | | | | | | |
| | | | 12,865,659 | |
| | | | | | | | |
| | |
| | | | Pharmaceuticals 0.0% | | | | |
| | 13,017,213 | | | China Animal Healthcare Ltd.* ***§§ (China) | | | 16,790 | |
| | | | | | | | |
| | |
| | | | Property & Casualty Insurance 4.8% | | | | |
| | 631,929 | | | ICICI Lombard General Insurance Co. Ltd. (India) | | | 9,180,861 | |
| | 1,645,684 | | | Qualitas Controladora S.A.B. de C.V. (Mexico) | | | 4,206,735 | |
| | | | | | | | |
| | | | 13,387,596 | |
| | | | | | | | |
| | |
| | | | Regional Banks 4.2% | | | | |
| | 1,122,259 | | | AU Small Finance Bank Ltd. (India) | | | 7,670,033 | |
| | 15,551,200 | | | PT Bank Tabungan Pensiunan Nasional Syariah Tbk* (Indonesia) | | | 2,024,552 | |
| | 782,362 | | | Regional S.A.B. de C.V. (Mexico) | | | 2,057,936 | |
| | | | | | | | |
| | | | 11,752,521 | |
| | | | | | | | |
| | |
| | | | Semiconductors 13.4% | | | | |
| | 253,374 | | | ASPEED Technology, Inc. (Taiwan) | | | 8,631,111 | |
| | 98,262 | | | LEENO Industrial, Inc. (South Korea) | | | 5,994,845 | |
| | 174,735 | | | Parade Technologies Ltd. (Taiwan) | | | 3,693,149 | |
| | 487,126 | | | Silergy Corp. (Taiwan) | | | 15,800,267 | |
| | 408,000 | | | Win Semiconductors Corp. (Taiwan) | | | 3,501,555 | |
| | | | | | | | |
| | | | 37,620,927 | |
| | | | | | | | |
| | |
| | | | Systems Software 2.1% | | | | |
| | 88,249 | | | Douzone Bizon Co. Ltd. (South Korea) | | | 5,823,707 | |
| | | | | | | | |
| | |
| | | | Thrifts & Mortgage Finance 1.1% | | | | |
| | 195,327 | | | Aavas Financiers Ltd.* (India) | | | 3,156,990 | |
| | | | | | | | |
| | |
| | | | Total Common Stocks
(cost $220,560,491) | | | 272,715,452 | |
| | | | | | | | |
48
| | |
| | MARCH 31, 2020 (UNAUDITED) |
|
|
|
| | | | | | | | |
| Shares | | | | | Value | |
| | | | | | | |
| | | | PREFERRED STOCKS 2.0% | | | | |
| | |
| | | | Personal Products 2.0% | | | | |
| | 10,702 | | | LG Household & Health Care Ltd., 1.74% (South Korea) | | $ | 5,579,388 | |
| | | | | | | | |
| | |
| | | | Total Preferred Stocks
(cost $5,002,852) | | | 5,579,388 | |
| | | | | | | | |
| | |
Principal Amount | | | | | Value | |
| | | | | | | |
| | | | SHORT-TERM INVESTMENTS 0.5% | | | | |
| | |
| | | | Repurchase Agreement 0.5% | | | | |
| | $1,507,568 | | | Repurchase Agreement dated 3/31/20,
0.00% due 4/1/20 with Fixed Income
Clearing Corp. collateralized by $1,485,000
of United States Treasury Notes 1.750%
due 7/15/22; value: $1,541,773; repurchase
proceeds: $1,507,568 (cost $1,507,568) | | $ | 1,507,568 | |
| | | | | | | | |
| | |
| | | | Total Short-Term Investments
(cost $1,507,568) | | | 1,507,568 | |
| | | | | | | | |
| | |
| | | | Total Investments
(cost $227,070,911) 99.7%§ | | | 279,802,408 | |
| | |
| | | | Other Assets less Liabilities 0.3% | | | 946,651 | |
| | | | | | | | |
| | |
| | | | NET ASSETS 100.0% | | $ | 280,749,059 | |
| | | | | | | | |
| |
| | | | *Non-income producing. ***Security was fair valued under procedures adopted by the Board of Trustees (see Note 12). §The aggregate amount of foreign securities fair valued pursuant to a systematic valuation model as a percent of net assets was 69.19%. §§The aggregate value of illiquid holdings at March 31, 2020, amounted to approximately $16,790, and represented 0.01% of net assets. ADR American Depositary Receipt. GDR Global Depositary Receipt. See Notes to Financial Statements. | |
At March 31, 2020, Wasatch Emerging Markets Small Cap Fund’s investments, excluding short-term investments, were in the following countries:
| | | | | |
| Country | | % |
Argentina | | | | 3.4 | |
Brazil | | | | 7.4 | |
China | | | | 6.5 | |
Egypt | | | | 1.7 | |
Hong Kong | | | | 5.5 | |
India | | | | 31.6 | |
Indonesia | | | | 1.9 | |
Mexico | | | | 5.2 | |
Russia | | | | 1.7 | |
South Africa | | | | 2.8 | |
South Korea | | | | 7.8 | |
Taiwan | | | | 20.4 | |
Thailand | | | | 4.1 | |
| | | | | |
TOTAL | | | | 100.0 | % |
| | | | | |
49
| | |
| WASATCH FRONTIER EMERGING SMALL COUNTRIES FUND(WAFMX / WIFMX) | | |
|
|
|
Schedule of Investments
| | | | | | | | |
| Shares | | | | | Value | |
| | | | | | | |
| | | | COMMON STOCKS 95.4% | | | | |
| | |
| | | | Airport Services 1.7% | | | | |
| | 197,400 | | | Grupo Aeroportuario del Centro Norte S.A.B. de C.V. (Mexico) | | $ | 668,027 | |
| | | | | | | | |
| | |
| | | | Application Software 4.3% | | | | |
| | 19,712 | | | Globant S.A.* (Argentina) | | | 1,732,291 | |
| | | | | | | | |
| | |
| | | | Asset Management & Custody Banks 2.2% | | | | |
| | 4,471,368 | | | Vostok Emerging Finance Ltd.* (Sweden) | | | 888,559 | |
| | | | | | | | |
| | |
| | | | Brewers 1.0% | | | | |
| | 79,780 | | | Saigon Beer Alcohol Beverage Corp. (Vietnam) | | | 413,628 | |
| | | | | | | | |
| | |
| | | | Consumer Finance 6.9% | | | | |
| | 289,466 | | | ASA International Group plc (United Kingdom) | | | 341,569 | |
| | 483,039 | | | Delta Brac Housing Finance Corp. Ltd. (Bangladesh) | | | 515,636 | |
| | 240,400 | | | Muangthai Capital Public Company Ltd. (Thailand) | | | 256,388 | |
| | 39,681 | | | Spandana Sphoorty Financial Ltd.* (India) | | | 316,235 | |
| | 460,100 | | | Srisawad Corp. Public Company Ltd. Class A (Thailand) | | | 595,848 | |
| | 894,920 | | | Unifin Financiera S.A.B de C.V. (Mexico) | | | 711,485 | |
| | | | | | | | |
| | | | 2,737,161 | |
| | | | | | | | |
| | |
| | | | Data Processing & Outsourced Services 1.6% | | | | |
| | 132,674 | | | Network International Holdings plc* (United Kingdom) | | | 645,116 | |
| | | | | | | | |
| | |
| | | | Diversified Banks 14.2% | | | | |
| | 356,510 | | | Bank for Foreign Trade of Vietnam JSC (Vietnam) | | | 924,099 | |
| | 422,538 | | | Commercial International Bank S.A.E* (Egypt) | | | 1,559,825 | |
| | 1,583 | | | Credicorp Ltd. (Peru) | | | 226,480 | |
| | 1,643,000 | | | Equity Group Holdings plc (Kenya) | | | 530,984 | |
| | 825,600 | | | PT Bank Central Asia Tbk (Indonesia) | | | 1,391,068 | |
| | 91,448 | | | TCS Group Holding plc GDR (Russia) | | | 1,057,139 | |
| | | | | | | | |
| | | | 5,689,595 | |
| | | | | | | | |
| | |
| | | | Drug Retail 8.4% | | | | |
| | 77,213 | | | Clicks Group Ltd. (South Africa) | | | 1,112,909 | |
| | 114,300 | | | Raia Drogasil S.A. (Brazil) | | | 2,240,422 | |
| | | | | | | | |
| | | | 3,353,331 | |
| | | | | | | | |
| | |
| | | | Electrical Components & Equipment 1.3% | | | | |
| | 80,400 | | | Weg S.A. (Brazil) | | | 519,433 | |
| | | | | | | | |
| | |
| | | | Food Retail 7.5% | | | | |
| | 432,200 | | | CP ALL Public Company Ltd. (Thailand) | | | 803,358 | |
| | 856,764 | | | Philippine Seven Corp. (Philippines) | | | 2,186,722 | |
| | | | | | | | |
| | | | 2,990,080 | |
| | | | | | | | |
| | |
| | | | General Merchandise Stores 1.4% | | | | |
| | 75,100 | | | Magazine Luiza S.A. (Brazil) | | | 563,528 | |
| | | | | | | | |
| | |
| | | | Health Care Distributors 1.7% | | | | |
| | 1,368,438 | | | Ibnsina Pharma S.A.E. (Egypt) | | | 691,659 | |
| | | | | | | | |
| | |
| | | | Health Care Facilities 5.9% | | | | |
| | 7,983,144 | | | Cleopatra Hospital* (Egypt) | | | 2,333,066 | |
| | | | | | | | |
| | |
| | | | Human Resource & Employment Services 1.4% | | | | |
| | 34,083 | | | HeadHunter Group plc. ADR (Russia) | | | 544,306 | |
| | | | | | | | |
| | |
| | | | Hypermarkets & Super Centers 2.0% | | | | |
| | 25,878 | | | InRetail Peru Corp. (Peru) | | | 807,394 | |
| | | | | | | | |
| | | | | | | | |
| Shares | | | | | Value | |
| | | | | | | |
| | |
| | | | Insurance Brokers 3.0% | | | | |
| | 579,715 | | | TQM Corp. Public Company Ltd. (Thailand) | | $ | 1,187,959 | |
| | | | | | | | |
| | |
| | | | Internet & Direct Marketing Retail 12.4% | | | | |
| | 5,360 | | | MercadoLibre, Inc.* | | | 2,618,789 | |
| | 11,040 | | | Naspers Ltd., Class N (South Africa) | | | 1,568,943 | |
| | 11,040 | | | Prosus N.V.* (Netherlands) | | | 773,029 | |
| | | | | | | | |
| | | | 4,960,761 | |
| | | | | | | | |
| | |
| | | | Life & Health Insurance 1.3% | | | | |
| | 118,609 | | | Discovery Ltd. (South Africa) | | | 517,183 | |
| | | | | | | | |
| | |
| | | | Property & Casualty Insurance 4.5% | | | | |
| | 703,900 | | | Qualitas Controladora S.A.B. de C.V. (Mexico) | | | 1,799,325 | |
| | | | | | | | |
| | |
| | | | Regional Banks 4.1% | | | | |
| | 164,784 | | | AU Small Finance Bank Ltd. (India) | | | 1,126,209 | |
| | 3,906,400 | | | PT Bank Tabungan Pensiunan Nasional Syariah Tbk* (Indonesia) | | | 508,560 | |
| | | | | | | | |
| | | | 1,634,769 | |
| | | | | | | | |
| | |
| | | | Technology Distributors 3.7% | | | | |
| | 865,070 | | | FPT Corp. (Vietnam) | | | 1,488,412 | |
| | | | | | | | |
| | |
| | | | Wireless Telecommunication Services 4.9% | | | | |
| | 7,748,738 | | | Safaricom plc (Kenya) | | | 1,962,610 | |
| | | | | | | | |
| | |
| | | | Total Common Stocks
(cost $45,555,293) | | | 38,128,193 | |
| | | | | | | | |
| | |
| | | | PREFERRED STOCKS 3.4% | | | | |
| | |
| | | | Diversified Banks 3.4% | | | | |
| | 183,559 | | | Banco Davivienda S.A., 2.90% (Colombia) | | | 1,378,274 | |
| | | | | | | | |
| | |
| | | | Total Preferred Stocks
(cost $2,032,420) | | | 1,378,274 | |
| | | | | | | | |
| | |
Principal Amount | | | | | Value | |
| | | | | | | |
| | | | SHORT-TERM INVESTMENTS 1.6% | | | | |
| | |
| | | | Repurchase Agreement 1.6% | | | | |
| | $621,965 | | | Repurchase Agreement dated 3/31/20,
0.00% due 4/1/20 with Fixed Income
Clearing Corp. collateralized by $615,000
of United States Treasury Notes 1.750%
due 7/15/22; value: $638,512; repurchase
proceeds: $621,965 (cost $621,965) | | $ | 621,965 | |
| | | | | | | | |
| | |
| | | | Total Short-Term Investments
(cost $621,965) | | | 621,965 | |
| | | | | | | | |
| | |
| | | | Total Investments
(cost $48,209,678) 100.4%§ | | | 40,128,432 | |
| | |
| | | | Liabilities less Other Assets (0.4%) | | | (167,057 | ) |
| | | | | | | | |
| | |
| | | | NET ASSETS 100.0% | | $ | 39,961,375 | |
| | | | | | | | |
| |
| | | | *Non-income producing. §The aggregate amount of foreign securities fair valued pursuant to a systematic valuation model as a percent of net assets was 46.52%. ADR American Depositary Receipt. GDR Global Depositary Receipt. See Notes to Financial Statements. | |
50
| | |
| | MARCH 31, 2020 (UNAUDITED) |
|
|
|
At March 31, 2020, Wasatch Frontier Emerging Small Countries Fund’s investments, excluding short-term investments, were in the following countries:
| | | | | |
| Country | | % |
Argentina | | | | 4.4 | |
Bangladesh | | | | 1.3 | |
Brazil | | | | 8.4 | |
Colombia | | | | 3.5 | |
Egypt | | | | 11.6 | |
India | | | | 3.7 | |
Indonesia | | | | 4.8 | |
Kenya | | | | 6.3 | |
Mexico | | | | 8.0 | |
Netherlands | | | | 2.0 | |
Peru | | | | 2.6 | |
Philippines | | | | 5.5 | |
Russia | | | | 4.1 | |
South Africa | | | | 8.1 | |
Sweden | | | | 2.2 | |
Thailand | | | | 7.2 | |
United Kingdom | | | | 2.5 | |
United States | | | | 6.6 | |
Vietnam | | | | 7.2 | |
| | | | | |
TOTAL | | | | 100.0 | % |
| | | | | |
51
| | |
| WASATCH GLOBAL OPPORTUNITIES FUND(WAGOX / WIGOX) | | |
|
|
|
Schedule of Investments
| | | | | | | | |
| Shares | | | | | Value | |
| | | | | | | |
| | | | COMMON STOCKS 98.9% | | | | |
| | |
| | | | Airlines 0.9% | | | | |
| | 10,687 | | | Allegiant Travel Co. | | $ | 874,197 | |
| | | | | | | | |
| | |
| | | | Application Software 17.7% | | | | |
| | 30,444 | | | Five9, Inc.* | | | 2,327,748 | |
| | 28,136 | | | Globant S.A.* (Argentina) | | | 2,472,592 | |
| | 12,718 | | | HubSpot, Inc.* | | | 1,693,910 | |
| | 113,430 | | | Infomart Corp. (Japan) | | | 746,446 | |
| | 67,661 | | | Medallia, Inc.* | | | 1,355,926 | |
| | 18,045 | | | Paylocity Holding Corp.* | | | 1,593,734 | |
| | 16,499 | | | Q2 Holdings, Inc.* | | | 974,431 | |
| | 93,318 | | | Systena Corp. (Japan) | | | 1,261,072 | |
| | 102,857 | | | Technology One Ltd. (Australia) | | | 496,835 | |
| | 7,858 | | | Tyler Technologies, Inc.* | | | 2,330,369 | |
| | 29,884 | | | Zendesk, Inc.* | | | 1,912,875 | |
| | | | | | | | |
| | | | 17,165,938 | |
| | | | | | | | |
| | |
| | | | Automotive Retail 1.0% | | | | |
| | 22,815 | | | Monro, Inc. | | | 999,525 | |
| | | | | | | | |
| | |
| | | | Biotechnology 2.6% | | | | |
| | 101,538 | | | Abcam plc (United Kingdom) | | | 1,432,308 | |
| | 16,859 | | | Esperion Therapeutics, Inc.* | | | 531,564 | |
| | 170 | | | Medytox, Inc. (South Korea) | | | 27,045 | |
| | 86,299 | | | Sangamo Therapeutics, Inc.* | | | 549,725 | |
| | | | | | | | |
| | | | 2,540,642 | |
| | | | | | | | |
| | |
| | | | Building Products 3.1% | | | | |
| | 37,382 | | | Trex Co., Inc.* | | | 2,995,793 | |
| | | | | | | | |
| | |
| | | | Commercial Printing 0.6% | | | | |
| | 11,429 | | | Cimpress plc* | | | 608,023 | |
| | | | | | | | |
| | |
| | | | Consumer Finance 2.6% | | | | |
| | 33,630 | | | Bajaj Finance Ltd. (India) | | | 982,240 | |
| | 784,708 | | | Srisawad Corp. Public Co. Ltd., Class A (Thailand) | | | 1,016,229 | |
| | 644,500 | | | Unifin Financiera S.A.B de C.V. (Mexico) | | | 512,394 | |
| | | | | | | | |
| | | | 2,510,863 | |
| | | | | | | | |
| | |
| | | | Data Processing & Outsourced Services 2.9% | | | | |
| | 23,458 | | | Euronet Worldwide, Inc.* | | | 2,010,820 | |
| | 11,400 | | | GMO Payment Gateway, Inc. (Japan) | | | 798,973 | |
| | | | | | | | |
| | | | 2,809,793 | |
| | | | | | | | |
| | |
| | | | Diversified Chemicals 1.4% | | | | |
| | 73,457 | | | Pidilite Industries Ltd. (India) | | | 1,315,263 | |
| | | | | | | | |
| | |
| | | | Diversified Real Estate Activities 1.0% | | | | |
| | 42,728 | | | Patrizia AG (Germany) | | | 977,619 | |
| | | | | | | | |
| | |
| | | | Diversified Support Services 1.9% | | | | |
| | 26,107 | | | Copart, Inc.* | | | 1,788,852 | |
| | | | | | | | |
| | |
| | | | Drug Retail 1.5% | | | | |
| | 10,690 | | | Ain Holdings, Inc. (Japan) | | | 628,359 | |
| | 15,500 | | | Sugi Holdings Co. Ltd. (Japan) | | | 830,016 | |
| | | | | | | | |
| | | | 1,458,375 | |
| | | | | | | | |
| | |
| | | | Electrical Components & Equipment 2.0% | | | | |
| | 95,281 | | | Voltronic Power Technology Corp. (Taiwan) | | | 1,980,113 | |
| | | | | | | | |
| | |
| | | | General Merchandise Stores 1.4% | | | | |
| | 29,255 | | | Ollie’s Bargain Outlet Holdings, Inc.* | | | 1,355,677 | |
| | | | | | | | |
| | |
| | | | Health Care Equipment 2.8% | | | | |
| | 21,469 | | | Cantel Medical Corp. | | | 770,737 | |
| | 17,042 | | | Cochlear Ltd. (Australia) | | | 1,942,299 | |
| | | | | | | | |
| | | | 2,713,036 | |
| | | | | | | | |
| | | | | | | | |
| Shares | | | | | Value | |
| | | | | | | |
| | |
| | | | Health Care Facilities 2.5% | | | | |
| | 53,944 | | | Ensign Group, Inc. (The) | | $ | 2,028,834 | |
| | 30,936 | | | Pennant Group, Inc. (The)* | | | 438,054 | |
| | | | | | | | |
| | | | 2,466,888 | |
| | | | | | | | |
| | |
| | | | Health Care Services 1.1% | | | | |
| | 59,361 | | | Dr. Lal PathLabs Ltd. (India) | | | 1,092,810 | |
| | | | | | | | |
| | |
| | | | Health Care Supplies 1.2% | | | | |
| | 45,700 | | | Asahi Intecc Co. Ltd. (Japan) | | | 1,130,254 | |
| | | | | | | | |
| | |
| | | | Homebuilding 1.2% | | | | |
| | 25,624 | | | LGI Homes, Inc.* | | | 1,156,924 | |
| | | | | | | | |
| | |
| | | | Human Resource & Employment Services 1.4% | | | | |
| | 22,500 | | | en-japan, Inc. (Japan) | | | 418,029 | |
| | 50,730 | | | SMS Co. Ltd. (Japan) | | | 978,367 | |
| | | | | | | | |
| | | | 1,396,396 | |
| | | | | | | | |
| | |
| | | | Industrial Conglomerates 1.1% | | | | |
| | 4,226 | | | 3M India Ltd.* (India) | | | 1,058,095 | |
| | | | | | | | |
| | |
| | | | Industrial Machinery 7.3% | | | | |
| | 35,669 | | | Altra Industrial Motion Corp. | | | 623,851 | |
| | 23,238 | | | Barnes Group, Inc. | | | 972,046 | |
| | 30,575 | | | Helios Technologies, Inc. | | | 1,159,404 | |
| | 44,032 | | | Kornit Digital Ltd.* (Israel) | | | 1,095,956 | |
| | 62,300 | | | MISUMI Group, Inc. (Japan) | | | 1,347,607 | |
| | 16,345 | | | RBC Bearings, Inc.* | | | 1,843,553 | |
| | | | | | | | |
| | | | 7,042,417 | |
| | | | | | | | |
| | |
| | | | Interactive Media & Services 0.6% | | | | |
| | 2,738 | | | New Work SE (Germany) | | | 576,172 | |
| | | | | | | | |
| | |
| | | | Internet & Direct Marketing Retail 3.9% | | | | |
| | 62,227 | | | MakeMyTrip Ltd.* (India) | | | 743,924 | |
| | 4,274 | | | MercadoLibre, Inc.* | | | 2,088,191 | |
| | 224,623 | | | Trainline plc* (United Kingdom) | | | 932,575 | |
| | | | | | | | |
| | | | 3,764,690 | |
| | | | | | | | |
| | |
| | | | Leisure Facilities 0.7% | | | | |
| | 13,305 | | | Planet Fitness, Inc., Class A* | | | 647,953 | |
| | | | | | | | |
| | |
| | | | Life & Health Insurance 0.7% | | | | |
| | 138,449 | | | ICICI Prudential Life Insurance Co. Ltd. (India) | | | 645,829 | |
| | | | | | | | |
| | |
| | | | Managed Health Care 1.2% | | | | |
| | 23,517 | | | HealthEquity, Inc.* | | | 1,189,725 | |
| | | | | | | | |
| | |
| | | | Other Diversified Financial Services 0.6% | | | | |
| | 2,066 | | | Hypoport AG* (Germany) | | | 591,601 | |
| | | | | | | | |
| | |
| | | | Packaged Foods & Meats 4.3% | | | | |
| | 26,800 | | | Freshpet, Inc.* | | | 1,711,716 | |
| | 822,000 | | | Vitasoy International Holdings Ltd. (Hong Kong) | | | 2,473,715 | |
| | | | | | | | |
| | | | 4,185,431 | |
| | | | | | | | |
| | |
| | | | Pharmaceuticals 1.0% | | | | |
| | 63,591 | | | Intra-Cellular Therapies, Inc.* | | | 977,394 | |
| | | | | | | | |
| | |
| | | | Property & Casualty Insurance 1.6% | | | | |
| | 108,691 | | | ICICI Lombard General Insurance Co. Ltd. (India) | | | 1,579,096 | |
| | | | | | | | |
| | |
| | | | Regional Banks 4.4% | | | | |
| | 382,677 | | | AU Small Finance Bank Ltd. (India) | | | 2,615,390 | |
| | 41,416 | | | Canadian Western Bank (Canada) | | | 570,047 | |
| | 35,208 | | | Eagle Bancorp, Inc. | | | 1,063,634 | |
| | | | | | | | |
| | | | 4,249,071 | |
| | | | | | | | |
52
| | |
| | MARCH 31, 2020 (UNAUDITED) |
|
|
|
| | | | | | | | |
| Shares | | | | | Value | |
| | | | | | | |
| | |
| | | | Research & Consulting Services 1.7% | | | | |
| | 33,093 | | | Funai Soken Holdings, Inc. (Japan) | | $ | 653,935 | |
| | 36,700 | | | Nihon M&A Center, Inc. (Japan) | | | 999,556 | |
| | | | | | | | |
| | | | 1,653,491 | |
| | | | | | | | |
| | |
| | | | Restaurants 1.2% | | | | |
| | 36,174 | | | Domino’s Pizza Enterprises Ltd. (Australia) | | | 1,119,959 | |
| | | | | | | | |
| | |
| | | | Semiconductor Equipment 1.2% | | | | |
| | 35,247 | | | Nova Measuring Instruments Ltd.* (Israel) | | | 1,150,814 | |
| | | | | | | | |
| | |
| | | | Semiconductors 8.1% | | | | |
| | 48,000 | | | ASPEED Technology, Inc. (Taiwan) | | | 1,635,106 | |
| | 22,607 | | | Melexis N.V. (Belgium) | | | 1,179,048 | |
| | 15,304 | | | Monolithic Power Systems, Inc. | | | 2,562,808 | |
| | 75,000 | | | Silergy Corp. (Taiwan) | | | 2,432,677 | |
| | | | | | | | |
| | | | 7,809,639 | |
| | | | | | | | |
| | |
| | | | Soft Drinks 1.0% | | | | |
| | 66,600 | | | Fevertree Drinks plc (United Kingdom) | | | 993,211 | |
| | | | | | | | |
| | |
| | | | Specialty Stores 1.1% | | | | |
| | 15,662 | | | Five Below, Inc.* | | | 1,102,292 | |
| | | | | | | | |
| | |
| | | | Systems Software 1.9% | | | | |
| | 10,054 | | | CyberArk Software Ltd.* (Israel) | | | 860,220 | |
| | 22,017 | | | Rapid7, Inc.* | | | 953,997 | |
| | | | | | | | |
| | | | 1,814,217 | |
| | | | | | | | |
| | |
| | | | Technology Distributors 0.7% | | | | |
| | 111,272 | | | Electrocomponents plc (United Kingdom) | | | 708,432 | |
| | | | | | | | |
| | |
| | | | Thrifts & Mortgage Finance 1.0% | | | | |
| | 59,570 | | | Aavas Financiers Ltd.* (India) | | | 962,805 | |
| | | | | | | | |
| | |
| | | | Trading Companies & Distributors 2.8% | | | | |
| | 83,720 | | | Diploma plc (United Kingdom) | | | 1,676,250 | |
| | 39,500 | | | MonotaRO Co. Ltd. (Japan) | | | 1,043,646 | |
| | | | | | | | |
| | | | 2,719,896 | |
| | | | | | | | |
| | |
| | | | Total Common Stocks
(cost $85,175,665) | | | 95,879,211 | |
| | | | | | | | |
| | | | | | | | |
Principal
Amount | | | | | Value | |
| | | | | | | |
| | | | SHORT-TERM INVESTMENTS 1.2% | |
| | |
| | | | Repurchase Agreement 1.2% | | | | |
| | $1,146,292 | | | Repurchase Agreement dated 3/31/20, 0.00% due 4/1/20 with Fixed Income Clearing Corp. collateralized by $1,130,000 of United States Treasury Notes 1.750% due 7/15/22; value: $1,173,201; repurchase proceeds: $1,146,292 (cost $1,146,292) | | $ | 1,146,292 | |
| | | | | | | | |
| | |
| | | | Total Short-Term Investments
(cost $1,146,292) | | | 1,146,292 | |
| | | | | | | | |
| | |
| | | | Total Investments
(cost $86,321,957) 100.1%§ | | | 97,025,503 | |
| | |
| | | | Liabilities less Other Assets (0.1%) | | | (90,591 | ) |
| | | | | | | | |
| | |
| | | | NET ASSETS 100.0% | | $ | 96,934,912 | |
| | | | | | | | |
| |
| | | | *Non-income producing. §The aggregate amount of foreign securities fair valued pursuant to a systematic valuation model as a percent of net assets was 43.60%. See Notes to Financial Statements. | |
At March 31, 2020, Wasatch Global Opportunities Fund’s investments, excluding short-term investments, were in the following countries:
| | | | | |
| Country | | % |
Argentina | | | | 2.6 | |
Australia | | | | 3.7 | |
Belgium | | | | 1.2 | |
Canada | | | | 0.6 | |
Germany | | | | 2.2 | |
Hong Kong | | | | 2.6 | |
India | | | | 11.5 | |
Israel | | | | 3.3 | |
Japan | | | | 11.3 | |
Mexico | | | | 0.5 | |
South Korea | | | | 0.0 | |
Taiwan | | | | 6.3 | |
Thailand | | | | 1.1 | |
United Kingdom | | | | 6.0 | |
United States | | | | 47.1 | |
| | | | | |
TOTAL | | | | 100.0 | % |
| | | | | |
53
| | |
| WASATCH GLOBAL SELECT FUND(WAGSX / WGGSX) | | MARCH 31, 2020 (UNAUDITED) |
|
|
|
Schedule of Investments
| | | | | | | | |
| Shares | | | | | Value | |
| | | | | | | |
| | | | COMMON STOCKS 98.7% | | | | |
| | |
| | | | Aerospace & Defense 2.5% | | | | |
| | 3,746 | | | HEICO Corp., Class A | | $ | 239,369 | |
| | | | | | | | |
| | |
| | | | Application Software 13.4% | | | | |
| | 1,579 | | | Dassault Systemes SE (France) | | | 230,520 | |
| | 3,261 | | | DocuSign, Inc.* | | | 301,316 | |
| | 1,676 | | | Guidewire Software, Inc.* | | | 132,924 | |
| | 1,452 | | | Tyler Technologies, Inc.* | | | 430,605 | |
| | 4,650 | | | Xero Ltd.* (New Zealand) | | | 193,395 | |
| | | | | | | | |
| | | | 1,288,760 | |
| | | | | | | | |
| | |
| | | | Building Products 4.3% | | | | |
| | 22,048 | | | Assa Abloy AB, Class B (Sweden) | | | 411,607 | |
| | | | | | | | |
| | |
| | | | Consumer Finance 3.2% | | | | |
| | 10,413 | | | Bajaj Finance Ltd. (India) | | | 304,135 | |
| | | | | | | | |
| | |
| | | | Data Processing & Outsourced Services 11.8% | | | | |
| | 6,525 | | | Amadeus IT Group S.A. (Spain) | | | 307,124 | |
| | 3,606 | | | Euronet Worldwide, Inc.* | | | 309,106 | |
| | 2,109 | | | Jack Henry & Associates, Inc. | | | 327,401 | |
| | 1,857 | | | WEX, Inc.* | | | 194,150 | |
| | | | | | | | |
| | | | 1,137,781 | |
| | | | | | | | |
| | |
| | | | Distributors 4.6% | | | | |
| | 2,263 | | | Pool Corp. | | | 445,291 | |
| | | | | | | | |
| | |
| | | | Diversified Support Services 4.4% | | | | |
| | 6,186 | | | Copart, Inc.* | | | 423,865 | |
| | | | | | | | |
| | |
| | | | Drug Retail 4.5% | | | | |
| | 3,300 | | | Tsuruha Holdings, Inc. (Japan) | | | 435,097 | |
| | | | | | | | |
| | |
| | | | Electrical Components & Equipment 2.9% | | | | |
| | 3,855 | | | AMETEK, Inc. | | | 277,637 | |
| | | | | | | | |
| | |
| | | | Electronic Components 3.5% | | | | |
| | 4,554 | | | Amphenol Corp., Class A | | | 331,896 | |
| | | | | | | | |
| | |
| | | | Electronic Equipment & Instruments 2.4% | | | | |
| | 5,458 | | | Cognex Corp. | | | 230,437 | |
| | | | | | | | |
| | |
| | | | Financial Exchanges & Data 3.3% | | | | |
| | 954 | | | MarketAxess Holdings, Inc. | | | 317,272 | |
| | | | | | | | |
| | |
| | | | Health Care Equipment 6.9% | | | | |
| | 3,049 | | | Cochlear Ltd. (Australia) | | | 347,498 | |
| | 1,790 | | | Sonova Holding AG (Switzerland) | | | 319,183 | |
| | | | | | | | |
| | | | 666,681 | |
| | | | | | | | |
| | |
| | | | Health Care Supplies 7.8% | | | | |
| | 11,600 | | | Asahi Intecc Co. Ltd. (Japan) | | | 286,892 | |
| | 3,224 | | | Coloplast A/S, Class B (Denmark) | | | 467,565 | |
| | | | | | | | |
| | | | 754,457 | |
| | | | | | | | |
| | |
| | | | Health Care Technology 3.1% | | | | |
| | 1,919 | | | Veeva Systems, Inc., Class A* | | | 300,074 | |
| | | | | | | | |
| | |
| | | | Industrial Conglomerates 3.7% | | | | |
| | 1,147 | | | Roper Technologies, Inc. | | | 357,646 | |
| | | | | | | | |
| | |
| | | | Industrial Machinery 2.1% | | | | |
| | 9,400 | | | MISUMI Group, Inc. (Japan) | | | 203,331 | |
| | | | | | | | |
| | |
| | | | Life Sciences Tools & Services 4.0% | | | | |
| | 2,849 | | | ICON plc* (Ireland) | | | 387,464 | |
| | | | | | | | |
| | |
| | | | Packaged Foods & Meats 3.0% | | | | |
| | 8,290 | | | Britannia Industries Ltd. (India) | | | 293,004 | |
| | | | | | | | |
| | | | | | | | |
| Shares | | | | | Value | |
| | | | | | | |
| | |
| | | | Specialty Chemicals 2.6% | | | | |
| | 3,396 | | | Chr. Hansen Holding A/S (Denmark) | | $ | 250,600 | |
| | | | | | | | |
| | |
| | | | Trucking 4.7% | | | | |
| | 3,423 | | | Old Dominion Freight Line, Inc. | | | 449,303 | |
| | | | | | | | |
| | |
| | | | Total Common Stocks
(cost $10,877,746) | | | 9,505,707 | |
| | | | | | | | |
| | |
| | | | Total Investments
(cost $10,877,746) 98.7%§ | | | 9,505,707 | |
| | |
| | | | Other Assets less Liabilities 1.3% | | | 124,488 | |
| | | | | | | | |
| | |
| | | | NET ASSETS 100.0% | | $ | 9,630,195 | |
| | | | | | | | |
| |
| | | | *Non-income producing. §The aggregate amount of foreign securities fair valued pursuant to a systematic valuation model as a percent of net assets was 42.05%. See Notes to Financial Statements. | |
At March 31, 2020, Wasatch Global Select Fund’s investments, were in the following countries:
| | | | | |
| Country | | % |
Australia | | | | 3.7 | |
Denmark | | | | 7.6 | |
France | | | | 2.4 | |
India | | | | 6.3 | |
Ireland | | | | 4.1 | |
Japan | | | | 9.7 | |
New Zealand | | | | 2.0 | |
Spain | | | | 3.2 | |
Sweden | | | | 4.3 | |
Switzerland | | | | 3.4 | |
United States | | | | 53.3 | |
| | | | | |
TOTAL | | | | 100.0 | % |
| | | | | |
54
| | |
| WASATCH GLOBAL VALUE FUND(FMIEX / WILCX) | | MARCH 31, 2020 (UNAUDITED) |
|
|
|
Schedule of Investments
| | | | | | | | |
| Shares | | | | | Value | |
| | | | | | | |
| | | | COMMON STOCKS 98.0% | | | | |
| | |
| | | | Airlines 0.9% | | | | |
| | 50,000 | | | Japan Airlines Co. Ltd. (Japan) | | $ | 918,872 | |
| | | | | | | | |
| | |
| | | | Automobile Manufacturers 1.9% | | | | |
| | 91,000 | | | General Motors Co. | | | 1,890,980 | |
| | | | | | | | |
| | |
| | | | Construction & Engineering 0.6% | | | | |
| | 1,400,000 | | | Sinopec Engineering Group Co. Ltd., Class H (China) | | | 582,741 | |
| | | | | | | | |
| | |
| | | | Diversified Banks 8.6% | | | | |
| | 68,957 | | | Citigroup, Inc. | | | 2,904,469 | |
| | 335,000 | | | ING Groep N.V. ADR (Netherlands) | | | 1,725,250 | |
| | 18,500 | | | JPMorgan Chase & Co. | | | 1,665,555 | |
| | 173,000 | | | United Overseas Bank Ltd. (Singapore) | | | 2,373,567 | |
| | | | | | | | |
| | | | 8,668,841 | |
| | | | | | | | |
| | |
| | | | Diversified Metals & Mining 1.8% | | | | |
| | 98,000 | | | BHP Group Ltd. (Australia) | | | 1,777,848 | |
| | | | | | | | |
| | |
| | | | Electric Utilities 8.6% | | | | |
| | 51,500 | | | Duke Energy Corp. | | | 4,165,320 | |
| | 123,500 | | | Exelon Corp. | | | 4,546,035 | |
| | | | | | | | |
| | | | 8,711,355 | |
| | | | | | | | |
| | |
| | | | Electrical Components & Equipment 3.5% | | | | |
| | 45,000 | | | Eaton Corp. plc | | | 3,496,050 | |
| | | | | | | | |
| | |
| | | | Electronic Manufacturing Services 1.6% | | | | |
| | 700,000 | | | Hon Hai Precision Industry Co. Ltd. (Taiwan) | | | 1,611,586 | |
| | | | | | | | |
| | |
| | | | Food Retail 6.1% | | | | |
| | 120,000 | | | Koninklijke Ahold Delhaize N.V. (Netherlands) | | | 2,795,585 | |
| | 100,000 | | | Seven & i Holdings Co. Ltd. (Japan) | | | 3,302,488 | |
| | | | | | | | |
| | | | 6,098,073 | |
| | | | | | | | |
| | |
| | | | Hypermarkets & Super Centers 2.6% | | | | |
| | 23,000 | | | Walmart, Inc. | | | 2,613,260 | |
| | | | | | | | |
| | |
| | | | Industrial Conglomerates 1.7% | | | | |
| | 1,700,000 | | | NWS Holdings Ltd. (Hong Kong) | | | 1,732,447 | |
| | | | | | | | |
| | |
| | | | Integrated Oil & Gas 7.0% | | | | |
| | 900,000 | | | BP plc (United Kingdom) | | | 3,690,850 | |
| | 210,000 | | | Suncor Energy, Inc. (Canada) | | | 3,351,524 | |
| | | | | | | | |
| | | | 7,042,374 | |
| | | | | | | | |
| | |
| | | | Integrated Telecommunication Services 2.9% | | | | |
| | 100,000 | | | AT&T, Inc. | | | 2,915,000 | |
| | | | | | | | |
| | |
| | | | IT Consulting & Other Services 5.3% | | | | |
| | 19,000 | | | International Business Machines Corp. | | | 2,107,670 | |
| | 43,000 | | | Science Applications International Corp. | | | 3,209,090 | |
| | | | | | | | |
| | | | 5,316,760 | |
| | | | | | | | |
| | |
| | | | Managed Health Care 3.1% | | | | |
| | 52,000 | | | Centene Corp.* | | | 3,089,320 | |
| | | | | | | | |
| | |
| | | | Multi-Line Insurance 2.7% | | | | |
| | 160,000 | | | AXA S.A. (France) | | | 2,709,110 | |
| | | | | | | | |
| | |
| | | | Pharmaceuticals 11.6% | | | | |
| | 38,000 | | | Johnson & Johnson | | | 4,982,940 | |
| | 36,000 | | | Novartis AG (Switzerland) | | | 2,969,956 | |
| | 115,000 | | | Pfizer, Inc. | | | 3,753,600 | |
| | | | | | | | |
| | | | | | | 11,706,496 | |
| | | | | | | | |
| | | | | | | | |
| Shares | | | | | Value | |
| | | | | | | |
| | |
| | | | Property & Casualty Insurance 3.1% | | | | |
| | 82,000 | | | Axis Capital Holdings Ltd. | | $ | 3,169,300 | |
| | | | | | | | |
| | |
| | | | Railroads 1.0% | | | | |
| | 7,500 | | | Union Pacific Corp. | | | 1,057,800 | |
| | | | | | | | |
| | |
| | | | Regional Banks 2.0% | | | | |
| | 122,000 | | | Bank OZK | | | 2,037,400 | |
| | | | | | | | |
| | |
| | | | Reinsurance 4.1% | | | | |
| | 20,500 | | | Muenchener Rueckversicherungs-Gesellschaft AG in Muenchen (Germany) | | | 4,121,939 | |
| | | | | | | | |
| | |
| | | | Semiconductors 0.9% | | | | |
| | 9,500 | | | Texas Instruments, Inc. | | | 949,335 | |
| | | | | | | | |
| | |
| | | | Specialized REITs 1.1% | | | | |
| | 47,000 | | | EPR Properties | | | 1,138,340 | |
| | | | | | | | |
| | |
| | | | Steel 2.2% | | | | |
| | 61,000 | | | Nucor Corp. | | | 2,197,220 | |
| | | | | | | | |
| | |
| | | | Technology Hardware, Storage & Peripherals 4.1% | | | | |
| | 105,000 | | | Samsung Electronics Co. Ltd. (South Korea) | | | 4,082,556 | |
| | | | | | | | |
| | |
| | | | Tobacco 3.0% | | | | |
| | 50,000 | | | KT&G Corp. (South Korea) | | | 3,061,362 | |
| | | | | | | | |
| | |
| | | | Wireless Telecommunication Services 6.0% | | | | |
| | 800,000 | | | China Mobile Ltd. (China) | | | 5,995,424 | |
| | | | | | | | |
| | |
| | | | Total Common Stocks
(cost $115,034,953) | | | 98,691,789 | |
| | | | | | | | |
| | |
Principal
Amount | | | | | Value | |
| | | | | | | |
| | | | SHORT-TERM INVESTMENTS 1.7% | | | | |
| | |
| | | | Repurchase Agreement 1.7% | | | | |
| | $1,719,483 | | | Repurchase Agreement dated 3/31/20,
0.00% due 4/1/20 with Fixed Income
Clearing Corp. collateralized by $1,690,000
of United States Treasury Notes 1.750%
due 7/15/22; value: $1,754,610; repurchase
proceeds: $1,719,483 (cost $1,719,483) | | $ | 1,719,483 | |
| | | | | | | | |
| | |
| | | | Total Short-Term Investments
(cost $1,719,483) | | | 1,719,483 | |
| | | | | | | | |
| | |
| | | | Total Investments
(cost $116,754,436) 99.7%§ | | | 100,411,272 | |
| | |
| | | | Other Assets less Liabilities 0.3% | | | 342,125 | |
| | | | | | | | |
| | |
| | | | NET ASSETS 100.0% | | $ | 100,753,397 | |
| | | | | | | | |
| |
| | | | *Non-income producing. §The aggregate amount of foreign securities fair valued pursuant to a systematic valuation model as a percent of net assets was 41.41%. ADR American Depositary Receipt. REIT Real Estate Investment Trust. See Notes to Financial Statements. | |
55
| | |
| WASATCH GLOBAL VALUE FUND(FMIEX / WILCX) | | MARCH 31, 2020 (UNAUDITED) |
|
|
|
Schedule of Investments(continued)
At March 31, 2020, Wasatch Global Value Fund’s investments, excluding short-term investments, were in the following countries:
| | | | | |
| Country | | % |
Australia | | | | 1.8 | |
Canada | | | | 3.4 | |
China | | | | 6.7 | |
France | | | | 2.7 | |
Germany | | | | 4.2 | |
Hong Kong | | | | 1.8 | |
Japan | | | | 4.3 | |
Netherlands | | | | 4.6 | |
Singapore | | | | 2.4 | |
South Korea | | | | 7.2 | |
Switzerland | | | | 3.0 | |
Taiwan | | | | 1.6 | |
United Kingdom | | | | 3.7 | |
United States | | | | 52.6 | |
| | | | | |
TOTAL | | | | 100.0 | % |
| | | | | |
56
| | |
| WASATCH INTERNATIONAL GROWTH FUND(WAIGX / WIIGX) | | MARCH 31, 2020 (UNAUDITED) |
|
|
|
Schedule of Investments
| | | | | | | | |
| Shares | | | | | Value | |
| | | | | | | |
| | | | COMMON STOCKS 98.4% | | | | |
| | |
| | | | Airport Services 1.0% | | | | |
| | 2,736,960 | | | Grupo Aeroportuario del Centro Norte S.A.B. de C.V. (Mexico) | | $ | 9,262,226 | |
| | | | | | | | |
| | |
| | | | Application Software 11.0% | | | | |
| | 197,489 | | | Descartes Systems Group, Inc. (The)* (Canada) | | | 6,793,464 | |
| | 92,393 | | | Globant S.A.* (Argentina) | | | 8,119,497 | |
| | 1,381,279 | | | Infomart Corp. (Japan) | | | 9,089,750 | |
| | 169,981 | | | Kinaxis, Inc.* (Canada) | | | 13,152,300 | |
| | 336,100 | | | Lightspeed POS, Inc.* (Canada) | | | 4,547,249 | |
| | 512,101 | | | Miroku Jyoho Service Co. Ltd. (Japan) | | | 11,268,137 | |
| | 169,902 | | | Nemetschek SE (Germany) | | | 8,282,329 | |
| | 1,076,950 | | | Systena Corp. (Japan) | | | 14,553,584 | |
| | 2,822,577 | | | Technology One Ltd. (Australia) | | | 13,634,022 | |
| | 917,330 | | | WiseTech Global Ltd. (Australia) | | | 9,536,532 | |
| | | | | | | | |
| | | | 98,976,864 | |
| | | | | | | | |
| | |
| | | | Asset Management & Custody Banks 2.4% | | | | |
| | 880,916 | | | AJ Bell plc (United Kingdom) | | | 3,349,764 | |
| | 2,372,003 | | | Ashmore Group plc (United Kingdom) | | | 10,444,552 | |
| | 2,002,189 | | | Netwealth Group Ltd. (Australia) | | | 8,220,107 | |
| | | | | | | | |
| | | | 22,014,423 | |
| | | | | | | | |
| | |
| | | | Biotechnology 1.3% | | | | |
| | 820,873 | | | Abcam plc (United Kingdom) | | | 11,579,341 | |
| | 489 | | | Medytox, Inc. (South Korea) | | | 77,795 | |
| | | | | | | | |
| | | | 11,657,136 | |
| | | | | | | | |
| | |
| | | | Brewers 1.0% | | | | |
| | 124,521 | | | Royal Unibrew A/S (Denmark) | | | 8,950,849 | |
| | | | | | | | |
| | |
| | | | Commodity Chemicals 0.9% | | | | |
| | 1,250,476 | | | Berger Paints India Ltd. (India) | | | 8,169,809 | |
| | | | | | | | |
| | |
| | | | Construction Machinery & Heavy Trucks 0.9% | | | | |
| | 623,944 | | | Takeuchi Manufacturing Co. Ltd. (Japan) | | | 7,693,357 | |
| | | | | | | | |
| | |
| | | | Data Processing & Outsourced Services 1.3% | | | | |
| | 166,500 | | | GMO Payment Gateway, Inc. (Japan) | | | 11,669,215 | |
| | | | | | | | |
| | |
| | | | Department Stores 0.2% | | | | |
| | 135,574 | | | Poya International Co. Ltd. (Taiwan) | | | 1,919,759 | |
| | | | | | | | |
| | |
| | | | Diversified Real Estate Activities 2.1% | | | | |
| | 816,647 | | | Patrizia AG (Germany) | | | 18,684,934 | |
| | | | | | | | |
| | |
| | | | Diversified Support Services 2.9% | | | | |
| | 943,961 | | | HomeServe plc (United Kingdom) | | | 12,295,638 | |
| | 1,769,052 | | | Prestige International, Inc. (Japan) | | | 13,500,676 | |
| | | | | | | | |
| | | | 25,796,314 | |
| | | | | | | | |
| | |
| | | | Drug Retail 7.5% | | | | |
| | 168,228 | | | Ain Holdings, Inc. (Japan) | | | 9,888,463 | |
| | 955,702 | | | Clicks Group Ltd. (South Africa) | | | 13,775,003 | |
| | 142,800 | | | Kusuri no Aoki Holdings Co. Ltd. (Japan) | | | 11,892,734 | |
| | 302,700 | | | Raia Drogasil S.A. (Brazil) | | | 5,933,295 | |
| | 289,100 | | | Sugi Holdings Co. Ltd. (Japan) | | | 15,481,135 | |
| | 79,800 | | | Tsuruha Holdings, Inc. (Japan) | | | 10,521,434 | |
| | | | | | | | |
| | | | 67,492,064 | |
| | | | | | | | |
| | |
| | | | Electrical Components & Equipment 1.6% | | | | |
| | 685,740 | | | Voltronic Power Technology Corp. (Taiwan) | | | 14,250,925 | |
| | | | | | | | |
| | |
| | | | Electronic Equipment & Instruments 2.1% | | | | |
| | 823,012 | | | Halma plc (United Kingdom) | | | 19,329,309 | |
| | | | | | | | |
| | | | | | | | |
| Shares | | | | | Value | |
| | | | | | | |
| | |
| | | | Financial Exchanges & Data 1.0% | | | | |
| | 1,730,549 | | | IntegraFin Holdings plc (United Kingdom) | | $ | 9,277,992 | |
| | | | | | | | |
| | |
| | | | General Merchandise Stores 1.3% | | | | |
| | 3,510,620 | | | B&M European Value Retail S.A. (United Kingdom) | | | 11,922,825 | |
| | | | | | | | |
| | |
| | | | Health Care Equipment 5.7% | | | | |
| | 209,931 | | | CellaVision AB (Sweden) | | | 5,156,443 | |
| | 212,049 | | | Cochlear Ltd. (Australia) | | | 24,167,501 | |
| | 163,265 | | | DiaSorin S.p.A. (Italy) | | | 21,520,621 | |
| | | | | | | | |
| | | | 50,844,565 | |
| | | | | | | | |
| | |
| | | | Health Care Supplies 2.7% | | | | |
| | 613,200 | | | Asahi Intecc Co. Ltd. (Japan) | | | 15,165,691 | |
| | 206,714 | | | Menicon Co. Ltd. (Japan) | | | 9,223,676 | |
| | | | | | | | |
| | | | 24,389,367 | |
| | | | | | | | |
| | |
| | | | Health Care Technology 0.2% | | | | |
| | 290,744 | | | RaySearch Laboratories AB* (Sweden) | | | 1,667,531 | |
| | | | | | | | |
| | |
| | | | Highways & Railtracks 0.2% | | | | |
| | 2,417,343 | | | Yuexiu Transport Infrastructure Ltd. (China) | | | 1,462,947 | |
| | | | | | | | |
| | |
| | | | Home Improvement Retail 0.0% | | | | |
| | 3,114,325 | | | PT Ace Hardware Indonesia Tbk (Indonesia) | | | 247,774 | |
| | | | | | | | |
| | |
| | | | Household Appliances 1.4% | | | | |
| | 1,198,656 | | | Breville Group Ltd. (Australia) | | | 12,512,330 | |
| | | | | | | | |
| | |
| | | | Human Resource & Employment Services 3.9% | | | | |
| | 141,446 | | | 51job, Inc. ADR* (China) | | | 8,683,370 | |
| | 460,411 | | | Benefit One, Inc. (Japan) | | | 5,968,207 | |
| | 498,580 | | | en-japan, Inc. (Japan) | | | 9,263,149 | |
| | 576,592 | | | SMS Co. Ltd. (Japan) | | | 11,120,022 | |
| | | | | | | | |
| | | | 35,034,748 | |
| | | | | | | | |
| | |
| | | | Industrial Machinery 2.4% | | | | |
| | 570,415 | | | MISUMI Group, Inc. (Japan) | | | 12,338,610 | |
| | 3,518,768 | | | Rotork plc (United Kingdom) | | | 9,309,948 | |
| | | | | | | | |
| | | | 21,648,558 | |
| | | | | | | | |
| | |
| | | | Interactive Media & Services 3.4% | | | | |
| | 12,294 | | | Atrae, Inc.* (Japan) | | | 291,239 | |
| | 275,147 | | | Info Edge India Ltd. (India) | | | 7,496,416 | |
| | 58,847 | | | New Work SE (Germany) | | | 12,383,485 | |
| | 1,753,329 | | | Rightmove plc (United Kingdom) | | | 10,574,258 | |
| | | | | | | | |
| | | | 30,745,398 | |
| | | | | | | | |
| | |
| | | | Internet & Direct Marketing Retail 2.3% | | | | |
| | 4,528,155 | | | Trainline plc* (United Kingdom) | | | 18,799,700 | |
| | 1,649,997 | | | Webjet Ltd.*** (Australia) | | | 1,989,141 | |
| | | | | | | | |
| | | | 20,788,841 | |
| | | | | | | | |
| | |
| | | | Investment Banking & Brokerage 1.1% | | | | |
| | 1,226,568 | | | Avanza Bank Holding AB (Sweden) | | | 10,120,410 | |
| | | | | | | | |
| | |
| | | | IT Consulting & Other Services 3.9% | | | | |
| | 205,490 | | | Endava plc ADR* (United Kingdom) | | | 7,225,029 | |
| | 413,343 | | | Larsen & Toubro Infotech Ltd. (India) | | | 7,824,152 | |
| | 207,247 | | | Reply S.p.A. (Italy) | | | 12,600,244 | |
| | 572,579 | | | Softcat plc (United Kingdom) | | | 7,291,021 | |
| | | | | | | | |
| | | | 34,940,446 | |
| | | | | | | | |
| | |
| | | | Life Sciences Tools & Services 1.5% | | | | |
| | 46,675 | | | Tecan Group AG (Switzerland) | | | 13,979,374 | |
| | | | | | | | |
| | |
| | | | Movies & Entertainment 1.5% | | | | |
| | 287,162 | | | CTS Eventim AG & Co KGaA (Germany) | | | 13,139,928 | |
| | | | | | | | |
57
| | |
| WASATCH INTERNATIONAL GROWTH FUND(WAIGX / WIIGX) | | MARCH 31, 2020 (UNAUDITED) |
|
|
|
Schedule of Investments(continued)
| | | | | | | | |
Shares | | | | | Value | |
| | | | | | | |
| | |
| | | | Other Diversified Financial Services 1.5% | | | | |
| | 46,621 | | | Hypoport AG* (Germany) | | $ | 13,349,968 | |
| | | | | | | | |
| | |
| | | | Packaged Foods & Meats 3.2% | | | | |
| | 302,514 | | | Morinaga & Co. Ltd. (Japan) | | | 12,383,888 | |
| | 5,589,449 | | | Vitasoy International Holdings Ltd. (Hong Kong) | | | 16,820,805 | |
| | | | | | | | |
| | | | 29,204,693 | |
| | | | | | | | |
| | |
| | | | Pharmaceuticals 0.7% | | | | |
| | 69,400 | | | JCR Pharmaceuticals Co. Ltd. (Japan) | | | 6,015,290 | |
| | | | | | | | |
| | |
| | | | Property & Casualty Insurance 1.4% | | | | |
| | 842,126 | | | ICICI Lombard General Insurance Co. Ltd. (India) | | | 12,234,667 | |
| | | | | | | | |
| | |
| | | | Regional Banks 2.5% | | | | |
| | 1,488,224 | | | AU Small Finance Bank Ltd. (India) | | | 10,171,205 | |
| | 872,999 | | | Canadian Western Bank (Canada) | | | 12,015,910 | |
| | | | | | | | |
| | | | 22,187,115 | |
| | | | | | | | |
| | |
| | | | Research & Consulting Services 2.4% | | | | |
| | 480,175 | | | Funai Soken Holdings, Inc. (Japan) | | | 9,488,520 | |
| | 432,728 | | | Nihon M&A Center, Inc. (Japan) | | | 11,785,716 | |
| | | | | | | | |
| | | | 21,274,236 | |
| | | | | | | | |
| | |
| | | | Restaurants 1.3% | | | | |
| | 387,029 | | | Domino’s Pizza Enterprises Ltd. (Australia) | | | 11,982,543 | |
| | | | | | | | |
| | |
| | | | Semiconductor Equipment 1.0% | | | | |
| | 700,072 | | | Japan Material Co. Ltd. (Japan) | | | 9,111,094 | |
| | | | | | | | |
| | |
| | | | Semiconductors 3.9% | | | | |
| | 366,611 | | | Elmos Semiconductor AG (Germany) | | | 7,553,458 | |
| | 52,140 | | | LEENO Industrial, Inc. (South Korea) | | | 3,180,998 | |
| | 165,580 | | | Melexis N.V. (Belgium) | | | 8,635,680 | |
| | 472,165 | | | Silergy Corp. (Taiwan) | | | 15,314,997 | |
| | | | | | | | |
| | | | 34,685,133 | |
| | | | | | | | |
| | |
| | | | Soft Drinks 1.3% | | | | |
| | 770,529 | | | Fevertree Drinks plc (United Kingdom) | | | 11,490,957 | |
| | | | | | | | |
| | |
| | | | Specialty Chemicals 1.5% | | | | |
| | 181,098 | | | Chr. Hansen Holding A/S (Denmark) | | | 13,363,715 | |
| | | | | | | | |
| | |
| | | | Systems Software 0.8% | | | | |
| | 105,298 | | | Douzone Bizon Co. Ltd. (South Korea) | | | 6,948,800 | |
| | | | | | | | |
| | |
| | | | Technology Distributors 1.3% | | | | |
| | 1,817,431 | | | Electrocomponents plc (United Kingdom) | | | 11,570,987 | |
| | | | | | | | |
| | |
| | | | Textiles 1.2% | | | | |
| | 351,067 | | | Brunello Cucinelli S.p.A. (Italy) | | | 10,630,501 | |
| | | | | | | | |
| | |
| | | | Trading Companies & Distributors 5.7% | | | | |
| | 733,665 | | | Diploma plc (United Kingdom) | | | 14,689,512 | |
| | 2,048,162 | | | Howden Joinery Group plc (United Kingdom) | | | 12,884,342 | |
| | 149,373 | | | IMCD N.V. (Netherlands) | | | 10,718,636 | |
| | 482,724 | | | MonotaRO Co. Ltd. (Japan) | | | 12,754,254 | |
| | | | | | | | |
| | | | 51,046,744 | |
| | | | | | | | |
| | |
| | | | Total Common Stocks
(cost $749,638,393) | | | 883,686,661 | |
| | | | | | | | |
| | | | | | | | |
Principal
Amount | | | | | Value | |
| | | | | | | |
| | | | SHORT-TERM INVESTMENTS 1.7% | | | | |
| | |
| | | | Repurchase Agreement 1.7% | | | | |
| | $15,256,660 | | | Repurchase Agreement dated 3/31/20,
0.00% due 4/1/20 with Fixed Income
Clearing Corp. collateralized by $14,990,000 of United States Treasury Notes 1.750% due 7/15/22; value: $15,563,083; repurchase proceeds: $15,256,660 (cost $15,256,660) | | $ | 15,256,660 | |
| | | | | | | | |
| | |
| | | | Total Short-Term Investments
(cost $15,256,660) | | | 15,256,660 | |
| | | | | | | | |
| | |
| | | | Total Investments
(cost $764,895,053) 100.1%§ | | | 898,943,321 | |
| | |
| | | | Liabilities less Other Assets (0.1%) | | | (573,739 | ) |
| | | | | | | | |
| | |
| | | | NET ASSETS 100.0% | | $ | 898,369,582 | |
| | | | | | | | |
| |
| | | | *Non-income producing. ***Security was fair valued under procedures adopted by the Board of Trustees (see Note 12) §The aggregate amount of foreign securities fair valued pursuant to a systematic valuation model as a percent of net assets was 89.94%. ADR American Depositary Receipt. See Notes to Financial Statements. | |
At March 31, 2020, Wasatch International Growth Fund’s investments, excluding short-term investments, were in the following countries:
| | | | | |
| Country | | % |
Argentina | | | | 0.9 | |
Australia | | | | 9.3 | |
Belgium | | | | 1.0 | |
Brazil | | | | 0.7 | |
Canada | | | | 4.1 | |
China | | | | 1.1 | |
Denmark | | | | 2.5 | |
Germany | | | | 8.3 | |
Hong Kong | | | | 1.9 | |
India | | | | 5.2 | |
Indonesia | | | | 0.0 | |
Italy | | | | 5.1 | |
Japan | | | | 27.2 | |
Mexico | | | | 1.0 | |
Netherlands | | | | 1.2 | |
South Africa | | | | 1.6 | |
South Korea | | | | 1.2 | |
Sweden | | | | 1.9 | |
Switzerland | | | | 1.6 | |
Taiwan | | | | 3.6 | |
United Kingdom | | | | 20.6 | |
| | | | | |
TOTAL | | | | 100.0 | % |
| | | | | |
58
| | |
| WASATCH INTERNATIONAL OPPORTUNITIES FUND(WAIOX / WIIOX) | | MARCH 31, 2020 (UNAUDITED) |
|
|
|
Schedule of Investments
| | | | | | | | |
| Shares | | | | | Value | |
| | | | | | | |
| | | | COMMON STOCKS 97.1% | | | | |
| | |
| | | | Advertising 3.0% | | | | |
| | 240,593 | | �� | 4imprint Group plc (United Kingdom) | | $ | 5,662,122 | |
| | 969,422 | | | YouGov plc (United Kingdom) | | | 7,465,540 | |
| | | | | | | | |
| | | | 13,127,662 | |
| | | | | | | | |
| | |
| | | | Aerospace & Defense 2.1% | | | | |
| | 334,930 | | | Avon Rubber plc (United Kingdom) | | | 9,514,580 | |
| | | | | | | | |
| | |
| | | | Alternative Carriers 1.4% | | | | |
| | 703,000 | | | Chief Telecom, Inc. (Taiwan) | | | 6,263,617 | |
| | | | | | | | |
| | |
| | | | Application Software 16.4% | | | | |
| | 34,621 | | | Atoss Software AG (Germany) | | | 4,903,471 | |
| | 21,759 | | | Elmo Software Ltd.* (Australia) | | | 58,975 | |
| | 99,744 | | | Esker S.A. (France) | | | 10,165,857 | |
| | 659,370 | | | Fortnox AB (Sweden) | | | 10,931,123 | |
| | 125,400 | | | freee KK* (Japan) | | | 4,030,941 | |
| | 791,092 | | | GB Group plc (United Kingdom) | | | 5,646,502 | |
| | 11,617,636 | | | Humanica Public Co. Ltd. (Thailand) | | | 2,159,445 | |
| | 1,036,400 | | | Infomart Corp. (Japan) | | | 6,820,212 | |
| | 59,290 | | | Mensch und Maschine Software SE (Germany) | | | 2,508,029 | |
| | 356,306 | | | Miroku Jyoho Service Co. Ltd. (Japan) | | | 7,840,064 | |
| | 610,572 | | | Rakus Co. Ltd. (Japan) | | | 9,046,471 | |
| | 667,500 | | | Systena Corp. (Japan) | | | 9,020,398 | |
| | | | | | | | |
| | | | 73,131,488 | |
| | | | | | | | |
| | |
| | | | Auto Parts & Equipment 0.4% | | | | |
| | 2,379,262 | | | Minda Corp. Ltd. (India) | | | 1,813,627 | |
| | | | | | | | |
| | |
| | | | Brewers 1.5% | | | | |
| | 607,145 | | | Carlsberg Brewery Malaysia Berhad, Class B (Malaysia) | | | 3,488,463 | |
| | 42,497 | | | Royal Unibrew A/S (Denmark) | | | 3,054,780 | |
| | | | | | | | |
| | | | 6,543,243 | |
| | | | | | | | |
| | |
| | | | Building Products 0.2% | | | | |
| | 194,678 | | | Kajaria Ceramics Ltd. (India) | | | 959,927 | |
| | | | | | | | |
| | |
| | | | Commercial Printing 0.6% | | | | |
| | 127,200 | | | Raksul, Inc.* (Japan) | | | 2,745,597 | |
| | | | | | | | |
| | |
| | | | Commodity Chemicals 3.0% | | | | |
| | 867,649 | | | Berger Paints India Ltd. (India) | | | 5,668,663 | |
| | 666,740 | | | Gulf Oil Lubricants India Ltd. (India) | | | 4,609,376 | |
| | 255,016 | | | Supreme Industries Ltd. (India) | | | 2,903,524 | |
| | | | | | | | |
| | | | 13,181,563 | |
| | | | | | | | |
| | |
| | | | Consumer Finance 1.7% | | | | |
| | 236,148 | | | Gruppo MutuiOnline S.p.A. (Italy) | | | 3,964,020 | |
| | 227,554 | | | Spandana Sphoorty Financial Ltd.* (India) | | | 1,813,477 | |
| | 2,204,062 | | | Unifin Financiera S.A.B de C.V. (Mexico) | | | 1,752,286 | |
| | | | | | | | |
| | | | 7,529,783 | |
| | | | | | | | |
| | |
| | | | Department Stores 1.3% | | | | |
| | 396,908 | | | Poya International Co. Ltd. (Taiwan) | | | 5,620,307 | |
| | | | | | | | |
| | |
| | | | Diversified Support Services 5.3% | | | | |
| | 75,422 | | | Clipper Logistics plc (United Kingdom) | | | 140,708 | |
| | 328,900 | | | Japan Elevator Service Holdings Co. Ltd. (Japan) | | | 7,522,328 | |
| | 4,327,885 | | | Johnson Service Group plc (United Kingdom) | | | 5,504,038 | |
| | 1,354,362 | | | Prestige International, Inc. (Japan) | | | 10,335,933 | |
| | | | | | | | |
| | | | 23,503,007 | |
| | | | | | | | |
| | |
| | | | Drug Retail 2.0% | | | | |
| | 50,000 | | | Kusuri no Aoki Holdings Co. Ltd. (Japan) | | | 4,164,123 | |
| | 207,597 | | | Yakuodo Holdings Co. Ltd. (Japan) | | | 4,638,653 | |
| | | | | | | | |
| | | | 8,802,776 | |
| | | | | | | | |
| | | | | | | | |
| Shares | | | | | Value | |
| | | | | | | |
| | |
| | | | Education Services 0.4% | | | | |
| | 295,202 | | | Dadi Early-Childhood Education Group Ltd. (Taiwan) | | $ | 1,575,410 | |
| | | | | | | | |
| | |
| | | | Electrical Components & Equipment 1.9% | | | | |
| | 294,780 | | | Amara Raja Batteries Ltd. (India) | | | 1,851,587 | |
| | 326,158 | | | Voltronic Power Technology Corp. (Taiwan) | | | 6,778,157 | |
| | | | | | | | |
| | | | 8,629,744 | |
| | | | | | | | |
| | |
| | | | Electronic Components 0.6% | | | | |
| | 1,233,950 | | | Strix Group plc (United Kingdom) | | | 2,507,635 | |
| | | | | | | | |
| | |
| | | | Electronic Equipment & Instruments 2.1% | | | | |
| | 189,470 | | | Carel Industries S.p.A. (Italy) | | | 2,429,106 | |
| | 129,328 | | | Isra Vision AG (Germany) | | | 7,071,212 | |
| | | | | | | | |
| | | | 9,500,318 | |
| | | | | | | | |
| | |
| | | | Food Retail 3.9% | | | | |
| | 3,819,129 | | | Philippine Seven Corp. (Philippines) | | | 9,747,580 | |
| | 70,499 | | | Rami Levy Chain Stores Hashikma Marketing 2006 Ltd. (Israel) | | | 3,890,928 | |
| | 4,502,100 | | | Sheng Siong Group Ltd. (Singapore) | | | 3,761,657 | |
| | | | | | | | |
| | | | 17,400,165 | |
| | | | | | | | |
| | |
| | | | Health Care Equipment 6.4% | | | | |
| | 7,974,000 | | | AK Medical Holdings Ltd. (China) | | | 17,250,167 | |
| | 166,826 | | | CellaVision AB (Sweden) | | | 4,097,674 | |
| | 143,892 | | | Inmode Ltd.* (Israel) | | | 3,093,678 | |
| | 91,952 | | | Medistim ASA (Norway) | | | 1,421,456 | |
| | 239,982 | | | Xvivo Perfusion AB* (Sweden) | | | 2,405,698 | |
| | | | | | | | |
| | | | 28,268,673 | |
| | | | | | | | |
| | |
| | | | Health Care Facilities 1.6% | | | | |
| | 24,257,437 | | | Cleopatra Hospital* (Egypt) | | | 7,089,213 | |
| | | | | | | | |
| | |
| | | | Health Care Services 3.3% | | | | |
| | 255,177 | | | Dr. Lal PathLabs Ltd. (India) | | | 4,697,696 | |
| | 140,605 | | | Elan Corp. (Japan) | | | 1,872,568 | |
| | 498,039 | | | Metropolis Healthcare Ltd.* (India) | | | 8,277,216 | |
| | | | | | | | |
| | | | 14,847,480 | |
| | | | | | | | |
| | |
| | | | Health Care Supplies 1.7% | | | | |
| | 716,358 | | | Bioteque Corp. (Taiwan) | | | 2,217,584 | |
| | 1,500,696 | | | Nanosonics Ltd.* (Australia) | | | 5,149,030 | |
| | | | | | | | |
| | | | 7,366,614 | |
| | | | | | | | |
| | |
| | | | Health Care Technology 4.0% | | | | |
| | 275,380 | | | Craneware plc (United Kingdom) | | | 6,550,249 | |
| | 165,800 | | | Medley, Inc.* (Japan) | | | 3,044,174 | |
| | 99,198 | | | Nexus AG (Germany) | | | 3,036,026 | |
| | 354,877 | | | Pro Medicus Ltd. (Australia) | | | 4,194,425 | |
| | 204,249 | | | RaySearch Laboratories AB* (Sweden) | | | 1,171,448 | |
| | | | | | | | |
| | | | 17,996,322 | |
| | | | | | | | |
| | |
| | | | Home Improvement Retail 1.3% | | | | |
| | 3,984,055 | | | Italtile Ltd. (South Africa) | | | 2,462,053 | |
| | 43,238,500 | | | PT Ace Hardware Indonesia Tbk (Indonesia) | | | 3,440,038 | |
| | | | | | | | |
| | | | 5,902,091 | |
| | | | | | | | |
| | |
| | | | Human Resource & Employment Services 1.7% | | | | |
| | 168,288 | | | en-japan, Inc. (Japan) | | | 3,126,634 | |
| | 234,262 | | | SMS Co. Ltd. (Japan) | | | 4,517,923 | |
| | | | | | | | |
| | | | 7,644,557 | |
| | | | | | | | |
| | |
| | | | Insurance Brokers 1.0% | | | | |
| | 2,231,200 | | | TQM Corp. Public Co. Ltd. (Thailand) | | | 4,572,201 | |
| | | | | | | | |
59
| | |
| WASATCH INTERNATIONAL OPPORTUNITIES FUND(WAIOX / WIIOX) | | |
|
|
|
Schedule of Investments(continued)
| | | | | | | | |
| Shares | | | | | Value | |
| | | | | | | |
| | |
| | | | Interactive Media & Services 1.9% | | | | |
| | 134,884 | | | Atrae, Inc.* (Japan) | | $ | 3,195,331 | |
| | 24,030 | | | New Work SE (Germany) | | | 5,056,760 | |
| | | | | | | | |
| | | | 8,252,091 | |
| | | | | | | | |
| | |
| | | | Internet & Direct Marketing Retail 1.1% | | | | |
| | 860,583 | | | Trainline plc* (United Kingdom) | | | 3,572,913 | |
| | 1,057,933 | | | Webjet Ltd.*** (Australia) | | | 1,275,383 | |
| | | | | | | | |
| | | | 4,848,296 | |
| | | | | | | | |
| | |
| | | | Internet Services & Infrastructure 1.2% | | | | |
| | 383,000 | | | BASE, Inc.* (Japan) | | | 3,876,936 | |
| | 54,200 | | | Hennge KK* (Japan) | | | 1,316,359 | |
| | | | | | | | |
| | | | 5,193,295 | |
| | | | | | | | |
| | |
| | | | Investment Banking & Brokerage 0.5% | | | | |
| | 101,500 | | | M&A Capital Partners Co. Ltd.* (Japan) | | | 2,417,129 | |
| | | | | | | | |
| | |
| | | | IT Consulting & Other Services 2.6% | | | | |
| | 233,971 | | | Appen Ltd. (Australia) | | | 2,793,858 | |
| | 61,681 | | | Aubay (France) | | | 1,356,119 | |
| | 891,944 | | | Avant Corp. (Japan) | | | 6,321,272 | |
| | 134,018 | | | FDM Group Holdings plc (United Kingdom) | | | 1,216,447 | |
| | | | | | | | |
| | | | 11,687,696 | |
| | | | | | | | |
| | |
| | | | Life Sciences Tools & Services 0.9% | | | | |
| | 417,174 | | | Biotage AB (Sweden) | | | 4,159,242 | |
| | | | | | | | |
| | |
| | | | Oil & Gas Equipment & Services 0.4% | | | | |
| | 583,959 | | | Computer Modelling Group Ltd. (Canada) | | | 1,589,258 | |
| | | | | | | | |
| | |
| | | | Other Diversified Financial Services 1.7% | | | | |
| | 26,512 | | | Hypoport AG* (Germany) | | | 7,591,737 | |
| | | | | | | | |
| | |
| | | | Packaged Foods & Meats 2.1% | | | | |
| | 2,003,120 | | | Vitasoy International Holdings Ltd. (Hong Kong) | | | 6,028,159 | |
| | 445,000 | | | Yihai International Holding Ltd.* (China) | | | 3,351,962 | |
| | | | | | | | |
| | | | 9,380,121 | |
| | | | | | | | |
| | |
| | | | Personal Products 0.9% | | | | |
| | 543,629 | | | Sarantis S.A. (Greece) | | | 4,220,073 | |
| | | | | | | | |
| | |
| | | | Property & Casualty Insurance 1.5% | | | | |
| | 2,654,019 | | | Qualitas Controladora S.A.B. de C.V. (Mexico) | | | 6,784,264 | |
| | | | | | | | |
| | |
| | | | Publishing 1.1% | | | | |
| | 381,259 | | | Future plc (United Kingdom) | | | 4,734,705 | |
| | | | | | | | |
| | |
| | | | Research & Consulting Services 3.1% | | | | |
| | 169,000 | | | IR Japan Holdings Ltd. (Japan) | | | 9,040,138 | |
| | 426,472 | | | NICE Information Service Co. Ltd. (South Korea) | | | 4,595,238 | |
| | | | | | | | |
| | | | 13,635,376 | |
| | | | | | | | |
| | |
| | | | Restaurants 0.4% | | | | |
| | 141,500 | | | Arcland Service Holdings Co. Ltd. (Japan) | | | 1,894,557 | |
| | 630,045 | | | Patisserie Holdings plc* ***§§ (United Kingdom) | | | 7,826 | |
| | | | | | | | |
| | | | | | | 1,902,383 | |
| | | | | | | | |
| | | | | | | | |
| Shares | | | | | Value | |
| | | | | | | |
| | |
| | | | Semiconductor Equipment 1.0% | | | | |
| | 349,932 | | | Japan Material Co. Ltd. (Japan) | | $ | 4,554,193 | |
| | | | | | | | |
| | |
| | | | Semiconductors 3.6% | | | | |
| | 326,529 | | | Elmos Semiconductor AG (Germany) | | | 6,727,630 | |
| | 154,852 | | | LEENO Industrial, Inc. (South Korea) | | | 9,447,332 | |
| | | | | | | | |
| | | | 16,174,962 | |
| | | | | | | | |
| | |
| | | | Specialized Finance 1.3% | | | | |
| | 410,900 | | | eGuarantee, Inc. (Japan) | | | 5,992,234 | |
| | | | | | | | |
| | |
| | | | Technology Hardware, Storage & Peripherals 0.5% | | | | |
| | 57,241 | | | MGI Digital Graphic Technology* (France) | | | 2,129,954 | |
| | | | | | | | |
| | |
| | | | Thrifts & Mortgage Finance 2.5% | | | | |
| | 397,577 | | | Aavas Financiers Ltd.* (India) | | | 6,425,874 | |
| | 108,532 | | | Equitable Group, Inc. (Canada) | | | 4,478,401 | |
| | | | | | | | |
| | | | 10,904,275 | |
| | | | | | | | |
| | |
| | | | Total Common Stocks
(cost $357,717,686) | | | 432,188,884 | |
| | | | | | | | |
| | |
Principal
Amount | | | | | Value | |
| | | | | | | |
| | | | SHORT-TERM INVESTMENTS 3.3% | | | | |
| | |
| | | | Repurchase Agreement 3.3% | | | | |
| | $14,461,322 | | | Repurchase Agreement dated 3/31/20,
0.00% due 4/1/20 with Fixed Income
Clearing Corp. collateralized by $14,210,000 of United States Treasury Notes 1.750% due 7/15/22; value: $14,753,263; repurchase proceeds: $14,461,322 (cost $14,461,322) | | $ | 14,461,322 | |
| | | | | | | | |
| | |
| | | | Total Short-Term Investments
(cost $14,461,322) | | | 14,461,322 | |
| | | | | | | | |
| | |
| | | | Total Investments
(cost $372,179,008) 100.4% | | | 446,650,206 | |
| | |
| | | | Liabilities less Other Assets (0.4%) | | | (1,931,496 | ) |
| | | | | | | | |
| | |
| | | | NET ASSETS 100.0% | | $ | 444,718,710 | |
| | | | | | | | |
| |
| | | | *Non-income producing. ***Security was fair valued under procedures adopted by the Board of Trustees (see Note 12). §The aggregate amount of foreign securities fair valued pursuant to a systematic valuation model as a percent of net assets was 83.45%. §§The aggregate value of illiquid holdings at March 31, 2020, amounted to approximately $7,826 and represented 0.00% of net assets. See Notes to Financial Statements. | |
60
| | |
| | MARCH 31, 2020 (UNAUDITED) |
|
|
|
At March 31, 2020, Wasatch International Opportunities Fund’s investments, excluding short-term investments, were in the following countries:
| | | | | |
| Country | | % |
Australia | | | | 3.1 | |
Canada | | | | 1.4 | |
China | | | | 4.8 | |
Denmark | | | | 0.7 | |
Egypt | | | | 1.6 | |
France | | | | 3.2 | |
Germany | | | | 8.5 | |
Greece | | | | 1.0 | |
Hong Kong | | | | 1.4 | |
India | | | | 9.0 | |
Indonesia | | | | 0.8 | |
Israel | | | | 1.6 | |
Italy | | | | 1.5 | |
Japan | | | | 27.1 | |
Malaysia | | | | 0.8 | |
Mexico | | | | 2.0 | |
Norway | | | | 0.3 | |
Philippines | | | | 2.3 | |
Singapore | | | | 0.9 | |
South Africa | | | | 0.6 | |
South Korea | | | | 3.2 | |
Sweden | | | | 5.3 | |
Taiwan | | | | 5.2 | |
Thailand | | | | 1.6 | |
United Kingdom | | | | 12.1 | |
| | | | | |
TOTAL | | | | 100.0 | % |
| | | | | |
61
| | |
| WASATCH INTERNATIONAL SELECT FUND(WAISX / WGISX) | | MARCH 31, 2020 (UNAUDITED) |
|
|
|
Schedule of Investments
| | | | | | | | |
| Shares | | | | | Value | |
| | | | | | | |
| | | | COMMON STOCKS 100.1% | | | | |
| | |
| | | | Aerospace & Defense 1.7% | | | | |
| | 3,703 | | | CAE, Inc. (Canada) | | $ | 46,810 | |
| | | | | | | | |
| | |
| | | | Apparel, Accessories & Luxury Goods 3.5% | | | | |
| | 142 | | | Hermes International (France) | | | 96,618 | |
| | | | | | | | |
| | |
| | | | Application Software 10.2% | | | | |
| | 868 | | | Dassault Systemes SE (France) | | | 126,720 | |
| | 628 | | | Temenos AG* (Switzerland) | | | 81,860 | |
| | 1,851 | | | Xero Ltd.* (New Zealand) | | | 76,984 | |
| | | | | | | | |
| | | | 285,564 | |
| | | | | | | | |
| | |
| | | | Asset Management & Custody Banks 3.0% | | | | |
| | 124 | | | Partners Group Holding AG (Switzerland) | | | 84,899 | |
| | | | | | | | |
| | |
| | | | Building Products 4.8% | | | | |
| | 7,130 | | | Assa Abloy AB, Class B (Sweden) | | | 133,108 | |
| | | | | | | | |
| | |
| | | | Data Processing & Outsourced Services 6.2% | | | | |
| | 1,888 | | | Amadeus IT Group S.A. (Spain) | | | 88,866 | |
| | 1,452 | | | Worldline S.A.* (France) | | | 85,699 | |
| | | | | | | | |
| | | | 174,565 | |
| | | | | | | | |
| | |
| | | | Drug Retail 5.7% | | | | |
| | 1,200 | | | Tsuruha Holdings, Inc. (Japan) | | | 158,217 | |
| | | | | | | | |
| | |
| | | | Electronic Equipment & Instruments 4.4% | | | | |
| | 5,275 | | | Halma plc (United Kingdom) | | | 123,889 | |
| | | | | | | | |
| | |
| | | | Health Care Equipment 14.0% | | | | |
| | 987 | | | Cochlear Ltd. (Australia) | | | 112,490 | |
| | 9,523 | | | Fisher & Paykel Healthcare Corp. Ltd. (New Zealand) | | | 173,114 | |
| | 590 | | | Sonova Holding AG (Switzerland) | | | 105,205 | |
| | | | | | | | |
| | | | 390,809 | |
| | | | | | | | |
| | |
| | | | Health Care Supplies 9.7% | | | | |
| | 3,800 | | | Asahi Intecc Co. Ltd. (Japan) | | | 93,982 | |
| | 1,222 | | | Coloplast A/S, Class B (Denmark) | | | 177,222 | |
| | | | | | | | |
| | | | 271,204 | |
| | | | | | | | |
| | |
| | | | Health Care Technology 3.3% | | | | |
| | 3,100 | | | M3, Inc. (Japan) | | | 91,441 | |
| | | | | | | | |
| | |
| | | | Industrial Machinery 5.4% | | | | |
| | 2,500 | | | MISUMI Group, Inc. (Japan) | | | 54,077 | |
| | 184 | | | Rational AG (Germany) | | | 97,309 | |
| | | | | | | | |
| | | | 151,386 | |
| | | | | | | | |
| | |
| | | | Interactive Media & Services 1.8% | | | | |
| | 1,065 | | | REA Group Ltd. (Australia) | | | 49,889 | |
| | | | | | | | |
| | |
| | | | Internet & Direct Marketing Retail 2.3% | | | | |
| | 15,771 | | | Trainline plc* (United Kingdom) | | | 65,477 | |
| | | | | | | | |
| | |
| | | | IT Consulting & Other Services 2.3% | | | | |
| | 500 | | | Obic Co. Ltd. (Japan) | | | 65,145 | |
| | | | | | | | |
| | |
| | | | Leisure Products 2.0% | | | | |
| | 400 | | | Shimano, Inc. (Japan) | | | 57,045 | |
| | | | | | | | |
| | |
| | | | Life Sciences Tools & Services 7.8% | | | | |
| | 682 | | | ICON plc* (Ireland) | | | 92,752 | |
| | 626 | | | Sartorius Stedim Biotech (France) | | | 124,921 | |
| | | | | | | | |
| | | | 217,673 | |
| | | | | | | | |
| | | | | | | | |
| Shares | | | | | Value | |
| | | | | | | |
| | |
| | | | Packaged Foods & Meats 2.8% | | | | |
| | 26,000 | | | Vitasoy International Holdings Ltd. (Hong Kong) | | $ | 78,244 | |
| | | | | | | | |
| | |
| | | | Research & Consulting Services 3.3% | | | | |
| | 1,587 | | | Intertek Group plc (United Kingdom) | | | 92,720 | |
| | | | | | | | |
| | |
| | | | Soft Drinks 1.9% | | | | |
| | 3,486 | | | Fevertree Drinks plc (United Kingdom) | | | 51,987 | |
| | | | | | | | |
| | |
| | | | Specialty Chemicals 4.0% | | | | |
| | 1,521 | | | Chr. Hansen Holding A/S (Denmark) | | | 112,239 | |
| | | | | | | | |
| | |
| | | | Total Common Stocks
(cost $3,094,156) | | | 2,798,929 | |
| | | | | | | | |
| | |
| | | | Total Investments
(cost $3,094,156) 100.1%§ | | | 2,798,929 | |
| | |
| | | | Liabilities less Other Assets (0.1%) | | | (2,601 | ) |
| | | | | | | | |
| | |
| | | | NET ASSETS 100.0% | | $ | 2,796,328 | |
| | | | | | | | |
| |
| | | | *Non-income producing. §The aggregate amount of foreign securities fair valued pursuant to a systematic valuation model as a percent of net assets was 95.10%. See Notes to Financial Statements. | |
At March 31, 2020, Wasatch International Select Fund’s investments, were in the following countries:
| | | | | |
| Country | | % |
Australia | | | | 5.8 | |
Canada | | | | 1.7 | |
Denmark | | | | 10.3 | |
France | | | | 15.5 | |
Germany | | | | 3.5 | |
Hong Kong | | | | 2.8 | |
Ireland | | | | 3.3 | |
Japan | | | | 18.6 | |
New Zealand | | | | 8.9 | |
Spain | | | | 3.2 | |
Sweden | | | | 4.8 | |
Switzerland | | | | 9.7 | |
United Kingdom | | | | 11.9 | |
| | | | | |
TOTAL | | | | 100.0 | % |
| | | | | |
62
| | |
| WASATCH MICRO CAP FUND(WMICX / WGICX) | | MARCH 31, 2020 (UNAUDITED) |
|
|
|
Schedule of Investments
| | | | | | | | |
| Shares | | | | | Value | |
| | | | | | | |
| | | | COMMON STOCKS 99.1% | | | | |
| | |
| | | | Advertising 0.5% | | | | |
| | 70,776 | | | Cardlytics, Inc.* | | $ | 2,474,329 | |
| | | | | | | | |
| | |
| | | | Airlines 0.9% | | | | |
| | 48,820 | | | Allegiant Travel Co. | | | 3,993,476 | |
| | | | | | | | |
| | |
| | | | Alternative Carriers 2.4% | | | | |
| | 163,973 | | | Bandwidth, Inc., Class A* | | | 11,033,743 | |
| | | | | | | | |
| | |
| | | | Apparel Retail 1.5% | | | | |
| | 507,921 | | | Boot Barn Holdings, Inc.* | | | 6,567,419 | |
| | | | | | | | |
| | |
| | | | Apparel, Accessories & Luxury Goods 1.2% | | | | |
| | 621,568 | | | Superior Group of Cos., Inc. | | | 5,258,465 | |
| | | | | | | | |
| | |
| | | | Application Software 9.6% | | | | |
| | 131,297 | | | Five9, Inc.* | | | 10,038,969 | |
| | 566,638 | | | Medallia, Inc.* | | | 11,355,425 | |
| | 464,776 | | | Model N, Inc.* | | | 10,322,675 | |
| | 438,108 | | | Upland Software, Inc.* | | | 11,750,057 | |
| | | | | | | | |
| | | | 43,467,126 | |
| | | | | | | | |
| | |
| | | | Biotechnology 8.4% | | | | |
| | 189,052 | | | Castle Biosciences, Inc.* | | | 5,635,640 | |
| | 136,522 | | | ChemoCentryx, Inc.* | | | 5,485,454 | |
| | 369,074 | | | Cytokinetics, Inc.* | | | 4,351,382 | |
| | 111,009 | | | Esperion Therapeutics, Inc.* | | | 3,500,114 | |
| | 264,701 | | | Flexion Therapeutics, Inc.* | | | 2,083,197 | |
| | 95,909 | | | Frequency Therapeutics, Inc.* | | | 1,708,139 | |
| | 462,990 | | | Inovio Pharmaceuticals, Inc.* | | | 3,444,646 | |
| | 336,219 | | | MacroGenics, Inc.* | | | 1,956,794 | |
| | 937,165 | | | MEI Pharma, Inc.* | | | 1,508,836 | |
| | 576,611 | | | Sangamo Therapeutics, Inc.* | | | 3,673,012 | |
| | 1,803,229 | | | Selecta Biosciences, Inc.* | | | 4,345,782 | |
| | | | | | | | |
| | | | 37,692,996 | |
| | | | | | | | |
| | |
| | | | Construction & Engineering 2.7% | | | | |
| | 709,019 | | | Construction Partners, Inc., Class A* | | | 11,975,331 | |
| | | | | | | | |
| | |
| | | | Construction Machinery & Heavy Trucks 2.3% | | | | |
| | 115,098 | | | Alamo Group, Inc. | | | 10,218,401 | |
| | | | | | | | |
| | |
| | | | Data Processing & Outsourced Services 2.4% | | | | |
| | 452,616 | | | Repay Holdings Corp.* | | | 6,495,040 | |
| | 915,672 | | | USA Technologies, Inc.* | | | 4,212,091 | |
| | | | | | | | |
| | | | 10,707,131 | |
| | | | | | | | |
| | |
| | | | Electronic Equipment & Instruments 2.8% | | | | |
| | 424,328 | | | Napco Security Technologies, Inc.* | | | 6,437,056 | |
| | 569,697 | | | nLight, Inc.* | | | 5,976,121 | |
| | | | | | | | |
| | | | 12,413,177 | |
| | | | | | | | |
| | |
| | | | Electronic Manufacturing Services 1.9% | | | | |
| | 157,763 | | | Fabrinet* | | | 8,607,549 | |
| | | | | | | | |
| | |
| | | | Environmental & Facilities Services 1.5% | | | | |
| | 411,747 | | | Heritage-Crystal Clean, Inc.* | | | 6,686,771 | |
| | | | | | | | |
| | |
| | | | Food Distributors 1.1% | | | | |
| | 486,960 | | | Chefs’ Warehouse, Inc. (The)* | | | 4,903,687 | |
| | | | | | | | |
| | |
| | | | Health Care Equipment 4.8% | | | | |
| | 229,096 | | | AtriCure, Inc.* | | | 7,695,334 | |
| | 105,383 | | | Cantel Medical Corp. | | | 3,783,250 | |
| | 341,750 | | | CryoLife, Inc.* | | | 5,782,410 | |
| | 64,542 | | | Tandem Diabetes Care, Inc.* | | | 4,153,278 | |
| | | | | | | | |
| | | | 21,414,272 | |
| | | | | | | | |
| | | | | | | | |
| Shares | | | | | Value | |
| | | | | | | |
| | |
| | | | Health Care Facilities 1.7% | | | | |
| | 380,551 | | | Pennant Group, Inc. (The)* | | $ | 5,388,602 | |
| | 30,113 | | | U.S. Physical Therapy, Inc. | | | 2,077,797 | |
| | | | | | | | |
| | | | 7,466,399 | |
| | | | | | | | |
| | |
| | | | Health Care Services 2.3% | | | | |
| | 71,491 | | | Addus HomeCare Corp.* | | | 4,832,791 | |
| | 251,552 | | | Exagen, Inc.* | | | 4,009,739 | |
| | 8,313,643 | | | IM Cannabis Corp.* ‡‡§§ (Canada) | | | 1,713,179 | |
| | | | | | | | |
| | | | 10,555,709 | |
| | | | | | | | |
| | |
| | | | Health Care Supplies 2.9% | | | | |
| | 181,145 | | | OrthoPediatrics Corp.* | | | 7,180,588 | |
| | 194,427 | | | Silk Road Medical, Inc.* | | | 6,120,562 | |
| | | | | | | | |
| | | | 13,301,150 | |
| | | | | | | | |
| | |
| | | | Health Care Technology 6.1% | | | | |
| | 84,919 | | | Inspire Medical Systems, Inc.* | | | 5,118,918 | |
| | 323,824 | | | Simulations Plus, Inc. | | | 11,307,934 | |
| | 207,328 | | | Tabula Rasa HealthCare, Inc.* | | | 10,841,181 | |
| | | | | | | | |
| | | | 27,268,033 | |
| | | | | | | | |
| | |
| | | | Home Furnishings 0.7% | | | | |
| | 584,032 | | | Purple Innovation, Inc.* | | | 3,317,302 | |
| | | | | | | | |
| | |
| | | | Homebuilding 1.2% | | | | |
| | 116,975 | | | LGI Homes, Inc.* | | | 5,281,421 | |
| | | | | | | | |
| | |
| | | | Industrial Machinery 7.8% | | | | |
| | 288,709 | | | Altra Industrial Motion Corp. | | | 5,049,520 | |
| | 141,033 | | | Helios Technologies, Inc. | | | 5,347,971 | |
| | 179,547 | | | Kadant, Inc. | | | 13,403,184 | |
| | 460,394 | | | Kornit Digital Ltd.* (Israel) | | | 11,459,207 | |
| | | | | | | | |
| | | | 35,259,882 | |
| | | | | | | | |
| | |
| | | | Insurance Brokers 1.0% | | | | |
| | 99,940 | | | Goosehead Insurance, Inc., Class A* | | | 4,460,322 | |
| | | | | | | | |
| | |
| | | | Internet Services & Infrastructure 3.0% | | | | |
| | 2,375,912 | | | Limelight Networks, Inc.* | | | 13,542,698 | |
| | | | | | | | |
| | |
| | | | Leisure Products 1.1% | | | | |
| | 682,288 | | | MasterCraft Boat Holdings, Inc.* | | | 4,980,702 | |
| | | | | | | | |
| | |
| | | | Office Services & Supplies 0.4% | | | | |
| | 144,512 | | | Kimball International, Inc., Class B | | | 1,721,138 | |
| | | | | | | | |
| | |
| | | | Oil & Gas Equipment & Services 1.3% | | | | |
| | 248,678 | | | DMC Global, Inc. | | | 5,722,081 | |
| | | | | | | | |
| | |
| | | | Oil & Gas Exploration & Production 0.2% | | | | |
| | 2,096,029 | | | Lonestar Resources US, Inc., Class A* ‡‡ | | | 867,756 | |
| | | | | | | | |
| | |
| | | | Other Diversified Financial Services 1.2% | | | | |
| | 456,763 | | | Diamond Eagle Acquisition Corp., Class A* | | | 5,636,455 | |
| | | | | | | | |
| | |
| | | | Packaged Foods & Meats 2.8% | | | | |
| | 195,962 | | | Freshpet, Inc.* | | | 12,516,093 | |
| | | | | | | | |
| | |
| | | | Paper Packaging 2.2% | | | | |
| | 257,317 | | | UFP Technologies, Inc.* | | | 9,801,205 | |
| | | | | | | | |
| | |
| | | | Pharmaceuticals 3.5% | | | | |
| | 784,476 | | | BioDelivery Sciences International, Inc.* | | | 2,973,164 | |
| | 786,850 | | | Green Thumb Industries, Inc.* (Canada) | | | 4,580,647 | |
| | 344,211 | | | Intra-Cellular Therapies, Inc.* | | | 5,290,523 | |
| | 663,416 | | | Optinose, Inc.* | | | 2,978,738 | |
| | | | | | | | |
| | | | 15,823,072 | |
| | | | | | | | |
| | |
| | | | Regional Banks 2.4% | | | | |
| | 290,800 | | | CBTX, Inc. | | | 5,167,516 | |
| | 288,752 | | | People’s Utah Bancorp | | | 5,593,126 | |
| | | | | | | | |
| | | | 10,760,642 | |
| | | | | | | | |
63
| | |
| WASATCH MICRO CAP FUND(WMICX / WGICX) | | MARCH 31, 2020 (UNAUDITED) |
|
|
|
Schedule of Investments(continued)
| | | | | | | | |
Shares | | | | | Value | |
| | | | | | | |
| | |
| | | | Research & Consulting Services 2.5% | | | | |
| | 161,590 | | | ICF International, Inc. | | $ | 11,101,233 | |
| | | | | | | | |
| | |
| | | | Restaurants 0.8% | | | | |
| | 381,829 | | | Chuy’s Holdings, Inc.* | | | 3,845,018 | |
| | | | | | | | |
| | |
| | | | Semiconductor Equipment 2.3% | | | | |
| | 315,443 | | | Nova Measuring Instruments Ltd.* (Israel) | | | 10,299,214 | |
| | | | | | | | |
| | |
| | | | Systems Software 5.1% | | | | |
| | 109,970 | | | CyberArk Software Ltd.* (Israel) | | | 9,409,033 | |
| | 212,052 | | | Rapid7, Inc.* | | | 9,188,213 | |
| | 70,978 | | | Varonis Systems, Inc.* | | | 4,519,170 | |
| | | | | | | | |
| | | | 23,116,416 | |
| | | | | | | | |
| | |
| | | | Trading Companies & Distributors 2.6% | | | | |
| | 451,005 | | | Transcat, Inc.* ‡‡ | | | 11,951,633 | |
| | | | | | | | |
| | |
| | | | Total Common Stocks
(cost $463,779,261) | | | 446,009,447 | |
| | | | | | | | |
| | |
| | | | WARRANTS 0.1% | | | | |
| | |
| | | | Biotechnology 0.1% | | | | |
| | 512,465 | | | Selecta Biosciences, Inc., 12/23/2024* *** † | | | 640,581 | |
| | | | | | | | |
| | |
| | | | Health Care Services 0.0% | | | | |
| | 1,897,571 | | | IM Cannabis Corp., 10/10/2021* ***§§ (Canada) | | | — | |
| | | | | | | | |
| | |
| | | | Total Warrants
(cost $64,058) | | | 640,581 | |
| | | | | | | | |
| | | | | | | | |
Principal
Amount | | | | | Value | |
| | | | | | | |
| | | | SHORT-TERM INVESTMENTS 0.7% | | | | |
| | |
| | | | Repurchase Agreement 0.7% | | | | |
| | $3,323,503 | | | Repurchase Agreement dated 3/31/20, 0.00% due 4/1/20 with Fixed Income Clearing Corp. collateralized by $3,270,000 of United States Treasury Notes 1.750% due 7/15/22; value: $3,395,015; repurchase proceeds: $3,323,503 (cost $3,323,503) | | $ | 3,323,503 | |
| | | | | | | | |
| | |
| | | | Total Short-Term Investments
(cost $3,323,503) | | | 3,323,503 | |
| | | | | | | | |
| | |
| | | | Total Investments
(cost $467,166,822) 99.9% | | | 449,973,531 | |
| | |
| | | | Other Assets less Liabilities 0.1% | | | 327,681 | |
| | | | | | | | |
| | |
| | | | NET ASSETS 100.0% | | $ | 450,301,212 | |
| | | | | | | | |
| |
| | | | *Non-income producing. ***Security was fair valued under procedures adopted by the Board of Trustees (see Note 12). †Security purchased in a private placement transaction or under Rule 144A of the Securities Act of 1933 (see Note 9). The aggregate value of securities purchased in a private placement transaction or under Rule 144A of the Securities Act of 1933 at March 31, 2020, amounted to approximately $640,581, and represented 0.14% of net assets. ‡‡Affiliated company (see Note 8). §§The aggregate value of illiquid holdings at March 31, 2020, amounted to approximately $1,713,179, and represented 0.38% of net assets. See Notes to Financial Statements. | |
At March 31, 2020, Wasatch Micro Cap Fund’s investments, excluding short-term investments, were in the following countries:
| | | | | |
| Country | | % |
Canada | | | | 1.4 | |
Israel | | | | 7.0 | |
United States | | | | 91.6 | |
| | | | | |
TOTAL | | | | 100.0 | % |
| | | | | |
64
| | |
| WASATCH MICRO CAP VALUE FUND(WAMVX / WGMVX) | | MARCH 31, 2020 (UNAUDITED) |
|
|
|
Schedule of Investments
| | | | | | | | |
| Shares | | | | | Value | |
| | | | | | | |
| | | | COMMON STOCKS 95.5% | | | | |
| | |
| | | | Advertising 1.7% | | | | |
| | 186,000 | | | National CineMedia, Inc. | | $ | 606,360 | |
| | 304,264 | | | YouGov plc (United Kingdom) | | | 2,343,144 | |
| | | | | | | | |
| | | | 2,949,504 | |
| | | | | | | | |
| | |
| | | | Air Freight & Logistics 1.0% | | | | |
| | 473,000 | | | Radiant Logistics, Inc.* | | | 1,830,510 | |
| | | | | | | | |
| | |
| | | | Airlines 0.7% | | | | |
| | 15,000 | | | Allegiant Travel Co. | | | 1,227,000 | |
| | | | | | | | |
| | |
| | | | Alternative Carriers 3.5% | | | | |
| | 61,706 | | | Bandwidth, Inc., Class A* | | | 4,152,197 | |
| | 163,205 | | | Gamma Communications plc
(United Kingdom) | | | 1,996,344 | |
| | | | | | | | |
| | | | 6,148,541 | |
| | | | | | | | |
| | |
| | | | Application Software 10.9% | | | | |
| | 44,363 | | | Ebix, Inc. | | | 673,430 | |
| | 376,000 | | | eGain Corp.* | | | 2,756,080 | |
| | 31,000 | | | Esker S.A. (France) | | | 3,159,504 | |
| | 16,000 | | | Globant S.A.* (Argentina) | | | 1,406,080 | |
| | 112,800 | | | Miroku Jyoho Service Co. Ltd. (Japan) | | | 2,482,022 | |
| | 106,000 | | | Model N, Inc.* | | | 2,354,260 | |
| | 70,000 | | | QAD, Inc., Class A | | | 2,795,100 | |
| | 204,000 | | | SharpSpring, Inc.* | | | 1,236,240 | |
| | 169,000 | | | Systena Corp. (Japan) | | | 2,283,816 | |
| | | | | | | | |
| | | | 19,146,532 | |
| | | | | | | | |
| | |
| | | | Asset Management & Custody Banks 2.3% | | | | |
| | 708,340 | | | Fiducian Group Ltd. (Australia) | | | 1,888,837 | |
| | 40,000 | | | Hamilton Lane, Inc., Class A | | | 2,212,400 | |
| | | | | | | | |
| | | | 4,101,237 | |
| | | | | | | | |
| | |
| | | | Biotechnology 3.0% | | | | |
| | 112,000 | | | Cytokinetics, Inc.* | | | 1,320,480 | |
| | 178,256 | | | Inovio Pharmaceuticals, Inc.* | | | 1,326,224 | |
| | 100,000 | | | MacroGenics, Inc.* | | | 582,000 | |
| | 460,977 | | | MEI Pharma, Inc.* | | | 742,173 | |
| | 195,000 | | | Sangamo Therapeutics, Inc.* | | | 1,242,150 | |
| | | | | | | | |
| | | | 5,213,027 | |
| | | | | | | | |
| | |
| | | | Building Products 0.3% | | | | |
| | 20,428 | | | Patrick Industries, Inc. | | | 575,252 | |
| | | | | | | | |
| | |
| | | | Communications Equipment 1.1% | | | | |
| | 202,000 | | | Digi International, Inc.* | | | 1,927,080 | |
| | | | | | | | |
| | |
| | | | Construction & Engineering 2.4% | | | | |
| | 139,000 | | | Construction Partners, Inc., Class A* | | | 2,347,710 | |
| | 46,000 | | | NV5 Global, Inc.* | | | 1,899,340 | |
| | | | | | | | |
| | | | 4,247,050 | |
| | | | | | | | |
| | |
| | | | Data Processing & Outsourced Services 2.7% | | | | |
| | 117,000 | | | i3 Verticals, Inc., Class A* | | | 2,233,530 | |
| | 44,747 | | | Repay Holdings Corp.* | | | 642,120 | |
| | 406,704 | | | USA Technologies, Inc.* | | | 1,870,838 | |
| | | | | | | | |
| | | | 4,746,488 | |
| | | | | | | | |
| | |
| | | | Diversified Banks 0.7% | | | | |
| | 720,000 | | | City Union Bank Ltd. (India) | | | 1,226,976 | |
| | | | | | | | |
| | |
| | | | Diversified Support Services 1.2% | | | | |
| | 1,621,000 | | | Johnson Service Group plc
(United Kingdom) | | | 2,061,525 | |
| | | | | | | | |
| | |
| | | | Education Services 0.7% | | | | |
| | 238,851 | | | Dadi Early-Childhood Education Group Ltd. (Taiwan) | | | 1,274,681 | |
| | | | | | | | |
| | | | | | | | |
| Shares | | | | | Value | |
| | | | | | | |
| | |
| | | | Electronic Equipment & Instruments 1.3% | | | | |
| | 148,000 | | | Napco Security Technologies, Inc.* | | $ | 2,245,160 | |
| | | | | | | | |
| | |
| | | | Electronic Manufacturing Services 2.6% | | | | |
| | 74,000 | | | Fabrinet* | | | 4,037,440 | |
| | 110,680 | | | RF Industries Ltd. | | | 439,399 | |
| | | | | | | | |
| | | | 4,476,839 | |
| | | | | | | | |
| | |
| | | | Health Care Distributors 2.9% | | | | |
| | 4,161,922 | | | Ibnsina Pharma S.A.E. (Egypt) | | | 2,103,590 | |
| | 129,000 | | | PetIQ, Inc.* | | | 2,996,670 | |
| | | | | | | | |
| | | | 5,100,260 | |
| | | | | | | | |
| | |
| | | | Health Care Equipment 4.0% | | | | |
| | 53,000 | | | AtriCure, Inc.* | | | 1,780,270 | |
| | 83,826 | | | Inmode Ltd.* (Israel) | | | 1,802,259 | |
| | 463,000 | | | IRIDEX Corp.* | | | 745,430 | |
| | 65,000 | | | Tactile Systems Technology, Inc.* | | | 2,610,400 | |
| | | | | | | | |
| | | | 6,938,359 | |
| | | | | | | | |
| | |
| | | | Health Care Facilities 1.4% | | | | |
| | 53,000 | | | Ensign Group, Inc. (The) | | | 1,993,330 | |
| | 39,960 | | | Joint Corp. (The)* | | | 433,566 | |
| | | | | | | | |
| | | | 2,426,896 | |
| | | | | | | | |
| | |
| | | | Health Care Services 2.4% | | | | |
| | 28,000 | | | Addus HomeCare Corp.* | | | 1,892,800 | |
| | 476,000 | | | Viemed Healthcare, Inc.* (Canada) | | | 2,235,742 | |
| | | | | | | | |
| | | | 4,128,542 | |
| | | | | | | | |
| | |
| | | | Health Care Supplies 1.2% | | | | |
| | 54,070 | | | OrthoPediatrics Corp.* | | | 2,143,335 | |
| | | | | | | | |
| | |
| | | | Health Care Technology 4.3% | | | | |
| | 85,000 | | | Nexus AG (Germany) | | | 2,601,486 | |
| | 26,000 | | | Omnicell, Inc.* | | | 1,705,080 | |
| | 351,000 | | | OptimizeRx Corp.* | | | 3,180,060 | |
| | | | | | | | |
| | | | 7,486,626 | |
| | | | | | | | |
| | |
| | | | Heavy Electrical Equipment 1.2% | | | | |
| | 143,000 | | | TPI Composites, Inc.* | | | 2,113,540 | |
| | | | | | | | |
| | |
| | | | Home Furnishings 0.5% | | | | |
| | 140,000 | | | Lovesac Co. (The)* | | | 816,200 | |
| | | | | | | | |
| | |
| | | | Homebuilding 3.0% | | | | |
| | 37,000 | | | LGI Homes, Inc.* | | | 1,670,550 | |
| | 228,000 | | | Skyline Champion Corp.* | | | 3,575,040 | |
| | | | | | | | |
| | | | 5,245,590 | |
| | | | | | | | |
| | |
| | | | Human Resource & Employment Services 0.4% | | | | |
| | 101,462 | | | BG Staffing, Inc. | | | 758,936 | |
| | | | | | | | |
| | |
| | | | Industrial Machinery 5.3% | | | | |
| | 24,000 | | | John Bean Technologies Corp. | | | 1,782,480 | |
| | 37,000 | | | Kadant, Inc. | | | 2,762,050 | |
| | 97,000 | | | Kornit Digital Ltd.* (Israel) | | | 2,414,330 | |
| | 245,000 | | | va-Q-tec AG* (Germany) | | | 2,338,446 | |
| | | | | | | | |
| | | | 9,297,306 | |
| | | | | | | | |
| | |
| | | | Industrial REITs 0.9% | | | | |
| | 131,000 | | | Monmouth Real Estate Investment Corp. | | | 1,578,550 | |
| | | | | | | | |
| | |
| | | | Insurance Brokers 1.2% | | | | |
| | 48,000 | | | Goosehead Insurance, Inc., Class A* | | | 2,142,240 | |
| | | | | | | | |
| | |
| | | | Integrated Telecommunication Services 1.5% | | | | |
| | 215,098 | | | Ooma, Inc.* | | | 2,566,119 | |
| | | | | | | | |
| | |
| | | | Internet Services & Infrastructure 0.9% | | | | |
| | 34,000 | | | Tucows, Inc., Class A* | | | 1,640,840 | |
| | | | | | | | |
65
| | |
| WASATCH MICRO CAP VALUE FUND(WAMVX / WGMVX) | | |
|
|
|
Schedule of Investments(continued)
| | | | | | | | |
| Shares | | | | | Value | |
| | | | | | | |
| | |
| | | | Investment Banking & Brokerage 1.5% | | | | |
| | 462,000 | | | JDC Group AG* (Germany) | | $ | 2,548,634 | |
| | | | | | | | |
| | |
| | | | IT Consulting & Other Services 4.4% | | | | |
| | 236,000 | | | Avant Corp. (Japan) | | | 1,672,549 | |
| | 60,427 | | | Endava plc ADR* (United Kingdom) | | | 2,124,613 | |
| | 157,000 | | | Hackett Group, Inc. (The) | | | 1,997,040 | |
| | 68,000 | | | Virtusa Corp.* | | | 1,931,200 | |
| | | | | | | | |
| | | | 7,725,402 | |
| | | | | | | | |
| | |
| | | | Mortgage REITs 0.6% | | | | |
| | 219,000 | | | Arbor Realty Trust, Inc. | | | 1,073,100 | |
| | | | | | | | |
| | |
| | | | Office Services & Supplies 0.9% | | | | |
| | 137,000 | | | Kimball International, Inc., Class B | | | 1,631,670 | |
| | | | | | | | |
| | |
| | | | Oil & Gas Equipment & Services 0.4% | | | | |
| | 546,000 | | | Mitcham Industries, Inc.* | | | 682,500 | |
| | | | | | | | |
| | |
| | | | Packaged Foods & Meats 2.6% | | | | |
| | 70,000 | | | Freshpet, Inc.* | | | 4,470,900 | |
| | | | | | | | |
| | |
| | | | Personal Products 1.6% | | | | |
| | 15,738 | | | Medifast, Inc. | | | 983,625 | |
| | 226,000 | | | Sarantis S.A. (Greece) | | | 1,754,389 | |
| | | | | | | | |
| | | | 2,738,014 | |
| | | | | | | | |
| | |
| | | | Pharmaceuticals 0.4% | | | | |
| | 45,600 | | | Intra-Cellular Therapies, Inc.* | | | 700,872 | |
| | | | | | | | |
| | |
| | | | Regional Banks 2.0% | | | | |
| | 150,000 | | | Esquire Financial Holdings, Inc.* | | | 2,257,500 | |
| | 56,000 | | | Sound Financial Bancorp, Inc. | | | 1,195,040 | |
| | | | | | | | |
| | | | 3,452,540 | |
| | | | | | | | |
| | |
| | | | Research & Consulting Services 3.0% | | | | |
| | 64,132 | | | Franklin Covey Co.* | | | 996,611 | |
| | 55,000 | | | IR Japan Holdings Ltd. (Japan) | | | 2,942,057 | |
| | 70,000 | | | Red Violet, Inc.* | | | 1,260,000 | |
| | | | | | | | |
| | | | 5,198,668 | |
| | | | | | | | |
| | |
| | | | Restaurants 0.6% | | | | |
| | 88,000 | | | Kura Sushi USA, Inc., Class A* | | | 1,052,480 | |
| | | | | | | | |
| | |
| | | | Semiconductor Equipment 1.6% | | | | |
| | 86,000 | | | Nova Measuring Instruments Ltd.* (Israel) | | | 2,807,900 | |
| | | | | | | | |
| | |
| | | | Semiconductors 1.3% | | | | |
| | 101,136 | | | SiTime Corp.* | | | 2,201,731 | |
| | | | | | | | |
| | |
| | | | Systems Software 0.5% | | | | |
| | 62,000 | | | Cyan AG* (Germany) | | | 936,055 | |
| | | | | | | | |
| | |
| | | | Technology Hardware, Storage & Peripherals 1.5% | | | | |
| | 48,656 | | | MGI Digital Graphic Technology* (France) | | | 1,810,504 | |
| | 615,000 | | | One Stop Systems, Inc.* | | | 885,600 | |
| | | | | | | | |
| | | | 2,696,104 | |
| | | | | | | | |
| | |
| | | | Thrifts & Mortgage Finance 2.1% | | | | |
| | 62,000 | | | Axos Financial, Inc.* | | | 1,124,060 | |
| | 389,000 | | | Mortgage Advice Bureau Holdings Ltd. (United Kingdom) | | | 2,539,042 | |
| | | | | | | | |
| | | | 3,663,102 | |
| | | | | | | | |
| | |
| | | | Trading Companies & Distributors 2.3% | | | | |
| | 187,439 | | | Hardwoods Distribution, Inc. (Canada) | | | 1,290,616 | |
| | 149,700 | | | Systemax, Inc. | | | 2,654,181 | |
| | | | | | | | |
| | | | 3,944,797 | |
| | | | | | | | |
| | |
| | | | Water Utilities 1.0% | | | | |
| | 163,519 | | | Global Water Resources, Inc. | | | 1,666,259 | |
| | | | | | | | |
| | |
| | | | Total Common Stocks
(cost $167,081,928) | | | 166,971,469 | |
| | | | | | | | |
| | | | | | | | |
| Shares | | | | | Value | |
| | | | | | | |
| | | | CONVERTIBLE PREFERRED STOCKS 1.1% | | | | |
| | |
| | | | Oil & Gas Refining & Marketing 1.1% | | | | |
| | 644,656 | | | Vertex Energy, Inc., Pfd., 6.00% PIK, Series B*** † | | $ | 1,998,434 | |
| | | | | | | | |
| | |
| | | | Total Convertible Preferred Stocks
(cost $1,903,433) | | | 1,998,434 | |
| | | | | | | | |
| | |
| | | | LIMITED LIABILITY COMPANY MEMBERSHIP INTEREST 0.0% | | | | |
| | |
| | | | Pharmaceuticals 0.0% | | | | |
| | 50,528 | | | Regenacy Pharmaceuticals, LLC* *** † | | | 20,211 | |
| | | | | | | | |
| | |
| | | | Total Limited Liability Company Membership Interest
(cost $30,001) | | | 20,211 | |
| | | | | | | | |
| | |
| | | | WARRANTS 0.0% | | | | |
| | |
| | | | Oil & Gas Refining & Marketing 0.0% | | | | |
| | 250,000 | | | Vertex Energy, Inc., expiring
12/24/2020* *** † | | | — | |
| | | | | | | | |
| | |
| | | | Total Warrants
(cost $95,000) | | | — | |
| | | | | | | | |
| | |
Principal
Amount | | | | | Value | |
| | | | | | | |
| | | | SHORT-TERM INVESTMENTS 3.3% | | | | |
| | |
| | | | Repurchase Agreement 3.3% | | | | |
| | $5,798,515 | | | Repurchase Agreement dated 3/31/20, 0.00% due 4/1/20 with Fixed Income Clearing Corp. collateralized by $5,700,000 of United States Treasury Notes 1.750% due 7/15/22; value: $5,917,917; repurchase proceeds: $5,798,515 (cost $5,798,515) | | $ | 5,798,515 | |
| | | | | | | | |
| | |
| | | | Total Short-Term Investments
(cost $5,798,515) | | | 5,798,515 | |
| | | | | | | | |
| | |
| | | | Total Investments
(cost $174,908,877) 99.9%§ | | | 174,788,629 | |
| | |
| | | | Other Assets less Liabilities 0.1% | | | 130,479 | |
| | | | | | | | |
| | |
| | | | NET ASSETS 100.0% | | $ | 174,919,108 | |
| | | | | | | | |
| |
| | | | *Non-income producing. ***Security was fair valued under procedures adopted by the Board of Trustees (see Note 12). †Security purchased in a private placement transaction or under Rule 144A of the Securities Act of 1933 (see Note 9). The aggregate value of securities purchased in a private placement transaction or under Rule 144A of the Securities Act of 1933 at March 31, 2020, amounted to approximately $2,018,645, and represented 1.15% of net assets. §The aggregate amount of foreign securities fair valued pursuant to a systematic valuation model as a percent of net assets was 21.51%. ADR American Depositary Receipt. PIK Payment In Kind. REIT Real Estate Investment Trust. See Notes to Financial Statements. | |
66
| | |
| | MARCH 31, 2020 (UNAUDITED) |
|
|
|
At March 31, 2020, Wasatch Micro Cap Value Fund’s investments, excluding short-term investments, were in the following countries:
| | | | | |
| Country | | % |
Argentina | | | | 0.8 | |
Australia | | | | 1.1 | |
Canada | | | | 2.1 | |
Egypt | | | | 1.2 | |
France | | | | 2.9 | |
Germany | | | | 5.0 | |
Greece | | | | 1.0 | |
India | | | | 0.7 | |
Israel | | | | 4.2 | |
Japan | | | | 5.6 | |
Taiwan | | | | 0.8 | |
United Kingdom | | | | 6.6 | |
United States | | | | 68.0 | |
| | | | | |
TOTAL | | | | 100.0 | % |
| | | | | |
67
| | |
| WASATCH SMALL CAP GROWTH FUND(WAAEX / WIAEX) | | |
|
|
|
Schedule of Investments
| | | | | | | | |
| Shares | | | | | Value | |
| | | | | | | |
| | | | COMMON STOCKS 98.2% | | | | |
| | |
| | | | Aerospace & Defense 1.6% | | | | |
| | 379,488 | | | HEICO Corp., Class A | | $ | 24,249,283 | |
| | | | | | | | |
| | |
| | | | Airlines 1.3% | | | | |
| | 246,775 | | | Allegiant Travel Co. | | | 20,186,195 | |
| | | | | | | | |
| | |
| | | | Application Software 18.4% | | | | |
| | 478,225 | | | DocuSign, Inc.* | | | 44,187,990 | |
| | 745,476 | | | Five9, Inc.* | | | 56,999,095 | |
| | 434,708 | | | Globant S.A.* (Argentina) | | | 38,202,139 | |
| | 232,349 | | | HubSpot, Inc.* | | | 30,946,563 | |
| | 1,849,334 | | | Medallia, Inc.* | | | 37,060,653 | |
| | 553,986 | | | Paylocity Holding Corp.* | | | 48,928,044 | |
| | 385,809 | | | Zendesk, Inc.* | | | 24,695,634 | |
| | | | | | | | |
| | | | 281,020,118 | |
| | | | | | | | |
| | |
| | | | Automotive Retail 2.4% | | | | |
| | 848,993 | | | Monro, Inc. | | | 37,194,383 | |
| | | | | | | | |
| | |
| | | | Biotechnology 5.6% | | | | |
| | 493,194 | | | ChemoCentryx, Inc.* | | | 19,816,535 | |
| | 959,648 | | | Cytokinetics, Inc.* | | | 11,314,250 | |
| | 570,609 | | | Denali Therapeutics, Inc.* | | | 9,991,364 | |
| | 247,950 | | | Esperion Therapeutics, Inc.* | | | 7,817,863 | |
| | 902,627 | | | Flexion Therapeutics, Inc.* | | | 7,103,674 | |
| | 506,667 | | | Frequency Therapeutics, Inc.* | | | 9,023,739 | |
| | 1,019,375 | | | Inovio Pharmaceuticals, Inc.* | | | 7,584,150 | |
| | 811,622 | | | MacroGenics, Inc.* | | | 4,723,640 | |
| | 1,381,294 | | | Sangamo Therapeutics, Inc.* | | | 8,798,843 | |
| | | | | | | | |
| | | | 86,174,058 | |
| | | | | | | | |
| | |
| | | | Building Products 1.6% | | | | |
| | 508,112 | | | AAON, Inc. | | | 24,551,972 | |
| | | | | | | | |
| | |
| | | | Data Processing & Outsourced Services 3.5% | | | | |
| | 473,572 | | | Euronet Worldwide, Inc.* | | | 40,594,592 | |
| | 921,402 | | | Repay Holdings Corp.* | | | 13,222,119 | |
| | | | | | | | |
| | | | 53,816,711 | |
| | | | | | | | |
| | |
| | | | Food Retail 1.0% | | | | |
| | 436,501 | | | Grocery Outlet Holding Corp.* | | | 14,989,444 | |
| | | | | | | | |
| | |
| | | | General Merchandise Stores 2.8% | | | | |
| | 904,685 | | | Ollie’s Bargain Outlet Holdings, Inc.* | | | 41,923,103 | |
| | | | | | | | |
| | |
| | | | Health Care Distributors 1.1% | | | | |
| | 749,595 | | | PetIQ, Inc.* | | | 17,413,092 | |
| | | | | | | | |
| | |
| | | | Health Care Equipment 2.7% | | | | |
| | 347,554 | | | Cantel Medical Corp. | | | 12,477,189 | |
| | 169,047 | | | Insulet Corp.* | | | 28,007,707 | |
| | | | | | | | |
| | | | 40,484,896 | |
| | | | | | | | |
| | |
| | | | Health Care Facilities 3.2% | | | | |
| | 1,067,095 | | | Ensign Group, Inc. (The) | | | 40,133,443 | |
| | 651,253 | | | Pennant Group, Inc. (The)* | | | 9,221,742 | |
| | | | | | | | |
| | | | 49,355,185 | |
| | | | | | | | |
| | |
| | | | Health Care Supplies 3.5% | | | | |
| | 587,012 | | | Neogen Corp.* | | | 39,323,934 | |
| | 430,704 | | | Silk Road Medical, Inc.* | | | 13,558,562 | |
| | | | | | | | |
| | | | 52,882,496 | |
| | | | | | | | |
| | |
| | | | Health Care Technology 1.3% | | | | |
| | 332,293 | | | Inspire Medical Systems, Inc.* | | | 20,030,622 | |
| | | | | | | | |
| | |
| | | | Home Improvement Retail 2.1% | | | | |
| | 997,613 | | | Floor & Decor Holdings, Inc., Class A* | | | 32,013,401 | |
| | | | | | | | |
| | |
| | | | Homebuilding 1.9% | | | | |
| | 629,267 | | | LGI Homes, Inc.* | | | 28,411,405 | |
| | | | | | | | |
| | | | | | | | |
| Shares | | | | | Value | |
| | | | | | | |
| | |
| | | | Industrial Machinery 9.9% | | | | |
| | 1,052,443 | | | Barnes Group, Inc. | | $ | 44,023,691 | |
| | 753,960 | | | Helios Technologies, Inc. | | | 28,590,163 | |
| | 1,168,658 | | | Kornit Digital Ltd.* (Israel) | | | 29,087,898 | |
| | 444,165 | | | RBC Bearings, Inc.* | | | 50,097,370 | |
| | | | | | | | |
| | | | 151,799,122 | |
| | | | | | | | |
| | |
| | | | Insurance Brokers 1.3% | | | | |
| | 440,004 | | | Goosehead Insurance, Inc., Class A* | | | 19,637,379 | |
| | | | | | | | |
| | |
| | | | Leisure Facilities 1.0% | | | | |
| | 305,974 | | | Planet Fitness, Inc., Class A* | | | 14,900,934 | |
| | | | | | | | |
| | |
| | | | Life Sciences Tools & Services 6.4% | | | | |
| | 340,050 | | | ICON plc* (Ireland) | | | 46,246,800 | |
| | 696,684 | | | Medpace Holdings, Inc.* | | | 51,122,672 | |
| | | | | | | | |
| | | | 97,369,472 | |
| | | | | | | | |
| | |
| | | | Managed Health Care 2.3% | | | | |
| | 692,100 | | | HealthEquity, Inc.* | | | 35,013,339 | |
| | | | | | | | |
| | |
| | | | Packaged Foods & Meats 2.6% | | | | |
| | 626,287 | | | Freshpet, Inc.* | | | 40,000,951 | |
| | | | | | | | |
| | |
| | | | Pharmaceuticals 0.7% | | | | |
| | 717,917 | | | Intra-Cellular Therapies, Inc.* | | | 11,034,384 | |
| | | | | | | | |
| | |
| | | | Regional Banks 3.0% | | | | |
| | 557,075 | | | Eagle Bancorp, Inc. | | | 16,829,236 | |
| | 779,964 | | | Pinnacle Financial Partners, Inc. | | | 29,279,848 | |
| | | | | | | | |
| | | | 46,109,084 | |
| | | | | | | | |
| | |
| | | | Restaurants 1.5% | | | | |
| | 745,159 | | | Chuy’s Holdings, Inc.* | | | 7,503,751 | |
| | 400,736 | | | Shake Shack, Inc., Class A* | | | 15,123,777 | |
| | | | | | | | |
| | | | 22,627,528 | |
| | | | | | | | |
| | |
| | | | Semiconductors 3.0% | | | | |
| | 276,984 | | | Monolithic Power Systems, Inc. | | | 46,383,741 | |
| | | | | | | | |
| | |
| | | | Specialty Stores 3.8% | | | | |
| | 425,609 | | | Five Below, Inc.* | | | 29,954,362 | |
| | 1,481,967 | | | National Vision Holdings, Inc.* | | | 28,779,799 | |
| | | | | | | | |
| | | | 58,734,161 | |
| | | | | | | | |
| | |
| | | | Systems Software 6.8% | | | | |
| | 413,039 | | | CyberArk Software Ltd.* (Israel) | | | 35,339,617 | |
| | 310,400 | | | Proofpoint, Inc.* | | | 31,843,936 | |
| | 858,338 | | | Rapid7, Inc.* | | | 37,191,785 | |
| | | | | | | | |
| | | | 104,375,338 | |
| | | | | | | | |
| | |
| | | | Trading Companies & Distributors 1.9% | | | | |
| | 397,840 | | | SiteOne Landscape Supply, Inc.* | | | 29,288,981 | |
| | | | | | | | |
| | |
| | | | Total Common Stocks
(cost $1,362,171,772) | | | 1,501,970,778 | |
| | | | | | | | |
| | |
| | | | PREFERRED STOCKS 0.6% | | | | |
| | |
| | | | Biotechnology 0.0% | | | | |
| | 677,966 | | | Nanosys, Inc., Series D Pfd.* *** † | | | 325,424 | |
| | 161,519 | | | Nanosys, Inc., Series E Pfd.* *** † | | | 188,977 | |
| | | | | | | | |
| | | | 514,401 | |
| | | | | | | | |
| | |
| | | | Systems Software 0.6% | | | | |
| | 1,114,610 | | | DataStax, Inc., Series E Pfd.* *** † | | | 8,359,575 | |
| | | | | | | | |
| | |
| | | | Total Preferred Stocks
(cost $10,184,941) | | | 8,873,976 | |
| | | | | | | | |
68
| | |
| | MARCH 31, 2020 (UNAUDITED) |
|
|
|
| | | | | | | | |
| Shares | | | | | Value | |
| | | | | | | |
| | | | LIMITED PARTNERSHIP INTEREST 0.1% | | | | |
| | |
| | | | Asset Management & Custody Banks 0.1% | | | | |
| | 1 | | | Greenspring Global PartnersII-B, L.P.* *** † | | $ | 813,460 | |
| | 1 | | | Greenspring Global PartnersIII-B, L.P.* *** † | | | 542,714 | |
| | | | | | | | |
| | | | 1,356,174 | |
| | | | | | | | |
| | |
| | | | Total Limited Partnership Interest
(cost $2,293,091) | | | 1,356,174 | |
| | | | | | | | |
| | |
Principal
Amount | | | | | Value | |
| | | | | | | |
| | | | SHORT-TERM INVESTMENTS 1.2% | | | | |
| | |
| | | | Repurchase Agreement 1.2% | | | | |
| | $19,057,062 | | | Repurchase Agreement dated 3/31/20, 0.00% due 4/1/20 with Fixed Income Clearing Corp. collateralized by $18,725,000 of United States Treasury Notes 1.750% due 7/15/22; value: $19,440,875; repurchase proceeds: $19,057,062 (cost $19,057,062) | | $ | 19,057,062 | |
| | | | | | | | |
| | |
| | | | Total Short-Term Investments
(cost $19,057,062) | | | 19,057,062 | |
| | | | | | | | |
| | |
| | | | Total Investments
(cost $1,393,706,866) 100.1% | | | 1,531,257,990 | |
| | |
| | | | Liabilities less Other Assets (0.1%) | | | (2,230,603 | ) |
| | | | | | | | |
| | |
| | | | NET ASSETS 100.0% | | $ | 1,529,027,387 | |
| | | | | | | | |
| |
| | | | *Non-income producing. ***Security was fair valued under procedures adopted by the Board of Trustees (see Note 12). †Security purchased in a private placement transaction or under Rule 144A of the Securities Act of 1933 (see Note 9). The aggregate value of securities purchased in a private placement transaction or under Rule 144A of the Securities Act of 1933 at March 31, 2020, amounted to approximately $10,230,150, and represented 0.67% of net assets. See Notes to Financial Statements. | |
At March 31, 2020, Wasatch Small Cap Growth Fund’s investments, excluding short-term investments, were in the following countries:
| | | | | |
| Country | | % |
Argentina | | | | 2.5 | |
Ireland | | | | 3.1 | |
Israel | | | | 4.3 | |
United States | | | | 90.1 | |
| | | | | |
TOTAL | | | | 100.0 | % |
| | | | | |
69
| | |
| WASATCH SMALL CAP VALUE FUND(WMCVX / WICVX) | | |
|
|
|
Schedule of Investments
| | | | | | | | |
| Shares | | | | | Value | |
| | | | | | | |
| | | | COMMON STOCKS 99.2% | | | | |
| | |
| | | | Advertising 1.2% | | | | |
| | 2,203,465 | | | National CineMedia, Inc. | | $ | 7,183,296 | |
| | | | | | | | |
| | |
| | | | Aerospace & Defense 1.5% | | | | |
| | 138,490 | | | HEICO Corp., Class A | | | 8,849,511 | |
| | | | | | | | |
| | |
| | | | Airlines 3.0% | | | | |
| | 108,416 | | | Allegiant Travel Co. | | | 8,868,429 | |
| | 191,133 | | | Copa Holdings S.A., Class A (Panama) | | | 8,656,413 | |
| | | | | | | | |
| | | | 17,524,842 | |
| | | | | | | | |
| | |
| | | | Apparel Retail 0.8% | | | | |
| | 594,625 | | | American Eagle Outfitters, Inc. | | | 4,727,269 | |
| | | | | | | | |
| | |
| | | | Application Software 4.0% | | | | |
| | 268,351 | | | Ebix, Inc. | | | 4,073,568 | |
| | 439,073 | | | Medallia, Inc.* | | | 8,799,023 | |
| | 399,431 | | | Upland Software, Inc.* | | | 10,712,740 | |
| | | | | | | | |
| | | | 23,585,331 | |
| | | | | | | | |
| | |
| | | | Asset Management & Custody Banks 5.0% | | | | |
| | 511,671 | | | Artisan Partners Asset Management, Inc., Class A | | | 10,995,810 | |
| | 336,282 | | | Hamilton Lane, Inc., Class A | | | 18,599,757 | |
| | | | | | | | |
| | | | 29,595,567 | |
| | | | | | | | |
| | |
| | | | Auto Parts & Equipment 2.2% | | | | |
| | 613,717 | | | Dana, Inc. | | | 4,793,130 | |
| | 143,824 | | | Dorman Products, Inc.* | | | 7,949,152 | |
| | | | | | | | |
| | | | 12,742,282 | |
| | | | | | | | |
| | |
| | | | Automotive Retail 4.8% | | | | |
| | 872,259 | | | Camping World Holdings, Inc., Class A | | | 4,963,154 | |
| | 78,286 | | | Lithia Motors, Inc., Class A | | | 6,403,012 | |
| | 384,157 | | | Monro, Inc. | | | 16,829,918 | |
| | | | | | | | |
| | | | 28,196,084 | |
| | | | | | | | |
| | |
| | | | Biotechnology 1.1% | | | | |
| | 91,303 | | | Ligand Pharmaceuticals, Inc.* | | | 6,639,554 | |
| | | | | | | | |
| | |
| | | | Building Products 1.2% | | | | |
| | 89,909 | | | Trex Co., Inc.* | | | 7,205,307 | |
| | | | | | | | |
| | |
| | | | Commercial Printing 2.0% | | | | |
| | 224,618 | | | Cimpress plc* | | | 11,949,678 | |
| | | | | | | | |
| | |
| | | | Commodity Chemicals 2.9% | | | | |
| | 1,290,992 | | | Valvoline, Inc. | | | 16,899,085 | |
| | | | | | | | |
| | |
| | | | Construction & Engineering 0.8% | | | | |
| | 294,741 | | | Construction Partners, Inc., Class A* | | | 4,978,175 | |
| | | | | | | | |
| | |
| | | | Data Processing & Outsourced Services 3.1% | | | | |
| | 210,965 | | | Euronet Worldwide, Inc.* | | | 18,083,920 | |
| | | | | | | | |
| | |
| | | | Diversified Banks 0.6% | | | | |
| | 2,107,384 | | | City Union Bank Ltd. (India) | | | 3,591,264 | |
| | | | | | | | |
| | |
| | | | Electrical Components & Equipment 0.9% | | | | |
| | 89,087 | | | Regal Beloit Corp. | | | 5,608,027 | |
| | | | | | | | |
| | |
| | | | Electronic Manufacturing Services 4.4% | | | | |
| | 473,370 | | | Fabrinet* | | | 25,827,067 | |
| | | | | | | | |
| | |
| | | | General Merchandise Stores 1.3% | | | | |
| | 161,246 | | | Ollie’s Bargain Outlet Holdings, Inc.* | | | 7,472,140 | |
| | | | | | | | |
| | |
| | | | Health Care Equipment 1.7% | | | | |
| | 273,880 | | | Cantel Medical Corp. | | | 9,832,292 | |
| | | | | | | | |
| | | | | | | | |
| Shares | | | | | Value | |
| | | | | | | |
| | |
| | | | Health Care Facilities 3.1% | | | | |
| | 488,644 | | | Ensign Group, Inc. (The) | | $ | 18,377,901 | |
| | | | | | | | |
| | |
| | | | Health Care Services 2.3% | | | | |
| | 97,407 | | | LHC Group, Inc.* | | | 13,656,461 | |
| | | | | | | | |
| | |
| | | | Home Furnishings 0.6% | | | | |
| | 582,418 | | | Lovesac Co. (The)* | | | 3,395,497 | |
| | | | | | | | |
| | |
| | | | Homebuilding 3.5% | | | | |
| | 242,624 | | | LGI Homes, Inc.* | | | 10,954,473 | |
| | 621,598 | | | Skyline Champion Corp.* | | | 9,746,657 | |
| | | | | | | | |
| | | | 20,701,130 | |
| | | | | | | | |
| | |
| | | | Hotel & Resort REITs 0.8% | | | | |
| | 438,115 | | | Xenia Hotels & Resorts, Inc. | | | 4,512,585 | |
| | | | | | | | |
| | |
| | | | Industrial Machinery 9.4% | | | | |
| | 592,011 | | | Altra Industrial Motion Corp. | | | 10,354,272 | |
| | 195,110 | | | Barnes Group, Inc. | | | 8,161,451 | |
| | 275,795 | | | Helios Technologies, Inc. | | | 10,458,147 | |
| | 357,760 | | | Kadant, Inc. | | | 26,706,784 | |
| | | | | | | | |
| | | | 55,680,654 | |
| | | | | | | | |
| | |
| | | | Industrial REITs 1.9% | | | | |
| | 945,408 | | | Monmouth Real Estate Investment Corp. | | | 11,392,166 | |
| | | | | | | | |
| | |
| | | | Investment Banking & Brokerage 2.3% | | | | |
| | 476,434 | | | Moelis & Co., Class A | | | 13,387,795 | |
| | | | | | | | |
| | |
| | | | Leisure Facilities 1.1% | | | | |
| | 137,777 | | | Planet Fitness, Inc., Class A* | | | 6,709,740 | |
| | | | | | | | |
| | |
| | | | Life Sciences Tools & Services 2.5% | | | | |
| | 110,471 | | | ICON plc* (Ireland) | | | 15,024,056 | |
| | | | | | | | |
| | |
| | | | Mortgage REITs 2.5% | | | | |
| | 1,788,378 | | | Arbor Realty Trust, Inc. | | | 8,763,052 | |
| | 1,236,950 | | | Ladder Capital Corp. | | | 5,863,143 | |
| | | | | | | | |
| | | | 14,626,195 | |
| | | | | | | | |
| | |
| | | | Office Services & Supplies 0.9% | | | | |
| | 229,244 | | | Herman Miller, Inc. | | | 5,089,217 | |
| | | | | | | | |
| | |
| | | | Paper Products 0.8% | | | | |
| | 219,533 | | | Domtar Corp. | | | 4,750,694 | |
| | | | | | | | |
| | |
| | | | Personal Products 0.9% | | | | |
| | 235,916 | | | Nu Skin Enterprises, Inc., Class A | | | 5,154,765 | |
| | | | | | | | |
| | |
| | | | Property & Casualty Insurance 1.0% | | | | |
| | 148,819 | | | Employers Holdings, Inc. | | | 6,028,658 | |
| | | | | | | | |
| | |
| | | | Publishing 0.3% | | | | |
| | 164,126 | | | Meredith Corp. | | | 2,005,620 | |
| | | | | | | | |
| | |
| | | | Regional Banks 8.1% | | | | |
| | 610,624 | | | Boston Private Financial Holdings, Inc. | | | 4,365,962 | |
| | 454,165 | | | FB Financial Corp. | | | 8,956,134 | |
| | 362,243 | | | Pinnacle Financial Partners, Inc. | | | 13,598,602 | |
| | 187,056 | | | South State Corp. | | | 10,985,799 | |
| | 429,960 | | | Webster Financial Corp. | | | 9,846,084 | |
| | | | | | | | |
| | | | 47,752,581 | |
| | | | | | | | |
| | |
| | | | Restaurants 0.8% | | | | |
| | 54,465 | | | Cracker Barrel Old Country Store, Inc. | | | 4,532,577 | |
| | | | | | | | |
| | |
| | | | Semiconductor Equipment 2.0% | | | | |
| | 358,134 | | | Nova Measuring Instruments Ltd.* (Israel) | | | 11,693,075 | |
| | | | | | | | |
| | |
| | | | Semiconductors 1.7% | | | | |
| | 641,877 | | | Tower Semiconductor Ltd.* (Israel) | | | 10,218,682 | |
| | | | | | | | |
70
| | |
| | MARCH 31, 2020 (UNAUDITED) |
|
|
|
| | | | | | | | |
| Shares | | | | | Value | |
| | | | | | | |
| | |
| | | | Specialized REITs 3.0% | | | | |
| | 594,439 | | | National Storage Affiliates Trust | | $ | 17,595,394 | |
| | | | | | | | |
| | |
| | | | Specialty Chemicals 3.4% | | | | |
| | 210,923 | | | Innospec, Inc. | | | 14,657,039 | |
| | 149,554 | | | Minerals Technologies, Inc. | | | 5,422,828 | |
| | | | | | | | |
| | | | 20,079,867 | |
| | | | | | | | |
| | |
| | | | Thrifts & Mortgage Finance 1.9% | | | | |
| | 605,403 | | | Axos Financial, Inc.* | | | 10,975,956 | |
| | | | | | | | |
| | |
| | | | Trucking 1.9% | | | | |
| | 333,052 | | | Knight-Swift Transportation Holdings, Inc. | | | 10,924,106 | |
| | | | | | | | |
| | |
| | | | Total Common Stocks
(cost $759,477,950) | | | 584,756,063 | |
| | | | | | | | |
| | |
Principal
Amount | | | | | Value | |
| | | | | | | |
| | | | SHORT-TERM INVESTMENTS 0.4% | | | | |
| | |
| | | | Repurchase Agreement 0.4% | | | | |
| | $2,554,797 | | | Repurchase Agreement dated 3/31/20, 0.00% due 4/1/20 with Fixed Income Clearing Corp. collateralized by $2,510,000 of United States Treasury Notes 1.750% due 7/15/22; value: $2,605,960; repurchase proceeds: $2,554,797 (cost $2,554,797) | | $ | 2,554,797 | |
| | | | | | | | |
| | |
| | | | Total Short-Term Investments
(cost $2,554,797) | | | 2,554,797 | |
| | | | | | | | |
| | |
| | | | Total Investments
(cost $762,032,747) 99.6%§ | | | 587,310,860 | |
| | |
| | | | Other Assets less Liabilities 0.4% | | | 2,246,043 | |
| | | | | | | | |
| | |
| | | | NET ASSETS 100.0% | | $ | 589,556,903 | |
| | | | | | | | |
| |
| | | | *Non-income producing. §The aggregate amount of foreign securities fair valued pursuant to a systematic valuation model as a percent of net assets was 0.61%. REIT Real Estate Investment Trust. See Notes to Financial Statements. | |
At March 31, 2020, Wasatch Small Cap Value Fund’s investments, excluding short-term investments, were in the following countries:
| | | | | |
| Country | | % |
India | | | | 0.6 | |
Ireland | | | | 2.6 | |
Israel | | | | 3.7 | |
Panama | | | | 1.5 | |
United States | | | | 91.6 | |
| | | | | |
TOTAL | | | | 100.0 | % |
| | | | | |
71
| | |
| WASATCH ULTRA GROWTH FUND(WAMCX / WGMCX) | | |
|
|
|
Schedule of Investments
| | | | | | | | |
| Shares | | | | | Value | |
| | | | | | | |
| | | | COMMON STOCKS 96.3% | | | | |
| | |
| | | | Alternative Carriers 1.7% | | | | |
| | 186,538 | | | Bandwidth, Inc., Class A* | | $ | 12,552,142 | |
| | | | | | | | |
| | |
| | | | Application Software 16.0% | | | | |
| | 191,910 | | | Avalara, Inc.* | | | 14,316,486 | |
| | 164,485 | | | DocuSign, Inc.* | | | 15,198,414 | |
| | 255,718 | | | Five9, Inc.* | | | 19,552,198 | |
| | 99,192 | | | Globant S.A.* (Argentina) | | | 8,716,993 | |
| | 125,557 | | | HubSpot, Inc.* | | | 16,722,937 | |
| | 655,970 | | | Medallia, Inc.* | | | 13,145,639 | |
| | 207,026 | | | Paylocity Holding Corp.* | | | 18,284,536 | |
| | 232,976 | | | Zendesk, Inc.* | | | 14,912,794 | |
| | | | | | | | |
| | | | 120,849,997 | |
| | | | | | | | |
| | |
| | | | Automotive Retail 0.9% | | | | |
| | 153,722 | | | Monro, Inc. | | | 6,734,561 | |
| | | | | | | | |
| | |
| | | | Biotechnology 15.0% | | | | |
| | 139,152 | | | Atara Biotherapeutics, Inc.* | | | 1,184,184 | |
| | 458,204 | | | Castle Biosciences, Inc.* | | | 13,659,061 | |
| | 213,998 | | | ChemoCentryx, Inc.* | | | 8,598,440 | |
| | 780,555 | | | Cytokinetics, Inc.* | | | 9,202,743 | |
| | 189,807 | | | Denali Therapeutics, Inc.* | | | 3,323,521 | |
| | 198,404 | | | Esperion Therapeutics, Inc.* | | | 6,255,678 | |
| | 284,886 | | | Exact Sciences Corp.* | | | 16,523,388 | |
| | 585,286 | | | Flexion Therapeutics, Inc.* | | | 4,606,201 | |
| | 227,868 | | | Frequency Therapeutics, Inc.* | | | 4,058,329 | |
| | 1,014,882 | | | Inovio Pharmaceuticals, Inc.* | | | 7,550,722 | |
| | 87,474 | | | Ligand Pharmaceuticals, Inc.* | | | 6,361,109 | |
| | 676,664 | | | MacroGenics, Inc.* | | | 3,938,185 | |
| | 3,260,094 | | | MEI Pharma, Inc.* | | | 5,248,751 | |
| | 1,617,910 | | | Sangamo Therapeutics, Inc.* | | | 10,306,087 | |
| | 78,647 | | | Seattle Genetics, Inc.* | | | 9,074,291 | |
| | 1,407,074 | | | Selecta Biosciences, Inc.* | | | 3,391,048 | |
| | | | | | | | |
| | | | 113,281,738 | |
| | | | | | | | |
| | |
| | | | Building Products 2.8% | | | | |
| | 111,288 | | | AAON, Inc. | | | 5,377,436 | |
| | 197,751 | | | Trex Co., Inc.* | | | 15,847,765 | |
| | | | | | | | |
| | | | 21,225,201 | |
| | | | | | | | |
| | |
| | | | Construction & Engineering 0.7% | | | | |
| | 130,491 | | | NV5 Global, Inc.* | | | 5,387,973 | |
| | | | | | | | |
| | |
| | | | Data Processing & Outsourced Services 0.8% | | | | |
| | 117,220 | | | Square, Inc.* | | | 6,139,984 | |
| | | | | | | | |
| | |
| | | | Diversified Banks 0.6% | | | | |
| | 2,489,169 | | | City Union Bank Ltd. (India) | | | 4,241,877 | |
| | | | | | | | |
| | |
| | | | Electronic Equipment & Instruments 1.1% | | | | |
| | 807,221 | | | nLight, Inc.* | | | 8,467,748 | |
| | | | | | | | |
| | |
| | | | Electronic Manufacturing Services 1.1% | | | | |
| | 75,925 | | | IPG Photonics Corp.* | | | 8,373,009 | |
| | | | | | | | |
| | |
| | | | Financial Exchanges & Data 1.1% | | | | |
| | 206,512 | | | Tradeweb Markets, Inc., Class A | | | 8,681,764 | |
| | | | | | | | |
| | |
| | | | Food Distributors 0.2% | | | | |
| | 186,752 | | | Chefs’ Warehouse, Inc. (The)* | | | 1,880,593 | |
| | | | | | | | |
| | |
| | | | Food Retail 2.1% | | | | |
| | 471,529 | | | Grocery Outlet Holding Corp.* | | | 16,192,306 | |
| | | | | | | | |
| | |
| | | | General Merchandise Stores 2.3% | | | | |
| | 378,261 | | | Ollie’s Bargain Outlet Holdings, Inc.* | | | 17,528,615 | |
| | | | | | | | |
| | | | | | | | |
| Shares | | | | | Value | |
| | | | | | | |
| | |
| | | | Health Care Equipment 8.7% | | | | |
| | 417,208 | | | AtriCure, Inc.* | | $ | 14,014,017 | |
| | 701,462 | | | CryoLife, Inc.* | | | 11,868,737 | |
| | 413,406 | | | Glaukos Corp.* | | | 12,757,709 | |
| | 54,536 | | | Insulet Corp.* | | | 9,035,525 | |
| | 276,769 | | | Tandem Diabetes Care, Inc.* | | | 17,810,085 | |
| | | | | | | | |
| | | | 65,486,073 | |
| | | | | | | | |
| | |
| | | | Health Care Services 0.9% | | | | |
| | 437,732 | | | Exagen, Inc.*§§ | | | 6,977,448 | |
| | | | | | | | |
| | |
| | | | Health Care Supplies 2.1% | | | | |
| | 495,412 | | | Silk Road Medical, Inc.* | | | 15,595,570 | |
| | | | | | | | |
| | |
| | | | Health Care Technology 5.7% | | | | |
| | 206,597 | | | Inspire Medical Systems, Inc.* | | | 12,453,667 | |
| | 275,646 | | | Tabula Rasa HealthCare, Inc.* | | | 14,413,530 | |
| | 101,030 | | | Veeva Systems, Inc., Class A* | | | 15,798,061 | |
| | | | | | | | |
| | | | 42,665,258 | |
| | | | | | | | |
| | |
| | | | Heavy Electrical Equipment 1.0% | | | | |
| | 499,468 | | | TPI Composites, Inc.* | | | 7,382,137 | |
| | | | | | | | |
| | |
| | | | Home Improvement Retail 1.4% | | | | |
| | 340,857 | | | Floor & Decor Holdings, Inc., Class A* | | | 10,938,101 | |
| | | | | | | | |
| | |
| | | | Homebuilding 1.1% | | | | |
| | 191,688 | | | LGI Homes, Inc.* | | | 8,654,713 | |
| | | | | | | | |
| | |
| | | | Industrial Machinery 3.4% | | | | |
| | 240,288 | | | Barnes Group, Inc. | | | 10,051,247 | |
| | 632,338 | | | Kornit Digital Ltd.* (Israel) | | | 15,738,893 | |
| | | | | | | | |
| | | | 25,790,140 | |
| | | | | | | | |
| | |
| | | | Industrial REITs 1.4% | | | | |
| | 848,929 | | | Monmouth Real Estate Investment Corp. | | | 10,229,594 | |
| | | | | | | | |
| | |
| | | | Insurance Brokers 0.9% | | | | |
| | 154,259 | | | Goosehead Insurance, Inc., Class A* | | | 6,884,579 | |
| | | | | | | | |
| | |
| | | | Internet & Direct Marketing Retail 1.1% | | | | |
| | 157,739 | | | Wayfair, Inc., Class A* | | | 8,429,572 | |
| | | | | | | | |
| | |
| | | | IT Consulting & Other Services 1.1% | | | | |
| | 230,374 | | | Endava plc ADR* (United Kingdom) | | | 8,099,950 | |
| | | | | | | | |
| | |
| | | | Life Sciences Tools & Services 2.1% | | | | |
| | 115,384 | | | ICON plc* (Ireland) | | | 15,692,224 | |
| | | | | | | | |
| | |
| | | | Oil & Gas Equipment & Services 0.4% | | | | |
| | 625,384 | | | Solaris Oilfield Infrastructure, Inc., Class A | | | 3,283,266 | |
| | | | | | | | |
| | |
| | | | Packaged Foods & Meats 3.3% | | | | |
| | 388,157 | | | Freshpet, Inc.* | | | 24,791,588 | |
| | | | | | | | |
| | |
| | | | Pharmaceuticals 1.7% | | | | |
| | 444,493 | | | BioDelivery Sciences International, Inc.* | | | 1,684,628 | |
| | 562,875 | | | Intra-Cellular Therapies, Inc.* | | | 8,651,389 | |
| | 526,410 | | | Optinose, Inc.* | | | 2,363,581 | |
| | | | | | | | |
| | | | 12,699,598 | |
| | | | | | | | |
| | |
| | | | Regional Banks 2.5% | | | | |
| | 411,046 | | | Bank OZK | | | 6,864,468 | |
| | 110,478 | | | Eagle Bancorp, Inc. | | | 3,337,540 | |
| | 253,041 | | | Esquire Financial Holdings, Inc.* | | | 3,808,267 | |
| | 125,083 | | | Pinnacle Financial Partners, Inc. | | | 4,695,616 | |
| | | | | | | | |
| | | | 18,705,891 | |
| | | | | | | | |
| | |
| | | | Restaurants 0.3% | | | | |
| | 241,893 | | | Chuy’s Holdings, Inc.* | | | 2,435,863 | |
| | | | | | | | |
| | |
| | | | Semiconductor Equipment 1.5% | | | | |
| | 337,399 | | | Nova Measuring Instruments Ltd.* (Israel) | | | 11,016,077 | |
| | | | | | | | |
72
| | |
| | MARCH 31, 2020 (UNAUDITED) |
|
|
|
| | | | | | | | |
Shares | | | | | Value | |
| | | | | | | |
| | |
| | | | Semiconductors 2.5% | | | | |
| | 101,676 | | | Monolithic Power Systems, Inc. | | $ | 17,026,663 | |
| | 42,910 | | | NVE Corp. | | | 2,232,607 | |
| | | | | | | | |
| | | | 19,259,270 | |
| | | | | | | | |
| | |
| | | | Specialty Chemicals 1.4% | | | | |
| | 103,753 | | | Balchem Corp. | | | 10,242,496 | |
| | | | | | | | |
| | |
| | | | Specialty Stores 1.7% | | | | |
| | 183,727 | | | Five Below, Inc.* | | | 12,930,706 | |
| | | | | | | | |
| | |
| | | | Systems Software 2.2% | | | | |
| | 162,583 | | | Proofpoint, Inc.* | | | 16,679,390 | |
| | | | | | | | |
| | |
| | | | Trucking 1.5% | | | | |
| | 340,768 | | | Knight-Swift Transportation Holdings, Inc. | | | 11,177,190 | |
| | | | | | | | |
| | |
| | | | Total Common Stocks
(cost $758,000,684) | | | 727,584,202 | |
| | | | | | | | |
| | |
| | | | PREFERRED STOCKS 0.0% | | | | |
| | |
| | | | Biotechnology 0.0% | | | | |
| | 169,492 | | | Nanosys, Inc., Series D Pfd.* *** † | | | 81,356 | |
| | 40,380 | | | Nanosys, Inc., Series E Pfd.* *** † | | | 47,245 | |
| | | | | | | | |
| | | | 128,601 | |
| | | | | | | | |
| | |
| | | | Total Preferred Stocks
(cost $546,237) | | | 128,601 | |
| | | | | | | | |
| | |
| | | | LIMITED PARTNERSHIP INTEREST 0.2% | | | | |
| | |
| | | | Asset Management & Custody Banks 0.2% | | | | |
| | 1 | | | Greenspring Global PartnersII-B, L.P.* *** † | | | 732,108 | |
| | 1 | | | Greenspring Global PartnersIII-B, L.P.* *** † | | | 542,714 | |
| | | | | | | | |
| | | | 1,274,822 | |
| | | | | | | | |
| | |
| | | | Total Limited Partnership Interest
(cost $2,118,351) | | | 1,274,822 | |
| | | | | | | | |
| | |
| | | | WARRANTS 0.1% | | | | |
| | |
| | | | Biotechnology 0.1% | | | | |
| | 636,960 | | | Selecta Biosciences, Inc., 12/23/2024* *** † | | | 796,200 | |
| | | | | | | | |
| | |
| | | | Total Warrants
(cost $79,620) | | | 796,200 | |
| | | | | | | | |
| | | | | | | | |
Principal
Amount | | | | | Value | |
| | | | | | | |
| | | | SHORT-TERM INVESTMENTS 3.2% | | | | |
| | |
| | | | Repurchase Agreement 3.2% | | | | |
| | $24,090,965 | | | Repurchase Agreement dated 3/31/20, 0.00% due 4/1/20 with Fixed Income Clearing Corp. collateralized by $23,670,000 of United States Treasury Notes 1.750% due 7/15/22; value: $24,574,928; repurchase proceeds: $24,090,965 (cost $24,090,965) | | $ | 24,090,965 | |
| | | | | | | | |
| | |
| | | | Total Short-Term Investments
(cost $24,090,965) | | | 24,090,965 | |
| | | | | | | | |
| | |
| | | | Total Investments
(cost $784,835,857) 99.8%§ | | | 753,874,790 | |
| | |
| | | | Other Assets less Liabilities 0.2% | | | 1,140,762 | |
| | | | | | | | |
| | |
| | | | NET ASSETS 100.0% | | $ | 755,015,552 | |
| | | | | | | | |
| |
| | | | *Non-income producing. ***Security was fair valued under procedures adopted by the Board of Trustees (see Note 12). †Security purchased in a private placement transaction or under Rule 144A of the Securities Act of 1933 (see Note 9). The aggregate value of securities purchased in a private placement transaction or under Rule 144A of the Securities Act of 1933 at March 31, 2020, amounted to approximately $1,403,423, and represented 0.19% of net assets. §The aggregate amount of foreign securities fair valued pursuant to a systematic valuation model as a percent of net assets was 0.56%. §§The aggregate value of illiquid holdings at March 31, 2020, amounted to approximately $6,977,448, and represented 0.92% of net assets. ADR American Depositary Receipt. REIT Real Estate Investment Trust. See Notes to Financial Statements. | |
At March 31, 2020, Wasatch Ultra Growth Fund’s investments, excluding short-term investments, were in the following countries:
| | | | | |
| Country | | % |
Argentina | | | | 1.2 | |
India | | | | 0.6 | |
Ireland | | | | 2.1 | |
Israel | | | | 3.7 | |
United Kingdom | | | | 1.1 | |
United States | | | | 91.3 | |
| | | | | |
TOTAL | | | | 100.0 | % |
| | | | | |
73
| | |
| WASATCH-HOISINGTON U.S. TREASURY FUND(WHOSX) | | MARCH 31, 2020 (UNAUDITED) |
|
|
|
Schedule of Investments
| | | | | | | | |
Principal
Amount | | | | | Value | |
| | | | | | | |
| | | | U.S. GOVERNMENT OBLIGATIONS 98.1% | |
| | |
| | $87,900,000 | | | U.S. Treasury Bond, 2.25%, 8/15/46 | | $ | 106,104,914 | |
| | 9,500,000 | | | U.S. Treasury Bond, 2.25%, 8/15/49 | | | 11,573,301 | |
| | 25,150,000 | | | U.S. Treasury Bond, 2.50%, 2/15/45 | | | 31,446,342 | |
| | 3,500,000 | | | U.S. Treasury Bond, 2.875%, 5/15/49 | | | 4,775,723 | |
| | 45,530,000 | | | U.S. Treasury Bond, 3.00%, 8/15/48 | | | 63,244,016 | |
| | 33,000,000 | | | U.S. Treasury Strip, principal only, 8/15/40 | | | 25,969,717 | |
| | 96,000,000 | | | U.S. Treasury Strip, principal only, 5/15/44 | | | 68,753,490 | |
| | 136,700,000 | | | U.S. Treasury Strip, principal only, 8/15/45 | | | 96,578,643 | |
| | | | | | | | |
| | |
| | | | Total U.S. Government Obligations
(cost $304,350,984) | | | 408,446,146 | |
| | | | | | | | |
| | | | | | | | |
Principal
Amount | | | | | Value | |
| | | | | | | |
| | | | SHORT-TERM INVESTMENTS 1.7% | | | | |
| | |
| | | | Repurchase Agreement 1.7% | | | | |
| | $ 7,018,524 | | | Repurchase Agreement dated 3/31/20, 0.00% due 4/1/20 with Fixed Income Clearing Corp. collateralized by $6,900,000 of United States Treasury Notes 2.375% due 3/15/22; value $7,163,794; repurchase proceeds: $7,018,524 (cost $7,018,524) | | $ | 7,018,524 | |
| | | | | | | | |
| | |
| | | | Total Short-Term Investments
(cost $7,018,524) | | | 7,018,524 | |
| | | | | | | | |
| | |
| | | | Total Investments
(cost $311,369,508) 99.8% | | | 415,464,670 | |
| | |
| | | | Other Assets less Liabilities 0.2% | | | 963,439 | |
| | | | | | | | |
| | |
| | | | NET ASSETS 100.0% | | $ | 416,428,109 | |
| | | | | | | | |
| |
| | | | See Notes to Financial Statements. | |
74
(This page intentionally left blank.)
75
Statements of Assets and Liabilities
| | | | | | | | | | | | | | | |
| | | CORE
GROWTH
FUND | | EMERGING
INDIA
FUND | | EMERGING
MARKETS
SELECT FUND |
| | | | | | | | | | | | | | | |
Assets: | | | | | | | | | | | | | | | |
Investments, at cost | |
Unaffiliated issuers | | | $ | 1,714,731,544 | | | | $ | 208,838,307 | | | | $ | 33,051,994 | |
Repurchase agreements | | | | 16,332,508 | | | | | — | | | | | — | |
| | | | | | | | | | | | | | | |
| | | $ | 1,731,064,052 | | | | $ | 208,838,307 | | | | $ | 33,051,994 | |
| | | | | | | | | | | | | | | |
Investments, at market value | |
Unaffiliated issuers | | | $ | 1,868,906,502 | | | | $ | 207,585,536 | | | | $ | 35,707,695 | |
Repurchase agreements | | | | 16,332,508 | | | | | — | | | | | — | |
| | | | | | | | | | | | | | | |
| | | | 1,885,239,010 | | | | | 207,585,536 | | | | | 35,707,695 | |
Cash | | | | — | | | | | 1 | | | | | 90,831 | |
Foreign currency on deposit (cost of $62,148, $1,762,790, $1, $11,273, $17,898, $7,210, $0, $0 and $112,217, respectively) | | | | 62,122 | | | | | 1,762,082 | | | | | 1 | |
Receivable for investment securities sold | | | | 6,990,190 | | | | | 1,164,818 | | | | | 411,914 | |
Capital shares receivable | | | | 3,895,398 | | | | | 270,556 | | | | | 582,630 | |
Interest and dividends receivable | | | | 662,671 | | | | | 213,969 | | | | | 34,280 | |
Receivable from Investment Advisor | | | | — | | | | | — | | | | | — | |
Prepaid expenses and other assets | | | | 112,209 | | | | | 33,323 | | | | | 4,747 | |
| | | | | | | | | | | | | | | |
Total Assets | | | | 1,896,961,600 | | | | | 211,030,285 | | | | | 36,832,098 | |
| | | | | | | | | | | | | | | |
Liabilities: | |
Bank overdraft | | | | 55,581 | | | | | — | | | | | — | |
Payable for securities purchased | | | | 5,749,875 | | | | | — | | | | | 55,845 | |
Capital shares payable | | | | 3,150,249 | | | | | 1,159,885 | | | | | — | |
Dividends payable to shareholders | | | | — | | | | | — | | | | | — | |
Payable to Advisor | | | | 1,666,935 | | | | | 268,666 | | | | | 29,230 | |
Accrued fund administration fees | | | | 214,743 | | | | | 29,574 | | | | | 4,372 | |
Accrued expenses and other liabilities | | | | 438,735 | | | | | 200,410 | | | | | 69,925 | |
Foreign capital gains taxes payable | | | | 20,016 | | | | | 42,689 | | | | | — | |
Line of credit payable | | | | — | | | | | 8,179,937 | | | | | — | |
| | | | | | | | | | | | | | | |
Total Liabilities | | | | 11,296,134 | | | | | 9,881,161 | | | | | 159,372 | |
| | | | | | | | | | | | | | | |
Net Assets | | | $ | 1,885,665,466 | | | | $ | 201,149,124 | | | | $ | 36,672,726 | |
| | | | | | | | | | | | | | | |
Net Assets Consist of: | |
Capital stock | | | $ | 343,311 | | | | $ | 621,164 | | | | $ | 37,711 | |
Paid-in-capital in excess of par | | | | 1,696,523,761 | | | | | 209,841,583 | | | | | 38,790,253 | |
Distributable earnings (accumulated loss) | | | | 188,798,394 | | | | | (9,313,623 | ) | | | | (2,155,238 | ) |
| | | | | | | | | | | | | | | |
Net Assets | | | $ | 1,885,665,466 | | | | $ | 201,149,124 | | | | $ | 36,672,726 | |
| | | | | | | | | | | | | | | |
Net Assets | |
Investor Class | | | | 1,147,310,179 | | | | | 115,873,347 | | | | | 8,956,989 | |
Institutional Class | | | | 738,355,287 | | | | | 85,275,777 | | | | | 27,715,737 | |
| | | |
Capital Stock Issued and Outstanding (Unlimited number of
shares authorized, $0.01 par value) | | | | | | | | | | | | | | | |
Investor Class | | | | 20,977,734 | | | | | 35,911,762 | | | | | 934,706 | |
Institutional Class | | | | 13,353,390 | | | | | 26,204,620 | | | | | 2,836,347 | |
| | | |
NET ASSET VALUE, REDEMPTION PRICEAND OFFERING PRICE PER SHARE | | | | | | | | | | | | | | | |
Investor Class | | | $ | 54.69 | | | | $ | 3.23 | | | | $ | 9.58 | |
| | | | | | | | | | | | | | | |
Institutional Class | | | $ | 55.29 | | | | $ | 3.25 | | | | $ | 9.77 | |
| | | | | | | | | | | | | | | |
| 1 | Fund inception date was October 1, 2019. |
See Notes to Financial Statements.
76
| | |
| | MARCH 31, 2020 (UNAUDITED) |
|
|
|
| | | | | | | | | | | | | | | | | | | | | | | | | | | | |
EMERGING
MARKETS
SMALL CAP
FUND | | FRONTIER
EMERGING
SMALL COUNTRIES
FUND | | GLOBAL
OPPORTUNITIES
FUND | | GLOBAL
SELECT
FUND1 | | GLOBAL
VALUE
FUND | | INTERNATIONAL
GROWTH
FUND |
| | | | | | | | | | | | | | | | | | | | | | | | | | | | | |
| | | | | | | | | | | | | | | | | | | | | | | | | | | | | |
| | | | | | | | | | | | | | | | | | | | | | | | | | | | | |
| | $ | 225,563,343 | | | | $ | 47,587,713 | | | | $ | 85,175,665 | | | | $ | 10,877,746 | | | | $ | 115,034,953 | | | | $ | 749,638,393 | |
| | | 1,507,568 | | | | | 621,965 | | | | | 1,146,292 | | | | | — | | | | | 1,719,483 | | | | | 15,256,660 | |
| | | | | | | | | | | | | | | | | | | | | | | | | | | | | |
| | $ | 227,070,911 | | | | $ | 48,209,678 | | | | $ | 86,321,957 | | | | $ | 10,877,746 | | | | $ | 116,754,436 | | | | $ | 764,895,053 | |
| | | | | | | | | | | | | | | | | | | | | | | | | | | | | |
| | | | | | | | | | | | | | | | | | | | | | | | | | | | | |
| | $ | 278,294,840 | | | | $ | 39,506,467 | | | | $ | 95,879,211 | | | | $ | 9,505,707 | | | | $ | 98,691,789 | | | | $ | 883,686,661 | |
| | | 1,507,568 | | | | | 621,965 | | | | | 1,146,292 | | | | | — | | | | | 1,719,483 | | | | | 15,256,660 | |
| | | | | | | | | | | | | | | | | | | | | | | | | | | | | |
| | | 279,802,408 | | | | | 40,128,432 | | | | | 97,025,503 | | | | | 9,505,707 | | | | | 100,411,272 | | | | | 898,943,321 | |
| | | 1 | | | | | 260,343 | | | | | — | | | | | 49,206 | | | | | — | | | | | 4 | |
| |
|
11,268 |
| | | | 17,879 | | | | | 7,217 | | | | | — | | | | | — | | | | | 112,378 | |
| | | 1,431,122 | | | | | 89,140 | | | | | 36,537 | | | | | — | | | | | 1,224,086 | | | | | 2,781,108 | |
| | | 488,759 | | | | | 5,600 | | | | | 67,537 | | | | | 12,118 | | | | | 9,898 | | | | | 1,194,175 | |
| | | 1,083,866 | | | | | 68,085 | | | | | 104,100 | | | | | 4,346 | | | | | 792,842 | | | | | 3,360,065 | |
| | | — | | | | | — | | | | | — | | | | | 12,688 | | | | | — | | | | | — | |
| | | 44,740 | | | | | 19,185 | | | | | 23,497 | | | | | 48,144 | | | | | 15,868 | | | | | 76,775 | |
| | | | | | | | | | | | | | | | | | | | | | | | | | | | | |
| | | 282,862,164 | | | | | 40,588,664 | | | | | 97,264,391 | | | | | 9,632,209 | | | | | 102,453,966 | | | | | 906,467,826 | |
| | | | | | | | | | | | | | | | | | | | | | | | | | | | | |
| | | | | | | | | | | | | | | | | | | | | | | | | | | | | |
| | | — | | | | | — | | | | | — | | | | | — | | | | | — | | | | | — | |
| | | 147,997 | | | | | — | | | | | 182 | | | | | — | | | | | 1,292,140 | | | | | 5,144,703 | |
| | | 631,415 | | | | | 89,135 | | | | | 103,183 | | | | | 861 | | | | | 143,327 | | | | | 1,461,743 | |
| | | — | | | | | — | | | | | — | | | | | — | | | | | 11,469 | | | | | — | |
| | | 449,031 | | | | | 55,701 | | | | | 110,383 | | | | | — | | | | | 64,966 | | | | | 1,022,735 | |
| | | 43,781 | | | | | 8,414 | | | | | 13,672 | | | | | 666 | | | | | 21,454 | | | | | 132,924 | |
| | | 219,584 | | | | | 90,900 | | | | | 88,539 | | | | | 487 | | | | | 167,213 | | | | | 315,280 | |
| | | 621,297 | | | | | 383,139 | | | | | 13,520 | | | | | — | | | | | — | | | | | 20,859 | |
| | | — | | | | | — | | | | | — | | | | | — | | | | | — | | | | | — | |
| | | | | | | | | | | | | | | | | | | | | | | | | | | | | |
| | | 2,113,105 | | | | | 627,289 | | | | | 329,479 | | | | | 2,014 | | | | | 1,700,569 | | | | | 8,098,244 | |
| | | | | | | | | | | | | | | | | | | | | | | | | | | | | |
| | $ | 280,749,059 | | | | $ | 39,961,375 | | | | $ | 96,934,912 | | | | $ | 9,630,195 | | | | $ | 100,753,397 | | | | $ | 898,369,582 | |
| | | | | | | | | | | | | | | | | | | | | | | | | | | | | |
| | | | | | | | | | | | | | | | | | | | | | | | | | | | | |
| | $ | 1,318,428 | | | | $ | 192,253 | | | | $ | 371,103 | | | | $ | 10,697 | | | | $ | 175,005 | | | | $ | 371,343 | |
| | | 223,498,088 | | | | | 155,860,568 | | | | | 86,929,597 | | | | | 11,002,628 | | | | | 292,748,059 | | | | | 747,927,055 | |
| | | 55,932,543 | | | | | (116,091,446 | ) | | | | 9,634,212 | | | | | (1,383,130 | ) | | | | (192,169,667 | ) | | | | 150,071,184 | |
| | | | | | | | | | | | | | | | | | | | | | | | | | | | | |
| | $ | 280,749,059 | | | | $ | 39,961,375 | | | | $ | 96,934,912 | | | | $ | 9,630,195 | | | | $ | 100,753,397 | | | | $ | 898,369,582 | |
| | | | | | | | | | | | | | | | | | | | | | | | | | | | | |
| | | | | | | | | | | | | | | | | | | | | | | | | | | | | |
| | | 152,500,570 | | | | | 30,196,523 | | | | | 78,268,265 | | | | | 2,100,474 | | | | | 95,143,390 | | | | | 425,430,375 | |
| | | 128,248,489 | | | | | 9,764,852 | | | | | 18,666,647 | | | | | 7,529,721 | | | | | 5,610,007 | | | | | 472,939,207 | |
| | | | | |
| | | | | | | | | | | | | | | | | | | | | | | | | | | | | |
| | | 71,870,475 | | | | | 14,562,296 | | | | | 29,997,823 | | | | | 233,695 | | | | | 16,524,380 | | | | | 17,624,656 | |
| | | 59,972,309 | | | | | 4,663,021 | | | | | 7,112,469 | | | | | 835,963 | | | | | 976,081 | | | | | 19,509,683 | |
| | | | | |
| | | | | | | | | | | | | | | | | | | | | | | | | | | | | |
| | $ | 2.12 | | | | $ | 2.07 | | | | $ | 2.61 | | | | $ | 8.99 | | | | $ | 5.76 | | | | $ | 24.14 | |
| | | | | | | | | | | | | | | | | | | | | | | | | | | | | |
| | $ | 2.14 | | | | $ | 2.09 | | | | $ | 2.62 | | | | $ | 9.01 | | | | $ | 5.75 | | | | $ | 24.24 | |
| | | | | | | | | | | | | | | | | | | | | | | | | | | | | |
77
Statements of Assets and Liabilities(continued)
| | | | | | | | | | | | | | | |
| | | INTERNATIONAL
OPPORTUNITIES
FUND | | INTERNATIONAL
SELECT
FUND1 | | MICRO
CAP
FUND2 |
| | | | | | | | | | | | | | | |
Assets: | | | | | | | | | | | | | | | |
Investments, at cost | |
Unaffiliated issuers | | | $ | 357,717,686 | | | | $ | 3,094,156 | | | | $ | 438,967,545 | |
Affiliated issuers3 | | | | — | | | | | — | | | | | 24,875,774 | |
Repurchase agreements | | | | 14,461,322 | | | | | — | | | | | 3,323,503 | |
| | | | | | | | | | | | | | | |
| | | $ | 372,179,008 | | | | $ | 3,094,156 | | | | $ | 467,166,822 | |
| | | | | | | | | | | | | | | |
Investments, at market value | |
Unaffiliated issuers | | | $ | 432,188,884 | | | | $ | 2,798,929 | | | | $ | 432,117,460 | |
Affiliated issuers3 | | | | — | | | | | — | | | | | 14,532,568 | |
Repurchase agreements | | | | 14,461,322 | | | | | — | | | | | 3,323,503 | |
| | | | | | | | | | | | | | | |
| | | | 446,650,206 | | | | | 2,798,929 | | | | | 449,973,531 | |
Cash | | | | 2 | | | | | — | | | | | 2 | |
Foreign currency on deposit (cost of $1,153,833, $872, $5, $4,761, $0, $13,934, $16,458 and $0, respectively) | | | | 1,153,833 | | | | | 877 | | | | | 5 | |
Receivable for investment securities sold | | | | 5,395,894 | | | | | 6,976 | | | | | 3,156,904 | |
Capital shares receivable | | | | 810,346 | | | | | 6,000 | | | | | 584,975 | |
Interest and dividends receivable | | | | 1,388,843 | | | | | 1,700 | | | | | 82,787 | |
Receivable from Investment Advisor | | | | — | | | | | 17,749 | | | | | — | |
Prepaid expenses and other assets | | | | 31,151 | | | | | 47,652 | | | | | 31,867 | |
| | | | | | | | | | | | | | | |
Total Assets | | | | 455,430,275 | | | | | 2,879,883 | | | | | 453,830,071 | |
| | | | | | | | | | | | | | | |
Liabilities: | |
Payable for securities purchased | | | | 9,260,502 | | | | | — | | | | | 2,252,864 | |
Capital shares payable | | | | 540,311 | | | | | — | | | | | 519,790 | |
Dividends payable to shareholders | | | | — | | | | | — | | | | | — | |
Payable to Advisor | | | | 684,656 | | | | | — | | | | | 614,096 | |
Accrued fund administration fees | | | | 52,245 | | | | | 149 | | | | | 54,080 | |
Accrued expenses and other liabilities | | | | 173,851 | | | | | 647 | | | | | 88,029 | |
Foreign capital gains taxes payable | | | | — | | | | | — | | | | | — | |
Line of credit payable | | | | — | | | | | 82,759 | | | | | — | |
| | | | | | | | | | | | | | | |
Total Liabilities | | | | 10,711,565 | | | | | 83,555 | | | | | 3,528,859 | |
| | | | | | | | | | | | | | | |
Net Assets | | | $ | 444,718,710 | | | | $ | 2,796,328 | | | | $ | 450,301,212 | |
| | | | | | | | | | | | | | | |
Net Assets Consist of: | |
Capital stock | | | $ | 1,453,902 | | | | $ | 2,948 | | | | $ | 785,330 | |
Paid-in-capital in excess of par | | | | 375,940,143 | | | | | 3,110,655 | | | | | 444,741,795 | |
Distributable earnings (accumulated loss) | | | | 67,324,665 | | | | | (317,275 | ) | | | | 4,774,087 | |
| | | | | | | | | | | | | | | |
Net Assets | | | $ | 444,718,710 | | | | $ | 2,796,328 | | | | $ | 450,301,212 | |
| | | | | | | | | | | | | | | |
Net Assets | |
Investor Class | | | | 98,087,274 | | | | | 1,674,992 | | | | | 435,739,367 | |
Institutional Class | | | | 346,631,436 | | | | | 1,121,336 | | | | | 14,561,845 | |
| | | |
Capital Stock Issued and Outstanding (Unlimited number of shares authorized, $0.01 par value) | | | | | | | | | | | | | | | |
Investor Class | | | | 32,391,792 | | | | | 176,945 | | | | | 75,990,010 | |
Institutional Class | | | | 112,998,414 | | | | | 117,846 | | | | | 2,542,959 | |
| | | |
NET ASSET VALUE, REDEMPTION PRICEAND OFFERING PRICE PER SHARE | | | | | | | | | | | | | | | |
Investor Class | | | $ | 3.03 | | | | $ | 9.47 | | | | $ | 5.73 | |
| | | | | | | | | | | | | | | |
Institutional Class | | | $ | 3.07 | | | | $ | 9.52 | | | | $ | 5.73 | |
| | | | | | | | | | | | | | | |
| 1 | Fund inception date was October 1, 2019. |
| 2 | Institutional class inception date was January 31, 2020. |
| 3 | See Note 8 for information on affiliated issuers. |
See Notes to Financial Statements.
78
| | |
| | MARCH 31, 2020 (UNAUDITED) |
|
|
|
| | | | | | | | | | | | | | | | | | | | | | | |
MICRO CAP
VALUE
FUND2 | | SMALL CAP
GROWTH
FUND | | SMALL CAP
VALUE
FUND | | ULTRA
GROWTH
FUND2 | | U.S.
TREASURY
FUND |
| | | | | | | | | | | | | | | | | | | | | | | | |
| | | | | | | | | | | | | | | | | | | | | | | | |
| | | | | | | | | | | | | | | | | | | | | | | | |
| | $ | 169,110,362 | | | | $ | 1,374,649,804 | | | | $ | 759,477,950 | | | | $ | 760,744,892 | | | | $ | 304,350,984 | |
| | | — | | | | | — | | | | | — | | | | | — | | | | | — | |
| | | 5,798,515 | | | | | 19,057,062 | | | | | 2,554,797 | | | | | 24,090,965 | | | | | 7,018,524 | |
| | | | | | | | | | | | | | | | | | | | | | | | |
| | $ | 174,908,877 | | | | $ | 1,393,706,866 | | | | $ | 762,032,747 | | | | $ | 784,835,857 | | | | $ | 311,369,508 | |
| | | | | | | | | | | | | | | | | | | | | | | | |
| | | | | | | | | | | | | | | | | | | | | | | | |
| | $ | 168,990,114 | | | | $ | 1,512,200,928 | | | | $ | 584,756,063 | | | | $ | 729,783,825 | | | | $ | 408,446,146 | |
| | | — | | | | | — | | | | | — | | | | | — | | | | | — | |
| | | 5,798,515 | | | | | 19,057,062 | | | | | 2,554,797 | | | | | 24,090,965 | | | | | 7,018,524 | |
| | | | | | | | | | | | | | | | | | | | | | | | |
| | | 174,788,629 | | | | | 1,531,257,990 | | | | | 587,310,860 | | | | | 753,874,790 | | | | | 415,464,670 | |
| | | 110,773 | | | | | 8 | | | | | 3 | | | | | 225,504 | | | | | 2 | |
| |
|
4,759 |
| | | | — | | | | | 13,928 | | | | | 16,451 | | | | | — | |
| | | 1,788,634 | | | | | 3,441,147 | | | | | 2,337,818 | | | | | — | | | | | — | |
| | | 38,981 | | | | | 2,440,617 | | | | | 1,868,472 | | | | | 3,179,795 | | | | | 1,667,703 | |
| | | 140,866 | | | | | 218,376 | | | | | 764,630 | | | | | 52,380 | | | | | 567,168 | |
| | | — | | | | | — | | | | | — | | | | | — | | | | | — | |
| | | 54,857 | | | | | 103,481 | | | | | 97,512 | | | | | 61,008 | | | | | 25,407 | |
| | | | | | | | | | | | | | | | | | | | | | | | |
| | | 176,927,499 | | | | | 1,537,461,619 | | | | | 592,393,223 | | | | | 757,409,928 | | | | | 417,724,950 | |
| | | | | | | | | | | | | | | | | | | | | | | | |
| | | | | | | | | | | | | | | | | | | | | | | | |
| | | 1,306,837 | | | | | 4,514,516 | | | | | 614,104 | | | | | 675,042 | | | | | — | |
| | | 327,779 | | | | | 2,019,600 | | | | | 1,472,213 | | | | | 861,855 | | | | | 934,607 | |
| | | — | | | | | — | | | | | — | | | | | — | | | | | 79,943 | |
| | | 246,446 | | | | | 1,346,802 | | | | | 541,975 | | | | | 645,466 | | | | | 175,096 | |
| | | 16,192 | | | | | 194,656 | | | | | 76,081 | | | | | 50,208 | | | | | 25,623 | |
| | | 108,032 | | | | | 358,658 | | | | | 125,222 | | | | | 161,246 | | | | | 81,572 | |
| | | 3,105 | | | | | — | | | | | 6,725 | | | | | 559 | | | | | — | |
| | | — | | | | | — | | | | | — | | | | | — | | | | | — | |
| | | | | | | | | | | | | | | | | | | | | | | | |
| | | 2,008,391 | | | | | 8,434,232 | | | | | 2,836,320 | | | | | 2,394,376 | | | | | 1,296,841 | |
| | | | | | | | | | | | | | | | | | | | | | | | |
| | $ | 174,919,108 | | | | $ | 1,529,027,387 | | | | $ | 589,556,903 | | | | $ | 755,015,552 | | | | $ | 416,428,109 | |
| | | | | | | | | | | | | | | | | | | | | | | | |
| | | | | | | | | | | | | | | | | | | | | | | | |
| | $ | 748,208 | | | | $ | 508,163 | | | | $ | 1,154,221 | | | | $ | 320,912 | | | | $ | 182,303 | |
| | | 175,934,008 | | | | | 1,334,088,905 | | | | | 790,839,623 | | | | | 765,562,126 | | | | | 325,922,376 | |
| | | (1,763,108 | ) | | | | 194,430,319 | | | | | (202,436,941 | ) | | | | (10,867,486 | ) | | | | 90,323,430 | |
| | | | | | | | | | | | | | | | | | | | | | | | |
| | $ | 174,919,108 | | | | $ | 1,529,027,387 | | | | $ | 589,556,903 | | | | $ | 755,015,552 | | | | $ | 416,428,109 | |
| | | | | | | | | | | | | | | | | | | | | | | | |
| | | | | | | | | | | | | | | | | | | | | | | | |
| | | 171,168,909 | | | | | 805,265,217 | | | | | 305,551,053 | | | | | 730,448,695 | | | | | 416,428,109 | |
| | | 3,750,199 | | | | | 723,762,170 | | | | | 284,005,850 | | | | | 24,566,857 | | | | | — | |
| | | | |
| | | | | | | | | | | | | | | | | | | | | | | | |
| | | 73,219,252 | | | | | 26,903,502 | | | | | 60,019,334 | | | | | 31,047,072 | | | | | 18,230,321 | |
| | | 1,601,569 | | | | | 23,912,840 | | | | | 55,402,718 | | | | | 1,044,139 | | | | | — | |
| | | | |
| | | | | | | | | | | | | | | | | | | | | | | | |
| | $ | 2.34 | | | | $ | 29.93 | | | | $ | 5.09 | | | | $ | 23.53 | | | | $ | 22.84 | |
| | | | | | | | | | | | | | | | | | | | | | | | |
| | $ | 2.34 | | | | $ | 30.27 | | | | $ | 5.13 | | | | $ | 23.53 | | | | $ | — | |
| | | | | | | | | | | | | | | | | | | | | | | | |
79
Statements of Operations
| | | | | | | | | | | | | | | |
| | | CORE
GROWTH
FUND | | EMERGING
INDIA
FUND | | EMERGING
MARKETS
SELECT FUND |
| | | | | | | | | | | | | | | |
Investment Income: | |
Interest | | | $ | 12,074 | | | | $ | 990 | | | | $ | — | |
Dividends2 | |
Unaffiliated issuers | | | | 11,071,992 | | | | | 1,159,114 | | | | | 134,585 | |
| | | | | | | | | | | | | | | |
Total investment income | | | | 11,084,066 | | | | | 1,160,104 | | | | | 134,585 | |
| | | | | | | | | | | | | | | |
Expenses: | |
Investment advisory fees | | | | 11,897,805 | | | | | 1,870,213 | | | | | 221,413 | |
Shareholder servicing fees — Investor Class | | | | 791,316 | | | | | 160,494 | | | | | 16,301 | |
Shareholder servicing fees — Institutional Class | | | | 13,619 | | | | | 1,650 | | | | | 2,375 | |
Fund administration fees | | | | 222,907 | | | | | 31,782 | | | | | 4,877 | |
Fund accounting fees | | | | 128,181 | | | | | 27,882 | | | | | 12,731 | |
Reports to shareholders — Investor Class | | | | 82,625 | | | | | 22,423 | | | | | 4,727 | |
Reports to shareholders — Institutional Class | | | | 59,869 | | | | | 2,052 | | | | | 1,041 | |
Custody fees | | | | 8,383 | | | | | 63,485 | | | | | 12,791 | |
Federal and state registration fees — Investor Class | | | | 23,976 | | | | | 11,574 | | | | | 4,636 | |
Federal and state registration fees — Institutional Class | | | | 28,115 | | | | | 11,367 | | | | | 5,502 | |
Legal fees | | | | 76,603 | | | | | 9,437 | | | | | 1,482 | |
Trustees’ fees | | | | 163,003 | | | | | 19,746 | | | | | 3,003 | |
Interest | | | | 40,602 | | | | | 20,346 | | | | | 3,242 | |
Audit fees | | | | 18,589 | | | | | 18,590 | | | | | 18,590 | |
Other expenses | | | | 49,977 | | | | | 40,305 | | | | | 16,680 | |
| | | | | | | | | | | | | | | |
Total expenses before reimbursement | | | | 13,605,570 | | | | | 2,311,346 | | | | | 329,391 | |
Reimbursement of expenses by Advisor | | | | (131,713 | ) | | | | — | | | | | (44,255 | ) |
| | | | | | | | | | | | | | | |
Net Expenses | | | | 13,473,857 | | | | | 2,311,346 | | | | | 285,136 | |
| | | | | | | | | | | | | | | |
Net Investment Income (Loss) | | | | (2,389,791 | ) | | | | (1,151,242 | ) | | | | (150,551 | ) |
| | | | | | | | | | | | | | | |
Realized Gain (Loss): | |
Investments sold | | | | 92,266,893 | | | | | (741,777 | ) | | | | 371,001 | |
Foreign currency transactions | | | | 3,810 | | | | | (351,364 | ) | | | | (1,436 | ) |
Foreign capital gains taxes | | | | (13,756 | ) | | | | (637,729 | ) | | | | (73,138 | ) |
| | | | | | | | | | | | | | | |
Net realized gain (loss) | | | | 92,256,947 | | | | | (1,730,870 | ) | | | | 296,427 | |
| | | | | | | | | | | | | | | |
Change in Unrealized Appreciation (Depreciation): | |
Investments | | | | (492,802,539 | ) | | | | (71,869,547 | ) | | | | (7,848,513 | ) |
Foreign currency translations | | | | (26 | ) | | | | (2,199 | ) | | | | (1,816 | ) |
Deferred foreign capital gains taxes | | | | 987,269 | | | | | 5,854,737 | | | | | 472,249 | |
| | | | | | | | | | | | | | | |
Net change in unrealized depreciation | | | | (491,815,296 | ) | | | | (66,017,009 | ) | | | | (7,378,080 | ) |
| | | | | | | | | | | | | | | |
Net loss on investments | | | | (399,558,349 | ) | | | | (67,747,879 | ) | | | | (7,081,653 | ) |
| | | | | | | | | | | | | | | |
Net Decrease in Net Assets Resulting from Operations | | | $ | (401,948,140 | ) | | | $ | (68,899,121 | ) | | | $ | (7,232,204 | ) |
| | | | | | | | | | | | | | | |
| 1 | Fund inception date was October 1, 2019. |
| 2 | Net of $0, $0, $10,637, $114,273, $21,086, $13,967, $1,761, $87,951 and $653,855 in foreign withholding taxes, respectively. |
See Notes to Financial Statements.
80
| | |
| | MARCH 31, 2020 (UNAUDITED) |
|
|
|
| | | | | | | | | | | | | | | | | | | | | | | | | | | | |
EMERGING
MARKETS
SMALL CAP
FUND | | FRONTIER
EMERGING
SMALL COUNTRIES FUND | | GLOBAL
OPPORTUNITIES
FUND | | GLOBAL
SELECT
FUND1 | | GLOBAL
VALUE
FUND | | INTERNATIONAL
GROWTH
FUND |
| | | | | | | | | | | | | | | | | | | | | | | | | | | | | |
| | | | | | | | | | | | | | | | | | | | | | | | | | | | | |
| | $ | 431 | | | | $ | 295 | | | | $ | 673 | | | | $ | 29 | | | | $ | 2,491 | | | | $ | 11,313 | |
| | | | | | | | | | | | | | | | | | | | | | | | | | | | | |
| | | 1,252,126 | | | | | 177,351 | | | | | 313,264 | | | | | 18,052 | | | | | 2,205,347 | | | | | 6,545,757 | |
| | | | | | | | | | | | | | | | | | | | | | | | | | | | | |
| | | 1,252,557 | | | | | 177,646 | | | | | 313,937 | | | | | 18,081 | | | | | 2,207,838 | | | | | 6,557,070 | |
| | | | | | | | | | | | | | | | | | | | | | | | | | | | | |
| | | | | | | | | | | | | | | | | | | | | | | | | | | | | |
| | | 3,165,118 | | | | | 498,579 | | | | | 799,396 | | | | | 27,583 | | | | | 646,480 | | | | | 7,351,046 | |
| | | 134,616 | | | | | 52,655 | | | | | 61,118 | | | | | 3,851 | | | | | 119,933 | | | | | 293,774 | |
| | | 1,994 | | | | | 1,441 | | | | | 1,455 | | | | | 646 | | | | | 1,737 | | | | | 4,444 | |
| | | 40,145 | | | | | 6,627 | | | | | 13,679 | | | | | 721 | | | | | 15,297 | | | | | 121,703 | |
| | | 33,889 | | | | | 13,424 | | | | | 19,818 | | | | | 4,711 | | | | | 17,559 | | | | | 80,954 | |
| | | 20,058 | | | | | 9,646 | | | | | 9,049 | | | | | 3,103 | | | | | 16,447 | | | | | 39,230 | |
| | | 8,046 | | | | | 264 | | | | | 1,202 | | | | | 2,088 | | | | | 854 | | | | | 13,061 | |
| | | 81,736 | | | | | 40,532 | | | | | 8,918 | | | | | 1,381 | | | | | 7,387 | | | | | 101,449 | |
| | | 6,875 | | | | | 7,895 | | | | | 5,114 | | | | | 7,065 | | | | | 7,547 | | | | | 14,083 | |
| | | 10,997 | | | | | 6,614 | | | | | 7,210 | | | | | 7,179 | | | | | 5,844 | | | | | 30,178 | |
| | | 13,162 | | | | | 2,164 | | | | | 4,192 | | | | | 19,257 | | | | | 5,300 | | | | | 40,129 | |
| | | 28,725 | | | | | 4,584 | | | | | 8,822 | | | | | 766 | | | | | 11,581 | | | | | 87,084 | |
| | | 19,065 | | | | | 1,452 | | | | | 3,430 | | | | | 179 | | | | | 2,212 | | | | | 19,510 | |
| | | 18,590 | | | | | 18,589 | | | | | 18,590 | | | | | 17,709 | | | | | 19,718 | | | | | 20,733 | |
| | | 51,622 | | | | | 13,966 | | | | | 17,414 | | | | | 5,267 | | | | | 7,508 | | | | | 44,343 | |
| | | | | | | | | | | | | | | | | | | | | | | | | | | | | |
| | | 3,634,638 | | | | | 678,432 | | | | | 979,407 | | | | | 101,506 | | | | | 885,404 | | | | | 8,261,721 | |
| | | (13,710 | ) | | | | (43,758 | ) | | | | (17,893 | ) | | | | (66,690 | ) | | | | (99,201 | ) | | | | (640 | ) |
| | | | | | | | | | | | | | | | | | | | | | | | | | | | | |
| | | 3,620,928 | | | | | 634,674 | | | | | 961,514 | | | | | 34,816 | | | | | 786,203 | | | | | 8,261,081 | |
| | | | | | | | | | | | | | | | | | | | | | | | | | | | | |
| | | (2,368,371 | ) | | | | (457,028 | ) | | | | (647,577 | ) | | | | (16,735 | ) | | | | 1,421,635 | | | | | (1,704,011 | ) |
| | | | | | | | | | | | | | | | | | | | | | | | | | | | | |
| | | | | | | | | | | | | | | | | | | | | | | | | | | | | |
| | | 14,277,121 | | | | | 1,217,502 | | | | | 1,880,520 | | | | | 6,113 | | | | | (8,038,154 | ) | | | | 27,652,062 | |
| | | (119,145 | ) | | | | (22,892 | ) | | | | (7,630 | ) | | | | (437 | ) | | | | (11,753 | ) | | | | (186,412 | ) |
| | | (96,911 | ) | | | | (80,572 | ) | | | | (19,265 | ) | | | | (138 | ) | | | | — | | | | | (73,763 | ) |
| | | | | | | | | | | | | | | | | | | | | | | | | | | | | |
| | | 14,061,065 | | | | | 1,114,038 | | | | | 1,853,625 | | | | | 5,538 | | | | | (8,049,907 | ) | | | | 27,391,887 | |
| | | | | | | | | | | | | | | | | | | | | | | | | | | | | |
| | | | | | | | | | | | | | | | | | | | | | | | | | | | | |
| | | (61,383,739 | ) | | | | (13,414,880 | ) | | | | (23,687,164 | ) | | | | (1,372,039 | ) | | | | (26,056,740 | ) | | | | (163,953,276 | ) |
| | | (65,380 | ) | | | | 1,653 | | | | | (653 | ) | | | | 106 | | | | | (1,769 | ) | | | | 77,687 | |
| | | 2,331,577 | | | | | 71,077 | | | | | 315,489 | | | | | — | | | | | — | | | | | 1,191,306 | |
| | | | | | | | | | | | | | | | | | | | | | | | | | | | | |
| | | (59,117,542 | ) | | | | (13,342,150 | ) | | | | (23,372,328 | ) | | | | (1,371,933 | ) | | | | (26,058,509 | ) | | | | (162,684,283 | ) |
| | | | | | | | | | | | | | | | | | | | | | | | | | | | | |
| | | (45,056,477 | ) | | | | (12,228,112 | ) | | | | (21,518,703 | ) | | | | (1,366,395 | ) | | | | (34,108,416 | ) | | | | (135,292,396 | ) |
| | | | | | | | | | | | | | | | | | | | | | | | | | | | | |
| | $ | (47,424,848 | ) | | | $ | (12,685,140 | ) | | | $ | (22,166,280 | ) | | | $ | (1,383,130 | ) | | | $ | (32,686,781 | ) | | | $ | (136,996,407 | ) |
| | | | | | | | | | | | | | | | | | | | | | | | | | | | | |
81
Statements of Operations(continued)
| | | | | | | | | | | | | | | |
| | | INTERNATIONAL
OPPORTUNITIES
FUND | | INTERNATIONAL
SELECT
FUND1 | | MICRO
CAP
FUND2 |
| | | | | | | | | | | | | | | |
Investment Income: | |
Interest | | | $ | 11,860 | | | | $ | 28 | | | | $ | 11,574 | |
Dividends3 | |
Unaffiliated issuers | | | | 2,250,733 | | | | | 6,820 | | | | | 501,850 | |
| | | | | | | | | | | | | | | |
Total investment income | | | | 2,262,593 | | | | | 6,848 | | | | | 513,424 | |
| | | | | | | | | | | | | | | |
Expenses: | |
Investment advisory fees | | | | 4,544,082 | | | | | 10,025 | | | | | 4,008,084 | |
Shareholder servicing fees — Investor Class | | | | 90,387 | | | | | 3,829 | | | | | 152,016 | |
Shareholder servicing fees — Institutional Class | | | | 95,322 | | | | | 644 | | | | | — | |
Fund administration fees | | | | 52,306 | | | | | 274 | | | | | 52,861 | |
Fund accounting fees | | | | 44,712 | | | | | 5,129 | | | | | 36,677 | |
Reports to shareholders — Investor Class | | | | 13,092 | | | | | 2,604 | | | | | 21,494 | |
Reports to shareholders — Institutional Class | | | | 30,313 | | | | | 1,997 | | | | | — | |
Custody fees | | | | 60,124 | | | | | 1,381 | | | | | 6,714 | |
Federal and state registration fees — Investor Class | | | | 6,444 | | | | | 7,065 | | | | | 16,083 | |
Federal and state registration fees — Institutional Class | | | | 11,182 | | | | | 7,171 | | | | | — | |
Legal fees | | | | 18,380 | | | | | 19,221 | | | | | 17,335 | |
Trustees’ fees | | | | 35,606 | | | | | 766 | | | | | 33,959 | |
Dividends on securities sold short | | | | 25,373 | | | | | — | | | | | — | |
Interest | | | | 7,127 | | | | | 219 | | | | | 6,839 | |
Audit fees | | | | 18,588 | | | | | 17,709 | | | | | 17,290 | |
Other expenses | | | | 30,719 | | | | | 5,202 | | | | | 18,277 | |
| | | | | | | | | | | | | | | |
Total expenses before reimbursement | | | | 5,083,757 | | | | | 83,236 | | | | | 4,387,629 | |
Reimbursement of expenses by Advisor | | | | — | | | | | (69,128 | ) | | | | — | |
| | | | | | | | | | | | | | | |
Net Expenses | | | | 5,083,757 | | | | | 14,108 | | | | | 4,387,629 | |
| | | | | | | | | | | | | | | |
Net Investment Income (Loss) | | | | (2,821,164 | ) | | | | (7,260 | ) | | | | (3,874,205 | ) |
| | | | | | | | | | | | | | | |
Realized Gain (Loss): | |
Investments sold | | | | 629,548 | | | | | (4,482 | ) | | | | 40,421,412 | |
Foreign currency transactions | | | | (64,676 | ) | | | | (10,345 | ) | | | | (15,146 | ) |
Foreign capital gains taxes | | | | — | | | | | — | | | | | (201,149 | ) |
| | | | | | | | | | | | | | | |
Net realized gain (loss) | | | | 564,872 | | | | | (14,827 | ) | | | | 40,205,117 | |
| | | | | | | | | | | | | | | |
Change in Unrealized Appreciation (Depreciation): | |
Investments | | | | (64,162,882 | ) | | | | (295,227 | ) | | | | (111,711,689 | ) |
Investments in affiliates | | | | — | | | | | — | | | | | (7,529,143 | ) |
Foreign currency translations | | | | (3,596 | ) | | | | 39 | | | | | 46 | |
Deferred foreign capital gains taxes | | | | 709,257 | | | | | — | | | | | 168,978 | |
| | | | | | | | | | | | | | | |
Net change in unrealized appreciation (depreciation) | | | | (63,457,221 | ) | | | | (295,188 | ) | | | | (119,071,808 | ) |
| | | | | | | | | | | | | | | |
Net gain (loss) on investments | | | | (62,892,349 | ) | | | | (310,015 | ) | | | | (78,866,691 | ) |
| | | | | | | | | | | | | | | |
Net Increase (Decrease) in Net Assets Resulting from Operations | | | $ | (65,713,513 | ) | | | $ | (317,275 | ) | | | $ | (82,740,896 | ) |
| | | | | | | | | | | | | | | |
| 1 | Fund inception date was October 1, 2019. |
| 2 | Institutional class inception date was January 31, 2020. |
| 3 | Net of $226,323, $1,224, $9, $16,045, $0, $0, $0 and $0 in foreign withholding taxes, respectively. |
See Notes to Financial Statements.
82
| | |
| | MARCH 31, 2020 (UNAUDITED) |
|
|
|
| | | | | | | | | | | | | | | | | | | | | | | |
MICRO CAP
VALUE
FUND2 | | SMALL CAP
GROWTH
FUND | | SMALL CAP
VALUE
FUND | | ULTRA
GROWTH
FUND2 | | U.S.
TREASURY
FUND |
| | | | | | | | | | | | | | | | | | | | | | | | |
| | | | | | | | | | | | | | | | | | | | | | | | |
| | $ | 20,489 | | | | $ | 392,511 | | | | $ | 14,794 | | | | $ | 45,935 | | | | $ | 4,392,248 | |
| | | | | | | | | | | | | | | | | | | | | | | | |
| | | 1,122,366 | | | | | 2,762,194 | | | | | 9,434,495 | | | | | 1,148,599 | | | | | — | |
| | | | | | | | | | | | | | | | | | | | | | | | |
| | | 1,142,855 | | | | | 3,154,705 | | | | | 9,449,289 | | | | | 1,194,534 | | | | | 4,392,248 | |
| | | | | | | | | | | | | | | | | | | | | | | | |
| | | | | | | | | | | | | | | | | | | | | | | | |
| | | 1,864,813 | | | | | 9,459,094 | | | | | 4,274,554 | | | | | 3,767,911 | | | | | 946,759 | |
| | | 141,023 | | | | | 459,256 | | | | | 239,820 | | | | | 440,784 | | | | | 144,518 | |
| | | — | | | | | 7,480 | | | | | 2,508 | | | | | — | | | | | — | |
| | | 19,566 | | | | | 186,238 | | | | | 80,427 | | | | | 59,380 | | | | | 29,912 | |
| | | 20,254 | | | | | 108,791 | | | | | 51,048 | | | | | 39,586 | | | | | 18,364 | |
| | | 20,030 | | | | | 53,279 | | | | | 34,426 | | | | | 46,065 | | | | | 18,108 | |
| | | — | | | | | 74,979 | | | | | 15,073 | | | | | — | | | | | — | |
| | | 9,661 | | | | | 62,676 | | | | | 2,868 | | | | | 3,234 | | | | | 717 | |
| | | 15,157 | | | | | 15,278 | | | | | 22,043 | | | | | 44,505 | | | | | 17,736 | |
| | | — | | | | | 26,306 | | | | | 17,231 | | | | | — | | | | | — | |
| | | 9,619 | | | | | 58,674 | | | | | 25,982 | | | | | 21,363 | | | | | 11,885 | |
| | | 18,088 | | | | | 122,609 | | | | | 53,827 | | | | | 40,747 | | | | | 25,504 | |
| | | — | | | | | — | | | | | — | | | | | — | | | | | — | |
| | | 3,578 | | | | | 24,300 | | | | | 11,639 | | | | | 8,948 | | | | | 5,234 | |
| | | 17,290 | | | | | 18,590 | | | | | 18,590 | | | | | 17,290 | | | | | 17,290 | |
| | | 15,702 | | | | | 46,082 | | | | | 18,048 | | | | | 14,525 | | | | | 8,778 | |
| | | | | | | | | | | | | | | | | | | | | | | | |
| | | 2,154,781 | | | | | 10,723,632 | | | | | 4,868,084 | | | | | 4,504,338 | | | | | 1,244,805 | |
| | | (38 | ) | | | | (169,516 | ) | | | | (53,999 | ) | | | | (88 | ) | | | | — | |
| | | | | | | | | | | | | | | | | | | | | | | | |
| | | 2,154,743 | | | | | 10,554,116 | | | | | 4,814,085 | | | | | 4,504,250 | | | | | 1,244,805 | |
| | | | | | | | | | | | | | | | | | | | | | | | |
| | | (1,011,888 | ) | | | | (7,399,411 | ) | | | | 4,635,204 | | | | | (3,309,716 | ) | | | | 3,147,443 | |
| | | | | | | | | | | | | | | | | | | | | | | | |
| | | | | | | | | | | | | | | | | | | | | | | | |
| | | 3,512,827 | | | | | 86,039,710 | | | | | (22,574,928 | ) | | | | 27,042,481 | | | | | 6,220,880 | |
| | | (12,912 | ) | | | | 6,686 | | | | | (18,848 | ) | | | | (718 | ) | | | | — | |
| | | (16,410 | ) | | | | — | | | | | (6,725 | ) | | | | (11,498 | ) | | | | — | |
| | | | | | | | | | | | | | | | | | | | | | | | |
| | | 3,483,505 | | | | | 86,046,396 | | | | | (22,600,501 | ) | | | | 27,030,265 | | | | | 6,220,880 | |
| | | | | | | | | | | | | | | | | | | | | | | | |
| | | | | | | | | | | | | | | | | | | | | | | | |
| | | (49,315,044 | ) | | | | (338,356,724 | ) | | | | (272,064,809 | ) | | | | (86,524,899 | ) | | | | 61,002,991 | |
| | | — | | | | | — | | | | | — | | | | | — | | | | | — | |
| | | 795 | | | | | 311 | | | | | (6 | ) | | | | (111 | ) | | | | — | |
| | | 92,048 | | | | | — | | | | | 145,879 | | | | | 255,086 | | | | | — | |
| | | | | | | | | | | | | | | | | | | | | | | | |
| | | (49,222,201 | ) | | | | (338,356,413 | ) | | | | (271,918,936 | ) | | | | (86,269,924 | ) | | | | 61,002,991 | |
| | | | | | | | | | | | | | | | | | | | | | | | |
| | | (45,738,696 | ) | | | | (252,310,017 | ) | | | | (294,519,437 | ) | | | | (59,239,659 | ) | | | | 67,223,871 | |
| | | | | | | | | | | | | | | | | | | | | | | | |
| | $ | (46,750,584 | ) | | | $ | (259,709,428 | ) | | | $ | (289,884,233 | ) | | | $ | (62,549,375 | ) | | | $ | 70,371,314 | |
| | | | | | | | | | | | | | | | | | | | | | | | |
83
Statements of Changes in Net Assets
| | | | | | | | | | | | | | | | | | | | |
| | | CORE GROWTH
FUND | |
EMERGING INDIA
FUND |
| | | Six Months
Ended
March 31, 2020
(Unaudited) | | Year Ended
September 30, 2019 | | Six Months
Ended
March 31, 2020
(Unaudited) | | Year Ended
September 30, 2019 |
| | | | | | | | | | | | | | | | | | | | |
Operations: | |
Net investment income (loss) | | | $ | (2,389,791 | ) | | | $ | (11,786,255 | ) | | | $ | (1,151,242 | ) | | | $ | (2,348,420 | ) |
Net realized gain (loss) on investments, foreign
currency translations and foreign capital gains taxes | | | | 92,256,947 | | | | | 215,644,009 | | | | | (1,730,870 | ) | | | | 411,045 | |
Change in unrealized appreciation (depreciation) on
investments, foreign currency translations and
deferred capital gains taxes | | | | (491,815,296 | ) | | | | (216,536,421 | ) | | | | (66,017,009 | ) | | | | 36,867,160 | |
| | | | | | | | | | | | | | | | | | | | |
Net increase (decrease) in net assets resulting from operations | | | | (401,948,140 | ) | | | | (12,678,667 | ) | | | | (68,899,121 | ) | | | | 34,929,785 | |
|
Distributions to shareholders from distributable earnings | |
Investor Class | | | | (149,403,088 | ) | | | | (115,894,672 | ) | | | | (641,437 | ) | | | | (12,103,683 | ) |
Institutional Class | | | | (93,662,303 | ) | | | | (56,240,911 | ) | | | | (372,918 | ) | | | | (3,516,107 | ) |
|
Capital share transactions: | |
Investor Class | | | | | | | | | | | | | | | | | | | | |
Shares sold | | | | 171,406,955 | | | | | 189,187,622 | | | | | 31,282,783 | | | | | 65,709,960 | |
Shares issued to holders in reinvestment of dividends | | | | 145,016,231 | | | | | 112,651,644 | | | | | 638,968 | | | | | 12,002,230 | |
Shares redeemed | | | | (207,635,046 | ) | | | | (308,539,799 | ) | | | | (63,339,560 | ) | | | | (87,395,827 | ) |
Redemption fees | | | | 22,162 | | | | | 117,547 | | | | | 20,472 | | | | | 76,280 | |
| | | | | | | | | | | | | | | | | | | | |
Net increase (decrease) | | | | 108,810,302 | | | | | (6,582,986 | ) | | | | (31,397,337 | ) | | | | (9,607,357 | ) |
| | | | | | | | | | | | | | | | | | | | |
Institutional Class | | | | | | | | | | | | | | | | | | | | |
Shares sold | | | | 207,291,880 | | | | | 325,369,900 | | | | | 39,056,257 | | | | | 54,672,753 | |
Shares issued to holders in reinvestment of dividends | | | | 89,581,586 | | | | | 53,665,284 | | | | | 372,838 | | | | | 3,516,108 | |
Shares redeemed | | | | (160,812,323 | ) | | | | (201,747,911 | ) | | | | (16,808,534 | ) | | | | (15,244,042 | ) |
Redemption fees | | | | 26,458 | | | | | 34,892 | | | | | 1,338 | | | | | 193 | |
| | | | | | | | | | | | | | | | | | | | |
Net increase (decrease) | | | | 136,087,601 | | | | | 177,322,165 | | | | | 22,621,899 | | | | | 42,945,012 | |
| | | | | | | | | | | | | | | | | | | | |
Total increase (decrease) in net assets | | | | (400,115,628 | ) | | | | (14,075,071 | ) | | | | (78,688,914 | ) | | | | 52,647,650 | |
|
Net assets: | |
Beginning of period | | | | 2,285,781,094 | | | | | 2,299,856,165 | | | | | 279,838,038 | | | | | 227,190,388 | |
| | | | | | | | | | | | | | | | | | | | |
End of period | | | $ | 1,885,665,466 | | | | $ | 2,285,781,094 | | | | $ | 201,149,124 | | | | $ | 279,838,038 | |
| | | | | | | | | | | | | | | | | | | | |
|
Capital share transactions — shares: | |
Investor Class | | | | | |
Shares sold | | | | 2,472,204 | | | | | 2,666,806 | | | | | 7,234,169 | | | | | 16,292,452 | |
Shares issued to holders in reinvestment of dividends | | | | 2,011,879 | | | | | 1,925,011 | | | | | 143,266 | | | | | 3,030,866 | |
Shares redeemed | | | | (3,130,676 | ) | | | | (4,433,956 | ) | | | | (15,593,538 | ) | | | | (22,008,586 | ) |
| | | | | | | | | | | | | | | | | | | | |
Net increase (decrease) in shares outstanding | | | | 1,353,407 | | | | | 157,861 | | | | | (8,216,103 | ) | | | | (2,685,268 | ) |
| | | | | | | | | | | | | | | | | | | | |
Institutional Class | | | | | |
Shares sold | | | | 2,915,157 | | | | | 4,595,902 | | | | | 8,896,441 | | | | | 13,743,037 | |
Shares issued to holders in reinvestment of dividends | | | | 1,229,841 | | | | | 909,581 | | | | | 83,037 | | | | | 881,230 | |
Shares redeemed | | | | (2,297,597 | ) | | | | (2,848,564 | ) | | | | (4,296,597 | ) | | | | (3,796,046 | ) |
| | | | | | | | | | | | | | | | | | | | |
Net increase (decrease) in shares outstanding | | | | 1,847,401 | | | | | 2,656,919 | | | | | 4,682,881 | | | | | 10,828,221 | |
| | | | | | | | | | | | | | | | | | | | |
See Notes to Financial Statements.
84
| | |
| | MARCH 31, 2020 (UNAUDITED) |
|
|
|
| | | | | | | | | | | | | | | | | | | | | | | | | | | | |
EMERGING MARKETS SELECT
FUND | | EMERGING MARKETS SMALL CAP
FUND | | FRONTIER EMERGING SMALL COUNTRIES
FUND |
Six Months
Ended
March 31, 2020
(Unaudited) | | Year Ended
September 30, 2019 | | Six Months
Ended
March 31, 2020
(Unaudited) | | Year Ended
September 30, 2019 | | Six Months
Ended
March 31, 2020
(Unaudited) | | Year Ended
September 30, 2019 |
| | | | | | | | | | | | | | | | | | | | | | | | | | | | | |
| | | | | | | | | | | | | | | | | | | | | | | | | | | | | |
| | $ | (150,551 | ) | | | $ | (100,282 | ) | | | $ | (2,368,371 | ) | | | $ | (3,225,668 | ) | | | $ | (457,028 | ) | | | $ | 553,025 | |
| | | 296,427 | | | | | (12,717 | ) | | | | 14,061,065 | | | | | 19,514,955 | | | | | 1,114,038 | | | | | (81,296 | ) |
| | | (7,378,080 | ) | | | | 3,983,601 | | | | | (59,117,542 | ) | | | | 3,745,786 | | | | | (13,342,150 | ) | | | | 4,525,461 | |
| | | | | | | | | | | | | | | | | | | | | | | | | | | | | |
| | | (7,232,204 | ) | | | | 3,870,602 | | | | | (47,424,848 | ) | | | | 20,035,073 | | | | | (12,685,140 | ) | | | | 4,997,190 | |
| | | | | |
| | | | | | | | | | | | | | | | | | | | | | | | | | | | | |
| | | — | | | | | — | | | | | (11,627,154 | ) | | | | (26,880,563 | ) | | | | — | | | | | — | |
| | | — | | | | | — | | | | | (10,395,643 | ) | | | | (22,096,890 | ) | | | | — | | | | | — | |
| | | | | |
| | | | | | | | | | | | | | | | | | | | | | | | | | | | | |
| | | | | | | | | | | | | | | | | | | | | | | | | | | | | |
| | | 2,128,444 | | | | | 1,051,049 | | | | | 20,274,006 | | | | | 26,627,101 | | | | | 2,087,454 | | | | | 3,387,642 | |
| | | — | | | | | — | | | | | 11,005,252 | | | | | 25,451,093 | | | | | — | | | | | — | |
| | | (1,212,782 | ) | | | | (5,608,056 | ) | | | | (31,457,407 | ) | | | | (130,410,766 | ) | | | | (5,896,368 | ) | | | | (20,744,583 | ) |
| | | 4,480 | | | | | 3,152 | | | | | 5,977 | | | | | 3,897 | | | | | 920 | | | | | 7,717 | |
| | | | | | | | | | | | | | | | | | | | | | | | | | | | | |
| | | 920,142 | | | | | (4,553,855 | ) | | | | (172,172 | ) | | | | (78,328,675 | ) | | | | (3,807,994 | ) | | | | (17,349,224 | ) |
| | | | | | | | | | | | | | | | | | | | | | | | | | | | | |
| | | | | | | | | | | | | | | | | | | | | | | | | | | | | |
| | | 4,562,262 | | | | | 4,503,557 | | | | | 22,627,990 | | | | | 69,254,821 | | | | | 770,996 | | | | | 920,083 | |
| | | — | | | | | — | | | | | 9,521,929 | | | | | 20,773,470 | | | | | — | | | | | — | |
| | | (5,724,606 | ) | | | | (3,409,102 | ) | | | | (47,244,850 | ) | | | | (143,750,216 | ) | | | | (4,562,712 | ) | | | | (6,315,306 | ) |
| | | 483 | | | | | 315 | | | | | 9,346 | | | | | 15,117 | | | | | 1,272 | | | | | — | |
| | | | | | | | | | | | | | | | | | | | | | | | | | | | | |
| | | (1,161,861 | ) | | | | 1,094,770 | | | | | (15,085,585 | ) | | | | (53,706,808 | ) | | | | (3,790,444 | ) | | | | (5,395,223 | ) |
| | | | | | | | | | | | | | | | | | | | | | | | | | | | | |
| | | (7,473,923 | ) | | | | 411,517 | | | | | (84,705,402 | ) | | | | (160,977,863 | ) | | | | (20,283,578 | ) | | | | (17,747,257 | ) |
| | | | | |
| | | | | | | | | | | | | | | | | | | | | | | | | | | | | |
| | | 44,146,649 | | | | | 43,735,132 | | | | | 365,454,461 | | | | | 526,432,324 | | | | | 60,244,953 | | | | | 77,992,210 | |
| | | | | | | | | | | | | | | | | | | | | | | | | | | | | |
| | $ | 36,672,726 | | | | $ | 44,146,649 | | | | $ | 280,749,059 | | | | $ | 365,454,461 | | | | $ | 39,961,375 | | | | $ | 60,244,953 | |
| | | | | | | | | | | | | | | | | | | | | | | | | | | | | |
| | | | | |
| | | | | | | | | | | | | | | | | | | | | | | | | | | | | |
| | | | | | | | | | | | | | | | | | | | | | | | | | | | | |
| | | 177,580 | | | | | 102,864 | | | | | 7,261,621 | | | | | 10,680,727 | | | | | 772,295 | | | | | 1,324,685 | |
| | | — | | | | | — | | | | | 4,001,910 | | | | | 11,162,760 | | | | | — | | | | | — | |
| | | (105,760 | ) | | | | (540,323 | ) | | | | (11,950,740 | ) | | | | (52,036,343 | ) | | | | (2,189,393 | ) | | | | (8,208,619 | ) |
| | | | | | | | | | | | | | | | | | | | | | | | | | | | | |
| | | 71,820 | | | | | (437,459 | ) | | | | (687,209 | ) | | | | (30,192,856 | ) | | | | (1,417,098 | ) | | | | (6,883,934 | ) |
| | | | | | | | | | | | | | | | | | | | | | | | | | | | | |
| | | | | | | | | | | | | | | | | | | | | | | | | | | | | |
| | | 369,846 | | | | | 419,680 | | | | | 8,223,330 | | | | | 27,208,564 | | | | | 256,493 | | | | | 362,002 | |
| | | — | | | | | — | | | | | 3,437,519 | | | | | 9,071,384 | | | | | — | | | | | — | |
| | | (513,876 | ) | | | | (300,531 | ) | | | | (17,244,817 | ) | | | | (57,064,550 | ) | | | | (1,546,620 | ) | | | | (2,551,687 | ) |
| | | | | | | | | | | | | | | | | | | | | | | | | | | | | |
| | | (144,030 | ) | | | | 119,149 | | | | | (5,583,968 | ) | | | | (20,784,602 | ) | | | | (1,290,127 | ) | | | | (2,189,685 | ) |
| | | | | | | | | | | | | | | | | | | | | | | | | | | | | |
85
Statements of Changes in Net Assets(continued)
| | | | | | | | | | | | | | | |
| | | GLOBAL OPPORTUNITIES
FUND | | GLOBAL SELECT
FUND |
| | | Six Months
Ended
March 31, 2020
(Unaudited) | | Year Ended
September 30, 2019 | | Six Months
Ended
March 31, 20201
(Unaudited) |
| | | | | | | | | | | | | | | |
Operations: | |
Net investment income (loss) | | | $ | (647,577 | ) | | | $ | (1,068,879 | ) | | | $ | (16,735 | ) |
Net realized gain (loss) on investments, foreign
currency translations and foreign capital gains taxes | | | | 1,853,625 | | | | | 9,825,436 | | | | | 5,538 | |
Change in unrealized appreciation (depreciation) on
investments, foreign currency translations and
deferred capital gains taxes | | | | (23,372,328 | ) | | | | (8,613,378 | ) | | | | (1,371,933 | ) |
| | | | | | | | | | | | | | | |
Net increase (decrease) in net assets resulting from operations | | | | (22,166,280 | ) | | | | 143,179 | | | | | (1,383,130 | ) |
|
Distributions to shareholders from distributable earnings | |
Investor Class | | | | (8,871,843 | ) | | | | (13,508,893 | ) | | | | — | |
Institutional Class | | | | (1,711,832 | ) | | | | (2,069,212 | ) | | | | — | |
|
Capital share transactions: | |
Investor Class | | | | | | | | | | | | | | | |
Shares sold | | | | 10,685,694 | | | | | 18,263,643 | | | | | 3,141,867 | |
Shares issued to holders in reinvestment of dividends | | | | 8,792,560 | | | | | 13,261,385 | | | | | — | |
Shares redeemed | | | | (18,484,470 | ) | | | | (24,803,012 | ) | | | | (743,544 | ) |
Redemption fees | | | | 5,154 | | | | | 5,927 | | | | | 171 | |
| | | | | | | | | | | | | | | |
Net increase (decrease) | | | | 998,938 | | | | | 6,727,943 | | | | | 2,398,494 | |
| | | | | | | | | | | | | | | |
Institutional Class | | | | | | | | | | | | | | | |
Shares sold | | | | 5,697,108 | | | | | 7,653,936 | | | | | 8,620,785 | |
Shares issued to holders in reinvestment of dividends | | | | 1,626,534 | | | | | 1,897,942 | | | | | — | |
Shares redeemed | | | | (1,409,666 | ) | | | | (4,830,069 | ) | | | | (6,076 | ) |
Redemption fees | | | | 1,875 | | | | | 2,232 | | | | | 122 | |
| | | | | | | | | | | | | | | |
Net increase (decrease) | | | | 5,915,851 | | | | | 4,724,041 | | | | | 8,614,831 | |
| | | | | | | | | | | | | | | |
Total increase (decrease) in net assets | | | | (25,835,166 | ) | | | | (3,982,942 | ) | | | | 9,630,195 | |
|
Net assets: | |
Beginning of period | | | | 122,770,078 | | | | | 126,753,020 | | | | | — | |
| | | | | | | | | | | | | | | |
End of period | | | $ | 96,934,912 | | | | $ | 122,770,078 | | | | $ | 9,630,195 | |
| | | | | | | | | | | | | | | |
|
Capital share transactions — shares: | |
Investor Class | | | | | | | | | | | | | | | |
Shares sold | | | | 3,167,309 | | | | | 5,400,753 | | | | | 301,935 | |
Shares issued to holders in reinvestment of dividends | | | | 2,541,203 | | | | | 4,736,209 | | | | | — | |
Shares redeemed | | | | (5,683,388 | ) | | | | (7,290,883 | ) | | | | (68,240 | ) |
| | | | | | | | | | | | | | | |
Net increase (decrease) in shares outstanding | | | | 25,124 | | | | | 2,846,079 | | | | | 233,695 | |
| | | | | | | | | | | | | | | |
Institutional Class | | | | | | | | | | | | | | | |
Shares sold | | | | 1,620,417 | | | | | 2,341,370 | | | | | 836,493 | |
Shares issued to holders in reinvestment of dividends | | | | 468,742 | | | | | 675,424 | | | | | — | |
Shares redeemed | | | | (459,894 | ) | | | | (1,410,992 | ) | | | | (530 | ) |
| | | | | | | | | | | | | | | |
Net increase (decrease) in shares outstanding | | | | 1,629,265 | | | | | 1,605,802 | | | | | 835,963 | |
| | | | | | | | | | | | | | | |
| 1 | Fund inception date was October 1, 2019. |
See Notes to Financial Statements.
86
| | |
| | MARCH 31, 2020 (UNAUDITED) |
|
|
|
| | | | | | | | | | | | | | | | | | | | | | | | | | | | |
GLOBAL VALUE
FUND | | INTERNATIONAL GROWTH
FUND | | INTERNATIONAL OPPORTUNITIES
FUND |
Six Months
Ended
March 31, 2020
(Unaudited) | | Year Ended
September 30, 2019 | | Six Months
Ended
March 31, 2020
(Unaudited) | | Year Ended
September 30, 2019 | | Six Months
Ended
March 31, 2020
(Unaudited) | | Year Ended
September 30, 2019 |
| | | | | | | | | | | | | | | | | | | | | | | | | | | | | |
| | | | | | | | | | | | | | | | | | | | | | | | | | | | | |
| | $ | 1,421,635 | | | | $ | 3,930,311 | | | | $ | (1,704,011 | ) | | | $ | (2,330,095 | ) | | | $ | (2,821,164 | ) | | | $ | (4,015,942 | ) |
| | | (8,049,907 | ) | | | | 5,362,420 | | | | | 27,391,887 | | | | | 35,546,556 | | | | | 564,872 | | | | | 19,328,327 | |
| | | (26,058,509 | ) | | | | (13,287,556 | ) | | | | (162,684,283 | ) | | | | (200,457,253 | ) | | | | (63,457,221 | ) | | | | (19,771,713 | ) |
| | | | | | | | | | | | | | | | | | | | | | | | | | | | | |
| | | (32,686,781 | ) | | | | (3,994,825 | ) | | | | (136,996,407 | ) | | | | (167,240,792 | ) | | | | (65,713,513 | ) | | | | (4,459,328 | ) |
| | | | | |
| | | | | | | | | | | | | | | | | | | | | | | | | | | | | |
| | | (2,920,949 | ) | | | | (26,014,674 | ) | | | | (14,384,249 | ) | | | | (85,858,576 | ) | | | | (3,279,205 | ) | | | | (5,015,701 | ) |
| | | (181,915 | ) | | | | (1,351,568 | ) | | | | (16,077,813 | ) | | | | (85,816,934 | ) | | | | (9,208,299 | ) | | | | (6,283,811 | ) |
| | | | | |
| | | | | | | | | | | | | | | | | | | | | | | | | | | | | |
| | | | | | | | | | | | | | | | | | | | | | | | | | | | | |
| | | 1,443,551 | | | | | 5,167,863 | | | | | 22,751,205 | | | | | 91,035,974 | | | | | 6,364,001 | | | | | 13,999,031 | |
| | | 2,847,105 | | | | | 25,699,903 | | | | | 12,847,729 | | | | | 79,082,009 | | | | | 3,145,044 | | | | | 4,816,572 | |
| | | (22,271,355 | ) | | | | (47,130,370 | ) | | | | (78,920,917 | ) | | | | (210,507,702 | ) | | | | (27,412,063 | ) | | | | (109,687,557 | ) |
| | | 2,152 | | | | | 4,784 | | | | | 15,169 | | | | | 11,574 | | | | | 1,718 | | | | | 259 | |
| | | | | | | | | | | | | | | | | | | | | | | | | | | | | |
| | | (17,978,547 | ) | | | | (16,257,820 | ) | | | | (43,306,814 | ) | | | | (40,378,145 | ) | | | | (17,901,300 | ) | | | | (90,871,695 | ) |
| | | | | | | | | | | | | | | | | | | | | | | | | | | | | |
| | | | | | | | | | | | | | | | | | | | | | | | | | | | | |
| | | 1,330,764 | | | | | 1,335,472 | | | | | 68,831,260 | | | | | 208,768,921 | | | | | 93,365,364 | | | | | 134,483,838 | |
| | | 180,978 | | | | | 1,324,616 | | | | | 15,159,166 | | | | | 80,888,827 | | | | | 6,000,461 | | | | | 4,723,790 | |
| | | (1,672,150 | ) | | | | (2,784,876 | ) | | | | (114,201,872 | ) | | | | (336,838,011 | ) | | | | (67,628,031 | ) | | | | (56,333,268 | ) |
| | | 14 | | | | | 48 | | | | | 15,034 | | | | | 17,266 | | | | | 2,773 | | | | | 2,902 | |
| | | | | | | | | | | | | | | | | | | | | | | | | | | | | |
| | | (160,394 | ) | | | | (124,740 | ) | | | | (30,196,412 | ) | | | | (47,162,997 | ) | | | | 31,740,567 | | | | | 82,877,262 | |
| | | | | | | | | | | | | | | | | | | | | | | | | | | | | |
| | | (53,928,586 | ) | | | | (47,743,627 | ) | | | | (240,961,695 | ) | | | | (426,457,444 | ) | | | | (64,361,750 | ) | | | | (23,753,273 | ) |
| | | | | |
| | | | | | | | | | | | | | | | | | | | | | | | | | | | | |
| | | 154,681,983 | | | | | 202,425,610 | | | | | 1,139,331,277 | | | | | 1,565,788,721 | | | | | 509,080,460 | | | | | 532,833,733 | |
| | | | | | | | | | | | | | | | | | | | | | | | | | | | | |
| | $ | 100,753,397 | | | | $ | 154,681,983 | | | | $ | 898,369,582 | | | | $ | 1,139,331,277 | | | | $ | 444,718,710 | | | | $ | 509,080,460 | |
| | | | | | | | | | | | | | | | | | | | | | | | | | | | | |
| | | | | |
| | | | | | | | | | | | | | | | | | | | | | | | | | | | | |
| | | | | | | | | | | | | | | | | | | | | | | | | | | | | |
| | | 196,401 | | | | | 657,457 | | | | | 778,868 | | | | | 3,254,697 | | | | | 1,756,429 | | | | | 4,249,540 | |
| | | 376,889 | | | | | 3,590,285 | | | | | 417,405 | | | | | 3,267,852 | | | | | 854,632 | | | | | 1,684,116 | |
| | | (2,999,151 | ) | | | | (6,045,374 | ) | | | | (2,843,783 | ) | | | | (7,514,820 | ) | | | | (7,643,770 | ) | | | | (35,750,861 | ) |
| | | | | | | | | | | | | | | | | | | | | | | | | | | | | |
| | | (2,425,861 | ) | | | | (1,797,632 | ) | | | | (1,647,510 | ) | | | | (992,271 | ) | | | | (5,032,709 | ) | | | | (29,817,205 | ) |
| | | | | | | | | | | | | | | | | | | | | | | | | | | | | |
| | | | | | | | | | | | | | | | | | | | | | | | | | | | | |
| | | 175,034 | | | | | 167,348 | | | | | 2,403,983 | | | | | 7,461,278 | | | | | 25,493,450 | | | | | 39,730,459 | |
| | | 24,040 | | | | | 185,078 | | | | | 490,429 | | | | | 3,332,872 | | | | | 1,613,027 | | | | | 1,628,893 | |
| | | (255,179 | ) | | | | (356,260 | ) | | | | (4,400,398 | ) | | | | (11,839,348 | ) | | | | (19,165,034 | ) | | | | (17,169,665 | ) |
| | | | | | | | | | | | | | | | | | | | | | | | | | | | | |
| | | (56,105 | ) | | | | (3,834 | ) | | | | (1,505,986 | ) | | | | (1,045,198 | ) | | | | 7,941,443 | | | | | 24,189,687 | |
| | | | | | | | | | | | | | | | | | | | | | | | | | | | | |
87
Statements of Changes in Net Assets(continued)
| | | | | | | | | | | | | | | |
| | | INTERNATIONAL SELECT
FUND | | MICRO CAP
FUND |
| | | Six Months
Ended
March 31, 20201
(Unaudited) | | Six Months
Ended
March 31, 20202
(Unaudited) | | Year Ended
September 30, 2019 |
| | | | | | | | | | | | | | | |
Operations: | | | | | | | | | | | |
Net investment income (loss) | | | $ | (7,260 | ) | | | $ | (3,874,205 | ) | | | $ | (5,839,436 | ) |
Net realized gain (loss) on investments, foreign
currency translations and foreign capital gains taxes | | | | (14,827 | ) | | | | 40,205,117 | | | | | 55,047,174 | |
Change in unrealized appreciation (depreciation) on
investments, foreign currency translations and
deferred capital gains taxes | | | | (295,188 | ) | | | | (119,071,808 | ) | | | | (60,370,211 | ) |
| | | | | | | | | | | | | | | |
Net increase (decrease) in net assets resulting from operations | | | | (317,275 | ) | | | | (82,740,896 | ) | | | | (11,162,473 | ) |
| | |
Distributions to shareholders from distributable earnings | | | | | | | | | | | |
Investor Class | | | | — | | | | | (56,926,728 | ) | | | | (87,356,742 | ) |
Institutional Class | | | | — | | | | | — | | | | | — | |
| | |
Capital share transactions: | | | | | | | | | | | |
Investor Class | | | | | | | | | | | | | | | |
Shares sold | | | | 2,063,831 | | | | | 126,889,433 | | | | | 101,288,047 | |
Shares issued to holders in reinvestment of dividends | | | | — | | | | | 53,969,369 | | | | | 82,402,243 | |
Shares redeemed | | | | (223,026 | ) | | | | (82,385,236 | ) | | | | (107,977,732 | ) |
Redemption fees | | | | 525 | | | | | 103,480 | | | | | 183,961 | |
| | | | | | | | | | | | | | | |
Net increase (decrease) | | | | 1,841,330 | | | | | 98,577,046 | | | | | 75,896,519 | |
| | | | | | | | | | | | | | | |
Institutional Class | | | | | | | | | | | | | | | |
Shares sold | | | | 1,763,113 | | | | | 18,295,066 | | | | | — | |
Shares issued to holders in reinvestment of dividends | | | | — | | | | | — | | | | | — | |
Shares redeemed | | | | (496,018 | ) | | | | (408,663 | ) | | | | — | |
Redemption fees | | | | 5,178 | | | | | — | | | | | — | |
| | | | | | | | | | | | | | | |
Net increase | | | | 1,272,273 | | | | | 17,886,403 | | | | | — | |
| | | | | | | | | | | | | | | |
Total increase (decrease) in net assets | | | | 2,796,328 | | | | | (23,204,175 | ) | | | | (22,622,696 | ) |
| | |
Net assets: | | | | | | | | | | | |
Beginning of period | | | | — | | | | | 473,505,387 | | | | | 496,128,083 | |
| | | | | | | | | | | | | | | |
End of period | | | $ | 2,796,328 | | | | $ | 450,301,212 | | | | $ | 473,505,387 | |
| | | | | | | | | | | | | | | |
| | |
Capital share transactions — shares: | | | | | | | | | | | |
Investor Class | | | | | | | | | | | | | | | |
Shares sold | | | | 197,008 | | | | | 17,074,919 | | | | | 13,494,255 | |
Shares issued to holders in reinvestment of dividends | | | | — | | | | | 7,332,795 | | | | | 14,256,443 | |
Shares redeemed | | | | (20,063 | ) | | | | (12,017,919 | ) | | | | (14,460,006 | ) |
| | | | | | | | | | | | | | | |
Net increase (decrease) in shares outstanding | | | | 176,945 | | | | | 12,389,795 | | | | | 13,290,692 | |
| | | | | | | | | | | | | | | |
Institutional Class | | | | | | | | | | | | | | | |
Shares sold | | | | 166,006 | | | | | 2,613,725 | | | | | — | |
Shares issued to holders in reinvestment of dividends | | | | — | | | | | — | | | | | — | |
Shares redeemed | | | | (48,160 | ) | | | | (70,766 | ) | | | | — | |
| | | | | | | | | | | | | | | |
Net increase in shares outstanding | | | | 117,846 | | | | | 2,542,959 | | | | | — | |
| | | | | | | | | | | | | | | |
| 1 | Fund inception date was October 1, 2019. |
| 2 | Institutional Class inceptions date was January 31, 2020. |
See Notes to Financial Statements.
88
| | |
| | MARCH 31, 2020 (UNAUDITED) |
|
|
|
| | | | | | | | | | | | | | | | | | | | | | | | | | | | |
MICRO CAP VALUE
FUND | | SMALL CAP GROWTH
FUND | | SMALL CAP VALUE
FUND |
Six Months
Ended
March 31, 20202
(Unaudited) | | Year Ended
September 30, 2019 | | Six Months
Ended
March 31, 2020
(Unaudited) | | Year Ended
September 30, 2019 | | Six Months
Ended
March 31, 2020
(Unaudited) | | Year Ended
September 30, 2019 |
| | | | | | | | | | | | | | | | | | | | | | | | | | | | | |
| | | | | | | | | | | | | | | | | | | | | | | | | | | | | |
| | $ | (1,011,888 | ) | | | $ | (2,283,385 | ) | | | $ | (7,399,411 | ) | | | $ | (12,773,288 | ) | | | $ | 4,635,204 | | | | $ | 3,208,817 | |
| |
|
3,483,505 |
| | | | 21,624,333 | | | | | 86,046,396 | | | | | 288,451,840 | | | | | (22,600,501 | ) | | | | 605,596 | |
| | | (49,222,201 | ) | | | | (33,197,979 | ) | | | | (338,356,413 | ) | | | | (270,686,501 | ) | | | | (271,918,936 | ) | | | | (9,729,926 | ) |
| | | | | | | | | | | | | | | | | | | | | | | | | | | | | |
| | | (46,750,584 | ) | | | | (13,857,031 | ) | | | | (259,709,428 | ) | | | | 4,992,051 | | | | | (289,884,233 | ) | | | | (5,915,513 | ) |
| | | | | |
| | | | | | | | | | | | | | | | | | | | | | | | | | | | | |
| | | (22,300,292 | ) | | | | (26,873,692 | ) | | | | (142,862,943 | ) | | | | (254,160,201 | ) | | | | (5,460,620 | ) | | | | (24,527,924 | ) |
| | | — | | | | | — | | | | | (122,088,144 | ) | | | | (160,748,953 | ) | | | | (5,195,933 | ) | | | | (7,190,903 | ) |
| | | | | |
| | | | | | | | | | | | | | | | | | | | | | | | | | | | | |
| | | | | | | | | | | | | | | | | | | | | | | | | | | | | |
| | | 11,442,659 | | | | | 36,404,994 | | | | | 94,871,883 | | | | | 86,238,800 | | | | | 70,474,067 | | | | | 172,350,782 | |
| | | 21,926,724 | | | | | 26,433,514 | | | | | 138,509,163 | | | | | 244,434,466 | | | | | 5,350,153 | | | | | 23,919,067 | |
| | | (42,768,863 | ) | | | | (56,224,461 | ) | | | | (127,642,262 | ) | | | | (266,135,679 | ) | | | | (65,379,112 | ) | | | | (58,961,428 | ) |
| | | 2,237 | | | | | 16,557 | | | | | 6,027 | | | | | 31,675 | | | | | 23,963 | | | | | 28,941 | |
| | | | | | | | | | | | | | | | | | | | | | | | | | | | | |
| | | (9,397,243 | ) | | | | 6,630,604 | | | | | 105,744,811 | | | | | 64,569,262 | | | | | 10,469,071 | | | | | 137,337,362 | |
| | | | | | | | | | | | | | | | | | | | | | | | | | | | | |
| | | | | | | | | | | | | | | | | | | | | | | | | | | | | |
| | | 4,073,648 | | | | | — | | | | | 262,146,022 | | | | | 206,555,979 | | | | | 94,540,895 | | | | | 307,998,467 | |
| | | — | | | | | — | | | | | 115,509,794 | | | | | 150,566,964 | | | | | 5,117,346 | | | | | 6,896,928 | |
| | | (229,342 | ) | | | | — | | | | | (121,400,223 | ) | | | | (205,138,374 | ) | | | | (42,992,383 | ) | | | | (30,806,582 | ) |
| | | 54 | | | | | — | | | | | 29,053 | | | | | 29,207 | | | | | 12,996 | | | | | 3,117 | |
| | | | | | | | | | | | | | | | | | | | | | | | | | | | | |
| | | 3,844,360 | | | | | — | | | | | 256,284,646 | | | | | 152,013,776 | | | | | 56,678,854 | | | | | 284,091,930 | |
| | | | | | | | | | | | | | | | | | | | | | | | | | | | | |
| | | (74,603,759 | ) | | | | (34,100,119 | ) | | | | (162,631,058 | ) | | | | (193,334,065 | ) | | | | (233,392,861 | ) | | | | 383,794,952 | |
| | | | | |
| | | | | | | | | | | | | | | | | | | | | | | | | | | | | |
| | | 249,522,867 | | | | | 283,622,986 | | | | | 1,691,658,445 | | | | | 1,884,992,510 | | | | | 822,949,764 | | | | | 439,154,812 | |
| | | | | | | | | | | | | | | | | | | | | | | | | | | | | |
| | $ | 174,919,108 | | | | $ | 249,522,867 | | | | $ | 1,529,027,387 | | | | $ | 1,691,658,445 | | | | $ | 589,556,903 | | | | $ | 822,949,764 | |
| | | | | | | | | | | | | | | | | | | | | | | | | | | | | |
| | | | | |
| | | | | | | | | | | | | | | | | | | | | | | | | | | | | |
| | | | | | | | | | | | | | | | | | | | | | | | | | | | | |
| | | 3,918,834 | | | | | 11,499,085 | | | | | 2,405,642 | | | | | 2,157,282 | | | | | 9,568,735 | | | | | 23,179,792 | |
| | | 6,830,755 | | | | | 9,863,251 | | | | | 3,578,124 | | | | | 7,801,930 | | | | | 662,968 | | | | | 3,662,950 | |
| | | (15,196,726 | ) | | | | (17,766,372 | ) | | | | (3,409,382 | ) | | | | (6,802,853 | ) | | | | (9,909,804 | ) | | | | (7,841,265 | ) |
| | | | | | | | | | | | | | | | | | | | | | | | | | | | | |
| | | (4,447,137 | ) | | | | 3,595,964 | | | | | 2,574,384 | | | | | 3,156,359 | | | | | 321,899 | | | | | 19,001,477 | |
| | | | | | | | | | | | | | | | | | | | | | | | | | | | | |
| | | | | | | | | | | | | | | | | | | | | | | | | | | | | |
| | | 1,705,708 | | | | | — | | | | | 6,635,754 | | | | | 5,108,334 | | | | | 13,323,213 | | | | | 40,388,583 | |
| | | — | | | | | — | | | | | 2,951,950 | | | | | 4,766,286 | | | | | 630,215 | | | | | 1,049,761 | |
| | | (104,139 | ) | | | | — | | | | | (3,231,320 | ) | | | | (5,161,091 | ) | | | | (6,588,439 | ) | | | | (4,104,717 | ) |
| | | | | | | | | | | | | | | | | | | | | | | | | | | | | |
| | | 1,601,569 | | | | | — | | | | | 6,356,384 | | | | | 4,713,529 | | | | | 7,364,989 | | | | | 37,333,627 | |
| | | | | | | | | | | | | | | | | | | | | | | | | | | | | |
89
| | |
| WASATCH FUNDS | | MARCH 31, 2020 (UNAUDITED) |
|
|
|
Statements of Changes in Net Assets(continued)
| | | | | | | | | | | | | | | | | | | | |
| | | ULTRA GROWTH
FUND | | U.S. TREASURY
FUND |
| | | Six Months
Ended
March 31, 20202
(Unaudited) | | Year Ended
September 30, 2019 | | Six Months
Ended
March 31, 2020
(Unaudited) | | Year Ended
September 30, 2019 |
| | | | | | | | | | | | | | | | | | | | |
Operations: | | | | | | | | | | | |
Net investment income (loss) | | | $ | (3,309,716 | ) | | | $ | (4,333,950 | ) | | | $ | 3,147,443 | | | | $ | 6,654,738 | |
Net realized gain (loss) on investments, foreign
currency translations and foreign capital gains taxes | | | | 27,030,265 | | | | | 16,498,858 | | | |
|
6,220,880 |
| | | | (3,118,076 | ) |
Change in unrealized appreciation (depreciation) on
investments, foreign currency translations and
deferred capital gains taxes | | | | (86,269,924 | ) | | | | (11,443,749 | ) | | |
|
61,002,991 |
| | | | 80,540,022 | |
| | | | | | | | | | | | | | | | | | | | |
Net increase (decrease) in net assets resulting from operations | | | | (62,549,375 | ) | | | | 721,159 | | | | | 70,371,314 | | | | | 84,076,684 | |
| | | | |
Distributions to shareholders from distributable earnings | | | | | | | | | | | | | | | | | | | | |
Investor Class | | | | (14,642,656 | ) | | | | (18,922,846 | ) | | | | (3,201,797 | ) | | | | (6,645,318 | ) |
Institutional Class | | | | — | | | | | — | | | | | — | | | | | — | |
| | | | |
Capital share transactions: | | | | | | | | | | | | | | | | | | | | |
Investor Class | | | | | | | | | | | | | | | | | | | | |
Shares sold | | | | 340,142,482 | | | | | 531,592,985 | | | | | 89,729,484 | | | | | 186,910,235 | |
Shares issued to holders in reinvestment of dividends | | | | 13,973,397 | | | | | 17,633,875 | | | | | 3,026,949 | | | | | 6,204,428 | |
Shares redeemed | | | | (168,105,904 | ) | | | | (205,793,858 | ) | | | | (123,300,691 | ) | | | | (194,165,022 | ) |
Redemption fees | | | | 173,228 | | | | | 360,528 | | | | | 158,904 | | | | | 157,515 | |
| | | | | | | | | | | | | | | | | | | | |
Net increase (decrease) | | | | 186,183,203 | | | | | 343,793,530 | | | | | (30,385,354 | ) | | | | (892,844 | ) |
| | | | | | | | | | | | | | | | | | | | |
Institutional Class | | | | | | | | | | | | | | | | | | | | |
Shares sold | | | | 23,232,769 | | | | | — | | | | | — | | | | | — | |
Shares issued to holders in reinvestment of dividends | | | | — | | | | | — | | | | | — | | | | | — | |
Shares redeemed | | | | (362,527 | ) | | | | — | | | | | — | | | | | — | |
Redemption fees | | | | 346 | | | | | — | | | | | — | | | | | — | |
| | | | | | | | | | | | | | | | | | | | |
Net increase | | | | 22,870,588 | | | | | — | | | | | — | | | | | — | |
| | | | | | | | | | | | | | | | | | | | |
Total increase in net assets | | | | 131,861,760 | | | | | 325,591,843 | | | | | 36,784,163 | | | | | 76,538,522 | |
| | | | |
Net assets: | | | | | | | | | | | | | | | | | | | | |
Beginning of period | | | | 623,153,792 | | | | | 297,561,949 | | | | | 379,643,946 | | | | | 303,105,424 | |
| | | | | | | | | | | | | | | | | | | | |
End of period | | | $ | 755,015,552 | | | | $ | 623,153,792 | | | | $ | 416,428,109 | | | | $ | 379,643,946 | |
| | | | | | | | | | | | | | | | | | | | |
| | | | |
Capital share transactions — shares: | | | | | | | | | | | | | | | | | | | | |
Investor Class | | | | | | | | | | | | | | | | | | | | |
Shares sold | | | | 12,645,461 | | | | | 21,348,607 | | | | | 4,361,565 | | | | | 11,232,700 | |
Shares issued to holders in reinvestment of dividends | | | | 508,678 | | | | | 869,520 | | | | | 149,846 | | | | | 360,102 | |
Shares redeemed | | | | (6,739,834 | ) | | | | (8,334,761 | ) | | | | (5,993,467 | ) | | | | (11,737,556 | ) |
| | | | | | | | | | | | | | | | | | | | |
Net increase (decrease) in shares outstanding | | | | 6,414,305 | | | | | 13,883,366 | | | | | (1,482,056 | ) | | | | (144,754 | ) |
| | | | | | | | | | | | | | | | | | | | |
Institutional Class | | | | | | | | | | | | | | | | | | | | |
Shares sold | | | | 1,060,972 | | | | | — | | | | | — | | | | | — | |
Shares issued to holders in reinvestment of dividends | | | | — | | | | | — | | | | | — | | | | | — | |
Shares redeemed | | | | (16,833 | ) | | | | — | | | | | — | | | | | — | |
| | | | | | | | | | | | | | | | | | | | |
Net increase in shares outstanding | | | | 1,044,139 | | | | | — | | | | | — | | | | | — | |
| | | | | | | | | | | | | | | | | | | | |
| 2 | Institutional Class inception date was January 31, 2020. |
See Notes to Financial Statements.
90
(This page intentionally left blank.)
91
Financial Highlights
| | | | | | | | | | | | | | | | | | | | | | | | | | | | | | | | | | | | | | | | |
| | | | | Income (Loss) from
Investment Operations | | | | | | Less Distributions | | |
| | | Net Asset
Value
Beginning
of Period | | Net
Investment
Income (Loss) | | Net Realized
and Unrealized
Gains (Losses)
on Investments | | Total from
Investment
Operations | | Redemption
Fees
(See Note 2) | | Dividends
from Net
Investment
Income | | Distributions
from Net
Realized
Gains | | Total
Distributions |
Core Growth Fund — Investor Class | | | | | | | | | | | | | | | | | | | | | | | | | | | | | | | | | | | | | | | | |
Six Months ended 3/31/20 (unaudited) | | | $ | 73.17 | | | | | (0.07 | ) | | | | (10.70 | ) | | | | (10.77 | ) | | | | — | 4 | | | | — | | | | | (7.71 | ) | | | | (7.71 | ) |
Year ended 9/30/19 | | | $ | 81.04 | | | | | (0.42 | ) | | | | (1.40 | ) | | | | (1.82 | ) | | | | 0.01 | | | | | — | | | | | (6.06 | ) | | | | (6.06 | ) |
Year ended 9/30/18 | | | $ | 67.44 | | | | | (0.43 | ) | | | | 18.30 | | | | | 17.87 | | | | | — | 4 | | | | — | | | | | (4.27 | ) | | | | (4.27 | ) |
Year ended 9/30/17 | | | $ | 56.90 | | | | | (0.50 | ) | | | | 11.13 | | | | | 10.63 | | | | | — | 4 | | | | — | | | | | (0.09 | ) | | | | (0.09 | ) |
Year ended 9/30/1616 | | | $ | 57.83 | | | | | (0.30 | ) | | | | 6.09 | | | | | 5.79 | | | | | — | 4 | | | | — | | | | | (6.72 | ) | | | | (6.72 | ) |
Year ended 9/30/15 | | | $ | 53.46 | | | | | (0.14 | )9 | | | | 5.95 | | | | | 5.81 | | | | | — | 4 | | | | — | | | | | (1.44 | ) | | | | (1.44 | ) |
Core Growth Fund — Institutional Class | | | | | | | | | | | | | | | | | | | | | | | | | | | | | | | | | | | | | | | | |
Six Months ended 3/31/20 (unaudited) | | | $ | 73.86 | | | | | — | | | | | (10.86 | ) | | | | (10.86 | ) | | | | — | 4 | | | | — | | | | | (7.71 | ) | | | | (7.71 | ) |
Year ended 9/30/19 | | | $ | 81.62 | | | | | (0.26 | ) | | | | (1.44 | ) | | | | (1.70 | ) | | | | — | 4 | | | | — | | | | | (6.06 | ) | | | | (6.06 | ) |
Year ended 9/30/18 | | | $ | 67.81 | | | | | (0.21 | ) | | | | 18.29 | | | | | 18.08 | | | | | — | 4 | | | | — | | | | | (4.27 | ) | | | | (4.27 | ) |
Year ended 9/30/17 | | | $ | 57.16 | | | | | (0.30 | ) | | | | 11.07 | | | | | 10.77 | | | | | — | 4 | | | | (0.03 | ) | | | | (0.09 | ) | | | | (0.12 | ) |
Year ended 9/30/1616 | | | $ | 57.99 | | | | | (0.14 | ) | | | | 6.03 | | | | | 5.89 | | | | | — | 4 | | | | — | | | | | (6.72 | ) | | | | (6.72 | ) |
Year ended 9/30/15 | | | $ | 53.58 | | | | | 0.06 | 9 | | | | 5.79 | | | | | 5.85 | | | | | — | 4 | | | | — | | | | | (1.44 | ) | | | | (1.44 | ) |
Emerging India Fund — Investor Class | | | | | | | | | | | | | | | | | | | | | | | | | | | | | | | | | | | | | | | | |
Six Months ended 3/31/20 (unaudited) | | | $ | 4.25 | | | | | (0.03 | ) | | | | (0.98 | ) | | | | (1.01 | ) | | | | — | 4 | | | | — | | | | | (0.01 | ) | | | | (0.01 | ) |
Year ended 9/30/19 | | | $ | 3.95 | | | | | (0.05 | ) | | | | 0.62 | | | | | 0.57 | | | | | — | 4 | | | | — | | | | | (0.27 | ) | | | | (0.27 | ) |
Year ended 9/30/18 | | | $ | 4.08 | | | | | (0.06 | ) | | | | 0.06 | | | | | — | | | | | — | 4 | | | | — | | | | | (0.13 | ) | | | | (0.13 | ) |
Year ended 9/30/17 | | | $ | 3.39 | | | | | 0.02 | 17 | | | | 0.70 | | | | | 0.72 | | | | | — | 4 | | | | — | | | | | (0.03 | ) | | | | (0.03 | ) |
Year ended 9/30/1616 | | | $ | 3.07 | | | | | (0.03 | ) | | | | 0.39 | | | | | 0.36 | | | | | — | 4 | | | | — | | | | | (0.04 | ) | | | | (0.04 | ) |
Year ended 9/30/15 | | | $ | 2.73 | | | | | (0.04 | ) | | | | 0.38 | | | | | 0.34 | | | | | — | 4 | | | | — | 4 | | | | — | | | | | — | 4 |
Emerging India Fund — Institutional Class | | | | | | | | | | | | | | | | | | | | | | | | | | | | | | | | | | | | |
Six Months ended 3/31/20 (unaudited) | | | $ | 4.28 | | | | | (0.01 | ) | | | | (1.01 | ) | | | | (1.02 | ) | | | | — | 4 | | | | — | | | | | (0.01 | ) | | | | (0.01 | ) |
Year ended 9/30/19 | | | $ | 3.97 | | | | | (0.01 | ) | | | | 0.59 | | | | | 0.58 | | | | | — | 4 | | | | — | | | | | (0.27 | ) | | | | (0.27 | ) |
Year ended 9/30/18 | | | $ | 4.10 | | | | | — | 4 | | | | — | 4 | | | | — | 4 | | | | — | 4 | | | | — | | | | | (0.13 | ) | | | | (0.13 | ) |
Year ended 9/30/17 | | | $ | 3.40 | | | | | 0.02 | 17 | | | | 0.71 | | | | | 0.73 | | | | | — | 4 | | | | — | | | | | (0.03 | ) | | | | (0.03 | ) |
Period ended 9/30/1614 16 | | | $ | 2.82 | | | | | (0.01 | ) | | | | 0.59 | | | | | 0.58 | | | | | — | | | | | — | | | | | — | | | | | — | |
Emerging Markets Select Fund — Investor Class | | | | | | | | | | | | | | | | | | | | | | | | | | | | | | | | | | | | |
Six Months ended 3/31/20 (unaudited) | | | $ | 11.32 | | | | | (0.04 | ) | | | | (1.70 | ) | | | | (1.74 | ) | | | | — | 4 | | | | — | | | | | — | | | | | — | |
Year ended 9/30/19 | | | $ | 10.40 | | | | | (0.13 | ) | | | | 1.05 | | | | | 0.92 | | | | | — | 4 | | | | — | | | | | — | | | | | — | |
Year ended 9/30/18 | | | $ | 10.46 | | | | | (0.09 | ) | | | | 0.03 | | | | | (0.06 | ) | | | | — | 4 | | | | — | | | | | — | | | | | — | |
Year ended 9/30/17 | | | $ | 9.23 | | | | | (0.03 | ) | | | | 1.26 | | | | | 1.23 | | | | | — | 4 | | | | — | | | | | — | | | | | — | |
Year ended 9/30/1616 | | | $ | 8.35 | | | | | (0.05 | ) | | | | 0.93 | | | | | 0.88 | | | | | — | 4 | | | | — | | | | | — | | | | | — | |
Year ended 9/30/15 | | | $ | 10.31 | | | | | (0.04 | ) | | | | (1.89 | ) | | | | (1.93 | ) | | | | — | 4 | | | | (0.03 | ) | | | | — | | | | | (0.03 | ) |
Emerging Markets Select Fund — Institutional Class | | | | | | | | | | | | | | | | | | | | | | | | | | | | | | | |
Six Months ended 3/31/20 (unaudited) | | | $ | 11.53 | | | | | (0.04 | ) | | | | (1.72 | ) | | | | (1.76 | ) | | | | — | 4 | | | | — | | | | | — | | | | | — | |
Year ended 9/30/19 | | | $ | 10.56 | | | | | (0.01 | ) | | | | 0.98 | | | | | 0.97 | | | | | — | 4 | | | | — | | | | | — | | | | | — | |
Year ended 9/30/18 | | | $ | 10.60 | | | | | (0.04 | ) | | | | — | 4 | | | | (0.04 | ) | | | | — | 4 | | | | — | | | | | — | | | | | — | |
Year ended 9/30/17 | | | $ | 9.32 | | | | | (0.01 | ) | | | | 1.29 | | | | | 1.28 | | | | | — | 4 | | | | — | | | | | — | | | | | — | |
Year ended 9/30/1616 | | | $ | 8.41 | | | | | 0.04 | | | | | 0.87 | | | | | 0.91 | | | | | — | | | | | — | | | | | — | | | | | — | |
Year ended 9/30/15 | | | $ | 10.37 | | | | | (0.03 | ) | | | | (1.88 | ) | | | | (1.91 | ) | | | | — | 4 | | | | (0.05 | ) | | | | — | | | | | (0.05 | ) |
Emerging Markets Small Cap Fund — Investor Class | | | | | | | | | | | | | | | | | | | | | | | | | | | | | | | | | | | | |
Six Months ended 3/31/20 (unaudited) | | | $ | 2.64 | | | | | (0.02 | ) | | | | (0.34 | ) | | | | (0.36 | )4 | | | | — | 4 | | | | — | | | | | (0.16 | ) | | | | (0.16 | ) |
Year ended 9/30/19 | | | $ | 2.78 | | | | | (0.05 | ) | | | | 0.21 | | | | | 0.16 | | | | | — | 4 | | | | — | | | | | (0.30 | ) | | | | (0.30 | ) |
Year ended 9/30/18 | | | $ | 2.99 | | | | | (0.03 | ) | | | | (0.18 | ) | | | | (0.21 | ) | | | | — | 4 | | | | — | | | | | — | | | | | — | |
Year ended 9/30/17 | | | $ | 2.67 | | | | | (0.04 | ) | | | | 0.36 | | | | | 0.32 | | | | | — | 4 | | | | — | | | | | — | | | | | — | |
Year ended 9/30/1616 | | | $ | 2.39 | | | | | (0.04 | ) | | | | 0.32 | | | | | 0.28 | | | | | — | 4 | | | | — | 4 | | | | — | | | | | — | 4 |
Year ended 9/30/15 | | | $ | 2.74 | | | | | (0.03 | ) | | | | (0.32 | ) | | | | (0.35 | ) | | | | — | 4 | | | | — | 4 | | | | — | | | | | — | 4 |
Emerging Markets Small Cap Fund — Institutional Class | | | | | | | | | | | | | | | | | | | | | | | | | | | | | | | |
Six Months ended 3/31/20 (unaudited) | | | $ | 2.65 | | | | | (0.02 | ) | | | | (0.33 | ) | | | | (0.35 | )4 | | | | — | 4 | | | | — | | | | | (0.16 | ) | | | | (0.16 | ) |
Year ended 9/30/19 | | | $ | 2.79 | | | | | (0.02 | ) | | | | 0.18 | | | | | 0.16 | | | | | — | 4 | | | | — | | | | | (0.30 | ) | | | | (0.30 | ) |
Year ended 9/30/18 | | | $ | 3.00 | | | | | (0.01 | ) | | | | (0.20 | ) | | | | (0.21 | ) | | | | — | 4 | | | | — | | | | | — | | | | | — | |
Year ended 9/30/17 | | | $ | 2.67 | | | | | 0.01 | | | | | 0.32 | | | | | 0.33 | | | | | — | 4 | | | | — | | | | | — | | | | | — | |
Period ended 9/30/1614 16 | | | $ | 2.31 | | | | | (— | )4 | | | | 0.36 | | | | | 0.36 | | | | | — | | | | | — | | | | | — | | | | | — | |
See Notes to Financial Highlights and Notes to Financial Statements.
92
| | |
| | (for a share outstanding throughout each period) |
|
|
|
| | | | | | | | | | | | | | | | | | | | | | | | | | | | | | |
| | | | | | | Ratios to Average Net Assets | | | Supplemental Data | |
Net Asset
Value
End of
Period | | | Total Return (%)1 | | | Expenses
Net of
Waivers and
Reimbursements (%)2 | | | Expenses
Before Waivers and
Reimbursements (%)2 | | | Net Investment
Income (Loss) Net
of Waivers and
Reimbursements (%)2 | | | Net Investment
Income (Loss)
Before Waivers and
Reimbursements (%)2 | | | Net Assets
End of
Period
(000s) | | | Portfolio
Turnover
Rate1 3 | |
| | | | | | | | | | | | | | | | | | | | | | | | | | | | | | |
| $ | 54.69 | | | | (17.26 | ) | | | 1.18 | 5 | | | 1.18 | 5 | | | (0.25 | ) | | | (0.25 | ) | | $ | 1,147,310 | | | | 22% | |
| $ | 73.17 | | | | (0.37 | ) | | | 1.19 | 5 | | | 1.19 | 5 | | | (0.59 | ) | | | (0.59 | ) | | $ | 1,435,994 | | | | 31% | |
| $ | 81.04 | | | | 27.66 | | | | 1.18 | 5 8 | | | 1.18 | 5 8 | | | (0.66 | ) | | | (0.66 | ) | | $ | 1,577,554 | | | | 27% | |
| $ | 67.44 | | | | 18.69 | | | | 1.21 | 5 | | | 1.21 | 5 | | | (0.78 | ) | | | (0.78 | ) | | $ | 1,211,089 | | | | 26% | |
| $ | 56.90 | | | | 10.69 | | | | 1.21 | 5 | | | 1.21 | 5 | | | (0.62 | ) | | | (0.62 | ) | | $ | 1,082,679 | | | | 18% | |
| $ | 57.83 | | | | 10.87 | | | | 1.17 | 5 | | | 1.17 | 5 | | | (0.29 | )9 | | | (0.29 | )9 | | $ | 1,014,515 | | | | 39% | |
| | | | | | | | | | | | | | | | | | | | | | | | | | | | | | |
| $ | 55.29 | | | | (17.22 | ) | | | 1.05 | 5 | | | 1.08 | 5 | | | (0.12 | ) | | | (0.15 | ) | | $ | 738,355 | | | | 22% | |
| $ | 73.86 | | | | (0.22 | ) | | | 1.05 | 5 | | | 1.09 | 5 | | | (0.45 | ) | | | (0.48 | ) | | $ | 849,787 | | | | 31% | |
| $ | 81.62 | | | | 27.82 | | | | 1.06 | 5 8 | | | 1.08 | 5 8 | | | (0.53 | ) | | | (0.55 | ) | | $ | 722,302 | | | | 27% | |
| $ | 67.81 | | | | 18.87 | | | | 1.05 | 5 | | | 1.10 | 5 | | | (0.63 | ) | | | (0.67 | ) | | $ | 383,159 | | | | 26% | |
| $ | 57.16 | | | | 10.83 | | | | 1.07 | 5 | | | 1.09 | 5 | | | (0.48 | ) | | | (0.50 | ) | | $ | 251,181 | | | | 18% | |
| $ | 57.99 | | | | 10.94 | | | | 1.12 | 5 | | | 1.13 | 5 | | | (0.29 | )9 | | | (0.30 | )9 | | $ | 150,614 | | | | 39% | |
| | | | | | | | | | | | | | | | | | | | | | | | | | | | | | |
| $ | 3.23 | | | | (23.99 | ) | | | 1.61 | 6 | | | 1.61 | 6 | | | (0.85 | ) | | | (0.85 | ) | | $ | 115,873 | | | | 20% | |
| $ | 4.25 | | | | 15.06 | | | | 1.68 | 6 | | | 1.68 | 6 | | | (0.99 | ) | | | (0.99 | ) | | $ | 187,625 | | | | 21% | |
| $ | 3.95 | | | | (0.33 | ) | | | 1.71 | 6 7 | | | 1.71 | 6 7 | | | (1.22 | ) | | | (1.22 | ) | | $ | 184,733 | | | | 48% | |
| $ | 4.08 | | | | 21.65 | | | | 1.73 | 5 | | | 1.73 | 5 | | | (0.92 | ) | | | (0.92 | ) | | $ | 207,949 | | | | 17% | |
| $ | 3.39 | | | | 11.98 | | | | 1.82 | 5 | | | 1.96 | 5 | | | (1.18 | ) | | | (1.32 | ) | | $ | 71,973 | | | | 42% | |
| $ | 3.07 | | | | 12.51 | | | | 1.95 | 5 | | | 2.12 | 5 | | | (1.38 | ) | | | (1.55 | ) | | $ | 63,850 | | | | 36% | |
| | | | | | | | | | | | | | | | | | | | | | | | | | | | | | |
| $ | 3.25 | | | | (23.82 | ) | | | 1.44 | 5 | | | 1.44 | 5 | | | (0.63 | ) | | | (0.63 | ) | | $ | 85,276 | | | | 20% | |
| $ | 4.28 | | | | 15.23 | | | | 1.49 | 6 | | | 1.49 | 6 | | | (0.75 | ) | | | (0.75 | ) | | $ | 92,214 | | | | 21% | |
| $ | 3.97 | | | | (0.33 | ) | | | 1.51 | 6 8 | | | 1.60 | 6 8 | | | (0.93 | ) | | | (1.02 | ) | | $ | 42,457 | | | | 48% | |
| $ | 4.10 | | | | 21.89 | | | | 1.50 | 5 | | | 1.67 | 5 | | | (0.77 | ) | | | (0.94 | ) | | $ | 23,739 | | | | 17% | |
| $ | 3.40 | | | | 20.57 | | | | 1.50 | 5 | | | 2.00 | 5 | | | (0.70 | ) | | | (1.20 | ) | | $ | 9,799 | | | | 42% | |
| | | | | | | | | | | | | | | | | | | | | | | | | | | | | | |
| $ | 9.58 | | | | (15.37 | ) | | | 1.51 | 6 | | | 1.79 | 6 | | | (0.91 | ) | | | (1.19 | ) | | $ | 8,957 | | | | 18% | |
| $ | 11.32 | | | | 8.85 | 5 | | | 1.51 | 6 | | | 1.97 | 6 | | | (0.51 | ) | | | (0.97 | ) | | $ | 9,771 | | | | 14% | |
| $ | 10.40 | | | | (0.57 | ) | | | 1.51 | 6 8 | | | 1.76 | 6 8 | | | (0.67 | ) | | | (0.92 | ) | | $ | 13,520 | | | | 44% | |
| $ | 10.46 | | | | 13.33 | | | | 1.51 | 6 | | | 1.90 | 6 | | | (0.38 | ) | | | (0.76 | ) | | $ | 15,273 | | | | 55% | |
| $ | 9.23 | | | | 10.54 | | | | 1.58 | 6 | | | 1.98 | 6 | | | (0.15 | ) | | | (0.55 | ) | | $ | 11,892 | | | | 62% | |
| $ | 8.35 | | | | (18.81 | ) | | | 1.70 | 6 | | | 2.00 | 6 | | | (0.23 | ) | | | (0.53 | ) | | $ | 18,527 | | | | 46% | |
| | | | | | | | | | | | | | | | | | | | | | | | | | | | | | |
| $ | 9.77 | | | | (15.26 | ) | | | 1.21 | 6 | | | 1.39 | 6 | | | (0.61 | ) | | | (0.78 | ) | | $ | 27,716 | | | | 18% | |
| $ | 11.53 | | | | 9.19 | | | | 1.21 | 6 | | | 1.43 | 6 | | | (0.14 | ) | | | (0.36 | ) | | $ | 34,375 | | | | 14% | |
| $ | 10.56 | | | | (0.38 | ) | | | 1.21 | 6 8 | | | 1.45 | 6 8 | | | (0.36 | ) | | | (0.60 | ) | | $ | 30,215 | | | | 44% | |
| $ | 10.60 | | | | 13.73 | | | | 1.21 | 6 | | | 1.52 | 6 | | | (0.09 | ) | | | (0.39 | ) | | $ | 28,868 | | | | 55% | |
| $ | 9.32 | | | | 10.82 | | | | 1.29 | 6 | | | 1.59 | 6 | | | 0.29 | | | | (0.01 | ) | | $ | 26,763 | | | | 62% | |
| $ | 8.41 | | | | (18.67 | ) | | | 1.51 | 6 | | | 1.77 | 6 | | | (0.06 | ) | | | (0.32 | ) | | $ | 19,270 | | | | 46% | |
| | | | | | | | | | | | | | | | | | | | | | | | | | | | | | |
| $ | 2.12 | | | | (14.97 | ) | | | 1.96 | 6 | | | 1.96 | 6 | | | (1.30 | ) | | | (1.30 | ) | | $ | 152,501 | | | | 7% | |
| $ | 2.64 | | | | 7.29 | | | | 1.97 | 6 | | | 1.99 | 6 | | | (0.83 | ) | | | (0.84 | ) | | $ | 191,405 | | | | 16% | |
| $ | 2.78 | | | | (7.02 | ) | | | 1.96 | 7 | | | 1.98 | 6 7 | | | (0.51 | ) | | | (0.53 | ) | | $ | 285,540 | | | | 40% | |
| $ | 2.99 | | | | 11.99 | | | | 1.96 | 6 | | | 2.02 | 6 | | | (0.49 | ) | | | (0.56 | ) | | $ | 390,903 | | | | 58% | |
| $ | 2.67 | | | | 11.73 | | | | 1.96 | 6 | | | 2.00 | 6 | | | (0.75 | ) | | | (0.79 | ) | | $ | 674,632 | | | | 42% | |
| $ | 2.39 | | | | (12.65 | ) | | | 1.95 | 5 | | | 2.01 | 5 | | | (0.63 | ) | | | (0.69 | ) | | $ | 981,367 | | | | 59% | |
| | | | | | | | | | | | | | | | | | | | | | | | | | | | | | |
| $ | 2.14 | | | | (14.53 | ) | | | 1.81 | 6 | | | 1.83 | 6 | | | (1.16 | ) | | | (1.18 | ) | | $ | 128,248 | | | | 7% | |
| $ | 2.65 | | | | 7.25 | | | | 1.82 | 6 | | | 1.85 | 6 | | | (0.73 | ) | | | (0.76 | ) | | $ | 174,050 | | | | 16% | |
| $ | 2.79 | | | | (7.00 | ) | | | 1.82 | 7 | | | 1.84 | 6 7 | | | (0.33 | ) | | | (0.35 | ) | | $ | 240,892 | | | | 40% | |
| $ | 3.00 | | | | 12.36 | | | | 1.81 | 6 | | | 1.88 | 6 | | | (0.05 | ) | | | (0.12 | ) | | $ | 252,823 | | | | 58% | |
| $ | 2.67 | | | | 15.58 | | | | 1.80 | 6 | | | 1.81 | 6 | | | (0.03 | ) | | | (0.04 | ) | | $ | 160,729 | | | | 42% | |
93
Financial Highlights(continued)
| | | | | | | | | | | | | | | | | | | | | | | | | | | | | | | | | | | | | | | | |
| | | | | Income (Loss) from
Investment Operations | | | | | | Less Distributions | | |
| | | Net Asset
Value
Beginning
of Period | | Net
Investment
Income (Loss) | | Net Realized
and Unrealized
Gains (Losses)
on Investments | | Total from
Investment
Operations | | Redemption
Fees
(See Note 2) | | Dividends
from Net
Investment
Income | | Distributions
from Net
Realized
Gains | | Total
Distributions |
Frontier Emerging Small Countries Fund — Investor Class | | | | | | | | | | | | | | | | | | | | | | | | | | | | | | | |
Six Months ended 3/31/20 (unaudited) | | | $ | 2.74 | | | | | (0.05 | ) | | | | (0.62 | ) | | | | (0.67 | ) | | | | — | 4 | | | | — | | | | | — | | | | | — | |
Year ended 9/30/19 | | | $ | 2.51 | | | | | — | 4 | | | | 0.23 | | | | | 0.23 | | | | | — | 4 | | | | — | | | | | — | | | | | — | |
Year ended 9/30/18 | | | $ | 2.75 | | | | | (0.11 | ) | | | | (0.13 | ) | | | | (0.24 | ) | | | | — | 4 | | | | — | | | | | — | | | | | — | |
Year ended 9/30/17 | | | $ | 2.63 | | | | | (0.08 | ) | | | | 0.20 | | | | | 0.12 | | | | | — | 4 | | | | — | | | | | — | | | | | — | |
Year ended 9/30/1616 | | | $ | 2.77 | | | | | 0.02 | | | | | (0.16 | ) | | | | (0.14 | ) | | | | — | 4 | | | | — | 4 | | | | — | | | | | — | 4 |
Year ended 9/30/15 | | | $ | 3.32 | | | | | 0.02 | | | | | (0.50 | ) | | | | (0.48 | ) | | | | — | 4 | | | | (0.02 | ) | | | | (0.05 | ) | | | | (0.07 | ) |
Frontier Emerging Small Countries Fund — Institutional Class | | | | | | | | | | | | | | | | | | | | | | | | | | | | | | | |
Six Months ended 3/31/20 (unaudited) | | | $ | 2.76 | | | | | 0.02 | | | | | (0.69 | ) | | | | (0.67 | ) | | | | — | 4 | | | | — | | | | | — | | | | | — | |
Year ended 9/30/19 | | | $ | 2.53 | | | | | 0.03 | | | | | 0.20 | | | | | 0.23 | | | | | — | 4 | | | | — | | | | | — | | | | | — | |
Year ended 9/30/18 | | | $ | 2.76 | | | | | (0.04 | ) | | | | (0.19 | ) | | | | (0.23 | ) | | | | — | 4 | | | | — | | | | | — | | | | | — | |
Year ended 9/30/17 | | | $ | 2.64 | | | | | (0.06 | ) | | | | 0.18 | | | | | 0.12 | | | | | — | 4 | | | | — | | | | | — | | | | | — | |
Period ended 9/30/1614 16 | | | $ | 2.58 | | | | | 0.02 | | | | | 0.04 | | | | | 0.06 | | | | | — | 4 | | | | — | | | | | — | | | | | — | |
Global Opportunities Fund — Investor Class | | | | | | | | | | | | | | | | | | | | | | | | | | | | | | | |
Six Months ended 3/31/20 (unaudited) | | | $ | 3.46 | | | | | (0.02 | ) | | | | (0.53 | ) | | | | (0.55 | ) | | | | — | 4 | | | | — | | | | | (0.30 | ) | | | | (0.30 | ) |
Year ended 9/30/19 | | | $ | 4.09 | | | | | (0.03 | ) | | | | (0.06 | ) | | | | (0.09 | ) | | | | — | 4 | | | | — | | | | | (0.54 | ) | | | | (0.54 | ) |
Year ended 9/30/18 | | | $ | 3.76 | | | | | (0.03 | ) | | | | 0.77 | | | | | 0.74 | | | | | — | 4 | | | | — | | | | | (0.41 | ) | | | | (0.41 | ) |
Year ended 9/30/17 | | | $ | 3.52 | | | | | (0.07 | ) | | | | 0.58 | | | | | 0.51 | | | | | — | 4 | | | | — | 4 | | | | (0.27 | ) | | | | (0.27 | ) |
Year ended 9/30/1616 | | | $ | 3.51 | | | | | (0.04 | ) | | | | 0.51 | | | | | 0.47 | | | | | — | 4 | | | | (0.01 | ) | | | | (0.45 | ) | | | | (0.46 | ) |
Year ended 9/30/15 | | | $ | 4.28 | | | | | (0.05 | ) | | | | (0.08 | ) | | | | (0.13 | ) | | | | — | 4 | | | | (0.01 | ) | | | | (0.63 | ) | | | | (0.64 | ) |
Global Opportunities Fund — Institutional Class | | | | | | | | | | | | | | | | | | | | | | | | | | | | | | | |
Six Months ended 3/31/20 (unaudited) | | | $ | 3.48 | | | | | (0.01 | ) | | | | (0.55 | ) | | | | (0.56 | ) | | | | — | 4 | | | | — | | | | | (0.30 | ) | | | | (0.30 | ) |
Year ended 9/30/19 | | | $ | 4.10 | | | | | (0.03 | ) | | | | (0.05 | ) | | | | (0.08 | ) | | | | — | | | | | — | | | | | (0.54 | ) | | | | (0.54 | ) |
Year ended 9/30/18 | | | $ | 3.76 | | | | | (0.02 | ) | | | | 0.77 | | | | | 0.75 | | | | | — | | | | | — | | | | | (0.41 | ) | | | | (0.41 | ) |
Year ended 9/30/17 | | | $ | 3.52 | | | | | (0.02 | ) | | | | 0.54 | | | | | 0.52 | | | | | — | | | | | (0.01 | ) | | | | (0.27 | ) | | | | (0.28 | ) |
Period ended 9/30/1614 16 | | | $ | 3.09 | | | | | (— | )4 | | | | 0.43 | | | | | 0.43 | | | | | — | | | | | — | | | | | — | | | | | — | |
Global Select Fund — Investor Class | | | | | | | | | | | | | | | | | | | | | | | | | | | | | | | | | | | | | | | | |
Six Months ended 3/31/2019 (unaudited) | | | $ | 10.00 | | | | | (0.03 | ) | | | | (0.98 | ) | | | | (1.01 | ) | | | | — | 4 | | | | — | | | | | — | | | | | — | |
Global Select Fund — Institutional Class | | | | | | | | | | | | | | | | | | | | | | | | | | | | | | | | | | | | | | | | |
Six Months ended 3/31/2019 (unaudited) | | | $ | 10.00 | | | | | (0.01 | ) | | | | (0.98 | ) | | | | (0.99 | ) | | | | — | 4 | | | | — | | | | | — | | | | | — | |
Global Value Fund — Investor Class | | | | | | | | | | | | | | | | | | | | | | | | | | | | | | | | | | | | | | | | |
Six Months ended 3/31/20 (unaudited) | | | $ | 7.74 | | | | | 0.08 | | | | | (1.90 | ) | | | | (1.82 | ) | | | | — | 4 | | | | (0.12 | ) | | | | (0.04 | ) | | | | (0.16 | ) |
Year ended 9/30/19 | | | $ | 9.29 | | | | | 0.19 | | | | | (0.42 | ) | | | | (0.23 | ) | | | | — | 4 | | | | (0.19 | ) | | | | (1.13 | ) | | | | (1.32 | ) |
Year ended 9/30/18 | | | $ | 9.93 | | | | | 0.19 | | | | | 0.65 | 18 | | | | 0.84 | | | | | — | 4 | | | | (0.19 | ) | | | | (1.29 | ) | | | | (1.48 | ) |
Year ended 9/30/17 | | | $ | 9.02 | | | | | 0.19 | | | | | 1.23 | | | | | 1.42 | | | | | — | 4 | | | | (0.19 | ) | | | | (0.32 | ) | | | | (0.51 | ) |
Year ended 9/30/1616 | | | $ | 8.84 | | | | | 0.16 | | | | | 1.01 | | | | | 1.17 | | | | | — | 4 | | | | (0.16 | ) | | | | (0.83 | ) | | | | (0.99 | ) |
Year ended 9/30/15 | | | $ | 12.69 | | | | | 0.15 | | | | | (0.69 | ) | | | | (0.54 | ) | | | | — | 4 | | | | (0.16 | ) | | | | (3.15 | ) | | | | (3.31 | ) |
Global Value Fund — Institutional Class | | | | | | | | | | | | | | | | | | | | | | | | | | | | | | | | | | | | | | | | |
Six Months ended 3/31/20 (unaudited) | | | $ | 7.73 | | | | | 0.08 | | | | | (1.89 | ) | | | | (1.81 | ) | | | | — | 4 | | | | (0.13 | ) | | | | (0.04 | ) | | | | (0.17 | ) |
Year ended 9/30/19 | | | $ | 9.28 | | | | | 0.19 | | | | | (0.41 | ) | | | | (0.22 | ) | | | | — | 4 | | | | (0.20 | ) | | | | (1.13 | ) | | | | (1.33 | ) |
Year ended 9/30/18 | | | $ | 9.92 | | | | | 0.20 | | | | | 0.66 | 18 | | | | 0.86 | | | | | — | 4 | | | | (0.20 | ) | | | | (1.30 | ) | | | | (1.50 | ) |
Year ended 9/30/17 | | | $ | 9.01 | | | | | 0.18 | | | | | 1.25 | | | | | 1.43 | | | | | — | 4 | | | | (0.20 | ) | | | | (0.32 | ) | | | | (0.52 | ) |
Year ended 9/30/1616 | | | $ | 8.84 | | | | | 0.29 | | | | | 0.88 | | | | | 1.17 | | | | | — | 4 | | | | (0.17 | ) | | | | (0.83 | ) | | | | (1.00 | ) |
Year ended 9/30/15 | | | $ | 12.69 | | | | | (0.04 | ) | | | | (0.49 | ) | | | | (0.53 | ) | | | | — | 4 | | | | (0.17 | ) | | | | (3.15 | ) | | | | (3.32 | ) |
International Growth Fund — Investor Class | | | | | | | | | | | | | | | | | | | | | | | | | | |
Six Months ended 3/31/20 (unaudited) | | | $ | 28.23 | | | | | (0.06 | ) | | | | (3.25 | ) | | | | (3.31 | ) | | | | — | 4 | | | | — | | | | | (0.78 | ) | | | | (0.78 | ) |
Year ended 9/30/19 | | | $ | 36.95 | | | | | (0.08 | ) | | | | (4.26 | ) | | | | (4.34 | ) | | | | — | 4 | | | | — | | | | | (4.38 | ) | | | | (4.38 | ) |
Year ended 9/30/18 | | | $ | 33.84 | | | | | (— | )4 | | | | 4.04 | | | | | 4.04 | | | | | — | 4 | | | | — | | | | | (0.93 | ) | | | | (0.93 | ) |
Year ended 9/30/17 | | | $ | 31.43 | | | | | (0.13 | ) | | | | 3.61 | | | | | 3.48 | | | | | — | 4 | | | | — | | | | | (1.07 | ) | | | | (1.07 | ) |
Year ended 9/30/1616 | | | $ | 27.88 | | | | | (0.22 | ) | | | | 3.77 | | | | | 3.55 | | | | | — | 4 | | | | — | | | | | — | | | | | — | |
Year ended 9/30/15 | | | $ | 26.78 | | | | | (0.09 | ) | | | | 1.39 | | | | | 1.30 | | | | | — | 4 | | | | (0.01 | ) | | | | (0.19 | ) | | | | (0.20 | ) |
International Growth Fund — Institutional Class | | | | | | | | | | | | | | | | | | | | | | | | | | | | | | | |
Six Months ended 3/31/20 (unaudited) | | | $ | 28.33 | | | | | (0.04 | ) | | | | (3.27 | ) | | | | (3.31 | ) | | | | — | 4 | | | | — | | | | | (0.78 | ) | | | | (0.78 | ) |
Year ended 9/30/19 | | | $ | 37.03 | | | | | (0.04 | ) | | | | (4.28 | ) | | | | (4.32 | ) | | | | — | 4 | | | | — | | | | | (4.38 | ) | | | | (4.38 | ) |
Year ended 9/30/18 | | | $ | 33.88 | | | | | 0.06 | | | | | 4.02 | | | | | 4.08 | | | | | — | 4 | | | | — | | | | | (0.93 | ) | | | | (0.93 | ) |
Year ended 9/30/17 | | | $ | 31.46 | | | | | (0.05 | ) | | | | 3.56 | | | | | 3.51 | | | | | — | 4 | | | | (0.02 | ) | | | | (1.07 | ) | | | | (1.09 | ) |
Period ended 9/30/1614 16 | | | $ | 28.46 | | | | | 0.01 | | | | | 2.99 | | | | | 3.00 | | | | | — | 4 | | | | — | | | | | — | | | | | — | |
See Notes to Financial Highlights and Notes to Financial Statements.
94
| | |
| | (for a share outstanding throughout each period) |
|
|
|
| | | | | | | | | | | | | | | | | | | | | | | | | | | | | | |
| | | | | | | Ratios to Average Net Assets | | | Supplemental Data | |
Net Asset
Value
End of
Period | | | Total Return (%)1 | | | Expenses
Net of
Waivers and
Reimbursements (%)2 | | | Expenses
Before Waivers and
Reimbursements (%)2 | | | Net Investment
Income (Loss) Net
of Waivers and
Reimbursements (%)2 | | | Net Investment
Income (Loss)
Before Waivers and
Reimbursements (%)2 | | | Net Assets
End of
Period
(000s) | | | Portfolio
Turnover
Rate1 3 | |
| | | | | | | | | | | | | | | | | | | | | | | | | | | | | | |
| $ | 2.07 | | | | (24.45 | ) | | | 2.15 | 5 | | | 2.29 | 5 | | | (1.56 | ) | | | (1.69 | ) | | $ | 30,197 | | | | 18% | |
| $ | 2.74 | | | | 9.16 | | | | 2.20 | 6 | | | 2.30 | 6 | | | 0.78 | | | | 0.69 | | | $ | 43,789 | | | | 63% | |
| $ | 2.51 | | | | (8.73 | ) | | | 2.22 | 6 7 | | | 2.36 | 6 7 | | | (0.39 | ) | | | (0.53 | ) | | $ | 57,406 | | | | 42% | |
| $ | 2.75 | | | | 4.56 | | | | 2.28 | 6 | | | 2.46 | 6 | | | (0.48 | ) | | | (0.67 | ) | | $ | 155,758 | | | | 59% | |
| $ | 2.63 | | | | (4.89 | ) | | | 2.25 | 5 | | | 2.39 | 5 | | | 0.35 | | | | 0.21 | | | $ | 437,850 | | | | 80% | |
| $ | 2.77 | | | | (14.88 | ) | | | 2.25 | 5 | | | 2.28 | 5 | | | 0.39 | | | | 0.36 | | | $ | 1,027,673 | | | | 34% | |
| | | | | | | | | | | | | | | | | | | | | | | | | | | | | | |
| $ | 2.09 | | | | (24.28 | ) | | | 1.95 | 5 | | | 2.12 | 5 | | | (1.39 | ) | | | (1.56 | ) | | $ | 9,765 | | | | 18% | |
| $ | 2.76 | | | | 9.09 | | | | 2.00 | 6 | | | 2.15 | 6 | | | 1.04 | | | | 0.90 | | | $ | 16,456 | | | | 63% | |
| $ | 2.53 | | | | (8.33 | ) | | | 2.02 | 6 8 | | | 2.11 | 6 8 | | | (0.30 | ) | | | (0.39 | ) | | $ | 20,586 | | | | 42% | |
| $ | 2.76 | | | | 4.55 | | | | 2.08 | 6 | | | 2.17 | 6 | | | (0.34 | ) | | | (0.44 | ) | | $ | 42,006 | | | | 59% | |
| $ | 2.64 | | | | 2.33 | | | | 2.06 | 6 | | | 2.06 | 6 | | | 1.40 | | | | 1.40 | | | $ | 139,699 | | | | 80% | |
| | | | | | | | | | | | | | | | | | | | | | | | | | | | | | |
| $ | 2.61 | | | | (17.97 | ) | | | 1.53 | 5 | | | 1.53 | 5 | | | (1.04 | ) | | | (1.04 | ) | | $ | 78,268 | | | | 10% | |
| $ | 3.46 | | | | 0.82 | | | | 1.56 | 5 | | | 1.56 | 5 | | | (0.95 | ) | | | (0.95 | ) | | $ | 103,710 | | | | 24% | |
| $ | 4.09 | | | | 20.75 | | | | 1.55 | 6 8 | | | 1.55 | 6 8 | | | (0.78 | ) | | | (0.78 | ) | | $ | 110,874 | | | | 40% | |
| $ | 3.76 | | | | 16.61 | | | | 1.59 | 6 | | | 1.59 | 6 | | | (1.09 | ) | | | (1.09 | ) | | $ | 95,847 | | | | 27% | |
| $ | 3.52 | | | | 13.73 | | | | 1.62 | 6 | | | 1.62 | 6 | | | (0.98 | ) | | | (0.98 | ) | | $ | 150,945 | | | | 44% | |
| $ | 3.51 | | | | (3.88 | ) | | | 1.81 | 5 | | | 1.81 | 5 | | | (1.10 | ) | | | (1.10 | ) | | $ | 155,968 | | | | 54% | |
| | | | | | | | | | | | | | | | | | | | | | | | | | | | | | |
| $ | 2.62 | | | | (18.15 | ) | | | 1.36 | 5 | | | 1.52 | 5 | | | (0.86 | ) | | | (1.02 | ) | | $ | 18,667 | | | | 10% | |
| $ | 3.48 | | | | 1.09 | | | | 1.35 | 5 | | | 1.57 | 5 | | | (0.74 | ) | | | (0.95 | ) | | $ | 19,060 | | | | 24% | |
| $ | 4.10 | | | | 21.04 | | | | 1.36 | 6 8 | | | 1.66 | 6 8 | | | (0.57 | ) | | | (0.86 | ) | | $ | 15,879 | | | | 40% | |
| $ | 3.76 | | | | 16.92 | | | | 1.36 | 6 | | | 1.93 | 6 | | | (0.85 | ) | | | (1.41 | ) | | $ | 7,149 | | | | 27% | |
| $ | 3.52 | | | | 13.92 | | | | 1.35 | 5 | | | 2.32 | 5 | | | (0.57 | ) | | | (1.54 | ) | | $ | 5,348 | | | | 44% | |
| | | | | | | | | | | | | | | | | | | | | | | | | | | | | | |
| $ | 8.99 | | | | (10.10 | ) | | | 1.35 | 5 | | | 3.86 | 5 | | | (0.78 | ) | | | (3.29 | ) | | $ | 2,100 | | | | 4% | |
| | | | | | | | | | | | | | | | | | | | | | | | | | | | | | |
| $ | 9.01 | | | | (9.90 | ) | | | 0.95 | 5 | | | 2.82 | 5 | | | (0.40 | ) | | | (2.27 | ) | | $ | 7,530 | | | | 4% | |
| | | | | | | | | | | | | | | | | | | | | | | | | | | | | | |
| $ | 5.76 | | | | (23.93 | ) | | | 1.10 | 5 | | | 1.23 | 5 | | | 1.97 | | | | 1.84 | | | $ | 95,143 | | | | 40% | |
| $ | 7.74 | | | | (0.40 | ) | | | 1.10 | 5 | | | 1.19 | 5 | | | 2.30 | | | | 2.22 | | | $ | 146,704 | | | | 49% | |
| $ | 9.29 | | | | 9.56 | 18 | | | 1.11 | 5 8 | | | 1.19 | 5 8 | | | 2.17 | | | | 2.08 | | | $ | 192,811 | | | | 72% | |
| $ | 9.93 | | | | 16.11 | | | | 1.10 | 5 | | | 1.19 | 5 | | | 1.93 | | | | 1.84 | | | $ | 175,730 | | | | 44% | |
| $ | 9.02 | | | | 13.92 | | | | 1.10 | 5 | | | 1.17 | 5 | | | 1.70 | | | | 1.63 | | | $ | 189,691 | | | | 26% | |
| $ | 8.84 | | | | (6.61 | ) | | | 1.10 | 5 | | | 1.12 | 5 | | | 1.34 | | | | 1.32 | | | $ | 244,056 | | | | 39% | |
| | | | | | | | | | | | | | | | | | | | | | | | | | | | | | |
| $ | 5.75 | | | | (23.91 | ) | | | 0.95 | 5 | | | 1.32 | 5 | | | 2.16 | | | | 1.79 | | | $ | 5,610 | | | | 40% | |
| $ | 7.73 | | | | (0.25 | ) | | | 0.97 | 5 | | | 1.23 | 5 | | | 2.44 | | | | 2.19 | | | $ | 7,978 | | | | 49% | |
| $ | 9.28 | | | | 9.61 | 18 | | | 0.95 | 5 8 | | | 1.58 | 5 8 | | | 2.39 | | | | 1.76 | | | $ | 9,615 | | | | 72% | |
| $ | 9.92 | | | | 16.31 | | | | 0.95 | 5 | | | 2.31 | 5 | | | 2.05 | | | | 0.70 | | | $ | 4,594 | | | | 44% | |
| $ | 9.01 | | | | 13.97 | | | | 0.96 | 5 | | | 1.72 | 5 | | | 1.76 | | | | 1.00 | | | $ | 3,589 | | | | 26% | |
| $ | 8.84 | | | | (6.50 | ) | | | 0.98 | 5 | | | 1.44 | 5 | | | 1.40 | | | | 0.94 | | | $ | 1,525 | | | | 39% | |
| | | | | | | | | | | | | | | | | | | | | | | | | | | | | | |
| $ | 24.14 | | | | (12.33 | ) | | | 1.46 | 5 | | | 1.46 | 5 | | | (0.35 | ) | | | (0.35 | ) | | $ | 425,430 | | | | 20% | |
| $ | 28.23 | | | | (9.76 | ) | | | 1.46 | 5 | | | 1.46 | 5 | | | (0.25 | ) | | | (0.25 | ) | | $ | 543,990 | | | | 40% | |
| $ | 36.95 | | | | 12.13 | | | | 1.45 | 5 8 | | | 1.45 | 5 8 | | | 0.01 | | | | 0.01 | | | $ | 748,847 | | | | 44% | |
| $ | 33.84 | | | | 12.04 | | | | 1.46 | 5 | | | 1.46 | 5 | | | (0.28 | ) | | | (0.28 | ) | | $ | 804,613 | | | | 31% | |
| $ | 31.43 | | | | 12.73 | | | | 1.48 | 5 | | | 1.48 | 5 | | | (0.41 | ) | | | (0.41 | ) | | $ | 945,168 | | | | 50% | |
| $ | 27.88 | | | | 4.83 | | | | 1.50 | 5 | | | 1.50 | 8 | | | (0.32 | ) | | | (0.32 | ) | | $ | 1,316,095 | | | | 46% | |
| | | | | | | | | | | | | | | | | | | | | | | | | | | | | | |
| $ | 24.24 | | | | (12.29 | ) | | | 1.35 | 5 | | | 1.35 | 5 | | | (0.23 | ) | | | (0.24 | ) | | $ | 472,939 | | | | 20% | |
| $ | 28.33 | | | | (9.67 | ) | | | 1.35 | 5 | | | 1.35 | 5 | | | (0.13 | ) | | | (0.13 | ) | | $ | 595,341 | | | | 40% | |
| $ | 37.03 | | | | 12.24 | | | | 1.35 | 5 8 | | | 1.36 | 5 8 | | | 0.16 | | | | 0.16 | | | $ | 816,942 | | | | 44% | |
| $ | 33.88 | | | | 12.16 | | | | 1.35 | 5 | | | 1.37 | 5 | | | (0.14 | ) | | | (0.16 | ) | | $ | 656,860 | | | | 31% | |
| $ | 31.46 | | | | 10.54 | | | | 1.35 | 5 | | | 1.36 | 5 | | | 0.07 | | | | 0.06 | | | $ | 509,016 | | | | 50% | |
95
Financial Highlights(continued)
| | | | | | | | | | | | | | | | | | | | | | | | | | | | | | | | | | | | | | | | |
| | | | | Income (Loss) from
Investment Operations | | | | | | Less Distributions | | |
| | | Net Asset
Value
Beginning
of Period | | Net
Investment
Income (Loss) | | Net Realized
and Unrealized
Gains (Losses)
on Investments | | Total from
Investment
Operations | | Redemption
Fees
(See Note 2) | | Dividends
from Net
Investment
Income | | Distributions
from Net
Realized
Gains | | Total
Distributions |
International Opportunities Fund — Investor Class | | | | | | | | | | | | | | | | | | | | | | | | | | |
Six Months ended 3/31/20 (unaudited) | | | $ | 3.54 | | | | | (0.04 | ) | | | | (0.38 | ) | | | | (0.42 | ) | | | | — | 4 | | | | — | | | | | (0.09 | ) | | | | (0.09 | ) |
Year ended 9/30/19 | | | $ | 3.58 | | | | | (0.09 | ) | | | | 0.13 | | | | | 0.04 | | | | | — | 4 | | | | — | | | | | (0.08 | ) | | | | (0.08 | ) |
Year ended 9/30/18 | | | $ | 3.47 | | | | | (0.05 | ) | | | | 0.40 | | | | | 0.35 | | | | | — | 4 | | | | — | | | | | (0.24 | ) | | | | (0.24 | ) |
Year ended 9/30/17 | | | $ | 3.21 | | | | | (0.04 | ) | | | | 0.30 | | | | | 0.26 | | | | | — | 4 | | | | — | | | | | — | | | | | — | |
Year ended 9/30/1616 | | | $ | 2.74 | | | | | (0.01 | ) | | | | 0.61 | | | | | 0.60 | | | | | — | 4 | | | | — | | | | | (0.13 | ) | | | | (0.13 | ) |
Year ended 9/30/15 | | | $ | 3.09 | | | | | (0.01 | ) | | | | (0.04 | ) | | | | (0.05 | ) | | | | — | 4 | | | | — | | | | | (0.30 | ) | | | | (0.30 | ) |
International Opportunities Fund — Institutional Class | | | | | | | | | | | | | | | | | | | | | | | | | | |
Six Months ended 3/31/20 (unaudited) | | | $ | 3.58 | | | | | (0.02 | ) | | | | (0.40 | ) | | | | (0.42 | ) | | | | — | 4 | | | | — | | | | | (0.09 | ) | | | | (0.09 | ) |
Year ended 9/30/19 | | | $ | 3.62 | | | | | (0.02 | ) | | | | 0.06 | | | | | 0.04 | | | | | — | 4 | | | | — | | | | | (0.08 | ) | | | | (0.08 | ) |
Year ended 9/30/18 | | | $ | 3.50 | | | | | (0.03 | ) | | | | 0.39 | | | | | 0.36 | | | | | — | 4 | | | | — | | | | | (0.24 | ) | | | | (0.24 | ) |
Year ended 9/30/17 | | | $ | 3.23 | | | | | (0.01 | ) | | | | 0.28 | | | | | 0.27 | | | | | — | 4 | | | | — | | | | | — | | | | | — | |
Period ended 9/30/1614 16 | | | $ | 2.71 | | | | | 0.01 | | | | | 0.51 | | | | | 0.52 | | | | | — | 4 | | | | — | | | | | — | | | | | — | |
International Select Fund — Investor Class | | | | | | | | | | | | | | | | | | | | | | | | | | | | | | | |
Six Months ended 3/31/2019 (unaudited) | | | $ | 10.00 | | | | | (0.03 | ) | | | | (0.50 | ) | | | | (0.53 | ) | | | | — | 4 | | | | — | | | | | — | | | | | — | |
International Select Fund — Institutional Class | | | | | | | | | | | | | | | | | | | | | | | | | | | | | | | |
Six Months ended 3/31/2019 (unaudited) | | | $ | 10.00 | | | | | (0.02 | ) | | | | (0.50 | ) | | | | (0.52 | ) | | | | 0.04 | | | | | — | | | | | — | | | | | — | |
Micro Cap Fund — Investor Class | | | | | | | | | | | | | | | | | | | | | | | | | | |
Six Months ended 3/31/20 (unaudited) | | | $ | 7.45 | | | | | (0.04 | ) | | | | (0.81 | ) | | | | (0.85 | ) | | | | — | 4 | | | | — | | | | | (0.87 | ) | | | | (0.87 | ) |
Year ended 9/30/19 | | | $ | 9.86 | | | | | (0.08 | ) | | | | (0.55 | ) | | | | (0.63 | ) | | | | — | 4 | | | | — | | | | | (1.78 | ) | | | | (1.78 | ) |
Year ended 9/30/18 | | | $ | 8.23 | | | | | (0.08 | ) | | | | 2.88 | | | | | 2.80 | | | | | — | 4 | | | | — | | | | | (1.17 | ) | | | | (1.17 | ) |
Year ended 9/30/17 | | | $ | 7.19 | | | | | (0.11 | ) | | | | 1.75 | | | | | 1.64 | | | | | — | 4 | | | | (0.01 | ) | | | | (0.59 | ) | | | | (0.60 | ) |
Year ended 9/30/1616 | | | $ | 7.21 | | | | | (0.08 | ) | | | | 1.15 | | | | | 1.07 | | | | | — | 4 | | | | — | | | | | (1.09 | ) | | | | (1.09 | ) |
Year ended 9/30/15 | | | $ | 7.36 | | | | | (0.08 | )10 | | | | 0.28 | | | | | 0.20 | | | | | — | 4 | | | | — | 4 | | | | (0.35 | ) | | | | (0.35 | ) |
Micro Cap Fund — Institutional Class | | | | | | | | | | | | | | | | | | | | | | | | | | | | | | | |
Period ended 3/31/2020 (unaudited) | | | $ | 7.74 | | | | | (0.01 | ) | | | | (2.00 | ) | | | | (2.01 | ) | | | | — | 4 | | | | — | | | | | — | | | | | — | |
Micro Cap Value Fund — Investor Class | | | | | | | | | | | | | | | | | | | | | | | | | | |
Six Months ended 3/31/20 (unaudited) | | | $ | 3.21 | | | | | (0.02 | ) | | | | (0.55 | ) | | | | (0.57 | ) | | | | — | 4 | | | | — | | | | | (0.30 | ) | | | | (0.30 | ) |
Year ended 9/30/19 | | | $ | 3.83 | | | | | (0.03 | ) | | | | (0.20 | ) | | | | (0.23 | ) | | | | — | 4 | | | | (0.02 | ) | | | | (0.37 | ) | | | | (0.39 | ) |
Year ended 9/30/18 | | | $ | 3.48 | | | | | (0.03 | ) | | | | 0.65 | | | | | 0.62 | | | | | — | 4 | | | | — | | | | | (0.27 | ) | | | | (0.27 | ) |
Year ended 9/30/17 | | | $ | 2.87 | | | | | (0.02 | ) | | | | 0.68 | | | | | 0.66 | | | | | — | 4 | | | | — | 4 | | | | (0.05 | ) | | | | (0.05 | ) |
Year ended 9/30/1616 | | | $ | 2.87 | | | | | (0.02 | ) | | | | 0.34 | | | | | 0.32 | | | | | — | 4 | | | | — | | | | | (0.32 | ) | | | | (0.32 | ) |
Year ended 9/30/15 | | | $ | 3.02 | | | | | (0.02 | )11 | | | | 0.31 | | | | | 0.29 | | | | | — | 4 | | | | — | | | | | (0.44 | ) | | | | (0.44 | ) |
Micro Cap Value Fund — Institutional Class | | | | | | | | | | | | | | | | | | | | | | | | | | | | | | | |
Period ended 3/31/2020 (unaudited) | | | $ | 3.26 | | | | | — | | | | | (0.92 | ) | | | | (0.92 | ) | | | | — | 4 | | | | — | | | | | — | | | | | — | |
Small Cap Growth Fund — Investor Class | | | | | | | | | | | | | | | | | | | | | | | | | | |
Six Months ended 3/31/20 (unaudited) | | | $ | 40.23 | | | | | (0.13 | ) | | | | (4.38 | ) | | | | (4.51 | ) | | | | — | 4 | | | | — | | | | | (5.79 | ) | | | | (5.79 | ) |
Year ended 9/30/19 | | | $ | 55.30 | | | | | (0.28 | ) | | | | (2.33 | ) | | | | (2.61 | ) | | | | — | 4 | | | | — | | | | | (12.46 | ) | | | | (12.46 | ) |
Year ended 9/30/18 | | | $ | 45.72 | | | | | (0.54 | ) | | | | 15.19 | | | | | 14.65 | | | | | — | 4 | | | | — | | | | | (5.07 | ) | | | | (5.07 | ) |
Year ended 9/30/17 | | | $ | 43.52 | | | | | (0.53 | ) | | | | 6.24 | | | | | 5.71 | | | | | — | 4 | | | | — | | | | | (3.51 | ) | | | | (3.51 | ) |
Year ended 9/30/1616 | | | $ | 45.97 | | | | | (0.47 | ) | | | | 5.65 | | | | | 5.18 | | | | | — | 4 | | | | — | | | | | (7.63 | ) | | | | (7.63 | ) |
Year ended 9/30/15 | | | $ | 50.25 | | | | | (0.40 | ) | | | | 0.93 | | | | | 0.53 | | | | | — | 4 | | | | — | | | | | (4.81 | ) | | | | (4.81 | ) |
Small Cap Growth Fund — Institutional Class | | | | | | | | | | | | | | | | | | | | | | | | | | |
Six Months ended 3/31/20 (unaudited) | | | $ | 40.60 | | | | | (0.09 | ) | | | | (4.45 | ) | | | | (4.54 | ) | | | | — | 4 | | | | — | | | | | (5.79 | ) | | | | (5.79 | ) |
Year ended 9/30/19 | | | $ | 55.61 | | | | | (0.24 | ) | | | | (2.31 | ) | | | | (2.55 | ) | | | | — | 4 | | | | — | | | | | (12.46 | ) | | | | (12.46 | ) |
Year ended 9/30/18 | | | $ | 45.89 | | | | | (0.31 | ) | | | | 15.10 | | | | | 14.79 | | | | | — | 4 | | | | — | | | | | (5.07 | ) | | | | (5.07 | ) |
Year ended 9/30/17 | | | $ | 43.58 | | | | | (0.17 | ) | | | | 5.99 | | | | | 5.82 | | | | | — | 4 | | | | — | | | | | (3.51 | ) | | | | (3.51 | ) |
Period ended 9/30/1614 16 | | | $ | 37.58 | | | | | (0.07 | ) | | | | 6.07 | | | | | 6.00 | | | | | — | 4 | | | | — | | | | | — | | | | | — | |
See Notes to Financial Highlights and Notes to Financial Statements.
96
| | |
| | (for a share outstanding throughout each period) |
|
|
|
| | | | | | | | | | | | | | | | | | | | | | | | | | | | | | |
| | | | | | | Ratios to Average Net Assets | | | Supplemental Data | |
Net Asset
Value
End of
Period | | | Total Return (%)1 | | | Expenses
Net of Waivers and
Reimbursements (%)2 | | | Expenses
Before Waivers and
Reimbursements (%)2 | | | Net Investment
Income (Loss) Net
of Waivers and
Reimbursements (%)2 | | | Net Investment
Income (Loss)
Before Waivers and
Reimbursements (%)2 | | | Net Assets
End of
Period
(000s) | | | Portfolio
Turnover
Rate1 3 | |
| | | | | | | | | | | | | | | | | | | | | | | | | | | | | | |
| $ | 3.03 | | | | (12.34 | ) | | | 2.03 | 5 | | | 2.03 | 5 | | | (1.21 | ) | | | (1.21 | ) | | $ | 98,087 | | | | 16% | |
| $ | 3.54 | | | | 1.61 | | | | 2.09 | 6 | | | 2.09 | 6 | | | (1.04 | ) | | | (1.04 | ) | | $ | 132,503 | | | | 46% | |
| $ | 3.58 | | | | 10.45 | | | | 2.10 | 5 7 | | | 2.10 | 5 7 | | | (1.07 | ) | | | (1.07 | ) | | $ | 240,489 | | | | 36% | |
| $ | 3.47 | | | | 8.10 | | | | 2.24 | 6 | | | 2.24 | 6 | | | (0.88 | ) | | | (0.88 | ) | | $ | 265,879 | | | | 59% | |
| $ | 3.21 | | | | 22.73 | | | | 2.25 | 5 | | | 2.29 | 5 | | | (0.35 | ) | | | (0.39 | ) | | $ | 512,252 | | | | 41% | |
| $ | 2.74 | | | | (1.44 | ) | | | 2.25 | 5 | | | 2.43 | 5 | | | (0.36 | ) | | | (0.54 | ) | | $ | 453,495 | | | | 25% | |
| | | | | | | | | | | | | | | | | | | | | | | | | | | | | | |
| $ | 3.07 | | | | (12.20 | ) | | | 1.93 | 5 | | | 1.93 | 5 | | | (1.04 | ) | | | (1.04 | ) | | $ | 346,631 | | | | 16% | |
| $ | 3.58 | | | | 1.59 | | | | 1.96 | 6 | | | 1.96 | 6 | | | (0.81 | ) | | | (0.81 | ) | | $ | 376,578 | | | | 46% | |
| $ | 3.62 | | | | 10.66 | | | | 1.96 | 5 7 | | | 1.97 | 5 7 | | | (0.86 | ) | | | (0.87 | ) | | $ | 292,345 | | | | 36% | |
| $ | 3.50 | | | | 8.36 | | | | 1.96 | 6 | | | 2.04 | 6 | | | (0.39 | ) | | | (0.47 | ) | | $ | 234,795 | | | | 59% | |
| $ | 3.23 | | | | 19.19 | | | | 1.95 | 5 | | | 2.04 | 5 | | | 0.64 | | | | 0.55 | | | $ | 168,136 | | | | 41% | |
| | | | | | | | | | | | | | | | | | | | | | | | | | | | | | |
| $ | 9.47 | | | | (5.30 | ) | | | 1.31 | 5 | | | 6.51 | 5 | | | (0.75 | ) | | | (5.95 | ) | | $ | 1,675 | | | | 21% | |
| | | | | | | | | | | | | | | | | | | | | | | | | | | | | | |
| $ | 9.52 | | | | (4.80 | ) | | | 0.92 | 5 | | | 6.75 | 5 | | | (0.39 | ) | | | (6.23 | ) | | $ | 1,121 | | | | 21% | |
| | | | | | | | | | | | | | | | | | | | | | | | | | | | | | |
| $ | 5.73 | | | | (14.01 | ) | | | 1.64 | 5 | | | 1.64 | 5 | | | (1.45 | ) | | | (1.45 | ) | | $ | 435,739 | | | | 38% | |
| $ | 7.45 | | | | (1.15 | ) | | | 1.66 | 5 | | | 1.66 | 5 | | | (1.31 | ) | | | (1.31 | ) | | $ | 473,505 | | | | 67% | |
| $ | 9.86 | | | | 38.04 | | | | 1.65 | 5 8 | | | 1.65 | 5 8 | | | (1.27 | ) | | | (1.27 | ) | | $ | 496,128 | | | | 54% | |
| $ | 8.23 | | | | 25.10 | | | | 1.75 | 5 | | | 1.75 | 5 | | | (1.43 | ) | | | (1.43 | ) | | $ | 311,583 | | | | 31% | |
| $ | 7.19 | | | | 16.04 | | | | 1.92 | 5 | | | 1.92 | 5 | | | (1.14 | ) | | | (1.14 | ) | | $ | 277,691 | | | | 32% | |
| $ | 7.21 | | | | 2.45 | | | | 1.90 | 5 | | | 1.90 | 5 | | | (0.85 | )10 | | | (0.85 | )10 | | $ | 273,311 | | | | 31% | |
| | | | | | | | | | | | | | | | | | | | | | | | | | | | | | |
| $ | 5.73 | | | | (25.97 | ) | | | 1.58 | 5 | | | 1.58 | 5 | | | (1.33 | ) | | | (1.33 | ) | | $ | 14,562 | | | | 38% | |
| | | | | | | | | | | | | | | | | | | | | | | | | | | | | | |
| $ | 2.34 | | | | (20.40 | ) | | | 1.73 | 5 | | | 1.73 | 5 | | | (0.82 | ) | | | (0.82 | ) | | $ | 171,169 | | | | 29% | |
| $ | 3.21 | | | | (4.50 | ) | | | 1.74 | 5 | | | 1.74 | 5 | | | (0.90 | ) | | | (0.90 | ) | | $ | 249,523 | | | | 66% | |
| $ | 3.83 | | | | 18.84 | | | | 1.74 | 5 8 | | | 1.74 | 5 8 | | | (0.89 | ) | | | (0.89 | ) | | $ | 283,623 | | | | 69% | |
| $ | 3.48 | | | | 23.29 | | | | 1.85 | 5 | | | 1.85 | 5 | | | (0.81 | ) | | | (0.81 | ) | | $ | 216,087 | | | | 57% | |
| $ | 2.87 | | | | 12.04 | | | | 1.95 | 5 | | | 2.04 | 5 | | | (0.59 | ) | | | (0.68 | ) | | $ | 179,116 | | | | 73% | |
| $ | 2.87 | | | | 9.99 | | | | 1.96 | 6 | | | 2.02 | 6 | | | (0.55 | )11 | | | (0.61 | )11 | | $ | 154,169 | | | | 53% | |
| | | | | | | | | | | | | | | | | | | | | | | | | | | | | | |
| $ | 2.34 | | | | (28.22 | ) | | | 1.60 | 5 | | | 1.62 | 5 | | | 0.23 | | | | 0.21 | | | $ | 3,750 | | | | 29% | |
| | | | | | | | | | | | | | | | | | | | | | | | | | | | | | |
| $ | 29.93 | | | | (14.48 | ) | | | 1.17 | 5 | | | 1.17 | 5 | | | (0.84 | ) | | | (0.84 | ) | | $ | 805,265 | | | | 24% | |
| $ | 40.23 | | | | 1.67 | 5 | | | 1.17 | 6 | | | 1.17 | 6 | | | (0.80 | ) | | | (0.80 | ) | | $ | 978,825 | | | | 26% | |
| $ | 55.30 | | | | 35.08 | | | | 1.20 | 5 8 | | | 1.20 | 5 8 | | | (0.84 | ) | | | (0.84 | ) | | $ | 1,170,809 | | | | 36% | |
| $ | 45.72 | | | | 14.29 | | | | 1.27 | 5 | | | 1.27 | 5 | | | (0.88 | ) | | | (0.88 | ) | | $ | 1,182,573 | | | | 19% | |
| $ | 43.52 | | | | 11.87 | | | | 1.29 | 5 | | | 1.29 | 5 | | | (0.79 | ) | | | (0.79 | ) | | $ | 1,544,796 | | | | 20% | |
| $ | 45.97 | | | | 0.39 | | | | 1.22 | 5 | | | 1.22 | 5 | | | (0.75 | ) | | | (0.75 | ) | | $ | 2,000,588 | | | | 31% | |
| | | | | | | | | | | | | | | | | | | | | | | | | | | | | | |
| $ | 30.27 | | | | (14.42 | ) | | | 1.05 | 5 | | | 1.09 | 5 | | | (0.72 | ) | | | (0.76 | ) | | $ | 723,762 | | | | 24% | |
| $ | 40.60 | | | | 1.80 | | | | 1.06 | 6 | | | 1.09 | 6 | | | (0.68 | ) | | | (0.72 | ) | | $ | 712,833 | | | | 26% | |
| $ | 55.61 | | | | 35.27 | | | | 1.06 | 5 7 | | | 1.10 | 5 7 | | | (0.70 | ) | | | (0.74 | ) | | $ | 714,184 | | | | 36% | |
| $ | 45.89 | | | | 14.54 | | | | 1.05 | 5 | | | 1.11 | 5 | | | (0.66 | ) | | | (0.72 | ) | | $ | 508,373 | | | | 19% | |
| $ | 43.58 | | | | 15.97 | | | | 1.05 | 5 | | | 1.11 | 5 | | | (0.63 | ) | | | (0.69 | ) | | $ | 337,605 | | | | 20% | |
97
Financial Highlights(continued)
| | | | | | | | | | | | | | | | | | | | | | | | | | | | | | | | | | | | | | | | |
| | | | | Income (Loss) from
Investment Operations | | | | | | Less Distributions | | |
| | | Net Asset
Value
Beginning
of Period | | Net
Investment
Income (Loss) | | Net Realized
and Unrealized
Gains (Losses)
on Investments | | Total from
Investment
Operations | | Redemption
Fees
(See Note 2) | | Dividends
from Net
Investment
Income | | Distributions
from Net
Realized
Gains | | Total
Distributions |
Small Cap Value Fund — Investor Class | | | | | | | | | | | | | | | | | | | | | | | | | | |
Six Months ended 3/31/20 (unaudited) | | | $ | 7.61 | | | | | 0.04 | | | | | (2.47 | ) | | | | (2.43 | ) | | | | — | 4 | | | | (0.04 | ) | | | | (0.05 | ) | | | | (0.09 | ) |
Year ended 9/30/19 | | | $ | 8.53 | | | | | 0.03 | | | | | (0.36 | ) | | | | (0.33 | ) | | | | — | 4 | | | | — | | | | | (0.59 | ) | | | | (0.59 | ) |
Year ended 9/30/18 | | | $ | 7.94 | | | | | 0.02 | | | | | 1.10 | | | | | 1.12 | | | | | — | 4 | | | | (0.01 | ) | | | | (0.52 | ) | | | | (0.53 | ) |
Year ended 9/30/17 | | | $ | 6.61 | | | | | — | 4 | | | | 1.33 | | | | | 1.33 | | | | | — | 4 | | | | — | 4 | | | | — | | | | | — | |
Year ended 9/30/1616 | | | $ | 5.86 | | | | | 0.01 | | | | | 0.77 | | | | | 0.78 | | | | | — | 4 | | | | (0.03 | ) | | | | — | | | | | (0.03 | ) |
Year ended 9/30/15 | | | $ | 5.69 | | | | | 0.05 | 12 | | | | 0.12 | | | | | 0.17 | | | | | — | 4 | | | | — | | | | | — | | | | | — | |
Small Cap Value Fund — Institutional Class | | | | | | | | | | | | | | | | | | | | | | | | | | |
Six Months ended 3/31/20 (unaudited) | | | $ | 7.67 | | | | | 0.04 | | | | | (2.48 | ) | | | | (2.44 | ) | | | | — | 4 | | | | (0.05 | ) | | | | (0.05 | ) | | | | (0.10 | ) |
Year ended 9/30/19 | | | $ | 8.58 | | | | | 0.03 | | | | | (0.35 | ) | | | | (0.32 | ) | | | | — | 4 | | | | — | | | | | (0.59 | ) | | | | (0.59 | ) |
Year ended 9/30/18 | | | $ | 7.98 | | | | | 0.04 | | | | | 1.10 | | | | | 1.14 | | | | | — | 4 | | | | (0.02 | ) | | | | (0.52 | ) | | | | (0.54 | ) |
Year ended 9/30/17 | | | $ | 6.65 | | | | | 0.01 | | | | | 1.34 | | | | | 1.35 | | | | | — | 4 | | | | (0.02 | ) | | | | — | | | | | (0.02 | ) |
Year ended 9/30/1616 | | | $ | 5.88 | | | | | 0.02 | | | | | 0.78 | | | | | 0.80 | | | | | — | 4 | | | | (0.03 | ) | | | | — | | | | | (0.03 | ) |
Year ended 9/30/15 | | | $ | 5.72 | | | | | 0.05 | 12 | | | | 0.11 | | | | | 0.16 | | | | | — | 4 | | | | — | | | | | — | | | | | — | |
Ultra Growth Fund — Investor Class | | | | | | | | | | | | | | | | | | | | | | | | | | |
Six Months ended 3/31/20 (unaudited) | | | $ | 25.30 | | | | | (0.08 | ) | | | | (1.14 | ) | | | | (1.22 | ) | | | | 0.01 | | | | | — | | | | | (0.56 | ) | | | | (0.56 | ) |
Year ended 9/30/19 | | | $ | 27.68 | | | | | (0.18 | ) | | | | (0.60 | ) | | | | (0.78 | ) | | | | 0.01 | | | | | — | | | | | (1.61 | ) | | | | (1.61 | ) |
Year ended 9/30/18 | | | $ | 21.81 | | | | | — | 4 | | | | 8.31 | | | | | 8.31 | | | | | — | 4 | | | | (0.10 | ) | | | | (2.34 | ) | | | | (2.44 | ) |
Year ended 9/30/17 | | | $ | 19.89 | | | | | (0.20 | ) | | | | 4.12 | | | | | 3.92 | | | | | — | 4 | | | | (0.11 | ) | | | | (1.89 | ) | | | | (2.00 | ) |
Year ended 9/30/1616 | | | $ | 18.06 | | | | | (0.18 | ) | | | | 3.66 | | | | | 3.48 | | | | | — | 4 | | | | — | | | | | (1.65 | ) | | | | (1.65 | ) |
Year ended 9/30/15 | | | $ | 23.67 | | | | | (0.26 | ) | | | | 1.54 | | | | | 1.28 | | | | | — | 4 | | | | (0.01 | ) | | | | (6.88 | ) | | | | (6.89 | ) |
Ultra Growth Fund — Institutional Class | | | | | | | | | | | | | | | | | | | | | |
Period ended 3/31/2020 (unaudited) | | | $ | 23.39 | | | | | (0.01 | ) | | | | 0.15 | | | | | 0.14 | | | | | — | 4 | | | | — | | | | | — | | | | | — | |
U.S. Treasury Fund | | | | | | | | | | | | | | | | | | | | | | | | | | |
Six Months ended 3/31/20 (unaudited) | | | $ | 19.26 | | | | | 0.17 | | | | | 3.57 | | | | | 3.74 | | | | | 0.01 | | | | | (0.17 | ) | | | | — | | | | | (0.17 | ) |
Year ended 9/30/19 | | | $ | 15.26 | | | | | 0.34 | | | | | 3.99 | | | | | 4.33 | | | | | 0.01 | | | | | (0.34 | ) | | | | — | | | | | (0.34 | ) |
Year ended 9/30/18 | | | $ | 16.32 | | | | | 0.35 | | | | | (1.07 | ) | | | | (0.72 | ) | | | | — | 4 | | | | (0.34 | ) | | | | — | | | | | (0.34 | ) |
Year ended 9/30/17 | | | $ | 19.86 | | | | | 0.35 | | | | | (2.23 | ) | | | | (1.88 | ) | | | | 0.01 | | | | | (0.35 | ) | | | | (1.32 | ) | | | | (1.67 | ) |
Year ended 9/30/1616 | | | $ | 18.42 | | | | | 0.37 | | | | | 2.29 | | | | | 2.66 | | | | | 0.01 | | | | | (0.36 | ) | | | | (0.87 | ) | | | | (1.23 | ) |
Year ended 9/30/15 | | | $ | 17.08 | | | | | 0.38 | | | | | 1.33 | | | | | 1.71 | | | | | 0.01 | | | | | (0.38 | ) | | | | — | | | | | (0.38 | ) |
See Notes to Financial Highlights and Notes to Financial Statements.
98
| | |
| | (for a share outstanding throughout each period) |
|
|
|
| | | | | | | | | | | | | | | | | | | | | | | | | | | | | | |
| | | | | | | Ratios to Average Net Assets | | | Supplemental Data | |
Net Asset
Value
End of
Period | | | Total Return (%)1 | | | Expenses
Net of Waivers and
Reimbursements (%)2 | | | Expenses
Before Waivers and
Reimbursements (%)2 | | | Net Investment
Income (Loss) Net
of Waivers and
Reimbursements (%)2 | | | Net Investment
Income (Loss)
Before Waivers and
Reimbursements (%)2 | | | Net Assets
End of
Period
(000s) | | | Portfolio
Turnover
Rate1 3 | |
| | | | | | | | | | | | | | | | | | | | | | | | | | | | | | |
| $ | 5.09 | | | | (32.38 | ) | | | 1.19 | 5 | | | 1.19 | 5 | | | 1.02 | | | | 1.02 | | | $ | 305,551 | | | | 27% | |
| $ | 7.61 | | | | (2.69 | ) | | | 1.20 | 5 | | | 1.20 | 5 | | | 0.51 | | | | 0.51 | | | $ | 454,451 | | | | 25% | |
| $ | 8.53 | | | | 14.54 | | | | 1.20 | 5 8 | | | 1.20 | 5 8 | | | 0.29 | | | | 0.29 | | | $ | 347,298 | | | | 46% | |
| $ | 7.94 | | | | 20.20 | | | | 1.21 | 5 | | | 1.21 | 5 | | | 0.04 | | | | 0.04 | | | $ | 320,978 | | | | 37% | |
| $ | 6.61 | | | | 13.37 | | | | 1.24 | 5 | | | 1.24 | 5 | | | 0.23 | | | | 0.23 | | | $ | 269,710 | | | | 57% | |
| $ | 5.86 | | | | 2.99 | | | | 1.21 | 5 | | | 1.21 | 5 | | | 0.82 | 12 | | | 0.82 | 12 | | $ | 257,655 | | | | 57% | |
| | | | | | | | | | | | | | | | | | | | | | | | | | | | | | |
| $ | 5.13 | | | | (32.28 | ) | | | 1.05 | 5 | | | 1.08 | 5 | | | 1.17 | | | | 1.14 | | | $ | 284,006 | | | | 27% | |
| $ | 7.67 | | | | (2.55 | ) | | | 1.05 | 5 | | | 1.09 | 5 | | | 0.70 | | | | 0.66 | | | $ | 368,498 | | | | 25% | |
| $ | 8.58 | | | | 14.78 | | | | 1.06 | 5 8 | | | 1.13 | 5 8 | | | 0.43 | | | | 0.35 | | | $ | 91,857 | | | | 46% | |
| $ | 7.98 | | | | 20.28 | | | | 1.05 | 5 | | | 1.16 | 5 | | | 0.21 | | | | 0.11 | | | $ | 49,671 | | | | 37% | |
| $ | 6.65 | | | | 13.54 | | | | 1.08 | 5 | | | 1.20 | 5 | | | 0.40 | | | | 0.28 | | | $ | 23,839 | | | | 57% | |
| $ | 5.88 | | | | 2.97 | | | | 1.15 | 5 | | | 1.20 | 5 | | | 0.92 | 12 | | | 0.87 | 12 | | $ | 18,941 | | | | 57% | |
| | | | | | | | | | | | | | | | | | | | | | | | | | | | | | |
| $ | 23.53 | | | | (5.11 | ) | | | 1.20 | 5 | | | 1.20 | 5 | | | (0.88 | ) | | | (0.88 | ) | | $ | 730,449 | | | | 27% | |
| $ | 25.30 | | | | (1.35 | ) | | | 1.24 | 5 | | | 1.24 | 5 | | | (0.93 | ) | | | (0.93 | ) | | $ | 623,154 | | | | 17% | |
| $ | 27.68 | | | | 41.97 | | | | 1.24 | 5 8 | | | 1.24 | 5 8 | | | (1.00 | ) | | | (1.00 | ) | | $ | 297,562 | | | | 44% | |
| $ | 21.81 | | | | 22.13 | | | | 1.30 | 5 | | | 1.30 | 5 | | | (1.06 | ) | | | (1.06 | ) | | $ | 111,366 | | | | 34% | |
| $ | 19.89 | | | | 20.08 | | | | 1.33 | 5 | | | 1.33 | 5 | | | (1.03 | ) | | | (1.03 | ) | | $ | 101,402 | | | | 28% | |
| $ | 18.06 | | | | 4.02 | | | | 1.31 | 5 | | | 1.31 | 5 | | | (1.06 | ) | | | (1.06 | ) | | $ | 96,015 | | | | 38% | |
| | | | | | | | | | | | | | | | | | | | | | | | | | | | | | |
| $ | 23.53 | | | | (19.94 | ) | | | 1.05 | 5 | | | 1.06 | 5 | | | (0.75 | ) | | | (0.76 | ) | | $ | 24,567 | | | | 27% | |
| | | | | | | | | | | | | | | | | | | | | | | | | | | | | | |
| $ | 22.84 | | | | 19.58 | | | | 0.66 | 5 | | | 0.66 | 5 | | | 1.66 | | | | 1.66 | | | $ | 416,428 | | | | 3% | |
| $ | 19.26 | | | | 28.73 | | | | 0.69 | 5 | | | 0.69 | 5 | | | 2.05 | | | | 2.05 | | | $ | 379,644 | | | | 29% | |
| $ | 15.26 | | | | (4.47 | ) | | | 0.70 | 5 8 | | | 0.70 | 5 8 | | | 2.13 | | | | 2.13 | | | $ | 303,105 | | | | 6% | |
| $ | 16.32 | | | | (8.86 | ) | | | 0.72 | 5 | | | 0.72 | 5 | | | 2.04 | | | | 2.04 | | | $ | 360,866 | | | | 20% | |
| $ | 19.86 | | | | 15.49 | | | | 0.69 | 5 15 | | | 0.73 | 5 | | | 1.97 | 15 | | | 1.93 | | | $ | 489,011 | | | | 59% | |
| $ | 18.42 | | | | 10.09 | | | | 0.67 | 5 | | | 0.67 | 5 | | | 2.12 | | | | 2.12 | | | $ | 327,861 | | | | 131% | |
99
Notes to Financial Highlights
| 1 | Not annualized for periods less than one year. |
| 2 | Annualized for periods less than one year. |
| 3 | Portfolio turnover is calculated on the basis of the Fund as a whole without distinguishing between the classes of shares issued. |
| 4 | Represents amounts less than $0.005 per share. |
| 5 | Includes interest expense of less than 0.005%. |
| 6 | Includes interest expenses of more than 0.005%. |
| 7 | Includes extraordinary expenses greater than or equal to 0.01% (see Note 7 in “Notes to Financial Statements”). |
| 8 | Includes extraordinary expenses of less than 0.01% (see Note 7 in “Notes to Financial Statements”). |
| 9 | Investment income per share reflects a large,non-recurring dividend which amounted to $0.17 and $0.08 per share for the Investor Class and Institutional Class, respectively. Excluding thisnon-recurring dividend, the ratio of Net Investment Income (Loss) to Average Net Assets would have been as follows: |
| | | | | | | | | | | | |
| | | Net Investment
Income (Loss) Net
of Waivers and
Reimbursements (%) | | Net Investment
Income (Loss)
Before Waivers and
Reimbursements (%) | | |
Core Growth Fund — Investor Class | | | | (0.58 | ) | | | | (0.58 | ) | | |
Core Growth Fund — Institutional Class | | | | (0.59 | ) | | | | (0.60 | ) | | |
10Investment income per share reflects a large,non-recurring dividend which amounted to $0.04 per share. Excluding thisnon-recurring dividend, the ratio of Net Investment Income (Loss) to Average Net Assets would have been (1.40)%. 11Investment income per share reflects a large,non-recurring dividend which amounted to $0.01 per share. Excluding thisnon-recurring dividend, the ratio of Net Investment Income (Loss) to Average Net Assets would have been (1.04)% for Net Investment Income Net of Waivers and Reimbursements and (1.10)% for Net Investment Income (Loss) Before Waivers and Reimbursements. 12Investment income per share reflects a large,non-recurring dividend which amounted to $0.05 and $0.05 per share for the Investor Class and Institutional Class, respectively. Excluding thisnon-recurring dividend, the ratio of Net Investment Income (Loss) to Average Net Assets would have been as follows: |
| | | |
| | | Net Investment
Income (Loss) Net
of Waivers and
Reimbursements (%) | | Net Investment
Income (Loss)
Before Waivers and
Reimbursements (%) | | |
Small Cap Value Fund — Investor Class | | | | (0.00 | )13 | | | | (0.00 | )13 | | |
Small Cap Value Fund — Institutional Class | | | | 0.10 | | | | | 0.05 | | | |
13Amount is less than 0.005%. 14Institutional class inception date was February 1, 2016. 15Includes reimbursement by Hoisington Investment Management Co., theSub-Advisor, for proxy statement expenses which amounted to $0.01 per share. 16Includes anon-recurring offer to reimburse prior period custody and fund accountingout-of-pocket expenses (see Note 7 “Related Party Transactions” “CustodianOut-of-Pocket Expense Reimbursement” in “Notes to Financial Statements”). Excluding thisnon-recurring reimbursement, the Ratio of Expenses to Average Net Assets would have been as follows: |
| | | |
| | | Expenses Net
of Waivers and
Reimbursements (%) | | Expenses
Before Waivers and
Reimbursements (%) | | |
Core Growth Fund — Investor Class | | | | 1.21 | | | | | 1.21 | | | |
Core Growth Fund — Institutional Class | | | | 1.07 | | | | | 1.09 | | | |
Emerging India Fund — Investor Class | | | | 1.84 | | | | | 1.98 | | | |
Emerging India Fund — Institutional Class | | | | 1.56 | | | | | 2.06 | | | |
Emerging Markets Select Fund — Investor Class | | | | 1.60 | | | | | 2.00 | | | |
Emerging Markets Select Fund — Institutional Class | | | | 1.33 | | | | | 1.63 | | | |
Emerging Markets Small Cap Fund — Investor Class | | | | 1.97 | | | | | 2.01 | | | |
Emerging Markets Small Cap Fund — Institutional Class | | | | 1.82 | | | | | 1.83 | | | |
Frontier Emerging Small Countries Fund — Investor Class | | | | 2.25 | | | | | 2.39 | | | |
Frontier Emerging Small Countries Fund — Institutional Class | | | | 2.08 | | | | | 2.08 | | | |
Global Opportunities Fund — Investor Class | | | | 1.64 | | | | | 1.64 | | | |
Global Opportunities Fund — Institutional Class | | | | 1.42 | | | | | 2.39 | | | |
Global Value Fund — Investor Class | | | | 1.10 | | | | | 1.17 | | | |
Global Value Fund — Institutional Class | | | | 0.96 | | | | | 1.72 | | | |
International Growth Fund — Investor Class | | | | 1.48 | | | | | 1.48 | | | |
International Growth Fund — Institutional Class | | | | 1.36 | | | | | 1.37 | | | |
International Opportunities Fund — Investor Class | | | | 2.26 | | | | | 2.30 | | | |
International Opportunities Fund — Institutional Class | | | | 1.97 | | | | | 2.06 | | | |
Micro Cap Fund — Investor Class | | | | 1.92 | | | | | 1.92 | | | |
Micro Cap Value Fund — Investor Class | | | | 1.96 | | | | | 2.05 | | | |
Small Cap Growth Fund — Investor Class | | | | 1.29 | | | | | 1.29 | | | |
Small Cap Growth Fund — Institutional Class | | | | 1.05 | | | | | 1.11 | | | |
Small Cap Value Fund — Investor Class | | | | 1.24 | | | | | 1.24 | | | |
Small Cap Value Fund — Institutional Class | | | | 1.08 | | | | | 1.20 | | | |
Ultra Growth Fund — Investor Class | | | | 1.34 | | | | | 1.34 | | | |
U.S. Treasury Fund | | | | 0.69 | | | | | 0.73 | | | |
17Per share amounts do not correlate to amounts reported in the Statement of Operations due to timing of share activity. |
100
| | |
| | MARCH 31, 2020 (UNAUDITED) |
|
|
|
| | | | | | | | | | | | |
18Net Realized and Unrealized Gains (Losses) on Investments per share reflects a large,non-recurring receivable for security litigation which amounted to $0.06 and $0.06 per share for the Investor Class and Institutional Class, respectively. Excluding thisnon-recurring receivable, Net Realized and Unrealized Gains (Losses) on Investments would have been $0.59 and $0.60 per share for the Investor Class and Institutional Class, respectively. Excluding thisnon-recurring receivable, Total Return would have been 8.74% and 8.91% for the Investor Class and Institutional Class, respectively. 19Fund inception date was October 1, 2019. 20Institutional Class inception date was January 31, 2020. |
See Notes to Financial Statements.
101
Notes to Financial Statements
1. ORGANIZATION
Wasatch Funds Trust (the “Trust”) is a Massachusetts business trust registered under the Investment Company Act of 1940, as amended (the “1940 Act”), as anopen-end management investment company and consists of 17 series or funds (each a “Fund” and collectively the “Funds”). The Core Growth Fund, Emerging India Fund, Emerging Markets Select Fund, Emerging Markets Small Cap Fund, Frontier Emerging Small Countries Fund, Global Opportunities Fund, Global Value Fund, International Growth Fund, International Opportunities Fund, Micro Cap Fund, Micro Cap Value Fund, Small Cap Growth Fund, Small Cap Value Fund, Ultra Growth Fund, and Wasatch-Hoisington U.S. Treasury Fund (“U.S. Treasury Fund”)(sub-advised) are each a diversified fund. The Global Select Fund and International Select Fund are each anon-diversified fund. Each Fund maintains its own investment objective(s).
On November 9, 2011, the Trustre-designated the shares of the Funds into Investor Class shares effective January 31, 2012, and authorized and designated a new Institutional Class of shares in the Funds. Currently 16 funds offer Institutional Class shares: Core Growth Fund, Global Value Fund and Small Cap Value Fund, which commenced operations on January 31, 2012, Emerging Markets Select Fund, which commenced operations on December 13, 2012 and Emerging India Fund, Emerging Markets Small Cap Fund, Frontier Emerging Small Countries Fund, Global Opportunities Fund, International Growth Fund, International Opportunities Fund and Small Cap Growth Fund, which commenced operations on February 1, 2016, International Select Fund and Global Select Fund, which commenced operations on October 1, 2019 and Wasatch Micro Cap Fund, Wasatch Micro Cap Value Fund and Wasatch Ultra Growth Fund, which commenced operations on January 31, 2020. Each class of shares for each Fund has identical rights and privileges except with respect to purchase minimums, distribution and service charges, shareholder services, voting rights on matters affecting a single class of shares, and the exchange and conversion features. The Funds have entered into an investment advisory agreement with Wasatch Global Investors, Inc. (the “Advisor” or “Wasatch”) as investment advisor.
The Core Growth, Emerging India, Emerging Markets Select, Emerging Markets Small Cap, Frontier Emerging Small Countries, Global Opportunities, Global Select, Global Value, International Growth, International Opportunities, International Select, Micro Cap, Micro Cap Value, Small Cap Growth, Small Cap Value and Ultra Growth Funds are referred to herein as the “Equity Funds.”
2. SIGNIFICANT ACCOUNTING POLICIES
The following is a summary of significant policies related to investments of the Funds held at March 31, 2020. These policies are in conformity with accounting principles generally accepted in the United States of America (“U.S. GAAP”).
Valuation of Securities — All investments in securities are recorded at their estimated fair value as described in Note 12.
Foreign Currency Translations — Values of investments denominated in foreign currencies are converted into U.S. dollars using the current exchange rates each business day (generally 4:00 p.m. Eastern Time). Purchases and sales of investments and dividend income are translated into U.S. dollars using the current prevailing exchange rate on the transaction date. The effect of changes in foreign exchange rates on realized and unrealized gains or losses on securities is reflected as a component of such gains or losses. Transactions in foreign denominated assets may involve greater risks than domestic transactions.
Investment in Securities and Related Investment Income — Security transactions are accounted for on the trade date. Gains or losses on securities sold are determined on the identified cost basis. Dividend income and distributions to shareholders are recorded on theex-dividend date except that certain dividends from foreign securities may be recorded after theex-dividend date based on when the Fund is informed of the dividend. Interest income and estimated expenses are accrued daily. Bond discount and premiums are amortized using the interest method. To the extent dividends received include return of capital or capital gain distributions, such distributions are recorded as a reduction to cost of the related security or as realized gain or loss.
For financial purposes the estimates of all REIT rates are based on prior year average rates made public by the REITs. To obtain these rates we utilize a service through Wall Street Concepts which gathers and disseminates the information. Prior to filing the tax returns the REIT rates are trued up for actual rates. The differences between the actual verses thetrued-up rates are captured in the next fiscal year’s financial process.
Expenses — The Funds contract for various services on a collective basis. Most expenses are directly attributable to each Fund and therefore are charged accordingly. Expenses that are not directly attributable to one or more Funds are allocated among applicable Funds on an equitable and consistent basis considering such things as the nature and type of expense and the relative net assets of the Funds.
Use of Management Estimates — The preparation of financial statements in conformity with U.S. GAAP requires management to make estimates and assumptions that affect the reported amounts of assets and liabilities at the date of the financial statements and the reported changes in net assets during the reporting period. Actual results could differ from those estimates.
Guarantees and Indemnifications — In the normal course of business, the Funds enter into contracts that contain a variety of representations and warranties which provide general indemnifications. The maximum exposure under these arrangements is unknown, as this would involve future claims that may be made against the Funds and/or their affiliates that have not yet occurred. Based on experience, however, the risk of loss is expected to be remote.
Redemption Fees — The Funds deduct a fee of 2.00% from redemption proceeds on shares of the Funds held 60 days or less. Redemption fees retained by the Funds are credited to additionalpaid-in capital.
Other — Income, expenses, and realized and unrealized
102
| | |
| | MARCH 31, 2020 (UNAUDITED) |
|
|
|
gains or losses on investments are generally allocated to each class of shares based on its relative net assets, except that each class separately bears expenses related specifically to that class, such as certain shareholder servicing fees.
3. SECURITIESAND OTHER INVESTMENTS
Repurchase Agreements — The Funds may engage in repurchase transactions. Under the terms of a typical repurchase agreement, a fund takes possession of an underlying debt obligation subject to an obligation of the seller to repurchase and the fund to resell the obligation at an agreed upon price and time. The market value of the collateral must be at least equal at all times to the total amount of the repurchase obligation, including interest. Generally, in the event of counterparty default, the fund has the right to use the collateral to offset losses incurred.
Short Sales — The Equity Funds may enter into short sales whereby a fund sells a security it generally does not own (the security is borrowed), in anticipation of a decline in the security’s price. The initial amount of a short sale is recorded as a liability which ismarked-to-market daily. Fluctuations in the value of the short liability are recorded as unrealized gains or losses. If a Fund shorts a security when also holding a long position in the security (a “short against the box”), as the security’s price declines, the short position increases in value, offsetting the long position’s decrease in value. The opposite effect occurs if the security’s price rises. A Fund realizes a gain or loss upon closing of the short sale (returning the security to the counterparty by way of purchase or delivery of a long position owned). Possible losses from short sales may be unlimited, whereas losses from security purchases cannot exceed the total amount invested. The Funds are liable to the buyer for any dividends payable on securities while those securities are in a short position. These dividends are an expense of the Funds. The Funds designate collateral consisting of cash, U.S. government securities or other liquid assets sufficient to collateralize the market value of short positions.
Participation Notes — Certain Funds may invest in Participation Notes(P-Notes).P-Notes are promissory notes that are designed to offer a return linked to the performance of a particular underlying equity security ormarket. P-Notes are issued by banks or broker-dealers and allow a fund to gain exposure to common stocks in markets in which the fund is currently not approved to directly invest, or in markets that prohibit direct investment by foreign purchasers. While the holder of aP-Note is entitled to receive from the bank or broker-dealer any dividends or other distributions paid on the underlying securities, the holder is not entitled to the same rights as an owner of the underlying securities, such as voting rights. Income received fromP-Notes is recorded as dividend income in the Statement of Operations.P-Notes are considered general unsecured contractual obligations of the bank or broker-dealer. Risks associated withP-Notes include the possible failure of a counterparty (i.e., the issuing bank or broker-dealer) to perform in accordance with the terms of the agreement, inability to transfer
or liquidate the notes, potential delays or an inability to redeem the notes before maturity under certain market conditions, and limited legal recourse against the issuer of the underlying common stock.
4. FINANCIAL DERIVATIVE INSTRUMENTS
Foreign Currency Contracts — The Funds may enter into foreign currency contracts to settle planned purchases or sales of securities or to protect against a possible loss resulting from an adverse change in the relationship between the U.S. dollar and a foreign currency involved in an underlying transaction. Foreign currency contracts are agreements between two parties to buy and sell a currency at a set price on a future date. The market value of a foreign currency contract fluctuates with changes in currency exchange rates. Foreign currency contracts aremarked-to-market daily and the change in market value is recorded by a fund as unrealized appreciation or depreciation. When a foreign currency contract is closed, the fund records a realized gain or loss equal to the difference between the value at the time it was opened and the value at the time it was closed. These contracts may involve market risk in excess of the unrealized gain or loss reflected in the Schedule of Investments. In addition, a fund could be exposed to credit risk if a counterparty is unable or unwilling to meet the terms of the contracts or if the value of the currency changes unfavorably. In connection with these contracts, the Funds may segregate cash and/or securities in a sufficient amount as collateral in accordance with the terms of the respective contracts.
103
Notes to Financial Statements (continued)
5. PURCHASESAND SALESOF SECURITIES
The cost of investment securities purchased and proceeds from sales of investment securities, excluding U.S. government and short-term securities, for the six months ended March 31, 2020 are summarized below:
| | | | | | | | | | | | | | | | | | | | | | | | | | | | | | |
| | | Core
Growth
Fund | | Emerging
India
Fund | | Emerging
Markets
Select
Fund | | Emerging
Markets
Small Cap
Fund | | Frontier
Emerging
Small Countries
Fund | | Global
Opportunities
Fund |
Purchases | | | $ | 510,309,442 | | | | $ | 58,905,355 | | | | $ | 7,890,439 | | | | $ | 28,043,341 | | | | $ | 10,671,341 | | | | $ | 12,967,079 | |
Sales | | | | 529,263,264 | | | | | 63,328,998 | | | | | 9,259,947 | | | | | 70,500,201 | | | | | 19,651,978 | | | | | 17,943,630 | |
| | | | | | |
| | | Global
Select
Fund | | Global
Value
Fund | | International
Growth
Fund | | International
Opportunities
Fund | | International
Select Fund | | Micro
Cap
Fund |
Purchases | | | $ | 11,179,411 | | | | $ | 54,394,056 | | | | $ | 228,421,198 | | | | $ | 95,427,865 | | | | $ | 3,649,369 | | | | $ | 250,399,967 | |
Sales | | | | 307,408 | | | | | 69,317,479 | | | | | 310,938,480 | | | | | 79,643,130 | | | | | 542,649 | | | | | 192,637,754 | |
| | | | | | |
| | | Micro Cap
Value
Fund | | Small Cap
Growth
Fund | | Small Cap
Value
Fund | | Ultra
Growth
Fund | | | | |
Purchases | | | $ | 67,718,907 | | | | $ | 512,435,054 | | | | $ | 282,957,954 | | | | $ | 377,207,004 | | | | | | | | | | | |
Sales | | | | 88,726,615 | | | | | 433,737,254 | | | | | 215,049,593 | | | | | 197,094,933 | | | | | | | | | | | |
Purchases and sales of U.S. government securities in the U.S. Treasury Fund were $9,991,820 and $48,147,834, respectively.
6. FEDERAL INCOME TAX INFORMATION
It is each Fund’s policy to comply with the requirements under Subchapter M of the Internal Revenue Code applicable to regulated investment companies and to distribute substantially all taxable income to shareholders. The Funds are no longer subject to examination by tax authorities for years prior to 2017. At this time, management believes there are no uncertain tax positions which, based on their technical merit, would not be sustained upon examination and for which it is reasonably possible that the total of amounts of unrecognized tax benefits will significantly change in the next 12 months. Accordingly, no provision for federal income or excise taxes has been made.
As of March 31, 2020, the cost and unrealized appreciation (depreciation) of securities on a tax basis were as follows:
| | | | | | | | | | | | | | | | | | | | | | | | | | | | | | |
| | | Core
Growth
Fund | | Emerging
India
Fund | | Emerging
Markets
Select
Fund | | Emerging
Markets
Small Cap
Fund | | Frontier
Emerging
Small
Countries
Fund | | Global
Opportunities
Fund |
Cost | | | $ | 1,733,438,143 | | | | $ | 209,292,209 | | | | $ | 33,170,140 | | | | $ | 229,043,511 | | | | $ | 48,360,978 | | | | $ | 86,401,608 | |
| | | | | | | | | | |
Gross appreciation | | | $ | 434,630,558 | | | | $ | 36,386,132 | | | | $ | 7,687,533 | | | | $ | 96,413,116 | | | | $ | 3,479,717 | | | | $ | 25,707,656 | |
Gross (depreciation) | | | | (282,829,691 | ) | | | | (38,092,805 | ) | | | | (5,149,978 | ) | | | | (45,654,219 | ) | | | | (11,712,263 | ) | | | | (15,083,761 | ) |
| | | | | | | | | | |
Net appreciation (depreciation) | | | $ | 151,800,867 | | | | $ | (1,706,673 | ) | | | $ | 2,537,555 | | | | $ | 50,758,897 | | | | $ | (8,232,546 | ) | | | $ | 10,623,895 | |
| | | | | |
| | | | | | |
| | | Global
Select Fund | | Global
Value
Fund | | International
Growth
Fund | | International
Opportunities
Fund | | International
Select
Fund | | Micro Cap Fund |
Cost | | | $ | 10,877,746 | | | | $ | 117,956,112 | | | | $ | 776,757,017 | | | | $ | 372,592,853 | | | | $ | 3,118,125 | | | | $ | 474,456,426 | |
| | | | | |
Gross appreciation | | | $ | 273,715 | | | | $ | 5,813,040 | | | | $ | 214,166,523 | | | | $ | 128,799,235 | | | | $ | 160,729 | | | | $ | 79,629,245 | |
Gross (depreciation) | | | | (1,645,754 | ) | | | | (23,357,880 | ) | | | | (91,980,219 | ) | | | | (54,741,882 | ) | | | | (479,925 | ) | | | | (104,112,140 | ) |
| | | | | |
Net appreciation (depreciation) | | | $ | (1,372,039 | ) | | | $ | (17,544,840 | ) | | | $ | 122,186,304 | | | | $ | 74,057,353 | | | | $ | (319,196 | ) | | | $ | (24,482,895 | ) |
| | | | | |
104
| | |
| | MARCH 31, 2020 (UNAUDITED) |
|
|
|
| | | | | | | | | | | | | | | | | | | | | | | | | |
| | | Micro Cap
Value
Fund | | Small Cap
Growth
Fund | | Small Cap
Value
Fund | | Ultra
Growth
Fund | | U.S.
Treasury
Fund |
Cost | | | $ | 175,660,018 | | | | $ | 1,394,907,602 | | | | $ | 764,415,334 | | | | $ | 789,461,799 | | | | $ | 311,840,149 | |
| | | | | |
Gross appreciation | | | $ | 30,577,282 | | | | $ | 318,400,839 | | | | $ | 44,354,899 | | | | $ | 95,969,856 | | | | $ | 103,624,521 | |
Gross (depreciation) | | | | (31,448,671 | ) | | | | (182,050,451 | ) | | | | (221,459,373 | ) | | | | (131,556,865 | ) | | | | — | |
| | | | | |
Net appreciation (depreciation) | | | $ | (871,389 | ) | | | $ | 136,350,388 | | | | $ | (177,104,474 | ) | | | $ | (35,587,009 | ) | | | $ | 103,624,521 | |
| | | | | |
The difference between book-basis andtax-basis unrealized gains is primarily attributable to the tax deferral of losses on wash sales, unrealized appreciation on passive foreign investment companies (PFICs), partnership adjustments and other temporary tax adjustments.
The amount and character oftax-basis distributions and composition of net assets are finalized at fiscalyear-end. Accordingly, tax basis balances have not been determined as of the date of this report.
Dividends from net investment income and net realized gains, if any, are declared and paid at least annually for all Funds, except for dividends from net investment income in two funds. The Global Value and U.S. Treasury Funds declare and pay dividends quarterly. The amount of dividends and distributions from net investment income and net realized gains are determined in accordance with federal income tax regulations, which may differ from U.S. GAAP. The Funds may utilize earnings and profits distributed to shareholders on redemption of shares as part of the dividends paid deduction (tax equalization).
To the extent these book and tax differences are permanent in nature, such amounts are reclassified at the end of the fiscal year among additionalpaid-in capital, undistributed net investment income (loss), and undistributed net realized gain (loss) on investments, options and foreign currency translations. The reclassifications generally relate to the tax treatment of net operating losses, the netting of net operating losses to short-term gains, investments in REITs and partnerships, redemptionsin-kind, distribution reclassifications, foreign capital gains taxes, Section 988 currency gains and losses, PFICs, paydown gains and losses,non-REIT return of capital dividends, and equalization. These reclassifications have no impact on the net asset values of the Funds.
Capital loss carryforwards are available through the date specified below to offset future realized net capital gains for federal income tax purposes. Future capital loss carryover utilization in any given year may be subject to Internal Revenue Code limitations. To the extent future gains are offset by capital loss carryforwards, such gains will not be distributed.
Under the Regulated Investment Company Modernization Act of 2010, a Fund will be permitted to carry forward capital losses incurred in taxable years beginning after December 22, 2010 for an unlimited period. Post-enactment losses that are carried forward will retain their character as either short-term or long-term capital losses rather than being considered all short-term as under previous law.
Capital loss carryforwards as of September 30, 2019 are as follows:
| | | | | | | | | | |
| | | Non-expiring |
| Fund | | Short Term | | Long Term |
Emerging India Fund | | | $ | 1,258,163 | | | | $ | — | |
Emerging Markets Select Fund | | | | 4,595,927 | | | | | — | |
Frontier Emerging Small Countries Fund | | | | 92,551,793 | | | | | 13,409,150 | |
Global Value Fund* | | | | 24,236,995 | | | | | 139,146,556 | |
U.S. Treasury Fund | | | | 11,484,403 | | | | | 8,231,585 | |
| * | The Fund’s capital loss carryforward is subject to an annual limitation under the Internal Revenue Code and related regulations. |
During the tax year ended September 30, 2019, the Funds used capital loss carryforwards in the following amounts:
| | | | | |
| Fund | | Amount Used |
Frontier Emerging Small Countries Fund | | | $ | 2,166,331 | |
Global Value Fund | | | | 1,027,950 | |
The Funds have elected to defer losses incurred from November 1, 2018 through September 30, 2019 in accordance with federal income tax rules. These losses are treated as having arisen on the first day of the following fiscal year. The Funds have elected to defer losses as follows:
| | | | | | | | | | |
| Fund | | Post-October Capital Losses | | Late-Year Ordinary
Losses |
Core Growth Fund | | | $ | — | | | | $ | 9,295,073 | |
Emerging India Fund | | | | — | | | | | 2,083,000 | |
Emerging Markets Select Fund | | | | — | | | | | 82,935 | |
105
Notes to Financial Statements (continued)
| | | | | | | | | | |
| Fund | | Post-October Capital Losses | | Late-Year Ordinary
Losses |
Emerging Markets Small Cap Fund | | | $ | — | | | | $ | 1,866,761 | |
Frontier Emerging Small Countries Fund | | | | — | | | | | 1,682,001 | |
Global Opportunities Fund | | | | — | | | | | 764,451 | |
International Growth Fund | | | | — | | | | | 582,415 | |
International Opportunities Fund | | | | — | | | | | 2,420,284 | |
Micro Cap Fund | | | | — | | | | | 4,633,175 | |
Micro Cap Value Fund | | | | — | | | | | 1,847,977 | |
Small Cap Growth Fund | | | | — | | | | | 9,503,034 | |
Ultra Growth Fund | | | | — | | | | | 3,004,715 | |
EU Reclaims — As a result of several court cases in certain countries across the European Union, the Emerging Markets Small Cap Fund, Global Opportunities Fund, Global Value Fund, International Growth Fund and International Opportunities Fund filed tax reclaims for previously withheld taxes on dividends earned in Finland and Poland (EU Reclaims). These additional filings are subject to various administrative proceedings by the local jurisdictions’ tax authorities within the European Union, as well as a number of related judicial proceedings. Income recognized, if any, for EU Reclaims is reflected as dividend income in the Statements of Operations and related receivables, if any, are reflected as interest and dividends receivable in the Statements of Assets and Liabilities. When uncertainty exists as to the ultimate resolution of these proceedings, the likelihood of receipt of these EU Reclaims and the potential timing of payment, no amounts are reflected in the financial statements.
7. RELATED PARTY TRANSACTIONS
Investment Advisory Fees, Expense Limitations — As the Funds’ investment advisor, the Advisor receives a monthly fee calculated on average daily net assets. The Advisor has contractually agreed to waive its fees and/or reimburse certain Funds should a Fund’s operating expenses exceed a specified annual limitation through at least January 31, 2021. If operating expenses are less than the specified expense limit for the Fund, the Advisor shall be entitled to recoup the fees waived or reduced to the extent that the operating expenses and the amounts reimbursed do not exceed such expense limit for the Fund, under the period of the agreement (currently through January 31, 2021). The Funds may only make repayments to the Advisor for the amounts reimbursed if such repayment does not cause the Funds’ expense ratio, after repayment is taken into account, to exceed both (i) the expense cap at the time such amounts were waived; and (ii) the Fund’s current expense cap. All amounts not recovered at the end of the period expire on January 31, 2021. Shareholder expenses will increase if the Advisor does not renew the contractual expense cap after its expiration date. Ordinary operating expenses exclude any interest, dividend expense on short sales/interest expense, taxes, brokerage commissions, other investment-related costs, acquired fund fees and expenses, and extraordinary expenses, such as litigation and other expenses not incurred in the ordinary course of the Funds’ business. Investment advisory fees and fees waived, if any, for the six months ended March 31, 2020 are disclosed in the Statements of Operations. Investment advisory fee and expense limitation annual rates are shown below.
| | | | | | | | | | | | | | | | | | | | | | | | | |
| Fund | | Advisory
Fee | | Expense
Limitation
Investor Class | | Expense
Limitation
Institutional Class | | Contractual Expense
Limitation/
Reimbursement
Recoverable
Expiration Date | | Reimbursement
Recoverable |
Core Growth Fund | | | | 1.00% | | | | | 1.50% | | | | | 1.05% | | | | | 1/31/2021 | | | | $ | 131,713 | |
Emerging India Fund | | | | 1.25% | | | | | 1.75% | | | | | 1.50% | | | | | 1/31/2021 | | | | | — | |
Emerging Markets Select Fund | | | | 1.00% | | | | | 1.50% | | | | | 1.20% | | | | | 1/31/2021 | | | | | 44,255 | |
Emerging Markets Small Cap Fund | | | | 1.65% | | | | | 1.95% | | | | | 1.80% | | | | | 1/31/2021 | | | | | 13,710 | |
Frontier Emerging Small Countries Fund | | | | 1.65% | | | | | 2.15% | | | | | 1.95% | | | | | 1/31/2021 | | | | | 43,758 | |
Global Opportunities Fund | | | | 1.25% | | | | | 1.75% | | | | | 1.35% | | | | | 1/31/2021 | | | | | 17,893 | |
Global Select Fund | | | | 0.85% | | | | | 1.35% | | | | | 0.95% | | | | | 1/31/2021 | | | | | 66,690 | |
Global Value Fund | | | | 0.90% | | | | | 1.10% | | | | | 0.95% | | | | | 1/31/2021 | | | | | 99,201 | |
International Growth Fund | | | | 1.25% | | | | | 1.75% | | | | | 1.35% | | | | | 1/31/2021 | | | | | 640 | |
International Opportunities Fund | | | | 1.75% | | | | | 2.25% | | | | | 1.95% | | | | | 1/31/2021 | | | | | — | |
International Select Fund | | | | 0.80% | | | | | 1.30% | | | | | 0.90% | | | | | 1/31/2021 | | | | | 69,128 | |
Micro Cap Fund | | | | 1.50% | | | | | 1.95% | | | | | 1.60% | | | | | 1/31/2021 | | | �� | | — | |
Micro Cap Value Fund | | | | 1.50% | | | | | 1.95% | | | | | 1.60% | | | | | 1/31/2021 | | | | | 38 | |
Small Cap Growth Fund | | | | 1.00% | | | | | 1.50% | | | | | 1.05% | | | | | 1/31/2021 | | | | | 169,516 | |
Small Cap Value Fund | | | | 1.00% | | | | | 1.50% | | | | | 1.05% | | | | | 1/31/2021 | | | | | 53,999 | |
Ultra Growth Fund | | | | 1.00% | | | | | 1.50% | | | | | 1.05% | | | | | 1/31/2021 | | | | | 88 | |
U.S. Treasury Fund | | | | 0.50% | | | | | 0.75% | | | | | N/A | | | | | 1/31/2021 | | | | | — | |
106
| | |
| | MARCH 31, 2020 (UNAUDITED) |
|
|
|
Affiliated Trades — Certain Funds are permitted to purchase or sell securities from or to certain related affiliated funds under specified conditions outlined in the procedures adopted by the Board of Trustees (the “Board”). The procedures have been designed to ensure that any purchase or sale of securities by the Funds from or to another fund (or funds) that are, or could be, considered an affiliate by virtue of having a common investment advisor (or affiliated investment advisors), common Trustees and/or common officers complies with Rule17a-7 of the 1940 Act. Further, each transaction is effected at the current market price, as that term is defined under the procedures. During the six months ended March 31, 2020, the Funds did not engage in purchases or sales of securities pursuant to Rule17a-7 of the 1940 Act.
Compensation — Officers serve in that capacity without compensation from the Trust. Beginning in the calendar year of 2020, the Funds’ method of compensating Trustees is to pay each Independent Trustee a retainer of $125,000 per year for services rendered and a fee of $25,000 for each Board of Trustees meeting attended in person or telephonically. In addition, each Independent Trustee receives a fee of $25,000 for attendance at an executive session held with respect to the contract renewal process for the Funds. In addition, the Chairman of the Board receives an additional fee of $31,250 a year as Chairman and $7,813 for attendance in person or telephonically at a Board meeting; the Chairman of the Audit Committee and the Chairman of the Nominating Committee each receive an additional $18,750 per year as Chairman and $4,688 for attendance in person or telephonically at a Board meeting. Additionally, each Independent Trustee is entitled to reimbursement of expenses related to his or her duties as a Trustee of the Funds.
Payments by Advisor — On October 16, 2014, the Advisor discovered a trade error involving the Ultra Growth Fund. The Advisor reimbursed the Fund $12,267. On August 2, 2016, the Advisor discovered a trade error involving the Small Cap Growth Fund. The Advisor reimbursed the Fund $12,890.
During 2018, the Advisor paid for a portion of the expenses in connection with the merger of the Long/Short and Global Value Funds.
The impact of the payments detailed above is reflected in the net expense ratios in the Financial Highlights.
Payments bySub-Advisor — In June 2016, the Funds filed a proxy statement with the Securities and Exchange Commission to inform shareholders about a Special Meeting of Shareholders of the Wasatch-Hoisington U.S. Treasury Fund. The purpose of the Shareholder Meeting was to ask shareholders to approve a newSub-Advisory Agreement between the Advisor and Hoisington Investment Management Company (HIMCo) with respect to the Wasatch-Hoisington U.S. Treasury Fund. HIMCo theSub-Advisor for the Fund, reimbursed the Wasatch-Hoisington U.S. Treasury Fund for the costs associated with the proxy statement filing. TheSub-Advisor does not intend to be reimbursed for this amount.
Pursuant to asub-advisory agreement entered into between the Advisor and HIMCo (“HIMCoSub-Advisory
Agreement”), and subject to the supervision of the Advisor, HIMCo directs the investment of the U.S. Treasury Fund’s assets and is responsible for the continuing management of the Fund’s assets, including the placement of purchase and sale orders on behalf of the Fund. The HIMCoSub-Advisory Agreement provides that the Advisor shall pay HIMCo a monthly management fee computed at the annual rate of 0.02% of the Fund’s average daily net assets as long as and whenever the Fund has net assets less than $20 million andone-half (1/2) of the monthly fee the Advisor receives from the Fund under the Advisory and Service Contract as long as and whenever the Fund has net assets of $20 million or more. The Advisor retains the remainder of the advisory fee paid under the Advisory and Service Contract. TheSub-Advisor may reimburse the Advisor for certain expenses.
Transfer Agent Intermediary Fees Reimbursed to the Advisor — Each Fund paid fees to, and reimbursed certainout-of-pocket expenses of, the Funds’ transfer agent during the period. In addition, the Advisor and the Funds’ distributor have entered into selling dealer agreements and service agreements with certain financial services companies, broker-dealers, banks, advisors, retirement service providers or other authorized agents or organizations (each an “Intermediary,” together, “Intermediaries”) to accept purchase, exchange and redemption orders on the Funds’ behalf. For Investor Class shares of the Funds, some Intermediaries do not charge investors a direct transaction fee, but instead charge a fee for accounting and shareholder services that the agent provided to Fund shareholders on the Funds’ behalf. Those services typically included recordkeeping, transaction processing for shareholders’ accounts, communication of tax information, income distribution and other services. Generally, the fee was either a per account charge based on the number of accounts to which the Intermediary provided such services, or was a percentage (as of March 31, 2020 up to 0.40% annually) of the average value of Fund Investor Class shares held in such accounts. The Advisor paid the Intermediary fees and the Funds reimbursed the Advisor for the portion of such fees, which is intended to compensate the Intermediary for provision of services of the type that would be provided by the Funds’ transfer agent or other service providers if the shares were registered on the books of the Funds’ transfer agent. Institutional Class shares of the Funds do not reimburse the Advisor for payments to Intermediaries. The Funds’ reimbursement of expenses incurred for services provided by Intermediaries are included in “Shareholder servicing fees — Investor Class” in the Statements of Operations.
CustodianOut-of-Pocket Expense Reimbursement — In September 2016, State Street Bank and Trust Company (“SSB”), the Funds’ custodian, provided each Fund with an offer to reimburse the Fund for certainout-of-pocket expenses it charged the Fund between 2003 and 2015. The incorrect charges were due to inaccurate billing rates used by SSB for certainout-of-pocket expenses. SSB made the reimbursements in May 2017.
107
Notes to Financial Statements (continued)
10% Shareholders — As of March 31, 2020, the Funds had individual shareholder accounts and/or omnibus shareholder accounts (comprised of a group of individual shareholders), which individually amounted to more than 10% of the total shares outstanding of the Fund as detailed below:
| | | | | | | | |
| Fund | | Number of
Accounts | | | Percent of Shares
Outstanding | |
Core Growth Fund | | | 2 | | | | 43.27 | % |
Emerging India Fund | | | 2 | | | | 56.20 | % |
Emerging Markets Select Fund | | | 2 | | | | 67.02 | % |
Emerging Markets Small Cap Fund | | | 2 | | | | 56.76 | % |
Frontier Emerging Small Countries Fund | | | 3 | | | | 58.32 | % |
Global Opportunities Fund | | | 3 | | | | 60.86 | % |
Global Select Fund | | | 3 | | | | 68.05 | % |
Global Value Fund | | | 2 | | | | 72.53 | % |
International Growth Fund | | | 2 | | | | 56.26 | % |
International Opportunities Fund | | | 2 | | | | 41.98 | % |
International Select Fund | | | 3 | | | | 84.25 | % |
Micro Cap Fund | | | 2 | | | | 42.29 | % |
Micro Cap Value Fund | | | 3 | | | | 57.64 | % |
Small Cap Growth Fund | | | 2 | | | | 49.43 | % |
Small Cap Value Fund | | | 3 | | | | 55.95 | % |
Ultra Growth Fund | | | 2 | | | | 57.10 | % |
U.S. Treasury Fund | | | 3 | | | | 50.28 | % |
Affiliated Interests — As of March 31, 2020, the Advisor and its affiliates, and the retirement plans of the Advisor and its affiliates, held shares of the Funds which may be redeemed at any time as detailed below:
| | | | | | | | |
| Fund | | Number of
Accounts* | | | Percent of Shares
Outstanding | |
Core Growth Fund | | | 25 | | | | 1.31 | % |
Emerging India Fund | | | 36 | | | | 8.08 | % |
Emerging Markets Select Fund | | | 24 | | | | 27.62 | % |
Emerging Markets Small Cap Fund | | | 17 | | | | 3.87 | % |
Frontier Emerging Small Countries Fund | | | 14 | | | | 2.34 | % |
Global Opportunities Fund | | | 19 | | | | 8.71 | % |
Global Select Fund | | | 20 | | | | 84.10 | % |
Global Value Fund | | | 7 | | | | 2.04 | % |
International Growth Fund | | | 18 | | | | 1.25 | % |
International Opportunities Fund | | | 20 | | | | 1.06 | % |
International Select Fund | | | 10 | | | | 62.77 | % |
Micro Cap Fund | | | 20 | | | | 0.88 | % |
Micro Cap Value Fund | | | 18 | | | | 4.23 | % |
Small Cap Growth Fund | | | 19 | | | | 1.19 | % |
Small Cap Value Fund | | | 16 | | | | 1.73 | % |
Ultra Growth Fund | | | 16 | | | | 0.62 | % |
U.S. Treasury Fund | | | 14 | | | | 3.80 | % |
| * | Multiple accounts with the same beneficial owner are treated as one account. |
8. TRANSACTIONSWITH AFFILIATES
If a Fund’s holding represents ownership of 5% or more of the voting securities of a company, the company is deemed to be an affiliate as defined by the 1940 Act. The following Funds conducted transactions during the six months ended March 31, 2020 with an “affiliated company” as so defined:
| | | | | | | | | | | | | | | | | | | | | | | | | | | | | | | | | | | |
| | | Value,
Beginning
of Year | | Purchases
at Cost
9/30/2019 | | Proceeds
from Sales | | Value, End
of Period
3/30/2020 | | Dividends
Credited to
Income for the
period ended
3/31/2020 | | Gain (Loss)
Realized on
Sale of Shares
for the
period ended
3/31/2020 | | Change in
Unrealized
Appreciation
(Depreciation)
for the
period ended
3/31/2020 |
Micro Cap Fund | | | | | | | | | | | | | | | | | | | | | | | | | | | | | | |
IM Cannabis Corp. | | | $ | 3,007,813 | | | | $ | 1,538,268 | | | | $ | — | | | | $ | 1,713,179 | | | | $ | — | | | | $ | — | | | | $ | (2,832,902 | ) |
Lonestar Resources US, Inc., Class A | | | | 5,180,047 | | | | | 462,685 | | | | | — | | | | | 867,756 | | | | | — | | | | | — | | | | | (4,774,976 | ) |
Transcat, Inc. | | | | 10,031,463 | | | | | 3,130,713 | | | | | (1,362,879 | ) | | | | 11,951,633 | | | | | — | | | | | 84,910 | | | | | 67,426 | |
| | | | | |
| | | $ | 18,219,323 | | | | $ | 5,131,666 | | | | $ | (1,362,879 | ) | | | $ | 14,532,568 | | | | $ | — | | | | $ | 84,910 | | | | $ | (7,540,452 | ) |
| | | | | |
108
| | |
| | MARCH 31, 2020 (UNAUDITED) |
|
|
|
9. RESTRICTED SECURITIES
The Funds may own investments that were purchased through private placement transactions or under Rule 144A of the Securities Act of 1933 (the “Securities Act”) and cannot be sold without prior registration under the Securities Act or may be limited due to certain restrictions. These securities are generally deemed to be illiquid and are valued at fair value as determined by a designated Pricing Committee of the Advisor (“Pricing Committee”), comprised of personnel of the Advisor, with oversight by the Board of Trustees and in accordance with Board-approved Pricing Policies and Procedures. If and when such securities are registered, the costs of registering such securities are paid by the issuer. At March 31, 2020, the Funds held the following restricted securities:
| | | | | | | | | | | | | | | | | | | | | | |
| | | Security
Type | | Acquisition
Date | | Cost | | Fair
Value | | Value as a Percent
of Net Assets |
Emerging India Fund | | | | | | | | | | | | | | | | | | | | | | |
SBI Cards & Payment Services Ltd. | | Common Stock | | | | 2/28/20 - 3/31/20 | | | | $ | 4,129,484 | | | | $ | 3,227,300 | | | | | 1.60 | % |
|
| |
Micro Cap Fund | | | | | | | | | | | | | | | | | | | | | | |
Selecta Biosciences, Inc., expiring 12/23/2024 | | Warrants | | | | 12/19/19 | | | | $ | 64,058 | | | | $ | 640,581 | | | | | 0.14 | % |
|
| |
Micro Cap Value Fund | | | | | | | | | | | | | | | | | | | | | | |
Regenacy Pharmaceuticals, LLC | | LLC Membership Interest | | | | 12/21/16 | | | | $ | 30,001 | | | | $ | 20,211 | | | | | 0.01 | % |
Vertex Energy, Inc., Pfd., 6.00% PIK Series B | | Convertible Preferred Stock | | | | 6/22/15 - 10/7/19 | | | | | 1,903,434 | | | | | 1,998,434 | | | | | 1.14 | % |
Vertex Energy, Inc., expiring 12/24/2020 | | Warrants | | | | 6/22/15 | | | | | 95,000 | | | | | — | | | | | — | % |
| | | | | | | | | | | | |
| | | | | | | | | | $ | 2,028,435 | | | | $ | 2,018,645 | | | | | 1.15 | % |
|
| |
Small Cap Growth Fund | | | | | | | | | | | | | | | | | | | | | | |
DataStax, Inc., Series E Pfd. | | Preferred Stock | | | | 8/12/14 | | | | $ | 8,000,002 | | | | $ | 8,359,575 | | | | | 0.55 | % |
Greenspring Global PartnersII-B, L.P. | | LP Interest | | | | 10/10/03 - 3/31/17 | | | | | 1,778,530 | | | | | 813,460 | | | | | 0.05 | % |
Greenspring Global PartnersIII-B, L.P. | | LP Interest | | | | 3/16/06 - 6/29/17 | | | | | 514,561 | | | | | 542,714 | | | | | 0.04 | % |
Nanosys, Inc., Series D Pfd. | | Preferred Stock | | | | 11/8/05 | | | | | 2,000,000 | | | | | 325,424 | | | | | 0.02 | % |
Nanosys, Inc., Series E Pfd. | | Preferred Stock | | | | 8/13/10 | | | | | 184,939 | | | | | 188,977 | | | | | 0.01 | % |
| | | | | | | | | | | | |
| | | | | | | | | | $ | 12,478,032 | | | | $ | 10,230,150 | | | | | 0.67 | % |
|
| |
Ultra Growth Fund | | | | | | | | | | | | | | | | | | | | | | |
Greenspring Global PartnersII-B, L.P. | | LP Interest | | | | 10/10/03 - 3/31/17 | | | | $ | 1,602,778 | | | | $ | 732,108 | | | | | 0.10 | % |
Greenspring Global PartnersIII-B, L.P. | | LP Interest | | | | 3/16/06 - 6/29/17 | | | | | 515,573 | | | | | 542,714 | | | | | 0.07 | % |
Nanosys, Inc., Series D Pfd. | | Preferred Stock | | | | 11/8/05 | | | | | 500,001 | | | | | 81,356 | | | | | 0.01 | % |
Nanosys, Inc., Series E Pfd. | | Preferred Stock | | | | 8/13/10 | | | | | 46,235 | | | | | 47,245 | | | | | 0.01 | % |
Selecta Biosciences, Inc., expiring 12/23/2024 | | Warrants | | | | 12/19/19 | | | | | 79,620 | | | | | 796,200 | | | | | 0.11 | % |
| | | | | | | | | | | | |
| | | | | | | | | | $ | 2,744,207 | | | | $ | 2,199,623 | | | | | 0.29 | % |
|
| |
10. LINEOF CREDIT
Effective May 17, 2019, the Trust and each Fund (except the Wasatch Global Select Fund and the Wasatch International Select Fund) renewed and amended agreements for two open lines of credit totaling $300,000,000, one of which is $100,000,000 committed, and the other of which is $200,000,000 uncommitted, with State Street Bank and Trust Company (together, the “Line”). The agreements, as amended, have no change in the committed, uncommitted and total amounts available on the Line. The Funds incur commitment fees on the undrawn portion of the committed part of the Line, and interest expense to the extent of amounts drawn (borrowed) under the entire Line. Interest is based on the higher of (a) the overnight federal-funds rate in effect on the date of borrowing, plus a margin, or (b) the daily1-Month London Interbank Offered Rate (LIBOR) in effect on the date of borrowing, plus a margin. Commitment fees arepro-rated among the Funds based upon relative average net assets. Interest expense is charged directly to a Fund based upon actual amounts borrowed by that Fund. Effective October 22, 2019, the Wasatch Global Select Fund and the Wasatch International Select Fund became parties to the renewed and amended agreements.
109
Notes to Financial Statements (continued)
For the six months ended March 31, 2020, the following Funds had borrowings:
| | | | | | | | | | | | | | | | | | | | | | | | | |
| Funds Utilizing the Line of Credit | | Average Daily
Borrowings | | Number of
Days
Outstanding | | Interest
Expense | | Weighted
Average
Annualized
Interest Rate | | Balance at
3/31/2020 |
Core Growth Fund | | | $ | 8,309,767 | | | | | 13 | | | | $ | 7,831 | | | | | 2.61 | % | | | $ | — | |
Emerging India Fund | | | | 3,945,830 | | | | | 60 | | | | | 16,071 | | | | | 2.44 | % | | | | 8,179,937 | |
Emerging Markets Select Fund | | | | 916,529 | | | | | 31 | | | | | 2,450 | | | | | 3.10 | % | | | | — | |
Emerging Markets Small Cap Fund | | | | 2,080,958 | | | | | 82 | | | | | 13,385 | | | | | 2.82 | % | | | | — | |
Frontier Emerging Small Countries Fund | | | | 307,030 | | | | | 20 | | | | | 476 | | | | | 2.79 | % | | | | — | |
Global Opportunities Fund | | | | 771,196 | | | | | 28 | | | | | 1,565 | | | | | 2.61 | % | | | | — | |
Global Select Fund | | | | 151,710 | | | | | 2 | | | | | 25 | | | | | 2.92 | % | | | | — | |
Global Value Fund | | | | 53,076 | | | | | 1 | | | | | 3 | | | | | 2.21 | % | | | | — | |
International Growth Fund | | | | 5,594,906 | | | | | 8 | | | | | 2,764 | | | | | 2.22 | % | | | | — | |
International Select Fund | | | | 92,454 | | | | | 8 | | | | | 59 | | | | | 2.87 | % | | | | — | |
Micro Cap Fund | | | | 156,345 | | | | | 1 | | | | | 9 | | | | | 2.17 | % | | | | — | |
11. PRINCIPAL RISKS
Market and Credit Risk — In the normal course of business the Funds trade financial instruments and enter into financial transactions where risk of loss exists due to changes in the market (market risk) or the failure of the other party to a transaction to perform (credit risk). Similar to credit risk, the Funds may be exposed to counterparty risk, or the risk that an institution or other entity with which the Funds have unsettled or open transactions will default. The potential loss could exceed the value of the financial assets recorded in the financial statements. Financial assets, which potentially expose the Funds to credit risk, consist principally of cash due from counterparties and investments. The extent of the Funds’ exposure to credit and counterparty risks with respect to these financial assets approximates their carrying value as recorded in the Funds’ Statements of Assets and Liabilities.
Inflation Risk — Inflation risk is the possibility that inflation will reduce the purchasing power of a currency, and subsequently reduce the value of a security or asset, and may result in rising interest rates. Inflation is the overall upward price movement of goods and services in an economy that causes the value of a currency to decline.
Interest Rate Risk — Interest rate risk is the risk that fixed-income securities will decline in value because of changes in interest rates. A rise in interest rates typically causes a fall in values. Interest rate risk should be modest for shorter-term securities, moderate for intermediate-term securities and high for longer-term securities. Generally, an increase in the average maturity of a fund will make it more sensitive to interest rate risk. The interest rate is the amount charged, expressed as a percentage of principal, by a lender to a borrower for the use of assets.
Foreign Currency Risk — If a fund invests directly in foreign currencies or in securities that trade in, and receive revenues in, foreign currencies, or in derivatives that provide exposure to foreign currencies, it will be subject to the risk that those currencies will decline in value relative to the U.S. dollar. This also includes the risk associated with higher transaction costs, delayed settlements, currency controls and adverse economic developments related to foreign investments.
Region Risk — The Funds, except the U.S. Treasury Fund, invest in equity and fixed-income securities ofnon-U.S. issuers. Because certain foreign markets are illiquid, market prices may not necessarily represent realizable value. Although the Funds maintain diversified investment portfolios, political or economic developments within a particular country or region may have an adverse effect on the ability of domiciled issuers to meet their obligations. These risks are exaggerated for securities of issuers tied economically to emerging and frontier market countries. Additionally, political or economic developments may have an adverse effect on the liquidity and volatility of portfolio securities and currency holdings.
India Region Risk — The securities markets in the India region (India, Bangladesh, Pakistan and Sri Lanka) are substantially smaller, less liquid and more volatile than the major securities markets in the United States and the securities industries in these countries are comparatively underdeveloped. Financial intermediaries may not perform as well as their counterparts in the United States or in other countries with more developed securities markets. In some cases, physical delivery of securities in small lots has been required in India and shortages of vault capacity and trained personnel have existed among qualified custodial Indian banks. A fund may be unable to sell securities when the registration process is incomplete and may experience delays in receipt of dividends. If trading volume is limited by operational difficulties, the ability of the fund to invest may be impaired and the fund’s ability to buy or sell Indian securities may be impaired if the fund’s ability to transact is denied, delayed, suspended or not renewed by local regulators. In recent years, exchange-listed companies in the information technology sector and related industries (such as software) have grown so as to represent a significant portion of the total capitalization of the Indian market. The value of these companies will generally fluctuate in response to technological and regulatory developments. In addition, governmental actions can have a significant effect on economic conditions in the India region, which could adversely affect the value and liquidity of investments. Although the governments of India, Bangladesh, Pakistan and Sri Lanka have recently begun to institute economic reform policies, there can be no assurance that they will continue to pursue such policies or,
110
| | |
| | MARCH 31, 2020 (UNAUDITED) |
|
|
|
if they do, that such policies will succeed. The region is an uncertain tax environment and it is difficult to know and predict the potential implications of future tax developments. Religious, cultural and military disputes persist in India, and between India and Pakistan (as well as sectarian groups within each country). The longstanding border dispute with Pakistan remains unresolved. In recent years, terrorists believed to be based in Pakistan struck Mumbai (India’s financial capital), further damaging relations between the two countries. If the Indian government is unable to control the violence and disruption associated with these tensions (including both domestic and external sources of terrorism), the result may be military conflict, which could destabilize the economy of India. Both India and Pakistan have tested nuclear arms, and the threat of deployment of such weapons could hinder development of the Indian economy, and escalating tensions could impact the broader region, including China.
Liquidity Risk — The trading market for a particular security may be less liquid than it appears and market prices may not represent realizable value. This may be likely when a fund has a proportionately large investment in securities with small market capitalizations or securities in foreign markets that trade infrequently. Reduced liquidity will have an adverse impact on a fund’s ability to sell such securities quickly at the currently marked price if necessary to meet redemptions.
Shareholder Concentration Risk — A significant portion of the net assets of the Frontier Emerging Small Countries Fund is owned by a group of shareholders advised by a common investment advisor. The Emerging Markets Select Fund also has a significant portion of net assets concentrated in relatively few related accounts. In the event of significant redemption activity by these shareholders, the Funds could experience a loss when selling portfolio securities to meet such redemption requests. The Funds could be forced to sell portfolio securities at unfavorable prices in an effort to generate sufficient cash to pay redeeming shareholders. Fund expenses may increase and performance may be materially affected.
12. FAIR VALUE MEASUREMENTSAND INVESTMENTS
The fair value of a financial instrument is the amount that would be received to sell an asset or paid to transfer a liability in an orderly transaction between market participants at the measurement date. The Funds use various methods to measure the fair value of their investments on a recurring basis. U.S. GAAP established a hierarchy that prioritizes inputs to valuation methods. The three levels of inputs are:
| | • | | Level 1 — Unadjusted quoted prices in active markets for identical assets or liabilities that the Funds have the ability to access. |
| | • | | Level 2 — Observable inputs other than quoted prices included in Level 1 that are observable for the asset or liability, either directly or indirectly. The inputs may include quoted prices for the identical investment on an inactive market, prices for similar investments, interest rates, prepayment speeds, credit risk, yield curves, default rates and similar data. |
| | • | | Level 3 — Unobservable inputs for the asset or liability, to the extent relevant observable inputs are not available, representing the Funds’ own assumptions about the assumptions a market participant would use in valuing the asset or liability, and would be based on the best information available. |
The availability of observable inputs can vary from security to security and is affected by a wide variety of factors, including, for example, the type of security, whether a security is new and not yet established in the marketplace, the liquidity of markets, and other characteristics particular to the security. To the extent that valuation is based on models or inputs that are less observable or unobservable in the market, the determination of fair value requires more judgment. Accordingly, the degree of judgment exercised in determining fair value is greatest for instruments categorized in Level 3.
Equity Securities (common and preferred stock) — Securities are valued as of the close of the New York Stock Exchange (“NYSE”) (generally 4:00 p.m. Eastern Time) on the valuation date. Equity securities and listed warrants are valued using a commercial pricing service at the last quoted sales price taken from the primary market in which each security trades and, with respect to equity securities traded on the National Association of Securities Dealer Automated Quotation (“NASDAQ”) system, such securities are valued using the NASDAQ Official Closing Price (“NOCP”) or last sales price if no NOCP is available. If there are no sales on the primary exchange or market on a day, then the security shall be valued at the mean of the last bid and ask price on the primary exchange or market as provided by a pricing service. If the mean cannot be calculated or there is no trade activity on a day, then the security shall be valued at the previous trading day’s price as provided by a pricing service. Insome instances, particularly on foreign exchanges, an official close or evaluated price may be used if the pricing service is unable to provide the last trade or most recent mean price. To the extent that these securities are actively traded and valuation adjustments are not applied, they are categorized in Level 1 of the fair value hierarchy. Additionally, a fund’s investments are valued at fair value by the Pricing Committee if the Advisor determines that an event impacting the value of an investment occurred between the closing time of a security’s primary market or exchange (for example, a foreign exchange or market) and the time the fund’s share price is calculated. Significant events include, but are not limited to the following: significant fluctuations in domestic markets, foreign markets or foreign currencies; occurrences not directly tied to the securities markets such as natural disasters, armed conflicts or significant governmental actions; and major announcements affecting a single issuer or an entire market or market sector. In responding to a significant event, the Pricing Committee determines the fair value of affected securities by considering factors including, but not limited to: index options and futures traded subsequent to the close; American Depositary Receipts (“ADRs”), Global Depositary Receipts (“GDRs”) or other related receipts; currency spot or forward markets that trade after
111
Notes to Financial Statements (continued)
pricing of the foreign exchange; other derivative securities traded after the close such as Standard & Poor’s Depositary Receipts (“SPDRs”) and other exchange-traded funds (“ETFs”); and alternative market quotes on the affected securities. When applicable, the Funds use a systematic fair valuation model provided by an independent third party to assist in adjusting the valuation of foreign securities. When a Fund uses this fair value pricing method, the values assigned to the Fund’s foreign securities may not be the quoted or published prices of the investments on their primary markets or exchanges, and the securities are categorized in Level 2 of the fair value hierarchy. These valuation procedures apply equally to long or short equity positions in a fund.
Participation Notes — Investments are valued at the market price of the underlying security. Counterparty risk is regularly reviewed and considered for valuation. To the extent the inputs are observable and timely, the values would be categorized in Level 2 of the fair value hierarchy.
Corporate Debt Securities — Investments are valued at current market value by a pricing service, or by using the last sale or bid price based on observable inputs. Observable inputs may include benchmark yields, reported trades, broker/dealer quotes, issuer spreads,two-sided markets, benchmark securities, bids, offers and reference data including market research publications. Although most corporate bonds are categorized in Level 2 of the fair value hierarchy, in instances where observable inputs are not available, they are categorized as Level 3.
Short-Term Notes — Investments maturing in 60 days or less at the time of purchase, are generally valued at amortized cost, unless it is determined that the amortized cost method would not represent fair value, in which case the securities aremarked-to-market. To the extent the inputs are observable and timely, the values would be categorized in Level 2 of the fair value hierarchy.
Asset-Backed Securities — Investments are priced using the closing bid as supplied by a pricing service based on observable inputs. Observable inputs may include benchmark yields, reported trades, broker/dealer quotes, issuer spreads,two-sided markets, benchmark securities, bids, offers and reference data including market research publications, new issue data, monthly payment information and collateral performance. Although most asset-backed securities are categorized in Level 2 of the fair value hierarchy, in instances where observable inputs are not available, they are categorized as Level 3.
U.S. Government Issuers — Investments are priced using the closing bid as supplied by a pricing service based on
observable inputs. Observable inputs may include benchmark yields, reported trades, broker/dealer quotes, issuer spreads,two-sided markets, benchmark securities, bids, offers and reference data including market research publications. Although most U.S. government bonds are categorized in Level 2 of the fair value hierarchy, in instances where observable inputs are not available, they are categorized as Level 3.
Derivative Instruments — Listed derivatives that are actively traded are valued based on quoted prices from the exchange and categorized in Level 1 of the fair value hierarchy. Exchange-traded options are valued at the last sale price in the market where they are principally traded. If there are no sales on the primary exchange or market on a given day, then the option is valued at the mean of the last bid price and ask price on the primary exchange or market as provided by a pricing service. Forward foreign currency contracts are valued at the market rate provided by the pricing service and categorized as Level 2.
Restricted Securities — If market quotations are not readily available for the Funds’ investments in securities such as restricted securities, private placements, securities for which trading has been halted or other illiquid securities, these investments are valued at fair value in accordance with Board-approved Pricing Policies and Procedures by the Pricing Committee with oversight by the Board of Trustees. Fair value is defined as the price that would be received upon the sale of an asset, or paid to transfer a liability, in an orderly transaction between market participants at the measurement date under current market conditions. For each applicable investment that is fair valued, the Pricing Committee considers, to the extent applicable, various factors including, but not limited to, the financial condition of the company or limited partnership, operating results, prices paid infollow-on rounds, comparable companies in the public market, the nature and duration of the restrictions for holding the securities, a stated net asset value (NAV) for the partnership, if applicable, and other relevant factors. Depending on the relative significance of valuation inputs, these instruments may be classified in either Level 2 or Level 3 of the fair value hierarchy.
When the last day of the reporting period is anon-business day, certain foreign markets may be open on days the NYSE is closed, which could result in differences between the value of a fund’s portfolio securities on the last business day and the last calendar day of the reporting period. Any significant security valuation changes due to an open foreign market are adjusted and reflected by the fund for financial reporting purposes.
112
| | |
| | MARCH 31, 2020 (UNAUDITED) |
|
|
|
The following is a summary of the fair valuations according to the inputs used as of March 31, 2020 in valuing the Funds’ assets and liabilities:
| | | | | | | | | | | | | | | | | | | | | | |
| Fund | | Category | | Quoted Prices
in Active
Markets
for Identical
Investments
(Level 1) | | Significant Other
Observable
Inputs
(Level 2) | | Significant
Unobservable
Inputs
(Level 3) | | Value at
3/31/2020 |
Core Growth Fund | | | | | | | | | | | | | | | | | | | | | | |
Assets | | | | | | | | | | | | | | | | | | | | | | |
Common Stocks | | | | | | | | | | | | | | | | | | | | | | |
| | Diversified Banks | | | $ | — | | | | $ | 16,017,559 | | | | $ | — | | | | $ | 16,017,559 | |
| | Other | | | | 1,852,888,943 | | | | | — | | | | | — | | | | | 1,852,888,943 | |
Short-Term Investments | | | | | | — | | | | | 16,332,508 | | | | | — | | | | | 16,332,508 | |
| | | | | | | |
| | | | | $ | 1,852,888,943 | | | | $ | 32,350,067 | | | | $ | — | | | | $ | 1,885,239,010 | |
| | | | | | | |
Emerging India Fund | | | | | | | | | | | | | | | | | | | | | | |
Assets | | | | | | | | | | | | | | | | | | | | | | |
Common Stocks | | | | | | | | | | | | | | | | | | | | | | |
| | Apparel, Accessories & Luxury Goods | | | $ | — | | | | $ | 6,425,733 | | | | $ | — | | | | $ | 6,425,733 | |
| | Auto Parts & Equipment | | | | — | | | | | 2,703,503 | | | | | — | | | | | 2,703,503 | |
| | Brewers | | | | — | | | | | 5,447,869 | | | | | — | | | | | 5,447,869 | |
| | Commodity Chemicals | | | | 2,525,664 | | | | | 10,045,473 | | | | | — | | | | | 12,571,137 | |
| | Consumer Finance | | | | — | | | | | 15,452,700 | | | | | — | | | | | 15,452,700 | |
| | Department Stores | | | | — | | | | | 5,157,155 | | | | | — | | | | | 5,157,155 | |
| | Diversified Banks | | | | — | | | | | 20,720,510 | | | | | — | | | | | 20,720,510 | |
| | Diversified Chemicals | | | | — | | | | | 11,811,636 | | | | | — | | | | | 11,811,636 | |
| | Financial Exchanges & Data | | | | — | | | | | 5,404,432 | | | | | — | | | | | 5,404,432 | |
| | Health Care Services | | | | — | | | | | 12,325,421 | | | | | — | | | | | 12,325,421 | |
| | Industrial Conglomerates | | | | — | | | | | 5,953,973 | | | | | — | | | | | 5,953,973 | |
| | Industrial Machinery | | | | — | | | | | 4,206,075 | | | | | — | | | | | 4,206,075 | |
| | Interactive Media & Services | | | | — | | | | | 8,529,606 | | | | | — | | | | | 8,529,606 | |
| | IT Consulting & Other Services | | | | 9,537,853 | | | | | 6,743,214 | | | | | — | | | | | 16,281,067 | |
| | Life & Health Insurance | | | | — | | | | | 4,812,687 | | | | | — | | | | | 4,812,687 | |
| | Life Sciences Tools & Services | | | | — | | | | | 13,016,084 | | | | | — | | | | | 13,016,084 | |
| | Packaged Foods & Meats | | | | — | | | | | 10,041,346 | | | | | — | | | | | 10,041,346 | |
| | Personal Products | | | | — | | | | | 2,959,115 | | | | | — | | | | | 2,959,115 | |
| | Pharmaceuticals | | | | — | | | | | 1,358,229 | | | | | — | | | | | 1,358,229 | |
| | Property & Casualty Insurance | | | | — | | | | | 11,800,329 | | | | | — | | | | | 11,800,329 | |
| | Regional Banks | | | | — | | | | | 9,739,513 | | | | | — | | | | | 9,739,513 | |
| | Specialty Chemicals | | | | — | | | | | 5,124,508 | | | | | — | | | | | 5,124,508 | |
| | Thrifts & Mortgage Finance | | | | — | | | | | 11,256,898 | | | | | — | | | | | 11,256,898 | |
| | Other | | | | 4,486,010 | | | | | — | | | | | — | | | | | 4,486,010 | |
| | | | | | | |
| | | | | $ | 16,549,527 | | | | $ | 191,036,009 | | | | $ | — | | | | $ | 207,585,536 | |
| | | | | | | |
113
Notes to Financial Statements (continued)
| | | | | | | | | | | | | | | | | | | | | | |
| Fund | | Category | | Quoted Prices
in Active
Markets
for Identical
Investments
(Level 1) | | Significant Other
Observable
Inputs
(Level 2) | | Significant
Unobservable
Inputs
(Level 3) | | Value at
3/31/2020 |
Emerging Markets Select Fund | | | | | | | | | | | | | | | | | | | | | | |
Assets | | | | | | | | | | | | | | | | | | | | | | |
Common Stocks | | | | | | | | | | | | | | | | | | | | | | |
| | Apparel, Accessories & Luxury Goods | | | $ | — | | | | $ | 635,227 | | | | $ | — | | | | $ | 635,227 | |
| | Biotechnology | | | | — | | | | | 630,788 | | | | | — | | | | | 630,788 | |
| | Consumer Finance | | | | — | | | | | 1,635,227 | | | | | — | | | | | 1,635,227 | |
| | Diversified Banks | | | | 593,976 | | | | | 2,327,077 | | | | | — | | | | | 2,921,053 | |
| | Diversified Chemicals | | | | — | | | | | 679,144 | | | | | — | | | | | 679,144 | |
| | Electrical Components & Equipment | | | | 902,554 | | | | | 1,541,716 | | | | | — | | | | | 2,444,270 | |
| | Health Care Equipment | | | | — | | | | | 1,159,472 | | | | | — | | | | | 1,159,472 | |
| | Industrial Machinery | | | | — | | | | | 882,636 | | | | | — | | | | | 882,636 | |
| | Interactive Media & Services | | | | — | | | | | 1,207,269 | | | | | — | | | | | 1,207,269 | |
| | IT Consulting & Other Services | | | | — | | | | | 1,014,422 | | | | | — | | | | | 1,014,422 | |
| | Life & Health Insurance | | | | — | | | | | 881,495 | | | | | — | | | | | 881,495 | |
| | Life Sciences Tools & Services | | | | — | | | | | 887,295 | | | | | — | | | | | 887,295 | |
| | Packaged Foods & Meats | | | | — | | | | | 2,153,262 | | | | | — | | | | | 2,153,262 | |
| | Personal Products | | | | — | | | | | 730,958 | | | | | — | | | | | 730,958 | |
| | Pharmaceuticals | | | | — | | | | | 766,329 | | | | | — | | | | | 766,329 | |
| | Property & Casualty Insurance | | | | 55,260 | | | | | 1,310,468 | | | | | — | | | | | 1,365,728 | |
| | Regional Banks | | | | — | | | | | 335,039 | | | | | — | | | | | 335,039 | |
| | Semiconductors | | | | — | | | | | 3,696,971 | | | | | — | | | | | 3,696,971 | |
| | Specialized Finance | | | | — | | | | | 352,396 | | | | | — | | | | | 352,396 | |
| | Specialty Chemicals | | | | — | | | | | 1,176,745 | | | | | — | | | | | 1,176,745 | |
| | Thrifts & Mortgage Finance | | | | — | | | | | 325,256 | | | | | — | | | | | 325,256 | |
| | Other | | | | 9,120,670 | | | | | — | | | | | — | | | | | 9,120,670 | |
Preferred Stocks | | | | | | 706,043 | | | | | — | | | | | — | | | | | 706,043 | |
| | | | | | | |
| | | | | $ | 11,378,503 | | | | $ | 24,329,192 | | | | $ | — | | | | $ | 35,707,695 | |
| | | | | | | |
Emerging Markets Small Cap Fund | | | | | | | | | | | | | | | | | | | | | | |
Assets | | | | | | | | | | | | | | | | | | | | | | |
Common Stocks | | | | | | | | | | | | | | | | | | | | | | |
| | Biotechnology | | | $ | — | | | | $ | 4,426,809 | | | | $ | — | | | | $ | 4,426,809 | |
| | Commodity Chemicals | | | | — | | | | | 12,029,388 | | | | | — | | | | | 12,029,388 | |
| | Consumer Finance | | | | 3,658,188 | | | | | 13,122,379 | | | | | — | | | | | 16,780,567 | |
| | Department Stores | | | | — | | | | | 3,312,728 | | | | | — | | | | | 3,312,728 | |
| | Distillers & Vintners | | | | — | | | | | 3,664,302 | | | | | — | | | | | 3,664,302 | |
| | Diversified Banks | | | | 4,717,682 | | | | | 2,905,439 | | | | | — | | | | | 7,623,121 | |
| | Diversified Chemicals | | | | — | | | | | 5,780,875 | | | | | — | | | | | 5,780,875 | |
| | Drug Retail | | | | 10,959,249 | | | | | 6,942,230 | | | | | — | | | | | 17,901,479 | |
| | Electrical Components & Equipment | | | | — | | | | | 15,843,506 | | | | | — | | | | | 15,843,506 | |
| | Electronic Equipment & Instruments | | | | — | | | | | 4,470,221 | | | | | — | | | | | 4,470,221 | |
| | Health Care Equipment | | | | — | | | | | 7,232,062 | | | | | — | | | | | 7,232,062 | |
| | Health Care Services | | | | — | | | | | 9,223,042 | | | | | — | | | | | 9,223,042 | |
| | Highways & Railtracks | | | | — | | | | | 2,746,002 | | | | | — | | | | | 2,746,002 | |
| | Home Improvement Retail | | | | — | | | | | 3,314,948 | | | | | — | | | | | 3,314,948 | |
| | Industrial Conglomerates | | | | — | | | | | 5,553,369 | | | | | — | | | | | 5,553,369 | |
| | Industrial Machinery | | | | — | | | | | 3,916,097 | | | | | — | | | | | 3,916,097 | |
| | Insurance Brokers | | | | — | | | | | 3,633,836 | | | | | — | | | | | 3,633,836 | |
| | Interactive Media & Services | | | | — | | | | | 6,835,095 | | | | | — | | | | | 6,835,095 | |
| | IT Consulting & Other Services | | | | 4,795,967 | | | | | 5,789,535 | | | | | — | | | | | 10,585,502 | |
| | Life & Health Insurance | | | | — | | | | | 834,023 | | | | | — | | | | | 834,023 | |
| | Packaged Foods & Meats | | | | — | | | | | 12,865,659 | | | | | — | | | | | 12,865,659 | |
| | Pharmaceuticals | | | | — | | | | | — | | | | | 16,790 | | | | | 16,790 | |
| | Property & Casualty Insurance | | | | 4,206,735 | | | | | 9,180,861 | | | | | — | | | | | 13,387,596 | |
| | Regional Banks | | | | 2,057,936 | | | | | 9,694,585 | | | | | — | | | | | 11,752,521 | |
| | Semiconductors | | | | — | | | | | 37,620,927 | | | | | — | | | | | 37,620,927 | |
| | Systems Software | | | | — | | | | | 5,823,707 | | | | | — | | | | | 5,823,707 | |
| | Thrifts & Mortgage Finance | | | | — | | | | | 3,156,990 | | | | | — | | | | | 3,156,990 | |
| | Other | | | | 42,384,290 | | | | | — | | | | | — | | | | | 42,384,290 | |
Preferred Stocks | | | | | | — | | | | | 5,579,388 | | | | | — | | | | | 5,579,388 | |
Short-Term Investments | | | | | | — | | | | | 1,507,568 | | | | | — | | | | | 1,507,568 | |
| | | | | | | |
| | | | | $ | 72,780,047 | | | | $ | 207,005,571 | | | | $ | 16,790 | | | | $ | 279,802,408 | |
| | | | | | | |
114
| | |
| | MARCH 31, 2020 (UNAUDITED) |
|
|
|
| | | | | | | | | | | | | | | | | | | | | | |
| Fund | | Category | | Quoted Prices
in Active
Markets
for Identical
Investments
(Level 1) | | Significant Other
Observable
Inputs
(Level 2) | | Significant
Unobservable
Inputs
(Level 3) | | Value at
3/31/2020 |
Frontier Emerging Small Countries Fund | | | | | | | | | | | | | | | | | | | | | | |
Assets | | | | | | | | | | | | | | | | | | | | | | |
Common Stocks | | | | | | | | | | | | | | | | | | | | | | |
| | Asset Management & Custody Banks | | | $ | — | | | | $ | 888,559 | | | | $ | — | | | | $ | 888,559 | |
| | Brewers | | | | — | | | | | 413,628 | | | | | — | | | | | 413,628 | |
| | Consumer Finance | | | | 1,053,053 | | | | | 1,684,108 | | | | | — | | | | | 2,737,161 | |
| | Data Processing & Outsourced Services | | | | — | | | | | 645,116 | | | | | — | | | | | 645,116 | |
| | Diversified Banks | | | | 1,814,602 | | | | | 3,874,993 | | | | | — | | | | | 5,689,595 | |
| | Drug Retail | | | | 2,240,422 | | | | | 1,112,909 | | | | | — | | | | | 3,353,331 | |
| | Food Retail | | | | — | | | | | 2,990,080 | | | | | — | | | | | 2,990,080 | |
| | Health Care Distributors | | | | — | | | | | 691,659 | | | | | — | | | | | 691,659 | |
| | Insurance Brokers | | | | — | | | | | 1,187,959 | | | | | — | | | | | 1,187,959 | |
| | Internet & Direct Marketing Retail | | | | 2,618,789 | | | | | 2,341,972 | | | | | — | | | | | 4,960,761 | |
| | Life & Health Insurance | | | | — | | | | | 517,183 | | | | | — | | | | | 517,183 | |
| | Regional Banks | | | | — | | | | | 1,634,769 | | | | | — | | | | | 1,634,769 | |
| | Technology Distributors | | | | — | | | | | 1,488,412 | | | | | — | | | | | 1,488,412 | |
| | Wireless Telecommunication Services | | | | — | | | | | 1,962,610 | | | | | — | | | | | 1,962,610 | |
| | Other | | | | 8,967,370 | | | | | — | | | | | — | | | | | 8,967,370 | |
Preferred Stocks | | | | | | 1,378,274 | | | | | — | | | | | — | | | | | 1,378,274 | |
Short-Term Investments | | | | | | — | | | | | 621,965 | | | | | — | | | | | 621,965 | |
| | | | | | | |
| | | | | $ | 18,072,510 | | | | $ | 22,055,922 | | | | $ | — | | | | $ | 40,128,432 | |
| | | | | | | |
Global Opportunities Fund | | | | | | | | | | | | | | | | | | | | | | |
Assets | | | | | | | | | | | | | | | | | | | | | | |
Common Stocks | | | | | | | | | | | | | | | | | | | | | | |
| | Application Software | | | $ | — | | | | $ | 2,504,353 | | | | $ | — | | | | $ | 2,504,353 | |
| | Biotechnology | | | | 1,081,289 | | | | | 1,459,353 | | | | | — | | | | | 2,540,642 | |
| | Consumer Finance | | | | 512,394 | | | | | 1,998,469 | | | | | — | | | | | 2,510,863 | |
| | Data Processing & Outsourced Services | | | | 2,010,820 | | | | | 798,973 | | | | | — | | | | | 2,809,793 | |
| | Diversified Chemicals | | | | — | | | | | 1,315,263 | | | | | — | | | | | 1,315,263 | |
| | Diversified Real Estate Activities | | | | — | | | | | 977,619 | | | | | — | | | | | 977,619 | |
| | Drug Retail | | | | — | | | | | 1,458,375 | | | | | — | | | | | 1,458,375 | |
| | Electrical Components & Equipment | | | | — | | | | | 1,980,113 | | | | | — | | | | | 1,980,113 | |
| | Health Care Equipment | | | | 770,737 | | | | | 1,942,299 | | | | | — | | | | | 2,713,036 | |
| | Health Care Services | | | | — | | | | | 1,092,810 | | | | | — | | | | | 1,092,810 | |
| | Health Care Supplies | | | | — | | | | | 1,130,255 | | | | | — | | | | | 1,130,255 | |
| | Human Resource & Employment Services | | | | — | | | | | 1,396,396 | | | | | — | | | | | 1,396,396 | |
| | Industrial Conglomerates | | | | — | | | | | 1,058,095 | | | | | — | | | | | 1,058,095 | |
| | Industrial Machinery | | | | 5,694,809 | | | | | 1,347,607 | | | | | — | | | | | 7,042,416 | |
| | Interactive Media & Services | | | | — | | | | | 576,172 | | | | | — | | | | | 576,172 | |
| | Internet & Direct Marketing Retail | | | | 2,832,115 | | | | | 932,575 | | | | | — | | | | | 3,764,690 | |
| | Life & Health Insurance | | | | — | | | | | 645,829 | | | | | — | | | | | 645,829 | |
| | Other Diversified Financial Services | | | | — | | | | | 591,601 | | | | | — | | | | | 591,601 | |
| | Packaged Foods & Meats | | | | 1,711,716 | | | | | 2,473,715 | | | | | — | | | | | 4,185,431 | |
| | Property & Casualty Insurance | | | | — | | | | | 1,579,096 | | | | | — | | | | | 1,579,096 | |
| | Regional Banks | | | | 1,633,681 | | | | | 2,615,390 | | | | | — | | | | | 4,249,071 | |
| | Research & Consulting Services | | | | — | | | | | 1,653,492 | | | | | — | | | | | 1,653,492 | |
| | Restaurants | | | | — | | | | | 1,119,959 | | | | | — | | | | | 1,119,959 | |
| | Semiconductors | | | | 2,562,808 | | | | | 5,246,831 | | | | | — | | | | | 7,809,639 | |
| | Soft Drinks | | | | — | | | | | 993,211 | | | | | — | | | | | 993,211 | |
| | Technology Distributors | | | | — | | | | | 708,432 | | | | | — | | | | | 708,432 | |
| | Thrifts & Mortgage Finance | | | | — | | | | | 962,805 | | | | | — | | | | | 962,805 | |
| | Trading Companies & Distributors | | | | — | | | | | 2,719,896 | | | | | — | | | | | 2,719,896 | |
| | Other | | | | 33,789,858 | | | | | — | | | | | — | | | | | 33,789,858 | |
Short-Term Investments | | | | | | — | | | | | 1,146,292 | | | | | — | | | | | 1,146,292 | |
| | | | | | | |
| | | | | $ | 52,600,227 | | | | $ | 44,425,276 | | | | $ | — | | | | $ | 97,025,503 | |
| | | | | | | |
115
Notes to Financial Statements (continued)
| | | | | | | | | | | | | | | | | | | | | | |
| Fund | | Category | | Quoted Prices
in Active
Markets
for Identical
Investments
(Level 1) | | Significant Other
Observable
Inputs
(Level 2) | | Significant
Unobservable
Inputs
(Level 3) | | Value at
3/31/2020 |
Global Select Fund | | | | | | | | | | | | | | | | | | | | | | |
Assets | | | | | | | | | | | | | | | | | | | | | | |
Common Stocks | | | | | | | | | | | | | | | | | | | | | | |
| | Application Software | | | $ | 864,845 | | | | $ | 423,916 | | | | $ | — | | | | $ | 1,288,761 | |
| | Building Products | | | | — | | | | | 411,607 | | | | | — | | | | | 411,607 | |
| | Consumer Finance | | | | — | | | | | 304,135 | | | | | — | | | | | 304,135 | |
| | Data Processing & Outsourced Services | | | | 830,657 | | | | | 307,124 | | | | | — | | | | | 1,137,781 | |
| | Drug Retail | | | | — | | | | | 435,097 | | | | | — | | | | | 435,097 | |
| | Health Care Equipment | | | | — | | | | | 666,681 | | | | | — | | | | | 666,681 | |
| | Health Care Supplies | | | | — | | | | | 754,457 | | | | | — | | | | | 754,457 | |
| | Industrial Machinery | | | | — | | | | | 203,331 | | | | | — | | | | | 203,331 | |
| | Packaged Foods & Meats | | | | — | | | | | 293,004 | | | | | — | | | | | 293,004 | |
| | Specialty Chemicals | | | | — | | | | | 250,600 | | | | | — | | | | | 250,600 | |
| | Other | | | | 3,760,253 | | | | | — | | | | | — | | | | | 3,760,253 | |
| | | | | | | |
| | | | | $ | 5,455,755 | | | | $ | 4,049,952 | | | | $ | — | | | | $ | 9,505,707 | |
| | | | | | | |
Global Value Fund | | | | | | | | | | | | | | | | | | | | | | |
Assets | | | | | | | | | | | | | | | | | | | | | | |
Common Stocks | | | | | | | | | | | | | | | | | | | | | | |
| | Airlines | | | $ | — | | | | $ | 918,872 | | | | $ | — | | | | $ | 918,872 | |
| | Construction & Engineering | | | | — | | | | | 582,741 | | | | | — | | | | | 582,741 | |
| | Diversified Banks | | | | 6,295,274 | | | | | 2,373,567 | | | | | — | | | | | 8,668,841 | |
| | Diversified Metals & Mining | | | | — | | | | | 1,777,848 | | | | | — | | | | | 1,777,848 | |
| | Electronic Manufacturing Services | | | | — | | | | | 1,611,586 | | | | | — | | | | | 1,611,586 | |
| | Food Retail | | | | — | | | | | 6,098,073 | | | | | — | | | | | 6,098,073 | |
| | Industrial Conglomerates | | | | — | | | | | 1,732,447 | | | | | — | | | | | 1,732,447 | |
| | Integrated Oil & Gas | | | | 3,351,524 | | | | | 3,690,850 | | | | | — | | | | | 7,042,374 | |
| | Multi-Line Insurance | | | | — | | | | | 2,709,110 | | | | | — | | | | | 2,709,110 | |
| | Pharmaceuticals | | | | 8,736,540 | | | | | 2,969,956 | | | | | — | | | | | 11,706,496 | |
| | Reinsurance | | | | — | | | | | 4,121,939 | | | | | — | | | | | 4,121,939 | |
| | Technology Hardware, Storage & Peripherals | | | | — | | | | | 4,082,556 | | | | | — | | | | | 4,082,556 | |
| | Tobacco | | | | — | | | | | 3,061,362 | | | | | — | | | | | 3,061,362 | |
| | Wireless Telecommunication Services | | | | — | | | | | 5,995,424 | | | | | — | | | | | 5,995,424 | |
| | Other | | | | 38,582,120 | | | | | — | | | | | — | | | | | 38,582,120 | |
Short-Term Investments | | | | | | — | | | | | 1,719,483 | | | | | — | | | | | 1,719,483 | |
| | | | | | | |
| | | | | $ | 56,965,458 | | | | $ | 43,445,814 | | | | $ | — | | | | $ | 100,411,272 | |
| | | | | | | |
116
| | |
| | MARCH 31, 2020 (UNAUDITED) |
|
|
|
| | | | | | | | | | | | | | | | | | | | | | |
| Fund | | Category | | Quoted Prices
in Active
Markets
for Identical
Investments
(Level 1) | | Significant Other
Observable
Inputs
(Level 2) | | Significant
Unobservable
Inputs
(Level 3) | | Value at
3/31/2020 |
International Growth Fund | | | | | | | | | | | | | | | | | | | | | | |
Assets | | | | | | | | | | | | | | | | | | | | | | |
Common Stocks | | | | | | | | | | | | | | | | | | | | | | |
| | Application Software | | | $ | 32,612,510 | | | | $ | 66,364,354 | | | | $ | — | | | | $ | 98,976,864 | |
| | Asset Management & Custody Banks | | | | — | | | | | 22,014,423 | | | | | — | | | | | 22,014,423 | |
| | Biotechnology | | | | — | | | | | 11,657,136 | | | | | — | | | | | 11,657,136 | |
| | Brewers | | | | — | | | | | 8,950,850 | | | | | — | | | | | 8,950,850 | |
| | Commodity Chemicals | | | | — | | | | | 8,169,809 | | | | | — | | | | | 8,169,809 | |
| | Construction Machinery & Heavy Trucks | | | | — | | | | | 7,693,357 | | | | | — | | | | | 7,693,357 | |
| | Data Processing & Outsourced Services | | | | — | | | | | 11,669,215 | | | | | — | | | | | 11,669,215 | |
| | Department Stores | | | | — | | | | | 1,919,759 | | | | | — | | | | | 1,919,759 | |
| | Diversified Real Estate Activities | | | | — | | | | | 18,684,934 | | | | | — | | | | | 18,684,934 | |
| | Diversified Support Services | | | | — | | | | | 25,796,314 | | | | | — | | | | | 25,796,314 | |
| | Drug Retail | | | | 5,933,295 | | | | | 61,558,768 | | | | | — | | | | | 67,492,063 | |
| | Electrical Components��& Equipment | | | | — | | | | | 14,250,925 | | | | | — | | | | | 14,250,925 | |
| | Electronic Equipment & Instruments | | | | — | | | | | 19,329,309 | | | | | — | | | | | 19,329,309 | |
| | Financial Exchanges & Data | | | | — | | | | | 9,277,992 | | | | | — | | | | | 9,277,992 | |
| | General Merchandise Stores | | | | — | | | | | 11,922,825 | | | | | — | | | | | 11,922,825 | |
| | Health Care Equipment | | | | — | | | | | 50,844,565 | | | | | — | | | | | 50,844,565 | |
| | Health Care Supplies | | | | — | | | | | 24,389,367 | | | | | — | | | | | 24,389,367 | |
| | Health Care Technology | | | | — | | | | | 1,667,531 | | | | | — | | | | | 1,667,531 | |
| | Highways & Railtracks | | | | — | | | | | 1,462,947 | | | | | — | | | | | 1,462,947 | |
| | Home Improvement Retail | | | | — | | | | | 247,774 | | | | | — | | | | | 247,774 | |
| | Household Appliances | | | | — | | | | | 12,512,330 | | | | | — | | | | | 12,512,330 | |
| | Human Resource & Employment Services | | | | 8,683,370 | | | | | 26,351,378 | | | | | — | | | | | 35,034,748 | |
| | Industrial Machinery | | | | — | | | | | 21,648,558 | | | | | — | | | | | 21,648,558 | |
| | Interactive Media & Services | | | | — | | | | | 30,745,398 | | | | | — | | | | | 30,745,398 | |
| | Internet & Direct Marketing Retail | | | | — | | | | | 18,799,699 | | | | | 1,989,141 | | | | | 20,788,840 | |
| | Investment Banking & Brokerage | | | | — | | | | | 10,120,410 | | | | | — | | | | | 10,120,410 | |
| | IT Consulting & Other Services | | | | 7,225,029 | | | | | 27,715,417 | | | | | — | | | | | 34,940,446 | |
| | Life Sciences Tools & Services | | | | — | | | | | 13,979,374 | | | | | — | | | | | 13,979,374 | |
| | Movies & Entertainment | | | | — | | | | | 13,139,928 | | | | | — | | | | | 13,139,928 | |
| | Other Diversified Financial Services | | | | — | | | | | 13,349,968 | | | | | — | | | | | 13,349,968 | |
| | Packaged Foods & Meats | | | | — | | | | | 29,204,693 | | | | | — | | | | | 29,204,693 | |
| | Pharmaceuticals | | | | — | | | | | 6,015,290 | | | | | — | | | | | 6,015,290 | |
| | Property & Casualty Insurance | | | | — | | | | | 12,234,667 | | | | | — | | | | | 12,234,667 | |
| | Regional Banks | | | | 12,015,910 | | | | | 10,171,205 | | | | | — | | | | | 22,187,115 | |
| | Research & Consulting Services | | | | — | | | | | 21,274,236 | | | | | — | | | | | 21,274,236 | |
| | Restaurants | | | | — | | | | | 11,982,543 | | | | | — | | | | | 11,982,543 | |
| | Semiconductor Equipment | | | | — | | | | | 9,111,094 | | | | | — | | | | | 9,111,094 | |
| | Semiconductors | | | | — | | | | | 34,685,133 | | | | | — | | | | | 34,685,133 | |
| | Soft Drinks | | | | — | | | | | 11,490,957 | | | | | — | | | | | 11,490,957 | |
| | Specialty Chemicals | | | | — | | | | | 13,363,715 | | | | | — | | | | | 13,363,715 | |
| | Systems Software | | | | — | | | | | 6,948,801 | | | | | — | | | | | 6,948,801 | |
| | Technology Distributors | | | | — | | | | | 11,570,987 | | | | | — | | | | | 11,570,987 | |
| | Textiles | | | | — | | | | | 10,630,501 | | | | | — | | | | | 10,630,501 | |
| | Trading Companies & Distributors | | | | — | | | | | 51,046,744 | | | | | — | | | | | 51,046,744 | |
| | Other | | | | 9,262,226 | | | | | — | | | | | — | | | | | 9,262,226 | |
Short-Term Investments | | | | | | — | | | | | 15,256,660 | | | | | — | | | | | 15,256,660 | |
| | | | | | | |
| | | | | $ | 75,732,340 | | | | $ | 821,221,840 | | | | $ | 1,989,141 | | | | $ | 898,943,321 | |
| | | | | | | |
117
Notes to Financial Statements (continued)
| | | | | | | | | | | | | | | | | | | | | | |
| Fund | | Category | | Quoted Prices
in Active
Markets
for Identical
Investments
(Level 1) | | Significant Other
Observable
Inputs
(Level 2) | | Significant
Unobservable
Inputs
(Level 3) | | Value at
3/31/2020 |
International Opportunities Fund | | | | | | | | | | | | | | | | | | | | | | |
Assets | | | | | | | | | | | | | | | | | | | | | | |
Common Stocks | | | | | | | | | | | | | | | | | | | | | | |
| | Advertising | | | $ | 7,465,540 | | | | $ | 5,662,122 | | | | $ | — | | | | $ | 13,127,662 | |
| | Aerospace & Defense | | | | — | | | | | 9,514,580 | | | | | — | | | | | 9,514,580 | |
| | Alternative Carriers | | | | — | | | | | 6,263,617 | | | | | — | | | | | 6,263,617 | |
| | Application Software | | | | 10,931,123 | | | | | 62,200,365 | | | | | — | | | | | 73,131,488 | |
| | Auto Parts & Equipment | | | | — | | | | | 1,813,627 | | | | | — | | | | | 1,813,627 | |
| | Brewers | | | | — | | | | | 6,543,243 | | | | | — | | | | | 6,543,243 | |
| | Building Products | | | | — | | | | | 959,927 | | | | | — | | | | | 959,927 | |
| | Commercial Printing | | | | — | | | | | 2,745,597 | | | | | — | | | | | 2,745,597 | |
| | Commodity Chemicals | | | | 4,609,376 | | | | | 8,572,187 | | | | | — | | | | | 13,181,563 | |
| | Consumer Finance | | | | 1,752,286 | | | | | 5,777,497 | | | | | — | | | | | 7,529,783 | |
| | Department Stores | | | | — | | | | | 5,620,307 | | | | | — | | | | | 5,620,307 | |
| | Diversified Support Services | | | | — | | | | | 23,503,007 | | | | | — | | | | | 23,503,007 | |
| | Drug Retail | | | | — | | | | | 8,802,776 | | | | | — | | | | | 8,802,776 | |
| | Education Services | | | | — | | | | | 1,575,410 | | | | | — | | | | | 1,575,410 | |
| | Electrical Components & Equipment | | | | — | | | | | 8,629,744 | | | | | — | | | | | 8,629,744 | |
| | Electronic Components | | | | — | | | | | 2,507,635 | | | | | — | | | | | 2,507,635 | |
| | Electronic Equipment & Instruments | | | | — | | | | | 9,500,318 | | | | | — | | | | | 9,500,318 | |
| | Food Retail | | | | — | | | | | 17,400,165 | | | | | — | | | | | 17,400,165 | |
| | Health Care Equipment | | | | 3,093,678 | | | | | 25,174,995 | | | | | — | | | | | 28,268,673 | |
| | Health Care Services | | | | — | | | | | 14,847,480 | | | | | — | | | | | 14,847,480 | |
| | Health Care Supplies | | | | — | | | | | 7,366,614 | | | | | — | | | | | 7,366,614 | |
| | Health Care Technology | | | | 6,550,249 | | | | | 11,446,073 | | | | | — | | | | | 17,996,322 | |
| | Home Improvement Retail | | | | — | | | | | 5,902,091 | | | | | — | | | | | 5,902,091 | |
| | Human Resource & Employment Services | | | | — | | | | | 7,644,557 | | | | | — | | | | | 7,644,557 | |
| | Insurance Brokers | | | | — | | | | | 4,572,201 | | | | | — | | | | | 4,572,201 | |
| | Interactive Media & Services | | | | — | | | | | 8,252,091 | | | | | — | | | | | 8,252,091 | |
| | Internet & Direct Marketing Retail | | | | — | | | | | 3,572,913 | | | | | 1,275,383 | | | | | 4,848,296 | |
| | Internet Services & Infrastructure | | | | — | | | | | 5,193,295 | | | | | — | | | | | 5,193,295 | |
| | Investment Banking & Brokerage | | | | — | | | | | 2,417,129 | | | | | — | | | | | 2,417,129 | |
| | IT Consulting & Other Services | | | | — | | | | | 11,687,696 | | | | | — | | | | | 11,687,696 | |
| | Life Sciences Tools & Services | | | | — | | | | | 4,159,242 | | | | | — | | | | | 4,159,242 | |
| | Other Diversified Financial Services | | | | — | | | | | 7,591,737 | | | | | — | | | | | 7,591,737 | |
| | Packaged Foods & Meats | | | | — | | | | | 9,380,121 | | | | | — | | | | | 9,380,121 | |
| | Personal Products | | | | — | | | | | 4,220,073 | | | | | — | | | | | 4,220,073 | |
| | Publishing | | | | — | | | | | 4,734,705 | | | | | — | | | | | 4,734,705 | |
| | Research & Consulting Services | | | | — | | | | | 13,635,376 | | | | | — | | | | | 13,635,376 | |
| | Restaurants | | | | — | | | | | 1,894,557 | | | | | 7,826 | | | | | 1,902,383 | |
| | Semiconductor Equipment | | | | — | | | | | 4,554,193 | | | | | — | | | | | 4,554,193 | |
| | Semiconductors | | | | — | | | | | 16,174,962 | | | | | — | | | | | 16,174,962 | |
| | Specialized Finance | | | | — | | | | | 5,992,234 | | | | | — | | | | | 5,992,234 | |
| | Technology Hardware, Storage & Peripherals | | | | — | | | | | 2,129,954 | | | | | — | | | | | 2,129,954 | |
| | Thrifts & Mortgage Finance | | | | 4,478,401 | | | | | 6,425,874 | | | | | — | | | | | 10,904,275 | |
| | Other | | | | 15,462,735 | | | | | — | | | | | — | | | | | 15,462,735 | |
Short-Term Investments | | | | | | — | | | | | 14,461,322 | | | | | — | | | | | 14,461,322 | |
| | | | | | | |
| | | | | $ | 54,343,388 | | | | $ | 391,023,609 | | | | $ | 1,283,209 | | | | $ | 446,650,206 | |
| | | | | | | |
118
| | |
| | MARCH 31, 2020 (UNAUDITED) |
|
|
|
| | | | | | | | | | | | | | | | | | | | | | |
| Fund | | Category | | Quoted Prices
in Active
Markets
for Identical
Investments
(Level 1) | | Significant Other
Observable
Inputs
(Level 2) | | Significant
Unobservable
Inputs
(Level 3) | | Value at
3/31/2020 |
International Select Fund | | | | | | | | | | | | | | | | | | | | | | |
Assets | | | | | | | | | | | | | | | | | | | | | | |
Common Stocks | | | | | | | | | | | | | | | | | | | | | | |
| | Apparel, Accessories & Luxury Goods | | | $ | — | | | | $ | 96,618 | | | | $ | — | | | | $ | 96,618 | |
| | Application Software | | | | — | | | | | 285,564 | | | | | — | | | | | 285,564 | |
| | Asset Management & Custody Banks | | | | — | | | | | 84,898 | | | | | — | | | | | 84,898 | |
| | Building Products | | | | — | | | | | 133,108 | | | | | — | | | | | 133,108 | |
| | Data Processing & Outsourced Services | | | | — | | | | | 174,565 | | | | | — | | | | | 174,565 | |
| | Drug Retail | | | | — | | | | | 158,217 | | | | | — | | | | | 158,217 | |
| | Electronic Equipment & Instruments | | | | — | | | | | 123,889 | | | | | — | | | | | 123,889 | |
| | Health Care Equipment | | | | — | | | | | 390,809 | | | | | — | | | | | 390,809 | |
| | Health Care Supplies | | | | — | | | | | 271,204 | | | | | — | | | | | 271,204 | |
| | Health Care Technology | | | | — | | | | | 91,441 | | | | | — | | | | | 91,441 | |
| | Industrial Machinery | | | | — | | | | | 151,386 | | | | | — | | | | | 151,386 | |
| | Interactive Media & Services | | | | — | | | | | 49,889 | | | | | — | | | | | 49,889 | |
| | Internet & Direct Marketing Retail | | | | — | | | | | 65,477 | | | | | — | | | | | 65,477 | |
| | IT Consulting & Other Services | | | | — | | | | | 65,145 | | | | | — | | | | | 65,145 | |
| | Leisure Products | | | | — | | | | | 57,045 | | | | | — | | | | | 57,045 | |
| | Life Sciences Tools & Services | | | | 92,753 | | | | | 124,921 | | | | | — | | | | | 217,674 | |
| | Packaged Foods & Meats | | | | — | | | | | 78,244 | | | | | — | | | | | 78,244 | |
| | Research & Consulting Services | | | | — | | | | | 92,720 | | | | | — | | | | | 92,720 | |
| | Soft Drinks | | | | — | | | | | 51,987 | | | | | — | | | | | 51,987 | |
| | Specialty Chemicals | | | | — | | | | | 112,239 | | | | | — | | | | | 112,239 | |
| | Other | | | | 46,810 | | | | | — | | | | | — | | | | | 46,810 | |
| | | | | | | |
| | | | | $ | 139,563 | | | | $ | 2,659,366 | | | | $ | — | | | | $ | 2,798,929 | |
| | | | | | | |
Micro Cap Fund | | | | | | | | | | | | | | | | | | | | | | |
Assets | | | | | | | | | | | | | | | | | | | | | | |
Common Stocks | | | | | $ | 446,009,447 | | | | $ | — | | | | $ | — | | | | $ | 446,009,447 | |
Warrants | | | | | | — | | | | | — | | | | | 640,581 | | | | | 640,581 | |
Short-Term Investments | | | | | | — | | | | | 3,323,503 | | | | | — | | | | | 3,323,503 | |
| | | | | | | |
| | | | | $ | 446,009,447 | | | | $ | 3,323,503 | | | | $ | 640,581 | | | | $ | 449,973,531 | |
| | | | | | | |
Micro Cap Value Fund | | | | | | | | | | | | | | | | | | | | | | |
Assets | | | | | | | | | | | | | | | | | | | | | | |
Common Stocks | | | | | | | | | | | | | | | | | | | | | | |
| | Alternative Carriers | | | $ | 4,152,197 | | | | $ | 1,996,344 | | | | $ | — | | | | $ | 6,148,541 | |
| | Application Software | | | | 11,221,190 | | | | | 7,925,342 | | | | | — | | | | | 19,146,532 | |
| | Asset Management & Custody Banks | | | | 2,212,400 | | | | | 1,888,837 | | | | | — | | | | | 4,101,237 | |
| | Diversified Banks | | | | — | | | | | 1,226,976 | | | | | — | | | | | 1,226,976 | |
| | Diversified Support Services | | | | — | | | | | 2,061,525 | | | | | — | | | | | 2,061,525 | |
| | Education Services | | | | — | | | | | 1,274,681 | | | | | — | | | | | 1,274,681 | |
| | Health Care Distributors | | | | 2,996,670 | | | | | 2,103,590 | | | | | — | | | | | 5,100,260 | |
| | Health Care Technology | | | | 4,885,140 | | | | | 2,601,486 | | | | | — | | | | | 7,486,626 | |
| | Industrial Machinery | | | | 6,958,860 | | | | | 2,338,446 | | | | | — | | | | | 9,297,306 | |
| | Investment Banking & Brokerage | | | | — | | | | | 2,548,634 | | | | | — | | | | | 2,548,634 | |
| | IT Consulting & Other Services | | | | 6,052,853 | | | | | 1,672,549 | | | | | — | | | | | 7,725,402 | |
| | Personal Products | | | | 983,625 | | | | | 1,754,389 | | | | | — | | | | | 2,738,014 | |
| | Research & Consulting Services | | | | 2,256,611 | | | | | 2,942,057 | | | | | — | | | | | 5,198,668 | |
| | Systems Software | | | | — | | | | | 936,055 | | | | | — | | | | | 936,055 | |
| | Technology Hardware, Storage & Peripherals | | | | 885,600 | | | | | 1,810,504 | | | | | — | | | | | 2,696,104 | |
| | Thrifts & Mortgage Finance | | | | 1,124,060 | | | | | 2,539,042 | | | | | — | | | | | 3,663,102 | |
| | Other | | | | 85,621,806 | | | | | — | | | | | — | | | | �� | 85,621,806 | |
Convertible Preferred Stocks | | | | | | — | | | | | — | | | | | 1,998,434 | | | | | 1,998,434 | |
Limited Liability Company Membership Interest | | | | | | — | | | | | — | | | | | 20,211 | | | | | 20,211 | |
Warrants | | | | | | — | | | | | — | | | | | — | | | | | — | |
Short-Term Investments | | | | | | — | | | | | 5,798,515 | | | | | — | | | | | 5,798,515 | |
| | | | | | | | | | | | | | | | | | | | | | |
| | | | | $ | 129,351,012 | | | | $ | 43,418,972 | | | | $ | 2,018,645 | | | | $ | 174,788,629 | |
| | | | | | | |
119
Notes to Financial Statements (continued)
| | | | | | | | | | | | | | | | | | | | | | |
| Fund | | Category | | Quoted Prices
in Active
Markets
for Identical
Investments
(Level 1) | | Significant Other
Observable
Inputs
(Level 2) | | Significant
Unobservable
Inputs
(Level 3) | | Value at
3/31/2020 |
Small Cap Growth Fund | | | | | | | | | | | | | | | | | | | | | | |
Assets | | | | | | | | | | | | | | | | | | | | | | |
Common Stocks | | | | | $ | 1,501,970,778 | | | | $ | — | | | | $ | — | | | | $ | 1,501,970,778 | |
Preferred Stocks | | | | | | — | | | | | — | | | | | 8,873,976 | | | | | 8,873,976 | |
Limited Partnership Interest | | | | | | — | | | | | — | | | | | 1,356,174 | | | | | 1,356,174 | |
Short-Term Investments | | | | | | — | | | | | 19,057,062 | | | | | — | | | | | 19,057,062 | |
| | | | | | | |
| | | | | $ | 1,501,970,778 | | | | $ | 19,057,062 | | | | $ | 10,230,150 | | | | $ | 1,531,257,990 | |
| | | | | | | |
Small Cap Value Fund | | | | | | | | | | | | | | | | | | | | | | |
Assets | | | | | | | | | | | | | | | | | | | | | | |
Common Stocks | | | | | | | | | | | | | | | | | | | | | | |
| | Diversified Banks | | | $ | — | | | | $ | 3,591,264 | | | | $ | — | | | | $ | 3,591,264 | |
| | Other | | | | 581,164,799 | | | | | — | | | | | — | | | | | 581,164,799 | |
Short-Term Investments | | | | | | — | | | | | 2,554,797 | | | | | — | | | | | 2,554,797 | |
| | | | | | | |
| | | | | $ | 581,164,799 | | | | $ | 6,146,061 | | | | $ | — | | | | $ | 587,310,860 | |
| | | | | | | |
Ultra Growth Fund | | | | | | | | | | | | | | | | | | | | | | |
Assets | | | | | | | | | | | | | | | | | | | | | | |
Common Stocks | | | | | | | | | | | | | | | | | | | | | | |
| | Diversified Banks | | | $ | — | | | | $ | 4,241,877 | | | | $ | — | | | | $ | 4,241,877 | |
| | Other | | | | 723,342,325 | | | | | — | | | | | — | | | | | 723,342,325 | |
Limited Partnership Interest | | | | | | — | | | | | — | | | | | 1,274,822 | | | | | 1,274,822 | |
Preferred Stocks | | | | | | — | | | | | — | | | | | 128,601 | | | | | 128,601 | |
Warrants | | | | | | — | | | | | — | | | | | 796,200 | | | | | 796,200 | |
Short-Term Investments | | | | | | — | | | | | 24,090,965 | | | | | — | | | | | 24,090,965 | |
| | | | | | | |
| | | | | $ | 723,342,325 | | | | $ | 28,332,842 | | | | $ | 2,199,623 | | | | $ | 753,874,790 | |
| | | | | | | |
U.S. Treasury Fund | | | | | | | | | | | | | | | | | | | | | | |
Assets | | | | | | | | | | | | | | | | | | | | | | |
U.S. Government Obligations | | | | | $ | — | | | | $ | 408,446,146 | | | | $ | — | | | | $ | 408,446,146 | |
Short-Term Investments | | | | | | — | | | | | 7,018,524 | | | | | — | | | | | 7,018,524 | |
| | | | | | | |
| | | | | $ | — | | | | $ | 415,464,670 | | | | $ | — | | | | $ | 415,464,670 | |
| | | | | | | |
If the securities of an Asset Class are all the same level, the asset class is shown in total. If the securities of an Asset Class cross levels, the level with the smallest number of categories and with multiple levels within a category is displayed by category. The remaining categories that do not cross levels are combined into the “Other” category.
The valuation techniques used by the Funds to measure fair value for the six months ended March 31, 2020 maximized the use of observable inputs and minimized the use of unobservable inputs.
The Funds’ policy is to recognize transfers between levels at the end of the reporting period.
There was a transfer of $3,007,812 in the Micro Cap Fund from Level 3 to Level 1 due to a change in pricing strategy on a private company that came public. This transfer amount represents the beginning of the period value for IM Cannabis Corp., which transferred to Level 1 during the period in order to properly represent the activity on the Level 3 Rollforward presented below.
There were transfers of $14,841,216 in the Micro Cap Fund and $16,980,008 in the Small Cap Growth Fund and $3,820,500 in the Ultra Growth Fund from Level 3 to Level 1 due to a change in pricing strategy on a private company that came public. This transfer amount represents the beginning of the period value for Medallia, Inc., which transferred to Level 1 during the period in order to properly represent the activity on the Level 3 Rollforward presented below.
120
| | |
| | MARCH 31, 2020 (UNAUDITED) |
|
|
|
The following is a reconciliation of the fair valuations using significant unobservable inputs (Level 3) for the Funds during the six months ended March 31, 2020:
| | | | | | | | | | | | | | | | | | | | | | | | | | | | | | | | | | | | | | | | | | | | | | | | | | |
| Fund | | Market Value
Beginning
Balance
9/30/2019 | | Purchases
at Cost | | Sales
(Proceeds) | | Accrued
Discounts
(Premiums) | | Realized
Gain/
(Loss) | | Change in
Unrealized
Appreciation
(Depreciation) | | Transfers
in at
Market
Value | | Transfers
out at
Market
Value | | Market
Value
Ending
Balance
3/31/2020 | | Net Change
in Unrealized
Appreciation
(Depreciation)
on Investments
Held at
3/31/2020 |
Emerging Markets Small Cap Fund | | | | | | | | | | | | | | | | | | | | | | | | | | | | | | | | | | | | | | | | | | | | | | | | | | |
Common Stocks | | | $ | 16,608 | | | | $ | — | | | | $ | — | | | | $ | — | | | | $ | — | | | | $ | 182 | | | | $ | — | | | | $ | — | | | | $ | 16,790 | | | | $ | 182 | |
| | | | | |
| | | $ | 16,608 | | | | $ | — | | | | $ | — | | | | $ | — | | | | $ | — | | | | $ | 182 | | | | $ | — | | | | $ | — | | | | $ | 16,790 | | | | $ | 182 | |
| | | | | |
International Growth Fund | | | | | | | | | | | | | | | | | | | | | | | | | | | | | | | | | | | | | | | | | | | | | | | | | | |
Common Stocks | | | $ | — | | | | $ | — | | | | $ | — | | | | $ | — | | | | $ | — | | | | $ | — | | | | $ | 1,989,141 | | | | $ | — | | | | $ | 1,989,141 | | | | $ | — | |
| | | | | |
| | | $ | — | | | | $ | — | | | | $ | — | | | | $ | — | | | | $ | — | | | | $ | — | | | | $ | 1,989,141 | | | | $ | — | | | | $ | 1,989,141 | | | | $ | — | |
| | | | | |
International Opportunities
Fund | | | | | | | | | | | | | | | | | | | | | | | | | | | | | | | | | | | | | | | | | | | | | | | | | | |
Common Stocks | | | $ | 7,747 | | | | $ | — | | | | $ | — | | | | $ | — | | | | $ | — | | | | $ | 79 | | | | $ | 1,275,383 | | | | $ | — | | | | $ | 1,283,209 | | | | $ | 79 | |
| | | | | |
| | | $ | 7,747 | | | | $ | — | | | | $ | — | | | | $ | — | | | | $ | — | | | | $ | 79 | | | | $ | 1,275,383 | | | | $ | — | | | | $ | 1,283,209 | | | | $ | 79 | |
| | | | | |
Micro Cap Fund | | | | | | | | | | | | | | | | | | | | | | | | | | | | | | | | | | | | | | | | | | | | | | | | | | |
Common Stocks | | | $ | 17,849,029 | | | | $ | — | | | | $ | — | | | | $ | — | | | | $ | — | | | | $ | — | | | | $ | — | | | | $ | 17,849,029 | | | | $ | — | | | | $ | — | |
Warrants | | | | — | | | | | 64,058 | | | | | — | | | | | — | | | | | — | | | | | 576,523 | | | | | — | | | | | — | | | | | 64,0581 | | | | | 576,523 | |
| | | | | |
| | | $ | 17,849,029 | | | | $ | 64,058 | | | | $ | — | | | | $ | — | | | | $ | — | | | | $ | 576,523 | | | | $ | — | | | | $ | 17,849,029 | | | | $ | 64,0581 | | | | $ | 576,523 | |
| | | | | |
Micro Cap Value Fund | | | | | | | | | | | | | | | | | | | | | | | | | | | | | | | | | | | | | | | | | | | | | | | | | | |
Common Stocks | | | $ | 20,211 | | | | $ | — | | | | $ | — | | | | $ | — | | | | $ | — | | | | $ | — | | | | $ | — | | | | $ | — | | | | $ | 20,211 | | | | $ | — | |
Preferred Stocks | | | | 1,956,197 | | | | | 29,534 | | | | | — | | | | | — | | | | | — | | | | | 12,703 | | | | | — | | | | | — | | | | | 1,998,434 | | | | | 12,703 | |
Warrants | | | | 28,900 | | | | | — | | | | | 79,198 | | | | | — | | | | | (195,484 | ) | | | | 245,782 | | | | | — | | | | | — | | | | | — | | | | | (2,500 | ) |
Rights | | | | 391,628 | | | | | — | | | | | — | | | | | — | | | | | — | | | | | (391,628 | ) | | | | — | | | | | — | | | | | — | | | | | — | |
| | | | | |
| | | $ | 2,396,936 | | | | $ | 29,534 | | | | $ | 79,198 | | | | $ | — | | | | $ | (195,484 | ) | | | $ | (133,143 | ) | | | $ | — | | | | $ | — | | | | $ | 2,018,645 | | | | $ | 10,203 | |
| | | | | |
Small Cap Growth Fund | | | | | | | | | | | | | | | | | | | | | | | | | | | | | | | | | | | | | | | | | | | | | | | | | | |
Common Stocks | | | $ | 16,980,008 | | | | $ | — | | | | $ | — | | | | $ | — | | | | $ | — | | | | $ | — | | | | $ | — | | | | $ | 16,980,008 | | | | $ | — | | | | $ | — | |
Preferred Stocks | | | | 11,141,900 | | | | | — | | | | | — | | | | | — | | | | | — | | | | | (2,267,924 | ) | | | | — | | | | | — | | | | | 8,873,976 | | | | | (2,267,924 | ) |
Limited Partnership Interest | | | | 2,552,478 | | | | | — | | | | | — | | | | | — | | | | | — | | | | | (1,196,304 | ) | | | | — | | | | | — | | | | | 1,356,174 | | | | | (1,196,304 | ) |
Seller’s Note | | | | 1,728,000 | | | | | — | | | | | 1,728,000 | | | | | 363,859 | | | | | — | | | | | (363,859 | ) | | | | — | | | | | — | | | | | — | | | | | — | |
| | | | | |
| | | $ | 32,402,386 | | | | $ | — | | | | $ | 1,728,000 | | | | $ | 363,859 | | | | $ | — | | | | $ | (3,828,087 | ) | | | $ | — | | | | $ | 16,980,008 | | | | $ | 10,230,150 | | | | $ | (3,464,228 | ) |
| | | | | |
Ultra Growth Fund | | | | | | | | | | | | | | | | | | | | | | | | | | | | | | | | | | | | | | | | | | | | | | | | | | |
Common Stocks | | | $ | 3,820,500 | | | | $ | — | | | | $ | — | | | | $ | — | | | | $ | — | | | | $ | — | | | | $ | — | | | | $ | 3,820,500 | | | | $ | — | | | | $ | — | |
Preferred Stocks | | | | 377,919 | | | | | — | | | | | — | | | | | — | | | | | — | | | | | (249,318 | ) | | | | — | | | | | — | | | | | 128,601 | | | | | (249,318 | ) |
Limited Partnership Interest | | | | 2,391,055 | | | | | — | | | | | — | | | | | — | | | | | — | | | | | (1,116,233 | ) | | | | — | | | | | — | | | | | 1,274,822 | | | | | (1,116,233 | ) |
Warrants | | | | — | | | | | 79,620 | | | | | — | | | | | — | | | | | — | | | | | 716,580 | | | | | — | | | | | — | | | | | 796,200 | | | | | 716,580 | |
Seller’s Note | | | | 132,000 | | | | | — | | | | | 132,000 | | | | | 28,207 | | | | | — | | | | | (28,207 | ) | | | | — | | | | | — | | | | | — | | | | | — | |
| | | | | |
| | | $ | 6,721,474 | | | | $ | 79,620 | | | | $ | 132,000 | | | | $ | 28,207 | | | | $ | — | | | | $ | (677,178 | ) | | | $ | — | | | | $ | 3,820,500 | | | | $ | 2,199,623 | | | | $ | (648,971 | ) |
| | | | | |
QUANTITATIVE INFORMATION ABOUT LEVEL 3 FAIR VALUE MEASUREMENTS
| | | | | | | | | | | | | | |
| Fund | | Description | | Fair Value at 3/31/2020 | | | Valuation Technique | | Unobservable Input | | Range
(Average) | |
International Growth Fund | | Common Stock:Internet & Direct Marketing Retail | | $ | 1,989,141 | | | Discount to last trade | | Discount to last trade | | | 50% | |
International Opportunities Fund | | Common Stock: Internet & Direct Marketing Retail | | $ | 1,275,383 | | | Discount to last trade | | Discount to last trade | | | 50% | |
Micro Cap Fund | | Warrants: Biotechnology | | $ | 640,581 | | | Black Scholes | | Black Scholes | | | 100% | |
Micro Cap Value Fund | | Convertible Preferred Stocks: Oil & Gas Refining & Marketing | | $ | 1,998,434 | | | Bond model with
call option | | Bond model with
call option | | | 100% | |
Small Cap Growth Fund | | Direct Venture Capital Investments: Biotechnology | | $ | 514,401 | | | Market comparable
companies | | EV/R* multiple
Discount for lack
of marketability | |
| 0.7 - 22.3 (6.4)
20% |
|
121
| | |
| WASATCH FUNDS | | MARCH 31, 2020 (UNAUDITED) |
|
|
|
Notes to Financial Statements (continued)
| | | | | | | | | | | | | | |
| Fund | | Description | | Fair Value at 3/31/2020 | | | Valuation Technique | | Unobservable Input | | Range
(Average) | |
Small Cap Growth Fund | | Direct Venture Capital Investments: Systems Software | | $ | 8,359,575 | | | Market comparable
companies | | EV/R* multiple
Discount for lack
of marketability | |
| 1.3 - 19.1 (8.1)
20% |
|
Small Cap Growth Fund | | Limited Partnership Interest: Asset Management & Custody Banks | | $ | 1,356,174 | | | Discount to NAV | | Discount to NAV | | | 10% | |
Ultra Growth Fund | | Direct Venture Capital Investments: Biotechnology | | $ | 128,601 | | | Market comparable
companies | | EV/R* multiple
Discount for lack
of marketability | |
| 0.7 - 22.3 (6.4)
20% |
|
Ultra Growth Fund | | Warrants: Biotechnology | | $ | 796,200 | | | Black Scholes | | Black Scholes | | | 100% | |
Ultra Growth Fund | | Limited Partnership Interest: Asset Management & Custody Banks | | $ | 1,274,822 | | | Discount to NAV | | Discount to NAV | | | 10% | |
| * | Enterprise-Value-To-Revenue Multiple (“EV/R”) is a measure of the value of a stock that compares a company’s enterprise value to its revenue. |
Changes in EV/R multiples may change the fair value of an investment. Generally, a decrease in this multiple will result in a decrease in the fair value of an investment.
The Funds’ other Level 3 investments have been valued using observable inputs, unadjusted third-party transactions and quotations or unadjusted historical third party information. No unobservable inputs internally developed by the Funds have been applied to these investments, thus they have been excluded from the above table.
Other information is available in the Funds’ most recent Prospectus and Report to Shareholders. This information is available on the Funds’ website atwasatchglobal.com and on the Securities and Exchange Commission’s website atwww.sec.gov.
13. OFFSETTING
Each Fund is party to various netting arrangements. The Financial Accounting Standards Board (“FASB”) requires disclosure about certain netting arrangements and similar agreements to enable users of a Fund’s financial statements to evaluate the effect or potential effect of netting arrangements on the Fund’s financial position. The scope of the disclosure is limited to derivative instruments, repurchase agreements and reverse repurchase agreements, and securities borrowing and securities lending transactions.
The following tables present information about financial instruments that were subject to enforceable netting arrangements as of March 31, 2020:
REPURCHASE AGREEMENTS
| | | | | | | | | | | | | | | | | | | | | | |
| | | Gross Amounts Not Offset in the Statements of Assets and Liabilities |
| Fund | | Counterparty | | Gross Asset Amounts
Presented in Statements
of Assets and Liabilities | | Financial
Instrument | | Collateral
Received1 | | Net Amount
(not less
than 0) |
Core Growth Fund | | State Street Bank and Trust Co. | | | $ | 16,332,508 | | | | $ | — | | | | $ | (16,332,508 | ) | | | $ | — | |
Emerging India Fund | | State Street Bank and Trust Co. | | | | — | | | | | — | | | | | — | | | | | — | |
Emerging Markets Select Fund | | State Street Bank and Trust Co. | | | | — | | | | | — | | | | | — | | | | | — | |
Emerging Markets Small Cap Fund | | State Street Bank and Trust Co. | | | | 1,507,568 | | | | | — | | | | | (1,507,568 | ) | | | | — | |
Frontier Emerging Small Countries Fund | | State Street Bank and Trust Co. | | | | 621,965 | | | | | — | | | | | (621,965 | ) | | | | — | |
Global Opportunities Fund | | State Street Bank and Trust Co. | | | | 1,146,292 | | | | | — | | | | | (1,146,292 | ) | | | | — | |
Global Select Fund | | State Street Bank and Trust Co. | | | | — | | | | | — | | | | | — | | | | | — | |
Global Value Fund | | State Street Bank and Trust Co. | | | | 1,719,483 | | | | | — | | | | | (1,719,483 | ) | | | | — | |
International Growth Fund | | State Street Bank and Trust Co. | | | | 15,256,660 | | | | | — | | | | | (15,256,660 | ) | | | | — | |
International Opportunities Fund | | State Street Bank and Trust Co. | | | | 14,461,322 | | | | | — | | | | | (14,461,322 | ) | | | | — | |
International Select Fund | | State Street Bank and Trust Co. | | | | — | | | | | — | | | | | — | | | | | — | |
Micro Cap Fund | | State Street Bank and Trust Co. | | | | 3,323,503 | | | | | — | | | | | (3,323,503 | ) | | | | — | |
Micro Cap Value Fund | | State Street Bank and Trust Co. | | | | 5,798,515 | | | | | — | | | | | (5,798,515 | ) | | | | — | |
Small Cap Growth Fund | | State Street Bank and Trust Co. | | | | 19,057,062 | | | | | — | | | | | (19,057,062 | ) | | | | — | |
Small Cap Value Fund | | State Street Bank and Trust Co. | | | | 2,554,797 | | | | | — | | | | | (2,554,797 | ) | | | | — | |
Ultra Growth Fund | | State Street Bank and Trust Co. | | | | 24,090,965 | | | | | — | | | | | (24,090,965 | ) | | | | — | |
Wasatch-Hoisington U.S. Treasury Fund | | State Street Bank and Trust Co. | | | | 7,018,524 | | | | | — | | | | | (7,018,524 | ) | | | | — | |
| 1 | Repurchase agreements are classified as short-term investments in the Statements of Assets and Liabilities. The market value of the collateral received is greater than the amounts indicated in the table. For further information, see Note 3 — Securities and Other Investments “Repurchase Agreements” and the Schedules of Investments. |
14. SUBSEQUENT EVENTS
Management has evaluated the possibility of subsequent events and has determined that there are no additional events that would require adjustment to or additional disclosure in the Funds’ financial statements.
122
| | |
| WASATCH FUNDS | | MARCH 31, 2020 (UNAUDITED) |
|
|
|
Supplemental Information
MANAGEMENTOFTHE TRUST
Management Information. The business affairs of Wasatch Funds are overseen by its Board of Trustees. The Board consists of five Independent Trustees. Each of the Independent Trustees except Mr. Robinson were elected by shareholders to serve until their successors are qualified, appointed or elected in accordance with the Trust’s Declaration of Trust andBy-Laws.
The Trustees and executive officers of Wasatch Funds and their principal occupations for at least the last five years are set forth below. The Advisor retains proprietary rights to the Trust name.The Funds’ Statement of Additional Information includes additional information about the Trustees and is available, without charge, online atwasatchglobal.com or upon request by calling Wasatch Funds at800.551.1700.
| | | | | | | | | | | | |
Name, Address
and Age | | Position(s)
Held with
Wasatch Funds | | Term of Office1
and Length of
Time Served | | Principal Occupation(s)
during Past 5 Years | | Number of
Portfolios
in Fund
Complex
Overseen
by Trustee | | | Other Directorships
Held by Trustees
during Past 5 Years2 |
Independent Trustees | | | | | | | | | | | | |
| | | | | |
Miriam M. Allison 505 Wakara Way 3rd Floor Salt Lake City, UT 84108 Age 72 | | Trustee and Chair of the Board | | Indefinite
Served as
Trustee since 2010 | | Rancher since 2004. Chairman of UMB Fund Services, Inc. from 2001 to 2005. | | | 17 | | | Director, Northwestern Mutual Series Fund, Inc. (27 portfolios) since 2006. |
| | | | | |
James U. Jensen, J.D., MBA 505 Wakara Way 3rd Floor Salt Lake City, UT 84108 Age 75 | | Trustee and former Chair of the Board | | Indefinite
Served as
Chair of the Board from 2004 to 2019 and Trustee since 1986 | | Chief Executive Officer of Clearwater Law & Governance Group (an operating law firm board governance consulting company) April 2008 to present; Vice President, Corporate Development, Legal Affairs and General Counsel, and Secretary, NPS Pharmaceuticals, Inc. from 1991 to 2004. | | | 17 | | | Director and Board Chairman of Agricon Global Corp. (formerly known as Bayhill Capital Corp. (telephone communications) from December 2007 to February 2014. Trustee, Northern Lights Fund Trust III (38 portfolios) since 2012. |
| | | | | |
Heikki Rinne, MBA, Ph.D. 505 Wakara Way 3rd Floor Salt Lake City, UT 84108 Age 68 | | Trustee and Chair of the Governance and Nominating Committee | | Indefinite
Served as
Trustee since October 2012 | | Chief Executive Officer of the Halton Group Ltd. (an indoor environmental control manufacturing and technology company) from 2002 to 2016. A Founder and Principal Owner of Sitoumus LLC (a training and consulting firm focusing on empowering organizational and individual engagement as well as general consulting) from January 2017 to present. | | | 17 | | | Director, Halton Group Ltd 2016-2019. |
| | | | | |
Kristen M. Fletcher 505 Wakara Way 3rd Floor Salt Lake City, UT 84108 Age 66 | | Trustee and Chair of the Audit Committee | | Indefinite
Served as
Trustee since October 2014 | | Director, Youth Sports Alliance since 2015. Trustee, Woodlands Commercial Bank (a/k/a Lehman Brothers Commercial Bank) from 2009 to 2012. Chairman and CEO, ABN AMRO, Inc. and U.S. Country Representative, ABN AMRO Bank, NV from 2002 to 2004. | | | 17 | | | Director, Youth Sports Alliance since 2015,. Trustee, Woodlands Commercial Bank (a/k/a Lehman Brothers Commercial Bank) from 2009 to 2012. DirectorEmeritus, Utah Symphony/Utah Opera since September 2017. Director, Utah Symphony/Utah Opera from 2005 to September 2017. |
| | | | | |
Mark Robinson3 505 Wakara Way 3rd Floor Salt Lake City, UT 84108 Age 61 | | Trustee | | Indefinite
Served as
Trustee since 2020 | | Chief Financial Officer of Truckstop.com LLC from 2016 to 2019. Chief Financial Officer of SABA Software, Inc. from 2013 to 2015. | | | 17 | | | Vita Vis Nutrition, Inc., Chairman from 2014 to 2016 |
|
|
| 1 | A Trustee may serve until his/her death, resignation, removal or retirement. Each Independent Trustee shall retire as Trustee at the end of the calendar year in which he/she attains the age of 75 years. The Board of Trustees reserves the right to permit continued service after the mandatory retirement age for any individual Trustee in its sole discretion. The Board has approved aone-year waiver from the mandatory retirement age for Mr. Jensen. |
| 2 | Directorships are those held by a Trustee in any company with a class of securities registered pursuant to Section 12 of the Securities Exchange Act of 1934 or subject to the requirements of Section 15(d) of the Securities Exchange Act or any company registered as an investment company under the 1940 Act. |
| 3 | Effective April 1, 2020, Mr. Robinson was appointed a Trustee of the Trust. |
123
Supplemental Information(continued)
| | | | | | |
Name, Address
and Age | | Position(s)
Held with
Trust | | Term of Office and
Length of Time Served | | Principal Occupation(s)
during Past 5 Years |
Officers | | | | | | |
| | | |
Eric S. Bergeson 505 Wakara Way 3rd Floor Salt Lake City, UT 84108 Age 53 | | President | | Indefinite Served as President since May 2018 | | President for Wasatch Funds since May 2018. President of the Advisor since January 2017. Vice President of Institutional Sales for the Advisor since June 1998. |
| | | |
Russell L. Biles 505 Wakara Way 3rd Floor Salt Lake City, UT 84108 Age 52 | | Chief Compliance Officer, Vice President and Secretary | | Indefinite Served as Chief Compliance Officer and Vice President since February 2007 and Secretary since November 2008 | | Chief Compliance Officer and Vice President for Wasatch Funds since February 2007. Secretary for Wasatch Funds since November 2008. Counsel for the Advisor since October 2006. |
| | | |
Michael K. Yeates 505 Wakara Way 3rd Floor Salt Lake City, UT 84108 Age 38 | | Treasurer | | Indefinite Served as Treasurer since May 2018 | | Treasurer for Wasatch Funds since May 2018. Chief Financial Officer of the Advisor since September 2007. |
| | | |
David Corbett 505 Wakara Way 3rd Floor Salt Lake City, UT 84108 Age 47 | | Assistant Vice President | | Indefinite Served as Assistant Vice President since August 2012 | | Assistant Vice President for Wasatch Funds since August 2012. Director of Mutual Fund Services for the Advisor since June 2007. |
| | | |
Cheryl Reich 505 Wakara Way 3rd Floor Salt Lake City, UT 84108 Age 36 | | Assistant Secretary | | Indefinite Served as Assistant Secretary since February 2017 | | Assistant Secretary for Wasatch Funds since February 2017. Compliance Associate for the Advisor since September 2012. |
| | | |
Kara H. Becker 505 Wakara Way 3rd Floor Salt Lake City, UT 84108 Age 36 | | Assistant Treasurer | | Indefinite Served as Assistant Treasurer since May 2018 | | Assistant Treasurer for Wasatch Funds since May 2018. Controller for the Advisor since January 2012. |
|
|
Additional information about the Funds’ trustees is provided in the Statement of Additional Information and is available without charge, upon request, by calling 800.551.1700.
124
| | |
| | MARCH 31, 2020 (UNAUDITED) |
|
|
|
ADDITIONAL TAX INFORMATION
The Funds hereby designate the following amounts or maximum amounts allowable as long term capital gain dividends for the purpose of the dividends paid deduction. The amounts designated here include the utilization of earnings and profits distributed to shareholders on the redemption of shares.
| | | | | |
| Fund | | Amount |
Core Growth Fund | | | $ | 172,135,583 | |
Emerging India Fund | | | | 15,619,790 | |
Emerging Markets Small Cap Fund | | | | 48,977,453 | |
Global Opportunities Fund | | | | 15,578,105 | |
Global Value Fund | | | | 23,053,698 | |
International Growth Fund | | | | 170,045,903 | |
International Opportunities Fund | | | | 11,299,512 | |
Micro Cap Fund | | | | 87,356,742 | |
Micro Cap Value Fund | | | | 26,820,661 | |
Small Cap Growth Fund | | | | 414,909,154 | |
Small Cap Value Fund | | | | 31,718,827 | |
Ultra Growth Fund | | | | 11,813,532 | |
For the fiscal year ended September 30, 2019, certain dividends paid by each Fund may be subject to a maximum tax rate of 20% as provided for by the Jobs and Growth Tax Relief Reconciliation Act of 2003. To the extent dividends are paid during calendar year 2019, complete information will be reported on shareholders’ 2019 Form1099-DIV.
The amount designated as qualified dividend income for the year ended September 30, 2019 will be at the highest amount permitted by law.
Corporate shareholders should note that for the year ended September 30, 2019, the percentage of the Funds’ investment income (i.e., net investment income plus short-term capital gains) that qualified for the corporate dividends received deductions was as follows:
| | | | | |
| Fund | | Percentage |
Global Value Fund | | | | 40 | % |
Ultra Growth Fund | | | | 3 | % |
The Wasatch Global Value Fund has made an election under Internal Revenue Code Section 853 to pass through foreign taxes paid by the Fund to its shareholders. For the year ended September 30, 2019, the total amount of foreign taxes paid that was passed through to its shareholders for information reporting purposes was $413,005.
PROXY VOTING POLICIES, PROCEDURESAND RECORD
A description of the policies and procedures that the Advisor. uses to vote proxies related to the Funds’ portfolio securities is set forth in the Funds’ Statement of Additional Information, which is available without charge, upon request, on the Funds’ website atwasatchglobal.comor by calling800.551.1700and on the Securities and Exchange Commission’s (SEC) website atwww.sec.gov.
Wasatch Funds’ proxy voting record is available without charge on the Funds’ website atwasatchglobal.comand on the SEC’s website atwww.sec.govno later than August 31 for the prior 12 months ended June 30.
QUARTERLY PORTFOLIO HOLDINGS DISCLOSUREON FORMN-PORT
The Funds file their complete schedules of investments with the SEC for their first and third quarters of each fiscal year on FormN-PORT. The Funds’ FormN-PORT filings are available on the SEC’s website atwww.sec.gov,and may be reviewed and copied at the SEC’s Public Reference Room in Washington, D.C. (information on the operation of the Public Reference room may be obtained by calling800.SEC.0330).
125
Supplemental Information(continued)
BOARD CONSIDERATIONSFOR ADVISORYAND SUB-ADVISORY AGREEMENTSOFTHE WASATCH FUNDS
I. Board Considerations for the renewal of Advisory andSub-Advisory Agreements of the Wasatch Funds, except the Wasatch Global Select Fund and Wasatch International Select Fund which are discussed in Section II below.
At a meeting held on November 12, 2019 (the “Meeting”), the Board of Trustees (the “Board”) of Wasatch Funds Trust (the “Trust”), including the disinterested Trustees (hereafter, the “Independent Trustees”), unanimously approved the Advisory and Service Contract (the “Advisory Agreement”) between the Trust Wasatch Global Investors, Inc. (the “Advisor”) on behalf of each series of the Trust other than the Wasatch Global Select Fund and Wasatch International Select Fund (for purposes of this Section I, each a “Fund”) and thesub-advisory agreement (the“Sub-Advisory Agreement”) between the Advisor and Hoisington Investment Management Company (“HIMCo” or the“Sub-Advisor”) on behalf of the Wasatch-Hoisington U.S. Treasury Fund (the “U.S. Treasury Fund”). The Advisory Agreement andSub-Advisory Agreement are collectively the “Advisory Agreements.”
The Board, including the Independent Trustees, is responsible for overseeing the management of the Funds and as such, the Board determines each year as required by law whether to continue the Advisory Agreement with the Advisor on behalf of each Fund, and theSub-Advisory Agreement with HIMCo on behalf of the U.S. Treasury Fund. In preparation for their review of the Advisory Agreements, the Independent Trustees requested through independent legal counsel and received extensive materials specifically prepared for the annual review of such agreements by the Advisor as well as certain materials provided by Broadridge Financial Solutions, Inc. (“Broadridge”), an independent provider of investment company data. The materials covered a breadth of subject matters including, among other things, an overview of the organization of the Advisor and its culture; organization and leadership structure and investment process of the Advisor, including its investment risk management process; the nature, extent and quality of services performed pursuant to the Advisory Agreement; the experience of the relevant investment personnel; the performance of each Fund in absolute terms and as compared to the performance of peers compiled by Broadridge and benchmark(s); the brokerage policies and practices and commission results; the fees and expenses of each Fund and as compared to peers compiled by Broadridge; the expense caps provided by the Advisor on the expenses of the applicable classes of the Funds; and the profitability of the Advisor. With respect to theSub-Advisor, the materials also covered, among other things, an evaluation of theSub-Advisor by the Advisor; the organizational and leadership structure of theSub-Advisor; the services performed pursuant to theSub-Advisory Agreement; the experience of the relevant investment personnel; the performance of the U.S. Treasury Fund in absolute terms and as compared to the performance of peers compiled by Broadridge and a benchmark; the fees and expenses of the U.S. Treasury Fund and as compared to
peers compiled by Broadridge; and certain financial data regarding theSub-Advisor.
The information prepared specifically for the annual review of the Advisory andSub-Advisory Agreements supplemented the information provided to the Board and its committees throughout the year. The Board and its committees met regularly during the year and the information provided and topics discussed were relevant to the review of the Advisory Agreements. Some of these reports and other data included, among other things, materials that outlined the investment performance of the Funds with particular focus on Funds the Board considered to have had periods of challenged performance and the drivers underlying the performance; compliance, risk and liquidity management; valuation of securities; compliance with the respective Fund’s investment objectives and investment restrictions; Fund expenses; the execution of portfolio transactions; and overall market and regulatory developments. The Independent Trustees considered their review of Advisory Agreements to be an ongoing process and employed the accumulated information, knowledge and experience the Trustees had gained during their tenure on the Board governing the Funds and evaluating the Advisor andSub-Advisor.
The Independent Trustees were advised by independent legal counsel during the annual review process as well as throughout the year, including meeting in execution sessions with such counsel at which no representatives from the Advisor orSub-Advisor were present. In connection with their annual review, the Independent Trustees also received a memorandum from independent legal counsel outlining their fiduciary duties and legal standards in reviewing the Advisory Agreements.
In continuing their practice, the Independent Trustees met in executive session on October29-30, 2019 to consider and discuss, among other things, the services provided by the Advisor to the Funds and in comparison to other types of clients; the Funds’ performance in absolute terms and in comparison to the performance of other peers and benchmarks; the fees and expenses of each Fund in absolute terms and in comparison to peers and other clients of the Advisor; the profitability of the Advisor from its relationship with the Funds; any economies of scale achieved in managing the Funds, the profitability of the Advisor and any indirect benefits received by the Advisor as a result of its relationship with the Funds. The Independent Trustees also considered the renewal of theSub-Advisory Agreement on behalf of the U.S. Treasury Fund and reviewed, among other things, the services performed by theSub-Advisor; the performance of the U.S. Treasury Fund in absolute terms and in comparison to other peers and a benchmark; thesub-advisory fees; certain financial data of theSub-Advisor; any economies of scale; and any indirect benefits received by theSub-Advisor as a result of its relationship with the U.S. Treasury Fund. In their review, the Independent Trustees evaluated the advisory arrangements separately on aFund-by-Fund and per class basis. The Independent Trustees invited members of management of the Advisor to attend the executive session from time to time to respond to questions and provide additional information.
126
| | |
| | MARCH 31, 2020 (UNAUDITED) |
|
|
|
Following these discussions, the Independent Trustees requested through their independent counsel additional information, and the Advisor provided written and oral responses to this request.
At the Meeting, the Independent Trustees met, including in executive session without management present, to further consider, in relevant part, the renewal of the Advisory andSub-Advisory Agreements. The Independent Trustees had the benefit of independent legal counsel throughout the process. After the discussions and taking into account the accumulated knowledge and information the Trustees have received during their tenure in overseeing the Funds and the legal guidance provided by independent legal counsel, the Independent Trustees approved the renewal of the Advisory Agreement andSub-Advisory Agreement on behalf of the applicable Funds. The Independent Trustees’ consideration of the contractual fee arrangements for the Funds were the result of several years of review and discussion between the Independent Trustees and Fund management, and the Independent Trustees’ conclusions may be based, in part, on their consideration of the fee arrangements and other factors developed in prior years. The Independent Trustees did not identify any single factor asall-important or controlling, but rather the decision reflected the comprehensive consideration of all the information presented, and each Trustee may have attributed different weights to the various factors and information considered in the approval process. The following summarized the principal factors, but not all the factors, the Board considered in its review of the Advisory andSub-Advisory Agreements and its conclusions.
A. NATURE, EXTENTAND QUALITYOF SERVICES
In evaluating the renewal of the Advisory Agreements, the Board considered, in relevant part, the nature, extent and quality of the Advisor’s andSub-Advisor’s services to the Funds. The Board considered the comprehensive set of management, oversight and administrative services the Advisor provides to manage and operate the Funds in a highly regulated industry. The Independent Trustees recognized that the Advisor provides portfolio management services for the Funds (other than the U.S. Treasury Fund). In connection with providing these portfolio management services, the Board considered the Advisor’s investment philosophy and process, including its research-intensive screening process to identify investments, the methodology followed to construct portfolios, the principles and process followed to manage investment risk and the Advisor’s sell discipline. In seeking to assess the Advisor’s ability to continue to provide the various services, the Board further considered, among other things, the stability of the Advisor’s organization and its governance structure, the experience and tenure of the portfolio manager(s) and breadth of its research and trading teams, the compensation arrangements for investment personnel and whether they were sufficient to attract and retain qualified personnel and deter taking undue risks in portfolio management, the Advisor’s succession planning for both portfolio management and the firm’s management, the Advisor’s process to identify and address risks that it faces, the Advisor’s business continuity policies and procedures, the Advisor’s
culture and as described in further detail below, certain financial data of the Advisor, including its profitability.
The Independent Trustees also continue to seek to meet with the portfolio manager(s) of the various Funds during the year to discuss and keep updated on, among other things, the investment approach employed, any adjustments thereto, market conditions and investment performance. As noted below, the Independent Trustees also reviewed Fund performance in considering the Advisor’s investment management performance.
In addition to portfolio management services, the Board considered the wide range of administrative ornon-advisory services the Advisor provides to manage and operate the Funds (in addition to those provided by other third-parties). The Advisor oversees theday-to-day operations of the Funds including overseeing the service providers involved in the daily operations of the Funds. The Board recognized that many of thesenon-advisory services are unique to operating mutual funds and noted that the services included, but were not limited to, administrative services (such as providing the employees and officers necessary for the Funds’ operations); oversight services (such as coordinating and evaluating the services of the various third-party service providers, including theSub-Advisor, custodian, transfer agent and other intermediaries); board support and administration (such as overseeing the organization of the Board and committee
meetings and preparing or overseeing the timely preparation of various materials and/or presentations for such meetings); shareholder communications (such as overseeing the preparation of annual and semi-annual and other periodic shareholder reports); tax administration; Fund regulatory and other administrative services (such as overseeing the preparation of the Fund’s registration statements and other required regulatory filings, including applicable foreign registration requirements; overseeing the valuation of portfolio securities and daily pricing; reviewing and certifying the Funds’ financial statements; overseeing the Funds’ distributions; and analyzing trade execution including monitoring and evaluating cross-trades [if any]); and compliance services (such as helping to maintain and update the Funds’ compliance program and related policies and procedures as necessary or appropriate to meet new regulatory requirements and reviewing such program annually; helping to ensure each Fund complies with its portfolio limitations and restrictions; voting proxies on behalf of the Funds; monitoring the liquidity of the portfolios; providing compliance training for personnel; and evaluating the compliance programs of the Funds’ service providers).
In addition to the services provided by the Advisor, the Independent Trustees also considered the risks borne by the Advisor in managing the Funds, including various material entrepreneurial, reputational and regulatory risks.
With respect to the U.S. Treasury Fund, the Board recognized that the Fund utilizes aSub-Advisor and therefore evaluated the renewal of theSub-Advisory Agreement. With respect to such Fund, the Board considered the division of responsibilities between the Advisor andSub-Advisor and recognized that theSub-Advisor and its investment personnel are responsible for the management of the portfolio of the
127
Supplemental Information(continued)
U.S. Treasury Fund but are not expected to provide the other significant administrative services to the Fund such as those provided by the Advisor. The Board noted that the Advisor oversees and evaluates theSub-Advisor with respect to the latter’s portfolio management of the Fund and considered the Advisor’s evaluation of theSub-Advisor. The Independent Trustees considered the background and experience of the investment personnel of theSub-Advisor and the performance history of the U.S. Treasury Fund. Similarly, in seeking to help ensure the continuity of the services of theSub-Advisor, the Independent Trustees considered, among other things, the history and experience of theSub-Advisor as a registered investment advisor and as aSub-Advisor to the Fund; the stability, organizational structure, tenure of portfolio managers and compensation arrangements of theSub-Advisor; theSub-Advisor’s disaster recovery plans and process; its compliance program, including its regulatory history; and certain financial data of theSub-Advisor as described in further detail below. The Board noted that the Advisor recommended the renewal of theSub-Advisory Agreement.
Based on their review, the Independent Trustees found that, overall, the nature, extent and quality of services provided under the Advisory Agreement and theSub-Advisory Agreement were satisfactory on behalf of each applicable Fund.
B. THE INVESTMENT PERFORMANCEOFTHE FUNDS
In evaluating the quality of the services provided by the Advisor andSub-Advisor, the Board also received and considered the investment performance of the Fund(s) they advise. In this regard, the Board received and reviewed a report (the “Broadridge Report”) prepared by Broadridge which generally provided a Fund’s performance data for theone-,two-,three-, four-, five- and10-year periods ended August 31, 2019 (or for the periods available for Funds that did not exist for part of the foregoing timeframe) on an absolute basis and as compared to the performance of unaffiliated funds with similar investment objectives or classifications (a “Broadridge Peer Universe”), to a more focused subset of peers (a “Broadridge Peer Group”) and a benchmark provided by Broadridge for the prescribed periods (subject to certain exceptions). The Board was provided with information describing the methodology Broadridge used to create the Broadridge Peer Group and Broadridge Peer Universe.
In addition to the Broadridge Report, the Independent Trustees also reviewed materials reflecting, among other things, the respective Fund’s historic performance for the quarter,one-, three-, five- and10-year periods ended September 30, 2019 (or for the periods available for Funds that did not exist for part of the foregoing time frame), and annual returns from 2009 through 2018 (or for the calendar years available for Funds that did not exist for part of the foregoing time frame) in absolute terms and as compared to the Fund’s respective benchmark(s) as described below.
The Board also considered information reflecting a Fund’s peer ranking in its respective Morningstar investment category and any Morningstar ratings on the applicable Fund. The Independent Trustees further received analyst reports provided by an unaffiliated party for the following Funds: the
Core Growth Fund, the International Opportunities Fund, the Small Cap Growth Fund and the U.S. Treasury Fund. The Independent Trusts also reviewed the performance of the following Funds (the Core Growth Fund, the Emerging India Fund, the Emerging Markets Select Fund, the Emerging Markets Small Cap Fund, the Frontier Emerging Small Countries Fund, the Global Opportunities Fund, the International Growth Fund, the International Opportunities Fund, the Micro Cap Fund, the Micro Cap Value Fund, the Small Cap Growth Fund, the Small Cap Value Fund and the Ultra Growth Fund), compared to the performance of certain composites of separate accounts for theone-, three-, five- and10-year periods ended September 30, 2019 (or for such shorter periods if the Funds a separate account composite did not exist for part of the foregoing timeframe).
The performance data prepared for the annual review of the Advisory andSub-Advisory Agreements supplements the performance data the Trustees received throughout the year as the Board regularly reviews and meets with portfolio manager(s) during the year to discuss, in relevant part, the performance of their respective Fund.
In evaluating performance, the Independent Trustees recognized certain limitations in assessing performance data which may impact the weight given to particular performance data, including the following:
| • | | The performance data reflects a snapshot in time as of a particular period (in this case, the periods ended August 31, 2019 and September 30, 2019) and a different performance period could generate significantly different results; |
| • | | Long-term performance can be adversely affected by even one period of significant underperformance so that a single investment decision or theme has the ability to disproportionately affect long-term performance; |
| • | | The investment experience of a particular shareholder in the Funds will vary depending on the shareholder’s particular investment period and the Fund’s performance during that period and the class held (if multiple classes are offered in a Fund); |
| • | | Although the performance data included in the Broadridge Report was based on the performance of the Investor Class shares of the Funds, the Board recognized that the Funds, except the U.S. Treasury Fund, also offer Institutional Class shares. The performance of another class of a Fund, however, should be substantially similar on a relative basis because the classes are invested in the same portfolio of securities and differences in performance between the classes could be principally attributed to the variation in the expenses of each class; and |
| • | | There may be difficulties in establishing appropriate peer groups and benchmarks for certain Funds. In this regard, the Independent Trustees considered that the Advisor andSub-Advisor are responsible for managing the respective Fund in accordance with its investment objectives, investment parameters and guidelines and peers and/or benchmarks may be following different objective(s), investment parameters and guidelines and risk tolerance levels which will lead to differing performance results and may limit the value of the comparative performance data in assessing a particular Fund’s performance. The Independent |
128
| | |
| | MARCH 31, 2020 (UNAUDITED) |
|
|
|
| | | Trustees have recognized some limitations with the Broadridge Peer Group for the Micro Cap Fund and Micro Cap Value Fund (collectively, the “Micro Cap Funds”)as the respective Broadridge Peer Group generally focused on companies with a larger market capitalization than those sought by the Micro Cap Funds. As a result, the Independent Trustees also reviewed the Micro Cap Funds’ performance compared to a customno-load peer group provided by the Advisor for theone-, three-, five- and10-year periods ended September 30, 2019. |
| • | | The Independent Trustees recognized that in comparing the performance of certain Funds to the performance of separate account composites managed by the Advisor in similar styles, the differences in expenses and strategies between the Funds and separate accounts in the composites may limit some of the usefulness of the comparative data. |
Based on their review of the performance data, the Independent Trustees determined the following:
Core Growth Fund
With respect to the Core Growth Fund, the Fund’s Investor Class outperformed the median of the Broadridge Peer Group for theone-,two-, three-, four-, five- and 10-year periods ended August 31, 2019. The average annual total returns of the Fund’s Investor Class and Institutional Class also outperformed the Russell 2000® Index and Russell 2000 Growth Index for theone-, three-, five- and 10-year periods ended September 30, 2019. The Board considered that the Fund’s overall performance had been generally favorable.
Emerging India Fund
With respect to the Emerging India Fund, the Fund’s Investor Class outperformed the median of its Broadridge Peer Group in theone-,two-, three-, four- and five-year periods ended August 31, 2019. The average annual total returns of the Fund’s Investor Class and Institutional Class also outperformed the MSCI India Investable Market Index for theone-, three- and five-year periods ended September 30, 2019. The Board considered that the Fund’s performance had been generally favorable.
Emerging Markets Select Fund
With respect to the Emerging Markets Select Fund, the Independent Trustees noted that the Fund’s Investor Class outperformed the median of the Broadridge Peer Group for theone-,two-, three-, four- and five-year periods. Similarly, although the average annual total returns of the Fund’s Investor Class and Institutional Class underperformed the MSCI Emerging Markets Index over the five-year period ended September 30, 2019, each class outperformed such index for theone- and three-year periods ended September 30, 2019. The Board was satisfied with the Fund’s overall performance.
Emerging Markets Small Cap Fund
With respect to the Emerging Markets Small Cap Fund, the Independent Trustees noted that although the Fund’s Investor Class underperformed the median of its Broadridge
Peer Group for the three-, four- and five-year periods ended August 31, 2019, the Fund’s Investor Class outperformed the median of its Broadridge Peer Group for the more recentone- andtwo-year periods ended August 31, 2019. In addition, the average annual total returns of the Fund’s Investor Class and Institutional Class outperformed the MSCI Emerging Markets Small Cap Index for theone-, three-, five- and 10-year periods ended September 30, 2019. In addition, although the average annual total returns of the Investor Class and Institutional Class underperformed the MSCI Emerging Markets Index for the three- and five-year periods ended September 30, 2019, both classes outperformed such index for theone- and 10-year periods ended September 30, 2019. The Board noted that although the Fund had experienced periods of challenged performance, the Fund’s performance had improved in more recent years. Nevertheless, the Board noted the continued challenges of the emerging market asset class and determined to continue to monitor this Fund closely.
Frontier Emerging Small Countries Fund
With respect to the Frontier Emerging Small Countries Fund, the Independent Trustees noted that although the Fund has experienced periods of challenged performance with the Investor Class underperforming the median of its Broadridge Peer Group for the three-, four- and five-year periods ended August 31, 2019, the Fund’s performance improved with it outperforming the median of the Broadridge Peer Group for theone- andtwo-year periods ended August 31, 2019. Although the average annual total returns of the Fund’s Investor Class and Institutional Class underperformed the MSCI Frontier Emerging Markets Index and MSCI Frontier Markets Index for the three- and five-year periods ended September 30, 2019, both classes outperformed such indexes for theone-year period ended September 30, 2019. The Board recognized that the Fund had experienced periods of challenged performance over the years, the steps taken to address performance concerns, and the improved performance in recent years. Nevertheless, the Board would continue to monitor this Fund closely.
Global Opportunities Fund
With respect to the Global Opportunities Fund, the Independent Trustees noted that the Fund’s Investor Class outperformed the median of its Broadridge Peer Group for theone-,two-, three-, four- and five-year periods ended August 31, 2019 and matched the performance of the median of its Broadridge Peer Group for the 10-year period. Similarly, the average annual total returns of the Fund’s Investor Class and Institutional Class outperformed its benchmark, the MSCI AC (All Country) World Small Cap Index, for theone-, three-, five- and 10-year periods ended September 30, 2019. The Board determined that the Fund’s overall performance over time had been generally favorable.
Global Value Fund
With respect to the Global Value Fund, the Independent Trustees noted that although the Fund’s Investor Class underperformed the median of its Broadridge Peer Group
129
Supplemental Information(continued)
for the 10-year period ended August 31, 2019, the Fund’s Investor Class outperformed or matched the median of its Broadridge Peer Group for theone-,two-, three-, four-, and five-year periods ended August 31, 2019. The Board, however, noted the small number of peers comprising the Broadridge Expense Group limits some of the usefulness of the Broadridge comparative data. The Board also noted the Fund’s Investor Class and Institutional Class performance was below that of the MSCI All Country World Index for theone-, three-, five- and 10-year periods ended September 30, 2019. In reviewing the performance, the Independent Trustees recognized that the Board previously had approved a change in the principal investment strategies of the Fund to permit the Fund greater ability to invest in foreign securities becoming a global value fund effective October 31, 2017, and the past performance prior to such effective date would not reflect the foregoing change. Although the Fund previously had experienced periods of challenged performance, the Board recognized the steps the Advisor has taken to address performance issues and would continue to monitor this Fund closely.
International Growth Fund
With respect to the International Growth Fund, the Independent Trustees noted that although the Fund’s Investor Class underperformed the median of its Broadridge Peer Group in theone-, three- and four-year periods ended August 31, 2019, the class outperformed or matched the performance of the median in thetwo-, five- and 10-year periods ended August 31, 2019. The Independent Trustees further noted that although the average annual total returns of the Fund’s Investor Class and Institutional Class underperformed the benchmarks, the MSCI AC (All Country) World ex USA. Small Cap Index and MSCI World ex USA. Small Cap Index, for theone- and three-year periods ended September 30, 2019, both classes outperformed such indexes for the five- and 10-year periods. The Board recognized that the Fund had experienced some periods of challenged performance and the Board determined it would monitor this Fund closely.
International Opportunities Fund
With respect to the International Opportunities Fund, the Independent Trustees noted that the Fund’s Investor Class outperformed the median of its Broadridge Peer Group for theone-,two-, three-, four-, five- and 10-year periods ended August 31, 2019. Similarly, the Independent Trustees noted that the average annual total returns of the Fund’s Investor Class and Institutional Class outperformed the performance of its benchmarks the MSCI AC (All Country) World ex USA. Small Cap Index and MSCI World ex USA. Small Cap Index for theone-, three-, five- and 10-year periods ended September 30, 2019. The Board determined the Fund’s overall performance had been generally favorable.
Micro Cap Fund
With respect to the Micro Cap Fund, the Independent Trustees noted that the Fund’s Investor Class outperformed the median of its Broadridge Peer Group for theone-,two-,
three- four-, five- and 10-year periods ended August 31, 2019. In addition, the average annual total returns of the Fund’s Investor Class outperformed its benchmark, the Russell Microcap Index, for theone-, three-, five- and 10-year periods ended September 30, 2019. In considering the comparative data, the Independent Trustees have recognized that the Broadridge Peer Group may not adequately reflect the investment strategies and investable universe of the Fund limiting some of the value of the comparative data. Accordingly, the Independent Trustees also reviewed the Fund’s performance compared to a custom peer group provided by the Advisor for theone-, three-, five- and 10-year periods ended September 30, 2019. In considering the foregoing, the Board determined the Fund’s overall performance had been generally favorable.
Micro Cap Value Fund
With respect to the Micro Cap Value Fund, the Independent Trustees noted that although the Fund’s performance was below the performance of its Broadridge Peer Group for thetwo-year period ended August 31, 2019, the Fund’s Investor Class outperformed or matched the performance of the median of its Broadridge Peer Group for theone-,three-, four-, five-, and 10-year periods ended August 31, 2019. Similarly, the average annual total returns of the Fund’s Investor Class outperformed its benchmark, the Russell Microcap Index, for theone-, three-, five- and 10-year periods ended September 30, 2019. In considering the comparative data, as noted above with the Micro Cap Fund, the Independent Trustees recognized that Broadridge Peer Group may not adequately reflect the investment strategies and investable universe of the Fund thereby limiting some of the usefulness of the comparative data. Accordingly, the Independent Trustees also reviewed the Fund’s performance compared to a custom peer group provided by the Advisor for theone-, three-, five- and 10-year periods ended September 30, 2019. In considering the foregoing, the Board was satisfied with the Fund’s overall performance.
Small Cap Growth Fund
With respect to the Small Cap Growth Fund, the Independent Trustees noted that the Fund’s Investor Class outperformed the median of its Broadridge Peer Group for theone-,two-, three-, four-, five- and 10-year periods ended August 31, 2019. In addition, the average annual total returns of the Fund’s Investor Class and Institutional Class outperformed the Russell 2000 Growth Index and Russell 2000 Index for theone-, three-, five- and 10-year periods ended September 30, 2019. The Board was satisfied with the Fund’s overall performance.
Small Cap Value Fund
With respect to the Small Cap Value Fund, the Independent Trustees noted that the Fund’s Investor Class outperformed the median of its Broadridge Peer Group for theone-,two-, three-, four-, five- and 10-year periods ended August 31, 2019. In addition, the average annual total returns of the Fund’s Investor Class and Institutional Class outperformed the Russell 2000 Value Index and Russell 2000
130
| | |
| | MARCH 31, 2020 (UNAUDITED) |
|
|
|
Index for theone-, three-, five- and 10-year periods ended September 30, 2019. The Board determined the Fund’s performance had been generally favorable.
Ultra Growth Fund
With respect to the Ultra Growth Fund, the Independent Trustees noted that the Fund’s Investor Class outperformed the median of its Broadridge Peer Group for theone-,two-, three-, four-, five- and 10-year periods ended August 31, 2019. In addition, the average annual total returns of the Fund’s Investor Class outperformed the Russell 2000 Growth Index for theone-, three-, five- and 10-year periods ended September 30, 2019. In light of the foregoing, the Board determined the Fund’s overall performance had been generally favorable.
U.S. Treasury Fund
With respect to the U.S. Treasury Fund, the Independent Trustees noted that the Fund’s Investor Class outperformed the median of its Broadridge Peer Group for theone-,two-, three-, four-, five- and 10-year periods ended August 31, 2019. Similarly, the average annual total returns of the Fund’s Investor Class outperformed its benchmark, the Bloomberg Barclays US Aggregate Bond Index, for theone-, three-, five- and 10-year periods ended September 30, 2019. The Board determined the Fund’s overall performance had been generally favorable.
C. FEES, EXPENSESAND PROFITABILITY
In its annual review, the Board considered the fees paid to the Advisor andSub-Advisor and the total operating expense ratio of each Fund before and after any expense cap undertaken by the Advisor to limit the respective Fund’s operating expenses to certain levels. More specifically, the Independent Trustees reviewed, among other things, the contractual management fee rate, the net management fee rate (i.e. the management fee after taking into account expense reimbursements and/or fee waivers, if any) and net total expense ratio of each class of the respective Fund in relation to those of a comparable universe of funds (the “Broadridge Expense Universe”) and to a more focused subset of comparable funds (the “Broadridge Expense Group”) established by Broadridge. The Board reviewed information regarding the methodology followed by Broadridge to develop the Broadridge Expense Universe and Broadridge Expense Group. The Board considered the net total expense ratio of each class of each Fund (expressed as a percentage of average net assets) as the expense ratio is more reflective of the investors’ net experience in a Fund as it directly reflects the costs of investing in a Fund.
In reviewing the comparative data provided by Broadridge, the Board recognized that differences between the applicable Fund and the peers comprising such Fund’s respective Broadridge Expense Universe or Broadridge Expense Group may limit some of the value of the comparative data, particularly with respect to the Micro Cap Fund and Micro Cap Value Fund. Given these limitations, the
Independent Trustees also reviewed comparisons of the Micro Cap Fund’s and Micro Cap Value Fund’s management fee and net expense ratio with those of a custom peer group provided by the Advisor. Aside from the comparative data provided by Broadridge, the Independent Trustees also considered comparative data between the fee rates charged by the Advisor andSub-Advisor to the Funds compared to other types of clients, as described in further detail below.
In addition to the comparative data, the Board considered the various factors the Advisor considered in proposing the management fee level for a Fund, including, among other things, the value of the potential service being provided (e.g., the expertise of the Advisor with the proposed strategy and the respective Fund’s potential to deliver alpha), the competitive marketplace (i.e., the uniqueness of the Fund and the fees of competitor funds) and the economics to the Advisor (e.g., the costs of operating the Fund and whether the capacity of the Fund was limited thereby limiting potential revenues). In evaluating fee levels, the Board also considered, among other things, the costs incurred in applying the Advisor’s research-intensive approach to stock selection, particularly for evaluating small ormicro-cap companies and foreign companies; the costs of maintaining quality and experienced portfolio managers and research staff; the loss of potential revenues that could have been earned on higher asset levels when the Advisor closes capacity-constrained Funds to maintain assets at a level necessary to protect performance to the benefit of shareholders; and the Advisor’s contractual commitment to cap the expenses of each of the classes of various Funds to certain levels to the benefit of shareholders and the expenses reimbursed or fees waived by the Advisor in the last three fiscal years. The Board also considered a Fund’s net management fee and net total expense ratio in light of its performance history.
In considering the fees of theSub-Advisor for the U.S. Treasury Fund, the Independent Trustees considered the fee rate paid to theSub-Advisor with respect to such Fund in absolute terms and as compared to theSub-Advisor’s pricing schedule for portfolio management services for other clients. The Independent Trustees also noted that the Advisor pays theSub-Advisor from its own revenues and not the Fund. Further, the Independent Trustees recognized that the Advisor andSub-Advisor are not affiliates and thesub-advisory fee was established through arm’s length negotiations between the Advisor and theSub-Advisor.
In its evaluation of the advisory andsub-advisory fees of the Funds, the Board observed, among other things, the following:
With respect to the Core Growth Fund, the Independent Trustees recognized that although the contractual management fee rate for the Investor Class and Institutional Class shares was above the median of its respective Broadridge Expense Group, the Fund had a net expense ratio that was slightly higher (within 5 basis points) than the median of its Broadridge Expense Group for the Investor Class shares and lower than the median of its Broadridge Expense Group for the Institutional Class shares. The Independent Trustees also noted, in part, the capacity constraints of this Fund, the experience and expertise of the Advisor with this strategy,
131
Supplemental Information(continued)
the costs of the research-intensive approach, and the potential for the Fund to deliver alpha. Based on its review, the Board determined that the advisory fee for the foregoing Fund was acceptable in light of the nature, extent and quality of services provided.
With respect to the Emerging India Fund, although the Fund’s contractual management fee rate for the Investor Class and Institutional Class shares was higher than the median of its Broadridge Expense Group, its net expense ratio was below the median of its Broadridge Expense Group for the Investor Class shares and the Institutional Class shares. The Independent Trustees also noted, in part, the capacity constraints of this Fund, the uniqueness of the Fund in the marketplace, the expertise of the Advisor in the small-cap asset class, and the additional expenses associated with evaluating and investing in companies in India. Based on its review, the Board determined that the advisory fee for the foregoing Fund was acceptable in light of the nature, extent and quality of services provided.
With respect to the Core Growth Fund, the Independent Trustees recognized that although the contractual management fee rate for the institutional and Investor Class shares was above the median of its respective Broadridge Expense Group, the Fund had a net expense ratio that was slightly higher (within 5 basis points) than the median of its Broadridge Expense Group for the Investor Class shares and lower than the median of its Broadridge Expense Group for the Institutional Class shares. The Independent Trustees also noted, in part, the capacity constraints of this Fund, the experience and expertise of the Advisor with this strategy, the costs of the research-intensive approach, and the potential for the Fund to deliver alpha. Based on its review, the Board determined that the advisory fee for the foregoing Fund was acceptable in light of the nature, extent and quality of services provided.
With respect to the Emerging Markets Small Cap Fund, the Independent Trustees noted that the Fund’s contractual management fee rate and net total expense ratio for the Investor Class shares and Institutional Class shares were above the median of its Broadridge Expense Group. The Independent Trustees also noted, in part, the capacity constraints of this Fund, the uniqueness of the Fund in the marketplace, and the additional expenses associated with evaluating and investing in companies dispersed among the various emerging market countries. Based on its review, the Board determined that the advisory fee for the foregoing Fund was acceptable in light of the nature, extent and quality of services provided.
With respect to the Frontier Emerging Small Countries Fund, the Independent Trustees noted that the contractual management fee rate was above the median of its Broadridge Expense Group for the Investor Class and Institutional Class shares. In addition, the Fund’s net expense ratio was above the median of its Broadridge Expense Group for the Investor Class shares but below the median for the Institutional Class shares. The Trustees further recognized, however, the management fee and expense cap on the classes of this Fund had been reduced in 2017. The Independent Trustees also noted, in part, the capacity constraints of this Fund, the uniqueness of the Fund in the marketplace, and the additional expenses
associated with evaluating and investing in companies dispersed among the various emerging-market and frontier-market countries. Based on its review, the Board determined that the advisory fee for the foregoing Fund was acceptable in light of the nature, extent and quality of services provided.
With respect to the Global Opportunities Fund, the Independent Trustees noted that although the contractual management fee rate of the Fund was above the median of its Broadridge Expense Group for the Investor Class shares and the Institutional Class shares, the Fund’s net expense ratio was slightly higher (within 5 basis points) of the median of its Broadridge Expense Group for the Investor Class shares and below the median for the Institutional Class shares. In addition, the Independent Trustees noted, in part, the uniqueness of the Fund in the marketplace and the capacity constraints of this Fund. Based on its review, the Board determined that the advisory fee for the foregoing Fund was acceptable in light of the nature, extent and quality of services provided.
With respect to the Global Value Fund, although the Independent Trustees noted that the contractual management fee rate was above (but within 10 basis points) of the median of its Broadridge Expense Group for the Investor Class shares and Institutional Class shares, the Fund’s net expense ratio was below the median of its Broadridge Expense Group for both share classes. In addition, the Independent Trustees recognized that the Fund generally had no capacity constraints given its investment strategies. Based on its review, the Board determined that the advisory fee for the foregoing Fund was acceptable in light of the nature, extent and quality of services provided.
With respect to the International Growth Fund, the Independent Trustees noted that although the Fund’s contractual management fee rate for the Investor Class shares and Institutional Class shares was above the median of its Broadridge Expense Group, its net expense ratio was below the median of the Broadridge Expense Group for both share classes. In addition, the Independent Trustees noted, in part, the capacity constraints of the Fund, the uniqueness of the strategy of the Fund, the ability to add value through its investment approach and the additional costs incurred in evaluating and investing in foreign companies. Based on its review, the Board determined that the advisory fee for the foregoing Fund was acceptable in light of the nature, extent and quality of services provided.
With respect to the International Opportunities Fund, the Independent Trustees noted that the Fund’s contractual management fee rate and net expense ratio were above the median of its Broadridge Expense Group for the Investor Class shares and Institutional Class shares. In addition, the Independent Trustees noted, in part, the capacity constraints of the Fund, the uniqueness of the strategy of the Fund, the ability to add value through its investment approach, and the additional costs incurred in evaluating and investing in foreign companies. Based on its review, the Board determined that the advisory fee for the foregoing Fund was acceptable in light of the nature, extent and quality of services provided.
With respect to the Micro Cap Fund and the Micro Cap Value Fund, the Independent Trustees noted that each
132
| | |
| | MARCH 31, 2020 (UNAUDITED) |
|
|
|
Fund’s contractual management fee rate and net expense ratio were above the median of its respective Broadridge Expense Group. In addition, the Independent Trustees noted, in part, the capacity constraints of the Funds, the uniqueness of the Funds and their potential to deliver alpha, the Advisor’s expertise in this asset category, and the amount of due diligence and the costs associated with applying the Advisor’s research-intensive approach to screen and research companies in themicro-cap asset class. Based on its review, the Board determined that the advisory fee for each of the foregoing Funds was acceptable in light of the nature, extent and quality of services provided.
With respect to the Small Cap Growth Fund, the Independent Trustees noted that the Fund’s contractual management fee rate was above the median of its Broadridge Expense Group for the Investor Class shares and Institutional Class shares and its net expense ratio was approximately the same as the median of its Broadridge Expense Group for the Investor Class shares and below the median for the Institutional Class shares. In addition, the Trustees noted, in part, the capacity constraints of the Fund, the potential to deliver alpha, the expertise of the Advisor with the strategy and the costs associated with applying the Advisor’s research-intensive approach to the small-cap asset class. Based on its review, the Board determined that the advisory fee for the foregoing Fund was acceptable in light of the nature, extent and quality of services provided.
With respect to the Small Cap Value Fund, the Independent Trustees noted that the Fund’s contractual management fee rate was above the median of its Broadridge Expense Group for the Investor Class shares and Institutional Class shares, and the net expense ratio of the Investor Class shares was above the median of its Broadridge Expense Group but below the median for the Institutional Class shares. In addition, the Trustees noted, in part, the capacity constraints of the Fund, the potential to deliver alpha, the expertise of the Advisor with the strategy and the costs associated with applying the Advisor’s research-intensive approach to the small-cap asset class. Based on its review, the Board determined that the advisory fee for the foregoing Fund was acceptable in light of the nature, extent and quality of services provided.
With respect to the Ultra Growth Fund, the Independent Trustees noted that the Fund’s contractual management fee rate for its Investor Class shares was above the respective median of the Broadridge Expense Group, but the net expense ratio was approximately the same as the median of this expense group. In addition, the Independent Trustees noted, in part, the capacity constraints of the Fund, the potential to deliver alpha, the Advisor’s expertise in the small cap asset class and the costs associated with applying the Advisor’s research-intensive approach to the small-cap asset class. Based on its review, the Board determined the advisory fees for the Fund were acceptable in light of the nature, extent and quality of services provided.
With respect to the U.S. Treasury Fund, the Independent Trustees noted that the Fund’s contractual management fee and the Fund’s net expense ratio were below the median of its Broadridge Expense Group for the Investor Class shares.
In addition, the Independent Trustees recognized that the Fund did not have any capacity constraints. Based on its review, the Board determined that the advisory fee for the foregoing Fund was acceptable in light of the nature, extent and quality of services provided. In addition to the advisory fee paid to the Advisor, the Board recognized that the Fund issub-advised and separately considered thesub-advisory fee rate paid to theSub-Advisor by the Advisor. The Board reviewed, among other things, theSub-Advisor’s fee rate for services to the Fund compared to theSub-Advisor’s pricing schedule for portfolio management services to other clients. With respect to the U.S. Treasury Fund, the Independent Trustees noted that thesub-advisory fee rate was in line with theSub-Advisor’s fee schedule in light of the asset size of the Fund. In addition, the Independent Trustees also recognized that the Advisor pays theSub-Advisor from its own revenues, and that the Advisor andSub-Advisor were not affiliated and therefore thesub-advisory fee had been established through arm’s length negotiations between the Advisor and theSub-Advisor. Based on its review, the Board determined that thesub-advisory fee for the U.S. Treasury Fund was acceptable in light of the nature, extent and quality of services provided.
| 2. | Fees Charged to Other Advisor andSub-Advisor Clients |
In determining the appropriateness of the fees, the Board also considered information regarding fee rates assessed by the Advisor to other types of clients and the type of services provided to these other clients, including separate accounts, unified managed accounts, model accounts, collective investment trusts and certain domestic and foreign funds outside the Wasatch family of funds for which the Advisor serves as a sub-advisor. The Independent Trustees reviewed, among other things, information regarding the fee rates of certain separate accounts and if multiple separate accounts existed with varying fee rates, the range of fees and the weighted average of such accounts that were managed in a style similar to that of certain Funds. Such Funds with comparative separate account data included the Core Growth Fund, Emerging India Fund, Emerging Markets Select Fund, Emerging Markets Small Cap Fund, Frontier Emerging Small Countries Fund, Global Opportunities Fund, Global Value Fund, International Growth Fund, Micro Cap Fund, Micro Cap Value Fund, Small Cap Growth Fund, Small Cap Value Fund and Ultra Growth Fund. The Independent Trustees further reviewed the changes (if any) of the management fees to the Funds compared to the weighted average fee rate for corresponding separate accounts in the last five years.
In considering the comparative fee data, the Board reviewed information reflecting the services the Advisor provided to the Funds compared to those provided to each other type of client. The Independent Trustees considered, among other things, that the different levels of services provided to the other types of clients, the differences in investment strategies and the differences in regulatory requirements all contribute to the variations in the fee schedules. The Independent Trustees noted that, in general, the Advisor seeks to charge higher fees to clients that require
133
Supplemental Information(continued)
a higher degree of service and recognized the breadth of services the Advisor provided to the Funds when it is principally responsible for all aspects of operating the Funds. While the Independent Trustees recognized that some services the Advisor provides to the Funds and other clients may be similar, such as security selection, research and trading, the Independent Trustees acknowledged the myriad of additional services required to support the operations of the Funds as summarized above. Such services included, among other things, certain administrative services, third party oversight, fund governance services, shareholder communications, tax administration and compliance and regulatory services. Further, while the Advisor may provide portfolio management services to both the Funds and other clients, the Independent Trustees noted the level of services, expertise and resources required may differ significantly between the Funds and other clients due to differences in investment strategies and parameters (such as the ability to invest in foreign securities or restricted securities). Aside from the services provided, the Independent Trustees also recognized the entrepreneurial, reputational and regulatory risk the Advisor incurs in managing the Funds. The Board determined that the varying levels of fees were justified given, among other things, the inherent differences in the products and level of services provided to the Funds versus other clients, the differing regulatory requirements and the entrepreneurial, reputational, and regulatory risks incurred in sponsoring and advising the Funds.
With respect to theSub-Advisor of the U.S. Treasury Fund, the Independent Trustees, as noted above, had reviewed thesub-advisory fee rate paid to theSub-Advisor compared to theSub-Advisor’s pricing schedule for portfolio management services for other clients. The Independent Trustees noted that the fee rate paid to theSub-Advisor for its services was in line with its respective pricing schedule. In addition, in their review of theSub-Advisor’s fee, the Independent Trustees recognized that the Advisor paid out of its own resources theSub-Advisor’s fee and given that theSub-Advisor is unaffiliated with the Advisor, thesub-advisory fee rate was the result of arms-length negotiations. As noted, the Board considered thesub-advisory fee to be acceptable in light of the nature, extent and quality of services provided.
| 3. | Profitability of the Fund Advisors |
In conjunction with their review of fees, the Independent Trustees reviewed information reflecting the Advisor’s financial condition. The Independent Trustees reviewed the consolidated financial statements of WA Holdings, Inc. (the parent of the Advisor) and its subsidiary (the Advisor) for the years ended December 31, 2018 and 2017. The Independent Trustees considered the factors contributing to the revenue and expense changes.
The Independent Trustees also reviewed the profitability information for the Advisor derived from its relationship with each Fund for the calendar year ended December 31, 2018 on an actual and adjusted basis. The Independent Trustees evaluated, among other things, the Advisor’s revenues, expenses and net income(pre-tax andafter-tax) and the net profit margins(pre-tax andafter-tax). The Independent Trustees
also reviewed the level of profitability realized by the Advisor including and excluding distribution expenses incurred by the Advisor from its own resources.
In its evaluation of profitability, the Independent Trustees reviewed the Advisor’s methodology used to allocate revenue and expenses for the purposes of calculating profitability per Fund. The Independent Trustees also recognized the difficulty in calculating profitability at the individual Fund level given that other reasonable allocation methodologies could be employed and lead to significantly different results. Further, the Independent Trustees recognized that employee compensation was the primary expense for the Advisor and as a privately held S corporation owned by employees, the Advisor’s level of profitability could be influenced, in part, by paying employees through compensation expense as opposed to dividends as shareholders. As a result, the Independent Trustees also reviewed the Advisor’s profitability data for 2018 with certain adjustments to the compensation expense to assist in the comparability of the Advisor’s profitability to certain industry peers. In this regard, the Independent Trustees received and reviewed comparative profitability data which included, among other things, the revenues, expenses and profit margin(pre-tax) of certain other public advisory firms in the industry which the Advisor considered to resemble its business model compared to the profitability data of the Advisor on an actual and compensation expense adjusted basis. The Trustees, however, recognized the inherent limitations of the comparative data of other publicly traded peers given that the calculation of profitability is rather subjective and numerous factors (such as types of funds, business mix, cost of capital, methodology to allocate expenses and other factors) can have a significant impact on the results. Based on the information presented and recognizing the above limitations, the Independent Trustees noted that the Advisor’s profitability (with and without the compensation adjustment) appeared reasonable when compared to the peer group of unaffiliated advisors. In addition to the comparative data, the Independent Trustees also considered in assessing profitability any indirect benefits (such as soft dollars) that the Advisor orSub-Advisor received that were directly attributable to the management of the applicable Funds as discussed in further detail below. Based on its review, the Board was satisfied that the Advisor’s level of profitability from its relationship with each Fund was not unreasonable in light of the services provided.
In addition to the Advisor’s profitability, the Independent Trustees reviewed information reflecting the financial condition of theSub-Advisor. Although profitability on a per account level was not available, the Trustees reviewed theSub-Advisor’s financial statements for the years ended December 31, 2018 and 2017. Based on its review, including theSub-Advisor’s fee schedule and the fact that thesub-advisory fee was established through arm’s length negotiations, the Board concluded that theSub-Advisor’s profitability from its relationship with the U.S. Treasury Fund was not unreasonable.
134
| | |
| | MARCH 31, 2020 (UNAUDITED) |
|
|
|
| D. | | ECONOMIES OF SCALE AND WHETHER FEE LEVELS REFLECT THESE ECONOMIES OF SCALE |
With respect to economies of scale, the Board considered information provided by the Advisor regarding the possible existence of economies of scale as a Fund’s assets grow and whether the Funds have appropriately benefited from such economies of scale. In its review, the Independent Trustees recognized that economies of scale are difficult to assess or quantify, particularly on aFund-by-Fund basis, and certain expenses may not decline with a rise in assets. The Independent Trustees further considered that economies of scale may be shared in various ways including breakpoints in the management fee schedule, fee waivers and/or expense limitations, or pricing of Funds at scale at inception. The Independent Trustees noted that the Advisor’s management fee schedule does not contain breakpoints. However, the Independent Trustees recognized that many of the Funds have capacity constraints, particularly those investing primarily in small andmicro-cap companies. In light of these constraints, the Advisor has periodically closed certain Funds to new investments to preserve the integrity of the respective Fund’s investment strategy and protect its performance which may not be able to be achieved at higher asset levels. While this practice may limit asset growth and thereby preclude certain economies of scale from being achieved, the Independent Trustees recognized the benefit of protecting performance for existing shareholders and maintaining assets at a level that the Advisor can effectively manage. The Independent Trustees further considered that the Advisor foregoes potential revenues that it may have earned on higher asset levels when it closes Funds to new investments. With respect to Funds without capacity constraints, the Independent Trustees recognized that breakpoints would be beneficial if the Fund’s assets were large enough to meet the breakpoint and noted the Advisor’s position that such Funds were not at asset levels that would benefit from breakpoints in the fee schedule. The Independent Trustees further considered that shareholders would benefit from the temporary expense limitation agreements that limit the overall net expense ratios on the respective classes of the Funds and which may be considered another means for sharing economies of scale.
Considering the factors above, the Independent Trustees concluded the absence of breakpoints in the management fee was acceptable and that any economies of scale that exist are adequately reflected in the Advisor’s fee structure.
E. INDIRECT BENEFITS
The Independent Trustees received and considered information regarding indirect benefits the Advisor andSub-Advisor may receive as a result of their relationship with the respective Fund(s). In this regard, with the exception of the U.S. Treasury Fund, the Independent Trustees recognized that the Advisor received benefits from soft dollar arrangements whereby the Advisor used a portion of the brokerage commissions paid by the Funds to acquire research that may be useful to the Advisor in managing the Funds and other clients. The Independent Trustees recognized that the Advisor’s profitability would be lower if it paid for such research with its own revenues. With respect to theSub-Advisor, the Independent Trustees recognized that
theSub-Advisor had not participated in soft dollar arrangements with respect to the U.S. Treasury Fund’s portfolio transactions. The Independent Trustees further considered the reputational and/or marketing benefits the Advisor andSub-Advisor may receive as a result of their association with the Funds. The Independent Trustees took these indirect benefits into account when accessing the level of advisory fees paid to the Advisor andsub-advisory fee to theSub-Advisor and concluded that the indirect benefits received were reasonable.
| F. | | ANNUAL APPROVALOF ADVISORYAND SUB-ADVISORY AGREEMENTS |
The Independent Trustees did not identify any single factor discussed previously asall-important or controlling. The Board, including a majority of Independent Trustees, concluded that the terms of the Advisory Agreement for each Fund and theSub-Advisory Agreement with theSub-Advisor on behalf of the U.S. Treasury Fund were fair and reasonable, that the Advisor’s andSub-Advisor’s fees were reasonable in light of the services provided to each respective Fund, and that the Advisory Agreement should be approved on behalf of each Fund and theSub-Advisory Agreement should be approved on behalf of the U.S. Treasury Fund.
| II. | Board Considerations for the renewal of Advisory Agreements of the Wasatch Global Select Fund and Wasatch International Select Fund |
At a meeting held on February 12, 2019 (the “February Meeting”), the Board of the Trust, including the Independent Trustees, unanimously approved the Advisory and Service Contract (each a “New Fund Advisory Agreement” and collectively, the “New Fund Advisory Agreements”) between the Trust Wasatch Global Investors, Inc. (i.e., the Advisor) on behalf of the Wasatch Global Select Fund (the “Global Select Fund”) and Wasatch International Select Fund (the “International Select Fund”), each a series of the Trust (the Global Select Fund and the International Select Fund are each a “New Fund”).
In connection with the evaluation of the New Fund Advisory Agreement on behalf of each New Fund, the Independent Trustees received materials and other information, in adequate time for careful review in advance of the February Meeting, which outlined, among other things:
| • | | The terms and conditions of the New Fund Advisory Agreements, including the nature, extent and quality of services provided to each New Fund by the Advisor. |
| • | | The organization of the Advisor, including the experience of persons who will manage each New Fund. |
| • | | Certain performance-related information (as described below). |
| • | | The proposed management fees of the Advisor, including comparisons of such fees with the management fees of comparable, unaffiliated funds prepared by an independent third party. |
| • | | The projected expenses of each New Fund, including comparisons with the expense ratios of comparable, unaffiliated funds compiled by Broadridge Financial Solutions, Inc. (i.e., Broadridge), an independent provider of investment company data. |
135
Supplemental Information(continued)
| • | | The profitability of the Advisor for advisory services. |
| • | | The soft dollar practices of the Advisor. |
During the previous day and earlier at the February Meeting, the Independent Trustees also met privately with their legal counsel to, among other things, consider the proposed New Funds and review the Board’s duties under the Investment Company Act of 1940, the general principles of state law in reviewing and approving advisory contracts, the standards used by courts in determining whether investment company boards of directors have fulfilled their duties, factors to be considered in voting on advisory contracts and an advisor’s fiduciary duty with respect to advisory agreements and compensation. With this background, the Independent Trustees considered the approval of the New Fund Advisory Agreements for each New Fund.
As outlined in more detail below, the Independent Trustees considered all factors they believed relevant with respect to each New Fund, including the following: (a) the nature, extent and quality of the services to be provided by the Advisor; (b) the investment performance of the Advisor (as described below); (c) the advisory fees and costs of the services to be provided and profits estimated to be realized by the Advisor and its affiliates; (d) the extent to which economies of scale may be realized as a New Fund grows; and (e) whether fee levels reflect any such economies of scale.
A. NATURE, EXTENTAND QUALITYOF SERVICES
The Independent Trustees considered the nature, extent and quality of services to be provided by the Advisor, including portfolio management services and administrative services, to the New Funds. Given that the Advisor already serves as advisor to other Wasatch Funds overseen by the Independent Trustees, the Board is familiar with and has a good understanding of the organization, operation, personnel and services of the Advisor. As the Independent Trustees meet regularly throughout the year to oversee the Wasatch Funds, the Independent Trustees have also relied upon their knowledge from their meetings and any other interactions throughout the years with the Advisor in evaluating the proposed New Fund Advisory Agreements.
At the February Meeting and/or at prior meetings, the Independent Trustees reviewed materials outlining, among other things, the Advisor’s organization and business; the types of services that the Advisor provides to the Wasatch Funds and is expected to provide to the New Funds; the experience and tenure of the portfolio managers for the New Funds; the Advisor’s research and trading capabilities; and the Advisor’s investment approach and philosophy. In addition to portfolio management services, the Independent Trustees recognized that the Wasatch Funds, including the New Funds, operate in a highly regulated industry and as such, considered the comprehensive set of administrative andnon-advisory services the Advisor provides to manage and operate the funds (in addition to those provided by third parties). As illustrative, these services included, but are not limited to, service provider oversight services, Board support and administration, shareholder communications, fund regulatory and other administration services and compliance services. In addition to the services to be provided by the Advisor, the
Independent Trustees considered the various costs and entrepreneurial, reputational and regulatory risks the Advisor incurs in launching and managing the New Funds in a highly regulated industry.
Based on their review, the Independent Trustees concluded that, overall, the nature, extent and quality of services expected to be provided to each New Fund under the New Fund Advisory Agreements were satisfactory.
B. INVESTMENT PERFORMANCE
Each New Fund had not commenced operations and, therefore, does not have its own performance history. The Independent Trustees, however, reviewed certain historical performance information related to certain proprietary accounts managed in the same styles as those proposed for the New Funds. In addition, the Independent Trustees are familiar with the performance records of other Wasatch funds advised by the Advisor.
C. FEES, EXPENSESAND PROFITABILITY
In evaluating the proposed management fees and expenses that the New Funds were expected to bear, the Independent Trustees considered, among other things, each New Fund’s proposed management fee and expected expense ratio in absolute terms and as compared with the fees and expenses of a peer group of comparable unaffiliated funds provided by an independent third party. The Independent Trustees reviewed, among other things, the contractual management fee rate, the estimated expense ratios of each class of the New Funds assuming different levels of assets under management, and the expense limitation expected to be provided by the Advisor on behalf of each class of each New Fund. The Independent Trustees also reviewed the contractual management fee, the net management fee (i.e., the management fee after taking into account expense reimbursements and/or fee waivers, if any), and the net total expense ratio of each class of each New Fund in relation to those of a comparable universe of funds (i.e., the Broadridge Expense Universe) and to a more focused subset of comparable funds (i.e., the Broadridge Expense Group) established by Broadridge. The Board observed that with respect to the Global Select Fund, the proposed contractual management fee rate was below the median of the Broadridge Expense Group for the Investor Class and the Institutional Class shares and the Fund’s estimated net expense ratio was below the median of its Broadridge Expense Group for the Institutional Class shares but slightly higher (within 5 basis points) for the Investor Class shares. With respect to the International Select Fund, the proposed contractual management fee rate was below the median of the Broadridge Expense Group for the Investor Class and Institutional Class shares and the estimated net expense ratio was below the median of its Broadridge Expense Group for Institutional Class shares but above the median for its Investor Class shares.
In addition to the foregoing fee and expense data, the Board considered the various factors that the Advisor considers in proposing a management fee level for a respective fund, including, among other things, the potential value of the service (such as the experience of the management team), the competitive marketplace (such as the uniqueness of the fund
136
| | |
| | MARCH 31, 2020 (UNAUDITED) |
|
|
|
and the fees of competitor funds) and the economics to the Advisor (such as, the costs to provide advisory services to the particular fund and the existence of any capacity constraints of the fund which may reduce the potential for revenues to the Advisor). In this regard, the Board is aware of the research-intensive approach followed by the Advisor and the related costs incurred of such approach. The Board further considered the Advisor’s contractual commitment to limit certain operating expenses of each of the classes of the New Funds to the benefit of shareholders and the rationale for the level of these expense caps. In addition, at the February Meeting and/or at prior meetings, the Board reviewed information regarding the fee rates that the Advisor assesses for certain other types of clients and the types of services provided to these other clients, including separately managed accounts, model accounts, collective investment trusts and certain domestic and foreign funds outside the Wasatch family of funds. The Independent Trustees recognized that the variation in fee rates between funds and other types of clients are generally due to, among other things, the extensive regulatory requirements associated with operating registered investment companies and the differences in investment parameters and strategies between the investment companies and the clients. The Independent Trustees, however, noted that the Advisor represented that it did not manage other funds or separately managed accounts in the same style as either of the New Funds as of the date of the February Meeting.
Based on their review, the Independent Board Members determined that each New Fund’s management fee to the Advisor was reasonable in light of the nature, extent and quality of services to be provided to the respective New Fund.
D. PROFITABILITY
In conjunction with its review of fees, at the February Meeting and/or at prior meetings, the Independent Trustees have considered the profitability of the Advisor for its advisory activities to the Wasatch Funds. The Independent Trustees reviewed the Advisor’s profitability margin for 2017 and 2018. In considering profitability, the Independent Trustees have recognized the difficulty and subjective nature of determining profitability which may be affected by numerous factors, including the allocation of expenses. In addition to reviewing the Advisor’s profitability, the Trustees also reviewed at the February Meeting or prior meetings the Advisor’s relative profitability compared to publicly available information concerning unaffiliated publicly traded investment managers. However, the Independent Trustees recognized the difficulties in comparing the profitability of various advisors given that, among other things, many of these managers are much larger than the Advisor, have different lines of business, may employ different expense allocations and charges, the profitability derived from individual funds or product lines is not generally publicly available and the profitability information of managers that is available may not be representative of the industry. The Independent Trustees also noted that the Advisor is privately held and is taxed as a Subchapter S corporation, thus certain expenses had to be attributed and/or estimated. The Independent Trustees also noted with respect to the New Funds, the costs of launching the New Funds and as a result of
their small asset base in early years, the Advisor anticipated reimbursing the New Funds for costs incurred in excess of the proposed expense caps. Based on their review, the Trustees were satisfied that the Advisor’s level of profitability was not unreasonable in light of the services to be provided.
E. ECONOMIESOF SCALE
The Independent Trustees considered whether the New Funds could be expected to benefit from any economies of scale. In reviewing compensation, the Independent Trustees noted that, similar to other Wasatch Funds the proposed advisory fee schedule for each New Fund did not contain breakpoints that reduce the fee rate on assets above specified levels. The Independent Trustees recognized that breakpoints may be one way for the benefits of any economies of scale to be shared with investors. In their review, the Independent Trustees recognized that economies of scale are difficult to assess or quantify, particularly on afund-by-fund basis. The Independent Trustees observed that economies of scale generally occur as assets grow. However, the Trustees considered that the New Funds had not commenced operations and will have small asset bases in the beginning and as a result, the Advisor generally must reimburse the New Funds in excess of their expense limits until they have gained sufficient assets to be self-sustaining. Considering the above, the Independent Trustees concluded that the absence of breakpoints in each New Fund’s advisory fee schedule was acceptable and that the economies that may exist as assets under management increase are adequately reflected in the Advisor’s fee structure.
F. INDIRECT BENEFITS
In evaluating fees, the Independent Trustees also considered any indirect benefits or profits the Advisor or its affiliates may receive as a result of its relationship with each New Fund. In this regard, the Independent Trustees recognized that the Advisor may receive benefits from soft dollar arrangements whereby the Advisor may use a portion of the brokerage commissions paid by the New Funds to acquire research that may be useful to the Advisor in managing the New Funds, the other Wasatch Funds other clients. The Independent Trustees have reviewed at the February Meeting and/or prior meetings information concerning the Advisor’s soft dollar arrangements, including its policies for allocating brokerage commissions in exchange for brokerage and research services. In light of their experience, the Independent Trustees are familiar with the Advisor’s soft dollar arrangements and recognize that the Advisor’s profitability may be lower if the Advisor was required to pay for this research with hard dollars.
G. CONCLUSION
The Independent Trustees did not identify any single factor discussed previously asall-important or controlling. The Independent Trustees concluded that the terms of the New Fund Advisory Agreements were fair and reasonable, that the Advisor’s fees are reasonable in light of the services expected to be provided to each New Fund, and that the New Fund Advisory Agreements should be approved.
137
| | |
| WASATCH FUNDS | | MARCH 31, 2020 (UNAUDITED) |
|
|
|
Service Providers
INVESTMENT ADVISOR
Wasatch Advisors, Inc.
505 Wakara Way, 3rd Floor
Salt Lake City, UT 84108
SUB-ADVISORFORTHE WASATCH-HOISINGTON U.S. TREASURY FUND
Hoisington Investment Management Co.
6836 Bee Caves Road
Building 2, Suite 100
Austin, TX 78746
ADMINISTRATORAND FUND ACCOUNTANT
State Street Bank and Trust Company
801 Pennsylvania Avenue
Kansas City, MO 64105
DISTRIBUTOR
ALPS Distributors, Inc.
1290 Broadway, Suite 1100
Denver, CO 80203
TRANSFER AGENT
UMB Fund Services, Inc.
235 West Galena Street
Milwaukee, WI 53212
CUSTODIAN
State Street Bank and Trust Company
801 Pennsylvania Avenue
Kansas City, MO 64105
LEGAL COUNSELTO WASATCH FUNDSANDINDEPENDENT TRUSTEES
Chapman and Cutler, LLP
111 West Monroe Street
Chicago, IL 60603
INDEPENDENT REGISTERED PUBLIC ACCOUNTING FIRM
PricewaterhouseCoopers LLP
1100 Walnut Street, Suite 1300
Kansas City, MO 64106
TELEPHONE
800.551.1700
M - F, 7:00 a.m. to 7:00 p.m. Central Time
Automated Line, 24 Hours
U.S. MAIL
Wasatch Funds
P.O. Box 2172
Milwaukee, WI 53201-2172
OVERNIGHT DELIVERY
Wasatch Funds
235 West Galena Street
Milwaukee, WI 53212
ONLINE
wasatchglobal.com
shareholderservice@wasatchfunds.com
138
WASATCHGLOBAL . COM ACTIVE MANAGEMENT FOR INEFFICIENT MARKETS SMALL CAP MICRO CAP INTERNATIONAL EMERGING MARKETS FRONTIER MARKETS GLOBAL
Not required.
| Item 3. | Audit Committee Financial Expert. |
Not required.
| Item 4. | Principal Accountant Fees and Services. |
Not required.
| Item 5. | Audit Committee of Listed Registrants. |
Not applicable.
| (a) | Schedule of Investments is included as a part of the report to shareholders filed under Item 1 of this FormN-CSR. |
| Item 7. | Disclosure of Proxy Voting Policies and Procedures forClosed-End Management Investment Companies. |
Not applicable.
| Item 8. | Portfolio Managers ofClosed-End Investment Companies. |
Not applicable.
| Item 9. | Purchases of Equity Securities byClosed-End Management Investment Company and Affiliated Purchasers. |
Not applicable.
| Item 10. | Submission of Matters to a Vote of Security Holders. |
There have been no material changes to the procedures by which shareholders may recommend nominees to the Registrant’s board of trustees, where those changes were implemented after the Registrant last provided disclosure in response to this item.
| Item 11. | Controls and Procedures. |
| (a) | The Registrant’s principal executive and principal financial officers have concluded that the Registrant’s disclosure controls and procedures (as defined in Rule30a-3(c) under the Investment Company Act of 1940, as amended (the “1940 Act”)) are effective, as of a date within 90 days of the filing date of this FormN-CSR based on their evaluation of these controls and procedures required by Rule30a-3(b) under the 1940 Act) and Rules13a-15(b) or15d-15(b) under the Securities Exchange Act of 1934). |
| (b) | There were no changes in the Registrant’s internal control over financial reporting (as defined in Rule30a-3(d) under the 1940 Act) that occurred during the period covered by this report that has materially affected, or is reasonably likely to materially affect, the Registrant’s internal control over financial reporting. |
| Item 12. | Disclosure of Securities Lending Activities forClosed-End Management Investment Companies. |
SIGNATURES
Pursuant to the requirements of the Securities Exchange Act of 1934 and the Investment Company Act of 1940, the Registrant has duly caused this report to be signed on its behalf by the undersigned, thereunto duly authorized.
| | |
| WASATCH FUNDS TRUST |
| |
| By: | | /s/ Eric S. Bergeson |
| | Eric S. Bergeson |
| | President (principal executive officer) of Wasatch Funds Trust |
| |
| Date: | | May 29, 2020 |
Pursuant to the requirements of the Securities Exchange Act of 1934 and the Investment Company Act of 1940, this report has been signed below by the following persons on behalf of the Registrant and in the capacities and on the dates indicated.
| | |
| |
| By: | | /s/ Eric S. Bergeson |
| | Eric S. Bergeson |
| | President (principal executive officer) of Wasatch Funds Trust |
| |
| Date: | | May 29, 2020 |
| | |
| |
| By: | | /s/ Michael K. Yeates |
| | Michael K. Yeates |
| | Treasurer (principal financial officer) of Wasatch Funds Trust |
| |
| Date: | | May 29, 2020 |