UNITED STATES
SECURITIES AND EXCHANGE COMMISSION
Washington, D.C. 20549
FORM N-CSR
CERTIFIED SHAREHOLDER REPORT OF REGISTERED
MANAGEMENT INVESTMENT COMPANIES
Investment Company Act file number: 811-04920
WASATCH FUNDS TRUST
(Exact name of registrant as specified in charter)
505 Wakara Way, 3rd Floor
Salt Lake City, UT 84108
(Address of principal executive offices)(Zip code)
| | |
| (Name and Address of Agent for Service) | | Copy to: |
| |
Eric S. Bergeson Wasatch Advisors, Inc. 505 Wakara Way, 3rd Floor Salt Lake City, UT 84108 | | Eric F. Fess, Esq. Chapman & Cutler LLP 320 S. Canal Street Chicago, IL 60606 |
Registrant’s telephone number, including area code: (801) 533-0777
Date of fiscal year end: September 30
Date of reporting period: March 31, 2022
Item 1. Report to Shareholders.
| (a) | A copy of the report transmitted to shareholders pursuant to Rule 30e-1 under the Investment Company Act of 1940 (the “1940 Act”) is filed herewith. |
WASATCHGLOBAL.COM MARCH 31, 2022 2022 Semi-Annual Report Fund Name Investor Class Institutional Class Wasatch Core Growth Fund WGROX WIGRX Wasatch Emerging India Fund WAINX WIINX Wasatch Emerging Markets Select Fund WAESX WIESX Wasatch Emerging Markets Small Cap Fund WAEMX WIEMX Wasatch Frontier Emerging Small Countries Fund WAFMX WIFMX Wasatch Global Opportunities Fund WAGOX WIGOX Wasatch Global Select Fund WAGSX WGGSX Wasatch Global Value Fund FMIEX WILCX Wasatch Greater China Fund WAGCX WGGCX Wasatch International Growth Fund WAIGX WIIGX Fund Name Investor Class Institutional Class Wasatch International Opportunities Fund WAIOX WIIOX Wasatch International Select Fund WAISX WGISX Wasatch Long/Short Alpha Fund WALSX WGLSX Wasatch Micro Cap Fund WMICX WGICX Wasatch Micro Cap Value Fund WAMVX WGMVX Wasatch Small Cap Growth Fund WAAEX WIAEX Wasatch Small Cap Value Fund WMCVX WICVX Wasatch Ultra Growth Fund WAMCX WGMCX Wasatch-Hoisington U.S. Treasury Fund WHOSX
Wasatch Funds
Salt Lake City, Utah
wasatchglobal.com
800.551.1700
This material must be accompanied or preceded by a prospectus.
Please read the prospectus carefully before you invest.
Wasatch Funds are distributed by ALPS Distributors, Inc.
1
| | |
Letter to Shareholders—“Button-Mashing” in Video Games . . . and Investing | | |
| | |

JB Taylor CEO and Portfolio Manager, Wasatch Global Investors | | DEAR FELLOW SHAREHOLDERS: In a frantic effort to compete against my teenage son in NBA 2K, I often resort to repeated random strikes on the video-game controller. Although I may score a sporadic victory, this is no way to win consistently. For those of you not familiar with video games, NBA 2K is one of the most popular sports titles on the market. This hyper-realistic basketball game is also my son’s favorite. While I’m a huge basketball fan, I’ve never been an avid video gamer. But that doesn’t stop my son from occasionally trash-talking me into accepting a challenge on the virtual basketball court. What’s amazing about today’s video games is how intricate and precise the controls are. Though I’m aware of how to execute basic offensive and defensive moves, my son can perform around-the-back dribbles, alley-oop dunks and pick-and-rolls. |
I haven’t spent enough time learning the game—and so often in the heat of battle, I just start frantically pressing buttons. Sometimes, this results in a spectacular but unintended and unrepeatable play for the old man. “You’re just button-mashing, Dad!” my son yells. Despite my button-mashing occasionally resulting in a strong run, I’ve yet to beat him in an entire game.
INDEXING, FACTOR INVESTING AND QUANTITATIVE TRADING
In trying to keep up with my son in NBA 2K, it occurred to me that something analogous has been happening in the world of investing. While trend-following among some investors has always been prevalent—and usually unsuccessful, in my view—the situation seems to have gotten worse. In other words, trend-following has morphed into the investing equivalent of “button-mashing.”
Moreover, I believe indexing, factor investing and quantitative trading have made button-mashing especially easy. Any investor can quickly find an exchange-traded fund (ETF) that matches an index or a set of predetermined factors. And the so-called “quants” can execute massive volumes of trades in an instant. As a result, the first quarter of 2022 was one of the most volatile quarters in the past 10 years. The mentality seems to be, just press the buttons because that’s what’s required to keep up.
GROWTH INVESTING AMID LOW INTEREST RATES AND A STAGNANT ECONOMY
From early 2017 through the latter part of 2021, interest rates were contained at a modest level and even trended lower for a while. During that time, growth investing was in favor largely because growth companies have their cash flows more heavily weighted in the future—and distant cash flows were viewed positively as long as rates stayed down.
Amid an intervening period that was the initial phase of the Covid-19 pandemic in the first quarter of 2020, most stocks—regardless of type—fell sharply. In the ensuing rally, however, growth companies were favored again not only due to low interest rates but also due to the perception that growth companies would be especially attractive in a stagnant, virus-ravaged economy. That’s when button-mashing started in earnest. Many investors wanted growth companies irrespective of priciness. The frenzy for growth continued through October 2021.
On November 3, the Federal Reserve (Fed) announced that it would begin to taper accommodative monetary policies because economic expansion and inflation were trending higher than previously anticipated.
VALUE INVESTING DURING AN UPTURN IN INTEREST RATES AND A SURGE IN INFLATION
For many years, inflationary pressures had been building. But monetary policy had remained loose—to a large extent for good reason, especially during the height of the pandemic. More recently, with the U.S. Consumer Price Index around a 40-year high, it became clear that the Fed was “behind the curve” and needed to accelerate the schedule for hiking interest rates.
So in late 2021 and early 2022, button-mashing moved away from growth companies and toward value names such as banks that were perceived to benefit from higher interest rates. With Russia’s invasion of Ukraine in February causing even greater fears of inflation, button-mashing rotated to a different segment of value—namely, energy companies.
Near the end of the first quarter of 2022, stocks generally moved higher and button-mashers seemed to have no clear favorites, at least for the time being.
WE REMAIN GROWTH INVESTORS
At Wasatch, we’ve never engaged in button-mashing. We’ve always been growth investors, and we don’t believe vacillating preferences for investment styles can be “timed.” Having said that, we do use short-term market volatility to pursue long-term advantages. For example, we trimmed overpriced information-technology holdings about a year ago—and we rounded up on what we saw as unfairly punished health-care names more recently.
As for the unnerving downturns that periodically occur in investing, we simply consider them to be inherent factors in the business we’ve chosen.
2
| | |
| | | MARCH 31, 2022 (Unaudited) |
A “PERFECT STORM”
Regarding the 2021–22 downturn, there’s another important point to consider. Many of the Wasatch funds underperformed their benchmarks during this decline. Historically, our funds have more often outperformed their benchmarks amid a downturn. We think the reason for the recent underperformance was a “perfect storm” of factors including: (1) value exceling relative to growth; (2) positive momentum faltering and trading activity becoming increasingly disconnected from company fundamentals; 3) corporate leverage working to investors’ advantage; and (4) procyclical asset-heavy companies gaining support.
We’ve already discussed issues related to value and growth. As for momentum, on average our stocks had positive price action coming into November 2021, but then that momentum faltered based on button-mashing. In terms of leverage, we typically avoid highly indebted companies in favor of those with healthy balance sheets. And procyclical companies usually have undifferentiated operating models—so even though these companies may benefit from commodity inflation, they typically don’t meet our criteria as long-duration growth businesses taking share in expanding markets.
While the recent storm clearly wasn’t conducive for our investment approach, our bottom-up research today indicates that most of our companies have been improving their competitive positions and have the potential to come out of this challenging period as even stronger market leaders.
WE HAVE INCREASED CONVICTION IN OUR HOLDINGS TODAY
Even before the perfect storm, we liked our holdings and considered them to be attractive investments for three to five years—and generally much longer. As a result, during the volatility, we weren’t shaken out of our well-researched positions.
We’re unlikely to be shaken out of a holding if the company has: (1) a large and growing addressable market; (2) a defensible competitive advantage; (3) a unique business model; and (4) an ability to consistently boost market share. Because we’re pleased with our current holdings based on these characteristics, we haven’t made many changes to our funds recently. In fact, with stock prices having come down and with the well-publicized gap between growth and value having narrowed, our conviction in our names has actually increased.
More specifically, we can report that our companies’ 2021 sales and earnings for the fourth quarter and for the full year mostly came in above expectations. Sales and earnings for the first quarter of 2022 hadn’t been released as of this writing. Going forward, we continue to expect double-digit sales growth overall because positive demand trends have shown no signs of abating. Earnings growth may be a bit weaker due to rising costs for labor and other inputs that can’t be immediately offset by charging higher prices.
Furthermore, while we have no forecast regarding when inflation will peak and begin to turn down, we note that such an inflection point has often marked the beginning of a favorable period for small caps.
WE MANAGE MACRO RISKS AT THE PORTFOLIO LEVEL
We make most of our investment calls on individual companies, but we don’t usually make calls on macro risks. This doesn’t mean macro risks are unimportant. It’s just that they generally don’t change our long-term views on company fundamentals. One of the ways we manage risk is by having, for example, only reasonable portfolio exposure to energy-sensitive companies like travel-related names. The same logic applies to interest-rate risk for banks, regulatory risk for health-care companies, etc.
As for the risks tied to supply chains and inflationary input costs, they’re high on our agenda when we speak with management teams. We want to understand where there could be long-term damage to a company’s competitive position. Similarly, although the war in Ukraine doesn’t seem to be a major factor for most of our holdings, we try to assess whether the war could cause permanent destruction to the worth of a business. After all, unlike volatility—which long-term, diversified investors frequently endure—a stock losing most or all of its value is much more impactful on a portfolio.
In closing, I’d like to assure you that we at Wasatch will never participate in button-mashing with investments we manage on your behalf. As for the next NBA 2K virtual face-off against my teenage son, I make no such assurances. Then again, maybe I’ll just lay down a challenge on a real basketball court. This seems like a better bet—as I still have about 90 pounds and 8 inches on him.
With sincere thanks for your continuing investment and for your trust,
JB Taylor
Information in this report regarding market or economic trends, or the factors influencing historical or future performance, reflects the opinions of management as of the date of this report. These statements should not be relied upon for any other purpose. Past performance is no guarantee of future results, and there is no guarantee that the market forecasts discussed will be realized.
Wasatch Advisors, Inc., doing business as Wasatch Global Investors, is the investment advisor to Wasatch Funds.
Wasatch Funds are distributed by ALPS Distributors, Inc. (ADI). ADI is not affiliated with Wasatch Global Investors.
Definitions of financial terms and index descriptions and disclosures begin on page 42.
3
| | |
| Wasatch Core Growth Fund (WGROX / WIGRX) | | MARCH 31, 2022 (Unaudited) |
Management Discussion
The Wasatch Core Growth Fund is managed by a team of Wasatch portfolio managers led by JB Taylor, Paul Lambert and Mike Valentine.
| | | | |
JB Taylor Lead Portfolio Manager | | 
Paul Lambert Portfolio Manager | | 
Mike Valentine Portfolio Manager |
OVERVIEW
During the first quarter of 2022, the benchmark Russell 2000® Index fell -7.53% while the Russell 2000 Growth Index declined -12.63%. Underperforming its benchmark, the Wasatch Core Growth Fund—Investor Class dropped -15.92%.
We think there were three main reasons for the Fund’s underperformance during the quarter. First, most of our stocks had strong gains over the preceding several years—so an eventual period of consolidation was to be expected. Second, the prospect of rising interest rates was perceived to be especially detrimental to growth companies whose earnings and cash flows are more heavily weighted further into the future. Third, the war in Ukraine boosted commodity prices and general inflationary pressures—but the Fund typically avoids undifferentiated energy and materials companies.
We’ve always focused on high-quality, long-duration growth companies. We make our investment calls on individual companies, not macro risks. This doesn’t mean macro risks are unimportant, but they generally don’t change our long-term views on company fundamentals.
DETAILS OF THE QUARTER
The greatest detractor from Fund performance for the first quarter was Trex Co., Inc.—a manufacturer of high-performance composite (non-wood) decking and accessories. The company has continued to take market share in composite decking and from traditional suppliers of wood products but faced headwinds during the quarter. Higher energy and logistics costs squeezed margins, and investors became nervous about companies like Trex that thrived during the pandemic when homebound Americans upgraded their living spaces. In addition, fears of rising interest rates disproportionately impacted higher-growth and housing-related companies. However, we believe the company’s leading position in its product category leaves Trex well-positioned to pass along future cost increases. Moreover, higher oil prices aren’t likely to significantly affect costs for the recycled plastic from which the company’s products are made. We continue to be impressed with the company’s strong cash flows.
Hamilton Lane, Inc., a traditional investment firm with approximately $850 billion in assets under management/supervision, was also a large detractor. The firm’s financial-
data platform, Global Evergreen, has seen promising growth. Hamilton Lane recently reported that the platform accounted for nearly $1.6 billion in assets under management in just over two years since its launch. The success of Global Evergreen is indicative of why we like Hamilton Lane. We expect this well-run firm will continue to expand quickly. But during the quarter, the stock pulled back on fears of higher interest rates and a temporarily deteriorating environment for raising assets.
The top contributor to Fund performance was HealthEquity, Inc., the largest U.S. non-bank custodian for health-savings accounts (HSAs). Account holders have online access to their HSAs and can compare treatment options, pay medical bills, and receive personalized benefit and clinical information. HealthEquity reported strong growth in its HSA business, with total HSA assets increasing 37% year-over-year and the number of HSAs on the company’s platform up 25% from a year ago. Management’s upwardly revised forecasts for revenues and earnings in the current fiscal year also cheered investors. We believe HealthEquity is largely insulated from supply-chain constraints and rising materials costs, and is well-situated for an environment of higher interest rates.
Another contributor was Holley, Inc., a maker of high-performance automotive parts for car and truck enthusiasts. The company’s loyal customer base, healthy margins and specialized product offerings have enabled it to pass along higher costs and better withstand the impacts of inflation. Investors reacted positively to Holley’s most recent round of acquisitions and the company’s latest earnings report confirmed its organic growth profile. Holley is a former special-purpose acquisition company (SPAC) whose stock was hurt by general concerns over SPACs because they usually issue warrants that can dilute shareholder ownership down the road. Whenever we invest in a former SPAC, we factor potential dilution into our analysis. Last year, we maintained our positive outlook for Holley and were rewarded in the first quarter of 2022.
OUTLOOK
Like investors everywhere, we at Wasatch engage in discussions about world-wide events. These discussions, however, rarely lead to specific views on the road ahead. Conversely, we can always explain our evaluations of individual companies. That’s why we usually confine our investment decisions to company fundamentals.
Because we’re pleased with our current holdings, we haven’t made many changes to the Fund’s portfolio recently. We think our companies, now tested by supply-chain disruptions and rising costs, may have made competitive inroads and are positioned for even better market-share gains. As always, our job is to find great long-duration growth companies selling at reasonable stock prices.
Thank you for the opportunity to manage your assets.
Current and future holdings are subject to risk.
4
| | |
| Wasatch Core Growth Fund (WGROX / WIGRX) | | MARCH 31, 2022 (Unaudited) |
Portfolio Summary
AVERAGE ANNUAL TOTAL RETURNS
| | | | | | | | | | | | | | | | | | | | |
| | | | |
| | | Six Months
(Not annualized) | | 1 Year | | 5 Years | | 10 Years |
| | | | |
Core Growth (WGROX) — Investor | | | | –11.12% | | | | | –3.62% | | | | | 16.32% | | | | | 14.23% | |
| | | | |
Core Growth (WIGRX) — Institutional | | | | –11.07% | | | | | –3.51% | | | | | 16.47% | | | | | 14.35% | |
| | | | |
Russell 2000® Index | | | | –5.55% | | | | | –5.79% | | | | | 9.74% | | | | | 11.04% | |
| | | | |
Russell 2000® Growth Index | | | | –12.62% | | | | | –14.33% | | | | | 10.33% | | | | | 11.21% | |
Data show past performance, which is not indicative of future performance. Current performance may be lower or higher than the performance quoted. To obtain the most recent month-end performance data available, please visit wasatchglobal.com. The Advisor may absorb certain Fund expenses, without which total returns would have been lower. Investment returns and principal value will fluctuate and shares, when redeemed, may be worth more or less than their original cost.
As of the January 31, 2022 prospectus, the Total Annual Fund Operating Expenses for the Wasatch Core Growth Fund are Investor Class: 1.17% / Institutional Class: 1.05%. The expense ratio shown elsewhere in this report may be different. Net expenses are based on Fund expenses, net of waivers and reimbursements. See the prospectus for additional information regarding Fund expenses.
Wasatch will deduct a 2.00% redemption fee on Fund shares held 60 days or less. Performance data do not reflect the deduction of fees, including sales charges, or the taxes you would pay on fund distributions or the redemption of fund shares. Fees and taxes, if reflected, would reduce the performance quoted. Wasatch does not charge any sales fees. For more complete information including charges, risks and expenses, read the prospectus carefully.
Performance for the Institutional Class prior to 1/31/2012 is based on the performance of the Investor Class. Performance of the Fund’s Institutional Class prior to 1/31/2012 uses the actual expenses of the Fund’s Investor Class without any adjustments. For any such period of time, the performance of the Fund’s Institutional Class would have been substantially similar to, yet higher than, the performance of the Fund’s Investor Class, because the shares of both classes are invested in the same portfolio of securities, but the classes bear different expenses.
Investing in small cap funds will be more volatile and loss of principal could be greater than investing in large cap or more diversified funds. Investing in foreign securities, especially in emerging markets, entails special risks, such as currency fluctuations and political uncertainties, which are described in more detail in the prospectus.
TOP 10 EQUITY HOLDINGS*
| | | | |
| |
| Company | | % of Net Assets | |
| |
Morningstar, Inc. | | | 3.3% | |
| |
Bank OZK | | | 3.2% | |
| |
CyberArk Software Ltd. | | | 3.2% | |
| |
Medpace Holdings, Inc. | | | 3.1% | |
| |
HealthEquity, Inc. | | | 3.1% | |
| | | | |
| |
| Company | | % of Net Assets | |
| |
Ensign Group, Inc. | | | 3.1% | |
| |
Five Below, Inc. | | | 2.9% | |
| |
Kadant, Inc. | | | 2.9% | |
| |
ICON PLC | | | 2.8% | |
| |
Holley, Inc. | | | 2.6% | |
| * | As of March 31, 2022, there were 55 holdings in the Fund. Foreign currency contracts, written options and repurchase agreements, if any, are not included in the number of holdings. Portfolio holdings are subject to change at any time. References to specific securities should not be construed as recommendations by the Funds or their Advisor. Current and future holdings are subject to risk. |
SECTOR BREAKDOWN**
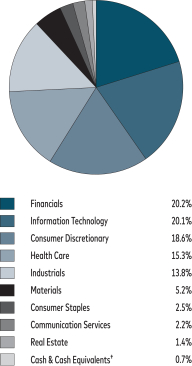
| ** | Excludes securities sold short and options written, if any. |
| † | Also includes Other Assets & Liabilities. |
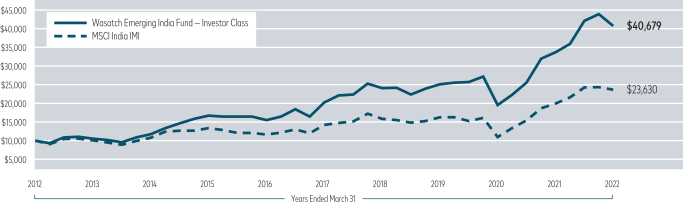
GROWTH OF A HYPOTHETICAL $10,000 INVESTMENT
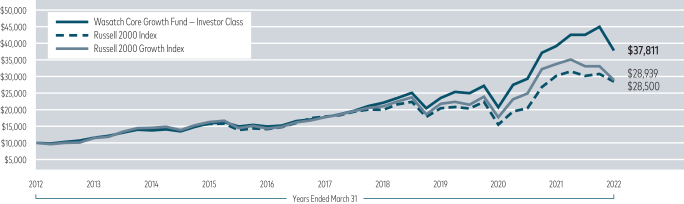
Past performance does not predict future performance. The graph above does not reflect the deduction of fees, sales charges, or taxes that you would pay on fund distributions or the redemption of fund shares. Wasatch does not charge any sales fees.
5
| | |
| Wasatch Emerging India Fund (WAINX / WIINX) | | MARCH 31, 2022 (Unaudited) |
Management Discussion
The Wasatch Emerging India Fund is managed by a team of Wasatch portfolio managers led by Ajay Krishnan and Matthew Dreith.
| | | | |

Ajay Krishnan, CFA Lead Portfolio Manager | | 
Matthew Dreith, CFA Portfolio Manager | | OVERVIEW Indian stocks got off to a weak start in 2022 as the outbreak of war between Russia and Ukraine disrupted supplies of commodities and threatened |
to stoke inflation. The Wasatch Emerging India Fund—Investor Class declined -7.35% during the first quarter and underperformed the benchmark MSCI India Investable Market Index (IMI), which lost -2.79%.
Inflationary pressures, especially soaring prices for crude oil and fertilizer, weighed on India’s equity market. India is the world’s third-biggest importer of petroleum and a major international buyer of fertilizer for its massive agricultural sector. Investors feared higher energy and food costs could reduce disposable income in a nation where private consumption accounts for about 60% of gross domestic product (GDP).
The economic backdrop didn’t favor our investment style. Energy, materials and utilities were the benchmark’s best-performing sectors during the first quarter. The Fund is normally underinvested in these areas due to the capital-intensive and undifferentiated nature of most such businesses. Although underexposure to these sectors was a headwind to performance in the quarter, we believe our preference for dynamic, high-quality companies will serve the Fund better over the long term. To that end, we seek enduring businesses with high returns on capital, talented management teams and sustainable competitive advantages.
DETAILS OF THE QUARTER
The greatest detractor from Fund performance was Dr. Lal PathLabs Ltd., which operates one of the largest chains of diagnostic pathology labs in India. Shares of Dr. Lal’s moved lower after the company reported a -39% drop in quarterly net profit versus the same quarter a year ago. Attributing most of the shortfall to costs from a recent acquisition, management said it expected profitability to improve as economies of scale and operating efficiencies are realized. As Dr. Lal’s continues to consolidate and formalize the market, we think it has the potential to become the dominant consumer brand in diagnostics in India and one of the top health-care services companies in emerging markets.
Larsen & Toubro Infotech Ltd. was also a significant detractor. An IT-services firm often referred to as LTI, the company serves more than 476 clients in 33 countries. LTI has benefited as the pandemic has accelerated the large-scale
migration of corporate clients to digital platforms and the cloud. The company’s stock pulled back after LTI reported lower margins for operating profit and net income in its most recent quarter. Management cited pay hikes for staff as the employee-attrition rate rose to 22.5% from 19.6% during the year-ago quarter. Even so, fundamental business trends remain strong at LTI. We believe it possesses the right skill sets to capture market share and continue growing at attractive rates.
The strongest contributor to Fund performance was Tata Elxsi Ltd., a provider of design-led technology services that include software development and integration. Shares of Tata Elxsi rose sharply after quarterly net profit came in 43.5% above the year-ago period. Revenue gains of 33.2% were driven by Embedded Product Design, the firm’s largest division, which grew 36% year-over-year. Tata Elxsi has been experiencing strong growth in the automotive market, winning strategic deals with both original equipment manufacturers (OEMs) and suppliers for design, technology and digital services across geographies.
Trent Ltd. was also a significant contributor. The company operates a leading chain of retail stores specializing in fashion apparel, cosmetics, perfumes and toiletries. Trent benefited from aggressive cost-cutting that included renegotiating leases at some of its locations. Consolidated net profit jumped 89% in the company’s most recent quarter on revenue growth of 75% compared to the same quarter a year ago. Foot traffic got a boost from improved consumer sentiment, which continued to recover on the back of higher vaccination rates and further relaxation of pandemic-related curbs on activity. Management noted strong demand in up-and-coming categories such as beauty and personal care, innerwear and home products.
OUTLOOK
A recent trip to India gave us a firsthand look at the rapid industrialization taking place there. Launched in 2020 under the Modi government’s “Make in India” initiative, the “Production Linked Incentive Scheme” aims to boost domestic manufacturing and reduce India’s dependence on imports. Disruptions caused by Covid-19 helped kickstart those efforts, as companies adopting the “China Plus One” supply-chain diversification strategy increasingly view India as an attractive destination for manufacturing activities.
In the meantime, we’re keeping a close eye on overall economic performance. GDP grew 5.4% in the fourth quarter of 2021—missing expectations for a 5.9% expansion and down from 8.4% growth in the previous quarter. Moreover, the Russia-Ukraine conflict has the potential to exacerbate inflation on an ongoing basis. Nevertheless, we don’t believe fallout from the war poses serious risks for our companies.
Thank you for the opportunity to manage your assets.
Current and future holdings are subject to risk.
6
| | |
| Wasatch Emerging India Fund (WAINX / WIINX) | | MARCH 31, 2022 (Unaudited) |
Portfolio Summary
AVERAGE ANNUAL TOTAL RETURNS
| | | | | | | | | | | | | | | | | | | | |
| | | | |
| | | Six Months
(Not annualized) | | 1 Year | | 5 Years | | 10 Years |
| | | | |
Emerging India (WAINX) — Investor | | | | –3.37% | | | | | 20.78% | | | | | 15.05% | | | | | 15.06% | |
| | | | |
Emerging India (WIINX) — Institutional | | | | –3.48% | | | | | 20.73% | | | | | 15.15% | | | | | 15.17% | |
| | | | |
MSCI India IMI | | | | –2.58% | | | | | 18.53% | | | | | 10.73% | | | | | 8.98% | |
Data show past performance, which is not indicative of future performance. Current performance may be lower or higher than the performance quoted. To obtain the most recent month-end performance data available, please visit wasatchglobal.com. The Advisor may absorb certain Fund expenses, without which total returns would have been lower. Investment returns and principal value will fluctuate and shares, when redeemed, may be worth more or less than their original cost.
As of the January 31, 2022 prospectus, the Total Annual Fund Operating Expenses for the Wasatch Emerging India Fund are Investor Class: 1.52% / Institutional Class: 1.37%. The expense ratio shown elsewhere in this report may be different. Net expenses are based on Fund expenses, net of waivers and reimbursements. See the prospectus for additional information regarding Fund expenses.
Wasatch will deduct a 2.00% redemption fee on Fund shares held 60 days or less. Performance data do not reflect the deduction of fees, including sales charges, or the taxes you would pay on fund distributions or the redemption of fund shares. Fees and taxes, if reflected, would reduce the performance quoted. Wasatch does not charge any sales fees. For more complete information including charges, risks and expenses, read the prospectus carefully.
Performance for the Institutional Class prior to 2/1/2016 is based on the performance of the Investor Class. Performance of the Fund’s Institutional Class prior to 2/1/2016 uses the actual expenses of the Fund’s Investor Class without any adjustments. For any such period of time, the performance of the Fund’s Institutional Class would have been substantially similar to, yet higher than, the performance of the Fund’s Investor Class, because the shares of both classes are invested in the same portfolio of securities, but the classes bear different expenses.
Investing in foreign securities, especially in emerging markets, entails special risks, such as unstable currencies, highly volatile securities markets and political and social instability, which are described in more detail in the prospectus. Investing in small cap funds will be more volatile and loss of principal could be greater than investing in large cap or more diversified funds. Being non-diversified, the Fund can invest a larger portion of its assets in the stocks of a limited number of companies than a diversified fund. Non-diversification increases the risk of loss to the Fund if the values of these securities decline.
TOP 10 EQUITY HOLDINGS*
| | | | |
| |
| Company | | % of Net Assets | |
| |
Bajaj Finance Ltd. | | | 9.5% | |
| |
Mindtree Ltd. | | | 7.5% | |
| |
Larsen & Toubro Infotech Ltd. | | | 6.7% | |
| |
L&T Technology Services Ltd. | | | 6.0% | |
| |
AU Small Finance Bank Ltd. | | | 5.9% | |
| | | | |
| |
| Company | | % of Net Assets | |
| |
Trent Ltd. | | | 5.9% | |
| |
HDFC Bank Ltd. | | | 5.4% | |
| |
Divi’s Laboratories Ltd. | | | 5.3% | |
| |
Elgi Equipments Ltd. | | | 5.3% | |
| |
Tata Elxsi Ltd. | | | 4.6% | |
| * | As of March 31, 2022, there were 24 holdings in the Fund. Foreign currency contracts, written options and repurchase agreements, if any, are not included in the number of holdings. Portfolio holdings are subject to change at any time. References to specific securities should not be construed as recommendations by the Funds or their Advisor. Current and future holdings are subject to risk. |
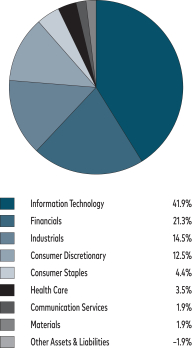
SECTOR BREAKDOWN**
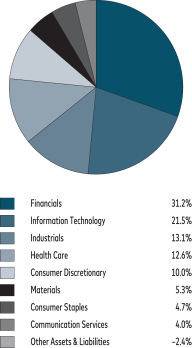
| ** | Excludes securities sold short and options written, if any. |
GROWTH OF A HYPOTHETICAL $10,000 INVESTMENT
Past performance does not predict future performance. The graph above does not reflect the deduction of fees, sales charges, or taxes that you would pay on fund distributions or the redemption of fund shares. Wasatch does not charge any sales fees.
7
| | |
| Wasatch Emerging Markets Select Fund (WAESX / WIESX) | | MARCH 31, 2022 (Unaudited) |
Management Discussion
The Wasatch Emerging Markets Select Fund is managed by a team of Wasatch portfolio managers led by Ajay Krishnan, Neal Dihora, Scott Thomas and Matthew Dreith.
| | | | |

Ajay Krishnan, CFA Lead Portfolio Manager 
Scott Thomas, CFA Associate Portfolio
Manager | | 
Neal Dihora, CFA Portfolio Manager 
Matthew Dreith, CFA Associate Portfolio
Manager | | OVERVIEW Inflation, rising interest rates and the outbreak of war between Russia and Ukraine posed headwinds for emerging-market equities during the first quarter of 2022. Gains in commodity-exporting nations that stand to benefit from inflation—such as Brazil, South Africa and Saudi Arabia—were offset by losses in other countries. |
The benchmark MSCI Emerging Markets Index fell -6.97% for the quarter while the Wasatch Emerging Markets Select Fund—Investor Class declined -16.37%. Underweight exposure to commodity-linked assets factored significantly in the Fund’s worse-than-benchmark performance.
Disruption of shipments from the warring countries added to inflationary pressures around the globe. Russia is the world’s biggest exporter of natural gas, wheat and fertilizer—and the third-largest exporter of crude oil and coal. Russia and Ukraine together account for more than a quarter of the global trade in wheat, one-fifth of corn sales and over three-quarters of global exports of sunflower oil. These countries also supply key raw materials such as neon and palladium, both of which are vital to the manufacture of semiconductor chips.
DETAILS OF THE QUARTER
The greatest detractor from Fund performance for the first quarter was TCS Group Holding PLC, GDR. TCS is the holding company for Tinkoff Bank, Russia’s largest digital bank. The company’s London-traded global depositary receipts lost nearly all their value after Russia’s central bank raised interest rates and imposed exchange controls on the ruble in response to sanctions from Western nations.
Silergy Corp. was also a significant detractor. The company manufactures high-performance mixed-signal and analog integrated circuits used in a wide array of electronic devices. Considered a Taiwanese stock for portfolio-management purposes, Silergy was part of a broader selloff in technology shares. Revenues at the firm remained strong, rising 46.4% in January through February compared to the same period in 2021. Because Silergy’s business model—which is based on analog design engineering—is difficult to replicate, we believe the company has ample headroom for growth.
The strongest contributor to Fund performance for the quarter was Discovery Ltd. A financial-services conglomerate based in South Africa, the company provides life- and health-insurance products and services world-wide. Higher vaccination rates and lower mortality from Covid-19 among Discovery’s policyholders boded well for the company’s life- and health-insurance businesses. Other positive developments included improving investor sentiment toward South Africa and faster-than-expected paths to profitability for Discovery’s new businesses—one of which is the world’s first behavior-based digital bank.
Tata Elxsi Ltd. was also a contributor. Headquartered in India, Tata Elsxi provides design-led technology services that include software development and integration. The company’s stock price surged in January after quarterly net profit came in 43.5% above the year-ago period. Revenue gains of 33.2% were driven by Embedded Product Design, the firm’s largest division, which grew 36% year-over-year. Tata Elxsi has been experiencing strong growth in the automotive market, winning strategic deals with both original equipment manufacturers (OEMs) and suppliers for design, technology and digital services across geographies.
OUTLOOK
While central banks in the U.S., the United Kingdom, Korea and other countries have begun raising interest rates to rein in inflation, the People’s Bank of China cut rates in January to spur economic growth. Slowed by restrictive virus-containment measures and a slumping real-estate market, the Chinese economy grew just 4% in the fourth quarter of 2021 from a year earlier—its weakest pace since early 2020. The central bank has pledged to take additional steps to drive credit expansion and shore up domestic demand.
These moves come in addition to recent efforts by China’s government to stabilize the battered equity market. The nation’s top financial-policy committee, led by Vice Premier Liu He, vowed to ease a crackdown on technology firms, support the real-estate sector and stimulate the economy. With further interest-rate cuts potentially on the way as early as the second quarter of this year, we think the stage may be set for an environment that’s more supportive of Chinese stocks. Covid-19 remains a wild card, however, as it has for most of the past two years.
Looking forward, we’ll seek to take advantage of volatility in the markets—buying companies that have been unfairly punished and selling those whose valuations have gotten too far ahead of fundamentals. Although rapid swings in stock prices aren’t something we can foresee, we’ve found they often create opportunities to enhance portfolio positioning.
Thank you for the opportunity to manage your assets.
Current and future holdings are subject to risk.
8
| | |
| Wasatch Emerging Markets Select Fund (WAESX / WIESX) | | MARCH 31, 2022 (Unaudited) |
Portfolio Summary
AVERAGE ANNUAL TOTAL RETURNS
| | | | | | | | | | | | | | | | | | | | |
| | | | |
| | | Six Months
(Not annualized) | | 1 Year | | 5 Years | | Since Inception 12/13/2012 |
| | | | |
Emerging Markets Select (WAESX) — Investor | | | | –16.34% | | | | | 1.14% | | | | | 15.40% | | | | | 7.09% | |
| | | | |
Emerging Markets Select (WIESX) — Institutional | | | | –16.37% | | | | | 1.17% | | | | | 15.66% | | | | | 7.38% | |
| | | | |
MSCI Emerging Markets Index | | | | –8.20% | | | | | –11.37% | | | | | 5.98% | | | | | 3.37% | |
Data show past performance, which is not indicative of future performance. Current performance may be lower or higher than the performance quoted. To obtain the most recent month-end performance data available, please visit wasatchglobal.com. The Advisor may absorb certain Fund expenses, without which total returns would have been lower. Investment returns and principal value will fluctuate and shares, when redeemed, may be worth more or less than their original cost.
As of the January 31, 2022 prospectus, the Total Annual Fund Operating Expenses for the Wasatch Emerging Markets Select Fund are Investor Class: 1.37% / Institutional Class: 1.18%. The expense ratio shown elsewhere in this report may be different. Net expenses are based on Fund expenses, net of waivers and reimbursements. See the prospectus for additional information regarding Fund expenses.
Wasatch will deduct a 2.00% redemption fee on Fund shares held 60 days or less. Performance data do not reflect the deduction of fees, including sales charges, or the taxes you would pay on fund distributions or the redemption of fund shares. Fees and taxes, if reflected, would reduce the performance quoted. Wasatch does not charge any sales fees. For more complete information including charges, risks and expenses, read the prospectus carefully.
Investing in foreign securities, especially in emerging markets, entails special risks, such as currency fluctuations and political uncertainties, which are described in more detail in the prospectus. Investing in small cap funds will be more volatile and loss of principal could be greater than investing in large cap or more diversified funds. Being non-diversified, the Fund can invest a larger portion of its assets in the stocks of a limited number of companies than a diversified fund. Non-diversification increases the risk of loss to the Fund if the values of these securities decline.
TOP 10 EQUITY HOLDINGS*
| | | | |
| |
| Company | | % of Net Assets | |
| |
Bajaj Finance Ltd. | | | 6.8% | |
| |
MercadoLibre, Inc. | | | 6.0% | |
| |
Silergy Corp. | | | 5.7% | |
| |
Globant SA | | | 5.5% | |
| |
Larsen & Toubro Infotech Ltd. | | | 5.0% | |
| | | | |
| |
| Company | | % of Net Assets | |
| |
ASPEED Technology, Inc. | | | 5.0% | |
| |
HDFC Bank Ltd. | | | 4.9% | |
| |
Voltronic Power Technology Corp. | | | 4.7% | |
| |
Chailease Holding Co. Ltd. | | | 4.6% | |
| |
Grupo Aeroportuario del Pacifico SAB de CV, Class B | | | 4.5% | |
| * | As of March 31, 2022, there were 33 holdings in the Fund. Foreign currency contracts, written options and repurchase agreements, if any, are not included in the number of holdings. Portfolio holdings are subject to change at any time. References to specific securities should not be construed as recommendations by the Funds or their Advisor. Current and future holdings are subject to risk. |
SECTOR BREAKDOWN**

| ** | Excludes securities sold short and options written, if any. |
| † | Also includes Other Assets & Liabilities. |
GROWTH OF A HYPOTHETICAL $10,000 INVESTMENT

††Inception: December 13, 2012. Past performance does not predict future performance. The graph above does not reflect the deduction of fees, sales charges, or taxes that you would pay on fund distributions or the redemption of fund shares. Wasatch does not charge any sales fees.
9
| | |
| Wasatch Emerging Markets Small Cap Fund (WAEMX / WIEMX) | | MARCH 31, 2022 (Unaudited) |
Management Discussion
The Wasatch Emerging Markets Small Cap Fund is managed by a team of Wasatch portfolio managers led by Ajay Krishnan, Dan Chace, Scott Thomas, Kevin Unger and Anh Hoang.
| | | | |

Ajay Krishnan, CFA Lead Portfolio Manager 
Kevin Unger, CFA Associate Portfolio Manager | | 
Dan Chace, CFA Portfolio Manager 
Anh Hoang, CFA Associate Portfolio Manager | | 
Scott Thomas, CFA Portfolio Manager OVERVIEW The benchmark MSCI Emerging Markets Small Cap Index fell -4.33% for the first quarter of 2022 amid inflation, rising interest rates and Russia’s invasion of |
|
Ukraine. The Wasatch Emerging Markets Small Cap Fund—Investor Class lagged the benchmark with a decline of -18.29%. Underweight exposure to commodity-linked assets factored significantly in the Fund’s worse-than-benchmark performance.
Russia is the world’s biggest exporter of natural gas, wheat and fertilizer—and the third-largest exporter of crude oil and coal. Russia and Ukraine together account for more than a quarter of the global trade in wheat, one-fifth of corn sales and over three-quarters of global exports of sunflower oil.
The Fund tends to avoid companies tightly linked to the production of natural resources. In addition to lackluster returns on capital, commodity-oriented firms tend to have undifferentiated business models that are highly cyclical—with success often tied to a single commodity. We instead seek companies positioned to benefit from secular increases in domestic demand as emerging markets continue to grow, develop and be transformed by new technologies. Although the Fund’s underweight position in commodity-related businesses hurt performance relative to the benchmark during the first quarter, we believe innovative growth companies that can create their own destinies offer more-attractive opportunities in the long run.
Rising interest rates also significantly impacted the Fund’s performance. Because long-duration growth companies of the type we typically favor generate cash flows that are further into the future, higher interest rates make their income streams less valuable in the present. With fallout from the Omicron variant of Covid-19 less severe than initially expected, stocks tied to e-commerce, digital consulting and other areas that had previously benefited from the pandemic tended to face an additional headwind during the quarter.
DETAILS OF THE QUARTER
The greatest detractors from performance for the first quarter were the Fund’s Russian positions—HeadHunter Group PLC, ADR and TCS Group Holding PLC, GDR. Depositary receipts of both companies lost nearly all of their value after Russia’s central bank raised interest rates and imposed exchange controls on the ruble in response to sanctions from Western nations. HeadHunter operates an online recruitment platform in Russia, Kazakhstan, Belarus and other countries. TCS is the holding company for Tinkoff Bank, Russia’s largest digital bank.
The strongest contributor to Fund performance for the quarter was Discovery Ltd. A financial-services conglomerate based in South Africa, the company provides life- and health-insurance products and services world-wide. Higher vaccination rates and lower mortality from Covid-19 among Discovery’s policyholders boded well for the company’s life- and health-insurance businesses. Other positive developments included improving investor sentiment toward South Africa and faster-than-expected paths to profitability for Discovery’s new businesses—one of which is the world’s first behavior-based digital bank.
Trent Ltd. was also a contributor. The company operates a leading chain of retail stores in India that specialize in fashion apparel, cosmetics, perfumes and toiletries. Trent benefited from aggressive cost-cutting that included renegotiating leases at some of its locations. Consolidated net profit jumped 89% in the company’s most recent quarter on 75% revenue growth versus the same quarter a year ago. Foot traffic got a boost from improved consumer sentiment, which continued to recover on the back of higher vaccination rates and further relaxation of pandemic-related curbs on activity.
OUTLOOK
India has held its ground thus far and retained an accommodative bias to monetary policy. After bouncing back from a deadly second wave of coronavirus last year, India’s economy is positioned in our view to continue chugging along in 2022. Rising prices for fuel, food, clothing and other items may present the most serious challenge as the Reserve Bank of India attempts to sustain economic momentum. Consumer inflation breached the central bank’s target ceiling of 6% in the first two months of the year, while inflation at the wholesale level surged to 13.1% in February.
Despite having underperformed the benchmark in the first quarter, we’re comfortable with the companies we own. We’ve thoroughly reviewed the Fund’s holdings, revisiting our investment theses, double-checking our revenue and earnings models and looking for changes in the underlying fundamentals. We’ve also spoken with management teams to ensure—to the extent possible—that our analysis correctly includes all relevant factors.
Thank you for the opportunity to manage your assets.
Current and future holdings are subject to risk.
10
| | |
| Wasatch Emerging Markets Small Cap Fund (WAEMX / WIEMX) | | MARCH 31, 2022 (Unaudited) |
Portfolio Summary
AVERAGE ANNUAL TOTAL RETURNS
| | | | | | | | | | | | | | | | | | | | |
| | | | |
| | | Six Months
(Not annualized) | | 1 Year | | 5 Years | | 10 Years |
| | | | |
Emerging Markets Small Cap (WAEMX) — Investor | | | | –13.55% | | | | | 3.01% | | | | | 12.79% | | | | | 6.26% | |
| | | | |
Emerging Markets Small Cap (WIEMX) — Institutional | | | | –13.35% | | | | | 3.06% | | | | | 13.02% | | | | | 6.36% | |
| | | | |
MSCI Emerging Markets Small Cap Index | | | | –3.07% | | | | | 5.52% | | | | | 7.81% | | | | | 5.31% | |
| | | | |
MSCI Emerging Markets Index | | | | –8.20% | | | | | –11.37% | | | | | 5.98% | | | | | 3.36% | |
Data show past performance, which is not indicative of future performance. Current performance may be lower or higher than the performance quoted. To obtain the most recent month-end performance data available, please visit wasatchglobal.com. The Advisor may absorb certain Fund expenses, without which total returns would have been lower. Investment returns and principal value will fluctuate and shares, when redeemed, may be worth more or less than their original cost.
As of the January 31, 2022 prospectus, the Total Annual Fund Operating Expenses for the Wasatch Emerging Markets Small Cap Fund are Investor Class: 1.88% / Institutional Class: 1.76% . The expense ratio shown elsewhere in this report may be different. Net expenses are based on Fund expenses, net of waivers and reimbursements. See the prospectus for additional information regarding Fund expenses.
Wasatch will deduct a 2.00% redemption fee on Fund shares held 60 days or less. Performance data do not reflect the deduction of fees, including sales charges, or the taxes you would pay on fund distributions or the redemption of fund shares. Fees and taxes, if reflected, would reduce the performance quoted. Wasatch does not charge any sales fees. For more complete information including charges, risks and expenses, read the prospectus carefully.
Performance for the Institutional Class prior to 2/1/2016 is based on the performance of the Investor Class. Performance of the Fund’s Institutional Class prior to 2/1/2016 uses the actual expenses of the Fund’s Investor Class without any adjustments. For any such period of time, the performance of the Fund’s Institutional Class would have been substantially similar to, yet higher than, the performance of the Fund’s Investor Class, because the shares of both classes are invested in the same portfolio of securities, but the classes bear different expenses.
Investing in foreign securities, especially in emerging markets, entails special risks, such as currency fluctuations and political uncertainties, which are described in more detail in the prospectus. Investing in small cap funds will be more volatile and loss of principal could be greater than investing in large cap or more diversified funds. Being non-diversified, the Fund can invest a larger portion of its assets in the stocks of a limited number of companies than a diversified fund. Non-diversification increases the risk of loss to the Fund if the values of these securities decline.
TOP 10 EQUITY HOLDINGS*
| | | | |
| |
| Company | | % of Net Assets | |
| |
Silergy Corp. | | | 6.1% | |
| |
Mindtree Ltd. | | | 5.9% | |
| |
Voltronic Power Technology Corp. | | | 5.5% | |
| |
AU Small Finance Bank Ltd. | | | 4.7% | |
| |
ASPEED Technology, Inc. | | | 4.7% | |
| | | | |
| |
| Company | | % of Net Assets | |
| |
Globant SA | | | 4.2% | |
| |
Trent Ltd. | | | 4.1% | |
| |
Larsen & Toubro Infotech Ltd. | | | 3.9% | |
| |
L&T Technology Services Ltd. | | | 3.9% | |
| |
Aavas Financiers Ltd. | | | 3.7% | |
| * | As of March 31, 2022, there were 49 holdings in the Fund. Foreign currency contracts, written options and repurchase agreements, if any, are not included in the number of holdings. Portfolio holdings are subject to change at any time. References to specific securities should not be construed as recommendations by the Funds or their Advisor. Current and future holdings are subject to risk. |
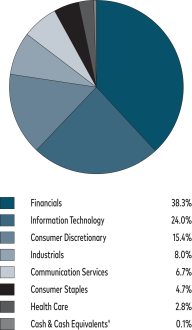
SECTOR BREAKDOWN**
| ** | Excludes securities sold short and options written, if any. |
GROWTH OF A HYPOTHETICAL $10,000 INVESTMENT
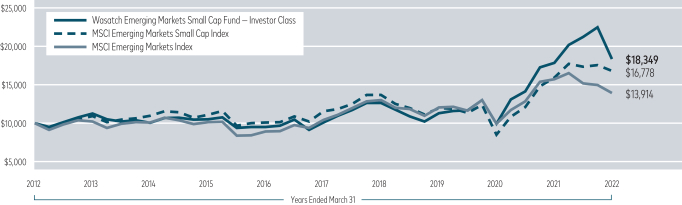
Past performance does not predict future performance. The graph above does not reflect the deduction of fees, sales charges, or taxes that you would pay on fund distributions or the redemption of fund shares. Wasatch does not charge any sales fees.
11
| | |
| Wasatch Frontier Emerging Small Countries Fund (WAFMX / WIFMX) | | MARCH 31, 2022 (Unaudited) |
Management Discussion
The Wasatch Frontier Emerging Small Countries Fund is managed by a team of Wasatch portfolio managers led by Scott Thomas.
| | |
Scott Thomas, CFA Lead Portfolio Manager | | OVERVIEW Stocks in frontier and emerging markets were volatile in the first quarter, as concern about inflation and rising interest rates weighed on investor sentiment. Russia’s invasion of Ukraine was also a source of volatility. As we explain in our outlook, the market environment was a headwind to |
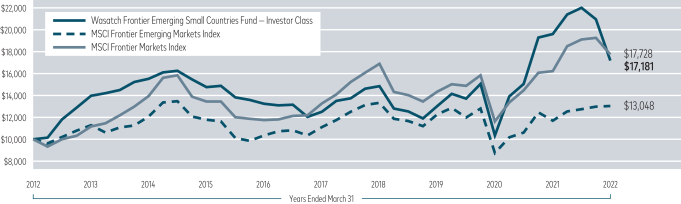
performance. The Fund finished the quarter with a loss of -18.03%. The Fund’s primary benchmark, the MSCI Frontier Emerging Markets Index, finished the period up 0.49%.
DETAILS OF THE QUARTER
Among the largest detractors from Fund performance in the first quarter were two Russian holdings — TCS Group Holding PLC, GDR and HeadHunter Group PLC, ADR. TCS is the holding company for Tinkoff Bank, Russia’s largest digital bank. HeadHunter provides online services to connect job seekers with employers and offers fee-based access to a résumé database and job-posting platform for employers and recruiters. Unfortunately, the repercussions of Russia’s attack on Ukraine overwhelmed what we had believed to be strong business fundamentals for both companies. After the first-quarter declines, these holdings are minuscule weights in the Fund.
Sea Ltd., ADR, was another large detractor. The company’s business segments include Shopee, the leading e-commerce platform in Southeast Asia and Taiwan, and Garena, a platform for mobile and PC online games. Sea was caught up in a broader selloff of information-technology (IT) stocks, as the prospect of rising interest rates caused some investors to discount the valuations of growth-oriented stocks. However, the company continues to put up phenomenal operating results, and we believe it is well-positioned for the ongoing shift to digital consumption and entertainment around the world.
Discovery Ltd., a South African financial-services conglomerate, was the top contributor to Fund performance. The company’s life and health insurance businesses built up considerable reserves to cover costs associated with the pandemic. Indications of higher vaccination rates among Discovery’s policyholders and the emergence of less virulent Covid-19 strains have boded well for the businesses, and the stock has risen accordingly. We continue to like management’s strategy for its insurance business, which pioneered bundling health and wellness programs with life-insurance policies. What’s more, the company’s investment in building a digital bank to complement its other suite of products appears to be ahead of schedule in terms of client growth.
Brazilian motor-maker WEG SA was another top contributor. Like Pet Center, mentioned below, WEG’s stock benefited from an improved economic outlook for Brazil. The company also appears poised to benefit from a weaker Brazilian currency and a global economic reopening. Going forward, we continue to be confident in WEG’s management team, and its ability to execute in a variety of areas such as commercial and appliance motors, industrial electronic equipment and energy generation, transmission and distribution.
Pet Center Comercio e Participacoes SA was also a significant contributor. Large inflows from overseas touched off a broad rally in Brazilian stocks that helped lift the company’s share price during the period. Pet Center sells food, medicines, and other pet products through its digital platform and retail stores. We like the economic resiliency of the pet business. We also like the way management has positioned the company as more shopping takes place online and digitally.
OUTLOOK
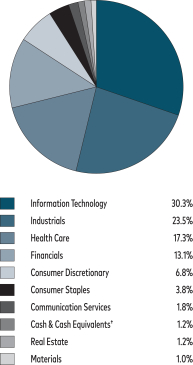
The Fund’s positioning tends to look quite different from the benchmark’s. The MSCI Frontier Emerging Markets Index has roughly a 35% combined weight in the energy, materials, industrials and consumer-staples sectors, but less than a 1% weight in the IT sector. Conversely, the Fund has a weighting in IT of more than 20% and no energy or materials holdings.
In the first quarter, that positioning worked against us. Inflation provides a direct revenue boost to companies in the energy, materials and consumer-staples sectors, which provided an immediate tailwind for those stocks. Meanwhile, the prospect of rising interest rates led to discounted valuations for many IT companies whose cash flows are weighted further into the future.
While painful, we’re willing to tolerate the near-term setback. We rarely invest in energy and materials companies because we find few businesses within those sectors that possess sustainable competitive advantages. Further, we believe many of these old-line, commodity-driven companies represent the past for frontier and emerging small countries.
We prefer to invest in the future of these dynamic markets. We’ve built a portfolio of companies that we believe will play a vital role in the domestic transformation taking place within the economies of frontier and emerging small countries. Examples include: companies at the heart of a new digital age; financial-service firms that facilitate safer and frictionless digital transactions; and retail companies and communication-services firms aligned to new purchasing and consumption trends.
In summation, we believe the Fund is positioned for where frontier and emerging small countries are going, not where they’ve been. As long-term investors, that’s precisely how we want to be aligned.
Thank you for the opportunity to manage your assets.
Current and future holdings are subject to risk.
12
| | |
| Wasatch Frontier Emerging Small Countries Fund (WAFMX / WIFMX) | | MARCH 31, 2022 (Unaudited) |
Portfolio Summary
AVERAGE ANNUAL TOTAL RETURNS
| | | | | | | | | | | | | | | | | | | | |
| | | | |
| | | Six Months
(Not annualized) | | 1 Year | | 5 Years | | 10 Years |
| | | | |
Frontier Emerging Small Countries (WAFMX) — Investor | | | | –21.68% | | | | | –12.34% | | | | | 6.57% | | | | | 5.56% | |
| | | | |
Frontier Emerging Small Countries (WIFMX) — Institutional | | | | –21.72% | | | | | –11.84% | | | | | 6.82% | | | | | 5.73% | |
| | | | |
MSCI Frontier Emerging Markets Index | | | | 2.44% | | | | | 11.58% | | | | | 3.25% | | | | | 2.70% | |
| | | | |
MSCI Frontier Markets Index | | | | –7.25% | | | | | 9.39% | | | | | 5.96% | | | | | 5.89% | |
Data show past performance, which is not indicative of future performance. Current performance may be lower or higher than the performance quoted. To obtain the most recent month-end performance data available, please visit wasatchglobal.com. The Advisor may absorb certain Fund expenses, without which total returns would have been lower. Investment returns and principal value will fluctuate and shares, when redeemed, may be worth more or less than their original cost.
As of the January 31, 2022 prospectus, the Total Annual Fund Operating Expenses for the Wasatch Frontier Emerging Small Countries Fund are Investor Class: 2.13% / Institutional Class—Gross: 2.09%, Net: 1.96%. The expense ratio shown elsewhere in this report may be different. Net expenses are based on Fund expenses, net of waivers and reimbursements. See the prospectus for additional information regarding Fund expenses.
Wasatch will deduct a 2.00% redemption fee on Fund shares held 60 days or less. Performance data do not reflect the deduction of fees, including sales charges, or the taxes you would pay on fund distributions or the redemption of fund shares. Fees and taxes, if reflected, would reduce the performance quoted. Wasatch does not charge any sales fees. For more complete information including charges, risks and expenses, read the prospectus carefully.
Performance for the Institutional Class prior to 2/1/2016 is based on the performance of the Investor Class. Performance of the Fund’s Institutional Class prior to 2/1/2016 uses the actual expenses of the Fund’s Investor Class without any adjustments. For any such period of time, the performance of the Fund’s Institutional Class would have been substantially similar to, yet higher than, the performance of the Fund’s Investor Class, because the shares of both classes are invested in the same portfolio of securities, but the classes bear different expenses.
Investing in foreign securities, especially in frontier and emerging markets, entails special risks, such as currency fluctuations and political uncertainties, which are described in more detail in the prospectus. Investing in small cap funds will be more volatile and loss of principal could be greater than investing in large cap or more diversified funds. Being non-diversified, the Fund can invest a larger portion of its assets in the stocks of a limited number of companies than a diversified fund. Non-diversification increases the risk of loss to the Fund if the values of these securities decline.
TOP 10 EQUITY HOLDINGS*
| | | | |
| |
| Company | | % of Net Assets | |
| |
Bajaj Finance Ltd. | | | 8.9% | |
| |
FPT Corp. | | | 7.3% | |
| |
MercadoLibre, Inc. | | | 7.1% | |
| |
Globant SA | | | 6.1% | |
| |
VEF AB | | | 5.4% | |
| | | | |
| |
| Company | | % of Net Assets | |
| |
Discovery Ltd. | | | 5.1% | |
| |
DCVFMVN Diamond ETF | | | 4.8% | |
| |
Sea Ltd., ADR | | | 4.1% | |
| |
Qualitas Controladora SAB de CV | | | 3.7% | |
| |
Bank for Foreign Trade of Vietnam JSC | | | 3.4% | |
| * | As of March 31, 2022, there were 37 holdings in the Fund. Foreign currency contracts, written options and repurchase agreements, if any, are not included in the number of holdings. Portfolio holdings are subject to change at any time. References to specific securities should not be construed as recommendations by the Funds or their Advisor. Current and future holdings are subject to risk. |
SECTOR BREAKDOWN**
| ** | Excludes securities sold short and options written, if any. |
| † | Also includes Other Assets & Liabilities. |
GROWTH OF A HYPOTHETICAL $10,000 INVESTMENT
Past performance does not predict future performance. The graph above does not reflect the deduction of fees, sales charges, or taxes that you would pay on fund distributions or the redemption of fund shares. Wasatch does not charge any sales fees.
13
| | |
| Wasatch Global Opportunities Fund (WAGOX / WIGOX) | | MARCH 31, 2022 (Unaudited) |
Management Discussion
The Wasatch Global Opportunities Fund is managed by a team of Wasatch portfolio managers led by JB Taylor, Ajay Krishnan, Ken Applegate and Paul Lambert.
| | | | |

JB Taylor Lead Portfolio Manager 
Ken Applegate, CFA Portfolio Manager | | 
Ajay Krishnan, CFA Lead Portfolio Manager 
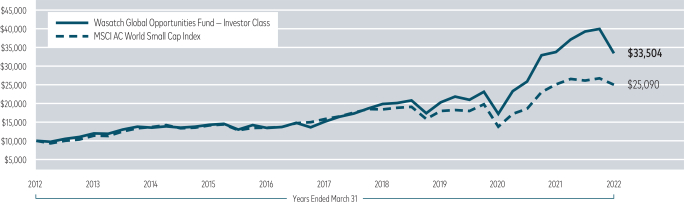
Paul Lambert Portfolio Manager | | OVERVIEW In a tough period for global equities, inflation, rising interest rates, the spread of Covid-19’s Omicron variant and Russia’s invasion of Ukraine each played a role in sparking volatility and driving stocks lower. In this environment, the Wasatch Global Opportunities Fund — Investor Class declined -16.27% and under- |
|
performed its benchmark, the MSCI AC (All Country) World Small Cap Index, which was down -6.24% for the quarter.
At a broad level, we think there were three main reasons for the Fund’s underperformance. First, our group of stocks as a whole had strong gains over the preceding several years—so an eventual period of consolidation was to be expected. Second, the prospect of continually rising interest rates was perceived to be especially detrimental to long-duration growth companies whose earnings and cash flows are more heavily weighted further into the future. Third, the war in Ukraine boosted commodity prices and general inflationary pressures, which benefited energy and materials stocks. This detracted from performance relative to the benchmark because the Fund typically avoids energy companies, which in our view often possess undifferentiated business models and few competitive advantages.
DETAILS OF THE QUARTER
The greatest detractor from Fund performance was Silergy Corp. The stock price declined amid a broader selloff in technology shares, as rising interest rates caused some investors to reassess the valuations of growth-oriented companies. Nothing has fundamentally changed for the business, however. The company manufactures high-performance mixed-signal and analog integrated circuits used in a wide array of electronic devices. We continue to believe Silergy’s business model — which is based on complex, analog-design engineering — is difficult to replicate, and provides the company with ample headroom for growth.
Kornit Digital Ltd. was our second-largest detractor. The company makes machines for the environmentally sustainable printing of designs and images on clothing and fabrics. The Covid-19 pandemic highlighted the advantages of Kornit’s
on-demand technology, which reduces the need for inventory on hand and in supply chains. Having run up in price significantly during 2021, the stock pulled back in the first quarter of 2022 amid fears that persistent inflation may force the Federal Reserve onto a more aggressive path with respect to interest rates. While other investors pondered this possibility, we considered Kornit’s fundamental strengths: a large and growing addressable market, talented management team, recurring revenue streams and attractive business model with few competitors. In our view, Kornit is positioned for continued market-share gains and revenue growth.
HealthEquity, Inc. was the top contributor to Fund performance. The company is the largest U.S. non-bank custodian for health-savings accounts (HSAs). Account holders have online access to their tax-advantaged HSAs and can compare treatment options, pay medical bills, earn wellness incentives, and receive personalized benefit and clinical information. HealthEquity reported strong growth in its HSA business during the quarter. Management’s upwardly revised forecasts for revenues and earnings in the current fiscal year also cheered investors. We believe HealthEquity is largely insulated from supply-chain constraints and rising materials costs. The company also appears well-positioned for an environment of higher interest rates.
Among our emerging-market holdings, Tata Elxsi Ltd. was the top contributor. Headquartered in Bangalore, India, Tata Elxsi provides design-led technology services that include software development and integration. The company’s stock price surged in January after quarterly net profit came in 43.5% above the year-ago period. Revenue gains of 33.2% were driven by Embedded Product Design, the firm’s largest division, which grew 36% year-over-year. Tata Elxsi has been experiencing strong growth in the automotive market, winning strategic deals with both original equipment manufacturers (OEMs) and suppliers for design, technology and digital services across geographies.
OUTLOOK
It’s certainly possible that market volatility will continue based on the macro events already described and new ones that may emerge. But as long-term investors, we won’t be shaken out of our well-researched positions. In fact, with stock prices having come down and with the well-publicized gap between growth and value having narrowed, our conviction in our names has only increased.
Looking across the portfolio, we like how our businesses have responded to obstacles such as supply-chain disruptions and rising costs. We believe many of our companies have made competitive inroads and positioned themselves for even better market-share gains. We look forward to seeing these firms execute their business plans in the months ahead.
Thank you for the opportunity to manage your assets.
Current and future holdings are subject to risk.
14
| | |
| Wasatch Global Opportunities Fund (WAGOX / WIGOX) | | MARCH 31, 2022 (Unaudited) |
Portfolio Summary
AVERAGE ANNUAL TOTAL RETURNS
| | | | | | | | | | | | | | | | | | | | |
| | | | |
| | | Six Months
(Not annualized) | | 1 Year | | 5 Years | | 10 Years |
| | | | |
Global Opportunities (WAGOX) — Investor | | | | –14.84% | | | | | –0.90% | | | | | 17.09% | | | | | 12.85% | |
| | | | |
Global Opportunities (WIGOX) — Institutional | | | | –14.82% | | | | | –0.62% | | | | | 17.35% | | | | | 12.97% | |
| | | | |
MSCI AC World Small Cap Index | | | | –4.26% | | | | | –0.35% | | | | | 9.55% | | | | | 9.64% | |
Data show past performance, which is not indicative of future performance. Current performance may be lower or higher than the performance quoted. To obtain the most recent month-end performance data available, please visit wasatchglobal.com. The Advisor may absorb certain Fund expenses, without which total returns would have been lower. Investment returns and principal value will fluctuate and shares, when redeemed, may be worth more or less than their original cost.
As of the January 31, 2022 prospectus, the Total Annual Fund Operating Expenses for the Wasatch Global Opportunities Fund are Investor Class: 1.46% / Institutional Class—Gross: 1.40%, Net: 1.35%. The expense ratio shown elsewhere in this report may be different. Net expenses are based on Fund expenses, net of waivers and reimbursements. See the prospectus for additional information regarding Fund expenses.
Wasatch will deduct a 2.00% redemption fee on Fund shares held 60 days or less. Performance data do not reflect the deduction of fees, including sales charges, or the taxes you would pay on fund distributions or the redemption of fund shares. Fees and taxes, if reflected, would reduce the performance quoted. Wasatch does not charge any sales fees. For more complete information including charges, risks and expenses, read the prospectus carefully.
Performance for the Institutional Class prior to 2/1/2016 is based on the performance of the Investor Class. Performance of the Fund’s Institutional Class prior to 2/1/2016 uses the actual expenses of the Fund’s Investor Class without any adjustments. For any such period of time, the performance of the Fund’s Institutional Class would have been substantially similar to, yet higher than, the performance of the Fund’s Investor Class, because the shares of both classes are invested in the same portfolio of securities, but the classes bear different expenses.
Investing in small and micro cap funds will be more volatile and loss of principal could be greater than investing in large cap or more diversified funds. Investing in foreign securities, especially in emerging markets, entails special risks, such as currency fluctuations and political uncertainties, which are described in more detail in the prospectus.
TOP 10 EQUITY HOLDINGS*
| | | | |
| |
| Company | | % of Net Assets | |
| |
BayCurrent Consulting, Inc. | | | 4.6% | |
| |
AU Small Finance Bank Ltd. | | | 3.9% | |
| |
Globant SA | | | 3.4% | |
| |
Ensign Group, Inc. | | | 3.2% | |
| |
Silergy Corp. | | | 3.2% | |
| | | | |
| |
| Company | | % of Net Assets | |
| |
L&T Technology Services Ltd. | | | 2.8% | |
| |
Five Below, Inc. | |
| 2.8%
|
|
| |
Mindtree Ltd. | |
| 2.8%
|
|
| |
JMDC, Inc. | |
| 2.8%
|
|
| |
ASPEED Technology, Inc. | | | 2.7% | |
| * | As of March 31, 2022, there were 63 holdings in the Fund. Foreign currency contracts, written options and repurchase agreements, if any, are not included in the number of holdings. Portfolio holdings are subject to change at any time. References to specific securities should not be construed as recommendations by the Funds or their Advisor. Current and future holdings are subject to risk. |
SECTOR BREAKDOWN**
| ** | Excludes securities sold short and options written, if any. |
| † | Also includes Other Assets & Liabilities. |
GROWTH OF A HYPOTHETICAL $10,000 INVESTMENT
Past performance does not predict future performance. The graph above does not reflect the deduction of fees, sales charges, or taxes that you would pay on fund distributions or the redemption of fund shares. Wasatch does not charge any sales fees.
15
| | |
| Wasatch Global Select Fund (WAGSX / WGGSX) | | MARCH 31, 2022 (Unaudited) |
Management Discussion
The Wasatch Global Select Fund is managed by a team of Wasatch portfolio managers led by Ken Applegate, Paul Lambert, Linda Lasater and Mike Valentine.
| | | | |
Ken Applegate, CFA Portfolio Manager 
Linda Lasater, CFA Portfolio Manager | |
Paul Lambert Portfolio Manager
Mike Valentine Portfolio Manager | | OVERVIEW The first quarter was a tough period for global equities. Inflation, rising int erest rates, the spread of Covid-19’s Omicron variant and Russia’s invasion of Ukraine each played a role in sparking volatility and driving stocks lower. In this environment, The Wasatch Global Select Fund—Investor Class declined -16.87% |
and underperformed its benchmark, the MSCI AC (All Country) World Index, which was down -5.36%.
At a broad level, we think there were three main reasons for the Fund’s underperformance. First, our group of stocks as a whole had strong gains over the preceding couple of years—so an eventual period of consolidation was to be expected. Second, the prospect of continually rising interest rates was perceived to be especially detrimental to long-duration growth companies whose earnings and cash flows are more heavily weighted further into the future. Third, the war in Ukraine boosted commodity prices and general inflationary pressures, which was beneficial to the stocks of many energy and materials companies. This was detrimental to performance relative to the benchmark because the Fund typically avoids energy and materials companies, which often possess undifferentiated business models and few competitive advantages, in our view.
DETAILS OF THE QUARTER
The greatest detractor from Fund performance in the first quarter was TCS Group Holding PLC, GDR, our sole position in Russia. TCS is the holding company for Tinkoff Bank, Russia’s largest digital bank. The repercussions of Russia’s attack on Ukraine overwhelmed what we had believed to be strong business fundamentals, and the stock sold off with the rest of the Russian equity market. We were unable to exit our position in the company before trading in depositary receipts of Russian stocks was halted. However, as of March 31, 2022, TCS was a minuscule position in the Fund.
Silergy Corp. was another large detractor from performance. The stock price declined amid a broader selloff in technology shares, as rising interest rates caused some
investors to reassess the valuations of growth-oriented companies. Nothing has fundamentally changed for the business, however. The company manufactures high-performance mixed-signal and analog integrated circuits used in a wide array of electronic devices. We continue to believe Silergy’s business model—which is based on complex, analog-design engineering—is difficult to replicate, and provides the company with ample headroom for growth.
HealthEquity, Inc. was a notable contributor to performance. The company is the largest U.S. non-bank custodian for health-savings accounts (HSAs). Account holders have online access to their tax-advantaged HSAs and can compare treatment options, pay medical bills, earn wellness incentives, and receive personalized benefit and clinical information. HealthEquity reported strong growth in its HSA business, with total HSA assets up 37% year-over-year and 25% growth in the number of HSAs on the company’s platform. Management’s upwardly revised forecasts for revenues and earnings in the current fiscal year also cheered investors. We believe HealthEquity is largely insulated from supply-chain constraints and rising materials costs. The company also appears well-positioned for an environment of higher interest rates.
We also like Monolithic Power Systems, Inc., a specialized analog semiconductor manufacturer. Monolithic develops custom analog products to solve unique and difficult problems for its customers. We believe its proprietary manufacturing process is a competitive advantage for the firm. We also like that the company is focused on a variety of growing end markets, and that its parts are mission-critical for customers but represent a relatively low cost for those businesses. In our view, this should give Monolithic a high degree of pricing power.
OUTLOOK
It’s certainly possible that market volatility will continue based on the macro events already described and new ones that may emerge. But as long-term investors, we won’t be shaken out of our well-researched positions. In fact, with stock prices having come down and with the well-publicized gap between growth and value having narrowed, our conviction in our names has only increased. That conviction is underpinned by extensive due diligence and conversations with management teams across the globe in recent months.
Looking across the portfolio, we like how our businesses have responded to obstacles such as supply-chain disruptions and rising costs. We believe many of our companies have made competitive inroads and positioned themselves for even better market-share gains. We look forward to seeing these firms execute their business plans in the months and years ahead.
Thank you for the opportunity to manage your assets.
Current and future holdings are subject to risk.
16
| | |
| Wasatch Global Select Fund (WAGSX / WGGSX) | | MARCH 31, 2022 (Unaudited) |
Portfolio Summary
AVERAGE ANNUAL TOTAL RETURNS
| | | | | | | | | | | | | | | |
| | | |
| | | Six Months
(Not annualized) | | 1 Year | | Since Inception 10/1/2019 |
| | | |
Global Select (WAGSX) — Investor | | | | –16.54% | | | | | –4.88% | | | | | 11.85% | |
| | | |
Global Select (WGGSX) — Institutional | | | | –16.34% | | | | | –4.48% | | | | | 12.27% | |
| | | |
MSCI AC World Index | | | | 0.96% | | | | | 7.28% | | | | | 15.09% | |
Data show past performance, which is not indicative of future performance. Current performance may be lower or higher than the performance quoted. To obtain the most recent month-end performance data available, please visit wasatchglobal.com. The Advisor may absorb certain Fund expenses, without which total returns would have been lower. Investment returns and principal value will fluctuate and shares, when redeemed, may be worth more or less than their original cost.
As of the January 31, 2022 prospectus, the Total Annual Fund Operating Expenses for the Wasatch Global Select Fund are Investor Class—Gross: 2.17%, Net: 1.35% / Institutional Class—Gross: 1.56%, Net: 0.95%. The expense ratio shown elsewhere in this report may be different. Net expenses are based on Fund expenses, net of waivers and reimbursements. See the prospectus for additional information regarding Fund expenses.
Wasatch will deduct a 2.00% redemption fee on Fund shares held 60 days or less. Performance data do not reflect the deduction of fees, including sales charges, or the taxes you would pay on fund distributions or the redemption of fund shares. Fees and taxes, if reflected, would reduce the performance quoted. Wasatch does not charge any sales fees. For more complete information including charges, risks and expenses, read the prospectus carefully.
Investing in foreign securities, especially in emerging and frontier markets, entails special risks, such as currency fluctuations and political uncertainties, which are described in more detail in the prospectus. Investing in small cap funds will be more volatile and loss of principal could be greater than investing in large cap or more diversified funds. Being non-diversified, the Fund can invest a larger portion of its assets in the stocks of a limited number of companies than a diversified fund. Non-diversification increases the risk of loss to the Fund if the values of these securities decline.
TOP 10 EQUITY HOLDINGS*
| | | | |
| |
| Company | | % of Net Assets | |
| |
Roper Technologies, Inc. | | | 4.5% | |
| |
Amphenol Corp., Class A | | | 4.3% | |
| |
Morningstar, Inc. | | | 4.2% | |
| |
Bajaj Finance Ltd. | | | 4.2% | |
| |
Copart, Inc. | | | 4.0% | |
| | | | |
| |
| Company | | % of Net Assets | |
| |
Bank OZK | | | 3.9% | |
| |
HDFC Bank Ltd. | | | 3.9% | |
| |
ICON PLC | | | 3.7% | |
| |
Assa Abloy AB, Class B | | | 3.7% | |
| |
Abcam PLC | | | 3.7% | |
| * | As of March 31, 2022, there were 36 holdings in the Fund. Foreign currency contracts, written options and repurchase agreements, if any, are not included in the number of holdings. Portfolio holdings are subject to change at any time. References to specific securities should not be construed as recommendations by the Funds or their Advisor. Current and future holdings are subject to risk. |
SECTOR BREAKDOWN**
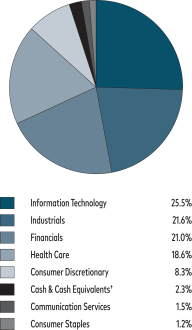
| ** | Excludes securities sold short and options written, if any. |
| † | Also includes Other Assets & Liabilities. |
GROWTH OF A HYPOTHETICAL $10,000 INVESTMENT
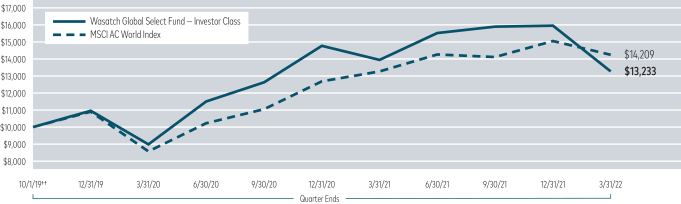
††Inception: October 1, 2019. Past performance does not predict future performance. The graph above does not reflect the deduction of fees, sales charges, or taxes that you would pay on fund distributions or the redemption of fund shares. Wasatch does not charge any sales fees.
17
| | |
| Wasatch Global Value Fund (FMIEX / WILCX) | | MARCH 31, 2022 (Unaudited) |
Management Discussion
The Wasatch Global Value Fund is managed by a team of Wasatch portfolio managers led by David Powers.
| | |

David Powers, CFA Lead Portfolio Manager | | OVERVIEW The Wasatch Global Value Fund—Investor Class gained 2.37% in the first quarter of 2022, outperforming its primary benchmark, the MSCI AC (All Country) World Value Index, which lost -0.95%. Global equities finished the quarter in negative territory. Entering the period, market participants were closely |
monitoring statements from U.S. Federal Reserve (Fed) officials regarding the trajectory for interest-rate increases. Investors expected the Fed to raise its lending rate by a quarter-point at least twice during 2022. Russia’s invasion of Ukraine in late February raised the prospect of continued disruptions to global supply chains and dimmed the outlook for global growth. Sanctions imposed on Russia by the United States and Europe spurred a spike in the price of oil and other commodities, throwing additional fuel on the inflationary fire. As a result, investors anticipated that many of the world’s central banks would set a more aggressive course for raising interest rates. Against this backdrop, stocks trended lower before bottoming in early March and rallying to recover a portion of their earlier losses.
DETAILS OF THE QUARTER
Stock selections in commodity-oriented sectors like energy, materials and industrials as well as more defensive areas like consumer staples, health care and utilities contributed to the Fund’s outperformance of the benchmark in the first quarter. The Fund’s overweight position in energy was also beneficial. Financials were the primary area of weakness for the Fund as our holdings in aggregate posted a loss.
We maintained our U.S. exposure at about half of the portfolio, and these holdings outperformed many other countries in which the Fund had investments. As a reminder, our investment process is driven by bottom-up, fundamental analysis of individual companies. Although we consider macro factors, our country weightings have more to do with the companies we own and the industries they operate in as opposed to the countries where they’re domiciled. As a result, our country weightings may differ quite a bit from the benchmark’s weightings.
The leading contributor to Fund performance for the quarter was energy exploration and production company EOG Resources, Inc. EOG benefited from the rise in energy prices in recent quarters, and an additional jump in prices as a result of Russia’s invasion of Ukraine. Moreover, EOG reported strong earnings and cash flow while declaring a special dividend. We trimmed the position as part of managing the Fund’s overweight exposure to energy, but our outlook remains positive.
Within materials, shares of Anglo American PLC also finished notably higher. This miner is a major producer of industrial metals including platinum, copper and nickel—metals also produced by Russia and Ukraine. As such, the company has been a prime beneficiary of the ongoing commodity squeeze created by the war and subsequent sanctions on Russia.
On the downside, shares of ING Groep NV, ADR lagged as the Dutch multinational bank reported a slight earnings miss driven by higher costs and loan-loss provisions. More broadly, sentiment with respect to European banks was negatively impacted as investors worried the European Central Bank would push back plans to raise interest rates in the wake of Russia’s invasion of Ukraine. We added to the position as we regard ING as well-positioned to return substantial capital to shareholders over the next few years and we viewed the stock as having become overly discounted and inexpensive.
Expectations of higher mortgage rates and slower growth hurt shares of U.K. homebuilder Bellway PLC. In addition, the British government is requiring builders to remediate fire-safety issues in existing apartment buildings constructed as long as 30 years ago. As a result, builders are being hit with substantial incremental costs as they comply with the government mandate. We added to our position on the view that the stock had become deeply oversold.
OUTLOOK
We expect current macro forces to continue weighing on markets over the next several quarters. When approaching a likely economic slowdown, companies with the ability to sustain their growth normally come into favor. However, the valuation disparity between growth and value stocks remains historically high, with growth still expensive relative to value. Within our valuation-based framework and process, we have been gradually reducing the cyclicality of the portfolio by favoring more stable companies and high dividend yields. We expect to keep our U.S. weighting at roughly half of the portfolio.
As for commodities, we believe energy prices will remain elevated as demand remains strong and additional supply will take some time to come online. We trimmed some holdings during the quarter but maintained our overall exposure to the energy sector. It’s likely that the prices of other commodities will also remain high throughout 2022 due to strong demand and disrupted supply.
While the markets may experience volatility in response to a shifting macroeconomic and geopolitical backdrop, we’ll continue to adhere to our fundamental discipline in selecting stocks.
Thank you for the opportunity to manage your assets.
Current and future holdings are subject to risk.
18
| | |
| Wasatch Global Value Fund (FMIEX / WILCX) | | MARCH 31, 2022 (Unaudited) |
Portfolio Summary
AVERAGE ANNUAL TOTAL RETURNS
| | | | | | | | | | | | | | | | | | | | |
| | | | |
| | | Six Months
(Not annualized) | | 1 Year | | 5 Years | | 10 Years |
| | | | |
Global Value (FMIEX) — Investor | | | | 9.54% | | | | | 11.45% | | | | | 9.32% | | | | | 9.36% | |
| | | | |
Global Value (WILCX) — Institutional | | | | 9.64% | | | | | 11.75% | | | | | 9.52% | | | | | 9.52% | |
| | | | |
MSCI AC World Value Index | | | | 5.26% | | | | | 8.83% | | | | | 7.46% | | | | | 7.64% | |
| | | | |
MSCI AC World Index | | | | 0.96% | | | | | 7.28% | | | | | 11.64% | | | | | 10.00% | |
Data show past performance, which is not indicative of future performance. Current performance may be lower or higher than the performance quoted. To obtain the most recent month-end performance data available, please visit wasatchglobal.com. The Advisor may absorb certain Fund expenses, without which total returns would have been lower. Investment returns and principal value will fluctuate and shares, when redeemed, may be worth more or less than their original cost.
As of the January 31, 2022 prospectus, the Total Annual Fund Operating Expenses for the Wasatch Global Value Fund are Investor Class—Gross: 1.18%, Net: 1.10% / Institutional Class—Gross: 1.43%, Net: 0.99%. The expense ratio shown elsewhere in this report may be different. Net expenses are based on Fund expenses, net of waivers and reimbursements. See the prospectus for additional information regarding Fund expenses.
Wasatch will deduct a 2.00% redemption fee on Fund shares held 60 days or less. Performance data do not reflect the deduction of fees, including sales charges, or the taxes you would pay on fund distributions or the redemption of fund shares. Fees and taxes, if reflected, would reduce the performance quoted. Wasatch does not charge any sales fees. For more complete information including charges, risks and expenses, read the prospectus carefully.
Performance for the Institutional Class prior to 1/31/2012 is based on the performance of the Investor Class. Performance of the Fund’s Institutional Class prior to 1/31/2012 uses the actual expenses of the Fund’s Investor Class without any adjustments. For any such period of time, the performance of the Fund’s Institutional Class would have been substantially similar to, yet higher than, the performance of the Fund’s Investor Class, because the shares of both classes are invested in the same portfolio of securities, but the classes bear different expenses.
Investments in value stocks can perform differently from the market as a whole and from other types of stocks and can continue to be undervalued by the market for long periods of time. Investing in foreign securities entails special risks, such as currency fluctuations and political uncertainties, which are described in more detail in the prospectus. Loss of principal is a risk of investing.
TOP 10 EQUITY HOLDINGS*
| | | | |
| |
| Company | | % of Net Assets | |
| |
Johnson & Johnson | | | 4.8% | |
| |
Verizon Communications, Inc. | | | 4.2% | |
| |
Muenchener Rueckversicherungs-Gesellschaft AG in Muenchen | | | 3.7% | |
| |
Suncor Energy, Inc. | | | 3.6% | |
| |
TotalEnergies SE | | | 3.6% | |
| | | | |
| |
| Company | | % of Net Assets | |
| |
Duke Energy Corp. | | | 3.6% | |
| |
Union Pacific Corp. | | | 3.4% | |
| |
Axis Capital Holdings Ltd. | | | 3.3% | |
| |
JPMorgan Chase & Co. | | | 3.3% | |
| |
Bristol-Myers Squibb Co. | | | 3.3% | |
| * | As of March 31, 2022, there were 36 holdings in the Fund. Foreign currency contracts, written options and repurchase agreements, if any, are not included in the number of holdings. Portfolio holdings are subject to change at any time. References to specific securities should not be construed as recommendations by the Funds or their Advisor. Current and future holdings are subject to risk. |
SECTOR BREAKDOWN**
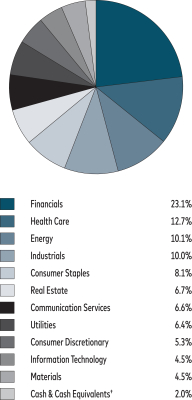
| ** | Excludes securities sold short and options written, if any. |
| † | Also includes Other Assets & Liabilities. |
GROWTH OF A HYPOTHETICAL $10,000 INVESTMENT
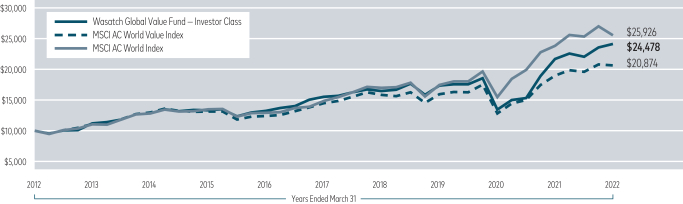
Past performance does not predict future performance. The graph above does not reflect the deduction of fees, sales charges, or taxes that you would pay on fund distributions or the redemption of fund shares. Wasatch does not charge any sales fees.
19
| | |
| Wasatch Greater China Fund (WAGCX / WGGCX) | | MARCH 31, 2022 (Unaudited) |
Management Discussion
The Wasatch Greater China Fund is managed by a team of Wasatch portfolio managers led by Dan Chace, Allison He, Pedro Huerta, Kai Pan and Kevin Unger.
| | | | |
Dan Chace, CFA Lead Portfolio Manager 
Kai Pan, PhD Associate Portfolio Manager | | 
Allison He, CFA Associate Portfolio Manager
Kevin Unger, CFA Associate Portfolio Manager | | 
Pedro Huerta, CFA Associate Portfolio Manager |
OVERVIEW
Chinese stocks hit a six-year low during the period. Investors were rattled by several concerns including a resurgence of Covid-19 cases, regulatory crackdowns from Beijing, the potential delisting of Chinese companies from U.S. exchanges and rising geopolitical tensions with the West. In this environment, the Wasatch Greater China Fund—Investor Class declined -18.20% and underperformed its benchmark, the MSCI China Index, which was down -14.19%.
DETAILS OF THE QUARTER
The top-performing sectors within the Index were energy and financials. The Fund’s lack of exposure to energy and our stock selections in financials detracted from performance relative to the benchmark during the period. Meanwhile, the information-technology (IT) and health-care sectors were the biggest laggards. Our overweight positions in these sectors hindered relative performance.
The largest detractor from Fund performance was Silergy Corp. The stock price declined amid a global slump in technology shares, as rising interest rates caused some investors to reassess the valuations of growth-oriented companies. Nothing has fundamentally changed for the business, however. The company manufactures high-performance mixed-signal and analog integrated circuits. We continue to believe Silergy’s business model—which is based on complex, analog-design engineering—is difficult to replicate and provides the company with ample headroom for growth.
Wuxi Biologics Cayman, Inc. was another detractor. A Chinese contract development and manufacturing firm, Wuxi helps create biological medicines and provides value-added services to pharmaceutical companies. Its stock was down after the U.S. Department of Commerce added two Wuxi
subsidiaries to its unverified list, which means the department can’t verify how Wuxi is using the products it imports. The company has explained that the department had approved its imports of hardware controllers for bioreactors and hollow-fiber filters for years, but due to the pandemic, it hadn’t been able to conduct its normal, on-site approval process. We expect a resolution of the issue and continue to like Wuxi’s role in the complex process of researching, developing and manufacturing biologic treatments.
SG Micro Corp. was a top contributor. The stock was up after the company pre-released full-year earnings that showed impressive growth for the year. We like the semiconductor manufacturer and distributor for its expertise in analog semiconductors, which are distributed in a wide range of products. Further, we think SG Micro may benefit as the Chinese government seeks to localize its semiconductor supply chain.
AIA Group Ltd. also contributed. The stock was up after the company announced its first-ever share buyback on the heels of better-than-expected growth in 2021. We continue to like the management team of the Hong Kong-based provider of insurance products and services. We also think the company stands to benefit from China’s rising middle class that is seeking to protect its wealth.
OUTLOOK
Between regulatory scrutiny, the re-emergence of Covid-19, heightened geopolitical tensions and potential U.S. delistings, there has been plenty of negative news hanging over China’s equity markets. The degree to which these factors are priced into stocks is a key debate.
As bottom-up investors, business fundamentals guide our decisions more than macroeconomic or geopolitical viewpoints. However, we’re attuned to the risks noted above and we’ve positioned the Fund accordingly. We made a decision years ago to invest only in H-shares, which we believe should help insulate the Fund from some of the risks posed by possible U.S. delistings. We’re also underweight relative to our benchmark in the large internet platforms that are in China’s regulatory crosshairs.
Regarding geopolitical tensions, we have exposure to companies that may benefit from China’s efforts to become more economically independent. For example, we own companies that play a vital role in the supply chain for semiconductors, an industry whose security was highlighted in the government’s five-year plan.
Going forward, we believe it’s important to look past the volatility and take a long-term view of Chinese equities. The world’s second-largest economy is still a major source of innovation and economic growth, and China remains an inefficient market where active investors can add alpha. With stocks of high-quality Chinese growth companies trading at the low range of their historic price/earnings multiples, we believe that opportunity has only increased, and we’ll try to use any volatility to the Fund’s advantage.
Thank you for the opportunity to manage your assets.
Current and future holdings are subject to risk.
20
| | |
| Wasatch Greater China Fund (WAGCX / WGGCX) | | MARCH 31, 2022 (Unaudited) |
Portfolio Summary
AVERAGE ANNUAL TOTAL RETURNS
| | | | | | | | | | | | | | | |
| | | |
| | | Six Months (Not annualized) | | 1 Year | | Since Inception
11/30/2020 |
| | | |
Greater China (WAGCX) — Investor | | | | –19.53% | | | | | –25.66% | | | | | –16.15% | |
| | | |
Greater China (WGGCX) — Institutional | | | | –19.76% | | | | | –25.73% | | | | | –16.38% | |
| | | |
MSCI China Index | | | | –19.39% | | | | | –32.54% | | | | | –24.31% | |
Data show past performance, which is not indicative of future performance. Current performance may be lower or higher than the performance quoted. To obtain the most recent month-end performance data available, please visit wasatchglobal.com. The Advisor may absorb certain Fund expenses, without which total returns would have been lower. Investment returns and principal value will fluctuate and shares, when redeemed, may be worth more or less than their original cost.
As of the January 31, 2022 prospectus, the Total Annual Fund Operating Expenses for the Wasatch Greater China Fund are Investor Class—Gross: 3.76%, Net: 1.51% / Institutional Class—Gross: 3.09%, Net: 1.26%. The expense ratio shown elsewhere in this report may be different. Net expenses are based on Fund expenses, net of waivers and reimbursements. See the prospectus for additional information regarding Fund expenses.
Wasatch will deduct a 2.00% redemption fee on Fund shares held 60 days or less. Performance data do not reflect the deduction of fees, including sales charges, or the taxes you would pay on fund distributions or the redemption of fund shares. Fees and taxes, if reflected, would reduce the performance quoted. Wasatch does not charge any sales fees. For more complete information including charges, risks and expenses, read the prospectus carefully.
Investing in small cap funds will be more volatile and loss of principal could be greater than investing in large cap or more diversified funds. Investing in foreign securities, especially in emerging markets, entails special risks, such as unstable currencies, highly volatile securities markets and political and social instability, which are described in more detail in the prospectus. Being non-diversified, the Fund can invest a larger portion of its assets in the stocks of a limited number of companies than a diversified fund. Non-diversification increases the risk of loss to the Fund if the values of these securities decline.
The Fund is subject to risks associated with investments in the Greater China Region that could affect the value of your investment. The Fund may invest in securities through the China Stock Connect programs, which subject the Fund to unique accessibility risks affecting the Fund’s ability to efficiently execute its strategy. These risks are described in more detail in the prospectus.
TOP 10 EQUITY HOLDINGS*
| | | | |
| |
| Company | | % of Net Assets | |
| |
Chailease Holding Co. Ltd. | | | 8.9% | |
| |
Silergy Corp. | | | 8.5% | |
| |
Techtronic Industries Co. Ltd. | | | 6.4% | |
| |
Sino Wealth Electronic Ltd., Class A | | | 5.9% | |
| |
SG Micro Corp., Class A | | | 5.4% | |
| | | | |
| |
| Company | | % of Net Assets | |
| |
Shenzhen Mindray Bio-Medical Electronics Co. Ltd., Class A | | | 4.9% | |
| |
China Merchants Bank Co. Ltd., Class H | | | 4.3% | |
| |
AIA Group Ltd. | | | 4.3% | |
| |
Hangzhou Tigermed Consulting Co. Ltd., Class A | | | 4.2% | |
| |
Wuxi Biologics Cayman, Inc. | | | 4.0% | |
| * | As of March 31, 2022, there were 32 holdings in the Fund. Foreign currency contracts, written options and repurchase agreements, if any, are not included in the number of holdings. Portfolio holdings are subject to change at any time. References to specific securities should not be construed as recommendations by the Funds or their Advisor. Current and future holdings are subject to risk. |
SECTOR BREAKDOWN**
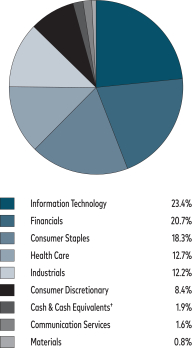
| ** | Excludes securities sold short and options written, if any. |
| † | Also includes Other Assets & Liabilities.. |
GROWTH OF A HYPOTHETICAL $10,000 INVESTMENT
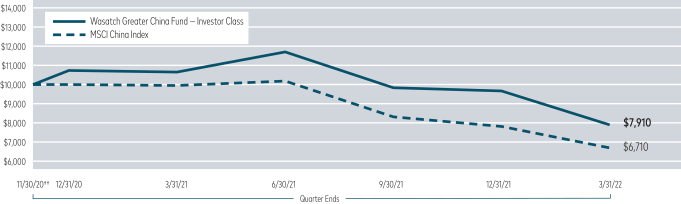
††Inception: November 30, 2020. Past performance does not predict future performance. The graph above does not reflect the deduction of fees, sales charges, or taxes that you would pay on fund distributions or the redemption of fund shares. Wasatch does not charge any sales fees.
21
| | |
| Wasatch International Growth Fund (WAIGX / WIIGX) | | MARCH 31, 2022 (Unaudited) |
Management Discussion
The Wasatch International Growth Fund is managed by a team of Wasatch portfolio managers led by Ken Applegate, Linda Lasater and Derrick Tzau.
| | | | |

Ken Applegate, CFA Lead Portfolio Manager | |
Linda Lasater, CFA Portfolio Manager | | 
Derrick Tzau, CFA Associate Portfolio Manager |
OVERVIEW
International small cap stocks lost ground in the first quarter. Inflation, rising interest rates, the spread of Covid-19’s Omicron variant and Russia’s invasion of Ukraine all played a role in sparking volatility and driving markets lower. In this environment, the Wasatch International Growth Fund—Investor Class declined -16.93% and underperformed the benchmark MSCI AC (All Country) World ex USA Small Cap Index, which was down -6.51%.
While geopolitical and macroeconomic concerns negatively affected stocks broadly, the overwhelming factor driving the Fund’s underperformance relative to its benchmark was a rotation from growth to value stocks. We discuss our views on that shift in our outlook but believe nothing has changed about the underlying fundamentals of our companies.
DETAILS OF THE QUARTER
HeadHunter Group PLC, ADR, our only Russian holding, was the largest detractor from Fund performance for the quarter. We felt the company played a vital role connecting job seekers with employers, and liked the potential of its fee-based, résumé database and job-posting platform for employers and recruiters. Unfortunately, the repercussions of Russia’s attack on Ukraine overwhelmed what we had believed were strong fundamentals for the business, and the stock sold off with the rest of the Russian equity market. Trading of Russian ADRs was suspended before we could divest our shares.
Silergy Corp. was our second-largest detractor. The stock price declined amid a broader selloff in technology shares. Nothing has fundamentally changed for the business, however. The company manufactures high-performance mixed-signal and analog integrated circuits used in a wide array of electronic devices. We continue to believe Silergy’s business model—which is based on complex, analog-design engineering—is difficult to replicate, and provides the company with ample headroom for growth.
Grupo Aeroportuario del Centro Norte SAB de CV, was the top contributor to Fund performance. The company, often referred to as “OMA,” operates international airports in the northern and central regions of Mexico under contracts
with the government. OMA’s stock price has risen in recent months as declining Covid-19 caseloads boosted airport traffic and tariff revenue. Consolidated net income rose 324% in OMA’s most recent quarter on a 65.2% increase in total revenue versus the year-ago period. Total passenger traffic rose 62.1%, recovering to about 10% below pre-Covid levels.
MonotaRO Co. Ltd. was the second-largest contributor. The company is an online-only distributor of maintenance, repair and operations (MRO) supplies for a number of industries. The stock enjoyed strong performance in the early phases of the pandemic, due to heightened demand for the personal-protection equipment the company sells to health-care industries. The pandemic pulled forward demand for such supplies, and the stock gave back much of those gains in 2021. With the height of the pandemic in the rearview mirror, the company has cycled past a tough period for earnings comparisons. A strong earnings report in its most recent quarter reaffirmed to us the durability and economic resiliency of MonotaRO’s business model. We continue to like the firm’s online sales and distribution model, which offers convenience and price transparency, and has been disruptive to the inefficient networks of MRO suppliers and wholesalers that traditionally served Japanese businesses.
OUTLOOK
While the first quarter was a tough one for our investment style, we’re not letting a short period undermine our focus on high-quality growth companies. During a broad rotation from growth to value stocks, investors were indiscriminate, and the stocks of both high-quality growth companies and more speculative businesses—those with high growth but tenuous, unproven business models—sold off in unison.
After the rotation, the valuation gap between growth and value stocks has narrowed considerably. From here, we’d expect some differentiation between high-quality growth stocks and those that are more speculative. In our view, what’s most important now is to dig deep, and make sure the underlying investment thesis for each holding remains intact. In nearly every case, we’ve found it is.
Going forward, we’ll focus most on the underlying fundamentals of our businesses and stay attuned to any macroeconomic risks they face. But in general, we think they’re well positioned to manage current macroeconomic headwinds. We believe our companies have pricing power that should help them pass through rising input and labor costs. They also possess strong balance sheets that should allow them to continue their strategic growth initiatives and even press their advantages relative to competitors if the economic environment softens. We look forward to seeing how these companies execute their business plans in the months and years ahead.
Thank you for the opportunity to manage your assets.
Current and future holdings are subject to risk.
22
| | |
| Wasatch International Growth Fund (WAIGX / WIIGX) | | MARCH 31, 2022 (Unaudited) |
Portfolio Summary
AVERAGE ANNUAL TOTAL RETURNS
| | | | | | | | | | | | | | | | | | | | |
| | | | |
| | | Six Months
(Not annualized) | | 1 Year | | 5 Years | | 10 Years |
| | | | |
International Growth (WAIGX) — Investor | | | | –17.59% | | | | | –6.42% | | | | | 8.69% | | | | | 8.63% | |
| | | | |
International Growth (WIIGX) — Institutional | | | | –17.55% | | | | | –6.35% | | | | | 8.80% | | | | | 8.70% | |
| | | | |
MSCI AC World ex USA Small Cap Index | | | | –5.94% | | | | | 0.03% | | | | | 7.89% | | | | | 7.28% | |
| | | | |
MSCI World ex USA Small Cap Index | | | | –6.87% | | | | | –1.69% | | | | | 7.79% | | | | | 7.78% | |
Data show past performance, which is not indicative of future performance. Current performance may be lower or higher than the performance quoted. To obtain the most recent month-end performance data available, please visit wasatchglobal.com. The Advisor may absorb certain Fund expenses, without which total returns would have been lower. Investment returns and principal value will fluctuate and shares, when redeemed, may be worth more or less than their original cost.
As of the January 31, 2022 prospectus, the Total Annual Fund Operating Expenses for the Wasatch International Growth Fund are Investor Class: 1.41% / Institutional Class: 1.32%. The expense ratio shown elsewhere in this report may be different. Net expenses are based on Fund expenses, net of waivers and reimbursements. See the prospectus for additional information regarding Fund expenses.
Wasatch will deduct a 2.00% redemption fee on Fund shares held 60 days or less. Performance data do not reflect the deduction of fees, including sales charges, or the taxes you would pay on fund distributions or the redemption of fund shares. Fees and taxes, if reflected, would reduce the performance quoted. Wasatch does not charge any sales fees. For more complete information including charges, risks and expenses, read the prospectus carefully.
Performance for the Institutional Class prior to 2/1/2016 is based on the performance of the Investor Class. Performance of the Fund’s Institutional Class prior to 2/1/2016 uses the actual expenses of the Fund’s Investor Class without any adjustments. For any such period of time, the performance of the Fund’s Institutional Class would have been substantially similar to, yet higher than, the performance of the Fund’s Investor Class, because the shares of both classes are invested in the same portfolio of securities, but the classes bear different expenses.
Investing in foreign securities, especially in frontier and emerging markets, entails special risks, such as currency fluctuations and political uncertainties, which are described in more detail in the prospectus. Investing in small cap funds will be more volatile and loss of principal could be greater than investing in large cap or more diversified funds.
TOP 10 EQUITY HOLDINGS*
| | | | |
| |
| Company | | % of Net Assets | |
| |
JMDC, Inc. | | | 3.7% | |
| |
BayCurrent Consulting, Inc. | | | 3.1% | |
| |
Abcam PLC | | | 3.0% | |
| |
Voltronic Power Technology Corp. | | | 2.7% | |
| |
Electrocomponents PLC | | | 2.6% | |
| | | | |
| |
| Company | | % of Net Assets | |
| |
Reply SpA | | | 2.5% | |
| |
Descartes Systems Group, Inc. | | | 2.5% | |
| |
Silergy Corp. | | | 2.3% | |
| |
Diploma PLC | | | 2.1% | |
| |
Endava PLC, ADR | | | 2.0% | |
| * | As of March 31, 2022, there were 72 holdings in the Fund. Foreign currency contracts, written options and repurchase agreements, if any, are not included in the number of holdings. Portfolio holdings are subject to change at any time. References to specific securities should not be construed as recommendations by the Funds or their Advisor. Current and future holdings are subject to risk. |
SECTOR BREAKDOWN**
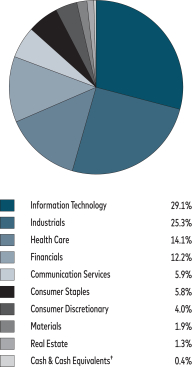
| ** | Excludes securities sold short and options written, if any. |
| † | Also includes Other Assets & Liabilities. |
GROWTH OF A HYPOTHETICAL $10,000 INVESTMENT
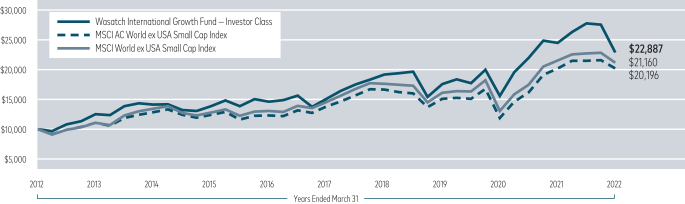
Past performance does not predict future performance. The graph above does not reflect the deduction of fees, sales charges, or taxes that you would pay on fund distributions or the redemption of fund shares. Wasatch does not charge any sales fees.
23
| | |
| Wasatch International Opportunities Fund (WAIOX / WIIOX) | | MARCH 31, 2022 (Unaudited) |
Management Discussion
The Wasatch International Opportunities Fund is managed by a team of Wasatch portfolio managers led by Linda Lasater, Dan Chace and Allison He.
| | | | |
Linda Lasater, CFA Lead Portfolio Manager | |
Dan Chace, CFA Portfolio Manager | |
Allison He, CFA Associate Portfolio Manager |
OVERVIEW
International micro cap stocks lost ground in the first quarter. Inflation, rising interest rates, the spread of Covid-19’s Omicron variant and Russia’s invasion of Ukraine all played a role in sparking volatility and driving markets lower. In this environment, the Wasatch International Opportunities Fund—Investor Class declined -22.25% and underperformed the benchmark MSCI AC (All Country) World ex USA Small Cap Index, which was down -6.51%.
While geopolitical and macroeconomic concerns negatively affected stocks broadly, the overwhelming factor driving the Fund’s underperformance relative to its benchmark was a rotation from growth to value stocks. We discuss our views on that shift more below but believe nothing has changed about the underlying fundamentals of our companies.
DETAILS OF THE QUARTER
HeadHunter Group PLC, ADR, our only Russian holding, was the largest detractor from Fund performance for the quarter. We felt the company played a vital role connecting job seekers with employers, and liked the potential of its fee-based, résumé database and job-posting platform for employers and recruiters. Unfortunately, the repercussions of Russia’s attack on Ukraine overwhelmed what we had believed were strong fundamentals for the business, and the stock sold off with the rest of the Russian equity market. Trading of Russian ADRs was suspended before we could divest our shares. As of quarter end, the position was a minuscule weight in the Fund.
Our second-largest detractor was Esker SA. Like other high-quality growth stocks in the Fund, Esker traded down as rising interest rates caused some investors to reassess the valuations of high-growth companies. However, nothing has fundamentally changed about the French information-technology company. Esker offers software systems—for example, an artificial-intelligence-powered cloud interface—that support a variety of back-office business-management tasks related to the cash conversion cycle. We believe Esker has a strong position in the office-automation space and think the company will continue to benefit from the digital-transformation movement and the need to improve back-office efficiencies.
Qualitas Controladora SAB de CV was the Fund’s top contributor to performance for the quarter. The company is the leading issuer of automotive insurance in Mexico. Qualitas benefited during the worst of the Covid-19 pandemic as customers working from home were involved in fewer traffic accidents. As the economy reopened, the stock declined as investors anticipated more driving and, consequently, a greater number of auto-insurance claims. In January, the stock rebounded in anticipation of more normal economic conditions going forward. We continue to like Qualitas’ long-term growth potential, given the low penetration of auto insurance in Mexico.
Direct Marketing MiX, Inc. was also a strong contributor during the period. The stock declined with the broader Japanese equity market in early 2022 but enjoyed a significant rebound in March. Direct Marketing MiX provides sales, marketing and business-process outsourcing for Japanese companies. We believe the company has carved out a unique niche in Japan, handling low-ticket sales for businesses that don’t want to hire to create their own expensive, consumer-facing physical sales footprint. We also believe management has created a differentiated labor model under which employees are trained to become highly productive sales agents.
OUTLOOK
While the first quarter was a tough one for our investment style, we’re not letting a short period undermine our focus on high-quality growth companies. During a broad rotation from growth to value stocks, investors were indiscriminate, and the stocks of both high-quality growth companies and more speculative businesses—those with high growth but tenuous, unproven business models—sold off in unison.
After the rotation, the valuation gap between growth and value stocks has narrowed considerably. From here, we’d expect some differentiation between high-quality growth stocks and those that are more speculative. In our view, what’s most important now is to dig deep, and make sure the underlying investment thesis for each holding remains intact. In nearly every case, we’ve found it is.
Going forward, we’ll focus most on the underlying fundamentals of our businesses and stay attuned to any macroeconomic risks they face. But in general, we think they’re well positioned to manage current macroeconomic headwinds. We believe our companies have pricing power that should help them pass through rising input and labor costs. They also possess strong balance sheets that should allow them to continue their strategic growth initiatives and even press their advantages relative to competitors if the economic environment softens. We look forward to seeing how these companies execute their business plans in the months and years ahead.
Thank you for the opportunity to manage your assets.
Current and future holdings are subject to risk.
24
| | |
| Wasatch International Opportunities Fund (WAIOX / WIIOX) | | MARCH 31, 2022 (Unaudited) |
Portfolio Summary
AVERAGE ANNUAL TOTAL RETURNS
| | | | | | | | | | | | | | | | | | | | |
| | | | |
| | | Six Months
(Not annualized) | | 1 Year | | 5 Years | | 10 Years |
| | | | |
International Opportunities (WAIOX) — Investor | | | | –24.52% | | | | | –21.69% | | | | | 7.84% | | | | | 9.48% | |
| | | | |
International Opportunities (WIIOX) — Institutional | | | | –24.37% | | | | | –21.58% | | | | | 8.00% | | | | | 9.63% | |
| | | | |
MSCI AC World ex USA Small Cap Index | | | | –5.94% | | | | | 0.03% | | | | | 7.89% | | | | | 7.28% | |
| | | | |
MSCI World ex USA Small Cap Index | | | | –6.87% | | | | | –1.69% | | | | | 7.79% | | | | | 7.78% | |
Data show past performance, which is not indicative of future performance. Current performance may be lower or higher than the performance quoted. To obtain the most recent month-end performance data available, please visit wasatchglobal.com. The Advisor may absorb certain Fund expenses, without which total returns would have been lower. Investment returns and principal value will fluctuate and shares, when redeemed, may be worth more or less than their original cost.
As of the January 31, 2022 prospectus, the Total Annual Fund Operating Expenses for the Wasatch International Opportunities Fund are Investor Class: 1.91% / Institutional Class: 1.89%. The expense ratio shown elsewhere in this report may be different. Net expenses are based on Fund expenses, net of waivers and reimbursements. See the prospectus for additional information regarding Fund expenses.
Wasatch will deduct a 2.00% redemption fee on Fund shares held 60 days or less. Performance data do not reflect the deduction of fees, including sales charges, or the taxes you would pay on fund distributions or the redemption of fund shares. Fees and taxes, if reflected, would reduce the performance quoted. Wasatch does not charge any sales fees. For more complete information including charges, risks and expenses, read the prospectus carefully.
Performance for the Institutional Class prior to 2/1/2016 is based on the performance of the Investor Class. Performance of the Fund’s Institutional Class prior to 2/1/2016 uses the actual expenses of the Fund’s Investor Class without any adjustments. For any such period of time, the performance of the Fund’s Institutional Class would have been substantially similar to, yet higher than, the performance of the Fund’s Investor Class, because the shares of both classes are invested in the same portfolio of securities, but the classes bear different expenses.
Investing in foreign securities, especially in frontier and emerging markets, entails special risks, such as currency fluctuations and political uncertainties, which are described in more detail in the prospectus. Investing in micro cap funds will be more volatile and loss of principal could be greater than investing in large cap or more diversified funds.
TOP 10 EQUITY HOLDINGS*
| | | | |
| |
| Company | | % of Net Assets | |
| |
YouGov PLC | | | 3.7% | |
| |
LEENO Industrial, Inc. | | | 3.3% | |
| |
Aavas Financiers Ltd. | | | 3.0% | |
| |
Voltronic Power Technology Corp. | | | 2.9% | |
| |
Qualitas Controladora SAB de CV | | | 2.8% | |
| | | | |
| |
| Company | | % of Net Assets | |
| |
SIGMAXYZ Holdings, Inc. | | | 2.7% | |
| |
DiscoverIE Group PLC | | | 2.6% | |
| |
JTC PLC | | | 2.6% | |
| |
Johns Lyng Group Ltd. | | | 2.5% | |
| |
Mortgage Advice Bureau Holdings Ltd. | | | 2.2% | |
| * | As of March 31, 2022, there were 83 holdings in the Fund. Foreign currency contracts, written options and repurchase agreements, if any, are not included in the number of holdings. Portfolio holdings are subject to change at any time. References to specific securities should not be construed as recommendations by the Funds or their Advisor. Current and future holdings are subject to risk. |
SECTOR BREAKDOWN**
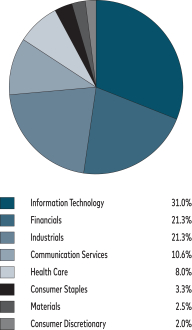
| ** | Excludes securities sold short and options written, if any. |
| † | Also includes Other Assets & Liabilities. |
GROWTH OF A HYPOTHETICAL $10,000 INVESTMENT
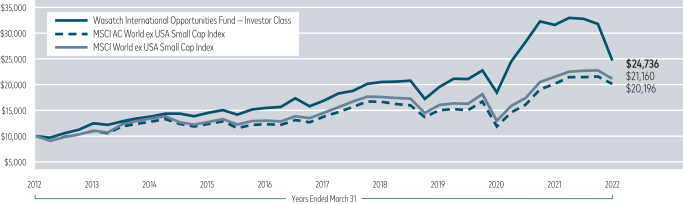
Past performance does not predict future performance. The graph above does not reflect the deduction of fees, sales charges, or taxes that you would pay on fund distributions or the redemption of fund shares. Wasatch does not charge any sales fees.
25
| | |
| Wasatch International Select Fund (WAISX / WGISX) | | MARCH 31, 2022 (Unaudited) |
Management Discussion
The Wasatch International Select Fund is managed by a team of Wasatch portfolio managers led by Ken Applegate, Linda Lasater and Derrick Tzau.
| | | | |
Ken Applegate, CFA Lead Portfolio Manager | |
Linda Lasater, CFA Lead Portfolio Manager | |
Derrick Tzau, CFA Associate Portfolio Manager |
OVERVIEW
International small cap stocks lost ground in the first quarter. Inflation, rising interest rates, the spread of Covid-19’s Omicron variant and Russia’s invasion of Ukraine all played a role in sparking volatility and driving markets lower. In this environment, the Wasatch International Select Fund—Investor Class declined -19.48% and underperformed the benchmark MSCI EAFE Index, which was down -5.91%.
While geopolitical and macroeconomic concerns negatively affected stocks broadly, the overwhelming factor driving the Fund’s underperformance relative to its benchmark was a rotation from growth to value stocks. We discuss that shift in our outlook, but in short, we believe the underlying fundamentals of our companies remain solid. Moreover, we’ve found that market volatility has created attractive buying opportunities among high-quality growth stocks.
DETAILS OF THE QUARTER
Rational AG, a German manufacturer and retailer of cooking appliances, was one of the Fund’s largest detractors from performance in the first quarter. Supply-chain issues and rising input costs are expected to put pressure on profit margins in 2022, and that has negatively affected the stock. We continue to like the company, however. Rational’s strategy has always been to implement periodic price hikes instead of passing through an inflationary cost immediately. While this could pressure margins in the near term, we expect Rational to pass along those costs eventually. Further, we believe rising energy costs and labor shortages reinforce the value proposition of Rational’s appliances, which are energy efficient and less labor intensive than other products on the market.
Another large detractor was JMDC, Inc. JMDC’s stock was one of those hurt by the rotation from growth to value, even though nothing has fundamentally changed for the business. We still have high conviction in the Japanese provider of health, medical and life-insurance data. We continue to believe JMDC will play a vital role in helping Japan’s health-care system achieve better patient outcomes by using data and analytics. That view was perhaps shared by Omron, another device company, which announced it would take an ownership stake in JMDC during the period.
CAE, Inc. was the top contributor to Fund performance for the quarter. This Canadian company provides training services for civil and defense customers globally. In particular, the company enables airlines to lower their operating costs by outsourcing pilot-training programs. Over the past year, CAE has made a concerted effort to strengthen its long-term competitive position. We believe the company’s services will be increasingly desirable as airlines work to chart a path forward. Flight-simulator utilization was stubbornly low during the pandemic, which weighed on CAE’s stock. In the first quarter, however, the stock rose as investors came to anticipate greater demand for CAE’s services in a more normalized business environment.
GMO Payment Gateway, Inc. was up moderately and contributed to Fund performance. The Japanese company provides credit-card transaction services for e-commerce firms. We believe GMO is well-positioned to benefit as the Japanese government takes steps to encourage more cashless transactions. We think the headroom for growth is considerable. Currently, cashless payments account for only about 30% of transactions in Japan, compared to roughly 70% in South Korea and China.
OUTLOOK
While the first quarter was a tough one for our investment style, we’re not letting a short period undermine our focus on high-quality growth companies. During a broad rotation from growth to value stocks, investors were indiscriminate. The stocks of both high-quality growth companies and more speculative businesses—those with high growth but tenuous, unproven business models—sold off in unison.
After the rotation, the valuation gap between growth and value stocks has narrowed considerably. From here, we’d expect some differentiation between high-quality growth stocks and those that are more speculative. In our view, what’s most important now is to dig deep, and make sure the underlying investment thesis for each holding remains intact. We’ve found it is in nearly every case.
Going forward, we’ll focus most on the underlying fundamentals of our businesses and stay attuned to any macroeconomic risks they face. But in general, we think they’re well positioned to manage current macroeconomic headwinds. We believe our companies have pricing power that should help them pass through rising input and labor costs. They also possess strong balance sheets that should allow them to continue their strategic growth initiatives and even press their advantages relative to competitors if the economic environment softens. We look forward to seeing how these companies execute their business plans in the months and years ahead.
Thank you for the opportunity to manage your assets.
Current and future holdings are subject to risk.
26
| | |
| Wasatch International Select Fund (WAISX / WGISX) | | MARCH 31, 2022 (Unaudited) |
Portfolio Summary
AVERAGE ANNUAL TOTAL RETURNS
| | | | | | | | | | | | | | | |
| | | |
| | | Six Months
(Not annualized) | | 1 Year | | Since Inception 10/1/2019 |
| | | |
International Select (WAISX) — Investor | | | | –19.59% | | | | | –9.41% | | | | | 7.67% | |
| | | |
International Select (WGISX) — Institutional | | | | –19.47% | | | | | –9.12% | | | | | 8.13% | |
| | | |
MSCI EAFE Index | | | | –3.38% | | | | | 1.16% | | | | | 8.31% | |
Data show past performance, which is not indicative of future performance. Current performance may be lower or higher than the performance quoted. To obtain the most recent month-end performance data available, please visit wasatchglobal.com. The Advisor may absorb certain Fund expenses, without which total returns would have been lower. Investment returns and principal value will fluctuate and shares, when redeemed, may be worth more or less than their original cost.
As of the January 31, 2022 prospectus, the Total Annual Fund Operating Expenses for the Wasatch International Select Fund are Investor Class—Gross: 3.09%, Net: 1.30% / Institutional Class—Gross: 3.03%, Net: 0.90%. The expense ratio shown elsewhere in this report may be different. Net expenses are based on Fund expenses, net of waivers and reimbursements. See the prospectus for additional information regarding Fund expenses.
Wasatch will deduct a 2.00% redemption fee on Fund shares held 60 days or less. Performance data do not reflect the deduction of fees, including sales charges, or the taxes you would pay on fund distributions or the redemption of fund shares. Fees and taxes, if reflected, would reduce the performance quoted. Wasatch does not charge any sales fees. For more complete information including charges, risks and expenses, read the prospectus carefully
Investing in foreign securities, especially in frontier and emerging markets, entails special risks, such as currency fluctuations and political uncertainties, which are described in more detail in the prospectus. Investing in small cap funds will be more volatile and loss of principal could be greater than investing in large cap or more diversified funds. Being non-diversified, the Fund can invest a larger portion of its assets in the stocks of a limited number of companies than a diversified fund. Non-diversification increases the risk of loss to the Fund if the values of these securities decline.
TOP 10 EQUITY HOLDINGS*
| | | | |
| |
| Company | | % of Net Assets | |
| |
BayCurrent Consulting, Inc. | | | 7.6% | |
| |
JMDC, Inc. | | | 6.6% | |
| |
Amadeus IT Group SA, Class B | | | 5.5% | |
| |
Assa Abloy AB | | | 5.4% | |
| |
CAE, Inc. | | | 5.4% | |
| | | | |
| |
| Company | | % of Net Assets | |
| |
Dassault Systemes SE | | | 5.2% | |
| |
ICON PLC | | | 5.2% | |
| |
Halma PLC | | | 4.3% | |
| |
Abcam PLC | | | 4.1% | |
| |
Coloplast A/S, Class B | | | 4.1% | |
| * | As of March 31, 2022, there were 26 holdings in the Fund. Foreign currency contracts, written options and repurchase agreements, if any, are not included in the number of holdings. Portfolio holdings are subject to change at any time. References to specific securities should not be construed as recommendations by the Funds or their Advisor. Current and future holdings are subject to risk. |
SECTOR BREAKDOWN**
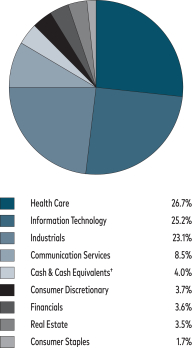
| ** | Excludes securities sold short and options written, if any. |
| † | Also includes Other Assets & Liabilities. |
GROWTH OF A HYPOTHETICAL $10,000 INVESTMENT
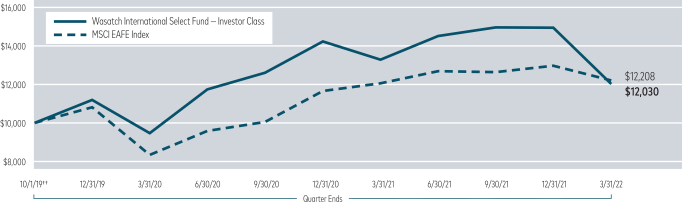
††Inception: October 1, 2019. Past performance does not predict future performance. The graph above does not reflect the deduction of fees, sales charges, or taxes that you would pay on fund distributions or the redemption of fund shares. Wasatch does not charge any sales fees.
27
| | |
| Wasatch Long/Short Alpha Fund (WALSX / WGLSX) | | MARCH 31, 2022 (Unaudited) |
Management Discussion
The Wasatch Long/Short Alpha Fund is managed by a team of Wasatch portfolio managers led by Mick Rasmussen.
| | |

Mick Rasmussen, CFA Lead Portfolio Manager | | OVERVIEW During the first quarter of 2022, the Wasatch Long/Short Alpha Fund—Investor Class fell -10.52% and underperformed the benchmark Russell 2500TM Index, which lost -5.82%. The Fund’s underperformance of the benchmark came mostly from our long positions—while our short positions |
were strong contributors overall.
Because the benchmark has no short positions, we only compare our stock selections to the benchmark positions on the long side. And in this regard, our selections overall were disadvantageous—particularly in software & services, retailing, diversified financials, materials, capital goods and insurance. Conversely, our stock selections were mostly beneficial in health care equipment & services and pharmaceuticals, biotechnology & life sciences.
The Fund takes a “directional” approach, meaning we always have a bias toward greater long exposure than short exposure. As of March 31, the Fund’s long exposure was about 116% and its short exposure was approximately -47%. Our long positions consist of companies we’ve selected based on bottom-up, fundamental research. Our short positions are arrived at through a multifactor quantitative model that includes momentum and valuation signals to determine which companies are conducive for short-selling.
LONG POSITIONS DURING THE QUARTER
Among long positions, a large detractor from Fund performance for the first quarter was Hydrofarm Holdings Group, Inc.—which sells hydroponics equipment and supplies such as lighting, climate regulators and garden accessories for controlled-environment agriculture. In the second half of 2022, we expect to see some business improvement versus prior periods. In the first half, however, the company faces difficult comparisons to 2021. This may have dampened investors’ enthusiasm for Hydrofarm’s shares. In addition, weak crop prices in California have raised concerns about the near-term outlook for sales of the company’s products. The state currently accounts for about 35% of Hydrofarm’s business. Nevertheless, we’re maintaining our position in this relatively inexpensive name despite what we think are temporary—albeit significant—headwinds.
A top contributor to Fund performance for the first quarter was HealthEquity, Inc. The company is the largest U.S. non-bank custodian for health-savings accounts (HSAs). Account holders have online access to their tax-advantaged HSAs and can compare treatment options, pay medical bills, earn wellness incentives, and receive personalized benefit and clinical information. HealthEquity reported strong growth in its HSA business, with total HSA assets increasing 37% year-
over-year and the number of HSAs on the company’s platform up 25% from a year ago. Management’s upwardly revised forecasts for revenues and earnings in the current fiscal year also cheered investors. We believe HealthEquity is largely insulated from supply-chain constraints and rising materials costs, and is well-situated for an environment of higher interest rates.
SHORT POSITIONS DURING THE QUARTER
Turning to short positions, detractors were those stocks that rose in price. For example, within materials, we shorted Century Aluminum Co. and generated a loss as the stock climbed higher. Century produces “primary aluminum,” in both molten and ingot form, through facilities located in West Virginia, South Carolina and Kentucky. The war in Ukraine boosted commodity prices—which benefited companies like Century.
Among shorts, contributors were those stocks that declined in price. We added the most value by shorting stocks in retailing, software & services, automobiles & components and insurance. For example, in retailing, we shorted Vroom, Inc., an online seller of new and used cars, spare parts and accessories. The company also provides maintenance, repair, funding, insurance and vehicle-renting services. While Vroom operates in an important segment of retailing, the company lacks overwhelming competitive advantages, its margins are low, its valuation seems high and its stock has exhibited relatively poor momentum.
OUTLOOK
It’s certainly possible that a heightened level of stock-market volatility will continue based on the macro events already in force and new ones that may emerge. Therefore, we’ve slightly reduced the Fund’s exposure on both the long side and the short side.
Nevertheless, we note that in Wasatch’s experience managing assets for more than 45 years, some of our best investments over long stretches were in stocks that actually spent more time with lagging results than with leading returns. In these cases, the stocks’ briefer periods of outperformance more than compensated for lengthier periods of underperformance. This is why it’s important for investors to avoid being shaken out of their well-researched positions.
In our experience, we’re unlikely to be shaken out of a holding if the company has: (1) a large and growing addressable market; (2) a defensible competitive advantage; (3) a unique business model; and (4) an ability to consistently boost market share. Because we’re pleased with our current long positions based on these characteristics, we haven’t made many changes other than reducing exposure slightly. In fact, with stock prices having come down and with the well-publicized gap between growth and value having narrowed, our conviction in our names has actually increased.
Thank you for the opportunity to manage your assets.
Current and future holdings are subject to risk.
28
| | |
| Wasatch Long/Short Alpha Fund (WALSX / WGLSX) | | MARCH 31, 2022 (Unaudited) |
Portfolio Summary
AVERAGE ANNUAL TOTAL RETURNS
| | | | | | | | | | |
| | |
| | | Six Months
(Not annualized) | | Since Inception
10/1/2021 |
| | |
Long/Short Alpha (WALSX) — Investor | | | | 0.40% | | | | | 0.40% | |
| | |
Long/Short Alpha (WGLSX) — Institutional | | | | 0.50% | | | | | 0.50% | |
| | |
Russell 2500™ Index | | | | –2.22% | | | | | –2.22% | |
| | |
FTSE US 3-Month Treasury Bill Index | | | | 0.04% | | | | | 0.04% | |
Data show past performance, which is not indicative of future performance. Current performance may be lower or higher than the performance quoted. To obtain the most recent month-end performance data available, please visit wasatchglobal.com. The Advisor may absorb certain Fund expenses, without which total returns would have been lower. Investment returns and principal value will fluctuate and shares, when redeemed, may be worth more or less than their original cost.
As of the January 31, 2022 prospectus, the Total Annual Fund Operating Expenses for the Wasatch Long/Short Alpha Fund are Investor Class—Gross: 4.96%, Net: 2.50% / Institutional Class—Gross: 4.06%, Net: 2.25%. The expense ratio shown elsewhere in this report may be different. Net expenses are based on Fund expenses, net of waivers and reimbursements. See the prospectus for additional information regarding Fund expenses.
Wasatch will deduct a 2.00% redemption fee on Fund shares held 60 days or less. Performance data do not reflect the deduction of fees, including sales charges, or the taxes you would pay on fund distributions or the redemption of fund shares. Fees and taxes, if reflected, would reduce the performance quoted. Wasatch does not charge any sales fees. For more complete information including charges, risks and expenses, read the prospectus carefully.
Equity investing involves risks, including potential loss of the principal amount invested. Short selling incurs significant unique risks, including potentially unlimited downside risk, high short-sale related expenses, and unavailability of securities to sell short, among others, all of which could negatively impact the performance of the Fund. Additionally, the Fund may not be able to borrow the securities it intends to sell short.
The Fund’s investments in long and short equity positions expose it to changes in the value of securities, which exceed the value of the Fund’s assets. Investment in the Fund will involve market risks associated with different types of investment decisions than those made for a typical “long only” fund. The Fund relies on quantitative models which entail unique risks, including the risk that a model may be limited or incorrect. These risks are described in more detail in the prospectus.
Being non-diversified, the Fund can invest a larger portion of its assets in the stocks of a limited number of companies than a diversified fund. Non-diversification increases the risk of loss to the Fund if the values of these securities decline.
TOP 10 EQUITY HOLDINGS*
| | | | |
| |
| Company | | % of Net Assets | |
| |
Roper Technologies, Inc. | | | 3.2% | |
| |
Morningstar, Inc. | | | 3.1% | |
| |
Bank OZK | | | 3.0% | |
| |
Balchem Corp. | | | 2.8% | |
| |
Ensign Group, Inc. | | | 2.8% | |
| | | | |
| |
| Company | | % of Net Assets | |
| |
Medpace Holdings, Inc. | | | 2.7% | |
| |
Cognex Corp. | | | 2.6% | |
| |
Monolithic Power Systems, Inc. | | | 2.6% | |
| |
Globant SA | | | 2.4% | |
| |
HealthEquity, Inc. | | | 2.2% | |
| * | As of March 31, 2022, there were 54 long and 51 short positions in the Fund. Foreign currency contracts, written options and repurchase agreements, if any, are not included in the number of positions. Portfolio positions are subject to change at any time. References to specific securities should not be construed as recommendations by the Funds or their Advisor. Current and future positions are subject to risk. |
SECTOR BREAKDOWN**
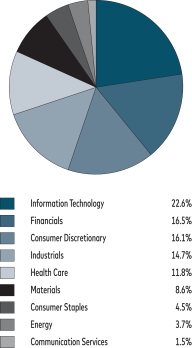
| **Excludes | securities sold short and options written, if any. |
| †Also | includes Other Assets & Liabilities. |
GROWTH OF A HYPOTHETICAL $10,000 INVESTMENT
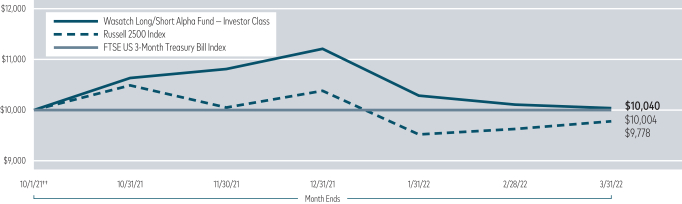
††Inception: October 1, 2021. Past performance does not predict future performance. The graph above does not reflect the deduction of fees, sales charges, or taxes that you would pay on fund distributions or the redemption of fund shares. Wasatch does not charge any sales fees.
29
| | |
| Wasatch Micro Cap Fund (WMICX / WGICX) | | MARCH 31, 2022 (Unaudited) |
Management Discussion
The Wasatch Micro Cap Fund is managed by a team of Wasatch portfolio managers led by Ken Korngiebel and Natalie Pesqué.
| | | | | | |

Ken Komgiebel, CFA Lead Portfolio Manager | | 
Natalie Pesqué, CFA Associate Portfolio Manager | | OVERVIEW The Wasatch Micro Cap Fund—Investor Class declined -19.15% in the first quarter. The Fund was down more than the benchmark Russell |
Microcap® Index, which fell -7.60%. Expectations of higher interest rates slammed growth stocks. Rising interest rates can negatively affect growth companies because the cash flows of these businesses are typically weighted further into the future. Additionally, equities of smaller companies were impacted more than larger companies as investors became more averse to risk.
DETAILS OF THE QUARTER
The Fund’s emphasis of growth over value hurt in two ways. First, our bottom-up focus on dynamic, growing companies naturally results in the Fund being underweight versus the benchmark in the financials, energy and materials sectors. With inflation driving gains in energy and materials stocks and financials declining less than most other sectors, underweights in these areas worked against us in the first quarter.
Second, the Fund’s holdings in information technology (IT), consumer discretionary and industrials declined more than those in the Index. We attribute this to a rotation away from the types of growth stocks we favor.
Health care was a source of strength for the Fund as our group of stocks held up much better than their benchmark counterparts. We look for health-care companies that can address unmet medical needs and create value by reducing health-care costs.
Among individual holdings, the greatest detractor from Fund performance for the quarter was Grid Dynamics Holdings, Inc. The company serves Fortune 1000 businesses by providing digital-transformation consulting and implementation services. We see strong demand for Grid’s services in a digital-revolution era. During the quarter, the stock was down because a portion of Grid’s workers are in Ukraine. At the onset of Russia’s invasion, the company quickly shifted work to other areas and relocated its Ukrainian employees to safer locations. Grid’s recent earnings have been strong and customers haven’t shown signs of decreased spending.
Kornit Digital Ltd. was also a significant detractor. The company makes machines for environmentally sustainable printing on clothing and fabrics. The Covid-19 pandemic highlighted the advantages of Kornit’s on-demand technology,
which reduces the need for inventory on hand and in supply chains. Having run up in price significantly during 2021, the stock pulled back in the first quarter of 2022 amid fears that inflation may force the U.S. Federal Reserve to raise interest rates more aggressively. While other investors pondered this possibility, we considered Kornit’s fundamental strengths—a large and growing addressable market, talented management team, recurring revenue streams and attractive business model with relatively few competitors.
The strongest contributor to Fund performance was Intra-Cellular Therapies, Inc., which develops therapeutics for central nervous system disorders. Intra-Cellular reported robust prescription growth for Caplyta, which was recently approved for the treatment of bipolar depression in adults. Previously labeled for schizophrenia, the drug’s appeal for treating bipolar depression is enhanced by its favorable safety and tolerability profile. Intra-Cellular aims to expand approval for Caplyta to treat major depressive disorder, certain neurologically based sleep disorders and Parkinson’s disease.
Holley, Inc. was also a contributor. The company makes high-performance automotive parts for car and truck enthusiasts. Holley’s loyal customer base, healthy margins and specialized product offerings enable it to pass along higher costs and better withstand the impacts of inflation. Investors reacted positively to Holley’s recent round of acquisitions, which are expected to help unlock large, strategic markets. Holley’s latest earnings report confirmed its organic growth profile, further underpinning confidence in the company’s prospects.
OUTLOOK
Downturns in the stock market create opportunities for us to purchase companies falling back into micro-cap range. We’re familiar with many of these businesses and have previously owned a number of them. In addition, we’re taking a fresh look at compelling companies that in the past didn’t offer rates of return we considered attractive.
We’re unlikely to commit significant assets to areas of the market, such as energy and materials, that historically haven’t been sources of the innovative companies we seek. We also aren’t likely to be swayed by periodic shifts in the types of stocks favored by investors. Our general view regarding such trends is that if they’re truly impactful, they’ll show up in our company-specific fundamental analysis. So, rather than revamp the Fund’s portfolio to more closely resemble the Index, or follow cycles of value versus growth, we’ll accept temporary market volatility and stay focused on business-model quality.
While we don’t know when inflation will turn down and supply chains will begin to function more normally again, we do believe such an environment would be especially good for the types of stocks owned in the Fund.
Thank you for the opportunity to manage your assets.
Current and future holdings are subject to risk.
30
| | |
| Wasatch Micro Cap Fund (WMICX / WGICX) | | MARCH 31, 2022 (Unaudited) |
Portfolio Summary
AVERAGE ANNUAL TOTAL RETURNS
| | | | | | | | | | | | | | | | | | | | |
| | | | |
| | | Six Months
(Not annualized) | | 1 Year | | 5 Years | | 10 Years |
| | | | |
Micro Cap (WMICX) — Investor | | | | –19.51% | | | | | –23.29% | | | | | 21.00% | | | | | 15.49% | |
| | | | |
Micro Cap (WGICX) — Institutional | | | | –19.48% | | | | | –23.22% | | | | | 21.01% | | | | | 15.50% | |
| | | | |
Russell Microcap® Index | | | | –10.05% | | | | | –10.99% | | | | | 9.86% | | | | | 11.14% | |
Data show past performance, which is not indicative of future performance. Current performance may be lower or higher than the performance quoted. To obtain the most recent month-end performance data available, please visit wasatchglobal.com. The Advisor may absorb certain Fund expenses, without which total returns would have been lower. Investment returns and principal value will fluctuate and shares, when redeemed, may be worth more or less than their original cost.
As of the January 31, 2022 prospectus, the Total Annual Fund Operating Expenses for the Wasatch Micro Cap Fund are Investor Class: 1.63% / Institutional Class — Gross: 1.56%. The expense ratio shown elsewhere in this report may be different. Net expenses are based on Fund expenses, net of waivers and reimbursements. See the prospectus for additional information regarding Fund expenses.
Wasatch will deduct a 2.00% redemption fee on Fund shares held 60 days or less. Performance data do not reflect the deduction of fees, including sales charges, or the taxes you would pay on fund distributions or the redemption of fund shares. Fees and taxes, if reflected, would reduce the performance quoted. Wasatch does not charge any sales fees. For more complete information including charges, risks and expenses, read the prospectus carefully.
Performance for the Institutional Class prior to 1/31/2020 is based on the performance of the Investor Class. Performance of the Fund’s Institutional Class prior to 1/31/2020 uses the actual expenses of the Fund’s Investor Class without any adjustments. For any such period of time, the performance of the Fund’s Institutional Class would have been substantially similar to, yet higher than, the performance of the Fund’s Investor Class, because the shares of both classes are invested in the same portfolio of securities, but the classes bear different expenses.
Investing in micro cap funds will be more volatile and loss of principal could be greater than investing in large cap or more diversified funds. Investing in foreign securities, especially in emerging markets, entails special risks, such as currency fluctuations and political uncertainties, which are described in more detail in the prospectus.
TOP 10 EQUITY HOLDINGS*
| | | | |
| |
| Company | | % of Net Assets | |
| |
Vintage Wine Estates, Inc. | | | 4.4% | |
| |
Holley, Inc. | | | 3.9% | |
| |
Transcat, Inc. | | | 3.2% | |
| |
Kornit Digital Ltd. | | | 2.7% | |
| |
CyberArk Software Ltd. | | | 2.7% | |
| | | | |
| |
| Company | | % of Net Assets | |
| |
Castle Biosciences, Inc. | | | 2.7% | |
| |
Addus HomeCare Corp. | | | 2.6% | |
| |
Construction Partners, Inc., Class A | | | 2.6% | |
| |
Helios Technologies, Inc. | | | 2.3% | |
| |
Heritage-Crystal Clean, Inc. | | | 2.3% | |
| * | As of March 31, 2022, there were 72 holdings in the Fund. Foreign currency contracts, written options and repurchase agreements, if any, are not included in the number of holdings. Portfolio holdings are subject to change at any time. References to specific securities should not be construed as recommendations by the Funds or their Advisor. Current and future holdings are subject to risk. |
SECTOR BREAKDOWN**
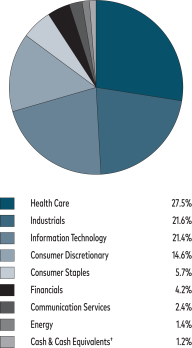
| ** | Excludes securities sold short and options written, if any. |
| † | Also includes Other Assets & Liabilities. |
GROWTH OF A HYPOTHETICAL $10,000 INVESTMENT

Past performance does not predict future performance. The graph above does not reflect the deduction of fees, sales charges, or taxes that you would pay on fund distributions or the redemption of fund shares. Wasatch does not charge any sales fees.
31
| | |
| Wasatch Micro Cap Value Fund (WAMVX / WGMVX) | | MARCH 31, 2022 (Unaudited) |
Management Discussion
The Wasatch Micro Cap Value Fund is managed by a team of Wasatch portfolio managers led by Brian Bythrow and Thomas Bradley.
| | | | |

Brian Bythrow, CFA Lead Portfolio Manager | | 
Thomas Bradley Associate Portfolio Manager | | OVERVIEW During the first quarter of 2022, the Wasatch Micro Cap Value Fund—Investor Class fell -14.59% and lagged the benchmark Russell Microcap® Index, which |
declined -7.60%. Even before Russia’s invasion of Ukraine, investors were already fretting over higher interest rates, inflation and disrupted supply chains.
Regarding the Micro Cap Value Fund’s underperformance of its benchmark, our assessment is that the Fund lagged for three main reasons. First, our stocks have been coming off such strong gains that it’s normal for them—including moderately priced ones—to take a pause. Second, rising interest rates and inflation have been perceived as threats to some of our companies that have their cash flows more heavily weighted further into the future. Third, underexposure in energy and materials has been a drag amid the preference for commodities—which have gained strength due to the Russia/Ukraine conflict.
DETAILS OF THE QUARTER
From a sector perspective, our stock selections in industrials, consumer discretionary, financials and communication services were some of the Fund’s largest sources of weakness relative to the benchmark in the first quarter. Our underexposure in energy and materials and our overexposure and stock selections in information technology also impaired relative performance. On the other hand, our stock selections and underexposure in health care were advantageous.
The Fund’s largest individual detractor from performance was Grid Dynamics Holdings, Inc. The company serves Fortune 1000 businesses by providing digital-transformation consulting and implementation services. We see strong demand for Grid’s services in a digital-revolution era. During the quarter, the stock was down because a portion of Grid’s workers are in Ukraine. At the onset of Russia’s invasion, the company quickly shifted work to other areas and relocated its Ukrainian employees to safer locations. Grid’s recent earnings have been strong, and customers haven’t shown signs of decreased spending.
GTY Technology Holdings, Inc. also detracted. The company offers a suite of cloud-based solutions for state and local governments spanning functions in procurement, payments, grant management, budgeting and permitting. GTY became a publicly traded entity through a special-purpose acquisition company (SPAC). Because the SPAC structure
has become unpopular after a period of excessive speculation, we’re especially careful to invest in former SPACs like GTY only after they’ve had some success as operating businesses. Nevertheless, we underestimated the residual nervousness among investors.
The top contributor to Fund performance was specialty pharmaceutical company BioDelivery Sciences International, Inc. The stock rose after the company updated revenue guidance above that stated in previous communications. We continue to like the potential of BioDelivery’s lead drug, BELBUCA,® a partial opioid agonist that is effective in managing pain but is less addictive than full opioid agonists such as oxycodone. The stock rose even further based on a surprise announcement that Collegium Pharmaceutical, Inc. will acquire BioDelivery for a significant premium above the recent market price.
Evolution Petroleum Corp., an oil and gas exploration and production company, was also a strong contributor. Evolution acquires established oil and gas fields—and applies specialized technology to increase production rates. The stock has clearly benefited from higher energy prices. And we’ve been especially impressed with CEO Jason Brown, who joined the company in 2019. Prior to Mr. Brown’s arrival, Evolution’s balance sheet was overcapitalized. In our view, the balance sheet has now been properly utilized. Moreover, the company has continually raised its dividend, which we see as an additional indication of Mr. Brown’s appropriate financial management of Evolution.
OUTLOOK
We don’t think it makes sense to invest based on macro predictions. Still, we’re often asked to comment on how we think conditions will unfold. In this regard, we expect that cost inflation and disrupted supply chains will continue to be problems for much of 2022. We’ll also probably see a drop in consumer demand, which may cause the U.S. Federal Reserve to be somewhat less aggressive in raising interest rates.
When inflation starts to turn down and supply chains begin to function more normally—which may occur in late 2022 or 2023—we think the market environment will be especially good for micro- and small-cap companies. We also hope to see an end to the war in Ukraine, which could create a “peace dividend” in the market. But again, we don’t believe investors should make short-term moves in stock positions based on these views. Instead, we think it’s best to accept temporary volatility—and use that volatility to position portfolios based on long-term assessments of company fundamentals.
Going forward, we like the prime characteristics of our companies—namely, strong competitive positions, excellent management teams, significant returns on capital, positive cash flows and healthy balance sheets.
Thank you for the opportunity to manage your assets.
Current and future holdings are subject to risk.
32
| | |
| Wasatch Micro Cap Value Fund (WAMVX / WGMVX) | | MARCH 31, 2022 (Unaudited) |
Portfolio Summary
AVERAGE ANNUAL TOTAL RETURNS
| | | | | | | | | | | | | | | | | | | | |
| | | | |
| | | Six Months
(Not annualized) | | 1 Year | | 5 Years | | 10 Years |
| | | | |
Micro Cap Value (WAMVX) — Investor | | | | –13.76% | | | | | –5.63% | | | | | 16.97% | | | | | 15.41% | |
| | | | |
Micro Cap Value (WGMVX) — Institutional | | | | –13.53% | | | | | –5.60% | | | | | 17.07% | | | | | 15.46% | |
| | | | |
Russell Microcap® Index | | | | –10.05% | | | | | –10.99% | | | | | 9.86% | | | | | 11.14% | |
Data show past performance, which is not indicative of future performance. Current performance may be lower or higher than the performance quoted. To obtain the most recent month-end performance data available, please visit wasatchglobal.com. The Advisor may absorb certain Fund expenses, without which total returns would have been lower. Investment returns and principal value will fluctuate and shares, when redeemed, may be worth more or less than their original cost.
As of the January 31, 2022 prospectus, the Total Annual Fund Operating Expenses for the Wasatch Micro Cap Value Fund are Investor Class: 1.66% / Institutional Class—Gross: 1.61%, Net: 1.60%. The expense ratio shown elsewhere in this report may be different. Net expenses are based on Fund expenses, net of waivers and reimbursements. See the prospectus for additional information regarding Fund expenses.
Wasatch will deduct a 2.00% redemption fee on Fund shares held 60 days or less. Performance data do not reflect the deduction of fees, including sales charges, or the taxes you would pay on fund distributions or the redemption of fund shares. Fees and taxes, if reflected, would reduce the performance quoted. Wasatch does not charge any sales fees. For more complete information including charges, risks and expenses, read the prospectus carefully.
Performance for the Institutional Class prior to 1/31/2020 is based on the performance of the Investor Class. Performance of the Fund’s Institutional Class prior to 1/31/2020 uses the actual expenses of the Fund’s Investor Class without any adjustments. For any such period of time, the performance of the Fund’s Institutional Class would have been substantially similar to, yet higher than, the performance of the Fund’s Investor Class, because the shares of both classes are invested in the same portfolio of securities, but the classes bear different expenses.
Investing in micro cap funds will be more volatile and loss of principal could be greater than investing in large cap or more diversified funds. Investments in value stocks can perform differently from the market as a whole and from other types of stocks and can continue to be undervalued by the market for long periods of time. Investing in foreign securities, especially in emerging markets, entails special risks, such as currency fluctuations and political uncertainties, which are described in more detail in the prospectus.
TOP 10 EQUITY HOLDINGS*
| | | | |
| |
| Company | | % of Net Assets | |
| |
JDC Group AG | | | 2.6% | |
| |
Esquire Financial Holdings, Inc. | | | 2.3% | |
| |
Veeco Instruments, Inc. | | | 2.2% | |
| |
Evolution Petroleum Corp. | | | 2.2% | |
| |
Skyline Champion Corp. | | | 2.0% | |
| | | | |
| |
| Company | | % of Net Assets | |
| |
Addus HomeCare Corp. | | | 1.9% | |
| |
Sterling Construction Co., Inc. | | | 1.8% | |
| |
Full House Resorts, Inc. | | | 1.8% | |
| |
A-Mark Precious Metals, Inc. | | | 1.7% | |
| |
Instem PLC | | | 1.7% | |
| * | As of March 31, 2022, there were 87 holdings in the Fund. Foreign currency contracts, written options and repurchase agreements, if any, are not included in the number of holdings. Portfolio holdings are subject to change at any time. References to specific securities should not be construed as recommendations by the Funds or their Advisor. Current and future holdings are subject to risk. |
SECTOR BREAKDOWN**
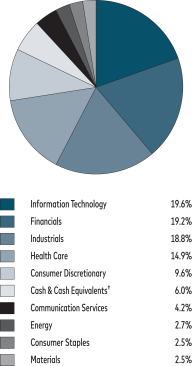
| ** | Excludes securities sold short and options written, if any. |
| † | Also includes Other Assets & Liabilities. |
GROWTH OF A HYPOTHETICAL $10,000 INVESTMENT
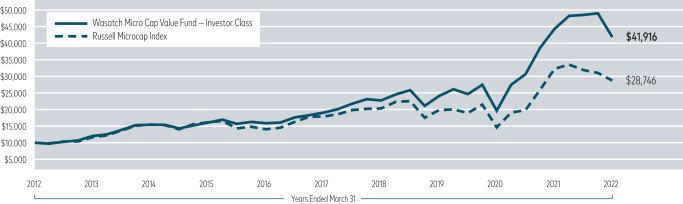
Past performance does not predict future performance. The graph above does not reflect the deduction of fees, sales charges, or taxes that you would pay on fund distributions or the redemption of fund shares. Wasatch does not charge any sales fees.
33
| | |
| Wasatch Small Cap Growth Fund (WAAEX / WIAEX) | | MARCH 31, 2022 (Unaudited) |
Management Discussion
The Wasatch Small Cap Growth Fund is managed by a team of Wasatch portfolio managers led by JB Taylor, Ken Korngiebel and Ryan Snow.
| | | | |

JB Taylor Lead Portfolio Manager | | 
Ken Korngiebel, CFA Portfolio Manager | | 
Ryan Snow Portfolio Manager |
OVERVIEW
During the first quarter of 2022, the benchmark Russell 2000® Growth Index fell -12.63% while the Russell 2000 Index declined -7.53%. Underperforming its benchmark, the Wasatch Small Cap Growth Fund—Investor Class dropped -18.17%.
We think there were three main reasons for the Fund’s underperformance during the quarter. First, most of our stocks had strong gains over the preceding several years—so an eventual period of consolidation was to be expected. Second, the prospect of rising interest rates was perceived to be especially detrimental to growth companies whose earnings and cash flows are more heavily weighted further into the future. Third, the war in Ukraine boosted commodity prices and general inflationary pressures—but the Fund typically avoids undifferentiated energy and materials companies.
If macro events haven’t changed our three- to five-year outlook for a company, we don’t respond much…if at all. We’ve always focused on long-duration growth companies, and we don’t change our process in an effort to “time” a rotation in styles.
DETAILS OF THE QUARTER
The greatest detractor from Fund performance was Kornit Digital Ltd. The company makes machines for the environmentally sustainable printing of designs and images on clothing and fabrics. The Covid-19 pandemic highlighted the advantages of Kornit’s on-demand technology, which reduces the need for inventory on hand and in supply chains. Having run up in price significantly during 2021, the stock pulled back in the first quarter of 2022 amid fears that inflation may force the U.S. Federal Reserve to raise interest rates more aggressively. While other investors pondered this possibility, we considered Kornit’s fundamental strengths—a large and growing addressable market, talented management team, recurring revenue streams and attractive business model with relatively few competitors. We think Kornit is positioned for continued market-share gains and annual revenue growth north of 30%.
Another significant detractor was Medpace Holdings, Inc., a provider of clinical research services for biotechnology companies. Despite strong fourth-quarter results, Medpace indicated that request-for-proposal (RFP) volume was down
in January, so some investors anticipated fewer bookings in the coming months. We, however, know that Medpace’s pipeline can be volatile, and that RFP volume can be an unreliable reporting metric. Based on our research, we continue to have a positive outlook for Medpace. In addition to admiring the company’s business model, management team and solid balance sheet, we like the fact that Medpace serves small biotechnology firms, giving us exposure to biotech without the often “all or nothing” nature of the industry.
The top contributor to Fund performance was HealthEquity, Inc., the largest U.S. non-bank custodian for health-savings accounts (HSAs). Account holders have online access to their HSAs and can compare treatment options, pay medical bills, and receive personalized benefit and clinical information. HealthEquity reported strong growth in its HSA business, with total HSA assets increasing 37% year-over-year and the number of HSAs on the company’s platform up 25% from a year ago. Management’s upwardly revised forecasts for revenues and earnings in the current fiscal year also cheered investors. We believe HealthEquity is largely insulated from supply-chain constraints and rising materials costs, and is well-situated for an environment of higher interest rates.
Intra-Cellular Therapies, Inc. was also a contributor. The company develops therapeutics for central nervous system disorders. Intra-Cellular reported robust prescription growth for Caplyta, which was recently approved for the treatment of bipolar depression in adults. Previously labeled for schizophrenia, the drug’s appeal for treating bipolar depression is enhanced by its favorable safety and tolerability profile. Intra-Cellular aims to expand approval of Caplyta to treat major depressive disorder, certain neurologically based sleep disorders and Parkinson’s disease. A post-Covid environment in which patients are returning to in-person health-care visits should also support prescriptions. Now that Intra-Cellular has proven the efficacy of its intellectual property, we view it as a developing pharmaceutical business rather than as a biotech “lottery ticket.”
OUTLOOK
Like investors everywhere, we at Wasatch engage in discussions about world-wide events. These discussions, however, rarely lead to specific views on the road ahead. Conversely, we can always explain our evaluations of individual companies. That’s why we usually confine our investment decisions to company fundamentals.
Because we’re pleased with our current holdings, we haven’t made many changes to the Fund’s portfolio recently. We think our companies, now tested by supply-chain disruptions and rising costs, may have made competitive inroads and are positioned for even better market-share gains. As always, our job is to find great long-duration growth companies selling at reasonable stock prices.
Thank you for the opportunity to manage your assets.
Current and future holdings are subject to risk.
34
| | |
| Wasatch Small Cap Growth Fund (WAAEX / WIAEX) | | MARCH 31, 2022 (Unaudited) |
Portfolio Summary
AVERAGE ANNUAL TOTAL RETURNS
| | | | | | | | | | | | | | | | | | | | |
| | | | |
| | | Six Months
(Not annualized) | | 1 Year | | 5 Years | | 10 Years |
| | | | |
Small Cap Growth (WAAEX) — Investor | | | | –19.34% | | | | | –14.84% | | | | | 18.07% | | | | | 13.26% | |
| | | | |
Small Cap Growth (WIAEX) — Institutional | | | | –19.29% | | | | | –14.76% | | | | | 18.21% | | | | | 13.36% | |
| | | | |
Russell 2000® Growth Index | | | | –12.62% | | | | | –14.33% | | | | | 10.33% | | | | | 11.21% | |
| | | | |
Russell 2000® Index | | | | –5.55% | | | | | –5.79% | | | | | 9.74% | | | | | 11.04% | |
Data show past performance, which is not indicative of future performance. Current performance may be lower or higher than the performance quoted. To obtain the most recent month-end performance data available, please visit wasatchglobal.com. The Advisor may absorb certain Fund expenses, without which total returns would have been lower. Investment returns and principal value will fluctuate and shares, when redeemed, may be worth more or less than their original cost.
As of the January 31, 2022 prospectus, the Total Annual Fund Operating Expenses for the Wasatch Small Cap Growth Fund are Investor Class: 1.12% / Institutional Class—Gross: 1.06%, Net: 1.05%. The expense ratio shown elsewhere in this report may be different. Net expenses are based on Fund expenses, net of waivers and reimbursements. See the prospectus for additional information regarding Fund expenses.
Wasatch will deduct a 2.00% redemption fee on Fund shares held 60 days or less. Performance data do not reflect the deduction of fees, including sales charges, or the taxes you would pay on fund distributions or the redemption of fund shares. Fees and taxes, if reflected, would reduce the performance quoted. Wasatch does not charge any sales fees. For more complete information including charges, risks and expenses, read the prospectus carefully.
Performance for the Institutional Class prior to 2/1/2016 is based on the performance of the Investor Class. Performance of the Fund’s Institutional Class prior to 2/1/2016 uses the actual expenses of the Fund’s Investor Class without any adjustments. For any such period of time, the performance of the Fund’s Institutional Class would have been substantially similar to, yet higher than, the performance of the Fund’s Investor Class, because the shares of both classes are invested in the same portfolio of securities, but the classes bear different expenses.
Investing in small cap funds will be more volatile and loss of principal could be greater than investing in large cap or more diversified funds. Investing in foreign securities, especially in emerging markets, entails special risks, such as currency fluctuations and political uncertainties, which are described in more detail in the prospectus.
TOP 10 EQUITY HOLDINGS*
| | | | |
| |
| Company | | % of Net Assets | |
| |
Ensign Group, Inc. | | | 4.1% | |
| |
CyberArk Software Ltd. | | | 4.0% | |
| |
Rapid7, Inc. | | | 3.8% | |
| |
Medpace Holdings, Inc. | | | 3.5% | |
| |
HealthEquity, Inc. | | | 3.0% | |
| | | | |
| |
| Company | | % of Net Assets | |
| |
Globant SA | | | 2.8% | |
| |
Euronet Worldwide, Inc. | | | 2.8% | |
| |
Kornit Digital Ltd. | | | 2.7% | |
| |
Freshpet, Inc. | | | 2.7% | |
| |
Pinnacle Financial Partners, Inc. | | | 2.6% | |
| * | As of March 31, 2022, there were 65 holdings in the Fund. Foreign currency contracts, written options and repurchase agreements, if any, are not included in the number of holdings. Portfolio holdings are subject to change at any time. References to specific securities should not be construed as recommendations by the Funds or their Advisor. Current and future holdings are subject to risk. |
SECTOR BREAKDOWN**
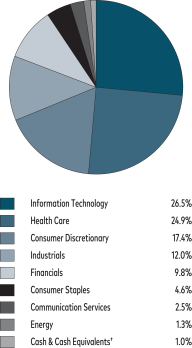
| ** | Excludes securities sold short and options written, if any. |
| † | Also includes Other Assets & Liabilities. |
GROWTH OF A HYPOTHETICAL $10,000 INVESTMENT
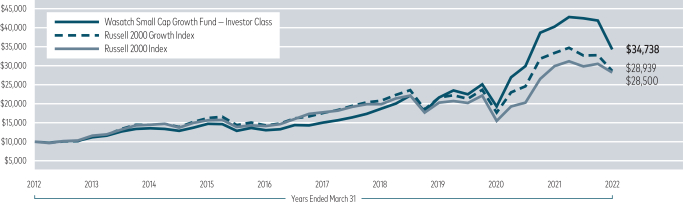
Past performance does not predict future performance. The graph above does not reflect the deduction of fees, sales charges, or taxes that you would pay on fund distributions or the redemption of fund shares. Wasatch does not charge any sales fees.
35
| | |
| Wasatch Small Cap Value Fund (WMCVX / WICVX) | | MARCH 31, 2022 (Unaudited) |
Management Discussion
The Wasatch Small Cap Value Fund is managed by a team of Wasatch portfolio managers led by Jim Larkins and Austin Bone.
| | | | |

Jim Larkins Lead Portfolio Manager | | 
Austin Bone Portfolio Manager | | OVERVIEW U.S. equities moved lower in the first quarter, as a litany of adverse developments led to heightened investor uncertainty. The markets were |
challenged by Russia’s invasion of Ukraine, ongoing supply-chain disruptions and surging energy prices. It also became apparent that the U.S. Federal Reserve intends to hike interest rates aggressively to stave off inflation. These factors led to underperformance for smaller companies in general. The Wasatch Small Cap Value Fund—Investor Class fell -9.88% and underperformed its benchmark, the Russell 2000® Value Index, which declined -2.40%.
Our approach tends to place the Fund at the “growthier” end of the value category, which was a positive for much of 2020–21 but proved to be a headwind during the quarter. In addition, a sizable underweight in energy was a hindrance. Energy was the best-performing sector in the benchmark with a gain of over 43% driven by surging prices for oil and natural gas. Our overweight positions in the industrials and consumer-discretionary sectors were vulnerable to the macroeconomic forces that affected market performance in the first quarter.
In our 20-plus years of managing the Fund, we have witnessed other periods when events led to wide divergences in performance among the various segments of the market. During these times, we maintained our conviction that good companies with attractive valuations are likely to outperform over time. We think our steady, bottom-up approach is a key factor in the Fund’s outperformance of the Russell 2000 Value Index over the five-year, 10-year and since-inception periods ended March 31, 2022.
DETAILS OF THE QUARTER
The underperformance of our holdings in the industrials and consumer-discretionary sectors illustrated the impact of macroeconomic factors during the quarter. With investors expecting an increasing number of rate hikes before year-end, stocks with higher interest-rate sensitivity generally lagged. This weighed on the stocks of homebuilders LGI Homes, Inc., Skyline Champion Corp. and Toll Brothers, Inc. Producers of building products, such as Trex Co., Inc., were similarly affected by fears of a slowdown in housing construction. We maintained these positions, remaining confident in each company’s fundamentals.
Companies with international exposure were hurt by increased supply-chain disruptions. Altra Industrial Motion Corp. felt these pressures in the first quarter, as did Janus International Group, Inc. We continue to hold both companies, considering them well-positioned to grow once shorter-term issues have dissipated.
On the positive side, energy-sector holdings Cactus, Inc. and Magnolia Oil & Gas Corp. were two of the Fund’s top contributors for the quarter. We had maintained a low or zero weighting in energy for some time coming into 2020, but the sector’s downturn led us to establish positions in these higher-quality companies at compelling prices. In our energy-sector holdings, we aim to own well-positioned companies with sound balance sheets and skilled management teams that we believe can navigate positive and negative oil-price movements.
Health care was another area of strength for the Fund. Because this sector tends to have lower sensitivity to macroeconomic trends, company-level developments are more likely to be reflected in performance. HealthEquity, Inc., a custodian of health-savings accounts, was a top performer. We bought the stock at what we considered an attractive price during a stretch of poor performance in 2021. The stock has since rebounded on strength in HealthEquity’s core business and anticipation of higher yields on its cash holdings.
Consistent with our steady, longer-term approach, we avoided making broad portfolio shifts. During times of rapid changes in the macroeconomic outlook, we seek to reconfirm the reasons why we hold each individual position. This process gave us confidence that our holdings have strong fundamentals across the board, with most meeting or exceeding our expectations. We did reduce or eliminate some positions that may remain challenged over the next several quarters, and we modestly increased exposure to the value-oriented side of our investment universe.
OUTLOOK
Our discussions with management teams suggest that company fundamentals remain solid, but there’s an increasing level of caution regarding the economic backdrop. While our portfolio companies continue to demonstrate healthy fundamentals, their management teams are being conservative as they assess the outlook for the remainder of the year. Amid this uncertainty, we remain focused on using market weakness as an opportunity to purchase shares of companies we wouldn’t typically expect to find in value territory. We believe using bottom-up research to identify companies whose stock prices have become disconnected from their fundamentals remains a prudent approach in both up and down markets.
Thank you for the opportunity to manage your assets.
Current and future holdings are subject to risk.
36
| | |
| Wasatch Small Cap Value Fund (WMCVX / WICVX) | | MARCH 31, 2022 (Unaudited) |
Portfolio Summary
AVERAGE ANNUAL TOTAL RETURNS
| | | | | | | | | | | | | | | | | | | | |
| | | | |
| | | Six Months
(Not annualized) | | 1 Year | | 5 Years | | 10 Years |
| | | | |
Small Cap Value (WMCVX) — Investor | | | | –3.93% | | | | | –2.10% | | | | | 10.69% | | | | | 12.19% | |
| | | | |
Small Cap Value (WICVX) — Institutional | | | | –3.89% | | | | | –1.98% | | | | | 10.86% | | | | | 12.32% | |
| | | | |
Russell 2000® Value Index | | | | 1.85% | | | | | 3.32% | | | | | 8.57% | | | | | 10.54% | |
| | | | |
Russell 2000® Index | | | | –5.55% | | | | | –5.79% | | | | | 9.74% | | | | | 11.04% | |
Data show past performance, which is not indicative of future performance. Current performance may be lower or higher than the performance quoted. To obtain the most recent month-end performance data available, please visit wasatchglobal.com. The Advisor may absorb certain Fund expenses, without which total returns would have been lower. Investment returns and principal value will fluctuate and shares, when redeemed, may be worth more or less than their original cost.
As of the January 31, 2022 prospectus, the Total Annual Fund Operating Expenses for the Wasatch Small Cap Value Fund are Investor Class: 1.16% / Institutional Class—Gross: 1.06%, Net: 1.05%. The expense ratio shown elsewhere in this report may be different. Net expenses are based on Fund expenses, net of waivers and reimbursements. See the prospectus for additional information regarding Fund expenses.
Wasatch will deduct a 2.00% redemption fee on Fund shares held 60 days or less. Performance data do not reflect the deduction of fees, including sales charges, or the taxes you would pay on fund distributions or the redemption of fund shares. Fees and taxes, if reflected, would reduce the performance quoted. Wasatch does not charge any sales fees. For more complete information including charges, risks and expenses, read the prospectus carefully.
Performance for the Institutional Class prior to 1/31/2012 is based on the performance of the Investor Class. Performance of the Fund’s Institutional Class prior to 1/31/2012 uses the actual expenses of the Fund’s Investor Class without any adjustments. For any such period of time, the performance of the Fund’s Institutional Class would have been substantially similar to, yet higher than, the performance of the Fund’s Investor Class, because the shares of both classes are invested in the same portfolio of securities, but the classes bear different expenses.
Investing in small cap funds will be more volatile and loss of principal could be greater than investing in large cap or more diversified funds. Investments in value stocks can perform differently from the market as a whole and from other types of stocks and can continue to be undervalued by the market for long periods of time. Investing in foreign securities, especially in emerging markets, entails special risks, such as currency fluctuations and political uncertainties, which are described in more detail in the prospectus.
TOP 10 EQUITY HOLDINGS*
| | | | |
| |
| Company | | % of Net Assets | |
| |
Kadant, Inc. | | | 4.1% | |
| |
Ensign Group, Inc. | | | 4.0% | |
| |
Bank OZK | | | 3.6% | |
| |
Magnolia Oil & Gas Corp., Class A | | | 3.3% | |
| |
Axos Financial, Inc. | | | 2.9% | |
| | | | |
| |
| Company | | % of Net Assets | |
| |
Fabrinet | | | 2.7% | |
| |
FB Financial Corp. | | | 2.7% | |
| |
HealthEquity, Inc. | | | 2.5% | |
| |
Euronet Worldwide, Inc. | | | 2.5% | |
| |
Innospec, Inc. | | | 2.4% | |
| * | As of March 31, 2022, there were 58 holdings in the Fund. Foreign currency contracts, written options and repurchase agreements, if any, are not included in the number of holdings. Portfolio holdings are subject to change at any time. References to specific securities should not be construed as recommendations by the Funds or their Advisor. Current and future holdings are subject to risk. |
SECTOR BREAKDOWN**
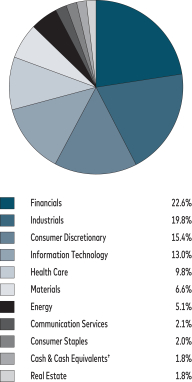
| ** | Excludes securities sold short and options written, if any. |
| † | Also includes Other Assets & Liabilities. |
GROWTH OF A HYPOTHETICAL $10,000 INVESTMENT
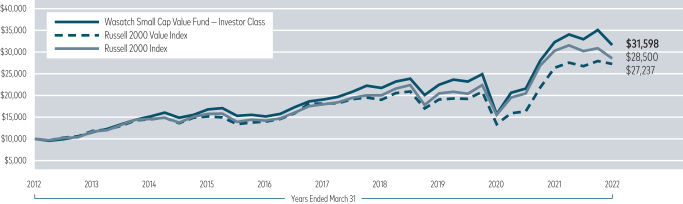
Past performance does not predict future performance. The graph above does not reflect the deduction of fees, sales charges, or taxes that you would pay on fund distributions or the redemption of fund shares. Wasatch does not charge any sales fees.
37
| | |
| Wasatch Ultra Growth Fund (WAMCX / WGMCX) | | MARCH 31, 2022 (Unaudited) |
Management Discussion
The Wasatch Ultra Growth Fund is managed by a team of Wasatch portfolio managers led by John Malooly.
| | |

John Malooly, CFA Lead Portfolio Manager | | OVERVIEW Equities posted steep losses during the first quarter as macroeconomic issues, magnified by Russia’s invasion of Ukraine, weighed heavily on markets. Small-capitalization stocks underperformed as volatile financial markets caused some investors to seek the perceived safety of larger companies. |
Growth stocks fared worse than value stocks in the quarter, with the benchmark Russell 2000® Growth Index down -12.63%. The Wasatch Ultra Growth Fund—Investor Class posted a larger decline of -16.69%.
Rising interest rates posed strong headwinds for growth stocks as the Federal Reserve (Fed) began tightening monetary policy to rein in inflation. Because the cash flows of growth companies typically occur further into the future, higher rates make the income streams of these businesses less valuable in the present, lowering their valuations.
DETAILS OF THE QUARTER
Industrials were the Fund’s largest source of weakness relative to the benchmark during the first quarter. The Fund’s underweight position in energy also hurt performance by limiting exposure to what was the highest-returning sector of the Index. Significant exposure to energy doesn’t align with our preference for dynamic, high-quality companies.
The Fund’s area of greatest strength against the benchmark was health care, driven by outperformance in the pharmaceuticals and health-care providers & services industries. Health-care stocks in general performed poorly in the quarter, weighed down by biotechnology—which was stung by several setbacks in clinical trials, and a resurgence of Covid-19 in December and January.
The largest individual detractor from Fund performance for the quarter was Kornit Digital Ltd. The company makes machines for environmentally sustainable printing on clothing and fabrics. The Covid-19 pandemic highlighted the advantages of Kornit’s on-demand technology, which reduces the need for inventory on hand and in supply chains. Having run up in price significantly during 2021, the stock pulled back in the first quarter of 2022 amid fears that inflation may force the Fed to raise interest rates more aggressively. While other investors pondered this possibility, we considered Kornit’s fundamental strengths—a large and growing addressable market, talented management team, recurring revenue streams and attractive business model with relatively few competitors. We think Kornit is well-positioned for continued market-share gains.
Trex Co., Inc. was another significant detractor. The company manufactures wood-alternative decking primarily from recycled materials. Although higher energy and logistics costs
squeezed margins in the company’s most recently reported quarter, Trex raised prices with little impact on demand. We believe the company’s leading position in its product category leaves it well-positioned to pass along future cost increases as well. Moreover, higher oil prices aren’t likely to significantly affect costs for the recycled plastic from which the company’s products are made.
The strongest contributor to Fund performance for the quarter was Intra-Cellular Therapies, Inc., which develops therapeutics for central nervous system disorders. Intra-Cellular reported robust prescription growth for Caplyta, which was recently approved for the treatment of bipolar depression Type 1 and Type 2 in adults. Previously labeled for schizophrenia, the drug’s appeal for treating bipolar depression is enhanced by its favorable safety and tolerability profile. Intra-Cellular aims to expand approval for Caplyta to treat major depressive disorder, certain neurologically based sleep disorders and Parkinson’s disease. A post-Covid environment in which patients are returning to in-person health-care visits should also support prescriptions.
HealthEquity, Inc., the largest U.S. non-bank custodian for health-savings accounts (HSAs), was also a significant contributor. Account holders have online access to their HSAs and can compare treatment options, pay medical bills, and receive personalized benefit and clinical information. HealthEquity reported strong growth in its HSA business, with total HSA assets increasing 37% year-over-year and the number of HSAs on the company’s platform up 25% from a year ago. Management’s upwardly revised forecasts for revenues and earnings in the current fiscal year also cheered investors. We believe HealthEquity is largely insulated from supply-chain constraints and rising materials costs, and is well-situated for an environment of higher interest rates.
OUTLOOK
While faster-than-expected increases in interest rates would affect growth stocks negatively, we believe the impact on our portfolio companies would likely be more muted. The Fund tends to own businesses that are less dependent on borrowing and less sensitive to economic cycles.
We’ve been looking closer at companies whose cash flows are more likely to be realized sooner rather than later. We think these companies may find better valuation support amid rising interest rates. Moreover, high-quality companies with attractive rates of earnings growth can often withstand moderate contractions in their valuation multiples without seeing their stock prices get crushed.
We make no forecasts as to how high inflation may go or how long it may last. With the U.S. labor market likely to remain tight for some time, we want to own companies that can hire, attract talent and absorb rising labor costs without disrupting their business models.
Thank you for the opportunity to manage your assets.
Current and future holdings are subject to risk.
38
| | |
| Wasatch Ultra Growth Fund (WAMCX / WGMCX) | | MARCH 31, 2022 (Unaudited) |
Portfolio Summary
AVERAGE ANNUAL TOTAL RETURNS
| | | | | | | | | | | | | | | | | | | | |
| | | | |
| | | Six Months
(Not annualized) | | 1 Year | | 5 Years | | 10 Years |
| | | | |
Ultra Growth (WAMCX) — Investor | | | | –18.39% | | | | | –15.98% | | | | | 22.97% | | | | | 16.63% | |
| | | | |
Ultra Growth (WGMCX) — Institutional | | | | –18.36% | | | | | –15.90% | | | | | 23.01% | | | | | 16.65% | |
| | | | |
Russell 2000® Growth Index | | | | –12.62% | | | | | –14.33% | | | | | 10.33% | | | | | 11.21% | |
Data show past performance, which is not indicative of future performance. Current performance may be lower or higher than the performance quoted. To obtain the most recent month-end performance data available, please visit wasatchglobal.com. The Advisor may absorb certain Fund expenses, without which total returns would have been lower. Investment returns and principal value will fluctuate and shares, when redeemed, may be worth more or less than their original cost.
As of the January 31, 2022 prospectus, the Total Annual Fund Operating Expenses for the Wasatch Ultra Growth Fund are Investor Class: 1.16% / Institutional Class—Gross: 1.06%, Net: 1.05%. The expense ratio shown elsewhere in this report may be different. Net expenses are based on Fund expenses, net of waivers and reimbursements. See the prospectus for additional information regarding Fund expenses.
Wasatch will deduct a 2.00% redemption fee on Fund shares held 60 days or less. Performance data do not reflect the deduction of fees, including sales charges, or the taxes you would pay on fund distributions or the redemption of fund shares. Fees and taxes, if reflected, would reduce the performance quoted. Wasatch does not charge any sales fees. For more complete information including charges, risks and expenses, read the prospectus carefully.
Performance for the Institutional Class prior to 1/31/2020 is based on the performance of the Investor Class. Performance of the Fund’s Institutional Class prior to 1/31/2020 uses the actual expenses of the Fund’s Investor Class without any adjustments. For any such period of time, the performance of the Fund’s Institutional Class would have been substantially similar to, yet higher than, the performance of the Fund’s Investor Class, because the shares of both classes are invested in the same portfolio of securities, but the classes bear different expenses.
Investing in small cap funds will be more volatile and loss of principal could be greater than investing in large cap or more diversified funds. Investing in foreign securities, especially in emerging markets, entails special risks, such as currency fluctuations and political uncertainties, which are described in more detail in the prospectus.
TOP 10 EQUITY HOLDINGS*
| | | | |
| |
| Company | | % of Net Assets | |
| |
Intra-Cellular Therapies, Inc. | | | 4.2% | |
| |
Freshpet, Inc. | | | 3.6% | |
| |
Five Below, Inc. | | | 2.9% | |
| |
Paylocity Holding Corp. | | | 2.9% | |
| |
Inspire Medical Systems, Inc. | | | 2.7% | |
| | | | |
| |
| Company | | % of Net Assets | |
| |
CyberArk Software Ltd. | | | 2.6% | |
| |
Kornit Digital Ltd. | | | 2.6% | |
| |
Five9, Inc. | | | 2.6% | |
| |
Castle Biosciences, Inc. | | | 2.6% | |
| |
Silk Road Medical, Inc. | | | 2.5% | |
| * | As of March 31, 2022, there were 75 holdings in the Fund. Foreign currency contracts, written options and repurchase agreements, if any, are not included in the number of holdings. Portfolio holdings are subject to change at any time. References to specific securities should not be construed as recommendations by the Funds or their Advisor. Current and future holdings are subject to risk. |
SECTOR BREAKDOWN**
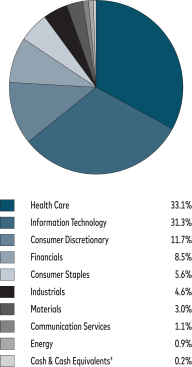
| ** | Excludes securities sold short and options written, if any. |
| † | Also includes Other Assets & Liabilities. |
GROWTH OF A HYPOTHETICAL $10,000 INVESTMENT
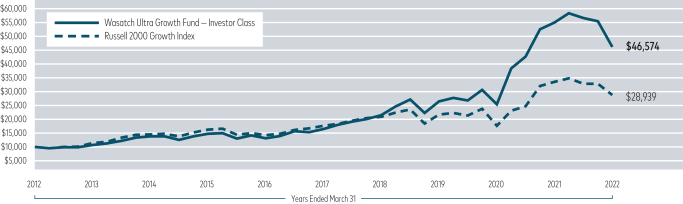
Past performance does not predict future performance. The graph above does not reflect the deduction of fees, sales charges, or taxes that you would pay on fund distributions or the redemption of fund shares. Wasatch does not charge any sales fees.
39
| | |
| Wasatch-Hoisington U.S. Treasury Fund (WHOSX) | | MARCH 31, 2022 (Unaudited) |
Management Discussion
The Wasatch-Hoisington U.S. Treasury Fund is sub-advised by Hoisington Investment Management Company (HIMCo).
| | | | |

Van Hoisington Lead Portfolio Manager | | 
Van R. Hoisington, Jr. Portfolio Manager | | 
David Hoisington Portfolio Manager |
DETAILS OF THE QUARTER
The Wasatch-Hoisington U.S. Treasury Fund, which is invested in long-dated U.S. Treasury securities (bonds with maturities longer than 20 years), declined -11.96% in the first quarter of 2022 compared to a decline of -5.93% for the benchmark Bloomberg US Aggregate Bond Index. Thirty-year Treasury bond yields closed at 2.44% at the end of March, up from 1.903% at the end of 2021.
During the first quarter, three factors put upward pressure on long-term Treasury bond yields. First, all key measures of inflation accelerated on a year-over-year basis. Second, the U.S. Federal Reserve (Fed) finished its program of buying $120 billion of Treasury and mortgage-backed securities. Third, in March the Fed raised its policy interest rate for the first time since 2018. Sharply slower growth in real economic activity was overwhelmed by these three factors.
OVERVIEW
Disaster is a strong but appropriate word that applies perfectly to the state of monetary policy. Consider the following:
| | A. | The Fed, in reaction to the Covid-19 crisis, dropped the federal-funds rate to 0.25% and expanded total reserves of the depository institutions by a per annum average of 63% in 2020–21. This unprecedented growth was achieved by increasing total U.S. Treasury and other securities held outright by $4.5 trillion, equaling 70% of the $6.4 trillion increase in total Treasury securities outstanding. Consequently, the commercial bank deposit component of M2 (that accounts for about 78% of M2) surged by a record 20.5% over the past two years. This fact reveals the massive coordination of monetary and fiscal policy as the government checks that were deposited were directly funded by monetary largesse. In the face of an unsurpassed breakdown in product-delivery systems, this money creation caused a massive imbalance between the demand and supply of goods. |
| | B. | The result of coordinated monetary and fiscal actions last year was a 5.7% increase in real gross domestic product (GDP) and a 10.1% rise in nominal GDP. Both increases were the highest since 1984. The Consumer Price Index (CPI) inflation rate jumped from 2.3% in the 12 months ended December 2019 to 8.5% in the 12 months ended March 2022, the fastest such increase in 40 years. Reversing the past monetary and fiscal excess liquidity error will take time and persistence by the Fed. |
Most Americans have suffered a substantial fall in their standard of living. In the latest available 12-month change, 116.2 million American wage and salary workers suffered a 3.7% decline in their inflation-adjusted paychecks, the largest drop since 1980. That alone more than offset the gain in income going to the 6.5 million newly employed. Inflationary damage to 70 million retired Americans cannot be calculated in precise terms, but qualitatively the situation is not good. Summing those whose incomes trailed price increases (116.2 + 70) yields a figure of over 180 million Americans, a huge imbalance between those who benefited and those who were harmed.
The war in Ukraine has lifted bond yields by a quick 0.5 of a percentage point, elevating yields to nearly one full point above the year-end level of 1.9%. At this current level, the long end of the U.S. Treasury bond market has value considering the impending recessionary conditions, which have always reduced inflation and interest rates. In addition to the decline in the standard of living for many Americans, economic data suggesting negative growth ahead include: (1) The largest 12-month decline in real weekly earnings of 3.3% since this series began in 2000, which covers 72 million people; (2) Real-per-capita disposable income now stands 1.8% below year-ago levels and has fallen for seven consecutive months; (3) The composite index of the NFIB Small Business Survey sank to 93.2 in March, the lowest level since April 2020; (4) Interest-sensitive sectors such as housing and autos are already declining; (5) Inventories are rising rapidly and will accelerate further with any softness in demand causing cutbacks in production; and (6) Fiscal policy turns restrictive in 2022 and there is just a hint of early restraint in Fed policy as total reserves have declined by $425 billion since December and the main component of M2—other checkable deposits—has shown just 2% growth over the last three months.
In light of these and many other harbingers of recession, we believe the environment should be favorable for long-term bond investors. However, should Federal Reserve officials cease their efforts to calm inflation before it has been fully restrained, we think bond investors should be wary.
Thank you for the opportunity to manage your assets.
40
| | |
| Wasatch-Hoisington U.S. Treasury Fund (WHOSX) | | MARCH 31, 2022 (Unaudited) |
Portfolio Summary
AVERAGE ANNUAL TOTAL RETURNS
| | | | | | | | | | | | | | | | | | | | |
| | | | |
| | | Six Months
(Not annualized) | | 1 Year | | 5 Years | | 10 Years |
| | | | |
U.S. Treasury | | | | –7.55% | | | | | 0.77% | | | | | 4.32% | | | | | 4.18% | |
| | | | |
Bloomberg US Aggregate Bond Index | | | | –5.92% | | | | | –4.15% | | | | | 2.14% | | | | | 2.24% | |
Data show past performance, which is not indicative of future performance. Current performance may be lower or higher than the performance quoted. To obtain the most recent month-end performance data available, please visit wasatchglobal.com. The Advisor may absorb certain Fund expenses, without which total returns would have been lower. Investment returns and principal value will fluctuate and shares, when redeemed, may be worth more or less than their original cost.
As of the January 31, 2022 prospectus, the Total Annual Fund Operating Expenses for the Wasatch-Hoisington U.S. Treasury Fund are 0.66%. The expense ratio shown elsewhere in this report may be different. Net expenses are based on Fund expenses, net of waivers and reimbursements. See the prospectus for additional information regarding Fund expenses.
Wasatch will deduct a 2.00% redemption fee on Fund shares held 60 days or less. Performance data do not reflect the deduction of fees, including sales charges, or the taxes you would pay on fund distributions or the redemption of fund shares. Fees and taxes, if reflected, would reduce the performance quoted. Wasatch does not charge any sales fees. For more complete information including charges, risks and expenses, read the prospectus carefully.
Investments in fixed income funds are subject to the same interest rate, inflation, credit and other risks associated with the underlying bonds. Return of principal is not guaranteed.
TOP U.S. TREASURY HOLDINGS*
| | | | | | | | |
| | |
| Holding | | Maturity
Date | | | % of Net
Assets | |
| | |
U.S. Treasury Bond, 2.250% | | | 8/15/2046 | | | | 19.7% | |
| | |
U.S. Treasury Principal Strip | | | 8/15/2049 | | | | 18.0% | |
| | |
U.S. Treasury Bond, 1.250% | | | 5/15/2050 | | | | 16.8% | |
| | |
U.S. Treasury Principal Strip | | | 5/15/2049 | | | | 13.0% | |
| | |
U.S. Treasury Bond, 3.000% | | | 8/15/2048 | | | | 11.9% | |
| | | | | | | | |
| | |
| Holding | | Maturity
Date | | | % of Net
Assets | |
| | |
U.S. Treasury Bond, 1.375% | | | 8/15/2050 | | | | 7.2% | |
| | |
U.S. Treasury Principal Strip | | | 2/15/2049 | | | | 6.4% | |
| | |
U.S. Treasury Bond, 2.500% | | | 2/15/2045 | | | | 5.9% | |
| | |
U.S. Treasury Bond, 2.250% | | | 8/15/2049 | | | | 2.2% | |
| * | As of March 31, 2022, there were 9 holdings in the Fund. Repurchase agreements, if any, are not included in the number of holdings. Portfolio holdings are subject to change at any time. References to specific securities should not be construed as recommendations by the Funds or their Advisor. Current and future holdings are subject to risk. |
INVESTMENTS & CASH
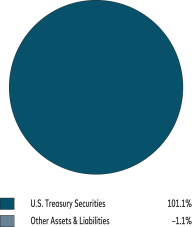
GROWTH OF A HYPOTHETICAL $10,000 INVESTMENT
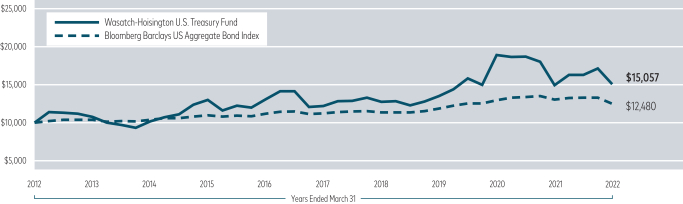
Past performance does not predict future performance. The graph above does not reflect the deduction of fees, sales charges, or taxes that you would pay on fund distributions or the redemption of fund shares. Wasatch does not charge any sales fees.
41
| | |
| Wasatch Funds Management Discussions | | MARCH 31, 2022 (Unaudited) |
DEFINITIONS OF FINANCIAL TERMS
Alpha is a risk-adjusted measure of the so-called “excess return” on an investment. It is a common measure of assessing an active manager’s performance as it is the return in excess of a benchmark index or “risk-free” investment. The difference between the fair and actually expected rates of return on a stock is called the stock’s alpha.
CFA® stands for Chartered Financial Analyst and is a trademark owned by the CFA Institute.
The “cloud” is the internet. Cloud-computing is a model for delivering information-technology services in which resources are retrieved from the internet through web-based tools and applications, rather than from a direct connection to a server.
The Consumer Price Index (CPI), also called the cost-of-living index, is an inflationary indicator that measures the change in the cost of a fixed basket of products and services, including housing, electricity, food, and transportation. The CPI is published monthly. The headline CPI includes volatile food and energy prices, while the core CPI excludes food and energy.
Earnings growth is a measure of growth in a company’s net income over a specific period, often one year.
An Exchange-Traded Fund (ETF) is a security that tracks an index, a commodity or a basket of assets like an index fund, but trades like a stock on a securities exchange. ETFs experience price changes throughout the day as they are bought and sold.
The federal-funds rate is the interest rate at which private depository institutions (mostly banks) lend balances (federal funds) at the Federal Reserve to other depository institutions, usually overnight. It is the interest rate banks charge each other for loans.
Gross domestic product (GDP) is a basic measure of a country’s economic performance and is the market value of all final goods and services made within the borders of a country in a year.
The term H-shares refers to the shares of companies incorporated in mainland China that are traded on the Hong Kong Stock Exchange. Many companies float their shares simultaneously on the Hong Kong market and one of the two mainland Chinese stock exchanges in Shanghai or Shenzhen. Such companies are known as A+H companies.
M2 money supply consists of currency and checking accounts, consumer-type time and savings accounts and equivalent near monies, while M3 money supply consists of M2 plus business-type time deposits and less liquid near monies. Both M2 and M3 exclude monies and near monies owned by the Treasury, depository institutions and foreign banks and official institutions and IRA and Keogh balances owned by consumers.
Mortgage-backed securities are debt issues backed by a pool of mortgages. Investors receive payments from the interest and principal payments made on the underlying mortgages.
The National Federation of Independent Business (NFIB) research center has collected small business economic trends data with quarterly surveys since the fourth quarter of 1973 and monthly surveys since 1986. Survey respondents are drawn from NFIB’s membership. The Small Business Optimism Index report is released on the second Tuesday of each month.
The price/earnings (P/E) ratio, also known as the P/E multiple, is the price of a stock divided by its earnings per share.
Return on capital is a measure of how effectively a company uses the money, owned or borrowed, that has been invested in its operations.
Sales growth is the increase in sales over a specified period of time, not necessarily one year.
A special purpose acquisition company (SPAC), also known as a “blank check company,” is a company with no commercial operations that is formed specifically to raise capital through an initial public offering for the purpose of acquiring an existing company.
Valuation is the process of determining the current worth of an asset or company.
INDEX DESCRIPTIONS AND DISCLOSURES
The Bloomberg US Aggregate Bond Index is a broad-based flagship benchmark that measures the investment grade, U.S. dollar denominated, fixed-rate taxable bond market. The index includes Treasuries, government-related and corporate securities, mortgage-backed securities (MBS) (agency fixed-rate and hybrid adjustable-rate mortgage [ARM] pass-throughs), asset-backed securities (ABS) and commercial mortgage-backed securities (CMBS) (agency and non-agency).
The FTSE 3-Month US Treasury Bill Index is intended to track the daily performance of 3-month U.S. Treasury bills.
The MSCI AC (All Country) World Index captures large- and mid-cap representation across 23 developed-market and 24 emerging-market countries.
The MSCI AC (All Country) World ex USA Small Cap Index is an unmanaged index and includes reinvestment of all dividends of issuers located in countries throughout the world representing developed and emerging markets, excluding securities of U.S. issuers. This index is a free float adjusted market capitalization index designed to measure the performance of small-capitalization securities.
The MSCI AC (All Country) World Small Cap Index is an unmanaged index and includes reinvestment of all dividends of issuers located in countries throughout the world representing developed and emerging markets. This index is a free float adjusted market capitalization index designed to measure the performance of small-capitalization securities.
The MSCI AC (All Country) World Value Index captures large- and mid-cap securities exhibiting overall value style characteristics across 23 developed-market countries and 24 emerging-market countries.
The MSCI China Index captures large- and mid-cap representation across China A shares, H shares, B shares, Red
42
| | |
| Wasatch Funds Management Discussions | | MARCH 31, 2022 (Unaudited) |
chips, P chips and foreign listings (e.g. ADRs). The index covers about 85% of this China equity universe. Currently, the index includes large-cap A and mid-cap A shares represented at 20% of their free float adjusted market capitalization.
The MSCI EAFE Index is an unmanaged index and includes reinvestment of all dividends of issuers located in 21 developed-market countries, excluding the U.S. and Canada. This index is a free float adjusted market capitalization index designed to measure the performance of mid-cap and large-cap securities.
The MSCI Emerging Markets Index captures large- and mid-cap representation across 24 emerging-market countries.
The MSCI Emerging Markets Small Cap Index captures small-cap representation across 24 emerging-market countries.
The MSCI Frontier Emerging Markets and MSCI Frontier Markets indexes are free float adjusted market capitalization indexes designed to measure equity market performance in the global frontier and emerging markets.
The MSCI India Investable Market Index (IMI) covers all investable large-, mid- and small-cap securities across India, targeting approximately 99% of the Indian market’s free float adjusted market capitalization.
The MSCI World ex USA Index captures large- and mid-cap representation across 22 of 23 developed-market countries, excluding the United States.
The MSCI World ex USA Small Cap Index is a free float adjusted market capitalization weighted index designed to measure the equity market performance of developed markets, excluding the United States.
Pertaining to the use of MSCI information. Source: MSCI. The MSCI information may only be used for your internal use, may not be reproduced or redisseminated in any form and may not be used as a basis for or a component of any financial instruments or products or indices. None of the MSCI information is intended to constitute investment advice or a recommendation to make (or refrain from making) any kind of investment decision and may not be relied on as such. Historical data and analysis should not be taken as an indication or guarantee of any future performance analysis, forecast or prediction. The MSCI information is provided on an “as is” basis and the user of this information assumes the entire risk of any use made of this information. MSCI, each of its affiliates and each other person involved in or related to compiling, computing or creating any MSCI information (collectively, the “MSCI
Parties”) expressly disclaims all warranties (including, without limitation, any warranties or originality, accuracy, completeness, timeliness, non-infringement, merchantability and fitness for a particular purpose) with respect to this information. Without limiting any of the foregoing, in no event shall any MSCI Party have any liability for any direct, indirect, special, incidental, punitive, consequential (including, without limitation, lost profits) or any other damages. (www.msci.com)
The Russell 2000 Index is an unmanaged total-return index of the smallest 2,000 companies in the Russell 3000 Index, as ranked by total market capitalization. The Russell 2000 is widely used in the industry to measure the performance of small-company stocks.
The Russell 2000 Growth Index measures the performance of Russell 2000 Index companies with higher price-to-book ratios and higher forecasted growth values.
The Russell 2000 Value Index measures the performance of Russell 2000 Index companies with lower price-to-book ratios and lower forecasted growth values.
The Russell 2500 Index is a market-cap weighted index that includes the smallest 2,500 small- and mid-cap stocks covered in the broad-based Russell 3000 of U.S.-based listed equities.
The Russell Microcap Index is an unmanaged total return index of the smallest 1,000 securities in the small-cap Russell 2000 Index along with the next smallest 1,000 companies, based on a ranking of all U.S. equities by market capitalization.
Pertaining to the use of Russell information. All rights in the Russell 2000, Russell 2000 Growth, Russell 2000 Value and Russell Microcap vest in the relevant London Stock Exchange Group PLC (collectively, the “LSE Group”), which owns these indexes. Russell® is a trademark of the relevant LSE Group company and is used by any other LSE Group company under license. These indexes are calculated by or on behalf of FTSE International Limited or its affiliate, agent or partner. The LSE Group does not accept any liability whatsoever to any person arising out of (a) the use of, reliance on or any error in the Index or (b) investment in or operation of any Wasatch portfolio. The LSE Group makes no claim, prediction, warranty or representation either as to the results to be obtained from any Wasatch portfolio or the suitability of these indexes for the purpose to which they are being put by Wasatch Global Investors.
You cannot invest directly in these or any indexes.
43
| | |
| Wasatch Funds | | MARCH 31, 2022 (Unaudited) |
Operating Expenses
EXPENSE EXAMPLE
As a shareholder of Wasatch Funds, you incur two types of costs: (1) transaction costs, including redemption fees and (2) ongoing costs, including management fees and other fund expenses. This example is intended to help you understand your ongoing costs (in dollars) of investing in a Wasatch Fund and to compare these costs with the ongoing costs of investing in other mutual funds.
The example is based on an investment of $1,000.00 invested at the beginning of the period and held for the entire six-month period ended March 31, 2022.
ACTUAL EXPENSES
The first line of the table on the next page provides information about actual account values and actual expenses, based upon the actual total return of the fund during the most recent six-month period ended March 31, 2022. You may use the information in this line, together with the amount you invested, to estimate the expenses you paid over the period. Simply divide your account value by $1,000.00 (for example, an $8,600.00 account value divided by $1,000.00 = 8.6), then multiply the result by the number in the first line under the heading entitled “Expenses Paid During Period” to estimate the expenses you paid on your account during this period.
In addition, the Funds charge a $12.50 IRA annual maintenance fee and a $15.00 fee for redemptions paid by wire. To the extent these fees apply to your account, your expenses paid during the period would be higher and your ending account value would be lower than the amounts shown in the table on the next page.
HYPOTHETICAL EXAMPLE FOR COMPARISON PURPOSES
The second line of the table on the next page provides information about hypothetical account values and hypothetical expenses based on a fund’s actual expense ratio and
an assumed rate of return of 5% per year before expenses, which is not the fund’s actual return. The hypothetical account values and expenses may not be used to estimate the actual ending account balance or expenses you paid for the period. You may use this information to compare the ongoing costs of investing in a Wasatch Fund and other funds. To do so, compare this 5% hypothetical example with the 5% hypothetical examples that appear in the shareholder reports of other funds.
In addition, the Funds charge a $12.50 IRA annual maintenance fee and a $15.00 fee for redemptions paid by wire. To the extent these fees apply to your account, your expenses paid during the period would be higher and your ending account value would be lower than the amounts shown in the table on the next page. If another fund’s fees differ from those listed above, your expenses paid and your ending account value could be higher or lower than those of other funds.
Please note that the expenses shown in the table are meant to highlight your ongoing costs only and do not reflect any transactional costs, such as redemption fees. Therefore, the second line of the table is useful in comparing ongoing costs only, and will not help you determine the relative total costs of owning different funds. In addition, if these transactional costs were included, your costs would have been higher.
A Fund’s annualized expense ratio may vary as a result of various factors including expenses that are not reimbursable under the contractual agreement between the Fund and the Advisor such as interest, taxes, brokerage commissions, other investment related costs, dividend expense on short sales, and extraordinary expenses.
44
| | |
| Wasatch Funds | | MARCH 31, 2022 (Unaudited) |
Operating Expenses (continued)
| | | | | | | | | | | | | | | | | | | | |
| | | Account Value | | Expenses Paid
During Period* | | Annualized Expense
Ratio* |
| Fund/Class and Return | | Beginning of Period
October 1, 2021 | | End of Period
March 31, 2022 |
Core Growth Fund — Investor Class | | | | | | | | | | | | | | | | | | | | |
Actual | | | $ | 1,000.00 | | | | $ | 888.80 | | | | $ | 5.46 | | | | | 1.16% | |
Hypothetical (5% before expenses) | | | $ | 1,000.00 | | | | $ | 1,019.15 | | | | $ | 5.84 | | | | | 1.16% | |
Core Growth Fund — Institutional Class | | | | | | | | | | | | | | | | | | | | |
Actual | | | $ | 1,000.00 | | | | $ | 889.30 | | | | $ | 4.95 | | | | | 1.05% | |
Hypothetical (5% before expenses) | | | $ | 1,000.00 | | | | $ | 1,019.70 | | | | $ | 5.29 | | | | | 1.05% | |
Emerging India Fund — Investor Class | | | | | | | | | | | | | | | | | | | | |
Actual | | | $ | 1,000.00 | | | | $ | 966.30 | | | | $ | 7.11 | | | | | 1.45% | |
Hypothetical (5% before expenses) | | | $ | 1,000.00 | | | | $ | 1,017.70 | | | | $ | 7.29 | | | | | 1.45% | |
Emerging India Fund — Institutional Class | | | | | | | | | | | | | | | | | | | | |
Actual | | | $ | 1,000.00 | | | | $ | 965.20 | | | | $ | 6.61 | | | | | 1.35% | |
Hypothetical (5% before expenses) | | | $ | 1,000.00 | | | | $ | 1,018.20 | | | | $ | 6.79 | | | | | 1.35% | |
Emerging Markets Select Fund — Investor Class | | | | | | | | | | | | | | | | |
Actual | | | $ | 1,000.00 | | | | $ | 836.60 | | | | $ | 5.54 | | | | | 1.21% | |
Hypothetical (5% before expenses) | | | $ | 1,000.00 | | | | $ | 1,018.90 | | | | $ | 6.09 | | | | | 1.21% | |
Emerging Markets Select Fund — Institutional Class | | | | | | | | | | | | | | | | |
Actual | | | $ | 1,000.00 | | | | $ | 836.30 | | | | $ | 4.94 | | | | | 1.08% | |
Hypothetical (5% before expenses) | | | $ | 1,000.00 | | | | $ | 1,019.55 | | | | $ | 5.44 | | | | | 1.08% | |
Emerging Markets Small Cap Fund — Investor Class | | | | | | | | | | | | | | | | |
Actual | | | $ | 1,000.00 | | | | $ | 864.50 | | | | $ | 8.55 | | | | | 1.84% | |
Hypothetical (5% before expenses) | | | $ | 1,000.00 | | | | $ | 1,015.76 | | | | $ | 9.25 | | | | | 1.84% | |
Emerging Markets Small Cap Fund — Institutional Class | | | | | | | | | | | | | | | | |
Actual | | | $ | 1,000.00 | | | | $ | 866.50 | | | | $ | 8.10 | | | | | 1.74% | |
Hypothetical (5% before expenses) | | | $ | 1,000.00 | | | | $ | 1,016.26 | | | | $ | 8.75 | | | | | 1.74% | |
Frontier Emerging Small Countries Fund — Investor Class | | | | | | | | | | | | | | | | |
Actual | | | $ | 1,000.00 | | | | $ | 783.20 | | | | $ | 9.56 | | | | | 2.15% | |
Hypothetical (5% before expenses) | | | $ | 1,000.00 | | | | $ | 1,014.21 | | | | $ | 10.80 | | | | | 2.15% | |
Frontier Emerging Small Countries Fund — Institutional Class | | | | | | | | | | | |
Actual | | | $ | 1,000.00 | | | | $ | 782.80 | | | | $ | 8.53 | | | | | 1.92% | |
Hypothetical (5% before expenses) | | | $ | 1,000.00 | | | | $ | 1,015.36 | | | | $ | 9.65 | | | | | 1.92% | |
Global Opportunities Fund — Investor Class | | | | | | | | | | | | | | | | | | | | |
Actual | | | $ | 1,000.00 | | | | $ | 851.60 | | | | $ | 6.65 | | | | | 1.44% | |
Hypothetical (5% before expenses) | | | $ | 1,000.00 | | | | $ | 1,017.75 | | | | $ | 7.24 | | | | | 1.44% | |
Global Opportunities Fund — Institutional Class | | | | | | | | | | | | | | | | |
Actual | | | $ | 1,000.00 | | | | $ | 851.80 | | | | $ | 6.19 | | | | | 1.34% | |
Hypothetical (5% before expenses) | | | $ | 1,000.00 | | | | $ | 1,018.25 | | | | $ | 6.74 | | | | | 1.34% | |
Global Select Fund — Investor Class | | | | | | | | | | | | | | | | |
Actual | | | $ | 1,000.00 | | | | $ | 834.60 | | | | $ | 6.17 | | | | | 1.35% | |
Hypothetical (5% before expenses) | | | $ | 1,000.00 | | | | $ | 1,018.20 | | | | $ | 6.79 | | | | | 1.35% | |
Global Select Fund — Institutional Class | | | | | | | | | | | | | | | | |
Actual | | | $ | 1,000.00 | | | | $ | 836.60 | | | | $ | 4.35 | | | | | 0.95% | |
Hypothetical (5% before expenses) | | | $ | 1,000.00 | | | | $ | 1,020.19 | | | | $ | 4.78 | | | | | 0.95% | |
Global Value Fund — Investor Class | | | | | | | | | | | | | | | | | | | | |
Actual | | | $ | 1,000.00 | | | | $ | 1,095.40 | | | | $ | 5.75 | | | | | 1.10% | |
Hypothetical (5% before expenses) | | | $ | 1,000.00 | | | | $ | 1,019.45 | | | | $ | 5.54 | | | | | 1.10% | |
Global Value Fund — Institutional Class | | | | | | | | | | | | | | | | | | | | |
Actual | | | $ | 1,000.00 | | | | $ | 1,096.40 | | | | $ | 4.97 | | | | | 0.95% | |
Hypothetical (5% before expenses) | | | $ | 1,000.00 | | | | $ | 1,020.19 | | | | $ | 4.78 | | | | | 0.95% | |
Greater China Fund — Investor Class | | | | | | | | | | | | | | | | | | | | |
Actual | | | $ | 1,000.00 | | | | $ | 804.70 | | | | $ | 6.84 | | | | | 1.52% | |
Hypothetical (5% before expenses) | | | $ | 1,000.00 | | | | $ | 1,017.35 | | | | $ | 7.64 | | | | | 1.52% | |
Greater China Fund — Institutional Class | | | | | | | | | | | | | | | | |
Actual | | | $ | 1,000.00 | | | | $ | 802.40 | | | | $ | 5.71 | | | | | 1.27% | |
Hypothetical (5% before expenses) | | | $ | 1,000.00 | | | | $ | 1,018.60 | | | | $ | 6.39 | | | | | 1.27% | |
International Growth Fund — Investor Class | | | | | | | | | | | | | | | | |
Actual | | | $ | 1,000.00 | | | | $ | 824.10 | | | | $ | 6.46 | | | | | 1.42% | |
Hypothetical (5% before expenses) | | | $ | 1,000.00 | | | | $ | 1,017.85 | | | | $ | 7.14 | | | | | 1.42% | |
45
| | |
| Wasatch Funds | | MARCH 31, 2022 (Unaudited) |
Operating Expenses (continued)
| | | | | | | | | | | | | | | | | | | | |
| | | Account Value | | Expenses Paid
During Period* | | Annualized Expense
Ratio* |
| Fund/Class and Return | | Beginning of Period
October 1, 2021 | | End of Period
March 31, 2022 |
International Growth Fund — Institutional Class | | | | | | | | | | | | | | | | | | | | |
Actual | | | $ | 1,000.00 | | | | $ | 824.50 | | | | $ | 6.00 | | | | | 1.32% | |
Hypothetical (5% before expenses) | | | $ | 1,000.00 | | | | $ | 1,018.35 | | | | $ | 6.64 | | | | | 1.32% | |
International Opportunities Fund — Investor Class | | | | | | | | | | | | | | | | | | | | |
Actual | | | $ | 1,000.00 | | | | $ | 754.80 | | | | $ | 8.49 | | | | | 1.94% | |
Hypothetical (5% before expenses) | | | $ | 1,000.00 | | | | $ | 1,015.26 | | | | $ | 9.75 | | | | | 1.94% | |
International Opportunities Fund — Institutional Class | | | | | | | | | | | | | | | | | | | | |
Actual | | | $ | 1,000.00 | | | | $ | 756.30 | | | | $ | 8.28 | | | | | 1.89% | |
Hypothetical (5% before expenses) | | | $ | 1,000.00 | | | | $ | 1,015.51 | | | | $ | 9.50 | | | | | 1.89% | |
International Select Fund — Investor Class | | | | | | | | | | | | | | | | | | | | |
Actual | | | $ | 1,000.00 | | | | $ | 804.10 | | | | $ | 5.85 | | | | | 1.30% | |
Hypothetical (5% before expenses) | | | $ | 1,000.00 | | | | $ | 1,018.45 | | | | $ | 6.54 | | | | | 1.30% | |
International Select Fund — Institutional Class | | | | | | | | | | | | | | | | |
Actual | | | $ | 1,000.00 | | | | $ | 805.30 | | | | $ | 4.05 | | | | | 0.90% | |
Hypothetical (5% before expenses) | | | $ | 1,000.00 | | | | $ | 1,020.44 | | | | $ | 4.53 | | | | | 0.90% | |
Long/Short Alpha Fund — Investor Class | | | | | | | | | | | | | | | | |
Actual | | | $ | 1,000.00 | | | | $ | 1,004.00 | | | | $ | 11.19 | | | | | 2.24% | |
Hypothetical (5% before expenses) | | | $ | 1,000.00 | | | | $ | 1,013.76 | | | | $ | 11.25 | | | | | 2.24% | |
Long/Short Alpha Fund — Institutional Class | | | | | | | | | | | | | | | | |
Actual | | | $ | 1,000.00 | | | | $ | 1,005.00 | | | | $ | 10.20 | | | | | 2.04% | |
Hypothetical (5% before expenses) | | | $ | 1,000.00 | | | | $ | 1,014.76 | | | | $ | 10.25 | | | | | 2.04% | |
Micro Cap Fund — Investor Class | | | | | | | | | | | | | | | | |
Actual | | | $ | 1,000.00 | | | | $ | 804.90 | | | | $ | 7.42 | | | | | 1.65% | |
Hypothetical (5% before expenses) | | | $ | 1,000.00 | | | | $ | 1,016.70 | | | | $ | 8.30 | | | | | 1.65% | |
Micro Cap Fund — Institutional Class | | | | | | | | | | | | | | | | |
Actual | | | $ | 1,000.00 | | | | $ | 805.20 | | | | $ | 7.07 | | | | | 1.57% | |
Hypothetical (5% before expenses) | | | $ | 1,000.00 | | | | $ | 1,017.10 | | | | $ | 7.90 | | | | | 1.57% | |
Micro Cap Value Fund — Investor Class | | | | | | | | | | | |
Actual | | | $ | 1,000.00 | | | | $ | 862.40 | | | | $ | 7.71 | | | | | 1.66% | |
Hypothetical (5% before expenses) | | | $ | 1,000.00 | | | | $ | 1,016.65 | | | | $ | 8.35 | | | | | 1.66% | |
Micro Cap Value Fund — Institutional Class | | | | | | | | | | | | | | | | | | | | |
Actual | | | $ | 1,000.00 | | | | $ | 864.70 | | | | $ | 7.44 | | | | | 1.60% | |
Hypothetical (5% before expenses) | | | $ | 1,000.00 | | | | $ | 1,016.95 | | | | $ | 8.05 | | | | | 1.60% | |
Small Cap Growth Fund — Investor Class | | | | | | | | | | | | | | | | |
Actual | | | $ | 1,000.00 | | | | $ | 806.60 | | | | $ | 5.13 | | | | | 1.14% | |
Hypothetical (5% before expenses) | | | $ | 1,000.00 | | | | $ | 1,019.25 | | | | $ | 5.74 | | | | | 1.14% | |
Small Cap Growth Fund — Institutional Class | | | | | | | | | | | | | | | | |
Actual | | | $ | 1,000.00 | | | | $ | 807.10 | | | | $ | 4.73 | | | | | 1.05% | |
Hypothetical (5% before expenses) | | | $ | 1,000.00 | | | | $ | 1,019.70 | | | | $ | 5.29 | | | | | 1.05% | |
Small Cap Value Fund — Investor Class | | | | | | | | | | | | | | | | |
Actual | | | $ | 1,000.00 | | | | $ | 960.70 | | | | $ | 5.62 | | | | | 1.15% | |
Hypothetical (5% before expenses) | | | $ | 1,000.00 | | | | $ | 1,019.20 | | | | $ | 5.79 | | | | | 1.15% | |
Small Cap Value Fund — Institutional Class | | | | | | | | | | | | | | | | | | | | |
Actual | | | $ | 1,000.00 | | | | $ | 961.10 | | | | $ | 5.13 | | | | | 1.05% | |
Hypothetical (5% before expenses) | | | $ | 1,000.00 | | | | $ | 1,019.70 | | | | $ | 5.29 | | | | | 1.05% | |
Ultra Growth Fund — Investor Class | | | | | | | | | | | | | | | | | | | | |
Actual | | | $ | 1,000.00 | | | | $ | 816.10 | | | | $ | 5.30 | | | | | 1.17% | |
Hypothetical (5% before expenses) | | | $ | 1,000.00 | | | | $ | 1,019.10 | | | | $ | 5.89 | | | | | 1.17% | |
Ultra Growth Fund — Institutional Class | | | | | | | | | | | | | | | | | | | | |
Actual | | | $ | 1,000.00 | | | | $ | 816.40 | | | | $ | 4.75 | | | | | 1.05% | |
Hypothetical (5% before expenses) | | | $ | 1,000.00 | | | | $ | 1,019.70 | | | | $ | 5.29 | | | | | 1.05% | |
U.S. Treasury Fund | | | | | | | | | | | | | | | | |
Actual | | | $ | 1,000.00 | | | | $ | 924.50 | | | | $ | 3.12 | | | | | 0.65% | |
Hypothetical (5% before expenses) | | | $ | 1,000.00 | | | | $ | 1,021.69 | | | | $ | 3.28 | | | | | 0.65% | |
*Expenses are equal to a fund’s annualized expense ratio as indicated above multiplied by the average account value over the period, multiplied by the number of days in the most recent fiscal half-year divided by the number of days in the full fiscal year (182/365).
46
| | |
| Wasatch Core Growth Fund (WGROX / WIGRX) | | MARCH 31, 2022 (Unaudited) |
Schedule of Investments
| | | | | | | | |
| Shares | | | | | Value | |
| | | | | | | |
| |
| | | | COMMON STOCKS 99.2% | |
| | |
| | | | Airlines 1.1% | | | |
| | 247,238 | | | Allegiant Travel Co.* | | $ | 40,148,979 | |
| | | | | | | | |
| | |
| | | | Application Software 7.0% | | | |
| | 315,850 | | | Avalara, Inc.* | | | 31,430,234 | |
| | 1,638,250 | | | Clearwater Analytics Holdings, Inc., Class A* | | | 34,403,250 | |
| | 333,718 | | | Five9, Inc.* | | | 36,842,467 | |
| | 494,490 | | | Guidewire Software, Inc.* | | | 46,788,644 | |
| | 217,743 | | | Paylocity Holding Corp.* | | | 44,804,977 | |
| | 868,005 | | | Q2 Holdings, Inc.* | | | 53,512,508 | |
| | | | | | | | |
| | | | 247,782,080 | |
| | | | | |
| | |
| | | | Asset Management & Custody
Banks 6.5% | | | |
| | 888,453 | | | Cohen & Steers, Inc. | | | 76,309,228 | |
| | 1,407,222 | | | Focus Financial Partners, Inc., Class A* | | | 64,366,334 | |
| | 1,166,961 | | | Hamilton Lane, Inc., Class A | | | 90,194,416 | |
| | | | | | | | |
| | | | 230,869,978 | |
| | | | | |
| | |
| | | | Auto Parts & Equipment 3.7% | | | |
| | 6,632,747 | | | Holley, Inc.* ‡‡ | | | 92,261,511 | |
| | 717,360 | | | XPEL, Inc.* | | | 37,740,309 | |
| | | | | | | | |
| | | | 130,001,820 | |
| | | | | |
| | |
| | | | Automotive Retail 1.0% | | | |
| | 788,623 | | | Monro, Inc. | | | 34,967,544 | |
| | | | | | | | |
| | |
| | | | Building Products 3.1% | | | |
| | 4,839,362 | | | Janus International Group, Inc.* | | | 43,554,258 | |
| | 997,729 | | | Trex Co., Inc.* | | | 65,181,636 | |
| | | | | | | | |
| | | | 108,735,894 | |
| | | | | |
| | |
| | | | Commodity Chemicals 1.2% | | | |
| | 1,390,548 | | | Valvoline, Inc. | | | 43,885,695 | |
| | | | | | | | |
| | |
| | | | Data Processing & Outsourced
Services 2.1% | | | |
| | 560,120 | | | Euronet Worldwide, Inc.* | | | 72,899,618 | |
| | | | | | | | |
| | |
| | | | Distillers & Vintners 1.3% | | | |
| | 2,431,237 | | | Duckhorn Portfolio, Inc.* | | | 44,224,201 | |
| | | | | | | | |
| | |
| | | | Distributors 2.2% | | | |
| | 184,642 | | | Pool Corp. | | | 78,075,870 | |
| | | | | | | | |
| | |
| | | | Electronic Equipment &
Instruments 2.6% | | | |
| | 641,831 | | | Novanta, Inc.* | | | 91,326,133 | |
| | | | | | | | |
| | |
| | | | Electronic Manufacturing
Services 1.9% | | | |
| | 639,613 | | | Fabrinet* | | | 67,242,515 | |
| | | | | | | | |
| | |
| | | | Financial Exchanges & Data 4.9% | | | |
| | 426,513 | | | Morningstar, Inc. | | | 116,510,556 | |
| | 2,996,643 | | | Open Lending Corp., Class A* | | | 56,666,519 | |
| | | | | | | | |
| | | | 173,177,075 | |
| | | | | |
| | |
| | | | General Merchandise Stores 1.6% | | | |
| | 1,301,496 | | | Ollie’s Bargain Outlet Holdings, Inc.* | | | 55,912,268 | |
| | | | | | | | |
| | | | | | | | |
| Shares | | | | | Value | |
| | | | | | | |
| | |
| | | | Health Care Facilities 3.0% | | | |
| | 1,189,248 | | | Ensign Group, Inc. | | $ | 107,044,212 | |
| | | | | | | | |
| | |
| | | | Health Care Supplies 1.7% | | | |
| | 1,966,474 | | | Neogen Corp.* | | | 60,646,058 | |
| | | | | | | | |
| | |
| | | | Home Improvement Retail 1.4% | | | |
| | 623,619 | | | Floor & Decor Holdings, Inc., Class A* | | | 50,513,139 | |
| | | | | | | | |
| | |
| | | | Homebuilding 1.0% | | | |
| | 402,192 | | | Installed Building Products, Inc. | | | 33,981,202 | |
| | | | | | | | |
| | |
| | | | Industrial Machinery 9.6% | | | |
| | 2,029,744 | | | Altra Industrial Motion Corp. | | | 79,017,934 | |
| | 991,054 | | | Helios Technologies, Inc. | | | 79,532,084 | |
| | 516,438 | | | Kadant, Inc. | | | 100,287,095 | |
| | 401,641 | | | RBC Bearings, Inc.* | | | 77,870,157 | |
| | | | | | | | |
| | | | 336,707,270 | |
| | | | | |
| | |
| | | | Insurance Brokers 1.7% | | | |
| | 345,377 | | | Goosehead Insurance, Inc., Class A | | | 27,136,271 | |
| | 3,000,000 | | | Hagerty, Inc., Class A* | | | 32,370,000 | |
| | | | | | | | |
| | | | 59,506,271 | |
| | | | | |
| | |
| | | | Interactive Media & Services 2.2% | | | |
| | 3,395,572 | | | ZipRecruiter, Inc., Class A* | | | 78,030,244 | |
| | | | | | | | |
| | |
| | | | IT Consulting & Other Services 1.9% | | | |
| | 250,557 | | | Globant SA* | | | 65,663,473 | |
| | | | | | | | |
| | |
| | | | Leisure Products 2.7% | | | |
| | 1,790,072 | | | Callaway Golf Co.* | | | 41,923,486 | |
| | 881,591 | | | YETI Holdings, Inc.* | | | 52,877,828 | |
| | | | | | | | |
| | | | 94,801,314 | |
| | | | | |
| | |
| | | | Life Sciences Tools & Services 5.9% | | | |
| | 406,475 | | | ICON PLC* | | | 98,862,850 | |
| | 661,555 | | | Medpace Holdings, Inc.* | | | 108,223,782 | |
| | | | | | | | |
| | | | 207,086,632 | |
| | | | | |
| | |
| | | | Managed Health Care 3.1% | | | |
| | 1,603,632 | | | HealthEquity, Inc.* | | | 108,148,942 | |
| | | | | | | | |
| | |
| | | | Metal & Glass Containers 1.6% | | | |
| | 1,737,597 | | | TriMas Corp. | | | 55,759,488 | |
| | | | | | | | |
| | |
| | | | Packaged Foods & Meats 1.2% | | | |
| | 421,950 | | | Freshpet, Inc.* | | | 43,308,948 | |
| | | | | | | | |
| | |
| | | | Pharmaceuticals 1.6% | | | |
| | 925,700 | | | Intra-Cellular Therapies, Inc.* | | | 56,643,583 | |
| | | | | | | | |
| | |
| | | | Regional Banks 7.0% | | | |
| | 2,650,535 | | | Bank OZK | | | 113,177,844 | |
| | 872,287 | | | Eagle Bancorp, Inc. | | | 49,729,082 | |
| | 1,507,664 | | | Webster Financial Corp. | | | 84,610,104 | |
| | | | | | | | |
| | | | 247,517,030 | |
| | | | | |
| | |
| | | | Semiconductors 1.5% | | | |
| | 105,934 | | | Monolithic Power Systems, Inc. | | | 51,450,025 | |
| | | | | | | | |
47
| | |
| Wasatch Core Growth Fund (WGROX / WIGRX) | | MARCH 31, 2022 (Unaudited) |
Schedule of Investments (continued)
| | | | | | | | |
| Shares | | | | | Value | |
| | | | | | | |
| | |
| | | | Specialized Consumer
Services 1.2% | | | |
| | 2,745,985 | | | Mister Car Wash, Inc.* | | $ | 40,613,118 | |
| | | | | | | | |
| | |
| | | | Specialized REITs 1.4% | | | |
| | 798,772 | | | National Storage Affiliates Trust | | | 50,130,931 | |
| | | | | | | | |
| | |
| | | | Specialty Chemicals 2.3% | | | |
| | 602,230 | | | Balchem Corp. | | | 82,324,841 | |
| | | | | | | | |
| | |
| | | | Specialty Stores 3.8% | | | |
| | 648,644 | | | Five Below, Inc.* | | | 102,725,750 | |
| | 752,585 | | | National Vision Holdings, Inc.* | | | 32,790,129 | |
| | | | | | | | |
| | | | 135,515,879 | |
| | | | | |
| | |
| | | | Systems Software 3.2% | | | |
| | 663,394 | | | CyberArk Software Ltd.* | | | 111,947,737 | |
| | | | | | | | |
| | |
| | | | Total Common Stocks
(cost $2,575,707,679) | | | 3,496,590,007 | |
| | | | | | | | |
| |
| | | | WARRANTS 0.1% | |
| | |
| | | | Insurance Brokers 0.1% | | | |
| | 540,000 | | | Hagerty, Inc., expiring 12/2/2026* *** † | | | 1,204,200 | |
| | | | | | | | |
| | |
| | | | Total Warrants
(cost $1,859,173) | | | 1,204,200 | |
| | | | | | | | |
| | | | | | | | |
Principal
Amount | | | | | Value | |
| | | | | | | |
| |
| | | | SHORT-TERM INVESTMENTS 0.8% | |
| | |
| | | | Repurchase Agreement 0.8% | | | |
| $ | 28,707,850 | | | Repurchase Agreement dated 3/31/22, 0.00% due 4/1/22 with Fixed Income Clearing Corp. collateralized by $31,759,200 of United States Treasury Notes 1.125% due 8/31/28; value: $29,282,068; repurchase proceeds: $28,707,850 (cost $28,707,850) | | $ | 28,707,850 | |
| | | | | | | | |
| | |
| | | | Total Short-Term Investments
(cost $28,707,850) | | | 28,707,850 | |
| | | | | | | | |
| | |
| | | | Total Investments
(cost $2,606,274,702) 100.1% | | | 3,526,502,057 | |
| | |
| | | | Liabilities less Other Assets (0.1%) | | | (2,833,584 | ) |
| | | | | | | | |
| | |
| | | | Net Assets 100.0% | | $ | 3,523,668,473 | |
| | | | | | | | |
| |
| | | | *Non-income producing. ***Security was fair valued under procedures adopted by the Board of Trustees (see Note 12). †Security purchased in a private placement transaction or under Rule 144A of the Securities Act of 1933 (see Note 9). The aggregate value of securities purchased in a private placement transaction or under Rule 144A of the Securities Act of 1933 at March 31, 2022 amounted to approximately $1,204,200 and represented 0.03% of net assets. ‡‡Affiliated company (see Note 8). REIT Real Estate Investment Trust. | |
| |
| | | | See Notes to Financial Statements. | |
At March 31, 2022, Wasatch Core Growth Fund’s investments, excluding short-term investments, were in the following countries:
| | | | | |
| Country | | % |
Ireland | | | | 2.8 | |
Israel | | | | 3.2 | |
United States | | | | 94.0 | |
| | | | | |
TOTAL | | | | 100.0 | % |
| | | | | |
48
| | |
| Wasatch Emerging India Fund (WAINX / WIINX) | | MARCH 31, 2022 (Unaudited) |
Schedule of Investments
| | | | | | | | |
| Shares | | | | | Value | |
| | | | | | | |
| |
| | | | COMMON STOCKS 102.3% | |
| | |
| | | | Apparel, Accessories & Luxury
Goods 3.9% | | | |
| | 44,927 | | | Page Industries Ltd. | | $ | 25,505,333 | |
| | | | | | | | |
| | |
| | | | Commodity Chemicals 2.9% | | | |
| | 2,095,613 | | | Berger Paints India Ltd. | | | 19,310,814 | |
| | | | | | | | |
| | |
| | | | Consumer Finance 9.5% | | | |
| | 659,483 | | | Bajaj Finance Ltd. | | | 62,629,973 | |
| | | | | | | | |
| | |
| | | | Department Stores 6.1% | | | |
| | 2,386,459 | | | Trent Ltd. | | | 39,940,720 | |
| | | | | | | | |
| | |
| | | | Diversified Banks 7.9% | | | |
| | 1,883,991 | | | HDFC Bank Ltd. | | | 36,285,308 | |
| | 698,700 | | | Kotak Mahindra Bank Ltd. | | | 16,046,783 | |
| | | | | | | | |
| | | | 52,332,091 | |
| | | | | |
| | |
| | | | Food Retail 4.6% | | | |
| | 576,862 | | | Avenue Supermarts Ltd.* | | | 30,336,650 | |
| | | | | | | | |
| | |
| | | | Health Care Services 7.1% | | | |
| | 835,095 | | | Dr. Lal PathLabs Ltd. | | | 28,599,190 | |
| | 3,178,246 | | | Vijaya Diagnostic Centre Pvt. Ltd.* | | | 18,296,148 | |
| | | | | | | | |
| | | | 46,895,338 | |
| | | | | |
| | |
| | | | Industrial Conglomerates 1.0% | | | |
| | 24,570 | | | 3M India Ltd.* | | | 6,367,096 | |
| | | | | | | | |
| | |
| | | | Industrial Machinery 6.0% | | | |
| | 9,761,045 | | | Elgi Equipments Ltd. | | | 35,735,727 | |
| | 58,136 | | | GMM Pfaudler Ltd. | | | 3,472,542 | |
| | | | | | | | |
| | | | 39,208,269 | |
| | | | | |
| | |
| | | | Interactive Media & Services 4.0% | | | |
| | 445,952 | | | Info Edge India Ltd. | | | 26,384,111 | |
| | | | | | | | |
| | |
| | | | IT Consulting & Other Services 16.8% | | | |
| | 559,911 | | | Larsen & Toubro Infotech Ltd. | | | 45,145,631 | |
| | 893,721 | | | Mindtree Ltd. | | | 50,284,104 | |
| | 239,918 | | | Persistent Systems Ltd. | | | 15,005,312 | |
| | | | | | | | |
| | | | 110,435,047 | |
| | | | | |
| | |
| | | | Life Sciences Tools & Services 5.4% | | | |
| | 620,413 | | | Divi’s Laboratories Ltd. | | | 35,885,231 | |
| | | | | | | | |
| | |
| | | | Personal Products 0.1% | | | |
| | 3,220 | | | Procter & Gamble Hygiene & Health Care Ltd. | | | 611,564 | |
| | | | | | | | |
| | |
| | | | Property & Casualty Insurance 3.2% | | | |
| | 1,195,817 | | | ICICI Lombard General Insurance Co. Ltd. | | | 20,859,876 | |
| | | | | | | | |
| | |
| | | | Regional Banks 6.1% | | | |
| | 2,450,428 | | | AU Small Finance Bank Ltd.* | | | 40,007,779 | |
| | | | | | | | |
| | |
| | | | Research & Consulting Services 6.2% | | | |
| | 605,893 | | | L&T Technology Services Ltd. | | | 40,517,472 | |
| | | | | | | | |
| | |
| | | | Specialty Chemicals 2.4% | | | |
| | 388,528 | | | Asian Paints Ltd. | | | 15,721,468 | |
| | | | | | | | |
| | | | | | | | |
| Shares | | | | | Value | |
| | | | | | | |
| | |
| | | | Systems Software 4.7% | | | |
| | 268,699 | | | Tata Elxsi Ltd. | | $ | 31,149,125 | |
| | | | | | | | |
| | |
| | | | Thrifts & Mortgage Finance 4.4% | | | |
| | 869,242 | | | Aavas Financiers Ltd.* | | | 29,283,664 | |
| | | | | | | | |
| | |
| | | | Total Common Stocks
(cost $405,994,735) | | | 673,381,621 | |
| | | | | | | | |
| | |
Principal
Amount | | | | | Value | |
| | | | | | | |
| |
| | | | SHORT-TERM INVESTMENTS 1.4% | |
| | |
| | | | Repurchase Agreement 1.4% | | | |
| $ | 9,027,191 | | | Repurchase Agreement dated 3/31/22, 0.00% due 4/1/22 with Fixed Income Clearing Corp. collateralized by $9,986,700 of United States Treasury Notes 1.125% due 8/31/28; value: $9,207,764; repurchase proceeds: $9,027,191 (cost $9,027,191) | | $ | 9,027,191 | |
| | | | | | | | |
| | |
| | | | Total Short-Term Investments
(cost $9,027,191) | | | 9,027,191 | |
| | | | | | | | |
| | |
| | | | Total Investments
(cost $415,021,926) 103.7%§ | | | 682,408,812 | |
| | |
| | | | Liabilities less Other Assets (3.7%) | | | (24,526,761 | ) |
| | | | | | | | |
| | |
| | | | Net Assets 100.0% | | $ | 657,882,051 | |
| | | | | | | | |
| |
| | | | *Non-income producing. §The aggregate amount of foreign securities fair valued pursuant to a systematic valuation model as a percent of net assets was 102.36%. | |
| |
| | | | See Notes to Financial Statements. | |
At March 31, 2022, Wasatch Emerging India Fund’s investments, excluding short-term investments, were in the following countries:
| | | | | |
| Country | | % |
India | | | | 100.0 | |
| | | | | |
TOTAL | | | | 100.0 | % |
| | | | | |
49
| | |
| Wasatch Emerging Markets Select Fund (WAESX / WIESX) | | MARCH 31, 2022 (Unaudited) |
Schedule of Investments
| | | | | | | | |
| Shares | | | | | Value | |
| | | | | | | |
| | |
| | | | COMMON STOCKS 99.3% | | | | |
| | |
| | | | Airport Services 4.5% | | | |
| | 1,335,513 | | | Grupo Aeroportuario del Pacifico SAB de CV, Class B* | | $ | 21,661,631 | |
| | | | | | | | |
| | |
| | | | Apparel, Accessories & Luxury
Goods 2.4% | | | |
| | 20,154 | | | Page Industries Ltd. | | | 11,441,549 | |
| | | | | | | | |
| | |
| | | | Consumer Finance 6.7% | | | |
| | 340,389 | | | Bajaj Finance Ltd. | | | 32,326,161 | |
| | | | | | | | |
| | |
| | | | Data Processing & Outsourced
Services 3.0% | | | |
| | 456,220 | | | Dlocal Ltd.* | | | 14,261,437 | |
| | | | | | | | |
| | |
| | | | Department Stores 2.4% | | | |
| | 704,913 | | | Trent Ltd. | | | 11,797,702 | |
| | | | | | | | |
| | |
| | | | Diversified Banks 8.1% | | | |
| | 1,226,097 | | | HDFC Bank Ltd. | | | 23,614,395 | |
| | 1,996,052 | | | NU Holdings Ltd.* | | | 15,409,522 | |
| | 66,488 | | | TCS Group Holding PLC, GDR* *** §§ | | | 47,871 | |
| | | | | | | | |
| | | | 39,071,788 | |
| | | | | |
| | |
| | | | Drug Retail 2.1% | | | |
| | 2,050,330 | | | Raia Drogasil SA | | | 10,309,680 | |
| | | | | | | | |
| | |
| | | | Electrical Components &
Equipment 6.8% | | | |
| | 442,765 | | | Voltronic Power Technology Corp. | | | 22,344,360 | |
| | 1,436,902 | | | WEG SA | | | 10,523,891 | |
| | | | | | | | |
| | | | 32,868,251 | |
| | | | | |
| | |
| | | | General Merchandise Stores 0.2% | | | |
| | 654,200 | | | Magazine Luiza SA | | | 937,113 | |
| | | | | | | | |
| | |
| | | | Industrial Machinery 2.2% | | | |
| | 79,691 | | | Airtac International Group | | | 2,562,135 | |
| | 501,722 | | | Techtronic Industries Co. Ltd. | | | 8,038,320 | |
| | | | | | | | |
| | | | 10,600,455 | |
| | | | | |
| | |
| | | | Interactive Home Entertainment 4.2% | | | |
| | 167,009 | | | Sea Ltd., ADR* | | | 20,006,008 | |
| | | | | | | | |
| | |
| | | | Internet & Direct Marketing Retail 8.0% | | | |
| | 23,989 | | | MercadoLibre, Inc.* | | | 28,534,436 | |
| | 311,188 | | | momo.com, Inc. | | | 10,114,778 | |
| | | | | | | | |
| | | | 38,649,214 | |
| | | | | |
| | |
| | | | IT Consulting & Other Services 10.4% | | | |
| | 99,620 | | | Globant SA* | | | 26,107,413 | |
| | 298,109 | | | Larsen & Toubro Infotech Ltd. | | | 24,036,533 | |
| | | | | | | | |
| | | | 50,143,946 | |
| | | | | |
| | |
| | | | Life & Health Insurance 4.1% | | | |
| | 1,574,153 | | | Discovery Ltd.* | | | 19,608,733 | |
| | | | | | | | |
| | | | | | | | |
| Shares | | | | | Value | |
| | | | | | | |
| | |
| | | | Life Sciences Tools & Services 3.2% | | | |
| | 164,024 | | | Divi’s Laboratories Ltd. | | $ | 9,487,291 | |
| | 764,313 | | | Wuxi Biologics Cayman, Inc.* | | | 6,069,101 | |
| | | | | | | | |
| | | | 15,556,392 | |
| | | | | |
| | |
| | | | Managed Health Care 1.4% | | | |
| | 2,754,700 | | | Hapvida Participacoes e Investimentos SA | | | 6,850,516 | |
| | | | | | | | |
| | |
| | | | Property & Casualty Insurance 2.5% | | | |
| | 412,619 | | | ICICI Lombard General Insurance Co. Ltd. | | | 7,197,741 | |
| | 857,244 | | | Qualitas Controladora SAB de CV | | | 4,912,883 | |
| | | | | | | | |
| | | | 12,110,624 | |
| | | | | |
| | |
| | | | Regional Banks 3.4% | | | |
| | 993,818 | | | AU Small Finance Bank Ltd.* | | | 16,225,921 | |
| | | | | | | | |
| | |
| | | | Semiconductor Equipment 3.7% | | | |
| | 106,500 | | | Lasertec Corp. | | | 17,717,766 | |
| | | | | | | | |
| | |
| | | | Semiconductors 12.0% | | | |
| | 210,540 | | | ASPEED Technology, Inc. | | | 23,700,257 | |
| | 231,959 | | | Silergy Corp. | | | 27,197,373 | |
| | 783,357 | | | Sino Wealth Electronic Ltd., Class A | | | 7,027,519 | |
| | | | | | | | |
| | | | 57,925,149 | |
| | | | | |
| | |
| | | | Specialized Finance 4.6% | | | |
| | 2,521,706 | | | Chailease Holding Co. Ltd. | | | 22,118,696 | |
| | | | | | | | |
| | |
| | | | Specialty Chemicals 1.5% | | | |
| | 180,771 | | | Asian Paints Ltd. | | | 7,314,751 | |
| | | | | | | | |
| | |
| | | | Systems Software 1.9% | | | |
| | 79,956 | | | Tata Elxsi Ltd. | | | 9,268,957 | |
| | | | | | | | |
| | |
| | | | Total Common Stocks
(cost $463,471,317) | | | 478,772,440 | |
| | | | | | | | |
50
| | |
| Wasatch Emerging Markets Select Fund (WAESX / WIESX) | | MARCH 31, 2022 (Unaudited) |
Schedule of Investments (continued)
| | | | | | | | |
Principal
Amount | | | | | Value | |
| | | | | | | |
| |
| | | | SHORT-TERM INVESTMENTS 6.4% | |
| | |
| | | | Repurchase Agreement 6.4% | | | |
| $ | 31,016,489 | | | Repurchase Agreement dated 3/31/22,
0.00% due 4/1/22 with Fixed Income
Clearing Corp. collateralized by $34,313,200 of United States Treasury Notes 1.125% due 8/31/28; value: $31,636,863; repurchase proceeds: $31,016,489 (cost $31,016,489) | | $ | 31,016,489 | |
| | | | | | | | |
| | |
| | | | Total Short-Term Investments
(cost $31,016,489) | | | 31,016,489 | |
| | | | | | | | |
| | |
| | | | Total Investments
(cost $494,487,806) 105.7%§ | | | 509,788,929 | |
| | |
| | | | Liabilities less Other Assets (5.7%) | | | (27,497,285 | ) |
| | | | | | | | |
| | |
| | | | Net Assets 100.0% | | $ | 482,291,644 | |
| | | | | | | | |
| |
| | | | *Non-income producing. ***Security was fair valued under procedures adopted by the Board of Trustees (see Note 12). §The aggregate amount of foreign securities fair valued pursuant to a systematic valuation model as a percent of net assets was 66.19%. §§The aggregate value of illiquid holdings at March 31, 2022 amounted to approximately $47,871 and represented 0.01% of net assets. ADR American Depositary Receipt. GDR Global Depositary Receipt. | |
| | |
| | | | See Notes to Financial Statements. | | | | |
At March 31, 2022, Wasatch Emerging Markets Select Fund’s investments, excluding short-term investments, were in the following countries:
| | | | | |
| Country | | % |
Brazil | | | | 9.2 | |
China | | | | 2.7 | |
Hong Kong | | | | 1.7 | |
India | | | | 31.9 | |
Japan | | | | 3.7 | |
Mexico | | | | 5.5 | |
Russia | | | | 0.0 | |
Singapore | | | | 4.2 | |
South Africa | | | | 4.1 | |
Taiwan | | | | 22.6 | |
United States | | | | 11.4 | |
Uruguay | | | | 3.0 | |
| | | | | |
TOTAL | | | | 100.0 | % |
| | | | | |
51
| | |
| Wasatch Emerging Markets Small Cap Fund (WAEMX / WIEMX) | | MARCH 31, 2022 (Unaudited) |
Schedule of Investments
| | | | | | | | |
| Shares | | | | | Value | |
| | | | | | | |
| |
| | | | COMMON STOCKS 101.9% | |
| | |
| | | | Airport Services 2.9% | | | |
| | 2,276,625 | | | Grupo Aeroportuario del Centro Norte SAB de CV | | $ | 17,035,198 | |
| | | | | | | | |
| | |
| | | | Asset Management & Custody
Banks 1.4% | | | |
| | 17,554,351 | | | VEF AB* | | | 8,206,751 | |
| | | | | | | | |
| | |
| | | | Commodity Chemicals 1.9% | | | |
| | 1,197,391 | | | Berger Paints India Ltd. | | | 11,033,809 | |
| | | | | | | | |
| | |
| | | | Communications Equipment 1.9% | | | |
| | 1,428,000 | | | Accton Technology Corp. | | | 10,979,908 | |
| | | | | | | | |
| | |
| | | | Consumer Finance 2.7% | | | |
| | 3,802,075 | | | Muangthai Capital Public Co. Ltd. | | | 6,003,277 | |
| | 2,592,400 | | | Ngern Tid Lor Public Co. Ltd.* | | | 3,001,726 | |
| | 5,754,377 | | | Unifin Financiera SAB de CV* | | | 6,992,624 | |
| | | | | | | | |
| | | | | | | 15,997,627 | |
| | | | | | | | |
| | |
| | | | Department Stores 4.2% | | | |
| | 1,469,918 | | | Trent Ltd. | | | 24,601,128 | |
| | | | | | | | |
| | |
| | | | Diversified Banks 0.0% | | | |
| | 68,809 | | | TCS Group Holding PLC, GDR* *** §§ | | | 49,542 | |
| | | | | | | | |
| | |
| | | | Drug Retail 4.4% | | | |
| | 536,146 | | | Clicks Group Ltd. | | | 11,339,327 | |
| | 2,902,850 | | | Raia Drogasil SA | | | 14,596,408 | |
| | | | | | | | |
| | | | | | | 25,935,735 | |
| | | | | | | | |
| | |
| | | | Electrical Components &
Equipment 5.6% | | | |
| | 659,863 | | | Voltronic Power Technology Corp. | | | 33,300,320 | |
| | | | | | | | |
| | |
| | | | Electronic Equipment &
Instruments 2.7% | | | |
| | 1,535,616 | | | Chroma ATE, Inc. | | | 9,576,118 | |
| | 11,780 | | | Honeywell Automation India Ltd. | | | 6,146,903 | |
| | | | | | | | |
| | | | | | | 15,723,021 | |
| | | | | | | | |
| | |
| | | | Electronic Manufacturing
Services 1.5% | | | |
| | 83,296 | | | Fabrinet* | | | 8,756,908 | |
| | | | | | | | |
| | |
| | | | Health Care Facilities 1.3% | | | |
| | 27,060,361 | | | Cleopatra Hospital* | | | 7,379,899 | |
| | | | | | | | |
| | |
| | | | Health Care Services 2.2% | | | |
| | 384,446 | | | Dr. Lal PathLabs Ltd. | | | 13,165,980 | |
| | | | | | | | |
| | |
| | | | Health Care Supplies 0.0% | | | |
| | 100,972 | | | Shanghai Kindly Medical Instruments Co. Ltd., Class H | | | 205,829 | |
| | | | | | | | |
| | |
| | | | Home Improvement Retail 2.1% | | | |
| | 3,561,000 | | | MR DIY Group M Berhad | | | 2,926,142 | |
| | 17,962,097 | | | Wilcon Depot, Inc. | | | 9,372,435 | |
| | | | | | | | |
| | | | | | | 12,298,577 | |
| | | | | | | | |
| | | | | | | | |
| Shares | | | | | Value | |
| | | | | | | |
| | |
| | | | Hotels, Resorts & Cruise Lines 0.8% | | | |
| | 1,394,570 | | | Huazhu Group Ltd. | | $ | 4,657,576 | |
| | | | | | | | |
| | |
| | | | Human Resource & Employment
Services 0.3% | | | |
| | 127,813 | | | Grupa Pracuj SA* | | | 1,913,815 | |
| | 482,457 | | | HeadHunter Group PLC, ADR*** §§ | | | 144,737 | |
| | | | | | | | |
| | | | | | | 2,058,552 | |
| | | | | | | | |
| | |
| | | | Industrial Machinery 0.9% | | | |
| | 1,523,365 | | | Elgi Equipments Ltd. | | | 5,577,124 | |
| | | | | | | | |
| | |
| | | | Insurance Brokers 0.5% | | | |
| | 2,668,953 | | | TQM Corp. Public Co. Ltd. | | | 3,210,771 | |
| | | | | | | | |
| | |
| | | | Interactive Media & Services 1.9% | | | |
| | 1,099,586 | | | Baltic Classifieds Group PLC* | | | 1,981,845 | |
| | 153,978 | | | Info Edge India Ltd. | | | 9,109,888 | |
| | | | | | | | |
| | | | | | | 11,091,733 | |
| | | | | | | | |
| | |
| | | | Internet & Direct Marketing
Retail 2.8% | | | |
| | 504,500 | | | momo.com, Inc. | | | 16,398,145 | |
| | | | | | | | |
| | |
| | | | IT Consulting & Other Services 15.6% | | | |
| | 95,972 | | | Globant SA* | | | 25,151,382 | |
| | 293,061 | | | Larsen & Toubro Infotech Ltd. | | | 23,629,512 | |
| | 624,789 | | | Mindtree Ltd. | | | 35,152,979 | |
| | 123,581 | | | Persistent Systems Ltd. | | | 7,729,189 | |
| | | | | | | | |
| | | | | | | 91,663,062 | |
| | | | | | | | |
| | |
| | | | Life & Health Insurance 3.6% | | | |
| | 1,697,913 | | | Discovery Ltd.* | | | 21,150,372 | |
| | | | | | | | |
| | |
| | | | Pharmaceuticals 0.0% | | | |
| | 13,017,213 | | | China Animal Healthcare Ltd.* *** §�� | | | 16,618 | |
| | | | | | | | |
| | |
| | | | Property & Casualty Insurance 3.6% | | | |
| | 536,821 | | | ICICI Lombard General Insurance Co. Ltd. | | | 9,364,325 | |
| | 2,070,584 | | | Qualitas Controladora SAB de CV | | | 11,866,560 | |
| | | | | | | | |
| | | | | | | 21,230,885 | |
| | | | | | | | |
| | |
| | | | Regional Banks 5.7% | | | |
| | 1,734,062 | | | AU Small Finance Bank Ltd.* | | | 28,311,777 | |
| | 726,462 | | | Regional SAB de CV | | | 5,105,322 | |
| | | | | | | | |
| | | | | | | 33,417,099 | |
| | | | | | | | |
| | |
| | | | Research & Consulting Services 4.6% | | | |
| | 10,690,600 | | | CTOS Digital Bhd | | | 4,006,101 | |
| | 349,488 | | | L&T Technology Services Ltd. | | | 23,371,074 | |
| | | | | | | | |
| | | | | | | 27,377,175 | |
| | | | | | | | |
| | |
| | | | Semiconductor Equipment 1.7% | | | |
| | 95,491 | | | Tokai Carbon Korea Co. Ltd. | | | 10,223,484 | |
| | | | | | | | |
| | |
| | | | Semiconductors 18.6% | | | |
| | 248,774 | | | ASPEED Technology, Inc. | | | 28,004,217 | |
| | 144,761 | | | LEENO Industrial, Inc. | | | 21,863,541 | |
| | 83,735 | | | Parade Technologies Ltd. | | | 5,233,266 | |
| | 311,143 | | | Silergy Corp. | | | 36,481,758 | |
| | 1,446,240 | | | Sino Wealth Electronic Ltd., Class A | | | 12,974,262 | |
| | 558,000 | | | Win Semiconductors Corp. | | | 5,135,045 | |
| | | | | | | | |
| | | | | | | 109,692,089 | |
| | | | | | | | |
52
| | |
| Wasatch Emerging Markets Small Cap Fund (WAEMX / WIEMX) | | MARCH 31, 2022 (Unaudited) |
Schedule of Investments (continued)
| | | | | | | | |
| Shares | | | | | Value | |
| | | | | | | |
| | |
| | | | Specialty Stores 2.7% | | | |
| | 4,042,300 | | | Pet Center Comercio e Participacoes SA | | $ | 15,843,001 | |
| | | | | | | | |
| | |
| | | | Thrifts & Mortgage Finance 3.8% | | | |
| | 658,823 | | | Aavas Financiers Ltd.* | | | 22,194,914 | |
| | | | | | | | |
| | |
| | | | Total Common Stocks
(cost $395,724,864) | | | 600,472,832 | |
| | | | | | | | |
| | |
Principal
Amount | | | | | Value | |
| | | | | | | |
| |
| | | | SHORT-TERM INVESTMENTS 0.5% | |
| | |
| | | | Repurchase Agreement 0.5% | | | |
| $ | 2,731,840 | | | Repurchase Agreement dated 3/31/22, 0.00% due 4/1/22 with Fixed Income Clearing Corp. collateralized by $3,022,300 of United States Treasury Notes 1.125% due 8/31/28; value: $2,786,569; repurchase proceeds: $2,731,840 (cost $2,731,840) | | $ | 2,731,840 | |
| | | | | | | | |
| | |
| | | | Total Short-Term Investments
(cost $2,731,840) | | | 2,731,840 | |
| | | | | | | | |
| | |
| | | | Total Investments
(cost $398,456,704) 102.4%§ | | | 603,204,672 | |
| | |
| | | | Liabilities less Other Assets (2.4%) | | | (13,902,286 | ) |
| | | | | | | | |
| | |
| | | | Net Assets 100.0% | | $ | 589,302,386 | |
| | | | | | | | |
| |
| | | | *Non-income producing. ***Security was fair valued under procedures adopted by the Board of Trustees (see Note 12). §The aggregate amount of foreign securities fair valued pursuant to a systematic valuation model as a percent of net assets was 78.40%. §§The aggregate value of illiquid holdings at March 31, 2022, amounts to approximately $210,897 and represents 0.04% of net assets. ADR American Depositary Receipt. GDR Global Depositary Receipt. | |
| |
| | | | See Notes to Financial Statements. | |
At March 31, 2022, Wasatch Emerging Markets Small Cap Fund’s investments, excluding short-term investments, were in the following countries:
| | | | | |
| Country | | % |
Brazil | | | | 5.1 | |
China | | | | 3.0 | |
Egypt | | | | 1.2 | |
India | | | | 36.5 | |
Malaysia | | | | 1.2 | |
Mexico | | | | 6.8 | |
Philippines | | | | 1.6 | |
Poland | | | | 0.3 | |
Russia | | | | 0.0 | |
South Africa | | | | 5.4 | |
South Korea | | | | 5.3 | |
Sweden | | | | 1.4 | |
Taiwan | | | | 24.2 | |
Thailand | | | | 2.0 | |
United Kingdom | | | | 0.3 | |
United States | | | | 5.7 | |
| | | | | |
TOTAL | | | | 100.0 | % |
| | | | | |
53
| | |
| Wasatch Frontier Emerging Small Countries Fund (WAFMX / WIFMX) | | MARCH 31, 2022 (Unaudited) |
Schedule of Investments
| | | | | | | | |
| Shares | | | | | Value | |
| | | | | | | |
| | |
| | | | COMMON STOCKS 99.7% | | | | |
| | |
| | | | Airport Services 4.8% | | | |
| | 185,400 | | | Grupo Aeroportuario del Centro Norte SAB de CV | | $ | 1,387,284 | |
| | 83,300 | | | Grupo Aeroportuario del Pacifico SAB de CV, Class B* | | | 1,351,102 | |
| | | | | | | | |
| | | | 2,738,386 | |
| | | | | | | | |
| | |
| | | | Asset Management & Custody
Banks 10.2% | | | |
| | 2,089,200 | | | DCVFMVN Diamond ETF* | | | 2,751,391 | |
| | 6,545,108 | | | VEF AB* | | | 3,059,872 | |
| | | | | | | | |
| | | | 5,811,263 | |
| | | | | | | | |
| | |
| | | | Computer & Electronics Retail 2.8% | | | |
| | 249,250 | | | Mobile World Investment Corp. | | | 1,587,625 | |
| | | | | | | | |
| | |
| | | | Consumer Finance 12.0% | | | |
| | 53,486 | | | Bajaj Finance Ltd. | | | 5,079,474 | |
| | 869,200 | | | Ngern Tid Lor Public Co. Ltd.* | | | 1,006,442 | |
| | 643,651 | | | Unifin Financiera SAB de CV* | | | 782,154 | |
| | | | | | | | |
| | | | 6,868,070 | |
| | | | | | | | |
| | |
| | | | Data Processing & Outsourced
Services 4.4% | | | |
| | 563 | | | Adyen NV* | | | 1,115,130 | |
| | 44,503 | | | Dlocal Ltd.* | | | 1,391,164 | |
| | | | | | | | |
| | | | 2,506,294 | |
| | | | | | | | |
| | |
| | | | Distillers & Vintners 1.0% | | | |
| | 269,860 | | | Ginebra San Miguel, Inc. | | | 578,886 | |
| | | | | | | | |
| | |
| | | | Diversified Banks 6.2% | | | |
| | 542,471 | | | Bank for Foreign Trade of Vietnam JSC | | | 1,945,530 | |
| | 3,181 | | | Credicorp Ltd. | | | 546,719 | |
| | 138,497 | | | NU Holdings Ltd.* | | | 1,069,197 | |
| | 12,442 | | | TCS Group Holding PLC, GDR* *** §§ | | | 8,958 | |
| | | | | | | | |
| | | | 3,570,404 | |
| | | | | | | | |
| | |
| | | | Drug Retail 2.4% | | | |
| | 276,700 | | | Raia Drogasil SA | | | 1,391,331 | |
| | | | | | | | |
| | |
| | | | Electrical Components &
Equipment 2.9% | | | |
| | 224,800 | | | WEG SA | | | 1,646,438 | |
| | | | | | | | |
| | |
| | | | Food Retail 1.3% | | | |
| | 8,992 | | | Dino Polska SA* | | | 725,715 | |
| | | | | | | | |
| | |
| | | | Health Care Facilities 1.7% | | | |
| | 3,532,003 | | | Cleopatra Hospital* | | | 963,248 | |
| | | | | | | | |
| | |
| | | | Home Improvement Retail 2.9% | | | |
| | 3,232,200 | | | Wilcon Depot, Inc. | | | 1,686,528 | |
| | | | | | | | |
| | |
| | | | Human Resource & Employment
Services 0.3% | | | |
| | 11,641 | | | Grupa Pracuj SA* | | | 174,307 | |
| | 12,332 | | | HeadHunter Group PLC, ADR*** §§ | | | 3,700 | |
| | | | | | | | |
| | | | 178,007 | |
| | | | | |
| | | | | | | | |
| Shares | | | | | Value | |
| | | | | | | |
| | |
| | | | Insurance Brokers 0.5% | | | |
| | 235,997 | | | TQM Corp. Public Co. Ltd. | | $ | 283,906 | |
| | | | | | | | |
| | |
| | | | Interactive Home Entertainment 4.1% | | | |
| | 19,487 | | | Sea Ltd., ADR* | | | 2,334,348 | |
| | | | | | | | |
| | |
| | | | Internet & Direct Marketing
Retail 7.0% | | | |
| | 3,383 | | | MercadoLibre, Inc.* | | | 4,024,011 | |
| | | | | | | | |
| | |
| | | | IT Consulting & Other Services 13.3% | | | |
| | 886,114 | | | FPT Corp. | | | 4,140,849 | |
| | 13,185 | | | Globant SA* | | | 3,455,393 | |
| | | | | | | | |
| | | | 7,596,242 | |
| | | | | |
| | |
| | | | Life & Health Insurance 5.1% | | | |
| | 233,972 | | | Discovery Ltd.* | | | 2,914,516 | |
| | | | | | | | |
| | |
| | | | Managed Health Care 1.1% | | | |
| | 259,100 | | | Hapvida Participacoes e Investimentos SA | | | 644,342 | |
| | | | | | | | |
| | |
| | | | Property & Casualty Insurance 3.7% | | | |
| | 369,722 | | | Qualitas Controladora SAB de CV | | | 2,118,884 | |
| | | | | | | | |
| | |
| | | | Regional Banks 0.5% | | | |
| | 44,000 | | | Regional SAB de CV | | | 309,217 | |
| | | | | | | | |
| | |
| | | | Semiconductor Equipment 2.8% | | | |
| | 28,241 | | | Camtek Ltd.* | | | 860,221 | |
| | 6,834 | | | Nova Ltd.* | | | 744,086 | |
| | | | | | | | |
| | | | 1,604,307 | |
| | | | | |
| | |
| | | | Semiconductors 3.4% | | | |
| | 6,000 | | | ASPEED Technology, Inc. | | | 675,413 | |
| | 11,000 | | | Silergy Corp. | | | 1,289,759 | |
| | | | | | | | |
| | | | 1,965,172 | |
| | | | | |
| | |
| | | | Specialty Stores 2.7% | | | |
| | 386,565 | | | Pet Center Comercio e Participacoes SA | | | 1,515,066 | |
| | | | | | | | |
| | |
| | | | Wireless Telecommunication
Services 2.6% | | | |
| | 4,936,838 | | | Safaricom PLC | | | 1,461,216 | |
| | | | | | | | |
| | |
| | | | Total Common Stocks
(cost $47,011,406) | | | 57,023,422 | |
| | | | | | | | |
54
| | |
| Wasatch Frontier Emerging Small Countries Fund (WAFMX / WIFMX) | | MARCH 31, 2022 (Unaudited) |
Schedule of Investments (continued)
| | | | | | | | |
Principal
Amount | | | | | Value | |
| | | | | | | |
| |
| | | | SHORT-TERM INVESTMENTS 1.0% | |
| | |
| | | | Repurchase Agreement 1.0% | | | |
| $ | 599,924 | | | Repurchase Agreement dated 3/31/22, 0.00% due 4/1/22 with Fixed Income Clearing Corp. collateralized by $663,700 of United States Treasury Notes 1.125% due 8/31/28; value: $611,933; repurchase proceeds: $599,924 (cost $599,924) | | $ | 599,924 | |
| | | | | | | | |
| | |
| | | | Total Short-Term Investments
(cost $599,924) | | | 599,924 | |
| | | | | | | | |
| | |
| | | | Total Investments
(cost $47,611,330) 100.7%§ | | | 57,623,346 | |
| | |
| | | | Liabilities less Other Assets (0.7%) | | | (423,833 | ) |
| | | | | | | | |
| | |
| | | | Net Assets 100.0% | | $ | 57,199,513 | |
| | | | | | | | |
| |
| | | | *Non-income producing. ***Security was fair valued under procedures adopted by the Board of Trustees (see Note 12). §The aggregate amount of foreign securities fair valued pursuant to a systematic valuation model as a percent of net assets was 43.94%. §§The aggregate value of illiquid holdings at March 31, 2022 amounted to approximately $12,658 and represented 0.02% of net assets. ADR American Depositary Receipt. ETF Exchange-Traded Fund. GDR Global Depositary Receipt. | |
| |
| | | | See Notes to Financial Statements. | |
At March 31, 2022, Wasatch Frontier Emerging Small Countries Fund’s investments, excluding short-term investments, were in the following countries:
| | | | | |
| Country | | % |
Brazil | | | | 11.0 | |
Egypt | | | | 1.7 | |
India | | | | 8.9 | |
Israel | | | | 2.8 | |
Kenya | | | | 2.6 | |
Mexico | | | | 10.4 | |
Netherlands | | | | 1.9 | |
Peru | | | | 1.0 | |
Philippines | | | | 4.0 | |
Poland | | | | 1.6 | |
Russia | | | | 0.0 | |
Singapore | | | | 4.1 | |
South Africa | | | | 5.1 | |
Sweden | | | | 5.4 | |
Taiwan | | | | 3.4 | |
Thailand | | | | 2.3 | |
United States | | | | 13.1 | |
Uruguay | | | | 2.4 | |
Vietnam | | | | 18.3 | |
| | | | | |
TOTAL | | | | 100.0 | % |
| | | | | |
55
| | |
| Wasatch Global Opportunities Fund (WAGOX / WIGOX) | | MARCH 31, 2022 (Unaudited) |
Schedule of Investments
| | | | | | | | |
| Shares | | | | | Value | |
| | | | | | | |
| |
| | | | COMMON STOCKS 98.8% | |
| | |
| | | | Airlines 0.9% | | | |
| | 12,495 | | | Allegiant Travel Co.* | | $ | 2,029,063 | |
| | | | | | | | |
| | |
| | | | Application Software 6.1% | | | |
| | 25,263 | | | Five9, Inc.* | | | 2,789,035 | |
| | 13,124 | | | Paylocity Holding Corp.* | | | 2,700,525 | |
| | 55,463 | | | Q2 Holdings, Inc.* | | | 3,419,294 | |
| | 896,472 | | | Systena Corp. | | | 3,142,242 | |
| | 302,646 | | | Technology One Ltd. | | | 2,566,970 | |
| | | | | | | | |
| | | | | | | 14,618,066 | |
| | | | | | | | |
| | |
| | | | Asset Management & Custody
Banks 2.5% | | | |
| | 54,913 | | | Focus Financial Partners, Inc., Class A* | | | 2,511,721 | |
| | 43,686 | | | Hamilton Lane, Inc., Class A | | | 3,376,491 | |
| | | | | | | | |
| | | | | | | 5,888,212 | |
| | | | | | | | |
| | |
| | | | Biotechnology 2.8% | | | |
| | 348,392 | | | Abcam PLC* | | | 6,297,212 | |
| | 81,192 | | | Sangamo Therapeutics, Inc.* | | | 471,725 | |
| | | | | | | | |
| | | | | | | 6,768,937 | |
| | | | | | | | |
| | |
| | | | Building Products 1.8% | | | |
| | 65,441 | | | Trex Co., Inc.* | | | 4,275,261 | |
| | | | | | | | |
| | |
| | | | Commodity Chemicals 1.0% | | | |
| | 75,709 | | | Valvoline, Inc. | | | 2,389,376 | |
| | | | | | | | |
| | |
| | | | Data Processing & Outsourced
Services 1.4% | | | |
| | 18,117 | | | Euronet Worldwide, Inc.* | | | 2,357,928 | |
| | 10,500 | | | GMO Payment Gateway, Inc. | | | 1,069,699 | |
| | | | | | | | |
| | | | | | | 3,427,627 | |
| | | | | | | | |
| | |
| | | | Diversified Banks 0.0% | | | |
| | 9,462 | | | TCS Group Holding PLC, GDR* *** §§ | | | 6,813 | |
| | | | | | | | |
| | |
| | | | Diversified Real Estate Activities 1.2% | | | |
| | 150,821 | | | Patrizia AG | | | 2,836,827 | |
| | | | | | | | |
| | |
| | | | Drug Retail 0.9% | | | |
| | 41,400 | | | Sugi Holdings Co. Ltd. | | | 2,049,153 | |
| | | | | | | | |
| | |
| | | | Electrical Components &
Equipment 2.5% | | | |
| | 119,896 | | | Voltronic Power Technology Corp. | | | 6,050,612 | |
| | | | | | | | |
| | |
| | | | Financial Exchanges & Data 1.6% | | | |
| | 198,753 | | | Open Lending Corp., Class A* | | | 3,758,419 | |
| | | | | | | | |
| | |
| | | | General Merchandise Stores 1.7% | | | |
| | 96,781 | | | Ollie’s Bargain Outlet Holdings, Inc.* | | | 4,157,712 | |
| | | | | | | | |
| | |
| | | | Health Care Equipment 0.4% | | | |
| | 5,354 | | | DiaSorin SpA | | | 836,258 | |
| | | | | | | | |
| | |
| | | | Health Care Facilities 3.2% | | | |
| | 84,697 | | | Ensign Group, Inc. | | | 7,623,577 | |
| | | | | | | | |
| | |
| | | | Health Care Services 1.1% | | | |
| | 75,690 | | | Dr. Lal PathLabs Ltd. | | | 2,592,127 | |
| | | | | | | | |
| | | | | | | | |
| Shares | | | | | Value | |
| | | | | | | |
| | |
| | | | Health Care Supplies 1.1% | | | |
| | 63,421 | | | Silk Road Medical, Inc.* | | $ | 2,618,653 | |
| | | | | | | | |
| | |
| | | | Health Care Technology 2.7% | | | |
| | 119,650 | | | JMDC, Inc.* | | | 6,522,222 | |
| | | | | | | | |
| | |
| | | | Home Improvement Retail 0.5% | | | |
| | 16,201 | | | Floor & Decor Holdings, Inc., Class A* | | | 1,312,281 | |
| | | | | | | | |
| | |
| | | | Homebuilding 1.2% | | | |
| | 29,110 | | | LGI Homes, Inc.* | | | 2,843,465 | |
| | | | | | | | |
| | |
| | | | Human Resource & Employment
Services 1.5% | | | |
| | 132,500 | | | SMS Co. Ltd. | | | 3,633,692 | |
| | | | | | | | |
| | |
| | | | Industrial Machinery 6.3% | | | |
| | 90,775 | | | Altra Industrial Motion Corp. | | | 3,533,871 | |
| | 29,139 | | | Helios Technologies, Inc. | | | 2,338,405 | |
| | 61,734 | | | Kornit Digital Ltd.* | | | 5,104,784 | |
| | 57,800 | | | MISUMI Group, Inc. | | | 1,720,754 | |
| | 12,482 | | | RBC Bearings, Inc.* | | | 2,420,010 | |
| | | | | | | | |
| | | | | | | 15,117,824 | |
| | | | | | | | |
| | |
| | | | Interactive Media & Services 1.8% | | | |
| | 191,094 | | | ZipRecruiter, Inc., Class A* | | | 4,391,340 | |
| | | | | | | | |
| | |
| | | | IT Consulting & Other Services 7.3% | | | |
| | 18,992 | | | Endava PLC, ADR* | | | 2,526,506 | |
| | 30,569 | | | Globant SA* | | | 8,011,218 | |
| | 116,473 | | | Mindtree Ltd. | | | 6,553,209 | |
| | 5,767 | | | Persistent Systems Ltd. | | | 360,688 | |
| | | | | | | | |
| | | | | | | 17,451,621 | |
| | | | | | | | |
| | |
| | | | Life Sciences Tools & Services 1.3% | | | |
| | 19,051 | | | Medpace Holdings, Inc.* | | | 3,116,553 | |
| | | | | | | | |
| | |
| | | | Managed Health Care 2.2% | | | |
| | 77,776 | | | HealthEquity, Inc.* | | | 5,245,213 | |
| | | | | | | | |
| | |
| | | | Packaged Foods & Meats 2.5% | | | |
| | 58,000 | | | Freshpet, Inc.* | | | 5,953,120 | |
| | | | | | | | |
| | |
| | | | Pharmaceuticals 2.5% | | | |
| | 191,713 | | | Esperion Therapeutics, Inc.* | | | 889,548 | |
| | 82,871 | | | Intra-Cellular Therapies, Inc.* | | | 5,070,877 | |
| | | | | | | | |
| | | | | | | 5,960,425 | |
| | | | | | | | |
| | |
| | | | Regional Banks 7.1% | | | |
| | 563,617 | | | AU Small Finance Bank Ltd.* | | | 9,202,092 | |
| | 90,514 | | | Bank OZK | | | 3,864,948 | |
| | 66,364 | | | Eagle Bancorp, Inc. | | | 3,783,412 | |
| | | | | | | | |
| | | | | | | 16,850,452 | |
| | | | | | | | |
| | |
| | | | Research & Consulting Services 7.3% | | | |
| | 30,107 | | | BayCurrent Consulting, Inc. | | | 10,898,073 | |
| | 98,887 | | | L&T Technology Services Ltd. | | | 6,612,803 | |
| | | | | | | | |
| | | | | | | 17,510,876 | |
| | | | | | | | |
| | |
| | | | Restaurants 0.6% | | | |
| | 22,441 | | | Domino’s Pizza Enterprises Ltd. | | | 1,460,770 | |
| | | | | | | | |
56
| | |
| Wasatch Global Opportunities Fund (WAGOX / WIGOX) | | MARCH 31, 2022 (Unaudited) |
Schedule of Investments (continued)
| | | | | | | | |
| Shares | | | | | Value | |
| | | | | | | |
| | |
| | | | Semiconductor Equipment 1.5% | | | |
| | 32,702 | | | Nova Ltd.* | | $ | 3,560,594 | |
| | | | | | | | |
| | |
| | | | Semiconductors 8.7% | | | |
| | 57,000 | | | ASPEED Technology, Inc. | | | 6,416,427 | |
| | 29,541 | | | Melexis NV | | | 2,719,614 | |
| | 8,572 | | | Monolithic Power Systems, Inc. | | | 4,163,249 | |
| | 64,000 | | | Silergy Corp. | | | 7,504,050 | |
| | | | | | | | |
| | | | | | | 20,803,340 | |
| | | | | | | | |
| | |
| | | | Soft Drinks 0.5% | | | |
| | 47,032 | | | Fevertree Drinks PLC | | | 1,098,143 | |
| | | | | | | | |
| | |
| | | | Specialty Stores 2.8% | | | |
| | 41,518 | | | Five Below, Inc.* | | | 6,575,206 | |
| | | | | | | | |
| | |
| | | | Systems Software 5.2% | | | |
| | 25,847 | | | CyberArk Software Ltd.* | | | 4,361,681 | |
| | 27,675 | | | Rapid7, Inc.* | | | 3,078,567 | |
| | 42,660 | | | Tata Elxsi Ltd. | | | 4,945,391 | |
| | | | | | | | |
| | | | | | | 12,385,639 | |
| | | | | | | | |
| | |
| | | | Thrifts & Mortgage Finance 2.0% | | | |
| | 143,861 | | | Aavas Financiers Ltd.* | | | 4,846,495 | |
| | | | | | | | |
| | |
| | | | Trading Companies &
Distributors 3.1% | | | |
| | 85,445 | | | Diploma PLC | | | 2,933,393 | |
| | 205,924 | | | Electrocomponents PLC | | | 2,908,319 | |
| | 73,400 | | | MonotaRO Co. Ltd. | | | 1,575,334 | |
| | | | | | | | |
| | | | | | | 7,417,046 | |
| | | | | | | | |
| | |
| | | | Total Common Stocks
(cost $172,183,228) | | | 235,983,010 | |
| | | | | | | | |
| | | | | | | | |
Principal
Amount | | | | | Value | |
| | | | | | | |
| |
| | | | SHORT-TERM INVESTMENTS 1.4% | |
| | |
| | | | Repurchase Agreement 1.4% | | | |
| $ | 3,350,801 | | | Repurchase Agreement dated 3/31/22, 0.00% due 4/1/22 with Fixed Income Clearing Corp. collateralized by $3,707,000 of United States Treasury Notes 1.125% due 8/31/28; value: $3,417,864; repurchase proceeds: $3,350,801 (cost $3,350,801) | | $ | 3,350,801 | |
| | | | | | | | |
| | |
| | | | Total Short-Term Investments
(cost $3,350,801) | | | 3,350,801 | |
| | | | | | | | |
| | |
| | | | Total Investments
(cost $175,534,029) 100.2%§ | | | 239,333,811 | |
| | |
| | | | Liabilities less Other Assets (0.2%) | | | (549,914 | ) |
| | | | | | | | |
| | |
| | | | Net Assets 100.0% | | $ | 238,783,897 | |
| | | | | | | | |
| |
| | | | *Non-income producing. ***Security was fair valued under procedures adopted by the Board of Trustees (see Note 12). §The aggregate amount of foreign securities fair valued pursuant to a systematic valuation model as a percent of net assets was 45.80%. §§The aggregate value of illiquid holdings at March 31, 2022 amounted to approximately $6,813 and represented 0.00% of net assets. ADR American Depositary Receipt. GDR Global Depositary Receipt. | |
| |
| | | | See Notes to Financial Statements. | |
At March 31, 2022, Wasatch Global Opportunities Fund’s investments, excluding short-term investments, were in the following countries:
| | | | | |
| Country | | % |
Australia | | | | 1.7 | |
Belgium | | | | 1.1 | |
Germany | | | | 1.2 | |
India | | | | 14.9 | |
Israel | | | | 5.5 | |
Italy | | | | 0.3 | |
Japan | | | | 13.0 | |
Russia | | | | 0.0 | |
Taiwan | | | | 8.5 | |
United Kingdom | | | | 6.7 | |
United States | | | | 47.1 | |
| | | | | |
TOTAL | | | | 100.0 | % |
| | | | | |
57
| | |
| Wasatch Global Select Fund (WAGSX / WGGSX) | | MARCH 31, 2022 (Unaudited) |
Schedule of Investments
| | | | | | | | |
| Shares | | | | | Value | |
| | | | | | | |
| |
| | | | COMMON STOCKS 97.7% | |
| | |
| | | | Application Software 7.3% | | | |
| | 9,956 | | | Dassault Systemes SE | | $ | 489,124 | |
| | 2,441 | | | Five9, Inc.* | | | 269,487 | |
| | 570 | | | HubSpot, Inc.* | | | 270,716 | |
| | 3,064 | | | Xero Ltd.* | | | 232,213 | |
| | | | | | | | |
| | | | 1,261,540 | |
| | | | | |
| | |
| | | | Biotechnology 3.6% | | | |
| | 34,269 | | | Abcam PLC* | | | 619,415 | |
| | | | | | | | |
| | |
| | | | Building Products 3.6% | | | |
| | 23,134 | | | Assa Abloy AB, Class B | | | 621,832 | |
| | | | | | | | |
| | |
| | | | Consumer Finance 4.1% | | | |
| | 7,476 | | | Bajaj Finance Ltd. | | | 709,983 | |
| | | | | | | | |
| | |
| | | | Data Processing & Outsourced
Services 4.6% | | | |
| | 7,840 | | | Amadeus IT Group SA* | | | 509,741 | |
| | 2,050 | | | Block, Inc.* | | | 277,980 | |
| | | | | | | | |
| | | | 787,721 | |
| | | | | |
| | |
| | | | Distributors 3.5% | | | |
| | 1,413 | | | Pool Corp. | | | 597,487 | |
| | | | | | | | |
| | |
| | | | Diversified Banks 3.8% | | | |
| | 33,784 | | | HDFC Bank Ltd. | | | 650,673 | |
| | 1,234 | | | TCS Group Holding PLC, GDR* *** §§ | | | 889 | |
| | | | | | | | |
| | | | 651,562 | |
| | | | | |
| | |
| | | | Diversified Support Services 3.9% | | | |
| | 5,318 | | | Copart, Inc.* | | | 667,249 | |
| | | | | | | | |
| | |
| | | | Drug Retail 1.3% | | | |
| | 3,400 | | | Tsuruha Holdings, Inc. | | | 215,894 | |
| | | | | | | | |
| | |
| | | | Electronic Components 4.2% | | | |
| | 9,629 | | | Amphenol Corp., Class A | | | 725,545 | |
| | | | | | | | |
| | |
| | | | Financial Exchanges & Data 7.1% | | | |
| | 1,489 | | | MarketAxess Holdings, Inc. | | | 506,558 | |
| | 2,607 | | | Morningstar, Inc. | | | 712,154 | |
| | | | | | | | |
| | | | 1,218,712 | |
| | | | | |
| | |
| | | | Health Care Equipment 2.2% | | | |
| | 2,457 | | | DiaSorin SpA | | | 383,766 | |
| | | | | | | | |
| | |
| | | | Health Care Supplies 3.5% | | | |
| | 3,922 | | | Coloplast A/S, Class B | | | 593,942 | |
| | | | | | | | |
| | |
| | | | Health Care Technology 2.6% | | | |
| | 8,300 | | | JMDC, Inc.* | | | 452,440 | |
| | | | | | | | |
| | |
| | | | Industrial Conglomerates 4.4% | | | |
| | 1,589 | | | Roper Technologies, Inc. | | | 750,373 | |
| | | | | | | | |
| | |
| | | | Industrial Machinery 1.7% | | | |
| | 9,500 | | | MISUMI Group, Inc. | | | 282,823 | |
| | | | | | | | |
| | |
| | | | Interactive Home Entertainment 1.5% | | | |
| | 2,090 | | | Sea Ltd., ADR* | | | 250,361 | |
| | | | | | | | |
| | | | | | | | |
| Shares | | | | | Value | |
| | | | | | | |
| | |
| | | | Internet & Direct Marketing Retail 2.4% | | | |
| | 341 | | | MercadoLibre, Inc.* | | $ | 405,613 | |
| | | | | | | | |
| | |
| | | | IT Consulting & Other Services 5.0% | | | |
| | 1,651 | | | Globant SA* | | | 432,678 | |
| | 5,323 | | | Larsen & Toubro Infotech Ltd. | | | 429,193 | |
| | | | | | | | |
| | | | | | | 861,871 | |
| | | | | | | | |
| | |
| | | | Life Sciences Tools & Services 3.6% | | | |
| | 2,569 | | | ICON PLC* | | | 624,832 | |
| | | | | | | | |
| | |
| | | | Managed Health Care 3.0% | | | |
| | 7,641 | | | HealthEquity, Inc.* | | | 515,309 | |
| | | | | | | | |
| | |
| | | | Regional Banks 3.8% | | | |
| | 15,364 | | | Bank OZK | | | 656,043 | |
| | | | | | | | |
| | |
| | | | Research & Consulting Services 3.5% | | | |
| | 1,646 | | | BayCurrent Consulting, Inc. | | | 595,816 | |
| | | | | | | | |
| | |
| | | | Semiconductors 4.3% | | | |
| | 877 | | | Monolithic Power Systems, Inc. | | | 425,941 | |
| | 2,698 | | | Silergy Corp. | | | 316,343 | |
| | | | | | | | |
| | | | | | | 742,284 | |
| | | | | | | | |
| | |
| | | | Specialized Finance 2.1% | | | |
| | 42,000 | | | Chailease Holding Co. Ltd. | | | 368,396 | |
| | | | | | | | |
| | |
| | | | Specialty Stores 2.5% | | | |
| | 2,681 | | | Five Below, Inc.* | | | 424,590 | |
| | | | | | | | |
| | |
| | | | Trucking 4.6% | | | |
| | 6,676 | | | Lyft, Inc., Class A* | | | 256,358 | |
| | 1,811 | | | Old Dominion Freight Line, Inc. | | | 540,910 | |
| | | | | | | | |
| | | | 797,268 | |
| | | | | | | | |
| | |
| | | | Total Common Stocks
(cost $15,737,793) | | | 16,782,667 | |
| | | | | | | | |
58
| | |
| Wasatch Global Select Fund (WAGSX / WGGSX) | | MARCH 31, 2022 (Unaudited) |
Schedule of Investments (continued)
| | | | | | | | |
Principal
Amount | | | | | Value | |
| | | | | | | |
| |
| | | | SHORT-TERM INVESTMENTS 5.5% | |
| | |
| | | | Repurchase Agreement 5.5% | | | |
| $ | 939,916 | | | Repurchase Agreement dated 3/31/22, 0.00% due 4/1/22 with Fixed Income Clearing Corp. collateralized by $1,039,900 of United States Treasury Notes 1.125% due 8/31/28; value: $958,791; repurchase proceeds: $939,916 (cost $939,916) | | $ | 939,916 | |
| | | | | | | | |
| | |
| | | | Total Short-Term Investments
(cost $939,916) | | | 939,916 | |
| | | | | | | | |
| | |
| | | | Total Investments
(cost $16,677,709) 103.2%§ | | | 17,722,583 | |
| | |
| | | | Liabilities less Other Assets (3.2%) | | | (549,075 | ) |
| | | | | | | | |
| | |
| | | | Net Assets 100.0% | | $ | 17,173,508 | |
| | | | | | | | |
| |
| | | | *Non-income producing. ***Security was fair valued under procedures adopted by the Board of Trustees (see Note 12). §The aggregate amount of foreign securities fair valued pursuant to a systematic valuation model as a percent of net assets was 43.51%. §§The aggregate value of illiquid holdings at March 31, 2022 amounted to approximately $889 and represented 0.00% of net assets. ADR American Depositary Receipt. GDR Global Depositary Receipt. | |
| |
| | | | See Notes to Financial Statements. | |
At March 31, 2022, Wasatch Global Select Fund’s investments, excluding short-term investments, were in the following countries:
| | | | | |
| Country | | % |
Australia | | | | 1.4 | |
Denmark | | | | 3.5 | |
France | | | | 2.9 | |
India | | | | 10.7 | |
Ireland | | | | 3.7 | |
Italy | | | | 2.3 | |
Japan | | | | 9.2 | |
Russia | | | | 0.0 | |
Singapore | | | | 1.5 | |
Spain | | | | 3.0 | |
Sweden | | | | 3.7 | |
Taiwan | | | | 4.1 | |
United Kingdom | | | | 3.7 | |
United States | | | | 50.3 | |
| | | | | |
TOTAL | | | | 100.0 | % |
| | | | | |
59
| | |
| Wasatch Global Value Fund (FMIEX / WILCX) | | MARCH 31, 2022 (Unaudited) |
Schedule of Investments
| | | | | | | | |
| Shares | | | | | Value | |
| | | | | | | |
| | |
| | | | COMMON STOCKS 97.9% | | | | |
| | |
| | | | Aerospace & Defense 2.1% | | | |
| | 320,000 | | | BAE Systems PLC | | $ | 3,005,263 | |
| | | | | | | | |
| | |
| | | | Airlines 2.2% | | | |
| | 169,000 | | | Japan Airlines Co. Ltd.* | | | 3,150,717 | |
| | | | | | | | |
| | |
| | | | Automobile Manufacturers 1.0% | | | |
| | 31,000 | | | General Motors Co.* | | | 1,355,940 | |
| | | | | | | | |
| | |
| | | | Casinos & Gaming 2.4% | | | |
| | 149,000 | | | Kangwon Land, Inc.* | | | 3,398,392 | |
| | | | | | | | |
| | |
| | | | Communications Equipment 2.1% | | | |
| | 50,000 | | | Ciena Corp.* | | | 3,031,500 | |
| | | | | | | | |
| | |
| | | | Construction Materials 1.6% | | | |
| | 39,000 | | | HeidelbergCement AG | | | 2,210,293 | |
| | | | | | | | |
| | |
| | | | Diversified Banks 11.1% | | | |
| | 63,000 | | | Citigroup, Inc. | | | 3,364,200 | |
| | 330,000 | | | ING Groep NV, ADR | | | 3,441,900 | |
| | 33,500 | | | JPMorgan Chase & Co. | | | 4,566,720 | |
| | 183,941 | | | United Overseas Bank Ltd. | | | 4,303,852 | |
| | | | | | | | |
| | | | 15,676,672 | |
| | | | | |
| | |
| | | | Diversified Metals & Mining 2.9% | | | |
| | 80,000 | | | Anglo American PLC | | | 4,156,986 | |
| | | | | | | | |
| | |
| | | | Electric Utilities 6.4% | | | |
| | 44,500 | | | Duke Energy Corp. | | | 4,968,870 | |
| | 85,000 | | | Exelon Corp. | | | 4,048,550 | |
| | | | | | | | |
| | | | 9,017,420 | |
| | | | | |
| | |
| | | | Electrical Components &
Equipment 2.4% | | | |
| | 22,000 | | | Eaton Corp. PLC | | | 3,338,720 | |
| | | | | | | | |
| | |
| | | | Electronic Manufacturing Services 2.3% | | | |
| | 900,000 | | | Hon Hai Precision Industry Co. Ltd. | | | 3,304,646 | |
| | | | | | | | |
| | |
| | | | Food Retail 2.5% | | | |
| | 74,000 | | | Seven & i Holdings Co. Ltd. | | | 3,528,113 | |
| | | | | | | | |
| | |
| | | | Health Care Equipment 1.9% | | | |
| | 166,000 | | | Smith & Nephew PLC | | | 2,640,208 | |
| | | | | | | | |
| | |
| | | | Health Care Services 2.9% | | | |
| | 17,000 | | | Cigna Corp. | | | 4,073,370 | |
| | | | | | | | |
| | |
| | | | Homebuilding 2.0% | | | |
| | 88,000 | | | Bellway PLC | | | 2,797,363 | |
| | | | | | | | |
| | |
| | | | Industrial REITs 2.4% | | | |
| | 1,750,000 | | | Mapletree Industrial Trust | | | 3,464,491 | |
| | | | | | | | |
| | |
| | | | Integrated Oil & Gas 7.1% | | | |
| | 155,000 | | | Suncor Energy, Inc. | | | 5,046,194 | |
| | 98,500 | | | TotalEnergies SE | | | 4,984,053 | |
| | | | | | | | |
| | | | 10,030,247 | |
| | | | | |
| | | | | | | | |
| Shares | | | | | Value | |
| | | | | | | |
| | |
| | | | Integrated Telecommunication
Services 4.1% | | | |
| | 113,000 | | | Verizon Communications, Inc. | | $ | 5,756,220 | |
| | | | | | | | |
| | |
| | | | Interactive Media & Services 2.5% | | | |
| | 16,200 | | | Meta Platforms, Inc. Class A* | | | 3,602,232 | |
| | | | | | | | |
| | |
| | | | Multi-Line Insurance 2.6% | | | |
| | 124,000 | | | AXA SA | | | 3,630,016 | |
| | | | | | | | |
| | |
| | | | Office REITs 2.3% | | | |
| | 185,000 | | | Piedmont Office Realty Trust, Inc., Class A | | | 3,185,700 | |
| | | | | | | | |
| | |
| | | | Oil & Gas Exploration &
Production 3.0% | | | |
| | 35,000 | | | EOG Resources, Inc. | | | 4,173,050 | |
| | | | | | | | |
| | |
| | | | Pharmaceuticals 7.9% | | | |
| | 62,000 | | | Bristol-Myers Squibb Co. | | | 4,527,860 | |
| | 37,500 | | | Johnson & Johnson | | | 6,646,125 | |
| | | | | | | | |
| | | | 11,173,985 | |
| | | | | |
| | |
| | | | Property & Casualty Insurance 3.3% | | | |
| | 76,000 | | | Axis Capital Holdings Ltd. | | | 4,595,720 | |
| | | | | | | | |
| | |
| | | | Railroads 3.3% | | | |
| | 17,000 | | | Union Pacific Corp. | | | 4,644,570 | |
| | | | | | | | |
| | |
| | | | Regional Banks 2.5% | | | |
| | 84,000 | | | Bank OZK | | | 3,586,800 | |
| | | | | | | | |
| | |
| | | | Reinsurance 3.6% | | | |
| | 19,000 | | | Muenchener Rueckversicherungs-Gesellschaft AG in Muenchen | | | 5,079,453 | |
| | | | | | | | |
| | |
| | | | Retail REITs 2.0% | | | |
| | 116,000 | | | Kimco Realty Corp. | | | 2,865,200 | |
| | | | | | | | |
| | |
| | | | Soft Drinks 2.6% | | | |
| | 97,950 | | | Suntory Beverage & Food Ltd. | | | 3,733,380 | |
| | | | | | | | |
| | |
| | | | Tobacco 2.9% | | | |
| | 62,000 | | | KT&G Corp. | | | 4,124,861 | |
| | | | | | | | |
| | |
| | | | Total Common Stocks
(cost $113,486,608) | | | 138,331,528 | |
| | | | | | | | |
60
| | |
| Wasatch Global Value Fund (FMIEX / WILCX) | | MARCH 31, 2022 (Unaudited) |
Schedule of Investments (continued)
| | | | | | | | |
Principal
Amount | | | | | Value | |
| | | | | | | |
| |
| | | | SHORT-TERM INVESTMENTS 1.9% | |
| | |
| | | | Repurchase Agreement 1.9% | | | |
| $ | 2,663,539 | | | Repurchase Agreement dated 3/31/22, 0.00% due 4/1/22 with Fixed Income Clearing Corp. collateralized by $2,946,700 of United States Treasury Notes 1.125% due 8/31/28; value: $2,716,865; repurchase proceeds: $2,663,539 (cost $2,663,539) | | $ | 2,663,539 | |
| | | | | | | | |
| | |
| | | | Total Short-Term Investments
(cost $2,663,539) | | | 2,663,539 | |
| | | | | | | | |
| | |
| | | | Total Investments
(cost $116,150,147) 99.8%§ | | | 140,995,067 | |
| | |
| | | | Other Assets less Liabilities 0.2% | | | 230,735 | |
| | | | | | | | |
| | |
| | | | Net Assets 100.0% | | $ | 141,225,802 | |
| | | | | | | | |
| |
| | | | *Non-income producing. §The aggregate amount of foreign securities fair valued pursuant to a systematic valuation model as a percent of net assets was 40.72%. ADR American Depositary Receipt. | |
| |
| | | | See Notes to Financial Statements. | |
At March 31, 2022, Wasatch Global Value Fund’s investments, excluding short-term investments, were in the following countries:
| | | | | |
| Country | | % |
Canada | | | | 3.7 | |
France | | | | 6.2 | |
Germany | | | | 5.3 | |
Japan | | | | 7.5 | |
Netherlands | | | | 2.5 | |
Singapore | | | | 5.6 | |
South Korea | | | | 5.4 | |
Taiwan | | | | 2.4 | |
United Kingdom | | | | 9.1 | |
United States | | | | 52.3 | |
| | | | | |
TOTAL | | | | 100.0 | % |
| | | | | |
61
| | |
| Wasatch Greater China Fund (WAGCX / WGGCX) | | MARCH 31, 2022 (Unaudited) |
Schedule of Investments
| | | | | | | | |
| Shares | | | | | Value | |
| | | | | | | |
| |
| | | | COMMON STOCKS 98.1% | |
| | |
| | | | Apparel, Accessories & Luxury Goods 1.9% | | | |
| | 12,400 | | | Shenzhou International Group Holdings Ltd. | | $ | 163,705 | |
| | | | | | | | |
| | |
| | | | Application Software 1.3% | | | |
| | 14,500 | | | Glodon Co. Ltd., Class A | | | 112,984 | |
| | | | | | | | |
| | |
| | | | Commodity Chemicals 0.8% | | | |
| | 4,740 | | | Skshu Paint Co. Ltd., Class A | | | 66,037 | |
| | | | | | | | |
| | |
| | | | Distillers & Vintners 4.6% | | | |
| | 900 | | | Kweichow Moutai Co. Ltd., Class A | | | 242,461 | |
| | 6,000 | | | Wuliangye Yibin Co. Ltd., Class A | | | 145,669 | |
| | | | | | | | |
| | | | | | | 388,130 | |
| | | | | | | | |
| | |
| | | | Diversified Banks 4.2% | | | |
| | 45,500 | | | China Merchants Bank Co. Ltd., Class H | | | 354,191 | |
| | | | | | | | |
| | |
| | | | Drug Retail 2.3% | | | |
| | 30,570 | | | Yifeng Pharmacy Chain Co. Ltd., Class A | | | 192,061 | |
| | | | | | | | |
| | |
| | | | Electrical Components & Equipment 2.3% | | | |
| | 2,400 | | | Contemporary Amperex Technology Co. Ltd., Class A | | | 192,048 | |
| | | | | | | | |
| | |
| | | | Health Care Equipment 4.8% | | | |
| | 8,300 | | | Shenzhen Mindray Bio-Medical Electronics Co. Ltd., Class A | | | 401,024 | |
| | | | | | | | |
| | |
| | | | Hotels, Resorts & Cruise Lines 2.7% | | | |
| | 69,300 | | | Huazhu Group Ltd. | | | 231,448 | |
| | | | | | | | |
| | |
| | | | Industrial Machinery 9.9% | | | |
| | 4,000 | | | Airtac International Group | | | 128,603 | |
| | 9,963 | | | Shenzhen Inovance Technology Co. Ltd. | | | 88,957 | |
| | 33,278 | | | Techtronic Industries Co. Ltd. | | | 533,162 | |
| | 9,000 | | | Wuxi Lead Intelligent Equipment Co. Ltd. | | | 82,204 | |
| | | | | | | | |
| | | | | | | 832,926 | |
| | | | | | | | |
| | |
| | | | Interactive Media & Services 1.6% | | | |
| | 2,900 | | | Tencent Holdings Ltd. | | | 133,674 | |
| | | | | | | | |
| | |
| | | | Internet & Direct Marketing Retail 1.4% | | | |
| | 6,300 | | | Meituan, Class B* | | | 119,347 | |
| | | | | | | | |
| | |
| | | | Life & Health Insurance 6.6% | | | |
| | 33,800 | | | AIA Group Ltd. | | | 352,936 | |
| | 29,500 | | | Ping An Insurance Group Co. of China Ltd., Class H | | | 206,236 | |
| | | | | | | | |
| | | | | | | 559,172 | |
| | | | | | | | |
| | |
| | | | Life Sciences Tools & Services 8.0% | | | |
| | 20,600 | | | Hangzhou Tigermed Consulting Co. Ltd., Class A | | | 347,398 | |
| | 41,187 | | | Wuxi Biologics Cayman, Inc.* | | | 327,049 | |
| | | | | | | | |
| | | | | | | 674,447 | |
| | | | | | | | |
| | |
| | | | Packaged Foods & Meats 5.9% | | | |
| | 45,000 | | | Chongqing Fuling Zhacai Group Co. Ltd., Class A | | | 229,415 | |
| | 19,460 | | | Foshan Haitian Flavouring & Food Co. Ltd., Class A | | | 267,265 | |
| | | | | | | | |
| | | | 496,680 | |
| | | | | |
| | | | | | | | |
| Shares | | | | | Value | |
| | | | | | | |
| | |
| | | | Personal Products 5.6% | | | |
| | 10,658 | | | Proya Cosmetics Co. Ltd., Class A | | $ | 315,675 | |
| | 5,200 | | | Yunnan Botanee Bio-Technology Group Co. Ltd., Class A | | | 152,640 | |
| | | | | | | | |
| | | | | | | 468,315 | |
| | | | | | | | |
| | |
| | | | Regional Banks 1.1% | | | |
| | 16,000 | | | Bank of Ningbo Co. Ltd. | | | 93,745 | |
| | | | | | | | |
| | |
| | | | Semiconductors 19.4% | | | |
| | 8,700 | | | SG Micro Corp., Class A | | | 444,550 | |
| | 6,000 | | | Silergy Corp. | | | 703,505 | |
| | 54,024 | | | Sino Wealth Electronic Ltd., Class A | | | 484,651 | |
| | | | | | | | |
| | | | | | | 1,632,706 | |
| | | | | | | | |
| | |
| | | | Specialized Finance 8.7% | | | |
| | 83,800 | | | Chailease Holding Co. Ltd. | | | 735,037 | |
| | | | | | | | |
| | |
| | | | Specialty Stores 2.3% | | | |
| | 7,400 | | | China Tourism Group Duty Free Corp. Ltd., Class A | | | 190,347 | |
| | | | | | | | |
| | |
| | | | Systems Software 2.7% | | | |
| | 31,300 | | | Hangzhou Dptech Technologies Co. Ltd., Class A | | | 136,211 | |
| | 5,300 | | | Sangfor Technologies, Inc., Class A | | | 92,867 | |
| | | | | | | | |
| | | | | | | 229,078 | |
| | | | | | | | |
| | |
| | | | Total Common Stocks
(cost $9,801,594) | | | 8,267,102 | |
| | | | | | | | |
| | |
| | | | Total Investments
(cost $9,801,594) 98.1%§ | | | 8,267,102 | |
| | |
| | | | Other Assets less Liabilities 1.9% | | | 161,635 | |
| | | | | | | | |
| | |
| | | | Net Assets 100.0% | | $ | 8,428,737 | |
| | | | | | | | |
| |
| | | | *Non-income producing. §The aggregate amount of foreign securities fair valued pursuant to a systematic valuation model as a percent of net assets was 98.08%. | |
| |
| | | | See Notes to Financial Statements. | |
At March 31, 2022, Wasatch Greater China Fund’s investments, were in the following countries:
| | | | | |
| Country | | % |
China | | | | 70.3 | |
Hong Kong | | | | 10.7 | |
Taiwan | | | | 19.0 | |
| | | | | |
TOTAL | | | | 100.0 | % |
| | | | | |
62
| | |
| Wasatch International Growth Fund (WAIGX / WIIGX) | | MARCH 31, 2022 (Unaudited) |
Schedule of Investments
| | | | | | | | |
| Shares | | | | | Value | |
| | | | | | | |
| | |
| | | | COMMON STOCKS 99.6% | | | | |
| | |
| | | | Aerospace & Defense 1.9% | | | |
| | 731,778 | | | CAE, Inc.* | | $ | 19,047,359 | |
| | | | | | | | |
| | |
| | | | Airport Services 1.8% | | | |
| | 2,455,660 | | | Grupo Aeroportuario del Centro Norte SAB de CV | | | 18,374,856 | |
| | | | | | | | |
| | |
| | | | Apparel, Accessories & Luxury
Goods 1.0% | | | |
| | 364,515 | | | Canada Goose Holdings, Inc.* | | | 9,578,305 | |
| | | | | | | | |
| | |
| | | | Application Software 7.9% | | | |
| | 339,134 | | | Descartes Systems Group, Inc.* | | | 24,829,768 | |
| | 142,604 | | | Kinaxis, Inc.* | | | 18,664,054 | |
| | 333,100 | | | Rakus Co. Ltd. | | | 4,470,964 | |
| | 4,292,718 | | | Systena Corp. | | | 15,046,491 | |
| | 1,794,836 | | | Technology One Ltd. | | | 15,223,362 | |
| | | | | | | | |
| | | | | | | 78,234,639 | |
| | | | | | | | |
| | |
| | | | Asset Management & Custody
Banks 1.8% | | | |
| | 1,008,743 | | | Netwealth Group Ltd. | | | 11,201,761 | |
| | 402,900 | | | WealthNavi, Inc.* | | | 6,691,257 | |
| | | | | | | | |
| | | | | | | 17,893,018 | |
| | | | | | | | |
| | |
| | | | Biotechnology 3.0% | | | |
| | 1,671,488 | | | Abcam PLC* | | | 30,212,271 | |
| | | | | | | | |
| | |
| | | | Brewers 1.2% | | | |
| | 129,140 | | | Royal Unibrew A/S | | | 12,064,988 | |
| | | | | | | | |
| | |
| | | | Commodity Chemicals 0.9% | | | |
| | 927,869 | | | Berger Paints India Ltd. | | | 8,550,198 | |
| | | | | | | | |
| | |
| | | | Construction & Engineering 1.2% | | | |
| | 1,788,346 | | | Johns Lyng Group Ltd. | | | 11,576,460 | |
| | | | | | | | |
| | |
| | | | Data Processing & Outsourced
Services 0.9% | | | |
| | 91,000 | | | GMO Payment Gateway, Inc. | | | 9,270,724 | |
| | | | | | | | |
| | |
| | | | Diversified Real Estate Activities 1.3% | | | |
| | 689,237 | | | Patrizia AG | | | 12,964,015 | |
| | | | | | | | |
| | |
| | | | Diversified Support Services 0.6% | | | |
| | 42,446 | | | Boyd Group Services, Inc. | | | 5,621,553 | |
| | | | | | | | |
| | |
| | | | Drug Retail 3.8% | | | |
| | 265,164 | | | Ain Holdings, Inc. | | | 13,778,464 | |
| | 345,629 | | | Clicks Group Ltd. | | | 7,309,950 | |
| | 1,173,600 | | | Raia Drogasil SA | | | 5,901,216 | |
| | 212,500 | | | Sugi Holdings Co. Ltd. | | | 10,517,994 | |
| | | | | | | | |
| | | | | | | 37,507,624 | |
| | | | | | | | |
| | |
| | | | Electrical Components &
Equipment 2.7% | | | |
| | 528,485 | | | Voltronic Power Technology Corp. | | | 26,670,263 | |
| | | | | | | | |
| | |
| | | | Electronic Equipment &
Instruments 2.0% | | | |
| | 613,307 | | | Halma PLC | | | 20,065,627 | |
| | | | | | | | |
| | | | | | | | |
| Shares | | | | | Value | |
| | | | | | | |
| | |
| | | | General Merchandise Stores 0.6% | | | |
| | 863,067 | | | B&M European Value Retail SA | | $ | 6,038,271 | |
| | | | | | | | |
| | |
| | | | Health Care Equipment 1.7% | | | |
| | 111,355 | | | DiaSorin SpA | | | 17,392,878 | |
| | | | | | | | |
| | |
| | | | Health Care Services 1.1% | | | |
| | 329,842 | | | Dr. Lal PathLabs Ltd. | | | 11,295,977 | |
| | | | | | | | |
| | |
| | | | Health Care Supplies 1.2% | | | |
| | 482,228 | | | Menicon Co. Ltd. | | | 11,538,942 | |
| | | | | | | | |
| | |
| | | | Health Care Technology 4.9% | | | |
| | 680,527 | | | JMDC, Inc.* | | | 37,096,100 | |
| | 183,000 | | | MedPeer, Inc.* | | | 5,899,755 | |
| | 152,444 | | | Pro Medicus Ltd. | | | 5,522,558 | |
| | | | | | | | |
| | | | | | | 48,518,413 | |
| | | | | | | | |
| | |
| | | | Human Resource & Employment
Services 3.3% | | | |
| | 202,111 | | | Benefit One, Inc. | | | 4,241,755 | |
| | 277,221 | | | HeadHunter Group PLC, ADR*** §§ | | | 83,166 | |
| | 524,736 | | | SMS Co. Ltd. | | | 14,390,409 | |
| | 507,400 | | | TechnoPro Holdings, Inc. | | | 13,707,280 | |
| | | | | | | | |
| | | | | | | 32,422,610 | |
| | | | | | | | |
| | |
| | | | Industrial Machinery 1.1% | | | |
| | 352,815 | | | MISUMI Group, Inc. | | | 10,503,593 | |
| | | | | | | | |
| | |
| | | | Insurance Brokers 0.4% | | | |
| | 3,559,262 | | | TQM Corp. Public Co. Ltd. | | | 4,281,819 | |
| | | | | | | | |
| | |
| | | | Interactive Home Entertainment 0.3% | | | |
| | 967,334 | | | Kahoot! ASA* | | | 3,006,664 | |
| | | | | | | | |
| | |
| | | | Interactive Media & Services 2.7% | | | |
| | 494,900 | | | Kakaku.com, Inc. | | | 11,052,474 | |
| | 1,874,421 | | | Rightmove PLC | | | 15,491,405 | |
| | | | | | | | |
| | | | | | | 26,543,879 | |
| | | | | | | | |
| | |
| | | | Investment Banking & Brokerage 0.8% | | | |
| | 2,057,434 | | | AJ Bell PLC | | | 8,172,154 | |
| | | | | | | | |
| | |
| | | | IT Consulting & Other Services 9.3% | | | |
| | 152,475 | | | Endava PLC, ADR* | | | 20,283,749 | |
| | 55,094 | | | Globant SA* | | | 14,438,485 | |
| | 238,727 | | | Larsen & Toubro Infotech Ltd. | | | 19,248,561 | |
| | 152,386 | | | Reply SpA | | | 25,036,336 | |
| | 610,297 | | | Softcat PLC | | | 13,607,340 | |
| | | | | | | | |
| | | | | | | 92,614,471 | |
| | | | | | | | |
| | |
| | | | Life Sciences Tools & Services 1.0% | | | |
| | 120,746 | | | PolyPeptide Group AG* | | | 9,552,595 | |
| | | | | | | | |
| | |
| | | | Movies & Entertainment 1.9% | | | |
| | 279,962 | | | CTS Eventim AG & Co. KGaA* | | | 19,014,255 | |
| | | | | | | | |
| | |
| | | | Pharmaceuticals 1.1% | | | |
| | 623,000 | | | JCR Pharmaceuticals Co. Ltd. | | | 11,457,968 | |
| | | | | | | | |
63
| | |
| Wasatch International Growth Fund (WAIGX / WIIGX) | | MARCH 31, 2022 (Unaudited) |
Schedule of Investments (continued)
| | | | | | | | |
| Shares | | | | | Value | |
| | | | | | | |
| | |
| | | | Property & Casualty Insurance 2.2% | | | |
| | 619,211 | | | ICICI Lombard General Insurance Co. Ltd. | | $ | 10,801,539 | |
| | 2,027,205 | | | Qualitas Controladora SAB de CV | | | 11,617,954 | |
| | | | | | | | |
| | | | | | | 22,419,493 | |
| | | | | | | | |
| | |
| | | | Publishing 1.1% | | | |
| | 308,938 | | | Future PLC | | | 10,497,631 | |
| | | | | | | | |
| | |
| | | | Regional Banks 3.3% | | | |
| | 1,104,282 | | | AU Small Finance Bank Ltd.* | | | 18,029,450 | |
| | 523,791 | | | Canadian Western Bank | | | 15,225,825 | |
| | | | | | | | |
| | | | | | | 33,255,275 | |
| | | | | | | | |
| | |
| | | | Research & Consulting Services 3.9% | | | |
| | 85,150 | | | BayCurrent Consulting, Inc. | | | 30,822,430 | |
| | 486,884 | | | NICE Information Service Co. Ltd. | | | 7,889,363 | |
| | | | | | | | |
| | | | | | | 38,711,793 | |
| | | | | | | | |
| | |
| | | | Restaurants 1.5% | | | |
| | 108,767 | | | Domino’s Pizza Enterprises Ltd. | | | 7,080,058 | |
| | 1,643,587 | | | Domino’s Pizza Group PLC | | | 8,142,626 | |
| | | | | | | | |
| | | | | | | 15,222,684 | |
| | | | | | | | |
| | |
| | | | Semiconductors 7.1% | | | |
| | 124,000 | | | ASPEED Technology, Inc. | | | 13,958,544 | |
| | 118,021 | | | LEENO Industrial, Inc. | | | 17,824,946 | |
| | 178,676 | | | Melexis NV | | | 16,449,334 | |
| | 194,249 | | | Silergy Corp. | | | 22,775,846 | |
| | | | | | | | |
| | | | | | | 71,008,670 | |
| | | | | | | | |
| | |
| | | | Soft Drinks 0.9% | | | |
| | 364,122 | | | Fevertree Drinks PLC | | | 8,501,828 | |
| | | | | | | | |
| | |
| | | | Specialty Chemicals 1.0% | | | |
| | 1,028,620 | | | Hexpol AB | | | 10,040,108 | |
| | | | | | | | |
| | |
| | | | Specialty Stores 0.9% | | | |
| | 2,208,700 | | | Pet Center Comercio e Participacoes SA | | | 8,656,566 | |
| | | | | | | | |
| | |
| | | | Systems Software 1.8% | | | |
| | 108,700 | | | CyberArk Software Ltd.* | | | 18,343,125 | |
| | | | | | | | |
| | |
| | | | Thrifts & Mortgage Finance 3.6% | | | |
| | 339,270 | | | Equitable Group, Inc. | | | 19,469,047 | |
| | 2,210,084 | | | OSB Group PLC | | | 16,369,724 | |
| | | | | | | | |
| | | | | | | 35,838,771 | |
| | | | | | | | |
| | |
| | | | Trading Companies &
Distributors 8.9% | | | |
| | 604,198 | | | Diploma PLC | | | 20,742,584 | |
| | 1,828,638 | | | Electrocomponents PLC | | | 25,826,339 | |
| | 1,415,156 | | | Howden Joinery Group PLC | | | 14,186,978 | |
| | 92,779 | | | IMCD NV | | | 15,827,388 | |
| | 543,248 | | | MonotaRO Co. Ltd. | | | 11,659,362 | |
| | | | | | | | |
| | | | | | | 88,242,651 | |
| | | | | | | | |
| | |
| | | | Total Common Stocks
(cost $681,877,893) | | | 990,724,984 | |
| | | | | | | | |
| | | | | | | | |
Principal
Amount | | | | | Value | |
| | | | | | | |
| |
| | | | SHORT-TERM INVESTMENTS 0.5% | |
| | |
| | | | Repurchase Agreement 0.5% | | | |
| $ | 5,178,293 | | | Repurchase Agreement dated 3/31/22, 0.00% due 4/1/22 with Fixed Income Clearing Corp. collateralized by $5,728,700 of United States Treasury Notes 1.125% due 8/31/28; value: $5,281,877; repurchase proceeds: $5,178,293 (cost $5,178,293) | | $ | 5,178,293 | |
| | | | | | | | |
| | |
| | | | Total Short-Term Investments
(cost $5,178,293) | | | 5,178,293 | |
| | | | | | | | |
| | |
| | | | Total Investments
(cost $687,056,186) 100.1%§ | | | 995,903,277 | |
| | |
| | | | Liabilities less Other Assets (0.1%) | | | (1,406,451 | ) |
| | | | | | | | |
| | |
| | | | Net Assets 100.0% | | $ | 994,496,826 | |
| | | | | | | | |
| |
| | | | *Non-income producing. ***Security was fair valued under procedures adopted by the Board of Trustees (see Note 12). §The aggregate amount of foreign securities fair valued pursuant to a systematic valuation model as a percent of net assets was 77.32%. §§The aggregate value of illiquid holdings at March 31, 2022 amounted to approximately $83,166 and represented 0.01% of net assets. ADR American Depositary Receipt. | |
| |
| | | | See Notes to Financial Statements. | |
At March 31, 2022, Wasatch International Growth Fund’s investments, excluding short-term investments, were in the following countries:
| | | | | |
| Country | | % |
Australia | | | | 5.1 | |
Belgium | | | | 1.7 | |
Brazil | | | | 1.5 | |
Canada | | | | 11.3 | |
Denmark | | | | 1.2 | |
Germany | | | | 3.2 | |
India | | | | 6.9 | |
Israel | | | | 1.9 | |
Italy | | | | 4.3 | |
Japan | | | | 22.4 | |
Mexico | | | | 3.0 | |
Netherlands | | | | 1.6 | |
Norway | | | | 0.3 | |
Russia | | | | 0.0 | |
South Africa | | | | 0.7 | |
South Korea | | | | 2.6 | |
Sweden | | | | 1.0 | |
Switzerland | | | | 1.0 | |
Taiwan | | | | 6.4 | |
Thailand | | | | 0.4 | |
United Kingdom | | | | 22.0 | |
United States | | | | 1.5 | |
| | | | | |
TOTAL | | | | 100.0 | % |
| | | | | |
64
| | |
| Wasatch International Opportunities Fund (WAIOX / WIIOX) | | MARCH 31, 2022 (Unaudited) |
Schedule of Investments
| | | | | | | | |
| Shares | | | | | Value | |
| | | | | | | |
| |
| | | | COMMON STOCKS 100.1% | |
| | |
| | | | Advertising 6.9% | | | |
| | 522,692 | | | Direct Marketing MiX, Inc. | | $ | 7,789,963 | |
| | 339,400 | | | ValueCommerce Co. Ltd. | | | 10,250,336 | |
| | 1,186,669 | | | YouGov PLC | | | 21,356,482 | |
| | | | | | | | |
| | | | | | | 39,396,781 | |
| | | | | | | | |
| | |
| | | | Air Freight & Logistics 0.0% | | | |
| | 19,683 | | | Maruwa Unyu Kikan Co. Ltd. | | | 181,567 | |
| | | | | | | | |
| | |
| | | | Alternative Carriers 0.9% | | | |
| | 529,927 | | | Chief Telecom, Inc. | | | 5,076,568 | |
| | | | | | | | |
| | |
| | | | Application Software 14.8% | | | |
| | 58,192 | | | Atoss Software AG | | | 11,479,550 | |
| | 1,832,770 | | | Bytes Technology Group PLC | | | 11,985,120 | |
| | 58,863 | | | cBrain A/S | | | 1,822,998 | |
| | 129,100 | | | Cybozu, Inc. | | | 1,454,045 | |
| | 952,862 | | | Elmo Software Ltd.* | | | 3,060,361 | |
| | 40,850 | | | Esker SA | | | 7,656,797 | |
| | 1,643,190 | | | Fortnox AB | | | 8,937,570 | |
| | 96,800 | | | Freee KK* | | | 3,436,044 | |
| | 124,600 | | | LiveChat Software SA | | | 3,025,421 | |
| | 77,328 | | | Mensch und Maschine Software SE | | | 4,835,728 | |
| | 285,232 | | | Rakus Co. Ltd. | | | 3,828,466 | |
| | 3,223,800 | | | Systena Corp. | | | 11,299,805 | |
| | 225,735 | | | Vitec Software Group AB, Class B | | | 11,635,427 | |
| | | | | | | | |
| | | | | | | 84,457,332 | |
| | | | | | | | |
| | |
| | | | Asset Management & Custody
Banks 4.0% | | | |
| | 1,335,203 | | | JTC PLC | | | 14,764,198 | |
| | 9,654,619 | | | VEF AB* | | | 4,513,585 | |
| | 199,000 | | | WealthNavi, Inc.* | | | 3,304,940 | |
| | | | | | | | |
| | | | | | | 22,582,723 | |
| | | | | | | | |
| | |
| | | | Brewers 0.7% | | | |
| | 40,486 | | | Royal Unibrew A/S | | | 3,782,431 | |
| | | | | | | | |
| | |
| | | | Commodity Chemicals 2.5% | | | |
| | 826,601 | | | Berger Paints India Ltd. | | | 7,617,025 | |
| | 242,951 | | | Supreme Industries Ltd. | | | 6,533,211 | |
| | | | | | | | |
| | | | 14,150,236 | |
| | | | | |
| | |
| | | | Construction & Engineering 2.6% | | | |
| | 2,244,170 | | | Johns Lyng Group Ltd. | | | 14,527,135 | |
| | | | | | | | |
| | |
| | | | Consumer Finance 2.6% | | | |
| | 224,976 | | | Gruppo MutuiOnline SpA | | | 8,017,350 | |
| | 200,924 | | | Premium Group Co. Ltd. | | | 6,597,047 | |
| | | | | | | | |
| | | | | | | 14,614,397 | |
| | | | | | | | |
| | |
| | | | Data Processing & Outsourced
Services 0.0% | | | |
| | 1 | | | Fawry for Banking & Payment Technology Services SAE* | | | 1 | |
| | | | | | | | |
| | |
| | | | Department Stores 0.9% | | | |
| | 389,245 | | | Poya International Co. Ltd. | | | 5,269,968 | |
| | | | | | | | |
| | |
| | | | Diversified Banks 1.1% | | | |
| | 3,850,355 | | | City Union Bank Ltd. | | | 6,523,616 | |
| | | | | | | | |
| | | | | | | | |
| Shares | | | | | Value | |
| | | | | | | |
| | |
| | | | Diversified Support Services 4.0% | | | |
| | 667,700 | | | Japan Elevator Service Holdings Co. Ltd. | | $ | 8,643,344 | |
| | 5,834,195 | | | Johnson Service Group PLC* | | | 8,999,563 | |
| | 883,067 | | | Prestige International, Inc. | | | 5,213,484 | |
| | | | | | | | |
| | | | | | | 22,856,391 | |
| | | | | | | | |
| | |
| | | | Electrical Components &
Equipment 5.5% | | | |
| | 1,453,534 | | | DiscoverIE Group PLC | | | 14,911,302 | |
| | 326,471 | | | Voltronic Power Technology Corp. | | | 16,475,524 | |
| | | | | | | | |
| | | | | | | 31,386,826 | |
| | | | | | | | |
| | |
| | | | Electronic Components 0.7% | | | |
| | 495,863 | | | M3 Technology, Inc. | | | 3,801,423 | |
| | | | | | | | |
| | |
| | | | Electronic Equipment &
Instruments 0.8% | | | |
| | 2,506,098 | | | Nayax Ltd.* | | | 4,601,063 | |
| | | | | | | | |
| | |
| | | | Food Retail 1.8% | | | |
| | 67,164 | | | Rami Levy Chain Stores Hashikma Marketing 2006 Ltd. | | | 5,355,745 | |
| | 4,289,100 | | | Sheng Siong Group Ltd. | | | 4,802,918 | |
| | | | | | | | |
| | | | | | | 10,158,663 | |
| | | | | | | | |
| | |
| | | | Health Care Equipment 0.6% | | | |
| | 113,453 | | | Medistim ASA | | | 3,389,215 | |
| | | | | | | | |
| | |
| | | | Health Care Services 2.7% | | | |
| | 243,105 | | | Dr. Lal PathLabs Ltd. | | | 8,325,527 | |
| | 1,243,005 | | | Vijaya Diagnostic Centre Pvt. Ltd.* | | | 7,155,583 | |
| | | | | | | | |
| | | | | | | 15,481,110 | |
| | | | | | | | |
| | |
| | | | Health Care Supplies 0.1% | | | |
| | 162,641 | | | Shanghai Kindly Medical Instruments Co. Ltd., Class H | | | 331,539 | |
| | | | | | | | |
| | |
| | | | Health Care Technology 4.1% | | | |
| | 72,600 | | | MedPeer, Inc.* | | | 2,340,558 | |
| | 192,308 | | | Nexus AG | | | 11,459,724 | |
| | 261,159 | | | Pro Medicus Ltd. | | | 9,460,954 | |
| | | | | | | | |
| | | | | | | 23,261,236 | |
| | | | | | | | |
| | |
| | | | Human Resource & Employment
Services 1.8% | | | |
| | 122,937 | | | Grupa Pracuj SA* | | | 1,840,804 | |
| | 338,225 | | | HeadHunter Group PLC, ADR*** §§ | | | 101,468 | |
| | 363,300 | | | S-Pool, Inc. | | | 3,685,370 | |
| | 171,262 | | | SMS Co. Ltd. | | | 4,696,705 | |
| | | | | | | | |
| | | | | | | 10,324,347 | |
| | | | | | | | |
| | |
| | | | Insurance Brokers 0.7% | | | |
| | 3,359,202 | | | TQM Corp. Public Co. Ltd. | | | 4,041,145 | |
| | | | | | | | |
| | |
| | | | Interactive Media & Services 0.7% | | | |
| | 2,172,596 | | | Baltic Classifieds Group PLC* | | | 3,915,792 | |
| | | | | | | | |
| | |
| | | | Internet & Direct Marketing Retail 0.5% | | | |
| | 77,300 | | | Temairazu, Inc. | | | 2,990,850 | |
| | | | | | | | |
| | |
| | | | Investment Banking & Brokerage 1.8% | | | |
| | 263,831 | | | Strike Co. Ltd. | | | 10,086,759 | |
| | | | | | | | |
65
| | |
| Wasatch International Opportunities Fund (WAIOX / WIIOX) | | MARCH 31, 2022 (Unaudited) |
Schedule of Investments (continued)
| | | | | | | | |
| Shares | | | | | Value | |
| | | | | | | |
| | |
| | | | IT Consulting & Other Services 7.6% | | | |
| | 20,233 | | | Adesso SE | | $ | 4,141,576 | |
| | 93,528 | | | Aubay | | | 6,198,782 | |
| | 486,135 | | | Avant Corp. | | | 5,347,749 | |
| | 302,650 | | | Comture Corp. | | | 7,616,481 | |
| | 379,364 | | | FDM Group Holdings PLC | | | 5,236,878 | |
| | 2,442,848 | | | Kin & Carta PLC* | | | 8,156,472 | |
| | 96,433 | | | KNOW IT AB | | | 3,196,695 | |
| | 318,800 | | | SERAKU Co. Ltd. | | | 3,685,524 | |
| | | | | | | | |
| | | | | | | 43,580,157 | |
| | | | | | | | |
| | |
| | | | Life Sciences Tools & Services 0.6% | | | |
| | 197,149 | | | Ergomed PLC* | | | 3,484,369 | |
| | | | | | | | |
| | |
| | | | Movies & Entertainment 0.0% | | | |
| | 5,564 | | | NexTone, Inc. | | | 131,993 | |
| | | | | | | | |
| | |
| | | | Personal Products 0.8% | | | |
| | 588,400 | | | Sarantis SA | | | 4,660,245 | |
| | | | | | | | |
| | |
| | | | Property & Casualty Insurance 2.8% | | | |
| | 2,826,267 | | | Qualitas Controladora SAB de CV | | | 16,197,395 | |
| | | | | | | | |
| | |
| | | | Publishing 2.1% | | | |
| | 352,403 | | | Future PLC | | | 11,974,560 | |
| | | | | | | | |
| | |
| | | | Research & Consulting Services 7.4% | | | |
| | 8,491,400 | | | CTOS Digital Bhd | | | 3,181,992 | |
| | 551,725 | | | Funai Soken Holdings, Inc. | | | 9,932,348 | |
| | 521,089 | | | NICE Information Service Co. Ltd. | | | 8,443,614 | |
| | 1,658,800 | | | SIGMAXYZ Holdings, Inc. | | | 15,455,630 | |
| �� | 478,295 | | | Talenom Oyj | | | 5,175,291 | |
| | | | | | | | |
| | | | | | | 42,188,875 | |
| | | | | | | | |
| | |
| | | | Restaurants 0.0% | | | |
| | 630,045 | | | Patisserie Holdings PLC* *** §§ | | | 8,277 | |
| | | | | | | | |
| | |
| | | | Semiconductors 4.1% | | | |
| | 79,873 | | | Elmos Semiconductor SE | | | 4,615,053 | |
| | 124,531 | | | LEENO Industrial, Inc. | | | 18,808,164 | |
| | | | | | | | |
| | | | | | | 23,423,217 | |
| | | | | | | | |
| | |
| | | | Specialized Finance 1.1% | | | |
| | 364,500 | | | eGuarantee, Inc. | | | 6,073,584 | |
| | | | | | | | |
| | |
| | | | Specialty Stores 0.5% | | | |
| | 109,467 | | | Musti Group Oyj* | | | 2,887,293 | |
| | | | | | | | |
| | |
| | | | Systems Software 3.0% | | | |
| | 119,664 | | | Digital Value SpA* | | | 11,551,131 | |
| | 2,017,600 | | | Ideagen PLC | | | 5,777,914 | |
| | | | | | | | |
| | | | | | | 17,329,045 | |
| | | | | | | | |
| | |
| | | | Thrifts & Mortgage Finance 7.3% | | | |
| | 507,914 | | | Aavas Financiers Ltd.* | | | 17,110,981 | |
| | 214,212 | | | Equitable Group, Inc. | | | 12,284,213 | |
| | 825,845 | | | Mortgage Advice Bureau Holdings Ltd. | | | 12,367,529 | |
| | | | | | | | |
| | | | | | | 41,762,723 | |
| | | | | | | | |
| | |
| | | | Total Common Stocks
(cost $438,581,691) | | | 570,890,847 | |
| | | | | | | | |
| | | | | | | | |
Principal
Amount | | | | | Value | |
| | | | | | | |
| |
| | | | SHORT-TERM INVESTMENTS 0.3% | |
| | |
| | | | Repurchase Agreement 0.3% | | | |
| $ | 1,873,870 | | | Repurchase Agreement dated 3/31/22, 0.00% due 4/1/22 with Fixed Income Clearing Corp. collateralized by $2,073,100 of United States Treasury Notes 1.125% due 8/31/28; value: $1,911,404 repurchase proceeds: $1,873,870 (cost $1,873,870) | | $ | 1,873,870 | |
| | | | | | | | |
| | |
| | | | Total Short-Term Investments
(cost $1,873,870) | | | 1,873,870 | |
| | | | | | | | |
| | |
| | | | Total Investments
(cost $440,455,561) 100.4%§ | | | 572,764,717 | |
| | |
| | | | Liabilities less Other Assets (0.4%) | | | (2,002,166 | ) |
| | | | | | | | |
| | |
| | | | Net Assets 100.0% | | $ | 570,762,551 | |
| | | | | | | | |
| |
| | | | *Non-income producing. ***Security was fair valued under procedures adopted by the Board of Trustees (see Note 12) §The aggregate amount of foreign securities fair valued pursuant to a systematic valuation model as a percent of net assets was 84.64%. §§The aggregate value of illiquid holdings at March 31, 2022, amounted to approximately $109,745 and represented 0.02% of net assets. ADR American Depositary Receipt. | |
| |
| | | | See Notes to Financial Statements. | |
66
| | |
| Wasatch International Opportunities Fund (WAIOX / WIIOX) | | MARCH 31, 2022 (Unaudited) |
Schedule of Investments (continued)
At March 31, 2022, Wasatch International Opportunities Fund’s investments, excluding short-term investments, were in the following countries:
| | | | | |
| Country | | % |
Australia | | | | 4.7 | |
Canada | | | | 2.2 | |
China | | | | 0.1 | |
Denmark | | | | 1.0 | |
Egypt | | | | 0.0 | |
Finland | | | | 1.4 | |
France | | | | 2.4 | |
Germany | | | | 6.4 | |
Greece | | | | 0.8 | |
India | | | | 9.3 | |
Israel | | | | 1.7 | |
Italy | | | | 3.4 | |
Japan | | | | 23.5 | |
Malaysia | | | | 0.6 | |
Mexico | | | | 2.8 | |
Norway | | | | 0.6 | |
Poland | | | | 0.9 | |
Russia | | | | 0.0 | |
Singapore | | | | 0.8 | |
South Korea | | | | 4.8 | |
Sweden | | | | 5.0 | |
Taiwan | | | | 5.4 | |
Thailand | | | | 0.7 | |
United Kingdom | | | | 21.5 | |
United States | | | | 0.0 | |
| | | | | |
TOTAL | | | | 100.0 | % |
| | | | | |
67
| | |
| Wasatch International Select Fund (WAISX / WGISX) | | MARCH 31, 2022 (Unaudited) |
Schedule of Investments
| | | | | | | | |
| Shares | | | | | Value | |
| | | | | | | |
| | |
| | | | COMMON STOCKS 96.0% | | | | |
| | |
| | | | Aerospace & Defense 5.2% | | | |
| | 13,767 | | | CAE, Inc.* | | $ | 358,340 | |
| | | | | | | | |
| | |
| | | | Apparel, Accessories & Luxury Goods 3.7% | | | |
| | 181 | | | Hermes International | | | 256,178 | |
| | | | | | | | |
| | |
| | | | Application Software 8.1% | | | |
| | 7,093 | | | Dassault Systemes SE | | | 348,469 | |
| | 2,791 | | | Xero Ltd.* | | | 211,523 | |
| | | | | | | | |
| | | | | | | 559,992 | |
| | | | | | | | |
| | |
| | | | Asset Management & Custody Banks 3.6% | | | |
| | 201 | | | Partners Group Holding AG | | | 248,878 | |
| | | | | | | | |
| | |
| | | | Biotechnology 4.0% | | | |
| | 15,267 | | | Abcam PLC* | | | 275,952 | |
| | | | | | | | |
| | |
| | | | Building Products 5.2% | | | |
| | 13,421 | | | Assa Abloy AB, Class B | | | 360,751 | |
| | | | | | | | |
| | |
| | | | Data Processing & Outsourced
Services 10.2% | | | |
| | 101 | | | Adyen NV* | | | 200,050 | |
| | 5,603 | | | Amadeus IT Group SA* | | | 364,296 | |
| | 1,400 | | | GMO Payment Gateway, Inc. | | | 142,627 | |
| | | | | | | | |
| | | | | | | 706,973 | |
| | | | | | | | |
| | |
| | | | Drug Retail 1.7% | | | |
| | 1,900 | | | Tsuruha Holdings, Inc. | | | 120,647 | |
| | | | | | | | |
| | |
| | | | Electronic Equipment & Instruments 4.1% | | | |
| | 8,684 | | | Halma PLC | | | 284,115 | |
| | | | | | | | |
| | |
| | | | Health Care Equipment 3.0% | | | |
| | 1,313 | | | DiaSorin SpA | | | 205,081 | |
| | | | | | | | |
| | |
| | | | Health Care Supplies 3.9% | | | |
| | 1,803 | | | Coloplast A/S, Class B | | | 273,044 | |
| | | | | | | | |
| | |
| | | | Health Care Technology 7.7% | | | |
| | 8,001 | | | JMDC, Inc.* | | | 436,141 | |
| | 2,700 | | | M3, Inc. | | | 97,513 | |
| | | | | | | | |
| | | | 533,654 | |
| | | | | |
| | |
| | | | Industrial Machinery 5.4% | | | |
| | 5,300 | | | MISUMI Group, Inc. | | | 157,785 | |
| | 318 | | | Rational AG | | | 219,014 | |
| | | | | | | | |
| | | | 376,799 | |
| | | | | |
| | |
| | | | Interactive Media & Services 8.5% | | | |
| | 7,600 | | | Kakaku.com, Inc. | | | 169,729 | |
| | 2,204 | | | REA Group Ltd. | | | 220,950 | |
| | 3,516 | | | Scout24 AG | | | 200,454 | |
| | | | | | | | |
| | | | 591,133 | |
| | | | | |
| | |
| | | | IT Consulting & Other Services 2.8% | | | |
| | 1,300 | | | Obic Co. Ltd. | | | 194,710 | |
| | | | | | | | |
| | | | | | | | |
| Shares | | | | | Value | |
| | | | | | | |
| | |
| | | | Life Sciences Tools & Services 8.1% | | | |
| | 1,432 | | | ICON PLC* | | $ | 348,291 | |
| | 517 | | | Sartorius Stedim Biotech | | | 211,667 | |
| | | | | | | | |
| | | | | | | 559,958 | |
| | | | | | | | |
| | |
| | | | Real Estate Services 3.5% | | | |
| | 1,671 | | | FirstService Corp. | | | 241,705 | |
| | | | | | | | |
| | |
| | | | Research & Consulting Services 7.3% | | | |
| | 1,400 | | | BayCurrent Consulting, Inc. | | | 506,769 | |
| | | | | | | | |
| | |
| | | | Total Common Stocks
(cost $6,332,353) | | | 6,654,679 | |
| | | | | | | | |
| | |
Principal
Amount | | | | | Value | |
| | | | | | | |
| |
| | | | SHORT-TERM INVESTMENTS 4.0% | |
| | |
| | | | Repurchase Agreement 4.0% | | | |
| $ | 279,966 | | | Repurchase Agreement dated 3/31/22, 0.00% due 4/1/22 with Fixed Income Clearing Corp. collateralized by $309,800 of United States Treasury Notes 1.125% due 8/31/28; value: $285,636; repurchase proceeds: $279,966 (cost $279,966) | | $ | 279,966 | |
| | | | | | | | |
| | |
| | | | Total Short-Term Investments
(cost $279,966) | | | 279,966 | |
| | | | | | | | |
| | |
| | | | Total Investments
(cost $6,612,319) 100.0%§ | | | 6,934,645 | |
| | |
| | | | Liabilities less Other Assets (0.0%) | | | (2,600 | ) |
| | | | | | | | |
| | |
| | | | Net Assets 100.0% | | $ | 6,932,045 | |
| | | | | | | | |
| |
| | | | *Non-income producing. §The aggregate amount of foreign securities fair valued pursuant to a systematic valuation model as a percent of net assets was 82.32%. | |
| |
| | | | See Notes to Financial Statements. | |
At March 31, 2022, Wasatch International Select Fund’s investments, excluding short-term investments, were in the following countries:
| | | | | |
| Country | | % |
Australia | | | | 6.5 | |
Canada | | | | 9.0 | |
Denmark | | | | 4.1 | |
France | | | | 12.3 | |
Germany | | | | 6.3 | |
Ireland | | | | 5.2 | |
Italy | | | | 3.1 | |
Japan | | | | 27.4 | |
Netherlands | | | | 3.0 | |
Spain | | | | 5.5 | |
Sweden | | | | 5.4 | |
Switzerland | | | | 3.8 | |
United Kingdom | | | | 8.4 | |
| | | | | |
TOTAL | | | | 100.0 | % |
| | | | | |
68
| | |
| Wasatch Long/Short Alpha Fund (WALSX / WGLSX) | | MARCH 31, 2022 (Unaudited) |
Schedule of Investments
| | | | | | | | |
| Shares | | | | | Value | |
| | | | | | | |
| |
| | | | COMMON STOCKS 116.0% | |
| | |
| | | | Agricultural & Farm Machinery 1.0% | | | |
| | 16,761 | | | Hydrofarm Holdings Group, Inc.* | | $ | 253,929 | |
| | | | | | | | |
| | |
| | | | Apparel, Accessories & Luxury Goods 1.9% | | | |
| | 17,750 | | | G-III Apparel Group Ltd.* | | | 480,137 | |
| | | | | | | | |
| | |
| | | | Application Software 8.9% | | | |
| | 3,504 | | | DocuSign, Inc.* | | | 375,349 | |
| | 5,360 | | | Five9, Inc.* | | | 591,744 | |
| | 4,508 | | | Guidewire Software, Inc.* | | | 426,547 | |
| | 926 | | | HubSpot, Inc.* | | | 439,794 | |
| | 2,048 | | | Paylocity Holding Corp.* | | | 421,417 | |
| | | | | | | | |
| | | | 2,254,851 | |
| | | | | |
| | |
| | | | Asset Management & Custody Banks 4.3% | | | |
| | 6,877 | | | Cohen & Steers, Inc. | | | 590,666 | |
| | 6,376 | | | Hamilton Lane, Inc., Class A | | | 492,801 | |
| | | | | | | | |
| | | | 1,083,467 | |
| | | | | |
| | |
| | | | Auto Parts & Equipment 2.0% | | | |
| | 11,987 | | | Standard Motor Products, Inc. | | | 517,119 | |
| | | | | | | | |
| | |
| | | | Casinos & Gaming 1.4% | | | |
| | 22,456 | | | NEOGAMES SA* | | | 346,496 | |
| | | | | | | | |
| | |
| | | | Commodity Chemicals 2.2% | | | |
| | 18,092 | | | Valvoline, Inc. | | | 570,983 | |
| | | | | | | | |
| | |
| | | | Construction Machinery & Heavy
Trucks 1.9% | | | |
| | 37,069 | | | REV Group, Inc. | | | 496,725 | |
| | | | | | | | |
| | |
| | | | Distributors 2.2% | | | |
| | 1,312 | | | Pool Corp. | | | 554,779 | |
| | | | | | | | |
| | |
| | | | Education Services 2.2% | | | |
| | 5,691 | | | Grand Canyon Education, Inc.* | | | 552,653 | |
| | | | | | | | |
| | |
| | | | Electronic Equipment & Instruments 5.5% | | | |
| | 9,890 | | | Cognex Corp. | | | 763,013 | |
| | 4,461 | | | Novanta, Inc.* | | | 634,756 | |
| | | | | | | | |
| | | | 1,397,769 | |
| | | | | |
| | |
| | | | Electronic Manufacturing Services 4.5% | | | |
| | 5,704 | | | Fabrinet* | | | 599,662 | |
| | 13,746 | | | Sanmina Corp.* | | | 555,613 | |
| | | | | | | | |
| | | | 1,155,275 | |
| | | | | |
| | |
| | | | Environmental & Facilities Services 1.6% | | | |
| | 8,871 | | | ABM Industries, Inc. | | | 408,421 | |
| | | | | | | | |
| | |
| | | | Financial Exchanges & Data 5.9% | | | |
| | 1,780 | | | MarketAxess Holdings, Inc. | | | 605,556 | |
| | 3,322 | | | Morningstar, Inc. | | | 907,471 | |
| | | | | | | | |
| | | | 1,513,027 | |
| | | | | |
| | |
| | | | Food Distributors 1.5% | | | |
| | 11,660 | | | Chefs’ Warehouse, Inc.* | | | 380,116 | |
| | | | | | | | |
| | | | | | | | |
| Shares | | | | | Value | |
| | | | | | | |
| | |
| | | | Food Retail 2.0% | | | |
| | 16,134 | | | Sprouts Farmers Market, Inc.* | | $ | 515,965 | |
| | | | | | | | |
| | |
| | | | General Merchandise Stores 1.6% | | | |
| | 9,807 | | | Ollie’s Bargain Outlet Holdings, Inc.* | | | 421,309 | |
| | | | | | | | |
| | |
| | | | Health Care Facilities 3.2% | | | |
| | 9,161 | | | Ensign Group, Inc. | | | 824,582 | |
| | | | | | | | |
| | |
| | | | Health Care Services 2.6% | | | |
| | 6,971 | | | Addus HomeCare Corp.* | | | 650,325 | |
| | | | | | | | |
| | |
| | | | Home Improvement Retail 1.8% | | | |
| | 5,589 | | | Floor & Decor Holdings, Inc., Class A* | | | 452,709 | |
| | | | | | | | |
| | |
| | | | Homebuilding 1.7% | | | |
| | 7,887 | | | Skyline Champion Corp.* | | | 432,839 | |
| | | | | | | | |
| | |
| | | | Industrial Conglomerates 3.8% | | | |
| | 2,026 | | | Roper Technologies, Inc. | | | 956,738 | |
| | | | | | | | |
| | |
| | | | Industrial Machinery 4.8% | | | |
| | 12,175 | | | Altra Industrial Motion Corp. | | | 473,973 | |
| | 8,744 | | | Barnes Group, Inc. | | | 351,421 | |
| | 4,781 | | | Kornit Digital Ltd.* | | | 395,341 | |
| | | | | | | | |
| | | | 1,220,735 | |
| | | | | | | | |
| | |
| | | | Insurance Brokers 1.4% | | | |
| | 4,550 | | | Goosehead Insurance, Inc., Class A | | | 357,493 | |
| | | | | | | | |
| | |
| | | | Interactive Media & Services 1.7% | | | |
| | 18,663 | | | ZipRecruiter, Inc., Class A* | | | 428,876 | |
| | | | | | | | |
| | |
| | | | Investment Banking & Brokerage 1.8% | | | |
| | 9,757 | | | Moelis & Co., Class A | | | 458,091 | |
| | | | | | | | |
| | |
| | | | IT Consulting & Other Services 2.8% | | | |
| | 2,684 | | | Globant SA* | | | 703,396 | |
| | | | | | | | |
| | |
| | | | Leisure Products 1.7% | | | |
| | 7,227 | | | YETI Holdings, Inc.* | | | 433,475 | |
| | | | | | | | |
| | |
| | | | Life Sciences Tools & Services 3.1% | | | |
| | 4,825 | | | Medpace Holdings, Inc.* | | | 789,322 | |
| | | | | | | | |
| | |
| | | | Managed Health Care 2.6% | | | |
| | 9,707 | | | HealthEquity, Inc.* | | | 654,640 | |
| | | | | | | | |
| | |
| | | | Oil & Gas Equipment & Services 1.8% | | | |
| | 7,975 | | | Cactus, Inc., Class A | | | 452,501 | |
| | | | | | | | |
| | |
| | | | Oil & Gas Exploration & Production 2.6% | | | |
| | 27,593 | | | Magnolia Oil & Gas Corp., Class A | | | 652,574 | |
| | | | | | | | |
| | |
| | | | Packaged Foods & Meats 1.7% | | | |
| | 4,170 | | | Freshpet, Inc.* | | | 428,009 | |
| | | | | | | | |
| | |
| | | | Paper Products 2.1% | | | |
| | 41,071 | | | Resolute Forest Products, Inc. | | | 530,227 | |
| | | | | | | | |
| | |
| | | | Pharmaceuticals 2.2% | | | |
| | 9,028 | | | Intra-Cellular Therapies, Inc.* | | | 552,423 | |
| | | | | | | | |
69
| | |
| Wasatch Long/Short Alpha Fund (WALSX / WGLSX) | | MARCH 31, 2022 (Unaudited) |
Schedule of Investments (continued)
| | | | | | | | |
| Shares | | | | | Value | |
| | | | | | | |
| | |
| | | | Regional Banks 5.8% | | | |
| | 20,475 | | | Bank OZK | | $ | 874,283 | |
| | 3,983 | | | Silvergate Capital Corp., Class A* | | | 599,720 | |
| | | | | | | | |
| | | | 1,474,003 | |
| | | | | | | | |
| | |
| | | | Research & Consulting Services 2.2% | | | |
| | 5,904 | | | ICF International, Inc. | | | 555,803 | |
| | | | | | | | |
| | |
| | | | Semiconductors 3.0% | | | |
| | 1,569 | | | Monolithic Power Systems, Inc. | | | 762,032 | |
| | | | | | | | |
| | |
| | | | Specialty Chemicals 5.7% | | | |
| | 6,059 | | | Balchem Corp. | | | 828,265 | |
| | 6,791 | | | Innospec, Inc. | | | 628,507 | |
| | | | | | | | |
| | | | 1,456,772 | |
| | | | | | | | |
| | |
| | | | Specialty Stores 2.2% | | | |
| | 3,571 | | | Five Below, Inc.* | | | 565,539 | |
| | | | | | | | |
| | |
| | | | Systems Software 1.5% | | | |
| | 2,242 | | | CyberArk Software Ltd.* | | | 378,337 | |
| | | | | | | | |
| | |
| | | | Trucking 1.6% | | | |
| | 10,892 | | | Lyft, Inc., Class A* | | | 418,253 | |
| | | | | | | | |
| | |
| | | | Total Common Stocks
(cost $32,194,707) | | | 29,492,715 | |
| | | | | | | | |
| | |
| | | | Total Investments, Before Investments Sold Short
(cost $32,194,707) 116.0% | | | 29,492,715 | |
| | | | | | | | |
| |
| | | | COMMON STOCKS SOLD SHORT (47.2%) | |
| | |
| | | | Advertising (0.8%) | | | |
| | (3,747 | ) | | Cardlytics, Inc.* | | | (206,010 | ) |
| | | | | | | | |
| | |
| | | | Aerospace & Defense (1.1%) | | | |
| | (5,794 | ) | | Spirit AeroSystems Holdings, Inc., Class A | | | (283,269 | ) |
| | | | | | | | |
| | |
| | | | Airlines (1.2%) | | | |
| | (16,096 | ) | | Hawaiian Holdings, Inc.* | | | (317,091 | ) |
| | | | | | | | |
| | |
| | | | Alternative Carriers (1.1%) | | | |
| | (188,596 | ) | | Globalstar, Inc.* | | | (277,236 | ) |
| | | | | | | | |
| | |
| | | | Aluminum (0.9%) | | | |
| | (8,549 | ) | | Century Aluminum Co.* | | | (224,924 | ) |
| | | | | | | | |
| | |
| | | | Application Software (6.7%) | | | |
| | (26,531 | ) | | 8x8, Inc.* | | | (334,025 | ) |
| | (5,462 | ) | | Alteryx, Inc., Class A* | | | (390,697 | ) |
| | (5,797 | ) | | Domo, Inc., Class B* | | | (293,155 | ) |
| | (579 | ) | | MicroStrategy, Inc., Class A* | | | (281,579 | ) |
| | (9,790 | ) | | Nutanix, Inc., Class A* | | | (262,568 | ) |
| | (20,145 | ) | | Yext, Inc.* | | | (138,799 | ) |
| | | | | | | | |
| | | | (1,700,823 | ) |
| | | | | |
| | |
| | | | Asset Management & Custody
Banks (1.1%) | | | |
| | (3,415 | ) | | Ares Management Corp. | | | (277,400 | ) |
| | | | | | | | |
| | | | | | | | |
| Shares | | | | | Value | |
| | | | | | | |
| | |
| | | | Auto Parts & Equipment (0.5%) | | | |
| | (14,513 | ) | | Cooper-Standard Holdings, Inc.* | | $ | (127,279 | ) |
| | | | | | | | |
| | |
| | | | Automotive Retail (0.4%) | | | |
| | (36,267 | ) | | Vroom, Inc.* | | | (96,470 | ) |
| | | | | | | | |
| | |
| | | | Construction & Engineering (1.2%) | | | |
| | (7,756 | ) | | WillScot Mobile Mini Holdings Corp.* | | | (303,492 | ) |
| | | | | | | | |
| | |
| | | | Consumer Finance (1.3%) | | | |
| | (7,736 | ) | | LendingClub Corp.* | | | (122,074 | ) |
| | (1,721 | ) | | LendingTree, Inc.* | | | (205,952 | ) |
| | | | | | | | |
| | | | (328,026 | ) |
| | | | | |
| | |
| | | | Education Services (0.5%) | | | |
| | (10,389 | ) | | 2U, Inc.* | | | (137,966 | ) |
| | | | | | | | |
| | |
| | | | Electrical Components & Equipment (2.3%) | | | |
| | (9,673 | ) | | Plug Power, Inc.* | | | (276,745 | ) |
| | (9,960 | ) | | Sunrun, Inc.* | | | (302,485 | ) |
| | | | | | | | |
| | | | (579,230 | ) |
| | | | | | | | |
| | |
| | | | Electronic Equipment & Instruments (0.7%) | | | |
| | (19,339 | ) | | Arlo Technologies, Inc.* | | | (171,344 | ) |
| | | | | | | | |
| | |
| | | | Health Care Equipment (1.9%) | | | |
| | (25,972 | ) | | Alphatec Holdings, Inc.* | | | (298,678 | ) |
| | (2,662 | ) | | Nevro Corp.* | | | (192,543 | ) |
| | | | | | | | |
| | | | (491,221 | ) |
| | | | | | | | |
| | |
| | | | Health Care Supplies (1.0%) | | | |
| | (9,926 | ) | | Pulmonx Corp.* | | | (246,264 | ) |
| | | | | | | | |
| | |
| | | | Health Care Technology (1.1%) | | | |
| | (11,175 | ) | | Definitive Healthcare Corp.* | | | (275,464 | ) |
| | | | | | | | |
| | |
| | | | Heavy Electrical Equipment (0.8%) | | | |
| | (8,105 | ) | | Bloom Energy Corp., Class A* | | | (195,736 | ) |
| | | | | | | | |
| | |
| | | | Hotel & Resort REITs (0.8%) | | | |
| | (10,580 | ) | | Park Hotels & Resorts, Inc. | | | (206,627 | ) |
| | | | | | | | |
| | |
| | | | Hotels, Resorts & Cruise Lines (2.2%) | | | |
| | (2,961 | ) | | Hyatt Hotels Corp., Class A* | | | (282,627 | ) |
| | (17,961 | ) | | Lindblad Expeditions Holdings, Inc.* | | | (270,852 | ) |
| | | | | | | | |
| | | | (553,479 | ) |
| | | | | | | | |
| | |
| | | | Insurance Brokers (0.9%) | | | |
| | (18,802 | ) | | eHealth, Inc.* | | | (233,333 | ) |
| | | | | | | | |
| | |
| | | | Interactive Media & Services (0.8%) | | | |
| | (35,971 | ) | | Angi, Inc.* | | | (203,956 | ) |
| | | | | | | | |
| | |
| | | | Internet & Direct Marketing Retail (3.2%) | | | |
| | (24,320 | ) | | Farfetch Ltd., Class A* | | | (367,718 | ) |
| | (2,597 | ) | | Fiverr International Ltd.* | | | (197,554 | ) |
| | (15,168 | ) | | RealReal, Inc.* | | | (110,120 | ) |
| | (3,751 | ) | | Xometry, Inc.* | | | (137,849 | ) |
| | | | | | | | |
| | | | (813,241 | ) |
| | | | | | | | |
70
| | |
| Wasatch Long/Short Alpha Fund (WALSX / WGLSX) | | MARCH 31, 2022 (Unaudited) |
Schedule of Investments (continued)
| | | | | | | | |
| Shares | | | | | Value | |
| | | | | | | |
| | |
| | | | Internet Services &
Infrastructure (1.0%) | | | |
| | (8,335 | ) | | Switch, Inc., Class A | | $ | (256,885 | ) |
| | | | | | | | |
| | |
| | | | Leisure Products (1.0%) | | | |
| | (53,857 | ) | | AMMO, Inc.* | | | (258,514 | ) |
| | | | | | | | |
| | |
| | | | Mortgage REITs (1.0%) | | | |
| | (24,186 | ) | | New Residential Investment Corp. | | | (265,562 | ) |
| | | | | | | | |
| | |
| | | | Multi-Sector Holdings (0.9%) | | | |
| | (9,495 | ) | | Cannae Holdings, Inc.* | | | (227,120 | ) |
| | | | | | | | |
| | |
| | | | Multi-Utilities (0.9%) | | | |
| | (7,599 | ) | | CenterPoint Energy, Inc. | | | (232,833 | ) |
| | | | | | | | |
| | |
| | | | Oil & Gas Refining & Marketing (0.8%) | | | |
| | (15,458 | ) | | Par Pacific Holdings, Inc.* | | | (201,263 | ) |
| | | | | | | | |
| | |
| | | | Oil & Gas Storage &
Transportation (1.9%) | | | |
| | (7,943 | ) | | Golar LNG Ltd.* | | | (196,827 | ) |
| | (14,047 | ) | | Scorpio Tankers, Inc. | | | (300,325 | ) |
| | | | | | | | |
| | | | (497,152 | ) |
| | | | | | | | |
| | |
| | | | Packaged Foods & Meats (1.2%) | | | |
| | (2,204 | ) | | The J M Smucker Co. | | | (298,444 | ) |
| | | | | | | | |
| | |
| | | | Personal Products (0.9%) | | | |
| | (25,669 | ) | | Coty, Inc., Class A* | | | (230,764 | ) |
| | | | | | | | |
| | |
| | | | Pharmaceuticals (2.0%) | | | |
| | (42,779 | ) | | Tilray, Inc.* | | | (332,393 | ) |
| | (15,147 | ) | | Viatris, Inc. | | | (164,799 | ) |
| | | | | | | | |
| | | | (497,192 | ) |
| | | | | | | | |
| | |
| | | | Precious Metals & Minerals (0.7%) | | | |
| | (41,336 | ) | | Coeur Mining, Inc.* | | | (183,945 | ) |
| | | | | | | | |
| | |
| | | | Real Estate Development (1.1%) | | | |
| | (2,591 | ) | | Howard Hughes Corp.* | | | (268,454 | ) |
| | | | | | | | |
| | |
| | | | Soft Drinks (0.5%) | | | |
| | (2,241 | ) | | Celsius Holdings, Inc.* | | | (123,658 | ) |
| | | | | | | | |
| | |
| | | | Trading Companies &
Distributors (0.8%) | | | |
| | (8,393 | ) | | Fortress Transportation and Infrastructure Investors LLC | | | (216,120 | ) |
| | | | | | | | |
| | |
| | | | Total Investments Sold Short
(proceeds $13,898,733) (47.2%) | | | (12,007,787 | ) |
| | | | | | | | |
| | |
| | | | Total Investments, Net of Investments Sold Short
(cost $18,295,974) 68.8% | | | 17,484,928 | |
| | |
| | | | Other Assets less Liabilities 31.2% | | | 7,945,521 | |
| | | | | | | | |
| | |
| | | | Net Assets 100.0% | | $ | 25,430,449 | |
| | | | | | | | |
| |
| | | | *Non-income producing. REIT Real Estate Investment Trust. | |
| |
| | | | See Notes to Financial Statements. | |
At March 31, 2022, Wasatch Long/Short Alpha Fund’s investments, excluding investments sold short, were in the following countries:
| | | | | |
| Country | | % |
Canada | | | | 1.8 | |
Israel | | | | 3.8 | |
United States | | | | 94.4 | |
| | | | | |
TOTAL | | | | 100.0 | % |
| | | | | |
71
| | |
| Wasatch Micro Cap Fund (WMICX / WGICX) | | MARCH 31, 2022 (Unaudited) |
Schedule of Investments
| | | | | | | | |
| Shares | | | | | Value | |
| | | | | | | |
| |
| | | | COMMON STOCKS 97.6% | |
| | |
| | | | Advertising 2.0% | | | |
| | 668,353 | | | Thryv Holdings, Inc.* | | $ | 18,794,086 | |
| | | | | | | | |
| | |
| | | | Agricultural & Farm Machinery 1.2% | | | |
| | 730,550 | | | Hydrofarm Holdings Group, Inc.* | | | 11,067,833 | |
| | | | | | | | |
| | |
| | | | Apparel, Accessories & Luxury
Goods 1.6% | | | |
| | 851,141 | | | Superior Group of Cos., Inc.‡‡ | | | 15,192,867 | |
| | | | | | | | |
| | |
| | | | Application Software 4.2% | | | |
| | 480,857 | | | Agilysys, Inc.* | | | 19,176,577 | |
| | 594,124 | | | CS Disco, Inc.* | | | 20,182,392 | |
| | | | | | | | |
| | | | 39,358,969 | |
| | | | | | | | |
| | |
| | | | Auto Parts & Equipment 5.7% | | | |
| | 2,581,663 | | | Holley, Inc.* | | | 35,910,932 | |
| | 326,474 | | | XPEL, Inc.* | | | 17,175,797 | |
| | | | | | | | |
| | | | 53,086,729 | |
| | | | | | | | |
| | |
| | | | Biotechnology 4.0% | | | |
| | 502,413 | | | Atara Biotherapeutics, Inc.* | | | 4,667,417 | |
| | 235,045 | | | BriaCell Therapeutics Corp.* | | | 2,383,356 | |
| | 197,734 | | | C4 Therapeutics, Inc.* | | | 4,797,027 | |
| | 162,839 | | | Cytokinetics, Inc.* | | | 5,994,104 | |
| | 405,384 | | | MacroGenics, Inc.* | | | 3,571,433 | |
| | 317,345 | | | Nkarta, Inc.* | | | 3,611,386 | |
| | 273,554 | | | Nurix Therapeutics, Inc.* | | | 3,832,491 | |
| | 1,218,017 | | | Sangamo Therapeutics, Inc.* | | | 7,076,679 | |
| | 486,746 | | | Silverback Therapeutics, Inc.* | | | 1,708,478 | |
| | | | | | | | |
| | | | 37,642,371 | |
| | | | | | | | |
| | |
| | | | Building Products 1.6% | | | |
| | 1,676,318 | | | Janus International Group, Inc.* | | | 15,086,862 | |
| | | | | | | | |
| | |
| | | | Casinos & Gaming 1.5% | | | |
| | 448,330 | | | NEOGAMES SA* | | | 6,917,732 | |
| | 340,659 | | | Pollard Banknote Ltd. | | | 7,338,277 | |
| | | | | | | | |
| | | | 14,256,009 | |
| | | | | | | | |
| | |
| | | | Construction & Engineering 3.0% | | | |
| | 915,180 | | | Construction Partners, Inc., Class A* | | | 23,959,412 | |
| | 1,373,408 | | | QUALTEK SERVICES, Inc.* | | | 4,408,640 | |
| | | | | | | | |
| | | | 28,368,052 | |
| | | | | | | | |
| | |
| | | | Data Processing & Outsourced
Services 1.6% | | | |
| | 2,217,893 | | | Cantaloupe, Inc.* | | | 15,015,136 | |
| | | | | | | | |
| | |
| | | | Distillers & Vintners 4.4% | | | |
| | 4,167,396 | | | Vintage Wine Estates, Inc.* ‡‡ | | | 41,132,199 | |
| | | | | | | | |
| | |
| | | | Electrical Components &
Equipment 1.9% | | | |
| | 585,863 | | | Allied Motion Technologies, Inc. | | | 17,482,152 | |
| | | | | | | | |
| | | | | | | | |
| Shares | | | | | Value | |
| | | | | | | |
| | |
| | | | Electronic Equipment &
Instruments 5.0% | | | |
| | 673,680 | | | Identiv, Inc.* | | $ | 10,893,406 | |
| | 988,829 | | | Napco Security Technologies, Inc.* | | | 20,290,771 | |
| | 886,827 | | | nLight, Inc.* | | | 15,377,580 | |
| | | | | | | | |
| | | | 46,561,757 | |
| | | | | | | | |
| | |
| | | | Environmental & Facilities
Services 2.3% | | | |
| | 718,822 | | | Heritage-Crystal Clean, Inc.* | | | 21,284,319 | |
| | | | | | | | |
| | |
| | | | Financial Exchanges & Data 1.9% | | | |
| | 950,445 | | | Open Lending Corp., Class A* | | | 17,972,915 | |
| | | | | | | | |
| | |
| | | | Food Distributors 1.3% | | | |
| | 374,006 | | | Chefs’ Warehouse, Inc.* | | | 12,192,596 | |
| | | | | | | | |
| | |
| | | | Health Care Equipment 2.8% | | | |
| | 771,730 | | | Artivion, Inc.* | | | 16,499,587 | |
| | 614,705 | | | Paragon 28, Inc.* | | | 10,290,162 | |
| | | | | | | | |
| | | | 26,789,749 | |
| | | | | |
| | |
| | | | Health Care Facilities 2.7% | | | |
| | 837,525 | | | Pennant Group, Inc.* | | | 15,603,091 | |
| | 99,637 | | | U.S. Physical Therapy, Inc. | | | 9,908,899 | |
| | | | | | | | |
| | | | 25,511,990 | |
| | | | | |
| | |
| | | | Health Care Services 5.2% | | | |
| | 262,225 | | | Addus HomeCare Corp.* | | | 24,462,970 | |
| | 549,076 | | | Castle Biosciences, Inc.* | | | 24,631,550 | |
| | | | | | | | |
| | | | 49,094,520 | |
| | | | | |
| | |
| | | | Health Care Supplies 6.0% | | | |
| | 290,239 | | | OrthoPediatrics Corp.* | | | 15,670,004 | |
| | 494,705 | | | Silk Road Medical, Inc.* | | | 20,426,369 | |
| | 302,466 | | | UFP Technologies, Inc.* | | | 20,014,175 | |
| | | | | | | | |
| | | | 56,110,548 | |
| | | | | |
| | |
| | | | Health Care Technology 2.1% | | | |
| | 387,752 | | | Simulations Plus, Inc. | | | 19,767,597 | |
| | | | | | | | |
| | |
| | | | Home Furnishings 0.6% | | | |
| | 1,037,555 | | | Purple Innovation, Inc.* | | | 6,069,697 | |
| | | | | | | | |
| | |
| | | | Homebuilding 1.8% | | | |
| | 997,947 | | | Dream Finders Homes, Inc., Class A* | | | 17,044,935 | |
| | | | | | | | |
| | |
| | | | Industrial Machinery 6.8% | | | |
| | 267,068 | | | Helios Technologies, Inc. | | | 21,432,207 | |
| | 60,455 | | | Kadant, Inc. | | | 11,739,756 | |
| | 306,528 | | | Kornit Digital Ltd.* | | | 25,346,800 | |
| | 1,399,039 | | | Markforged Holding Corp.* | | | 5,582,166 | |
| | | | | | | | |
| | | | 64,100,929 | |
| | | | | |
| | |
| | | | Insurance Brokers 1.4% | | | |
| | 169,058 | | | Goosehead Insurance, Inc., Class A | | | 13,282,887 | |
| | | | | | | | |
72
| | |
| Wasatch Micro Cap Fund (WMICX / WGICX) | | MARCH 31, 2022 (Unaudited) |
Schedule of Investments (continued)
| | | | | | | | |
| Shares | | | | | Value | |
| | | | | | | |
| | |
| | | | Interactive Home
Entertainment 0.4% | | | |
| | 1,053,699 | | | Motorsport Games, Inc., Class A* ‡‡ | | $ | 1,390,883 | |
| | 1,776,021 | | | Versus Systems, Inc.* ‡‡ | | | 2,397,628 | |
| | | | | | | | |
| | | | 3,788,511 | |
| | | | | |
| | |
| | | | IT Consulting & Other Services 1.9% | | | |
| | 1,289,619 | | | Grid Dynamics Holdings, Inc.* | | | 18,157,836 | |
| | | | | | | | |
| | |
| | | | Leisure Products 2.3% | | | |
| | 659,382 | | | MasterCraft Boat Holdings, Inc.* | | | 16,227,391 | |
| | 599,146 | | | Solo Brands, Inc., Class A* | | | 5,110,715 | |
| | | | | | | | |
| | | | 21,338,106 | |
| | | | | |
| | |
| | | | Oil & Gas Equipment & Services 1.4% | | | |
| | 423,360 | | | DMC Global, Inc.* | | | 12,912,480 | |
| | | | | | | | |
| | |
| | | | Pharmaceuticals 4.6% | | | |
| | 381,611 | | | Athira Pharma, Inc.* | | | 5,151,749 | |
| | 1,067,737 | | | Esperion Therapeutics, Inc.* | | | 4,954,300 | |
| | 3,737,952 | | | IM Cannabis Corp.* ‡‡ | | | 7,923,507 | |
| | 333,112 | | | Intra-Cellular Therapies, Inc.* | | | 20,383,123 | |
| | 8,458,927 | | | PharmaCielo Ltd.* ‡‡ | | | 4,736,431 | |
| | | | | | | | |
| | | | 43,149,110 | |
| | | | | | | | |
| | |
| | | | Regional Banks 0.9% | | | |
| | 242,992 | | | Esquire Financial Holdings, Inc.* | | | 8,166,961 | |
| | | | | | | | |
| | |
| | | | Research & Consulting Services 1.6% | | | |
| | 162,557 | | | ICF International, Inc. | | | 15,303,116 | |
| | | | | | | | |
| | |
| | | | Semiconductor Equipment 3.3% | | | |
| | 148,450 | | | Nova Ltd.* | | | 16,163,236 | |
| | 540,490 | | | Veeco Instruments, Inc.* | | | 14,695,923 | |
| | | | | | | | |
| | | | 30,859,159 | |
| | | | | | | | |
| | |
| | | | Semiconductors 1.0% | | | |
| | 151,968 | | | Impinj, Inc.* | | | 9,656,047 | |
| | | | | | | | |
| | |
| | | | Systems Software 4.4% | | | |
| | 147,526 | | | CyberArk Software Ltd.* | | | 24,895,012 | |
| | 148,775 | | | Rapid7, Inc.* | | | 16,549,731 | |
| | | | | | | | |
| | | | 41,444,743 | |
| | | | | | | | |
| | |
| | | | Trading Companies &
Distributors 3.2% | | | |
| | 368,877 | | | Transcat, Inc.* | | | 29,930,680 | |
| | | | | | | | |
| | |
| | | | Total Common Stocks
(cost $880,410,946) | | | 916,974,453 | |
| | | | | | | | |
| |
| | | | PREFERRED STOCKS 1.1% | |
| | |
| | | | Textiles 1.1% | | | |
| | 339,559 | | | Johnnie-O Holdings, Inc., Series A Pfd. Series A* *** † | | | 10,000,013 | |
| | | | | | | | |
| | |
| | | | Total Preferred Stocks
(cost $10,000,013) | | | 10,000,013 | |
| | | | | | | | |
| | | | | | | | |
| Shares | | | | | Value | |
| | | | | | | |
| |
| | | | WARRANTS 0.1% | |
| | |
| | | | Interactive Home
Entertainment 0.1% | | | |
| | 937,500 | | | Versus Systems, Inc., expiring 2/28/2027* *** † ‡‡ | | $ | 337,500 | |
| | 448,000 | | | Versus Systems, Inc., expiring 1/15/2026* ‡‡ §§ | | | 203,840 | |
| | 192,000 | | | Versus Systems, Inc., expiring 1/15/2026* *** † ‡‡ | | | 82,560 | |
| | | | | | | | |
| | | | 623,900 | |
| | | | | | | | |
| | |
| | | | Pharmaceuticals 0.0% | | | |
| | 691,416 | | | Esperion Therapeutics, Inc., expiring 12/7/2023* *** † | | | 124,455 | |
| | 450,000 | | | IM Cannabis Corp., expiring 5/7/2026* *** † ‡‡ | | | 49,500 | |
| | | | | | | | |
| | | | 173,955 | |
| | | | | | | | |
| | |
| | | | Total Warrants
(cost $1,211,350) | | | 797,855 | |
| | | | | | | | |
| | |
Principal
Amount | | | | | Value | |
| | | | | | | |
| |
| | | | SHORT-TERM INVESTMENTS 1.2% | |
| | |
| | | | Repurchase Agreement 1.2% | | | |
| $ | 10,996,351 | | | Repurchase Agreement dated 3/31/22,
0.00% due 4/1/22 with Fixed Income
Clearing Corp. collateralized by $12,165,200 of United States Treasury Notes 1.125% due 8/31/28; value: $11,216,347; repurchase proceeds: $10,996,351 (cost $10,996,351) | | $ | 10,996,351 | |
| | | | | | | | |
| | |
| | | | Total Short-Term Investments
(cost $10,996,351) | | | 10,996,351 | |
| | | | | | | | |
| | |
| | | | Total Investments
(cost $902,618,660) 100.0% | | | 938,768,672 | |
| | |
| | | | Other Assets less Liabilities 0.0% | | | 385,306 | |
| | | | | | | | |
| | |
| | | | Net Assets 100.0% | | $ | 939,153,978 | |
| | | | | | | | |
| |
| | | | *Non-income producing. ***Security was fair valued under procedures adopted by the Board of Trustees (see Note 12). †Security purchased in a private placement transaction or under Rule 144A of the Securities Act of 1933 (see Note 9). The aggregate value of securities purchased in a private placement transaction or under Rule 144A of the Securities Act of 1933 at March 31, 2022 amounted to approximately $10,594,028 and represented 1.13% of net assets. ‡‡Affiliated company (see Note 8). §§The aggregate value of illiquid holdings at March 31, 2022 amounted to approximately $203,840 and represented 0.02% of net assets. | |
| |
| | | | See Notes to Financial Statements. | |
73
| | |
| Wasatch Micro Cap Fund (WMICX / WGICX) | | MARCH 31, 2022 (Unaudited) |
Schedule of Investments (continued)
At March 31, 2022, Wasatch Micro Cap Fund’s investments, excluding short-term investments, were in the following countries:
| | | | | |
| Country | | % |
Canada | | | | 1.5 | |
Israel | | | | 8.8 | |
United States | | | | 89.7 | |
| | | | | |
TOTAL | | | | 100.0 | % |
| | | | | |
74
| | |
| Wasatch Micro Cap Value Fund (WAMVX / WGMVX) | | MARCH 31, 2022 (Unaudited) |
Schedule of Investments
| | | | | | | | |
| Shares | | | | | Value | |
| | | | | | | |
| | |
| | | | COMMON STOCKS 94.1% | | | | |
| | |
| | | | Advertising 0.8% | | | |
| | 182,000 | | | YouGov PLC | | $ | 3,275,454 | |
| | | | | | | | |
| | |
| | | | Agricultural & Farm Machinery 0.1% | | | |
| | 52,800 | | | Urban-Gro, Inc.* | | | 567,072 | |
| | | | | | | | |
| | |
| | | | Agricultural Products 0.7% | | | |
| | 99,000 | | | Winfarm SAS* | | | 2,736,873 | |
| | | | | | | | |
| | |
| | | | Air Freight & Logistics 1.4% | | | |
| | 853,000 | | | Radiant Logistics, Inc.* | | | 5,433,610 | |
| | | | | | | | |
| | |
| | | | Application Software 2.8% | | | |
| | 137,000 | | | Ebix, Inc. | | | 4,541,550 | |
| | 792,000 | | | GTY Technology Holdings, Inc.* | | | 2,558,160 | |
| | 617,000 | | | Kaleyra, Inc.* | | | 3,689,660 | |
| | | | | | | | |
| | | | 10,789,370 | |
| | | | | |
| | |
| | | | Asset Management & Custody
Banks 1.4% | | | |
| | 858,268 | | | Fiducian Group Ltd. | | | 5,536,127 | |
| | | | | | | | |
| | |
| | | | Auto Parts & Equipment 1.5% | | | |
| | 95,250 | | | Patrick Industries, Inc. | | | 5,743,575 | |
| | | | | | | | |
| | |
| | | | Casinos & Gaming 1.7% | | | |
| | 671,000 | | | Full House Resorts, Inc.* | | | 6,448,310 | |
| | | | | | | | |
| | |
| | | | Communications Equipment 1.2% | | | |
| | 222,000 | | | Digi International, Inc.* | | | 4,777,440 | |
| | | | | | | | |
| | |
| | | | Construction & Engineering 4.7% | | | |
| | 358,122 | | | Bowman Consulting Group Ltd.* | | | 5,887,526 | |
| | 216,000 | | | Construction Partners, Inc., Class A* | | | 5,654,880 | |
| | 250,000 | | | Sterling Construction Co., Inc.* | | | 6,700,000 | |
| | | | | | | | |
| | | | 18,242,406 | |
| | | | | |
| | |
| | | | Consumer Finance 1.4% | | | |
| | 914,000 | | | EZCORP, Inc., Class A* | | | 5,520,560 | |
| | | | | | | | |
| | |
| | | | Data Processing & Outsourced
Services 1.6% | | | |
| | 217,000 | | | i3 Verticals, Inc., Class A* | | | 6,045,620 | |
| | | | | | | | |
| | |
| | | | Diversified Metals & Mining 1.1% | | | |
| | 6,108,000 | | | Talon Metals Corp.* | | | 4,152,942 | |
| | | | | | | | |
| | |
| | | | Diversified Support Services 1.0% | | | |
| | 2,516,000 | | | Johnson Service Group PLC* | | | 3,881,067 | |
| | | | | | | | |
| | |
| | | | Electronic Components 0.4% | | | |
| | 210,000 | | | VIA Optronics AG* | | | 1,680,000 | |
| | | | | | | | |
| | |
| | | | Electronic Equipment &
Instruments 3.4% | | | |
| | 73,000 | | | FARO Technologies, Inc.* | | | 3,790,160 | |
| | 24,234 | | | Intellicheck, Inc.* | | | 61,797 | |
| | 454,000 | | | Luna Innovations, Inc.* | | | 3,500,340 | |
| | 295,000 | | | Napco Security Technologies, Inc.* | | | 6,053,400 | |
| | | | | | | | |
| | | | 13,405,697 | |
| | | | | |
| | | | | | | | |
| Shares | | | | | Value | |
| | | | | | | |
| | |
| | | | Electronic Manufacturing Services 0.9% | | | |
| | 32,000 | | | Fabrinet* | | $ | 3,364,160 | |
| | | | | | | | |
| | |
| | | | Financial Exchanges & Data 0.8% | | | |
| | 163,000 | | | Open Lending Corp., Class A* | | | 3,082,330 | |
| | | | | | | | |
| | |
| | | | Food Distributors 1.2% | | | |
| | 148,000 | | | Chefs’ Warehouse, Inc.* | | | 4,824,800 | |
| | | | | | | | |
| | |
| | | | Health Care Distributors 1.3% | | | |
| | 209,000 | | | PetIQ, Inc.* | | | 5,099,600 | |
| | | | | | | | |
| | |
| | | | Health Care Equipment 2.7% | | | |
| | 643,000 | | | Brainsway Ltd., ADR* | | | 5,600,530 | |
| | 2,907,000 | | | Conformis, Inc.* | | | 1,813,387 | |
| | 85,000 | | | Inmode Ltd.* | | | 3,137,350 | |
| | | | | | | | |
| | | | 10,551,267 | |
| | | | | |
| | |
| | | | Health Care Facilities 0.6% | | | |
| | 67,000 | | | Joint Corp.* | | | 2,371,130 | |
| | | | | | | | |
| | |
| | | | Health Care Services 3.6% | | | |
| | 74,000 | | | Addus HomeCare Corp.* | | | 6,903,460 | |
| | 435,000 | | | InfuSystem Holdings, Inc.* | | | 4,263,000 | |
| | 320,608 | | | Sharps Compliance Corp.* | | | 1,891,587 | |
| | 163,033 | | | Viemed Healthcare, Inc.* | | | 811,905 | |
| | | | | | | | |
| | | | 13,869,952 | |
| | | | | |
| | |
| | | | Health Care Supplies 2.6% | | | |
| | 354,709 | | | Bioventus, Inc. Class A* | | | 5,001,397 | |
| | 91,350 | | | OrthoPediatrics Corp.* | | | 4,931,986 | |
| | | | | | | | |
| | | | 9,933,383 | |
| | | | | |
| | |
| | | | Health Care Technology 2.5% | | | |
| | 639,378 | | | Instem PLC* | | | 6,210,854 | |
| | 61,000 | | | Nexus AG | | | 3,635,019 | |
| | | | | | | | |
| | | | 9,845,873 | |
| | | | | |
| | |
| | | | Home Furnishings 1.3% | | | |
| | 92,000 | | | Lovesac Co.* | | | 4,973,520 | |
| | | | | | | | |
| | |
| | | | Homebuilding 1.9% | | | |
| | 131,504 | | | Skyline Champion Corp.* | | | 7,216,940 | |
| | | | | | | | |
| | |
| | | | Human Resource & Employment
Services 1.5% | | | |
| | 353,600 | | | Creek & River Co. Ltd. | | | 5,906,771 | |
| | | | | | | | |
| | |
| | | | Industrial Machinery 4.0% | | | |
| | 34,000 | | | John Bean Technologies Corp. | | | 4,027,980 | |
| | 22,000 | | | Kadant, Inc. | | | 4,272,180 | |
| | 34,000 | | | Kornit Digital Ltd.* | | | 2,811,460 | |
| | 197,000 | | | va-Q-tec AG* | | | 4,466,743 | |
| | | | | | | | |
| | | | 15,578,363 | |
| | | | | |
| | |
| | | | Integrated Telecommunication
Services 1.2% | | | |
| | 323,000 | | | Ooma, Inc.* | | | 4,841,770 | |
| | | | | | | | |
| | |
| | | | Interactive Media & Services 0.8% | | | |
| | 193,000 | | | VerticalScope Holdings, Inc.* | | | 3,008,895 | |
| | | | | | | | |
75
| | |
| Wasatch Micro Cap Value Fund (WAMVX / WGMVX) | | MARCH 31, 2022 (Unaudited) |
Schedule of Investments (continued)
| | | | | | | | |
| Shares | | | | | Value | |
| | | | | | | |
| | |
| | | | Internet & Direct Marketing Retail 0.2% | | | |
| | 396,018 | | | iPower, Inc.* | | $ | 665,310 | |
| | | | | | | | |
| | |
| | | | Internet Services & Infrastructure 1.2% | | | |
| | 70,000 | | | Tucows, Inc., Class A* | | | 4,781,000 | |
| | | | | | | | |
| | |
| | | | Investment Banking & Brokerage 2.5% | | | |
| | 384,000 | | | JDC Group AG* | | | 9,557,998 | |
| | | | | | | | |
| | |
| | | | IT Consulting & Other Services 3.0% | | | |
| | 1,021,000 | | | AgileThought, Inc.* | | | 4,645,550 | |
| | 182,000 | | | Grid Dynamics Holdings, Inc.* | | | 2,562,560 | |
| | 1,241,000 | | | Pivotree, Inc.* | | | 4,417,430 | |
| | | | | | | | |
| | | | 11,625,540 | |
| | | | | |
| | |
| | | | Leisure Facilities 1.0% | | | |
| | 1,590,000 | | | Gym Group PLC* | | | 4,054,147 | |
| | | | | | | | |
| | |
| | | | Leisure Products 1.6% | | | |
| | 241,000 | | | American Outdoor Brands, Inc.* | | | 3,164,330 | |
| | 130,000 | | | Clarus Corp. | | | 2,961,400 | |
| | | | | | | | |
| | | | 6,125,730 | |
| | | | | |
| | |
| | | | Life Sciences Tools & Services 1.0% | | | |
| | 220,085 | | | Ergomed PLC* | | | 3,889,735 | |
| | | | | | | | |
| | |
| | | | Mortgage REITs 1.4% | | | |
| | 286,567 | | | AFC Gamma, Inc. | | | 5,479,161 | |
| | | | | | | | |
| | |
| | | | Movies & Entertainment 1.3% | | | |
| | 1,547,953 | | | Thunderbird Entertainment Group, Inc.* | | | 5,188,116 | |
| | | | | | | | |
| | |
| | | | Oil & Gas Exploration &
Production 2.7% | | | |
| | 1,192,000 | | | Evolution Petroleum Corp. | | | 8,093,680 | |
| | 1,000,921 | | | Yangarra Resources Ltd.* | | | 2,265,813 | |
| | | | | | | | |
| | | | 10,359,493 | |
| | | | | |
| | |
| | | | Packaged Foods & Meats 0.6% | | | |
| | 23,000 | | | Freshpet, Inc.* | | | 2,360,720 | |
| | | | | | | | |
| | |
| | | | Pharmaceuticals 0.6% | | | |
| | 368,000 | | | Harrow Health, Inc.* | | | 2,509,760 | |
| | | | | | | | |
| | |
| | | | Regional Banks 4.8% | | | |
| | 157,561 | | | California BanCorp* | | | 3,625,478 | |
| | 255,047 | | | Esquire Financial Holdings, Inc.* | | | 8,572,130 | |
| | 218,692 | | | Finwise Bancorp* | | | 3,750,568 | |
| | 74,169 | | | Sound Financial Bancorp, Inc. | | | 2,828,064 | |
| | | | | | | | |
| | | | 18,776,240 | |
| | | | | |
| | |
| | | | Research & Consulting Services 2.8% | | | |
| | 58,815 | | | ICF International, Inc. | | | 5,536,844 | |
| | 442,822 | | | Knights Group Holdings PLC | | | 959,826 | |
| | 151,450 | | | Red Violet, Inc.* | | | 4,316,325 | |
| | | | | | | | |
| | | | 10,812,995 | |
| | | | | |
| | |
| | | | Restaurants 0.6% | | | |
| | 376,000 | | | Noodles & Co.* | | | 2,244,720 | |
| | | | | | | | |
| | |
| | | | Semiconductor Equipment 2.1% | | | |
| | 300,357 | | | Veeco Instruments, Inc.* | | | 8,166,707 | |
| | | | | | | | |
| | | | | | | | |
| Shares | | | | | Value | |
| | | | | | | |
| | |
| | | | Semiconductors 2.6% | | | |
| | 73,000 | | | Impinj, Inc.* | | $ | 4,638,420 | |
| | 22,000 | | | SiTime Corp.* | | | 5,452,040 | |
| | | | | | | | |
| | | | 10,090,460 | |
| | | | | |
| | |
| | | | Specialized Finance 1.6% | | | |
| | 82,000 | | | A-Mark Precious Metals, Inc. | | | 6,341,880 | |
| | | | | | | | |
| | |
| | | | Specialty Chemicals 0.9% | | | |
| | 301,000 | | | Neo Performance Materials, Inc. | | | 3,664,536 | |
| | | | | | | | |
| | |
| | | | Steel 0.5% | | | |
| | 49,530 | | | Haynes International, Inc. | | | 2,109,978 | |
| | | | | | | | |
| | |
| | | | Technology Hardware, Storage &
Peripherals 0.4% | | | |
| | 234,865 | | | TransAct Technologies, Inc.* | | | 1,658,147 | |
| | | | | | | | |
| | |
| | | | Thrifts & Mortgage Finance 5.3% | | | |
| | 109,000 | | | Axos Financial, Inc.* | | | 5,056,510 | |
| | 366,000 | | | Mortgage Advice Bureau Holdings Ltd. | | | 5,481,071 | |
| | 693,128 | | | Sterling Bancorp, Inc.* | | | 4,921,209 | |
| | 464,000 | | | Velocity Financial, Inc.* | | | 5,076,160 | |
| | | | | | | | |
| | | | 20,534,950 | |
| | | | | |
| | |
| | | | Trading Companies &
Distributors 3.3% | | | |
| | 135,000 | | | Global Industrial Co. | | | 4,351,050 | |
| | 152,000 | | | Hardwoods Distribution, Inc. | | | 4,437,867 | |
| | 201,200 | | | Karat Packaging, Inc.* | | | 3,993,820 | |
| | | | | | | | |
| | | | 12,782,737 | |
| | | | | |
| | |
| | | | Total Common Stocks
(cost $298,811,669) | | | 366,484,937 | |
| | | | | | | | |
| |
| | | | LIMITED LIABILITY COMPANY MEMBERSHIP INTEREST 0.0% | |
| | |
| | | | Pharmaceuticals 0.0% | | | |
| | 50,528 | | | Regenacy Pharmaceuticals LLC* *** † | | | 22,232 | |
| | | | | | | | |
| | |
| | | | Total Limited Liability Company Membership Interest
(cost $30,001) | | | 22,232 | |
| | | | | | | | |
| | |
| | | | WARRANTS 0.0% | | | | |
| | |
| | | | Trading Companies &
Distributors 0.0% | | | |
| | 289,536 | | | Greenlane Holdings, Inc., expiring 2/24/2026* *** † | | | 0 | |
| | | | | | | | |
| | |
| | | | Total Warrants
(cost $396,902) | | | 0 | |
| | | | | | | | |
76
| | |
| Wasatch Micro Cap Value Fund (WAMVX / WGMVX) | | MARCH 31, 2022 (Unaudited) |
Schedule of Investments (continued)
| | | | | | | | |
Principal
Amount | | | | | Value | |
| | | | | | | |
| |
| | | | SHORT-TERM INVESTMENTS 6.9% | |
| | |
| | | | Repurchase Agreement 6.9% | | | |
| $ | 26,910,607 | | | Repurchase Agreement dated 3/31/22, 0.00% due 4/1/22 with Fixed Income Clearing Corp. collateralized by $27,448,850 of United States Treasury Notes 1.125% due 8/31/28; value: $27,448,850; repurchase proceeds: $26,910,607 (cost $26,910,607) | | $ | 26,910,607 | |
| | | | | | | | |
| | |
| | | | Total Short-Term Investments
(cost $26,910,607) | | | 26,910,607 | |
| | | | | | | | |
| | |
| | | | Total Investments
(cost $326,149,179) 101.0%§ | | | 393,417,776 | |
| | |
| | | | Liabilities less Other Assets (1.0%) | | | (3,729,473 | ) |
| | | | | | | | |
| | |
| | | | Net Assets 100.0% | | $ | 389,688,303 | |
| | | | | | | | |
| |
| | | | *Non-income producing. ***Security was fair valued under procedures adopted by the Board of Trustees (see Note 12). †Security purchased in a private placement transaction or under Rule 144A of the Securities Act of 1933 (see Note 9). The aggregate value of securities purchased in a private placement transaction or under Rule144A of the Securities Act of 1933 at March 31, 2022 amounted to approximately $22,232 and represented 0.00% of net assets. §The aggregate amount of foreign securities fair valued pursuant to a systematic valuation model as a percent of net assets was 8.22%. ADR American Depositary Receipt. REIT Real Estate Investment Trust. | |
| |
| | | | See Notes to Financial Statements. | |
At March 31, 2022, Wasatch Micro Cap Value Fund’s investments, excluding short-term investments, were in the following countries:
| | | | | |
| Country | | % |
Australia | | | | 1.5 | |
Canada | | | | 7.6 | |
France | | | | 0.7 | |
Germany | | | | 5.3 | |
Israel | | | | 3.2 | |
Italy | | | | 1.0 | |
Japan | | | | 1.6 | |
United Kingdom | | | | 7.6 | |
United States | | | | 71.5 | |
| | | | | |
TOTAL | | | | 100.0 | % |
| | | | | |
77
| | |
| Wasatch Small Cap Growth Fund (WAAEX / WIAEX) | | MARCH 31, 2022 (Unaudited) |
Schedule of Investments
| | | | | | | | |
| Shares | | | | | Value | |
| | | | | | | |
| |
| | | | COMMON STOCKS 97.9% | |
| | |
| | | | Aerospace & Defense 0.0% | | | |
| | 0 | | | HEICO Corp., Class A | | $ | 0 | |
| | | | | | | | |
| | |
| | | | Agricultural & Farm Machinery 0.5% | | | |
| | 1,052,201 | | | Hydrofarm Holdings Group, Inc.* | | | 15,940,845 | |
| | | | | | | | |
| | |
| | | | Airlines 1.4% | | | |
| | 246,969 | | | Allegiant Travel Co.* | | | 40,105,296 | |
| | | | | | | | |
| | |
| | | | Apparel Retail 2.3% | | | |
| | 701,504 | | | Boot Barn Holdings, Inc.* | | | 66,495,564 | |
| | | | | | | | |
| | |
| | | | Application Software 6.3% | | | |
| | 981,771 | | | CS Disco, Inc.* | | | 33,350,761 | |
| | 390,684 | | | Five9, Inc.* | | | 43,131,513 | |
| | 756,588 | | | nCino, Inc.* | | | 31,004,976 | |
| | 211,135 | | | Paylocity Holding Corp.* | | | 43,445,249 | |
| | 458,375 | | | Q2 Holdings, Inc.* | | | 28,258,819 | |
| | | | | | | | |
| | | | 179,191,318 | |
| | | | | |
| | |
| | | | Asset Management & Custody
Banks 4.7% | | | |
| | 1,346,262 | | | Focus Financial Partners, Inc., Class A* | | | 61,578,024 | |
| | 2,186,577 | | | StepStone Group, Inc., Class A | | | 72,288,236 | |
| | | | | | | | |
| | | | 133,866,260 | |
| | | | | |
| | |
| | | | Auto Parts & Equipment 1.4% | | | |
| | 757,028 | | | XPEL, Inc.* | | | 39,827,243 | |
| | | | | | | | |
| | |
| | | | Biotechnology 3.0% | | | |
| | 1,262,897 | | | Atara Biotherapeutics, Inc.* | | | 11,732,313 | |
| | 541,438 | | | C4 Therapeutics, Inc.* | | | 13,135,286 | |
| | 394,375 | | | ChemoCentryx, Inc.* | | | 9,886,981 | |
| | 424,556 | | | Cytokinetics, Inc.* | | | 15,627,906 | |
| | 895,239 | | | Frequency Therapeutics, Inc.* | | | 1,897,907 | |
| | 1,160,786 | | | MacroGenics, Inc.* | | | 10,226,525 | |
| | 494,513 | | | Nurix Therapeutics, Inc.* | | | 6,928,127 | |
| | 2,269,701 | | | Sangamo Therapeutics, Inc.* | | | 13,186,963 | |
| | 619,243 | | | Silverback Therapeutics, Inc.* | | | 2,173,543 | |
| | | | | | | | |
| | | | 84,795,551 | |
| | | | | |
| | |
| | | | Building Products 1.1% | | | |
| | 554,546 | | | AAON, Inc. | | | 30,904,849 | |
| | | | | | | | |
| | |
| | | | Data Processing & Outsourced
Services 5.1% | | | |
| | 601,359 | | | Euronet Worldwide, Inc.* | | | 78,266,874 | |
| | 2,128,403 | | | Repay Holdings Corp.* | | | 31,436,512 | |
| | 919,443 | | | TaskUS, Inc., Class A* | | | 35,361,778 | |
| | | | | | | | |
| | | | 145,065,164 | |
| | | | | |
| | |
| | | | Distillers & Vintners 1.9% | | | |
| | 5,500,000 | | | Vintage Wine Estates, Inc.* ‡‡ | | | 54,285,000 | |
| | | | | | | | |
| | |
| | | | Financial Exchanges & Data 1.4% | | | |
| | 2,089,753 | | | Open Lending Corp., Class A* | | | 39,517,229 | |
| | | | | | | | |
| | |
| | | | General Merchandise Stores 1.7% | | | |
| | 1,142,445 | | | Ollie’s Bargain Outlet Holdings, Inc.* | | | 49,079,437 | |
| | | | | | | | |
| | | | | | | | |
| Shares | | | | | Value | |
| | | | | | | |
| | |
| | | | Health Care Facilities 5.4% | | | |
| | 1,292,919 | | | Ensign Group, Inc. | | $ | 116,375,639 | |
| | 2,019,805 | | | Pennant Group, Inc.* ‡‡ | | | 37,628,967 | |
| | | | | | | | |
| | | | 154,004,606 | |
| | | | | |
| | |
| | | | Health Care Services 1.6% | | | |
| | 1,004,634 | | | Castle Biosciences, Inc.* | | | 45,067,881 | |
| | | | | | | | |
| | |
| | | | Health Care Supplies 3.5% | | | |
| | 2,079,370 | | | Neogen Corp.* | | | 64,127,771 | |
| | 899,354 | | | Silk Road Medical, Inc.* | | | 37,134,327 | |
| | | | | | | | |
| | | | 101,262,098 | |
| | | | | |
| | |
| | | | Health Care Technology 2.1% | | | |
| | 232,910 | | | Inspire Medical Systems, Inc.* | | | 59,785,668 | |
| | | | | | | | |
| | |
| | | | Home Improvement Retail 2.0% | | | |
| | 720,540 | | | Floor & Decor Holdings, Inc., Class A* | | | 58,363,740 | |
| | | | | | | | |
| | |
| | | | Homebuilding 1.9% | | | |
| | 572,146 | | | LGI Homes, Inc.* | | | 55,887,221 | |
| | | | | | | | |
| | |
| | | | Industrial Machinery 8.1% | | | |
| | 920,037 | | | Helios Technologies, Inc. | | | 73,832,969 | |
| | 936,140 | | | Kornit Digital Ltd.* | | | 77,409,417 | |
| | 4,189,173 | | | Markforged Holding Corp.* | | | 16,714,800 | |
| | 321,964 | | | RBC Bearings, Inc.* | | | 62,422,381 | |
| | | | | | | | |
| | | | 230,379,567 | |
| | | | | |
| | |
| | | | Insurance Brokers 1.1% | | | |
| | 418,752 | | | Goosehead Insurance, Inc., Class A | | | 32,901,345 | |
| | | | | | | | |
| | |
| | | | Interactive Media & Services 2.5% | | | |
| | 3,069,816 | | | ZipRecruiter, Inc., Class A* | | | 70,544,372 | |
| | | | | | | | |
| | |
| | | | IT Consulting & Other Services 3.8% | | | |
| | 300,160 | | | Globant SA* | | | 78,662,931 | |
| | 2,188,538 | | | Grid Dynamics Holdings, Inc.* | | | 30,814,615 | |
| | | | | | | | |
| | | | 109,477,546 | |
| | | | | |
| | |
| | | | Leisure Products 2.2% | | | |
| | 1,030,384 | | | YETI Holdings, Inc.* | | | 61,802,432 | |
| | | | | | | | |
| | |
| | | | Life Sciences Tools & Services 3.5% | | | |
| | 605,232 | | | Medpace Holdings, Inc.* | | | 99,009,903 | |
| | | | | | | | |
| | |
| | | | Managed Health Care 3.0% | | | |
| | 1,267,139 | | | HealthEquity, Inc.* | | | 85,455,854 | |
| | | | | | | | |
| | |
| | | | Oil & Gas Equipment & Services 1.3% | | | |
| | 1,215,402 | | | DMC Global, Inc.* ‡‡ | | | 37,069,761 | |
| | | | | | | | |
| | |
| | | | Packaged Foods & Meats 2.6% | | | |
| | 740,581 | | | Freshpet, Inc.* | | | 76,013,234 | |
| | | | | | | | |
| | |
| | | | Pharmaceuticals 2.9% | | | |
| | 88,820 | | | Arvinas, Inc.* | | | 5,977,586 | |
| | 1,199,678 | | | Esperion Therapeutics, Inc.* | | | 5,566,506 | |
| | 1,166,785 | | | Intra-Cellular Therapies, Inc.* | | | 71,395,574 | |
| | | | | | | | |
| | | | 82,939,666 | |
| | | | | |
78
| | |
| Wasatch Small Cap Growth Fund (WAAEX / WIAEX) | | MARCH 31, 2022 (Unaudited) |
Schedule of Investments (continued)
| | | | | | | | |
| Shares | | | | | Value | |
| | | | | | | |
| | |
| | | | Regional Banks 2.6% | | | |
| | 807,660 | | | Pinnacle Financial Partners, Inc. | | $ | 74,369,333 | |
| | | | | | | | |
| | |
| | | | Semiconductor Equipment 1.4% | | | |
| | 371,689 | | | Nova Ltd.* | | | 40,469,498 | |
| | | | | | | | |
| | |
| | | | Semiconductors 1.7% | | | |
| | 200,406 | | | SiTime Corp.* | | | 49,664,615 | |
| | | | | | | | |
| | |
| | | | Specialized Consumer
Services 1.6% | | | |
| | 3,124,282 | | | Mister Car Wash, Inc.* | | | 46,208,131 | |
| | | | | | | | |
| | |
| | | | Specialty Stores 3.6% | | | |
| | 355,677 | | | Five Below, Inc.* | | | 56,328,566 | |
| | 1,043,708 | | | National Vision Holdings, Inc.* | | | 45,474,358 | |
| | | | | | | | |
| | | | 101,802,924 | |
| | | | | |
| | |
| | | | Systems Software 7.8% | | | |
| | 674,018 | | | CyberArk Software Ltd.* | | | 113,740,538 | |
| | 978,913 | | | Rapid7, Inc.* | | | 108,894,282 | |
| | | | | | | | |
| | | | 222,634,820 | |
| | | | | |
| | |
| | | | Trading Companies &
Distributors 0.9% | | | |
| | 157,606 | | | SiteOne Landscape Supply, Inc.* | | | 25,483,314 | |
| | | | | | | | |
| | |
| | | | Total Common Stocks
(cost $2,235,918,866) | | | 2,799,671,285 | |
| | | | | | | | |
| |
| | | | PREFERRED STOCKS 1.0% | |
| | |
| | | | Semiconductor Equipment 0.0% | | | |
| | 184,939 | | | Nanosys, Inc., Series A-1 Pfd.* *** † | | | 109,114 | |
| | 991,999 | | | Nanosys, Inc., Series A-2 Pfd.* *** † | | | 585,280 | |
| | | | | | | | |
| | | | 694,394 | |
| | | | | |
| | |
| | | | Systems Software 0.4% | | | |
| | 1,114,610 | | | DataStax, Inc., Series E Pfd.* *** † | | | 10,622,233 | |
| | | | | | | | |
| | |
| | | | Textiles 0.6% | | | |
| | 611,205 | | | Johnnie-O Holdings, Inc., Series A Pfd.* *** † ‡‡ | | | 17,999,987 | |
| | | | | | | | |
| | |
| | | | Total Preferred Stocks
(cost $28,184,928) | | | 29,316,614 | |
| | | | | | | | |
| | |
| | | | WARRANTS 0.0% | | | | |
| | |
| | | | Pharmaceuticals 0.0% | | | |
| | 1,199,678 | | | Esperion Therapeutics, Inc., expiring 12/7/2023* *** † | | | 215,942 | |
| | | | | | | | |
| | |
| | | | Total Warrants
(cost $538,893) | | | 215,942 | |
| | | | | | | | |
| | | | | | | | |
Principal
Amount | | | | | Value | |
| | | | | | | |
| |
| | | | SHORT-TERM INVESTMENTS 1.2% | |
| | |
| | | | Repurchase Agreement 1.2% | | | |
| $ | 32,934,229 | | | Repurchase Agreement dated 3/31/22, 0.00% due 4/1/22 with Fixed Income Clearing Corp. collateralized by $36,434,800 of United States Treasury Notes 1.125% due 8/31/28; value: $33,592,984; repurchase proceeds: $32,934,229
(cost $32,934,229) | | $ | 32,934,229 | |
| | | | | | | | |
| | |
| | | | Total Short-Term Investments
(cost $32,934,229) | | | 32,934,229 | |
| | | | | | | | |
| | |
| | | | Total Investments
(cost $2,297,576,916) 100.1% | | | 2,862,138,070 | |
| | |
| | | | Liabilities less Other Assets (0.1%) | | | (3,593,271 | ) |
| | | | | | | | |
| | |
| | | | Net Assets 100.0% | | $ | 2,858,544,799 | |
| | | | | | | | |
| |
| | | | *Non-income producing. ***Security was fair valued under procedures adopted by the Board of Trustees (see Note 12). †Security purchased in a private placement transaction or under Rule 144A of the Securities Act of 1933 (see Note 9).The aggregate value of securities purchased in a private placement transaction or under Rule 144A of the Securities Act of 1933 at March 31, 2022 amounted to approximately $29,532,556 and represented 1.03% of net assets. ‡‡Affiliated company (see Note 8). | |
| |
| | | | See Notes to Financial Statements. | |
At March 31, 2022, Wasatch Small Cap Growth Fund’s investments, excluding short-term investments, were in the following countries:
| | | | | |
| Country | | % |
Israel | | | | 8.2 | |
United States | | | | 91.8 | |
| | | | | |
TOTAL | | | | 100.0 | % |
| | | | | |
79
| | |
| Wasatch Small Cap Value Fund (WMCVX / WICVX) | | MARCH 31, 2022 (Unaudited) |
Schedule of Investments
| | | | | | | | |
| Shares | | | | | Value | |
| | | | | | | |
| |
| | | | COMMON STOCKS 98.3% | |
| | |
| | | | Advertising 2.1% | | | |
| | 3,776,045 | | | National CineMedia, Inc. | | $ | 9,591,154 | |
| | 898,715 | | | Thryv Holdings, Inc.* | | | 25,271,866 | |
| | | | | | | | |
| | | | 34,863,020 | |
| | | | | |
| | |
| | | | Aerospace & Defense 1.2% | | | |
| | 153,827 | | | HEICO Corp., Class A | | | 19,509,879 | |
| | | | | | | | |
| | |
| | | | Airlines 1.1% | | | |
| | 106,608 | | | Allegiant Travel Co.* | | | 17,312,073 | |
| | | | | | | | |
| | |
| | | | Apparel, Accessories & Luxury
Goods 1.1% | | | |
| | 646,221 | | | G-III Apparel Group Ltd.* | | | 17,480,278 | |
| | | | | | | | |
| | |
| | | | Application Software 1.2% | | | |
| | 612,347 | | | Ebix, Inc. | | | 20,299,303 | |
| | | | | | | | |
| | |
| | | | Asset Management & Custody
Banks 3.9% | | | |
| | 652,107 | | | Artisan Partners Asset Management, Inc., Class A | | | 25,660,410 | |
| | 453,024 | | | Focus Financial Partners, Inc., Class A* | | | 20,721,318 | |
| | 232,421 | | | Hamilton Lane, Inc., Class A | | | 17,963,819 | |
| | | | | | | | |
| | | | 64,345,547 | |
| | | | | |
| | |
| | | | Auto Parts & Equipment 1.0% | | | |
| | 379,598 | | | Standard Motor Products, Inc. | | | 16,375,858 | |
| | | | | | | | |
| | |
| | | | Automobile Manufacturers 0.7% | | | |
| | 219,475 | | | Winnebago Industries, Inc. | | | 11,858,234 | |
| | | | | | | | |
| | |
| | | | Automotive Retail 1.8% | | | |
| | 667,445 | | | Monro, Inc. | | | 29,594,511 | |
| | | | | | | | |
| | |
| | | | Building Products 2.2% | | | |
| | 2,617,282 | | | Janus International Group, Inc.* | | | 23,555,538 | |
| | 189,590 | | | Trex Co., Inc.* | | | 12,385,915 | |
| | | | | | | | |
| | | | 35,941,453 | |
| | | | | |
| | |
| | | | Commercial Printing 0.9% | | | |
| | 232,627 | | | Cimpress PLC* | | | 14,792,751 | |
| | | | | | | | |
| | |
| | | | Commodity Chemicals 3.2% | | | |
| | 371,851 | | | AdvanSix, Inc. | | | 18,997,868 | |
| | 1,076,289 | | | Valvoline, Inc. | | | 33,967,681 | |
| | | | | | | | |
| | | | 52,965,549 | |
| | | | | |
| | |
| | | | Construction & Engineering 1.7% | | | |
| | 1,072,430 | | | Construction Partners, Inc., Class A* | | | 28,076,217 | |
| | | | | | | | |
| | |
| | | | Data Processing & Outsourced
Services 3.4% | | | |
| | 304,073 | | | Euronet Worldwide, Inc.* | | | 39,575,101 | |
| | 423,155 | | | TaskUS, Inc., Class A* | | | 16,274,541 | |
| | | | | | | | |
| | | | 55,849,642 | |
| | | | | |
| | |
| | | | Education Services 1.9% | | | |
| | 312,300 | | | Grand Canyon Education, Inc.* | | | 30,327,453 | |
| | | | | | | | |
| | | | | | | | |
| Shares | | | | | Value | |
| | | | | | | |
| | |
| | | | Electronic Components 1.0% | | | |
| | 865,869 | | | Vishay Intertechnology, Inc. | | $ | 16,971,032 | |
| | | | | | | | |
| | |
| | | | Electronic Manufacturing
Services 3.8% | | | |
| | 418,330 | | | Fabrinet* | | | 43,979,033 | |
| | 463,693 | | | Sanmina Corp.* | | | 18,742,471 | |
| | | | | | | | |
| | | | 62,721,504 | |
| | | | | |
| | |
| | | | Environmental & Facilities
Services 1.2% | | | |
| | 413,159 | | | ABM Industries, Inc. | | | 19,021,840 | |
| | | | | | | | |
| | |
| | | | Financial Exchanges & Data 2.2% | | | |
| | 470,553 | | | Donnelley Financial Solutions, Inc.* | | | 15,650,593 | |
| | 1,103,787 | | | Open Lending Corp., Class A* | | | 20,872,612 | |
| | | | | | | | |
| | | | 36,523,205 | |
| | | | | |
| | |
| | | | Food Retail 2.0% | | | |
| | 1,050,652 | | | Sprouts Farmers Market, Inc.* | | | 33,599,851 | |
| | | | | | | | |
| | |
| | | | General Merchandise Stores 1.9% | | | |
| | 712,318 | | | Ollie’s Bargain Outlet Holdings, Inc.* | | | 30,601,181 | |
| | | | | | | | |
| | |
| | | | Health Care Facilities 3.9% | | | |
| | 717,716 | | | Ensign Group, Inc. | | | 64,601,617 | |
| | | | | | | | |
| | |
| | | | Home Furnishings 1.7% | | | |
| | 512,263 | | | Lovesac Co.* | | | 27,692,938 | |
| | | | | | | | |
| | |
| | | | Homebuilding 3.9% | | | |
| | 209,438 | | | LGI Homes, Inc.* | | | 20,457,904 | |
| | 531,099 | | | Skyline Champion Corp.* | | | 29,146,713 | |
| | 299,302 | | | Toll Brothers, Inc. | | | 14,073,180 | |
| | | | | | | | |
| | | | 63,677,797 | |
| | | | | |
| | |
| | | | Industrial Machinery 9.6% | | | |
| | 897,928 | | | Altra Industrial Motion Corp. | | | 34,956,337 | |
| | 626,064 | | | Barnes Group, Inc. | | | 25,161,512 | |
| | 387,201 | | | Helios Technologies, Inc. | | | 31,072,881 | |
| | 341,290 | | | Kadant, Inc. | | | 66,275,105 | |
| | | | | | | | |
| | | | 157,465,835 | |
| | | | | |
| | |
| | | | Investment Banking & Brokerage 1.8% | | | |
| | 627,906 | | | Moelis & Co., Class A | | | 29,480,187 | |
| | | | | | | | |
| | |
| | | | Leisure Products 1.5% | | | |
| | 421,285 | | | YETI Holdings, Inc.* | | | 25,268,674 | |
| | | | | | | | |
| | |
| | | | Life Sciences Tools & Services 1.4% | | | |
| | 141,660 | | | Medpace Holdings, Inc.* | | | 23,174,159 | |
| | | | | | | | |
| | |
| | | | Managed Health Care 2.5% | | | |
| | 596,210 | | | HealthEquity, Inc.* | | | 40,208,402 | |
| | | | | | | | |
| | |
| | | | Mortgage REITs 1.3% | | | |
| | 1,243,937 | | | Arbor Realty Trust, Inc. | | | 21,221,565 | |
| | | | | | | | |
| | |
| | | | Oil & Gas Equipment & Services 1.8% | | | |
| | 522,611 | | | Cactus, Inc., Class A | | | 29,652,948 | |
| | | | | | | | |
80
| | |
| Wasatch Small Cap Value Fund (WMCVX / WICVX) | | MARCH 31, 2022 (Unaudited) |
Schedule of Investments (continued)
| | | | | | | | |
| Shares | | | | | Value | |
| | | | | | | |
| | |
| | | | Oil & Gas Exploration &
Production 3.3% | | | |
| | 2,273,850 | | | Magnolia Oil & Gas Corp., Class A | | $ | 53,776,553 | |
| | | | | | | | |
| | |
| | | | Paper Products 1.0% | | | |
| | 1,270,335 | | | Resolute Forest Products, Inc. | | | 16,400,025 | |
| | | | | | | | |
| | |
| | | | Pharmaceuticals 2.0% | | | |
| | 544,399 | | | Intra-Cellular Therapies, Inc.* | | | 33,311,775 | |
| | | | | | | | |
| | |
| | | | Regional Banks 10.5% | | | |
| | 1,359,498 | | | Bank OZK | | | 58,050,565 | |
| | 989,726 | | | FB Financial Corp. | | | 43,963,629 | |
| | 364,339 | | | ServisFirst Bancshares, Inc. | | | 34,717,863 | |
| | 630,172 | | | Webster Financial Corp. | | | 35,365,253 | |
| | | | | | | | |
| | | | 172,097,310 | |
| | | | | |
| | |
| | | | Semiconductor Equipment 3.5% | | | |
| | 233,215 | | | Nova Ltd.* | | | 25,392,449 | |
| | 1,193,249 | | | Veeco Instruments, Inc.* | | | 32,444,441 | |
| | | | | | | | |
| | | | 57,836,890 | |
| | | | | |
| | |
| | | | Specialized REITs 1.8% | | | |
| | 461,678 | | | National Storage Affiliates Trust | | | 28,974,911 | |
| | | | | | | | |
| | |
| | | | Specialty Chemicals 2.3% | | | |
| | 414,800 | | | Innospec, Inc. | | | 38,389,740 | |
| | | | | | | | |
| | |
| | | | Thrifts & Mortgage Finance 2.9% | | | |
| | 1,010,187 | | | Axos Financial, Inc.* | | | 46,862,575 | |
| | | | | | | | |
| | |
| | | | Trading Companies &
Distributors 1.1% | | | |
| | 340,667 | | | Rush Enterprises, Inc., Class A | | | 17,343,357 | |
| | | | | | | | |
| | |
| | | | Trucking 1.0% | | | |
| | 623,359 | | | Schneider National, Inc., Class B | | | 15,895,655 | |
| | | | | | | | |
| | |
| | | | Total Common Stocks
(cost $1,305,520,338) | | | 1,612,363,294 | |
| | | | | | | | |
| | | | | | | | |
Principal
Amount | | | | | Value | |
| | | | | | | |
| |
| | | | SHORT-TERM INVESTMENTS 1.9% | |
| | |
| | | | Repurchase Agreement 1.9% | | | |
| $ | 31,951,595 | | | Repurchase Agreement dated 3/31/22, 0.00% due 4/1/22 with Fixed Income Clearing Corp. collateralized by $35,347,700 of United States Treasury Notes 1.125% due 8/31/28; value: $32,590,674; repurchase proceeds: $31,951,595 (cost $31,951,595) | | $ | 31,951,595 | |
| | | | | | | | |
| | |
| | | | Total Short-Term Investments
(cost $31,951,595) | | | 31,951,595 | |
| | | | | | | | |
| | |
| | | | Total Investments
(cost $1,337,471,933) 100.2% | | | 1,644,314,889 | |
| | |
| | | | Liabilities less Other Assets (0.2%) | | | (2,879,477 | ) |
| | | | | | | | |
| | |
| | | | Net Assets 100.0% | | $ | 1,641,435,412 | |
| | | | | | | | |
| | |
| | | | *Non-income producing. REIT Real Estate Investment Trust. | | | | |
| | |
| | | | See Notes to Financial Statements. | | | | |
At March 31, 2022, Wasatch Small Cap Value Fund’s investments, excluding short-term investments, were in the following countries:
| | | | | |
| Country | | % |
Canada | | | | 1.0 | |
Israel | | | | 1.6 | |
United States | | | | 97.4 | |
| | | | | |
TOTAL | | | | 100.0 | % |
| | | | | |
81
| | |
| Wasatch Ultra Growth Fund (WAMCX / WGMCX) | | MARCH 31, 2022 (Unaudited) |
Schedule of Investments
| | | | | | | | |
| Shares | | | | | Value | |
| | | | | | | |
| |
| | | | COMMON STOCKS 99.0% | |
| | |
| | | | Agricultural & Farm Machinery 0.5% | | | |
| | 741,726 | | | Hydrofarm Holdings Group, Inc.* | | $ | 11,237,149 | |
| | | | | | | | |
| | |
| | | | Application Software 11.5% | | | |
| | 320,138 | | | Avalara, Inc.* | | | 31,856,933 | |
| | 255,818 | | | DocuSign, Inc.* | | | 27,403,224 | |
| | 507,187 | | | Five9, Inc.* | | | 55,993,445 | |
| | 74,797 | | | HubSpot, Inc.* | | | 35,524,087 | |
| | 303,177 | | | Paylocity Holding Corp.* | | | 62,384,731 | |
| | 591,559 | | | Q2 Holdings, Inc.* | | | 36,469,612 | |
| | | | | | | | |
| | | | 249,632,032 | |
| | | | | |
| | |
| | | | Biotechnology 6.8% | | | |
| | 1,230,795 | | | Atara Biotherapeutics, Inc.* | | | 11,434,086 | |
| | 446,929 | | | C4 Therapeutics, Inc.* | | | 10,842,498 | |
| | 427,164 | | | ChemoCentryx, Inc.* | | | 10,709,001 | |
| | 304,603 | | | Cytokinetics, Inc.* | | | 11,212,436 | |
| | 228,476 | | | Denali Therapeutics, Inc.* | | | 7,350,073 | |
| | 295,463 | | | Exact Sciences Corp.* | | | 20,658,773 | |
| | 1,039,107 | | | Exagen, Inc.* ‡‡ | | | 8,344,029 | |
| | 889,203 | | | Frequency Therapeutics, Inc.* | | | 1,885,110 | |
| | 228,260 | | | Kymera Therapeutics, Inc.* | | | 9,659,963 | |
| | 1,736,786 | | | MacroGenics, Inc.* | | | 15,301,085 | |
| | 493,757 | | | Nkarta, Inc.* | | | 5,618,955 | |
| | 458,644 | | | Nurix Therapeutics, Inc.* | | | 6,425,602 | |
| | 4,280,057 | | | Sangamo Therapeutics, Inc.* | | | 24,867,131 | |
| | 1,177,121 | | | Silverback Therapeutics, Inc.* | | | 4,131,695 | |
| | | | | | | | |
| | | | 148,440,437 | |
| | | | | |
| | |
| | | | Building Products 1.5% | | | |
| | 493,191 | | | Trex Co., Inc.* | | | 32,220,168 | |
| | | | | | | | |
| | |
| | | | Data Processing & Outsourced
Services 2.4% | | | |
| | 202,127 | | | Block, Inc.* | | | 27,408,421 | |
| | 1,695,008 | | | Repay Holdings Corp.* | | | 25,035,268 | |
| | | | | | | | |
| | | | 52,443,689 | |
| | | | | |
| | |
| | | | Distillers & Vintners 2.0% | | | |
| | 4,500,000 | | | Vintage Wine Estates, Inc.* ‡‡ | | | 44,415,000 | |
| | | | | | | | |
| | |
| | | | Electronic Equipment &
Instruments 1.3% | | | |
| | 1,598,752 | | | nLight, Inc.* | | | 27,722,360 | |
| | | | | | | | |
| | |
| | | | Financial Exchanges & Data 4.1% | | | |
| | 57,534 | | | MarketAxess Holdings, Inc. | | | 19,573,067 | |
| | 2,090,764 | | | Open Lending Corp., Class A* | | | 39,536,347 | |
| | 349,642 | | | Tradeweb Markets, Inc., Class A | | | 30,723,043 | |
| | | | | | | | |
| | | | 89,832,457 | |
| | | | | |
| | |
| | | | General Merchandise Stores 1.8% | | | |
| | 897,950 | | | Ollie’s Bargain Outlet Holdings, Inc.* | | | 38,575,932 | |
| | | | | | | | |
| | |
| | | | Health Care Equipment 7.4% | | | |
| | 283,626 | | | AtriCure, Inc.* | | | 18,625,719 | |
| | 13,764,042 | | | Conformis, Inc.* ‡‡ | | | 8,586,009 | |
| | 2,219,947 | | | Artivion, Inc.* ‡‡ | | | 47,462,467 | |
| | 677,171 | | | Outset Medical, Inc.* | | | 30,743,563 | |
| | 1,675,747 | | | Paragon 28, Inc.* | | | 28,052,005 | |
| | 241,743 | | | Tandem Diabetes Care, Inc.* | | | 28,112,294 | |
| | | | | | | | |
| | | | 161,582,057 | |
| | | | | |
| | | | | | | | |
| Shares | | | | | Value | |
| | | | | | | |
| | |
| | | | Health Care Services 2.6% | | | |
| | 1,233,956 | | | Castle Biosciences, Inc.* | | $ | 55,355,266 | |
| | | | | | | | |
| | |
| | | | Health Care Supplies 4.6% | | | |
| | 8,087,616 | | | Cerus Corp.* | | | 44,401,012 | |
| | 1,319,739 | | | Silk Road Medical, Inc.* | | | 54,492,023 | |
| | | | | | | | |
| | | | 98,893,035 | |
| | | | | |
| | |
| | | | Health Care Technology 4.2% | | | |
| | 228,395 | | | Inspire Medical Systems, Inc.* | | | 58,626,713 | |
| | 148,502 | | | Veeva Systems, Inc., Class A* | | | 31,550,735 | |
| | | | | | | | |
| | | | 90,177,448 | |
| | | | | |
| | |
| | | | Home Furnishings 0.5% | | | |
| | 2,025,345 | | | Purple Innovation, Inc.* | | | 11,848,268 | |
| | | | | | | | |
| | |
| | | | Home Improvement Retail 2.4% | | | |
| | 634,204 | | | Floor & Decor Holdings, Inc., Class A* | | | 51,370,524 | |
| | | | | | | | |
| | |
| | | | Homebuilding 2.8% | | | |
| | 242,670 | | | LGI Homes, Inc.* | | | 23,704,006 | |
| | 665,365 | | | Skyline Champion Corp.* | | | 36,515,231 | |
| | | | | | | | |
| | | | 60,219,237 | |
| | | | | |
| | |
| | | | Industrial Machinery 2.6% | | | |
| | 681,362 | | | Kornit Digital Ltd.* | | | 56,341,824 | |
| | | | | | | | |
| | |
| | | | Insurance Brokers 1.2% | | | |
| | 2,385,162 | | | Hagerty, Inc. Class A* | | | 25,735,898 | |
| | | | | | | | |
| | |
| | | | Interactive Media & Services 1.1% | | | |
| | 914,108 | | | TripAdvisor, Inc.* | | | 24,790,609 | |
| | | | | | | | |
| | |
| | | | IT Consulting & Other Services 3.8% | | | |
| | 409,367 | | | Endava PLC, ADR* | | | 54,458,092 | |
| | 109,434 | | | Globant SA* | | | 28,679,368 | |
| | | | | | | | |
| | | | 83,137,460 | |
| | | | | |
| | |
| | | | Leisure Products 0.7% | | | |
| | 1,714,214 | | | Solo Brands, Inc., Class A* | | | 14,622,245 | |
| | | | | | | | |
| | |
| | | | Managed Health Care 2.0% | | | |
| | 644,598 | | | HealthEquity, Inc.* | | | 43,471,689 | |
| | | | | | | | |
| | |
| | | | Metal & Glass Containers 1.0% | | | |
| | 705,002 | | | TriMas Corp. | | | 22,623,514 | |
| | | | | | | | |
| | |
| | | | Oil & Gas Exploration &
Production 0.9% | | | |
| | 820,908 | | | Magnolia Oil & Gas Corp., Class A | | | 19,414,474 | |
| | | | | | | | |
| | |
| | | | Packaged Foods & Meats 3.6% | | | |
| | 756,171 | | | Freshpet, Inc.* | | | 77,613,391 | |
| | | | | | | | |
| | |
| | | | Pharmaceuticals 5.5% | | | |
| | 130,037 | | | Arvinas, Inc.* | | | 8,751,490 | |
| | 849,362 | | | Athira Pharma, Inc.* | | | 11,466,387 | |
| | 2,135,377 | | | Esperion Therapeutics, Inc.* | | | 9,908,149 | |
| | 1,470,612 | | | Intra-Cellular Therapies, Inc.* | | | 89,986,749 | |
| | | | | | | | |
| | | | 120,112,775 | |
| | | | | |
82
| | |
| Wasatch Ultra Growth Fund (WAMCX / WGMCX) | | MARCH 31, 2022 (Unaudited) |
Schedule of Investments (continued)
| | | | | | | | |
| Shares | | | | | Value | |
| | | | | | | |
| | |
| | | | Regional Banks 3.1% | | | |
| | 1,229,830 | | | Bank OZK | | $ | 52,513,741 | |
| | 160,201 | | | Pinnacle Financial Partners, Inc. | | | 14,751,308 | |
| | | | | | | | |
| | | | 67,265,049 | |
| | | | | |
| | |
| | | | Semiconductor Equipment 4.9% | | | |
| | 624,045 | | | Kulicke & Soffa Industries, Inc. | | | 34,959,001 | |
| | 400,889 | | | Nova Ltd.* | | | 43,648,794 | |
| | 971,146 | | | PDF Solutions, Inc.* | | | 27,065,839 | |
| | | | | | | | |
| | | | 105,673,634 | |
| | | | | |
| | |
| | | | Semiconductors 3.3% | | | |
| | 93,605 | | | Monolithic Power Systems, Inc. | | | 45,462,076 | |
| | 286,029 | | | Power Integrations, Inc. | | | 26,509,168 | |
| | | | | | | | |
| | | | 71,971,244 | |
| | | | | |
| | |
| | | | Specialty Chemicals 1.9% | | | |
| | 307,725 | | | Balchem Corp. | | | 42,066,008 | |
| | | | | | | | |
| | |
| | | | Specialty Stores 2.9% | | | |
| | 394,732 | | | Five Below, Inc.* | | | 62,513,707 | |
| | | | | | | | |
| | |
| | | | Systems Software 4.1% | | | |
| | 336,590 | | | CyberArk Software Ltd.* | | | 56,799,563 | |
| | 299,071 | | | Rapid7, Inc.* | | | 33,268,658 | |
| | | | | | | | |
| | | | 90,068,221 | |
| | | | | |
| | |
| | | | Total Common Stocks
(cost $1,865,820,051) | | | 2,151,386,801 | |
| | | | | | | | |
| |
| | | | PREFERRED STOCKS 0.7% | |
| | |
| | | | Semiconductor Equipment 0.0% | | | |
| | 46,235 | | | Nanosys, Inc., Series A-1 Pfd.* *** † | | | 27,279 | |
| | 248,000 | | | Nanosys, Inc., Series A-2 Pfd.* *** † | | | 146,320 | |
| | | | | | | | |
| | | | 173,599 | |
| | | | | |
| | |
| | | | Textiles 0.7% | | | |
| | 509,338 | | | Johnnie-O Holdings, Inc., Series A Pfd.* *** ‡‡ † | | | 15,000,004 | |
| | | | | | | | |
| | |
| | | | Total Preferred Stocks
(cost $15,546,241) | | | 15,173,603 | |
| | | | | | | | |
| | |
| | | | WARRANTS 0.1% | | | | |
| | |
| | | | Insurance Brokers 0.1% | | | |
| | 450,000 | | | Hagerty, Inc., expiring 12/2/2026* *** † | | | 1,003,500 | |
| | | | | | | | |
| | |
| | | | Pharmaceuticals 0.0% | | | |
| | 1,061,689 | | | Esperion Therapeutics, Inc., expiring 12/7/2023* *** † | | | 191,104 | |
| | | | | | | | |
| | |
| | | | Total Warrants
(cost $2,026,219) | | | 1,194,604 | |
| | | | | | | | |
| | | | | | | | |
Principal
Amount | | | | | Value | |
| | | | | | | |
| |
| | | | SHORT-TERM INVESTMENTS 0.3% | |
| | |
| | | | Repurchase Agreement 0.3% | | | |
| $ | 7,409,491 | | | Repurchase Agreement dated 3/31/22, 0.00% due 4/1/22 with Fixed Income Clearing Corp. collateralized by $8,197,100 of United States Treasury Notes 1.125% due 8/31/28; value: $7,557,748; repurchase proceeds: $7,409,491 (cost $7,409,491) | | $ | 7,409,491 | |
| | | | | | | | |
| | |
| | | | Total Short-Term Investments
(cost $7,409,491) | | | 7,409,491 | |
| | | | | | | | |
| | |
| | | | Total Investments
(cost $1,890,802,002) 100.1% | | | 2,175,164,499 | |
| | |
| | | | Liabilities less Other Assets (0.1%) | | | (2,959,960 | ) |
| | | | | | | | |
| | |
| | | | Net Assets 100.0% | | $ | 2,172,204,539 | |
| | | | | | | | |
| |
| | | | *Non-income producing. | |
| |
| | | | ***Security was fair valued under procedures adopted by the Board of Trustees (see Note 12). | |
| |
| | | | †Security purchased in a private placement transaction or under Rule 144A of the Securities Act of 1933 (see Note 9). The aggregate value of securities purchased in a private placement transaction or under Rule 144A of the Securities Act of 1933 at March 31, 2022 amounted to approximately $16,368,207 and represented 0.75% of net assets. | |
| |
| | | | ‡‡Affiliated company (see Note 8). | |
| | |
| | | | ADR American Depositary Receipt. | | | | |
| | |
| | | | See Notes to Financial Statements. | | | | |
At March 31, 2022, Wasatch Ultra Growth Fund’s investments, excluding short-term investments, were in the following countries:
| | | | | |
| Country | | % |
Israel | | | | 7.2 | |
United Kingdom | | | | 2.5 | |
United States | | | | 90.3 | |
| | | | | |
TOTAL | | | | 100.0 | % |
| | | | | |
83
| | |
| Wasatch-Hoisington U.S. Treasury Fund (WHOSX) | | MARCH 31, 2022 (Unaudited) |
Schedule of Investments
| | | | | | | | |
Principal
Amount | | | | | Value | |
| | | | | | | |
| | | | | | | | |
| |
| | | | U.S. GOVERNMENT
OBLIGATIONS 101.1% | |
| $ | 93,800,000 | | | U.S. Treasury Bond, 1.25%, 5/15/50 | | $ | 70,100,844 | |
| | 39,100,000 | | | U.S. Treasury Bond, 1.375%, 8/15/50 | | | 30,158,930 | |
| | 87,900,000 | | | U.S. Treasury Bond, 2.25%, 8/15/46 | | | 82,382,215 | |
| | 9,500,000 | | | U.S. Treasury Bond, 2.25%, 8/15/49 | | | 9,038,730 | |
| | 25,150,000 | | | U.S. Treasury Bond, 2.50%, 2/15/45 | | | 24,560,547 | |
| | 45,530,000 | | | U.S. Treasury Bond, 3.00%, 8/15/48 | | | 49,736,189 | |
| | 51,000,000 | | | U.S. Treasury Strip, principal only, 2/15/49 | | | 26,618,220 | |
| | 105,000,000 | | | U.S. Treasury Strip, principal only, 5/15/49 | | | 54,396,823 | |
| | 147,000,000 | | | U.S. Treasury Strip, principal only, 8/15/49 | | | 75,336,350 | |
| | | | | | | | |
| | |
| | | | Total U.S. Government Obligations
(cost $476,842,934) | | | 422,328,848 | |
| | | | | | | | |
| | | | | | | | |
Principal
Amount | | | | | Value | |
| | | | | | | |
| |
| | | | SHORT-TERM INVESTMENTS 0.3% | |
| | |
| | | | Repurchase Agreement 0.3% | | | |
| $ | 1,065,753 | | | Repurchase Agreement dated 3/31/22, 0.00% due 4/1/22 with Fixed Income Clearing Corp. collateralized by $1,179,100 of United States Treasury Notes 1.125% due 8/31/28; value $1,087,133; repurchase proceeds: $1,065,753 (cost $1,065,753) | | $ | 1,065,753 | |
| | | | | | | | |
| | |
| | | | Total Short-Term Investments
(cost $1,065,753) | | | 1,065,753 | |
| | | | | | | | |
| | |
| | | | Total Investments
(cost $477,908,687) 101.4% | | | 423,394,601 | |
| | |
| | | | Liabilities less Other Assets (1.4%) | | | (5,712,059 | ) |
| | | | | | | | |
| | |
| | | | Net Assets 100.0% | | $ | 417,682,542 | |
| | | | | | | | |
| |
| | | | See Notes to Financial Statements. | |
84
(This page intentionally left blank.)
85
Statements of Assets and Liabilities
| | | | | | | | | | | | | | | |
| | | Core
Growth
Fund | | Emerging
India
Fund | | Emerging
Markets
Select
Fund |
| | | | | | | | | | | | | | | |
Assets: | | | | | | | | | | | | | | | |
Investments, at cost | | | | | | | | | | | | | | | |
Unaffiliated issuers | | | $ | 2,507,391,144 | | | | $ | 405,994,735 | | | | $ | 463,471,317 | |
Affiliated issuers1 | | | | 70,175,708 | | | | | — | | | | | — | |
Repurchase agreements | | | | 28,707,850 | | | | | 9,027,191 | | | | | 31,016,489 | |
| | | | | | | | | | | | | | | |
| | | $ | 2,606,274,702 | | | | $ | 415,021,926 | | | | $ | 494,487,806 | |
| | | | | | | | | | | | | | | |
Investments, at market value | | | | | | | | | | | | | | | |
Unaffiliated issuers | | | $ | 3,405,532,696 | | | | $ | 673,381,621 | | | | $ | 478,772,440 | |
Affiliated issuers1 | | | | 92,261,511 | | | | | — | | | | | — | |
Repurchase agreements | | | | 28,707,850 | | | | | 9,027,191 | | | | | 31,016,489 | |
| | | | | | | | | | | | | | | |
| | | | 3,526,502,057 | | | | | 682,408,812 | | | | | 509,788,929 | |
Cash | | | | — | | | | | — | | | | | — | |
Foreign currency on deposit (cost of $0, $4,944,905, $3,618,916, $1,190,043, $286,631, $1,147,691, $256,030 and $162,962, respectively) | | | | — | | | | | 4,946,658 | | | | | 3,618,916 | |
Receivable for investment securities sold | | | | 1,213,600 | | | | | 1,032,121 | | | | | — | |
Capital shares receivable | | | | 2,500,668 | | | | | 301,483 | | | | | 1,151,856 | |
Interest and dividends receivable | | | | 879,013 | | | | | 306,605 | | | | | 166,970 | |
Prepaid expenses and other assets | | | | 80,455 | | | | | 29,428 | | | | | 78,975 | |
| | | | | | | | | | | | | | | |
Total Assets | | | | 3,531,175,793 | | | | | 689,025,107 | | | | | 514,805,646 | |
| | | | | | | | | | | | | | | |
Liabilities: | | | | | | | | | | | | | | | |
Payable for securities purchased | | | | — | | | | | 2,346,407 | | | | | 29,625,753 | |
Capital shares payable | | | | 3,527,605 | | | | | 442,484 | | | | | 205,224 | |
Dividends payable to shareholders | | | | — | | | | | — | | | | | — | |
Payable to Advisor | | | | 2,970,700 | | | | | 686,492 | | | | | 369,851 | |
Accrued fund administration fees | | | | 591,523 | | | | | 86,914 | | | | | 31,965 | |
Accrued expenses and other liabilities | | | | 417,492 | | | | | 135,951 | | | | | 17,932 | |
Foreign capital gains taxes payable | | | | — | | | | | 27,444,808 | | | | | 2,263,277 | |
| | | | | | | | | | | | | | | |
Total Liabilities | | | | 7,507,320 | | | | | 31,143,056 | | | | | 32,514,002 | |
| | | | | | | | | | | | | | | |
Net Assets | | | $ | 3,523,668,473 | | | | $ | 657,882,051 | | | | $ | 482,291,644 | |
| | | | | | | | | | | | | | | |
Net Assets Consist of: | | | | | | | | | | | | | | | |
Capital stock | | | $ | 441,579 | | | | $ | 1,016,855 | | | | $ | 252,958 | |
Paid-in-capital in excess of par | | | | 2,576,016,448 | | | | | 432,162,666 | | | | | 501,234,345 | |
Distributable earnings (accumulated loss) | | | | 947,210,446 | | | | | 224,702,530 | | | | | (19,195,659 | ) |
| | | | | | | | | | | | | | | |
Net Assets | | | $ | 3,523,668,473 | | | | $ | 657,882,051 | | | | $ | 482,291,644 | |
| | | | | | | | | | | | | | | |
Net Assets | | | | | | | | | | | | | | | |
Investor Class | | | | 1,849,035,113 | | | | | 275,017,365 | | | | | 94,080,668 | |
Institutional Class | | | | 1,674,633,360 | | | | | 382,864,686 | | | | | 388,210,976 | |
| | | |
Capital Stock Issued and Outstanding (Unlimited number of
shares authorized, $0.01 par value) | | | | | | | | | | | | | | | |
Investor Class | | | | 23,356,187 | | | | | 42,801,874 | | | | | 5,023,547 | |
Institutional Class | | | | 20,801,744 | | | | | 58,883,610 | | | | | 20,272,216 | |
| | | |
Net Asset Value, Redemption Price and Offering Price Per Share | | | | | | | | | | | | | | | |
Investor Class | | | $ | 79.17 | | | | $ | 6.43 | | | | $ | 18.73 | |
| | | | | | | | | | | | | | | |
Institutional Class | | | $ | 80.50 | | | | $ | 6.50 | | | | $ | 19.15 | |
| | | | | | | | | | | | | | | |
| 1 | See Note 8 for information on affiliated issuers. |
See Notes to Financial Statements.
86
| | |
| | | MARCH 31, 2022 (Unaudited) |
| | | | | | | | | | | | | | | | | | | | | | | |
Emerging
Markets
Small Cap
Fund | | Frontier
Emerging
Small Countries
Fund | | Global
Opportunities
Fund | | Global
Select
Fund | | Global
Value
Fund |
| | | | | | | | | | | | | | | | | | | | | | | | |
| | | | | | | | | | | | | | | | | | | | | | | | |
| | | | | | | | | | | | | | | | | | | | | | | | |
| | $ | 395,724,864 | | | | $ | 47,011,406 | | | | $ | 172,183,228 | | | | $ | 15,737,793 | | | | $ | 113,486,608 | |
| | | — | | | | | — | | | | | — | | | | | — | | | | | — | |
| | | 2,731,840 | | | | | 599,924 | | | | | 3,350,801 | | | | | 939,916 | | | | | 2,663,539 | |
| | | | | | | | | | | | | | | | | | | | | | | | |
| | $ | 398,456,704 | | | | $ | 47,611,330 | | | | $ | 175,534,029 | | | | $ | 16,677,709 | | | | $ | 116,150,147 | |
| | | | | | | | | | | | | | | | | | | | | | | | |
| | | | | | | | | | | | | | | | | | | | | | | | |
| | $ | 600,472,832 | | | | $ | 57,023,422 | | | | $ | 235,983,010 | | | | $ | 16,782,667 | | | | $ | 138,331,528 | |
| | | — | | | | | — | | | | | — | | | | | — | | | | | — | |
| | | 2,731,840 | | | | | 599,924 | | | | | 3,350,801 | | | | | 939,916 | | | | | 2,663,539 | |
| | | | | | | | | | | | | | | | | | | | | | | | |
| | | 603,204,672 | | | | | 57,623,346 | | | | | 239,333,811 | | | | | 17,722,583 | | | | | 140,995,067 | |
| | | — | | | | | 101,734 | | | | | — | | | | | — | | | | | 117,376 | |
| |
|
1,190,043 |
| | | | 285,972 | | | | | 1,147,691 | | | | | 256,030 | | | | | 162,962 | |
| | | 251,904 | | | | | 20,839 | | | | | — | | | | | 118,262 | | | | | 235,016 | |
| | | 225,335 | | | | | 2,089 | | | | | 11,590 | | | | | 39 | | | | | 83,171 | |
| | | 748,921 | | | | | 31,186 | | | | | 178,036 | | | | | 10,764 | | | | | 715,908 | |
| | | 36,080 | | | | | 24,521 | | | | | 27,021 | | | | | 18,003 | | | | | 22,992 | |
| | | | | | | | | | | | | | | | | | | | | | | | |
| | | 605,656,955 | | | | | 58,089,687 | | | | | 240,698,149 | | | | | 18,125,681 | | | | | 142,332,492 | |
| | | | | | | | | | | | | | | | | | | | | | | | |
| | | | | | | | | | | | | | | | | | | | | | | | |
| | | 4,773,387 | | | | | 660 | | | | | — | | | | | 867,587 | | | | | 763,356 | |
| | | 369,371 | | | | | 8,299 | | | | | 28,961 | | | | | — | | | | | 68,480 | |
| | | — | | | | | — | | | | | — | | | | | — | | | | | 23,510 | |
| | | 818,980 | | | | | 73,487 | | | | | 247,803 | | | | | 2,499 | | | | | 94,109 | |
| | | 114,418 | | | | | 16,546 | | | | | 42,290 | | | | | 3,480 | | | | | 38,953 | |
| | | 117,889 | | | | | 65,363 | | | | | 60,550 | | | | | 34,247 | | | | | 118,282 | |
| | | 10,160,524 | | | | | 725,819 | | | | | 1,534,648 | | | | | 44,360 | | | | | — | |
| | | | | | | | | | | | | | | | | | | | | | | | |
| | | 16,354,569 | | | | | 890,174 | | | | | 1,914,252 | | | | | 952,173 | | | | | 1,106,690 | |
| | | | | | | | | | | | | | | | | | | | | | | | |
| | $ | 589,302,386 | | | | $ | 57,199,513 | | | | $ | 238,783,897 | | | | $ | 17,173,508 | | | | $ | 141,225,802 | |
| | | | | | | | | | | | | | | | | | | | | | | | |
| | | | | | | | | | | | | | | | | | | | | | | | |
| | $ | 1,702,942 | | | | $ | 166,637 | | | | $ | 519,928 | | | | $ | 14,610 | | | | $ | 144,865 | |
| | | 386,440,093 | | | | | 147,800,199 | | | | | 170,085,728 | | | | | 16,712,341 | | | | | 268,722,965 | |
| | | 201,159,351 | | | | | (90,767,323 | ) | | | | 68,178,241 | | | | | 446,557 | | | | | (127,642,028 | ) |
| | | | | | | | | | | | | | | | | | | | | | | | |
| | $ | 589,302,386 | | | | $ | 57,199,513 | | | | $ | 238,783,897 | | | | $ | 17,173,508 | | | | $ | 141,225,802 | |
| | | | | | | | | | | | | | | | | | | | | | | | |
| | | | | | | | | | | | | | | | | | | | | | | | |
| | | 252,749,458 | | | | | 40,524,772 | | | | | 157,178,944 | | | | | 5,567,388 | | | | | 131,022,333 | |
| | | 336,552,928 | | | | | 16,674,741 | | | | | 81,604,953 | | | | | 11,606,120 | | | | | 10,203,469 | |
| | | | |
| |
|
|
| | | | | | | | | | | | | | | | | | | | |
| | | 73,469,698 | | | | | 11,847,267 | | | | | 34,318,003 | | | | | 476,795 | | | | | 13,438,436 | |
| | | 96,824,540 | | | | | 4,816,442 | | | | | 17,674,813 | | | | | 984,179 | | | | | 1,048,037 | |
| | | | |
| | | | | | | | | | | | | | | | | | | | | | | | |
| | $ | 3.44 | | | | $ | 3.42 | | | | $ | 4.58 | | | | $ | 11.68 | | | | $ | 9.75 | |
| | | | | | | | | | | | | | | | | | | | | | | | |
| | $ | 3.48 | | | | $ | 3.46 | | | | $ | 4.62 | | | | $ | 11.79 | | | | $ | 9.74 | |
| | | | | | | | | | | | | | | | | | | | | | | | |
87
Statements of Assets and Liabilities (continued)
| | | | | | | | | | | | | | | |
| | | Greater
China
Fund | | International
Growth
Fund | | International
Opportunities
Fund |
| | | | | | | | | | | | | | | |
Assets: | | | | | | | | | | | | | | | |
Investments, at cost | |
Unaffiliated issuers | | | $ | 9,801,594 | | | | $ | 681,877,893 | | | | $ | 438,581,691 | |
Affiliated issuers2 | | | | — | | | | | — | | | | | — | |
Repurchase agreements | | | | — | | | | | 5,178,293 | | | | | 1,873,870 | |
| | | | | | | | | | | | | | | |
| | | $ | 9,801,594 | | | | $ | 687,056,186 | | | | $ | 440,455,561 | |
| | | | | | | | | | | | | | | |
Investments, at market value | |
Unaffiliated issuers | | | $ | 8,267,102 | | �� | | $ | 990,724,984 | | | | $ | 570,890,847 | |
Affiliated issuers2 | | | | — | | | | | — | | | | | — | |
Repurchase agreements | | | | — | | | | | 5,178,293 | | | | | 1,873,870 | |
| | | | | | | | | | | | | | | |
| | | | 8,267,102 | | | | | 995,903,277 | | | | | 572,764,717 | |
Cash | | | | 146,496 | | | | | — | | | | | — | |
Foreign currency on deposit (cost of $0, $63,321, $54,680, $5, $0, $5, $0 and $0, respectively) | | | | — | | | | | 63,189 | | | | | 54,469 | |
Receivable for investment securities sold | | | | — | | | | | 190,525 | | | | | 1,157,953 | |
Capital shares receivable | | | | 50 | | | | | 2,733,560 | | | | | 178,650 | |
Interest and dividends receivable | | | | 5,221 | | | | | 2,449,306 | | | | | 1,076,081 | |
Receivable from Investment Advisor | | | | 4,578 | | | | | — | | | | | — | |
Prepaid expenses and other assets | | | | 22,919 | | | | | 32,155 | | | | | 30,731 | |
| | | | | | | | | | | | | | | |
Total Assets | | | | 8,446,366 | | | | | 1,001,372,012 | | | | | 575,262,601 | |
| | | | | | | | | | | | | | | |
Liabilities: | |
Securities sold short, at value (proceeds of $0, $0, $0, $0, $13,898,733, $0, $0 and $0, respectively) | | | | — | | | | | — | | | | | — | |
Payable for securities purchased | | | | — | | | | | 322,874 | | | | | 827,314 | |
Capital shares payable | | | | 5,609 | | | | | 1,203,397 | | | | | 421,080 | |
Payable to Advisor | | | | — | | | | | 1,046,093 | | | | | 869,319 | |
Accrued fund administration fees | | | | 151 | | | | | 289,173 | | | | | 149,726 | |
Accrued expenses and other liabilities | | | | 11,869 | | | | | 283,539 | | | | | 218,719 | |
Foreign capital gains taxes payable | | | | — | | | | | 3,730,110 | | | | | 2,013,892 | |
Dividends payable on securities sold short | | | | — | | | | | — | | | | | — | |
| | | | | | | | | | | | | | | |
Total Liabilities | | | | 17,629 | | | | | 6,875,186 | | | | | 4,500,050 | |
| | | | | | | | | | | | | | | |
Net Assets | | | $ | 8,428,737 | | | | $ | 994,496,826 | | | | $ | 570,762,551 | |
| | | | | | | | | | | | | | | |
Net Assets Consist of: | |
Capital stock | | | $ | 10,684 | | | | $ | 342,072 | | | | $ | 1,628,092 | |
Paid-in-capital in excess of par | | | | 11,907,922 | | | | | 690,406,544 | | | | | 467,262,116 | |
Distributable earnings (accumulated loss) | | | | (3,489,869 | ) | | | | 303,748,210 | | | | | 101,872,343 | |
| | | | | | | | | | | | | | | |
Net Assets | | | $ | 8,428,737 | | | | $ | 994,496,826 | | | | $ | 570,762,551 | |
| | | | | | | | | | | | | | | |
Net Assets | |
Investor Class | | | | 2,827,227 | | | | | 442,585,859 | | | | | 97,567,208 | |
Institutional Class | | | | 5,601,510 | | | | | 551,910,967 | | | | | 473,195,343 | |
| | | |
Capital Stock Issued and Outstanding (Unlimited number of
shares authorized, $0.01 par value) | | | | | | | | | | | | | | | |
Investor Class | | | | 357,553 | | | | | 15,286,804 | | | | | 28,205,008 | |
Institutional Class | | | | 710,807 | | | | | 18,920,445 | | | | | 134,604,165 | |
| | | |
Net Asset Value, Redemption Price and Offering Price Per Share | | | | | | | | | | | | | | | |
Investor Class | | | $ | 7.91 | | | | $ | 28.95 | | | | $ | 3.46 | |
| | | | | | | | | | | | | | | |
Institutional Class | | | $ | 7.88 | | | | $ | 29.17 | | | | $ | 3.52 | |
| | | | | | | | | | | | | | | |
| 1 | Fund inception date was October 1, 2021. |
| 2 | See Note 8 for information on affiliated issuers. |
See Notes to Financial Statements.
88
| | |
| | | MARCH 31, 2022 (Unaudited) |
| | | | | | | | | | | | | | | | | | | | | | | |
International
Select
Fund | | Long/Short
Alpha
Fund1 | | Micro
Cap
Fund | | Micro Cap
Value
Fund | | Small Cap
Growth
Fund |
| | | | | | | | | | | | | | | | | | | | | | | | |
| | | | | | | | | | | | | | | | | | | | | | | | |
| | | | | | | | | | | | | | | | | | | | | | | | |
| | $ | 6,332,353 | | | | $ | 32,194,707 | | | | $ | 774,641,072 | | | | $ | 299,238,572 | | | | $ | 2,105,707,950 | |
| | | — | | | | | — | | | | | 116,981,237 | | | | | — | | | | | 158,934,737 | |
| | | 279,966 | | | | | — | | | | | 10,996,351 | | | | | 26,910,607 | | | | | 32,934,229 | |
| | | | | | | | | | | | | | | | | | | | | | | | |
| | $ | 6,612,319 | | | | $ | 32,194,707 | | | | $ | 902,618,660 | | | | $ | 326,149,179 | | | | $ | 2,297,576,916 | |
| | | | | | | | | | | | | | | | | | | | | | | | |
| | | | | | | | | | | | | | | | | | | | | | | | |
| | $ | 6,654,679 | | | | $ | 29,492,715 | | | | $ | 854,325,406 | | | | $ | 366,507,169 | | | | $ | 2,682,220,126 | |
| | | — | | | | | — | | | | | 73,446,915 | | | | | — | | | | | 146,983,715 | |
| | | 279,966 | | | | | — | | | | | 10,996,351 | | | | | 26,910,607 | | | | | 32,934,229 | |
| | | | | | | | | | | | | | | | | | | | | | | | |
| | | 6,934,645 | | | | | 29,492,715 | | | | | 938,768,672 | | | | | 393,417,776 | | | | | 2,862,138,070 | |
| | | — | | | | | 6,767,595 | | | | | — | | | | | 56,132 | | | | | — | |
| |
|
5 |
| | | | — | | | | | 5 | | | | | — | | | | | — | |
| | | — | | | | | 1,110,801 | | | | | 16,002,081 | | | | | 437,374 | | | | | 632,713 | |
| | | 200 | | | | | 1,350 | | | | | 596,961 | | | | | 138,769 | | | | | 2,362,308 | |
| | | 8,519 | | | | | 8,957 | | | | | 88,209 | | | | | 250,284 | | | | | 71,111 | |
| | | 5,392 | | | | | — | | | | | — | | | | | — | | | | | — | |
| | | 18,659 | | | | | 88,409 | | | | | 43,621 | | | | | 78,136 | | | | | 85,628 | |
| | | | | | | | | | | | | | | | | | | | | | | | |
| | | 6,967,420 | | | | | 37,469,827 | | | | | 955,499,549 | | | | | 394,378,471 | | | | | 2,865,289,830 | |
| | | | | | | | | | | | | | | | | | | | | | | | |
| | | | | | | | | | | | | | | | | | | | | | | | |
| |
|
— |
| | | | 12,007,787 | | | | | — | | | | | — | | | | | — | |
| | | — | | | | | — | | | | | 14,391,418 | | | | | 3,696,317 | | | | | — | |
| | | — | | | | | 1,624 | | | | | 426,254 | | | | | 385,099 | | | | | 3,599,175 | |
| | | — | | | | | 13,495 | | | | | 1,188,280 | | | | | 493,300 | | | | | 2,381,715 | |
| | | 232 | | | | | 1,292 | | | | | 164,842 | | | | | 56,982 | | | | | 509,238 | |
| | | 35,143 | | | | | 15,016 | | | | | 174,777 | | | | | 58,470 | | | | | 254,903 | |
| | | — | | | | | — | | | | | — | | | | | — | | | | | — | |
| | | — | | | | | 164 | | | | | — | | | | | — | | | | | — | |
| | | | | | | | | | | | | | | | | | | | | | | | |
| | | 35,375 | | | | | 12,039,378 | | | | | 16,345,571 | | | | | 4,690,168 | | | | | 6,745,031 | |
| | | | | | | | | | | | | | | | | | | | | | | | |
| | $ | 6,932,045 | | | | $ | 25,430,449 | | | | $ | 939,153,978 | | | | $ | 389,688,303 | | | | $ | 2,858,544,799 | |
| | | | | | | | | | | | | | | | | | | | | | | | |
| | | | | | | | | | | | | | | | | | | | | | | | |
| | $ | 5,730 | | | | $ | 25,321 | | | | $ | 1,236,354 | | | | $ | 1,089,639 | | | | $ | 692,778 | |
| | | 7,080,267 | | | | | 26,683,521 | | | | | 906,093,790 | | | | | 331,677,367 | | | | | 2,241,851,406 | |
| | | (153,952 | ) | | | | (1,278,393 | ) | | | | 31,823,834 | | | | | 56,921,297 | | | | | 616,000,615 | |
| | | | | | | | | | | | | | | | | | | | | | | | |
| | $ | 6,932,045 | | | | $ | 25,430,449 | | | | $ | 939,153,978 | | | | $ | 389,688,303 | | | | $ | 2,858,544,799 | |
| | | | | | | | | | | | | | | | | | | | | | | | |
| | | | | | | | | | | | | | | | | | | | | | | | |
| | | 3,151,875 | | | | | 9,498,811 | | | | | 817,243,538 | | | | | 338,028,044 | | | | | 1,303,147,728 | |
| | | 3,780,170 | | | | | 15,931,638 | | | | | 121,910,440 | | | | | 51,660,259 | | | | | 1,555,397,071 | |
| | | | |
| |
|
|
| | | | | | | | | | | | | | | | | | | | |
| | | 262,075 | | | | | 946,176 | | | | | 107,579,461 | | | | | 94,581,666 | | | | | 31,866,796 | |
| | | 310,908 | | | | | 1,585,896 | | | | | 16,055,969 | | | | | 14,382,249 | | | | | 37,410,974 | |
| | | | |
| | | | | | | | | | | | | | | | | | | | | | | | |
| | $ | 12.03 | | | | $ | 10.04 | | | | $ | 7.60 | | | | $ | 3.57 | | | | $ | 40.89 | |
| | | | | | | | | | | | | | | | | | | | | | | | |
| | $ | 12.16 | | | | $ | 10.05 | | | | $ | 7.59 | | | | $ | 3.59 | | | | $ | 41.58 | |
| | | | | | | | | | | | | | | | | | | | | | | | |
89
| | |
| Wasatch Funds | | MARCH 31, 2022 (Unaudited) |
Statements of Assets and Liabilities (continued)
| | | | | | | | | | | | | | | |
| | | Small Cap
Value
Fund | | Ultra
Growth
Fund | | U.S.
Treasury
Fund |
| | | | | | | | | | | | | | | |
Assets: | | | | | | | | | | | | | | | |
Investments, at cost | |
Unaffiliated issuers | | | $ | 1,305,520,338 | | | | $ | 1,744,959,487 | | | | $ | 476,842,934 | |
Affiliated issuers1 | | | | — | | | | | 138,433,024 | | | | | — | |
Repurchase agreements | | | | 31,951,595 | | | | | 7,409,491 | | | | | 1,065,753 | |
| | | | | | | | | | | | | | | |
| | | $ | 1,337,471,933 | | | | $ | 1,890,802,002 | | | | $ | 477,908,687 | |
| | | | | | | | | | | | | | | |
Investments, at market value | |
Unaffiliated issuers | | | $ | 1,612,363,294 | | | | $ | 2,043,947,498 | | | | $ | 422,328,848 | |
Affiliated issuers1 | | | | — | | | | | 123,807,510 | | | | | — | |
Repurchase agreements | | | | 31,951,595 | | | | | 7,409,491 | | | | | 1,065,753 | |
| | | | | | | | | | | | | | | |
| | | | 1,644,314,889 | | | | | 2,175,164,499 | | | | | 423,394,601 | |
Receivable for investment securities sold | | | | — | | | | | 4,178,758 | | | | | — | |
Capital shares receivable | | | | 1,858,950 | | | | | 1,928,860 | | | | | 1,648,140 | |
Interest and dividends receivable | | | | 326,412 | | | | | 176,291 | | | | | 1,030,946 | |
Prepaid expenses and other assets | | | | 60,294 | | | | | 75,105 | | | | | 46,301 | |
| | | | | | | | | | | | | | | |
Total Assets | | | | 1,646,560,545 | | | | | 2,181,523,513 | | | | | 426,119,988 | |
| | | | | | | | | | | | | | | |
Liabilities: | |
Payable for securities purchased | | | | 1,043,952 | | | | | 5,396,319 | | | | | — | |
Capital shares payable | | | | 2,289,589 | | | | | 1,474,743 | | | | | 8,053,989 | |
Dividends payable to shareholders | | | | — | | | | | — | | | | | 80,480 | |
Payable to Advisor | | | | 1,376,254 | | | | | 1,825,433 | | | | | 185,125 | |
Accrued fund administration fees | | | | 237,715 | | | | | 251,928 | | | | | 49,920 | |
Accrued expenses and other liabilities | | | | 177,623 | | | | | 370,551 | | | | | 67,932 | |
| | | | | | | | | | | | | | | |
Total Liabilities | | | | 5,125,133 | | | | | 9,318,974 | | | | | 8,437,446 | |
| | | | | | | | | | | | | | | |
Net Assets | | | $ | 1,641,435,412 | | | | $ | 2,172,204,539 | | | | $ | 417,682,542 | |
| | | | | | | | | | | | | | | |
Net Assets Consist of: | |
Capital stock | | | $ | 1,721,108 | | | | $ | 589,968 | | | | $ | 251,460 | |
Paid-in-capital in excess of par | | | | 1,286,457,332 | | | | | 1,770,010,581 | | | | | 482,274,695 | |
Distributable earnings (accumulated loss) | | | | 353,256,972 | | | | | 401,603,990 | | | | | (64,843,613 | ) |
| | | | | | | | | | | | | | | |
Net Assets | | | $ | 1,641,435,412 | | | | $ | 2,172,204,539 | | | | $ | 417,682,542 | |
| | | | | | | | | | | | | | | |
Net Assets | |
Investor Class | | | | 781,361,913 | | | | | 1,585,348,993 | | | | | 417,682,542 | |
Institutional Class | | | | 860,073,499 | | | | | 586,855,546 | | | | | — | |
| | | |
Capital Stock Issued and Outstanding (Unlimited number of
shares authorized, $0.01 par value) | | | | | | | | | | | | | | | |
Investor Class | | | | 82,319,000 | | | | | 43,084,707 | | | | | 25,145,997 | |
Institutional Class | | | | 89,791,824 | | | | | 15,912,123 | | | | | — | |
| | | |
Net Asset Value, Redemption Price and Offering Price Per Share | | | | | | | | | | | | | | | |
Investor Class | | | $ | 9.49 | | | | $ | 36.80 | | | | $ | 16.61 | |
| | | | | | | | | | | | | | | |
Institutional Class | | | $ | 9.58 | | | | $ | 36.88 | | | | $ | — | |
| | | | | | | | | | | | | | | |
| 1 | See Note 8 for information on affiliated issuers. |
See Notes to Financial Statements.
90
(This page intentionally left blank.)
91
Statements of Operations
| | | | | | | | | | | | | | | |
| | | Core
Growth
Fund | | Emerging
India
Fund | | Emerging
Markets
Select
Fund |
| | | | | | | | | | | | | | | |
Investment Income: | |
Interest | | | $ | — | | | | $ | — | | | | $ | — | |
Dividends1 | |
Unaffiliated issuers | | | | 11,327,803 | | | | | 616,725 | | | | | 374,310 | |
| | | | | | | | | | | | | | | |
Total investment income | | | | 11,327,803 | | | | | 616,725 | | | | | 374,310 | |
| | | | | | | | | | | | | | | |
Expenses: | |
Investment advisory fees | | | | 19,728,261 | | | | | 4,138,686 | | | | | 1,951,969 | |
Shareholder servicing fees — Investor Class | | | | 1,217,343 | | | | | 136,990 | | | | | 59,864 | |
Shareholder servicing fees — Institutional Class | | | | 18,691 | | | | | 14,124 | | | | | 2,717 | |
Fund administration fees | | | | 270,145 | | | | | 46,115 | | | | | 28,055 | |
Fund accounting fees | | | | 152,829 | | | | | 33,855 | | | | | 24,608 | |
Reports to shareholders — Investor Class | | | | 79,398 | | | | | 14,248 | | | | | 7,552 | |
Reports to shareholders — Institutional Class | | | | 54,390 | | | | | 5,385 | | | | | 5,206 | |
Custody fees | | | | 4,470 | | | | | 129,292 | | | | | 29,675 | |
Federal and state registration fees — Investor Class | | | | 28,861 | | | | | 11,468 | | | | | 11,841 | |
Federal and state registration fees — Institutional Class | | | | 30,783 | | | | | 12,132 | | | | | 20,043 | |
Legal fees | | | | 62,012 | | | | | 9,528 | | | | | 5,174 | |
Trustees’ fees | | | | 135,070 | | | | | 19,627 | | | | | 9,203 | |
Interest | | | | 40,241 | | | | | 9,907 | | | | | 1,728 | |
Audit fees | | | | 8,534 | | | | | 8,534 | | | | | 8,534 | |
Other expenses | | | | 60,544 | | | | | 14,078 | | | | | 11,940 | |
| | | | | | | | | | | | | | | |
Total expenses before reimbursement | | | | 21,891,572 | | | | | 4,603,969 | | | | | 2,178,109 | |
Reimbursement of expenses by Advisor | | | | — | | | | | — | | | | | — | |
| | | | | | | | | | | | | | | |
Net Expenses | | | | 21,891,572 | | | | | 4,603,969 | | | | | 2,178,109 | |
| | | | | | | | | | | | | | | |
Net Investment Income (Loss) | | | | (10,563,769 | ) | | | | (3,987,244 | ) | | | | (1,803,799 | ) |
| | | | | | | | | | | | | | | |
Realized Gain (Loss): | |
Investments sold | | | | 62,939,477 | | | | | 6,668,440 | | | | | (28,727,788 | ) |
Foreign currency transactions | | | | — | | | | | (312,966 | ) | | | | (244,437 | ) |
Foreign capital gains taxes | | | | — | | | | | (2,202,424 | ) | | | | (1,035,861 | ) |
| | | | | | | | | | | | | | | |
Net realized gain (loss) | | | | 62,939,477 | | | | | 4,153,050 | | | | | (30,008,086 | ) |
| | | | | | | | | | | | | | | |
Change in Unrealized Appreciation (Depreciation): | |
Investments | | | | (513,862,034 | ) | | | | (35,185,374 | ) | | | | (43,065,172 | ) |
Investments in affiliates | | | | 18,301,571 | | | | | — | | | | | — | |
Foreign currency translations | | | | (204 | ) | | | | (7,235 | ) | | | | 16,715 | |
Deferred foreign capital gains taxes | | | | — | | | | | 6,875,004 | | | | | 255,816 | |
Unfunded commitment with a SPAC | | | | 1,740,000 | | | | | — | | | | | — | |
| | | | | | | | | | | | | | | |
Net change in unrealized appreciation (depreciation) | | | | (493,820,667 | ) | | | | (28,317,605 | ) | | | | (42,792,641 | ) |
| | | | | | | | | | | | | | | |
Net gain (loss) on investments | | | | (430,881,190 | ) | | | | (24,164,555 | ) | | | | (72,800,727 | ) |
| | | | | | | | | | | | | | | |
Net Increase (Decrease) in Net Assets Resulting from Operations | | | $ | (441,444,959 | ) | | | $ | (28,151,799 | ) | | | $ | (74,604,526 | ) |
| | | | | | | | | | | | | | | |
| 1 | Net of $0, $169,022, $36,712, $429,821, $30,194, $37,169, $2,709 and $107,110 in foreign withholding taxes, respectively. |
See Notes to Financial Statements.
92
| | |
| | | SIX MONTHS ENDED MARCH 31, 2022 (Unaudited) |
| | | | | | | | | | | | | | | | | | | | | | | |
Emerging
Markets
Small Cap
Fund | | Frontier
Emerging
Small Countries
Fund | | Global
Opportunities
Fund | | Global
Select
Fund | | Global
Value
Fund |
| | | | | | | | | | | | | | | | | | | | | | | | |
| | | | | | | | | | | | | | | | | | | | | | | | |
| | $ | — | | | | $ | — | | | | $ | — | | | | $ | — | | | | $ | 117,376 | |
| | | | | | | | | | | | | | | | | | | | | | | | |
| | | 3,133,543 | | | | | 243,045 | | | | | 523,610 | | | | | 40,931 | | | | | 1,910,574 | |
| | | | | | | | | | | | | | | | | | | | | | | | |
| | | 3,133,543 | | | | | 243,045 | | | | | 523,610 | | | | | 40,931 | | | | | 2,027,950 | |
| | | | | | | | | | | | | | | | | | | | | | | | |
| | | | | | | | | | | | | | | | | | | | | | | | |
| | | 5,453,454 | | | | | 533,611 | | | | | 1,637,239 | | | | | 78,168 | | | | | 614,487 | |
| | | 152,019 | | | | | 49,588 | | | | | 87,572 | | | | | 13,348 | | | | | 88,870 | |
| | | 1,693 | | | | | 1,320 | | | | | 1,550 | | | | | 3,107 | | | | | 1,476 | |
| | | 47,619 | | | | | 5,200 | | | | | 20,174 | | | | | 1,513 | | | | | 11,162 | |
| | | 36,889 | | | | | 11,468 | | | | | 21,731 | | | | | 9,074 | | | | | 14,683 | |
| | | 13,239 | | | | | 7,936 | | | | | 8,681 | | | | | 6,877 | | | | | 12,887 | |
| | | 7,517 | | | | | 2,048 | | | | | 4,561 | | | | | 1,019 | | | | | 981 | |
| | | 109,264 | | | | | 28,148 | | | | | 14,461 | | | | | 2,663 | | | | | 9,567 | |
| | | 13,615 | | | | | 8,411 | | | | | 10,394 | | | | | 8,810 | | | | | 8,171 | |
| | | 12,731 | | | | | 7,968 | | | | | 8,427 | | | | | 8,802 | | | | | 7,627 | |
| | | 9,885 | | | | | 1,047 | | | | | 4,078 | | | | | 362 | | | | | 1,914 | |
| | | 21,103 | | | | | 2,339 | | | | | 8,372 | | | | | 642 | | | | | 4,459 | |
| | | 21,113 | | | | | 982 | | | | | 3,271 | | | | | 221 | | | | | 1,074 | |
| | | 8,534 | | | | | 8,534 | | | | | 8,534 | | | | | 13,540 | | | | | 8,913 | |
| | | 15,917 | | | | | 9,559 | | | | | 9,908 | | | | | 4,177 | | | | | 8,914 | |
| | | | | | | | | | | | | | | | | | | | | | | | |
| | | 5,924,592 | | | | | 678,159 | | | | | 1,848,953 | | | | | 152,323 | | | | | 795,185 | |
| | | — | | | | | (2,452 | ) | | | | — | | | | | (51,631 | ) | | | | (49,063 | ) |
| | | | | | | | | | | | | | | | | | | | | | | | |
| | | 5,924,592 | | | | | 675,707 | | | | | 1,848,953 | | | | | 100,692 | | | | | 746,122 | |
| | | | | | | | | | | | | | | | | | | | | | | | |
| | | (2,791,049 | ) | | | | (432,662 | ) | | | | (1,325,343 | ) | | | | (59,761 | ) | | | | 1,281,828 | |
| | | | | | | | | | | | | | | | | | | | | | | | |
| | | | | | | | | | | | | | | | | | | | | | | | |
| | | 24,602,981 | | | | | (1,381,681 | ) | | | | 10,318,853 | | | | | 53,290 | | | | | 10,719,475 | |
| | | (223,102 | ) | | | | 57 | | | | | (12,964 | ) | | | | (44,504 | ) | | | | (4,116 | ) |
| | | (2,388,524 | ) | | | | (7,961 | ) | | | | (856,781 | ) | | | | (33,307 | ) | | | | (24 | ) |
| | | | | | | | | | | | | | | | | | | | | | | | |
| | | 21,991,355 | | | | | (1,389,585 | ) | | | | 9,449,108 | | | | | (24,521 | ) | | | | 10,715,335 | |
| | | | | | | | | | | | | | | | | | | | | | | | |
| | | | | | | | | | | | | | | | | | | | | | | | |
| | | (121,075,249 | ) | | | | (13,954,269 | ) | | | | (52,939,713 | ) | | | | (3,259,779 | ) | | | | 164,379 | |
| | | — | | | | | — | | | | | — | | | | | — | | | | | — | |
| | | (9,770 | ) | | | | (16,819 | ) | | | | (3,166 | ) | | | | 611 | | | | | (10,036 | ) |
| | | 5,000,381 | | | | | 8,978 | | | | | 1,378,454 | | | | | 25,479 | | | | | — | |
| | | — | | | | | — | | | | | — | | | | | — | | | | | — | |
| | | | | | | | | | | | | | | | | | | | | | | | |
| | | (116,084,638 | ) | | | | (13,962,110 | ) | | | | (51,564,425 | ) | | | | (3,233,689 | ) | | | | 154,343 | |
| | | | | | | | | | | | | | | | | | | | | | | | |
| | | (94,093,283 | ) | | | | (15,351,695 | ) | | | | (42,115,317 | ) | | | | (3,258,210 | ) | | | | 10,869,678 | |
| | | | | | | | | | | | | | | | | | | | | | | | |
| | $ | (96,884,332 | ) | | | $ | (15,784,357 | ) | | | $ | (43,440,660 | ) | | | $ | (3,317,971 | ) | | | $ | 12,151,506 | |
| | | | | | | | | | | | | | | | | | | | | | | | |
93
Statements of Operations (continued)
| | | | | | | | | | | | | | | |
| | | Greater
China
Fund | | International
Growth
Fund | | International
Opportunities
Fund |
| | | | | | | | | | | | | | | |
Investment Income: | |
Interest | | | $ | — | | | | $ | — | | | | $ | 194 | |
Dividends2 | |
Unaffiliated issuers | | | | 15,630 | | | | | 6,569,559 | | | | | 1,969,651 | |
Affiliated issuers3 | | | | — | | | | | — | | | | | — | |
| | | | | | | | | | | | | | | |
Total investment income | | | | 15,630 | | | | | 6,569,559 | | | | | 1,969,845 | |
| | | | | | | | | | | | | | | |
Expenses: | |
Investment advisory fees | | | | 50,738 | | | | | 7,258,680 | | | | | 6,250,581 | |
Shareholder servicing fees — Investor Class | | | | 5,096 | | | | | 240,660 | | | | | 54,015 | |
Shareholder servicing fees — Institutional Class | | | | 901 | | | | | 3,777 | | | | | 136,785 | |
Fund administration fees | | | | — | | | | | 93,030 | | | | | 55,296 | |
Fund accounting fees | | | | 10,248 | | | | | 64,441 | | | | | 46,337 | |
Reports to shareholders — Investor Class | | | | 5,366 | | | | | 19,235 | | | | | 4,527 | |
Reports to shareholders — Institutional Class | | | | 1,577 | | | | | 11,722 | | | | | 29,082 | |
Custody fees | | | | 3,210 | | | | | 103,071 | | | | | 92,217 | |
Federal and state registration fees — Investor Class | | | | 10,104 | | | | | 13,272 | | | | | 8,596 | |
Federal and state registration fees — Institutional Class | | | | 9,211 | | | | | 12,732 | | | | | 13,251 | |
Legal fees | | | | 370 | | | | | 18,800 | | | | | 11,803 | |
Trustees’ fees | | | | 317 | | | | | 42,623 | | | | | 26,927 | |
Dividends on securities sold short | | | | — | | | | | — | | | | | — | |
Interest | | | | 918 | | | | | 12,563 | | | | | 13,871 | |
Audit fees | | | | 18,738 | | | | | 8,535 | | | | | 8,534 | |
Other expenses | | | | 941 | | | | | 26,008 | | | | | 17,396 | |
| | | | | | | | | | | | | | | |
Total expenses before reimbursement | | | | 117,735 | | | | | 7,929,149 | | | | | 6,769,218 | |
Reimbursement of expenses by Advisor | | | | (48,827 | ) | | | | — | | | | | — | |
| | | | | | | | | | | | | | | |
Net Expenses | | | | 68,908 | | | | | 7,929,149 | | | | | 6,769,218 | |
| | | | | | | | | | | | | | | |
Net Investment Income (Loss) | | | | (53,278 | ) | | | | (1,359,590 | ) | | | | (4,799,373 | ) |
| | | | | | | | | | | | | | | |
Realized Gain (Loss): | |
Investments sold | | | | (1,161,726 | ) | | | | 38,429,230 | | | | | (2,479,939 | ) |
Investments in affiliates | | | | — | | | | | — | | | | | — | |
Foreign currency transactions | | | | (341 | ) | | | | (23,194 | ) | | | | (70,866 | ) |
Net realized gain on short positions | | | | — | | | | | — | | | | | — | |
Foreign capital gains taxes | | | | — | | | | | (2,404,557 | ) | | | | (6 | ) |
| | | | | | | | | | | | | | | |
Net realized gain (loss) | | | | (1,162,067 | ) | | | | 36,001,479 | | | | | (2,550,811 | ) |
| | | | | | | | | | | | | | | |
Change in Unrealized Appreciation (Depreciation): | |
Investments | | | | (999,785 | ) | | | | (259,943,064 | ) | | | | (191,179,506 | ) |
Investments in affiliates | | | | — | | | | | — | | | | | — | |
Foreign currency translations | | | | (4 | ) | | | | (74,951 | ) | | | | (26,178 | ) |
Short positions | | | | — | | | | | — | | | | | — | |
Deferred foreign capital gains taxes | | | | — | | | | | 3,643,280 | | | | | 1,567,075 | |
Unfunded commitment with a SPAC | | | | — | | | | | — | | | | | — | |
| | | | | | | | | | | | | | | |
Net change in unrealized appreciation (depreciation) | | | | (999,789 | ) | | | | (256,374,735 | ) | | | | (189,638,609 | ) |
| | | | | | | | | | | | | | | |
Net gain (loss) on investments | | | | (2,161,856 | ) | | | | (220,373,256 | ) | | | | (192,189,420 | ) |
| | | | | | | | | | | | | | | |
Net Increase (Decrease) in Net Assets Resulting from Operations | | | $ | (2,215,134 | ) | | | $ | (221,732,846 | ) | | | $ | (196,988,793 | ) |
| | | | | | | | | | | | | | | |
| 1 | Fund inception date was October 1, 2021. |
| 2 | Net of $212, $646,838, $209,920, $2,730, $0, $4,292, $15,851 and $0 in foreign withholding taxes, respectively. |
| 3 | See Note 8 for information on affiliated issuers. |
See Notes to Financial Statements.
94
| | |
| | | SIX MONTHS ENDED MARCH 31, 2022 (Unaudited) |
| | | | | | | | | | | | | | | | | | | | | | | |
International
Select
Fund | | Long/Short
Alpha
Fund1 | | Micro
Cap
Fund | | Micro Cap
Value
Fund | | Small Cap
Growth
Fund |
| | | | | | | | | | | | | | | | | | | | | | | | |
| | | | | | | | | | | | | | | | | | | | | | | | |
| | $ | — | | | | $ | — | | | | $ | — | | | | $ | 7,678 | | | | $ | — | |
| | | | | | | | | | | | | | | | | | | | | | | | |
| | | 15,631 | | | | | 99,321 | | | | | 413,479 | | | | | 1,133,623 | | | | | 1,621,212 | |
| | | — | | | | | — | | | | | 218,487 | | | | | — | | | | | — | |
| | | | | | | | | | | | | | | | | | | | | | | | |
| | | 15,631 | | | | | 99,321 | | | | | 631,966 | | | | | 1,141,301 | | | | | 1,621,212 | |
| | | | | | | | | | | | | | | | | | | | | | | | |
| | | | | | | | | | | | | | | | | | | | | | | | |
| | | 33,751 | | | | | 128,084 | | | | | 8,812,354 | | | | | 3,298,327 | | | | | 16,502,443 | |
| | | 12,858 | | | | | 4,842 | | | | | 448,209 | | | | | 158,977 | | | | | 710,976 | |
| | | 3,311 | | | | | 1,252 | | | | | 1,384 | | | | | 1,278 | | | | | 12,481 | |
| | | 689 | | | | | 1,634 | | | | | 82,249 | | | | | 32,001 | | | | | 222,221 | |
| | | 9,868 | | | | | 8,657 | | | | | 52,643 | | | | | 27,418 | | | | | 127,889 | |
| | | 6,254 | | | | | 4,492 | | | | | 35,566 | | | | | 15,312 | | | | | 38,442 | |
| | | 1,561 | | | | | 4,598 | | | | | 5,416 | | | | | 1,616 | | | | | 68,106 | |
| | | 3,697 | | | | | 7,079 | | | | | 4,825 | | | | | 12,387 | | | | | 1,036 | |
| | | 9,493 | | | | | 8,773 | | | | | 31,817 | | | | | 13,793 | | | | | 27,919 | |
| | | 9,566 | | | | | 10,192 | | | | | 15,523 | | | | | 10,515 | | | | | 40,414 | |
| | | 210 | | | | | 52,144 | | | | | 20,478 | | | | | 6,639 | | | | | 52,359 | |
| | | 294 | | | | | 350 | | | | | 44,029 | | | | | 14,483 | | | | | 120,265 | |
| | | — | | | | | 20,766 | | | | | — | | | | | — | | | | | — | |
| | | 177 | | | | | 32,013 | | | | | 15,775 | | | | | 3,178 | | | | | 34,059 | |
| | | 13,540 | | | | | 18,691 | | | | | 18,738 | | | | | 18,738 | | | | | 8,534 | |
| | | 2,961 | | | | | 2,726 | | | | | 22,376 | | | | | 11,421 | | | | | 52,159 | |
| | | | | | | | | | | | | | | | | | | | | | | | |
| | | 108,230 | | | | | 306,293 | | | | | 9,611,382 | | | | | 3,626,083 | | | | | 18,019,303 | |
| | | (61,891 | ) | | | | (89,060 | ) | | | | — | | | | | (1,743 | ) | | | | — | |
| | | | | | | | | | | | | | | | | | | | | | | | |
| | | 46,339 | | | | | 217,233 | | | | | 9,611,382 | | | | | 3,624,340 | | | | | 18,019,303 | |
| | | | | | | | | | | | | | | | | | | | | | | | |
| | | (30,708 | ) | | | | (117,912 | ) | | | | (8,979,416 | ) | | | | (2,483,039 | ) | | | | (16,398,091 | ) |
| | | | | | | | | | | | | | | | | | | | | | | | |
| | | | | | | | | | | | | | | | | | | | | | | | |
| | | (269,750 | ) | | | | (587,235 | ) | | | | 19,546,470 | | | | | (4,323,998 | ) | | | | 109,040,977 | |
| | | — | | | | | — | | | | | (7,610,273 | ) | | | | — | | | | | (2,470,718 | ) |
| | | (65,095 | ) | | | | — | | | | | (1,099 | ) | | | | 4,944 | | | | | — | |
| | | — | | | | | 237,800 | | | | | — | | | | | — | | | | | — | |
| | | — | | | | | — | | | | | — | | | | | — | | | | | — | |
| | | | | | | | | | | | | | | | | | | | | | | | |
| | | (334,845 | ) | | | | (349,435 | ) | | | | 11,935,098 | | | | | (4,319,054 | ) | | | | 106,570,259 | |
| | | | | | | | | | | | | | | | | | | | | | | | |
| | | | | | | | | | | | | | | | | | | | | | | | |
| | | (1,430,529 | ) | | | | (2,701,992 | ) | | | | (187,321,495 | ) | | | | (56,360,943 | ) | | | | (776,380,246 | ) |
| | | — | | | | | — | | | | | (58,867,975 | ) | | | | — | | | | | (5,295,527 | ) |
| | | (67 | ) | | | | — | | | | | (440 | ) | | | | (3,527 | ) | | | | — | |
| | | — | | | | | 1,890,946 | | | | | — | | | | | — | | | | | — | |
| | | — | | | | | — | | | | | — | | | | | — | | | | | — | |
| | | — | | | | | — | | | | | 697,000 | | | | | — | | | | | — | |
| | | | | | | | | | | | | | | | | | | | | | | | |
| | | (1,430,596 | ) | | | | (811,046 | ) | | | | (245,492,910 | ) | | | | (56,364,470 | ) | | | | (781,675,773 | ) |
| | | | | | | | | | | | | | | | | | | | | | | | |
| | | (1,765,441 | ) | | | | (1,160,481 | ) | | | | (233,557,812 | ) | | | | (60,683,524 | ) | | | | (675,105,514 | ) |
| | | | | | | | | | | | | | | | | | | | | | | | |
| | $ | (1,796,149 | ) | | | $ | (1,278,393 | ) | | | $ | (242,537,228 | ) | | | $ | (63,166,563 | ) | | | $ | (691,503,605 | ) |
| | | | | | | | | | | | | | | | | | | | | | | | |
95
| | |
| Wasatch Funds | | SIX MONTHS ENDED MARCH 31, 2022 (Unaudited) |
Statements of Operations (continued)
| | | | | | | | | | | | | | | |
| | | Small Cap
Value
Fund | | Ultra
Growth
Fund | | U.S.
Treasury
Fund |
| | | | | | | | | | | | | | | |
Investment Income: | |
Interest | | | $ | — | | | | $ | — | | | | $ | 4,666,226 | |
Dividends1 | |
Unaffiliated issuers | | | | 11,535,166 | | | | | 2,345,429 | | | | | — | |
| | | | | | | | | | | | | | | |
Total investment income | | | | 11,535,166 | | | | | 2,345,429 | | | | | 4,666,226 | |
| | | | | | | | | | | | | | | |
Expenses: | |
Investment advisory fees | | | | 8,582,221 | | | | | 13,075,346 | | | | | 1,141,815 | |
Shareholder servicing fees — Investor Class | | | | 395,711 | | | | | 1,122,336 | | | | | 186,566 | |
Shareholder servicing fees — Institutional Class | | | | 3,455 | | | | | 2,827 | | | | | — | |
Fund administration fees | | | | 120,688 | | | | | 171,592 | | | | | 26,497 | |
Fund accounting fees | | | | 72,006 | | | | | 101,224 | | | | | 15,697 | |
Reports to shareholders — Investor Class | | | | 43,274 | | | | | 76,037 | | | | | 20,749 | |
Reports to shareholders — Institutional Class | | | | 17,802 | | | | | 21,838 | | | | | — | |
Custody fees | | | | 784 | | | | | 17,226 | | | | | 673 | |
Federal and state registration fees — Investor Class | | | | 20,209 | | | | | 36,894 | | | | | 30,530 | |
Federal and state registration fees — Institutional Class | | | | 20,842 | | | | | 24,740 | | | | | — | |
Legal fees | | | | 25,142 | | | | | 43,464 | | | | | 6,998 | |
Trustees’ fees | | | | 55,846 | | | | | 98,441 | | | | | 16,181 | |
Interest | | | | 15,459 | | | | | 33,466 | | | | | 3,909 | |
Audit fees | | | | 8,534 | | | | | 18,738 | | | | | 18,738 | |
Other expenses | | | | 28,042 | | | | | 41,048 | | | | | 9,238 | |
| | | | | | | | | | | | | | | |
Total expenses before reimbursement | | | | 9,410,015 | | | | | 14,885,217 | | | | | 1,477,591 | |
Reimbursement of expenses by Advisor | | | | — | | | | | (10,518 | ) | | | | — | |
| | | | | | | | | | | | | | | |
Net Expenses | | | | 9,410,015 | | | | | 14,874,699 | | | | | 1,477,591 | |
| | | | | | | | | | | | | | | |
Net Investment Income (Loss) | | | | 2,125,151 | | | | | (12,529,270 | ) | | | | 3,188,635 | |
| | | | | | | | | | | | | | | |
Realized Gain (Loss): | |
Investments sold | | | | 69,180,403 | | | | | 159,073,008 | | | | | (3,299,187 | ) |
Investments in affiliates | | | | — | | | | | (1,807,046 | ) | | | | — | |
Foreign currency transactions | | | | — | | | | | (8,169 | ) | | | | — | |
| | | | | | | | | | | | | | | |
Net realized gain (loss) | | | | 69,180,403 | | | | | 157,257,793 | | | | | (3,299,187 | ) |
| | | | | | | | | | | | | | | |
Change in Unrealized Appreciation (Depreciation): | |
Investments | | | | (144,390,205 | ) | | | | (655,959,231 | ) | | | | (36,309,052 | ) |
Investments in affiliates | | | | 5,778,443 | | | | | (15,005,768 | ) | | | | — | |
Foreign currency translations | | | | — | | | | | (1,232 | ) | | | | — | |
Unfunded commitment with a SPAC | | | | — | | | | | 1,450,000 | | | | | — | |
| | | | | | | | | | | | | | | |
Net change in unrealized appreciation (depreciation) | | | | (138,611,762 | ) | | | | (669,516,231 | ) | | | | (36,309,052 | ) |
| | | | | | | | | | | | | | | |
Net gain (loss) on investments | | | | (69,431,359 | ) | | | | (512,258,438 | ) | | | | (39,608,239 | ) |
| | | | | | | | | | | | | | | |
Net Increase (Decrease) in Net Assets Resulting from Operations | | | $ | (67,306,208 | ) | | | $ | (524,787,708 | ) | | | $ | (36,419,604 | ) |
| | | | | | | | | | | | | | | |
| 1 | Net of $0, $0 and $0 in foreign withholding taxes, respectively. |
See Notes to Financial Statements.
96
(This page intentionally left blank.)
97
Statements of Changes in Net Assets
| | | | | | | | | | | | | | | | |
| | | Core Growth
Fund | | | Emerging India
Fund | |
| | | Six Months Ended
March 31, 2022
(Unaudited) | | | Year Ended
September 30, 2021 | | | Six Months Ended
March 31, 2022
(Unaudited) | | | Year Ended
September 30, 2021 | |
| | | | | | | | | | | | | | | | |
Operations: | | | | | | | | | | | | | | | | |
Net investment loss | | $ | (10,563,769 | ) | | $ | (22,095,785 | ) | | $ | (3,987,244 | ) | | $ | (4,779,600 | ) |
Net realized gain (loss) on investments, foreign currency translations and foreign capital gains taxes | | | 62,939,477 | | | | 626,733,610 | | | | 4,153,050 | | | | 27,354,857 | |
Change in unrealized appreciation (depreciation) on investments, foreign currency translations, deferred foreign capital gains taxes and unrealized appreciation on an unfunded commitment with a SPAC | | | (493,820,667 | ) | | | 614,198,976 | | | | (28,317,605 | ) | | | 196,112,797 | |
| | | | | | | | | | | | | | | | |
Net increase (decrease) in net assets resulting from operations | | | (441,444,959 | ) | | | 1,218,836,801 | | | | (28,151,799 | ) | | | 218,688,054 | |
| | | | |
Distributions to shareholders from distributable earnings | | | | | | | | | | | | | | | | |
Investor Class | | | (326,601,199 | ) | | | (134,139,688 | ) | | | (11,748,479 | ) | | | — | |
Institutional Class | | | (284,274,389 | ) | | | (96,241,665 | ) | | | (15,680,233 | ) | | | — | |
| | | | |
Capital share transactions: | | | | | | | | | | | | | | | | |
Investor Class | | | | | | | | | | | | | | | | |
Shares sold | | | 152,043,106 | | | | 285,293,963 | | | | 77,383,006 | | | | 72,552,290 | |
Shares issued to holders in reinvestment of dividends | | | 313,193,819 | | | | 129,567,047 | | | | 11,693,871 | | | | — | |
Shares redeemed | | | (229,429,417 | ) | | | (396,773,770 | ) | | | (47,968,469 | ) | | | (45,105,601 | ) |
Redemption fees | | | 45,551 | | | | 57,178 | | | | 130,404 | | | | 21,479 | |
| | | | | | | | | | | | | | | | |
Net increase (decrease) | | | 235,853,059 | | | | 18,144,418 | | | | 41,238,812 | | | | 27,468,168 | |
| | | | | | | | | | | | | | | | |
Institutional Class | | | | |
Shares sold | | | 274,708,933 | | | | 522,135,790 | | | | 74,055,273 | | | | 171,145,086 | |
Shares issued to holders in reinvestment of dividends | | | 261,121,349 | | | | 88,636,169 | | | | 14,141,713 | | | | — | |
Shares redeemed | | | (235,093,204 | ) | | | (308,194,284 | ) | | | (32,993,199 | ) | | | (82,697,169 | ) |
Redemption fees | | | 20,347 | | | | 52,681 | | | | 2,278 | | | | 17,077 | |
| | | | | | | | | | | | | | | | |
Net increase (decrease) | | | 300,757,425 | | | | 302,630,356 | | | | 55,206,065 | | | | 88,464,994 | |
| | | | | | | | | | | | | | | | |
Total increase (decrease) in net assets | | | (515,710,063 | ) | | | 1,309,230,222 | | | | 40,864,366 | | | | 334,621,216 | |
| | | | |
Net assets: | | | | | | | | | | | | | | | | |
Beginning of period | | | 4,039,378,536 | | | | 2,730,148,314 | | | | 617,017,685 | | | | 282,396,469 | |
| | | | | | | | | | | | | | | | |
End of period | | $ | 3,523,668,473 | | | $ | 4,039,378,536 | | | $ | 657,882,051 | | | $ | 617,017,685 | |
| | | | | | | | | | | | | | | | |
| | | | |
Capital share transactions — shares: | | | | | | | | | | | | | | | | |
Investor Class | | | | |
Shares sold | | | 1,676,504 | | | | 2,901,779 | | | | 11,191,968 | | | | 13,216,525 | |
Shares issued to holders in reinvestment of dividends | | | 3,484,190 | | | | 1,433,264 | | | | 1,745,354 | | | | — | |
Shares redeemed | | | (2,559,543 | ) | | | (4,142,514 | ) | | | (7,335,339 | ) | | | (8,368,087 | ) |
| | | | | | | | | | | | | | | | |
Net increase (decrease) in shares outstanding | | | 2,601,151 | | | | 192,529 | | | | 5,601,983 | | | | 4,848,438 | |
| | | | | | | | | | | | | | | | |
Institutional Class | | | | |
Shares sold | | | 2,941,601 | | | | 5,305,898 | | | | 10,650,273 | | | | 29,268,874 | |
Shares issued to holders in reinvestment of dividends | | | 2,857,846 | | | | 967,961 | | | | 2,085,798 | | | | — | |
Shares redeemed | | | (2,560,091 | ) | | | (3,155,071 | ) | | | (4,825,676 | ) | | | (12,584,440 | ) |
| | | | | | | | | | | | | | | | |
Net increase in shares outstanding | | | 3,239,356 | | | | 3,118,788 | | | | 7,910,395 | | | | 16,684,434 | |
| | | | | | | | | | | | | | | | |
See Notes to Financial Statements.
98
| | |
| | | MARCH 31, 2022 (Unaudited) |
| | | | | | | | | | | | | | | | | | | | | | |
Emerging Markets Select
Fund | | | Emerging Markets Small Cap
Fund | | | Frontier Emerging Small Countries
Fund | |
Six Months Ended
March 31, 2022
(Unaudited) | | | Year Ended
September 30, 2021 | | | Six Months Ended
March 31, 2022
(Unaudited) | | | Year Ended
September 30, 2021 | | | Six Months Ended
March 31, 2022
(Unaudited) | | | Year Ended
September 30, 2021 | |
| | | | | | | | | | | | | | | | | | | | | | |
| | | | | | | | | | | | | | | | | | | | | | |
| $ | (1,803,799 | ) | | $ | (522,166 | ) | | $ | (2,791,049 | ) | | $ | (5,117,886 | ) | | $ | (432,662 | ) | | $ | (817,427 | ) |
| (30,008,086 | ) | | | 4,277,978 | | | | 21,991,355 | | | | 38,976,385 | | | | (1,389,585 | ) | | | 7,270,444 | |
| (42,792,641 | ) | | | 35,535,079 | | | | (116,084,638 | ) | | | 159,034,703 | | | | (13,962,110 | ) | | | 16,301,503 | |
| | | | | | | | | | | | | | | | | | | | | | |
| (74,604,526 | ) | | | 39,290,891 | | | | (96,884,332 | ) | | | 192,893,202 | | | | (15,784,357 | ) | | | 22,754,520 | |
| | | | | |
| | | | | | | | | | | | | | | | | | | | | | |
| | (578,279 | ) | | | — | | | | (20,036,368 | ) | | | (16,201,918 | ) | | | (365,738 | ) | | | — | |
| | (1,049,729 | ) | | | — | | | | (19,590,549 | ) | | | (14,450,142 | ) | | | (154,376 | ) | | | — | |
| | | | | |
| | | | | | | | | | | | | | | | | | | | | | |
| | | | | | | | | | | | | | | | | | | | | | |
| | 90,851,777 | | | | 74,966,286 | | | | 88,378,039 | | | | 67,652,710 | | | | 3,637,958 | | | | 4,625,113 | |
| | 577,642 | | | | — | | | | 18,833,390 | | | | 15,429,738 | | | | 328,775 | | | | — | |
| | (71,433,113 | ) | | | (8,539,243 | ) | | | (110,427,504 | ) | | | (42,352,912 | ) | | | (3,890,437 | ) | | | (9,870,437 | ) |
| | 129,487 | | | | 20,990 | | | | 43,953 | | | | 6,899 | | | | 1,653 | | | | 2,525 | |
| | | | | | | | | | | | | | | | | | | | | | |
| | 20,125,793 | | | | 66,448,033 | | | | (3,172,122 | ) | | | 40,736,435 | | | | 77,949 | | | | (5,242,799 | ) |
| | | | | | | | | | | | | | | | | | | | | | |
| | | | | | | | | | | | | | | | | | | | | | |
| | 364,746,478 | | | | 107,774,616 | | | | 144,602,037 | | | | 84,918,309 | | | | 4,123,447 | | | | 2,827,190 | |
| | 703,049 | | | | — | | | | 18,882,311 | | | | 13,131,207 | | | | 151,926 | | | | — | |
| | (91,293,548 | ) | | | (7,958,135 | ) | | | (77,865,325 | ) | | | (31,745,756 | ) | | | (646,637 | ) | | | (1,001,816 | ) |
| | 16,109 | | | | 4,807 | | | | 8,378 | | | | — | | | | 680 | | | | — | |
| | | | | | | | | | | | | | | | | | | | | | |
| | 274,172,088 | | | | 99,821,288 | | | | 85,627,401 | | | | 66,303,760 | | | | 3,629,416 | | | | 1,825,374 | |
| | | | | | | | | | | | | | | | | | | | | | |
| | 218,065,347 | | | | 205,560,212 | | | | (54,055,970 | ) | | | 269,281,337 | | | | (12,597,106 | ) | | | 19,337,095 | |
| | | | | |
| | | | | | | | | | | | | | | | | | | | | | |
| | 264,226,297 | | | | 58,666,085 | | | | 643,358,356 | | | | 374,077,019 | | | | 69,796,619 | | | | 50,459,524 | |
| | | | | | | | | | | | | | | | | | | | | | |
| $ | 482,291,644 | | | $ | 264,226,297 | | | $ | 589,302,386 | | | $ | 643,358,356 | | | $ | 57,199,513 | | | $ | 69,796,619 | |
| | | | | | | | | | | | | | | | | | | | | | |
| | | | | |
| | | | | | | | | | | | | | | | | | | | | | |
| | | | | | | | | | | | | | | | | | | | | | |
| | 4,199,045 | | | | 3,547,349 | | | | 22,096,560 | | | | 17,518,756 | | | | 893,342 | | | | 1,141,142 | |
| | 27,069 | | | | — | | | | 4,673,298 | | | | 4,551,545 | | | | 82,815 | | | | — | |
| | (3,378,320 | ) | | | (412,092 | ) | | | (29,522,981 | ) | | | (11,317,581 | ) | | | (1,011,138 | ) | | | (2,490,690 | ) |
| | | | | | | | | | | | | | | | | | | | | | |
| | 847,794 | | | | 3,135,257 | | | | (2,753,123 | ) | | | 10,752,720 | | | | (34,981 | ) | | | (1,349,548 | ) |
| | | | | | | | | | | | | | | | | | | | | | |
| | | | | | | | | | | | | | | | | | | | | | |
| | 17,320,263 | | | | 4,811,742 | | | | 37,229,242 | | | | 21,883,056 | | | | 1,013,225 | | | | 721,918 | |
| | 32,205 | | | | — | | | | 4,628,017 | | | | 3,828,340 | | | | 37,887 | | | | — | |
| | (4,481,769 | ) | | | (380,480 | ) | | | (20,154,474 | ) | | | (8,614,946 | ) | | | (158,884 | ) | | | (262,213 | ) |
| | | | | | | | | | | | | | | | | | | | | | |
| | 12,870,699 | | | | 4,431,262 | | | | 21,702,785 | | | | 17,096,450 | | | | 892,228 | | | | 459,705 | |
| | | | | | | | | | | | | | | | | | | | | | |
99
Statements of Changes in Net Assets (continued)
| | | | | | | | | | | | | | | | |
| | | Global Opportunities
Fund | | | Global Select
Fund | |
| | | Six Months Ended
March 31, 2022
(Unaudited) | | | Year Ended
September 30, 2021 | | | Six Months Ended
March 31, 2022
(Unaudited) | | | Year Ended
September 30, 2021 | |
| | | | | | | | | | | | | | | | |
Operations: | | | | | | | | | | | | | | | | |
Net investment income (loss) | | $ | (1,325,343 | ) | | $ | (2,132,294 | ) | | $ | (59,761 | ) | | $ | (105,828 | ) |
Net realized gain (loss) on investments, foreign currency translations and foreign capital gains taxes | | | 9,449,108 | | | | 21,898,520 | | | | (24,521 | ) | | | 2,100,307 | |
Change in unrealized appreciation (depreciation) on investments, foreign currency translations and deferred foreign capital gains taxes | | | (51,564,425 | ) | | | 57,490,762 | | | | (3,233,689 | ) | | | 1,756,738 | |
| | | | | | | | | | | | | | | | |
Net increase (decrease) in net assets resulting from operations | | | (43,440,660 | ) | | | 77,256,988 | | | | (3,317,971 | ) | | | 3,751,217 | |
| | | | |
Distributions to shareholders from distributable earnings | | | | | | | | | | | | | | | | |
Investor Class | | | (14,804,572 | ) | | | (2,570,977 | ) | | | (813,040 | ) | | | (8,940 | ) |
Institutional Class | | | (5,997,363 | ) | | | (995,402 | ) | | | (1,403,979 | ) | | | (16,853 | ) |
| | | | |
Capital share transactions: | | | | | | | | | | | | | | | | |
Investor Class | | | | | | | | | | | | | | | | |
Shares sold | | | 34,120,309 | | | | 48,268,784 | | | | 561,465 | | | | 3,119,571 | |
Shares issued to holders in reinvestment of dividends | | | 14,715,236 | | | | 2,541,567 | | | | 813,040 | | | | 8,940 | |
Shares redeemed | | | (28,298,781 | ) | | | (22,753,133 | ) | | | (885,864 | ) | | | (1,658,422 | ) |
Redemption fees | | | 23,823 | | | | 14,567 | | | | 543 | | | | 2,933 | |
| | | | | | | | | | | | | | | | |
Net increase (decrease) | | | 20,560,587 | | | | 28,071,785 | | | | 489,184 | | | | 1,473,022 | |
| | | | | | | | | | | | | | | | |
Institutional Class | | | | | | | | | | | | | | | | |
Shares sold | | | 32,145,184 | | | | 22,325,925 | | | | 1,814,603 | | | | 1,320,860 | |
Shares issued to holders in reinvestment of dividends | | | 5,863,776 | | | | 968,419 | | | | 1,403,979 | | | | 16,853 | |
Shares redeemed | | | (11,253,213 | ) | | | (8,844,008 | ) | | | (440,003 | ) | | | (468,215 | ) |
Redemption fees | | | 2,651 | | | | 1,624 | | | | 1,865 | | | | — | |
| | | | | | | | | | | | | | | | |
Net increase (decrease) | | | 26,758,398 | | | | 14,451,960 | | | | 2,780,444 | | | | 869,498 | |
| | | | | | | | | | | | | | | | |
Total increase (decrease) in net assets | | | (16,923,610 | ) | | | 116,214,354 | | | | (2,265,362 | ) | | | 6,067,944 | |
| | | | |
Net assets: | | | | | | | | | | | | | | | | |
Beginning of period | | | 255,707,507 | | | | 139,493,153 | | | | 19,438,870 | | | | 13,370,926 | |
| | | | | | | | | | | | | | | | |
End of period | | $ | 238,783,897 | | | $ | 255,707,507 | | | $ | 17,173,508 | | | $ | 19,438,870 | |
| | | | | | | | | | | | | | | | |
| | | | |
Capital share transactions — shares: | | | | | | | | | | | | | | | | |
Investor Class | | | | | | | | | | | | | | | | |
Shares sold | | | 6,170,197 | | | | 9,385,865 | | | | 40,871 | | | | 218,046 | |
Shares issued to holders in reinvestment of dividends | | | 2,829,853 | | | | 531,709 | | | | 60,003 | | | | 607 | |
Shares redeemed | | | (5,802,612 | ) | | | (4,493,298 | ) | | | (69,563 | ) | | | (114,926 | ) |
| | | | | | | | | | | | | | | | |
Net increase (decrease) in shares outstanding | | | 3,197,438 | | | | 5,424,276 | | | | 31,311 | | | | 103,727 | |
| | | | | | | | | | | | | | | | |
Institutional Class | | | | | | | | | | | | | | | | |
Shares sold | | | 6,214,037 | | | | 4,281,400 | | | | 139,672 | | | | 90,616 | |
Shares issued to holders in reinvestment of dividends | | | 1,119,041 | | | | 201,335 | | | | 102,780 | | | | 1,139 | |
Shares redeemed | | | (2,270,104 | ) | | | (1,707,010 | ) | | | (35,092 | ) | | | (32,058 | ) |
| | | | | | | | | | | | | | | | |
Net increase (decrease) in shares outstanding | | | 5,062,974 | | | | 2,775,725 | | | | 207,360 | | | | 59,697 | |
| | | | | | | | | | | | | | | | |
| 1 | Fund inception date was November 30, 2020. |
See Notes to Financial Statements.
100
| | |
| | | MARCH 31, 2022 (Unaudited) |
| | | | | | | | | | | | | | | | | | | | | | |
Global Value
Fund | | | Greater China
Fund | | | International Growth
Fund | |
Six Months Ended
March 31, 2022
(Unaudited) | | | Year Ended
September 30, 2021 | | | Six Months Ended
March 31, 2022
(Unaudited) | | | Period Ended
September 30, 20211 | | | Six Months Ended
March 31, 2022
(Unaudited) | | | Year Ended
September 30, 2021 | |
| | | | | | | | | | | | | | | | | | | | | | |
| | | | | | | | | | | | | | | | | | | | | | |
| $ | 1,281,828 | | | $ | 2,486,384 | | | $ | (53,278 | ) | | $ | (41,016 | ) | | $ | (1,359,590 | ) | | $ | (5,019,470 | ) |
|
10,715,335 |
| | | 11,411,611 | | | | (1,162,067 | ) | | | (701,483 | ) | | | 36,001,479 | | | | 99,884,694 | |
|
154,343 |
| | | 28,322,848 | | | | (999,789 | ) | | | (534,708 | ) | | | (256,374,735 | ) | | | 182,359,658 | |
| | | | | | | | | | | | | | | | | | | | | | |
|
12,151,506 |
| | | 42,220,843 | | | | (2,215,134 | ) | | | (1,277,207 | ) | | | (221,732,846 | ) | | | 277,224,882 | |
| | | | | |
| | | | | | | | | | | | | | | | | | | | | | |
| | (4,714,627 | ) | | | (2,003,728 | ) | | | — | | | | — | | | | (51,916,282 | ) | | | (54,626,174 | ) |
| | (293,434 | ) | | | (126,976 | ) | | | — | | | | — | | | | (63,352,795 | ) | | | (62,832,624 | ) |
| | | | | |
| | | | | | | | | | | | | | | | | | | | | | |
| | | | | | | | | | | | | | | | | | | | | | |
| | 8,170,636 | | | | 6,816,083 | | | | 1,732,442 | | | | 8,986,007 | | | | 22,649,715 | | | | 48,872,849 | |
| | 4,593,744 | | | | 1,946,735 | | | | — | | | | — | | | | 47,744,025 | | | | 49,768,442 | |
| | (8,463,839 | ) | | | (22,936,090 | ) | | | (1,903,198 | ) | | | (4,799,277 | ) | | | (56,101,142 | ) | | | (89,623,700 | ) |
| | 3,409 | | | | 10,770 | | | | 11,360 | | | | 18,104 | | | | 5,289 | | | | 3,660 | |
| | | | | | | | | | | | | | | | | | | | | | |
| | 4,303,950 | | | | (14,162,502 | ) | | | (159,396 | ) | | | 4,204,834 | | | | 14,297,887 | | | | 9,021,251 | |
| | | | | | | | | | | | | | | | | | | | | | |
| | | | | | | | | | | | | | | | | | | | | | |
| | 3,652,995 | | | | 1,198,637 | | | | 3,091,435 | | | | 9,671,913 | | | | 48,730,314 | | | | 75,309,424 | |
| | 292,236 | | | | 126,361 | | | | — | | | | — | | | | 58,809,033 | | | | 58,970,595 | |
| | (1,296,466 | ) | | | (2,899,730 | ) | | | (2,864,142 | ) | | | (2,025,474 | ) | | | (68,816,789 | ) | | | (90,761,018 | ) |
| | 941 | | | | 4,273 | | | | 1,908 | | | | — | | | | 36 | | | | 44 | |
| | | | | | | | | | | | | | | | | | | | | | |
| | 2,649,706 | | | | (1,570,459 | ) | | | 229,201 | | | | 7,646,439 | | | | 38,722,594 | | | | 43,519,045 | |
| | | | | | | | | | | | | | | | | | | | | | |
| | 14,097,101 | | | | 24,357,178 | | | | (2,145,329 | ) | | | 10,574,066 | | | | (283,981,442 | ) | | | 212,306,380 | |
| | | | | |
| | | | | | | | | | | | | | | | | | | | | | |
| | 127,128,701 | | | | 102,771,523 | | | | 10,574,066 | | | | — | | | | 1,278,478,268 | | | | 1,066,171,888 | |
| | | | | | | | | | | | | | | | | | | | | | |
| $ | 141,225,802 | | | $ | 127,128,701 | | | $ | 8,428,737 | | | $ | 10,574,066 | | | $ | 994,496,826 | | | $ | 1,278,478,268 | |
| | | | | | | | | | | | | | | | | | | | | | |
| | | | | |
| | | | | | | | | | | | | | | | | | | | | | |
| | | | | | | | | | | | | | | | | | | | | | |
| | 846,393 | | | | 752,115 | | | | 176,178 | | | | 816,427 | | | | 705,648 | | | | 1,362,318 | |
| | 484,942 | | | | 215,835 | | | | — | | | | — | | | | 1,409,210 | | | | 1,467,663 | |
| | (875,041 | ) | | | (2,664,292 | ) | | | (204,500 | ) | | | (430,552 | ) | | | (1,755,888 | ) | | | (2,492,622 | ) |
| | | | | | | | | | | | | | | | | | | | | | |
| | 456,294 | | | | (1,696,342 | ) | | | (28,322 | ) | | | 385,875 | | | | 358,970 | | | | 337,359 | |
| | | | | | | | | | | | | | | | | | | | | | |
| | | | | | | | | | | | | | | | | | | | | | |
| | 373,809 | | | | 149,716 | | | | 317,573 | | | | 876,966 | | | | 1,505,511 | | | | 2,072,631 | |
| | 30,815 | | | | 14,054 | | | | — | | | | — | | | | 1,723,594 | | | | 1,728,836 | |
| | (132,972 | ) | | | (371,161 | ) | | | (297,303 | ) | | | (186,429 | ) | | | (2,222,861 | ) | | | (2,508,278 | ) |
| | | | | | | | | | | | | | | | | | | | | | |
| | 271,652 | | | | (207,391 | ) | | | 20,270 | | | | 690,537 | | | | 1,006,244 | | | | 1,293,189 | |
| | | | | | | | | | | | | | | | | | | | | | |
101
Statements of Changes in Net Assets (continued)
| | | | | | | | | | | | | | | | |
| | | International Opportunities
Fund | | | International Select
Fund | |
| | | Six Months Ended
March 31, 2022
(Unaudited) | | | Year Ended
September 30, 2021 | | | Six Months Ended
March 31, 2022
(Unaudited) | | | Year Ended
September 30, 2021 | |
| | | | | | | | | | | | | | | | |
Operations: | | | | | | | | | | | | | | | | |
Net investment loss | | $ | (4,799,373 | ) | | $ | (8,573,888 | ) | | $ | (30,708 | ) | | $ | (36,551 | ) |
Net realized gain (loss) on investments, foreign currency translations and foreign capital gains taxes | | | (2,550,811 | ) | | | 94,867,256 | | | | (334,845 | ) | | | (11,801 | ) |
Net realized gain on short positions | | | — | | | | — | | | | — | | | | — | |
Change in unrealized appreciation (depreciation) on investments, foreign currency translations, deferred foreign capital gains taxes, securities sold short and unrealized appreciation on an unfunded commitment with a SPAC | | | (189,638,609 | ) | | | 16,485,313 | | | | (1,430,596 | ) | | | 975,864 | |
| | | | | | | | | | | | | | | | |
Net increase (decrease) in net assets resulting from operations | | | (196,988,793 | ) | | | 102,778,681 | | | | (1,796,149 | ) | | | 927,512 | |
| | | | |
Distributions to shareholders from distributable earnings | | | | | | | | | | | | | | | | |
Investor Class | | | (16,548,898 | ) | | | (2,818,253 | ) | | | — | | | | — | |
Institutional Class | | | (79,947,261 | ) | | | (11,776,758 | ) | | | — | | | | — | |
| | | | |
Capital share transactions: | | | | | | | | | | | | | | | | |
Investor Class | | | | | | | | | | | | | | | | |
Shares sold | | | 3,224,779 | | | | 11,132,601 | | | | 434,496 | | | | 2,658,754 | |
Shares issued to holders in reinvestment of dividends | | | 15,590,314 | | | | 2,669,546 | | | | — | | | | — | |
Shares redeemed | | | (11,303,548 | ) | | | (20,773,406 | ) | | | (1,166,795 | ) | | | (1,390,088 | ) |
Redemption fees | | | 615 | | | | 571 | | | | 2,437 | | | | 3,620 | |
| | | | | | | | | | | | | | | | |
Net increase (decrease) | | | 7,512,160 | | | | (6,970,688 | ) | | | (729,862 | ) | | | 1,272,286 | |
| | | | | | | | | | | | | | | | |
Institutional Class | | | | | | | | | | | | | | | | |
Shares sold | | | 140,765,156 | | | | 165,435,970 | | | | 172,693 | | | | 2,521,298 | |
Shares issued to holders in reinvestment of dividends | | | 54,694,121 | | | | 7,718,205 | | | | — | | | | — | |
Shares redeemed | | | (153,681,831 | ) | | | (113,397,293 | ) | | | (223,585 | ) | | | (142,274 | ) |
Redemption fees | | | 1,209 | | | | 2,116 | | | | — | | | | — | |
| | | | | | | | | | | | | | | | |
Net increase (decrease) | | | 41,778,655 | | | | 59,758,998 | | | | (50,892 | ) | | | 2,379,024 | |
| | | | | | | | | | | | | | | | |
Total increase (decrease) in net assets | | | (244,194,137 | ) | | | 140,971,980 | | | | (2,576,903 | ) | | | 4,578,822 | |
| | | | |
Net assets: | | | | | | | | | | | | | | | | |
Beginning of period | | | 814,956,688 | | | | 673,984,708 | | | | 9,508,948 | | | | 4,930,126 | |
| | | | | | | | | | | | | | | | |
End of period | | $ | 570,762,551 | | | $ | 814,956,688 | | | $ | 6,932,045 | | | $ | 9,508,948 | |
| | | | | | | | | | | | | | | | |
| | | | |
Capital share transactions — shares: | | | | | | | | | | | | | | | | |
Investor Class | | | | | | | | | | | | | | | | |
Shares sold | | | 811,611 | | | | 2,194,333 | | | | 31,392 | | | | 191,631 | |
Shares issued to holders in reinvestment of dividends | | | 3,600,534 | | | | 532,844 | | | | — | | | | — | |
Shares redeemed | | | (2,686,314 | ) | | | (4,043,325 | ) | | | (87,684 | ) | | | (100,099 | ) |
| | | | | | | | | | | | | | | | |
Net increase (decrease) in shares outstanding | | | 1,725,831 | | | | (1,316,148 | ) | | | (56,292 | ) | | | 91,532 | |
| | | | | | | | | | | | | | | | |
Institutional Class | | | | | | | | | | | | | | | | |
Shares sold | | | 35,185,429 | | | | 31,425,484 | | | | 13,285 | | | | 161,299 | |
Shares issued to holders in reinvestment of dividends | | | 12,430,482 | | | | 1,519,332 | | | | — | | | | — | |
Shares redeemed | | | (39,801,984 | ) | | | (21,946,474 | ) | | | (16,652 | ) | | | (10,088 | ) |
| | | | | | | | | | | | | | | | |
Net increase (decrease) in shares outstanding | | | 7,813,927 | | | | 10,998,342 | | | | (3,367 | ) | | | 151,211 | |
| | | | | | | | | | | | | | | | |
| 1 | Fund inception date was October 1, 2021. |
See Notes to Financial Statements.
102
| | |
| | | MARCH 31, 2022 (Unaudited) |
| | | | | | | | | | | | | | | | | | |
Long/Short Alpha
Fund1 | | | Micro Cap
Fund | | | Micro Cap Value
Fund | |
Six Months Ended
March 31, 2022
(Unaudited) | | | Six Months Ended
March 31, 2022
(Unaudited) | | | Year Ended
September 30, 2021 | | | Six Months Ended
March 31, 2022
(Unaudited) | | | Year Ended
September 30, 2021 | |
| | | | | | | | | | | | | | | | | | |
| | | | | | | | | | | | | | | | | | |
| | | | | | | | | | | | | | | | | | |
| $ | (117,912 | ) | | $ | (8,979,416 | ) | | $ | (20,259,518 | ) | | $ | (2,483,039 | ) | | $ | (4,206,723 | ) |
| (587,235 | ) | | | 11,935,098 | | | | 327,060,619 | | | | (4,319,054 | ) | | | 102,059,372 | |
| | 237,800 | | | | — | | | | — | | | | — | | | | — | |
| (811,046 | ) | | | (245,492,910 | ) | | | 20,503,701 | | | | (56,364,470 | ) | | | 48,749,380 | |
| | | | | | | | | | | | | | | | | | |
| (1,278,393 | ) | | | (242,537,228 | ) | | | 327,304,802 | | | | (63,166,563 | ) | | | 146,602,029 | |
| | | | |
| | | | | | | | | | | | | | | | | | |
| | — | | | | (257,919,727 | ) | | | (57,786,059 | ) | | | (73,081,163 | ) | | | (32,167,241 | ) |
| | — | | | | (41,304,544 | ) | | | (5,602,699 | ) | | | (12,549,879 | ) | | | (3,839,014 | ) |
| | | | |
| | | | | | | | | | | | | | | | | | |
| | | | | | | | | | | | | | | | | | |
| | 10,195,102 | | | | 58,889,800 | | | | 377,733,208 | | | | 61,331,940 | | | | 82,538,633 | |
| | — | | | | 243,675,646 | | | | 54,969,115 | | | | 71,677,406 | | | | 31,505,664 | |
| | (461,989 | ) | | | (172,357,335 | ) | | | (272,390,014 | ) | | | (55,031,367 | ) | | | (47,498,149 | ) |
| | 3,329 | | | | 20,472 | | | | 262,321 | | | | 24,369 | | | | 33,421 | |
| | | | | | | | | | | | | | | | | | |
| | 9,736,442 | | | | 130,228,583 | | | | 160,574,630 | | | | 78,002,348 | | | | 66,579,569 | |
| | | | | | | | | | | | | | | | | | |
| | | | | | | | | | | | | | | | | | |
| | 18,461,796 | | | | 51,611,561 | | | | 194,062,520 | | | | 20,262,782 | | | | 29,301,417 | |
| | — | | | | 39,473,070 | | | | 5,596,541 | | | | 12,450,069 | | | | 3,812,083 | |
| | (1,490,190 | ) | | | (94,009,926 | ) | | | (76,415,465 | ) | | | (15,850,598 | ) | | | (14,957,122 | ) |
| | 794 | | | | 1,879 | | | | 3,161 | | | | 4,363 | | | | 5,063 | |
| | | | | | | | | | | | | | | | | | |
| | 16,972,400 | | | | (2,923,416 | ) | | | 123,246,757 | | | | 16,866,616 | | | | 18,161,441 | |
| | | | | | | | | | | | | | | | | | |
| | 25,430,449 | | | | (414,456,332 | ) | | | 547,737,431 | | | | (53,928,641 | ) | | | 195,336,784 | |
| | | | |
| | | | | | | | | | | | | | | | | | |
| | — | | | | 1,353,610,310 | | | | 805,872,879 | | | | 443,616,944 | | | | 248,280,160 | |
| | | | | | | | | | | | | | | | | | |
| $ | 25,430,449 | | | $ | 939,153,978 | | | $ | 1,353,610,310 | | | $ | 389,688,303 | | | $ | 443,616,944 | |
| | | | | | | | | | | | | | | | | | |
| | | | |
| | | | | | | | | | | | | | | | | | |
| | | | | | | | | | | | | | | | | | |
| | 990,003 | | | | 6,331,794 | | | | 30,678,399 | | | | 14,138,611 | | | | 17,348,497 | |
| | — | | | | 27,690,414 | | | | 4,674,244 | | | | 17,964,263 | | | | 7,798,432 | |
| | (43,827 | ) | | | (18,452,138 | ) | | | (21,435,378 | ) | | | (13,376,293 | ) | | | (10,376,452 | ) |
| | | | | | | | | | | | | | | | | | |
| | 946,176 | | | | 15,570,070 | | | | 13,917,265 | | | | 18,726,581 | | | | 14,770,477 | |
| | | | | | | | | | | | | | | | | | |
| | | | | | | | | | | | | | | | | | |
| | 1,732,647 | | | | 5,361,824 | | | | 15,024,249 | | | | 4,300,089 | | | | 6,275,738 | |
| | — | | | | 4,490,680 | | | | 476,707 | | | | 3,104,755 | | | | 941,255 | |
| | (146,751 | ) | | | (9,614,524 | ) | | | (5,871,834 | ) | | | (4,025,147 | ) | | | (3,129,699 | ) |
| | | | | | | | | | | | | | | | | | |
| | 1,585,896 | | | | 237,980 | | | | 9,629,122 | | | | 3,379,697 | | | | 4,087,294 | |
| | | | | | | | | | | | | | | | | | |
103
Statements of Changes in Net Assets (continued)
| | | | | | | | | | | | | | | | |
| | | Small Cap Growth
Fund | | | Small Cap Value
Fund | |
| | | Six Months Ended
March 31, 2022
(Unaudited) | | | Year Ended
September 30, 2021 | | | Six Months Ended
March 31, 2022
(Unaudited) | | | Year Ended
September 30, 2021 | |
| | | | | | | | | | | | | | | | |
Operations: | | | | | | | | | | | | | | | | |
Net investment income (loss) | | $ | (16,398,091 | ) | | $ | (32,055,024 | ) | | $ | 2,125,151 | | | $ | (1,623,545 | ) |
Net realized gain (loss) on investments, foreign currency translations and foreign capital gains taxes | | | 106,570,259 | | | | 633,416,642 | | | | 69,180,403 | | | | 172,310,310 | |
Change in unrealized appreciation (depreciation) on investments, foreign currency translations, deferred foreign capital gains taxes and unrealized appreciation on an unfunded commitment with a SPAC | | | (781,675,773 | ) | | | 437,113,290 | | | | (138,611,762 | ) | | | 364,219,286 | |
| | | | | | | | | | | | | | | | |
Net increase (decrease) in net assets resulting from operations | | | (691,503,605 | ) | | | 1,038,474,908 | | | | (67,306,208 | ) | | | 534,906,051 | |
| | | | |
Distributions to shareholders from distributable earnings | | | | | | | | | | | | | | | | |
Investor Class | | | (298,275,007 | ) | | | (96,235,323 | ) | | | (63,940,106 | ) | | | — | |
Institutional Class | | | (324,759,466 | ) | | | (86,937,817 | ) | | | (65,113,713 | ) | | | — | |
| | | | |
Capital share transactions: | | | | | | | | | | | | | | | | |
Investor Class | | | | | | | | | | | | | | | | |
Shares sold | | | 121,711,166 | | | | 266,539,467 | | | | 85,367,316 | | | | 236,881,288 | |
Shares issued to holders in reinvestment of dividends | | | 287,667,859 | | | | 93,553,193 | | | | 62,945,104 | | | | — | |
Shares redeemed | | | (225,967,178 | ) | | | (299,046,644 | ) | | | (110,832,363 | ) | | | (205,993,454 | ) |
Redemption fees | | | 53,845 | | | | 89,234 | | | | 10,686 | | | | 35,787 | |
| | | | | | | | | | | | | | | | |
Net increase (decrease) | | | 183,465,692 | | | | 61,135,250 | | | | 37,490,743 | | | | 30,923,621 | |
| | | | | | | | | | | | | | | | |
Institutional Class | | | | | | | | | | | | | | | | |
Shares sold | | | 285,536,198 | | | | 607,073,733 | | | | 181,246,548 | | | | 315,082,542 | |
Shares issued to holders in reinvestment of dividends | | | 302,906,157 | | | | 80,532,098 | | | | 63,842,825 | | | | — | |
Shares redeemed | | | (241,184,825 | ) | | | (442,958,726 | ) | | | (134,345,909 | ) | | | (189,649,025 | ) |
Redemption fees | | | 20,283 | | | | 53,319 | | | | 2,175 | | | | 7,350 | |
| | | | | | | | | | | | | | | | |
Net increase (decrease) | | | 347,277,813 | | | | 244,700,424 | | | | 110,745,639 | | | | 125,440,867 | |
| | | | | | | | | | | | | | | | |
Total increase (decrease) in net assets | | | (783,794,573 | ) | | | 1,161,137,442 | | | | (48,123,645 | ) | | | 691,270,539 | |
| | | | |
Net assets: | | | | | | | | | | | | | | | | |
Beginning of period | | | 3,642,339,372 | | | | 2,481,201,930 | | | | 1,689,559,057 | | | | 998,288,518 | |
| | | | | | | | | | | | | | | | |
End of period | | $ | 2,858,544,799 | | | $ | 3,642,339,372 | | | $ | 1,641,435,412 | | | $ | 1,689,559,057 | |
| | | | | | | | | | | | | | | | |
| | | | |
Capital share transactions — shares: | | | | | | | | | | | | | | | | |
Investor Class | | | | | | | | | | | | | | | | |
Shares sold | | | 2,566,840 | | | | 4,516,189 | | | | 8,290,823 | | | | 23,765,389 | |
Shares issued to holders in reinvestment of dividends | | | 6,173,130 | | | | 1,684,429 | | | | 6,281,947 | | | | — | |
Shares redeemed | | | (4,797,099 | ) | | | (5,033,375 | ) | | | (10,906,679 | ) | | | (20,327,258 | ) |
| | | | | | | | | | | | | | | | |
Net increase (decrease) in shares outstanding | | | 3,942,871 | | | | 1,167,243 | | | | 3,666,091 | | | | 3,438,131 | |
| | | | | | | | | | | | | | | | |
Institutional Class | | | | | | | | | | | | | | | | |
Shares sold | | | 5,986,423 | | | | 9,932,157 | | | | 17,871,045 | | | | 30,568,064 | |
Shares issued to holders in reinvestment of dividends | | | 6,395,823 | | | | 1,431,936 | | | | 6,314,819 | | | | — | |
Shares redeemed | | | (4,964,755 | ) | | | (7,509,088 | ) | | | (13,230,678 | ) | | | (18,750,542 | ) |
| | | | | | | | | | | | | | | | |
Net increase in shares outstanding | | | 7,417,491 | | | | 3,855,005 | | | | 10,955,186 | | | | 11,817,522 | |
| | | | | | | | | | | | | | | | |
See Notes to Financial Statements.
104
| | |
| | | MARCH 31, 2022 (Unaudited) |
| | | | | | | | | | | | | | |
Ultra Growth
Fund | | | U.S. Treasury
Fund | |
Six Months Ended
March 31, 2022
(Unaudited) | | | Year Ended
September 30, 2021 | | | Six Months Ended
March 31, 2022
(Unaudited) | | | Year Ended
September 30, 2021 | |
| | | | | | | | | | | | | | |
| | | | | | | | | | | | | | |
| $ | (12,529,270 | ) | | $ | (26,648,533 | ) | | $ | 3,188,635 | | | $ | 6,128,604 | |
|
157,257,793 |
| | | 315,216,686 | | | | (3,299,187 | ) | | | 39,385,439 | |
| (669,516,231 | ) | | | 415,913,507 | | | | (36,309,052 | ) | | | (112,378,324 | ) |
| | | | | | | | | | | | | | |
| (524,787,708 | ) | | | 704,481,660 | | | | (36,419,604 | ) | | | (66,864,281 | ) |
| | | |
| | | | | | | | | | | | | | |
| | (229,039,647 | ) | | | (61,840,753 | ) | | | (3,292,078 | ) | | | (38,402,521 | ) |
| | (76,370,747 | ) | | | (16,342,126 | ) | | | — | | | | — | |
| | | |
| | | | | | | | | | | | | | |
| | | | | | | | | | | | | | |
| | 172,216,069 | | | | 599,052,364 | | | | 87,419,215 | | | | 209,948,604 | |
| | 218,714,597 | | | | 59,462,213 | | | | 3,083,111 | | | | 36,348,620 | |
| | (438,334,644 | ) | | | (637,371,694 | ) | | | (96,095,850 | ) | | | (223,805,099 | ) |
| | 48,641 | | | | 219,044 | | | | 39,065 | | | | 136,905 | |
| | | | | | | | | | | | | | |
| | (47,355,337 | ) | | | 21,361,927 | | | | (5,554,459 | ) | | | 22,629,030 | |
| | | | | | | | | | | | | | |
| | | | | | | | | | | | | | |
| | 155,076,055 | | | | 392,665,468 | | | | — | | | | — | |
| | 74,406,337 | | | | 16,004,270 | | | | — | | | | — | |
| | (152,718,791 | ) | | | (165,082,752 | ) | | | — | | | | — | |
| | 1,768 | | | | 77,106 | | | | — | | | | — | |
| | | | | | | | | | | | | | |
| | 76,765,369 | | | | 243,664,092 | | | | — | | | | — | |
| | | | | | | | | | | | | | |
| | (800,788,070 | ) | | | 891,324,800 | | | | (45,266,141 | ) | | | (82,637,772 | ) |
| | | |
| | | | | | | | | | | | | | |
| | 2,972,992,609 | | | | 2,081,667,809 | | | | 462,948,683 | | | | 545,586,455 | |
| | | | | | | | | | | | | | |
| $ | 2,172,204,539 | | | $ | 2,972,992,609 | | | $ | 417,682,542 | | | $ | 462,948,683 | |
| | | | | | | | | | | | | | |
| | | |
| | | | | | | | | | | | | | |
| | | | | | | | | | | | | | |
| | 4,063,674 | | | | 12,414,162 | | | | 4,844,176 | | | | 11,250,430 | |
| | 5,346,238 | | | | 1,276,013 | | | | 173,945 | | | | 1,841,330 | |
| | (10,566,732 | ) | | | (13,262,721 | ) | | | (5,444,588 | ) | | | (11,858,247 | ) |
| | | | | | | | | | | | | | |
| | (1,156,820 | ) | | | 427,454 | | | | (426,467 | ) | | | 1,233,513 | |
| | | | | | | | | | | | | | |
| | | | | | | | | | | | | | |
| | 3,719,989 | | | | 8,228,836 | | | | — | | | | — | |
| | 1,815,231 | | | | 343,145 | | | | — | | | | — | |
| | (3,679,818 | ) | | | (3,318,408 | ) | | | — | | | | — | |
| | | | | | | | | | | | | | |
| | 1,855,402 | | | | 5,253,573 | | | | — | | | | — | |
| | | | | | | | | | | | | | |
105
Statement of Cash Flows
| | | | | |
| | | Long/Short
Alpha Fund1 |
| | | Six Months Ended March 31, 2022 (Unaudited) |
| | | | | |
Cash flows used in operating activities: | | | | | |
Net decrease in net assets resulting from operations | | | $ | (1,278,393 | ) |
Adjustments to reconcile net increase in net assets resulting from operations to net cash used in operating activities | | | | | |
Long-term investments purchased | | | | (38,944,561 | ) |
Long-term investments sold | | | | 6,162,619 | |
Purchases to cover securities sold short | | | | (2,286,576 | ) |
Securities sold short | | | | 16,423,109 | |
Increase in investment securities sold receivable | | | | (1,110,801 | ) |
Increase in dividends and interest receivable | | | | (8,957 | ) |
Increase in prepaid expenses and other assets | | | | (88,409 | ) |
Increase in dividends payable on securities sold short | | | | 164 | |
Increase in accrued fund administration fees | | | | 1,292 | |
Increase in payable to advisor | | | | 13,495 | |
Increase in accrued expenses and other liabilities | | | | 15,016 | |
Net change in unrealized appreciation on unaffiliated investments | | | | 2,701,992 | |
Net realized loss from unaffiliated investments | | | | 587,235 | |
Net realized gain from securities sold short | | | | (237,800 | ) |
Net change in unrealized depreciation on securities sold short | | | | (1,890,946 | ) |
| | | | | |
Net cash used in operating activities | | | | (19,941,521 | ) |
| | | | | |
| |
Cash flows from financing activities: | | | | | |
Proceeds from shares sold | | | | 28,655,548 | |
Payment on shares redeemed | | | | (1,950,555 | ) |
Redemption fees | | | | 4,123 | |
| | | | | |
Net cash from financing activities | | | | 26,709,116 | |
| | | | | |
| |
Net increase in cash | | | | 6,767,595 | |
Cash at beginning of period | | | | — | |
| | | | | |
Cash at end of period | | | $ | 6,767,595 | |
| | | | | |
| 1 | Fund inception date was October 1, 2021. |
See Notes to Financial Statements.
106
(This page intentionally left blank.)
107
Financial Highlights
| | | | | | | | | | | | | | | | | | | | | | | | | | | | | | | | | | | | | | | | |
| | | | | Income (Loss) from
Investment Operations | | | | | | Less Distributions | | |
| | | Net Asset
Value
Beginning
Of Period | | Net
Investment
Income (Loss) | | Net Realized
And Unrealized
Gains (Losses)
On Investments | | Total from
Investment
Operations | | Redemption
Fees
(See Note 2) | | Dividends
From Net
Investment
Income | | Distributions
From Net
Realized
Gains | | Total
Distributions |
| Core Growth Fund — Investor Class | | | | | | | | | | | | | | | | | | | | | | | | | | | | | | | | | | | | |
| Six Months ended 3/31/22 (unaudited) | | | $ | 104.75 | | | | | (0.24 | ) | | | | (9.51 | ) | | | | (9.75 | ) | | | | — | 4 | | | | — | | | | | (15.83 | ) | | | | (15.83 | ) |
| Year ended 9/30/21 | | | $ | 77.61 | | | | | (0.63 | ) | | | | 34.37 | | | | | 33.74 | | | | | — | 4 | | | | — | | | | | (6.60 | ) | | | | (6.60 | ) |
| Year ended 9/30/20 | | | $ | 73.17 | | | | | (0.32 | ) | | | | 12.47 | | | | | 12.15 | | | | | — | 4 | | | | — | | | | | (7.71 | ) | | | | (7.71 | ) |
| Year ended 9/30/19 | | | $ | 81.04 | | | | | (0.42 | ) | | | | (1.40 | ) | | | | (1.82 | ) | | | | 0.01 | | | | | — | | | | | (6.06 | ) | | | | (6.06 | ) |
| Year ended 9/30/18 | | | $ | 67.44 | | | | | (0.43 | ) | | | | 18.30 | | | | | 17.87 | | | | | — | 4 | | | | — | | | | | (4.27 | ) | | | | (4.27 | ) |
| Year ended 9/30/17 | | | $ | 56.90 | | | | | (0.50 | ) | | | | 11.13 | | | | | 10.63 | | | | | — | 4 | | | | — | | | | | (0.09 | ) | | | | (0.09 | ) |
| Core Growth Fund — Institutional Class | | | | | | | | | | | | | | | | | | | | | | | | | | | | | | | | | | | | |
| Six Months ended 3/31/22 (unaudited) | | | $ | 106.20 | | | | | (0.25 | ) | | | | (9.62 | ) | | | | (9.87 | ) | | | | — | 4 | | | | — | | | | | (15.83 | ) | | | | (15.83 | ) |
| Year ended 9/30/21 | | | $ | 78.53 | | | | | (0.50 | ) | | | | 34.77 | | | | | 34.27 | | | | | — | 4 | | | | — | | | | | (6.60 | ) | | | | (6.60 | ) |
| Year ended 9/30/20 | | | $ | 73.86 | | | | | (0.29 | ) | | | | 12.67 | | | | | 12.38 | | | | | — | 4 | | | | — | | | | | (7.71 | ) | | | | (7.71 | ) |
| Year ended 9/30/19 | | | $ | 81.62 | | | | | (0.26 | ) | | | | (1.44 | ) | | | | (1.70 | ) | | | | — | 4 | | | | — | | | | | (6.06 | ) | | | | (6.06 | ) |
| Year ended 9/30/18 | | | $ | 67.81 | | | | | (0.21 | ) | | | | 18.29 | | | | | 18.08 | | | | | — | 4 | | | | — | | | | | (4.27 | ) | | | | (4.27 | ) |
| Year ended 9/30/17 | | | $ | 57.16 | | | | | (0.30 | ) | | | | 11.07 | | | | | 10.77 | | | | | — | 4 | | | | (0.03 | ) | | | | (0.09 | ) | | | | (0.12 | ) |
| Emerging India Fund — Investor Class | | | | | | | | | | | | | | | | | | | | | | | | | | | | | | | | | | | | |
| Six Months ended 3/31/22 (unaudited) | | | $ | 6.95 | | | | | (0.02 | ) | | | | (0.20 | ) | | | | (0.22 | ) | | | | — | 4 | | | | — | | | | | (0.30 | ) | | | | (0.30 | ) |
| Year ended 9/30/21 | | | $ | 4.22 | | | | | (0.05 | ) | | | | 2.78 | | | | | 2.73 | | | | | — | 4 | | | | — | | | | | — | | | | | — | |
| Year ended 9/30/20 | | | $ | 4.25 | | | | | (0.06 | ) | | | | 0.04 | | | | | (0.02 | ) | | | | — | 4 | | | | — | | | | | (0.01 | ) | | | | (0.01 | ) |
| Year ended 9/30/19 | | | $ | 3.95 | | | | | (0.05 | ) | | | | 0.62 | | | | | 0.57 | | | | | — | 4 | | | | — | | | | | (0.27 | ) | | | | (0.27 | ) |
| Year ended 9/30/18 | | | $ | 4.08 | | | | | (0.06 | ) | | | | 0.06 | | | | | — | | | | | — | 4 | | | | — | | | | | (0.13 | ) | | | | (0.13 | ) |
| Year ended 9/30/17 | | | $ | 3.39 | | | | | 0.02 | 9 | | | | 0.70 | | | | | 0.72 | | | | | — | 4 | | | | — | | | | | (0.03 | ) | | | | (0.03 | ) |
| Emerging India Fund — Institutional Class | | | | | | | | | | | | | | | | | | | | | | | | | | | | | | | | | | | | |
| Six Months ended 3/31/22 (unaudited) | | | $ | 7.03 | | | | | (0.03 | ) | | | | (0.20 | ) | | | | (0.23 | ) | | | | — | 4 | | | | — | | | | | (0.30 | ) | | | | (0.30 | ) |
| Year ended 9/30/21 | | | $ | 4.26 | | | | | (0.05 | ) | | | | 2.82 | | | | | 2.77 | | | | | — | 4 | | | | — | | | | | — | | | | | — | |
| Year ended 9/30/20 | | | $ | 4.28 | | | | | (0.02 | ) | | | | 0.01 | | | | | (0.01 | ) | | | | — | 4 | | | | — | | | | | (0.01 | ) | | | | (0.01 | ) |
| Year ended 9/30/19 | | | $ | 3.97 | | | | | (0.01 | ) | | | | 0.59 | | | | | 0.58 | | | | | — | 4 | | | | — | | | | | (0.27 | ) | | | | (0.27 | ) |
| Year ended 9/30/18 | | | $ | 4.10 | | | | | — | 4 | | | | — | 4 | | | | — | 4 | | | | — | 4 | | | | — | | | | | (0.13 | ) | | | | (0.13 | ) |
| Year ended 9/30/17 | | | $ | 3.40 | | | | | 0.02 | 9 | | | | 0.71 | | | | | 0.73 | | | | | — | 4 | | | | — | | | | | (0.03 | ) | | | | (0.03 | ) |
| Emerging Markets Select Fund — Investor Class | | | | | | | | | | | | | | | | | | | | | | | | | | | | | | | | | | | | |
| Six Months ended 3/31/22 (unaudited) | | | $ | 22.49 | | | | | (0.10 | ) | | | | (3.60 | ) | | | | (3.70 | ) | | | | 0.03 | | | | | — | | | | | (0.09 | ) | | | | (0.09 | ) |
| Year ended 9/30/21 | | | $ | 14.40 | | | | | 0.11 | | | | | 7.97 | | | | | 8.08 | | | | | 0.01 | | | | | — | | | | | — | | | | | — | |
| Year ended 9/30/20 | | | $ | 11.32 | | | | | (0.04 | ) | | | | 3.12 | | | | | 3.08 | | | | | — | 4 | | | | — | | | | | — | | | | | — | |
| Year ended 9/30/19 | | | $ | 10.40 | | | | | (0.13 | ) | | | | 1.05 | | | | | 0.92 | | | | | — | 4 | | | | — | | | | | — | | | | | — | |
| Year ended 9/30/18 | | | $ | 10.46 | | | | | (0.09 | ) | | | | 0.03 | | | | | (0.06 | ) | | | | — | 4 | | | | — | | | | | — | | | | | — | |
| Year ended 9/30/17 | | | $ | 9.23 | | | | | (0.03 | ) | | | | 1.26 | | | | | 1.23 | | | | | — | 4 | | | | — | | | | | — | | | | | — | |
| Emerging Markets Select Fund — Institutional Class | | | | | | | | | | | | | | | | | | | | | | | | | | | | | | | | | | | | |
| Six Months ended 3/31/22 (unaudited) | | | $ | 23.01 | | | | | (0.04 | ) | | | | (3.73 | ) | | | | (3.77 | ) | | | | — | 4 | | | | — | | | | | (0.09 | ) | | | | (0.09 | ) |
| Year ended 9/30/21 | | | $ | 14.71 | | | | | (0.03 | ) | | | | 8.33 | | | | | 8.30 | | | | | — | 4 | | | | — | | | | | — | | | | | — | |
| Year ended 9/30/20 | | | $ | 11.53 | | | | | (0.05 | ) | | | | 3.23 | | | | | 3.18 | | | | | — | 4 | | | | — | | | | | — | | | | | — | |
| Year ended 9/30/19 | | | $ | 10.56 | | | | | (0.01 | ) | | | | 0.98 | | | | | 0.97 | | | | | — | 4 | | | | — | | | | | — | | | | | — | |
| Year ended 9/30/18 | | | $ | 10.60 | | | | | (0.04 | ) | | | | — | 4 | | | | (0.04 | ) | | | | — | 4 | | | | — | | | | | — | | | | | — | |
| Year ended 9/30/17 | | | $ | 9.32 | | | | | (0.01 | ) | | | | 1.29 | | | | | 1.28 | | | | | — | 4 | | | | — | | | | | — | | | | | — | |
See Notes to Financial Highlights and Notes to Financial Statements.
108
| | |
| | | (for a share outstanding throughout each period) |
| | | | | | | | | | | | | | | | | | | | | | | | | | | | | | |
| | | | | | | Ratios to Average Net Assets | | | Supplemental Data | |
Net Asset
Value End of
Period | | | Total Return (%)1 | | | Expenses
Net of
Waivers and
Reimbursements (%)2 | | | Expenses
Before
Waivers and
Reimbursements (%)2 | | | Net Investment
Income Net (Loss)
Of Waivers and
Reimbursements (%)2 | | | Net Investment
Income (Loss)
Before Waivers and
Reimbursements (%)2 | | | Net Assets
End of Period
(000s) | | | Portfolio
Turnover
Rate1 3 | |
| | | | | | | | | | | | | | | | | | | | | | | | | | | | | | |
| $ | 79.17 | | | | (11.12 | ) | | | 1.16 | 5 8 | | | 1.16 | 5 8 | | | (0.59 | ) | | | (0.59 | ) | | $ | 1,849,035 | | | | 12% | |
| $ | 104.75 | | | | 44.82 | | | | 1.17 | 5 | | | 1.17 | 5 | | | (0.65 | ) | | | (0.65 | ) | | $ | 2,174,178 | | | | 35% | |
| $ | 77.61 | | | | 17.41 | | | | 1.19 | 5 | | | 1.19 | 5 | | | (0.48 | ) | | | (0.48 | ) | | $ | 1,595,920 | | | | 38% | |
| $ | 73.17 | | | | (0.37 | ) | | | 1.19 | 5 | | | 1.19 | 5 | | | (0.59 | ) | | | (0.59 | ) | | $ | 1,435,994 | | | | 31% | |
| $ | 81.04 | | | | 27.66 | | | | 1.18 | 5 8 | | | 1.18 | 5 8 | | | (0.66 | ) | | | (0.66 | ) | | $ | 1,577,554 | | | | 27% | |
| $ | 67.44 | | | | 18.69 | | | | 1.21 | 5 | | | 1.21 | 5 | | | (0.78 | ) | | | (0.78 | ) | | $ | 1,211,089 | | | | 26% | |
| | | | | | | | | | | | | | | | | | | | | | | | | | | | | | |
| $ | 80.50 | | | | (11.07 | ) | | | 1.05 | 5 8 | | | 1.05 | 5 8 | | | (0.47 | ) | | | (0.47 | ) | | $ | 1,674,633 | | | | 12% | |
| $ | 106.20 | | | | 44.98 | | | | 1.05 | | | | 1.05 | | | | (0.54 | ) | | | (0.55 | ) | | $ | 1,865,201 | | | | 35% | |
| $ | 78.53 | | | | 17.58 | | | | 1.05 | | | | 1.08 | | | | (0.45 | ) | | | (0.48 | ) | | $ | 1,134,229 | | | | 38% | |
| $ | 73.86 | | | | (0.22 | ) | | | 1.05 | | | | 1.09 | | | | (0.45 | ) | | | (0.48 | ) | | $ | 849,787 | | | | 31% | |
| $ | 81.62 | | | | 27.82 | | | | 1.06 | 8 | | | 1.08 | 8 | | | (0.53 | ) | | | (0.55 | ) | | $ | 722,302 | | | | 27% | |
| $ | 67.81 | | | | 18.87 | | | | 1.05 | | | | 1.10 | | | | (0.63 | ) | | | (0.67 | ) | | $ | 383,159 | | | | 26% | |
| | | | | | | | | | | | | | | | | | | | | | | | | | | | | | |
| $ | 6.43 | | | | (3.37 | ) | | | 1.45 | 5 8 | | | 1.45 | 5 8 | | | (1.26 | ) | | | (1.26 | ) | | $ | 275,017 | | | | 11% | |
| $ | 6.95 | | | | 64.69 | | | | 1.52 | 5 | | | 1.52 | 5 | | | (1.15 | ) | | | (1.15 | ) | | $ | 258,617 | | | | 21% | |
| $ | 4.22 | | | | (0.38 | ) | | | 1.64 | 6 | | | 1.64 | 6 | | | (0.89 | ) | | | (0.89 | ) | | $ | 136,415 | | | | 44% | |
| $ | 4.25 | | | | 15.06 | | | | 1.68 | 6 | | | 1.68 | 6 | | | (0.99 | ) | | | (0.99 | ) | | $ | 187,625 | | | | 21% | |
| $ | 3.95 | | | | (0.33 | ) | | | 1.71 | 6 7 | | | 1.71 | 6 7 | | | (1.22 | ) | | | (1.22 | ) | | $ | 184,733 | | | | 48% | |
| $ | 4.08 | | | | 21.65 | | | | 1.73 | 5 | | | 1.73 | 5 | | | (0.92 | ) | | | (0.92 | ) | | $ | 207,949 | | | | 17% | |
| | | | | | | | | | | | | | | | | | | | | | | | | | | | | | |
| $ | 6.50 | | | | (3.48 | ) | | | 1.35 | 5 8 | | | 1.35 | 5 8 | | | (1.16 | ) | | | (1.16 | ) | | $ | 382,865 | | | | 11% | |
| $ | 7.03 | | | | 65.02 | | | | 1.37 | 5 | | | 1.37 | 5 | | | (0.97 | ) | | | (0.97 | ) | | $ | 358,401 | | | | 21% | |
| $ | 4.26 | | | | (0.15 | ) | | | 1.45 | 6 | | | 1.45 | 6 | | | (0.69 | ) | | | (0.69 | ) | | $ | 145,981 | | | | 44% | |
| $ | 4.28 | | | | 15.23 | | | | 1.49 | 6 | | | 1.49 | 6 | | | (0.75 | ) | | | (0.75 | ) | | $ | 92,214 | | | | 21% | |
| $ | 3.97 | | | | (0.33 | ) | | | 1.51 | 6 8�� | | | 1.60 | 6 8 | | | (0.93 | ) | | | (1.02 | ) | | $ | 42,457 | | | | 48% | |
| $ | 4.10 | | | | 21.89 | | | | 1.50 | 5 | | | 1.67 | 5 | | | (0.77 | ) | | | (0.94 | ) | | $ | 23,739 | | | | 17% | |
| | | | | | | | | | | | | | | | | | | | | | | | | | | | | | |
| $ | 18.73 | | | | (16.34 | ) | | | 1.21 | 5 8 | | | 1.21 | 5 8 | | | (1.03 | ) | | | (1.03 | ) | | $ | 94,081 | | | | 11% | |
| $ | 22.49 | | | | 56.18 | | | | 1.37 | 5 | | | 1.37 | 5 | | | (0.55 | ) | | | (0.55 | ) | | $ | 93,932 | | | | 20% | |
| $ | 14.40 | | | | 27.21 | | | | 1.51 | 6 | | | 1.80 | 6 | | | (0.69 | ) | | | (0.99 | ) | | $ | 14,984 | | | | 35% | |
| $ | 11.32 | | | | 8.85 | 5 | | | 1.51 | 6 | | | 1.97 | 6 | | | (0.51 | ) | | | (0.97 | ) | | $ | 9,771 | | | | 14% | |
| $ | 10.40 | | | | (0.57 | ) | | | 1.51 | 6 8 | | | 1.76 | 6 8 | | | (0.67 | ) | | | (0.92 | ) | | $ | 13,520 | | | | 44% | |
| $ | 10.46 | | | | 13.33 | | | | 1.51 | 6 | | | 1.90 | 6 | | | (0.38 | ) | | | (0.76 | ) | | $ | 15,273 | | | | 55% | |
| | | | | | | | | | | | | | | | | | | | | | | | | | | | | | |
| $ | 19.15 | | | | (16.37 | ) | | | 1.08 | 5 8 | | | 1.08 | 5 8 | | | (0.88 | ) | | | (0.88 | ) | | $ | 388,211 | | | | 11% | |
| $ | 23.01 | | | | 56.42 | | | | 1.18 | 5 | | | 1.18 | 5 | | | (0.44 | ) | | | (0.44 | ) | | $ | 170,294 | | | | 20% | |
| $ | 14.71 | | | | 27.58 | | | | 1.21 | 6 | | | 1.41 | 6 | | | (0.40 | ) | | | (0.59 | ) | | $ | 43,682 | | | | 35% | |
| $ | 11.53 | | | | 9.19 | | | | 1.21 | 6 | | | 1.43 | 6 | | | (0.14 | ) | | | (0.36 | ) | | $ | 34,375 | | | | 14% | |
| $ | 10.56 | | | | (0.38 | ) | | | 1.21 | 6 8 | | | 1.45 | 6 8 | | | (0.36 | ) | | | (0.60 | ) | | $ | 30,215 | | | | 44% | |
| $ | 10.60 | | | | 13.73 | | | | 1.21 | 6 | | | 1.52 | 6 | | | (0.09 | ) | | | (0.39 | ) | | $ | 28,868 | | | | 55% | |
109
Financial Highlights (continued)
| | | | | | | | | | | | | | | | | | | | | | | | | | | | | | | | | | | | | | | | |
| | | | | Income (Loss) from
Investment Operations | | | | | | Less Distributions | | |
| | | Net Asset
Value
Beginning
Of Period | | Net
Investment
Income (Loss) | | Net Realized
And Unrealized
Gains (Losses)
On Investments | | Total from
Investment
Operations | | Redemption
Fees
(See Note 2) | | Dividends
From Net
Investment
Income | | Distributions
From Net
Realized
Gains | | Total
Distributions |
| Emerging Markets Small Cap Fund — Investor Class | | | | | | | | | | | | | | | | | | | | | | | | | | | | | | | | | | | | |
| Six Months ended 3/31/22 (unaudited) | | | $ | 4.23 | | | | | (0.02 | ) | | | | (0.52 | ) | | | | (0.54 | ) | | | | — | 4 | | | | (0.01 | ) | | | | (0.24 | ) | | | | (0.25 | ) |
| Year ended 9/30/21 | | | $ | 3.02 | | | | | (0.03 | ) | | | | 1.49 | | | | | 1.46 | | | | | — | 4 | | | | — | | | | | (0.25 | ) | | | | (0.25 | ) |
| Year ended 9/30/20 | | | $ | 2.64 | | | | | (0.04 | ) | | | | 0.58 | | | | | 0.54 | | | | | — | 4 | | | | — | | | | | (0.16 | ) | | | | (0.16 | ) |
| Year ended 9/30/19 | | | $ | 2.78 | | | | | (0.05 | ) | | | | 0.21 | | | | | 0.16 | | | | | — | 4 | | | | — | | | | | (0.30 | ) | | | | (0.30 | ) |
| Year ended 9/30/18 | | | $ | 2.99 | | | | | (0.03 | ) | | | | (0.18 | ) | | | | (0.21 | ) | | | | — | 4 | | | | — | | | | | — | | | | | — | |
| Year ended 9/30/17 | | | $ | 2.67 | | | | | (0.04 | ) | | | | 0.36 | | | | | 0.32 | | | | | — | 4 | | | | — | | | | | — | | | | | — | |
| Emerging Markets Small Cap Fund — Institutional Class | | | | | | | | | | | | | | | | | | | | | | | | | | | | | | | | | | | | |
| Six Months ended 3/31/22 (unaudited) | | | $ | 4.27 | | | | | (0.01 | )4 | | | | (0.52 | ) | | | | (0.53 | ) | | | | — | 4 | | | | (0.01 | ) | | | | (0.25 | ) | | | | (0.26 | ) |
| Year ended 9/30/21 | | | $ | 3.04 | | | | | (0.03 | ) | | | | 1.51 | | | | | 1.48 | | | | | — | 4 | | | | — | | | | | (0.25 | ) | | | | (0.25 | ) |
| Year ended 9/30/20 | | | $ | 2.65 | | | | | (0.02 | ) | | | | 0.57 | | | | | 0.55 | | | | | — | 4 | | | | — | | | | | (0.16 | ) | | | | (0.16 | ) |
| Year ended 9/30/19 | | | $ | 2.79 | | | | | (0.02 | ) | | | | 0.18 | | | | | 0.16 | | | | | — | 4 | | | | — | | | | | (0.30 | ) | | | | (0.30 | ) |
| Year ended 9/30/18 | | | $ | 3.00 | | | | | (0.01 | ) | | | | (0.20 | ) | | | | (0.21 | ) | | | | — | 4 | | | | — | | | | | — | | | | | — | |
| Year ended 9/30/17 | | | $ | 2.67 | | | | | 0.01 | | | | | 0.32 | | | | | 0.33 | | | | | — | 4 | | | | — | | | | | — | | | | | — | |
| Frontier Emerging Small Countries Fund — Investor Class | | | | | | | | | | | | | | | | | | | | | | | | | | | | | | | | | | | | |
| Six Months ended 3/31/22 (unaudited) | | | $ | 4.40 | | | | | (0.03 | ) | | | | (0.92 | ) | | | | (0.95 | ) | | | | — | 4 | | | | (0.03 | ) | | | | — | | | | | (0.03 | ) |
| Year ended 9/30/21 | | | $ | 3.02 | | | | | (0.07 | ) | | | | 1.45 | | | | | 1.38 | | | | | — | 4 | | | | — | | | | | — | | | | | — | |
| Year ended 9/30/20 | | | $ | 2.74 | | | | | (0.07 | ) | | | | 0.35 | | | | | 0.28 | | | | | — | 4 | | | | — | | | | | — | | | | | — | |
| Year ended 9/30/19 | | | $ | 2.51 | | | | | — | 4 | | | | 0.23 | | | | | 0.23 | | | | | — | 4 | | | | — | | | | | — | | | | | — | |
| Year ended 9/30/18 | | | $ | 2.75 | | | | | (0.11 | ) | | | | (0.13 | ) | | | | (0.24 | ) | | | | — | 4 | | | | — | | | | | — | | | | | — | |
| Year ended 9/30/17 | | | $ | 2.63 | | | | | (0.08 | ) | | | | 0.20 | | | | | 0.12 | | | | | — | 4 | | | | — | | | | | — | | | | | — | |
| Frontier Emerging Small Countries Fund — Institutional Class | | | | | | | | | | | | | | | | | | | | | | | | | | | | | | | | | | | | |
| Six Months ended 3/31/22 (unaudited) | | | $ | 4.46 | | | | | (0.01 | ) | | | | (0.95 | ) | | | | (0.96 | ) | | | | — | 4 | | | | (0.04 | ) | | | | — | | | | | (0.04 | ) |
| Year ended 9/30/21 | | | $ | 3.05 | | | | | (0.04 | ) | | | | 1.45 | | | | | 1.41 | | | | | — | 4 | | | | — | | | | | — | | | | | — | |
| Year ended 9/30/20 | | | $ | 2.76 | | | | | (0.08 | ) | | | | 0.37 | | | | | 0.29 | | | | | — | 4 | | | | — | | | | | — | | | | | — | |
| Year ended 9/30/19 | | | $ | 2.53 | | | | | 0.03 | | | | | 0.20 | | | | | 0.23 | | | | | — | 4 | | | | — | | | | | — | | | | | — | |
| Year ended 9/30/18 | | | $ | 2.76 | | | | | (0.04 | ) | | | | (0.19 | ) | | | | (0.23 | ) | | | | — | 4 | | | | — | | | | | — | | | | | — | |
| Year ended 9/30/17 | | | $ | 2.64 | | | | | (0.06 | ) | | | | 0.18 | | | | | 0.12 | | | | | — | 4 | | | | — | | | | | — | | | | | — | |
| Global Opportunities Fund — Investor Class | | | | | | | | | | | | | | | | | | | | | | | | | | | | | | | | | | | | |
| Six Months ended 3/31/22 (unaudited) | | | $ | 5.83 | | | | | (0.02 | ) | | | | (0.79 | ) | | | | (0.81 | ) | | | | — | 4 | | | | — | 4 | | | | (0.44 | ) | | | | (0.44 | ) |
| Year ended 9/30/21 | | | $ | 3.92 | | | | | (0.04 | ) | | | | 2.05 | | | | | 2.01 | | | | | — | 4 | | | | — | | | | | (0.10 | ) | | | | (0.10 | ) |
| Year ended 9/30/20 | | | $ | 3.46 | | | | | (0.05 | ) | | | | 0.81 | | | | | 0.76 | | | | | — | 4 | | | | — | | | | | (0.30 | ) | | | | (0.30 | ) |
| Year ended 9/30/19 | | | $ | 4.09 | | | | | (0.03 | ) | | | | (0.06 | ) | | | | (0.09 | ) | | | | — | 4 | | | | — | | | | | (0.54 | ) | | | | (0.54 | ) |
| Year ended 9/30/18 | | | $ | 3.76 | | | | | (0.03 | ) | | | | 0.77 | | | | | 0.74 | | | | | — | 4 | | | | — | | | | | (0.41 | ) | | | | (0.41 | ) |
| Year ended 9/30/17 | | | $ | 3.52 | | | | | (0.07 | ) | | | | 0.58 | | | | | 0.51 | | | | | — | 4 | | | | — | 4 | | | | (0.27 | ) | | | | (0.27 | ) |
| Global Opportunities Fund — Institutional Class | | | | | | | | | | | | | | | | | | | | | | | | | | | | | | | | | | | | |
| Six Months ended 3/31/22 (unaudited) | | | $ | 5.88 | | | | | (0.01 | ) | | | | (0.81 | ) | | | | (0.82 | ) | | | | — | 4 | | | | (0.01 | ) | | | | (0.43 | ) | | | | (0.44 | ) |
| Year ended 9/30/21 | | | $ | 3.94 | | | | | (0.05 | ) | | | | 2.09 | | | | | 2.04 | | | | | — | 4 | | | | — | | | | | (0.10 | ) | | | | (0.10 | ) |
| Year ended 9/30/20 | | | $ | 3.48 | | | | | (0.03 | ) | | | | 0.79 | | | | | 0.76 | | | | | — | 4 | | | | — | | | | | (0.30 | ) | | | | (0.30 | ) |
| Year ended 9/30/19 | | | $ | 4.10 | | | | | (0.03 | ) | | | | (0.05 | ) | | | | (0.08 | ) | | | | — | | | | | — | | | | | (0.54 | ) | | | | (0.54 | ) |
| Year ended 9/30/18 | | | $ | 3.76 | | | | | (0.02 | ) | | | | 0.77 | | | | | 0.75 | | | | | — | | | | | — | | | | | (0.41 | ) | | | | (0.41 | ) |
| Year ended 9/30/17 | | | $ | 3.52 | | | | | (0.02 | ) | | | | 0.54 | | | | | 0.52 | | | | | — | | | | | (0.01 | ) | | | | (0.27 | ) | | | | (0.28 | ) |
| Global Select Fund — Investor Class | | | | | | | | | | | | | | | | | | | | | | | | | | | | | | | | | | | | |
| Six Months ended 3/31/22 (unaudited) | | | $ | 15.83 | | | | | (0.06 | ) | | | | (2.31 | ) | | | | (2.37 | ) | | | | — | 4 | | | | — | | | | | (1.78 | ) | | | | (1.78 | ) |
| Year ended 9/30/21 | | | $ | 12.60 | | | | | (0.12 | ) | | | | 3.36 | | | | | 3.24 | | | | | 0.01 | | | | | — | | | | | (0.02 | ) | | | | (0.02 | ) |
| Year ended 9/30/2011 | | | $ | 10.00 | | | | | (0.06 | ) | | | | 2.65 | | | | | 2.59 | | | | | 0.01 | | | | | — | | | | | — | | | | | — | |
| Global Select Fund — Institutional Class | | | | | | | | | | | | | | | | | | | | | | | | | | | | | | | | | | | | |
| Six Months ended 3/31/22 (unaudited) | | | $ | 15.94 | | | | | (0.04 | ) | | | | (2.33 | ) | | | | (2.37 | ) | | | | — | 4 | | | | — | | | | | (1.78 | ) | | | | (1.78 | ) |
| Year ended 9/30/21 | | | $ | 12.64 | | | | | (0.07 | ) | | | | 3.39 | | | | | 3.32 | | | | | — | | | | | — | | | | | (0.02 | ) | | | | (0.02 | ) |
| Year ended 9/30/2011 | | | $ | 10.00 | | | | | (0.04 | ) | | | | 2.68 | | | | | 2.64 | | | | | — | 4 | | | | — | | | | | — | | | | | — | |
See Notes to Financial Highlights and Notes to Financial Statements.
110
| | |
| | | (for a share outstanding throughout each period) |
| | | | | | | | | | | | | | | | | | | | | | | | | | | | | | |
| | | | | | | Ratios to Average Net Assets | | | Supplemental Data | |
Net Asset
Value End of
Period | | | Total Return (%)1 | | | Expenses
Net of
Waivers and
Reimbursements (%)2 | | | Expenses
Before
Waivers and
Reimbursements (%)2 | | | Net Investment
Income Net (Loss)
Of Waivers and
Reimbursements (%)2 | | | Net Investment
Income (Loss)
Before Waivers and
Reimbursements (%)2 | | | Net Assets
End of Period
(000s) | | | Portfolio
Turnover
Rate1 3 | |
| | | | | | | | | | | | | | | | | | | | | | | | | | | | | | |
| $ | 3.44 | | | | (13.55 | ) | | | 1.84 | 5 7 | | | 1.84 | 5 7 | | | (0.89 | ) | | | (0.89 | ) | | $ | 252,749 | | | | 14% | |
| $ | 4.23 | | | | 50.23 | | | | 1.88 | 5 | | | 1.88 | 5 | | | (1.07 | ) | | | (1.07 | ) | | $ | 322,350 | | | | 22% | |
| $ | 3.02 | | | | 21.12 | | | | 1.95 | 6 | | | 1.95 | 6 | | | (1.02 | ) | | | (1.02 | ) | | $ | 197,524 | | | | 20% | |
| $ | 2.64 | | | | 7.29 | | | | 1.97 | 6 | | | 1.99 | 6 | | | (0.83 | ) | | | (0.84 | ) | | $ | 191,405 | | | | 16% | |
| $ | 2.78 | | | | (7.02 | ) | | | 1.96 | 7 | | | 1.98 | 6 7 | | | (0.51 | ) | | | (0.53 | ) | | $ | 285,540 | | | | 40% | |
| $ | 2.99 | | | | 11.99 | | | | 1.96 | 6 | | | 2.02 | 6 | | | (0.49 | ) | | | (0.56 | ) | | $ | 390,903 | | | | 58% | |
| | | | | | | | | | | | | | | | | | | | | | | | | | | | | | |
| $ | 3.48 | | | | (13.35 | ) | | | 1.74 | 5 7 | | | 1.74 | 5 7 | | | (0.81 | ) | | | (0.81 | ) | | $ | 336,553 | | | | 14% | |
| $ | 4.27 | | | | 50.53 | | | | 1.76 | 5 | | | 1.76 | 5 | | | (0.94 | ) | | | (0.94 | ) | | $ | 321,008 | | | | 22% | |
| $ | 3.04 | | | | 21.41 | | | | 1.81 | 6 | | | 1.81 | 6 | | | (0.88 | ) | | | (0.88 | ) | | $ | 176,548 | | | | 20% | |
| $ | 2.65 | | | | 7.25 | | | | 1.82 | 6 | | | 1.85 | 6 | | | (0.73 | ) | | | (0.76 | ) | | $ | 174,050 | | | | 16% | |
| $ | 2.79 | | | | (7.00 | ) | | | 1.82 | 6 7 | | | 1.84 | 6 7 | | | (0.33 | ) | | | (0.35 | ) | | $ | 240,892 | | | | 40% | |
| $ | 3.00 | | | | 12.36 | | | | 1.81 | 6 | | | 1.88 | 6 | | | (0.05 | ) | | | (0.12 | ) | | $ | 252,823 | | | | 8% | |
| | | | | | | | | | | | | | | | | | | | | | | | | | | | | | |
| $ | 3.42 | | | | (21.68 | ) | | | 2.15 | 5 8 | | | 2.16 | 5 8 | | | (1.41 | ) | | | (1.42 | ) | | $ | 40,525 | | | | 24% | |
| $ | 4.40 | | | | 45.70 | | | | 2.12 | 5 | | | 2.12 | 5 | | | (1.33 | ) | | | (1.33 | ) | | $ | 52,307 | | | | 39% | |
| $ | 3.02 | | | | 10.22 | | | | 2.15 | 5 | | | 2.38 | 5 | | | (1.12 | ) | | | (1.34 | ) | | $ | 39,899 | | | | 33% | |
| $ | 2.74 | | | | 9.16 | | | | 2.20 | 6 | | | 2.30 | 6 | | | 0.78 | | | | 0.69 | | | $ | 43,789 | | | | 63% | |
| $ | 2.51 | | | | (8.73 | ) | | | 2.22 | 6 7 | | | 2.36 | 6 7 | | | (0.39 | ) | | | (0.53 | ) | | $ | 57,406 | | | | 42% | |
| $ | 2.75 | | | | 4.56 | | | | 2.28 | 6 | | | 2.46 | 6 | | | (0.48 | ) | | | (0.67 | ) | | $ | 155,758 | | | | 59% | |
| | | | | | | | | | | | | | | | | | | | | | | | | | | | | | |
| $ | 3.46 | | | | (21.72 | ) | | | 1.92 | 5 8 | | | 1.92 | 5 8 | | | (1.15 | ) | | | (1.15 | ) | | $ | 16,675 | | | | 24% | |
| $ | 4.46 | | | | 46.23 | | | | 1.95 | 5 | | | 2.08 | 5 | | | (1.13 | ) | | | (1.26 | ) | | $ | 17,490 | | | | 39% | |
| $ | 3.05 | | | | 10.51 | | | | 1.96 | 5 | | | 2.18 | 5 | | | (0.98 | ) | | | (1.20 | ) | | $ | 10,560 | | | | 33% | |
| $ | 2.76 | | | | 9.09 | | | | 2.00 | 6 | | | 2.15 | 6 | | | 1.04 | | | | 0.90 | | | $ | 16,456 | | | | 63% | |
| $ | 2.53 | | | | (8.33 | ) | | | 2.02 | 6 8 | | | 2.11 | 6 8 | | | (0.30 | ) | | | (0.39 | ) | | $ | 20,586 | | | | 42% | |
| $ | 2.76 | | | | 4.55 | | | | 2.08 | 6 | | | 2.17 | 6 | | | (0.34 | ) | | | (0.44 | ) | | $ | 42,006 | | | | 59% | |
| | | | | | | | | | | | | | | | | | | | | | | | | | | | | | |
| $ | 4.58 | | | | (14.84 | ) | | | 1.44 | 5 8 | | | 1.44 | 5 8 | | | (1.05 | ) | | | (1.05 | ) | | $ | 157,179 | | | | 15% | |
| $ | 5.83 | | | | 51.70 | | | | 1.46 | 5 | | | 1.46 | 5 | | | (1.08 | ) | | | (1.08 | ) | | $ | 181,563 | | | | 22% | |
| $ | 3.92 | | | | 23.20 | | | | 1.53 | 5 | | | 1.53 | 5 | | | (1.03 | ) | | | (1.03 | ) | | $ | 100,698 | | | | 20% | |
| $ | 3.46 | | | | 0.82 | | | | 1.56 | 5 | | | 1.56 | 5 | | | (0.95 | ) | | | (0.95 | ) | | $ | 103,710 | | | | 24% | |
| $ | 4.09 | | | | 20.75 | | | | 1.55 | 6 8 | | | 1.55 | 6 8 | | | (0.78 | ) | | | (0.78 | ) | | $ | 110,874 | | | | 40% | |
| $ | 3.76 | | | | 16.61 | | | | 1.59 | 6 | | | 1.59 | 6 | | | (1.09 | ) | | | (1.09 | ) | | $ | 95,847 | | | | 27% | |
| | | | | | | | | | | | | | | | | | | | | | | | | | | | | | |
| $ | 4.62 | | | | (14.82 | ) | | | 1.34 | 5 8 | | | 1.34 | 5 8 | | | (0.94 | ) | | | (0.94 | ) | | $ | 81,605 | | | | 15% | |
| $ | 5.88 | | | | 52.21 | | | | 1.35 | 5 | | | 1.40 | 5 | | | (0.96 | ) | | | (1.01 | ) | | $ | 74,144 | | | | 22% | |
| $ | 3.94 | | | | 23.09 | | | | 1.35 | 5 | | | 1.48 | 5 | | | (0.83 | ) | | | (0.96 | ) | | $ | 38,795 | | | | 20% | |
| $ | 3.48 | | | | 1.09 | | | | 1.35 | 5 | | | 1.57 | 5 | | | (0.74 | ) | | | (0.95 | ) | | $ | 19,060 | | | | 24% | |
| $ | 4.10 | | | | 21.04 | | | | 1.36 | 6 8 | | | 1.66 | 6 8 | | | (0.57 | ) | | | (0.86 | ) | | $ | 15,879 | | | | 40% | |
| $ | 3.76 | | | | 16.92 | | | | 1.36 | 6 | | | 1.93 | 6 | | | (0.85 | ) | | | (1.41 | ) | | $ | 7,149 | | | | 27% | |
| | | | | | | | | | | | | | | | | | | | | | | | | | | | | | |
| $ | 11.68 | | | | (16.54 | ) | | | 1.35 | 5 8 | | | 2.12 | 5 8 | | | (0.91 | ) | | | (1.68 | ) | | $ | 5,567 | | | | 21% | |
| $ | 15.83 | | | | 25.84 | | | | 1.35 | 5 | | | 2.17 | 5 | | | (0.86 | ) | | | (1.68 | ) | | $ | 7,054 | | | | 58% | |
| $ | 12.60 | | | | 26.00 | | | | 1.36 | 6 | | | 4.70 | 6 | | | (0.81 | ) | | | (4.16 | ) | | $ | 4,306 | | | | 35% | |
| | | | | | | | | | | | | | | | | | | | | | | | | | | | | | |
| $ | 11.79 | | | | (16.34 | ) | | | 0.95 | 5 8 | | | 1.40 | 5 8 | | | (0.51 | ) | | | (0.95 | ) | | $ | 11,606 | | | | 21% | |
| $ | 15.94 | | | | 26.31 | | | | 0.95 | 5 | | | 1.56 | 5 | | | (0.46 | ) | | | (1.07 | ) | | $ | 12,385 | | | | 58% | |
| $ | 12.64 | | | | 26.40 | | | | 0.96 | 6 | | | 2.79 | 6 | | | (0.42 | ) | | | (2.25 | ) | | $ | 9,065 | | | | 35% | |
111
Financial Highlights (continued)
| | | | | | | | | | | | | | | | | | | | | | | | | | | | | | | | | | | | | | | | |
| | | | | Income (Loss) from
Investment Operations | | | | | | Less Distributions | | |
| | | Net Asset
Value
Beginning
Of Period | | Net
Investment
Income (Loss) | | Net Realized
And Unrealized
Gains (Losses)
On Investments | | Total from
Investment
Operations | | Redemption
Fees
(See Note 2) | | Dividends
From Net
Investment
Income | | Distributions
From Net
Realized
Gains | | Total
Distributions |
| Global Value Fund — Investor Class | | | | | | | | | | | | | | | | | | | | | | | | | | | | | | | | | | | | |
| Six Months ended 3/31/22 (unaudited) | | | $ | 9.24 | | | | | 0.09 | | | | | 0.78 | | | | | 0.87 | | | | | — | 4 | | | | (0.08 | ) | | | | (0.28 | ) | | | | (0.36 | ) |
| Year ended 9/30/21 | | | $ | 6.56 | | | | | 0.18 | | | | | 2.65 | | | | | 2.83 | | | | | — | 4 | | | | (0.15 | ) | | | | — | | | | | (0.15 | ) |
| Year ended 9/30/20 | | | $ | 7.74 | | | | | 0.16 | | | | | (1.09 | )13 | | | | (0.93 | ) | | | | — | 4 | | | | (0.21 | ) | | | | (0.04 | ) | | | | (0.25 | ) |
| Year ended 9/30/19 | | | $ | 9.29 | | | | | 0.19 | | | | | (0.42 | ) | | | | (0.23 | ) | | | | — | 4 | | | | (0.19 | ) | | | | (1.13 | ) | | | | (1.32 | ) |
| Year ended 9/30/18 | | | $ | 9.93 | | | | | 0.19 | | | | | 0.65 | 10 | | | | 0.84 | | | | | — | 4 | | | | (0.19 | ) | | | | (1.29 | ) | | | | (1.48 | ) |
| Year ended 9/30/17 | | | $ | 9.02 | | | | | 0.19 | | | | | 1.23 | | | | | 1.42 | | | | | — | 4 | | | | (0.19 | ) | | | | (0.32 | ) | | | | (0.51 | ) |
| Global Value Fund — Institutional Class | | | | | | | | | | | | | | | | | | | | | | | | | | | | | | | | | | | | |
| Six Months ended 3/31/22 (unaudited) | | | $ | 9.23 | | | | | 0.08 | | | | | 0.80 | | | | | 0.88 | | | | | — | 4 | | | | (0.09 | ) | | | | (0.28 | ) | | | | (0.37 | ) |
| Year ended 9/30/21 | | | $ | 6.56 | | | | | 0.19 | | | | | 2.63 | | | | | 2.82 | | | | | 0.01 | | | | | (0.16 | ) | | | | — | | | | | (0.16 | ) |
| Year ended 9/30/20 | | | $ | 7.73 | | | | | 0.16 | | | | | (1.07 | )13 | | | | (0.91 | ) | | | | — | 4 | | | | (0.22 | ) | | | | (0.04 | ) | | | | (0.26 | ) |
| Year ended 9/30/19 | | | $ | 9.28 | | | | | 0.19 | | | | | (0.41 | ) | | | | (0.22 | ) | | | | — | 4 | | | | (0.20 | ) | | | | (1.13 | ) | | | | (1.33 | ) |
| Year ended 9/30/18 | | | $ | 9.92 | | | | | 0.20 | | | | | 0.66 | 10 | | | | 0.86 | | | | | — | 4 | | | | (0.20 | ) | | | | (1.30 | ) | | | | (1.50 | ) |
| Year ended 9/30/17 | | | $ | 9.01 | | | | | 0.18 | | | | | 1.25 | | | | | 1.43 | | | | | — | 4 | | | | (0.20 | ) | | | | (0.32 | ) | | | | (0.52 | ) |
| Greater China Fund — Investor Class | | | | | | | | | | | | | | | | | | | | | | | | | | | | | | | | | | | | |
| Six Months ended 3/31/22 (unaudited) | | | $ | 9.83 | | | | | (0.07 | ) | | | | (1.88 | ) | | | | (1.95 | ) | | | | 0.03 | | | | | — | | | | | — | | | | | — | |
| Period ended 9/30/2114 | | | $ | 10.00 | | | | | (0.05 | ) | | | | (0.17 | ) | | | | (0.22 | ) | | | | 0.05 | | | | | — | | | | | — | | | | | — | |
| Greater China Fund — Institutional Class | | | | | | | | | | | | | | | | | | | | | | | | | | | | | | | | | | | | |
| Six Months ended 3/31/22 (unaudited) | | | $ | 9.82 | | | | | (0.04 | ) | | | | (1.90 | ) | | | | (1.94 | ) | | | | — | 4 | | | | — | | | | | — | | | | | — | |
| Period ended 9/30/2114 | | | $ | 10.00 | | | | | (0.03 | ) | | | | (0.15 | ) | | | | (0.18 | ) | | | | — | 4 | | | | — | | | | | — | | | | | — | |
| International Growth Fund — Investor Class | | | | | | | | | | | | | | | | | | | | | | | | | | | | | | | | | | | | |
| Six Months ended 3/31/22 (unaudited) | | | $ | 38.79 | | | | | (0.04 | ) | | | | (6.27 | ) | | | | (6.31 | ) | | | | — | 4 | | | | — | | | | | (3.53 | ) | | | | (3.53 | ) |
| Year ended 9/30/21 | | | $ | 34.07 | | | | | (0.17 | ) | | | | 8.68 | | | | | 8.51 | | | | | — | 4 | | | | — | | | | | (3.79 | ) | | | | (3.79 | ) |
| Year ended 9/30/20 | | | $ | 28.23 | | | | | (0.20 | ) | | | | 6.82 | | | | | 6.62 | | | | | — | 4 | | | | — | | | | | (0.78 | ) | | | | (0.78 | ) |
| Year ended 9/30/19 | | | $ | 36.95 | | | | | (0.08 | ) | | | | (4.26 | ) | | | | (4.34 | ) | | | | — | 4 | | | | — | | | | | (4.38 | ) | | | | (4.38 | ) |
| Year ended 9/30/18 | | | $ | 33.84 | | | | | (— | )4 | | | | 4.04 | | | | | 4.04 | | | | | — | 4 | | | | — | | | | | (0.93 | ) | | | | (0.93 | ) |
| Year ended 9/30/17 | | | $ | 31.43 | | | | | (0.13 | ) | | | | 3.61 | | | | | 3.48 | | | | | — | 4 | | | | — | | | | | (1.07 | ) | | | | (1.07 | ) |
| International Growth Fund — Institutional Class | | | | | | | | | | | | | | | | | | | | | | | | | | | | | | | | | | | | |
| Six Months ended 3/31/22 (unaudited) | | | $ | 39.04 | | | | | (0.03 | ) | | | | (6.31 | ) | | | | (6.34 | ) | | | | — | 4 | | | | — | | | | | (3.53 | ) | | | | (3.53 | ) |
| Year ended 9/30/21 | | | $ | 34.24 | | | | | (0.13 | ) | | | | 8.72 | | | | | 8.59 | | | | | — | 4 | | | | — | | | | | (3.79 | ) | | | | (3.79 | ) |
| Year ended 9/30/20 | | | $ | 28.33 | | | | | (0.12 | ) | | | | 6.81 | | | | | 6.69 | | | | | — | 4 | | | | — | | | | | (0.78 | ) | | | | (0.78 | ) |
| Year ended 9/30/19 | | | $ | 37.03 | | | | | (0.04 | ) | | | | (4.28 | ) | | | | (4.32 | ) | | | | — | 4 | | | | — | | | | | (4.38 | ) | | | | (4.38 | ) |
| Year ended 9/30/18 | | | $ | 33.88 | | | | | 0.06 | | | | | 4.02 | | | | | 4.08 | | | | | — | 4 | | | | — | | | | | (0.93 | ) | | | | (0.93 | ) |
| Year ended 9/30/17 | | | $ | 31.46 | | | | | (0.05 | ) | | | | 3.56 | | | | | 3.51 | | | | | — | 4 | | | | (0.02 | ) | | | | (1.07 | ) | | | | (1.09 | ) |
| International Opportunities Fund — Investor Class | | | | | | | | | | | | | | | | | | | | | | | | | | | | | | | | | | | | |
| Six Months ended 3/31/22 (unaudited) | | | $ | 5.26 | | | | | (0.02 | ) | | | | (1.14 | ) | | | | (1.16 | ) | | | | — | 4 | | | | — | | | | | (0.64 | ) | | | | (0.64 | ) |
| Year ended 9/30/21 | | | $ | 4.64 | | | | | (0.07 | ) | | | | 0.79 | | | | | 0.72 | | | | | — | 4 | | | | — | | | | | (0.10 | ) | | | | (0.10 | ) |
| Year ended 9/30/20 | | | $ | 3.54 | | | | | (0.09 | ) | | | | 1.28 | | | | | 1.19 | | | | | — | | | | | — | | | | | (0.09 | ) | | | | (0.09 | ) |
| Year ended 9/30/19 | | | $ | 3.58 | | | | | (0.09 | ) | | | | 0.13 | | | | | 0.04 | | | | | — | 4 | | | | — | | | | | (0.08 | ) | | | | (0.08 | ) |
| Year ended 9/30/18 | | | $ | 3.47 | | | | | (0.05 | ) | | | | 0.40 | | | | | 0.35 | | | | | — | 4 | | | | — | | | | | (0.24 | ) | | | | (0.24 | ) |
| Year ended 9/30/17 | | | $ | 3.21 | | | | | (0.04 | ) | | | | 0.30 | | | | | 0.26 | | | | | — | 4 | | | | — | | | | | — | | | | | — | |
| International Opportunities Fund — Institutional Class | | | | | | | | | | | | | | | | | | | | | | | | | | | | | | | | | | | | |
| Six Months ended 3/31/22 (unaudited) | | | $ | 5.33 | | | | | (0.03 | ) | | | | (1.14 | ) | | | | (1.17 | ) | | | | — | 4 | | | | — | | | | | (0.64 | ) | | | | (0.64 | ) |
| Year ended 9/30/21 | | | $ | 4.71 | | | | | (0.05 | ) | | | | 0.77 | | | | | 0.72 | | | | | — | 4 | | | | — | | | | | (0.10 | ) | | | | (0.10 | ) |
| Year ended 9/30/20 | | | $ | 3.58 | | | | | (0.04 | ) | | | | 1.26 | | | | | 1.22 | | | | | — | | | | | — | | | | | (0.09 | ) | | | | (0.09 | ) |
| Year ended 9/30/19 | | | $ | 3.62 | | | | | (0.02 | ) | | | | 0.06 | | | | | 0.04 | | | | | — | 4 | | | | — | | | | | (0.08 | ) | | | | (0.08 | ) |
| Year ended 9/30/18 | | | $ | 3.50 | | | | | (0.03 | ) | | | | 0.39 | | | | | 0.36 | | | | | — | 4 | | | | — | | | | | (0.24 | ) | | | | (0.24 | ) |
| Year ended 9/30/17 | | | $ | 3.23 | | | | | (0.01 | ) | | | | 0.28 | | | | | 0.27 | | | | | — | 4 | | | | — | | | | | — | | | | | — | |
See Notes to Financial Highlights and Notes to Financial Statements.
112
| | |
| | | (for a share outstanding throughout each period) |
| | | | | | | | | | | | | | | | | | | | | | | | | | | | | | |
| | | | | | | Ratios to Average Net Assets | | | Supplemental Data | |
Net Asset
Value End of
Period | | | Total Return (%)1 | | | Expenses
Net of
Waivers and
Reimbursements (%)2 | | | Expenses
Before
Waivers and
Reimbursements (%)2 | | | Net Investment
Income Net (Loss)
Of Waivers and
Reimbursements (%)2 | | | Net Investment
Income (Loss)
Before Waivers and
Reimbursements (%)2 | | | Net Assets
End of Period
(000s) | | | Portfolio
Turnover
Rate1 3 | |
| | | | | | | | | | | | | | | | | | | | | | | | | | | | | | |
| $ | 9.75 | | | | 9.54 | | | | 1.10 | 5 8 | | | 1.17 | 5 8 | | | 1.86 | | | | 1.79 | | | $ | 131,022 | | | | 24% | |
| $ | 9.24 | | | | 43.20 | | | | 1.10 | 5 | | | 1.18 | 5 | | | 1.97 | | | | 1.89 | | | $ | 119,966 | | | | 41% | |
| $ | 6.56 | | | | (12.18 | )13 | | | 1.10 | 5 | | | 1.30 | 5 | | | 2.04 | | | | 1.84 | | | $ | 96,323 | | | | 76% | |
| $ | 7.74 | | | | (0.40 | ) | | | 1.10 | 5 | | | 1.19 | 5 | | | 2.30 | | | | 2.22 | | | $ | 146,704 | | | | 49% | |
| $ | 9.29 | | | | 9.56 | 10 | | | 1.11 | 5 8 | | | 1.19 | 5 8 | | | 2.17 | | | | 2.08 | | | $ | 192,811 | | | | 72% | |
| $ | 9.93 | | | | 16.11 | | | | 1.10 | 5 | | | 1.19 | 5 | | | 1.93 | | | | 1.84 | | | $ | 175,730 | | | | 44% | |
| | | | | | | | | | | | | | | | | | | | | | | | | | | | | | |
| $ | 9.74 | | | | 9.64 | | | | 0.95 | 5 8 | | | 1.04 | 5 8 | | | 2.15 | | | | 2.06 | | | $ | 10,203 | | | | 24% | |
| $ | 9.23 | | | | 43.26 | | | | 0.99 | 5 | | | 1.43 | 5 | | | 2.04 | | | | 1.60 | | | $ | 7,163 | | | | 41% | |
| $ | 6.56 | | | | (11.93 | )13 | | | 0.95 | 5 | | | 1.38 | 5 | | | 2.21 | | | | 1.78 | | | $ | 6,449 | | | | 76% | |
| $ | 7.73 | | | | (0.25 | ) | | | 0.97 | 5 | | | 1.23 | 5 | | | 2.44 | | | | 2.19 | | | $ | 7,978 | | | | 49% | |
| $ | 9.28 | | | | 9.61 | 10 | | | 0.95 | 5 8 | | | 1.58 | 5 8 | | | 2.39 | | | | 1.76 | | | $ | 9,615 | | | | 72% | |
| $ | 9.92 | | | | 16.31 | | | | 0.95 | 5 | | | 2.31 | 5 | | | 2.05 | | | | 0.70 | | | $ | 4,594 | | | | 44% | |
| | | | | | | | | | | | | | | | | | | | | | | | | | | | | | |
| $ | 7.91 | | | | (19.53 | ) | | | 1.52 | 6 7 | | | 2.78 | 6 7 | | | (1.22 | ) | | | (2.49 | ) | | $ | 2,827 | | | | 34% | |
| $ | 9.83 | | | | (1.70 | ) | | | 1.51 | 6 | | | 3.76 | 6 | | | (0.60 | ) | | | (2.85 | ) | | $ | 3,795 | | | | 43% | |
| | | | | | | | | | | | | | | | | | | | | | | | | | | | | | |
| $ | 7.88 | | | | (19.76 | ) | | | 1.27 | 6 7 | | | 2.06 | 6 7 | | | (0.95 | ) | | | (1.74 | ) | | $ | 5,602 | | | | 34% | |
| $ | 9.82 | | | | (1.80 | ) | | | 1.26 | 6 | | | 3.09 | 6 | | | (0.34 | ) | | | (2.17 | ) | | $ | 6,779 | | | | 43% | |
| | | | | | | | | | | | | | | | | | | | | | | | | | | | | | |
| $ | 28.95 | | | | (17.59 | ) | | | 1.42 | 5 8 | | | 1.42 | 5 8 | | | (0.29 | ) | | | (0.29 | ) | | $ | 442,586 | | | | 12% | |
| $ | 38.79 | | | | 26.59 | | | | 1.41 | 5 | | | 1.41 | 5 | | | (0.47 | ) | | | (0.47 | ) | | $ | 579,102 | | | | 25% | |
| $ | 34.07 | | | | 23.73 | | | | 1.47 | 5 | | | 1.47 | 5 | | | (0.50 | ) | | | (0.50 | ) | | $ | 497,104 | | | | 45% | |
| $ | 28.23 | | | | (9.76 | ) | | | 1.46 | 5 | | | 1.46 | 5 | | | (0.25 | ) | | | (0.25 | ) | | $ | 543,990 | | | | 40% | |
| $ | 36.95 | | | | 12.13 | | | | 1.45 | 5 8 | | | 1.45 | 5 8 | | | 0.01 | | | | 0.01 | | | $ | 748,847 | | | | 44% | |
| $ | 33.84 | | | | 12.04 | | | | 1.46 | 5 | | | 1.46 | 5 | | | (0.28 | ) | | | (0.28 | ) | | $ | 804,613 | | | | 31% | |
| | | | | | | | | | | | | | | | | | | | | | | | | | | | | | |
| $ | 29.17 | | | | (17.55 | ) | | | 1.32 | 5 8 | | | 1.32 | 5 8 | | | (0.19 | ) | | | (0.19 | ) | | $ | 551,911 | | | | 12% | |
| $ | 39.04 | | | | 26.70 | | | | 1.32 | 5 | | | 1.32 | 5 | | | (0.38 | ) | | | (0.38 | ) | | $ | 699,377 | | | | 25% | |
| $ | 34.24 | | | | 23.89 | | | | 1.35 | 5 | | | 1.36 | 5 | | | (0.38 | ) | | | (0.38 | ) | | $ | 569,068 | | | | 45% | |
| $ | 28.33 | | | | (9.67 | ) | | | 1.35 | 5 | | | 1.35 | 5 | | | (0.13 | ) | | | (0.13 | ) | | $ | 595,341 | | | | 40% | |
| $ | 37.03 | | | | 12.24 | | | | 1.35 | 5 8 | | | 1.36 | 5 8 | | | 0.16 | | | | 0.16 | | | $ | 816,942 | | | | 44% | |
| $ | 33.88 | | | | 12.16 | | | | 1.35 | 5 | | | 1.37 | 5 | | | (0.14 | ) | | | (0.16 | ) | | $ | 656,860 | | | | 31% | |
| | | | | | | | | | | | | | | | | | | | | | | | | | | | | | |
| $ | 3.46 | | | | (24.52 | ) | | | 1.94 | 5 8 | | | 1.94 | 5 8 | | | (1.39 | ) | | | (1.39 | ) | | $ | 97,567 | | | | 23% | |
| $ | 5.26 | | | | 15.68 | | | | 1.91 | 5 | | | 1.91 | 5 | | | (1.14 | ) | | | (1.14 | ) | | $ | 139,189 | | | | 35% | |
| $ | 4.64 | | | | 34.24 | | | | 2.02 | 6 | | | 2.02 | 6 | | | (1.20 | ) | | | (1.20 | ) | | $ | 129,071 | | | | 35% | |
| $ | 3.54 | | | | 1.61 | | | | 2.09 | 6 | | | 2.09 | 6 | | | (1.04 | ) | | | (1.04 | ) | | $ | 132,503 | | | | 46% | |
| $ | 3.58 | | | | 10.45 | | | | 2.10 | 5 7 | | | 2.10 | 5 7 | | | (1.07 | ) | | | (1.07 | ) | | $ | 240,489 | | | | 36% | |
| $ | 3.47 | | | | 8.10 | | | | 2.24 | 6 | | | 2.24 | 6 | | | (0.88 | ) | | | (0.88 | ) | | $ | 265,879 | | | | 59% | |
| | | | | | | | | | | | | | | | | | | | | | | | | | | | | | |
| $ | 3.52 | | | | (24.37 | ) | | | 1.89 | 5 8 | | | 1.89 | 5 8 | | | (1.33 | ) | | | (1.33 | ) | | $ | 473,195 | | | | 23% | |
| $ | 5.33 | | | | 15.44 | | | | 1.89 | 5 | | | 1.89 | 5 | | | (1.10 | ) | | | (1.10 | ) | | $ | 675,768 | | | | 35% | |
| $ | 4.71 | | | | 34.71 | | | | 1.93 | 5 | | | 1.93 | 5 | | | (1.06 | ) | | | (1.06 | ) | | $ | 544,914 | | | | 35% | |
| $ | 3.58 | | | | 1.59 | | | | 1.96 | 6 | | | 1.96 | 6 | | | (0.81 | ) | | | (0.81 | ) | | $ | 376,578 | | | | 46% | |
| $ | 3.62 | | | | 10.66 | | | | 1.96 | 5 7 | | | 1.97 | 5 7 | | | (0.86 | ) | | | (0.87 | ) | | $ | 292,345 | | | | 36% | |
| $ | 3.50 | | | | 8.36 | | | | 1.96 | 6 | | | 2.04 | 6 | | | (0.39 | ) | | | (0.47 | ) | | $ | 234,795 | | | | 59% | |
113
Financial Highlights (continued)
| | | | | | | | | | | | | | | | | | | | | | | | | | | | | | | | | | | | | | | | |
| | | | | Income (Loss) from
Investment Operations | | | | | | Less Distributions | | |
| | | Net Asset
Value
Beginning
Of Period | | Net
Investment
Income (Loss) | | Net Realized
And Unrealized
Gains (Losses)
On Investments | | Total from
Investment
Operations | | Redemption
Fees
(See Note 2) | | Dividends
From Net
Investment
Income | | Distributions
From Net
Realized
Gains | | Total
Distributions |
| International Select Fund — Investor Class | | | | | | | | | | | | | | | | | | | | | | | | | | | | | | | | | | | | |
| Six Months ended 3/31/22 (unaudited) | | | $ | 14.96 | | | | | (0.09 | ) | | | | (2.85 | ) | | | | (2.94 | ) | | | | 0.01 | | | | | — | | | | | — | | | | | — | |
| Year ended 9/30/21 | | | $ | 12.61 | | | | | (0.07 | ) | | | | 2.41 | | | | | 2.34 | | | | | 0.01 | | | | | — | | | | | — | | | | | — | |
| Year ended 9/30/2011 | | | $ | 10.00 | | | | | (0.04 | ) | | | | 2.64 | | | | | 2.60 | | | | | 0.01 | | | | | — | | | | | — | | | | | — | |
| International Select Fund — Institutional Class | | | | | | | | | | | | | | | | | | | | | | | | | | | | | | | | | | | | |
| Six Months ended 3/31/22 (unaudited) | | | $ | 15.10 | | | | | (0.04 | ) | | | | (2.90 | ) | | | | (2.94 | ) | | | | — | | | | | — | | | | | — | | | | | — | |
| Year ended 9/30/21 | | | $ | 12.69 | | | | | — | 4 | | | | 2.41 | | | | | 2.41 | | | | | — | | | | | — | | | | | — | | | | | — | |
| Year ended 9/30/2011 | | | $ | 10.00 | | | | | (0.02 | ) | | | | 2.68 | | | | | 2.66 | | | | | 0.03 | | | | | — | | | | | — | | | | | — | |
| Long/Short Alpha Fund — Investor Class | | | | | | | | | | | | | | | | | | | | | | | | | | | | | | | | | | | | |
| Six Months ended 3/31/22 (unaudited)15 | | | $ | 10.00 | | | | | (0.05 | ) | | | | 0.09 | | | | | 0.04 | | | | | — | | | | | — | | | | | — | | | | | — | |
| Long/Short Alpha Fund — Institutional Class | | | | | | | | | | | | | | | | | | | | | | | | | | | | | | | | | | | | |
| Six Months ended 3/31/22 (unaudited)15 | | | $ | 10.00 | | | | | (0.04 | ) | | | | 0.09 | | | | | 0.05 | | | | | — | | | | | — | | | | | — | | | | | — | |
| Micro Cap Fund — Investor Class | | | | | | | | | | | | | | | | | | | | | | | | | | | | | | | | | | | | |
| Six Months ended 3/31/22 (unaudited) | | | $ | 12.55 | | | | | (0.07 | ) | | | | (1.98 | ) | | | | (2.05 | ) | | | | — | 4 | | | | — | | | | | (2.90 | ) | | | | (2.90 | ) |
| Year ended 9/30/21 | | | $ | 9.56 | | | | | (0.19 | ) | | | | 3.85 | | | | | 3.66 | | | | | — | 4 | | | | — | | | | | (0.67 | ) | | | | (0.67 | ) |
| Year ended 9/30/20 | | | $ | 7.45 | | | | | (0.10 | ) | | | | 3.08 | | | | | 2.98 | | | | | — | | | | | — | | | | | (0.87 | ) | | | | (0.87 | ) |
| Year ended 9/30/19 | | | $ | 9.86 | | | | | (0.08 | ) | | | | (0.55 | ) | | | | (0.63 | ) | | | | — | 4 | | | | — | | | | | (1.78 | ) | | | | (1.78 | ) |
| Year ended 9/30/18 | | | $ | 8.23 | | | | | (0.08 | ) | | | | 2.88 | | | | | 2.80 | | | | | — | 4 | | | | — | | | | | (1.17 | ) | | | | (1.17 | ) |
| Year ended 9/30/17 | | | $ | 7.19 | | | | | (0.11 | ) | | | | 1.75 | | | | | 1.64 | | | | | — | 4 | | | | (0.01 | ) | | | | (0.59 | ) | | | | (0.60 | ) |
| Micro Cap Fund — Institutional Class | | | | | | | | | | | | | | | | | | | | | | | | | | | | | | | | | | | | |
| Six Months ended 3/31/22 (unaudited) | | | $ | 12.55 | | | | | (0.08 | ) | | | | (1.98 | ) | | | | (2.06 | ) | | | | — | 4 | | | | — | | | | | (2.90 | ) | | | | (2.90 | ) |
| Year ended 9/30/21 | | | $ | 9.55 | | | | | (0.19 | ) | | | | 3.86 | | | | | 3.67 | | | | | — | 4 | | | | — | | | | | (0.67 | ) | | | | (0.67 | ) |
| Period ended 9/30/2012 | | | $ | 7.74 | | | | | (0.05 | ) | | | | 1.86 | | | | | 1.81 | | | | | — | | | | | — | | | | | — | | | | | — | |
| Micro Cap Value Fund — Investor Class | | | | | | | | | | | | | | | | | | | | | | | | | | | | | | | | | | | | |
| Six Months ended 3/31/22 (unaudited) | | | $ | 5.10 | | | | | (0.02 | ) | | | | (0.57 | ) | | | | (0.59 | ) | | | | — | 4 | | | | — | | | | | (0.94 | ) | | | | (0.94 | ) |
| Year ended 9/30/21 | | | $ | 3.65 | | | | | (0.04 | ) | | | | 2.02 | | | | | 1.98 | | | | | — | 4 | | | | — | | | | | (0.53 | ) | | | | (0.53 | ) |
| Year ended 9/30/20 | | | $ | 3.21 | | | | | (0.04 | ) | | | | 0.78 | | | | | 0.74 | | | | | — | | | | | — | | | | | (0.30 | ) | | | | (0.30 | ) |
| Year ended 9/30/19 | | | $ | 3.83 | | | | | (0.03 | ) | | | | (0.20 | ) | | | | (0.23 | ) | | | | — | 4 | | | | (0.02 | ) | | | | (0.37 | ) | | | | (0.39 | ) |
| Year ended 9/30/18 | | | $ | 3.48 | | | | | (0.03 | ) | | | | 0.65 | | | | | 0.62 | | | | | — | 4 | | | | — | | | | | (0.27 | ) | | | | (0.27 | ) |
| Year ended 9/30/17 | | | $ | 2.87 | | | | | (0.02 | ) | | | | 0.68 | | | | | 0.66 | | | | | — | 4 | | | | — | 4 | | | | (0.05 | ) | | | | (0.05 | ) |
| Micro Cap Value Fund — Institutional Class | | | | | | | | | | | | | | | | | | | | | | | | | | | | | | | | | | | | |
| Six Months ended 3/31/22 (unaudited) | | | $ | 5.12 | | | | | (0.03 | ) | | | | (0.56 | ) | | | | (0.59 | ) | | | | — | 4 | | | | — | | | | | (0.94 | ) | | | | (0.94 | ) |
| Year ended 9/30/21 | | | $ | 3.66 | | | | | (0.05 | ) | | | | 2.04 | | | | | 1.99 | | | | | — | 4 | | | | — | | | | | (0.53 | ) | | | | (0.53 | ) |
| Period ended 9/30/2012 | | | $ | 3.26 | | | | | (0.01 | ) | | | | 0.41 | | | | | 0.40 | | | | | — | | | | | — | | | | | — | | | | | — | |
| Small Cap Growth Fund — Investor Class | | | | | | | | | | | | | | | | | | | | | | | | | | | | | | | | | | | | |
| Six Months ended 3/31/22 (unaudited) | | | $ | 62.46 | | | | | (0.23 | ) | | | | (10.52 | ) | | | | (10.75 | ) | | | | — | 4 | | | | — | | | | | (10.82 | ) | | | | (10.82 | ) |
| Year ended 9/30/21 | | | $ | 46.64 | | | | | (0.57 | ) | | | | 19.94 | | | | | 19.37 | | | | | — | 4 | | | | — | | | | | (3.55 | ) | | | | (3.55 | ) |
| Year ended 9/30/20 | | | $ | 40.23 | | | | | (0.32 | ) | | | | 12.52 | | | | | 12.20 | | | | | — | | | | | — | | | | | (5.79 | ) | | | | (5.79 | ) |
| Year ended 9/30/19 | | | $ | 55.30 | | | | | (0.28 | ) | | | | (2.33 | ) | | | | (2.61 | ) | | | | — | 4 | | | | — | | | | | (12.46 | ) | | | | (12.46 | ) |
| Year ended 9/30/18 | | | $ | 45.72 | | | | | (0.54 | ) | | | | 15.19 | | | | | 14.65 | | | | | — | 4 | | | | — | | | | | (5.07 | ) | | | | (5.07 | ) |
| Year ended 9/30/17 | | | $ | 43.52 | | | | | (0.53 | ) | | | | 6.24 | | | | | 5.71 | | | | | — | 4 | | | | — | | | | | (3.51 | ) | | | | (3.51 | ) |
| Small Cap Growth Fund — Institutional Class | | | | | | | | | | | | | | | | | | | | | | | | | | | | | | | | | | | | |
| Six Months ended 3/31/22 (unaudited) | | | $ | 63.29 | | | | | (0.26 | ) | | | | (10.63 | ) | | | | (10.89 | ) | | | | — | 4 | | | | — | | | | | (10.82 | ) | | | | (10.82 | ) |
| Year ended 9/30/21 | | | $ | 47.18 | | | | | (0.51 | ) | | | | 20.17 | | | | | 19.66 | | | | | — | 4 | | | | — | | | | | (3.55 | ) | | | | (3.55 | ) |
| Year ended 9/30/20 | | | $ | 40.60 | | | | | (0.28 | ) | | | | 12.65 | | | | | 12.37 | | | | | — | | | | | — | | | | | (5.79 | ) | | | | (5.79 | ) |
| Year ended 9/30/19 | | | $ | 55.61 | | | | | (0.24 | ) | | | | (2.31 | ) | | | | (2.55 | ) | | | | — | 4 | | | | — | | | | | (12.46 | ) | | | | (12.46 | ) |
| Year ended 9/30/18 | | | $ | 45.89 | | | | | (0.31 | ) | | | | 15.10 | | | | | 14.79 | | | | | — | 4 | | | | — | | | | | (5.07 | ) | | | | (5.07 | ) |
| Year ended 9/30/17 | | | $ | 43.58 | | | | | (0.17 | ) | | | | 5.99 | | | | | 5.82 | | | | | — | 4 | | | | — | | | | | (3.51 | ) | | | | (3.51 | ) |
See Notes to Financial Highlights and Notes to Financial Statements.
114
| | |
| | | (for a share outstanding throughout each period) |
| | | | | | | | | | | | | | | | | | | | | | | | | | | | | | |
| | | | | | | Ratios to Average Net Assets | | | Supplemental Data | |
Net Asset
Value End of
Period | | | Total Return (%)1 | | | Expenses
Net of
Waivers and
Reimbursements (%)2 | | | Expenses
Before
Waivers and
Reimbursements (%)2 | | | Net Investment
Income Net (Loss)
Of Waivers and
Reimbursements (%)2 | | | Net Investment
Income (Loss)
Before Waivers and
Reimbursements (%)2 | | | Net Assets
End of Period
(000s) | | | Portfolio
Turnover
Rate1 3 | |
| | | | | | | | | | | | | | | | | | | | | | | | | | | | | | |
| $ | 12.03 | | | | (19.59 | ) | | | 1.30 | 5 8 | | | 3.02 | 5 8 | | | (0.94 | ) | | | (2.65 | ) | | $ | 3,152 | | | | 13% | |
| $ | 14.96 | | | | 18.64 | | | | 1.30 | 5 | | | 3.09 | 5 | | | (0.68 | ) | | | (2.46 | ) | | $ | 4,763 | | | | 35% | |
| $ | 12.61 | | | | 26.10 | | | | 1.30 | 5 | | | 6.96 | 5 | | | (0.55 | ) | | | (6.20 | ) | | $ | 2,861 | | | | 36% | |
| | | | | | | | | | | | | | | | | | | | | | | | | | | | | | |
| $ | 12.16 | | | | (19.47 | ) | | | 0.90 | 5 8 | | | 2.14 | 5 8 | | | (0.53 | ) | | | (1.76 | ) | | $ | 3,780 | | | | 13% | |
| $ | 15.10 | | | | 18.99 | | | | 0.90 | 5 | | | 3.03 | 5 | | | (0.27 | ) | | | (2.40 | ) | | $ | 4,746 | | | | 35% | |
| $ | 12.69 | | | | 26.90 | | | | 0.90 | 6 | | | 7.68 | 6 | | | (0.19 | ) | | | (6.96 | ) | | $ | 2,069 | | | | 36% | |
| | | | | | | | | | | | | | | | | | | | | | | | | | | | | | |
| $ | 10.04 | | | | 0.40 | | | | 2.24 | 6 7 16 | | | 3.12 | 6 7 16 | | | (1.20 | ) | | | (2.08 | ) | | $ | 9,499 | | | | 24% | |
| | | | | | | | | | | | | | | | | | | | | | | | | | | | | | |
| $ | 10.05 | | | | 0.50 | | | | 2.04 | 6 7 16 | | | 2.89 | 6 7 16 | | | (1.11 | ) | | | (1.97 | ) | | $ | 15,932 | | | | 24% | |
| | | | | | | | | | | | | | | | | | | | | | | | | | | | | | |
| $ | 7.60 | | | | (19.51 | ) | | | 1.65 | 5 8 | | | 1.65 | 5 8 | | | (1.54 | ) | | | (1.54 | ) | | $ | 817,244 | | | | 30% | |
| $ | 12.55 | | | | 38.81 | | | | 1.63 | 5 | | | 1.63 | 5 | | | (1.52 | ) | | | (1.52 | ) | | $ | 1,155,133 | | | | 63% | |
| $ | 9.56 | | | | 43.47 | | | | 1.66 | 5 | | | 1.66 | 5 | | | (1.48 | ) | | | (1.48 | ) | | $ | 746,749 | | | | 75% | |
| $ | 7.45 | | | | (1.15 | ) | | | 1.66 | 5 | | | 1.66 | 5 | | | (1.31 | ) | | | (1.31 | ) | | $ | 473,505 | | | | 67% | |
| $ | 9.86 | | | | 38.04 | | | | 1.65 | 5 8 | | | 1.65 | 5 8 | | | (1.27 | ) | | | (1.27 | ) | | $ | 496,128 | | | | 54% | |
| $ | 8.23 | | | | 25.10 | | | | 1.75 | 5 | | | 1.75 | 5 | | | (1.43 | ) | | | (1.43 | ) | | $ | 311,583 | | | | 31% | |
| | | | | | | | | | | | | | | | | | | | | | | | | | | | | | |
| $ | 7.59 | | | | (19.48 | ) | | | 1.57 | 5 8 | | | 1.57 | 5 8 | | | (1.47 | ) | | | (1.47 | ) | | $ | 121,910 | | | | 30% | |
| $ | 12.55 | | | | 38.96 | | | | 1.56 | 5 | | | 1.56 | 5 | | | (1.45 | ) | | | (1.45 | ) | | $ | 198,477 | | | | 63% | |
| $ | 9.55 | | | | 23.39 | | | | 1.60 | 5 | | | 1.62 | 5 | | | (1.43 | ) | | | (1.45 | ) | | $ | 59,124 | | | | 75% | |
| | | | | | | | | | | | | | | | | | | | | | | | | | | | | | |
| $ | 3.57 | | | | (13.76 | ) | | | 1.66 | 5 8 | | | 1.66 | 5 8 | | | (1.14 | ) | | | (1.14 | ) | | $ | 338,028 | | | | 25% | |
| $ | 5.10 | | | | 58.11 | | | | 1.66 | 5 | | | 1.66 | 5 | | | (1.15 | ) | | | (1.15 | ) | | $ | 387,236 | | | | 82% | |
| $ | 3.65 | | | | 24.17 | | | | 1.74 | 5 | | | 1.74 | 5 | | | (1.01 | ) | | | (1.01 | ) | | $ | 222,963 | | | | 63% | |
| $ | 3.21 | | | | (4.50 | ) | | | 1.74 | 5 | | | 1.74 | 5 | | | (0.90 | ) | | | (0.90 | ) | | $ | 249,523 | | | | 66% | |
| $ | 3.83 | | | | 18.84 | | | | 1.74 | 5 8 | | | 1.74 | 5 8 | | | (0.89 | ) | | | (0.89 | ) | | $ | 283,623 | | | | 69% | |
| $ | 3.48 | | | | 23.29 | | | | 1.85 | 5 | | | 1.85 | 5 | | | (0.81 | ) | | | (0.81 | ) | | $ | 216,087 | | | | 57% | |
| | | | | | | | | | | | | | | | | | | | | | | | | | | | | | |
| $ | 3.59 | | | | (13.53 | ) | | | 1.60 | 5 8 | | | 1.61 | 5 8 | | | (1.08 | ) | | | (1.09 | ) | | $ | 51,660 | | | | 25% | |
| $ | 5.12 | | | | 58.25 | | | | 1.60 | 5 | | | 1.61 | 5 | | | (1.10 | ) | | | (1.10 | ) | | $ | 56,381 | | | | 82% | |
| $ | 3.66 | | | | 12.27 | | | | 1.60 | 5 | | | 1.84 | 5 | | | (0.99 | ) | | | (1.23 | ) | | $ | 25,317 | | | | 63% | |
| | | | | | | | | | | | | | | | | | | | | | | | | | | | | | |
| $ | 40.89 | | | | (19.34 | ) | | | 1.14 | 5 8 | | | 1.14 | 5 8 | | | (1.04 | ) | | | (1.04 | ) | | $ | 1,303,148 | | | | 16% | |
| $ | 62.46 | | | | 42.49 | | | | 1.12 | 5 | | | 1.12 | 5 | | | (1.00 | ) | | | (1.00 | ) | | $ | 1,744,187 | | | | 40% | |
| $ | 46.64 | | | | 33.26 | | | | 1.16 | 5 | | | 1.16 | 5 | | | (0.89 | ) | | | (0.89 | ) | | $ | 1,247,871 | | | | 37% | |
| $ | 40.23 | | | | 1.67 | 5 | | | 1.17 | 6 | | | 1.17 | 6 | | | (0.80 | ) | | | (0.80 | ) | | $ | 978,825 | | | | 26% | |
| $ | 55.30 | | | | 35.08 | | | | 1.20 | 5 8 | | | 1.20 | 5 8 | | | (0.84 | ) | | | (0.84 | ) | | $ | 1,170,809 | | | | 36% | |
| $ | 45.72 | | | | 14.29 | | | | 1.27 | 5 | | | 1.27 | 5 | | | (0.88 | ) | | | (0.88 | ) | | $ | 1,182,573 | | | | 19% | |
| | | | | | | | | | | | | | | | | | | | | | | | | | | | | | |
| $ | 41.58 | | | | (19.29 | ) | | | 1.05 | 5 8 | | | 1.05 | 5 8 | | | (0.95 | ) | | | (0.95 | ) | | $ | 1,555,397 | | | | 16% | |
| $ | 63.29 | | | | 42.62 | | | | 1.05 | 5 | | | 1.06 | 5 | | | (0.92 | ) | | | (0.93 | ) | | $ | 1,898,152 | | | | 40% | |
| $ | 47.18 | | | | 33.39 | | | | 1.05 | 5 | | | 1.08 | 5 | | | (0.78 | ) | | | (0.81 | ) | | $ | 1,233,331 | | | | 37% | |
| $ | 40.60 | | | | 1.80 | | | | 1.06 | 6 | | | 1.09 | 6 | | | (0.68 | ) | | | (0.72 | ) | | $ | 712,833 | | | | 26% | |
| $ | 55.61 | | | | 35.27 | | | | 1.06 | 5 7 | | | 1.10 | 5 7 | | | (0.70 | ) | | | (0.74 | ) | | $ | 714,184 | | | | 36% | |
| $ | 45.89 | | | | 14.54 | | | | 1.05 | 5 | | | 1.11 | 5 | | | (0.66 | ) | | | (0.72 | ) | | $ | 508,373 | | | | 19% | |
115
Financial Highlights (continued)
| | | | | | | | | | | | | | | | | | | | | | | | | | | | | | | | | | | | | | | | |
| | | | | Income (Loss) from
Investment Operations | | | | | | Less Distributions | | |
| | | Net Asset
Value
Beginning
Of Period | | Net
Investment
Income (Loss) | | Net Realized
And Unrealized
Gains (Losses)
On Investments | | Total from
Investment
Operations | | Redemption
Fees
(See Note 2) | | Dividends
From Net
Investment
Income | | Distributions
From Net
Realized
Gains | | Total
Distributions |
| Small Cap Value Fund — Investor Class | | | | | | | | | | | | | | | | | | | | | | | | | | | | | | | | | | | | |
| Six Months ended 3/31/22 (unaudited) | | | $ | 10.68 | | | | | 0.01 | | | | | (0.39 | ) | | | | (0.38 | ) | | | | — | 4 | | | | — | 4 | | | | (0.81 | ) | | | | (0.81 | ) |
| Year ended 9/30/21 | | | $ | 6.99 | | | | | (0.02 | ) | | | | 3.71 | | | | | 3.69 | | | | | — | 4 | | | | — | | | | | — | | | | | — | |
| Year ended 9/30/20 | | | $ | 7.61 | | | | | 0.01 | | | | | (0.54 | ) | | | | (0.53 | ) | | | | — | | | | | (0.04 | ) | | | | (0.05 | ) | | | | (0.09 | ) |
| Year ended 9/30/19 | | | $ | 8.53 | | | | | 0.03 | | | | | (0.36 | ) | | | | (0.33 | ) | | | | — | 4 | | | | — | | | | | (0.59 | ) | | | | (0.59 | ) |
| Year ended 9/30/18 | | | $ | 7.94 | | | | | 0.02 | | | | | 1.10 | | | | | 1.12 | | | | | — | 4 | | | | (0.01 | ) | | | | (0.52 | ) | | | | (0.53 | ) |
| Year ended 9/30/17 | | | $ | 6.61 | | | | | — | 4 | | | | 1.33 | | | | | 1.33 | | | | | — | 4 | | | | — | 4 | | | | — | | | | | — | |
| Small Cap Value Fund — Institutional Class | | | | | | | | | | | | | | | | | | | | | | | | | | | | | | | | | | | | |
| Six Months ended 3/31/22 (unaudited) | | | $ | 10.78 | | | | | 0.01 | | | | | (0.39 | ) | | | | (0.38 | ) | | | | — | 4 | | | | (0.01 | ) | | | | (0.81 | ) | | | | (0.82 | ) |
| Year ended 9/30/21 | | | $ | 7.05 | | | | | — | 4 | | | | 3.73 | | | | | 3.73 | | | | | — | 4 | | | | — | | | | | — | | | | | — | |
| Year ended 9/30/20 | | | $ | 7.67 | | | | | 0.03 | | | | | (0.55 | ) | | | | (0.52 | ) | | | | — | | | | | (0.05 | ) | | | | (0.05 | ) | | | | (0.10 | ) |
| Year ended 9/30/19 | | | $ | 8.58 | | | | | 0.03 | | | | | (0.35 | ) | | | | (0.32 | ) | | | | — | 4 | | | | — | | | | | (0.59 | ) | | | | (0.59 | ) |
| Year ended 9/30/18 | | | $ | 7.98 | | | | | 0.04 | | | | | 1.10 | | | | | 1.14 | | | | | — | 4 | | | | (0.02 | ) | | | | (0.52 | ) | | | | (0.54 | ) |
| Year ended 9/30/17 | | | $ | 6.65 | | | | | 0.01 | | | | | 1.34 | | | | | 1.35 | | | | | — | 4 | | | | (0.02 | ) | | | | — | | | | | (0.02 | ) |
| Ultra Growth Fund — Investor Class | | | | | | | | | | | | | | | | | | | | | | | | | | | | | | | | | | | | |
| Six Months ended 3/31/22 (unaudited) | | | $ | 50.98 | | | | | (0.22 | ) | | | | (8.63 | ) | | | | (8.85 | ) | | | | — | 4 | | | | — | | | | | (5.33 | ) | | | | (5.33 | ) |
| Year ended 9/30/21 | | | $ | 39.56 | | | | | (0.48 | ) | | | | 13.30 | | | | | 12.82 | | | | | 0.01 | | | | | — | | | | | (1.41 | ) | | | | (1.41 | ) |
| Year ended 9/30/20 | | | $ | 25.30 | | | | | (0.17 | ) | | | | 14.98 | | | | | 14.81 | | | | | 0.01 | | | | | — | | | | | (0.56 | ) | | | | (0.56 | ) |
| Year ended 9/30/19 | | | $ | 27.68 | | | | | (0.18 | ) | | | | (0.60 | ) | | | | (0.78 | ) | | | | 0.01 | | | | | — | | | | | (1.61 | ) | | | | (1.61 | ) |
| Year ended 9/30/18 | | | $ | 21.81 | | | | | — | 4 | | | | 8.31 | | | | | 8.31 | | | | | — | 4 | | | | (0.10 | ) | | | | (2.34 | ) | | | | (2.44 | ) |
| Year ended 9/30/17 | | | $ | 19.89 | | | | | (0.20 | ) | | | | 4.12 | | | | | 3.92 | | | | | — | 4 | | | | (0.11 | ) | | | | (1.89 | ) | | | | (2.00 | ) |
| Ultra Growth Fund — Institutional Class | | | | | | | | | | | | | | | | | | | | | | | | | | | | | | | | | | | | |
| Six Months ended 3/31/22 (unaudited) | | | $ | 51.05 | | | | | (0.19 | ) | | | | (8.65 | ) | | | | (8.84 | ) | | | | — | 4 | | | | — | | | | | (5.33 | ) | | | | (5.33 | ) |
| Year ended 9/30/21 | | | $ | 39.58 | | | | | (0.41 | ) | | | | 13.28 | | | | | 12.87 | | | | | 0.01 | | | | | — | | | | | (1.41 | ) | | | | (1.41 | ) |
| Period ended 9/30/2012 | | | $ | 29.39 | | | | | (0.09 | ) | | | | 10.28 | | | | | 10.19 | | | | | — | 4 | | | | — | | | | | — | | | | | — | |
| U.S. Treasury Fund — Investor Class | | | | | | | | | | | | | | | | | | | | | | | | | | | | | | | | | | | | |
| Six Months ended 3/31/22 (unaudited) | | | $ | 18.10 | | | | | 0.13 | | | | | (1.49 | ) | | | | (1.36 | ) | | | | — | 4 | | | | (0.13 | ) | | | | — | | | | | (0.13 | ) |
| Year ended 9/30/21 | | | $ | 22.42 | | | | | 0.25 | | | | | (3.00 | ) | | | | (2.75 | ) | | | | 0.01 | | | | | (0.24 | ) | | | | (1.34 | ) | | | | (1.58 | ) |
| Year ended 9/30/20 | | | $ | 19.26 | | | | | 0.30 | | | | | 3.13 | | | | | 3.43 | | | | | 0.03 | | | | | (0.30 | ) | | | | — | | | | | (0.30 | ) |
| Year ended 9/30/19 | | | $ | 15.26 | | | | | 0.34 | | | | | 3.99 | | | | | 4.33 | | | | | 0.01 | | | | | (0.34 | ) | | | | — | | | | | (0.34 | ) |
| Year ended 9/30/18 | | | $ | 16.32 | | | | | 0.35 | | | | | (1.07 | ) | | | | (0.72 | ) | | | | — | 4 | | | | (0.34 | ) | | | | — | | | | | (0.34 | ) |
| Year ended 9/30/17 | | | $ | 19.86 | | | | | 0.35 | | | | | (2.23 | ) | | | | (1.88 | ) | | | | 0.01 | | | | | (0.35 | ) | | | | (1.32 | ) | | | | (1.67 | ) |
See Notes to Financial Highlights and Notes to Financial Statements.
116
| | |
| | | (for a share outstanding throughout each period) |
| | | | | | | | | | | | | | | | | | | | | | | | | | | | | | |
| | | | | | | Ratios to Average Net Assets | | | Supplemental Data | |
Net Asset
Value End of
Period | | | Total Return (%)1 | | | Expenses
Net of
Waivers and
Reimbursements (%)2 | | | Expenses
Before
Waivers and
Reimbursements (%)2 | | | Net Investment
Income Net (Loss) Of Waivers and
Reimbursements (%)2 | | | Net Investment
Income (Loss) Before Waivers and
Reimbursements (%)2 | | | Net Assets
End of Period
(000s) | | | Portfolio
Turnover
Rate1 3 | |
| | | | | | | | | | | | | | | | | | | | | | | | | | | | | | |
| $ | 9.49 | | | | (3.93 | ) | | | 1.15 | 5 8 | | | 1.15 | 5 8 | | | 0.19 | | | | 0.19 | | | $ | 781,362 | | | | 28% | |
| $ | 10.68 | | | | 52.79 | | | | 1.16 | 5 | | | 1.16 | 5 | | | (0.16 | ) | | | (0.16 | ) | | $ | 840,022 | | | | 50% | |
| $ | 6.99 | | | | (7.13 | ) | | | 1.21 | 5 | | | 1.21 | 5 | | | 0.22 | | | | 0.22 | | | $ | 525,957 | | | | 58% | |
| $ | 7.61 | | | | (2.69 | ) | | | 1.20 | 5 | | | 1.20 | 5 | | | 0.51 | | | | 0.51 | | | $ | 454,451 | | | | 25% | |
| $ | 8.53 | | | | 14.54 | | | | 1.20 | 5 8 | | | 1.20 | 5 8 | | | 0.29 | | | | 0.29 | | | $ | 347,298 | | | | 46% | |
| $ | 7.94 | | | | 20.20 | | | | 1.21 | 5 | | | 1.21 | 5 | | | 0.04 | | | | 0.04 | | | $ | 320,978 | | | | 37% | |
| | | | | | | | | | | | | | | | | | | | | | | | | | | | | | |
| $ | 9.58 | | | | (3.89 | ) | | | 1.05 | 5 8 | | | 1.05 | 5 8 | | | 0.30 | | | | 0.30 | | | $ | 860,073 | | | | 28% | |
| $ | 10.78 | | | | 52.91 | | | | 1.05 | 5 | | | 1.06 | 5 | | | (0.05 | ) | | | (0.06 | ) | | $ | 849,537 | | | | 50% | |
| $ | 7.05 | | | | (6.94 | ) | | | 1.05 | 5 | | | 1.08 | 5 | | | 0.38 | | | | 0.34 | | | $ | 472,331 | | | | 58% | |
| $ | 7.67 | | | | (2.55 | ) | | | 1.05 | 5 | | | 1.09 | 5 | | | 0.70 | | | | 0.66 | | | $ | 368,498 | | | | 25% | |
| $ | 8.58 | | | | 14.78 | | | | 1.06 | 5 8 | | | 1.13 | 5 8 | | | 0.43 | | | | 0.35 | | | $ | 91,857 | | | | 46% | |
| $ | 7.98 | | | | 20.28 | | | | 1.05 | 5 | | | 1.16 | 5 | | | 0.21 | | | | 0.11 | | | $ | 49,671 | | | | 37% | |
| | | | | | | | | | | | | | | | | | | | | | | | | | | | | | |
| $ | 36.80 | | | | (18.39 | ) | | | 1.17 | 5 8 | | | 1.17 | 5 8 | | | (0.99 | ) | | | (0.99 | ) | | $ | 1,585,349 | | | | 17% | |
| $ | 50.98 | | | | 32.78 | | | | 1.16 | 5 | | | 1.16 | 5 | | | (0.96 | ) | | | (0.96 | ) | | $ | 2,255,327 | | | | 35% | |
| $ | 39.56 | | | | 59.54 | | | | 1.19 | 5 | | | 1.19 | 5 | | | (0.95 | ) | | | (0.95 | ) | | $ | 1,733,280 | | | | 37% | |
| $ | 25.30 | | | | (1.35 | ) | | | 1.24 | 5 | | | 1.24 | 5 | | | (0.93 | ) | | | (0.93 | ) | | $ | 623,154 | | | | 17% | |
| $ | 27.68 | | | | 41.97 | | | | 1.24 | 5 8 | | | 1.24 | 5 8 | | | (1.00 | ) | | | (1.00 | ) | | $ | 297,562 | | | | 44% | |
| $ | 21.81 | | | | 22.13 | | | | 1.30 | 5 | | | 1.30 | 5 | | | (1.06 | ) | | | (1.06 | ) | | $ | 111,366 | | | | 34% | |
| | | | | | | | | | | | | | | | | | | | | | | | | | | | | | |
| $ | 36.88 | | | | (18.36 | ) | | | 1.05 | 5 8 | | | 1.06 | 5 8 | | | (0.87 | ) | | | (0.88 | ) | | $ | 586,856 | | | | 17% | |
| $ | 51.05 | | | | 32.89 | | | | 1.05 | 5 | | | 1.06 | 5 | | | (0.86 | ) | | | (0.87 | ) | | $ | 717,666 | | | | 35% | |
| $ | 39.58 | | | | 34.67 | | | | 1.05 | 5 | | | 1.07 | 5 | | | (0.97 | ) | | | (0.98 | ) | | $ | 348,388 | | | | 37% | |
| | | | | | | | | | | | | | | | | | | | | | | | | | | | | | |
| $ | 16.61 | | | | (7.55 | ) | | | 0.65 | 5 8 | | | 0.65 | 5 8 | | | 1.40 | | | | 1.40 | | | $ | 417,683 | | | | 8% | |
| $ | 18.10 | | | | (12.74 | ) | | | 0.66 | 5 | | | 0.66 | 5 | | | 1.30 | | | | 1.30 | | | $ | 462,949 | | | | 50% | |
| $ | 22.42 | | | | 18.06 | | | | 0.66 | 5 | | | 0.66 | 5 | | | 1.41 | | | | 1.41 | | | $ | 545,586 | | | | 13% | |
| $ | 19.26 | | | | 28.73 | | | | 0.69 | 5 | | | 0.69 | 5 | | | 2.05 | | | | 2.05 | | | $ | 379,644 | | | | 29% | |
| $ | 15.26 | | | | (4.47 | ) | | | 0.70 | 5 8 | | | 0.70 | 5 8 | | | 2.13 | | | | 2.13 | | | $ | 303,105 | | | | 6% | |
| $ | 16.32 | | | | (8.86 | ) | | | 0.72 | 5 | | | 0.72 | 5 | | | 2.04 | | | | 2.04 | | | $ | 360,866 | | | | 20% | |
117
| | |
| Wasatch Funds | | MARCH 31, 2022 (Unaudited) |
Notes to Financial Highlights
| 1Not | annualized for periods less than one year. |
| 2Annualized | for periods less than one year. |
| 3Portfolio | turnover is calculated on the basis of the Fund as a whole without distinguishing between the classes of shares issued. |
| 4Represents | amounts less than $0.005 per share. |
| 5Includes | interest expense of less than 0.005%. |
| 6Includes | interest expenses of more than 0.005%. |
| 7Includes | extraordinary expenses greater than or equal to 0.01% (see Note 7 in “Notes to Financial Statements”). |
| 8Includes | extraordinary expenses of less than 0.01% (see Note 7 in “Notes to Financial Statements”). |
| 9Per | share amounts do not correlate to amounts reported in the Statement of Operations due to timing of share activity. |
| 10Net | Realized and Unrealized Gains (Losses) on Investments per share reflects a large, non-recurring receivable for security litigation which amounted to $0.06 and $0.06 per share for the Investor Class and Institutional Class, respectively. Excluding this non-recurring receivable, Net Realized and Unrealized Gains (Losses) would have been $0.59 and $0.60 per share for the Investor Class and Institutional Class, respectively. Excluding this non-recurring receivable, Total Return would have been 8.74% and 8.91% for the Investor Class and Institutional Class, respectively. |
| 11Fund | inception date was October 1, 2019. |
| 12Institutional | Class inception date was January 31, 2020. |
| 13Net | Realized and Unrealized Gains (Losses) on Investments per share reflects a large, non-recurring receivable for security litigation which amounted to $0.07 and $0.07 per share for the Investor Class and Institutional Class, respectively. Excluding this non-recurring receivable, Net Realized and Unrealized Gains (Losses) on Investments would have been $(1.16) and $(1.14) per share for the Investor Class and Institutional Class, respectively. Excluding this non-recurring receivable, Total Return would have been (13.11)% and (13.00)% for the Investor Class and Institutional Class, respectively. |
| 14Fund | inception date was November 30, 2020. |
| 15Fund | inception date was October 1, 2021. |
| 16Includes | interest expense and dividend payments for securities sold short. The ratios excluding such expenses are listed below: |
| | | | | | | | | | | | |
| | | Expenses Net of
Waivers and
Reimbursements2 | | Expenses Before
Waivers and
Reimbursements2 | | |
Long/Short Alpha Fund — Investor Class | | | | | | | | | | | | |
Six Months ended 3/31/22 (unaudited)15 | | | | 1.75 | % | | | | 2.63 | % | | |
| | | |
Long/Short Alpha Fund — Institutional Class | | | | | | | | | | | | |
Six Months ended 3/31/22 (unaudited)15 | | | | 1.50 | % | | | | 2.36 | % | | |
See Notes to Financial Statements.
118
| | |
| Wasatch Funds | | MARCH 31, 2022 (Unaudited) |
Notes to Financial Statements
1. ORGANIZATION
Wasatch Funds Trust (the “Trust”) is a Massachusetts business trust registered under the Investment Company Act of 1940, as amended (the “1940 Act”), as an open-end management investment company and consists of 19 series or funds (each a “Fund” and collectively the “Funds”). The Core Growth Fund, Global Opportunities Fund, Global Value Fund, International Growth Fund, International Opportunities Fund, Long/Short Alpha Fund, Micro Cap Fund, Micro Cap Value Fund, Small Cap Growth Fund, Small Cap Value Fund, Ultra Growth Fund and Wasatch-Hoisington U.S. Treasury Fund (“U.S. Treasury Fund”) (sub-advised) are each a diversified fund. The Emerging India Fund, Emerging Markets Select Fund, Emerging Markets Small Cap Fund, Frontier Emerging Small Countries Fund, Global Select Fund, Greater China Fund and International Select Fund are each a non-diversified fund. Each Fund maintains its own investment objective(s).
On November 9, 2011, the Trust redesignated the shares of the Funds into Investor Class shares effective January 31, 2012, and authorized and designated a new Institutional Class of shares in the Funds. Currently 18 funds offer Institutional Class shares: Core Growth Fund, Global Value Fund and Small Cap Value Fund, which commenced operations on January 31, 2012, Emerging Markets Select Fund, which commenced operations on December 13, 2012; Emerging India Fund, Emerging Markets Small Cap Fund, Frontier Emerging Small Countries Fund, Global Opportunities Fund, International Growth Fund, International Opportunities Fund and Small Cap Growth Fund, which commenced operations on February 1, 2016; Global Select Fund and International Select Fund, which commenced operations on October 1, 2019; Micro Cap Fund, Micro Cap Value Fund and Ultra Growth Fund, which commenced operations on January 31, 2020; Greater China Fund, which commenced operations on November 30, 2020; and Long/Short Alpha Fund, which commenced operations on October 1, 2021. Each class of shares for each Fund has identical rights and privileges except with respect to purchase minimums, distribution and service charges, shareholder services, voting rights on matters affecting a single class of shares, and the exchange and conversion features. The Funds have entered into an investment advisory agreement with Wasatch Advisors, Inc., d/b/a Wasatch Global Investors, as investment advisor (the “Advisor” or “Wasatch”).
The Core Growth, Emerging India, Emerging Markets Select, Emerging Markets Small Cap, Frontier Emerging Small Countries, Global Opportunities, Global Select, Global Value, Greater China, International Growth, International Opportunities, International Select, Long/Short Alpha Micro Cap, Micro Cap Value, Small Cap Growth, Small Cap Value and Ultra Growth Funds are referred to herein as “Equity Funds.”
2. SIGNIFICANT ACCOUNTING POLICIES
The following is a summary of significant policies related to investments of the Funds held at March 31, 2022. These policies are in conformity with accounting principles generally accepted in the United States of America (“U.S. GAAP”).
The Funds are investment companies and accordingly they follow the investment company accounting and reporting guidance in accordance with the Financial Accounting Standards Board Accounting Standards Codification Topic 946, Financial Services — Investment Companies.
Valuation of Securities — All investments in securities are recorded at their estimated fair value as described in Note 12.
Foreign Currency Translations — Values of investments denominated in foreign currencies are converted into U.S. dollars using the current exchange rates each business day (generally 4:00 p.m. Eastern Time). Purchases and sales of investments and dividend income are translated into U.S. dollars using the current prevailing exchange rate on the transaction date. The effect of changes in foreign exchange rates on realized and unrealized gains or losses on securities is reflected as a component of such gains or losses. Transactions in foreign denominated assets may involve greater risks than domestic transactions.
Investment in Securities and Related Investment Income — Security transactions are accounted for on the trade date. Gains or losses on securities sold are determined on the identified cost basis. Dividend income and distributions to shareholders are recorded on the ex-dividend date except that certain dividends from foreign securities may be recorded after the ex-dividend date based on when the Fund is informed of the dividend. Interest income and estimated expenses are accrued daily. Bond discount and premiums are amortized using the interest method. To the extent dividends received include return of capital or capital gain distributions, such distributions are recorded as a reduction to cost of the related security or as a realized gain or loss.
For financial reporting purposes, estimates on all real estate investment trust (REIT) rates are based on prior year average rates made public by the REITs. To obtain these rates Wasatch utilizes a service through Wall Street Concepts, which gathers and disseminates the information. Prior to filing tax returns, REIT rates are trued up for actual rates. The differences between the actual versus the trued-up rates are captured in the next fiscal year’s financial reporting process.
Expenses — The Funds contract for various services on a collective basis. Most expenses are directly attributable to each Fund and therefore are charged accordingly. Expenses not directly attributable to one or more Funds are allocated among applicable Funds on an equitable and consistent basis considering such things as the nature and type of expense and the relative net assets of the Funds.
119
Notes to Financial Statements (continued)
Use of Management Estimates — The preparation of financial statements in conformity with U.S. GAAP requires management to make estimates and assumptions that affect the reported amounts of assets and liabilities at the date of the financial statements and the reported changes in net assets during the reporting period. Actual results could differ from those estimates.
Guarantees and Indemnifications — In the normal course of business, the Funds enter into contracts that contain a variety of representations and warranties which provide general indemnifications. The maximum exposure under these arrangements is unknown, as this would involve future claims that may be made against the Funds and/or their affiliates that have not yet occurred. Based on experience, however, the risk of loss is expected to be remote.
Redemption Fees — The Funds deduct a fee of 2.00% from redemption proceeds on shares of the Funds held 60 days or less. Redemption fees retained by the Funds are credited to additional paid-in capital.
Other — Income, expenses, and realized and unrealized gains or losses on investments are generally allocated to each class of shares based on its relative net assets, except that each class separately bears expenses related specifically to that class, such as certain shareholder servicing fees.
3. SECURITIES AND OTHER INVESTMENTS
Repurchase Agreements — The Funds may engage in repurchase transactions. Under the terms of a typical repurchase agreement, a fund takes possession of an underlying debt obligation subject to an obligation of the seller to repurchase and the fund to resell the obligation at an agreed upon price and time. The market value of the collateral must be at least equal at all times to the total amount of the repurchase obligation, including interest. Generally, in the event of counterparty default, the fund has the right to use the collateral to offset losses incurred.
Short Sales — The Equity Funds, the Long/Short Alpha Fund in particular, may enter into short sales whereby a fund sells a security it generally does not own (the security is borrowed), in anticipation of a decline in the security’s price. The initial amount of a short sale is recorded as a liability which is marked-to-market daily. Fluctuations in the value of the short liability are recorded as unrealized gains or losses. If a Fund shorts a security when also holding a long position in the security (a “short against the box”), as the security’s price declines, the short position increases in value, offsetting the long position’s decrease in value. The opposite effect occurs if the security’s price rises. A Fund realizes a gain or loss upon closing of the short sale (returning the security to the counterparty by way of purchase or delivery of a long position owned). Possible losses from short sales may be unlimited, whereas losses from security purchases cannot exceed the total amount invested. The Funds are liable to the lender for any dividends payable on securities while those securities are in
a short position. These dividends are an expense of the Funds. The Funds designate collateral consisting of cash, U.S. government securities or other liquid assets sufficient to collateralize the market value of short positions.
Participation Notes — Certain Funds may invest in Participation Notes (P-Notes). P-Notes are promissory notes designed to offer a return linked to the performance of a particular underlying equity security or market. P-Notes are issued by banks or broker-dealers and allow a fund to gain exposure to common stocks in markets in which the fund is currently not approved to directly invest, or in markets that prohibit direct investment by foreign purchasers. While the holder of a P-Note is entitled to receive from the bank or broker-dealer any dividends or other distributions paid on the underlying securities, the holder is not entitled to the same rights as an owner of the underlying securities, such as voting rights. Income received from P-Notes is recorded as dividend income in the Statements of Operations. P-Notes are considered general unsecured contractual obligations of the bank or broker-dealer. Risks associated with P-Notes include the possible failure of a counterparty (i.e., the issuing bank or broker-dealer) to perform in accordance with the terms of the agreement, inability to transfer or liquidate the notes, potential delays or an inability to redeem the notes before maturity under certain market conditions, and limited legal recourse against the issuer of the underlying common stock.
4. FINANCIAL DERIVATIVE INSTRUMENTS
Foreign Currency Contracts — The Funds may enter into foreign currency contracts to settle planned purchases or sales of securities or to protect against a possible loss resulting from an adverse change in the relationship between the U.S. dollar and a foreign currency involved in an underlying transaction. Foreign currency contracts are agreements between two parties to buy and sell a currency at a set price on a future date. The market value of a foreign currency contract fluctuates with changes in currency exchange rates. Foreign currency contracts are marked-to-market daily and the change in market value is recorded by a fund as unrealized appreciation or depreciation. When a foreign currency contract is closed, the fund records a realized gain or loss equal to the difference between the value at the time it was opened and the value at the time it was closed. These contracts may involve market risk in excess of the unrealized gain or loss reflected in the Schedule of Investments. In addition, a fund could be exposed to credit risk if a counterparty is unable or unwilling to meet the terms of the contracts or if the value of the currency changes unfavorably. In connection with these contracts, the Funds may segregate cash and/or securities in a sufficient amount as collateral in accordance with the terms of the respective contracts. None of the Funds entered into foreign currency contracts transactions during the six-month period ended March 31, 2022.
120
| | |
| | | MARCH 31, 2022 (Unaudited) |
5. PURCHASES AND SALES OF SECURITIES
The cost of investment securities purchased and proceeds from sales of investment securities, excluding U.S. government and short-term securities, for the six months ended March 31, 2022 are summarized below:
| | | | | | | | | | | | | | | | | | | | | | | | | |
| | | Core
Growth
Fund | | Emerging
India
Fund | | Emerging
Markets
Select
Fund | | Emerging
Markets
Small Cap
Fund | | Frontier
Emerging
Small Countries
Fund |
Purchases | | | $ | 453,378,038 | | | | $ | 141,118,214 | | | | $ | 343,684,044 | | | | $ | 159,350,679 | | | | $ | 20,483,052 | |
Sales | | | | 558,016,384 | | | | | 77,266,986 | | | | | 41,761,586 | | | | | 95,153,056 | | | | | 15,233,902 | |
| | | | | |
| | | Global
Opportunities
Fund | | Global
Select
Fund | | Global
Value
Fund | | Greater
China
Fund | | International
Growth
Fund |
Purchases | | | $ | 64,044,658 | | | | $ | 4,507,603 | | | | $ | 35,952,523 | | | | $ | 3,583,609 | | | | $ | 138,536,734 | |
Sales | | | | 39,997,130 | | | | | 3,924,840 | | | | | 32,294,771 | | | | | 3,437,583 | | | | | 194,378,928 | |
| | | | | |
| | | International
Opportunities
Fund | | International
Select
Fund | | Long/Short
Alpha
Fund | | Micro
Cap
Fund | | Micro Cap
Value
Fund |
Purchases | | | $ | 156,915,486 | | | | $ | 1,121,386 | | | | $ | 38,944,561 | | | | $ | 353,624,523 | | | | $ | 109,330,523 | |
Sales | | | | 186,657,477 | | | | | 2,009,429 | | | | | 6,162,619 | | | | | 555,099,227 | | | | | 101,890,507 | |
| | | | | |
| | | Small Cap
Growth
Fund | | Small Cap
Value
Fund | | Ultra
Growth
Fund | | | | |
Purchases | | | $ | 511,448,459 | | | | $ | 484,094,182 | | | | $ | 450,283,877 | | | | | | | | | | | |
Sales | | | | 568,134,657 | | | | | 466,816,837 | | | | | 756,942,406 | | | | | | | | | | | |
Purchases and sales of U.S. government securities in the U.S. Treasury Fund were $37,408,672 and $37,989,408, respectively.
6. FEDERAL INCOME TAX INFORMATION
It is the Funds’ policy to qualify as regulated investment companies and distribute substantially all of their taxable income to shareholders. The Funds’ tax returns are open to examination by the relevant tax authorities until expiration of the applicable statute of limitations, which is generally three years after the filing of the tax return.
Management has analyzed the Funds’ tax positions taken for all open federal and state income tax years, and has concluded that no provision for income tax is required in the Funds’ financial statements.
As of March 31, 2022, the cost and unrealized appreciation (depreciation) of securities on a tax basis were as follows:
| | | | | | | | | | | | | | | | | | | | | | | | | |
| | | Core
Growth
Fund | | Emerging
India
Fund | | Emerging
Markets
Select
Fund | | Emerging
Markets
Small Cap
Fund | | Frontier
Emerging
Small Countries
Fund |
Cost | | | $ | 2,579,089,370 | | | | $ | 409,443,057 | | | | $ | 467,472,111 | | | | $ | 396,528,700 | | | | $ | 47,207,783 | |
| | | | | |
Gross appreciation | | | $ | 1,121,961,033 | | | | $ | 264,325,380 | | | | $ | 44,034,941 | | | | $ | 251,512,220 | | | | $ | 15,629,809 | |
Gross (depreciation) | | | | (203,256,196 | ) | | | | (386,816 | ) | | | | (32,734,612 | ) | | | | (47,568,088 | ) | | | | (5,814,170 | ) |
| | | | | |
Net appreciation | | | $ | 918,704,837 | | | | $ | 263,938,564 | | | | $ | 11,300,329 | | | | $ | 203,944,132 | | | | $ | 9,815,639 | |
| | | | | |
| | | | | |
| | | Global
Opportunities
Fund | | Global
Select
Fund | | Global
Value
Fund | | Greater
China
Fund | | International
Growth
Fund |
Cost | | | $ | 173,042,453 | | | | $ | 15,901,020 | | | | $ | 114,610,925 | | | | $ | 9,847,823 | | | | $ | 688,291,537 | |
| | | | | |
Gross appreciation | | | $ | 75,979,328 | | | | $ | 2,523,763 | | | | $ | 26,214,910 | | | | $ | 448,830 | | | | $ | 358,558,959 | |
Gross (depreciation) | | | | (13,038,771 | ) | | | | (1,642,116 | ) | | | | (2,494,307 | ) | | | | (2,029,551 | ) | | | | (56,125,512 | ) |
| | | | | |
Net appreciation (depreciation) | | | $ | 62,940,557 | | | | $ | 881,647 | | | | $ | 23,720,603 | | | | $ | (1,580,721 | ) | | | $ | 302,433,447 | |
| | | | | |
121
Notes to Financial Statements (continued)
| | | | | | | | | | | | | | | | | | | | | | | | | |
| | | International
Opportunities
Fund | | International Select
Fund | | Long/Short
Alpha
Fund | | Micro
Cap
Fund | | Micro Cap
Value
Fund |
Cost | | | $ | 439,387,736 | | | | $ | 6,405,628 | | | | $ | 32,295,773 | | | | $ | 909,245,910 | | | | $ | 300,594,177 | |
| | | | | |
Gross appreciation | | | $ | 181,805,370 | | | | $ | 773,068 | | | | $ | 999,021 | | | | $ | 161,688,122 | | | | $ | 91,685,718 | |
Gross (depreciation) | | | | (50,302,259 | ) | | | | (524,017 | ) | | | | (3,802,079 | ) | | | | (143,161,711 | ) | | | | (25,772,726 | ) |
| | | | | |
Net appreciation (depreciation) | | | $ | 131,503,111 | | | | $ | 249,051 | | | | $ | (2,803,058 | ) | | | $ | 18,526,411 | | | | $ | 65,912,992 | |
| | | | | |
| | | | | |
| | | Small Cap
Growth
Fund | | Small Cap
Value
Fund | | Ultra
Growth
Fund | | U.S.
Treasury
Fund | | |
Cost | | | $ | 2,275,008,577 | | | | $ | 1,315,408,334 | | | | $ | 1,905,934,240 | | | | $ | 477,313,575 | | | | | | |
| | | | | | | | | | |
Gross appreciation | | | $ | 902,088,481 | | | | $ | 377,660,099 | | | | $ | 550,760,297 | | | | $ | 6,048,607 | | | | | | |
Gross (depreciation) | | | | (347,893,217 | ) | | | | (80,705,139 | ) | | | | (288,939,529 | ) | | | | (61,033,334 | ) | | | | | |
| | | | | | | | | | |
Net appreciation (depreciation) | | | $ | 554,195,264 | | | | $ | 296,954,960 | | | | $ | 261,820,768 | | | | $ | (54,984,727 | ) | | | | | |
| | | | | | | | | | |
The difference between book-basis and tax-basis unrealized gains (losses) is primarily attributable to the tax deferral of losses on wash sales, unrealized appreciation (depreciation) on passive foreign investment companies (PFICs), partnership adjustments and other temporary tax adjustments.
The amount and character of tax-basis distributions and composition of net assets are finalized at the end of the fiscal year. Accordingly, tax basis balances have not been determined as of the date of this report.
Distributions to shareholders are recorded on the ex-dividend date. Distributions are determined on a tax basis at the fiscal year-end and may differ from ordinary income and realized capital gains for financial reporting purposes. The Funds may utilize earnings and profits distributed to
shareholders on redemption of shares as part of the dividends-paid deduction (tax equalization).
Differences between income and/or capital gains as determined on a book basis and a tax basis are primarily due to differing treatments of EU reclaims, passive foreign investment company shares, foreign capital gains taxes, foreign currency transactions, corporate actions, wash sales and investments in REITs. These reclassifications have no effect on net assets or the net asset value per share.
The Fund’s are permitted to carry forward capital losses for an unlimited period. The losses carried forward retain their character as either short-term or long-term capital losses.
Capital loss carryforwards as of September 30, 2021 are as follows:
| | | | | | | | | | |
| | | Non-expiring |
| Fund | | Short Term | | Long Term |
Frontier Emerging Small Countries Fund | | | $ | 91,976,148 | | | | $ | 4,415,591 | |
Global Value Fund* | | | | 23,932,015 | | | | | 137,395,636 | |
Greater China Fund | | | | 682,646 | | | | | — | |
International Select Fund | | | | 33,009 | | | | | — | |
| * | The Fund’s capital loss carryforward is subject to an annual limitation under the Internal Revenue Code and related regulations. |
During the tax year ended September 30, 2021, the Funds used capital loss carryforwards in the following amounts:
| | | | | |
| Fund | | Amount Used |
Emerging Markets Select Fund | | | $ | 2,806,868 | |
Frontier Emerging Small Countries Fund | | | | 6,636,366 | |
Global Value Fund | | | | 1,027,950 | |
U.S. Treasury Fund | | | | 13,584,324 | |
122
| | |
| | | MARCH 31, 2022 (Unaudited) |
Under current tax law, Post-October Capital Losses and Late-Year Ordinary Losses may be deferred and treated as occurring on the first business day of the following fiscal year for tax purposes. The Funds have elected to defer losses as follows:
| | | | | | | | | | |
| Fund | | Post-October
Capital Losses | | Late-Year
Ordinary Losses |
Emerging India Fund | | | $ | — | | | | $ | (7,436,538 | ) |
Emerging Markets Select Fund | | | | — | | | | | (477,589 | ) |
Emerging Markets Small Cap Fund | | | | — | | | | | (2,272,809 | ) |
Global Opportunities Fund | | | | — | | | | | (1,914,666 | ) |
Greater China Fund | | | | — | | | | | (48,848 | ) |
International Growth Fund | | | | — | | | | | (6,124,780 | ) |
International Opportunities Fund | | | | (168,826 | ) | | | | (4,956,526 | ) |
International Select Fund | | | | — | | | | | (26,889 | ) |
U.S. Treasury Fund | | | | (6,578,439 | ) | | | | — | |
EU Reclaims — Withholding taxes on foreign dividends and capital gains have been provided for in accordance with the Funds’ understanding of the applicable countries’ tax rules and rates. Several Wasatch Funds have filed tax reclaims for previously withheld taxes on dividends earned in certain European Union countries. These filings are subject to various administrative and judicial proceedings within these countries. Such tax reclaims received during the year, if any, are included in dividend income in the Statements of Operations and any related receivable, if any, is reflected as interest and dividends receivable in the Statements of Assets and Liabilities. When uncertainty exists as to the ultimate resolution of these proceedings, the likelihood of receipt of these EU reclaims, and the potential timing of payment, no amounts are reflected in the financial statements. For U.S. income tax purposes, EU reclaims received by the Funds, if any, reduce the amounts of foreign taxes Fund shareholders can use as tax credits in their individual income tax returns. In the event that EU reclaims received by the Funds during the fiscal year exceed foreign withholding taxes paid, and the Funds had previously passed foreign tax credits on to their shareholders, the Funds may enter into a closing agreement with the Internal Revenue Service (IRS) in order to pay the associated tax liability on behalf of the Funds’ shareholders.
7. RELATED PARTY TRANSACTIONS
Investment Advisory Fees, Expense Limitations — As the Funds’ investment advisor, the Advisor receives a
monthly fee calculated on average daily net assets. The Advisor has contractually agreed to waive its fees and/or reimburse certain Funds should a Fund’s operating expenses exceed a specified annual limitation through at least January 31, 2023. If operating expenses are less than the specified expense limit for the Fund, the Advisor shall be entitled to recoup the fees waived or reduced to the extent that the operating expenses and the amounts reimbursed do not exceed such expense limit for the Fund, under the period of the agreement (currently through January 31, 2023). A Fund may only make a repayment to the Advisor for the amount reimbursed if such repayment does not cause the Fund’s expense ratio, after repayment is taken into account, to exceed both (i) the expense cap at the time such amounts were waived; and (ii) the Fund’s current expense cap. All amounts not recovered at the end of the period expire on January 31, 2023. Shareholder expenses will increase if the Advisor does not renew the contractual expense cap after its expiration date. Ordinary operating expenses exclude any interest, dividend expense on short sales/interest expense, taxes, brokerage commissions, other investment-related costs, acquired fund fees and expenses, and extraordinary expenses, such as litigation and other expenses not incurred in the ordinary course of the Funds’ business in excess of such limitations. Investment advisory fees and fees waived, if any, for the six months ended March 31, 2022 are disclosed in the Statements of Operations. Investment advisory fee and expense limitation annual rates are shown below.
123
Notes to Financial Statements (continued)
| | | | | | | | | | | | | | | | | | | | | | | | | |
| Fund | | Advisory
Fee | | Expense
Limitation
Investor Class | | Expense
Limitation
Institutional Class | | Contractual Expense
Limitation/
Reimbursement
Recoverable
Expiration Date | | Reimbursement
Recoverable |
Core Growth Fund | | | | 1.00% | | | | | 1.50% | | | | | 1.05% | | | | | 1/31/2023 | | | | $ | — | |
Emerging India Fund | | | | 1.25% | | | | | 1.75% | | | | | 1.50% | | | | | 1/31/2023 | | | | | — | |
Emerging Markets Select Fund | | | | 1.00% | | | | | 1.50% | | | | | 1.20% | | | | | 1/31/2023 | | | | | — | |
Emerging Markets Small Cap Fund | | | | 1.65% | | | | | 1.95% | | | | | 1.80% | | | | | 1/31/2023 | | | | | — | |
Frontier Emerging Small Countries Fund | | | | 1.65% | | | | | 2.15% | | | | | 1.95% | | | | | 1/31/2023 | | | | | 2,452 | |
Global Opportunities Fund | | | | 1.25% | | | | | 1.75% | | | | | 1.35% | | | | | 1/31/2023 | | | | | — | |
Global Select Fund | | | | 0.85% | | | | | 1.35% | | | | | 0.95% | | | | | 1/31/2023 | | | | | 51,631 | |
Global Value Fund | | | | 0.90% | | | | | 1.10% | | | | | 0.95% | | | | | 1/31/2023 | | | | | 49,063 | |
Greater China Fund | | | | 1.00% | | | | | 1.50% | | | | | 1.25% | | | | | 1/31/2023 | | | | | 48,827 | |
International Growth Fund | | | | 1.25% | | | | | 1.75% | | | | | 1.35% | | | | | 1/31/2023 | | | | | — | |
International Opportunities Fund | | | | 1.75% | | | | | 2.25% | | | | | 1.95% | | | | | 1/31/2023 | | | | | — | |
International Select Fund | | | | 0.80% | | | | | 1.30% | | | | | 0.90% | | | | | 1/31/2023 | | | | | 61,891 | |
Long/Short Alpha Fund | | | | 1.25% | | | | | 1.75% | | | | | 1.50% | | | | | 1/31/2023 | | | | | 89,060 | |
Micro Cap Fund | | | | 1.50% | | | | | 1.95% | | | | | 1.60% | | | | | 1/31/2023 | | | | | — | |
Micro Cap Value Fund | | | | 1.50% | | | | | 1.95% | | | | | 1.60% | | | | | 1/31/2023 | | | | | 1,743 | |
Small Cap Growth Fund | | | | 1.00% | | | | | 1.50% | | | | | 1.05% | | | | | 1/31/2023 | | | | | — | |
Small Cap Value Fund | | | | 1.00% | | | | | 1.50% | | | | | 1.05% | | | | | 1/31/2023 | | | | | — | |
Ultra Growth Fund | | | | 1.00% | | | | | 1.50% | | | | | 1.05% | | | | | 1/31/2023 | | | | | 10,518 | |
U.S. Treasury Fund | | | | 0.50% | | | | | 0.75% | | | | | N/A | | | | | 1/31/2023 | | | | | — | |
Affiliated Trades — Certain Funds are permitted to purchase or sell securities from or to certain related affiliated funds under specified conditions outlined in the procedures adopted by the Board of Trustees (the “Board”). The procedures have been designed to ensure that any purchase or sale of securities by the Funds from or to another fund (or funds) that is, or could be, considered an affiliate by virtue of having a common investment advisor (or affiliated investment advisors), common Trustees and/or common officers complies with Rule 17a-7 of the 1940 Act. Further, each transaction is effected at the current market price, as that term is defined under the procedures.
Compensation — Officers serve in that capacity without compensation from the Trust. Beginning in the calendar year of 2022, the Funds’ method of compensating Trustees is to pay each Independent Trustee a retainer of $150,000 per year for services rendered and a fee of $30,000 for each regularly scheduled Board of Trustees meeting, including the executive session held with respect to the investment advisory contract renewal process for the Funds, whether attended in person or telephonically (including any committee meeting attended) (collectively, the “2022 Base Compensation”). Trustees will receive an additional $12,000 for in-person attendance at any special Board meeting or committee meeting (or any combination thereof), and $6,000 for telephonic attendance at any special Board meeting or committee meeting (or any combination thereof). In addition, the Chair of the Board would receive an additional 25% of the 2022 Base Compensation and the Chair of a Committee would receive an additional 15% of the 2022 Base Compensation. Accordingly, to implement this additional compensation for services as a
Chair, the Chair of the Board receives an additional fee of $75,000 a year as Chair. The Chair of the Audit Committee and the Chair of the Nominating Committee each receive an additional $45,000 per year as Chair.
In the calendar year of 2021, each Independent Trustee was paid a retainer of $126,750 per year for services rendered and a fee of $25,350 for each regularly scheduled Board of Trustees meeting, including the executive session held with respect to the investment advisory contract renewal process for the Funds, whether attended in person or telephonically (including any committee meeting attended) (collectively, the “2021 Base Compensation”). Trustees received an additional $12,000 for in-person attendance at any special Board meeting or committee meeting (or any combination thereof), and $6,000 for telephonic attendance at any special Board meeting or committee meeting (or any combination thereof). In addition, the Chair of the Board received an additional 25% of the 2021 Base Compensation and the Chair of a Committee received an additional 15% of the 2021 Base Compensation. Accordingly, to implement this additional compensation for services as a Chair, the Chair of the Board received an additional fee of $31,687.50 a year as Chair and $7,921.75 for attendance in person or telephonically at each regular Board meeting (four meetings per year) in 2021. The Chair of the Audit Committee and the Chair of the Nominating Committee each received an additional $19,012.50 per year as Chair and $4,753.13 for attendance in person or telephonically at each regular Board meeting (four meetings per year) in 2021.
Payments by Advisor — During 2018, the Advisor paid for a portion of the expenses in connection with the merger
124
| | |
| | | MARCH 31, 2022 (Unaudited) |
of the Long/Short and Global Value Funds. The Advisor will not be reimbursed for these amounts.
The impact of the payments detailed above is reflected in the net expense ratios in the Financial Highlights.
Payments by Sub-Advisor — Pursuant to a sub-advisory agreement entered into between the Advisor and Hoisington Investment Management Company (“HIMCo”), the Sub-Advisor for the U.S. Treasury Fund, (“HIMCo Sub-Advisory Agreement”), and subject to the supervision of the Advisor, HIMCo directs the investment of the U.S. Treasury Fund’s assets and is responsible for the continuing management of the Fund’s assets, including the placement of orders to purchase or sell securities on behalf of the Fund. The HIMCo Sub-Advisory Agreement provides that the Advisor shall pay HIMCo a monthly management fee computed at the annual rate of 0.02% of the Fund’s average daily net assets as long as and whenever the Fund has net assets less than $20 million and one-half (1/2) of the monthly fee the Advisor receives from the Fund under the Advisory and Service Contract as long as and whenever the Fund has net assets of $20 million or more. The Advisor retains the remainder of the advisory fee paid under the Advisory and Service Contract. The Sub-Advisor may reimburse the Advisor for certain expenses.
Transfer Agent Intermediary Fees Reimbursed to the Advisor — Each Fund paid fees to, and reimbursed certain out-of-pocket expenses of, the Funds’ transfer agent during the period. In addition, the Advisor and the Funds’ distributor have entered into selling dealer agreements and service agreements with certain financial services companies, broker-dealers, banks, advisors, retirement service providers or other authorized agents or organizations (each an “Intermediary,” together, “Intermediaries”) to
accept purchase, exchange and redemption orders on the Funds’ behalf. For Investor Class shares of the Funds, some Intermediaries do not charge investors a direct transaction fee, but instead charge a fee for accounting and shareholder services that the agent provided to Fund shareholders on the Funds’ behalf. Those services typically included recordkeeping, transaction processing for shareholders’ accounts, communication of tax information, income distribution and other services. Generally, the fee was either a per account charge based on the number of accounts to which the Intermediary provided such services, or was a percentage (as of March 31, 2022 up to 0.40% annually) of the average value of a Fund’s Investor Class shares held in such accounts. The Advisor paid the Intermediary fees and the Funds reimbursed the Advisor for the portion of such fees, which are intended to compensate the Intermediary for provision of services of the type that would be provided by the Funds’ transfer agent or other service providers if the shares were registered on the books of the Funds’ transfer agent. Institutional Class shares of the Funds do not reimburse the Advisor for payments to Intermediaries. The Funds’ reimbursement of expenses incurred for services provided by Intermediaries are included in “Shareholder servicing fees—Investor Class” in the Statements of Operations.
Custodian Out-of-Pocket Expense Reimbursement — In September 2016, State Street Bank and Trust Company (“SSB”), the Funds’ custodian, provided each Fund with an offer to reimburse the Fund for certain out-of-pocket expenses it charged the Fund between 2003 and 2015. The incorrect charges were due to inaccurate billing rates used by SSB for certain out-of-pocket expenses. SSB made the reimbursements in May 2017.
125
Notes to Financial Statements (continued)
10% Shareholders — As of March 31, 2022, the Funds had individual shareholder accounts and/or omnibus shareholder accounts (comprised of a group of individual shareholders), which individually amounted to more than 10% of the total shares outstanding of each Fund as detailed below:
| | | | | | | | | | | | | | | |
| Fund | | Number of
Accounts | | | | Percent of Shares
Outstanding |
Core Growth Fund | | | | 2 | | | | | | | | | | 41.25 | % |
Emerging India Fund | | | | 3 | | | | | | | | | | 65.79 | % |
Emerging Markets Select Fund | | | | 3 | | | | | | | | | | 70.63 | % |
Emerging Markets Small Cap Fund | | | | 2 | | | | | | | | | | 54.53 | % |
Frontier Emerging Small Countries Fund | | | | 3 | | | | | | | | | | 60.32 | % |
Global Opportunities Fund | | | | 3 | | | | | | | | | | 66.00 | % |
Global Select Fund | | | | 3 | | | | | | | | | | 69.19 | % |
Global Value Fund | | | | 2 | | | | | | | | | | 70.66 | % |
Greater China Fund | | | | 3 | | | | | | | | | | 68.27 | % |
International Growth Fund | | | | 2 | | | | | | | | | | 51.13 | % |
International Opportunities Fund | | | | 2 | | | | | | | | | | 39.14 | % |
International Select Fund | | | | 5 | | | | | | | | | | 79.70 | % |
Long/Short Alpha Fund | | | | 4 | | | | | | | | | | 91.58 | % |
Micro Cap Fund | | | | 2 | | | | | | | | | | 45.50 | % |
Micro Cap Value Fund | | | | 3 | | | | | | | | | | 59.48 | % |
Small Cap Growth Fund | | | | 3 | | | | | | | | | | 58.57 | % |
Small Cap Value Fund | | | | 4 | | | | | | | | | | 68.37 | % |
Ultra Growth Fund | | | | 2 | | | | | | | | | | 58.03 | % |
U.S. Treasury Fund | | | | 3 | | | | | | | | | | 47.63 | % |
Affiliated Interests — As of March 31, 2022, the Advisor and its affiliates, and the retirement plans of the Advisor and its affiliates, held shares of the Funds, which may be redeemed at any time as detailed below:
| | | | | | | | | | | | | | | |
| Fund | | Number of
Accounts* | | | | Percent of Shares
Outstanding |
Core Growth Fund | | | | 17 | | | | | | | | | | 2.23 | % |
Emerging India Fund | | | | 28 | | | | | | | | | | 3.06 | % |
Emerging Markets Select Fund | | | | 21 | | | | | | | | | | 2.37 | % |
Emerging Markets Small Cap Fund | | | | 11 | | | | | | | | | | 1.25 | % |
Frontier Emerging Small Countries Fund | | | | 9 | | | | | | | | | | 2.57 | % |
Global Opportunities Fund | | | | 15 | | | | | | | | | | 5.06 | % |
Global Select Fund | | | | 18 | | | | | | | | | | 65.28 | % |
Global Value Fund | | | | 6 | | | | | | | | | | 3.46 | % |
Greater China Fund | | | | 15 | | | | | | | | | | 44.34 | % |
International Growth Fund | | | | 12 | | | | | | | | | | 0.34 | % |
International Opportunities Fund | | | | 14 | | | | | | | | | | 0.72 | % |
International Select Fund | | | | 12 | | | | | | | | | | 38.55 | % |
Long/Short Alpha Fund | | | | 12 | | | | | | | | | | 45.13 | % |
Micro Cap Fund | | | | 17 | | | | | | | | | | 0.66 | % |
Micro Cap Value Fund | | | | 13 | | | | | | | | | | 1.65 | % |
Small Cap Growth Fund | | | | 18 | | | | | | | | | | 1.40 | % |
Small Cap Value Fund | | | | 11 | | | | | | | | | | 1.14 | % |
Ultra Growth Fund | | | | 14 | | | | | | | | | | 0.53 | % |
U.S. Treasury Fund | | | | 6 | | | | | | | | | | 0.38 | % |
| * | Multiple accounts with the same beneficial owner are treated as one account. |
126
| | |
| | | MARCH 31, 2022 (Unaudited) |
8. TRANSACTIONS WITH AFFILIATES
If a Fund’s holding represents ownership of 5% or more of the voting securities of a company, the company is deemed to be an affiliate as defined by the 1940 Act. The following Funds conducted transactions during the six months ended March 31, 2022 with an “affiliated company” as so defined:
| | | | | | | | | | | | | | | | | | | | | | | | | | | | | | | | | | | |
| | | Value, Beginning Of the Period | | Purchases At Cost | | Proceeds From Sales | | Value, End Of the Period | | Dividends
Credited to
Income for the Period ended
3/31/2022 | | Gain (Loss)
Realized on
Sale of Shares
For the Period ended
3/31/2022 | | Change in
Unrealized
Appreciation
For the Period ended
3/31/2022 |
Core Growth Fund | | | | | | | | | | | | | | | | | | | | | | | | | | | | | | | | | | | |
Common Stock | | | | | | | | | | | | | | | | | | | | | | | | | | | | | | | | | | | |
Holley, Inc. | | | $ | 43,374,999 | | | | $ | 33,599,151 | | | | $ | — | | | | $ | 92,261,511 | | | | $ | — | | | | $ | — | | | | $ | 15,287,361 | |
1-800-Flowers.com, Inc., Class A* | | | | 58,669,388 | | | | | — | | | | | 46,616,756 | | | | | — | | | | | — | | | | | (8,268,400 | ) | | | | (3,784,232 | ) |
| | | | | |
| | | $ | 102,044,387 | | | | $ | 33,599,151 | | | | $ | 46,616,756 | | | | $ | 92,261,511 | | | | $ | — | | | | $ | (8,268,400 | ) | | | $ | 11,503,129 | |
| | | | | |
Micro Cap Fund | | | | | | | | | | | | | | | | | | | | | | | | | | | | | | | | | | | |
Common Stock | | | | | | | | | | | | | | | | | | | | | | | | | | | | | | | | | | | |
Allied Motion Technologies, Inc.* | | | $ | 23,140,694 | | | | $ | — | | | | $ | 5,668,299 | | | | $ | 17,482,152 | | | | $ | 18,297 | | | | $ | 541,031 | | | | $ | (531,274 | ) |
IM Cannabis Corp. | | | | 14,940,315 | | | | | — | | | | | 947,113 | | | | | 7,923,507 | | | | | — | | | | | (1,434,553 | ) | | | | (4,635,142 | ) |
Motorsport Games, Inc., Class A | | | | 18,194,448 | | | | | — | | | | | 837,580 | | | | | 1,390,883 | | | | | — | | | | | (3,132,023 | ) | | | | (12,833,962 | ) |
PharmaCielo Ltd. | | | | 10,806,048 | | | | | 66,445 | | | | | 1,241,881 | | | | | 4,736,431 | | | | | — | | | | | (2,133,151 | ) | | | | (2,761,030 | ) |
Superior Group of Cos., Inc. | | | | 22,445,738 | | | | | — | | | | | 2,395,640 | | | | | 15,192,867 | | | | | 218,487 | | | | | (608,651 | ) | | | | (4,248,580 | ) |
Transcat, Inc.* | | | | 41,283,384 | | | | | — | | | | | 22,585,566 | | | | | 29,930,680 | | | | | — | | | | | 13,979,630 | | | | | (2,746,768 | ) |
UFP Technologies, Inc.* | | | | 27,674,235 | | | | | 2,275,638 | | | | | 12,093,698 | | | | | 20,014,175 | | | | | — | | | | | 3,424,270 | | | | | (1,266,270 | ) |
Versus Systems, Inc. | | | | 3,085,757 | | | | | 1,229,003 | | | | | — | | | | | 2,397,628 | | | | | — | | | | | — | | | | | (1,917,132 | ) |
Vintage Wine Estates, Inc. | | | | 44,325,092 | | | | | — | | | | | 1,722,824 | | | | | 41,132,199 | | | | | — | | | | | (301,895 | ) | | | | (1,168,174 | ) |
Warrants | | | | | | | | | | | | | | | | | | | | | | | | | | | | | | | | | | | |
IM Cannabis Corp., expiring
5/7/2026 | | | | 225,000 | | | | | — | | | | | — | | | | | 49,500 | | | | | — | | | | | — | | | | | (175,500 | ) |
Versus Systems, Inc., expiring 1/15/2022 | | | | — | | | | | — | | | | | — | | | | | — | | | | | — | | | | | (6,400 | ) | | | | 6,400 | |
Versus Systems, Inc., expiring 1/15/2026 | | | | 891,520 | | | | | — | | | | | — | | | | | 203,840 | | | | | — | | | | | — | | | | | (687,680 | ) |
Versus Systems, Inc., expiring 1/15/2026 | | | | 359,040 | | | | | — | | | | | — | | | | | 82,560 | | | | | — | | | | | — | | | | | (276,480 | ) |
Versus Systems, Inc., expiring 2/28/2027 | | | | — | | | | | 277,397 | | | | | — | | | | | 337,500 | | | | | — | | | | | — | | | | | 60,103 | |
| | | | | |
| | | $ | 207,371,271 | | | | $ | 3,848,483 | | | | $ | 47,492,601 | | | | $ | 140,873,922 | | | | $ | 236,784 | | | | $ | 10,328,258 | | | | $ | (33,181,489 | ) |
| | | | | |
Small Cap Growth Fund | | | | | | | | | | | | | | | | | | | | | | | | | | | | | | | | | | | |
Common Stock | | | | | | | | | | | | | | | | | | | | | | | | | | | | | | | | | | | |
DMC Global, Inc. | | | $ | 45,955,866 | | | | $ | — | | | | $ | 1,095,081 | | | | $ | 37,069,761 | | | | $ | — | | | | $ | (531,373 | ) | | | $ | (7,259,651 | ) |
Johnnie-O Holdings, Inc., Series A Pfd. | | | | — | | | | | 17,999,987 | | | | | — | | | | | 17,999,987 | | | | | — | | | | | — | | | | | — | |
Pennant Group, Inc. | | | | 20,453,003 | | | | | 28,075,444 | | | | | 949,765 | | | | | 37,628,967 | | | | | | | | | | (1,939,344 | ) | | | | (8,010,371 | ) |
Vintage Wine Estates, Inc., PIPE Shares | | | | 52,800,000 | | | | | — | | | | | — | | | | | 54,285,000 | | | | | — | | | | | — | | | | | 1,485,000 | |
| | | | | |
| | | $ | 119,208,869 | | | | $ | 46,075,431 | | | | $ | 2,044,846 | | | | $ | 146,983,715 | | | | $ | — | | | | $ | (2,470,717 | ) | | | $ | (13,785,022 | ) |
| | | | | |
Small Cap Value Fund | | | | | | | | | | | | | | | | | | | | | | | | | | | | | | | | | | | |
Common Stock | | | | | | | | | | | | | | | | | | | | | | | | | | | | | | | | | | | |
National CineMedia, Inc.* | | | $ | 14,495,864 | | | | $ | — | | | | $ | 897,429 | | | | $ | 9,591,154 | | | | $ | 392,396 | | | | $ | (1,074,063 | ) | | | $ | (2,933,218 | ) |
| | | | | |
Ultra Growth Fund | | | | | | | | | | | | | | | | | | | | | | | | | | | | | | | | | | | |
Common Stock | | | | | | | | | | | | | | | | | | | | | | | | | | | | | | | | | | | |
Artivion, Inc. | | | $ | 51,376,332 | | | | $ | 1,217,618 | | | | $ | 2,815,717 | | | | $ | 47,462,467 | | | | $ | — | | | | $ | (1,509,483 | ) | | | $ | (806,283 | ) |
Conformis, Inc. | | | | 18,586,645 | | | | | — | | | | | 140,387 | | | | | 8,586,009 | | | | | — | | | | | (81,036 | ) | | | | (9,779,213 | ) |
Exagen, Inc. | | | | 14,348,367 | | | | | — | | | | | 152,539 | | | | | 8,344,029 | | | | | — | | | | | (216,527 | ) | | | | (5,635,272 | ) |
Johnnie-O Holdings, Inc., Series A Pfd. | | | | — | | | | | 15,000,004 | | | | | — | | | | | 15,000,004 | | | | | — | | | | | — | | | | | — | |
Vintage Wine Estates, Inc., PIPE Shares | | | | 43,200,000 | | | | | — | | | | | — | | | | | 44,415,000 | | | | | — | | | | | — | | | | | 1,215,000 | |
| | | | | |
| | | $ | 127,511,344 | | | | $ | 16,217,622 | | | | $ | 3,108,643 | | | | $ | 123,807,509 | | | | $ | — | | | | $ | (1,807,046 | ) | | | $ | (15,005,768 | ) |
| | | | | |
127
Notes to Financial Statements (continued)
| | | | | | | | | | | | | | | | | | | | | | | | | | | | | | | | | | | |
| | | Share Activity | | Dividends
Credited to
Income for the Period ended
3/31/2022 | | Gain (Loss)
Realized on
Sale of Shares
For the Period ended
3/31/2022 | | Change in
Unrealized
Appreciation
For the
Period ended
3/31/2022 |
| | | Balance
9/30/2021 | | Purchases/
Additions | | Sales/
Reductions | | Balance
3/31/2022 |
Core Growth Fund | | | | | | | | | | | | | | | | | | | | | | | | | | | | | | | | | | | |
Common Stock | | | | | | | | | | | | | | | | | | | | | | | | | | | | | | | | | | | |
Holley, Inc. | | | | 3,632,747 | | | | | 3,000,000 | | | | | — | | | | | 6,632,747 | | | | $ | — | | | | $ | — | | | | $ | 15,287,361 | |
1-800-Flowers.com, Inc., Class A* | | | | 1,922,956 | | | | | — | | | | | 1,922,956 | | | | | — | | | | | — | | | | | (8,268,400 | ) | | | | (3,784,232 | ) |
| | | | | |
| | | | 5,555,703 | | | | | 3,000,000 | | | | | 1,922,956 | | | | | 6,632,747 | | | | $ | — | | | | $ | (8,268,400 | ) | | | $ | 11,503,129 | |
| | | | | |
Micro Cap Fund | | | | | | | | | | | | | | | | | | | | | | | | | | | | | | | | | | | |
Common Stock | | | | | | | | | | | | | | | | | | | | | | | | | | | | | | | | | | | |
Allied Motion Technologies, Inc.* | | | | 739,792 | | | | | — | | | | | 153,929 | | | | | 585,863 | | | | $ | 18,297 | | | | $ | 541,031 | | | | $ | (531,274 | ) |
IM Cannabis Corp. | | | | 4,208,221 | | | | | — | | | | | 470,269 | | | | | 3,737,952 | | | | | — | | | | | (1,434,553 | ) | | | | (4,635,142 | ) |
Motorsport Games, Inc., Class A | | | | 1,275,908 | | | | | — | | | | | 222,209 | | | | | 1,053,699 | | | | | — | | | | | (3,132,023 | ) | | | | (12,833,962 | ) |
PharmaCielo Ltd. | | | | 10,290,933 | | | | | 101,500 | | | | | 1,933,506 | | | | | 8,458,927 | | | | | — | | | | | (2,133,151 | ) | | | | (2,761,030 | ) |
Superior Group of Cos., Inc. | | | | 963,750 | | | | | — | | | | | 112,609 | | | | | 851,141 | | | | | 218,487 | | | | | (608,651 | ) | | | | (4,248,580 | ) |
Transcat, Inc.* | | | | 640,251 | | | | | — | | | | | 271,374 | | | | | 368,877 | | | | | — | | | | | 13,979,630 | | | | | (2,746,768 | ) |
UFP Technologies, Inc.* | | | | 449,330 | | | | | 36,062 | | | | | 182,926 | | | | | 302,466 | | | | | — | | | | | 3,424,270 | | | | | (1,266,270 | ) |
Versus Systems, Inc. | | | | 838,521 | | | | | 937,500 | | | | | — | | | | | 1,776,021 | | | | | — | | | | | — | | | | | (1,917,132 | ) |
Vintage Wine Estates, Inc. | | | | 4,341,341 | | | | | — | | | | | 173,945 | | | | | 4,167,396 | | | | | — | | | | | (301,895 | ) | | | | (1,168,174 | ) |
Warrants | | | | | | | | | | | | | | | | | | | | | | | | | | | | | | | | | | | |
IM Cannabis Corp., expiring 5/7/2026 | | | | 450,000 | | | | | — | | | | | — | | | | | 450,000 | | | | | — | | | | | — | | | | | (175,500 | ) |
Versus Systems, Inc., expiring 1/15/2022 | | | | 640,000 | | | | | — | | | | | 640,000 | | | | | — | | | | | — | | | | | (6,400 | ) | | | | 6,400 | |
Versus Systems, Inc., expiring 1/15/2026 | | | | 448,000 | | | | | — | | | | | — | | | | | 448,000 | | | | | — | | | | | — | | | | | (687,680 | ) |
Versus Systems, Inc., expiring 1/15/2026 | | | | 192,000 | | | | | — | | | | | — | | | | | 192,000 | | | | | — | | | | | — | | | | | (276,480 | ) |
Versus Systems, Inc., expiring 2/28/2027 | | | | — | | | | | 937,500 | | | | | — | | | | | 937,500 | | | | | — | | | | | — | | | | | 60,103 | |
| | | | | |
| | | | 25,478,047 | | | | | 2,012,562 | | | | | 4,160,767 | | | | | 23,329,842 | | | | $ | 236,784 | | | | $ | 10,328,258 | | | | $ | (33,181,489 | ) |
| | | | | |
Small Cap Growth Fund | | | | | | | | | | | | | | | | | | | | | | | | | | | | | | | | | | | |
Common Stock | | | | | | | | | | | | | | | | | | | | | | | | | | | | | | | | | | | |
DMC Global, Inc. | | | | 1,245,079 | | | | | — | | | | | 29,677 | | | | | 1,215,402 | | | | $ | — | | | | $ | (531,373 | ) | | | $ | (7,259,651 | ) |
Johnnie-O Holdings, Inc., Series A Pfd. | | | | — | | | | | 611,205 | | | | | — | | | | | 611,205 | | | | | — | | | | | — | | | | | — | |
Pennant Group, Inc. | | | | 728,124 | | | | | 1,341,000 | | | | | 49,319 | | | | | 2,019,805 | | | | | | | | | | (1,939,344 | ) | | | | (8,010,371 | ) |
Vintage Wine Estates, Inc., PIPE Shares | | | | 5,500,000 | | | | | — | | | | | — | | | | | 5,500,000 | | | | | — | | | | | — | | | | | 1,485,000 | |
| | | | | |
| | | | 7,473,203 | | | | | 1,952,205 | | | | | 78,996 | | | | | 9,346,412 | | | | $ | — | | | | $ | (2,470,717 | ) | | | $ | (13,785,022 | ) |
| | | | | |
Small Cap Value Fund | | | | | | | | | | | | | | | | | | | | | | | | | | | | | | | | | | | |
Common Stock | | | | | | | | | | | | | | | | | | | | | | | | | | | | | | | | | | | |
National CineMedia, Inc.* | | | | 4,071,872 | | | | | — | | | | | 295,827 | | | | | 3,776,045 | | | | $ | 392,396 | | | | $ | (1,074,063 | ) | | | $ | (2,933,218 | ) |
| | | | | |
Ultra Growth Fund | | | | | | | | | | | | | | | | | | | | | | | | | | | | | | | | | | | |
Common Stock | | | | | | | | | | | | | | | | | | | | | | | | | | | | | | | | | | | |
Artivion, Inc. | | | | 2,304,905 | | | | | 69,155 | | | | | 154,113 | | | | | 2,219,947 | | | | $ | — | | | | $ | (1,509,483 | ) | | | $ | (806,283 | ) |
Conformis, Inc. | | | | 13,974,921 | | | | | — | | | | | 210,879 | | | | | 13,764,042 | | | | | — | | | | | (81,036 | ) | | | | (9,779,213 | ) |
Exagen, Inc. | | | | 1,055,027 | | | | | — | | | | | 15,920 | | | | | 1,039,107 | | | | | — | | | | | (216,527 | ) | | | | (5,635,272 | ) |
Johnnie-O Holdings, Inc., Series A Pfd. | | | | — | | | | | 509,338 | | | | | — | | | | | 509,338 | | | | | — | | | | | — | | | | | — | |
Vintage Wine Estates, Inc., PIPE Shares | | | | 4,500,000 | | | | | — | | | | | — | | | | | 4,500,000 | | | | | — | | | | | — | | | | | 1,215,000 | |
| | | | | |
| | | | 21,834,853 | | | | | 578,493 | | | | | 380,912 | | | | | 22,032,434 | | | | $ | — | | | | $ | (1,807,046 | ) | | | $ | (15,005,768 | ) |
| | | | | |
| * | This security was deemed to no longer meet the criteria of an affiliated company at the reporting date. For financial statement purposes, the total amount of the gain (loss) realized on sale of shares and the total change in unrealized appreciation for the period ended September 30, 2021 is included in the Statements of Operations even though the security was not deemed an affiliated company as of the end of the period. |
128
| | |
| | | MARCH 31, 2022 (Unaudited) |
9. RESTRICTED SECURITIES
The Funds may own investments that were purchased through private placement transactions or under Rule 144A of the Securities Act of 1933 (the “Securities Act”) and cannot be sold without prior registration under the Securities Act or may be limited due to certain restrictions. These securities are generally deemed to be illiquid and are valued at fair value as determined by a designated Pricing Committee of the Advisor (“Pricing Committee”), comprised of personnel of the Advisor, with oversight by the Board of Trustees and in accordance with Board-approved Pricing Policies and Procedures. If and when such securities are registered, the costs of registering such securities are paid by the issuer. At March 31, 2022, the Funds held the following restricted securities:
| | | | | | | | | | | | | | | | | | | | | | |
| | | Security
Type | | Acquisition
Date | | Cost | | Fair
Value | | Value as a Percent Of Net Assets |
Core Growth Fund | | | | | | | | | | | | | | | | | | | | | | |
Hagerty, Inc., expiring 12/2/2026 | | Warrants | | | | 12/2/2021 | | | | $ | 1,859,173 | | | | $ | 1,204,200 | | | | | 0.03 | % |
|
| |
Micro Cap Fund | | | | | | | | | | | | | | | | | | | | | | |
Johnnie-O Holdings, Inc., Series A Pfd. | | Preferred Stock | | | | 3/16/2022 | | | | $ | 10,000,013 | | | | $ | 10,000,013 | | | | | 1.06 | % |
Esperion Therapeutics, Inc. expiring, 12/7/2023 | | Warrants | | | | 12/3/2021 | | | | | 310,583 | | | | | 124,455 | | | | | 0.01 | % |
IM Cannabis Corp., expiring 5/7/2026 | | Warrants | | | | 5/5/2021 | | | | | 616,971 | | | | | 49,500 | | | | | 0.01 | % |
Versus Systems, Inc., expiring 1/15/2026 | | Warrants | | | | 1/15/2021 | | | | | 1,920 | | | | | 82,560 | | | | | 0.01 | % |
Versus Systems, Inc., expiring 2/28/2027 | | Warrants | | | | 2/24/2022 | | | | | 277,397 | | | | | 337,500 | | | | | 0.04 | % |
| | | | | | | | | | | | |
| | | | | | | | | | $ | 11,206,884 | | | | $ | 10,594,028 | | | | | 1.13 | % |
|
| |
Micro Cap Value Fund | | | | | | | | | | | | | | | | | | | | | | |
Regenacy Pharmaceuticals LLC | | LLC Membership Interest | | | | 12/21/2016 | | | | $ | 30,001 | | | | $ | 22,232 | | | | | 0.01 | % |
Greenlane Holdings, Inc., expiring, 2/24/2026 | | Warrants | | | | 2/22/2021 | | | | | 396,902 | | | | | 0 | | | | | 0.00 | % |
| | | | | | | | | | | | |
| | | | | | | | | | $ | 426,903 | | | | $ | 22,232 | | | | | 0.01 | % |
|
| |
Small Cap Growth Fund | | | | | | | | | | | | | | | | | | | | | | |
DataStax, Inc., Series E Pfd. | | Preferred Stock | | | | 8/12/2014 | | | | $ | 8,000,002 | | | | $ | 10,622,233 | | | | | 0.37 | % |
Johnnie-O Holdings, Inc., Series A Pfd. | | Preferred Stock | | | | 3/16/2022 | | | | | 17,999,987 | | | | | 17,999,987 | | | | | 0.63 | % |
Nanosys, Inc., Series A-1 Pfd. | | Preferred Stock | | | | 8/13/2010 | | | | | 184,939 | | | | | 109,114 | | | | | 0.00 | % |
Nanosys, Inc., Series A-2 Pfd. | | Preferred Stock | | | | 11/8/2005 | | | | | 2,000,000 | | | | | 585,280 | | | | | 0.02 | % |
Esperion Therapeutics, Inc., expiring 12/7/2023 | | Warrants | | | | 12/3/2021 | | | | | 538,893 | | | | | 215,942 | | | | | 0.01 | % |
| | | | | | | | | | | | |
| | | | | | | | | | $ | 28,723,821 | | | | $ | 29,532,556 | | | | | 1.03 | % |
|
| |
Ultra Growth Fund | | | | | | | | | | | | | | | | | | | | | | |
Johnnie-O Holdings, Inc., Series A Pfd. | | Preferred Stock | | | | 3/16/2022 | | | | $ | 15,000,004 | | | | $ | 15,000,004 | | | | | 0.69 | % |
Nanosys, Inc., Series A-1 Pfd. | | Preferred Stock | | | | 8/13/2010 | | | | | 46,235 | | | | | 27,279 | | | | | 0.00 | % |
Nanosys, Inc., Series A-2 Pfd. | | Preferred Stock | | | | 11/8/2005 | | | | | 500,001 | | | | | 146,320 | | | | | 0.01 | % |
Esperion Therapeutics, Inc., expiring 12/7/2023 | | Warrants | | | | 12/3/2021 | | | | | 476,908 | | | | | 191,104 | | | | | 0.01 | % |
Hagerty, Inc., expiring 12/2/2026 | | Warrants | | | | 12/2/2021 | | | | | 1,549,310 | | | | | 1,003,500 | | | | | 0.04 | % |
| | | | | | | | | | | | |
| | | | | | | | | | $ | 17,572,458 | | | | $ | 16,368,207 | | | | | 0.75 | % |
|
| |
10. LINE OF CREDIT
Effective May 14, 2021, the Trust and each Fund renewed and amended agreements for two open lines of credit totaling $300,000,000, one of which is $100,000,000 committed, and the other of which is $200,000,000 uncommitted, with State Street Bank and Trust Company (together, the “Line”). The agreements, as amended, have no change in the committed, uncommitted and total amounts available on the Line. The Funds incur commitment fees on the undrawn portion of the committed part of the Line, and interest expense to the extent of amounts drawn (borrowed) under the entire Line. Interest is based on the overnight federal-funds rate in effect on the date of borrowing, plus a margin. Commitment fees are pro-rated among the Funds based upon relative average net assets. Interest expense is charged directly to a Fund based upon actual amounts borrowed by that Fund.
129
Notes to Financial Statements (continued)
For the six months ended March 31, 2022, the following Funds had borrowings:
| | | | | | | | | | | | | | | | | | | | | | | | | |
| Funds Utilizing the Line of Credit | | Average Daily
Borrowings | | Number of
Days
Outstanding | | Interest
Expense | | Weighted
Average
Annualized
Interest Rate | | Balance at
3/31/2022 |
Core Growth Fund | | | $ | 9,851,268 | | | | | 23 | | | | $ | 8,385 | | | | | 1.33 | % | | | $ | — | |
Emerging India Fund | | | | 3,908,933 | | | | | 12 | | | | | 1,788 | | | | | 1.37 | % | | | | — | |
Emerging Markets Select Fund | | | | 2,606,283 | | | | | 5 | | | | | 564 | | | | | 1.56 | % | | | | — | |
Emerging Markets Small Cap Fund | | | | 8,761,680 | | | | | 46 | | | | | 14,892 | | | | | 1.33 | % | | | | — | |
Frontier Emerging Small Countries Fund | | | | 364,005 | | | | | 5 | | | | | 67 | | | | | 1.33 | % | | | | — | |
Global Opportunities Fund | | | | 1,636,833 | | | | | 22 | | | | | 1,342 | | | | | 1.34 | % | | | | — | |
Global Select Fund | | | | 117,008 | | | | | 13 | | | | | 56 | | | | | 1.33 | % | | | | — | |
Greater China Fund | | | | 276,747 | | | | | 46 | | | | | 470 | | | | | 1.33 | % | | | | — | |
International Growth Fund | | | | 5,247,435 | | | | | 7 | | | | | 1,353 | | | | | 1.33 | % | | | | — | |
International Opportunities Fund | | | | 17,222,489 | | | | | 12 | | | | | 7,635 | | | | | 1.33 | % | | | | — | |
International Select Fund | | | | 283,697 | | | | | 9 | | | | | 94 | | | | | 1.33 | % | | | | — | |
Micro Cap Fund | | | | 3,896,902 | | | | | 14 | | | | | 2,016 | | | | | 1.33 | % | | | | — | |
Small Cap Growth Fund | | | | 19,431,245 | | | | | 6 | | | | | 4,307 | | | | | 1.33 | % | | | | — | |
Small Cap Value Fund | | | | 6,787,256 | | | | | 6 | | | | | 1,505 | | | | | 1.33 | % | | | | — | |
Ultra Growth Fund | | | | 6,921,934 | | | | | 34 | | | | | 8,793 | | | | | 1.35 | % | | | | — | |
11. PRINCIPAL RISKS
Market Risk — Market risk is the risk that a particular security, or shares of a Fund in general, may fall in value. Securities are subject to market fluctuations caused by such factors as economic, political, regulatory or market developments, changes in interest rates and perceived trends in securities prices. Shares of a Fund could decline in value or underperform other investments due to short-term market movements or any longer periods during more prolonged market downturns. In addition, local, regional or global events such as war, acts of terrorism, spread of infectious diseases or other public health issues, recessions, or other events could have a significant negative impact on a Fund and its investments. Such events may affect certain geographic regions, countries, sectors and industries more significantly than others. Such events could adversely affect the prices and liquidity of a Fund’s portfolio securities or other instruments and could result in disruptions in the trading markets. Any of such circumstances could have a materially negative impact on the value of a Fund’s shares and result in increased market volatility.
Global Pandemic Risk — The value of a Fund’s investments may be impacted by global health crises or other events. For example, an outbreak of the respiratory disease designated as Covid-19 was first detected in China in December 2019 and subsequently spread internationally. The transmission of Covid-19 and efforts to contain its spread have resulted in international, national and local border closings and other significant travel restrictions and disruptions; significant disruptions to business operations across many industries, to supply chains and to customer activity; and have resulted in event cancellations and restrictions; service cancellations, reductions and other changes; significant challenges in health care service
preparation and delivery; and quarantines, as well as general concern and uncertainty that has negatively affected the economic environment. These impacts also have caused significant market volatility and disruption which may continue over extended periods. The ultimate impact of Covid-19 or other health emergencies on the domestic and global economies is impossible to predict accurately. Less developed countries and their health-care systems may be more vulnerable to these impacts. The impact of this Covid-19 pandemic may be short term or may last for an extended period of time, and in either case could result in a substantial economic downturn or recession and may adversely impact the value of an investment in a fund.
Credit Risk — In the normal course of business, the Funds trade financial instruments and enter into financial transactions where the other party to a transaction may fail to perform (credit risk). Similar to credit risk, the Funds may be exposed to counterparty risk, or the risk that an institution or other entity with which the Funds have unsettled or open transactions will default on its obligations. The potential loss could exceed the value of the financial assets recorded in the financial statements. Financial assets, which potentially expose the Funds to credit risk, consist principally of cash due from counterparties and investments. The extent of the Funds’ exposure to credit and counterparty risks with respect to these financial assets approximates their carrying value as recorded in the Funds’ Statements of Assets and Liabilities.
Inflation Risk — Inflation risk is the possibility that inflation will reduce the purchasing power of a currency, and subsequently reduce the value of a security or asset, and may result in rising interest rates. Inflation is the overall upward price movement of goods and services in an economy that causes the value of a currency to decline.
130
| | |
| | | MARCH 31, 2022 (Unaudited) |
Interest Rate Risk — Interest rate risk is the risk that fixed-income securities will decline in value because of changes in interest rates. A rise in interest rates typically causes a fall in values. Interest rate risk should be modest for shorter-term securities, moderate for intermediate-term securities and high for longer-term securities. Generally, an increase in the average maturity of a Fund will make it more sensitive to interest rate risk. The interest rate is the amount charged, expressed as a percentage of principal, by a lender to a borrower for the use of assets.
Foreign Currency Risk — If a Fund invests directly in foreign currencies or in securities that trade in, and receive revenues in, foreign currencies, or in derivatives that provide exposure to foreign currencies, it will be subject to the risk that those currencies will decline in value relative to the U.S. dollar. This also includes the risk associated with higher transaction costs, delayed settlements, currency controls and adverse economic developments related to foreign investments.
Region Risk — The Funds, except the U.S. Treasury Fund, invest in equity and fixed-income securities of non-U.S. issuers. Because certain foreign markets are illiquid, market prices may not necessarily represent realizable value. Although the Funds maintain diversified investment portfolios, political or economic developments within a particular country or region may have an adverse effect on the ability of domiciled issuers to meet their obligations. These risks are exaggerated for securities of issuers tied economically to emerging- and frontier-market countries. Additionally, political or economic developments may have an adverse effect on the liquidity and volatility of portfolio securities and currency holdings.
India Region Risk — The securities markets in the India region (India, Bangladesh, Pakistan and Sri Lanka) are substantially smaller, less liquid and more volatile than the major securities markets in the United States and the securities industries in these countries are comparatively underdeveloped. Financial intermediaries may not perform as well as their counterparts in the United States or in other countries with more developed securities markets. In some cases, physical delivery of securities in small lots has been required in India and shortages of vault capacity and trained personnel have existed among qualified custodial Indian banks. A Fund may be unable to sell securities when the registration process is incomplete and may experience delays in receipt of dividends. If trading volume is limited by operational difficulties, the ability of the Fund to invest may be impaired. A Fund’s ability to buy or sell Indian securities may be impaired if the Fund’s ability to transact is denied, delayed, suspended or not renewed by local regulators. In recent years, exchange-listed companies in the information-technology sector and related industries (such as software) have grown so as to represent a significant portion of the total capitalization of the Indian market. The
value of these companies will generally fluctuate in response to technological and regulatory developments. In addition, governmental actions can have a significant effect on economic conditions in the India region, which could adversely affect the value and liquidity of investments. Although the governments of India, Bangladesh, Pakistan and Sri Lanka have recently begun to institute economic reform policies, there can be no assurance that they will continue to pursue such policies or, if they do, that such policies will succeed. The region is an uncertain tax environment and it is difficult to know and predict the potential implications of future tax developments. Religious, cultural and military disputes persist in India, and between India and Pakistan (as well as between sectarian groups within each country). The longstanding border dispute with Pakistan remains unresolved. In recent years, terrorists believed to be based in Pakistan struck Mumbai (India’s financial capital), further damaging relations between the two countries. If the Indian government is unable to control the violence and disruption associated with these tensions (including both domestic and external sources of terrorism), the result may be military conflict, which could destabilize the economy of India. Both India and Pakistan have tested nuclear arms, and the threat of deployment of such weapons could hinder development of the Indian economy, and escalating tensions could impact the broader region, including China.
Liquidity Risk — The trading market for a particular security may be less liquid than it appears and market prices may not represent realizable value. This may be likely when a Fund has a proportionately large investment in securities with small market capitalizations or securities in foreign markets that trade infrequently. Reduced liquidity will have an adverse impact on a Fund’s ability to sell such securities quickly at the currently marked price if necessary to meet redemptions.
Greater China Region Risk — The Greater China Fund invests primarily in the securities of companies tied to economically to the Greater China Region (China, Hong Kong and Taiwan). Each Fund, except the U.S. Treasury Fund, may invest in the securities of companies tied economically to the Greater China Region. In addition to the risks of investing in foreign securities in general, which are described in the Funds’ prospectus and Statement of Additional Information, investing in the Greater China Region subjects a fund to unique risks that could significantly impact the value of the fund’s investments.
Chinese governmental actions can significantly affect economic conditions in China, Hong Kong and Taiwan, or a particular issuer or industry, which could adversely affect the value and liquidity of investments. The Chinese government exercises significant control over China’s economy through, among other things, its industrial policies,
131
Notes to Financial Statements (continued)
monetary policies, management of currency exchange rates, and management of the payment of foreign currency-denominated obligations. Changes in these policies may adversely impact industries and companies in China. Although over the years the Chinese government has been reforming economic and market practices, the Chinese government could, at any time, alter or discontinue such economic and market reform programs, which could adversely affect industries and companies in China.
China’s economy, particularly its export-oriented industries, may be adversely impacted by developments in the economies and by governmental actions of its principal trading partners, including the United States, such as the imposition of trading restrictions, tariffs or other protectionist trade policies. The current political climate has intensified concerns of a potential trade war between China and the United States, as each country has recently imposed tariffs on the other country’s products. In addition, on November 12, 2020, President Trump issued Executive Order 13959, which prohibits U.S. persons from transacting in publicly traded securities designated by the U.S. Department of Defense as “Communist Chinese Military Companies” or “CCMCs” or in instruments derived from, or designed to provide investment exposure to, prohibited CCMC securities. The list of CCMCs is subject to change from time to time, which could prevent a fund from acquiring securities previously deemed suitable investments or could result in a forced sale of a security in the portfolio at an inopportune time or price, which may result in losses to the fund. Such government prohibitions may affect the value of the securities held in a fund’s portfolio, directly or indirectly, as well as negatively impact the market for other China-based issuers, resulting in reduced liquidity and price declines. The government prohibition also could lead to the inability to transact in the securities of other companies within the Greater China Region as the result of escalating trade tensions between the U.S. and China. The prohibition took effect on January 11, 2021, but it is unclear whether the Executive Order will continue in effect under the new presidential administration or be amended. Additionally, on December 2, 2020, the U.S. Congress passed the Holding Foreign Companies Accountable Act, which could cause the securities of foreign issuers (including China) to be delisted from U.S. stock exchanges if those companies do not permit U.S. oversight of the auditing of their financial information. To the extent a fund invests in securities of Chinese companies listed in the U.S., delisting could impact the fund‘s ability to transact in such securities and could significantly impact their liquidity and market price. In addition, the fund would have to seek other markets in which to transact in such securities, which would also increase the fund’s costs. It is difficult to predict the consequences of these actions or whether further tariffs will be imposed or actions will be taken.
Further, China’s domestically oriented industries may be particularly sensitive to, and adversely affected by, changes in government policy and investment cycles as China’s consumer class continues to grow. China has historically managed its currency in a tight range relative to the U.S. dollar, but this may be subject to greater uncertainty as Chinese authorities may change the policies that determine the exchange rate mechanism.
In addition, the Chinese government may actively attempt to influence the operation of China’s securities markets through, among other things, currency controls, direct investments, limitations on specific types of transactions (such as short selling), limiting or prohibiting investors (including foreign institutional investors) from selling holdings in Chinese companies, or other similar actions. Certain securities issued by companies located or operating in China, such as China A-shares are subject to trading restrictions, quota limitations, and less market liquidity. Chinese authorities may intervene in China’s securities markets and halt or suspend trading of securities for short or even longer periods of time. China’s securities markets have experienced considerable volatility and have been subject to relatively frequent and excessive trading halts and suspensions which, among other things, contributes to uncertainty in the markets, reduces the liquidity of securities subject to trading halts or suspensions and leads to greater market execution and valuation risks. Such actions could adversely impact a fund’s ability to achieve its investment objective(s) and its ability to trade China A-shares during such periods and could result in a fund’s limiting or suspending shareholder redemption privileges as permitted in accordance with applicable law. China’s securities markets generally continue to experience inefficiencies, volatility and pricing anomalies resulting from governmental influence, lack of publicly available information and/or political or social instability.
Additional risks of loss from investing in China include currency fluctuations, interest rate fluctuations, less liquidity, higher rates of inflation, expropriation of property, confiscatory taxation, nationalization, imposition of tariffs, limitations on repatriation of currency, exchange control regulations (including currency blockage), trading halts and differing legal, accounting, auditing, financial and reporting standards. Financial reporting by Chinese companies does not have as much regulatory oversight as in the United States. Frequent intervention by the Chinese government, limits on credible corporate governance standards, limited transparency of market and accounting information, and limited oversight of accounting firms increase the risk of insider dealing, market manipulation, improper accounting, accounting fraud and other types of corporate misconduct. Social unrest within China and between China and Hong Kong, or confrontations with neighboring countries, including military conflicts in response to such events, strained
132
| | |
| | | MARCH 31, 2022 (Unaudited) |
international relations and security concerns, such as terrorism, may also adversely impact China’s economy, disrupting its economic growth and adversely affecting a fund’s investments. Any spread of an infectious illness, public health threats or similar issues could reduce consumer demand or economic output, result in market closures, travel restrictions or quarantines, and generally also have a significant impact on the economies of the Greater China Region (China, Hong Kong and Taiwan) and other Asian countries, which in turn could adversely affect a fund’s investments. The economies of many Asian countries differ from the economies of more developed countries in many respects such as the rate of growth, inflation, capital investment, resource self-sufficiency, financial system stability, and sensitivity to changes in global trade. Certain Asian countries are highly dependent upon and may be affected by developments in the United States, Europe and other Asian economies, and their economies and companies could be affected if global economic conditions deteriorate as a result of political instability and uncertainty and by the imposition of tariffs and other protectionist trade policies.
The Greater China Region includes China, Hong Kong and Taiwan. With respect to Hong Kong, the Chinese and Hong Kong economies are vulnerable to China’s longstanding disagreement with Hong Kong related to the former British colony’s integration into a special administrative region of China. If China were to exert its authority so as to alter the economic, political or legal structures or the existing social policy of Hong Kong, such actions may have a negative impact on investor and business confidence in Hong Kong, its markets and business performance, and in turn on a fund’s investments. In addition, the Hong Kong dollar trades at a fixed exchange rate in relation to the U.S. dollar, which has contributed to the growth and stability of the Hong Kong economy. However, it is uncertain how long the currency peg will continue or what effect the establishment of an alternative exchange rate system would have on the Hong Kong economy. Because a fund’s net asset value is denominated in U.S. dollars, the establishment of an alternative exchange rate system could result in a decline in the fund’s net asset value.
With respect to Taiwan, China has a complex territorial dispute regarding the sovereignty of Taiwan. Continuing hostility between China and Taiwan and any potential military conflict or future political or economic disturbances may adversely impact investments in such countries or make investments in such countries impracticable or impossible. Any escalation in hostilities may, among other things, distort Taiwan’s capital account, adversely impact other Asian countries and adversely impact a fund’s investments in Asia, including China and Taiwan. Taiwan’s
market and economy also face increasing competition from other low-cost emerging economies and certain protectionist threats.
In China, direct ownership of companies in certain sectors by foreign individuals and entities (including U.S. persons and entities such as Wasatch Funds) is prohibited. To facilitate foreign investment in these businesses, many Chinese companies have created Variable Interest Entities (“VIEs”) to facilitate indirect foreign ownership. In such an arrangement, a China-based operating company typically establishes an offshore shell company in another jurisdiction, such as the Cayman Islands. That shell company enters into service and other contracts with the China-based operating company, then issues shares on a foreign exchange, such as the New York Stock Exchange or the Hong Kong Stock Exchange. Foreign investors hold stock in the VIE shell company rather than directly in the China-based operating company. This arrangement allows U.S. investors to obtain economic exposure to the China-based company indirectly through the contractual VIE structure rather than directly through a formal equity ownership structure.
VIEs are a common industry practice and well known to officials and regulators in China. However, VIEs are not formally recognized under Chinese law. Recently, the government of China provided new guidance to and placed restrictions on China-based companies raising capital offshore, including through VIE structures. Investors face uncertainty about future actions by the government of China that could significantly affect an operating company’s financial performance and the enforceability of the VIE shell company’s contractual arrangements. It is uncertain whether Chinese officials or regulators will withdraw their implicit acceptance of the VIE structure, or whether any new laws, rules or regulations relating to these structures will be adopted or, if adopted, what impact they would have on the interests of foreign shareholders. Under extreme circumstances, China might prohibit the existence of VIEs, or limit a VIE’s ability to pass through economic and governance rights to foreign individuals and entities. If the Chinese government takes action that affects VIEs, the market value of a fund’s associated portfolio holdings would likely suffer significant, detrimental, and possibly permanent effects, which could result in substantial investment losses.
In addition, Chinese companies, including Chinese companies listed on U.S. exchanges, are not subject to the same regulatory requirements, accounting standards or auditor oversight as companies in more developed countries. As a result, information about Chinese securities and VIEs in which a fund invests may be less reliable or complete. As with other Chinese companies with securities listed on U.S. exchanges, U.S.-listed VIEs and American
133
Notes to Financial Statements (continued)
Depositary Receipts (ADRs) may be delisted if they do not meet U.S. accounting standards and auditor oversight requirements. Delisting would significantly decrease the liquidity and value of the securities, decrease the ability of a fund to transact in such securities and may increase the cost of the fund if it must seek other markets in which to transact in such securities. There also may be significant obstacles to obtaining information necessary for investigations into or litigation against Chinese companies, and shareholders may have limited legal remedies.
Shareholder Concentration Risk — A significant portion of the net assets of the Frontier Emerging Small Countries Fund is owned by a group of shareholders advised by a common investment advisor. The Emerging Markets Select Fund also has a significant portion of net assets concentrated in relatively few related accounts. In the event of significant redemption activity by these shareholders, these Funds could experience a loss when selling portfolio securities to meet such redemption requests. The Funds could be forced to sell portfolio securities at unfavorable prices in an effort to generate sufficient cash to pay redeeming shareholders. Fund expenses may increase and performance may be materially affected.
12. FAIR VALUE MEASUREMENTS AND INVESTMENTS
The fair value of a financial instrument is the amount that would be received to sell an asset or paid to transfer a liability in an orderly transaction between market participants at the measurement date. The Funds use various methods to measure the fair value of their investments on a recurring basis. U.S. GAAP established a hierarchy that prioritizes inputs to valuation methods. The three levels of inputs are:
| | • | | Level 1 — Unadjusted quoted prices in active markets for identical assets or liabilities that the Funds have the ability to access. |
| | • | | Level 2 — Observable inputs other than quoted prices included in Level 1 that are observable for the asset or liability, either directly or indirectly. The inputs may include quoted prices for the identical investment on an inactive market, prices for similar investments, interest rates, prepayment speeds, credit risk, yield curves, default rates and similar data. |
| | • | | Level 3 — Unobservable inputs for the asset or liability, to the extent relevant observable inputs are not available, represent the Funds’ own assumptions about the assumptions a market participant would use in valuing the asset or liability, and would be based on the best information available. |
The availability of observable inputs can vary from security to security and is affected by a wide variety of factors, including, for example, the type of security, whether a security is new and not yet established in the marketplace, the liquidity of markets, and other characteristics particular to the security. To the extent that valuation is based on models or inputs that are less observable or unobservable in the market, the determination of fair value requires more judgment. Accordingly, the degree of judgment exercised in determining fair value is greatest for instruments categorized in Level 3.
Equity Securities (common and preferred stock) — Securities are valued as of the close of the New York Stock Exchange (“NYSE”) (generally 4:00 p.m. Eastern Time) on the valuation date. Equity securities and listed warrants are valued using a commercial pricing service at the official close price or last quoted sales price taken from the primary market in which each security trades and, with respect to equity securities traded on the National Association of Securities Dealer Automated Quotation (“NASDAQ”) system, such securities are valued using the NASDAQ Official Closing Price (“NOCP”) or last sales price if no NOCP is available. If there is no official close or sales on the primary exchange or market on a day, then the security shall be valued at the mean of the last bid and ask price on the primary exchange or market as provided by a pricing service. If the mean cannot be calculated or there is no trade activity on a day, then the security shall be valued at the previous trading day’s price as provided by a pricing service. To the extent that these securities are actively traded and valuation adjustments are not applied, they are categorized in Level 1 of the fair value hierarchy. Additionally, a Fund’s investments are valued at fair value by the Pricing Committee if the Advisor determines that an event impacting the value of an investment occurred between the closing time of a security’s primary market or exchange (for example, a foreign exchange or market) and the time the Fund’s share price is calculated. Significant events include, but are not limited to the following: significant fluctuations in domestic markets, foreign markets or foreign currencies; occurrences not directly tied to the securities markets such as natural disasters, armed conflicts or significant governmental actions; and major announcements affecting a single issuer or an entire market or market sector. In responding to a significant event, the Pricing Committee determines the fair value of affected securities by considering factors including, but not limited to: index options and futures traded subsequent to the close; American Depositary Receipts (“ADRs”), Global Depositary Receipts (“GDRs”) or other related receipts; currency spot or forward markets that trade after pricing of the foreign exchange; other derivative securities traded after the close such as Standard & Poor’s Depositary Receipts (“SPDRs”)
134
| | |
| | | MARCH 31, 2022 (Unaudited) |
and other exchange-traded funds (“ETFs”); and alternative market quotes on the affected securities. When applicable, the Funds use a systematic fair valuation model provided by an independent third party to assist in adjusting the valuation of foreign securities. When a Fund uses this fair value pricing method, the values assigned to the Fund’s foreign securities may not be the quoted or published prices of the investments on their primary markets or exchanges, and the securities are categorized in Level 2 of the fair value hierarchy. These valuation procedures apply equally to long or short equity positions in a Fund.
Participation Notes — Investments are valued at the market price of the underlying security. Counterparty risk is regularly reviewed and considered for valuation. To the extent the inputs are observable and timely, the values would be categorized in Level 2 of the fair value hierarchy.
Corporate Debt Securities — Investments are valued at current market value by a pricing service, or by using the last sale or bid price based on observable inputs. Observable inputs may include benchmark yields, reported trades, broker/dealer quotes, issuer spreads, two-sided markets, benchmark securities, bids, offers and reference data including market research publications. Although most corporate bonds are categorized in Level 2 of the fair value hierarchy, in instances where observable inputs are not available, they are categorized as Level 3.
Short-Term Notes — Investments maturing in 60 days or less at the time of purchase, are generally valued at amortized cost, unless it is determined that the amortized cost method would not represent fair value, in which case the securities are marked-to-market. To the extent the inputs are observable and timely, the values would be categorized in Level 2 of the fair value hierarchy.
Asset-Backed Securities — Investments are priced using the closing bid as supplied by a pricing service based on observable inputs. Observable inputs may include benchmark yields, reported trades, broker/dealer quotes, issuer spreads, two-sided markets, benchmark securities, bids, offers and reference data including market research publications, new issue data, monthly payment information and collateral performance. Although most asset-backed securities are categorized in Level 2 of the fair value hierarchy, in instances where observable inputs are not available, they are categorized as Level 3.
U.S. Government Issuers — Investments are priced using the closing bid as supplied by a pricing service based on observable inputs. Observable inputs may include benchmark yields, reported trades, broker/dealer quotes, issuer
spreads, two-sided markets, benchmark securities, bids, offers and reference data including market research publications. Although most U.S. government securities are categorized in Level 2 of the fair value hierarchy, in instances where observable inputs are not available, they are categorized as Level 3.
Derivative Instruments — Listed derivatives that are actively traded are valued based on quoted prices from the exchange and categorized in Level 1 of the fair value hierarchy. Exchange-traded options are valued at the last sale price in the market where they are principally traded. If there are no sales on the primary exchange or market on a given day, then the option is valued at the mean of the last bid price and ask price on the primary exchange or market as provided by a pricing service. Forward foreign currency contracts are valued at the market rate provided by the pricing service and categorized as Level 2.
Restricted Securities — If market quotations are not readily available for the Funds’ investments in securities such as restricted securities, private placements, securities for which trading has been halted or other illiquid securities, these investments are valued at fair value in accordance with Board-approved Pricing Policies and Procedures by the Pricing Committee with oversight by the Board of Trustees. Fair value is defined as the price that would be received upon the sale of an asset, or paid to transfer a liability, in an orderly transaction between market participants at the measurement date under current market conditions. For each applicable investment that is fair valued, the Pricing Committee considers, to the extent applicable, various factors including, but not limited to, the financial condition of the company or limited partnership, operating results, prices paid in follow-on rounds, comparable companies in the public market, the nature and duration of the restrictions for holding the securities, a stated net asset value (NAV) for the partnership, if applicable, and other relevant factors. Depending on the relative significance of valuation inputs, these instruments may be classified in either Level 2 or Level 3 of the fair value hierarchy.
When the last day of the reporting period is a non-business day, certain foreign markets may be open on days the NYSE is closed, which could result in differences between the value of a Fund’s portfolio securities on the last business day and the last calendar day of the reporting period. Any significant security valuation changes due to an open foreign market are adjusted and reflected by the Fund for financial reporting purposes.
135
Notes to Financial Statements (continued)
The following is a summary of the fair valuations according to the inputs used as of March 31, 2022 in valuing the Funds’ assets and liabilities:
| | | | | | | | | | | | | | | | | | | | | | |
| Fund | | Category | | Quoted Prices
In Active Markets
For Identical
Investments
(Level 1) | | Significant Other
Observable Inputs
(Level 2) | | Significant
Unobservable
Inputs
(Level 3) | | Value at
3/31/2022 |
Core Growth Fund | | | | | | | | | | | | | | | | | | | | | | |
Assets | | | | | | | | | | | | | | | | | | | | | | |
Common Stocks | | | | | $ | 3,496,590,007 | | | | $ | — | | | | $ | — | | | | $ | 3,496,590,007 | |
Warrants | | | | | | — | | | | | — | | | | | 1,204,200 | | | | | 1,204,200 | |
Short-Term Investments | | | | | | — | | | | | 28,707,850 | | | | | — | | | | | 28,707,850 | |
| | | | | | | |
| | | | | $ | 3,496,590,007 | | | | $ | 28,707,850 | | | | $ | 1,204,200 | | | | $ | 3,526,502,057 | |
| | | | | | | |
Emerging India Fund | | | | | | | | | | | | | | | | | | | | | | |
Assets | | | | | | | | | | | | | | | | | | | | | | |
Common Stocks | | | | | | | | | | | | | | | | | | | | | | |
| | Apparel, Accessories & Luxury Goods | | | $ | — | | | | $ | 25,505,333 | | | | $ | — | | | | $ | 25,505,333 | |
| | Commodity Chemicals | | | | — | | | | | 19,310,814 | | | | | — | | | | | 19,310,814 | |
| | Consumer Finance | | | | — | | | | | 62,629,973 | | | | | — | | | | | 62,629,973 | |
| | Department Stores | | | | — | | | | | 39,940,720 | | | | | — | | | | | 39,940,720 | |
| | Diversified Banks | | | | — | | | | | 52,332,091 | | | | | — | | | | | 52,332,091 | |
| | Food Retail | | | | — | | | | | 30,336,650 | | | | | — | | | | | 30,336,650 | |
| | Health Care Services | | | | — | | | | | 46,895,338 | | | | | — | | | | | 46,895,338 | |
| | Industrial Conglomerates | | | | — | | | | | 6,367,096 | | | | | — | | | | | 6,367,096 | |
| | Industrial Machinery | | | | — | | | | | 39,208,269 | | | | | — | | | | | 39,208,269 | |
| | Interactive Media & Services | | | | — | | | | | 26,384,111 | | | | | — | | | | | 26,384,111 | |
| | IT Consulting & Other Services | | | | — | | | | | 110,435,047 | | | | | — | | | | | 110,435,047 | |
| | Life Sciences Tools & Services | | | | — | | | | | 35,885,231 | | | | | — | | | | | 35,885,231 | |
| | Personal Products | | | | — | | | | | 611,564 | | | | | — | | | | | 611,564 | |
| | Property & Casualty Insurance | | | | — | | | | | 20,859,876 | | | | | — | | | | | 20,859,876 | |
| | Regional Banks | | | | — | | | | | 40,007,779 | | | | | — | | | | | 40,007,779 | |
| | Research & Consulting Services | | | | — | | | | | 40,517,472 | | | | | — | | | | | 40,517,472 | |
| | Specialty Chemicals | | | | — | | | | | 15,721,468 | | | | | — | | | | | 15,721,468 | |
| | Systems Software | | | | — | | | | | 31,149,125 | | | | | — | | | | | 31,149,125 | |
| | Thrifts & Mortgage Finance | | | | — | | | | | 29,283,664 | | | | | — | | | | | 29,283,664 | |
Short-Term Investments | | | | | | — | | | | | 9,027,191 | | | | | — | | | | | 9,027,191 | |
| | | | | | | |
| | | | | $ | — | | | | $ | 682,408,812 | | | | $ | — | | | | $ | 682,408,812 | |
| | | | | | | |
Emerging Markets Select Fund | | | | | | | | | | | | | | | | | | | | | | |
Assets | | | | | | | | | | | | | | | | | | | | | | |
Common Stocks | | | | | | | | | | | | | | | | | | | | | | |
| | Apparel, Accessories & Luxury Goods | | | $ | — | | | | $ | 11,441,549 | | | | $ | — | | | | $ | 11,441,549 | |
| | Consumer Finance | | | | — | | | | | 32,326,161 | | | | | — | | | | | 32,326,161 | |
| | Department Stores | | | | — | | | | | 11,797,702 | | | | | — | | | | | 11,797,702 | |
| | Diversified Banks | | | | 15,409,522 | | | | | 23,614,395 | | | | | 47,871 | | | | | 39,071,788 | |
| | Electrical Components & Equipment | | | | 10,523,891 | | | | | 22,344,360 | | | | | — | | | | | 32,868,251 | |
| | Industrial Machinery | | | | — | | | | | 10,600,455 | | | | | — | | | | | 10,600,455 | |
| | Internet & Direct Marketing Retail | | | | 28,534,436 | | | | | 10,114,778 | | | | | — | | | | | 38,649,214 | |
| | IT Consulting & Other Services | | | | 26,107,413 | | | | | 24,036,533 | | | | | — | | | | | 50,143,946 | |
| | Life & Health Insurance | | | | — | | | | | 19,608,733 | | | | | — | | | | | 19,608,733 | |
| | Life Sciences Tools & Services | | | | — | | | | | 15,556,392 | | | | | — | | | | | 15,556,392 | |
| | Property & Casualty Insurance | | | | 4,912,883 | | | | | 7,197,741 | | | | | — | | | | | 12,110,624 | |
| | Regional Banks | | | | — | | | | | 16,225,921 | | | | | — | | | | | 16,225,921 | |
| | Semiconductor Equipment | | | | — | | | | | 17,717,766 | | | | | — | | | | | 17,717,766 | |
| | Semiconductors | | | | — | | | | | 57,925,149 | | | | | — | | | | | 57,925,149 | |
| | Specialized Finance | | | | — | | | | | 22,118,696 | | | | | — | | | | | 22,118,696 | |
| | Specialty Chemicals | | | | — | | | | | 7,314,751 | | | | | — | | | | | 7,314,751 | |
| | Systems Software | | | | — | | | | | 9,268,957 | | | | | — | | | | | 9,268,957 | |
| | Other | | | | 74,026,385 | | | | | — | | | | | — | | | | | 74,026,385 | |
Short-Term Investments | | | | | | — | | | | | 31,016,489 | | | | | — | | | | | 31,016,489 | |
| | | | | | | |
| | | $ | 159,514,530 | | | | $ | 350,226,528 | | | | $ | 47,871 | | | | $ | 509,788,929 | |
| | | | | | | |
136
| | |
| | | MARCH 31, 2022 (Unaudited) |
| | | | | | | | | | | | | | | | | | | | | | |
| Fund | | Category | | Quoted Prices
In Active Markets
For Identical
Investments
(Level 1) | | Significant Other
Observable Inputs
(Level 2) | | Significant
Unobservable
Inputs
(Level 3) | | Value at
3/31/2022 |
Emerging Markets Small Cap Fund | | | | | | | | | | | | | | | | | | | | | | |
Assets | | | | | | | | | | | | | | | | | | | | | | |
Common Stocks | | | | | | | | | | | | | | | | | | | | | | |
| | Asset Management & Custody Banks | | | $ | — | | | | $ | 8,206,751 | | | | $ | — | | | | $ | 8,206,751 | |
| | Commodity Chemicals | | | | — | | | | | 11,033,809 | | | | | — | | | | | 11,033,809 | |
| | Communications Equipment | | | | — | | | | | 10,979,908 | | | | | — | | | | | 10,979,908 | |
| | Consumer Finance | | | | 9,994,350 | | | | | 6,003,277 | | | | | — | | | | | 15,997,627 | |
| | Diversified Banks | | | | — | | | | | — | | | | | 49,542 | | | | | 49,542 | |
| | Department Stores | | | | — | | | | | 24,601,128 | | | | | — | | | | | 24,601,128 | |
| | Electrical Components & Equipment | | | | — | | | | | 33,300,320 | | | | | — | | | | | 33,300,320 | |
| | Electronic Equipment & Instruments | | | | — | | | | | 15,723,021 | | | | | — | | | | | 15,723,021 | |
| | Health Care Facilities | | | | — | | | | | 7,379,899 | | | | | — | | | | | 7,379,899 | |
| | Health Care Services | | | | — | | | | | 13,165,980 | | | | | — | | | | | 13,165,980 | |
| | Health Care Supplies | | | | — | | | | | 205,829 | | | | | — | | | | | 205,829 | |
| | Home Improvement Retail | | | | 9,372,435 | | | | | 2,926,142 | | | | | — | | | | | 12,298,577 | |
| | Hotels, Resorts & Cruise Lines | | | | — | | | | | 4,657,576 | | | | | — | | | | | 4,657,576 | |
| | Human Resource & Employment Services | | | | — | | | | | 1,913,815 | | | | | 144,737 | | | | | 2,058,552 | |
| | Industrial Machinery | | | | — | | | | | 5,577,124 | | | | | — | | | | | 5,577,124 | |
| | Insurance Brokers | | | | — | | | | | 3,210,771 | | | | | — | | | | | 3,210,771 | |
| | Interactive Media & Services | | | | — | | | | | 11,091,733 | | | | | — | | | | | 11,091,733 | |
| | Internet & Direct Marketing Retail | | | | — | | | | | 16,398,145 | | | | | — | | | | | 16,398,145 | |
| | IT Consulting & Other Services | | | | 25,151,382 | | | | | 66,511,680 | | | | | — | | | | | 91,663,062 | |
| | Life & Health Insurance | | | | — | | | | | 21,150,372 | | | | | — | | | | | 21,150,372 | |
| | Pharmaceuticals | | | | — | | | | | — | | | | | 16,618 | | | | | 16,618 | |
| | Property & Casualty Insurance | | | | 11,866,560 | | | | | 9,364,325 | | | | | — | | | | | 21,230,885 | |
| | Regional Banks | | | | 5,105,322 | | | | | 28,311,777 | | | | | — | | | | | 33,417,099 | |
| | Research & Consulting Services | | | | — | | | | | 27,377,175 | | | | | — | | | | | 27,377,175 | |
| | Semiconductor Equipment | | | | — | | | | | 10,223,484 | | | | | — | | | | | 10,223,484 | |
| | Semiconductors | | | | — | | | | | 109,692,089 | | | | | — | | | | | 109,692,089 | |
| | Thrifts & Mortgage Finance | | | | — | | | | | 22,194,914 | | | | | — | | | | | 22,194,914 | |
| | Other | | | | 67,570,842 | | | | | — | | | | | — | | | | | 67,570,842 | |
Short-Term Investments | | | | | | — | | | | | 2,731,840 | | | | | — | | | | | 2,731,840 | |
| | | | | | | | | | | | | | | | | | | | | | |
| | | | | $ | 129,060,891 | | | | $ | 473,932,884 | | | | $ | 210,897 | | | | $ | 603,204,672 | |
| | | | | | | |
Frontier Emerging Small Countries Fund | | | | | | | | | | | | | | | | | | | | | | |
Assets | | | | | | | | | | | | | | | | | | | | | | |
Common Stocks | | | | | | | | | | | | | | | | | | | | | | |
| | Asset Management & Custody Banks | | | $ | 2,751,391 | | | | $ | 3,059,872 | | | | $ | — | | | | $ | 5,811,263 | |
| | Computer & Electronics Retail | | | | — | | | | | 1,587,625 | | | | | — | | | | | 1,587,625 | |
| | Consumer Finance | | | | 1,788,596 | | | | | 5,079,474 | | | | | — | | | | | 6,868,070 | |
| | Data Processing & Outsourced Services | | | | 1,391,164 | | | | | 1,115,130 | | | | | — | | | | | 2,506,294 | |
| | Diversified Banks | | | | 1,615,916 | | | | | 1,945,530 | | | | | 8,958 | | | | | 3,570,404 | |
| | Food Retail | | | | — | | | | | 725,715 | | | | | — | | | | | 725,715 | |
| | Health Care Facilities | | | | — | | | | | 963,248 | | | | | — | | | | | 963,248 | |
| | Human Resource & Employment Services | | | | — | | | | | 174,307 | | | | | 3,700 | | | | | 178,007 | |
| | Insurance Brokers | | | | — | | | | | 283,906 | | | | | — | | | | | 283,906 | |
| | IT Consulting & Other Services | | | | 3,455,393 | | | | | 4,140,849 | | | | | — | | | | | 7,596,242 | |
| | Life & Health Insurance | | | | — | | | | | 2,914,516 | | | | | — | | | | | 2,914,516 | |
| | Semiconductors | | | | — | | | | | 1,965,172 | | | | | — | | | | | 1,965,172 | |
| | Wireless Telecommunication Services | | | | — | | | | | 1,461,216 | | | | | — | | | | | 1,461,216 | |
| | Other | | | | 20,591,744 | | | | | — | | | | | — | | | | | 20,591,744 | |
Short-Term Investments | | | | | | — | | | | | 599,924 | | | | | — | | | | | 599,924 | |
| | | | | | | | | | | | | | | | | | | | | | |
| | | | | $ | 31,594,204 | | | | $ | 26,016,484 | | | | $ | 12,658 | | | | $ | 57,623,346 | |
| | | | | | | |
137
Notes to Financial Statements (continued)
| | | | | | | | | | | | | | | | | | | | | | |
| Fund | | Category | | Quoted Prices
In Active Markets
For Identical
Investments
(Level 1) | | Significant Other
Observable Inputs
(Level 2) | | Significant
Unobservable
Inputs
(Level 3) | | Value at
3/31/2022 |
Global Opportunities Fund | | | | | | | | | | | | | | | | | | | | | | |
Assets | | | | | | | | | | | | | | | | | | | | | | |
Common Stocks | | | | | | | | | | | | | | | | | | | | | | |
| | Application Software | | | $ | 8,908,855 | | | | $ | 5,709,211 | | | | $ | — | | | | $ | 14,618,066 | |
| | Biotechnology | | | | 471,726 | | | | | 6,297,211 | | | | | — | | | | | 6,768,937 | |
| | Data Processing & Outsourced Services | | | | 2,357,928 | | | | | 1,069,699 | | | | | — | | | | | 3,427,627 | |
| | Diversified Banks | | | | — | | | | | — | | | | | 6,813 | | | | | 6,813 | |
| | Diversified Real Estate Activities | | | | — | | | | | 2,836,827 | | | | | — | | | | | 2,836,827 | |
| | Drug Retail | | | | — | | | | | 2,049,153 | | | | | — | | | | | 2,049,153 | |
| | Electrical Components & Equipment | | | | — | | | | | 6,050,612 | | | | | — | | | | | 6,050,612 | |
| | Health Care Equipment | | | | — | | | | | 836,258 | | | | | — | | | | | 836,258 | |
| | Health Care Services | | | | — | | | | | 2,592,127 | | | | | — | | | | | 2,592,127 | |
| | Health Care Technology | | | | — | | | | | 6,522,222 | | | | | — | | | | | 6,522,222 | |
| | Human Resource & Employment Services | | | | — | | | | | 3,633,692 | | | | | — | | | | | 3,633,692 | |
| | Industrial Machinery | | | | 13,397,070 | | | | | 1,720,754 | | | | | — | | | | | 15,117,824 | |
| | IT Consulting & Other Services | | | | 10,537,724 | | | | | 6,913,897 | | | | | — | | | | | 17,451,621 | |
| | Regional Banks | | | | 7,648,360 | | | | | 9,202,092 | | | | | — | | | | | 16,850,452 | |
| | Research & Consulting Services | | | | — | | | | | 17,510,876 | | | | | — | | | | | 17,510,876 | |
| | Restaurants | | | | — | | | | | 1,460,770 | | | | | — | | | | | 1,460,770 | |
| | Semiconductors | | | | 4,163,249 | | | | | 16,640,091 | | | | | — | | | | | 20,803,340 | |
| | Soft Drinks | | | | — | | | | | 1,098,143 | | | | | — | | | | | 1,098,143 | |
| | Systems Software | | | | 7,440,248 | | | | | 4,945,391 | | | | | — | | | | | 12,385,639 | |
| | Thrifts & Mortgage Finance | | | | — | | | | | 4,846,495 | | | | | — | | | | | 4,846,495 | |
| | Trading Companies & Distributors | | | | — | | | | | 7,417,046 | | | | | — | | | | | 7,417,046 | |
| | Other | | | | 71,698,470 | | | | | — | | | | | — | | | | | 71,698,470 | |
Short-Term Investments | | | | | | — | | | | | 3,350,801 | | | | | — | | | | | 3,350,801 | |
| | | | | | | | | | | | | | | | | | | | | | |
| | | | | $ | 126,623,630 | | | | $ | 112,703,368 | | | | $ | 6,813 | | | | $ | 239,333,811 | |
| | | | | | | |
Global Select Fund | | | | | | | | | | | | | | | | | | | | | | |
Assets | | | | | | | | | | | | | | | | | | | | | | |
Common Stocks | | | | | | | | | | | | | | | | | | | | | | |
| | Application Software | | | $ | 540,202 | | | | $ | 721,338 | | | | $ | — | | | | $ | 1,261,540 | |
| | Biotechnology | | | | — | | | | | 619,415 | | | | | — | | | | | 619,415 | |
| | Building Products | | | | — | | | | | 621,832 | | | | | — | | | | | 621,832 | |
| | Consumer Finance | | | | — | | | | | 709,983 | | | | | — | | | | | 709,983 | |
| | Data Processing & Outsourced Services | | | | 277,980 | | | | | 509,741 | | | | | — | | | | | 787,721 | |
| | Diversified Banks | | | | — | | | | | 650,673 | | | | | 889 | | | | | 651,562 | |
| | Drug Retail | | | | — | | | | | 215,894 | | | | | — | | | | | 215,894 | |
| | Health Care Equipment | | | | — | | | | | 383,766 | | | | | — | | | | | 383,766 | |
| | Health Care Supplies | | | | — | | | | | 593,942 | | | | | — | | | | | 593,942 | |
| | Health Care Technology | | | | — | | | | | 452,440 | | | | | — | | | | | 452,440 | |
| | Industrial Machinery | | | | — | | | | | 282,823 | | | | | — | | | | | 282,823 | |
| | IT Consulting & Other Services | | | | 432,678 | | | | | 429,193 | | | | | — | | | | | 861,871 | |
| | Research & Consulting Services | | | | — | | | | | 595,816 | | | | | — | | | | | 595,816 | |
| | Semiconductors | | | | 425,941 | | | | | 316,343 | | | | | — | | | | | 742,284 | |
| | Specialized Finance | | | | — | | | | | 368,396 | | | | | — | | | | | 368,396 | |
| | Other | | | | 7,633,382 | | | | | — | | | | | — | | | | | 7,633,382 | |
Short-Term Investments | | | | | | — | | | | | 939,916 | | | | | — | | | | | 939,916 | |
| | | | | | | | | | | | | | | | | | | | | | |
| | | | | $ | 9,310,183 | | | | $ | 8,411,511 | | | | $ | 889 | | | | $ | 17,722,583 | |
| | | | | | | |
138
| | |
| | | MARCH 31, 2022 (Unaudited) |
| | | | | | | | | | | | | | | | | | | | | | |
| Fund | | Category | | Quoted Prices
In Active Markets
For Identical
Investments
(Level 1) | | Significant Other
Observable Inputs
(Level 2) | | Significant
Unobservable
Inputs
(Level 3) | | Value at
3/31/2022 |
Global Value Fund | | | | | | | | | | | | | | | | | | | | | | |
Assets | | | | | | | | | | | | | | | | | | | | | | |
Common Stocks | | | | | | | | | | | | | | | | | | | | | | |
| | Aerospace & Defense | | | $ | — | | | | $ | 3,005,263 | | | | $ | — | | | | $ | 3,005,263 | |
| | Airlines | | | | — | | | | | 3,150,717 | | | | | — | | | | | 3,150,717 | |
| | Casinos & Gaming | | | | — | | | | | 3,398,392 | | | | | — | | | | | 3,398,392 | |
| | Construction Materials | | | | — | | | | | 2,210,293 | | | | | — | | | | | 2,210,293 | |
| | Diversified Banks | | | | 11,372,820 | | | | | 4,303,852 | | | | | — | | | | | 15,676,672 | |
| | Diversified Metals & Mining | | | | — | | | | | 4,156,986 | | | | | — | | | | | 4,156,986 | |
| | Electronic Manufacturing Services | | | | — | | | | | 3,304,646 | | | | | — | | | | | 3,304,646 | |
| | Food Retail | | | | — | | | | | 3,528,113 | | | | | — | | | | | 3,528,113 | |
| | Health Care Equipment | | | | — | | | | | 2,640,208 | | | | | — | | | | | 2,640,208 | |
| | Homebuilding | | | | — | | | | | 2,797,363 | | | | | — | | | | | 2,797,363 | |
| | Industrial REITs | | | | — | | | | | 3,464,491 | | | | | — | | | | | 3,464,491 | |
| | Integrated Oil & Gas | | | | 5,046,194 | | | | | 4,984,053 | | | | | — | | | | | 10,030,247 | |
| | Multi-Line Insurance | | | | — | | | | | 3,630,016 | | | | | — | | | | | 3,630,016 | |
| | Reinsurance | | | | — | | | | | 5,079,453 | | | | | — | | | | | 5,079,453 | |
| | Soft Drinks | | | | — | | | | | 3,733,380 | | | | | — | | | | | 3,733,380 | |
| | Tobacco | | | | — | | | | | 4,124,861 | | | | | — | | | | | 4,124,861 | |
| | Other | | | | 64,400,427 | | | | | — | | | | | — | | | | | 64,400,427 | |
Short-Term Investments | | | | | | — | | | | | 2,663,539 | | | | | — | | | | | 2,663,539 | |
| | | | | | | | | | | | | | | | | | | | | | |
| | | | | $ | 80,819,441 | | | | $ | 60,175,626 | | | | $ | — | | | | $ | 140,995,067 | |
| | | | | | | |
Greater China Fund | | | | | | | | | | | | | | | | | | | | | | |
Assets | | | | | | | | | | | | | | | | | | | | | | |
Common Stocks | | | | | | | | | | | | | | | | | | | | | | |
| | Apparel, Accessories & Luxury Goods | | | $ | — | | | | $ | 163,705 | | | | $ | — | | | | $ | 163,705 | |
| | Application Software | | | | — | | | | | 112,984 | | | | | — | | | | | 112,984 | |
| | Commodity Chemicals | | | | — | | | | | 66,037 | | | | | — | | | | | 66,037 | |
| | Distillers & Vintners | | | | — | | | | | 388,130 | | | | | — | | | | | 388,130 | |
| | Diversified Banks | | | | — | | | | | 354,191 | | | | | — | | | | | 354,191 | |
| | Drug Retail | | | | — | | | | | 192,061 | | | | | — | | | | | 192,061 | |
| | Electrical Components & Equipment | | | | — | | | | | 192,048 | | | | | — | | | | | 192,048 | |
| | Health Care Equipment | | | | — | | | | | 401,024 | | | | | — | | | | | 401,024 | |
| | Hotels, Resorts & Cruise Lines | | | | — | | | | | 231,448 | | | | | — | | | | | 231,448 | |
| | Industrial Machinery | | | | — | | | | | 832,926 | | | | | — | | | | | 832,926 | |
| | Interactive Media & Services | | | | — | | | | | 133,674 | | | | | — | | | | | 133,674 | |
| | Internet & Direct Marketing Retail | | | | — | | | | | 119,347 | | | | | — | | | | | 119,347 | |
| | Life & Health Insurance | | | | — | | | | | 559,172 | | | | | — | | | | | 559,172 | |
| | Life Sciences Tools & Services | | | | — | | | | | 674,447 | | | | | — | | | | | 674,447 | |
| | Packaged Foods & Meats | | | | — | | | | | 496,680 | | | | | — | | | | | 496,680 | |
| | Personal Products | | | | — | | | | | 468,315 | | | | | — | | | | | 468,315 | |
| | Regional Banks | | | | — | | | | | 93,745 | | | | | — | | | | | 93,745 | |
| | Semiconductors | | | | — | | | | | 1,632,706 | | | | | — | | | | | 1,632,706 | |
| | Specialized Finance | | | | — | | | | | 735,037 | | | | | — | | | | | 735,037 | |
| | Specialty Stores | | | | — | | | | | 190,347 | | | | | — | | | | | 190,347 | |
| | Systems Software | | | | — | | | | | 229,078 | | | | | — | | | | | 229,078 | |
| | | | | | | | | | | | | | | | | | | | | | |
| | | | | $ | — | | | | $ | 8,267,102 | | | | $ | — | | | | $ | 8,267,102 | |
| | | | | | | |
139
Notes to Financial Statements (continued)
| | | | | | | | | | | | | | | | | | | | | | |
| Fund | | Category | | Quoted Prices
In Active Markets
For Identical
Investments
(Level 1) | | Significant Other
Observable Inputs
(Level 2) | | Significant
Unobservable
Inputs
(Level 3) | | Value at
3/31/2022 |
International Growth Fund | | | | | | | | | | | | | | | | | | | | | | |
Assets | | | | | | | | | | | | | | | | | | | | | | |
Common Stocks | | | | | | | | | | | | | | | | | | | | | | |
| | Application Software | | | $ | 43,493,822 | | | | $ | 34,740,817 | | | | $ | — | | | | $ | 78,234,639 | |
| | Asset Management & Custody Banks | | | | — | | | | | 17,893,018 | | | | | — | | | | | 17,893,018 | |
| | Biotechnology | | | | — | | | | | 30,212,271 | | | | | — | | | | | 30,212,271 | |
| | Brewers | | | | — | | | | | 12,064,988 | | | | | — | | | | | 12,064,988 | |
| | Commodity Chemicals | | | | — | | | | | 8,550,198 | | | | | — | | | | | 8,550,198 | |
| | Construction & Engineering | | | | — | | | | | 11,576,460 | | | | | — | | | | | 11,576,460 | |
| | Data Processing & Outsourced Services | | | | — | | | | | 9,270,724 | | | | | — | | | | | 9,270,724 | |
| | Diversified Real Estate Activities | | | | — | | | | | 12,964,015 | | | | | — | | | | | 12,964,015 | |
| | Drug Retail | | | | 13,211,166 | | | | | 24,296,458 | | | | | — | | | | | 37,507,624 | |
| | Electrical Components & Equipment | | | | — | | | | | 26,670,263 | | | | | — | | | | | 26,670,263 | |
| | Electronic Equipment & Instruments | | | | — | | | | | 20,065,627 | | | | | — | | | | | 20,065,627 | |
| | General Merchandise Stores | | | | — | | | | | 6,038,271 | | | | | — | | | | | 6,038,271 | |
| | Health Care Equipment | | | | — | | | | | 17,392,878 | | | | | — | | | | | 17,392,878 | |
| | Health Care Services | | | | — | | | | | 11,295,977 | | | | | — | | | | | 11,295,977 | |
| | Health Care Supplies | | | | — | | | | | 11,538,942 | | | | | — | | | | | 11,538,942 | |
| | Health Care Technology | | | | — | | | | | 48,518,413 | | | | | — | | | | | 48,518,413 | |
| | Human Resource & Employment Services | | | | — | | | | | 32,339,444 | | | | | 83,166 | | | | | 32,422,610 | |
| | Industrial Machinery | | | | — | | | | | 10,503,593 | | | | | — | | | | | 10,503,593 | |
| | Insurance Brokers | | | | — | | | | | 4,281,819 | | | | | — | | | | | 4,281,819 | |
| | Interactive Home Entertainment | | | | — | | | | | 3,006,664 | | | | | — | | | | | 3,006,664 | |
| | Interactive Media & Services | | | | — | | | | | 26,543,879 | | | | | — | | | | | 26,543,879 | |
| | Investment Banking & Brokerage | | | | — | | | | | 8,172,154 | | | | | — | | | | | 8,172,154 | |
| | IT Consulting & Other Services | | | | 34,722,234 | | | | | 57,892,237 | | | | | — | | | | | 92,614,471 | |
| | Life Sciences Tools & Services | | | | — | | | | | 9,552,595 | | | | | — | | | | | 9,552,595 | |
| | Movies & Entertainment | | | | — | | | | | 19,014,255 | | | | | — | | | | | 19,014,255 | |
| | Pharmaceuticals | | | | — | | | | | 11,457,968 | | | | | — | | | | | 11,457,968 | |
| | Property & Casualty Insurance | | | | 11,617,954 | | | | | 10,801,539 | | | | | — | | | | | 22,419,493 | |
| | Publishing | | | | 0 | | | | | 10,497,631 | | | | | — | | | | | 10,497,631 | |
| | Regional Banks | | | | 15,225,825 | | | | | 18,029,450 | | | | | — | | | | | 33,255,275 | |
| | Research & Consulting Services | | | | — | | | | | 38,711,793 | | | | | — | | | | | 38,711,793 | |
| | Restaurants | | | | — | | | | | 15,222,684 | | | | | — | | | | | 15,222,684 | |
| | Semiconductors | | | | — | | | | | 71,008,670 | | | | | — | | | | | 71,008,670 | |
| | Soft Drinks | | | | — | | | | | 8,501,828 | | | | | — | | | | | 8,501,828 | |
| | Specialty Chemicals | | | | — | | | | | 10,040,108 | | | | | — | | | | | 10,040,108 | |
| | Thrifts & Mortgage Finance | | | | 19,469,047 | | | | | 16,369,724 | | | | | — | | | | | 35,838,771 | |
| | Trading Companies & Distributors | | | | — | | | | | 88,242,651 | | | | | — | | | | | 88,242,651 | |
| | Other | | | | 79,621,764 | | | | | — | | | | | — | | | | | 79,621,764 | |
Short-Term Investments | | | | | | — | | | | | 5,178,293 | | | | | — | | | | | 5,178,293 | |
| | | | | | | | | | | | | | | | | | | | | | |
| | | | | $ | 217,361,812 | | | | $ | 778,458,299 | | | | $ | 83,166 | | | | $ | 995,903,277 | |
| | | | | | | |
140
| | |
| | | MARCH 31, 2022 (Unaudited) |
| | | | | | | | | | | | | | | | | | | | | | |
| Fund | | Category | | Quoted Prices
In Active Markets
For Identical
Investments
(Level 1) | | Significant Other
Observable Inputs
(Level 2) | | Significant
Unobservable
Inputs
(Level 3) | | Value at
3/31/2022 |
International Opportunities Fund | | | | | | | | | | | | | | | | | | | | | | |
Assets | | | | | | | | | | | | | | | | | | | | | | |
Common Stocks | | | | | | | | | | | | | | | | | | | | | | |
| | Advertising | | | $ | 21,356,482 | | | | $ | 18,040,299 | | | | $ | — | | | | $ | 39,396,781 | |
| | Alternative Carriers | | | | — | | | | | 5,076,568 | | | | | — | | | | | 5,076,568 | |
| | Application Software | | | | 11,985,120 | | | | | 72,472,212 | | | | | — | | | | | 84,457,332 | |
| | Asset Management & Custody Banks | | | | — | | | | | 22,582,723 | | | | | — | | | | | 22,582,723 | |
| | Brewers | | | | — | | | | | 3,782,431 | | | | | — | | | | | 3,782,431 | |
| | Commodity Chemicals | | | | — | | | | | 14,150,236 | | | | | — | | | | | 14,150,236 | |
| | Construction & Engineering | | | | — | | | | | 14,527,135 | | | | | — | | | | | 14,527,135 | |
| | Consumer Finance | | | | — | | | | | 14,614,397 | | | | | — | | | | | 14,614,397 | |
| | Data Processing & Outsourced Services | | | | — | | | | | 1 | | | | | — | | | | | 1 | |
| | Department Stores | | | | — | | | | | 5,269,968 | | | | | — | | | | | 5,269,968 | |
| | Diversified Banks | | | | — | | | | | 6,523,616 | | | | | — | | | | | 6,523,616 | |
| | Diversified Support Services | | | | — | | | | | 22,856,391 | | | | | — | | | | | 22,856,391 | |
| | Electrical Components & Equipment | | | | — | | | | | 31,386,826 | | | | | — | | | | | 31,386,826 | |
| | Electronic Components | | | | — | | | | | 3,801,423 | | | | | — | | | | | 3,801,423 | |
| | Electronic Equipment & Instruments | | | | — | | | | | 4,601,063 | | | | | — | | | | | 4,601,063 | |
| | Food Retail | | | | — | | | | | 10,158,663 | | | | | — | | | | | 10,158,663 | |
| | Health Care Services | | | | — | | | | | 15,481,110 | | | | | — | | | | | 15,481,110 | |
| | Health Care Supplies | | | | — | | | | | 331,539 | | | | | — | | | | | 331,539 | |
| | Health Care Technology | | | | — | | | | | 23,261,236 | | | | | — | | | | | 23,261,236 | |
| | Human Resource & Employment Services | | | | — | | | | | 10,222,879 | | | | | 101,468 | | | | | 10,324,347 | |
| | Insurance Brokers | | | | — | | | | | 4,041,145 | | | | | — | | | | | 4,041,145 | |
| | Interactive Media & Services | | | | — | | | | | 3,915,792 | | | | | — | | | | | 3,915,792 | |
| | Internet & Direct Marketing Retail | | | | — | | | | | 2,990,850 | | | | | — | | | | | 2,990,850 | |
| | Investment Banking & Brokerage | | | | — | | | | | 10,086,759 | | | | | — | | | | | 10,086,759 | |
| | IT Consulting & Other Services | | | | — | | | | | 43,580,157 | | | | | — | | | | | 43,580,157 | |
| | Life Sciences Tools & Services | | | | — | | | | | 3,484,369 | | | | | — | | | | | 3,484,369 | |
| | Personal Products | | | | — | | | | | 4,660,245 | | | | | — | | | | | 4,660,245 | |
| | Publishing | | | | — | | | | | 11,974,560 | | | | | — | | | | | 11,974,560 | |
| | Research & Consulting Services | | | | — | | | | | 42,188,875 | | | | | — | | | | | 42,188,875 | |
| | Restaurants | | | | — | | | | | — | | | | | 8,277 | | | | | 8,277 | |
| | Semiconductors | | | | — | | | | | 23,423,217 | | | | | — | | | | | 23,423,217 | |
| | Specialized Finance | | | | — | | | | | 6,073,584 | | | | | — | | | | | 6,073,584 | |
| | Specialty Stores | | | | — | | | | | 2,887,293 | | | | | — | | | | | 2,887,293 | |
| | Systems Software | | | | 5,777,914 | | | | | 11,551,131 | | | | | — | | | | | 17,329,045 | |
| | Thrifts & Mortgage Finance | | | | 24,651,742 | | | | | 17,110,981 | | | | | — | | | | | 41,762,723 | |
| | Other | | | | 19,900,170 | | | | | — | | | | | — | | | | | 19,900,170 | |
Short-Term Investments | | | | | | — | | | | | 1,873,870 | | | | | — | | | | | 1,873,870 | |
| | | | | | | | | | | | | | | | | | | | | | |
| | | | | $ | 83,671,428 | | | | $ | 488,983,544 | | | | $ | 109,745 | | | | $ | 572,764,717 | |
| | | | | | | |
141
Notes to Financial Statements (continued)
| | | | | | | | | | | | | | | | | | | | | | |
| Fund | | Category | | Quoted Prices
In Active Markets
For Identical
Investments
(Level 1) | | Significant Other
Observable Inputs
(Level 2) | | Significant
Unobservable
Inputs
(Level 3) | | Value at
3/31/2022 |
International Select Fund | | | | | | | | | | | | | | | | | | | | | | |
Assets | | | | | | | | | | | | | | | | | | | | | | |
Common Stocks | | | | | | | | | | | | | | | | | | | | | | |
| | Apparel, Accessories & Luxury Goods | | | $ | — | | | | $ | 256,178 | | | | $ | — | | | | $ | 256,178 | |
| | Application Software | | | | — | | | | | 559,992 | | | | | — | | | | | 559,992 | |
| | Asset Management & Custody Banks | | | | — | | | | | 248,878 | | | | | — | | | | | 248,878 | |
| | Biotechnology | | | | — | | | | | 275,952 | | | | | — | | | | | 275,952 | |
| | Building Products | | | | — | | | | | 360,751 | | | | | — | | | | | 360,751 | |
| | Data Processing & Outsourced Services | | | | — | | | | | 706,973 | | | | | — | | | | | 706,973 | |
| | Drug Retail | | | | — | | | | | 120,647 | | | | | — | | | | | 120,647 | |
| | Electronic Equipment & Instruments | | | | — | | | | | 284,115 | | | | | — | | | | | 284,115 | |
| | Health Care Equipment | | | | — | | | | | 205,081 | | | | | — | | | | | 205,081 | |
| | Health Care Supplies | | | | — | | | | | 273,044 | | | | | — | | | | | 273,044 | |
| | Health Care Technology | | | | — | | | | | 533,654 | | | | | — | | | | | 533,654 | |
| | Industrial Machinery | | | | — | | | | | 376,799 | | | | | — | | | | | 376,799 | |
| | Interactive Media & Services | | | | — | | | | | 591,133 | | | | | — | | | | | 591,133 | |
| | IT Consulting & Other Services | | | | — | | | | | 194,710 | | | | | — | | | | | 194,710 | |
| | Life Sciences Tools & Services | | | | 348,291 | | | | | 211,667 | | | | | — | | | | | 559,958 | |
| | Research & Consulting Services | | | | — | | | | | 506,769 | | | | | — | | | | | 506,769 | |
| | Other | | | | 600,045 | | | | | — | | | | | — | | | | | 600,045 | |
Short-Term Investments | | | | | | — | | | | | 279,966 | | | | | — | | | | | 279,966 | |
| | | | | | | | | | | | | | | | | | | | | | |
| | | | | $ | 948,336 | | | | $ | 5,986,309 | | | | $ | — | | | | $ | 6,934,645 | |
| | | | | | | |
Long/Short Alpha Fund | |
Assets | |
Common Stocks | | | | | $ | 29,492,715 | | | | $ | — | | | | $ | — | | | | $ | 29,492,715 | |
| | | | | | | | | | | | | | | | | | | | | | |
| | | | | $ | 29,492,715 | | | | $ | — | | | | $ | — | | | | $ | 29,492,715 | |
| | | | | | | |
Other Financial Instruments | | | | | | | | | | | | | | | | | | | | | | |
Common Stocks Sold Short | | | | | $ | (12,007,787 | ) | | | $ | — | | | | $ | — | | | | $ | (12,007,787 | ) |
| | | | | | | |
Micro Cap Fund | |
Assets | |
Common Stocks | | | | | $ | 916,974,453 | | | | $ | — | | | | $ | — | | | | $ | 916,974,453 | |
Preferred Stocks | | | | | | — | | | | | — | | | | | 10,000,013 | | | | | 10,000,013 | |
Warrants | | | | | | 203,840 | | | | | — | | | | | 594,015 | | | | | 797,855 | |
Short-Term Investments | | | | | | — | | | | | 10,996,351 | | | | | — | | | | | 10,996,351 | |
| | | | | | | | | | | | | | | | | | | | | | |
| | | | | $ | 917,178,293 | | | | $ | 10,996,351 | | | | $ | 10,594,028 | | | | $ | 938,768,672 | |
| | | | | | | |
Micro Cap Value Fund | | | | | | | | | | | | | | | | | | | | | | |
Assets | |
Common Stocks | |
| | Diversified Support Services | | | $ | — | | | | $ | 3,881,067 | | | | $ | — | | | | $ | 3,881,067 | |
| | Health Care Technology | | | | — | | | | | 9,845,873 | | | | | — | | | | | 9,845,873 | |
| | Human Resource & Employment Services | | | | — | | | | | 5,906,771 | | | | | — | | | | | 5,906,771 | |
| | Industrial Machinery | | | | 11,111,620 | | | | | 4,466,743 | | | | | — | | | | | 15,578,363 | |
| | Leisure Facilities | | | | — | | | | | 4,054,147 | | | | | — | | | | | 4,054,147 | |
| | Life Sciences Tools & Services | | | | — | | | | | 3,889,735 | | | | | — | | | | | 3,889,735 | |
| | Other | | | | 323,328,981 | | | | | — | | | | | — | | | | | 323,328,981 | |
Limited Liability Company Membership Interest | | | | | | — | | | | | — | | | | | 22,232 | | | | | 22,232 | |
Warrants | | | | | | — | | | | | — | | | | | — | | | | | — | |
Short-Term Investments | | | | | | — | | | | | 26,910,607 | | | | | — | | | | | 26,910,607 | |
| | | | | | | | | | | | | | | | | | | | | | |
| | | | | $ | 334,440,601 | | | | $ | 58,954,943 | | | | $ | 22,232 | | | | $ | 393,417,776 | |
| | | | | | | |
142
| | |
| | | MARCH 31, 2022 (Unaudited) |
| | | | | | | | | | | | | | | | | | | | | | |
| Fund | | Category | | Quoted Prices
In Active Markets
For Identical
Investments
(Level 1) | | Significant Other
Observable Inputs
(Level 2) | | Significant
Unobservable
Inputs
(Level 3) | | Value at
3/31/2022 |
Small Cap Growth Fund | | | | | | | | | | | | | | | | | | | | | | |
Assets | |
Common Stocks | | | | | $ | 2,799,671,285 | | | | $ | — | | | | $ | — | | | | $ | 2,799,671,285 | |
Preferred Stocks | | | | | | — | | | | | — | | | | | 29,316,614 | | | | | 29,316,614 | |
Warrants | | | | | | — | | | | | — | | | | | 215,942 | | | | | 215,942 | |
Short-Term Investments | | | | | | — | | | | | 32,934,229 | | | | | — | | | | | 32,934,229 | |
| | | | | | | | | | | | | | | | | | | | | | |
| | | | | $ | 2,799,671,285 | | | | $ | 32,934,229 | | | | $ | 29,532,556 | | | | $ | 2,862,138,070 | |
| | | | | | | |
Small Cap Value Fund | | | | | | | | | | | | | | | | | | | | | | |
Assets | |
Common Stocks | | | | | $ | 1,612,363,294 | | | | $ | — | | | | $ | — | | | | $ | 1,612,363,294 | |
Short-Term Investments | | | | | | — | | | | | 31,951,595 | | | | | — | | | | | 31,951,595 | |
| | | | | | | | | | | | | | | | | | | | | | |
| | | | | $ | 1,612,363,294 | | | | $ | 31,951,595 | | | | $ | — | | | | $ | 1,644,314,889 | |
| | | | | | | |
Ultra Growth Fund | | | | | | | | | | | | | | | | | | | | | | |
Assets | |
Common Stocks | | | | | $ | 2,151,386,801 | | | | $ | — | | | | $ | — | | | | $ | 2,151,386,801 | |
Preferred Stocks | | | | | | — | | | | | — | | | | | 15,173,603 | | | | | 15,173,603 | |
Warrants | | | | | | — | | | | | — | | | | | 1,194,604 | | | | | 1,194,604 | |
Short-Term Investments | | | | | | — | | | | | 7,409,491 | | | | | — | | | | | 7,409,491 | |
| | | | | | | | | | | | | | | | | | | | | | |
| | | | | $ | 2,151,386,801 | | | | $ | 7,409,491 | | | | $ | 16,368,207 | | | | $ | 2,175,164,499 | |
| | | | | | | |
U.S. Treasury Fund | | | | | | | | | | | | | | | | | | | | | | |
Assets | |
U.S. Government Obligations | | | | | $ | — | | | | $ | 422,328,848 | | | | $ | — | | | | $ | 422,328,848 | |
Short-Term Investments | | | | | | — | | | | | 1,065,753 | | | | | — | | | | | 1,065,753 | |
| | | | | | | | | | | | | | | | | | | | | | |
| | | | | $ | — | | | | $ | 423,394,601 | | | | $ | — | | | | $ | 423,394,601 | |
| | | | | | | |
If the securities of an Asset Class are all the same level, the asset class is shown in total. If the securities of an Asset Class cross levels, the level with the smallest number of categories and with multiple levels within a category is displayed by category. The remaining categories that do not cross levels are combined into the “Other” category.
The valuation techniques used by the Funds to measure fair value for the period ended March 31, 2022 maximized the use of observable inputs and minimized the use of unobservable inputs.
There was a transfer of $1,740,000, $697,000 and $1,450,000 in the Core Growth Fund, Micro Cap Fund and Ultra Growth Fund, respectively, from Level 3 to Level 1 due to the conversion of an unlisted security into a freely trading common stock. This transfer amount represents the beginning
of the period value plus the purchases for the dividends paid in kind over the reporting period for Aldel Financial, Inc. and Roth CH Acquisition III Co., which transferred to Level 1 during the period in order to properly represent the activity on the Level 3 Rollforward presented below.
There was a transfer of $52,800,000 and $43,200,000 in the Small Cap Growth Fund and Ultra Growth Fund, respectively, from Level 3 to Level 1 due to the conversion of an unlisted security into a freely trading common stock. This transfer amount represents the beginning of the period value plus the purchases for the dividends paid in kind over the reporting period for Vintage Wine Estates, Inc., PIPE shares which transferred to Level 1 during the period in order to properly represent the activity on the Level 3 Rollforward presented below.
143
Notes to Financial Statements (continued)
The following is a reconciliation of the fair valuations using significant unobservable inputs (Level 3) for the Funds during the six months ended March 31, 2022:
| | | | | | | | | | | | | | | | | | | | | | | | | | | | | | | | | | | | | | | | | | | | | | | | | | |
| Fund | | Market Value
Beginning
Balance
9/30/2021 | | Purchases
At Cost | | Sales
(Proceeds) | | Accrued
Discounts
(Premiums) | | Realized
Gain/
(Loss) | | Change in
Unrealized
Appreciation
(Depreciation) | | Transfers
In at
Market
Value | | Transfers
Out at
Market
Value | | Market Value
Ending
Balance
3/31/2022 | | Net Change
In Unrealized
Appreciation
(Depreciation)
On Investments
Held at
3/31/2022 |
Core Growth Fund | | | | | | | | | | | | | | | | | | | | | | | | | | | | | | | | | | | | | | | | | | | | | | | | | | |
Warrants | | | $ | — | | | | $ | 1,859,173 | | | | $ | — | | | | $ | — | | | | $ | — | | | | $ | (654,973 | ) | | | $ | — | | | | $ | — | | | | $ | 1,204,200 | | | | $ | (654,973 | ) |
Unfunded Commitment with a SPAC | | | | (1,740,000 | ) | | | | — | | | | | — | | | | | — | | | | | — | | | | | — | | | | | — | | | | | 1,740,000 | | | | | — | | | | | — | |
| | | | | |
| | | $ | (1,740,000 | ) | | | $ | 1,859,173 | | | | $ | — | | | | $ | — | | | | $ | — | | | | $ | (654,973 | ) | | | $ | — | | | | $ | 1,740,000 | | | | $ | 1,204,200 | | | | $ | (654,973 | ) |
| | | | | |
Emerging Markets Select Fund | | | | | | | | | | | | | | | | | | | | | | | | | | | | | | | | | | | | | | | | | | | | | | | | | | |
Common Stocks | | | $ | — | | | | $ | — | | | | $ | — | | | | $ | — | | | | $ | — | | | | $ | — | | | | $ | 47,871 | | | | $ | — | | | | $ | 47,871 | | | | $ | — | |
| | | | | |
| | | $ | — | | | | $ | — | | | | $ | — | | | | $ | — | | | | $ | — | | | | $ | — | | | | $ | 47,871 | | | | $ | — | | | | $ | 47,871 | | | | $ | — | |
| | | | | |
Emerging Markets Small Cap Fund | | | | | | | | | | | | | | | | | | | | | | | | | | | | | | | | | | | | | | | | | | | | | | | | | | |
Common Stocks | | | $ | 16,722 | | | | $ | — | | | | $ | — | | | | $ | — | | | | $ | — | | | | $ | (105 | ) | | | $ | 194,280 | | | | $ | — | | | | $ | 210,897 | | | | $ | (105 | ) |
| | | | | |
| | | $ | 16,722 | | | | $ | — | | | | $ | — | | | | $ | — | | | | $ | — | | | | $ | (105 | ) | | | $ | 194,280 | | | | $ | — | | | | $ | 210,897 | | | | $ | (105 | ) |
| | | | | |
Frontier Emerging Small Countries Fund | | | | | | | | | | | | | | | | | | | | | | | | | | | | | | | | | | | | | | | | | | | | | | | | | | |
Common Stocks | | | $ | — | | | | $ | — | | | | $ | — | | | | $ | — | | | | $ | — | | | | $ | — | | | | $ | 12,658 | | | | $ | — | | | | $ | 12,658 | | | | $ | — | |
| | | | | |
| | | $ | — | | | | $ | — | | | | $ | — | | | | $ | — | | | | $ | — | | | | $ | — | | | | $ | 12,658 | | | | $ | — | | | | $ | 12,658 | | | | $ | — | |
| | | | | |
Global Opportunities Fund | | | | | | | | | | | | | | | | | | | | | | | | | | | | | | | | | | | | | | | | | | | | | | | | | | |
Common Stocks | | | $ | — | | | | $ | — | | | | $ | — | | | | $ | — | | | | $ | — | | | | $ | — | | | | $ | 6,813 | | | | $ | — | | | | $ | 6,813 | | | | $ | — | |
| | | | | |
| | | $ | — | | | | $ | — | | | | $ | — | | | | $ | — | | | | $ | — | | | | $ | — | | | | $ | 6,813 | | | | $ | — | | | | $ | 6,813 | | | | $ | — | |
| | | | | |
Global Select Fund | | | | | | | | | | | | | | | | | | | | | | | | | | | | | | | | | | | | | | | | | | | | | | | | | | |
Common Stocks | | | $ | — | | | | $ | — | | | | $ | — | | | | $ | — | | | | $ | — | | | | $ | — | | | | $ | 889 | | | | $ | — | | | | $ | 889 | | | | $ | — | |
| | | | | |
| | | $ | — | | | | $ | — | | | | $ | — | | | | $ | — | | | | $ | — | | | | $ | — | | | | $ | 889 | | | | $ | — | | | | $ | 889 | | | | $ | — | |
| | | | | |
International Growth Fund | | | | | | | | | | | | | | | | | | | | | | | | | | | | | | | | | | | | | | | | | | | | | | | | | | |
Common Stocks | | | $ | — | | | | $ | — | | | | $ | — | | | | $ | — | | | | $ | — | | | | $ | — | | | | $ | 83,166 | | | | $ | — | | | | $ | 83,166 | | | | $ | — | |
| | | | | |
| | | $ | — | | | | $ | — | | | | $ | — | | | | $ | — | | | | $ | — | | | | $ | — | | | | $ | 83,166 | | | | $ | — | | | | $ | 83,166 | | | | $ | — | |
| | | | | |
International Opportunities Fund | | | | | | | | | | | | | | | | | | | | | | | | | | | | | | | | | | | | | | | | | | | | | | | | | | |
Common Stocks | | | $ | 8,489 | | | | $ | — | | | | $ | — | | | | $ | — | | | | $ | — | | | | $ | (212 | ) | | | $ | 101,468 | | | | $ | — | | | | $ | 109,745 | | | | $ | (212 | ) |
| | | | | |
| | | $ | 8,489 | | | | $ | — | | | | $ | — | | | | $ | — | | | | $ | — | | | | $ | (212 | ) | | | $ | 101,468 | | | | $ | — | | | | $ | 109,745 | | | | $ | (212 | ) |
| | | | | |
Micro Cap Fund | | | | | | | | | | | | | | | | | | | | | | | | | | | | | | | | | | | | | | | | | | | | | | | | | | |
Preferred Stocks | | | $ | — | | | | $ | 10,000,013 | | | | $ | — | | | | $ | — | | | | $ | — | | | | $ | — | | | | $ | — | | | | $ | — | | | | $ | 10,000,013 | | | | $ | — | |
Warrants | | | | 584,040 | | | | | 587,980 | | | | | (6,400 | ) | | | | — | | | | | — | | | | | (571,605 | ) | | | | — | | | | | — | | | | | 594,015 | | | | | (578,005 | ) |
Unfunded Commitment with a SPAC | | | | (697,000 | ) | | | | — | | | | | — | | | | | — | | | | | — | | | | | — | | | | | — | | | | | 697,000 | | | | | — | | | | | — | |
| | | | | |
| | | $ | (112,960 | ) | | | $ | 10,587,993 | | | | $ | (6,400 | ) | | | $ | — | | | | $ | — | | | | $ | (571,605 | ) | | | $ | — | | | | $ | 697,000 | | | | $ | 10,594,028 | | | | $ | (578,005 | ) |
| | | | | |
Micro Cap Value Fund | | | | | | | | | | | | | | | | | | | | | | | | | | | | | | | | | | | | | | | | | | | | | | | | | | |
Common Stocks | | | $ | 17,685 | | | | $ | — | | | | $ | — | | | | $ | — | | | | $ | — | | | | $ | 4,547 | | | | $ | — | | | | $ | — | | | | $ | 22,232 | | | | $ | 4,547 | |
Warrants | | | | 56,064 | | | | | — | | | | | — | | | | | — | | | | | (26,065 | ) | | | | (29,999 | ) | | | | — | | | | | — | | | | | — | | | | | (52,116 | ) |
| | | | | |
| | | $ | 73,749 | | | | $ | — | | | | $ | — | | | | $ | — | | | | $ | (26,065 | ) | | | $ | (25,452 | ) | | | $ | — | | | | $ | — | | | | $ | 22,232 | | | | $ | (47,569 | ) |
| | | | | |
Small Cap Growth Fund | | | | | | | | | | | | | | | | | | | | | | | | | | | | | | | | | | | | | | | | | | | | | | | | | | |
Common Stocks | | | $ | 52,800,000 | | | | $ | — | | | | $ | — | | | | $ | — | | | | $ | — | | | | $ | — | | | | $ | — | | | | $ | (52,800,000 | ) | | | $ | — | | | | $ | — | |
Preferred Stocks | | | | 13,282,849 | | | | | 17,999,987 | | | | | — | | | | | — | | | | | — | | | | | (1,966,222 | ) | | | | — | | | | | — | | | | | 29,316,614 | | | | | (1,966,222 | ) |
Warrants | | | | — | | | | | 538,893 | | | | | — | | | | | — | | | | | — | | | | | (322,951 | ) | | | | — | | | | | — | | | | | 215,942 | | | | | (322,951 | ) |
| | | | | |
| | | $ | 66,082,849 | | | | $ | 18,538,880 | | | | $ | — | | | | $ | — | | | | $ | — | | | | $ | (2,289,173 | ) | | | $ | — | | | | $ | (52,800,000 | ) | | | $ | 29,532,556 | | | | $ | (2,289,173 | ) |
| | | | | |
144
| | |
| | | MARCH 31, 2022 (Unaudited) |
| | | | | | | | | | | | | | | | | | | | | | | | | | | | | | | | | | | | | | | | | | | | | | | | | | |
| Fund | | Market Value
Beginning
Balance
9/30/2021 | | Purchases
At Cost | | Sales
(Proceeds) | | Accrued
Discounts
(Premiums) | | Realized
Gain/
(Loss) | | Change in
Unrealized
Appreciation
(Depreciation) | | Transfers
In at
Market
Value | | Transfers
Out at
Market
Value | | Market Value
Ending
Balance
3/31/2022 | | Net Change
In Unrealized
Appreciation
(Depreciation)
On Investments
Held at
3/31/2022 |
Ultra Growth Fund | | | | | | | | | | | | | | | | | | | | | | | | | | | | | | | | | | | | | | | | | | | | | | | | | | |
Common Stocks | | | $ | 43,200,000 | | | | $ | — | | | | $ | — | | | | $ | — | | | | $ | — | | | | $ | — | | | | $ | — | | | | $ | (43,200,000 | ) | | | $ | — | | | | $ | — | |
Preferred Stocks | | | | 300,120 | | | | | 15,000,004 | | | | | — | | | | | — | | | | | — | | | | | (126,521 | ) | | | | — | | | | | — | | | | | 15,173,603 | | | | | (126,521 | ) |
Warrants | | | | — | | | | | 2,026,219 | | | | | — | | | | | — | | | | | — | | | | | (831,615 | ) | | | | — | | | | | — | | | | | 1,194,604 | | | | | (831,615 | ) |
Unfunded Commitment with a SPAC | | | | (1,450,000 | ) | | | | — | | | | | — | | | | | — | | | | | — | | | | | — | | | | | — | | | | | 1,450,000 | | | | | — | | | | | — | |
| | | | | |
| | | $ | 42,050,120 | | | | $ | 17,026,223 | | | | $ | — | | | | $ | — | | | | $ | — | | | | $ | (958,136 | ) | | | $ | — | | | | $ | (41,750,000 | ) | | | $ | 16,368,207 | | | | $ | (958,136 | ) |
| | | | | |
QUANTITATIVE INFORMATION ABOUT LEVEL 3 FAIR VALUE MEASUREMENTS
| | | | | | | | | | | | | | |
| Fund | | Description | | Fair Value
At 3/31/2022 | | | Valuation Technique | | Unobservable Input | | Range (Average) | |
| Core Growth Fund | | Warrant: Insurance Brokers | | $ | 1,204,200 | | | Black Scholes | | Black Scholes | | | 100% | |
| Emerging Markets Select Fund | | Common Stock: Diversified Banks | | $ | 47,871 | | | Discount for lack of marketability | | Discount for lack of marketability | | | 98% | |
| Emerging Markets Small Cap Fund | | Common Stock: Diversified Banks | | $ | 49,542 | | | Discount for lack of marketability | | Discount for lack of marketability | | | 98% | |
| Emerging Markets Small Cap Fund | | Common Stock: Human Resource & Employment Services | | $ | 144,737 | | | Discount for lack of marketability | | Discount for lack of marketability | | | 98% | |
| Frontier Emerging Small Countries Fund | | Common Stock: Diversified Banks | | $ | 8,958 | | | Discount for lack of marketability | | Discount for lack of marketability | | | 98% | |
| Frontier Emerging Small Countries Fund | | Common Stock: Human Resource & Employment Services | | $ | 3,700 | | | Discount for lack of marketability | | Discount for lack of marketability | | | 98% | |
| Global Opportunities Fund | | Common Stock: Diversified Banks | | $ | 6,813 | | | Discount for lack of marketability | | Discount for lack of marketability | | | 98% | |
| Global Select Fund | | Common Stock: Diversified Banks | | $ | 889 | | | Discount for lack of marketability | | Discount for lack of marketability | | | 98% | |
| International Growth Fund | | Common Stock: Human Resource & Employment Services | | $ | 83,166 | | | Discount for lack of marketability | | Discount for lack of marketability | | | 98% | |
| International Opportunities Fund | | Common Stock: Human Resource & Employment Services | | $ | 101,468 | | | Discount for lack of marketability | | Discount for lack of marketability | | | 98% | |
| Micro Cap Fund | | Direct Venture Capital Investments: Textiles | | $ | 10,000,013 | | | Cost | | Cost | | | 100% | |
| Micro Cap Fund | | Warrant: Interactive Home Entertainment | | $ | 337,500 | | | Black Scholes | | Black Scholes | | | 100% | |
| Small Cap Growth Fund | | Direct Venture Capital Investments: Textiles | | $ | 17,999,987 | | | Cost | | Cost | | | 100% | |
| Small Cap Growth Fund | | Direct Venture Capital Investments: Semiconductor Equipment | | $ | 694,394 | | | Market comparable companies | | EV/R* multiple | | | 3.0 – 14.2 (9.6) | |
| | | | | | | | | | | Discount for lack of marketability | | | 20% | |
| Small Cap Growth Fund | | Direct Venture Capital Investments: Systems Software | | $ | 10,622,233 | | | Market comparable companies | | EV/R* multiple | | | 2.7 – 24.6 (9.0) | |
| | | | | | | | | | | Discount for lack of marketability | | | 20% | |
| Ultra Growth Fund | | Direct Venture Capital Investments: Textiles | | $ | 15,000,004 | | | Cost | | Cost | | | 100% | |
| Ultra Growth Fund | | Warrant: Insurance Brokers | | $ | 1,003,500 | | | Black Scholes | | Black Scholes | | | 100% | |
| Ultra Growth Fund | | Direct Venture Capital Investments: Semiconductor Equipment | | $ | 173,599 | | | Market comparable companies | | EV/R* multiple | | | 3.0 – 14.2 (9.6) | |
| | | | | | | | | | | Discount for lack of marketability | | | 20% | |
| * | Enterprise-Value-To-Revenue (“EV/R”) multiple is a measure of the value of a stock that compares a company’s enterprise value to its revenue. |
145
Notes to Financial Statements (continued)
Changes in EV/R multiples may change the fair value of an investment. Generally, a decrease in this multiple will result in a decrease in the fair value of an investment.
The Funds’ other Level 3 investments have been valued using observable inputs, unadjusted third-party transactions and quotations or unadjusted historical third-party information. No unobservable inputs internally developed by the Funds have been applied to these investments, thus they have been excluded from the above table.
Additional information about the Funds’ fair valuation practices is available in the Funds’ most recent Prospectus, Statement of Additional Information (SAI) and Report to Shareholders. This information is available on the Funds’ website at wasatchglobal.com and on the Securities and Exchange Commission’s website at www.sec.gov.
13. OFFSETTING
Each Fund is party to various netting arrangements. The Financial Accounting Standards Board (FASB) requires disclosure about certain netting arrangements and similar agreements to enable users of a Fund’s financial statements to evaluate the effect or potential effect of netting arrangements on the Fund’s financial position. The scope of the disclosure is limited to derivative instruments, repurchase agreements and reverse repurchase agreements, and securities borrowing and securities lending transactions.
The following tables present information about financial instruments that were subject to enforceable netting arrangements as of March 31, 2022:
Repurchase Agreements
| | | | | | | | | | | | | | | | | | | | | | |
| | | | | Gross Amounts Not Offset in the Statements of Assets and Liabilities |
| Fund | | Counterparty | | Gross Asset Amounts
Presented in Statements
Of Assets and Liabilities | | Financial
Instrument | | Collateral
Received1 | | Net Amount
(Not less
Than 0) |
Core Growth Fund | | Fixed Income Clearing Corp. | | | $ | 28,707,850 | | | | $ | — | | | | $ | (28,707,850 | ) | | | $ | — | |
Emerging India Fund | | Fixed Income Clearing Corp. | | | | 9,027,191 | | | | | — | | | | | (9,027,191 | ) | | | | — | |
Emerging Markets Select Fund | | Fixed Income Clearing Corp. | | | | 31,016,489 | | | | | — | | | | | (31,016,489 | ) | | | | — | |
Emerging Markets Small Cap Fund | | Fixed Income Clearing Corp. | | | | 2,731,840 | | | | | — | | | | | (2,731,840 | ) | | | | — | |
Frontier Emerging Small Countries Fund | | Fixed Income Clearing Corp. | | | | 599,924 | | | | | — | | | | | (599,924 | ) | | | | — | |
Global Opportunities Fund | | Fixed Income Clearing Corp. | | | | 3,350,801 | | | | | — | | | | | (3,350,801 | ) | | | | — | |
Global Select Fund | | Fixed Income Clearing Corp. | | | | 939,916 | | | | | — | | | | | (939,916 | ) | | | | — | |
Global Value Fund | | Fixed Income Clearing Corp. | | | | 2,663,539 | | | | | — | | | | | (2,663,539 | ) | | | | — | |
International Growth Fund | | Fixed Income Clearing Corp. | | | | 5,178,293 | | | | | — | | | | | (5,178,293 | ) | | | | — | |
International Opportunities Fund | | Fixed Income Clearing Corp. | | | | 1,873,870 | | | | | — | | | | | (1,873,870 | ) | | | | — | |
International Select Fund | | Fixed Income Clearing Corp. | | | | 279,966 | | | | | — | | | | | (279,966 | ) | | | | — | |
Micro Cap Fund | | Fixed Income Clearing Corp. | | | | 10,996,351 | | | | | — | | | | | (10,996,351 | ) | | | | — | |
Micro Cap Value Fund | | Fixed Income Clearing Corp. | | | | 26,910,607 | | | | | — | | | | | (26,910,607 | ) | | | | — | |
Small Cap Growth Fund | | Fixed Income Clearing Corp. | | | | 32,934,229 | | | | | — | | | | | (32,934,229 | ) | | | | — | |
Small Cap Value Fund | | Fixed Income Clearing Corp. | | | | 31,951,595 | | | | | — | | | | | (31,951,595 | ) | | | | — | |
Ultra Growth Fund | | Fixed Income Clearing Corp. | | | | 7,409,491 | | | | | — | | | | | (7,409,491 | ) | | | | — | |
U.S. Treasury Fund | | Fixed Income Clearing Corp. | | | | 1,065,753 | | | | | — | | | | | (1,065,753 | ) | | | | — | |
| 1 | Repurchase agreements are classified as short-term investments in the Statements of Assets and Liabilities. The market value of the collateral received is greater than the amounts indicated in the table above. For further information, see Note 3—Securities and Other Investments “Repurchase Agreements” and the Schedules of Investments. |
Securities Borrowed For Short Sales
| | | | | | | | | | | | | | | | | | | | | | |
| | | | | Gross Amounts Not Offset in the Statements of Assets and Liabilities |
| Fund | | Counterparty | | Gross Asset Amounts
Presented in Statements
Of Assets and Liabilities | | Financial
Instrument | | Collateral
Received1 | | Net Amount
(Not less
Than 0) |
Long/Short Alpha Fund | | Fixed Income Clearing Corp. | | | $ | 12,007,787 | | | | $ | — | | | | $ | (12,007,787 | ) | | | $ | — | |
| 1 | The market value of the collateral received is greater than the amounts indicated in the table. For further information, see Note 3—Securities and Other Investments “Short Sales” and the Schedule of Investments. |
14. SUBSEQUENT EVENTS
Management has evaluated the possibility of subsequent events and has determined that there are no additional events that would require adjustment to or additional disclosure in the Funds’ financial statements.
146
| | |
| Wasatch Funds | | MARCH 31, 2022 (Unaudited) |
Supplemental Information
MANAGEMENT OF THE TRUST
Management Information. The business affairs of Wasatch Funds are overseen by its Board of Trustees. The Board consists of four Independent Trustees. Each of the Independent Trustees will serve until their successors are qualified, appointed or elected in accordance with the Trust’s Declaration of Trust and By-Laws. Ms. Allison, Mr. Rinne and Ms. Fletcher were elected by shareholders.
The Trustees and executive officers of Wasatch Funds and their principal occupations for at least the last five years are set forth below. The Advisor retains proprietary rights to the Trust name. The Funds’ Statement of Additional Information includes additional information about the Trustees and is available, without charge, online at wasatchglobal.com or upon request by calling Wasatch Funds at 800.551.1700.
| | | | | | | | | | | | |
Name, Address
And Age | | Position(s)
Held with
Wasatch Funds | | Term of Office1
And Length of
Time Served | | Principal Occupation(s)
During Past 5 Years | | Number of
Portfolios
In Fund
Complex
Overseen
By Trustee | | | Other Directorships
Held by Trustees
During Past 5 Years2 |
Independent Trustees | | | | | | | | | | | | |
| | | | | |
Miriam M. Allison 505 Wakara Way 3rd Floor Salt Lake City, UT 84108 Age 74 | | Trustee and Chair of the Board | | Indefinite Served as Trustee since 2010 | | Rancher since 2004. From 2001 to 2005, Chairman of UMB Fund Services, Inc. | | | 19 | | | Director, Northwestern Mutual Series Fund, Inc. (27 portfolios) from 2006 to 2021. |
| | | | | |
Heikki Rinne 505 Wakara Way 3rd Floor Salt Lake City, UT 84108 Age 70 | | Trustee and Chair of the Governance and Nominating Committee | | Indefinite Served as Trustee since 2012 | | Chief Executive Officer of the Halton Group Ltd. (an indoor environmental control manufacturing and technology company), from 2002 to 2016; A Founder and Principal Owner of Sitoumus LLC (a training and consulting firm focusing on empowering organizational and individual engagement as well as general consulting), January 2017 to present. | | | 19 | | | Director, Halton Group Ltd. from 2016 to 2020. |
| | | | | |
Kristen M. Fletcher 505 Wakara Way 3rd Floor Salt Lake City, UT 84108 Age 68 | | Trustee and Chair of the Audit Committee | | Indefinite Served as Trustee since 2014 | | Director, Utah Museum of Fine Arts since 2021; Director, Youth Sports Alliance from 2015 to 2021; Trustee, Woodlands Commercial Bank (a/k/a Lehman Brothers Commercial Bank) from 2009 to 2012; Chairman and CEO, ABN AMRO, Inc. and U.S. Country Representative, ABN AMRO Bank, NV from 2002 to 2004. | | | 19 | | | Director, Youth Sports Alliance since 2015. Trustee, Woodlands Commercial Bank (a/k/a Lehman Brothers Commercial Bank) from 2009 to 2012; Director Emeritus, Utah Symphony/Utah Opera since September 2017. Director, Utah Symphony/Utah Opera from 2005-September 2017. |
| | | | | |
Mark Robinson 505 Wakara Way 3rd Floor Salt Lake City, UT 84108 Age 63 | | Trustee | | Indefinite Served as Trustee since 2020 | | Chief Financial Officer of Truckstop.com LLC from 2016 to 2019; Chief Financial Officer of SABA Software, Inc. from 2013 to 2015. | | | 19 | | | Chairman of Vita Vis Nutrition, Inc. from 2014 to 2016. |
|
|
| 1 | A Trustee may serve until his/her death, resignation, removal or retirement. Each Independent Trustee shall retire as Trustee at the end of the calendar year in which he/she attains the age of 75 years. The Board of Trustees reserves the right to permit continued service after the mandatory retirement age for any individual Trustee in its sole discretion. |
| 2 | Directorships are those held by a Trustee in any company with a class of securities registered pursuant to Section 12 of the Securities Exchange Act of 1934 or subject to the requirements of Section 15(d) of the Securities Exchange Act or any company registered as an investment company under the 1940 Act. |
147
Supplemental Information (continued)
| | | | | | |
Name, Address
And Age | | Position(s)
Held with
Trust | | Term of Office and
Length of Time Served | | Principal Occupation(s)
During Past 5 Years |
Officers | | | | | | |
| | | |
Eric S. Bergeson 505 Wakara Way 3rd Floor Salt Lake City, UT 84108 Age 55 | | President | | Indefinite Served as President since May 2018 | | President for Wasatch Funds since May 2018. President of the Advisor since January 2017; Vice President of Institutional Sales for the Advisor since June 1998. |
| | | |
Russell L. Biles 505 Wakara Way 3rd Floor Salt Lake City, UT 84108 Age 54 | | Chief Compliance Officer, Vice President and Secretary | | Indefinite Served as Chief Compliance Officer and Vice President since February 2007 and Secretary since November 2008 | | Chief Compliance Officer and Vice President for Wasatch Funds since February 2007; Secretary for Wasatch Funds since November 2008; Counsel for the Advisor since October 2006. |
| | | |
Michael K. Yeates 505 Wakara Way 3rd Floor Salt Lake City, UT 84108 Age 40 | | Treasurer | | Indefinite Served as Treasurer since May 2018 | | Treasurer for Wasatch Funds since May 2018; Chief Financial Officer of the Advisor since September 2007. |
| | | |
David Corbett 505 Wakara Way 3rd Floor Salt Lake City, UT 84108 Age 49 | | Assistant Vice President | | Indefinite Served as Assistant Vice President since August 2012 | | Assistant Vice President for Wasatch Funds since August 2012; Director of Mutual Fund Services for the Advisor since June 2007. |
| | | |
Cheryl Reich 505 Wakara Way, 3rd Floor Salt Lake City, UT 84108 Age 38 | | Assistant Secretary | | Indefinite Served as Assistant Secretary since February 2017 | | Assistant Secretary for Wasatch Funds since February 2017; Compliance Associate for the Advisor since September 2012. |
| | | |
Kara H. Becker 505 Wakara Way 3rd Floor Salt Lake City, UT 84108 Age 38 | | Assistant Treasurer | | Indefinite Served as Assistant Treasurer since May 2018 | | Assistant Treasurer for Wasatch Funds since May 2018; Controller for the Advisor since January 2012. |
|
|
PROXY VOTING POLICIES, PROCEDURES AND RECORD
A description of the policies and procedures the Advisor uses to vote proxies related to the Funds’ portfolio securities is set forth in the Funds’ Statement of Additional Information, which is available without charge, upon request or by calling 800.551.1700 or visiting the Funds’ website at wasatchglobal.com or the Securities and Exchange Commission’s (SEC) website at www.sec.gov.
Wasatch Funds’ proxy voting record is available without charge on the Funds’ website at wasatchglobal.com and on the SEC’s website at www.sec.gov no later than August 31 for the prior 12 months ended June 30.
QUARTERLY PORTFOLIO HOLDINGS DISCLOSURE ON FORM N-PORT
The Funds file their complete schedules of investments with the SEC for their first and third quarters of each fiscal year on Form N-PORT. The Funds’ Form N-PORT filings are available on the SEC’s website at www.sec.gov.
STATEMENT REGARDING LIQUIDITY RISK MANAGEMENT PROGRAM
Consistent with Rule 22e-4 under the Investment Company Act of 1940, the Wasatch Funds have adopted a Liquidity Risk Management Program to govern the approach to managing liquidity risk within the Wasatch Funds (the “Program”). The Board has approved the designation of the Advisor’s Liquidity Risk Committee to oversee the Program.
The Program’s principal objectives include supporting each Fund’s compliance with limits on investments in illiquid assets and mitigating the risk that a Fund will be unable to meet its redemption obligations timely. The Program also includes a number of elements that support the management and assessment of liquidity risk, including an annual assessment of factors that influence a Fund’s liquidity and the periodic classification and re-classification of a Fund’s investments into groupings that reflect the Liquidity Risk Committee’s assessment of their relative liquidity under current market conditions.
148
| | |
| | | MARCH 31, 2022 (Unaudited) |
Each of the Wasatch Funds maintains a high level of liquidity and is deemed to be a fund that primarily holds assets that are defined as highly liquid investments. A Highly Liquid Investment is defined as cash and any investment reasonably expected to be convertible to cash in current market conditions in three business days or less without the conversion to cash significantly changing the market value of the investment. A fund that is deemed to primarily hold assets that are Highly Liquid Investments will have at least 55% of its net assets in Highly Liquid Investments. As a result, each Fund has not adopted a Highly Liquid Investment minimum.
There have been no liquidity events that have materially affected the performance of the Funds or their ability to timely meet redemptions without dilution to existing shareholders. The Liquidity Risk Committee has determined, and reported to the Board, that the Program has operated adequately and effectively to manage the Funds’ liquidity risk since implementation. There can be no assurance that the Program will achieve its objectives in the future. Please refer to your Fund’s Prospectus for more information regarding the Fund’s exposure to liquidity risk and other principal risks to which an investment in the Fund may be subject.
Further information on liquidity risks applicable to the Funds can be found within the Prospectus.
BOARD CONSIDERATIONS FOR INVESTMENT ADVISORY AND SUB-ADVISORY AGREEMENTS OF THE WASATCH FUNDS
| I. | Board Considerations for the renewal of the Investment Advisory and Sub-Advisory Agreements for the Wasatch Funds, except the Wasatch Long/Short Alpha Fund, which is discussed in Section II, below. |
At a meeting held on November 2, 2021 (the “Meeting”), the Board of Trustees (the “Board”) of Wasatch Funds Trust (the “Trust”) unanimously approved the Advisory and Service Contract (the “Investment Advisory Agreement”) between Wasatch Advisors, Inc. doing business as Wasatch Global Investors, Inc. (the “Advisor”)and the Trust on behalf of each existing series of the Trust other than the Wasatch Long/Short Alpha Fund (for the purposes of this Section I, each a “Fund”) and the sub-advisory agreement (the “Sub-Advisory Agreement”) between the Advisor and Hoisington Investment Management Company (“HIMCo” or the “Sub-Advisor”) on behalf of the Wasatch-Hoisington U.S. Treasury Fund (the “U.S. Treasury Fund”). As the Board is comprised of all disinterested Trustees (the “Independent Trustees”), the references to Board and/or Independent Trustees shall mean all the Independent Trustees. The Investment Advisory Agreement and Sub-Advisory Agreement are collectively hereafter the “Advisory Agreements” and each an “Advisory Agreement.”
The Board is responsible for overseeing the management of the Funds and, as such, the Board determines each year as required by law whether to continue the Advisory Agreement with the Advisor on behalf of each Fund, and the Sub-Advisory Agreement with HIMCo on behalf of the U.S. Treasury Fund. The Board and its committees meet regularly throughout the year and, at these meetings, receive regular and/or special reports that cover an array of topics and information relevant to its annual consideration of the renewal of the Advisory Agreements. Some of these reports and discussions include, among other things, materials that outline the investment performance of the Funds over various time periods with additional discussions on Funds that may have experienced periods of challenged performance; internal ratings for each Fund; periodic presentations from portfolio managers; compliance, risk and liquidity management; valuation of securities; compliance with the respective Fund’s investment objectives and investment restrictions; Fund expenses; the execution of portfolio transactions; cross-holdings of securities among the Funds; and overall economic, market and regulatory developments, including during periods of market volatility generally caused by the Covid-19 pandemic.
In addition to the information provided and discussions held throughout the year, in response to a request on behalf of the Independent Trustees by independent legal counsel, the Independent Trustees received and reviewed extensive materials specifically prepared for the annual review of the Advisory Agreements by the Advisor as well as certain materials provided by Broadridge Financial Solutions, Inc. (“Broadridge”), an independent provider of investment company data. The materials covered a wide range of topics including, among other things, the investment process of the Advisor, including its investment risk management; the organizational structure and culture of the Advisor; the ownership, management and committee structure of the Advisor, including its succession planning; the nature, extent and quality of services performed pursuant to the respective Advisory Agreement; the experience of the relevant investment personnel; the performance of each Fund in absolute terms and as compared to the performance of certain peers, including peers compiled by Broadridge and benchmark(s); the third-party performance ranking of the Funds for various periods comparing a Fund against similarly categorized funds; the management fee and net expenses ratios of each class of shares of each Fund and as compared to peers compiled by Broadridge; the expense caps provided by the Advisor on certain expenses of the applicable classes of the Funds; the management fees of certain Funds compared to certain fee data of accounts managed in a similar style to such Funds; the services provided to other types of clients; investment personnel compensation arrangements; the brokerage policies and practices and commission results; and certain
149
Supplemental Information (continued)
financial data of the Advisor and its parent and the profitability of the Advisor as described below. With respect to the Sub-Advisor, the materials also covered, among other things, an evaluation of the Sub-Advisor by the Advisor; the organizational and leadership structure of the Sub-Advisor; the services performed pursuant to the Sub-Advisory Agreement; the experience of the relevant investment personnel; the performance of the U.S. Treasury Fund in absolute terms and as compared to the performance of peers compiled by Broadridge and a benchmark; the management fee rate and net expense ratio of the U.S. Treasury Fund and as compared to peers compiled by Broadridge; and certain financial data regarding the Sub-Advisor.
The information prepared specifically for the annual review of the Advisory Agreements supplemented the information provided to the Board and its committees and the evaluations of the Funds by the Board and its committees throughout the year. The Independent Trustees considered their review of Advisory Agreements to be an ongoing process and employed the accumulated information, knowledge and experience the Trustees had gained during their tenure on the Board governing the Funds and evaluating the Advisor and Sub-Advisor. The Board’s considerations of the Advisory Agreements also reflect the information, negotiations and discussions with management in connection with the Board’s prior reviews of the Funds’ advisory arrangements, and the Independent Trustees’ conclusions may be based, in part, on their consideration of the fee arrangements and other factors developed in prior years.
The Independent Trustees were advised by independent legal counsel during the annual review process as well as throughout the year, including meetings in execution sessions with such counsel at which no representatives from the Advisor or Sub-Advisor were present. In connection with their annual review, the Independent Trustees also received a memorandum from independent legal counsel outlining their fiduciary duties and legal standards in reviewing the Advisory Agreements.
As part of their continuing practice, the Independent Trustees met in executive session on October 26, 2021 (the “October Executive Session”) to begin their considerations and discussions of the Advisory Agreements and the materials provided in connection with their review. In their review, the Independent Trustees evaluated the advisory arrangements separately on a Fund-by-Fund and per class basis. The Independent Trustees invited members of management of the Advisor to attend the executive sessions from time to time to respond to questions.
At the Meeting, the Independent Trustees met, including in executive session without management present, to further consider, in relevant part, the renewal of the Advisory Agreements. After the discussions and with the background and knowledge described above, the Independent
Trustees approved the renewal of the Advisory Agreements on behalf of the applicable Funds. The Independent Trustees did not identify any single factor as all-important or controlling, but rather the decision reflected the comprehensive consideration of all the information presented, and each Trustee may have attributed different weights to the various factors and information considered in the approval process. The following summarizes the principal factors, but not all the factors, the Board considered in its review of the Investment Advisory and Sub-Advisory Agreements and its conclusions.
A. Nature, Extent and Quality of Services
In evaluating the renewal of the Advisory Agreements, the Board considered, in relevant part, the nature, extent and quality of the Advisor’s and Sub-Advisor’s services to the applicable Fund(s). With respect to the U.S. Treasury Fund, the Independent Board Members considered the Investment Advisory Agreement and the Sub-Advisory Agreement separately in the course of their review.
The Board considered the vast array of management, oversight and administrative services the Advisor provides to manage and operate the Funds, and the increase in the scope and complexity of such services over time due to, among other things, new or revised regulatory requirements. The Board further considered the resources and capabilities necessary to provide such services. With respect to the Advisor, the Independent Trustees recognized that the Advisor provides portfolio management services for the Funds (other than the U.S. Treasury Fund). In connection with providing these portfolio management services to the applicable Funds, the Board reviewed, among other things, the Advisor’s investment philosophy and the steps taken to construct a portfolio, including the Advisor’s screening process and due diligence followed to evaluate companies and their industries, collaborative research process and trading execution and the evaluation thereof. The Board also considered the Advisor’s process and principles in managing investment risk, including the functions of the Advisor’s investment risk committee, and evaluating the Funds and their performance. The Independent Trustees further continued their practice of meeting with the portfolio manager(s) of the Funds during the year to discuss, in relevant part, the portfolio manager’s investment approach and any adjustments thereto, market conditions and investment performance. As part of its review, the Board considered the Advisor’s ability to continue to provide quality services to the Funds and reviewed, among other things, the Advisor’s employee-ownership structure; its management and committee structure and culture; the functions of its business risk committee; the experience, education and tenure of portfolio managers; its succession planning for portfolio and firm management; the Advisor’s business continuity policies and procedures; and, as described in further detail below, certain financial data of the Advisor, including its profitability. The
150
| | |
| | | MARCH 31, 2022 (Unaudited) |
Independent Trustees recognized the need to offer competitive compensation to investment personnel and considered whether the compensation structure provided appropriate incentives to act in the Funds’ best interests. As noted below, the Independent Trustees reviewed Fund performance in considering the Advisor’s investment management performance.
In addition to the portfolio management services provided, the Board considered the extensive administrative or non-advisory services the Advisor provides to manage and operate the Funds (in addition to those provided by other third parties). These services include, but are not limited to, oversight of third-party Fund service providers (such as overseeing, supporting, coordinating and evaluating the services of other service providers, including the Funds’ transfer agent, administrator, auditor and custodian); oversight of the Sub-Advisor on behalf of the U.S. Treasury Fund; administrative services (such as providing the employees and officers necessary for the Funds’ overall management and day-to-day operations); operational support (such as providing or assisting with preparing and filing regulatory and tax reports; preparing and filing registration statements and other regulatory filings; complying with federal and state laws and regulations; overseeing the valuation of portfolio securities and daily pricing; voting proxies; and assisting with insurance renewals); board support and administration (such as overseeing the organization of the Board and committee meetings and preparing or overseeing the timely preparation of various materials and/or presentations for such meetings); fund share transactions (such as monitoring daily purchases and redemptions); shareholder communications (such as overseeing the preparation of annual and semiannual and other periodic shareholder reports); tax and financial statement preparation and related regulatory filing services; and compliance services (such as helping to maintain and update the Funds’ compliance program and related policies and procedures as necessary or appropriate to meet new or revised regulatory requirements, reviewing and testing such program and its policies and procedures periodically, providing compliance training for personnel and monitoring and managing the liquidity and the risks of the portfolios).
In addition to the services provided by the Advisor, the Independent Trustees also considered the risks borne by the Advisor in managing the Funds in a highly regulated industry, including various material entrepreneurial, operational, reputational, regulatory and litigation risks.
With respect to the U.S. Treasury Fund, the Board recognized that the Fund utilizes a Sub-Advisor and therefore also evaluated the renewal of the Sub-Advisory Agreement. With respect to such Fund, the Board considered the division of responsibilities between the Advisor and Sub-Advisor and the respective roles of the Advisor and Sub-Advisor in providing services to the Fund. The Board recognized that the Sub-Advisor and its investment personnel are responsible for
the portfolio management of the U.S. Treasury Fund but are not expected to provide the other significant administrative or non-advisory services that the Advisor provides to the Fund as described above. The Board noted that the Advisor oversees and evaluates the Sub-Advisor with respect to the latter’s portfolio management of the Fund and considered the Advisor’s evaluation of the Sub-Advisor. The Independent Trustees considered the background and experience of the investment personnel of the Sub-Advisor and the performance history of the U.S. Treasury Fund. Similarly, in seeking to help ensure the continuity of the services of the Sub-Advisor, the Independent Trustees considered, among other things, the stability and organization of the Sub-Advisor; the history, experience and tenure of the investment personnel of the Sub-Advisor to the Fund; the Sub-Advisor’s disaster recovery plans and process; its compliance program, including its regulatory history; and certain financial data of the Sub-Advisor as described in further detail below. The Board noted the Advisor’s favorable assessment of the Sub-Advisor and its recommendation for renewal of the Sub-Advisory Agreement.
The Board also recognized the continuing impact of the COVID-19 pandemic during the year and the ability of the Advisor and Sub-Advisor to adapt as necessary to provide their services continuously despite the disruptions of the pandemic.
Based on their review, the Independent Trustees found that, overall, the nature, extent and quality of services provided under the Advisory Agreement and the Sub-Advisory Agreement were satisfactory on behalf of each applicable Fund.
B. The Investment Performance of the Funds
In evaluating the quality of the services provided by the Advisor and Sub-Advisor, the Board also received and considered the investment performance of the Fund(s) they advise over various periods. In this regard, the Board received and reviewed a report (the “Broadridge Report”) prepared by Broadridge which generally provided a Fund’s performance data for the one-, two-, three-, four-, five-, and ten-year periods ended August 31, 2021 (or for the periods available for Funds that did not exist for part of the foregoing time frame) on an absolute basis and as compared to the performance of unaffiliated comparable funds (a “Broadridge Peer Universe”), to a more focused subset of peers (a “Broadridge Peer Group”) and to a benchmark provided by Broadridge for the prescribed periods (subject to certain exceptions). The Board was provided with information describing the methodology Broadridge used to create the Broadridge Peer Group and Broadridge Peer Universe.
In addition to the Broadridge Report, the Independent Trustees also reviewed materials reflecting, among other things, the respective Fund’s historic performance for the
151
Supplemental Information (continued)
quarter and one-, three-, five-, and ten-year periods ended September 30, 2021 (or for the periods available for Funds that did not exist for part of the foregoing time frame), and annual returns from 2011 through 2020 (or for the calendar years available for Funds that did not exist for part of the foregoing time frame) in absolute terms and as compared to the Fund’s respective benchmark(s) as described below.
The Board also considered information reflecting a Fund’s peer ranking in its respective Morningstar investment category and any Morningstar ratings on the applicable Fund. The Independent Trustees further received analyst reports provided by an unaffiliated party for the following Funds: the Core Growth Fund, the International Opportunities Fund, the Small Cap Growth Fund, and the U.S. Treasury Fund. The Independent Trustees also reviewed the performance of the following Funds (the Core Growth Fund, the Emerging India Fund, the Emerging Markets Select Fund, the Emerging Markets Small Cap Fund, the Frontier Emerging Small Countries Fund, the Global Opportunities Fund, the International Growth Fund, the International Opportunities Fund, the International Select Fund, the Micro Cap Fund, the Micro Cap Value Fund, the Small Cap Growth Fund, the Small Cap Value Fund and the Ultra Growth Fund) compared to the performance of certain composites of funds and/or separate accounts for the one-, three-, five- and ten-year periods ended September 30, 2021 (or for such shorter periods if the Funds or separate account composite did not exist for part of the foregoing time frame). Similarly, the Independent Trustees reviewed the performance of the U.S. Treasury Fund compared to, among other things, certain accounts for a trailing 12-month period ended September 30, 2021 and an annualized five-year period.
The performance data prepared for the annual review of the Advisory Agreements supplements the performance data the Trustees received throughout the year as the Board regularly reviews and meets with portfolio manager(s) during the year to discuss, in relevant part, the performance of their respective Fund.
In evaluating performance, the Independent Trustees considered the appropriateness of fund performance metrics in evaluating the results achieved. The Independent Trustees recognized certain limitations in assessing performance data that may impact the weight given to particular performance data, including the following:
| • | | The performance data reflects a snapshot in time as of a particular period (in this case, the periods ended August 31, 2021 and September 30, 2021) and a different performance period could generate significantly different results, particularly during volatile market periods; |
| • | | Long-term performance can be adversely affected by even one period of significant underperformance so that |
| | | a single investment decision or theme has the ability to disproportionately affect long-term performance; |
| • | | The investment experience of a particular shareholder in the Funds will vary depending on the shareholder’s particular investment period and the Fund’s performance during that period and the class held (if multiple classes are offered in a Fund); |
| • | | Although the performance data included in the Broadridge Report was based on the performance of the investor class shares of the Funds, the Board recognized that certain Funds offer multiple classes. The performance of another class of a Fund, however, should be substantially similar on a relative basis because the classes are invested in the same portfolio of securities, and differences in performance between the classes could be principally attributed to the variation in the expenses and the Advisor-agreed expense limitations of each class; |
| • | | There may be difficulties in establishing appropriate peer groups and benchmarks for certain Funds. In this regard, the Independent Trustees considered that the Advisor and Sub-Advisor are responsible for managing the respective Fund in accordance with its investment objectives, investment parameters and guidelines, and that peers and/or benchmarks may be following different objectives, investment parameters and guidelines and risk tolerance levels which will lead to differing performance results and may limit the value of the comparative performance data in assessing a particular Fund’s performance. The Independent Trustees have recognized that the respective Broadridge Peer Group for the Micro Cap Fund and Micro Cap Value Fund (collectively, the “Micro Cap Funds”) generally focuses on companies with a larger market capitalization than those sought by the Micro Cap Funds. As a result, the Independent Trustees also reviewed the Micro Cap Funds’ performance compared to a custom no-load peer group provided by the Advisor for the one-, three-, five- and ten-year periods ended September 30, 2021; and |
| • | | The comparative performance data comparing the performance of certain Funds to the performance of composites of certain separate accounts and/or funds managed by the Advisor in similar styles may have some limitations to its usefulness due to, among other things, the differences in expenses and strategies between the Funds and clients in the composites. |
Based on their review of the performance data provided to the Board, the Independent Trustees determined the following:
Core Growth Fund
With respect to the Core Growth Fund, the Fund’s investor class outperformed the performance of the median of the Broadridge Peer Group for the one-, two-,
152
| | |
| | | MARCH 31, 2022 (Unaudited) |
three-, four-, five- and ten-year periods ended August 31, 2021. Although the average annual total returns of the Fund’s investor and institutional classes were below the performance of the Russell 2000® Index for the one-year period ended September 30, 2021, the average annual total returns of the Fund’s investor class and institutional class outperformed such index for the three-, five- and ten-year periods ended September 30, 2021. Similarly, the average annual returns of the Funds’ investor class and institutional class outperformed the Russell 2000® Growth Index for the one-, three-, five- and ten-year periods ended September 30, 2021. Performance for the institutional class prior to January 31, 2012 was based on the performance of the investor class. The Board was satisfied with the Fund’s overall performance.
Emerging India Fund
With respect to the Emerging India Fund, the Fund’s investor class outperformed the performance of the median of its Broadridge Peer Group for the one-, two-, three-, four-, five- and ten-year periods ended August 31, 2021. Similarly, the average annual total returns of the Fund’s investor class and institutional class outperformed the MSCI India Investable Market Index for the one-, three-, five- and ten-year periods ended September 30, 2021. Performance for the institutional class prior to February 1, 2016 was based on the performance of the investor class. The Board was satisfied with the Fund’s overall performance.
Emerging Markets Select Fund
With respect to the Emerging Markets Select Fund, the Independent Trustees noted that the Fund’s investor class outperformed the performance of the median of the Broadridge Peer Group for the one-, two-, three-, four- and five-year periods ended August 31, 2021. Similarly, the average annual total returns of the Fund’s investor class and institutional class outperformed the MSCI Emerging Markets Index for the one-, three- and five-year periods ended September 30, 2021. The Board was satisfied with the Fund’s overall performance.
Emerging Markets Small Cap Fund
With respect to the Emerging Markets Small Cap Fund, the Independent Trustees noted that the Fund’s investor class outperformed the performance of the median of its Broadridge Peer Group for the one-, two-, three-, four-, five- and ten-year periods ended August 31, 2021. Similarly, the average annual total returns of the Fund’s investor class and institutional class outperformed the MSCI Emerging Markets Small Cap Index and MSCI Emerging Markets Index for the one-, three-, five- and ten-year periods ended September 30, 2021. Performance for the institutional class prior to February 1, 2016 was based on the performance of the investor class. The Board was satisfied with the Fund’s overall performance.
| Frontier | Emerging Small Countries Fund |
With respect to the Frontier Emerging Small Countries Fund, the Independent Trustees noted that the Fund’s investor class outperformed the performance of the median of its Broadridge Peer Group for the one-, two-, three-, four- and five-year periods ended August 31, 2021. Similarly, the Board noted that the average annual total returns of the Fund’s investor class and institutional class outperformed the MSCI Frontier Emerging Markets Index and the MSCI Frontier Markets Index for the one-, three- and five-year periods ended September 30, 2021. Performance for the institutional class prior to February 1, 2016 was based on the performance of the investor class. The Board was satisfied with the Fund’s overall performance.
Global Opportunities Fund
With respect to the Global Opportunities Fund, the Independent Trustees noted that the Fund’s investor class outperformed the performance of the median of its Broadridge Peer Group for the one-, two-, three-, four-, five- and ten-year periods ended August 31, 2021. Similarly, the average annual total returns of the Fund’s investor class and institutional class outperformed the Fund’s benchmark, the MSCI AC World Small Cap Index, for the one-, three-, five- and ten-year periods ended September 30, 2021. Performance for the institutional class prior to February 1, 2016 was based on the performance of the investor class. The Board was satisfied with the Fund’s overall performance.
Global Select Fund
With respect to the Global Select Fund, the Independent Trustees noted that the performance of the Fund’s investor class was below the performance of the median of its Broadridge Peer Group for the one-year period ended August 31, 2021. Similarly, the average annual total returns of the Fund’s investor class and institutional class were below the performance of the Fund’s benchmark, the MSCI AC World Index, for the one-year period ended September 30, 2021. The Board, however, recognized that the Fund was new with a performance history too limited to make a meaningful assessment.
Global Value Fund
With respect to the Global Value Fund (formerly, the Large Cap Value Fund), the Independent Trustees noted that the Fund’s investor class outperformed the performance of the median of its Broadridge Peer Group for the one-, two-, three-, four-, five- and ten-year periods ended August 31, 2021. Similarly, the Board noted that the average annual total returns of the Fund’s investor class and institutional class outperformed the Fund’s benchmark, MSCI All Country World Value Index for the one-, three-, five- and ten-year periods ended September 30, 2021.
153
Supplemental Information (continued)
Although the average annual total returns of the Fund’s investor class and institutional class were below the performance of the MSCI All Country World Index for the three-, five- and ten-year periods ended September 30, 2021, the Fund’s investor class and institutional class outperformed the performance of such index for the one-year period ended September 30, 2021. Performance for the institutional class prior to January 31, 2012 was based on the performance of the investor class. In reviewing the performance data, the Independent Trustees also recognized that the Board previously had approved a change in the principal investment strategies of the Fund to permit the Fund greater ability to invest in foreign securities, becoming a global value fund effective October 31, 2017. Accordingly, the Fund’s past performance prior to such effective date would not reflect the foregoing change. The Board was satisfied with the Fund’s overall performance.
Greater China Fund
With respect to the Greater China Fund, the Board noted that the Fund was new with a performance history too limited to make a meaningful assessment of performance.
International Growth Fund
With respect to the International Growth Fund, the Independent Trustees noted that although the performance of the Fund’s investor class was below the median of its Broadridge Peer Group for the two-, three-, four-, and five-year periods ended August 31, 2021, the investor class matched or outperformed the performance of the median of its Broadridge Peer Group for the one- and ten-year periods ended August 31, 2021. Although for the one-year period ended September 30, 2021 the average annual total returns of the Fund’s investor class and institutional class were below the performance of its benchmarks, the MSCI AC World EX-U.S.A. Small Cap Index and MSCI World EX-U.S.A. Small Cap Index, the Fund’s investor class and institutional class outperformed such indices for the three-, five- and ten-year periods ended September 30, 2021. Performance for the institutional class prior to February 1, 2016 was based on the performance of the investor class. The Board noted that it was satisfied with the Fund’s overall performance.
International Opportunities Fund
With respect to the International Opportunities Fund, the Independent Trustees noted that the performance of the Fund’s investor class was below the performance of the median of its Broadridge Peer Group for the one-, two- and five-year periods ended August 31, 2021, but such class outperformed the median for the three-, four- and ten-year periods ended August 31, 2021. Similarly, the Independent Trustees noted that the average annual total returns of the Fund’s investor class and institutional class for the one-year period ended September 30, 2021 were
below the performance of its benchmarks, the MSCI AC World EX-U.S.A. Small Cap Index and MSCI World EX-U.S.A. Small Cap Index but outperformed the performance of such benchmarks for the three-, five- and ten-year periods ended September 30, 2021. Performance for the institutional class prior to February 1, 2016 was based on the performance of the investor class. The Board was satisfied with the Fund’s overall performance.
International Select Fund
With respect to the International Select Fund, the Independent Trustees noted that the performance of the Fund’s investor class was below the performance of the median of its Broadridge Peer Group for the one-year period ended August 31, 2021. Similarly, the average annual total returns of the Fund’s investor class and institutional class were below the performance of its benchmark, the MSCI EAFE Index, for the one-year period ended September 30, 2021. The Board, however, recognized that the Fund was new with a performance history too limited to make a meaningful assessment.
Micro Cap Fund
With respect to the Micro Cap Fund, the Independent Trustees noted that the Fund’s investor class matched or outperformed the performance of the median of its Broadridge Peer Group for the one-, two-, three-, four-, five- and ten-year periods ended August 31, 2021. Similarly, although the average annual total returns of the Fund’s investor class and institutional class were below the performance of its benchmark, the Russell Microcap® Index, for the one-year period ended September 30, 2021, the Fund’s investor class and institutional class outperformed such benchmark for the three-, five- and ten-year periods ended September 30, 2021. Performance for the institutional class prior to January 31, 2020 was based on the performance of the investor class. In addition to the Broadridge comparative data, the Independent Trustees also reviewed the Fund’s performance compared to a custom peer group provided by the Advisor for the one-, three-, five- and ten-year periods ended September 30, 2021. The Board was satisfied with the Fund’s performance.
Micro Cap Value Fund
With respect to the Micro Cap Value Fund, the Independent Trustees noted that the Fund’s investor class outperformed the performance of the median of its Broadridge Peer Group for the one-, two-, three-, four-, five-, and ten-year periods ended August 31, 2021. Similarly, although the average annual total returns of the Fund’s investor class and institutional class were below the performance of its benchmark, the Russell Microcap® Index, for the one-year period ended September 30, 2021, the Fund’s investor class and institutional class outperformed such
154
| | |
| | | MARCH 31, 2022 (Unaudited) |
index for the three-, five- and ten-year periods ended September 30, 2021. Performance for the institutional class prior to January 31, 2020 was based on the performance of the investor class. In addition to the Broadridge comparative data, the Independent Trustees also reviewed the Fund’s performance compared to a custom peer group provided by the Advisor for the one-, three-, five- and ten-year periods ended September 30, 2021. In considering the foregoing, the Board was satisfied with the Fund’s overall performance.
Small Cap Growth Fund
With respect to the Small Cap Growth Fund, the Independent Trustees noted that the Fund’s investor class outperformed the performance of the median of its Broadridge Peer Group for the one-, two-, three-, four-, five- and ten-year periods ended August 31, 2021. In addition, the average annual total returns of the Fund’s investor class and institutional class were above the performance of its benchmark, Russell 2000® Growth Index, for the one-, three-, five-, and ten-year periods ended September 30, 2021. In addition, although the average annual total returns of the Fund’s investor and institutional classes were below the performance of the Russell 2000® Index for the one-year period ended September 30, 2021, the Fund’s investor class and institutional class outperformed such index for the three-, five- and ten-year periods ended September 30, 2021. Performance for the institutional class prior to February 1, 2016 was based on the performance of the investor class. The Board was satisfied with the Fund’s performance.
Small Cap Value Fund
With respect to the Small Cap Value Fund, the Independent Trustees noted that although the performance of the Fund’s investor class was below the performance of the median of its Broadridge Peer Group for the one-year period ended August 31, 2021, the Fund’s investor class outperformed the median for the two-, three-, four-, five- and ten-year periods ended August 31, 2021. In addition, the average annual total returns of the Fund’s investor class and institutional class were below the performance of the Russell 2000® Value Index for the one-year period ended September 30, 2021 but outperformed such index for the three-, five-, and ten-year periods ended September 30, 2021. The average annual total returns of the Fund’s investor class and institutional class also were above the performance of the Russell 2000® Index for the one-, three-, five-, and ten-year periods ended September 30, 2021. Performance for the institutional class prior to January 31, 2021 is based on the performance of the investor class. The Board was satisfied with the Fund’s overall performance.
Ultra Growth Fund
With respect to the Ultra Growth Fund, the Independent Trustees noted that the Fund’s investor class outperformed
the performance of the median of its Broadridge Peer Group for the one-, two-, three-, four-, five- and ten-year periods ended August 31, 2021. In addition, the average annual total returns of the Fund’s investor class and institutional class were below the performance of the Russell 2000® Growth Index for the one-year period ended September 30, 2021 but were above the performance of such index for the three-, five- and ten-year periods ended September 30, 2021. Performance for the institutional class prior to January 31, 2020 was based on the performance of the investor class. The Board was satisfied with the Fund’s overall performance.
U.S. Treasury Fund
With respect to the U.S. Treasury Fund, the Independent Trustees noted that although the performance of the Fund’s investor class was below the performance of the median of its Broadridge Peer Group for the one- and two-year periods ended August 31, 2021, the Fund outperformed the median of the Broadridge Peer Group for the longer three-, four-, five- and ten-year periods ended August 31, 2021. Similarly, the average annual total returns of the Fund’s investor class were below the Bloomberg Barclays US Aggregate Bond Index for the one- and five-year periods ended September 30, 2021 but were above the performance of such index for the three- and ten-year periods ended September 30, 2021. The Board was satisfied with the Fund’s overall performance.
C. Fees, Expenses and Profitability
1. Fees and Expenses
As part of its annual review, the Board considered, among other things, the contractual management fee rate and the net management fee rate (i.e., the management fee after taking into account expense reimbursements and/or fee waivers, if any) paid by a Fund to the Advisor in light of the nature, extent and quality of the services provided. The Board also considered the net total expense ratio of each class of the respective Fund in relation to those of a comparable universe of funds (the “Broadridge Expense Universe”) and to a more focused subset of comparable funds (the “Broadridge Expense Group”) established by Broadridge. The Board considered the net total expense ratio of each class of each Fund (expressed as a percentage of average net assets) as the expense ratio is more reflective of the shareholder’s costs in investing in the respective Fund.
In reviewing the comparative data provided by Broadridge, the Board reviewed information regarding the methodology followed to develop the Broadridge Expense Universe and Broadridge Expense Group. The Board recognized some of the limitations of the comparative data given the differences between the applicable Fund and the peers comprising such Fund’s respective Broadridge
155
Supplemental Information (continued)
Expense Universe or Broadridge Expense Group, particularly with respect to the Micro Cap Fund and Micro Cap Value Fund. Given these limitations, the Independent Trustees also reviewed comparisons of the Micro Cap Fund’s and Micro Cap Value Fund’s management fee and net expense ratio with those of a custom peer group provided by the Advisor. Aside from the comparative data provided by Broadridge, the Independent Trustees also considered comparative data between the fee rates charged by the Advisor and Sub-Advisor to the Funds compared to other types of clients, as described in further detail below.
In evaluating the management fee rates, the Board considered the Advisor’s rationale for setting a management fee rate for a Fund which included its evaluation of various factors such as, in relevant part, the value of the service to shareholders (e.g., the expertise of the Advisor with respect to the proposed strategy and the potential to deliver alpha), the competitive marketplace (e.g., the uniqueness of the Fund and the fees of competitor funds) and the economics to the Advisor (e.g., the costs of operating the Fund and whether potential revenues will be limited by capacity constraints of the Fund). The Board reviewed the fee rates for the Funds and reductions to fee rates, if any, in prior years from 2009 through 2021 (or such shorter period if the Fund was not in existence during such period). The Board also considered, among other things, the expense limitations and/or fee waivers proposed by the Advisor to keep expenses of the classes of the Funds to certain levels and reviewed the amounts the Advisor had waived or reimbursed over the last three fiscal years; the costs incurred and resources necessary in effectively managing mutual funds, particularly given the Advisor’s research-intensive investment approach and its application to small or micro-cap companies and foreign companies; and the costs in attracting and maintaining quality and experienced portfolio managers and research staff. In reviewing the fee levels, the Board also recognized the Advisor’s potential loss of revenues when the Advisor closes capacity-constrained Funds to maintain assets at a level it considers necessary to protect performance for the benefit of the respective Funds and their shareholders. The Board further considered a Fund’s net management fee and net total expense ratio in light of its performance history.
In considering the fees of the Sub-Advisor for the U.S. Treasury Fund, the Independent Trustees considered the fee rate paid to the Sub-Advisor with respect to such Fund in absolute terms and as compared to the Sub-Advisor’s pricing schedule for portfolio management services for other clients. The Independent Trustees also noted that the Advisor, not the Fund, pays the Sub-Advisor from the Advisor’s own revenues. Further, the Independent Trustees recognized that the Advisor and Sub-Advisor are not affiliates and the sub-advisory fee was established through arm’s-length negotiations between the Advisor and the Sub-Advisor.
In its evaluation of the advisory and sub-advisory fees of the Funds, the Board observed, among other things, the following:
Core Growth Fund
With respect to the Core Growth Fund, the Independent Trustees recognized that although the contractual management fee rate for the institutional and investor class shares was above the median of its respective Broadridge Expense Group, the Fund had a net expense ratio that matched the median of its Broadridge Expense Group for the investor class shares and was lower than the median of its Broadridge Expense Group for the institutional class shares. The Independent Trustees also considered the Advisor’s analysis of various factors that contributed to setting the fee level, including, among other things, the Fund’s comparative ranking in its Morningstar category, the capacity constraints of the Fund and related limits on revenue potential, the experience and expertise of the Advisor with regard to this strategy, the competitive marketplace, the costs of the Advisor’s research-intensive approach, and the potential for the Fund to deliver alpha. Based on its review, the Board determined that the advisory fee for the Core Growth Fund was acceptable in light of the nature, extent and quality of services provided.
Emerging India Fund
With respect to the Emerging India Fund, although the Fund’s contractual management fee rate for the investor class and institutional class shares was higher than the median of its Broadridge Expense Group, its net expense ratio was slightly higher (within 5 basis points) than the median of its Broadridge Expense Group for the investor class shares and was below the median of its Broadridge Expense Group for the institutional class shares. The Independent Trustees also considered the Advisor’s analysis of various factors that contributed to setting the fee level, including, among other things, the uniqueness of the Fund in the marketplace, the capacity constraints of the Fund and related limits on revenue potential, the expertise of the Advisor in the small-cap asset class, and the additional expenses associated with evaluating and investing in companies in India, including small-cap companies. Based on its review, the Board determined that the advisory fee for the Emerging India Fund was acceptable in light of the nature, extent and quality of services provided.
Emerging Markets Select Fund
With respect to the Emerging Markets Select Fund, the Independent Trustees noted that the Fund’s contractual management fee rate was slightly above (within 5 basis points) the median of its Broadridge Expense Group for the investor class shares and the institutional class shares. Similarly, the Fund’s net expense ratio was slightly above
156
| | |
| | | MARCH 31, 2022 (Unaudited) |
(within 5 basis points) the median for the Broadridge Expense Group for the investor class shares and below the median of the Broadridge Expense Group for the institutional class shares. The Independent Trustees also considered the Advisor’s analysis of various factors that contributed to setting the fee level, including the uniqueness of the Fund and its focused strategy in the emerging markets segment and the higher capacity of the Fund compared to other Wasatch funds. Based on its review, the Board determined that the advisory fee for the Emerging Markets Select Fund was acceptable in light of the nature, extent and quality of services provided.
Emerging Markets Small Cap Fund
With respect to the Emerging Markets Small Cap Fund, the Independent Trustees noted that the Fund’s contractual management fee rate and net total expense ratio for the investor class shares and institutional class shares were above the median of its Broadridge Expense Group. The Independent Trustees also considered the Advisor’s analysis of various factors that contributed to setting the fee level, including, among other things, the uniqueness of the Fund in the emerging markets segment, the capacity constraints of the Fund and related limits on revenue potential, and the additional expenses associated with investing in companies dispersed among the various emerging markets countries and the higher trading and operating fees in these countries. Based on its review, the Board determined that the advisory fee for the Emerging Markets Small Cap Fund was acceptable in light of the nature, extent and quality of services provided.
Frontier Emerging Small Countries Fund
With respect to the Frontier Emerging Small Countries Fund, the Independent Trustees noted that the Fund’s contractual management fee rate and net expense ratio were above the median of its Broadridge Expense Group for the institutional and investor class shares. The Independent Trustees also considered the Advisor’s analysis of various factors that contributed to setting the fee level, including, among other things, the uniqueness of the Fund in the frontier emerging small countries market segment, the capacity constraints of the Fund and related limits on revenue potential and the additional expenses associated with investing in companies dispersed among the various smaller emerging and frontier countries, including the higher trading and operating fees in these countries. Based on its review, the Board determined that the advisory fee for the Frontier Emerging Small Countries Fund was acceptable in light of the nature, extent and quality of services provided.
Global Opportunities Fund
With respect to the Global Opportunities Fund, the Independent Trustees noted that although the contractual
management fee rate of the Fund was above the median of its Broadridge Expense Group for the investor class shares and the institutional class shares, the Fund’s net expense ratio was below the median of its Broadridge Expense Group for the investor class shares and institutional class shares. The Independent Trustees also considered the Advisor’s analysis of various factors that contributed to setting the fee level, including, among other things, the uniqueness of the Fund in the marketplace and the capacity constraints of the Fund and related limits on revenue potential. Based on its review, the Board determined that the advisory fee for the Global Opportunities Fund was acceptable in light of the nature, extent and quality of services provided.
Global Select Fund
With respect to the Global Select Fund, the Board noted that although the contractual management fee rate of the Fund was above the median of its Broadridge Expense Group for the investor class shares and institutional class shares, the Fund’s net expense ratio was slightly above (within 5 basis points) the median of the Broadridge Expense Group for the investor class shares and below the median for the institutional class shares. The Independent Trustees also considered the Advisor’s analysis of various factors that contributed to setting the fee level, including, among other things, the uniqueness of the Fund’s focused strategy and the higher capacity of the Fund compared to other Wasatch funds. Based on its review, the Board determined that the advisory fee for the Global Select Fund was acceptable in light of the nature, extent and quality of services provided.
Global Value Fund
With respect to the Global Value Fund, the Independent Trustees noted that the contractual management fee rate and the net expense ratio of the investment class shares and institutional class shares were below the median of its Broadridge Expense Group for both share classes. In addition, the Independent Trustees also considered the Advisor’s analysis of various factors that contributed to setting the fee level, including that the Fund generally had no capacity constraints given its investment strategies and operated in a competitive market segment. Based on its review, the Board determined that the advisory fee for the Global Value Fund was acceptable in light of the nature, extent and quality of services provided.
Greater China Fund
With respect to the Greater China Fund, the Independent Trustees noted that the contractual management fee rate of the Fund was slightly higher (within 5 basis points) than the median of its Broadridge Expense Group and its net expense ratio was the same as the median of its
157
Supplemental Information (continued)
Broadridge Expense Group for the investor class shares and below the median of its Broadridge Expense Group for the institutional class shares. In addition, the Independent Trustees also considered the Advisor’s analysis of various factors that contributed to setting the fee level, including the Advisor’s investment process, the higher costs of operating the Fund, and the larger capacity of the Fund compared to other Wasatch funds. Based on its review, the Board determined that the advisory fee for the Greater China Fund was acceptable in light of the nature, extent and quality of services provided.
International Growth Fund
With respect to the International Growth Fund, the Independent Trustees noted that although the Fund’s contractual management fee rate for the investor class shares and institutional class shares was above the median of its Broadridge Expense Group, its net expense ratio was above the median of the Broadridge Expense Group for the investor class shares but below the median for the institutional class shares. In addition, the Independent Trustees also considered the Advisor’s analysis of various factors that contributed to setting the fee level, including the potential to deliver alpha, the uniqueness of the strategy of the Fund, the higher costs in operating the Fund and the capacity constraints of the Fund and related limits on the revenue potential. Based on its review, the Board determined that the advisory fee for the International Growth Fund was acceptable in light of the nature, extent and quality of services provided.
International Opportunities Fund
With respect to the International Opportunities Fund, the Independent Trustees noted that the Fund’s contractual management fee rate and net expense ratio were above the median of its Broadridge Expense Group for the investor class shares and institutional class shares. In addition, the Independent Trustees also considered the Advisor’s analysis of various factors that contributed to setting the fee level, including the potential to add value through its investment approach, the uniqueness of the strategy of the Fund, the capacity constraints of the Fund and related limits on revenue potential and the higher costs in operating the Fund due, in part, to additional research resources required to screen and research companies in the micro-cap asset class across the world. Based on its review, the Board determined that the advisory fee for the International Opportunities Fund was acceptable in light of the nature, extent and quality of services provided.
International Select Fund
With respect to the International Select Fund, the Independent Trustees noted that the Fund’s contractual management fee rate was below the median of its Broadridge
Expense Group for the investor class shares and institutional class shares, and the Fund’s net expense ratio was above the median of the Broadridge Expense Group for the investor class shares but below the median of the Broadridge Expense Group for the institutional class shares. In addition, the Independent Trustees also considered the Advisor’s analysis of various factors that contributed to setting the fee level. The Independent Trustees recognized that the Fund had more capacity than certain other Wasatch funds in the complex, but the Independent Trustees also considered the uniqueness of the Fund’s focused strategy. Based on its review, the Board determined that the advisory fee for the International Select Fund was acceptable in light of the nature, extent and quality of services provided.
Micro Cap Fund and Micro Cap Value Fund
With respect to the Micro Cap Fund and the Micro Cap Value Fund, the Independent Trustees noted that each Fund’s contractual management fee rate and net expense ratio were above the median of its respective Broadridge Expense Group. In addition, the Independent Trustees also considered the Advisor’s analysis of various factors that contributed to setting the fee level, including, among other things, the capacity constraints of the Funds and related limited revenue potential, the uniqueness of the Funds and their potential to deliver alpha, the Advisor’s expertise in this asset category, and the higher costs in managing the Funds due, in part, to the costs associated with the due diligence necessary to screen and research companies in the micro-cap asset class. Based on its review, the Board determined that the advisory fee for each of the foregoing Funds was acceptable in light of the nature, extent and quality of services provided.
Small Cap Growth Fund
With respect to the Small Cap Growth Fund, the Independent Trustees noted that the Fund’s contractual management fee rate was above the median of its Broadridge Expense Group for the investor class shares and institutional class shares, but its net expense ratio was below the median of its Broadridge Expense Group for both share classes. In addition, the Independent Trustees also considered the Advisor’s analysis of various factors that contributed to setting the fee level, including, among other things, the potential to deliver alpha, the expertise of the Advisor with regard to this strategy, the competitive market segment, the Fund’s capacity constraints and related limited revenue potential and the higher costs to manage the Fund due, in part, to the costs associated with the due diligence necessary to screen and research companies in the small-cap asset class. Based on its review, the Board determined that the advisory fee for the Small Cap Growth Fund was acceptable in light of the nature, extent and quality of services provided.
158
| | |
| | | MARCH 31, 2022 (Unaudited) |
Small Cap Value Fund
With respect to the Small Cap Value Fund, the Independent Trustees noted that the Fund’s contractual management fee rate was above the median of its Broadridge Expense Group for the investor class shares and institutional class shares, and the Fund’s net expense ratio of the investor class shares was slightly above (within 5 basis points) the median of its Broadridge Expense Group but below the median for the institutional class shares. In addition, the Independent Trustees also considered the Advisor’s analysis of various factors that contributed to setting the fee level, including, among other things, the potential to deliver alpha, the expertise of the Advisor with respect to this strategy, the competitive market segment, the Fund’s capacity constraints and related limited revenue potential and the higher costs to manage the Fund due, in part, to the costs associated with the due diligence necessary to screen and research companies in the small-cap asset class. Based on its review, the Board determined that the advisory fee for the Small Cap Value Fund was acceptable in light of the nature, extent and quality of services provided.
Ultra Growth Fund
With respect to the Ultra Growth Fund, the Independent Trustees noted that the Fund’s contractual management fee rate for its investor class shares and institutional class shares was above the median of the Broadridge Expense Group, but the Fund’s net expense ratio matched the median of this expense group for the Fund’s investor class shares and was below the median for its institutional class shares. In addition, the Independent Trustees also considered the Advisor’s analysis of various factors that contributed to setting the fee level, including, among other things, the potential to deliver alpha, the competitive market segment, the Fund’s capacity constraints and related limited revenue potential and the higher costs to manage the Fund due, in part, to the costs associated with the due diligence necessary to screen and research companies in the small-cap asset class. Based on its review, the Board determined the advisory fee for the Ultra Growth Fund was acceptable in light of the nature, extent and quality of services provided.
U.S. Treasury Fund
With respect to the U.S. Treasury Fund, the Independent Trustees noted that the Fund’s contractual management fee and the Fund’s net expense ratio were below the median of its Broadridge Expense Group for the investor class shares. In addition, the Independent Trustees recognized that the Fund did not have any capacity constraints. Based on its review, the Board determined that the advisory fee for the U.S. Treasury Fund was acceptable in light of the nature, extent and quality of services provided.
In addition to the advisory fee paid to the Advisor, the Board recognized that the U.S. Treasury Fund is sub-advised and separately considered the sub-advisory fee rate paid to the Sub-Advisor by the Advisor. The Board reviewed, among other things, the Sub-Advisor’s fee rate for services to the Fund compared to the Sub-Advisor’s pricing schedule for portfolio management services to other clients. With respect to the U.S. Treasury Fund, the Independent Trustees noted that the sub-advisory fee rate was in line with the Sub-Advisor’s fee schedule for its other clients in light of the asset size of the Fund. In addition, the Independent Trustees also recognized that the Advisor pays the Sub-Advisor from its own revenues, and that the Advisor and Sub-Advisor were not affiliated persons and therefore the sub-advisory fee had been established through arm’s-length negotiations between the Advisor and the Sub-Advisor. Based on its review, the Board determined that the sub-advisory fee for the U.S. Treasury Fund was acceptable in light of the nature, extent and quality of services provided.
2. Fees Charged to Other Advisor and Sub-Advisor Clients
In determining the appropriateness of the fees, the Board considered information regarding the fee rates charged by the Advisor to its other clients and the types of services provided to these other clients. Such other clients of the Advisor included separately managed accounts, model accounts, collective investment trusts and certain domestic and foreign funds outside the Wasatch family of funds for which the Advisor serves as a sub-adviser. The Independent Trustees noted that, in general, the Advisor seeks to charge higher fees to clients that require a higher degree of service. The Independent Trustees considered the more extensive and complex services the Advisor provides to the Funds which are unique to the Funds and the corresponding additional resources necessary to provide these services. Such services included, among other things, certain administrative services, operational expertise, third-party oversight, daily fund share transaction monitoring, Board support services, shareholder communications, tax administration and compliance and regulatory services. The Independent Trustees further reviewed a description of the services provided to the other types of clients. Although the Advisor provides portfolio management services or investment advice to the Funds and other clients, the Independent Trustees recognized that the level of these services, expertise and resources still may differ significantly due, in part, to the differences in investment objectives, guidelines or parameters of the accounts. For example, certain accounts may not permit foreign investments which tend to require more expensive services. In addition to the differences in services provided to the Funds compared to other clients, the Independent Trustees recognized the additional regulatory, entrepreneurial and reputational risks incurred
159
Supplemental Information (continued)
by the Advisor in managing the Funds that it does not incur in managing other types of clients.
With respect to separate accounts managed in a style similar to a Fund, the Board, as noted above, reviewed certain performance data of composites of such accounts compared to the respective Funds; the fee rates of certain separate accounts; and, if multiple separate accounts existed with varying fee rates, the range of fees and their weighted average of such accounts. Such Funds with comparative separate account data included the Core Growth Fund, Emerging India Fund, Emerging Markets Select Fund, Emerging Markets Small Cap Fund, Frontier Emerging Small Countries Fund, Global Opportunities Fund, Global Value Fund, International Growth Fund, Micro Cap Fund, Micro Cap Value Fund, Small Cap Growth Fund, Small Cap Value Fund and Ultra Growth Fund.
The Board determined that the varying levels of fees were justified given, among other things, the inherent differences in the products and level of services provided to the Funds versus other clients, the differing regulatory requirements and the entrepreneurial, reputational, and regulatory risks incurred in sponsoring and advising the Funds.
With respect to the Sub-Advisor of the U.S. Treasury Fund, the Independent Trustees, as noted above, had reviewed the sub-advisory fee rate paid to the Sub-Advisor compared to the Sub-Advisor’s pricing schedule for portfolio management services for other clients. The Independent Trustees noted that the fee rate paid to the Sub-Advisor for its services was in line with the Sub-Advisor’s respective pricing schedule. In addition, in their review of the Sub-Advisor’s fee, the Independent Trustees recognized that the Advisor paid the Sub-Advisor’s fee out of its own resources and, given that the Sub-Advisor is unaffiliated with the Advisor, the sub-advisory fee rate was the result of arm’s-length negotiations. As noted, the Board considered the sub-advisory fee to be acceptable in light of the nature, extent and quality of services provided.
3. Profitability of the Fund Advisors
In conjunction with their review of fees, the Independent Trustees reviewed information reflecting the Advisor’s financial condition and profitability. The Independent Trustees reviewed the consolidated financial statements of WA Holdings, Inc. (the parent of the Advisor) and its subsidiary (the Advisor) for the years ended December 31, 2020 and 2019. The Independent Trustees considered, among other things, the Advisor’s business model; growth in assets under management in 2020; expenses, including the manner in which the Advisor funds its future financial commitments; and changes in revenues in 2020 compared to 2019.
The Independent Trustees also reviewed the profitability information for the Advisor derived from its relationship with each Fund for the calendar year ended December 31, 2020 on an actual and adjusted basis (as described below).
The Independent Trustees evaluated, among other things, the Advisor’s revenues, total operating expenses and net income (pre-tax and after-tax) and net profit margins (pre-tax and after-tax). The Independent Trustees also reviewed the level of profitability realized by the Advisor, including and excluding distribution expenses incurred by the Advisor from its own resources.
In their evaluation of the Advisor’s profitability, the Independent Trustees recognized the difficulty in calculating profitability at the individual Fund level given that differing but reasonable allocation methodologies could be employed and lead to significantly different results. Further, the Independent Trustees recognized that employee compensation was the primary expense for the Advisor and that, as a privately held S corporation owned by employees, the Advisor’s level of profitability could be influenced, in part, by paying employees through compensation expense as opposed to dividends as shareholders. As a result, the Independent Trustees also reviewed the Advisor’s profitability data for 2020 with certain adjustments to the compensation expense to assist in the comparability of the Advisor’s profitability to that of certain industry peers. In this regard, the Independent Trustees received profitability data of certain industry peers of the Advisor, including, among other things, their revenues, expenses and profit margin (pre-tax) compared to the profitability data of the Advisor on an actual and compensation expense adjusted basis. The Independent Trustees, however, recognized the inherent limitations of such comparative data given that the calculation of profitability is the result of numerous factors (such as the structure of the particular adviser, the types of funds it manages, its business mix, its cost of capital, the methodology used to allocate expenses and other factors) that can have a significant impact on the results. Based on the information presented and recognizing the above limitations, the Independent Trustees noted that the Advisor’s profitability (with and without the compensation adjustment) appeared reasonable when compared to the peer group of unaffiliated advisers. In addition to the comparative data, the Independent Trustees also considered in assessing profitability any indirect benefits (such as soft dollars) that the Advisor or Sub-Advisor received that were directly attributable to the management of the applicable Funds as discussed in further detail below. Based on its review, the Board was satisfied that the Advisor’s level of profitability from its relationship with each Fund was not unreasonable in light of the services provided.
With respect to the Sub-Advisor, the Independent Trustees reviewed information reflecting the financial condition of the Sub-Advisor. Although profitability on a per-account level was not available, the Trustees reviewed the Sub-Advisor’s financial statements for the years ended December 31, 2020 and 2019. Based on its review, including
160
| | |
| | | MARCH 31, 2022 (Unaudited) |
the Sub-Advisor’s fee schedule and the fact that the sub-advisory fee was established through arm’s-length negotiations, the Board concluded that the Sub-Advisor’s profitability from its relationship with the U.S. Treasury Fund was not unreasonable.
D. Economies of Scale and Whether Fee Levels Reflect These Economies of Scale
In evaluating the reasonableness of the advisory fees, the Board considered the existence of any economies of scale in the provision of services by the Advisor and Sub-Advisor and whether those economies were appropriately shared with the Funds. In the Board’s review, the Independent Trustees recognized that although economies of scale are difficult to measure, particularly on a Fund-by-Fund basis, and certain expenses may not decline with a rise in assets, there are several methods to help share the benefits of economies of scale, including breakpoints in the management fee schedule, fee waivers and/or expense limitations, pricing of Funds at scale at inception or other means. While the management fee schedule does not have breakpoints, the Board noted that many of the Funds have temporary expense limitation arrangements in place pursuant to which the Advisor pays expenses of the Fund that exceed the expense cap (subject to certain exceptions). The Independent Trustees reviewed, among other things, the Funds’ expense ratios, the expense caps for the investor and institutional classes per Fund, the amounts the Advisor reimbursed certain Funds per class for the Funds’ fiscal year 2021 as well as the amounts the Advisor reimbursed to Funds, if any, for the 2019, 2020 and 2021 fiscal years of the Funds. The Independent Trustees further reviewed the advisory fee rate the Advisor received after waivers of fees or expenses reimbursed by the Advisor.
In addition to expense caps, the Independent Trustees recognized that many of the Funds have capacity constraints, particularly those Funds investing primarily in small- and micro-cap companies, and, as a result, the Advisor periodically closes Funds to new investments as it determines necessary to preserve the integrity of the respective Fund’s investment strategy and to protect performance. Although this practice may limit asset growth and thereby preclude certain economies of scale from being achieved, the Independent Trustees also recognized the benefit of protecting performance for existing shareholders and maintaining assets at a level that the Advisor believes it can effectively manage. The Independent Trustees further considered that the practice may limit the profit potential of the Advisor as it may preclude the Advisor from earning additional revenues from managing presumed higher asset levels. With respect to Funds without capacity constraints, the Independent Trustees recognized that breakpoints would be beneficial if the Fund’s assets were large enough to meet the breakpoint and noted the
Advisor’s position that such larger capacity Funds were not at asset levels that would benefit from breakpoints in the fee schedule.
Considering the factors above, the Independent Trustees concluded the absence of breakpoints in the management fee was acceptable and that any economies of scale that exist are adequately reflected in the Advisor’s fee structure.
E. Indirect Benefits
The Independent Trustees received and considered information regarding indirect benefits the Advisor and Sub-Advisor may receive as a result of their relationship with the respective Fund(s). In this regard, with the exception of the U.S. Treasury Fund, the Independent Trustees recognized that the Advisor received benefits from soft dollar arrangements whereby the Advisor used a portion of the brokerage commissions paid by the Funds to acquire research that may be useful to the Advisor in managing the Funds and other clients. The Independent Trustees recognized that the Advisor’s profitability would be lower if it paid for such research with its own revenues. With respect to the Sub-Advisor, the Independent Trustees recognized that the Sub-Advisor had not participated in soft dollar arrangements with respect to the U.S. Treasury Fund’s portfolio transactions. The Independent Trustees further considered the reputational and/or marketing benefits the Advisor and Sub-Advisor may receive as a result of their association with the Funds. The Independent Trustees took these indirect benefits into account when accessing the level of advisory fees paid to the Advisor and sub-advisory fee to the Sub-Advisor and concluded that the indirect benefits received were reasonable.
F. Annual Approval of Advisory Agreements
The Independent Trustees did not identify any single factor discussed previously as all-important or controlling. The Board, including a majority of Independent Trustees, concluded that the terms of the Investment Advisory Agreement for each Fund and the Sub-Advisory Agreement with the Sub-Advisor on behalf of the U.S. Treasury Fund were fair and reasonable, that the Advisor’s and Sub-Advisor’s fees were reasonable in light of the services provided to each respective Fund, and that the Investment Advisory Agreement should be approved on behalf of each Fund and the Sub-Advisory Agreement should be approved on behalf of the U.S. Treasury Fund.
| II. | Board Considerations for the approval of the Advisory Agreement of the Wasatch Long/Short Alpha Fund |
At a special meeting held on March 23, 2021 (the “March Meeting”), the Board of the Trust unanimously approved the Advisory and Service Contract (the “New Fund Advisory Agreement”) between Wasatch Advisors, Inc., doing business as Wasatch Global Investors, Inc. (the
161
Supplemental Information (continued)
“Advisor”) and the Trust on behalf of the Wasatch Long/Short Alpha Fund, a new series of the Trust (the “New Fund”). As the Board is comprised of all disinterested Trustees (the “Independent Trustees”), the references to Board and/or Independent Trustees shall mean all the Independent Trustees.
Although the Investment Company Act of 1940 (the “1940 Act”) requires the New Fund Advisory Agreement to be approved at an in-person meeting by the Board and a vote of a majority of the Independent Trustees, the March Meeting was held virtually through the internet in view of the health risks associated with holding in-person meetings during the Covid-19 pandemic and governmental restrictions on gatherings. The meeting was held virtually in reliance on certain exemptive relief the Securities and Exchange Commission provided to registered investment companies providing temporary relief from the in-person voting requirements of the 1940 Act with respect to, in relevant part, approval of advisory agreements in light of the challenges arising in connection with the Covid-19 pandemic.
In connection with the evaluation of the New Fund Advisory Agreement, the Independent Trustees through independent counsel requested and received materials regarding the New Fund prior to the meeting of the Board held on February 9, 2021 (the “February Meeting”). The materials covered, among other things:
| • | | The terms and conditions of the New Fund Advisory Agreement, including the nature, extent and quality of services provided to the New Fund by the Advisor; |
| • | | The organization of the Advisor, including the experience of persons who will manage the New Fund; |
| • | | Certain performance-related information (as described below); |
| • | | The proposed management fee of the Advisor, including comparisons of such fees with the management fees of comparable, unaffiliated funds prepared by an independent third party provider of investment company data, Broadridge Solutions, Inc. (“Broadridge”); |
| • | | The projected expenses of the New Fund, including comparisons with the expense ratios of comparable, unaffiliated funds compiled by Broadridge; |
| • | | Certain financial data of the Advisor and its parent and certain profitability data of the Advisor as described below; and |
| • | | The soft dollar practices of the Advisor. |
At the February Meeting, the Independent Trustees met with management and the proposed portfolio manager of the New Fund and discussed, among other things, the investment objective and strategy of the New Fund, the services to be provided by the Advisor including the investment process for the New Fund, the rationale for the New Fund within the Wasatch family of funds, the quantitative models to be employed for the New Fund, the potential risks of the New Fund, certain performance data of a seed
account following a similar strategy, the portfolio manager and his qualifications, the program used to execute short sales and the related costs, the anticipated composition of the portfolio of the New Fund, the proposed fees and expenses of the New Fund, the proposed expense caps for classes of the New Fund, certain comparative fee data, and the market for the New Fund. The Independent Trustees had met privately with their legal counsel prior to and during the February Meeting to discuss, among other things, the proposed New Fund, including the fees and expenses, the services for a long/short portfolio, the short sale mechanism, the portfolio manager and his qualifications and the risks of the Fund. At the February Meeting, the Independent Trustees requested additional information through their independent legal counsel that was provided prior to the March Meeting. Prior to the March Meeting, the Independent Trustees also met in executive session without management present to discuss, among other things, the supplemental information received.
The Independent Trustees were advised by the independent legal counsel throughout the review and received a memorandum outlining their fiduciary duties and legal standards in reviewing advisory agreements.
As outlined in more detail below, the Independent Trustees considered all factors they believed relevant with respect to the New Fund, including the following: (a) the nature, extent and quality of the services to be provided by the Advisor; (b) certain investment performance of the Advisor (as described below); (c) the advisory fees and costs of the services to be provided and certain profitability data of the Advisor and its affiliates; (d) the extent to which economies of scale may be realized as the New Fund grows; and (e) whether fee levels reflect any such economies of scale.
A. Nature, Extent and Quality of Services
The Independent Trustees considered the nature, extent and quality of services to be provided by the Advisor, including portfolio management services and administrative services, to the New Fund. Given that the Advisor already serves as adviser to other Wasatch funds overseen by the Independent Trustees, the Board is familiar with and has a good understanding of the organization, operation, personnel and services of the Advisor. As the Independent Trustees meet regularly throughout the year to oversee the Wasatch funds, the Independent Trustees have also relied upon their knowledge from their meetings and any other interactions throughout the years with the Advisor in evaluating the proposed New Fund Advisory Agreement.
At the March Meeting and/or at prior meetings, the Independent Trustees reviewed materials outlining, among other things, the Advisor’s organization and business; the types of services that the Advisor provides to the Wasatch funds and are expected to provide to the New Fund; the
162
| | |
| | | MARCH 31, 2022 (Unaudited) |
experience and tenure of the portfolio manager for the New Fund; the Advisor’s research and trading capabilities; and the Advisor’s investment process and philosophy for the New Fund, including the quantitative models and other analysis to be applied in managing the New Fund and the program used to execute short positions for the New Fund.
In addition to portfolio management services, the Independent Trustees recognized that the New Fund, as a registered investment company, will operate in a highly regulated industry and as such, considered the comprehensive set of administrative and non-advisory services the Advisor provides to manage and operate the funds (in addition to those provided by third parties). In this regard, the services the Advisor will provide shall include, but not be limited to, service provider oversight, Board support and administration, shareholder communications, fund regulatory and compliance, tax administration, and other administration services. In addition to the services to be provided by the Advisor, the Independent Trustees considered the various costs and entrepreneurial, reputational and regulatory risks the Advisor incurs in launching and managing the New Fund in a highly regulated industry.
Based on their review, the Independent Trustees concluded that, overall, the nature, extent and quality of services expected to be provided to the New Fund under the New Fund Advisory Agreement were satisfactory.
B. Investment Performance
The New Fund has not commenced operations and, therefore, does not have its own performance history. The Independent Trustees, however, reviewed certain historical performance information of the proprietary seed account managed in a similar style as that proposed for the New Fund, including quarterly returns for the period from the first quarter of 2017 through the first quarter of 2021 and data reflecting the contribution to such quarterly returns from the long portion of the portfolio of the account and the short portion of the portfolio of the account. In addition, the Independent Trustees are familiar with the performance records of other Wasatch funds advised by the Advisor.
C. Fees, Expenses and Profitability
In evaluating the proposed management fees and expenses that each class of the New Fund was expected to bear, the Independent Trustees considered, among other things, the New Fund’s proposed management fee and expected expense ratio for each class in absolute terms and in relation to the fees and expenses of a peer universe of comparable unaffiliated funds as the New Fund and to a more focused subset thereof (the “Peer Group”) provided by Broadridge, an independent third party. The Independent
Trustees reviewed, among other things, the contractual management fee rate, the estimated expense ratios of each class of the New Fund, and the expense limitation expected to be provided by the Advisor on behalf of each class of the New Fund. The Board observed that with respect to the institutional class of the New Fund, the proposed contractual management fee rate and the estimated net total expense ratio were below the median for its Peer Group. With respect to the investor class, the proposed contractual management fee rate was slightly higher (within 5 basis points) of the median of its Peer Group but the estimated net total expense ratio for the New Fund investor class was below the median of its Peer Group.
In addition to the foregoing fee and expense data, at the March Meeting and/or prior meetings, the Board has considered the Advisor’s approach in proposing a management fee level for a respective fund, including, among other things, the potential value of the service (such as the experience of the management team and the fund’s potential to deliver alpha), the competitive marketplace (such as the uniqueness of the fund and the fees of competitor funds) and the economics to the Advisor (such as, the costs to provide advisory services to the particular fund and the existence of any capacity constraints of the fund which may reduce the potential for revenues to the Advisor). In this regard, the Board is aware of the research-intensive approach followed by the Advisor and the related costs incurred of such approach. The Board further considered the Advisor’s contractual commitment to limit certain operating expenses of each of the classes of the New Fund to the benefit of shareholders and the rationale for the level of these expense caps. In addition, at the March Meeting and/or at prior meetings, the Board has reviewed information regarding the fee rates that the Advisor assesses for certain other types of clients and the types of services provided to these other clients, including separately managed accounts, model accounts, collective investment trusts and certain domestic and foreign funds outside the Wasatch family of funds. The Independent Trustees have recognized that the variation in fee rates between funds and other types of clients are generally due to, among other things, the extensive regulatory requirements associated with operating registered investment companies and the differences in investment parameters and strategies between the investment companies and the clients. The Independent Trustees, however, noted that the Advisor represented that it did not manage other funds or separately managed accounts in the same style as the New Fund as of the date of the March Meeting.
Based on their review, the Independent Board Members determined that the New Fund’s management fees to the Advisor were reasonable in light of the nature, extent and quality of services to be provided to the New Fund.
163
| | |
| Wasatch Funds | | MARCH 31, 2022 (Unaudited) |
Supplemental Information (continued)
D. Profitability
In conjunction with its review of fees, at the March Meeting and/or at prior meetings, the Independent Trustees have considered the profitability of the Advisor for its advisory activities to the Wasatch funds. The Independent Trustees had previously reviewed the consolidated financial statements of WA Holdings, Inc. (the parent of the Advisor) and its subsidiary (the Advisor) for the years ended December 31, 2019 and December 31, 2018 and certain profitability information for the Advisor from its relationship with the Wasatch funds for the calendar year ended December 31, 2019. In considering profitability, the Independent Trustees have recognized the difficulty and subjective nature of determining profitability which may be affected by numerous factors, including the allocation of expenses. In addition to considering the Advisor’s profitability, the Trustees have also reviewed at the March Meeting or prior meetings the Advisor’s relative profitability compared to publicly available information concerning unaffiliated publicly traded investment managers. However, the Independent Trustees recognized the difficulties in comparing the profitability of various advisors given that, among other things, many of these managers are much larger than the Advisor, have different lines of business, may employ different expense allocations and charges, the profitability derived from individual funds or product lines is not generally publicly available and the profitability information of managers that is available may not be representative of the industry. The Independent Trustees also noted that the Advisor is privately held and is taxed as a Subchapter S corporation, thus certain expenses had to be attributed and/or estimated. With respect to the New Fund, however, the Independent Trustees considered the cost of launching the New Fund and as a result of its small asset base in early years, the Advisor anticipated reimbursing the New Fund for costs incurred in excess of the proposed expense cap. Based on their review, the Trustees were satisfied that the Advisor’s level of profitability was not unreasonable in light of the services to be provided.
E. Economies of Scale
The Independent Trustees considered whether the New Fund could be expected to benefit from any economies of scale. In reviewing compensation, the Independent Trustees noted that, similar to other Wasatch funds, the proposed advisory fee schedule for the New Fund did not contain breakpoints that reduce the fee rate on assets above
specified levels. The Independent Trustees recognized that breakpoints may be one way for the benefits of any economies of scale to be shared with investors. In their review, the Independent Trustees recognized that economies of scale are difficult to assess or quantify, particularly on a fund-by-fund basis. The Independent Trustees observed that economies of scale generally occur as assets grow. However, the Trustees considered that the New Fund has not commenced operations and will have a small asset base in the beginning and as a result, the Advisor anticipates reimbursing the New Fund in excess of its expense limits until the New Fund has gained sufficient assets to be self-sustaining. Considering the above, among other things, the Independent Trustees concluded that the absence of breakpoints in the New Fund’s advisory fee schedule was acceptable and that the economies that may exist as assets under management increase are adequately reflected in the Advisor’s fee structure.
F. Indirect Benefits
In evaluating fees, the Independent Trustees also considered any indirect benefits or profits the Advisor or its affiliates may receive as a result of its relationship with the New Fund. In this regard, the Independent Trustees recognized that the Advisor may receive benefits from soft dollar arrangements whereby the Advisor may use a portion of the brokerage commissions paid by the New Fund to acquire research that may be useful to the Advisor in managing the New Fund and other clients. The Independent Trustees have reviewed at the March Meeting and/or prior meetings information concerning the Advisor’s soft dollar arrangements, including its policies for allocating brokerage in exchange for brokerage and research services. In light of their experience, the Independent Trustees are familiar with the Advisor’s soft dollar arrangements and recognize that the Advisor’s profitability may be lower if the Advisor was required to pay for this research with hard dollars.
G. Conclusion
The Independent Trustees did not identify any single factor discussed previously as all-important or controlling. The Independent Trustees concluded that the terms of the New Fund Advisory Agreement were fair and reasonable, that the Advisor’s fees are reasonable in light of the services expected to be provided to the New Fund, and that the New Fund Advisory Agreement should be approved.
164
| | |
| Wasatch Funds | | MARCH 31, 2022 |
Service Providers
Investment Advisor
Wasatch Advisors, Inc. d/b/a Wasatch Global Investors
505 Wakara Way, 3rd Floor
Salt Lake City, UT 84108
Sub-Advisor for the Wasatch-Hoisington U.S. Treasury Fund
Hoisington Investment Management Co. (HIMCo)
6836 Bee Caves Road
Building 2, Suite 100
Austin, TX 78746
Administrator and Fund Accountant
State Street Bank and Trust Company
801 Pennsylvania Avenue
Kansas City, MO 64105
Distributor
ALPS Distributors, Inc.
1290 Broadway, Suite 1100
Denver, CO 80203
Transfer Agent
UMB Fund Services, Inc.
235 West Galena Street
Milwaukee, WI 53212
Custodian
State Street Bank and Trust Company
801 Pennsylvania Avenue
Kansas City, MO 64105
Legal Counsel to Wasatch Funds and Independent Trustees
Chapman and Cutler, LLP
111 West Monroe Street
Chicago, IL 60603
Independent Registered Public Accounting Firm
PricewaterhouseCoopers LLP
1100 Walnut Street, Suite 1300
Kansas City, MO 64106
ONLINE
wasatchglobal.com
or via email
shareholderservice@wasatchfunds.com
TELEPHONE
800.551.1700
M - F, 7:00 a.m. to 7:00 p.m. Central Time
Automated Line, 24 Hours
MAIL
Regular Mail Delivery
Wasatch Funds
P.O. Box 2172
Milwaukee, WI 53201-2172
Overnight Delivery
Wasatch Funds
235 West Galena Street
Milwaukee, WI 53212
165
WASATCHGLOBAL.COM ACTIVE MANAGEMENT FOR INEFFICIENT MARKETS SMALL CAP MICRO CAP INTERNATIONAL EMERGING MARKETS FRONTIER MARKETS GLOBAL
Item 2. Code of Ethics.
Not required.
Item 3. Audit Committee Financial Expert.
Not required.
Item 4. Principal Accountant Fees and Services.
Not required.
Item 5. Audit Committee of Listed Registrants.
Not applicable.
Item 6. Investments.
| (a) | Schedule of Investments is included as a part of the report to shareholders filed under Item 1 of this Form N-CSR. |
Item 7. Disclosure of Proxy Voting Policies and Procedures for Closed-End Management Investment Companies.
Not applicable.
Item 8. Portfolio Managers of Closed-End Investment Companies.
Not applicable.
Item 9. Purchases of Equity Securities by Closed-End Management Investment Company and Affiliated Purchasers.
Not applicable.
Item 10. Submission of Matters to a Vote of Security Holders.
There have been no material changes to the procedures by which shareholders may recommend nominees to the Registrant’s board of trustees, where those changes were implemented after the Registrant last provided disclosure in response to this item.
Item 11. Controls and Procedures.
| (a) | The Registrant’s principal executive and principal financial officers have concluded that the Registrant’s disclosure controls and procedures (as defined in Rule 30a-3(c) under the 1940 Act) are effective, as of a date within 90 days of the filing date of this Form N-CSR based on their evaluation of these controls and procedures required by Rule 30a-3(b) under the 1940 Act) and Rules 13a-15(b) or 15d-15(b) under the Securities Exchange Act of 1934). |
| (b) | There were no changes in the Registrant’s internal control over financial reporting (as defined in Rule 30a-3(d) under the 1940 Act) that occurred during the period covered by this report that has materially affected, or is reasonably likely to materially affect, the Registrant’s internal control over financial reporting. |
Item 12. Disclosure of Securities Lending Activities for Closed-End Management Investment Companies.
Item 13. Exhibits.
SIGNATURES
Pursuant to the requirements of the Securities Exchange Act of 1934 and the Investment Company Act of 1940, the Registrant has duly caused this report to be signed on its behalf by the undersigned, thereunto duly authorized.
WASATCH FUNDS TRUST
| | |
By: | | /s/ Eric S. Bergeson |
| | Eric S. Bergeson |
| | President (principal executive officer) of Wasatch Funds Trust |
| |
Date: | | June 1, 2022 |
Pursuant to the requirements of the Securities Exchange Act of 1934 and the Investment Company Act of 1940, this report has been signed below by the following persons on behalf of the Registrant and in the capacities and on the dates indicated.
| | |
By: | | /s/ Eric S. Bergeson |
| | Eric S. Bergeson |
| | President (principal executive officer) of Wasatch Funds Trust |
| |
Date: | | June 1, 2022 |
| |
By: | | /s/ Michael K. Yeates |
| | Michael K. Yeates |
| | Treasurer (principal financial officer) of Wasatch Funds Trust |
| |
Date: | | June 1, 2022 |