Item 1: Report to Shareholders| Spectrum Funds | June 30, 2005 |
The views and opinions in this report were current as of June 30, 2005. They are not guarantees of performance or investment results and should not be taken as investment advice. Investment decisions reflect a variety of factors, and the managers reserve the right to change their views about individual stocks, sectors, and the markets at any time. As a result, the views expressed should not be relied upon as a forecast of the fund’s future investment intent. The report is certified under the Sarbanes-Oxley Act of 2002, which requires mutual funds and other public companies to affirm that, to the best of their knowledge, the information in their financial reports is fairly and accurately stated in all material respects.
REPORTS ON THE WEB
Sign up for our E-mail Program, and you can begin to receive updated fund reports and prospectuses online rather than through the mail. Log in to your account at troweprice.com for more information.
Fellow Shareholders
Global investment returns were muted in the first six months of 2005. The markets were buffeted by many conflicting influences—higher oil prices, slowing global economic growth, rising short-term interest rates in the U.S., and a stronger U.S. dollar. Bonds gained ground during the period, domestic stocks were flat to down slightly, and foreign stocks declined modestly. The performance of the Spectrum Funds mirrored these results.
MARKET ENVIRONMENT
Economic growth worldwide decelerated in the first half of 2005. Surging oil prices, which rose by more than 30% during the period, served as a headwind to economic growth. In the U.S., economic data was mixed but still seemed to paint a picture of moderate, sustained expansion. Consequently, the Federal Reserve continued to raise short-term interest rates, adding four more rate hikes to the five from the second half of 2004. The Fed’s efforts boosted the federal funds target rate to 3.25%, its highest level in nearly four years.
In this environment, the U.S. stock market was unable to generate any momentum. Despite better-than-expected corporate earnings, brisk merger activity, and a lack of broad-based inflationary pressure, stocks were held in check by concerns about the slowing economy, oil prices, and higher short-term interest rates.
| GLOBAL EQUITY RETURNS |
| | | |
| Periods Ended 6/30/05 | 6 Months | 12 Months |
| S&P 500 Stock Index | -0.81% | 6.32% |
| Russell 2000 Index | -1.25 | 9.45 |
| MSCI EAFE Index | -0.85 | 14.13 |
| MSCI Emerging Markets Index | 6.26 | 34.89 |
As the table shows, two major U.S. stock indexes declined modestly in the first half of the year. Mid-cap stocks were the best performers, posting solid gains, while large-cap stocks held up better than smaller companies. Value stocks generally performed better than growth issues across all market capitalizations.
International stocks in developed markets were mixed but fell overall during the period, trailing the domestic market. The main reason was the U.S. dollar’s rebound against major foreign currencies, which reduced overseas investment returns for U.S. investors. Emerging markets, led by a surge in Latin American stocks, strongly outpaced developed markets. Asian bourses (excluding Japan) also posted solid gains, European markets were largely unchanged, and Japanese stocks suffered the most significant declines.
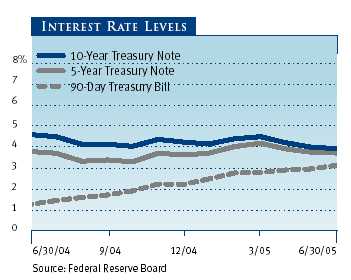
In contrast to stocks, the U.S. bond market rallied in the first half of 2005. Although short-term bond yields rose in line with the Fed’s actions, intermediate- and long-term yields declined following mixed economic data and tame inflation reports. Treasury bonds, which have the greatest sensitivity to interest rate fluctuations, posted the best results. High-quality corporate bonds also fared well, but lower-rated corporate securities lagged after downgrades of Ford and General Motors caused investors to reassess risk premiums. Mortgage-backed securities also struggled as falling long-term rates sparked concerns about renewed mortgage refinancing activity.
International bonds declined because of the stronger dollar. However, emerging market debt performed well, posting solid gains. The J.P. Morgan Emerging Markets Bond Index Plus returned 5.52%, while the J.P. Morgan Non-U.S. Dollar Government Bond Index returned -5.54% .
Spectrum Growth Fund
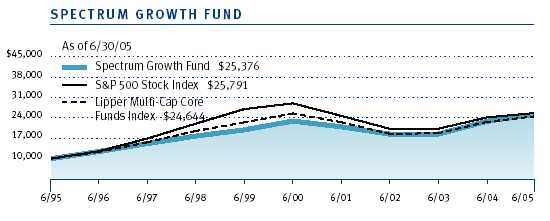
Your fund returned 0.18% for the six months ended June 30, 2005, outperforming the S&P 500 Stock Index but falling just short of its Lipper peer group index. The fund’s 10.72% return for the 12 months ended June 30 comfortably outpaced both the S&P 500 and the Lipper benchmark. The outperformance of the portfolio’s smaller-cap and international positions contributed the most to results.
| PERFORMANCE COMPARISON |
| | | |
| Periods Ended 6/30/05 | 6 Months | 12 Months |
| Spectrum Growth Fund | 0.18% | 10.72% |
| Lipper Multi-Cap Core | | |
| Funds Index | 0.46 | 8.51 |
| S&P 500 Stock Index | -0.81 | 6.32 |
The best performers in the portfolio were the international components. Emerging Markets Stock posted a strong return, reflecting the outperformance of developing markets. International Growth & Income also registered a gain, in contrast to the declines in the major international stock indexes. We trimmed our overall exposure to foreign stocks during the six-month period due to our expectations of weaker economic growth overseas, particularly in Europe.
The portfolio’s lone small-cap holding, New Horizons, was another strong contributor to performance, gaining while small-cap stocks in general lost ground. We continue to underweight small-caps in the wake of more than five years of consistent outperformance. The Value and Mid-Cap Value components also managed to eke out a positive return during the period. We increased our position in Value by eliminating our remaining holdings of Growth & Income, which was removed from the portfolio along with New Era as of May 1, 2005.
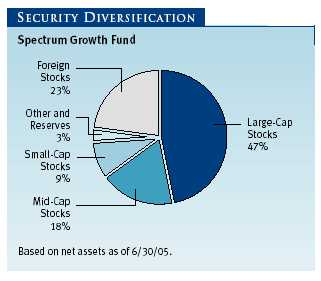
The laggards in the portfolio continued to be the two large-cap growth holdings, Blue Chip Growth and Growth Stock, both of which declined during the period. However, relative valuations and earnings prospects favor both large-cap and growth, so we continued to increase our overweight in these two components over the past few months.
Spectrum Income Fund
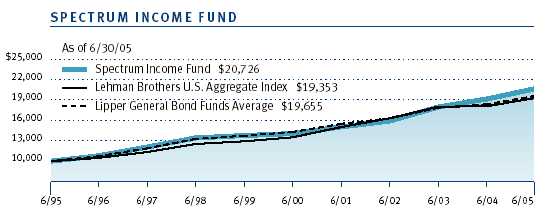
As the table on page 4 shows, your fund returned 0.69% for the six months ended June 30, 2005, trailing both the Lehman Brothers U.S. Aggregate Index and its Lipper peer group average. However, Spectrum Income’s 7.97% return for the 12 months ended June 30 outperformed both the index and peer group average. The key to performance in both time periods was the “diversifiers” in the portfolio—dividend-paying stocks, international bonds of developed countries, and high-yield securities—that enhanced results in the second half of 2004 but detracted from performance during the last six months.
| PERFORMANCE COMPARISON |
| | | |
| Periods Ended 6/30/05 | 6 Months | 12 Months |
| Spectrum Income Fund | 0.69% | 7.97% |
| Lipper General Bond | | |
| Funds Average | 1.35 | 5.69 |
| Lehman Brothers U.S. | | |
| Aggregate Index | 2.51 | 6.80 |
The top performers during the last six months were one of the largest and two of the smallest positions in the portfolio. The portfolio’s biggest holding, New Income, performed well as its emphasis on higher-quality bonds boosted results. U.S. Treasury Long-Term, which made up just 2% of the portfolio, posted the best return, benefiting the most from declining long-term interest rates. Emerging Markets Bond, another small holding, also produced a solid gain, especially in the latter part of the period when investors’ appetite for risk increased.
On the downside, International Bond suffered the most significant decline in the portfolio, largely because of the strong U.S. dollar. Another declining component was Equity Income, which provides exposure to dividend-paying stocks. Stocks underperformed bonds during the period, and our overweight detracted from relative results.
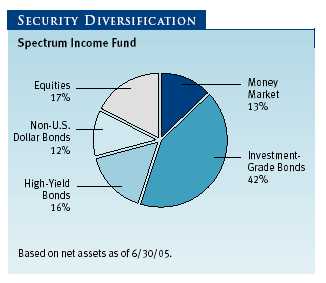
We increased our position in higher-quality bonds, such as New Income and GNMA, at the expense of High Yield because of the historically rich valuations in the high-yield segment of the bond market. In addition, we shifted a significant portion of our Short-Term Bond holdings into Summit Cash Reserves; the Fed’s rate hikes typically boost the yields of money market securities but hurt short-term bond values.
Spectrum International Fund
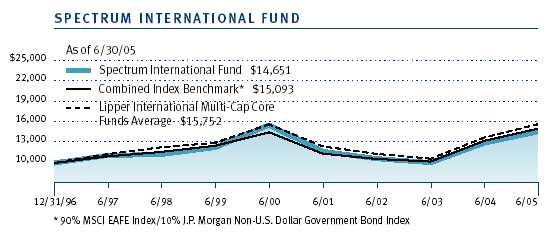
Your fund declined slightly for the six months ended June 30, 2005, posting a return of -0.20% . However, the fund held up better than its combined index benchmark and its Lipper peer group average. As the table shows, the portfolio posted a double-digit return for the 12 months ended June 30 but narrowly lagged the combined index benchmark and Lipper average. The portfolio’s six-month outperformance was the result of strong returns in emerging markets and Asian stocks.
| PERFORMANCE COMPARISON |
| | | |
| Periods Ended 6/30/05 | 6 Months | 12 Months |
| Spectrum International Fund | -0.20% | 13.01% |
| Lipper International | | |
| Multi-Cap Core Funds Average | -0.67 | 13.72 |
| Combined Index Benchmark* | -1.31 | 13.52 |
| * 90% MSCI EAFE Index/10% J.P. Morgan Non-U.S. Dollar |
| Government Bond Index. | | |
As in 2004, the best performers in the portfolio were the emerging market components. Emerging Europe & Mediterranean gained more than 20%, led by markets in Egypt and Russia, while a surge in Latin American stocks boosted Emerging Markets Stock. New Asia was another top performer as Pacific Rim bourses, except for Japan, posted solid gains overall. International Stock and European Stock, which together comprise nearly three-quarters of the portfolio, lagged the major foreign stock indexes. The continued outperformance of value stocks worldwide hindered the performance of these two growth-oriented holdings.
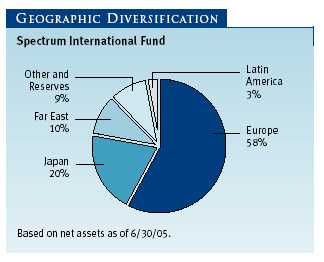
We made no changes to the allocation of the portfolio during the first six months of 2005. The portfolio remained fully invested in stocks, with no fixed-income component.
OUTLOOK
The global financial markets face an uncertain future as we enter the second half of 2005. It is clear that economic growth worldwide is slowing, though more so abroad than domestically. Despite oil prices hovering near record highs, inflation remains subdued in most segments of the U.S. economy. Given this environment, we could see the Fed’s cycle of interest rate hikes come to an end in the coming months, while central banks in Europe may begin to lower short-term rates. The dollar has strengthened in the last six months but has a long way to go to retrace its declines of the past few years.
We continue to believe that broad diversification is the best investment strategy, regardless of the near-term outlook for the global stock and bond markets.
Respectfully submitted,

Edmund M. Notzon III
President of the Spectrum Funds and chairman of the Investment Advisory Committee
July 19, 2005
The committee has day-to-day responsibility for managing the portfolios and works with committee members in developing and executing the funds’ investment program.
RISKS OF INVESTING
As with all stock and bond mutual funds, each fund’s share price can fall because of weakness in the stock or bond markets, a particular industry, or specific holdings. Stock markets can decline for many reasons, including adverse political or economic developments, changes in investor psychology, or heavy institutional selling. The prospects for an industry or company may deteriorate because of a variety of factors, including disappointing earnings or changes in the competitive environment. In addition, the investment manager’s assessment of companies held in a fund may prove incorrect, resulting in losses or poor performance even in rising markets.
Bonds are subject to interest rate risk, the decline in bond prices that usually accompanies a rise in interest rates, and credit risk, the chance that any fund holding could have its credit rating downgraded, or that a bond issuer will default (fail to make timely payments of interest or principal), potentially reducing the fund’s income level and share price. High-yield corporate bonds could have greater price declines than funds that invest primarily in high-quality bonds. Companies issuing high-yield bonds are not as strong financially as those with higher credit ratings, so the bonds are usually considered speculative investments.
Funds that invest overseas may carry more risk than funds that invest strictly in U.S. assets. Risks can result from varying stages of economic and political development, differing regulatory environments, trading days, and accounting standards, and higher transaction costs of non-U.S. markets. Non-U.S. investments are also subject to currency risk, or a decline in the value of a foreign currency versus the U.S. dollar, which reduces the dollar value of securities denominated in that currency.
GLOSSARY
J.P. Morgan Emerging Markets Bond Index Plus: An unmanaged index that tracks dollar-denominated bonds issued by emerging market countries.
J.P. Morgan Non-U.S. Dollar Government Bond Index: An unmanaged index that tracks the performance of major non-U.S. bond markets.
Lehman Brothers U.S. Aggregate Index: An unmanaged index that tracks investment-grade corporate and government bonds.
MSCI EAFE Index: An unmanaged index that tracks the stocks of about 1,000 companies in Europe, Australasia, and the Far East (EAFE).
MSCI Emerging Markets Index: An unmanaged index that tracks stocks in 26 emerging market countries.
Russell 2000 Index: An unmanaged index that tracks the smallest 2,000 of the largest 3,000 U.S. stocks.
S&P 500 Stock Index: An unmanaged index that tracks the stocks of 500 primarily large-cap U.S. companies.
| PORTFOLIO HIGHLIGHTS |
| |
| TEN LARGEST HOLDINGS | |
| | Percent of |
| (Of the combined underlying funds at 6/30/05) | Net Assets |
| | 6/30/05 |
| Spectrum Growth Fund | |
| GE | 1.5% |
| Citigroup | 1.4 |
| Microsoft | 1.1 |
| UnitedHealth Group | 1.0 |
| Apollo Group | 0.9 |
| American International Group | 0.8 |
| ExxonMobil | 0.7 |
| Wal-Mart | 0.7 |
| Dell | 0.7 |
| WellPoint | 0.7 |
| Total | 9.5% |
| |
| |
| TEN LARGEST HOLDINGS | |
| | Percent of |
| (Of the combined underlying funds at 6/30/05) | Net Assets |
| | 6/30/05 |
| Spectrum International Fund | |
| GlaxoSmithKline | 2.5% |
| Total | 2.1 |
| Shell T&T/Royal Dutch | 1.9 |
| Royal Bank of Scotland | 1.9 |
| Vodafone | 1.8 |
| Sanofi-Aventis | 1.7 |
| UBS | 1.6 |
| Nestle | 1.5 |
| UniCredito | 1.3 |
| Banco Bilbao Vizcaya Argenta | 1.1 |
| Total | 17.4% |
| PORTFOLIO HIGHLIGHTS |
| |
| KEY STATISTICS | | |
| | 12/31/04 | 6/30/05 |
| Spectrum Income Fund | | |
| Price Per Share | $12.09 | $11.92 |
| Capital Gain Distributions Per Share | | |
| Short-Term | 0.05 | – |
| Long-Term | 0.06 | 0.01 |
| Dividends Per Share | | |
| For 6 months | 0.25 | 0.24 |
| For 12 months | 0.49 | 0.49 |
| 30-Day Standardized Yield to Maturity* | 3.66% | 3.70% |
| Weighted Average Maturity (years)* | 6.6 | 6.5 |
| Weighted Average Effective Duration (years)* | 3.8 | 3.6 |
| * Excludes Equity Income Fund. | | |
| PORTFOLIO HIGHLIGHTS |
| |
| TARGET ALLOCATIONS FOR UNDERLYING FUNDS | | |
| | Minimum- | Target at | Target at |
| | Maximum | 12/31/04 | 6/30/05 |
| Spectrum Growth Fund | | | |
| Growth Stock | 5-20% | 16.50% | 17.50% |
| Blue Chip Growth | 5-20 | 15.50 | 16.50 |
| Equity Income | 5-20 | 16.25 | 16.25 |
| New Horizons | 10-25 | 15.00 | 15.00 |
| International Stock | 0-15 | 10.00 | 9.00 |
| Value | 5-20 | 6.00 | 8.75 |
| International Growth & Income | 0-15 | 6.00 | 7.00 |
| Mid-Cap Value | 0-15 | 8.00 | 7.00 |
| Emerging Markets Stock | 0-10 | 4.00 | 3.00 |
| Summit Cash Reserves | 0-25 | – | – |
| Growth & Income* | – | 2.75 | – |
| New Era* | – | – | – |
| * Effective 5/1/05, these funds were eliminated as underlying funds. | | |
| |
| Spectrum Income Fund | | | |
| New Income | 10-25% | 23.00% | 24.00% |
| Equity Income | 10-25 | 16.00 | 17.00 |
| High Yield | 10-25 | 19.50 | 17.00 |
| GNMA | 5-20 | 12.00 | 12.50 |
| International Bond | 5-20 | 12.50 | 11.50 |
| Summit Cash Reserves | 0-25 | 1.50 | 7.50 |
| Short-Term Bond | 0-15 | 9.00 | 4.00 |
| Corporate Income | 0-10 | 2.50 | 2.50 |
| Emerging Markets Bond | 0-10 | 2.00 | 2.00 |
| U.S. Treasury Long-Term | 0-15 | 2.00 | 2.00 |
| | | | |
| Spectrum International Fund | | | |
| International Stock | 0-55% | 46.05% | 46.05% |
| European Stock | 0-30 | 28.35 | 28.35 |
| Japan | 0-30 | 9.55 | 9.55 |
| Emerging Markets Stock | 0-20 | 6.75 | 6.75 |
| International Discovery | 0-20 | 4.65 | 4.65 |
| New Asia | 0-20 | 2.65 | 2.65 |
| Emerging Europe & Mediterranean | 0-15 | 2.00 | 2.00 |
| Emerging Markets Bond | 0-15 | – | – |
| International Bond | 0-20 | – | – |
| International Growth & Income* | 0-35 | – | – |
| Latin America | 0-15 | – | – |
| Summit Cash Reserves | 0-25 | – | – |
| * Effective 5/1/05, this fund was added as an underlying fund. | | |
This chart shows the value of a hypothetical $10,000 investment in the fund over the past 10 fiscal year periods or since inception (for funds lacking 10-year records). The result is compared with benchmarks, which may include a broad-based market index and a peer group average or index. Market indexes do not include expenses, which are deducted from fund returns as well as mutual fund averages and indexes.
| AVERAGE ANNUAL COMPOUND TOTAL RETURN |
This table shows how the fund and its benchmarks would have performed if their actual (or
cumulative) returns for the periods shown had been earned at a constant rate.
| Periods Ended 6/30/05 | 1 Year | 5 Years | 10 Years |
| |
| Spectrum Growth Fund | 10.72% | 2.01% | 9.76% |
| |
| Lipper Multi-Cap Core Funds Index | 8.51 | -0.77 | 9.44 |
| |
| S&P 500 Stock Index | 6.32 | -2.37 | 9.94 |
| |
| Current performance may be higher or lower than the quoted past performance, which can- |
| not guarantee future results. Share price, principal value, and return will vary, and you may |
| have a gain or loss when you sell your shares. For the most recent month-end performance |
| information, please visit our Web site (troweprice.com) or contact a T. Rowe Price repre- |
| sentative at 1-800-225-5132. | | | |
| | | | |
| Average annual total return figures include changes in principal value, reinvested dividends, and capital |
| gain distributions. Returns do not reflect taxes that the shareholder may pay on fund distributions or |
| the redemption of fund shares. When assessing performance, investors should consider both short- and |
| long-term returns. | | | |
This chart shows the value of a hypothetical $10,000 investment in the fund over the past 10 fiscal year periods or since inception (for funds lacking 10-year records). The result is compared with benchmarks, which may include a broad-based market index and a peer group average or index. Market indexes do not include expenses, which are deducted from fund returns as well as mutual fund averages and indexes.
| AVERAGE ANNUAL COMPOUND TOTAL RETURN |
This table shows how the fund and its benchmarks would have performed if their actual (or
cumulative) returns for the periods shown had been earned at a constant rate.
| Periods Ended 6/30/05 | 1 Year | 5 Years | 10 Years |
| |
| Spectrum Income Fund | 7.97% | 8.02% | 7.56% |
| |
| Lipper General Bond Funds Average | 5.69 | 6.29 | 6.99 |
| |
| Lehman Brothers U.S. Aggregate Index | 6.80 | 7.40 | 6.83 |
| |
| Current performance may be higher or lower than the quoted past performance, which can- |
| not guarantee future results. Share price, principal value, and return will vary, and you may |
| have a gain or loss when you sell your shares. For the most recent month-end performance |
| information, please visit our Web site (troweprice.com) or contact a T. Rowe Price repre- |
| sentative at 1-800-225-5132. |
| | | | |
| Average annual total return figures include changes in principal value, reinvested dividends, and capital |
| gain distributions. Returns do not reflect taxes that the shareholder may pay on fund distributions or |
| the redemption of fund shares. When assessing performance, investors should consider both short- and |
| long-term returns. | | | |
This chart shows the value of a hypothetical $10,000 investment in the fund over the past 10 fiscal year periods or since inception (for funds lacking 10-year records). The result is compared with benchmarks, which may include a broad-based market index and a peer group average or index. Market indexes do not include expenses, which are deducted from fund returns as well as mutual fund averages and indexes.
| AVERAGE ANNUAL COMPOUND TOTAL RETURN |
This table shows how the fund and its benchmarks would have performed if their actual (or
cumulative) returns for the periods shown had been earned at a constant rate.
| | | | Since |
| | | | Inception |
| Periods Ended 6/30/05 | 1 Year | 5 Years | 12/31/96 |
| |
| Spectrum International Fund | 13.01% | -1.28% | 4.60% |
| |
| Lipper International Multi-Cap Core Funds Average | 13.72 | -0.61 | 5.24 |
| |
| Combined Index Benchmark* | 13.52 | 0.73 | 4.97 |
| |
| * 90% MSCI EAFE Index/10% J.P. Morgan Non-U.S. Dollar Government Bond Index |
| | | | |
| Current performance may be higher or lower than the quoted past performance, which can- |
| not guarantee future results. Share price, principal value, and return will vary, and you may |
| have a gain or loss when you sell your shares. For the most recent month-end performance |
| information, please visit our Web site (troweprice.com) or contact a T. Rowe Price repre- |
| sentative at 1-800-225-5132. The fund charges a redemption fee of 2% on shares held for |
| three months or less. The performance information shown does not reflect the deduction |
| of the redemption fee. If it did, the performance would be lower. | | |
| | | | |
| Average annual total return figures include changes in principal value, reinvested dividends, and capital |
| gain distributions. Returns do not reflect taxes that the shareholder may pay on fund distributions or |
| the redemption of fund shares. When assessing performance, investors should consider both short- and |
| long-term returns. | | | |
As a mutual fund shareholder, you may incur two types of costs: (1) transaction costs such as redemption fees or sales loads and (2) ongoing costs, including management fees, distribution and service (12b-1) fees, and other fund expenses. The following example is intended to help you understand your ongoing costs (in dollars) of investing in the fund and to compare these costs with the ongoing costs of investing in other mutual funds. The example is based on an investment of $1,000 invested at the beginning of the most recent six-month period and held for the entire period.
Actual Expenses
The first line of the following table (“Actual”) provides information about actual account values and expenses based on the fund’s actual returns. You may use the information in this line, together with your account balance, to estimate the expenses that you paid over the period. Simply divide your account value by $1,000 (for example, an $8,600 account value divided by $1,000 = 8.6), then multiply the result by the number in the first line under the heading “Expenses Paid During Period” to estimate the expenses you paid on your account during this period.
Hypothetical Example for Comparison Purposes
The information on the second line of the table (“Hypothetical”) is based on hypothetical account values and expenses derived from the fund’s actual expense ratio and an assumed 5% per year rate of return before expenses (not the fund’s actual return). You may compare the ongoing costs of investing in the fund with other funds by contrasting this 5% hypothetical example and the 5% hypothetical examples that appear in the shareholder reports of the other funds. The hypothetical account values and expenses may not be used to estimate the actual ending account balance or expenses you paid for the period.
Note: T. Rowe Price charges an annual small-account maintenance fee of $10, generally for accounts with less than $2,000 ($500 for UGMA/UTMA). The fee is waived for any investor whose T. Rowe Price mutual fund accounts total $25,000 or more, accounts employing automatic investing, and IRAs and other retirement plan accounts that utilize a prototype plan sponsored by T. Rowe Price (although a separate custodial or administrative fee may apply to such accounts). This fee is not included in the accompanying table. If you are subject to the fee, keep it in mind when you are estimating the ongoing expenses of investing in the fund and when comparing the expenses of this fund with other funds.
You should also be aware that the expenses shown in the table highlight only your ongoing costs and do not reflect any transaction costs, such as redemption fees or sales loads. Therefore, the second line of the table is useful in comparing ongoing costs only and will not help you determine the relative total costs of owning different funds. To the extent a fund charges transaction costs, however, the total cost of owning that fund is higher.
| T. ROWE PRICE SPECTRUM FUNDS |
| |
| | | | | Effective |
| | | | Expenses | Expenses |
| | Beginning | Ending | Paid During | Paid During |
| | Account | Account | Period * | Period ** |
| | Value | Value | 1/1/05 to | 1/1/05 to |
| | 1/1/05 | 6/30/05 | 6/30/05 | 6/30/05 |
| |
| Spectrum Growth | | | | |
| Actual | $1,000.00 | $1,001.80 | $0.00 | $4.22 |
| |
| Hypothetical (assumes 5% | | | | |
| return before expenses) | 1,000.00 | 1,020.58 | 0.00 | 4.26 |
| |
| Spectrum Income | | | | |
| Actual | 1,000.00 | 1,006.90 | 0.00 | 3.58 |
| |
| Hypothetical (assumes 5% | | | | |
| return before expenses) | 1,000.00 | 1,021.22 | 0.00 | 3.61 |
| |
| Spectrum International | | | | |
| Actual | 1,000.00 | 998.00 | 0.00 | 5.15 |
| |
| Hypothetical (assumes 5% | | | | |
| return before expenses) | 1,000.00 | 1,019.64 | 0.00 | 5.21 |
| |
| * Expenses are equal to a fund’s annualized expense ratio for the six-month period, multiplied by the |
| average account value over the period, multiplied by the number of days in the most recent fiscal |
| half year (181) divided by days in the year (365) to reflect the half-year period. Expenses reflect only |
| costs borne directly by a fund. Because all expenses associated with the operation of the Spectrum |
| Funds are fully reimbursed by the underlying Price funds, the annualized expense ratio for each |
| Spectrum Fund for the six-month period was 0.00%. |
| ** Effective expenses reflect the sum of expenses borne directly by the fund plus the fund’s pro-rata |
| share of the weighted average expense ratio of the underlying Price funds in which it invests. The |
| annualized weighted average expense ratio of the underlying Price funds for the six-month period |
| reflects the actual expense ratio of each underlying Price fund for the six-month period, annualized |
| and weighted for the Spectrum Fund’s relative average investment therein during the period. The |
| annualized expense ratio of the underlying Price funds for the six-month period was: 0.85% for |
| Spectrum Growth, 0.72% for Spectrum Income, and 1.04% for Spectrum International. |
T. ROWE PRICE SPECTRUM GROWTH FUND
Unaudited
| FINANCIAL HIGHLIGHTS | | | | For a share outstanding throughout each period |
| |
| | 6 Months | | Year | | | | | | | | |
| | | Ended | | Ended | | | | | | | | |
| | 6/30/05** | 12/31/04 | 12/31/03 | 12/31/02 | 12/31/01 | 12/31/00 |
| NET ASSET VALUE | | | | | | | | | | | | |
| Beginning of period | $ | 16.87 | $ | 14.80 | $ | 11.13 | $ | 14.07 | $ | 15.72 | $ | 17.71 |
|
|
| |
| Investment activities | | | | | | | | | | | | |
| Net investment | | | | | | | | | | | | |
| income (loss) | | 0.02 | | 0.12 | | 0.09 | | 0.09 | | 0.16 | | 0.13 |
| Net realized and | | | | | | | | | | | | |
| unrealized gain (loss) | | 0.01 | | 2.12 | | 3.70 | | (2.88) | | (1.37) | | (0.15) |
|
|
| | | | | | | | | | | | |
| Total from | | | | | | | | | | | | |
| investment activities | | 0.03 | | 2.24 | | 3.79 | | (2.79) | | (1.21) | | (0.02) |
|
|
| |
| Distributions | | | | | | | | | | | | |
| Net investment income | | – | | (0.12) | | (0.10) | | (0.08) | | (0.16) | | (0.12) |
| Net realized gain | | – | | (0.05) | | (0.02) | | (0.07) | | (0.28) | | (1.85) |
|
|
| Total distributions | | – | | (0.17) | | (0.12) | | (0.15) | | (0.44) | | (1.97) |
|
|
| |
| NET ASSET VALUE | | | | | | | | | | | | |
| End of period | $ | 16.90 | $ | 16.87 | $ | 14.80 | $ | 11.13 | $ | 14.07 | $ | 15.72 |
|
|
| |
| |
| Ratios‡ | | | | | | | | | | | | |
| Total return^ | | 0.18% | | 15.16% | | 34.09% | | (19.83)% | | (7.63)% | | (0.11)% |
| Ratio of total expenses to | | | | | | | | | | | | |
| average net assets | | 0.00%† | | 0.00% | | 0.00% | | 0.00% | | 0.00% | | 0.00% |
| Ratio of net investment | | | | | | | | | | | | |
| income (loss) to average | | | | | | | | | | | | |
| net assets | | 0.25%† | | 0.81% | | 0.75% | | 0.68% | | 1.05% | | 0.70% |
| Portfolio turnover rate | | 10.7%† | | 20.3% | | 18.0% | | 3.9% | | 6.1% | | 11.6% |
| Net assets, end of period | | | | | | | | | | | | |
| (in millions) | $ | 2,624 | $ | 2,603 | $ | 2,236 | $ | 1,739 | $ | 2,373 | $ | 2,889 |
| Supplemental Data | | | | | | |
| Weighted average | | | | | | |
| expense ratio of | | | | | | |
| underlying Price funds* | 0.85%† | 0.86% | 0.88% | 0.88% | 0.87% | 0.83% |
| Effective expense ratio | 0.85%† | 0.86% | 0.88% | 0.88% | 0.87% | 0.83% |
| ‡ | Reflects the activity of the fund, and does not include the activity of the underlying Price funds. However, invest- |
| | ment performance of the fund is directly related to the investment performance of the underlying Price funds in |
| | which it invests. |
| ^ | Total return reflects the rate that an investor would have earned on an investment in the fund during each period, |
| | assuming reinvestment of all distributions. |
| * | Reflects the indirect expense impact to the fund from its investment in the underlying Price funds, based on the |
| | actual expense ratio of each underlying Price fund weighted for the fund’s relative average investment therein. |
| ** Per share amounts calculated using average shares outstanding method. |
| † | Annualized |
The accompanying notes are an integral part of these financial statements.
T. ROWE PRICE SPECTRUM INCOME FUND
Unaudited
| FINANCIAL HIGHLIGHTS | | | | For a share outstanding throughout each period |
| |
| | 6 Months | | Year | | | | | | | | |
| | | Ended | | Ended | | | | | | | | |
| | 6/30/05** | 12/31/04 | 12/31/03 | 12/31/02 | 12/31/01 | 12/31/00 |
| NET ASSET VALUE | | | | | | | | | | | | |
| Beginning of period | $ | 12.09 | $ | 11.77 | $ | 10.76 | $ | 10.60 | $ | 10.77 | $ | 10.71 |
|
|
| |
| Investment activities | | | | | | | | | | | | |
| Net investment | | | | | | | | | | | | |
| income (loss) | | 0.24 | | 0.49 | | 0.51 | | 0.55 | | 0.63 | | 0.62 |
| Net realized and | | | | | | | | | | | | |
| unrealized gain (loss) | | (0.16) | | 0.43 | | 1.06 | | 0.16 | | (0.15) | | 0.14 |
|
|
| Total from | | | | | | | | | | | | |
| investment activities | | 0.08 | | 0.92 | | 1.57 | | 0.71 | | 0.48 | | 0.76 |
|
|
| |
| Distributions | | | | | | | | | | | | |
| Net investment income | | (0.24) | | (0.49) | | (0.50) | | (0.55) | | (0.55) | | (0.70) |
| Net realized gain | | (0.01) | | (0.11) | | (0.06) | | – | | (0.02) | | – |
| Tax return of capital | | – | | – | | – | | – | | (0.08) | | – |
|
|
| Total distributions | | (0.25) | | (0.60) | | (0.56) | | (0.55) | | (0.65) | | (0.70) |
|
|
| |
| NET ASSET VALUE | | | | | | | | | | | | |
| End of period | $ | 11.92 | $ | 12.09 | $ | 11.77 | $ | 10.76 | $ | 10.60 | $ | 10.77 |
|
|
| |
| |
| Ratios‡ | | | | | | | | | | | | |
| Total return^ | | 0.69% | | 8.05% | | 14.96% | | 6.86% | | 4.59% | | 7.40% |
| Ratio of total expenses to | | | | | | | | | | | | |
| average net assets | | 0.00%† | | 0.00% | | 0.00% | | 0.00% | | 0.00% | | 0.00% |
| Ratio of net investment | | | | | | | | | | | | |
| income (loss) to average | | | | | | | | | | | | |
| net assets | | 4.08%† | | 4.18% | | 4.47% | | 5.17% | | 5.91% | | 6.03% |
| Portfolio turnover rate | | 20.9%† | | 8.2% | | 7.4% | | 14.1% | | 22.7% | | 19.3% |
| Net assets, end of period | | | | | | | | | | | | |
| (in millions) | $ | 4,717 | $ | 4,502 | $ | 3,552 | $ | 2,713 | $ | 2,465 | $ | 2,471 |
| Supplemental Data | | | | | | |
| Weighted average | | | | | | |
| expense ratio of | | | | | | |
| underlying Price funds* | 0.72%† | 0.73% | 0.78% | 0.80% | 0.80% | 0.77% |
| Effective expense ratio | 0.72%† | 0.73% | 0.78% | 0.80% | 0.80% | 0.77% |
| ‡ | Reflects the activity of the fund, and does not include the activity of the underlying Price funds. However, invest- |
| | ment performance of the fund is directly related to the investment performance of the underlying Price funds in |
| | which it invests. |
| ^ | Total return reflects the rate that an investor would have earned on an investment in the fund during each period, |
| | assuming reinvestment of all distributions. |
| * | Reflects the indirect expense impact to the fund from its investment in the underlying Price funds, based on the |
| | actual expense ratio of each underlying Price fund weighted for the fund’s relative average investment therein. |
| ** Per share amounts calculated using average shares outstanding method. |
| † | Annualized |
The accompanying notes are an integral part of these financial statements.
T. ROWE PRICE SPECTRUM INTERNATIONAL FUND
Unaudited
| FINANCIAL HIGHLIGHTS | | | | For a share outstanding throughout each period |
| |
| | 6 Months | | Year | | | | | | | | |
| | | Ended | | Ended | | | | | | | | |
| | 6/30/05** | 12/31/04 | 12/31/03 | 12/31/02 | 12/31/01 | 12/31/00 |
| NET ASSET VALUE | | | | | | | | | | | | |
| Beginning of period | $ | 10.03 | $ | 8.70 | $ | 6.40 | $ | 7.76 | $ | 10.08 | $ | 13.53 |
|
|
| |
| Investment activities | | | | | | | | | | | | |
| Net investment | | | | | | | | | | | | |
| income (loss) | | – | | 0.10 | | 0.09 | | 0.07 | | 0.18 | | 0.12 |
| Net realized and | | | | | | | | | | | | |
| unrealized gain (loss) | | (0.02) | | 1.32 | | 2.32 | | (1.36) | | (2.17) | | (2.10) |
|
|
| Total from | | | | | | | | | | | | |
| investment activities | | (0.02) | | 1.42 | | 2.41 | | (1.29) | | (1.99) | | (1.98) |
|
|
| |
| Distributions | | | | | | | | | | | | |
| Net investment income | | – | | (0.09) | | (0.10) | | (0.07) | | (0.18) | | (0.12) |
| Net realized gain | | – | | – | | (0.01) | | – | | (0.15) | | (1.35) |
|
|
| Total distributions | | – | | (0.09) | | (0.11) | | (0.07) | | (0.33) | | (1.47) |
|
|
| |
| NET ASSET VALUE | | | | | | | | | | | | |
| End of period | $ | 10.01 | $ | 10.03 | $ | 8.70 | $ | 6.40 | $ | 7.76 | $ | 10.08 |
|
|
| |
| |
| Ratios‡ | | | | | | | | | | | | |
| Total return^ | | (0.20)% | | 16.36% | | 37.73% | | (16.61)% | | (19.71)% | | (14.71)% |
| Ratio of total expenses to | | | | | | | | | | | | |
| average net assets | | 0.00%† | | 0.00% | | 0.00% | | 0.00% | | 0.00% | | 0.00% |
| Ratio of net investment | | | | | | | | | | | | |
| income (loss) to average | | | | | | | | | | | | |
| net assets | | 0.00%† | | 1.13% | | 1.36% | | 1.01% | | 2.06% | | 0.94% |
| Portfolio turnover rate | | 3.0%† | | 12.5% | | 48.0%v | | 94.4% | | 30.6% | | 42.5% |
| Net assets, end of period | | | | | | | | | | | | |
| (in thousands) | $ | 124,456 | $ | 112,523 | $ | 79,477 | $ | 52,652 | $ | 64,153 | $ | 81,843 |
| Supplemental Data | | | | | | |
| Weighted average | | | | | | |
| expense ratio of | | | | | | |
| underlying Price funds* | 1.04%† | 1.05% | 1.10% | 1.12% | 1.09% | 0.98% |
| Effective expense ratio | 1.04%† | 1.05% | 1.10% | 1.12% | 1.09% | 0.98% |
| ‡ | Reflects the activity of the fund, and does not include the activity of the underlying Price funds. However, invest- |
| | ment performance of the fund is directly related to the investment performance of the underlying Price funds in |
| | which it invests. |
| ^ | Total return reflects the rate that an investor would have earned on an investment in the fund during each period, |
| | assuming reinvestment of all distributions and payment of no redemption or account fees. |
| v | Revised; this revision had no impact on net assets or results of operations. |
| * | Reflects the indirect expense impact to the fund from its investment in the underlying Price funds, based on the |
| | actual expense ratio of each underlying Price fund weighted for the fund’s relative average investment therein. |
| ** Per share amounts calculated using average shares outstanding method. |
| † | Annualized |
The accompanying notes are an integral part of these financial statements.
T. ROWE PRICE SPECTRUM GROWTH FUND
Unaudited
| | Percent of | | | |
| PORTFOLIO OF INVESTMENTS (1)† | Net Assets | Shares | | Value |
| (Cost and value in $ 000s) | | | | |
| T. Rowe Price Growth Stock Fund | 17.4% | 17,312,489 | $ | 456,357 |
| T. Rowe Price Blue Chip Growth Fund | 16.4 | 14,173,149 | | 430,864 |
| T. Rowe Price Equity Income Fund | 16.1 | 16,139,147 | | 421,232 |
| T. Rowe Price New Horizons Fund * | 15.5 | 13,486,245 | | 407,015 |
| T. Rowe Price International Stock Fund | 9.0 | 18,544,562 | | 235,145 |
| T. Rowe Price Value Fund | 8.5 | 9,706,177 | | 222,465 |
| T. Rowe Price International Growth & | | | | |
| Income Fund | 6.9 | 14,506,520 | | 182,492 |
| T. Rowe Price Mid-Cap Value Fund | 6.9 | 7,891,126 | | 182,285 |
| T. Rowe Price Emerging Markets Stock Fund | 3.3 | 4,105,477 | | 85,969 |
| |
| |
| Total Investments in Securities | | | | |
| 100.0% of Net Assets (Cost $1,996,819) | | | $ | 2,623,824 |
| (1) | Denominated in U.S. dollars unless otherwise noted |
| * | Non-income producing |
| †Affiliated Companies |
| ($ 000s) | | | | | | | | | | |
| |
| |
| The fund may invest in certain securities that are considered affiliated companies. As defined |
| by the 1940 Act, an affiliated company is one in which the fund owns 5% or more of the |
| outstanding voting securities, or a company which is under common ownership or control. |
| |
| | Purchase | | Sales | Investment | | Value |
| Affiliate | | Cost | | Cost | | Income | | 6/30/05 | | 12/31/04 |
| T. Rowe Price Growth | | | | | | | | | |
| Stock Fund | $ | 36,897 | $ | 1,021 | $ | - | $ | 456,357 | $ | 424,516 |
| T. Rowe Price Blue Chip | | | | | | | | | |
| Growth Fund | | 40,540 | | 1,345 | | - | | 430,864 | | 397,638 |
| T. Rowe Price Equity | | | | | | | | | | |
| Income Fund | | 17,213 | | 5,505 | | 3,206 | | 421,232 | | 417,376 |
| T. Rowe Price New | | | | | | | | | | |
| Horizons Fund | | 1,299 | | 2,999 | | - | | 407,015 | | 396,713 |
| T. Rowe Price | | | | | | | | | | |
| International Stock | | | | | | | | | | |
| Fund | | 298 | | 20,980 | | - | | 235,145 | | 261,989 |
| T. Rowe Price Value | | | | | | | | | | |
| Fund | | 36,124 | | - | | - | | 222,465 | | 185,914 |
| T. Rowe Price | | | | | | | | | | |
| International Growth & | | | | | | | | | |
| Income Fund | | 23,209 | | 1,782 | | - | | 182,492 | | 160,607 |
| T. Rowe Price Mid-Cap | | | | | | | | | |
| Value Fund | | 3,707 | | 20,352 | | - | | 182,285 | | 207,896 |
| T. Rowe Price Emerging | | | | | | | | | |
| Markets Stock Fund | | - | | 27,701 | | - | | 85,969 | | 116,344 |
| T. Rowe Price Growth & | | | | | | | | | |
| Income Fund | | - | | 21,508 | | - | | - | | 34,270 |
| Totals | | | | | $ | 3,206 | $ | 2,623,824 | $ | 2,603,263 |
The accompanying notes are an integral part of these financial statements.
Unaudited
| STATEMENT OF ASSETS AND LIABILITIES |
| (In thousands except shares and per share amounts) | | |
| Assets | | |
| Investments in affiliated companies, at value (cost $1,996,819) | $ | 2,623,824 |
| Receivable for investment securities sold | | 1,808 |
| Receivable for shares sold | | 1,626 |
|
|
| Total assets | | 2,627,258 |
|
|
| |
| Liabilities | | |
| Payable for shares redeemed | | 3,433 |
|
|
| Total liabilities | | 3,433 |
|
|
| |
| NET ASSETS | $ | 2,623,825 |
|
|
| Net Assets Consist of: | | |
| Undistributed net investment income (loss) | $ | 4,122 |
| Undistributed net realized gain (loss) | | (24,027) |
| Net unrealized gain (loss) | | 627,005 |
| Paid-in-capital applicable to 155,258,823 shares of | | |
| $0.01 par value capital stock outstanding; | | |
| 1,000,000,000 shares of the Corporation authorized | | 2,016,725 |
|
|
| |
| NET ASSETS | $ | 2,623,825 |
|
|
| |
| NET ASSET VALUE PER SHARE | $ | 16.90 |
|
|
The accompanying notes are an integral part of these financial statements.
T. ROWE PRICE SPECTRUM INCOME FUND
Unaudited
| | Percent of | | | |
| PORTFOLIO OF INVESTMENTS (1)† | Net Assets | Shares | | Value |
| (Cost and value in $ 000s) | | | | |
| T. Rowe Price New Income Fund | 24.1% | 124,119,293 | $ | 1,138,174 |
| T. Rowe Price High Yield Fund | 17.1 | 115,434,517 | | 805,733 |
| T. Rowe Price Equity Income Fund | 16.7 | 30,212,135 | | 788,537 |
| T. Rowe Price GNMA Fund | 12.4 | 60,948,037 | | 585,710 |
| T. Rowe Price International Bond Fund | 11.6 | 55,670,354 | | 545,013 |
| T. Rowe Price Summit Cash Reserves Fund | 7.6 | 359,842,524 | | 359,843 |
| T. Rowe Price Short-Term Bond Fund | 3.9 | 39,274,525 | | 185,768 |
| T. Rowe Price Corporate Income Fund | 2.5 | 11,815,774 | | 117,094 |
| �� T. Rowe Price Emerging Markets Bond Fund | 2.1 | 6,967,872 | | 96,993 |
| T. Rowe Price U.S. Treasury Long-Term Fund | 2.0 | 7,605,807 | | 94,540 |
| |
| |
| Total Investments in Securities | | | | |
| 100.0% of Net Assets (Cost $4,469,647) | | | $ | 4,717,405 |
| (1) | Denominated in U.S. dollars unless otherwise noted |
| †Affiliated Companies | | | | | | | | | |
| ($ 000s) | | | | | | | | | | |
| |
| |
| The fund may invest in certain securities that are considered affiliated companies. As defined |
| by the 1940 Act, an affiliated company is one in which the fund owns 5% or more of the |
| outstanding voting securities, or a company which is under common ownership or control. |
| |
| | | Purchase | | Sales | | Investment | | Value |
| Affiliate | | Cost | | Cost | | Income | | 6/30/05 | | 12/31/04 |
| T. Rowe Price New | | | | | | | | | | |
| Income Fund | $ | 142,810 | $ | 42,382 | $ | 22,178 | $ | 1,138,174 | $ | 1,029,081 |
| T. Rowe Price High Yield | | | | | | | | | |
| Fund | | 44,663 | | 106,286 | | 30,929 | | 805,733 | | 876,281 |
| T. Rowe Price Equity | | | | | | | | | | |
| Income Fund | | 88,739 | | 28,532 | | 5,895 | | 788,537 | | 743,541 |
| T. Rowe Price GNMA | | | | | | | | | | |
| Fund | | 76,707 | | 22,519 | | 12,666 | | 585,710 | | 533,800 |
| T. Rowe Price | | | | | | | | | | |
| International Bond Fund | 63,440 | | 34,197 | | 7,510 | | 545,013 | | 563,905 |
| T. Rowe Price Summit | | | | | | | | | |
| Cash Reserves Fund | | 303,830 | | 13,111 | | 2,422 | | 359,843 | | 69,123 |
| T. Rowe Price Short- | | | | | | | | | | |
| Term Bond Fund | | 34,402 | | 255,028 | | 5,045 | | 185,768 | | 403,817 |
| T. Rowe Price Corporate | | | | | | | | | |
| Income Fund | | 21,702 | | 4,417 | | 2,621 | | 117,094 | | 99,653 |
| T. Rowe Price Emerging | | | | | | | | | |
| Markets Bond Fund | | 3,546 | | 3,386 | | 3,242 | | 96,993 | | 92,279 |
| T. Rowe Price U.S. | | | | | | | | | | |
| Treasury Long-Term | | | | | | | | | | |
| Fund | | 2,325 | | 3,413 | | 2,021 | | 94,540 | | 91,285 |
| Totals | | | | | $ | 94,529 | $ | 4,717,405 | $ | 4,502,765 |
The accompanying notes are an integral part of these financial statements.
Unaudited
| STATEMENT OF ASSETS AND LIABILITIES |
| (In thousands except shares and per share amounts) | | |
| Assets | | |
| Investments in affiliated companies, at value (cost $4,469,647) | $ | 4,717,405 |
| Receivable for investment securities sold | | 7,065 |
| Receivable for shares sold | | 7,726 |
|
|
| Total assets | | 4,732,196 |
|
|
| |
| Liabilities | | |
| Payable for shares redeemed | | 14,361 |
| Other liabilities | | 972 |
|
|
| Total liabilities | | 15,333 |
|
|
| |
| NET ASSETS | $ | 4,716,863 |
|
|
| Net Assets Consist of: | | |
| Undistributed net realized gain (loss) | $ | 1,661 |
| Net unrealized gain (loss) | | 247,758 |
| Paid-in-capital applicable to 395,825,110 shares of | | |
| $0.01 par value capital stock outstanding; | | |
| 1,000,000,000 shares of the Corporation authorized | | 4,467,444 |
|
|
| |
| NET ASSETS | $ | 4,716,863 |
|
|
| |
| NET ASSET VALUE PER SHARE | $ | 11.92 |
|
|
The accompanying notes are an integral part of these financial statements.
T. ROWE PRICE SPECTRUM INTERNATIONAL FUND
Unaudited
| | Percent of | | | |
| PORTFOLIO OF INVESTMENTS (1)† | Net Assets | Shares | | Value |
| (Cost and value in $ 000s) | | | | |
| T. Rowe Price International Stock Fund | 46.0% | 4,511,485 | $ | 57,205 |
| T. Rowe Price European Stock Fund | 28.1 | 1,788,971 | | 35,046 |
| T. Rowe Price Japan Fund * | 9.4 | 1,387,080 | | 11,679 |
| T. Rowe Price Emerging Markets Stock Fund | 7.0 | 417,612 | | 8,745 |
| T. Rowe Price International Discovery Fund | 4.7 | 173,912 | | 5,807 |
| T. Rowe Price New Asia Fund | 2.7 | 316,815 | | 3,374 |
| T. Rowe Price Emerging Europe & | | | | |
| Mediterranean Fund * | 2.1 | 133,386 | | 2,600 |
| |
| |
| Total Investments in Securities | | | | |
| 100.0% of Net Assets (Cost $122,498) | | | $ | 124,456 |
| (1) | Denominated in U.S. dollars unless otherwise noted |
| * | Non-income producing |
| †Affiliated Companies | | | | | | | | |
| ($ 000s) | | | | | | | | | | |
| |
| |
| The fund may invest in certain securities that are considered affiliated companies. As defined |
| by the 1940 Act, an affiliated company is one in which the fund owns 5% or more of the |
| outstanding voting securities, or a company which is under common ownership or control. |
| |
| | | Purchase | | Sales | | Investment | | Value |
| Affiliate | | Cost | | Cost | | Income | | 6/30/05 | | 12/31/04 |
| T. Rowe Price | | | | | | | | | | |
| International Stock | | | | | | | | | | |
| Fund | $ | 7,355 | $ | 1,184 | $ | - | $ | 57,205 | $ | 51,746 |
| T. Rowe Price European | | | | | | | | | |
| Stock Fund | | 4,329 | | 706 | | - | | 35,046 | | 31,829 |
| T. Rowe Price Japan | | | | | | | | | | |
| Fund | | 1,333 | | - | | - | | 11,679 | | 10,455 |
| T. Rowe Price Emerging | | | | | | | | | |
| Markets Stock Fund | | 289 | | 48 | | - | | 8,745 | | 7,877 |
| T. Rowe Price | | | | | | | | | | |
| International Discovery | | | | | | | | | |
| Fund | | 699 | | - | | - | | 5,807 | | 4,989 |
| T. Rowe Price New Asia | | | | | | | | | |
| Fund | | - | | 199 | | - | | 3,374 | | 3,298 |
| T. Rowe Price Emerging | | | | | | | | | |
| Europe & | | | | | | | | | | |
| Mediterranean Fund | | - | | 164 | | - | | 2,600 | | 2,326 |
| Totals | | | | | $ | - | $ | 124,456 | $ | 112,520 |
The accompanying notes are an integral part of these financial statements.
Unaudited
| STATEMENT OF ASSETS AND LIABILITIES |
| (In thousands except shares and per share amounts) | | |
| Assets | | |
| Investments in affiliated companies, at value (cost $122,498) | $ | 124,456 |
| Receivable for investment securities sold | | 26 |
| Receivable for shares sold | | 58 |
|
|
| Total assets | | 124,540 |
|
|
| |
| Liabilities | | |
| Payable for shares redeemed | | 84 |
|
|
| Total liabilities | | 84 |
|
|
| |
| NET ASSETS | $ | 124,456 |
|
|
| Net Assets Consist of: | | |
| Undistributed net investment income (loss) | $ | 61 |
| Undistributed net realized gain (loss) | | (4,956) |
| Net unrealized gain (loss) | | 1,958 |
| Paid-in-capital applicable to 12,438,420 shares of | | |
| $0.01 par value capital stock outstanding; | | |
| 1,000,000,000 shares of the Corporation authorized | | 127,393 |
|
|
| |
| NET ASSETS | $ | 124,456 |
|
|
| |
| NET ASSET VALUE PER SHARE | $ | 10.01 |
|
|
The accompanying notes are an integral part of these financial statements.
Unaudited
| STATEMENT OF OPERATIONS |
| ($ 000s) | | Growth | | Income | International |
| | | Fund | | Fund | | Fund |
| | | 6 Months | | 6 Months | | 6 Months |
| | | Ended | | Ended | | Ended |
| | | 6/30/05 | | 6/30/05 | | 6/30/05 |
| Investment Income (Loss) | | | | | | |
| Income | | | | | | |
| Dividend | $ | 3,206 | $ | 5,895 | $ | – |
| Interest | | – | | 88,634 | | – |
|
|
| Total income | | 3,206 | | 94,529 | | – |
|
|
| Expenses | | | | | | |
| Shareholder servicing | | 2,212 | | 4,150 | | 141 |
| Prospectus and shareholder reports | | 65 | | 54 | | 8 |
| Registration | | 53 | | 89 | | 10 |
| Custody and accounting | | 23 | | 23 | | 23 |
| Proxy and annual meeting | | 19 | | 19 | | 2 |
| Legal and audit | | 7 | | 8 | | 4 |
| Directors | | 6 | | 7 | | 3 |
| Expenses reimbursed by | | | | | | |
| underlying Price funds | | (2,385) | | (4,350) | | (191) |
|
|
| Total expenses | | – | | – | | – |
|
|
| Net investment income (loss) | | 3,206 | | 94,529 | | – |
|
|
| |
| Realized and Unrealized Gain (Loss) | | | | | | |
| Net realized gain (loss) | | | | | | |
| Sale of underlying Price funds | | 34,695 | | (24,887) | | (489) |
| Capital gain distributions from | | | | | | |
| underlying Price funds | | 3,357 | | 15,133 | | – |
|
|
| Net realized gain (loss) | | 38,052 | | (9,754) | | (489) |
|
|
| Change in net unrealized gain (loss) | | | | | | |
| from underlying Price funds | | (35,534) | | (54,253) | | 233 |
|
|
| Net realized and unrealized gain (loss) | | 2,518 | | (64,007) | | (256) |
|
|
| |
| INCREASE (DECREASE) IN NET | | | | | | |
| ASSETS FROM OPERATIONS | $ | 5,724 | $ | 30,522 | $ | (256) |
|
|
The accompanying notes are an integral part of these financial statements.
T. ROWE PRICE SPECTRUM GROWTH FUND
Unaudited
| STATEMENT OF CHANGES IN NET ASSETS |
| ($ 000s) | | | | |
| | | 6 Months | | Year |
| | | Ended | | Ended |
| | | 6/30/05 | | 12/31/04 |
| |
| Increase (Decrease) in Net Assets | | | | |
| Operations | | | | |
| Net investment income (loss) | $ | 3,206 | $ | 18,864 |
| Net realized gain (loss) | | 38,052 | | 90,886 |
| Change in net unrealized gain (loss) | | (35,534) | | 229,890 |
|
|
| Increase (decrease) in net assets from operations | | 5,724 | | 339,640 |
|
|
| |
| Distributions to shareholders | | | | |
| Net investment income | | – | | (18,322) |
| Net realized gain | | – | | (7,634) |
|
|
| Decrease in net assets from distributions | | – | | (25,956) |
|
|
| |
| Capital share transactions * | | | | |
| Shares sold | | 191,502 | | 336,630 |
| Distributions reinvested | | – | | 25,318 |
| Shares redeemed | | (176,717) | | (307,826) |
|
|
| Increase (decrease) in net assets from capital | | | | |
| share transactions | | 14,785 | | 54,122 |
|
|
| |
| Net Assets | | | | |
| Increase (decrease) during period | | 20,509 | | 367,806 |
| Beginning of period | | 2,603,316 | | 2,235,510 |
|
|
| |
| End of period | $ | 2,623,825 | $ | 2,603,316 |
|
|
| (Including undistributed net investment income of | | | | |
| $4,122 at 6/30/05 and $916 at 12/31/04) | | | | |
| |
| *Share information | | | | |
| Shares sold | | 11,555 | | 21,859 |
| Distributions reinvested | | – | | 1,530 |
| Shares redeemed | | (10,656) | | (20,060) |
|
|
| Increase (decrease) in shares outstanding | | 899 | | 3,329 |
The accompanying notes are an integral part of these financial statements.
T. ROWE PRICE SPECTRUM INCOME FUND
Unaudited
| STATEMENT OF CHANGES IN NET ASSETS |
| ($ 000s) | | | | |
| | | 6 Months | | Year |
| | | Ended | | Ended |
| | | 6/30/05 | | 12/31/04 |
| |
| Increase (Decrease) in Net Assets | | | | |
| Operations | | | | |
| Net investment income (loss) | $ | 94,529 | $ | 167,675 |
| Net realized gain (loss) | | (9,754) | | 51,127 |
| Change in net unrealized gain (loss) | | (54,253) | | 103,803 |
|
|
| Increase (decrease) in net assets from operations | | 30,522 | | 322,605 |
|
|
| |
| Distributions to shareholders | | | | |
| Net investment income | | (94,529) | | (167,675) |
| Net realized gain | | (3,783) | | (40,165) |
|
|
| Decrease in net assets from distributions | | (98,312) | | (207,840) |
|
|
| |
| Capital share transactions * | | | | |
| Shares sold | | 660,465 | | 1,241,161 |
| Distributions reinvested | | 93,107 | | 196,747 |
| Shares redeemed | | (470,874) | | (602,725) |
|
|
| Increase (decrease) in net assets from capital | | | | |
| share transactions | | 282,698 | | 835,183 |
|
|
| |
| Net Assets | | | | |
| Increase (decrease) during period | | 214,908 | | 949,948 |
| Beginning of period | | 4,501,955 | | 3,552,007 |
|
|
| |
| End of period | $ | 4,716,863 | $ | 4,501,955 |
|
|
| (Including undistributed net investment income of | | | | |
| $0 at 6/30/05 and $0 at 12/31/04) | | | | |
| |
| *Share information | | | | |
| Shares sold | | 55,212 | | 104,888 |
| Distributions reinvested | | 7,802 | | 16,589 |
| Shares redeemed | | (39,423) | | (51,123) |
|
|
| Increase (decrease) in shares outstanding | | 23,591 | | 70,354 |
The accompanying notes are an integral part of these financial statements.
T. ROWE PRICE SPECTRUM INTERNATIONAL FUND
Unaudited
| STATEMENT OF CHANGES IN NET ASSETS |
| ($ 000s) | | | | |
| | | 6 Months | | Year |
| | | Ended | | Ended |
| | | 6/30/05 | | 12/31/04 |
| |
| Increase (Decrease) in Net Assets | | | | |
| Operations | | | | |
| Net investment income (loss) | $ | – | $ | 1,047 |
| Net realized gain (loss) | | (489) | | 366 |
| Change in net unrealized gain (loss) | | 233 | | 13,516 |
|
|
| Increase (decrease) in net assets from operations | | (256) | | 14,929 |
|
|
| |
| Distributions to shareholders | | | | |
| Net investment income | | – | | (986) |
|
|
| |
| Capital share transactions * | | | | |
| Shares sold | | 24,508 | | 39,324 |
| Distributions reinvested | | – | | 940 |
| Shares redeemed | | (12,319) | | (21,161) |
|
|
| Increase (decrease) in net assets from capital | | | | |
| share transactions | | 12,189 | | 19,103 |
|
|
| |
| Net Assets | | | | |
| Increase (decrease) during period | | 11,933 | | 33,046 |
| Beginning of period | | 112,523 | | 79,477 |
|
|
| |
| End of period | $ | 124,456 | $ | 112,523 |
|
|
| (Including undistributed net investment income of | | | | |
| $61 at 6/30/05 and $61 at 12/31/04) | | | | |
| |
| *Share information | | | | |
| Shares sold | | 2,448 | | 4,345 |
| Distributions reinvested | | – | | 97 |
| Shares redeemed | | (1,233) | | (2,356) |
|
|
| Increase (decrease) in shares outstanding | | 1,215 | | 2,086 |
The accompanying notes are an integral part of these financial statements.
Unaudited
| NOTES TO FINANCIAL STATEMENTS |
T. Rowe Price Spectrum Fund, Inc. (the corporation), is registered under the Investment Company Act of 1940 (the 1940 Act) as a nondiversified, open-end management investment company. Spectrum Growth Fund, Spectrum Income Fund, and Spectrum International Fund (collectively, the Spectrum Funds) are three portfolios established by the corporation. Spectrum Growth and Spectrum Income commenced operations on June 29, 1990, and Spectrum International commenced operations on December 31, 1996.
Each Spectrum Fund diversifies its assets within set limits among specific underlying T. Rowe Price funds (underlying Price funds). Spectrum Growth seeks long-term capital appreciation and growth of income, with current income a secondary objective. Spectrum Income seeks a high level of current income with moderate share price fluctuation. Spectrum International seeks long-term capital appreciation.
NOTE 1 - SIGNIFICANT ACCOUNTING POLICIES
Basis of Preparation The accompanying financial statements were prepared in accordance with accounting principles generally accepted in the United States of America, which require the use of estimates made by fund management. Certain prior period amounts have been restated to conform to current period presentation.
Valuation Each fund values its investments and computes its net asset value per share at the close of the New York Stock Exchange (NYSE), normally 4 p.m. ET, each day that the NYSE is open for business. Investments in the underlying Price funds are valued at their closing net asset value per share on the day of valuation. One of the underlying Price funds held by Spectrum International, the T. Rowe Price Japan Fund, is not open on certain days when Spectrum International is open. On such days, a net asset value per share is computed for the Japan Fund solely for purposes of valuing Spectrum International. The net asset value is computed in the normal manner using the most recent yen-denominated closing prices and exchange rates on the day of valuation. Investments for which these valuation procedures are inappropriate or are deemed not to reflect fair value are stated at fair value as determined in good faith by the T. Rowe Price Valuation Committee, established by the funds’ Board of Directors.
Redemption Fees A 2% fee is assessed on redemptions of Spectrum International fund shares held less than 90 days/3 months to deter short-term trading and protect the interests of long-term shareholders. Redemption fees are withheld from proceeds that shareholders receive from the sale or exchange of fund shares. The fees are paid to the fund, and are recorded as an increase to paid-in capital. The fees may cause the redemption price per share to differ from the net asset value per share.
Investment Transactions, Investment Income, and Distributions Income is recorded on an accrual basis. Income and capital gain distributions from the underlying Price funds are recorded on the ex-dividend date. Purchases and sales of the underlying Price funds are accounted for on the trade date. Realized gains and losses are reported on the identified cost basis. Distributions to the Spectrum Funds’ shareholders are recorded on the ex-dividend date. Income distributions are declared and paid by Spectrum Growth and Spectrum International on an annual basis. Income distributions are declared by Spectrum Income on a daily basis and paid monthly. Capital gain distributions, if any, are declared and paid by the fund, typically on an annual basis.
NOTE 2 - INVESTMENTS IN UNDERLYING PRICE FUNDS
Purchases and sales of the underlying Price funds for the six months ended June 30, 2005 were as follows:
| | Spectrum | Spectrum | Spectrum |
| | Growth | Income | International |
| Purchases | $159,287,000 | $782,164,000 | $14,005,000 |
| Sales | 137,887,000 | 488,384,000 | 1,813,000 |
NOTE 3 - FEDERAL INCOME TAXES
No provision for federal income taxes is required since each fund intends to continue to qualify as a regulated investment company under Subchapter M of the Internal Revenue Code and distribute to shareholders all of its taxable income and gains. Federal income tax regulations differ from generally accepted accounting principles; therefore, distributions determined in accordance with tax regulations may differ in amount or character from net investment income and realized gains for financial reporting purposes. Financial reporting records are adjusted for permanent book/tax differences to reflect tax character. Financial records are not adjusted for temporary differences. The amount and character of tax-basis distributions and composition of net assets are finalized at fiscal year-end; accordingly, tax-basis balances have not been determined as of June 30, 2005.
Each fund intends to retain realized gains to the extent of available capital loss carryforwards. As of December 31, 2004, Spectrum Growth had $62,521,000 of unused capital loss carryforwards, of which $62,521,000 expire in 2011. Spectrum International had $4,514,000 of unused capital loss carryforwards at December 31, 2004, of which $793,000 expire in 2009, $1,841,000 expire in 2010, and $1,880,000 expire in 2011.
At June 30, 2005, the cost of investments for federal income tax purposes and net unrealized gain (loss) on investments was as follows:
| | | Spectrum | | Spectrum | | Spectrum |
| | | Growth | | Income | | International |
| Cost | $ | 1,996,819,000 | $ | 4,469,647,000 | $ | 122,498,000 |
|
|
| Unrealized appreciation | | 627,005,000 | | 292,241,000 | | 6,504,000 |
| Unrealized depreciation | | – | | (44,483,000) | | (4,546,000) |
|
|
| Net unrealized | | | | | | |
| appreciation (depreciation) | $ | 627,005,000 | $ | 247,758,000 | $ | 1,958,000 |
|
|
NOTE 4 - RELATED PARTIES
T. Rowe Price Associates, Inc. (Price Associates), a wholly owned subsidiary of T. Rowe Price Group, Inc., is the investment manager for Spectrum Growth and Spectrum Income, and also serves as manager for the domestic underlying Price funds. T. Rowe Price International, Inc. (Price International), a wholly owned subsidiary of Price Associates, is the investment manager for Spectrum International and also serves as manager for the international underlying Price funds. Pursuant to various service agreements, Price Associates and its wholly owned subsidiaries provide shareholder servicing and administrative, transfer and dividend disbursing, accounting, marketing, and certain other services to the Spectrum Funds. Certain officers and directors of the Spectrum Funds are also officers and directors of Price Associates and its subsidiaries, and of the underlying Price funds.
The Spectrum Funds pay no management fees; however, Price Associates and Price International receive management fees from the underlying Price funds. The Spectrum Funds operate in accordance with the investment management and special servicing agreements between and among the corporation, the underlying Price funds, Price Associates, and, in the case of Spectrum International, Price International. Pursuant to these agreements, expenses associated with the operation of the Spectrum Funds are reimbursed by each underlying Price fund to the extent of estimated savings to it and in proportion to the average daily value of its shares owned by the Spectrum Funds. Therefore, each Spectrum Fund operates at a zero expense ratio. However, each Spectrum Fund indirectly bears its proportionate share of the management fees and operating costs of the underlying Price funds in which it invests.
The Spectrum Funds do not invest in the underlying Price funds for the purpose of exercising management or control; however, investments by the Spectrum Funds may represent a significant portion of an underlying Price fund’s net assets. At June 30, 2005, Spectrum Growth and Spectrum International Funds each held less than 25% of the outstanding shares of any underlying Price fund; Spectrum Income Fund held approximately 49.6% of the outstanding shares of the Corporate Income Fund, 41.8% of the GNMA Fund, 38.6% of the U.S. Treasury Long-Term Fund, 34.7% of the New Income Fund, 29.7% of the International Bond Fund, and 26.9% of the Emerging Market Bond Fund.
Additionally, Spectrum Income is one of several mutual funds in which certain college savings plans managed by Price Associates may invest. Shareholder servicing costs associated with each college savings plan are allocated to Spectrum Income in proportion to the average daily value of its shares owned by the college savings plan and, in turn, are borne by the underlying Price funds in accordance with the terms of the investment management and special servicing agreements. At June 30, 2005, approximately 9.8% of the outstanding shares of Spectrum Income were held by the college savings plans.
| INFORMATION ON PROXY VOTING POLICIES, PROCEDURES, AND RECORDS |
A description of the policies and procedures used by T. Rowe Price funds and portfolios to determine how to vote proxies relating to portfolio securities is available in each fund’s Statement of Additional Information, which you may request by calling 1-800-225-5132 or by accessing the SEC’s Web site, www.sec.gov. The description of our proxy voting policies and procedures is also available on our Web site, www.troweprice.com. To access it, click on the words “Company Info” at the top of our homepage for individual investors. Then, in the window that appears, click on the “Proxy Voting Policy” navigation button in the top left corner.
Each fund’s most recent annual proxy voting record is available on our Web site and through the SEC’s Web site. To access it through our Web site, follow the directions above, then click on the words “Proxy Voting Record” at the bottom of the Proxy Voting Policy page.
| HOW TO OBTAIN QUARTERLY PORTFOLIO HOLDINGS |
The fund files a complete schedule of portfolio holdings with the Securities and Exchange Commission for the first and third quarters of each fiscal year on Form N-Q. The fund’s Form N-Q is available electronically on the SEC’s Web site (www.sec.gov); hard copies may be reviewed and copied at the SEC’s Public Reference Room, 450 Fifth St. N.W., Washington, DC 20549. For more information on the Public Reference Room, call 1-800-SEC-0330.
T. ROWE PRICE SPECTRUM GROWTH FUND
| APPROVAL OF INVESTMENT MANAGEMENT AGREEMENT |
On March 2, 2005, the fund’s Board of Directors unanimously approved the investment advisory contract (“Contract”) between the fund and its investment manager, T. Rowe Price Associates, Inc. (“Manager”). The Board considered a variety of factors in connection with its review of the Contract, also taking into account information provided by the Manager during the course of the year, as discussed below:
Services Provided by the Manager
The Board considered the nature, quality, and extent of the services provided to the fund by the Manager. These services included, but were not limited to, management of the fund’s portfolio and a variety of activities related to portfolio management. The Board also reviewed the background and experience of the Manager’s senior management team and investment personnel involved in the management of the fund. The Board concluded that it was satisfied with the nature, quality, and extent of the services provided by the Manager.
Investment Performance of the Fund
The Board reviewed the fund’s average annual total return over the 1-, 3-, 5-, and 10-year periods as well as the fund’s year-by-year returns and compared these returns to previously agreed upon comparable performance measures and market data, including those supplied by Lipper and Morningstar, which are independent providers of mutual fund data. On the basis of this evaluation and the Board’s ongoing review of investment results, the Board concluded that the fund’s performance was satisfactory.
Costs, Benefits, Profits, and Economies of Scale
The Manager does not receive fees from the fund, and the fund does not bear any expenses. (The Manager does receive fees from other T. Rowe Price funds in which the fund invests.) Accordingly, the Board did not review information relating to revenues received by the Manager under the Contract. The Board did review information regarding benefits that the Manager (and its affiliates) may have realized from its relationship with the fund, including research received under “soft dollar” agreements. The Board also received information on the estimated costs incurred and profits realized by the Manager and its affiliates from advising T. Rowe Price mutual funds and concluded that the Manager’s profits were reasonable. Because the Manager does not receive fees from the fund, the Board did not consider whether the fund or other funds benefit under the fee levels set forth in the Contract from any economies of scale realized by the Manager. Nor did the Board review fees and expenses of other funds or of privately managed accounts of the Manager and its affiliates.
Approval of the Contract
As noted, the Board approved the continuation of the Contract. No single factor was considered in isolation or to be determinative to the decision. Rather, the Board concluded, in light of a weighting and balancing of all factors considered, that it was in the best interests of the fund to approve the continuation of the Contract.
T. ROWE PRICE SPECTRUM INCOME FUND
| APPROVAL OF INVESTMENT MANAGEMENT AGREEMENT |
On March 2, 2005, the fund’s Board of Directors unanimously approved the investment advisory contract (“Contract”) between the fund and its investment manager, T. Rowe Price Associates, Inc. (“Manager”). The Board considered a variety of factors in connection with its review of the Contract, also taking into account information provided by the Manager during the course of the year, as discussed below:
Services Provided by the Manager
The Board considered the nature, quality, and extent of the services provided to the fund by the Manager. These services included, but were not limited to, management of the fund’s portfolio and a variety of activities related to portfolio management. The Board also reviewed the background and experience of the Manager’s senior management team and investment personnel involved in the management of the fund. The Board concluded that it was satisfied with the nature, quality, and extent of the services provided by the Manager.
Investment Performance of the Fund
The Board reviewed the fund’s average annual total return over the 1-, 3-, 5-, and 10-year periods as well as the fund’s year-by-year returns and compared these returns to previously agreed upon comparable performance measures and market data, including those supplied by Lipper and Morningstar, which are independent providers of mutual fund data. On the basis of this evaluation and the Board’s ongoing review of investment results, the Board concluded that the fund’s performance was satisfactory.
Costs, Benefits, Profits, and Economies of Scale
The Manager does not receive fees from the fund, and the fund does not bear any expenses. (The Manager does receive fees from other T. Rowe Price funds in which the fund invests.) Accordingly, the Board did not review information relating to revenues received by the Manager under the Contract. The Board did review information regarding benefits that the Manager (and its affiliates) may have realized from its relationship with the fund, including research received under “soft dollar” agreements. The Board also received information on the estimated costs incurred and profits realized by the Manager and its affiliates from advising T. Rowe Price mutual funds and concluded that the Manager’s profits were reasonable. Because the Manager does not receive fees from the fund, the Board did not consider whether the fund or other funds benefit under the fee levels set forth in the Contract from any economies of scale realized by the Manager. Nor did the Board review fees and expenses of other funds or of privately managed accounts of the Manager and its affiliates.
Approval of the Contract
As noted, the Board approved the continuation of the Contract. No single factor was considered in isolation or to be determinative to the decision. Rather, the Board concluded, in light of a weighting and balancing of all factors considered, that it was in the best interests of the fund to approve the continuation of the Contract.
T. ROWE PRICE SPECTRUM INTERNATIONAL FUND
| APPROVAL OF INVESTMENT MANAGEMENT AGREEMENT |
On March 2, 2005, the fund’s Board of Directors unanimously approved the investment advisory contract (“Contract”) between the fund and its investment manager, T. Rowe Price International, Inc. (“Manager”). The Board considered a variety of factors in connection with its review of the Contract, also taking into account information provided by the Manager during the course of the year, as discussed below:
Services Provided by the Manager
The Board considered the nature, quality, and extent of the services provided to the fund by the Manager. These services included, but were not limited to, management of the fund’s portfolio and a variety of activities related to portfolio management. The Board also reviewed the background and experience of the Manager’s senior management team and investment personnel involved in the management of the fund. The Board had previously conducted a detailed review of the organization, structure, and investment teams of the Manager at a meeting held in October 2004. The Board concluded that it was satisfied with the nature, quality, and extent of the services provided by the Manager.
Investment Performance of the Fund
The Board reviewed the fund’s average annual total return over the 1-, 3-, and 5-year periods as well as the fund’s year-by-year returns and compared these returns to previously agreed upon comparable performance measures and market data, including those supplied by Lipper and Morningstar, which are independent providers of mutual fund data. On the basis of this evaluation and the Board’s ongoing review of investment results, the Board concluded that the fund’s results for certain time periods were less than satisfactory. The Manager provided its assessment of the fund’s investment results and reviewed steps taken to address issues raised by the Board. The Board concluded that the Manager’s response and steps taken were satisfactory.
Costs, Benefits, Profits, and Economies of Scale
The Manager does not receive fees from the fund, and the fund does not bear any expenses. (The Manager does receive fees from other T. Rowe Price funds in which the fund invests.) Accordingly, the Board did not review information relating to revenues received by the Manager under the Contract. The Board did review information regarding benefits that the Manager (and its affiliates) may have realized from its relationship with the fund, including research received under “soft dollar” agreements. The Board also received information on the estimated costs incurred and profits realized by the Manager and its affiliates from advising T. Rowe Price mutual funds and concluded that the Manager’s profits were reasonable. Because the Manager does not receive fees from the fund, the Board did not consider whether the fund or other funds benefit under the fee levels set forth in the Contract from any economies of scale realized by the Manager. Nor did the Board review fees and expenses of other funds or of privately managed accounts of the Manager and its affiliates.
Approval of the Contract
As noted, the Board approved the continuation of the Contract. No single factor was considered in isolation or to be determinative to the decision. Rather, the Board concluded, in light of a weighting and balancing of all factors considered, that it was in the best interests of the fund to approve the continuation of the Contract.
Item 2. Code of Ethics.
A code of ethics, as defined in Item 2 of Form N-CSR, applicable to its principal executive officer, principal financial officer, principal accounting officer or controller, or persons performing similar functions is filed as an exhibit to the registrant’s annual Form N-CSR. No substantive amendments were approved or waivers were granted to this code of ethics during the registrant’s most recent fiscal half-year.
Item 3. Audit Committee Financial Expert.
Disclosure required in registrant’s annual Form N-CSR.
Item 4. Principal Accountant Fees and Services.
Disclosure required in registrant’s annual Form N-CSR.
Item 5. Audit Committee of Listed Registrants.
Not applicable.
Item 6. Schedule of Investments.
Not applicable. The complete schedule of investments is included in Item 1 of this Form N-CSR.
Item 7. Disclosure of Proxy Voting Policies and Procedures for Closed-End Management Investment Companies.
Not applicable.
Item 8. Portfolio Managers of Closed-End Management Investment Companies.
Not applicable.
Item 9. Purchases of Equity Securities by Closed-End Management Investment Company and Affiliated Purchasers.
Not applicable.
Item 10. Submission of Matters to a Vote of Security Holders.
Not applicable.
Item 11. Controls and Procedures.
(a) The registrant’s principal executive officer and principal financial officer have evaluated the registrant’s disclosure controls and procedures within 90 days of this filing and have concluded that the registrant’s disclosure controls and procedures were effective, as of that date, in ensuring that information required to be disclosed by the registrant in this Form N-CSR was recorded, processed, summarized, and reported timely.
(b) The registrant’s principal executive officer and principal financial officer are aware of no change in the registrant’s internal control over financial reporting that occurred during the registrant’s second fiscal quarter covered by this report that has materially affected, or is reasonably likely to materially affect, the registrant’s internal control over financial reporting.
Item 12. Exhibits.
(a)(1) The registrant’s code of ethics pursuant to Item 2 of Form N-CSR is filed with the registrant’s annual Form N-CSR.
(2) Separate certifications by the registrant's principal executive officer and principal financial officer, pursuant to Section 302 of the Sarbanes-Oxley Act of 2002 and required by Rule 30a-2(a) under the Investment Company Act of 1940, are attached.
(3) Written solicitation to repurchase securities issued by closed-end companies: not applicable.
(b) A certification by the registrant's principal executive officer and principal financial officer, pursuant to Section 906 of the Sarbanes-Oxley Act of 2002 and required by Rule 30a-2(b) under the Investment Company Act of 1940, is attached.
| | |
SIGNATURES |
| |
| | Pursuant to the requirements of the Securities Exchange Act of 1934 and the Investment |
| Company Act of 1940, the registrant has duly caused this report to be signed on its behalf by the |
| undersigned, thereunto duly authorized. |
| |
| T. Rowe Price Spectrum Funds, Inc. |
| |
| By | /s/ James S. Riepe |
| | James S. Riepe |
| | Principal Executive Officer |
| |
| Date | August 18, 2005 |
| |
| |
| | Pursuant to the requirements of the Securities Exchange Act of 1934 and the Investment |
| Company Act of 1940, this report has been signed below by the following persons on behalf of |
| the registrant and in the capacities and on the dates indicated. |
| |
| |
| By | /s/ James S. Riepe |
| | James S. Riepe |
| | Principal Executive Officer |
| |
| Date | August 18, 2005 |
| |
| |
| |
| By | /s/ Joseph A. Carrier |
| | Joseph A. Carrier |
| | Principal Financial Officer |
| |
| Date | August 18, 2005 |