| UNITED STATES |
| SECURITIES AND EXCHANGE COMMISSION |
| Washington, D.C. 20549 |
| |
FORM N-CSR |
| |
CERTIFIED SHAREHOLDER REPORT OF REGISTERED |
MANAGEMENT INVESTMENT COMPANIES |
| |
| |
| |
| Investment Company Act File Number: 811-4998 |
|
| |
| T. Rowe Price Spectrum Fund, Inc. |
|
| (Exact name of registrant as specified in charter) |
| |
| 100 East Pratt Street, Baltimore, MD 21202 |
|
| (Address of principal executive offices) |
| |
| David Oestreicher |
| 100 East Pratt Street, Baltimore, MD 21202 |
|
| (Name and address of agent for service) |
| |
| |
| Registrant’s telephone number, including area code: (410) 345-2000 |
| |
| |
| Date of fiscal year end: December 31 |
| |
| |
| Date of reporting period: June 30, 2008 |
Item 1: Report to Shareholders| Spectrum Funds | June 30, 2008 |
The views and opinions in this report were current as of June 30, 2008. They are not guarantees of performance or investment results and should not be taken as investment advice. Investment decisions reflect a variety of factors, and the managers reserve the right to change their views about individual stocks, sectors, and the markets at any time. As a result, the views expressed should not be relied upon as a forecast of the fund’s future investment intent. The report is certified under the Sarbanes-Oxley Act, which requires mutual funds and other public companies to affirm that, to the best of their knowledge, the information in their financial reports is fairly and accurately stated in all material respects.
REPORTS ON THE WEB
Sign up for our E-mail Program, and you can begin to receive updated fund reports and prospectuses online rather than through the mail. Log in to your account at troweprice.com for more information.
Manager’s Letter
Fellow Shareholders
Global financial markets took a turn for the worse in the first half of 2008. A slowdown in the global economy, a spreading credit crunch, and soaring energy and food prices put downward pressure on equity markets worldwide. Bonds, on the other hand, weathered some interim volatility to finish the period little changed. As illustrated by the performance of the Spectrum Funds, domestic and foreign stocks suffered double-digit declines in the first six months of 2008, while bonds posted relatively flat returns.
HIGHLIGHTS
• Domestic and international stocks suffered double-digit declines, while bonds posted flat returns in the last six months.
• Spectrum Growth Fund was in line with its broad benchmark, while Spectrum International and Spectrum Income lagged.
• Broad diversification among multiple T. Rowe Price funds is at the heart of each fund’s long-term investment strategy.
• The U.S. economy will likely remain weak through the second half of 2008. Interest rates may increase to offset rising inflation, which would hinder U.S. bonds. Relatively strong growth in emerging markets is helping to offset the slowdown in the domestic economy.
MARKET ENVIRONMENT
Global economic and financial trends that took hold in late 2007 widened in scope in the first half of 2008. The U.S. housing and mortgage markets deteriorated further, providing no relief from a deepening credit crunch that hobbled liquidity in the global credit markets. As a result, financial companies around the world were saddled with substantial mortgage- and credit-related losses, leading many to seek out additional capital to bolster their balance sheets.
Inflation remained on an upward trajectory as the prices of energy, food, and other commodities soared due to strong demand from emerging markets. In the U.S., the consumer price index rose by 5% for the year ended June 30, 2008—the highest 12-month increase since 1991. Oil was the main culprit, rising approximately 45% in the first half of the year and reaching a record high of nearly $140 a barrel. However, the prices of natural gas, copper, and agricultural commodities such as corn and soybeans also rose substantially.
The combination of worsening conditions in the credit markets and rising inflation contributed to a broad slowdown in global economic growth. The most pronounced downturn occurred in the U.S., where the economy grew at an annualized rate of 1% or less in both the fourth quarter of 2007 and the first quarter of 2008. Weakness in employment and consumer spending led the Federal Reserve to cut interest rates aggressively to stave off a recession. Europe also experienced a slowdown in economic activity, though it was more modest than in the U.S. Even the rapidly growing economies in China and India slowed noticeably during the period.
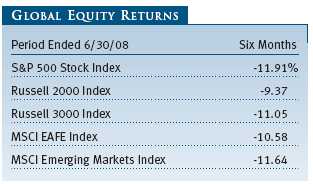
The challenging economic and credit environment weighed on U.S. stocks, which declined in the first six months of the year. Corporate profit growth decelerated as the economy slowed and higher raw materials prices squeezed profit margins. After a disastrous first quarter, the U.S. market recovered somewhat in April and May amid optimism that the economy and credit markets were on the mend, but stocks gave back the gains in June as weak economic data and financial sector losses resurfaced. The major stock indexes declined more than 10% in the six-month period. Small-cap stocks held up better than large-cap issues, and growth stocks continued to outperform value across all market capitalizations.
Foreign stocks tracked the performance of the domestic market, declining steadily amid slowing global economic growth and a general shift toward risk aversion. Despite strong returns from Latin America, emerging markets lagged as China and India—the largest of the developing markets—suffered sizable declines. Japan held up the best among developed markets, while European bourses were the weakest performers.
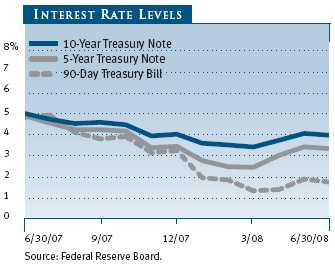
The U.S. bond market advanced modestly in the first six months of 2008. Early in the year, bonds attracted strong demand as a safe haven from the slowing economy, credit turmoil, and financial market volatility. Bonds also benefited from the Fed’s four short-term interest rate cuts in the first four months of the year. However, the bond market surrendered some of its earlier gains toward the end of the period as inflation fears drove interest rates higher and bond prices lower. The broad Lehman Brothers U.S. Aggregate Index returned 1.13% for the six months. The flight to quality lifted Treasury and mortgage-backed securities, which generated the best returns, while credit market turbulence weighed on corporate bonds.
Overseas bonds were mixed, but generally outperformed domestic fixed-income securities as the U.S. dollar continued to weaken versus major foreign currencies. The J.P. Morgan Non-U.S. Dollar Government Bond Index returned 5.47% in the first half of 2008, while the J.P. Morgan Emerging Markets Bond Index Plus returned -0.64%.
SPECTRUM GROWTH FUND
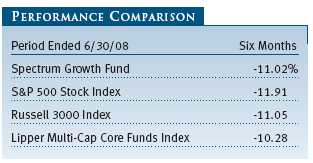
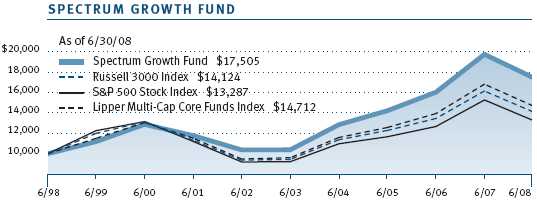
Your fund’s results in the first half of 2008 reflected the broad decline in the global equity markets. As the accompanying table shows, Spectrum Growth returned -11.02% for the six months ended June 30, 2008, outpacing its old benchmark, the S&P 500 Index, and performing in line with its new benchmark, the Russell 3000 Index. (The new benchmark represents a broader measure of U.S. equity performance and better reflects the fund’s strategy.) The fund modestly trailed the Lipper Multi-Cap Core Funds Index for the six-month period.
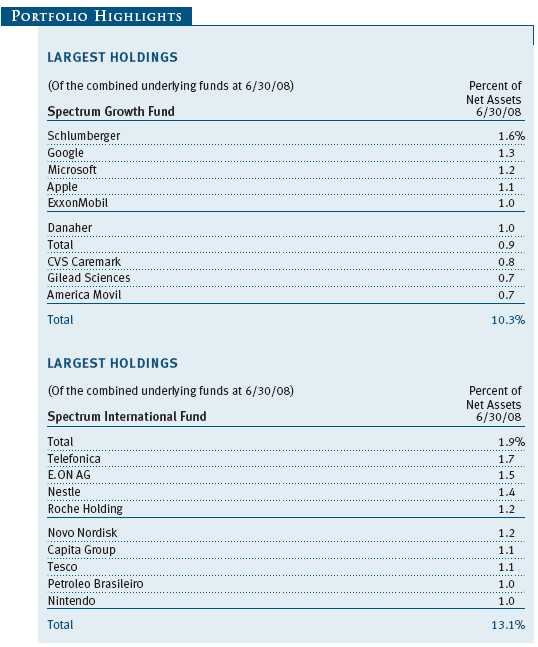
There was little variation in the performance of the portfolio’s individual components, with all but two posting declines of 10%–15%. The best-performing holding in the portfolio was Mid-Cap Value, which benefited from the general outperformance of mid-cap stocks. The fund’s growth holdings also held up well, most notably the large-cap Growth Stock and Blue Chip Growth Funds.
The weaker performers included the fund’s international holdings, with Emerging Markets Stock—the top performer in 2007—producing the worst return in the portfolio for the first half of 2008. International Growth & Income, which focuses on value stocks in developed overseas markets, also lagged during the period as value shares underperformed. The biggest laggard among domestic holdings was Equity Income, another value-oriented holding.
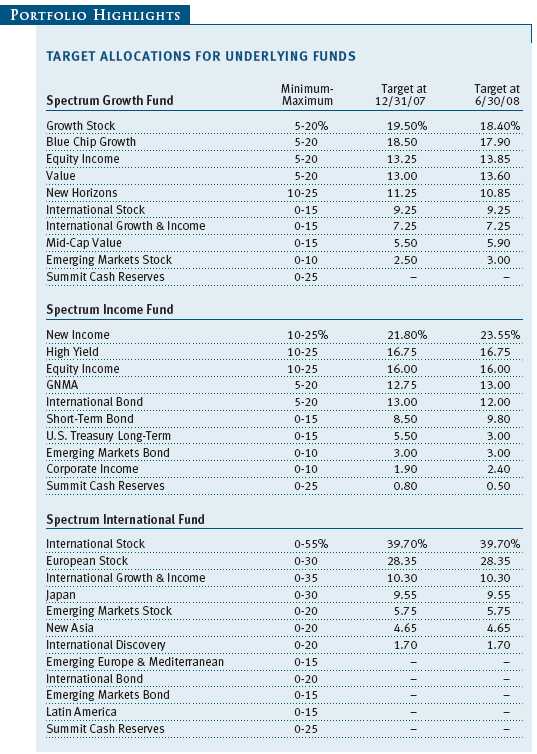
We made some adjustments to the portfolio’s asset allocation during the first half of the year. Although we still favor growth over value, the outperformance of growth stocks over the past 18 months has led us to reduce our overweight in this segment of the market. As a result, we lowered our weightings in Growth Stock and Blue Chip Growth, as well as New Horizons, our small-cap growth fund. We shifted these assets into our domestic value components—Equity Income, Value, and Mid-Cap Value. We also brought up our weighting in Emerging Markets Stock to a more neutral position after the recent underper-formance in emerging markets made valuations more reasonable.
We are also making changes to the fund’s overall investment program. Effective September 1, 2008, Mid-Cap Growth and Small-Cap Value will join the list of underlying funds in the Spectrum Growth portfolio. In addition, we plan to increase our target allocation range for Blue Chip Growth and Growth Stock in an effort to better focus on this segment of the market. Furthermore, we intend to reduce the target allocation range for New Horizons.
SPECTRUM INCOME FUND
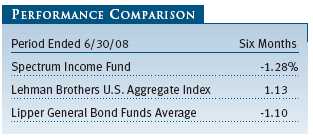
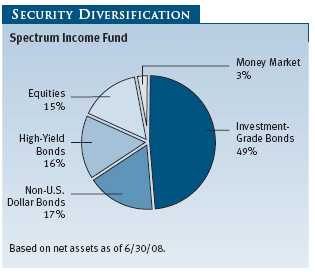
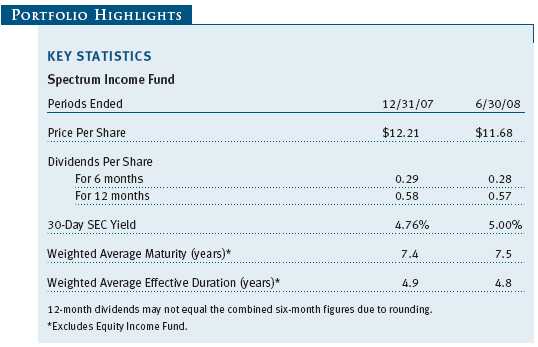
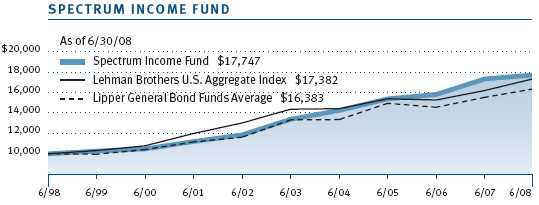
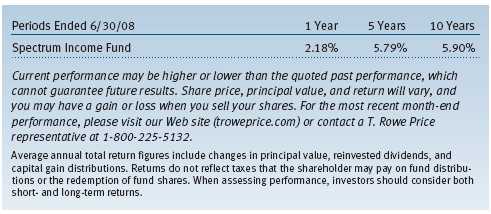
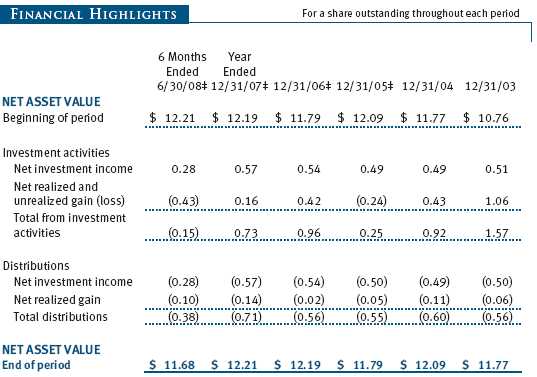
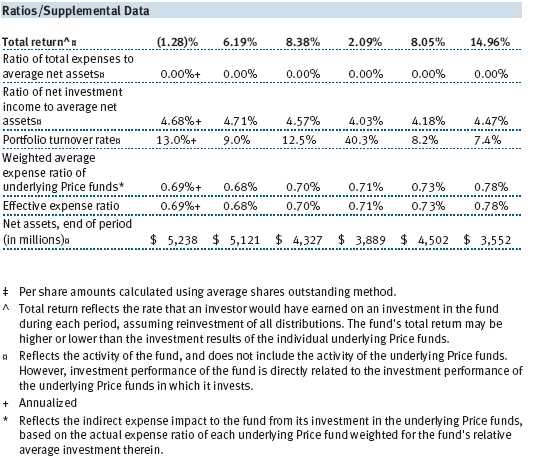
Your fund declined modestly in the first half of 2008. Spectrum Income returned -1.28% for the six months ended June 30, 2008, trailing the positive return of the Lehman Brothers U.S. Aggregate Index, but in line with the performance of the Lipper General Bond Funds Average as shown in the accompanying performance table. The fund’s underperformance of its benchmark index was driven largely by its notable position in dividend-paying stocks, which declined sharply in the first half of the year.
The portfolio’s two best performers in the first six months of 2008 were also the top performers in 2007—International Bond, which benefited from further weakness in the U.S. dollar, and U.S. Treasury Long-Term, which continued to rally as the slowing economy and financial market turmoil led investors to the relative safety of Treasury bonds. We reduced our exposure to these two funds during the period, taking profits after their strong performance over the past 18 months.
Other positive performers within the portfolio included Short-Term Bond, which benefited from the Fed’s interest rate cuts in the first four months of the period, and GNMA, which reflected the outperformance of high-quality mortgage-backed securities. New Income, the portfolio’s largest position, also advanced in the first half of the year thanks to its well-diversified bond holdings. We increased our exposure to all three of these funds over the last six months.
Equity Income, which invests in dividend-paying stocks, was by far the worst-performing component in the portfolio, declining more than 13%. High Yield also produced a negative return as expectations of higher defaults were priced into the high-yield corporate bond market. We remained slightly overweight in Equity Income and slightly underweight in High Yield.
Other decliners included two of the smallest positions in the portfolio—Emerging Markets Bond and Corporate Income. We increased our exposure to Corporate Income as valuations in the corporate bond market have become more attractive.
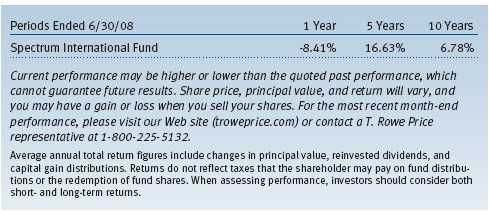
SPECTRUM INTERNATIONAL FUND
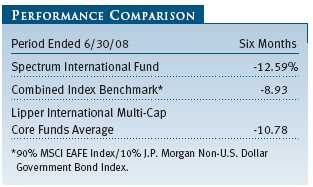
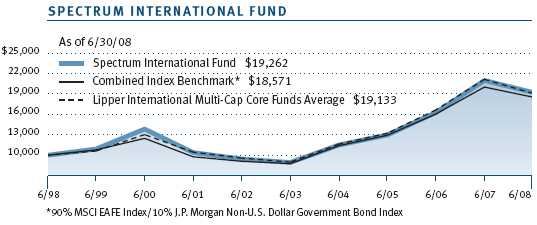
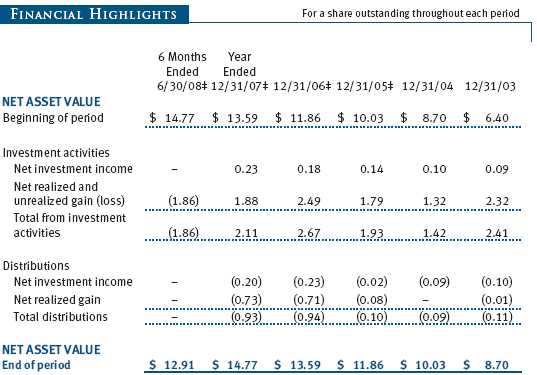
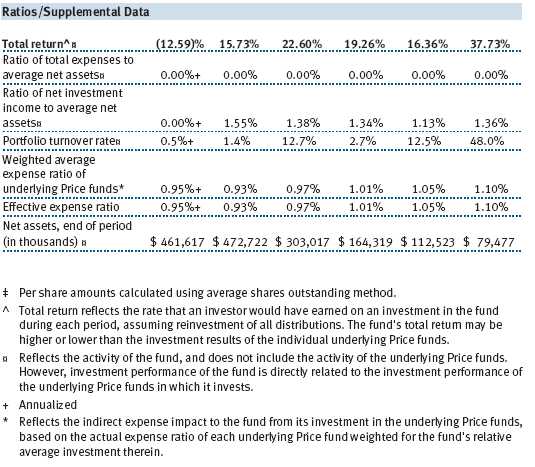
As the accompanying table illustrates, your fund declined in the first half of 2008. Spectrum International returned -12.59% for the six months ended June 30, 2008, underperforming both its combined index benchmark and the Lipper International Multi-Cap Core Funds Average. The main factor contributing to Spectrum International’s outperformance of its benchmark in 2007—noteworthy exposure to emerging markets, particularly in Asia—was responsible for its underperformance of the index in the first half of 2008.
Every component of the portfolio declined during the six-month period. New Asia, the portfolio’s best performer in 2006 and 2007, suffered the most substantial losses, falling by more than 36%. A sharp drop in the stock markets of China and India was the main reason behind New Asia’s sizable decline.
Emerging Markets Stock was another significant detractor, reflecting the general underperformance of emerging markets during the period. European Stock and the value-oriented International Growth & Income, two of the larger positions in the portfolio, also fell notably. Europe was the weakest-performing region among developed markets, while value shares underperformed on a global basis.
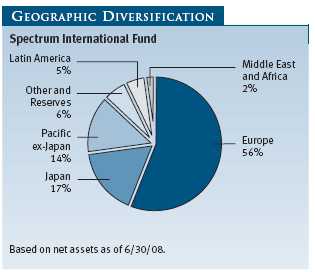
The best performer in the first half of the year was Japan, which was the only portfolio holding to decline by less than 10%. The fund’s largest holding, International Stock, also held up better than the broad international equity indexes.
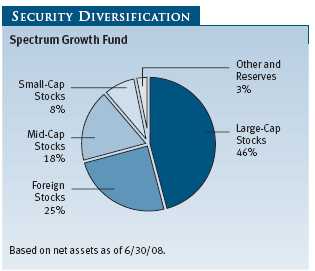
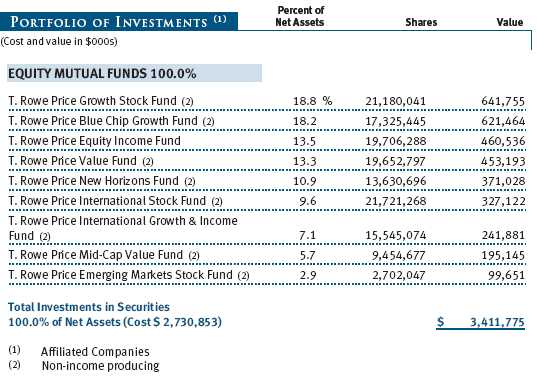
The portfolio’s individual fund weightings remained unchanged during the six-month period. Developed markets remain the primary emphasis in Spectrum International—Europe and Japan account for nearly three-quarters of the portfolio—but a meaningful position in emerging markets provides additional growth potential and diversification.
OUTLOOK
Uncertainty regarding the health of the U.S. economy has clouded the global economic outlook. Despite significant monetary and fiscal stimulus from the central bank and the federal government, recent data suggest that the U.S. economy will likely remain weak through the second half of the year. In addition, the lingering problems in the financial system have yet to be resolved, and higher input prices (resulting mainly from soaring energy costs) continue to exert pressure on corporate profits.
On the positive side, however, the financial markets have already priced in much of the bad news regarding the economic, credit, and inflationary environment. Furthermore, relatively strong growth in emerging markets is helping to offset the slowdown in the domestic economy.
Overall, the potential for additional market turmoil remains, highlighting the importance of the broad diversification found in the Spectrum Funds.
Respectfully submitted,

Edmund M. Notzon III
President of the Spectrum Funds and chairman of the Investment Advisory Committee
July 21, 2008
The committee has day-to-day responsibility for managing the portfolios
and works with committee members in developing and executing the funds’
investment program.
T. ROWE PRICE SPECTRUM FUND, INC.
SPECTRUM GROWTH FUND
SPECTRUM INCOME FUND
SUPPLEMENT TO PROSPECTUS DATED MAY 1, 2008
The following updates the Spectrum Funds’ prospectus dated May 1, 2008:
Spectrum Growth and Spectrum Income Funds are no longer subject to the restriction that they will not redeem from any underlying fund at a rate in excess of 1% of the underlying fund’s assets in any period of less than 15 days. Elimination of this restriction is designed to provide greater flexibility in managing the funds. On April 22, 2008, the Board of Directors for the Spectrum Funds approved removing the restriction but it inadvertently remained in the prospectus. The third operating policy under “Other Investment Restrictions” on page 33 is hereby deleted.
The date of this supplement is June 30, 2008.
T. ROWE PRICE SPECTRUM FUND, INC.
SPECTRUM GROWTH FUND
SUPPLEMENT TO PROSPECTUS DATED MAY 1, 2008
Please note that the T. Rowe Price Mid-Cap Growth Fund and T. Rowe Price Small-Cap Value Fund have been added to the list of funds in which T. Rowe Price Spectrum Growth Fund can invest. Initial investments in these funds will begin on September 1, 2008, or later, depending on market conditions. The prospectus sets the minimum and maximum percentages of the Spectrum Growth Fund’s portfolio that can be allocated to each underlying fund. The fund will be permitted to allocate up to 15% of its assets to the Mid-Cap Growth Fund and up to 15% of its assets to the Small-Cap Value Fund.
Additionally, the fund has changed the minimum and/or maximum percentages of its portfolio that can be allocated to other underlying funds. The percentages are set forth below:
Table 1 Asset Allocation Ranges for Underlying Funds
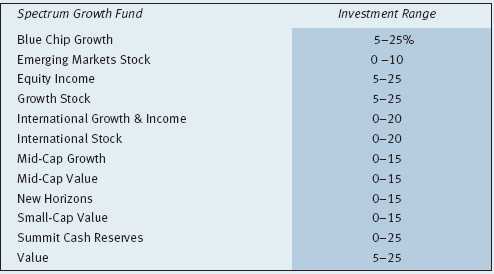
The Mid-Cap Growth Fund seeks to provide long-term capital appreciation by investing in mid-cap stocks with potential for above-average earnings growth. The Small-Cap Value Fund seeks long-term capital growth by investing primarily in small companies whose common stocks are believed to be undervalued.
The table entitled “Description of Underlying Funds” in Section 3 of the prospectus is hereby revised accordingly.
The date of this supplement is August 15, 2008.
RISKS OF INVESTING
As with all stock and bond mutual funds, each fund’s share price can fall because of weakness in the stock or bond markets, a particular industry, or specific holdings. Stock markets can decline for many reasons, including adverse political or economic developments, changes in investor psychology, or heavy institutional selling. The prospects for an industry or company may deteriorate because of a variety of factors, including disappointing earnings or changes in the competitive environment. In addition, the investment manager’s assessment of companies held in a fund may prove incorrect, resulting in losses or poor performance even in rising markets.
Bonds are subject to interest rate risk, the decline in bond prices that usually accompanies a rise in interest rates, and credit risk, the chance that any fund holding could have its credit rating downgraded, or that a bond issuer will default (fail to make timely payments of interest or principal), potentially reducing the fund’s income level and share price. High-yield corporate bonds could have greater price declines than funds that invest primarily in high-quality bonds. Companies issuing high-yield bonds are not as strong financially as those with higher credit ratings, so the bonds are usually considered speculative investments.
Funds that invest overseas may carry more risk than funds that invest strictly in U.S. assets. Risks can result from varying stages of economic and political development; differing regulatory environments, trading days, and accounting standards; and higher transaction costs of non-U.S. markets. Non-U.S. investments are also subject to currency risk, or a decline in the value of a foreign currency versus the U.S. dollar, which reduces the dollar value of securities denominated in that currency.
GLOSSARY
J.P. Morgan Non-U.S. Dollar Government Bond Index: An unmanaged index that tracks the performance of major non-U.S. bond markets.
J.P. Morgan Emerging Markets Bond Index: An unmanaged index that tracks dollar-denominated bonds issued by emerging market countries.
Lehman Brothers U.S. Aggregate Index: An unmanaged index that tracks investment-grade corporate and government bonds.
MSCI EAFE Index: An unmanaged index that tracks the stocks of about 1,000 companies in Europe, Australasia, and the Far East (EAFE).
MSCI Emerging Markets Free Index: An unmanaged index that tracks stocks in 26 emerging market countries.
Russell 2000 Index: An unmanaged index that tracks the smallest 2,000 of the largest 3,000 U.S. stocks.
S&P 500 Stock Index: An unmanaged index that tracks the stocks of 500 U.S. primarily large-cap companies.
Performance and Expenses
This chart shows the value of a hypothetical $10,000 investment in the fund over the past 10 fiscal year periods or since inception (for funds lacking 10-year records). The result is compared with benchmarks, which may include a broad-based market index and a peer group average or index. Market indexes do not include expenses, which are deducted from fund returns as well as mutual fund averages and indexes.
| AVERAGE ANNUAL COMPOUND TOTAL RETURN |
This table shows how the fund would have performed each year if its actual (or cumulative) returns had been earned at a constant rate.
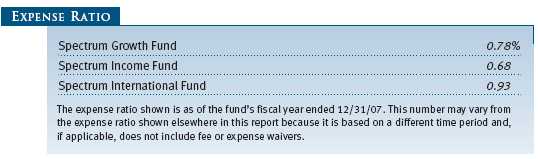
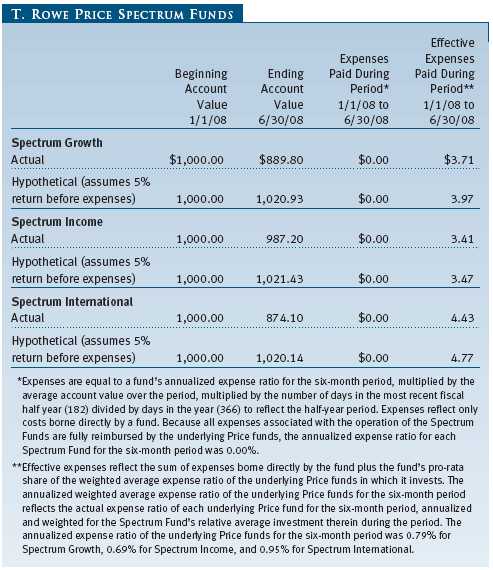
As a mutual fund shareholder, you may incur two types of costs: (1) transaction costs, such as redemption fees or sales loads, and (2) ongoing costs, including management fees, distribution and service (12b-1) fees, and other fund expenses. The following example is intended to help you understand your ongoing costs (in dollars) of investing in the fund and to compare these costs with the ongoing costs of investing in other mutual funds. The example is based on an investment of $1,000 invested at the beginning of the most recent six-month period and held for the entire period.
Actual Expenses
The first line of the following table (“Actual”) provides information about actual account values and expenses based on the fund’s actual returns. You may use the information in this line, together with your account balance, to estimate the expenses that you paid over the period. Simply divide your account value by $1,000 (for example, an $8,600 account value divided by $1,000 = 8.6), then multiply the result by the number in the first line under the heading “Expenses Paid During Period” to estimate the expenses you paid on your account during this period.
Hypothetical Example for Comparison Purposes
The information on the second line of the table (“Hypothetical”) is based on hypothetical account values and expenses derived from the fund’s actual expense ratio and an assumed 5% per year rate of return before expenses (not the fund’s actual return). You may compare the ongoing costs of investing in the fund with other funds by contrasting this 5% hypothetical example and the 5% hypothetical examples that appear in the shareholder reports of the other funds. The hypothetical account values and expenses may not be used to estimate the actual ending account balance or expenses you paid for the period.
Note: T. Rowe Price charges an annual small-account maintenance fee of $10, generally for accounts with less than $2,000 ($500 for UGMA/UTMA). The fee is waived for any investor whose T. Rowe Price mutual fund accounts total $25,000 or more, accounts employing automatic investing, and IRAs and other retirement plan accounts that utilize a prototype plan sponsored by T. Rowe Price (although a separate custodial or administrative fee may apply to such accounts). This fee is not included in the accompanying table. If you are subject to the fee, keep it in mind when you are estimating the ongoing expenses of investing in the fund and when comparing the expenses of this fund with other funds.
You should also be aware that the expenses shown in the table highlight only your ongoing costs and do not reflect any transaction costs, such as redemption fees or sales loads. Therefore, the second line of the table is useful in comparing ongoing costs only and will not help you determine the relative total costs of owning different funds. To the extent a fund charges transaction costs, however, the total cost of owning that fund is higher.
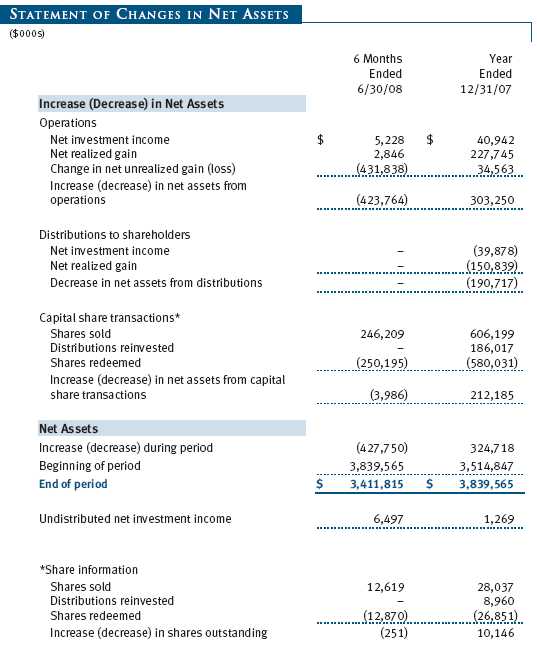
T. ROWE PRICE SPECTRUM GROWTH FUND
Unaudited
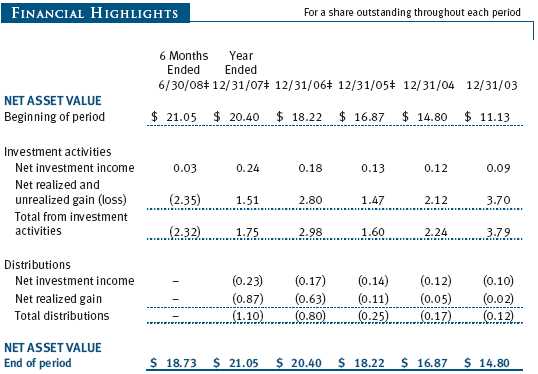
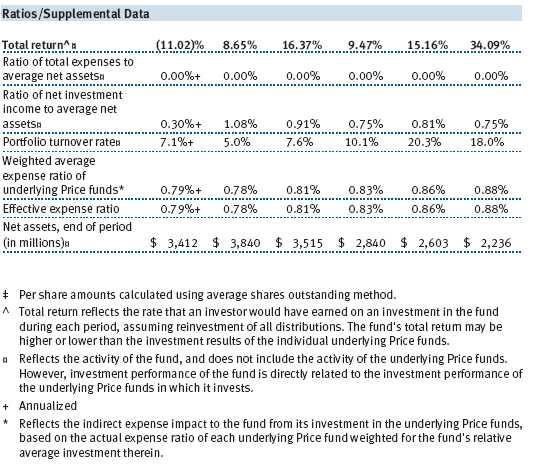
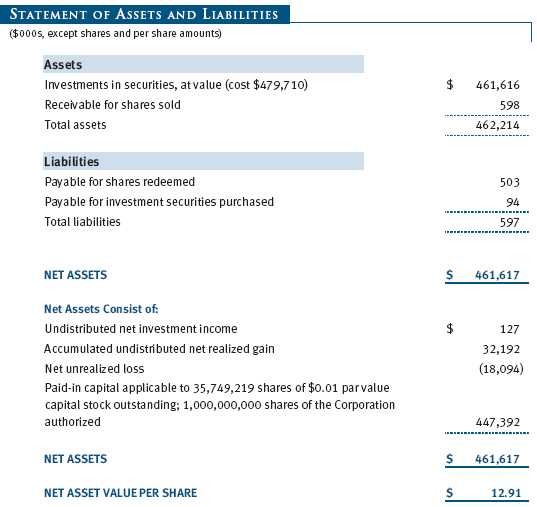
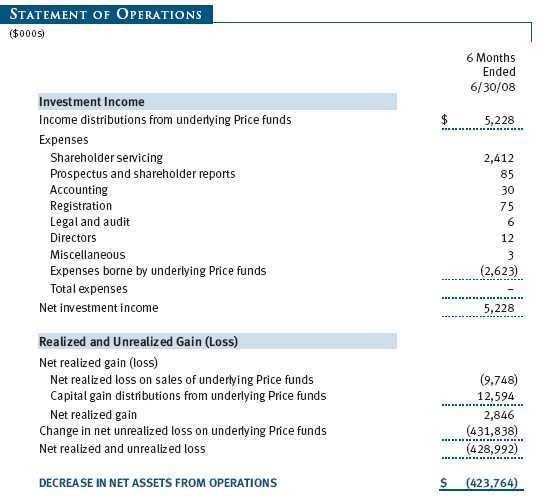
The accompanying notes are an integral part of these financial statements.
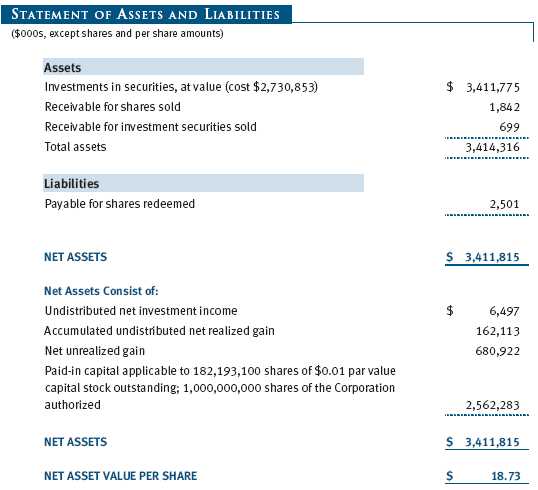
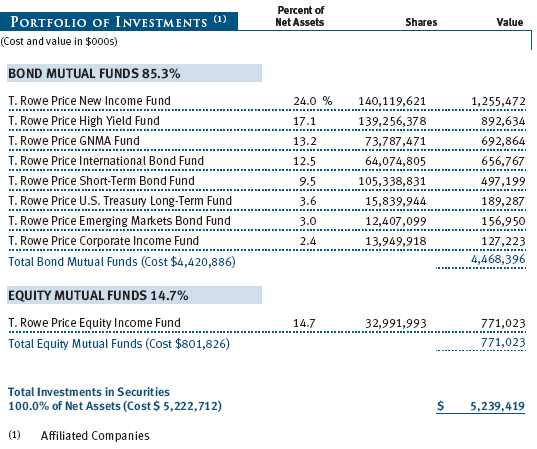
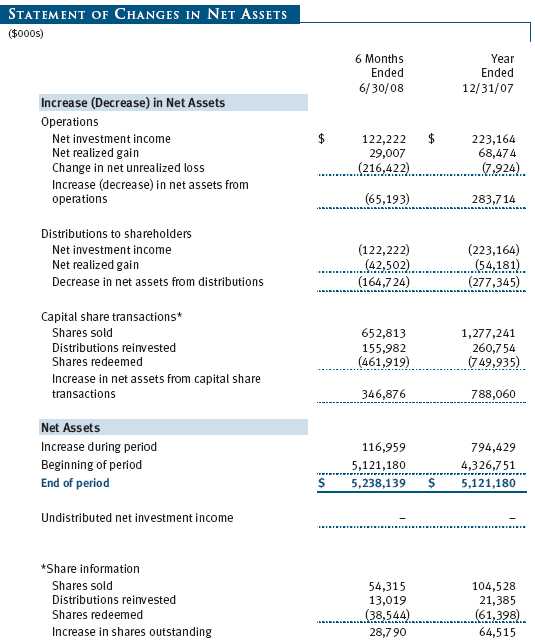
T. ROWE PRICE SPECTRUM INCOME FUND
Unaudited
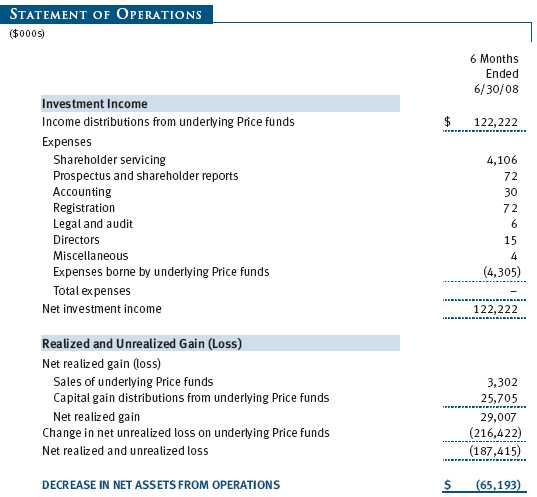
The accompanying notes are an integral part of these financial statements.
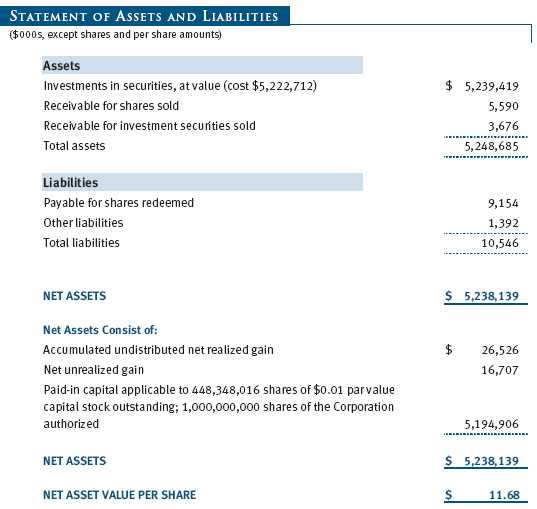
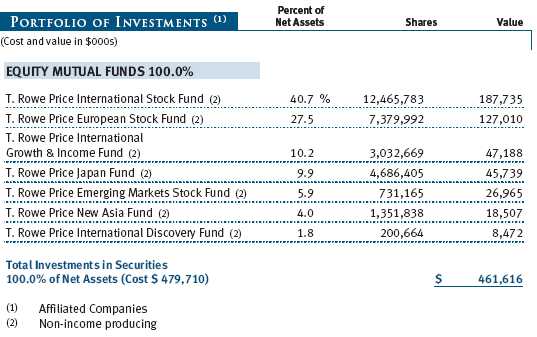
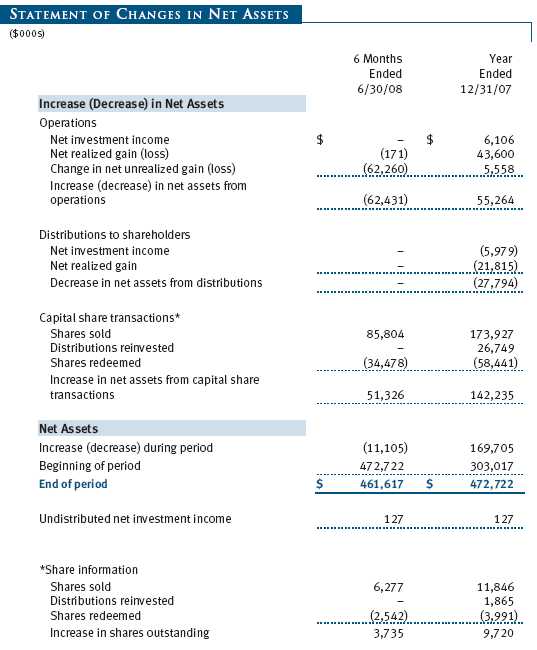
T. ROWE PRICE SPECTRUM INTERNATIONAL FUND
Unaudited
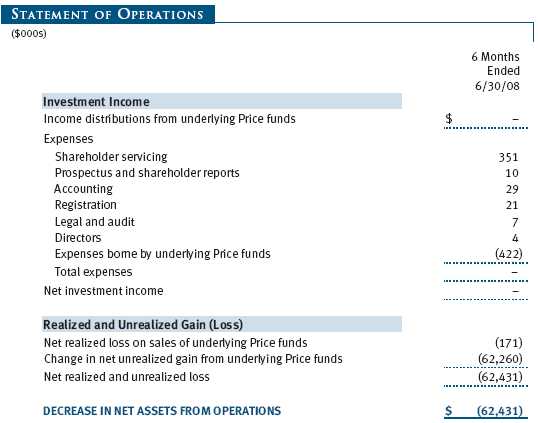
The accompanying notes are an integral part of these financial statements.
T. ROWE PRICE SPECTRUM GROWTH FUND
Unaudited
The accompanying notes are an integral part of these financial statements.
T. ROWE PRICE SPECTRUM GROWTH FUND
Unaudited
The accompanying notes are an integral part of these financial statements.
T. ROWE PRICE SPECTRUM INCOME FUND
Unaudited
The accompanying notes are an integral part of these financial statements.
T. ROWE PRICE SPECTRUM INCOME FUND
Unaudited
The accompanying notes are an integral part of these financial statements.
T. ROWE PRICE SPECTRUM INTERNATIONAL FUND
Unaudited
The accompanying notes are an integral part of these financial statements.
T. ROWE PRICE SPECTRUM INTERNATIONAL FUND
Unaudited
The accompanying notes are an integral part of these financial statements.
T. ROWE PRICE SPECTRUM GROWTH FUND
Unaudited
The accompanying notes are an integral part of these financial statements.
T. ROWE PRICE SPECTRUM INCOME FUND
Unaudited
The accompanying notes are an integral part of these financial statements.
T. ROWE PRICE SPECTRUM INTERNATIONAL FUND
Unaudited
The accompanying notes are an integral part of these financial statements.
T. ROWE PRICE SPECTRUM FUNDS
Unaudited
| NOTES TO FINANCIAL STATEMENTS |
T. Rowe Price Spectrum Fund, Inc. (the corporation), is registered under the Investment Company Act of 1940 (the 1940 Act) as a nondiversified, open-end management investment company. Spectrum Growth Fund, Spectrum Income Fund, and Spectrum International Fund (collectively, the Spectrum Funds) are three portfolios established by the corporation. Spectrum Growth and Spectrum Income commenced operations on June 29, 1990, and Spectrum International commenced operations on December 31, 1996.
Each Spectrum Fund diversifies its assets within set limits among specific underlying T. Rowe Price funds (underlying Price funds). Spectrum Growth seeks long-term capital appreciation and growth of income with current income a secondary objective. Spectrum Income seeks a high level of current income with moderate share price fluctuation. Spectrum International seeks long-term capital appreciation.
NOTE 1 - SIGNIFICANT ACCOUNTING POLICIES
Basis of Preparation The accompanying financial statements were prepared in accordance with accounting principles generally accepted in the United States of America, which require the use of estimates made by fund management. Fund management believes that estimates and valuations of the underlying Price funds are appropriate; however, actual results may differ from those estimates, and the valuations reflected in the financial statements may differ from the value the funds receive upon sale of the underlying Price funds.
Investment Transactions, Investment Income, and Distributions Income is recorded on the accrual basis. Income and capital gain distributions from the underlying Price funds are recorded on the ex-dividend date. Purchases and sales of the underlying Price funds are accounted for on the trade date. Income tax-related interest and penalties, if incurred, would be recorded as income tax expense. Realized gains and losses are reported on the identified cost basis. Distributions to the Spectrum Funds’ shareholders are recorded on the ex-dividend date. Income distributions are declared by Spectrum Income on a daily basis and paid monthly. Income distributions are declared and paid by Spectrum Growth and Spectrum International on an annual basis. Capital gain distributions, if any, are declared and paid by the fund, typically on an annual basis.
Redemption Fees A 2% fee is assessed on redemptions of Spectrum International Fund shares held for 90 days or less to deter short-term trading and to protect the interests of long-term shareholders. Redemption fees are withheld from proceeds that shareholders receive from the sale or exchange of fund shares and are paid to the fund. Redemption fees received by the fund are allocated to each underlying Price fund in proportion to the average daily value of its shares owned by the fund. Accordingly, redemption fees have no effect on the net assets of the fund.
New Accounting Pronouncements On January 1, 2008, the funds adopted Statement of Financial Accounting Standards No. 157 (FAS 157), Fair Value Measurements. FAS 157 defines fair value, establishes the framework for measuring fair value, and expands the disclosures of fair value measurements in the financial statements. Adoption of FAS 157 did not have a material impact on the funds’ net assets or results of operations.
In March 2008, the Financial Accounting Standards Board issued Statement of Financial Accounting Standards No. 161, Disclosures about Derivative Instruments and Hedging Activities (FAS 161), which is effective for fiscal years and interim periods beginning after November 15, 2008. FAS 161 requires enhanced disclosures about derivative and hedging activities, including how such activities are accounted for and their effect on financial position, performance and cash flows. Management is currently evaluating the impact the adoption of FAS 161 will have on the funds’ financial statements and related disclosures.
NOTE 2 - VALUATION
Each fund’s investments are reported at fair value as defined under FAS 157. Each fund values its investments and computes its net asset value per share at the close of the New York Stock Exchange (NYSE), normally 4 p.m. ET, each day that the NYSE is open for business. Investments in the underlying Price funds are valued at their closing net asset value per share on the day of valuation. Investments for which these valuation procedures are inappropriate or are deemed not to reflect fair value are stated at fair value as determined in good faith by the T. Rowe Price Valuation Committee, established by the funds’ Board of Directors.
Various inputs are used to determine the value of the funds’ investments. These inputs are summarized in the three broad levels listed below:
Level 1 – quoted prices in active markets for identical securities
Level 2 – observable inputs other than Level 1 quoted prices (including, but not limited to, quoted prices for similar securities, interest rates, prepayment speeds, and credit risk)
Level 3 – unobservable inputs
Observable inputs are those based on market data obtained from sources independent of the funds, and unobservable inputs reflect the funds’ own assumptions based on the best information available. The input levels are not necessarily an indication of the risk or liquidity associated with investments at that level. The funds’ investments are summarized by level, based on the inputs used to determine their values. On June 30, 2008, all of the investments in underlying Price funds were classified as Level 1.
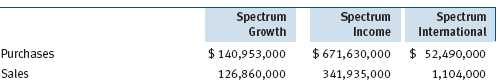
NOTE 3 - INVESTMENTS IN UNDERLYING PRICE FUNDS
Purchases and sales of the underlying Price funds for the six-months period ended June 30, 2008, were as follows:
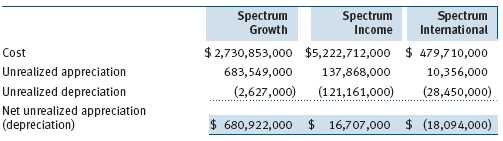
NOTE 4 - FEDERAL INCOME TAXES
No provision for federal income taxes is required since each fund intends to continue to qualify as a regulated investment company under Subchapter M of the Internal Revenue Code and distribute to shareholders all of its taxable income and gains. Distributions are determined in accordance with Federal income tax regulations, which differ from generally accepted accounting principles, and, therefore, may differ in amount or character from net investment income and realized gains for financial reporting purposes. Financial reporting records are adjusted for permanent book/tax differences to reflect tax character but are not adjusted for temporary differences. The amount and character of tax-basis distributions and composition of net assets are finalized at fiscal year-end; accordingly, tax-basis balances have not been determined as of June 30, 2008.
At June 30, 2008, the cost of investments for federal income tax purposes and net unrealized gain (loss) on investments was as follows:
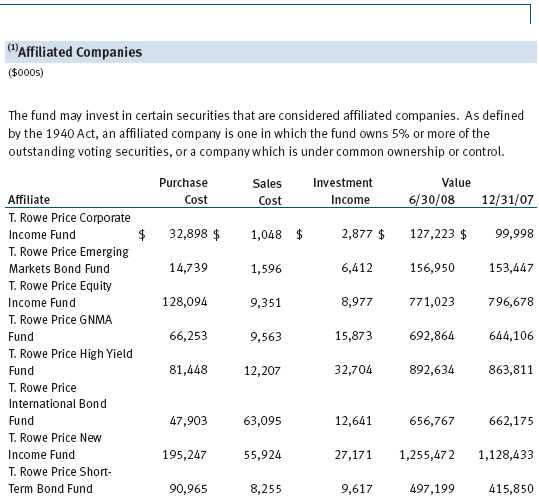
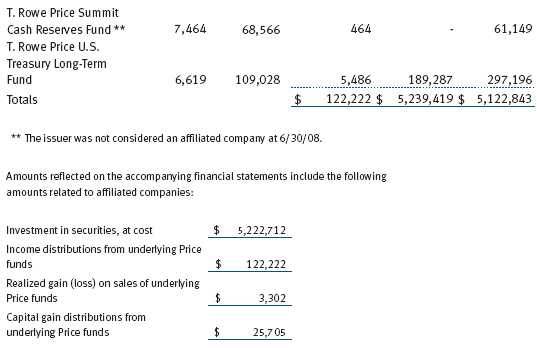
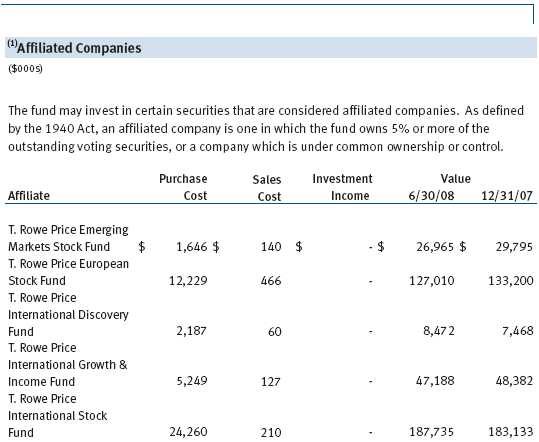
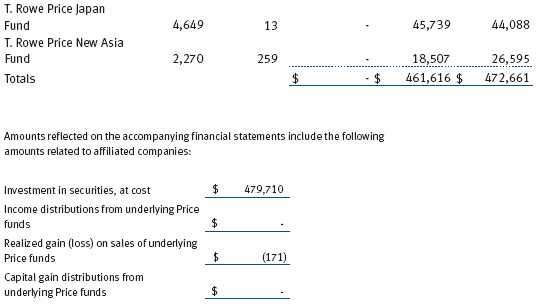
NOTE 5 - RELATED PARTIES
T. Rowe Price Associates, Inc. (Price Associates), a wholly owned subsidiary of T. Rowe Price Group, Inc., is the investment manager for Spectrum Growth and Spectrum Income, and also serves as manager for the domestic underlying Price funds. T. Rowe Price International, Inc. (Price International), a wholly owned subsidiary of Price Associates, is the investment manager for Spectrum International and also serves as manager for the international underlying Price funds. Pursuant to various service agreements, Price Associates and its wholly owned subsidiaries provide shareholder servicing and administrative, transfer and dividend disbursing, accounting, marketing, and certain other services to the Spectrum Funds. Certain officers and directors of the Spectrum Funds are also officers and directors of Price Associates and its subsidiaries, and of the underlying Price funds.
The Spectrum Funds pay no management fees; however, Price Associates and Price International receive management fees from the underlying Price funds. The Spectrum Funds operate in accordance with the investment management and special servicing agreements between and among the corporation, the underlying Price funds, Price Associates, and, in the case of Spectrum International, Price International. Pursuant to these agreements, expenses associated with the operation of the Spectrum Funds are borne by each underlying Price fund to the extent of estimated savings to it and in proportion to the average daily value of its shares owned by the Spectrum Funds. Therefore, each Spectrum Fund operates at a zero expense ratio. However, each Spectrum Fund indirectly bears its proportionate share of the management fees and operating costs of the underlying Price funds in which it invests.
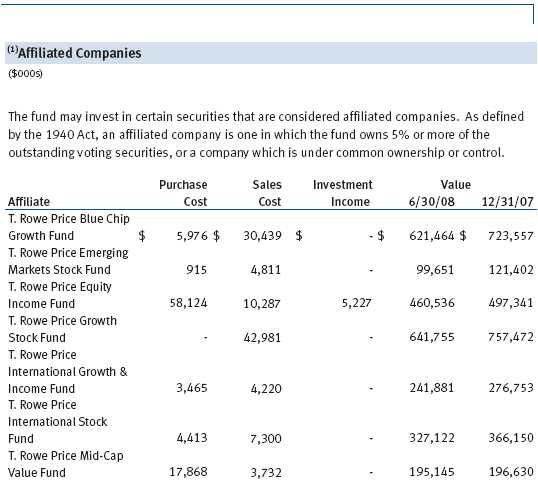
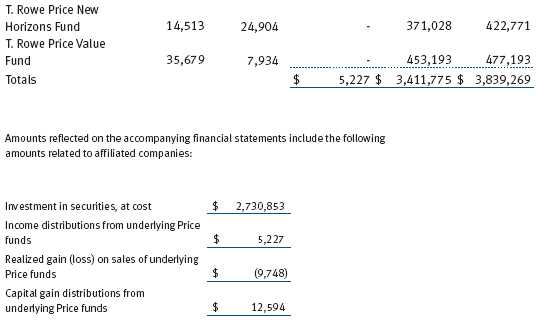
The Spectrum Funds do not invest in the underlying Price funds for the purpose of exercising management or control; however, investments by the Spectrum Funds may represent a significant portion of an underlying Price fund’s net assets. At June 30, 2008, Spectrum Growth and Spectrum International Funds each held less than 25% of the outstanding shares of any underlying Price fund; Spectrum Income Fund held approximately 51% of the outstanding shares of the Corporate Income Fund, 49% of the GNMA Fund, 49% of the U.S. Treasury Long-Term Fund, 27% of the Short-Term Bond Fund and 25% of the International Bond Fund.
Additionally, Spectrum Income Fund is one of several mutual funds in which certain college savings plans managed by Price Associates may invest. Shareholder servicing costs associated with each college savings plan are allocated to Spectrum Income Fund in proportion to the average daily value of its shares owned by the college savings plan and, in turn, are borne by the underlying Price funds in accordance with the terms of the investment management and special servicing agreements. At June 30, 2008, approximately 18% of the outstanding shares of Spectrum Income Fund were held by the college savings plans.
As of June 30, 2008, T. Rowe Price Group, Inc., and/or its wholly owned subsidiaries owned 2,465,341 shares of the Spectrum Growth Fund, representing 1% of the fund’s net assets.
| INFORMATION ON PROXY VOTING POLICIES, PROCEDURES, AND RECORDS |
A description of the policies and procedures used by T. Rowe Price funds and portfolios to determine how to vote proxies relating to portfolio securities is available in each fund’s Statement of Additional Information, which you may request by calling 1-800-225-5132 or by accessing the SEC’s Web site, www.sec.gov. The description of our proxy voting policies and procedures is also available on our Web site, www.troweprice.com. To access it, click on the words “Company Info” at the top of our homepage for individual investors. Then, in the window that appears, click on the “Proxy Voting Policy” navigation button in the top left corner.
Each fund’s most recent annual proxy voting record is available on our Web site and through the SEC’s Web site. To access it through our Web site, follow the directions above, then click on the words “Proxy Voting Record” at the bottom of the Proxy Voting Policy page.
| HOW TO OBTAIN QUARTERLY PORTFOLIO HOLDINGS |
The fund files a complete schedule of portfolio holdings with the Securities and Exchange Commission for the first and third quarters of each fiscal year on Form N-Q. The fund’s Form N-Q is available electronically on the SEC’s Web site (www.sec.gov); hard copies may be reviewed and copied at the SEC’s Public Reference Room, 450 Fifth St. N.W., Washington, DC 20549. For more information on the Public Reference Room, call 1-800-SEC-0330.
T. ROWE PRICE SPECTRUM GROWTH FUND
| APPROVAL OF INVESTMENT MANAGEMENT AGREEMENT |
On March 4, 2008, the fund’s Board of Directors (Board) unanimously approved the investment advisory contract (Contract) between the fund and its investment manager, T. Rowe Price Associates, Inc. (Manager). The Board considered a variety of factors in connection with its review of the Contract, also taking into account information provided by the Manager during the course of the year, as discussed below:
Services Provided by the Manager
The Board considered the nature, quality, and extent of the services provided to the fund by the Manager. These services included, but were not limited to, management of the fund’s portfolio and a variety of related activities, as well as financial and administrative services, reporting, and communications. The Board also reviewed the background and experience of the Manager’s senior management team and investment personnel involved in the management of the fund. The Board concluded that it was satisfied with the nature, quality, and extent of the services provided by the Manager.
Investment Performance of the Fund
The Board reviewed the fund’s average annual total returns over the 1-, 3-, 5-, and 10-year periods as well as the fund’s year-by-year returns and compared these returns with previously agreed upon comparable performance measures and market data, including those supplied by Lipper and Morningstar, which are independent providers of mutual fund data. On the basis of this evaluation and the Board’s ongoing review of investment results, the Board concluded that the fund’s performance was satisfactory.
Costs, Benefits, Profits, and Economies of Scale
The Manager does not receive fees from the fund, and expenses of the fund are borne by the underlying funds in which it invests pursuant to a Special Servicing Agreement. The Manager does receive fees from other T. Rowe Price funds in which the fund invests. Accordingly, the Board did not review information relating to revenues received by the Manager under the Contract. The Board did review information regarding benefits that the Manager (and its affiliates) may have realized from its relationship with the fund, including research received under “soft dollar” agreements. The Board noted that soft dollars were not used to pay for third-party, non-broker research. The Board also received information on the estimated costs incurred and profits realized by the Manager and its affiliates from advising T. Rowe Price mutual funds and concluded that the Manager’s profits were reasonable. Because the Manager does not receive fees from the fund, the Board did not consider whether the fund or other funds benefit under the fee levels set forth in the Contract from any economies of scale realized by the Manager. Nor did the Board review fees and expenses of other funds or of privately managed accounts of the Manager and its affiliates.
Approval of the Contract
As noted, the Board approved the continuation of the Contract. No single factor was considered in isolation or to be determinative to the decision. Rather, the Board concluded, in light of a weighting and balancing of all factors considered, that it was in the best interests of the fund to approve the continuation of the Contract.
T. ROWE PRICE SPECTRUM INCOME FUND
| APPROVAL OF INVESTMENT MANAGEMENT AGREEMENT |
On March 4, 2008, the fund’s Board of Directors (Board) unanimously approved the investment advisory contract (Contract) between the fund and its investment manager, T. Rowe Price Associates, Inc. (Manager). The Board considered a variety of factors in connection with its review of the Contract, also taking into account information provided by the Manager during the course of the year, as discussed below:
Services Provided by the Manager
The Board considered the nature, quality, and extent of the services provided to the fund by the Manager. These services included, but were not limited to, management of the fund’s portfolio and a variety of related activities, as well as financial and administrative services, reporting, and communications. The Board also reviewed the background and experience of the Manager’s senior management team and investment personnel involved in the management of the fund. The Board concluded that it was satisfied with the nature, quality, and extent of the services provided by the Manager.
Investment Performance of the Fund
The Board reviewed the fund’s average annual total returns over the 1-, 3-, 5-, and 10-year periods as well as the fund’s year-by-year returns and compared these returns with previously agreed upon comparable performance measures and market data, including those supplied by Lipper and Morningstar, which are independent providers of mutual fund data. On the basis of this evaluation and the Board’s ongoing review of investment results, the Board concluded that the fund’s performance was satisfactory.
Costs, Benefits, Profits, and Economies of Scale
The Manager does not receive fees from the fund, and expenses of the fund are borne by the underlying funds in which it invests pursuant to a Special Servicing Agreement. The Manager does receive fees from other T. Rowe Price funds in which the fund invests. Accordingly, the Board did not review information relating to revenues received by the Manager under the Contract. The Board did review information regarding benefits that the Manager (and its affiliates) may have realized from its relationship with the fund, including research received under “soft dollar” agreements. The Board noted that soft dollars were not used to pay for third-party, non-broker research. The Board also received information on the estimated costs incurred and profits realized by the Manager and its affiliates from advising T. Rowe Price mutual funds and concluded that the Manager’s profits were reasonable. Because the Manager does not receive fees from the fund, the Board did not consider whether the fund or other funds benefit under the fee levels set forth in the Contract from any economies of scale realized by the Manager. Nor did the Board review fees and expenses of other funds or of privately managed accounts of the Manager and its affiliates.
Approval of the Contract
As noted, the Board approved the continuation of the Contract. No single factor was considered in isolation or to be determinative to the decision. Rather, the Board concluded, in light of a weighting and balancing of all factors considered, that it was in the best interests of the fund to approve the continuation of the Contract.
T. ROWE PRICE SPECTRUM INTERNATIONAL FUND
| APPROVAL OF INVESTMENT MANAGEMENT AGREEMENT |
On March 4, 2008, the fund’s Board of Directors (Board) unanimously approved the investment advisory contract (Contract) between the fund and its investment manager, T. Rowe Price International, Inc. (Manager). The Board considered a variety of factors in connection with its review of the Contract, also taking into account information provided by the Manager during the course of the year, as discussed below:
Services Provided by the Manager
The Board considered the nature, quality, and extent of the services provided to the fund by the Manager. These services included, but were not limited to, management of the fund’s portfolio and a variety of related activities, as well as financial and administrative services, reporting, and communications. The Board also reviewed the background and experience of the Manager’s senior management team and investment personnel involved in the management of the fund. The Board concluded that it was satisfied with the nature, quality, and extent of the services provided by the Manager.
Investment Performance of the Fund
The Board reviewed the fund’s average annual total returns over the 1-, 3-, 5-, and 10-year periods as well as the fund’s year-by-year returns and compared these returns with previously agreed upon comparable performance measures and market data, including those supplied by Lipper and Morningstar, which are independent providers of mutual fund data. On the basis of this evaluation and the Board’s ongoing review of investment results, the Board concluded that the fund’s performance was satisfactory.
Costs, Benefits, Profits, and Economies of Scale
The Manager does not receive fees from the fund, and expenses of the fund are borne by the underlying funds in which it invests pursuant to a Special Servicing Agreement. The Manager does receive fees from other T. Rowe Price funds in which the fund invests. Accordingly, the Board did not review information relating to revenues received by the Manager under the Contract. The Board did review information regarding benefits that the Manager (and its affiliates) may have realized from its relationship with the fund, including research received under “soft dollar” agreements. The Board noted that soft dollars were not used to pay for third-party, non-broker research. The Board also received information on the estimated costs incurred and profits realized by the Manager and its affiliates from advising T. Rowe Price mutual funds and concluded that the Manager’s profits were reasonable. Because the Manager does not receive fees from the fund, the Board did not consider whether the fund or other funds benefit under the fee levels set forth in the Contract from any economies of scale realized by the Manager. Nor did the Board review fees and expenses of other funds or of privately managed accounts of the Manager and its affiliates.
Approval of the Contract
As noted, the Board approved the continuation of the Contract. No single factor was considered in isolation or to be determinative to the decision. Rather, the Board concluded, in light of a weighting and balancing of all factors considered, that it was in the best interests of the fund to approve the continuation of the Contract.
Item 2. Code of Ethics.
A code of ethics, as defined in Item 2 of Form N-CSR, applicable to its principal executive officer, principal financial officer, principal accounting officer or controller, or persons performing similar functions is filed as an exhibit to the registrant’s annual Form N-CSR. No substantive amendments were approved or waivers were granted to this code of ethics during the registrant’s most recent fiscal half-year.
Item 3. Audit Committee Financial Expert.
Disclosure required in registrant’s annual Form N-CSR.
Item 4. Principal Accountant Fees and Services.
Disclosure required in registrant’s annual Form N-CSR.
Item 5. Audit Committee of Listed Registrants.
Not applicable.
Item 6. Investments.
(a) Not applicable. The complete schedule of investments is included in Item 1 of this Form N-CSR.
(b) Not applicable.
Item 7. Disclosure of Proxy Voting Policies and Procedures for Closed-End Management Investment Companies.
Not applicable.
Item 8. Portfolio Managers of Closed-End Management Investment Companies.
Not applicable.
Item 9. Purchases of Equity Securities by Closed-End Management Investment Company and Affiliated Purchasers.
Not applicable.
Item 10. Submission of Matters to a Vote of Security Holders.
Not applicable.
Item 11. Controls and Procedures.
(a) The registrant’s principal executive officer and principal financial officer have evaluated the registrant’s disclosure controls and procedures within 90 days of this filing and have concluded that the registrant’s disclosure controls and procedures were effective, as of that date, in ensuring that information required to be disclosed by the registrant in this Form N-CSR was recorded, processed, summarized, and reported timely.
(b) The registrant’s principal executive officer and principal financial officer are aware of no change in the registrant’s internal control over financial reporting that occurred during the registrant’s second fiscal quarter covered by this report that has materially affected, or is reasonably likely to materially affect, the registrant’s internal control over financial reporting.
Item 12. Exhibits.
(a)(1) The registrant’s code of ethics pursuant to Item 2 of Form N-CSR is filed with the registrant’s annual Form N-CSR.
(2) Separate certifications by the registrant's principal executive officer and principal financial officer, pursuant to Section 302 of the Sarbanes-Oxley Act of 2002 and required by Rule 30a-2(a) under the Investment Company Act of 1940, are attached.
(3) Written solicitation to repurchase securities issued by closed-end companies: not applicable.
(b) A certification by the registrant's principal executive officer and principal financial officer, pursuant to Section 906 of the Sarbanes-Oxley Act of 2002 and required by Rule 30a-2(b) under the Investment Company Act of 1940, is attached.
| | |
SIGNATURES |
| |
| | Pursuant to the requirements of the Securities Exchange Act of 1934 and the Investment |
| Company Act of 1940, the registrant has duly caused this report to be signed on its behalf by the |
| undersigned, thereunto duly authorized. |
| |
| T. Rowe Price Spectrum Fund, Inc. |
| |
| |
| |
| By | /s/ Edward C. Bernard |
| | Edward C. Bernard |
| | Principal Executive Officer |
| |
| Date | August 20, 2008 |
| |
| |
| |
| | Pursuant to the requirements of the Securities Exchange Act of 1934 and the Investment |
| Company Act of 1940, this report has been signed below by the following persons on behalf of |
| the registrant and in the capacities and on the dates indicated. |
| |
| |
| By | /s/ Edward C. Bernard |
| | Edward C. Bernard |
| | Principal Executive Officer |
| |
| Date | August 20, 2008 |
| |
| |
| |
| By | /s/ Gregory K. Hinkle |
| | Gregory K. Hinkle |
| | Principal Financial Officer |
| |
| Date | August 20, 2008 |