Item 1: Report to Shareholders| Spectrum Funds | June 30, 2007 |
The views and opinions in this report were current as of June 30, 2007. They are not guarantees of performance or investment results and should not be taken as investment advice. Investment decisions reflect a variety of factors, and the managers reserve the right to change their views about individual stocks, sectors, and the markets at any time. As a result, the views expressed should not be relied upon as a forecast of the fund’s future investment intent. The report is certified under the Sarbanes-Oxley Act, which requires mutual funds and other public companies to affirm that, to the best of their knowledge, the information in their financial reports is fairly and accurately stated in all material respects.
REPORTS ON THE WEB
Sign up for our E-mail Program, and you can begin to receive updated fund reports and prospectuses online rather than through the mail. Log in to your account at troweprice.com for more information.
Manager’s Letter
Fellow Shareholders
The performance of the global financial markets remained positive in the first half of 2007. Improving economic conditions and strong corporate profit growth boosted stocks worldwide, but those same factors put upward pressure on interest rates, muting performance in the bond market. As illustrated by the performance of the Spectrum Funds over the last six months, international stocks generated double-digit returns, U.S. stocks enjoyed slightly lower but still robust gains, and bonds posted narrowly positive results.
HIGHLIGHTS
• International stocks generated double-digit returns, U.S. stocks enjoyed slightly lower but still robust gains, and bonds posted narrowly positive results in the first half of 2007.
• The Spectrum Funds generally mirrored these performance patterns and performed mostly in line with or better than their respective benchmarks.
• Broad diversification among multiple T. Rowe Price funds is at the heart of each fund’s long-term investment strategy.
• We believe the environment will remain favorable for global financial markets, but a pull-back in U.S. consumption—particularly if the housing and mortgage markets deteriorate further—or a faster rate of inflation are possible risks.
MARKET ENVIRONMENT
Global economic growth remained on an upward trajectory in the first six months of 2007, led by strength in Europe and emerging markets. In contrast, the U.S. saw economic activity weaken considerably in the first quarter of the year, though growth improved somewhat in the second quarter, while the Japanese economy struggled with the dichotomy of strong exports and weak domestic consumption. While central banks in Europe continued to raise short-term interest rates, many Asian central banks stood pat amid concerns that the U.S. slowdown would curb exports. For its part, the Federal Reserve held the fed funds target rate steady at 5.25%, as it has since June 2006.
The generally positive global economic conditions provided a favorable backdrop for corporate profits, which continued to grow at a healthy rate in most regions of the world. Mergers and acquisitions also remained at the forefront of the corporate landscape, thanks to a steady stream of leveraged buyouts from private equity firms. While much of the buyout activity occurred in the U.S., some of the largest transactions in recent months have involved European companies.
U.S. stocks extended a four-year rally in the first half of 2007. Corporate profit growth slowed from the double-digit pace of the past few years, but not as much as originally anticipated. The better-than-expected earnings, combined with substantial merger activity and signs of an economic pickup, provided a lift to the stock market. However, volatility increased during the six-month period, exemplified by sharp downturns in late February and mid-June in response to higher energy prices and problems in the subprime lending industry. Mid-cap issues decisively outperformed their small-and large-cap peers, while growth shares comfortably outpaced value across all market capitalizations.
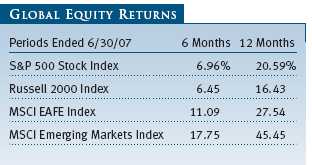
While the U.S. market performed well, international stocks fared even better. Emerging markets were the top performers, led by sharp gains in Latin America and Asia, though they also experienced the greatest volatility during the period. Among developed markets, European stocks delivered the best returns, followed closely by strong gains in Pacific Rim countries, while Japan advanced modestly because of the country’s uncertain economic environment.
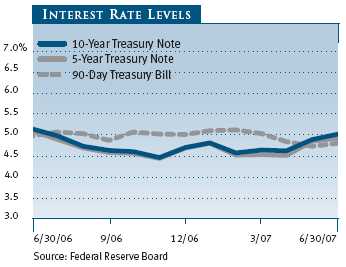
U.S. bonds produced modestly positive returns despite higher interest rates. Bonds gained ground early in the year as weak economic growth and the subprime lending woes led to a “flight to quality” in late February. In the second quarter, however, stronger-than-expected economic data and persistently above-trend inflation figures caused interest rates to rise, erasing most of the bond market’s earlier gains. Overall, the broad Lehman Brothers U.S. Aggregate Index returned 0.98% for the six-month period. High-yield corporate bonds, which benefited from strong demand for yield, outperformed investment-grade bonds.
Foreign bonds underperformed domestic fixed-income securities. The J.P. Morgan Non-U.S. Dollar Government Bond Index returned -1.00% in the first half of the year, while the J.P. Morgan Emerging Markets Bond Index Plus returned 0.58%.
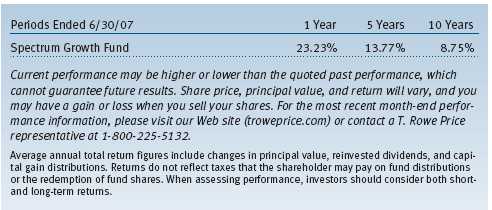
SPECTRUM GROWTH FUND
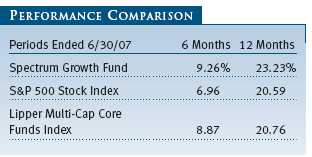
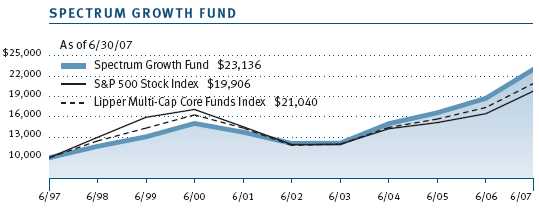
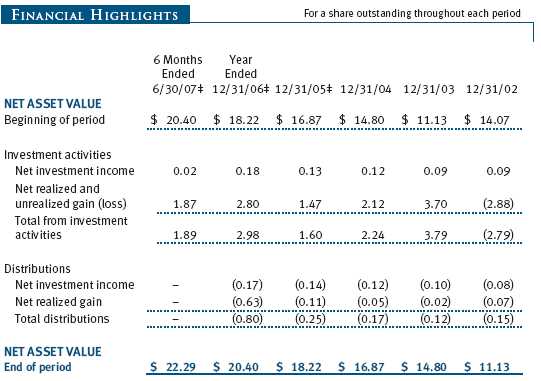
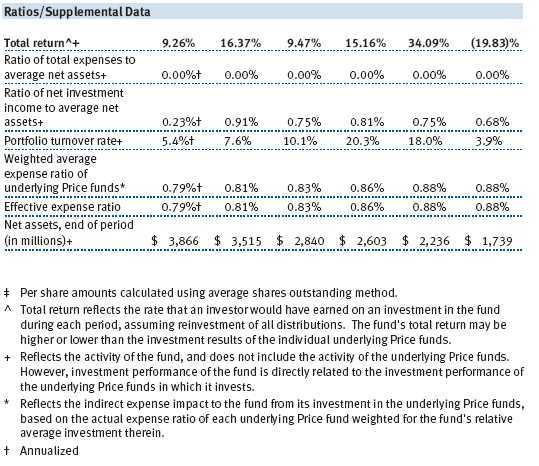
As the accompanying table shows, your fund outperformed its benchmark for the six and 12 months ended June 30, 2007. Spectrum Growth’s 9.26% return for the six-month period and 23.23% return for the 12-month period outdistanced the performance of both the S&P 500 Index and the Lipper Multi-Cap Core Funds Index over the same time periods. The fund’s international stocks and value holdings contributed the most to its outperformance.
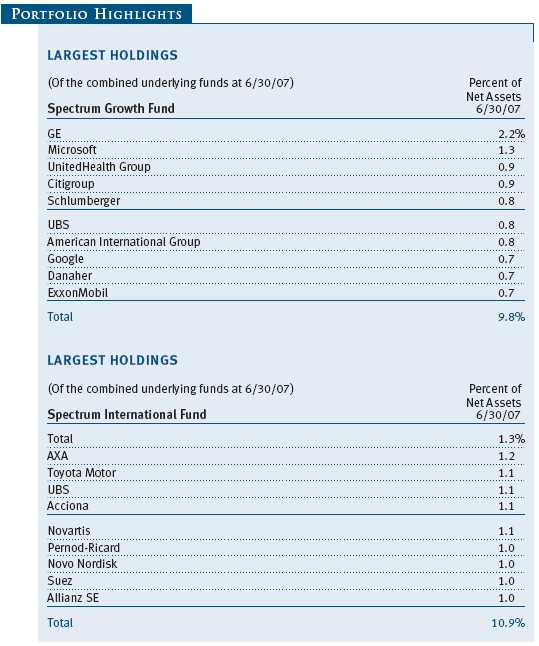
Every one of the portfolio’s underlying equity funds posted better returns than the S&P 500 during the six-month period. Among the best performers were the fund’s international stock holdings. Emerging Markets Stock enjoyed the best results, gaining more than 17%. Because of the strong performance of emerging markets in recent years, we trimmed our position in Emerging Markets Stock during the period, shifting the assets into International Stock and International Growth & Income, which focus on developed foreign markets.
Despite the general outperformance of growth stocks in the broader U.S. market, two of the fund’s value components delivered the best returns among its domestic holdings. Mid-Cap Value was the best performer in this group, benefiting from the strong results of mid-cap stocks, and the Value Fund also fared well. Equity Income, another value-oriented fund with a focus on dividends, posted the lowest return in the portfolio but still gained more than 8%.
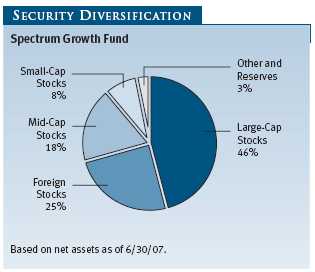
The growth positions in the portfolio—large-cap holdings Blue Chip Growth and Growth Stock, as well as small-cap New Horizons—were not far behind the Value and Mid-Cap Value Funds in terms of performance. This was a welcome change, particularly for Blue Chip Growth and Growth Stock, which had underperformed as large-cap growth stocks trailed large-cap value and small-caps over the past several years. We continue to believe that the large-cap growth segment of the market is undervalued and poised to outperform, especially in a slower economic environment. Consequently, we remain overweight in Blue Chip Growth and Growth Stock, the two largest positions in the portfolio.
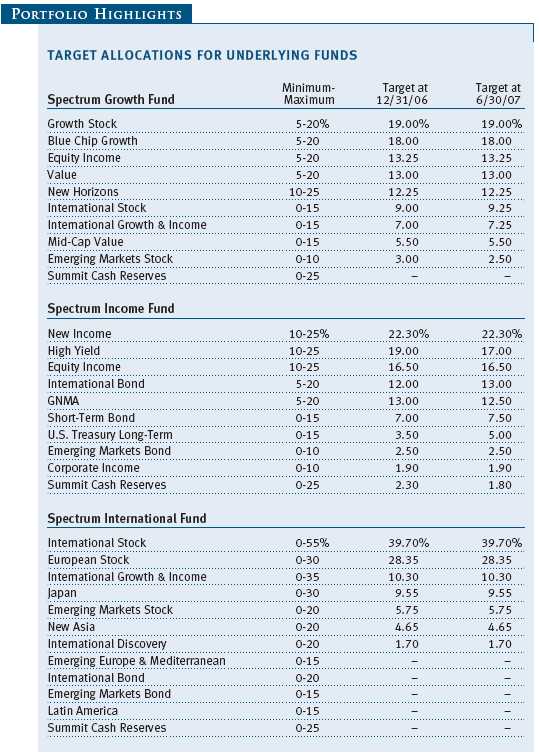
Other than the slight reshuffling in the international segment, the weightings in the portfolio did not materially change during the six-month period.
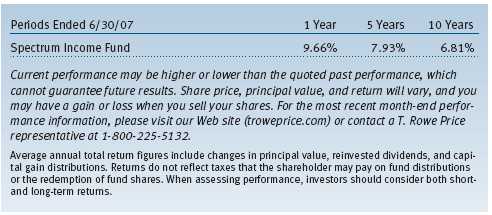
SPECTRUM INCOME FUND
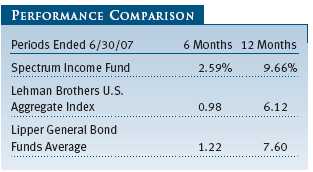
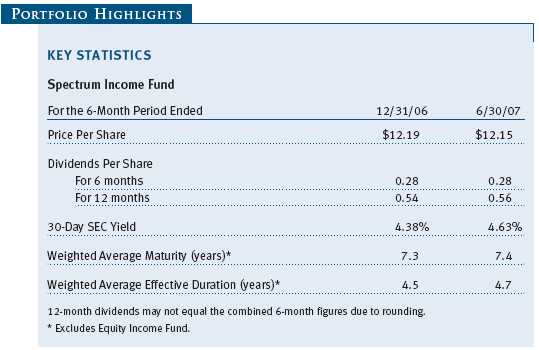
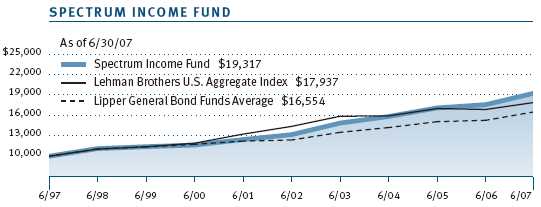
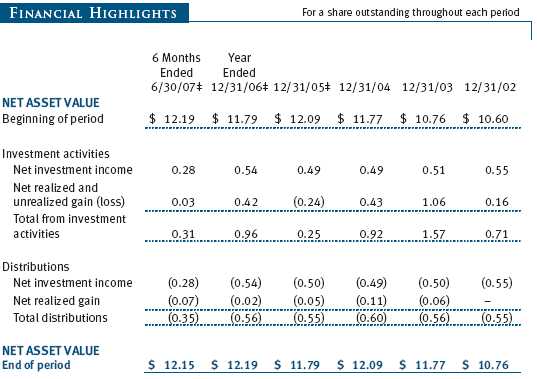
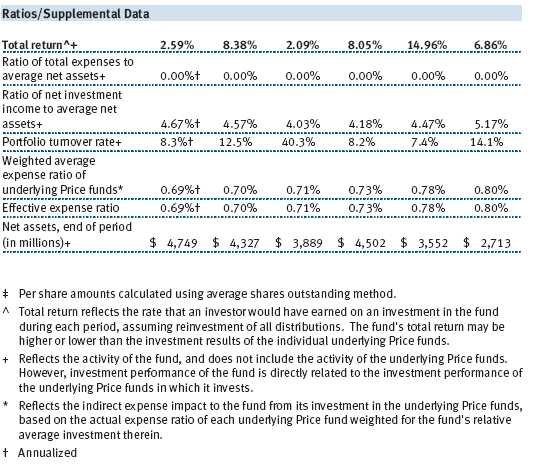
Your fund posted a modest return in the first half of 2007 but outperformed its benchmark index. As the accompanying table indicates, Spectrum Income’s 2.59% return for the six months outpaced both the Lehman Brothers U.S. Aggregate Index and the Lipper General Bond Funds Average. The fund’s 9.66% return for the 12 months ended June 30, 2007, also comfortably beat the index and peer group average. In a challenging environment for bonds, Spectrum Income’s commitment to diversification paid off as strong results from high-yield corporate bonds and dividend-paying stocks helped the portfolio outperform.
Equity Income, which generates income from dividend-paying stocks, was the best performer in the portfolio, reflecting the strong returns of the stock market. In a portfolio made up largely of fixed-income investments, Equity Income provides diversification while also offering a dividend yield of more than 2% as of June 30, 2007.
High Yield was also a solid contributor during the period as high-yield corporate bonds posted the best returns in the bond market. Demand for yield also lifted Emerging Markets Bond, one of the smallest holdings in the portfolio. The weakest performer was U.S. Treasury Long-Term, which was the only portfolio holding to decline during the last six months, as rising interest rates led to lower long-term bond prices. International Bond and GNMA, which invests in mortgage-backed securities, also lagged, posting slight positive returns for the period.
We shifted assets out of several top-performing holdings and reallocated them to other sectors during the period. We lowered our exposure to High Yield after several years of outperformance, shifting these assets into two underperforming segments—International Bond and U.S. Treasury Long-Term. With the fallout from the subprime mortgage debacle causing turmoil in the mortgage market, we chose to reduce our position in GNMA and move the assets into U.S. Treasury Long-Term. With the Fed likely on hold through the end of 2007 and a modestly positive slope to the Treasury yield curve, we also continued to transfer assets from Summit Cash Reserves to Short-Term Bond to capture higher yields.
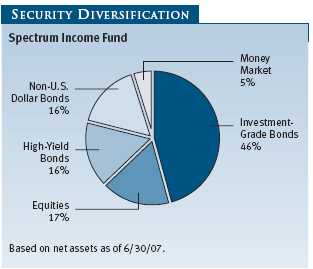
We maintained our healthy weighting in Equity Income despite the recent outperformance because we value the diversification it provides, although we did lower our allocation toward the end of the period. In addition, New Income, a diversified bond fund, remains the portfolio’s largest holding as of June 30, 2007.
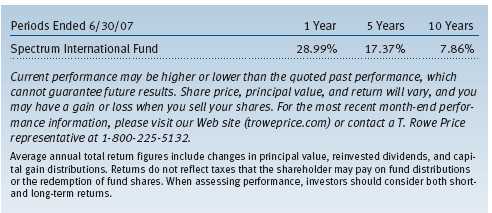
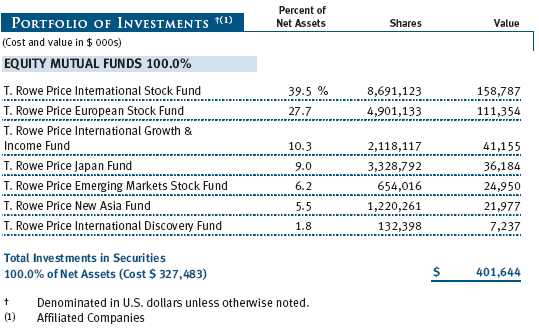
SPECTRUM INTERNATIONAL FUND
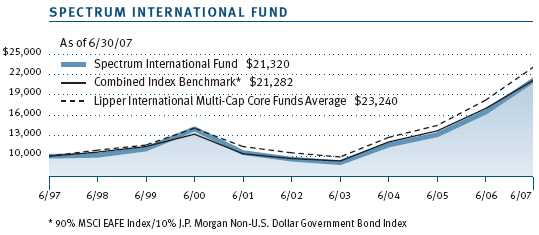
In the first six months of 2007, Spectrum International returned 10.45%, ahead of its combined index benchmark and mostly in line with the Lipper International Multi-Cap Core Funds Average. Performance was even better for the 12 months ended June 30, 2007—Spectrum International’s 28.99% return surpassed both the combined benchmark and the Lipper peer group average. A sizable weighting in European stocks and our exposure to emerging markets helped the portfolio outperform its benchmark during the last six months.
As in 2006, the top performer in the portfolio was New Asia, which gained nearly 27% during the six-month period as Asian markets soared. We added to our position in mid-2006, and since then, the New Asia Fund has returned 67%. Emerging Markets Stock and International Discovery, which has some exposure to developing markets, also generated strong results, with each gaining more than 15% in the last six months.
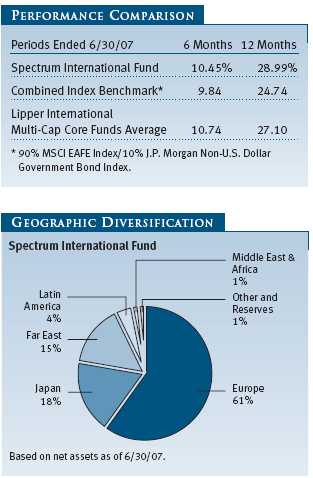
Among the portfolio’s positions in developed markets, European Stock was the best performer, reflecting the robust returns in European equities. The more-diversified International Stock (the fund’s largest holding) and International Growth & Income Funds posted solid gains but underperformed the broad foreign stock indexes. The combination of European Stock and the European allocations in these diversified holdings gave Spectrum International a 61% position in European stocks as of June 30, 2007.
Japan was the only holding in the portfolio to decline during the period. The Japan Fund comprised about 9% of the portfolio as of the end of the period, but the portfolio’s overall exposure to Japanese stocks was 18%.
We made no material changes to the portfolio’s individual weightings during the six-month period. The portfolio continues to emphasize the developed markets of the world, though we maintained some exposure to equities in emerging markets.
OUTLOOK
Although we expect global economic growth to moderate as we move into the second half of 2007, we believe the environment will remain favorable for global financial markets. Stocks should continue to benefit from growth in corporate earnings and healthy balance sheets, while stabilizing monetary policy should be helpful for bonds.
However, as the recent market volatility has shown, downside risks are ever present. A further pullback in U.S. consumption remains one of the largest risks for global economic growth, particularly if the housing and mortgage markets deteriorate further. Persistently high energy and commodity prices could lead to a faster rate of inflation, lower profit margins, and rising interest rates.
These risks accentuate the importance of broad diversification, an investment concept that is our mandate in managing the Spectrum Funds.
Respectfully submitted,

Edmund M. Notzon III
President of the Spectrum Funds and chairman of the Investment Advisory
Committee
July 19, 2007
The committee chairman has day-to-day responsibility for managing the portfolios and works with committee members in developing and executing the funds’ investment program.
RISKS OF INVESTING
As with all stock and bond mutual funds, each fund’s share price can fall because of weakness in the stock or bond markets, a particular industry, or specific holdings. Stock markets can decline for many reasons, including adverse political or economic developments, changes in investor psychology, or heavy institutional selling. The prospects for an industry or company may deteriorate because of a variety of factors, including disappointing earnings or changes in the competitive environment. In addition, the investment manager’s assessment of companies held in a fund may prove incorrect, resulting in losses or poor performance even in rising markets.
Bonds are subject to interest rate risk, the decline in bond prices that usually accompanies a rise in interest rates, and credit risk, the chance that any fund holding could have its credit rating downgraded, or that a bond issuer will default (fail to make timely payments of interest or principal), potentially reducing the fund’s income level and share price. High-yield corporate bonds could have greater price declines than funds that invest primarily in high-quality bonds. Companies issuing high-yield bonds are not as strong financially as those with higher credit ratings, so the bonds are usually considered speculative investments.
Funds that invest overseas may carry more risk than funds that invest strictly in U.S. assets. Risks can result from varying stages of economic and political development, differing regulatory environments, trading days, and accounting standards, and higher transaction costs of non-U.S. markets. Non-U.S. investments are also subject to currency risk, or a decline in the value of a foreign currency versus the U.S. dollar, which reduces the dollar value of securities denominated in that currency.
GLOSSARY
J.P. Morgan Non-U.S. Dollar Government Bond Index: An unmanaged index that tracks the performance of major non-U.S. bond markets.
J.P. Morgan Emerging Markets Bond Index: An unmanaged index that tracks dollar-denominated bonds issued by emerging-market countries.
Lehman Brothers U.S. Aggregate Index: An unmanaged index that tracks investment-grade corporate and government bonds.
MSCI EAFE Index: An unmanaged index that tracks the stocks of more than 1,000 companies in Europe, Australasia, and the Far East (EAFE).
MSCI Emerging Markets Index: An unmanaged index that tracks stocks in 25 emerging-market countries.
Russell 2000 Index: An unmanaged index that tracks the smallest 2,000 of the largest 3,000 U.S. stocks.
S&P 500 Stock Index: An unmanaged index that tracks the stocks of 500 U.S. primarily large-cap companies.
Performance and Expenses
This chart shows the value of a hypothetical $10,000 investment in the fund over the past 10 fiscal year periods or since inception (for funds lacking 10-year records). The result is compared with benchmarks, which may include a broad-based market index and a peer group average or index. Market indexes do not include expenses, which are deducted from fund returns as well as mutual fund averages and indexes.
| AVERAGE ANNUAL COMPOUND TOTAL RETURN |
This table shows how the fund would have performed each year if its actual (or cumulative) returns had been earned at a constant rate.
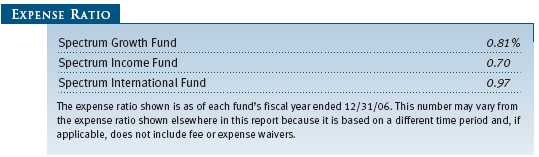
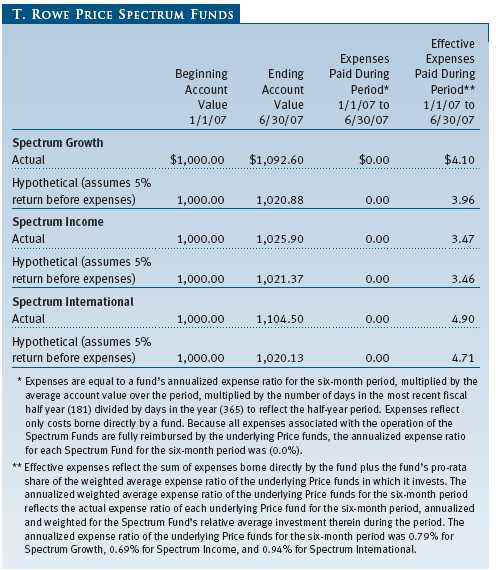
As a mutual fund shareholder, you may incur two types of costs: (1) transaction costs, such as redemption fees or sales loads, and (2) ongoing costs, including management fees, distribution and service (12b-1) fees, and other fund expenses. The following example is intended to help you understand your ongoing costs (in dollars) of investing in the fund and to compare these costs with the ongoing costs of investing in other mutual funds. The example is based on an investment of $1,000 invested at the beginning of the most recent six-month period and held for the entire period.
Actual Expenses
The first line of the following table (“Actual”) provides information about actual account values and expenses based on the fund’s actual returns. You may use the information in this line, together with your account balance, to estimate the expenses that you paid over the period. Simply divide your account value by $1,000 (for example, an $8,600 account value divided by $1,000 = 8.6), then multiply the result by the number in the first line under the heading “Expenses Paid During Period” to estimate the expenses you paid on your account during this period.
Hypothetical Example for Comparison Purposes
The information on the second line of the table (“Hypothetical”) is based on hypothetical account values and expenses derived from the fund’s actual expense ratio and an assumed 5% per year rate of return before expenses (not the fund’s actual return). You may compare the ongoing costs of investing in the fund with other funds by contrasting this 5% hypothetical example and the 5% hypothetical examples that appear in the shareholder reports of the other funds. The hypothetical account values and expenses may not be used to estimate the actual ending account balance or expenses you paid for the period.
Note: T. Rowe Price charges an annual small-account maintenance fee of $10, generally for accounts with less than $2,000 ($500 for UGMA/UTMA). The fee is waived for any investor whose T. Rowe Price mutual fund accounts total $25,000 or more, accounts employing automatic investing, and IRAs and other retirement plan accounts that utilize a prototype plan sponsored by T. Rowe Price (although a separate custodial or administrative fee may apply to such accounts). This fee is not included in the accompanying table. If you are subject to the fee, keep it in mind when you are estimating the ongoing expenses of investing in the fund and when comparing the expenses of this fund with other funds.
You should also be aware that the expenses shown in the table highlight only your ongoing costs and do not reflect any transaction costs, such as redemption fees or sales loads. Therefore, the second line of the table is useful in comparing ongoing costs only and will not help you determine the relative total costs of owning different funds. To the extent a fund charges transaction costs, however, the total cost of owning that fund is higher.
T. ROWE PRICE SPECTRUM GROWTH FUND
Unaudited
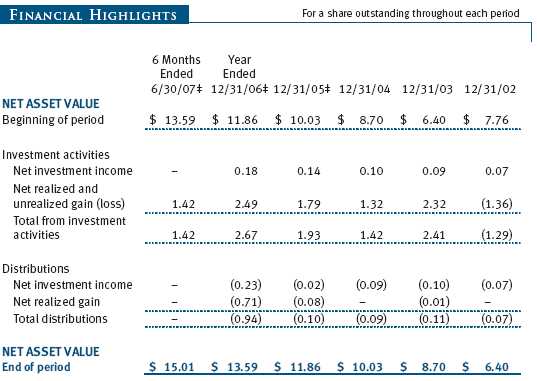
The accompanying notes are an integral part of these financial statements.
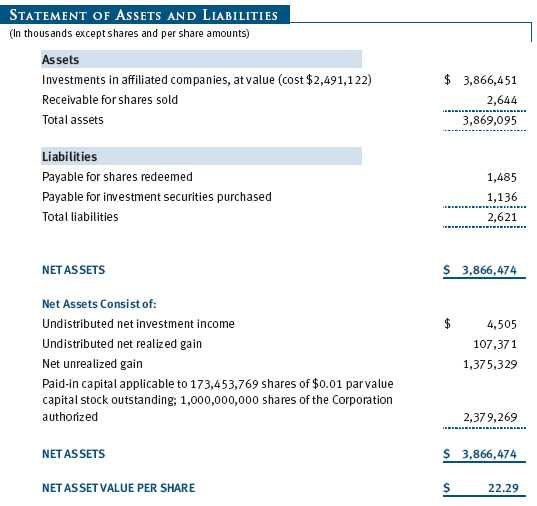
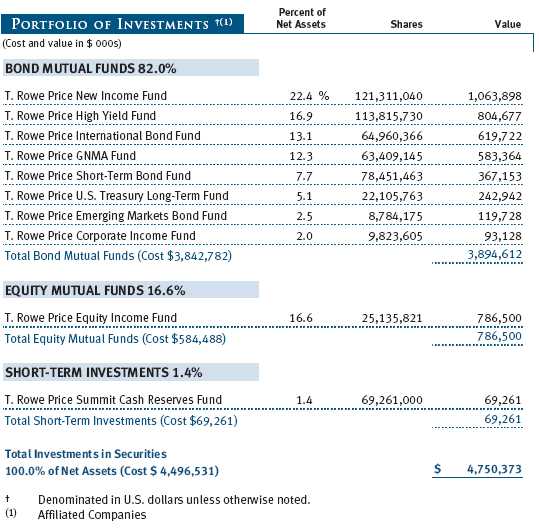
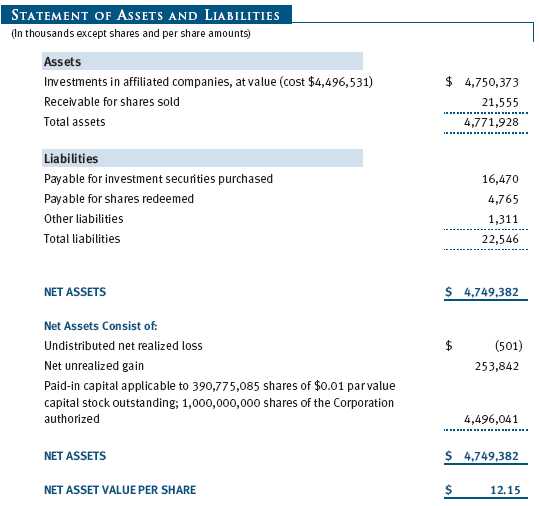
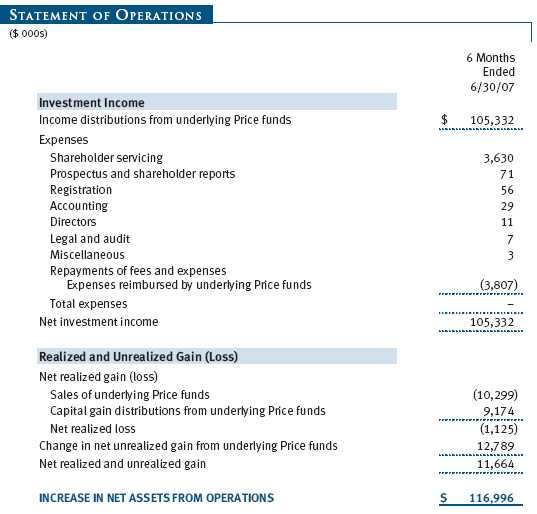
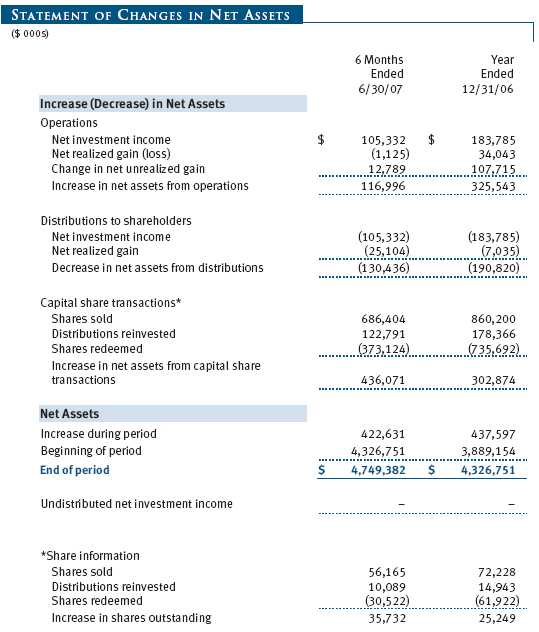
T. ROWE PRICE SPECTRUM INCOME FUND
Unaudited
The accompanying notes are an integral part of these financial statements.
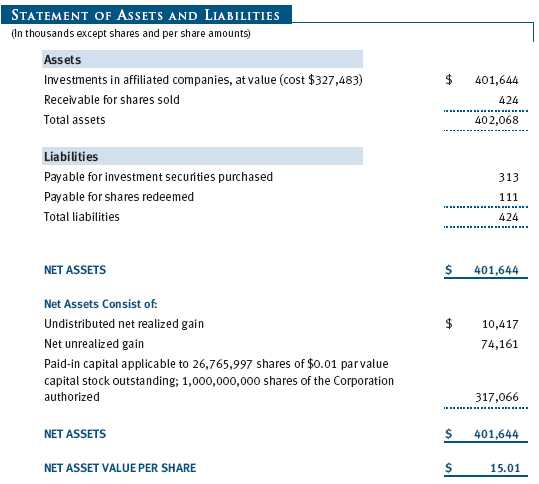
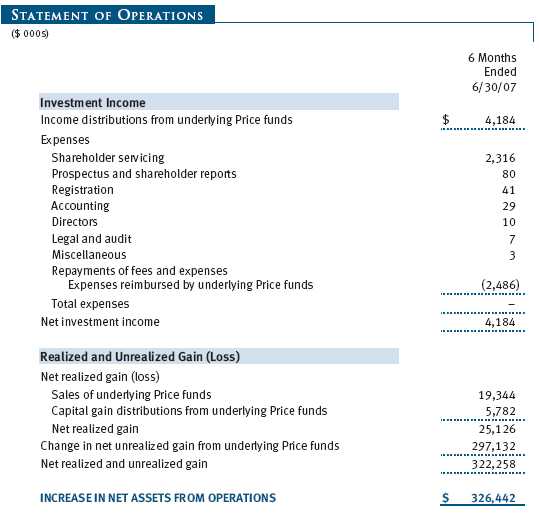
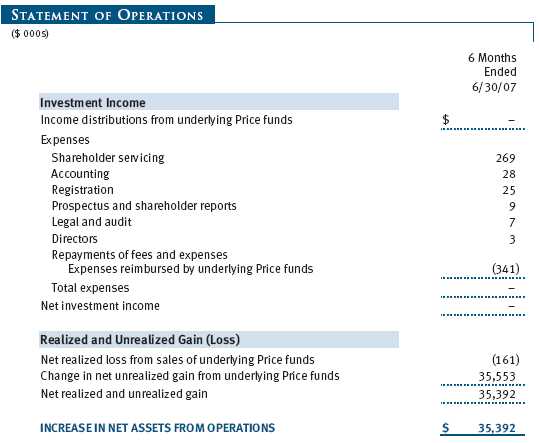
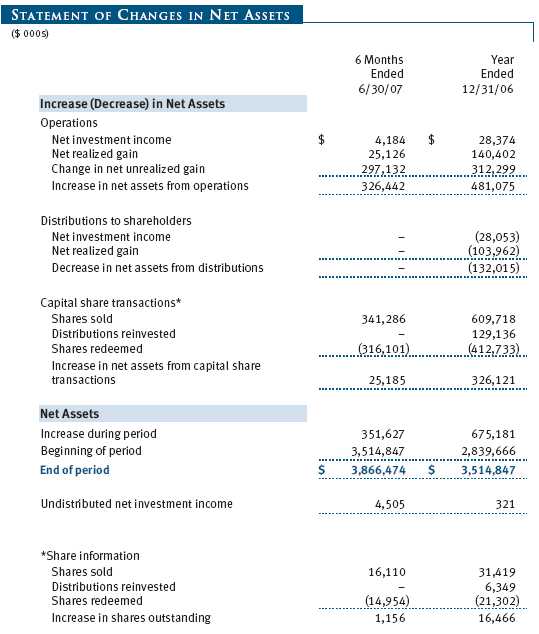
T. ROWE PRICE SPECTRUM INTERNATIONAL FUND
Unaudited
The accompanying notes are an integral part of these financial statements.
T. ROWE PRICE SPECTRUM GROWTH FUND
Unaudited
The accompanying notes are an integral part of these financial statements.
T. ROWE PRICE SPECTRUM GROWTH FUND
Unaudited
The accompanying notes are an integral part of these financial statements.
T. ROWE PRICE SPECTRUM INCOME FUND
Unaudited
The accompanying notes are an integral part of these financial statements.
T. ROWE PRICE SPECTRUM INCOME FUND
Unaudited
The accompanying notes are an integral part of these financial statements.
T. ROWE PRICE SPECTRUM INTERNATIONAL FUND
Unaudited
The accompanying notes are an integral part of these financial statements.
T. ROWE PRICE SPECTRUM INTERNATIONAL FUND
Unaudited
The accompanying notes are an integral part of these financial statements.
T. ROWE PRICE SPECTRUM GROWTH FUND
Unaudited
The accompanying notes are an integral part of these financial statements.
T. ROWE PRICE SPECTRUM INCOME FUND
Unaudited
The accompanying notes are an integral part of these financial statements.
T. ROWE PRICE SPECTRUM INTERNATIONAL FUND
Unaudited
The accompanying notes are an integral part of these financial statements.
T. ROWE PRICE SPECTRUM FUNDS
Unaudited
| NOTES TO FINANCIAL STATEMENTS |
T. Rowe Price Spectrum Fund, Inc. (the corporation), is registered under the Investment Company Act of 1940 (the 1940 Act) as a nondiversified, open-end management investment company. Spectrum Growth Fund, Spectrum Income Fund, and Spectrum International Fund (collectively, the Spectrum Funds) are three portfolios established by the corporation. Spectrum Growth and Spectrum Income commenced operations on June 29, 1990, and Spectrum International commenced operations on December 31, 1996.
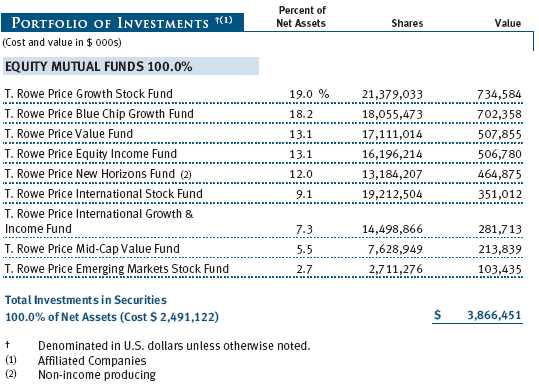
Each Spectrum Fund diversifies its assets within set limits among specific underlying T. Rowe Price funds (underlying Price funds). Spectrum Growth seeks long-term capital appreciation and growth of income with current income a secondary objective. Spectrum Income seeks a high level of current income with moderate share price fluctuation. Spectrum International seeks long-term capital appreciation.
NOTE 1 - SIGNIFICANT ACCOUNTING POLICIES
Basis of Preparation The accompanying financial statements were prepared in accordance with accounting principles generally accepted in the United States of America, which require the use of estimates made by fund management.
Valuation Each fund values its investments and computes its net asset value per share at the close of the New York Stock Exchange (NYSE), normally 4 p.m. ET, each day that the NYSE is open for business. Investments in the underlying Price funds are valued at their closing net asset value per share on the day of valuation. One of the underlying Price funds held by Spectrum International, the T. Rowe Price Japan Fund, is not open on certain days when Spectrum International is open. On such days, a net asset value per share is computed for the Japan Fund solely for purposes of valuing Spectrum International. The net asset value is computed in the normal manner using the most recent yen-denominated closing prices and exchange rates on the day of valuation. Investments for which these valuation procedures are inappropriate or are deemed not to reflect fair value are stated at fair value as determined in good faith by the T. Rowe Price Valuation Committee, established by the funds’ Board of Directors.
Redemption Fees A 2% fee is assessed on redemptions of Spectrum International fund shares held for 90 days or less to deter short-term trading and to protect the interests of long-term shareholders. Redemption fees are withheld from proceeds that shareholders receive from the sale or exchange of fund shares and are paid to the fund. Redemption fees received by the fund are allocated to each underlying Price fund in proportion to the average daily value of its shares owned by the fund. Accordingly, redemption fees have no effect on the net assets of the fund.
Investment Transactions, Investment Income, and Distributions Income is recorded on the accrual basis. Income and capital gain distributions from the underlying Price funds are recorded on the ex-dividend date. Purchases and sales of the underlying Price funds are accounted for on the trade date. Any income tax-related interest and penalties would be classified as income tax expense. Realized gains and losses are reported on the identified cost basis. Distributions to the Spectrum Funds’ shareholders are recorded on the ex-dividend date. Income distributions are declared by Spectrum Income on a daily basis and paid monthly. Income distributions are declared and paid by Spectrum Growth and Spectrum International on an annual basis. Capital gain distributions, if any, are declared and paid by the fund, typically on an annual basis.
New Accounting Pronouncements Effective June 29, 2007, the funds adopted Financial Accounting Standards Board (“FASB”) Interpretation No. 48 (“FIN 48”), Accounting for Uncertainty in Income Taxes, a clarification of FASB Statement No. 109, Accounting for Income Taxes. FIN 48 establishes financial accounting and disclosure requirements for recognition and measurement of tax positions taken or expected to be taken on an income tax return. The adoption of FIN 48 had no impact on the funds’ net assets or results of operations.
In September 2006, the FASB released the Statement of Financial Accounting Standard No. 157 (“FAS 157”), Fair Value Measurements. FAS 157 clarifies the definition of fair value and establishes the framework for measuring fair value, as well as proper disclosure of this methodology in the financial statements. It will be effective for the funds’ fiscal years beginning January 1, 2008. Management is evaluating the effects of FAS 157; however, it is not expected to have a material impact on the funds’ net assets or results of operations.
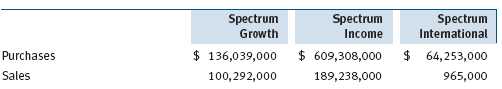
NOTE 2 - INVESTMENTS IN UNDERLYING PRICE FUNDS
Purchases and sales of the underlying Price funds for the six months ended June 30, 2007, were as follows:
NOTE 3 - FEDERAL INCOME TAXES
No provision for federal income taxes is required since each fund intends to continue to qualify as a regulated investment company under Subchapter M of the Internal Revenue Code and distribute to shareholders all of its taxable income and gains. Federal income tax regulations differ from generally accepted accounting principles; therefore, distributions determined in accordance with tax regulations may differ in amount or character from net investment income and realized gains for financial reporting purposes. Financial reporting records are adjusted for permanent book/tax differences to reflect tax character. Financial records are not adjusted for temporary differences. The amount and character of tax-basis distributions and composition of net assets are finalized at fiscal year-end; accordingly, tax-basis balances have not been determined as of June 30, 2007.
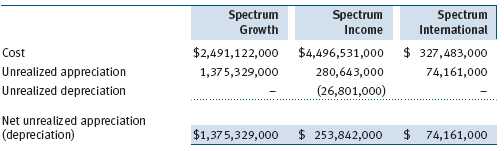
At June 30, 2007, the cost of investments for federal income tax purposes and net unrealized gain (loss) on investments was as follows:
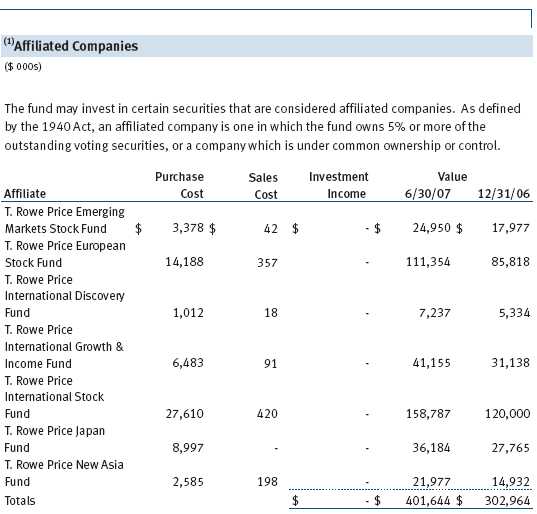
NOTE 4 - RELATED PARTIES
T. Rowe Price Associates, Inc. (Price Associates), a wholly owned subsidiary of T. Rowe Price Group, Inc., is the investment manager for Spectrum Growth and Spectrum Income, and also serves as manager for the domestic underlying Price funds. T. Rowe Price International, Inc. (Price International), a wholly owned subsidiary of Price Associates, is the investment manager for Spectrum International and also serves as manager for the international underlying Price funds. Pursuant to various service agreements, Price Associates and its wholly owned subsidiaries provide shareholder servicing and administrative, transfer and dividend disbursing, accounting, marketing, and certain other services to the Spectrum Funds. Certain officers and directors of the Spectrum Funds are also officers and directors of Price Associates and its subsidiaries, and of the underlying Price funds.
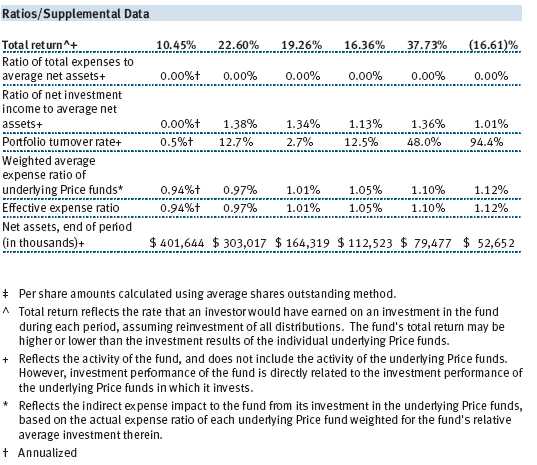
The Spectrum Funds pay no management fees; however, Price Associates and Price International receive management fees from the underlying Price funds. The Spectrum Funds operate in accordance with the investment management and special servicing agreements between and among the corporation, the underlying Price funds, Price Associates, and, in the case of Spectrum International, Price International. Pursuant to these agreements, expenses associated with the operation of the Spectrum Funds are reimbursed by each underlying Price fund to the extent of estimated savings to it and in proportion to the average daily value of its shares owned by the Spectrum Funds. Therefore, each Spectrum Fund operates at a zero expense ratio. However, each Spectrum Fund indirectly bears its proportionate share of the management fees and operating costs of the underlying Price funds in which it invests.
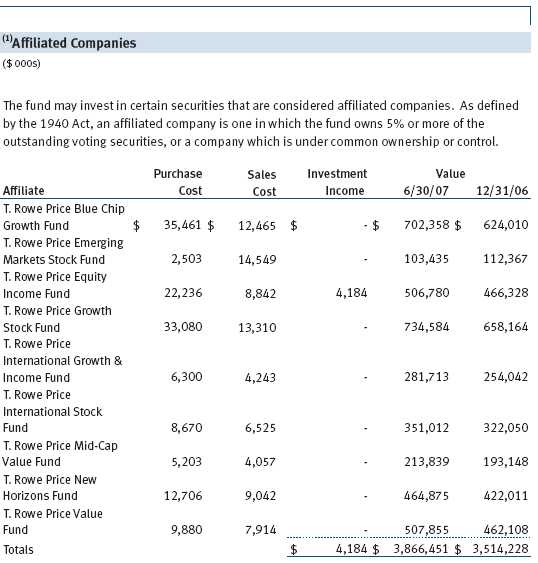
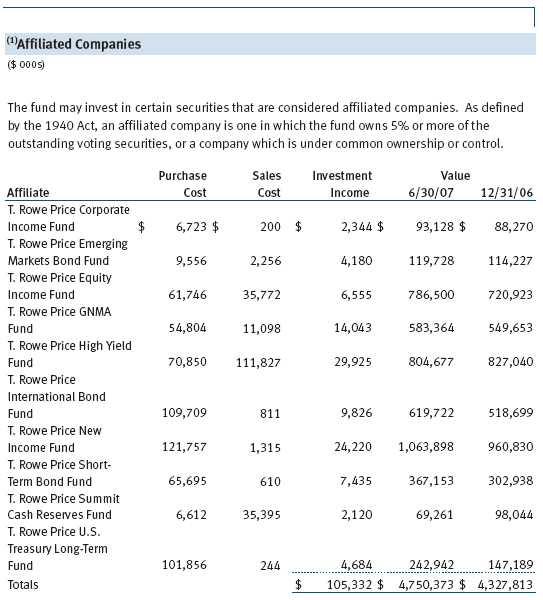
The Spectrum Funds do not invest in the underlying Price funds for the purpose of exercising management or control; however, investments by the Spectrum Funds may represent a significant portion of an underlying Price fund’s net assets. At June 30, 2007, Spectrum Growth and Spectrum International Funds each held less than 25% of the outstanding shares of any underlying Price fund; Spectrum Income Fund held approximately 63.0% of the outstanding shares of the U.S Treasury Long-Term Fund, 45.9% of the GNMA Fund, 43.5% of the Corporate Income Fund, 27.4% of the International Bond Fund, and 25.8% of the Short-Term Bond Fund.
Additionally, Spectrum Income Fund is one of several mutual funds in which certain college savings plans managed by Price Associates may invest. Shareholder servicing costs associated with each college savings plan are allocated to Spectrum Income Fund in proportion to the average daily value of its shares owned by the college savings plan and, in turn, are borne by the underlying Price funds in accordance with the terms of the investment management and special servicing agreements. At June 30, 2007, approximately 17% of the outstanding shares of Spectrum Income Fund were held by the college savings plans.
As of June 30, 2007, T. Rowe Price Group, Inc., and/or its wholly owned subsidiaries owned 2,341,284 shares of the Spectrum Growth Fund, representing 1% of the fund’s net assets.
| INFORMATION ON PROXY VOTING POLICIES, PROCEDURES, AND RECORDS |
A description of the policies and procedures used by T. Rowe Price funds and portfolios to determine how to vote proxies relating to portfolio securities is available in each fund’s Statement of Additional Information, which you may request by calling 1-800-225-5132 or by accessing the SEC’s Web site, www.sec.gov. The description of our proxy voting policies and procedures is also available on our Web site, www.troweprice.com. To access it, click on the words “Company Info” at the top of our homepage for individual investors. Then, in the window that appears, click on the “Proxy Voting Policy” navigation button in the top left corner.
Each fund’s most recent annual proxy voting record is available on our Web site and through the SEC’s Web site. To access it through our Web site, follow the directions above, then click on the words “Proxy Voting Record” at the bottom of the Proxy Voting Policy page.
| HOW TO OBTAIN QUARTERLY PORTFOLIO HOLDINGS |
The fund files a complete schedule of portfolio holdings with the Securities and Exchange Commission for the first and third quarters of each fiscal year on Form N-Q. The fund’s Form N-Q is available electronically on the SEC’s Web site (www.sec.gov); hard copies may be reviewed and copied at the SEC’s Public Reference Room, 450 Fifth St. N.W., Washington, DC 20549. For more information on the Public Reference Room, call 1-800-SEC-0330.
T. ROWE PRICE SPECTRUM GROWTH FUND
| APPROVAL OF INVESTMENT MANAGEMENT AGREEMENT |
On March 7, 2007, the fund’s Board of Directors (Board) unanimously approved the investment advisory contract (Contract) between the fund and its investment manager, T. Rowe Price Associates, Inc. (Manager). The Board considered a variety of factors in connection with its review of the Contract, also taking into account information provided by the Manager during the course of the year, as discussed below:
Services Provided by the Manager
The Board considered the nature, quality, and extent of the services provided to the fund by the Manager. These services included, but were not limited to, management of the fund’s portfolio and a variety of related activities, as well as financial and administrative services, reporting, and communications. The Board also reviewed the background and experience of the Manager’s senior management team and investment personnel involved in the management of the fund. The Board concluded that it was satisfied with the nature, quality, and extent of the services provided by the Manager.
Investment Performance of the Fund
The Board reviewed the fund’s average annual total return over the 1-, 3-, 5-, and 10-year periods as well as the fund’s year-by-year returns and compared these returns with previously agreed upon comparable performance measures and market data, including those supplied by Lipper and Morningstar, which are independent providers of mutual fund data. On the basis of this evaluation and the Board’s ongoing review of investment results, the Board concluded that the fund’s performance was satisfactory.
Costs, Benefits, Profits, and Economies of Scale
The Manager does not receive fees from the fund. (The Manager does receive fees from other T. Rowe Price funds in which the fund invests.) Accordingly, the Board did not review information relating to revenues received by the Manager under the Contract. The Board did review information regarding benefits that the Manager (and its affiliates) may have realized from its relationship with the fund, including research received under “soft dollar” agreements. The Board noted that soft dollars were not used to pay for third-party, non-broker research. The Board also received information on the estimated costs incurred and profits realized by the Manager and its affiliates from advising T. Rowe Price mutual funds and concluded that the Manager’s profits were reasonable. Because the Manager does not receive fees from the fund, the Board did not consider whether the fund or other funds benefit under the fee levels set forth in the Contract from any economies of scale realized by the Manager. Nor did the Board review fees and expenses of other funds or of privately managed accounts of the Manager and its affiliates.
Approval of the Contract
As noted, the Board approved the continuation of the Contract. No single factor was considered in isolation or to be determinative to the decision. Rather, the Board concluded, in light of a weighting and balancing of all factors considered, that it was in the best interests of the fund to approve the continuation of the Contract.
T. ROWE PRICE SPECTRUM INCOME FUND
| APPROVAL OF INVESTMENT MANAGEMENT AGREEMENT |
On March 7, 2007, the fund’s Board of Directors (Board) unanimously approved the investment advisory contract (Contract) between the fund and its investment manager, T. Rowe Price Associates, Inc. (Manager). The Board considered a variety of factors in connection with its review of the Contract, also taking into account information provided by the Manager during the course of the year, as discussed below:
Services Provided by the Manager
The Board considered the nature, quality, and extent of the services provided to the fund by the Manager. These services included, but were not limited to, management of the fund’s portfolio and a variety of related activities, as well as financial and administrative services, reporting, and communications. The Board also reviewed the background and experience of the Manager’s senior management team and investment personnel involved in the management of the fund. The Board concluded that it was satisfied with the nature, quality, and extent of the services provided by the Manager.
Investment Performance of the Fund
The Board reviewed the fund’s average annual total return over the 1-, 3-, 5-, and 10-year periods as well as the fund’s year-by-year returns and compared these returns with previously agreed upon comparable performance measures and market data, including those supplied by Lipper and Morningstar, which are independent providers of mutual fund data. On the basis of this evaluation and the Board’s ongoing review of investment results, the Board concluded that the fund’s performance was satisfactory.
Costs, Benefits, Profits, and Economies of Scale
The Manager does not receive fees from the fund. (The Manager does receive fees from other T. Rowe Price funds in which the fund invests.) Accordingly, the Board did not review information relating to revenues received by the Manager under the Contract. The Board did review information regarding benefits that the Manager (and its affiliates) may have realized from its relationship with the fund, including research received under “soft dollar” agreements. The Board noted that soft dollars were not used to pay for third-party, non-broker research. The Board also received information on the estimated costs incurred and profits realized by the Manager and its affiliates from advising T. Rowe Price mutual funds and concluded that the Manager’s profits were reasonable. Because the Manager does not receive fees from the fund, the Board did not consider whether the fund or other funds benefit under the fee levels set forth in the Contract from any economies of scale realized by the Manager. Nor did the Board review fees and expenses of other funds or of privately managed accounts of the Manager and its affiliates.
Approval of the Contract
As noted, the Board approved the continuation of the Contract. No single factor was considered in isolation or to be determinative to the decision. Rather, the Board concluded, in light of a weighting and balancing of all factors considered, that it was in the best interests of the fund to approve the continuation of the Contract.
T. ROWE PRICE SPECTRUM INTERNATIONAL FUND
| APPROVAL OF INVESTMENT MANAGEMENT AGREEMENT |
On March 7, 2007, the fund’s Board of Directors (Board) unanimously approved the investment advisory contract (Contract) between the fund and its investment manager, T. Rowe Price International, Inc. (Manager). The Board considered a variety of factors in connection with its review of the Contract, also taking into account information provided by the Manager during the course of the year, as discussed below:
Services Provided by the Manager
The Board considered the nature, quality, and extent of the services provided to the fund by the Manager. These services included, but were not limited to, management of the fund’s portfolio and a variety of related activities, as well as financial and administrative services, reporting, and communications. The Board also reviewed the background and experience of the Manager’s senior management team and investment personnel involved in the management of the fund. The Board concluded that it was satisfied with the nature, quality, and extent of the services provided by the Manager.
Investment Performance of the Fund
The Board reviewed the fund’s average annual total return over the 1-, 3-, 5-, and 10-year periods as well as the fund’s year-by-year returns and compared these returns with previously agreed upon comparable performance measures and market data, including those supplied by Lipper and Morningstar, which are independent providers of mutual fund data. On the basis of this evaluation and the Board’s ongoing review of investment results, the Board concluded that the fund’s performance was satisfactory.
Costs, Benefits, Profits, and Economies of Scale
The Manager does not receive fees from the fund. (The Manager does receive fees from other T. Rowe Price funds in which the fund invests.) Accordingly, the Board did not review information relating to revenues received by the Manager under the Contract. The Board did review information regarding benefits that the Manager (and its affiliates) may have realized from its relationship with the fund, including research received under “soft dollar” agreements. The Board noted that soft dollars were not used to pay for third-party, non-broker research. The Board also received information on the estimated costs incurred and profits realized by the Manager and its affiliates from advising T. Rowe Price mutual funds and concluded that the Manager’s profits were reasonable. Because the Manager does not receive fees from the fund, the Board did not consider whether the fund or other funds benefit under the fee levels set forth in the Contract from any economies of scale realized by the Manager. Nor did the Board review fees and expenses of other funds or of privately managed accounts of the Manager and its affiliates.
Approval of the Contract
As noted, the Board approved the continuation of the Contract. No single factor was considered in isolation or to be determinative to the decision. Rather, the Board concluded, in light of a weighting and balancing of all factors considered, that it was in the best interests of the fund to approve the continuation of the Contract.
Item 2. Code of Ethics.
A code of ethics, as defined in Item 2 of Form N-CSR, applicable to its principal executive officer, principal financial officer, principal accounting officer or controller, or persons performing similar functions is filed as an exhibit to the registrant’s annual Form N-CSR. No substantive amendments were approved or waivers were granted to this code of ethics during the registrant’s most recent fiscal half-year.
Item 3. Audit Committee Financial Expert.
Disclosure required in registrant’s annual Form N-CSR.
Item 4. Principal Accountant Fees and Services.
Disclosure required in registrant’s annual Form N-CSR.
Item 5. Audit Committee of Listed Registrants.
Not applicable.
Item 6. Schedule of Investments.
Not applicable. The complete schedule of investments is included in Item 1 of this Form N-CSR.
Item 7. Disclosure of Proxy Voting Policies and Procedures for Closed-End Management Investment Companies.
Not applicable.
Item 8. Portfolio Managers of Closed-End Management Investment Companies.
Not applicable.
Item 9. Purchases of Equity Securities by Closed-End Management Investment Company and Affiliated Purchasers.
Not applicable.
Item 10. Submission of Matters to a Vote of Security Holders.
Not applicable.
Item 11. Controls and Procedures.
(a) The registrant’s principal executive officer and principal financial officer have evaluated the registrant’s disclosure controls and procedures within 90 days of this filing and have concluded that the registrant’s disclosure controls and procedures were effective, as of that date, in ensuring that information required to be disclosed by the registrant in this Form N-CSR was recorded, processed, summarized, and reported timely.
(b) The registrant’s principal executive officer and principal financial officer are aware of no change in the registrant’s internal control over financial reporting that occurred during the registrant’s second fiscal quarter covered by this report that has materially affected, or is reasonably likely to materially affect, the registrant’s internal control over financial reporting.
Item 12. Exhibits.(a)(1) The registrant’s code of ethics pursuant to Item 2 of Form N-CSR is filed with the registrant’s annual Form N-CSR.
(2) Separate certifications by the registrant's principal executive officer and principal financial officer, pursuant to Section 302 of the Sarbanes-Oxley Act of 2002 and required by Rule 30a-2(a) under the Investment Company Act of 1940, are attached.
(3) Written solicitation to repurchase securities issued by closed-end companies: not applicable.
(b) A certification by the registrant's principal executive officer and principal financial officer, pursuant to Section 906 of the Sarbanes-Oxley Act of 2002 and required by Rule 30a-2(b) under the Investment Company Act of 1940, is attached.
| |
| | |
SIGNATURES |
| |
| | Pursuant to the requirements of the Securities Exchange Act of 1934 and the Investment |
| Company Act of 1940, the registrant has duly caused this report to be signed on its behalf by the |
| undersigned, thereunto duly authorized. |
| |
| T. Rowe Price Spectrum Fund, Inc. |
| |
| |
| By | /s/ Edward C. Bernard |
| | Edward C. Bernard |
| | Principal Executive Officer |
| |
| Date | August 17, 2007 |
| |
| |
| |
| | Pursuant to the requirements of the Securities Exchange Act of 1934 and the Investment |
| Company Act of 1940, this report has been signed below by the following persons on behalf of |
| the registrant and in the capacities and on the dates indicated. |
| |
| |
| By | /s/ Edward C. Bernard |
| | Edward C. Bernard |
| | Principal Executive Officer |
| |
| Date | August 17, 2007 |
| |
| |
| |
| By | /s/ Joseph A. Carrier |
| | Joseph A. Carrier |
| | Principal Financial Officer |
| |
| Date | August 17, 2007 |