UNITED STATES
SECURITIES AND EXCHANGE COMMISSION
Washington, D.C. 20549
FORMN-CSR
CERTIFIED SHAREHOLDER REPORT OF REGISTERED
MANAGEMENT INVESTMENT COMPANIES
Investment Company Act file number:811-04980
TCW Strategic Income Fund, Inc.
(Exact name of registrant as specified in charter)
865 South Figueroa Street, Suite 1800, Los Angeles, CA 90017
(Address of principal executive offices)
Patrick W. Dennis, Esq.
Vice President and Assistant Secretary
865 South Figueroa Street, Suite 1800
Los Angeles, CA 90017
(Name and address of agent for service)
Registrant’s telephone number, including area code: (213)244-0000
Date of fiscal year end: December 31
Date of reporting period: June 30, 2019
| Item 1. | Report to Shareholders. |


TCW Strategic Income Fund, Inc.
Beginning on January 1, 2021, as permitted by regulations adopted by the Securities and Exchange Commission, paper copies of the Funds’ annual and semi-annual shareholder reports will no longer be sent by mail, unless you specifically request paper copies of the reports. Instead, the reports will be made available on the Funds’ website (www.tcw.com), and you will be notified by mail each time a report is posted and provided with a website link to access the report.
If you already elected to receive shareholder reports electronically, you will not be affected by this change and you need not take any action. You may elect to receive shareholder reports and other communications from the Funds or your financial intermediary electronically by contacting your financial intermediary (such as a broker-dealer or bank) if you invest through a financial intermediary, or by calling 1-800-FUND-TCW (1-800-386-3829) if you invest directly with the Funds.
Beginning on January 1, 2019, you may elect to receive all future reports in paper free of charge. You can call1-800-FUND-TCW (1-800-386-3829), if you invest directly with the Funds, or contact your financial intermediary, if you invest though a financial intermediary, to inform the Funds or the financial intermediary that you wish to continue receiving paper copies of your shareholder reports. Your election to receive reports in paper will apply to all Funds held directly with TCW or through your financial intermediary.
| | |
To Our Valued Shareholders | | |
| | |

| | David S. DeVito President, Chief Executive Officer and Director |
To the shareholders of the TCW Strategic Income Fund:
Executive Summary
TCW is pleased to present the 2019 semi-annual report for the TCW Strategic Income Fund (“TSI” or the “Fund”). TSI is a multi-asset classclosed-end fund managed by TCW Investment Management Company and is listed on the New York Stock Exchange under the ticker TSI. For the first half of 2019, the market value of shares of TSI experienced a positive 12.26% return while the return on Fund’s net asset value (i.e., return on the underlying assets) increased by 5.86%. For reference, TSI’s customized benchmark, a construct that is 25% high yield, 15% equities, 15% convertible bonds, and 45% U.S. Aggregate Bond Index, gained 10.22% in the first half of 2019. While the return on the underlying assets trailed the benchmark return, the Fund’syear-to-date price based return was higher than the net asset value per share (“NAV”) based return due to a decrease in the discount between NAV and share price from 6.73% at the beginning of the year to 1.20% by June 30, 2019. Annualized price based performance over most longer periods remained ahead of the Fund’s benchmark performance.
The TSI Fund paid a quarterly dividend of 7.68 cents per share in the first quarter of 2019 and 8.25 cents per share in the second quarter of 2019. This represents an annualized rate of approximately 32 cents per share, contributing to a realized12-month trailing yield of 6.77%, as of 6/30/2019. Of course, since yield is a function of a number of parameters, thego-forward yield of TSI will likely differ from the trailing figure.
Fund Performance
| | | | | | | | | | | | | | | | | | | | | | | | | | | | |
| | | | | | Annualized Total Return as of June 30, 2019 | |
| | | YTD | | | 1 Year | | | 3 Year | | | 5 Year | | | 10 Year | | | Since
3/1/06(2) | | | Since
3/5/87(3) | |
Price Based Return | | | +12.26 | % | | | +12.56 | % | | | +8.34 | % | | | +6.28 | % | | | +13.92 | % | | | +10.48 | % | | | +8.32 | % |
NAV Based Return | | | +5.86 | % | | | +6.88 | % | | | +5.92 | % | | | +4.61 | % | | | +12.37 | % | | | +9.01 | % | | | +8.48 | % |
Custom Benchmark(1) | | | +10.22 | % | | | +8.37 | % | | | +6.86 | % | | | +5.16 | % | | | +7.98 | % | | | +6.34 | % | | | n/a | |
| (1) | Custom Benchmark Index: 15% S&P 500 with Income, 15% Merrill Lynch Convertible Index, 45% Bloomberg Barclays Capital U.S. Aggregate Bond Index, 25% Citi High Yield Cash Pay Index. Past performance is no guarantee of future results. Current performance may be lower or higher than that quoted. The market value and net asset value of the Fund’s shares will fluctuate with market conditions. Returns shown do not reflect the deduction of taxes that a shareholder would pay on the Fund’s distributions. You should not draw any conclusions about the Fund’s performance from the amount of the quarterly distribution or from the terms of the Fund’s distribution policy. |
| (2) | The date on which the Fund objective changed to a multi-asset class fund. Prior to this date, the Fund primarily invested in convertible securities. |
| (3) | Inception date of the Fund. |
Management Commentary
TCW manages the portfolio of securities according to a full cycle discipline. Effectively, this means that our management style opportunistically increases the level of risk taking with respect to the assets in the early years of an asset price/credit cycle. In the latter stages of the cycle, our proclivity is to reduce risk, which naturally also has the tendency to pull down the overall yield of the portfolio. TCW does judge the cycle to be in its later stages and hence the portfolio has been activelyde-risked across a number of different dimensions, resulting in a more defensive posture to (1) protect the capital position and (2) provide liquidity for opportunistic deployment.
This value-oriented approach allowed the Fund to take advantage of sudden spread widening in December 2018 that was a consequence of tight liquidity conditions and fears of slowing growth. Positions were added in asset-backed securities (“ABS”) such as AAA collateralized loan obligations (“CLOs”), and in both investment grade and high yield credit where we found value in excess of price levels, with selective buys in several sectors including manufacturing, financials, communications, and energy, while positions were trimmed in some of the structured product holdings that had held up well, including agency commercial mortgage-backed securities (“CMBS”). In the first part of 2019, markets remediated in the wake of a dovish turn in central bank rhetoric, resulting in opportunities to trim selectively.
Late cycle concerns remain the dominant theme informing Fund strategy, as risk markets pin hopes on continued support from dovish central banks to buoy asset prices, even though underlying fundamentals have weakened further. Consistent trends that indicate growing risks include:
| | 1. | High and rising leverage within the corporate debt sector |
| | 2. | Deteriorating underwriting standards |
| | 3. | Credit spreads at the tight end of the historical range provide scant compensation for rising risks |
| | 4. | Challenged global growth, with numerous sources of downside volatility such as growing trade tensions, an increasing likelihood of a disorderly Brexit, a slowdown and bank bailouts in China, and geopolitical tensions in the Middle East |
1
Notwithstanding cyclical lows for lagging indicators of credit market stress (such as trailing default rates), cracks are forming as idiosyncratic capital structure collapses are becoming more frequent. In particular, the potential for swift and significant withdrawal of investor sponsorship should sentiment turn is highly motivating to exercise restraint in budgeting risk. As such, Fund positioning remains defensive, with corporate credit emphasizing regulated financials and counter-cyclical industrials like pharmaceuticals, food and beverage, and communications, and we will continue to look for opportunities to add exposure if spreads widen toward median levels. Despite looser underwriting standards — typical of late cycle — in certain sectors and relatively tight spreads overall, senior parts of the structured products markets remain a haven from credit excesses while still generating incrementalreturn. Non-agency mortgage-backed securities (“MBS”) continue to present attractive risk-adjusted return potential despite a shrinking market. Agency MBS offers better liquidity characteristics, but there is risk as the Fed continues to shrink its position, therefore exposure is minimal. Finally, super senior ABS, particularly government-guaranteed student loan collateral, and CMBS markets are still solid fundamentally, but tighter spreads have made the sectors less compelling. Within CMBS, the emphasis remains on agency-backed issues, though exposure may be reduced in favor of better opportunities. Thenon-agency CMBS allocation continues to emphasize seasoned issues at the top of the capital structure and single asset single borrower deals to avoid the underwriting challenges faced by current vintage issues. Finally, as Treasury yields rallied over the pastsix-months, duration was trimmed from 2.0 years to approximately 1.9 years, and the position may be further shortened should rates decline.
Portfolio Positioning
SECTOR ALLOCATION
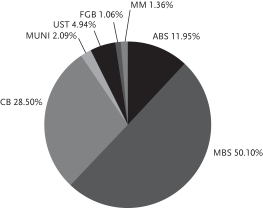
Asset-backed Securities (ABS)
Mortgage-backed Securities (MBS)
Corporate Bonds (CB)
Municipal Bonds (MUNI)
U.S. Treasury Securities (UST)
Foreign Government Bonds (FGB)
Money Market Investments (MM)
MBS ALLOCATION
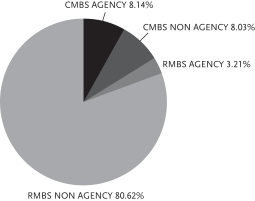
Commercial Mortgage-backed Securities — Agency (CMBS AGENCY)
Commercial Mortgage-backed Securities — Non-agency (CMBS NON AGENCY)
Residential Mortgage-backed Securities — Agency (RMBS AGENCY)
Residential Mortgage-backed Securities — Non-agency (RMBS NON AGENCY)
Modest leverage can be utilized by the TSI Fund through a Line of Credit facility, though the Fund does not currently use any of the available $70 million commitment. Leverage may return to the Fund when management considers the market opportunity to be more abundant and the use of leverage has the potential to be accretive to returns.
We greatly appreciate your investment in the Fund and your continuing support of TCW. If you have any additional questions or comments, we invite you to visit our web site at www.tcw.com or contact our shareholder services department at1-866-227-8179, or contact@tcw.com.
Sincerely,

David S. DeVito
President, Chief Executive Officer and Director
The views expressed in this report reflect those of the Fund’s Advisor as of the date this is written and may not reflect its views on the date this report is first published or anytime thereafter. This report may contain discussions about investments that may or may not be held by the Fund as of the date of this report. All current and future holdings are subject to risk and to change. To the extent this report contains forward looking statements, unforeseen circumstances may cause actual results to differ materially from the views expressed as of the date this is written.
2
TCW Strategic Income Fund, Inc.
Schedule of Investments (Unaudited) | June 30, 2019 |
| | | | | | | | | | | | |
| Issues | | Maturity
Date | | | Principal
Amount | | | Value | |
|
FIXED INCOME SECURITIES —94.8% of Net Assets | |
|
| ASSET-BACKED SECURITIES — 12.1% | |
| |
321 Henderson Receivables LLC(17-1A-A) | | | | | |
| | | |
3.99%(1) | | | 08/16/60 | | | $ | 240,038 | | | $ | 256,201 | |
| |
AMMC CLO(16-19A-A) | | | | | |
| | | |
4.10% (3 mo. USD LIBOR + 1.500%) (1)(2) | | | 10/15/28 | | | | 1,370,000 | | | | 1,370,739 | |
|
AMUR Finance I LLC(13-1) | |
| | | |
10.00%(3)(4) | | | 01/25/22 | | | | 777,891 | | | | 217,820 | |
|
AMUR Finance I LLC(13-2) | |
| | | |
10.00%(3)(4) | | | 03/20/24 | | | | 529,571 | | | | 164,174 | |
| |
Babson CLO, Ltd. (13-IA-AR) | | | | | |
| | | |
3.39%(1)(5) | | | 01/20/28 | | | | 640,000 | | | | 637,919 | |
| |
Babson CLO, Ltd.(16-2A-AR) | | | | | |
| | | |
3.67%(1)(5) | | | 07/20/28 | | | | 650,000 | | | | 650,131 | |
| |
Barings CLO, Ltd.(18-3A-A1) | | | | | |
| | | |
3.54%(1)(5) | | | 07/20/29 | | | | 675,000 | | | | 672,048 | |
| |
Bayview Commercial Asset Trust(03-2-A) | | | | | |
| | | |
3.27% (1 mo. USD LIBOR + 0.870%) (1)(2) | | | 12/25/33 | | | | 432,546 | | | | 428,824 | |
| |
Bayview Commercial Asset Trust(04-1-A) | | | | | |
| | | |
2.94% (1 mo. USD LIBOR + 0.540%) (1)(2) | | | 04/25/34 | | | | 357,317 | | | | 354,498 | |
| |
Bayview Commercial Asset Trust(04-2-A) | | | | | |
| | | |
2.83% (1 mo. USD LIBOR + 0.645%) (1)(2) | | | 08/25/34 | | | | 332,495 | | | | 327,000 | |
| |
Bayview Commercial Asset Trust(04-3-A1) | | | | | |
| | | |
2.96% (1 mo. USD LIBOR + 0.370%) (1)(2) | | | 01/25/35 | | | | 177,830 | | | | 177,109 | |
| |
BlueMountain CLO, Ltd.(13-1A-A1R2) | | | | | |
| | | |
3.82%(1)(5) | | | 01/20/29 | | | | 1,400,000 | | | | 1,402,060 | |
| |
Brazos Higher Education Authority, Inc.(10-1-A2) | | | | | |
| | | |
3.72% (3 mo. USD LIBOR + 1.200%) (2) | | | 02/25/35 | | | | 2,200,000 | | | | 2,245,674 | |
| |
CIT Education Loan Trust(07-1-A) | | | | | |
| | | |
2.44% (3 mo. USD LIBOR + 0.090%) (1)(2) | | | 03/25/42 | | | | 700,429 | | | | 669,543 | |
| |
Corevest American Finance Trust(19-1-XA) (I/O) | | | | | |
| | | |
2.35%(1)(5) | | | 03/15/52 | | | | 1,911,902 | | | | 187,538 | |
| |
Education Loan Asset-Backed Trust I(13-1-A2) | | | | | |
| | | |
3.20% (1 mo. USD LIBOR + 0.800%) (1)(2) | | | 04/26/32 | | | | 1,260,000 | | | | 1,256,287 | |
| |
EFS Volunteer No 2 LLC(12-1-A2) | | | | | |
| | | |
3.75% (1 mo. USD LIBOR + 1.350%) (1)(2) | | | 03/25/36 | | | | 1,500,000 | | | | 1,510,236 | |
| |
GCO Education Loan Funding Master Trust II(06-2AR-A1RN) | | | | | |
| | | |
3.05% (1 mo. USD LIBOR + 0.650%) (1)(2) | | | 08/27/46 | | | | 2,071,282 | | | | 1,976,191 | |
| |
Global SC Finance SRL(14-1A-A2) | | | | | |
| | | |
3.09%(1) | | | 07/17/29 | | | | 221,125 | | | | 222,019 | |
| | | | | | | | | | | | |
| Issues | | Maturity
Date | | | Principal
Amount | | | Value | |
|
| ASSET-BACKED SECURITIES (Continued) | |
| |
Goal Capital Funding Trust(06-1-B) | | | | | |
| | | |
2.97% (3 mo. USD LIBOR + 0.450%) (2) | | | 08/25/42 | | | $ | 246,636 | | | $ | 227,649 | |
| |
GoldenTree Loan Opportunities IX, Ltd.(14-9A-AR2) | | | | | |
| | | |
3.69%(1)(5) | | | 10/29/29 | | | | 1,400,000 | | | | 1,398,926 | |
| |
Higher Education Funding I(14-1-A) | | | | | |
| | | |
3.57% (3 mo. USD LIBOR + 1.050%) (1)(2) | | | 05/25/34 | | | | 518,200 | | | | 521,928 | |
| |
LCM XXI LP(21A-AR) | | | | | |
| | | |
3.47%(1)(5) | | | 04/20/28 | | | | 1,100,000 | | | | 1,095,600 | |
| |
Madison Park Funding, Ltd.(18-30A-A) 3 | | | | | |
| | | |
.35%(1)(5) | | | 04/15/29 | | | | 1,400,000 | | | | 1,387,567 | |
| |
Magnetite VII, Ltd.(12-7A-A1R2) | | | | | |
| | | |
3.40%(1)(5) | | | 01/15/28 | | | | 410,000 | | | | 407,856 | |
| |
Nelnet Student Loan Trust(14-4A-A2) | | | | | |
| | | |
3.35% (1 mo. USD LIBOR + 0.950%) (1)(2) | | | 11/25/48 | | | | 575,000 | | | | 569,434 | |
| |
Neuberger Berman CLOXVI-S, Ltd.(17-16SA-A) | | | | | |
| | | |
3.45%(1)(5) | | | 01/15/28 | | | | 1,400,000 | | | | 1,396,460 | |
| |
North Carolina State Education Assistance Authority(11-1-A3) | | | | | |
| | | |
3.67% (3 mo. USD LIBOR + 0.900%) (2) | | | 10/25/41 | | | | 1,852,172 | | | | 1,852,240 | |
| |
Riserva Clo, Ltd.(16-3A-AR) | | | | | |
| | | |
0.00% (3 mo. USD LIBOR + 1.140%) (1)(2)(4) | | | 10/18/28 | | | | 1,400,000 | | | | 1,400,069 | |
| |
Scholar Funding Trust(12-B-A2) | | | | | |
| | | |
3.53% (1 mo. USD LIBOR + 1.100%) (1)(2) | | | 03/28/46 | | | | 751,826 | | | | 757,088 | |
| |
SLC Student Loan Trust(04-1-B) | | | | | |
| | | |
2.81% (3 mo. USD LIBOR + 0.290%) (2) | | | 08/15/31 | | | | 341,718 | | | | 312,835 | |
| |
SLC Student Loan Trust(06-1-B) | | | | | |
| | | |
2.62% (3 mo. USD LIBOR + 0.210%) (2) | | | 03/15/55 | | | | 440,038 | | | | 407,788 | |
| |
SLM Student Loan Trust(04-2-B) | | | | | |
| | | |
3.05% (3 mo. USD LIBOR + 0.470%) (2) | | | 07/25/39 | | | | 374,697 | | | | 352,726 | |
| |
SLM Student Loan Trust(05-9-B) | | | | | |
| | | |
2.88% (3 mo. USD LIBOR + 0.300%) (2) | | | 01/25/41 | | | | 449,293 | | | | 424,766 | |
| |
SLM Student Loan Trust(06-8-A6) | | | | | |
| | | |
2.74% (3 mo. USD LIBOR + 0.160%) (2) | | | 01/25/41 | | | | 1,400,000 | | | | 1,331,664 | |
| |
SLM Student Loan Trust(07-6-B) | | | | | |
| | | |
3.43% (3 mo. USD LIBOR + 0.850%) (2) | | | 04/27/43 | | | | 143,908 | | | | 137,000 | |
| |
SLM Student Loan Trust(07-7-B) | | | | | |
| | | |
3.33% (3 mo. USD LIBOR + 0.750%) (2) | | | 10/27/70 | | | | 150,000 | | | | 140,187 | |
See accompanying notes to financial statements.
3
TCW Strategic Income Fund, Inc.
Schedule of Investments (Unaudited) (Continued)
| | | | | | | | | | | | |
| Issues | | Maturity
Date | | | Principal
Amount | | | Value | |
|
| ASSET-BACKED SECURITIES (Continued) | |
| |
SLM Student Loan Trust(08-2-B) | | | | | |
| | | |
3.78% (3 mo. USD LIBOR + 1.200%) (2) | | | 01/25/83 | | | $ | 225,000 | | | $ | 215,456 | |
| |
SLM Student Loan Trust(08-3-B) | | | | | |
| | | |
3.78% (3 mo. USD LIBOR + 1.200%) (2) | | | 04/26/83 | | | | 225,000 | | | | 213,768 | |
| |
SLM Student Loan Trust(08-4-B) | | | | | |
| | | |
4.43% (3 mo. USD LIBOR + 1.850%) (2) | | | 04/25/73 | | | | 480,000 | | | | 486,799 | |
| |
SLM Student Loan Trust(08-5-B) | | | | | |
| | | |
4.43% (3 mo. USD LIBOR + 1.850%) (2) | | | 07/25/73 | | | | 225,000 | | | | 227,135 | |
| |
SLM Student Loan Trust(08-6-B) | | | | | |
| | | |
4.43% (3 mo. USD LIBOR + 1.850%) (2) | | | 07/26/83 | | | | 225,000 | | | | 228,446 | |
| |
SLM Student Loan Trust(08-7-B) | | | | | |
| | | |
4.43% (3 mo. USD LIBOR + 1.850%) (2) | | | 07/26/83 | | | | 270,000 | | | | 274,173 | |
| |
SLM Student Loan Trust(08-8-B) | | | | | |
| | | |
4.83% (3 mo. USD LIBOR + 2.250%) (2) | | | 10/25/75 | | | | 225,000 | | | | 229,601 | |
| |
SLM Student Loan Trust(08-9-B) | | | | | |
| | | |
4.83% (3 mo. USD LIBOR + 2.250%) (2) | | | 10/25/83 | | | | 225,000 | | | | 230,257 | |
| |
Structured Receivables Finance LLC(10-A-B) | | | | | |
| | | |
7.61%(1) | | | 01/16/46 | | | | 622,161 | | | | 726,924 | |
| |
Structured Receivables Finance LLC(10-B-B) | | | | | |
| | | |
7.97%(1) | | | 08/15/36 | | | | 368,187 | | | | 436,246 | |
| |
Student Loan Consolidation Center(02-2-B2) | | | | | |
| | | |
0.00% (28 day Auction Rate) (1)(2)(4) | | | 07/01/42 | | | | 1,250,000 | | | | 1,179,167 | |
| |
Vermont Student Assistance Corp.(12-1-A) | | | | | |
| | | |
3.13% (1 mo. USD LIBOR + 0.700%)(2) | | | 07/28/34 | | | | 241,502 | | | | 239,683 | |
| | | | | | | | | | | | |
| |
Total Asset-backed Securities | | | | | |
| |
(Cost: $33,474,879) | | | | 33,535,449 | |
| | | | | | | | | | | | |
|
MORTGAGE-BACKED SECURITIES — 50.7% | |
|
| Commercial Mortgage-backed Securities — Agency —4.1% | |
| |
Fannie Mae, Pool #AN9619 | | | | | |
| | | |
3.77% | | | 06/01/33 | | | | 830,000 | | | | 922,769 | |
| |
Fannie Mae, Pool #AN9420 | | | | | |
| | | |
3.77% | | | 07/01/43 | | | | 636,698 | | | | 707,065 | |
| |
Fannie Mae(11-M5-A2) (ACES)(I/O) | | | | | |
| | | |
1.21%(5) | | | 07/25/21 | | | | 5,316,733 | | | | 97,496 | |
| |
Fannie Mae(12-M14-X2) (I/O) | | | | | |
| | | |
0.48%(5) | | | 09/25/22 | | | | 11,284,093 | | | | 116,452 | |
| |
Fannie Mae(16-M11-AL) | | | | | |
| | | |
2.94% | | | 07/25/39 | | | | 902,054 | | | | 929,116 | |
| |
Fannie Mae(16-M11-X2) (I/O) | | | | | |
| | | |
2.72%(5) | | | 07/25/39 | | | | 5,243,187 | | | | 192,388 | |
| | | | | | | | | | | | |
| Issues | | Maturity
Date | | | Principal
Amount | | | Value | |
|
| Commercial Mortgage-backed Securities — Agency (Continued) | |
|
Freddie Mac, Pool #WA3303 | |
| | | |
3.83% | | | 05/01/35 | | | $ | 1,390,318 | | | $ | 1,544,204 | |
| |
Freddie Mac Multifamily Structured Pass-Through Certificates(K093-XAM) (I/O) | | | | | |
| | | |
1.19%(5) | | | 05/25/29 | | | | 3,205,000 | | | | 335,482 | |
| |
Freddie Mac Multifamily Structured Pass-Through Certificates(K015-X3) (I/O) | | | | | |
| | | |
2.90%(5) | | | 08/25/39 | | | | 4,000,000 | | | | 220,360 | |
| |
Freddie Mac Multifamily Structured Pass-Through Certificates(K021-X3) (I/O) | | | | | |
| | | |
2.03%(5) | | | 07/25/40 | | | | 3,475,000 | | | | 191,829 | |
| |
Freddie Mac Multifamily Structured Pass-Through Certificates(K022-X3) (I/O) | | | | | |
| | | |
1.87%(5) | | | 08/25/40 | | | | 2,500,000 | | | | 133,432 | |
| |
Freddie Mac Multifamily Structured Pass-Through Certificates(K025-X3) (I/O) | | | | | |
| | | |
1.81%(5) | | | 11/25/40 | | | | 5,400,000 | | | | 301,342 | |
| |
Freddie Mac Multifamily Structured Pass-Through Certificates(K031-X3) (I/O) | | | | | |
| | | |
1.71%(5) | | | 07/25/41 | | | | 4,500,000 | | | | 268,832 | |
| |
Freddie Mac Multifamily Structured Pass-Through Certificates(K047-X1) (I/O) | | | | | |
| | | |
0.26%(5) | | | 05/25/25 | | | | 58,378,396 | | | | 488,709 | |
| |
Freddie Mac Multifamily Structured Pass-Through Certificates(K728-X3) (I/O) | | | | | |
| | | |
2.02%(5) | | | 11/25/45 | | | | 3,455,000 | | | | 321,626 | |
| |
Freddie Mac Multifamily Structured Pass-Through Certificates(K732-X3) (I/O) | | | | | |
| | | |
2.25%(5) | | | 05/25/46 | | | | 2,400,000 | | | | 276,868 | |
| |
Freddie Mac Multifamily Structured Pass-Through Certificates(K734-X1) (I/O) | | | | | |
| | | |
0.79%(5) | | | 02/25/26 | | | | 7,248,972 | | | | 273,497 | |
| |
Freddie Mac Multifamily StructuredPass-Through Certificates(KIR1-X) (I/O) | | | | | |
| | | |
1.21%(5) | | | 03/25/26 | | | | 4,603,193 | | | | 279,574 | |
| |
Freddie Mac Multifamily Structured Pass-Through Certificates(Q004-A2H) | | | | | |
| | | |
3.05%(5) | | | 01/25/46 | | | | 859,493 | | | | 864,780 | |
| |
Freddie Mac Multifamily Structured Pass-Through Certificates (Q006-APT1) | | | | | |
| | | |
2.62%(5) | | | 07/25/26 | | | | 1,293,877 | | | | 1,325,952 | |
| |
Ginnie Mae(08-92-E) | | | | | |
| | | |
5.56%(5) | | | 03/16/44 | | | | 466,182 | | | | 477,623 | |
|
Ginnie Mae(09-114-IO) (I/O) | |
| | | |
0.00%(5) | | | 10/16/49 | | | | 8,509,082 | | | | 3,574 | |
|
Ginnie Mae(11-10-IO) (I/O) | |
| | | |
0.06%(5) | | | 12/16/45 | | | | 15,532,172 | | | | 63,527 | |
|
Ginnie Mae(11-105-IO) (I/O) | |
| | | |
0.00%(5)(4) | | | 09/16/51 | | | | 8,718,076 | | | | 41,193 | |
|
Ginnie Mae(11-152-IO) (I/O) | |
| | | |
0.32%(5) | | | 08/16/51 | | | | 3,856,674 | | | | 35,520 | |
See accompanying notes to financial statements.
4
TCW Strategic Income Fund, Inc.
June 30, 2019
| | | | | | | | | | | | |
| Issues | | Maturity
Date | | | Principal
Amount | | | Value | |
|
| Commercial Mortgage-backed Securities — Agency (Continued) | |
|
Ginnie Mae(11-42-IO) (I/O) | |
| | | |
0.00%(5)(4) | | | 08/16/50 | | | $ | 15,889,316 | | | $ | 69,277 | |
|
Ginnie Mae(12-4-IO) (I/O) | |
| | | |
0.17%(5) | | | 05/16/52 | | | | 13,269,772 | | | | 111,242 | |
|
Ginnie Mae(14-103-IO) (I/O) | |
| | | |
0.61%(5) | | | 05/16/55 | | | | 6,391,871 | | | | 193,418 | |
|
Ginnie Mae(14-125-IO) (I/O) | |
| | | |
0.96%(5) | | | 11/16/54 | | | | 6,439,934 | | | | 389,126 | |
|
Ginnie Mae(14-88-IE) (I/O) | |
| | | |
0.32%(5) | | | 03/16/55 | | | | 7,633,526 | | | | 178,630 | |
|
Ginnie Mae(16-22-IX) (I/O) | |
| | | |
1.29%(5) | | | 06/16/38 | | | | 484,771 | | | | 91,921 | |
| | | | | | | | | | | | |
| |
Total Commercial Mortgage-backed Securities — Agency | | | | | |
| |
(Cost: $13,019,513) | | | | 11,446,824 | |
| | | | | | | | | | | | |
|
| Commercial Mortgage-backed Securities —Non-agency — 4.1% | |
|
BAMLL Commercial Mortgage Securities Trust(11-FSHN-A) | |
| | | |
4.42%(1) | | | 07/11/33 | | | | 300,000 | | | | 310,050 | |
|
BAMLL Commercial Mortgage Securities Trust(18-PARK-A) | |
| | | |
4.23%(1)(5) | | | 08/10/38 | | | | 415,000 | | | | 459,588 | |
|
Banc of America Commercial Mortgage Trust(07-5-AJ) | |
| | | |
6.24%(5) | | | 02/10/51 | | | | 536,345 | | | | 513,919 | |
|
CALI Mortgage Trust(19-101C-A) | |
| | | |
3.96%(1) | | | 03/10/39 | | | | 680,000 | | | | 748,736 | |
|
CGRBS Commercial Mortgage Trust(13-VN05-A) | |
| | | |
3.37%(1) | | | 03/13/35 | | | | 290,000 | | | | 302,961 | |
|
Citigroup Commercial Mortgage Trust(12-GC8-XA) (I/O) | |
| | | |
1.94%(1)(5)(6) | | | 09/10/45 | | | | 3,266,063 | | | | 148,086 | |
|
COMM Mortgage Trust(12-LC4-XB) (I/O) | |
| | | |
0.64%(1)(5) | | | 12/10/44 | | | | 18,671,016 | | | | 275,771 | |
|
COMM Mortgage Trust(13-CR13-XA) (I/O) | |
| | | |
0.96%(5) | | | 11/10/46 | | | | 5,483,166 | | | | 168,421 | |
|
COMM Mortgage Trust(13-CR12-XA) (I/O) | |
| | | |
1.33%(5) | | | 10/10/46 | | | | 9,923,631 | | | | 402,045 | |
|
COMM Mortgage Trust(13-LC13-XA) (I/O) | |
| | | |
1.33%(5) | | | 08/10/46 | | | | 9,367,819 | | | | 337,587 | |
|
COMM Mortgage Trust(14-CR18-XA) (I/O) | |
| | | |
1.17%(5) | | | 07/15/47 | | | | 7,141,303 | | | | 286,442 | |
|
Credit Suisse Commercial Mortgage Trust(07-C2-AJ) | |
| | | |
5.75%(5) | | | 01/15/49 | | | | 62,754 | | | | 63,111 | |
|
CSMC Trust(15-GLPB-A) | |
| | | |
3.64%(1) | | | 11/15/34 | | | | 1,500,000 | | | | 1,578,295 | |
|
Four Times Square Trust Commercial Mortgage Pass-Through Certificates(06-4TS-X) (I/O) | |
| | | |
0.36%(1)(5)(6) | | | 12/13/28 | | | | 51,997,322 | | | | 174,399 | |
|
GS Mortgage Securities Trust(11-GC3-X) (I/O) | |
| | | |
0.82%(1)(5) | | | 03/10/44 | | | | 16,388,029 | | | | 161,796 | |
|
GS Mortgage Securities Trust(12-GC6-XB) (I/O) | |
| | | |
0.26%(1)(5)(6) | | | 01/10/45 | | | | 17,397,372 | | | | 99,838 | |
| | | | | | | | | | | | |
| Issues | | Maturity
Date | | | Principal
Amount | | | Value | |
|
| Commercial Mortgage-backed Securities —Non-agency (Continued) | |
|
GS Mortgage Securities Trust(14-GC18-XB) (I/O) | |
| | | |
0.27%(5) | | | 01/10/47 | | | $ | 66,563,000 | | | $ | 452,196 | |
|
Hudson Yards Mortgage Trust(19-30HY-A) | |
| | | |
3.23%(1) | | | 07/10/39 | | | | 560,000 | | | | 576,537 | |
|
JPMBB Commercial Mortgage Securities Trust(14-C24-XA) (I/O) | |
| | | |
1.11%(5) | | | 11/15/47 | | | | 8,615,790 | | | | 280,758 | |
| |
JPMBB Commercial Mortgage Securities Trust(14-C21-XA) (I/O) | | | | | |
| | | |
1.17%(5) | | | 08/15/47 | | | | 1,945,685 | | | | 78,526 | |
| |
JPMorgan Chase Commercial Mortgage Securities Trust(09-IWST-XA) (I/O) | | | | | |
| | | |
2.08%(1)(5)(6) | | | 12/05/27 | | | | 11,697,758 | | | | 94,396 | |
| |
JPMorgan Chase Commercial Mortgage Securities Trust(11-C3-XB) (I/O) | | | | | |
| | | |
0.61%(1)(5) | | | 02/15/46 | | | | 53,641,794 | | | | 476,817 | |
| |
JPMorgan Chase Commercial Mortgage Securities Trust(12-HSBC-XA) (I/O) | | | | | |
| | | |
1.58%(1)(5)(6) | | | 07/05/32 | | | | 4,536,445 | | | | 173,983 | |
| |
JPMorgan Chase Commercial Mortgage Securities Trust(13-LC11-XA) (I/O) | | | | | |
| | | |
1.40%(5) | | | 04/15/46 | | | | 3,056,227 | | | | 124,906 | |
| |
JPMorgan Chase Commercial Mortgage Securities Trust(19-OSB-A) | | | | | |
| | | |
3.40%(1) | | | 06/05/39 | | | | 275,000 | | | | 289,731 | |
| |
Morgan Stanley Capital I Trust(12-C4-XA) (I/O) | | | | | |
| | | |
2.26%(1)(5)(6) | | | 03/15/45 | | | | 5,540,767 | | | | 244,740 | |
| |
SFAVE Commercial Mortgage Securities Trust(15-5AVE-A2A) | | | | | |
| | | |
3.66%(1)(5) | | | 01/05/43 | | | | 390,000 | | | | 408,463 | |
| |
UBS Commercial Mortgage Trust(12-C1-XA) (I/O) | | | | | |
| | | |
2.25%(1)(5)(6) | | | 05/10/45 | | | | 5,610,914 | | | | 261,807 | |
| |
VNDO Mortgage Trust(12-6AVE-A) | | | | | |
| | | |
3.00%(1) | | | 11/15/30 | | | | 280,000 | | | | 286,902 | |
| |
Wells Fargo Commercial Mortgage Trust(12-LC5-XA) (I/O) | | | | | |
| | | |
1.93%(1)(5) | | | 10/15/45 | | | | 5,819,608 | | | | 270,728 | |
| |
WFRBS Commercial Mortgage Trust(12-C8-XA) (I/O) | | | | | |
| | | |
1.99%(1)(5)(6) | | | 08/15/45 | | | | 4,490,468 | | | | 199,648 | |
| |
WFRBS Commercial Mortgage Trust(12-C9-XA) (I/O) | | | | | |
| | | |
2.07%(1)(5) | | | 11/15/45 | | | | 2,632,928 | | | | 137,623 | |
| |
WFRBS Commercial Mortgage Trust(13-C14-XA) (I/O) | | | | | |
| | | |
0.87%(5) | | | 06/15/46 | | | | 8,857,170 | | | | 206,549 | |
|
WFRBS Commercial Mortgage Trust(14-C24-XA) (I/O) | |
| | | |
1.01%(5) | | | 11/15/47 | | | | 5,976,860 | | | | 200,934 | |
|
WFRBS Commercial Mortgage Trust(14-LC14-XA) (I/O) | |
| | | |
1.40%(5) | | | 03/15/47 | | | | 11,052,344 | | | | 485,342 | |
| | | | | | | | | | | | |
| |
Total Commercial Mortgage-backed Securities —Non-agency | | | | | |
| | |
(Cost: $13,458,686) | | | | | | | | 11,281,631 | |
| | | | | | | | | | | | |
See accompanying notes to financial statements.
5
TCW Strategic Income Fund, Inc.
Schedule of Investments (Unaudited) (Continued)
| | | | | | | | | | | | |
| Issues | | Maturity
Date | | | Principal
Amount | | | Value | |
|
| Residential Mortgage-backed Securities — Agency —1.6% | |
| |
Fannie Mae(04-53-QV) (I/O) (I/F) | | | | | |
| | | |
1.59% (1 mo. USD LIBOR + 7.590%)(2) | | | 02/25/34 | | | $ | 1,087,919 | | | $ | 19,403 | |
| |
Fannie Mae(07-42-SE) (I/O) (I/F) | | | | | |
| | | |
3.71%(-1.00 x 1 mo. USD LIBOR + 6.110%)(2) | | | 05/25/37 | | | | 141,453 | | | | 18,370 | |
| |
Fannie Mae(07-48-SD) (I/O) (I/F) | | | | | |
| | | |
3.70%(-1.00 x 1 mo. USD LIBOR + 6.100%)(2) | | | 05/25/37 | | | | 1,599,309 | | | | 237,816 | |
| |
Fannie Mae(09-69-CS) (I/O) (I/F) | | | | | |
| | | |
4.35%(-1.00 x 1 mo. USD LIBOR + 6.750%)(2) | | | 09/25/39 | | | | 300,640 | | | | 47,890 | |
| |
Freddie Mac(1673-SD) (I/F) (PAC) | | | | | |
| | | |
14.28%(-2.15 x T10Y + 19.391%)(2) | | | 02/15/24 | | | | 78,208 | | | | 92,205 | |
| |
Freddie Mac(1760-ZD) | | | | | |
| | | |
1.87% (1 x T10Y - 0.500%)(2) | | | 02/15/24 | | | | 168,873 | | | | 166,187 | |
| |
Freddie Mac(2990-JK) (I/F) | | | | | |
| | | |
12.43%(-4.00079 x 1 mo. USD LIBOR + 22.004%)(2) | | | 03/15/35 | | | | 133,182 | | | | 160,218 | |
| |
Freddie Mac(3122-SG) (I/O) (I/F) (TAC) (PAC) | | | | | |
| | | |
3.24%(-1.00 x 1 mo. USD LIBOR + 5.630%)(2) | | | 03/15/36 | | | | 2,564,344 | | | | 405,709 | |
| |
Freddie Mac(3239-SI) (I/O) (I/F) (PAC) | | | | | |
| | | |
4.26%(-1.00 x 1 mo. USD LIBOR + 6.650%)(2) | | | 11/15/36 | | | | 632,244 | | | | 129,751 | |
| |
Freddie Mac(3323-SA) (I/O) (I/F) | | | | | |
| | | |
3.63%(-1.00 x 1 mo. USD LIBOR + 6.110%)(2) | | | 05/15/37 | | | | 223,080 | | | | 29,737 | |
| |
Freddie Mac(3459-JS) (I/O) (I/F) | | | | | |
| | | |
3.77%(5) | | | 06/15/38 | | | | 226,680 | | | | 35,295 | |
| |
Freddie Mac(4030-HS) (I/O) (I/F) | | | | | |
| | | |
4.22%(-1.00 x 1 mo. USD LIBOR + 6.610%)(2) | | | 04/15/42 | | | | 1,320,659 | | | | 247,244 | |
| |
Ginnie Mae(06-35-SA) (I/O) (I/F) | | | | | |
| | | |
4.22%(-1.00 x 1 mo. USD LIBOR + 6.600%)(2) | | | 07/20/36 | | | | 1,902,951 | | | | 372,833 | |
| |
Ginnie Mae(06-61-SA) (I/O) (I/F) (TAC) | | | | | |
| | | |
2.31%(5) | | | 11/20/36 | | | | 3,162,416 | | | | 318,839 | |
| |
Ginnie Mae(08-58-TS) (I/O) (I/F) (TAC) | | | | | |
| | | |
4.02%(-1.00 x 1 mo. USD LIBOR + 6.400%)(2) | | | 05/20/38 | | | | 1,622,664 | | | | 155,076 | |
| |
Ginnie Mae(16-153-IO) (I/O) | | | | | |
| | | |
3.50% | | | 11/20/46 | | | | 3,887,225 | | | | 664,498 | |
| | | |
Ginnie Mae II TBA, 30 Year | | | | | | | | | | | | |
| | | |
4.50%(7) | | | 07/29/48 | | | | 1,350,000 | | | | 1,406,863 | |
| | | | | | | | | | | | |
| |
Total Residential Mortgage-backed Securities — Agency | | | | | |
| | |
(Cost: $3,421,059) | | | | | | | | 4,507,934 | |
| | | | | | | | | | | | |
| | | | | | | | | | | | |
| Issues | | Maturity
Date | | | Principal
Amount | | | Value | |
|
| Residential Mortgage-backed Securities —Non-agency —40.9% | |
| |
ACE Securities Corp.(04-IN1-A1) | | | | | |
| | | |
3.04% (1 mo. USD LIBOR + 0.640%)(2) | | | 05/25/34 | | | $ | 537,651 | | | $ | 519,244 | |
| |
ACE Securities Corp.(07-ASP1-A2C) | | | | | |
| | | |
2.66% (1 mo. USD LIBOR + 0.260%)(2) | | | 03/25/37 | | | | 1,555,629 | | | | 974,828 | |
| |
Adjustable Rate Mortgage Trust(05-4-6A22) | | | | | |
| | | |
4.42%(5) | | | 08/25/35 | | | | 639,200 | | | | 412,518 | |
| |
Adjustable Rate Mortgage Trust(06-1-2A1) | | | | | |
| | | |
4.52%(5) | | | 03/25/36 | | | | 492,092 | | | | 391,691 | |
| |
Asset-Backed Funding Certificates(07-NC1-A2) | | | | | |
| | | |
2.70% (1 mo. USD LIBOR + 0.300%)(1)(2) | | | 05/25/37 | | | | 1,425,363 | | | | 1,405,466 | |
| |
Asset-Backed Securities Corp. Home Equity(06-HE3-A5) | | | | | |
| | | |
2.67% (1 mo. USD LIBOR + 0.270%)(2) | | | 03/25/36 | | | | 3,000,000 | | | | 2,940,195 | |
| |
Asset-Backed Securities Corp. Home Equity(07-HE1-A1B) | | | | | |
| | | |
2.55% (1 mo. USD LIBOR + 0.150%)(2) | | | 12/25/36 | | | | 678,577 | | | | 667,097 | |
| |
Banc of America Alternative Loan Trust(05-10-1CB1) | | | | | |
| | | |
2.80% (1 mo. USD LIBOR + 0.400%)(2) | | | 11/25/35 | | | | 786,129 | | | | 705,716 | |
| |
Banc of America Funding Corp.(15-R3-6A2) | | | | | |
| | | |
2.60%(1)(5) | | | 05/27/36 | | | | 1,920,986 | | | | 1,826,724 | |
| |
Banc of America Funding Trust(06-3-4A14) | | | | | |
| | | |
6.00% | | | 03/25/36 | | | | 479,447 | | | | 479,237 | |
| |
Banc of America Funding Trust(06-3-5A3) | | | | | |
| | | |
5.50% | | | 03/25/36 | | | | 269,618 | | | | 258,197 | |
| |
Banc of America Funding Trust(15-R4-2A1) | | | | | |
| | | |
2.63% (1 mo. USD LIBOR + 0.205%)(1)(2) | | | 02/25/37 | | | | 1,082,429 | | | | 1,067,223 | |
| |
BCAP LLC Trust(11-RR3-5A3) | | | | | |
| | | |
3.70%(1)(5) | | | 11/27/37 | | | | 162,551 | | | | 163,079 | |
| |
BCMSC Trust(00-A-A4) | | | | | |
| | | |
8.29%(5) | | | 06/15/30 | | | | 3,316,690 | | | | 1,274,540 | |
| |
Bear Stearns Adjustable Rate Mortgage Trust(03-7-9A) | | | | | |
| | | |
4.75%(5) | | | 10/25/33 | | | | 395,072 | | | | 405,508 | |
| |
Bear Stearns Adjustable Rate Mortgage Trust(05-9-A1) | | | | | |
| | | |
4.73% (1 year Treasury Constant Maturity Rate + 2.300%)(2) | | | 10/25/35 | | | | 344,291 | | | | 354,088 | |
| |
Bear Stearns Adjustable Rate Mortgage Trust(07-4-22A1) | | | | | |
| | | |
4.03%(5)(8) | | | 06/25/47 | | | | 1,308,270 | | | | 1,255,993 | |
| |
Bear StearnsALT-A Trust(05-3-4A3) | | | | | |
| | | |
4.31%(5) | | | 04/25/35 | | | | 837,476 | | | | 855,491 | |
| |
Bear Stearns Asset-Backed Securities Trust(05-AC6-1A3) | | | | | |
| | | |
5.50%(5) | | | 09/25/35 | | | | 566,543 | | | | 581,670 | |
See accompanying notes to financial statements.
6
TCW Strategic Income Fund, Inc.
June 30, 2019
| | | | | | | | | | | | |
| Issues | | Maturity
Date | | | Principal
Amount | | | Value | |
|
| Residential Mortgage-backed Securities —Non-agency (Continued) | |
| |
Bear Stearns Asset-Backed Securities Trust(06-IM1-A1) | | | | | |
| | | |
2.63% (1 mo. USD LIBOR + 0.230%)(2) | | | 04/25/36 | | | $ | 344,224 | | | $ | 461,887 | |
| |
Bear Stearns Mortgage Funding Trust(07-AR3-1X) (I/O) | | | | | |
| | | |
0.50% | | | 03/25/37 | | | | 39,574,936 | | | | 1,078,073 | |
| |
Centex Home Equity Loan Trust(05-A-AF5) | | | | | |
| | | |
5.78% | | | 01/25/35 | | | | 455,990 | | | | 459,265 | |
| |
CIM Trust(17-7-A) | | | | | |
| | | |
3.00%(1)(5) | | | 12/25/65 | | | | 992,316 | | | | 998,224 | |
| |
CIM Trust(18-R2-A1) | | | | | |
| | | |
3.69%(1)(5) | | | 08/25/57 | | | | 1,087,416 | | | | 1,077,511 | |
| |
CIM Trust(18-R4-A1) | | | | | |
| | | |
4.07%(1)(5) | | | 12/26/57 | | | | 1,107,487 | | | | 1,120,552 | |
| |
Citigroup Mortgage Loan Trust, Inc.(05-11-A2A) | | | | | |
| | | |
4.82% (1 year Treasury Constant Maturity Rate + 2.400%)(2) | | | 10/25/35 | | | | 477,543 | | | | 487,120 | |
| |
Citigroup Mortgage Loan Trust, Inc.(05-8-1A1A) | | | | | |
| | | |
4.54%(5) | | | 10/25/35 | | | | 1,065,074 | | | | 1,020,711 | |
| |
Citigroup Mortgage Loan Trust, Inc.(14-10-2A2) | | | | | |
| | | |
2.68% (1 mo. USD LIBOR + 0.250%)(1)(2) | | | 07/25/37 | | | | 1,972,354 | | | | 1,929,308 | |
| |
CitiMortgage Alternative Loan Trust(06-A3-1A7) | | | | | |
| | | |
6.00% | | | 07/25/36 | | | | 976,210 | | | | 965,388 | |
| |
CitiMortgage Alternative Loan Trust(06-A5-1A8) | | | | | |
| | | |
6.00% | | | 10/25/36 | | | | 1,097,096 | | | | 1,087,899 | |
| |
Conseco Finance Securitizations Corp.(01-4-A4) | | | | | |
| | | |
7.36%(5) | | | 08/01/32 | | | | 29,868 | | | | 30,036 | |
| |
Conseco Finance Securitizations Corp.(99-6-A1) | | | | | |
| | | |
7.36%(1)(5) | | | 06/01/30 | | | | 1,560,190 | | | | 965,024 | |
| |
Conseco Financial Corp.(96-6-M1) | | | | | |
| | | |
7.95%(5) | | | 09/15/27 | | | | 235,950 | | | | 260,205 | |
| |
Conseco Financial Corp.(96-7-M1) | | | | | |
| | | |
7.70%(5) | | | 09/15/26 | | | | 748,027 | | | | 795,230 | |
| |
Conseco Financial Corp.(98-3-A6) | | | | | |
| | | |
6.76%(5) | | | 03/01/30 | | | | 149,399 | | | | 154,630 | |
| |
Conseco Financial Corp.(98-4-A5) | | | | | |
| | | |
6.18% | | | 04/01/30 | | | | 274,776 | | | | 281,102 | |
| |
Conseco Financial Corp.(98-4-A6) | | | | | |
| | | |
6.53%(5) | | | 04/01/30 | | | | 167,162 | | | | 174,656 | |
| |
Conseco Financial Corp.(98-4-A7) | | | | | |
| | | |
6.87%(5) | | | 04/01/30 | | | | 177,005 | | | | 185,824 | |
| |
Countryplace Manufactured Housing Contract Trust(07-1-A4) | | | | | |
| | | |
5.85%(1)(5) | | | 07/15/37 | | | | 851,438 | | | | 864,337 | |
| |
Countrywide Alternative Loan Trust(05-20CB-4A1) | | | | | |
| | | |
5.25% | | | 07/25/20 | | | | 83,047 | | | | 82,650 | |
| | | | | | | | | | | | |
| Issues | | Maturity
Date | | | Principal
Amount | | | Value | |
|
| Residential Mortgage-backed Securities —Non-agency (Continued) | |
| |
Countrywide Alternative Loan Trust(06-8T1-1A2) (I/O) | | | | | |
| | | |
3.10% (1 mo. USD LIBOR + 5.500%)(2)(3) | | | 04/25/36 | | | $ | 6,515,182 | | | $ | 1,135,984 | |
| |
Countrywide Asset-Backed Certificates(07-13-2A1) | | | | | |
| | | |
3.30% (1 mo. USD LIBOR + 0.900%)(2) | | | 10/25/47 | | | | 748,903 | | | | 734,910 | |
| |
Countrywide Home Loans(04-HYB4-B1) | | | | | |
| | | |
4.51%(5) | | | 09/20/34 | | | | 945,216 | | | | 289,813 | |
| |
Countrywide Home Loans(06-14-X) (I/O) | | | | | |
| | | |
0.18%(3)(5) | | | 09/25/36 | | | | 22,555,204 | | | | 123,887 | |
| |
Countrywide Home Loans(06-HYB2-1A1) | | | | | |
| | | |
4.63%(5) | | | 04/20/36 | | | | 1,305,117 | | | | 1,070,796 | |
| |
Credit Suisse First Boston Mortgage Securities Corp.(04-AR5-11A2) | | | | | |
| | | |
3.14% (1 mo. USD LIBOR + 0.740%)(2) | | | 06/25/34 | | | | 170,850 | | | | 170,859 | |
| |
Credit Suisse First Boston Mortgage Securities Corp.(05-12-1A1) | | | | | |
| | | |
6.50% | | | 01/25/36 | | | | 1,276,768 | | | | 777,856 | |
| |
Credit Suisse Mortgage Capital Certificates(06-6-1A8) | | | | | |
| | | |
6.00% | | | 07/25/36 | | | | 651,704 | | | | 538,952 | |
| |
Credit Suisse Mortgage Trust(12-2R-1A2) | | | | | |
| | | |
4.70%(1)(5) | | | 05/27/35 | | | | 1,066,226 | | | | 1,100,018 | |
| |
Credit-Based Asset Servicing and Securitization LLC(03-CB3-AF1) | | | | | |
| | | |
3.38% | | | 12/25/32 | | | | 515,066 | | | | 524,743 | |
| |
Credit-Based Asset Servicing and Securitization LLC(05-CB4-M2) | | | | | |
| | | |
2.85% (1 mo. USD LIBOR + 0.450%)(2) | | | 07/25/35 | | | | 1,070,295 | | | | 1,077,503 | |
| |
Credit-Based Asset Servicing and Securitization LLC(06-CB1-AF2) | | | | | |
| | | |
3.36% | | | 01/25/36 | | | | 1,401,392 | | | | 1,221,689 | |
| |
Credit-Based Asset Servicing and Securitization LLC(06-CB2-AF2) | | | | | |
| | | |
3.43% | | | 12/25/36 | | | | 2,561,747 | | | | 2,295,632 | |
| |
Credit-Based Asset Servicing and Securitization LLC(07-CB2-A2B) | | | | | |
| | | |
4.03% | | | 02/25/37 | | | | 1,179,109 | | | | 947,965 | |
| |
Credit-Based Asset Servicing and Securitization LLC(07-CB2-A2C) | | | | | |
| | | |
4.03% | | | 02/25/37 | | | | 1,158,489 | | | | 931,284 | |
| |
Credit-Based Asset Servicing and Securitization LLC(07-CB3-A3) | | | | | |
| | | |
3.82% | | | 03/25/37 | | | | 1,453,470 | | | | 738,923 | |
| |
DeutscheAlt-A Securities, Inc. Mortgage Loan Trust(06-AB2-A2) | | | | | |
| | | |
5.26%(5) | | | 06/25/36 | | | | 1,739,589 | | | | 1,699,980 | |
| |
DeutscheAlt-A Securities, Inc. Mortgage Loan Trust(06-AR6-A6) | | | | | |
| | | |
2.59% (1 mo. USD LIBOR + 0.190%)(2) | | | 02/25/37 | | | | 658,069 | | | | 605,661 | |
See accompanying notes to financial statements.
7
TCW Strategic Income Fund, Inc.
Schedule of Investments (Unaudited) (Continued)
| | | | | | | | | | | | |
| Issues | | Maturity
Date | | | Principal
Amount | | | Value | |
|
| Residential Mortgage-backed Securities —Non-agency (Continued) | |
| |
DSLA Mortgage Loan Trust(06-AR2-2A1A) | | | | | |
| | | |
2.59% (1 mo. USD LIBOR + 0.200%)(2) | | | 10/19/36 | | | $ | 489,085 | | | $ | 451,827 | |
| |
First Franklin Mortgage Loan Asset-Backed Certificates(06-FF11-2A3) | | | | | |
| | | |
2.55% (1 mo. USD LIBOR + 0.150%)(2) | | | 08/25/36 | | | | 1,513,356 | | | | 1,366,706 | |
| |
First Franklin Mortgage Loan Asset-Backed Certificates(06-FF13-A2C) | | | | | |
| | | |
2.56% (1 mo. USD LIBOR + 0.160%)(2) | | | 10/25/36 | | | | 965,962 | | | | 768,295 | |
| |
First Franklin Mortgage Loan Asset-Backed Certificates(06-FF18-A2D) | | | | | |
| | | |
2.61% (1 mo. USD LIBOR + 0.210%)(2) | | | 12/25/37 | | | | 1,219,467 | | | | 1,070,751 | |
| |
First Horizon Alternative Mortgage Securities Trust(05-AA10-2A1) | | | | | |
| | | |
3.83%(5) | | | 12/25/35 | | | | 426,805 | | | | 371,796 | |
| |
Greenpoint Manufactured Housing(00-1-A4) | | | | | |
| | | |
8.14%(5) | | | 03/20/30 | | | | 748,341 | | | | 751,420 | |
| |
GSAA Home Equity Trust(06-13-AF6) | | | | | |
| | | |
6.04% | | | 07/25/36 | | | | 1,546,170 | | | | 850,252 | |
| |
GSC Capital Corp. Mortgage Trust(06-2-A1) | | | | | |
| | | |
2.58% (1 mo. USD LIBOR + 0.180%)(2) | | | 05/25/36 | | | | 397,748 | | | | 373,772 | |
| |
GSR Mortgage Loan Trust(05-AR3-6A1) | | | | | |
| | | |
4.49%(5) | | | 05/25/35 | | | | 340,706 | | | | 318,734 | |
| |
HSI Asset Loan Obligation Trust(07-2-2A12) | | | | | |
| | | |
6.00% | | | 09/25/37 | | | | 517,250 | | | | 474,731 | |
| |
Indymac INDX Mortgage Loan Trust(04-AR6-5A1) | | | | | |
| | | |
4.40%(5) | | | 10/25/34 | | | | 440,092 | | | | 458,009 | |
| |
Indymac INDX Mortgage Loan Trust(05-AR19-A1) | | | | | |
| | | |
3.76%(5)(8) | | | 10/25/35 | | | | 593,556 | | | | 518,060 | |
| |
Indymac INDX Mortgage Loan Trust(06-AR13-A4X) (I/O) | | | | | |
| | | |
0.73%(3)(5) | | | 07/25/36 | | | | 234,745 | | | | 915 | |
| |
Indymac INDX Mortgage Loan Trust(06-AR9-1A1) | | | | | |
| | | |
4.26%(5) | | | 06/25/36 | | | | 810,859 | | | | 684,773 | |
| |
Indymac INDX Mortgage Loan Trust(07-AR5-2A1) | | | | | |
| | | |
3.84%(5)(8) | | | 05/25/37 | | | | 1,064,346 | | | | 1,021,245 | |
| |
Indymac INDX Mortgage Loan Trust(07-FLX2-A1C) | | | | | |
| | | |
2.59% (1 mo. USD LIBOR + 0.190%)(2) | | | 04/25/37 | | | | 2,051,990 | | | | 1,928,746 | |
| |
JPMorgan Alternative Loan Trust(06-A2-5A1) | | | | | |
| | | |
4.11%(5) | | | 05/25/36 | | | | 698,787 | | | | 546,594 | |
| |
JPMorgan Mortgage Acquisition Corp.(05-FRE1-A2F3) | | | | | |
| | | |
3.37% | | | 10/25/35 | | | | 600,825 | | | | 602,289 | |
| |
JPMorgan Mortgage Acquisition Trust(06-WF1-A5) | | | | | |
| | | |
6.41% | | | 07/25/36 | | | | 2,471,587 | | | | 1,303,748 | |
| | | | | | | | | | | | |
| Issues | | Maturity
Date | | | Principal
Amount | | | Value | |
|
| Residential Mortgage-backed Securities —Non-agency (Continued) | |
| |
JPMorgan Mortgage Acquisition Trust(07-CH4-A4) | | | | | |
| | | |
2.56% (1 mo. USD LIBOR + 0.160%)(2) | | | 01/25/36 | | | $ | 271,570 | | | $ | 270,967 | |
| |
JPMorgan Mortgage Trust(04-A6-5A1) | | | | | |
| | | |
4.23%(5) | | | 12/25/34 | | | | 315,551 | | | | 310,160 | |
| |
JPMorgan Mortgage Trust(07-S2-1A1) | | | | | |
| | | |
5.00% | | | 06/25/37 | | | | 222,357 | | | | 162,518 | |
| |
JPMorgan Resecuritization Trust(15-4-1A5) | | | | | |
| | | |
2.62% (1 mo. USD LIBOR + 0.190%)(1)(2) | | | 06/26/47 | | | | 1,863,000 | | | | 1,763,200 | |
| |
JPMorgan Resecuritization Trust(15-4-2A2) | | | | | |
| | | |
4.20%(1)(5) | | | 06/26/47 | | | | 4,187,652 | | | | 1,830,050 | |
| |
Legacy Mortgage Asset Trust(19-GS4-A1) | | | | | |
| | | |
3.44%(1) | | | 05/25/59 | | | | 1,292,792 | | | | 1,295,539 | |
| |
Lehman Mortgage Trust(06-7-2A5) (I/O) | | | | | |
| | | |
4.15% (1 mo. USD LIBOR + 6.550%)(2)(3) | | | 11/25/36 | | | | 3,467,214 | | | | 1,031,881 | |
| |
Lehman XS Trust(06-10N-1A3A) | | | | | |
| | | |
2.61% (1 mo. USD LIBOR + 0.210%)(2) | | | 07/25/46 | | | | 880,309 | | | | 867,793 | |
| |
Lehman XS Trust(06-12N-A31A) | | | | | |
| | | |
2.60% (1 mo. USD LIBOR + 0.200%)(2) | | | 08/25/46 | | | | 1,283,938 | | | | 1,212,719 | |
| |
Long Beach Mortgage Loan Trust(04-4-M1) | | | | | |
| | | |
3.30% (1 mo. USD LIBOR + 0.900%)(2) | | | 10/25/34 | | | | 1,020,054 | | | | 1,027,090 | |
| |
MASTR Alternative Loan Trust(06-2-2A2) (I/O) | | | | | |
| | | |
4.70% (1 mo. USD LIBOR + 7.100%)(2) | | | 03/25/36 | | | | 6,033,319 | | | | 1,293,163 | |
| |
MASTR Alternative Loans Trust(07-HF1-4A1) | | | | | |
| | | |
7.00%(8) | | | 10/25/47 | | | | 1,138,495 | | | | 848,158 | |
| |
MASTR Asset-Backed Securities Trust(06-NC1-A4) | | | | | |
| | | |
3.00% (1 mo. USD LIBOR + 0.300%)(2)(3) | | | 01/25/36 | | | | 192,260 | | | | 190,442 | |
| |
MASTR Asset-Backed Securities Trust(07-HE1-A4) | | | | | |
| | | |
2.68% (1 mo. USD LIBOR + 0.280%)(2) | | | 05/25/37 | | | | 2,000,000 | | | | 1,760,947 | |
| |
Merrill Lynch Alternative Note Asset Trust(07-OAR2-A2) | | | | | |
| | | |
2.61% (1 mo. USD LIBOR + 0.210%)(2) | | | 04/25/37 | | | | 1,401,398 | | | | 1,229,698 | |
| |
Merrill Lynch First Franklin Mortgage Loan Trust(07-3-A2B) | | | | | |
| | | |
2.53% (1 mo. USD LIBOR + 0.130%)(2) | | | 06/25/37 | | | | 699,123 | | | | 549,182 | |
| |
Merrill Lynch First Franklin Mortgage Loan Trust(07-3-A2C) | | | | | |
| | | |
2.58% (1 mo. USD LIBOR + 0.180%)(2) | | | 06/25/37 | | | | 1,427,593 | | | | 1,128,330 | |
See accompanying notes to financial statements.
8
TCW Strategic Income Fund, Inc.
June 30, 2019
| | | | | | | | | | | | |
| Issues | | Maturity
Date | | | Principal
Amount | | | Value | |
|
| Residential Mortgage-backed Securities —Non-agency (Continued) | |
| |
Merrill Lynch Mortgage-Backed Securities Trust(07-2-1A1) | | | | | |
| | | |
4.69% (1 year Treasury Constant Maturity Rate + 2.400%)(2) | | | 08/25/36 | | | $ | 322,665 | | | $ | 320,699 | |
| |
Mid-State Trust(04-1-B) | | | | | |
| | | |
8.90% | | | 08/15/37 | | | | 334,675 | | | | 381,458 | |
| |
Mid-State Trust(04-1-M1) | | | | | |
| | | |
6.50% | | | 08/15/37 | | | | 334,675 | | | | 353,648 | |
| |
Morgan Stanley ABS Capital I, Inc. Trust(06-HE3-A1) | | | | | |
| | | |
2.54% (1 mo. USD LIBOR + 0.140%)(2) | | | 04/25/36 | | | | 700,331 | | | | 683,501 | |
| |
Morgan Stanley ABS Capital I, Inc. Trust(07-15AR-4A1) | | | | | |
| | | |
3.52%(5) | | | 11/25/37 | | | | 537,254 | | | | 534,468 | |
| |
Morgan Stanley Home Equity Loan Trust(06-2-A4) | | | | | |
| | | |
2.68% (1 mo. USD LIBOR + 0.280%)(2) | | | 02/25/36 | | | | 826,711 | | | | 821,911 | |
| |
MortgageIT Trust(05-5-A1) | | | | | |
| | | |
2.92% (1 mo. USD LIBOR + 0.260%)(2) | | | 12/25/35 | | | | 455,440 | | | | 452,118 | |
| |
Nationstar Home Equity Loan Trust(07-B-2AV3) | | | | | |
| | | |
2.65% (1 mo. USD LIBOR + 0.250%)(2) | | | 04/25/37 | | | | 1,516,338 | | | | 1,518,417 | |
| |
New Century Home Equity Loan Trust(05-B-A2D) | | | | | |
| | | |
2.80% (1 mo. USD LIBOR + 0.400%)(2) | | | 10/25/35 | | | | 688,240 | | | | 683,441 | |
| |
Nomura Asset Acceptance Corp.(06-AR1-1A) | | | | | |
| | | |
5.28%(5) | | | 02/25/36 | | | | 1,045,914 | | | | 942,177 | |
| |
Oakwood Mortgage Investors, Inc.(00-A-A4) | | | | | |
| | | |
8.15%(5) | | | 09/15/29 | | | | 1,807,143 | | | | 953,066 | |
| |
Oakwood Mortgage Investors, Inc.(00-D-A4) | | | | | |
| | | |
7.40%(5) | | | 07/15/30 | | | | 730,271 | | | | 329,465 | |
| |
Oakwood Mortgage Investors, Inc.(01-C-A3) | | | | | |
| | | |
6.61%(5) | | | 06/15/31 | | | | 1,671,841 | | | | 461,138 | |
| |
Oakwood Mortgage Investors, Inc.(01-D-A3) | | | | | |
| | | |
5.90%(5) | | | 09/15/22 | | | | 854,698 | | | | 665,214 | |
| |
Oakwood Mortgage Investors, Inc.(01-D-A4) | | | | | |
| | | |
6.93%(5) | | | 09/15/31 | | | | 495,193 | | | | 417,463 | |
| |
Oakwood Mortgage Investors, Inc.(02-A-A3) | | | | | |
| | | |
6.03%(5) | | | 05/15/24 | | | | 241,178 | | | | 249,470 | |
| |
Oakwood Mortgage Investors, Inc.(98-A-M) | | | | | |
| | | |
6.83%(5) | | | 05/15/28 | | | | 187,034 | | | | 192,633 | |
| |
Oakwood Mortgage Investors, Inc.(99-B-A4) | | | | | |
| | | |
6.99% | | | 12/15/26 | | | | 216,567 | | | | 222,354 | |
| |
Oakwood Mortgage Investors, Inc.(99-E-A1) | | | | | |
| | | |
7.61%(5) | | | 03/15/30 | | | | 943,228 | | | | 826,584 | |
| |
Popular ABS Mortgage Pass-Through Trust(05-6-A4) | | | | | |
| | | |
3.77% | | | 01/25/36 | | | | 586,148 | | | | 587,592 | |
| |
RALI Series Trust(06-QS13-1A2) (I/O) | | | | | |
| | | |
4.76% (1 mo. USD LIBOR + 7.160%)(2)(3) | | | 09/25/36 | | | | 4,699,059 | | | | 800,730 | |
| | | | | | | | | | | | |
| Issues | | Maturity
Date | | | Principal
Amount | | | Value | |
|
| Residential Mortgage-backed Securities —Non-agency (Continued) | |
| |
RALI Series Trust(06-QS7-A2) | | | | | |
| | | |
6.00% | | | 06/25/36 | | | $ | 677,865 | | | $ | 636,708 | |
| |
RASC Series Trust(05-KS11-M1) | | | | | |
| | | |
2.80% (1 mo. USD LIBOR + 0.400%)(2) | | | 12/25/35 | | | | 389,448 | | | | 391,043 | |
| |
RBSSP Resecuritization Trust(12-6-4A2) | | | | | |
| | | |
2.76% (1 mo. USD LIBOR + 0.330%)(1)(2) | | | 01/26/36 | | | | 2,257,107 | | | | 2,237,405 | |
| |
Residential Accredit Loans, Inc.(05-QA7-A1) | | | | | |
| | | |
4.22%(5) | | | 07/25/35 | | | | 1,168,622 | | | | 996,458 | |
| |
Residential Accredit Loans, Inc.(05-QA8-CB21) | | | | | |
| | | |
4.63%(5) | | | 07/25/35 | | | | 612,864 | | | | 478,581 | |
| |
Residential Accredit Loans, Inc.(06-QA10-A2) | | | | | |
| | | |
2.58% (1 mo. USD LIBOR + 0.180%)(2) | | | 12/25/36 | | | | 882,956 | | | | 832,539 | |
| |
Residential Accredit Loans, Inc.(06-QS1-A3) (PAC) | | | | | |
| | | |
5.75% | | | 01/25/36 | | | | 517,960 | | | | 493,706 | |
| |
Residential Accredit Loans, Inc.(06-QS11-AV) (I/O) | | | | | |
| | | |
0.34%(3)(5) | | | 08/25/36 | | | | 12,592,401 | | | | 186,466 | |
| |
Residential Accredit Loans, Inc.(06-QS6-1AV) (I/O) | | | | | |
| | | |
0.75%(3)(5) | | | 06/25/36 | | | | 5,551,680 | | | | 146,059 | |
| |
Residential Accredit Loans, Inc.(06-QS8-A3) | | | | | |
| | | |
6.00% | | | 08/25/36 | | | | 1,114,301 | | | | 1,037,786 | |
| |
Residential Accredit Loans, Inc.(07-QS2-AV) (I/O) | | | | | |
| | | |
0.33%(3)(5) | | | 01/25/37 | | | | 14,077,467 | | | | 170,277 | |
| |
Residential Accredit Loans, Inc.(07-QS3-AV) (I/O) | | | | | |
| | | |
0.36%(3)(5) | | | 02/25/37 | | | | 14,686,880 | | | | 201,849 | |
| |
Residential Accredit Loans, Inc.(07-QS6-A62) (TAC) | | | | | |
| | | |
5.50% | | | 04/25/37 | | | | 334,795 | | | | 312,871 | |
| |
Residential Asset Mortgage Products, Inc.(06-RZ3-A3) | | | | | |
| | | |
2.69% (1 mo. USD LIBOR + 0.290%)(2) | | | 08/25/36 | | | | 393,462 | | | | 394,398 | |
| |
Residential Asset Securitization Trust(05-A15-4A1) | | | | | |
| | | |
6.00% | | | 02/25/36 | | | | 1,053,764 | | | | 677,407 | |
| |
Residential Asset Securitization Trust(07-A5-AX) (I/O) | | | | | |
| | | |
6.00%(3) | | | 05/25/37 | | | | 2,500,146 | | | | 399,774 | |
| |
Residential Funding Mortgage Securities(06-S9-AV) (I/O) | | | | | |
| | | |
0.32%(3)(5) | | | 09/25/36 | | | | 34,480,645 | | | | 316,581 | |
| |
Saxon Asset Securities Trust(07-3-2A4) | | | | | |
| | | |
2.89% (1 mo. USD LIBOR + 0.490%)(2) | | | 09/25/47 | | | | 2,926,000 | | | | 2,631,588 | |
| |
Securitized Asset-Backed Receivables LLC Trust(07-NC2-A2C) | | | | | |
| | | |
2.62% (1 mo. USD LIBOR + 0.220%)(2) | | | 01/25/37 | | | | 4,614,000 | | | | 3,636,951 | |
| |
Soundview Home Loan Trust(06-1-A4) | | | | | |
| | | |
2.70% (1 mo. USD LIBOR + 0.300%)(2) | | | 02/25/36 | | | | 778,520 | | | | 755,219 | |
| |
Structured Adjustable Rate Mortgage Loan Trust(05-20-1A1) | | | | | |
| | | |
4.68%(5) | | | 10/25/35 | | | | 248,782 | | | | 244,618 | |
See accompanying notes to financial statements.
9
TCW Strategic Income Fund, Inc.
Schedule of Investments (Unaudited) (Continued)
| | | | | | | | | | | | |
| Issues | | Maturity
Date | | | Principal
Amount | | | Value | |
|
| Residential Mortgage-backed Securities —Non-agency (Continued) | |
| |
Structured Adjustable Rate Mortgage Loan Trust(07-9-2A1) | | | | | |
| | | |
4.23%(5) | | | 10/25/47 | | | $ | 414,693 | | | $ | 371,452 | |
| |
Structured Asset Investment Loan Trust(05-3-M2) | | | | | |
| | | |
3.06% (1 mo. USD LIBOR + 0.660%)(2) | | | 04/25/35 | | | | 353,824 | | | | 355,179 | |
| |
Structured Asset Mortgage Investments II Trust(06-AR4-5A1) | | | | | |
| | | |
2.58% (1 mo. USD LIBOR + 0.180%)(2) | | | 06/25/36 | | | | 1,369,828 | | | | 1,272,430 | |
| |
Structured Asset Securities Corp.(06-GEL4-A3) | | | | | |
| | | |
2.70% (1 mo. USD LIBOR + 0.300%)(1)(2) | | | 10/25/36 | | | | 399,118 | | | | 399,680 | |
| |
WAMU Asset-Backed Certificates(07-HE1-2A3) | | | | | |
| | | |
2.55% (1 mo. USD LIBOR + 0.150%)(2) | | | 01/25/37 | | | | 2,153,575 | | | | 1,378,890 | |
| |
Wells Fargo Alternative Loan Trust(07-PA2-2A2) (I/O) | | | | | |
| | | |
3.67%(-1.00 x 1 mo. USD LIBOR + 6.070%)(2)(3) | | | 06/25/37 | | | | 3,966,264 | | | | 593,565 | |
| |
Wells Fargo Home Equity Trust(06-2-A3) | | | | | |
| | | |
2.61% (1 mo. USD LIBOR + 0.210%)(2) | | | 01/25/37 | | | | 730,000 | | | | 711,779 | |
| |
Wells Fargo Home Equity Trust(06-2-A4) | | | | | |
| | | |
2.65% (1 mo. USD LIBOR + 0.250%)(2) | | | 07/25/36 | | | | 239,526 | | | | 238,233 | |
| |
Wells Fargo Mortgage-Backed Securities Trust(06-AR10-5A1) | | | | | |
| | | |
4.99%(5) | | | 07/25/36 | | | | 333,783 | | | | 339,834 | |
| |
Wells Fargo Mortgage-Backed Securities Trust(07-AR3-A4) | | | | | |
| | | |
5.20%(5) | | | 04/25/37 | | | | 303,753 | | | | 298,151 | |
| |
Wells Fargo Mortgage-Backed Securities Trust(08-1-4A1) | | | | | |
| | | |
5.75% | | | 02/25/38 | | | | 136,797 | | | | 145,899 | |
| | | | | | | | | | | | |
| |
Total Residential Mortgage-backed Securities —Non-agency | | | | | |
| | |
(Cost: $99,282,737) | | | | | | | | 113,320,015 | |
| | | | | | | | | | | | |
| |
Total Mortgage-backed Securities | | | | | |
| | |
(Cost: $129,181,995) | | | | | | | | 140,556,404 | |
| | | | | | | | | | | | |
|
| CORPORATE BONDS—28.8% | |
| |
| Advertising — 0.0% | | | | |
|
Clear Channel International BV (Netherlands) | |
| | | |
8.75%(1) | | | 12/15/20 | | | | 95,000 | | | | 97,494 | |
| | | | | | | | | | | | |
| |
| Aerospace/Defense — 0.6% | | | | |
|
BAE Systems Holdings, Inc. | |
| | | |
2.85%(1) | | | 12/15/20 | | | | 500,000 | | | | 502,108 | |
|
L3 Technologies, Inc. | |
| | | |
4.40% | | | 06/15/28 | | | | 420,000 | | | | 459,895 | |
| | | | | | | | | | | | |
| Issues | | Maturity
Date | | | Principal
Amount | | | Value | |
| |
| Aerospace/Defense (Continued) | | | | |
| | | |
Northrop Grumman Corp. | | | | | | | | | | | | |
| | | |
2.93% | | | 01/15/25 | | | $ | 590,000 | | | $ | 601,329 | |
| | | | | | | | | | | | |
| | | |
| | | | | | | | | | | 1,563,332 | |
| | | | | | | | | | | | |
| |
| Agriculture — 0.2% | | | | |
|
BAT Capital Corp. | |
| | | |
4.54% | | | 08/15/47 | | | | 130,000 | | | | 120,721 | |
|
Reynolds American, Inc. | |
| | | |
5.85% | | | 08/15/45 | | | | 300,000 | | | | 323,589 | |
| | | | | | | | | | | | |
| | | |
| | | | | | | | | | | 444,310 | |
| | | | | | | | | | | | |
| |
| Airlines — 0.5% | | | | |
|
America West Airlines, Inc. Pass-Through Certificates(01-1) (EETC) | |
| | | |
7.10% | | | 10/02/22 | | | | 226,752 | | | | 234,733 | |
|
Continental Airlines, Inc. Pass-Through Certificates(00-2-A1) (EETC) | |
| | | |
7.71% | | | 10/02/22 | | | | 238,347 | | | | 248,473 | |
|
Delta Air Lines, Inc. Pass-Through Certificates(02-1G1) (EETC) | |
| | | |
6.72% | | | 07/02/24 | | | | 359,796 | | | | 386,301 | |
|
US Airways Group, Inc. Pass-Through Certificates(10-1A) (EETC) | |
| | | |
6.25% | | | 10/22/24 | | | | 435,174 | | | | 475,324 | |
| | | | | | | | | | | | |
| | | |
| | | | | | | | | | | 1,344,831 | |
| | | | | | | | | | | | |
| |
| Auto Manufacturers — 0.7% | | | | |
|
Ford Motor Credit Co. LLC | |
| | | |
3.20% | | | 01/15/21 | | | | 525,000 | | | | 528,310 | |
| | | |
3.34% | | | 03/28/22 | | | | 645,000 | | | | 647,789 | |
| | | |
3.60% (3 mo. USD LIBOR + 1.270%)(2) | | | 03/28/22 | | | | 345,000 | | | | 339,567 | |
| | | |
8.13% | | | 01/15/20 | | | | 280,000 | | | | 287,820 | |
| | | |
General Motors Co. 4.88% | | | 10/02/23 | | | | 150,000 | | | | 159,183 | |
| | | | | | | | | | | | |
| | | |
| | | | | | | | | | | 1,962,669 | |
| | | | | | | | | | | | |
| |
| Banks — 5.3% | | | | |
|
Bank of America Corp. | |
| | | |
2.74% (2.738% until 1/23/21 then 3 mo. USD LIBOR + 0.370%)(2) | | | 01/23/22 | | | | 10,000 | | | | 10,047 | |
| | | |
3.00% (3.004% until 12/20/22 then 3 mo. USD LIBOR + 0.790%)(2) | | | 12/20/23 | | | | 140,000 | | | | 142,648 | |
| | | |
3.12% (3 mo. USD LIBOR + 1.160%)(2) | | | 01/20/23 | | | | 406,000 | | | | 412,228 | |
| | | |
3.42% (3.419% until 12/20/27 then 3 mo. USD LIBOR + 1.040%)(2) | | | 12/20/28 | | | | 1,916,000 | | | | 1,973,219 | |
See accompanying notes to financial statements.
10
TCW Strategic Income Fund, Inc.
June 30, 2019
| | | | | | | | | | | | |
| Issues | | Maturity
Date | | | Principal
Amount | | | Value | |
| |
| Banks (Continued) | | | | |
| | | |
3.50% (3.499% until 5/17/21 then 3 mo. USD LIBOR + 0.630%)(2) | | | 05/17/22 | | | $ | 500,000 | | | $ | 509,960 | |
| | | |
4.27% (4.271% u 7/23/28 then 3 mo. USD LIBOR + 1.31%)(2) | | | 07/23/29 | | | | 175,000 | | | | 190,803 | |
|
Bank of New York Mellon Corp. (The) | |
| | | |
2.60% | | | 02/07/22 | | | | 835,000 | | | | 842,808 | |
|
Goldman Sachs Group, Inc. (The) | |
| | | |
2.30% | | | 12/13/19 | | | | 810,000 | | | | 809,591 | |
| | | |
3.27% (3.272% until 9/29/24 then 3 mo. USD LIBOR + 1.201%)(2) | | | 09/29/25 | | | | 430,000 | | | | 438,092 | |
| | | |
3.75% | | | 05/22/25 | | | | 750,000 | | | | 784,761 | |
| | | |
4.12% (3 mo. USD LIBOR + 1.600%)(2) | | | 11/29/23 | | | | 500,000 | | | | 513,864 | |
| | | |
4.22% (4.223% until 5/01/18 then 3 mo. USD LIBOR + 1.301%)(2) | | | 05/01/29 | | | | 140,000 | | | | 150,140 | |
|
JPMorgan Chase & Co. | |
| | | |
3.22% (3 mo. USD LIBOR + 1.155%)(2) | | | 03/01/25 | | | | 380,000 | | | | 391,043 | |
| | | |
3.51% (3.514% until 6/18/21 then 3 mo. USD LIBOR + 0.610%)(2) | | | 06/18/22 | | | | 560,000 | | | | 572,445 | |
| | | |
3.56%(5) | | | 04/23/24 | | | | 1,000,000 | | | | 1,037,344 | |
| | | |
3.96%(5) | | | 01/29/27 | | | | 690,000 | | | | 738,648 | |
|
Lloyds Bank PLC (United Kingdom) | |
| | | |
5.80%(1) | | | 01/13/20 | | | | 650,000 | | | | 661,653 | |
|
Lloyds Banking Group PLC (United Kingdom) | |
| | | |
2.91% (2.907% until 11/07/22 then 3 mo. USD LIBOR + 0.810%)(2) | | | 11/07/23 | | | | 285,000 | | | | 284,502 | |
| | | |
Morgan Stanley 3.63% | | | 01/20/27 | | | | 550,000 | | | | 577,760 | |
| | | |
3.88% | | | 04/29/24 | | | | 400,000 | | | | 424,232 | |
|
Santander UK Group Holdings PLC (United Kingdom) | |
| | | |
3.37% (3.373% until 1/05/23 then 3 mo. USD LIBOR + 1.080%)(2) | | | 01/05/24 | | | | 435,000 | | | | 439,354 | |
|
Santander UK PLC (United Kingdom) | |
| | | |
3.40% | | | 06/01/21 | | | | 975,000 | | | | 991,520 | |
|
Wells Fargo & Co. | |
| | | |
2.63% | | | 07/22/22 | | | | 140,000 | | | | 140,911 | |
| | | |
3.00% | | | 04/22/26 | | | | 450,000 | | | | 455,723 | |
| | | |
3.00% | | | 10/23/26 | | | | 750,000 | | | | 758,449 | |
| | | |
3.81% (3 mo. USD LIBOR + 1.230%)(2) | | | 10/31/23 | | | | 500,000 | | | | 510,159 | |
| | | | | | | | | | | | |
| | | |
| | | | | | | | | | | 14,761,904 | |
| | | | | | | | | | | | |
| | | | | | | | | | | | |
| Issues | | Maturity
Date | | | Principal
Amount | | | Value | |
| |
| Beverages — 0.5% | | | | |
| |
Anheuser-Busch Cos LLC / Anheuser-Busch InBev Worldwide, Inc. | | | | | |
| | | |
4.90% | | | 02/01/46 | | | $ | 469,000 | | | $ | 520,416 | |
|
Anheuser-Busch InBev Worldwide, Inc. | |
| | | |
4.75% | | | 01/23/29 | | | | 420,000 | | | | 477,169 | |
|
Bacardi, Ltd. | |
| | | |
4.70%(1) | | | 05/15/28 | | | | 15,000 | | | | 16,061 | |
| | | |
5.30%(1) | | | 05/15/48 | | | | 280,000 | | | | 295,159 | |
| | | | | | | | | | | | |
| | | |
| | | | | | | | | | | 1,308,805 | |
| | | | | | | | | | | | |
| |
| Biotechnology — 0.5% | | | | |
|
Amgen, Inc. | |
| | | |
4.40% | | | 05/01/45 | | | | 770,000 | | | | 819,260 | |
|
Baxalta, Inc. | |
| | | |
2.88% | | | 06/23/20 | | | | 90,000 | | | | 90,286 | |
|
Celgene Corp. | |
| | | |
4.63% | | | 05/15/44 | | | | 500,000 | | | | 570,848 | |
| | | | | | | | | | | | |
| | | |
| | | | | | | | | | | 1,480,394 | |
| | | | | | | | | | | | |
| |
| Chemicals — 0.2% | | | | |
|
International Flavors & Fragrances, Inc. | |
| | | |
5.00% | | | 09/26/48 | | | | 410,000 | | | | 454,741 | |
| | | | | | | | | | | | |
Commercial Services — 0.3% | |
|
IHS Markit, Ltd. | |
| | | |
4.00%(1) | | | 03/01/26 | | | | 73,000 | | | | 75,519 | |
| | | |
4.75% | | | 08/01/28 | | | | 120,000 | | | | 131,240 | |
| | | |
5.00%(1) | | | 11/01/22 | | | | 421,000 | | | | 448,154 | |
|
Matthews International Corp. | |
| | | |
5.25%(1) | | | 12/01/25 | | | | 160,000 | | | | 157,800 | |
| | | | | | | | | | | | |
| | | |
| | | | | | | | | | | 812,713 | |
| | | | | | | | | | | | |
| |
| Computers — 0.1% | | | | |
|
Apple, Inc. | |
| | | |
3.00% | | | 11/13/27 | | | | 400,000 | | | | 412,026 | |
| | | | | | | | | | | | |
| |
| Cosmetics/Personal Care — 0.0% | | | | |
|
First Quality Finance Co., Inc. | |
| | | |
5.00%(1) | | | 07/01/25 | | | | 54,000 | | | | 54,540 | |
| | | | | | | | | | | | |
| |
| Diversified Financial Services — 1.5% | | | | |
|
AerCap Ireland Capital DAC / AerCap Global Aviation Trust (Ireland) | |
| | | |
4.50% | | | 05/15/21 | | | | 300,000 | | | | 310,125 | |
|
Air Lease Corp. | |
| | | |
2.13% | | | 01/15/20 | | | | 500,000 | | | | 498,866 | |
| | | |
3.50% | | | 01/15/22 | | | | 490,000 | | | | 501,968 | |
|
GE Capital International Funding Co. Unlimited Co. (Ireland) | |
| | | |
2.34% | | | 11/15/20 | | | | 1,090,000 | | | | 1,084,368 | |
| | | |
4.42% | | | 11/15/35 | | | | 1,165,000 | | | | 1,154,998 | |
|
Raymond James Financial, Inc. | |
| | | |
5.63% | | | 04/01/24 | | | | 650,000 | | | | 735,878 | |
| | | | | | | | | | | | |
| | | |
| | | | | | | | | | | 4,286,203 | |
| | | | | | | | | | | | |
See accompanying notes to financial statements.
11
TCW Strategic Income Fund, Inc.
Schedule of Investments (Unaudited) (Continued)
| | | | | | | | | | | | |
| Issues | | Maturity
Date | | | Principal
Amount | | | Value | |
| |
| Electric — 0.7% | | | | |
| |
FirstEnergy Transmission LLC | | | | | |
| | | |
4.35%(1) | | | 01/15/25 | | | $ | 750,000 | | | $ | 805,082 | |
| |
Puget Energy, Inc. | | | | | |
| | | |
6.00% | | | 09/01/21 | | | | 500,000 | | | | 534,607 | |
| |
Vistra Operations Co. LLC | | | | | |
| | | |
3.55%(1) | | | 07/15/24 | | | | 500,000 | | | | 503,437 | |
| | | | | | | | | | | | |
| | | |
| | | | | | | | | | | 1,843,126 | |
| | | | | | | | | | | | |
| |
| Engineering & Construction — 0.3% | | | | |
| |
Heathrow Funding, Ltd. (United Kingdom) | | | | | |
| | | |
4.88%(1) | | | 07/15/21 | | | | 700,000 | | | | 745,668 | |
| | | | | | | | | | | | |
| |
| Entertainment — 0.2% | | | | |
| |
Churchill Downs, Inc. | | | | | |
| | | |
4.75%(1) | | | 01/15/28 | | | | 140,000 | | | | 141,365 | |
| | | |
5.50%(1) | | | 04/01/27 | | | | 150,000 | | | | 157,125 | |
| |
Rivers Pittsburgh Borrower LP / Rivers Pittsburgh Finance Corp. | | | | | |
| | | |
6.13%(1) | | | 08/15/21 | | | | 125,000 | | | | 127,188 | |
|
Twin River Worldwide Holdings, Inc. | |
| | | |
6.75%(1) | | | 06/01/27 | | | | 75,000 | | | | 78,375 | |
| | | | | | | | | | | | |
| | | |
| | | | | | | | | | | 504,053 | |
| | | | | | | | | | | | |
| |
| Environmental Control — 0.3% | | | | |
| |
Clean Harbors, Inc. | | | | | |
| | | |
5.13% | | | 06/01/21 | | | | 135,000 | | | | 135,404 | |
| |
Covanta Holding Corp. | | | | | |
| | | |
5.88% | | | 07/01/25 | | | | 125,000 | | | | 130,469 | |
|
GFL Environmental, Inc. (Canada) | |
| | | |
5.38%(1) | | | 03/01/23 | | | | 160,000 | | | | 159,200 | |
| | | |
8.50%(1) | | | 05/01/27 | | | | 275,000 | | | | 296,656 | |
| |
Hulk Finance Corp. | | | | | |
| | | |
7.00%(1) | | | 06/01/26 | | | | 60,000 | | | | 61,725 | |
| | | | | | | | | | | | |
| | | |
| | | | | | | | | | | 783,454 | |
| | | | | | | | | | | | |
| |
| Food — 0.8% | | | | |
| |
Chobani LLC / Chobani Finance Corp., Inc. | | | | | |
| | | |
7.50%(1) | | | 04/15/25 | | | | 60,000 | | | | 56,400 | |
| |
Conagra Brands, Inc. | | | | | |
| | | |
3.09% (3 mo. USD LIBOR + 0.500%)(2) | | | 10/09/20 | | | | 650,000 | | | | 648,649 | |
| |
Kraft Heinz Foods Co. | | | | | |
| | | |
4.63% | | | 01/30/29 | | | | 455,000 | | | | 489,992 | |
| | | |
5.00% | | | 06/04/42 | | | | 188,000 | | | | 194,517 | |
| | | |
6.38% | | | 07/15/28 | | | | 210,000 | | | | 245,110 | |
|
Kroger Co. (The) | |
| | | |
5.40% | | | 01/15/49 | | | | 151,000 | | | | 167,662 | |
| |
Lamb Weston Holdings, Inc. | | | | | |
| | | |
4.63%(1) | | | 11/01/24 | | | | 120,000 | | | | 124,950 | |
| |
Post Holdings, Inc. | | | | | |
| | | |
5.50%(1) | | | 12/15/29 | | | | 280,000 | | | | 281,750 | |
| | | | | | | | | | | | |
| Issues | | Maturity
Date | | | Principal
Amount | | | Value | |
| |
| Food (Continued) | | | | |
| |
Tyson Foods, Inc. | | | | | |
| | | |
4.00% | | | 03/01/26 | | | $ | 125,000 | | | $ | 133,231 | |
| | | | | | | | | | | | |
| | | |
| | | | | | | | | | | 2,342,261 | |
| | | | | | | | | | | | |
| |
| Healthcare-Products — 0.2% | | | | |
| |
Becton Dickinson and Co. | | | | | |
| | | |
3.19% (3 mo. USD LIBOR + 0.875%)(2) | | | 12/29/20 | | | | 300,000 | | | | 300,049 | |
|
Hologic, Inc. | |
| | | |
4.63%(1) | | | 02/01/28 | | | | 320,000 | | | | 325,200 | |
| | | | | | | | | | | | |
| | | |
| | | | | | | | | | | 625,249 | |
| | | | | | | | | | | | |
| |
| Healthcare-Services — 1.9% | | | | |
| |
Anthem, Inc. | | | | | |
| | | |
3.65% | | | 12/01/27 | | | | 430,000 | | | | 446,907 | |
| |
Catalent Pharma Solutions, Inc. | | | | | |
| | | |
4.88%(1) | | | 01/15/26 | | | | 285,000 | | | | 290,344 | |
| | | |
5.00%(1) | | | 07/15/27 | | | | 155,000 | | | | 158,487 | |
|
Centene Corp. | |
| | | |
5.38%(1) | | | 06/01/26 | | | | 288,000 | | | | 302,760 | |
| | | |
5.63% | | | 02/15/21 | | | | 255,000 | | | | 260,100 | |
|
CHS / Community Health Systems, Inc. | |
| | | |
8.00%(1) | | | 03/15/26 | | | | 59,000 | | | | 57,083 | |
|
Cigna Corp. | |
| | | |
3.05% | | | 10/15/27 | | | | 430,000 | | | | 425,510 | |
|
HCA, Inc. | |
| | | |
4.13% | | | 06/15/29 | | | | 320,000 | | | | 330,800 | |
| | | |
5.00% | | | 03/15/24 | | | | 130,000 | | | | 141,776 | |
| | | |
5.25% | | | 06/15/49 | | | | 130,000 | | | | 135,677 | |
| | | |
5.63% | | | 09/01/28 | | | | 100,000 | | | | 108,187 | |
| | | |
5.88% | | | 02/01/29 | | | | 200,000 | | | | 219,500 | |
| | | |
6.50% | | | 02/15/20 | | | | 167,000 | | | | 171,323 | |
|
Humana, Inc. | |
| | | |
2.90% | | | 12/15/22 | | | | 435,000 | | | | 441,623 | |
|
Molina Healthcare, Inc. | |
| | | |
5.38% | | | 11/15/22 | | | | 140,000 | | | | 146,650 | |
|
NYU Hospitals Center | |
| | | |
4.43% | | | 07/01/42 | | | | 700,000 | | | | 787,950 | |
|
Tenet Healthcare Corp. | |
| | | |
4.50% | | | 04/01/21 | | | | 140,000 | | | | 142,800 | |
| | | |
4.63% | | | 07/15/24 | | | | 234,000 | | | | 237,802 | |
| | | |
4.75% | | | 06/01/20 | | | | 50,000 | | | | 50,438 | |
|
WellCare Health Plans, Inc. | |
| | | |
5.25% | | | 04/01/25 | | | | 122,000 | | | | 127,642 | |
| | | |
5.38%(1) | | | 08/15/26 | | | | 157,000 | | | | 167,205 | |
| | | | | | | | | | | | |
| | | |
| | | | | | | | | | | 5,150,564 | |
| | | | | | | | | | | | |
See accompanying notes to financial statements.
12
TCW Strategic Income Fund, Inc.
June 30, 2019
| | | | | | | | | | | | |
| Issues | | Maturity
Date | | | Principal
Amount | | | Value | |
| |
| Household Products/Wares — 0.2% | | | | |
|
Central Garden & Pet Co. | |
| | | |
6.13% | | | 11/15/23 | | | $ | 158,000 | | | $ | 164,320 | |
|
Spectrum Brands, Inc. | |
| | | |
5.75% | | | 07/15/25 | | | | 135,000 | | | | 140,265 | |
| | | |
6.13% | | | 12/15/24 | | | | 135,000 | | | | 140,400 | |
| | | | | | | | | | | | |
| | | |
| | | | | | | | | | | 444,985 | |
| | | | | | | | | | | | |
|
| Insurance — 0.7% | |
|
Berkshire Hathaway Finance Corp. | |
| | | |
4.20% | | | 08/15/48 | | | | 400,000 | | | | 445,674 | |
|
Farmers Exchange Capital | |
| | | |
7.05%(1) | | | 07/15/28 | | | | 500,000 | | | | 600,661 | |
|
Nationwide Mutual Insurance Co. | |
| | | |
4.70% (3 mo. USD LIBOR + 2.290%)(1)(2) | | | 12/15/24 | | | | 1,000,000 | | | | 996,250 | |
| | | | | | | | | | | | |
| | | |
| | | | | | | | | | | 2,042,585 | |
| | | | | | | | | | | | |
|
| Machinery-Diversified — 0.0% | |
|
Titan Acquisition, Ltd. / TitanCo-Borrower LLC | |
| | | |
7.75%(1) | | | 04/15/26 | | | | 140,000 | | | | 126,700 | |
| | | | | | | | | | | | |
|
| Media — 1.1% | |
| |
CCO Holdings LLC / CCO Holdings Capital Corp. | | | | | |
| | | |
5.38%(1) | | | 06/01/29 | | | | 273,000 | | | | 282,555 | |
| |
Charter Communications Operating LLC / Charter Communications Operating Capital | | | | | |
| | | |
4.91% | | | 07/23/25 | | | | 850,000 | | | | 924,689 | |
| | | |
6.48% | | | 10/23/45 | | | | 150,000 | | | | 178,027 | |
|
Comcast Corp. | |
| | | |
2.35% | | | 01/15/27 | | | | 280,000 | | | | 273,103 | |
|
CSC Holdings LLC | |
| | | |
6.50%(1) | | | 02/01/29 | | | | 550,000 | | | | 601,219 | |
|
Discovery Communications LLC | |
| | | |
2.80% | | | 06/15/20 | | | | 345,000 | | | | 345,745 | |
|
Sirius XM Radio, Inc. | |
| | | |
3.88%(1) | | | 08/01/22 | | | | 130,000 | | | | 130,813 | |
| |
Virgin Media Secured Finance PLC (United Kingdom) | | | | | |
| | | |
5.50% (1) | | | 08/15/26 | | | | 200,000 | | | | 207,500 | |
| | | | | | | | | | | | |
| | | |
| | | | | | | | | | | 2,943,651 | |
| | | | | | | | | | | | |
|
| Mining — 0.3% | |
| |
Corp. Nacional del Cobre de Chile | | | | | |
| | | |
3.63% (9) | | | 08/01/27 | | | | 350,000 | | | | 363,055 | |
| |
Indonesia Asahan Aluminium Persero PT | | | | | |
| | | |
6.53% (1) | | | 11/15/28 | | | | 500,000 | | | | 590,900 | |
| | | | | | | | | | | | |
| | | |
| | | | | | | | | | | 953,955 | |
| | | | | | | | | | | | |
|
| Miscellaneous Manufacturers — 0.6% | |
| |
General Electric Co. | | | | | |
| | | |
3.00% (3 mo. USD LIBOR + 0.480%) (2) | | | 08/15/36 | | | | 2,400,000 | | | | 1,794,895 | |
| | | | | | | | | | | | |
| | | | | | | | | | | | |
| Issues | | Maturity
Date | | | Principal
Amount | | | Value | |
|
| Oil & Gas — 1.1% | |
| |
Antero Resources Corp. | | | | | |
| | | |
5.00% | | | 03/01/25 | | | $ | 320,000 | | | $ | 296,800 | |
| | | |
5.13% | | | 12/01/22 | | | | 125,000 | | | | 120,625 | |
| |
Centennial Resource Production LLC | | | | | |
| | | |
5.38%(1) | | | 01/15/26 | | | | 80,000 | | | | 76,400 | |
| | | |
6.88%(1) | | | 04/01/27 | | | | 70,000 | | | | 71,050 | |
| |
CrownRock LP / CrownRock Finance, Inc. | | | | | |
| | | |
5.63%(1) | | | 10/15/25 | | | | 72,000 | | | | 72,360 | |
| |
Endeavor Energy Resources LP / EER Finance, Inc. | | | | | |
| | | |
5.50%(1) | | | 01/30/26 | | | | 52,000 | | | | 54,145 | |
| |
Gulfport Energy Corp. | | | | | |
| | | |
6.38% | | | 05/15/25 | | | | 35,000 | | | | 27,256 | |
| |
KazMunayGas National Co. | | | | | |
| | | |
5.38%(9) | | | 04/24/30 | | | | 300,000 | | | | 333,234 | |
| |
Matador Resources Co. | | | | | |
| | | |
5.88% | | | 09/15/26 | | | | 84,000 | | | | 85,260 | |
| |
Parsley Energy LLC / Parsley Finance Corp. | | | | | |
| | | |
5.25%(1) | | | 08/15/25 | | | | 130,000 | | | | 132,600 | |
| | | |
5.63%(1) | | | 10/15/27 | | | | 65,000 | | | | 68,006 | |
| |
Petrobras Global Finance B.V. | | | | | |
| | | |
5.75% | | | 02/01/29 | | | | 100,000 | | | | 104,549 | |
| |
Petroleos Mexicanos | | | | | |
| | | |
6.50% | | | 03/13/27 | | | | 140,000 | | | | 138,390 | |
| | | |
6.50% | | | 01/23/29 | | | | 735,000 | | | | 712,950 | |
| | | |
6.63% | | | 06/15/35 | | | | 245,000 | | | | 227,544 | |
| |
Range Resources Corp. | | | | | |
| | | |
4.88% | | | 05/15/25 | | | | 150,000 | | | | 132,375 | |
| |
Transocean Guardian, Ltd. | | | | | |
| | | |
5.88%(1) | | | 01/15/24 | | | | 72,765 | | | | 74,311 | |
| |
Transocean Pontus, Ltd. | | | | | |
| | | |
6.13%(1) | | | 08/01/25 | | | | 96,390 | | | | 99,764 | |
| |
Transocean Poseidon, Ltd. | | | | | |
| | | |
6.88%(1) | | | 02/01/27 | | | | 190,000 | | | | 201,281 | |
| |
WPX Energy, Inc. | | | | | |
| | | |
5.75% | | | 06/01/26 | | | | 73,000 | | | | 76,103 | |
| | | | | | | | | | | | |
| | | |
| | | | | | | | | | | 3,105,003 | |
| | | | | | | | | | | | |
|
| Oil & Gas Services — 0.2% | |
| |
Transocean Proteus, Ltd. | | | | | |
| | | |
6.25%(1) | | | 12/01/24 | | | | 146,250 | | | | 151,551 | |
| |
USA Compression Partners LP / USA Compression Finance Corp. | | | | | |
| | | |
6.88% | | | 04/01/26 | | | | 142,000 | | | | 150,861 | |
| | | |
6.88%(1) | | | 09/01/27 | | | | 127,000 | | | | 133,999 | |
| | | | | | | | | | | | |
| | | |
| | | | | | | | | | | 436,411 | |
| | | | | | | | | | | | |
See accompanying notes to financial statements.
13
TCW Strategic Income Fund, Inc.
Schedule of Investments (Unaudited) (Continued)
| | | | | | | | | | | | |
| Issues | | Maturity
Date | | | Principal
Amount | | | Value | |
|
| Packaging & Containers — 0.8% | |
| |
Amcor Finance USA, Inc. | | | | | |
| | | |
3.63%(1) | | | 04/28/26 | | | $ | 400,000 | | | $ | 407,795 | |
|
Ball Corp. | |
| | | |
4.00% | | | 11/15/23 | | | | 90,000 | | | | 93,487 | |
| |
Berry Global Escrow Corp. | | | | | |
| | | |
4.88%(1) | | | 07/15/26 | | | | 86,000 | | | | 88,043 | |
| |
Crown Americas LLC / Crown Americas Capital Corp. V | | | | | |
| | | |
4.25% | | | 09/30/26 | | | | 100,000 | | | | 102,375 | |
| |
Graphic Packaging International LLC | | | | | |
| | | |
4.75%(1) | | | 07/15/27 | | | | 130,000 | | | | 133,900 | |
| |
Reynolds Group Issuer, Inc. / Reynolds Group Issuer LLC / Reynolds Group Issuer (Luxembourg) | | | | | |
| | | |
5.75% | | | 10/15/20 | | | | 566,928 | | | | 569,054 | |
| |
Sealed Air Corp. | | | | | |
| | | |
5.50%(1) | | | 09/15/25 | | | | 140,000 | | | | 149,450 | |
| |
WRKCo, Inc. | | | | | |
| | | |
4.65% | | | 03/15/26 | | | | 555,000 | | | | 604,168 | |
| | | | | | | | | | | | |
| | | |
| | | | | | | | | | | 2,148,272 | |
| | | | | | | | | | | | |
|
| Pharmaceuticals — 1.6% | |
| |
AbbVie, Inc. | | | | | |
| | | |
4.88% | | | 11/14/48 | | | | 275,000 | | | | 289,070 | |
| |
Allergan Finance LLC | | | | | |
| | | |
3.25% | | | 10/01/22 | | | | 500,000 | | | | 506,700 | |
| |
Bayer US Finance II LLC | | | | | |
| | | |
4.38%(1) | | | 12/15/28 | | | | 815,000 | | | | 861,537 | |
| |
Bristol-Myers Squibb Co. | | | | | |
| | | |
4.13%(1) | | | 06/15/39 | | | | 395,000 | | | | 426,755 | |
| |
CVS Health Corp. | | | | | |
| | | |
5.05% | | | 03/25/48 | | | | 705,000 | | | | 752,066 | |
| |
Halfmoon Parent, Inc. | | | | | |
| | | |
4.13%(1) | | | 11/15/25 | | | | 750,000 | | | | 799,341 | |
| |
Shire Acquisitions Investments Ireland DAC (Ireland) | | | | | |
| | | |
1.90% | | | 09/23/19 | | | | 500,000 | | | | 499,253 | |
| | | |
2.40% | | | 09/23/21 | | | | 350,000 | | | | 349,691 | |
| | | | | | | | | | | | |
| | | |
| | | | | | | | | | | 4,484,413 | |
| | | | | | | | | | | | |
|
| Pipelines — 2.0% | |
| |
Enbridge Energy Partners LP | | | | | |
| | | |
5.88% | | | 10/15/25 | | | | 50,000 | | | | 57,769 | |
| |
Energy Transfer Operating LP | | | | | |
| | | |
4.05% | | | 03/15/25 | | | | 300,000 | | | | 312,999 | |
| | | |
5.50% | | | 06/01/27 | | | | 287,000 | | | | 321,324 | |
| |
EQT Midstream Partners LP | | | | | |
| | | |
4.13% | | | 12/01/26 | | | | 500,000 | | | | 483,226 | |
| |
NGPL PipeCo LLC | | | | | |
| | | |
4.38%(1) | | | 08/15/22 | | | | 190,000 | | | | 196,650 | |
| |
Peru LNG SRL | | | | | |
| | | |
5.38%(9) | | | 03/22/30 | | | | 400,000 | | | | 431,440 | |
| | | | | | | | | | | | |
| Issues | | Maturity
Date | | | Principal
Amount | | | Value | |
|
| Pipelines (Continued) | |
| |
Pipeline Funding Co. LLC | | | | | |
| | | |
7.50%(1) | | | 01/15/30 | | | $ | 470,050 | | | $ | 563,556 | |
| |
Plains All American Pipeline LP / PAA Finance Corp. | | | | | |
| | | |
4.65% | | | 10/15/25 | | | | 500,000 | | | | 531,815 | |
| |
Rockies Express Pipeline LLC | | | | | |
| | | |
5.63%(1) | | | 04/15/20 | | | | 585,000 | | | | 597,431 | |
| |
Sabine Pass Liquefaction LLC | | | | | |
| | | |
5.75% | | | 05/15/24 | | | | 210,000 | | | | 233,717 | |
| |
Sunoco Logistics Partners Operations LP | | | | | |
| | | |
5.40% | | | 10/01/47 | | | | 831,000 | | | | 881,658 | |
| |
Targa Resources Partners LP / Targa Resources Partners Finance Corp. | | | | | |
| | | |
6.88%(1) | | | 01/15/29 | | | | 127,000 | | | | 141,121 | |
| |
Texas Eastern Transmission LP | | | | | |
| | | |
2.80%(1) | | | 10/15/22 | | | | 300,000 | | | | 299,605 | |
| |
TransMontaigne Partners LP / TLP Finance Corp. | | | | | |
| | | |
6.13% | | | 02/15/26 | | | | 115,000 | | | | 111,262 | |
| |
Williams Partners LP | | | | | |
| | | |
6.30% | | | 04/15/40 | | | | 400,000 | | | | 486,501 | |
| | | | | | | | | | | | |
| | | |
| | | | | | | | | | | 5,650,074 | |
| | | | | | | | | | | | |
|
| REIT — 1.8% | |
| |
American Campus Communities Operating Partnership LP | | | | | |
| | | |
3.75% | | | 04/15/23 | | | | 300,000 | | | | 310,691 | |
|
Boston Properties LP | |
| | | |
2.75% | | | 10/01/26 | | | | 300,000 | | | | 295,586 | |
| | | |
3.20% | | | 01/15/25 | | | | 290,000 | | | | 296,484 | |
| |
CC Holdings GS V LLC / Crown Castle GS III Corp. | | | | | |
| | | |
3.85% | | | 04/15/23 | | | | 500,000 | | | | 523,756 | |
| |
GLP Capital LP / GLP Financing II, Inc. | | | | | |
| | | |
5.30% | | | 01/15/29 | | | | 210,000 | | | | 227,510 | |
| | | |
5.38% | | | 04/15/26 | | | | 721,000 | | | | 781,528 | |
|
HCP, Inc. | |
| | | |
4.25% | | | 11/15/23 | | | | 630,000 | | | | 668,332 | |
| |
Healthcare Trust of America Holdings LP | | | | | |
| | | |
2.95% | | | 07/01/22 | | | | 710,000 | | | | 714,521 | |
| |
Host Hotels & Resorts LP | | | | | |
| | | |
6.00% | | | 10/01/21 | | | | 400,000 | | | | 424,396 | |
| |
Hudson Pacific Properties LP | | | | | |
| | | |
3.95% | | | 11/01/27 | | | | 275,000 | | | | 281,169 | |
| |
MGM Growth Properties Operating Partnership LP / MGP FinanceCo-Issuer, Inc. | | | | | |
| | | |
5.63% | | | 05/01/24 | | | | 135,000 | | | | 145,969 | |
|
Piedmont Operating Partnership LP | |
| | | |
3.40% | | | 06/01/23 | | | | 425,000 | | | | 426,603 | |
| | | | | | | | | | | | |
| | | |
| | | | | | | | | | | 5,096,545 | |
| | | | | | | | | | | | |
See accompanying notes to financial statements.
14
TCW Strategic Income Fund, Inc.
June 30, 2019
| | | | | | | | | | | | |
| Issues | | Maturity
Date | | | Principal
Amount | | | Value | |
|
| Retail — 0.8% | |
| |
Alimentation Couche-Tard, Inc. (Canada) | | | | | |
| | | |
2.70%(1) | | | 07/26/22 | | | $ | 140,000 | | | $ | 140,328 | |
| |
Cumberland Farms, Inc. | | | | | |
| | | |
6.75%(1) | | | 05/01/25 | | | | 175,000 | | | | 187,335 | |
| |
eG Global Finance PLC (United Kingdom) | | | | | |
| | | |
6.75%(1) | | | 02/07/25 | | | | 283,000 | | | | 281,500 | |
| |
KFC Holding Co. / Pizza Hut Holdings LLC / Taco Bell of America LLC | | | | | |
| | | |
4.75%(1) | | | 06/01/27 | | | | 80,000 | | | | 82,200 | |
| |
Rite Aid Corp. | | | | | |
| | | |
6.13%(1) | | | 04/01/23 | | | | 544,000 | | | | 461,040 | |
| |
Walgreens Boots Alliance, Inc. | | | | | |
| | | |
3.45% | | | 06/01/26 | | | | 755,000 | | | | 762,828 | |
| | | |
4.80% | | | 11/18/44 | | | | 225,000 | | | | 226,942 | |
| | | | | | | | | | | | |
| | | |
| | | | | | | | | | | 2,142,173 | |
| | | | | | | | | | | | |
|
| Savings & Loans — 0.1% | |
| |
Nationwide Building Society (United Kingdom) | | | | | |
| | | |
3.77% (3.766% until 3/08/23 then 3 mo. USD LIBOR + 1.064%) (1)(2) | | | 03/08/24 | | | | 275,000 | | | | 280,859 | |
| | | | | | | | | | | | |
|
| Semiconductors — 0.1% | |
| |
NXP BV / NXP Funding LLC (Netherlands) | | | | | |
| | | |
4.13%(1) | | | 06/01/21 | | | | 200,000 | | | | 205,120 | |
| | | | | | | | | | | | |
|
| Software — 0.3% | |
| |
Change Healthcare Holdings LLC / Change Healthcare Finance, Inc. | | | | | |
| | | |
5.75%(1) | | | 03/01/25 | | | | 224,000 | | | | 227,920 | |
| |
First Data Corp. | | | | | |
| | | |
5.00%(1) | | | 01/15/24 | | | | 181,000 | | | | 185,547 | |
| |
IQVIA, Inc. | | | | | |
| | | |
5.00%(1) | | | 05/15/27 | | | | 200,000 | | | | 206,250 | |
| |
SS&C Technologies, Inc. | | | | | |
| | | |
5.50%(1) | | | 09/30/27 | | | | 138,000 | | | | 143,434 | |
| | | | | | | | | | | | |
| | | |
| | | | | | | | | | | 763,151 | |
| | | | | | | | | | | | |
|
| Telecommunications — 2.0% | |
| |
AT&T, Inc. | | | | | |
| | | |
4.75% | | | 05/15/46 | | | | 385,000 | | | | 407,219 | |
| | | |
4.85% | | | 03/01/39 | | | | 348,000 | | | | 373,628 | |
| | | |
5.25% | | | 03/01/37 | | | | 705,000 | | | | 793,261 | |
| |
C&W Senior Financing DAC | | | | | |
| | | |
6.88% (1) | | | 09/15/27 | | | | 200,000 | | | | 206,770 | |
| |
Intelsat Jackson Holdings S. A. (Luxembourg) | | | | | |
| | | |
5.50% | | | 08/01/23 | | | | 311,000 | | | | 285,342 | |
| | | |
9.75% (1) | | | 07/15/25 | | | | 321,000 | | | | 329,025 | |
| |
Koninklijke KPN NV (Netherlands) | | | | | |
| | | |
8.38% | | | 10/01/30 | | | | 345,000 | | | | 455,280 | |
| |
Level 3 Financing, Inc. | | | | | |
| | | |
5.38% | | | 05/01/25 | | | | 190,000 | | | | 196,650 | |
| | | | | | | | | | | | |
| Issues | | Maturity
Date | | | Principal
Amount | | | Value | |
|
| Telecommunications (Continued) | |
|
Qwest Corp. | |
| | | |
7.25% | | | 09/15/25 | | | $ | 250,000 | | | $ | 277,844 | |
| |
SES Global Americas Holdings GP | | | | | |
| | | |
5.30% (1) | | | 03/25/44 | | | | 325,000 | | | | 313,784 | |
| |
Sprint Capital Corp. | | | | | |
| | | |
8.75% | | | 03/15/32 | | | | 129,000 | | | | 149,318 | |
| |
Sprint Corp. | | | | | |
| | | |
7.63% | | | 03/01/26 | | | | 18,000 | | | | 19,233 | |
| |
Sprint Spectrum Co. LLC / Sprint Spectrum Co. II LLC / Sprint Spectrum Co. III LLC | | | | | |
| | | |
4.74% (1) | | | 09/20/29 | | | | 565,000 | | | | 587,600 | |
| |
T-Mobile USA, Inc. | | | | | |
| | | |
4.50% | | | 02/01/26 | | | | 113,000 | | | | 115,825 | |
| | | |
4.75% | | | 02/01/28 | | | | 186,000 | | | | 191,366 | |
| | | |
6.00% | | | 03/01/23 | | | | 44,000 | | | | 45,100 | |
| | | |
6.50% | | | 01/15/24 | | | | 71,000 | | | | 73,529 | |
| |
T-Mobile USA, Inc. (Contingent payment) | | | | | |
| | | |
4.50%(3)(4) | | | 02/01/26 | | | | 113,000 | | | | — | |
| | | |
4.75%(3)(4) | | | 02/01/28 | | | | 170,000 | | | | — | |
| |
Verizon Communications, Inc. | | | | | |
| | | |
4.02%(1) | | | 12/03/29 | | | | 615,000 | | | | 666,445 | |
| |
Vodafone Group PLC (United Kingdom) | | | | | |
| | | |
4.88% | | | 06/19/49 | | | | 134,000 | | | | 141,368 | |
| | | | | | | | | | | | |
| | | |
| | | | | | | | | | | 5,628,587 | |
| | | | | | | | | | | | |
|
| Transportation — 0.1% | |
| |
Union Pacific Corp. | | | | | |
| | | |
3.95% | | | 09/10/28 | | | | 280,000 | | | | 305,701 | |
| | | | | | | | | | | | |
|
| Trucking & Leasing — 0.2% | |
| |
Avolon Holdings Funding, Ltd. | | | | | |
| | | |
3.95%(1) | | | 07/01/24 | | | | 280,000 | | | | 287,233 | |
| |
Park Aerospace Holdings, Ltd. | | | | | |
| | | |
4.50%(1) | | | 03/15/23 | | | | 135,000 | | | | 139,483 | |
| | | | | | | | | | | | |
| | | |
| | | | | | | | | | | 426,716 | |
| | | | | | | | | | | | |
| | |
Total Corporate Bonds | | | | | | | | | |
| | |
(Cost: $76,830,486) | | | | | | | | 79,958,133 | |
| | | | | | | | | | | | |
|
| MUNICIPAL BONDS —2.1% | |
| |
Alabama Economic Settlement Authority, Revenue Bond | | | | | |
| | | |
4.26% | | | 09/15/32 | | | | 705,000 | | | | 774,584 | |
| |
City of New York, New York, Build America Bonds | | | | | |
| | | |
6.65% | | | 12/01/31 | | | | 1,000,000 | | | | 1,060,550 | |
| |
Florida’s Turnpike Enterprise, Build America Bonds | | | | | |
| | | |
6.80% | | | 07/01/39 | | | | 460,000 | | | | 460,000 | |
| |
Metropolitan Water District of Southern California, Build America Bonds | | | | | |
| | | |
6.54% | | | 07/01/39 | | | | 500,000 | | | | 500,000 | |
| |
New York City Water and Sewer System, Build America Bonds | | | | | |
| | | |
6.49% | | | 06/15/42 | | | | 800,000 | | | | 831,488 | |
See accompanying notes to financial statements.
15
TCW Strategic Income Fund, Inc.
Schedule of Investments (Unaudited) (Continued)
| | | | | | | | | | | | |
| Issues | | Maturity
Date | | | Principal
Amount | | | Value | |
|
| MUNICIPAL BONDS (Continued) | |
|
New York State Dormitory Authority, Revenue Bond | |
| | | |
5.29% | | | 03/15/33 | | | $ | 1,000,000 | | | $ | 1,207,600 | |
|
State of California, General Obligation | |
| | | |
7.95% | | | 03/01/36 | | | | 1,000,000 | | | | 1,037,710 | |
| | | | | | | | | | | | |
| |
Total Municipal Bonds | | | | | |
| |
(Cost: $6,194,272) | | | | 5,871,932 | |
| | | | | | | | | | | | |
|
| FOREIGN GOVERNMENT BONDS—1.1% | |
|
Bahrain Government International Bond | |
| | | |
7.00%(9) | | | 10/12/28 | | | | 300,000 | | | | 324,187 | |
|
Brazilian Government International Bond | |
| | | |
4.63% | | | 01/13/28 | | | | 200,000 | | | | 210,060 | |
|
Colombia Government International Bond | |
| | | |
4.50% | | | 01/28/26 | | | | 200,000 | | | | 216,300 | |
|
Dominican Republic International Bond | |
| | | |
6.60%(9) | | | 01/28/24 | | | | 250,000 | | | | 278,225 | |
|
Mexico Government International Bond | |
| | | |
3.75% | | | 01/11/28 | | | | 400,000 | | | | 408,200 | |
|
Panama Government International Bond | |
| | | |
4.00% | | | 09/22/24 | | | | 250,000 | | | | 266,675 | |
|
Qatar Government International Bond | |
| | | |
4.50%(9) | | | 04/23/28 | | | | 350,000 | | | | 392,147 | |
|
Saudi Government International Bond | |
| | | |
3.63%(9) | | | 03/04/28 | | | | 300,000 | | | | 308,700 | |
|
South Africa Government Bond | |
| | | |
4.88% | | | 04/14/26 | | | | 350,000 | | | | 363,781 | |
|
Uruguay Government International Bond | |
| | | |
4.38% | | | 10/27/27 | | | | 200,000 | | | | 216,627 | |
| | | | | | | | | | | | |
|
Total Foreign Government Bonds | |
| |
(Cost: $2,776,000) | | | | 2,984,902 | |
| | | | | | | | | | | | |
|
Total Fixed Income Securities | |
| |
(Cost: $248,457,632) | | | | 262,906,820 | |
| | | | | | | | | | | | |
| | | |
| | | | | | | | | | | | |
| Security | | | Shares | | | | |
|
MONEY MARKET INVESTMENTS—1.4% | |
| | |
State Street Institutional U.S. Government Money Market Fund — Premier Class, 2.31%(10) | | | | 3,821,877 | | | | 3,821,877 | |
| | | | | | | | | | | | |
|
| Total Money Market Investments | |
| |
(Cost: $3,821,877) | | | | 3,821,877 | |
| | | | | | | | | | | | |
| | | | | | | | | | | | |
| Issues | | Maturity Date | | | Principal Amount | | | | |
|
SHORT TERM INVESTMENTS—5.0% | |
|
| U.S. TREASURY SECURITIES—5.0% | |
|
U.S. Treasury Bill | |
| | | |
1.77%(11) | | | 07/18/19 | | | $ | 3,601,000 | | | $ | 3,597,520 | |
| | | |
2.00%(11) | | | 07/11/19 | | | | 740,000 | | | | 739,474 | |
| | | |
2.00%(11) | | | 07/16/19 | | | | 5,833,000 | | | | 5,827,130 | |
| | | |
2.00%(11) | | | 10/24/19 | | | | 1,781,000 | | | | 1,769,500 | |
| | | |
2.10%(11) | | | 07/23/19 | | | | 1,306,000 | | | | 1,304,138 | |
| | | |
2.10%(11)(12) | | | 09/26/19 | | | | 616,000 | | | | 612,774 | |
| | | | | | | | | | | | |
| |
Total U.S. Treasury Securities | | | | | |
| | | |
(Cost: $13,848,266) | | | | | | | | | | | 13,850,536 | |
| | | | | | | | | | | | |
|
Total Short Term Investments | |
| |
(Cost: $13,848,266) | | | | 13,850,536 | |
| | | | | | | | | | | | |
| | | |
Total Investments (101.2%) | | | | | | | | | | | | |
| |
(Cost: $266,127,775) | | | | 280,579,233 | |
| |
Liabilities In Excess Of Other Assets(-1.2%) | | | | (3,218,804 | ) |
| | | | | | | | | | | | |
| |
Net Assets (100.0%) | | | $ | 277,360,429 | |
| | | | | | | | | | | | |
See accompanying notes to financial statements.
16
TCW Strategic Income Fund, Inc.
June 30, 2019
| | | | | | | | | | | | | | | | | | |
| FUTURES CONTRACTS | |
| | | | | |
Number of
Contracts | | Type | | Expiration
Date | | | Notional
Contract
Value | | | Market
Value | | | Net Unrealized
Appreciation
(Depreciation) | |
Long Futures | | | | | | | | | | | | | | | | | | |
| 32 | | S&P 500E-Mini Index Futures | | | 09/20/19 | | | $ | 4,506,061 | | | $ | 4,710,720 | | | $ | 204,659 | |
| 5 | | 5-Year U.S. Treasury Note Futures | | | 09/30/19 | | | | 590,674 | | | | 590,781 | | | | 107 | |
| | | | | | | | | | | | | | | | | | |
| | | | | | | | $ | 5,096,735 | | | $ | 5,301,501 | | | $ | 204,766 | |
| | | | | | | | | | | | | | | | | | |
Short Futures | | | | | | | | | | | | | | | | | | |
| 87 | | 10-Year U.S. Treasury Note Futures | | | 09/19/19 | | | $ | (11,781,378 | ) | | $ | (12,016,875 | ) | | $ | (235,497 | ) |
| 46 | | U.S. Ultra Long Bond Futures | | | 09/19/19 | | | | (7,934,843 | ) | | | (8,167,875 | ) | | | (233,032 | ) |
| | | | | | | | | | | | | | | | | | |
| | | | | | | | $ | (19,716,221 | ) | | $ | (20,184,750 | ) | | $ | (468,529 | ) |
| | | | | | | | | | | | | | | | | | |
| | | | | | | | | | | | | | | | | | | | | | | | |
| CENTRALLY CLEARED-INTEREST RATE SWAP AGREEMENTS | |
Notional Amount | | | Expiration
Date | | | Payment
Frequency | | Payment Made by Fund | | Payment Received by Fund | | Unrealized Appreciation (Depreciation) | | | Premium
Paid | | | Value | |
| | 15,025,000 (13) | | | | 04/11/22 | | | Quarterly | | 3 Month USD LIBOR | | 2.26% | | $ | 192,242 | | | $ | — | | | $ | 192,242 | |
| | 7,070,000 (13) | | | | 05/08/22 | | | Quarterly | | 3 Month USD LIBOR | | 2.28% | | | 92,920 | | | | — | | | | 92,920 | |
| | 6,180,000 (13) | | | | 04/11/25 | | | Quarterly | | 2.34% | | 3 Month USD LIBOR | | | (177,801 | ) | | | — | | | | (177,801 | ) |
| | 2,895,000 (13) | | | | 05/08/25 | | | Quarterly | | 2.37% | | 3 Month USD LIBOR | | | (85,844 | ) | | | — | | | | (85,844 | ) |
| | | | | | | | | | | | | | | | | | | | | | | | |
| | | | | | | | | | | | | | $ | 21,517 | | | $ | — | | | $ | 21,517 | |
| | | | | | | | | | | | | | | | | | | | | | | | |
Notes to Schedule of Investments:
| (1) | | Security exempt from registration under Rule 144A of the Securities Act of 1933, as amended. These securities may be resold, normally only to qualified institutional buyers. At June 30, 2019, the value of these securities amounted to $72,517,453 or 26.2% of net assets. These securities are determined to be liquid by the Fund’s investment advisor, unless otherwise noted, under procedures established by and under the general supervision of the Fund’s Board of Directors. |
| (2) | | Floating or variable rate security. The interest shown reflects the rate in effect at June 30, 2019. |
| (3) | | For fair value measurement disclosure purposes, security is categorized as Level 3. |
| (4) | | Security is not accruing interest. |
| (5) | | Variable rate security. Interest rate disclosed is as of the most recent information available. Certain variable rate securities are not based on a published reference rate and spread but are determined by the issuer or agent and are based on current market conditions. These securities do not indicate a reference rate and spread in their description above. |
| (6) | | Restricted security (Note 9). |
| (7) | | Security purchased on a forward commitment with an approximate principal amount. The actual principal amount and maturity date will be determined upon settlement when the security is delivered. |
| (8) | | A portion of the principal balance has beenwritten-off during the period due to defaults in the underlying loans. Cost basis has been adjusted. |
| (9) | | Investments issued under Regulation S of the Securities Act of 1933, as amended, may not be offered, sold, or delivered within the United States except under special exemptions. At June 30, 2019, the value of these securities amounted to $2,430,988 or 0.9% of net assets. |
| (10) | | Rate disclosed is the7-day net yield as of June 30, 2019. |
| (11) | | Rate shown representsyield-to-maturity. |
| (12) | | All or a portion of this security is held as collateral for open futures contracts. |
| (13) | | This instrument has a forward starting effective date. See Note 3, Portfolio Investments in the Notes to Financial Statements for further information. |
| ABS - | | Asset-Backed Securities. |
| ACES - | | Alternative Credit Enhancement Securities. |
| CLO - | | Collateralized Loan Obligation. |
| EETC - | | Enhanced Equipment Trust Certificate. |
| I/F - | | Inverse Floating rate security whose interest rate moves in the opposite direction of prevailing interest rates. |
| I/O - | | Interest Only Security. |
| PAC - | | Planned Amortization Class. |
| TAC - | | Target Amortization Class. |
See accompanying notes to financial statements.
17
TCW Strategic Income Fund, Inc.
Investments by Sector (Unaudited) | June 30, 2019 |
| | | | |
| Sector | | Percentage of
Net Assets | |
Residential Mortgage-Backed Securities —Non-Agency | | | 40.9 | % |
Corporate Bonds | | | 28.8 | |
Asset-Backed Securities | | | 12.1 | |
U.S. Treasury Bills | | | 5.0 | |
Commercial Mortgage-Backed Securities — Agency | | | 4.1 | |
Commercial Mortgage-Backed Securities —Non-Agency | | | 4.1 | |
Municipal Bonds | | | 2.1 | |
Residential Mortgage-Backed Securities — Agency | | | 1.6 | |
Foreign Government Bonds | | | 1.1 | |
Money Market Investments | | | 1.4 | |
Other* | | | (1.2 | ) |
| | | | |
Total | | | 100.0 | % |
| | | | |
| * | Includes cash, futures, swaps, pending trades, interest receivable and accrued expenses payable. |
See accompanying notes to financial statements.
18
TCW Strategic Income Fund, Inc.
Fair Valuation Summary (Unaudited) | June 30, 2019 |
The following is a summary of the fair valuations according to the inputs used as of June 30, 2019 in valuing the Fund’s investments:
| | | | | | | | | | | | | | | | |
Description | | Quoted Prices
in Active
Markets for
Identical
Assets
(Level 1) | | | Other
Significant
Observable
Inputs
(Level 2) | | | Significant
Unobservable
Inputs
(Level 3) | | | Total | |
Fixed Income Securities | | | | | | | | | | | | | | | | |
Asset-Backed Securities | | $ | — | | | $ | 33,153,455 | | | $ | 381,994 | | | $ | 33,535,449 | |
Mortgage-Backed Securities | | | | | | | | | | | | | | | | |
Commercial Mortgage-Backed Securities — Agency | | | — | | | | 11,446,824 | | | | — | | | | 11,446,824 | |
Commercial Mortgage-Backed Securities —Non-Agency | | | — | | | | 11,281,631 | | | | — | | | | 11,281,631 | |
Residential Mortgage-Backed Securities — Agency | | | — | | | | 4,507,934 | | | | — | | | | 4,507,934 | |
Residential Mortgage-Backed Securities —Non-Agency | | | — | | | | 105,840,811 | | | | 7,479,204 | | | | 113,320,015 | |
| | | | | | | | | | | | | | | | |
Total Mortgage-Backed Securities | | | — | | | | 133,077,200 | | | | 7,479,204 | | | | 140,556,404 | |
| | | | | | | | | | | | | | | | |
Corporate Bonds* | | | — | | | | 79,958,133 | | | | — | | | | 79,958,133 | |
Municipal Bonds | | | — | | | | 5,871,932 | | | | — | | | | 5,871,932 | |
Foreign Government Bonds | | | — | | | | 2,984,902 | | | | — | | | | 2,984,902 | |
| | | | | | | | | | | | | | | | |
Total Fixed Income Securities | | | — | | | | 255,045,622 | | | | 7,861,198 | | | | 262,906,820 | |
| | | | | | | | | | | | | | | | |
Money Market Investments | | | 3,821,877 | | | | — | | | | — | | | | 3,821,877 | |
Short-Term Investments | | | 13,850,536 | | | | — | | | | — | | | | 13,850,536 | |
| | | | | | | | | | | | | | | | |
Total Investments | | $ | 17,672,413 | | | $ | 255,045,622 | | | $ | 7,861,198 | | | $ | 280,579,233 | |
| | | | | | | | | | | | | | | | |
Asset Derivatives | | | | | | | | | | | | | | | | |
Futures Contracts | | | | | | | | | | | | | | | | |
Equity Risk | | | 204,659 | | | | — | | | | — | | | | 204,659 | |
Interest Rate Risk | | | 107 | | | | — | | | | — | | | | 107 | |
Swap Agreements | | | | | | | | | | | | | | | | |
Interest Rate Risk | | | — | | | | 285,162 | | | | — | | | | 285,162 | |
| | | | | | | | | | | | | | | | |
Total | | $ | 17,877,179 | | | $ | 255,330,784 | | | $ | 7,861,198 | | | $ | 281,069,161 | |
| | | | | | | | | | | | | | | | |
Liability Derivatives | | | | | | | | | | | | | | | | |
Futures Contracts | | | | | | | | | | | | | | | | |
Interest Rate Risk | | $ | (468,529 | ) | | $ | — | | | $ | — | | | $ | (468,529 | ) |
Swap Agreements | | | | | | | | | | | | | | | | |
Interest Rate Risk | | | — | | | | (263,645 | ) | | | — | | | | (263,645 | ) |
| | | | | | | | | | | | | | | | |
Total | | $ | (468,529 | ) | | $ | (263,645 | ) | | $ | — | | | $ | (732,174 | ) |
| | | | | | | | | | | | | | | | |
| * | See Schedule of Investments for corresponding industries. |
See accompanying notes to financial statements.
19
TCW Strategic Income Fund, Inc.
Statement of Assets and Liabilities (Unaudited) | June 30, 2019 |
| | | | |
ASSETS: | |
Investments, at Value (Cost: $266,127,775) | | $ | 280,579,233 | |
Cash | | | 3,367 | |
Interest Receivable | | | 2,012,247 | |
Receivable for Securities Sold | | | 1,645,067 | |
Cash Collateral Held for Broker for Swaps | | | 95,934 | |
Receivable for Variation Margin on Open Futures Contracts to Broker | | | 28,130 | |
| | | | |
Total Assets | | | 284,363,978 | |
| | | | |
LIABILITIES: | |
Distributions Payable | | | 3,934,174 | |
Payable for When-Issued Securities | | | 1,405,160 | |
Payables for Securities Purchased | | | 1,328,402 | |
Accrued Other Expenses | | | 167,469 | |
Accrued Investment Advisory Fees | | | 135,521 | |
Accrued Directors’ Fees and Expenses | | | 17,269 | |
Commitment Fee Payable on Open Line of Credit | | | 12,475 | |
Payable for Variation Margin on Centrally Cleared Interest Rate Swap Agreements to Broker | | | 3,079 | |
| | | | |
Total Liabilities | | | 7,003,549 | |
| | | | |
NET ASSETS | | $ | 277,360,429 | |
| | | | |
NET ASSETS CONSIST OF: | |
Common Stock, par value $0.01 per share (75,000,000 shares authorized, 47,686,957 shares issued and outstanding) | | $ | 476,870 | |
Paid-in Capital | | | 268,963,511 | |
Accumulated Earnings (Loss) | | | 7,920,048 | |
| | | | |
NET ASSETS | | $ | 277,360,429 | |
| | | | |
NET ASSET VALUE PER SHARE | | $ | 5.82 | |
| | | | |
MARKET PRICE PER SHARE | | $ | 5.75 | |
| | | | |
See accompanying notes to financial statements.
20
TCW Strategic Income Fund, Inc.
Statement of Operations (Unaudited) | Six Months Ended June 30, 2019 |
| | | | |
INVESTMENT INCOME: | |
Income | |
Interest | | $ | 8,539,255 | |
| | | | |
Total Investment Income | | | 8,539,255 | |
| | | | |
Expenses | |
Investment Advisory Fees | | | 807,881 | |
Audit and Tax Service Fees | | | 82,190 | |
Directors’ Fees and Expenses | | | 47,214 | |
Legal Fees | | | 32,382 | |
Commitment Fee on Open Line of Credit | | | 28,432 | |
Transfer Agent Fees | | | 28,277 | |
Proxy Expense | | | 25,161 | |
Insurance Expense | | | 24,674 | |
Listing Fees | | | 24,239 | |
Printing and Distribution Costs | | | 14,792 | |
Accounting Fees | | | 13,360 | |
Custodian Fees | | | 11,004 | |
Administration Fees | | | 9,928 | |
Miscellaneous Expense | | | 8,070 | |
| | | | |
Total Expenses | | | 1,157,604 | |
| | | | |
Net Investment Income | | | 7,381,651 | |
| | | | |
NET REALIZED GAIN (LOSS) AND CHANGE IN UNREALIZED APPRECIATION ON Investments, Futures Contracts and Swap Agreements: | | | | |
Net Realized Gain (Loss) on: | |
Investments | | | 1,165,793 | |
Futures Contracts | | | (915,642 | ) |
Swap Agreements | | | 863 | |
Change in Unrealized Appreciation on: | |
Investments | | | 7,211,801 | |
Futures Contracts | | | 507,067 | |
Swap Agreements | | | 11,002 | |
| | | | |
Net Realized Gain (Loss) and Change in Unrealized Appreciation on Investments,
Futures Contracts and Swap Agreements | | | 7,980,884 | |
| | | | |
INCREASE IN NET ASSETS FROM OPERATIONS | | $ | 15,362,535 | |
| | | | |
See accompanying notes to financial statements.
21
TCW Strategic Income Fund, Inc.
Statements of Changes in Net Assets
| | | | | | | | |
| | | Six Months
Ended June 30,
2019
(Unaudited) | | | Year Ended
December 31,
2018 | |
OPERATIONS: | |
Net Investment Income | | $ | 7,381,651 | | | $ | 14,342,728 | |
Net Realized Gain on Investments, Futures Contracts, Swap Agreements and Foreign Currency | | | 251,014 | | | | 1,119,835 | |
Change in Unrealized Appreciation (Depreciation) on Investments, Futures Contracts, Swap Agreements and Foreign Currency | | | 7,729,870 | | | | (10,128,898 | ) |
| | | | | | | | |
Increase in Net Assets Resulting from Operations | | | 15,362,535 | | | | 5,333,665 | |
| | | | | | | | |
DISTRIBUTIONS TO SHAREHOLDERS: | |
Distributions to Shareholders | | | (7,596,533 | ) | | | (17,772,928 | ) |
| | | | | | | | |
Total Increase (Decrease) in Net Assets | | | 7,766,002 | | | | (12,439,263 | ) |
| | | | | | | | |
NET ASSETS: | |
Beginning of Period | | | 269,594,427 | | | | 282,033,690 | |
| | | | | | | | |
End of Period | | $ | 277,360,429 | | | $ | 269,594,427 | |
| | | | | | | | |
See accompanying notes to financial statements.
22
TCW Strategic Income Fund, Inc.
Notes to Financial Statements (Unaudited) | June 30, 2019 |
Note 1 — Organization
TCW Strategic Income Fund, Inc. (the “Fund”) was incorporated in Maryland on January 13, 1987 as a diversified,closed-end investment management company and is registered under the Investment Company Act of 1940, as amended (the “1940 Act”). Its shares are traded on the New York Stock Exchange under the symbol TSI. The Fund commenced operations on March 5, 1987. The Fund’s investment objective is to seek a total return comprised of current income and capital appreciation, and it seeks to achieve its investment objective by investing in a wide range of securities including convertible securities, marketable equity securities, investment-grade debt securities, high-yield debt securities, securities issued or guaranteed by the U.S. Government, its agencies and instrumentalities (“U.S. Government Securities”), repurchase agreements, mortgage related securities, asset-backed securities, money market securities, other securities and derivative instruments without limit believed by the Fund’s investment advisor to be consistent with the Fund’s investment objective. TCW Investment Management Company LLC (the “Advisor”) is the investment advisor to the Fund and is registered under the Investment Advisers Act of 1940, as amended.
Note 2 — Significant Accounting Policies
The following is a summary of significant accounting policies, which are in conformity with accounting principles generally accepted in the United States of America (“GAAP”) and which are consistently followed by the Fund in the preparation of its financial statements. The Fund is considered an investment company under the Financial Accounting Standards Board (“FASB”) Accounting Standards Codification (“ASC”) No. 946, Financial Services — Investment Companies.
Principles of Accounting: The Fund uses the accrual method of accounting for financial reporting purposes.
Security Valuation: Securities traded on national exchanges are valued at the last reported sales prices. Securities traded on the NASDAQ stock market (“NASDAQ”) are valued using the official closing prices as reported by NASDAQ, which may not be the last sale price. Other securities, including short-term investments, swap agreements and forward currency contracts, which are tradedover-the-counter (“OTC”), are valued at the mean of the current bid and asked prices as furnished by independent pricing services or by dealer quotations. Futures contracts are valued at the official settlement prices of the exchanges on which they are traded.
Securities for which market quotations are not readily available, including circumstances under which it is determined by the Advisor that prices received are not reflective of their market values, are valued by the Advisor’s Pricing Committee in accordance with the guidelines established by the Valuation Committee of the Board of Directors of the Fund (the “Board”) and under the general oversight of the Board.
Fair value is defined as the price that the Fund would receive upon selling an investment in a timely transaction to an independent buyer in the principal or most advantageous market for the investment. In accordance with the authoritative guidance on fair value measurements and disclosures under GAAP, the Fund discloses investments in a three-tier hierarchy. This hierarchy is utilized to establish classification of fair value measurement broadly based on inputs that market participants would use in pricing the asset or liability, including assumptions about risk. Inputs may be observable or unobservable. Observable inputs are inputs that reflect the assumptions market participants would use in pricing the asset or liability developed based on market data obtained from sources independent of the reporting entity. Unobservable inputs are inputs that reflect the reporting entity’s own assumptions about the inputs market participants would use in pricing the asset or liability developed based on the best information available in the circumstances.
23
TCW Strategic Income Fund, Inc.
Notes to Financial Statements (Unaudited) (Continued)
Note 2 — Significant Accounting Policies (Continued)
The three-tier hierarchy of inputs is summarized in the three broad levels listed below.
| | |
| Level 1 — | | quoted prices in active markets for identical investments. |
| Level 2 — | | other significant observable inputs (including quoted prices for similar investments, interest rates, prepayment speeds, credit risk, etc.). |
| Level 3 — | | significant unobservable inputs (including the Fund’s own assumptions in determining the fair value of investments). |
Changes in valuation techniques may result in transfers in or out of an investment’s assigned level within the hierarchy. The inputs or methodologies used for valuing investments are not necessarily an indication of the risk associated with investing in those investments and the determination of the significance of a particular input to the fair value measurement in its entirety requires judgment and consideration of factors specific to each security.
The availability of observable inputs can vary from security to security and is affected by a wide variety of factors, including, for example, the type of security, whether the security is new and not yet established in the marketplace, the liquidity of markets, and other characteristics particular to the security. To the extent that valuation is based on models or inputs that are less observable or unobservable in the market, the determination of fair value requires more judgment. Accordingly, the degree of judgment exercised in determining fair value is greatest for instruments categorized in Level 3.
In periods of market dislocation, the observability of prices and inputs may be reduced for many instruments. This condition, as well as changes related to liquidity of investments, could cause a security to be reclassified between Level 1, Level 2, or Level 3.
In certain cases, the inputs used to measure fair value may fall into different levels of the fair value hierarchy. In such cases, for disclosure purposes, the level in the fair value hierarchy is determined based on the lowest level input that is significant to the fair value measurement.
Fair Value Measurements: Descriptions of the valuation techniques applied to the Fund’s major categories of assets and liabilities on a recurring basis are as follows:
Asset-backed securities (“ABS”) and mortgage-backed securities (“MBS”). The fair value of ABS and MBS is estimated based on pricing models that consider the estimated cash flows of each debt tranche of the issuer, establish a benchmark yield, and develop an estimated tranche specific spread to the benchmark yield based on the unique attributes of the tranche including, but not limited to, the prepayment speed assumptions and attributes of the collateral. To the extent the inputs are observable and timely, the values would be categorized in Level 2 of the fair value hierarchy; otherwise, they would be categorized in Level 3.
Corporate bonds. The fair value of corporate bonds is estimated using recently executed transactions, market price quotations (where observable), bond spreads, or credit default swap spreads adjusted for any basis difference between cash and derivative instruments. Corporate bonds are generally categorized in Level 2 of the fair value hierarchy.
Futures contracts. Futures contracts are generally valued at the settlement price established at the close of business each day by the exchange on which they are traded. They are categorized in Level 1.
Government and agency securities. Government and agency securities are normally valued using a model that incorporates market observable data such as reported sales of similar securities, broker quotes, yields,
24
TCW Strategic Income Fund, Inc.
June 30, 2019
Note 2 — Significant Accounting Policies (Continued)
bids, offers, quoted market prices, and reference data. Accordingly, government and agency securities are normally categorized in Level 1 or 2 of the fair value hierarchy depending on the liquidity and transparency of the market.
Interest Rate swaps. Interest rate and total return swaps are fair valued using pricing models that take into account among other factors, index spread curves, nominal values, modified duration values and cash flows. To the extent that these inputs are observable and timely, the fair values of credit default swaps are categorized as Level 2; otherwise, the fair values are categorized in Level 3.
Money market funds. Money market funds areopen-end mutual funds that invest in short-term debt securities. To the extent that these funds are valued based upon the reported net asset value (“NAV”), they are categorized in Level 1 of the fair value hierarchy.
Municipal bonds. Municipal bonds are fair valued based on pricing models that take into account, among other factors, information received from market makers and broker-dealers, current trades, bid wants lists, offerings, market movements, the callability of the bond, state of issuance, benchmark yield curves, and bond insurance. To the extent that these inputs are observable and timely, the fair values of municipal bonds are categorized in Level 2; otherwise, the fair values are categorized in Level 3.
Restricted securities. Restricted securities, including illiquid Rule 144A securities, issued bynon-public entities are included in Level 3 of the fair value hierarchy because they trade infrequently, and therefore, the inputs are unobservable. Any other restricted securities valued similar to publicly traded securities are categorized in Level 2 or 3 of the fair value hierarchy depending on whether a discount is applied and significant to the fair value.
Short-term investments. Short-term investments are valued using market price quotations, and are reflected in Level 2 of the fair value hierarchy.
The summary of the inputs used as of June 30, 2019 is listed after the Investments by Sector table.
The following is a reconciliation of investments in which significant unobservable inputs (Level 3) were used in determining value:
| | | | | | | | | | | | |
| | | Asset-
Backed
Securities | | | Residential
Mortgage-Backed
Securities —
Non-Agency | | | Total | |
Balance as of December 31, 2018 | | $ | 400,385 | | | $ | 5,016,324 | | | $ | 5,416,709 | |
Accrued Discounts (Premiums) | | | — | | | | (352,168 | ) | | | (352,168 | ) |
Realized Gain (Loss) | | | — | | | | — | | | | — | |
Change in Unrealized Appreciation (Depreciation) | | | (18,391 | ) | | | 664,950 | | | | 646,559 | |
Purchases | | | — | | | | 2,150,098 | | | | 2,150,098 | |
Sales | | | — | | | | — | | | | — | |
Transfers in to Level 3(1) | | | — | | | | — | | | | — | |
Transfers out of Level 3(1) | | | — | | | | — | | | | — | |
| | | | | | | | | | | | |
Balance as of June 30, 2019 | | $ | 381,994 | | | $ | 7,479,204 | | | $ | 7,861,198 | |
| | | | | | | | | | | | |
Change in Unrealized Appreciation (Depreciation) from Investments Still Held at June 30, 2019 | | $ | (18,391 | ) | | $ | 664,950 | | | $ | 646,559 | |
| | | | | | | | | | | | |
| (1) | The Fund recognizes transfers in and out at the beginning of the period. |
25
TCW Strategic Income Fund, Inc.
Notes to Financial Statements (Unaudited) (Continued)
Note 2 — Significant Accounting Policies (Continued)
Significant unobservable valuation inputs of Level 3 investments as of June 30, 2019 are as follows:
| | | | | | | | | | | | | | |
Description | | Fair Value at
June 30, 2019 | | | Valuation
Techniques* | | Unobservable
Input | | Price or Price Range | | Weighted Average
Price | |
Asset-Backed Securities | | | $ 381,994 | | | Third-party Broker | | Broker Quotes | | $ 28.00 to $31.00 | | | $ 29.216 | |
Residential Mortgage-Backed Securities —Non-Agency (Interest Only Collateral Strip Rate Securities) | | | $ 1,146,034 | | | Third-party Vendor | | Vendor Prices | | $ 0.39 to $2.63 | | | $ 1.10 | |
Residential Mortgage-Backed Securities —Non-Agency (Interest Only Securities) | | | $ 6,333,170 | | | Third-party Vendor | | Vendor Prices | | $ 2.72 to $29.76 | | | $ 9.487 | |
| * | The valuation technique employed on the Level 3 securities involves the use of third-party broker quotes and vendor prices. The Advisor monitors the effectiveness of third-party brokers and vendor prices using the Advisor’s own model and inputs. |
Security Transactions and Related Investment Income: Security transactions are recorded as of the trade date. Dividend income is recorded on theex-dividend date. Interest income is recognized on an accrual basis. Realized gains and losses on investments are recorded on the basis of specific identification.
Use of Estimates: The preparation of the accompanying financial statements requires management to make estimates and assumptions that affect the reported amount of assets and liabilities at the date of the financial statements and the reported amounts of income and expenses during the reporting period. Actual results could differ from these estimates.
Foreign Currency Translation: The books and records of the Fund are maintained in U.S. dollars as follows: (1) the foreign currency denominated securities and other assets and liabilities stated in foreign currencies are translated using the daily spot rate; and (2) purchases, sales, income and expenses are translated at the rate of exchange prevailing on the respective dates of such transactions. The resultant exchange gains and losses are included in net realized or net unrealized gain (loss) in the Statement of Operations. Pursuant to U.S. federal income tax regulations, certain foreign exchange gains and losses included in realized and unrealized gains and losses are included in, or are a reduction of, ordinary income for U.S. federal income tax purposes.
Distributions: Distributions to shareholders are recorded on eachex-dividend date. The Fund declared and paid or reinvested dividends quarterly under an income-based distribution policy. The income-based distribution policy has a stated goal of providing quarterly distributions out of the Fund’s accumulated undistributed net investment income and/or other sources subject to the requirements of the 1940 Act andSub-chapter M of the Internal Revenue Code (the “Code”). The source for the dividend can come from net investment income and net realized capital gains measured on a fiscal year basis. Any portion of the distribution that exceeds income and capital gains will be treated as a return of capital. Under certain conditions, U.S. federal tax regulations cause some or all of the return of capital to be taxed as ordinary income. Income and capital gain distributions are determined in accordance with income tax regulations which may differ from GAAP. These differences may be primarily due to differing treatments for market discount and premium, losses recognized on structured debt, losses deferred due to wash sales, foreign currency gains and losses, and spillover distributions. Permanent book and tax basis differences relating to shareholder distributions will result in reclassifications topaid-in capital and may affect net investment income per share.
26
TCW Strategic Income Fund, Inc.
June 30, 2019
Note 2 — Significant Accounting Policies (Continued)
Derivative Instruments: Derivatives are financial instruments whose values are based on the values of one or more indicators, such as a security, asset, currency, interest rate, or index. Derivative transactions can create investment leverage and may be highly volatile. It is possible that a derivative transaction will result in a loss greater than the principal amount invested. The Fund may not be able to close out a derivative transaction at a favorable time or price.
For the period ended June 30, 2019, the Fund had derivatives and transactions in derivatives, grouped in the following risk categories (amounts in thousands except notional amounts or number of contracts):
| | | | | | | | | | | | |
| | | Equity Risk | | | Interest
Rate
Risk | | | Total | |
Asset Derivatives | |
Futures Contracts(1) | | $ | 204,659 | | | $ | 107 | | | $ | 204,766 | |
Swaps Agreements(2) | | | — | | | | 285,162 | | | | 285,162 | |
| | | | | | | | | | | | |
Total Value | | $ | 204,659 | | | $ | 285,269 | | | $ | 489,928 | |
|
Liability Derivatives | |
Futures Contracts(1) | | $ | — | | | $ | (468,529 | ) | | $ | (468,529 | ) |
Swaps Agreements(2) | | | — | | | | (263,645 | ) | | | (263,645 | ) |
| | | | | | | | | | | | |
Total Value | | $ | — | | | $ | (732,174 | ) | | $ | (732,174 | ) |
|
Statement of Operations: | |
Realized Gain (Loss) | |
Futures Contracts | | $ | 196,018 | | | $ | (1,111,660 | ) | | $ | (915,642 | ) |
Swaps Agreements | | | — | | | | 863 | | | | 863 | |
| | | | | | | | | | | | |
Total Realized Gain (Loss) | | $ | 196,018 | | | $ | (1,110,797 | ) | | $ | (914,779 | ) |
|
Change in Appreciation (Depreciation) | |
Futures Contracts | | $ | 491,370 | | | $ | 15,697 | | | $ | 507,067 | |
Swaps Agreements | | | — | | | | 11,002 | | | | 11,002 | |
| | | | | | | | | | | | |
Total Change in Appreciation (Depreciation) | | $ | 491,370 | | | $ | 26,699 | | | $ | 518,069 | |
|
Number of Contracts or Notional Amounts(3) | |
Futures Contracts | | | 32 | | | | 142 | | | | 174 | |
Swaps Agreements | | $ | — | | | $ | 24,526,667 | | | $ | 24,526,667 | |
| (1) | Represents appreciation (depreciation) of futures contracts as reported in the Schedule of Investments as of June 30, 2019. Only the variation margin is reported within the Statement of Assets and Liabilities. |
| (2) | Represents appreciation (depreciation) on swap agreements as reported in the Schedule of Investments as of June 30, 2019. Only the variation margin is reported within the Statement of Assets and Liabilities |
| (3) | Amount disclosed represents average number of contracts or notional amounts, which are representative of the volume traded for the period ended June 30, 2019. |
Counterparty Credit Risk: Derivative contracts may expose the Fund to counterparty risk. Losses can occur if the counterparty does not perform under the contract.
With exchange traded futures and centrally cleared swaps, there is less counterparty credit risk to the Fund since the exchange or clearinghouse, as counterparty to such instruments, guarantees against a possible default. The clearinghouse stands between the buyer and the seller of the contract; therefore, the counterparty credit risk is limited to failure of the clearinghouse. While offset rights may exist under applicable law, the Fund does not have a contractual right of offset against a clearing broker or clearinghouse in the event of a default (including the bankruptcy or insolvency) of the clearing broker or clearinghouse. Additionally, credit risk exists in exchange traded futures and centrally cleared swaps with respect to initial and variation margin that is held in a clearing broker’s customer accounts. While clearing brokers are required to segregate customer margin from their own assets, in the event that a clearing
27
TCW Strategic Income Fund, Inc.
Notes to Financial Statements (Unaudited) (Continued)
Note 2 — Significant Accounting Policies (Continued)
broker becomes insolvent or goes into bankruptcy and at that time there is a shortfall in the aggregate amount of margin held by the clearing broker for all its clients, typically the shortfall would be allocated on a pro rata basis across all the clearing broker’s customers, potentially resulting in losses to the Fund.
The Fund’s risk of loss from counterparty credit risk on OTC derivatives is generally limited to the aggregate unrealized gain netted against any collateral held by the Fund. For OTC derivatives, the Fund entered into an International Swaps and Derivatives Association, Inc. Master Agreement (“ISDA Master Agreement”) with each counterparty. An ISDA Master Agreement is a bilateral agreement between the Fund and a counterparty that governs OTC derivatives and typically contains, among other things, collateral posting terms and netting provisions in the event of a default and/or termination event. Under an ISDA Master Agreement, the Fund may, under certain circumstances, offset with the counterparty certain derivative financial instruments’ payables and/or receivables with collateral held and/or posted and create one single net payment. The provisions of the ISDA Master Agreement typically permit a single net payment in the event of default including the bankruptcy or insolvency of the counterparty. However, bankruptcy or insolvency laws of a particular jurisdiction may impose restrictions on or prohibitions against the right of offset in bankruptcy, insolvency or other events. In addition, certain ISDA Master Agreements allow counterparties to OTC derivatives to terminate derivative contracts prior to maturity in the event the Fund’s net assets decline by a stated percentage or the Fund fails to meet the terms of its ISDA Master Agreements, which would cause the Fund to accelerate payment of any net liability owed to the counterparty.
Collateral Requirements: For derivatives traded under an ISDA Master Agreement, the collateral requirements are typically calculated by netting the mark to market amount for each transaction under such agreement and comparing that amount to the value of any collateral pledged or received by the Fund.
Cash collateral that has been pledged to cover obligations of the Fund is reported separately on the Statement of Assets and Liabilities.Non-cash collateral pledged by the Fund, if any, is noted in the Schedule of Investments. Generally, the amount of collateral due from or to a party has to exceed a minimum transfer amount threshold, typically $250,000 or $500,000, before a transfer is required, which is determined at the close of each business day and the collateral is transferred on the next business day. To the extent amounts due to the Fund from its counterparties are not fully collateralized, contractually or otherwise, the Fund bears the risk of loss from counterpartynon-performance. The Fund attempts to mitigate counterparty risk by entering into agreements only with counterparties that the Advisor believes have the financial resources to honor their obligations and by monitoring the financial stability of those counterparties. For financial reporting purposes, the Fund does not offset derivative assets and derivative liabilities that are subject to netting arrangements in the Statement of Assets and Liabilities. The Fund has implemented the disclosure requirements pursuant to FASB ASUNo. 2013-01, Disclosures about Offsetting Assets and Liabilities that requires disclosures to make financial statements that are prepared under GAAP more comparable to those prepared under International Financial Reporting Standards.
The Fund had no OTC derivatives for offset under an ISDA Master Agreement as of June 30, 2019.
Note 3 — Portfolio Investments
Mortgage-Backed and Other Asset-Backed Securities: The Fund may invest in mortgage pass-through securities, which represent interests in pools of mortgages. Payments of both principal and interest on the securities are generally made monthly, in effect “passing through” monthly payments made by borrowers on the residential or commercial mortgage loans that underlie the securities (net of any fees paid to the
28
TCW Strategic Income Fund, Inc.
June 30, 2019
Note 3 — Portfolio Investments (Continued)
issuer or guarantor of the securities). Mortgage pass-through securities differ from other forms of debt securities, which normally provide for periodic payment of interest in fixed amounts with principal payments at maturity or specified call dates. The Fund may also invest in collateralized mortgage obligations (“CMOs”). CMOs are debt obligations collateralized by residential or commercial mortgage loans or residential or commercial mortgage pass-through securities. Interest and principal are generally paid monthly. CMOs may be collateralized by whole mortgage loans or private mortgage pass-through securities but are more typically collateralized by portfolios of mortgage pass-through securities guaranteed by the Government National Mortgage Association (Ginnie Mae), Federal Home Loan Mortgage Corporation (Freddie Mac) or Federal National Mortgage Corporation (Fannie Mae). The issuer of a series of CMOs may elect to be treated for tax purposes as a Real Estate Mortgage Investment Conduit. CMOs are structured into multiple classes, each bearing a different stated maturity. Monthly payment of principal received from the pool of underlying mortgages, including prepayments, is first returned to investors holding the shortest maturity class. Investors holding the longer maturity classes usually receive principal only after shorter classes have been retired. An investor may be partially protected against a sooner than desired return of principal because of the sequential payments. The Fund may invest in stripped MBS. Stripped MBS are usually structured with two classes that receive different proportions of the interest and principal distributions on a pool of mortgage assets. In certain cases, one class will receive all of the interest (the interest only or “IO” class), while the other class will receive all of the principal (the principal-only or “PO” class). The yield to maturity on IOs is sensitive to the rate of principal prepayments (including prepayments) on the related underlying mortgage assets, and principal payments may have a material effect on yield to maturity. If the underlying mortgage assets experience greater than anticipated prepayments of principal, the Fund may not fully recoup its initial investment in IOs. Mortgage-backed and other asset-backed securities held by the Fund at June 30, 2019 are listed in the Fund’s Schedule of Investment.
Repurchase Agreements: The Fund may enter into repurchase agreements under the terms of a Master Repurchase Agreement (“MRA”). In a repurchase agreement transaction, the Fund will purchase a security from a counterparty who agrees to repurchase the same security at a mutually agreed upon date and price. The MRA permits the Fund, under certain circumstances, including an event of default (such as bankruptcy or insolvency), to offset payables and/or receivables under the MRA with collateral held and/or posted to the counterparty and create one single net payment due to or from the Fund. However, bankruptcy or insolvency laws of a particular jurisdiction may impose restrictions on or prohibitions against such a right of offset in the event of the MRA counterparty’s bankruptcy or insolvency. Pursuant to the terms of the MRA, the Fund receives securities as collateral with a market value in excess of the repurchase price. Upon a bankruptcy or insolvency of the MRA counterparty, the Fund recognizes a liability with respect to such excess collateral to reflect the Fund’s obligation under bankruptcy law to return the excess to the counterparty. The Fund had no repurchase agreements outstanding at June 30, 2019.
When-Issued, Delayed-Delivery, and Forward Commitment Transactions: The Fund may enter into when issued, delayed-delivery or forward commitment transactions in order to lock in the purchase price of the underlying security or to adjust the interest rate exposure of the Fund’s existing portfolio. In when-issued, delayed-delivery, or forward commitment transactions, the Fund commits to purchase particular securities, with payment and delivery to take place at a future date. Although the Fund does not pay for the securities or start earning interest on them until they are delivered, it immediately assumes the risks of ownership, including the risk of price fluctuation. If the Fund’s counterparty fails to deliver a security purchased on a
29
TCW Strategic Income Fund, Inc.
Notes to Financial Statements (Unaudited) (Continued)
Note 3 — Portfolio Investments (Continued)
when issued, delayed-delivery or forward commitment basis, there may be a loss, and the Fund may have missed an opportunity to make an alternative investment.
Prior to settlement of these transactions, the value of the subject securities will fluctuate. In addition, because the Fund is not required to pay for when-issued, delayed-delivery or forward commitment securities until the delivery date, they may result in a form of leverage. To guard against this deemed leverage, the Fund monitors the obligations under these transactions and ensures that the Fund has sufficient liquid assets to cover them.
Security Lending: The Fund may lend its securities to qualified brokers. The loans must be collateralized at all times primarily with cash although the Fund can accept money market instruments or U.S. government securities with a market value at least equal to the market value of the securities on loan. As with any extensions of credit, the Fund may bear the risk of delay in recovery or even loss of rights in the collateral if the borrowers of the securities fail financially. The Fund earns additional income for lending its securities by investing the cash collateral in short-term investments. The Fund did not lend any securities during the period ended June 30, 2019.
Derivatives:
Forward Foreign Currency Contracts: The Fund enters into forward foreign currency contracts as a hedge against fluctuations in foreign exchange rates. Forward foreign currency contracts are marked to market daily and the change in market value is recorded by the Fund as unrealized gains or losses in the Statement of Assets and Liabilities. When a contract is closed or delivery is taken, the Fund records a realized gain or loss equal to the difference between the value of the contract at the time it was opened and the value at the time it was closed. Risks arise upon entering into these contracts from the potential inability of counterparties to meet the terms of their contracts and from unanticipated movements in the value of the foreign currency relative to the U.S. dollar. There were no outstanding foreign currency forward contracts as of June 30, 2019.
Futures Contracts: The Fund seeks to manage a variety of different risks or obtain exposure through the use of futures contracts. The Fund may use index futures to hedge against broad market risks to its portfolio or to gain broad market exposure when it holds uninvested cash or as an inexpensive substitute for cash investments directly in securities or other assets. Securities index futures contracts are contracts to buy or sell units of a securities index at a specified future date at a price agreed upon when the contract is made and are settled in cash. Positions in futures may be closed out only on an exchange or board of trade which provides a secondary market for such futures. Because futures contracts are exchange-traded, they typically have minimal exposure to counterparty risk. Parties to a futures contract are not required to post the entire notional amount of the contract, but rather a small percentage of that amount (by way of margin), both at the time they enter into futures transactions, and then on a daily basis if their positions decline in value; as a result, futures contracts are highly leveraged. Such payments are known as variation margin and are recorded by the Fund as unrealized gains or losses. Because futures markets are highly leveraged, they can be extremely volatile, and there can be no assurance that the pricing of a futures contract will correlate precisely with the pricing of the asset or index underlying it or the asset or liability of the Fund that is the subject of the hedge. It may not always be possible for the Fund to enter into a closing transaction with respect to a futures contract it has entered into at a favorable time or price. When the Fund enters into a futures transaction, it is subject to the risk that the value of the futures contract will move in a direction unfavorable to it.
30
TCW Strategic Income Fund, Inc.
June 30, 2019
Note 3 — Portfolio Investments (Continued)
When the Fund uses futures contracts for hedging purposes, it is likely that the Fund will have an asset or liability that will offset any loss (or gain) on the transactions, at least in part. When a futures contract is closed, the Fund records a realized gain or loss equal to the difference between the value of the contract at the time it was opened and the value at the time it was closed. During the period ended June 30, 2019, the Fund used S&P 500 Index futures to gain exposure to the equity market. The Fund also utilized treasury futures to help manage interest rate duration and credit market exposure. Futures contracts outstanding at June 30, 2019 are listed in the Fund’s Schedule of Investments.
Swap Agreements: The Fund may enter into swap agreements. Swap agreements are typicallytwo-party contracts entered into primarily by institutional investors. In a standard “swap” transaction, two parties agree to exchange the returns (or differentials in rates of return) earned or realized on particular predetermined investments or instruments, which may be adjusted for an interest factor. The gross returns to be exchanged or “swapped” between the parties are generally calculated with respect to a “notional amount” (i.e., the return on or increase in value of a particular dollar amount invested at a particular interest rate or in a “basket” of securities representing a particular index).
Interest rate swaps are agreements in which one party pays a floating rate of interest on a notional principal amount and receives a fixed rate of interest on the same notional principal amount for a specified period of time. Alternatively, a party may pay a fixed rate and receive a floating rate. In more complex swaps, the notional principal amount may decline (or amortize) over time. The Fund’s maximum risk of loss due to counterparty default is the discounted NAV of the cash flows paid to/received from the counterparty over the interest rate swap’s remaining life.
During the term of a swap transaction, changes in the value of the swap are recognized as unrealized gains or losses by marking to market to reflect the market value of the swap. When the swap is terminated, the Fund will record a realized gain or loss equal to the difference, if any, between the proceeds from (or cost of) the closing transaction and the Fund’s basis in the agreement. Upfront swap premium payments paid or received by the Fund, if any, are recorded within the value of the open swap agreement on the Fund’s Statement of Assets and Liabilities and represent payments paid or received upon entering into the swap agreement to compensate for differences between stated terms of the swap agreement and prevailing market conditions (credit spreads, currency exchange rates, and other relevant factors). These upfront payments are recorded as realized gain or loss on the Fund’s Statement of Operations upon termination or maturity of the swap agreement.
During the term of a swap transaction, the periodic net payments can be made for a set period of time or may be triggered by a predetermined credit event. The net periodic payments may be based on a fixed or variable interest rate, the change in market value of a specified security, basket of securities or index, or the return generated by a security. These periodic payments received or made by the Fund are recorded as realized gains and losses, respectively. During the period ended June 30, 2019, the Fund entered into interest rate swaps to manage duration, the yield curve or interest rate risk by economically hedging the value of the fixed-rate bonds which may decrease when interest rates rise (interest rate risk). Swap agreements outstanding at June 30, 2019 are listed in the Fund’s Schedule of Investments.
Note 4 — Risk Considerations
Market Risk: The Fund’s investments will fluctuate with market conditions, and so will the value of your investment in the Fund. You could lose money on your investment in the Fund or the Fund could underperform other investments.
31
TCW Strategic Income Fund, Inc.
Notes to Financial Statements (Unaudited) (Continued)
Note 4 — Risk Considerations (Continued)
Liquidity Risk: The Fund’s investments in illiquid securities may reduce the returns of the Fund because it may not be able to sell the illiquid securities at an advantageous time or price. Investments in high yield securities, foreign securities, derivatives or other securities with substantial market and/or credit risk tend to have the greatest exposure to liquidity risk. Certain investments in private placements and Rule 144A securities may be considered illiquid investments. The Fund may invest in private placements and Rule 144A securities.
Interest Rate Risk: The values of the Fund’s investments fluctuate in response to movements in interest rates. If rates rise, the values of debt securities generally fall. The longer the average duration of a Fund’s investment portfolio, the greater the change in value.
Mortgage-Backed and Other Asset-Backed Securities Risk: The Fund may invest in MBS or other ABS. The values of some mortgage-backed securities or other asset backed securities may expose the Fund to a lower rate of return upon reinvestment of principal. When interest rates rise, the value of mortgage-related securities generally will decline; however, when interest rates are declining, the value of mortgage related-securities with prepayment features may not increase as much as other fixed-income securities. The rate of prepayments on underlying mortgages will affect the price and volatility of a mortgage related security, and may shorten or extend the effective maturity of the security beyond what was anticipated at the time of purchase. The value of these securities may fluctuate in response to the market’s perception of the creditworthiness of the issuers. Additionally, although mortgages and mortgage- related securities are generally supported by some form of government or private guarantee and/or insurance, there is no assurance that private guarantors or insurers will meet their obligations.
Derivatives Risk: Use of derivatives, which at times is an important part of the Fund’s investment strategy, involves risks different from, or possibly greater than, the risks associated with investing directly in securities and other traditional investments. Investments in derivatives could cause the Fund to lose more than the principal amount invested. Also, suitable derivative transactions may not be available in all circumstances and there can be no assurance that the Fund will achieve its objective with these transactions to reduce exposure to other risks when that would be beneficial.
Credit Risk: The values of any of the Fund’s investments may also decline in response to events affecting the issuer or its credit rating. The lower rated debt securities in which the Fund may invest are considered speculative and are subject to greater volatility and risk of loss than investment-grade securities, particularly in deteriorating economic conditions. The value of some mortgage-related securities in which the Fund invests also may fall because of unanticipated levels of principal prepayments that can occur when interest rates decline. The Fund invests a material portion of its assets in securities of issuers that hold mortgage- and asset-backed securities and direct investments in securities backed by commercial and residential mortgage loans and other financial assets. The value and related income of these securities are sensitive to changes in economic conditions, including delinquencies and/or defaults. Continuing shifts in the market’s perception of credit quality on securities backed by commercial and residential mortgage loans and other financial assets may result in increased volatility of market prices and periods of illiquidity which can negatively impact the valuation of certain issuers held by the Fund.
MBS and ABS are characterized and classified in a variety of different ways. These classifications include a view of the securities’ cash flow structure (pass through, sequential pay, prepayment-protected, interest only, principal-only, etc.), the security of the claim on the underlying assets (senior, mezzanine and subordinated), as well as types of underlying collateral (prime conforming loans, primenon-conforming
32
TCW Strategic Income Fund, Inc.
June 30, 2019
Note 4— Risk Considerations (Continued)
loans,Alt-A loans, subprime loans, commercial loans, etc.). In many cases, the classification incorporates a degree of subjectivity — a particular loan might be categorized as “prime” by the underwriting standards of one mortgage issuer while another might classify the loan as “subprime.” The level of risk associated with an investment in a mortgage loan can be impacted by, among other factors, the nature of the collateral, the form and the level of credit enhancement, the vintage of the loan, the geography of the loan, the purpose of the loan (e.g. refinance versus purchase versus equitytake-out), the borrower’s credit quality (e.g., FICO score), and whether the loan is a first trust deed or a second lien.
Counterparty Risk: The Fund may be exposed to counterparty risk, or the risk that an entity with which the Fund has unsettled or open transactions may not fulfill its obligations.
Note 5 — Federal Income Taxes:
It is the policy of the Fund to comply with the requirements of the Code applicable to regulated investment companies and distribute all of its net taxable income, including any net realized gains on investments, to its shareholders. Therefore, no federal income tax provision is required.
At June 30, 2019, net unrealized appreciation for federal income tax purposes is comprised of the following components:
| | | | |
Unrealized appreciation | | $ | 22,607,549 | |
Unrealized (depreciation) | | | (13,962,827 | ) |
| | | | |
Net unrealized appreciation | | $ | 8,644,722 | |
| | | | |
Cost of Investments for Federal Income Tax Purposes | | $ | 271,934,511 | |
| | | | |
The Fund did not have any unrecognized tax benefits at June 30, 2019, nor were there any increases or decreases in unrecognized tax benefits for the period then ended; and therefore no interest or penalties were accrued. The Fund is subject to examination by U.S. federal and state tax authorities for returns filed for the prior three and four fiscal years, respectively.
The following table shows the character of distributed and undistributed amounts on a tax basis for the year ended December 31, 2018.
| | | | | | | | |
| | | Amount Distributed During the | | | Undistributed Amount at | |
| | | Year Ended
December 31,
2018 | | | Year Ended
December 31,
2018 | |
Ordinary Income | | $ | 17,346,285 | | | $ | 10,517 | |
Capital Gain | | | 426,643 | | | | — | |
| | | | | | | | |
| | $ | 17,772,928 | | | $ | 10,517 | |
| | | | | | | | |
Note 6 — Investment Advisory and Service Fees
As compensation for the investment advisory services rendered, facilities provided, and expenses borne, the Advisor is paid a monthly fee by the Fund computed at the annual rate of 0.75% of the first $100 million of the Fund’s average managed assets and 0.50% of the Fund’s average managed assets in excess of $100 million.
33
TCW Strategic Income Fund, Inc.
Notes to Financial Statements (Unaudited) (Continued)
Note 7 — Purchases and Sales of Securities
For the period ended June 30, 2019, purchases and sales or maturities of investment securities (excluding short-term investments) aggregated to $34,756,624 and $55,596,412, respectively, fornon-U.S. Government securities, and aggregated to $4,498,608 and $2,336,900 respectively, for U.S. Government securities.
Purchases during the period ended June 30, 2019 include the Fund’s purchase of a security from an affiliated investment account for a total of $1,302,492 in accordance with the provisions set forth in SEC Rule 17a-7.
Note 8 — Directors’ Fees
Directors who are not affiliated with the Advisor received, as a group, fees and expenses of $47,214 from the Fund for the period ended June 30, 2019. Directors may elect to defer receipt of their fees in accordance with the terms of aNon-Qualified Deferred Compensation Plan. Deferred compensation is included within Accrued Directors’ Fees and Expenses in the Statement of Assets and Liabilities. Certain Officers and/or Directors of the Fund are also Officers and/or Directors of the Advisor but do not receive any compensation from the Fund.
Note 9 — Restricted Securities
The Fund is permitted to invest in securities that have legal or contractual restrictions on resale. These securities may be sold privately, but are required to be registered before being sold to the public (exemption rules apply). Private placement securities are generally considered to be restricted except for those securities traded between qualified institutional investors under the provisions of Rule 144A of the Securities Act of 1933, as amended (the “Securities Act”). However, the Fund considers 144A securities to be restricted if those securities have been deemed illiquid by the Advisor. Disposal of these securities may involve time consuming negotiations and expense, and prompt sale at an acceptable price may be difficult. Restricted securities held by the Fund at June 30, 2019 are listed below:
| | | | | | | | | | | | | | |
Issuer Description | | Acquisition
Date | | Acquisition
Cost | | | Aggregate
Value | | | Percentage
of Net Assets | |
Citigroup Commercial Mortgage Trust,(12-GC8-XA), 1.814%, due 09/10/45 | | 2/13/2015-2/26/2015 | | $ | 323,009 | | | $ | 148,086 | | | | 0.1 | % |
Four Times Square Trust Commercial Mortgage Pass-Through Certificates(06-4TS-X) , 0.364% due 12/13/28 | | 3/22/2018-6/19/2018 | | | 294,305 | | | | 174,399 | | | | 0.1 | % |
GS Mortgage Securities Trust GSMS(12-GC6-XB), 0.257% due 01/10/2045 | | 2/1/2018 | | | 141,354 | | | | 99,838 | | | | 0.0 | % |
JPMorgan Chase Commercial Mortgage Securities Trust,(09-IWST-XA), 1.873%, due 12/05/27 | | 3/23/2017 | | | 531,426 | | | | 94,396 | | | | 0.0 | % |
JPMorgan Chase Commercial Mortgage Securities Trust,(12-HSBC-XA), 1.431%, due 07/05/2032 | | 10/11/2017 | | | 270,060 | | | | 173,983 | | | | 0.1 | % |
Morgan Stanley Capital I Trust(12-C4-XA), 2.271% due 03/15/45 | | 5/16/2018 | | | 350,627 | | | | 244,740 | | | | 0.1 | % |
UBS Commercial Mortgage Trust(12-C1-XA) , 2.271%, due 05/10/45 | | 6/27/2017 | | | 418,393 | | | | 261,807 | | | | 0.1 | % |
WFRBS Commercial Mortgage Trust(12-C8-XA) 1.8514% due 08/15/2045 | | 12/22/2017 | | | 302,405 | | | | 199,648 | | | | 0.1 | % |
| | | | | | | | | | | | | | |
| | | | $ | 2,631,579 | | | $ | 1,396,897 | | | | 0.6 | % |
| | | | | | | | | | | | | | |
34
TCW Strategic Income Fund, Inc.
June 30, 2019
Note 10 — Loan Outstanding
The Fund is permitted to have borrowings for investment purposes. The Fund has entered into a line of credit agreement, renewed annually, with The Bank of New York Mellon which permits the Fund to borrow up to $70 million at a rate, per annum, equal to the Federal Funds Rate plus 1.00%. There is also an annual facility fee of $56,000 for the contract period. The Fund did not have any borrowings during the period ended June 30, 2019.
Note 11 — Indemnifications
Under the Fund’s organizational documents, its Officers and Directors may be indemnified against certain liabilities and expenses arising out of the performance of their duties to the Fund. In addition, the Fund entered into an agreement with each of the Directors which provides that the Fund will indemnify and hold harmless each Director against any expenses actually and reasonably incurred by such Director in any proceeding arising out of or in connection with the Director’s services to the Fund, to the fullest extent permitted by the Fund’s Articles of Incorporation andBy-Laws, the Maryland General Corporation Law, the Securities Act, and the 1940 Act, each as now or hereinafter in force. Additionally, in the normal course of business, the Fund enters into agreements with service providers that may contain indemnification clauses. The Fund’s maximum exposure under these arrangements is unknown as this would involve future claims that may be made against the Fund that have not yet occurred. However, based on experience, the Fund expects the risk of loss to be remote. The Fund has not accrued any liability in connection with such indemnification.
Note 12 — New Accounting Pronouncement
In August 2018, the FASB released an accounting standards update (“ASU”)2018-13, which changes the fair value measurement disclosure requirements of Topic 820. The amendments in this ASU are the result of a broader disclosure project called FASB Concept Statement, Conceptual Framework for Financial Reporting — Chapter 8: Notes to Financial Statements. The objective and primary focus of the project are to improve the effectiveness of disclosures in the notes to the financial statements by facilitating clear communication of the information required by GAAP that is most important to users of the financial statements. This ASU will go effective for all entities for fiscal years beginning after December 15, 2019, including interim periods therein. Early adoption is permitted for any eliminated or modified disclosures upon issuance of this ASU. As of June 30, 2019, the Fund has early adopted the removal of applicable disclosures.
Note 13 — Change in Accounting Principal
The Fund has adopted FASB ASU2017-08 to amend the amortization period for certain purchased callable debt securities held at a premium. Under the new standard, the Fund has changed the amortization period for the premium on certain purchased callable debt securities withnon-contingent call features to the earliest call date. In accordance with the transition provisions of the standard, the Fund applied the amendments on a modified retrospective basis beginning with the fiscal year ended December 31, 2018. The cost basis of securities at December 31, 2018 has been adjusted to $268,053,794. This change in accounting policy has been made to comply with the newly issued accounting standard and had no impact on total accumulated earnings (loss) or the net asset value of the Fund.
35
TCW Strategic Income Fund, Inc.
Financial Highlights
| | | | | | | | | | | | | | | | | | | | | | | | |
| | | Six Months
Ended
June 30,
2019
(Unaudited) | | | Year Ended
December 31,
2018 | | | Year Ended
December 31,
2017 | | | Year Ended
December 31,
2016 | | | Year Ended
December 31,
2015 | | | Year Ended
December 31,
2014 | |
Net Asset Value Per Share, Beginning of Period | | $ | 5.65 | | | $ | 5.91 | | | $ | 5.81 | | | $ | 5.83 | | | $ | 5.95 | | | $ | 5.82 | |
| | | | | | | | | | | | | | | | | | | | | | | | |
Income from Operations: | | | | | | | | | | | | | | | | | | | | | | | | |
| | | | | | |
Net Investment Income (1) | | | 0.15 | | | | 0.30 | | | | 0.27 | | | | 0.26 | | | | 0.22 | | | | 0.24 | |
| | | | | | |
Net Realized and Unrealized Gain (Loss) on Investments | | | 0.18 | | | | (0.19 | ) | | | 0.14 | | | | 0.00 | (2) | | | (0.13 | ) | | | 0.14 | |
| | | | | | | | | | | | | | | | | | | | | | | | |
| | | | | | |
Total from Investment Operations | | | 0.33 | | | | 0.11 | | | | 0.41 | | | | 0.26 | | | | 0.09 | | | | 0.38 | |
| | | | | | | | | | | | | | | | | | | | | | | | |
Less Distributions: | | | | | | | | | | | | | | | | | | | | | | | | |
| | | | | | |
Distributions from Net Investment Income | | | (0.16 | ) | | | (0.34 | ) | | | (0.28 | ) | | | (0.21 | ) | | | (0.21 | ) | | | (0.25 | ) |
| | | | | | |
Distributions from Net Realized Gains | | | — | | | | (0.03 | ) | | | (0.03 | ) | | | (0.07 | ) | | | — | | | | — | |
| | | | | | | | | | | | | | | | | | | | | | | | |
| | | | | | |
Total Distributions | | | (0.16 | ) | | | (0.37 | ) | | | (0.31 | ) | | | (0.28 | ) | | | (0.21 | ) | | | (0.25 | ) |
| | | | | | | | | | | | | | | | | | | | | | | | |
Net Asset Value Per Share, End of Period | | $ | 5.82 | | | $ | 5.65 | | | $ | 5.91 | | | $ | 5.81 | | | $ | 5.83 | | | $ | 5.95 | |
| | | | | | | | | | | | | | | | | | | | | | | | |
Market Value Per Share, End of Period | | $ | 5.75 | | | $ | 5.27 | | | $ | 5.87 | | | $ | 5.33 | | | $ | 5.27 | | | $ | 5.39 | |
| | | | | | | | | | | | | | | | | | | | | | | | |
Net Asset Value Total Return (3) | | | 5.86 | % (4) | | | 1.86 | % | | | 7.22 | % | | | 4.49 | % | | | 1.60 | % | | | 6.66 | % |
Market Price Return (5) | | | 12.26 | % (4) | | | (3.88 | )% | | | 16.36 | % | | | 6.56 | % | | | 1.83 | % | | | 5.66 | % |
| | | | | | |
Ratios/Supplemental Data: | | | | | | | | | | | | | | | | | | | | | | | | |
Net Assets, End of Period (in thousands) | | $ | 277,360 | | | $ | 269,594 | | | $ | 282,034 | | | $ | 277,132 | | | $ | 277,932 | | | $ | 283,835 | |
Ratio of Expenses Before Interest Expense to Average Net Assets | | | 0.83 | % (6) | | | 0.81 | % | | | 0.81 | % | | | 0.84 | % | | | 0.87 | % | | | 0.85 | % |
Ratio of Interest Expense to Average Net Assets | | | 0.02 | % (6) | | | 0.02 | % | | | 0.01 | % | | | 0.01 | % | | | 0.01 | % | | | 0.02 | % |
Ratio of Total Expenses to Average Net Assets | | | 0.85 | % (6) | | | 0.83 | % | | | 0.82 | % | | | 0.85 | % | | | 0.88 | % | | | 0.87 | % |
Ratio of Net Investment Income to Average Net Assets | | | 5.40 | % (6) | | | 5.13 | % | | | 4.47 | % | | | 4.38 | % | | | 3.70 | % | | | 4.05 | % |
Portfolio Turnover Rate | | | 14.99 | % (4) | | | 31.16 | % | | | 32.46 | % | | | 29.20 | % | | | 24.81 | % | | | 12.09 | % |
| (1) | Computed using average shares outstanding throughout the period. |
| (2) | Amount rounds to less than $0.01 per share. |
| (3) | Based on net asset value per share, adjusted for reinvestment of distributions. |
| (4) | For the six months ended June 30, 2019 and not indicative of a full year’s results. |
| (5) | Based on market price per share, adjusted for reinvestment of distributions. |
See accompanying notes to financial statements.
36
TCW Strategic Income Fund, Inc.
Supplemental Information
Proxy Voting Guidelines
The policies and procedures that the Fund uses to determine how to vote proxies are available without charge. The Board of the Fund has delegated the Fund’s proxy voting authority to the Advisor.
Disclosure of Proxy Voting Guidelines
The proxy voting guidelines of the Advisor are available:
| | 1. | By calling1-(877)829-4768 to obtain a hard copy; or |
| | 2. | By going to the Securities and Exchange Commission’s (the “SEC”) website atwww.sec.gov. |
When the Fund receives a request for a description of the Advisor’s proxy voting guidelines, it will deliver the description that is disclosed in the Fund’s Statement of Additional Information. This information will be sent out via first class mail (or other means designed to ensure equally prompt delivery) within three business days of receiving the request.
The Advisor, on behalf of the Fund, must prepare and file FormN-PX with the SEC not later than August 31 of each year, which must include the Fund’s proxy voting record for the most recent twelve-month period ended June 30 of that year. The Fund’s proxy voting record for the most recent twelve-month period ended June 30, 2019 is available without charge:
| | 1. | By calling1-(877)829-4768 to obtain a hard copy; or |
| | 2. | By going to the SEC website at http://www.sec.gov. |
When the Fund receives a request for the Fund’s proxy voting record, it will send the information disclosed in the Fund’s most recently filed report on FormN-PX via first class mail (or other means designed to ensure equally prompt delivery) within three business days of receiving the request.
The Fund also discloses its proxy voting record on its website as soon as is reasonably practicable after its report on FormN-PX is filed with the SEC.
Availability of Quarterly Portfolio Schedule
The Fund files a complete schedule of its portfolio holdings with the SEC for the first and third quarters of its fiscal year on FormN-PORT-EX. Such filings occur no later than 60 days after the end of the Funds’ first and third quarters and are available on the SEC’s website at www.sec.gov.
Corporate Governance Listing Standards
In accordance with Section 303A.12 (a) of the New York Stock Exchange Listed Company Manual, the Fund’s Annual CEO Certification certifying compliance with NYSE’s Corporate Governance Listing Standards was submitted to the Exchange on October 19, 2018 as part of its Annual Written Affirmation. Also in accordance with Section 303A.12 of the New York Stock Exchange Listed Company Manual, the Fund submitted an Interim Written Affirmation on March 28, 2018 and December 19, 2018.
37
TCW Strategic Income Fund, Inc.
Dividend Reinvestment Plan
Shareholders who wish to add to their investment may do so by making an election to participate in the Dividend Reinvestment Plan (the “Plan”). Under the Plan, your dividend is used to purchase Fund shares on the open market whenever shares, including the related sales commission, are selling below the Fund’s net asset value per share. You will be charged apro-rata portion of brokerage commissions on open-market purchases under the Plan. If the market price, including commission, of Fund shares is above the Fund’s net asset value per share, you will receive shares at a price equal to the higher of the Fund’s net asset value per share on the payment date or 95% of the closing market price of Fund shares on the payment date. Generally, for tax purposes, shareholders participating in the Plan will be treated as having received a distribution from the Fund in cash equal to the value of the shares purchased from them under the Plan.
To enroll in the Plan, if your shares are registered in your name, write to Computershare, P.O. Box #505000, Louisville, KY 40233, or call toll free at (866)227-8179. If your shares are held by a brokerage firm, please call your broker. If you participate in the Plan through a broker, you may not be able to transfer your shares to another broker and continue to participate in the Plan if your new broker does not permit such participation. If you no longer want to participate in the Plan, please contact Computershare or your broker. You may elect to continue to hold shares previously purchased on your behalf or to sell your shares and receive the proceeds, net of any brokerage commissions. If you need additional information or assistance, please call our investor relations department at (877)829-4768 or visit our website at www.tcw.com. As always, we would be pleased to accommodate your investment needs.
Distribution Policy
The Fund has a net investment income-based distribution policy. The policy is to pay quarterly distributions out of the Fund’s accumulated undistributed net investment income and/or other sources subject to the requirements of the 1940 Act andSub-chapter M of the Code.
Distribution policies are a matter of Board discretion and may be modified or terminated at any time without prior notice. Any such change or termination may have an adverse effect on the market price for the Fund’s shares.
You should not draw any conclusions about the Fund’s investment performance from the amount of the quarterly distribution or from the terms of the Fund’s distribution policy.
38

TCW Strategic Income Fund, Inc.
865 South Figueroa Street
Los Angeles, California 90017
800 386 3829
www.TCW.com
INVESTMENT ADVISOR
TCW Investment Management Company LLC
865 South Figueroa Street
Los Angeles, California 90017
TRANSFER AGENT, DIVIDEND REINVESTMENT AND DISBURSEMENT AGENT AND REGISTRAR
Computershare
P.O. Box 50500
Louisville, KY 40233
INDEPENDENT REGISTERED PUBLIC ACCOUNTING FIRM
Deloitte & Touche LLP
555 West 5th Street
Los Angeles, California 90013
CUSTODIAN & ADMINISTRATOR
State Street Bank & Trust Company
One Lincoln Street
Boston, Massachusetts 02111
LEGAL COUNSEL
Paul Hastings LLP
101 California Street, 48th Floor
San Francisco, California 94111
DIRECTORS
Samuel P. Bell
Director
David S. DeVito
Director, President, and Chief Executive Officer
Patrick C. Haden
Director and Chairman
David B. Lippman
Director
Peter McMillan
Director
Victoria B. Rogers
Director
Andrew Tarica
Director
OFFICERS
Meredith S. Jackson
Senior Vice President, General Counsel and Secretary
Richard M. Villa
Treasurer and Principal Financial and Accounting Officer
Jeffrey A. Engelsman
Chief Compliance Officer
and Anti-Money Laundering Officer
Lisa Eisen
Tax Officer
Eric W. Chan
Assistant Treasurer
Patrick W. Dennis
Assistant Secretary
TSIart9445 6/30/19
Not required for this filing.
| Item 3. | Audit Committee Financial Expert. |
Not required for this filing.
| Item 4. | Principal Accountant Fees and Services. |
Not required for this filing.
| Item 5. | Audit Committee of Listed Registrants. |
Not required for this filing.
| (a) | The Schedule of Investments is included as part of the Report to Shareholders filed under Item 1 of this FormN-CSR. |
| Item 7. | Disclosure of Proxy Voting Policies and Procedures forClosed-End Management Investment Companies. |
Not required for this filing.
| Item 8. | Portfolio Managers ofClosed-End Management Investment Companies. |
Not required for this filing.
| Item 9. | Purchases of Equity Securities byClosed-End Management Investment Company and Affiliated Purchasers. |
None.
| Item 10. | Submission of Matters to a Vote of Security Holders. |
There have been no material changes to the procedures by which shareholders may recommend nominees to the Registrant’s Board of Directors.
| Item 11. | Controls and Procedures. |
| (a) | The Chief Executive Officer and Principal Financial and Accounting Officer have concluded that the Registrant’s disclosure controls and procedures (as defined in Rule30a-3(c) under the Investment Company Act of 1940, as amended (the “1940 Act”)) provide reasonable assurances that material information relating to the |
| | Registrant is made known to them by the appropriate persons as of a date within 90 days of the filing date of this report, based on their evaluation of these controls and procedures required by Rule30a-3(b) under the 1940 Act and15d-15(b) under the Securities Exchange Act of 1934, as amended. |
| (b) | There were no changes in the Registrant’s internal control over financial reporting (as defined in Rule30a-3(d) under the 1940 Act) that occurred during the period covered by this report that have materially affected, or are reasonably likely to materially affect, the Registrant’s internal control over financial reporting. |
| Item 12. | Disclosure of Securities Lending Activities forClosed-End Management Investment Companies. |
Not applicable.
| | |
| (a)(1) | | Not required for this filing. |
| |
| (a)(2) | | EX-99.CERT – The certifications required by Rule 30a-2(a) of the 1940 Act and Section 302 of the Sarbanes-Oxley Act of 2002 (“Sarbanes-Oxley Act”) are filed herewith. |
| |
| (a)(3) | | Not applicable. |
| |
| (a)(4) | | Not applicable. |
| |
| (b) | | EX-99.906CERT – The certifications required by Rule 30a-2(b) of the 1940 Act and Section 906 of the Sarbanes-Oxley Act are filed herewith. |
| |
| (c) | | Not required for this filing. |
SIGNATURES
Pursuant to the requirements of the Securities Exchange Act of 1934, as amended, and the Investment Company Act of 1940, as amended, the Registrant has duly caused this report to be signed on its behalf by the undersigned, thereunto duly authorized.
| | | | | | |
| (Registrant) | | | | TCW Strategic Income Fund, Inc. | | |
| | | |
| By (Signature and Title) | | | | /s/ David S. DeVito | | |
| | | | David S. DeVito | | |
| | | | President and Chief Executive Officer | | |
| | | |
| Date | | | | August 23, 2019 | | |
Pursuant to the requirements of the Securities Exchange Act of 1934, as amended, and the Investment Company Act of 1940, as amended, this report has been signed below by the following persons on behalf of the Registrant and in the capacities and on the dates indicated.
| | | | | | |
| By (Signature and Title) | | | | /s/ David S. DeVito | | |
| | | | David S. DeVito | | |
| | | | President and Chief Executive Officer | | |
| | | |
| Date | | | | August 23, 2019 | | |
| | | |
| By (Signature and Title) | | | | /s/ Richard M. Villa | | |
| | | | Richard M. Villa | | |
| | | | Treasurer and Principal Financial and Accounting Officer | | |
| | | |
| Date | | | | August 23, 2019 | | |