UNITED STATES
SECURITIES AND EXCHANGE COMMISSION
Washington, D.C. 20549
FORM N-CSR
CERTIFIED SHAREHOLDER REPORT OF REGISTERED
MANAGEMENT INVESTMENT COMPANIES
Investment Company Act file number: 811-04980
TCW Strategic Income Fund, Inc.
(Exact name of registrant as specified in charter)
865 South Figueroa Street, Suite 1800, Los Angeles, CA 90017
(Address of principal executive offices)
Patrick W. Dennis, Esq.
Vice President and Assistant Secretary
865 South Figueroa Street, Suite 1800
Los Angeles, CA 90017
(Name and address of agent for service)
Registrant’s telephone number, including area code: (213) 244-0000
Date of fiscal year end: December 31
Date of reporting period: June 30, 2021
| Item 1. | Reports to Stockholders. |
| (a) | The following is a copy of the report transmitted to shareholders pursuant to Rule 30e-1 under the Investment Company Act of 1940, as amended (the “1940 Act”): |


TCW Strategic Income Fund, Inc.
Paper copies of the Fund’s annual and semi-annual shareholder reports will no longer be sent by mail, unless you specifically request paper copies of the reports. Instead, the reports will be made available on the Fund’s website (www.tcw.com), and you will be notified by mail each time a report is posted and provided with a website link to access the report.
You may elect to receive all future reports in paper free of charge. You can call 1-800-FUND-TCW (1-800-386-3829), if you invest directly with the Fund, or contact your financial intermediary, if you invest though a financial intermediary, to inform the Fund or the financial intermediary that you wish to continue receiving paper copies of your shareholder reports. Your election to receive reports in paper will apply to all funds held directly with TCW or through your financial intermediary.
| | |
To Our Valued Shareholders | | |
| | |

| | David Lippman President, Chief Executive Officer and Director |
To the shareholders of the TCW Strategic Income Fund, Inc.:
Executive Summary
TCW is pleased to present the 2021 semi-annual report for the TCW Strategic Income Fund, Inc. (“TSI” or the “Fund”). TSI is a multi-asset class closed-end fund managed by TCW Investment Management Company and is listed on the New York Stock Exchange under the ticker TSI. For the first half of 2021, the market price of TSI shares increased by 6.04% while the Fund’s net asset value (i.e., returns of the underlying assets) grew by 3.44%. For reference, TSI’s customized benchmark, a construct that is 25% high yield, 15% equities, 15% convertible bonds, and 45% U.S. Aggregate Bond Index, gained 3.40% over the same period. While the underlying assets performed largely in line with the benchmark, the Fund’s six-month price-based return was higher than the NAV-based return due to a decrease in the discount between NAV and share price from 2.7% at the beginning of the year to 0.3% by June 30, 2021. For the since inception period, annualized NAV-based and price-based returns both remain ahead of the Fund’s benchmark.
Over the past four quarters, the Fund paid quarterly dividends of 5.50, 5.50, 3.82, and 6.50 cents per share. This represents an annualized rate of approximately 21 cents per share, contributing to a realized 12-month trailing yield of 3.60% as of 6/30/2021. As yield is a function of a number of parameters, the go-forward yield of TSI will likely differ from the trailing figure.
Fund Performance (%)
| | | | | | | | | | | | | | | | | | | | | | | | | | | | |
| | | | | | Annualized Total Return as of June 30, 2021 | |
| | | YTD | | | 1 Year | | | 3 Year | | | 5 Year | | | 10 Year | | | Since
3/1/06(2) | | | Since
3/5/87(3) | |
Price-Based Return | | | 6.04 | | | | 12.55 | | | | 8.92 | | | | 7.86 | | | | 8.47 | | | | 10.04 | | | | 8.25 | |
NAV-Based Return | | | 3.44 | | | | 9.62 | | | | 6.67 | | | | 6.18 | | | | 7.40 | | | | 8.69 | | | | 8.37 | |
Custom Benchmark(1) | | | 3.40 | | | | 15.65 | | | | 10.41 | | | | 8.67 | | | | 7.36 | | | | 6.99 | | | | N/A | |
| (1) | Custom Benchmark Index: 15% S&P 500 with Income, 15% Merrill Lynch Convertible Index, 45% Bloomberg Barclays Capital U.S. Aggregate Bond Index, 25% Citi High Yield Cash Pay Index. |
| (2) | The date on which the Fund’s investment objective changed to a multi-asset class fund. Prior to this date, the Fund primarily invested in convertible securities. |
| (3) | Inception date of the Fund. |
Past performance is no guarantee of future results. Current performance may be lower or higher than that quoted. The market value and net asset value of the Fund’s shares will fluctuate with market conditions. Returns shown do not reflect the deduction of taxes that a shareholder would pay on the Fund’s distributions. You should not draw any conclusions about the Fund’s performance from the amount of the quarterly distribution or from the terms of the Fund’s distribution policy.
Management Commentary
TCW manages the Fund according to a full cycle discipline. Effectively, this means that our management style opportunistically increases the level of risk taken in the early stages of an asset price/credit cycle. In the latter stages of the cycle, our proclivity is to reduce risk, which naturally also has the tendency to pull down the overall yield of the portfolio.
This discipline proved particularly beneficial throughout 2020 as market volatility picked up dramatically given a massive reduction in risk exposure as a result of the pandemic, leading to abundant opportunities for value investors to deploy liquidity at attractive valuations. With the remediation in subsequent months on an implied Fed backstop and optimism surrounding the rollout of a COVID vaccine, these additions made earlier in the year were then opportunistically trimmed on strength. Markets have continued to improve through the first half of 2021, with fixed income spreads compressing to pre-COVID levels, and the team has continued to take a prudent approach to positioning in the credit space, de-risking exposure by moving up the quality spectrum (given tight A/BBB relationships), reducing tight commodity-exposed names/sectors, swapping into shorter-dated maturities (where curves are flat), and enhancing liquidity. The focus remains on sectors that offer more stability in times of volatility (such as consumer non-cyclicals and communications) and on idiosyncratic opportunities where wider spreads offer more compelling value. Additionally, the allocation to municipal debt was significantly reduced given higher valuations in that sector. Other notable changes included a continued increase in exposure to current (low) coupon agency mortgage-backed securities (MBS) via the to-be-announced (TBA) market as increased Fed buying of agency mortgages has enhanced the implied carry of TBAs, while among asset-backed securities (ABS), positons backed by senior government-guaranteed FFELP student loans were trimmed in favor of mostly high quality collateralized loan obligations (CLOs).
COVID-19 and the associated disruptions delivered an unprecedented shock to the U.S. economy and the recovery has proceeded in fits and starts. With no historical corollary to reference, economic forecasting is particularly difficult. The impact of government stimulus efforts has clearly been substantial, while the impact on consumer finances and overall demand as that stimulus fades in the coming months is uncertain. All of this
1
implies that asset prices at all-time highs supported by relentlessly optimistic economic outlooks do not fully account for the myriad risks confronting the economy today. Those downside risks include the potential for slowing growth in the U.S. or China later this year, as well as policymakers’ significant challenge of engineering a smooth exit from policy support or shifting to a more hawkish policy stance in the face of rising price pressures. Given prevailing conditions, the strategy maintains a defensive position and ample levels of liquidity to respond to potential volatility. The duration profile of the Fund remains relatively short at 2.2 years against a backdrop of historically low rates that are likely to remain anchored with accommodative central bank policy for the foreseeable future. Corporate credit is viewed as generally expensive and positioning remains largely defensive as noted above, with an emphasis on communications and consumer non-cyclicals, while exposure to vulnerable issuers and industries is minimized. Within securitized, the strategy continues to prefer current coupon agency MBS TBAs which remain attractive given relatively high carry of TBAs versus specified pools; the sector continues to benefit from the significant tailwind of Fed sponsorship as well as money center banks. Legacy non-agency MBS remains attractive from a collateral perspective, with the added benefit of having largely floating rate coupons, and the strategy will seek to add new exposure at favorable valuations. In commercial mortgage-backed securities (CMBS), though current holdings continue to focus on top-of the-capital structure exposures in single asset, single borrower (SASB) AAA-rated issues, opportunities are beginning to present in AA- and A-rated collateral with good loan-to-value (LTV) ratios, i.e., protection, and good spread compensation. A similar strategy applies to CLOs, with possible additions on well-collateralized AA-rated issues offering good yields, while remaining ABS exposure continues to be made up largely of government-guaranteed FFELP student loan collateral.
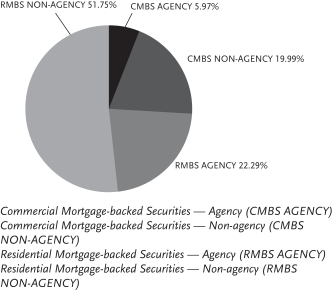
Portfolio Positioning
SECTOR ALLOCATION
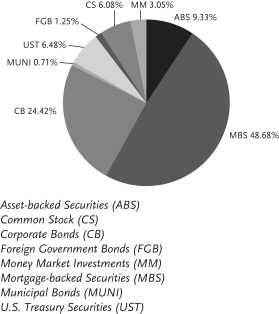
MBS ALLOCATION
Modest leverage can be utilized by TSI through a Line of Credit facility, though the Fund does not currently use any of the available $70 million commitment. Leverage may return to the Fund when market opportunity is more abundant and management deems the use of leverage is accretive to returns.
We greatly appreciate your investment in the Fund and your continuing support of TCW. If you have any additional questions or comments, we invite you to visit our website at www.tcw.com or contact our shareholder services department at 1-866-227-8179, or contact@tcw.com.
Sincerely,

David Lippman
President, Chief Executive Officer and Director
The views expressed in this report reflect those of the Fund’s Advisor as of the date this is written and may not reflect its views on the date this report is first published or anytime thereafter. These views are intended to assist shareholders in understanding the Fund’s investment methodology and do not constitute investment advice. This report may contain discussions about investments that may or may not be held by the Fund as of the date of this report. All current and future holdings are subject to risk and to change. To the extent this report contains forward looking statements, unforeseen circumstances may cause actual results to differ materially from the views expressed as of the date this is written.
2
TCW Strategic Income Fund, Inc.
Schedule of Investments (Unaudited)
June 30, 2021
| | | | | | | | | | | | |
| Issues | | Maturity
Date | | | Principal
Amount | | | Value | |
|
FIXED INCOME SECURITIES — 94.2% of Net Assets | |
|
| ASSET-BACKED SECURITIES — 10.4% | |
| |
321 Henderson Receivables LLC | | | | | |
| | | |
(17-1A-A) 3.99% (1) | | | 08/16/60 | | | $ | 210,336 | | | $ | 239,910 | |
| |
Aimco CLO, Ltd. (20-11A-A2) | | | | | |
| | | |
1.48% (3 mo. USD
LIBOR + 1.300%) (1)(2) | | | 10/15/31 | | | | 1,000,000 | | | | 1,000,942 | |
| |
Allegro CLO XII, Ltd. (20-1A-B) | | | | | |
| | | |
1.88% (3 mo. USD
LIBOR + 1.700%) (1)(2) | | | 01/21/32 | | | | 475,000 | | | | 475,475 | |
| |
Bayview Commercial Asset Trust (03-2-A) | | | | | |
| | | |
0.96% (1 mo. USD
LIBOR + 0.870%) (1)(2) | | | 12/25/33 | | | | 272,203 | | | | 268,264 | |
| |
Bayview Commercial Asset Trust (04-1-A) | | | | | |
| | | |
0.63% (1 mo. USD
LIBOR + 0.540%) (1)(2) | | | 04/25/34 | | | | 228,438 | | | | 228,533 | |
| |
Bayview Commercial Asset Trust (04-2-A) | | | | | |
| | | |
0.74% (1 mo. USD
LIBOR + 0.645%) (1)(2) | | | 08/25/34 | | | | 229,700 | | | | 228,084 | |
| |
Bayview Commercial Asset Trust (04-3-A1) | | | | | |
| | | |
0.46% (-1 mo. USD
LIBOR + 0.555%) (1)(2) | | | 01/25/35 | | | | 125,782 | | | | 124,091 | |
| |
Blackrock Rainier CLO VI, Ltd. (21-6A-A) | | | | | |
| | | |
1.89% (3 mo. USD
LIBOR + 1.700%) (1)(2) | | | 04/20/33 | | | | 700,000 | | | | 700,973 | |
| |
Brazos Higher Education Authority, Inc. (10-1-A2) | | | | | |
| | | |
1.35% (3 mo. USD
LIBOR + 1.200%) (2) | | | 02/25/35 | | | | 2,200,000 | | | | 2,234,928 | |
| |
Cedar Funding CLO, Ltd. (20-12A-A) | | | | | |
| | | |
1.45% (3 mo. USD
LIBOR + 1.270%) (1)(2) | | | 10/25/32 | | | | 1,375,000 | | | | 1,376,581 | |
| |
CIFC Funding, Ltd. (18-1A-SUB) | | | | | |
| | | |
1.00% (1)(3) | | | 04/18/31 | | | | 650,000 | | | | 490,978 | |
| |
CIT Education Loan Trust (07-1-A) | | | | | |
| | | |
0.24% (3 mo. USD
LIBOR + 0.090%) (1)(2) | | | 03/25/42 | | | | 571,359 | | | | 554,690 | |
| |
CoreVest American Finance Trust (19-1-XA) (I/O) | | | | | |
| | | |
2.34% (1)(3) | | | 03/15/52 | | | | 1,721,870 | | | | 112,200 | |
| |
CoreVest American Finance Trust (20-1-A2) | | | | | |
| | | |
2.30% (1) | | | 03/15/50 | | | | 470,000 | | | | 482,642 | |
| |
CoreVest American Finance Trust (20-3-XA) (I/O) | | | | | |
| | | |
3.80% (1)(3) | | | 08/15/53 | | | | 1,836,659 | | | | 280,276 | |
| |
CoreVest American Finance Trust (20-3-XB) (I/O) | | | | | |
| | | |
2.74% (1)(3) | | | 08/15/53 | | | | 1,650,000 | | | | 278,084 | |
| |
Dryden CLO, Ltd. (20-85A-A1) | | | | | |
| | | |
1.53% (3 mo. USD
LIBOR + 1.350%) (1)(2) | | | 10/15/32 | | | | 1,375,000 | | | | 1,376,744 | |
| |
Education Loan Asset-Backed Trust I (13-1-A2) | | | | | |
| | | |
0.89% (1 mo. USD
LIBOR + 0.800%) (1)(2) | | | 04/26/32 | | | | 1,130,959 | | | | 1,135,359 | |
| | | | | | | | | | | | |
| Issues | | Maturity
Date | | | Principal
Amount | | | Value | |
|
| ASSET-BACKED SECURITIES (Continued) | |
| |
EFS Volunteer No 2 LLC (12-1-A2) | | | | | |
| | | |
1.44% (1 mo. USD
LIBOR + 1.350%) (1)(2) | | | 03/25/36 | | | $ | 1,088,936 | | | $ | 1,111,874 | |
| |
FORT CRE LLC (18-1A-A1) | | | | | |
| | | |
1.45% (1 mo. USD
LIBOR + 1.350%) (1)(2) | | | 11/16/35 | | | | 443,179 | | | | 443,761 | |
| |
Global SC Finance SRL (14-1A-A2) | | | | | |
| | | |
3.09% (1) | | | 07/17/29 | | | | 134,125 | | | | 135,393 | |
| |
Goal Capital Funding Trust (06-1-B) | | | | | |
| | | |
0.60% (3 mo. USD
LIBOR + 0.450%) (2) | | | 08/25/42 | | | | 195,991 | | | | 184,183 | |
| |
HPS Loan Management, Ltd. (0A-16-A1RR) | | | | | |
| | | |
1.23% (3 mo. USD
LIBOR + 1.140%) (1)(2) | | | 04/20/34 | | | | 875,000 | | | | 875,529 | |
| |
ITE Rail Fund Levered LP (21-1A-A) | | | | | |
| | | |
2.25% (1) | | | 02/28/51 | | | | 412,816 | | | | 414,299 | |
| |
LMREC Inc. (19-CRE3-A) | | | | | |
| | | |
1.49% (1 mo. USD
LIBOR + 1.400%) (1)(2) | | | 12/22/35 | | | | 890,000 | | | | 891,037 | |
| |
Magnetite VII, Ltd. (12-7A-A1R2) | | | | | |
| | | |
0.98% (3 mo. USD
LIBOR + 0.800%) (1)(2) | | | 01/15/28 | | | | 407,074 | | | | 406,687 | |
| |
Nelnet Student Loan Trust (14-4A-A2) | | | | | |
| | | |
1.04% (1 mo. USD
LIBOR + 0.950%) (1)(2) | | | 11/25/48 | | | | 575,000 | | | | 590,097 | |
| |
Neuberger Berman Loan Advisers CLO, Ltd. (21-43A-A) | | | | | |
| | | |
1.13% (3 mo. USD
LIBOR + 1.130%) (1)(2)(4) | | | 07/17/35 | | | | 800,000 | | | | 800,400 | |
| |
North Carolina State Education Assistance Authority (11-1-A3) | | | | | |
| | | |
1.08% (3 mo. USD
LIBOR + 0.900%) (2) | | | 10/25/41 | | | | 1,395,550 | | | | 1,398,376 | |
| |
OCP CLO, Ltd. (21-21A-B) | | | | | |
| | | |
1.83% (3 mo. USD
LIBOR + 1.700%) (1)(2) | | | 07/20/34 | | | | 400,000 | | | | 400,360 | |
| |
OHA Credit Funding, Ltd. (20-7A-A) | | | | | |
| | | |
1.44% (3 mo. USD
LIBOR + 1.250%) (1)(2) | | | 10/19/32 | | | | 1,400,000 | | | | 1,401,470 | |
| |
Palmer Square CLO, Ltd. (18-1A-A1) | | | | | |
| | | |
1.22% (3 mo. USD
LIBOR + 1.030%) (1)(2) | | | 04/18/31 | | | | 600,000 | | | | 599,910 | |
| |
Palmer Square Loan Funding Ltd. (20-2A-A2) | | | | | |
| | | |
1.74% (3 mo. USD
LIBOR + 1.550%) (1)(2) | | | 04/20/28 | | | | 350,000 | | | | 350,218 | |
| |
Park Avenue Institutional Advisers CLO, Ltd. (21-1A-A2) | | | | | |
| | | |
1.95% (3 mo. USD
LIBOR + 1.750%) (1)(2) | | | 01/20/34 | | | | 420,000 | | | | 421,302 | |
| |
Rockford Tower CLO, Ltd. (20-1A-D) | | | | | |
| | | |
4.00% (3 mo. USD
LIBOR + 3.750%) (1)(2) | | | 01/20/32 | | | | 900,000 | | | | 903,636 | |
See accompanying Notes to Financial Statements.
3
TCW Strategic Income Fund, Inc.
Schedule of Investments (Unaudited) (Continued)
| | | | | | | | | | | | |
| Issues | | Maturity
Date | | | Principal
Amount | | | Value | |
|
| ASSET-BACKED SECURITIES (Continued) | |
| |
Scholar Funding Trust (12-B-A2) | | | | | |
| | | |
1.20% (1 mo. USD
LIBOR + 1.100%) (1)(2) | | | 03/28/46 | | | $ | 630,316 | | | $ | 641,489 | |
| |
SLC Student Loan Trust (04-1-B) | | | | | |
| | | |
0.45% (3 mo. USD
LIBOR + 0.290%) (2) | | | 08/15/31 | | | | 258,829 | | | | 240,678 | |
| |
SLC Student Loan Trust (06-1-B) | | | | | |
| | | |
0.33% (3 mo. USD
LIBOR + 0.210%) (2) | | | 03/15/55 | | | | 352,524 | | | | 320,782 | |
| |
SLM Student Loan Trust (04-2-B) | | | | | |
| | | |
0.65% (3 mo. USD
LIBOR + 0.470%) (2) | | | 07/25/39 | | | | 299,567 | | | | 285,564 | |
| |
SLM Student Loan Trust (05-9-B) | | | | | |
| | | |
0.48% (3 mo. USD
LIBOR + 0.300%) (2) | | | 01/25/41 | | | | 363,759 | | | | 338,538 | |
| |
SLM Student Loan Trust (07-6-B) | | | | | |
| | | |
1.03% (3 mo. USD
LIBOR + 0.850%) (2) | | | 04/27/43 | | | | 126,205 | | | | 119,992 | |
| |
SLM Student Loan Trust (07-7-B) | | | | | |
| | | |
0.93% (3 mo. USD
LIBOR + 0.750%) (2) | | | 10/27/70 | | | | 150,000 | | | | 136,647 | |
| |
SLM Student Loan Trust (08-2-B) | | | | | |
| | | |
1.38% (3 mo. USD
LIBOR + 1.200%) (2) | | | 01/25/83 | | | | 225,000 | | | | 213,792 | |
| |
SLM Student Loan Trust (08-3-B) | | | | | |
| | | |
1.38% (3 mo. USD
LIBOR + 1.200%) (2) | | | 04/26/83 | | | | 225,000 | | | | 210,560 | |
| |
SLM Student Loan Trust (08-4-B) | | | | | |
| | | |
2.03% (3 mo. USD
LIBOR + 1.850%) (2) | | | 04/25/73 | | | | 515,000 | | | | 513,991 | |
| |
SLM Student Loan Trust (08-5-B) | | | | | |
| | | |
2.03% (3 mo. USD
LIBOR + 1.850%) (2) | | | 07/25/73 | | | | 260,000 | | | | 257,456 | |
| |
SLM Student Loan Trust (08-6-B) | | | | | |
| | | |
2.03% (3 mo. USD
LIBOR + 1.850%) (2) | | | 07/26/83 | | | | 225,000 | | | | 221,752 | |
| |
SLM Student Loan Trust (08-7-B) | | | | | |
| | | |
2.03% (3 mo. USD
LIBOR + 1.850%) (2) | | | 07/26/83 | | | | 305,000 | | | | 304,599 | |
| |
SLM Student Loan Trust (08-8-B) | | | | | |
| | | |
2.43% (3 mo. USD
LIBOR + 2.250%) (2) | | | 10/25/75 | | | | 260,000 | | | | 261,503 | |
| |
SLM Student Loan Trust (08-9-B) | | | | | |
| | | |
2.43% (3 mo. USD
LIBOR + 2.250%) (2) | | | 10/25/83 | | | | 260,000 | | | | 262,549 | |
| |
Structured Receivables Finance LLC (10-A-B) | | | | | |
| | | |
7.61% (1) | | | 01/16/46 | | | | 542,216 | | | | 613,782 | |
| |
Structured Receivables Finance LLC (10-B-B) | | | | | |
| | | |
7.97% (1) | | | 08/15/36 | | | | 339,563 | | | | 410,024 | |
| |
Student Loan Consolidation Center (02-2-B2) | | | | | |
| | | |
1.65% (28 day Auction Rate) (1)(2) | | | 07/01/42 | | | | 1,050,000 | | | | 969,280 | |
| | | | | | | | | | | | |
| Issues | | Maturity
Date | | | Principal
Amount | | | Value | |
|
| ASSET-BACKED SECURITIES (Continued) | |
| |
TCI-Flatiron CLO, Ltd. (16-1A-BR2) | | | | | |
| | | |
1.79% (3 mo. USD
LIBOR + 1.600%) (1)(2) | | | 01/17/32 | | | $ | 280,000 | | | $ | 280,232 | |
| | | | | | | | | | | | |
| | |
Total Asset-backed Securities | | | | | | | | | |
| | |
(Cost: $28,791,012) | | | | | | | | 29,520,496 | |
| | | | | | | | | | | | |
|
MORTGAGE-BACKED SECURITIES — 54.3% | |
|
| Commercial Mortgage-backed Securities — Agency — 3.2% | |
| |
BMO SBA COOF Trust (19-1-A) (I/O) | | | | | |
| | | |
1.87% (1)(3) | | | 10/25/45 | | | | 8,648,064 | | | | 517,933 | |
| |
COOF Securitization Trust II (15-2-A1) (I/O) | | | | | |
| | | |
2.80% (1)(3) | | | 08/25/41 | | | | 4,733,150 | | | | 358,998 | |
| |
Fannie Mae, Pool #464398 | | | | | |
| | | |
5.97% | | | 01/01/40 | | | | 551,744 | | | | 636,983 | |
| |
Fannie Mae, Pool #464400 | | | | | |
| | | |
5.97% | | | 01/01/40 | | | | 417,988 | | | | 482,563 | |
| |
Fannie Mae, Pool #AN3542 | | | | | |
| | | |
3.41% | | | 11/01/46 | | | | 1,122,536 | | | | 1,246,627 | |
| |
Fannie Mae (11-M5-A2) (ACES) (I/O) | | | | | |
| | | |
1.13% (3) | | | 07/25/21 | | | | 576,995 | | | | 14 | |
| |
Fannie Mae (16-M11-X2) (ACES) (I/O) | | | | | |
| | | |
2.95% (3) | | | 07/25/39 | | | | 1,639,320 | | | | 62,385 | |
| |
Fannie Mae (19-M29-X4) (ACES) (I/O) | | | | | |
| | | |
0.70% (3) | | | 03/25/29 | | | | 7,900,000 | | | | 326,132 | |
| |
Freddie Mac Multifamily Structured Pass Through Certificates (K023-X3) (I/O) | | | | | |
| | | |
1.75% (3) | | | 10/25/40 | | | | 12,555,000 | | | | 230,520 | |
| |
Freddie Mac Multifamily Structured Pass Through Certificates (K032-X3) (I/O) | | | | | |
| | | |
1.71% (3) | | | 10/25/41 | | | | 4,020,000 | | | | 128,413 | |
| |
Freddie Mac Multifamily Structured Pass Through Certificates (K039-X3) (I/O) | | | | | |
| | | |
2.18% (3) | | | 08/25/42 | | | | 3,110,000 | | | | 218,617 | |
| |
Freddie Mac Multifamily Structured Pass Through Certificates (K057-X1) (I/O) | | | | | |
| | | |
1.31% (3) | | | 07/25/26 | | | | 5,244,864 | | | | 266,624 | |
| |
Freddie Mac Multifamily Structured Pass Through Certificates (K722-X1) (I/O) | | | | | |
| | | |
1.44% (3) | | | 03/25/23 | | | | 15,547,970 | | | | 245,244 | |
| |
Freddie Mac Multifamily Structured Pass Through Certificates (K735-X3) (I/O) | | | | | |
| | | |
2.23% (3) | | | 05/25/47 | | | | 3,750,000 | | | | 352,958 | |
| |
Freddie Mac Multifamily Structured Pass Through Certificates (Q013-XPT2) (I/O) | | | | | |
| | | |
1.81% | | | 05/25/27 | | | | 4,119,231 | | | | 157,817 | |
| |
Freddie Mac Multifamily Structured Pass-Through Certificates (19-P002-X) (I/O) | | | | | |
| | | |
1.14% (3) | | | 07/25/33 | | | | 1,295,000 | | | | 141,583 | |
| |
Freddie Mac Multifamily Structured Pass-Through Certificates (K015-X3) (I/O) | | | | | |
| | | |
2.88% (3) | | | 08/25/39 | | | | 4,000,000 | | | | 5,697 | |
See accompanying Notes to Financial Statements.
4
TCW Strategic Income Fund, Inc.
| | | | | | | | | | | | |
| Issues | | Maturity
Date | | | Principal
Amount | | | Value | |
|
| Commercial Mortgage-backed Securities — Agency (Continued) | |
| |
Freddie Mac Multifamily Structured Pass-Through Certificates (K021-X3) (I/O) | | | | | |
| | | |
2.03% (3) | | | 07/25/40 | | | $ | 3,475,000 | | | $ | 64,968 | |
| |
Freddie Mac Multifamily Structured Pass-Through Certificates (K022-X3) (I/O) | | | | | |
| | | |
1.87% (3) | | | 08/25/40 | | | | 2,500,000 | | | | 48,580 | |
| |
Freddie Mac Multifamily Structured Pass-Through Certificates (K025-X3) (I/O) | | | | | |
| | | |
1.81% (3) | | | 11/25/40 | | | | 5,400,000 | | | | 118,847 | |
| |
Freddie Mac Multifamily Structured Pass-Through Certificates (K027-X3) (I/O) | | | | | |
| | | |
1.76% (3) | | | 01/25/41 | | | | 4,095,000 | | | | 102,535 | |
| |
Freddie Mac Multifamily Structured Pass-Through Certificates (K031-X1) (I/O) | | | | | |
| | | |
0.31% (3) | | | 04/25/23 | | | | 55,708,098 | | | | 193,572 | |
| |
Freddie Mac Multifamily Structured Pass-Through Certificates (K031-X3) (I/O) | | | | | |
| | | |
1.72% (3) | | | 07/25/41 | | | | 4,500,000 | | | | 130,102 | |
| |
Freddie Mac Multifamily Structured Pass-Through Certificates (K034-X1) (I/O) | | | | | |
| | | |
0.20% (3) | | | 07/25/23 | | | | 26,739,988 | | | | 50,822 | |
| |
Freddie Mac Multifamily Structured Pass-Through Certificates (K040-X3) (I/O) | | | | | |
| | | |
2.10% (3) | | | 11/25/42 | | | | 4,875,000 | | | | 305,029 | |
| |
Freddie Mac Multifamily Structured Pass-Through Certificates (K049-X3) (I/O) | | | | | |
| | | |
1.60% (3) | | | 10/25/43 | | | | 2,330,000 | | | | 132,625 | |
| |
Freddie Mac Multifamily Structured Pass-Through Certificates (K060-X3) (I/O) | | | | | |
| | | |
1.96% (3) | | | 12/25/44 | | | | 2,500,000 | | | | 224,915 | |
| |
Freddie Mac Multifamily Structured Pass-Through Certificates (K726-X1) (I/O) | | | | | |
| | | |
1.02% (3) | | | 04/25/24 | | | | 12,792,690 | | | | 242,614 | |
| |
Freddie Mac Multifamily Structured Pass-Through Certificates (K728-X3) (I/O) | | | | | |
| | | |
2.02% (3) | | | 11/25/45 | | | | 3,455,000 | | | | 202,555 | |
| |
Freddie Mac Multifamily Structured Pass-Through Certificates (K732-X3) (I/O) | | | | | |
| | | |
2.25% (3) | | | 05/25/46 | | | | 2,400,000 | | | | 191,828 | |
| |
Freddie Mac Multifamily Structured Pass-Through Certificates (KC05-X1) (I/O) | | | | | |
| | | |
1.34% (3) | | | 06/25/27 | | | | 7,974,130 | | | | 401,140 | |
| |
Freddie Mac Multifamily Structured Pass-Through Certificates (KIR1-X) (I/O) | | | | | |
| | | |
1.20% (3) | | | 03/25/26 | | | | 8,506,872 | | | | 358,775 | |
| |
Freddie Mac Multifamily Structured Pass-Through Certificates (KLU2-X1) (I/O) | | | | | |
| | | |
1.17% (3) | | | 08/25/29 | | | | 4,963,199 | | | | 350,896 | |
| |
Freddie Mac Multifamily Structured Pass-Through Certificates (KS11-XFX) (I/O) | | | | | |
| | | |
1.76% (3) | | | 06/25/29 | | | | 2,290,000 | | | | 234,121 | |
| | | | | | | | | | | | |
| Issues | | Maturity
Date | | | Principal
Amount | | | Value | |
|
| Commercial Mortgage-backed Securities — Agency (Continued) | |
| |
Freddie Mac Multifamily Structured Pass-Through Certificates (KW01-X3) (I/O) | | | | | |
| | | |
4.22% (3) | | | 03/25/29 | | | $ | 690,000 | | | $ | 111,597 | |
| |
Freddie Mac Multifamily Structured Pass-Through Certificates (Q010-XPT2) (I/O) | | | | | |
| | | |
0.36% | | | 08/25/24 | | | | 4,949,983 | | | | 32,135 | |
|
Ginnie Mae (12-139-IO) (I/O) | |
| | | |
0.69% (3) | | | 02/16/53 | | | | 3,308,312 | | | | 84,755 | |
|
Ginnie Mae (13-52-IO) (I/O) | |
| | | |
0.28% (3) | | | 02/16/55 | | | | 8,206,754 | | | | 46,944 | |
|
Ginnie Mae (09-114-IO) (I/O) | |
| | | |
0.03% (3) | | | 10/16/49 | | | | 5,213,050 | | | | 557 | |
|
Ginnie Mae (10-148-IO) (I/O) | |
| | | |
0.29% (3) | | | 09/16/50 | | | | 5,541,237 | | | | 64,337 | |
|
Ginnie Mae (11-105-IO) (I/O) | |
| | | |
0.00% (3)(5) | | | 09/16/51 | | | | 5,502,878 | | | | 1,142 | |
|
Ginnie Mae (11-152-IO) (I/O) | |
| | | |
0.06% (3) | | | 08/16/51 | | | | 2,329,475 | | | | 2,367 | |
|
Ginnie Mae (11-42-IO) (I/O) | |
| | | |
0.00% (3)(5) | | | 08/16/50 | | | | 2,293,626 | | | | 129 | |
|
Ginnie Mae (12-4-IO) (I/O) | |
| | | |
0.04% (3) | | | 05/16/52 | | | | 7,136,136 | | | | 8,373 | |
|
Ginnie Mae (14-103-IO) (I/O) | |
| | | |
0.18% (3) | | | 05/16/55 | | | | 2,872,185 | | | | 38,500 | |
| |
Ginnie Mae (14-125-IO) (I/O) | | | | | |
| | | |
0.88% (3) | | | 11/16/54 | | | | 1,976,791 | | | | 73,636 | |
| | | | | | | | | | | | |
| | |
Total Commercial Mortgage-backed
Securities — Agency | | | | | | | | | |
| | |
(Cost: $13,009,633) | | | | | | | | 9,197,504 | |
| | | | | | | | | | | | |
|
| Commercial Mortgage-backed Securities — Non-Agency — 10.9% | |
| |
BAMLL Commercial Mortgage Securities Trust (18-PARK-A) | | | | | |
| | | |
4.23% (1)(3) | | | 08/10/38 | | | | 590,000 | | | | 677,093 | |
|
BBCMS Mortgage Trust (17-C1-XA) (I/O) | |
| | | |
1.62% (3) | | | 02/15/50 | | | | 3,894,902 | | | | 250,891 | |
|
BBCMS Mortgage Trust (18-C2-A5) | |
| | | |
4.31% | | | 12/15/51 | | | | 430,000 | | | | 500,625 | |
|
Benchmark Mortgage Trust (19-B10-3CCB) | |
| | | |
4.03% (1)(3) | | | 03/15/62 | | | | 435,000 | | | | 428,575 | |
|
Benchmark Mortgage Trust (19-B14-225D) | |
| | | |
3.40% (1)(3) | | | 12/15/62 | | | | 535,000 | | | | 508,762 | |
|
Benchmark Mortgage Trust (20-B17-A5) | |
| | | |
2.29% | | | 03/15/53 | | | | 1,040,000 | | | | 1,067,416 | |
|
Benchmark Mortgage Trust (20-IG3-BXC) | |
| | | |
3.65% (1)(3) | | | 09/15/48 | | | | 555,000 | | | | 544,952 | |
|
BF Mortgage Trust (19-NYT-E) | |
| | | |
2.57% (1 mo. USD
LIBOR + 2.500%)(1)(2) | | | 12/15/35 | | | | 525,000 | | | | 516,636 | |
|
BX Commercial Mortgage Trust (18-IND-G) | |
| | | |
2.12% (1 mo. USD
LIBOR + 2.050%) (1)(2) | | | 11/15/35 | | | | 360,500 | | | | 360,980 | |
See accompanying Notes to Financial Statements.
5
TCW Strategic Income Fund, Inc.
Schedule of Investments (Unaudited) (Continued)
| | | | | | | | | | | | |
| Issues | | Maturity
Date | | | Principal
Amount | | | Value | |
|
| Commercial Mortgage-backed Securities — Non-Agency (Continued) | |
| |
BX Commercial Mortgage Trust (20-FOX-E) | | | | | |
| | | |
3.67% (1 mo. USD
LIBOR + 3.600%) (1)(2) | | | 11/15/32 | | | $ | 893,994 | | | $ | 900,141 | |
| |
BX Trust (19-OC11-A) | | | | | |
| | | |
3.20% (1) | | | 12/09/41 | | | | 265,000 | | | | 286,214 | |
| |
CALI Mortgage Trust (19-101C-A) | | | | | |
| | | |
3.96% (1) | | | 03/10/39 | | | | 680,000 | | | | 777,635 | |
| |
CALI Mortgage Trust (19-101C-E) | | | | | |
| | | |
4.47% (1)(3) | | | 03/10/39 | | | | 315,000 | | | | 319,918 | |
|
Citigroup Commercial Mortgage Trust (12-GC8-XA) (I/O) | |
| | | |
1.90% (1)(3)(6) | | | 09/10/45 | | | | 2,924,426 | | | | 40,752 | |
|
Citigroup Commercial Mortgage Trust (14-GC21-XD) (I/O) | |
| | | |
1.52% (1)(3) | | | 05/10/47 | | | | 4,703,442 | | | | 154,101 | |
|
Citigroup Commercial Mortgage Trust (15-GC35-XA) (I/O) | |
| | | |
0.93% (3) | | | 11/10/48 | | | | 6,466,773 | | | | 174,563 | |
|
Citigroup Commercial Mortgage Trust (19-PRM-X) (I/O) | |
| | | |
1.33% (1)(3) | | | 05/10/36 | | | | 14,000,000 | | | | 395,541 | |
| |
COMM Mortgage Trust (12-LC4-XB) (I/O) | | | | | |
| | | |
0.64% (1)(3) | | | 12/10/44 | | | | 18,671,016 | | | | 58,737 | |
| |
COMM Mortgage Trust (13-CR11-XA) (I/O) | | | | | |
| | | |
1.08% (3) | | | 08/10/50 | | | | 9,683,629 | | | | 178,496 | |
| |
COMM Mortgage Trust (13-CR12-XA) (I/O) | | | | | |
| | | |
1.28% (3) | | | 10/10/46 | | | | 9,194,850 | | | | 202,512 | |
| |
COMM Mortgage Trust (13-LC13-XA) (I/O) | | | | | |
| | | |
1.18% (3) | | | 08/10/46 | | | | 6,169,889 | | | | 112,528 | |
|
COMM Mortgage Trust (14-CR18-XA) (I/O) | |
| | | |
1.17% (3) | | | 07/15/47 | | | | 6,368,782 | | | | 161,777 | |
|
COMM Mortgage Trust (14-CR21-XA) (I/O) | |
| | | |
1.00% (3) | | | 12/10/47 | | | | 17,159,187 | | | | 424,053 | |
|
COMM Mortgage Trust (20-CBM-XCP) (I/O) | |
| | | |
0.72% (1)(3) | | | 02/10/37 | | | | 5,644,863 | | | | 116,552 | |
|
COMM Mortgage Trust (20-CX-E) | |
| | | |
2.77% (1)(3) | | | 11/10/46 | | | | 370,000 | | | | 353,014 | |
| |
CPT Mortgage Trust (19-CPT-A) | | | | | |
| | | |
2.87% (1) | | | 11/13/39 | | | | 1,165,000 | | | | 1,243,951 | |
| |
DBGS Mortgage Trust (18-5BP-E) | | | | | |
| | | |
2.12% (1 mo. USD
LIBOR + 1.900%) (1)(2) | | | 06/15/33 | | | | 685,000 | | | | 679,660 | |
| |
DBWF Mortgage Trust (16-85T-A) | | | | | |
| | | |
3.79% (1) | | | 12/10/36 | | | | 615,000 | | | | 681,544 | |
| |
DC Office Trust (19-MTC-A) | | | | | |
| | | |
2.97% (1) | | | 09/15/45 | | | | 550,000 | | | | 588,794 | |
| |
Grace Trust (20-GRCE-A) | | | | | |
| | | |
2.35% (1) | | | 12/10/40 | | | | 1,350,000 | | | | 1,379,469 | |
| |
Grace Trust (20-GRCE-D) | | | | | |
| | | |
2.77% (1)(3) | | | 12/10/40 | | | | 1,249,000 | | | | 1,240,954 | |
| | | | | | | | | | | | |
| Issues | | Maturity
Date | | | Principal
Amount | | | Value | |
|
| Commercial Mortgage-backed Securities — Non-Agency (Continued) | |
| |
Grace Trust (20-GRCE-F) | | | | | |
| | | |
2.77% (1)(3) | | | 12/10/40 | | | $ | 376,000 | | | $ | 344,054 | |
| |
Grace Trust (20-GRCE-X) (I/O) | | | | | |
| | | |
0.39% (1)(3) | | | 12/10/40 | | | | 10,620,000 | | | | 284,166 | |
|
GS Mortgage Securities Corp. Trust (20-UPTN-XA) (I/O) | |
| | | |
0.45% (1)(3) | | | 02/10/37 | | | | 3,150,000 | | | | 38,970 | |
| |
GS Mortgage Securities Trust (11-GC3-X) (I/O) | | | | | |
| | | |
0.42% (1)(3) | | | 03/10/44 | | | | 2,701,548 | | | | 8,210 | |
| |
GS Mortgage Securities Trust (12-GC6-XB) (I/O) | | | | | |
| | | |
0.26% (1)(3)(6) | | | 01/10/45 | | | | 17,386,264 | | | | 22,908 | |
| |
GS Mortgage Securities Trust (12-GCJ7-XB) (I/O) | | | | | |
| | | |
0.54% (1)(3) | | | 05/10/45 | | | | 34,082,467 | | | | 98,318 | |
| |
GS Mortgage Securities Trust (14-GC18-XB) (I/O) | | | | | |
| | | |
0.27% (3) | | | 01/10/47 | | | | 66,563,000 | | | | 273,667 | |
| |
GS Mortgage Securities Trust (16-GS2-XA) (I/O) | | | | | |
| | | |
1.90% (3) | | | 05/10/49 | | | | 4,200,099 | | | | 298,255 | |
| |
Hudson Yards Mortgage Trust (19-30HY-A) | | | | | |
| | | |
3.23% (1) | | | 07/10/39 | | | | 560,000 | | | | 611,071 | |
| |
Hudson Yards Mortgage Trust (19-55HY-A) | | | | | |
| | | |
3.04% (1)(3) | | | 12/10/41 | | | | 550,000 | | | | 593,502 | |
| |
Hudson Yards Mortgage Trust (19-55HY-F) | | | | | |
| | | |
3.04% (1)(3) | | | 12/10/41 | | | | 150,000 | | | | 144,295 | |
| |
ILPT Trust (19-SURF-A) | | | | | |
| | | |
4.15% (1) | | | 02/11/41 | | | | 240,000 | | | | 275,690 | |
| |
JPMBB Commercial Mortgage Securities Trust (14-C24-XA) (I/O) | | | | | |
| | | |
1.06% (3) | | | 11/15/47 | | | | 7,860,603 | | | | 176,015 | |
| |
JPMBB Commercial Mortgage Securities Trust (14-C21-XA) (I/O) | | | | | |
| | | |
1.13% (3) | | | 08/15/47 | | | | 1,714,247 | | | | 44,719 | |
| |
JPMBB Commercial Mortgage Securities Trust (14-C23-XA) (I/O) | | | | | |
| | | |
0.76% (3) | | | 09/15/47 | | | | 9,671,856 | | | | 167,016 | |
| |
JPMBB Commercial Mortgage Securities Trust (15-C29-XD) (I/O) | | | | | |
| | | |
0.50% (1)(3) | | | 05/15/48 | | | | 26,458,000 | | | | 473,376 | |
| |
JPMCC Commercial Mortgage Securities Trust (17-JP5-XA) (I/O) | | | | | |
| | | |
1.16% (3) | | | 03/15/50 | | | | 13,466,080 | | | | 555,063 | |
| |
JPMorgan Chase Commercial Mortgage Securities Trust (11-C3-XB) (I/O) | | | | | |
| | | |
0.51% (1)(3) | | | 02/15/46 | | | | 52,560,935 | | | | 635,995 | |
| |
JPMorgan Chase Commercial Mortgage Securities Trust (12-HSBC-XA) (I/O) | | | | | |
| | | |
1.58% (1)(3)(6) | | | 07/05/32 | | | | 4,293,041 | | | | 47,220 | |
| |
JPMorgan Chase Commercial Mortgage Securities Trust (12-LC9-XA) (I/O) | | | | | |
| | | |
1.63% (3) | | | 12/15/47 | | | | 6,611,551 | | | | 107,523 | |
See accompanying Notes to Financial Statements.
6
TCW Strategic Income Fund, Inc.
| | | | | | | | | | | | |
| Issues | | Maturity
Date | | | Principal
Amount | | | Value | |
|
| Commercial Mortgage-backed Securities — Non-Agency (Continued) | |
| |
JPMorgan Chase Commercial Mortgage Securities Trust (13-LC11-XA) (I/O) | | | | | |
| | | |
1.38% (3) | | | 04/15/46 | | | $ | 22,030,185 | | | $ | 386,428 | |
| |
JPMorgan Chase Commercial Mortgage Securities Trust (19-OSB-A) | | | | | |
| | | |
3.40% (1) | | | 06/05/39 | | | | 585,000 | | | | 647,451 | |
| |
JPMorgan Chase Commercial Mortgage Securities Trust (19-OSB-C) | | | | | |
| | | |
3.75% (1)(3) | | | 06/05/39 | | | | 150,000 | | | | 163,519 | |
| |
Manhattan West Mortgage Trust (20-1MW-A) | | | | | |
| | | |
2.13% (1) | | | 09/10/39 | | | | 695,000 | | | | 711,112 | |
| |
MFT Mortgage Trust (20-B6-C) | | | | | |
| | | |
3.39% (1)(3) | | | 08/10/40 | | | | 220,000 | | | | 221,030 | |
| |
MFT Trust (20-ABC-C) | | | | | |
| | | |
3.59% (1)(3) | | | 02/10/42 | | | | 175,000 | | | | 175,561 | |
| |
MFT Trust (20-ABC-D) | | | | | |
| | | |
3.59% (1)(3) | | | 02/10/42 | | | | 180,000 | | | | 175,383 | |
| |
MKT Mortgage Trust (20-525M-A) | | | | | |
| | | |
2.69% (1) | | | 02/12/40 | | | | 335,000 | | | | 352,364 | |
| |
Morgan Stanley Bank of America Merrill Lynch Trust (15-C22-XA) (I/O) | | | | | |
| | | |
1.17% (3) | | | 04/15/48 | | | | 8,731,215 | | | | 254,792 | |
| |
Morgan Stanley Bank of America Merrill Lynch Trust (15-C24-XA) (I/O) | | | | | |
| | | |
0.86% (3) | | | 05/15/48 | | | | 9,877,330 | | | | 250,762 | |
| |
Morgan Stanley Bank of America Merrill Lynch Trust (16-C31-XA) (I/O) | | | | | |
| | | |
1.47% (3) | | | 11/15/49 | | | | 7,277,467 | | | | 383,682 | |
| |
Morgan Stanley Capital I Trust (12-C4-XA) (I/O) | | | | | |
| | | |
2.23% (1)(3)(6) | | | 03/15/45 | | | | 3,989,114 | | | | 18,237 | |
| |
Morgan Stanley Capital I Trust (19-L2-A3) | | | | | |
| | | |
3.81% | | | 03/15/52 | | | | 460,000 | | | | 510,684 | |
| |
Morgan Stanley Capital I Trust (19-L2-A4) | | | | | |
| | | |
4.07% | | | 03/15/52 | | | | 980,000 | | | | 1,126,783 | |
| |
Morgan Stanley Capital I Trust (20-CNP-A) | | | | | |
| | | |
2.51% (1)(3) | | | 04/05/42 | | | | 650,000 | | | | 671,080 | |
| |
One Bryant Park Trust (19-OBP-A) | | | | | |
| | | |
2.52% (1) | | | 09/15/54 | | | | 1,295,000 | | | | 1,346,296 | |
| |
SFAVE Commercial Mortgage Securities Trust (15-5AVE-A2A) | | | | | |
| | | |
3.66% (1)(3) | | | 01/05/43 | | | | 805,000 | | | | 892,038 | |
| |
SFAVE Commercial Mortgage Securities Trust (15-5AVE-A2B) | | | | | |
| | | |
4.14% (1)(3) | | | 01/05/43 | | | | 65,000 | | | | 71,434 | |
| |
SFAVE Commercial Mortgage Securities Trust (15-5AVE-D) | | | | | |
| | | |
4.53% (1)(3) | | | 01/05/43 | | | | 880,000 | | | | 723,754 | |
| |
UBS Commercial Mortgage Trust (12-C1-XA) (I/O) | | | | | |
| | | |
2.24% (1)(3)(6) | | | 05/10/45 | | | | 4,444,487 | | | | 38,284 | |
| |
UBS Commercial Mortgage Trust (17-C5-XA) (I/O) | | | | | |
| | | |
1.14% (3) | | | 11/15/50 | | | | 7,198,984 | | | | 323,450 | |
| | | | | | | | | | | | |
| Issues | | Maturity
Date | | | Principal
Amount | | | Value | |
|
| Commercial Mortgage-backed Securities — Non-Agency (Continued) | |
|
UBS-Barclays Commercial Mortgage Trust (12-C3-XA) (I/O) | |
| | | |
1.98% (1)(3) | | | 08/10/49 | | | $ | 12,300,291 | | | $ | 195,634 | |
|
UBS-Barclays Commercial Mortgage Trust (13-C5-XA) (I/O) | |
| | | |
1.04% (1)(3) | | | 03/10/46 | | | | 12,420,743 | | | | 125,730 | |
| |
Wells Fargo Commercial Mortgage Trust (12-LC5-XA) (I/O) | | | | | |
| | | |
1.89% (1)(3) | | | 10/15/45 | | | | 4,988,779 | | | | 76,750 | |
| |
WFRBS Commercial Mortgage Trust (12-C8-XA) (I/O) | | | | | |
| | | |
1.94% (1)(3)(6) | | | 08/15/45 | | | | 4,124,437 | | | | 42,255 | |
| |
WFRBS Commercial Mortgage Trust (12-C9-XA) (I/O) | | | | | |
| | | |
2.03% (1)(3) | | | 11/15/45 | | | | 2,431,126 | | | | 41,681 | |
| |
WFRBS Commercial Mortgage Trust (13-C14-XA) (I/O) | | | | | |
| | | |
0.81% (3) | | | 06/15/46 | | | | 7,093,218 | | | | 66,569 | |
| |
WFRBS Commercial Mortgage Trust (13-C16-XA) (I/O) | | | | | |
| | | |
0.80% (3) | | | 09/15/46 | | | | 11,459,772 | | | | 133,844 | |
| |
WFRBS Commercial Mortgage Trust (14-C24-XA) (I/O) | | | | | |
| | | |
1.00% (3) | | | 11/15/47 | | | | 5,293,712 | | | | 130,530 | |
| | | | | | | | | | | | |
| | |
Total Commercial Mortgage-backed
Securities — Non-Agency | | | | | | | | | |
| | |
(Cost: $35,466,361) | | | | | | | | 30,783,986 | |
| | | | | | | | | | | | |
|
| Residential Mortgage-backed Securities — Agency — 12.1% | |
| |
Fannie Mae (04-53-QV) (I/O) (I/F) | | | | | |
| | | |
1.59% (3) | | | 02/25/34 | | | | 114,556 | | | | 359 | |
| |
Fannie Mae (07-42-SE) (I/O) (I/F) | | | | | |
| | | |
6.02% (-1 mo. USD
LIBOR + 6.110%) (2) | | | 05/25/37 | | | | 70,388 | | | | 9,519 | |
| |
Fannie Mae (07-48-SD) (I/O) (I/F) | | | | | |
| | | |
6.01% (-1 mo. USD
LIBOR + 6.100%) (2) | | | 05/25/37 | | | | 1,068,968 | | | | 187,025 | |
| |
Fannie Mae (09-69-CS) (I/O) (I/F) | | | | | |
| | | |
6.66% (-1 mo. USD
LIBOR + 6.750%) (2) | | | 09/25/39 | | | | 218,905 | | | | 34,387 | |
| |
Freddie Mac (1673-SD) (I/F) (PAC) | | | | | |
| | | |
15.86% (-2.15 x T10Y + 19.391%) (2) | | | 02/15/24 | | | | 28,852 | | | | 32,732 | |
| |
Freddie Mac (1760-ZD) | | | | | |
| | | |
1.14% (1 x T10Y -
0.500%) (2) | | | 02/15/24 | | | | 62,300 | | | | 62,467 | |
| |
Freddie Mac (2990-JK) (I/F) | | | | | |
| | | |
21.71% (-1 mo. USD
LIBOR + 22.004%) (2) | | | 03/15/35 | | | | 63,995 | | | | 73,848 | |
| |
Freddie Mac (3122-SG) (I/O) (I/F) (TAC) (P AC) | | | | | |
| | | |
5.56% (-1 mo. USD
LIBOR + 5.630%) (2) | | | 03/15/36 | | | | 1,839,626 | | | | 331,904 | |
| |
Freddie Mac (3239-SI) (I/O) (I/F) (PAC) | | | | | |
| | | |
6.58% (-1 mo. USD
LIBOR + 6.650%) (2) | | | 11/15/36 | | | | 420,907 | | | | 93,273 | |
See accompanying Notes to Financial Statements.
7
TCW Strategic Income Fund, Inc.
Schedule of Investments (Unaudited) (Continued)
| | | | | | | | | | | | |
| Issues | | Maturity
Date | | | Principal
Amount | | | Value | |
|
| Residential Mortgage-backed Securities — Agency (Continued) | |
| |
Freddie Mac (3323-SA) (I/O) (I/F) | | | | | |
| | | |
6.04% (-1 mo. USD
LIBOR + 6.110%) (2) | | | 05/15/37 | | | $ | 91,856 | | | $ | 10,860 | |
| |
Freddie Mac (3459-JS) (I/O) (I/F) | | | | | |
| | | |
6.18% (-1 mo. USD
LIBOR + 6.250%) (2) | | | 06/15/38 | | | | 129,216 | | | | 24,016 | |
| |
Freddie Mac (4030-HS) (I/O) (I/F) | | | | | |
| | | |
6.54% (-1 mo. USD
LIBOR + 6.610% ) (2) | | | 04/15/42 | | | | 808,018 | | | | 168,076 | |
|
Ginnie Mae (06-35-SA) (I/O) (I/F) | |
| | | |
6.51% (-1 mo. USD
LIBOR + 6.600%) (2) | | | 07/20/36 | | | | 1,168,630 | | | | 254,857 | |
| |
Ginnie Mae (06-61-SA) (I/O) (I/F) (TAC) | | | | | |
| | | |
4.66% (-1 mo. USD
LIBOR + 4.750%) (2) | | | 11/20/36 | | | | 1,921,882 | | | | 222,986 | |
| |
Ginnie Mae (08-58-TS) (I/O) (I/F) (TAC) | | | | | |
| | | |
6.31% (-1 mo. USD
LIBOR + 6.400%) (2) | | | 05/20/38 | | | | 896,032 | | | | 84,574 | |
| |
Ginnie Mae (16-153-IO) (I/O) | | | | | |
| | | |
3.50% | | | 11/20/46 | | | | 2,305,914 | | | | 300,707 | |
|
Uniform Mortgage-Backed Securities TBA, 30 Year | |
| | | |
2.00% (7) | | | 08/12/51 | | | | 14,700,000 | | | | 14,814,844 | |
| |
Uniform Mortgage-Backed Securities TBA, 30 Year | | | | | |
| | | |
2.50% (7) | | | 08/12/51 | | | | 17,075,000 | | | | 17,628,604 | |
| | | | | | | | | | | | |
| | |
Total Residential Mortgage-backed Securities — Agency | | | | | | | | | |
| |
(Cost: $33,559,531) | | | | 34,335,038 | |
| | | | | | | | | | | | |
|
| Residential Mortgage-backed Securities — Non-Agency — 28.1% | |
|
ACE Securities Corp. (04-IN1-A1) | |
| | | |
0.73% (1 mo. USD
LIBOR + 0.640%) (2) | | | 05/25/34 | | | | 418,249 | | | | 410,066 | |
|
ACE Securities Corp. (07-ASP1-A2C) | |
| | | |
0.35% (1 mo. USD
LIBOR + 0.260%) (2) | | | 03/25/37 | | | | 1,365,667 | | | | 835,675 | |
|
Adjustable Rate Mortgage Trust (05-4-6A22) | |
| | | |
2.86% (3)(8) | | | 08/25/35 | | | | 497,699 | | | | 330,447 | |
|
Adjustable Rate Mortgage Trust (06-1-2A1) | |
| | | |
3.48% (3)(8) | | | 03/25/36 | | | | 361,509 | | | | 253,205 | |
|
Ajax Mortgage Loan Trust (19-F-A2) | |
| | | |
3.50% (1) | | | 07/25/59 | | | | 1,300,000 | | | | 1,309,375 | |
|
Alternative Loan Trust (05-46CB-A20)(TAC) | |
| | | |
5.50% | | | 10/25/35 | | | | 709,299 | | | | 657,896 | |
|
Asset-Backed Funding Certificates (07-NC1-A2) | |
| | | |
0.39% (1 mo. USD
LIBOR + 0.300%) (1)(2) | | | 05/25/37 | | | | 1,150,612 | | | | 1,109,793 | |
|
Asset-Backed Securities Corp. Home Equity (06-HE3-A5) | |
| | | |
0.36% (1 mo. USD
LIBOR + 0.270%) (2) | | | 03/25/36 | | | | 1,425,000 | | | | 1,430,444 | |
|
Asset-Backed Securities Corp. Home Equity (07-HE1-A1B) | |
| | | |
0.24% (1 mo. USD
LIBOR + 0.150%) (2) | | | 12/25/36 | | | | 449,037 | | | | 437,943 | |
| | | | | | | | | | | | |
| Issues | | Maturity
Date | | | Principal
Amount | | | Value | |
|
| Residential Mortgage-backed Securities — Non-Agency (Continued) | |
|
Banc of America Alternative Loan Trust (05-10-1CB1) | |
| | | |
0.49% (1 mo. USD
LIBOR + 0.400%) (2)(8) | | | 11/25/35 | | | $ | 489,574 | | | $ | 417,091 | |
|
Banc of America Funding Corp. (15-R3-6A2) | |
| | | |
0.26% (1)(3) | | | 05/27/36 | | | | 1,848,180 | | | | 1,741,072 | |
|
Banc of America Funding Trust (06-3-4A14) | |
| | | |
6.00% | | | 03/25/36 | | | | 260,630 | | | | 261,784 | |
|
Banc of America Funding Trust (06-3-5A3) | |
| | | |
5.50% (8) | | | 03/25/36 | | | | 157,355 | | | | 157,016 | |
|
Banc of America Funding Trust (14-R5-1A1) | |
| | | |
1.68% (6 mo. USD
LIBOR + 1.500%) (1)(2) | | | 09/26/45 | | | | 470,355 | | | | 467,516 | |
|
Banc of America Funding Trust (15-R4-2A1) | |
| | | |
0.30% (1 mo. USD
LIBOR + 0.205%) (1)(2) | | | 02/25/37 | | | | 685,203 | | | | 672,561 | |
|
BCMSC Trust (00-A-A4) | |
| | | |
8.29% (3) | | | 06/15/30 | | | | 3,316,690 | | | | 831,896 | |
|
Bear Stearns Adjustable Rate Mortgage Trust (03-7-9A) | |
| | | |
2.78% (3) | | | 10/25/33 | | | | 287,238 | | | | 291,126 | |
|
Bear Stearns Adjustable Rate Mortgage Trust (05-9-A1) | |
| | | |
2.41% (1 year Treasury Constant Maturity
Rate + 2.300%) (2) | | | 10/25/35 | | | | 171,475 | | | | 175,039 | |
|
Bear Stearns Adjustable Rate Mortgage Trust (07-4-22A1) | |
| | | |
3.34% (3)(8) | | | 06/25/47 | | | | 840,989 | | | | 842,164 | |
|
Bear Stearns ALT-A Trust (05-3-4A3) | |
| | | |
2.50% (3) | | | 04/25/35 | | | | 449,054 | | | | 456,659 | |
|
Bear Stearns Asset-Backed Securities Trust (05-AC6-1A3) | |
| | | |
5.50% (3) | | | 09/25/35 | | | | 407,118 | | | | 412,372 | |
|
Bear Stearns Asset-Backed Securities Trust (06-IM1-A1) | |
| | | |
0.55% (1 mo. USD
LIBOR + 0.460%) (2) | | | 04/25/36 | | | | 213,612 | | | | 327,253 | |
|
Bear Stearns Mortgage Funding Trust (07-AR3-1X) | |
| | | |
(I/O) 0.50% (9) | | | 03/25/37 | | | | 31,937,321 | | | | 874,160 | |
|
Centex Home Equity Loan Trust (05-A-AF5) | |
| | | |
5.78% | | | 01/25/35 | | | | 42,175 | | | | 42,160 | |
|
CIM Trust (19-R1-A) | |
| | | |
3.25% (1)(3) | | | 10/25/58 | | | | 1,014,400 | | | | 945,325 | |
|
CIM Trust (21-NR3-A1) | |
| | | |
2.57% (1) | | | 06/25/57 | | | | 567,952 | | | | 569,204 | |
|
CIM Trust (21-R3-A1A) | |
| | | |
1.95% (1)(3) | | | 06/25/57 | | | | 1,329,778 | | | | 1,346,356 | |
|
CIM Trust (21-R4-A1A) | |
| | | |
2.00% (1)(3) | | | 05/01/61 | | | | 1,300,000 | | | | 1,306,503 | |
|
Citigroup Mortgage Loan Trust, Inc. (05-11-A2A) | |
| | | |
2.53% (1 year Treasury Constant Maturity Rate + 2.400%) (2) | | | 10/25/35 | | | | 259,325 | | | | 266,952 | |
|
Citigroup Mortgage Loan Trust, Inc. (05-8-1A1A) | |
| | | |
2.59% (3)(8) | | | 10/25/35 | | | | 599,625 | | | | 550,418 | |
See accompanying Notes to Financial Statements.
8
TCW Strategic Income Fund, Inc.
| | | | | | | | | | | | |
| Issues | | Maturity
Date | | | Principal
Amount | | | Value | |
|
| Residential Mortgage-backed Securities — Non-Agency (Continued) | |
| |
Citigroup Mortgage Loan Trust, Inc. (14-10-2A2) | | | | | |
| | | |
0.34% (1 mo. USD
LIBOR + 0.250%) (1)(2) | | | 07/25/37 | | | $ | 1,348,873 | | | $ | 1,318,121 | |
| |
CitiMortgage Alternative Loan Trust (06-A3-1A7) | | | | | |
| | | |
6.00% (8) | | | 07/25/36 | | | | 810,824 | | | | 819,988 | |
| |
CitiMortgage Alternative Loan Trust (06-A5-1A8) | | | | | |
| | | |
6.00% (8) | | | 10/25/36 | | | | 724,801 | | | | 722,019 | |
| |
Conseco Finance Securitizations Corp. (99-6-A1) | | | | | |
| | | |
7.36% (1)(3) | | | 06/01/30 | | | | 1,396,057 | | | | 746,367 | |
| |
Conseco Financial Corp. (96-6-M1) | | | | | |
| | | |
7.95% (3) | | | 09/15/27 | | | | 116,002 | | | | 122,414 | |
| |
Conseco Financial Corp. (96-7-M1) | | | | | |
| | | |
7.70% (3) | | | 09/15/26 | | | | 92,641 | | | | 93,603 | |
| |
Conseco Financial Corp. (98-3-A6) | | | | | |
| | | |
6.76% (3) | | | 03/01/30 | | | | 9,158 | | | | 9,163 | |
| |
Conseco Financial Corp. (98-4-A5) | | | | | |
| | | |
6.18% | | | 04/01/30 | | | | 57,734 | | | | 57,757 | |
| |
Conseco Financial Corp. (98-4-A6) | | | | | |
| | | |
6.53% (3) | | | 04/01/30 | | | | 35,123 | | | | 35,477 | |
| |
Conseco Financial Corp. (98-4-A7) | | | | | |
| | | |
6.87% (3) | | | 04/01/30 | | | | 37,191 | | | | 37,604 | |
| |
Countrywide Alternative Loan Trust (05-20CB-4A1) (I/F) | | | | | |
| | | |
5.25% | | | 07/25/20 | | | | 683 | | | | 673 | |
| |
Countrywide Alternative Loan Trust (06-8T1-1A2) | | | | | |
| | | |
(I/O) 5.41% (-1 mo. USD
LIBOR + 5.500%) (2)(9) | | | 04/25/36 | | | | 5,470,932 | | | | 1,237,234 | |
| |
Countrywide Asset-Backed Certificates (07-13-2A1) | | | | | |
| | | |
0.99% (1 mo. USD
LIBOR + 0.900%) (2) | | | 10/25/47 | | | | 573,462 | | | | 571,583 | |
| |
Countrywide Home Loans (04-HYB4-B1) | | | | | |
| | | |
2.93% (3) | | | 09/20/34 | | | | 564,015 | | | | 267,621 | |
| |
Countrywide Home Loans (06-14-X) (I/O) | | | | | |
| | | |
0.15% (3)(9) | | | 09/25/36 | | | | 12,519,875 | | | | 52,257 | |
| |
Countrywide Home Loans (06-HYB2-1A1) | | | | | |
| | | |
3.18% (3)(8) | | | 04/20/36 | | | | 773,198 | | | | 590,780 | |
| |
Credit Suisse First Boston Mortgage Securities Corp. (04-AR5-11A2) | | | | | |
| | | |
0.83% (1 mo. USD
LIBOR + 0.740%) (2) | | | 06/25/34 | | | | 117,051 | | | | 117,545 | |
| |
Credit Suisse First Boston Mortgage Securities Corp. (05-12-1A1) | | | | | |
| | | |
6.50% (8) | | | 01/25/36 | | | | 1,029,148 | | | | 458,682 | |
| |
Credit Suisse Mortgage Capital Certificates (06-6-1A8) | | | | | |
| | | |
6.00% (8) | | | 07/25/36 | | | | 553,285 | | | | 428,600 | |
| |
Credit-Based Asset Servicing and Securitization LLC (03-CB3-AF1) | | | | | |
| | | |
3.38% | | | 12/25/32 | | | | 416,592 | | | | 416,114 | |
| |
Credit-Based Asset Servicing and Securitization LLC (06-CB1-AF2) | | | | | |
| | | |
3.01% | | | 01/25/36 | | | | 1,103,441 | | | | 902,168 | |
| | | | | | | | | | | | |
| Issues | | Maturity
Date | | | Principal
Amount | | | Value | |
|
| Residential Mortgage-backed Securities — Non-Agency (Continued) | |
| |
Credit-Based Asset Servicing and Securitization LLC (06-CB2-AF2) | | | | | |
| | | |
3.11% | | | 12/25/36 | | | $ | 2,145,369 | | | $ | 2,122,234 | |
| |
Credit-Based Asset Servicing and Securitization LLC (07-CB2-A2B) | | | | | |
| | | |
3.74% | | | 02/25/37 | | | | 967,479 | | | | 781,524 | |
| |
Credit-Based Asset Servicing and Securitization LLC (07-CB2-A2C) | | | | | |
| | | |
3.74% | | | 02/25/37 | | | | 950,560 | | | | 767,767 | |
| |
Credit-Based Asset Servicing and Securitization LLC (07-CB3-A3) | | | | | |
| | | |
3.46% | | | 03/25/37 | | | | 1,294,317 | | | | 661,103 | |
| |
Deutsche Alt-A Securities, Inc. Mortgage Loan Trust (06-AB2-A2) | | | | | |
| | | |
4.91% (3)(8) | | | 06/25/36 | | | | 1,315,921 | | | | 1,308,016 | |
| |
Deutsche Alt-A Securities, Inc. Mortgage Loan Trust (06-AR6-A6) | | | | | |
| | | |
0.47% (1 mo. USD
LIBOR + 0.380%) (2) | | | 02/25/37 | | | | 437,943 | | | | 424,987 | |
| |
DSLA Mortgage Loan Trust (06-AR2-2A1A) | | | | | |
| | | |
0.29% (1 mo. USD
LIBOR + 0.200%) (2) | | | 10/19/36 | | | | 398,330 | | | | 342,525 | |
| |
First Franklin Mortgage Loan Asset-Backed Certificates (06-FF11-2A3) | | | | | |
| | | |
0.39% (1 mo. USD
LIBOR + 0.300%)(2) | | | 08/25/36 | | | | 841,508 | | | | 825,896 | |
| |
First Franklin Mortgage Loan Asset-Backed Certificates (06-FF13-A2C) | | | | | |
| | | |
0.41% (1 mo. USD
LIBOR + 0.320%) (2) | | | 10/25/36 | | | | 750,693 | | | | 611,122 | |
| |
First Franklin Mortgage Loan Asset-Backed Certificates (06-FF18-A2D) | | | | | |
| | | |
0.30% (1 mo. USD
LIBOR + 0.210%) (2) | | | 12/25/37 | | | | 696,825 | | | | 652,572 | |
| |
First Horizon Alternative Mortgage Securities Trust (05-AA10-2A1) | | | | | |
| | | |
2.37% (3)(8) | | | 12/25/35 | | | | 306,284 | | | | 265,196 | |
| |
Greenpoint Manufactured Housing (00-1-A4) | | | | | |
| | | |
8.14% (3) | | | 03/20/30 | | | | 600,364 | | | | 525,214 | |
| |
GSAA Home Equity Trust (06-13-AF6) | | | | | |
| | | |
6.54% | | | 07/25/36 | | | | 1,291,465 | | | | 583,347 | |
| |
GSC Capital Corp. Mortgage Trust (06-2-A1) | | | | | |
| | | |
0.45% (1 mo. USD
LIBOR + 0.360%) (2) | | | 05/25/36 | | | | 260,218 | | | | 255,196 | |
| |
GSR Mortgage Loan Trust (05-AR3-6A1) | | | | | |
| | | |
2.87% (3) | | | 05/25/35 | | | | 206,294 | | | | 187,362 | |
| |
HSI Asset Loan Obligation Trust (07-2-2A12) | | | | | |
| | | |
6.00% | | | 09/25/37 | | | | 382,571 | | | | 359,957 | |
| |
Indymac INDX Mortgage Loan Trust (04-AR6-5A1) | | | | | |
| | | |
3.01% (3) | | | 10/25/34 | | | | 350,804 | | | | 356,449 | |
| |
Indymac INDX Mortgage Loan Trust (05-AR19-A1) | | | | | |
| | | |
2.79% (3) | | | 10/25/35 | | | | 483,369 | | | | 419,898 | |
See accompanying Notes to Financial Statements.
9
TCW Strategic Income Fund, Inc.
Schedule of Investments (Unaudited) (Continued)
| | | | | | | | | | | | |
| Issues | | Maturity
Date | | | Principal
Amount | | | Value | |
|
| Residential Mortgage-backed Securities — Non-Agency (Continued) | |
| |
Indymac INDX Mortgage Loan Trust (06-AR13-A4X) | | | | | |
| | | |
(I/O) 2.30% (3)(9) | | | 07/25/36 | | | $ | 212,168 | | | $ | 2,679 | |
| |
Indymac INDX Mortgage Loan Trust (06-AR9-1A1) | | | | | |
| | | |
3.07% (3) | | | 06/25/36 | | | | 638,518 | | | | 486,043 | |
| |
Indymac INDX Mortgage Loan Trust (07-AR5-2A1) | | | | | |
| | | |
3.02% (3) | | | 05/25/37 | | | | 828,885 | | | | 781,378 | |
| |
Indymac INDX Mortgage Loan Trust (07-FLX2-A1C) | | | | | |
| | | |
0.28% (1 mo. USD LIBOR + 0.190%) (2) | | | 04/25/37 | | | | 1,979,760 | | | | 1,888,596 | |
| |
JPMorgan Alternative Loan Trust (06-A2-5A1) | | | | | |
| | | |
2.99% (3)(8) | | | 05/25/36 | | | | 459,963 | | | | 332,044 | |
| |
JPMorgan Mortgage Acquisition Trust (06-WF1-A5) | | | | | |
| | | |
6.91% | | | 07/25/36 | | | | 2,148,956 | | | | 933,765 | |
| |
JPMorgan Mortgage Acquisition Trust (07-CH4-A4) | | | | | |
| | | |
0.25% (1 mo. USD LIBOR + 0.160%) (2) | | | 01/25/36 | | | | 17,883 | | | | 17,892 | |
| |
JPMorgan Mortgage Trust (04-A6-5A1) | | | | | |
| | | |
2.78% (3) | | | 12/25/34 | | | | 276,340 | | | | 278,170 | |
| |
JPMorgan Mortgage Trust (07-S2-1A1) | | | | | |
| | | |
5.00% | | | 06/25/37 | | | | 147,728 | | | | 89,883 | |
| |
JPMorgan Resecuritization Trust (15-4-1A5) | | | | | |
| | | |
0.28% (1 mo. USD
LIBOR + 0.190%) (1)(2) | | | 06/26/47 | | | | 1,863,000 | | | | 1,756,551 | |
| |
JPMorgan Resecuritization Trust (15-4-2A2) | | | | | |
| | | |
3.56% (1)(3)(8) | | | 06/26/47 | | | | 3,710,634 | | | | 2,192,538 | |
| |
Legacy Mortgage Asset Trust (19-GS4-A1) | | | | | |
| | | |
3.44% (1) | | | 05/25/59 | | | | 979,141 | | | | 981,040 | |
| |
Lehman Mortgage Trust (06-7-2A5) (I/O) (I/F) | | | | | |
| | | |
6.46% (-1 mo. USD
LIBOR + 6.550%) (2)(9) | | | 11/25/36 | | | | 3,099,601 | | | | 952,510 | |
| |
Lehman XS Trust (06-10N-1A3A) | | | | | |
| | | |
0.51% (1 mo. USD
LIBOR + 0.420%) (2) | | | 07/25/46 | | | | 576,162 | | | | 588,368 | |
| |
Lehman XS Trust (06-12N-A31A) | | | | | |
| | | |
0.49% (1 mo. USD
LIBOR + 0.400%) (2) | | | 08/25/46 | | | | 793,942 | | | | 787,340 | |
| |
Long Beach Mortgage Loan Trust (04-4-M1) | | | | | |
| | | |
0.99% (1 mo. USD
LIBOR + 0.900%) (2) | | | 10/25/34 | | | | 667,746 | | | | 663,599 | |
| |
MASTR Alternative Loan Trust (06-2-2A2) (I/O) (I/F) | | | | | |
| | | |
7.01% (-1 mo. USD
LIBOR + 7.100%) (2) | | | 03/25/36 | | | | 5,934,859 | | | | 1,471,905 | |
| |
MASTR Alternative Loans Trust (07-HF1-4A1) | | | | | |
| | | |
7.00% (8) | | | 10/25/47 | | | | 1,089,048 | | | | 712,381 | |
| |
MASTR Asset-Backed Securities Trust (07-HE1-A4) | | | | | |
| | | |
0.37% (1 mo. USD
LIBOR + 0.280%) (2) | | | 05/25/37 | | | | 2,000,000 | | | | 1,796,487 | |
| |
Merrill Lynch Alternative Note Asset Trust (07-OAR2-A2) | | | | | |
| | | |
0.51% (1 mo. USD
LIBOR + 0.420%) (2) | | | 04/25/37 | | | | 912,780 | | | | 862,197 | |
| | | | | | | | | | | | |
| Issues | | Maturity
Date | | | Principal
Amount | | | Value | |
|
| Residential Mortgage-backed Securities — Non-Agency (Continued) | |
| |
Merrill Lynch First Franklin Mortgage Loan Trust (07-3-A2B) | | | | | |
| | | |
0.22% (1 mo. USD
LIBOR + 0.130%) (2) | | | 06/25/37 | | | $ | 578,990 | | | $ | 428,502 | |
| |
Merrill Lynch First Franklin Mortgage Loan Trust (07-3-A2C) | | | | | |
| | | |
0.27% (1 mo. USD
LIBOR + 0.180%) (2) | | | 06/25/37 | | | | 1,182,284 | | | | 881,797 | |
| |
Merrill Lynch Mortgage-Backed Securities Trust (07-2-1A1) | | | | | |
| | | |
2.44% (1 year Treasury Constant Maturity Rate + 2.400%) (2)(8) | | | 08/25/36 | | | | 181,837 | | | | 173,025 | |
| |
Mid-State Trust (04-1-B) | | | | | |
| | | |
8.90% | | | 08/15/37 | | | | 194,651 | | | | 219,519 | |
| |
Mid-State Trust (04-1-M1) | | | | | |
| | | |
6.50% | | | 08/15/37 | | | | 194,651 | | | | 211,218 | |
| |
Morgan Stanley ABS Capital I, Inc. Trust (06-HE3-A1) | | | | | |
| | | |
0.37% (1 mo. USD
LIBOR + 0.280%) (2) | | | 04/25/36 | | | | 185,794 | | | | 181,293 | |
| |
Morgan Stanley ABS Capital I, Inc. Trust (07-15AR-4A1) | | | | | |
| | | |
2.88% (3) | | | 11/25/37 | | | | 377,731 | | | | 380,152 | |
| |
Nomura Asset Acceptance Corp. (06-AR1-1A) | | | | | |
| | | |
3.49% (3) | | | 02/25/36 | | | | 545,862 | | | | 515,291 | |
| |
Oakwood Mortgage Investors, Inc. (00-A-A4) | | | | | |
| | | |
8.15% (3) | | | 09/15/29 | | | | 1,755,843 | | | | 763,470 | |
| |
Oakwood Mortgage Investors, Inc. (00-D-A4) | | | | | |
| | | |
7.40% (3) | | | 07/15/30 | | | | 698,880 | | | | 270,926 | |
| |
Oakwood Mortgage Investors, Inc. (01-C-A3) | | | | | |
| | | |
6.61% (3) | | | 06/15/31 | | | | 1,671,028 | | | | 330,064 | |
| |
Oakwood Mortgage Investors, Inc. (01-D-A3) | | | | | |
| | | |
5.90% (3) | | | 09/15/22 | | | | 683,286 | | | | 490,645 | |
| |
Oakwood Mortgage Investors, Inc. (01-D-A4) | | | | | |
| | | |
6.93% (3) | | | 09/15/31 | | | | 395,881 | | | | 309,804 | |
| |
Oakwood Mortgage Investors, Inc. (02-A-A3) | | | | | |
| | | |
6.03% (3) | | | 05/15/24 | | | | 130,220 | | | | 133,029 | |
| |
Oakwood Mortgage Investors, Inc. (98-A-M) | | | | | |
| | | |
6.83% (3) | | | 05/15/28 | | | | 16,085 | | | | 16,111 | |
| |
Oakwood Mortgage Investors, Inc. (99-B-A4) | | | | | |
| | | |
6.99% | | | 12/15/26 | | | | 94,294 | | | | 95,506 | |
| |
Oakwood Mortgage Investors, Inc. (99-E-A1) | | | | | |
| | | |
7.61% (3) | | | 03/15/30 | | | | 737,075 | | | | 581,067 | |
| |
Popular ABS Mortgage Pass-Through Trust (05-6-A4) | | | | | |
| | | |
3.45% | | | 01/25/36 | | | | 162,293 | | | | 162,856 | |
| |
RALI Series Trust (06-QS13-1A2) (I/O) (I/F) | | | | | |
| | | |
7.07% (-1 mo. USD
LIBOR + 7.160%)(2)(9) | | | 09/25/36 | | | | 3,208,475 | | | | 589,038 | |
| |
RALI Series Trust (06-QS7-A2) | | | | | |
| | | |
6.00% (8) | | | 06/25/36 | | | | 433,079 | | | | 418,686 | |
See accompanying Notes to Financial Statements.
10
TCW Strategic Income Fund, Inc.
| | | | | | | | | | | | |
| Issues | | Maturity
Date | | | Principal
Amount | | | Value | |
|
| Residential Mortgage-backed Securities — Non-Agency (Continued) | |
| |
RBSSP Resecuritization Trust (12-6-4A2) | | | | | |
| | | |
0.75% (1 mo. USD
LIBOR + 0.330%)(1)(2) | | | 01/26/36 | | | $ | 1,494,216 | | | $ | 1,463,617 | |
| |
Residential Accredit Loans, Inc. (05-QA7-A1) | | | | | |
| | | |
3.30% (3)(8) | | | 07/25/35 | | | | 839,224 | | | | 726,790 | |
| |
Residential Accredit Loans, Inc. (05-QA8-CB21) | | | | | |
| | | |
3.57% (3)(8) | | | 07/25/35 | | | | 420,430 | | | | 306,152 | |
| |
Residential Accredit Loans, Inc. (06-QA10-A2) | | | | | |
| | | |
0.27% (1 mo. USD
LIBOR + 0.180%)(2) | | | 12/25/36 | | | | 575,604 | | | | 564,833 | |
| |
Residential Accredit Loans, Inc. (06-QS1-A3) (PAC) | | | | | |
| | | |
5.75% (8) | | | 01/25/36 | | | | 318,820 | | | | 312,114 | |
| |
Residential Accredit Loans, Inc. (06-QS11-AV) (I/O) | | | | | |
| | | |
0.36% (3)(9) | | | 08/25/36 | | | | 8,445,423 | | | | 112,099 | |
| |
Residential Accredit Loans, Inc. (06-QS6-1AV) (I/O) | | | | | |
| | | |
0.76% (3)(9) | | | 06/25/36 | | | | 3,729,257 | | | | 84,594 | |
| |
Residential Accredit Loans, Inc. (06-QS8-A3) | | | | | |
| | | |
6.00% (8) | | | 08/25/36 | | | | 705,781 | | | | 692,138 | |
| |
Residential Accredit Loans, Inc. (07-QS2-AV) (I/O) | | | | | |
| | | |
0.33% (3)(9) | | | 01/25/37 | | | | 9,533,747 | | | | 109,345 | |
| |
Residential Accredit Loans, Inc. (07-QS3-AV) (I/O) | | | | | |
| | | |
0.35% (3)(9) | | | 02/25/37 | | | | 10,199,916 | | | | 120,377 | |
| |
Residential Accredit Loans, Inc. (07-QS6-A62) (TAC) | | | | | |
| | | |
5.50% (8) | | | 04/25/37 | | | | 217,979 | | | | 207,705 | |
| |
Residential Asset Securitization Trust (05-A15-4A1) | | | | | |
| | | |
6.00% (8) | | | 02/25/36 | | | | 972,170 | | | | 491,859 | |
| |
Residential Asset Securitization Trust (07-A5-AX) (I/O) | | | | | |
| | | |
6.00% (9) | | | 05/25/37 | | | | 1,730,521 | | | | 342,422 | |
| |
Residential Funding Mortgage Securities (06-S9-AV) (I/O) | | | | | |
| | | |
0.34% (3)(9) | | | 09/25/36 | | | | 23,025,325 | | | | 272,659 | |
| |
Saxon Asset Securities Trust (07-3-2A4) | | | | | |
| | | |
0.58% (1 mo. USD
LIBOR + 0.490%)(2) | | | 09/25/47 | | | | 2,926,000 | | | | 2,637,984 | |
| |
Securitized Asset-Backed Receivables LLC Trust (07-NC2-A2C) | | | | | |
| | | |
0.31% (1 mo. USD
LIBOR + 0.220%)(2) | | | 01/25/37 | | | | 4,614,000 | | | | 3,362,518 | |
| |
Soundview Home Loan Trust (06-1-A4) | | | | | |
| | | |
0.69% (1 mo. USD
LIBOR + 0.600%)(2) | | | 02/25/36 | | | | 263,635 | | | | 263,897 | |
| |
Structured Adjustable Rate Mortgage Loan Trust (05-20-1A1) | | | | | |
| | | |
2.85% (3)(8) | | | 10/25/35 | | | | 140,582 | | | | 134,293 | |
| |
Structured Adjustable Rate Mortgage Loan Trust (07-9-2A1) | | | | | |
| | | |
3.21% (3)(8) | | | 10/25/47 | | | | 307,031 | | | | 261,448 | |
| |
Structured Asset Mortgage Investments II Trust (06-AR4-5A1) | | | | | |
| | | |
0.45% (1 mo. USD
LIBOR + 0.360%) (2) | | | 06/25/36 | | | | 853,902 | | | | 756,595 | |
| | | | | | | | | | | | |
| Issues | | Maturity
Date | | | Principal
Amount | | | Value | |
|
| Residential Mortgage-backed Securities — Non-Agency (Continued) | |
| |
WAMU Asset-Backed Certificates (07-HE1-2A3) | | | | | |
| | | |
0.24% (1 mo. USD LIBOR + 0.150%) (2) | | | 01/25/37 | | | $ | 1,835,182 | | | $ | 1,153,627 | |
| |
Wells Fargo Alternative Loan Trust (07-PA2-2A2) (I/O) (I/F) | | | | | |
| | | |
5.98% (-1 mo. USD LIBOR + 6.070%) (2)(9) | | | 06/25/37 | | | | 2,063,705 | | | | 240,864 | |
| |
Wells Fargo Mortgage-Backed Securities Trust (07-AR3-A4) | | | | | |
| | | |
2.68% (3)(8) | | | 04/25/37 | | | | 185,447 | | | | 177,316 | |
| | | | | | | | | | | | |
| | |
Total Residential Mortgage-backed Securities — Non-Agency | | | | | | | | | |
| |
(Cost: $73,232,036) | | | | 79,708,217 | |
| | | | | | | | | | | | |
| | |
Total Mortgage-backed Securities | | | | | | | | | |
| |
(Cost: $155,267,561) | | | | 154,024,745 | |
| | | | | | | | | | | | |
|
CORPORATE BONDS — 27.3% | |
|
| Advertising — 0.1% | |
| |
National CineMedia LLC | | | | | |
| | | |
5.88% (1) | | | 04/15/28 | | | | 225,000 | | | | 221,391 | |
| | | | | | | | | | | | |
| |
| Aerospace/Defense — 0.2% | | | | |
| | | |
Boeing Co. (The) | | | | | | | | | | | | |
| | | |
1.43% | | | 02/04/24 | | | | 705,000 | | | | 706,903 | |
| | | | | | | | | | | | |
| |
| Agriculture — 0.6% | | | | |
| |
BAT Capital Corp. | | | | | |
| | | |
2.73% | | | 03/25/31 | | | | 5,000 | | | | 4,928 | |
| | | |
4.54% | | | 08/15/47 | | | | 130,000 | | | | 138,502 | |
| |
Imperial Brands Finance PLC | | | | | |
| | | |
3.13% (1) | | | 07/26/24 | | | | 270,000 | | | | 284,318 | |
| |
Reynolds American, Inc. | | | | | |
| | | |
5.85% | | | 08/15/45 | | | | 975,000 | | | | 1,196,881 | |
| | | | | | | | | | | | |
| | | |
| | | | | | | | | | | 1,624,629 | |
| | | | | | | | | | | | |
|
| Airlines — 0.4% | |
| |
JetBlue Pass-Through Certificates (20-1A) | | | | | |
| | | |
4.00% | | | 05/15/34 | | | | 773,825 | | | | 853,135 | |
| |
US Airways Group, Inc. Pass-Through Certificates (10-1A) (EETC) | | | | | |
| | | |
6.25% | | | 10/22/24 | | | | 318,967 | | | | 327,917 | |
| | | | | | | | | | | | |
| | | |
| | | | | | | | | | | 1,181,052 | |
| | | | | | | | | | | | |
|
| Auto Manufacturers — 1.3% | |
| |
Daimler Finance North America LLC | | | | | |
| | | |
1.06% (3 mo. USD LIBOR + 0.900%)(1)(2) | | | 02/15/22 | | | | 350,000 | | | | 351,902 | |
| |
Ford Motor Credit Co. LLC | | | | | |
| | | |
1.42% (3 mo. USD LIBOR + 1.270%)(2) | | | 03/28/22 | | | | 345,000 | | | | 344,218 | |
| | | |
3.22% | | | 01/09/22 | | | | 1,150,000 | | | | 1,163,743 | |
| | | |
3.34% | | | 03/28/22 | | | | 645,000 | | | | 655,139 | |
See accompanying Notes to Financial Statements.
11
TCW Strategic Income Fund, Inc.
Schedule of Investments (Unaudited) (Continued)
| | | | | | | | | | | | |
| Issues | | Maturity
Date | | | Principal
Amount | | | Value | |
|
| Auto Manufacturers (Continued) | |
| |
General Motors Co. | | | | | |
| | | |
4.88% | | | 10/02/23 | | | $ | 150,000 | | | $ | 163,458 | |
| |
General Motors Financial Co., Inc. | | | | | |
| | | |
3.15% | | | 06/30/22 | | | | 180,000 | | | | 184,523 | |
| | | |
3.45% | | | 04/10/22 | | | | 55,000 | | | | 56,017 | |
| | | |
4.38% | | | 09/25/21 | | | | 656,000 | | | | 662,137 | |
| | | | | | | | | | | | |
| | | |
| | | | | | | | | | | 3,581,137 | |
| | | | | | | | | | | | |
|
| Banks — 4.8% | |
| | | |
Bank of America Corp. | | | | | | | | | | | | |
| | | |
1.66% (SOFR + 0.910%)(2) | | | 03/11/27 | | | | 595,000 | | | | 599,645 | |
| | | |
1.73% (SOFR + 0.960%)(2) | | | 07/22/27 | | | | 590,000 | | | | 595,050 | |
| | | |
2.09% (SOFR + 1.060%)(2) | | | 06/14/29 | | | | 570,000 | | | | 574,799 | |
|
Citigroup, Inc. | |
| | | |
1.46% (SOFR+ 0.770%) (2) | | | 06/09/27 | | | | 430,000 | | | | 428,276 | |
| | | |
4.41% (SOFR + 3.914%) (2) | | | 03/31/31 | | | | 440,000 | | | | 514,281 | |
| |
Comerica, Inc. | | | | | |
| | | |
5.63% (U.S. 5 year Treasury Constant Maturity Rate + 5.291%) (2) | | | 12/31/99 | | | | 395,000 | | | | 438,450 | |
| |
Credit Suisse Group AG | | | | | |
| | | |
1.31% (SOFR + 0.980%) (1)(2) | | | 02/02/27 | | | | 190,000 | | | | 186,299 | |
| | | |
2.19% (SOFR + 2.044%) (1)(2) | | | 06/05/26 | | | | 425,000 | | | | 435,275 | |
| | | |
2.59% (SOFR + 1.560%) (1)(2) | | | 09/11/25 | | | | 55,000 | | | | 57,225 | |
| | | |
3.09% (SOFR + 1.730%) (1)(2) | | | 05/14/32 | | | | 270,000 | | | | 278,529 | |
| | | |
3.75% | | | 03/26/25 | | | | 330,000 | | | | 358,201 | |
| | | |
4.55% | | | 04/17/26 | | | | 75,000 | | | | 84,992 | |
| |
Goldman Sachs Group, Inc. (The) | | | | | |
| | | |
1.09% (SOFR + 0.789%) (2) | | | 12/09/26 | | | | 215,000 | | | | 211,801 | |
| | | |
1.43% (SOFR + 0.798%) (2) | | | 03/09/27 | | | | 425,000 | | | | 423,887 | |
| | | |
1.54% (SOFR + 0.818%) (2) | | | 09/10/27 | | | | 430,000 | | | | 428,830 | |
| |
HSBC Holdings PLC | | | | | |
| | | |
0.98% (SOFR + 0.708%) (2) | | | 05/24/25 | | | | 430,000 | | | | 429,888 | |
| | | |
1.59% (SOFR + 1.290%) (2) | | | 05/24/27 | | | | 285,000 | | | | 285,764 | |
| | | |
2.01% (SOFR + 1.732%) (2) | | | 09/22/28 | | | | 685,000 | | | | 687,740 | |
| |
JPMorgan Chase & Co | | | | | |
| | | |
. 0.97% (SOFR + 0.580%) (2) | | | 06/23/25 | | | | 350,000 | | | | 350,497 | |
| | | |
1.58% (SOFR + 0.885%) (2) | | | 04/22/27 | | | | 425,000 | | | | 427,423 | |
| | | |
2.01% (SOFR + 1.585%) (2) | | | 03/13/26 | | | | 505,000 | | | | 521,640 | |
| | | |
3.56% (3) | | | 04/23/24 | | | | 385,000 | | | | 406,051 | |
| |
Lloyds Banking Group PLC (United Kingdom) | | | | | |
| | | |
1.63% (U.S. 1 year Treasury Constant Maturity Rate + 0.850%) (2) | | | 05/11/27 | | | | 395,000 | | | | 395,616 | |
| | | |
2.86% (3 mo. USD LIBOR + 1.249%) (2) | | | 03/17/23 | | | | 275,000 | | | | 279,729 | |
| | | |
3.87% (1 year Treasury Constant Maturity Rate + 3.500%) (2) | | | 07/09/25 | | | | 285,000 | | | | 308,890 | |
| | | | | | | | | | | | |
| Issues | | Maturity
Date | | | Principal
Amount | | | Value | |
|
| Banks (Continued) | |
| |
Macquarie Group, Ltd. | | | | | |
| | | |
1.63% (SOFR + 0.910%)(1)(2) | | | 09/23/27 | | | $ | 430,000 | | | $ | 428,198 | |
| |
Morgan Stanley | | | | | |
| | | |
1.59% (SOFR + 0.879%)(2) | | | 05/04/27 | | | | 425,000 | | | | 428,047 | |
| |
NatWest Group PLC (United Kingdom) | | | | | |
| | | |
4.27% (3) | | | 03/22/25 | | | | 260,000 | | | | 282,199 | |
| |
Santander UK Group Holdings PLC (United Kingdom) | | | | | |
| | | |
1.09% (SOFR + 0.787%) (2) | | | 03/15/25 | | | | 565,000 | | | | 567,294 | |
| | | |
3.37% (3) | | | 01/05/24 | | | | 435,000 | | | | 453,010 | |
| | | |
4.80% (3) | | | 11/15/24 | | | | 335,000 | | | | 366,443 | |
|
Wells Fargo & Co. | |
| | | |
2.16% (3 mo. USD LIBOR + 0.750%) (2) | | | 02/11/26 | | | | 115,000 | | | | 119,433 | |
| | | |
2.39% (SOFR+ 2.100%)(2) | | | 06/02/28 | | | | 885,000 | | | | 918,439 | |
| | | |
2.88% (SOFR+ 1.432%)(3) | | | 10/30/30 | | | | 205,000 | | | | 217,236 | |
| | | | | | | | | | | | |
| | | |
| | | | | | | | | | | 13,489,077 | |
| | | | | | | | | | | | |
|
| Beverages — 0.6% | |
| |
Anheuser-Busch Cos LLC / Anheuser-Busch InBev Worldwide, Inc. | | | | | |
| | | |
4.90% | | | 02/01/46 | | | | 704,000 | | | | 892,649 | |
| |
Bacardi, Ltd. | | | | | |
| | | |
5.30% (1) | | | 05/15/48 | | | | 205,000 | | | | 267,831 | |
| |
Primo Water Holdings, | | | | | |
| | | |
Inc. 4.38% (1) | | | 04/30/29 | | | | 415,000 | | | | 415,519 | |
| | | | | | | | | | | | |
| | | |
| | | | | | | | | | | 1,575,999 | |
| | | | | | | | | | | | |
|
| Commercial Services — 0.3% | |
| |
Adtalem Global Education, Inc. | | | | | |
| | | |
5.50% (1) | | | 03/01/28 | | | | 190,000 | | | | 193,549 | |
| |
IHS Markit, Ltd. | | | | | |
| | | |
4.00% (1) | | | 03/01/26 | | | | 243,000 | | | | 270,180 | |
| | | |
4.75% (1) | | | 02/15/25 | | | | 370,000 | | | | 415,140 | |
| | | | | | | | | | | | |
| | | |
| | | | | | | | | | | 878,869 | |
| | | | | | | | | | | | |
|
| Computers — 0.1% | |
| | | |
NCR Corp. | | | | | | | | | | | | |
| | | |
5.13% (1) | | | 04/15/29 | | | | 285,000 | | | | 294,234 | |
| | | | | | | | | | | | |
|
| Diversified Financial Services — 0.8% | |
| |
AerCap Ireland Capital DAC / AerCap Global Aviation Trust (Ireland) | | | | | |
| | | |
3.65% | | | 07/21/27 | | | | 120,000 | | | | 128,271 | |
| | | |
3.88% | | | 01/23/28 | | | | 130,000 | | | | 139,634 | |
| | | |
3.95% | | | 02/01/22 | | | | 415,000 | | | | 422,044 | |
| | | |
4.13% | | | 07/03/23 | | | | 135,000 | | | | 143,224 | |
| |
Air Lease Corp. | | | | | |
| | | |
3.50% | | | 01/15/22 | | | | 490,000 | | | | 498,154 | |
| |
Avolon Holdings Funding, Ltd. | | | | | |
| | | |
2.88% (1) | | | 02/15/25 | | | | 305,000 | | | | 314,345 | |
See accompanying Notes to Financial Statements.
12
TCW Strategic Income Fund, Inc.
| | | | | | | | | | | | |
| Issues | | Maturity
Date | | | Principal
Amount | | | Value | |
|
| Diversified Financial Services (Continued) | |
| | | |
3.95% (1) | | | 07/01/24 | | | $ | 85,000 | | | $ | 90,679 | |
| | | |
5.13% (1) | | | 10/01/23 | | | | 30,000 | | | | 32,445 | |
| |
Park Aerospace Holdings, Ltd. | | | | | |
| | | |
4.50% (1) | | | 03/15/23 | | | | 110,000 | | | | 115,652 | |
| | | |
5.50% (1) | | | 02/15/24 | | | | 470,000 | | | | 516,951 | |
| | | | | | | | | | | | |
| | | |
| | | | | | | | | | | 2,401,399 | |
| | | | | | | | | | | | |
|
| Electric — 0.6% | |
| |
FirstEnergy Corp. | | | | | |
| | | |
3.40% | | | 03/01/50 | | | | 450,000 | | | | 442,270 | |
| |
FirstEnergy Transmission LLC | | | | | |
| | | |
4.35% (1) | | | 01/15/25 | | | | 750,000 | | | | 828,310 | |
| |
Puget Energy, Inc. | | | | | |
| | | |
6.00% | | | 09/01/21 | | | | 500,000 | | | | 504,791 | |
| | | | | | | | | | | | |
| | | |
| | | | | | | | | | | 1,775,371 | |
| | | | | | | | | | | | |
|
| Engineering & Construction — 0.3% | |
| |
Heathrow Funding, Ltd. (United Kingdom) | | | | | |
| | | |
4.88% (1) | | | 07/15/23 | | | | 700,000 | | | | 701,025 | |
| | | |
PowerTeam Services LLC | | | | | | | | | | | | |
| | | |
9.03% (1) | | | 12/04/25 | | | | 254,000 | | | | 279,718 | |
| | | | | | | | | | | | |
| | | |
| | | | | | | | | | | 980,743 | |
| | | | | | | | | | | | |
|
| Entertainment — 0.1% | |
| |
Colt Merger Sub, Inc. | | | | | |
| | | |
6.25% (1) | | | 07/01/25 | | | | 273,000 | | | | 289,822 | |
| | | | | | | | | | | | |
|
| Environmental Control — 0.1% | |
|
GFL Environmental, Inc. (Canada) | |
| | | |
4.75% (1) | | | 06/15/29 | | | | 140,000 | | | | 145,560 | |
| | | |
5.13% (1) | | | 12/15/26 | | | | 157,000 | | | | 166,346 | |
| | | | | | | | | | | | |
| | | |
| | | | | | | | | | | 311,906 | |
| | | | | | | | | | | | |
|
| Food — 1.0% | |
| |
JBS USA LUX SA / JBS USA Food Co. / JBS USA Finance, Inc. | | | | | |
| | | |
3.75% (1) | | | 12/01/31 | | | | 550,000 | | | | 562,232 | |
| | | |
5.50% (1) | | | 01/15/30 | | | | 25,000 | | | | 27,993 | |
|
Kraft Heinz Foods Co. | |
| | | |
4.38% | | | 06/01/46 | | | | 210,000 | | | | 238,163 | |
| | | |
5.00% | | | 07/15/35 | | | | 85,000 | | | | 104,338 | |
| | | |
5.00% | | | 06/04/42 | | | | 303,000 | | | | 370,689 | |
| | | |
6.38% | | | 07/15/28 | | | | 210,000 | | | | 261,862 | |
|
Kroger Co. (The) | |
| | | |
4.45% | | | 02/01/47 | | | | 60,000 | | | | 71,809 | |
|
Lamb Weston Holdings, Inc. | |
| | | |
4.63% (1) | | | 11/01/24 | | | | 120,000 | | | | 124,504 | |
|
Pilgrim’s Pride Corp. | |
| | | |
4.25% (1) | | | 04/15/31 | | | | 285,000 | | | | 295,682 | |
| | | |
5.88% (1) | | | 09/30/27 | | | | 250,000 | | | | 266,887 | |
| | | | | | | | | | | | |
| Issues | | Maturity
Date | | | Principal
Amount | | | Value | |
|
| Food (Continued) | |
|
Post Holdings, Inc. | |
| | | |
4.50% (1) | | | 09/15/31 | | | $ | 425,000 | | | $ | 424,668 | |
| | | | | | | | | | | | |
| | | |
| | | | | | | | | | | 2,748,827 | |
| | | | | | | | | | | | |
|
| Forest Products & Paper — 0.2% | |
|
Clearwater Paper Corp. | |
| | | |
4.75% (1) | | | 08/15/28 | | | | 475,000 | | | | 476,643 | |
| | | | | | | | | | | | |
|
| Health Care-Products — 0.1% | |
|
Hologic, Inc. | |
| | | |
4.63% (1) | | | 02/01/28 | | | | 320,000 | | | | 335,600 | |
| | | | | | | | | | | | |
|
| Health Care-Services — 1.4% | |
|
Centene Corp. | |
| | | |
2.45% | | | 07/15/28 | | | | 350,000 | | | | 354,813 | |
| | | |
3.00% | | | 10/15/30 | | | | 248,000 | | | | 255,075 | |
| | | |
5.38% (1) | | | 08/15/26 | | | | 157,000 | | | | 164,284 | |
|
CommonSpirit Health | |
| | | |
2.78% | | | 10/01/30 | | | | 135,000 | | | | 140,964 | |
|
HCA, Inc. | |
| | | |
4.13% | | | 06/15/29 | | | | 208,000 | | | | 234,636 | |
| | | |
5.00% | | | 03/15/24 | | | | 315,000 | | | | 348,299 | |
| | | |
5.25% | | | 06/15/49 | | | | 312,000 | | | | 398,466 | |
| | | |
5.63% | | | 09/01/28 | | | | 100,000 | | | | 118,625 | |
| | | |
7.05% | | | 12/01/27 | | | | 235,000 | | | | 285,039 | |
|
Humana, Inc. | |
| | | |
4.95% | | | 10/01/44 | | | | 125,000 | | | | 162,024 | |
|
Molina Healthcare, Inc. | |
| | | |
3.88% (1) | | | 11/15/30 | | | | 520,000 | | | | 542,006 | |
| | | |
5.38% | | | 11/15/22 | | | | 140,000 | | | | 146,912 | |
|
Prime Healthcare Services, Inc. | |
| | | |
7.25% (1) | | | 11/01/25 | | | | 455,000 | | | | 492,237 | |
|
Providence Service Corp. (The) | |
| | | |
5.88% (1) | | | 11/15/25 | | | | 270,000 | | | | 289,598 | |
| | | | | | | | | | | | |
| | | |
| | | | | | | | | | | 3,932,978 | |
| | | | | | | | | | | | |
|
| Household Products/Wares — 0.0% | |
|
Spectrum Brands, Inc. | |
| | | |
3.88% (1) | | | 03/15/31 | | | | 135,000 | | | | 132,774 | |
| | | | | | | | | | | | |
|
| Insurance — 0.9% | |
|
Acrisure LLC / Finance, Inc. | |
| | | |
4.25% (1) | | | 02/15/29 | | | | 280,000 | | | | 276,769 | |
|
Athene Global Funding | |
| | | |
0.74% (SOFR + 0.700%)(1)(2) | | | 05/24/24 | | | | 425,000 | | | | 428,833 | |
| | | |
1.61% (1) | | | 06/29/26 | | | | 285,000 | | | | 285,345 | |
|
Farmers Exchange Capital | |
| | | |
7.05% (1) | | | 07/15/28 | | | | 500,000 | | | | 619,260 | |
|
Farmers Insurance Exchange | |
| | | |
4.75% (3 mo. USD LIBOR + 3.231%) (1)(2) | | | 11/01/57 | | | | 5,000 | | | | 5,707 | |
See accompanying Notes to Financial Statements.
13
TCW Strategic Income Fund, Inc.
Schedule of Investments (Unaudited) (Continued)
| | | | | | | | | | | | |
| Issues | | Maturity
Date | | | Principal
Amount | | | Value | |
|
| Insurance (Continued) | |
|
Nationwide Mutual Insurance Co. | |
| | | |
2.41% (3 mo. USD LIBOR + 2.290%) (1)(2) | | | 12/15/24 | | | $ | 1,000,000 | | | $ | 1,000,839 | |
| | | | | | | | | | | | |
| | | |
| | | | | | | | | | | 2,616,753 | |
| | | | | | | | | | | | |
|
| Internet — 0.1% | |
|
Tencent Holdings, Ltd. | |
| | | |
3.68% (1) | | | 04/22/41 | | | | 285,000 | | | | 306,107 | |
| | | | | | | | | | | | |
|
| Machinery-Diversified — 0.1% | |
|
Titan Acquisition, Ltd. / Titan Co-Borrower LLC | |
| | | |
7.75% (1) | | | 04/15/26 | | | | 140,000 | | | | 145,775 | |
| | | | | | | | | | | | |
|
| Media — 1.1% | |
|
Cable One, Inc. | |
| | | |
4.00% (1) | | | 11/15/30 | | | | 415,000 | | | | 416,556 | |
| |
Charter Communications Operating LLC / Charter Communications Operating Capital | | | | | |
| | | |
2.30% | | | 02/01/32 | | | | 165,000 | | | | 159,035 | |
| | | |
5.38% | | | 05/01/47 | | | | 125,000 | | | | 153,510 | |
| | | |
5.75% | | | 04/01/48 | | | | 150,000 | | | | 192,273 | |
|
CSC Holdings LLC | |
| | | |
5.38% (1) | | | 02/01/28 | | | | 25,000 | | | | 26,480 | |
| |
Diamond Sports Group LLC / Diamond Sports Finance Co. | | | | | |
| | | |
5.38% (1) | | | 08/15/26 | | | | 522,000 | | | | 338,919 | |
| | | |
6.63% (1) | | | 08/15/27 | | | | 420,000 | | | | 206,695 | |
|
Scripps Escrow II, Inc. | |
| | | |
5.38% (1) | | | 01/15/31 | | | | 290,000 | | | | 289,447 | |
|
Sinclair Television Group, Inc. | |
| | | |
4.13% (1) | | | 12/01/30 | | | | 285,000 | | | | 280,369 | |
|
Sirius XM Radio, Inc. | |
| | | |
3.88% (1) | | | 08/01/22 | | | | 130,000 | | | | 130,520 | |
|
Virgin Media Secured Finance PLC (United Kingdom) | |
| | | |
5.50% (1) | | | 08/15/26 | | | | 200,000 | | | | 206,650 | |
| | | |
5.50% (1) | | | 05/15/29 | | | | 225,000 | | | | 242,156 | |
|
Walt Disney Co. (The) | |
| | | |
3.60% | | | 01/13/51 | | | | 305,000 | | | | 346,632 | |
| | | | | | | | | | | | |
| | | |
| | | | | | | | | | | 2,989,242 | |
| | | | | | | | | | | | |
|
| Mining — 0.3% | |
|
Corp. Nacional del Cobre de Chile | |
| | | |
3.15% (10) | | | 01/14/30 | | | | 350,000 | | | | 369,004 | |
|
Indonesia Asahan Aluminium Persero PT | |
| | | |
6.53% (1) | | | 11/15/28 | | | | 300,000 | | | | 369,044 | |
| | | | | | | | | | | | |
| | | |
| | | | | | | | | | | 738,048 | |
| | | | | | | | | | | | |
|
| Miscellaneous Manufacturers — 0.7% | |
|
General Electric Co. | |
| | | |
0.64% (3 mo. USD LIBOR + 0.480%) (2) | | | 08/15/36 | | | | 2,400,000 | | | | 1,962,338 | |
| | | | | | | | | | | | |
| | | | | | | | | | | | |
| Issues | | Maturity
Date | | | Principal
Amount | | | Value | |
|
| Oil & Gas — 1.1% | |
|
Endeavor Energy Resources LP / EER Finance, Inc. | |
| | | |
5.50% (1) | | | 01/30/26 | | | $ | 52,000 | | | $ | 54,189 | |
|
Hess Corp. | |
| | | |
4.30% | | | 04/01/27 | | | | 380,000 | | | | 423,020 | |
|
KazMunayGas National Co. JSC | |
| | | |
3.50% (10) | | | 04/14/33 | | | | 200,000 | | | | 207,960 | |
|
Pertamina Persero PT (Indonesia) | |
| | | |
3.10% (1) | | | 08/27/30 | | | | 200,000 | | | | 206,060 | |
|
Petroleos Mexicanos | |
| | | |
5.95% | | | 01/28/31 | | | | 180,000 | | | | 175,095 | |
| | | |
6.63% | | | 06/15/35 | | | | 385,000 | | | | 372,295 | |
| | | |
6.75% | | | 09/21/47 | | | | 75,000 | | | | 66,470 | |
| | | |
6.95% | | | 01/28/60 | | | | 130,000 | | | | 115,375 | |
| | | |
7.69% | | | 01/23/50 | | | | 365,000 | | | | 351,769 | |
|
Petronas Capital, Ltd. | |
| | | |
3.50% (1) | | | 04/21/30 | | | | 200,000 | | | | 219,678 | |
|
Sunoco LP / Sunoco Finance Corp. | |
| | | |
4.50% (1) | | | 05/15/29 | | | | 425,000 | | | | 432,437 | |
|
Transocean Pontus, Ltd. | |
| | | |
6.13% (1) | | | 08/01/25 | | | | 73,950 | | | | 74,912 | |
|
Transocean Poseidon, Ltd. | |
| | | |
6.88% (1) | | | 02/01/27 | | | | 314,000 | | | | 316,025 | |
| | | | | | | | | | | | |
| | | |
| | | | | | | | | | | 3,015,285 | |
| | | | | | | | | | | | |
|
| Oil & Gas Services — 0.2% | |
|
Archrock Partners LP / Archrock Partners Finance Corp. | |
| | | |
6.25% (1) | | | 04/01/28 | | | | 140,000 | | | | 146,497 | |
|
Transocean Proteus, Ltd. | |
| | | |
6.25% (1) | | | 12/01/24 | | | | 107,250 | | | | 108,623 | |
| |
USA Compression Partners LP / USA Compression Finance Corp. | | | | | |
| | | |
6.88% | | | 04/01/26 | | | | 162,000 | | | | 170,089 | |
| | | |
6.88% | | | 09/01/27 | | | | 127,000 | | | | 135,925 | |
| | | |
| | | | | | | | | | | 561,134 | |
|
| Packaging & Containers — 0.5% | |
|
Amcor Finance USA, Inc. | |
| | | |
3.63% | | | 04/28/26 | | | | 400,000 | | | | 439,172 | |
|
Ball Corp. | |
| | | |
4.00% | | | 11/15/23 | | | | 90,000 | | | | 95,652 | |
|
Berry Global, Inc. | |
| | | |
1.57% (1) | | | 01/15/26 | | | | 475,000 | | | | 475,807 | |
| | | |
4.88% (1) | | | 07/15/26 | | | | 85,000 | | | | 90,050 | |
|
Graphic Packaging International LLC | |
| | | |
4.75% (1) | | | 07/15/27 | | | | 130,000 | | | | 141,213 | |
|
Intertape Polymer Group, Inc. | |
| | | |
4.38% (1) | | | 06/15/29 | | | | 268,000 | | | | 272,068 | |
|
Sealed Air Corp. | |
| | | |
4.00% (1) | | | 12/01/27 | | | | 25,000 | | | | 26,719 | |
| | | | | | | | | | | | |
| | | |
| | | | | | | | | | | 1,540,681 | |
| | | | | | | | | | | | |
See accompanying Notes to Financial Statements.
14
TCW Strategic Income Fund, Inc.
| | | | | | | | | | | | |
Issues | | Maturity
Date | | | Principal
Amount | | | Value | |
|
| Pharmaceuticals — 1.6% | |
|
AbbVie, Inc. | |
| | | |
4.05% | | | 11/21/39 | | | $ | 65,000 | | | $ | 75,543 | |
| | | |
4.25% | | | 11/21/49 | | | | 100,000 | | | | 120,050 | |
| | | |
4.50% | | | 05/14/35 | | | | 651,000 | | | | 785,141 | |
|
Bausch Health Companies, Inc. | |
| | | |
4.88% (1) | | | 06/01/28 | | | | 285,000 | | | | 292,054 | |
|
Bayer US Finance II LLC | |
| | | |
4.38% (1) | | | 12/15/28 | | | | 590,000 | | | | 676,601 | |
| | | |
4.63% (1) | | | 06/25/38 | | | | 375,000 | | | | 446,992 | |
| | | |
4.88% (1) | | | 06/25/48 | | | | 425,000 | | | | 534,595 | |
|
Cigna Corp. | |
| | | |
3.88% | | | 10/15/47 | | | | 170,000 | | | | 190,801 | |
|
CVS Health Corp. | |
| | | |
5.05% | | | 03/25/48 | | | | 825,000 | | | | 1,073,721 | |
| |
Endo Luxembourg Finance Co. I Sarl / Endo US, Inc. | | | | | |
| | | |
6.13% (1) | | | 04/01/29 | | | | 285,000 | | | | 279,648 | |
|
Organon Finance 1 LLC | |
| | | |
5.13% (1) | | | 04/30/31 | | | | 199,000 | | | | 205,258 | |
| | | | | | | | | | | | |
| | | |
| | | | | | | | | | | 4,680,404 | |
| | | | | | | | | | | | |
|
| Pipelines — 1.6% | |
|
Enbridge Energy Partners LP | |
| | | |
5.88% | | | 10/15/25 | | | | 50,000 | | | | 59,115 | |
|
Energy Transfer LP | |
| | | |
5.15% | | | 03/15/45 | | | | 325,000 | | | | 375,580 | |
| | | |
5.40% | | | 10/01/47 | | | | 831,000 | | | | 985,383 | |
| | | |
6.63% (3 mo. USD LIBOR + 4.155%) (2) | | | 12/31/99 | | | | 634,000 | | | | 622,905 | |
|
NGL Energy Operating LLC / NGL Energy Finance Corp. | |
| | | |
7.50% (1) | | | 02/01/26 | | | | 225,000 | | | | 236,565 | |
|
Pipeline Funding Co. LLC | |
| | | |
7.50% (1) | | | 01/15/30 | | | | 450,400 | | | | 577,467 | |
|
Plains All American Pipeline LP / PAA Finance Corp. | |
| | | |
3.80% | | | 09/15/30 | | | | 500,000 | | | | 535,724 | |
|
Rockies Express Pipeline LLC | |
| | | |
4.80% (1) | | | 05/15/30 | | | | 125,000 | | | | 125,625 | |
| | | |
4.95% (1) | | | 07/15/29 | | | | 425,000 | | | | 439,340 | |
|
Texas Eastern Transmission LP | |
| | | |
2.80% (1) | | | 10/15/22 | | | | 300,000 | | | | 306,324 | |
|
TransMontaigne Partners LP / TLP Finance Corp. | |
| | | |
6.13% | | | 02/15/26 | | | | 265,000 | | | | 270,300 | |
| | | | | | | | | | | | |
| | | |
| | | | | | | | | | | 4,534,328 | |
| | | | | | | | | | | | |
|
| REIT — 1.3% | |
|
CyrusOne LP / CyrusOne Finance Corp. | |
| | | |
2.90% | | | 11/15/24 | | | | 280,000 | | | | 296,038 | |
| | | |
3.45% | | | 11/15/29 | | | | 1,045,000 | | | | 1,114,482 | |
|
GLP Capital LP / GLP Financing II, Inc. | |
| | | |
5.30% | | | 01/15/29 | | | | 210,000 | | | | 245,942 | |
| | | |
5.38% | | | 04/15/26 | | | | 621,000 | | | | 716,348 | |
| | | | | | | | | | | | |
Issues | | Maturity
Date | | | Principal
Amount | | | Value | |
|
| REIT (Continued) | |
| | | |
5.75% | | | 06/01/28 | | | $ | 345,000 | | | $ | 410,981 | |
|
Hudson Pacific Properties LP | |
| | | |
3.95% | | | 11/01/27 | | | | 275,000 | | | | 301,709 | |
|
Lexington Realty Trust | |
| | | |
2.70% | | | 09/15/30 | | | | 275,000 | | | | 279,958 | |
|
Piedmont Operating Partnership LP | |
| | | |
3.40% | | | 06/01/23 | | | | 425,000 | | | | 441,640 | |
| | | | | | | | | | | | |
| | | |
| | | | | | | | | | | 3,807,098 | |
| | | | | | | | | | | | |
|
| Retail — 0.2% | |
|
1011778 BC ULC / New Red Finance, Inc. | |
| | | |
3.50% (1) | | | 02/15/29 | | | | 270,000 | | | | 267,187 | |
|
Magic Mergeco, Inc. | |
| | | |
5.25% (1) | | | 05/01/28 | | | | 175,000 | | | | 179,756 | |
| | | |
7.88% (1) | | | 05/01/29 | | | | 190,000 | | | | 196,175 | |
| | | | | | | | | | | | |
| | | |
| | | | | | | | | | | 643,118 | |
| | | | | | | | | | | | |
|
| Savings & Loans — 0.2% | |
|
Nationwide Building Society (United Kingdom) | |
| | | |
3.77% (3 mo. USD LIBOR + 1.064%) (1)(2) | | | 03/08/24 | | | | 520,000 | | | | 546,294 | |
| | | | | | | | | | | | |
|
| Semiconductors — 0.3% | |
|
Intel Corp. | |
| | | |
4.75% | | | 03/25/50 | | | | 550,000 | | | | 732,040 | |
| | | | | | | | | | | | |
|
| Software — 0.3% | |
| |
Change Healthcare Holdings LLC / Change Healthcare Finance, Inc. | | | | | |
| | | |
5.75% (1) | | | 03/01/25 | | | | 25,000 | | | | 25,500 | |
|
Oracle Corp. | |
| | | |
2.88% | | | 03/25/31 | | | | 265,000 | | | | 276,021 | |
| | | |
3.95% | | | 03/25/51 | | | | 425,000 | | | | 464,653 | |
| | | | | | | | | | | | |
| | | |
| | | | | | | | | | | 766,174 | |
| | | | | | | | | | | | |
|
| Telecommunications — 3.7% | |
|
AT&T, Inc. | |
| | | |
3.80% (1) | | | 12/01/57 | | | | 503,000 | | | | 528,325 | |
| | | |
4.75% | | | 05/15/46 | | | | 530,000 | | | | 644,828 | |
| | | |
4.85% | | | 03/01/39 | | | | 348,000 | | | | 423,394 | |
| | | |
5.25% | | | 03/01/37 | | | | 705,000 | | | | 890,605 | |
|
C&W Senior Financing DAC | |
| | | |
6.88% (1) | | | 09/15/27 | | | | 200,000 | | | | 213,320 | |
|
Frontier Communications Corp. | |
| | | |
5.00% (1) | | | 05/01/28 | | | | 350,000 | | | | 362,229 | |
|
Intelsat Jackson Holdings S. A. (Luxembourg) | |
| | | |
8.50% (1)(11) | | | 10/15/24 | | | | 535,000 | | | | 321,669 | |
| | | |
9.75% (1)(11) | | | 07/15/25 | | | | 621,000 | | | | 362,912 | |
|
Level 3 Financing, Inc. | |
| | | |
4.63% (1) | | | 09/15/27 | | | | 176,000 | | | | 183,210 | |
|
Lumen Technologies, Inc. | |
| | | |
5.38% (1) | | | 06/15/29 | | | | 425,000 | | | | 431,906 | |
See accompanying Notes to Financial Statements.
15
TCW Strategic Income Fund, Inc.
Schedule of Investments (Unaudited) (Continued)
| | | | | | | | | | | | |
Issues | | Maturity
Date | | | Principal
Amount | | | Value | |
|
| Telecommunications (Continued) | |
|
Qwest Corp. | |
| | | |
7.25% | | | 09/15/25 | | | $ | 250,000 | | | $ | 296,790 | |
|
SES Global Americas Holdings GP | |
| | | |
5.30% (1) | | | 03/25/44 | | | | 675,000 | | | | 791,495 | |
|
Sprint Corp. | |
| | | |
7.88% | | | 09/15/23 | | | | 373,000 | | | | 424,223 | |
| |
Sprint Spectrum Co. LLC / Sprint Spectrum Co. II LLC / Sprint Spectrum Co. III LLC | | | | | |
| | | |
3.36% (1) | | | 03/20/23 | | | | 43,125 | | | | 43,203 | |
| | | |
4.74% (1) | | | 03/20/25 | | | | 1,157,813 | | | | 1,245,227 | |
|
T-Mobile USA, Inc. | |
| | | |
2.25% | | | 02/15/26 | | | | 75,000 | | | | 75,780 | |
| | | |
2.63% | | | 04/15/26 | | | | 489,000 | | | | 500,614 | |
| | | |
3.88% | | | 04/15/30 | | | | 235,000 | | | | 263,494 | |
| | | |
4.38% | | | 04/15/40 | | | | 350,000 | | | | 411,399 | |
| | | |
4.50% | | | 02/01/26 | | | | 113,000 | | | | 115,684 | |
| | | |
4.75% | | | 02/01/28 | | | | 186,000 | | | | 199,950 | |
|
Verizon Communications, Inc. | |
| | | |
2.10% | | | 03/22/28 | | | | 140,000 | | | | 143,024 | |
| | | |
2.55% | | | 03/21/31 | | | | 425,000 | | | | 435,136 | |
|
Vmed O2 UK Financing I PLC | |
| | | |
4.25% (1) | | | 01/31/31 | | | | 260,000 | | | | 255,781 | |
|
Vodafone Group PLC (United Kingdom) | |
| | | |
4.88% | | | 06/19/49 | | | | 759,000 | | | | 959,089 | |
| | | | | | | | | | | | |
| | | |
| | | | | | | | | | | 10,523,287 | |
| | | | | | | | | | | | |
|
| Transportation — 0.1% | |
|
Empresa de Transporte de Pasajeros Metro S.A. | |
| | | |
3.65% (1) | | | 05/07/30 | | | | 200,000 | | | | 215,320 | |
| | | | | | | | | | | | |
|
Total Corporate Bonds | |
| |
(Cost: $73,750,712) | | | | 77,262,780 | |
| | | | | | | | | | | | |
|
| MUNICIPAL BONDS — 0.8% | |
|
Alabama Economic Settlement Authority, Revenue Bond | |
| | | |
4.26% | | | 09/15/32 | | | | 705,000 | | | | 815,739 | |
|
County of Miami-Dade FL Aviation Revenue, Revenue Bond | |
| | | |
3.45% | | | 10/01/30 | | | | 130,000 | | | | 141,823 | |
|
Metropolitan Transportation Authority, Revenue Bond | |
| | | |
5.18% | | | 11/15/49 | | | | 55,000 | | | | 73,345 | |
|
New York State Dormitory Authority, Revenue Bond | |
| | | |
5.29% | | | 03/15/33 | | | | 1,000,000 | | | | 1,218,919 | |
| | | | | | | | | | | | |
|
Total Municipal Bonds | |
| |
(Cost: $2,080,579) | | | | 2,249,826 | |
| | | | | | | | | | | | |
|
| FOREIGN GOVERNMENT BONDS — 1.4% | |
|
Abu Dhabi Government International Bond | |
| | | |
2.50% (10) | | | 09/30/29 | | | | 200,000 | | | | 209,289 | |
|
Brazilian Government International Bond | |
| | | |
3.88% | | | 06/12/30 | | | | 200,000 | | | | 202,440 | |
| | | | | | | | | | | | |
Issues | | Maturity
Date | | | Principal
Amount | | | Value | |
|
| FOREIGN GOVERNMENT BONDS (Continued) | |
|
Colombia Government International Bond | |
| | | |
3.00% | | | 01/30/30 | | | $ | 450,000 | | | $ | 441,682 | |
|
Dominican Republic International Bond | |
| | | |
4.50% (1) | | | 01/30/30 | | | | 200,000 | | | | 204,540 | |
|
Egypt Government International Bond | |
| | | |
5.25% (10) | | | 10/06/25 | | | | 200,000 | | | | 211,330 | |
|
Mexico Government International Bond | |
| | | |
2.66% | | | 05/24/31 | | | | 638,000 | | | | 624,755 | |
|
Panama Government International Bond | |
| | | |
3.16% | | | 01/23/30 | | | | 250,000 | | | | 262,815 | |
|
Philippine Government International Bond | |
| | | |
2.46% | | | 05/05/30 | | | | 200,000 | | | | 208,398 | |
|
Qatar Government International Bond | |
| | | |
4.50% (10) | | | 04/23/28 | | | | 350,000 | | | | 414,225 | |
|
Saudi Government International Bond | |
| | | |
3.25% (10) | | | 10/26/26 | | | | 200,000 | | | | 218,299 | |
| | | |
3.63% (10) | | | 03/04/28 | | | | 300,000 | | | | 332,094 | |
|
South Africa Government Bond | |
| | | |
4.88% | | | 04/14/26 | | | | 350,000 | | | | 380,765 | |
|
Uruguay Government International Bond | |
| | | |
4.38% | | | 01/23/31 | | | | 200,000 | | | | 233,543 | |
| | | | | | | | | | | | |
|
Total Foreign Government Bonds | |
| |
(Cost: $3,844,746) | | | | 3,944,175 | |
| | | | | | | | | | | | |
|
Total Fixed Income Securities | |
| |
(Cost: $263,734,610) | | | | 267,002,022 | |
| | | | | | | | | | | | |
|
| |
| Security | | | | | Shares | | | | |
|
COMMON STOCK — 6.8% | |
|
| Agriculture — 0.4% | |
| | |
Altria Group, Inc. | | | | 12,670 | | | | 604,105 | |
| | |
British American Tobacco PLC | | | | 15,706 | | | | 617,403 | |
| | | | | | | | | | | | |
|
Total Agriculture | |
| |
(Cost: $1,140,228) | | | | 1,221,508 | |
| | | | | | | | | | | | |
|
| Banks — 1.5% | |
| | |
Bank of America Corp. | | | | 20,516 | | | | 845,875 | |
| | |
Comerica, Inc. | | | | 14,117 | | | | 1,007,107 | |
| | |
JPMorgan Chase & Co. | | | | 7,204 | | | | 1,120,510 | |
| | |
Wells Fargo & Co. | | | | 29,225 | | | | 1,323,600 | |
| | | | | | | | | | | | |
| | | |
| | | | | | | | | | | 4,297,092 | |
| | | | | | | | | | | | |
|
| Oil & Gas — 1.7% | |
| | |
BP PLC (SP ADR) (United Kingdom) | | | | 25,680 | | | | 678,466 | |
| | |
Chevron Corp. | | | | 6,954 | | | | 728,362 | |
| | |
ConocoPhillips | | | | 9,012 | | | | 548,831 | |
| | |
Exxon Mobil Corp. | | | | 19,680 | | | | 1,241,414 | |
| | |
Royal Dutch Shell PLC (SP ADR) (United Kingdom) | | | | 18,856 | | | | 761,782 | |
| | |
TOTAL SA (SP ADR) (France) | | | | 16,370 | | | | 740,906 | |
| | | | | | | | | | | | |
| | | |
| | | | | | | | | | | 4,699,761 | |
| | | | | | | | | | | | |
See accompanying Notes to Financial Statements.
16
TCW Strategic Income Fund, Inc.
| | | | | | | | | | | | |
| Security | | | | |
Shares | | | Value | |
|
| Pharmaceuticals — 0.2% | |
| | |
Pfizer, Inc. | | | | 16,874 | | | $ | 660,786 | |
| | | | | | | | | | | | |
|
| Pipelines — 0.4% | |
| | |
Energy Transfer LP | | | | 103,400 | | | | 1,099,142 | |
| | | | | | | | | | | | |
|
| REIT — 1.9% | |
| | |
AGNC Investment Corp. | | | | 144,641 | | | | 2,442,987 | |
| | |
Annaly Capital Management, Inc. | | | | 165,767 | | | | 1,472,011 | |
| | |
Chimera Investment Corp. | | | | 48,368 | | | | 728,422 | |
| | |
New Residential Investment Corp. | | | | 55,339 | | | | 586,040 | |
| | | | | | | | | | | | |
| | | |
| | | | | | | | | | | 5,229,460 | |
| | | | | | | | | | | | |
|
| Telecommunications — 0.7% | |
| | |
AT&T, Inc. | | | | 29,535 | | | | 850,017 | |
| | |
Lumen Technologies, Inc. | | | | 46,584 | | | | 633,076 | |
| | |
Verizon Communications, Inc. | | | | 10,086 | | | | 565,119 | |
| | | | | | | | | | | | |
| | | |
| | | | | | | | | | | 2,048,212 | |
| | | | | | | | | | | | |
|
Total Common Stock | |
| |
(Cost: $13,520,856) | | | | 19,255,961 | |
| | | | | | | | | | | | |
|
| MONEY MARKET INVESTMENTS — 3.4% | |
| | |
State Street Institutional U.S. Government Money Market Fund — Premier Class, 0.03% (12) | | | | 9,666,154 | | | | 9,666,154 | |
| | | | | | | | | | | | |
|
Total Money Market Investments | |
| |
(Cost: $9,666,154) | | | | 9,666,154 | |
| | | | | | | | | | | | |
| | | | | | | | | | | | |
| Issues | | Maturity
Date | | | Principal
Amount | | | | |
|
SHORT TERM INVESTMENTS — 7.2% | |
|
| U.S. TREASURY SECURITIES — 7.2% | |
|
U.S. Treasury Bill | |
| | | |
0.03% (13) | | | 07/15/21 | | | $ | 2,500,000 | | | $ | 2,499,961 | |
| | | |
0.05% (13) | | | 08/12/21 | | | | 18,000,000 | | | | 17,998,950 | |
| | | | | | | | | | | | |
| |
Total U.S. Treasury Securities | | | | | |
| |
(Cost: $20,499,253) | | | | 20,498,911 | |
| | | | | | | | | | | | |
|
Total Short Term Investments | |
| |
(Cost: $20,499,253) | | | | 20,498,911 | |
| | | | | | | | | | | | |
| |
Total Investments (111.6%) | | | | | |
| |
(Cost: $307,420,873) | | | | 316,423,048 | |
| |
Liabilities In Excess Of Other Assets (-11.6%) | | | | (33,015,021 | ) |
| | | | | | | | | | | | |
| |
Net Assets (100.0%) | | | $ | 283,408,027 | |
| | | | | | | | | | | | |
| | | | | | | | | | | | | | | | | | |
| Futures Contracts | |
| | | | | |
Number of
Contracts | | Type | | Expiration
Date | | | Notional
Contract
Value | | | Value | | | Net Unrealized
Appreciation
(Depreciation) | |
Long Futures | | | | | | | | | | | | | | | | | | |
| 214 | | 5-Year U.S. Treasury Note Futures | | | 09/30/21 | | | $ | 26,528,876 | | | $ | 26,413,953 | | | $ | (114,923 | ) |
| | | | | | | | | | | | | | | | | | |
Short Futures | | | | | | | | | | | | | | | | | | |
| 201 | | 10-Year U.S. Ultra Treasury Note Futures | | | 09/21/21 | | | $ | (29,178,826 | ) | | $ | (29,587,828 | ) | | $ | (409,002 | ) |
| 73 | | U.S. Ultra Long Bond Futures | | | 09/21/21 | | | | (13,607,463 | ) | | | (14,066,188 | ) | | | (458,725 | ) |
| | | | | | | | | | | | | | | | | | |
| | | | | | | | $ | (42,786,289 | ) | | $ | (43,654,016 | ) | | $ | (867,727 | ) |
| | | | | | | | | | | | | | | | | | |
| | | | | | | | | | | | | | | | | | | | | | | | | | | | |
| Written Options — Exchange Traded | |
| | | | | | | |
| Description | | Exercise
Price | | | Expiration
Date | | | Number of
Contracts | | | Notional
Amount | | | Market
Value | | | Premiums
Received
by Fund | | | Unrealized
Appreciation
(Depreciation) | |
Call | | | | | | | | | | | | | | | | | | | | | | | | | | | | |
AGNC Investment Corp. | | | 18.00 | | | | 12/17/21 | | | | (596 | ) | | $ | (1,006,644 | ) | | $ | (16,986 | ) | | $ | (18,217 | ) | | $ | 1,231 | |
Comerica, Inc. | | | 80.00 | | | | 7/16/21 | | | | (47 | ) | | | (335,298 | ) | | | (588 | ) | | | (9,469 | ) | | | 8,881 | |
JPMorgan Chase & Co. | | | 160.00 | | | | 9/17/21 | | | | (24 | ) | | | (373,296 | ) | | | (10,620 | ) | | | (7,835 | ) | | | (2,785 | ) |
Wells Fargo & Co. | | | 47.50 | | | | 7/16/21 | | | | (97 | ) | | | (439,313 | ) | | | (4,801 | ) | | | (15,177 | ) | | | 10,376 | |
| | | | | | | | | | | | | | | | | | | | | | | | | | | | |
| | | | | | | | | | | | | | | | | | $ | (32,995 | ) | | $ | (50,698 | ) | | $ | 17,703 | |
| | | | | | | | | | | | | | | | | | | | | | | | | | | | |
See accompanying Notes to Financial Statements.
17
TCW Strategic Income Fund, Inc.
Schedule of Investments (Unaudited) (Continued)
Notes to the Schedule of Investments:
| ABS | | Asset-Backed Securities. |
| ACES | | Alternative Credit Enhancement Securities. |
| CLO | | Collateralized Loan Obligation. |
| EETC | | Enhanced Equipment Trust Certificate. |
| I/F | | Inverse Floating rate security whose interest rate moves in the opposite direction of prevailing interest rates. |
| I/O | | Interest Only Security. |
| PAC | | Planned Amortization Class. |
| SOFR | | Secured Overnight Financing Rate. |
| TAC | | Target Amortization Class. |
| (1) | | Security exempt from registration under Rule 144A of the Securities Act of 1933, as amended. These securities may be resold, normally only to qualified institutional buyers. At June 30, 2021, the value of these securities amounted to $93,688,637 or 33.1% of net assets. These securities are determined to be liquid by the Fund’s investment advisor, unless otherwise noted, under procedures established by and under the general supervision of the Fund’s Board of Directors. |
| (2) | | Floating or variable rate security. The interest shown reflects the rate in effect at June 30, 2021. |
| (3) | | Variable rate security. Interest rate disclosed is as of the most recent information available. Certain variable rate securities are not based on a published reference rate and spread but are determined by the issuer or agent and are based on current market conditions. These securities do not indicate a reference rate and spread in their description above. |
| (4) | | This security is purchased on a when-issued, delayed-delivery or forward commitment basis. |
| (5) | | Security is not accruing interest. |
| (6) | | Restricted security (Note 9). |
| (7) | | Security purchased on a forward commitment with an approximate principal amount. The actual principal amount and maturity date will be determined upon settlement when the security is delivered. |
| (8) | | A portion of the principal balance has been written-off during the period due to defaults in the underlying loans. Cost basis has been adjusted. |
| (9) | | For fair value measurement disclosure purposes, security is categorized as Level 3. Security is valued using significant unobservable inputs. |
| (10) | | Investments issued under Regulation S of the Securities Act of 1933, as amended, may not be offered, sold, or delivered within the United States except under special exemptions. At June 30, 2021, the value of these securities amounted to $1,962,201 or 0.7% of net assets. |
| (11) | | Security is currently in default due to bankruptcy or failure to make payment of principal or interest of the issuer. Income is not being accrued. |
| (12) | | Rate disclosed is the 7-day net yield as of June 30, 2021. |
| (13) | | Rate shown represents yield-to-maturity. |
See accompanying Notes to Financial Statements.
18
TCW Strategic Income Fund, Inc.
Investments by Sector (Unaudited) | June 30, 2021 |
| | | | |
| Sector | | Percentage of
Net Assets | |
Residential Mortgage-Backed Securities — Non-Agency | | | 28.1 | % |
Corporate Bonds | | | 27.3 | |
Residential Mortgage-Backed Securities — Agency | | | 12.1 | |
Commercial Mortgage-Backed Securities — Non-Agency | | | 10.9 | |
Asset-Backed Securities | | | 10.4 | |
Short Term Investments | | | 7.2 | |
Common Stock | | | 6.8 | |
Money Market Investments | | | 3.4 | |
Commercial Mortgage-Backed Securities — Agency | | | 3.2 | |
Foreign Government Bonds | | | 1.4 | |
Municipal Bonds | | | 0.8 | |
Other* | | | (11.6 | ) |
| | | | |
Total | | | 100.0 | % |
| | | | |
| * | Includes cash, futures, written options, pending trades, interest receivable and accrued expenses payable. |
See accompanying Notes to Financial Statements.
19
TCW Strategic Income Fund, Inc.
Fair Valuation Summary (Unaudited) | June 30, 2021 |
The following is a summary of the fair valuations according to the inputs used as of June 30, 2021 in valuing the Fund’s investments:
| | | | | | | | | | | | | | | | |
Description | | Quoted Prices
in Active
Markets for
Identical
Assets
(Level 1) | | | Other
Significant
Observable
Inputs
(Level 2) | | | Significant
Unobservable
Inputs
(Level 3) | | | Total | |
Fixed Income Securities | | | | | | | | | | | | | | | | |
Asset-Backed Securities | | $ | — | | | $ | 29,520,496 | | | $ | — | | | $ | 29,520,496 | |
Mortgage-Backed Securities | | | | | | | | | | | | | | | | |
Commercial Mortgage-Backed Securities — Agency | | | — | | | | 9,197,504 | | | | — | | | | 9,197,504 | |
Commercial Mortgage-Backed Securities — Non-Agency | | | — | | | | 30,783,986 | | | | — | | | | 30,783,986 | |
Residential Mortgage-Backed Securities — Agency | | | — | | | | 34,335,038 | | | | — | | | | 34,335,038 | |
Residential Mortgage-Backed Securities — Non-Agency | | | — | | | | 74,717,979 | | | | 4,990,238 | | | | 79,708,217 | |
| | | | | | | | | | | | | | | | |
Total Mortgage-Backed Securities | | | — | | | | 149,034,507 | | | | 4,990,238 | | | | 154,024,745 | |
| | | | | | | | | | | | | | | | |
Corporate Bonds* | | | — | | | | 77,262,780 | | | | — | | | | 77,262,780 | |
Municipal Bonds | | | — | | | | 2,249,826 | | | | — | | | | 2,249,826 | |
Foreign Government Bonds | | | — | | | | 3,944,175 | | | | — | | | | 3,944,175 | |
| | | | | | | | | | | | | | | | |
Total Fixed Income Securities | | | — | | | | 262,011,784 | | | | 4,990,238 | | | | 267,002,022 | |
| | | | | | | | | | | | | | | | |
Common Stock* | | | 19,255,961 | | | | — | | | | — | | | | 19,255,961 | |
Money Market Investments | | | 9,666,154 | | | | — | | | | — | | | | 9,666,154 | |
Short Term Investments | | | 20,498,911 | | | | — | | | | — | | | | 20,498,911 | |
Total Investments | | $ | 49,421,026 | | | $ | 262,011,784 | | | $ | 4,990,238 | | | $ | 316,423,048 | |
| | | | | | | | | | | | | | | | �� |
Liability Derivatives | | | | | | | | | | | | | | | | |
Futures Contracts | | | | | | | | | | | | | | | | |
Interest Rate Risk | | $ | (982,650 | ) | | $ | — | | | $ | — | | | $ | (982,650 | ) |
Written Options | | | | | | | | | | | | | | | | |
Equity Risk | | | (32,995 | ) | | | | | | | | | | | (32,995 | ) |
| | | | | | | | | | | | | | | | |
Total | | $ | (1,015,645 | ) | | $ | — | | | $ | — | | | $ | (1,015,645 | ) |
| | | | | | | | | | | | | | | | |
| * | See Schedule of Investments for corresponding industries. |
See accompanying Notes to Financial Statements.
20
TCW Strategic Income Fund, Inc.
Statement of Assets and Liabilities (Unaudited) | June 30, 2021 |
| | | | |
ASSETS: | |
Investments, at Value (Cost: $307,420,873) | | $ | 316,423,048 | |
Cash | | | 6,117 | |
Receivable for Securities Sold | | | 36,777,415 | |
Cash Collateral Held for Broker for Futures | | | 2,182,000 | |
Interest and Dividends Receivable | | | 1,954,692 | |
Foreign Tax Reclaims Receivable | | | 2,966 | |
| | | | |
Total Assets | | | 357,346,238 | |
| | | | |
LIABILITIES: | |
Payables for Securities Purchased | | | 70,852,329 | |
Distributions Payable | | | 2,626,164 | |
Payable for Variation Margin on Open Futures Contracts to Broker | | | 166,132 | |
Accrued Investment Advisory Fees | | | 138,093 | |
Accrued Other Expenses | | | 62,858 | |
Interest Expense Payable | | | 41,119 | |
Options Written, at Value (Premium Received $50,698) | | | 32,995 | |
Accrued Directors’ Fees and Expenses | | | 18,521 | |
| | | | |
Total Liabilities | | | 73,938,211 | |
| | | | |
NET ASSETS | | $ | 283,408,027 | |
| | | | |
NET ASSETS CONSIST OF: | |
Common Stock, par value $0.01 per share (75,000,000 shares authorized, 47,748,439 shares issued and outstanding) | | $ | 477,484 | |
Paid-in Capital | | | 269,310,055 | |
Accumulated Earnings (Loss) | | | 13,620,488 | |
| | | | |
NET ASSETS | | $ | 283,408,027 | |
| | | | |
NET ASSET VALUE PER SHARE | | $ | 5.94 | |
| | | | |
MARKET PRICE PER SHARE | | $ | 5.92 | |
| | | | |
See accompanying Notes to Financial Statements.
21
TCW Strategic Income Fund, Inc.
Statement of Operations (Unaudited) | Six Months Ended June 30, 2021 |
| | | | |
INVESTMENT INCOME: | | | | |
Income | | | | |
Interest | | $ | 8,637,202 | |
Dividends (net of foreign withholding taxes of $5,723) | | | 506,202 | |
| | | | |
Total Investment Income | | | 9,143,404 | |
| | | | |
Expenses | | | | |
Investment Advisory Fees | | | 826,594 | |
Audit and Tax Service Fees | | | 87,584 | |
Legal Fees | | | 71,694 | |
Directors’ Fees and Expenses | | | 55,884 | |
Custodian Fees | | | 28,765 | |
Interest Expense | | | 27,770 | |
Transfer Agent Fees | | | 26,761 | |
Listing Fees | | | 24,233 | |
Administration Fees | | | 19,681 | |
Printing and Distribution Costs | | | 19,448 | |
Insurance Expense | | | 17,951 | |
Proxy Expense | | | 17,331 | |
Accounting Fees | | | 8,984 | |
Miscellaneous Expense | | | 8,678 | |
| | | | |
Total Expenses | | | 1,241,358 | |
| | | | |
Net Investment Income | | | 7,902,046 | |
| | | | |
NET REALIZED GAIN (LOSS) AND CHANGE IN UNREALIZED APPRECIATION (DEPRECIATION) ON INVESTMENTS, FUTURES CONTRACTS AND WRITTEN OPTIONS: | | | | |
Net Realized Gain (Loss) on: | | | | |
Investments | | | 3,610,953 | |
Futures Contracts | | | 3,108,136 | |
Written Options | | | 19,580 | |
Net Change in Unrealized Appreciation (Depreciation) on: | | | | |
Investments | | | (3,891,137 | ) |
Futures Contracts | | | (1,174,127 | ) |
Written Options | | | 17,703 | |
| | | | |
Net Realized Gain (Loss) and Change in Unrealized Appreciation (Depreciation) on Investments, Futures Contracts and Written Options | | | 1,691,108 | |
| | | | |
INCREASE IN NET ASSETS FROM OPERATIONS | | $ | 9,593,154 | |
| | | | |
See accompanying Notes to Financial Statements.
22
TCW Strategic Income Fund, Inc.
Statements of Changes in Net Assets (Unaudited)
| | | | | | | | |
| | | Six Months Ended
June 30, 2021
(Unaudited) | | | Year Ended
December 31,
2020 | |
OPERATIONS: | | | | | | | | |
Net Investment Income | | $ | 7,902,046 | | | $ | 13,710,449 | |
Net Realized Gain on Investments, Futures Contracts, Written Options and Swap Agreements | | | 6,738,669 | | | | 3,978,847 | |
Change in Unrealized Appreciation (Depreciation) on Investments, Futures Contracts, Written Options and Swap Agreements | | | (5,047,561 | ) | | | 869,748 | |
| | | | | | | | |
Increase in Net Assets Resulting from Operations | | | 9,593,154 | | | | 18,559,044 | |
| | | | | | | | |
DISTRIBUTIONS TO SHAREHOLDERS: | | | | | | | | |
Distributions to Shareholders | | | (5,252,329 | ) | | | (13,131,985 | ) |
| | | | | | | | |
Shares Issued in Reinvestment of Dividends (0 for the six months ended June 30, 2021 and 61,482 for the year ended December 31, 2020) | | | — | | | | 347,158 | |
| | | | | | | | |
Total Increase in Net Assets | | | 4,340,825 | | | | 5,774,217 | |
| | | | | | | | |
NET ASSETS: | | | | | | | | |
Beginning of period | | | 279,067,202 | | | | 273,292,985 | |
| | | | | | | | |
End of period | | $ | 283,408,027 | | | $ | 279,067,202 | |
| | | | | | | | |
See accompanying Notes to Financial Statements.
23
TCW Strategic Income Fund, Inc.
Notes to Financial Statements (Unaudited)
Note 1 — Organization
TCW Strategic Income Fund, Inc. (the “Fund”) was incorporated in Maryland on January 13, 1987 as a diversified, closed-end investment management company and is registered under the Investment Company Act of 1940, as amended (the “1940 Act”). Its shares are traded on the New York Stock Exchange under the symbol TSI. The Fund commenced operations on March 5, 1987. The Fund’s investment objective is to seek a total return comprised of current income and capital appreciation, and it seeks to achieve its investment objective by investing in a wide range of securities including convertible securities, marketable equity securities, investment-grade debt securities, high-yield debt securities, securities issued or guaranteed by the U.S. Government, its agencies and instrumentalities (“U.S. Government Securities”), repurchase agreements, mortgage-related securities, asset-backed securities, money market securities, and other securities and derivative instruments without limit believed by the Fund’s investment advisor to be consistent with the Fund’s investment objective. TCW Investment Management Company LLC (the “Advisor”) is the investment advisor to the Fund and is registered under the Investment Advisers Act of 1940, as amended.
Note 2 — Significant Accounting Policies
The following is a summary of significant accounting policies, which are in conformity with accounting principles generally accepted in the United States of America (“GAAP”) and which are consistently followed by the Fund in the preparation of its financial statements. The Fund is considered an investment company under the Financial Accounting Standards Board (“FASB”) Accounting Standards Codification (“ASC”) No. 946, Financial Services — Investment Companies. Subsequent events, if any, have been evaluated through the date of issuance in the preparation of the financial statements.
Principles of Accounting: The Fund uses the accrual method of accounting for financial reporting purposes.
Security Valuations: Securities listed or traded on the NYSE and other stock exchanges are valued at the latest sale price on that exchange. Securities traded on the NASDAQ stock market (“NASDAQ”) are valued using official closing prices as reported by NASDAQ, which may not be the last sale price. All other securities for which over-the-counter (“OTC”) market quotations are readily available, including short-term investments, swap agreements and forward currency contracts, are valued with prices furnished by independent pricing services or by broker-dealers. Futures contracts are valued at the official settlement prices of the exchanges on which they are traded.
Securities for which market quotations are not readily available, including in circumstances under which it is determined by the Advisor that prices received are not reflective of their market values, are valued by the Advisor’s Pricing Committee in accordance with the guidelines established by the Valuation Committee of the Board of Directors of the Fund (the “Board,” and each member thereof, a “Director”) and under the general oversight of the Board.
Fair value is defined as the price that the Fund would receive upon selling an investment in a timely transaction to an independent buyer in the principal or most advantageous market for the investment. In accordance with the authoritative guidance on fair value measurements and disclosures under GAAP, the Fund discloses investments in its financial statements in a three-tier hierarchy. This hierarchy is utilized to establish classification of fair value measurements based on inputs. Inputs that go into fair value measurement refer broadly to the assumptions that market participants would use in pricing the asset or liability, including assumptions about risk. Inputs may be observable or unobservable. Observable inputs are inputs that reflect the assumptions market participants would use in pricing the asset or liability,
24
TCW Strategic Income Fund, Inc.
Note 2 — Significant Accounting Policies (Continued)
developed based on market data obtained from sources independent of the reporting entity. Unobservable inputs are inputs that reflect the reporting entity’s own assumptions about the inputs market participants would use in pricing the asset or liability, developed based on the best information available in the circumstances.
The three-tier hierarchy of inputs is summarized in the three broad levels listed below.
| | |
| Level 1 — | | quoted prices in active markets for identical investments. |
| Level 2 — | | other significant observable inputs (including quoted prices for similar investments, interest rates, prepayment speeds, credit risk, etc.). |
| Level 3 — | | significant unobservable inputs (including the Fund’s own assumptions in determining the fair value of investments). |
Changes in valuation techniques may result in transfers in or out of an investment’s assigned Level within the hierarchy. The inputs or methodologies used for valuing investments are not necessarily an indication of the risk associated with investing in those investments and the determination of the significance of a particular input to the fair value measurement in its entirety requires judgment and consideration of factors specific to each security.
The availability of observable inputs can vary from security to security and is affected by a wide variety of factors, including, for example, the type of security, whether the security is new and not yet established in the marketplace, the liquidity of markets, and other characteristics particular to the security. To the extent that valuation is based on models or inputs that are less observable or unobservable in the market, the determination of fair value requires more judgment. Accordingly, the degree of judgment exercised in determining fair value is greatest for instruments categorized in Level 3.
In periods of market dislocation, the observability of prices and inputs may be reduced for many instruments. This condition, as well as changes related to liquidity of investments, could cause a security to be reclassified between Level 1, Level 2, or Level 3.
In certain cases, the inputs used to measure fair value may fall into different levels of the fair value hierarchy. In such cases, for disclosure purposes the level in the fair value hierarchy within which the fair value measurement falls in its entirety is determined based on the lowest level input that is significant to the fair value measurement.
Fair Value Measurements: Descriptions of the valuation techniques applied to the Fund’s major categories of assets and liabilities measured at fair value on a recurring basis are as follows:
Asset-backed securities (“ABS”) and mortgage-backed securities (“MBS”). The fair value of ABS and MBS is estimated based on pricing models that consider the estimated cash flows of each debt tranche of the issuer, establish a benchmark yield, and develop an estimated tranche-specific spread to the benchmark yield based on the unique attributes of the tranche including, but not limited to, the prepayment speed assumptions and attributes of the collateral. To the extent the inputs are observable and timely, the values would be categorized in Level 2 of the fair value hierarchy; otherwise, they would be categorized in Level 3.
Corporate bonds. The fair value of corporate bonds is estimated using recently executed transactions, market price quotations (where observable), bond spreads, or credit default swap spreads adjusted for any basis difference between cash and derivative instruments. Corporate bonds are generally categorized in Level 2 of the fair value hierarchy; in instances where prices, spreads, or any of the other aforementioned key inputs are unobservable, they are categorized in Level 3 of the hierarchy.
25
TCW Strategic Income Fund, Inc.
Notes to Financial Statements (Unaudited) (Continued)
Note 2 — Significant Accounting Policies (Continued)
Equity securities. Securities are generally valued based on quoted prices from the applicable exchange. To the extent these securities are actively traded and valuation adjustments are not applied, they are generally categorized in Level 1 of the fair value hierarchy. Restricted securities issued by publicly held companies are generally categorized in Level 2 of the fair value hierarchy; if a discount is applied and significant, they are categorized in Level 3. Restricted securities held in non-public entities are included in Level 3 of the fair value hierarchy because they trade infrequently, and therefore the inputs are unobservable. Certain foreign securities that are fair valued using a pricing service that considers the correlation of the trading patterns of the foreign security to the intraday trading in the U.S. markets are categorized in Level 2 of the fair value hierarchy.
Futures contracts. Futures contracts are generally valued at the settlement price established at the close of business each day by the exchange on which they are traded. They are categorized in Level 1.
Government and agency securities. Government and agency securities are normally valued using a model that incorporates market observable data such as reported sales of similar securities, broker quotes, yields, bids, offers, quoted market prices, and reference data. Accordingly, government and agency securities are normally categorized in Level 1 or 2 of the fair value hierarchy depending on the liquidity and transparency of the market.
Money market funds. Money market funds are open-end mutual funds that invest in short-term debt securities. To the extent that these funds are valued based upon the reported net asset value (“NAV”), they are categorized in Level 1 of the fair value hierarchy.
Municipal bonds. Municipal bonds are fair valued based on pricing models that take into account, among other factors, information received from market makers and broker-dealers, current trades, bid-wanted lists, offerings, market movements, the callability of the bond, state of issuance, benchmark yield curves, and bond insurance. To the extent that these inputs are observable and timely, the fair values of municipal bonds are categorized in Level 2; otherwise, the fair values are categorized in Level 3.
Options contracts. Option contracts traded on securities exchanges are fair valued using market mid prices; as such, they are categorized in Level 1. Option contracts traded OTC are fair valued based on pricing models and incorporate various inputs such as interest rate, credit spreads, currency exchange rates and volatility measurements for in-the-money, at the-money, and out-of-money contracts on a given strike price. To the extent that these inputs are observable and timely, the fair value of OTC option contracts would be categorized in Level 2; otherwise, the fair values would be categorized in Level 3.
Restricted securities. Restricted securities, including illiquid Rule 144A securities, issued by non-public entities are included in Level 3 of the fair value hierarchy because they trade infrequently, and therefore the inputs are unobservable. Any other restricted securities valued similar to publicly traded securities may be categorized in Level 2 or 3 of the fair value hierarchy depending on whether a discount is applied and significant to the fair value.
Short-term investments. Short-term investments are valued using market price quotations, and are reflected in Level 1 or Level 2 of the fair value hierarchy.
The summary of the inputs used as of June 30, 2021 in valuing the Fund’s investments is listed after the Investments by Sector table.
26
TCW Strategic Income Fund, Inc.
Note 2 — Significant Accounting Policies (Continued)
The following is a reconciliation of investments in which significant unobservable inputs (Level 3) were used in determining value:
| | | | |
| | | Residential
Mortgage-Backed
Securities — Non-
Agency | |
Balance as of December 31, 2020 | | $ | 7,225,731 | |
Accrued Discounts (Premiums) | | | (445,637 | ) |
Realized Gain (Loss) | | | — | |
Change in Unrealized Appreciation (Depreciation) | | | (201,883 | ) |
Purchases | | | — | |
Sales | | | — | |
Transfers in to Level 3 | | | — | |
Transfers out of Level 3 (1) | | | (1,587,973 | ) |
| | | | |
Balance as of June 30, 2021 | | $ | 4,990,238 | |
| | | | |
Change in Unrealized Appreciation (Depreciation) from Investments Still Held at June 30, 2021 | | $ | (201,883 | ) |
| | | | |
| (1) | Financial assets transferred between Level 2 and Level 3 were due to a change in observable and/or unobservable inputs. |
Significant unobservable valuation inputs for Level 3 investments as of June 30, 2021 are as follows:
| | | | | | | | | | | | | | | | |
Description | | Fair Value at
June 30,
2021 | | | Valuation Techniques | | Unobservable Input | | Price or Price
Range | | | Weighted Average
Price | |
Residential Mortgage-Backed Securities — Non-Agency (Interest Only Collateral Strip Rate Securities) | | $ | 754,011 | | | Third-party Vendor | | Vendor Prices | | | $0.417 to $2.268 | | | $ | 1.114 | |
Residential Mortgage-Backed Securities — Non-Agency (Interest Only Securities) | | $ | 4,236,227 | | | Third-party Vendor | | Vendor Prices | | | $2.737 to $30.730 | | | $ | 8.916 | |
Security Transactions and Related Investment Income: Security transactions are recorded as of the trade date. Dividend income is recorded on the ex-dividend date. Interest income is recognized on an accrual basis. Realized gains and losses on investments are recorded on the basis of specific identification.
Use of Estimates: The preparation of the accompanying financial statements requires management to make estimates and assumptions that affect the reported amount of assets and liabilities at the date of the financial statements and the reported amounts of income and expenses during the reporting period. Actual results could differ from these estimates.
Foreign Currency Translation: The books and records of the Fund are maintained in U.S. dollars as follows: (1) the foreign currency denominated securities, and other assets and liabilities stated in foreign currencies are translated using the daily spot rate; and (2) purchases, sales, income and expenses are translated at the rate of exchange prevailing on the respective dates of such transactions. The resultant exchange gains and losses are included in net realized or net unrealized gain (loss) in the Statement of Operations. Pursuant to U.S. federal income tax regulations, certain foreign exchange gains and losses included in realized and unrealized gains and losses are included in, or are a reduction of, ordinary income for federal income tax purposes.
Distributions: Distributions to shareholders are recorded on each ex-dividend date. The Fund declared and paid or reinvested dividends quarterly under an income-based distribution policy. The income-based
27
TCW Strategic Income Fund, Inc.
Notes to Financial Statements (Unaudited) (Continued)
Note 2 — Significant Accounting Policies (Continued)
distribution policy has a stated goal of providing quarterly distributions out of the Fund’s accumulated undistributed net investment income and/or other sources subject to the requirements of the 1940 Act and Subchapter M of the Internal Revenue Code (the “Code”). The source for the dividend can come from net investment income and net realized capital gains measured on a fiscal year basis. Any portion of the distribution that exceeds income and capital gains will be treated as a return of capital. Under certain conditions, U.S. federal tax regulations cause some or all of the return of capital to be taxed as ordinary income. Income and capital gain distributions are determined in accordance with income tax regulations which may differ from GAAP. These differences may be primarily due to differing treatments for market discount and premium, losses recognized on structured debt, losses deferred due to wash sales, foreign currency gains and losses, and spillover distributions. Permanent book and tax basis differences relating to shareholder distributions will result in reclassifications to paid-in capital and may affect net investment income per share.
Derivative Instruments: Derivatives are financial instruments whose values are based on the values of one or more indicators, such as a security, asset, currency, interest rate, or index. Derivative transactions can create investment leverage and may be highly volatile. A derivative contract may result in a mark-to-market loss if the value of the contract decreases due to an unfavorable change in the market rates or values of the underlying instrument. It is possible that a derivative transaction will result in a loss greater than the principal amount invested. The Fund may not be able to close out a derivative transaction at a favorable time or price.
For the period ended June 30, 2021, the Fund had derivatives and transactions in derivatives, grouped in the following risk categories:
| | | | | | | | | | | | |
| | | Equity Risk | | | Interest
Rate
Risk | | | Total | |
Statement of Assets and Liabilities: | |
Liability Derivatives | |
Futures Contracts(1) | | $ | — | | | $ | (982,650 | ) | | $ | (982,650 | ) |
Written Options | | | (32,995 | ) | | | — | | | | (32,995 | ) |
| | | | | | | | | | | | |
Total Value | | $ | (32,995 | ) | | $ | (982,650 | ) | | $ | (1,015,645 | ) |
| | | | | | | | | | | | |
| | | | | | | | | | | | |
Statement of Operations: | |
Net Realized Gain (Loss) | |
Futures Contracts(1) | | $ | — | | | $ | 3,108,136 | | | $ | 3,108,136 | |
Written Options | | | 19,580 | | | | — | | | | 19,580 | |
| | | | | | | | | | | | |
Net Realized Gain (Loss) | | $ | 19,580 | | | $ | 3,108,136 | | | $ | 3,127,716 | |
| | | | | | | | | | | | |
| | | | | | | | | | | | |
Net Change in Appreciation (Depreciation) | |
Futures Contracts | | $ | — | | | $ | (1,174,127 | ) | | $ | (1,174,127 | ) |
Written Options | | | 17,703 | | | | — | | | | 17,703 | |
| | | | | | | | | | | | |
Total Net Change in Appreciation (Depreciation) | | $ | 17,703 | | | $ | (1,174,127 | ) | | $ | (1,156,424 | ) |
| | | | | | | | | | | | |
| | | | | | | | | | | | |
Number of Contracts (2) | |
Futures Contracts | | | — | | | | 323 | | | | 323 | |
Written Options | | | 466 | | | | — | | | | 466 | |
| (1) | Represents appreciation (depreciation) of futures contracts as reported in the Schedule of Investments as of June 30, 2021. Only the variation margin is reported within the Statement of Assets and Liabilities. |
| (2) | Amount disclosed represents average number of contracts which are representative of the volume traded for the period ended June 30, 2021. |
28
TCW Strategic Income Fund, Inc.
Note 2 — Significant Accounting Policies (Continued)
Counterparty Credit Risk: Derivative contracts may be exposed to counterparty risk. Losses can occur if the counterparty does not perform under the contract.
The Fund’s risk of loss from counterparty credit risk on OTC derivatives is generally limited to the aggregate unrealized gain netted against any collateral held by the Funds.
With exchange-traded futures and centrally cleared swaps, there is less counterparty credit risk to the Fund since the exchange or clearinghouse, as counterparty to such instruments, guarantees against a possible default. The clearinghouse stands between the buyer and the seller of the contract; therefore, the counterparty credit risk is limited to failure of the clearinghouse. While offset rights may exist under applicable law, the Fund does not have a contractual right of offset against a clearing broker or clearinghouse in the event of a default (including the bankruptcy or insolvency) of the clearing broker or clearinghouse. Additionally, credit risk exists in exchange-traded futures and centrally cleared swaps with respect to initial and variation margin that is held in a clearing broker’s customer accounts. While clearing brokers are required to segregate customer margin from their own assets, in the event that a clearing broker becomes insolvent or goes into bankruptcy and at that time there is a shortfall in the aggregate amount of margin held by the clearing broker for all its clients, typically the shortfall would be allocated on a pro rata basis across all the clearing broker’s customers, potentially resulting in losses to the Fund.
For OTC derivatives, the Fund mitigates its counterparty risk by entering into an International Swaps and Derivatives Association, Inc. Master Agreement (“ISDA Master Agreement”) or similar agreement with each counterparty. An ISDA Master Agreement is a bilateral agreement between the Fund and a counterparty that governs OTC derivatives and typically contains, among other things, collateral posting terms and netting provisions in the event of a default and/or termination event. Under an ISDA Master Agreement, the Fund may, under certain circumstances, offset with the counterparty certain derivative financial instruments’ payables and/or receivables with collateral held and/or posted and create one single net payment. The provisions of the ISDA Master Agreement typically permit a single net payment in the event of default including the bankruptcy or insolvency of the counterparty. However, bankruptcy or insolvency laws of a particular jurisdiction may impose restrictions on or prohibitions against the right of offset in bankruptcy, insolvency or other events. In addition, certain ISDA Master Agreements allow counterparties to OTC derivatives to terminate derivative contracts prior to maturity in the event the Fund’s net assets decline by a stated percentage or the Fund fails to meet the terms of its ISDA Master Agreements, which would cause the Fund to accelerate payment of any net liability owed to the counterparty.
Collateral Requirements: For derivatives traded under an ISDA Master Agreement, the collateral requirements are typically calculated by netting the mark-to-market amount for each transaction under such agreement and comparing that amount to the value of any collateral pledged or received by the Fund.
Cash collateral that has been pledged to cover obligations of the Fund is reported separately on the Statement of Assets and Liabilities. Non-cash collateral pledged by the Fund, if any, is noted in the Schedule of Investments. Generally, the amount of collateral due from or to a party has to exceed a minimum transfer amount threshold, typically $250,000 or $500,000, before a transfer is required, which is determined at the close of each business day and the collateral is transferred on the next business day. To the extent amounts due to the Fund from its counterparties are not fully collateralized, contractually or otherwise, the Fund bears the risk of loss from counterparty non-performance. The Fund attempts to mitigate counterparty risk by entering into agreements only with counterparties that the Advisor believes
29
TCW Strategic Income Fund, Inc.
Notes to Financial Statements (Unaudited) (Continued)
Note 2 — Significant Accounting Policies (Continued)
have the financial resources to honor their obligations and by monitoring the financial stability of those counterparties. For financial reporting purposes, the Fund does not offset derivative assets and derivative liabilities that are subject to netting arrangements in the Statement of Assets and Liabilities.
Master Agreements and Netting Arrangements. The Fund is party to various agreements, including but not limited to International Swaps and Derivatives Association Agreements and related Credit Support Annex, Master Repurchase Agreements, and Master Securities Forward Transactions Agreements (collectively “Master Agreements”), which govern the terms of certain transactions with select counterparties. These Master Agreements generally include provisions for general obligations, representations, agreements, collateral, and certain events of default or termination. These Master Agreements also include provisions for netting arrangements that help reduce credit and counterparty risk associated with relevant transactions (“netting arrangements”). The netting arrangements are generally tied to credit-related events that, if triggered, would cause an event of default or termination giving a Fund or counterparty the right to terminate early and cause settlement, on a net basis, of all transactions under the applicable Master Agreement. In the event of an early termination as a result of an event of default under the Master Agreement, the total value exposure of all transactions will be offset against collateral exchanged to date, which would result in a net receivable or payable that would be due from or to the counterparty. However, bankruptcy or insolvency laws of a particular jurisdiction may impose restrictions on or prohibitions against the right of offset in the event of a bankruptcy or insolvency of the counterparty. Credit related events include, but are not limited to, bankruptcy, failure to make timely payments, restructuring, obligation acceleration, obligation default, a material decline in net assets, decline in credit rating or repudiation/moratorium. Any election made by a counterparty to early terminate the transactions under a Master Agreement could have a material adverse impact on a Fund’s financial statements. A Fund’s overall exposure to credit risk subject to netting arrangements can change substantially within a short period, as it is affected by each transaction subject to the arrangement.
Master Agreements can also help limit counterparty risk by specifying collateral posting arrangements at pre-arranged exposure levels. Under the Master Agreements, collateral is routinely transferred if the total net exposure to certain transactions under the relevant Master Agreement with a counterparty in a given Fund exceeds a specified threshold, net of collateral already in place, typically $250,000 or $500,000 depending on the counterparty and the type of Master Agreement. Collateral under the Master Agreements is usually in the form of cash or U.S. Treasury Bills but could include other types of securities. If permitted under the Master Agreement, certain funds may rehypothecate cash collateral received from a counterparty. The value of all derivative transactions outstanding under a Master Agreement is calculated daily to determine the amount of collateral to be received or pledged by the counterparty. Posting of collateral for OTC derivative transactions are covered under tri-party collateral agreements between the Fund, the Fund’s custodian, and each counterparty. Collateral for centrally cleared derivatives transactions are posted with the applicable derivatives clearing organization.
The Fund had no OTC derivatives for offset under an ISDA Master Agreement as of June 30, 2021.
Note 3 — Portfolio Investments
Mortgage-Backed and Other Asset-Backed Securities: The Fund may invest in MBS, which represent interests in pools of mortgages in which payments of both principal and interest on the securities are generally made monthly, in effect “passing through” monthly payments made by borrowers on the residential or commercial mortgage loans which underlie the securities (net of any fees paid to the issuer
30
TCW Strategic Income Fund, Inc.
Note 3 — Portfolio Investments (Continued)
or guarantor of the securities). Mortgage pass-through securities differ from other forms of debt securities, which normally provide for periodic payment of interest in fixed amounts with principal payments at maturity or specified call dates. The Fund may also invest in Collateralized Mortgage Obligations (“CMOs”). CMOs are debt obligations collateralized by residential or commercial mortgage loans or residential or commercial mortgage pass-through securities. Interest and principal are generally paid monthly. CMOs may be collateralized by whole mortgage loans or private mortgage pass-through securities but are more typically collateralized by portfolios of mortgage pass-through securities guaranteed by the Government National Mortgage Association (Ginnie Mae), Federal Home Loan Mortgage Corporation (Freddie Mac) or Federal National Mortgage Corporation (Fannie Mae). The issuer of a series of CMOs may elect to be treated for tax purposes as a Real Estate Mortgage Investment Conduit. CMOs are structured into multiple classes, each bearing a different stated maturity. Monthly payment of principal received from the pool of underlying mortgages, including prepayments, is first returned to investors holding the shortest maturity class. Investors holding the longer maturity classes usually receive principal only after shorter classes have been retired. An investor may be partially protected against a sooner than desired return of principal because of the sequential payments. The Fund may invest in stripped MBS. Stripped MBS are usually structured with two classes that receive different proportions of the interest and principal distributions on a pool of mortgage assets. In certain cases, one class will receive all of the interest (the interest only or “IO” class), while the other class will receive all of the principal (the principal only or “PO” class). The yield to maturity on IOs is sensitive to the rate of principal repayments (including prepayments) on the related underlying mortgage assets, and principal payments may have a material effect on yield to maturity. If the underlying mortgage assets experience greater than anticipated prepayments of principal, the Fund may not fully recoup its initial investment in IOs. Mortgage-backed and other asset-backed securities held by the Fund at June 30, 2021 are listed in the Fund’s Schedule of Investments.
Repurchase Agreements: The Fund may enter into repurchase agreements under the terms of a Master Repurchase Agreement (“MRA”). In a repurchase agreement, the Fund purchases a security from a counterparty who agrees to repurchase the same security at a mutually agreed upon date and price. The MRA permits the Fund, under certain circumstances including an event of default (such as bankruptcy or insolvency), to offset payables and/or receivables under the MRA with collateral held and/or posted to the counterparty and create one single net payment due to or from the Fund. However, bankruptcy or insolvency laws of a particular jurisdiction may impose restrictions on or prohibitions against such a right of offset in the event of the MRA counterparty’s bankruptcy or insolvency. Pursuant to the terms of the MRA, the Fund receives securities as collateral with a market value in excess of the repurchase price. Upon a bankruptcy or insolvency of the MRA counterparty, the Fund recognizes a liability with respect to such excess collateral to reflect the Fund’s obligation under bankruptcy law to return the excess to the counterparty. The Fund had no repurchase agreements outstanding at June 30, 2021.
When-Issued, Delayed-Delivery, and Forward Commitment Transactions: The Fund may enter into when-issued, delayed-delivery or forward commitment transactions in order to lock in the purchase price of the underlying security or to adjust the interest rate exposure of the Fund’s existing portfolio. In when-issued, delayed-delivery, or forward commitment transactions, the Fund commits to purchase or sell particular securities, with payment and delivery to take place at a future date. Although the Fund does not pay for the securities or start earning interest on them until they are delivered, it immediately assumes the risks of ownership, including the risk of price fluctuation. If the Fund’s counterparty fails to deliver a security
31
TCW Strategic Income Fund, Inc.
Notes to Financial Statements (Unaudited) (Continued)
Note 3 — Portfolio Investments (Continued)
purchased on a when-issued, delayed-delivery or forward commitment basis, there may be a loss, and the Fund may have missed an opportunity to make an alternative investment.
Prior to settlement of these transactions, the value of the subject securities will fluctuate with market conditions. In addition, because the Fund is not required to pay for when-issued, delayed-delivery or forward commitment securities until the delivery date, they may result in a form of leverage to the extent the Fund does not set aside liquid assets to cover the commitment. To guard against this deemed leverage, the Fund monitors the obligations under these transactions on a daily basis and ensures that the Fund has sufficient liquid assets to cover them.
Security Lending: The Fund may lend its securities to qualified brokers. The loans must be collateralized at all times primarily with cash although the Fund can accept money market instruments or U.S. Government securities with a market value at least equal to the market value of the securities on loan. As with any extensions of credit, the Fund may bear the risk of delay in recovery or even loss of rights in the collateral if the borrowers of the securities fail financially. The Fund earns additional income for lending its securities by investing the cash collateral in short-term investments. The Fund did not lend any securities during the period ended June 30, 2021.
Derivatives:
Forward Foreign Currency Contracts: The Fund enters into forward foreign currency contracts as a hedge against fluctuations in foreign exchange rates. Forward foreign currency contracts are marked-to-market daily and the change in market value is recorded by the Fund as unrealized gains or losses in the Statement of Assets and Liabilities. When a contract is closed or delivery is taken, the Fund records a realized gain or loss equal to the difference between the value of the contract at the time it was opened and the value at the time it was closed. Risks may arise upon entering into these contracts from the potential inability of counterparties to meet the terms of their contracts and from unanticipated movements in the value of the foreign currency relative to the U.S. dollar. The Fund did not have any foreign currency forward contracts as of June 30, 2021.
Futures Contracts: The Fund may enter into futures contracts. The Fund may seek to manage a variety of different risks through the use of futures contracts, such as interest rate risk, equity price risk, and currency risk. The Fund may use index futures to hedge against broad market risks to its portfolio or to gain broad market exposure. Securities index futures contracts are contracts to buy or sell units of a securities index at a specified future date at a price agreed upon when the contract is made, and are settled in cash. Positions in futures may be closed out only on an exchange or board of trade which provides a secondary market for such futures. Because futures contracts are exchange-traded, they typically have minimal exposure to counterparty risk. Parties to a futures contract are not required to post the entire notional amount of the contract, but rather a small percentage of that amount (by way of margin), both at the time they enter into futures transactions, and then on a daily basis if their positions decline in value; as a result, futures contracts are highly leveraged. Such payments are known as variation margin and are recorded by the Fund as unrealized gains or losses. Because futures markets are highly leveraged, they can be extremely volatile, and there can be no assurance that the pricing of a futures contract will correlate precisely with the pricing of the asset or index underlying it or the asset or liability of the Fund that is the subject of the hedge. It may not always be possible for the Fund to enter into a closing transaction with respect to a futures contract it has entered into at a favorable time or price. When the Fund enters into a futures transaction, it is subject to the risk that the value of the futures contract will move in a direction unfavorable to it.
32
TCW Strategic Income Fund, Inc.
Note 3 — Portfolio Investments (Continued)
When the Fund uses futures contracts for hedging purposes, it is likely that the Fund will have an asset or liability that will offset any loss (or gain) on the transactions, at least in part. When a futures contract is closed, the Fund records a realized gain or loss equal to the difference between the value of the contract at the time it was opened and the value at the time it was closed. During the period ended June 30, 2021, the Fund utilized treasury futures to help manage interest rate duration and credit market exposure. Futures contracts outstanding at June 30, 2021 are listed in the Fund’s Schedule of Investments.
Options: The Fund may purchase and sell put and call options on a security or an index of securities to enhance investment performance and/or to protect against changes in market prices. The Fund may also enter into currency options to hedge against or to take advantage of currency fluctuations.
A call option gives the holder the right to purchase, and obligates the writer to sell, a security at the strike price at any time before the expiration date. A put option gives the holder the right to sell, and obligates the writer to buy, a security at the exercise price at any time before the expiration date. A Fund may purchase put options to protect portfolio holdings against a decline in market value of a security or securities held by it. A Fund may also purchase a put option hoping to profit from an anticipated decline in the value of the underlying security. If a Fund holds the security underlying the option, the option premium and any transaction costs will reduce any profit the Fund might have realized had it sold the underlying security instead of buying the put option. A Fund may purchase call options to hedge against an increase in the price of securities that the Fund ultimately wants to buy. A Fund may also purchase a call option as a long directional investment hoping to profit from an anticipated increase in the value of the underlying security. In order for a call option to be profitable, the market price of the underlying security must rise sufficiently above the exercise price to cover the premium and transaction costs. These costs will reduce any profit a Fund might have realized had it bought the underlying security at the time it purchased the call option.
Purchasing foreign currency options gives a Fund the right, but not the obligation, to buy or sell specified amounts of currency at a rate of exchange that may be exercised by a certain date. These currency options may be used as a short or long hedge against possible variations in foreign exchange rates or to gain exposure to foreign currencies.
When a Fund purchases an option, it runs the risk that it will lose its entire investment in the option in a relatively short period of time, unless the Fund exercises the option or enters into a closing sale transaction before the option’s expiration. If the price of the underlying security does not rise (in the case of a call) or fall (in the case of a put) to an extent sufficient to cover the option premium and transaction costs, the Fund will lose part or all of its investment in the option. Premiums paid for purchasing options that expire are treated as realized losses.
Options purchased or sold by a Fund may be traded on a securities or options exchange. Such options typically have minimal exposure to counterparty risk. However, an exchange or market may at times find it necessary to impose restrictions on particular types of options transactions, such as opening transactions. If an underlying security ceases to meet qualifications imposed by an exchange or the Options Clearing Corporation, new series of options on that security will no longer be opened to replace the expiring series, and opening transactions in existing series may be prohibited.
OTC options are options not traded on exchanges or backed by clearinghouses. Rather, they are entered into directly between a Fund and the counterparty to the option. In the case of an OTC option purchased by a Fund, the value of the option to the Fund will depend on the willingness and ability of the option writer to perform its obligations to the Fund. In addition, OTC options may not be transferable and there may be
33
TCW Strategic Income Fund, Inc.
Notes to Financial Statements (Unaudited) (Continued)
Note 3 — Portfolio Investments (Continued)
little or no secondary market for them, so they may be considered illiquid. It may not be possible to enter into closing transactions with respect to OTC options or otherwise to terminate such options, and as a result a Fund may be required to remain obligated on an unfavorable OTC option until its expiration. During the period ended June 30, 2021, the Fund entered into written option contracts to gain exposure to the equity market.
Swap Agreements: The Fund may enter into swap agreements. Swap agreements are typically two-party contracts entered into primarily by institutional investors. In a standard “swap” transaction, two parties agree to exchange the returns (or differentials in rates of return) earned or realized on particular predetermined investments or instruments, which may be adjusted for an interest factor. The gross returns to be exchanged or “swapped” between the parties are generally calculated with respect to a “notional amount” (i.e., the return on or increase in value of a particular dollar amount invested at a particular interest rate or in a “basket” of securities representing a particular index).
In a total return swap, one party typically agrees to pay to the other a short-term interest rate in return for a payment at one or more times in the future based on the increase in the value of an underlying security or other asset, or index of securities or assets; if the underlying security, asset, or index declines in value, the party that pays the short-term interest rate must also pay to its counterparty a payment based on the amount of the decline. The Fund may take either side of such a swap, and so may take a long or short position in the underlying security, asset, or index. The Fund may enter into a total return swap to hedge against an exposure in its portfolio — such as interest rate risk (including to adjust the duration or credit quality of the Fund’s bond portfolio), equity risk, or credit risk — or generally to put cash to work efficiently in the markets in anticipation of, or as a replacement for, cash investments. The Fund may also enter into a total return swap to gain exposure to securities or markets in which it might not be able to invest directly (in so-called market access transactions).
Interest rate swaps are agreements in which one party pays a floating rate of interest on a notional principal amount and receives a fixed rate of interest on the same notional principal amount for a specified period of time. Alternatively, a party may pay a fixed rate and receive a floating rate. In more complex swaps, the notional principal amount may decline (or amortize) over time. The Fund’s maximum risk of loss due to counterparty default is the discounted NAV of the cash flows paid to/received from the counterparty over the interest rate swap’s remaining life.
The Fund may enter into credit default swap transactions as a “buyer” or “seller” of credit protection. In a credit default swap, one party provides what is in effect insurance against a default or other adverse credit event affecting an issuer of debt securities (typically referred to as a “reference entity”). In general, the buyer of credit protection is obligated to pay the protection seller an upfront amount or a periodic stream of payments over the term of the swap. If a “credit event” occurs, the buyer has the right to deliver to the seller bonds (or other obligations of the reference entity with a value up to the full notional value of the swap), and to receive a payment equal to the par value of the bonds or other obligations. Credit events that would trigger a request that the seller make payment are specific to each credit default swap agreement, but generally include bankruptcy, failure to pay, restructuring, obligation acceleration, obligation default, or repudiation/moratorium. When the Fund buys protection, it may or may not own securities of the reference entity. When the Fund sells protection under a credit default swap, the position may have the effect of creating leverage in the Fund’s portfolio through the Fund’s indirect long exposure to the issuer or securities on which the swap is written. When the Fund sells protection, it may do so either to earn additional income or to create such a “synthetic” long position.
34
TCW Strategic Income Fund, Inc.
Note 3 — Portfolio Investments (Continued)
Whenever the Fund enters into a swap agreement, it takes on counterparty risk — the risk that its counterparty will be unable or unwilling to meet its obligations under the swap agreement. The Fund also takes the risk that the market will move against its position in the swap agreement. In the case of a total return swap, the swap will change in value depending on the change in value of the asset or index on which the swap is written. When the Fund enters into any type of swap for hedging purposes, it is likely that the Fund will have an asset or liability that will offset any loss (or gain) on the swap, at least in part. Swap agreements may be non-transferable or otherwise highly illiquid, and the Fund may not be able to terminate or transfer a swap agreement at any particular time or at an acceptable price.
During the term of a swap transaction, changes in the value of the swap are recognized as unrealized gains or losses by marking-to-market to reflect the market value of the swap. When the swap is terminated, the Fund will record a realized gain or loss equal to the difference, if any, between the proceeds from (or cost of) the closing transaction and the Fund’s basis in the agreement. Upfront swap premium payments paid or received by the Fund, if any, are recorded within the value of the open swap agreement on the Fund’s Statement of Assets and Liabilities and represent payments paid or received upon entering into the swap agreement to compensate for differences between stated terms of the swap agreement and prevailing market conditions (credit spreads, currency exchange rates, and other relevant factors). These upfront payments are recorded as realized gains or losses on the Fund’s Statement of Operations upon termination or maturity of the swap agreement.
During the term of a swap transaction, the periodic net payments can be made for a set period of time or may be triggered by a predetermined credit event. The net periodic payments may be based on a fixed or variable interest rate, the change in market value of a specified security, basket of securities or index, or the return generated by a security. These periodic payments received or made by the Fund are recorded as realized gains and losses, respectively. There were no swap agreements outstanding at June 30, 2021.
Note 4 — Investment Objective, Investment Strategy, and Risk Considerations
Investment objective: The Fund’s investment objective is to seek a total return comprised of current income and capital appreciation.
Investment strategy: The Fund seeks to achieve its investment objective by investing in a wide range of securities, including securities issued or guaranteed by the U.S. Government, its agencies and instrumentalities (“U.S. Government Securities”), investment-grade corporate debt securities, high yield corporate debt securities, non-U.S. developed and emerging market debt mortgage-related securities, asset-backed securities, marketable small-, mid- and large-capitalization equity securities, convertible securities, money market securities, repurchase agreements, other securities and derivative instruments without limit believed by the Fund’s investment adviser to be consistent with the Fund’s investment objective. The Fund will shift and reallocate its investments on an opportunistic basis and may invest in additional asset classes other than those identified above. The Fund may also employ leverage up to 33% of its total assets (including assets purchased with borrowings). The Fund has a stated goal of providing dependable, but not assured, quarterly distributions out of accumulated net investment income and/or other sources, subject to the requirements of the 1940 Act.
Market Risk: The Fund’s investments will fluctuate with market conditions, and so will the value of your investment in the Fund. You could lose money on your investment in the Fund or the Fund could underperform other investments.
35
TCW Strategic Income Fund, Inc.
Notes to Financial Statements (Unaudited) (Continued)
Note 4 — Investment Objective, Investment Strategy, and Risk Considerations (Continued)
Liquidity Risk: The Fund’s investments in illiquid securities may reduce the returns of the Fund because it may not be able to sell the illiquid securities at an advantageous time or price. Investments in high-yield securities, foreign securities, derivatives or other securities with substantial market and/or credit risk tend to have the greatest exposure to liquidity risk. Certain investments in private placements and Rule 144A securities may be considered illiquid investments. The Fund may invest in private placements and Rule 144A securities.
Interest Rate Risk: The values of the Fund’s investments fluctuate in response to movements in interest rates. If rates rise, the values of debt securities generally fall. The longer the average duration of the Fund’s investment portfolio, the greater the change in value.
Mortgage-Backed and Other Asset-Backed Securities Risk: The Fund may invest in MBS or other ABS. The values of some mortgage-backed securities or other asset-backed securities may expose the Fund to a lower rate of return upon reinvestment of principal. When interest rates rise, the value of mortgage-related securities generally will decline; however, when interest rates are declining, the value of mortgage-related securities with prepayment features may not increase as much as other fixed-income securities. The rate of prepayments on underlying mortgages will affect the price and volatility of a mortgage-related security, and may shorten or extend the effective maturity of the security beyond what was anticipated at the time of purchase. The value of these securities may fluctuate in response to the market’s perception of the creditworthiness of the issuers. Additionally, although mortgages and mortgage-related securities are generally supported by some form of government or private guarantee and/or insurance, there is no assurance that private guarantors or insurers will meet their obligations.
Derivatives Risk: Use of derivatives, which at times is an important part of the Fund’s investment strategy, involves risks different from, or possibly greater than, the risks associated with investing directly in securities and other traditional investments. Investments in derivatives could cause the Fund to lose more than the principal amount invested. Also, suitable derivative transactions may not be available in all circumstances and there can be no assurance that the Fund will achieve its objective through the use of the derivatives.
Credit Risk: The values of any of the Fund’s investments may also decline in response to events affecting the issuer or its credit rating. The lower-rated debt securities in which the Fund may invest are considered speculative and are subject to greater volatility and risk of loss than investment-grade securities, particularly in deteriorating economic conditions. The value of some mortgage-related securities in which the Fund invests also may fall because of unanticipated levels of principal prepayments that can occur when interest rates decline. The Fund invests a material portion of its assets in securities of issuers that hold mortgage- and asset-backed securities and direct investments in securities backed by commercial and residential mortgage loans and other financial assets. The value and related income of these securities are sensitive to changes in economic conditions, including delinquencies and/or defaults. Continuing shifts in the market’s perception of credit quality on securities backed by commercial and residential mortgage loans and other financial assets may result in increased volatility of market prices and periods of illiquidity that can negatively impact the valuation of certain issuers held by the Fund.
MBS and ABS are characterized and classified in a variety of different ways. These classifications include a view of the securities’ cash flow structure (pass-through, sequential pay, prepayment-protected, interest only, principal only, etc.), the security of the claim on the underlying assets (senior, mezzanine and subordinated), as well as types of underlying collateral (prime conforming loans, prime non-conforming
36
TCW Strategic Income Fund, Inc.
Note 4 — Investment Objective, Investment Strategy, and Risk Considerations (Continued)
loans, Alt-A loans, subprime loans, commercial loans, etc.). In many cases, the classification incorporates a degree of subjectivity — a particular loan might be categorized as “prime” by the underwriting standards of one mortgage issuer while another might classify the loan as “subprime.” In addition to other functions, the risk associated with an investment in a mortgage loan must take into account the nature of the collateral, the form and the level of credit enhancement, the vintage of the loan, the geography of the loan, the purpose of the loan (refinance versus purchase versus equity takeout), the borrower’s credit quality (e.g., FICO score), and whether the loan is a first trust deed or a second lien.
Counterparty Risk: The Fund may be exposed to counterparty risk, the risk that an entity with which the Fund has unsettled or open transactions may not fulfill its obligations.
LIBOR Risk: The London Interbank Offered Rate (“LIBOR”) is used extensively in the U.S. and globally as a “benchmark” or “reference rate” for various commercial and financial contracts, including corporate and municipal bonds, bank loans, asset-backed and mortgage-related securities, interest rate swaps and other derivatives. For example, debt securities in which the Fund invests may pay interest at floating rates based on LIBOR or may be subject to interest caps or floors based on LIBOR. The Fund’s derivative investments may also reference LIBOR. In addition, issuers of instruments in which the Fund invests may obtain financing at floating rates based on LIBOR, and the Fund may use leverage or borrowings based on LIBOR. The head of the United Kingdom Financial Conduct Authority has announced the intention to begin phasing out the use of LIBOR by the end of 2021. Although the transition process away from LIBOR has become increasingly well-defined in advance of the anticipated discontinuation date, there remains uncertainty regarding the future utilization of LIBOR and the nature of any replacement rate. The ultimate abandonment of or modifications to LIBOR could have adverse impacts on newly issued financial instruments and existing financial instruments that reference LIBOR. Any potential effects of the transition away from LIBOR on the Fund or on certain instruments in which the Fund invests can be difficult to ascertain, and they may vary depending on factors that include, but are not limited to: (i) existing fallback or termination provisions in individual contracts and (ii) whether, how, and when industry participants develop and adopt new reference rates and fallbacks for both legacy and new products and instruments. For example, certain of the Fund’s investments may involve individual contracts that have (i) no existing fallback provision or language that contemplates the discontinuation of LIBOR or (ii) inadequate fallback provisions or language that does not contemplate a permanent discontinuation of LIBOR, and those investments could experience increased volatility or reduced liquidity as a result of the transition process. In addition, interest rate provisions included in such contracts may need to be renegotiated in contemplation of the transition away from LIBOR. The transition may also result in a reduction in the value of certain instruments held by the Funds or a reduction in the effectiveness of related Fund transactions such as hedges. In addition, an instrument’s transition to a replacement rate could result in variations in the reported yields of the Fund that holds such instrument. Any such effects of the transition away from LIBOR, as well as other unforeseen effects, could result in losses to the Fund.
Public Health Emergencies Risk and Impact of the Coronavirus (COVID-19): Pandemics and other local, national, and international public health emergencies, including outbreaks of infectious diseases such as SARS, H1N1/09 Flu, the Avian Flu, Ebola and the current coronavirus pandemic (“COVID-19”), can result, and in the case of COVID-19 is resulting, in market volatility and disruption, and any similar future emergencies may materially and adversely impact economic production and activity in ways that cannot be predicted, all of which could result in substantial investment losses.
37
TCW Strategic Income Fund, Inc.
Notes to Financial Statements (Unaudited) (Continued)
Note 4 — Investment Objective, Investment Strategy, and Risk Considerations (Continued)
This outbreak has caused a worldwide public health emergency, straining healthcare resources and resulting in extensive and growing numbers of infections, hospitalizations and deaths. In an effort to contain COVID-19, local, regional, and national governments, as well as private businesses and other organizations, have imposed and continue to impose severely restrictive measures, including instituting local and regional quarantines, restricting travel (including closing certain international borders), prohibiting public activity (including “stay-at-home,” “shelter-in-place,” and similar orders), and ordering the closure of a wide range of offices, businesses, schools, and other public venues. Consequently, COVID-19 has significantly diminished and disrupted global economic production and activity of all kinds and has contributed to both volatility and a severe decline in financial markets. Among other things, these unprecedented developments have resulted in: (i) material reductions in demand across most categories of consumers and businesses; (ii) dislocation (or, in some cases, a complete halt) in the credit and capital markets; (iii) labor force and operational disruptions; (iv) slowing or complete idling of certain supply chains and manufacturing activity; and (v) strain and uncertainty for businesses and households, with a particularly acute impact on industries dependent on travel and public accessibility, such as transportation, hospitality, tourism, retail, sports, and entertainment. The ultimate impact of COVID-19 (and of the resulting precipitous decline and disruption in economic and commercial activity across many of the world’s economies) on global economic conditions, and on the operations, financial condition, and performance of any particular market, industry or business, is impossible to predict. However, ongoing and potential additional materially adverse effects, including further global, regional and local economic downturns (including recessions) of indeterminate duration and severity, are possible. The extent of COVID-19’s impact will depend on many factors, including the ultimate duration and scope of the public health emergency and the restrictive countermeasures being undertaken, as well as the effectiveness of other governmental, legislative, and financial and monetary policy interventions designed to mitigate the crisis and address its negative externalities, all of which are evolving rapidly and may have unpredictable results. The ongoing COVID-19 crisis and any other public health emergency could have a significant adverse impact on our investments and result in significant investment losses.
Note 5 — Federal Income Taxes
It is the policy of the Fund to comply with the requirements under Subchapter M of the Code applicable to regulated investment companies and to distribute all of its net taxable income, including any net realized gains on investments, to its shareholders. Therefore, no federal income tax provision is required.
At June 30, 2021, net unrealized appreciation for federal income tax purposes is comprised of the following components:
| | | | |
Unrealized appreciation | | $ | 28,594,318 | |
Unrealized (depreciation) | | | (22,364,128 | ) |
| | | | |
Net unrealized appreciation | | $ | 6,230,190 | |
| | | | |
Cost of Investments for Federal Income Tax Purposes | | $ | 310,192,858 | |
| | | | |
The Fund did not have any unrecognized tax benefits at June 30, 2021, nor were there any increases or decreases in unrecognized tax benefits for the period then ended; and therefore no interest or penalties were accrued. The Fund is subject to examination by the U.S. Federal and state tax authorities for returns filed for the prior three and four fiscal years, respectively.
38
TCW Strategic Income Fund, Inc.
Note 5 — Federal Income Taxes (Continued)
The following table shows the character of distributed and undistributed amounts on a tax basis for the year ended December 31, 2020.
| | | | | | | | |
| | | Amount Distributed During
the Year Ended | | | Undistributed Amount
at Year End | |
| | | December 31,
2020 | | | December 31,
2020 | |
Ordinary Income | | $ | 13,131,985 | | | $ | — | |
Capital Gain | | | — | | | | — | |
| | | | | | | | |
| | $ | 13,131,985 | | | $ | — | |
| | | | | | | | |
Note 6 — Investment Advisory and Service Fees
As compensation for the investment advisory services rendered, facilities provided, and expenses borne, the Advisor is paid a monthly fee by the Fund computed at the annual rate of 0.75% of the first $100 million of the Fund’s average managed assets and 0.50% of the Fund’s average managed assets in excess of $100 million.
Note 7 — Purchases and Sales of Securities
For the period ended June 30, 2021, purchases and sales or maturities of investment securities (excluding short-term investments) aggregated to $41,935,201 and $54,680,951, respectively, for non-U.S. Government securities, and aggregated to $237,975,826 and $234,068,483, respectively, for U.S. Government securities.
Note 8 — Directors’ Fees
Directors who are not affiliated with the Advisor received, as a group, fees and expenses of $55,884 from the Fund for the period ended June 30, 2021. Directors may elect to defer receipt of their fees in accordance with the terms of a Non-Qualified Deferred Compensation Plan. Deferred compensation is included within Accrued Directors’ Fees and Expenses in the Statement of Assets and Liabilities. Certain Officers and/or Directors of the Fund are also Officers and/or Directors of the Advisor but do not receive any compensation from the Fund.
Note 9 — Restricted Securities
The Fund is permitted to invest in securities that have legal or contractual restrictions on resale. These securities may be sold privately, but are required to be registered before being sold to the public (exemption rules apply). Private placement securities are generally considered to be restricted except for those securities traded between qualified institutional investors under the provisions of Rule 144A of the Securities Act of 1933, as amended (the “Securities Act”). However, the Fund considers 144A securities to be restricted if those securities have been deemed illiquid. Disposal of these securities may involve
39
TCW Strategic Income Fund, Inc.
Notes to Financial Statements (Unaudited) (Continued)
Note 9 — Restricted Securities (Continued)
time-consuming negotiations and expense, and prompt sale at an acceptable price may be difficult. Restricted securities held by the Fund at June 30, 2021 are listed below:
| | | | | | | | | | | | | | |
Issuer Description | | Acquisition
Date | | Acquisition
Cost | | | Aggregate
Value | | | Percentage
of Net Assets | |
Citigroup Commercial Mortgage Trust (12-GC8-XA), 1.90%, due 09/10/45 | | 2/13/2015-2/26/2015 | | $ | 289,221 | | | $ | 40,752 | | | | 0.01 | % |
GS Mortgage Securities Trust GSMS (12-GC6-XB), 0.26%, due 01/10/2045 | | 2/1/2018 | | | 141,263 | | | | 22,908 | | | | 0.01 | % |
JPMorgan Chase Commercial Mortgage Securities Trust (12-HSBC-XA), 1.58%, due 07/05/2032 | | 10/11/2017 | | | 255,570 | | | | 47,220 | | | | 0.02 | % |
Morgan Stanley Capital I Trust (12-C4-XA), 2.23%, due 03/15/45 | | 5/16/2018 | | | 252,436 | | | | 18,237 | | | | 0.01 | % |
UBS Commercial Mortgage Trust (12-C1-XA), 2.24%, due 05/10/45 | | 6/27/2017 | | | 331,415 | | | | 38,284 | | | | 0.01 | % |
WFRBS Commercial Mortgage Trust (12-C8-XA), 1.94%, due 08/15/2045 | | 12/22/2017 | | | 277,755 | | | | 42,255 | | | | 0.01 | % |
| | | | | | | | | | | | | | |
| | | | $ | 1,547,660 | | | $ | 209,656 | | | | 0.07 | % |
| | | | | | | | | | | | | | |
Note 10 — Loan Outstanding
The Fund is permitted to have borrowings for investment purposes. The Fund has entered into a line of credit agreement, renewed annually, with The Bank of New York Mellon (the “Bank”) which permits the Fund to borrow up to $70 million at a rate, per annum, equal to the Federal Funds Rate plus 1.00%. The Fund did not have any borrowings during the period ended June 30, 2021. The Fund pays the Bank a commitment fee equal to 0.08% per annum on the daily unused portion of the committed line amount. The commitment fee incurred by the Fund is presented in the Interest Expense line in the Statement of Operations.
Note 11 — Indemnifications
Under the Fund’s organizational documents, its Officers and Directors may be indemnified against certain liabilities and expenses arising out of the performance of their duties to the Fund. In addition, the Fund entered into an agreement with each of the Directors which provides that the Fund will indemnify and hold harmless each Director against any expenses actually and reasonably incurred by such Director in any proceeding arising out of or in connection with the Director’s services to the Fund, to the fullest extent permitted by the Fund’s Articles of Incorporation and By-Laws, the Maryland General Corporation Law, the Securities Act, and the 1940 Act, each as now or hereinafter in force. Additionally, in the normal course of business, the Fund enters into agreements with service providers that may contain indemnification clauses. The Fund’s maximum exposure under these arrangements is unknown as this would involve future claims that may be made against the Fund that have not yet occurred. However, based on experience, the Fund expects the risk of loss to be remote. The Fund has not accrued any liability in connection with such indemnification.
Note 12 — New Accounting Pronouncement
In March 2020, FASB issued Accounting Standards Update (ASU) No. 2020-04 — Reference Rate Reform (Topic 848): Facilitation of the Effects of Reference Rate Reform on Financial Reporting. The amendments in the ASU provide optional temporary financial reporting relief from the effect of certain types of contract
40
TCW Strategic Income Fund, Inc.
Note 12 — New Accounting Pronouncement (Continued)
modifications due to the planned discontinuation of the LIBOR and other interbank offered reference rates as of the end of 2021. The ASU is effective for certain reference rate-related contract modifications that occur during the period March 12, 2020 through December 31, 2022. Management has reviewed the requirements and believes the adoption of this ASU will not have a material impact on the financial statements.
41
TCW Strategic Income Fund, Inc.
Financial Highlights (Unaudited)
| | | | | | | | | | | | | | | | | | | | | | | | |
| | | Six Months
Ended
June 30, 2021
(Unaudited) | | | Year Ended December 31, | |
| | | 2020 | | | 2019 | | | 2018 | | | 2017 | | | 2016 | |
Net Asset Value Per Share, Beginning of period | | $ | 5.85 | | | $ | 5.73 | | | $ | 5.65 | | | $ | 5.91 | | | $ | 5.81 | | | $ | 5.83 | |
| | | | | | | | | | | | | | | | | | | | | | | | |
Income from Operations: | |
Net Investment Income (1) | | | 0.17 | | | | 0.29 | | | | 0.33 | | | | 0.30 | | | | 0.27 | | | | 0.26 | |
Net Realized and Unrealized Gain (Loss) on Investments | | | 0.03 | | | | 0.11 | | | | 0.14 | | | | (0.19 | ) | | | 0.14 | | | | 0.00 | (2) |
| | | | | | | | | | | | | | | | | | | | | | | | |
Total from Investment Operations | | | 0.20 | | | | 0.40 | | | | 0.47 | | | | 0.11 | | | | 0.41 | | | | 0.26 | |
| | | | | | | | | | | | | | | | | | | | | | | | |
Less Distributions: | |
Distributions from Net Investment Income | | | (0.11 | ) | | | (0.28 | ) | | | (0.35 | ) | | | (0.34 | ) | | | (0.28 | ) | | | (0.21 | ) |
Distributions from Net Realized Gains | | | — | | | | — | | | | (0.04 | ) | | | (0.03 | ) | | | (0.03 | ) | | | (0.07 | ) |
| | | | | | | | | | | | | | | | | | | | | | | | |
Total Distributions | | | (0.11 | ) | | | (0.28 | ) | | | (0.39 | ) | | | (0.37 | ) | | | (0.31 | ) | | | (0.28 | ) |
| | | | | | | | | | | | | | | | | | | | | | | | |
Net Asset Value Per Share, End of period | | $ | 5.94 | | | $ | 5.85 | | | $ | 5.73 | | | $ | 5.65 | | | $ | 5.91 | | | $ | 5.81 | |
| | | | | | | | | | | | | | | | | | | | | | | | |
Market Value Per Share, End of period | | $ | 5.92 | | | $ | 5.69 | | | $ | 5.77 | | | $ | 5.27 | | | $ | 5.87 | | | $ | 5.33 | |
| | | | | | | | | | | | | | | | | | | | | | | | |
Net Asset Value Total Return (3) | | | 3.44 | % (4) | | | 7.25 | % | | | 8.37 | % | | | 1.86 | % | | | 7.22 | % | | | 4.49 | % |
Market Price Return (5) | | | 6.04 | % (4) | | | 3.75 | % | | | 17.14 | % | | | (3.88 | )% | | | 16.36 | % | | | 6.56 | % |
|
Ratios/Supplemental Data: | |
| | | | | | |
Net Assets, End of period (in thousands) | | $ | 283,408 | | | $ | 279,067 | | | $ | 273,293 | | | $ | 269,594 | | | $ | 282,034 | | | $ | 277,132 | |
| | | | | | |
Ratio of Expenses Before Interest Expense to Average Net Assets | | | 0.86 | % (6) | | | 0.93 | % | | | 0.85 | % | | | 0.81 | % | | | 0.81 | % | | | 0.84 | % |
| | | | | | |
Ratio of Interest Expense to Average Net Assets | | | 0.02 | % (6) | | | 0.04 | % | | | 0.02 | % | | | 0.02 | % | | | 0.01 | % | | | 0.01 | % |
| | | | | | |
Ratio of Total Expenses to Average Net Assets | | | 0.88 | % (6) | | | 0.97 | % | | | 0.87 | % | | | 0.83 | % | | | 0.82 | % | | | 0.85 | % |
| | | | | | |
Ratio of Net Investment Income to Average Net Assets | | | 5.62 | % (6) | | | 5.07 | % | | | 5.62 | % | | | 5.13 | % | | | 4.47 | % | | | 4.38 | % |
| | | | | | |
Portfolio Turnover Rate | | | 96.07 | % (4) | | | 72.59 | % | | | 34.64 | % | | | 31.16 | % | | | 32.46 | % | | | 29.20 | % |
| | | | | | |
Asset Coverage Ratio Per Share (7) | | | — | | | | — | | | | — | | | | — | | | | — | | | | — | |
| | | | | | |
Total Debt Outstanding | | | — | | | | — | | | | — | | | | — | | | | — | | | | — | |
| (1) | Computed using average shares outstanding throughout the period. |
| (2) | Amount rounds to less than $0.01 per share. |
| (3) | Based on net asset value per share, adjusted for reinvestment of distributions. The fund does not incur charges to investors for purchasing or selling shares. |
| (4) | For the six months ended June 30, 2021 and not indicative of a full year’s results. |
| (5) | Based on market price per share, adjusted for reinvestment of distributions. The fund does not incur charges to investors for purchasing or selling shares. |
| (7) | The asset coverage ratio for a class of senior securities representing indebtedness is calculated as total assets, less all liabilities and indebtedness not represented by senior securities, divided by senior securities representing indebtedness. This asset coverage ratio is multiplied by one thousand to determine the asset coverage per share. |
See accompanying Notes to Financial Statements.
42
TCW Strategic Income Fund, Inc.
Supplemental Information
Proxy Voting Guidelines
The policies and procedures that the Fund uses to determine how to vote proxies are available without charge. The Board of the Fund has delegated the Fund’s proxy voting authority to the Advisor.
Disclosure of Proxy Voting Guidelines
The proxy voting guidelines of the Advisor are available:
| | 1. | By calling 1-877-829-4768 to obtain a hard copy; or |
| | 2. | By going to the SEC website at http://www.sec.gov. |
When the Fund receives a request for a description of the Advisor’s proxy voting guidelines, it will deliver the description that is disclosed in the Fund’s Statement of Additional Information. This information will be sent out via first class mail (or other means designed to ensure equally prompt delivery) within three
business days of receiving the request.
The Advisor, on behalf of the Fund, prepares and files Form N-PX with the SEC not later than August 31 of each year, which must include the Fund’s proxy voting record for the most recent twelve-month period ended June 30 of that year. The Fund’s proxy voting record for the most recent twelve-month period ended June 30 is available without charge:
| | 1. | By calling 1-877-829-4768 to obtain a hard copy; or |
| | 2. | By going to the SEC website at http://www.sec.gov. |
When the Fund receives a request for the Fund’s proxy voting record, it will send the information disclosed in the Fund’s most recently filed report on Form N-PX via first class mail (or other means designed to ensure equally prompt delivery) within three business days of receiving the request.
The Fund also discloses its proxy voting record on its website as soon as is reasonably practicable after its report on Form N-PX is filed with the SEC.
Availability of Quarterly Portfolio Schedule
The Fund files a complete schedule of its portfolio holdings with the SEC for the first and third quarters of its fiscal year on Form NPORT-P. Such filings occur no later than 60 days after the end of the Fund’s first and third quarters and are available on the SEC’s website at www.sec.gov.
Corporate Governance Listing Standards
In accordance with Section 303A.12(a) of the New York Stock Exchange Listed Company Manual, the Fund submitted the Annual CEO Certification certifying compliance with NYSE’s Corporate Governance Listing Standards on October 6, 2020 as part of its Annual Written Affirmation. In accordance with Section 303A.12(c) of the New York Stock Exchange Listed Company Manual, the Fund submitted the Annual Written Affirmation on October 6, 2020 and an Interim Written Affirmation on February 22, 2021.
43
TCW Strategic Income Fund, Inc.
Dividend Reinvestment Plan
Shareholders who wish to add to their investment may do so by making an election to participate in the Dividend Reinvestment Plan (the “Plan”). Under the Plan, your dividend is used to purchase Fund shares on the open market whenever shares, including the related sales commission, are selling below the Fund’s net asset value per share. You will be charged a pro-rata portion of brokerage commissions on open-market purchases under the Plan. If the market price, including commission, of Fund shares is above the Fund’s net asset value per share, you will receive shares at a price equal to the higher of the Fund’s net asset value per share on the payment date or 95% of the closing market price of Fund shares on the payment date. Generally, for tax purposes, shareholders participating in the Plan will be treated as having received a distribution from the Fund in cash equal to the value of the shares purchased from them under the Plan.
To enroll in the Plan, if your shares are registered in your name, write to Computershare, P.O. Box #50500, Louisville, KY 40233, or call toll free at (866) 227-8179. If your shares are held by a brokerage firm, please call your broker. If you participate in the Plan through a broker, you may not be able to transfer your shares to another broker and continue to participate in the Plan if your new broker does not permit such participation. If you no longer want to participate in the Plan, please contact Computershare or your broker. You may elect to continue to hold shares previously purchased on your behalf or to sell your shares and receive the proceeds, net of any brokerage commissions. If you need additional information or assistance, please call our investor relations department at (877) 829-4768 or visit our website at www.tcw.com. As always, we would be pleased to accommodate your investment needs.
Distribution Policy
The Fund has a net investment income-based distribution policy. The policy is to pay quarterly distributions out of the Fund’s accumulated undistributed net investment income and/or other sources subject to the requirements of the 1940 Act and Sub-chapter M of the Code.
Distribution policies are a matter of Board discretion and may be modified or terminated at any time without prior notice. Any such change or termination may have an adverse effect on the market price for the Fund’s shares.
You should not draw any conclusions about the Fund’s investment performance from the amount of the quarterly distribution or from the terms of the Fund’s distribution policy.
44

TCW Strategic Income Fund, Inc.
865 South Figueroa Street, Suite 1800
Los Angeles, California 90017
800 386 3829
www.TCW.com
INVESTMENT ADVISOR
TCW Investment Management Company LLC
865 South Figueroa Street, Suite 1800
Los Angeles, California 90017
TRANSFER AGENT, DIVIDEND REINVESTMENT AND DISBURSEMENT AGENT AND REGISTRAR
Computershare
P.O. Box 50500
Louisville, KY 40233
INDEPENDENT REGISTERED PUBLIC ACCOUNTING FIRM
Deloitte & Touche LLP
555 West 5th Street
Los Angeles, California 90013
CUSTODIAN & ADMINISTRATOR
State Street Bank & Trust Company
One Lincoln Street
Boston, Massachusetts 02111
LEGAL COUNSEL
Paul Hastings LLP
101 California Street, 48th Floor
San Francisco, California 94111
DIRECTORS
Samuel P. Bell
Director
Patrick C. Haden
Director and Chairman
David B. Lippman
Director, President, and Chief Executive Officer
Peter McMillan
Director
Victoria B. Rogers
Director
Andrew Tarica
Director
OFFICERS
Meredith S. Jackson
Senior Vice President, General Counsel and Secretary
Richard M. Villa
Treasurer and Principal Financial and Accounting Officer
Gladys Xiques
Chief Compliance Officer
and Anti-Money Laundering Officer
Lisa Eisen
Tax Officer
Eric W. Chan
Assistant Treasurer
Patrick W. Dennis
Assistant Secretary
TSIart9445 6/30/21
Not required for this filing.
| Item 3. | Audit Committee Financial Expert. |
Not required for this filing.
| Item 4. | Principal Accountant Fees and Services. |
Not required for this filing.
| Item 5. | Audit Committee of Listed Registrants. |
Not required for this filing.
| (a) | The Schedule of Investments is included as part of the Report to Shareholders filed under Item 1 of this Form N-CSR. |
| Item 7. | Disclosure of Proxy Voting Policies and Procedures for Closed-End Management Investment Companies. |
Not required for this filing.
| Item 8. | Portfolio Managers of Closed-End Management Investment Companies. |
Not required for this filing.
| Item 9. | Purchases of Equity Securities by Closed-End Management Investment Company and Affiliated Purchasers. |
None.
| Item 10. | Submission of Matters to a Vote of Security Holders. |
There have been no material changes to the procedures by which shareholders may recommend nominees to the Registrant’s Board of Directors.
| Item 11. | Controls and Procedures. |
| (a) | The Chief Executive Officer and Principal Financial and Accounting Officer have concluded that the Registrant’s disclosure controls and procedures (as defined in Rule 30a-3(c) under the 1940 Act) provide reasonable assurances that material information relating to the Registrant is made known to them by the appropriate persons as of a date within 90 days of the filing date of this report, based on their evaluation of these controls and procedures required by Rule 30a-3(b) under the 1940 Act and 15d-15(b) under the Securities Exchange Act of 1934, as amended. |
| (b) | There were no changes in the Registrant’s internal control over financial reporting (as defined in Rule 30a-3(d) under the 1940 Act) that occurred during the period covered by this report that have materially affected, or are reasonably likely to materially affect, the Registrant’s internal control over financial reporting. |
| Item 12. | Disclosure of Securities Lending Activities for Closed-End Management Investment Companies. |
Not applicable.
SIGNATURES
Pursuant to the requirements of the Securities Exchange Act of 1934, as amended, and the Investment Company Act of 1940, as amended, the Registrant has duly caused this report to be signed on its behalf by the undersigned, thereunto duly authorized.
| | |
| (Registrant) | | TCW Strategic Income Fund, Inc. |
| |
| By (Signature and Title) | | /s/ David B. Lippman |
| | David B. Lippman President and Chief Executive Officer |
| |
| Date | | August 31, 2021 |
Pursuant to the requirements of the Securities Exchange Act of 1934, as amended, and the Investment Company Act of 1940, as amended, this report has been signed below by the following persons on behalf of the Registrant and in the capacities and on the dates indicated.
| | |
| By (Signature and Title) | | /s/ David B. Lippman |
| | David B. Lippman |
| | President and Chief Executive Officer |
| |
| Date | | August 31, 2021 |
| |
| By (Signature and Title) | | /s/ Richard M. Villa |
| | Richard M. Villa |
| | Treasurer and Principal Financial and Accounting Officer |
| |
| Date | | August 31, 2021 |