UNITED STATES
SECURITIES AND EXCHANGE COMMISSION
Washington, D.C. 20549
FORM N-CSR
CERTIFIED SHAREHOLDER REPORT OF
REGISTERED MANAGEMENT INVESTMENT COMPANIES
Investment Company Act file number: 811-04980
TCW Strategic Income Fund, Inc.
(Exact name of registrant as specified in charter)
865 South Figueroa Street, Suite 1800, Los Angeles, CA 90017
(Address of principal executive offices)
Patrick W. Dennis, Esq.
Vice President and Assistant Secretary
865 South Figueroa Street, Suite 1800
Los Angeles, CA 90017
(Name and address of agent for service)
Registrant’s telephone number, including area code: (213) 244-0000
Date of fiscal year end: December 31
Date of reporting period: December 31, 2021
| Item 1. | Reports to Stockholders. |
| (a) | The following is a copy of the report transmitted to shareholders pursuant to Rule 30e-1 under the Investment Company Act of 1940, as amended (the “1940 Act”): |

Paper copies of the Fund’s annual and semi-annual shareholder reports will no longer be sent by mail, unless you specifically request paper copies of the reports. Instead, the reports will be made available on the Fund’s website (www.tcw.com), and you will be notified by mail each time a report is posted and provided with a website link to access the report.
You may elect to receive all future reports in paper free of charge. You can call 1-800-FUND-TCW (1-800-386-3829), if you invest directly with the Fund, or contact your financial intermediary, if you invest though a financial intermediary, to inform the Fund or the financial intermediary that you wish to continue receiving paper copies of your shareholder reports. Your election to receive reports in paper will apply to all funds held directly with TCW or through your financial intermediary.
| | |
To Our Valued Shareholders | | |
| | |

| | David Lippman President, Chief Executive Officer and Director |
To the shareholders of the TCW Strategic Income Fund:
Executive Summary
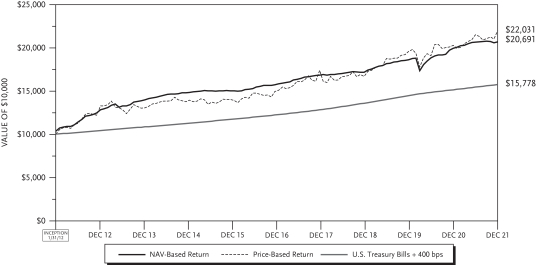
TCW is pleased to present the 2021 annual report for the TCW Strategic Income Fund (“TSI” or the “Fund”). TSI is a multi-asset class closed-end fund managed by TCW Investment Management Company and is listed on the New York Stock Exchange under the ticker TSI. For 2021, the price of TSI shares increased by 8.03% while the Fund’s net asset value (i.e., returns of the underlying assets) grew by 3.55%. For reference, TSI’s customized benchmark, a construct that is 25% high yield, 15% equities, 15% convertible bonds, and 45% U.S. Aggregate Bond Index, gained 5.60% in 2021. While the underlying assets trailed the benchmark, the Fund’s one-year price-based return was higher than the NAV-based return as the share price moved from a discount to NAV of 2.7% at the start of the year to a 1.4% premium by December 31, 2021. Since inception and 10 Year annualized NAV-based and price-based returns both remain ahead of the Fund’s benchmark.
Over the past four quarters, the Fund paid dividends of 5.5 cents per share each quarter, as well as a short- and a long-term capital gains distribution of 4.02 cents per share and 7.77 cents per share, respectively, and a special cash payment of 2.90 cents per share. This represents an annualized rate of approximately 37 cents per share, contributing to a realized 12-month trailing yield of approximately 6.4%, as of 12/31/2021. As yield is a function of a number of parameters, the go-forward yield of TSI will likely differ from the trailing figure.
TSI Benchmark Discussion
TSI’s existing blended benchmark1 dates back to the inception of the Fund when it was envisioned to be a (predominantly) convertibles fund. The management team believes that since TSI is now run as a multi-sector fund, primarily a fixed income fund, the original blended benchmark has lost its relevance. As such, TSI’s existing benchmark with be replaced effective March 1, 2022 with a benchmark that more closely aligns with its multi-sector fixed-income orientation, U.S. Treasury Bills + 400 basis points.
The table below shows TSI price-based and NAV-based returns historically compared to the existing blended benchmark and the proposed new benchmark of U.S. Treasury Bills + 400 basis points.
Fund Performance (%)
| | | | | | | | | | | | | | | | | | | | | | | | |
| | | Annualized Total Return as of December 31, 2021 | |
| | | 1 Year | | | 3 Year | | | 5 Year | | | 10 Year | | | Since
3/1/06(2) | | | Since
3/5/87(3) | |
Price-Based Return | | | 8.03 | | | | 9.50 | | | | 7.99 | | | | 8.20 | | | | 9.84 | | | | 8.18 | |
NAV-Based Return | | | 3.55 | | | | 6.37 | | | | 5.64 | | | | 7.54 | | | | 8.41 | | | | 8.25 | |
Custom Benchmark (1) | | | 5.60 | | | | 11.82 | | | | 8.48 | | | | 7.53 | | | | 6.91 | | | | N/A | |
U.S. Treasury Bills + 400 bps | | | 4.05 | | | | 5.04 | | | | 5.19 | | | | 4.67 | | | | 5.19 | | | | 7.21 | |
| (1) | Custom Benchmark Index: 15% S&P 500 with Income, 15% ICE BofA U.S. Convertibles Index, 45% Bloomberg U.S. Aggregate Bond Index, 25% FTSE High Yield Cash Pay Index. |
| (2) | The date on which the Fund’s investment objective changed to a multi-asset class fund. Prior to this date, the Fund primarily invested in convertible securities. |
| (3) | Inception date of the Fund. |
Past performance is no guarantee of future results. Current performance may be lower or higher than that quoted. The market value and net asset value of the Fund’s shares will fluctuate with market conditions. Returns shown do not reflect the deduction of taxes that a shareholder would pay on the Fund’s distributions. You should not draw any conclusions about the Fund’s performance from the amount of the quarterly distribution or from the terms of the Fund’s distribution policy.
1
Management Commentary
For everything that went on in between, in many ways the year finished much like it started — inflation as a headline risk, proving more lasting than expected, while COVID-19 once again dominated investor sentiment, this time with the Omicron variant. The persistence of inflation beyond a transitory post-vaccine surge was highlighted by a year-on-year 6.8% advance for headline Consumer Price Index (CPI) in November, its largest such increase in nearly 30 years. Against this backdrop, the Fed and elected officials are in rare accord over an aim to curb inflation. For its part, the Fed responded in December with an accelerated pace to its tapering of U.S. Treasury and agency mortgage-backed securities (MBS) purchases with expectations to segue hiking the funds rate from the zero bound. Fed funds futures now signal three hikes in 2022 to be followed by three in 2023 (a far cry from the March 2021 Federal Open Market Committee (FOMC) meeting, when the median dot reflected NO rate hikes through the end of 2023). Markets are currently rather sanguine about Chair Powell and the FOMC’s handle on the course of monetary policy, perhaps overly optimistic, as the last decade has been marked by seemingly unavoidable detours on the Fed’s road to a would-be terminal rate. This view is further motivated by the waning impact of (and lessened appetite for new) fiscal stimulus that might exacerbate inflationary leanings much beyond the short-intermediate term. Meanwhile, from a macroeconomic perspective, the traditional set of indicators used to evaluate the health of the economy all pointed in different directions throughout the year. Robust GDP growth and strong corporate earnings suggest the economy is in early cycle form, while high inflation, a flat yield curve, record equity market valuations, and tight credit spreads are all indicative of later cycle conditions. The labor market is similarly confounding — while unemployment levels have dropped dramatically from lockdown highs and workers seem to be finding some long-dormant pricing power, the participation rate remains lackluster, suggesting there are still millions of people who could be working but are not. To be sure, pandemic-related distortions are rampant, and uncertainty does not appear to be fading soon.
Equities proved ebullient despite a lack of much consistently good news, with the S&P 500 Index defying even the most confident early-year projections and rising to its 70th record close for the year as 2021 came to an end. The Index soared 11% in Q4, and over 28% for the year — a doubling since the pandemic low of March 2020! Fixed income markets, by contrast, were held back by rate volatility. The Bloomberg U.S. Aggregate Bond Index return was flat in the fourth quarter, and the sector trailed duration-matched Treasuries by 15 basis points (bps). Over the full year, a nearly 60 bps move higher for the 10-Year U.S. Treasury yield challenged fixed income total returns and the Bloomberg U.S. Aggregate Bond Index delivered a 1.5% loss, with Treasuries leading the decline by falling 2.3%, its first full-year loss since 2013, while
2
credit and mortgage-backed securities fell by approximately 1%. Nevertheless, yield premiums actually declined over the year and most sectors beat Treasuries on a duration-adjusted basis. The risk factors that led to rate volatility, such as the prospect of monetary tightening and increased inflation, did little to deter inflows and rattle corporate spreads against a relatively stable year of muted credit volatility, i.e., range-bound yield spreads in investment grade and high yield. Sectors linked to economic re-opening outperformed in 2021, notably airlines, lodging and energy. Lower quality credits were also outperformers on seemingly little stress, with the speculative universe posting a 0.7% return in 4Q and 5.3% for the year with a default rate under 0.5%, the slowest calendar year pace since 2007. Among securitized issues, returns were mixed, though legacy non-Agency MBS led on strong housing price appreciation and continued borrower profile improvements, while also benefitting from their floating rate structures. Conversely, agency MBS was victim not only to higher rates, but also to concerns over accelerated Fed tapering, though TBAs (To-Be-Announced) still profited from the Fed’s ongoing buys, especially lower coupons. The sector slipped 0.4% in the fourth quarter and 1.0% for the year (and lagged duration-matched Treasuries). Meanwhile, commercial MBS fell 0.6% in 4Q, and 1.2% in 2021, though non-agency issues outran agency-backed issues during the full year. Similarly, asset-backed securities (ABS) was down 0.6% for the quarter and 0.3% for the year, though the sector managed positive excess returns for the year.
The Economy and Market Ahead
As the end of the year demonstrated, markets are in a vulnerable position as economic momentum, which was positive coming into the final quarter of 2021, showed signs of subsiding. Market corrections can be anticipated in the coming months, particularly as valuations currently price in a “Goldilocks” environment of reasonable growth, controlled inflation, and solid earnings, none of which are guaranteed. In fact, risks to this outlook lean heavily negative, with potential drags from slower demand due to depleted consumer savings and significantly less direct fiscal support, rising inflation leading to higher interest rates, virus-related shutdowns, and ongoing labor shortages. Meanwhile, the risk of a policy error is heightened, as the Fed must negotiate the degree and pace of policy pullback at the same time that fiscal stimulus fades, particularly as growth prospects in the face of ongoing pandemic restrictions remain suspect. Remove accommodation too quickly, and the threat of deflation and recession rises, while too slow a withdrawal increases the possibility of higher inflation and meaningfully higher interest rates. Neither of those potential outcomes is priced into markets currently and, with economic cycle indicators still diverging greatly, expectations are for elevated volatility — with pinpoint forecasting of the sources less important than the volatility itself.
With markets optimistically pricing in a seamless transition from the end of taper to the start of a hiking regime a month later, duration positioning remains somewhat defensive versus the broader fixed income market, owing to inflationary expectations persisting into 2022 and consequent reactions in rates. Discipline will dictate the portfolio management team’s response with tactical adjustments to overall duration and yield curve positioning predicated on the reaction to policy action (or lack of) in the form of steepening or flattening. On the credit side of things, the biggest obstacle to prospective performance is valuations. As such, the team worked throughout the year to de-risk among credit holdings — reducing exposure (especially tight cyclical exposure while rotating into less cyclical sectors like banks and select technology companies), trimming spread duration, and maintaining liquidity in order to be prepared for the next bout of volatility. Municipal debt was also trimmed early in the year as valuations improved. Exposure to high yield credit was also taken modestly lower in a disciplined fashion. Emerging market debt remains a small position, as potentially raising rates and risks of slowing global growth make relative value unattractive in most cases, and was reduced slightly over the year. Within securitized, legacy non-agency MBS remains attractive from a collateral perspective, with the added benefit of having largely floating rate coupons, and the Fund will continue sourcing exposure at favorable valuations. The position in current coupon agency MBS TBAs was increased early in the year, then trimmed as valuations improved, but maintained an emphasis on current (low) coupon TBAs with attractive financing rates given the Fed’s sizable (albeit declining)
3
buying. In commercial mortgage-backed securities (CMBS), though current holdings continue to focus on top-of-the-capital structure exposures in single asset, single borrower (SASB) AAA-rated issues, opportunities are beginning to present in AA- and A-rated collateral with good loan-to-value (LTV) ratios, i.e., protection, and good spread compensation. A similar strategy applies to collateralized loan obligations (CLOs), with additions of well-collateralized AA-rated issues offering good yields alongside solid liquidity, while other ABS exposure includes government-guaranteed FFELP student loans.
Portfolio Positioning
SECTOR ALLOCATION
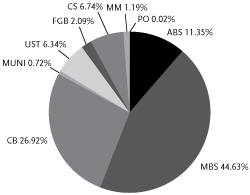
| Asset-backed | Securities (ABS) |
| Foreign | Government Bonds (FGB) |
| Money | Market Investments (MM) |
| Mortgage-backed | Securities (MBS) |
U.S. Treasury Securities (UST)
MBS ALLOCATION

| Commercial | Mortgage-Backed Securities (CMBS) |
| Residential | Mortgage-Backed Securities (RMBS) |
Modest leverage can be utilized by the Fund through a Line of Credit facility, though the Fund does not currently use any of the available $70 million commitment. Leverage may return to the Fund when market opportunity is more abundant and management deems the use of leverage is accretive to returns.
We greatly appreciate your investment in the Fund and your continuing support of TCW. If you have any additional questions or comments, we invite you to visit our website at www.tcw.com or contact our shareholder services department at 1-866-227-8179, or contact@tcw.com.
Sincerely,

David Lippman
President, Chief Executive Officer and Director
The views expressed in this report reflect those of the Fund’s Advisor as of the date this is written and may not reflect its views on the date this report is first published or anytime thereafter. These views are intended to assist shareholders in understanding the Fund’s investment methodology and do not constitute investment advice. This report may contain discussions about investments that may or may not be held by the Fund as of the date of this report. All current and future holdings are subject to risk and to change. To the extent this report contains forward-looking statements, unforeseen circumstances may cause actual results to differ materially from the views expressed as of the date this is written.
4
TCW Strategic Income Fund, Inc.
Management Discussion
The TCW Strategic Income Fund gained 3.55% (NAV-based return), trailing the TSI Custom Benchmark by just over 200 bps. Underperformance relative to the benchmark can almost entirely be attributed to the Fund’s lower allocation to “plus” sectors — equities, convertibles and high yield corporates, all of which posted strong returns in 2021. An overweight to investment grade credit and the allocation to securitized credit products helped to offset underperformance. Throughout the year, the Fund maintained its sizable position in non-agency residential MBS (absent in the benchmark) and the sector gained more than 6%, supported by a solid U.S. housing backdrop with prices rising and loan-to-value ratios improving. Finally, the allocation to CMBS and ABS also added marginally to returns as non-agency CMBS outpaced Treasuries by over 140 bps while ABS was supported (more-so during the first half of the year) by policy that helped keep the consumer afloat. Finally, the moderate allocation to agency MBS (predominantly TBAs) had a mild positive net contribution to return as additional roll carry helped offset spread widening in the sector.
Dividend Distribution Discussion
Over time, the manner in which the Fund’s quarterly distribution is determined has evolved. Prior to 2014, the Fund had a managed distribution policy whereby dividends for the upcoming year were estimated at the beginning of the year and dividends were held constant throughout the given calendar year. The Fund approached over-distribution, a return of capital, in 2013 due to volatility in income and corresponding tax adjustments on Non-Agency MBS bonds. This resulted in switching to a “pass-through” distribution policy in 2014, essentially distributing all income to shareholders. In 2020, the dispersion of quarterly dividend amounts under the “pass-through” distribution policy was very high, due to interest rate volatility associated with the onset of the pandemic and the corresponding impact of tax adjustments to distributable income. The dividend dispersion led to a re-evaluation of the distribution policy and adjustments to the methods being used to project distributable income summarized in this memo.
The goal of the Fund’s distribution policy is to maintain a stable payout without having to return capital to investors. A stable dividend policy will inevitably result in income surplus or deficit at the end of the year given it is impossible to estimate the Fund’s distributable income with 100% precision. Income from MBS securities, real estate mortgage investment conduits (REMIC), are also subject to tax adjustments. REMIC adjustments represent differences between distributable income recognized for tax purposes and income per GAAP accounting records maintained by State Street Bank. Fluctuating interest rates tend to impact the magnitude of REMIC adjustments and hence, the distributable income. The Fund will aim to improve its estimate of distributable income by increasing the frequency of REMIC adjustment analysis performed by KPMG from twice a year to at least four times a year to match the Fund’s dividend distribution frequency. TCW will also furnish KPMG with cash flow projections for securitized bonds held in TSI based on internal modeling in order to further improve projections of distributable income. Finally, the Fund will also maintain a modest reserve balance such that an income surplus remains at the end of the year as opposed to a shortfall.
This new approach was applied beginning in 2021 and the results were satisfactory. The fund maintained a 5.5 cent quarterly dividend throughout the year with a modest income surplus of 3.1 cents at year-end of which 2.9 cents was paid out as a special year-end dividend. TCW will continue to monitor the Fund’s income reserve for increases in surplus or shortfall and make adjustments to the quarterly dividend as warranted, with the goal of minimizing the dispersion of the quarterly dividend amounts and maintaining the dividend’s stability.
5
TCW Strategic Income Fund, Inc.
Management Discussions (Continued)
Rule 8b-16 Disclosure
Rule 8b-16 under the Investment Company Act of 1940, as amended, requires that we disclose certain information to stockholders in our annual report. That disclosure is included in this report as follows: (1) information about our dividend investment plan is included on page 60. (2) information about our investment objectives and policies is included on pages 43-44, and (3) information regarding the principal risk factors associated with investment in the Fund is included on pages 44-46. During the fiscal year ended December 31, 2021, there were no changes to our charter or by-laws that were not approved by stockholders that delay or prevent a change of control, nor were there changes to persons who are primarily responsible for the day-to-day management of the Company’s investment portfolio other than the retirement of Tad Rivelle effective as of December 31, 2021. After the retirement of Mr. Rivelle, Laird R. Landmann, Stephen M. Kane, Bryan T. Whalen and Mitch Flack continue to be jointly and primarily responsible for the day-to-day management of the Fund’s assets. The foregoing information is a summary of certain changes since the date the Fund’s annual report for the fiscal year ended December 31, 2020. This information may not reflect all of the changes that have occurred since you purchased shares of the Fund.
6
TCW Strategic Income Fund, Inc.
Schedule of Investments | December 31, 2021 |
| | | | | | | | | | | | |
| Issues | | Maturity
Date | | | Principal
Amount | | | Value | |
|
FIXED INCOME SECURITIES — 96.2% of Net Assets | |
|
| ASSET-BACKED SECURITIES — 12.9% | |
| |
321 Henderson Receivables LLC (17-1A-A) | | | | | |
| | | |
3.99% (1) | | | 08/16/60 | | | $ | 203,591 | | | $ | 228,341 | |
| |
Allegro CLO XII, Ltd. (20-1A-B) | | | | | |
| | | |
1.83% (3 mo. USD
LIBOR + 1.700%) (1)(2) | | | 01/21/32 | | | | 475,000 | | | | 474,952 | |
| |
AMSR Trust (20-SFR1-I) | | | | | |
| | | |
8.19% (1) | | | 04/17/37 | | | | 685,000 | | | | 724,573 | |
| |
Apidos CLO (21-37A-B) | | | | | |
| | | |
1.73% (3 mo. USD
LIBOR + 1.600%) (1)(2) | | | 10/22/34 | | | | 725,000 | | | | 721,032 | |
| |
Bayview Commercial Asset Trust (03-2-A) | | | | | |
| | | |
0.97% (1 mo. USD
LIBOR + 0.870%) (1)(2) | | | 12/25/33 | | | | 222,217 | | | | 219,188 | |
| |
Bayview Commercial Asset Trust (04-2-A) | | | | | |
| | | |
0.75% (1 mo. USD
LIBOR + 0.645%) (1)(2) | | | 08/25/34 | | | | 210,414 | | | | 209,976 | |
| |
Bayview Commercial Asset Trust (04-3-A1) | | | | | |
| | | |
0.66% (1 mo. USD
LIBOR + 0.555%) (1)(2) | | | 01/25/35 | | | | 106,871 | | | | 106,027 | |
| |
Blackrock Rainier CLO VI, Ltd. (21-6A-A) | | | | | |
| | | |
1.83% (3 mo. USD
LIBOR + 1.700%) (1)(2) | | | 04/20/33 | | | | 700,000 | | | | 701,993 | |
| |
BMO SBA COOF Trust (19-1-A) (I/O) | | | | | |
| | | |
1.57% (1)(3) | | | 10/25/45 | | | | 7,808,422 | | | | 450,831 | |
| |
Brazos Higher Education Authority, Inc. (10-1-A2) | | | | | |
| | | |
1.38% (3 mo. USD
LIBOR + 1.200%) (2) | | | 02/25/35 | | | | 2,200,000 | | | | 2,239,669 | |
| |
Carvana Auto Receivables Trust 2020-P1
(20-P1-R) | | | | | |
| | | |
0.00% (1)(4) | | | 09/08/27 | | | | 2,000 | | | | 595,000 | |
| |
Carvana Auto Receivables Trust 2021-N3
(21-N3-R) | | | | | |
| | | |
0.00% (1)(4) | | | 06/12/28 | | | | 2,200 | | | | 862,656 | |
| |
Cedar Funding XII CLO, Ltd. (20-12A-A1R) | | | | | |
| | | |
1.26% (3 mo. USD
LIBOR + 1.130%) (1)(2) | | | 10/25/34 | | | | 1,375,000 | | | | 1,372,627 | |
| |
CIFC Funding, Ltd. (18-1A-SUB) | | | | | |
| | | |
1.00% (1)(3) | | | 04/18/31 | | | | 650,000 | | | | 480,894 | |
| |
CIT Education Loan Trust (07-1-A) | | | | | |
| | | |
0.31% (3 mo. USD
LIBOR + 0.090%) (1)(2) | | | 03/25/42 | | | | 526,723 | | | | 506,937 | |
| |
COOF Securitization Trust II (15-2-A1) (I/O) | | | | | |
| | | |
2.44% (1)(3) | | | 08/25/41 | | | | 3,484,019 | | | | 240,027 | |
| |
CoreVest American Finance Trust (19-1-XA) (I/O) | | | | | |
| | | |
2.16% (1)(3) | | | 03/15/52 | | | | 1,512,627 | | | | 80,014 | |
| | | | | | | | | | | | |
| Issues | | Maturity
Date | | | Principal
Amount | | | Value | |
|
| ASSET-BACKED SECURITIES (Continued) | |
| |
CoreVest American Finance Trust (20-1-A2) | | | | | |
| | | |
2.30% (1) | | | 03/15/50 | | | $ | 470,000 | | | $ | 472,293 | |
| |
CoreVest American Finance Trust (20-3-XA) (I/O) | | | | | |
| | | |
3.67% (1)(3) | | | 08/15/53 | | | | 1,552,292 | | | | 223,776 | |
| |
CoreVest American Finance Trust (20-3-XB) (I/O) | | | | | |
| | | |
2.61% (1)(3) | | | 08/15/53 | | | | 1,650,000 | | | | 275,644 | |
| |
Dryden CLO, Ltd. (20-85A-AR) | | | | | |
| | | |
1.27% (3 mo. USD
LIBOR +
1.150%) (1)(2) | | | 10/15/35 | | | | 1,375,000 | | | | 1,375,929 | |
| |
Eaton Vance CLO, Ltd. (20-1A-AR) | | | | | |
| | | |
1.29% (3 mo. USD
LIBOR +
1.170%) (1)(2) | | | 10/15/34 | | | | 850,000 | | | | 850,878 | |
| |
Education Loan Asset-Backed Trust I (13-1-A2) | | | | | |
| | | |
0.90% (1 mo. USD
LIBOR +
0.800%) (1)(2)(5) | | | 04/26/32 | | | | 999,241 | | | | 1,000,090 | |
| |
EFS Volunteer No 2 LLC (12-1-A2) | | | | | |
| | | |
1.45% (1 mo. USD
LIBOR +
1.350%) (1)(2) | | | 03/25/36 | | | | 964,487 | | | | 977,299 | |
| |
Global SC Finance SRL (14-1A-A2) | | | | | |
| | | |
3.09% (1) | | | 07/17/29 | | | | 112,375 | | | | 113,076 | |
| |
Goal Capital Funding Trust (06-1-B) | | | | | |
| | | |
0.63% (3 mo. USD
LIBOR + 0.450%) (2) | | | 08/25/42 | | | | 184,194 | | | | 173,864 | |
| |
Harvest Commercial Capital Loan Trust (19-1-A) | | | | | |
| | | |
3.29% (1)(3) | | | 09/25/46 | | | | 573,110 | | | | 575,523 | |
| |
HPS Loan Management, Ltd. (0A-16-A1RR) | | | | | |
| | | |
1.27% (3 mo. USD
LIBOR +
1.140%) (1)(2) | | | 04/20/34 | | | | 875,000 | | | | 873,922 | |
| |
ITE Rail Fund Levered LP (21-1A-A) | | | | | |
| | | |
2.25% (1) | | | 02/28/51 | | | | 403,106 | | | | 403,025 | |
| |
LMREC Inc. (19-CRE3-A) | | | | | |
| | | |
1.50% (1 mo. USD
LIBOR +
1.400%) (1)(2) | | | 12/22/35 | | | | 890,000 | | | | 889,040 | |
| |
Magnetite VII, Ltd. (12-7A-A1R2) | | | | | |
| | | |
0.92% (3 mo. USD
LIBOR +
0.800%) (1)(2) | | | 01/15/28 | | | | 402,030 | | | | 401,206 | |
| |
Nelnet Student Loan Trust (14-4A-A2) | | | | | |
| | | |
1.05% (1 mo. USD
LIBOR +
0.950%) (1)(2) | | | 11/25/48 | | | | 575,000 | | | | 578,271 | |
| |
Neuberger Berman Loan Advisers CLO, Ltd. (21-43A-A) | | | | | |
| | | |
1.24% (3 mo. USD
LIBOR +
1.130%) (1)(2) | | | 07/17/35 | | | | 800,000 | | | | 800,098 | |
See accompanying Notes to Financial Statements.
7
TCW Strategic Income Fund, Inc.
Schedule of Investments (Continued)
| | | | | | | | | | | | |
| Issues | | Maturity
Date | | | Principal
Amount | | | Value | |
|
| ASSET-BACKED SECURITIES (Continued) | |
| |
North Carolina State Education Assistance Authority (11-1-A3) | | | | | |
| | | |
1.02% (3 mo. USD
LIBOR + 0.900%) (2) | | | 10/25/41 | | | $ | 1,287,237 | | | $ | 1,285,891 | |
| |
OCP CLO, Ltd. (21-21A-B) | | | | | |
| | | |
1.83% (3 mo. USD
LIBOR + 1.700%) (1)(2) | | | 07/20/34 | | | | 400,000 | | | | 398,917 | |
| |
OHA Credit Funding, Ltd. (20-7A-A) | | | | | |
| | | |
1.37% (3 mo. USD
LIBOR + 1.250%) (1)(2) | | | 10/19/32 | | | | 1,400,000 | | | | 1,400,210 | |
| |
Palmer Square CLO, Ltd. (18-1A-A1) | | | | | |
| | | |
1.15% (3 mo. USD
LIBOR + 1.030%) (1)(2) | | | 04/18/31 | | | | 600,000 | | | | 599,622 | |
| |
Palmer Square Loan Funding Ltd. (20-2A-A2) | | | | | |
| | | |
1.68% (3 mo. USD
LIBOR + 1.550%) (1)(2) | | | 04/20/28 | | | | 350,000 | | | | 350,075 | |
| |
Park Avenue Institutional Advisers CLO, Ltd.
(21-1A-A2) | | | | | |
| | | |
1.88% (3 mo. USD
LIBOR + 1.750%) (1)(2) | | | 01/20/34 | | | | 420,000 | | | | 419,924 | |
| |
Regata XII Funding, Ltd. (19-1A-BR) | | | | | |
| | | |
1.68% (3 mo. USD
LIBOR + 1.600%) (1)(2) | | | 10/15/32 | | | | 725,000 | | | | 724,420 | |
| |
Rockford Tower CLO, Ltd. (20-1A-D) | | | | | |
| | | |
3.88% (3 mo. USD
LIBOR + 3.750%) (1)(2) | | | 01/20/32 | | | | 900,000 | | | | 900,316 | |
| |
Scholar Funding Trust (12-B-A2) | | | | | |
| | | |
1.20% (1 mo. USD
LIBOR + 1.100%) (1)(2) | | | 03/28/46 | | | | 605,993 | | | | 615,675 | |
| |
SLC Student Loan Trust (04-1-B) | | | | | |
| | | |
0.44% (3 mo. USD
LIBOR + 0.290%) (2) | | | 08/15/31 | | | | 240,798 | | | | 224,230 | |
| |
SLC Student Loan Trust (06-1-B) | | | | | |
| | | |
0.41% (3 mo. USD
LIBOR +
0.210%) (2) | | | 03/15/55 | | | | 329,348 | | | | 304,468 | |
| |
SLM Student Loan Trust (04-2-B) | | | | | |
| | | |
0.59% (3 mo. USD
LIBOR + 0.470%) (2) | | | 07/25/39 | | | | 282,809 | | | | 270,294 | |
| |
SLM Student Loan Trust (05-9-B) | | | | | |
| | | |
0.42% (3 mo. USD
LIBOR + 0.300%) (2) | | | 01/25/41 | | | | 344,801 | | | | 326,484 | |
| |
SLM Student Loan Trust (07-6-B) | | | | | |
| | | |
0.97% (3 mo. USD
LIBOR + 0.850%) (2) | | | 04/27/43 | | | | 126,205 | | | | 121,457 | |
| | | | | | | | | | | | |
| Issues | | Maturity
Date | | | Principal
Amount | | | Value | |
|
| ASSET-BACKED SECURITIES (Continued) | |
| |
SLM Student Loan Trust (07-7-B) | | | | | |
| | | |
0.87% (3 mo. USD
LIBOR + 0.750%) (2) | | | 10/27/70 | | | $ | 150,000 | | | $ | 140,420 | |
| |
SLM Student Loan Trust (08-2-B) | | | | | |
| | | |
1.32% (3 mo. USD
LIBOR + 1.200%) (2) | | | 01/25/83 | | | | 225,000 | | | | 216,376 | |
| |
SLM Student Loan Trust (08-3-B) | | | | | |
| | | |
1.32% (3 mo. USD
LIBOR + 1.200%) (2) | | | 04/26/83 | | | | 225,000 | | | | 211,439 | |
| |
SLM Student Loan Trust (08-4-B) | | | | | |
| | | |
1.97% (3 mo. USD
LIBOR + 1.850%) (2) | | | 04/25/73 | | | | 515,000 | | | | 517,577 | |
| |
SLM Student Loan Trust (08-5-B) | | | | | |
| | | |
1.97% (3 mo. USD
LIBOR + 1.850%) (2) | | | 07/25/73 | | | | 260,000 | | | | 260,527 | |
| |
SLM Student Loan Trust (08-6-B) | | | | | |
| | | |
1.97% (3 mo. USD
LIBOR + 1.850%) (2) | | | 07/26/83 | | | | 225,000 | | | | 227,027 | |
| |
SLM Student Loan Trust (08-7-B) | | | | | |
| | | |
1.97% (3 mo. USD
LIBOR + 1.850%) (2) | | | 07/26/83 | | | | 305,000 | | | | 306,907 | |
| |
SLM Student Loan Trust (08-8-B) | | | | | |
| | | |
2.37% (3 mo. USD
LIBOR + 2.250%) (2) | | | 10/25/75 | | | | 260,000 | | | | 261,326 | |
| |
SLM Student Loan Trust (08-9-B) | | | | | |
| | | |
2.37% (3 mo. USD
LIBOR + 2.250%) (2) | | | 10/25/83 | | | | 260,000 | | | | 262,471 | |
| |
SLM Student Loan Trust (13-M1-M1R) | | | | | |
| | | |
0.00% (1)(4) | | | 10/28/29 | | | | 1,000 | | | | 940,330 | |
| |
Stratus CLO, Ltd. (21-3A) | | | | | |
| | | |
1.00% (1)(3) | | | 12/29/29 | | | | 750,000 | | | | 716,247 | |
| |
Structured Receivables Finance LLC (10-A-B) | | | | | |
| | | |
7.61% (1) | | | 01/16/46 | | | | 522,005 | | | | 575,313 | |
| |
Structured Receivables Finance LLC (10-B-B) | | | | | |
| | | |
7.97% (1) | | | 08/15/36 | | | | 332,949 | | | | 390,770 | |
| |
Student Loan Consolidation Center (02-2-B2) | | | | | |
| | | |
1.65% (28 day Auction
Rate) (1)(2) | | | 07/01/42 | | | | 1,050,000 | | | | 968,161 | |
| |
TCI-Flatiron CLO, Ltd. (16-1A-BR2) | | | | | |
| | | |
1.72% (3 mo. USD LIBOR +
1.600%) (1)(2) | | | 01/17/32 | | | | 280,000 | | | | 280,000 | |
| |
TRESTLES CLO V, Ltd. (21-5A-A1) | | | | | |
| | | |
1.34% (3 mo. USD
LIBOR + 1.170%) (1)(2) | | | 10/20/34 | | | | 525,000 | | | | 525,359 | |
| | | | | | | | | | | | |
| | |
Total Asset-backed Securities | | | | | | | | | |
| | | |
(Cost: $34,492,877) | | | | | | | | | | | 34,940,904 | |
| | | | | | | | | | | | |
See accompanying Notes to Financial Statements.
8
TCW Strategic Income Fund, Inc.
December 31, 2021
| | | | | | | | | | | | |
| Issues | | Maturity
Date | | | Principal
Amount | | | Value | |
|
MORTGAGE-BACKED SECURITIES — 50.6% | |
|
| Commercial Mortgage-backed Securities — Agency — 2.6% | |
| |
Fannie Mae, Pool #464398 | | | | | |
| | | |
5.97% | | | 01/01/40 | | | $ | 544,628 | | | $ | 609,160 | |
| | | |
Fannie Mae, Pool #464400 | | | | | | | | | | | | |
| | | |
5.97% | | | 01/01/40 | | | | 412,597 | | | | 461,485 | |
| |
Fannie Mae, Pool #AN3542 | | | | | |
| | | |
3.41% | | | 11/01/46 | | | | 1,110,787 | | | | 1,235,511 | |
| |
Fannie Mae (16-M11-X2) (ACES) (I/O) | | | | | |
| | | |
2.93% (3) | | | 07/25/39 | | | | 1,399,494 | | | | 42,951 | |
| |
Fannie Mae (19-M29-X4) (ACES) (I/O) | | | | | |
| | | |
0.70% (3) | | | 03/25/29 | | | | 7,900,000 | | | | 305,694 | |
| |
Freddie Mac Multifamily Structured Pass Through Certificates (K023-X3) (I/O) | | | | | |
| | | |
1.69% (3) | | | 10/25/40 | | | | 12,555,000 | | | | 124,108 | |
| |
Freddie Mac Multifamily Structured Pass Through Certificates (K032-X3) (I/O) | | | | | |
| | | |
1.66% (3) | | | 10/25/41 | | | | 4,020,000 | | | | 95,709 | |
| |
Freddie Mac Multifamily Structured Pass Through Certificates (K039-X3) (I/O) | | | | | |
| | | |
2.11% (3) | | | 08/25/42 | | | | 3,110,000 | | | | 184,680 | |
| |
Freddie Mac Multifamily Structured Pass Through Certificates (K057-X1) (I/O) | | | | | |
| | | |
1.17% (3) | | | 07/25/26 | | | | 5,202,424 | | | | 234,942 | |
| |
Freddie Mac Multifamily Structured Pass Through Certificates (K722-X1) (I/O) | | | | | |
| | | |
1.31% (3) | | | 03/25/23 | | | | 14,695,130 | | | | 151,332 | |
| |
Freddie Mac Multifamily Structured Pass Through Certificates (K735-X3) (I/O) | | | | | |
| | | |
2.15% (3) | | | 05/25/47 | | | | 3,750,000 | | | | 315,960 | |
| |
Freddie Mac Multifamily Structured Pass Through Certificates (Q013-XPT2) (I/O) | | | | | |
| | | |
1.81% | | | 05/25/27 | | | | 3,868,479 | | | | 135,411 | |
| |
Freddie Mac Multifamily Structured Pass-Through Certificates (19-P002-X) (I/O) | | | | | |
| | | |
1.01% (3) | | | 07/25/33 | | | | 1,295,000 | | | | 134,493 | |
| |
Freddie Mac Multifamily Structured Pass-Through Certificates (K021-X3) (I/O) | | | | | |
| | | |
1.97% (3) | | | 07/25/40 | | | | 3,475,000 | | | | 32,307 | |
| |
Freddie Mac Multifamily Structured Pass-Through Certificates (K022-X3) (I/O) | | | | | |
| | | |
1.81% (3) | | | 08/25/40 | | | | 2,500,000 | | | | 25,970 | |
| |
Freddie Mac Multifamily Structured Pass-Through Certificates (K025-X3) (I/O) | | | | | |
| | | |
1.75% (3) | | | 11/25/40 | | | | 5,400,000 | | | | 71,259 | |
| |
Freddie Mac Multifamily Structured Pass-Through Certificates (K027-X3) (I/O) | | | | | |
| | | |
1.71% (3) | | | 01/25/41 | | | | 4,095,000 | | | | 68,178 | |
| |
Freddie Mac Multifamily Structured Pass-Through Certificates (K031-X1) (I/O) | | | | | |
| | | |
0.19% (3) | | | 04/25/23 | | | | 54,774,456 | | | | 125,800 | |
| | | | | | | | | | | | |
| Issues | | Maturity
Date | | | Principal
Amount | | | Value | |
|
| Commercial Mortgage-backed Securities — Agency (Continued) | |
| |
Freddie Mac Multifamily Structured Pass-Through Certificates (K031-X3) (I/O) | | | | | |
| | | |
1.66% (3) | | | 07/25/41 | | | $ | 4,500,000 | | | $ | 93,222 | |
| |
Freddie Mac Multifamily Structured Pass-Through Certificates (K034-X1) (I/O) | | | | | |
| | | |
0.06% (3) | | | 07/25/23 | | | | 26,239,840 | | | | 31,965 | |
| |
Freddie Mac Multifamily Structured Pass-Through Certificates (K040-X3) (I/O) | | | | | |
| | | |
2.04% (3) | | | 11/25/42 | | | | 4,875,000 | | | | 258,916 | |
| |
Freddie Mac Multifamily Structured Pass-Through Certificates (K049-X3) (I/O) | | | | | |
| | | |
1.55% (3) | | | 10/25/43 | | | | 2,330,000 | | | | 115,389 | |
| |
Freddie Mac Multifamily Structured Pass-Through Certificates (K060-X3) (I/O) | | | | | |
| | | |
1.89% (3) | | | 12/25/44 | | | | 2,500,000 | | | | 207,593 | |
| |
Freddie Mac Multifamily Structured Pass-Through Certificates (K726-X1) (I/O) | | | | | |
| | | |
0.89% (3) | | | 04/25/24 | | | | 11,730,396 | | | | 195,273 | |
| |
Freddie Mac Multifamily Structured Pass-Through Certificates (K728-X3) (I/O) | | | | | |
| | | |
1.95% (3) | | | 11/25/45 | | | | 3,455,000 | | | | 178,474 | |
| |
Freddie Mac Multifamily Structured Pass-Through Certificates (K732-X3) (I/O) | | | | | |
| | | |
2.17% (3) | | | 05/25/46 | | | | 2,400,000 | | | | 167,692 | |
| |
Freddie Mac Multifamily Structured Pass-Through Certificates (KC05-X1) (I/O) | | | | | |
| | | |
1.20% (3) | | | 06/25/27 | | | | 7,957,875 | | | | 352,198 | |
| |
Freddie Mac Multifamily Structured Pass-Through Certificates (KIR1-X) (I/O) | | | | | |
| | | |
1.05% (3) | | | 03/25/26 | | | | 8,413,726 | | | | 314,664 | |
| |
Freddie Mac Multifamily Structured Pass-Through Certificates (KLU2-X1) (I/O) | | | | | |
| | | |
1.04% (3) | | | 08/25/29 | | | | 4,419,888 | | | | 257,218 | |
| |
Freddie Mac Multifamily Structured Pass-Through Certificates (KS11-XFX) (I/O) | | | | | |
| | | |
1.60% (3) | | | 06/25/29 | | | | 2,290,000 | | | | 217,937 | |
| |
Freddie Mac Multifamily Structured Pass-Through Certificates (KW01-X3) (I/O) | | | | | |
| | | |
4.08% (3) | | | 03/25/29 | | | | 690,000 | | | | 99,370 | |
| |
Freddie Mac Multifamily Structured Pass-Through Certificates (Q010-XPT2) (I/O) | | | | | |
| | | |
0.36% | | | 08/25/24 | | | | 3,471,473 | | | | 18,524 | |
| |
Ginnie Mae (12-139-IO) (I/O) | | | | | |
| | | |
0.73% (3) | | | 02/16/53 | | | | 2,472,612 | | | | 63,568 | |
| |
Ginnie Mae (13-52-IO) (I/O) | | | | | |
| | | |
0.14% (3) | | | 02/16/55 | | | | 7,355,815 | | | | 28,465 | |
| |
Ginnie Mae (09-114-IO) (I/O) | | | | | |
| | | |
0.02% (3) | | | 10/16/49 | | | | 5,144,548 | | | | 483 | |
| |
Ginnie Mae (10-148-IO) (I/O) | | | | | |
| | | |
0.29% (3) | | | 09/16/50 | | | | 5,219,597 | | | | 57,962 | |
See accompanying Notes to Financial Statements.
9
TCW Strategic Income Fund, Inc.
Schedule of Investments (Continued)
| | | | | | | | | | | | |
| Issues | | Maturity
Date | | | Principal
Amount | | | Value | |
|
| Commercial Mortgage-backed Securities — Agency (Continued) | |
| |
Ginnie Mae (11-105-IO) (I/O) | | | | | |
| | | |
0.00% (3) | | | 09/16/51 | | | $ | 4,427,142 | | | $ | 7 | |
| |
Ginnie Mae (11-152-IO) (I/O) | | | | | |
| | | |
0.04% (3) | | | 08/16/51 | | | | 1,628,302 | | | | 546 | |
| |
Ginnie Mae (11-42-IO) (I/O) | | | | | |
| | | |
0.00% (3) | | | 08/16/50 | | | | 2,068,944 | | | | 10 | |
| |
Ginnie Mae (12-4-IO) (I/O) | | | | | |
| | | |
0.00% (3) | | | 05/16/52 | | | | 4,443,591 | | | | 44 | |
| |
Ginnie Mae (14-103-IO) (I/O) | | | | | |
| | | |
0.28% (3) | | | 05/16/55 | | | | 2,358,682 | | | | 28,826 | |
| |
Ginnie Mae (14-125-IO) (I/O) | | | | | |
| | | |
0.92% (3) | | | 11/16/54 | | | | 1,760,187 | | | | 62,137 | |
| | | | | | | | | | | | |
| | |
Total Commercial Mortgage-backed Securities — Agency | | | | | | | | | |
| | |
(Cost: $11,393,262) | | | | | | | | 7,105,433 | |
| | | | | | | | | | | | |
|
| Commercial Mortgage-backed Securities — Non-Agency — 10.1% | |
| |
BAMLL Commercial Mortgage Securities Trust (18-PARK-A) | | | | | |
| | | |
4.09% (1)(3) | | | 08/10/38 | | | | 590,000 | | | | 659,295 | |
| |
BBCMS Mortgage Trust (17-C1-XA) (I/O) | | | | | |
| | | |
1.44% (3) | | | 02/15/50 | | | | 3,829,919 | | | | 226,387 | |
| |
BBCMS Mortgage Trust (20-BID-D) | | | | | |
| | | |
4.74% (1 mo. USD
LIBOR + 4.630%) (1)(2) | | | 10/15/37 | | | | 705,000 | | | | 708,508 | |
| |
BCRR Trust (16-FRR3-E) | | | | | |
| | | |
2.02% (-1 mo. USD
LIBOR + 18.348%) (1)(2) | | | 05/26/26 | | | | 695,789 | | | | 636,619 | |
| |
Benchmark Mortgage Trust (19-B14-225D) | | | | | |
| | | |
3.29% (1)(3) | | | 12/15/62 | | | | 535,000 | | | | 504,564 | |
| |
Benchmark Mortgage Trust (20-B17-A5) | | | | | |
| | | |
2.29% | | | 03/15/53 | | | | 1,040,000 | | | | 1,050,956 | |
| |
Benchmark Mortgage Trust (20-IG3-BXC) | | | | | |
| | | |
3.54% (1)(3) | | | 09/15/48 | | | | 555,000 | | | | 537,676 | |
| |
BF Mortgage Trust (19-NYT-E) | | | | | |
| | | |
2.61% (1 mo. USD
LIBOR + 2.500%) (1)(2) | | | 12/15/35 | | | | 525,000 | | | | 521,020 | |
| |
BX Commercial Mortgage Trust (18-IND-G) | | | | | |
| | | |
2.16% (1 mo. USD
LIBOR + 2.050%) (1)(2) | | | 11/15/35 | | | | 360,500 | | | | 359,721 | |
| |
BX Commercial Mortgage Trust (20-FOX-E) | | | | | |
| | | |
3.71% (1 mo. USD
LIBOR + 3.600%) (1)(2) | | | 11/15/32 | | | | 766,951 | | | | 768,630 | |
| |
BX Commercial Mortgage Trust (20-FOX-G) | | | | | |
| | | |
4.86% (1 mo. USD
LIBOR + 4.750%) (1)(2) | | | 11/15/32 | | | | 994,508 | | | | 1,001,859 | |
| | | | | | | | | | | | |
| Issues | | Maturity
Date | | | Principal
Amount | | | Value | |
|
| Commercial Mortgage-backed Securities — Non-Agency (Continued) | |
| |
BX Trust (19-OC11-A) | | | | | |
| | | |
3.20% (1) | | | 12/09/41 | | | $ | 265,000 | | | $ | 279,596 | |
| |
CALI Mortgage Trust (19-101C-A) | | | | | |
| | | |
3.96% (1) | | | 03/10/39 | | | | 680,000 | | | | 755,921 | |
| |
Citigroup Commercial Mortgage Trust
(12-GC8-XA) (I/O) | | | | | |
| | | |
1.72% (1)(3)(6) | | | 09/10/45 | | | | 2,873,422 | | | | 13,819 | |
| |
Citigroup Commercial Mortgage Trust
(14-GC21-XD) (I/O) | | | | | |
| | | |
1.35% (1)(3) | | | 05/10/47 | | | | 4,702,111 | | | | 128,446 | |
| |
Citigroup Commercial Mortgage Trust
(15-GC35-XA) (I/O) | | | | | |
| | | |
0.72% (3) | | | 11/10/48 | | | | 6,443,850 | | | | 155,830 | |
| |
Citigroup Commercial Mortgage Trust
(19-PRM-X) (I/O) | | | | | |
| | | |
1.18% (1)(3) | | | 05/10/36 | | | | 14,000,000 | | | | 314,926 | |
| |
COMM Mortgage Trust (12-LC4-XB) (I/O) | | | | | |
| | | |
0.55% (1)(3) | | | 12/10/44 | | | | 18,671,016 | | | | 187 | |
| |
COMM Mortgage Trust (13-CR11-XA) (I/O) | | | | | |
| | | |
0.91% (3) | | | 08/10/50 | | | | 9,591,925 | | | | 122,825 | |
| |
COMM Mortgage Trust (13-CR12-XA) (I/O) | | | | | |
| | | |
1.11% (3) | | | 10/10/46 | | | | 8,927,965 | | | | 144,303 | |
| |
COMM Mortgage Trust (13-LC13-XA) (I/O) | | | | | |
| | | |
1.00% (3) | | | 08/10/46 | | | | 6,051,210 | | | | 80,638 | |
| |
COMM Mortgage Trust (14-CR18-XA) (I/O) | | | | | |
| | | |
1.00% (3) | | | 07/15/47 | | | | 6,269,051 | | | | 128,505 | |
| |
COMM Mortgage Trust (14-CR21-XA) (I/O) | | | | | |
| | | |
0.85% (3) | | | 12/10/47 | | | | 16,972,529 | | | | 353,385 | |
| |
COMM Mortgage Trust (20-CBM-XCP) (I/O) | | | | | |
| | | |
0.60% (1)(3) | | | 02/10/37 | | | | 5,644,863 | | | | 98,151 | |
| |
COMM Mortgage Trust (20-CX-E) | | | | | |
| | | |
2.68% (1)(3) | | | 11/10/46 | | | | 370,000 | | | | 347,303 | |
| |
CPT Mortgage Trust (19-CPT-A) | | | | | |
| | | |
2.87% (1) | | | 11/13/39 | | | | 510,000 | | | | 531,727 | |
| |
CSMC (20-FACT-F) | | | | | |
| | | |
6.27% (1 mo. USD
LIBOR + 6.157%) (1)(2) | | | 10/15/37 | | | | 1,017,000 | | | | 1,027,830 | |
| |
DBGS Mortgage Trust (18-5BP-E) | | | | | |
| | | |
2.16% (1 mo. USD
LIBOR + 2.050%) (1)(2) | | | 06/15/33 | | | | 685,000 | | | | 665,493 | |
| |
DBWF Mortgage Trust (16-85T-A) | | | | | |
| | | |
3.79% (1) | | | 12/10/36 | | | | 615,000 | | | | 664,294 | |
| |
DC Office Trust (19-MTC-A) | | | | | |
| | | |
2.97% (1) | | | 09/15/45 | | | | 550,000 | | | | 574,445 | |
| |
Grace Trust (20-GRCE-A) | | | | | |
| | | |
2.35% (1) | | | 12/10/40 | | | | 1,350,000 | | | | 1,350,838 | |
| |
Grace Trust (20-GRCE-D) | | | | | |
| | | |
2.68% (1)(3) | | | 12/10/40 | | | | 1,249,000 | | | | 1,192,640 | |
See accompanying Notes to Financial Statements.
10
TCW Strategic Income Fund, Inc.
December 31, 2021
| | | | | | | | | | | | |
| Issues | | Maturity
Date | | | Principal
Amount | | | Value | |
|
| Commercial Mortgage-backed Securities — Non-Agency (Continued) | |
| |
Grace Trust (20-GRCE-F) | | | | | |
| | | |
2.68% (1)(3) | | | 12/10/40 | | | $ | 376,000 | | | $ | 339,175 | |
| |
Grace Trust (20-GRCE-X) (I/O) | | | | | |
| | | |
0.30% (1)(3) | | | 12/10/40 | | | | 10,620,000 | | | | 266,140 | |
| |
GS Mortgage Securities Corp. Trust
(20-UPTN-XA) (I/O) | | | | | |
| | | |
0.35% (1)(3) | | | 02/10/37 | | | | 3,150,000 | | | | 32,813 | |
| |
GS Mortgage Securities Trust (11-GC3-X) (I/O) | | | | | |
| | | |
0.00% (1)(3) | | | 03/10/44 | | | | 706,439 | | | | 7 | |
| |
GS Mortgage Securities Trust (12-GC6-XB) (I/O) | | | | | |
| | | |
0.52% (1)(3)(6) | | | 01/10/45 | | | | 6,186,622 | | | | 62 | |
| |
GS Mortgage Securities Trust (12-GCJ7-XB) (I/O) | | | | | |
| | | |
0.40% (1)(3) | | | 05/10/45 | | | | 30,442,756 | | | | 28,714 | |
| |
GS Mortgage Securities Trust (14-GC18-XB) (I/O) | | | | | |
| | | |
0.09% (3) | | | 01/10/47 | | | | 66,563,000 | | | | 197,492 | |
| |
GS Mortgage Securities Trust (16-GS2-XA) (I/O) | | | | | |
| | | |
1.74% (3) | | | 05/10/49 | | | | 4,176,872 | | | | 262,322 | |
| |
Hudson Yards Mortgage Trust (19-55HY-A) | | | | | |
| | | |
2.94% (1)(3) | | | 12/10/41 | | | | 550,000 | | | | 576,456 | |
| |
Hudson Yards Mortgage Trust (19-55HY-F) | | | | | |
| | | |
2.94% (1)(3) | | | 12/10/41 | | | | 150,000 | | | | 139,379 | |
| |
ILPT Trust (19-SURF-A) | | | | | |
| | | |
4.15% (1) | | | 02/11/41 | | | | 240,000 | | | | 266,769 | |
| |
JPMBB Commercial Mortgage Securities Trust (14-C24-XA) (I/O) | | | | | |
| | | |
0.86% (3) | | | 11/15/47 | | | | 7,459,652 | | | | 140,195 | |
| |
JPMBB Commercial Mortgage Securities Trust
(14-C21-XA) (I/O) | | | | | |
| | | |
0.96% (3) | | | 08/15/47 | | | | 1,681,766 | | | | 35,367 | |
| |
JPMBB Commercial Mortgage Securities Trust
(14-C23-XA) (I/O) | | | | | |
| | | |
0.60% (3) | | | 09/15/47 | | | | 9,416,049 | | | | 129,348 | |
| |
JPMBB Commercial Mortgage Securities Trust
(15-C29-XD) (I/O) | | | | | |
| | | |
0.50% (1)(3) | | | 05/15/48 | | | | 26,458,000 | | | | 398,513 | |
| |
JPMCC Commercial Mortgage Securities Trust (17-JP5-XA) (I/O) | | | | | |
| | | |
0.96% (3) | | | 03/15/50 | | | | 12,416,208 | | | | 471,546 | |
| |
JPMorgan Chase Commercial Mortgage Securities Trust (11-C3-XB) (I/O) | | | | | |
| | | |
0.39% (1)(3) | | | 02/15/46 | | | | 51,987,800 | | | | 467,251 | |
| |
JPMorgan Chase Commercial Mortgage Securities Trust (12-HSBC-XA) (I/O) | | | | | |
| | | |
1.43% (1)(3)(6) | | | 07/05/32 | | | | 4,228,801 | | | | 15,492 | |
| |
JPMorgan Chase Commercial Mortgage Securities Trust (12-LC9-XA) (I/O) | | | | | |
| | | |
1.39% (3) | | | 12/15/47 | | | | 5,517,462 | | | | 48,427 | |
| |
JPMorgan Chase Commercial Mortgage Securities Trust (13-LC11-XA) (I/O) | | | | | |
| | | |
1.23% (3) | | | 04/15/46 | | | | 21,467,842 | | | | 242,353 | |
| | | | | | | | | | | | |
| Issues | | Maturity
Date | | | Principal
Amount | | | Value | |
|
| Commercial Mortgage-backed Securities — Non-Agency (Continued) | |
| |
JPMorgan Chase Commercial Mortgage Securities Trust (19-OSB-A) | | | | | |
| | | |
3.40% (1) | | | 06/05/39 | | | $ | 585,000 | | | $ | 631,807 | |
| |
JPMorgan Chase Commercial Mortgage Securities Trust (19-OSB-C) | | | | | |
| | | |
3.75% (1)(3) | | | 06/05/39 | | | | 150,000 | | | | 159,130 | |
| |
Manhattan West Mortgage Trust (20-1MW-A) | | | | | |
| | | |
2.13% (1) | | | 09/10/39 | | | | 695,000 | | | | 694,485 | |
| |
Med Trust 2021-MDLN (21-MDLN-G) | | | | | |
| | | |
5.36% (1 mo. USD LIBOR +
5.250%) (1)(2) | | | 11/15/38 | | | | 670,000 | | | | 667,711 | |
| |
MFT Mortgage Trust (20-B6-C) | | | | | |
| | | |
3.28% (1)(3) | | | 08/10/40 | | | | 220,000 | | | | 206,482 | |
| |
MFT Trust (20-ABC-C) | | | | | |
| | | |
3.48% (1)(3) | | | 02/10/42 | | | | 175,000 | | | | 167,797 | |
| |
MFT Trust (20-ABC-D) | | | | | |
| | | |
3.48% (1)(3) | | | 02/10/42 | | | | 180,000 | | | | 168,828 | |
| |
Morgan Stanley Bank of America Merrill Lynch Trust (15-C22-XA) (I/O) | | | | | |
| | | |
1.02% (3) | | | 04/15/48 | | | | 8,633,971 | | | | 215,971 | |
| |
Morgan Stanley Bank of America Merrill Lynch Trust (15-C24-XA) (I/O) | | | | | |
| | | |
0.72% (3) | | | 05/15/48 | | | | 9,771,414 | | | | 212,753 | |
| |
Morgan Stanley Bank of America Merrill Lynch Trust (16-C31-XA) (I/O) | | | | | |
| | | |
1.29% (3) | | | 11/15/49 | | | | 6,866,920 | | | | 338,683 | |
| |
Morgan Stanley Capital I Trust (12-C4-XA) (I/O) | | | | | |
| | | |
1.78% (1)(3)(6) | | | 03/15/45 | | | | 552,945 | | | | 6 | |
| |
Morgan Stanley Capital I Trust (19-L2-A3) | | | | | |
| | | |
3.81% | | | 03/15/52 | | | | 230,000 | | | | 250,230 | |
| |
One Bryant Park Trust (19-OBP-A) | | | | | |
| | | |
2.52% (1) | | | 09/15/54 | | | | 1,295,000 | | | | 1,311,888 | |
| |
SFAVE Commercial Mortgage Securities Trust (15-5AVE-A2A) | | | | | |
| | | |
3.66% (1)(3) | | | 01/05/43 | | | | 805,000 | | | | 875,408 | |
| |
SFAVE Commercial Mortgage Securities Trust (15-5AVE-A2B) | | | | | |
| | | |
4.14% (1)(3) | | | 01/05/43 | | | | 65,000 | | | | 70,786 | |
| |
SFAVE Commercial Mortgage Securities Trust (15-5AVE-D) | | | | | |
| | | |
4.39% (1)(3) | | | 01/05/43 | | | | 880,000 | | | | 720,830 | |
| |
UBS Commercial Mortgage Trust (12-C1-XA) (I/O) | | | | | |
| | | |
1.85% (1)(3)(6) | | | 05/10/45 | | | | 856,081 | | | | 36 | |
| |
UBS Commercial Mortgage Trust (17-C5-XA) (I/O) | | | | | |
| | | |
0.99% (3) | | | 11/15/50 | | | | 7,159,448 | | | | 289,978 | |
| |
UBS-Barclays Commercial Mortgage Trust (12-C3-XA) (I/O) | | | | | |
| | | |
1.81% (1)(3) | | | 08/10/49 | | | | 11,346,907 | | | | 80,944 | |
| |
UBS-Barclays Commercial Mortgage Trust (13-C5-XA) (I/O) | | | | | |
| | | |
0.90% (1)(3) | | | 03/10/46 | | | | 12,264,709 | | | | 69,464 | |
See accompanying Notes to Financial Statements.
11
TCW Strategic Income Fund, Inc.
Schedule of Investments (Continued)
| | | | | | | | | | | | |
| Issues | | Maturity
Date | | | Principal
Amount | | | Value | |
|
| Commercial Mortgage-backed Securities — Non-Agency (Continued) | |
| |
Wells Fargo Commercial Mortgage Trust
(12-LC5-XA) (I/O) | | | | | |
| | | |
1.72% (1)(3) | | | 10/15/45 | | | $ | 4,904,598 | | | $ | 33,445 | |
| |
WFRBS Commercial Mortgage Trust (12-C8-XA) (I/O) | | | | | |
| | | |
1.76% (1)(3)(6) | | | 08/15/45 | | | | 3,127,046 | | | | 10,631 | |
| |
WFRBS Commercial Mortgage Trust (12-C9-XA) (I/O) | | | | | |
| | | |
1.85% (1)(3) | | | 11/15/45 | | | | 2,334,654 | | | | 19,460 | |
| |
WFRBS Commercial Mortgage Trust (13-C14-XA) (I/O) | | | | | |
| | | |
0.66% (3) | | | 06/15/46 | | | | 6,896,076 | | | | 46,085 | |
| |
WFRBS Commercial Mortgage Trust (13-C16-XA) (I/O) | | | | | |
| | | |
0.62% (3) | | | 09/15/46 | | | | 11,281,922 | | | | 95,051 | |
| |
WFRBS Commercial Mortgage Trust (14-C24-XA) (I/O) | | | | | |
| | | |
0.85% (3) | | | 11/15/47 | | | | 5,215,494 | | | | 105,824 | |
| | | | | | | | | | | | |
| | |
Total Commercial Mortgage-backed Securities — Non-Agency | | | | | | | | | |
| | | |
(Cost: $33,555,041) | | | | | | | | | | | 27,407,871 | |
| | | | | | | | | | | | |
|
| Residential Mortgage-backed Securities — Agency — 11.6% | |
| |
Fannie Mae (07-42-SE) (I/O) (I/F) | | | | | |
| | | |
6.01% (-1 mo. USD
LIBOR + 6.110%) (2) | | | 05/25/37 | | | | 62,855 | | | | 7,819 | |
| |
Fannie Mae (07-48-SD) (I/O) (I/F) | | | | | |
| | | |
6.00% (-1 mo. USD
LIBOR + 6.100%) (2) | | | 05/25/37 | | | | 1,003,041 | | | | 164,733 | |
| |
Fannie Mae (09-69-CS) (I/O) (I/F) | | | | | |
| | | |
6.65% (-1 mo. USD
LIBOR + 6.750%) (2) | | | 09/25/39 | | | | 185,233 | | | | 27,805 | |
| |
Freddie Mac (1673-SD) (I/F) (PAC) | | | | | |
| | | |
15.94% (-2.15 x T10Y + 19.391%) (2) | | | 02/15/24 | | | | 19,904 | | | | 22,028 | |
| |
Freddie Mac (1760-ZD) | | | | | |
| | | |
1.10% (1 x T10Y -0.500%) (2) | | | 02/15/24 | | | | 42,978 | | | | 43,069 | |
| |
Freddie Mac (2990-JK) (I/F) | | | | | |
| | | |
21.57% (-1 mo. USD
LIBOR + 22.004%) (2) | | | 03/15/35 | | | | 55,310 | | | | 60,353 | |
| |
Freddie Mac (3122-SG) (I/O) (I/F) (TAC) (PAC) | | | | | |
| | | |
5.52% (-1 mo. USD
LIBOR + 5.630%) (2) | | | 03/15/36 | | | | 1,644,871 | | | | 276,521 | |
| |
Freddie Mac (3239-SI) (I/O) (I/F) (PAC) | | | | | |
| | | |
6.54% (-1 mo. USD
LIBOR + 6.650%) (2) | | | 11/15/36 | | | | 379,398 | | | | 79,719 | |
| |
Freddie Mac (3323-SA) (I/O) (I/F) | | | | | |
| | | |
6.00% (-1 mo. USD
LIBOR + 6.110%) (2) | | | 05/15/37 | | | | 82,173 | | | | 8,784 | |
| |
Freddie Mac (3459-JS) (I/O) (I/F) | | | | | |
| | | |
6.14% (-1 mo. USD
LIBOR + 6.250%) (2) | | | 06/15/38 | | | | 109,396 | | | | 20,166 | |
| |
Freddie Mac (4030-HS) (I/O) (I/F) | | | | | |
| | | |
6.50% (-1 mo. USD
LIBOR + 6.610%) (2) | | | 04/15/42 | | | | 699,321 | | | | 137,625 | |
| | | | | | | | | | | | |
| Issues | | Maturity
Date | | | Principal
Amount | | | Value | |
|
| Residential Mortgage-backed Securities — Agency (Continued) | |
| |
Ginnie Mae (06-35-SA) (I/O) (I/F) | | | | | |
| | | |
6.50% (-1 mo. USD
LIBOR + 6.600%) (2) | | | 07/20/36 | | | $ | 1,037,781 | | | $ | 211,770 | |
| |
Ginnie Mae (06-61-SA) (I/O) (I/F) (TAC) | | | | | |
| | | |
4.65% (-1 mo. USD
LIBOR + 4.750%) (2) | | | 11/20/36 | | | | 1,669,765 | | | | 168,534 | |
| |
Ginnie Mae (08-58-TS) (I/O) (I/F) (TAC) | | | | | |
| | | |
6.30% (-1 mo. USD
LIBOR + 6.400%) (2) | | | 05/20/38 | | | | 760,271 | | | | 60,771 | |
| |
Ginnie Mae (16-153-IO) (I/O) | | | | | |
| | | |
3.50% | | | 11/20/46 | | | | 1,881,127 | | | | 255,234 | |
| |
Uniform Mortgage-Backed Securities TBA, 30 Year | | | | | |
| | | |
2.00% (7) | | | 07/01/51 | | | | 13,625,000 | | | | 13,553,747 | |
| |
Uniform Mortgage-Backed Securities TBA, 30 Year | | | | | |
| | | |
2.50% (7) | | | 07/01/51 | | | | 16,050,000 | | | | 16,347,338 | |
| | | | | | | | | | | | |
| | |
Total Residential Mortgage-backed Securities — Agency | | | | | | | | | |
| | |
(Cost: $30,856,965) | | | | | | | | 31,446,016 | |
| | | | | | | | | | | | |
|
| Residential Mortgage-backed Securities — Non-Agency — 26.3% | |
| |
ACE Securities Corp. (04-IN1-A1) | | | | | |
| | | |
0.74% (1 mo. USD
LIBOR + 0.640%) (2) | | | 05/25/34 | | | | 375,567 | | | | 367,990 | |
| |
ACE Securities Corp. (07-ASP1-A2C) | | | | | |
| | | |
0.36% (1 mo. USD
LIBOR + 0.260%) (2) | | | 03/25/37 | | | | 1,286,553 | | | | 748,772 | |
| |
Adjustable Rate Mortgage Trust (05-4-6A22) | | | | | |
| | | |
2.86% (3)(5) | | | 08/25/35 | | | | 433,846 | | | | 381,375 | |
| |
Adjustable Rate Mortgage Trust (06-1-2A1) | | | | | |
| | | |
3.46% (3)(5) | | | 03/25/36 | | | | 358,558 | | | | 247,688 | |
| |
Ajax Mortgage Loan Trust (19-F-A2) | | | | | |
| | | |
3.50% (1) | | | 07/25/59 | | | | 1,300,000 | | | | 1,288,730 | |
| |
Alternative Loan Trust (05-46CB-A20) (TAC) | | | | | |
| | | |
5.50% (5) | | | 10/25/35 | | | | 642,400 | | | | 582,990 | |
| |
Asset-Backed Funding Certificates (07-NC1-A2) | | | | | |
| | | |
0.40% (1 mo. USD
LIBOR + 0.300%) (1)(2) | | | 05/25/37 | | | | 1,075,504 | | | | 1,036,748 | |
| |
Asset-Backed Securities Corp. Home Equity (06-HE3-A5) | | | | | |
| | | |
0.64% (1 mo. USD
LIBOR + 0.540%) (2) | | | 03/25/36 | | | | 1,227,075 | | | | 1,224,797 | |
| |
Asset-Backed Securities Corp. Home Equity (07-HE1-A1B) | | | | | |
| | | |
0.25% (1 mo. USD
LIBOR + 0.150%) (2) | | | 12/25/36 | | | | 413,101 | | | | 403,609 | |
| |
Banc of America Alternative Loan Trust (05-10-1CB1) | | | | | |
| | | |
0.50% (1 mo. USD
LIBOR + 0.400%) (2)(5) | | | 11/25/35 | | | | 401,626 | | | | 345,368 | |
| |
Banc of America Funding Corp. (15-R3-6A2) | | | | | |
| | | |
0.26% (1)(3) | | | 05/27/36 | | | | 1,574,462 | | | | 1,491,802 | |
See accompanying Notes to Financial Statements.
12
TCW Strategic Income Fund, Inc.
December 31, 2021
| | | | | | | | | | | | |
| Issues | | Maturity
Date | | | Principal
Amount | | | Value | |
|
| Residential Mortgage-backed Securities — Non-Agency (Continued) | |
| |
Banc of America Funding Trust (06-3-4A14) | | | | | |
| | | |
6.00% | | | 03/25/36 | | | $ | 185,619 | | | $ | 183,203 | |
| |
Banc of America Funding Trust (06-3-5A3) | | | | | |
| | | |
5.50% (5) | | | 03/25/36 | | | | 133,203 | | | | 132,584 | |
| |
Banc of America Funding Trust (14-R5-1A1) | | | | | |
| | | |
1.75% (6 mo. USD
LIBOR + 1.500%) (1)(2) | | | 09/26/45 | | | | 247,845 | | | | 247,866 | |
| |
Banc of America Funding Trust (15-R4-2A1) | | | | | |
| | | |
0.30% (1 mo. USD
LIBOR + 0.205%) (1)(2) | | | 02/25/37 | | | | 552,905 | | | | 546,053 | |
| |
BCMSC Trust (00-A-A4) | | | | | |
| | | |
8.29% (3) | | | 06/15/30 | | | | 3,316,690 | | | | 777,078 | |
| |
Bear Stearns Adjustable Rate Mortgage Trust (03-7-9A) | | | | | |
| | | |
2.62% (3) | | | 10/25/33 | | | | 277,807 | | | | 282,387 | |
| |
Bear Stearns Adjustable Rate Mortgage Trust (05-9-A1) | | | | | |
| | | |
2.38% (1 year Treasury Constant Maturity Rate + 2.300%) (2) | | | 10/25/35 | | | | 135,708 | | | | 139,006 | |
| |
Bear Stearns Adjustable Rate Mortgage Trust (07-4-22A1) | | | | | |
| | | |
3.27% (3)(5) | | | 06/25/47 | | | | 738,881 | | | | 738,508 | |
| |
Bear Stearns ALT-A Trust (05-3-4A3) | | | | | |
| | | |
2.41% (3) | | | 04/25/35 | | | | 368,062 | | | | 375,300 | |
| |
Bear Stearns Asset-Backed Securities Trust (05-AC6-1A3) | | | | | |
| | | |
5.50% (3) | | | 09/25/35 | | | | 387,976 | | | | 392,387 | |
| |
Bear Stearns Asset-Backed Securities Trust (06-IM1-A1) | | | | | |
| | | |
0.56% (1 mo. USD
LIBOR + 0.460%) (2) | | | 04/25/36 | | | | 181,835 | | | | 303,372 | |
| |
Bear Stearns Mortgage Funding Trust (07-AR3-1X) (I/O) | | | | | |
| | | |
0.50% (8) | | | 03/25/37 | | | | 29,967,474 | | | | 712,685 | |
| |
CIM Trust (19-R1-A) | | | | | |
| | | |
3.25% (1)(3) | | | 10/25/58 | | | | 897,427 | | | | 838,969 | |
| |
CIM Trust (21-NR3-A1) | | | | | |
| | | |
2.57% (1)(5) | | | 06/25/57 | | | | 491,697 | | | | 492,281 | |
| |
CIM Trust (21-R3-A1A) | | | | | |
| | | |
1.95% (1)(3) | | | 06/25/57 | | | | 1,125,788 | | | | 1,121,924 | |
| |
CIM Trust (21-R4-A1A) | | | | | |
| | | |
2.00% (1)(3) | | | 05/01/61 | | | | 1,112,399 | | | | 1,106,664 | |
| |
CIM Trust (21-R5-A1B) | | | | | |
| | | |
2.00% (1)(3) | | | 08/25/61 | | | | 1,096,000 | | | | 981,669 | |
| |
Citigroup Mortgage Loan Trust, Inc. (05-11-A2A) | | | | | |
| | | |
2.47% (1 year Treasury Constant Maturity Rate + 2.400%) (2) | | | 10/25/35 | | | | 224,596 | | | | 231,170 | |
| |
Citigroup Mortgage Loan Trust, Inc. (05-8-1A1A) | | | | | |
| | | |
2.50% (3)(5) | | | 10/25/35 | | | | 487,907 | | | | 438,444 | |
| | | | | | | | | | | | |
| Issues | | Maturity
Date | | | Principal
Amount | | | Value | |
|
| Residential Mortgage-backed Securities — Non-Agency (Continued) | |
| |
Citigroup Mortgage Loan Trust, Inc. (14-10-2A2) | | | | | |
| | | |
0.34% (1 mo. USD
LIBOR + 0.250%) (1)(2) | | | 07/25/37 | | | $ | 913,854 | | | $ | 900,758 | |
| |
CitiMortgage Alternative Loan Trust (06-A3-1A7) | | | | | |
| | | |
6.00% (5) | | | 07/25/36 | | | | 719,464 | | | | 717,562 | |
| |
CitiMortgage Alternative Loan Trust (06-A5-1A8) | | | | | |
| | | |
6.00% (5) | | | 10/25/36 | | | | 632,100 | | | | 630,358 | |
| |
Conseco Finance Securitizations Corp. (99-6-A1) | | | | | |
| | | |
7.36% (1)(3)(5) | | | 06/01/30 | | | | 1,350,847 | | | | 684,224 | |
| |
Conseco Financial Corp. (96-6-M1) | | | | | |
| | | |
7.95% (3) | | | 09/15/27 | | | | 87,012 | | | | 90,419 | |
| |
Countrywide Alternative Loan Trust
(05-20CB-4A1) (I/F) | | | | | |
| | | |
5.25% | | | 07/25/20 | | | | 808 | | | | 796 | |
| |
Countrywide Alternative Loan Trust (06-8T1-1A2) (I/O) | | | | | |
| | | |
5.40% (-1 mo. USD LIBOR +
5.500%) (2)(8) | | | 04/25/36 | | | | 5,130,077 | | | | 994,929 | |
| |
Countrywide Asset-Backed Certificates (07-13-2A1) | | | | | |
| | | |
1.00% (1 mo. USD LIBOR + 0.900%) (2) | | | 10/25/47 | | | | 520,291 | | | | 520,236 | |
| |
Countrywide Home Loans (04-HYB4-B1) | | | | | |
| | | |
2.87% (3) | | | 09/20/34 | | | | 540,885 | | | | 274,702 | |
| |
Countrywide Home Loans (06-14-X) (I/O) | | | | | |
| | | |
0.17% (3)(8) | | | 09/25/36 | | | | 10,443,088 | | | | 44,680 | |
| |
Countrywide Home Loans (06-HYB2-1A1) | | | | | |
| | | |
3.16% (3)(5) | | | 04/20/36 | | | | 735,401 | | | | 572,359 | |
| |
Credit Suisse First Boston Mortgage Securities Corp. (04-AR5-11A2) | | | | | |
| | | |
0.84% (1 mo. USD
LIBOR + 0.740%) (2) | | | 06/25/34 | | | | 117,051 | | | | 117,972 | |
| |
Credit Suisse First Boston Mortgage Securities Corp. (05-12-1A1) | | | | | |
| | | |
6.50% (5) | | | 01/25/36 | | | | 962,332 | | | | 347,301 | |
| |
Credit Suisse Mortgage Capital Certificates (06-6-1A8) | | | | | |
| | | |
6.00%(5) | | | 07/25/36 | | | | 526,413 | | | | 372,740 | |
| |
Credit-Based Asset Servicing and Securitization LLC (03-CB3-AF1) | | | | | |
| | | |
3.38% | | | 12/25/32 | | | | 377,868 | | | | 371,929 | |
| |
Credit-Based Asset Servicing and Securitization LLC (06-CB1-AF2) | | | | | |
| | | |
2.92% | | | 01/25/36 | | | | 1,052,724 | | | | 858,489 | |
| |
Credit-Based Asset Servicing and Securitization LLC (06-CB2-AF2) | | | | | |
| | | |
3.07% | | | 12/25/36 | | | | 2,039,310 | | | | 2,029,629 | |
| |
Credit-Based Asset Servicing and Securitization LLC (07-CB2-A2B) | | | | | |
| | | |
3.63% | | | 02/25/37 | | | | 902,207 | | | | 710,332 | |
See accompanying Notes to Financial Statements.
13
TCW Strategic Income Fund, Inc.
Schedule of Investments (Continued)
| | | | | | | | | | | | |
| Issues | | Maturity
Date | | �� | Principal
Amount | | | Value | |
|
| Residential Mortgage-backed Securities — Non-Agency (Continued) | |
| |
Credit-Based Asset Servicing and Securitization LLC (07-CB2-A2C) | | | | | |
| | | |
3.63% | | | 02/25/37 | | | $ | 886,429 | | | $ | 697,823 | |
| |
Credit-Based Asset Servicing and Securitization LLC (07-CB3-A3) | | | | | |
| | | |
3.31% | | | 03/25/37 | | | | 1,253,540 | | | | 646,288 | |
| |
Deutsche Alt-A Securities, Inc. Mortgage Loan Trust (06-AB2-A2) | | | | | |
| | | |
4.94% (3)(5) | | | 06/25/36 | | | | 1,158,312 | | | | 1,152,642 | |
| |
Deutsche Alt-A Securities, Inc. Mortgage Loan Trust (06-AR6-A6) | | | | | |
| | | |
0.48% (1 mo. USD
LIBOR + 0.380%) (2) | | | 02/25/37 | | | | 375,882 | | | | 369,922 | |
| |
DSLA Mortgage Loan Trust (06-AR2-2A1A) | | | | | |
| | | |
0.30% (1 mo. USD
LIBOR + 0.200%) (2) | | | 10/19/36 | | | | 375,808 | | | | 327,119 | |
| |
First Franklin Mortgage Loan Asset-Backed Certificates (06-FF11-2A3) | | | | | |
| | | |
0.40% (1 mo. USD
LIBOR + 0.300%) (2) | | | 08/25/36 | | | | 739,023 | | | | 725,025 | |
| |
First Franklin Mortgage Loan Asset-Backed Certificates (06-FF13-A2C) | | | | | |
| | | |
0.42% (1 mo. USD
LIBOR + 0.320%) (2) | | | 10/25/36 | | | | 679,357 | | | | 547,758 | |
| |
First Franklin Mortgage Loan Asset-Backed Certificates (06-FF18-A2D) | | | | | |
| | | |
0.31% (1 mo. USD
LIBOR + 0.210%) (2) | | | 12/25/37 | | | | 628,388 | | | | 602,434 | |
| |
First Horizon Alternative Mortgage Securities Trust (05-AA10-2A1) | | | | | |
| | | |
2.30% (3)(5) | | | 12/25/35 | | | | 271,083 | | | | 235,383 | |
| |
Greenpoint Manufactured Housing (00-1-A4) | | | | | |
| | | |
8.14% (3) | | | 03/20/30 | | | | 559,707 | | | | 476,569 | |
| |
GSAA Home Equity Trust (06-13-AF6) | | | | | |
| | | |
6.54% | | | 07/25/36 | | | | 1,243,892 | | | | 539,019 | |
| |
GSC Capital Corp. Mortgage Trust (06-2-A1) | | | | | |
| | | |
0.46% (1 mo. USD
LIBOR + 0.360%) (2) | | | 05/25/36 | | | | 242,782 | | | | 237,546 | |
| |
GSR Mortgage Loan Trust (05-AR3-6A1) | | | | | |
| | | |
2.85% (3) | | | 05/25/35 | | | | 177,564 | | | | 163,814 | |
| |
HSI Asset Loan Obligation Trust (07-2-2A12) | | | | | |
| | | |
6.00% | | | 09/25/37 | | | | 372,294 | | | | 342,655 | |
| |
Indymac INDX Mortgage Loan Trust (04-AR6-5A1) | | | | | |
| | | |
2.81% (3) | | | 10/25/34 | | | | 309,343 | | | | 314,296 | |
| |
Indymac INDX Mortgage Loan Trust (05-AR19-A1) | | | | | |
| | | |
2.74% (3) | | | 10/25/35 | | | | 445,346 | | | | 420,204 | |
| |
Indymac INDX Mortgage Loan Trust
(06-AR13-A4X) (I/O) | | | | | |
| | | |
1.65% (3)(8) | | | 07/25/36 | | | | 252,528 | | | | 3,068 | |
| |
Indymac INDX Mortgage Loan Trust
(06-AR9-1A1) | | | | | |
| | | |
2.94% (3) | | | 06/25/36 | | | | 566,082 | | | | 414,867 | |
| | | | | | | | | | | | |
| Issues | | Maturity
Date | | | Principal
Amount | | | Value | |
|
| Residential Mortgage-backed Securities — Non-Agency (Continued) | |
| |
Indymac INDX Mortgage Loan Trust (07-AR5-2A1) | | | | | |
| | | |
2.98% (3)(5) | | | 05/25/37 | | | $ | 752,325 | | | $ | 708,203 | |
| |
Indymac INDX Mortgage Loan Trust (07-FLX2-A1C) | | | | | |
| | | |
0.29% (1 mo. USD
LIBOR + 0.190%) (2) | | | 04/25/37 | | | | 1,686,303 | | | | 1,618,622 | |
| |
JPMorgan Alternative Loan Trust (06-A2-5A1) | | | | | |
| | | |
3.04% (3)(5) | | | 05/25/36 | | | | 401,980 | | | | 278,032 | |
| |
JPMorgan Mortgage Acquisition Trust (06-WF1-A5) | | | | | |
| | | |
6.91% | | | 07/25/36 | | | | 2,063,157 | | | | 825,130 | |
| |
JPMorgan Mortgage Trust (04-A6-5A1) | | | | | |
| | | |
2.43% (3) | | | 12/25/34 | | | | 200,935 | | | | 201,345 | |
| |
JPMorgan Mortgage Trust (07-S2-1A1) | | | | | |
| | | |
5.00% | | | 06/25/37 | | | | 146,981 | | | | 85,529 | |
| |
JPMorgan Resecuritization Trust (15-4-1A5) | | | | | |
| | | |
0.47% (1 mo. USD
LIBOR + 0.190%) (1)(2) | | | 06/26/47 | | | | 1,863,000 | | | | 1,808,416 | |
| |
JPMorgan Resecuritization Trust (15-4-2A2) | | | | | |
| | | |
3.65% (1)(3)(5) | | | 06/26/47 | | | | 3,346,557 | | | | 1,748,910 | |
| |
Legacy Mortgage Asset Trust (19-GS4-A1) | | | | | |
| | | |
3.44% (1) | | | 05/25/59 | | | | 861,561 | | | | 863,140 | |
| |
Lehman Mortgage Trust (06-7-2A5) (I/O) (I/F) | | | | | |
| | | |
6.45% (-1 mo. USD
LIBOR + 6.550%) (2)(8) | | | 11/25/36 | | | | 2,970,721 | | | | 712,345 | |
| |
Lehman XS Trust (06-10N-1A3A) | | | | | |
| | | |
0.52% (1 mo. USD
LIBOR + 0.420%) (2) | | | 07/25/46 | | | | 499,485 | | | | 519,471 | |
| |
Lehman XS Trust (06-12N-A31A) | | | | | |
| | | |
0.50% (1 mo. USD
LIBOR + 0.400%) (2) | | | 08/25/46 | | | | 664,778 | | | | 676,142 | |
| |
Long Beach Mortgage Loan Trust (04-4-M1) | | | | | |
| | | |
1.00% (1 mo. USD
LIBOR + 0.900%) (2) | | | 10/25/34 | | | | 562,390 | | | | 559,433 | |
| |
MASTR Alternative Loan Trust (06-2-2A2) (I/O) (I/F) | | | | | |
| | | |
7.00% (-1 mo. USD
LIBOR + 7.100%) (2)(8) | | | 03/25/36 | | | | 5,921,452 | | | | 1,046,768 | |
| |
MASTR Alternative Loans Trust (07-HF1-4A1) | | | | | |
| | | |
7.00% (5) | | | 10/25/47 | | | | 1,060,946 | | | | 676,121 | |
| |
MASTR Asset-Backed Securities Trust (07-HE1-A4) | | | | | |
| | | |
0.38% (1 mo. USD
LIBOR + 0.280%) (2) | | | 05/25/37 | | | | 2,000,000 | | | | 1,853,920 | |
| |
Merrill Lynch Alternative Note Asset Trust
(07-OAR2-A2) | | | | | |
| | | |
0.52% (1 mo. USD
LIBOR + 0.420%) (2) | | | 04/25/37 | | | | 781,474 | | | | 737,476 | |
| |
Merrill Lynch First Franklin Mortgage Loan Trust
(07-3-A2B) | | | | | |
| | | |
0.23% (1 mo. USD
LIBOR + 0.130%) (2) | | | 06/25/37 | | | | 537,959 | | | | 506,922 | |
See accompanying Notes to Financial Statements.
14
TCW Strategic Income Fund, Inc.
December 31, 2021
| | | | | | | | | | | | |
| Issues | | Maturity
Date | | | Principal
Amount | | | Value | |
|
| Residential Mortgage-backed Securities — Non-Agency (Continued) | |
| |
Merrill Lynch First Franklin Mortgage Loan Trust
(07-3-A2C) | | | | | |
| | | |
0.28% (1 mo. USD
LIBOR + 0.180%) (2) | | | 06/25/37 | | | $ | 1,098,499 | | | $ | 1,040,052 | |
| |
Merrill Lynch Mortgage-Backed Securities Trust
(07-2-1A1) | | | | | |
| | | |
2.61% (1 year Treasury Constant Maturity Rate + 2.400%) (2)(5) | | | 08/25/36 | | | | 161,437 | | | | 157,503 | |
| |
Mid-State Trust (04-1-B) | | | | | |
| | | |
8.90% | | | 08/15/37 | | | | 152,819 | | | | 160,539 | |
| |
Mid-State Trust (04-1-M1) | | | | | |
| | | |
6.50% | | | 08/15/37 | | | | 152,819 | | | | 157,904 | |
| |
Morgan Stanley ABS Capital I, Inc. Trust (06-HE3-A1) | | | | | |
| | | |
0.38% (1 mo. USD
LIBOR + 0.280%) (2) | | | 04/25/36 | | | | 28,416 | | | | 28,399 | |
| |
Morgan Stanley ABS Capital I, Inc. Trust (07-15AR-4A1) | | | | | |
| | | |
2.83% (3) | | | 11/25/37 | | | | 334,560 | | | | 336,125 | |
| |
Nomura Asset Acceptance Corp. (06-AR1-1A) | | | | | |
| | | |
4.48% (3) | | | 02/25/36 | | | | 176,960 | | | | 152,390 | |
| |
Oakwood Mortgage Investors, Inc. (00-A-A4) | | | | | |
| | | |
8.15% (3) | | | 09/15/29 | | | | 1,741,180 | | | | 687,797 | |
| |
Oakwood Mortgage Investors, Inc. (00-D-A4) | | | | | |
| | | |
7.40% (3) | | | 07/15/30 | | | | 692,971 | | | | 248,980 | |
| |
Oakwood Mortgage Investors, Inc. (01-C-A3) | | | | | |
| | | |
6.61% (3) | | | 06/15/31 | | | | 1,671,028 | | | | 305,199 | |
| |
Oakwood Mortgage Investors, Inc. (01-D-A3) | | | | | |
| | | |
5.90% (3) | | | 09/15/22 | | | | 649,834 | | | | 447,354 | |
| |
Oakwood Mortgage Investors, Inc. (01-D-A4) | | | | | |
| | | |
6.93% (3) | | | 09/15/31 | | | | 376,500 | | | | 282,092 | |
| |
Oakwood Mortgage Investors, Inc. (02-A-A3) | | | | | |
| | | |
6.03% (3) | | | 05/15/24 | | | | 85,623 | | | | 87,010 | |
| |
Oakwood Mortgage Investors, Inc. (99-B-A4) | | | | | |
| | | |
6.99% | | | 12/15/26 | | | | 65,180 | | | | 65,747 | |
| |
Oakwood Mortgage Investors, Inc. (99-E-A1) | | | | | |
| | | |
7.61% (3) | | | 03/15/30 | | | | 695,185 | | | | 524,605 | |
| |
Popular ABS Mortgage Pass-Through Trust (05-6-A4) | | | | | |
| | | |
3.42% | | | 01/25/36 | | | | 41,524 | | | | 41,445 | |
| |
RALI Series Trust (06-QS13-1A2) (I/O) (I/F) | | | | | |
| | | |
7.06% (-1 mo. USD
LIBOR + 7.160%) (2)(8) | | | 09/25/36 | | | | 2,835,783 | | | | 484,530 | |
| |
RALI Series Trust (06-QS7-A2) | | | | | |
| | | |
6.00% (5) | | | 06/25/36 | | | | 371,018 | | | | 358,250 | |
| |
RBSSP Resecuritization Trust (12-6-4A2) | | | | | |
| | | |
0.75% (1 mo. USD
LIBOR + 0.330%) (1)(2) | | | 01/26/36 | | | | 927,851 | | | | 917,749 | |
| |
Residential Accredit Loans, Inc. (05-QA7-A1) | | | | | |
| | | |
3.35% (3)(5) | | | 07/25/35 | | | | 729,402 | | | | 614,549 | |
| | | | | | | | | | | | |
| Issues | | Maturity
Date | | | Principal
Amount | | | Value | |
|
| Residential Mortgage-backed Securities — Non-Agency (Continued) | |
| |
Residential Accredit Loans, Inc. (05-QA8-CB21) | | | | | |
| | | |
3.44% (3)(5) | | | 07/25/35 | | | $ | 384,726 | | | $ | 271,277 | |
| |
Residential Accredit Loans, Inc. (06-QA10-A2) | | | | | |
| | | |
0.46% (1 mo. USD
LIBOR + 0.360%) (2) | | | 12/25/36 | | | | 483,582 | | | | 486,950 | |
| |
Residential Accredit Loans, Inc. (06-QS1-A3) (PAC) | | | | | |
| | | |
5.75% (5) | | | 01/25/36 | | | | 283,585 | | | | 273,856 | |
| |
Residential Accredit Loans, Inc. (06-QS11-AV) (I/O) | | | | | |
| | | |
0.35% (3)(8) | | | 08/25/36 | | | | 7,652,867 | | | | 97,933 | |
| |
Residential Accredit Loans, Inc. (06-QS6-1AV) (I/O) | | | | | |
| | | |
0.76% (3)(8) | | | 06/25/36 | | | | 3,304,316 | | | | 74,686 | |
| |
Residential Accredit Loans, Inc. (06-QS8-A3) | | | | | |
| | | |
6.00% (5) | | | 08/25/36 | | | | 641,178 | | | | 625,615 | |
| |
Residential Accredit Loans, Inc. (07-QS2-AV) (I/O) | | | | | |
| | | |
0.33% (3)(8) | | | 01/25/37 | | | | 8,431,026 | | | | 93,967 | |
| |
Residential Accredit Loans, Inc. (07-QS3-AV) (I/O) | | | | | |
| | | |
0.35% (3)(8) | | | 02/25/37 | | | | 9,273,089 | | | | 109,435 | |
| |
Residential Accredit Loans, Inc. (07-QS6-A62) (TAC) | | | | | |
| | | |
5.50% (5) | | | 04/25/37 | | | | 196,634 | | | | 191,059 | |
| |
Residential Asset Securitization Trust (05-A15-4A1) | | | | | |
| | | |
6.00% (5) | | | 02/25/36 | | | | 953,750 | | | | 451,848 | |
| |
Residential Asset Securitization Trust (07-A5-AX) (I/O) | | | | | |
| | | |
6.00% (8) | | | 05/25/37 | | | | 1,562,309 | | | | 297,303 | |
| |
Residential Funding Mortgage Securities
(06-S9-AV) (I/O) | | | | | |
| | | |
0.36% (3)(8) | | | 09/25/36 | | | | 20,810,989 | | | | 238,943 | |
| |
Saxon Asset Securities Trust (07-3-2A4) | | | | | |
| | | |
0.59% (1 mo. USD
LIBOR + 0.490%) (2) | | | 09/25/47 | | | | 2,926,000 | | | | 2,719,721 | |
| |
Securitized Asset-Backed Receivables LLC Trust
(07-NC2-A2C) | | | | | |
| | | |
0.32% (1 mo. USD
LIBOR + 0.220%) (2) | | | 01/25/37 | | | | 4,614,000 | | | | 3,741,447 | |
| |
Soundview Home Loan Trust (06-1-A4) | | | | | |
| | | |
0.70% (1 mo. USD LIBOR + 0.600%) (2) | | | 02/25/36 | | | | 142,443 | | | | 142,467 | |
| |
Structured Adjustable Rate Mortgage Loan Trust
(05-20-1A1) | | | | | |
| | | |
2.76% (3)(5) | | | 10/25/35 | | | | 136,805 | | | | 130,203 | |
| |
Structured Adjustable Rate Mortgage Loan Trust
(07-9-2A1) | | | | | |
| | | |
3.20% (3)(5) | | | 10/25/47 | | | | 265,787 | | | | 217,953 | |
| |
Structured Asset Mortgage Investments II Trust
(06-AR4-5A1) | | | | | |
| | | |
0.46% (1 mo. USD
LIBOR + 0.360%) (2) | | | 06/25/36 | | | | 777,325 | | | | 697,425 | |
| |
WAMU Asset-Backed Certificates (07-HE1-2A3) | | | | | |
| | | |
0.25% (1 mo. USD
LIBOR + 0.150%) (2) | | | 01/25/37 | | | | 1,734,770 | | | | 1,090,010 | |
See accompanying Notes to Financial Statements.
15
TCW Strategic Income Fund, Inc.
Schedule of Investments (Continued)
| | | | | | | | | | | | |
| Issues | | Maturity
Date | | | Principal
Amount | | | Value | |
|
| Residential Mortgage-backed Securities — Non-Agency (Continued) | |
| |
Wells Fargo Alternative Loan Trust
(07-PA2-2A2) (I/O) (I/F) | | | | | |
| | | |
5.97% (-1 mo. USD
LIBOR + 6.070%) (2)(8) | | | 06/25/37 | | | $ | 1,878,299 | | | $ | 198,767 | |
| |
Wells Fargo Mortgage-Backed Securities Trust
(07-AR3-A4) | | | | | |
| | | |
2.67% (3)(5) | | | 04/25/37 | | | | 138,162 | | | | 134,637 | |
| | | | | | | | | | | | |
| | |
Total Residential Mortgage-backed Securities — Non-Agency | | | | | | | | | |
| |
(Cost: $67,333,138) | | | | 71,426,912 | |
| | | | | | | | | | | | |
| | |
Total Mortgage-backed Securities | | | | | | | | | |
| |
(Cost: $143,138,406) | | | | 137,386,232 | |
| | | | | | | | | | | | |
|
| CORPORATE BONDS — 30.5% | |
| |
| Advertising — 0.1% | | | | |
| |
National CineMedia LLC | | | | | |
| | | |
5.88% (1) | | | 04/15/28 | | | | 317,000 | | | | 284,956 | |
| | | | | | | | | | | | |
| |
| Aerospace/Defense — 0.3% | | | | |
| |
Boeing Co. (The) | | | | | |
| | | |
1.43% | | | 02/04/24 | | | | 705,000 | | | | 704,563 | |
| | | | | | | | | | | | |
| |
| Agriculture — 0.6% | | | | |
| |
BAT Capital Corp. | | | | | |
| | | |
4.54% | | | 08/15/47 | | | | 135,000 | | | | 141,513 | |
| |
Imperial Brands Finance PLC | | | | | |
| | | |
3.13% (1) | | | 07/26/24 | | | | 270,000 | | | | 279,323 | |
| |
Reynolds American, Inc. | | | | | |
| | | |
5.85% | | | 08/15/45 | | | | 975,000 | | | | 1,187,443 | |
| | | | | | | | | | | | |
| | | |
| | | | | | | | | | | 1,608,279 | |
| | | | | | | | | | | | |
|
| Airlines — 0.4% | |
| |
JetBlue Pass-Through Certificates (20-1A) | | | | | |
| | | |
4.00% | | | 05/15/34 | | | | 747,650 | | | | 805,466 | |
| |
US Airways Group, Inc. Pass-Through Certificates (10-1A) (EETC) | | | | | |
| | | |
6.25% | | | 10/22/24 | | | | 289,916 | | | | 293,792 | |
| | | | | | | | | | | | |
| | | |
| | | | | | | | | | | 1,099,258 | |
| | | | | | | | | | | | |
|
| Auto Manufacturers — 1.1% | |
| |
Daimler Finance North America LLC | | | | | |
| | | |
1.06% (3 mo. USD
LIBOR + 0.900%) (1)(2) | | | 02/15/22 | | | | 350,000 | | | | 350,317 | |
| |
Ford Motor Credit Co. LLC | | | | | |
| | | |
1.49% (3 mo. USD
LIBOR + 1.270%) (2) | | | 03/28/22 | | | | 345,000 | | | | 344,846 | |
| | | |
3.22% | | | 01/09/22 | | | | 1,150,000 | | | | 1,151,461 | |
| | | |
3.34% | | | 03/28/22 | | | | 645,000 | | | | 647,451 | |
| |
General Motors Co. | | | | | |
| | | |
4.88% | | | 10/02/23 | | | | 150,000 | | | | 159,414 | |
| | | | | | | | | | | | |
| Issues | | Maturity
Date | | | Principal
Amount | | | Value | |
|
| Auto Manufacturers (Continued) | |
| |
General Motors Financial Co., Inc. | | | | | |
| | | |
3.15% | | | 06/30/22 | | | $ | 180,000 | | | $ | 181,903 | |
| | | |
3.45% | | | 04/10/22 | | | | 55,000 | | | | 55,170 | |
| | | | | | | | | | | | |
| | | |
| | | | | | | | | | | 2,890,562 | |
| | | | | | | | | | | | |
|
| Banks — 7.1% | |
| |
Bank of America Corp. | | | | | |
| | | |
0.98% (SOFR + 0.690%) (2) | | | 04/22/25 | | | | 395,000 | | | | 391,891 | |
| | | |
1.66% (SOFR + 0.910%) (2) | | | 03/11/27 | | | | 1,085,000 | | | | 1,077,144 | |
| | | |
2.09% (SOFR + 1.060%) (2) | | | 06/14/29 | | | | 570,000 | | | | 566,956 | |
| | | |
3.00% (3.004% until 12/20/22 then 3 mo. USD LIBOR + 0.790%) (2) | | | 12/20/23 | | | | 830,000 | | | | 847,346 | |
| | | |
3.56% (3 mo. USD
LIBOR + 1.060%) (2) | | | 04/23/27 | | | | 55,000 | | | | 58,847 | |
| | | |
3.82% (3 mo. USD
LIBOR + 1.575%) (2) | | | 01/20/28 | | | | 120,000 | | | | 130,145 | |
| |
Citigroup, Inc. | | | | | |
| | | |
1.46% (SOFR+ 0.770%) (2) | | | 06/09/27 | | | | 430,000 | | | | 422,509 | |
| | | |
4.41% (SOFR + 3.914%) (2) | | | 03/31/31 | | | | 440,000 | | | | 503,012 | |
| |
Comerica, Inc. | | | | | |
| | | |
5.63% (U.S. 5 year Treasury Constant Maturity Rate + 5.291%) (2)(9) | | | 12/31/99 | | | | 395,000 | | | | 431,538 | |
| |
Credit Suisse Group AG | | | | | |
| | | |
1.31% (SOFR + 0.980%) (1)(2) | | | 02/02/27 | | | | 190,000 | | | | 183,759 | |
| | | |
2.19% (SOFR + 2.044%) (1)(2) | | | 06/05/26 | | | | 480,000 | | | | 482,995 | |
| | | |
2.59% (SOFR + 1.560%) (1)(2) | | | 09/11/25 | | | | 85,000 | | | | 86,754 | |
| | | |
3.09% (SOFR + 1.730%) (1)(2) | | | 05/14/32 | | | | 270,000 | | | | 274,930 | |
| | | |
3.75% | | | 03/26/25 | | | | 330,000 | | | | 350,445 | |
| |
DNB Bank ASA | | | | | |
| | | |
1.61% (U.S. 1 year Treasury Constant Maturity Rate + 0.680%) (1)(2) | | | 03/30/28 | | | | 430,000 | | | | 420,035 | |
| |
Goldman Sachs Group, Inc. (The) | | | | | |
| | | |
0.93% (SOFR + 0.486%) (2) | | | 10/21/24 | | | | 285,000 | | | | 283,888 | |
| | | |
1.09% (SOFR + 0.789%) (2) | | | 12/09/26 | | | | 215,000 | | | | 209,614 | |
| | | |
1.22% | | | 12/06/23 | | | | 700,000 | | | | 701,729 | |
| | | |
1.43% (SOFR + 0.798%) (2) | | | 03/09/27 | | | | 705,000 | | | | 690,815 | |
| | | |
1.54% (SOFR + 0.818%) (2) | | | 09/10/27 | | | | 430,000 | | | | 421,778 | |
See accompanying Notes to Financial Statements.
16
TCW Strategic Income Fund, Inc.
December 31, 2021
| | | | | | | | | | | | |
| Issues | | Maturity
Date | | | Principal
Amount | | | Value | |
|
| Banks (Continued) | |
| |
HSBC Holdings PLC | | | | | |
| | | |
1.59% (SOFR + 1.290%) (2) | | | 05/24/27 | | | $ | 285,000 | | | $ | 278,879 | |
| | | |
2.10% (SOFR + 1.929%) (2) | | | 06/04/26 | | | | 430,000 | | | | 433,117 | |
| | | |
2.21% (SOFR + 1.285%) (2) | | | 08/17/29 | | | | 1,075,000 | | | | 1,055,457 | |
| |
JPMorgan Chase & Co. | | | | | |
| | | |
0.77% (SOFR + 0.490%) (2) | | | 08/09/25 | | | | 270,000 | | | | 266,134 | |
| | | |
0.97% (SOFR + 0.580%) (2) | | | 06/23/25 | | | | 495,000 | | | | 490,634 | |
| | | |
1.58% (SOFR + 0.885%) (2) | | | 04/22/27 | | | | 425,000 | | | | 420,278 | |
| | | |
2.01% (SOFR + 1.585%) (2) | | | 03/13/26 | | | | 505,000 | | | | 511,661 | |
| |
JPMorgan Chase & Co. (Australia) | | | | | |
| | | |
3.56% (3 mo. USD
LIBOR + 0.730%) (2) | | | 04/23/24 | | | | 385,000 | | | | 397,975 | |
| |
Lloyds Banking Group PLC (United Kingdom) | | | | | |
| | | |
1.63% (U.S. 1 year Treasury Constant Maturity Rate + 0.850%) (2) | | | 05/11/27 | | | | 395,000 | | | | 388,747 | |
| | | |
2.86% (3 mo. USD
LIBOR + 1.249%) (2) | | | 03/17/23 | | | | 275,000 | | | | 276,078 | |
| | | |
2.91% (3 mo. USD
LIBOR + 0.810%) (2) | | | 11/07/23 | | | | 150,000 | | | | 152,492 | |
| | | |
3.87% (1 year Treasury Constant Maturity Rate + 3.500%) (2) | | | 07/09/25 | | | | 285,000 | | | | 301,238 | |
| |
Macquarie Group, Ltd. (Australia) | | | | | |
| | | |
2.69% (SOFR + 1.440%) (1)(2) | | | 06/23/32 | | | | 160,000 | | | | 159,486 | |
| | | |
2.87% (SOFR + 1.532%) (1)(2) | | | 01/14/33 | | | | 555,000 | | | | 553,776 | |
| |
Morgan Stanley | | | | | |
| | | |
0.79% (SOFR + 0.509%) (2) | | | 01/22/25 | | | | 425,000 | | | | 420,887 | |
| | | |
1.16% (SOFR + 0.560%) (2) | | | 10/21/25 | | | | 920,000 | | | | 912,631 | |
| |
NatWest Group PLC (United Kingdom) | | | | | |
| | | |
4.27% (3 mo. USD LIBOR + 1.762%) (2) | | | 03/22/25 | | | | 530,000 | | | | 561,429 | |
| |
Santander UK Group Holdings PLC (United Kingdom) | | | | | |
| | | |
1.09% (SOFR + 0.787%) (2) | | | 03/15/25 | | | | 565,000 | | | | 560,045 | |
| | | |
1.53% (U.S. 1 year Treasury Constant Maturity Rate + 1.250%) (2) | | | 08/21/26 | | | | 55,000 | | | | 54,149 | |
| | | |
3.37% (3 mo. USD
LIBOR + 1.080%) (2) | | | 01/05/24 | | | | 275,000 | | | | 281,021 | |
| | | |
4.80% (3 mo. USD
LIBOR + 1.570%) (2) | | | 11/15/24 | | | | 475,000 | | | | 504,362 | |
| | | | | | | | | | | | |
| Issues | | Maturity
Date | | | Principal
Amount | | | Value | |
|
| Banks (Continued) | |
| |
UBS AG/London | | | | | |
| | | |
0.70% (1) | | | 08/09/24 | | | $ | 425,000 | | | $ | 419,879 | |
| |
Wells Fargo & Co. | | | | | |
| | | |
2.16% (3 mo. USD
LIBOR + 0.750%) (2) | | | 02/11/26 | | | | 285,000 | | | | 289,419 | |
| | | |
2.39% (SOFR+ 2.100%) (2) | | | 06/02/28 | | | | 1,090,000 | | | | 1,108,600 | |
| | | | | | | | | | | | |
| | | |
| | | | | | | | | | | 19,334,504 | |
| | | | | | | | | | | | |
|
| Beverages — 0.4% | |
| |
Anheuser-Busch Cos LLC / Anheuser-Busch InBev Worldwide, Inc. | | | | | |
| | | |
4.70% | | | 02/01/36 | | | | 250,000 | | | | 302,480 | |
| | | |
4.90% | | | 02/01/46 | | | | 454,000 | | | | 575,148 | |
| |
Bacardi, Ltd. | | | | | |
| | | |
5.30% (1) | | | 05/15/48 | | | | 205,000 | | | | 268,167 | |
| | | | | | | | | | | | |
| | | |
| | | | | | | | | | | 1,145,795 | |
| | | | | | | | | | | | |
|
| Chemicals — 0.2% | |
| |
EverArc Escrow Sarl | | | | | |
| | | |
5.00% (1) | | | 10/30/29 | | | | 285,000 | | | | 285,640 | |
| |
Unifrax Escrow Issuer Corp. | | | | | |
| | | |
5.25% (1) | | | 09/30/28 | | | | 280,000 | | | | 284,667 | |
| | | | | | | | | | | | |
| | | |
| | | | | | | | | | | 570,307 | |
| | | | | | | | | | | | |
|
| Commercial Services — 0.6% | |
| |
Adtalem Global Education, Inc. | | | | | |
| | | |
5.50% (1) | | | 03/01/28 | | | | 270,000 | | | | 264,430 | |
| |
HealthEquity, Inc. | | | | | |
| | | |
4.50% (1) | | | 10/01/29 | | | | 285,000 | | | | 283,777 | |
| |
Hertz Corp. (The) | | | | | |
| | | |
4.63% (1) | | | 12/01/26 | | | | 140,000 | | | | 140,875 | |
| | | |
5.00% (1) | | | 12/01/29 | | | | 140,000 | | | | 141,050 | |
| |
IHS Markit, Ltd. | | | | | |
| | | |
4.00% (1) | | | 03/01/26 | | | | 398,000 | | | | 431,164 | |
| | | |
4.75% (1) | | | 02/15/25 | | | | 370,000 | | | | 403,807 | |
| | | | | | | | | | | | |
| | | |
| | | | | | | | | | | 1,665,103 | |
| | | | | | | | | | | | |
|
| Computers — 0.1% | |
| |
NCR Corp. | | | | | |
| | | |
5.13% (1) | | | 04/15/29 | | | | 285,000 | | | | 295,112 | |
| | | | | | | | | | | | |
|
| Diversified Financial Services — 0.9% | |
| |
AerCap Ireland Capital DAC / AerCap Global Aviation Trust | | | | | |
| | | |
3.30% | | | 01/30/32 | | | | 445,000 | | | | 453,958 | |
| |
AerCap Ireland Capital DAC / AerCap Global Aviation Trust (Ireland) | | | | | |
| | | |
3.65% | | | 07/21/27 | | | | 120,000 | | | | 126,556 | |
| | | |
3.88% | | | 01/23/28 | | | | 130,000 | | | | 138,192 | |
| | | |
4.13% | | | 07/03/23 | | | | 135,000 | | | | 140,385 | |
See accompanying Notes to Financial Statements.
17
TCW Strategic Income Fund, Inc.
Schedule of Investments (Continued)
| | | | | | | | | | | | |
| Issues | | Maturity
Date | | | Principal
Amount | | | Value | |
|
| Diversified Financial Services (Continued) | |
| |
Air Lease Corp. | | | | | |
| | | |
3.50% | | | 01/15/22 | | | $ | 490,000 | | | $ | 490,435 | |
| |
Avolon Holdings Funding, Ltd. | | | | | |
| | | |
2.53% (1) | | | 11/18/27 | | | | 406,000 | | | | 394,667 | |
| | | |
2.88% (1) | | | 02/15/25 | | | | 305,000 | | | | 311,756 | |
| | | |
3.95% (1) | | | 07/01/24 | | | | 85,000 | | | | 89,090 | |
| |
Park Aerospace Holdings, Ltd. | | | | | |
| | | |
4.50% (1) | | | 03/15/23 | | | | 110,000 | | | | 113,563 | |
| | | |
5.50% (1) | | | 02/15/24 | | | | 132,000 | | | | 141,620 | |
| | | | | | | | | | | | |
| | | |
| | | | | | | | | | | 2,400,222 | |
| | | | | | | | | | | | |
|
| Electric — 0.5% | |
| |
FirstEnergy Corp. | | | | | |
| | | |
3.40% | | | 03/01/50 | | | | 450,000 | | | | 442,125 | |
| |
FirstEnergy Transmission LLC | | | | | |
| | | |
4.35% (1) | | | 01/15/25 | | | | 750,000 | | | | 796,964 | |
| | | | | | | | | | | | |
| | | |
| | | | | | | | | | | 1,239,089 | |
| | | | | | | | | | | | |
|
| Engineering & Construction — 0.1% | |
| |
PowerTeam Services LLC | | | | | |
| | | |
9.03% (1) | | | 12/04/25 | | | | 254,000 | | | | 268,387 | |
| | | | | | | | | | | | |
|
| Entertainment — 0.3% | |
| |
Caesars Entertainment, Inc. | | | | | |
| | | |
6.25% (1) | | | 07/01/25 | | | | 273,000 | | | | 286,926 | |
| |
Cinemark USA, Inc. | | | | | |
| | | |
5.25% (1) | | | 07/15/28 | | | | 300,000 | | | | 293,190 | |
| |
WMG Acquisition Corp. | | | | | |
| | | |
3.75% (1) | | | 12/01/29 | | | | 140,000 | | | | 139,825 | |
| | | | | | | | | | | | |
| | | |
| | | | | | | | | | | 719,941 | |
| | | | | | | | | | | | |
|
| Environmental Control — 0.1% | |
| |
GFL Environmental, Inc. (Canada) | | | | | |
| | | |
5.13% (1) | | | 12/15/26 | | | | 157,000 | | | | 164,131 | |
| | | | | | | | | | | | |
|
| Food — 0.8% | |
| |
JBS USA LUX SA / JBS USA Food Co. / JBS USA Finance, Inc. | | | | | |
| | | |
3.75% (1) | | | 12/01/31 | | | | 650,000 | | | | 665,541 | |
| | | |
5.50% (1) | | | 01/15/30 | | | | 25,000 | | | | 27,230 | |
| |
Kraft Heinz Foods Co. | | | | | |
| | | |
4.38% | | | 06/01/46 | | | | 210,000 | | | | 246,700 | |
| | | |
5.00% | | | 06/04/42 | | | | 303,000 | | | | 377,739 | |
| | | |
6.38% | | | 07/15/28 | | | | 210,000 | | | | 260,844 | |
| |
Pilgrim’s Pride Corp. | | | | | |
| | | |
4.25% (1) | | | 04/15/31 | | | | 285,000 | | | | 300,347 | |
| | | |
5.88% (1) | | | 09/30/27 | | | | 250,000 | | | | 264,168 | |
| | | | | | | | | | | | |
| | | |
| | | | | | | | | | | 2,142,569 | |
| | | | | | | | | | | | |
|
| Gas — 0.2% | |
| |
Southern Co. Gas Capital Corp. | | | | | |
| | | |
3.88% | | | 11/15/25 | | | | 640,000 | | | | 688,571 | |
| | | | | | | | | | | | |
| | | | | | | | | | | | |
| Issues | | Maturity
Date | | | Principal
Amount | | | Value | |
|
| Health Care-Products — 0.1% | |
| |
Mozart Debt Merger Sub, Inc. | | | | | |
| | | |
3.88% (1) | | | 04/01/29 | | | $ | 284,000 | | | $ | 283,222 | |
| | | | | | | | | | | | |
|
| Health Care-Services — 1.6% | |
| |
Centene Corp. | | | | | |
| | | |
2.45% | | | 07/15/28 | | | | 635,000 | | | | 629,114 | |
| | | |
3.00% | | | 10/15/30 | | | | 248,000 | | | | 252,523 | |
| |
CommonSpirit Health | | | | | |
| | | |
2.78% | | | 10/01/30 | | | | 135,000 | | | | 138,529 | |
| |
HCA, Inc. | | | | | |
| | | |
4.13% | | | 06/15/29 | | | | 208,000 | | | | 229,584 | |
| | | |
5.00% | | | 03/15/24 | | | | 315,000 | | | | 338,956 | |
| | | |
5.25% | | | 06/15/49 | | | | 312,000 | | | | 401,463 | |
| | | |
5.25% | | | 06/15/26 | | | | 250,000 | | | | 281,395 | |
| | | |
5.63% | | | 09/01/28 | | | | 100,000 | | | | 117,017 | |
| | | |
7.05% | | | 12/01/27 | | | | 235,000 | | | | 291,149 | |
| |
Humana, Inc. | | | | | |
| | | |
4.95% | | | 10/01/44 | | | | 125,000 | | | | 161,150 | |
| |
ModivCare, Inc. | | | | | |
| | | |
5.88% (1) | | | 11/15/25 | | | | 270,000 | | | | 283,824 | |
| |
Molina Healthcare, Inc. | | | | | |
| | | |
3.88% (1) | | | 11/15/30 | | | | 520,000 | | | | 540,831 | |
| | | |
3.88% (1) | | | 05/15/32 | | | | 175,000 | | | | 177,506 | |
| |
Prime Healthcare Services, Inc. | | | | | |
| | | |
7.25% (1) | | | 11/01/25 | | | | 455,000 | | | | 483,437 | |
| | | | | | | | | | | | |
| | | |
| | | | | | | | | | | 4,326,478 | |
| | | | | | | | | | | | |
|
| Household Products/Wares — 0.0% | |
| |
Spectrum Brands, Inc. | | | | | |
| | | |
3.88% (1) | | | 03/15/31 | | | | 135,000 | | | | 133,955 | |
| | | | | | | | | | | | |
|
| Insurance — 1.2% | |
| |
Acrisure LLC / Acrisure Finance, Inc. | | | | | |
| | | |
4.25% (1) | | | 02/15/29 | | | | 280,000 | | | | 273,370 | |
| |
Athene Global Funding | | | | | |
| | | |
1.61% (1) | | | 06/29/26 | | | | 285,000 | | | | 280,095 | |
| | | |
1.99% (1) | | | 08/19/28 | | | | 425,000 | | | | 413,937 | |
| |
Farmers Exchange Capital | | | | | |
| | | |
7.05% (1) | | | 07/15/28 | | | | 500,000 | | | | 615,584 | |
| |
Farmers Insurance Exchange | | | | | |
| | | |
4.75% (3 mo. USD
LIBOR + 3.231%) (1)(2) | | | 11/01/57 | | | | 5,000 | | | | 5,730 | |
| |
Nationwide Mutual Insurance Co. | | | | | |
| | | |
2.49% (3 mo. USD
LIBOR + 2.290%) (1)(2) | | | 12/15/24 | | | | 1,000,000 | | | | 1,001,214 | |
| |
Teachers Insurance & Annuity Association of America | | | | | |
| | | |
4.38% (3 mo. USD LIBOR + 2.661%) (1)(2) | | | 09/15/54 | | | | 675,000 | | | | 698,349 | |
| | | | | | | | | | | | |
| | | |
| | | | | | | | | | | 3,288,279 | |
| | | | | | | | | | | | |
See accompanying Notes to Financial Statements.
18
TCW Strategic Income Fund, Inc.
December 31, 2021
| | | | | | | | | | | | |
| Issues | | Maturity
Date | | | Principal
Amount | | | Value | |
|
| Internet — 0.1% | |
| |
Tencent Holdings, Ltd. | | | | | |
| | | |
3.68% (1) | | | 04/22/41 | | | $ | 285,000 | | | $ | 296,408 | |
| | | | | | | | | | | | |
|
| Machinery-Diversified — 0.2% | |
| |
OT Merger Corp. | | | | | |
| | | |
7.88% (1) | | | 10/15/29 | | | | 425,000 | | | | 414,345 | |
| |
Titan Acquisition, Ltd. / Titan Co-Borrower LLC | | | | | |
| | | |
7.75% (1) | | | 04/15/26 | | | | 140,000 | | | | 142,800 | |
| | | | | | | | | | | | |
| | |
Total Machinery-diversified | | | | | | | | | |
| |
(Cost: $565,000) | | | | 557,145 | |
| | | | | | | | | | | | |
|
| Media — 1.0% | |
| |
Cable One, Inc. | | | | | |
| | | |
4.00% (1) | | | 11/15/30 | | | | 415,000 | | | | 410,850 | |
| |
Charter Communications Operating LLC / Charter Communications Operating Capital | | | | | |
| | | |
2.30% | | | 02/01/32 | | | | 165,000 | | | | 156,885 | |
| | | |
5.38% | | | 05/01/47 | | | | 125,000 | | | | 149,830 | |
| | | |
5.75% | | | 04/01/48 | | | | 150,000 | | | | 188,369 | |
| |
CSC Holdings LLC | | | | | |
| | | |
4.50% (1) | | | 11/15/31 | | | | 400,000 | | | | 396,108 | |
| | | |
5.38% (1) | | | 02/01/28 | | | | 25,000 | | | | 25,924 | |
| |
Diamond Sports Group LLC / Diamond Sports Finance Co. | | | | | |
| | | |
5.38% (1) | | | 08/15/26 | | | | 522,000 | | | | 264,263 | |
| | | |
6.63% (1) | | | 08/15/27 | | | | 630,000 | | | | 177,975 | |
|
DIRECTV Holdings LLC / DIRECTV Financing Co., Inc. | |
| | | |
5.88% (1) | | | 08/15/27 | | | | 225,000 | | | | 230,627 | |
|
Gray Escrow II, Inc. | |
| | | |
5.38% (1) | | | 11/15/31 | | | | 140,000 | | | | 144,308 | |
|
Sinclair Television Group, Inc. | |
| | | |
4.13% (1) | | | 12/01/30 | | | | 285,000 | | | | 270,469 | |
|
Virgin Media Secured Finance PLC (United Kingdom) | |
| | | |
5.50% (1) | | | 05/15/29 | | | | 225,000 | | | | 237,963 | |
| | | | | | | | | | | | |
| |
| | | | 2,653,571 | |
| | | | | | | | | | | | |
|
| Mining — 0.3% | |
| |
Corp. Nacional del Cobre de Chile | | | | | |
| | | |
3.15% (10) | | | 01/14/30 | | | | 350,000 | | | | 357,400 | |
| |
Indonesia Asahan Aluminium Persero PT | | | | | |
| | | |
6.53% (1) | | | 11/15/28 | | | | 300,000 | | | | 362,121 | |
| | | | | | | | | | | | |
| |
| | | | 719,521 | |
| | | | | | | | | | | | |
| |
| Miscellaneous Manufacturers — 0.8% | | | | |
| | | |
General Electric Co. | | | | | | | | | | | | |
| | | |
0.64% (3 mo. USD
LIBOR + 0.480%) (2) | | | 08/15/36 | | | | 2,400,000 | | | | 2,084,014 | |
| | | | | | | | | | | | |
| | | |
| Oil & Gas — 0.9% | | | | | | | | | |
| |
KazMunayGas National Co. JSC | | | | | |
| | | |
3.50% (10) | | | 04/14/33 | | | | 200,000 | | | | 208,980 | |
| | | | | | | | | | | | |
| Issues | | Maturity
Date | | | Principal
Amount | | | Value | |
| | | |
| Oil & Gas (Continued) | | | | | | | | | |
| |
Occidental Petroleum Corp. | | | | | |
| | | |
0.00% (11) | | | 10/10/36 | | | $ | 513,000 | | | $ | 291,943 | |
| |
Pertamina Persero PT (Indonesia) | | | | | |
| | | |
3.10% (1) | | | 08/27/30 | | | | 200,000 | | | | 204,660 | |
| |
Petroleos Mexicanos | | | | | |
| | | |
6.63% | | | 06/15/35 | | | | 385,000 | | | | 370,562 | |
| | | |
6.75% | | | 09/21/47 | | | | 75,000 | | | | 66,711 | |
| | | |
6.95% | | | 01/28/60 | | | | 130,000 | | | | 115,538 | |
| | | |
7.69% | | | 01/23/50 | | | | 170,000 | | | | 164,386 | |
| |
Petronas Capital, Ltd. | | | | | |
| | | |
3.50% (1) | | | 04/21/30 | | | | 200,000 | | | | 216,600 | |
| |
Sunoco LP / Sunoco Finance Corp. | | | | | |
| | | |
4.50% | | | 05/15/29 | | | | 283,000 | | | | 289,062 | |
| | | |
4.50% (1) | | | 04/30/30 | | | | 86,000 | | | | 88,273 | |
| |
Transocean Pontus, Ltd. | | | | | |
| | | |
6.13% (1) | | | 08/01/25 | | | | 68,340 | | | | 66,873 | |
| |
Transocean Poseidon, Ltd. | | | | | |
| | | |
6.88% (1) | | | 02/01/27 | | | | 314,000 | | | | 303,729 | |
| | | | | | | | | | | | |
| |
| | | | 2,387,317 | |
| | | | | | | | | | | | |
| |
| Oil & Gas Services — 0.2% | | | | |
|
Archrock Partners LP / Archrock Partners Finance Corp. | |
| | | |
6.25% (1) | | | 04/01/28 | | | | 140,000 | | | | 146,825 | |
| | |
Transocean Proteus, Ltd. | | | | | | | | | |
| | | |
6.25% (1) | | | 12/01/24 | | | | 97,500 | | | | 96,328 | |
| |
USA Compression Partners LP / USA Compression Finance Corp. | | | | | |
| | | |
6.88% | | | 04/01/26 | | | | 162,000 | | | | 168,657 | |
| | | |
6.88% | | | 09/01/27 | | | | 127,000 | | | | 134,277 | |
| | | | | | | | | | | | |
| |
| | | | 546,087 | |
| | | | | | | | | | | | |
| |
| Packaging & Containers — 0.5% | | | | |
|
Amcor Finance USA, Inc. | |
| | | |
3.63% | | | 04/28/26 | | | | 400,000 | | | | 426,764 | |
|
Ball Corp. | |
| | | |
4.00% | | | 11/15/23 | | | | 90,000 | | | | 94,163 | |
|
Berry Global, Inc. | |
| | | |
1.57% | | | 01/15/26 | | | | 335,000 | | | | 328,089 | |
| | | |
4.88% (1) | | | 07/15/26 | | | | 85,000 | | | | 88,037 | |
|
Graphic Packaging International LLC | |
| | | |
4.75% (1) | | | 07/15/27 | | | | 130,000 | | | | 141,212 | |
|
Intertape Polymer Group, Inc. | |
| | | |
4.38% (1) | | | 06/15/29 | | | | 268,000 | | | | 268,354 | |
|
Sealed Air Corp. | |
| | | |
4.00% (1) | | | 12/01/27 | | | | 25,000 | | | | 26,156 | |
| | | | | | | | | | | | |
| |
| | | | 1,372,775 | |
| | | | | | | | | | | | |
| |
| Pharmaceuticals — 1.5% | | | | |
|
AbbVie, Inc. | |
| | | |
4.50% | | | 05/14/35 | | | | 816,000 | | | | 977,681 | |
See accompanying Notes to Financial Statements.
19
TCW Strategic Income Fund, Inc.
Schedule of Investments (Continued)
| | | | | | | | | | | | |
| Issues | | Maturity
Date | | | Principal
Amount | | | Value | |
| |
| Pharmaceuticals (Continued) | | | | |
|
Bayer US Finance II LLC | |
| | | |
4.38% (1) | | | 12/15/28 | | | $ | 590,000 | | | $ | 659,583 | |
| | | |
4.63% (1) | | | 06/25/38 | | | | 515,000 | | | | 602,411 | |
| | | |
4.88% (1) | | | 06/25/48 | | | | 285,000 | | | | 351,116 | |
|
Cigna Corp. | |
| | | |
3.88% | | | 10/15/47 | | | | 170,000 | | | | 190,302 | |
|
CVS Health Corp. | |
| | | |
5.05% | | | 03/25/48 | | | | 685,000 | | | | 896,836 | |
|
Endo Dac / Endo Finance LLC / Endo Finco, Inc. | |
| | | |
6.00% (1) | | | 06/30/28 | | | | 475,000 | | | | 361,142 | |
|
Endo Luxembourg Finance Co. I Sarl / Endo US, Inc. | |
| | | |
6.13% (1) | | | 04/01/29 | | | | 110,000 | | | | 107,908 | |
| | | | | | | | | | | | |
| |
| | | | 4,146,979 | |
| | | | | | | | | | | | |
| |
| Pipelines — 1.7% | | | | |
|
Enbridge Energy Partners LP | |
| | | |
5.88% | | | 10/15/25 | | | | 50,000 | | | | 57,042 | |
|
Energy Transfer LP | |
| | | |
5.15% | | | 03/15/45 | | | | 325,000 | | | | 369,961 | |
| | | |
5.40% | | | 10/01/47 | | | | 831,000 | | | | 981,652 | |
| | | |
6.63% (3 mo. USD LIBOR + 4.155%) (2)(9) | | | 12/31/99 | | | | 634,000 | | | | 603,042 | |
|
Global Partners LP / GLP Finance Corp. | |
| | | |
6.88% | | | 01/15/29 | | | | 275,000 | | | | 288,358 | |
|
NGL Energy Operating LLC / NGL Energy Finance Corp. | |
| | | |
7.50% (1) | | | 02/01/26 | | | | 225,000 | | | | 232,216 | |
|
Plains All American Pipeline LP / PAA Finance Corp. | |
| | | |
3.80% | | | 09/15/30 | | | | 500,000 | | | | 522,714 | |
|
Rockies Express Pipeline LLC | |
| | | |
4.80% (1) | | | 05/15/30 | | | | 125,000 | | | | 131,211 | |
| | | |
4.95% (1) | | | 07/15/29 | | | | 425,000 | | | | 456,828 | |
|
Texas Eastern Transmission LP | |
| | | |
2.80% (1) | | | 10/15/22 | | | | 300,000 | | | | 303,291 | |
|
TransMontaigne Partners LP / TLP Finance Corp. | |
| | | |
6.13% | | | 02/15/26 | | | | 265,000 | | | | 263,012 | |
|
Venture Global Calcasieu Pass LLC | |
| | | |
3.88% (1) | | | 08/15/29 | | | | 425,000 | | | | 443,118 | |
| | | | | | | | | | | | |
| |
| | | | 4,652,445 | |
| | | | | | | | | | | | |
| |
| Real Estate — 0.1% | | | | |
|
China Aoyuan Group Ltd, Reg. S | |
| | | |
6.35% (8)(10) | | | 02/08/24 | | | | 400,000 | | | | 79,000 | |
|
Sunac China Holdings Ltd, Reg. S | |
| | | |
6.50% (10) | | | 01/10/25 | | | | 200,000 | | | | 127,214 | |
|
Zhenro Properties Group Ltd, Reg. S | |
| | | |
6.63% (10) | | | 01/07/26 | | | | 200,000 | | | | 129,500 | |
| | | | | | | | | | | | |
| | |
Total Real Estate | | | | | | | | | |
| |
(Cost: $389,630) | | | | 335,714 | |
| | | | | | | | | | | | |
| | | | | | | | | | | | |
| Issues | | Maturity
Date | | | Principal
Amount | | | Value | |
| |
| REIT — 1.5% | | | | |
|
CyrusOne LP / CyrusOne Finance Corp. | |
| | | |
2.90% | | | 11/15/24 | | | $ | 280,000 | | | $ | 289,314 | |
| | | |
3.45% | | | 11/15/29 | | | | 1,045,000 | | | | 1,135,194 | |
|
GLP Capital LP / GLP Financing II, Inc. | |
| | | |
5.30% | | | 01/15/29 | | | | 210,000 | | | | 238,765 | |
| | | |
5.38% | | | 04/15/26 | | | | 621,000 | | | | 692,334 | |
| | | |
5.75% | | | 06/01/28 | | | | 345,000 | | | | 398,827 | |
|
Hudson Pacific Properties LP | |
| | | |
3.95% | | | 11/01/27 | | | | 275,000 | | | | 294,907 | |
|
Iron Mountain Information Management Services, Inc. | |
| | | |
5.00% (1) | | | 07/15/32 | | | | 280,000 | | | | 286,922 | |
|
Lexington Realty Trust | |
| | | |
2.70% | | | 09/15/30 | | | | 275,000 | | | | 272,827 | |
|
Piedmont Operating Partnership LP | |
| | | |
3.40% | | | 06/01/23 | | | | 425,000 | | | | 435,931 | |
| | | | | | | | | | | | |
| |
| | | | 4,045,021 | |
| | | | | | | | | | | | |
|
| Retail — 0.7% | |
| |
Asbury Automotive Group, Inc. | | | | | |
| | | |
5.00% (1) | | | 02/15/32 | | | | 290,000 | | | | 300,382 | |
| |
Bloomin’ Brands, Inc. / OSI Restaurant Partners LLC | | | | | |
| | | |
5.13% (1) | | | 04/15/29 | | | | 285,000 | | | | 290,344 | |
| |
FirstCash, Inc. | | | | | |
| | | |
5.63% (1) | | | 01/01/30 | | | | 280,000 | | | | 285,681 | |
| |
Golden Nugget, Inc. | | | | | |
| | | |
6.75% (1) | | | 10/15/24 | | | | 415,000 | | | | 415,523 | |
| |
Michaels Cos, Inc. (The) | | | | | |
| | | |
5.25% (1) | | | 05/01/28 | | | | 175,000 | | | | 175,367 | |
| |
Michaels Cos, Inc. (The) | | | | | |
| | | |
7.88% (1) | | | 05/01/29 | | | | 415,000 | | | | 409,482 | |
| | | | | | | | | | | | |
| |
| | | | 1,876,779 | |
| | | | | | | | | | | | |
|
| Savings & Loans — 0.2% | |
| |
Nationwide Building Society (United Kingdom) | | | | | |
| | | |
3.77% (3 mo. USD
LIBOR + 1.064%) (1)(2) | | | 03/08/24 | | | | 520,000 | | | | 535,745 | |
| | | |
4.36% (3 mo. USD
LIBOR + 1.392%) (1)(2) | | | 08/01/24 | | | | 150,000 | | | | 157,142 | |
| | | | | | | | | | | | |
| | |
Total Savings & Loans | | | | | | | | | |
| | | |
(Cost: $686,750) | | | | | | | | | | | 692,887 | |
| | | | | | | | | | | | |
|
| Semiconductors — 0.2% | |
| |
Intel Corp. | | | | | |
| | | |
3.05% | | | 08/12/51 | | | | 644,000 | | | | 661,014 | |
| | | | | | | | | | | | |
|
| Software — 0.2% | |
| |
Change Healthcare Holdings LLC / Change Healthcare Finance, Inc. | | | | | |
| | | |
5.75% (1) | | | 03/01/25 | | | | 25,000 | | | | 25,284 | |
See accompanying Notes to Financial Statements.
20
TCW Strategic Income Fund, Inc.
December 31, 2021
| | | | | | | | | | | | |
| Issues | | Maturity
Date | | | Principal
Amount | | | Value | |
|
| Software (Continued) | |
| |
Oracle Corp. | | | | | |
| | | |
2.88% | | | 03/25/31 | | | $ | 60,000 | | | $ | 60,374 | |
| | | |
3.95% | | | 03/25/51 | | | | 545,000 | | | | 567,410 | |
| | | | | | | | | | | | |
| |
| | | | 653,068 | |
| | | | | | | | | | | | |
|
| Telecommunications — 3.7% | |
| |
AT&T, Inc. | | | | | |
| | | |
3.80% | | | 12/01/57 | | | | 503,000 | | | | 525,449 | |
| | | |
4.75% | | | 05/15/46 | | | | 530,000 | | | | 641,597 | |
| | | |
4.85% | | | 03/01/39 | | | | 348,000 | | | | 416,918 | |
| | | |
5.25% | | | 03/01/37 | | | | 705,000 | | | | 873,051 | |
| |
Frontier Communications Holdings LLC | | | | | |
| | | |
5.00% (1) | | | 05/01/28 | | | | 350,000 | | | | 361,410 | |
| |
Intelsat Jackson Holdings S. A. (Luxembourg) | | | | | |
| | | |
8.50% (1)(12) | | | 10/15/24 | | | | 535,000 | | | | 249,109 | |
| | | |
9.75% (1)(12) | | | 07/15/25 | | | | 621,000 | | | | 287,107 | |
| |
Level 3 Financing, Inc. | | | | | |
| | | |
3.40% (1) | | | 03/01/27 | | | | 75,000 | | | | 77,546 | |
| | | |
3.88% (1) | | | 11/15/29 | | | | 315,000 | | | | 320,965 | |
| | | |
4.63% (1) | | | 09/15/27 | | | | 176,000 | | | | 179,787 | |
| |
Lumen Technologies, Inc. | | | | | |
| | | |
5.38% (1) | | | 06/15/29 | | | | 425,000 | | | | 425,659 | |
| |
Qwest Corp. | | | | | |
| | | |
7.25% | | | 09/15/25 | | | | 250,000 | | | | 292,852 | |
| |
SES Global Americas Holdings GP | | | | | |
| | | |
5.30% (1) | | | 03/25/44 | | | | 675,000 | | | | 773,276 | |
| | | |
Sprint Corp. | | | | | | | | | | | | |
| | | |
7.88% | | | 09/15/23 | | | | 373,000 | | | | 411,316 | |
| |
Sprint Spectrum Co. LLC / Sprint Spectrum Co. II LLC / Sprint Spectrum Co. III LLC | | | | | |
| | | |
4.74% (1) | | | 03/20/25 | | | | 1,417,813 | | | | 1,485,180 | |
| |
T-Mobile USA, Inc. | | | | | |
| | | |
2.25% | | | 02/15/26 | | | | 75,000 | | | | 75,265 | |
| | | |
2.55% | | | 02/15/31 | | | | 140,000 | | | | 139,408 | |
| | | |
2.63% | | | 04/15/26 | | | | 489,000 | | | | 494,193 | |
| | | |
3.88% | | | 04/15/30 | | | | 235,000 | | | | 257,261 | |
| | | |
4.38% | | | 04/15/40 | | | | 350,000 | | | | 400,766 | |
| | | |
4.75% | | | 02/01/28 | | | | 186,000 | | | | 196,695 | |
| |
Verizon Communications, Inc. | | | | | |
| | | |
2.55% | | | 03/21/31 | | | | 135,000 | | | | 136,499 | |
| |
Vmed O2 UK Financing I PLC | | | | | |
| | | |
4.25% (1) | | | 01/31/31 | | | | 260,000 | | | | 255,221 | |
| |
Vodafone Group PLC (United Kingdom) | | | | | |
| | | |
4.88% | | | 06/19/49 | | | | 529,000 | | | | 668,792 | |
| | | | | | | | | | | | |
| |
| | | | 9,945,322 | |
| | | | | | | | | | | | |
|
| Total Corporate Bonds | |
| | |
(Cost: $81,018,274) | | | | | | | | 82,879,350 | |
| | | | | | | | | | | | |
| | | | | | | | | | | | |
| Issues | | Maturity
Date | | | Principal
Amount | | | Value | |
|
| MUNICIPAL BONDS — 0.8% | |
|
Alabama Economic Settlement Authority, Revenue Bond | |
| | | |
4.26% | | | 09/15/32 | | | $ | 705,000 | | | $ | 803,163 | |
|
County of Miami-Dade FL Aviation Revenue, Revenue Bond | |
| | | |
3.45% | | | 10/01/30 | | | | 130,000 | | | | 137,422 | |
|
Metropolitan Transportation Authority, Revenue Bond | |
| | | |
5.18% | | | 11/15/49 | | | | 55,000 | | | | 75,069 | |
|
New York State Dormitory Authority, Revenue Bond | |
| | | |
5.29% | | | 03/15/33 | | | | 1,000,000 | | | | 1,202,936 | |
| | | | | | | | | | | | |
|
| Total Municipal Bonds | |
| | |
(Cost: $2,080,579) | | | | | | | | 2,218,590 | |
| | | | | | | | | | | | |
|
| FOREIGN GOVERNMENT BONDS — 1.4% | |
|
Abu Dhabi Government International Bond | |
| | | |
2.50% (10) | | | 09/30/29 | | | | 200,000 | | | | 207,938 | |
|
Brazilian Government International Bond | |
| | | |
3.88% | | | 06/12/30 | | | | 200,000 | | | | 194,630 | |
|
Colombia Government International Bond | |
| | | |
3.00% | | | 01/30/30 | | | | 450,000 | | | | 410,895 | |
|
Dominican Republic International Bond | |
| | | |
4.50% (1) | | | 01/30/30 | | | | 200,000 | | | | 204,294 | |
|
Egypt Government International Bond | |
| | | |
5.25% (10) | | | 10/06/25 | | | | 200,000 | | | | 202,500 | |
|
Mexico Government International Bond | |
| | | |
2.66% | | | 05/24/31 | | | | 438,000 | | | | 427,751 | |
|
Panama Government International Bond | |
| | | |
3.16% | | | 01/23/30 | | | | 250,000 | | | | 259,704 | |
|
Philippine Government International Bond | |
| | | |
2.46% | | | 05/05/30 | | | | 200,000 | | | | 206,778 | |
|
Qatar Government International Bond | |
| | | |
4.50% (10) | | | 04/23/28 | | | | 350,000 | | | | 402,215 | |
|
Saudi Government International Bond | |
| | | |
3.25% (10) | | | 10/26/26 | | | | 200,000 | | | | 213,378 | |
| | | |
3.63% (10) | | | 03/04/28 | | | | 300,000 | | | | 327,264 | |
|
South Africa Government Bond | |
| | | |
4.88% | | | 04/14/26 | | | | 350,000 | | | | 374,220 | |
|
Uruguay Government International Bond | |
| | | |
4.38% | | | 01/23/31 | | | | 200,000 | | | | 230,802 | |
| | | | | | | | | | | | |
|
Total Foreign Government Bonds | |
| |
(Cost: $3,646,719) | | | | 3,662,369 | |
| | | | | | | | | | | | |
|
Total Fixed Income Securities | |
| |
(Cost: $264,376,855) | | | | 261,087,445 | |
| | | | | | | | | | | | |
| | | |
| | | | | | | | | | | | |
See accompanying Notes to Financial Statements.
21
TCW Strategic Income Fund, Inc.
Schedule of Investments (Continued)
| | | | | | | | | | | | |
| Security | | | | |
Shares | | | Value | |
|
COMMON STOCK — 7.6% | |
|
| Agriculture — 0.4% | |
| | |
Altria Group, Inc. | | | | 12,670 | | | $ | 600,431 | |
| | |
British American Tobacco PLC | | | | 15,706 | | | | 587,562 | |
| | | | | | | | | | | | |
| |
Total Agriculture | | | | | |
| | | |
(Cost: $1,140,228) | | | | | | | | | | | 1,187,993 | |
| | | | | | | | | | | | |
|
| Banks — 1.4% | |
| | |
Bank of America Corp. | | | | 20,516 | | | | 912,757 | |
| | |
Comerica, Inc. | | | | 9,417 | | | | 819,279 | |
| | |
JPMorgan Chase & Co. | | | | 7,204 | | | | 1,140,753 | |
| | |
Wells Fargo & Co. | | | | 19,525 | | | | 936,810 | |
| | | | | | | | | | | | |
| |
| | | | 3,809,599 | |
| | | | | | | | | | | | |
|
| Oil & Gas — 1.9% | |
| | |
BP PLC (SP ADR) (United Kingdom) | | | | 25,680 | | | | 683,858 | |
| | |
Chevron Corp. | | | | 6,954 | | | | 816,052 | |
| | |
Exxon Mobil Corp. | | | | 19,680 | | | | 1,204,219 | |
| | |
Royal Dutch Shell PLC (SP ADR) (United Kingdom) | | | | 18,856 | | | | 818,351 | |
| | |
Sunoco LP | | | | 19,213 | | | | 784,467 | |
| | |
TOTAL SA (SP ADR) (France) | | | | 16,370 | | | | 809,660 | |
| | | | | | | | | | | | |
| |
| | | | 5,116,607 | |
| | | | | | | | | | | | |
|
| Oil & Gas Services — 0.4% | |
| | |
USA Compression Partners LP | | | | 63,481 | | | | 1,107,743 | |
| | | | | | | | | | | | |
|
| Pharmaceuticals — 0.4% | |
| | |
Pfizer, Inc. | | | | 16,874 | | | | 996,410 | |
| | | | | | | | | | | | |
|
| Pipelines — 0.3% | |
| | |
Energy Transfer LP | | | | 103,400 | | | | 850,982 | |
| | | | | | | | | | | | |
|
| REIT — 2.0% | |
| | |
AGNC Investment Corp. | | | | 144,641 | | | | 2,175,401 | |
| | |
Annaly Capital Management, Inc. | | | | 165,767 | | | | 1,296,298 | |
| | |
Chimera Investment Corp. | | | | 48,368 | | | | 729,389 | |
| | |
Gaming and Leisure Properties, Inc. | | | | 15,119 | | | | 735,690 | |
| | |
New Residential Investment Corp. | | | | 55,339 | | | | 592,681 | |
| | | | | | | | | | | | |
| |
| | | | 5,529,459 | |
| | | | | | | | | | | | |
|
| Telecommunications — 0.8% | |
| | |
AT&T, Inc. | | | | 41,349 | | | | 1,017,185 | |
| | |
Lumen Technologies, Inc. | | | | 46,584 | | | | 584,629 | |
| | |
Verizon Communications, Inc. | | | | 10,086 | | | | 524,069 | |
| | | | | | | | | | | | |
| | | |
| | | | | | | | | | | 2,125,883 | |
| | | | | | | | | | | | |
| |
Total Common Stock | | | | | |
| | | |
(Cost: $15,646,174) | | | | | | | | | | | 20,724,676 | |
| | | | | | | | | | | | |
| |
PURCHASED OPTIONS (13) (0.0%)
(Cost: $106,854) | | | | 76,500 | |
| | | | | | | | | | | | |
| | | | | | | | | | | | |
| Security | | | | |
Shares | | | Value | |
| |
MONEY MARKET INVESTMENTS — 1.4% | | | | | |
| | |
State Street Institutional U.S. Government Money Market Fund — Premier Class, 0.03% (14) | | | | 3,661,861 | | | $ | 3,661,861 | |
| | | | | | | | | | | | |
| |
Total Money Market Investments | | | | | |
| |
(Cost: $3,661,861) | | | | 3,661,861 | |
| | | | | | | | | | | | |
| | | |
| | | | | | | | | | | | |
| Issues | | Maturity
Date | | | Principal
Amount | | | | |
|
SHORT TERM INVESTMENTS — 8.2% | |
|
| FOREIGN GOVERNMENT BONDS — 1.0% | |
|
Japan Treasury Discount Bill | |
| | | |
0.00% (11) | | | 02/28/22 | | | JPY | 320,000,000 | | | | 2,779,347 | |
| | | | | | | | | | | | |
| |
Total Foreign Government Bonds | | | | | |
| |
(Cost: $2,789,479) | | | | 2,779,347 | |
| | | | | | | | | | | | |
|
| U.S. TREASURY SECURITIES — 7.2% | |
| |
U.S. Treasury Bill | | | | | |
| | | |
0.00% (15) | | | 01/06/22 | | | $ | 3,000,000 | | | | 3,000,000 | |
| | | |
0.03% (15) | | | 02/10/22 | | | | 8,500,000 | | | | 8,499,753 | |
| | | |
0.04% (15) | | | 03/03/22 | | | | 5,000,000 | | | | 4,999,652 | |
| | | |
0.07% (15) | | | 04/28/22 | | | | 3,000,000 | | | | 2,999,317 | |
| | | | | | | | | | | | |
| | |
Total U.S. Treasury Securities | | | | | | | | | |
| |
(Cost: $19,498,707) | | | | 19,498,722 | |
| | | | | | | | | | | | |
| |
Total Short Term Investments | | | | | |
| |
(Cost: $22,288,186) | | | | 22,278,069 | |
| | | | | | | | | | | | |
| |
Total Investments (113.4%) | | | | | |
| |
(Cost: $306,079,930) | | | | 307,828,551 | |
| |
Liabilities In Excess Of Other Assets (-13.4%) | | | | (36,255,801 | ) |
| | | | | | | | | | | | |
| |
Net Assets (100.0%) | | | $ | 271,572,750 | |
| | | | | | | | | | | | |
See accompanying Notes to Financial Statements.
22
TCW Strategic Income Fund, Inc.
December 31, 2021
| | | | | | | | | | | | | | | | | | |
| Futures Contracts | |
| | | | | |
Number of
Contracts | | Type | | Expiration
Date | | | Notional
Contract
Value | | | Market Value | | | Net
Unrealized
Appreciation
(Depreciation) | |
Long Futures | | | | | | | | | | | | | | | | | | |
| 282 | | 5-Year U.S. Treasury Note Futures | | | 03/31/22 | | | $ | 34,007,108 | | | $ | 34,115,391 | | | $ | 108,283 | |
| | | | | | | | | | | | | | | | | | |
| | | | | | | | $ | 34,007,108 | | | $ | 34,115,391 | | | $ | 108,283 | |
| | | | | | | | | | | | | | | | | | |
Short Futures | | | | | | | | | | | | | | | | | | |
| 252 | | 10-Year U.S. Ultra Treasury Note Futures | | | 03/22/22 | | | $ | (36,512,118 | ) | | $ | (36,902,250 | ) | | $ | (390,132 | ) |
| 70 | | U.S. Ultra Long Bond Futures | | | 03/22/22 | | | | (13,730,821 | ) | | | (13,798,750 | ) | | | (67,929 | ) |
| | | | | | | | | | | | | | | | | | |
| | | | | | | | $ | (50,242,939 | ) | | $ | (50,701,000 | ) | | $ | (458,061 | ) |
| | | | | | | | | | | | | | | | | | |
| | | | | | | | | | | | | | | | | | | | | | | | |
| Forward Currency Exchange Contracts | |
| | | | | | |
| Counterparty | | Contracts to
Deliver | | | Units of
Currency | | | Settlement
Date | | | In Exchange for
U.S. Dollars | | | Contracts
at Value | | | Unrealized
Appreciation
(Depreciation) | |
| SELL (16) | | | | | | | | | | | | | | | | | | |
Goldman Sachs & Co. | | | JPY | | | | 320,000,000 | | | | 02/28/22 | | | $ | 2,807,276 | | | $ | 2,779,963 | | | $ | 27,313 | |
| | | | | | | | | | | | | | | | | | | | | | | | |
| | | | | | | | | | | | | | $ | 2,807,276 | | | $ | 2,779,963 | | | $ | 27,313 | |
| | | | | | | | | | | | | | | | | | | | | | | | |
| | | | | | | | | | | | | | | | | | | | | | | | | | |
| Centrally Cleared — Interest Rate Swap Agreements | |
Notional Amount | | | Expiration
Date | | | Payment
Made by
Fund
Frequency | | Payment
Made by
Fund | | Payment
Received
by Fund
Frequency | | Payment
Received
by Fund | | Unrealized
Appreciation
(Depreciation) | | | Premium
Paid | | | Value | |
| $ | 3,190,000 (17 | ) | | | 07/24/25 | | | Quarterly | | 3-Month USD LIBOR | | Semi-Annually | | 1.073% | | $ | (33,313 | ) | | $ | — | | | $ | (33,313 | ) |
| | 4,725,000 (17 | ) | | | 07/24/25 | | | Quarterly | | 3-Month USD LIBOR | | Semi-Annually | | 1.034% | | | (52,935 | ) | | | — | | | | (52,935 | ) |
| | 6,380,000 (17 | ) | | | 07/24/25 | | | Quarterly | | 3-Month USD LIBOR | | Semi-Annually | | 1.026% | | | (72,471 | ) | | | — | | | | (72,471 | ) |
| | 7,515,000 (17 | ) | | | 09/28/25 | | | Quarterly | | 3-Month USD LIBOR | | Semi-Annually | | 1.390% | | | (34,847 | ) | | | — | | | | (34,847 | ) |
| | 7,445,000 (17 | ) | | | 12/07/25 | | | Quarterly | | 3-Month USD LIBOR | | Semi-Annually | | 1.688% | | | 6,920 | | | | — | | | | 6,920 | |
| | 265,000 (17 | ) | | | 07/24/53 | | | Semi-Annually | | 1.808% | | Quarterly | | 3-Month USD LIBOR | | | (2,540 | ) | | | — | | | | (2,540 | ) |
| | 400,000 (17 | ) | | | 07/24/53 | | | Semi- Annually | | 1.785% | | Quarterly | | 3-Month USD LIBOR | | | (1,692 | ) | | | — | | | | (1,692 | ) |
| | 530,000 (17 | ) | | | 07/24/53 | | | Semi- Annually | | 1.773% | | Quarterly | | 3-Month USD LIBOR | | | (667 | ) | | | — | | | | (667 | ) |
| | 640,000 (17 | ) | | | 09/28/53 | | | Semi- Annually | | 1.870% | | Quarterly | | 3-Month USD LIBOR | | | (15,504 | ) | | | — | | | | (15,504 | ) |
| | 625,000 (17 | ) | | | 12/07/53 | | | Semi- Annually | | 1.743% | | Quarterly | | 3-Month USD LIBOR | | | 3,806 | | | | — | | | | 3,806 | |
| | | | | | | | | | | | | | | | | | | | | | | | | | |
| | | | | | | | | | | | | | | | $ | (203,243 | ) | | $ | — | | | $ | (203,243 | ) |
| | | | | | | | | | | | | | | | | | | | | | | | | | |
| | | | | | | | | | | | | | | | | | | | | | | | | | | | |
| Purchased Options — Exchange Traded | |
| | | | | | | |
| Description | | Exercise
Price | | | Expiration
Date | | | Number of
Contracts | | | Notional
Amount | | | Market
Value | | | Premiums
Paid
(Received)
by Fund | | | Unrealized
Appreciation
(Depreciation) | |
Call | | | | | | | | | | | | | | | | | | | | | | | | | | | | |
Eurodollar Futures | | | 98.75 | | | | 9/16/22 | | | | 170 | | | $ | 425,000 | | | $ | 76,500 | | | $ | 106,854 | | | $ | (30,354 | ) |
| | | | | | | | | | | | | | | | | | | | | | | | | | | | |
| | | | | | | | | | | | | | | | | | $ | 76,500 | | | $ | 106,854 | | | $ | (30,354 | ) |
| | | | | | | | | | | | | | | | | | | | | | | | | | | | |
See accompanying Notes to Financial Statements.
23
TCW Strategic Income Fund, Inc.
Schedule of Investments (Continued)
| | | | | | | | | | | | | | | | | | | | | | | | | | | | |
| Written Options — Exchange Traded | |
| | | | | | | |
| Description | | Exercise
Price | | | Expiration
Date | | | Number of
Contracts | | | Notional
Amount | | | Market
Value | | | Premiums
Paid
(Received)
by Fund | | | Unrealized
Appreciation
(Depreciation) | |
Call | | | | | | | | | | | | | | | | | | | | | | | | | | | | |
Eurodollar Futures | | | 99.00 | | | | 9/16/22 | | | | (170 | ) | | $ | (425,000 | ) | | $ | (42,500 | ) | | $ | (56,271 | ) | | $ | 13,771 | |
| | | | | | | |
Put | | | | | | | | | | | | | | | | | | | | | | | | | | | | |
Eurodollar Futures | | | 97.88 | | | | 9/16/22 | | | | (170 | ) | | $ | (425,000 | ) | | | (43,563 | ) | | | (42,703 | ) | | | (860 | ) |
| | | | | | | | | | | | | | | | | | | | | | | | | | | | |
| | | | | | | | | | | | | | | | | | $ | (86,063 | ) | | $ | (98,974 | ) | | $ | 12,911 | |
| | | | | | | | | | | | | | | | | | | | | | | | | | | | |
| | | | | | | | | | | | | | | | | | | | | | | | | | | | |
| Written Options — Exchange Traded | |
| | | | | | | |
| Description | | Exercise
Price | | | Expiration
Date | | | Number of
Contracts | | | Notional
Amount | | | Market
Value | | | Premiums
Paid
(Received)
by Fund | | | Unrealized
Appreciation
(Depreciation) | |
Equity Options | |
Call | |
Bank Of America Corp. | | | 45.00 | | | | 1/21/22 | | | | (102 | ) | | $ | (453,798 | ) | | $ | (8,823 | ) | | $ | (12,900 | ) | | $ | 4,077 | |
Bank Of America Corp. | | | 42.00 | | | | 6/17/22 | | | | (103 | ) | | | (458,247 | ) | | | (47,380 | ) | | | (35,686 | ) | | | (11,694 | ) |
Comerica, Inc. | | | 90.00 | | | | 2/18/22 | | | | (71 | ) | | | (617,700 | ) | | | (17,573 | ) | | | (16,790 | ) | | | (783 | ) |
JPMorgan Chase & Co. | | | 170.00 | | | | 3/18/22 | | | | (24 | ) | | | (380,040 | ) | | | (4,872 | ) | | | (14,195 | ) | | | 9,323 | |
Pfizer, Inc. | | | 50.00 | | | | 3/18/22 | | | | (168 | ) | | | (992,040 | ) | | | (158,760 | ) | | | (81,726 | ) | | | (77,034 | ) |
Wells Fargo & Co. | | | 55.00 | | | | 6/17/22 | | | | (97 | ) | | | (465,406 | ) | | | (13,725 | ) | | | (29,242 | ) | | | 15,517 | |
| | | | | | | | | | | | | | | | | | | | | | | | | | | | |
| | | | | | | | | | | | | | | | | | $ | (251,133 | ) | | $ | (190,539 | ) | | $ | (60,594 | ) |
| | | | | | | | | | | | | | | | | | | | | | | | | | | | |
See accompanying Notes to Financial Statements.
24
TCW Strategic Income Fund, Inc.
December 31, 2021
Notes to the Schedule of Investments:
| ABS | | Asset-Backed Securities. |
| ACES | | Alternative Credit Enhancement Securities. |
| CLO | | Collateralized Loan Obligation. |
| EETC | | Enhanced Equipment Trust Certificate. |
| I/F | | Inverse Floating rate security whose interest rate moves in the opposite direction of prevailing interest rates. |
| I/O | | Interest Only Security. |
| PAC | | Planned Amortization Class. |
| SOFR | | Secured Overnight Financing Rate. |
| TAC | | Target Amortization Class. |
| (1) | | Security exempt from registration under Rule 144A of the Securities Act of 1933, as amended. These securities may be resold, normally only to qualified institutional buyers. At December 31, 2021, the value of these securities amounted to $97,644,613 or 36.0% of net assets. These securities are determined to be liquid by the Fund’s investment advisor, unless otherwise noted, under procedures established by and under the general supervision of the Fund’s Board of Directors. |
| (2) | | Floating or variable rate security. The interest shown reflects the rate in effect at December 31, 2021. |
| (3) | | Variable rate security. Interest rate disclosed is as of the most recent information available. Certain variable rate securities are not based on a published reference rate and spread but are determined by the issuer or agent and are based on current market conditions. These securities do not indicate a reference rate and spread in their description above. |
| (4) | | This security is a residual or equity position that does not have a stated interest rate. This residual or equity position is entitled to recurring distributions which are generally equal to the remaining cash flow of payments made by underlying securities less contractual payments to debtholders and fund expenses. |
| (5) | | A portion of the principal balance has been written-off during the period due to defaults in the underlying loans. Cost basis has been adjusted. |
| (6) | | Restricted security (Note 9). |
| (7) | | Security purchased on a forward commitment with an approximate principal amount. The actual principal amount and maturity date will be determined upon settlement when the security is delivered. |
| (8) | | For fair value measurement disclosure purposes, security is categorized as Level 3. Security is valued using significant unobservable inputs. |
| (10) | | Investments issued under Regulation S of the Securities Act of 1933, as amended, may not be offered, sold, or delivered within the United States except under special exemptions. At December 31, 2021, the value of these securities amounted to $2,255,389 or 0.8% of net assets. |
| (11) | | Security is not accruing interest. |
| (12) | | Security is currently in default due to bankruptcy or failure to make payment of principal or interest of the issuer. Income is not being accrued. |
| (13) | | See options table for description of purchased options. |
| (14) | | Rate disclosed is the 7-day net yield as of December 31, 2021. |
| (15) | | Rate shown represents yield-to-maturity. |
| (16) | | Fund sells foreign currency, buys U.S. Dollar. |
| (17) | | This instrument has a forward starting effective date. See Note 2, Significant Accounting Policies in the Notes to Financial Statements for further information. |
See accompanying Notes to Financial Statements.
25
TCW Strategic Income Fund, Inc.
Investments by Sector | December 31, 2021 |
| | | | |
| Sector | | Percentage of
Net Assets | |
Corporate Bonds | | | 30.5 | % |
Residential Mortgage-Backed Securities — Non-Agency | | | 26.3 | |
Residential Mortgage-Backed Securities — Agency | | | 11.6 | |
Commercial Mortgage-Backed Securities — Non-Agency | | | 10.1 | |
Asset-Backed Securities | | | 12.9 | |
Common Stock | | | 7.6 | |
U.S. Treasury Securities | | | 7.2 | |
Commercial Mortgage-Backed Securities — Agency | | | 2.6 | |
Foreign Government Bonds | | | 2.4 | |
Money Market Investments | | | 1.4 | |
Municipal Bonds | | | 0.8 | |
Purchased Options | | | 0.0 | * |
Other* | | | (13.4 | ) ** |
| | | | |
Total | | | 100.0 | % |
| | | | |
| * | Value rounds to less than 0.1% of net assets. |
| ** | Includes cash, futures, written options, foreign currency exchange contracts, swap agreements, pending trades, interest receivable, and accrued expenses payable. |
See accompanying Notes to Financial Statements.
26
TCW Strategic Income Fund, Inc.
Fair Valuation Summary | December 31, 2021 |
The following is a summary of the fair valuations according to the inputs used as of December 31, 2021 in valuing the Fund’s investments:
| | | | | | | | | | | | | | | | |
Description | | Quoted Prices
in Active
Markets for
Identical
Assets
(Level 1) | | | Other
Significant
Observable
Inputs
(Level 2) | | | Significant
Unobservable
Inputs
(Level 3) | | | Total | |
Fixed Income Securities | | | | | | | | | | | | | | | | |
Asset-Backed Securities | | $ | — | | | $ | 34,940,904 | | | $ | — | | | $ | 34,940,904 | |
Mortgage-Backed Securities | | | | | | | | | | | | | | | | |
Commercial Mortgage-Backed Securities — Agency | | | — | | | | 7,105,433 | | | | — | | | | 7,105,433 | |
Commercial Mortgage-Backed Securities — Non-Agency | | | — | | | | 27,407,871 | | | | — | | | | 27,407,871 | |
Residential Mortgage-Backed Securities — Agency | | | — | | | | 31,446,016 | | | | — | | | | 31,446,016 | |
Residential Mortgage-Backed Securities — Non-Agency | | | — | | | | 66,316,872 | | | | 5,110,040 | | | | 71,426,912 | |
| | | | | | | | | | | | | | | | |
Total Mortgage-Backed Securities | | | — | | | | 132,276,192 | | | | 5,110,040 | | | | 137,386,232 | |
| | | | | | | | | | | | | | | | |
Corporate Bonds* | | | — | | | | 82,800,350 | | | | 79,000 | | | | 82,879,350 | |
Municipal Bonds | | | — | | | | 2,218,590 | | | | — | | | | 2,218,590 | |
Foreign Government Bonds | | | — | | | | 3,662,369 | | | | — | | | | 3,662,369 | |
| | | | | | | | | | | | | | | | |
Total Fixed Income Securities | | | — | | | | 255,898,405 | | | | 5,189,040 | | | | 261,087,445 | |
| | | | | | | | | | | | | | | | |
Common Stock* | | | 20,724,676 | | | | — | | | | — | | | | 20,724,676 | |
Purchased Options | | | 76,500 | | | | — | | | | — | | | | 76,500 | |
Money Market Investments | | | 3,661,861 | | | | — | | | | — | | | | 3,661,861 | |
Short Term Investments | | | 19,498,722 | | | | 2,779,347 | | | | — | | | | 22,278,069 | |
| | | | | | | | | | | | | | | | |
Total Investments | | $ | 43,961,759 | | | $ | 258,677,752 | | | $ | 5,189,040 | | | $ | 307,828,551 | |
| | | | | | | | | | | | | | | | |
Asset Derivatives | | | | | | | | | | | | | | | | |
Futures Contracts | | | | | | | | | | | | | | | | |
Interest Rate Risk | | | 108,283 | | | | — | | | | — | | | | 108,283 | |
Forward Contracts | | | | | | | | | | | | | | | | |
Foreign Currency Risk | | | — | | | | 27,313 | | | | — | | | | 27,313 | |
Swap Agreements | | | | | | | | | | | | | | | | |
Interest Rate Risk | | | — | | | | 10,726 | | | | — | | | | 10,726 | |
| | | | | | | | | | | | | | | | |
Total | | $ | 44,070,042 | | | $ | 258,715,791 | | | $ | 5,189,040 | | | $ | 307,974,873 | |
| | | | | | | | | | | | | | | | |
Liability Derivatives | | | | | | | | | | | | | | | | |
Futures Contracts | | | | | | | | | | | | | | | | |
Interest Rate Risk | | $ | (458,061 | ) | | $ | — | | | $ | — | | | $ | (458,061 | ) |
Swap Agreements | | | | | | | | | | | | | | | | |
Interest Rate Risk | | | — | | | | (213,969 | ) | | | — | | | | (213,969 | ) |
Written Options | | | | | | | | | | | | | | | | |
Interest Rate Risk | | | (86,063 | ) | | | — | | | | — | | | | (86,063 | ) |
Equity Risk | | | (251,133 | ) | | | — | | | | — | | | | (251,133 | ) |
| | | | | | | | | | | | | | | | |
Total | | $ | (795,257 | ) | | $ | (213,969 | ) | | $ | — | | | $ | (1,009,226 | ) |
| | | | | | | | | | | | | | | | |
| * | See Schedule of Investments for corresponding industries. |
See accompanying Notes to Financial Statements.
27
TCW Strategic Income Fund, Inc.
Statement of Assets and Liabilities | December 31, 2021 |
| | | | |
ASSETS: | | | | |
Investments, at Value (Cost: $306,079,930) | | $ | 307,828,551 | |
Cash | | | 3,953 | |
Receivable for Securities Sold | | | 29,964,256 | |
Cash Collateral Held for Brokers | | | 2,449,684 | |
Interest and Dividends Receivable | | | 1,828,818 | |
Prepaid Expenses | | | 29,249 | |
Unrealized Appreciation on Forward Foreign Currency Contracts | | | 27,313 | |
Foreign Tax Reclaims Receivable | | | 4,545 | |
| | | | |
Total Assets | | | 342,136,369 | |
| | | | |
LIABILITIES: | | | | |
Payables for Securities Purchased | | | 59,873,206 | |
Distributions Payable | | | 9,640,410 | |
Accrued Other Expenses | | | 375,305 | |
Options Written, at Value (Premium Received $289,513) | | | 337,196 | |
Payable for Variation Margin on Open Futures Contracts | | | 156,512 | |
Accrued Investment Advisory Fees | | | 140,229 | |
Accrued Directors’ Fees and Expenses | | | 17,250 | |
Interest Expense Payable | | | 13,503 | |
Payable for Daily Variation Margin on Open Centrally Cleared Swap Contracts | | | 10,008 | |
| | | | |
Total Liabilities | | | 70,563,619 | |
| | | | |
NET ASSETS | | $ | 271,572,750 | |
| | | | |
NET ASSETS CONSIST OF: | | | | |
Common Stock, par value $0.01 per share (75,000,000 shares authorized, 47,748,439 shares issued and outstanding) | | $ | 477,484 | |
Paid-in Capital | | | 269,310,055 | |
Accumulated Earnings | | | 1,785,211 | |
| | | | |
NET ASSETS | | $ | 271,572,750 | |
| | | | |
NET ASSET VALUE PER SHARE | | $ | 5.69 | |
| | | | |
MARKET PRICE PER SHARE | | $ | 5.77 | |
| | | | |
See accompanying Notes to Financial Statements.
28
TCW Strategic Income Fund, Inc.
Statement of Operations | Year Ended December 31, 2021 |
| | | | |
INVESTMENT INCOME: | | | | |
Income | | | | |
Interest | | $ | 16,793,087 | |
Dividends (net of foreign withholding taxes of $12,370) | | | 1,132,580 | |
| | | | |
Total Investment Income | | | 17,925,667 | |
| | | | |
Expenses | | | | |
Investment Advisory Fees | | | 1,665,465 | |
Audit and Tax Service Fees | | | 298,129 | |
Legal Fees | | | 161,141 | |
Directors’ Fees and Expenses | | | 113,113 | |
Printing and Distribution Costs | | | 73,561 | |
Custodian Fees | | | 58,944 | |
Interest Expense | | | 56,154 | |
Transfer Agent Fees | | | 49,912 | |
Listing Fees | | | 48,942 | |
Proxy Expense | | | 48,388 | |
Insurance Expense | | | 41,649 | |
Administration Fees | | | 39,478 | |
Miscellaneous Expense | | | 20,986 | |
Accounting Fees | | | 18,061 | |
| | | | |
Total Expenses | | | 2,693,923 | |
| | | | |
Net Investment Income | | | 15,231,744 | |
| | | | |
NET REALIZED GAIN (LOSS) AND CHANGE IN UNREALIZED APPRECIATION (DEPRECIATION) ON INVESTMENTS, FUTURES CONTRACTS, WRITTEN OPTIONS, SWAP AGREEMENTS AND FOREIGN CURRENCY: | | | | |
Net Realized Gain (Loss) on: | | | | |
Investments | | | 5,219,797 | |
Foreign Currency | | | (39,328 | ) |
Foreign Currency Forward Contracts | | | 24,785 | |
Futures Contracts | | | 1,550,272 | |
Written Options | | | (52,788 | ) |
Swap Agreements | | | (472 | ) |
Net Change in Unrealized Appreciation (Depreciation) on: | | | | |
Investments | | | (11,144,691 | ) |
Foreign Currency Forward Contracts | | | 27,313 | |
Futures Contracts | | | (541,255 | ) |
Written Options | | | (47,683 | ) |
Swap Agreements | | | (203,243 | ) |
| | | | |
Net Realized Gain (Loss) and Change in Unrealized Appreciation (Depreciation) on Investments, Futures Contracts, Written Options, Swap Agreements and Foreign Currency | | | (5,207,293 | ) |
| | | | |
INCREASE IN NET ASSETS FROM OPERATIONS | | $ | 10,024,451 | |
| | | | |
See accompanying Notes to Financial Statements.
29
TCW Strategic Income Fund, Inc.
Statements of Changes in Net Assets
| | | | | | | | |
| | | Year Ended
December 31,
2021 | | | Year Ended
December 31,
2020 | |
OPERATIONS: | | | | | | | | |
Net Investment Income | | $ | 15,231,744 | | | $ | 13,710,449 | |
Net Realized Gain on Investments, Futures Contracts, Written Options, Swap Agreements and Foreign Currency | | | 6,702,266 | | | | 3,978,847 | |
Change in Unrealized Appreciation (Depreciation) on Investments, Futures Contracts, Written Options, Swap Agreements and Foreign Currency | | | (11,909,559 | ) | | | 869,748 | |
| | | | | | | | |
Increase in Net Assets Resulting from Operations | | | 10,024,451 | | | | 18,559,044 | |
| | | | | | | | |
DISTRIBUTIONS TO SHAREHOLDERS: | | | | | | | | |
Distributions to Shareholders | | | (17,518,903 | ) | | | (13,131,985 | ) |
| | | | | | | | |
Shares Issued in Reinvestment of Dividends (0 for the year ended December 31, 2021 and 61,482 for the year ended December 31, 2020) | | | — | | | | 347,158 | |
| | | | | | | | |
Total Increase (Decrease) in Net Assets | | | (7,494,452 | ) | | | 5,774,217 | |
| | | | | | | | |
NET ASSETS: | | | | | | | | |
Beginning of year | | | 279,067,202 | | | | 273,292,985 | |
| | | | | | | | |
End of year | | $ | 271,572,750 | | | $ | 279,067,202 | |
| | | | | | | | |
See accompanying Notes to Financial Statements.
30
TCW Strategic Income Fund, Inc.
Notes to Financial Statements | December 31, 2021 |
Note 1 — Organization
TCW Strategic Income Fund, Inc. (the “Fund”) was incorporated in Maryland on January 13, 1987 as a diversified, closed-end investment management company and is registered under the Investment Company Act of 1940, as amended (the “1940 Act”). Its shares are traded on the New York Stock Exchange under the symbol TSI. The Fund commenced operations on March 5, 1987. The Fund’s investment objective is to seek a total return comprised of current income and capital appreciation, and it seeks to achieve its investment objective by investing in a wide range of securities including convertible securities, marketable equity securities, investment-grade debt securities, high-yield debt securities, securities issued or guaranteed by the U.S. Government, its agencies and instrumentalities (“U.S. Government Securities”), repurchase agreements, mortgage-related securities, asset-backed securities, money market securities, and other securities and derivative instruments without limit believed by the Fund’s investment advisor to be consistent with the Fund’s investment objective. TCW Investment Management Company LLC (the “Advisor”) is the investment advisor to the Fund and is registered under the Investment Advisers Act of 1940, as amended.
Note 2 — Significant Accounting Policies
The following is a summary of significant accounting policies, which are in conformity with accounting principles generally accepted in the United States of America (“GAAP”) and which are consistently followed by the Fund in the preparation of its financial statements. The Fund is considered an investment company under the Financial Accounting Standards Board (“FASB”) Accounting Standards Codification (“ASC”) No. 946, Financial Services — Investment Companies. Subsequent events, if any, have been evaluated through the date of issuance in the preparation of the financial statements.
Principles of Accounting: The Fund uses the accrual method of accounting for financial reporting purposes.
Security Valuations: Securities listed or traded on the NYSE and other stock exchanges are valued at the latest sale price on that exchange. Securities traded on the NASDAQ stock market (“NASDAQ”) are valued using official closing prices as reported by NASDAQ, which may not be the last sale price. All other securities for which over-the-counter (“OTC”) market quotations are readily available, including short-term securities, swap agreements and forward currency contracts, are valued with prices furnished by independent pricing services or by broker-dealers.
Securities for which market quotations are not readily available, including in circumstances under which it is determined by the Advisor that prices received are not reflective of their market values, are valued by the Advisor’s Pricing Committee in accordance with the guidelines established by the Valuation Committee of the Board of Directors of the Fund (the “Board,” and each member thereof, a “Director”) and under the general oversight of the Board.
Fair value is defined as the price that the Fund would receive upon selling an investment in a timely transaction to an independent buyer in the principal or most advantageous market for the investment. In accordance with the authoritative guidance on fair value measurements and disclosures under GAAP, the Fund discloses investments in its financial statements in a three-tier hierarchy. This hierarchy is utilized to establish classification of fair value measurements based on inputs. Inputs that go into fair value measurement refer broadly to the assumptions that market participants would use in pricing the asset or liability, including assumptions about risk. Inputs may be observable or unobservable. Observable inputs are inputs that reflect the assumptions market participants would use in pricing the asset or liability,
31
TCW Strategic Income Fund, Inc.
Notes to Financial Statements (Continued)
Note 2 — Significant Accounting Policies (Continued)
developed based on market data obtained from sources independent of the reporting entity. Unobservable inputs are inputs that reflect the reporting entity’s own assumptions about the inputs market participants would use in pricing the asset or liability, developed based on the best information available in the circumstances.
The three-tier hierarchy of inputs is summarized in the three broad levels listed below.
| | |
| Level 1 — | | quoted prices in active markets for identical investments. |
| Level 2 — | | other significant observable inputs (including quoted prices for similar investments, interest rates, prepayment speeds, credit risk, etc.). |
| Level 3 — | | significant unobservable inputs (including the Fund’s own assumptions in determining the fair value of investments). |
Changes in valuation techniques may result in transfers in or out of an investment’s assigned Level within the hierarchy. The inputs or methodologies used for valuing investments are not necessarily an indication of the risk associated with investing in those investments and the determination of the significance of a particular input to the fair value measurement in its entirety requires judgment and consideration of factors specific to each security.
The availability of observable inputs can vary from security to security and is affected by a wide variety of factors, including, for example, the type of security, whether the security is new and not yet established in the marketplace, the liquidity of markets, and other characteristics particular to the security. To the extent that valuation is based on models or inputs that are less observable or unobservable in the market, the determination of fair value requires more judgment. Accordingly, the degree of judgment exercised in determining fair value is greatest for instruments categorized as Level 3.
In periods of market dislocation, the observability of prices and inputs may be reduced for many instruments. This condition, as well as changes related to liquidity of investments, could cause a security to be reclassified between Level 1, Level 2, or Level 3.
In certain cases, the inputs used to measure fair value may fall into different levels of the fair value hierarchy. In such cases, for disclosure purposes the level in the fair value hierarchy within which the fair value measurement falls in its entirety is determined based on the lowest level input that is significant to the fair value measurement.
Fair Value Measurements: Descriptions of the valuation techniques applied to the Fund’s major categories of assets and liabilities measured at fair value on a recurring basis are as follows:
Asset-backed securities (“ABS”) and mortgage-backed securities (“MBS”). The fair value of ABS and MBS is estimated based on pricing models that consider the estimated cash flows of each debt tranche of the issuer, establish a benchmark yield, and develop an estimated tranche-specific spread to the benchmark yield based on the unique attributes of the tranche including, but not limited to, the prepayment speed assumptions and attributes of the collateral. To the extent the inputs are observable and timely, the values would be categorized as Level 2 of the fair value hierarchy; otherwise, they would be categorized as Level 3.
Corporate bonds. The fair value of corporate bonds is estimated using recently executed transactions, market price quotations (where observable), bond spreads, or credit default swap spreads adjusted for any basis difference between cash and derivative instruments. Corporate bonds are generally categorized as Level 2 of the fair value hierarchy; in instances where prices, spreads, or any of the other aforementioned key inputs are unobservable, they are categorized as Level 3 of the hierarchy.
32
TCW Strategic Income Fund, Inc.
December 31, 2021
Note 2 — Significant Accounting Policies (Continued)
Equity securities. Securities are generally valued based on quoted prices from the applicable exchange. To the extent these securities are actively traded and valuation adjustments are not applied, they are generally categorized as Level 1 of the fair value hierarchy. Restricted securities issued by publicly held companies are generally categorized as Level 2 of the fair value hierarchy; if a discount is applied and significant, they are categorized as Level 3. Restricted securities held in non-public entities are included in Level 3 of the fair value hierarchy because they trade infrequently, and therefore the inputs are unobservable. Certain foreign securities that are fair valued using a pricing service that considers the correlation of the trading patterns of the foreign security to the intraday trading in the U.S. markets are categorized as Level 2 of the fair value hierarchy.
Foreign currency contracts. The fair values of foreign currency contracts are derived from indices, reference rates, and other inputs or a combination of these factors. To the extent that these factors can be observed, foreign currency contracts are categorized as Level 2 of the fair value hierarchy.
Futures contracts. Futures contracts are generally valued at the settlement price established at the close of business each day by the exchange on which they are traded. They are categorized as Level 1.
Government and agency securities. Government and agency securities are normally valued using a model that incorporates market observable data such as reported sales of similar securities, broker quotes, yields, bids, offers, quoted market prices, and reference data. Accordingly, government and agency securities are normally categorized as Level 1 or 2 of the fair value hierarchy depending on the liquidity and transparency of the market.
Interest rate swaps. Interest rate swaps are fair valued using pricing models that take into account, among other factors, index spread curves, nominal values, modified duration values and cash flows. To the extent that these inputs are observable and timely, the fair values of credit default swaps are categorized as Level 2; otherwise, the fair values are categorized as Level 3.
Money market funds. Money market funds are open-end mutual funds that invest in short-term debt securities. To the extent that these funds are valued based upon the reported net asset value (“NAV”), they are categorized as Level 1 of the fair value hierarchy.
Municipal bonds. Municipal bonds are fair valued based on pricing models that take into account, among other factors, information received from market makers and broker-dealers, current trades, bid-wanted lists, offerings, market movements, the callability of the bond, state of issuance, benchmark yield curves, and bond insurance. To the extent that these inputs are observable and timely, the fair values of municipal bonds are categorized as Level 2; otherwise, the fair values are categorized as Level 3.
Options contracts. Option contracts traded on securities exchanges are fair valued using market mid prices; as such, they are categorized as Level 1. Option contracts traded OTC are fair valued based on pricing models and incorporate various inputs such as interest rates, credit spreads, currency exchange rates and volatility measurements for in-the-money, at the-money, and out-of-money contracts on a given strike price. To the extent that these inputs are observable and timely, the fair value of OTC option contracts would be categorized as Level 2; otherwise, the fair values would be categorized as Level 3.
Restricted securities. Restricted securities, including illiquid Rule 144A securities, issued by non-public entities are categorized as Level 3 of the fair value hierarchy because they trade infrequently, and therefore the inputs are unobservable. Any other restricted securities valued similar to publicly traded securities may be categorized as Level 2 or 3 of the fair value hierarchy depending on whether a discount is applied and significant to the fair value.
33
TCW Strategic Income Fund, Inc.
Notes to Financial Statements (Continued)
Note 2 — Significant Accounting Policies (Continued)
Short-term investments. Short-term investments are valued using market price quotations, and are categorized as Level 1 or Level 2 of the fair value hierarchy.
The summary of the inputs used as of December 31, 2021 in valuing the Fund’s investments is listed after the Investments by Sector table.
Following is a reconciliation of investments in which significant unobservable inputs (Level 3) were used in determining value:
| | | | | | | | |
| | | Corporate
Bonds | | | Residential
Mortgage-Backed
Securities — Non-
Agency | |
Balance as of December 31, 2020 | | $ | — | | | $ | 7,225,731 | |
Accrued Discounts (Premiums) | | | 9,922 | | | | (788,191 | ) |
Realized Gain (Loss) | | | — | | | | — | |
Change in Unrealized Appreciation (Depreciation) | | | (66,922 | ) | | | (1,327,500 | ) |
Purchases | | | 136,000 | | | | — | |
Sales | | | — | | | | — | |
Transfers in to Level 3 | | | — | | | | — | |
Transfers out of Level 3 | | | — | | | | — | |
| | | | | | | | |
Balance as of December 31, 2021 | | $ | 79,000 | | | $ | 5,110,040 | |
| | | | | | | | |
Change in Unrealized Appreciation (Depreciation) from Investments Still Held at December 31, 2021 | | $ | (66,922 | ) | | $ | (1,327,500 | ) |
| | | | | | | | |
Significant unobservable valuation inputs for Level 3 investments as of December 31, 2021 are as follows:
| | | | | | | | | | | | | | |
Description | | Fair Value at
December 31,
2021 | | | Valuation
Techniques | | Unobservable
Input | | Price or Price
Range | | Weighted Average
Price | |
Corporate Bonds | | $ | 79,000 | | | Third-party Vendor | | Vendor Inputs & Assumptions | | $19.750 | | | $19.750 | |
Residential Mortgage-Backed Securities — Non-Agency (Interest Only Collateral Strip Rate Securities) | | $ | 662,712 | | | Third-party Vendor | | Vendor Inputs & Assumptions | | $0.428 to $2.260 | | | $ 1.101 | |
Residential Mortgage-Backed Securities — Non-Agency (Interest Only Securities) | | $ | 4,447,328 | | | Third-party Vendor | | Vendor Inputs & Assumptions | | $2.378 to $ 23.979 | | | $8.848 | |
Security Transactions and Related Investment Income: Security transactions are recorded as of the trade date. Dividend income is recorded on the ex-dividend date. Interest income is recognized on an accrual basis. REIT dividends are recorded as income for accounting purposes. Any portion that is return of capital will be reflected as a tax adjustment upon receiving annual tax documentation from the REIT. Realized gains and losses on investments are recorded on the basis of specific identification.
Use of Estimates: The preparation of the accompanying financial statements requires management to make estimates and assumptions that affect the reported amount of assets and liabilities at the date of the financial statements and the reported amounts of income and expenses during the reporting period. Actual results could differ from these estimates.
34
TCW Strategic Income Fund, Inc.
December 31, 2021
Note 2 — Significant Accounting Policies (Continued)
Foreign Currency Translation: The books and records of the Fund are maintained in U.S. dollars as follows: (1) foreign currency denominated securities, and other assets and liabilities stated in foreign currencies are translated using the daily spot rate; and (2) purchases, sales, income and expenses are translated at the rate of exchange prevailing on the respective dates of such transactions. The resultant exchange gains and losses are included in net realized or net unrealized gain (loss) in the Statement of Operations. Pursuant to U.S. federal income tax regulations, certain foreign exchange gains and losses included in realized and unrealized gains and losses are included in, or are a reduction of, ordinary income for federal income tax purposes.
Distributions: Distributions to shareholders are recorded on each ex-dividend date. The Fund declared and paid or reinvested dividends quarterly under an income-based distribution policy. The income-based distribution policy has a stated goal of providing quarterly distributions out of the Fund’s accumulated undistributed net investment income and/or other sources subject to the requirements of the 1940 Act and Subchapter M of the Internal Revenue Code (the “Code”). The source for the dividend can come from net investment income and net realized capital gains measured on a fiscal year basis. Any portion of the distribution that exceeds income and capital gains will be treated as a return of capital. Under certain conditions, U.S. federal tax regulations cause some or all of the return of capital to be taxed as ordinary income. Income and capital gain distributions are determined in accordance with income tax regulations which may differ from GAAP. These differences may be primarily due to differing treatments for market discount and premium, losses recognized on structured debt, losses deferred due to wash sales, foreign currency gains and losses, and spillover distributions. Permanent book and tax basis differences relating to shareholder distributions will result in reclassifications to paid-in capital and may affect net investment income per share.
Derivative Instruments: Derivatives are financial instruments which are valued based on the values of one or more indicators, such as a security, asset, currency, interest rate, or index. Derivative transactions can create investment leverage and may be highly volatile. A derivative contract may result in a mark-to-market loss if the value of the contract decreases due to an unfavorable change in the market rates or values of the underlying instrument. It is possible that a derivative transaction will result in a loss greater than the principal amount invested. The Fund may not be able to close out a derivative transaction at a favorable time or price.
For the year ended December 31, 2021, the Fund had derivatives and transactions in derivatives, grouped in the following risk categories:
| | | | | | | | | | | | | | | | |
| | | Equity Risk | | | Foreign
Currency
Risk | | | Interest
Rate
Risk | | | Total | |
Statement of Assets and Liabilities: | |
Asset Derivatives | |
Investments (1) | | $ | — | | | $ | — | | | $ | 76,500 | | | $ | 76,500 | |
Swaps Agreements (2) | | | — | | | | — | | | | 10,726 | | | | 10,726 | |
Futures Contracts (3) | | | — | | | | — | | | | 108,283 | | | | 108,283 | |
Forward Contracts | | | — | | | | 27,313 | | | | — | | | | 27,313 | |
| | | | | | | | | | | | | | | | |
Total Value | | $ | — | | | $ | 27,313 | | | $ | 195,509 | | | $ | 222,822 | |
| | | | | | | | | | | | | | | | |
Liability Derivatives | | | | | | | | | | | | | | | | |
Written Options | | $ | (251,133 | ) | | $ | — | | | $ | (86,063 | ) | | $ | (337,196 | ) |
Swap Agreements (2) | | | — | | | | — | | | | (213,969 | ) | | | (213,969 | ) |
Futures Contracts (3) | | | — | | | | — | | | | (458,061 | ) | | | (458,061 | ) |
| | | | | | | | | | | | | | | | |
Total Value | | $ | (251,133 | ) | | $ | — | | | $ | (758,093 | ) | | $ | (1,009,226 | ) |
| | | | | | | | | | | | | | | | |
35
TCW Strategic Income Fund, Inc.
Notes to Financial Statements (Continued)
Note 2 — Significant Accounting Policies (Continued)
| | | | | | | | | | | | | | | | |
| | | Equity Risk | | | Foreign
Currency
Risk | | | Interest
Rate
Risk | | | Total | |
Statement of Operations: | | | | | | | | | | | | | | | | |
Net Realized Gain (Loss) | | | | | | | | | | | | | | | | |
Forward Contracts | | $ | — | | | $ | 24,785 | | | $ | — | | | $ | 24,785 | |
Futures Contracts | | | — | | | | — | | | | 1,550,272 | | | | 1,550,272 | |
Investments (4) | | | — | | | | — | | | | 147,369 | | | | 147,369 | |
Written Options | | | 83,545 | | | | — | | | | (136,333 | ) | | | (52,788 | ) |
Swap Agreements | | | — | | | | — | | | | (472 | ) | | | (472 | ) |
| | | | | | | | | | | | | | | | |
Net Realized Gain (Loss) | | $ | 83,545 | | | $ | 24,785 | | | $ | 1,560,836 | | | $ | 1,669,166 | |
| | | | | | | | | | | | | | | | |
Net Change in Appreciation (Depreciation) | | | | | | | | | | | | | | | | |
Forward Contracts | | $ | — | | | $ | 27,313 | | | $ | — | | | $ | 27,313 | |
Futures Contracts | | | — | | | | — | | | | (541,255 | ) | | | (541,255 | ) |
Investments (5) | | | — | | | | — | | | | (30,354 | ) | | | (30,354 | ) |
Written Options | | | (60,594 | ) | | | — | | | | 12,911 | | | | (47,683 | ) |
Swap Agreements | | | — | | | | — | | | | (203,243 | ) | | | (203,243 | ) |
| | | | | | | | | | | | | | | | |
Total Net Change in Appreciation (Depreciation) | | $ | (60,594 | ) | | $ | 27,313 | | | $ | (761,941 | ) | | $ | (795,222 | ) |
| | | | | | | | | | | | | | | | |
Number of Contracts or Notional Amounts (6) | | | | | | | | | | | | | | | | |
Forward Contracts | | | — | | | $ | 2,800,850 | | | $ | — | | | $ | 2,800,850 | |
Futures Contracts | | | — | | | | — | | | | 440 | | | | 440 | |
Investments | | | — | | | | — | | | | 290 | | | | 290 | |
Written Options | | | 793 | | | | | | | | 415 | | | | 1,208 | |
Swap Agreements | | | — | | | $ | — | | | $ | 22,271,667 | | | $ | 22,271,667 | |
| (1) | Represents purchased options, at value. |
| (2) | Includes cumulative appreciation (depreciation) of swap agreements as reported in the Schedule of Investments. Only variation margin on December 31, 2021 is reported within the Statement of Assets and Liabilities. |
| (3) | Includes cumulative appreciation (depreciation) of futures contracts as reported in the Schedule of Investments. Only variation margin on December 31, 2021 is reported within the Statement of Assets and Liabilities. |
| (4) | Represents realized gain (loss) for purchased options. |
| (5) | Represents change in unrealized appreciation (depreciation) for purchased options during the year. |
| (6) | Amount disclosed represents average number of contracts or notional amounts, which are representative of the volume traded for the year ended December 31, 2021. |
Counterparty Credit Risk: Derivative contracts may be exposed to counterparty risk. Losses can occur if the counterparty does not perform under the contract.
The Fund’s risk of loss from counterparty credit risk on OTC derivatives is generally limited to the aggregate unrealized gain netted against any collateral held by the Fund.
With exchange-traded futures and centrally cleared swaps, there is less counterparty credit risk to the Fund since the exchange or clearinghouse, as counterparty to such instruments, guarantees against a possible default. The clearinghouse stands between the buyer and the seller of the contract; therefore, the counterparty credit risk is limited to failure of the clearinghouse. While offset rights may exist under applicable law, the Fund does not have a contractual right of offset against a clearing broker or clearinghouse in the event of a default (including the bankruptcy or insolvency) of the clearing broker or clearinghouse. Additionally, credit risk exists in exchange-traded futures and centrally cleared swaps with respect to initial and variation margin that is held in a clearing broker’s customer accounts. While clearing brokers are required to segregate customer margin from their own assets, in the event that a clearing broker becomes insolvent or goes into bankruptcy and at that time there is a shortfall in the aggregate
36
TCW Strategic Income Fund, Inc.
December 31, 2021
Note 2 — Significant Accounting Policies (Continued)
amount of margin held by the clearing broker for all its clients, typically the shortfall would be allocated on a pro rata basis across all the clearing broker’s customers, potentially resulting in losses to the Fund.
For OTC derivatives, the Fund mitigates its counterparty risk by entering into an International Swaps and Derivatives Association, Inc. Master Agreement (“ISDA Master Agreement”) or similar agreement with each counterparty. An ISDA Master Agreement is a bilateral agreement between the Fund and a counterparty that governs OTC derivatives and typically contains, among other things, collateral posting terms and netting provisions in the event of a default and/or termination event. Under an ISDA Master Agreement, the Fund may, under certain circumstances, offset with the counterparty certain derivative financial instruments’ payables and/or receivables with collateral held and/or posted and create one single net payment. The provisions of the ISDA Master Agreement typically permit a single net payment in the event of default including the bankruptcy or insolvency of the counterparty. However, bankruptcy or insolvency laws of a particular jurisdiction may impose restrictions on or prohibitions against the right of offset in bankruptcy, insolvency or other events. In addition, certain ISDA Master Agreements allow counterparties to OTC derivatives to terminate derivative contracts prior to maturity in the event the Fund’s net assets decline by a stated percentage or the Fund fails to meet the terms of its ISDA Master Agreements, which would cause the Fund to accelerate payment of any net liability owed to the counterparty.
Collateral Requirements: For derivatives traded under an ISDA Master Agreement, the collateral requirements are typically calculated by netting the mark-to-market amount for each transaction under such agreement and comparing that amount to the value of any collateral pledged or received by the Fund.
Cash collateral that has been pledged to cover obligations of the Fund is reported separately on the Statement of Assets and Liabilities. Non-cash collateral pledged by the Fund, if any, is noted in the Schedule of Investments. Generally, the amount of collateral due from or to a party has to exceed a minimum transfer amount threshold, typically $250,000 or $500,000, before a transfer is required, which is determined at the close of each business day and the collateral is transferred on the next business day. To the extent amounts due to the Fund from its counterparties are not fully collateralized, contractually or otherwise, the Fund bears the risk of loss from counterparty non-performance. The Fund attempts to mitigate counterparty risk by entering into agreements only with counterparties that the Advisor believes have the financial resources to honor their obligations and by monitoring the financial stability of those counterparties. For financial reporting purposes, the Fund does not offset derivative assets and derivative liabilities that are subject to netting arrangements in the Statement of Assets and Liabilities. The Fund has implemented the disclosure requirements pursuant to FASB Accounting Standards Update (“ASU”) No. 2011-11, Disclosures about Offsetting Assets and Liabilities that requires disclosures to make financial statements that are prepared under GAAP more comparable to those prepared under International Financial Reporting Standards.
Master Agreements and Netting Arrangements. The Fund is party to various agreements, including but not limited to International Swaps and Derivatives Association Agreements and related Credit Support Annex, Master Repurchase Agreements, and Master Securities Forward Transactions Agreements (collectively “Master Agreements”), which govern the terms of certain transactions with select counterparties. These Master Agreements generally include provisions for general obligations, representations, agreements, collateral, and certain events of default or termination. These Master Agreements also include provisions for netting arrangements that help reduce credit and counterparty risk associated with relevant transactions
37
TCW Strategic Income Fund, Inc.
Notes to Financial Statements (Continued)
Note 2 — Significant Accounting Policies (Continued)
(“netting arrangements”). The netting arrangements are generally tied to credit-related events that, if triggered, would cause an event of default or termination giving a Fund or counterparty the right to terminate early and cause settlement, on a net basis, of all transactions under the applicable Master Agreement. In the event of an early termination as a result of an event of default under the Master Agreement, the total value exposure of all transactions will be offset against collateral exchanged to date, which would result in a net receivable or payable that would be due from or to the counterparty. However, bankruptcy or insolvency laws of a particular jurisdiction may impose restrictions on or prohibitions against the right of offset in the event of a bankruptcy or insolvency of the counterparty. Credit related events include, but are not limited to, bankruptcy, failure to make timely payments, restructuring, obligation acceleration, obligation default, a material decline in net assets, decline in credit rating or repudiation/moratorium. Any election made by a counterparty to early terminate the transactions under a Master Agreement could have a material adverse impact on a Fund’s financial statements. A Fund’s overall exposure to credit risk subject to netting arrangements can change substantially within a short period, as it is affected by each transaction subject to the arrangement.
Master Agreements can also help limit counterparty risk by specifying collateral posting arrangements at pre-arranged exposure levels. Under the Master Agreements, collateral is routinely transferred if the total net exposure to certain transactions under the relevant Master Agreement with a counterparty in a given Fund exceeds a specified threshold, net of collateral already in place, typically $250,000 or $500,000 depending on the counterparty and the type of Master Agreement. Collateral under the Master Agreements is usually in the form of cash or U.S. Treasury Bills but could include other types of securities. If permitted under the Master Agreement, certain funds may rehypothecate cash collateral received from a counterparty. The value of all derivative transactions outstanding under a Master Agreement is calculated daily to determine the amount of collateral to be received or pledged by the counterparty. Posting of collateral for OTC derivative transactions are covered under tri-party collateral agreements between the Fund, the Fund’s custodian, and each counterparty. Collateral for centrally cleared derivatives transactions are posted with the applicable derivatives clearing organization.
The following table presents the Fund’s OTC derivatives assets and liabilities by counterparty net of amounts available for offset under an ISDA Master Agreement and net of the related collateral received by the Fund as of December 31, 2021.
| | | | | | | | | | | | | | | | | | | | |
Counterparty | | Gross Assets
Subject to Master
Agreements | | | Gross Liabilities
Subject to Master
Agreements | | | Net Assets
(Liabilities)
Subject to Master
Agreements | | | Collateral
Pledged
(Received) | | | Net
Amount (1) | |
Goldman Sachs & Co. | | $ | 27,313 | | | $ | — | | | $ | 27,313 | | | $ | — | | | $ | 27,313 | |
| | | | | | | | | | | | | | | | | | | | |
Total | | $ | 27,313 | | | $ | — | | | $ | 27,313 | | | $ | — | | | $ | 27,313 | |
| | | | | | | | | | | | | | | | | | | | |
| (1) | Represents the net amount receivable (payable) from (to) the counterparty in the event of default. |
Note 3 — Portfolio Investments
Mortgage-Backed and Other Asset-Backed Securities: The Fund may invest in MBS, which represent interests in pools of mortgages in which payments of both principal and interest on the securities are generally made monthly, in effect “passing through” monthly payments made by borrowers on the residential or commercial mortgage loans which underlie the securities (net of any fees paid to the issuer
38
TCW Strategic Income Fund, Inc.
December 31, 2021
Note 3 — Portfolio Investments (Continued)
or guarantor of the securities). Mortgage pass-through securities differ from other forms of debt securities, which normally provide for periodic payment of interest in fixed amounts with principal payments at maturity or specified call dates. The Fund may also invest in Collateralized Mortgage Obligations (“CMOs”). CMOs are debt obligations collateralized by residential or commercial mortgage loans or residential or commercial mortgage pass-through securities. Interest and principal are generally paid monthly. CMOs may be collateralized by whole mortgage loans or private mortgage pass-through securities but are more typically collateralized by portfolios of mortgage pass-through securities guaranteed by the Government National Mortgage Association (Ginnie Mae), Federal Home Loan Mortgage Corporation (Freddie Mac) or Federal National Mortgage Corporation (Fannie Mae). The issuer of a series of CMOs may elect to be treated for tax purposes as a Real Estate Mortgage Investment Conduit. CMOs are structured into multiple classes, each bearing a different stated maturity. Monthly payment of principal received from the pool of underlying mortgages, including prepayments, is first returned to investors holding the shortest maturity class. Investors holding the longer maturity classes usually receive principal only after shorter classes have been retired. An investor may be partially protected against a sooner than desired return of principal because of the sequential payments. The Fund may invest in stripped MBS. Stripped MBS are usually structured with two classes that receive different proportions of the interest and principal distributions on a pool of mortgage assets. In certain cases, one class will receive all of the interest (the interest only or “IO” class), while the other class will receive all of the principal (the principal-only or “PO” class). The yield to maturity on IOs is sensitive to the rate of principal repayments (including prepayments) on the related underlying mortgage assets, and principal payments may have a material effect on yield to maturity. If the underlying mortgage assets experience greater than anticipated prepayments of principal, the Fund may not fully recoup its initial investment in IOs. Mortgage-backed and other asset-backed securities held by the fund at December 31, 2021 are listed in the Fund’s Schedule of Investments.
Repurchase Agreements: The Fund may enter into repurchase agreements under the terms of a Master Repurchase Agreement (“MRA”). In a repurchase agreement, the Fund purchases a security from a counterparty who agrees to repurchase the same security at a mutually agreed upon date and price. The MRA permits the Fund, under certain circumstances including an event of default (such as bankruptcy or insolvency), to offset payables and/or receivables under the MRA with collateral held and/or posted to the counterparty and create one single net payment due to or from the Fund. However, bankruptcy or insolvency laws of a particular jurisdiction may impose restrictions on or prohibitions against such a right of offset in the event of the MRA counterparty’s bankruptcy or insolvency. Pursuant to the terms of the MRA, the Fund receives securities as collateral with a market value in excess of the repurchase price. Upon a bankruptcy or insolvency of the MRA counterparty, the Fund recognizes a liability with respect to such excess collateral to reflect the Fund’s obligation under bankruptcy law to return the excess to the counterparty. The Fund had no repurchase agreements outstanding at December 31, 2021.
When-Issued, Delayed-Delivery, To Be Announced (“TBA”) and Forward Commitment Transactions: The Fund may enter into when-issued, delayed-delivery, TBA or forward commitment transactions in order to lock in the purchase price of the underlying security or to adjust the interest rate exposure of the Fund’s existing portfolio. In when-issued, delayed-delivery, TBA or forward commitment transactions, the Fund commits to purchase or sell particular securities, with payment and delivery to take place at a future date. Although the Fund does not pay for the securities or start earning interest on them until they are delivered, it immediately assumes the risks of ownership, including the risk of price fluctuation. If the Fund’s
39
TCW Strategic Income Fund, Inc.
Notes to Financial Statements (Continued)
Note 3 — Portfolio Investments (Continued)
counterparty fails to deliver a security purchased on a when-issued, delayed-delivery, TBA or forward commitment basis, there may be a loss, and the Fund may have missed an opportunity to make an alternative investment.
Prior to settlement of these transactions, the value of the subject securities will fluctuate with market conditions. In addition, because the Fund is not required to pay for when-issued, delayed-delivery, TBA or forward commitment securities until the delivery date, they may result in a form of leverage to the extent the Fund does not set aside liquid assets to cover the commitment. To guard against this deemed leverage, the Fund monitors the obligations under these transactions on a daily basis and ensures that the Fund has sufficient liquid assets to cover them.
Security Lending: The Fund may lend its securities to qualified brokers. The loans must be collateralized at all times primarily with cash although the Fund can accept money market instruments or U.S. Government securities with a market value at least equal to the market value of the securities on loan. As with any extensions of credit, the Fund may bear the risk of delay in recovery or even loss of rights in the collateral if the borrowers of the securities fail financially. The Fund earns additional income for lending its securities by investing the cash collateral in short-term investments. The Fund did not lend any securities during the year ended December 31, 2021.
Derivatives:
Forward Foreign Currency Contracts: The Fund enters into forward foreign currency contracts as a hedge against fluctuations in foreign exchange rates. Forward foreign currency contracts are marked-to-market daily and the change in market value is recorded by the Fund as unrealized gains or losses in the Statement of Assets and Liabilities. When a contract is closed or delivery is taken, the Fund records a realized gain or loss equal to the difference between the value of the contract at the time it was opened and the value at the time it was closed. Risks may arise upon entering into these contracts from the potential inability of counterparties to meet the terms of their contracts and from unanticipated movements in the value of the foreign currency relative to the U.S. dollar. Outstanding foreign currency forward contracts at December 31, 2021 are disclosed in the Schedule of Investments.
Futures Contracts: The Fund may enter into futures contracts. The Fund may seek to manage a variety of different risks through the use of futures contracts, such as interest rate risk, equity price risk, and currency risk. The Fund may use index futures to hedge against broad market risks to its portfolio or to gain broad market exposure. Securities index futures contracts are contracts to buy or sell units of a securities index at a specified future date at a price agreed upon when the contract is made, and are settled in cash. Positions in futures may be closed out only on an exchange or board of trade which provides a secondary market for such futures. Because futures contracts are exchange-traded, they typically have minimal exposure to counterparty risk. Parties to a futures contract are not required to post the entire notional amount of the contract, but rather a small percentage of that amount (by way of margin), both at the time they enter into futures transactions, and then on a daily basis if their positions decline in value; as a result, futures contracts are highly leveraged. Such payments are known as variation margin and are recorded by the Fund as unrealized gains or losses. Because futures markets are highly leveraged, they can be extremely volatile, and there can be no assurance that the pricing of a futures contract will correlate precisely with the pricing of the asset or index underlying it or the asset or liability of the Fund that is the subject of the hedge. It may not always be possible for the Fund to enter into a closing transaction with respect to a futures contract it
40
TCW Strategic Income Fund, Inc.
December 31, 2021
Note 3 — Portfolio Investments (Continued)
has entered into at a favorable time or price. When the Fund enters into a futures transaction, it is subject to the risk that the value of the futures contract will move in a direction unfavorable to it.
When the Fund uses futures contracts for hedging purposes, it is likely that the Fund will have an asset or liability that will offset any loss (or gain) on the transactions, at least in part. When a futures contract is closed, the Fund records a realized gain or loss equal to the difference between the value of the contract at the time it was opened and the value at the time it was closed. During the year ended December 31, 2021, the Fund utilized treasury futures to help manage interest rate duration and credit market exposure. Futures contracts outstanding at December 31, 2021 are listed in the Fund’s Schedule of Investments.
Options: The Fund may purchase and sell put and call options on a security or an index of securities to enhance investment performance and/or to protect against changes in market prices. The Fund may also enter into currency options to hedge against or to take advantage of currency fluctuations.
A call option gives the holder the right to purchase, and obligates the writer to sell, a security at the strike price at any time before the expiration date. A put option gives the holder the right to sell, and obligates the writer to buy, a security at the exercise price at any time before the expiration date. A Fund may purchase put options to protect portfolio holdings against a decline in market value of a security or securities held by it. A Fund may also purchase a put option hoping to profit from an anticipated decline in the value of the underlying security. If a Fund holds the security underlying the option, the option premium and any transaction costs will reduce any profit the Fund might have realized had it sold the underlying security instead of buying the put option. A Fund may purchase call options to hedge against an increase in the price of securities that the Fund ultimately wants to buy. A Fund may also purchase a call option as a long directional investment hoping to profit from an anticipated increase in the value of the underlying security. In order for a call option to be profitable, the market price of the underlying security must rise sufficiently above the exercise price to cover the premium and transaction costs. These costs will reduce any profit a Fund might have realized had it bought the underlying security at the time it purchased the call option.
Purchasing foreign currency options gives a Fund the right, but not the obligation, to buy or sell specified amounts of currency at a rate of exchange that may be exercised by a certain date. These currency options may be used as a short or long hedge against possible variations in foreign exchange rates or to gain exposure to foreign currencies.
When a Fund purchases an option, it runs the risk that it will lose its entire investment in the option in a relatively short period of time, unless the Fund exercises the option or enters into a closing sale transaction before the option’s expiration. If the price of the underlying security does not rise (in the case of a call) or fall (in the case of a put) to an extent sufficient to cover the option premium and transaction costs, the Fund will lose part or all of its investment in the option. Premiums paid for purchasing options that expire are treated as realized losses.
Options purchased or sold by a Fund may be traded on a securities or options exchange. Such options typically have minimal exposure to counterparty risk. However, an exchange or market may at times find it necessary to impose restrictions on particular types of options transactions, such as opening transactions. If an underlying security ceases to meet qualifications imposed by an exchange or the Options Clearing Corporation, new series of options on that security will no longer be opened to replace the expiring series, and opening transactions in existing series may be prohibited.
41
TCW Strategic Income Fund, Inc.
Notes to Financial Statements (Continued)
Note 3 — Portfolio Investments (Continued)
OTC options are options not traded on exchanges or backed by clearinghouses. Rather, they are entered into directly between a Fund and the counterparty to the option. In the case of an OTC option purchased by a Fund, the value of the option to the Fund will depend on the willingness and ability of the option writer to perform its obligations to the Fund. In addition, OTC options may not be transferable and there may be little or no secondary market for them, so they may be considered illiquid. It may not be possible to enter into closing transactions with respect to OTC options or otherwise to terminate such options, and as a result a Fund may be required to remain obligated on an unfavorable OTC option until its expiration. During the year ended December 31, 2021, the Fund entered into written option contracts to gain exposure to the equity market.
Swap Agreements: The Fund may enter into swap agreements. Swap agreements are typically two-party contracts entered into primarily by institutional investors. In a standard “swap” transaction, two parties agree to exchange the returns (or differentials in rates of return) earned or realized on particular predetermined investments or instruments, which may be adjusted for an interest factor. The gross returns to be exchanged or “swapped” between the parties are generally calculated with respect to a “notional amount” (i.e., the return on or increase in value of a particular dollar amount invested at a particular interest rate or in a “basket” of securities representing a particular index).
In a total return swap, one party typically agrees to pay to the other a short-term interest rate in return for a payment at one or more times in the future based on the increase in the value of an underlying security or other asset, or index of securities or assets; if the underlying security, asset, or index declines in value, the party that pays the short-term interest rate must also pay to its counterparty a payment based on the amount of the decline. The Fund may take either side of such a swap, and so may take a long or short position in the underlying security, asset, or index. The Fund may enter into a total return swap to hedge against an exposure in its portfolio — such as interest rate risk (including to adjust the duration or credit quality of the Fund’s bond portfolio), equity risk, or credit risk — or generally to put cash to work efficiently in the markets in anticipation of, or as a replacement for, cash investments. The Fund may also enter into a total return swap to gain exposure to securities or markets in which it might not be able to invest directly (in so-called market access transactions).
Interest rate swaps are agreements in which one party pays a floating rate of interest on a notional principal amount and receives a fixed rate of interest on the same notional principal amount for a specified period of time. Alternatively, a party may pay a fixed rate and receive a floating rate. In more complex swaps, the notional principal amount may decline (or amortize) over time. The Fund’s maximum risk of loss due to counterparty default is the discounted NAV of the cash flows paid to/received from the counterparty over the interest rate swap’s remaining life.
The Fund may enter into credit default swap transactions as a “buyer” or “seller” of credit protection. In a credit default swap, one party provides what is in effect insurance against a default or other adverse credit event affecting an issuer of debt securities (typically referred to as a “reference entity”). In general, the buyer of credit protection is obligated to pay the protection seller an upfront amount or a periodic stream of payments over the term of the swap. If a “credit event” occurs, the buyer has the right to deliver to the seller bonds (or other obligations of the reference entity with a value up to the full notional value of the swap), and to receive a payment equal to the par value of the bonds or other obligations. Credit events that would trigger a request that the seller make payment are specific to each credit default swap agreement, but generally include bankruptcy, failure to pay, restructuring, obligation acceleration, obligation default, or
42
TCW Strategic Income Fund, Inc.
December 31, 2021
Note 3 — Portfolio Investments (Continued)
repudiation/moratorium. When the Fund buys protection, it may or may not own securities of the reference entity. When the Fund sells protection under a credit default swap, the position may have the effect of creating leverage in the Fund’s portfolio through the Fund’s indirect long exposure to the issuer or securities on which the swap is written. When the Fund sells protection, it may do so either to earn additional income or to create such a “synthetic” long position.
Whenever the Fund enters into a swap agreement, it takes on counterparty risk — the risk that its counterparty will be unable or unwilling to meet its obligations under the swap agreement. The Fund also takes the risk that the market will move against its position in the swap agreement. In the case of a total return swap, the swap will change in value depending on the change in value of the asset or index on which the swap is written. When the Fund enters into any type of swap for hedging purposes, it is likely that the Fund will have an asset or liability that will offset any loss (or gain) on the swap, at least in part. Swap agreements may be non-transferable or otherwise highly illiquid, and the Fund may not be able to terminate or transfer a swap agreement at any particular time or at an acceptable price.
During the term of a swap transaction, changes in the value of the swap are recognized as unrealized gains or losses by marking-to-market to reflect the market value of the swap. When the swap is terminated, the Fund will record a realized gain or loss equal to the difference, if any, between the proceeds from (or cost of) the closing transaction and the Fund’s basis in the agreement. Upfront swap premium payments paid or received by the Fund, if any, are recorded within the value of the open swap agreement on the Fund’s Statement of Assets and Liabilities and represent payments paid or received upon entering into the swap agreement to compensate for differences between stated terms of the swap agreement and prevailing market conditions (credit spreads, currency exchange rates, and other relevant factors). These upfront payments are recorded as realized gains or losses on the Fund’s Statement of Operations upon termination or maturity of the swap agreement.
During the term of a swap transaction, the periodic net payments can be made for a set period of time or may be triggered by a predetermined credit event. The net periodic payments may be based on a fixed or variable interest rate, the change in market value of a specified security, basket of securities or index, or the return generated by a security. These periodic payments received or made by the Fund are recorded as realized gains and losses, respectively. During the year ended December 31, 2021, the Fund entered into interest rate swaps to manage duration, the yield curve or interest rate risk by economically hedging the value of the fixed-rate bonds which may decrease when interest rates rise (interest rate risk). Outstanding swap agreements at December 31, 2021 are disclosed in the Schedule of Investments.
Note 4 — Investment Objective, Investment Strategy, and Risk Considerations
Investment objective: The Fund’s investment objective is to seek a total return comprised of current income and capital appreciation.
Investment strategy: The Fund seeks to achieve its investment objective by investing in a wide range of securities, including securities issued or guaranteed by the U.S. Government, its agencies and instrumentalities (“U.S. Government Securities”), investment-grade corporate debt securities, high yield corporate debt securities, non-U.S. developed and emerging market debt mortgage-related securities, asset-backed securities, marketable small-, mid- and large-capitalization equity securities, convertible securities, money market securities, repurchase agreements, other securities and derivative instruments without limit believed by the Fund’s investment adviser to be consistent with the Fund’s investment
43
TCW Strategic Income Fund, Inc.
Notes to Financial Statements (Continued)
Note 4 — Investment Objective, Investment Strategy, and Risk Considerations (Continued)
objective. The Fund will shift and reallocate its investments on an opportunistic basis and may invest in additional asset classes other than those identified above. The Fund may also employ leverage up to 33% of its total assets (including assets purchased with borrowings). The Fund has a stated goal of providing dependable, but not assured, quarterly distributions out of accumulated net investment income and/or other sources, subject to the requirements of the 1940 Act.
Market Risk: The Fund’s investments will fluctuate with market conditions, and so will the value of your investment in the Fund. You could lose money on your investment in the Fund or the Fund could underperform other investments.
Liquidity Risk: The Fund’s investments in illiquid securities may reduce the returns of the Fund because it may not be able to sell the illiquid securities at an advantageous time or price. Investments in high-yield securities, foreign securities, derivatives or other securities with substantial market and/or credit risk tend to have the greatest exposure to liquidity risk. Certain investments in private placements and Rule 144A securities may be considered illiquid investments. The Fund may invest in private placements and Rule 144A securities.
Interest Rate Risk: The values of the Fund’s investments fluctuate in response to movements in interest rates. If rates rise, the values of debt securities generally fall. The longer the average duration of the Fund’s investment portfolio, the greater the change in value.
Mortgage-Backed and Other Asset-Backed Securities Risk: The Fund may invest in MBS or other ABS. The values of some mortgage-backed securities or other asset-backed securities may expose the Fund to a lower rate of return upon reinvestment of principal. When interest rates rise, the value of mortgage-related securities generally will decline; however, when interest rates are declining, the value of mortgage-related securities with prepayment features may not increase as much as other fixed-income securities. The rate of prepayments on underlying mortgages will affect the price and volatility of a mortgage-related security, and may shorten or extend the effective maturity of the security beyond what was anticipated at the time of purchase. The value of these securities may fluctuate in response to the market’s perception of the creditworthiness of the issuers. Additionally, although mortgages and mortgage-related securities are generally supported by some form of government or private guarantee and/or insurance, there is no assurance that private guarantors or insurers will meet their obligations.
Derivatives Risk: Use of derivatives, which at times is an important part of the Fund’s investment strategy, involves risks different from, or possibly greater than, the risks associated with investing directly in securities and other traditional investments. Investments in derivatives could cause the Fund to lose more than the principal amount invested. Also, suitable derivative transactions may not be available in all circumstances and there can be no assurance that the Fund will achieve its objective through the use of the derivatives.
Credit Risk: The values of any of the Fund’s investments may also decline in response to events affecting the issuer or its credit rating. The lower-rated debt securities in which the Fund may invest are considered speculative and are subject to greater volatility and risk of loss than investment-grade securities, particularly in deteriorating economic conditions. The value of some mortgage-related securities in which the Fund invests also may fall because of unanticipated levels of principal prepayments that can occur when interest rates decline. The Fund invests a material portion of its assets in securities of issuers that hold mortgage- and asset-backed securities and direct investments in securities backed by commercial and
44
TCW Strategic Income Fund, Inc.
December 31, 2021
Note 4 — Investment Objective, Investment Strategy, and Risk Considerations (Continued)
residential mortgage loans and other financial assets. The value and related income of these securities are sensitive to changes in economic conditions, including delinquencies and/or defaults. Continuing shifts in the market’s perception of credit quality on securities backed by commercial and residential mortgage loans and other financial assets may result in increased volatility of market prices and periods of illiquidity that can negatively impact the valuation of certain issuers held by the Fund.
MBS and ABS are characterized and classified in a variety of different ways. These classifications include a view of the securities’ cash flow structure (pass-through, sequential pay, prepayment-protected, interest only, principal only, etc.), the security of the claim on the underlying assets (senior, mezzanine and subordinated), as well as types of underlying collateral (prime conforming loans, prime non-conforming loans, Alt-A loans, subprime loans, commercial loans, etc.). In many cases, the classification incorporates a degree of subjectivity — a particular loan might be categorized as “prime” by the underwriting standards of one mortgage issuer while another might classify the loan as “subprime.” In addition to other functions, the risk associated with an investment in a mortgage loan must take into account the nature of the collateral, the form and the level of credit enhancement, the vintage of the loan, the geography of the loan, the purpose of the loan (refinance versus purchase versus equity takeout), the borrower’s credit quality (e.g., FICO score), and whether the loan is a first trust deed or a second lien.
Counterparty Risk: The Fund may be exposed to counterparty risk, the risk that an entity with which the Fund has unsettled or open transactions may not fulfill its obligations.
LIBOR Risk: The London Interbank Offered Rate (“LIBOR”) historically has been and currently is used extensively in the U.S. and globally as a “benchmark” or “reference rate” for various commercial and financial contracts, including corporate and municipal bonds, bank loans, asset-backed and mortgage related securities, interest rate swaps and other derivatives. For example, debt securities in which a Fund invests may pay interest at floating rates based on LIBOR or may be subject to interest caps or floors based on LIBOR. A Fund’s derivative investments may also reference LIBOR. In July 2017, the head of the United Kingdom Financial Conduct Authority announced the intention to phase out the use of LIBOR by the end of 2021. However, the ICE Benchmark Administration, in its capacity as administrator of USD LIBOR announced it would extend publication of 1-month, 3-month, and 6-month USD LIBOR by 19 months to June 2023. It is expected that market participants will transition to the use of different alternative reference or benchmark rates. Although regulators have encouraged the development and adoption of alternative rates such as the Secured Overnight Financing Rate (“SOFR”), there is currently no definitive information regarding the future utilization of LIBOR or of any particular replacement reference rate. Abandonment of or modifications to LIBOR could have adverse impacts on newly issued financial instruments and existing financial instruments that reference LIBOR. The expected discontinuation of LIBOR could have a significant impact on the financial markets and may present a material risk for certain market participants, including investment companies such as the Fund. Abandonment of or modifications to LIBOR could lead to significant short- and long-term uncertainty and market instability. The risks associated with this discontinuation and transition may be exacerbated if the work necessary to effect an orderly transition to an alternative reference rate is not completed in a timely manner. It remains uncertain how such changes would be implemented and the effects such changes would have on the Fund, issuers of instruments in which the Fund invests, and the financial markets generally.
Public Health Emergencies Risk and Impact of the Coronavirus (COVID-19): Pandemics and other local, national, and international public health emergencies, including outbreaks of infectious diseases such as
45
TCW Strategic Income Fund, Inc.
Notes to Financial Statements (Continued)
Note 4 — Investment Objective, Investment Strategy, and Risk Considerations (Continued)
SARS, H1N1/09 Flu, the Avian Flu, Ebola and the current outbreak of the novel coronavirus (“COVID-19”), can result, and in the case of COVID-19 is resulting, in market volatility and disruption, and any similar future emergencies may materially and adversely impact economic production and activity in ways that cannot be predicted, all of which could result in substantial investment losses.
The World Health Organization declared in March 2020 that the COVID-19 outbreak officially constitutes a “pandemic.” This outbreak has caused a worldwide public health emergency, straining healthcare resources and resulting in extensive and growing numbers of infections, hospitalizations and deaths. In an effort to contain COVID-19, local, regional, and national governments, as well as private businesses and other organizations, imposed and in some cases continue to impose severely restrictive measures, including instituting local and regional quarantines, restricting travel (including closing certain international borders), prohibiting public activity (including “stay-at-home,” “shelter-in-place,” and similar orders), and ordering the closure of a wide range of offices, businesses, schools, and other public venues. Consequently, COVID-19 has significantly diminished and disrupted global economic production and activity of all kinds and has contributed to both volatility and a severe decline in financial markets.
The ultimate impact of COVID-19 (and of the resulting precipitous decline and disruption in economic and commercial activity across many of the world’s economies) on global economic conditions, and on the operations, financial condition, and performance of any particular market, industry or business, is impossible to predict. However, ongoing and potential additional materially adverse effects, including further global, regional and local economic downturns (including recessions) of indeterminate duration and severity, are possible. The ongoing COVID-19 crisis and any other public health emergency that may arise in future could have a significant adverse impact on our investments and result in significant investment losses.
Note 5 — Federal Income Taxes
It is the policy of the Fund to comply with the requirements under Subchapter M of the Internal Revenue Code applicable to regulated investment companies and to distribute all of its net taxable income, including any net realized gains on investments, to its shareholders. Therefore, no federal income tax provision is required.
The following table shows character of distributed and undistributed amounts on a tax basis.
| | | | | | | | | | | | | | | | |
| | | Amount Distributed During
the Year | | | Undistributed Amount
at Year End | |
| | | Year Ended
December 31,
2021 | | | Year Ended
December 31,
2020 | | | December 31,
2021 | | | December 31,
2020 | |
Ordinary Income | | $ | 13,914,618 | | | $ | 13,131,985 | | | $ | 27,312 | | | $ | — | |
Capital Gain | | | 3,604,285 | | | | — | | | | — | | | | — | |
| | | | | | | | | | | | | | | | |
| | $ | 17,518,903 | | | $ | 13,131,985 | | | $ | 27,312 | | | $ | — | |
| | | | | | | | | | | | | | | | |
46
TCW Strategic Income Fund, Inc.
December 31, 2021
Note 5 — Federal Income Taxes (Continued)
At December 31, 2021, net unrealized appreciation for federal income tax purposes is comprised of the following components:
| | | | |
Unrealized appreciation | | $ | 25,478,496 | |
Unrealized (depreciation) | | | (23,233,241 | ) |
| | | | |
Net unrealized appreciation | | $ | 2,245,255 | |
| | | | |
Cost of Investments for Federal Income Tax Purposes | | $ | 305,583,296 | |
| | | | |
The following reclassifications have been made for the permanent difference between book and tax accounting as of December 31, 2021:
| | | | |
| | | Increase
(Decrease) | |
Distributions in Excess of Net Investment Income | | $ | (2,770,387 | ) |
Accumulated Net Realized Loss on Investments | | $ | 2,770,387 | |
Paid in Capital | | $ | — | |
The Fund did not have any unrecognized tax benefits at December 31, 2021, nor were there any increases or decreases in unrecognized tax benefits for the period then ended; and therefore no interest or penalties were accrued. The Fund is subject to examination by U.S. Federal and state tax authorities for returns filed for the prior three and four fiscal years, respectively.
Note 6 — Investment Advisory and Service Fees
As compensation for the investment advisory services rendered, facilities provided, and expenses borne, the Advisor is paid a monthly fee by the Fund computed at the annual rate of 0.75% of the first $100 million of the Fund’s average managed assets and 0.50% of the Fund’s average managed assets in excess of $100 million.
Note 7 — Purchases and Sales of Securities
For the year ended December 31, 2021, purchases and sales or maturities of investment securities (excluding short-term investments) aggregated to $84,831,164 and $93,511,850, respectively, for non-U.S. Government securities, and aggregated to $427,581,492 and $426,242,522, respectively, for U.S. Government securities.
Note 8 — Directors’ Fees
Directors who are not affiliated with the Advisor received, as a group, fees and expenses of $113,113 from the Fund for the year ended December 31, 2021. Directors may elect to defer receipt of their fees in accordance with the terms of a Non-Qualified Deferred Compensation Plan. Deferred compensation is included within Accrued Directors’ Fees and Expenses in the Statement of Assets and Liabilities. Certain Officers and/or Directors of the Fund are also Officers and/or Directors of the Advisor but do not receive any compensation from the Fund.
Note 9 — Restricted Securities
The Fund is permitted to invest in securities that have legal or contractual restrictions on resale. These securities may be sold privately, but are required to be registered before being sold to the public (exemption rules apply). Private placement securities are generally considered to be restricted except for
47
TCW Strategic Income Fund, Inc.
Notes to Financial Statements (Continued)
Note 9 — Restricted Securities (Continued)
those securities traded between qualified institutional investors under the provisions of Rule 144A of the Securities Act of 1933, as amended (the “Securities Act”). However, the Fund considers 144A securities to be restricted if those securities have been deemed illiquid. Disposal of these securities may involve time-consuming negotiations and expense, and prompt sale at an acceptable price may be difficult. Restricted securities held by the Fund at December 31, 2021 are listed below:
| | | | | | | | | | | | | | | | |
Issuer Description | | Acquisition Date | | | Acquisition
Cost | | | Aggregate
Value | | | Percentage
of Net Assets | |
Citigroup Commercial Mortgage Trust (12-GC8-XA), 1.72%, due 09/10/45 | | | 2/13/2015-2/26/2015 | | | $ | 284,177 | | | $ | 13,819 | | | | 0.01 | % |
GS Mortgage Securities Trust (12-GC6-XB), 0.52%, due 01/10/2045 | | | 2/1/2018 | | | | 50,266 | | | | 62 | | | | 0.00 | % |
JPMorgan Chase Commercial Mortgage Securities Trust (12-HSBC-XA), 1.43%, due 07/05/2032 | | | 10/11/2017 | | | | 251,746 | | | | 15,492 | | | | 0.01 | % |
Morgan Stanley Capital I Trust (12-C4-XA), 1.78%, due 03/15/45 | | | 5/16/2018 | | | | 34,991 | | | | 6 | | | | 0.00 | % |
UBS Commercial Mortgage Trust (12-C1-XA), 1.85%, due 05/10/45 | | | 6/27/2017 | | | | 63,836 | | | | 36 | | | | 0.00 | % |
WFRBS Commercial Mortgage Trust (12-C8-XA), 1.76%, due 08/15/2045 | | | 12/22/2017 | | | | 210,587 | | | | 10,631 | | | | 0.00 | % |
| | | | | | | | | | | | | | | | |
| | | | | | $ | 895,603 | | | $ | 40,046 | | | | 0.02 | % |
| | | | | | | | | | | | | | | | |
Note 10 — Loan Outstanding
The Fund is permitted to have borrowings for investment purposes. The Fund has entered into a line of credit agreement, renewed annually, with The Bank of New York Mellon (the “Bank”) which permits the Fund to borrow up to $70 million at a rate, per annum, equal to the Federal Funds Rate plus 1.00%. The Fund did not have any borrowings during the year ended December 31, 2021. The Fund pays the Bank a commitment fee equal to 0.08% per annum on the daily unused portion of the committed line amount. The commitment fee incurred by the Fund is presented in the Interest Expense line in the Statement of Operations.
Note 11 — Indemnifications
Under the Fund’s organizational documents, its Officers and Directors may be indemnified against certain liabilities and expenses arising out of the performance of their duties to the Fund. In addition, the Fund entered into an agreement with each of the Directors which provides that the Fund will indemnify and hold harmless each Director against any expenses actually and reasonably incurred by such Director in any proceeding arising out of or in connection with the Director’s services to the Fund, to the fullest extent permitted by the Fund’s Articles of Incorporation and By-Laws, the Maryland General Corporation Law, the Securities Act, and the 1940 Act, each as now or hereinafter in force. Additionally, in the normal course of business, the Fund enters into agreements with service providers that may contain indemnification clauses. The Fund’s maximum exposure under these arrangements is unknown as this would involve future claims that may be made against the Fund that have not yet occurred. However, based on experience, the Fund expects the risk of loss to be remote. The Fund has not accrued any liability in connection with such indemnification.
48
TCW Strategic Income Fund, Inc.
December 31, 2021
Note 12 — New Accounting Pronouncement
In January 2021, the Financial Accounting Standards Board issued Accounting Standards Update No. 2021-01 (“ASU 2021-01”), “Reference Rate Reform (Topic 848).” ASU 2021-01 is an update of ASU 2020-04, which is in response to concerns about structural risks of interbank offered rates, and particularly the risk of cessation of LIBOR; regulators have undertaken reference rate reform initiatives to identify alternative reference rates that are more observable or transaction based and less susceptible to manipulation. ASU 2020-04 provides optional guidance for a limited period of time to ease the potential burden in accounting for (or recognizing the effects of) reference rate reform on financial reporting. ASU 2020-04 is elective and applies to all entities, subject to meeting certain criteria, that have contracts, hedging relationships, and other transactions that reference LIBOR or another reference rate expected to be discontinued because of reference rate reform. The ASU 2021-01 update clarifies that certain optional expedients and exceptions in Topic 848 for contract modifications and hedge accounting apply to derivatives that are affected by the discounting transition. The amendments in this update are in effect for the Fund. There have been no impacts to date.
49
TCW Strategic Income Fund, Inc.
Financial Highlights | December 31, 2021 |
| | | | | | | | | | | | | | | | | | | | |
| | | Year Ended December 31, | |
| | | 2021 | | | 2020 | | | 2019 | | | 2018 | | | 2017 | |
Net Asset Value Per Share, Beginning of year | | $ | 5.85 | | | $ | 5.73 | | | $ | 5.65 | | | $ | 5.91 | | | $ | 5.81 | |
| | | | | | | | | | | | | | | | | | | | |
Income from Operations: | |
Net Investment Income (1) | | | 0.32 | | | | 0.29 | | | | 0.33 | | | | 0.30 | | | | 0.27 | |
Net Realized and Unrealized Gain (Loss) on Investments | | | (0.11 | ) | | | 0.11 | | | | 0.14 | | | | (0.19 | ) | | | 0.14 | |
| | | | | | | | | | | | | | | | | | | | |
Total from Investment Operations | | | 0.21 | | | | 0.40 | | | | 0.47 | | | | 0.11 | | | | 0.41 | |
| | | | | | | | | | | | | | | | | | | | |
Less Distributions: | |
Distributions from Net Investment Income | | | (0.25 | ) | | | (0.28 | ) | | | (0.35 | ) | | | (0.34 | ) | | | (0.28 | ) |
Distributions from Net Realized Gains | | | (0.12 | ) | | | — | | | | (0.04 | ) | | | (0.03 | ) | | | (0.03 | ) |
| | | | | | | | | | | | | | | | | | | | |
Total Distributions | | | (0.37 | ) | | | (0.28 | ) | | | (0.39 | ) | | | (0.37 | ) | | | (0.31 | ) |
| | | | | | | | | | | | | | | | | | | | |
Net Asset Value Per Share, End of year | | $ | 5.69 | | | $ | 5.85 | | | $ | 5.73 | | | $ | 5.65 | | | $ | 5.91 | |
| | | | | | | | | | | | | | | | | | | | |
Market Value Per Share, End of year | | $ | 5.77 | | | $ | 5.69 | | | $ | 5.77 | | | $ | 5.27 | | | $ | 5.87 | |
| | | | | | | | | | | | | | | | | | | | |
Net Asset Value Total Return (2) | | | 3.55 | % | | | 7.25 | % | | | 8.37 | % | | | 1.86 | % | | | 7.22 | % |
Market Price Return (3) | | | 8.03 | % | | | 3.75 | % | | | 17.14 | % | | | (3.88 | )% | | | 16.36 | % |
|
Ratios/Supplemental Data: | |
| | | | | |
Net Assets, End of year (in thousands) | | $ | 271,573 | | | $ | 279,067 | | | $ | 273,293 | | | $ | 269,594 | | | $ | 282,034 | |
| | | | | |
Ratio of Expenses Before Interest Expense to Average Net Assets | | | 0.93 | % | | | 0.93 | % | | | 0.85 | % | | | 0.81 | % | | | 0.81 | % |
| | | | | |
Ratio of Interest Expense to Average Net Assets | | | 0.02 | % | | | 0.04 | % | | | 0.02 | % | | | 0.02 | % | | | 0.01 | % |
| | | | | |
Ratio of Total Expenses to Average Net Assets | | | 0.95 | % | | | 0.97 | % | | | 0.87 | % | | | 0.83 | % | | | 0.82 | % |
| | | | | |
Ratio of Net Investment Income to Average Net Assets | | | 5.38 | % | | | 5.07 | % | | | 5.62 | % | | | 5.13 | % | | | 4.47 | % |
| | | | | |
Portfolio Turnover Rate | | | 178.02 | % | | | 72.59 | % | | | 34.64 | % | | | 31.16 | % | | | 32.46 | % |
| | | | | |
Asset Coverage Ratio Per Share (4) | | | — | | | | — | | | | — | | | | — | | | | — | |
| | | | | |
Total Debt Outstanding | | | — | | | | — | | | | — | | | | — | | | | — | |
| (1) | Computed using average shares outstanding throughout the period. |
| (2) | Based on net asset value per share, adjusted for reinvestment of distributions. The fund does not incur charges to investors for purchasing or selling shares. |
| (3) | Based on market price per share, adjusted for reinvestment of distributions. The fund does not incur charges to investors for purchasing or selling shares. |
| (4) | The asset coverage ratio for a class of senior securities representing indebtedness is calculated as total assets, less all liabilities and indebtedness not represented by senior securities, divided by senior securities representing indebtedness. This asset coverage ratio is multiplied by one thousand to determine the asset coverage per share. |
See accompanying Notes to Financial Statements.
50
TCW Strategic Income Fund, Inc.
Report of Independent Registered Public Accounting Firm
To the Shareholders and the Board of Directors of
TCW Strategic Income Fund, Inc.
Opinion on the Financial Statements and Financial Highlights
We have audited the accompanying statement of assets and liabilities of TCW Strategic Income Fund, Inc. (the “Fund”), including the schedule of investments, as of December 31, 2021, the related statement of operations for the year then ended, the statements of changes in net assets for each of the two years in the period then ended, the financial highlights for each of the five years in the period then ended, and the related notes. In our opinion, the financial statements and financial highlights present fairly, in all material respects, the financial position of the Fund as of December 31, 2021, and the results of its operations for the year then ended, the changes in its net assets for each of the two years in the period then ended, and the financial highlights for each of the five years in the period then ended in conformity with accounting principles generally accepted in the United States of America.
Basis for Opinion
These financial statements and financial highlights are the responsibility of the Fund’s management. Our responsibility is to express an opinion on the Fund’s financial statements and financial highlights based on our audits. We are a public accounting firm registered with the Public Company Accounting Oversight Board (United States) (PCAOB) and are required to be independent with respect to the Fund in accordance with the U.S. federal securities laws and the applicable rules and regulations of the Securities and Exchange Commission and the PCAOB.
We conducted our audits in accordance with the standards of the PCAOB. Those standards require that we plan and perform the audit to obtain reasonable assurance about whether the financial statements and financial highlights are free of material misstatement, whether due to error or fraud. The Fund is not required to have, nor were we engaged to perform, an audit of its internal control over financial reporting. As part of our audits, we are required to obtain an understanding of internal control over financial reporting but not for the purpose of expressing an opinion on the effectiveness of the Fund’s internal control over financial reporting. Accordingly, we express no such opinion.
Our audits included performing procedures to assess the risks of material misstatement of the financial statements and financial highlights, whether due to error or fraud, and performing procedures that respond to those risks. Such procedures included examining, on a test basis, evidence regarding the amounts and disclosures in the financial statements and financial highlights. Our audits also included evaluating the accounting principles used and significant estimates made by management, as well as evaluating the overall presentation of the financial statements and financial highlights. Our procedures included confirmation of securities owned as of December 31, 2021, by correspondence with the custodian and brokers; when replies were not received from brokers, we performed other auditing procedures. We believe that our audits provide a reasonable basis for our opinion.

Los Angeles, California
February 18, 2022
We have served as the auditor of one or more TCW/Metropolitan West Funds investment companies since 1990.
51

Privacy Policy
The TCW Group, Inc. and Subsidiaries
TCW Investment Management Company LLC
TCW Asset Management Company LLC
Metropolitan West Asset Management, LLC
| | |
TCW Funds, Inc. TCW Strategic Income Fund, Inc. Metropolitan West Funds Sepulveda Management LLC | | TCW Direct Lending LLC TCW Direct Lending VII LLC TCW Direct Lending VIII LLC |
Effective May 2021
WHAT YOU SHOULD KNOW
At TCW, we recognize the importance of keeping information about you secure and confidential. We do not sell or share your nonpublic personal and financial information with marketers or others outside our affiliated group of companies.
We carefully manage information among our affiliated group of companies to safeguard your privacy and to provide you with consistently excellent service.
We are providing this notice to you to comply with the requirements of Regulation S-P, “Privacy of Consumer Financial Information,” issued by the United States Securities and Exchange Commission.
OUR PRIVACY POLICY
We, The TCW Group, Inc. and its subsidiaries, the TCW Funds, Inc., TCW Strategic Income Fund, Inc., the Metropolitan West Funds, Sepulveda Management LLC, TCW Direct Lending LLC, TCW Direct Lending VII LLC, and TCW Direct Lending VIII LLC (collectively, “TCW”) are committed to protecting the nonpublic personal and financial information of our customers and consumers who obtain or seek to obtain financial products or services primarily for personal, family or household purposes. We fulfill our commitment by establishing and implementing policies and systems to protect the security and confidentiality of this information.
In our offices, we limit access to nonpublic personal and financial information about you to those TCW personnel who need to know the information in order to provide products or services to you. We maintain physical, electronic, and procedural safeguards to protect your nonpublic personal and financial information.
CATEGORIES OF INFORMATION WE COLLECT
We may collect the following types of nonpublic personal and financial information about you from the following sources:
| | ◾ | | Your name, address and identifying numbers, and other personal and financial information, from you and from identification cards and papers you submit to us, on applications, subscription agreements or other forms or communications. |
| | ◾ | | Information about your account balances and financial transactions with us, our affiliated entities, or nonaffiliated third parties, from our internal sources, from affiliated entities and from nonaffiliated third parties. |
| | ◾ | | Information about your account balances and financial transactions and other personal and financial information, from consumer credit reporting agencies or other nonaffiliated third parties, to verify information received from you or others. |
52
CATEGORIES OF INFORMATION WE DISCLOSE TO NONAFFILIATED THIRD PARTIES
We may disclose your name, address and account and other identifying numbers, as well as information about your pending or past transactions and other personal financial information, to nonaffiliated third parties, for our everyday business purposes such as necessary to execute, process, service and confirm your securities transactions and mutual fund transactions, to administer and service your account and commingled investment vehicles in which you are invested, to market our products and services through joint marketing arrangements or to respond to court orders and legal investigations.
We may disclose nonpublic personal and financial information concerning you to law enforcement agencies, federal regulatory agencies, self-regulatory organizations or other nonaffiliated third parties, if required or requested to do so by a court order, judicial subpoena or regulatory inquiry.
We do not otherwise disclose your nonpublic personal and financial information to nonaffiliated third parties, except where we believe in good faith that disclosure is required or permitted by law. Because we do not disclose your nonpublic personal and financial information to nonaffiliated third parties, our Customer Privacy Policy does not contain opt-out provisions.
CATEGORIES OF INFORMATION WE DISCLOSE TO OUR AFFILIATED ENTITIES
| | ◾ | | We may disclose your name, address and account and other identifying numbers, account balances, information about your pending or past transactions and other personal financial information to our affiliated entities for any purpose. |
| | ◾ | | We regularly disclose your name, address and account and other identifying numbers, account balances and information about your pending or past transactions to our affiliates to execute, process and confirm securities transactions or mutual fund transactions for you, to administer and service your account and commingled investment vehicles in which you are invested, or to market our products and services to you. |
INFORMATION ABOUT FORMER CUSTOMERS
We do not disclose nonpublic personal and financial information about former customers to nonaffiliated third parties unless required or requested to do so by a court order, judicial subpoena or regulatory inquiry, or otherwise where we believe in good faith that disclosure is required or permitted by law.
QUESTIONS
Should you have any questions about our Customer Privacy Policy, please contact us by email or by regular mail at the address at the end of this policy.
REMINDER ABOUT TCW’S FINANCIAL PRODUCTS
Financial products offered by The TCW Group, Inc. and its subsidiaries, the TCW Funds, Inc., TCW Strategic Income Fund, Inc., the Metropolitan West Funds, Sepulveda Management LLC, TCW Direct Lending LLC, TCW Direct Lending VII LLC, and TCW Direct Lending VIII LLC.
| | ◾ | | Are not guaranteed by a bank; |
| | ◾ | | Are not obligations of The TCW Group, Inc. or of its subsidiaries; |
| | ◾ | | Are not insured by the Federal Deposit Insurance Corporation; and |
| | ◾ | | Are subject to investment risks, including possible loss of the principal amount committed or invested, and earnings thereon. |
| | |
THE TCW GROUP, INC. TCW FUNDS, INC. TCW STRATEGIC INCOME FUND, INC. METROPOLITAN WEST FUNDS | | SEPULVEDA MANAGEMENT LLC TCW DIRECT LENDING LLC TCW DIRECT LENDING VII LLC TCW DIRECT LENDING VIII LLC |
Attention: Privacy Officer | 865 South Figueroa Street, Suite 1800 | Los Angeles, CA 90017 | email: privacy@tcw.com
53
TCW Strategic Income Fund, Inc.
Renewal of Investment Advisory and Management Agreement (Unaudited)
TCW Strategic Income Fund, Inc. (the “Fund”) and TCW Investment Management Company LLC (the “Advisor”) are parties to an Investment Advisory and Management Agreement (“Agreement”), pursuant to which the Advisor is responsible for managing the investments of the Fund. Unless terminated by either party, the Agreement continues in effect from year to year provided that the continuance is specifically approved at least annually by the vote of the holders of at least a majority of the outstanding shares of the Fund, or by the Board of Directors of the Fund (the “Board”), and, in either event, by a majority of the Directors who are not “interested persons” of the Fund as such term is defined in Section 2(a)(19) of the Investment Company Act of 1940, as amended (the “Independent Directors”), casting votes in person at a meeting called for that purpose.
On September 20, 2021, the Board approved the renewal of the Agreement for an additional one-year term from February 6, 2022 through February 5, 2023. The Board met by videoconference to approve that renewal, notwithstanding the in-person approval requirement that normally applies under the Investment Company Act, as permitted by relief provided by the Securities and Exchange Commission in light of the COVID-19 pandemic. The renewal of the Agreement was approved by the Board (including by a majority of the Independent Directors) upon the recommendation of the Independent Directors. The Independent Directors also met by telephone in a working session on August 24, 2021 to hear presentations by representatives of the Advisor, to ask related questions, to review and discuss materials provided by the Advisor for their consideration, and to meet separately with their independent legal counsel. On September 20, 2021, they also met separately with their independent legal counsel to review and discuss supplemental information that had been requested on their behalf by their independent legal counsel and presented by the Advisor. The information, material facts, and conclusions that formed the basis for the Independent Directors’ recommendation and the Board’s subsequent approval are described below.
1. Information received
Materials reviewed — During the course of each year, the Directors receive a wide variety of materials relating to the services provided by the Advisor, including reports on the Advisor’s investment processes, as well as on the Fund’s investment results, portfolio composition, portfolio trading practices, compliance monitoring, shareholder services, and other information relating to the nature, extent, and quality of services provided by the Advisor to the Fund. In addition, the Board reviewed information furnished to the Independent Directors in response to a detailed request sent to the Advisor on their behalf. The information in the Advisor’s responses included extensive materials regarding the Fund’s investment results, advisory fee comparisons to advisory fees charged by the Advisor to its institutional clients, financial and profitability information regarding the Advisor, descriptions of various services provided to the Fund and to other advisory and sub-advisory clients, descriptions of functions such as compliance monitoring and portfolio trading practices, and information about the personnel providing investment management services to the Fund. The Directors also considered information provided by an independent data provider, Broadridge, comparing the investment performance and the fee and expense levels of the Fund to those of appropriate peer groups of funds selected by Broadridge. After reviewing this information, the Directors requested additional financial, profitability and service information from the Advisor, which the Advisor provided and the Directors considered.
Review process — The Directors’ determinations were made on the basis of each Director’s business judgment after consideration of all the information presented. The Independent Directors were advised by their independent legal counsel throughout the renewal process and received and reviewed advice from
54
TCW Strategic Income Fund, Inc.
their independent legal counsel regarding legal and industry standards applicable to the renewal of the Agreement, including a legal memorandum from their independent legal counsel discussing their fiduciary duties related to their approval of the continuation of the Agreement. The Independent Directors also discussed the renewal of the Agreement with the Advisor’s representatives and in private sessions at which no representatives of the Advisor were present. In deciding to recommend the renewal of the Agreement with respect to the Fund, the Independent Directors did not identify any single piece of information or particular factor that, in isolation, was the controlling factor. Each Independent Director may also have weighed factors differently. This summary describes the most important, but not all, of the factors considered by the Board and the Independent Directors.
2. Nature, extent, and quality of services provided by the Advisor
The Board and the Independent Directors considered the depth and quality of the Advisor’s investment management process, including its research and strong analytical capabilities; the experience, capability, and integrity of its senior management and other personnel; the relatively low turnover rates of its key personnel; the overall resources available to the Advisor; and the ability of its organizational structure to address the fluctuations in assets that had been experienced over the past several years. The Board and the Independent Directors considered the ability of the Advisor to attract and retain well-qualified investment professionals, noting in particular the Advisor’s hiring of professionals in various areas over the past several years, continued upgrading of resources in its middle office and back office operations and other areas, as well as a continuing and extensive program of infrastructure and systems enhancements. The Board and the Independent Directors also considered that the Advisor made available to its investment professionals a variety of resources and systems relating to investment management, compliance, trading, operations, administration, research, portfolio accounting and legal matters. They noted the substantial additional resources made available by The TCW Group, Inc., as the parent company of the Advisor. The Board and the Independent Directors examined and discussed a detailed description of the extensive additional services provided to the Fund to support its operations and compliance, as compared to the much narrower range of services provided to the Advisor’s institutional and sub-advised clients, as well as the Advisor’s oversight and coordination of numerous outside service providers to the Fund. They further noted the high level of regular communication between the Advisor and the Independent Directors. The Advisor explained its responsibility to supervise the activities of the Fund’s various service providers, as well as supporting the Independent Directors and their meetings, regulatory filings, and various operational personnel, and the related costs.
The Board and the Independent Directors concluded that the nature, extent, and quality of the services provided by the Advisor are of a high quality and have benefited and should continue to benefit the Fund and its shareholders.
3. Investment results
The Board and the Independent Directors considered the investment results of the Fund in light of its investment objective and principal investment strategies. They compared the Fund’s total returns with the total returns of other funds in peer group reports prepared by Broadridge with respect to various longer and more recent periods all ended May 31, 2021. The Board and the Independent Directors reviewed information as to a peer group selection presented by Broadridge and discussed the methodology for the selection with Broadridge. In reviewing the Fund’s relative performance, the Board and the Independent Directors took into account the Fund’s investment strategies, distinct characteristics, asset size and
55
TCW Strategic Income Fund, Inc.
Renewal of Investment Advisory and Management Agreement (Unaudited) (Continued)
diversification. The Board also considered the Advisor’s assessment of the Fund’s performance during the recent period of significant market volatility.
The Board and the Independent Directors noted that the Fund’s performance was in the fifth quintile for the ten- and five-year periods and the fourth quintile for the three- and one-year periods. The Board and the Independent Directors recognized that the peer group included many funds that were not considered to be sufficiently comparable to the Fund in terms of strategy or characteristics. The Board and the Independent Directors noted that the peer group funds had significantly higher aggregate exposure to common equity, preferred and convertible securities than the Fund, as well as generally higher levels of leverage. The Board considered the Advisor’s discussions of the Fund’s performance, including that the Fund’s relatively modest use of leverage and lower exposure to equities as compared to the peer funds contributed to underperformance in a period of strong equity market returns. The Board and the Independent Trustees also noted the substantially lower volatility for the Fund compared to the funds in the peer group.
The Board and the Independent Directors concluded that the Advisor was implementing the Fund’s investment objective and that the Advisor’s record in managing the Fund indicated that its continued management should benefit the Fund and its shareholders over the long term.
4. Advisory fees and total expenses
The Board and the Independent Directors compared the management fees (which Broadridge defines to include the advisory fee and the administrative fee) and total expenses of the Fund (as a percentage of average net assets) with the median management fee and operating expense level of the other funds in the Broadridge peer group. These comparisons assisted the Board and the Independent Directors by providing a reasonable statistical measure to assess the Fund’s fees relative to its relevant peers. The Board and the Independent Directors observed that the Fund’s management fee was below and total expenses were at the medians of the peer group funds. The Board and the Independent Directors concluded that the competitive fee charged by the Advisor, and competitive expense ratio, should continue to benefit the Fund and its shareholders.
The Board and the Independent Directors also reviewed information regarding the advisory fees charged by the Advisor to its institutional and sub-advisory clients with similar investment mandates. The Board and the Independent Directors concluded that, although the fees paid by those clients generally were lower than advisory fees paid by the Fund, the differences appropriately reflected the more extensive services provided by the Advisor to the Fund and the Advisor’s significantly greater responsibilities and expenses with respect to the Fund, including the additional risks of managing a pool of assets for public investors, administrative burdens, daily pricing and valuation responsibilities, the supervision of vendors and service providers, and the costs of additional infrastructure and operational resources and personnel and of complying with and supporting the more comprehensive regulatory and governance regime applicable to registered investment companies with shares listed on a stock exchange.
5. The Advisor’s costs, level of profits, and economies of scale
The Board and the Independent Directors reviewed information regarding the Advisor’s costs of providing services to the Fund, as well as the resulting level of profits to the Advisor. They reviewed the Advisor’s stated assumptions and methods of allocating certain costs, such as personnel costs, which constitute the Advisor’s largest operating cost. The Board and the Independent Directors recognized that the Advisor should be entitled to earn a reasonable level of profits for the services that it provides to the Fund. The
56
TCW Strategic Income Fund, Inc.
Board and the Independent Directors also reviewed a comparison of the Advisor’s profitability with respect to the Fund to the profitability of certain unaffiliated publicly traded asset managers, which the Advisor believed supported its view that the Advisor’s profitability was reasonable. Based on their review, the Board and the Independent Directors concluded that they were satisfied that the Advisor’s level of profitability from its relationship with the Fund was not unreasonable or excessive.
The Board and the Independent Directors considered the extent to which potential economies of scale could be realized as the Fund grows and whether the advisory fee reflects those potential economies of scale. They noted the breakpoint under the Agreement, which results in a lower advisory fee rate as the Fund grows larger. They also recognized the Advisor’s view that the advisory fee compares favorably to peer group fees, and that expenses remain competitive even at higher asset levels and that the relatively low advisory fees reflect the potential economies of scale. The Board and the Independent Directors recognized the benefits of the Advisor’s substantial past and ongoing investment in the advisory business, such as successfully recruiting and retaining key professional talent, systems and technology upgrades, added resources dedicated to legal, compliance and cybersecurity programs, and improvements to the overall firm infrastructure, as well as the financial pressures of competing against much larger firms and passive investment products. The Board and the Independent Directors also recognized that the Fund benefits from receiving investment advice from an organization with other types of advisory clients in addition to investment companies. The Board and the Independent Directors concluded that the Advisor was satisfactorily sharing potential economies of scale with the Fund through low fees and expenses, and through reinvesting in its capabilities for serving the Fund and its shareholders.
6. Ancillary benefits
The Board and the Independent Directors also considered ancillary benefits received or to be received by the Advisor and its affiliates as a result of the relationship of the Advisor with the Fund, including compensation for certain compliance support services. The Board and the Independent Directors concluded that any potential benefits to be received or to be derived by the Advisor from its relationships with the Fund are reasonably related to the services provided by the Advisor to the Fund.
7. Conclusions
Based on their overall review, including their consideration of each of the factors referred to above (and others), the Board and the Independent Directors concluded that the Agreement is fair and reasonable to the Fund and its shareholders, that the Fund’s shareholders received reasonable value in return for the advisory fees and other amounts paid to the Advisor by the Fund, and that the renewal of the Agreement was in the best interests of the Fund and its shareholders.
57
TCW Strategic Income Fund, Inc.
Supplemental Information
Proxy Voting Guidelines
The policies and procedures that the Fund uses to determine how to vote proxies are available without charge. The Board of the Fund has delegated the Fund’s proxy voting authority to the Advisor.
Disclosure of Proxy Voting Guidelines
The proxy voting guidelines of the Advisor are available:
| | 1. | By calling 1-877-829-4768 to obtain a hard copy; or |
| | 2. | By going to the SEC website at http://www.sec.gov. |
When the Fund receives a request for a description of the Advisor’s proxy voting guidelines, it will deliver the description that is disclosed in the Fund’s Statement of Additional Information. This information will be sent out via first class mail (or other means designed to ensure equally prompt delivery) within three business days of receiving the request.
The Advisor, on behalf of the Fund, prepares and files Form N-PX with the SEC not later than August 31 of each year, which must include the Fund’s proxy voting record for the most recent twelve-month period ended June 30 of that year. The Fund’s proxy voting record for the most recent twelve-month period ended June 30 is available without charge:
| | 1. | By calling 1-877-829-4768 to obtain a hard copy; or |
| | 2. | By going to the SEC website at http://www.sec.gov. |
When the Fund receives a request for the Fund’s proxy voting record, it will send the information disclosed in the Fund’s most recently filed report on Form N-PX via first class mail (or other means designed to ensure equally prompt delivery) within three business days of receiving the request.
The Fund also discloses its proxy voting record on its website as soon as is reasonably practicable after its report on Form N-PX is filed with the SEC.
Availability of Quarterly Portfolio Schedule
The Fund files a complete schedule of its portfolio holdings with the SEC for the first and third quarters of its fiscal year on Form NPORT-P. Such filings occur no later than 60 days after the end of the Fund’s first and third quarters and are available on the SEC’s website at www.sec.gov.
Corporate Governance Listing Standards
In accordance with Section 303A.12 (a) of the New York Stock Exchange Listed Company Manual, the Fund submitted the Annual CEO Certification certifying compliance with NYSE’s Corporate Governance Listing Standards on October 19, 2021 as part of its Annual Written Affirmation. In accordance with Section 303A.12(c) of the New York Stock Exchange Listed Company Manual, the Fund submitted the Annual Written Affirmation on October 19, 2021 and an Interim Written Affirmation on February 22, 2021.
58
TCW Strategic Income Fund, Inc.
Report of Annual Meeting and Special Meeting of Shareholders
The annual meeting of shareholders (the “Annual Meeting”) of the Fund was held on September 21, 2021. At the Annual Meeting, the following matters were submitted to a shareholder vote:
| | 1) | Election of Directors — the shareholders of the Fund elected the following Directors to serve on the Board of Directors until their successors have been duly elected and qualified. |
| | | | | | | | |
Director | | Votes Cast
For | | | Withheld | |
Samuel P. Bell | | | 32,503,690 | | | | 5,186,999 | |
Patrick C. Haden | | | 32,453,999 | | | | 5,236,689 | |
David B. Lippman | | | 32,250,188 | | | | 5,440,050 | |
Peter McMillan | | | 31,976,082 | | | | 5,714,606 | |
Victoria B. Rogers | | | 31,950,127 | | | | 5,740,561 | |
Andrew Tarica | | | 32,494,369 | | | | 5,196,319 | |
| | 2) | Ratification of Selection of Independent Registered Public Accounting Firm — the shareholders of the Fund approved the ratification of the selection of Deloitte & Touche LLP as the independent registered public accounting firm for the Fund for the fiscal year ended December 31, 2021. |
| | | | |
For | | Against | | Abstain |
32,644,308 | | 130,475 | | 4,915,900 |
59
TCW Strategic Income Fund, Inc.
Dividend Reinvestment Plan
Shareholders who wish to add to their investment may do so by making an election to participate in the Dividend Reinvestment Plan (the “Plan”). Under the Plan, your dividend is used to purchase Fund shares on the open market whenever shares, including the related sales commission, are selling below the Fund’s net asset value per share. You will be charged a pro-rata portion of brokerage commissions on open-market purchases under the Plan. If the market price, including commission, of Fund shares is above the Fund’s net asset value per share, you will receive shares at a price equal to the higher of the Fund’s net asset value per share on the payment date or 95% of the closing market price of Fund shares on the payment date. Generally, for tax purposes, shareholders participating in the Plan will be treated as having received a distribution from the Fund in cash equal to the value of the shares purchased from them under the Plan.
To enroll in the Plan, if your shares are registered in your name, write to Computershare, P.O. Box #50500, Louisville, KY 40233, or call toll free at (866) 227-8179. If your shares are held by a brokerage firm, please call your broker. If you participate in the Plan through a broker, you may not be able to transfer your shares to another broker and continue to participate in the Plan if your new broker does not permit such participation. If you no longer want to participate in the Plan, please contact Computershare or your broker. You may elect to continue to hold shares previously purchased on your behalf or to sell your shares and receive the proceeds, net of any brokerage commissions. If you need additional information or assistance, please call our investor relations department at (877) 829-4768 or visit our website at www.tcw.com. As always, we would be pleased to accommodate your investment needs.
Distribution Policy
The Fund has a net investment income-based distribution policy. The policy is to pay quarterly distributions out of the Fund’s accumulated undistributed net investment income and/or other sources subject to the requirements of the 1940 Act and Sub-chapter M of the Code.
Distribution policies are a matter of Board discretion and may be modified or terminated at any time without prior notice. Any such change or termination may have an adverse effect on the market price for the Fund’s shares.
You should not draw any conclusions about the Fund’s investment performance from the amount of the quarterly distribution or from the terms of the Fund’s distribution policy.
60
TCW Strategic Income Fund, Inc.
Tax Information Notice (Unaudited)
Under Section 854(b) (2) of the Code, the Fund designates 3.92% of the dividend paid as qualified dividends for purposes of the maximum rate under Section 1(h) (11) of the Code for the fiscal year ended December 31, 2021.
The dividend received deduction percentage for the Fund’s corporate shareholders was 2.80% for the fiscal year ended December 31, 2021.
This information is given to meet certain requirements of the Code and should not be used by shareholders for preparing their income tax returns. Shareholders should refer to the Form 1099-DIV provided by Computershare or your broker for tax filing purposes. Shareholders are advised to check with their tax advisors for information on the treatment of these amounts on their individual tax returns.
61
TCW Strategic Income Fund, Inc.
Directors and Officers
A board of six directors is responsible for overseeing the operations of the TCW Strategic Income Fund, Inc. (the “Fund”). The directors of the Fund, and their business addresses and their principal occupations for the last five years are set forth below.
Independent Directors
| | | | | | |
Name and Year of Birth (1) | | Term of Office and Length of Time Served | | Principal Occupation(s) During Past 5 Years (2) | | Other Directorships held by Director |
| Samuel P. Bell (1936) | | Mr. Bell has served as a director of the Fund since October 2002. | | Private Investor. | | Point.360 (post production services); TCW Funds, Inc. (mutual fund). |
Patrick C. Haden (1953) Chairman of the Board | | Mr. Haden has served as a director of the Fund since May 2001. | | President (since 2003), Wilson Ave. Consulting (business consulting firm); Senior Advisor to President (July 2016-June 2017) and Athletic Director (August 2010-June 2016), University of Southern California. | | Tetra Tech, Inc. (environmental consulting); Auto Club (affiliate of AAA); Metropolitan West Funds (mutual fund); TCW Funds, Inc. (mutual fund). |
| Peter McMillan (1957) | | Mr. McMillan has served as a director of the Fund since August 2010. | | Co-founder (since 2019), Pacific Oak Capital Advisors (investment advisory firm); Co-founder, Managing Partner and Chief Investment Officer (since May 2013), Temescal Canyon Partners (investment advisory firm); Co-founder and Executive Vice President (2005-2019), KBS Capital Advisors (a manager of real estate investment trusts). | | Pacific Oak Strategic Opportunity REIT (real estate investments); Keppel Pacific Oak U.S. REIT (real estate investments); Pacific Oak Residential Trust (real estate investments); Metropolitan West Funds (mutual fund); TCW DL VII Financing LLC (business development company); TCW Funds, Inc. (mutual fund). |
| Victoria B. Rogers (1961) | | Ms. Rogers has served as a director of the Fund since October 2011. | | President and Chief Executive Officer (since 1996), The Rose Hills Foundation (charitable foundation). | | Stanford University (university); Norton Simon Museum (art museum); Causeway Capital Management Trust (mutual funds; 6 portfolios); Causeway ETML Trust (mutual fund); The Rose Hills Foundation (charitable foundation); TCW Funds, Inc. (mutual fund). |
| Andrew Tarica (1959) | | Mr. Tarica has served as a director of the Fund since March 2012. | | Chief Executive Officer (since February 2001), Meadowbrook Capital Management (asset management company); Director of Fixed Income (since February 2022), Forest Road Securities (broker-dealer); and Employee (2003 – January 2022), Cowen Prime Services (broker-dealer). | | Metropolitan West Funds (mutual fund); TCW Funds, Inc. (mutual fund); TCW Direct Lending VII, LLC (business development company); TCW Direct Lending VIII, LLC (business development company). |
| (1) | The address of each Independent Director is c/o Morgan, Lewis & Bockius LLP, Counsel to the Independent Directors, 300 South Grand Avenue, Los Angeles, CA 90071. |
| (2) | Position with company may have changed over time. |
62
TCW Strategic Income Fund, Inc.
Interested Directors
The director is an “interested person” of the Fund as defined in the 1940 Act because he is a director and officer of the Advisor, and shareholder and director of The TCW Group, Inc., the parent company of the Advisor.
| | | | | | |
Name and Year of Birth (1) | | Term of Office and Length of Time Served | | Principal Occupation(s)
During Past 5 Years | | Other Directorships held by Director |
David Lippman (1958) President and Chief Executive Officer | | Mr. Lippman has served as a director of the Fund since January 2014 and as President and Chief Executive Officer of the Fund since January 2021. | | President and Chief Executive Officer, The TCW Group, Inc. (since August 2012), TCW LLC (since October 2015), the Advisor (since February 2013) and TCW Asset Management Company LLC (since February 2013); Chief Executive Officer , Metropolitan West Asset Management, LLC (since February 2013); President and Principal Executive Officer, Metropolitan West Funds (since January 2008). | | None. |
The officers of the Fund who are not directors of the Fund are:
| | | | |
| Name and Year of Birth (1) | | Position(s) Held with Fund | | Principal Occupation(s) During Past 5 Years (2) |
| Lisa Eisen (1963) | | Tax Officer | | Tax Officer (since December 2016), Metropolitan West Funds and TCW Funds, Inc.; Managing Director and Director of Tax (since August 2016), TCW, LLC; Vice President of Corporate Tax and Payroll for Health Net, Inc. (1998 – July 2016). |
| Meredith S. Jackson (1959) | | Senior Vice President, General Counsel and Secretary | | Executive Vice President, General Counsel and Secretary (since January 2016), TCW LLC; Executive Vice President, General Counsel and Secretary (since February 2013), TCW Investment Management Company LLC, The TCW Group Inc., TCW Asset Management Company LLC, and Metropolitan West Asset Management, LLC; Senior Vice President, General Counsel and Secretary (since February 2013), TCW Funds, Inc.; Vice President and Secretary (since February 2013), Metropolitan West Funds. |
63
TCW Strategic Income Fund, Inc.
Directors and Officers (Continued)
| | | | |
| Name and Year of Birth (1) | | Position(s) Held with Fund | | Principal Occupation(s) During Past 5 Years (2) |
| Gladys Xiques (1973) | | Chief Compliance Officer and AML Officer since January 2021 | | Chief Compliance Officer and AML Officer (since January 2021), TCW Funds, Inc. and Metropolitan West Funds; Managing Director and Global Chief Compliance Officer (since January 2021), TCW LLC, TCW Investment Management Company LLC, Metropolitan West Asset Management, LLC, and TCW Asset Management Company LLC; Global Chief Compliance Officer (since January 2021), The TCW Group, Inc.; Senior Vice President (February 2015 – December 2020), TCW LLC, TCW Investment Management Company LLC, Metropolitan West Asset Management, LLC, and TCW Asset Management Company LLC; Director and Compliance Counsel (March 2010 – January 2015), Kohlberg Kravis Roberts & Co. L.P. |
| Richard Villa (1964) | | Treasurer and Principal Financial and Accounting Officer since February, 2014 | | Executive Vice President, Chief Financial Officer and Assistant Secretary (since January 2016), TCW LLC and (since July 2008), TCW Investment Management Company LLC, the TCW Group, Inc., and TCW Asset Management Company LLC; Treasurer and Principal Financial and Accounting Officer (since February 2014), TCW Funds, Inc. and (since February 2021) Metropolitan West Funds. |
| (1) | The address of the Interested Director and each officer is c/o the TCW Group, Inc., 865 South Figueroa Street, Suite 1800, Los Angeles, CA 90017. |
| (2) | Positions with The TCW Group, Inc. and its affiliates may have changed over time. |
In addition, Eric Chan, Managing Director of Fund Operations for the Advisor, TCW Asset Management Company LLC, TCW LLC (since 2009), and Metropolitan West Asset Management, LLC (since November 2006), is Assistant Treasurer of the Fund (since 2009) and Metropolitan West Funds (since 2010). Mr. Chan is a Certified Public Accountant. Patrick W. Dennis, Senior Vice President, Associate General Counsel and Assistant Secretary of TCW Asset Management Company LLC, Metropolitan West Asset Management, LLC, TCW LLC and the Advisor (since February 2013), is Vice President and Assistant Secretary of the Fund and Metropolitan West Funds (since 2013).
64
TCW Strategic Income Fund, Inc.
865 South Figueroa Street, Suite 1800
Los Angeles, California 90017
800 386 3829
www.TCW.com
INVESTMENT ADVISOR
TCW Investment Management Company LLC
865 South Figueroa Street, Suite 1800
Los Angeles, California 90017
TRANSFER AGENT, DIVIDEND REINVESTMENT AND DISBURSEMENT AGENT AND REGISTRAR
Computershare
P.O. Box 50500
Louisville, KY 40233
INDEPENDENT REGISTERED PUBLIC ACCOUNTING FIRM
Deloitte & Touche LLP
555 West 5th Street
Los Angeles, California 90013
CUSTODIAN & ADMINISTRATOR
State Street Bank & Trust Company
One Lincoln Street
Boston, Massachusetts 02111
LEGAL COUNSEL
Paul Hastings LLP
101 California Street, 48th Floor
San Francisco, California 94111
DIRECTORS
Samuel P. Bell
Director
Patrick C. Haden
Director and Chairman
David B. Lippman
Director, President, and Chief Executive Officer
Peter McMillan
Director
Victoria B. Rogers
Director
Andrew Tarica
Director
OFFICERS
Meredith S. Jackson
Senior Vice President, General Counsel and Secretary
Richard M. Villa
Treasurer and Principal Financial and Accounting Officer
Gladys Xiques
Chief Compliance Officer
and Anti-Money Laundering Officer
Lisa Eisen
Tax Officer
Eric W. Chan
Assistant Treasurer
Patrick W. Dennis
Assistant Secretary
TSIart9445 12/31/21
| | |
| Item 2. | | Code of Ethics. |
| |
| (a) | | The Registrant has adopted a code of ethics that applies to its principal executive officer and principal financial officer or persons performing similar functions. |
| |
| (b) | | No disclosures are required by this Item 2(b). |
| |
| (c) | | The Registrant has made no material changes to its code of ethics during the period covered by this Form N-CSR. |
| |
| (d) | | The Registrant has not granted any waivers from any provisions of its code of ethics during the period covered by this Form N-CSR. |
| |
| (e) | | Not applicable. |
| |
| (f) | | A copy of the Registrant’s code of ethics is filed as Exhibit 13(a)(1) to this Form N-CSR. |
| |
| Item 3. | | Audit Committee Financial Expert. |
| |
| (a)(1) | | The Registrant’s Board of Directors (the “Board”) has determined that the Registrant has two members serving on the Registrant’s Audit Committee that possess the attributes identified in Form N-CSR to qualify as an “audit committee financial expert.” |
| |
| (a)(2) | | The audit committee financial experts are Samuel P. Bell and Victoria B. Rogers. Each has been deemed to be “independent” as that term is defined in Form N-CSR. |
| |
| (a)(3) | | Not applicable. |
| |
| Item 4. | | Principal Accountant Fees and Services. |
The firm of Deloitte & Touche LLP (“Deloitte”) serves as the independent registered public accounting firm for the Registrant.
(a) Audit Fees
For the fiscal years ended December 31, 2021 and December 31, 2020, the aggregate fees billed for professional services rendered by Deloitte for the audit of the Registrant’s annual financial statements or for services that are normally provided by Deloitte in connection with statutory and regulatory filings or engagements were:
| | | | |
2021 | | 2020 | |
$78,540 | | $ | 83,540 | |
(b) Audit-Related Fees
For the fiscal years December 31, 2021 and December 31, 2020, the aggregate fees billed for assurance and related services rendered by Deloitte that are reasonably related to the performance of the audit or review of the Registrant’s financial statements and that are not reported under Audit Fees above were:
(c) Tax Fees
For the fiscal years ended December 31, 2021 and December 31, 2020, the aggregate fees billed for tax compliance, tax advice, and tax planning by Deloitte were:
“Tax Fees” represents aggregate fees billed for each of the last two fiscal years for professional services related to tax compliance, tax advice and tax planning, including review of federal and state income tax returns, review of excise tax distribution requirements and excise tax returns.
(d) All Other Fees
For the fiscal years ended December 31, 2021 and December 31, 2020, the aggregate fees billed by Deloitte to the Registrant for all services other than services reported under Audit Fees, Audit-Related Fees, and Tax Fees were:
(e)(1) The Registrant’s Audit Committee approves each specific service the auditor will perform for the Registrant. Accordingly, the Audit Committee has not established pre-approval policies or procedures for services that the auditor may perform for the Registrant.
(e)(2) None of the services described in each of paragraphs (b) through (d) of this Item were approved by the Registrant’s Audit Committee pursuant to paragraph (c)(7)(i)(C) of Rule 2-01 of Regulation S-X.
(f) Not applicable.
(g) No non-audit fees except as disclosed in Item 4(c) above were billed by the Registrant’s accountant for services rendered to the Registrant, or rendered to the Registrant’s investment adviser and any entity controlling, controlled by, or under common control with the investment adviser that provides ongoing services to the Registrant for each of the last two fiscal years of the Registrant.
(h) Not applicable.
(i) Not applicable.
(j) Not applicable.
| Item 5. | Audit Committee of Listed Registrants. |
| (a) | The Registrant has a separately-designated standing Audit Committee established in accordance with Section 3(a)(58)(A) of the Securities Exchange Act of 1934, as amended. The Registrant’s Audit Committee members, consisting solely of independent directors, are: |
Samuel P. Bell
Patrick C. Haden
Peter McMillan
Victoria B. Rogers
Andrew Tarica
Item 6. Investments.
| (a) | The Schedule of Investments is included as part of the Report to Shareholders filed under Item 1 of this Form N-CSR. |
| Item 7. | Disclosure of Proxy Voting Policies and Procedures for Closed-End Management Investment Companies. |
Attached to this Form N-CSR as Exhibit 13(c) is a copy of the proxy voting policies and procedures of the Registrant.
Item 8. Portfolio Managers of Closed-End Management Investment Companies.
(a)(1) Portfolio Managers*
| | |
| Mitch Flack | | Portfolio Manager and Managing Director, TCW Investment Management Company LLC, and TCW LLC since December 2009, and Metropolitan West Asset Management, LLC since March 2001. |
| |
| Stephen Kane | | Portfolio Manager and Group Managing Director, TCW Investment Management Company LLC, TCW Asset Management Company LLC, and TCW LLC since December 2009, and Metropolitan West Asset Management, LLC since August 1996. |
| | |
| Laird R. Landmann | | Portfolio Manager and Group Managing Director, TCW Investment Management Company LLC, TCW Asset Management Company LLC, TCW LLC, and The TCW Group, Inc. since December 2009; and President, Metropolitan West Asset Management, LLC since August 1996. |
| |
| Bryan Whalen | | Portfolio Manager and Group Managing Director, TCW Investment Management Company LLC, TCW Asset Management Company LLC, and TCW LLC since December 2009, and Metropolitan West Asset Management, LLC since 2004. |
| * | The foregoing information regarding the Registrant’s portfolio managers is as of February 15, 2022. (Positions with TCW and its affiliates may have changed over time.) |
(a)(2) Other Accounts Managed as of December 31, 2021 in millions.
| | | | | | | | | | | | | | | | | | | | | | | | | | | | | | | | | | | | | | | | | | | | | | | | |
| | | Registered Investment
Companies
asset-based advisory fee | | | Other Pooled
Investment
Vehicles
asset-based advisory
fee | | | Other Accounts
asset-based advisory
fee | | | Registered Investment
Companies
performance-based
advisory fee | | | Other Pooled
Investment Vehicles
performance-based
advisory fee | | | Other Accounts
performance-based
advisory fee | |
| | | Number
of
Accounts | | | Total
Assets | | | Number
of
Accounts | | | Total
Assets | | | Number
of
Accounts | | | Total
Assets | | | Number of
Accounts | | | Total
Assets | | | Number of
Accounts | | | Total
Assets | | | Number of
Accounts | | | Total
Assets | |
Mitch Flack | | | 3 | | | $ | 5,144 | | | | 5 | | | $ | 2,244 | | | | 25 | | | $ | 11,206 | | | | 0 | | | $ | 0 | | | | 15 | | | $ | 654 | | | | 2 | | | $ | 2,917 | |
Stephen Kane | | | 30 | | | $ | 126,222 | | | | 20 | | | $ | 18,864 | | | | 174 | | | $ | 43,751 | | | | 0 | | | $ | 0 | | | | 3 | | | $ | 681 | | | | 7 | | | $ | 5,350 | |
Laird R. Landmann | | | 29 | | | $ | 131,525 | | | | 22 | | | $ | 19,594 | | | | 196 | | | $ | 54,393 | | | | 0 | | | $ | 0 | | | | 25 | | | $ | 4,340 | | | | 9 | | | $ | 8,267 | |
Bryan Whalen | | | 30 | | | $ | 130,193 | | | | 26 | | | $ | 22,553 | | | | 211 | | | $ | 59,693 | | | | 0 | | | $ | 0 | | | | 18 | | | $ | 1,334 | | | | 9 | | | $ | 8,267 | |
Conflicts
The TCW Group, Inc. and its subsidiaries, the Registrant, TCW Funds, Inc. and the Metropolitan West Funds (collectively, “TCW”) have policies and controls to avoid and/or mitigate conflicts of interest across its businesses. The policies and procedures in TCW’s Code of Ethics (the “Code”) serve to address or mitigate both conflicts of interest and the appearance of any conflict of interest. The Code contains several restrictions and procedures designed to eliminate conflicts of interest relating to personal investment transactions, including (i) reporting account openings, changes, or closings (including accounts in which an Access Person has a “beneficial interest”), (ii) pre-clearance of non-exempt personal investment transactions (make a personal trade request for Securities) and (iii) the completion of timely required reporting (Initial Holdings Report, Quarterly Transactions Report, Annual Holdings Report and Annual Certificate of Compliance).
In addition, the Code addresses potential conflicts of interest through its policies on insider trading, anti-corruption, an employee’s outside business activities, political activities and contributions, confidentiality and whistleblower provisions.
Conflicts of interest may also arise in the management of accounts and investment vehicles. These conflicts may raise questions that would allow TCW to allocate investment opportunities in a way that favors certain accounts or investment vehicles over other accounts or investment vehicles, or incentivize a TCW portfolio manager to receive greater compensation with regard to the management of certain account or investment vehicles. TCW may give advice or take action with certain accounts or investment vehicles that could differ from the advice given or action taken on other accounts or investment vehicles. When an investment opportunity is suitable for more than
one account or investment vehicle, such investments will be allocated in a manner that is fair and equitable under the circumstances to all TCW clients. As such, TCW has adopted compliance policies and procedures in its Portfolio Management Policy that helps to identify a conflict of interest and then specifies how a conflict of interest is managed. TCW’s Trading and Brokerage Policy also discusses the process of timing and method of allocations, and addresses how the firm handles affiliate transactions.
The respective Equity and Fixed Income Trading and Allocation Committees review trading activities on behalf of client accounts, including the allocation of investment opportunities and address any issues with regard to side-by-side management in order to ensure that all of TCW’s clients are treated on a fair and equitable basis. Further, the Portfolio Analytics Committee reviews TCW’s investment strategies, evaluates various analytics to facilitate risk assessment, changes to performance composites and benchmarks and monitors the implementation and maintenance of the Global Investment Performance Standards or GIPS® compliance.
TCW’s approach to handling conflicts of interest is multi-layered starting with its policies and procedures, reporting and pre-clearance processes and oversight by various committees.
(a)(3) Portfolio Manager Compensation
The overall objective of TCW Investment Management Company LLC’s (“Advisor”) compensation program for portfolio managers is to attract experienced and expert investment professionals and to retain them over the long-term. Compensation is comprised of several components which, in the aggregate, are designed to achieve these objectives and to reward the portfolio managers for their contributions to the successful performance of the accounts they manage. Portfolio managers are compensated through a combination of base salary, fee sharing based compensation (“fee sharing”), bonus and equity incentive participation in the Advisor’s parent company (“equity incentives”). Fee sharing and equity incentives generally represent most of the portfolio managers’ compensation. In some cases, portfolio managers are eligible for discretionary bonuses.
Salary. Salary is agreed to with portfolio managers at the time of employment and is reviewed from time to time. It does not change significantly and often does not constitute a significant part of a portfolio manager’s compensation.
Fee Sharing. Fee sharing for investment professionals is based on revenues generated by accounts in the investment strategy area for which the investment professionals are responsible. In most cases, revenues are allocated to a pool and fee sharing compensation is allocated among members of the investment team after the deduction of certain expenses (including compensation over a threshold level) related to the strategy group. The allocations are based on the investment professionals’ contributions to TCW and its clients, including qualitative and quantitative contributions.
In general, the same fee sharing percentage is used to compensate a portfolio manager for investment services related to the Registrant as that used to compensate portfolio managers for other client accounts in the same strategy managed by the Advisor or an affiliate of the Advisor (collectively, “the TCW Advisors”). In some cases, the fee sharing pool includes revenues related to more than one product, in which case each participant in the pool is entitled to fee sharing derived from his or her contributions to all the included products.
Investment professionals are not directly compensated for generating performance fees. In some cases, the overall fee sharing pool is subject to fluctuation based on the relative pre-tax performance of the investment strategy composite returns, net of fees and expenses, to that of the benchmark. The measurement of performance relative to the benchmark can be based on single year or multiple year metrics, or a combination thereof. The benchmark used is the one associated with the Registrant managed by the portfolio manager as disclosed in the prospectus. Benchmarks vary from strategy to strategy but, within a given strategy, the same benchmark applies to all accounts, including the Registrant.
Discretionary Bonus/Guaranteed Minimums. Discretionary bonuses may be paid out of an investment team’s fee sharing pool, as determined by the supervisor(s) in the department. In other cases where portfolio managers do not receive fee sharing or where it is determined that the combination of salary and fee sharing does not adequately compensate the portfolio manager, discretionary bonuses may be paid by the applicable TCW Advisor. Also, pursuant to contractual arrangements, some portfolio managers received minimum bonuses.
Equity Incentives. Management believes that equity ownership aligns the interests of portfolio managers with the interests of the firm and its clients. Accordingly, TCW’s key investment professionals participate in equity incentives through ownership or participation in restricted unit plans that vest over time or unit appreciation plans of the Advisor’s parent company. The plans include the Fixed Income Retention Plan, Restricted Unit Plan and 2013 Equity Unit Incentive Plan.
Under the Fixed Income Retention Plan, certain portfolio managers in the fixed income area were awarded cash and/or partnership units in the Advisor’s parent company, either on a contractually-determined basis or on a discretionary basis. Awards under this plan were made in 2010 that vest over time.
Under the Restricted Unit Plan, certain portfolio managers in the fixed income and equity areas may be awarded partnership units in the Advisor’s parent company. Awards under this plan have vested over time, subject to satisfaction of performance criteria.
Under the 2013 Equity Unit Incentive Plan, certain portfolio managers in the fixed income and equity areas may be awarded options to acquire partnership units in the Advisor’s parent company with a strike price equal to the fair market value of the option at the date of grant. The options granted under this plan are subject to vesting and other conditions.
Other Plans and Compensation Vehicles. Portfolio managers may also elect to participate in the applicable TCW Advisor’s 401(k) plan, to which they may contribute a portion of their pre- and post-tax compensation to the plan for investment on a tax-deferred basis.
(a)(4) Share Ownership in Registrant as of December 31, 2021.
| | | | | | | | | | | | | | | | | | | | | | | | | | | | |
Portfolio Manager | | None | | | $1
to
$10K | | | $10K
to
$50K | | | $50K
to
$100K | | | $100K
to
$500K | | | $500K
to
$1 Mill | | | Over
$1 Mill | |
Mitch Flack | | | | | | | | | | | | | | | | | | | X | | | | | | | | | |
Stephen Kane | | | | | | | | | | | | | | | | | | | | | | | | | | | X | |
Laird R. Landmann | | | | | | | | | | | | | | | | | | | | | | | | | | | X | |
Bryan Whalen | | | | | | | | | | | | | | | | | | | X | | | | | | | | | |
(b) Not applicable.
| Item 9. | Purchases of Equity Securities by Closed-End Management Investment Company and Affiliated Purchasers. |
None.
| Item 10. | Submission of Matters to a Vote of Security Holders. |
There have been no material changes to the procedures by which shareholders may recommend nominees to the Registrant’s Board of Directors.
| Item 11. | Controls and Procedures. |
| (a) | The Chief Executive Officer and Principal Financial and Accounting Officer have concluded, as of a date within 90 days of the filing date of this report, that the Registrant’s disclosure controls and procedures (as defined in Rule 30a-3(c) under the 1940 Act) are effective, as of such date, based on their evaluation of these controls and procedures required by Rule 30a-3(b) under the 1940 Act and 15d-15(b) under the Securities Exchange Act of 1934, as amended. |
| (b) | There were no changes in the Registrant’s internal control over financial reporting (as defined in Rule 30a-3(d) under the 1940 Act) that occurred during the period covered by this report that have materially affected, or are reasonably likely to materially affect, the Registrant’s internal control over financial reporting. |
| Item 12. | Disclosure of Securities Lending Activities for Closed-End Management Investment Companies. |
Not applicable.
Item 13. Exhibits.
SIGNATURES
Pursuant to the requirements of the Securities Exchange Act of 1934, as amended, and the Investment Company Act of 1940, as amended, the Registrant has duly caused this report to be signed on its behalf by the undersigned, thereunto duly authorized.
| | |
| (Registrant) | | TCW Strategic Income Fund, Inc. |
| |
| By (Signature and Title) | | /s/ David B. Lippman |
| | David B. Lippman |
| | President and Chief Executive Officer |
| |
| Date | | March 4, 2022 |
Pursuant to the requirements of the Securities Exchange Act of 1934, as amended, and the Investment Company Act of 1940, as amended, this report has been signed below by the following persons on behalf of the Registrant and in the capacities and on the dates indicated.
| | |
| By (Signature and Title) | | /s/ David B. Lippman |
| | David B. Lippman |
| | President and Chief Executive Officer |
| |
| Date | | March 4, 2022 |
| | |
| By (Signature and Title) | | /s/ Richard M. Villa |
| | Richard M. Villa |
| | Treasurer and Principal Financial and Accounting Officer |
| |
| Date | | March 4, 2022 |