UNITED STATES
SECURITIES AND EXCHANGE COMMISSION
Washington, D.C. 20549
FORM N-CSR
CERTIFIED SHAREHOLDER REPORT OF REGISTERED
MANAGEMENT INVESTMENT COMPANIES
Investment Company Act file number: 811-4984
AMERICAN BEACON FUNDS
(Exact name of registrant as specified in charter)
220 East Las Colinas Boulevard, Suite 1200
Irving, Texas 75039
(Address of principal executive offices)-(Zip code)
GENE L. NEEDLES, JR., PRESIDENT
220 East Las Colinas Boulevard, Suite 1200
Irving, Texas 75039
(Name and address of agent for service)
Registrant’s telephone number, including area code: (817) 391-6100
Date of fiscal year end: October 31, 2016
Date of reporting period: October 31, 2016
Form N-CSR is to be used by management investment companies to file reports with the Commission not later than 10 days after the transmission to stockholders of any report that is required to be transmitted to stockholders under Rule 30e-1 under the Investment Company Act of 1940 (17 CFR 270.30e-1). The Commission may use the information provided on Form N-CSR in its regulatory, disclosure review, inspection, and policymaking roles.
A registrant is required to disclose the information specified by Form N-CSR, and the Commission will make this information public. A registrant is not required to respond to the collection of information contained in Form N-CSR unless the Form displays a currently valid Office of Management and Budget (“OMB”) control number. Please direct comments concerning the accuracy of the information collection burden estimate and any suggestions for reducing the burden to Secretary, Securities and Exchange Commission, 450 Fifth Street, NW, Washington, DC 20549-0609. The OMB has reviewed this collection of information under the clearance requirements of 44 U.S.C. § 3507.
ITEM 1. REPORTS TO STOCKHOLDERS.

About American Beacon Advisors
Since 1986, American Beacon Advisors has offered a variety of products and investment advisory services to numerous institutional and retail clients, including a variety of mutual funds, corporate cash management, and separate account management.
Our clients include defined benefit plans, defined contribution plans, foundations, endowments, corporations, financial planners, and other institutional investors. With American Beacon Advisors, you can put the experience of a multi-billion dollar asset management firm to work for your company.
BALANCED FUND RISKS
The use of fixed-income securities entails interest rate and credit risks. Investing in foreign securities may involve heightened risk due to currency fluctuations and economic and political risks. Investing in value stocks may limit downside risk over time; however, the Fund may produce more modest gains than riskier stock funds as a trade-off for this potentially lower risk. The use of futures contracts for cash management may subject the Fund to losing more money than invested. Please see the prospectus for a complete discussion of the Fund’s risks. There can be no assurances that the investment objectives of this Fund will be met.
MID-CAP VALUE FUND RISKS
Investing in medium-capitalization stocks may involve greater volatility and lower liquidity than larger company stocks. Investing in value stocks may limit downside risk over time; however, the Fund may produce more modest gains than riskier stock funds as a trade-off for this potentially lower risk. Investing in foreign securities may involve heightened risk due to currency fluctuations and economic and political risks. The use of futures contracts for cash management may subject the Fund to losing more money than invested. The Fund may participate in a securities lending program. Please see the prospectus for a complete discussion of the Fund’s risks. There can be no assurances that the investment objectives of this Fund will be met.
Any opinions herein, including forecasts, reflect our judgment as of the end of the reporting period and are subject to change. Each advisor’s strategies and each Fund’s portfolio composition will change depending on economic and market conditions. This report is not a complete analysis of market conditions, and, therefore, should not be relied upon as investment advice. Although economic and market information has been compiled from reliable sources, American Beacon Advisors, Inc. makes no representation as to the completeness or accuracy of the statements contained herein.
| | |
American Beacon Funds | | October 31, 2016 |
Contents
President’s Message
| | |
 | | Dear Shareholders, During the 12-month period ended October 31, 2016, China’s slowing growth escalated concerns for global markets, and many of the world’s central banks – the Federal Reserve included – responded by either continuing or expanding their economic stimulation policies. In the first half of 2016, international stocks declined while U.S. and emerging-market stocks made modest gains. Falling global interest rates supported bond returns during the period. On June 24, 2016, the U.K. announced that the “Brexit” referendum to leave the European Union passed with a 52% majority vote, further shaking up global markets. By the end of that month, however, the U.S. stock market and some global markets had rebounded to near pre-Brexit levels as investors took opportunistic risks following the historic vote. After Theresa May’s succession as the U.K.’s prime minister on July 13, 2016, many central banks put their Brexit concerns on hold and turned their attention to their own economies. |
In the weeks ahead of the U.S. presidential election on November 8, 2016, uncertainty about the outcome caused many investors to stay on the sidelines. Although investors may question whether the election’s result could have negative consequences for their portfolios, elections rarely have a lasting effect on the market. Historically speaking, from August 1 to October 31 during 19 of the last 22 election years – or approximately 86% of the time – the S&P 500 rallied for an average gain of approximately 6%.
At American Beacon, we pride ourselves on offering a broad range of mutual funds to help investors navigate the economic storms and market surges in the U.S. and abroad. Our years of experience evaluating sub-advisors have led us to identify and partner with several asset managers who have adhered to their disciplined processes for many years and through a variety of economic and market conditions.
For the 12-month period ended October 31, 2016:
| | • | | American Beacon Balanced Fund (Investor Class) returned 2.85%. |
| | • | | American Beacon Mid-Cap Value Fund (Investor Class) returned 2.12%. |
Thank you for your continued interest in American Beacon Funds. For additional information about the Funds or to access your account information, please visit our website at www.americanbeaconfunds.com.
|
Best Regards, 
|
| Gene L. Needles, Jr. |
| President |
| American Beacon Funds |
1
Domestic Bond and Equity Market Overview
October 31, 2016 (Unaudited)
Bond Market Overview
The U.S. investment-grade bond market, as defined by the Barclays U.S. Aggregate Index, began the 12-month period ended October 31, 2016 with a yield of 2.38% and ended at 2.12%, producing a total return of 4.37%. The modest decline in yield was somewhat unexpected as the period began with fixed-income investors anticipating that the Federal Reserve (the “Fed”) would begin normalizing interest rates. The Fed raised rates in December 2015 for the first time in nearly 10 years, but that would be the only rate increase for the remainder of the period under review. Yields on the 10-year Treasury note initially rose from 2.14% at the beginning of the period to 2.27% by December 31, 2015; however, sentiment in the bond market changed quickly when global economic growth rates and commodity prices declined.
In response to persistent weakness in many world economies, central banks refocused on policies to keep interest rates down and money supplies elevated. This development put the Fed’s plans on hold, and U.S. interest rates followed global rates down accordingly. By period end, the 10-year Treasury note yielded 1.83%. Crude oil prices ended the period where they began, at approximately $47 per barrel, but they briefly touched $26 per barrel at the depths of the commodity price declines in early 2016.
Despite the risk-off environment, investment-grade corporate bonds performed well during the period, returning 7.23%. Corporate spreads narrowed from 164 basis points, or 1.64%, over Treasury yields at the beginning of the period to 135 basis points, or 1.35%, at period end – although they took a detour up to 215 basis points, or 2.15%, during the volatile months in between. Commodity-rated issuers struggled during the period, but the remaining issuers held up reasonably well as investors sought incremental yield in the low-yielding environment.
The agency mortgage-backed sector produced the lowest returns of the major sectors during the period, at 3.28%, as interest rates declined and caused acceleration in refinancing activity. Over time, however, the sector has been an attractive place for investors to seek relatively safe yield.
Equity Market Overview
U.S. and emerging markets rallied over the trailing 12-month period ended October 31, 2016. Central banks around the world continued to set the pace for equity markets. With more than one third of all sovereign debt ($13 trillion) posting negative yields, the monetary spigots remained wide open, forcing investors to search for yield elsewhere – including equities. However, European markets were shaken by the U.K.’s surprising Brexit vote in June and broadly declined. Among major benchmarks, the Standard & Poor’s 500 Index added 4.5%.
In December 2015, the Fed raised its benchmark rate after several years of near-zero interest rates, driven largely by the central bank’s confidence in the economy. U.S. interest rates then remained unchanged for the rest of the period. Fed Chair Janet Yellen began the year with a hawkish tone, and most market participants anticipated two or more rate hikes in 2016. However, market volatility related to the Brexit vote prompted policymakers to delay raising interest rates in spite of stable economic data in the U.S.
The Brexit vote dominated headlines in June and initially caused growth expectations to fall drastically. The referendum had far-reaching implications. U.S. markets declined in the aftermath, but quickly recovered as much of the market corrected what was largely viewed as an overreaction. The dollar rose versus the pound, which ended the period at a 31-year low. Growth forecasts in the U.K. have since been revised upward after decisive policy action from the Bank of England, the immediate appointment of Prime Minister Theresa May and strong manufacturing and services sector data. European Central Bank President Mario Draghi maintained low interest rates as the rest of Europe struggled to generate inflation, which turned positive in June. As the year progressed, post-Brexit risks seemed to recede.
2
Domestic Bond and Equity Market Overview
October 31, 2016 (Unaudited)
The Fed’s 2% GDP growth and inflation targets remained elusive for most of the period, and inventories were low. But most recently, third-quarter GDP showed 2.9% growth, which was the highest in two years and surpassed estimates of 2.5%. Consumer spending has been consistently strong, and the U.S. ended the period near full employment. Additionally, the Manufacturing sector’s Purchasing Managers’ Index was expansionary, with readings above 50 over the last 12 months. On the back of the measured policy response, the U.S. dollar ended the period only slightly higher overall.
For quite some time now, the battle for leadership within domestic equity markets has been raging between stocks perceived as “bond proxies” and those with more interest rate and economic sensitivity. The latter group struggled mightily during the first six months of 2016, but outperformed the bond proxies in the third quarter as interest rates rose.
The “battle of the bond proxies” should continue until interest rates trend toward sustainably higher levels. The Fed’s multi-year suppression of interest rates was designed to push investors out on the risk spectrum and encourage growth; instead, the unintended consequence has been risk aversion. This has caused investors to search for perceived safety in assets with a current yield, regardless of valuation (e.g., bond proxies). More broadly, risk aversion has been evident on a global basis, even in countries with negative interest rates. Negative interest rates may prove ineffective and the road back to normalized interest rates might be bumpy with additional unintended consequences.
Further, investors have flocked to passive funds at the expense of active funds in an attempt to avoid risk. The current cycle of passive outperformance began with the bull market that started about seven years ago. Since that time, lower interest rates and excess liquidity have propelled equity markets in a highly correlated manner, without much regard for fundamentals. After one of the longest and highest-returning bull markets in history, the overall market is no longer inexpensive, and many companies and sectors are richly valued. As such, the long run of outperformance by passive strategies has left many companies within the benchmark overvalued and susceptible to dividend cuts, price declines or both.
Election news dominated headlines over the period, particularly in the run-up to Election Day, and increased volatility. Most polls projected Democratic nominee Hillary Rodham Clinton would win the U.S. presidential election. Toward the end of the period, markets were shaken and the U.S. presidential election narrowed after the reemergence of the FBI investigation into Ms. Clinton’s private email servers. Uncertainty from the presidential election created an overhang at the end of the period.
3
American Beacon Balanced FundSM
Performance Overview
October 31, 2016 (Unaudited)
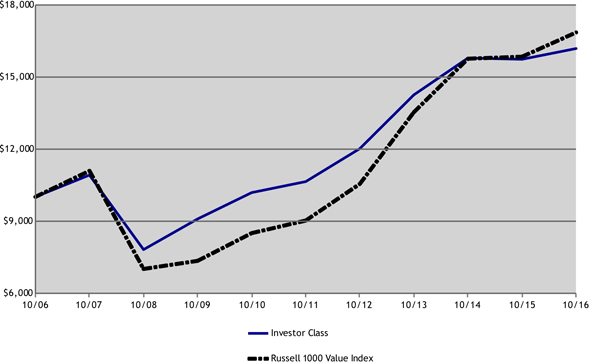
The Investor Class of the Balanced Fund (the “Fund”) returned 2.85% for the twelve months ended October 31, 2016, underperforming the 60% Russell 1000® Value Index/40% Barclays Capital U.S. Aggregate Index return of 5.69% for the same period.
Comparison of Change in Value of a $10,000 Investment for the period from 10/31/06 through 10/31/16
Total Returns for the Period ended October 31, 2016
| | | | | | | | | | | | | | | | | | | | | | | | |
| | | | | | | | | | | | | | | | | | Value of $10,000
10/31/2006- | |
| | | Ticker | | | 1 Year | | | 3 Years | | | 5 Years | | | 10 Years | | | 10/31/2016 | |
Institutional Class (1,7) | | | AADBX | | | | 3.30 | % | | | 4.69 | % | | | 9.11 | % | | | 5.26 | % | | $ | 16,692 | |
Y Class (1,2,7) | | | ACBYX | | | | 3.06 | % | | | 4.55 | % | | | 8.97 | % | | | 5.17 | % | | $ | 16,555 | |
Investor Class (1,7) | | | AABPX | | | | 2.85 | % | | | 4.31 | % | | | 8.73 | % | | | 4.92 | % | | $ | 16,168 | |
Advisor Class (1,7) | | | ABLSX | | | | 2.71 | % | | | 4.13 | % | | | 8.55 | % | | | 4.73 | % | | $ | 15,871 | |
A without Sales Charge (1,3,7) | | | ABFAX | | | | 2.84 | % | | | 4.24 | % | | | 8.61 | % | | | 4.85 | % | | $ | 16,059 | |
A with Sales Charge (1,3,7) | | | ABFAX | | | | -3.07 | % | | | 2.21 | % | | | 7.32 | % | | | 4.23 | % | | $ | 15,135 | |
C without Sales Charge (1,4,7) | | | ABCCX | | | | 2.03 | % | | | 3.46 | % | | | 7.80 | % | | | 4.35 | % | | $ | 15,314 | |
C with Sales Charge (1,4,7) | | | ABCCX | | | | 1.03 | % | | | 3.46 | % | | | 7.80 | % | | | 4.35 | % | | $ | 15,314 | |
Barclays Capital U.S. Aggregate Index (6) | | | | | | | 4.37 | % | | | 3.48 | % | | | 2.90 | % | | | 4.64 | % | | $ | 15,739 | |
Russell 1000 Value Index (6) | | | | | | | 6.37 | % | | | 7.59 | % | | | 13.31 | % | | | 5.35 | % | | $ | 16,837 | |
Balanced Composite Index (5) | | | | | | | 5.69 | % | | | 6.08 | % | | | 9.19 | % | | | 5.41 | % | | $ | 16,929 | |
| 1. | Performance shown is historical and is not indicative of future returns. Investment returns and principal value will vary, and shares may be worth more or less at redemption than at original purchase. Performance shown is calculated based on the published end of day net asset values as of date indicated, and current performance may be lower or higher than the performance data quoted. To obtain performance as of the most recent month end, please visit www.americanbeaconfunds.com or call 1-800-967-9009. Fund performance in the table above does not reflect the deduction of taxes a shareholder would pay on distributions or the redemption of shares. |
| 2. | Fund performance for the ten-year period represents the total returns achieved by the Institutional Class from 10/31/06 up to 3/1/10, the inception date of the Y Class, and the returns of the Y Class since its inception. Expenses of the Y Class are higher than those of the Institutional Class. Therefore, total returns shown may be higher than they would have been had the Y Class been in existence since 10/31/06. A portion of the fees charged to the Y Class of |
4
American Beacon Balanced FundSM
Performance Overview
October 31, 2016 (Unaudited)
| | the Fund was waived in 2011, partially recovered in 2013 and fully recovered in 2014. Performance prior to waiving fees was lower than the actual returns shown in 2011. |
| 3. | Fund performance for the ten-year period represents the total returns achieved by the Investor Class from 10/31/06 up to 5/17/10, the inception date of the A Class, and the returns of the A Class since its inception. Expenses of the A Class are higher than those of the Investor Class. Therefore, total returns shown may be higher than they would have been had the A Class been in existence since 10/31/06. A portion of the fees charged to the A Class of the Fund was waived in 2011 and 2012, partially recovered in 2013 and fully recovered in 2014. Performance prior to waiving fees was lower than the actual returns shown in 2011 and 2012. A Class has a maximum sales charge of 5.75%. |
| 4. | Fund performance for the ten-year period represents the total returns achieved by the Investor Class from 10/31/06 up to 9/1/10, the inception date of the C Class, and the returns of the C Class since its inception. Expenses of the C Class are higher than those of the Investor Class. Therefore, total returns shown may be higher than they would have been had the C Class been in existence since 10/31/06. A portion of the fees charged to the C Class of the Fund was waived from 2010 through 2012, and partially recovered in 2013 and fully recovered in 2014. Performance prior to waiving fees was lower than the actual returns shown from 2010 through 2012. The maximum contingent deferred sales charge for C Class is 1% for shares redeemed within one year of the date of purchase. |
| 5. | To reflect the Fund’s allocation of its assets between investment grade fixed-income securities and equity securities, the returns of the Russell 1000 Value Index and the Barclays Capital Aggregate Index have been combined in a 60%/40% proportion. |
| 6. | The Russell 1000 Value Index is an unmanaged index of those stocks in the Russell 1000 Index with lower price-to-book ratios and lower forecasted values. Russell 1000 Value Index and Russell 1000 Index are registered trademarks of Frank Russell Company. The Barclays Capital Aggregate Index is a market value weighted index of government, corporate, mortgage-backed and asset-backed fixed-rate debt securities of all maturities. One cannot directly invest in an index. |
| 7. | The total annual Fund operating expense ratio set forth in the most recent Fund prospectus for the Institutional, Y, Investor, Advisor, A, and C Class shares was 0.59%, 0.67%, 0.92%, 1.07%, 0.98%, and 1.73%, respectively. The expense ratios above may vary from the expense ratios presented in other sections of this report that are based on expenses incurred during the period covered by this report. |
During the twelve-month period, the Fund’s assets on average were invested 63% in equities (including equitized cash) and 37% in fixed-income securities, ending the period with 64% in equities (including equitized cash) and 36% in fixed-income securities.
The equity portion of the Fund (excluding equitized cash) returned 3.6% for the period, underperforming the Russell 1000 Value Index (the “Index”) return of 6.4%. The Fund underperformed the Index as both stock selection and sector allocation detracted value relative to the Index.
Stock selections in the Health Care, Industrials, and Utilities sectors contributed the majority of the underperformance during the twelve-month period. In the Health Care sector, Valeant Pharmaceuticals International (down 71.7%) was the largest detractor, followed closely by Sanofi ADR, which dropped 20.5%, and Anthem Inc. (down 10.6%). In the Industrials sector, the Fund’s position in American Airlines Group Inc. (down 11.9%) and Delta Air Lines Inc. (down 17.1%) contributed to the underperformance. Within Utilities, positions in Calpine Corp. (down 21.7%) and NRG Energy Inc. (down 11.8%) both had negative impacts on performance.
The Fund’s overweight in Consumer Discretionary, the worst performing sector in the Index (down 2.8%), and underweight in Utilities (up 17.5%), the best performing sector, damaged performance through sector allocation. On the other hand, being overweight in Telecommunication Services (up 11.4%) added relative value.
The fixed-income portion of the Fund returned 6.7% for the six-month period, outperforming the Barclays Capital U.S. Aggregate Index (the “Barclays Index”) return of 4.4%. The Fund’s fixed income excess performance relative to the Barclays Index was due to both positive sector allocation and security selection. The Fund’s selections in U.S. Treasuries (up 7.6%) added relative value. Good selection in the Manufacturing sector (up 6.6%) also benefited the Fund, as did a slight overweight to the Energy sector. From a duration perspective, the portfolio was helped by an overweight allocation to and selections within the 10 to 30 year range, as well as selections in the 7 to 10 year range.
The sub-advisors continue to focus on the disciplined selection of attractive securities that should allow the Fund to benefit long-term.
5
American Beacon Balanced FundSM
Performance Overview
October 31, 2016 (Unaudited)
| | | | | | | | |
Top Ten Holdings (% Net Assets) | | | | | | | | |
Bank of America Corp. | | | | | | | 2.7 | |
Citigroup, Inc. | | | | | | | 2.4 | |
JPMorgan Chase & Co. | | | | | | | 1.6 | |
American International Group, Inc. | | | | | | | 1.6 | |
BP PLC, Sponsored ADR | | | | | | | 1.6 | |
Microsoft Corp. | | | | | | | 1.3 | |
Oracle Corp. | | | | | | | 1.2 | |
General Motors Co. | | | | | | | 1.2 | |
Anthem, Inc. | | | | | | | 1.0 | |
Wells Fargo & Co. | | | | | | | 0.8 | |
Total Fund Holdings | | | 501 | | | | | |
| | |
Sector Allocation (% Equities) | | | | | | | | |
Financials | | | | | | | 27.0 | |
Consumer Discretionary | | | | | | | 14.5 | |
Industrials | | | | | | | 12.7 | |
Energy | | | | | | | 12.3 | |
Health Care | | | | | | | 10.8 | |
Information Technology | | | | | | | 10.3 | |
Telecommunication Services | | | | | | | 3.7 | |
Consumer Staples | | | | | | | 3.4 | |
Utilities | | | | | | | 2.7 | |
Materials | | | | | | | 2.5 | |
Real Estate | | | | | | | 0.1 | |
| | |
Sector Allocation (% Fixed Income) | | | | | | | | |
U.S. Treasury Obligations | | | | | | | 40.8 | |
U.S. Agency Mortgage-Backed Obligations | | | | | | | 17.3 | |
Finance | | | | | | | 10.9 | |
Manufacturing | | | | | | | 9.1 | |
Service | | | | | | | 4.9 | |
Energy | | | | | | | 4.3 | |
Commercial Mortgage-Backed Obligations | | | | | | | 3.5 | |
Asset-Backed Securities | | | | | | | 2.5 | |
Utilities | | | | | | | 1.9 | |
Telecommunications | | | | | | | 1.7 | |
Consumer | | | | | | | 1.2 | |
Municipal Obligations | | | | | | | 0.9 | |
Transportation | | | | | | | 0.9 | |
Foreign Sovereign | | | | | | | 0.1 | |
6
American Beacon Mid-Cap Value FundSM
Performance Overview
October 31, 2016 (Unaudited)
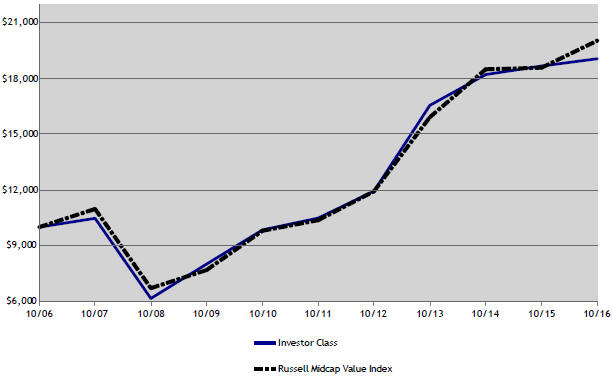
The Investor Class of the Mid-Cap Value Fund (the “Fund”) returned 2.12% for the twelve months ended October 31, 2016, underperforming the Russell Midcap® Value Index (the “Index”) return of 7.84% for the same period.
Comparison of Change in Value of a $10,000 Investment for the period from 10/31/06 through 10/31/16
Total Returns for the Period ended October 31, 2016
| | | | | | | | | | | | | | | | | | | | | | | | |
| | | Ticker | | | 1 Year | | | 3 Years | | | 5 Years | | | 10 Years | | | Value of $10,000
10/31/2006-
10/31/2016 | |
Institutional Class (1,3,9) | | | AACIX | | | | 2.39 | % | | | 5.05 | % | | | 12.97 | % | | | 6.87 | % | | $ | 19,426 | |
Y Class (1,4,9) | | | ACMYX | | | | 2.29 | % | | | 5.01 | % | | | 12.90 | % | | | 6.82 | % | | $ | 19,345 | |
Investor Class (1,2,9) | | | AMPAX | | | | 2.12 | % | | | 4.81 | % | | | 12.70 | % | | | 6.66 | % | | $ | 19,061 | |
Advisor Class (1,5,9) | | | AMCSX | | | | 1.82 | % | | | 4.49 | % | | | 12.37 | % | | | 6.40 | % | | $ | 18,589 | |
A without Sales Charge (1,6,9) | | | ABMAX | | | | 2.05 | % | | | 4.64 | % | | | 12.48 | % | | | 6.44 | % | | $ | 18,660 | |
A with Sales Charge (1,6,9) | | | ABMAX | | | | -3.81 | % | | | 2.59 | % | | | 11.15 | % | | | 5.81 | % | | $ | 17,585 | |
C without Sales Charge (1,7,9) | | | AMCCX | | | | 1.26 | % | | | 3.85 | % | | | 11.64 | % | | | 5.95 | % | | $ | 17,824 | |
C with Sales Charge (1,7,9) | | | AMCCX | | | | 0.26 | % | | | 3.85 | % | | | 11.64 | % | | | 5.95 | % | | $ | 17,824 | |
Russell Midcap Value Index (8) | | | | | | | 7.84 | % | | | 7.97 | % | | | 14.07 | % | | | 7.19 | % | | $ | 20,033 | |
| 1. | Performance shown is historical and is not indicative of future returns. Investment returns and principal value will vary, and shares may be worth more or less at redemption than at original purchase. Performance shown is calculated based on the published end of day net asset values as of date indicated, and current performance may be lower or higher than the performance data quoted. To obtain performance as of the most recent month end, please visit www.americanbeaconfunds.com or call 1-800-967-9009. Fund performance in the table above does not reflect the deduction of taxes a shareholder would pay on distributions or the redemption of shares. |
| 2. | A portion of the fees charged to the Investor Class of the Fund was waived from 2006 through 2013 and recovered in 2014. Performance prior to waiving fees was lower than actual returns shown from 2006 through 2013. |
| 3. | A portion of the fees charged to the Institutional Class of the Fund was waived from 2007 through 2013 and recovered in 2014. Performance prior to waiving fees was lower than actual returns shown from 2007 through 2013. |
7
American Beacon Mid-Cap Value FundSM
Performance Overview
October 31, 2016 (Unaudited)
| 4. | Fund performance for the ten-year period represents the total returns achieved by the Institutional Class from 10/31/06 up to 3/1/10, the inception date of the Y Class and the returns of the Y Class since its inception. Expenses of the Institutional Class are lower than those of the Y Class. As a result, total returns shown may be higher than they would have been had the Y Class been in existence since 10/31/06. A portion of the fees charged to the Y Class of the Fund was waived from 2010 through 2013. Performance prior to waiving fees was lower than the actual returns shown from 2010 through 2013. |
| 5. | Fund performance for the ten-year period represents the total returns achieved by the Investor Class from 10/31/06 to 6/29/07, the inception date of the Advisor Class, and the returns of the Advisor Class since its inception. Expenses of the Investor Class are lower than those of the Advisor Class. As a result, total returns shown may be higher than they would have been had the Advisor Class been in existence since 10/31/06. A portion of the fees charged to the Advisor Class of the Fund was waived from 2007 through 2013 and recovered in 2014. Performance prior to waiving fees was lower than the actual returns shown from 2007 through 2013. |
| 6. | Fund performance for the ten-year period represents the total returns achieved by the Investor Class from 10/31/06 to 5/17/10, the inception date of the A Class, and the returns of the A Class since its inception. Expenses of the Investor Class are lower than those of the A Class. As a result, total returns shown may be higher than they would have been had the A Class been in existence since 10/31/06. A portion of the fees charged to the A Class of the Fund was waived from 2010 through 2012 and recovered in 2013 and 2014. Performance prior to waiving fees was lower than the actual returns shown from 2010 through 2012. A Class shares have a maximum sales charge of 5.75%. |
| 7. | Fund performance for the ten-year period represents the total returns achieved by the Investor Class from 10/31/06 to 9/1/10, the inception date of the C Class, and the returns of the C Class since its inception. Expenses of the Investor Class are lower than those of the C Class. As a result, total returns shown may be higher than they would have been had the C Class been in existence since 10/31/06. A portion of the fees charged to the C Class of the Fund was waived from 2010 through 2013 and recovered in 2014. Performance prior to waiving fees was lower than the actual returns shown from 2010 through 2013. The maximum contingent deferred sales charge for C Class is 1.00% for shares redeemed within one year of the date of purchase. |
| 8. | The Russell Midcap Value Index is an unmanaged index of those stocks in the Russell Midcap Index with lower price-to-book ratios and lower forecasted growth values. The Russell Midcap Index measures the performance of the 800 smallest companies in the Russell 1000 Index. Russell Midcap Value Index, Russell Midcap Index and Russell 1000 Index are registered trademarks of Frank Russell Company. One cannot directly invest in an index. |
| 9. | The total annual Fund operating expense ratio set forth in the most recent Fund prospectus for the Institutional, Y, Investor, Advisor, A, and C Class shares was 0.86%, 0.95%, 1.10%, 1.38%, 1.26%, and 2.02%, respectively. The expense ratios above may vary from the expense ratios presented in other sections of this report that are based on expenses incurred during the period covered by this report. |
The Fund underperformed the Index due to poor stock selection. Sector allocation added value relative to the Index.
A significant portion of the Fund’s poor performance was attributed to holdings in the Consumer Discretionary and Financials sectors. In the Consumer Discretionary sector, Norwegian Cruise Line (down 38.4%), Royal Caribbean Cruises (down 19.8%) and HanesBrands (down 18.5%) were the largest detractors from performance. Legg Mason (down 41.9%), Franklin Resources (down 16.3%) and Ameriprise Financial (down 21.1%) detracted most from the Fund’s returns in the Financials sector. The Fund’s Industrials and Energy companies also detracted value relative to the Index. KBR (down 14.2%) was the largest detractor in the Industrials sector. The Fund’s allocation in PBF Energy (down 30.5%) and Weatherford International (down 50.6%) hurt performance in the Energy sector.
The Fund’s underweight position in Energy, one of the poorer performing sectors, added value relative to the Index through sector allocation. An overweighting in Information Technology, the best performing sector, also contributed to the Fund’s return.
The sub-advisors’ philosophy of investing in undervalued companies that exhibit improving profitability and earnings growth potential should allow the Fund to benefit longer term.
8
American Beacon Mid-Cap Value FundSM
Performance Overview
October 31, 2016 (Unaudited)
| | | | | | | | |
Top Ten Holdings (% Net Assets) | | | | | | | | |
Allstate Corp. | | | | | | | 1.9 | |
Royal Caribbean Cruises Ltd. | | | | | | | 1.8 | |
Lamar Advertising Co. | | | | | | | 1.8 | |
Pinnacle West Capital Corp. | | | | | | | 1.7 | |
Dover Corp. | | | | | | | 1.7 | |
Willis Towers Watson PLC | | | | | | | 1.7 | |
Voya Financial, Inc. | | | | | | | 1.6 | |
Murphy Oil Corp. | | | | | | | 1.5 | |
Dana, Inc. | | | | | | | 1.5 | |
FNF Group | | | | | | | 1.5 | |
Total Fund Holdings | | | 118 | | | | | |
| | |
Sector Allocation (% Equities) | | | | | | | | |
Financials | | | | | | | 26.0 | |
Consumer Discretionary | | | | | | | 17.2 | |
Industrials | | | | | | | 13.9 | |
Information Technology | | | | | | | 10.6 | |
Energy | | | | | | | 8.2 | |
Materials | | | | | | | 6.2 | |
Utilities | | | | | | | 5.7 | |
Real Estate | | | | | | | 5.5 | |
Health Care | | | | | | | 5.1 | |
Consumer Staples | | | | | | | 1.6 | |
9
American Beacon FundsSM
Expense Examples
October 31, 2016 (Unaudited)
Fund Expense Example
As a shareholder of a Fund, you incur two types of costs: (1) transaction costs, including sales charges (loads) on purchase payments and redemption fees if applicable, and (2) ongoing costs, including management fees, administrative service fees, distribution (12b-1) fees, and other Fund expenses. The Examples are intended to help you understand the ongoing cost (in dollars) of investing in the Funds and to compare these costs with the ongoing costs of investing in other mutual funds. The Examples are based on an investment of $1,000 invested at the beginning of the period in each Class and held for the entire period from May 1, 2016 through October 31, 2016.
Actual Expenses
The “Actual” lines on the tables provide information about actual account values and actual expenses. You may use the information on this page, together with the amount you invested, to estimate the expenses that you paid over the period. Simply divide your account value by $1,000 (for example, an $8,600 account value divided by $1,000 = $8.60), then multiply the result by the “Expenses Paid During Period” for the applicable Fund to estimate the expenses you paid on your account during this period. Shareholders of the Investor and Institutional Classes that invest in the Fund through an IRA or Roth IRA may be subject to a custodial IRA fee of $15 that is typically deducted each December. If your account was subject to a custodial IRA fee during the period, your costs would have been $15 higher.
Hypothetical Example for Comparison Purposes
The “Hypothetical” line of the tables provide information about hypothetical account values and hypothetical expenses based on the Fund’s actual expense ratio and an assumed 5% per year rate of return before expenses (not the Fund’s actual return). You may compare the ongoing costs of investing in the Funds with other funds by contrasting this 5% hypothetical example and the 5% hypothetical examples that appear in the shareholder reports of the other funds. The hypothetical account values and expenses may not be used to estimate the actual ending account balance or expenses you paid for the period. Shareholders of the Investor and Institutional Classes that invest in the Funds through an IRA or Roth IRA may be subject to a custodial IRA fee of $15 that is typically deducted each December. If your account was subject to a custodial IRA fee during the period, your costs would have been $15 higher.
You should also be aware that the expenses shown in the table highlight only your ongoing costs and do not reflect any transaction costs charged by the Funds, such as sales charges (loads) or redemption fees, as applicable. Similarly, the expense examples for other funds do not reflect any transaction costs charged by those funds, such as sales charges (loads), redemption fees or exchange fees. Therefore, the “Hypothetical” lines of the tables are useful in comparing ongoing costs only and will not help you determine the relative total costs of owning different funds. If you were subject to any transaction costs during the period, your costs would have been higher.
10
American Beacon FundsSM
Expense Examples
October 31, 2016 (Unaudited)
Balanced Fund
| | | | | | | | | | | | |
| | | Beginning Account Value
5/1/2016 | | | Ending Account Value
10/31/2016 | | | Expenses Paid During
Period
5/1/2016-10/31/2016* | |
Institutional Class | | | | | | | | | | | | |
Actual | | $ | 1,000.00 | | | $ | 1,029.35 | | | $ | 2.55 | |
Hypothetical** | | $ | 1,000.00 | | | $ | 1,022.60 | | | $ | 2.54 | |
Y Class | | | | | | | | | | | | |
Actual | | $ | 1,000.00 | | | $ | 1,027.72 | | | $ | 3.67 | |
Hypothetical** | | $ | 1,000.00 | | | $ | 1,021.53 | | | $ | 3.66 | |
Investor Class | | | | | | | | | | | | |
Actual | | $ | 1,000.00 | | | $ | 1,026.85 | | | $ | 4.84 | |
Hypothetical** | | $ | 1,000.00 | | | $ | 1,020.35 | | | $ | 4.82 | |
Advisor Class | | | | | | | | | | | | |
Actual | | $ | 1,000.00 | | | $ | 1,025.86 | | | $ | 5.70 | |
Hypothetical** | | $ | 1,000.00 | | | $ | 1,019.50 | | | $ | 5.69 | |
A Class | | | | | | | | | | | | |
Actual | | $ | 1,000.00 | | | $ | 1,026.49 | | | $ | 5.20 | |
Hypothetical** | | $ | 1,000.00 | | | $ | 1,019.99 | | | $ | 5.18 | |
C Class | | | | | | | | | | | | |
Actual | | $ | 1,000.00 | | | $ | 1,022.37 | | | $ | 9.00 | |
Hypothetical** | | $ | 1,000.00 | | | $ | 1,016.23 | | | $ | 8.97 | |
| * | Expenses are equal to the Fund’s annualized expense ratios for the six-month period of 0.50%, 0.72%, 0.95%, 1.12%, 1.02%, and 1.77% for the Institutional, Y, Investor, Advisor, A, and C Classes, respectively, multiplied by the average account value over the period, multiplied by the number derived by dividing the number of days in the most recent fiscal half-year (184) by days in the year (366) to reflect the half-year period. |
| ** | 5% return before expenses. |
Mid-Cap Value Fund
| | | | | | | | | | | | |
| | | Beginning Account Value
5/1/2016 | | | Ending Account Value
10/31/2016 | | | Expenses Paid During
Period
5/1/2016-10/31/2016* | |
Institutional Class | | | | | | | | | | | | |
Actual | | $ | 1,000.00 | | | $ | 1,030.86 | | | $ | 4.54 | |
Hypothetical** | | $ | 1,000.00 | | | $ | 1,020.66 | | | $ | 4.52 | |
Y Class | | | | | | | | | | | | |
Actual | | $ | 1,000.00 | | | $ | 1,030.35 | | | $ | 4.90 | |
Hypothetical** | | $ | 1,000.00 | | | $ | 1,020.29 | | | $ | 4.88 | |
Investor Class | | | | | | | | | | | | |
Actual | | $ | 1,000.00 | | | $ | 1,029.11 | | | $ | 5.71 | |
Hypothetical** | | $ | 1,000.00 | | | $ | 1,019.48 | | | $ | 5.69 | |
Advisor Class | | | | | | | | | | | | |
Actual | | $ | 1,000.00 | | | $ | 1,027.78 | | | $ | 7.14 | |
Hypothetical** | | $ | 1,000.00 | | | $ | 1,018.11 | | | $ | 7.10 | |
A Class | | | | | | | | | | | | |
Actual | | $ | 1,000.00 | | | $ | 1,028.53 | | | $ | 6.42 | |
Hypothetical** | | $ | 1,000.00 | | | $ | 1,018.79 | | | $ | 6.39 | |
C Class | | | | | | | | | | | | |
Actual | | $ | 1,000.00 | | | $ | 1,024.73 | | | $ | 10.38 | |
Hypothetical** | | $ | 1,000.00 | | | $ | 1,014.90 | | | $ | 10.33 | |
| * | Expenses are equal to the Fund’s annualized expense ratios for the six-month period of 0.89%, 0.96%, 1.12%, 1.40%, 1.26%, and 2.04% for the Institutional, Y, Investor, Advisor, A, and C Classes, respectively, multiplied by the average account value over the period, multiplied by the number derived by dividing the number of days in the most recent fiscal half-year (184) by days in the year (366) to reflect the half-year period. |
| ** | 5% return before expenses. |
11
American Beacon FundsSM
Report of Independent Registered Public Accounting Firm
To the Shareholders and the Board of Trustees of
American Beacon Balanced Fund and American Beacon Mid-Cap Value Fund:
We have audited the accompanying statements of assets and liabilities, including the schedules of investments, of American Beacon Balanced Fund and American Beacon Mid-Cap Value Fund (two of the funds constituting the American Beacon Funds) (collectively, the Funds), as of October 31, 2016, and the related statements of operations for the year then ended, the statements of changes in net assets for each of the two years in the period then ended and the financial highlights for each of the five years in the period then ended. These financial statements and financial highlights are the responsibility of the Funds’ management. Our responsibility is to express an opinion on these financial statements and financial highlights based on our audits.
We conducted our audits in accordance with the standards of the Public Company Accounting Oversight Board (United States). Those standards require that we plan and perform the audit to obtain reasonable assurance about whether the financial statements and financial highlights are free of material misstatement. We were not engaged to perform an audit of the Funds’ internal control over financial reporting. Our audits included consideration of internal control over financial reporting as a basis for designing audit procedures that are appropriate in the circumstances, but not for the purpose of expressing an opinion on the effectiveness of the Funds’ internal control over financial reporting. Accordingly, we express no such opinion. An audit also includes examining, on a test basis, evidence supporting the amounts and disclosures in the financial statements and financial highlights, assessing the accounting principles used and significant estimates made by management, and evaluating the overall financial statement presentation. Our procedures included confirmation of securities owned as of October 31, 2016, by correspondence with the custodian and brokers or by other appropriate auditing procedures where replies from brokers were not received. We believe that our audits provide a reasonable basis for our opinion.
In our opinion, the financial statements and financial highlights referred to above present fairly, in all material respects, the financial position of American Beacon Balanced Fund and American Beacon Mid-Cap Value Fund at October 31, 2016, the results of their operations for the year then ended, the changes in their net assets for each of the two years in the period then ended and the financial highlights for each of the five years in the period then ended in conformity with U.S. generally accepted accounting principles.

Dallas, Texas
December 29, 2016
12
American Beacon Balanced FundSM
Schedule of Investments
October 31, 2016
| | | | | | | | |
| | | Shares | | | Fair Value | |
COMMON STOCK - 59.91% | | | | | | | | |
CONSUMER DISCRETIONARY - 8.67% | | | | | | | | |
Auto Components - 1.67% | | | | | | | | |
Adient PLCA B | | | 23,015 | | | $ | 1,047,413 | |
Goodyear Tire & Rubber Co. | | | 67,962 | | | | 1,972,937 | |
Johnson Controls International PLCA | | | 145,159 | | | | 5,852,811 | |
Magna International, Inc., Class A | | | 75,074 | | | | 3,081,788 | |
| | | | | | | | |
| | | | | | | 11,954,949 | |
| | | | | | | | |
Automobiles - 2.12% | | | | | | | | |
Ford Motor Co. | | | 105,871 | | | | 1,242,926 | |
General Motors Co. | | | 263,826 | | | | 8,336,902 | |
Harley-Davidson, Inc. | | | 22,067 | | | | 1,258,260 | |
Honda Motor Co., Ltd., ADRC | | | 38,802 | | | | 1,157,464 | |
Toyota Motor Corp., ADRC | | | 28,100 | | | | 3,250,046 | |
| | | | | | | | |
| | | | | | | 15,245,598 | |
| | | | | | | | |
Hotels, Restaurants & Leisure - 0.33% | | | | | | | | |
Carnival Corp | | | 22,500 | | | | 1,104,750 | |
Norwegian Cruise Line Holdings Ltd.B | | | 32,300 | | | | 1,255,501 | |
| | | | | | | | |
| | | | | | | 2,360,251 | |
| | | | | | | | |
Household Durables - 0.51% | | | | | | | | |
Koninklijke Philips Electronics N.V. | | | 73,041 | | | | 2,193,421 | |
Tupperware Brands Corp. | | | 24,364 | | | | 1,450,145 | |
| | | | | | | | |
| | | | | | | 3,643,566 | |
| | | | | | | | |
Media - 1.64% | | | | | | | | |
CBS Corp., Class BD | | | 48,196 | | | | 2,728,858 | |
Comcast Corp., Class A | | | 30,419 | | | | 1,880,503 | |
Discovery Communications, Inc., Class AB | | | 139,084 | | | | 3,595,583 | |
Omnicom Group, Inc. | | | 8,687 | | | | 693,396 | |
Scripps Networks Interactive, Inc., Class A | | | 31,800 | | | | 2,046,648 | |
Viacom, Inc., Class B | | | 22,600 | | | | 848,856 | |
| | | | | | | | |
| | | | | | | 11,793,844 | |
| | | | | | | | |
Multiline Retail - 1.73% | | | | | | | | |
Dillard’s, Inc., Class A | | | 20,030 | | | | 1,227,839 | |
Kohl’s Corp. | | | 38,726 | | | | 1,694,263 | |
Macy’s, Inc. | | | 76,400 | | | | 2,787,836 | |
Michael Kors Holdings Ltd.B | | | 65,328 | | | | 3,317,356 | |
Target Corp. | | | 49,782 | | | | 3,421,517 | |
| | | | | | | | |
| | | | | | | 12,448,811 | |
| | | | | | | | |
Specialty Retail - 0.67% | | | | | | | | |
Bed Bath & Beyond, Inc. | | | 40,310 | | | | 1,629,330 | |
Signet Jewelers Ltd. | | | 28,400 | | | | 2,307,784 | |
Staples, Inc. | | | 120,200 | | | | 889,480 | |
| | | | | | | | |
| | | | | | | 4,826,594 | |
| | | | | | | | |
Total Consumer Discretionary | | | | | | | 62,273,613 | |
| | | | | | | | |
CONSUMER STAPLES - 2.02% | | | | | | | | |
Food & Drug Retailing - 0.45% | | | | | | | | |
CVS Caremark Corp. | | | 21,800 | | | | 1,833,380 | |
Wal-Mart Stores, Inc. | | | 20,006 | | | | 1,400,820 | |
| | | | | | | | |
| | | | | | | 3,234,200 | |
| | | | | | | | |
Food Products - 0.24% | | | | | | | | |
Bunge Ltd. | | | 11,975 | | | | 742,570 | |
Kellogg Co. | | | 13,058 | | | | 981,047 | |
| | | | | | | | |
| | | | | | | 1,723,617 | |
| | | | | | | | |
Tobacco - 1.33% | | | | | | | | |
Altria Group, Inc. | | | 45,281 | | | | 2,993,980 | |
See accompanying notes
13
American Beacon Balanced FundSM
Schedule of Investments
October 31, 2016
| | | | | | | | |
| | | Shares | | | Fair Value | |
CONSUMER STAPLES - 2.02% (continued) | | | | | | | | |
Tobacco - 1.33% (continued) | | | | | | | | |
Imperial Brands PLC, ADRA C | | | 64,554 | | | $ | 3,121,186 | |
Philip Morris International, Inc. | | | 35,348 | | | | 3,408,961 | |
| | | | | | | | |
| | | | | | | 9,524,127 | |
| | | | | | | | |
Total Consumer Staples | | | | | | | 14,481,944 | |
| | | | | | | | |
ENERGY - 7.37% | | | | | | | | |
Energy Equipment & Services - 0.32% | | | | | | | | |
Cobalt International Energy, Inc.B | | | 369,480 | | | | 348,826 | |
Helmerich & Payne, Inc. | | | 20,200 | | | | 1,274,822 | |
Oceaneering International, Inc. | | | 29,300 | | | | 697,340 | |
| | | | | | | | |
| | | | | | | 2,320,988 | |
| | | | | | | | |
Oil & Gas - 7.05% | | | | | | | | |
Anadarko Petroleum Corp. | | | 58,100 | | | | 3,453,464 | |
Apache Corp. | | | 42,652 | | | | 2,536,941 | |
BP PLC, Sponsored ADRA C | | | 332,471 | | | | 11,819,344 | |
Canadian Natural Resources Ltd. | | | 134,039 | | | | 4,250,377 | |
ConocoPhillips | | | 84,534 | | | | 3,673,002 | |
Devon Energy Corp. | | | 76,382 | | | | 2,894,114 | |
Hess Corp. | | | 78,998 | | | | 3,789,534 | |
Kosmos Energy Ltd.B | | | 139,184 | | | | 725,149 | |
Marathon Oil Corp. | | | 374,020 | | | | 4,929,584 | |
Marathon Petroleum Corp. | | | 42,016 | | | | 1,831,477 | |
Murphy Oil Corp. | | | 66,757 | | | | 1,727,003 | |
Occidental Petroleum Corp. | | | 43,815 | | | | 3,194,552 | |
Phillips 66 | | | 42,842 | | | | 3,476,628 | |
Royal Dutch Shell PLC, Class A, ADRA C | | | 46,143 | | | | 2,298,383 | |
| | | | | | | | |
| | | | | | | 50,599,552 | |
| | | | | | | | |
Total Energy | | | | | | | 52,920,540 | |
| | | | | | | | |
FINANCIALS - 16.19% | | | | | | | | |
Banks - 1.70% | | | | | | | | |
Citizens Financial Group | | | 123,092 | | | | 3,242,243 | |
PNC Financial Services Group, Inc. | | | 57,961 | | | | 5,541,072 | |
Popular, Inc. | | | 52,500 | | | | 1,905,750 | |
Regions Financial Corp. | | | 138,900 | | | | 1,487,619 | |
| | | | | | | | |
| | | | | | | 12,176,684 | |
| | | | | | | | |
Diversified Financials - 11.16% | | | | | | | | |
Bank of America Corp. | | | 1,160,669 | | | | 19,151,039 | |
Blackstone Group, LPE | | | 157,157 | | | | 3,933,640 | |
Capital One Financial Corp. | | | 67,239 | | | | 4,978,376 | |
Citigroup, Inc. | | | 357,165 | | | | 17,554,660 | |
Goldman Sachs Group, Inc. | | | 9,550 | | | | 1,702,192 | |
JPMorgan Chase & Co. | | | 169,372 | | | | 11,730,705 | |
KKR & Co., LPE | | | 360,881 | | | | 5,120,901 | |
Morgan Stanley | | | 90,139 | | | | 3,025,965 | |
Santander Consumer USA Holdings, Inc. | | | 156,843 | | | | 1,913,485 | |
SLM Corp.B | | | 134,591 | | | | 948,867 | |
State Street Corp. | | | 32,014 | | | | 2,247,703 | |
Synchrony Financial | | | 61,232 | | | | 1,750,623 | |
Wells Fargo & Co. | | | 131,705 | | | | 6,059,747 | |
| | | | | | | | |
| | | | | | | 80,117,903 | |
| | | | | | | | |
Insurance - 3.33% | | | | | | | | |
Allstate Corp. | | | 20,620 | | | | 1,400,098 | |
American International Group, Inc. | | | 190,312 | | | | 11,742,250 | |
Berkshire Hathaway, Inc., Class BB | | | 25,613 | | | | 3,695,956 | |
MetLife, Inc. | | | 62,338 | | | | 2,927,392 | |
Unum Group | | | 50,536 | | | | 1,788,974 | |
See accompanying notes
14
American Beacon Balanced FundSM
Schedule of Investments
October 31, 2016
| | | | | | | | |
| | | Shares | | | Fair Value | |
FINANCIALS - 16.19% (continued) | | | | | | | | |
Insurance - 3.33% (continued) | | | | | | | | |
XL Group Ltd. | | | 68,500 | | | $ | 2,376,950 | |
| | | | | | | | |
| | | | | | | 23,931,620 | |
| | | | | | | | |
Total Financials | | | | | | | 116,226,207 | |
| | | | | | | | |
HEALTH CARE - 6.46% | | | | | | | | |
Biotechnology - 0.41% | | | | | | | | |
Biogen Idec, Inc.B | | | 4,300 | | | | 1,204,774 | |
Gilead Sciences, Inc. | | | 23,700 | | | | 1,745,031 | |
| | | | | | | | |
| | | | | | | 2,949,805 | |
| | | | | | | | |
Health Care Equipment & Supplies - 0.84% | | | | | | | | |
Medtronic PLCA | | | 62,516 | | | | 5,127,562 | |
Zimmer Biomet Holdings, Inc. | | | 8,574 | | | | 903,700 | |
| | | | | | | | |
| | | | | | | 6,031,262 | |
| | | | | | | | |
Health Care Providers & Services - 1.05% | | | | | | | | |
Anthem, Inc. | | | 56,047 | | | | 6,829,887 | |
Humana, Inc. | | | 4,308 | | | | 738,951 | |
| | | | | | | | |
| | | | | | | 7,568,838 | |
| | | | | | | | |
Pharmaceuticals - 4.16% | | | | | | | | |
AbbVie, Inc. | | | 42,304 | | | | 2,359,717 | |
Akorn, Inc.B | | | 36,500 | | | | 874,175 | |
GlaxoSmithKline PLC, ADRA C | | | 64,421 | | | | 2,577,484 | |
Horizon Pharma PLCA B | | | 79,713 | | | | 1,332,801 | |
Jazz Pharmaceuticals PLCA B | | | 7,042 | | | | 770,888 | |
Johnson & Johnson | | | 33,174 | | | | 3,847,852 | |
Mallinckrodt PLCA B | | | 23,256 | | | | 1,378,151 | |
Merck & Co., Inc. | | | 69,169 | | | | 4,061,604 | |
Mylan N.V.B | | | 38,898 | | | | 1,419,777 | |
Pfizer, Inc. | | | 168,587 | | | | 5,345,894 | |
Sanofi, ADRC | | | 149,308 | | | | 5,806,588 | |
| | | | | | | | |
| | | | | | | 29,774,931 | |
| | | | | | | | |
Total Health Care | | | | | | | 46,324,836 | |
| | | | | | | | |
INDUSTRIALS - 7.62% | | | | | | | | |
Aerospace & Defense - 2.53% | | | | | | | | |
AerCap Holdings N.V.B | | | 99,800 | | | | 4,102,778 | |
B/E Aerospace, Inc. | | | 33,000 | | | | 1,964,160 | |
Boeing Co. | | | 16,353 | | | | 2,329,158 | |
Embraer S.A., ADRB C | | | 31,800 | | | | 680,202 | |
General Dynamics Corp. | | | 12,694 | | | | 1,913,494 | |
Raytheon Co. | | | 25,939 | | | | 3,543,527 | |
Rockwell Collins, Inc. | | | 27,111 | | | | 2,286,000 | |
United Technologies Corp. | | | 12,756 | | | | 1,303,663 | |
| | | | | | | | |
| | | | | | | 18,122,982 | |
| | | | | | | | |
Airlines - 1.24% | | | | | | | | |
American Airlines Group, Inc. | | | 102,400 | | | | 4,157,440 | |
Delta Air Lines, Inc. | | | 113,400 | | | | 4,736,718 | |
| | | | | | | | |
| | | | | | | 8,894,158 | |
| | | | | | | | |
Construction & Engineering - 0.51% | | | | | | | | |
AECOM Technology Corp.B | | | 37,938 | | | | 1,056,573 | |
Chicago Bridge & Iron Co., N.V. | | | 44,569 | | | | 1,427,099 | |
Fluor Corp. | | | 22,300 | | | | 1,159,377 | |
| | | | | | | | |
| | | | | | | 3,643,049 | |
| | | | | | | | |
Diversified Manufacturing - 0.37% | | | | | | | | |
Eaton Corp., PLCA | | | 41,932 | | | | 2,674,004 | |
| | | | | | | | |
See accompanying notes
15
American Beacon Balanced FundSM
Schedule of Investments
October 31, 2016
| | | | | | | | |
| | | Shares | | | Fair Value | |
INDUSTRIALS - 7.62% (continued) | | | | | | | | |
Electrical Equipment - 0.27% | | | | | | | | |
IPG Photonics Corp. | | | 20,200 | | | $ | 1,959,602 | |
| | | | | | | | |
Industrial Conglomerates - 0.42% | | | | | | | | |
Honeywell International, Inc. | | | 27,533 | | | | 3,019,819 | |
| | | | | | | | |
Machinery - 2.28% | | | | | | | | |
Caterpillar, Inc. | | | 20,164 | | | | 1,682,887 | |
CNH Industrial N.V. | | | 305,640 | | | | 2,377,879 | |
Cummins, Inc. | | | 30,197 | | | | 3,859,781 | |
PACCAR, Inc. | | | 12,739 | | | | 699,626 | |
Parker Hannifin Corp. | | | 16,107 | | | | 1,977,134 | |
Reliance Steel & Aluminum Co. | | | 33,177 | | | | 2,281,914 | |
Terex Corp. | | | 70,870 | | | | 1,692,376 | |
Xylem, Inc. | | | 36,849 | | | | 1,780,912 | |
| | | | | | | | |
| | | | | | | 16,352,509 | |
| | | | | | �� | | |
Total Industrials | | | | | | | 54,666,123 | |
| | | | | | | | |
INFORMATION TECHNOLOGY - 6.14% | | | | | | | | |
Communications Equipment - 1.08% | | | | | | | | |
Cisco Systems, Inc. | | | 108,522 | | | | 3,329,455 | |
Corning, Inc. | | | 193,772 | | | | 4,400,562 | |
| | | | | | | | |
| | | | | | | 7,730,017 | |
| | | | | | | | |
Computers & Peripherals - 0.60% | | | | | | | | |
Hewlett Packard Enterprise Co. | | | 158,593 | | | | 3,563,585 | |
Teradata Corp.B | | | 27,846 | | | | 750,728 | |
| | | | | | | | |
| | | | | | | 4,314,313 | |
| | | | | | | | |
Electronic Equipment & Instruments - 0.21% | | | | | | | | |
TE Connectivity Ltd. | | | 24,400 | | | | 1,534,028 | |
| | | | | | | | |
Semiconductor Equipment & Products - 1.58% | | | | | | | | |
Applied Materials, Inc. | | | 41,551 | | | | 1,208,303 | |
Intel Corp. | | | 43,743 | | | | 1,525,318 | |
Micron Technology, Inc.B | | | 261,814 | | | | 4,492,728 | |
Qualcomm, Inc. | | | 59,525 | | | | 4,090,558 | |
| | | | | | | | |
| | | | | | | 11,316,907 | |
| | | | | | | | |
Semiconductors & Semiconductor Equipment - 0.04% | | | | | | | | |
Versum Materials, Inc.B | | | 12,336 | | | | 280,027 | |
| | | | | | | | |
Software - 2.63% | | | | | | | | |
Microsoft Corp. | | | 156,626 | | | | 9,385,030 | |
Navient Corp. | | | 93,863 | | | | 1,199,569 | |
Oracle Corp. | | | 216,565 | | | | 8,320,427 | |
| | | | | | | | |
| | | | | | | 18,905,026 | |
| | | | | | | | |
Total Information Technology | | | | | | | 44,080,318 | |
| | | | | | | | |
MATERIALS - 1.49% | | | | | | | | |
Chemicals - 0.99% | | | | | | | | |
AdvanSix, Inc.B | | | 1,101 | | | | 17,572 | |
Air Products & Chemicals, Inc. | | | 24,672 | | | | 3,291,738 | |
Dow Chemical Co. | | | 22,918 | | | | 1,233,218 | |
Eastman Chemical Co. | | | 18,111 | | | | 1,302,362 | |
LyondellBasell Industries N.V., Class A | | | 15,600 | | | | 1,240,980 | |
| | | | | | | | |
| | | | | | | 7,085,870 | |
| | | | | | | | |
Containers & Packaging - 0.11% | | | | | | | | |
Packaging Corp. of America | | | 9,986 | | | | 823,845 | |
| | | | | | | | |
Paper & Forest Products - 0.39% | | | | | | | | |
International Paper Co. | | | 28,469 | | | | 1,281,959 | |
See accompanying notes
16
American Beacon Balanced FundSM
Schedule of Investments
October 31, 2016
| | | | | | | | |
| | | Shares | | | Fair Value | |
MATERIALS - 1.49% (continued) | | | | | | | | |
Paper & Forest Products - 0.39% (continued) | | | | | | | | |
Louisiana-Pacific Corp.B | | | 82,820 | | | $ | 1,519,747 | |
| | | | | | | | |
| | | | | | | 2,801,706 | |
| | | | | | | | |
Total Materials | | | | | | | 10,711,421 | |
| | | | | | | | |
REAL ESTATE - 0.11% | | | | | | | | |
Equity Real Estate Investment Trusts - 0.11% | | | | | | | | |
Two Harbors Investment Corp. F | | | 92,882 | | | | 773,707 | |
| | | | | | | | |
TELECOMMUNICATION SERVICES - 2.23% | | | | | | | | |
Diversified Telecommunication Services - 1.28% | | | | | | | | |
AT&T, Inc. | | | 63,018 | | | | 2,318,432 | |
Telefonaktiebolaget LM Ericsson, ADRC | | | 618,857 | | | | 3,013,834 | |
Verizon Communications, Inc. | | | 80,598 | | | | 3,876,764 | |
| | | | | | | | |
| | | | | | | 9,209,030 | |
| | | | | | | | |
Wireless Telecommunication Services - 0.95% | | | | | | | | |
China Mobile Ltd., Sponsored ADRC | | | 68,497 | | | | 3,933,783 | |
Vodafone Group PLC, ADRA C | | | 102,581 | | | | 2,855,855 | |
| | | | | | | | |
| | | | | | | 6,789,638 | |
| | | | | | | | |
Total Telecommunication Services | | | | | | | 15,998,668 | |
| | | | | | | | |
UTILITIES - 1.61% | | | | | | | | |
Electric - 1.61% | | | | | | | | |
Calpine Corp.B | | | 371,996 | | | | 4,426,752 | |
CenterPoint Energy, Inc. | | | 101,702 | | | | 2,318,806 | |
Entergy Corp. | | | 31,986 | | | | 2,356,728 | |
NRG Energy, Inc. | | | 110,366 | | | | 1,173,191 | |
PPL Corp. | | | 17,322 | | | | 594,837 | |
Southern Co. | | | 12,748 | | | | 657,414 | |
| | | | | | | | |
Total Utilities | | | | | | | 11,527,728 | |
| | | | | | | | |
Total Common Stock (Cost $392,914,667) | | | | | | | 429,985,105 | |
| | | | | | | | |
| | |
| | | Principal Amount | | | | |
CORPORATE OBLIGATIONS 12.37% | | | | | | | | |
MANUFACTURING - 3.20% | | | | | | | | |
American Honda Finance Corp., | | | | | | | | |
1.70%, Due 2/22/2019 | | $ | 290,000 | | | | 291,910 | |
3.875%, Due 9/21/2020G | | | 250,000 | | | | 269,293 | |
Analog Devices, Inc., | | | | | | | | |
3.90%, Due 12/15/2025 | | | 190,000 | | | | 203,598 | |
Apple, Inc., | | | | | | | | |
2.40%, Due 5/3/2023 | | | 445,000 | | | | 447,078 | |
4.50%, Due 2/23/2036 | | | 510,000 | | | | 568,481 | |
4.65%, Due 2/23/2046 | | | 1,315,000 | | | | 1,449,319 | |
BAE Systems Holdings, Inc., | | | | | | | | |
3.80%, Due 10/7/2024G | | | 650,000 | | | | 681,548 | |
Broadridge Financial Solutions, Inc., | | | | | | | | |
3.40%, Due 6/27/2026 | | | 175,000 | | | | 177,607 | |
Daimler Finance North America LLC, | | | | | | | | |
2.25%, Due 9/3/2019G H | | | 350,000 | | | | 354,549 | |
2.45%, Due 5/18/2020G H | | | 650,000 | | | | 660,565 | |
Delphi Corp., | | | | | | | | |
4.15%, Due 3/15/2024 | | | 315,000 | | | | 337,300 | |
Diamond 1 Finance Corp / Diamond 2 Finance Corp., | | | | | | | | |
3.48%, Due 6/1/2019G | | | 415,000 | | | | 425,790 | |
8.35%, Due 7/15/2046G | | | 1,360,000 | | | | 1,647,900 | |
Dow Chemical Co., | | | | | | | | |
4.125%, Due 11/15/2021 | | | 300,000 | | | | 325,567 | |
3.50%, Due 10/1/2024 | | | 620,000 | | | | 648,757 | |
See accompanying notes
17
American Beacon Balanced FundSM
Schedule of Investments
October 31, 2016
| | | | | | | | |
| | | Principal Amount | | | Fair Value | |
MANUFACTURING - 3.20% (continued) | | | | | | | | |
Eaton Corp., PLC, | | | | | | | | |
5.60%, Due 5/15/2018A | | $ | 160,000 | | | $ | 169,899 | |
2.75%, Due 11/2/2022A | | | 155,000 | | | | 157,949 | |
Eaton Electric Holdings LLC, | | | | | | | | |
3.875%, Due 12/15/2020H | | | 235,000 | | | | 250,203 | |
Ford Motor Credit Co., LLC, | | | | | | | | |
4.25%, Due 2/3/2017H | | | 300,000 | | | | 302,320 | |
1.483%, Due 3/27/2017H I | | | 400,000 | | | | 400,110 | |
1.750%, Due 6/15/2018H I | | | 980,000 | | | | 980,958 | |
5.875%, Due 8/2/2021H | | | 400,000 | | | | 454,211 | |
General Electric Co., | | | | | | | | |
5.25%, Due 12/6/2017 | | | 215,000 | | | | 224,507 | |
Hewlett Packard Enterprise Co., | | | | | | | | |
6.60%, Due 10/15/2045G | | | 2,445,000 | | | | 2,528,797 | |
HP, Inc., | | | | | | | | |
4.05%, Due 9/15/2022 | | | 300,000 | | | | 316,548 | |
Ingersoll-Rand Luxembourg Finance S.A., | | | | | | | | |
2.625%, Due 5/1/2020 | | | 300,000 | | | | 305,411 | |
Intel Corp., | | | | | | | | |
3.30%, Due 10/1/2021 | | | 240,000 | | | | 255,628 | |
Johnson Controls, Inc., | | | | | | | | |
5.00%, Due 3/30/2020 | | | 300,000 | | | | 326,968 | |
Koninklijke Philips Electronics N.V., | | | | | | | | |
5.75%, Due 3/11/2018 | | | 205,000 | | | | 216,978 | |
LYB International Finance BV, | | | | | | | | |
4.00%, Due 7/15/2023 | | | 305,000 | | | | 326,546 | |
Microsoft Corp., | | | | | | | | |
4.45%, Due 11/3/2045 | | | 1,580,000 | | | | 1,737,223 | |
Monsanto Co., | | | | | | | | |
1.15%, Due 6/30/2017 | | | 355,000 | | | | 354,399 | |
Nissan Motor Acceptance Corp., | | | | | | | | |
2.35%, Due 3/4/2019G | | | 600,000 | | | | 608,464 | |
Northrop Grumman Corp., | | | | | | | | |
5.05%, Due 8/1/2019 | | | 150,000 | | | | 163,420 | |
3.85%, Due 4/15/2045 | | | 310,000 | | | | 312,079 | |
Nucor Corp., | | | | | | | | |
4.125%, Due 9/15/2022 | | | 160,000 | | | | 173,407 | |
4.00%, Due 8/1/2023 | | | 165,000 | | | | 177,308 | |
Oracle Corp., | | | | | | | | |
2.25%, Due 10/8/2019 | | | 235,000 | | | | 240,235 | |
4.30%, Due 7/8/2034 | | | 325,000 | | | | 348,325 | |
PACCAR Financial Corp., | | | | | | | | |
1.30%, Due 5/10/2019 | | | 120,000 | | | | 119,859 | |
2.20%, Due 9/15/2019 | | | 190,000 | | | | 193,615 | |
Pentair Finance S.A., | | | | | | | | |
3.15%, Due 9/15/2022 | | | 125,000 | | | | 124,155 | |
Qualcomm, Inc., | | | | | | | | |
3.00%, Due 5/20/2022 | | | 135,000 | | | | 140,710 | |
Rio Tinto Finance USA Ltd., | | | | | | | | |
3.75%, Due 6/15/2025 | | | 130,000 | | | | 138,456 | |
Stanley Black & Decker, Inc., | | | | | | | | |
2.451%, Due 11/17/2018 | | | 375,000 | | | | 381,310 | |
Toyota Motor Credit Corp., | | | | | | | | |
2.125%, Due 7/18/2019 | | | 660,000 | | | | 670,849 | |
United Technologies Corp., | | | | | | | | |
6.125%, Due 7/15/2038 | | | 450,000 | | | | 597,311 | |
Volkswagen Group of America Finance LLC, | | | | | | | | |
2.45%, Due 11/20/2019G H | | | 650,000 | | | | 657,300 | |
See accompanying notes
18
American Beacon Balanced FundSM
Schedule of Investments
October 31, 2016
| | | | | | | | |
| | | Principal Amount | | | Fair Value | |
MANUFACTURING - 3.20% (continued) | | | | | | | | |
Xerox Corp., | | | | | | | | |
2.95%, Due 3/15/2017 | | $ | 150,000 | | | $ | 150,872 | |
| | | | | | | | |
| | | | | | | 22,995,592 | |
| | | | | | | | |
FINANCE - 3.85% | | | | | | | | |
ABN AMRO Bank N.V., | | | | | | | | |
1.80%, Due 6/4/2018G | | | 600,000 | | | | 601,421 | |
ACE INA Holdings, Inc., | | | | | | | | |
3.35%, Due 5/3/2026 | | | 140,000 | | | | 147,169 | |
Aetna, Inc., | | | | | | | | |
1.90%, Due 6/7/2019 | | | 145,000 | | | | 146,162 | |
4.375%, Due 6/15/2046 | | | 175,000 | | | | 177,462 | |
American Express Co., | | | | | | | | |
4.05%, Due 12/3/2042 | | | 215,000 | | | | 217,865 | |
American Express Credit Corp., | | | | | | | | |
2.125%, Due 3/18/2019 | | | 370,000 | | | | 374,693 | |
American International Group, Inc., | | | | | | | | |
4.875%, Due 6/1/2022 | | | 600,000 | | | | 670,067 | |
4.50%, Due 7/16/2044 | | | 110,000 | | | | 111,880 | |
Bank of America Corp., | | | | | | | | |
2.25%, Due 4/21/2020 | | | 580,000 | | | | 582,639 | |
4.125%, Due 1/22/2024 | | | 400,000 | | | | 429,280 | |
6.11%, Due 1/29/2037 | | | 365,000 | | | | 443,099 | |
5.00%, Due 1/21/2044 | | | 495,000 | | | | 566,818 | |
Bank of New York Mellon Corp., | | | | | | | | |
1.30%, Due 1/25/2018 | | | 390,000 | | | | 390,406 | |
2.20%, Due 3/4/2019 | | | 365,000 | | | | 370,942 | |
BB&T Corp., | | | | | | | | |
1.45%, Due 1/12/2018 | | | 345,000 | | | | 345,460 | |
Bear Stearns Cos., LLC, | | | | | | | | |
7.25%, Due 2/1/2018H | | | 635,000 | | | | 679,110 | |
Boston Properties LP, | | | | | | | | |
3.65%, Due 2/1/2026J | | | 360,000 | | | | 372,598 | |
Capital One Financial Corp., | | | | | | | | |
2.45%, Due 4/24/2019 | | | 275,000 | | | | 279,652 | |
Citigroup, Inc., | | | | | | | | |
1.385%, Due 3/10/2017I | | | 135,000 | | | | 135,092 | |
4.40%, Due 6/10/2025 | | | 360,000 | | | | 380,195 | |
3.70%, Due 1/12/2026 | | | 370,000 | | | | 385,248 | |
5.875%, Due 1/30/2042 | | | 300,000 | | | | 377,222 | |
CNA Financial Corp., | | | | | | | | |
7.35%, Due 11/15/2019 | | | 295,000 | | | | 337,851 | |
Crown Castle International Corp., | | | | | | | | |
3.40%, Due 2/15/2021 | | | 175,000 | | | | 181,848 | |
ERAC USA Finance LLC, | | | | | | | | |
3.30%, Due 12/1/2026G H | | | 240,000 | | | | 243,712 | |
ERP Operating LP, | | | | | | | | |
3.00%, Due 4/15/2023J | | | 160,000 | | | | 162,507 | |
General Electric Capital Corp., | | | | | | | | |
5.625%, Due 5/1/2018 | | | 375,000 | | | | 399,815 | |
6.00%, Due 8/7/2019 | | | 350,000 | | | | 392,998 | |
5.50%, Due 1/8/2020 | | | 250,000 | | | | 279,370 | |
Goldman Sachs Group, Inc., | | | | | | | | |
5.95%, Due 1/18/2018 | | | 450,000 | | | | 473,461 | |
5.75%, Due 1/24/2022 | | | 800,000 | | | | 924,934 | |
3.50%, Due 1/23/2025 | | | 190,000 | | | | 194,857 | |
Humana, Inc., | | | | | | | | |
3.15%, Due 12/1/2022 | | | 300,000 | | | | 309,153 | |
ING Bank N.V., | | | | | | | | |
3.75%, Due 3/7/2017G | | | 400,000 | | | | 403,378 | |
See accompanying notes
19
American Beacon Balanced FundSM
Schedule of Investments
October 31, 2016
| | | | | | | | |
| | | Principal Amount | | | Fair Value | |
FINANCE - 3.85% (continued) | | | | | | | | |
Intercontinental Exchange, Inc., | | | | | | | | |
2.75%, Due 12/1/2020 | | $ | 190,000 | | | $ | 196,211 | |
JPMorgan Chase & Co., | | | | | | | | |
3.625%, Due 5/13/2024 | | | 900,000 | | | | 946,126 | |
3.875%, Due 9/10/2024 | | | 330,000 | | | | 344,642 | |
5.50%, Due 10/15/2040 | | | 650,000 | | | | 792,741 | |
JPMorgan Chase Bank NA, | | | | | | | | |
1.313%, Due 9/21/2018I | | | 450,000 | | | | 450,292 | |
KeyCorp, | | | | | | | | |
5.10%, Due 3/24/2021 | | | 120,000 | | | | 134,467 | |
Liberty Mutual Group, Inc., | | | | | | | | |
4.95%, Due 5/1/2022G | | | 235,000 | | | | 263,412 | |
Liberty Mutual Insurance Co., | | | | | | | | |
7.875%, Due 10/15/2026G | | | 1,215,000 | | | | 1,540,011 | |
MetLife, Inc., | | | | | | | | |
6.375%, Due 6/15/2034 | | | 350,000 | | | | 446,549 | |
4.721%, Due 12/15/2044 | | | 400,000 | | | | 440,181 | |
Morgan Stanley, | | | | | | | | |
7.30%, Due 5/13/2019 | | | 750,000 | | | | 848,049 | |
5.625%, Due 9/23/2019 | | | 350,000 | | | | 385,345 | |
3.70%, Due 10/23/2024 | | | 480,000 | | | | 502,808 | |
3.125%, Due 7/27/2026 | | | 330,000 | | | | 328,427 | |
National Rural Utilities Cooperative Finance Corp., | | | | | | | | |
1.65%, Due 2/8/2019 | | | 190,000 | | | | 191,283 | |
Nordea Bank AB, | | | | | | | | |
4.875%, Due 1/27/2020G | | | 250,000 | | | | 272,929 | |
PNC Funding Corp., | | | | | | | | |
3.30%, Due 3/8/2022 | | | 325,000 | | | | 344,297 | |
Prudential Financial, Inc., | | | | | | | | |
4.60%, Due 5/15/2044 | | | 650,000 | | | | 691,153 | |
Raymond James Financial, Inc., | | | | | | | | |
3.625%, Due 9/15/2026 | | | 260,000 | | | | 262,627 | |
Simon Property Group LP, | | | | | | | | |
2.20%, Due 2/1/2019J | | | 485,000 | | | | 492,779 | |
3.375%, Due 10/1/2024J | | | 650,000 | | | | 682,628 | |
State Street Corp., | | | | | | | | |
2.55%, Due 8/18/2020 | | | 135,000 | | | | 139,064 | |
The Goldman Sachs Group, Inc., | | | | | | | | |
2.875%, Due 2/25/2021 | | | 270,000 | | | | 276,183 | |
Toronto Dominion Bank, | | | | | | | | |
2.625%, Due 9/10/2018 | | | 375,000 | | | | 382,847 | |
Trinity Acquisition PLC Co., | | | | | | | | |
4.40%, Due 3/15/2026A | | | 180,000 | | | | 187,822 | |
UnitedHealth Group, Inc., | | | | | | | | |
1.625%, Due 3/15/2019 | | | 250,000 | | | | 251,253 | |
3.95%, Due 10/15/2042 | | | 165,000 | | | | 169,264 | |
US Bancorp, | | | | | | | | |
1.95%, Due 11/15/2018 | | | 525,000 | | | | 530,829 | |
Ventas Realty LP, | | | | | | | | |
5.70%, Due 9/30/2043J | | | 135,000 | | | | 159,196 | |
Visa, Inc., | | | | | | | | |
1.20%, Due 12/14/2017 | | | 400,000 | | | | 400,755 | |
2.80%, Due 12/14/2022 | | | 190,000 | | | | 197,586 | |
3.15%, Due 12/14/2025 | | | 265,000 | | | | 276,438 | |
Wells Fargo & Co., | | | | | | | | |
2.15%, Due 1/30/2020 | | | 140,000 | | | | 141,043 | |
2.55%, Due 12/7/2020 | | | 220,000 | | | | 223,841 | |
1.909%, Due 7/26/2021I | | | 1,055,000 | | | | 1,061,126 | |
See accompanying notes
20
American Beacon Balanced FundSM
Schedule of Investments
October 31, 2016
| | | | | | | | |
| | | Principal Amount | | | Fair Value | |
FINANCE - 3.85% (continued) | | | | | | | | |
4.30%, Due 7/22/2027 | | $ | 135,000 | | | $ | 143,477 | |
| | | | | | | | |
| | | | | | | 27,586,045 | |
| | | | | | | | |
CONSUMER - 0.41% | | | | | | | | |
Altria Group, Inc., | | | | | | | | |
4.75%, Due 5/5/2021 | | | 300,000 | | | | 334,692 | |
Anheuser-Busch InBev Finance, Inc., | | | | | | | | |
2.65%, Due 2/1/2021 | | | 340,000 | | | | 347,722 | |
3.65%, Due 2/1/2026 | | | 340,000 | | | | 357,769 | |
General Mills, Inc., | | | | | | | | |
2.20%, Due 10/21/2019 | | | 600,000 | | | | 610,158 | |
Kraft Heinz Foods Co., | | | | | | | | |
3.50%, Due 7/15/2022 | | | 135,000 | | | | 142,244 | |
5.00%, Due 7/15/2035 | | | 130,000 | | | | 146,051 | |
Molson Coors Brewing Co., | | | | | | | | |
3.00%, Due 7/15/2026 | | | 275,000 | | | | 272,599 | |
Newell Rubbermaid, Inc., | | | | | | | | |
5.50%, Due 4/1/2046 | | | 170,000 | | | | 200,312 | |
PepsiCo, Inc., | | | | | | | | |
3.45%, Due 10/6/2046 | | | 185,000 | | | | 175,478 | |
Philip Morris International, Inc., | | | | | | | | |
2.75%, Due 2/25/2026 | | | 185,000 | | | | 186,938 | |
Reynolds American, Inc., | | | | | | | | |
5.85%, Due 8/15/2045 | | | 130,000 | | | | 161,630 | |
| | | | | | | | |
| | | | | | | 2,935,593 | |
| | | | | | | | |
SERVICE - 1.73% | | | | | | | | |
AbbVie, Inc., | | | | | | | | |
2.90%, Due 11/6/2022 | | | 170,000 | | | | 172,085 | |
4.30%, Due 5/14/2036 | | | 180,000 | | | | 180,297 | |
Alibaba Group Holding Ltd., | | | | | | | | |
3.60%, Due 11/28/2024 | | | 650,000 | | | | 670,791 | |
Amgen, Inc., | | | | | | | | |
4.40%, Due 5/1/2045 | | | 190,000 | | | | 193,191 | |
Baxalta, Inc., | | | | | | | | |
4.00%, Due 6/23/2025 | | | 140,000 | | | | 146,536 | |
Bayer US Finance LLC, | | | | | | | | |
2.375%, Due 10/8/2019G H | | | 300,000 | | | | 304,207 | |
Becton Dickinson and Co., | | | | | | | | |
3.125%, Due 11/8/2021 | | | 195,000 | | | | 204,206 | |
3.875%, Due 5/15/2024 | | | 235,000 | | | | 251,860 | |
Cardinal Health, Inc., | | | | | | | | |
3.20%, Due 3/15/2023 | | | 235,000 | | | | 244,384 | |
CBS Corp., | | | | | | | | |
3.375%, Due 3/1/2022 | | | 700,000 | | | | 729,872 | |
Celgene Corp., | | | | | | | | |
5.25%, Due 8/15/2043 | | | 145,000 | | | | 163,236 | |
Comcast Corp., | | | | | | | | |
5.875%, Due 2/15/2018 | | | 410,000 | | | | 433,982 | |
3.15%, Due 3/1/2026 | | | 175,000 | | | | 181,401 | |
6.55%, Due 7/1/2039 | | | 450,000 | | | | 615,994 | |
CVS Health Corp., | | | | | | | | |
2.125%, Due 6/1/2021 | | | 390,000 | | | | 390,034 | |
Express Scripts Holding Co., | | | | | | | | |
4.50%, Due 2/25/2026 | | | 1,340,000 | | | | 1,435,578 | |
Genzyme Corp., | | | | | | | | |
5.00%, Due 6/15/2020 | | | 80,000 | | | | 89,076 | |
Home Depot, Inc., | | | | | | | | |
2.70%, Due 4/1/2023 | | | 150,000 | | | | 154,257 | |
3.35%, Due 9/15/2025 | | | 135,000 | | | | 143,168 | |
See accompanying notes
21
American Beacon Balanced FundSM
Schedule of Investments
October 31, 2016
| | | | | | | | |
| | | Principal Amount | | | Fair Value | |
SERVICE - 1.73% (continued) | | | | | | | | |
MasterCard, Inc., | | | | | | | | |
3.375%, Due 4/1/2024 | | $ | 250,000 | | | $ | 266,167 | |
McDonald’s Corp., | | | | | | | | |
3.70%, Due 1/30/2026 | | | 380,000 | | | | 402,178 | |
Medtronic, Inc., | | | | | | | | |
3.50%, Due 3/15/2025 | | | 650,000 | | | | 689,700 | |
4.625%, Due 3/15/2045 | | | 175,000 | | | | 197,989 | |
Sanofi, | | | | | | | | |
1.25%, Due 4/10/2018 | | | 105,000 | | | | 105,054 | |
4.00%, Due 3/29/2021 | | | 210,000 | | | | 229,353 | |
Shire Acquisitions Investments Ireland DAC, | | | | | | | | |
2.875%, Due 9/23/2023 | | | 210,000 | | | | 206,528 | |
Teva Pharmaceutical Finance Netherlands III BV, | | | | | | | | |
3.15%, Due 10/1/2026 | | | 230,000 | | | | 223,683 | |
Thomson Reuters Corp., | | | | | | | | |
4.30%, Due 11/23/2023 | | | 300,000 | | | | 324,560 | |
3.85%, Due 9/29/2024 | | | 400,000 | | | | 422,324 | |
Time Warner, Inc., | | | | | | | | |
4.875%, Due 3/15/2020 | | | 450,000 | | | | 491,177 | |
4.75%, Due 3/29/2021 | | | 325,000 | | | | 357,784 | |
Viacom, Inc., | | | | | | | | |
4.50%, Due 2/27/2042 | | | 450,000 | | | | 424,397 | |
Walgreens Boots Alliance, Inc., | | | | | | | | |
2.60%, Due 6/1/2021 | | | 240,000 | | | | 242,945 | |
3.80%, Due 11/18/2024 | | | 300,000 | | | | 315,501 | |
Wal-Mart Stores, Inc., | | | | | | | | |
7.55%, Due 2/15/2030 | | | 350,000 | | | | 522,657 | |
Zimmer Biomet Holdings, Inc., | | | | | | | | |
3.55%, Due 4/1/2025 | | | 280,000 | | | | 284,875 | |
| | | | | | | | |
| | | | | | | 12,411,027 | |
| | | | | | | | |
UTILITIES - 0.68% | | | | | | | | |
Consolidated Edison Co. of New York, Inc., | | | | | | | | |
5.50%, Due 12/1/2039 | | | 350,000 | | | | 435,362 | |
4.625%, Due 12/1/2054 | | | 115,000 | | | | 128,677 | |
Delmarva Power & Light Co., | | | | | | | | |
3.50%, Due 11/15/2023 | | | 220,000 | | | | 234,865 | |
Duke Energy Corp., | | | | | | | | |
3.55%, Due 9/15/2021 | | | 370,000 | | | | 395,074 | |
Duke Energy Progress LLC, | | | | | | | | |
4.15%, Due 12/1/2044H | | | 260,000 | | | | 277,696 | |
Edison International, | | | | | | | | |
2.95%, Due 3/15/2023 | | | 170,000 | | | | 174,284 | |
Georgia Power Co., | | | | | | | | |
1.95%, Due 12/1/2018 | | | 150,000 | | | | 151,946 | |
MidAmerican Energy Holdings Co., | | | | | | | | |
6.125%, Due 4/1/2036 | | | 500,000 | | | | 654,284 | |
Pacific Gas & Electric Co., | | | | | | | | |
4.25%, Due 3/15/2046 | | | 280,000 | | | | 303,739 | |
Sierra Pacific Power Co., | | | | | | | | |
3.375%, Due 8/15/2023 | | | 160,000 | | | | 169,658 | |
Southern Co., | | | | | | | | |
2.15%, Due 9/1/2019 | | | 190,000 | | | | 192,230 | |
2.75%, Due 6/15/2020 | | | 500,000 | | | | 513,462 | |
Southern Power Co., | | | | | | | | |
4.15%, Due 12/1/2025 | | | 175,000 | | | | 187,221 | |
Southwestern Electric Power Co., | | | | | | | | |
3.55%, Due 2/15/2022 | | | 600,000 | | | | 635,130 | |
Union Electric Co., | | | | | | | | |
6.70%, Due 2/1/2019 | | | 200,000 | | | | 222,628 | |
See accompanying notes
22
American Beacon Balanced FundSM
Schedule of Investments
October 31, 2016
| | | | | | | | |
| | | Principal Amount | | | Fair Value | |
UTILITIES - 0.68% (continued) | | | | | | | | |
WEC Energy Group, Inc., | | | | | | | | |
3.55%, Due 6/15/2025 | | $ | 195,000 | | | $ | 206,215 | |
| | | | | | | | |
| | | | | | | 4,882,471 | |
| | | | | | | | |
ENERGY - 1.53% | | | | | | | | |
BP Capital Markets PLC, | | | | | | | | |
3.506%, Due 3/17/2025A | | | 1,340,000 | | | | 1,404,518 | |
3.119%, Due 5/4/2026A | | | 700,000 | | | | 708,290 | |
Buckeye Partners LP, | | | | | | | | |
4.875%, Due 2/1/2021J | | | 165,000 | | | | 178,694 | |
Canadian Natural Resources Ltd., | | | | | | | | |
3.90%, Due 2/1/2025 | | | 175,000 | | | | 178,502 | |
6.25%, Due 3/15/2038 | | | 365,000 | | | | 415,833 | |
Chevron Corp., | | | | | | | | |
1.79%, Due 11/16/2018 | | | 195,000 | | | | 196,663 | |
Columbia Pipeline Group, Inc., | | | | | | | | |
4.50%, Due 6/1/2025 | | | 210,000 | | | | 226,912 | |
Enterprise Products Operating LLC, | | | | | | | | |
6.125%, Due 10/15/2039H | | | 130,000 | | | | 149,374 | |
Exxon Mobil Corp., | | | | | | | | |
4.114%, Due 3/1/2046 | | | 1,465,000 | | | | 1,580,870 | |
Husky Energy, Inc., | | | | | | | | |
3.95%, Due 4/15/2022 | | | 280,000 | �� | | | 297,942 | |
Magellan Midstream Partners LP, | | | | | | | | |
5.00%, Due 3/1/2026J | | | 100,000 | | | | 113,423 | |
Marathon Petroleum Corp., | | | | | | | | |
3.625%, Due 9/15/2024 | | | 165,000 | | | | 164,370 | |
Phillips 66, | | | | | | | | |
2.95%, Due 5/1/2017 | | | 225,000 | | | | 227,296 | |
4.30%, Due 4/1/2022 | | | 170,000 | | | | 186,729 | |
Phillips 66 Partners LP, | | | | | | | | |
3.55%, Due 10/1/2026J | | | 110,000 | | | | 109,595 | |
Schlumberger Holdings Corp., | | | | | | | | |
4.00%, Due 12/21/2025G | | | 1,340,000 | | | | 1,439,153 | |
Shell International Finance BV, | | | | | | | | |
1.625%, Due 11/10/2018 | | | 375,000 | | | | 375,835 | |
4.00%, Due 5/10/2046 | | | 175,000 | | | | 173,432 | |
3.75%, Due 9/12/2046 | | | 2,200,000 | | | | 2,094,376 | |
Spectra Energy Partners LP, | | | | | | | | |
3.375%, Due 10/15/2026J | | | 130,000 | | | | 129,165 | |
Sunoco Logistics Partners Operations LP, | | | | | | | | |
4.25%, Due 4/1/2024J | | | 100,000 | | | | 104,612 | |
TransCanada PipeLines Ltd., | | | | | | | | |
3.75%, Due 10/16/2023 | | | 300,000 | | | | 319,128 | |
6.10%, Due 6/1/2040 | | | 170,000 | | | | 216,281 | |
| | | | | | | | |
| | | | | | | 10,990,993 | |
| | | | | | | | |
FOREIGN SOVEREIGN - 0.05% | | | | | | | | |
Province of Ontario Canada, | | | | | | | | |
$2.50%, Due 4/27/2026 | | | 345,000 | | | | 348,921 | |
| | | | | | | | |
TRANSPORTATION - 0.33% | | | | | | | | |
Burlington Northern Santa Fe LLC, | | | | | | | | |
3.65%, Due 9/1/2025H | | | 135,000 | | | | 146,125 | |
7.95%, Due 8/15/2030H | | | 225,000 | | | | 331,001 | |
5.75%, Due 5/1/2040H | | | 420,000 | | | | 535,936 | |
Canadian National Railway Co., | | | | | | | | |
5.55%, Due 5/15/2018 | | | 350,000 | | | | 371,779 | |
CSX Corp., | | | | | | | | |
5.50%, Due 4/15/2041 | | | 325,000 | | | | 386,678 | |
See accompanying notes
23
American Beacon Balanced FundSM
Schedule of Investments
October 31, 2016
| | | | | | | | |
| | | Principal Amount | | | Fair Value | |
TRANSPORTATION - 0.33% (continued) | | | | | | | | |
Norfolk Southern Corp., | | | | | | | | |
5.75%, Due 4/1/2018 | | $ | 425,000 | | | $ | 450,861 | |
Union Pacific Corp., | | | | | | | | |
3.375%, Due 2/1/2035 | | | 150,000 | | | | 149,247 | |
| | | | | | | | |
| | | | | | | 2,371,627 | |
| | | | | | | | |
TELECOMMUNICATIONS - 0.59% | | | | | | | | |
America Movil S.A.B. de C.V., | | | | | | | | |
6.375%, Due 3/1/2035 | | | 350,000 | | | | 425,931 | |
AT&T, Inc., | | | | | | | | |
4.45%, Due 4/1/2024 | | | 165,000 | | | | 178,397 | |
3.40%, Due 5/15/2025 | | | 350,000 | | | | 348,855 | |
4.50%, Due 5/15/2035 | | | 220,000 | | | | 218,392 | |
6.35%, Due 3/15/2040 | | | 120,000 | | | | 144,125 | |
Deutsche Telekom International Finance BV, | | | | | | | | |
4.875%, Due 3/6/2042G | | | 300,000 | | | | 338,897 | |
Rogers Communications, Inc., | | | | | | | | |
5.45%, Due 10/1/2043 | | | 245,000 | | | | 290,476 | |
TELUS Corp., | | | | | | | | |
2.80%, Due 2/16/2027 | | | 205,000 | | | | 200,831 | |
Verizon Communications, Inc., | | | | | | | | |
4.60%, Due 4/1/2021 | | | 360,000 | | | | 395,749 | |
6.40%, Due 9/15/2033 | | | 570,000 | | | | 711,008 | |
Vodafone Group PLC, | | | | | | | | |
6.15%, Due 2/27/2037A | | | 815,000 | | | | 969,790 | |
| | | | | | | | |
| | | | | | | 4,222,451 | |
| | | | | | | | |
Total Corporate Obligations (Cost $83,473,356) | | | | | | | 88,744,720 | |
| | | | | | | | |
ASSET-BACKED OBLIGATIONS - 0.89% | | | | | | | | |
Ally Auto Receivables Trust, | | | | | | | | |
1.39%, Due 9/16/2019, 2015 1 A3 | | | 605,000 | | | | 606,568 | |
Ally Master Owner Trust, | | | | | | | | |
1.54%, Due 9/15/2019, 2012 5 A | | | 595,000 | | | | 596,882 | |
Americredit Automobile Receivables Trust 2016-4, | | | | | | | | |
1.53%, Due 7/8/2021, 2016 4 A3 | | | 245,000 | | | | 244,924 | |
BMW Vehicle Lease Trust, | | | | | | | | |
1.34%, Due 1/22/2019, 2016 1 A3 | | | 405,000 | | | | 405,593 | |
Capital One Multi-Asset Execution Trust, | | | | | | | | |
1.34%, Due 4/15/2022, 2016 A3 A3 | | | 660,000 | | | | 660,041 | |
Chase Issuance Trust, | | | | | | | | |
1.37%, Due 6/15/2021, 2016 A2 A | | | 550,000 | | | | 550,193 | |
Ford Credit Auto Owner Trust, | | | | | | | | |
2.03%, Due 8/15/2020, 2015 A B | | | 605,000 | | | | 615,006 | |
Ford Credit Floorplan Master Owner Trust, | | | | | | | | |
1.40%, Due 8/15/2019, 2014 4 A1 | | | 780,000 | | | | 781,754 | |
GM Financial Automobile Leasing Trust, | | | | | | | | |
1.68%, Due 12/20/2018, 2015 2 A3 | | | 1,000,000 | | | | 1,005,212 | |
Honda Auto Receivables Owner Trust, | | | | | | | | |
1.39%, Due 4/15/2020, 2016 2 A3 | | | 425,000 | | | | 426,114 | |
Volkswagen Auto Lease Trust, | | | | | | | | |
1.25%, Due 12/20/2017, 2015 A A3 | | | 525,000 | | | | 525,101 | |
| | | | | | | | |
Total Asset-Backed Obligations (Cost $6,394,991) | | | | | | | 6,417,388 | |
| | | | | | | | |
COMMERCIAL MORTGAGE-BACKED OBLIGATIONS - 1.22% | | | | | | | | |
Ginnie Mae REMIC Trust, | | | | | | | | |
1.147%, Due 12/16/2038, 2013-139 A | | | 1,441,122 | | | | 1,424,829 | |
1.624%, Due 7/16/2039, 2013-78 AB | | | 1,457,889 | | | | 1,452,064 | |
2.586%, Due 9/16/2039, 2014-31 AB | | | 220,593 | | | | 221,422 | |
1.367%, Due 11/16/2041, 2013 125 AB | | | 1,676,631 | | | | 1,652,229 | |
3.20%, Due 11/16/2044, 2011-92 B | | | 739,012 | | | | 745,572 | |
See accompanying notes
24
American Beacon Balanced FundSM
Schedule of Investments
October 31, 2016
| | | | | | | | |
| | | Principal Amount | | | Fair Value | |
TELECOMMUNICATIONS - 0.59% (continued) | | | | | | | | |
GS Mortgage Securities Trust, | | | | | | | | |
3.679%, Due 8/10/2043, 2010-C1 A1G | | $ | 96,674 | | | $ | 99,784 | |
3.033%, Due 11/10/2046, 2013 GC16 A2 | | | 935,000 | | | | 959,973 | |
JP Morgan Chase Commercial Mortgage Securities Corp., | | | | | | | | |
4.388%, Due 2/15/2046, 2011-C3 A3G | | | 399,966 | | | | 413,618 | |
5.715%, Due 2/12/2049, 2007-CB19 A4 | | | 413,085 | | | | 417,810 | |
JPMBB Commercial Mortgage Securities Trust, | | | | | | | | |
3.157%, Due 7/15/2045, 2013 C12 ASB | | | 665,000 | | | | 696,959 | |
LB-UBS Commercial Mortgage Trust, | | | | | | | | |
5.424%, Due 2/15/2040, 2007-C1 A4 | | | 172,270 | | | | 172,747 | |
WF-RBS Commercial Mortgage Trust, | | | | | | | | |
3.66%, Due 3/15/2047, 2014 C19 A3 | | | 455,000 | | | | 483,302 | |
| | | | | | | | |
Total Commercial Mortgage-Backed Obligations (Cost $8,724,165) | | | | | | | 8,740,309 | |
| | | | | | | | |
U.S. AGENCY MORTGAGE-BACKED OBLIGATIONS - 6.09% | | | | | | | | |
Federal Home Loan Mortgage Corporation, | | | | | | | | |
4.50%, Due 3/1/2019 | | | 34,782 | | | | 35,751 | |
5.00%, Due 10/1/2020 | | | 19,365 | | | | 20,307 | |
3.50%, Due 8/1/2026 | | | 108,789 | | | | 115,950 | |
3.50%, Due 9/1/2028 | | | 665,263 | | | | 708,864 | |
5.00%, Due 8/1/2033 | | | 147,239 | | | | 164,428 | |
5.50%, Due 2/1/2034 | | | 139,854 | | | | 159,422 | |
5.00%, Due 3/1/2034 | | | 105,004 | | | | 117,080 | |
6.00%, Due 6/1/2034 | | | 108,847 | | | | 125,739 | |
6.00%, Due 8/1/2034 | | | 89,284 | | | | 103,144 | |
5.00%, Due 8/1/2035 | | | 80,166 | | | | 89,209 | |
5.00%, Due 9/1/2035 | | | 52,523 | | | | 58,193 | |
5.50%, Due 4/1/2037 | | | 85,856 | | | | 97,620 | |
5.50%, Due 5/1/2038 | | | 40,394 | | | | 45,731 | |
4.00%, Due 1/1/2041 | | | 483,992 | | | | 519,803 | |
4.50%, Due 2/1/2041 | | | 373,964 | | | | 409,886 | |
3.50%, Due 6/1/2042 | | | 1,499,129 | | | | 1,578,344 | |
3.50%, Due 7/1/2042 | | | 411,701 | | | | 433,558 | |
| | | | | | | | |
| | | | | | | 4,783,029 | |
| | | | | | | | |
Federal National Mortgage Association, | | | | | | | | |
5.00%, Due 12/1/2017 | | | 15,685 | | | | 16,084 | |
4.50%, Due 9/1/2018 | | | 18,222 | | | | 18,717 | |
4.00%, Due 8/1/2020 | | | 42,631 | | | | 44,130 | |
3.50%, Due 1/1/2026 | | | 94,006 | | | | 99,095 | |
4.00%, Due 5/1/2026 | | | 500,570 | | | | 535,267 | |
4.00%, Due 6/1/2026 | | | 635,664 | | | | 679,738 | |
3.50%, Due 1/1/2028 | | | 330,184 | | | | 348,454 | |
3.00%, Due 6/1/2029 | | | 824,462 | | | | 865,757 | |
3.00%, Due 7/1/2029 | | | 600,861 | | | | 630,981 | |
5.00%, Due 3/1/2034 | | | 164,662 | | | | 183,887 | |
4.50%, Due 4/1/2034 | | | 260,955 | | | | 287,242 | |
5.50%, Due 4/1/2036 | | | 75,119 | | | | 85,227 | |
5.50%, Due 6/1/2038 | | | 30,213 | | | | 34,249 | |
4.50%, Due 1/1/2040 | | | 401,904 | | | | 439,681 | |
5.00%, Due 5/1/2040 | | | 639,137 | | | | 709,784 | |
5.00%, Due 6/1/2040 | | | 509,600 | | | | 565,564 | |
4.00%, Due 9/1/2040 | | | 333,784 | | | | 358,135 | |
4.00%, Due 1/1/2041 | | | 1,030,160 | | | | 1,104,685 | |
4.00%, Due 2/1/2041 | | | 516,472 | | | | 558,347 | |
5.00%, Due 3/1/2041 | | | 463,826 | | | | 514,817 | |
4.50%, Due 4/1/2041 | | | 792,137 | | | | 868,717 | |
4.50%, Due 6/1/2041 | | | 605,409 | | | | 663,974 | |
4.50%, Due 8/1/2041 | | | 326,915 | | | | 358,553 | |
4.50%, Due 10/1/2041 | | | 417,429 | | | | 460,208 | |
See accompanying notes
25
American Beacon Balanced FundSM
Schedule of Investments
October 31, 2016
| | | | | | | | |
| | | Principal Amount | | | Fair Value | |
TELECOMMUNICATIONS - 0.59% (continued) | | | | | | | | |
Federal National Mortgage Association, (continued) | | | | | | | | |
3.00%, Due 2/1/2043 | | $ | 586,184 | | | $ | 604,834 | |
3.00%, Due 4/1/2043 | | | 268,148 | | | | 277,507 | |
3.00%, Due 5/1/2043 | | | 976,877 | | | | 1,010,976 | |
3.00%, Due 6/1/2043 | | | 3,098,471 | | | | 3,196,520 | |
3.50%, Due 6/1/2043 | | | 405,824 | | | | 427,665 | |
3.50%, Due 7/1/2043 | | | 410,778 | | | | 433,644 | |
3.00%, Due 8/1/2043 | | | 1,961,557 | | | | 2,023,538 | |
4.00%, Due 3/1/2045 | | | 893,325 | | | | 963,102 | |
3.50%, Due 4/1/2045 | | | 931,262 | | | | 977,610 | |
4.00%, Due 7/1/2045 | | | 2,099,127 | | | | 2,254,876 | |
3.50%, Due 8/1/2045 | | | 377,512 | | | | 396,946 | |
3.50%, Due 11/1/2045 | | | 5,231,244 | | | | 5,492,535 | |
4.00%, Due 3/1/2046 | | | 575,532 | | | | 621,032 | |
3.00%, Due 4/1/2046 | | | 692,860 | | | | 713,935 | |
3.50%, Due 5/1/2046 | | | 1,354,747 | | | | 1,424,691 | |
3.00%, Due 6/1/2046 | | | 680,014 | | | | 700,699 | |
4.00%, Due 7/1/2046 | | | 912,028 | | | | 983,160 | |
| | | | | | | | |
| | | | | | | 32,934,563 | |
| | | | | | | | |
Government National Mortgage Association, | | | | | | | | |
7.00%, Due 12/15/2025 | | | 68,972 | | | | 80,769 | |
6.50%, Due 8/15/2027 | | | 65,760 | | | | 75,927 | |
6.50%, Due 11/15/2027 | | | 70,796 | | | | 81,793 | |
7.50%, Due 12/15/2028 | | | 64,930 | | | | 77,879 | |
5.50%, Due 7/15/2033 | | | 145,725 | | | | 166,783 | |
6.00%, Due 12/15/2033 | | | 175,260 | | | | 205,480 | |
4.50%, Due 5/15/2039 | | | 364,445 | | | | 401,800 | |
5.00%, Due 10/15/2039 | | | 292,275 | | | | 331,337 | |
5.50%, Due 2/15/2040 | | | 302,325 | | | | 342,467 | |
4.50%, Due 6/15/2040 | | | 310,719 | | | | 346,098 | |
3.50%, Due 9/15/2041 | | | 842,905 | | | | 894,135 | |
3.50%, Due 3/15/2043 | | | 564,226 | | | | 601,964 | |
5.50%, Due 2/20/2034 | | | 204,678 | | | | 232,275 | |
3.50%, Due 3/20/2045 | | | 543,799 | | | | 580,849 | |
5.00%, Due 3/20/2045 | | | 447,258 | | | | 484,954 | |
4.00%, Due 3/20/2046 | | | 292,153 | | | | 313,045 | |
3.00%, Due 6/20/2046 | | | 739,372 | | | | 771,215 | |
| | | | | | | | |
| | | | | | | 5,988,770 | |
| | | | | | | | |
Total U.S. Agency Mortgage-Backed Obligations (Cost $42,617,794) | | | | | | | 43,706,362 | |
| | | | | | | | |
U.S. TREASURY OBLIGATIONS - 14.39% | | | | | | | | |
U.S. Treasury Floating Rate Note, | | | | | | | | |
0.514%, Due 7/31/2018I | | | 50,345,000 | | | | 50,362,872 | |
| | | | | | | | |
U.S. Treasury Notes/Bonds, | | | | | | | | |
0.75%, Due 2/28/2018 | | | 4,200,000 | | | | 4,198,853 | |
1.125%, Due 5/31/2019 | | | 1,500,000 | | | | 1,506,563 | |
0.75%, Due 7/15/2019 | | | 1,375,000 | | | | 1,366,944 | |
0.875%, Due 7/31/2019 | | | 1,000,000 | | | | 997,188 | |
1.00%, Due 8/31/2019 | | | 2,000,000 | | | | 2,000,938 | |
0.875%, Due 9/15/2019 | | | 2,500,000 | | | | 2,491,308 | |
1.25%, Due 2/29/2020 | | | 2,000,000 | | | | 2,011,172 | |
1.75%, Due 10/31/2020 | | | 2,000,000 | | | | 2,042,032 | |
1.25%, Due 3/31/2021 | | | 2,000,000 | | | | 1,997,344 | |
1.375%, Due 4/30/2021 | | | 2,000,000 | | | | 2,007,110 | |
2.00%, Due 5/31/2021 | | | 3,000,000 | | | | 3,092,343 | |
2.00%, Due 11/15/2021 | | | 3,100,000 | | | | 3,194,817 | |
2.00%, Due 2/15/2022 | | | 6,325,000 | | | | 6,515,983 | |
1.625%, Due 11/15/2022 | | | 2,000,000 | | | | 2,011,484 | |
See accompanying notes
26
American Beacon Balanced FundSM
Schedule of Investments
October 31, 2016
| | | | | | | | |
| | | Principal Amount | | | Fair Value | |
TELECOMMUNICATIONS - 0.59% (continued) | | | | | | | | |
U.S. Treasury Notes/Bonds, (continued) | | | | | | | | |
2.50%, Due 8/15/2023 | | $ | 2,000,000 | | | $ | 2,115,390 | |
2.375%, Due 8/15/2024 | | | 5,765,000 | | | | 6,051,221 | |
6.875%, Due 8/15/2025 | | | 580,000 | | | | 823,894 | |
5.25%, Due 11/15/2028 | | | 450,000 | | | | 608,748 | |
4.75%, Due 2/15/2037 | | | 630,000 | | | | 882,959 | |
4.50%, Due 8/15/2039 | | | 500,000 | | | | 681,172 | |
3.125%, Due 11/15/2041 | | | 5,240,000 | | | | 5,827,247 | |
2.50%, Due 5/15/2046 | | | 490,000 | | | | 481,023 | |
| | | | | | | | |
| | | | | | | 52,905,733 | |
| | | | | | | | |
Total U.S. Treasury Obligations (Cost $102,165,638) | | | | | | | 103,268,605 | |
| | | | | | | | |
MUNICIPAL OBLIGATIONS - 0.32% (Cost $1,815,189) | | | | | | | | |
Municipal Electric Authority of Georgia, | | | | | | | | |
6.655%, Due 4/1/2057 | | | 1,760,000 | | | | 2,284,075 | |
| | | | | | | | |
Total Municipal Obligations | | | | | | | 2,284,075 | |
| | | | | | | | |
| | |
| | | Shares | | | | |
SHORT-TERM INVESTMENTS - 4.47% (Cost $32,057,781) | | | | | | | | |
American Beacon U.S. Government Money Market Select Fund, Select ClassK | | | 32,057,781 | | | | 32,057,781 | |
| | | | | | | | |
TOTAL INVESTMENTS - 99.66% (Cost $670,163,581) | | | | | | | 715,204,345 | |
OTHER ASSETS, NET OF LIABILITIES - 0.34% | | | | | | | 2,428,094 | |
| | | | | | | | |
TOTAL NET ASSETS - 100.00% | | | | | | $ | 717,632,439 | |
| | | | | | | | |
Percentages are stated as a percent of net assets.
| A | PLC - Public Limited Company. |
| B | Non-income producing security. |
| C | ADR - American Depositary Receipt. |
| D | Non-voting participating shares. |
| E | MLP - Master Limited Partnership. |
| F | REIT - Real Estate Investment Trust. |
| G | Security exempt from registration under the Securities Act of 1933. These securities may be resold to qualified institutional buyers pursuant to Rule 144A. At the period end, the value of these securities amounted to $13,900 or 1.92% of net assets. The Fund has no right to demand registration of these securities. |
| H | LLC - Limited Liability Company. |
| I | The coupon rate shown on floating or adjustable rate securities represents the rate at period end. The due date on these types of securities reflects the final maturity date. |
| J | LP - Limited Partnership. |
| K | The Fund is affiliated by having the same investment advisor. |
Futures Contracts Open on October 31, 2016:
| | | | | | | | | | | | | | | | | | | | |
Description | | Type | | | Number of
Contracts | | | Expiration
Date | | | Contract
Value | | | Unrealized
Appreciation
(Depreciation) | |
S&P 500 E-Mini Index Futures | | | Long | | | | 262 | | | | December 2016 | | | $ | 27,773,310 | | | $ | (271,225 | ) |
| | | | | | | | | | | | | | | | | | | | |
| | | | | | | | | | | | | | $ | 27,773,310 | | | $ | (271,225 | ) |
| | | | | | | | | | | | | | | | | | | | |
See accompanying notes
27
American Beacon Mid-Cap Value FundSM
Schedule of Investments
October 31, 2016
| | | | | | | | |
| | | Shares | | | Fair Value | |
COMMON STOCK - 95.21% | | | | | | | | |
CONSUMER DISCRETIONARY - 16.39% | | | | | | | | |
Auto Components - 3.04% | | | | | | | | |
Adient PLCA B | | | 11,556 | | | $ | 525,914 | |
Dana, Inc. | | | 531,333 | | | | 8,225,034 | |
Delphi Automotive PLCA | | | 46,181 | | | | 3,004,998 | |
Johnson Controls International PLCA | | | 115,561 | | | | 4,659,420 | |
| | | | | | | | |
| | | | | | | 16,415,366 | |
| | | | | | | | |
Home Builders - 0.64% | | | | | | | | |
D.R. Horton, Inc. | | | 120,629 | | | | 3,477,734 | |
| | | | | | | | |
Hotels, Restaurants & Leisure - 5.13% | | | | | | | | |
Hilton Worldwide Holdings, Inc. | | | 197,510 | | | | 4,463,726 | |
Norwegian Cruise Line Holdings Ltd.B | | | 144,025 | | | | 5,598,252 | |
Royal Caribbean Cruises Ltd. | | | 126,441 | | | | 9,719,519 | |
SeaWorld Entertainment, Inc.C | | | 160,392 | | | | 2,247,092 | |
Wyndham Worldwide Corp. | | | 86,721 | | | | 5,709,711 | |
| | | | | | | | |
| | | | | | | 27,738,300 | |
| | | | | | | | |
Household Durables - 1.85% | | | | | | | | |
Stanley Black & Decker, Inc. | | | 43,698 | | | | 4,974,580 | |
Whirlpool Corp. | | | 33,532 | | | | 5,023,764 | |
| | | | | | | | |
| | | | | | | 9,998,344 | |
| | | | | | | | |
Leisure Equipment & Products - 0.56% | | | | | | | | |
Brunswick Corp. | | | 69,166 | | | | 3,008,721 | |
| | | | | | | | |
Media - 2.93% | | | | | | | | |
Interpublic Group of Cos., Inc. | | | 195,981 | | | | 4,388,015 | |
Meredith Corp. | | | 48,455 | | | | 2,197,434 | |
News Corp., Class A | | | 333,122 | | | | 4,037,439 | |
Omnicom Group, Inc. | | | 65,031 | | | | 5,190,774 | |
| | | | | | | | |
| | | | | | | 15,813,662 | |
| | | | | | | | |
Specialty Retail - 2.24% | | | | | | | | |
Hanesbrands, Inc. | | | 203,015 | | | | 5,217,486 | |
L Brands, Inc. | | | 55,611 | | | | 4,014,558 | |
Staples, Inc. | | | 390,071 | | | | 2,886,525 | |
| | | | | | | | |
| | | | | | | 12,118,569 | |
| | | | | | | | |
Total Consumer Discretionary | | | | | | | 88,570,696 | |
| | | | | | | | |
CONSUMER STAPLES - 1.57% | | | | | | | | |
Beverages - 0.48% | | | | | | | | |
Coca-Cola European Partners PLCA | | | 67,400 | | | | 2,590,856 | |
| | | | | | | | |
Tobacco - 1.09% | | | | | | | | |
Reynolds American, Inc. | | | 106,870 | | | | 5,886,400 | |
| | | | | | | | |
Total Consumer Staples | | | | | | | 8,477,256 | |
| | | | | | | | |
ENERGY - 7.85% | | | | | | | | |
Energy Equipment & Services - 2.22% | | | | | | | | |
FMC Technologies, Inc.B | | | 202,439 | | | | 6,532,707 | |
SEACOR Holdings, Inc. | | | 27,007 | | | | 1,331,715 | |
Superior Energy Services, Inc. | | | 128,528 | | | | 1,819,956 | |
Weatherford International PLCA B | | | 474,712 | | | | 2,288,112 | |
| | | | | | | | |
| | | | | | | 11,972,490 | |
| | | | | | | | |
Oil & Gas - 5.63% | | | | | | | | |
Cenovus Energy, Inc. | | | 301,628 | | | | 4,355,508 | |
Devon Energy Corp. | | | 117,100 | | | | 4,436,919 | |
EQT Corp. | | | 93,900 | | | | 6,197,400 | |
See accompanying notes
28
American Beacon Mid-Cap Value FundSM
Schedule of Investments
October 31, 2016
| | | | | | | | |
| | | Shares | | | Fair Value | |
ENERGY - 7.85% (continued) | | | | | | | | |
Oil & Gas - 5.63% (continued) | | | | | | | | |
Murphy Oil Corp. | | | 321,165 | | | $ | 8,308,539 | |
PBF Energy, Inc., Class A | | | 155,864 | | | | 3,397,835 | |
Vermilion Energy, Inc. | | | 95,000 | | | | 3,731,600 | |
| | | | | | | | |
| | | | | | | 30,427,801 | |
| | | | | | | | |
Total Energy | | | | | | | 42,400,291 | |
| | | | | | | | |
FINANCIALS - 24.66% | | | | | | | | |
Banks - 9.58% | | | | | | | | |
CIT Group, Inc. | | | 148,014 | | | | 5,377,348 | |
Comerica, Inc. | | | 108,866 | | | | 5,670,830 | |
Fifth Third Bancorp | | | 324,220 | | | | 7,055,027 | |
Frost Bankers, Inc. | | | 58,714 | | | | 4,461,677 | |
KeyCorp. | | | 575,198 | | | | 8,121,796 | |
M&T Bank Corp. | | | 38,103 | | | | 4,676,381 | |
New York Community Bancorp, Inc. | | | 339,275 | | | | 4,871,989 | |
Regions Financial Corp. | | | 662,068 | | | | 7,090,748 | |
TCF Financial Corp. | | | 102,292 | | | | 1,462,776 | |
Valley National Bancorp | | | 176,652 | | | | 1,741,789 | |
Webster Financial Corp. | | | 30,008 | | | | 1,212,323 | |
| | | | | | | | |
| | | | | | | 51,742,684 | |
| | | | | | | | |
Diversified Financials - 6.18% | | | | | | | | |
Ally Financial, Inc. | | | 184,600 | | | | 3,335,722 | |
Ameriprise Financial, Inc. | | | 34,489 | | | | 3,048,483 | |
Apollo Global Management LLC, Class AD E | | | 190,325 | | | | 3,479,141 | |
Capital One Financial Corp. | | | 32,742 | | | | 2,424,218 | |
Discover Financial Services | | | 90,261 | | | | 5,084,402 | |
Franklin Resources, Inc. | | | 124,088 | | | | 4,176,802 | |
Invesco Ltd. | | | 145,536 | | | | 4,088,106 | |
KKR & Co., LPE | | | 358,068 | | | | 5,080,985 | |
SLM Corp.B | | | 378,195 | | | | 2,666,275 | |
| | | | | | | | |
| | | | | | | 33,384,134 | |
| | | | | | | | |
Insurance - 8.90% | | | | | | | | |
Allstate Corp. | | | 153,651 | | | | 10,432,903 | |
Axis Capital Holdings Ltd. | | | 94,167 | | | | 5,364,694 | |
FNF Group | | | 228,092 | | | | 8,190,784 | |
Torchmark Corp. | | | 42,867 | | | | 2,718,196 | |
Validus Holdings Ltd. | | | 70,673 | | | | 3,611,390 | |
Voya Financial, Inc. | | | 289,129 | | | | 8,832,891 | |
Willis Towers Watson PLCA | | | 70,881 | | | | 8,923,918 | |
| | | | | | | | |
| | | | | | | 48,074,776 | |
| | | | | | | | |
Total Financials | | | | | | | 133,201,594 | |
| | | | | | | | |
HEALTH CARE - 4.84% | | | | | | | | |
Health Care Equipment & Supplies - 1.10% | | | | | | | | |
Zimmer Biomet Holdings, Inc. | | | 56,155 | | | | 5,918,737 | |
| | | | | | | | |
Health Care Providers & Services - 3.74% | | | | | | | | |
Cardinal Health, Inc. | | | 64,165 | | | | 4,407,494 | |
Cigna Corp. | | | 42,198 | | | | 5,014,388 | |
Mednax, Inc.B | | | 81,400 | | | | 4,985,750 | |
Universal Health Services, Inc., Class B | | | 47,960 | | | | 5,789,252 | |
| | | | | | | | |
| | | | | | | 20,196,884 | |
| | | | | | | | |
Total Health Care | | | | | | | 26,115,621 | |
| | | | | | | | |
See accompanying notes
29
American Beacon Mid-Cap Value FundSM
Schedule of Investments
October 31, 2016
| | | | | | | | |
| | | Shares | | | Fair Value | |
INDUSTRIALS - 13.21% | | | | | | | | |
Aerospace & Defense - 2.38% | | | | | | | | |
Orbital ATK, Inc. | | | 34,600 | | | $ | 2,572,856 | |
Spirit Aerosystems Holdings, Inc., Class A | | | 89,215 | | | | 4,492,867 | |
TransDigm Group, Inc. | | | 21,175 | | | | 5,769,341 | |
| | | | | | | | |
| | | | | | | 12,835,064 | |
| | | | | | | | |
Building Products - 1.19% | | | | | | | | |
Owens Corning | | | 132,189 | | | | 6,448,179 | |
| | | | | | | | |
Commercial Services & Supplies - 1.92% | | | | | | | | |
Convergys Corp. | | | 55,030 | | | | 1,606,876 | |
Genpact Ltd. | | | 143,821 | | | | 3,306,445 | |
Republic Services, Inc. | | | 83,915 | | | | 4,416,446 | |
Steelcase, Inc., Class A | | | 78,157 | | | | 1,043,396 | |
| | | | | | | | |
| | | | | | | 10,373,163 | |
| | | | | | | | |
Construction & Engineering - 0.65% | | | | | | | | |
AECOM Technology Corp.B | | | 125,289 | | | | 3,489,299 | |
| | | | | | | | |
Diversified Manufacturing - 0.49% | | | | | | | | |
Eaton Corp., PLCA | | | 41,708 | | | | 2,659,719 | |
| | | | | | | | |
Engineering & Construction - 1.33% | | | | | | | | |
KBR, Inc. | | | 485,825 | | | | 7,195,068 | |
| | | | | | | | |
Machinery - 3.79% | | | | | | | | |
CNH Industrial N.V. | | | 243,809 | | | | 1,896,834 | |
Dover Corp. | | | 135,121 | | | | 9,038,244 | |
Parker Hannifin Corp. | | | 29,122 | | | | 3,574,726 | |
Terex Corp. | | | 247,430 | | | | 5,908,628 | |
| | | | | | | | |
| | | | | | | 20,418,432 | |
| | | | | | | | |
Marine - 0.62% | | | | | | | | |
Golar LNG Ltd.C | | | 152,489 | | | | 3,337,984 | |
| | | | | | | | |
Road & Rail - 0.84% | | | | | | | | |
Ryder System, Inc. | | | 33,350 | | | | 2,314,157 | |
Werner Enterprises, Inc. | | | 93,283 | | | | 2,243,456 | |
| | | | | | | | |
| | | | | | | 4,557,613 | |
| | | | | | | | |
Total Industrials | | | | | | | 71,314,521 | |
| | | | | | | | |
INFORMATION TECHNOLOGY - 10.08% | | | | | | | | |
Computers & Peripherals - 2.55% | | | | | | | | |
Hewlett Packard Enterprise Co. | | | 244,558 | | | | 5,495,218 | |
HP, Inc. | | | 249,096 | | | | 3,609,401 | |
Seagate Technology PLCA | | | 135,350 | | | | 4,643,859 | |
| | | | | | | | |
| | | | | | | 13,748,478 | |
| | | | | | | | |
Electronic Equipment & Instruments - 2.60% | | | | | | | | |
Avnet, Inc. | | | 128,361 | | | | 5,384,744 | |
Flextronics International Ltd.B | | | 378,862 | | | | 5,376,052 | |
Keysight Technologies, Inc.B | | | 99,241 | | | | 3,255,105 | |
| | | | | | | | |
| | | | | | | 14,015,901 | |
| | | | | | | | |
IT Consulting & Services - 1.19% | | | | | | | | |
Computer Sciences Corp. | | | 34,168 | | | | 1,860,448 | |
CSRA, Inc. | | | 68,568 | | | | 1,720,371 | |
Total System Services, Inc. | | | 56,686 | | | | 2,827,497 | |
| | | | | | | | |
| | | | | | | 6,408,316 | |
| | | | | | | | |
Semiconductor Equipment & Products - 3.08% | | | | | | | | |
Marvell Technology Group Ltd. | | | 378,324 | | | | 4,929,562 | |
See accompanying notes
30
American Beacon Mid-Cap Value FundSM
Schedule of Investments
October 31, 2016
| | | | | | | | |
| | | Shares | | | Fair Value | |
INFORMATION TECHNOLOGY - 10.08% (continued) | | | | | | | | |
Semiconductor Equipment & Products - 3.08% (continued) | | | | | | | | |
Microchip Technology, Inc. | | | 106,435 | | | $ | 6,444,639 | |
ON Semiconductor Corp.B | | | 454,568 | | | | 5,304,809 | |
| | | | | | | | |
| | | | | | | 16,679,010 | |
| | | | | | | | |
Software - 0.66% | | | | | | | | |
Navient Corp. | | | 279,362 | | | | 3,570,246 | |
| | | | | | | | |
Total Information Technology | | | | | | | 54,421,951 | |
| | | | | | | | |
MATERIALS - 5.90% | | | | | | | | |
Chemicals - 3.23% | | | | | | | | |
Ashland Global Holdings, Inc. | | | 45,453 | | | | 5,078,464 | |
Axalta Coating Systems Ltd.B | | | 106,100 | | | | 2,665,232 | |
Celanese Corp., Series A | | | 27,000 | | | | 1,968,840 | |
Eastman Chemical Co. | | | 46,302 | | | | 3,329,577 | |
FMC Corp. | | | 93,306 | | | | 4,375,118 | |
| | | | | | | | |
| | | | | | | 17,417,231 | |
| | | | | | | | |
Construction Materials - 0.96% | | | | | | | | |
CRH PLC, ADRA F | | | 161,298 | | | | 5,209,925 | |
| | | | | | | | |
Containers & Packaging - 1.71% | | | | | | | | |
Owens-Illinois, Inc.B | | | 190,967 | | | | 3,685,663 | |
Packaging Corp. of America | | | 67,496 | | | | 5,568,420 | |
| | | | | | | | |
| | | | | | | 9,254,083 | |
| | | | | | | | |
Total Materials | | | | | | | 31,881,239 | |
| | | | | | | | |
REAL ESTATE - 5.24% | | | | | | | | |
Equity Real Estate Investment Trusts - 5.24% | | | | | | | | |
AvalonBay Communities, Inc.G | | | 18,548 | | | | 3,175,047 | |
CBL & Associates Properties, Inc.G | | | 155,703 | | | | 1,666,022 | |
Corporate Office Properties TrustG | | | 63,344 | | | | 1,690,651 | |
EPR PropertiesG | | | 48,664 | | | | 3,538,846 | |
Geo Group, Inc.G | | | 125,800 | | | | 3,014,168 | |
Host Hotels & Resorts, Inc.G | | | 170,828 | | | | 2,644,417 | |
Lamar Advertising Co., Class AG | | | 152,780 | | | | 9,693,891 | |
MFA Financial, Inc.G | | | 340,512 | | | | 2,489,143 | |
MGM Growth Properties LLC, Class A D G | | | 15,159 | | | | 398,985 | |
| | | | | | | | |
Total Real Estate | | | | | | | 28,311,170 | |
| | | | | | | | |
UTILITIES - 5.47% | | | | | | | | |
Electric - 4.08% | | | | | | | | |
CenterPoint Energy, Inc. | | | 58,186 | | | | 1,326,641 | |
Edison International | | | 70,707 | | | | 5,195,550 | |
Great Plains Energy, Inc. | | | 217,347 | | | | 6,181,349 | |
Pinnacle West Capital Corp. | | | 122,156 | | | | 9,299,736 | |
| | | | | | | | |
| | | | | | | 22,003,276 | |
| | | | | | | | |
Gas - 0.69% | | | | | | | | |
UGI Corp. | | | 80,832 | | | | 3,741,713 | |
| | | | | | | | |
Multi-Utilities - 0.70% | | | | | | | | |
Xcel Energy, Inc. | | | 90,778 | | | | 3,771,826 | |
| | | | | | | | |
Total Utilities | | | | | | | 29,516,815 | |
| | | | | | | | |
Total Common Stock (Cost $493,995,920) | | | | | | | 514,211,154 | |
| | | | | | | | |
See accompanying notes
31
American Beacon Mid-Cap Value FundSM
Schedule of Investments
October 31, 2016
| | | | | | | | |
| | | Shares | | | Fair Value | |
SHORT-TERM INVESTMENTS - 4.81% (Cost $25,957,274) | | | | | | | | |
American Beacon U.S. Government Money Market Select Fund, Select ClassH | | | 25,957,274 | | | $ | 25,957,274 | |
| | | | | | | | |
SECURITIES LENDING COLLATERAL - 1.05% | | | | | | | | |
American Beacon U.S. Government Money Market Select Fund, Select Class H | | | 4,103,281 | | | | 4,103,281 | |
DWS Government and Agency Securities Portfolio, Institutional Class | | | 1,542,369 | | | | 1,542,369 | |
| | | | | | | | |
Total Securities Lending Collateral (Cost $5,645,650) | | | | | | | 5,645,650 | |
| | | | | | | | |
TOTAL INVESTMENTS - 101.07% (Cost $525,598,844) | | | | | | | 545,814,078 | |
LIABILITIES, NET OF OTHER ASSETS - (1.07%) | | | | | | | (5,787,236 | ) |
| | | | | | | | |
TOTAL NET ASSETS - 100.00% | | | | | | $ | 540,026,842 | |
| | | | | | | | |
Percentages are stated as a percent of net assets.
| A | PLC - Public Limited Company. |
| B | Non-income producing security. |
| C | All or a portion of this security is on loan at October 31, 2016. |
| D | LLC - Limited Liability Company. |
| E | MLP - Master Limited Partnership. |
| F | ADR - American Depositary Receipt. |
| G | REIT - Real Estate Investment Trust. |
| H | The Fund is affiliated by having the same investment advisor. |
Futures Contracts Open on October 31, 2016:
| | | | | | | | | | | | | | | | | | | | |
| | | | | | | | | | | | | | | Unrealized | |
| | | | | | Number of | | | | | | | | | Appreciation | |
Description | | Type | | | Contracts | | | Expiration Date | | | Contract Value | | | (Depreciation) | |
S&P MidCap 400 E-Mini Index Futures | | | Long | | | | 154 | | | | December 2016 | | | $ | 23,204,720 | | | $ | (481,083 | ) |
| | | | | | | | | | | | | | | | | | | | |
| | | | | | | | | | | | | | $ | 23,204,720 | | | $ | (481,083 | ) |
| | | | | | | | | | | | | | | | | | | | |
See accompanying notes
32
American Beacon FundsSM
Statements of Assets and Liabilities
October 31, 2016
| | | | | | | | |
| | | | | | Mid-Cap Value | |
| | | Balanced Fund | | | Fund | |
Assets: | | | | | | | | |
Investments in unaffiliated securities, at fair value A C | | $ | 683,146,564 | | | $ | 515,753,523 | |
Investments in affiliated securities, at fair value B | | | 32,057,781 | | | | 30,060,555 | |
Cash | | | 63,400 | | | | — | |
Deposit with brokers for futures contracts | | | 1,440,589 | | | | 1,622,565 | |
Dividends and interest receivable | | | 2,268,932 | | | | 1,336,022 | |
Receivable for investments sold | | | 2,392,757 | | | | 389,043 | |
Receivable for fund shares sold | | | 145,398 | | | | 657,136 | |
Receivable for tax reclaims | | | 1,787 | | | | — | |
Prepaid expenses | | | 192,439 | | | | 36,148 | |
| | | | | | | | |
Total assets | | | 721,709,647 | | | | 549,854,992 | |
| | | | | | | | |
Liabilities: | | | | | | | | |
Payable for investments purchased | | | 2,688,087 | | | | 2,474,619 | |
Payable for fund shares redeemed | | | 672,315 | | | | 725,600 | |
Payable for variation margin from open futures contracts | | | 270,656 | | | | 480,755 | |
Payable upon return of securities loaned | | | — | | | | 5,645,650 | |
Management and investment advisory fees payable | | | 244,068 | | | | 371,578 | |
Administrative service and service fees payable | | | 75,444 | | | | 46,368 | |
Transfer agent fees payable | | | 4,980 | | | | 2,529 | |
Custody and fund accounting fees payable | | | 27,902 | | | | 17,082 | |
Professional fees payable | | | 54,662 | | | | 35,505 | |
Trustee fees payable | | | 7,096 | | | | 2,345 | |
Payable for prospectus and shareholder reports | | | 16,778 | | | | 18,087 | |
Other liabilities | | | 15,220 | | | | 8,032 | |
| | | | | | | | |
Total liabilities | | | 4,077,208 | | | | 9,828,150 | |
| | | | | | | | |
Net Assets | | $ | 717,632,439 | | | $ | 540,026,842 | |
| | | | | | | | |
Analysis of Net Assets: | | | | | | | | |
Paid-in-capital | | $ | 679,622,068 | | | $ | 537,394,493 | |
Undistributed net investment income | | | 5,642,174 | | | | 6,383,795 | |
Accumulated net realized (loss) | | | (12,401,342 | ) | | | (23,485,401 | ) |
Unrealized appreciation of investments | | | 45,040,764 | | | | 20,215,233 | |
Unrealized depreciation of currency transactions | | | — | | | | (195 | ) |
Unrealized depreciation of futures contracts | | | (271,225 | ) | | | (481,083 | ) |
Net assets | | $ | 717,632,439 | | | $ | 540,026,842 | |
| | | | | | | | |
See accompanying notes
33
American Beacon FundsSM
Statements of Assets and Liabilities
October 31, 2016
| | | | | | | | |
| | | | | | Mid-Cap Value | |
| | | Balanced Fund | | | Fund | |
Shares outstanding at no par value (unlimited shares authorized): | | | | | | | | |
Institutional Class | | | 31,794,308 | | | | 13,935,266 | |
| | | | | | | | |
Y Class | | | 1,884,625 | | | | 4,957,949 | |
| | | | | | | | |
Investor Class | | | 9,280,888 | | | | 17,212,419 | |
| | | | | | | | |
Advisor Class | | | 733,127 | | | | 483,603 | |
| | | | | | | | |
A Class | | | 1,818,651 | | | | 1,422,699 | |
| | | | | | | | |
C Class | | | 2,952,761 | | | | 454,847 | |
| | | | | | | | |
Net assets: | | | | | | | | |
Institutional Class D | | $ | 485,231,068 | | | $ | 195,472,135 | |
| | | | | | | | |
Y Class | | $ | 28,843,268 | | | $ | 68,994,531 | |
| | | | | | | | |
Investor Class | | $ | 127,235,433 | | | $ | 243,421,035 | |
| | | | | | | | |
Advisor Class | | $ | 10,603,004 | | | $ | 6,622,356 | |
| | | | | | | | |
A Class | | $ | 24,892,096 | | | $ | 19,486,655 | |
| | | | | | | | |
C Class | | $ | 40,827,570 | | | $ | 6,030,130 | |
| | | | | | | | |
Net asset value, offering and redemption price per share: | | | | | | | | |
Institutional Class D | | $ | 15.26 | | | $ | 14.03 | |
| | | | | | | | |
Y Class | | $ | 15.30 | | | $ | 13.92 | |
| | | | | | | | |
Investor Class | | $ | 13.71 | | | $ | 14.14 | |
| | | | | | | | |
Advisor Class | | $ | 14.46 | | | $ | 13.69 | |
| | | | | | | | |
A Class | | $ | 13.69 | | | $ | 13.70 | |
| | | | | | | | |
A Class (offering price) | | $ | 14.53 | | | $ | 14.54 | |
| | | | | | | | |
C Class | | $ | 13.83 | | | $ | 13.26 | |
| | | | | | | | |
A Cost of investments in unaffiliated securities | | $ | 638,105,800 | | | $ | 495,538,289 | |
B Cost of investments in affiliated securities | | $ | 32,057,781 | | | $ | 30,060,555 | |
C Fair Value of Securities on Loan | | $ | — | | | $ | 5,505,771 | |
D Includes AMR Class Assets of the Balanced Fund (Note 1). | | | | | | | | |
See accompanying notes
34
American Beacon FundsSM
Statements of Operations
For the year ended October 31, 2016
| | | | | | | | |
| | | | | | Mid-Cap Value | |
| | | Balanced Fund | | | Fund | |
Investment income: | | | | | | | | |
Dividend income from unaffiliated securities (net of foreign taxes) A | | $ | 11,223,010 | | | $ | 15,254,625 | |
Dividend income from affiliated securities | | | 62,143 | | | | 42,633 | |
Interest income | | | 6,805,759 | | | | — | |
Income derived from securities lending | | | — | | | | 49,960 | |
| | | | | | | | |
Total investment income | | | 18,090,912 | | | | 15,347,218 | |
| | | | | | | | |
Expenses: | | | | | | | | |
Management and investment advisory fees (Note 2) | | | 2,280,243 | | | | 3,795,256 | |
Administrative service fees (Note 2): | | | | | | | | |
Institutional Class B | | | 250,597 | | | | 409,542 | |
Y Class | | | 49,575 | | | | 118,515 | |
Investor Class | | | 232,554 | | | | 464,576 | |
Advisor Class | | | 19,071 | | | | 11,493 | |
A Class | | | 45,217 | | | | 31,618 | |
C Class | | | 72,650 | | | | 10,017 | |
AMR Class | | | — | | | | 336 | |
Transfer agent fees: | | | | | | | | |
Institutional Class B | | | 27,282 | | | | 48,366 | |
Y Class | | | 234 | | | | 3,300 | |
Investor Class | | | 11,424 | | | | 11,653 | |
Advisor Class | | | 508 | | | | 2,425 | |
A Class | | | 2,133 | | | | 2,039 | |
C Class | | | 2,504 | | | | 1,503 | |
AMR Class | | | — | | | | 116 | |
Custody and fund accounting fees | | | 94,783 | | | | 78,736 | |
Professional fees | | | 52,436 | | | | 57,717 | |
Registration fees and expenses | | | 103,844 | | | | 91,892 | |
Service fees (Note 2): | | | | | | | | |
Y Class | | | 28,742 | | | | 70,499 | |
Investor Class | | | 431,971 | | | | 663,976 | |
Advisor Class | | | 27,487 | | | | 16,932 | |
A Class | | | 39,655 | | | | 27,843 | |
C Class | | | 63,318 | | | | 8,912 | |
Distribution fees (Note 2): | | | | | | | | |
Advisor Class | | | 27,487 | | | | 16,932 | |
A Class | | | 66,092 | | | | 47,739 | |
C Class | | | 422,122 | | | | 59,412 | |
Prospectus and shareholder report expenses | | | 32,665 | | | | 59,146 | |
Trustee fees | | | 41,617 | | | | 45,480 | |
Other expenses | | | 68,487 | | | | 45,262 | |
| | | | | | | | |
Total expenses | | | 4,494,698 | | | | 6,201,233 | |
| | | | | | | | |
Net expenses | | | 4,494,698 | | | | 6,201,233 | |
| | | | | | | | |
Net investment income | | | 13,596,214 | | | | 9,145,985 | |
| | | | | | | | |
See accompanying notes
35
American Beacon FundsSM
Statements of Operations
For the year ended October 31, 2016
| | | | | | | | |
| | | | | | Mid-Cap Value | |
| | | Balanced Fund | | | Fund | |
Realized and unrealized gain (loss) from investments: | | | | | | | | |
Net realized gain (loss) from: | | | | | | | | |
Investments | | $ | (4,370,590 | ) | | $ | (22,549,404 | ) |
Commission recapture (Note 1) | | | 6,622 | | | | 35,944 | |
Foreign currency transactions | | | 25 | | | | (365 | ) |
Futures contracts | | | 2,239,111 | | | | 1,578,656 | |
Change in net unrealized appreciation (depreciation) of: | | | | | | | | |
Investments | | | 8,974,288 | | | | 24,660,461 | |
Foreign currency transactions | | | — | | | | (195 | ) |
Futures contracts | | | (334,912 | ) | | | (907,744 | ) |
| | | | | | | | |
Net gain from investments | | | 6,514,544 | | | | 2,817,353 | |
| | | | | | | | |
Net increase in net assets resulting from operations | | $ | 20,110,758 | | | $ | 11,963,338 | |
| | | | | | | | |
A Foreign taxes | | $ | 132,359 | | | $ | 19,423 | |
B Includes AMR Class Expenses of the Balanced Fund (Note 1). | | | | | | | | |
See accompanying notes
36
American Beacon FundsSM
Statements of Changes in Net Assets
| | | | | | | | | | | | | | | | |
| | | Balanced Fund | | | Mid-Cap Value Fund | |
| | | Year Ended | | | Year Ended | | | Year Ended | | | Year Ended | |
| | | October 31, 2016 | | | October 31, 2015 | | | October 31, 2016 | | | October 31, 2015 | |
Increase (Decrease) in Net Assets: | | | | | | | | | | | | | | | | |
Operations: | | | | | | | | | | | | | | | | |
Net investment income | | $ | 13,596,214 | | | $ | 20,252,845 | | | $ | 9,145,985 | | | $ | 7,504,884 | |
Net realized gain (loss) from investments, commission recapture, foreign currency transactions, and futures contracts | | | (2,124,832 | ) | | | 100,307,836 | | | | (20,935,169 | ) | | | 52,953,611 | |
Change in net unrealized appreciation (depreciation) from investments, foreign currency transactions, and futures contracts | | | 8,639,376 | | | | (122,051,739 | ) | | | 23,752,522 | | | | (47,749,286 | ) |
| | | | | | | | | | | | | | | | |
Net increase (decrease) in net assets resulting from operations | | | 20,110,758 | | | | (1,491,058 | ) | | | 11,963,338 | | | | 12,709,209 | |
| | | | | | | | | | | | | | | | |
Distributions to Shareholders: | | | | | | | | | | | | | | | | |
Net investment income: | | | | | | | | | | | | | | | | |
Institutional Class A | | | (8,111,530 | ) | | | (1,222,078 | ) | | | (3,042,980 | ) | | | (1,280,283 | ) |
Y Class | | | (394,207 | ) | | | (577,148 | ) | | | (804,213 | ) | | | (220,931 | ) |
Investor Class | | | (1,913,613 | ) | | | (2,181,155 | ) | | | (2,883,653 | ) | | | (1,551,881 | ) |
Advisor Class | | | (128,760 | ) | | | (159,858 | ) | | | (40,603 | ) | | | (45,732 | ) |
A Class | | | (367,530 | ) | | | (392,383 | ) | | | (117,192 | ) | | | (72,214 | ) |
C Class | | | (318,121 | ) | | | (320,163 | ) | | | (11,670 | ) | | | — | |
AMR Class | | | — | | | | (11,499,507 | ) | | | — | | | | (1,014,018 | ) |
Net realized gain from investments: | | | | | | | | | | | | | | | | |
Institutional Class A | | | (21,528,686 | ) | | | (3,534,578 | ) | | | (12,422,126 | ) | | | (5,870,373 | ) |
Y Class | | | (1,587,112 | ) | | | (1,913,666 | ) | | | (3,405,226 | ) | | | (996,642 | ) |
Investor Class | | | (7,811,741 | ) | | | (8,246,761 | ) | | | (14,625,725 | ) | | | (7,616,156 | ) |
Advisor Class | | | (610,329 | ) | | | (698,873 | ) | | | (345,718 | ) | | | (281,323 | ) |
A Class | | | (1,380,563 | ) | | | (1,315,977 | ) | | | (800,587 | ) | | | (576,439 | ) |
C Class | | | (2,350,891 | ) | | | (1,788,365 | ) | | | (322,638 | ) | | | (164,681 | ) |
AMR Class | | | — | | | | (33,411,237 | ) | | | — | | | | (3,582,758 | ) |
| | | | | | | | | | | | | | | | |
Net distributions to shareholders | | | (46,503,083 | ) | | | (67,261,749 | ) | | | (38,822,331 | ) | | | (23,273,431 | ) |
| | | | | | | | | | | | | | | | |
Capital Share Transactions: | | | | | | | | | | | | | | | | |
Proceeds from sales of shares | | | 461,674,934 | | | | 236,623,030 | | | | 152,464,371 | | | | 315,120,817 | |
Reinvestment of dividends and distributions | | | 45,872,150 | | | | 66,463,488 | | | | 38,345,842 | | | | 23,008,875 | |
Cost of shares redeemed | | | (481,741,305 | ) | | | (546,315,542 | ) | | | (287,829,842 | ) | | | (287,701,747 | ) |
Redemption fees | | | — | | | | — | | | | — | | | | 37,086 | |
| | | | | | | | | | | | | | | | |
Net increase (decrease) in net assets from capital share transactions | | | 25,805,779 | | | | (243,229,024 | ) | | | (97,019,629 | ) | | | 50,465,031 | |
| | | | | | | | | | | | | | | | |
Net increase (decrease) in net assets | | | (586,546 | ) | | | (311,981,831 | ) | | | (123,878,622 | ) | | | 39,900,809 | |
| | | | | | | | | | | | | | | | |
Net Assets: | | | | | | | | | | | | | | | | |
Beginning of period | | | 718,218,985 | | | | 1,030,200,816 | | | | 663,905,464 | | | | 624,004,655 | |
| | | | | | | | | | | | | | | | |
End of Period * | | $ | 717,632,439 | | | $ | 718,218,985 | | | $ | 540,026,842 | | | $ | 663,905,464 | |
| | | | | | | | | | | | | | | | |
*Includes undistributed (overdistribution of) net investment income | | $ | 5,642,174 | | | $ | 2,571,729 | | | $ | 6,383,795 | | | $ | 4,490,772 | |
| | | | | | | | | | | | | | | | |
A Includes AMR Class Distributions (Note 1). | | | | | | | | | | | | | | | | |
See accompanying notes
37
American Beacon FundsSM
Notes to Financial Statements
October 31, 2016
1. Organization
American Beacon Funds (the “Trust”), is organized as a Massachusetts business trust and is registered under the Investment Company Act of 1940, as amended, (the “Act”) as a diversified, open-end management investment company. As of October 31, 2016, the Trust consists of twenty-five active series, two of which are presented in this filing (collectively, the “Funds” and each individually a “Fund”): the American Beacon Balanced Fund and American Beacon Mid-Cap Value Fund. The remaining twenty-three active series are reported in separate filings.
American Beacon Advisors, Inc. (the “Manager”) is a wholly-owned subsidiary of Astro AB Borrower, Inc., which is indirectly owned by investment funds affiliated with Kelso & Company, L.P. and Estancia Capital Management, LLC, and was organized in 1986 to provide business management, advisory, administrative and asset management consulting services to the Trust and other investors.
Class Disclosure
The AMR Class of the Balanced Fund closed on May 31, 2016 and the shares merged into the Institutional Class. The AMR class of the Mid-Cap Value Fund closed on December 11, 2015.
Each Fund has multiple classes of shares designed to meet the needs of different groups of investors; however, not all Funds offer all classes. The following table sets forth the differences amongst the classes:
| | | | | | |
| | | | | Minimum Initial | |
Class | | Eligible Investors | | Investments | |
Institutional | | Large Institutional investors - sold directly or through intermediary channels. | | $ | 250,000 | |
Y Class | | Large institutional retirement plan investors. | | $ | 100,000 | |
Investor | | All investors using intermediary organizations such as broker-dealers or retirement plan sponsors. | | $ | 2,500 | |
Advisor Class | | All investors who invest through intermediary organizations, such as broker-dealers or third party administrators. | | $ | 2,500 | |
A Class | | All investors who invest through intermediary organizations, such as broker-dealers or third party administrator. Retail investors who invest directly through a financial intermediary such as a broker, bank, or registered investment advisor which may include a front-end sales charge and a contingent deferred sales charge (“CDSC”). | | $ | 2,500 | |
C Class | | Retail investors who invest directly through a financial intermediary such as a broker or employee directed benefit plans with applicable sales charges which may include CDSC. | | $ | 1,000 | |
Each class offered by the Trust has equal rights as to assets and voting privileges. Income and non-class specific expenses are allocated daily to each class on the basis of the relative net assets. Realized and unrealized capital gains and losses of each class are allocated daily based on the relative net assets of each class of the respective Fund. Class specific expenses, where applicable, currently include administrative service fees, service fees, and distribution fees and vary amongst the classes as described more fully in Note 2.
The following is a summary of significant accounting policies, consistently followed by the Funds in preparation of the financial statements. The Funds are considered investment companies and accordingly, follow the investment company accounting and reporting guidance of the Financial Accounting Standards Board Accounting Standard Codification Topic 946, Financial Services—Investment Companies, which is part of U.S. Generally Accepted Accounting Principles (“U.S. GAAP”).
Security Transactions and Investment Income
Security transactions are recorded on the trade date of the security purchase or sale. The Funds may purchase securities with delivery or payment to occur at a later date. At the time the Funds enter into a commitment to
38
American Beacon FundsSM
Notes to Financial Statements
October 31, 2016
purchase a security, the transaction is recorded, and the value of the security is reflected in the Net Asset Value (“NAV”). The value of the security may vary with market fluctuations.
Dividend income, net of foreign taxes, is recorded on the ex-dividend date, except certain dividends from foreign securities which are recorded as soon as the information is available to the Funds. Interest income is earned from settlement date, recorded on the accrual basis, and adjusted, if necessary, for accretion of discounts and amortization of premiums. For financial and tax reporting purposes, realized gains and losses are determined on the basis of specific lot identification.
Interest income is earned from settlement date, recorded on the accrual basis, and adjusted, if necessary, for accretion of discounts and amortization of premiums. For financial and tax reporting purposes, realized gains and losses are determined on the basis of specific lot identification.
Dividends to Shareholders
Dividends from net investment income of the Balanced Fund will normally be declared and paid quarterly. Dividends from net investment income of the Mid-Cap Value Fund will normally be declared and paid at least annually. Distributions, if any, of net realized capital gains are generally paid at least annually and recorded on the ex-dividend date. Dividends to shareholders are determined in accordance with federal income tax regulations, which may differ in amount and character from net investment income and realized gains recognized for purposes of U.S. GAAP. To the extent necessary to fully distribute capital gains, the Funds may also designate earnings and profits distributed to shareholders on the redemption of shares.
Commission Recapture
The Funds have established brokerage commission recapture arrangements with certain brokers or dealers. If the Fund’s investment advisor chooses to execute a transaction through a participating broker, the broker rebates a portion of the commission back to the Fund. Any collateral benefit received through participation in the commission recapture program is directed exclusively to the Funds. This amount is reported with the net realized gains in the Funds’ Statements of Operations.
Allocation of Income, Expenses, Gains, and Losses
Income, expenses (other than those attributable to a specific class), gains, and losses are allocated daily to each class of shares based upon the relative proportion of net assets represented by such class. Operating expenses directly attributable to a specific class are charged against the operations of that class.
Use of Estimates
The preparation of financial statements in conformity with U.S. GAAP requires management to make estimates and assumptions that affect the amounts reported in the financial statements and accompanying notes. Actual results may differ from those estimated.
Other
Under the Trust’s organizational documents, its officers and trustees are indemnified against certain liability arising out of the performance of their duties to the Trust. In the normal course of business, the Trust enters into contracts that provide indemnification to the other party or parties against potential costs or liabilities. The Trust’s maximum exposure under these arrangements is dependent on claims that may be made in the future and, therefore, cannot be estimated. The Trust has had no prior claims or losses pursuant to any such agreement.
39
American Beacon FundsSM
Notes to Financial Statements
October 31, 2016
2. Transactions with Affiliates
Management Agreement
From November 1, 2015 to May 29, 2016, the Trust and the Manager were parties to a Management Agreement that obligated the Manager to provide or oversee the provision of all investment advisory, fund management, and securities lending services. As compensation for performing the duties required under the Management Agreement, the Manager received from the Funds an annualized fee equal to 0.05% of the average daily net assets. Effective May 29, 2016, the Fund and the Manager entered into a management agreement that obligates the Manager to provide investment advisory, fund management, and administrative services to the Funds. As compensation for performing the duties under the Management Agreement, the Manager receives from the Funds an annualized fee at the following annual rates as a percentage of average daily net assets: 0.35% of the first $15 billion, 0.325% of the next $15 billion, and 0.30% over $30 billion. The Manager is one of the investment advisors of the Balanced and receives an annualized fee of 0.15% on the portion of assets managed by the Manager. The Funds also pay the unaffiliated investment advisors hired to direct investment activities of the Funds an annualized investment advisory fee based on a percentage of the Funds’ average daily assets. Management fees paid by the Funds during the year ended October 31, 2016 were as follows:
| | | | | | | | | | | | | | | | |
Fund | | Management Fee
Rate | | | Management
Fee | | | Amounts paid
to Investment
Advisors | | | Amounts Paid
to Manager | |
Balanced | | | 0.50 | % | | $ | 2,280,243 | | | $ | 1,313,288 | | | $ | 966,955 | |
Mid-Cap Value | | | 0.80 | % | | | 3,795,256 | | | | 2,724,216 | | | | 1,071,040 | |
As compensation for services provided by the Manager in connection with securities lending activities conducted by the Mid-Cap Value Fund, the lending Fund pays to the Manager, with respect to cash collateral posted by borrowers, a fee of 10% of the net monthly interest income (the gross income earned by the investment of cash collateral, less the amount paid to borrowers and related expenses) from such activities and, with respect to loan fees paid by borrowers, a fee up to 10% of such loan fees. This fee is included in “Management and investment advisory fees” on the Statements of Operations. During the year ended October 31, 2016, securities lending fees paid to the Manager were $4,958.
Administration Agreement
From November 1, 2015 to May 29, 2016, the Manager and the Trust were parties to an Administrative Agreement which obligated the Manager to provide or oversee administrative services to each Fund. As compensation for performing the duties required under the Administrative Agreement, the Manager received an annualized fee of 0.30% of the average daily net assets of the Institutional, Y, Investor, A, and C Classes of the Funds.
Distribution Plans
The Funds, except for the Advisor, A, and C Classes of the Funds, have adopted a “defensive” Distribution Plan (the “Plan”) in accordance with Rule 12b-1 under the Act, pursuant to which no separate fees may be charged to the Funds for distribution purposes. However, the Plan authorizes the management fees received by the Manager and the investment advisors hired by the Manager to be used for distribution purposes. Under this Plan, the Funds do not intend to compensate the Manager or any other party, either directly or indirectly, for the distribution of Fund shares.
Separate Distribution Plans (the “Distribution Plans”) have been adopted pursuant to Rule 12b-1 under the Act for the Advisor, A, and C Classes of the Fund. Under the Distribution Plans, as compensation for distribution assistance, the Manager receives an annual fee of 0.25% of the average daily net assets of the Advisor and A Classes, 0.50% of the average daily net assets of the Retirement Class, and 1.00% of the average daily net assets of the C Class. The fee will be payable without regard to whether
40
American Beacon FundsSM
Notes to Financial Statements
October 31, 2016
the amount of the fee is more or less than the actual expenses incurred in a particular month by the Manager for distribution assistance.
Service Plans
The Manager and the Trust entered into Service Plans that obligate the Manager to oversee additional shareholder servicing of the Y, Investor, Advisor, A, and C Classes. As compensation for performing the duties required under the Service Plans, the Manager receives 0.10% of the average daily net assets of the Y Class, 0.15% of the average daily net assets of the A and C Classes, 0.25% of the average daily net assets of the Advisor Class and up to 0.375% of the average daily net assets of the Investor Class of the Funds.
Sub-Transfer Agent Fees
The Manager has entered into agreements, which include servicing agreements, with financial intermediaries that provide recordkeeping, processing, shareholder communications and other services to customers of the intermediaries that hold positions in the Institutional Class of the Funds and has agreed to compensate the intermediaries for providing these services. Intermediaries transact with the Funds primarily through the use of omnibus accounts on behalf of their customers who hold positions in the Funds. Certain services would have been provided by the Funds’ transfer agent and other service providers if the shareholders’ accounts were maintained directly by the Funds’ transfer agent. Accordingly, the Funds, pursuant to the Trust’s Board of Trustees (the “Board”) approval, have agreed to reimburse the Manager for all or a portion of the servicing fees paid to these intermediaries for the Institutional Class. The reimbursement amounts (sub-transfer agent fees) paid to the Manager are subject to a fee limit of up to 0.10% of an intermediaries average net assets in the Institutional Class on an annual basis. For the year ended October 31, 2016, the sub-transfer agent fees, as reflected in “Transfer agent fees” in the Statements of Operations, were as follows:
| | | | |
Fund | | Sub-Transfer Agent Fees | |
Balanced | | $ | 11,534 | |
Mid-Cap Value | | | 33,150 | |
As of October 31, 2016, the Fund owes the Manager the following reimbursement of sub-transfer agent fees, as reflected in “Transfer agent fees payable” in the Statement of Assets and Liabilities.
| | | | |
Fund | | Reimbursement of
Sub-Transfer Agent Fees | |
Balanced | | $ | 1,106 | |
Mid-Cap Value | | | 861 | |
Investment in Affiliated Funds
The Funds may invest in the American Beacon U.S. Government Money Market Select Fund (the “USG Select Fund”). Cash collateral received by the Mid-Cap Value Fund in connection with Securities Lending may also be invested in the USG Select Fund. The Funds and the USG Select Fund have the same investment advisor and therefore, are considered to be affiliated. The Manager serves as investment advisor to the USG Select Fund and receives management fees totaling 0.10% of the average daily net assets of the USG Select Fund. During the year ended October 31, 2016, the Manager earned fees on the Funds direct and indirect investments in the USG Select Fund as shown below:
41
American Beacon FundsSM
Notes to Financial Statements
October 31, 2016
| | | | | | | | | | | | |
| | | Direct Investments in Select
Fund | | | Securities Lending Collateral
in USG Select Fund | | | | |
Fund | | | | Total | |
Balanced | | $ | 21,504 | | | $ | — | | | $ | 21,504 | |
Mid-Cap Value | | | 14,879 | | | | 9,343 | | | | 24,222 | |
Interfund Lending Program
Pursuant to an exemptive order by the Securities and Exchange Commission (“SEC”), the Funds, along with other registered investment companies having management contracts with the Manager, may participate in an interfund lending program. This program provides an alternative credit facility allowing the Funds to borrow from other participating funds. During the year ended October 31, 2016, the Balanced Fund loaned on average $1,607,954 for 107 days at an average rate of 0.95% with interest charges earned of $4,424. This amount is included in “Interest income” on the Statement of Operations. During the year ended October 31, 2016, the Mid-Cap Value Fund did not utilize the credit facility.
Expense Reimbursement Plan
The Funds have adopted an Expense Reimbursement Plan whereby the Manager may seek repayment of fees waived or expenses reimbursed for a period of up to three years. However, reimbursement will occur only if the Classes’ average net assets have grown or expenses have declined sufficiently to allow reimbursement without causing its expense ratio to exceed the previously agreed upon contractual expense limit. During the year ended October 31, 2016, there were no waived fees, expenses reimbursed, or recovered expenses.
Sales Commissions
The Funds’ distributor, Foreside Fund Services, LLC (“Foreside”), may receive a portion of A Class sales charges from broker-dealers and it may be used to offset distribution related expenses. For the year ended October 31, 2016, Foreside collected $15,672 and $1,308 for the Balanced and Mid-Cap Value Funds, respectively, from the sale of Class A Shares.
A CDSC of 0.50% will be deducted with respect to Class A Shares on certain purchases of $1,000,000 or more that are redeemed in whole or part within 18 months of purchase, unless waived as discussed in the Prospectus. Any applicable CDSC will be 0.50% of the lesser of the original purchase price or the value of the redemption of the Class A Shares redeemed. During the year ended October 31, 2016, there were no DCSC fees collected for the Class A Shares of the Balanced and Mid-Cap Value Funds.
A CDSC of 1.00% will be deducted with respect to Class C Shares redeemed within 12 months of purchase, unless waived as discussed in the Prospectus. Any applicable CDSC will be 1.00% of the lesser of the original purchase price or the value of the redemption of the Class C Shares redeemed. During the year ended October 31, 2016, CDSC fees of $16,196 and $671 were collected from the Class C Shares of the Balanced and Mid-Cap Value Funds, respectively.
Trustee Fees and Expenses
Effective July 1, 2016, as compensation for their service to the Trust and the American Beacon Select Funds, each Trustee receives an annual retainer of $120,000, plus $5,000 for each Board of Trustee meeting attended in person or via teleconference, $2,500 for attendance by Committee members at meetings of the Audit Committee and the Investment Committee, and $1,500 for attendance by Committee members at meetings of the Nominating and Governance Committee, plus reimbursement of reasonable expenses incurred in attending Board meetings, Committee meetings, and relevant educational seminars. The Trustees also may be compensated for attendance at special Board and/or Committee meetings from time to time. The Board Chairman receives an additional annual retainer of $50,000 as well as a single $5,000 fee each quarter for his attendance at the committee meetings. The
42
American Beacon FundsSM
Notes to Financial Statements
October 31, 2016
chairpersons of the Audit Committee and the Investment Committee each receive an additional annual retainer of $25,000 and the Chairman of the Nominating and Governance Committee receives an additional annual retainer of $10,000. These expenses are allocated on a prorated basis to each Fund of the Trust according to its respective net assets.
3. Security Valuation and Fair Value Measurements
Investments are valued at the close of the New York Stock Exchange (the “Exchange”), normally at 4:00 p.m. Eastern Time, each day that the Exchange is open for business. Equity securities, including exchange-traded funds (“ETFs”) for which market quotations are available are valued at the last sale price or official closing price (closing bid price or last evaluated quote if no sale has occurred) on the primary market or exchange on which they trade.
Debt securities are normally valued on the basis of prices provided by an independent pricing service and may take into account appropriate factors such as institution-size trading in similar groups of securities, yield, quality, coupon rate, maturity, type of issue, trading characteristics, and other market data. Prices of debt securities may be determined using quotes obtained from brokers.
Investments in open-end mutual funds are valued at the closing NAV per share of the mutual fund on the day of valuation.
Securities for which market prices are not readily available or are not reflective of the fair value of the security, as determined by the Manager, will be priced at fair value following procedures approved by the Board.
Futures contracts are valued based upon their quoted daily settlement prices. Upon entering into a futures contract, the Funds are required to deposit with its futures broker, an amount of cash or U.S. Government and Agency Obligations in accordance with the initial margin requirements of the broker or exchange. Futures contracts are marked to market daily and an appropriate payable or receivable for the change in value (“variation margin”) is recorded by the Funds. Gains or losses are recognized but not considered realized until the contracts expire or are closed. Futures contracts involve, to varying degrees, risk of loss in excess of the variation margin disclosed on the Statements of Assets and Liabilities.
Other investments, including restricted securities, and those financial instruments for which the above valuation procedures are inappropriate or are deemed not to reflect fair value are stated at fair value as determined in good faith by the Valuation Committee, established by the Board.
Valuation Inputs
Various inputs may be used to determine the fair value of the Funds’ investments. These inputs are summarized in three broad levels for financial statement purposes. The inputs or methodologies used to value securities are not necessarily an indication of the risk associated with investing in those securities.
| | |
Level 1 - | | Quoted prices in active markets for identical securities. |
| |
Level 2 - | | Prices determined using other significant observable inputs. These may include quoted prices for similar securities, interest rates, prepayment speeds, credit risk, and others. Fixed-income securities are considered Level 2 as they are valued using observable inputs. |
| |
Level 3 - | | Prices determined using other significant unobservable inputs. Unobservable inputs reflect the Fund’s own assumptions about the factors market participants would use in pricing an investment. |
43
American Beacon FundsSM
Notes to Financial Statements
October 31, 2016
Level 1 and Level 2 trading assets and trading liabilities, at fair value
Common stocks and financial derivative instruments, such as futures contracts that are traded on a national securities exchange, are stated at the last reported sale or settlement price on the day of valuation. To the extent these securities are actively traded and valuation adjustments are not applied, they are categorized as Level 1 of the fair value hierarchy. Securities using these valuation adjustments are categorized as Level 2 of the fair value hierarchy. Preferred securities and other equities traded on inactive markets or valued by reference to similar instruments are also categorized as Level 2 of the fair value hierarchy.
Fixed-income securities including corporate, convertible and municipal bonds and notes, U.S. government agencies, U.S. treasury obligations, sovereign issues, bank loans, convertible preferred securities, and non-U.S. bonds are normally valued by pricing service providers that use broker dealer quotations, reported trades or valuation estimates from their internal pricing models. The service providers’ internal models use inputs that are observable such as issuer details, interest rates, yield curves, prepayment speeds, credit risks/spreads, default rates, and quoted prices for similar assets. Securities that use similar valuation techniques and inputs as described above are categorized as Level 2 of the fair value hierarchy.
Fixed-income securities purchased on a delayed-delivery basis are marked to market daily until settlement at the forward settlement date are categorized as Level 2 of the fair value hierarchy.
Mortgage-related and asset-backed securities are usually issued as separate tranches, or classes, of securities within each deal. These securities are also normally valued by pricing service providers that use broker dealer quotations or valuation estimates from their internal pricing models. The pricing models for these securities usually consider tranche-level attributes, current market data, estimated cash flows, and market-based yield spreads for each tranche, and incorporates deal collateral performance, as available. Mortgage-related and asset-backed securities that use similar valuation techniques and inputs as described above are categorized as Level 2 of the fair value hierarchy.
Investments in registered open-end investment management companies will be valued based upon the NAVs of such investments and are categorized as Level 1 of the fair value hierarchy.
The Funds’ investments are summarized by level based on the inputs used to determine their values. As of October 31, 2016, the investments were classified as described below:
| | | | | | | | | | | | | | | | |
Balanced Fund(1) | | Level 1 | | | Level 2 | | | Level 3 | | | Total | |
Common Stock | | $ | 429,985,105 | | | $ | — | | | $ | — | | | $ | 429,985,105 | |
Corporate Obligations | | | — | | | | 88,744,720 | | | | — | | | | 88,744,720 | |
Asset-Backed Obligations | | | — | | | | 6,417,388 | | | | — | | | | 6,417,388 | |
Commercial Mortgage-Backed Obligations | | | — | | | | 8,740,309 | | | | — | | | | 8,740,309 | |
U.S. Agency Mortgage-Backed Obligations | | | — | | | | 43,706,362 | | | | — | | | | 43,706,362 | |
U.S. Treasury Obligations | | | — | | | | 103,268,605 | | | | — | | | | 103,268,605 | |
Municipal Obligations | | | — | | | | 2,284,075 | | | | — | | | | 2,284,075 | |
Short-Term Investments - Money Market Funds | | | 32,057,781 | | | | — | | | | — | | | | 32,057,781 | |
| | | | | | | | | | | | | | | | |
Total Investments in Securities | | $ | 462,042,886 | | | $ | 253,161,459 | | | $ | — | | | $ | 715,204,345 | |
| | | | | | | | | | | | | | | | |
Financial Derivatives Instruments - Liabilities | | | | | | | | | | | | | | | | |
Futures Contracts | | $ | (271,225 | ) | | $ | — | | | $ | — | | | $ | (271,225 | ) |
| | | | | | | | | | | | | | | | |
Total Financial Derivative Instruments | | $ | (271,225 | ) | | $ | — | | | $ | — | | | $ | (271,225 | ) |
| | | | | | | | | | | | | | | | |
44
American Beacon FundsSM
Notes to Financial Statements
October 31, 2016
| | | | | | | | | | | | | | | | |
Mid-Cap Value Fund(1) | | Level 1 | | | Level 2 | | | Level 3 | | | Total | |
Common Stock | | $ | 514,211,154 | | | $ | — | | | $ | — | | | $ | 514,211,154 | |
Short-Term Investments—Money Market Funds | | | 25,957,274 | | | | — | | | | — | | | | 25,957,274 | |
Securities Lending Collateral invested in Money Market Funds | | | 5,645,650 | | | | — | | | | — | | | | 5,645,650 | |
| | | | | | | | | | | | | | | | |
Total Investments in Securities | | $ | 545,814,078 | | | $ | — | | | $ | — | | | $ | 545,814,078 | |
| | | | | | | | | | | | | | | | |
Financial Derivatives Instruments—Liabilities | | | | | | | | | | | | | | | | |
Futures Contracts | | $ | (481,083 | ) | | $ | — | | | | — | | | $ | (481,083 | ) |
| | | | | | | | | | | | | | | | |
Total Financial Derivatives Instruments | | $ | (481,083 | ) | | $ | — | | | $ | — | | | $ | (481,083 | ) |
| | | | | | | | | | | | | | | | |
| (1) | Refer to Schedule of Investments for Industry Information. |
U.S. GAAP also requires all transfers between any levels to be disclosed. The end of the period timing recognition has been adopted for the transfers between levels of each Fund’s assets and liabilities. During the year ended October 31, 2016, there were no transfers between levels.
4. Securities and Other Investments
American Depositary Receipts (“ADRs”)
ADRs are depositary receipts for foreign issuers in registered form traded in U.S. securities markets. Depositary receipts may not be denominated in the same currency as the securities into which they may be converted. Investing in depositary receipts entails substantially the same risks as direct investment in foreign securities. There is generally less publicly available information about foreign companies and there may be less governmental regulation and supervision of foreign stock exchanges, brokers and listed companies. In addition, such companies may use different accounting and financial standards (and certain currencies may become unavailable for transfer from a foreign currency), resulting in the Funds’ possible inability to convert immediately into U.S. currency proceeds realized upon the sale of portfolio securities of the affected foreign companies. In addition, the Funds may invest in unsponsored depositary receipts, the issuers of which are not obligated to disclose material information about the underlying securities to investors in the United States. Ownership of unsponsored depositary receipts may not entitle the Funds to the same benefits and rights as ownership of a sponsored depositary receipt or the underlying security.
Real Estate Investment Trusts
The Funds may own shares of real estate investment trusts (“REITs”) which report information on the source of their distributions annually. The Funds re-characterize distributions received from REIT investments based on information provided by the REITs into the following categories: ordinary income, long-term capital gains, and return of capital. If information is not available on a timely basis from the REITs, the re-characterization will be estimated based on available information, which may include the previous year allocation. If new or additional information becomes available from the REITs at a later date, a re-characterization will be made the following year. These re-characterizations are not recorded for financial statement purposes, but as an adjustment to the calculation of taxable income.
Illiquid and Restricted Securities
The Fund may invest in securities that are subject to legal or contractual restrictions on resale. These securities may be sold privately, but are required to be registered or exempted from such registration before being sold to the public. Private placement securities are generally considered to be restricted except for those securities traded between qualified institutional investors under the provisions of Rule 144A of the Securities Act of 1933 (the “Securities Act”). Illiquid securities have included securities that have not been registered under the Securities Act, securities that are otherwise not readily marketable, and repurchase agreements having a remaining maturity of longer than seven calendar days. Disposal of both illiquid and restricted securities may
45
American Beacon FundsSM
Notes to Financial Statements
October 31, 2016
involve time-consuming negotiations and expenses, and prompt sale at an acceptable price may be difficult to achieve. Illiquid and restricted securities outstanding at the year ended October 31, 2016 are disclosed in the Notes to the Schedule of Investments.
Other Investment Company Securities and Other Exchange Traded Products
The Funds may invest in shares of other investment companies, including open-end funds, closed-end funds, business development companies, ETFs, unit investment trusts, and other investment companies of the Trust. The Funds may invest in investment company securities advised by the Manager or the sub-advisor. Investments in the securities of other investment companies may involve duplication of advisory fees and certain other expenses. By investing in another investment company, the Funds become a shareholder of that investment company. As a result, the Funds’ shareholders indirectly will bear a proportionate share of the fees and expenses paid by shareholders of the other investment company, in addition to the fees and expenses the Fund’s shareholders directly bear in connection with the Fund’s own operations. These other fees and expenses are reflected as Acquired Fund Fees and Expenses and are included in the Fees and Expenses Table for the Fund in its Prospectus, if applicable. Investments in other investment companies may involve the payment of substantial premiums above the value of such issuer’s portfolio securities.
Mortgage-Related and Other Asset-Backed Securities
The Balanced Fund may invest in mortgage or other asset-backed securities (“ABS”). These securities may include mortgage instruments issued by U.S. government agencies (“agency mortgages”) or those issued by private entities (“non-agency mortgages”). Specific types of instruments may include mortgage pass-through securities, collateralized mortgage obligations (“CMOs”), commercial mortgage-backed securities, mortgage dollar rolls, CMO residuals, stripped mortgage-backed securities and other securities that directly or indirectly represent a participation in, or are secured by a payable from, mortgage loans on real property. The value of the Fund’s mortgage-backed securities (“MBS”) may be affected by, among other things, changes or perceived changes in interest rates, factors concerning the interests in and structure of the issuer or the originator of the mortgage, or the quality of the underlying assets. The mortgages underlying the securities may default or decline in quality or value. Through its investments in MBS, a Fund has exposure to subprime loans, Alt-A loans and non-conforming loans as well as to the mortgage and credit markets generally. Underlying collateral related to subprime, Alt-A and non-conforming mortgage loans has become increasingly susceptible to defaults and declines in quality or value, especially in a declining residential real estate market. In addition, regulatory or tax changes may adversely affect the mortgage securities markets as a whole.
Mortgage-Backed Securities
MBS often have stated maturities of up to thirty years when they are issued, depending upon the length of the mortgages underlying the securities. In practice however, unscheduled or early payments of principal and interest on the underlying mortgages may make the securities’ effective maturity shorter than this, and the prevailing interest rates may be higher or lower than the current yield of the Fund’s portfolio at the time resulting in reinvestment risk.
Rising or high interest rates may result in slower than expected principal payments which may tend to extend the duration of MBS, making them more volatile and more sensitive to changes in interest rates. This is known as extension risk.
MBS may have less potential for capital appreciation than comparable fixed-income securities due to the likelihood of increased prepayments of mortgages resulting from foreclosures or declining interest rates. These foreclosed or refinanced mortgages are paid off at face value (par) or less, causing a loss, particularly for any investor who may have purchased the security at a premium or a price above par. In such an environment, this risk limits the potential price appreciation of these securities.
46
American Beacon FundsSM
Notes to Financial Statements
October 31, 2016
Agency Mortgage-Backed Securities
Certain MBS may be issued or guaranteed by the U.S. government or a government sponsored entity, such as Fannie Mae (the Federal National Mortgage Association) or Freddie Mac (the Federal Home Loan Mortgage Corporation). Although these instruments may be guaranteed by the U.S. government or a government sponsored entity, many such MBS are not backed by the full faith and credit of the United States and are still exposed to the risk of non-payment.
Privately Issued Mortgage-Backed Securities
MBS held by a Fund may be issued by private issuers including commercial banks, savings associations, mortgage companies, investment banking firms, finance companies and special purpose finance entities (called special purpose vehicles or SPVs) and other entities that acquire and package mortgage loans for resale as MBS. These privately issued non-agency MBS may offer higher yields than those issued by government agencies, but also may be subject to greater price changes than governmental issues. Subprime loans refer to loans made to borrowers with weakened credit histories or with a lower capacity to make timely payments on their loans. Alt-A loans refer to loans extended to borrowers who have incomplete documentation of income, assets, or other variables that are important to the credit underwriting processes. Non-conforming mortgages are loans that do not meet the standards that allow purchase by government-sponsored enterprises. MBS with exposure to subprime loans, Alt-A loans or non-conforming loans have had in many cases higher default rates than those loans that meet government underwriting requirements. The risk of non-payment is greater for MBS that are backed by mortgage pools that contain subprime, Alt-A and non-conforming loans, but a level of risk exists for all loans.
Unlike agency MBS issued or guaranteed by the U.S. government or a government-sponsored entity (e.g., Fannie Mae (the Federal National Mortgage Association) and Freddie Mac (the Federal Home Loan Mortgage Corporation), MBS issued by private issuers do not have a government or government-sponsored entity guarantee, but may have credit enhancements provided by external entities such as banks or financial institutions or achieved through the structuring of the transaction itself. Examples of such credit support arising out of the structure of the transaction include the issue of senior and subordinated securities (e.g., the issuance of securities by an SPV in multiple classes or “tranches,” with one or more classes being senior to other subordinated classes as to the payment of principal and interest, with the result that defaults on the underlying mortgage loans are borne first by the holders of the subordinated class); creation of “reserve funds” (in which case cash or investments, sometimes funded from a portion of the payments on the underlying mortgage loans, are held in reserve against future losses); and “overcollateralization” (in which case the scheduled payments on, or the principal amount of, the underlying mortgage loans exceeds that required to make payment on the securities and pay any servicing or other fees). However, there can be no guarantee that credit enhancements, if any, will be sufficient to prevent losses in the event of defaults on the underlying mortgage loans. In addition, MBS that are issued by private issuers are not subject to the underwriting requirements for the underlying mortgages that are applicable to those MBS that have a government or government-sponsored entity guarantee. As a result, the mortgage loans underlying private MBS may, and frequently do, have less favorable collateral, credit risk or other underwriting characteristics than government or government-sponsored MBS and have wider variances in a number of terms including interest rate, term, size, purpose and borrower characteristics. Privately issued pools more frequently include second mortgages, high loan-to-value mortgages and manufactured housing loans. The coupon rates and maturities of the underlying mortgage loans in a private-label MBS pool may vary to a greater extent than those included in a government guaranteed pool, and the pool may include subprime mortgage loans.
Privately issued MBS are not traded on an exchange and there may be a limited market for the securities, especially when there is a perceived weakness in the mortgage and real estate market sectors. Without an active trading market, MBS held in the Fund’s portfolio may be particularly difficult to value because of the complexities involved in assessing the value of the underlying mortgage loans.
47
American Beacon FundsSM
Notes to Financial Statements
October 31, 2016
Asset-Backed Securities
ABS may include MBS, loans, receivables or other assets. The value of the Fund’s ABS may be affected by, among other things, actual or perceived changes in interest rates, factors concerning the interests in and structure of the issuer or the originator of the receivables, the market’s assessment of the quality of underlying assets or actual or perceived changes in the credit worthiness of the individual borrowers, the originator, the servicing agent or the financial institution providing the credit support.
Payment of principal and interest may be largely dependent upon the cash flows generated by the assets backing the securities.
Rising or high interest rates tend to extend the duration of ABS, making them more volatile and more sensitive to changes in interest rates. The underlying assets are sometimes subject to prepayments which can shorten the security’s weighted average life and may lower its return. Defaults on loans underlying ABS have become an increasing risk for ABS that are secured by home equity loans related to sub-prime, Alt-A or non-conforming mortgage loans, especially in a declining residential real estate market.
ABS (other than MBS) present certain risks that are not presented by MBS. Primarily, these securities may not have the benefit of any security interest in the related assets. Credit card receivables are generally unsecured and the debtors are entitled to the protection of a number of state and federal consumer credit laws, many of which give such debtors the right to set off certain amounts owed on the credit cards, thereby reducing the balance due. There is the possibility that recoveries on repossessed collateral may not, in some cases, be available to support payments on these securities. ABS are often backed by a pool of assets representing the obligations of a number of different parties. To lessen the effect of failures by obligors on underlying assets to make payments, the securities may contain elements of credit support which fall into two categories: (i) liquidity protection, and (ii) protection against losses resulting from ultimate default by an obligor on the underlying assets. Liquidity protection refers to the provision of advances, generally by the entity administering the pool of assets, to ensure that the receipt of payments on the underlying pool occurs in a timely fashion. Protection against losses results from payment of the insurance obligations on at least a portion of the assets in the pool. This protection may be provided through guarantees, policies or letters of credit obtained by the issuer or sponsor from third parties, through various means of structuring the transaction or through a combination of such approaches. The Fund will not pay any additional or separate fees for credit support. The degree of credit support provided for each issue is generally based on historical information respecting the level of credit risk associated with the underlying assets.
Delinquency or loss in excess of that anticipated or failure of the credit support could adversely affect the return on an investment in such a security. The availability of ABS may be affected by legislative or regulatory developments. It is possible that such developments may require the Fund to dispose of any then existing holdings of such securities.
5. Financial Derivative Instruments
The Balanced and Mid-Cap Value Funds may utilize derivative instruments to market exposure on cash balances or reduce market exposure in anticipation of liquidity needs. When considering the Funds’ use of derivatives, it is important to note that the Funds do not use derivatives for the purpose of creating financial leverage.
Futures Contracts
Futures contracts are contracts to buy or sell a standard quantity of securities at a specified price on a future date. The Funds may enter into financial futures contracts as a method for keeping assets readily convertible to cash if needed to meet shareholder redemptions or for other needs while maintaining exposure to the stock or bond market, as applicable. The primary risks associated with the use of futures contracts are the possibility of
48
American Beacon FundsSM
Notes to Financial Statements
October 31, 2016
illiquid markets or imperfect correlation between the values of the contracts and the underlying securities, or that the counterparty will fail to perform its obligations.
Upon entering into a futures contract, the Funds are required to set aside or deposit with a broker an amount, termed the initial margin, which typically represents a portion of the face value of the futures contract. The Funds reflects this amount on the Schedule of Investments as a U.S. Treasury Bill held as collateral for futures contracts or as cash deposited with broker on the Statement of Assets and Liabilities. Payments to and from the broker, known as variation margin, are required to be made on a daily basis as the price of the futures contract fluctuates. Changes in initial settlement values are accounted for as unrealized appreciation (depreciation) until the contracts are terminated, at which time realized gains and losses are recognized. Futures contracts are valued at the most recent settlement price established each day by the exchange on which they are traded.
For the year ended October 31, 2016, the Funds entered into future contracts primarily for exposing cash to markets.
The Funds’ average futures contracts outstanding fluctuate throughout the operating year as required to meet strategic requirements. The following table illustrates the average quarterly volume of futures contracts. For purpose of this disclosure, volume is measured by contracts outstanding at each quarter end.
| | | | |
Number of Futures Contracts Outstanding | |
Fund | | Year ended October 31, 2016 | |
Balanced | | | 249 | |
Mid-Cap Value | | | 163 | |
The following is a summary of the Funds’ derivative financial instruments categorized by risk exposure(1):
Fair Values of financial derivative instruments not accounted for as hedging instruments as of October 31, 2016:
| | | | | | | | | | | | |
| | | Derivative | | | | | | Mid-Cap Value | |
| | | Type | | | Balanced Fund | | | Fund | |
Statements of Assets and Liabilities | | | | | | | | | | | | |
Payable for variation margin from open futures contracts (2) | | | Equity Contracts | | | $ | (271,225 | ) | | $ | (481,083 | ) |
The effect of financial derivative instruments not accounted for as hedging instruments during the year ended October 31, 2016:
| | | | | | | | | | | | |
| | | Derivative | | | | | | Mid-Cap Value | |
| | | Type | | | Balanced Fund | | | Fund | |
Statements of Operations | | | | | | | | | | | | |
Net realized gain (loss) from futures contracts | | | Equity Contracts | | | $ | 2,239,111 | | | $ | 1,578,656 | |
Change in net unrealized appreciation (depreciation) of futures contracts | | | Equity Contracts | | | | (334,912 | ) | | | (907,744 | ) |
| (1) | See Note 3 in the Notes to Financial Statements for additional information. |
| (2) | Includes cumulative appreciation (depreciation) of futures contracts as reported in the Schedules of Investment footnotes. Only current day’s variation margin is reported within the Statements of Assets and Liabilities. |
6. Principal Risks
In the normal course of business the Funds trade financial instruments and enter into financial transactions where risk of potential loss exists. Security values fluctuate (market risk) and may decline due to factors affecting securities markets in general, particular industries represented in the securities markets or conditions specifically related to a particular company. Failure of the other party to a transaction to perform (credit and counterparty risk), for example by not making principal and interest payments when due, reduces the value of the issuer’s debt and could reduce the Funds’ income. Similar to credit risk, the Funds may be exposed to counterparty risk, or the risk that an institution or other entity with which the Funds have unsettled or open transactions will fail
49
American Beacon FundsSM
Notes to Financial Statements
October 31, 2016
to make required payments or otherwise comply with the terms of the instrument, transaction or contract. The potential loss could exceed the value of the financial assets recorded in the financial statements. Some of the Funds’ investments may be illiquid and the Funds may not be able to vary the portfolio investments in response to changes in economic and other conditions. If the Fund is required to liquidate all or a portion of its investments quickly, the Fund may realize significantly less than the value at which it previously recorded those investments.
Market Risks
The Funds’ investments in financial derivatives and other financial instruments expose the Funds to various risks such as, but not limited to, interest rate, foreign currency and equity risks.
Interest rate risk is the risk that fixed-income securities will decline in value because of changes in interest rates. As nominal interest rates rise, the value of certain fixed-income securities held by the Funds are likely to decrease. A nominal interest rate can be described as the sum of a real interest rate and an expected inflation rate. Fixed-income securities with longer durations tend to be more sensitive to changes in interest rates, usually making them more volatile than securities with shorter durations. Duration is useful primarily as a measure of the sensitivity of a fixed-income’s market price to interest rate (i.e. yield) movements.
If the Funds invest directly in foreign currencies or in securities that trade in, and receive revenues in, foreign currencies, or in financial derivatives that provide exposure to foreign currencies, they will be subject to the risk that those currencies will decline in value relative to the base currency of the Funds, or, in the case of hedging positions, that the Funds’ base currency will decline in value relative to the currency being hedged. Currency rates in foreign countries may fluctuate significantly over short periods of time for a number of reasons, including changes in interest rates, intervention (or the failure to intervene) by U.S. or foreign governments, central banks or supranational entities such as the International Monetary Fund, or by the imposition of currency controls or other political developments in the United States or abroad. As a result, the Funds’ investments in foreign currency denominated securities may reduce the returns of the Fund.
The fair values of equities, such as common stocks and preferred securities or equity related investments such as futures, may decline due to general market conditions which are not specifically related to a particular company, such as real or perceived adverse economic conditions, changes in the general outlook for corporate earnings, changes in interest or currency rates or adverse investor sentiment generally. They may also decline due to factors which affect a particular industry or industries, such as labor shortages or increased production costs and competitive conditions within an industry. Equity securities and equity related investments generally have greater market price volatility than fixed-income securities.
Credit and Counterparty Risk
A derivative contract may suffer a mark-to-market loss if the value of the contract decreases due to an unfavorable change in the market rates or values of the underlying instrument. Losses can also occur if the counterparty does not perform under the contract.
With exchange-traded futures, there is less counterparty credit risk to the Funds since the exchange or clearinghouse, as counterparty to such instruments, guarantees against a possible default. The clearinghouse stands between the buyer and the seller of the contract; therefore, the credit risk is limited to failure of the clearinghouse. While offset rights may exist under applicable law, a Fund does not have a contractual right of offset against a clearing broker or clearinghouse in the event of a default (including the bankruptcy or insolvency) of the clearing broker or clearinghouse. Additionally, credit risk exists in exchange traded futures with respect to initial and variation margin that is held in a clearing broker’s customer accounts. While clearing brokers are required to segregate customer margin from their own assets, in the event that a clearing broker becomes insolvent or goes into bankruptcy and at that time there is a shortfall in the aggregate amount of margin held by the clearing broker
50
American Beacon FundsSM
Notes to Financial Statements
October 31, 2016
for all its clients, typically the shortfall would be allocated on a pro rata basis across all the clearing broker’s customers, potentially resulting in losses to the Funds.
Cash collateral that has been pledged to cover obligations of the Funds and cash collateral received from the counterparty, if any, is reported separately on the Statements of Assets and Liabilities as “Deposits with brokers for futures contracts” and “Payable to brokers for futures contracts”, respectively. Non-cash collateral pledged by the Funds, if any, is noted in the Schedule of Investments. Generally, the amount of collateral due from or to a party is determined at the close of business of the Funds and additional required collateral is delivered to/pledged by the Funds on the next business day. To the extent amounts due to the Funds from its counterparties are not fully collateralized, contractually or otherwise, the Funds bear the risk of loss from counterparty non-performance. The Funds attempt to mitigate counterparty risk by only entering into agreements with counterparties that it believes have the financial resources to honor their obligations and by monitoring the financial stability of those counterparties.
Offsetting Assets and Liabilities
The Funds are parties to enforceable master netting agreements between brokers and counterparties which provides for the right to offset under certain circumstances. The Funds employ multiple money managers and counterparties and have elected not to offset qualifying financial and derivative instruments on the Statements of Assets and Liabilities, as such all financial and derivative instruments are presented on a gross basis. The impacts of netting arrangements that provide the right to offset are detailed below. The net amount represents the net receivable or payable that would be due from or to the counterparty in the event of default. Exposure from borrowings and other financing agreements such as repurchase agreements can only be netted across transactions governed by the same Master Agreement with the same legal entity. All amounts reported below represent the balance as of October 31, 2016.
Balanced Fund
Offsetting of Financial Liabilities and Derivative Liabilities as of October 31, 2016:
| | | | | | | | | | | | |
| | | | | | | | | Net Amounts of Liabilities | |
| | | Gross Amounts | | | Gross Amounts Offset in the | | | Presented in the | |
| | | of Recognized | | | Statements of Assets and | | | Statements of Assets | |
Description | | Liabilities | | | Liabilities | | | and Liabilities | |
Futures Contracts (1) | | $ | (271,225 | ) | | $ | — | | | $ | (271,225 | ) |
Financial Liabilities, Derivative Liabilities, and Collateral Pledged by Counterparty as of October 31, 2015:
| | | | | | | | | | | | | | | | |
| | | | | | Gross Amounts Not Offset in the | | | | |
| | | Net amount of Assets | | | Statements of Assets and Liabilities | | | | |
| | | Presented in the Statements of | | | | | | Cash Collateral | | | Net | |
Counterparty | | Assets and Liabilities | | | Financial Instruments | | | Received | | | Amount | |
Goldman Sachs & Co. (1) | | $ | (271,225 | ) | | $ | — | | | $ | — | | | $ | (271,225 | ) |
51
American Beacon FundsSM
Notes to Financial Statements
October 31, 2016
Mid-Cap Value Fund
Offsetting of Financial Assets and Derivative Assets as of October 31, 2016:
| | | | | | | | | | | | |
| | | | | | Gross Amounts | | | Net Amounts of Assets | |
| | | | | | Offset in the | | | Presented in the | |
| | | Gross Amounts of | | | Statements of Assets | | | Statements of Assets | |
Description | | Recognized Assets | | | and Liabilities | | | and Liabilities | |
Securities Lending | | $ | 5,505,771 | | | $ | — | | | $ | 5,505,771 | |
Futures Contracts (1) | | | (481,083 | ) | | | — | | | | (481,083 | ) |
| | | | | | | | | | | | |
| | $ | 5,024,688 | | | $ | — | | | $ | 5,024,688 | |
| | | | | | | | | | | | |
Financial Assets, Derivative Assets, and Collateral Pledged by Counterparty as of October 31, 2016:
| | | | | | | | | | | | | | | | |
| | | | | | Gross Amounts Not Offset in the | | | | |
| | | Net amount of Assets | | | Statements of Assets and Liabilities | | | | |
| | | Presented in the Statements of | | | | | | Cash Collateral | | | Net | |
Counterparty | | Assets and Liabilities | | | Financial Instruments | | | Received(2) | | | Amount | |
Barclays Capital, Inc. | | $ | 305,730 | | | $ | — | | | $ | (305,730 | ) | | $ | — | |
Goldman Sachs & Co.(1) | | | (481,083 | ) | | | — | | | | — | | | | (481,083 | ) |
JP Morgan Clearing Corp. | | | 1,455,611 | | | | — | | | | (1,455,611 | ) | | | — | |
MS Securities Services Inc. | | | 1,528,650 | | | | — | | | | (1,528,650 | ) | | | — | |
UBS Securities, LLC | | | 2,215,780 | | | | — | | | | (2,215,780 | ) | | | — | |
| | | | | | | | | | | | | | | | |
| | $ | 5,024,688 | | | $ | — | | | $ | (5,505,771 | ) | | $ | (481,083 | ) |
| | | | | | | | | | | | | | | | |
| (1) | The securities presented here within are not subject to Master Netting Agreements. As such, this is disclosed for informational purposes only. |
| (2) | Excess of collateral received from the individual counterparty is not shown for financial reporting purposes. Collateral with a value of $5,645,650 has been received in connection with securities lending transactions |
7. Federal Income and Excise Taxes
It is the policy of each Fund to qualify as a regulated investment company (“RIC”), by complying with all applicable provisions of Subchapter M of the Internal Revenue Code, as amended, and to make distribution of taxable income sufficient to relieve it from substantially all federal income and excise taxes. For federal income tax purposes, each Fund is treated as a single entity for the purpose of determining such qualification.
The Funds do not have any unrecognized tax benefits in the accompanying financial statements. Each of the tax years in the four year period ended October 31, 2016 remain subject to examination by the Internal Revenue Service. If applicable, the Funds recognize interest accrued related to unrecognized tax benefits in interest expense and penalties in “Other expenses” on the Statements of Operations.
The Funds may be subject to taxes imposed by countries in which it invests. Such taxes are generally based on returns of income earned or gains realized or repatriated. Taxes are accrued and applied to net investment income, net realized capital gains and net unrealized appreciation (depreciation), as applicable, as the income is earned or capital gains are recorded.
Dividends are categorized in accordance with income tax regulations which may treat certain transactions differently than U.S. GAAP. Accordingly, the character of distributions and composition of net assets for tax purposes may differ from those reflected in the accompanying financial statements.
The tax character of distributions paid are as follows:
52
American Beacon FundsSM
Notes to Financial Statements
October 31, 2016
| | | | | | | | | | | | | | | | |
| | | Balanced Fund | | | Mid-Cap Value Fund | |
| | | Year Ended | | | Year Ended | | | Year Ended | | | Year Ended | |
| | | October 31, | | | October 31, | | | October 31, | | | October 31, | |
| | | 2016 | | | 2015 | | | 2016 | | | 2015 | |
Distributions paid from: | | | | | | | | | | | | | | | | |
Ordinary income* | | | | | | | | | | | | | | | | |
Institutional ClassA | | $ | 8,264,594 | | | $ | 1,579,207 | | | $ | 5,546,242 | | | $ | 2,270,070 | |
Y Class | | | 405,490 | | | | 770,502 | | | | 1,490,422 | | | | 388,972 | |
Investor Class | | | 1,969,152 | | | | 3,014,396 | | | | 5,830,974 | | | | 2,836,020 | |
Advisor Class | | | 133,099 | | | | 230,471 | | | | 110,271 | | | | 93,165 | |
A Class | | | 377,279 | | | | 525,347 | | | | 278,524 | | | | 169,406 | |
C Class | | | 334,834 | | | | 500,857 | | | | 76,687 | | | | 27,766 | |
AMR Class | | | — | | | | 14,875,332 | | | | — | | | | 1,618,097 | |
Long-term capital gains | | | | | | | | | | | | | | | | |
Institutional ClassA | | | 21,375,622 | | | | 3,177,449 | | | | 9,918,865 | | | | 4,880,586 | |
Y Class | | | 1,575,829 | | | | 1,720,312 | | | | 2,719,017 | | | | 828,601 | |
Investor Class | | | 7,756,202 | | | | 7,413,520 | | | | 11,678,403 | | | | 6,332,017 | |
Advisor Class | | | 605,990 | | | | 628,260 | | | | 276,050 | | | | 233,890 | |
A Class | | | 1,370,814 | | | | 1,183,013 | | | | 639,255 | | | | 479,247 | |
C Class | | | 2,334,178 | | | | 1,607,671 | | | | 257,621 | | | | 136,915 | |
AMR Class | | | — | | | | 30,035,412 | | | | — | | | | 2,978,679 | |
| | | | | | | | | | | | | | | | |
Total distributions paid | | $ | 46,503,083 | | | $ | 67,261,749 | | | $ | 38,822,331 | | | $ | 23,273,431 | |
| | | | | | | | | | | | | | | | |
| * | For tax purposes, short-term gains are considered ordinary income distributions. |
| A | Includes AMR Class distributions for the Balanced Fund (Note 1). |
As of October 31, 2016, the components of distributable earnings (deficits) on a tax basis were as follows:
| | | | | | | | |
| | | | | | Mid-Cap Value | |
| | | Balanced Fund | | | Fund | |
Cost basis of investments for federal income tax purposes | | $ | 676,793,264 | | | $ | 529,867,769 | |
Unrealized appreciation | | | 71,047,746 | | | | 53,997,828 | |
Unrealized depreciation | | | (32,636,665 | ) | | | (38,051,518 | ) |
| | | | | | | | |
Net unrealized appreciation (depreciation) | | | 38,411,081 | | | | 15,946,310 | |
Undistributed ordinary income | | | 5,854,487 | | | | 5,981,838 | |
Accumulated capital gains (losses) | | | (5,984,203 | ) | | | (18,814,520 | ) |
Other temporary differences | | | (270,994 | ) | | | (481,279 | ) |
| | | | | | | | |
Distributable earnings (deficits) | | $ | 38,010,371 | | | $ | 2,632,349 | |
| | | | | | | | |
Financial reporting records are adjusted for permanent book/tax differences to reflect tax character. Financial records are not adjusted for temporary differences. The temporary differences between financial reporting and tax-basis reporting of unrealized appreciation (depreciation) are attributable primarily to the tax deferral of losses from wash sales, the realization for tax purposes of unrealized gains or (losses) on certain derivative instruments, reclassifications of income from real estate investment securities and publicly traded partnerships, and book amortization of premiums.
Due to inherent differences in the recognition of income, expenses and realized gains (losses) under U.S. GAAP and federal income tax regulations, permanent differences between book and tax reporting have been identified and appropriately reclassified on the Statements of Assets and Liabilities.
Accordingly, the following amounts represent current year permanent differences derived from book amortization of premium, foreign currency reclasses, pay down reclasses, Section 732 basis adjustments, reclassifications of income from real estate investment securities and publicly traded partnerships, and reclassifications of dividends as of October 31, 2016.
53
American Beacon FundsSM
Notes to Financial Statements
October 31, 2016
| | | | | | | | |
| | | | | | Mid-Cap Value | |
| | | Balanced Fund | | | Fund | |
Paid-in-capital | | $ | 232 | | | $ | (95 | ) |
Undistributed net investment income | | | 707,992 | | | | (352,653 | ) |
Accumulated net realized gain (loss) | | | (708,224 | ) | | | 352,749 | |
Unrealized appreciation or (depreciation) of investments and futures contracts | | | — | | | | (1 | ) |
Under the Regulated Investment Company Modernization Act of 2010 (the “RIC MOD”), net capital losses recognized by Funds in taxable years beginning after December 22, 2010 are carried forward indefinitely and retain their character as short-term and/or long-term losses.
For the year ended October 31, 2016, the Funds’ had the following post RIC MOD capital loss carryforwards:
| | | | | | | | |
| | | Short-Term Capital Loss | | | Long-Term Capital Loss | |
Fund | | Carryforwards | | | Carryforwards | |
Balanced | | $ | 2,065,884 | | | $ | 4,189,544 | |
Mid-Cap Value | | | 8,005,273 | | | | 11,290,330 | |
8. Investment Transactions
The aggregate cost of purchases and proceeds from sales and maturities of investments, other than short-term obligations, for the year ended October 31, 2016 were as follows:
| | | | | | | | |
| | | | | | Mid-Cap Value | |
| | | Balanced Fund | | | Fund | |
Purchases (excluding U.S. government securities) | | $ | 100,807,856 | | | $ | 158,457,479 | |
Sales and maturities (excluding U.S. government securities) | | | 169,664,208 | | | | 285,161,700 | |
Purchases of U.S. government securities | | | 129,372,795 | | | | — | |
Sales and maturities of U.S. government securities | | | 122,460,635 | | | | — | |
A summary of the Funds’ transactions in the USG Select Fund for the year ended October 31, 2016 are as follows:
| | | | | | | | | | | | | | | | | | | | | | |
| | | Type of | | October 31, 2015 | | | | | | | | | October 31, 2016 | | | | |
Fund | | Transaction | | Share/Fair Value | | | Purchases | | | Sales | | | Share/Fair Value | | | Dividend Income | |
Balanced | | Direct | | $ | — | | | $ | 255,996,384 | | | $ | 223,938,603 | | | $ | 32,057,781 | | | $ | 62,143 | |
Mid-Cap Value | | Direct | | | — | | | | 198,961,765 | | | | 173,004,491 | | | | 25,957,274 | | | | 42,633 | |
Mid-Cap Value | | Securities Lending | | | 10,587,340 | | | | 145,207,688 | | | | 151,691,747 | | | | 4,103,281 | | | | n/a | |
9. Securities Lending
The Mid-Cap Value Fund may lend its securities to qualified financial institutions, such as certain broker-dealers, to earn additional income. The borrowers are required to secure their loans continuously with collateral in an amount at least equal to the fair value of the securities loaned, initially in an amount at least equal to 102% of the fair value of domestic securities loaned and 105% of the fair value of international securities loaned. Collateral is monitored and marked tomarket daily. Daily mark to market amounts are required to be paid to the borrower or received from the borrower by the end of the following business day. This one day settlement for mark-to-market amounts may result in the collateral being temporarily less than the value of the securities on loan or temporarily more than the required minimum collateral.
To the extent that a loan is collateralized by cash, such cash collateral shall be invested by the securities lending agent (the “Agent”) in money market mutual funds and other short-term investments, provided the investments meet certain quality and diversification requirements. Securities purchased with cash collateral
54
American Beacon FundsSM
Notes to Financial Statements
October 31, 2016
proceeds are listed in the Fund’s Schedule of Investments and the collateral is shown on the Statements of Assets and Liabilities as a payable.
Securities lending income is generated from the demand premium (if any) paid by the borrower to borrow a specific security and from the return on investment of cash collateral, reduced by negotiated rebate fees paid to the borrower and transaction costs. To the extent that a loan is secured by non-cash collateral, securities lending income is generated as a demand premium reduced by transaction costs. The Fund, the Agent, and the Manager retain 80%, 10%, and 10%, respectively, of the income generated from securities lending.
While securities are on loan, the Fund continues to receive certain income associated with that security and any gain or loss in the market price that may occur during the term of the loan. In the case of domestic equities, the value of any dividend is received in the form of a substitute payment approximately equal to the dividend. In the case of foreign securities, a negotiated amount is received that is less than the actual dividend, but higher than the dividend amount minus the foreign tax that the Fund would be subject to on the dividend.
Securities lending transactions pose certain risks to the Fund, including that the borrower may not provide additional collateral when required or return the securities when due, that the value of the short-term investments will be less than the amount of cash collateral required to be returned to the borrower, that non-cash collateral may be subject to legal constraints in the event of a borrower bankruptcy, and that the cash collateral investments could become illiquid and unable to be used to return collateral to the borrower. The Fund could also experience delays and costs in gaining access to the collateral. The Fund bears the risk of any deficiency in the amount of the cash collateral available for return to the borrower and any action which impairs its ability to liquidate non-cash collateral to satisfy a borrower default.
As of October 31, 2016, the value of outstanding securities on loan and the value of collateral was as follows:
| | | | | | | | | | |
| Fair Value of Securities on Loan | | | Non-Cash Collateral | | | Cash Collateral Posted by Borrower | |
| $ | 5,505,771 | | | $ | — | | | $ | 5,645,650 | |
Cash collateral is listed on the Mid-Cap Value Fund’s Schedule of Investments and is shown on the Statements of Assets and Liabilities. Income earned on these investments, is included in “Income derived from securities lending” on the Statements of Operations.
Non-cash collateral received by the Fund may not be sold or re-pledged except to satisfy a borrower default. Therefore, non-cash collateral is not included on the Fund’s Schedule of Investments or Statements of Assets and Liabilities.
10. Capital Share Transactions
The tables below summarize the activity in capital shares for each Class of the Funds:
| | | | | | | | | | | | | | | | |
| | | Institutional Class | |
| | | Year Ended October 31, | |
| | | 2016A | | | 2015 | |
Balanced Fund | | Shares | | | Amount | | | Shares | | | Amount | |
Shares sold | | | 27,615,173 | | | $ | 413,275,370 | | | | 2,986,775 | | | $ | 48,745,887 | |
Reinvestment of dividends | | | 2,110,281 | | | | 29,609,682 | | | | 291,829 | | | | 4,724,882 | |
Shares redeemed | | | (26,882,903 | ) | | | (378,720,594 | ) | | | (1,431,597 | ) | | | (23,116,816 | ) |
| | | | | | | | | | | | | | | | |
Net increase in shares outstanding | | | 2,842,551 | | | $ | 64,164,458 | | | | 1,847,007 | | | $ | 30,353,953 | |
| | | | | | | | | | | | | | | | |
55
American Beacon FundsSM
Notes to Financial Statements
October 31, 2016
| | | | | | | | | | | | | | | | |
| | | Y Class | |
| | | Year Ended October 31, | |
| | | 2016 | | | 2015 | |
Balanced Fund | | Shares | | | Amount | | | Shares | | | Amount | |
Shares sold | | | 1,011,636 | | | $ | 15,071,547 | | | | 1,308,195 | | | $ | 21,587,946 | |
Reinvestment of dividends | | | 126,508 | | | | 1,861,848 | | | | 146,023 | | | | 2,375,466 | |
Shares redeemed | | | (1,725,794 | ) | | | (25,396,659 | ) | | | (1,127,174 | ) | | | (18,305,963 | ) |
| | | | | | | | | | | | | | | | |
Net increase (decrease) in shares outstanding | | | (587,650 | ) | | $ | (8,463,264 | ) | | | 327,045 | | | $ | 5,657,449 | |
| | | | | | | | | | | | | | | | |
| |
| | | Investor Class | |
| | | Year Ended October 31, | |
| | | 2016 | | | 2015 | |
Balanced Fund | | Shares | | | Amount | | | Shares | | | Amount | |
Shares sold | | | 1,350,859 | | | $ | 18,123,424 | | | | 4,196,574 | | | $ | 62,493,388 | |
Reinvestment of dividends | | | 720,937 | | | | 9,524,234 | | | | 689,746 | | | | 10,149,130 | |
Shares redeemed | | | (3,685,502 | ) | | | (49,146,541 | ) | | | (4,822,173 | ) | | | (71,369,071 | ) |
| | | | | | | | | | | | | | | | |
Net increase (decrease) in shares outstanding | | | (1,613,706 | ) | | $ | (21,498,883 | ) | | | 64,147 | | | $ | 1,273,447 | |
| | | | | | | | | | | | | | | | |
| |
| | | Advisor Class | |
| | | Year Ended October 31, | |
| | | 2016 | | | 2015 | |
Balanced Fund | | Shares | | | Amount | | | Shares | | | Amount | |
Shares sold | | | 133,774 | | | $ | 1,850,033 | | | | 231,703 | | | $ | 3,609,915 | |
Reinvestment of dividends | | | 53,093 | | | | 739,089 | | | | 55,502 | | | | 858,519 | |
Shares redeemed | | | (352,921 | ) | | | (4,929,490 | ) | | | (304,979 | ) | | | (4,681,426 | ) |
| | | | | | | | | | | | | | | | |
Net (decrease) in shares outstanding | | | (166,054 | ) | | $ | (2,340,368 | ) | | | (17,774 | ) | | $ | (212,992 | ) |
| | | | | | | | | | | | | | | | |
| |
| | | A Class | |
| | | Year Ended October 31, | |
| | | 2016 | | | 2015 | |
Balanced Fund | | Shares | | | Amount | | | Shares | | | Amount | |
Shares sold | | | 482,815 | | | $ | 6,411,237 | | | | 1,136,985 | | | $ | 16,867,058 | |
Reinvestment of dividends | | | 125,899 | | | | 1,660,888 | | | | 108,335 | | | | 1,592,019 | |
Shares redeemed | | | (826,982 | ) | | | (11,295,620 | ) | | | (881,788 | ) | | | (12,823,461 | ) |
| | | | | | | | | | | | | | | | |
Net increase (decrease) in shares outstanding | | | (218,268 | ) | | $ | (3,223,495 | ) | | | 363,532 | | | $ | 5,635,616 | |
| | | | | | | | | | | | | | | | |
| |
| | | C Class | |
| | | Year Ended October 31, | |
| | | 2016 | | | 2015 | |
Balanced Fund | | Shares | | | Amount | | | Shares | | | Amount | |
Shares sold | | | 513,284 | | | $ | 6,943,323 | | | | 1,432,453 | | | $ | 21,546,131 | |
Reinvestment of dividends | | | 186,044 | | | | 2,476,409 | | | | 124,475 | | | | 1,852,727 | |
Shares redeemed | | | (909,921 | ) | | | (12,252,401 | ) | | | (464,654 | ) | | | (6,892,256 | ) |
| | | | | | | | | | | | | | | | |
Net increase (decrease) in shares outstanding | | | (210,593 | ) | | $ | (2,832,669 | ) | | | 1,092,274 | | | $ | 16,506,602 | |
| | | | | | | | | | | | | | | | |
| |
| | | AMR Class | |
| | | Year Ended October 31, | |
| | | 2016A | | | 2015 | |
Balanced Fund | | Shares | | | Amount | | | Shares | | | Amount | |
Shares sold | | $ | — | | | $ | — | | | | 4,030,020 | | | $ | 61,772,705 | |
Reinvestment of dividends | | | — | | | | — | | | | 2,951,408 | | | | 44,910,745 | |
Shares redeemed | | | — | | | | — | | | | (27,432,772 | ) | | | (409,126,549 | ) |
| | | | | | | | | | | | | | | | |
Net (decrease) in shares outstanding | | | — | | | $ | — | | | | (20,451,344 | ) | | $ | (302,443,099 | ) |
| | | | | | | | | | | | | | | | |
| A | Includes AMR Class Transactions of the Balanced Fund (Note 1). |
| | | | | | | | | | | | | | | | |
| | | Institutional Class | |
| | | Year Ended October 31, | |
| | | 2016 | | | 2015 | |
Mid-Cap Value Fund | | Shares | | | Amount | | | Shares | | | Amount | |
Shares sold | | | 4,825,944 | | | $ | 64,259,175 | | | | 8,219,667 | | | $ | 122,878,242 | |
Redemption Fees | | | — | | | | — | | | | — | | | | 11,931 | |
Reinvestment of dividends | | | 1,149,977 | | | | 15,064,696 | | | | 476,482 | | | | 6,980,461 | |
Shares redeemed | | | (9,719,197 | ) | | | (132,906,070 | ) | | | (4,139,346 | ) | | | (61,220,656 | ) |
| | | | | | | | | | | | | | | | |
Net increase (decrease) in shares outstanding | | | (3,743,276 | ) | | $ | (53,582,199 | ) | | | 4,556,803 | | | $ | 68,649,978 | |
| | | | | | | | | | | | | | | | |
56
American Beacon FundsSM
Notes to Financial Statements
October 31, 2016
| | | | | | | | | | | | | | | | |
| | | Y Class | |
| | | Year Ended October 31, | |
| | | 2016 | | | 2015 | |
Mid-Cap Value Fund | | Shares | | | Amount | | | Shares | | | Amount | |
Shares sold | | | 1,694,856 | | | $ | 21,909,728 | | | | 3,400,390 | | | $ | 50,233,018 | |
Redemption Fees | | | — | | | | — | | | | — | | | | 2,396 | |
Reinvestment of dividends | | | 323,352 | | | | 4,203,575 | | | | 81,809 | | | | 1,190,328 | |
Shares redeemed | | | (1,882,894 | ) | | | (24,911,078 | ) | | | (778,556 | ) | | | (11,516,512 | ) |
| | | | | | | | | | | | | | | | |
Net increase in shares outstanding | | | 135,314 | | | $ | 1,202,225 | | | | 2,703,643 | | | $ | 39,909,230 | |
| | | | | | | | | | | | | | | | |
| |
| | | Investor Class | |
| | | Year Ended October 31, | |
| | | 2016 | | | 2015 | |
Mid-Cap Value Fund | | Shares | | | Amount | | | Shares | | | Amount | |
Shares sold | | | 3,990,292 | | | $ | 53,655,559 | | | | 7,287,808 | | | $ | 109,453,268 | |
Redemption Fees | | | — | | | | — | | | | — | | | | 14,496 | |
Reinvestment of dividends | | | 1,320,670 | | | | 17,472,464 | | | | 619,058 | | | | 9,155,869 | |
Shares redeemed | | | (8,788,846 | ) | | | (117,484,842 | ) | | | (3,764,382 | ) | | | (56,035,133 | ) |
| | | | | | | | | | | | | | | | |
Net increase (decrease) in shares outstanding | | | (3,477,884 | ) | | $ | (46,356,819 | ) | | | 4,142,484 | | | $ | 62,588,500 | |
| | | | | | | | | | | | | | | | |
| |
| | | Advisor Class | |
| | | Year Ended October 31, | |
| | | 2016 | | | 2015 | |
Mid-Cap Value Fund | | Shares | | | Amount | | | Shares | | | Amount | |
Shares sold | | | 152,769 | | | $ | 1,990,312 | | | | 278,371 | | | $ | 3,989,149 | |
Redemption Fees | | | — | | | | — | | | | — | | | | 433 | |
Reinvestment of dividends | | | 30,087 | | | | 386,321 | | | | 22,769 | | | | 326,962 | |
Shares redeemed | | | (167,622 | ) | | | (2,196,069 | ) | | | (327,035 | ) | | | (4,785,894 | ) |
| | | | | | | | | | | | | | | | |
Net increase (decrease) in shares outstanding | | | 15,234 | | | $ | 180,564 | | | | (25,895 | ) | | $ | (469,350 | ) |
| | | | | | | | | | | | | | | | |
| |
| | | A Class | |
| | | Year Ended October 31, | |
| | | 2016 | | | 2015 | |
Mid-Cap Value Fund | | Shares | | | Amount | | | Shares | | | Amount | |
Shares sold | | | 798,185 | | | $ | 9,613,064 | | | | 424,744 | | | $ | 6,178,681 | |
Redemption Fees | | | — | | | | — | | | | — | | | | 1,023 | |
Reinvestment of dividends | | | 69,638 | | | | 893,451 | | | | 42,343 | | | | 607,617 | |
Shares redeemed | | | (595,507 | ) | | | (7,792,695 | ) | | | (587,609 | ) | | | (8,411,100 | ) |
| | | | | | | | | | | | | | | | |
Net increase (decrease) in shares outstanding | | | 272,316 | | | $ | 2,713,820 | | | | (120,522 | ) | | $ | (1,623,779 | ) |
| | | | | | | | | | | | | | | | |
| |
| | | C Class | |
| | | Year Ended October 31, | |
| | | 2016 | | | 2015 | |
Mid-Cap Value Fund | | Shares | | | Amount | | | Shares | | | Amount | |
Shares sold | | | 78,375 | | | $ | 1,022,759 | | | | 140,217 | | | $ | 1,986,357 | |
Redemption Fees | | | — | | | | — | | | | — | | | | 296 | |
Reinvestment of dividends | | | 26,027 | | | | 325,334 | | | | 10,753 | | | | 150,862 | |
Shares redeemed | | | (99,482 | ) | | | (1,268,556 | ) | | | (63,475 | ) | | | (884,228 | ) |
| | | | | | | | | | | | | | | | |
Net increase in shares outstanding | | | 4,920 | | | $ | 79,537 | | | | 87,495 | | | $ | 1,253,287 | |
| | | | | | | | | | | | | | | | |
| |
| | | AMR Class | |
| | | Year Ended October 31, | |
| | | 2016 | | | 2015 | |
Mid-Cap Value Fund | | Shares | | | Amount | | | Shares | | | Amount | |
Shares sold | | | 936 | | | $ | 13,774 | | | | 1,370,087 | | | $ | 20,402,103 | |
Redemption Fees | | | — | | | | — | | | | — | | | | 6,511 | |
Reinvestment of dividends | | | — | | | | — | | | | 313,345 | | | | 4,596,776 | |
Shares redeemed | | | (85,963 | ) | | | (1,270,532 | ) | | | (9,863,389 | ) | | | (144,848,224 | ) |
| | | | | | | | | | | | | | | | |
Net (decrease) in shares outstanding | | | (85,027 | ) | | $ | (1,256,758 | ) | | | (8,179,957 | ) | | $ | (119,842,834 | ) |
| | | | | | | | | | | | | | | | |
11. Subsequent Events
Management has evaluated subsequent events for possible recognition or disclosure in the financial
57
American Beacon FundsSM
Notes to Financial Statements
October 31, 2016
statements through the date the financial statements are issued. Management has determined that there are no material events that would require disclosure in the Fund’s financial statements through this date.
58
American Beacon Balanced FundSM
Financial Highlights
(For a share outstanding throughout the period)
| | | | | | | | | | | | | | | | | | | | |
| | | Institutional Class B | |
| | | Year Ended
October 31, | |
| | | 2016 | | | 2015 | | | 2014 | | | 2013 | | | 2012 | |
Net asset value, beginning of period | | $ | 15.79 | | | $ | 16.79 | | | $ | 16.31 | | | $ | 14.27 | | | $ | 12.89 | |
| | | | | | | | | | | | | | | | | | | | |
Income from investment operations: | | | | | | | | | | | | | | | | | | | | |
Net investment income | | | 0.27 | | | | 0.32 | | | | 0.38 | | | | 0.30 | | | | 0.32 | |
Net gains (losses) from investments (both realized and unrealized) | | | 0.20 | | | | (0.32 | ) | | | 1.35 | | | | 2.35 | | | | 1.38 | |
| | | | | | | | | | | | | | | | | | | | |
Total income from investment operations | | | 0.47 | | | | 0.00 | | | | 1.73 | | | | 2.65 | | | | 1.70 | |
| | | | | | | | | | | | | | | | | | | | |
Less distributions: | | | | | | | | | | | | | | | | | | | | |
Dividends from net investment income | | | (0.25 | ) | | | (0.22 | ) | | | (0.42 | ) | | | (0.30 | ) | | | (0.32 | ) |
Distributions from net realized gains | | | (0.75 | ) | | | (0.78 | ) | | | (0.83 | ) | | | (0.31 | ) | | | — | |
| | | | | | | | | | | | | | | | | | | | |
Total distributions | | | (1.00 | ) | | | (1.00 | ) | | | (1.25 | ) | | | (0.61 | ) | | | (0.32 | ) |
| | | | | | | | | | | | | | | | | | | | |
Net asset value, end of period | | $ | 15.26 | | | $ | 15.79 | | | $ | 16.79 | | | $ | 16.31 | | | $ | 14.27 | |
| | | | | | | | | | | | | | | | | | | | |
Total return A | | | 3.30 | % | | | (0.07 | )% | | | 11.15 | % | | | 19.04 | % | | | 13.23 | % |
| | | | | | | | | | | | | | | | | | | | |
Ratios and supplemental data: | | | | | | | | | | | | | | | | | | | | |
Net assets, end of period | | $ | 485,231,068 | | | $ | 99,173,943 | | | $ | 74,422,347 | | | $ | 60,916,035 | | | $ | 40,938,021 | |
Ratios to average net assets: | | | | | | | | | | | | | | | | | | | | |
Expenses, before reimbursements | | | 0.62 | % | | | 0.58 | % | | | 0.58 | % | | | 0.60 | % | | | 0.59 | % |
Expenses, net of reimbursements | | | 0.62 | % | | | 0.58 | % | | | 0.58 | % | | | 0.60 | % | | | 0.59 | % |
Net investment income, before reimbursements | | | 1.90 | % | | | 1.83 | % | | | 2.24 | % | | | 1.86 | % | | | 2.27 | % |
Net investment income, net of reimbursements | | | 1.90 | % | | | 1.83 | % | | | 2.24 | % | | | 1.86 | % | | | 2.27 | % |
Portfolio turnover rate | | | 16 | % | | | 62 | % | | | 34 | % | | | 56 | % | | | 58 | % |
| |
| | | Y Class | |
| | | Year Ended
October 31, | |
| | | 2016 | | | 2015 | | | 2014 | | | 2013 | | | 2012 | |
Net asset value, beginning of period | | $ | 15.84 | | | $ | 16.83 | | | $ | 16.37 | | | $ | 14.32 | | | $ | 12.93 | |
| | | | | | | | | | | | | | | | | | | | |
Income from investment operations: | | | | | | | | | | | | | | | | | | | | |
Net investment income | | | 0.30 | | | | 0.30 | | | | 0.40 | | | | 0.39 | | | | 0.17 | |
Net gains (losses) from investments (both realized and unrealized) | | | 0.13 | | | | (0.30 | ) | | | 1.31 | | | | 2.26 | | | | 1.51 | |
| | | | | | | | | | | | | | | | | | | | |
Total income from investment operations | | | 0.43 | | | | 0.00 | | | | 1.71 | | | | 2.65 | | | | 1.68 | |
| | | | | | | | | | | | | | | | | | | | |
Less distributions: | | | | | | | | | | | | | | | | | | | | |
Dividends from net investment income | | | (0.22 | ) | | | (0.21 | ) | | | (0.42 | ) | | | (0.29 | ) | | | (0.29 | ) |
Distributions from net realized gains | | | (0.75 | ) | | | (0.78 | ) | | | (0.83 | ) | | | (0.31 | ) | | | — | |
| | | | | | | | | | | | | | | | | | | | |
Total distributions | | | (0.97 | ) | | | (0.99 | ) | | | (1.25 | ) | | | (0.60 | ) | | | (0.29 | ) |
| | | | | | | | | | | | | | | | | | | | |
Net asset value, end of period | | $ | 15.30 | | | $ | 15.84 | | | $ | 16.83 | | | $ | 16.37 | | | $ | 14.32 | |
| | | | | | | | | | | | | | | | | | | | |
Total return A | | | 3.06 | % | | | (0.07 | )% | | | 10.98 | % | | | 18.97 | % | | | 13.04 | % |
| | | | | | | | | | | | | | | | | | | | |
Ratios and supplemental data: | | | | | | | | | | | | | | | | | | | | |
Net assets, end of period | | $ | 28,843,268 | | | $ | 39,151,318 | | | $ | 36,113,608 | | | $ | 7,262,894 | | | $ | 2,482,039 | |
Ratios to average net assets: | | | | | | | | | | | | | | | | | | | | |
Expenses, before reimbursements | | | 0.72 | % | | | 0.66 | % | | | 0.67 | % | | | 0.68 | % | | | 0.69 | % |
Expenses, net of reimbursements | | | 0.72 | % | | | 0.66 | % | | | 0.68 | % | | | 0.70 | % | | | 0.69 | % |
Net investment income, before reimbursements | | | 1.95 | % | | | 1.75 | % | | | 2.01 | % | | | 1.71 | % | | | 2.08 | % |
Net investment income, net of reimbursements | | | 1.95 | % | | | 1.75 | % | | | 2.01 | % | | | 1.69 | % | | | 2.08 | % |
Portfolio turnover rate | | | 16 | % | | | 62 | % | | | 34 | % | | | 56 | % | | | 58 | % |
| A | Based on net asset value, which does not reflect the sales charge, redemption fee, or contingent deferred sales charge, if applicable. May include adjustments in accordance with U.S. GAAP and as such, the net asset value for reporting purposes and the returns based upon those net asset values may differ from the net asset value and returns for shareholder transactions. |
| B | On May 31, 2016, the AMR Class closed and the assets were merged into the Institutional Class. |
59
American Beacon Balanced FundSM
Financial Highlights
(For a share outstanding throughout the period)
| | | | | | | | | | | | | | | | | | | | |
| | | Investor Class | |
| | | Year Ended
October 31, | |
| | | 2016 | | | 2015 | | | 2014 | | | 2013 | | | 2012 | |
Net asset value, beginning of period | | $ | 14.30 | | | $ | 15.31 | | | $ | 14.98 | | | $ | 13.16 | | | $ | 11.93 | |
| | | | | | | | | | | | | | | | | | | | |
Income from investment operations: | | | | | | | | | | | | | | | | | | | | |
Net investment income | | | 0.18 | | | | 0.22 | | | | 0.42 | | | | 0.26 | | | | 0.23 | |
Net gains (losses) from investments (both realized and unrealized) | | | 0.18 | | | | (0.26 | ) | | | 1.11 | | | | 2.13 | | | | 1.30 | |
| | | | | | | | | | | | | | | | | | | | |
Total income (loss) from investment operations | | | 0.36 | | | | (0.04 | ) | | | 1.53 | | | | 2.39 | | | | 1.53 | |
| | | | | | | | | | | | | | | | | | | | |
Less distributions: | | | | | | | | | | | | | | | | | | | | |
Dividends from net investment income | | | (0.20 | ) | | | (0.19 | ) | | | (0.37 | ) | | | (0.26 | ) | | | (0.30 | ) |
Distributions from net realized gains | | | (0.75 | ) | | | (0.78 | ) | | | (0.83 | ) | | | (0.31 | ) | | | — | |
| | | | | | | | | | | | | | | | | | | | |
Total distributions | | | (0.95 | ) | | | (0.97 | ) | | | (1.20 | ) | | | (0.57 | ) | | | (0.30 | ) |
| | | | | | | | | | | | | | | | | | | | |
Net asset value, end of period | | $ | 13.71 | | | $ | 14.30 | | | $ | 15.31 | | | $ | 14.98 | | | $ | 13.16 | |
| | | | | | | | | | | | | | | | | | | | |
Total return A | | | 2.85 | % | | | (0.35 | )% | | | 10.75 | % | | | 18.65 | % | | | 12.86 | % |
| | | | | | | | | | | | | | | | | | | | |
Ratios and supplemental data: | | | | | | | | | | | | | | | | | | | | |
Net assets, end of period | | $ | 127,235,433 | | | $ | 155,757,561 | | | $ | 165,808,020 | | | $ | 109,336,889 | | | $ | 89,271,812 | |
Ratios to average net assets: | | | | | | | | | | | | | | | | | | | | |
Expenses, before reimbursements | | | 0.95 | % | | | 0.91 | % | | | 0.92 | % | | | 0.92 | % | | | 0.92 | % |
Expenses, net of reimbursements | | | 0.95 | % | | | 0.91 | % | | | 0.92 | % | | | 0.92 | % | | | 0.92 | % |
Net investment income, before reimbursements | | | 1.72 | % | | | 1.51 | % | | | 1.84 | % | | | 1.62 | % | | | 1.95 | % |
Net investment income, net of reimbursements | | | 1.72 | % | | | 1.51 | % | | | 1.84 | % | | | 1.62 | % | | | 1.95 | % |
Portfolio turnover rate | | | 16 | % | | | 62 | % | | | 34 | % | | | 56 | % | | | 58 | % |
| |
| | | Advisor Class | |
| | | Year Ended
October 31, | |
| | | 2016 | | | 2015 | | | 2014 | | | 2013 | | | 2012 | |
Net asset value, beginning of period | | $ | 15.02 | | | $ | 16.04 | | | $ | 15.65 | | | $ | 13.73 | | | $ | 12.36 | |
| | | | | | | | | | | | | | | | | | | | |
Income from investment operations: | | | | | | | | | | | | | | | | | | | | |
Net investment income (loss) | | | 0.24 | | | | 0.22 | | | | 0.18 | | | | (0.12 | ) | | | 0.42 | |
Net gains (losses) from investments (both realized and unrealized) | | | 0.12 | | | | (0.29 | ) | | | 1.39 | | | | 2.60 | | | | 1.14 | |
| | | | | | | | | | | | | | | | | | | | |
Total income (loss) from investment operations | | | 0.36 | | | | (0.07 | ) | | | 1.57 | | | | 2.48 | | | | 1.56 | |
| | | | | | | | | | | | | | | | | | | | |
Less distributions: | | | | | | | | | | | | | | | | | | | | |
Dividends from net investment income | | | (0.17 | ) | | | (0.17 | ) | | | (0.35 | ) | | | (0.25 | ) | | | (0.19 | ) |
Distributions from net realized gains | | | (0.75 | ) | | | (0.78 | ) | | | (0.83 | ) | | | (0.31 | ) | | | — | |
| | | | | | | | | | | | | | | | | | | | |
Total distributions | | | (0.92 | ) | | | (0.95 | ) | | | (1.18 | ) | | | (0.56 | ) | | | (0.19 | ) |
| | | | | | | | | | | | | | | | | | | | |
Net asset value, end of period | | $ | 14.46 | | | $ | 15.02 | | | $ | 16.04 | | | $ | 15.65 | | | $ | 13.73 | |
| | | | | | | | | | | | | | | | | | | | |
Total return A | | | 2.71 | % | | | (0.58 | )% | | | 10.58 | % | | | 18.52 | % | | | 12.62 | % |
| | | | | | | | | | | | | | | | | | | | |
Ratios and supplemental data: | | | | | | | | | | | | | | | | | | | | |
Net assets, end of period | | $ | 10,603,004 | | | $ | 13,510,138 | | | $ | 14,705,747 | | | $ | 6,352,890 | | | $ | 2,506,831 | |
Ratios to average net assets: | | | | | | | | | | | | | | | | | | | | |
Expenses, before reimbursements | | | 1.12 | % | | | 1.06 | % | | | 1.07 | % | | | 1.07 | % | | | 1.09 | % |
Expenses, net of reimbursements | | | 1.12 | % | | | 1.06 | % | | | 1.07 | % | | | 1.07 | % | | | 1.09 | % |
Net investment income, before reimbursements | | | 1.55 | % | | | 1.35 | % | | | 1.75 | % | | | 1.32 | % | | | 1.82 | % |
Net investment income, net of reimbursements | | | 1.55 | % | | | 1.35 | % | | | 1.75 | % | | | 1.32 | % | | | 1.82 | % |
Portfolio turnover rate | | | 16 | % | | | 62 | % | | | 34 | % | | | 56 | % | | | 58 | % |
| A | Based on net asset value, which does not reflect the sales charge, redemption fee, or contingent deferred sales charge, if applicable. May include adjustments in accordance with U.S. GAAP and as such, the net asset value for reporting purposes and the returns based upon those net asset values may differ from the net asset value and returns for shareholder transactions. |
60
American Beacon Balanced FundSM
Financial Highlights
(For a share outstanding throughout the period)
| | | | | | | | | | | | | | | | | | | | |
| | | A Class | |
| | | Year Ended
October 31, | |
| | | 2016 | | | 2015 | | | 2014 | | | 2013 | | | 2012 | |
Net asset value, beginning of period | | $ | 14.27 | | | $ | 15.29 | | | $ | 14.97 | | | $ | 13.16 | | | $ | 12.06 | |
| | | | | | | | | | | | | | | | | | | | |
Income from investment operations: | | | | | | | | | | | | | | | | | | | | |
Net investment income | | | 0.21 | | | | 0.23 | | | | 0.33 | | | | 0.22 | | | | 0.33 | |
Net gains (losses) from investments (both realized and unrealized) | | | 0.15 | | | | (0.29 | ) | | | 1.18 | | | | 2.14 | | | | 1.17 | |
| | | | | | | | | | | | | | | | | | | | |
Total income (loss) from investment operations | | | 0.36 | | | | (0.06 | ) | | | 1.51 | | | | 2.36 | | | | 1.50 | |
| | | | | | | | | | | | | | | | | | | | |
Less distributions: | | | | | | | | | | | | | | | | | | | | |
Dividends from net investment income | | | (0.19 | ) | | | (0.18 | ) | | | (0.36 | ) | | | (0.24 | ) | | | (0.40 | ) |
Distributions from net realized gains | | | (0.75 | ) | | | (0.78 | ) | | | (0.83 | ) | | | (0.31 | ) | | | — | |
| | | | | | | | | | | | | | | | | | | | |
Total distributions | | | (0.94 | ) | | | (0.96 | ) | | | (1.19 | ) | | | (0.55 | ) | | | (0.40 | ) |
| | | | | | | | | | | | | | | | | | | | |
Net asset value, end of period | | $ | 13.69 | | | $ | 14.27 | | | $ | 15.29 | | | $ | 14.97 | | | $ | 13.16 | |
| | | | | | | | | | | | | | | | | | | | |
Total return A | | | 2.84 | % | | | (0.48 | )% | | | 10.67 | % | | | 18.45 | % | | | 12.65 | % |
| | | | | | | | | | | | | | | | | | | | |
Ratios and supplemental data: | | | | | | | | | | | | | | | | | | | | |
Net assets, end of period | | $ | 24,892,096 | | | $ | 29,074,120 | | | $ | 25,578,944 | | | $ | 6,284,539 | | | $ | 3,126,922 | |
Ratios to average net assets: | | | | | | | | | | | | | | | | | | | | |
Expenses, before reimbursements | | | 1.02 | % | | | 0.97 | % | | | 1.02 | % | | | 1.10 | % | | | 1.13 | % |
Expenses, net of reimbursements | | | 1.02 | % | | | 0.97 | % | | | 1.04 | % | | | 1.10 | % | | | 1.09 | % |
Net investment income, before reimbursements | | | 1.64 | % | | | 1.44 | % | | | 1.68 | % | | | 1.31 | % | | | 1.62 | % |
Net investment income, net of reimbursements | | | 1.64 | % | | | 1.44 | % | | | 1.67 | % | | | 1.30 | % | | | 1.66 | % |
Portfolio turnover rate | | | 16 | % | | | 62 | % | | | 34 | % | | | 56 | % | | | 58 | % |
| |
| | | C Class | |
| | | Year Ended
October 31, | |
| | | 2016 | | | 2015 | | | 2014 | | | 2013 | | | 2012 | |
Net asset value, beginning of period | | $ | 14.43 | | | $ | 15.47 | | | $ | 15.13 | | | $ | 13.33 | | | $ | 12.13 | |
| | | | | | | | | | | | | | | | | | | | |
Income from investment operations: | | | | | | | | | | | | | | | | | | | | |
Net investment income | | | 0.12 | | | | 0.14 | | | | 0.21 | | | | 0.17 | | | | 0.15 | |
Net gains (losses) from investments (both realized and unrealized) | | | 0.13 | | | | (0.29 | ) | | | 1.20 | | | | 2.11 | | | | 1.29 | |
| | | | | | | | | | | | | | | | | | | | |
Total income (loss) from investment operations | | | 0.25 | | | | (0.15 | ) | | | 1.41 | | | | 2.28 | | | | 1.44 | |
| | | | | | | | | | | | | | | | | | | | |
Less distributions: | | | | | | | | | | | | | | | | | | | | |
Dividends from net investment income | | | (0.10 | ) | | | (0.11 | ) | | | (0.24 | ) | | | (0.17 | ) | | | (0.24 | ) |
Distributions from net realized gains | | | (0.75 | ) | | | (0.78 | ) | | | (0.83 | ) | | | (0.31 | ) | | | — | |
| | | | | | | | | | | | | | | | | | | | |
Total distributions | | | (0.85 | ) | | | (0.89 | ) | | | (1.07 | ) | | | (0.48 | ) | | | (0.24 | ) |
| | | | | | | | | | | | | | | | | | | | |
Net asset value, end of period | | $ | 13.83 | | | $ | 14.43 | | | $ | 15.47 | | | $ | 15.13 | | | $ | 13.33 | |
| | | | | | | | | | | | | | | | | | | | |
Total return A | | | 2.03 | % | | | (1.14 | )% | | | 9.80 | % | | | 17.50 | % | | | 11.86 | % |
| | | | | | | | | | | | | | | | | | | | |
Ratios and supplemental data: | | | | | | | | | | | | | | | | | | | | |
Net assets, end of period | | $ | 40,827,570 | | | $ | 45,641,648 | | | $ | 32,045,404 | | | $ | 11,573,900 | | | $ | 3,578,962 | |
Ratios to average net assets: | | | | | | | | | | | | | | | | | | | | |
Expenses, before reimbursements | | | 1.77 | % | | | 1.72 | % | | | 1.78 | % | | | 1.84 | % | | | 1.85 | % |
Expenses, net of reimbursements | | | 1.77 | % | | | 1.72 | % | | | 1.79 | % | | | 1.85 | % | | | 1.83 | % |
Net investment income, before reimbursements | | | 0.89 | % | | | 0.69 | % | | | 0.94 | % | | | 0.51 | % | | | 0.88 | % |
Net investment income, net of reimbursements | | | 0.89 | % | | | 0.69 | % | | | 0.93 | % | | | 0.50 | % | | | 0.90 | % |
Portfolio turnover rate | | | 16 | % | | | 62 | % | | | 34 | % | | | 56 | % | | | 58 | % |
| A | Based on net asset value, which does not reflect the sales charge, redemption fee, or contingent deferred sales charge, if applicable. May include adjustments in accordance with U.S. GAAP and as such, the net asset value for reporting purposes and the returns based upon those net asset values may differ from the net asset value and returns for shareholder transactions. |
61
American Beacon Mid-Cap Value FundSM
Financial Highlights
(For a share outstanding throughout the period)
| | | | | | | | | | | | | | | | | | | | |
| | | Institutional Class | |
| | | Year Ended
October 31, | |
| | | 2016 | | | 2015C | | | 2014 | | | 2013 | | | 2012 | |
Net asset value, beginning of period | | $ | 14.62 | | | $ | 14.76 | | | $ | 14.33 | | | $ | 10.95 | | | $ | 9.73 | |
| | | | | | | | | | | | | | | | | | | | |
Income from investment operations: | | | | | | | | | | | | | | | | | | | | |
Net investment income | | | 0.26 | | | | 0.16 | | | | 0.12 | | | | 0.13 | | | | 0.14 | |
Net gains from investments (both realized and unrealized) | | | 0.03 | | | | 0.25 | | | | 1.27 | | | | 3.93 | | | | 1.21 | |
| | | | | | | | | | | | | | | | | | | | |
Total income from investment operations | | | 0.29 | | | | 0.41 | | | | 1.39 | | | | 4.06 | | | | 1.35 | |
| | | | | | | | | | | | | | | | | | | | |
Less distributions: | | | | | | | | | | | | | | | | | | | | |
Dividends from net investment income | | | (0.17 | ) | | | (0.10 | ) | | | (0.11 | ) | | | (0.20 | ) | | | (0.13 | ) |
Distributions from net realized gains | | | (0.71 | ) | | | (0.45 | ) | | | (0.85 | ) | | | (0.48 | ) | | | — | |
| | | | | | | | | | | | | | | | | | | | |
Total distributions | | | (0.88 | ) | | | (0.55 | ) | | | (0.96 | ) | | | (0.68 | ) | | | (0.13 | ) |
| | | | | | | | | | | | | | | | | | | | |
Redemption fees added to beneficial interests | | | — | | | | — | A | | | — | A | | | — | A | | | — | A |
| | | | | | | | | | | | | | | | | | | | |
Net asset value, end of period | | $ | 14.03 | | | $ | 14.62 | | | $ | 14.76 | | | $ | 14.33 | | | $ | 10.95 | |
| | | | | | | | | | | | | | | | | | | | |
Total return B | | | 2.39 | % | | | 2.73 | % | | | 10.20 | % | | | 39.18 | % | | | 14.07 | % |
| | | | | | | | | | | | | | | | | | | | |
Ratios and supplemental data: | | | | | | | | | | | | | | | | | | | | |
Net assets, end of period | | $ | 195,472,135 | | | $ | 258,503,278 | | | $ | 193,634,639 | | | $ | 72,206,907 | | | $ | 34,207,844 | |
Ratios to average net assets: | | | | | | | | | | | | | | | | | | | | |
Expenses, before reimbursements | | | 0.89 | % | | | 0.85 | % | | | 0.89 | % | | | 0.99 | % | | | 1.06 | % |
Expenses, net of reimbursements | | | 0.89 | % | | | 0.85 | % | | | 0.93 | % | | | 0.98 | % | | | 0.98 | % |
Net investment income, before reimbursements | | | 1.65 | % | | | 1.10 | % | | | 0.92 | % | | | 1.05 | % | | | 1.17 | % |
Net investment income, net of reimbursements | | | 1.65 | % | | | 1.10 | % | | | 0.88 | % | | | 1.06 | % | | | 1.25 | % |
Portfolio turnover rate | | | 27 | % | | | 79 | % | | | 24 | % | | | 48 | % | | | 87 | % |
| |
| | | Y Class | |
| | | Year Ended
October 31, | |
| | | 2016 | | | 2015 C | | | 2014 | | | 2013 | | | 2012 | |
Net asset value, beginning of period | | $ | 14.52 | | | $ | 14.66 | | | $ | 14.25 | | | $ | 10.92 | | | $ | 9.72 | |
| | | | | | | | | | | | | | | | | | | | |
Income from investment operations: | | | | | | | | | | | | | | | | | | | | |
Net investment income | | | 0.23 | | | | 0.15 | | | | 0.18 | | | | 0.17 | | | | 0.13 | |
Net gains from investments (both realized and unrealized) | | | 0.05 | | | | 0.26 | | | | 1.19 | | | | 3.86 | | | | 1.21 | |
| | | | | | | | | | | | | | | | | | | | |
Total income from investment operations | | | 0.28 | | | | 0.41 | | | | 1.37 | | | | 4.03 | | | | 1.34 | |
| | | | | | | | | | | | | | | | | | | | |
Less distributions: | | | | | | | | | | | | | | | | | | | | |
Dividends from net investment income | | | (0.17 | ) | | | (0.10 | ) | | | (0.11 | ) | | | (0.22 | ) | | | (0.14 | ) |
Distributions from net realized gains | | | (0.71 | ) | | | (0.45 | ) | | | (0.85 | ) | | | (0.48 | ) | | | — | |
| | | | | | | | | | | | | | | | | | | | |
Total distributions | | | (0.88 | ) | | | (0.55 | ) | | | (0.96 | ) | | | (0.70 | ) | | | (0.14 | ) |
| | | | | | | | | | | | | | | | | | | | |
Redemption fees added to beneficial interests | | | — | | | | — | A | | | — | A | | | — | A | | | — | A |
| | | | | | | | | | | | | | | | | | | | |
Net asset value, end of period | | $ | 13.92 | | | $ | 14.52 | | | $ | 14.66 | | | $ | 14.25 | | | $ | 10.92 | |
| | | | | | | | | | | | | | | | | | | | |
Total return B | | | 2.29 | % | | | 2.76 | % | | | 10.15 | % | | | 38.99 | % | | | 13.97 | % |
| | | | | | | | | | | | | | | | | | | | |
Ratios and supplemental data: | | | | | | | | | | | | | | | | | | | | |
Net assets, end of period | | $ | 68,994,531 | | | $ | 70,009,288 | | | $ | 31,074,584 | | | $ | 2,813,712 | | | $ | 516,032 | |
Ratios to average net assets: | | | | | | | | | | | | | | | | | | | | |
Expenses, before reimbursements | | | 0.96 | % | | | 0.94 | % | | | 0.98 | % | | | 1.11 | % | | | 1.28 | % |
Expenses, net of reimbursements | | | 0.96 | % | | | 0.94 | % | | | 0.98 | % | | | 1.08 | % | | | 1.06 | % |
Net investment income, before reimbursements | | | 1.59 | % | | | 1.02 | % | | | 0.80 | % | | | 0.79 | % | | | 0.82 | % |
Net investment income, net of reimbursements | | | 1.59 | % | | | 1.02 | % | | | 0.80 | % | | | 0.82 | % | | | 1.03 | % |
Portfolio turnover rate | | | 27 | % | | | 79 | % | | | 24 | % | | | 48 | % | | | 87 | % |
| A | Amounts represent less than $0.01 per share. |
| B | Based on net asset value, which does not reflect the sales charge, redemption fee, or contingent deferred sales charge, if applicable. May include adjustments in accordance with U.S. GAAP and as such, the net asset value for reporting purposes and the returns based upon those net asset values may differ from the net asset value and returns for shareholder transactions. |
| C | WEDGE Capital Management was added as an investment manager to the Mid-Cap Value Fund on May 11, 2015. |
62
American Beacon Mid-Cap Value FundSM
Financial Highlights
(For a share outstanding throughout the period)
| | | | | | | | | | | | | | | | | | | | |
| | | Investor Class | |
| | | Year Ended
October 31, | |
| | | 2016 | | | 2015C | | | 2014 | | | 2013 | | | 2012 | |
Net asset value, beginning of period | | $ | 14.73 | | | $ | 14.89 | | | $ | 14.47 | | | $ | 10.98 | | | $ | 9.71 | |
| | | | | | | | | | | | | | | | | | | | |
Income from investment operations: | | | | | | | | | | | | | | | | | | | | |
Net investment income | | | 0.21 | | | | 0.13 | | | | 0.16 | | | | 0.23 | | | | 0.34 | |
Net gains from investments (both realized and unrealized) | | | 0.05 | | | | 0.25 | | | | 1.21 | | | | 3.83 | | | | 1.00 | |
| | | | | | | | | | | | | | | | | | | | |
Total income from investment operations | | | 0.26 | | | | 0.38 | | | | 1.37 | | | | 4.06 | | | | 1.34 | |
| | | | | | | | | | | | | | | | | | | | |
Less distributions: | | | | | | | | | | | | | | | | | | | | |
Dividends from net investment income | | | (0.14 | ) | | | (0.09 | ) | | | (0.10 | ) | | | (0.09 | ) | | | (0.07 | ) |
Distributions from net realized gains | | | (0.71 | ) | | | (0.45 | ) | | | (0.85 | ) | | | (0.48 | ) | | | — | |
| | | | | | | | | | | | | | | | | | | | |
Total distributions | | | (0.85 | ) | | | (0.54 | ) | | | (0.95 | ) | | | (0.57 | ) | | | (0.07 | ) |
| | | | | | | | | | | | | | | | | | | | |
Redemption fees added to beneficial interests | | | — | | | | — | A | | | — | A | | | — | A | | | — | A |
| | | | | | | | | | | | | | | | | | | | |
Net asset value, end of period | | $ | 14.14 | | | $ | 14.73 | | | $ | 14.89 | | | $ | 14.47 | | | $ | 10.98 | |
| | | | | | | | | | | | | | | | | | | | |
Total return B | | | 2.12 | % | | | 2.52 | % | | | 9.99 | % | | | 38.69 | % | | | 13.84 | % |
| | | | | | | | | | | | | | | | | | | | |
Ratios and supplemental data: | | | | | | | | | | | | | | | | | | | | |
Net assets, end of period | | $ | 243,421,035 | | | $ | 304,799,582 | | | $ | 246,404,670 | | | $ | 17,871,568 | | | $ | 4,156,858 | |
Ratios to average net assets: | | | | | | | | | | | | | | | | | | | | |
Expenses, before reimbursements | | | 1.12 | % | | | 1.09 | % | | | 1.13 | % | | | 1.25 | % | | | 1.44 | % |
Expenses, net of reimbursements | | | 1.12 | % | | | 1.09 | % | | | 1.14 | % | | | 1.23 | % | | | 1.23 | % |
Net investment income, before reimbursements | | | 1.44 | % | | | 0.87 | % | | | 0.61 | % | | | 0.68 | % | | | 0.75 | % |
Net investment income, net of reimbursements | | | 1.44 | % | | | 0.87 | % | | | 0.60 | % | | | 0.70 | % | | | 0.96 | % |
Portfolio turnover rate | | | 27 | % | | | 79 | % | | | 24 | % | | | 48 | % | | | 87 | % |
| |
| | | Advisor Class | |
| | | Year Ended
October 31, | |
| | | 2016 | | | 2015C | | | 2014 | | | 2013 | | | 2012 | |
Net asset value, beginning of period | | $ | 14.27 | | | $ | 14.46 | | | $ | 14.07 | | | $ | 10.81 | | | $ | 9.56 | |
| | | | | | | | | | | | | | | | | | | | |
Income from investment operations: | | | | | | | | | | | | | | | | | | | | |
Net investment income | | | 0.16 | | | | 0.08 | | | | 0.11 | | | | 0.11 | | | | 0.05 | |
Net gains from investments (both realized and unrealized) | | | 0.05 | | | | 0.25 | | | | 1.17 | | | | 3.83 | | | | 1.23 | |
| | | | | | | | | | | | | | | | | | | | |
Total income from investment operations | | | 0.21 | | | | 0.33 | | | | 1.28 | | | | 3.94 | | | | 1.28 | |
| | | | | | | | | | | | | | | | | | | | |
Less distributions: | | | | | | | | | | | | | | | | | | | | |
Dividends from net investment income | | | (0.08 | ) | | | (0.07 | ) | | | (0.04 | ) | | | (0.20 | ) | | | (0.03 | ) |
Distributions from net realized gains | | | (0.71 | ) | | | (0.45 | ) | | | (0.85 | ) | | | (0.48 | ) | | | — | |
| | | | | | | | | | | | | | | | | | | | |
Total distributions | | | (0.79 | ) | | | (0.52 | ) | | | (0.89 | ) | | | (0.68 | ) | | | (0.03 | ) |
| | | | | | | | | | | | | | | | | | | | |
Redemption fees added to beneficial interests | | | — | | | | — | A | | | — | A | | | — | A | | | — | A |
| | | | | | | | | | | | | | | | | | | | |
Net asset value, end of period | | $ | 13.69 | | | $ | 14.27 | | | $ | 14.46 | | | $ | 14.07 | | | $ | 10.81 | |
| | | | | | | | | | | | | | | | | | | | |
Total return B | | | 1.82 | % | | | 2.25 | % | | | 9.58 | % | | | 38.43 | % | | | 13.44 | % |
| | | | | | | | | | | | | | | | | | | | |
Ratios and supplemental data: | | | | | | | | | | | | | | | | | | | | |
Net assets, end of period | | $ | 6,622,356 | | | $ | 6,684,131 | | | $ | 7,149,083 | | | $ | 727,587 | | | $ | 464,851 | |
Ratios to average net assets: | | | | | | | | | | | | | | | | | | | | |
Expenses, before reimbursements | | | 1.40 | % | | | 1.37 | % | | | 1.40 | % | | | 1.61 | % | | | 1.99 | % |
Expenses, net of reimbursements | | | 1.40 | % | | | 1.37 | % | | | 1.46 | % | | | 1.49 | % | | | 1.48 | % |
Net investment income, before reimbursements | | | 1.16 | % | | | 0.58 | % | | | 0.35 | % | | | 0.46 | % | | | 0.10 | % |
Net investment income, net of reimbursements | | | 1.16 | % | | | 0.58 | % | | | 0.30 | % | | | 0.58 | % | | | 0.61 | % |
Portfolio turnover rate | | | 27 | % | | | 79 | % | | | 24 | % | | | 48 | % | | | 87 | % |
| A | Amounts represent less than $0.01 per share. |
| B | Based on net asset value, which does not reflect the sales charge, redemption fee, or contingent deferred sales charge, if applicable. May include adjustments in accordance with U.S. GAAP and as such, the net asset value for reporting purposes and the returns based upon those net asset values may differ from the net asset value and returns for shareholder transactions. |
| C | WEDGE Capital Management was added as an investment manager to the Mid-Cap Value Fund on May 11, 2015. |
63
American Beacon Mid-Cap Value FundSM
Financial Highlights
(For a share outstanding throughout the period)
| | | | | | | | | | | | | | | | | | | | |
| | | A Class | |
| | | Year Ended
October 31, | |
| | | 2016 | | | 2015C | | | 2014 | | | 2013 | | | 2012 | |
Net asset value, beginning of period | | $ | 14.28 | | | $ | 14.43 | | | $ | 14.09 | | | $ | 10.82 | | | $ | 9.61 | |
| | | | | | | | | | | | | | | | | | | | |
Income from investment operations: | | | | | | | | | | | | | | | | | | | | |
Net investment income | | | 0.18 | | | | 0.11 | | | | 0.13 | | | | 0.14 | | | | 0.09 | |
Net gains from investments (both realized and unrealized) | | | 0.05 | | | | 0.25 | | | | 1.16 | | | | 3.80 | | | | 1.20 | |
| | | | | | | | | | | | | | | | | | | | |
Total income from investment operations | | | 0.23 | | | | 0.36 | | | | 1.29 | | | | 3.94 | | | | 1.29 | |
| | | | | | | | | | | | | | | | | | | | |
Less distributions: | | | | | | | | | | | | | | | | | | | | |
Dividends from net investment income | | | (0.10 | ) | | | (0.06 | ) | | | (0.10 | ) | | | (0.19 | ) | | | (0.08 | ) |
Distributions from net realized gains | | | (0.71 | ) | | | (0.45 | ) | | | (0.85 | ) | | | (0.48 | ) | | | — | |
| | | | | | | | | | | | | | | | | | | | |
Total distributions | | | (0.81 | ) | | | (0.51 | ) | | | (0.95 | ) | | | (0.67 | ) | | | (0.08 | ) |
| | | | | | | | | | | | | | | | | | | | |
Redemption fees added to beneficial interests | | | — | | | | — | A | | | — | A | | | — | A | | | — | A |
| | | | | | | | | | | | | | | | | | | | |
Net asset value, end of period | | $ | 13.70 | | | $ | 14.28 | | | $ | 14.43 | | | $ | 14.09 | | | $ | 10.82 | |
| | | | | | | | | | | | | | | | | | | | |
Total return B | | | 1.98 | % | | | 2.35 | % | | | 9.68 | % | | | 38.39 | % | | | 13.56 | % |
| | | | | | | | | | | | | | | | | | | | |
Ratios and supplemental data: | | | | | | | | | | | | | | | | | | | | |
Net assets, end of period | | $ | 19,486,655 | | | $ | 16,422,504 | | | $ | 18,345,497 | | | $ | 1,666,696 | | | $ | 263,939 | |
Ratios to average net assets: | | | | | | | | | | | | | | | | | | | | |
Expenses, before reimbursements | | | 1.26 | % | | | 1.25 | % | | | 1.33 | % | | | 1.48 | % | | | 1.61 | % |
Expenses, net of reimbursements | | | 1.26 | % | | | 1.25 | % | | | 1.33 | % | | | 1.49 | % | | | 1.49 | % |
Net investment income, before reimbursements | | | 1.30 | % | | | 0.71 | % | | | 0.42 | % | | | 0.44 | % | | | 0.56 | % |
Net investment income, net of reimbursements | | | 1.30 | % | | | 0.71 | % | | | 0.42 | % | | | 0.43 | % | | | 0.68 | % |
Portfolio turnover rate | | | 27 | % | | | 79 | % | | | 24 | % | | | 48 | % | | | 87 | % |
| |
| | | C Class | |
| | | Year Ended
October 31, | |
| | | 2016 | | | 2015C | | | 2014 | | | 2013 | | | 2012 | |
Net asset value, beginning of period | | $ | 13.87 | | | $ | 14.08 | | | $ | 13.81 | | | $ | 10.70 | | | $ | 9.56 | |
| | | | | | | | | | | | | | | | | | | | |
Income from investment operations: | | | | | | | | | | | | | | | | | | | | |
Net investment income | | | 0.07 | | | | 0.01 | | | | 0.08 | | | | 0.11 | | | | 0.06 | |
Net gains from investments (both realized and unrealized) | | | 0.06 | | | | 0.23 | | | | 1.09 | | | | 3.67 | | | | 1.15 | |
| | | | | | | | | | | | | | | | | | | | |
Total income from investment operations | | | 0.13 | | | | 0.24 | | | | 1.17 | | | | 3.78 | | | | 1.21 | |
| | | | | | | | | | | | | | | | | | | | |
Less distributions: | | | | | | | | | | | | | | | | | | | | |
Dividends from net investment income | | | (0.03 | ) | | | — | | | | (0.05 | ) | | | (0.19 | ) | | | (0.07 | ) |
Distributions from net realized gains | | | (0.71 | ) | | | (0.45 | ) | | | (0.85 | ) | | | (0.48 | ) | | | — | |
| | | | | | | | | | | | | | | | | | | | |
Total distributions | | | (0.74 | ) | | | (0.45 | ) | | | (0.90 | ) | | | (0.67 | ) | | | (0.07 | ) |
| | | | | | | | | | | | | | | | | | | | |
Redemption fees added to beneficial interests | | | — | | | | — | A | | | — | A | | | — | A | | | — | A |
| | | | | | | | | | | | | | | | | | | | |
Net asset value, end of period | | $ | 13.26 | | | $ | 13.87 | | | $ | 14.08 | | | $ | 13.81 | | | $ | 10.70 | |
| | | | | | | | | | | | | | | | | | | | |
Total return B | | | 1.19 | % | | | 1.57 | % | | | 8.88 | % | | | 37.32 | % | | | 12.75 | % |
| | | | | | | | | | | | | | | | | | | | |
Ratios and supplemental data: | | | | | | | | | | | | | | | | | | | | |
Net assets, end of period | | $ | 6,030,130 | | | $ | 6,238,827 | | | $ | 5,104,394 | | | $ | 904,692 | | | $ | 253,849 | |
Ratios to average net assets: | | | | | | | | | | | | | | | | | | | | |
Expenses, before reimbursements | | | 2.04 | % | | | 2.01 | % | | | 2.12 | % | | | 2.25 | % | | | 2.46 | % |
Expenses, net of reimbursements | | | 2.04 | % | | | 2.01 | % | | | 2.13 | % | | | 2.24 | % | | | 2.22 | % |
Net investment income (loss), before reimbursements | | | 0.53 | % | | | (0.05 | )% | | | (0.33 | )% | | | (0.27 | )% | | | (0.40 | )% |
Net investment income (loss), net of reimbursements | | | 0.53 | % | | | (0.05 | )% | | | (0.34 | )% | | | (0.26 | )% | | | (0.15 | )% |
Portfolio turnover rate | | | 27 | % | | | 79 | % | | | 24 | % | | | 48 | % | | | 87 | % |
| A | Amounts represent less than $0.01 per share. |
| B | Based on net asset value, which does not reflect the sales charge, redemption fee, or contingent deferred sales charge, if applicable. May include adjustments in accordance with U.S. GAAP and as such, the net asset value for reporting purposes and the returns based upon those net asset values may differ from the net asset value and returns for shareholder transactions. |
| C | WEDGE Capital Management was added as an investment manager to the Mid-Cap Value Fund on May 11, 2015. |
64
American Beacon FundsSM
Federal Tax Information
October 31, 2016 (Unaudited)
Certain tax information regarding the Fund is required to be provided to shareholders based upon the Fund’s income and distribution for the taxable year ended October 31, 2016. The information and distributions reported herein may differ from information and distributions taxable to the shareholders for the calendar year ended December 31, 2016.
The Funds designated the following items with regard to distributions paid during the year ended October 31, 2016. All designations are based on financial information available as of this annual report and, accordingly, are subject to change. For each item, it is the intention of the Fund to designate the maximum amount permitted under the Internal Revenue Code of 1986, as amended, and the regulations there under.
| | | | | | | | |
| | | Balanced Fund | | | Mid-Cap Value Fund | |
Corporate Dividends Received Deduction | | | 43.42 | % | | | 77.45 | % |
Qualified Dividend Income | | | 70.62 | % | | | 100.00 | % |
The Balanced Fund designated $35,018,635 as long-term capital gains distributions and $246,277 as short-term capital gain distributions for the year ended October 31, 2016.
The Mid-Cap Value Fund designated $25,489,211 as long-term capital gains distributions and $6,411,424 as short-term capital gain distributions for the year ended October 31, 2016.
Shareholders will receive notification in January 2017 of the applicable tax information necessary to prepare their 2016 income tax returns.
65
Disclosure Regarding Approval of the Management Agreement and
Investment Advisory Agreements (Unaudited)
Renewal and Approval of the Management Agreements and Investment Advisory Agreements of the Funds in June 2016
At in-person meetings held on May 17, 2016 and June 8, 2016 (collectively, the “Meetings”), the Board considered and then, at its June 8th meeting, approved the renewal of:
(1) the Management Agreement between American Beacon Advisors, Inc. (“Manager”) and the American Beacon Funds (the “Trust”), on behalf of American Beacon Balanced Fund (“Balanced Fund”) and the American Beacon Mid-Cap Value Fund (“Mid-Cap Fund”) (collectively, the “Funds”);
(2) the Investment Advisory Agreement among the Manager, the Trust, on behalf of the Balanced Fund, and Barrow, Hanley, Mewhinney & Strauss, LLC (“Barrow”), Brandywine Global Investment Management, LLC (“Brandywine”) and Hotchkis and Wiley Capital Management, LLC (“Hotchkis”); and
(3) the Investment Advisory Agreement among the Manager, the Trust, on behalf of the Mid-Cap Fund, and Barrow, Pzena Investment Management, LLC (“Pzena”) and WEDGE Capital Management, LLP (“WEDGE”);
Each of the Investment Advisory Agreements are hereinafter referred to as the “Investment Advisory Agreement,” and Barrow, Brandywine, Hotchkis, Pzena and WEDGE are hereinafter each referred to as a “subadvisor.” The Management Agreement and the Investment Advisory Agreements are collectively referred to herein as the “Agreements.” In preparation for the Board to consider the renewal of these Agreements, the Board undertook steps to gather and consider information furnished by the Manager, the subadvisors, Broadridge, Inc. (“Broadridge”) and Morningstar, Inc. (“Morningstar”). The Board, with the assistance of independent legal counsel, requested and received certain relevant information from the Manager and each subadvisor.
In advance of the Meetings, the Board’s Investment Committee and/or the Manager coordinated the production of information from Broadridge and Morningstar regarding the performance, fees and expenses of the Funds as well as information from the Manager and the subadvisors. At the Meetings, the Board considered the information provided. The Board noted that as a result of the acquisition of Lipper, Inc. (“Lipper”) by Broadridge, Lipper expense and performance information was provided by Broadridge. Further, the Board took into consideration information furnished for the Board’s review and consideration throughout the year at regular meetings of the Board and its committees, as well as information specifically prepared in connection with the renewal process.
In connection with the Board’s consideration of the Agreements, the Trustees received and evaluated such information as they deemed necessary. The information requested on behalf of the Board included, among other information, the following materials. References herein to the “firm” refer to the Manager and/or each applicable subadvisor.
| | • | | comparisons of the performance of an appropriate share class of each Fund to comparable investment companies and appropriate benchmark indices, including peer group averages and performance analyses provided by Broadridge and Morningstar, and to the performance of any similar accounts managed by the firm; |
| | • | | comparisons of each Fund’s management and subadvisory fee rates and expense ratio with the management fee rates paid by comparable mutual funds, including peer group averages and fee and expense analyses provided by Broadridge and Morningstar, and the advisory fee rates charged to other clients for which similar services are provided; |
| | • | | a description of any applicable fee waivers and/or expense reimbursements in place for each Fund during the past year, and any proposed changes to the expense caps; |
| | • | | the Manager’s profitability with respect to the services that it provided to each Fund; |
| | • | | any actual or anticipated economies of scale in relation to the services the firm provides or will provide to each Fund and whether the current fee rates charged or to be charged to each Fund reflect these economies of scale for the benefit of the Fund’s investors; |
| | • | | an evaluation of any other benefits to the firm or Funds as a result of their relationship, if any; |
| | • | | information regarding the securities lending, cash management, administrative and accounting-related services that the Manager provides to certain Funds and the fees that the Manager receives for such services; and |
| | • | | information regarding a firm’s financial condition, the personnel of the Manager who are assigned primary |
66
Disclosure Regarding Approval of the Management Agreement and
Investment Advisory Agreements (Unaudited)
| | responsibility for managing the Funds, staffing levels, portfolio managers’ compensation, disaster recovery plans, insurance coverage, material pending litigation, code of ethics, compliance matters, trading activities, and actual or potential conflicts of interest that the firm experiences, or anticipates that it will experience, in providing services to the Funds. |
The Board noted that the Manager provides management and administrative services to the Funds pursuant to the Management Agreement. The Board considered that prior to May 29, 2016, the Manager provided management and administrative services to the Funds pursuant to separate agreements. The Board noted, in this regard, that many mutual funds have separate contracts governing both types of services, and observed that the actual management fee rates provided by Broadridge for peer group funds reflect the combined advisory and administrative expenses, both gross and net of any waivers and/or reimbursements.
Certain firms may not have been able to, or opted not to, provide information in response to certain information requests, in which case the Board conducted its evaluation of those firms based on information that was provided. In such cases, the Board determined that the omission of any such information was not material to its considerations. For each Fund with more than one class of shares, the class of shares used for comparative performance purposes was the share class with the lowest expenses available for purchase by the general public, which, in most cases, was the Institutional Class. The Board also considered that the use of Institutional Class performance generally facilitates a meaningful comparison for expense and performance purposes.
Provided below is an overview of certain factors the Board considered in connection with its renewal and approval of the Management Agreement and Investment Advisory Agreements. The Board did not identify any particular information that was most relevant to its consideration to renew or approve each Agreement, and each Trustee may have afforded different weight to the various factors. Legal counsel to the independent Trustees provided the Board with a memorandum regarding its responsibilities pertaining to the renewal and approval of each Agreement. The memorandum explained the regulatory requirements surrounding the Trustees’ process for evaluating investment advisors and the terms of the contracts. Based on its evaluation, the Board unanimously concluded that the terms of each Agreement were reasonable and fair and that the renewal and approval of each Agreement was in the best interests of the Funds and their shareholders.
Considerations With Respect to the Renewal of the Management Agreement and Each Investment Advisory Agreement
In determining whether to renew the Agreements on behalf of the Funds, the Trustees considered the best interests of each Fund separately. While the Management Agreement and the Investment Advisory Agreements for all of the Funds were considered at the Meetings, the Board considered each Fund’s investment management and subadvisory relationships separately.
In each instance, the Board considered, among other things, the following factors: (1) the nature, extent and quality of the services provided; (2) the investment performance of a Fund and, as applicable, each subadvisor for a Fund; (3) the costs incurred by the Manager in rendering services to the Funds and its resulting profits or losses; (4) comparisons of services and fee rates with contracts entered into by the Manager or a subadvisor or their affiliates with other clients (such as pension funds and other institutional clients); (5) the extent to which economies of scale have been taken into account in setting each fee rate schedule; (6) whether fee rate levels reflect these economies of scale for the benefit of Fund investors; and (7) any other benefits derived or anticipated to be derived by the Manager or a subadvisor from their relationship with a Fund. The Trustees posed questions to various management personnel of the Manager regarding certain key aspects of the materials submitted in support of the renewal.
Nature, Extent and Quality of Services. With respect to the renewal of the Management Agreement, the Board considered, among other factors: each Fund’s long-term performance and the length of service of key investment personnel at the Manager; the cost structure of the Funds; the Manager’s culture of compliance and support for compliance operations that reduce risks to the Funds; the Manager’s commitment to enhance the Funds’ product line and increase assets in the Funds; the Manager’s quality of services; the Manager’s active role in
67
Disclosure Regarding Approval of the Management Agreement and
Investment Advisory Agreements (Unaudited)
monitoring and, as appropriate, recommending additional or replacement subadvisors; the Manager’s commitment to training employees; and the Manager’s efforts to retain key employees and maintain staffing levels.
With respect to the renewal of each Investment Advisory Agreement, the Trustees considered the level of staffing and the size of the subadvisor. The Board also considered the adequacy of the resources committed to the Funds by each subadvisor, and whether those resources were commensurate with the needs of the Funds and are sufficient to sustain appropriate levels of performance and compliance needs. In this regard, the Board considered the financial stability of each subadvisor. The Board also considered the subadvisors’ representations regarding their compliance programs and codes of ethics. Based on the foregoing information, the Board concluded that the nature, extent and quality of the management and advisory services provided by the Manager and each subadvisor were appropriate for each Fund and, thus, determined to renew the Agreements for each Fund.
Investment Performance. The Board evaluated the comparative information provided by Broadridge and the Manager regarding each Fund’s investment performance relative to its Lipper performance universe, Lipper performance group, and benchmark index(es), as well as the Fund’s Morningstar rating. The Board considered the information provided by Broadridge regarding its independent peer selection methodology to select all Lipper performance groups and universes. The Board also considered that the performance groups and universes selected by Broadridge may not provide appropriate comparisons for certain Funds. In addition, the Board considered the performance reports and discussions with management at Board and Committee meetings throughout the year. The Board also considered in each instance the Manager’s recommendation to continue to retain each subadvisor. A discussion regarding the Board’s considerations with respect to each Fund’s performance appears below under “Additional Considerations and Conclusions with Respect to Each Fund.”
Costs of the Services Provided to the Funds and the Profits Realized by the Manager from its Relationship with the Funds.
In analyzing the cost of services and profitability of the Manager, the Board considered the revenues earned and the expenses incurred by the Manager, before and after the payment of distribution-related expenses by the Manager. The profits or losses were noted at both an aggregate level for all Funds and at an individual Fund level, with each Fund being profitable for the Manager. The Board noted that the Manager did not manage other accounts in the same strategy as the Mid-Cap Fund. With respect to the Balanced Fund, the Board noted that the fee rates paid by other clients of the Manager are lower than the fee rate paid by the Balanced Fund, and considered the Manager’s representation that, among other matters, the difference is attributable to the fact that the Manager does not perform administrative services for non-investment company clients and reflects the greater level of responsibility and regulatory requirements associated with managing the Balanced Fund.
The Board further considered that, with respect to each Fund, the Management Agreement provides for the Manager to receive a management fee comprised of an annualized fee that is retained by the Manager. In addition, the Board considered that the Manager receives management fees for overseeing the securities lending program on behalf of the Mid-Cap Fund. The Board also noted that certain share classes of the Funds maintain higher expense ratios in order to compensate third-party financial intermediaries.
In analyzing the fee rates charged by each subadvisor in connection with its investment advisory services to the Balanced Fund, the Board considered that, with respect to Barrow, Brandywine and Hotchkis, the Manager has negotiated the lowest fee rate a subadvisor charges for any comparable client accounts. In analyzing the fee rates charged by each subadvisor in connection with its investment advisory services to the Mid-Cap Fund, the Board considered that, with respect to Barrow, Pzena and WEDGE, the Manager has negotiated the lowest fee rate a subadvisor charges for any comparable client accounts. The Board did not request profitability data from the subadvisors because the Board did not view this data as imperative to its deliberations given the arm’s-length nature of the relationship between the Manager and the subadvisors with respect to the negotiation of subadvisory fee rates. In addition, the Board noted that subadvisors may not account for their profits on an account-by-account basis and those that do likely employ different methodologies in connection with these calculations.
68
Disclosure Regarding Approval of the Management Agreement and
Investment Advisory Agreements (Unaudited)
Based on the foregoing information, the Board concluded that the profitability levels of the Manager were reasonable in light of the services performed by the Manager. A discussion regarding the Board’s considerations with respect to each Fund’s fee rates is set forth below under “Additional Considerations and Conclusions with Respect to Each Fund.”
Economies of Scale. In considering the reasonableness of the management and investment advisory fees rates, the Board considered whether economies of scale will be realized as the Funds grow and whether fee rate levels reflect these economies of scale for the benefit of Fund shareholders. In this regard, the Board considered that the Manager has negotiated breakpoints in the subadvisory fee rates for each subadvisor. The Board also noted that, for purposes of determining the fee rates chargeable to the Funds, Barrow, Brandywine, and Hotchkis have agreed to take into account assets of American Airlines Group and its pension plans that are managed by the subadvisors. Thus, the Funds are able to receive lower effective fee rates.
In addition, the Board noted the Manager’s representation that the Management Agreement contains fee schedule breakpoints at higher asset levels with respect to the Mid-Cap Fund. The Board also considered the Manager’s representation that the Balanced Fund benefits from economies of scale because comparably low fee rate levels are reflected in the current fee rates the Manager charges. Based on the foregoing information, the Board concluded that the Manager and subadvisor fee rate schedules for each Fund provide for a reasonable sharing of benefits from any economies of scale with the Funds.
Benefits Derived from the Relationship with the Funds. The Board considered the “fall-out” or ancillary benefits that accrue to the Manager and/or the subadvisors as a result of the advisory relationships with the Funds, including greater exposure in the marketplace with respect to the Manager’s or subadvisor’s investment process and expanding the level of assets under management by the Manager and the subadvisors. In addition, the Board noted that certain subadvisors benefit from soft dollar arrangements for third party and/or proprietary research.
In addition, the Manager noted that the Funds also derive benefits from their association with the Manager. Specifically, the Board noted the Manager’s representation that it provides services to most Funds at a lower than industry average cost. The Board considered that certain subadvisors reimburse the Manager for certain costs relating to distribution activities for the Funds, as well as representations by all such subadvisors that they would not reduce their fee rates in lieu of providing such reimbursements. Based on the foregoing information, the Board concluded that the potential benefits accruing to the Manager and the subadvisors by virtue of their relationships with the Funds appear to be fair and reasonable
Additional Considerations and Conclusions with Respect to Each Fund
The performance comparisons below were made versus each Fund’s Lipper performance universe and Lipper performance group, with the 1st Quintile representing the top twenty percent of the universe or group based on performance and the 5th Quintile representing the bottom twenty percent of the universe or group based on performance. References below to each Fund’s Lipper performance group and Lipper performance universe are to the respective group or universe of comparable mutual funds included in the analysis provided by Broadridge. A Lipper performance group consists of the Fund and a representative sample of funds with similar investment classifications and objectives as the Fund, as selected by Broadridge. A Lipper performance universe is an expansion of the performance group, providing a broader view of performance across the Fund’s investment classification/objective and allowing for a more extensive comparison. In reviewing the performance, the Trustees viewed longer-term performance over a full market cycle, typically five years or longer, if available, as the most important consideration, because relative performance over shorter periods may be significantly impacted by market or economic events that do not reflect manager skill.
The expense comparisons below were made versus each Fund’s Lipper expense universe and Lipper expense group, with the 1st Quintile representing the top twenty percent of the universe or group based on lowest total
69
Disclosure Regarding Approval of the Management Agreement and
Investment Advisory Agreements (Unaudited)
expense and the 5th Quintile representing the bottom twenty percent of the universe or group based on highest total expense. References below to each Fund’s expense group and expense universe are to the respective group or universe of comparable mutual funds included in the analysis by Broadridge. A Lipper expense group consists of the Fund and a representative sample of funds with similar operating structures and asset sizes, as selected by Broadridge. A Lipper expense universe includes all funds in the investment classification/objective with a similar load type to the share class of the Fund included in the Lipper comparative information and provides a broader view of expenses across the Fund’s investment classification/objective. The Trustees also considered a Fund’s Morningstar fee level category. In addition, information regarding the subadvisors’ use of soft dollars was requested from the Manager and was considered by the Trustees.
Additional Considerations and Conclusions with Respect to the American Beacon Balanced Fund
In considering the renewal of the Management Agreement for the Balanced Fund, the Trustees considered the following additional factors:
Lipper Total Expense Analysis and Morningstar Fee Level Ranking
| | |
Compared to Lipper Expense Universe | | 1st Quintile |
Compared to Lipper Expense Group | | 1st Quintile |
Morningstar Fee Level Ranking – Institutional Class | | Low Expense Ratio |
Lipper Fund Performance Analysis (five-year period ended March 31, 2016)
| | |
Compared to Lipper Performance Universe | | 2nd Quintile |
Compared to Lipper Performance Group | | 3rd Quintile |
The Trustees also considered: (1) the Manager’s representation that a comparison of its performance relative to the Manager��s benchmark index rather than its Lipper performance universe may be more appropriate because the Manager only manages an investment grade fixed income portion of the Fund; and (2) the Manager outperformed its applicable benchmark index for the five-year period ended March 31, 2016.
In considering the renewal of the Investment Advisory Agreements with Barrow, Brandywine and Hotchkis, the Trustees considered the following additional factors:
Subadvisor Performance (compared to Lipper Performance Universe for period indicated, ended March 31, 2016)
| | | | |
Barrow | | 5 years | | 1st Quintile |
Brandywine | | 5 years | | 2nd Quintile |
Hotchkis* | | 5 years | | 2nd Quintile |
| * | Hotchkis equity only return compared to the Lipper large cap value performance universe |
The Trustees also considered: (1) information provided by each subadvisor regarding fee rates charged for managing accounts in the same strategy as the subadvisor’s allocation portion of the Fund; and (2) the Manager’s recommendation to continue to retain each subadvisor, based upon, among other factors, the relative performance impact of the investment restrictions the Manager places on the subadvisors.
Based on these and other considerations, the Trustees: (1) concluded that the fees paid to the Manager and the subadvisors under the Management and Investment Advisory Agreements are fair and reasonable; (2) determined that the Fund and its shareholders would benefit from the Manager’s and subadvisors’ continued management of the Fund; and (3) approved the renewal of the Management and Investment Advisory Agreements with respect to the Fund.
Additional Considerations and Conclusions with Respect to the American Beacon Mid-Cap Value Fund
70
Disclosure Regarding Approval of the Management Agreement and
Investment Advisory Agreements (Unaudited)
In considering the renewal of the Management Agreement for the Mid-Cap Fund, the Trustees considered the following additional factors:
Lipper Total Expense Analysis and Morningstar Fee Level Ranking
| | |
Compared to Lipper Expense Universe | | 3rd Quintile |
Compared to Lipper Expense Group | | 3rd Quintile |
Morningstar Fee Level Ranking – Institutional Class | | Below Average Expense Ratio |
Lipper Fund Performance Analysis (five-year period ended March 31, 2016)
| | |
Compared to Lipper Performance Universe | | 2nd Quintile |
Compared to Lipper Performance Group | | 3rd Quintile |
In considering the renewal of the Investment Advisory Agreements with Barrow, Pzena and WEDGE, the Trustees considered the following additional factors:
Subadvisor Performance (compared to Lipper Performance Universe for period indicated, ended March 31, 2016)
| | | | |
Barrow | | 5 years | | 2nd Quintile |
Pzena | | 5 years | | 1st Quintile |
WEDGE* | | 1 year | | Not Available |
| * | Because WEDGE does not yet have a 1-year, 3-year, or 5-year performance record, the Trustees did not consider WEDGE’s prior performance with respect to the Fund. |
The Trustees also considered: (1) information provided by each subadvisor regarding fee rates charged for managing accounts in the same strategy as the subadvisor’s allocated portion of the Fund; and (2) the Manager’s recommendation to continue to retain each subadvisor.
Based on these and other considerations, the Trustees: (1) concluded that the fees paid to the Manager and the subadvisors under the Management and Investment Advisory Agreements are fair and reasonable; (2) determined that the Fund and its shareholders would benefit from the Manager’s and subadvisors’ continued management of the Fund; and (3) approved the renewal of the Management and Investment Advisory Agreements with respect to the Fund.
71
Trustees and Officers of the American Beacon FundsSM (Unaudited)
The Trustees and officers of the American Beacon Funds (the “Trust”) are listed below, together with their principal occupations during the past five years. Unless otherwise indicated, the address of each person listed below is 220 Las Colinas Boulevard East, Suite 1200, Irving, Texas 75039. Each Trustee oversees twenty-six seven funds in the fund complex that includes the Trust and the American Beacon Select Funds. The Trust’s Statement of Additional Information contains additional information about the Trustees and is available without charge by calling 1-800-658-5811.
| | | | |
Name, Age and Address | | Position, Term of Office and Length of Time Served with the Trust | | Principal Occupation(s) During Past 5 Years and Current Directorships |
| INTERESTED TRUSTEES | | | | |
| | |
| | Lifetime of Trust until removal, resignation or retirement* | | |
| | |
| Alan D. Feld** (79) | | Trustee since 1996 | | Sole Shareholder of a professional corporation which is a Partner in the law firm of Akin, Gump, Strauss, Hauer & Feld, LLP (law firm) (1960-Present); Trustee, American Beacon Mileage Funds (1996-2012); Trustee, American Beacon Select Funds (1999-Present); Trustee, American Beacon Master Trust (1996-2012). |
| | |
| NON-INTERESTED TRUSTEES | | Term | | |
| | |
| | Lifetime of Trust until removel resignation or retirement* | | |
| | |
| Gilbert G. Alvarado (46) | | Trustee since 2015 | | Director, Kura MD, Inc. (local telehealth organization) (2015-present); Vice President & CFO, Sierra Health Foundation (health conversion private foundation) (2006-Present) Vice President & CFO, Sierra Health Foundation: Center for Health Program Management (California public benefit corporation) (2012-Present); Director, Innovative North State (2012-Present); Director, Sacramento Regional Technology Alliance (2011-Present); Director, Women’s Empowerment (2009-2014); Trustee, American Beacon Select Funds (2015-Present). |
| | |
| Josephe B. Armes (54) | | Trustee since 2015 | | Chairman & CEO, CSW Industrials f/k/a Capital Southwest Corporation (investment company) (2013-Present); President & CEO, JBA Investment Partners (family investment vehicle) (2010-Present); Chief Operating Officer, Hicks Holdings, LLC (Hicks Family assets and investments) (2005-2010); Trustee, Baylor University Board of Regents (2001-2010); Director and Chair of Audit Committee, RSP Permian (oil and gas producer) (2013-Present); Trustee, American Beacon Select Funds (2015-Present). |
| | |
| Gerard J. Arpey (58) | | Trustee since 2012 | | Director, The Home Depot, Inc. (2015-Present); Partner, Emerald Creek Group (private equity firm) (2011-Present); Chairman and Chief Executive Officer, AMR Corp. and American Airlines; Inc. (2003- 2011); Director, S. C. Johnson & Son, Inc. (privately held company) (2008-present); Trustee, American Beacon Select Funds (2012-Present). |
| | |
| Brenda A. Cline (55) | | Trustee since 2004 | | Executive Vice President, Chief Financial Officer, Treasurer and Secretary, Kimbell Art Foundation (1993-Present); Director, Range Resources Corporation (oil and natural gas company) (2015-Present); Director, Tyler Technologies, Inc. (public sector software solutions company) (2014-Present); Trustee, American Beacon Mileage Funds (2004-2012); Trustee, American Beacon Select Funds (2004-Present); Trustee, American Beacon Master Trust (2004-2012). |
| | |
| Eugene J. Duffy (62) | | Trustee since 2008 | | Managing Director, Institutional Services, Intercontinental Real Estate Corporation (2014-Present); Principal and Executive Vice President, Paradigm Asset Management (1994-2014); Director, Sunrise Bank of Atlanta (2008-2013); Trustee, American Beacon Mileage Funds (2008- 2012); Trustee, American Beacon Select Funds (2008-Present); Trustee, American Beacon Master Trust (2008-2012). |
72
Trustees and Officers of the American Beacon FundsSM (Unaudited)
| | | | |
Name, Age and Address | | Position, Term of Office and Length of Time Served with the Trust | | Principal Occupation(s) During Past 5 Years and Current Directorships |
| TRUSTEES (CONT.) | | Term | | |
| | |
| M. Dunning (74) | | Trustee since 2008 | | Chairman Emeritus (2008-Present); Lockton Dunning Benefits (consulting firm in employee benefits); Board Director, Oncor Electric Delivery Company LLC (2007-Present); Board Member, BancTec (2010-Present) (software consulting); Trustee, American Beacon Mileage Funds (2008-2012); Trustee, American Beacon Select Funds (2008-Present); Trustee, American Beacon Master Trust (2008-2012). |
| | |
| Richard M. Massman (73) | | Trustee since 2004 Chairman since 2008 | | Consultant and General Counsel Emeritus (2009-Present) and Senior Vice President and General Counsel (1994-2009), Hunt Consolidated, Inc. (holding company engaged in oil and gas exploration and production, refining, real estate, farming, ranching and venture capital activities); Trustee, American Beacon Mileage Funds (2004- 2012); Trustee, American Beacon Select Funds (2004-Present); Trustee, American Beacon Master Trust (2004-2012). |
| | |
| Barbara J. McKenna, CFA (53) | | Trustee since 2012 | | Managing Principal, Longfellow Investment Management Company (2005- Present); Trustee, American Beacon Select Funds (2012-Present). |
| | |
| R. Gerald Turner (70) 225 Perkins Admin. Bldg. Southern Methodist Univ. Dallas, Texas 75275 | | Trustee since 2001 | | President, Southern Methodist University (1995-Present); Director, J.C. Penney Company, Inc. (1996-Present); Director, Kronus Worldwide Inc. (chemical manufacturing) (2003-Present); Trustee, American Beacon Mileage Funds (2001- 2012); Trustee, American Beacon Select Funds (2001-Present); Trustee, American Beacon Master Trust (2001-2012). |
| | |
| OFFICERS | | | | |
| | |
| Gene. L. Needles, Jr. (61) | | President since 2009 Executive Vice President since 2009 | | President, CEO and Director, American Beacon Advisors, Inc. (2009-Present); President, CEO and Director, Astro AB Borrower, Inc. (2015-Present); President, CEO and Director, Astro AB Acquisition, Inc. (2015-Present); President, CEO and Director, Astro AB Topco, Inc. (2015-Present), President, CEO and Director, Astro AB Holdings, LLC. (2015-Present); President, CEO and Director, Lighthouse Holdings, Inc.; (2009-2015); President and CEO, Lighthouse Holdings Parent, Inc. (2009-2015); Manager, President and CEO, American Private Equity Management, L.L.C. (2012-Present); President, American Beacon Cayman Managed Futures Strategy Fund, Ltd. (2014-Present). |
| | |
| Rosemary K. Behan (57) | | VP, Secretary and Chief Legal Officer since 2006 | | Secretary, American Beacon Advisors, Inc. (2006-Present); Secretary, Astro AB Borrower, Inc. (2015-Present); Secretary, Astro AB Acquisition, Inc. (2015- Present); Secretary, Astro AB Topco, Inc. (2015-Present); Secretary, Astro AB Holdings, LLC. (2015-Present); Secretary, Lighthouse Holdings, Inc. (2008- 2015); Secretary, Lighthouse Holdings Parent, Inc. (2008-2015); Secretary, American Private Equity Management, L.L.C. (2008-Present); Secretary, American Beacon Cayman Managed Futures Strategy Fund, Ltd. (2014-Present). |
| | |
| Brian E. Brett (56) | | VP since 2004 | | Vice President, Director of Sales, American Beacon Advisors, Inc. (2004-Present). |
| | |
| Paul B. Cavazos (47) | | VP since 2016 | | Chief Investment Officer and Vice President, Asset Management, American Beacon Advisors, Inc. (2016-Present); Chief Investment Officer and Assistant Treasurer, DTE Energy (2007-2016); |
| | |
| Erica Duncan (46) | | VP since 2011 | | Vice President, Marketing and Client Services, American Beacon Advisors, Inc. (2011-Present); Supervisor, Brand Marketing, Invesco (2010-2011); |
73
Trustees and Officers of the American Beacon FundsSM (Unaudited)
| | | | |
Name, Age and Address | | Position, Term of Office and Length of Time Served with the Trust | | Principal Occupation(s) During Past 5 Years and Current Directorships |
| OFFICERS | | Term | | |
| | |
| Melinda G. Heika (55) | | Treasurer since 2010 | | Treasurer, American Beacon Advisors, Inc. (2010-Present); Treasurer, Astro AB Borrower, Inc. (2015-Present); Treasurer, Astro AB Acquisition, Inc. (2015-Present); Treasurer, Astro AB Topco, Inc. (2015-Present); Treasurer, Astro AB Holdings, LLC. (2015-Present); Treasurer, Lighthouse Holdings, Inc. (2010-2015); Treasurer, Lighthouse Holdings Parent Inc., (2010-2015); Treasurer, American Private Equity Management, L.L.C. (2012-Present); Director and Treasurer, American Beacon Cayman Managed Futures Strategy Fund, Ltd. (2014-Present). |
| | |
| | One Year | | |
| | |
| Terri L. McKinney (52) | | VP since 2010 | | Vice President, Enterprise Services (2009-Present) and Managing Director (2003-2009), American Beacon Advisors, Inc. |
| | |
| Jeffrey K. Ringdahl (41) | | VP since 2010 | | Chief Operating Officer, American Beacon Advisors, Inc. (2010-Present); Manager and Senior Vice President, American Private Equity Management, L.L.C. (2012-Present); Senior Vice President and Director, Astro AB Borrower, Inc. (2015-Present); Senior Vice President and Director, Astro AB Acquisition, Inc. (2015-Present); Senior Vice President and Director, Astro AB Topco, Inc. (2015-Present), Senior Vice President and Director, Astro AB Holdings, LLC.(2015-Present); Senior Vice President, Lighthouse Holdings, Inc. (2013-2015); Senior Vice President, Lighthouse Holdings Parent, Inc. (2013-2015); Director and Vice President, American Beacon Cayman Managed Futures Strategy Fund, Ltd. (2014-Present); Vice President, Product Management, Touchstone Advisors, Inc. (2007-2010). |
| | |
| Samuel J. Silver (53) | | VP since 2011 | | Chief Fixed Income Officer (2016–Present), Vice President, Fixed Income Investments (2011-2016) and Senior Portfolio Manager, Fixed Income Investments (1999-2011), American Beacon Advisors, Inc. |
| | |
| Christina E. Sears (45) | | Chief Compliance Officer since 2004 and Asst. Secretary since 1999 | | Chief Compliance Officer, American Beacon Advisors, Inc. (2004-Present); Chief Compliance Officer, American Private Equity Management, L.L.C. (2012-Present). |
| | |
| Sonia L. Bates (59) | | Asst. Treasurer since 2011 | | Director, Tax and Financial Reporting (2011-Present), Manager, Tax and Financial Reporting (2005-2010), American Beacon Advisors, Inc.; Asst. Treasurer, Astro AB Borrower, Inc. (2015-Present); Asst. Treasurer, Astro AB Acquisition, Inc.(2015-Present); Asst. Treasurer, Astro AB Topco, Inc. (2015-Present); Asst. Treasurer, Astro AB Holdings, LLC.; Asst. Treasurer, Lighthouse Holdings, Inc. (2011-2015); Asst. Treasurer, Lighthouse Holdings Parent Inc. (2011-2015); Asst. Treasurer, American Private Equity Management, L.L.C. (2012-Present). |
| | |
| Shelley D. Abrahams (41) | | Assistant Secretary since 2008 | | Assistant Secretary, American Beacon Advisors, Inc. (2008-Present) |
| | |
| Rebecca L. Harris (49) | | Assistant Secretary since 2011 | | Assistant Secretary, American Beacon Advisors, Inc. (2011-Present) |
| | |
| Diana N. Lai (40) | | Assistant Secretary since 2012 | | Assistant Secretary, American Beacon Advisors, Inc. (2012-Present) |
| | |
| Teresa A. Oxford (58) | | Assistant Secretary since 2015 | | Assistant Secretary, American Beacon Advisors, Inc. (2015-Present) |
| * | As of 11/12/2014, the Board adopted a retirement plan that requires Trustees to retire no later than the last day of the calendar year in which they reach the age of 75. |
| ** | Mr. Feld is deemed to be an “interested person” of the Trusts, as defined by the 1940 Act. Mr. Feld’s law firm of Akin, Gump, Strauss, Hauer & Feld LLP has provided legal services within the past two fiscal years to one or more of the Trust’s sub-advisors. |
74
Trustees and Officers of the American Beacon FundsSM (Unaudited)
| * | The Board has adopted a retirement plan that requires Trustees to retire no later than the last day of the calendar year in which they reach the age of 72, provided, however, that the board may determine to grant one or more annual exemptions to this requirement. |
| ** | Mr. Feld is deemed to be an “interested person” of the Trust, as defined by the 1940 Act. Mr. Feld’s law firm of Akin, Gump, Strauss, Hauer & Feld LLP has provided legal services within the past two years to one or more of the Trust’s sub-advisors. |
75
American Beacon FundsSM
Privacy Policy
October 31, 2016 (Unaudited)
The American Beacon Funds recognize and respect the privacy of our shareholders. We are providing this notice to you so you will understand how shareholder information may be collected and used.
We may collect nonpublic personal information about you from one or more of the following sources:
| | • | | information we receive from you on applications or other forms; |
| | • | | information about your transactions with us or our service providers; and |
| | • | | information we receive from third parties. |
We do not disclose any nonpublic personal information about our customers or former customers to anyone, except as permitted by law.
We restrict access to your nonpublic personal information to those employees or service providers who need to know that information to provide products or services to you. To ensure the confidentiality of your nonpublic personal information, we maintain safeguards that comply with federal standards.
76

Delivery of Documents
eDelivery is NOW AVAILABLE – Stop traditional mail delivery and receive your
shareholder reports and summary prospectus on-line. Sign up at
www.americanbeaconfunds.com
If you invest in the Fund through a financial institution, you may be able to receive the Fund’s regulatory mailings, such as the Prospectus, Annual Report and Semi-Annual Report, by e-mail. If you are interested in this option, please go to www.icsdelivery.com and search for your financial institution’s name or contact your financial institution directly.
To obtain more information about the Fund:
| | |
 | |  |
| | |
| By E-mail: | | On the Internet: |
| american_beacon.funds@ambeacon.com | | Visit our website at www.americanbeaconfunds.com |
| | | |
| | | |
| | |
| | | |
| | |
 | |  |
| By Telephone: | | By Mail: |
| Institutional, Y, Investor, and Advisor Classes | | American Beacon Funds |
| Call (800) 658-5811 | | P.O. Box 219643 |
| | | Kansas City, MO 64121-9643 |
| | |
| | | |
| | |
| Availability of Quarterly Portfolio Schedules | | Availability of Proxy Voting Policy and Records |
| | |
| In addition to the Schedule of Investments provided in each semi-annual and annual report, the Fund files a complete schedule of its portfolio holdings with the Securities and Exchange Commission (“SEC”) on Form N-Q as of the first and third fiscal quarters. The Fund’s Forms N-Q are available on the SEC’s website at www.sec.gov. The Forms N-Q may also be reviewed and copied at the SEC’s Public Reference Section, 100 F Street, NE, Washington, D.C. 20549-2736. Information regarding the operation of the SEC’s Public Reference Room may be obtained by calling (800)-SEC-0330. A complete schedule of the Fund’s portfolio holdings is also available at www.americanbeaconfunds.com approximately twenty days after the end of each month. | | A description of the policies and procedures the Fund uses to determine how to vote proxies relating to portfolio securities is available in the Fund’s Statement of Additional Information, is available free of charge on the Fund’s website www.americanbeaconfunds.com and by calling 1-800-967-9009 or by accessing the SEC’s website at www. sec.gov. The Fund’s proxy voting record for the most recent year ended June 30 is filed annually with the SEC on Form N-PX. The Fund’s Forms N-PX are available on the SEC’s website at www.sec.gov. The Fund’s proxy voting record may also be obtained by calling 1-800-967-9009. |
Fund Service Providers:
| | | | | | | | | | | | | | |
| | CUSTODIAN State Street Bank and Trust Boston, Massachusetts | | | | TRANSFER AGENT Boston Financial Data Services Kansas City, Missouri | | | | INDEPENDENT REGISTERED PUBLIC ACCOUNTING FIRM Ernst & Young LLP Dallas, Texas | | | | DISTRIBUTOR Foreside Fund Services, LLC Portland, Maine |
This report is prepared for shareholders of the American Beacon Funds and may be distributed to others only if preceded or accompanied by a current Prospectus of Summary Prospectus.
American Beacon Funds, American Beacon Balanced Fund and American Beacon Mid-Cap Value Fund are service marks of American Beacon Advisors, Inc.
AR 10/16

About American Beacon Advisors
Since 1986, American Beacon Advisors has offered a variety of products and investment advisory services to numerous institutional and retail clients, including a variety of mutual funds, corporate cash management, and separate account management.
Our clients include defined benefit plans, defined contribution plans, foundations, endowments, corporations, financial planners, and other institutional investors. With American Beacon Advisors, you can put the experience of a multi-billion dollar asset management firm to work for your company.
GARCIA HAMILTON QUALITY BOND FUND RISKS
The use of fixed-income securities entails interest rate and credit risks. Credit risk is the risk that the issuer of a bond will fail to make timely payment of interest or principal; and the decline in an issuer’s credit rating can cause the price of its bonds to go down. Please see the prospectus for a complete discussion of the Fund’s risks. There can be no assurances that the investment objectives of this Fund will be met.
This may contain information obtained from third parties, including ratings from credit rating agencies such as Standard & Poor’s. Reproduction and distribution of third-party content in any form is prohibited except with the prior written permission of the related third party. Third-party content providers do not guarantee the accuracy, completeness, timeliness or availability of any information, including ratings, and are not responsible for any errors or omissions (negligent or otherwise), regardless of the cause, or for the results obtained from the use of such content. THIRD-PARTY CONTENT PROVIDERS GIVE NO EXPRESS OR IMPLIED WARRANTIES, INCLUDING, BUT NOT LIMITED TO, ANY WARRANTIES OF MERCHANTABILITY OR FITNESS FOR A PARTICULAR PURPOSE OR USE. THIRD-PARTY CONTENT PROVIDERS SHALL NOT BE LIABLE FOR ANY DIRECT, INDIRECT, INCIDENTAL, EXEMPLARY, COMPENSATORY, PUNITIVE, SPECIAL OR CONSEQUENTIAL DAMAGES, COSTS, EXPENSES, LEGAL FEES OR LOSSES (INCLUDING LOST INCOME OR PROFITS AND OPPORTUNITY COSTS OR LOSSES CAUSED BY NEGLIGENCE) IN CONNECTION WITH ANY USE OF THEIR CONTENT, INCLUDING RATINGS. Credit ratings are statements of opinions and are not statements of fact or recommendations to purchase, hold or sell securities. They do not address the suitability of securities or the suitability of securities for investment purposes and should not be relied on as investment advice.
Any opinions herein, including forecasts, reflect our judgment as of the end of the reporting period and are subject to change. Each advisor’s strategies and the Fund’s portfolio composition will change depending on economic and market conditions. This report is not a complete analysis of market conditions and therefore, should not be relied upon as investment advice. Although economic and market information has been compiled from reliable sources, American Beacon Advisors, Inc. makes no representation as to the completeness or accuracy of the statements contained herein.
| | |
American Beacon Funds | | October 31, 2016 |
Contents
President’s Message
| | |
 | | Dear Shareholders, During the 12-month period ended October 31, 2016, China’s slowing growth escalated concerns for global markets, and many of the world’s central banks - the Federal Reserve included - responded by either continuing or expanding their economic stimulation policies. In the first half of 2016, international stocks declined while U.S. and emerging-market stocks made modest gains. Falling global interest rates supported bond returns during the period. On June 24, 2016, the U.K. announced that the “Brexit” referendum to leave the European Union passed with a 52% majority vote, further shaking up global markets. By the end of that month, however, the U.S. stock market and some global markets had rebounded to near pre-Brexit levels as investors took opportunistic risks following the historic vote. After Theresa May’s succession as the U.K.’s prime minister on July 13, 2016, many central banks put their Brexit concerns on hold and turned their attention to their own economies. |
In the weeks ahead of the U.S. presidential election on November 8, 2016, uncertainty about the outcome caused many investors to stay on the sidelines. Although investors may question whether the election’s result could have negative consequences for their portfolios, elections rarely have a lasting effect on the market. Historically speaking, from August 1 to October 31 during 19 of the last 22 election years – or approximately 86% of the time – the S&P 500 rallied for an average gain of approximately 6%.
| • | | From its inception on April 4, 2016, through October 31, 2016, the American Beacon Garcia Hamilton Quality Bond Fund (Investor Class) returned 0.24%. The Fund is designed to provide income, quality and liquidity consistent with the preservation of capital. |
Thank you for your continued interest in American Beacon Funds. We are pleased to have a broad range of products that cover the global equity and fixed-income markets. For additional information about the Funds or to access your account information, please visit our website at www.americanbeaconfunds.com.
|
| Best Regards, |
|
 |
| Gene L. Needles, Jr. |
| President |
| American Beacon Funds |
1
Domestic Bond Market Overview
October 31, 2016 (Unaudited)
The U.S. investment-grade bond market, as defined by the Barclays U.S. Aggregate Index, began the 12-month period ended October 31, 2016 with a yield of 2.38% and ended at 2.12%, producing a total return of 4.37%. The modest decline in yield was somewhat unexpected as the period began with fixed-income investors anticipating that the Federal Reserve (the “Fed”) would begin normalizing interest rates. The Fed raised rates in December 2015 for the first time in nearly 10 years, but that would be the only rate increase for the remainder of the period under review. Yields on the 10-year Treasury note initially rose from 2.14% at the beginning of the period to 2.27% by December 31, 2015; however, sentiment in the bond market changed quickly when global economic growth rates and commodity prices declined.
In response to persistent weakness in many world economies, central banks refocused on policies to keep interest rates down and money supplies elevated. This development put the Fed’s plans on hold, and U.S. interest rates followed global rates down accordingly. By period end, the 10-year Treasury note yielded 1.83%. Crude oil prices ended the period where they began, at approximately $47 per barrel, but they briefly touched $26 per barrel at the depths of the commodity price declines in early 2016.
Despite the risk-off environment, investment-grade corporate bonds performed well during the period, returning 7.23%. Corporate spreads narrowed from 164 basis points, or 1.64%, over Treasury yields at the beginning of the period to 135 basis points, or 1.35%, at period end – although they took a detour up to 215 basis points, or 2.15%, during the volatile months in between. Commodity-rated issuers struggled during the period, but the remaining issuers held up reasonably well as investors sought incremental yield in the low-yielding environment.
The agency mortgage-backed sector produced the lowest returns of the major sectors during the period, at 3.28%, as interest rates declined and caused acceleration in refinancing activity. Over time, however, the sector has been an attractive place for investors to seek relatively safe yield.
The period ended with the U.S. election only days away and the Fed poised to raise interest rates in December 2016. Markets were somewhat volatile given the uncertainty. The Fed remains extremely data dependent, and the outlook for interest rates will reflect the strength of the underlying economy.
2
American Beacon Garcia Hamilton Quality Bond FundSM
Performance Overview
October 31, 2016 (Unaudited)
The Investor Class of the American Beacon Garcia Hamilton Quality Bond Fund (the “Fund”) returned 0.24% for the period ended October 31, 2016, underperforming the Barclays Capital U.S. Aggregate Index (the “Index”) return of 1.85% for the same period. The Fund’s inception was April 2016, and it does not have a full twelve months of performance as of this fiscal year-end report.
Comparison of Change in Value of a $10,000 Investment for the period from 4/4/16 through 10/31/16
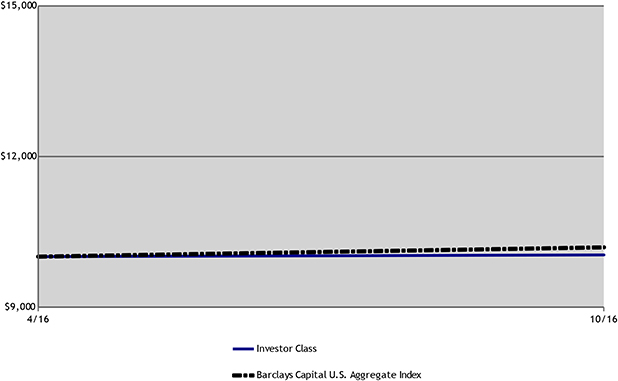
Total Returns for the Period ended October 31, 2016
| | | | | | | | | | | | | | | | |
| | | Ticker | | | 6 Months | | | Since Inception
(04/04/2016) | | | Value of $10,000
04/04/2016-
10/31/2016 | |
Institutional Class (1,3) | | | GHQIX | | | | 0.87 | % | | | 0.34 | % | | $ | 10,034 | |
Y Class (1,3) | | | GHQYX | | | | 0.84 | % | | | 0.29 | % | | $ | 10,029 | |
Investor Class (1,3) | | | GHQPX | | | | 0.77 | % | | | 0.24 | % | | $ | 10,024 | |
Barclays Capital U.S. Aggregate Index (2) | | | | | | | 1.51 | % | | | 1.85 | % | | $ | 10,185 | |
| 1. | Performance shown is historical and is not indicative of future returns. Investment returns and principal value will vary, and shares may be worth more or less at redemption than at original purchase. Performance shown is calculated based on the published end of day net asset values as of the date indicated and current performance may be lower or higher than the performance data quoted. To obtain performance as of the most recent month end, please visit www.americanbeaconfunds.com or call 1-800-967-9009. Fund performance in the table above does not reflect the deduction of taxes a shareholder would pay on distributions or the redemption of shares. A portion of the fees charged to each Class of the Fund has been waived since inception. Performance prior to waiving fees was lower than the actual returns shown since inception. |
| 2. | The Barclays Capital U.S. Aggregate Index is a market value weighted performance benchmark for government, corporate, mortgage-backed and asset-backed fixed-rate debt securities of all maturities. |
| 3. | The total annual Fund operating expense ratios set forth in the most recent Fund prospectus for the Institutional, Y, and Investor Class shares was 0.70%, 0.80%, and 1.07%, respectively. The expense ratios above may vary from the expense ratios presented in other sections of this report that are based on expenses incurred during the period covered by this report. |
3
American Beacon Garcia Hamilton Quality Bond FundSM
Performance Overview
October 31, 2016 (Unaudited)
Given the Fund’s short performance record, relative returns are difficult to analyze. With that being said, the Fund trailed its Index during the period primarily due to sector allocation as the sub-advisor began implementing its investment strategy. During the initial investing period, the Fund was underweight Agency Mortgages and instead held short-duration Agency Debentures. This approach allowed the sub-advisor to await a sufficient amount of Fund assets before allocating to the Mortgage sector; however, this approach resulted in lower yield than that of the Index. The Fund was also underweight the Corporate sector which detracted from returns as corporate bonds performed well during the period. In particular, the Fund’s underweight in Energy, a strong contributor to the Index, detracted from relative performance as the sector continued to rebound.
The Fund also held a barbell maturity position during the period which served as a positive contributor as the yield curve flattened in anticipation of Fed rate hikes. The sub-advisor expects interest rates to rise modestly to pre-Brexit levels and for the U.S. yield curve to continue flattening.
The Fund’s duration was a positive contributor to performance as it maintained a longer duration than the benchmark during the first half of the year and rates declined. In July, the Fund moved to a shorter duration than the benchmark as the sub-advisor felt the market overreacted to the British referendum. Since then, rates have generally moved higher.
The Fund’s investment strategy emphasizes high-quality, fixed-income investing that can perform well during periods of broader market volatility.
| | | | | | | | |
| Top Ten Holdings (% Net Assets) | | | | | | | | |
Federal Farm Credit Bank, 0.543%, Due 5/25/2018 | | | | | | | 7.3 | |
Federal Home Loan Bank, 0.535%, Due 12/5/2017 | | | | | | | 7.3 | |
Federal National Mortgage Association, 0.594%, Due 3/21/2018 | | | | | | | 4.9 | |
Federal Farm Credit Banks, 0.527%, Due 5/17/2018 | | | | | | | 4.6 | |
Federal Home Loan Bank, 0.535%, Due 12/7/2017 | | | | | | | 4.5 | |
Apple, Inc., 1.088%, Due 5/6/2019 | | | | | | | 4.1 | |
Freddie Mac Gold Pool, 4.50%, Due 12/1/2034 | | | | | | | 3.8 | |
Cisco Systems, Inc., 1.411%, Due 2/21/2018 | | | | | | | 3.6 | |
JP Morgan Chase & Co., 1.373%, Due 1/28/2019 | | | | | | | 3.5 | |
American Express Credit Corp., 1.407%, Due 3/18/2019 | | | | | | | 3.5 | |
Total Fund Holdings | | | 30 | | | | | |
| | | | |
| Sector Allocations (% Investments) | | | | |
U.S. Agency Obligations (non-mortgage) | | | 39.6 | |
Finance | | | 24.1 | |
U.S. Treasury Obligations | | | 19.4 | |
U.S. Agency Mortgage-Backed Securities | | | 7.1 | |
Telecom | | | 4.8 | |
Manufacturing | | | 4.1 | |
Investment Companies | | | 0.9 | |
4
American Beacon Garcia Hamilton Quality Bond FundSM
Expense Examples
October 31, 2016 (Unaudited)
Fund Expense Example
As a shareholder of a Fund, you incur two types of costs: (1) transaction costs, including sales charges (loads) on purchase payments and redemption fees if applicable, and (2) ongoing costs, including management fees, administrative service fees, distribution (12b-1) fees, and other Fund expenses. The Examples are intended to help you understand the ongoing cost (in dollars) of investing in the Fund and to compare these costs with the ongoing costs of investing in other mutual funds. The Examples are based on an investment of $1,000 invested at the beginning of the period in each Class and held for the entire period from May 1, 2016 through October 31, 2016.
Actual Expenses
The “Actual” lines of the table provide information about actual account values and actual expenses. You may use the information in this line, together with the amount you invested, to estimate the expenses that you paid over the period. Simply divide your account value by $1,000 (for example, an $8,600 account value divided by $1,000 = $8.60), then multiply the result by “Expenses Paid During Period” to estimate the expenses you paid on your account during this period. Shareholders of the Investor and Institutional Classes that invest in the Fund through an IRA or Roth IRA may be subject to a custodial IRA fee of $15 that is typically deducted each December. If your account was subject to a custodial IRA fee during the period, your costs would have been $15 higher.
Hypothetical Example for Comparison Purposes
The “Hypothetical” lines of the table provide information about hypothetical account values and hypothetical expenses based on the Fund’s actual expense ratio and an assumed 5% per year rate of return before expenses (not the Fund’s actual return). You may compare the ongoing costs of investing in the Fund with other funds by contrasting this 5% hypothetical example and the 5% hypothetical examples that appear in the shareholder reports of the other funds. The hypothetical account values and expenses may not be used to estimate the actual ending account balance or expenses you paid for the period. Shareholders of the Investor and Institutional Classes that invest in the Fund through an IRA or Roth IRA may be subject to a custodial IRA fee of $15 that is typically deducted each December. If your account was subject to a custodial IRA fee during the period, your costs would have been $15 higher.
You should also be aware that the expenses shown in the table highlight only your ongoing costs and do not reflect any transaction costs charged by the Fund, such as sales charges (loads). Similarly, the expense examples for other funds do not reflect any transaction costs charged by those funds, such as sales charges (loads), redemption fees or exchange fees. Therefore, the “Hypothetical” lines of the table are useful in comparing ongoing costs only and will not help you determine the relative total costs of owning different funds. If you were subject to any transaction costs during the period, your costs would have been higher.
Garcia Hamilton Quality Bond Fund
| | | | | | | | | | | | |
| | | Beginning Account Value
5/1/2016 | | | Ending Account Value
10/31/2016 | | | Expenses Paid During
Period
5/1/2016-10/31/2016* | |
Institutional Class | | | | | | | | | | | | |
Actual | | $ | 1,000.00 | | | $ | 1,008.73 | | | $ | 2.27 | |
Hypothetical** | | $ | 1,000.00 | | | $ | 1,022.90 | | | $ | 2.29 | |
Y Class | | | | | | | | | | | | |
Actual | | $ | 1,000.00 | | | $ | 1,008.45 | | | $ | 2.78 | |
Hypothetical** | | $ | 1,000.00 | | | $ | 1,022.40 | | | $ | 2.80 | |
Investor Class | | | | | | | | | | | | |
Actual | | $ | 1,000.00 | | | $ | 1,007.74 | | | $ | 4.19 | |
Hypothetical** | | $ | 1,000.00 | | | $ | 1,020.99 | | | $ | 4.22 | |
| * | Expenses are equal to the Fund’s annualized expense ratios for the six-month period of 0.45%, 0.55% and 0.83% for the Institutional, Y and Investor Classes respectively, multiplied by the average account value over the period, multiplied by the number derived by dividing the number of days in the most recent fiscal half-year (184) by days in the year (366) to reflect the half-year period. |
| ** | 5% return before expenses. |
5
American Beacon Garcia Hamilton Quality Bond FundSM
Report of Independent Registered Public Accounting Firm
To the Shareholders and the Board of Trustees of
American Beacon Garcia Hamilton Quality Bond Fund:
We have audited the accompanying statement of assets and liabilities, including the schedule of investments, of American Beacon Garcia Hamilton Quality Bond Fund (one of the funds constituting the American Beacon Funds) (the Fund), as of October 31, 2016, and the related statement of operations, statement of changes in net assets and the financial highlights for the period from April 4, 2016 (commencement of operations) to October 31, 2016. These financial statements and financial highlights are the responsibility of the Fund’s management. Our responsibility is to express an opinion on these financial statements and financial highlights based on our audit.
We conducted our audit in accordance with the standards of the Public Company Accounting Oversight Board (United States). Those standards require that we plan and perform the audit to obtain reasonable assurance about whether the financial statements and financial highlights are free of material misstatement. We were not engaged to perform an audit of the Fund’s internal control over financial reporting. Our audit included consideration of internal control over financial reporting as a basis for designing audit procedures that are appropriate in the circumstances, but not for the purpose of expressing an opinion on the effectiveness of the Fund’s internal control over financial reporting. Accordingly, we express no such opinion. An audit also includes examining, on a test basis, evidence supporting the amounts and disclosures in the financial statements and financial highlights, assessing the accounting principles used and significant estimates made by management, and evaluating the overall financial statement presentation. Our procedures included confirmation of securities owned as of October 31, 2016, by correspondence with the custodian and brokers or by other appropriate auditing procedures where replies from brokers were not received. We believe that our audit provides a reasonable basis for our opinion.
In our opinion, the financial statements and financial highlights referred to above present fairly, in all material respects, the financial position of American Beacon Garcia Hamilton Quality Bond Fund at October 31, 2016, the results of its operations, the changes in its net assets and the financial highlights for the period from April 4, 2016 (commencement of operations) to October 31, 2016, in conformity with U.S. generally accepted accounting principles.

Dallas, Texas
December 29, 2016
6
American Beacon Garcia Hamilton Quality Bond FundSM
Schedule of Investments
October 31, 2016
| | | | | | | | |
| | | Principal Amount | | | Fair Value | |
CORPORATE OBLIGATIONS - 32.92% | | | | | | | | |
Finance - 24.04% | | | | | | | | |
American Express Credit Corp., 1.407%, Due 3/18/2019A | | $ | 4,684,000 | | | $ | 4,694,942 | |
Bank of America Corp., 1.00%, Due 10/21/2022A | | | 2,640,000 | | | | 2,649,187 | |
Citigroup, Inc., | | | | | | | | |
4.40%, Due 6/10/2025 | | | 1,465,000 | | | | 1,547,181 | |
4.45%, Due 9/29/2027 | | | 3,775,000 | | | | 3,977,385 | |
Goldman Sachs Group, Inc., 2.242%, Due 4/23/2021A | | | 4,120,000 | | | | 4,171,805 | |
JP Morgan Chase & Co., 1.520%, Due 1/28/2019A | | | 4,733,000 | | | | 4,738,604 | |
Morgan Stanley, 1.834%, Due 6/16/2020A | | | 3,563,000 | | | | 3,581,467 | |
US Bank NA/Cincinnati OH, 1.370%, Due 10/28/2019A | | | 2,080,000 | | | | 2,081,826 | |
Wells Fargo & Co., | | | | | | | | |
1.909%, Due 7/26/2021A | | | 2,315,000 | | | | 2,328,443 | |
4.10%, Due 6/3/2026 | | | 2,760,000 | | | | 2,899,736 | |
| | | | | | | | |
| | | | | | | 32,670,576 | |
| | | | | | | | |
Manufacturing - 4.06% | | | | | | | | |
Apple, Inc., 1.088%, Due 5/6/2019 A | | | 5,504,000 | | | | 5,518,745 | |
| | | | | | | | |
Telecommunications - 4.82% | | | | | | | | |
Cisco Systems, Inc., 1.411%, Due 2/21/2018A | | | 4,885,000 | | | | 4,914,237 | |
Pacific Bell Telephone Co., 7.125%, Due 3/15/2026 | | | 1,300,000 | | | | 1,634,269 | |
| | | | | | | | |
Total Corporate Obligations (Cost $44,834,753) | | | | | | | 6,548,506 | |
| | | | | |
| | | | | | | 44,737,827 | |
| | | | | | | | |
U.S. GOVERNMENT AGENCY OBLIGATIONS - 46.62% | | | | | | | | |
Fannie Mae Pool, 5.00%, Due 7/1/2026 A | | | 4,338,146 | | | | 4,507,706 | |
Federal Farm Credit Bank, | | | | | | | | |
0.575%, Due 4/9/2018 A | | | 3,555,000 | | | | 3,558,939 | |
0.585%, Due 4/16/2018 | | | 1,680,000 | | | | 1,682,056 | |
0.555%, Due 5/17/2018 A | | | 6,300,000 | | | | 6,303,553 | |
0.624%, Due 5/25/2018 A | | | 9,945,000 | | | | 9,960,116 | |
Federal Home Loan Bank, | | | | | | | | |
0.805%, Due 8/25/2017 A | | | 1,075,000 | | | | 1,078,310 | |
0.568%, Due 9/5/2017 | | | 1,445,000 | | | | 1,446,741 | |
0.812%, Due 10/25/2017 | | | 130,000 | | | | 130,360 | |
0.598%, Due 12/5/2017 A | | | 9,905,000 | | | | 9,921,561 | |
0.596%, Due 12/7/2017 A | | | 6,110,000 | | | | 6,119,898 | |
0.726%, Due 9/14/2018 A | | | 2,630,000 | | | | 2,633,048 | |
Federal National Mortgage Association, | | | | | | | | |
0.546%, Due 7/20/2017 A | | | 2,755,000 | | | | 2,758,238 | |
0.571%, Due 11/13/2017 | | | 1,485,000 | | | | 1,486,890 | |
0.811%, Due 3/21/2018 | | | 6,595,000 | | | | 6,618,684 | |
Freddie Mac Gold Pool, 4.50%, Due 12/1/2034 . | | | 4,706,114 | | | | 5,144,460 | |
| | | | | | | | |
Total U.S. Government Agency Obligations (Cost $63,290,701) | | | | 63,350,560 | |
| | | | | | | | |
U.S. TREASURY OBLIGATIONS - 19.35% | | | | | | | | |
U.S. Treasury Note/Bond, | | | | | | | | |
2.75%, Due 8/15/2042 | | | 2,255,000 | | | | 2,343,085 | |
2.875%, Due 8/15/2045 . | | | 22,605,000 | | | | 23,954,247 | |
| | | | | | | | |
Total U.S. Treasury Obligations (Cost $27,646,020) | | | | 26,297,332 | |
| | | | | | | | |
| | |
| | | Shares | | | | |
SHORT-TERM INVESTMENTS - 0.93% (Cost $1,262,143) | | | | | |
American Beacon U.S. Government Money Market Select Fund, Select ClassB | | | 1,262,143 | | | | 1,262,143 | |
| | | | | | | | |
TOTAL INVESTMENTS - 99.82% (Cost $137,033,617) | | | | 135,647,862 | |
See accompanying notes
7
American Beacon Garcia Hamilton Quality Bond FundSM
Schedule of Investments
October 31, 2016
| | | | | | | | |
| | | Principal Amount | | | Fair Value | |
OTHER ASSETS, NET OF LIABILITIES - 0.18% | | | | | | $ | 244,674 | |
| | | | | | | | |
TOTAL NET ASSETS - 100.00% | | | | | | $ | 135,892,536 | |
| | | | | | | | |
Percentages are stated as a percent of net assets.
| A | The coupon rate shown on floating or adjustable rate securities represents the rate at period end. The due date on these types of securities reflects the final maturity date. |
| B | The Fund is affiliated by having the same investment advisor. |
See accompanying notes
8
American Beacon Garcia Hamilton Quality Bond FundSM
Statement of Assets and Liabilities
October 31, 2016
| | | | |
Assets: | | | | |
Investments in unaffiliated securities, at fair value A | | $ | 134,385,719 | |
Investments in affiliated securities, at fair value B | | | 1,262,143 | |
Cash | | | 16,607 | |
Receivable for investments sold | | | 2,646,892 | |
Receivable for fund shares sold | | | 28,258 | |
Dividends and interest receivable | | | 359,682 | |
Receivable for expense reimbursement (Note 2) | | | 17,305 | |
Prepaid expenses | | | 19,705 | |
| | | | |
Total assets | | | 138,736,311 | |
| | | | |
Liabilities: | | | | |
Payable for investments purchased | | | 2,651,152 | |
Payable for fund shares redeemed | | | 51,551 | |
Management and investment advisory fees payable | | | 62,750 | |
Administrative service and service fees payable | | | 2,129 | |
Transfer agent fees payable | | | 1,848 | |
Custody and fund accounting fees payable | | | 4,719 | |
Professional fees payable | | | 66,866 | |
Prospectus and shareholder reports fees payable | | | 2,550 | |
Trustee fees payable | | | 100 | |
Other liabilities | | | 110 | |
| | | | |
Total liabilities | | | 2,843,775 | |
| | | | |
Net assets | | $ | 135,892,536 | |
| | | | |
Analysis of Net Assets: | | | | |
Paid-in-capital | | $ | 137,179,861 | |
(Overdistribution) of net investment income | | | (1 | ) |
Accumulated net realized gain | | | 98,431 | |
Unrealized depreciation of investments | | | (1,385,755 | ) |
| | | | |
Net assets | | $ | 135,892,536 | |
| | | | |
Shares outstanding at no par value (unlimited shares authorized): | | | | |
Institutional Class | | | 12,424,123 | |
| | | | |
Y Class | | | 327,225 | |
| | | | |
Investor Class | | | 860,718 | |
| | | | |
Net assets: | | | | |
Institutional Class | | $ | 124,032,604 | |
| | | | |
Y Class | | $ | 3,265,315 | |
| | | | |
Investor Class | | $ | 8,594,617 | |
| | | | |
Net asset value, offering and redemption price per share: | | | | |
Institutional Class | | $ | 9.98 | |
| | | | |
Y Class | | $ | 9.98 | |
| | | | |
Investor Class | | $ | 9.99 | |
| | | | |
A Cost of investments in unaffiliated securities | | $ | 135,771,474 | |
B Cost of investments in affiliated securities | | $ | 1,262,143 | |
See accompanying notes
9
American Beacon Garcia Hamilton Quality Bond FundSM
Statement of Operations
For the period April 4, 2016 to October 31, 2016
| | | | |
Investment income: | | | | |
Dividend income from affiliated securities | | $ | 8,346 | |
Interest income | | | 543,998 | |
| | | | |
Total investment income | | | 552,344 | |
| | | | |
Expenses: | | | | |
Management and investment advisory fees (Note 2) | | | 220,541 | |
Transfer agent fees: | | | | |
Institutional Class | | | 4,872 | |
Y Class | | | 1,542 | |
Investor Class | | | 2,104 | |
Custody and fund accounting fees | | | 8,413 | |
Professional fees | | | 123,893 | |
Registration fees and expenses | | | 55,255 | |
Service fees (Note 2): | | | | |
Y Class | | | 848 | |
Investor Class | | | 5,638 | |
Prospectus and shareholder report expenses | | | 11,722 | |
Trustee fees | | | 696 | |
Other expenses | | | 4,006 | |
| | | | |
Total expenses | | | 439,530 | |
| | | | |
Net fees waived and expenses reimbursed by Manager (Note 2) | | | (248,391 | ) |
| | | | |
Net expenses | | | 191,139 | |
| | | | |
Net investment income | | | 361,205 | |
| | | | |
Realized and unrealized gain (loss) from investments: | | | | |
Net realized gain (loss) from: | | | | |
Investments | | | 120,054 | |
Change in net unrealized appreciation (depreciation) of: | | | | |
Investments | | | (1,385,755 | ) |
| | | | |
Net (loss) from investments | | | (1,265,701 | ) |
| | | | |
Net (decrease) in net assets resulting from operations | | $ | (904,496 | ) |
| | | | |
See accompanying notes
10
American Beacon Garcia Hamilton Quality Bond FundSM
Statement of Changes in Net Assets
| | | | |
| | | From April 4 to | |
| | | October 31, 2016 | |
Increase (Decrease) in Net Assets: | | | | |
Operations: | | | | |
Net investment income | | $ | 361,205 | |
Net realized gain (loss) from investments | | | 120,054 | |
Change in net unrealized appreciation (depreciation) from investments | | | (1,385,755 | ) |
| | | | |
Net (decrease) in net assets resulting from operations | | | (904,496 | ) |
| | | | |
Distributions to Shareholders: | | | | |
Net investment income: | | | | |
Institutional Class | | | (360,822 | ) |
Y Class | | | (7,732 | ) |
Investor Class | | | (14,275 | ) |
| | | | |
Net distributions to shareholders | | | (382,829 | ) |
| | | | |
Capital Share Transactions: | | | | |
Proceeds from sales of shares | | | 145,222,507 | |
Reinvestment of dividends and distributions | | | 382,829 | |
Cost of shares redeemed | | | (8,425,475 | ) |
| | | | |
Net increase in net assets from capital share transactions | | | 137,179,861 | |
| | | | |
Net increase in net assets | | | 135,892,536 | |
| | | | |
Net Assets: | | | | |
Beginning of Period | | | — | |
| | | | |
End of Period * | | $ | 135,892,536 | |
| | | | |
*Includes undistributed (overdistribution) of net investment income | | $ | (1 | ) |
| | | | |
See accompanying notes
11
American Beacon Garcia Hamilton Quality Bond FundSM
Notes to Financial Statements
October 31, 2016
1. Organization and Significant Accounting Policies
American Beacon Funds (the “Trust”) is organized as a Massachusetts business trust and is registered under the Investment Company Act of 1940, as amended, (the “Act”) as a diversified, open-end management investment company. As of October 31, 2016, the Trust consists of twenty-five active series, one of which is presented in this filing (the “Fund”): the American Beacon Garcia Hamilton Quality Bond Fund. The remaining twenty-four active series are reported in separate filings.
American Beacon Advisors, Inc. (the “Manager”) is a wholly-owned subsidiary of Astro AB Borrower, Inc., which is indirectly owned by investment funds affiliated with Kelso & Company, L.P. and Estancia Capital Management, LLC, and was organized in 1986 to provide business management, advisory, administrative and asset management consulting services to the Trust and other investors.
Class Disclosure
The inception date for all classes of the American Beacon Garcia Hamilton Quality Bond Fund is April 4, 2016.
The Fund has multiple classes of shares designed to meet the needs of different groups of investors. The following table sets forth the differences amongst the classes:
| | | | | | |
| | | | | Minimum Initial | |
Class | | Eligible Investors | | Investments | |
Institutional | | Large institutional investors - sold directly through intermediary channels. | | $ | 250,000 | |
Y Class | | Large institutional retirement plan investors - sold directly or through intermediary channels. | | $ | 100,000 | |
Investor | | All investors using intermediary organizations such as broker-dealers or retirement plan sponsors. | | $ | 25,000 | |
Each class offered by the Trust has equal rights as to assets and voting privileges. Income and non-class specific expenses are allocated daily to each class on the basis of the relative net assets. Realized and unrealized capital gains and losses of each class are allocated daily based on the relative net assets of each class of the Fund. Class specific expenses, where applicable, currently include service fees and distribution fees and vary amongst the classes as described more fully in Note 2.
The following is a summary of significant accounting policies, consistently followed by the Fund in preparation of the financial statements. The Fund is considered investment companies and accordingly, follows the investment company accounting and reporting guidance of the Financial Accounting Standards Board Accounting Standard Codification Topic 946, Financial Services—Investment Companies, which is part of the U.S. Generally Accepted Accounting Principles (“U.S. GAAP”).
Security Transactions and Investment Income
Security transactions are recorded on the trade date of the security purchase or sale. The Fund may purchase securities with delivery or payment to occur at a later date. At the time the Fund enters into a commitment to purchase a security, the transaction is recorded, and the value of the security is reflected in the Net Asset Value (“NAV”). The value of the security may vary with market fluctuations.
Interest income is earned from settlement date, recorded on the accrual basis, and adjusted, if necessary, for accretion of discounts and amortization of premiums. For financial and tax reporting purposes, realized gains and losses are determined on the basis of specific lot identification.
12
American Beacon Garcia Hamilton Quality Bond FundSM
Notes to Financial Statements
October 31, 2016
Dividends to Shareholders
Dividends from net investment income of the Fund will generally be declared daily and paid monthly. Distributions, if any, of net realized capital gains are generally paid at least annually and recorded on the ex-dividend date. Dividends to shareholders are determined in accordance with federal income tax regulations, which may differ in amount and character from net investment income and realized gains recognized for purposes of U.S. GAAP.
Allocation of Income, Expenses, Gains, and Losses
Income, expenses (other than those attributable to a specific class), gains, and losses are allocated daily to each class of shares based upon the relative proportion of net assets represented by such class. Operating expenses directly attributable to a specific class are charged against the operations of that class.
Use of Estimates
The preparation of financial statements in conformity with U.S. GAAP requires management to make estimates and assumptions that affect the amounts reported in the financial statements and accompanying notes. Actual results may differ from those estimated.
Other
Under the Trust’s organizational documents, its officers and trustees are indemnified against certain liabilities arising out of the performance of their duties to the Trust. In the normal course of business, the Trust enters into contracts that provide indemnification to the other party or parties against potential costs or liabilities. The Trust’s maximum exposure under these arrangements is dependent on claims that may be made in the future and, therefore, cannot be estimated. The Trust has had no prior claims or losses pursuant to any such agreement.
2. Transactions with Affiliates
Management Agreement
The Trust and the Manager are parties to a Management Agreement that obligates the Manager to provide investment advisory, fund management, and administrative services to the Fund. As compensation for performing the duties under the Management Agreement, the Manager receives from the Fund an annualized fee at the following annual rates as a percentage of average daily net assets: 0.35% of the first $5 billion, 0.325% of the next $5 billion, 0.30% of the next $10 billion, and 0.275% over $20 billion. The Fund also pays the unaffiliated investment advisor hired to direct investment activities of the Fund an annualized investment advisory fee based on a percentage of the Fund’s average daily assets. Management fees paid by the Fund during the period ended October 31, 2016 were as follows:
| | | | | | | | | | | | | | | | |
Fund | | Management
Fee Rate | | | Management
Fee | | | Amounts paid
to Investment
Advisor | | | Amounts Paid
to Manager | |
Garcia Hamilton Quality Bond | | | 0.55 | % | | $ | 220,541 | | | $ | 79,688 | | | $ | 140,853 | |
Distribution Plans
The Fund has adopted a “defensive” Distribution Plan (the “Plan”) in accordance with Rule 12b-1 under the Act, pursuant to which no separate fees may be charged to the Fund for distribution purposes. However, the Plan authorizes the management fees received by the Manager and the investment advisors hired by the Manager to be used for distribution purposes. Under this Plan, the Fund does not intend to compensate the Manager or any other party, either directly or indirectly, for the distribution of Fund shares.
13
American Beacon Garcia Hamilton Quality Bond FundSM
Notes to Financial Statements
October 31, 2016
Service Plans
The Manager and the Trust entered into Service Plans that obligate the Manager to oversee additional shareholder servicing of the Y and Investor Classes. As compensation for performing the duties required under the Service Plans, the Manager receives 0.10% of the average daily net assets of the Y Class and up to 0.375% of the average daily net assets of the Investor Class of the Fund.
Sub-Transfer Agent Fees
The Manager has entered into agreements, which include servicing agreements, with financial intermediaries that provide recordkeeping, processing, shareholder communications and other services to customers of the intermediaries that hold positions in the Institutional Class of the Fund and has agreed to compensate the intermediaries for providing these services. Intermediaries transact with the Fund primarily through the use of omnibus accounts on behalf of their customers who hold positions in the Fund. Certain services would have been provided by the Fund’s transfer agent and other service providers if the shareholders’ accounts were maintained directly by the Fund’s transfer agent. Accordingly, the Fund, pursuant to the Trust’s Board of Trustees (“The Board”) approval, has agreed to reimburse the Manager for all or a portion of the servicing fees paid to these intermediaries for the Institutional Class. The reimbursement amounts (sub-transfer agent fees) paid to the Manager are subject to a fee limit of up to 0.10% of an intermediaries average net assets in the Institutional Class on an annual basis.
For the period ended October 31, 2016, the sub-transfer agent fees, as reflected in “Transfer agent fees” in the Statement of Operations, were as follows:
| | | | |
Fund | | Sub-Transfer
Agent Fees | |
Garcia Hamilton Quality Bond | | $ | 2,481 | |
As of October 31, 2016, the Fund owes the Manager the following reimbursement for sub-transfer agent fees, as reflected in “Transfer agent fees payable” in the Statement of Assets and Liabilities:
| | | | |
Fund | | Sub-Transfer
Agent Fees | |
Garcia Hamilton Quality Bond | | $ | 1,630 | |
Investment in Affiliated Funds
The Fund may invest in the American Beacon U.S. Government Money Market Select Fund (the “USG Select Fund”). The Fund and the USG Select Fund have the same investment advisor and therefore, are considered to be affiliated. The Manager serves as the investment advisor to the USG Select Fund and receives management fees totaling 0.10% of the average daily net assets of the USG Select Fund. During the period ended October 31, 2016, the Manager earned fees of $5,455 on the Fund’s direct investments in the USG Select Fund.
Interfund Lending Program
Pursuant to an exemptive order issued by the Securities and Exchange Commission (“SEC”), the Fund, along with other registered investment companies having management contracts with the Manager, may participate in an interfund lending program as a borrower. This program provides an alternative credit facility allowing the Fund to borrow from other participating Funds. During the period ended October 31, 2016, the Fund did not utilize the credit facility.
14
American Beacon Garcia Hamilton Quality Bond FundSM
Notes to Financial Statements
October 31, 2016
Expense Reimbursement Plan
The Manager contractually agreed to reimburse classes of the Fund to the extent that total annual fund operating expenses exceed the Fund’s expense cap. During the year ended October 31, 2016, the Manager reimbursed expenses as follows:
| | | | | | | | | | | | |
| | | Expense Cap | | | Reimbursed | | | Expiration of | |
Class | | 4/4/16 - 10/31/16 | | | Expenses | | | Reimbursements | |
Institutional | | | 0.45 | % | | $ | 233,731 | | | | 2019 | |
Y | | | 0.55 | % | | | 6,383 | | | | 2019 | |
Investor | | | 0.83 | % | | | 8,277 | | | | 2019 | |
Of these amounts, $17,305 is disclosed as a receivable from the Manager on the Statement of Assets and Liabilities at October 31, 2016. The Fund has adopted an Expense Reimbursement Plan whereby the Manager may seek repayment of net expenses reimbursed for a period of up to three years. However, reimbursement will occur only if the Class’ average net assets have grown or expenses have declined sufficiently to allow reimbursement without causing its expense ratio to exceed the previously agreed upon contractual expense limit. The reimbursed expenses listed above will expire in 2019.
Trustee Fees and Expenses
Effective July 1, 2016, as compensation for their service to the Trust and the American Beacon Select Fund, each Trustee receives an annual retainer of $120,000, plus $5,000 for each Board of Trustee meeting attended in person or via teleconference, $2,500 for attendance by Committee members at meetings of the Audit Committee and the Investment Committee, and $1,500 for attendance by Committee members at meetings of the Nominating and Governance Committee, plus reimbursement of reasonable expenses incurred in attending Board meetings, Committee meetings, and relevant educational seminars. The Trustees also may be compensated for attendance at special Board and/or Committee meetings from time to time. The Board Chairman receives an additional annual retainer of $50,000 as well as a single $5,000 fee each quarter for his attendance at the committee meetings. The chairpersons of the Audit Committee and the Investment Committee each receive an additional annual retainer of $25,000 and the Chairman of the Nominating and Governance Committee receives an additional annual retainer of $10,000. These expenses are allocated on a prorated basis to each Fund of the Trust according to its respective net assets.
3. Security Valuation and Fair Value Measurements
Investments are valued at the close of the New York Stock Exchange (the “Exchange”), normally at 4:00 p.m. Eastern Time, each day that the Exchange is open for business. Debt securities normally are valued on the basis of prices provided by an independent pricing service and may take into account appropriate factors such as institution-size trading in similar groups of securities, yield, quality, coupon rate, maturity, type of issue, trading characteristics, and other market data. The prices of debt securities may be determined using quotes obtained from brokers.
Investments in open-end mutual funds are valued at the closing NAV per share of the mutual fund on the day of valuation.
Securities for which the market prices are not readily available or are not reflective of the fair value of the security, as determined by the Manager, will be priced at fair value following procedures approved by the Board.
Other investments for which the above valuation procedures are inappropriate or are deemed not to reflect fair value are stated at fair value as determined in good faith by the Valuation Committee, established by the Fund’s Board.
15
American Beacon Garcia Hamilton Quality Bond FundSM
Notes to Financial Statements
October 31, 2016
Valuation Inputs
Various inputs may be used to determine the fair value of the Fund’s investments. These inputs are summarized in three broad levels for financial statement purposes. The inputs or methodologies used to value securities are not necessarily an indication of the risk associated with investing in those securities.
| | |
| Level 1 - | | Quoted prices in active markets for identical securities. |
| |
| Level 2 - | | Prices determined using other significant observable inputs. These may include quoted prices for similar securities, interest rates, prepayment speeds, credit risk, and others. Fixed-income securities are considered Level 2 as they are valued using observable inputs. |
| |
| Level 3 - | | Prices determined using other significant unobservable inputs. Unobservable inputs reflect the Fund’s own assumptions about the factors market participants would use in pricing an investment. |
Level 1 and Level 2 trading assets and trading liabilities, at fair value
Fixed-income securities including corporate, convertible and municipal bonds and notes, U.S. government agencies, U.S. Treasury obligations, sovereign issues, bank loans, convertible preferred securities, and non-U.S. bonds are normally valued by pricing service providers that use broker dealer quotations, reported trades or valuation estimates from their internal pricing models. The service providers’ internal models use inputs that are observable such as issuer details, interest rates, yield curves, prepayment speeds, credit risks/spreads, default rates and quoted prices for similar assets. Securities that use similar valuation techniques and inputs as described above are categorized as Level 2 of the fair value hierarchy.
Fixed-income securities purchased on a delayed-delivery basis are marked to market daily until settlement at the forward settlement date and categorized as Level 2 of the fair value hierarchy.
Mortgage-related and asset-backed securities are usually issued as separate tranches, or classes, of securities within each deal. These securities are also normally valued by pricing service providers that use broker dealer quotations or valuation estimates from their internal pricing models. The pricing models for these securities usually consider tranche-level attributes, current market data, estimated cash flows and market-based yield spreads for each tranche, and incorporates deal collateral performance, as available. Mortgage-related and asset-backed securities that use similar valuation techniques and inputs as described above are categorized as Level 2 of the fair value hierarchy.
Investments in registered open-end investment management companies will be valued based upon the NAVs of such investments and are categorized as Level 1 of the fair value hierarchy.
The Fund’s investments are summarized by level based on the inputs used to determine their values. As of October 31, 2016, the investments were classified as described below:
| | | | | | | | | | | | | | | | |
Garcia Hamilton Quality Bond Fund(1) | | Level 1 | | | Level 2 | | | Level 3 | | | Total | |
Corporate Obligations | | $ | — | | | $ | 44,737,827 | | | $ | — | | | $ | 44,737,827 | |
U.S. Government Agency Obligations | | | — | | | | 63,350,560 | | | | — | | | | 63,350,560 | |
U.S. Treasury Obligations | | | — | | | | 26,297,332 | | | | — | | | | 26,297,332 | |
Short-Term Investments—Money Market Funds | | | 1,262,143 | | | | — | | | | — | | | | 1,262,143 | |
| | | | | | | | | | | | | | | | |
Total Investments in Securities | | $ | 1,262,143 | | | $ | 134,385,719 | | | $ | — | | | $ | 135,647,862 | |
| | | | | | | | | | | | | | | | |
| (1) | Refer to the Schedule of Investments for Industry Information. |
16
American Beacon Garcia Hamilton Quality Bond FundSM
Notes to Financial Statements
October 31, 2016
U.S. GAAP also requires all transfers between any levels to be disclosed. The end of period timing recognition has been adopted for the transfers between levels of each Fund’s assets and liabilities. During the period ended October 31, 2016, there were no transfers between levels.
4. Securities and Other Investments
Mortgage-Related and Other Asset-Backed Securities
The Fund may invest in mortgage or other asset-backed securities (“ABS”). These securities may include mortgage instruments issued by U.S. government agencies (“agency mortgages”) or those issued by private entities (“non-agency mortgages”). Specific types of instruments may include mortgage pass-through securities, collateralized mortgage obligations (“CMOs”), commercial mortgage-backed securities, mortgage dollar rolls, CMO residuals, stripped mortgage-backed securities and other securities that directly or indirectly represent a participation in, or are secured by a payable from, mortgage loans on real property. The value of the Fund’s mortgage-backed securities (“MBS”) may be affected by, among other things, changes or perceived changes in interest rates, factors concerning the interests in and structure of the issuer or the originator of the mortgage, or the quality of the underlying assets. The mortgages underlying the securities may default or decline in quality or value. Through its investments in MBS, a Fund has exposure to subprime loans, Alt-A loans and non-conforming loans as well as to the mortgage and credit markets generally. Underlying collateral related to subprime, Alt-A and non-conforming mortgage loans has become increasingly susceptible to defaults and declines in quality or value, especially in a declining residential real estate market. In addition, regulatory or tax changes may adversely affect the mortgage securities markets as a whole.
Mortgage-Backed Securities
MBS often have stated maturities of up to thirty years when they are issued, depending upon the length of the mortgages underlying the securities. In practice however, unscheduled or early payments of principal and interest on the underlying mortgages may make the securities’ effective maturity shorter than this, and the prevailing interest rates may be higher or lower than the current yield of the Fund’s portfolio at the time resulting in reinvestment risk.
Rising or high interest rates may result in slower than expected principal payments which may tend to extend the duration of MBS, making them more volatile and more sensitive to changes in interest rates. This is known as extension risk.
MBS may have less potential for capital appreciation than comparable fixed income securities due to the likelihood of increased prepayments of mortgages resulting from foreclosures or declining interest rates. These foreclosed or refinanced mortgages are paid off at face value (par) or less, causing a loss, particularly for any investor who may have purchased the security at a premium or a price above par. In such an environment, this risk limits the potential price appreciation of these securities.
Agency Mortgage-Backed Securities
Certain MBS may be issued or guaranteed by the U.S. government or a government sponsored entity, such as Fannie Mae (the Federal National Mortgage Association) or Freddie Mac (the Federal Home Loan Mortgage Corporation). Although these instruments may be guaranteed by the U.S. government or a government sponsored entity, many such MBS are not backed by the full faith and credit of the United States and are still exposed to the risk of non-payment.
17
American Beacon Garcia Hamilton Quality Bond FundSM
Notes to Financial Statements
October 31, 2016
Other Investment Company Securities and Other Exchange Traded Products
The Fund may invest in shares of other investment companies, including open-end funds, closed-end funds, business development companies, ETFs, unit investment trusts, and other investment companies of the Trust. The Fund may invest in investment company securities advised by the Manager or a sub-advisor. Investments in the securities of other investment companies may involve duplication of advisory fees and certain other expenses. By investing in another investment company, the Fund becomes a shareholder of that investment company. As a result, the Fund’s shareholders indirectly will bear a proportionate share of the fees and expenses paid by shareholders of the other investment company, in addition to the fees and expenses the Fund’s shareholders directly bear in connection with the Fund’s own operations. These other fees and expenses are reflected as Acquired Fund Fees and Expenses and are included in the Fees and Expenses Table for the Fund in its Prospectus, if applicable. Investments in other investment companies may involve the payment of substantial premiums above the value of such issuer’s portfolio securities.
5. Principal Risks
In the normal course of business the Fund trades financial instruments and enters into financial transactions where risk of potential loss exists. Security values fluctuate (market risk) and may decline due to factors affecting securities markets in general, particular industries represented in the securities markets or conditions specifically related to a particular company. Failure of the other party to a transaction to perform (credit risk), for example by not making principal and interest payments when due, reduces the value of the issuer’s debt and could reduce the Fund’s income. Some of the Fund’s investments may be illiquid and the Fund may not be able to vary the portfolio investments in response to changes in economic and other conditions. If the Fund is required to liquidate all or a portion of its investments quickly, the Fund may realize significantly less than the value at which it previously recorded those investments.
Market Risks
Interest rate risk is the risk that fixed-income securities will decline in value because of changes in interest rates. As nominal interest rates rise, the value of certain fixed-income securities held by the Fund is likely to decrease. A nominal interest rate can be described as the sum of a real interest rate and an expected inflation rate. Fixed-income securities with longer durations tend to be more sensitive to changes in interest rates, usually making them more volatile than securities with shorter durations. Duration is useful primarily as a measure of the sensitivity of a fixed-income’s market price to interest rate (i.e. yield) movements.
The Fund will be exposed to credit risk on parties with whom it trades and will also bear the risk of settlement default. The Fund minimizes concentrations of credit risk by undertaking transactions with a large number of customers and counterparties on recognized and reputable exchanges. The Fund could lose money if the issuer or guarantor of a fixed-income security, or the counterparty to a financial derivatives contract, repurchase agreement or a loan of portfolio securities, is unable or unwilling to make timely principal and/or interest payments, or to otherwise honor its obligations. Securities are subject to varying degrees of credit risk, which are often reflected in credit ratings.
6. Federal Income and Excise Taxes
It is the policy of the Fund to qualify as a regulated investment company (“RIC”), by complying with all applicable provisions of Subchapter M of the Internal Revenue Code, as amended, and to make distribution of taxable income sufficient to relieve it from substantially all federal income and excise taxes. For federal income tax purposes, the Fund is treated as a single entity for the purpose of determining such qualification.
18
American Beacon Garcia Hamilton Quality Bond FundSM
Notes to Financial Statements
October 31, 2016
The Fund does not have any unrecognized tax benefits in the accompanying financial statements. If applicable, the Fund recognizes interest accrued related to unrecognized tax benefits in interest expense and penalties in “Other expenses” on the Statement of Operations.
The Fund may be subject to taxes imposed by countries in which it invests. Such taxes are generally based on returns of income earned or gains realized or repatriated. Taxes are accrued and applied to net investment income, net realized capital gains and net unrealized appreciation (depreciation), as applicable, as the income is earned or capital gains are recorded.
Dividends are categorized in accordance with income tax regulations which may treat certain transactions differently than U.S. GAAP. Accordingly, the character of distributions and composition of net assets for tax purposes may differ from those reflected in the accompanying financial statements.
The tax character of distributions paid are as follows:
| | | | |
| | | From April 4
to October 31,
2016 | |
Distributions paid from: | | | | |
Ordinary income* | | | | |
Institutional Class | | $ | 360,822 | |
Y Class | | | 7,732 | |
Investor Class | | | 14,275 | |
| | | | |
Total distributions paid | | $ | 382,829 | |
| | | | |
| * | For tax purposes, short-term capital gains are considered ordinary income distributions. |
As of October 31, 2016, the components of distributable earnings (deficits) on a tax basis are as follows:
| | | | |
Cost basis of investments for federal income tax purposes | | $ | 137,033,621 | |
Unrealized appreciation | | | 151,549 | |
Unrealized depreciation | | | (1,537,308 | ) |
| | | | |
Net unrealized appreciation (depreciation) | | | (1,385,759 | ) |
Undistributed ordinary income | | | 98,435 | |
Undistributed long-term gain (loss) | | | — | |
Accumulated capital gain (loss) | | | — | |
Other temporary differences | | | (1 | ) |
| | | | |
Distributable earnings (deficits) | | $ | (1,287,325 | ) |
| | | | |
Financial reporting records are adjusted for permanent book/tax differences to reflect tax character. Financial records are not adjusted for temporary differences. The temporary differences between financial reporting and tax basis reporting of unrealized appreciation (depreciation) are attributed to the tax deferral of losses from wash sales and paydown classes.
Due to inherent differences in the recognition of income, expenses and realized gains (losses) under U.S. GAAP and federal tax regulations, permanent differences between book and tax reporting have been identified and appropriately reclassed on the Statement of Assets and Liabilities.
Accordingly, the following reclassified amounts represent current year permanent differences derived from foreign currency and dividend reclasses as of October 31, 2016:
| | | | |
Paid-in-capital | | $ | — | |
Undistributed net investment income (loss) | | | 21,623 | |
Accumulated net realized gain (loss) | | | (21,623 | ) |
Unrealized appreciation (depreciation) of investments | | | — | |
19
American Beacon Garcia Hamilton Quality Bond FundSM
Notes to Financial Statements
October 31, 2016
For the period ended October 31, 2016, the Fund did not have capital loss carryforwards.
Under the Regulated Investment Company Modernization Act of 2010 (the “RIC MOD”), net capital losses recognized by Funds in taxable years beginning after December 22, 2010 are carried forward indefinitely and retain their character as short-term and/or long-term losses.
7. Investment Transactions
The aggregate cost of purchases and proceeds from sales and maturities of investments, other than short-term obligations, for the period ended October 31, 2016, were:
| | | | | | | | |
| | | Purchases | | | Sales | |
Securities | | $ | 137,454,476 | | | $ | 29,364,336 | |
U.S. Treasury Obligations | | | 29,107,166 | | | | 1,462,702 | |
A summary of the Fund’s direct transactions in the USG Select Fund for the period ended October 31, 2016 are as follows:
| | | | | | | | | | | | | | | | | | |
April 4, 2016 Shares/
Fair Value | | | Purchases | | | Sales | | | October 31, 2016
Shares/Fair Value | | | Dividend
Income | |
| $ | — | | | $ | 140,105,123 | | | $ | 138,842,980 | | | $ | 1,262,143 | | | $ | 8,346 | |
8. Capital Share Transactions
The tables below summarize the activity in capital shares for each Class of the Fund:
| | | | | | | | |
| | | Institutional Class | |
| | | Period Ended October 31*, | |
| | | 2016 | |
Garcia Hamilton Quality Bond Fund | | Shares | | | Amount | |
Shares sold | | | 13,189,537 | | | $ | 132,905,019 | |
Reinvestment of dividends | | | 35,871 | | | | 360,822 | |
Shares redeemed | | | (801,285 | ) | | | (8,079,148 | ) |
| | | | | | | | |
Net increase in shares outstanding | | | 12,424,123 | | | $ | 125,186,693 | |
| | | | | | | | |
| |
| | | Y Class | |
| | | Period Ended October 31*, | |
| | | 2016 | |
Garcia Hamilton Quality Bond Fund | | Shares | | | Amount | |
Shares sold | | | 326,810 | | | $ | 3,292,688 | |
Reinvestment of dividends | | | 769 | | | | 7,732 | |
Shares redeemed | | | (354 | ) | | | (3,564 | ) |
| | | | | | | | |
Net increase in shares outstanding | | | 327,225 | | | $ | 3,296,856 | |
| | | | | | | | |
| |
| | | Investor Class | |
| | | Period Ended October 31*, | |
| | | 2016 | |
Garcia Hamilton Quality Bond Fund | | Shares | | | Amount | |
Shares sold | | | 893,424 | | | $ | 9,024,800 | |
Reinvestment of dividends | | | 1,419 | | | | 14,275 | |
Shares redeemed | | | (34,125 | ) | | | (342,763 | ) |
| | | | | | | | |
Net increase in shares outstanding | | | 860,718 | | | $ | 8,696,312 | |
| | | | | | | | |
| * | For the period of April 4, 2016 through October 31, 2016. |
20
American Beacon Garcia Hamilton Quality Bond FundSM
Notes to Financial Statements
October 31, 2016
9. Subsequent Events
Management has evaluated subsequent events for possible recognition or disclosure in the financial statements through the date the financial statements are issued. Management has determined that there are no material events that would require disclosure in the Fund’s financial statements through this date.
21
American Beacon Garcia Hamilton Quality Bond FundSM
Financial Highlights
(For a share outstanding throughout the period)
| | | | | | | | | | | | |
| | | Institutional
Class | | | Y Class | | | Investor Class | |
| | | April 4 D
to
October 31,
2016 | | | April 4 D
to
October 31,
2016 | | | April 4 D
to
October 31,
2016 | |
Net asset value, beginning of period | | $ | 10.00 | | | $ | 10.00 | | | $ | 10.00 | |
| | | | | | | | | | | | |
Income (loss) from investment operations: | | | | | | | | | | | | |
Net investment income | | | 0.05 | | | | 0.05 | | | | 0.03 | |
Net gains (losses) from investments (both realized and unrealized) | | | (0.02 | ) | | | (0.02 | ) | | | (0.01 | ) |
| | | | | | | | | | | | |
Total income from investment operations | | | 0.03 | | | | 0.03 | | | | 0.02 | |
| | | | | | | | | | | | |
Less distributions: | | | | | | | | | | | | |
Dividends from net investment income | | | (0.05 | ) | | | (0.05 | ) | | | (0.03 | ) |
Distributions from net realized gains | | | — | | | | — | | | | — | |
| | | | | | | | | | | | |
Total distributions | | | (0.05 | ) | | | (0.05 | ) | | | (0.03 | ) |
| | | | | | | | | | | | |
Net asset value, end of period | | $ | 9.98 | | | $ | 9.98 | | | $ | 9.99 | |
| | | | | | | | | | | | |
Total return A | | | 0.34 | %B | | | 0.29 | % B | | | 0.24 | % B |
| | | | | | | | | | | | |
Ratios and supplemental data: | | | | | | | | | | | | |
Net assets, end of period | | $ | 124,032,604 | | | $ | 3,265,315 | | | $ | 8,594,617 | |
Ratios to average net assets: | | | | | | | | | | | | |
Expenses, before reimbursements | | | 1.06 | % C | | | 1.29 | % C | | | 1.19 | % C |
Expenses, net of reimbursements | | | 0.45 | % C | | | 0.55 | % C | | | 0.83 | % C |
Net investment income, before reimbursements | | | 0.29 | % C | | | 0.11 | % C | | | 0.21 | % C |
Net investment income, net of reimbursements | | | 0.91 | % C | | | 0.85 | % C | | | 0.57 | % |
Portfolio turnover rate | | | 40 | % E | | | 40 | % E | | | 40 | % E |
| A | Based on net asset value, which does not reflect the sales charge, redemption fee, or contingent deferred sales charge, if applicable. May include adjustments in accordance with U.S. GAAP and as such, the net asset value for reporting purposes and the returns based upon those net asset values may differ from the net asset value and returns for shareholder transactions. |
| D | Commencement of Operations. |
| E | Portfolio turnover is for the period from April 4, 2016 through October 31, 2016 and is not annualized. |
22
American Beacon Garcia Hamilton Quality Bond FundSM
Federal Tax Information
October 31, 2016 (Unaudited)
Certain tax information regarding the Fund is required to be provided to shareholders based upon the Fund’s income and distribution for the taxable year ended October 31, 2016. The information and distributions reported herein may differ from information and distributions taxable to the shareholders for the calendar year ended December 31, 2016.
The Fund designated the following items with regard to distributions paid during the fiscal year ended October 31, 2016. All designations are based on financial information available as of this annual report and, accordingly, are subject to change. For each item, it is the intention of the Fund to designate the maximum amount permitted under the Internal Revenue Code of 1986, as amended, and the regulations there under.
| | | | |
Long-Term Capital Gain Distributions | | $ | — | |
Short-Term Capital Gain Distributions | | | — | |
Shareholders will receive notification in January 2017 of the applicable tax information necessary to prepare their 2016 income tax returns.
23
Trustees and Officers of the American Beacon FundsSM
The Trustees and officers of the American Beacon Funds (the “Trust”) are listed below, together with their principal occupations during the past five years. Unless otherwise indicated, the address of each person listed below is 220 Las Colinas Boulevard East, Suite 1200, Irving, Texas 75039. Each Trustee oversees twenty-six seven funds in the fund complex that includes the Trust and the American Beacon Select Funds. The Trust’s Statement of Additional Information contains additional information about the Trustees and is available without charge by calling 1-800-658-5811.
| | | | |
Name, Age and Address | | Position, Term of Office
and Length of Time
Served with the Trust | | Principal Occupation(s) During Past 5 Years and Current Directorships |
INTERESTED TRUSTEES | | | | |
| | Lifetime of Trust until removal, resignation or retirement* | | |
| | |
| Alan D. Feld** (79) | | Trustee since 1996 | | Sole Shareholder of a professional corporation which is a Partner in the law firm of Akin, Gump, Strauss, Hauer & Feld, LLP (law firm) (1960-Present); Trustee, American Beacon Mileage Funds (1996-2012); Trustee, American Beacon Select Funds (1999-Present); Trustee, American Beacon Master Trust (1996-2012). |
| | |
| NON-INTERESTED TRUSTEES | | Term | | |
| | |
| | Lifetime of Trust until removel resignation or retirement* | | |
| | |
| Gilbert G. Alvarado (46) | | Trustee since 2015 | | Director, Kura MD, Inc. (local telehealth organization) (2015-present); Vice President & CFO, Sierra Health Foundation (health conversion private foundation) (2006-Present) Vice President & CFO, Sierra Health Foundation: Center for Health Program Management (California public benefit corporation) (2012-Present); Director, Innovative North State (2012-Present); Director, Sacramento Regional Technology Alliance (2011-Present); Director, Women’s Empowerment (2009-2014); Trustee, American Beacon Select Funds (2015-Present). |
| | |
| Josephe B. Armes (54) | | Trustee since 2015 | | Chairman & CEO, CSW Industrials f/k/a Capital Southwest Corporation (investment company) (2013-Present); President & CEO, JBA Investment Partners (family investment vehicle) (2010-Present); Chief Operating Officer, Hicks Holdings, LLC (Hicks Family assets and investments) (2005-2010); Trustee, Baylor University Board of Regents (2001-2010); Director and Chair of Audit Committee, RSP Permian (oil and gas producer) (2013-Present); Trustee, American Beacon Select Funds (2015-Present). |
| | |
| Gerard J. Arpey (58) | | Trustee since 2012 | | Director, The Home Depot, Inc. (2015-Present); Partner, Emerald Creek Group (private equity firm) (2011-Present); Chairman and Chief Executive Officer, AMR Corp. and American Airlines; Inc. (2003- 2011); Director, S. C. Johnson & Son, Inc. (privately held company) (2008-present); Trustee, American Beacon Select Funds (2012-Present). |
| | |
| Brenda A. Cline (55) | | Trustee since 2004 | | Executive Vice President, Chief Financial Officer, Treasurer and Secretary, Kimbell Art Foundation (1993-Present); Director, Range Resources Corporation (oil and natural gas company) (2015-Present); Director, Tyler Technologies, Inc.(public sector software solutions company) (2014-Present); Trustee, American Beacon Mileage Funds (2004-2012); Trustee, American Beacon Select Funds (2004-Present); Trustee, American Beacon Master Trust (2004-2012). |
| | |
| Eugene J. Duffy (62) | | Trustee since 2008 | | Managing Director, Institutional Services, Intercontinental Real Estate Corporation (2014-Present); Principal and Executive Vice President, Paradigm Asset Management (1994-2014); Director, Sunrise Bank of Atlanta (2008-2013); Trustee, American Beacon Mileage Funds (2008- 2012); Trustee, American Beacon Select Funds (2008-Present); Trustee, American Beacon Master Trust (2008-2012). |
24
Trustees and Officers of the American Beacon FundsSM
| | | | |
Name, Age and Address | | Position, Term of Office
and Length of Time
Served with the Trust | | Principal Occupation(s) During Past 5 Years and Current Directorships |
| TRUSTEES (CONT.) | | Term | | |
| | |
| M. Dunning (74) | | Trustee since 2008 | | Chairman Emeritus (2008-Present); Lockton Dunning Benefits (consulting firm in employee benefits); Board Director, Oncor Electric Delivery Company LLC (2007-Present); Board Member, BancTec (2010-Present) (software consulting); Trustee, American Beacon Mileage Funds (2008-2012); Trustee, American Beacon Select Funds (2008-Present); Trustee, American Beacon Master Trust (2008-2012). |
| | |
| Richard M. Massman (73) | | Trustee since 2004 Chairman since 2008 | | Consultant and General Counsel Emeritus (2009-Present) and Senior Vice President and General Counsel (1994-2009), Hunt Consolidated, Inc. (holding company engaged in oil and gas exploration and production, refining, real estate, farming, ranching and venture capital activities); Trustee, American Beacon Mileage Funds (2004- 2012); Trustee, American Beacon Select Funds (2004-Present); Trustee, American Beacon Master Trust (2004-2012). |
| | |
Barbara J. McKenna, CFA (53) | | Trustee since 2012 | | Managing Principal, Longfellow Investment Management Company (2005- Present); Trustee, American Beacon Select Funds (2012-Present). |
| | |
R. Gerald Turner (70) 225 Perkins Admin. Bldg. Southern Methodist Univ. Dallas, Texas 75275 | | Trustee since 2001 | | President, Southern Methodist University (1995-Present); Director, J.C. Penney Company, Inc. (1996-Present); Director, Kronus Worldwide Inc. (chemical manufacturing) (2003-Present); Trustee, American Beacon Mileage Funds (2001- 2012); Trustee, American Beacon Select Funds (2001-Present); Trustee, American Beacon Master Trust (2001-2012). |
| | |
| OFFICERS | | | | |
| | |
| Gene. L. Needles, Jr. (61) | | President since 2009 Executive Vice President since 2009 | | President, CEO and Director, American Beacon Advisors, Inc. (2009-Present); President, CEO and Director, Astro AB Borrower, Inc. (2015-Present); President, CEO and Director, Astro AB Acquisition, Inc.(2015-Present); President, CEO and Director, Astro AB Topco, Inc. (2015-Present), President, CEO and Director, Astro AB Holdings, LLC. (2015-Present); President, CEO and Director, Lighthouse Holdings, Inc.; (2009-2015); President and CEO, Lighthouse Holdings Parent, Inc. (2009-2015); Manager, President and CEO, American Private Equity Management, L.L.C. (2012-Present); President, American Beacon Cayman Managed Futures Strategy Fund, Ltd. (2014-Present). |
| | |
| Rosemary K. Behan (57) | | VP, Secretary and Chief Legal Officer since 2006 | | Secretary, American Beacon Advisors, Inc. (2006-Present); Secretary, Astro AB Borrower, Inc. (2015-Present); Secretary, Astro AB Acquisition, Inc. (2015- Present); Secretary, Astro AB Topco, Inc. (2015-Present); Secretary, Astro AB Holdings, LLC. (2015-Present); Secretary, Lighthouse Holdings, Inc. (2008- 2015); Secretary, Lighthouse Holdings Parent, Inc. (2008-2015); Secretary, American Private Equity Management, L.L.C. (2008-Present); Secretary, American Beacon Cayman Managed Futures Strategy Fund, Ltd. (2014-Present). |
| | |
| Brian E. Brett (56) | | VP since 2004 | | Vice President, Director of Sales, American Beacon Advisors, Inc. (2004-Present). |
| | |
| Paul B. Cavazos (47) | | VP since 2016 | | Chief Investment Officer and Vice President, Asset Management, American Beacon Advisors, Inc. (2016-Present); Chief Investment Officer and Assistant Treasurer, DTE Energy (2007-2016); |
| | |
| Erica Duncan (46) | | VP since 2011 | | Vice President, Marketing and Client Services, American Beacon Advisors, Inc. (2011-Present); Supervisor, Brand Marketing, Invesco (2010-2011); |
25
Trustees and Officers of the American Beacon FundsSM
| | | | |
Name, Age and Address | | Position, Term of Office
and Length of Time
Served with the Trust | | Principal Occupation(s) During Past 5 Years and Current Directorships |
| OFFICERS | | Term | | |
| | |
| Melinda G. Heika (55) | | Treasurer since 2010 | | Treasurer, American Beacon Advisors, Inc. (2010-Present); Treasurer, Astro AB Borrower, Inc. (2015-Present); Treasurer, Astro AB Acquisition, Inc. (2015-Present); Treasurer, Astro AB Topco, Inc. (2015-Present); Treasurer, Astro AB Holdings, LLC. (2015-Present); Treasurer, Lighthouse Holdings, Inc. (2010-2015); Treasurer, Lighthouse Holdings Parent Inc., (2010-2015); Treasurer, American Private Equity Management, L.L.C. (2012-Present); Director and Treasurer, American Beacon Cayman Managed Futures Strategy Fund, Ltd. (2014-Present). |
| | |
| | One Year | | |
| | |
| Terri L. McKinney (52) | | VP since 2010 | | Vice President, Enterprise Services (2009-Present) and Managing Director (2003-2009), American Beacon Advisors, Inc. |
| | |
| Jeffrey K. Ringdahl (41) | | VP since 2010 | | Chief Operating Officer, American Beacon Advisors, Inc. (2010-Present); Manager and Senior Vice President, American Private Equity Management, L.L.C. (2012-Present); Senior Vice President and Director, Astro AB Borrower, Inc. (2015-Present); Senior Vice President and Director, Astro AB Acquisition, Inc. (2015-Present); Senior Vice President and Director, Astro AB Topco, Inc. (2015-Present), Senior Vice President and Director, Astro AB Holdings, LLC.(2015-Present); Senior Vice President, Lighthouse Holdings, Inc. (2013-2015); Senior Vice President, Lighthouse Holdings Parent, Inc. (2013-2015); Director and Vice President, American Beacon Cayman Managed Futures Strategy Fund, Ltd. (2014-Present); Vice President, Product Management, Touchstone Advisors, Inc. (2007-2010). |
| | |
| Samuel J. Silver (53) | | VP since 2011 | | Chief Fixed Income Officer (2016–Present), Vice President, Fixed Income Investments (2011-2016) and Senior Portfolio Manager, Fixed Income Investments (1999-2011), American Beacon Advisors, Inc. |
| | |
| Christina E. Sears (45) | | Chief Compliance Officer since 2004 and Asst. Secretary since 1999 | | Chief Compliance Officer, American Beacon Advisors, Inc. (2004-Present); Chief Compliance Officer, American Private Equity Management, L.L.C. (2012-Present). |
| | |
| Sonia L. Bates (59) | | Asst. Treasurer since 2011 | | Director, Tax and Financial Reporting (2011-Present), Manager, Tax and Financial Reporting (2005-2010), American Beacon Advisors, Inc.; Asst. Treasurer, Astro AB Borrower, Inc. (2015-Present); Asst. Treasurer, Astro AB Acquisition, Inc. (2015-Present); Asst. Treasurer, Astro AB Topco, Inc. (2015-Present); Asst. Treasurer, Astro AB Holdings, LLC.;Asst. Treasurer, Lighthouse Holdings, Inc. (2011-2015); Asst. Treasurer, Lighthouse Holdings Parent Inc. (2011-2015); Asst. Treasurer, American Private Equity Management, L.L.C. (2012-Present). |
| | |
| Shelley D. Abrahams (41) | | Assistant Secretary since 2008 | | Assistant Secretary, American Beacon Advisors, Inc. (2008-Present) |
| | |
| Rebecca L. Harris (49) | | Assistant Secretary since 2011 | | Assistant Secretary, American Beacon Advisors, Inc. (2011-Present) |
| | |
| Diana N. Lai (40) | | Assistant Secretary since 2012 | | Assistant Secretary, American Beacon Advisors, Inc. (2012-Present) |
| | |
| Teresa A. Oxford (58) | | Assistant Secretary since 2015 | | Assistant Secretary, American Beacon Advisors, Inc. (2015-Present) |
| * | As of 11/12/2014, the Board adopted a retirement plan that requires Trustees to retire no later than the last day of the calendar year in which they reach the age of 75. |
| ** | Mr. Feld is deemed to be an “interested person” of the Trusts, as defined by the 1940 Act. Mr. Feld’s law firm of Akin, Gump, Strauss, Hauer & Feld LLP has provided legal services within the past two fiscal years to one or more of the Trust’s sub-advisors. |
26
Trustees and Officers of the American Beacon FundsSM
| * | The Board has adopted a retirement plan that requires Trustees to retire no later than the last day of the calendar year in which they reach the age of 72, provided, however, that the board may determine to grant one or more annual exemptions to this requirement. |
| ** | Mr. Feld is deemed to be an “interested person” of the Trust, as defined by the 1940 Act. Mr. Feld’s law firm of Akin, Gump, Strauss, Hauer & Feld LLP has provided legal services within the past two years to one or more of the Trust’s sub-advisors. |
27
American Beacon Garcia Hamilton Quality Bond FundSM
Privacy Policy
October 31, 2016 (Unaudited)
The American Beacon Funds recognize and respect the privacy of our shareholders. We are providing this notice to you so you will understand how shareholder information may be collected and used.
We may collect nonpublic personal information about you from one or more of the following sources:
| | • | | information we receive from you on applications or other forms; |
| | • | | information about your transactions with us or our service providers; and |
| | • | | information we receive from third parties. |
We do not disclose any nonpublic personal information about our customers or former customers to anyone, except as permitted by law.
We restrict access to your nonpublic personal information to those employees or service providers who need to know that information to provide products or services to you. To ensure the confidentiality of your nonpublic personal information, we maintain safeguards that comply with federal standards.
28

Delivery of Documents
eDelivery is NOW AVAILABLE – Stop traditional mail delivery and receive your
shareholder reports and summary prospectus on-line. Sign up at
www.americanbeaconfunds.com
If you invest in the Fund through a financial institution, you may be able to receive the Fund’s regulatory mailings, such as the Prospectus, Annual Report and Semi-Annual Report, by e-mail. If you are interested in this option, please go to www.icsdelivery.com and search for your financial institution’s name or contact your financial institution directly.
To obtain more information about the Fund:
| | |
 | |  |
By E-mail: american_beacon.funds@ambeacon.com | | On the Internet: Visit our website at www.americanbeaconfunds.com |
| | | |
| | |
 | |  |
By Telephone: Institutional, Y, and Investor Classes Call (800) 658-5811 | | By Mail: American Beacon Funds P.O. Box 219643 Kansas City, MO 64121-9643 |
| | | |
| | |
Availability of Quarterly Portfolio Schedules In addition to the Schedule of Investments provided in each semi-annual and annual report, the Fund files a complete schedule of its portfolio holdings with the Securities and Exchange Commission (“SEC”) on Form N-Q as of the first and third fiscal quarters. The Fund’s Forms N-Q are available on the SEC’s website at www.sec.gov. The Forms N-Q may also be reviewed and copied at the SEC’s Public Reference Section, 100 F Street, NE, Washington, D.C. 20549-2736. Information regarding the operation of the SEC’s Public Reference Room may be obtained by calling (800)-SEC-0330. A complete schedule of the Fund’s portfolio holdings is also available at www.americanbeaconfunds.com approximately twenty days after the end of each month. | | Availability of Proxy Voting Policy and Records A description of the policies and procedures the Fund uses to determine how to vote proxies relating to portfolio securities is available in the Fund’s Statement of Additional Information, is available free of charge on the Fund’s website www.americanbeaconfunds.com and by calling 1-800-967-9009 or by accessing the SEC’s website at www. sec.gov. The Fund’s proxy voting record for the most recent year ended June 30 is filed annually with the SEC on Form N-PX. The Fund’s Forms N-PX are available on the SEC’s website at www.sec.gov. The Fund’s proxy voting record may also be obtained by calling 1-800-967-9009. |
Fund Service Providers:
| | | | | | | | | | | | |
CUSTODIAN State Street Bank and Trust Boston, Massachusetts | | | | TRANSFER AGENT Boston Financial Data Services Kansas City, Missouri | | | | INDEPENDENT REGISTERED PUBLIC ACCOUNTING FIRM Ernst & Young LLP Dallas, Texas | | | | DISTRIBUTOR Foreside Fund Services, LLC Portland, Maine |
This report is prepared for shareholders of the American Beacon Funds and may be distributed to others only if preceded or accompanied by a current Prospectus or Summary Prospectus.
American Beacon Funds and American Beacon Garcia Hamilton Quality Bond Fund are service marks of American Beacon Advisors, Inc.
AR 10/16

About American Beacon Advisors
Since 1986, American Beacon Advisors has offered a variety of products and investment advisory services to numerous institutional and retail clients, including a variety of mutual funds, corporate cash management, and separate account management.
Our clients include defined benefit plans, defined contribution plans, foundations, endowments, corporations, financial planners, and other institutional investors. With American Beacon Advisors, you can put the experience of a multi-billion dollar asset management firm to work for your company.
INTERNATIONAL EQUITY FUND RISKS
Investing in foreign securities may involve heightened risk due to currency fluctuations and economic and political risks. Investing in value stocks may limit downside risk over time; however, the Fund may produce more modest gains than riskier stock funds as a trade-off for this potentially lower risk. The use of futures contracts for cash management may subject the Fund to losing more money than invested. The Fund may participate in a securities lending program. Please see the prospectus for a complete discussion of the Fund’s risks. There can be no assurances that the investment objectives of this Fund will be met.
Any opinions herein, including forecasts, reflect our judgment as of the end of the reporting period and are subject to change. Each advisor’s strategies and each Fund’s portfolio composition will change depending on economic and market conditions. This report is not a complete analysis of market conditions, and, therefore, should not be relied upon as investment advice. Although economic and market information has been compiled from reliable sources, American Beacon Advisors, Inc. makes no representation as to the completeness or accuracy of the statements contained herein.
| | |
| American Beacon Funds | | October 31, 2016 |
Contents
President’s Message
| | |
 | | Dear Shareholders, During the 12-month period ended October 31, 2016, China’s slowing growth escalated concerns for global markets, and many of the world’s central banks – the Federal Reserve included – responded by either continuing or expanding their economic stimulation policies. In the first half of 2016, international stocks declined while U.S. and emerging-market stocks made modest gains. Falling global interest rates supported bond returns during the period. On June 24, 2016, the U.K. announced that the “Brexit” referendum to leave the European Union passed with a 52% majority vote, further shaking up global markets. By the end of that month, however, the U.S. stock market and some global markets had rebounded to near pre-Brexit levels as investors took opportunistic risks following the historic vote. After Theresa May’s succession as the U.K.’s prime minister on July 13, 2016, many central banks put their Brexit concerns on hold and turned their attention to their own economies. |
In the weeks ahead of the U.S. presidential election on November 8, 2016, uncertainty about the outcome caused many investors to stay on the sidelines. Although investors may question whether the election’s result could have negative consequences for their portfolios, elections rarely have a lasting effect on the market. Historically speaking, from August 1 to October 31 during 19 of the last 22 election years – or approximately 86% of the time – the S&P 500 rallied for an average gain of approximately 6%.
For the 12-month period ended October 31, 2016:
| | • | | American Beacon International Equity Fund (Investor Class) returned -5.38%. |
Our broad range of mutual funds helps investors navigate the economic storms and market downturns in the U.S. and abroad. Our years of experience evaluating sub-advisors have led us to identify and partner with several asset managers who have adhered to their disciplined processes for many years and through a variety of economic and market conditions.
Thank you for your continued investment in the American Beacon Funds. For additional information about the Funds or to access your account information, please visit our website at www.americanbeaconfunds.com.
|
Best Regards, 
|
| Gene L. Needles, Jr. |
| President |
| American Beacon Funds |
1
International Equity Market Overview
October 31, 2016 (Unaudited)
International equities were volatile and finished the 12-month period ended October 31, 2016, moderately lower, as investors decided that the Brexit vote in June would help keep interest rates extraordinarily low and moderate global economic growth was likely to continue.
A steady U.S. dollar, coupled with low yields in developed markets, again pushed money into emerging market (“EM”) debt. China’s continuing property and infrastructure rebound helped EM equities and supported commodity prices, while hints of wage inflation and fiscal spending on infrastructure further supported market perception that inflation could return.
U.S. economic data was broad and steady but not viewed as being strong enough to induce monetary tightening in the U.S. until late in the year.
The Bank of Japan’s decision to move to negative interest rates spooked investors, and banks fell sharply on fears that margins would be eroded in Japan, as well as in other developed markets.
Broadly speaking, most stocks in developed Europe struggled over the past 12 months. In contrast, the developed Asia-Pacific markets performed well.
Health Care sector stocks were among the worst performers of the period due to the ongoing political focus on drug pricing during the U.S. presidential election. Stocks in the Materials and Energy sectors were among the best performers.
2
American Beacon International Equity FundSM
Performance Overview
October 31, 2016 (Unaudited)
The Investor Class of the International Equity Fund (the “Fund”) returned -5.38% for the twelve months ended October 31, 2016. The Fund underperformed the MSCI EAFE Index (the “Index”) return of -3.23%.
Comparison of Change in Value of a $10,000 Investment for the period from 10/31/06 through 10/31/16
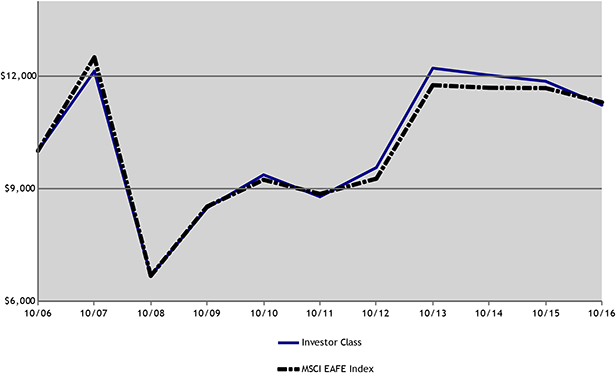
Total Returns for the Period ended October 31, 2016
| | | | | | | | | | | | | | | | | | | | | | | | |
| | | Ticker | | | 1 Year | | | 3 Years | | | 5 Years | | | 10 Years | | | Value of $10,000
10/31/2006-
10/31/2016 | |
Institutional Class (1,7) | | | AAIEX | | | | (5.07 | )% | | | (2.43 | )% | | | 5.39 | % | | | 1.49 | % | | $ | 11,590 | |
Y Class (1,2,7) | | | ABEYX | | | | (5.14 | )% | | | (2.52 | )% | | | 5.30 | % | | | 1.42 | % | | $ | 11,514 | |
Investor Class (1,7) | | | AAIPX | | | | (5.38 | )% | | | (2.77 | )% | | | 5.02 | % | | | 1.15 | % | | $ | 11,215 | |
Advisor Class (1,3,7) | | | AAISX | | | | (5.40 | )% | | | (2.87 | )% | | | 4.88 | % | | | 0.95 | % | | $ | 10,990 | |
A without Sales Charge (1,4,7) | | | AIEAX | | | | (5.34 | )% | | | (2.82 | )% | | | 4.92 | % | | | 1.08 | % | | $ | 11,136 | |
A with Sales Charge (1,4,7) | | | AIEAX | | | | (10.77 | )% | | | (4.73 | )% | | | 3.67 | % | | | 0.49 | % | | $ | 10,496 | |
C without Sales Charge (1,5,7) | | | AILCX | | | | (6.12 | )% | | | (3.55 | )% | | | 4.14 | % | | | 0.60 | % | | $ | 10,619 | |
C with Sales Charge (1,5,7) | | | AILCX | | | | (7.12 | )% | | | (3.55 | )% | | | 4.14 | % | | | 0.60 | % | | $ | 10,619 | |
MSCI EAFE Index (6) | | | | | | | (3.23 | )% | | | (1.31 | )% | | | 4.99 | % | | | 1.22 | % | | $ | 11,292 | |
| 1. | Performance shown is historical and is not indicative of future returns. Investment returns and principal value will vary, and shares may be worth more or less at redemption than at original purchase. Performance shown is calculated based on the published end of day net asset values as of date indicated and current performance may be lower or higher than the performance data quoted. To obtain performance as of the most recent month end, please visit www.americanbeaconfunds.com or call 1-800-967-9009. Fund performance in the table above does not reflect the deduction of taxes a shareholder would pay on distributions or the redemption of shares. A portion of the fees charged to the Institutional Class of the Fund was waived from 2013 through 2015. Performance prior to waiving fees was lower than actual returns show. |
3
American Beacon International Equity FundSM
Performance Overview
October 31, 2016 (Unaudited)
| 2. | Fund performance for the ten-year period represents the total returns achieved by the Institutional Class from 10/31/06 up to 8/3/09, the inception date of the Y Class, and the returns of the Y Class since its inception. Expenses of the Y Class are higher than those of the Institutional Class. As a result, total returns shown may be higher than they would have been had the Y Class been in existence since 10/31/06. |
| 3. | A portion of the fees charged to the Advisor Class of the Fund was waived from 2006 through 2007 and in 2009. Performance prior to waiving fees was lower than the actual returns shown for those periods. |
| 4. | Fund performance for the ten-year period represents the total returns achieved by the Investor Class from 10/31/06 up to 5/17/10, the inception date of the A Class, and the returns of the A Class since its inception. Expenses of the A Class are higher than those of the Investor Class. As a result, total returns shown may be higher than they would have been had the A Class been in existence since 10/31/06. A portion of the fees charged to the A Class of the Fund was waived from 2010 through 2012 and partially recovered in 2013 and 2015. Performance prior to waiving fees was lower than the actual returns shown from 2010 through 2012. The maximum sales charge for A Class is 5.75%. |
| 5. | Fund performance for the ten-year period represents the total returns achieved by the Investor Class from 10/31/06 up to 9/1/10, the inception date of the C Class, and the returns of the C Class since its inception. Expenses of the C Class are higher than those of the Investor Class. As a result, total returns shown may be higher than they would have been had the C Class been in existence since 10/31/06. A portion of the fees charged to the C Class of the Fund was waived from 2010 through 2012 and partially recovered in 2013 and 2015. Performance prior to waiving fees was lower than the actual returns shown from 2010 through 2012. The maximum contingent deferred sales charge for C Class is 1.00% for shares redeemed within one year of the date of purchase. |
| 6. | The MSCI EAFE Index is a market capitalization weighted index of international stock performance composed of equities from developed markets excluding the U.S. and Canada. One cannot directly invest in an index. |
| 7. | The total annual Fund operating expense ratio set forth in the most recent Fund prospectus for the Institutional, Y, Investor, Advisor, A, and C Class shares was 0.74%, 0.81%, 1.07%, 1.20%, 1.12%, and 1.86%, respectively. The expense ratios above may vary from the expense ratios presented in other sections of this report that are based on expenses incurred during the period covered by this report. |
The Fund underperformed the Index over the twelve-month period due to country allocation and stock selection.
Stock selections within the United Kingdom and Switzerland contributed to the Fund’s relative underperformance, despite value added from stock selections in Germany and France. Lagging securities included Lloyd’s Banking Group Plc. (down 36.7%) and Barclays Plc. (down 31.7%) within the United Kingdom, and Credit Suisse Group AG Reg. (down 50.4%) and Novartis AG Reg. (down 18.9%) within Switzerland. The Fund’s investments in Germany, including Volkswagen AG Pref (up 17.0%) and Infineon Technologies AG (up 48.7%) helped relative performance during the prior twelve months.
From a country allocation perspective, overweighting out-of-index Korea (up 5.2%) contributed positively to the Fund’s performance relative to the Index, though underweighting Australia and Japan (up 13.0% and 3.5%, respectively) detracted during the year.
Although economic and market conditions vary from period to period, the Fund’s primary strategy of investing in undervalued companies with above-average earnings growth expectations remains consistent.
| | | | | | | | |
Top Ten Holdings (% Net Assets) | | | | | | | | |
Royal Dutch Shell PLC | | | | | | | 2.7 | |
Novartis AG | | | | | | | 2.5 | |
KDDI Corp. | | | | | | | 2.1 | |
British American Tobacco PLC | | | | | | | 2.0 | |
Total S.A. | | | | | | | 2.0 | |
Samsung Electronics Co. Ltd. | | | | | | | 1.8 | |
Prudential PLC | | | | | | | 1.6 | |
SAP AG | | | | | | | 1.5 | |
Akzo Nobel | | | | | | | 1.5 | |
Roche Holding AG Genusschein | | | | | | | 1.4 | |
Total Fund Holdings | | | 161 | | | | | |
4
American Beacon International Equity FundSM
Performance Overview
October 31, 2016 (Unaudited)
| | | | |
Sector Allocation (% Equities) | | | | |
Financials | | | 19.2 | |
Consumer Discretionary | | | 12.8 | |
Industrials | | | 11.6 | |
Health Care | | | 10.5 | |
Energy | | | 10.2 | |
Consumer Staples | | | 8.7 | |
Telecommunication Services | | | 8.2 | |
Materials | | | 8.1 | |
Information Technology | | | 7.2 | |
Real Estate | | | 1.9 | |
Utilities | | | 1.6 | |
| |
Country Allocation (% Equities) | | | | |
United Kingdom | | | 22.7 | |
Japan | | | 17.5 | |
France | | | 12.0 | |
Switzerland | | | 8.4 | |
Germany | | | 8.4 | |
Netherlands | | | 6.0 | |
South Korea | | | 4.8 | |
Hong Kong/China | | | 3.2 | |
Canada | | | 2.3 | |
Belgium | | | 1.8 | |
Sweden | | | 1.8 | |
Spain | | | 1.6 | |
Israel | | | 1.4 | |
Australia | | | 1.3 | |
Norway | | | 1.2 | |
Ireland | | | 1.1 | |
Singapore | | | 1.0 | |
Italy | | | 1.0 | |
Finland | | | 0.9 | |
Luxembourg | | | 0.8 | |
Denmark | | | 0.5 | |
Portugal | | | 0.3 | |
5
American Beacon International Equity FundSM
Expense Examples
October 31, 2016 (Unaudited)
Fund Expense Example
As a shareholder of a Fund, you incur two types of costs: (1) transaction costs, including sales charges (loads) on purchase payments and redemption fees if applicable, and (2) ongoing costs, including management fees, administrative service fees, distribution (12b-1) fees, and other Fund expenses. The Examples are intended to help you understand the ongoing cost (in dollars) of investing in the Fund and to compare these costs with the ongoing costs of investing in other mutual funds. The Examples are based on an investment of $1,000 invested at the beginning of the period in each Class and held for the entire period from May 1, 2016 through October 31, 2016.
Actual Expenses
The “Actual” lines of the table provide information about actual account values and actual expenses. You may use the information on this page, together with the amount you invested, to estimate the expenses that you paid over the period. Simply divide your account value by $1,000 (for example, an $8,600 account value divided by $1,000 = $8.60), then multiply the result by the “Expenses Paid During Period” to estimate the expenses you paid on your account during this period. Shareholders of the Investor and Institutional Classes that invest in the Fund through an IRA or Roth IRA may be subject to a custodial IRA fee of $15 that is typically deducted each December. If your account was subject to a custodial IRA fee during the period, your costs would have been $15 higher.
Hypothetical Example for Comparison Purposes
The “Hypothetical” lines of the table provide information about hypothetical account values and hypothetical expenses based on the Fund’s actual expense ratio and an assumed 5% per year rate of return before expenses (not the Fund’s actual return). You may compare the ongoing costs of investing in the Fund with other funds by contrasting this 5% hypothetical example and the 5% hypothetical examples that appear in the shareholder reports of the other funds. The hypothetical account values and expenses may not be used to estimate the actual ending account balance or expenses you paid for the period. Shareholders of the Investor and Institutional Classes that invest in the Fund through an IRA or Roth IRA may be subject to a custodial IRA fee of $15 that is typically deducted each December. If your account was subject to a custodial IRA fee during the period, your costs would have been $15 higher.
You should also be aware that the expenses shown in the table highlight only your ongoing costs and do not reflect any transaction costs charged by the Fund, such as sales charges (loads) or redemption fees as applicable. Similarly, the expense examples for other funds do not reflect any transaction costs charged by those funds, such as sales charges (loads), redemption fees or exchange fees. Therefore, the “Hypothetical” lines of the table is useful in comparing ongoing costs only and will not help you determine the relative total costs of owning different funds. If you were subject to any transaction costs during the period, your costs would have been higher.
6
American Beacon International Equity FundSM
Expense Examples
October 31, 2016 (Unaudited)
International Equity Fund
| | | | | | | | | | | | |
| | | | | | | | | Expenses Paid During | |
| | | Beginning Account Value | | | Ending Account Value | | | Period | |
| | | 5/1/2016 | | | 10/31/2016 | | | 5/1/2016-10/31/2016* | |
Institutional Class | | | | | | | | | | | | |
Actual | | $ | 1,000.00 | | | $ | 990.89 | | | $ | 3.45 | |
Hypothetical** | | $ | 1,000.00 | | | $ | 1,021.65 | | | $ | 3.51 | |
Y Class | | | | | | | | | | | | |
Actual | | $ | 1,000.00 | | | $ | 990.66 | | | $ | 3.85 | |
Hypothetical** | | $ | 1,000.00 | | | $ | 1,021.28 | | | $ | 3.91 | |
Investor Class | | | | | | | | | | | | |
Actual | | $ | 1,000.00 | | | $ | 989.10 | | | $ | 5.30 | |
Hypothetical** | | $ | 1,000.00 | | | $ | 1,019.83 | | | $ | 5.38 | |
Advisor Class | | | | | | | | | | | | |
Actual | | $ | 1,000.00 | | | $ | 989.33 | | | $ | 5.95 | |
Hypothetical** | | $ | 1,000.00 | | | $ | 1,019.14 | | | $ | 6.04 | |
A Class | | | | | | | | | | | | |
Actual | | $ | 1,000.00 | | | $ | 989.09 | | | $ | 5.35 | |
Hypothetical** | | $ | 1,000.00 | | | $ | 1,019.75 | | | $ | 5.43 | |
C Class | | | | | | | | | | | | |
Actual | | $ | 1,000.00 | | | $ | 985.28 | | | $ | 9.23 | |
Hypothetical** | | $ | 1,000.00 | | | $ | 1,015.83 | | | $ | 9.37 | |
| * | Expenses are equal to the Fund’s annualized expense ratios for the six-month period of 0.69%, 0.77%, 1.06%, 1.19%, 1.07%, and 1.85% for the Institutional, Y, Investor, Advisor, A, and C Classes respectively, multiplied by the average account value over the period, multiplied by the number derived by dividing the number of days in the most recent fiscal half-year (184) by days in the year (366) to reflect the half-year period. |
| ** | 5% return before expenses. |
7
American Beacon International Equity FundSM
Report of Independent Registered Public Accounting Firm {Unaudited}
To the Shareholders and the Board of Trustees of
American Beacon International Equity Fund:
We have audited the accompanying statement of assets and liabilities, including the schedule of investments, of American Beacon International Equity Fund (one of the funds constituting the American Beacon Funds) (the Fund), as of October 31, 2016, and the related statement of operations for the year then ended, the statements of changes in net assets for each of the two years in the period then ended and the financial highlights for each of the five years in the period then ended. These financial statements and financial highlights are the responsibility of the Fund’s management. Our responsibility is to express an opinion on these financial statements and financial highlights based on our audits.
We conducted our audits in accordance with the standards of the Public Company Accounting Oversight Board (United States). Those standards require that we plan and perform the audit to obtain reasonable assurance about whether the financial statements and financial highlights are free of material misstatement. We were not engaged to perform an audit of the Fund’s internal control over financial reporting. Our audits included consideration of internal control over financial reporting as a basis for designing audit procedures that are appropriate in the circumstances, but not for the purpose of expressing an opinion on the effectiveness of the Fund’s internal control over financial reporting. Accordingly, we express no such opinion. An audit also includes examining, on a test basis, evidence supporting the amounts and disclosures in the financial statements and financial highlights, assessing the accounting principles used and significant estimates made by management, and evaluating the overall financial statement presentation. Our procedures included confirmation of securities owned as of October 31, 2016, by correspondence with the custodian and brokers or by other appropriate auditing procedures where replies from brokers were not received. We believe that our audits provide a reasonable basis for our opinion.
In our opinion, the financial statements and financial highlights referred to above present fairly, in all material respects, the financial position of American Beacon International Equity Fund at October 31, 2016, the results of its operations for the year then ended, the changes in its net assets for each of the two years in the period then ended and the financial highlights for each of the five years in the period then ended in conformity with U.S. generally accepted accounting principles.

Dallas, Texas
December 29, 2016
8
American Beacon International Equity FundSM
Schedule of Investments
October 31, 2016
| | | | | | | | |
| | | Shares | | | Fair Value | |
Australia - 1.23% | | | | | | | | |
Common Stocks - (Cost $31,502,605) | | | | | | | | |
Caltex Australia Ltd. | | | 627,934 | | | $ | 14,678,777 | |
James Hardie Industries PLC, CDIA B | | | 628,539 | | | | 9,385,682 | |
Westfield Corp.C | | | 1,252,674 | | | | 8,480,889 | |
| | | | | | | | |
Total Australia | | | | | | | 32,545,348 | |
| | | | | | | | |
Belgium - 1.77% | | | | | | | | |
Common Stocks - (Cost $42,022,432) | | | | | | | | |
Anheuser-Busch InBev S.A. | | | 256,256 | | | | 29,410,447 | |
KBC Groep N.V. | | | 163,047 | | | | 9,935,451 | |
UCB S.A. | | | 113,020 | | | | 7,653,739 | |
| | | | | | | | |
Total Belgium | | | | | | | 46,999,637 | |
| | | | | | | | |
Canada - 2.23% | | | | | | | | |
Common Stocks - (Cost $62,010,345) | | | | | | | | |
Canadian National Railway Co.D | | | 207,100 | | | | 13,019,214 | |
Encana Corp. | | | 726,000 | | | | 6,922,792 | |
Manulife Financial Corp. | | | 164,200 | | | | 2,378,592 | |
MDA Corp. | | | 127,589 | | | | 7,302,623 | |
National Bank of Canada | | | 404,802 | | | | 14,450,100 | |
Precision Drilling Corp | | | 893,626 | | | | 3,984,108 | |
Suncor Energy, Inc. | | | 372,195 | | | | 11,168,902 | |
| | | | | | | | |
Total Canada | | | | | | | 59,226,331 | |
| | | | | | | | |
Denmark - 0.50% | | | | | | | | |
Common Stocks - (Cost $14,213,555) | | | | | | | | |
Carlsberg A.S., Class B | | | 147,720 | | | | 13,320,482 | |
| | | | | | | | |
Finland - 0.89% | | | | | | | | |
Common Stocks - (Cost $20,107,722) | | | | | | | | |
Sampo OYJ, Class A | | | 516,455 | | | | 23,681,026 | |
| | | | | | | | |
France - 11.51% | | | | | | | | |
Common Stocks - (Cost $293,454,138) | | | | | | | | |
Air Liquide S.A. | | | 137,630 | | | | 14,002,407 | |
AXA S.A. | | | 422,197 | | | | 9,517,292 | |
BNP Paribas | | | 513,242 | | | | 29,770,666 | |
Cap Gemini S.A. | | | 216,533 | | | | 17,941,533 | |
Cie de Saint-Gobain | | | 252,759 | | | | 11,222,123 | |
Cie Generale des Etablissements Michelin | | | 177,495 | | | | 19,217,581 | |
Crédit Agricole S.A. | | | 935,180 | | | | 10,093,473 | |
ENGIE SA. | | | 1,240,804 | | | | 17,891,090 | |
Legrand S.A. | | | 141,589 | | | | 8,003,058 | |
Sanofi | | | 430,642 | | | | 33,545,444 | |
Schneider Electric S.A. | | | 377,428 | | | | 25,331,628 | |
Technip S.A. | | | 164,769 | | | | 10,928,480 | |
Total S.A. | | | 1,104,691 | | | | 53,018,144 | |
Valeo S.A. | | | 297,540 | | | | 17,147,792 | |
Vinci S.A. | | | 251,108 | | | | 18,187,643 | |
Zodiac Aerospace | | | 385,570 | | | | 9,383,665 | |
| | | | | | | | |
Total France | | | | | | | 305,202,019 | |
| | | | | | | | |
Germany - 8.03% | | | | | | | | |
Common Stocks - (Cost $140,554,824) | | | | | | | | |
BASF SE | | | 159,515 | | | | 14,061,143 | |
Bayer AG Reg | | | 122,671 | | | | 12,158,643 | |
Deutsche Boerse AGD | | | 49,785 | | | | 3,873,698 | |
Deutsche Lufthansa AG | | | 840,020 | | | | 10,738,229 | |
HeidelbergCement AG | | | 162,059 | | | | 15,327,891 | |
See accompanying notes
9
American Beacon International Equity FundSM
Schedule of Investments
October 31, 2016
| | | | | | | | |
| | | Shares | | | Fair Value | |
Germany - 8.03% (continued) | | | | | | | | |
Infineon Technologies AG | | | 737,800 | | | $ | 13,246,244 | |
Lanxess AG | | | 226,791 | | | | 14,521,830 | |
Linde AG | | | 68,038 | | | | 11,225,717 | |
Merck KGaA | | | 151,975 | | | | 15,625,354 | |
METRO AG | | | 240,892 | | | | 7,216,547 | |
SAP AG | | | 461,473 | | | | 40,648,149 | |
Siemens AG Reg. | | | 113,970 | | | | 12,942,691 | |
Thyssenkrupp AG | | | 296,800 | | | | 6,871,381 | |
| | | | | | | | |
Total Common Stocks | | | | | | | 178,457,517 | |
| | | | | | | | |
Preferred Stocks - (Cost $44,096,242) | | | | | | | | |
Volkswagen AG | | | 250,935 | | | | 34,488,088 | |
| | | | | | | | |
Total Germany | | | | | | | 212,945,605 | |
| | | | | | | | |
Hong Kong/China - 3.09% | | | | | | | | |
Common Stocks - (Cost $75,695,372) | | | | | | | | |
AIA Group Ltd. | | | 1,556,862 | | | | 9,826,304 | |
Cheung Kong Property Holdings Ltd. | | | 1,248,082 | | | | 9,245,290 | |
China Merchants Port Holdings Co. Ltd. | | | 2,318,044 | | | | 6,007,657 | |
China Mobile Ltd. | | | 2,212,276 | | | | 25,344,525 | |
CK Hutchison Holdings Ltd. | | | 873,082 | | | | 10,801,583 | |
CNOOC Ltd. | | | 14,704,635 | | | | 18,713,663 | |
GCL-Poly Energy Holdings Ltd. | | | 15,050,317 | | | | 2,037,616 | |
| | | | | | | | |
Total Hong Kong/China | | | | | | | 81,976,638 | |
| | | | | | | | |
Ireland - 1.10% | | | | | | | | |
Common Stocks - (Cost $23,817,137) | | | | | | | | |
CRH PLCA | | | 541,511 | | | | 17,524,693 | |
Ryanair Holdings PLCA | | | 154,183 | | | | 11,577,601 | |
| | | | | | | | |
Total Ireland | | | | | | | 29,102,294 | |
| | | | | | | | |
Israel - 1.34% | | | | | | | | |
Common Stocks - (Cost $41,428,820) | | | | | | | | |
Teva Pharmaceutical Industries Ltd., Sponsored ADR E | | | 831,963 | | | | 35,558,099 | |
| | | | | | | | |
Italy - 0.99% | | | | | | | | |
Common Stocks - (Cost $32,644,599) | | | | | | | | |
Azimut Holding SpA | | | 425,953 | | | | 6,836,166 | |
ENI SpA | | | 1,036,506 | | | | 15,030,665 | |
UniCredit SpA | | | 1,739,971 | | | | 4,316,721 | |
| | | | | | | | |
Total Italy | | | | | | | 26,183,552 | |
| | | | | | | | |
Japan - 16.76% | | | | | | | | |
Common Stocks - (Cost $400,807,630) | | | | | | | | |
ABC-Mart, Inc.D | | | 158,000 | | | | 9,627,348 | |
Asahi Group Holdings Ltd. | | | 167,500 | | | | 5,991,156 | |
Daiwa House Industry Co., Ltd. | | | 941,400 | | | | 25,907,127 | |
Don Quijote Co., Ltd. | | | 640,100 | | | | 24,384,471 | |
East Japan Railway Co. | | | 294,900 | | | | 26,031,175 | |
Hitachi Ltd. | | | 5,058,000 | | | | 26,970,855 | |
Inpex Corp. | | | 535,300 | | | | 5,030,911 | |
Isuzu Motors Ltd. | | | 1,156,800 | | | | 14,334,525 | |
Japan Airlines Co., Ltd. | | | 625,100 | | | | 18,454,368 | |
Japan Tobacco, Inc. | | | 370,900 | | | | 14,125,819 | |
KDDI Corp. | | | 1,829,700 | | | | 55,691,832 | |
Kirin Holdings Co., Ltd. | | | 742,100 | | | | 12,790,557 | |
Komatsu Ltd. | | | 710,400 | | | | 15,871,719 | |
Konica Minolta, Inc. | | | 1,726,200 | | | | 15,489,217 | |
Mitsui Fudosan Co., Ltd. | | | 221,000 | | | | 5,037,670 | |
Nikon Corp.F | | | 526,700 | | | | 7,970,563 | |
See accompanying notes
10
American Beacon International Equity FundSM
Schedule of Investments
October 31, 2016
| | | | | | | | |
| | | Shares | | | Fair Value | |
Japan - 16.76% (continued) | | | | | | | | |
Nissan Motor Co., Ltd. | | | 1,102,900 | | | $ | 11,237,232 | |
Omron Corp. | | | 154,800 | | | | 5,948,737 | |
Panasonic Corp. | | | 672,500 | | | | 7,034,733 | |
Seven & I Holdings Co., Ltd. | | | 424,900 | | | | 17,758,527 | |
Softbank Corp. | | | 300,200 | | | | 18,898,831 | |
Sony Corp. | | | 554,300 | | | | 17,764,874 | |
Sumitomo Metal Mining Co., Ltd. | | | 857,000 | | | | 11,109,865 | |
Sumitomo Mitsui Financial Group, Inc. | | | 916,300 | | | | 31,918,031 | |
Sumitomo Rubber Industries Ltd. | | | 304,500 | | | | 5,104,520 | |
Suntory Beverage & Food Ltd. | | | 229,400 | | | | 10,051,426 | |
Toshiba Corp. | | | 3,694,000 | | | | 13,420,559 | |
Toyota Motor Corp. | | | 83,100 | | | | 4,817,058 | |
United Arrows Ltd. | | | 202,300 | | | | 5,528,672 | |
| | | | | | | | |
Total Japan | | | | | | | 444,302,378 | |
| | | | | | | | |
Luxembourg - 0.75% | | | | | | | | |
Common Stocks - (Cost $20,122,928) | | | | | | | | |
ArcelorMittalD | | | 973,699 | | | | 6,560,776 | |
RTL Group S.A. | | | 112,000 | | | | 8,778,489 | |
Tenaris S.A. | | | 329,191 | | | | 4,654,439 | |
| | | | | | | | |
Total Luxembourg | | | | | | | 19,993,704 | |
| | | | | | | | |
Netherlands - 5.72% | | | | | | | | |
Common Stocks - (Cost $153,341,654) | | | | | | | | |
Aegon N.V | | | 2,216,920 | | | | 9,559,277 | |
Akzo Nobel | | | 620,651 | | | | 40,116,110 | |
ING Groep N.V. | | | 1,850,915 | | | | 24,371,950 | |
PostNL N.V.D | | | 1,492,795 | | | | 7,033,370 | |
QIAGEN N.V.D | | | 303,816 | | | | 7,439,032 | |
RELX N.V. | | | 530,235 | | | | 8,949,259 | |
Royal Dutch Shell PLC, Class AA | | | 1,011,089 | | | | 25,227,938 | |
SBM Offshore N.V. | | | 602,300 | | | | 8,651,475 | |
Wolters Kluwer N.V. | | | 522,349 | | | | 20,215,526 | |
| | | | | | | | |
Total Netherlands | | | | | | | 151,563,937 | |
| | | | | | | | |
Norway - 1.17% | | | | | | | | |
Common Stocks - (Cost $31,347,862) | | | | | | | | |
Telenor ASA | | | 1,801,085 | | | | 28,665,292 | |
Yara International ASA | | | 65,600 | | | | 2,318,372 | |
| | | | | | | | |
Total Norway | | | | | | | 30,983,664 | |
| | | | | | | | |
Portugal - 0.26% | | | | | | | | |
Common Stocks - (Cost $7,593,876) | | | | | | | | |
Galp Energia SGPS S.A. | | | 499,083 | | | | 6,766,176 | |
| | | | | | | | |
Singapore - 0.98% | | | | | | | | |
Common Stocks - (Cost $18,130,279) | | | | | | | | |
DBS Group Holdings Ltd. | | | 1,094,381 | | | | 11,799,256 | |
Singapore Telecommunications Ltd. | | | 5,068,895 | | | | 14,166,443 | |
| | | | | | | | |
Total Singapore | | | | | | | 25,965,699 | |
| | | | | | | | |
South Korea - 4.60% | | | | | | | | |
Common Stocks - (Cost $113,961,717) | | | | | | | | |
Hana Financial Group, Inc. | | | 503,063 | | | | 14,420,333 | |
Hyundai Mobis Co., Ltd. | | | 39,389 | | | | 9,432,017 | |
Hyundai Motor Co. | | | 90,851 | | | | 11,115,700 | |
KB Financial Group, Inc., ADRE | | | 288,657 | | | | 10,674,537 | |
KT&G Corp. | | | 59,451 | | | | 5,871,062 | |
Samsung Electronics Co., Ltd. | | | 34,012 | | | | 48,718,084 | |
See accompanying notes
11
American Beacon International Equity FundSM
Schedule of Investments
October 31, 2016
| | | | | | | | |
| | | Shares | | | Fair Value | |
South Korea - 4.60% (continued) | | | | | | | | |
SK Telecom Co., Ltd. | | | 111,182 | | | $ | 21,716,563 | |
| | | | | | | | |
Total South Korea | | | | | | | 121,948,296 | |
| | | | | | | | |
Spain - 1.53% | | | | | | | | |
Common Stocks - (Cost $44,485,985) | | | | | | | | |
CaixaBank S.A. | | | 4,505,728 | | | | 13,636,574 | |
Red Electrica Corp S.A. | | | 471,567 | | | | 9,838,182 | |
Telefonica S.A. | | | 1,687,403 | | | | 17,152,734 | |
| | | | | | | | |
Total Spain | | | | | | | 40,627,490 | |
| | | | | | | | |
Sweden - 1.71% | | | | | | | | |
Common Stocks - (Cost $48,977,903) | | | | | | | | |
Alfa Laval AB | | | 378,579 | | | | 5,440,516 | |
Assa Abloy AB | | | 1,002,266 | | | | 18,231,795 | |
Getinge AB, Class B | | | 450,388 | | | | 7,380,016 | |
Swedbank AB, Class A | | | 611,758 | | | | 14,331,914 | |
| | | | | | | | |
Total Sweden | | | | | | | 45,384,241 | |
| | | | | | | | |
Switzerland - 8.04% | | | | | | | | |
Common Stocks - (Cost $215,906,168) | | | | | | | | |
ABB Ltd. | | | 1,271,697 | | | | 26,216,582 | |
Aryzta AG | | | 327,495 | | | | 14,389,857 | |
Cie Financiere Richemont S.A. Reg. | | | 259,141 | | | | 16,668,511 | |
Clariant AG Reg. | | | 258,993 | | | | 4,289,723 | |
Novartis AG | | | 917,767 | | | | 65,293,109 | |
Roche Holding AG Genusschein | | | 158,170 | | | | 36,363,675 | |
Swiss Re AG | | | 110,671 | | | | 10,278,071 | |
UBS Group AG | | | 1,256,793 | | | | 17,780,913 | |
Zurich Insurance Group AG | | | 83,025 | | | | 21,722,169 | |
| | | | | | | | |
Total Switzerland | | | | | | | 213,002,610 | |
| | | | | | | | |
United Kingdom - 21.86% | | | | | | | | |
Common Stocks - (Cost $618,211,846) | | | | | | | | |
Aon PLCA | | | 164,399 | | | | 18,220,341 | |
Aviva PLCA | | | 4,234,534 | | | | 22,950,645 | |
BAE Systems PLCA | | | 1,673,090 | | | | 11,109,659 | |
Balfour Beatty PLCA | | | 2,655,985 | | | | 8,810,013 | |
Barclays PLCA | | | 12,932,313 | | | | 30,122,892 | |
BHP Billiton PLCA | | | 1,274,604 | | | | 19,259,634 | |
BP PLCA | | | 3,337,283 | | | | 19,758,355 | |
British American Tobacco PLCA | | | 944,878 | | | | 54,258,667 | |
Carnival PLCA | | | 376,360 | | | | 18,131,771 | |
Cobham PLCA | | | 2,836,966 | | | | 4,962,129 | |
Diageo PLCA | | | 901,471 | | | | 24,048,628 | |
Direct Line Insurance Group PLCA | | | 1,434,481 | | | | 6,076,844 | |
GlaxoSmithKline PLCA | | | 1,132,407 | | | | 22,433,494 | |
Glencore Xstrata PLCA | | | 3,927,820 | | | | 12,019,136 | |
Howden Joinery Group PLCA | | | 1,720,737 | | | | 7,896,081 | |
HSBC Holdings PLCA | | | 1,741,804 | | | | 13,107,923 | |
Informa PLCA | | | 1,489,905 | | | | 12,264,011 | |
Johnson Matthey PLCA | | | 154,280 | | | | 6,439,404 | |
Kingfisher PLCA | | | 1,793,333 | | | | 7,930,683 | |
Lloyds Banking Group PLCA | | | 21,443,667 | | | | 15,029,068 | |
Petrofac Ltd. | | | 649,264 | | | | 6,409,252 | |
Provident Financial Holdings PLCA | | | 235,338 | | | | 8,497,589 | |
Prudential PLCA | | | 2,631,288 | | | | 42,980,219 | |
RELX PLCA | | | 962,335 | | | | 17,209,100 | |
Royal Dutch Shell PLC, Class BA | | | 1,838,785 | | | | 47,601,758 | |
Shire PLCA | | | 422,938 | | | | 24,071,953 | |
See accompanying notes
12
American Beacon International Equity FundSM
Schedule of Investments
October 31, 2016
| | | | | | | | |
| | | Shares | | | Fair Value | |
United Kingdom - 21.86% (continued) | | | | | | | | |
Sky PLCA | | | 994,777 | | | $ | 9,960,031 | |
SSE PLCA | | | 620,412 | | | | 12,081,811 | |
Standard Chartered PLCA D | | | 1,911,397 | | | | 16,655,265 | |
Unilever PLCA | | | 281,809 | | | | 11,789,858 | |
Vodafone Group PLCA | | | 9,890,118 | | | | 27,213,189 | |
Wolseley PLCA | | | 380,673 | | | | 19,807,280 | |
| | | | | | | | |
Total United Kingdom | | | | | | | 579,106,683 | |
| | | | | | | | |
SHORT-TERM INVESTMENTS - 3.29% (Cost $87,141,057) | | | | | | | | |
American Beacon U.S. Government Money Market Select Fund, Select Class G | | | 87,141,057 | | | | 87,141,057 | |
| | | | | | | | |
SECURITIES LENDING COLLATERAL - 0.06% (Cost $1,711,611) | | | | | | | | |
DWS Government and Agency Securities Portfolio, Institutional Class | | | 427,903 | | | | 427,903 | |
American Beacon U.S. Government Money Market Select Fund, Select Class G | | | 1,283,708 | | | | 1,283,708 | |
| | | | | | | | |
Total Securities Lending Collateral | | | | | | | 1,711,611 | |
| | | | | | | | |
TOTAL INVESTMENTS - 99.41% (Cost $2,583,288,309) | | | | | | | 2,635,238,577 | |
OTHER ASSETS, NET OF LIABILITIES - 0.59% | | | | | | | 15,615,539 | |
| | | | | | | | |
TOTAL NET ASSETS - 100.00% | | | | | | $ | 2,650,854,116 | |
| | | | | | | | |
Percentages are stated as a percent of net assets.
| A | PLC - Public Limited Company. |
| B | CDI - Chess Depository Interest. |
| C | REIT - Real Estate Investment Trust. |
| D | Non-income producing security. |
| E | ADR - American Depositary Receipt. |
| F | All or a portion of this security is on loan at October 31, 2016. |
| G | The Fund is affiliated by having the same investment advisor. |
Futures Contracts Open on October 31, 2016:
| | | | | | | | | | | | | | | | | | | | |
| | | | | | | | | | | | | | | Unrealized | |
| | | | | | Number of | | | | | | | | | Appreciation | |
Description | | Type | | | Contracts | | | Expiration Date | | | Contract Value | | | (Depreciation) | |
AEX Index Futures | | | Long | | | | 33 | | | | November 2016 | | | $ | 3,269,010 | | | $ | 898 | |
ASX SPI 200 Index Futures | | | Long | | | | 71 | | | | December 2016 | | | | 7,142,619 | | | | 53,451 | |
CAC 40 Index Futures | | | Long | | | | 195 | | | | November 2016 | | | | 9,646,693 | | | | (6,618 | ) |
DAX Index Futures | | | Long | | | | 31 | | | | December 2016 | | | | 9,082,877 | | | | 214,836 | |
FTSE 100 Index Futures | | | Long | | | | 207 | | | | December 2016 | | | | 17,554,283 | | | | 528,056 | |
FTSE/MIB Index Futures | | | Long | | | | 21 | | | | December 2016 | | | | 1,971,732 | | | | 66,312 | |
Hang Seng Index | | | Long | | | | 23 | | | | November 2016 | | | | 3,396,644 | | | | (89,227 | ) |
IBEX 35 Index Futures | | | Long | | | | 32 | | | | November 2016 | | | | 3,205,702 | | | | 131,197 | |
OMX 30 Index Futures | | | Long | | | | 167 | | | | November 2016 | | | | 2,671,318 | | | | (15,285 | ) |
S&P/TSX 60 Index Futures | | | Long | | | | 70 | | | | December 2016 | | | | 9,043,476 | | | | 243,216 | |
TOPIX Index Futures | | | Long | | | | 182 | | | | December 2016 | | | | 24,206,660 | | | | 1,096,425 | |
| | | | | | | | | | | | | | | | | | | | |
| | | | | | | | | | | | | | $ | 91,191,014 | | | $ | 2,223,261 | |
| | | | | | | | | | | | | | | | | | | | |
See accompanying notes
13
American Beacon International Equity FundSM
Schedule of Investments
October 31, 2016
Foreign Currency Contracts Open on October 31, 2016:
| | | | | | | | | | | | | | | | | | | | | | | | | | | | |
| | | | | | | | | | | | | | | | | | | | | Net Unrealized | |
| | | | | | Principal Amount | | | | | | | | | Unrealized | | | Unrealized | | | Appreciation | |
Type | | Currency | | | Covered by Contract | | | Settlement Date | | | Counterparty | | | Appreciation | | | (Depreciation) | | | (Depreciation) | |
Buy | | | EUR | | | | 23,167,934 | | | | 12/8/2016 | | | | BNP | | | $ | — | | | $ | (605,569 | ) | | $ | (605,569 | ) |
Buy | | | EUR | | | | 6,456,940 | | | | 12/8/2016 | | | | BOM | | | | — | | | | (172,473 | ) | | | (172,473 | ) |
Buy | | | SEK | | | | 2,322,015 | | | | 12/8/2016 | | | | BOM | | | | — | | | | (159,482 | ) | | | (159,482 | ) |
Buy | | | CHF | | | | 11,252,995 | | | | 12/8/2016 | | | | CBK | | | | — | | | | (242,537 | ) | | | (242,537 | ) |
Buy | | | GBP | | | | 15,623,275 | | | | 12/8/2016 | | | | CBK | | | | — | | | | (1,535,093 | ) | | | (1,535,093 | ) |
Buy | | | SEK | | | | 590,561 | | | | 12/8/2016 | | | | GLM | | | | — | | | | (38,889 | ) | | | (38,889 | ) |
Buy | | | CAD | | | | 9,204,513 | | | | 12/8/2016 | | | | GLM | | | | — | | | | (411,346 | ) | | | (411,346 | ) |
Buy | | | CAD | | | | 1,888,209 | | | | 12/8/2016 | | | | RBC | | | | — | | | | (31,600 | ) | | | (31,600 | ) |
Buy | | | JPY | | | | 1,309,779 | | | | 12/8/2016 | | | | SCB | | | | — | | | | (35,869 | ) | | | (35,869 | ) |
Buy | | | GBP | | | | 4,717,248 | | | | 12/8/2016 | | | | SOG | | | | — | | | | (388,331 | ) | | | (388,331 | ) |
Buy | | | JPY | | | | 28,075,029 | | | | 12/8/2016 | | | | SOG | | | | — | | | | (799,014 | ) | | | (799,014 | ) |
Buy | | | AUD | | | | 7,387,917 | | | | 12/8/2016 | | | | TDB | | | | — | | | | (60,164 | ) | | | (60,164 | ) |
Buy | | | CHF | | | | 387,794 | | | | 12/8/2016 | | | | UAG | | | | — | | | | (7,459 | ) | | | (7,459 | ) |
Buy | | | AUD | | | | 1,277,545 | | | | 12/8/2016 | | | | WBC | | | | 24,343 | | | | — | | | | 24,343 | |
Sell | | | SEK | | | | 409,234 | | | | 12/8/2016 | | | | BNP | | | | 22,836 | | | | — | | | | 22,836 | |
Sell | | | CAD | | | | 1,469,104 | | | | 12/8/2016 | | | | BOM | | | | 34,426 | | | | — | | | | 34,426 | |
Sell | | | EUR | | | | 4,144,843 | | | | 12/8/2016 | | | | CBK | | | | 95,540 | | | | — | | | | 95,540 | |
Sell | | | SEK | | | | 440,509 | | | | 12/8/2016 | | | | CBK | | | | 5,501 | | | | — | | | | 5,501 | |
Sell | | | AUD | | | | 1,055,627 | | | | 12/8/2016 | | | | HUS | | | | 5,493 | | | | — | | | | 5,493 | |
Sell | | | JPY | | | | 3,749,785 | | | | 12/8/2016 | | | | JPM | | | | 24,898 | | | | — | | | | 24,898 | |
Sell | | | GBP | | | | 3,276,718 | | | | 12/8/2016 | | | | MYC | | | | — | | | | (12,868 | ) | | | (12,868 | ) |
Sell | | | CHF | | | | 1,498,524 | | | | 12/8/2016 | | | | RBC | | | | — | | | | (7,075 | ) | | | (7,075 | ) |
Sell | | | JPY | | | | 4,090,735 | | | | 12/8/2016 | | | | SCB | | | | 136,476 | | | | — | | | | 136,476 | |
Sell | | | EUR | | | | 4,288,400 | | | | 12/8/2016 | | | | SCB | | | | — | | | | (32,641 | ) | | | (32,641 | ) |
Sell | | | GBP | | | | 2,808,790 | | | | 12/8/2016 | | | | SOG | | | | 141,957 | | | | — | | | | 141,957 | |
Sell | | | CAD | | | | 1,473,579 | | | | 12/8/2016 | | | | TDB | | | | 6,817 | | | | — | | | | 6,817 | |
Sell | | | CHF | | | | 1,397,274 | | | | 12/8/2016 | | | | UAG | | | | 25,687 | | | | — | | | | 25,687 | |
Sell | | | AUD | | | | 1,152,906 | | | | 12/8/2016 | | | | WBC | | | | 9,665 | | | | — | | | | 9,665 | |
| | | | | | | | | | | | | | | | | | | | | | | | | | | | |
| | | | | | | | | | | | | | | | | | $ | 533,639 | | | $ | (4,540,410 | ) | | $ | (4,006,771 | ) |
| | | | | | | | | | | | | | | | | | | | | | | | | | | | |
Glossary:
Counterparty Abbreviations:
| | | | | | | | | | |
| BNP | | BNP Paribas, N.A. | | JPM | | JP Morgan Chase Bank, N.A. | | SOG | | Societe Generale |
| BOM | | Bank of Montreal | | MYC | | Morgan Stanley Bank, N.A. | | TDB | | Toronto Dominion Bank |
| CBK | | Citibank, N.A. | | RBC | | Royal Bank of Canada | | UAG | | UBS AG |
| GLM | | Goldman Sachs Bank USA | | SCB | | Standard Chartered Bank | | WBC | | Westpac Banking Corporation |
| HUS | | HSBC Bank USA | | | | | | | | |
|
Currency Abbreviations: |
| AUD | | Australian Dollar | | EUR | | Euro | | JPY | | Japanese Yen |
| CAD | | Canadian Dollar | | GBP | | British Pound | | SEK | | Swedish Krona |
| CHF | | Swiss Franc | | | | | | | | |
See accompanying notes
14
American Beacon International Equity FundSM
Statement of Assets and Liabilities
October 31, 2016
| | | | |
Assets: | | | | |
Investments in unaffiliated securities, at fair value A D | | $ | 2,546,813,812 | |
Investments in affiliated securities, at fair value B | | | 88,424,765 | |
Foreign currency, at fair value C | | | 896,485 | |
Foreign currency deposits with brokers, at fair value E | | | 13,886,070 | |
Receivable for investments sold | | | 541,312 | |
Receivable for fund shares sold | | | 5,450,380 | |
Dividends and interest receivable | | | 6,061,700 | |
Receivable for tax reclaims | | | 1,774,132 | |
Receivable for variation margin from open futures contracts | | | 14,282,050 | |
Unrealized appreciation from foreign currency contracts | | | 533,639 | |
Prepaid expenses | | | 127,298 | |
| | | | |
Total assets | | | 2,678,791,643 | |
| | | | |
Liabilities: | | | | |
Payable for investments purchased | | | 4,940,161 | |
Payable for fund shares redeemed | | | 3,234,717 | |
Payable upon return of securities loaned | | | 1,711,611 | |
Management and investment advisory fees payable | | | 913,530 | |
Administrative service and service fees payable | | | 105,515 | |
Transfer agent fees payable | | | 52,860 | |
Custody and fund accounting fees payable | | | 168,711 | |
Professional fees payable | | | 70,228 | |
Prospectus and shareholder reports fees payable | | | 99,852 | |
Trustee fees payable | | | 9,561 | |
Payable for variation margin from open futures contracts | | | 12,039,063 | |
Unrealized depreciation from foreign currency contracts | | | 4,540,410 | |
Other liabilities | | | 51,308 | |
| | | | |
Total liabilities | | | 27,937,527 | |
| | | | |
Net assets | | $ | 2,650,854,116 | |
| | | | |
Analysis of Net Assets: | | | | |
Paid-in-capital | | $ | 2,636,463,744 | |
Undistributed net investment income | | | 52,877,849 | |
Accumulated net realized (loss) | | | (88,221,686 | ) |
Unrealized appreciation of investments | | | 226,868,753 | |
Unrealized depreciation of foreign currency contracts | | | (179,357,805 | ) |
Unrealized appreciation of futures contracts | | | 2,223,261 | |
| | | | |
Net assets | | $ | 2,650,854,116 | |
| | | | |
See accompanying notes
15
American Beacon International Equity FundSM
Statement of Assets and Liabilities
October 31, 2016
| | | | |
Shares outstanding at no par value (unlimited shares authorized): | | | | |
Institutional Class | | | 83,271,648 | |
| | | | |
Y Class | | | 45,506,312 | |
| | | | |
Investor Class | | | 19,428,143 | |
| | | | |
Advisor Class | | | 1,344,903 | |
| | | | |
A Class | | | 1,084,025 | |
| | | | |
C Class | | | 176,087 | |
| | | | |
Net assets: | | | | |
Institutional ClassF | | $ | 1,450,052,040 | |
| | | | |
Y Class | | $ | 820,596,038 | |
| | | | |
Investor Class | | $ | 334,895,337 | |
| | | | |
Advisor ClassG | | $ | 23,692,313 | |
| | | | |
A Class | | $ | 18,673,142 | |
| | | | |
C Class | | $ | 2,945,246 | |
| | | | |
Net asset value, offering and redemption price per share: | | | | |
Institutional ClassF | | $ | 17.41 | |
| | | | |
Y Class | | $ | 18.03 | |
| | | | |
Investor Class | | $ | 17.24 | |
| | | | |
Advisor ClassG | | $ | 17.62 | |
| | | | |
A Class | | $ | 17.23 | |
| | | | |
A Class (offering price) | | $ | 18.28 | |
| | | | |
C Class | | $ | 16.73 | |
| | | | |
A Cost of investments in unaffiliated securities | | $ | 2,494,863,544 | |
B Cost of investments in affiliated securities | | $ | 88,424,765 | |
C Cost of foreign currency | | $ | 897,204 | |
D Fair value of securities on loan | | $ | 1,626,366 | |
E Cost of foreign currency deposits with brokers | | $ | 14,107,483 | |
F Includes AMR Class Assets (Note 1). | | | | |
G Includes Retirement Class Assets (Note 1). | | | | |
See accompanying notes
16
American Beacon International Equity FundSM
Statement of Operations
For the year ended October 31, 2016
| | | | |
Investment income: | | | | |
Dividend income from unaffiliated securities (net of foreign taxes) A | | $ | 70,074,935 | |
Dividend income from affiliated securities | | | 254,429 | |
Interest income | | | 1,181,420 | |
Income derived from securities lending | | | 286,093 | |
| | | | |
Total investment income | | | 71,796,877 | |
| | | | |
Expenses: | | | | |
Management and investment advisory fees (Note 2) | | | 10,028,181 | |
Administrative service fees (Note 2): | | | | |
Institutional ClassB | | | 2,005,137 | |
Y Class | | | 1,352,751 | |
Investor Class | | | 561,461 | |
Advisor ClassC | | | 42,342 | |
A Class | | | 23,895 | |
C Class | | | 5,452 | |
Transfer agent fees: | | | | |
Institutional ClassB | | | 447,820 | |
Y Class | | | 23,551 | |
Investor Class | | | 11,238 | |
Advisor ClassC | | | 3,964 | |
A Class | | | 3,230 | |
C Class | | | 374 | |
Custody and fund accounting fees | | | 593,707 | |
Professional fees | | | 137,895 | |
Registration fees and expenses | | | 162,723 | |
Service fees (Note 2): | | | | |
Y Class | | | 771,987 | |
Investor Class | | | 1,254,434 | |
Advisor ClassC | | | 62,463 | |
A Class | | | 21,555 | |
C Class | | | 4,922 | |
Distribution fees (Note 2): | | | | |
Advisor ClassC | | | 63,825 | |
A Class | | | 35,925 | |
C Class | | | 32,813 | |
Prospectus and shareholder report expenses | | | 261,045 | |
Trustee fees | | | 142,942 | |
Other expenses | | | 250,948 | |
| | | | |
Total expenses | | | 18,306,580 | |
| | | | |
Net expenses | | | 18,306,580 | |
| | | | |
Net investment income | | | 53,490,297 | |
| | | | |
Realized and unrealized gain (loss) from investments: | | | | |
Net realized gain (loss) from: | | | | |
Investments | | | (20,639,965 | ) |
Commission recapture (Note 1) | | | 99,055 | |
Foreign currency transactions | | | (62,870,906 | ) |
Futures contracts | | | 13,698,686 | |
Change in net unrealized appreciation (depreciation) of: | | | | |
Investments | | | (21,185,971 | ) |
Foreign currency transactions | | | (24,901,196 | ) |
Futures contracts | | | (2,583,868 | ) |
| | | | |
Net (loss) from investments | | | (118,384,165 | ) |
| | | | |
Net (decrease) in net assets resulting from operations | | $ | (64,893,868 | ) |
| | | | |
A Foreign taxes | | $ | 7,054,638 | |
B Includes AMR Class Expenses (Note 1). | | | | |
C Includes Retirement Class Expenses (Note 1). | | | | |
See accompanying notes
17
American Beacon International Equity FundSM
Statement of Changes in Net Assets
| | | | | | | | |
| | | Year Ended | | | Year Ended | |
| | | October 31, 2016 | | | October 31, 2015 | |
Increase (Decrease) in Net Assets: | | | | | | | | |
Operations: | | | | | | | | |
Net investment income | | $ | 53,490,297 | | | $ | 46,026,025 | |
Net realized gain (loss) from investments, commission recapture, foreign currency transactions, and futures contracts | | | (69,713,130 | ) | | | 104,760,714 | |
Change in net unrealized appreciation (depreciation) from investments, foreign currency transactions, and futures contracts | | | (48,671,035 | ) | | | (173,957,297 | ) |
| | | | | | | | |
Net (decrease) in net assets resulting from operations | | | (64,893,868 | ) | | | (23,170,558 | ) |
| | | | | | | | |
Distributions to Shareholders: | | | | | | | | |
Net investment income: | | | | | | | | |
Institutional ClassA | | | (16,686,558 | ) | | | (25,910,701 | ) |
Y Class | | | (8,452,221 | ) | | | (14,300,517 | ) |
Investor Class | | | (3,881,250 | ) | | | (8,329,125 | ) |
Advisor ClassB | | | (277,450 | ) | | | (182,971 | ) |
Retirement Class | | | — | | | | (23,149 | ) |
A Class | | | (124,783 | ) | | | (202,139 | ) |
C Class | | | (21,084 | ) | | | (55,584 | ) |
AMR Class | | | — | | | | (12,918,138 | ) |
Net realized gain from investments: | | | | | | | | |
Institutional ClassA | | | (9,476,767 | ) | | | — | |
Y Class | | | (4,762,157 | ) | | | — | |
Investor Class | | | (2,928,681 | ) | | | — | |
Advisor ClassB | | | (209,279 | ) | | | — | |
A Class | | | (91,005 | ) | | | — | |
C Class | | | (32,829 | ) | | | — | |
| | | | | | | | |
Net distributions to shareholders | | | (46,944,064 | ) | | | (61,922,324 | ) |
| | | | | | | | |
Capital Share Transactions: | | | | | | | | |
Proceeds from sales of shares | | | 1,257,857,958 | | | | 614,046,532 | |
Reinvestment of dividends and distributions | | | 42,786,888 | | | | 56,545,674 | |
Cost of shares redeemed | | | (638,592,286 | ) | | | (779,609,590 | ) |
Redemption fees | | | — | | | | 11,444 | |
| | | | | | | | |
Net increase (decrease) in net assets from capital share transactions | | | 662,052,560 | | | | (109,005,940 | ) |
| | | | | | | | |
Net increase (decrease) in net assets | | | 550,214,628 | | | | (194,098,822 | ) |
| | | | | | | | |
Net Assets: | | | | | | | | |
Beginning of period | | | 2,100,639,488 | | | | 2,294,738,310 | |
| | | | | | | | |
End of Period * | | $ | 2,650,854,116 | | | $ | 2,100,639,488 | |
| | | | | | | | |
*Includes undistributed (overdistribution of) net investment income | | $ | 52,877,849 | | | $ | 25,244,601 | |
| | | | | | | | |
| A Includes AMR Class Distributions (Note 1). | | | | | | | | |
| B Includes Retirement Class Distributions (Note 1). | | | | | | | | |
See accompanying notes
18
American Beacon International Equity FundSM
Notes to Financial Statements
October 31, 2016
1. Organization
American Beacon Funds (the “Trust”), is organized as a Massachusetts business trust and is registered under the Investment Company Act of 1940, as amended, (the “Act”) as a diversified, open-end management investment company. As of October 31, 2016, the Trust consists of twenty-five active series, one of which is presented in this filing (the “Fund”): the American Beacon International Equity Fund. The remaining twenty-four active series are reported in separate filings
American Beacon Advisors, Inc. (the “Manager”) is a wholly-owned subsidiary of Astro AB Borrower, Inc., which is indirectly owned by investment funds affiliated with Kelso & Company, L.P. and Estancia Capital Management, LLC, and was organized in 1986 to provide business management, advisory, administrative and asset management consulting services to the Trust and other investors.
Class Disclosure
The AMR Class closed on May 31, 2016 and the shares merged into the Institutional class. The Retirement Class closed on January 15, 2016 and the shares merged into the Advisor Class.
The Fund has multiple classes of shares designed to meet the needs of different groups of investors. The following table sets forth the differences amongst the classes:
| | | | | | |
| | | | | Minimum Initial | |
Class | | Eligible Investors | | Investments | |
Institutional | | Large institutional investors - sold directly or through intermediary channels. | | $ | 250,000 | |
Y Class | | Large institutional retirement plan investors - sold directly or through intermediary channels. | | $ | 100,000 | |
Investor | | All investors using intermediary organizations such as broker-dealers or retirement plan sponsors. | | $ | 2,500 | |
Advisor Class | | All investors who invest through intermediary organizations, such as broker- dealers or third party administrators. | | $ | 2,500 | |
A Class | | All investors who invest through intermediary organizations, such as broker- dealers or third party administrator. Retail investors who invest directly through a financial intermediary such as a broker, bank, or registered investment advisor, which may include a front-end sales charge and a contingent deferred sales charge (“CDSC”). | | $ | 2,500 | |
C Class | | Retail investors who invest directly through a financial intermediary such as a broker or employee directed benefit plans with applicable sales charges, which may include CDSC. | | $ | 1,000 | |
Each class offered by the Trust has equal rights as to assets and voting privileges. Income and non-class specific expenses are allocated daily to each class on the basis of the relative net assets. Realized and unrealized capital gains and losses of each class are allocated daily based on the relative net assets of each class of the respective Fund. Class specific expenses, where applicable, currently include administrative service fees, service fees, and distribution fees and vary amongst the classes as described more fully in Note 2.
The following is a summary of significant accounting policies, consistently followed by the Fund in preparation of the financial statements. The Fund is considered an investment company and follows the investment company accounting and reporting guidance of the Financial Accounting Standards Board Accounting Standard Codification Topic 946, Financial Services - Investment Companies, which is part of U.S. Generally Accepted Accounting Principles (“U.S. GAAP”).
Security Transactions and Investment Income
Security transactions are recorded on the trade date of the security purchase or sale. The Fund may purchase securities with delivery or payment to occur at a later date. At the time the Fund enters into a commitment to
19
American Beacon International Equity FundSM
Notes to Financial Statements
October 31, 2016
purchase a security, the transaction is recorded, and the value of the security is reflected in the Net Asset Value (“NAV”). The value of the security may vary with market fluctuations.
Dividend income, net of foreign taxes, is recorded on the ex-dividend date, except certain dividends from foreign securities which are recorded as soon as the information is available to the Fund. Interest income is earned from settlement date, recorded on the accrual basis, and adjusted, if necessary, for accretion of discounts and amortization of premiums. For financial and tax reporting purposes, realized gains and losses are determined on the basis of specific lot identification.
Dividends to Shareholders
Dividends from net investment income of the Fund will normally be declared and paid at least annually. Distributions, if any, of net realized capital gains are generally paid at least annually and recorded on the ex-dividend date. Dividends to shareholders are determined in accordance with federal income tax regulations, which may differ in amount and character from net investment income and realized gains recognized for purposes of U.S. GAAP. To the extent necessary to fully distribute capital gains, the Fund may also designate earnings and profits distributed to shareholders on the redemption of shares.
Commission Recapture
The Fund has established brokerage commission recapture arrangements with certain brokers or dealers. If the Fund’s investment advisor chooses to execute a transaction through a participating broker, the broker rebates a portion of the commission back to the Fund. Any collateral benefit received through participation in the commission recapture program is directed exclusively to the Fund. This amount is reported with the net realized gains in the Fund’s Statement of Operations.
Allocation of Income, Expenses, Gains, and Losses
Income, expenses (other than those attributable to a specific class), gains, and losses are allocated daily to each class of shares based upon the relative proportion of net assets represented by such class. Operating expenses directly attributable to a specific class are charged against the operations of that class.
Use of Estimates
The preparation of financial statements in conformity with U.S. GAAP requires management to make estimates and assumptions that affect the amounts reported in the financial statements and accompanying notes. Actual results may differ from those estimated.
Other
Under the Trust’s organizational documents, its officers and trustees are indemnified against certain liability arising out of the performance of their duties to the Trust. In the normal course of business, the Trust enters into contracts that provide indemnification to the other party or parties against potential costs or liabilities. The Trust’s maximum exposure under these arrangements is dependent on claims that may be made in the future and, therefore, cannot be estimated. The Trust has had no prior claims or losses pursuant to any such agreement.
2. Transactions with Affiliates
Management Agreement
From November 1, 2015 to May 29, 2016 the Trust and the Manager were parties to a Management Agreement that obligated the Manager to provide or oversee the provision of all investment advisory, fund management, and securities lending services. As compensation for performing the duties required under the Management Agreement,
20
American Beacon International Equity FundSM
Notes to Financial Statements
October 31, 2016
the Manager received from the Fund an annualized fee equal to 0.05% of the average daily net assets. Effective May 29, 2016, the Fund and the Manager entered into a Management Agreement that obligates the Manager to provide investment advisory, fund management, and administrative services to the Fund. As compensation for performing the duties under the Management Agreement, the Manager receives from the Fund an annualized fee at the following annual rates as a percentage of average daily net assets: 0.35% of the first $15 billion, 0.325% of the next $15 billion, and 0.30% over $30 billion. The Fund also pays the unaffiliated investment advisors hired to direct investment activities of the Fund an annualized investment advisory fee based on a percentage of the Fund’s average daily assets. Management fees paid by the Fund during the year ended October 31, 2016 were as follows:
| | | | | | |
Management Fee Rate | | Management Fee | | Amounts paid to Investment Advisors | | Amounts Paid to Manager |
| 0.62% | | $10,028,181 | | $5,688,099 | | $4,340,082 |
As compensation for services provided by the Manager in connection with securities lending activities conducted by the Fund, the lending Fund pays to the Manager, with respect to cash collateral posted by borrowers, a fee of 10% of the net monthly interest income (the gross income earned by the investment of cash collateral, less the amount paid to borrowers and related expenses) from such activities and, with respect to loan fees paid by borrowers, a fee of 10% of such loan fees. This fee is included in “Management and investment advisory fees” on the Statement of Operations. During the year ended October 31, 2016, securities lending fees paid to the Manager were $136,639.
Administration Agreement
From November 1, 2015 to May 29, 2016, the Manager and the Trust were parties to an Agreement which obligated the Manager to provide or oversee administrative services to the Fund. As compensation for performing the duties required under the Administration Agreement, the Manager received an annualized fee of 0.30% of the average daily net assets of the Institutional, Y, Investor, Advisor, A, and C Classes and 0.05% of the average daily net assets of the AMR Class of the Fund.
Distribution Plans
The Fund, except for the Advisor, A, and C Classes of the Fund, has adopted a “defensive” Distribution Plan (the “Plan”) in accordance with Rule 12b-1 under the Act, pursuant to which no separate fees may be charged to the Fund for distribution purposes. However, the Plan authorizes the management fees received by the Manager and the investment advisors hired by the Manager to be used for distribution purposes. Under this Plan, the Fund does not intend to compensate the Manager or any other party, either directly or indirectly, for the distribution of Fund shares.
Separate Distribution Plans (the “Distribution Plans”) have been adopted pursuant to Rule 12b-1 under the Act for the Advisor, A and C Classes of the Fund. Under the Distribution Plans, as compensation for distribution assistance, the Manager receives an annual fee of 0.25% of the average daily net assets of the Advisor and A Classes and 1.00% of the average daily net assets of the C Class. The fee will be payable without regard to whether the amount of the fee is more or less than the actual expenses incurred in a particular month by the Manager for distribution assistance.
Service Plans
The Manager and the Trust entered into Service Plans that obligate the Manager to oversee additional shareholder servicing of the Y, Investor, Advisor, A, and C Classes. As compensation for performing the duties required under the Service Plans, the Manager receives 0.10% of the average daily net assets of the Y Class, 0.15% of the average daily net assets of the A and C Classes, 0.25% of the average daily net assets of the Advisor Class, and up to 0.375% of the average daily net assets of the Investor Class of the Fund.
21
American Beacon International Equity FundSM
Notes to Financial Statements
October 31, 2016
Sub-Transfer Agent Fees
The Manager has entered into agreements, which include servicing agreements, with financial intermediaries that provide recordkeeping, processing, shareholder communications and other services to customers of the intermediaries that hold positions in the Institutional Class of the Fund and has agreed to compensate the intermediaries for providing these services. Intermediaries transact with the Fund primarily through the use of omnibus accounts on behalf of their customers who hold positions in the Fund. Certain services would have been provided by the Fund’s transfer agent and other service providers if the shareholders’ accounts were maintained directly by the Fund’s transfer agent. Accordingly, the Fund, pursuant to the Trust’s Board of Trustees (the “Board”) approval, has agreed to reimburse the Manager for all or a portion of the servicing fees paid to these intermediaries for the Institutional Class. The reimbursement amounts (sub-transfer agent fees) paid to the Manager are subject to a fee limit of up to 0.10% of an intermediaries average net assets in the Institutional Class on an annual basis.
For the year ended October 31, 2016, the sub-transfer agent fees, as reflected in “Transfer agent fees” in the Statement of Operations, were as follows:
| | | | |
Fund | | Sub-Transfer Agent Fees | |
International Equity Fund | | $ | 407,881 | |
As of October 31, 2016, the Fund owes the Manager the following reimbursement of sub-transfer agent fees, as reflected in “Transfer agent fees payable” in the Statement of Assets and Liabilities.
| | | | |
Fund | | Reimbursement of
Sub-Transfer Agent Fees | |
International Equity Fund | | $ | 42,128 | |
Investment in Affiliated Funds
The Fund may invest in the American Beacon U.S. Government Money Market Select Fund (the “USG Select Fund”). Cash collateral received by the Fund in connection with securities lending may also be invested in the USG Select Fund. The Fund and the USG Select Fund have the same investment advisor and therefore, are considered to be affiliated. The Manager serves as investment advisor to the USG Select Fund and receives management fees totaling 0.10% of the average daily net assets of the USG Select Fund. During the year ended October 31, 2016, the Manager earned fees totaling $91,781 from the Fund’s direct investment in the USG Select Fund and $39,271 from the Fund’s securities lending collateral invested in USG Select Fund.
Interfund Lending Program
Pursuant to an exemptive order by the Securities and Exchange Commission (“SEC”), the Fund, along with other registered investment companies having management contracts with the Manager, may participate in an interfund lending program as a borrower. This program provides an alternative credit facility allowing the Fund to borrow from other participating Funds. During the year ended October 31, 2016, the Fund did not utilize the credit facility.
Expense Reimbursement Plan
The Fund has adopted an Expense Reimbursement Plan whereby the Manager may seek repayment of fees waived or expenses reimbursed for a period of up to three years. However, reimbursement will occur only if the Class’ average net assets have grown or expenses have declined sufficiently to allow reimbursement without causing its expense ratio to exceed the previously agreed upon contractual expense limit. The carryover of excess expenses potentially reimbursable to the Manager, but not recorded as a liability are as follows:
22
American Beacon International Equity FundSM
Notes to Financial Statements
October 31, 2016
| | | | | | | | | | | | | | | | |
Fund | | Recovered
Expenses | | | Excess
Expenses
Carryover | | | Expired
Carryover
Expenses | | | Expiration of
Reimbursed
Expenses | |
International Equity Fund | | $ | — | | | $ | — | | | $ | 88,916 | | | | 2016 | |
International Equity Fund | | | — | | | | 151,730 | | | | — | | | | 2017 | |
International Equity Fund | | | — | | | | 105,014 | | | | — | | | | 2018 | |
Sales Commissions
The Fund’s distributor, Foreside Fund Services, LLC (“Foreside”), may receive a portion of A Class sales charges from broker dealers and it may be used to offset distribution related expenses. For the year ended October 31, 2016, Foreside collected $2,761 for the Fund from the sale of Class A Shares.
A CDSC of 0.50% will be deducted with respect to Class A Shares on certain purchases of $1,000,000 or more that are redeemed in whole or part within 18 months of purchase, unless waived as discussed in the Prospectus. Any applicable CDSC will be 0.50% of the lesser of the original purchase price or the value of the redemption of the Class A Shares redeemed. During the year ended October 31, 2016, there were no CDSC fees collected for Class A Shares.
A CDSC of 1.00% will be deducted with respect to Class C Shares redeemed within 12 months of purchase, unless waived as discussed in the Prospectus. Any applicable CDSC will be 1.00% of the lesser of the original purchase price or the value of the redemption of the Class C Shares redeemed. During the year ended October 31, 2016, $1,326 in CDSC fees was collected for Class C Shares of the Fund.
Trustee Fees and Expenses
Effective July 1, 2016, as compensation for their service to the Trust and the American Beacon Select Funds, each Trustee receives an annual retainer of $120,000, plus $5,000 for each Board of Trustee meeting attended in person or via teleconference, $2,500 for attendance by Committee members at meetings of the Audit Committee and the Investment Committee, and $1,500 for attendance by Committee members at meetings of the Nominating and Governance Committee, plus reimbursement of reasonable expenses incurred in attending Board meetings, Committee meetings, and relevant educational seminars. The Trustees also may be compensated for attendance at special Board and/or Committee meetings from time to time. The Board Chairman receives an additional annual retainer of $50,000 as well as a single $5,000 fee each quarter for his attendance at the committee meetings. The chairpersons of the Audit Committee and the Investment Committee each receive an additional annual retainer of $25,000 and the Chairman of the Nominating and Governance Committee receives an additional annual retainer of $10,000. These expenses are allocated on a prorated basis to each Fund of the Trust according to its respective net assets.
3. Security Valuation and Fair Value Measurements
Investments are valued at the close of the New York Stock Exchange (the “Exchange”), normally 4:00 p.m. Eastern Time, each day that the Exchange is open for business. Equity securities, including exchange-traded funds (“ETFs”) for which market quotations are available are valued at the last sale price or official closing price (closing bid price or last evaluated quote if no sale has occurred) on the primary market or exchange on which they trade.
Investments in open-end mutual funds are valued at the closing NAV per share of the mutual fund on the day of valuation.
Securities for which the market prices are not readily available or are not reflective of the fair value of the security, as determined by the Manager, will be priced at fair value following procedures approved by the Board.
Futures contracts are valued based upon their quoted daily settlement prices. Upon entering into a futures contract, the Fund is required to deposit with its futures broker, an amount of cash or U.S. Government and Agency
23
American Beacon International Equity FundSM
Notes to Financial Statements
October 31, 2016
Obligations in accordance with the initial margin requirements of the broker or exchange. Futures contracts are marked to market daily and an appropriate payable or receivable for the change in value (“variation margin”) is recorded by the Fund. Gains or losses are recognized, but not considered realized until the contracts expire or are closed. Futures contracts involve, to varying degrees, risk of loss in excess of the variation margin disclosed on the Statement of Assets and Liabilities.
For valuation purposes, the last quoted prices of non-U.S. equity securities may be adjusted under the circumstances described below. If the Manager determines that developments between the close of a foreign market and the close of the Exchange will, in its judgment, materially affect the value of some or all of the portfolio securities, the Manager will adjust the previous closing prices to reflect what it believes to be the fair value of the securities as of the close of the Exchange. In deciding whether it is necessary to adjust closing prices to reflect fair value, the Manager reviews a variety of factors, including developments in foreign markets, the performance of U.S. securities markets, and the performance of instruments trading in U.S. markets that represent foreign securities and baskets of foreign securities. In addition, the Fund may use fair value pricing for securities primarily traded in non-U.S. markets because most foreign markets close well before the Fund’s pricing time of 4:00 p.m. Eastern Time. The earlier close of these foreign markets gives rise to the possibility that significant events, including broad market moves, may have occurred in the interim and may materially affect the value of those securities. These securities are fair valued using a pricing service and are categorized as Level 2 in the fair value hierarchy. The pricing service, using methods approved by the Board, considers the correlation of the trading patterns of the foreign security to intraday trading in the U.S. markets, based on indices of domestic securities and other appropriate indicators such as prices of relevant ADRs and futures contracts. The Valuation Committee may also fair value securities in other situations, such as when a particular foreign market is closed but a Fund is open. The Fund uses outside pricing services to provide closing prices and information to evaluate and/or adjust those prices. As a means of evaluating its security valuation process, the Valuation Committee routinely compares closing prices, the next day’s opening prices in the same markets, and adjusted prices.
Other investments for which the above valuation procedures are inappropriate or are deemed not to reflect fair value are stated at fair value as determined in good faith by the Valuation Committee, established by the Fund’s Board.
Valuation Inputs
Various inputs may be used to determine the fair value of the Fund’s investments. These inputs are summarized in three broad levels for financial statement purposes. The inputs or methodologies used to value securities are not necessarily an indication of the risk associated with investing in those securities.
| | |
| Level 1 - | | Quoted prices in active markets for identical securities. |
| |
| Level 2 - | | Prices determined using other significant observable inputs. These may include quoted prices for similar securities, interest rates, prepayment speeds, credit risk, and others. Fixed-income securities are considered Level 2 as they are valued using observable inputs. |
| |
| Level 3 - | | Prices determined using other significant unobservable inputs. Unobservable inputs reflect the Fund’s own assumptions about the factors market participants would use in pricing an investment. |
Level 1 and Level 2 trading assets and trading liabilities, at fair value
Common stocks and financial derivative instruments, such as futures contracts that are traded on a national securities exchange, are stated at the last reported sale or settlement price on the day of valuation. To the extent these securities are actively traded and valuation adjustments are not applied, they are categorized as Level 1 of the fair value hierarchy. Preferred securities and other equities traded on inactive markets or valued by reference to similar instruments are generally categorized as Level 2 of the fair value hierarchy. Valuation adjustments may be applied to certain securities that are solely traded on a foreign exchange to account for the market movement
24
American Beacon International Equity FundSM
Notes to Financial Statements
October 31, 2016
between the close of the foreign market and the close of the Exchange. These securities are valued using pricing service providers that consider the correlation of the trading patterns of the foreign security to the intraday trading in the U.S. markets for investments. Securities using these valuation adjustments are categorized as Level 2 of the fair value hierarchy. Preferred securities and other equities traded on inactive markets or valued by reference to similar instruments are generally categorized as Level 2 of the fair value hierarchy.
Investments in registered open-end investment management companies will be valued based upon the NAVs of such investments and are categorized as Level 1 of the fair value hierarchy.
Over-the-counter (“OTC”) financial derivative instruments, such as foreign currency contracts, derive their value from underlying asset prices, indices, reference rates, and other inputs or a combination of these factors. These contracts are normally valued on the basis of broker dealer quotations or pricing service providers. Depending on the product and the terms of the transaction, the fair value of the financial derivative contracts can be estimated by a pricing service provider using a series of techniques, including simulation pricing models. The pricing models use inputs that are observed from actively quoted markets such as issuer details, indices, spreads, interest rates, curves, dividends, and exchange rates. Financial derivatives that use similar valuation techniques and inputs as described above are categorized as Level 2 of the fair value hierarchy.
The Fund’s investments are summarized by level based on the inputs used to determine their values. As of October 31, 2016, the investments were classified as described below:
| | | | | | | | | | | | | | | | |
International Equity Fund (1) | | Level 1 | | | Level 2 | | | Level 3 | | | Total | |
Foreign Common Stocks | | $ | 2,511,897,821 | | | $ | — | | | $ | — | | | $ | 2,511,897,821 | |
Foreign Preferred Stocks | | | 34,488,088 | | | | — | | | | — | | | | 34,488,088 | |
Short-Term Investments—Money Market Funds | | | 87,141,057 | | | | — | | | | — | | | | 87,141,057 | |
Securities Lending Collateral Invested in Money Market Funds | | | 1,711,611 | | | | — | | | | — | | | | 1,711,611 | |
| | | | | | | | | | | | | | | | |
Total Investments in Securities | | $ | 2,635,238,577 | | | $ | — | | | $ | — | | | $ | 2,635,238,577 | |
| | | | | | | | | | | | | | | | |
Financial Derivatives Instruments—Assets | | | | | | | | | | | | | | | | |
Futures Contracts | | $ | 2,334,391 | | | $ | — | | | $ | — | | | $ | 2,334,391 | |
Forward Currency Contracts | | | — | | | | 533,639 | | | | — | | | | 533,639 | |
| | | | | | | | | | | | | | | | |
Total Financial Derivative Instruments | | $ | 2,334,391 | | | $ | 533,639 | | | $ | — | | | $ | 2,868,030 | |
| | | | | | | | | | | | | | | | |
Financial Derivatives Instruments—Liabilities | | | | | | | | | | | | | | | | |
Futures Contracts | | $ | (111,130 | ) | | $ | — | | | $ | — | | | $ | (111,130 | ) |
Forward Currency Contracts | | | — | | | | (4,540,410 | ) | | | — | | | | (4,540,410 | ) |
| | | | | | | | | | | | | | | | |
Total Financial Derivative Instruments | | $ | (111,130 | ) | | $ | (4,540,410 | ) | | $ | — | | | $ | (4,651,540 | ) |
| | | | | | | | | | | | | | | | |
| * | Refer to the Schedule of Investments for country information. |
U.S. GAAP also requires all transfers between any levels to be disclosed. The end of period timing recognition has been adopted for the transfers between levels of the Fund’s assets and liabilities. During the year ended October 31, 2016, there were no transfers between levels.
4. Securities and Other Investments
American Depositary Receipts (“ADRs”)
ADRs are depositary receipts for foreign issuers in registered form traded in U.S. securities markets. Depositary receipts may not be denominated in the same currency as the securities into which they may be converted. Investing in depositary receipts entails substantially the same risks as direct investment in foreign securities. There is generally less publicly available information about foreign companies and there may be less governmental regulation and supervision of foreign stock exchanges, brokers and listed companies. In addition, such companies may use different accounting and financial standards (and certain currencies may become unavailable for transfer from a foreign currency), resulting in the Fund’s possible inability to convert immediately into U.S.
25
American Beacon International Equity FundSM
Notes to Financial Statements
October 31, 2016
currency proceeds realized upon the sale of portfolio securities of the affected foreign companies. In addition, the Fund may invest in unsponsored depositary receipts, the issuers of which are not obligated to disclose material information about the underlying securities to investors in the United States. Ownership of unsponsored depositary receipts may not entitle the Fund to the same benefits and rights as ownership of a sponsored depositary receipt or the underlying security.
Chess Depository Instruments (“CDIs”)
CDIs are financial products in which a unit of beneficial ownership is the underlying financial interests of the issuer. The financial interests of the issuer can be foreign equities, debt or other securities through one or more nominee companies, known as depository nominees. These underlying financial interests are quoted on the Australian Stock Exchange (“ASX”) market. With the exception of voting arrangements and some corporate actions of foreign issuers domiciled in certain jurisdictions, the CDI holder has the same rights as holders of financial interests of the issuer that are legally registered in the holder’s name. All of the economic benefits such as dividends, bonus issues, rights issues, interest payments, and maturity payments or similar corporate actions flow through to the CDI holder as if you were the legal owner of the corresponding financial product. The difference between holding CDIs and holding the foreign shares of the issuer is that the holder has beneficial ownership of the equivalent number of foreign shares of the issuer instead of legal title. Legal title to the foreign shares of the issuer is held by a nominee company on behalf of CDI holders.
Real Estate Investment Trusts
The Fund may own shares of real estate investment trusts (“REITs”) which report information on the source of their distributions annually. The Fund re-characterizes the distributions received from REIT investments based on information provided by the REITs into the following categories: ordinary income, long-term capital gains, and return of capital. If information is not available on a timely basis from the REITs, the re-characterization will be estimated based on available information which may include the previous year allocation. If new or additional information becomes available from the REITs at a later date, a re-characterization will be made the following year. These re-characterizations are not recorded for financial statement purposes, but as an adjustment to the calculation of taxable income.
Other Investment Company Securities and Other Exchange Traded Products
The Fund may invest in shares of other investment companies, including open-end fund, closed-end fund, business development companies, ETFs, unit investment trusts, and other investment companies of the Trust. The Fund may invest in investment company securities advised by the Manager or a sub-advisor. Investments in the securities of other investment companies may involve duplication of advisory fees and certain other expenses. By investing in another investment company, the Fund becomes a shareholder of that investment company. As a result, the Fund’s shareholders indirectly will bear the Fund’s proportionate share of the fees and expenses paid by shareholders of the other investment company, in addition to the fees and expenses the Fund shareholders directly bear in connection with the Fund’s own operations. These other fees and expenses are reflected as Acquired Fund Fees and Expenses and are included in the Fees and Expenses Table for the Fund in its Prospectus, if applicable. Investments in other investment companies may involve the payment of substantial premiums above the value of such issuer’s portfolio securities.
Master Agreements
The Fund is a party to International Swaps and Derivatives Association, Inc. Master Agreements (“ISDA Master Agreements”) with counterparties that govern transactions in over-the-counter derivative and foreign exchange contracts entered into by the Fund and those counterparties. The ISDA Master Agreements contain provisions for general obligations, representations, agreements, collateral and events of default or termination. Events of termination include conditions that may entitle counterparties to elect to terminate early and cause settlement of all outstanding transactions under the applicable ISDA Master Agreement. Any election to terminate early could
26
American Beacon International Equity FundSM
Notes to Financial Statements
October 31, 2016
be material to the financial statements. Since different types of forward and OTC financial derivative transactions have different mechanics and are sometimes traded out of different legal entities of a particular counterparty organization, each type of transaction may be covered by a different Master Agreement, resulting in the need for multiple agreements with a single counterparty. As the Master Agreements are specific to unique operations of different asset types, they allow a Fund to net its total exposure to a counterparty in the event of a default with respect to all the transactions governed under a single agreement with a counterparty.
5. Financial Derivative Instruments
The Fund may utilize derivative instruments to gain market exposure on cash balances or reduce market exposure in anticipation of liquidity needs. When considering the Fund’s use of derivatives, it is important to note that the Fund does not use derivatives for the purpose of creating financial leverage.
Forward Foreign Currency Contracts
The Fund may enter into forward foreign currency contracts to hedge the exchange rate risk on investment transactions or to hedge the value of the Fund’s securities denominated in foreign currencies. Forward foreign currency contracts are valued at the forward exchange rate prevailing on the day of valuation. The Fund bears the market risk that arises from changes in foreign exchange rates, and accordingly, the unrealized gain (loss) on these contracts is reflected in the accompanying financial statements. The Fund also bear the credit risk if the counterparty fails to perform under the contract.
For the year ended October 31, 2016, the Fund entered into forward foreign currency exchange contracts primarily for hedging foreign currency fluctuations.
The Fund’s forward foreign currency contract notional dollar values outstanding fluctuate throughout the operating year as required to meet strategic requirements. The following tables illustrate the average quarterly volume of foreign currency contracts. For the purpose of this disclosure, volume is measured by the amounts bought and sold in USD at each quarter end.
| | | | |
Average Forward Foreign Currency Notional Amount Outstanding—Purchased Contracts | |
Fund | | Year Ended
October 31, 2016 | |
International Equity | | $ | 180,679,362 | |
|
Average Forward Foreign Currency Notional Amount Outstanding—Sold Contracts | |
Fund | | Year Ended
October 31, 2016 | |
International Equity | | $ | 64,841,923 | |
Futures Contracts
Futures contracts are contracts to buy or sell a standard quantity of securities at a specified price on a future date. The Fund may enter into financial futures contracts as a method for keeping assets readily convertible to cash if needed to meet shareholder redemptions or for other needs while maintaining exposure to the stock or bond market, as applicable. The primary risks associated with the use of futures contracts are the possibility of illiquid markets or imperfect correlation between the values of the contracts and the underlying securities, or that the counterparty will fail to perform its obligations.
Upon entering into a futures contract, the Fund is required to set aside or deposit with a broker an amount, termed the initial margin, which typically represents a portion of the face value of the futures contract. The Fund usually reflects this amount on the Schedule of Investments as a U.S. Treasury Bill held as collateral for futures contracts or as Cash deposited with broker on the Statement of Assets and Liabilities. Payments to and from the broker, known as variation margin, are required to be made on a daily basis as the price of the futures contract fluctuates. Changes in initial settlement values are accounted for as unrealized appreciation (depreciation) until
27
American Beacon International Equity FundSM
Notes to Financial Statements
October 31, 2016
the contracts are terminated, at which time realized gains and losses are recognized. Futures contracts are valued at the most recent settlement price established each day by the exchange on which they are traded.
For the year ended October 31, 2016, the Fund entered into future contracts primarily for exposing cash to markets.
The Fund’s average futures contracts outstanding fluctuate throughout the operating year as required to meet strategic requirements. The following table illustrates the average quarterly volume of futures contracts. For purpose of this disclosure, volume is measured by contracts outstanding at each quarter end.
| | | | |
Number of Futures Contracts Outstanding | |
Fund | | Year ended
October 31, 2016 | |
International Equity | | | 1,513 | |
The following is a summary of the Fund’s derivative financial instruments categorized by risk exposure (1):
Fair Values of financial derivative instruments on the Statement of Assets and Liabilities not accounting for as hedging instruments as of October 31, 2016:
| | | | | | |
Assets | | Derivative | | Total | |
Unrealized appreciation of forward foreign currency contracts | | Foreign Exchange Contracts | | $ | 533,639 | |
Receivable for variation margin from open futures contracts (2) | | Equity Contracts | | | 2,334,391 | |
| | |
Liaibilities | | Derivative | | Total | |
Unrealized depreciation of forward foreign currency contracts | | Foreign Exchange Contracts | | $ | (4,540,410 | ) |
Payable for variation margin from open futures contracts(2) | | Equity Contracts | | | (111,130 | ) |
The effect of financial derivative instruments not accounted for as hedging instruments on the Statement of Operations for the year ended October 31, 2016:
| | | | | | |
| | |
Statement of Operations | | Derivative | | Total | |
Net realized gain (loss) from forward foreign currency contracts | | Foreign Exchange Contracts | | $ | 4,302,718 | |
Net realized gain (loss) from futures contracts | | Equity Contracts | | | 13,698,686 | |
| | |
Statement of Operations | | Derivative | | Total | |
Change in net unrealized appreciation (depreciation)of forward foreign currency contracts | | Foreign Exchange Contracts | | $ | (4,001,300 | ) |
Change in net unrealized appreciation (depreciation) of futures contracts | | Equity Contracts | | | (2,583,868 | ) |
| (1) | See Note 3 in the Notes to Financial Statements for additional information. |
| (2) | Includes cumulative appreciation (depreciation) of futures contracts as reported in the Schedule of Investments footnotes. Only current day’s variation margin is reported within the Statement of Assets and Liabilities. |
6. Principal Risks
In the normal course of business the Fund trades financial instruments and enters into financial transactions where risk of potential loss exists. Security values fluctuate (market risk) and may decline due to factors affecting securities markets in general, particular industries represented in the securities markets or conditions specifically related to a particular company. Failure of the other party to a transaction to perform (credit and counterparty risk), for example by not making principal and interest payments when due, reduces the value of the issuer’s debt and could reduce the Fund’s income. Similar to credit risk, the Fund may be exposed to counterparty risk, or the risk that an institution or other entity with which the Fund has unsettled or open transactions will fail to make required payments or otherwise comply with the terms of the instrument, transaction or contract. The potential loss could exceed the value of the financial assets recorded in the financial statements. Some of the Fund’s investments may be illiquid and the Fund may not be able to vary the portfolio investments in response to changes in economic and other conditions. If the Fund is required to liquidate all or a portion of its investments quickly, the Fund may realize significantly less than the value at which it previously recorded those investments.
28
American Beacon International Equity FundSM
Notes to Financial Statements
October 31, 2016
Market Risks
The Fund’s investments in financial derivatives and other financial instruments expose the Fund to various risks such as, but not limited to, interest rate, foreign currency and equity risks.
Interest rate risk is the risk that fixed-income securities will decline in value because of changes in interest rates. As nominal interest rates rise, the value of certain fixed income securities held by the Fund is likely to decrease. A nominal interest rate can be described as the sum of a real interest rate and an expected inflation rate. Fixed-income securities with longer durations tend to be more sensitive to changes in interest rates, usually making them more volatile than securities with shorter durations. Duration is useful primarily as a measure of the sensitivity of a fixed-income’s market price to interest rate (i.e. yield) movements.
If the Fund invests directly in foreign currencies or in securities that trade in, and receive revenues in, foreign currencies, or in financial derivatives that provide exposure to foreign currencies, they will be subject to the risk that those currencies will decline in value relative to the base currency of the Fund, or, in the case of hedging positions, that the Fund’s base currency will decline in value relative to the currency being hedged. Currency rates in foreign countries may fluctuate significantly over short periods of time for a number of reasons, including changes in interest rates, intervention (or the failure to intervene) by U.S. or foreign governments, central banks or supranational entities such as the International Monetary Fund, or by the imposition of currency controls or other political developments in the United States or abroad. As a result, the Fund’s investments in foreign currency denominated securities may reduce the returns of the Fund.
The fair values of equities, such as common stocks and preferred securities or equity related investments such as futures, may decline due to general market conditions which are not specifically related to a particular company, such as real or perceived adverse economic conditions, changes in the general outlook for corporate earnings, changes in interest or currency rates or adverse investor sentiment generally. They may also decline due to factors which affect a particular industry or industries, such as labor shortages or increased production costs and competitive conditions within an industry. Equity securities and equity related investments generally have greater market price volatility than fixed-income securities.
Credit and Counterparty Risk
A derivative contract may suffer a mark-to-market loss if the value of the contract decreases due to an unfavorable change in the market rates or values of the underlying instrument. Losses can also occur if the counterparty does not perform under the contract.
With exchange-traded futures, there is less counterparty credit risk to the Fund since the exchange or clearinghouse, as counterparty to such instruments, guarantees against a possible default. The clearinghouse stands between the buyer and the seller of the contract; therefore, the credit risk is limited to failure of the offset against a clearing broker or clearinghouse in the event of a default (including the bankruptcy or insolvency) of the clearing broker or clearinghouse. Additionally, credit risk exists in exchange traded futures with respect to initial and variation margin that is held in a clearing broker’s customer accounts. While clearing brokers are required to segregate customer margin from their own assets, in the event that a clearing broker becomes insolvent or goes into bankruptcy and at that time there is a shortfall in the aggregate amount of margin held by the clearing broker for all its clients, typically the shortfall would be allocated on a pro rata basis across all the clearing broker’s customers, potentially resulting in losses to the Fund.
Cash collateral that has been pledged to cover obligations of the Fund and cash collateral received from the counterparty, if any, is reported separately on the Statement of Assets and Liabilities as “Deposits with brokers for futures contracts” and “Payable to brokers for futures contracts”, respectively. Non-cash collateral pledged by the Fund, if any, is noted in the Schedule of Investments. Generally, the amount of collateral due from or to a party is determined at the close of business of the Fund and additional required collateral is delivered to/pledged
29
American Beacon International Equity FundSM
Notes to Financial Statements
October 31, 2016
by the Fund on the next business day. To the extent amounts due to the Fund from its counterparties are not fully collateralized, contractually or otherwise, the Fund bears the risk of loss from counterparty non-performance. The Fund attempts to mitigate counterparty risk by only entering into agreements with counterparties that it believes have the financial resources to honor their obligations and by monitoring the financial stability of those counterparties.
Offsetting Assets and Liabilities
The Fund is a party to enforceable master netting agreements between brokers and counterparties such as International Swaps and Derivatives Association (“ISDA”) agreements which provides for the right to offset under certain circumstances. The Fund employs multiple money managers and counterparties and has elected not to offset qualifying financial and derivative instruments on the Statement of Assets and Liabilities, as such all financial and derivative instruments are presented on a gross basis. The impacts of netting arrangements that provide the right to offset are detailed below. The net amount represents the net receivable or payable that would be due from or to the counterparty in the event of default. Exposure from borrowings and other financing agreements can only be netted across transactions governed by the same Master Agreement with the same legal entity. All amounts reported below represent the balance as of the report date, October 31, 2016:
Offsetting of Financial Assets and Derivative Assets as of October 31, 2016:
| | | | | | | | | | | | |
| | | | | | | | | Net Amounts of Assets | |
| | | | | | Gross Amounts Offset in | | | Presented in the | |
| | | Gross Amounts of | | | the Statement of Assets | | | Statement of Assets and | |
Description | | Recognized Assets | | | and Liabilities | | | Liabilities | |
Futures Contracts(1) | | $ | 2,334,391 | | | $ | — | | | $ | 2,334,391 | |
Forward Foreign Currency Contracts | | | 533,639 | | | | — | | | | 533,639 | |
Securities Lending | | | 1,626,366 | | | | — | | | | 1,626,366 | |
| | | | | | | | | | | | |
| | $ | 4,494,396 | | | $ | — | | | $ | 4,494,396 | |
| | | | | | | | | | | | |
Offsetting of Financial Liabilities and Derivative Liabilities as of October 31, 2016:
| | | | | | | | | | | | |
| | | | | | | | | Net Amounts of | |
| | | | | | | | | Liabilities | |
| | | | | | Gross Amounts Offset in | | | Presented in the | |
| | | Gross Amounts of | | | the Statement of Assets | | | Statement of Assets and | |
Description | | Recognized Liabilities | | | and Liabilities | | | Liabilities | |
Futures Contracts(1) | | $ | (111,130 | ) | | $ | — | | | $ | (111,130 | ) |
Forward Foreign Currency Contracts | | | (4,540,410 | ) | | | — | | | | (4,540,410 | ) |
| | | | | | | | | | | | |
| | $ | (4,651,540 | ) | | $ | — | | | $ | (4,651,540 | ) |
| | | | | | | | | | | | |
Financial Assets, Derivative Assets, and Collateral Pledged by Counterparty as of October 31, 2016:
| | | | | | | | | | | | | | | | |
| | | | | | Gross Amounts Not Offset in the
Statement of Assets and Liabilities | | | | |
| | | Net Amount of Assets | | | | | | | | | | |
| | | Presented in the Statement | | | Financial | | | Cash Collateral | | | | |
Counterparty | | of Assets and Liabilities | | | Instruments | | | Received(2) | | | Net Amount | |
BNP Paribas SA | | $ | (582,733 | ) | | $ | — | | | $ | — | | | $ | (582,733 | ) |
Bank of Montreal | | | (297,529 | ) | | | — | | | | — | | | | (297,529 | ) |
CitiBank, N.A | | | (1,676,590 | ) | | | — | | | | — | | | | (1,676,590 | ) |
Citigroup Global Markets Inc. | | | 104,364 | | | | — | | | | (104,364 | ) | | | — | |
Goldman Sachs Bank USA | | | (450,235 | ) | | | — | | | | — | | | | (450,235 | ) |
Goldman Sachs Bank USA(1) | | | 2,223,261 | | | | — | | | | — | | | | 2,223,261 | |
Goldman Sachs & Co | | | 1,413,711 | | | | — | | | | (1,413,711 | ) | | | — | |
HSBC Bank USA | | | 5,493 | | | | — | | | | — | | | | 5,493 | |
JPMorgan Chase Bank N.A. | | | 24,898 | | | | — | | | | — | | | | 24,898 | |
30
American Beacon International Equity FundSM
Notes to Financial Statements
October 31, 2016
| | | | | | | | | | | | | | | | |
| | | | | | Gross Amounts Not Offset in the
Statement of Assets and Liabilities | | | | |
| | | Net Amount of Assets | | | | | | | | | | |
| | | Presented in the Statement | | | Financial | | | Cash Collateral | | | | |
Counterparty | | of Assets and Liabilities | | | Instruments | | | Received(2) | | | Net Amount | |
Morgan Stanley & Co LLC | | | 108,291 | | | | — | | | | (108,291 | ) | | | — | |
Morgan Stanley Bank, N.A. | | | (12,868 | ) | | | — | | | | — | | | | (12,868 | ) |
Royal Bank of Canada | | | (38,675 | ) | | | — | | | | — | | | | (38,675 | ) |
Standard Chartered Bank | | | 67,967 | | | | — | | | | — | | | | 67,967 | |
Societe Generale | | | (1,045,387 | ) | | | — | | | | — | | | | (1,045,387 | ) |
Toronto Dominion Bank | | | (53,348 | ) | | | — | | | | — | | | | (53,348 | ) |
UBS AG | | | 18,228 | | | | — | | | | — | | | | 18,228 | |
Westpac Banking Corporation | | | 34,008 | | | | — | | | | — | | | | 34,008 | |
| | | | | | | | | | | | | | | | |
| | $ | (157,144 | ) | | $ | — | | | $ | (1,626,366 | ) | | $ | (1,783,510 | ) |
| | | | | | | | | | | | | | | | |
| (1) | The securities presented here within are not subject to Master Netting Agreements. As such, this is disclosed for informational purposes only. |
| (2) | Excess of collateral received from the individual counterparty is not shown for financial reporting purposes. Collateral with a value of $1,711,611 has been received in connection with securities lending transactions. |
7. Federal Income and Excise Taxes
It is the policy of the Fund to qualify as a regulated investment company (“RIC”), by complying with all applicable provisions of Subchapter M of the Internal Revenue Code, as amended, and to make distribution of taxable income sufficient to relieve it from substantially all federal income and excise taxes. For federal income tax purposes, the Fund is treated as a single entity for the purpose of determining such qualification.
The Fund does not have any unrecognized tax benefits in the accompanying financial statements. Each of the tax years in the four year period ended October 31, 2016 remain subject to examination by the Internal Revenue Service. If applicable, the Fund recognizes interest accrued related to unrecognized tax benefits in interest expense and penalties in “Other expenses” on the Statement of Operations.
The Fund may be subject to taxes imposed by countries in which it invests. Such taxes are generally based on returns of income earned or gains realized or repatriated. Taxes are accrued and applied to net investment income, net realized capital gains and net unrealized appreciation (depreciation), as applicable, as the income is earned or capital gains are recorded.
Dividends are categorized in accordance with income tax regulations which may treat certain transactions differently than U.S. GAAP. Accordingly, the character of distributions and composition of net assets for tax purposes may differ from those reflected in the accompanying financial statements.
The tax character of distributions paid are as follows:
| | | | | | | | |
Distributions paid from: Ordinary Income* | | Year Ended
October 31, 2016 | | | Year Ended
October 31, 2015 | |
Institutional ClassA | | $ | 16,689,014 | | | $ | 25,910,701 | |
Y Class | | | 8,453,455 | | | | 14,300,517 | |
Investor Class | | | 3,882,009 | | | | 8,329,125 | |
Advisor ClassB | | | 277,504 | | | | 182,971 | |
Retirement Class | | | — | | | | 23,149 | |
A Class | | | 124,807 | | | | 202,139 | |
C Class | | | 21,093 | | | | 55,584 | |
AMR Class | | | — | | | | 12,918,138 | |
31
American Beacon International Equity FundSM
Notes to Financial Statements
October 31, 2016
| | | | | | | | |
| Distributions paid from: | | Year Ended | | | Year Ended | |
| Long-term capital gain | | October 31, 2016 | | | October 31, 2015 | |
Institutional ClassA | | | 9,474,311 | | | | — | |
Y Class | | | 4,760,923 | | | | — | |
Investor Class | | | 2,927,922 | | | | — | |
Advisor ClassB | | | 209,225 | | | | — | |
Retirement Class | | | — | | | | — | |
A Class | | | 90,981 | | | | — | |
C Class | | | 32,820 | | | | — | |
AMR Class | | | — | | | | — | |
| | | | | | | | |
Total distributions paid | | $ | 46,944,064 | | | $ | 61,922,324 | |
| | | | | | | | |
| * | For tax purposes, short-term capital gains are considered ordinary income distributions. |
| A | Includes AMR Class Distributions (Note1). |
| B | Includes Retirement Class Distributions (Note1). |
As of October 31, 2016, the components of distributable earnings (deficits) on a tax basis were as follows:
| | | | |
Cost basis of investments for federal income tax purposes | | $ | 2,606,833,653 | |
Unrealized appreciation | | | 217,009,867 | |
Unrealized depreciation | | | (188,604,943 | ) |
| | | | |
Net unrealized appreciation (depreciation) | | | 28,404,924 | |
| | | | |
Undistributed ordinary income | | | 50,287,334 | |
Accumulated capital and other losses | | | (66,848,629 | ) |
Other temporary differences | | | 2,546,743 | |
| | | | |
Distributable earnings (deficits) | | $ | 14,390,372 | |
| | | | |
Financial reporting records are adjusted for permanent book/tax differences to reflect tax character. Financial records are not adjusted for temporary differences. The temporary differences between financial reporting and tax-basis reporting of unrealized appreciation (depreciation) are attributable primarily to the tax deferral of losses from wash sales, the realization for tax purposes of unrealized gain (losses) on certain derivative instruments, the realization for tax purposes of unrealized gain (losses) on investments in passive foreign investment companies, and Section 732 basis adjustments.
Due to inherent differences in the recognition of income, expenses and realized gains (losses) under U.S. GAAP and federal income tax regulations, permanent differences between book and tax reporting have been identified and appropriately reclassified on the Statement of Assets and Liabilities.
Accordingly, the following amounts represent current year permanent differences derived from foreign currency reclasses, gains (losses) from sales of investments in passive foreign investment companies and Section 732 basis adjustments as of October 31, 2016:
| | | | |
Paid-in-capital | | $ | 152,755 | |
Undistributed net investment income (loss) | | | 3,586,297 | |
Accumulated net realized gain (loss) | | | (3,739,052 | ) |
Unrealized appreciation (depreciation) of investments and futures contracts | | | — | |
Under the Regulated Investment Company Modernization Act of 2010 (the “RIC MOD”), net capital losses recognized by the Fund in taxable years beginning after December 22, 2010 are carried forward indefinitely and retain their character as short-term and/or long-term losses.
32
American Beacon International Equity FundSM
Notes to Financial Statements
October 31, 2016
As of October 31, 2016, the Fund had $21,948,151 short-term and $44,112,279 long-term post RIC MOD capital loss carryforwards.
8. Investment Transactions
The aggregate cost of purchases and proceeds from sales of investments, other than short-term obligations, for the year ended October 31, 2016 were as follows:
| | | | |
| | | International Equity | |
Purchases | | $ | 1,244,341,402 | |
Sales and Maturities | | | 556,079,683 | |
A summary of the Fund’s transactions in the USG Select Fund for the year ended October 31, 2016 are as follows:
| | | | | | | | | | | | | | | | | | | | |
| | | October 31, 2015 | | | | | | | | | October 31, 2016 | | | | |
Type of Transaction | | Shares/Fair Value | | | Purchases | | | Sales | | | Shares/Fair Value | | | Dividend Income | |
Direct | | $ | 10,000,000 | | | $ | 1,259,490,098 | | | $ | 1,182,349,041 | | | $ | 87,141,057 | | | $ | 254,429 | |
Securities Lending | | | 11,032,268 | | | | 805,353,120 | | | | 815,101,679 | | | | 1,283,709 | | | | N/A | |
9. Securities Lending
The Fund may lend its securities to qualified financial institutions, such as certain broker-dealers, to earn additional income. The borrowers are required to secure their loans continuously with collateral in an amount at least equal to the fair value of the securities loaned, initially in an amount at least equal to 102% of the fair value of domestic securities loaned and 105% of the fair value of international securities loaned. Collateral is monitored and marked-to-market daily. Daily mark-to-market amounts are required to be paid to the borrower or received from the borrower by the end of the following business day. This one day settlement for mark to market amounts may result in the collateral being temporarily less than the value of the securities on loan or temporarily more than the required minimum collateral.
To the extent that a loan is collateralized by cash, such cash collateral shall be invested by the securities lending agent (the “Agent”) in money market mutual funds and other short-term investments, provided the investments meet certain quality and diversification requirements. Securities purchased with cash collateral proceeds are listed in the Fund’s Schedule of Investments and the collateral is shown on the Statements of Assets and Liabilities as a payable.
Securities lending income is generated from the demand premium (if any) paid by the borrower to borrow a specific security and from the return on investment of cash collateral, reduced by negotiated rebate fees paid to the borrower and transaction costs. To the extent that a loan is secured by non-cash collateral, securities lending income is generated as a demand premium reduced by transaction costs. The Fund, the Agent, and the Manager retained 80%, 10% and 10%, respectively, of the income generated from securities lending.
While securities are on loan, the Fund continues to receive certain income associated with that security and any gain or loss in the market price that may occur during the term of the loan. In the case of domestic equities, the value of any dividend is received in the form of a substitute payment approximately equal to the dividend. In the case of foreign securities, a negotiated amount is received that is less than the actual dividend, but higher than the dividend amount minus the foreign tax that the Fund would be subject to on the dividend.
Securities lending transactions pose certain risks to the Fund, including that the borrower may not provide additional collateral when required or return the securities when due, that the value of the short-term investments will be less than the amount of cash collateral required to be returned to the borrower, that non-cash collateral
33
American Beacon International Equity FundSM
Notes to Financial Statements
October 31, 2016
may be subject to legal constraints in the event of a borrower bankruptcy, and that the cash collateral investments could become illiquid and unable to be used to return collateral to the borrower. The Fund could also experience delays and costs in gaining access to the collateral. The Fund bears the risk of any deficiency in the amount of the cash collateral available for return to the borrower and any action which impairs its ability to liquidate non-cash collateral to satisfy a borrower default.
As of October 31, 2016, the value of outstanding securities on loan and the value of collateral was as follows:
| | | | |
Fair Value of Securities on Loan | | Non-Cash Collateral | | Cash Collateral Posted by Borrower |
| $1,626,366 | | $— | | $1,711,611 |
Cash collateral is listed in the Fund’s Schedule of Investments and is shown on the Statement of Assets and Liabilities. Income earned on these investments is included in “Income derived from securities lending” on the Statement of Operations.
Non-cash collateral received by the Fund may not be sold or re-pledged except to satisfy a borrower default. Therefore, non-cash collateral is not included on the Fund’s Schedule of Investments or Statement of Assets and Liabilities.
10. Capital Share Transactions
The tables below summarize the activity in capital shares for each Class of the Fund:
| | | | | | | | | | | | | | | | |
| | | Institutional Class | |
| | | Year Ended October 31, | |
| | | 2016A | | | 2015 | |
International Equity Fund | | Shares | | | Amount | | | Shares | | | Amount | |
Shares sold | | | 39,315,483 | | | $ | 674,540,803 | | | | 14,554,114 | | | $ | 277,407,239 | |
Redemption Fees | | | — | | | | — | | | | — | | | | 4,774 | |
Reinvestment of dividends | | | 1,293,027 | | | | 22,763,428 | | | | 1,146,883 | | | | 21,400,844 | |
Shares redeemed | | | (17,470,092 | ) | | | (305,075,450 | ) | | | (9,538,836 | ) | | | (185,188,055 | ) |
| | | | | | | | | | | | | | | | |
Net increase in shares outstanding | | | 23,138,418 | | | $ | 392,228,781 | | | | 6,162,161 | | | $ | 113,624,802 | |
| | | | | | | | | | | | | | | | |
| |
| | | Y Class | |
| | | Year Ended October 31, | |
| | | 2016 | | | 2015 | |
International Equity Fund | | Shares | | | Amount | | | Shares | | | Amount | |
Shares sold | | | 27,158,767 | | | $ | 459,233,941 | | | | 7,834,210 | | | $ | 156,416,603 | |
Redemption Fees | | | — | | | | — | | | | — | | | | 2,682 | |
Reinvestment of dividends | | | 685,248 | | | | 12,498,922 | | | | 699,117 | | | | 13,513,939 | |
Shares redeemed | | | (12,558,440 | ) | | | (226,108,345 | ) | | | (4,577,514 | ) | | | (91,291,650 | ) |
| | | | | | | | | | | | | | | | |
Net increase in shares outstanding | | | 15,285,575 | | | $ | 245,624,518 | | | | 3,955,814 | | | $ | 78,641,574 | |
| | | | | | | | | | | | | | | | |
| |
| | | Investor Class | |
| | | Year Ended October 31, | |
| | | 2016 | | | 2015 | |
International Equity Fund | | Shares | | | Amount | | | Shares | | | Amount | |
Shares sold | | | 5,700,250 | | | $ | 96,710,198 | | | | 5,497,995 | | | $ | 103,983,625 | |
Redemption Fees | | | — | | | | — | | | | — | | | | 1,733 | |
Reinvestment of dividends | | | 388,556 | | | | 6,791,967 | | | | 447,841 | | | | 8,294,024 | |
Shares redeemed | | | (5,089,939 | ) | | | (87,258,245 | ) | | | (5,558,945 | ) | | | (105,616,253 | ) |
| | | | | | | | | | | | | | | | |
Net increase in shares outstanding | | | 998,867 | | | $ | 16,243,920 | | | | 386,892 | | | $ | 6,663,129 | |
| | | | | | | | | | | | | | | | |
34
American Beacon International Equity FundSM
Notes to Financial Statements
October 31, 2016
| | | | | | | | | | | | | | | | |
| | | Advisor Class | |
| | | Year Ended October 31, | |
| | | 2016B | | | 2015 | |
International Equity Fund | | Shares | | | Amount | | | Shares | | | Amount | |
Shares sold | | | 775,088 | | | $ | 13,279,031 | | | | 997,669 | | | $ | 19,927,464 | |
Redemption Fees | | | — | | | | — | | | | — | | | | 55 | |
Reinvestment of dividends | | | 27,102 | | | | 486,499 | | | | 9,635 | | | | 182,689 | |
Shares redeemed | | | (787,201 | ) | | | (13,645,734 | ) | | | (190,604 | ) | | | (3,717,444 | ) |
| | | | | | | | | | | | | | | | |
Net increase in shares outstanding | | | 14,989 | | | $ | 119,796 | | | | 816,701 | | | $ | 16,392,763 | |
| | | | | | | | | | | | | | | | |
| |
| | | Retirement Class | |
| | | Year Ended October 31, | |
| | | 2016 | | | 2015 | |
International Equity Fund | | Shares | | | Amount | | | Shares | | | Amount | |
Shares sold | | | — | | | $ | — | | | | 84,609 | | | $ | 1,756,598 | |
Redemption Fees | | | — | | | | — | | | | — | | | | 7 | |
Reinvestment of dividends | | | — | | | | — | | | | 1,162 | | | | 23,149 | |
Shares redeemed | | | — | | | | — | | | | (19,653 | ) | | | (404,425 | ) |
| | | | | | | | | | | | | | | | |
Net increase in shares outstanding | | | — | | | $ | — | | | | 66,118 | | | $ | 1,375,329 | |
| | | | | | | | | | | | | | | | |
| |
| | | A Class | |
| | | Year Ended October 31, | |
| | | 2016 | | | 2015 | |
International Equity Fund | | Shares | | | Amount | | | Shares | | | Amount | |
Shares sold | | | 798,761 | | | $ | 13,513,325 | | | | 347,418 | | | $ | 6,622,452 | |
Redemption Fees | | | — | | | | — | | | | — | | | | 43 | |
Reinvestment of dividends | | | 11,164 | | | | 195,041 | | | | 9,423 | | | | 174,604 | |
Shares redeemed | | | (303,956 | ) | | | (5,233,453 | ) | | | (220,828 | ) | | | (4,163,330 | ) |
| | | | | | | | | | | | | | | | |
Net increase in shares outstanding | | | 505,969 | | | $ | 8,474,913 | | | | 136,012 | | | $ | 2,633,769 | |
| | | | | | | | | | | | | | | | |
| |
| | | C Class | |
| | | Year Ended October 31, | |
| | | 2016 | | | 2015 | |
International Equity Fund | | Shares | | | Amount | | | Shares | | | Amount | |
Shares sold | | | 34,805 | | | $ | 580,660 | | | | 102,005 | | | $ | 1,903,152 | |
Redemption Fees | | | — | | | | — | | | | — | | | | 15 | |
Reinvestment of dividends | | | 2,988 | | | | 51,031 | | | | 2,111 | | | | 38,286 | |
Shares redeemed | | | (77,300 | ) | | | (1,271,059 | ) | | | (49,388 | ) | | | (912,923 | ) |
| | | | | | | | | | | | | | | | |
Net increase (decrease) in shares outstanding | | | (39,507 | ) | | $ | (639,368 | ) | | | 54,727 | | | $ | 1,028,530 | |
| | | | | | | | | | | | | | | | |
| |
| | | AMR Class | |
| | | Year Ended October 31, | |
| | | 2016 | | | 2015 | |
International Equity Fund | | Shares | | | Amount | | | Shares | | | Amount | |
Shares sold | | | — | | | $ | — | | | | 2,402,677 | | | $ | 46,029,399 | |
Redemption Fees | | | — | | | | — | | | | — | | | | 2,136 | |
Reinvestment of dividends | | | — | | | | — | | | | 691,920 | | | | 12,918,138 | |
Shares redeemed | | | — | | | | — | | | | (20,543,543 | ) | | | (388,315,509 | ) |
| | | | | | | | | | | | | | | | |
Net (decrease) in shares outstanding | | | — | | | $ | — | | | | (17,448,947 | ) | | $ | (329,365,836 | ) |
| | | | | | | | | | | | | | | | |
| A | Includes AMR Class transactions (Note 1). |
| B | Includes Retirement Class transactions (Note 1). |
11. Subsequent Events
Management has evaluated subsequent events for possible recognition or disclosure in the financial statements through the date the financial statements are issued. Management has determined that there are no material events that would require disclosure in the Fund’s financial statements through this date.
35
American Beacon International Equity FundSM
Financial Highlights
(For a share outstanding throughout the period)
| | | | | | | | | | | | | | | | | | | | |
| | | Institutional ClassD | |
| | | Year Ended | |
| | | October 31, | |
| | | 2016 | | | 2015 | | | 2014 | | | 2013 | | | 2012B | |
Net asset value, beginning of period | | $ | 18.79 | | | $ | 19.51 | | | $ | 20.07 | | | $ | 16.05 | | | $ | 15.27 | |
| | | | | | | | | | | | | | | | | | | | |
Income (loss) from investment operations: | | | | | | | | | | | | | | | | | | | | |
Net investment income | | | 0.29 | | | | 0.35 | | | | 0.54 | | | | 0.36 | | | | 0.41 | |
Net gains (losses) from investments (both realized and unrealized) | | | (1.24 | ) | | | (0.55 | ) | | | (0.77 | ) | | | 4.07 | | | | 0.92 | |
| | | | | | | | | | | | | | | | | | | | |
Total income (loss) from investment operations | | | (0.95 | ) | | | (0.20 | ) | | | (0.23 | ) | | | 4.43 | | | | 1.33 | |
| | | | | | | | | | | | | | | | | | | | |
Less distributions: | | | | | | | | | | | | | | | | | | | | |
Dividends from net investment income | | | (0.27 | ) | | | (0.52 | ) | | | (0.33 | ) | | | (0.41 | ) | | | (0.55 | ) |
Distributions from net realized gains | | | (0.16 | ) | | | — | | | | — | | | | — | | | | — | |
| | | | | | | | | | | | | | | | | | | | |
Total distributions | | | (0.43 | ) | | | (0.52 | ) | | | (0.33 | ) | | | (0.41 | ) | | | (0.55 | ) |
| | | | | | | | | | | | | | | | | | | | |
Redemption fees added to beneficial interest | | | — | | | | — | C | | | — | C | | | — | C | | | — | C |
| | | | | | | | | | | | | | | | | | | | |
Net asset value, end of period | | $ | 17.41 | | | $ | 18.79 | | | $ | 19.51 | | | $ | 20.07 | | | $ | 16.05 | |
| | | | | | | | | | | | | | | | | | | | |
Total return A | | | (5.07 | )% | | | (0.99 | )% | | | (1.18 | )% | | | 28.14 | % | | | 9.25 | % |
| | | | | | | | | | | | | | | | | | | | |
Ratios and supplemental data: | | | | | | | | | | | | | | | | | | | | |
Net assets, end of period | | $ | 1,450,052,040 | | | $ | 1,037,148,821 | | | $ | 956,960,452 | | | $ | 870,729,423 | | | $ | 608,256,240 | |
Ratios to average net assets: | | | | | | | | | | | | | | | | | | | | |
Expenses, before reimbursements | | | 0.69 | % | | | 0.70 | % | | | 0.72 | % | | | 0.72 | % | | | 0.72 | % |
Expenses, net of reimbursements | | | 0.69 | % | | | 0.69 | % | | | 0.70 | % | | | 0.71 | % | | | 0.72 | % |
Net investment income (loss), before reimbursements | | | 2.22 | % | | | 1.93 | % | | | 2.74 | % | | | 2.16 | % | | | 2.85 | % |
Net investment income, net of reimbursements | | | 2.22 | % | | | 1.94 | % | | | 2.76 | % | | | 2.17 | % | | | 2.85 | % |
Portfolio turnover rate | | | 25 | % | | | 33 | % | | | 23 | % | | | 27 | % | | | 60 | % |
| |
| | | Y Class | |
| | | Year Ended | |
| | | October 31, | |
| | | 2016 | | | 2015 | | | 2014 | | | 2013 | | | 2012 B | |
Net asset value, beginning of period | | $ | 19.46 | | | $ | 20.21 | | | $ | 20.81 | | | $ | 16.65 | | | $ | 15.82 | |
| | | | | | | | | | | | | | | | | | | | |
Income (loss) from investment operations: | | | | | | | | | | | | | | | | | | | | |
Net investment income | | | 0.41 | | | | 0.35 | | | | 0.50 | | | | 0.62 | | | | 0.41 | |
Net gains (losses) from investments (both realized and unrealized) | | | (1.40 | ) | | | (0.57 | ) | | | (0.77 | ) | | | 3.97 | | | | 0.95 | |
| | | | | | | | | | | | | | | | | | | | |
Total income (loss) from investment operations | | | (0.99 | ) | | | (0.22 | ) | | | (0.27 | ) | | | 4.59 | | | | 1.36 | |
| | | | | | | | | | | | | | | | | | | | |
Less distributions: | | | | | | | | | | | | | | | | | | | | |
Dividends from net investment income | | | (0.28 | ) | | | (0.53 | ) | | | (0.33 | ) | | | (0.43 | ) | | | (0.53 | ) |
Distributions from net realized gains | | | (0.16 | ) | | | — | | | | — | | | | — | | | | — | |
| | | | | | | | | | | | | | | | | | | | |
Total distributions | | | (0.44 | ) | | | (0.53 | ) | | | (0.33 | ) | | | (0.43 | ) | | | (0.53 | ) |
| | | | | | | | | | | | | | | | | | | | |
Redemption fees added to beneficial interest | | | — | | | | — | C | | | — | C | | | — | C | | | — | C |
| | | | | | | | | | | | | | | | | | | | |
Net asset value, end of period | | $ | 18.03 | | | $ | 19.46 | | | $ | 20.21 | | | $ | 20.81 | | | $ | 16.65 | |
| | | | | | | | | | | | | | | | | | | | |
Total return A | | | (5.14 | )% | | | (1.06 | )% | | | (1.31 | )% | | | 28.04 | % | | | 9.15 | % |
| | | | | | | | | | | | | | | | | | | | |
Ratios and supplemental data: | | | | | | | | | | | | | | | | | | | | |
Net assets, end of period | | $ | 820,596,038 | | | $ | 587,949,806 | | | $ | 530,836,707 | | | $ | 441,945,876 | | | $ | 1,511,614 | |
Ratios to average net assets: | | | | | | | | | | | | | | | | | | | | |
Expenses, before reimbursements | | | 0.77 | % | | | 0.77 | % | | | 0.82 | % | | | 0.85 | % | | | 0.80 | % |
Expenses, net of reimbursements | | | 0.77 | % | | | 0.77 | % | | | 0.82 | % | | | 0.85 | % | | | 0.80 | % |
Net investment income (loss), before reimbursements | | | 2.43 | % | | | 1.87 | % | | | 2.62 | % | | | 2.55 | % | | | 2.74 | % |
Net investment income, net of reimbursements | | | 2.43 | % | | | 1.87 | % | | | 2.62 | % | | | 2.55 | % | | | 2.74 | % |
Portfolio turnover rate | | | 25 | % | | | 33 | % | | | 23 | % | | | 27 | % | | | 60 | % |
| A | Based on net asset value, which does not reflect the sales charge, redemption fee, or contingent deferred sales charge, if applicable. May include adjustments in accordance with U.S. GAAP and as such, the net asset value for reporting purposes and the returns based upon those net asset values may differ from the net asset value and returns for shareholder transactions. |
| B | The Boston Company Asset Management, LLC was terminated as an investment advisor to the International Equity Fund on December 31, 2011. |
| C | Amount represents less than $0.01 per share. |
| D | On May 31, 2016, the AMR Class closed and the assets were merged into the Institutional Class. |
36
American Beacon International Equity FundSM
Financial Highlights
(For a share outstanding throughout the period)
| | | | | | | | | | | | | | | | | | | | |
| | | Investor Class | |
| | | Year Ended | |
| | | October 31, | |
| | | 2016 | | | 2015 | | | 2014 | | | 2013 | | | 2012 B | |
Net asset value, beginning of period | | $ | 18.60 | | | $ | 19.32 | | | $ | 19.86 | | | $ | 15.88 | | | $ | 15.11 | |
| | | | | | | | | | | | | | | | | | | | |
Income (loss) from investment operations: | | | | | | | | | | | | | | | | | | | | |
Net investment income | | | 0.34 | | | | 0.31 | | | | 0.46 | | | | 0.25 | | | | 0.38 | |
Net gains (losses) from investments (both realized and unrealized) | | | (1.33 | ) | | | (0.57 | ) | | | (0.76 | ) | | | 4.09 | | | | 0.87 | |
| | | | | | | | | | | | | | | | | | | | |
Total income (loss) from investment operations | | | (0.99 | ) | | | (0.26 | ) | | | (0.30 | ) | | | 4.34 | | | | 1.25 | |
| | | | | | | | | | | | | | | | | | | | |
Less distributions: | | | | | | | | | | | | | | | | | | | | |
Dividends from net investment income | | | (0.21 | ) | | | (0.46 | ) | | | (0.24 | ) | | | (0.36 | ) | | | (0.48 | ) |
Distributions from net realized gains | | | (0.16 | ) | | | — | | | | — | | | | — | | | | — | |
| | | | | | | | | | | | | | | | | | | | |
Total distributions | | | (0.37 | ) | | | (0.46 | ) | | | (0.24 | ) | | | (0.36 | ) | | | (0.48 | ) |
| | | | | | | | | | | | | | | | | | | | |
Redemption fees added to beneficial interest | | | — | | | | — | C | | | — | C | | | — | C | | | — | C |
| | | | | | | | | | | | | | | | | | | | |
Net asset value, end of period | | $ | 17.24 | | | $ | 18.60 | | | $ | 19.32 | | | $ | 19.86 | | | $ | 15.88 | |
| | | | | | | | | | | | | | | | | | | | |
Total return A | | | (5.38 | )% | | | (1.35 | )% | | | (1.54 | )% | | | 27.81 | % | | | 8.77 | % |
| | | | | | | | | | | | | | | | | | | | |
Ratios and supplemental data: | | | | | | | | | | | | | | | | | | | | |
Net assets, end of period | | $ | 334,895,337 | | | $ | 342,720,411 | | | $ | 348,541,811 | | | $ | 337,424,064 | | | $ | 453,141,427 | |
Ratios to average net assets: | | | | | | | | | | | | | | | | | | | | |
Expenses, before reimbursements | | | 1.06 | % | | | 1.03 | % | | | 1.05 | % | | | 1.04 | % | | | 1.09 | % |
Expenses, net of reimbursements | | | 1.06 | % | | | 1.03 | % | | | 1.05 | % | | | 1.04 | % | | | 1.09 | % |
Net investment income (loss), before reimbursements | | | 1.95 | % | | | 1.60 | % | | | 2.36 | % | | | 1.67 | % | | | 2.50 | % |
Net investment income, net of reimbursements | | | 1.95 | % | | | 1.60 | % | | | 2.36 | % | | | 1.67 | % | | | 2.50 | % |
Portfolio turnover rate | | | 25 | % | | | 33 | % | | | 23 | % | | | 27 | % | | | 60 | % |
| |
| | | Advisor ClassD | |
| | | Year Ended | |
| | | October 31, | |
| | | 2016 | | | 2015 | | | 2014 | | | 2013 | | | 2012 B | |
Net asset value, beginning of period | | $ | 19.01 | | | $ | 19.76 | | | $ | 20.36 | | | $ | 16.36 | | | $ | 15.52 | |
| | | | | | | | | | | | | | | | | | | | |
Income (loss) from investment operations: | | | | | | | | | | | | | | | | | | | | |
Net investment income (loss) | | | 0.35 | | | | 0.38 | | | | 0.44 | | | | (0.41 | ) | | | 0.09 | |
Net gains (losses) from investments (both realized and unrealized) | | | (1.37 | ) | | | (0.68 | ) | | | (0.77 | ) | | | 4.83 | | | | 1.18 | |
| | | | | | | | | | | | | | | | | | | | |
Total income (loss) from investment operations | | | (1.02 | ) | | | (0.30 | ) | | | (0.33 | ) | | | 4.42 | | | | 1.27 | |
| | | | | | | | | | | | | | | | | | | | |
Less distributions: | | | | | | | | | | | | | | | | | | | | |
Dividends from net investment income | | | (0.21 | ) | | | (0.45 | ) | | | (0.27 | ) | | | (0.42 | ) | | | (0.43 | ) |
Distributions from net realized gains | | | (0.16 | ) | | | — | | | | — | | | | — | | | | — | |
| | | | | | | | | | | | | | | | | | | | |
Total distributions | | | (0.37 | ) | | | (0.45 | ) | | | (0.27 | ) | | | (0.42 | ) | | | (0.43 | ) |
| | | | | | | | | | | | | | | | | | | | |
Redemption fees added to beneficial interest | | | — | | | | — | C | | | — | C | | | — | C | | | — | C |
| | | | | | | | | | | | | | | | | | | | |
Net asset value, end of period | | $ | 17.62 | | | $ | 19.01 | | | $ | 19.76 | | | $ | 20.36 | | | $ | 16.36 | |
| | | | | | | | | | | | | | | | | | | | |
Total return A | | | (5.40 | )% | | | (1.51 | )% | | | (1.64 | )% | | | 27.51 | % | | | 8.59 | % |
| | | | | | | | | | | | | | | | | | | | |
Ratios and supplemental data: | | | | | | | | | | | | | | | | | | | | |
Net assets, end of period | | $ | 23,692,313 | | | $ | 22,912,069 | | | $ | 7,677,201 | | | $ | 5,231,812 | | | $ | 1,396,948 | |
Ratios to average net assets: | | | | | | | | | | | | | | | | | | | | |
Expenses, before reimbursements | | | 1.19 | % | | | 1.16 | % | | | 1.19 | % | | | 1.20 | % | | | 1.31 | % |
Expenses, net of reimbursements | | | 1.19 | % | | | 1.16 | % | | | 1.19 | % | | | 1.20 | % | | | 1.31 | % |
Net investment income (loss), before reimbursements | | | 1.87 | % | | | 1.55 | % | | | 2.21 | % | | | 1.39 | % | | | 2.18 | % |
Net investment income, net of reimbursements | | | 1.87 | % | | | 1.55 | % | | | 2.21 | % | | | 1.39 | % | | | 2.18 | % |
Portfolio turnover rate | | | 25 | % | | | 33 | % | | | 23 | % | | | 27 | % | | | 60 | % |
| A | Based on net asset value, which does not reflect the sales charge, redemption fee, or contingent deferred sales charge, if applicable. May include adjustments in accordance with U.S. GAAP and as such, the net asset value for reporting purposes and the returns based upon those net asset values may differ from the net asset value and returns for shareholder transactions. |
| B | The Boston Company Asset Management, LLC was terminated as an investment advisor to the International Equity Fund on December 31, 2011. |
| C | Amount represents less than $0.01 per share. |
| D | On January 15, 2016, the Retirement Class closed and the assets were merged into the Advisor Class. |
37
American Beacon International Equity FundSM
Financial Highlights
(For a share outstanding throughout the period)
| | | | | | | | | | | | | | | | | | | | |
| | | A Class | |
| | | Year Ended | |
| | | October 31, | |
| | | 2016 | | | 2015 | | | 2014 | | | 2013 | | | 2012 B | |
Net asset value, beginning of period | | $ | 18.59 | | | $ | 19.32 | | | $ | 19.92 | | | $ | 16.02 | | | $ | 15.33 | |
| | | | | | | | | | | | | | | | | | | | |
Income (loss) from investment operations: | | | | | | | | | | | | | | | | | | | | |
Net investment income | | | 0.32 | | | | 0.31 | | | | 0.46 | | | | 0.43 | | | | 0.48 | |
Net gains (losses) from investments (both realized and unrealized) | | | (1.30 | ) | | | (0.59 | ) | | | (0.78 | ) | | | 3.89 | | | | 0.76 | |
| | | | | | | | | | | | | | | | | | | | |
Total income (loss) from investment operations | | | (0.98 | ) | | | (0.28 | ) | | | (0.32 | ) | | | 4.32 | | | | 1.24 | |
| | | | | | | | | | | | | | | | | | | | |
Less distributions: | | | | | | | | | | | | | | | | | | | | |
Dividends from net investment income | | | (0.22 | ) | | | (0.45 | ) | | | (0.28 | ) | | | (0.42 | ) | | | (0.55 | ) |
Distributions from net realized gains | | | (0.16 | ) | | | — | | | | — | | | | — | | | | — | |
| | | | | | | | | | | | | | | | | | | | |
Total distributions | | | (0.38 | ) | | | (0.45 | ) | | | (0.28 | ) | | | (0.42 | ) | | | (0.55 | ) |
| | | | | | | | | | | | | | | | | | | | |
Redemption fees added to beneficial interest | | | — | | | | — | C | | | — | C | | | — | C | | | — | C |
| | | | | | | | | | | | | | | | | | | | |
Net asset value, end of period | | $ | 17.23 | | | $ | 18.59 | | | $ | 19.32 | | | $ | 19.92 | | | $ | 16.02 | |
| | | | | | | | | | | | | | | | | | | | |
Total return A | | | (5.34 | )% | | | (1.42 | )% | | | (1.65 | )% | | | 27.51 | % | | | 8.62 | % |
| | | | | | | | | | | | | | | | | | | | |
Ratios and supplemental data: | | | | | | | | | | | | | | | | | | | | |
Net assets, end of period | | $ | 18,673,142 | | | $ | 10,747,749 | | | $ | 8,540,234 | | | $ | 4,113,299 | | | $ | 1,255,390 | |
Ratios to average net assets: | | | | | | | | | | | | | | | | | | | | |
Expenses, before reimbursements | | | 1.07 | % | | | 1.08 | % | | | 1.15 | % | | | 1.21 | % | | | 1.29 | % |
Expenses, net of reimbursements | | | 1.07 | % | | | 1.08 | % | | | 1.15 | % | | | 1.25 | % | | | 1.26 | % |
Net investment income (loss), before reimbursements | | | 1.94 | % | | | 1.55 | % | | | 2.31 | % | | | 1.73 | % | | | 2.03 | % |
Net investment income, net of reimbursements | | | 1.94 | % | | | 1.55 | % | | | 2.31 | % | | | 1.69 | % | | | 2.07 | % |
Portfolio turnover rate | | | 25 | % | | | 33 | % | | | 23 | % | | | 27 | % | | | 60 | % |
| |
| | | C Class | |
| | | Year Ended | |
| | | October 31, | |
| | | 2016 | | | 2015 | | | 2014 | | | 2013 | | | 2012 B | |
Net asset value, beginning of period | | $ | 18.09 | | | $ | 18.83 | | | $ | 19.47 | | | $ | 15.70 | | | $ | 15.21 | |
| | | | | | | | | | | | | | | | | | | | |
Income (loss) from investment operations: | | | | | | | | | | | | | | | | | | | | |
Net investment income | | | 0.18 | | | | 0.16 | | | | 0.30 | | | | 0.52 | | | | 0.40 | |
Net gains (losses) from investments (both realized and unrealized) | | | (1.28 | ) | | | (0.56 | ) | | | (0.75 | ) | | | 3.59 | | | | 0.71 | |
| | | | | | | | | | | | | | | | | | | | |
Total income (loss) from investment operations | | | (1.10 | ) | | | (0.40 | ) | | | (0.45 | ) | | | 4.11 | | | | 1.11 | |
| | | | | | | | | | | | | | | | | | | | |
Less distributions: | | | | | | | | | | | | | | | | | | | | |
Dividends from net investment income | | | (0.10 | ) | | | (0.34 | ) | | | (0.19 | ) | | | (0.34 | ) | | | (0.62 | ) |
Distributions from net realized gains | | | (0.16 | ) | | | — | | | | — | | | | — | | | | — | |
| | | | | | | | | | | | | | | | | | | | |
Total distributions | | | (0.26 | ) | | | (0.34 | ) | | | (0.19 | ) | | | (0.34 | ) | | | (0.62 | ) |
| | | | | | | | | | | | | | | | | | | | |
Redemption fees added to beneficial interest | | | — | | | | — | C | | | — | C | | | — | C | | | — | C |
| | | | | | | | | | | | | | | | | | | | |
Net asset value, end of period | | $ | 16.73 | | | $ | 18.09 | | | $ | 18.83 | | | $ | 19.47 | | | $ | 15.70 | |
| | | | | | | | | | | | | | | | | | | | |
Total return A | | | (6.12 | )% | | | (2.12 | )% | | | (2.36 | )% | | | 26.56 | % | | | 7.89 | % |
| | | | | | | | | | | | | | | | | | | | |
Ratios and supplemental data: | | | | | | | | | | | | | | | | | | | | |
Net assets, end of period | | $ | 2,945,246 | | | $ | 3,899,081 | | | $ | 3,028,934 | | | $ | 1,219,537 | | | $ | 114,972 | |
Ratios to average net assets: | | | | | | | | | | | | | | | | | | | | |
Expenses, before reimbursements | | | 1.85 | % | | | 1.82 | % | | | 1.90 | % | | | 1.95 | % | | | 2.12 | % |
Expenses, net of reimbursements | | | 1.85 | % | | | 1.83 | % | | | 1.90 | % | | | 1.99 | % | | | 1.98 | % |
Net investment income (loss), before reimbursements | | | 1.12 | % | | | 0.77 | % | | | 1.53 | % | | | 1.13 | % | | | 1.56 | % |
Net investment income, net of reimbursements | | | 1.12 | % | | | 0.77 | % | | | 1.53 | % | | | 1.09 | % | | | 1.70 | % |
Portfolio turnover rate | | | 25 | % | | | 33 | % | | | 23 | % | | | 27 | % | | | 60 | % |
| A | Based on net asset value, which does not reflect the sales charge, redemption fee, or contingent deferred sales charge, if applicable. May include adjustments in accordance with U.S. GAAP and as such, the net asset value for reporting purposes and the returns based upon those net asset values may differ from the net asset value and returns for shareholder transactions. |
| B | The Boston Company Asset Management, LLC was terminated as an investment advisor to the International Equity Fund on December 31, 2011. |
| C | Amount represents less than $0.01 per share. |
38
American Beacon International Equity FundSM
Federal Tax Information
October 31, 2016 (Unaudited)
Certain tax information regarding the Fund is required to be provided to shareholders based upon the Fund’s income and distribution for the taxable year ended October 31, 2016. The information and distributions reported herein may differ from information and distributions taxable to the shareholders for the calendar year ended December 31, 2016.
The Fund designated the following items with regard to distributions paid during the year ended October 31, 2016. All designations are based on financial information available as of this annual report and, accordingly, are subject to change. For each item, it is the intention of the Fund to designate the maximum amount permitted under the Internal Revenue Code of 1986, as amended, and the regulations there under.
| | | | |
Corporate Dividends Received Deduction | | | 0.00 | % |
Qualified Dividend Income | | | 100.00 | % |
The Fund designated a foreign tax credit of $6,319,497 based on foreign sourced income of $72,093,079.
The Fund designated $17,496,182 as long-term capital gains distribution for the year ended October 31, 2016.
Shareholders will receive notification in January 2017 of the applicable tax information necessary to prepare their 2016 income tax returns.
39
Disclosure Regarding Approval of the Management and Investment Advisory Agreements (Unaudited)
Renewal and Approval of the Management Agreement and Investment Advisory Agreements of the Fund in June 2016
At in-person meetings held on May 17, 2016 and June 8, 2016 (collectively, the “Meetings”), the Board considered and then, at its June 8th meeting, approved the renewal of: (1) the Management Agreement between American Beacon Advisors, Inc. (“Manager”) and the American Beacon Funds (the “Trust”) on behalf of the American Beacon International Equity Fund (“Fund”); and (2) the investment advisory agreements (the “Investment Advisory Agreements”) among the Manager, the Trust, on behalf of the Fund, and Causeway Capital Management LLC (“Causeway”), Templeton Investment Counsel, LLC (“Templeton”) and Lazard Asset Management LLC (“Lazard”), (collectively, the “subadvisors”). The Management Agreement and the Investment Advisory Agreements are collectively referred to herein as the “Agreements.” In preparation for the Board to consider the renewal of these Agreements, the Board undertook steps to gather and consider information furnished by the Manager, the subadvisors, Broadridge, Inc. (“Broadridge”) and Morningstar, Inc. (“Morningstar”). The Board, with the assistance of independent legal counsel, requested and received certain relevant information from the Manager and each subadvisor.
In advance of the Meetings, the Board’s Investment Committee and/or the Manager coordinated the production of information from Broadridge and Morningstar regarding the performance, fees and expenses of the Fund as well as information from the Manager and the subadvisors. At the Meetings, the Board considered the information provided. The Board noted that as a result of the acquisition of Lipper, Inc. (“Lipper”) by Broadridge, Lipper expense and performance information was provided by Broadridge. Further, the Board took into consideration information furnished for the Board’s review and consideration throughout the year at regular meetings of the Board and its committees, as well as information specifically prepared in connection with the renewal process.
In connection with the Board’s consideration of the Agreements, the Trustees received and evaluated such information as they deemed necessary. The information requested on behalf of the Board included, among other information, the following materials. References herein to the “firm” refer to the Manager and/or the subadvisors.
| | • | | comparisons of the performance of an appropriate share class of the Fund to comparable investment companies and appropriate benchmark indices, including peer group averages and performance analyses provided by Broadridge and Morningstar, and to the performance of any similar accounts managed by the firm; |
| | • | | comparisons of the Fund’s management and subadvisory fee rates and expense ratio with the management fee rates paid by comparable mutual funds, including peer group averages and fee and expense analyses provided by Broadridge and Morningstar, and the advisory fee rates charged to other clients for which similar services are provided; |
| | • | | a description of any applicable fee waivers and/or expense reimbursements in place for the Fund during the past year, and any proposed changes to the expense caps; |
| | • | | the Manager’s profitability with respect to the services that it provided to the Fund; |
| | • | | any actual or anticipated economies of scale in relation to the services the firm provides or will provide to the Fund and whether the current fee rates charged or to be charged to the Fund reflect these economies of scale for the benefit of the Fund’s investors; |
| | • | | an evaluation of any other benefits to the firm or Fund as a result of their relationship, if any; |
| | • | | information regarding the securities lending, cash management, administrative and accounting-related services that the Manager provides to the Fund, as applicable, and the fees that the Manager receives for such services; and |
| | • | | information regarding a firm’s financial condition, the personnel of the Manager who are assigned primary responsibility for managing the Fund, staffing levels, portfolio managers’ compensation, disaster recovery plans, insurance coverage, material pending litigation, code of ethics, compliance matters, trading activities, and actual or potential conflicts of interest that the firm experiences, or anticipates that it will experience, in providing services to the Fund. |
40
Disclosure Regarding Approval of the Management and Investment Advisory Agreements (Unaudited)
The Board noted that the Manager provides management and administrative services to the Fund pursuant to the Management Agreement. The Board considered that prior to May 29, 2016, the Manager provided management and administrative services to the Fund pursuant to separate agreements. The Board noted, in this regard, that many mutual funds have separate contracts governing both types of services, and observed that the actual management fee rates provided by Broadridge for peer group funds reflect the combined advisory and administrative expenses, both gross and net of any waivers and/or reimbursements.
Certain firms may not have been able to, or opted not to, provide information in response to certain information requests, in which case the Board conducted its evaluation of the firm based on information that was provided. In such cases, the Board determined that the omission of any such information was not material to its considerations. The class of shares used for comparative performance purposes was the share class with the lowest expenses available for purchase by the general public, which, was the Institutional Class. The Board also considered that the use of Institutional Class performance generally facilitates a meaningful comparison for expense and performance purposes.
Provided below is an overview of certain factors the Board considered in connection with its renewal and approval of the Management Agreement and Investment Advisory Agreements. The Board did not identify any particular information that was most relevant to its consideration to renew or approve each Agreement, and each Trustee may have afforded different weight to the various factors. Legal counsel to the independent Trustees provided the Board with a memorandum regarding its responsibilities pertaining to the renewal and approval of each Agreement. The memorandum explained the regulatory requirements surrounding the Trustees’ process for evaluating investment advisors and the terms of the contracts. Based on its evaluation, the Board unanimously concluded that the terms of each Agreement were reasonable and fair and that the renewal and approval of each Agreement was in the best interests of the Fund and its shareholders.
Considerations With Respect to the Renewal of the Management Agreement and the Investment Advisory Agreements
In determining whether to renew the Agreements on behalf of the Fund, the Trustees considered the best interests of the Fund. While the Management Agreement and the Investment Advisory Agreements for all series of the Trust and American Beacon Select Funds (together, the “Trusts”) were considered at the Meetings, the Board considered the Fund’s investment management and subadvisory relationships separately.
In each instance, the Board considered, among other things, the following factors: (1) the nature, extent and quality of the services provided; (2) the investment performance of the Fund and the subadvisors for the Fund; (3) the costs incurred by the Manager in rendering services to the Fund and its resulting profits or losses; (4) comparisons of services and fee rates with contracts entered into by the Manager or the subadvisors or their affiliates with other clients (such as pension funds and other institutional clients); (5) the extent to which economies of scale have been taken into account in setting each fee rate schedule; (6) whether fee rate levels reflect these economies of scale for the benefit of Fund investors; and (7) any other benefits derived or anticipated to be derived by the Manager or the subadvisors from their relationship with the Fund. The Trustees posed questions to various management personnel of the Manager regarding certain key aspects of the materials submitted in support of the renewal.
Nature, Extent and Quality of Services. With respect to the renewal of the Management Agreement, the Board considered, among other factors: the Fund’s long-term performance and the length of service of key investment personnel at the Manager; the cost structure of the Fund; the Manager’s culture of compliance and support for compliance operations that reduce risks to the Fund; the Manager’s commitment to enhance the Fund’s product line and increase assets in the Fund; the Manager’s quality of services; the Manager’s active role in monitoring and, as appropriate, recommending additional or replacement subadvisors; the Manager’s commitment to training employees; and the Manager’s efforts to retain key employees and maintain staffing levels.
41
Disclosure Regarding Approval of the Management and Investment Advisory Agreements (Unaudited)
With respect to the renewal of the Investment Advisory Agreements, the Trustees considered the level of staffing and the size of the subadvisors. The Board also considered the adequacy of the resources committed to the Fund by the subadvisors, and whether those resources were commensurate with the needs of the Fund and are sufficient to sustain appropriate levels of performance and compliance needs. In this regard, the Board considered the financial stability of the subadvisors. The Board also considered the subadvisors’ representations regarding their compliance programs and codes of ethics. Based on the foregoing information, the Board concluded that the nature, extent and quality of the management and advisory services provided by the Manager and the subadvisors were appropriate for the Fund and, thus, determined to renew the Agreements for the Fund.
Investment Performance. The Board evaluated the comparative information provided by Broadridge and the Manager regarding the Fund’s investment performance relative to its Lipper performance universe, Lipper performance group, and benchmark index, as well as the Fund’s Morningstar rating. The Board considered the information provided by Broadridge regarding its independent peer selection methodology to select all Lipper performance groups and universes. The Board also considered that the performance groups and universes selected by Broadridge may not provide appropriate comparisons for certain series of the Trusts. In addition, the Board considered the performance reports and discussions with management at Board and Committee meetings throughout the year. The Board also considered the Manager’s recommendation to continue to retain the subadvisors. A discussion regarding the Board’s considerations with respect to the Fund’s performance appears below under “Additional Considerations and Conclusions with Respect to the Fund.”
Costs of the Services Provided to the Fund and the Profits Realized by the Manager from its Relationship with the Fund. In analyzing the cost of services and profitability of the Manager, the Board considered the revenues earned and the expenses incurred by the Manager, before and after the payment of distribution-related expenses by the Manager. The profits or losses were noted at both an aggregate level for all series of the Trusts and at an individual Fund level, with the Fund being profitable for the Manager. The Board noted that the Manager did not manage other accounts in the same strategy as the Fund.
The Board further considered that, with respect to the Fund, the Management Agreement provides for the Manager to receive a management fee comprised of an annualized fee that is retained by the Manager. In addition, the Board considered that the Manager receives management fees for overseeing the securities lending program on behalf of the Fund. The Board also noted that certain share classes of the Fund maintain higher expense ratios in order to compensate third-party financial intermediaries.
In analyzing the fee rates charged by each subadvisor in connection with its investment advisory services to the Fund, the Board considered that, with respect to Templeton, Lazard and Causeway, the Manager has negotiated the lowest fee rate a subadvisor charges for any comparable client accounts. The Board did not request profitability data from the subadvisors because the Board did not view this data as imperative to its deliberations given the arm’s-length nature of the relationship between the Manager and the subadvisors with respect to the negotiation of the subadvisory fee rate. In addition, the Board noted that subadvisors may not account for their profits on an account-by-account basis and those that do likely employ different methodologies in connection with these calculations.
Based on the foregoing information, the Board concluded that the profitability levels of the Manager were reasonable in light of the services performed by the Manager. A discussion regarding the Board’s considerations with respect to the Fund’s fee rates is set forth below under “Additional Considerations and Conclusions with Respect to the Fund.”
Economies of Scale. In considering the reasonableness of the management and investment advisory fees rates, the Board considered whether economies of scale will be realized as the Fund grows and whether fee rate levels reflect these economies of scale for the benefit of Fund shareholders. In this regard, the Board considered that the Manager has negotiated breakpoints in the subadvisory fee rates for each subadvisor. The Board also noted that, for purposes of determining the fee rates chargeable to the Fund, Causeway, Lazard and Templeton
42
Disclosure Regarding Approval of the Management and Investment Advisory Agreements (Unaudited)
have agreed to take into account assets of American Airlines Group and its pension plans that are managed by the subadvisors. Thus, the Fund is able to receive lower effective fee rates.
In addition, the Board noted the Manager’s representation that the Management Agreement contains fee schedule breakpoints at higher asset levels with respect to the Fund. The Board also considered the Manager’s representation that the Fund benefits from economies of scale because comparably low fee rate levels are reflected in the current fee rates the Manager charges. Based on the foregoing information, the Board concluded that the Manager and subadvisor fee rate schedules for the Fund provide for a reasonable sharing of benefits from any economies of scale with the Fund.
Benefits Derived from the Relationship with the Fund. The Board considered the “fall-out” or ancillary benefits that accrue to the Manager and/or the subadvisor as a result of the advisory relationships with the Fund, including greater exposure in the marketplace with respect to the Manager’s or subadvisors’ investment process and expanding the level of assets under management by the Manager and the subadvisor. In addition, the Board noted that certain subadvisors benefit from soft dollar arrangements for third party and/or proprietary research.
In addition, the Manager noted that the Fund also derives benefits from its association with the Manager. Specifically, the Board noted the Manager’s representation that it provides services to most series of the Trusts at a lower than industry average cost. The Board considered that certain subadvisors reimburse the Manager for certain costs relating to distribution activities for the series of the Trusts, as well as representations by all such subadvisors that they would not reduce their fee rates in lieu of providing such reimbursements. Based on the foregoing information, the Board concluded that the potential benefits accruing to the Manager and the subadvisors by virtue of their relationships with the Fund appear to be fair and reasonable.
Additional Considerations and Conclusions with Respect to the Fund
The performance comparisons below were made versus the Fund’s Lipper performance universe and Lipper performance group, with the 1st Quintile representing the top twenty percent of the universe or group based on performance and the 5th Quintile representing the bottom twenty percent of the universe or group based on performance. References below to the Fund’s Lipper performance group and Lipper performance universe are to the respective group or universe of comparable mutual funds included in the analysis provided by Broadridge. A Lipper performance group consists of the Fund and a representative sample of funds with similar investment classifications and objectives as the Fund, as selected by Broadridge. A Lipper performance universe is an expansion of the performance group, providing a broader view of performance across the Fund’s investment classification/ objective and allowing for a more extensive comparison. In reviewing the performance, the Trustees viewed longer-term performance over a full market cycle, typically five years or longer, if available, as the most important consideration, because relative performance over shorter periods may be significantly impacted by market or economic events that do not reflect manager skill.
The expense comparisons below were made versus the Fund’s Lipper expense universe and Lipper expense group, with the 1st Quintile representing the top twenty percent of the universe or group based on lowest total expense and the 5th Quintile representing the bottom twenty percent of the universe or group based on highest total expense. References below to the Fund’s expense group and expense universe are to the respective group or universe of comparable mutual funds included in the analysis by Broadridge. A Lipper expense group consists of the Fund and a representative sample of funds with similar operating structures and asset sizes, as selected by Broadridge. A Lipper expense universe includes all funds in the investment classification/objective with a similar load type to the share class of the Fund included in the Lipper comparative information and provides a broader view of expenses across the Fund’s investment classification/objective. The Trustees also considered the Fund’s Morningstar fee level category. In addition, information regarding the subadvisors’ use of soft dollars was requested from the Manager and was considered by the Trustees.
In considering the renewal of the Management Agreement for the Fund, the Trustees considered the following additional factors:
43
Disclosure Regarding Approval of the Management and Investment Advisory Agreements (Unaudited)
Lipper Total Expense Analysis and Morningstar Fee Level Ranking
| | |
| Compared to Lipper Expense Universe | | 1st Quintile |
| Compared to Lipper Expense Group | | 1st Quintile |
| Morningstar Fee Level Ranking - Institutional Class | | Below Average Expense Ratio |
Lipper Fund Performance Analysis (five-year period ended March 31, 2016)
| | |
| Compared to Lipper Performance Universe | | 2nd Quintile |
| Compared to Lipper Performance Group | | 4th Quintile |
In considering the renewal of the Investment Advisory Agreements with Causeway, Lazard, and Templeton, the Trustees considered the following additional factors:
Subadvisor Performance (compared to Lipper Performance Universe for period indicated, ending March 31, 2016)
| | | | |
| Causeway | | 5 years | | 2nd Quintile |
| Lazard | | 5 years | | 1st Quintile |
| Templeton | | 5 years | | 4th Quintile |
The Trustees also considered: (1) information provided by each subadvisor regarding fee rates charged for managing accounts in the same strategy as the subadvisor manages its allocated of the Fund; (2) explanations from the Manager and the subadvisors regarding the subadvisors’ underperformance relative to their benchmarks and comparable accounts, as applicable; and (3) the Manager’s recommendation to continue to retain each subadvisor.
Based on these and other considerations, the Trustees: (1) concluded that the fees paid to the Manager and the subadvisors under the Management and Investment Advisory Agreements are fair and reasonable; (2) determined that the Fund and its shareholders would benefit from the Manager’s and subadvisors’ continued management of the Fund; and (3) approved the renewal of the Management and Investment Advisory Agreements with respect to the Fund.
44
Trustees and Officers of the American Beacon FundsSM (Unaudited)
The Trustees and officers of the American Beacon Funds (the “Trust”) are listed below, together with their principal occupations during the past five years. Unless otherwise indicated, the address of each person listed below is 220 Las Colinas Boulevard East, Suite 1200, Irving, Texas 75039. Each Trustee oversees twenty-six seven funds in the fund complex that includes the Trust and the American Beacon Select Funds. The Trust’s Statement of Additional Information contains additional information about the Trustees and is available without charge by calling 1-800-658-5811. A
| | | | |
| | | Position, Term of | | |
| | | Office and Length | | |
| | | of Time Served | | Principal Occupation(s) During Past 5 Years |
Name, Age and Address | | with the Trust | | and Current Directorships |
| INTERESTED TRUSTEES | | | | |
| | |
| | Lifetime of Trust until removal, resignation or retirement* | | |
| | |
| Alan D. Feld** (79) | | Trustee since 1996 | | Sole Shareholder of a professional corporation which is a Partner in the law firm of Akin, Gump, Strauss, Hauer & Feld, LLP (law firm) (1960-Present); Trustee, American Beacon Mileage Funds (1996-2012); Trustee, American Beacon Select Funds (1999-Present); Trustee, American Beacon Master Trust (1996-2012). |
| NON-INTERESTED TRUSTEES | | Term | | |
| | |
| | Lifetime of Trust until removel resignation or retirement* | | |
| | |
| Gilbert G. Alvarado (46) | | Trustee since 2015 | | Director, Kura MD, Inc. (local telehealth organization) (2015-present); Vice President & CFO, Sierra Health Foundation (health conversion private foundation) (2006-Present) Vice President & CFO, Sierra Health Foundation: Center for Health Program Management (California public benefit corporation) (2012-Present); Director, Innovative North State (2012-Present); Director, Sacramento Regional Technology Alliance (2011-Present); Director, Women’s Empowerment (2009-2014); Trustee, American Beacon Select Funds (2015-Present). |
| | |
| Josephe B. Armes (54) | | Trustee since 2015 | | Chairman & CEO, CSW Industrials f/k/a Capital Southwest Corporation (investment company) (2013-Present); President & CEO, JBA Investment Partners (family investment vehicle) (2010-Present); Chief Operating Officer, Hicks Holdings, LLC (Hicks Family assets and investments) (2005-2010); Trustee, Baylor University Board of Regents (2001-2010); Director and Chair of Audit Committee, RSP Permian (oil and gas producer) (2013-Present); Trustee, American Beacon Select Funds (2015-Present). |
| | |
| Gerard J. Arpey (58) | | Trustee since 2012 | | Director, The Home Depot, Inc. (2015-Present); Partner, Emerald Creek Group (private equity firm) (2011-Present); Chairman and Chief Executive Officer, AMR Corp. and American Airlines; Inc. (2003- 2011); Director, S. C. Johnson & Son, Inc. (privately held company) (2008-present); Trustee, American Beacon Select Funds (2012-Present). |
| | |
| Brenda A. Cline (55) | | Trustee since 2004 | | Executive Vice President, Chief Financial Officer, Treasurer and Secretary, Kimbell Art Foundation (1993-Present); Director, Range Resources Corporation (oil and natural gas company) (2015-Present); Director, Tyler Technologies, Inc.(public sector software solutions company) (2014-Present); Trustee, American Beacon Mileage Funds (2004-2012); Trustee, American Beacon Select Funds (2004-Present); Trustee, American Beacon Master Trust (2004-2012). |
| | |
| Eugene J. Duffy (62) | | Trustee since 2008 | | Managing Director, Institutional Services, Intercontinental Real Estate Corporation (2014-Present); Principal and Executive Vice President, Paradigm Asset Management (1994-2014); Director, Sunrise Bank of Atlanta (2008-2013); Trustee, American Beacon Mileage Funds (2008- 2012); Trustee, American Beacon Select Funds (2008-Present); Trustee, American Beacon Master Trust (2008-2012). |
45
Trustees and Officers of the American Beacon FundsSM (Unaudited)
| | | | |
| | | Position, Term of | | |
| | | Office and Length | | |
| | | of Time Served | | Principal Occupation(s) During Past 5 Years |
Name, Age and Address | | with the Trust | | and Current Directorships |
| TRUSTEES (CONT.) | | Term | | |
| | |
| M. Dunning (74) | | Trustee since 2008 | | Chairman Emeritus (2008-Present); Lockton Dunning Benefits (consulting firm in employee benefits); Board Director, Oncor Electric Delivery Company LLC (2007-Present); Board Member, BancTec (2010-Present) (software consulting); Trustee, American Beacon Mileage Funds (2008-2012); Trustee, American Beacon Select Funds (2008-Present); Trustee, American Beacon Master Trust (2008-2012). |
| | |
| Richard M. Massman (73) | | Trustee since 2004 Chairman since 2008 | | Consultant and General Counsel Emeritus (2009-Present) and Senior Vice President and General Counsel (1994-2009), Hunt Consolidated, Inc. (holding company engaged in oil and gas exploration and production, refining, real estate, farming, ranching and venture capital activities); Trustee, American Beacon Mileage Funds (2004- 2012); Trustee, American Beacon Select Funds (2004-Present); Trustee, American Beacon Master Trust (2004-2012). |
| | |
| Barbara J. McKenna, CFA (53) | | Trustee since 2012 | | Managing Principal, Longfellow Investment Management Company (2005- Present); Trustee, American Beacon Select Funds (2012-Present). |
| | |
R. Gerald Turner (70) 225 Perkins Admin. Bldg. Southern Methodist Univ. Dallas, Texas 75275 | | Trustee since 2001 | | President, Southern Methodist University (1995-Present); Director, J.C. Penney Company, Inc. (1996-Present); Director, Kronus Worldwide Inc. (chemical manufacturing) (2003-Present); Trustee, American Beacon Mileage Funds (2001- 2012); Trustee, American Beacon Select Funds (2001-Present); Trustee, American Beacon Master Trust (2001-2012). |
| | |
| OFFICERS | | | | |
| | |
| Gene. L. Needles, Jr. (61) | | President since 2009 Executive Vice President since 2009 | | President, CEO and Director, American Beacon Advisors, Inc. (2009-Present); President, CEO and Director, Astro AB Borrower, Inc. (2015-Present); President, CEO and Director, Astro AB Acquisition, Inc.(2015-Present); President, CEO and Director, Astro AB Topco, Inc. (2015-Present), President, CEO and Director, Astro AB Holdings, LLC. (2015-Present); President, CEO and Director, Lighthouse Holdings, Inc.; (2009-2015); President and CEO, Lighthouse Holdings Parent, Inc. (2009-2015); Manager, President and CEO, American Private Equity Management, L.L.C. (2012-Present); President, American Beacon Cayman Managed Futures Strategy Fund, Ltd. (2014-Present). |
| | |
| Rosemary K. Behan (57) | | VP, Secretary and Chief Legal Officer since 2006 | | Secretary, American Beacon Advisors, Inc. (2006-Present); Secretary, Astro AB Borrower, Inc. (2015-Present); Secretary, Astro AB Acquisition, Inc. (2015- Present); Secretary, Astro AB Topco, Inc. (2015-Present); Secretary, Astro AB Holdings, LLC. (2015-Present); Secretary, Lighthouse Holdings, Inc. (2008- 2015); Secretary, Lighthouse Holdings Parent, Inc. (2008-2015); Secretary, American Private Equity Management, L.L.C.(2008-Present); Secretary, American Beacon Cayman Managed Futures Strategy Fund, Ltd. (2014-Present). |
| | |
| Brian E. Brett (56) | | VP since 2004 | | Vice President, Director of Sales, American Beacon Advisors, Inc. (2004-Present). |
| | |
| Paul B. Cavazos (47) | | VP since 2016 | | Chief Investment Officer and Vice President, Asset Management, American Beacon Advisors, Inc. (2016-Present); Chief Investment Officer and Assistant Treasurer, DTE Energy (2007-2016); |
| | |
| Erica Duncan (46) | | VP since 2011 | | Vice President, Marketing and Client Services, American Beacon Advisors, Inc. (2011-Present); Supervisor, Brand Marketing, Invesco (2010-2011); |
46
Trustees and Officers of the American Beacon FundsSM (Unaudited)
| | | | |
| | | Position, Term of | | |
| | | Office and Length | | |
| | | of Time Served | | Principal Occupation(s) During Past 5 Years |
Name, Age and Address | | with the Trust | | and Current Directorships |
| OFFICERS | | Term | | |
| | |
| Melinda G. Heika (55) | | Treasurer since 2010 | | Treasurer, American Beacon Advisors, Inc. (2010-Present); Treasurer, Astro AB Borrower, Inc. (2015-Present); Treasurer, Astro AB Acquisition, Inc. (2015-Present); Treasurer, Astro AB Topco, Inc. (2015-Present); Treasurer, Astro AB Holdings, LLC. (2015-Present); Treasurer, Lighthouse Holdings, Inc. (2010-2015); Treasurer, Lighthouse Holdings Parent Inc., (2010-2015); Treasurer, American Private Equity Management, L.L.C. (2012-Present); Director and Treasurer, American Beacon Cayman Managed Futures Strategy Fund, Ltd. (2014-Present). |
| | |
| | One Year | | |
| | |
| Terri L. McKinney (52) | | VP since 2010 | | Vice President, Enterprise Services (2009-Present) and Managing Director (2003-2009), American Beacon Advisors, Inc. |
| | |
| Jeffrey K. Ringdahl (41) | | VP since 2010 | | Chief Operating Officer, American Beacon Advisors, Inc. (2010-Present); Manager and Senior Vice President, American Private Equity Management, L.L.C. (2012-Present); Senior Vice President and Director, Astro AB Borrower, Inc. (2015-Present); Senior Vice President and Director, Astro AB Acquisition, Inc. (2015-Present); Senior Vice President and Director, Astro AB Topco, Inc. (2015-Present), Senior Vice President and Director, Astro AB Holdings, LLC.(2015-Present); Senior Vice President, Lighthouse Holdings, Inc. (2013-2015); Senior Vice President, Lighthouse Holdings Parent, Inc. (2013-2015); Director and Vice President, American Beacon Cayman Managed Futures Strategy Fund, Ltd. (2014-Present); Vice President, Product Management, Touchstone Advisors, Inc. (2007-2010). |
| | |
| Samuel J. Silver (53) | | VP since 2011 | | Chief Fixed Income Officer (2016–Present), Vice President, Fixed Income Investments (2011-2016) and Senior Portfolio Manager, Fixed Income Investments (1999-2011), American Beacon Advisors, Inc. |
| | |
| Christina E. Sears (45) | | Chief Compliance Officer since 2004 and Asst. Secretary since 1999 | | Chief Compliance Officer, American Beacon Advisors, Inc. (2004-Present); Chief Compliance Officer, American Private Equity Management, L.L.C. (2012-Present). |
| | |
| Sonia L. Bates (59) | | Asst. Treasurer since 2011 | | Director, Tax and Financial Reporting (2011-Present), Manager, Tax and Financial Reporting (2005-2010), American Beacon Advisors, Inc.; Asst. Treasurer, Astro AB Borrower, Inc. (2015-Present); Asst. Treasurer, Astro AB Acquisition, Inc.(2015-Present); Asst. Treasurer, Astro AB Topco, Inc. (2015-Present); Asst. Treasurer, Astro AB Holdings, LLC.; Asst. Treasurer, Lighthouse Holdings, Inc. (2011-2015); Asst. Treasurer, Lighthouse Holdings Parent Inc. (2011-2015); Asst. Treasurer, American Private Equity Management, L.L.C. (2012-Present). |
| | |
| Shelley D. Abrahams (41) | | Assistant Secretary since 2008 | | Assistant Secretary, American Beacon Advisors, Inc. (2008-Present) |
| | |
| Rebecca L. Harris (49) | | Assistant Secretary since 2011 | | Assistant Secretary, American Beacon Advisors, Inc. (2011-Present) |
| | |
| Diana N. Lai (40) | | Assistant Secretary since 2012 | | Assistant Secretary, American Beacon Advisors, Inc. (2012-Present) |
| | |
| Teresa A. Oxford (58) | | Assistant Secretary since 2015 | | Assistant Secretary, American Beacon Advisors, Inc. (2015-Present) |
| * | As of 11/12/2014, the Board adopted a retirement plan that requires Trustees to retire no later than the last day of the calendar year in which they reach the age of 75. |
| ** | Mr. Feld is deemed to be an “interested person” of the Trusts, as defined by the 1940 Act. Mr. Feld’s law firm of Akin, Gump, Strauss, Hauer & Feld LLP has provided legal services within the past two fiscal years to one or more of the Trust’s sub-advisors. |
47
American Beacon FundsSM
Privacy Policy
October 31, 2016 (Unaudited)
The American Beacon Funds recognize and respect the privacy of our shareholders. We are providing this notice to you so you will understand how shareholder information may be collected and used.
We may collect nonpublic personal information about you from one or more of the following sources:
| | • | | information we receive from you on applications or other forms; |
| | • | | information about your transactions with us or our service providers; and |
| | • | | information we receive from third parties. |
We do not disclose any nonpublic personal information about our customers or former customers to anyone, except as permitted by law.
We restrict access to your nonpublic personal information to those employees or service providers who need to know that information to provide products or services to you. To ensure the confidentiality of your nonpublic personal information, we maintain safeguards that comply with federal standards.
48

Delivery of Documents
eDelivery is NOW AVAILABLE - Stop traditional mail delivery and receive your
shareholder reports and summary prospectus on-line. Sign up at
www.americanbeaconfunds.com
If you invest in the Fund through a financial institution, you may be able to receive the Fund’s regulatory mailings, such as the Prospectus, Annual Report and Semi-Annual Report, by e-mail. If you are interested in this option, please go to www.icsdelivery.com and search for your financial institution’s name or contact your financial institution directly.
To obtain more information about the Fund:
| | |
 | |  |
| | |
| By E-mail: | | On the Internet: |
| american_beacon.funds@ambeacon.com | | Visit our website at www.americanbeaconfunds.com |
| | | |
| | | |
| | |
| | |
 | |  |
| | |
| By Telephone: | | By Mail: |
| Institutional, Y, Investor, and Advisor Classes | | American Beacon Funds |
| Call (800) 658-5811 | | P.O. Box 219643 |
| | | Kansas City, MO 64121-9643 |
| | | |
| | |
| Availability of Quarterly Portfolio Schedules | | Availability of Proxy Voting Policy and Records |
| | |
| In addition to the Schedule of Investments provided in each semi-annual and annual report, the Fund files a complete schedule of its portfolio holdings with the Securities and Exchange Commission (“SEC”) on Form N-Q as of the first and third fiscal quarters. The Fund’s Forms N-Q are available on the SEC’s website at www.sec.gov. The Forms N-Q may also be reviewed and copied at the SEC’s Public Reference Section, 100 F Street, NE, Washington, D.C. 20549-2736. Information regarding the operation of the SEC’s Public Reference Room may be obtained by calling (800)-SEC-0330. A complete schedule of the Fund’s portfolio holdings is also available at www.americanbeaconfunds.com approximately twenty days after the end of each month. | | A description of the policies and procedures the Fund uses to determine how to vote proxies relating to portfolio securities is available in the Fund’s Statement of Additional Information, is available free of charge on the Fund’s website www.americanbeaconfunds.com and by calling 1-800-967-9009 or by accessing the SEC’s website at www. sec.gov. The Fund’s proxy voting record for the most recent year ended June 30 is filed annually with the SEC on Form N-PX. The Fund’s Forms N-PX are available on the SEC’s website at www.sec.gov. The Fund’s proxy voting record may also be obtained by calling 1-800-967-9009. |
Fund Service Providers:
| | | | | | | | | | | | |
| CUSTODIAN | | | | TRANSFER AGENT | | | | INDEPENDENT REGISTERED | | | | DISTRIBUTOR |
| State Street Bank and | | | | Boston Financial Data | | | | PUBLIC ACCOUNTING FIRM | | | | Foreside Fund Services, |
| Trust | | | | Services | | | | Ernst & Young LLP | | | | LLC |
| Boston, Massachusetts | | | | Kansas City, Missouri | | | | Dallas, Texas | | | | Portland, Maine |
| | | | | | | | | | | | | |
This report is prepared for shareholders of the American Beacon Funds and may be distributed to others only if preceded or accompanied by a current Prospectus or Summary Prospectus.
American Beacon Funds and American Beacon International Equity Fund are service marks of American Beacon Advisors, Inc.
AR 10/16

About American Beacon Advisors
Since 1986, American Beacon Advisors has offered a variety of products and investment advisory services to numerous institutional and retail clients, including a variety of mutual funds, corporate cash management, and separate account management.
Our clients include defined benefit plans, defined contribution plans, foundations, endowments, corporations, financial planners, and other institutional investors. With American Beacon Advisors, you can put the experience of a multi-billion dollar asset management firm to work for your company.
LARGE CAP VALUE FUND RISKS
Investing in value stocks may limit downside risk over time; however, the Fund may produce more modest gains than riskier stock funds as a trade-off for this potentially lower risk. Investing in foreign securities may involve heightened risk due to currency fluctuations and economic and political risks. The use of futures contracts for cash management may subject the Fund to losing more money than invested. Please see the prospectus for a complete discussion of the Fund’s risks. There can be no assurances that the investment objectives of this Fund will be met.
Any opinions herein, including forecasts, reflect our judgment as of the end of the reporting period and are subject to change. Each advisor’s strategies and the Fund’s portfolio composition will change depending on economic and market conditions. This report is not a complete analysis of market conditions and therefore, should not be relied upon as investment advice. Although economic and market information has been compiled from reliable sources, American Beacon Advisors, Inc. makes no representation as to the completeness or accuracy of the statements contained herein.
| | |
| American Beacon Funds | | October 31, 2016 |
President’s Message
| | |
 | | Dear Shareholders, During the 12-month period ended October 31, 2016, China’s slowing growth escalated concerns for global markets, and many of the world’s central banks - the Federal Reserve included - responded by either continuing or expanding their economic stimulation policies. In the first half of 2016, international stocks declined while U.S. and emerging-market stocks made modest gains. Falling global interest rates supported bond returns during the period. On June 24, 2016, the U.K. announced that the “Brexit” referendum to leave the European Union passed with a 52% majority vote, further shaking up global markets. By the end of that month, however, the U.S. stock market and some global markets had rebounded to near pre-Brexit levels as investors took opportunistic risks following the historic vote. After Theresa May’s succession as the U.K.’s prime minister on July 13, 2016, many central banks put their Brexit concerns on hold and turned their attention to their own economies. |
In the weeks ahead of the U.S. presidential election on November 8, 2016, uncertainty about the outcome caused many investors to stay on the sidelines. Although investors may question whether the election’s result could have negative consequences for their portfolios, elections rarely have a lasting effect on the market. Historically speaking, from August 1 to October 31 during 19 of the last 22 election years - or approximately 86% of the time - the S&P 500 rallied for an average gain of approximately 6%.
For the 12 months ended October 31, 2016, the American Beacon Large Cap Value Fund (Investor Class) returned 1.33%.
American Beacon Advisors identifies and partners with experienced asset managers from across all asset classes to help protect our shareholders’ portfolios over the long term. We are proud to offer a variety of funds that allow investors to invest in the asset classes best aligned with their long-term goals.
Thank you for your continued investment in American Beacon Funds. For additional information about the Funds or to access your account information, please visit our website at www.americanbeaconfunds.com.
Best Regards,

Gene L. Needles, Jr.
President
American Beacon Funds
1
Domestic Equity Market Overview
October 31, 2016 (Unaudited)
U.S. and emerging markets rallied over the trailing 12-month period ended October 31, 2016. Central banks around the world continued to set the pace for equity markets. With more than one third of all sovereign debt ($13 trillion) posting negative yields, the monetary spigots remained wide open, forcing investors to search for yield elsewhere – including equities. However, European markets were shaken by the U.K.’s surprising Brexit vote in June and broadly declined. Among major benchmarks, the Standard & Poor’s 500 Index added 4.5%.
In December 2015, the Federal Reserve (the “Fed”) raised its benchmark rate after several years of near-zero interest rates, driven largely by the central bank’s confidence in the economy. U.S. interest rates then remained unchanged for the rest of the period. Fed Chair Janet Yellen began the year with a hawkish tone, and most market participants anticipated two or more rates hikes in 2016. However, market volatility related to the Brexit vote prompted policymakers to delay raising interest rates in spite of stable economic data in the U.S.
The Brexit vote dominated headlines in June and initially caused growth expectations to fall drastically. The referendum had far-reaching implications. U.S. markets declined in the aftermath, but quickly recovered as much of the market corrected what was largely viewed as an overreaction. The dollar rose versus the pound, which ended the period at a 31-year low. Growth forecasts in the U.K. have since been revised upward after decisive policy action from the Bank of England, the immediate appointment of Prime Minister Theresa May and strong manufacturing and services sector data. European Central Bank President Mario Draghi maintained low interest rates as the rest of Europe struggled to generate inflation, which turned positive in June. As the year progressed, post-Brexit risks seemed to recede.
The Fed’s 2% GDP growth and inflation targets remained elusive for most of the period, and inventories were low. But most recently, third-quarter GDP showed 2.9% growth, which was the highest in two years and surpassed estimates of 2.5%. Consumer spending has been consistently strong, and the U.S. ended the period near full employment. Additionally, the Manufacturing sector’s Purchasing Managers’ Index was expansionary, with readings above 50 over the last 12 months. On the back of the measured policy response, the U.S. dollar ended the period only slightly higher overall.
For quite some time now, the battle for leadership within domestic equity markets has been raging between stocks perceived as “bond proxies” and those with more interest rate and economic sensitivity. The latter group struggled mightily during the first six months of 2016, but outperformed the bond proxies in the third quarter as interest rates rose.
The “battle of the bond proxies” should continue until interest rates trend toward sustainably higher levels. The Fed’s multi-year suppression of interest rates was designed to push investors out on the risk spectrum and encourage growth; instead, the unintended consequence has been risk aversion. This has caused investors to search for perceived safety in assets with a current yield, regardless of valuation (e.g., bond proxies). More broadly, risk aversion has been evident on a global basis, even in countries with negative interest rates. Negative interest rates may prove ineffective and the road back to normalized interest rates might be bumpy with additional unintended consequences.
Further, investors have flocked to passive funds at the expense of active funds in an attempt to avoid risk. The current cycle of passive outperformance began with the bull market that started about seven years ago. Since that time, lower interest rates and excess liquidity have propelled equity markets in a highly correlated manner, without much regard for fundamentals. After one of the longest and highest-returning bull markets in history, the overall market is no longer inexpensive, and many companies and sectors are richly valued. As such, the long run of outperformance by passive strategies has left many companies within the benchmark overvalued and susceptible to dividend cuts, price declines or both.
Election news dominated headlines over the period, particularly in the run-up to Election Day, and increased volatility. Most polls projected Democratic nominee Hillary Rodham Clinton would win the U.S. presidential election. Toward the end of the period, markets were shaken and the U.S. presidential election narrowed after
2
Domestic Equity Market Overview
October 31, 2016 (Unaudited)
the reemergence of the FBI investigation into Ms. Clinton’s private email servers. Uncertainty from the presidential election created an overhang at the end of the period.
3
American Beacon Large Cap Value FundSM
Performance Overview
October 31, 2016 (Unaudited)
The Investor Class of the Large Cap Value Fund (the “Fund”) returned 1.33% for the twelve months ended October 31, 2016, underperforming the Russell 1000® Value Index (the “Index”) return of 6.37% for the same period.
Comparison of Change in Value of a $10,000 Investment for the period from 10/31/06 through 10/31/16
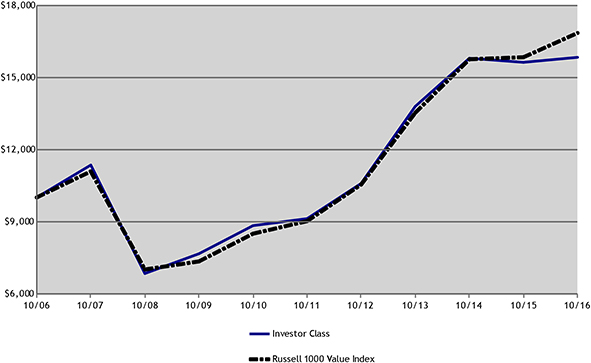
Total Returns for the Period ended October 31, 2016
| | | | | | | | | | | | | | | | | | | | | | | | |
| | | Ticker | | | 1 Year | | | 3 Years | | | 5 Years | | | 10 Years | | | Value of $10,000
10/31/2006-
10/31/2016 | |
Institutional Class (1,6) | | | AADEX | | | | 1.69 | % | | | 5.06 | % | | | 12.04 | % | | | 5.04 | % | | $ | 16,357 | |
Y Class (1,2,6) | | | ABLYX | | | | 1.61 | % | | | 4.98 | % | | | 11.96 | % | | | 4.98 | % | | $ | 16,256 | |
Investor Class (1,6) | | | AAGPX | | | | 1.33 | % | | | 4.70 | % | | | 11.65 | % | | | 4.70 | % | | $ | 15,826 | |
Advisor Class (1,6) | | | AVASX | | | | 1.21 | % | | | 4.56 | % | | | 11.51 | % | | | 4.53 | % | | $ | 15,572 | |
A without Sales Charge (1,3,6) | | | ALVAX | | | | 1.33 | % | | | 4.64 | % | | | 11.54 | % | | | 4.63 | % | | $ | 15,721 | |
A with Sales Charge (1,3,6) | | | ALVAX | | | | -4.50 | % | | | 2.59 | % | | | 10.23 | % | | | 4.01 | % | | $ | 14,815 | |
C without Sales Charge (1,4,6) | | | ALVCX | | | | 0.51 | % | | | 3.84 | % | | | 10.68 | % | | | 4.13 | % | | $ | 14,983 | |
C with Sales Charge (1,4,6) | | | ALVCX | | | | -0.49 | % | | | 3.84 | % | | | 10.68 | % | | | 4.13 | % | | $ | 14,983 | |
Russell 1000 Value Index (5) | | | | | | | 6.37 | % | | | 7.59 | % | | | 13.31 | % | | | 5.35 | % | | $ | 16,837 | |
| 1. | Performance shown is historical and is not indicative of future returns. Investment returns and principal value will vary, and shares may be worth more or less at redemption than at original purchase. Performance shown is calculated based on the published end of day net asset values as of date indicated, and current performance may be lower or higher than the performance data quoted. To obtain performance as of the most recent month end, please visit www. americanbeaconfunds.com or call 1-800-967-9009. Fund performance in the table above does not reflect the deduction of taxes a shareholder would pay on distributions or the redemption of shares. |
| 2. | Fund performance for the ten-year period represents the total returns achieved by the Institutional Class from 10/31/06 up to 8/3/09, the inception date of the Y Class, and the returns of the Y Class since its inception. Expenses of the Y Class are higher than those of the Institutional Class. As a result, total returns shown may be higher than they would have been had the Y Class been in existence since 10/31/06. |
4
American Beacon Large Cap Value FundSM
Performance Overview
October 31, 2016 (Unaudited)
| 3. | Fund performance for the ten-year period represents the total returns achieved by the Investor Class from 10/31/06 through 5/17/10, the inception date of the A Class, and the returns of the A Class since its inception. Expenses of the A Class are higher than those of the Investor Class. As a result, total returns shown may be higher than they would have been had the A Class been in existence since 10/31/06. A Class shares have a maximum sales charge of 5.75%. |
| 4. | Fund performance for the ten-year period represents the total returns achieved by the Investor Class from 10/31/06 through 9/1/10, the inception date of the C Class, and the returns of the C Class since its inception. Expenses of the C Class are higher than those of the Investor Class. As a result, total returns shown may be higher than they would have been had the C Class been in existence since 10/31/06. A portion of the fees charged to the C Class were waived from 2010 through 2012, partially recovered in 2013, and fully recovered in 2014. Performance prior to waiving fees was lower than the actual returns shown from 2010 through 2012. C Class shares have a maximum contingent deferred sales charge of 1.00% for shares redeemed within one year of the date of purchase. |
| 5. | The Russell 1000 Value Index is an unmanaged index of those stocks in the Russell 1000 Index with lower price-to-book ratios and lower forecasted growth values. Russell 1000 Value Index and Russell 1000 Index are registered trademarks of the Frank Russell Company. One cannot directly invest in an index. |
| 6. | The total annual Fund operating expense ratio set forth in the most recent Fund prospectus for the Institutional, Y, Investor, Advisor, A, and C Class shares was 0.59%, 0.68%, 0.94%, 1.08%, 0.98%, and 1.74% respectively. The expense ratios above may vary from the expense ratios presented in other sections of this report that are based on expenses incurred during the period covered by this report. |
The Fund underperformed the Index as both stock selection and sector allocation detracted value relative to the Index for the twelve-month period.
The Fund’s investments in the Health Care, Utilities, and Financials sectors contributed to most of the stock selection underperformance. In the Health Care sector, Valeant Pharmaceuticals International (down 71.7%) and Sanofi ADR (down 20.8%) were the largest negative contributors. Positions in Calpine Corp. (down 22.7%) and NRG Energy Inc. (down 12.9%) detracted from the Fund’s returns in the Utilities sector. In the Financials sector, the Fund’s position in Nomura Holdings Inc. Spons. ADR (down 44.3%) and Citigroup Inc. (down 5.9%) contributed to the Fund’s underperformance.
Sector allocation detracted as a significant overweight in Consumer Discretionary - the worst performing sector in the Index - and an underweight in Utilities (down 2.8% and up 17.5%, respectively) hurt relative performance compared to the Index. The Fund’s overweight position in Telecommunication Services (up 11.4%) and slight overweight position in Industrials (up 11.2%) somewhat muted relative underperformance from sector allocation.
The sub-advisors continue to invest in a broadly diversified portfolio of companies that they believe have attractive valuations and above-average earnings growth potential. This approach should allow the Fund to benefit over the longer term.
| | | | | | | | |
Top Ten Holdings (% Net Assets) | | | | | | | | |
Bank of America Corp. | | | | | | | 3.5 | |
Citigroup | | | | | | | 3.5 | |
JPMorgan Chase & Co. | | | | | | | 3.1 | |
BP PLC, Sponsored ADR | | | | | | | 2.4 | |
American Financial Group, Inc. | | | | | | | 2.3 | |
Microsoft Corp. | | | | | | | 1.9 | |
Oracle Corp. | | | | | | | 1.8 | |
Wells Fargo & Co. | | | | | | | 1.8 | |
General Motors Co. | | | | | | | 1.6 | |
Anthem, Inc. | | | | | | | 1.5 | |
Total Fund Holdings | | | 218 | | | | | |
5
American Beacon Large Cap Value FundSM
Performance Overview
October 31, 2016 (Unaudited)
| | | | | | | | |
Sector Allocation (% Equities) | | | | | | | | |
Financials | | | | | | | 26.8 | |
Consumer Discretionary | | | | | | | 13.5 | |
Industrials | | | | | | | 12.5 | |
Energy | | | | | | | 11.9 | |
Health Care | | | | | | | 11.6 | |
Information Technology | | | | | | | 9.7 | |
Consumer Staples | | | | | | | 5.3 | |
Telecommunication Services | | | | | | | 3.3 | |
Materials | | | | | | | 2.6 | |
Utilities | | | | | | | 2.5 | |
Real Estate | | | | | | | 0.3 | |
6
American Beacon Large Cap Value FundSM
Expense Examples
October 31, 2016 (Unaudited)
Fund Expense Example
As a shareholder of a Fund, you incur two types of costs: (1) transaction costs, including sales charges (loads) on purchase payments and redemption fees if applicable, and (2) ongoing costs, including management fees, administrative service fees, distribution (12b-1) fees, and other Fund expenses. The Examples are intended to help you understand the ongoing cost (in dollars) of investing in the Fund and to compare these costs with the ongoing costs of investing in other mutual funds. The Examples are based on an investment of $1,000 invested at the beginning of the period in each Class and held for the entire period from May 1, 2016 through October 31, 2016.
Actual Expenses
The “Actual” lines of the table provide information about actual account values and actual expenses. You may use the information in this line, together with the amount you invested, to estimate the expenses that you paid over the period. Simply divide your account value by $1,000 (for example, an $8,600 account value divided by $1,000 = $8.60), then multiply the result by the “Expenses Paid During Period” to estimate the expenses you paid on your account during this period. Shareholders of the Investor and Institutional Classes that invest in the Fund through an IRA or Roth IRA may be subject to a custodial IRA fee of $15 that is typically deducted each December. If your account was subject to a custodial IRA fee during the period, your costs would have been $15 higher.
Hypothetical Example for Comparison Purposes
The “Hypothetical” lines of the table provide information about hypothetical account values and hypothetical expenses based on the Fund’s actual expense ratio and an assumed 5% per year rate of return before expenses (not the Fund’s actual return). You may compare the ongoing costs of investing in the Fund with other funds by contrasting this 5% hypothetical example and the 5% hypothetical examples that appear in the shareholder reports of the other funds. The hypothetical account values and expenses may not be used to estimate the actual ending account balance or expenses you paid for the period. Shareholders of the Investor and Institutional Classes that invest in the Fund through an IRA or Roth IRA may be subject to a custodial IRA fee of $15 that is typically deducted each December. If your account was subject to a custodial IRA fee during the period, your costs would have been $15 higher.
You should also be aware that the expenses shown in the table highlight only your ongoing costs and do not reflect any transaction costs charged by the Fund, such as sales charges (loads) or redemption fees, as applicable. Similarly, the expense examples for other funds do not reflect any transaction costs charged by those funds, such as sales charges (loads), redemption fees or exchange fees. Therefore, the “Hypothetical” lines of the table are useful in comparing ongoing costs only and will not help you determine the relative total costs of owning different funds. If you were subject to any transaction costs during the period, your costs would have been higher.
7
American Beacon Large Cap Value FundSM
Expense Examples
October 31, 2016 (Unaudited)
Large Cap Value Fund
| | | | | | | | | | | | |
| | | Beginning Account Value
5/1/2016 | | | Ending Account Value
10/31/2016 | | | Expenses Paid During
Period
5/1/2016-10/31/2016* | |
Institutional Class | | | | | | | | | | | | |
Actual | | $ | 1,000.00 | | | $ | 1,032.83 | | | $ | 3.07 | |
Hypothetical** | | $ | 1,000.00 | | | $ | 1,022.12 | | | $ | 3.05 | |
Y Class | | | | | | | | | | | | |
Actual | | $ | 1,000.00 | | | $ | 1,032.63 | | | $ | 3.42 | |
Hypothetical** | | $ | 1,000.00 | | | $ | 1,021.77 | | | $ | 3.40 | |
Investor Class | | | | | | | | | | | | |
Actual | | $ | 1,000.00 | | | $ | 1,030.76 | | | $ | 4.75 | |
Hypothetical** | | $ | 1,000.00 | | | $ | 1,020.46 | | | $ | 4.72 | |
Advisor Class | | | | | | | | | | | | |
Actual | | $ | 1,000.00 | | | $ | 1,030.29 | | | $ | 5.51 | |
Hypothetical** | | $ | 1,000.00 | | | $ | 1,019.72 | | | $ | 5.48 | |
A Class | | | | | | | | | | | | |
Actual | | $ | 1,000.00 | | | $ | 1,031.07 | | | $ | 5.00 | |
Hypothetical** | | $ | 1,000.00 | | | $ | 1,020.23 | | | $ | 4.98 | |
C Class | | | | | | | | | | | | |
Actual | | $ | 1,000.00 | | | $ | 1,026.57 | | | $ | 8.86 | |
Hypothetical** | | $ | 1,000.00 | | | $ | 1,016.40 | | | $ | 8.82 | |
| * | Expenses are equal to the Fund’s annualized expense ratios for the six-month period of 0.60%, 0.67%, 0.93%, 1.08%, 0.98%, and 1.74% for the Institutional, Y, Investor, Advisor, A, and C Classes, respectively, multiplied by the average account value over the period, multiplied by the number derived by dividing the number of days in the most recent fiscal half-year (184) by days in the year (366) to reflect the half-year period. |
| ** | 5% return before expenses. |
8
American Beacon Large Cap Value FundSM
Report of Independent Registered Public Accounting Firm
The Shareholders and Board of Trustees of
American Beacon Large Cap Value Fund:
We have audited the accompanying statement of assets and liabilities, including the schedule of investments, of American Beacon Large Cap Value Fund (one of the funds constituting the American Beacon Funds) (the Fund), as of October 31, 2016, and the related statement of operations for the year then ended, the statements of changes in net assets for each of the two years in the period then ended and the financial highlights for each of the five years in the period then ended. These financial statements and financial highlights are the responsibility of the Fund’s management. Our responsibility is to express an opinion on these financial statements and financial highlights based on our audits.
We conducted our audits in accordance with the standards of the Public Company Accounting Oversight Board (United States). Those standards require that we plan and perform the audit to obtain reasonable assurance about whether the financial statements and financial highlights are free of material misstatement. We were not engaged to perform an audit of the Fund’s internal control over financial reporting. Our audits included consideration of internal control over financial reporting as a basis for designing audit procedures that are appropriate in the circumstances, but not for the purpose of expressing an opinion on the effectiveness of the Fund’s internal control over financial reporting. Accordingly, we express no such opinion. An audit also includes examining, on a test basis, evidence supporting the amounts and disclosures in the financial statements and financial highlights, assessing the accounting principles used and significant estimates made by management, and evaluating the overall financial statement presentation. Our procedures included confirmation of securities owned as of October 31, 2016, by correspondence with the custodian and brokers or by other appropriate auditing procedures where replies from brokers were not received. We believe that our audits provide a reasonable basis for our opinion.
In our opinion, the financial statements and financial highlights referred to above present fairly, in all material respects, the financial position of American Beacon Large Cap Value Fund at October 31, 2016, the results of its operations for the year then ended, the changes in its net assets for each of the two years in the period then ended and the financial highlights for each of the five years in the period then ended in conformity with U.S. generally accepted accounting principles.

Dallas, Texas
December 29, 2016
9
American Beacon Large Cap Value FundSM
Schedule of Investments
October 31, 2016
| | | | | | | | |
| | | Shares | | | Fair Value | |
COMMON STOCK - 97.98% | | | | | | | | |
CONSUMER DISCRETIONARY - 13.06% | | | | | | | | |
Auto Components - 2.68% | | | | | | | | |
Adient PLCA B | | | 378,657 | | | $ | 17,232,680 | |
Delphi Automotive PLCB | | | 128,990 | | | | 8,393,379 | |
Goodyear Tire & Rubber Co. | | | 965,109 | | | | 28,017,114 | |
Johnson Controls International PLC B | | | 2,927,772 | | | | 118,047,767 | |
Magna International, Inc., Class A | | | 971,041 | | | | 39,861,233 | |
| | | | | | | | |
| | | | | | | 211,552,173 | |
| | | | | | | | |
Automobiles - 2.86% | | | | | | | | |
Ford Motor Co. | | | 1,868,652 | | | | 21,937,974 | |
General Motors Co. | | | 3,961,405 | | | | 125,180,398 | |
Harley-Davidson, Inc. | | | 395,711 | | | | 22,563,441 | |
Honda Motor Co., Ltd., ADRC | | | 580,972 | | | | 17,330,395 | |
Toyota Motor Corp., ADRC | | | 336,099 | | | | 38,873,210 | |
| | | | | | | | |
| | | | | | | 225,885,418 | |
| | | | | | | | |
Hotels, Restaurants & Leisure - 0.43% | | | | | | | | |
Carnival Corp. | | | 303,500 | | | | 14,901,850 | |
Norwegian Cruise Line Holdings Ltd.A | | | 484,900 | | | | 18,848,063 | |
| | | | | | | | |
| | | | | | | 33,749,913 | |
| | | | | | | | |
Household Durables - 0.76% | | | | | | | | |
Koninklijke Philips Electronics N.V. | | | 1,028,802 | | | | 30,894,924 | |
Newell Rubbermaid, Inc. | | | 41,101 | | | | 1,973,670 | |
Stanley Black & Decker, Inc. | | | 48,327 | | | | 5,501,546 | |
Tupperware Brands Corp. | | | 363,884 | | | | 21,658,376 | |
| | | | | | | | |
| | | | | | | 60,028,516 | |
| | | | | | | | |
Media - 2.76% | | | | | | | | |
CBS Corp., Class BD | | | 693,403 | | | | 39,260,478 | |
Comcast Corp., Class A | | | 695,586 | | | | 43,001,127 | |
Discovery Communications, Inc., Class AA | | | 2,083,744 | | | | 53,847,656 | |
Interpublic Group of Cos., Inc. | | | 94,501 | | | | 2,115,877 | |
Omnicom Group, Inc. | | | 327,924 | | | | 26,174,894 | |
Scripps Networks Interactive, Inc., Class A | | | 463,800 | | | | 29,850,168 | |
Time Warner, Inc. | | | 102,480 | | | | 9,119,695 | |
Time, Inc. | | | 10,905 | | | | 141,765 | |
Viacom, Inc., Class B | | | 315,500 | | | | 11,850,180 | |
Walt Disney Co. | | | 26,341 | | | | 2,441,547 | |
| | | | | | | | |
| | | | | | | 217,803,387 | |
| | | | | | | | |
Multiline Retail - 2.56% | | | | | | | | |
Dillard’s, Inc., Class A | | | 288,700 | | | | 17,697,310 | |
Kohl’s Corp. | | | 579,756 | | | | 25,364,325 | |
Macy’s, Inc. | | | 1,006,500 | | | | 36,727,185 | |
Michael Kors Holdings Ltd.A | | | 961,328 | | | | 48,816,236 | |
Target Corp. | | | 1,064,644 | | | | 73,172,982 | |
| | | | | | | | |
| | | | | | | 201,778,038 | |
| | | | | | | | |
Specialty Retail - 1.01% | | | | | | | | |
Advance Auto Parts, Inc. | | | 20,420 | | | | 2,860,434 | |
Bed Bath & Beyond, Inc. | | | 677,206 | | | | 27,372,667 | |
Hanesbrands, Inc. | | | 127,597 | | | | 3,279,243 | |
Signet Jewelers Ltd. | | | 406,300 | | | | 33,015,938 | |
Staples, Inc. | | | 1,771,500 | | | | 13,109,100 | |
| | | | | | | | |
| | | | | | | 79,637,382 | |
| | | | | | | | |
Total Consumer Discretionary | | | | | | | 1,030,434,827 | |
| | | | | | | | |
See accompanying notes
10
American Beacon Large Cap Value FundSM
Schedule of Investments
October 31, 2016
| | | | | | | | |
| | | Shares | | | Fair Value | |
CONSUMER STAPLES - 5.22% | | | | | | | | |
Beverages - 0.19% | | | | | | | | |
Diageo PLC, Sponsored ADRB C | | | 106,169 | | | $ | 11,416,353 | |
PepsiCo, Inc. | | | 30,742 | | | | 3,295,542 | |
| | | | | | | | |
| | | | | | | 14,711,895 | |
| | | | | | | | |
Food & Drug Retailing - 0.94% | | | | | | | | |
CVS Caremark Corp. | | | 578,724 | | | | 48,670,688 | |
Mead Johnson Nutrition Co., Class A | | | 40,070 | | | | 2,996,034 | |
Wal-Mart Stores, Inc. | | | 325,282 | | | | 22,776,246 | |
| | | | | | | | |
| | | | | | | 74,442,968 | |
| | | | | | | | |
Food Products - 0.95% | | | | | | | | |
Archer Daniels Midland Co. | | | 201,139 | | | | 8,763,626 | |
Bunge Ltd. | | | 184,614 | | | | 11,447,914 | |
Danone S.A., Sponsored ADRC | | | 363,566 | | | | 5,057,203 | |
General Mills, Inc. | | | 184,342 | | | | 11,425,517 | |
JM Smucker Co. | | | 45,772 | | | | 6,010,321 | |
Kellogg Co. | | | 226,495 | | | | 17,016,569 | |
Nestle S.A., Sponsored ADRC | | | 213,893 | | | | 15,538,257 | |
| | | | | | | | |
| | | | | | | 75,259,407 | |
| | | | | | | | |
Household Products - 0.06% | | | | | | | | |
Procter & Gamble Co. | | | 51,278 | | | | 4,450,930 | |
| | | | | | | | |
Personal Products - 0.06% | | | | | | | | |
Coty, Inc. | | | 210,224 | | | | 4,833,050 | |
| | | | | | | | |
Tobacco - 3.02% | | | | | | | | |
Altria Group, Inc. | | | 1,102,011 | | | | 72,864,967 | |
Imperial Brands PLC, ADRB C | | | 1,277,114 | | | | 61,748,462 | |
Philip Morris International, Inc. | | | 1,071,553 | | | | 103,340,571 | |
| | | | | | | | |
| | | | | | | 237,954,000 | |
| | | | | | | | |
Total Consumer Staples | | | | | | | 411,652,250 | |
| | | | | | | | |
ENERGY - 11.61% | | | | | | | | |
Energy Equipment & Services - 0.51% | | | | | | | | |
Cobalt International Energy, Inc.A | | | 3,695,065 | | | | 3,488,511 | |
Helmerich & Payne, Inc. | | | 245,500 | | | | 15,493,505 | |
Oceaneering International, Inc. | | | 407,800 | | | | 9,705,640 | |
Schlumberger Ltd. | | | 149,615 | | | | 11,704,381 | |
| | | | | | | | |
| | | | | | | 40,392,037 | |
| | | | | | | | |
Oil & Gas - 11.10% | | | | | | | | |
Anadarko Petroleum Corp. | | | 736,800 | | | | 43,795,392 | |
Apache Corp. | | | 632,368 | | | | 37,613,249 | |
BP PLC, Sponsored ADRB C | | | 5,336,832 | | | | 189,724,378 | |
Canadian Natural Resources Ltd. | | | 2,104,303 | | | | 66,727,448 | |
Chevron Corp. | | | 104,577 | | | | 10,954,441 | |
ConocoPhillips | | | 1,549,516 | | | | 67,326,470 | |
Devon Energy Corp. | | | 1,051,166 | | | | 39,828,680 | |
EOG Resources, Inc. | | | 116,316 | | | | 10,517,293 | |
Exxon Mobil Corp. | | | 136,069 | | | | 11,337,269 | |
Hess Corp. | | | 1,198,292 | | | | 57,482,067 | |
Kosmos Energy Ltd.A | | | 1,991,145 | | | | 10,373,865 | |
Marathon Oil Corp. | | | 6,347,986 | | | | 83,666,455 | |
Marathon Petroleum Corp. | | | 1,237,639 | | | | 53,948,684 | |
Murphy Oil Corp. | | | 991,960 | | | | 25,662,005 | |
Occidental Petroleum Corp. | | | 847,616 | | | | 61,799,683 | |
Phillips 66 | | | 830,904 | | | | 67,427,860 | |
See accompanying notes
11
American Beacon Large Cap Value FundSM
Schedule of Investments
October 31, 2016
| | | | | | | | |
| | | Shares | | | Fair Value | |
ENERGY - 11.61% (continued) | | | | | | | | |
Oil & Gas - 11.10% (continued) | | | | | | | | |
Royal Dutch Shell PLC, Class A, ADRB C | | | 757,322 | | | $ | 37,722,209 | |
| | | | | | | | |
| | | | | | | 875,907,448 | |
| | | | | | | | |
Total Energy | | | | | | | 916,299,485 | |
| | | | | | | | |
FINANCIALS - 26.27% | | | | | | | | |
Banks - 2.85% | | | | | | | | |
Citizens Financial Group | | | 1,774,053 | | | | 46,728,556 | |
PNC Financial Services Group, Inc. | | | 1,114,444 | | | | 106,540,846 | |
Popular, Inc. | | | 786,700 | | | | 28,557,210 | |
Regions Financial Corp. | | | 2,064,900 | | | | 22,115,079 | |
U.S. Bancorp | | | 464,061 | | | | 20,771,370 | |
| | | | | | | | |
| | | | | | | 224,713,061 | |
| | | | | | | | |
Diversified Financials - 17.63% | | | | | | | | |
American Express Co. | | | 139,128 | | | | 9,240,882 | |
Bank of America Corp. | | | 16,788,298 | | | | 277,006,917 | |
Bank of New York Mellon Corp. | | | 273,912 | | | | 11,852,172 | |
BlackRock, Inc., Class A | | | 27,475 | | | | 9,375,569 | |
Blackstone Group, LPE | | | 2,180,248 | | | | 54,571,607 | |
Capital One Financial Corp. | | | 1,104,364 | | | | 81,767,111 | |
Citigroup, Inc. | | | 5,650,641 | | | | 277,729,005 | |
Franklin Resources, Inc. | | | 246,291 | | | | 8,290,155 | |
Goldman Sachs Group, Inc. | | | 243,929 | | | | 43,477,905 | |
JPMorgan Chase & Co. | | | 3,508,503 | | | | 242,998,918 | |
KKR & Co., LPE | | | 4,119,108 | | | | 58,450,143 | |
Moody’s Corp. | | | 56,887 | | | | 5,718,281 | |
Morgan Stanley | | | 1,284,378 | | | | 43,116,569 | |
Nasdaq OMX Group | | | 157,408 | | | | 10,069,390 | |
S&P Global, Inc. | | | 19,627 | | | | 2,391,550 | |
Santander Consumer USA Holdings, Inc. | | | 2,351,547 | | | | 28,688,873 | |
SLM Corp.A | | | 3,067,330 | | | | 21,624,677 | |
State Street Corp. | | | 598,216 | | | | 42,000,745 | |
Synchrony Financial | | | 824,787 | | | | 23,580,660 | |
Wells Fargo & Co. | | | 3,030,594 | | | | 139,437,630 | |
| | | | | | | | |
| | | | | | | 1,391,388,759 | |
| | | | | | | | |
Insurance - 5.79% | | | | | | | | |
Allstate Corp. | | | 334,047 | | | | 22,681,791 | |
American International Group, Inc. | | | 2,945,183 | | | | 181,717,791 | |
Aon PLCB | | | 151,068 | | | | 16,742,866 | |
Berkshire Hathaway, Inc., Class BA | | | 373,691 | | | | 53,923,611 | |
Chubb Ltd. | | | 160,325 | | | | 20,361,275 | |
MetLife, Inc. | | | 1,338,166 | | | | 62,840,275 | |
Prudential Financial, Inc. | | | 111,423 | | | | 9,447,556 | |
Travelers Cos., Inc. | | | 185,910 | | | | 20,111,744 | |
Unum Group | | | 776,037 | | | | 27,471,710 | |
XL Group Ltd. | | | 1,195,493 | | | | 41,483,607 | |
| | | | | | | | |
| | | | | | | 456,782,226 | |
| | | | | | | | |
Total Financials | | | | | | | 2,072,884,046 | |
| | | | | | | | |
HEALTH CARE - 11.36% | | | | | | | | |
Biotechnology - 0.54% | | | | | | | | |
Biogen Idec, Inc.A | | | 63,700 | | | | 17,847,466 | |
Gilead Sciences, Inc. | | | 339,900 | | | | 25,026,837 | |
| | | | | | | | |
| | | | | | | 42,874,303 | |
| | | | | | | | |
Health Care Equipment & Supplies - 1.80% | | | | | | | | |
Medtronic PLCB | | | 1,310,640 | | | | 107,498,693 | |
See accompanying notes
12
American Beacon Large Cap Value FundSM
Schedule of Investments
October 31, 2016
| | | | | | | | |
| | | Shares | | | Fair Value | |
HEALTH CARE - 11.36% (continued) | | | | | | | | |
Health Care Equipment & Supplies - 1.80% (continued) | | | | | | | | |
St. Jude Medical, Inc. | | | 105,139 | | | $ | 8,184,020 | |
Thermo Fisher Scientific, Inc. | | | 85,959 | | | | 12,638,552 | |
Zimmer Biomet Holdings, Inc. | | | 132,067 | | | | 13,919,862 | |
| | | | | | | | |
| | | | | | | 142,241,127 | |
| | | | | | | | |
Health Care Providers & Services - 1.88% | | | | | | | | |
Anthem, Inc. | | | 982,331 | | | | 119,706,856 | |
Cigna Corp. | | | 42,006 | | | | 4,991,573 | |
Express Scripts Holding Co.A | | | 93,068 | | | | 6,272,783 | |
Humana, Inc. | | | 64,153 | | | | 11,004,164 | |
McKesson Corp. | | | 52,650 | | | | 6,695,501 | |
| | | | | | | | |
| | | | | | | 148,670,877 | |
| | | | | | | | |
Pharmaceuticals - 7.14% | | | | | | | | |
Abbott Laboratories | | | 306,756 | | | | 12,037,105 | |
AbbVie, Inc. | | | 521,484 | | | | 29,088,378 | |
Akorn, Inc.A | | | 515,600 | | | | 12,348,620 | |
GlaxoSmithKline PLC, ADRB C | | | 1,009,934 | | | | 40,407,459 | |
Horizon Pharma PLCA B | | | 1,182,692 | | | | 19,774,610 | |
Jazz Pharmaceuticals PLCA B | | | 120,168 | | | | 13,154,791 | |
Johnson & Johnson | | | 918,979 | | | | 106,592,374 | |
Mallinckrodt PLCA B | | | 345,107 | | | | 20,451,041 | |
Merck & Co., Inc. | | | 1,290,456 | | | | 75,775,576 | |
Mylan N.V.A | | | 542,185 | | | | 19,789,753 | |
Novartis AG, ADRC | | | 34,256 | | | | 2,432,861 | |
Pfizer, Inc. | | | 3,622,421 | | | | 114,866,970 | |
Roche Holding AG, Sponsored ADRC | | | 78,323 | | | | 2,245,912 | |
Sanofi, ADRC | | | 2,399,145 | | | | 93,302,749 | |
| | | | | | | | |
| | | | | | | 562,268,199 | |
| | | | | | | | |
Total Health Care | | | | | | | 896,054,506 | |
| | | | | | | | |
INDUSTRIALS - 12.28% | | | | | | | | |
Aerospace & Defense - 3.89% | | | | | | | | |
AerCap Holdings N.V.A | | | 1,441,600 | | | | 59,264,176 | |
Boeing Co. | | | 229,785 | | | | 32,728,278 | |
Embraer S.A., ADRA C | | | 456,000 | | | | 9,753,840 | |
General Dynamics Corp. | | | 225,936 | | | | 34,057,593 | |
Lockheed Martin Corp. | | | 57,371 | | | | 14,135,067 | |
Northrop Grumman Corp. | | | 43,235 | | | | 9,900,815 | |
Raytheon Co. | | | 532,467 | | | | 72,740,317 | |
Rockwell Collins, Inc. | | | 455,739 | | | | 38,427,912 | |
United Technologies Corp. | | | 345,720 | | | | 35,332,584 | |
| | | | | | | | |
| | | | | | | 306,340,582 | |
| | | | | | | | |
Air Freight & Couriers - 0.20% | | | | | | | | |
United Parcel Service, Inc., Class B | | | 149,111 | | | | 16,068,201 | |
| | | | | | | | |
Airlines - 1.57% | | | | | | | | |
American Airlines Group, Inc. | | | 1,427,300 | | | | 57,948,380 | |
Delta Air Lines, Inc. | | | 1,581,600 | | | | 66,063,432 | |
| | | | | | | | |
| | | | | | | 124,011,812 | |
| | | | | | | | |
Commercial Services & Supplies - 0.03% | | | | | | | | |
Equifax, Inc. | | | 18,917 | | | | 2,345,140 | |
| | | | | | | | |
Construction & Engineering - 0.62% | | | | | | | | |
AECOM Technology Corp.A | | | 569,964 | | | | 15,873,497 | |
Chicago Bridge & Iron Co., N.V. | | | 672,519 | | | | 21,534,058 | |
See accompanying notes
13
American Beacon Large Cap Value FundSM
Schedule of Investments
October 31, 2016
| | | | | | | | |
| | | Shares | | | Fair Value | |
INDUSTRIALS - 12.28% (continued) | | | | | | | | |
Construction & Engineering - 0.62% (continued) | | | | | | | | |
Fluor Corp. | | | 224,400 | | | $ | 11,666,556 | |
| | | | | | | | |
| | | | | | | 49,074,111 | |
| | | | | | | | |
Diversified Manufacturing - 0.65% | | | | | | | | |
Eaton Corp., PLCB | | | 801,705 | | | | 51,124,728 | |
| | | | | | | | |
Electrical Equipment - 0.34% | | | | | | | | |
IPG Photonics Corp. | | | 273,900 | | | | 26,571,039 | |
| | | | | | | | |
Industrial Conglomerates - 1.26% | | | | | | | | |
3M Co. | | | 126,093 | | | | 20,843,173 | |
Honeywell International, Inc. | | | 717,276 | | | | 78,670,832 | |
| | | | | | | | |
| | | | | | | 99,514,005 | |
| | | | | | | | |
Machinery - 3.56% | | | | | | | | |
Caterpillar, Inc. | | | 305,714 | | | | 25,514,890 | |
CNH Industrial N.V. | | | 4,305,739 | | | | 33,498,649 | |
Cummins, Inc. | | | 448,997 | | | | 57,390,797 | |
Danaher Corp. | | | 157,084 | | | | 12,338,948 | |
Deere & Co. | | | 33,356 | | | | 2,945,335 | |
Illinois Tool Works, Inc. | | | 82,339 | | | | 9,351,240 | |
Ingersoll-Rand PLCB | | | 80,282 | | | | 5,402,176 | |
PACCAR, Inc. | | | 199,351 | | | | 10,948,357 | |
Parker Hannifin Corp. | | | 232,901 | | | | 28,588,598 | |
Pentair PLCB | | | 79,032 | | | | 4,357,034 | |
Reliance Steel & Aluminum Co. | | | 429,575 | | | | 29,546,169 | |
Terex Corp. | | | 953,010 | | | | 22,757,879 | |
Xylem, Inc. | | | 797,370 | | | | 38,536,892 | |
| | | | | | | | |
| | | | | | | 281,176,964 | |
| | | | | | | | |
Road & Rail - 0.16% | | | | | | | | |
Canadian National Railway Co. | | | 88,613 | | | | 5,571,099 | |
Union Pacific Corp. | | | 80,340 | | | | 7,084,381 | |
| | | | | | | | |
| | | | | | | 12,655,480 | |
| | | | | | | | |
Total Industrials | | | | | | | 968,882,062 | |
| | | | | | | | |
INFORMATION TECHNOLOGY - 9.55% | | | | | | | | |
Communications Equipment - 1.45% | | | | | | | | |
Cisco Systems, Inc. | | | 1,626,970 | | | | 49,915,440 | |
Corning, Inc. | | | 2,834,940 | | | | 64,381,487 | |
| | | | | | | | |
| | | | | | | 114,296,927 | |
| | | | | | | | |
Computers & Peripherals - 0.90% | | | | | | | | |
Hewlett Packard Enterprise Co. | | | 2,389,544 | | | | 53,693,054 | |
International Business Machines Corp. | | | 47,677 | | | | 7,327,478 | |
Teradata Corp.A | | | 378,794 | | | | 10,212,286 | |
| | | | | | | | |
| | | | | | | 71,232,818 | |
| | | | | | | | |
Electronic Equipment & Instruments - 0.29% | | | | | | | | |
TE Connectivity Ltd. | | | 361,800 | | | | 22,746,366 | |
| | | | | | | | |
IT Consulting & Services - 0.59% | | | | | | | | |
Accenture PLC, Class AB | | | 244,301 | | | | 28,397,548 | |
Cognizant Technology Solutions Corp., Class AA | | | 74,238 | | | | 3,812,121 | |
Fidelity National Information Services, Inc. | | | 130,776 | | | | 9,666,962 | |
Fiserv, Inc.A | | | 47,149 | | | | 4,643,234 | |
| | | | | | | | |
| | | | | | | 46,519,865 | |
| | | | | | | | |
Semiconductor Equipment & Products - 2.21% | | | | | | | | |
Analog Devices, Inc. | | | 33,353 | | | | 2,137,927 | |
See accompanying notes
14
American Beacon Large Cap Value FundSM
Schedule of Investments
October 31, 2016
| | | | | | | | |
| | | Shares | | | Fair Value | |
INFORMATION TECHNOLOGY - 9.55% (continued) | | | | | | | | |
Semiconductor Equipment & Products - 2.21% (continued) | | | | | | | | |
Applied Materials, Inc. | | | 579,625 | | | $ | 16,855,495 | |
Intel Corp. | | | 895,856 | | | | 31,238,499 | |
Micron Technology, Inc.A | | | 3,539,979 | | | | 60,746,040 | |
Qualcomm, Inc. | | | 678,608 | | | | 46,633,942 | |
Texas Instruments, Inc. | | | 236,344 | | | | 16,744,972 | |
| | | | | | | | |
| | | | | | | 174,356,875 | |
| | | | | | | | |
Semiconductors & Semiconductor Equipment - 0.07% | | | | | | | | |
Versum Materials, Inc.A | | | 229,346 | | | | 5,206,154 | |
| | | | | | | | |
Software - 4.04% | | | | | | | | |
Amdocs Ltd. | | | 37,833 | | | | 2,211,339 | |
Microsoft Corp. | | | 2,516,435 | | | | 150,784,785 | |
Navient Corp. | | | 1,693,101 | | | | 21,637,831 | |
Oracle Corp. | | | 3,762,127 | | | | 144,540,919 | |
| | | | | | | | |
| | | | | | | 319,174,874 | |
| | | | | | | | |
Total Information Technology | | | | | | | 753,533,879 | |
| | | | | | | | |
MATERIALS - 2.57% | | | | | | | | |
Chemicals - 1.90% | | | | | | | | |
AdvanSix, Inc.A | | | 21,609 | | | | 344,880 | |
Air Products & Chemicals, Inc. | | | 458,692 | | | | 61,198,687 | |
Dow Chemical Co. | | | 320,197 | | | | 17,229,801 | |
Eastman Chemical Co. | | | 253,126 | | | | 18,202,291 | |
EI du Pont de Nemours & Co. | | | 126,528 | | | | 8,703,861 | |
LyondellBasell Industries N.V., Class A | | | 217,700 | | | | 17,318,036 | |
Monsanto Co. | | | 39,956 | | | | 4,026,366 | |
PPG Industries, Inc. | | | 202,929 | | | | 18,898,778 | |
Sherwin-Williams Co. | | | 17,231 | | | | 4,219,183 | |
| | | | | | | | |
| | | | | | | 150,141,883 | |
| | | | | | | | |
Containers & Packaging - 0.21% | | | | | | | | |
Crown Holdings, Inc.A | | | 98,437 | | | | 5,340,207 | |
Packaging Corp. of America | | | 136,115 | | | | 11,229,488 | |
| | | | | | | | |
| | | | | | | 16,569,695 | |
| | | | | | | | |
Paper & Forest Products - 0.46% | | | | | | | | |
International Paper Co. | | | 409,486 | | | | 18,439,155 | |
Louisiana-Pacific Corp.A | | | 976,777 | | | | 17,923,858 | |
| | | | | | | | |
| | | | | | | 36,363,013 | |
| | | | | | | | |
Total Materials | | | | | | | 203,074,591 | |
| | | | | | | | |
REAL ESTATE - 0.31% | | | | | | | | |
Equity Real Estate Investment Trusts - 0.31% | | | | | | | | |
Two Harbors Investment Corp.F | | | 2,980,254 | | | | 24,825,516 | |
| | | | | | | | |
TELECOMMUNICATION SERVICES - 3.28% | | | | | | | | |
Diversified Telecommunication Services - 2.19% | | | | | | | | |
AT&T, Inc. | | | 1,137,026 | | | | 41,831,187 | |
Telefonaktiebolaget LM Ericsson, ADRC | | | 9,207,520 | | | | 44,840,622 | |
Verizon Communications, Inc. | | | 1,790,978 | | | | 86,146,042 | |
| | | | | | | | |
| | | | | | | 172,817,851 | |
| | | | | | | | |
Wireless Telecommunication Services - 1.09% | | | | | | | | |
China Mobile Ltd., Sponsored ADRC | | | 738,143 | | | | 42,391,552 | |
Vodafone Group PLC, ADRB C | | | 1,555,850 | | | | 43,314,864 | |
| | | | | | | | |
| | | | | | | 85,706,416 | |
| | | | | | | | |
Total Telecommunication Services | | | | | | | 258,524,267 | |
| | | | | | | | |
See accompanying notes
15
American Beacon Large Cap Value FundSM
Schedule of Investments
October 31, 2016
| | | | | | | | |
| | | Shares | | | Fair Value | |
UTILITIES - 2.47% | | | | | | | | |
Electric - 2.44% | | | | | | | | |
Calpine Corp.A | | | 4,750,278 | | | $ | 56,528,308 | |
CenterPoint Energy, Inc. | | | 1,920,602 | | | | 43,789,726 | |
Duke Energy Corp. | | | 120,784 | | | | 9,665,136 | |
Entergy Corp. | | | 577,229 | | | | 42,530,233 | |
NRG Energy, Inc. | | | 1,808,932 | | | | 19,228,947 | |
PPL Corp. | | | 292,554 | | | | 10,046,304 | |
Southern Co. | | | 200,199 | | | | 10,324,262 | |
| | | | | | | | |
| | | | | | | 192,112,916 | |
| | | | | | | | |
Multi-Utilities - 0.03% | | | | | | | | |
Xcel Energy, Inc. | | | 57,307 | | | | 2,381,106 | |
| | | | | | | | |
Total Utilities | | | | | | | 194,494,022 | |
| | | | | | | | |
Total Common Stock (Cost $6,919,143,905) | | | | | | | 7,730,659,451 | |
| | | | | | | | |
SHORT-TERM INVESTMENTS - 2.70% (Cost $213,056,490) | | | | | | | | |
American Beacon U.S. Government Money Market Select Fund, Select ClassG | | | 213,056,490 | | | | 213,056,490 | |
| | | | | | | | |
TOTAL INVESTMENTS - 100.68% (Cost $7,132,200,395) | | | | | | | 7,943,715,941 | |
LIABILITIES, NET OF OTHER ASSETS - (0.68%) | | | | | | | (53,760,778 | ) |
| | | | | | | | |
TOTAL NET ASSETS - 100.00% | | | | | | $ | 7,889,955,163 | |
| | | | | | | | |
Percentages are stated as a percent of net assets.
| A | Non-income producing security. |
| B | PLC - Public Limited Company. |
| C | ADR - American Depositary Receipt. |
| D | Non-voting participating shares. |
| E | MLP - Master Limited Partnership. |
| F | REIT - Real Estate Investment Trust. |
| G | The Fund is affiliated by having the same investment advisor. |
Futures Contracts Open on October 31, 2016:
| | | | | | | | | | | | | | | | | | | | |
| | | | | | Number of | | | | | | | | | Unrealized
Appreciation | |
Description | | Type | | | Contracts | | | Expiration Date | | | Contract Value | | | (Depreciation) | |
S&P 500 E-Mini Index Futures | | | Long | | | | 1,819 | | | | December 2016 | | | $ | 192,823,095 | | | $ | (1,333,265 | ) |
| | | | | | | | | | | | | | | | | | | | |
| | | | | | | | | | | | | | $ | 192,823,095 | | | $ | (1,333,265 | ) |
| | | | | | | | | | | | | | | | | | | | |
See accompanying notes
16
American Beacon Large Cap Value FundSM
Statement of Assets and Liabilities
October 31, 2016
| | | | |
Assets: | | | | |
Investments in unaffiliated securities, at fair value A | | $ | 7,730,659,451 | |
Investments in affiliated securities, at fair value B | | | 213,056,490 | |
Deposit with brokers for futures contracts | | | 11,598,821 | |
Receivable for investments sold | | | 30,765,204 | |
Receivable for fund shares sold | | | 2,121,790 | |
Dividends and interest receivable | | | 20,205,501 | |
Receivable for tax reclaims | | | 516,616 | |
Prepaid expenses | | | 504,423 | |
| | | | |
Total assets | | | 8,009,428,296 | |
| | | | |
Liabilities: | | | | |
Payable for investments purchased | | | 37,706,263 | |
Payable for fund shares redeemed | | | 75,358,203 | |
Management and investment advisory fees payable | | | 3,677,155 | |
Administrative service and service fees payable | | | 572,712 | |
Transfer agent fees payable | | | 79,870 | |
Custody and fund accounting fees payable | | | 283,421 | |
Professional fees payable | | | 84,429 | |
Prospectus and shareholder reports fees payable | | | 228,176 | |
Trustee fees payable | | | 33,525 | |
Payable for variation margin from open futures contracts | | | 1,329,518 | |
Other liabilities | | | 119,861 | |
| | | | |
Total liabilities | | | 119,473,133 | |
| | | | |
Net assets | | $ | 7,889,955,163 | |
| | | | |
Analysis of Net Assets: | | | | |
Paid-in-capital | | | 7,015,611,811 | |
Undistributed net investment income | | | 157,535,300 | |
Accumulated net realized (loss) | | | (93,374,228 | ) |
Unrealized appreciation of investments | | | 811,515,545 | |
Unrealized depreciation of futures contracts | | | (1,333,265 | ) |
| | | | |
Net assets | | $ | 7,889,955,163 | |
| | | | |
See accompanying notes
17
American Beacon Large Cap Value FundSM
Statement of Assets and Liabilities
October 31, 2016
| | | | |
| Shares outstanding at no par value (unlimited shares authorized): | | | | |
Institutional Class | | | 199,113,278 | |
| | | | |
Y Class | | | 13,633,017 | |
| | | | |
Investor Class | | | 93,050,896 | |
| | | | |
Advisor Class | | | 4,751,490 | |
| | | | |
A Class | | | 1,467,671 | |
| | | | |
C Class | | | 379,663 | |
| | | | |
Net assets: | | | | |
Institutional Class C | | $ | 5,137,688,375 | |
| | | | |
Y Class | | $ | 349,542,346 | |
| | | | |
Investor Class | | $ | 2,245,534,741 | |
| | | | |
Advisor Class D | | $ | 113,168,437 | |
| | | | |
A Class | | $ | 35,071,001 | |
| | | | |
C Class | | $ | 8,950,263 | |
| | | | |
Net asset value, offering and redemption price per share: | | | | |
Institutional Class C | | $ | 25.80 | |
| | | | |
Y Class | | $ | 25.64 | |
| | | | |
Investor Class | | $ | 24.13 | |
| | | | |
Advisor Class D | | $ | 23.82 | |
| | | | |
A Class | | $ | 23.90 | |
| | | | |
A Class (offering price) | | $ | 25.36 | |
| | | | |
C Class | | $ | 23.57 | |
| | | | |
A Cost of investments in unaffiliated securities | | $ | 6,919,143,905 | |
B Cost of investments in affiliated securities | | $ | 213,056,490 | |
C Includes AMR Class Assets (Note 1). | | | | |
D Includes Retirement Class Assets (Note 1). | | | | |
See accompanying notes
18
American Beacon Large Cap Value FundSM
Statement of Operations
For the year ended October 31, 2016
| | | | |
Investment income: | | | | |
Dividend income from unaffiliated securities (net of foreign taxes) A | | $ | 242,423,845 | |
Dividend income from affiliated securities | | | 329,864 | |
Interest income | | | 2,387 | |
Miscellaneous income (SEC litigation) | | | 3,463 | |
| | | | |
Total investment income | | | 242,759,559 | |
| | | | |
Expenses: | | | | |
Management and investment advisory fees (Note 2) | | | 31,756,907 | |
Administrative service fees (Note 2): | | | | |
Institutional Class B | | | 9,864,394 | |
Y Class | | | 661,211 | |
Investor Class | | | 4,415,537 | |
Advisor Class C | | | 225,527 | |
A Class | | | 63,994 | |
C Class | | | 18,547 | |
Transfer agent fees: | | | | |
Institutional Class B | | | 1,832,710 | |
Y Class | | | 11,964 | |
Investor Class | | | 93,868 | |
Advisor Class C | | | 7,614 | |
A Class | | | 3,049 | |
C Class | | | 923 | |
Custody and fund accounting fees | | | 906,654 | |
Professional fees | | | 259,871 | |
Registration fees and expenses | | | 218,719 | |
Service fees (Note 2): | | | | |
Y Class | | | 386,965 | |
Investor Class | | | 8,861,384 | |
Advisor Class C | | | 319,354 | |
A Class | | | 55,796 | |
C Class | | | 15,946 | |
Distribution fees (Note 2): | | | | |
Advisor Class C | | | 324,126 | |
A Class | | | 92,993 | |
C Class | | | 106,309 | |
Prospectus and shareholder report expenses | | | 639,008 | |
Trustee fees | | | 536,011 | |
Other expenses | | | 568,743 | |
| | | | |
Total expenses | | | 62,248,124 | |
| | | | |
Net expenses | | | 62,248,124 | |
| | | | |
Net investment income | | | 180,511,435 | |
| | | | |
Realized and unrealized gain (loss) from investments: | | | | |
Net realized gain (loss) from: | | | | |
Investments | | | 12,655,110 | |
Commission recapture (Note 1) | | | 145,831 | |
Foreign currency transactions | | | (302 | ) |
Futures contracts | | | 21,130,757 | |
Change in net unrealized appreciation (depreciation) of: | | | | |
Investments | | | (121,001,315 | ) |
Futures contracts | | | (9,701,174 | ) |
| | | | |
Net (loss) from investments | | | (96,771,093 | ) |
| | | | |
Net increase in net assets resulting from operations | | $ | 83,740,342 | |
| | | | |
A Foreign taxes | | $ | 2,550,027 | |
B Includes AMR Class Expenses (Note 1). | | | | |
C Includes Retirement Class Expenses (Note 1). | | | | |
See accompanying notes
19
American Beacon Large Cap Value FundSM
Statement of Changes in Net Assets
| | | | | | | | |
| | | Year Ended
October 31, 2016 | | | Year Ended
October 31, 2015 | |
Increase (Decrease) in Net Assets: | | | | | | | | |
Operations: | | | | | | | | |
Net investment income | | $ | 180,511,435 | | | $ | 201,033,970 | |
Net realized gain (loss) from investments, commission recapture, and futures contracts | | | 33,931,396 | | | | 1,203,995,675 | |
Change in net unrealized appreciation (depreciation) from investments, foreign currency, and futures contracts | | | (130,702,489 | ) | | | (1,484,220,925 | ) |
| | | | | | | | |
Net increase (decrease) in net assets resulting from operations | | | 83,740,342 | | | | (79,191,280 | ) |
| | | | | | | | |
Distributions to Shareholders: | | | | | | | | |
Net investment income: | | | | | | | | |
Institutional Class A | | | (112,844,075 | ) | | | (124,763,801 | ) |
Y Class | | | (7,022,245 | ) | | | (9,069,998 | ) |
Investor Class | | | (44,777,647 | ) | | | (80,020,378 | ) |
Advisor Class B | | | (2,064,915 | ) | | | (3,032,969 | ) |
Retirement Class | | | — | | | | (253,722 | ) |
A Class | | | (682,320 | ) | | | (602,546 | ) |
C Class | | | (109,038 | ) | | | (150,764 | ) |
AMR Class | | | — | | | | (19,775,107 | ) |
Net realized gain from investments: | | | | | | | | |
Institutional Class A | | | (517,703,342 | ) | | | (375,074,205 | ) |
Y Class | | | (34,252,889 | ) | | | (27,794,219 | ) |
Investor Class | | | (267,451,860 | ) | | | (281,034,917 | ) |
Advisor Class B | | | (13,186,133 | ) | | | (10,664,945 | ) |
Retirement Class | | | — | | | | (961,019 | ) |
A Class | | | (3,722,088 | ) | | | (1,967,168 | ) |
C Class | | | (1,104,967 | ) | | | (725,312 | ) |
AMR Class | | | — | | | | (52,660,349 | ) |
| | | | | | | | |
Net distributions to shareholders | | | (1,004,921,519 | ) | | | (988,551,419 | ) |
| | | | | | | | |
Capital Share Transactions: | | | | | | | | |
Proceeds from sales of shares | | | 1,146,991,291 | | | | 2,349,907,135 | |
Reinvestment of dividends and distributions | | | 959,961,629 | | | | 953,936,966 | |
Cost of shares redeemed | | | (3,312,409,718 | ) | | | (3,646,861,648 | ) |
| | | | | | | | |
Net (decrease) in net assets from capital share transactions | | | (1,205,456,798 | ) | | | (343,017,547 | ) |
| | | | | | | | |
Net (decrease) in net assets | | | (2,126,637,975 | ) | | | (1,410,760,246 | ) |
| | | | | | | | |
Net Assets: | | | | | | | | |
Beginning of period | | | 10,016,593,138 | | | | 11,427,353,384 | |
| | | | | | | | |
End of Period * | | $ | 7,889,955,163 | | | $ | 10,016,593,138 | |
| | | | | | | | |
*Includes undistributed (overdistribution of) net investment income | | $ | 157,535,300 | | | $ | 148,695,713 | |
| | | | | | | | |
A Includes AMR Class Distributions (Note 1). | | | | | | | | |
B Includes Retirement Class Distributions (Note 1). | | | | | | | | |
See accompanying notes
20
American Beacon Large Cap Value FundSM
Notes to Financial Statements
October 31, 2016
1. Organization and Significant Accounting Policies
American Beacon Funds (the “Trust”), is organized as a Massachusetts business trust and is registered under the Investment Company Act of 1940, as amended (the “Act”), as a diversified, open-end management investment company. As of October 31, 2016, the Trust consists of twenty-five active series, one of which is presented in this filing (the “Fund”): American Beacon Large Cap Value Fund. The remaining twenty-four active series are reported in separate filings.
American Beacon Advisors, Inc. (the “Manager”) is a wholly-owned subsidiary of Astro AB Borrower, Inc., which is indirectly owned by investment funds affiliated with Kelso & Company, L.P. and Estancia Capital Management, LLC, and was organized in 1986 to provide business management, advisory, administrative and asset management consulting services to the Trust and other investors.
Class Disclosure
The AMR Class closed on May 31, 2016, and the shares merged into the Institutional Class. The Retirement class closed on January 15, 2016, and the shares were merged into the Advisor Class.
The Fund has multiple classes of shares designed to meet the needs of different groups of investors. The following table sets forth the differences amongst the classes:
| | | | | | |
Class | | Eligible Investors | | Minimum Initial
Investments | |
Institutional | | Large institutional investors - sold directly or through intermediary channels. | | $ | 250,000 | |
Y Class | | Large institutional retirement plan investors - sold directly or through intermediary channels. | | $ | 100,000 | |
Investor | | All investors using intermediary organizations such as broker-dealers or retirement plan sponsors - sold directly through intermediary channels. | | $ | 2,500 | |
Advisor Class | | All investors who invest through intermediary organizations, such as broker-dealers or third party administrators. | | $ | 2,500 | |
A Class | | All investors who invest through intermediary organizations, such as broker-dealers or third party administrator. Retail investors who invest directly through a financial intermediary such as a broker, bank, or registered investment advisor, which may include a front-end sales charge and a contingent deferred sales charge (“CDSC”). | | $ | 2,500 | |
C Class | | Retail investors who invest directly through a financial intermediary such as a broker or employee directed benefit plans with applicable sales charges, which may include CDSC. | | $ | 1,000 | |
Each class offered by the Trust has equal rights as to assets and voting privileges. Income and non-class specific expenses are allocated daily to each class on the basis of the relative net assets. Realized and unrealized capital gains and losses of each class are allocated daily based on the relative net assets of each class of the respective Fund. Class specific expenses, where applicable, currently include administrative service fees, service fees, and distribution fees and vary amongst the classes as described more fully in Note 2.
The following is a summary of significant accounting policies, consistently followed by the Fund in preparation of the financial statements. The Fund is considered an investment company and accordingly, follow the investment company accounting and reporting guidance of the Financial Accounting Standards Board Accounting Standard Codification Topic 946, Financial Services - Investment Companies, which is part of U.S. Generally Accepted Accounting Principles (“U.S. GAAP”).
Security Transactions and Investment Income
Security transactions are recorded on the trade date of the security purchase or sale. The Fund may purchase securities with delivery or payment to occur at a later date. At the time the Fund enters into a commitment to
21
American Beacon Large Cap Value FundSM
Notes to Financial Statements
October 31, 2016
purchase a security, the transaction is recorded, and the value of the security is reflected in the Net Asset Value (“NAV”). The value of the security may vary with market fluctuations.
Dividend income, net of foreign taxes, is recorded on the ex-dividend date, except certain dividends from foreign securities which are recorded as soon as the information is available to the Fund. Interest income is earned from settlement date, recorded on the accrual basis, and adjusted, if necessary, for accretion of discounts and amortization of premiums. For financial and tax reporting purposes, realized gains and losses are determined on the basis of specific lot identification.
Dividends to Shareholders
Dividends from net investment income of the Fund normally will be declared and paid at least annually. Distributions, if any, of net realized capital gains are generally paid at least annually and recorded on the ex-dividend date. Dividends to shareholders are determined in accordance with federal income tax regulations, which may differ in amount and character from net investment income and realized gains recognized for purposes of U.S. GAAP. To the extent necessary to fully distribute capital gains, the Fund also designates earnings and profits distributed to shareholders on the redemption of shares.
Commission Recapture
The Fund has established brokerage commission recapture arrangements with certain brokers or dealers. If the Fund’s investment advisor chooses to execute a transaction through a participating broker, the broker rebates a portion of the commission back to the Fund. Any collateral benefit received through participation in the commission recapture program is directed exclusively to the Fund. This amount is reported with the net realized gain on the Fund’s Statement of Operations.
Allocation of Income, Expenses, Gains, and Losses
Income, expenses (other than those attributable to a specific class), gains, and losses are allocated daily to each class of shares based upon the relative proportion of net assets represented by such class. Operating expenses directly attributable to a specific class are charged against the operations of that class.
Use of Estimates
The preparation of financial statements in conformity with U.S. GAAP requires management to make estimates and assumptions that affect the amounts reported in the financial statements and accompanying notes. Actual results may differ from those estimated.
Other
Under the Trust’s organizational documents, its officers and trustees are indemnified against certain liability arising out of the performance of their duties to the Trust. In the normal course of business, the Trust enters into contracts that provide indemnification to the other party or parties against potential costs or liabilities. The Trust’s maximum exposure under these arrangements is dependent on claims that may be made in the future and, therefore, cannot be estimated. The Trust has had no prior claims or losses pursuant to any such agreement.
2. Transactions with Affiliates
Management Agreement
From November 1, 2015 to May 29, 2016 the Trust and the Manager were parties to a Management Agreement that obligated the Manager to provide or oversee the provision of all investment advisory, fund management, and securities lending services. As compensation for performing the duties required under the Management Agreement,
22
American Beacon Large Cap Value FundSM
Notes to Financial Statements
October 31, 2016
the Manager received from the Fund an annualized fee equal to 0.05% of the average daily net assets. Effective May 29, 2016, the Fund and the Manager entered a Management Agreement that obligates the Manager to provide investment advisory, fund management, and administrative services to the Fund. As compensation for performing the duties under the Management Agreement, the Manager receives from the Fund an annualized fee at the following annual rates as a percentage of average daily net assets: 0.35% of the first $15 billion, 0.325% of the next $15 billion, and 0.30% of the next $30 billion. The Fund also pays the unaffiliated investment advisors hired to direct investment activities of the Fund an annualized investment advisory fee based on a percentage of the Fund’s average daily assets. Management fees paid by the Fund during the year ended October 31, 2016 were as follows:
| | | | | | |
Management Fee Rate | | Management Fee | | Amounts paid to Investment Advisors | | Amounts Paid to Manager |
0.53% | | $31,756,907 | | $16,123,290 | | $15,633,617 |
Administration Agreement
From November 1, 2015 to May 29, 2016, the Manager and the Trust were parties to an Administrative Agreement which obligated the Manager to provide or oversee administrative services to the Fund. As compensation for performing the duties required under the Administrative Agreement, the Manager received an annualized fee of 0.30% of the average daily net assets of the Institutional, Y, Investor, A, and C Classes of the Fund.
Distribution Plans
The Fund, except for the Advisor, A, and C Classes of the Fund, has adopted a “defensive” Distribution Plan (the “Plan”) in accordance with Rule 12b-1 under the Act, pursuant to which no separate fees may be charged to the Fund for distribution purposes. However, the Plan authorizes the management and administrative service fees received by the Manager and the investment advisors hired by the Manager to be used for distribution purposes. Under this Plan, the Fund does not intend to compensate the Manager or any other party, either directly or indirectly, for the distribution of Fund shares.
Separate Distribution Plans (the “Distribution Plans”) have been adopted pursuant to Rule 12b-1 under the Act for the Advisor, A and C Classes of the Fund. Under the Distribution Plans, as compensation for distribution assistance, the Manager receives an annual fee of 0.25% of the average daily net assets of the Advisor and A Classes and 1.00% of the average daily net assets of the C Class. The fee will be payable without regard to whether the amount of the fee is more or less than the actual expenses incurred in a particular month by the Manager for distribution assistance.
Service Plans
The Manager and the Trust entered into Service Plans that obligate the Manager to oversee additional shareholder servicing of the Investor, advisor, A and C Classes of the Fund. As compensation for performing the duties required under the Service Plans, the Manager receives 0.10% of the average daily net assets of the Y Class, 0.15% of the average daily net assets of the A and C Classes, 0.25% of the average daily net assets of the Advisor Class, and up to 0.375% of the average daily net assets of the Investor Class of the Fund.
Sub-Transfer Agent Fees
The Manager has entered into agreements, which include servicing agreements, with financial intermediaries that provide recordkeeping, processing, shareholder communications and other services to customers of the intermediaries that hold positions in the Institutional Class of the Fund and has agreed to compensate the intermediaries for providing these services. Intermediaries transact with the Fund primarily through the use of omnibus accounts on behalf of its customers who hold positions in the Fund. Certain services would have been provided by the Fund’s transfer agent and other service providers if the shareholders’ accounts were maintained directly by the Fund’s transfer agent. Accordingly, the Fund, pursuant to the Trust’s Board of Trustees (the “Board”)
23
American Beacon Large Cap Value FundSM
Notes to Financial Statements
October 31, 2016
approval, has agreed to reimburse the Manager for all or a portion of the servicing fees paid to these intermediaries for the Institutional Class. The reimbursement amounts (sub-transfer agent fees) paid to the Manager are subject to a fee limit of up to 0.10% of an intermediaries average net assets in the Institutional Class on an annual basis.
For the year ended October 31, 2016, the sub-transfer agent fees, as reflected in “Transfer agent fees” in the Statement of Operations, were as follows:
| | | | |
Fund | | Sub-Transfer Agent Fees | |
Large Cap Value | | $ | 1,651,538 | |
As of October 31, 2016, the Fund owes the Manager the following reimbursement of sub-transfer agent fees, as reflect in “Transfer agent fees Payable” in the Statement of Assets and Liabilities.
| | | | |
Fund | | Reimbursement of
Sub-Transfer Agent Fees | |
Large Cap Value | | $ | 57,317 | |
Investment in Affiliated Funds
The Fund may invest in the American Beacon U.S. Government Money Market Select Fund (the “USG Select Fund”). The Fund and the USG Select Fund have the same investment advisor and therefore, are considered to be affiliated. The Manager serves as investment advisor to the USG Select Fund and receives management fees totaling 0.10% of its average daily net assets of the USG Select Fund. During the year ended October 31, 2016, the Manager earned fees totaling $117,880 on the Fund’s direct investments in the USG Select Fund.
Interfund Lending Program
Pursuant to an exemptive order issued by the Securities and Exchange Commission (“SEC”), the Fund, along with other registered investment companies having management contracts with the Manager, may participate in an interfund lending program as a borrower. This program provides an alternative credit facility allowing the Fund to borrow from other participating Funds. During the year ended October 31, 2016, the Fund participated as a lender by loaning, $20,142,926 for 2 days at an average rate of 0.99% with interest charges earned of $1,099. This amount is included in “Interest income” on the Statement of Operations.
Expense Reimbursement Plan
The Fund has adopted an Expense Reimbursement Plan whereby the Manager may seek repayment of fees waived or expenses reimbursed for a period of up to three years. However, reimbursement will occur only if the Class’ average net assets have grown or expenses have declined sufficiently to allow reimbursement without causing its expense ratio to exceed the previously agreed upon contractual expense limit. During the year ended October 31, 2016, there were no waived fees, expenses reimbursed, or recovered expenses.
Sales Commissions
The Fund’s distributor, Foreside Fund Services, LLC (“Foreside”), may receive a portion of A Class sales charges from broker dealers and it may be used to offset distribution related expenses. For the year ended October 31, 2016, Foreside collected $3,143 from the sale of Class A Shares.
A CDSC of 0.50% will be deducted with respect to Class A Shares on certain purchases of $1,000,000 or more that are redeemed in whole or part within 18 months of purchase, unless waived as discussed in the Prospectus. Any applicable CDSC will be 0.50% of the lesser of the original purchase price or the value of the redemption of the Class A Shares redeemed. During the year ended October 31, 2016, $1,255 in CDSC fees were collected for Class A Shares of the Fund.
24
American Beacon Large Cap Value FundSM
Notes to Financial Statements
October 31, 2016
A CDSC of 1.00% will be deducted with respect to Class C Shares redeemed within 12 months of purchase, unless waived as discussed in the Prospectus. Any applicable CDSC will be 1.00% of the lesser of the original purchase price or the value of the redemption of the Class C Shares redeemed. During the year ended October 31, 2016, $2,143 in CDSC fees were collected for Class C Shares of the Fund.
Trustee Fees and Expenses
Effective July 1, 2016, as compensation for their service to the Trust and the American Beacon Select Funds, each Trustee receives an annual retainer of $120,000, plus $5,000 for each Board of Trustee meeting attended in person or via teleconference, $2,500 for attendance by Committee members at meetings of the Audit Committee and the Investment Committee, and $1,500 for attendance by Committee members at meetings of the Nominating and Governance Committee, plus reimbursement of reasonable expenses incurred in attending Board meetings, Committee meetings, and relevant educational seminars. The Trustees also may be compensated for attendance at special Board and/or Committee meetings from time to time. The Board Chairman receives an additional annual retainer of $50,000 as well as a single $5,000 fee each quarter for his attendance at the committee meetings. The chairpersons of the Audit Committee and the Investment Committee each receive an additional annual retainer of $25,000 and the Chairman of the Nominating and Governance Committee receives an additional annual retainer of $10,000. These expenses are allocated on a prorated basis to each Fund of the Trust according to its respective net assets.
3. Security Valuation and Fair Value Measurements
Investments are valued at the close of the New York Stock Exchange (the “Exchange”), normally 4:00 p.m. Eastern Time, each day that the Exchange is open for business. Equity securities, including exchange-traded funds (“ETFs”), for which market quotations are available are valued at the last sale price or official closing price (closing bid price or last evaluated quote if no sale has occurred) on the primary market or exchange on which they trade.
Investments in open-end mutual funds are valued at the closing NAV per share of the mutual fund on the day of valuation.
Securities for which the market prices are not readily available or are not reflective of the fair value of the security, as determined by the Manager, will be priced at fair value following procedures approved by the Board.
Futures contracts are valued based upon their quoted daily settlement prices. Upon entering into a futures contract, the Fund is required to deposit with its futures broker, an amount of cash or U.S. Government and Agency Obligations in accordance with the initial margin requirements of the broker or exchange. Futures contracts are marked to market daily and an appropriate payable or receivable for the change in value (“variation margin”) is recorded by the Fund. Gains or losses are recognized, but not considered realized until the contracts expire or are closed. Futures contracts involve, to varying degrees, risk of loss in excess of the variation margin disclosed on the Statement of Assets and Liabilities.
Other
Under the Trust’s organizational documents, its officers and trustees are indemnified against certain liabilities arising out of the performance of their duties to the Trust. In the normal course of business, the Trust enters into contracts that provide indemnification to the other party or parties against potential costs or liabilities. The Trust’s maximum exposure under these arrangements is dependent on claims that may be made in the future and, therefore, cannot be estimated. The Trust has had no prior claims or losses pursuant to any such agreement.
25
American Beacon Large Cap Value FundSM
Notes to Financial Statements
October 31, 2016
Valuation Inputs
Various inputs may be used to determine the fair value of the Fund’s investments. These inputs are summarized in three broad levels for financial statement purposes. The inputs or methodologies used to value securities are not necessarily an indication of the risk associated with investing in those securities.
| | |
| Level 1 - | | Quoted prices in active markets for identical securities. |
| |
| Level 2 - | | Prices determined using other significant observable inputs. These may include quoted prices for similar securities, interest rates, prepayment speeds, credit risk, and others. Fixed-income securities are considered Level 2 as they are valued using observable inputs. |
| |
| Level 3 - | | Prices determined using other significant unobservable inputs. Unobservable inputs reflect the Fund’s own assumptions about the factors market participants would use in pricing an investment. |
Level 1 and Level 2 trading assets and trading liabilities, at fair value
Common stocks and financial derivative instruments, such as futures contracts that are traded on a national securities exchange, are stated at the last reported sale or settlement price on the day of valuation. To the extent these securities are actively traded and valuation adjustments are not applied, they are categorized as Level 1 of the fair value hierarchy. Preferred securities and other equities traded on inactive markets or valued by reference to similar instruments are generally categorized as Level 2 of the fair value hierarchy.
Investments in registered open-end investment management companies will be valued based upon the NAVs of such investments and are categorized as Level 1 of the fair value hierarchy.
The Fund’s investments are summarized by level based on the inputs used to determine their values. As of October 31, 2016, the investments were classified as described on the following page below:
| | | | | | | | | | | | | | | | |
Large Cap Value Fund(1) | | Level 1 | | | Level 2 | | | Level 3 | | | Total | |
Common Stock | | $ | 7,730,659,451 | | | $ | — | | | $ | — | | | $ | 7,730,659,451 | |
Short-Term Investments - Money Market Funds | | | 213,056,490 | | | | — | | | | — | | | | 213,056,490 | |
| | | | | | | | | | | | | | | | |
Total Investments in Securities | | $ | 7,943,715,941 | | | $ | — | | | $ | — | | | $ | 7,943,715,941 | |
| | | | | | | | | | | | | | | | |
Financial Derivative Instruments - Liabilities | | | | | | | | | | | | | | | | |
Futures Contracts | | $ | (1,333,265 | ) | | $ | — | | | $ | — | | | $ | (1,333,265 | ) |
| | | | | | | | | | | | | | | | |
Total Financial Derivative Instruments - Liabilities | | $ | (1,333,265 | ) | | $ | — | | | $ | — | | | $ | (1,333,265 | ) |
| | | | | | | | | | | | | | | | |
| (1) | Refer to the Schedule of Investments for industry information. |
U.S. GAAP requires all transfers between any levels to be disclosed. The end of period timing recognition has been adopted for the transfers between levels the Fund’s assets and liabilities. During the year ended October 31, 2016, there were no transfers between levels.
4. Securities and Other Investments
American Depositary Receipts (“ADRs”)
ADRs are depositary receipts for foreign issuers in registered form traded in U.S. securities markets. Depositary receipts may not be denominated in the same currency as the securities into which they may be converted. Investing in depositary receipts entails substantially the same risks as direct investment in foreign securities. There is generally less publicly available information about foreign companies and there may be less governmental regulation and supervision of foreign stock exchanges, brokers and listed companies. In addition, such companies may use different accounting and financial standards (and certain currencies may become unavailable for transfer from a foreign currency), resulting in the Fund’s possible inability to convert immediately into U.S. currency proceeds realized upon the sale of portfolio securities of the affected foreign companies. In addition, the
26
American Beacon Large Cap Value FundSM
Notes to Financial Statements
October 31, 2016
Fund may invest in unsponsored depositary receipts, the issuers of which are not obligated to disclose material information about the underlying securities to investors in the United States. Ownership of unsponsored depositary receipts may not entitle the Fund to the same benefits and rights as ownership of a sponsored depositary receipt or the underlying security.
Real Estate Investment Trusts
The Fund may own shares of real estate investment trusts (“REITS”) which report information on the source of their distributions annually. The Fund re-characterizes distributions received from REIT investments based on information provided by the REITs into the following categories: ordinary income, long-term capital gains, and return of capital. If information is not available on a timely basis from the REITs, the re-characterization will be estimated based on available information which may include the previous year allocation. If new or additional information becomes available from the REITs at a later date, a re-characterization will be made the following year. These re-characterizations are not recorded for financial statement purposes, but as an adjustment to the calculation of taxable income.
Other Investment Company Securities and Other Exchange Traded Products
The Fund may invest in shares of other investment companies, including open-end funds, closed-end funds, business development companies, ETFs, unit investment trusts, and other investment companies of the Trust. The Fund may invest in investment company securities advised by the Manager or a sub-advisor. Investments in the securities of other investment companies may involve duplication of advisory fees and certain other expenses. By investing in another investment company, a Fund becomes a shareholder of that investment company. As a result, Fund shareholders indirectly will bear a Fund’s proportionate share of the fees and expenses paid by shareholders of the other investment company, in addition to the fees and expenses Fund shareholders directly bear in connection with the Fund’s own operations. These other fees and expenses are reflected as Acquired Fund Fees and Expenses and are included in the Fees and Expenses Table for the Fund in its Prospectus, if applicable. Investments in other investment companies may involve the payment of substantial premiums above the value of such issuer’s portfolio securities.
5. Financial Derivative Instruments
The Fund may utilize derivative instruments to gain market exposure on cash balances or reduce market exposure in anticipation of liquidity needs. When considering the Fund’s use of derivatives, it is important to note that the Fund does not use derivatives for the purpose of creating financial leverage.
Futures Contracts
Futures contracts are contracts to buy or sell a standard quantity of securities at a specified price on a future date. The Fund may enter into financial futures contracts as a method for keeping assets readily convertible to cash if needed to meet shareholder redemptions or for other needs while maintaining exposure to the stock or bond market, as applicable. The primary risks associated with the use of futures contracts are the possibility of illiquid markets or imperfect correlation between the values of the contracts and the underlying securities, or that the counterparty will fail to perform its obligations.
Upon entering into a futures contract, the Fund is required to set aside or deposit with a broker an amount, termed the initial margin, which typically represents a portion of the face value of the futures contract. The Fund usually reflects this amount on the Schedule of Investments as a U.S. Treasury Bill held as collateral for futures contracts or as Cash deposited with broker on the Statement of Assets and Liabilities. Payments to and from the broker, known as variation margin, are required to be made on a daily basis as the price of the futures contract fluctuates. Changes in initial settlement values are accounted for as unrealized appreciation (depreciation) until the contracts are terminated, at which time realized gains and losses are recognized. Futures contracts are valued at the most recent settlement price established each day by the exchange on which they are traded.
27
American Beacon Large Cap Value FundSM
Notes to Financial Statements
October 31, 2016
For the year ended October 31, 2016, the Fund entered into futures contracts primarily for exposing cash to markets.
The Fund’s futures contracts outstanding fluctuate throughout the operating year as required to meet strategic requirements. The following table illustrates the average quarterly volume of futures contracts. For purpose of this disclosure, volume is measured by contracts outstanding at each quarter end.
| | | | |
Number of Futures Contracts Outstanding | |
Fund | | Year ended October 31, 2016 | |
Large Cap Value | | | 2,219 | |
The following is a summary of the Fund’s derivative financial instruments categorized by risk exposure (1):
Fair Values of financial derivative instruments not accounted for as hedging instruments as of October 31, 2016:
| | | | | | | | |
Statement of Assets and Liabilities | | Derivative | | | Total | |
Payable for variation margin from open futures contracts(2) | | | Equity Contracts | | | $ | (1,333,265 | ) |
The effect of financial derivative instruments not accounted for as hedging instruments during the year ended October 31, 2016:
| | | | | | | | |
Statement of Operations | | Derivative | | | Total | |
Net realized gain (loss) from futures contracts | | | Equity Contracts | | | $ | 21,130,757 | |
Change in net unrealized appreciation (depreciation) from futures contracts | | | Equity Contracts | | | | (9,701,174 | ) |
| (1) | See Note 3 in the Notes to Financial Statements for additional information. |
| (2) | Includes cumulative appreciation (depreciation) of futures contracts as reported in the Schedule of Investments footnotes. Only current day’s variation margin is reported within the Statement of Assets and Liabilities. |
6. Principal Risks
In the normal course of business the Fund trades financial instruments and enters into financial transactions where risk of potential loss exists. Security values fluctuate (market risk) and may decline due to factors affecting securities markets in general, particular industries represented in the securities markets or conditions specifically related to a particular company. Failure of the other party to a transaction to perform (credit and counterparty risk), for example by not making principal and interest payments when due, reduces the value of the issuer’s debt and could reduce the Fund’s income. Similar to credit risk, the Fund may be exposed to counterparty risk, or the risk that an institution or other entity with which the Fund has unsettled or open transactions will fail to make required payments or otherwise comply with the terms of the instrument, transaction or contract. The potential loss could exceed the value of the financial assets recorded in the financial statements. Some of the Fund’s investments may be illiquid and the Fund may not be able to vary the portfolio investments in response to changes in economic and other conditions. If the Fund is required to liquidate all or a portion of its investments quickly, the Fund may realize significantly less than the value at which it previously recorded those investments.
Market Risks
If the Fund’s investments in financial derivatives and other financial instruments expose the Fund to various risks such as, but not limited to, interest rate, foreign currency and equity risks.
Interest rate risk is the risk that fixed-income securities will decline in value because of changes in interest rates. As nominal interest rates rise, the value of certain fixed-income securities held by the Fund is likely to decrease. A nominal interest rate can be described as the sum of a real interest rate and an expected inflation rate. Fixed-income securities with longer durations tend to be more sensitive to changes in interest rates, usually making them more volatile than securities with shorter durations. Duration is useful primarily as a measure of the sensitivity of a fixed-income’s market price to interest rate (i.e. yield) movements.
28
American Beacon Large Cap Value FundSM
Notes to Financial Statements
October 31, 2016
If the Fund invests directly in foreign currencies or in securities that trade in, and receive revenues in, foreign currencies, or in financial derivatives that provide exposure to foreign currencies, they will be subject to the risk that those currencies will decline in value relative to the base currency of the Fund, or, in the case of hedging positions, that the Fund’s base currency will decline in value relative to the currency being hedged. Currency rates in foreign countries may fluctuate significantly over short periods of time for a number of reasons, including changes in interest rates, intervention (or the failure to intervene) by U.S. or foreign governments, central banks or supranational entities such as the International Monetary Fund, or by the imposition of currency controls or other political developments in the United States or abroad. As a result, the Fund’s investments in foreign currency denominated securities may reduce the returns of the Fund.
The fair values of equities, such as common stocks and preferred securities or equity related investments such as futures, may decline due to general market conditions which are not specifically related to a particular company, such as real or perceived adverse economic conditions, changes in the general outlook for corporate earnings, changes in interest or currency rates or adverse investor sentiment generally. They may also decline due to factors which affect a particular industry or industries, such as labor shortages or increased production costs and competitive conditions within an industry. Equity securities and equity related investments generally have greater market price volatility than fixed-income securities.
Credit and Counterparty Risk
A derivative contract may suffer a mark-to-market loss if the value of the contract decreases due to an unfavorable change in the market rates or values of the underlying instrument. Losses can also occur if the counterparty does not perform under the contract.
With exchange-traded futures, there is less counterparty credit risk to the Fund since the exchange or clearinghouse, as counterparty to such instruments, guarantees against a possible default. The clearinghouse stands between the buyer and the seller of the contract; therefore, the credit risk is limited to failure of the clearinghouse in the event of a default (including the bankruptcy or insolvency) of the clearinghouse. While offset rights may exist under applicable law, a Fund does not have a contractual right of offset against a clearing broker or clearinghouse in the event of a default (including the bankruptcy or insolvency) of the clearing broker or clearinghouse. Additionally, credit risk exists in exchange traded futures with respect to initial and variation margin that is held in a clearing broker’s customer accounts. While clearing brokers are required to segregate customer margin from their own assets, in the event that a clearing broker becomes insolvent or goes into bankruptcy and at that time there is a shortfall in the aggregate amount of margin held by the clearing broker for all its clients, typically the shortfall would be allocated on a pro rata basis across all the clearing broker’s customers, potentially resulting in losses to the Fund.
Cash collateral that has been pledged to cover obligations of the Fund and cash collateral received from the counterparty, if any, is reported separately on the Statement of Assets and Liabilities as “Deposits with brokers for futures contracts” and “Payable to brokers for futures contracts”, respectively. Non-cash collateral pledged by the Fund, if any, is noted in the Schedule of Investments. Generally, the amount of collateral due from or to a party is determined at the close of business of the Fund and additional required collateral is delivered to/pledged by the Fund on the next business day. To the extent amounts due to the Fund from its counterparties are not fully collateralized, contractually or otherwise, the Fund bears the risk of loss from counterparty non-performance. The Fund attempts to mitigate counterparty risk by only entering into agreements with counterparties that it believes have the financial resources to honor their obligations and by monitoring the financial stability of those counterparties.
Offsetting Assets and Liabilities
The Fund is a party to enforceable master netting agreements between brokers and counterparties which provides for the right to offset under certain circumstances. The Fund employs multiple money managers and
29
American Beacon Large Cap Value FundSM
Notes to Financial Statements
October 31, 2016
counterparties and has elected not to offset qualifying financial and derivative instruments on the Statement of Assets and Liabilities, as such all financial and derivative instruments are presented on a gross basis. The impacts of netting arrangements that provide the right to offset are detailed below. The net amount represents the net receivable or payable that would be due from or to the counterparty in the event of default. Exposure from borrowings and other financing agreements can only be netted across transactions governed by the same Master Agreement with the same legal entity. All amounts reported below represent the balance as of the report date, October 31, 2016:
Offsetting of Financial Liabilities and Derivative Liabilities as of October 31, 2016:
| | | | | | | | | | | | |
Description | | Gross Amounts
of Recognized
Liabilities | | | Gross Amounts Offset in the
Statement of Assets and
Liabilities | | | Net Amounts of Liabilities
Presented in the
Statement of Assets and
Liabilities | |
Futures Contracts (1) | | $ | (1,333,265 | ) | | $ | — | | | $ | (1,333,265 | ) |
Financial Liabilities, Derivative Liabilities, and Collateral Pledged by Counterparty as of October 31, 2016:
| | | | | | | | | | | | | | | | |
| | | | | | Gross Amounts Not Offset in the | |
| | | Net amount of Assets | | | Statement of Assets and Liabilities | |
Counterparty | | Presented in the Statement of
Assets and Liabilities | | | Financial
Instruments | | | Cash Collateral
Received | | | Net Amount | |
Goldman Sachs & Co.(1) | | $ | (1,333,265 | ) | | $ | — | | | $ | — | | | $ | (1,333,265 | ) |
| (1) | The securities presented here within are not subject to Master Netting Agreements. As such, this is disclosed for informational purposes only. |
7. Federal Income and Excise Taxes
It is the policy of the Fund to qualify as a regulated investment company (“RIC”), by complying with all applicable provisions of Subchapter M of the Internal Revenue Code, as amended, and to make distribution of taxable income sufficient to relieve it from substantially all federal income and excise taxes. For federal income tax purposes, the Fund is treated as a single entity for the purpose of determining such qualification.
The Fund does not have any unrecognized tax benefits in the accompanying financial statements. Each of the tax years in the four year period ended October 31, 2016 remain subject to examination by the Internal Revenue Service. If applicable, the Fund recognizes interest accrued related to unrecognized tax benefits in interest expense and penalties in “Other expenses” on the Statement of Operations.
The Fund may be subject to taxes imposed by countries in which it invests. Such taxes are generally based on returns of income earned or gains realized or repatriated. Taxes are accrued and applied to net investment income, net realized capital gains and net unrealized appreciation (depreciation), as applicable, as the income is earned or capital gains are recorded.
Dividends are categorized in accordance with income tax regulations which may treat certain transactions differently than U.S. GAAP. Accordingly, the character of distributions and composition of net assets for tax purposes may differ from those reflected in the accompanying financial statements.
30
American Beacon Large Cap Value FundSM
Notes to Financial Statements
October 31, 2016
The tax character of distributions paid are as follows:
| | | | | | | | |
| | | Year Ended
October 31, 2016 | | | Year Ended
October 31, 2015 | |
Distributions paid from: | | | | | | | | |
Ordinary Income* | | | | | | | | |
Institutional ClassA | | $ | 120,640,471 | | | $ | 124,763,801 | |
Y Class | | | 7,538,079 | | | | 9,069,998 | |
Investor Class | | | 48,805,360 | | | | 80,020,378 | |
Advisor ClassB | | | 2,263,492 | | | | 3,032,969 | |
Retirement Class | | | — | | | | 253,722 | |
A Class | | | 738,373 | | | | 602,546 | |
C Class | | | 125,679 | | | | 150,764 | |
AMR Class | | | — | | | | 19,775,107 | |
Capital Gains | | | | | | | | |
Institutional ClassA | | | 509,906,946 | | | | 375,074,205 | |
Y Class | | | 33,737,055 | | | | 27,794,219 | |
Investor Class | | | 263,424,147 | | | | 281,034,917 | |
Advisor ClassB | | | 12,987,556 | | | | 10,664,944 | |
Retirement Class | | | — | | | | 961,019 | |
A Class | | | 3,666,035 | | | | 1,967,168 | |
C Class | | | 1,088,326 | | | | 725,312 | |
AMR Class | | | — | | | | 52,660,349 | |
| | | | | | | | |
Total distributions paid | | $ | 1,004,921,519 | | | $ | 988,551,418 | |
| | | | | | | | |
| * | For tax purposes, short-term capital gains are considered ordinary income distributions. |
| A | Includes AMR Class Distributions (Note1). |
| B | Includes Retirement Class Distributions (Note1). |
As of October 31, 2016, the components of distributable earnings (deficits) on a tax basis were as follows:
| | | | |
Cost basis of investments for federal income tax purposes | | $ | 7,279,348,173 | |
Unrealized appreciation | | | 1,318,106,635 | |
Unrealized depreciation | | | (653,738,868 | ) |
| | | | |
Net unrealized appreciation (depreciation) | | | 664,367,767 | |
Undistributed ordinary income | | | 145,903,351 | |
Undistributed long-term capital gains | | | 64,071,134 | |
Accumulated capital and other losses | | | 1,333,265 | |
Other temporary differences | | | (1,332,165 | ) |
| | | | |
Distributable earnings (deficits) | | $ | 874,343,352 | |
| | | | |
Financial reporting records are adjusted for permanent book/tax differences to reflect tax character. Financial records are not adjusted for temporary differences. The temporary differences between financial reporting and tax-basis reporting of unrealized appreciation (depreciation) are attributable primarily to the tax deferral of losses from wash sales, the realization for tax purposes of unrealized gains (losses) on certain derivative instruments and reclassifications of income from real estate investment securities and publicly traded partnerships.
Due to inherent differences in the recognition of income, expenses and realized gains (losses) under U.S. GAAP and federal income tax regulations, permanent differences between book and tax reporting have been identified and appropriately reclassified on the Statement of Assets and Liabilities.
31
American Beacon Large Cap Value FundSM
Notes to Financial Statements
October 31, 2016
Accordingly, the following amounts represent current year permanent differences derived from foreign currency reclasses, reclassifications of income from real estate investment securities and publicly traded partnerships and Section 732 basis adjustments as of October 31, 2016:
| | | | |
Paid-in-capital | | $ | 2,571 | |
Undistributed net investment income (loss) | | | (4,171,607 | ) |
Accumulated net realized gain (loss) | | | 4,169,037 | |
Unrealized appreciation (depreciation) of investments and futures contracts | | | (1 | ) |
Under the Regulated Investment Company Modernization Act of 2010 (the “RICMOD”), net capital losses recognized by the Fund in taxable years beginning after December 22, 2010 are carried forward indefinitely and retain their character as short-term and/or long-term losses.
For the year ended October 31, 2016, the Fund did not have capital loss carryforwards.
8. Investment Transactions
The aggregate cost of purchases and proceeds from sales of investments, other than short-term obligations, for the year ended October 31, 2016, were $2,194,480,669 and $4,174,345,112, respectively.
A summary of the Fund’s direct transactions in the USG Select Fund for the year ended October 31, 2016 are as follows:
| | | | | | | | | | | | | | | | | | |
October 31, 2015
Shares/Fair Value | | | Purchases | | | Sales | | | October 31, 2016
Shares/Fair Value | | | Dividend Income | |
| $ | 30,000,000 | | | $ | 2,763,171,476 | | | $ | 2,580,114,986 | | | $ | 213,056,490 | | | $ | 329,864 | |
9. Capital Share Transactions
The tables below summarize the activity in capital shares for each Class of the Fund:
| | | | | | | | | | | | | | | | |
| | | Institutional Class | |
| | | Year Ended October 31, | |
| | | 2016A | | | 2015 | |
Large Cap Value Fund | | Shares | | | Amount | | | Shares | | | Amount | |
Shares sold | | | 29,011,141 | | | $ | 723,886,356 | | | | 53,940,136 | | | $ | 1,563,915,553 | |
Reinvestment of dividends | | | 24,324,597 | | | | 594,255,276 | | | | 16,487,630 | | | | 483,582,192 | |
Shares redeemed | | | (73,620,802 | ) | | | (1,858,257,006 | ) | | | (38,409,329 | ) | | | (1,127,129,052 | ) |
| | | | | | | | | | | | | | | | |
Net increase (decrease) in shares outstanding | | | (20,285,064 | ) | | $ | (540,115,374 | ) | | | 32,018,437 | | | $ | 920,368,693 | |
| | | | | | | | | | | | | | | | |
| |
| | | Y Class | |
| | | Year Ended October 31, | |
| | | 2016 | | | 2015 | |
Large Cap Value Fund | | Shares | | | Amount | | | Shares | | | Amount | |
Shares sold | | | 3,157,381 | | | $ | 76,912,328 | | | | 4,072,105 | | | $ | 118,729,192 | |
Reinvestment of dividends | | | 1,654,777 | | | | 40,194,522 | | | | 1,220,185 | | | | 35,592,785 | |
Shares redeemed | | | (6,036,346 | ) | | | (152,194,349 | ) | | | (4,444,927 | ) | | | (126,502,782 | ) |
| | | | | | | | | | | | | | | | |
Net increase (decrease) in shares outstanding | | | (1,224,188 | ) | | $ | (35,087,499 | ) | | | 847,363 | | | $ | 27,819,195 | |
| | | | | | | | | | | | | | | | |
| |
| | | Investor Class | |
| | | Year Ended October 31, | |
| | | 2016 | | | 2015 | |
Large Cap Value Fund | | Shares | | | Amount | | | Shares | | | Amount | |
Shares sold | | | 12,986,515 | | | $ | 300,013,977 | | | | 20,038,116 | | | $ | 556,589,704 | |
Reinvestment of dividends | | | 13,342,014 | | | | 305,665,560 | | | | 12,465,533 | | | | 344,921,297 | |
Shares redeemed | | | (51,928,422 | ) | | | (1,209,650,645 | ) | | | (54,777,328 | ) | | | (1,503,115,041 | ) |
| | | | | | | | | | | | | | | | |
Net (decrease) in shares outstanding | | | (25,599,893 | ) | | $ | (603,971,108 | ) | | | (22,273,679 | ) | | $ | (601,604,040 | ) |
| | | | | | | | | | | | | | | | |
32
American Beacon Large Cap Value FundSM
Notes to Financial Statements
October 31, 2016
| | | | | | | | | | | | | | | | |
| | | Advisor Class | |
| | | Year Ended October 31, | |
| | | 2016B | | | 2015 | |
Large Cap Value Fund | | Shares | | | Amount | | | Shares | | | Amount | |
Shares sold | | | 1,415,449 | | | $ | 30,873,647 | | | | 1,284,314 | | | $ | 35,421,241 | |
Reinvestment of dividends | | | 640,459 | | | | 14,483,364 | | | | 477,303 | | | | 13,073,330 | |
Shares redeemed | | | (3,029,002 | ) | | | (69,204,203 | ) | | | (1,531,067 | ) | | | (41,776,253 | ) |
| | | | | | | | | | | | | | | | |
Net increase (decrease) in shares outstanding | | | (973,094 | ) | | $ | (23,847,192 | ) | | | 230,550 | | | $ | 6,718,318 | |
| | | | | | | | | | | | | | | | |
| |
| | | Retirement Class | |
| | | Year Ended October 31, | |
| | | 2016 | | | 2015 | |
Large Cap Value Fund | | Shares | | | Amount | | | Shares | | | Amount | |
Shares sold | | | — | | | $ | — | | | | 158,425 | | | $ | 4,293,423 | |
Reinvestment of dividends | | | — | | | | — | | | | 45,141 | | | | 1,214,741 | |
Shares redeemed | | | — | | | | — | | | | (259,651 | ) | | | (6,873,024 | ) |
| | | | | | | | | | | | | | | | |
Net (decrease) in shares outstanding | | | — | | | $ | — | | | | (56,085 | ) | | $ | (1,364,860 | ) |
| | | | | | | | | | | | | | | | |
| |
| | | A Class | |
| | | Year Ended October 31, | |
| | | 2016 | | | 2015 | |
Large Cap Value Fund | | Shares | | | Amount | | | Shares | | | Amount | |
Shares sold | | | 569,278 | | | $ | 13,371,912 | | | | 954,410 | | | $ | 26,677,074 | |
Reinvestment of dividends | | | 189,233 | | | | 4,295,607 | | | | 86,705 | | | | 2,383,513 | |
Shares redeemed | | | (776,999 | ) | | | (17,974,601 | ) | | | (330,481 | ) | | | (9,157,669 | ) |
| | | | | | | | | | | | | | | | |
Net increase (decrease) in shares outstanding | | | (18,488 | ) | | $ | (307,082 | ) | | | 710,634 | | | $ | 19,902,918 | |
| | | | | | | | | | | | | | | | |
| |
| | | C Class | |
| | | Year Ended October 31, | |
| | | 2016 | | | 2015 | |
Large Cap Value Fund | | Shares | | | Amount | | | Shares | | | Amount | |
Shares sold | | | 82,706 | | | $ | 1,933,071 | | | | 177,393 | | | $ | 4,792,256 | |
Reinvestment of dividends | | | 47,350 | | | | 1,067,300 | | | | 27,874 | | | | 733,653 | |
Shares redeemed | | | (223,857 | ) | | | (5,128,914 | ) | | | (73,993 | ) | | | (1,965,588 | ) |
| | | | | | | | | | | | | | | | |
Net increase (decrease) in shares outstanding | | | (93,801 | ) | | $ | (2,128,543 | ) | | | 130,274 | | | $ | 3,560,321 | |
| | | | | | | | | | | | | | | | |
| |
| | | AMR Class | |
| | | Year Ended October 31, | |
| | | 2016 | | | 2015 | |
Large Cap Value Fund | | Shares | | | Amount | | | Shares | | | Amount | |
Shares sold | | | — | | | $ | — | | | | 1,347,254 | | | $ | 39,488,692 | |
Reinvestment of dividends | | | — | | | | — | | | | 2,502,953 | | | | 72,435,455 | |
Shares redeemed | | | — | | | | — | | | | (29,482,787 | ) | | | (830,342,239 | ) |
| | | | | | | | | | | | | | | | |
Net (decrease) in shares outstanding | | | — | | | $ | — | | | | (25,632,580 | ) | | $ | (718,418,092 | ) |
| | | | | | | | | | | | | | | | |
A Includes AMR Class transactions (Note 1). | | | | | |
B Includes Retirement Class transactions (Note 1). | | | | | |
10. Subsequent Events
Management has evaluated subsequent events for possible recognition or disclosure in the financial statements through the date the financial statements are issued. Management has determined that there are no material events that would require disclosure in the Fund’s financial statements through this date.
33
American Beacon Large Cap Value FundSM
Financial Highlights
(For a share outstanding throughout the period)
| | | | | | | | | | | | | | | | | | | | |
| | | Institutional ClassB | |
| | | Year Ended
October 31, | |
| | | 2016 | | | 2015 | | | 2014 | | | 2013 | | | 2012 | |
Net asset value, beginning of period | | $ | 28.38 | | | $ | 31.21 | | | $ | 27.59 | | | $ | 21.58 | | | $ | 18.99 | |
| | | | | | | | | | | | | | | | | | | | |
Income (loss) from investment operations: | | | | | | | | | | | | | | | | | | | | |
Net investment income | | | 0.61 | | | | 0.55 | | | | 0.73 | | | | 0.50 | | | | 0.45 | |
Net gains (losses) from investments (both realized and unrealized) | | | (0.29 | ) | | | (0.70 | ) | | | 3.33 | | | | 6.00 | | | | 2.60 | |
| | | | | | | | | | | | | | | | | | | | |
Total income (loss) from investment operations | | | 0.32 | | | | (0.15 | ) | | | 4.06 | | | | 6.50 | | | | 3.05 | |
| | | | | | | | | | | | | | | | | | | | |
Less distributions: | | | | | | | | | | | | | | | | | | | | |
Dividends from net investment income | | | (0.52 | ) | | | (0.67 | ) | | | (0.44 | ) | | | (0.49 | ) | | | (0.46 | ) |
Distributions from net realized gains | | | (2.38 | ) | | | (2.01 | ) | | | — | | | | — | | | | — | |
| | | | | | | | | | | | | | | | | | | | |
Total distributions | | | (2.90 | ) | | | (2.68 | ) | | | (0.44 | ) | | | (0.49 | ) | | | (0.46 | ) |
| | | | | | | | | | | | | | | | | | | | |
Net asset value, end of period | | $ | 25.80 | | | $ | 28.38 | | | $ | 31.21 | | | $ | 27.59 | | | $ | 21.58 | |
| | | | | | | | | | | | | | | | | | | | |
Total return A | | | 1.69 | % | | | (0.76 | )% | | | 14.89 | % | | | 30.70 | % | | | 16.48 | % |
| | | | | | | | | | | | | | | | | | | | |
Ratios and supplemental data: | | | | | | | | | | | | | | | | | | | | |
Net assets, end of period | | $ | 5,137,688,375 | | | $ | 6,198,883,300 | | | $ | 5,816,013,064 | | | $ | 5,428,755,279 | | | $ | 3,914,172,668 | |
Ratios to average net assets: | | | | | | | | | | | | | | | | | | | | |
Expenses, before reimbursements | | | 0.60 | % | | | 0.58 | % | | | 0.58 | % | | | 0.58 | % | | | 0.59 | % |
Expenses, net of reimbursements | | | 0.60 | % | | | 0.58 | % | | | 0.58 | % | | | 0.58 | % | | | 0.59 | % |
Net investment income, before reimbursements | | | 2.16 | % | | | 1.88 | % | | | 2.35 | % | | | 1.99 | % | | | 2.23 | % |
Net investment income, net of reimbursements | | | 2.16 | % | | | 1.88 | % | | | 2.35 | % | | | 1.99 | % | | | 2.23 | % |
Portfolio turnover rate | | | 25 | % | | | 32 | % | | | 29 | % | | | 34 | % | | | 30 | % |
| |
| | | Y Class | |
| | | Year Ended
October 31, | |
| | | 2016 | | | 2015 | | | 2014 | | | 2013 | | | 2012 | |
Net asset value, beginning of period | | $ | 28.21 | | | $ | 31.04 | | | $ | 27.46 | | | $ | 21.47 | | | $ | 18.92 | |
| | | | | | | | | | | | | | | | | | | | |
Income (loss) from investment operations: | | | | | | | | | | | | | | | | | | | | |
Net investment income | | | 0.59 | | | | 0.56 | | | | 0.64 | | | | 0.40 | | | | 0.53 | |
Net gains (losses) from investments (both realized and unrealized) | | | (0.29 | ) | | | (0.72 | ) | | | 3.37 | | | | 6.05 | | | | 2.50 | |
| | | | | | | | | | | | | | | | | | | | |
Total income (loss) from investment operations | | | 0.30 | | | | (0.16 | ) | | | 4.01 | | | | 6.45 | | | | 3.03 | |
| | | | | | | | | | | | | | | | | | | | |
Less distributions: | | | | | | | | | | | | | | | | | | | | |
Dividends from net investment income | | | (0.49 | ) | | | (0.66 | ) | | | (0.43 | ) | | | (0.46 | ) | | | (0.48 | ) |
Distributions from net realized gains | | | (2.38 | ) | | | (2.01 | ) | | | — | | | | — | | | | — | |
| | | | | | | | | | | | | | | | | | | | |
Total distributions | | | (2.87 | ) | | | (2.67 | ) | | | (0.43 | ) | | | (0.46 | ) | | | (0.48 | ) |
| | | | | | | | | | | | | | | | | | | | |
Net asset value, end of period | | $ | 25.64 | | | $ | 28.21 | | | $ | 31.04 | | | $ | 27.46 | | | $ | 21.47 | |
| | | | | | | | | | | | | | | | | | | | |
Total return A | | | 1.61 | % | | | (0.80 | )% | | | 14.78 | % | | | 30.59 | % | | | 16.43 | % |
| | | | | | | | | | | | | | | | | | | | |
Ratios and supplemental data: | | | | | | | | | | | | | | | | | | | | |
Net assets, end of period | | $ | 349,542,346 | | | $ | 419,096,844 | | | $ | 434,880,702 | | | $ | 327,938,666 | | | $ | 88,508,971 | |
Ratios to average net assets: | | | | | | | | | | | | | | | | | | | | |
Expenses, before reimbursements | | | 0.67 | % | | | 0.67 | % | | | 0.67 | % | | | 0.66 | % | | | 0.69 | % |
Expenses, net of reimbursements | | | 0.67 | % | | | 0.67 | % | | | 0.67 | % | | | 0.66 | % | | | 0.69 | % |
Net investment income, before reimbursements | | | 2.08 | % | | | 1.80 | % | | | 2.24 | % | | | 1.78 | % | | | 2.12 | % |
Net investment income, net of reimbursements | | | 2.08 | % | | | 1.80 | % | | | 2.24 | % | | | 1.78 | % | | | 2.12 | % |
Portfolio turnover rate | | | 25 | % | | | 32 | % | | | 29 | % | | | 34 | % | | | 30 | % |
| A | Based on net asset value, which does not reflect the sales charge, redemption fee, or contingent deferred sales charge, if applicable. May include adjustments in accordance with U.S. GAAP and as such, the net asset value for reporting purposes and the returns based upon those net asset values may differ from the net asset value and returns for shareholder transactions. |
| B | On May 31, 2016, the AMR Class closed and the assets were merged into the Institutional Class. |
34
American Beacon Large Cap Value FundSM
Financial Highlights
(For a share outstanding throughout the period)
| | | | | | | | | | | | | | | | | | | | |
| | | Investor Class | |
| | | Year Ended
October 31, | |
| | | 2016 | | | 2015 | | | 2014 | | | 2013 | | | 2012 | |
Net asset value, beginning of period | | $ | 26.70 | | | $ | 29.51 | | | $ | 26.11 | | | $ | 20.43 | | | $ | 17.99 | |
| | | | | | | | | | | | | | | | | | | | |
Income (loss) from investment operations: | | | | | | | | | | | | | | | | | | | | |
Net investment income | | | 0.46 | | | | 0.45 | | | | 0.57 | | | | 0.39 | | | | 0.36 | |
Net gains (losses) from investments (both realized and unrealized) | | | (0.25 | ) | | | (0.68 | ) | | | 3.18 | | | | 5.69 | | | | 2.47 | |
| | | | | | | | | | | | | | | | | | | | |
Total income (loss) from investment operations | | | 0.21 | | | | (0.23 | ) | | | 3.75 | | | | 6.08 | | | | 2.83 | |
| | | | | | | | | | | | | | | | | | | | |
Less distributions: | | | | | | | | | | | | | | | | | | | | |
Dividends from net investment income | | | (0.40 | ) | | | (0.57 | ) | | | (0.35 | ) | | | (0.40 | ) | | | (0.39 | ) |
Distributions from net realized gains | | | (2.38 | ) | | | (2.01 | ) | | | — | | | | — | | | | — | |
| | | | | | | | | | | | | | | | | | | | |
Total distributions | | | (2.78 | ) | | | (2.58 | ) | | | (0.35 | ) | | | (0.40 | ) | | | (0.39 | ) |
| | | | | | | | | | | | | | | | | | | | |
Net asset value, end of period | | $ | 24.13 | | | $ | 26.70 | | | $ | 29.51 | | | $ | 26.11 | | | $ | 20.43 | |
| | | | | | | | | | | | | | | | | | | | |
Total return A | | | 1.33 | % | | | (1.07 | )% | | | 14.50 | % | | | 30.26 | % | | | 16.05 | % |
| | | | | | | | | | | | | | | | | | | | |
Ratios and supplemental data: | | | | | | | | | | | | | | | | | | | | |
Net assets, end of period | | $ | 2,245,534,741 | | | $ | 3,167,585,961 | | | $ | 4,158,361,296 | | | $ | 3,899,010,929 | | | $ | 3,635,332,581 | |
Ratios to average net assets: | | | | | | | | | | | | | | | | | | | | |
Expenses, before reimbursements | | | 0.93 | % | | | 0.93 | % | | | 0.93 | % | | | 0.93 | % | | | 0.96 | % |
Expenses, net of reimbursements | | | 0.93 | % | | | 0.93 | % | | | 0.93 | % | | | 0.93 | % | | | 0.96 | % |
Net investment income, before reimbursements | | | 1.84 | % | | | 1.54 | % | | | 2.01 | % | | | 1.67 | % | | | 1.89 | % |
Net investment income, net of reimbursements | | | 1.84 | % | | | 1.54 | % | | | 2.01 | % | | | 1.67 | % | | | 1.89 | % |
Portfolio turnover rate | | | 25 | % | | | 32 | % | | | 29 | % | | | 34 | % | | | 30 | % |
| |
| | | Advisor ClassB | |
| | | Year Ended
October 31, | |
| | | 2016 | | | 2015 | | | 2014 | | | 2013 | | | 2012 | |
Net asset value, beginning of period | | $ | 26.40 | | | $ | 29.24 | | | $ | 25.89 | | | $ | 20.25 | | | $ | 17.83 | |
| | | | | | | | | | | | | | | | | | | | |
Income (loss) from investment operations: | | | | | | | | | | | | | | | | | | | | |
Net investment income | | | 0.40 | | | | 0.40 | | | | 0.47 | | | | 0.35 | | | | 0.31 | |
Net gains (losses) from investments (both realized and unrealized) | | | (0.22 | ) | | | (0.66 | ) | | | 3.20 | | | | 5.65 | | | | 2.48 | |
| | | | | | | | | | | | | | | | | | | | |
Total income (loss) from investment operations | | | 0.18 | | | | (0.26 | ) | | | 3.67 | | | | 6.00 | | | | 2.79 | |
| | | | | | | | | | | | | | | | | | | | |
Less distributions: | | | | | | | | | | | | | | | | | | | | |
Dividends from net investment income | | | (0.38 | ) | | | (0.57 | ) | | | (0.32 | ) | | | (0.36 | ) | | | (0.37 | ) |
Distributions from net realized gains | | | (2.38 | ) | | | (2.01 | ) | | | — | | | | — | | | | — | |
| | | | | | | | | | | | | | | | | | | | |
Total distributions | | | (2.76 | ) | | | (2.58 | ) | | | (0.32 | ) | | | (0.36 | ) | | | (0.37 | ) |
| | | | | | | | | | | | | | | | | | | | |
Net asset value, end of period | | $ | 23.82 | | | $ | 26.40 | | | $ | 29.24 | | | $ | 25.89 | | | $ | 20.25 | |
| | | | | | | | | | | | | | | | | | | | |
Total return A | | | 1.21 | % | | | (1.19 | )% | | | 14.31 | % | | | 30.05 | % | | | 15.96 | % |
| | | | | | | | | | | | | | | | | | | | |
Ratios and supplemental data: | | | | | | | | | | | | | | | | | | | | |
Net assets, end of period | | $ | 113,168,437 | | | $ | 140,975,319 | | | $ | 149,422,940 | | | $ | 128,528,036 | | | $ | 103,628,855 | |
Ratios to average net assets: | | | | | | | | | | | | | | | | | | | | |
Expenses, before reimbursements | | | 1.08 | % | | | 1.07 | % | | | 1.07 | % | | | 1.07 | % | | | 1.08 | % |
Expenses, net of reimbursements | | | 1.08 | % | | | 1.07 | % | | | 1.07 | % | | | 1.07 | % | | | 1.08 | % |
Net investment income, before reimbursements | | | 1.69 | % | | | 1.40 | % | | | 1.83 | % | | | 1.52 | % | | | 1.78 | % |
Net investment income, net of reimbursements | | | 1.69 | % | | | 1.40 | % | | | 1.83 | % | | | 1.52 | % | | | 1.78 | % |
Portfolio turnover rate | | | 25 | % | | | 32 | % | | | 29 | % | | | 34 | % | | | 30 | % |
| A | Based on net asset value, which does not reflect the sales charge, redemption fee, or contingent deferred sales charge, if applicable. May include adjustments in accordance with U.S. GAAP and as such, the net asset value for reporting purposes and the returns based upon those net asset values may differ from the net asset value and returns for shareholder transactions. |
| B | On January 15, 2016, the Retirement Class closed and the assets were merged into the Advisor Class. |
35
American Beacon Large Cap Value FundSM
Financial Highlights
(For a share outstanding throughout the period)
| | | | | | | | | | | | | | | | | | | | |
| | | A Class | |
| | | Year Ended
October 31, | |
| | | 2016 | | | 2015 | | | 2014 | | | 2013 | | | 2012 | |
Net asset value, beginning of period | | $ | 26.51 | | | $ | 29.38 | | | $ | 26.03 | | | $ | 20.41 | | | $ | 18.01 | |
| | | | | | | | | | | | | | | | | | | | |
Income (loss) from investment operations: | | | | | | | | | | | | | | | | | | | | |
Net investment income | | | 0.42 | | | | 0.47 | | | | 0.54 | | | | 0.38 | | | | 0.36 | |
Net gains (losses) from investments (both realized and unrealized) | | | (0.21 | ) | | | (0.71 | ) | | | 3.16 | | | | 5.65 | | | | 2.44 | |
| | | | | | | | | | | | | | | | | | | | |
Total income (loss) from investment operations | | | 0.21 | | | | (0.24 | ) | | | 3.70 | | | | 6.03 | | | | 2.80 | |
| | | | | | | | | | | | | | | | | | | | |
Less distributions: | | | | | | | | | | | | | | | | | | | | |
Dividends from net investment income | | | (0.44 | ) | | | (0.62 | ) | | | (0.35 | ) | | | (0.41 | ) | | | (0.40 | ) |
Distributions from net realized gains | | | (2.38 | ) | | | (2.01 | ) | | | — | | | | — | | | | — | |
| | | | | | | | | | | | | | | | | | | | |
Total distributions | | | (2.82 | ) | | | (2.63 | ) | | | (0.35 | ) | | | (0.41 | ) | | | (0.40 | ) |
| | | | | | | | | | | | | | | | | | | | |
Net asset value, end of period | | $ | 23.90 | | | $ | 26.51 | | | $ | 29.38 | | | $ | 26.03 | | | $ | 20.41 | |
| | | | | | | | | | | | | | | | | | | | |
Total return A | | | 1.33 | % | | | (1.14 | )% | | | 14.37 | % | | | 30.03 | % | | | 15.91 | % |
| | | | | | | | | | | | | | | | | | | | |
Ratios and supplemental data: | | | | | | | | | | | | | | | | | | | | |
Net assets, end of period | | $ | 35,071,001 | | | $ | 39,401,153 | | | $ | 22,781,918 | | | $ | 11,904,903 | | | $ | 6,222,523 | |
Ratios to average net assets: | | | | | | | | | | | | | | | | | | | | |
Expenses, before reimbursements | | | 0.98 | % | | | 0.97 | % | | | 1.04 | % | | | 1.08 | % | | | 1.12 | % |
Expenses, net of reimbursements | | | 0.98 | % | | | 0.97 | % | | | 1.04 | % | | | 1.08 | % | | | 1.12 | % |
Net investment income, before reimbursements | | | 1.78 | % | | | 1.48 | % | | | 1.83 | % | | | 1.44 | % | | | 1.66 | % |
Net investment income, net of reimbursements | | | 1.78 | % | | | 1.48 | % | | | 1.83 | % | | | 1.44 | % | | | 1.66 | % |
Portfolio turnover rate | | | 25 | % | | | 32 | % | | | 29 | % | | | 34 | % | | | 30 | % |
| |
| | | C Class | |
| | | Year Ended
October 31, | |
| | | 2016 | | | 2015 | | | 2014 | | | 2013 | | | 2012 | |
Net asset value, beginning of period | | $ | 26.17 | | | $ | 29.03 | | | $ | 25.81 | | | $ | 20.29 | | | $ | 17.95 | |
| | | | | | | | | | | | | | | | | | | | |
Income (loss) from investment operations: | | | | | | | | | | | | | | | | | | | | |
Net investment income | | | 0.20 | | | | 0.27 | | | | 0.35 | | | | 0.23 | | | | 0.22 | |
Net gains (losses) from investments (both realized and unrealized) | | | (0.19 | ) | | | (0.70 | ) | | | 3.11 | | | | 5.58 | | | | 2.42 | |
| | | | | | | | | | | | | | | | | | | | |
Total income (loss) from investment operations | | | 0.01 | | | | (0.43 | ) | | | 3.46 | | | | 5.81 | | | | 2.64 | |
| | | | | | | | | | | | | | | | | | | | |
Less distributions: | | | | | | | | | | | | | | | | | | | | |
Dividends from net investment income | | | (0.23 | ) | | | (0.42 | ) | | | (0.24 | ) | | | (0.29 | ) | | | (0.30 | ) |
Distributions from net realized gains | | | (2.38 | ) | | | (2.01 | ) | | | — | | | | — | | | | — | |
| | | | | | | | | | | | | | | | | | | | |
Total distributions | | | (2.61 | ) | | | (2.43 | ) | | | (0.24 | ) | | | (0.29 | ) | | | (0.30 | ) |
| | | | | | | | | | | | | | | | | | | | |
Net asset value, end of period | | $ | 23.57 | | | $ | 26.17 | | | $ | 29.03 | | | $ | 25.81 | | | $ | 20.29 | |
| | | | | | | | | | | | | | | | | | | | |
Total return A | | | 0.51 | % | | | (1.83 | )% | | | 13.48 | % | | | 29.00 | % | | | 14.97 | % |
| | | | | | | | | | | | | | | | | | | | |
Ratios and supplemental data: | | | | | | | | | | | | | | | | | | | | |
Net assets, end of period | | $ | 8,950,263 | | | $ | 12,389,141 | | | $ | 9,964,292 | | | $ | 5,199,605 | | | $ | 2,468,569 | |
Ratios to average net assets: | | | | | | | | | | | | | | | | | | | | |
Expenses, before reimbursements | | | 1.74 | % | | | 1.73 | % | | | 1.79 | % | | | 1.84 | % | | | 1.88 | % |
Expenses, net of reimbursements | | | 1.74 | % | | | 1.73 | % | | | 1.81 | % | | | 1.92 | % | | | 1.87 | % |
Net investment income, before reimbursements | | | 1.02 | % | | | 0.73 | % | | | 1.09 | % | | | 0.68 | % | | | 0.89 | % |
Net investment income, net of reimbursements | | | 1.02 | % | | | 0.73 | % | | | 1.07 | % | | | 0.60 | % | | | 0.89 | % |
Portfolio turnover rate | | | 25 | % | | | 32 | % | | | 29 | % | | | 34 | % | | | 30 | % |
| A | Based on net asset value, which does not reflect the sales charge, redemption fee, or contingent deferred sales charge, if applicable. May include adjustments in accordance with U.S. GAAP and as such, the net asset value for reporting purposes and the returns based upon those net asset values may differ from the net asset value and returns for shareholder transactions. |
36
American Beacon Large Cap Value FundSM
Federal Tax Information
October 31, 2016 (Unaudited)
Certain tax information regarding the Fund is required to be provided to shareholders based upon the Fund’s income and distribution for the taxable year ended October 31, 2016. The information and distributions reported herein may differ from information and distributions taxable to the shareholders for the calendar year ended December 31, 2016.
The Fund designated the following items with regard to distributions paid during the year ended December 31, 2015. All designations are based on financial information available as of this annual report and, accordingly, are subject to change. For each item, it is the intention of the Fund to designate the maximum amount permitted under the Internal Revenue Code of 1986, as amended, and the regulations there under.
| | | | |
Corporate Dividends Received Deduction | | | 75.46 | % |
Qualified Dividend Income | | | 100.00 | % |
The Fund designated $824,810,065 as long-term capital gain distributions and $12,628,416 short- term capital gains for the year ended October 31, 2016.
Shareholders will receive notification in January 2017 of the applicable tax information necessary to prepare their 2016 income tax returns.
37
Disclosure Regarding Approval of the Management and Investment Advisory Agreements of the Funds (Unaudited)
Renewal and Approval of the Management Agreement and Investment Advisory Agreements of the Fund in June 2016
At in-person meetings held on May 17, 2016 and June 8, 2016 (collectively, the “Meetings”), the Board considered and then, at its June 8th meeting, approved the renewal of: (1) the Management Agreement between American Beacon Advisors, Inc. (“Manager”) and the American Beacon Funds (the “Trust”) on behalf of the American Beacon Large Cap Value Fund (“Fund”); and (2) the investment advisory agreements (the “Investment Advisory Agreements”) among the Manager, the Trust, on behalf of the Fund, and Barrow, Hanley, Mewhinney & Strauss, LLC (“Barrow”), Brandywine Global Investment Management, LLC (“Brandywine”), Hotchkis and Wiley Capital Management, LLC (“Hotchkis”) and Massachusetts Financial Services Company (“MFS”), (collectively, the “subadvisors”). The Management Agreement and the Investment Advisory Agreements are collectively referred to herein as the “Agreements.” In preparation for the Board to consider the renewal of these Agreements, the Board undertook steps to gather and consider information furnished by the Manager, the subadvisors, Broadridge, Inc. (“Broadridge”) and Morningstar, Inc. (“Morningstar”). The Board, with the assistance of independent legal counsel, requested and received certain relevant information from the Manager and each subadvisor.
In advance of the Meetings, the Board’s Investment Committee and/or the Manager coordinated the production of information from Broadridge and Morningstar regarding the performance, fees and expenses of the Fund as well as information from the Manager and the subadvisors. At the Meetings, the Board considered the information provided. The Board noted that as a result of the acquisition of Lipper, Inc. (“Lipper”) by Broadridge, Lipper expense and performance information was provided by Broadridge. Further, the Board took into consideration information furnished for the Board’s review and consideration throughout the year at regular meetings of the Board and its committees, as well as information specifically prepared in connection with the renewal process.
In connection with the Board’s consideration of the Agreements, the Trustees received and evaluated such information as they deemed necessary. The information requested on behalf of the Board included, among other information, the following materials. References herein to the “firm” refer to the Manager and/or the subadvisors.
| | • | | comparisons of the performance of an appropriate share class of the Fund to comparable investment companies and appropriate benchmark indices, including peer group averages and performance analyses provided by Broadridge and Morningstar, and to the performance of any similar accounts managed by the firm; |
| | • | | comparisons of the Fund’s management and subadvisory fee rates and expense ratio with the management fee rates paid by comparable mutual funds, including peer group averages and fee and expense analyses provided by Broadridge and Morningstar, and the advisory fee rates charged to other clients for which similar services are provided; |
| | • | | a description of any applicable fee waivers and/or expense reimbursements in place for the Fund during the past year, and any proposed changes to the expense caps; |
| | • | | the Manager’s profitability with respect to the services that it provided to the Fund; |
| | • | | any actual or anticipated economies of scale in relation to the services the firm provides or will provide to the Fund and whether the current fee rates charged or to be charged to the Fund reflect these economies of scale for the benefit of the Fund’s investors; |
| | • | | an evaluation of any other benefits to the firm or Fund as a result of their relationship, if any; |
| | • | | information regarding the securities lending, cash management, administrative and accounting-related services that the Manager provides to the Fund, as applicable, and the fees that the Manager receives for such services; and |
| | • | | information regarding a firm’s financial condition, the personnel of the Manager who are assigned primary responsibility for managing the Fund, staffing levels, portfolio managers’ compensation, disaster recovery plans, insurance coverage, material pending litigation, code of ethics, compliance matters, trading activities, and actual or potential conflicts of interest that the firm experiences, or anticipates that it will experience, in providing services to the Fund. |
38
Disclosure Regarding Approval of the Management and Investment Advisory Agreements of the Funds (Unaudited)
The Board noted that the Manager provides management and administrative services to the Fund pursuant to the Management Agreement. The Board considered that prior to May 29, 2016, the Manager provided management and administrative services to the Fund pursuant to separate agreements. The Board noted, in this regard, that many mutual funds have separate contracts governing both types of services, and observed that the actual management fee rates provided by Broadridge for peer group funds reflect the combined advisory and administrative expenses, both gross and net of any waivers and/or reimbursements.
Certain firms may not have been able to, or opted not to, provide information in response to certain information requests, in which case the Board conducted its evaluation of the firm based on information that was provided. In such cases, the Board determined that the omission of any such information was not material to its considerations. The class of shares used for comparative performance purposes was the share class with the lowest expenses available for purchase by the general public, which, was the Institutional Class. The Board also considered that the use of Institutional Class performance generally facilitates a meaningful comparison for expense and performance purposes.
Provided below is an overview of certain factors the Board considered in connection with its renewal and approval of the Management Agreement and Investment Advisory Agreements. The Board did not identify any particular information that was most relevant to its consideration to renew or approve each Agreement, and each Trustee may have afforded different weight to the various factors. Legal counsel to the independent Trustees provided the Board with a memorandum regarding its responsibilities pertaining to the renewal and approval of each Agreement. The memorandum explained the regulatory requirements surrounding the Trustees’ process for evaluating investment advisors and the terms of the contracts. Based on its evaluation, the Board unanimously concluded that the terms of each Agreement were reasonable and fair and that the renewal and approval of each Agreement was in the best interests of the Fund and its shareholders.
Considerations With Respect to the Renewal of the Management Agreement and the Investment Advisory Agreements
In determining whether to renew the Agreements on behalf of the Fund, the Trustees considered the best interests of the Fund. While the Management Agreement and the Investment Advisory Agreements for all series of the Trust and American Beacon Select Funds (together, the “Trusts”) were considered at the Meetings, the Board considered the Fund’s investment management and subadvisory relationships separately.
In each instance, the Board considered, among other things, the following factors: (1) the nature, extent and quality of the services provided; (2) the investment performance of the Fund and the subadvisors for the Fund; (3) the costs incurred by the Manager in rendering services to the Fund and its resulting profits or losses; (4) comparisons of services and fee rates with contracts entered into by the Manager or the subadvisors or their affiliates with other clients (such as pension funds and other institutional clients); (5) the extent to which economies of scale have been taken into account in setting each fee rate schedule; (6) whether fee rate levels reflect these economies of scale for the benefit of Fund investors; and (7) any other benefits derived or anticipated to be derived by the Manager or the subadvisors from their relationship with the Fund. The Trustees posed questions to various management personnel of the Manager regarding certain key aspects of the materials submitted in support of the renewal.
Nature, Extent and Quality of Services. With respect to the renewal of the Management Agreement, the Board considered, among other factors: the Fund’s long-term performance and the length of service of key investment personnel at the Manager; the cost structure of the Fund; the Manager’s culture of compliance and support for compliance operations that reduce risks to the Fund; the Manager’s commitment to enhance the Fund’s product line and increase assets in the Fund; the Manager’s quality of services; the Manager’s active role in
39
Disclosure Regarding Approval of the Management and Investment Advisory Agreements of the Funds (Unaudited)
monitoring and, as appropriate, recommending additional or replacement subadvisors; the Manager’s commitment to training employees; and the Manager’s efforts to retain key employees and maintain staffing levels.
With respect to the renewal of the Investment Advisory Agreements, the Trustees considered the level of staffing and the size of the subadvisors. The Board also considered the adequacy of the resources committed to the Fund by the subadvisors, and whether those resources were commensurate with the needs of the Fund and are sufficient to sustain appropriate levels of performance and compliance needs. In this regard, the Board considered the financial stability of the subadvisors. The Board also considered the subadvisors’ representations regarding their compliance programs and codes of ethics. Based on the foregoing information, the Board concluded that the nature, extent and quality of the management and advisory services provided by the Manager and the subadvisors were appropriate for the Fund and, thus, determined to renew the Agreements for the Fund.
Investment Performance. The Board evaluated the comparative information provided by Broadridge and the Manager regarding the Fund’s investment performance relative to its Lipper performance universe, Lipper performance group, and benchmark index, as well as the Fund’s Morningstar rating. The Board considered the information provided by Broadridge regarding its independent peer selection methodology to select all Lipper performance groups and universes. The Board also considered that the performance groups and universes selected by Broadridge may not provide appropriate comparisons for certain series of the Trusts. In addition, the Board considered the performance reports and discussions with management at Board and Committee meetings throughout the year. The Board also considered the Manager’s recommendation to continue to retain the subadvisors. A discussion regarding the Board’s considerations with respect to the Fund’s performance appears below under “Additional Considerations and Conclusions with Respect to the Fund.”
Costs of the Services Provided to the Fund and the Profits Realized by the Manager from its Relationship with the Fund. In analyzing the cost of services and profitability of the Manager, the Board considered the revenues earned and the expenses incurred by the Manager, before and after the payment of distribution-related expenses by the Manager. The profits or losses were noted at both an aggregate level for all series of the Trusts and at an individual Fund level, with the Fund being profitable for the Manager. The Board noted that, at current asset levels, the Fund’s effective management fee rate is the same as that of another series of the Trusts with a similar strategy as the Fund, but that the Fund’s fee rate may be higher at higher asset levels.
The Board further considered that, with respect to the Fund, the Management Agreement provides for the Manager to receive a management fee comprised of an annualized fee that is retained by the Manager. The Board also noted that certain share classes of the Fund maintain higher expense ratios in order to compensate third-party financial intermediaries.
In analyzing the fee rates charged by each subadvisor in connection with its investment advisory services to the Fund, the Board considered that, with respect to Barrow, Brandywine, Hotchkis, the Manager has negotiated the lowest fee rate a subadvisor charges for any comparable client accounts. The Board did not request profitability data from the subadvisors because the Board did not view this data as imperative to its deliberations given the arm’s-length nature of the relationship between the Manager and the subadvisors with respect to the negotiation of the subadvisory fee rate. In addition, the Board noted that subadvisors may not account for their profits on an account-by-account basis and those that do likely employ different methodologies in connection with these calculations.
Based on the foregoing information, the Board concluded that the profitability levels of the Manager were reasonable in light of the services performed by the Manager. A discussion regarding the Board’s considerations with respect to the Fund’s fee rates is set forth below under “Additional Considerations and Conclusions with Respect to the Fund.”
Economies of Scale. In considering the reasonableness of the management and investment advisory fees rates, the Board considered whether economies of scale will be realized as the Fund grows and whether fee rate
40
Disclosure Regarding Approval of the Management and Investment Advisory Agreements of the Funds (Unaudited)
levels reflect these economies of scale for the benefit of Fund shareholders. In this regard, the Board considered that the Manager has negotiated breakpoints in the subadvisory fee rates for each subadvisor. The Board also noted that, for purposes of determining the fee rates chargeable to the Fund, Barrow, Brandywine, Hotchkis and MFS have agreed to take into account assets of American Airlines Group and its pension plans that are managed by the subadvisors. Thus, the Fund is able to receive lower effective fee rates.
In addition, the Board noted the Manager’s representation that the Management Agreement contains fee schedule breakpoints at higher asset levels with respect to the Fund. Based on the foregoing information, the Board concluded that the Manager and subadvisor fee rate schedules for the Fund provide for a reasonable sharing of benefits from any economies of scale with the Fund.
Benefits Derived from the Relationship with the Fund. The Board considered the “fall-out” or ancillary benefits that accrue to the Manager and/or the subadvisor as a result of the advisory relationships with the Fund, including greater exposure in the marketplace with respect to the Manager’s or subadvisors’ investment process and expanding the level of assets under management by the Manager and the subadvisor. In addition, the Board noted that certain subadvisors benefit from soft dollar arrangements for third party and/or proprietary research.
In addition, the Manager noted that the Fund also derives benefits from its association with the Manager. Specifically, the Board noted the Manager’s representation that it provides services to most series of the Trusts at a lower than industry average cost. The Board considered that certain subadvisors reimburse the Manager for certain costs relating to distribution activities for the series of the Trusts, as well as representations by all such subadvisors that they would not reduce their fee rates in lieu of providing such reimbursements. Based on the foregoing information, the Board concluded that the potential benefits accruing to the Manager and the subadvisors by virtue of their relationships with the Fund appear to be fair and reasonable.
Additional Considerations and Conclusions with Respect to the Fund
The performance comparisons below were made versus the Fund’s Lipper performance universe and Lipper performance group, with the 1st Quintile representing the top twenty percent of the universe or group based on performance and the 5th Quintile representing the bottom twenty percent of the universe or group based on performance. References below to the Fund’s Lipper performance group and Lipper performance universe are to the respective group or universe of comparable mutual funds included in the analysis provided by Broadridge. A Lipper performance group consists of the Fund and a representative sample of funds with similar investment classifications and objectives as the Fund, as selected by Broadridge. A Lipper performance universe is an expansion of the performance group, providing a broader view of performance across the Fund’s investment classification/ objective and allowing for a more extensive comparison. In reviewing the performance, the Trustees viewed longer-term performance over a full market cycle, typically five years or longer, if available, as the most important consideration, because relative performance over shorter periods may be significantly impacted by market or economic events that do not reflect manager skill.
The expense comparisons below were made versus the Fund’s Lipper expense universe and Lipper expense group, with the 1st Quintile representing the top twenty percent of the universe or group based on lowest total expense and the 5th Quintile representing the bottom twenty percent of the universe or group based on highest total expense. References below to the Fund’s expense group and expense universe are to the respective group or universe of comparable mutual funds included in the analysis by Broadridge. A Lipper expense group consists of the Fund and a representative sample of funds with similar operating structures and asset sizes, as selected by Broadridge. A Lipper expense universe includes all funds in the investment classification/objective with a similar load type to the share class of the Fund included in the Lipper comparative information and provides a broader view of expenses across the Fund’s investment classification/objective. The Trustees also considered the Fund’s Morningstar fee level category. In addition, information regarding the subadvisors’ use of soft dollars was requested from the Manager and was considered by the Trustees.
41
Disclosure Regarding Approval of the Management and Investment Advisory Agreements of the Funds (Unaudited)
In considering the renewal of the Management Agreement for the Fund, the Trustees considered the following additional factors:
Lipper Total Expense Analysis and Morningstar Fee Level Ranking
| | |
| Compared to Lipper Expense Universe | | 1st Quintile |
| Compared to Lipper Expense Group | | 2nd Quintile |
| Morningstar Fee Level Ranking - Institutional Class | | Low Expense Ratio |
Lipper Fund Performance Analysis (five-year period ended March 31, 2016)
| | |
| Compared to Lipper Performance Universe | | 3rd Quintile |
| Compared to Lipper Performance Group | | 3rd Quintile |
In considering the renewal of the Investment Advisory Agreements with Barrow, Brandywine, Hotchkis, and MFS, the Trustees considered the following additional factors:
Subadvisor Performance (compared to Lipper Performance Universe for period indicated, ending March 31, 2016)
| | | | |
| Barrow | | 5 years | | 2nd Quintile |
| Brandywine | | 5 years | | 4th Quintile |
| Hotchkis | | 5 years | | 2nd Quintile |
| MFS | | 5 years | | 1st Quintile |
The Trustees also considered: (1) information provided by each subadvisor regarding fee rates charged for managing accounts in the same strategy as the subadvisor’s allocated portion of the Fund; (2) explanations from the Manager and the subadvisors regarding the subadvisors’ underperformance relative to their benchmarks and comparable accounts, as applicable; and (3) the Manager’s recommendation to continue to retain each subadvisor.
Based on these and other considerations, the Trustees: (1) concluded that the fees paid to the Manager and the subadvisors under the Management and Investment Advisory Agreements are fair and reasonable; and (2) determined that the Fund and its shareholders would benefit from the Manager’s and subadvisors’ continued management of the Fund; and (3) approved the renewal of the Management and Investment Advisory Agreements with respect to the Fund.
42
Trustees and Officers of the American Beacon FundsSM (Unaudited)
The Trustees and officers of the American Beacon Funds (the “Trust”) are listed below, together with their principal occupations during the past five years. Unless otherwise indicated, the address of each person listed below is 220 Las Colinas Boulevard East, Suite 1200, Irving, Texas 75039. Each Trustee oversees twenty-six seven funds in the fund complex that includes the Trust and the American Beacon Select Funds. The Trust’s Statement of Additional Information contains additional information about the Trustees and is available without charge by calling 1-800-658-5811.
| | | | |
Name, Age and Address | | Position, Term of Office and Length of Time Served with the Trust | | Principal Occupation(s) During Past 5 Years and Current Directorships |
|
| INTERESTED TRUSTEES |
| | |
| | Lifetime of Trust until removal, resignation or retirement* | | |
| | |
| Alan D. Feld** (79) | | Trustee since 1996 | | Sole Shareholder of a professional corporation which is a Partner in the law firm of Akin, Gump, Strauss, Hauer & Feld, LLP (law firm) (1960-Present); Trustee, American Beacon Mileage Funds (1996-2012); Trustee, American Beacon Select Funds (1999-Present); Trustee, American Beacon Master Trust (1996-2012). |
| | |
| NON-INTERESTED TRUSTEES | | Term | | |
| | |
| | Lifetime of Trust until removal resignation or retirement* | | |
| | |
| Gilbert G. Alvarado (46) | | Trustee since 2015 | | Director, Kura MD, Inc. (local telehealth organization) (2015-present); Vice President & CFO, Sierra Health Foundation (health conversion private foundation) (2006-Present) Vice President & CFO, Sierra Health Foundation: Center for Health Program Management (California public benefit corporation) (2012-Present); Director, Innovative North State (2012-Present); Director, Sacramento Regional Technology Alliance (2011-Present); Director, Women’s Empowerment (2009-2014); Trustee, American Beacon Select Funds (2015-Present). |
| | |
| Josephe B. Armes (54) | | Trustee since 2015 | | Chairman & CEO, CSW Industrials f/k/a Capital Southwest Corporation (investment company) (2013-Present); President & CEO, JBA Investment Partners (family investment vehicle) (2010-Present); Chief Operating Officer, Hicks Holdings, LLC (Hicks Family assets and investments) (2005-2010); Trustee, Baylor University Board of Regents (2001-2010); Director and Chair of Audit Committee, RSP Permian (oil and gas producer) (2013-Present); Trustee, American Beacon Select Funds (2015-Present). |
| | |
| Gerard J. Arpey (58) | | Trustee since 2012 | | Director, The Home Depot, Inc. (2015-Present); Partner, Emerald Creek Group (private equity firm) (2011-Present); Chairman and Chief Executive Officer, AMR Corp. and American Airlines; Inc. (2003- 2011); Director, S. C. Johnson & Son, Inc. (privately held company) (2008-present); Trustee, American Beacon Select Funds (2012-Present). |
| | |
| Brenda A. Cline (55) | | Trustee since 2004 | | Executive Vice President, Chief Financial Officer, Treasurer and Secretary, Kimbell Art Foundation (1993-Present); Director, Range Resources Corporation (oil and natural gas company) (2015-Present); Director, Tyler Technologies, Inc.(public sector software solutions company) (2014-Present); Trustee, American Beacon Mileage Funds (2004-2012); Trustee, American Beacon Select Funds (2004-Present); Trustee, American Beacon Master Trust (2004-2012). |
| | |
| Eugene J. Duffy (62) | | Trustee since 2008 | | Managing Director, Institutional Services, Intercontinental Real Estate Corporation (2014-Present); Principal and Executive Vice President, Paradigm Asset Management (1994-2014); Director, Sunrise Bank of Atlanta (2008-2013); Trustee, American Beacon Mileage Funds (2008- 2012); Trustee, American Beacon Select Funds (2008-Present); Trustee, American Beacon Master Trust (2008-2012). |
43
Trustees and Officers of the American Beacon FundsSM (Unaudited)
| | | | |
Name, Age and Address | | Position, Term of Office and Length of Time Served with the Trust | | Principal Occupation(s) During Past 5 Years and Current Directorships |
TRUSTEES (CONT.) | | Term | | |
| | |
| M. Dunning (74) | | Trustee since 2008 | | Chairman Emeritus (2008-Present); Lockton Dunning Benefits (consulting firm in employee benefits); Board Director, Oncor Electric Delivery Company LLC (2007-Present); Board Member, BancTec (2010-Present) (software consulting); Trustee, American Beacon Mileage Funds (2008-2012); Trustee, American Beacon Select Funds (2008-Present); Trustee, American Beacon Master Trust (2008-2012). |
| | |
| Richard M. Massman (73) | | Trustee since 2004 Chairman since 2008 | | Consultant and General Counsel Emeritus (2009-Present) and Senior Vice President and General Counsel (1994-2009), Hunt Consolidated, Inc. (holding company engaged in oil and gas exploration and production, refining, real estate, farming, ranching and venture capital activities); Trustee, American Beacon Mileage Funds (2004-2012); Trustee, American Beacon Select Funds (2004-Present); Trustee, American Beacon Master Trust (2004-2012). |
| | |
| Barbara J. McKenna, CFA (53) | | Trustee since 2012 | | Managing Principal, Longfellow Investment Management Company (2005-Present); Trustee, American Beacon Select Funds (2012-Present). |
| | |
R. Gerald Turner (70) 225 Perkins Admin. Bldg. Southern Methodist Univ. Dallas, Texas 75275 | | Trustee since 2001 | | President, Southern Methodist University (1995-Present); Director, J.C. Penney Company, Inc. (1996-Present); Director, Kronus Worldwide Inc. (chemical manufacturing) (2003-Present); Trustee, American Beacon Mileage Funds (2001- 2012); Trustee, American Beacon Select Funds (2001-Present); Trustee, American Beacon Master Trust (2001-2012). |
| | |
| OFFICERS | | | | |
| | |
| Gene. L. Needles, Jr. (61) | | President since 2009 Executive Vice President since 2009 | | President, CEO and Director, American Beacon Advisors, Inc. (2009-Present); President, CEO and Director, Astro AB Borrower, Inc. (2015-Present); President, CEO and Director, Astro AB Acquisition, Inc.(2015-Present); President, CEO and Director, Astro AB Topco, Inc. (2015-Present), President, CEO and Director, Astro AB Holdings, LLC. (2015-Present); President, CEO and Director, Lighthouse Holdings, Inc.; (2009-2015); President and CEO, Lighthouse Holdings Parent, Inc. (2009-2015); Manager, President and CEO, American Private Equity Management, L.L.C. (2012-Present); President, American Beacon Cayman Managed Futures Strategy Fund, Ltd. (2014-Present). |
| | |
| Rosemary K. Behan (57) | | VP, Secretary and Chief Legal Officer since 2006 | | Secretary, American Beacon Advisors, Inc. (2006-Present); Secretary, Astro AB Borrower, Inc. (2015-Present); Secretary, Astro AB Acquisition, Inc. (2015- Present); Secretary, Astro AB Topco, Inc. (2015-Present); Secretary, Astro AB Holdings, LLC. (2015-Present); Secretary, Lighthouse Holdings, Inc. (2008- 2015); Secretary, Lighthouse Holdings Parent, Inc. (2008-2015); Secretary, American Private Equity Management, L.L.C. (2008-Present); Secretary, American Beacon Cayman Managed Futures Strategy Fund, Ltd. (2014-Present). |
| | |
| Brian E. Brett (56) | | VP since 2004 | | Vice President, Director of Sales, American Beacon Advisors, Inc. (2004-Present). |
| | |
| Paul B. Cavazos (47) | | VP since 2016 | | Chief Investment Officer and Vice President, Asset Management, American Beacon Advisors, Inc. (2016-Present); Chief Investment Officer and Assistant Treasurer, DTE Energy (2007-2016); |
| | |
| Erica Duncan (46) | | VP since 2011 | | Vice President, Marketing and Client Services, American Beacon Advisors, Inc. (2011-Present); Supervisor, Brand Marketing, Invesco (2010-2011); |
44
Trustees and Officers of the American Beacon FundsSM (Unaudited)
| | | | |
Name, Age and Address | | Position, Term of Office and Length of Time Served with the Trust | | Principal Occupation(s) During Past 5 Years and Current Directorships |
| OFFICERS | | Term | | |
| | |
| Melinda G. Heika (55) | | Treasurer since 2010 | | Treasurer, American Beacon Advisors, Inc. (2010-Present); Treasurer, Astro AB Borrower, Inc. (2015-Present); Treasurer, Astro AB Acquisition, Inc. (2015-Present); Treasurer, Astro AB Topco, Inc. (2015-Present); Treasurer, Astro AB Holdings, LLC. (2015-Present); Treasurer, Lighthouse Holdings, Inc. (2010-2015); Treasurer, Lighthouse Holdings Parent Inc., (2010-2015); Treasurer, American Private Equity Management, L.L.C. (2012-Present); Director and Treasurer, American Beacon Cayman Managed Futures Strategy Fund, Ltd. (2014-Present). |
| | |
| | One Year | | |
| | |
| Terri L. McKinney (52) | | VP since 2010 | | Vice President, Enterprise Services (2009-Present) and Managing Director (2003-2009), American Beacon Advisors, Inc. |
| | |
| Jeffrey K. Ringdahl (41) | | VP since 2010 | | Chief Operating Officer, American Beacon Advisors, Inc. (2010-Present); Manager and Senior Vice President, American Private Equity Management, L.L.C. (2012-Present); Senior Vice President and Director, Astro AB Borrower, Inc. (2015-Present); Senior Vice President and Director, Astro AB Acquisition, Inc. (2015-Present); Senior Vice President and Director, Astro AB Topco, Inc. (2015-Present), Senior Vice President and Director, Astro AB Holdings, LLC.(2015-Present); Senior Vice President, Lighthouse Holdings, Inc. (2013-2015); Senior Vice President, Lighthouse Holdings Parent, Inc. (2013-2015); Director and Vice President, American Beacon Cayman Managed Futures Strategy Fund, Ltd. (2014-Present); Vice President, Product Management, Touchstone Advisors, Inc. (2007-2010). |
| | |
| Samuel J. Silver (53) | | VP since 2011 | | Chief Fixed Income Officer (2016–Present), Vice President, Fixed Income Investments (2011-2016) and Senior Portfolio Manager, Fixed Income Investments (1999-2011), American Beacon Advisors, Inc. |
| | |
| Christina E. Sears (45) | | Chief Compliance Officer since 2004 and Asst. Secretary since 1999 | | Chief Compliance Officer, American Beacon Advisors, Inc. (2004-Present); Chief Compliance Officer, American Private Equity Management, L.L.C. (2012-Present). |
| | |
| Sonia L. Bates (59) | | Asst. Treasurer since 2011 | | Director, Tax and Financial Reporting (2011-Present), Manager, Tax and Financial Reporting (2005-2010), American Beacon Advisors, Inc.; Asst. Treasurer, Astro AB Borrower, Inc. (2015-Present); Asst. Treasurer, Astro AB Acquisition, Inc.(2015-Present); Asst. Treasurer, Astro AB Topco, Inc. (2015-Present); Asst. Treasurer, Astro AB Holdings, LLC.; Asst. Treasurer, Lighthouse Holdings, Inc. (2011-2015); Asst. Treasurer, Lighthouse Holdings Parent Inc. (2011-2015); Asst. Treasurer, American Private Equity Management, L.L.C. (2012-Present). |
| | |
| Shelley D. Abrahams (41) | | Assistant Secretary since 2008 | | Assistant Secretary, American Beacon Advisors, Inc. (2008-Present) |
| | |
| Rebecca L. Harris (49) | | Assistant Secretary since 2011 | | Assistant Secretary, American Beacon Advisors, Inc. (2011-Present) |
| | |
| Diana N. Lai (40) | | Assistant Secretary since 2012 | | Assistant Secretary, American Beacon Advisors, Inc. (2012-Present) |
| | |
| Teresa A. Oxford (58) | | Assistant Secretary since 2015 | | Assistant Secretary, American Beacon Advisors, Inc. (2015-Present) |
| * | As of 11/12/2014, the Board adopted a retirement plan that requires Trustees to retire no later than the last day of the calendar year in which they reach the age of 75. |
| ** | Mr. Feld is deemed to be an “interested person” of the Trusts, as defined by the 1940 Act. Mr. Feld’s law firm of Akin, Gump, Strauss, Hauer & Feld LLP has provided legal services within the past two fiscal years to one or more of the Trust’s sub-advisors. |
45
Trustees and Officers of the American Beacon FundsSM (Unaudited)
| * | The Board has adopted a retirement plan that requires Trustees to retire no later than the last day of the calendar year in which they reach the age of 72, provided, however, that the board may determine to grant one or more annual exemptions to this requirement. |
| ** | Mr. Feld is deemed to be an “interested person” of the Trust, as defined by the 1940 Act. Mr. Feld’s law firm of Akin, Gump, Strauss, Hauer & Feld LLP has provided legal services within the past two years to one or more of the Trust’s sub-advisors. |
46
American Beacon FundsSM
Privacy Policy
October 31, 2016 (Unaudited)
The American Beacon Funds recognize and respect the privacy of our shareholders. We are providing this notice to you so you will understand how shareholder information may be collected and used.
We may collect nonpublic personal information about you from one or more of the following sources:
| | • | | information we receive from you on applications or other forms; |
| | • | | information about your transactions with us or our service providers; and |
| | • | | information we receive from third parties. |
We do not disclose any nonpublic personal information about our customers or former customers to anyone, except as permitted by law.
We restrict access to your nonpublic personal information to those employees or service providers who need to know that information to provide products or services to you. To ensure the confidentiality of your nonpublic personal information, we maintain safeguards that comply with federal standards.
47
This page intentionally left blank.
48

Delivery of Documents
eDelivery is NOW AVAILABLE - Stop traditional mail delivery and receive your
shareholder reports and summary prospectus on-line. Sign up at
www.americanbeaconfunds.com
If you invest in the Fund through a financial institution, you may be able to receive the Fund’s regulatory mailings, such as the Prospectus, Annual Report and Semi-Annual Report, by e-mail. If you are interested in this option, please go to www.icsdelivery.com and search for your financial institution’s name or contact your financial institution directly.
To obtain more information about the Fund:
| | |

| | 
|
By E-mail: american_beacon.funds@ambeacon.com | | On the Internet: Visit our website at www.americanbeaconfunds.com |
| | | |
| | |

| | 
|
By Telephone: Institutional, Y, Investor, and Advisor Classes Call (800) 658-5811 | | By Mail: American Beacon Funds P.O. Box 219643 Kansas City, MO 64121-9643 |
| | | |
| | |
| Availability of Quarterly Portfolio Schedules | | Availability of Proxy Voting Policy and Records |
| | |
| In addition to the Schedule of Investments provided in each semi-annual and annual report, the Fund files a complete schedule of its portfolio holdings with the Securities and Exchange Commission (“SEC”) on Form N-Q as of the first and third fiscal quarters. The Fund’s Forms N-Q are available on the SEC’s website at www.sec.gov. The Forms N-Q may also be reviewed and copied at the SEC’s Public Reference Section, 100 F Street, NE, Washington, D.C. 20549-1520. Information regarding the operation of the SEC’s Public Reference Room may be obtained by calling (800)-SEC-0330. A complete schedule of the Fund’s portfolio holdings is also available at www.americanbeaconfunds.com approximately twenty days after the end of each month. | | A description of the policies and procedures the Fund uses to determine how to vote proxies relating to portfolio securities is available in the Fund’s Statement of Additional Information, is available free of charge on the Fund’s website www.americanbeaconfunds.com and by calling 1-800-967-9009 or by accessing the SEC’s website at www.sec.gov. The Fund’s proxy voting record for the most recent year ended June 30 is filed annually with the SEC on Form N-PX. The Fund’s Forms N-PX are available on the SEC’s website at www.sec.gov. The Fund’s proxy voting record may also be obtained by calling 1-800-967-9009. |
Fund Service Providers:
| | | | | | | | | | | | |
CUSTODIAN State Street Bank and Trust Boston, Massachusetts | | | | TRANSFER AGENT Boston Financial Data Services Kansas City, Missouri | | | | INDEPENDENT REGISTERED PUBLIC ACCOUNTING FIRM Ernst & Young LLP Dallas, Texas | | | | DISTRIBUTOR Foreside Fund Services, LLC Portland, Maine |
This report is prepared for shareholders of the American Beacon Funds and may be distributed to others only if preceded or accompanied by a current Prospectus or Summary Prospectus.
American Beacon Funds and American Beacon Large Cap Value Fund are service marks of American Beacon Advisors, Inc..
AR 10/16
About American Beacon Advisors
Since 1986, American Beacon Advisors has offered a variety of products and investment advisory services to numerous institutional and retail clients, including a variety of mutual funds, corporate cash management, and separate account management.
Our clients include defined benefit plans, defined contribution plans, foundations, endowments, corporations, financial planners, and other institutional investors. With American Beacon Advisors, you can put the experience of a multi-billion dollar asset management firm to work for your company.
SMALL CAP VALUE FUND RISKS
Investing in small-capitalization stocks may involve greater volatility and lower liquidity than larger company stocks. Investing in value stocks may limit downside risk over time; however, the Fund may produce more modest gains than riskier stock funds as a trade-off for this potentially lower risk. Investing in foreign securities may involve heightened risk due to currency fluctuations and economic and political risks. The use of futures contracts for cash management may subject the Fund to losing more money than invested. The Fund may participate in a securities lending program. Please see the prospectus for a complete discussion of the Fund’s risks. There can be no assurances that the investment objectives of this Fund will be met.
Any opinions herein, including forecasts, reflect our judgment as of the end of the reporting period and are subject to change. Each advisor’s strategies and the Fund’s portfolio composition will change depending on economic and market conditions. This report is not a complete analysis of market conditions and therefore, should not be relied upon as investment advice. Although economic and market information has been compiled from reliable sources, American Beacon Advisors, Inc. makes no representation as to the completeness or accuracy of the statements contained herein.
| | |
| American Beacon Funds | | October 31, 2016 |
President’s Message
| | |
 | | Dear Shareholders, During the 12-month period ended October 31, 2016, China’s slowing growth escalated concerns for global markets, and many of the world’s central banks – the Federal Reserve included – responded by either continuing or expanding their economic stimulation policies. In the first half of 2016, international stocks declined while U.S. and emerging-market stocks made modest gains. Falling global interest rates supported bond returns during the period. On June 24, 2016, the U.K. announced that the “Brexit” referendum to leave the European Union passed with a 52% majority vote, further shaking up global markets. By the end of that month, however, the U.S. stock market and some global markets had rebounded to near pre-Brexit levels as investors took opportunistic risks following the historic vote. After Theresa May’s succession as the U.K.’s prime minister on July 13, 2016, many central banks put their Brexit concerns on hold and turned their attention to their own economies. |
In the weeks ahead of the U.S. presidential election on November 8, 2016, uncertainty about the outcome caused many investors to stay on the sidelines. Although investors may question whether the election’s result could have negative consequences for their portfolios, elections rarely have a lasting effect on the market. Historically speaking, from August 1 to October 31 during 19 of the last 22 election years – or approximately 86% of the time – the S&P 500 rallied for an average gain of approximately 6%.
For the 12-month period ended October 31, 2016, the American Beacon Small Cap Value Fund (Investor Class) returned 4.27%.
Our broad range of mutual funds helps investors navigate the economic storms and market downturns in the U.S. and abroad. Our years of experience evaluating sub-advisors have led us to identify and partner with several asset managers who have adhered to their disciplined processes for many years and through a variety of economic and market conditions.
Thank you for your continued interest in the American Beacon Funds. For additional information about the Funds or to access your account information, please visit our website at www.americanbeaconfunds.com.
Best Regards,

Gene L. Needles, Jr.
President
American Beacon Funds
1
Domestic Equity Market Overview
October 31, 2016 (Unaudited)
U.S. and emerging markets rallied over the trailing 12-month period ended October 31, 2016. Central banks around the world continued to set the pace for equity markets. With more than one third of all sovereign debt ($13 trillion) posting negative yields, the monetary spigots remained wide open, forcing investors to search for yield elsewhere – including equities. However, European markets were shaken by the U.K.’s surprising Brexit vote in June and broadly declined. Among major benchmarks, the Standard & Poor’s 500 Index added 4.5%.
In December 2015, the Federal Reserve (the “Fed”) raised its benchmark rate after several years of near-zero interest rates, driven largely by the central bank’s confidence in the economy. U.S. interest rates then remained unchanged for the rest of the period. Fed Chair Janet Yellen began the year with a hawkish tone, and most market participants anticipated two or more rate hikes in 2016. However, market volatility related to the Brexit vote prompted policymakers to delay raising interest rates in spite of stable economic data in the U.S.
The Brexit vote dominated headlines in June and initially caused growth expectations to fall drastically. The referendum had far-reaching implications. U.S. markets declined in the aftermath, but quickly recovered as much of the market corrected what was largely viewed as an overreaction. The dollar rose versus the pound, which ended the period at a 31-year low. Growth forecasts in the U.K. have since been revised upward after decisive policy action from the Bank of England, the immediate appointment of Prime Minister Theresa May and strong manufacturing and services sector data. European Central Bank President Mario Draghi maintained low interest rates as the rest of Europe struggled to generate inflation, which turned positive in June. As the year progressed, post-Brexit risks seemed to recede.
The Fed’s 2% GDP growth and inflation targets remained elusive for most of the period, and inventories were low. But most recently, third-quarter GDP showed 2.9% growth, which was the highest in two years and surpassed estimates of 2.5%. Consumer spending has been consistently strong, and the U.S. ended the period near full employment. Additionally, the Manufacturing sector’s Purchasing Managers’ Index was expansionary, with readings above 50 over the last 12 months. On the back of the measured policy response, the U.S. dollar ended the period only slightly higher overall.
For quite some time now, the battle for leadership within domestic equity markets has been raging between stocks perceived as “bond proxies” and those with more interest rate and economic sensitivity. The latter group struggled mightily during the first six months of 2016, but outperformed the bond proxies in the third quarter as interest rates rose.
The “battle of the bond proxies” should continue until interest rates trend toward sustainably higher levels. The Fed’s multi-year suppression of interest rates was designed to push investors out on the risk spectrum and encourage growth; instead, the unintended consequence has been risk aversion. This has caused investors to search for perceived safety in assets with a current yield, regardless of valuation (e.g., bond proxies). More broadly, risk aversion has been evident on a global basis, even in countries with negative interest rates. Negative interest rates may prove ineffective and the road back to normalized interest rates might be bumpy with additional unintended consequences.
Further, investors have flocked to passive funds at the expense of active funds in an attempt to avoid risk. The current cycle of passive outperformance began with the bull market that started about seven years ago. Since that time, lower interest rates and excess liquidity have propelled equity markets in a highly correlated manner, without much regard for fundamentals. After one of the longest and highest-returning bull markets in history, the overall market is no longer inexpensive, and many companies and sectors are richly valued. As such, the long run of outperformance by passive strategies has left many companies within the benchmark overvalued and susceptible to dividend cuts, price declines or both.
Election news dominated headlines over the period, particularly in the run-up to Election Day, and increased volatility. Most polls projected Democratic nominee Hillary Rodham Clinton would win the U.S. presidential election. Toward the end of the period, markets were shaken and the U.S. presidential election narrowed after
2
Domestic Equity Market Overview
October 31, 2016 (Unaudited)
the reemergence of the FBI investigation into Ms. Clinton’s private email servers. Uncertainty from the presidential election created an overhang at the end of the period.
3
American Beacon Small Cap Value FundSM
Performance Overview
October 31, 2016 (Unaudited)
The Investor Class of the Small Cap Value Fund (the “Fund”) returned 4.27% for the twelve months ended October 31, 2016, underperforming the Russell 2000® Value Index (the “Index”) return of 8.81% for the same period.
Comparison of Change in Value of a $10,000 Investment for the period from 10/31/06 through 10/31/16
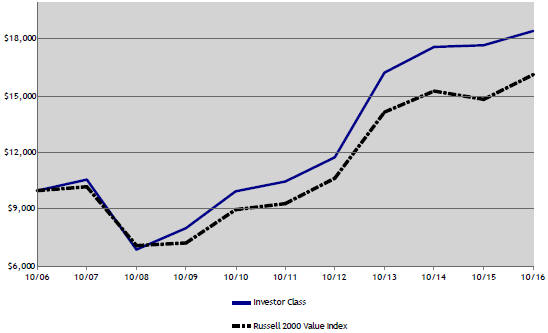
Total Returns for the Period ended October 31, 2016
| | | | | | | | | | | | | | | | | | | | | | | | |
| | | Ticker | | | 1 Year | | | 3 Years | | | 5 Years | | | 10 Years | | | Value of $10,000
10/31/2006-
10/31/2016 | |
Institutional Class (1,7) | | | AVFIX | | | | 4.54 | % | | | 4.68 | % | | | 12.37 | % | | | 6.67 | % | | $ | 19,076 | |
Y Class (1,2,7) | | | ABSYX | | | | 4.49 | % | | | 4.60 | % | | | 12.27 | % | | | 6.58 | % | | $ | 18,911 | |
Investor Class (1,7) | | | AVPAX | | | | 4.27 | % | | | 4.34 | % | | | 11.98 | % | | | 6.32 | % | | $ | 18,459 | |
Advisor Class (1,3,7) | | | AASSX | | | | 4.01 | % | | | 4.17 | % | | | 11.82 | % | | | 6.14 | % | | $ | 18,142 | |
A without Sales Charge (1,4,7) | | | ABSAX | | | | 4.17 | % | | | 4.26 | % | | | 11.86 | % | | | 6.23 | % | | $ | 18,293 | |
A with Sales Charge (1,4,7) | | | ABSAX | | | | (1.84 | )% | | | 2.22 | % | | | 10.54 | % | | | 5.60 | % | | $ | 17,239 | |
C without Sales Charge (1,5,7) | | | ASVCX | | | | 3.37 | % | | | 3.46 | % | | | 11.02 | % | | | 5.72 | % | | $ | 17,442 | |
C with Sales Charge (1,5,7) | | | ASVCX | | | | 2.37 | % | | | 3.46 | % | | | 11.02 | % | | | 5.72 | % | | $ | 17,442 | |
Russell 2000 Value Index (6) | | | | | | | 8.81 | % | | | 4.47 | % | | | 11.63 | % | | | 4.91 | % | | $ | 16,144 | |
| 1. | Performance shown is historical and is not indicative of future returns. Investment returns and principal value will vary, and shares may be worth more or less at redemption than at original purchase. Performance shown is calculated based on the published end of day net asset values as of date indicated, and current performance may be lower or higher than the performance data quoted. To obtain performance as of the most recent month end, please visit www.americanbeaconfunds.com or call 1-800-967-9009. Fund performance in the table above does not reflect the deduction of taxes a shareholder would pay on distributions or the redemption of shares. |
| 2. | Fund performance for the ten-year period represents the total returns achieved by the Institutional Class from 10/31/06 up to 8/3/09, the inception date of the Y Class. Expenses of the Y Class are higher than those of the Institutional Class. As a result, total returns shown may be higher than they would have been had the Y Class been in existence since 10/31/06. |
4
American Beacon Small Cap Value FundSM
Performance Overview
October 31, 2016 (Unaudited)
| 3. | A portion of the fees charged to the Advisor Class of the Fund were waived in 2009. Performance prior to waiving fees was lower than the actual returns shown for the ten-year period. |
| 4. | Fund performance for the ten-year period represents the total returns achieved by the Investor Class from 10/31/06 up to 5/17/10, the inception date of the A Class, and the returns of the A Class since its inception. Expenses of the A Class are higher than those of the Investor Class. As a result, total returns shown may be higher than they would have been had the A Class been in existence since 10/31/06. A portion of the fees charged to the A Class of the Fund was waived was 2012 and 2014 and partially recovered in 2015. Performance prior to waiving fees was lower than the actual returns shown in 2012 through 2014. The maximum sales charge for A Class is 5.75%. |
| 5. | Fund performance for the ten-year period represents the total returns achieved by the Investor Class from 10/31/06 up to 9/1/10, the inception date of the C Class, and the returns of the C Class since its inception. Expenses of the C Class are higher than those of the Investor Class. As a result, total returns shown may be higher than they would have been had the C Class been in existence since 10/31/06. A portion of the fees charged to the C Class of the Fund was waived from 2012 through 2013 and partially recovered in 2015. Performance prior to waiving fees was lower than the actual returns shown from 2012 through 2013. The maximum contingent deferred sales charge for C Class is 1.00% for shares redeemed within one year of the date of purchase. |
| 6. | The Russell 2000 Value Index is an unmanaged index of those stocks in the Russell 2000 Index with lower price-to-book ratios and lower forecasted growth values. Russell 2000 Value Index and Russell 2000 Index are registered trademarks of the Frank Russell Company. One cannot directly invest in an index. |
| 7. | The total annual Fund operating expense ratio set forth in the most recent Fund prospectus for the Institutional, Y, Investor, Advisor, A, and C Class shares was 0.82%, 0.91%, 1.16%, 1.32%, 1.22%, and 1.98%, respectively. The expense ratios above may vary from the expense ratios presented in other sections of this report that are based on expenses incurred during the period covered by this report. |
The Fund trailed the Index through stock selection as sector allocation added value relative to the Index.
Most of the Fund’s poor performance was attributed to holdings in the Industrials, Consumer Discretionary and Materials sectors. In the Industrials sector, companies detracting from the Fund’s return included KBR (down 18.1%) and Mobile Mini (down 23.6%). In the Consumer Discretionary sector, Restoration Hardware (down 35.0%), Office Depot (down 38.6%) and Tempur Sealy International (down 25.7%) were the largest detractors. A smaller allocation versus the Index in HECLA Mining (up 124.4%) and the Fund’s allocation in PolyOne (down 11.7%) detracted most from performance in the Materials sector.
The Fund’s overweight positions in Information Technology and Industrials, two of the better performing sectors, added value relative to the Index through sector allocation. Being underweight Energy, the worst performing sector, also contributed to the Fund’s returns. The aforementioned good performance was somewhat offset by the Fund’s overweight in the Consumer Discretionary sector, which detracted from performance.
The sub-advisors continue to focus on uncovering investment opportunities through stock selection that should benefit the Fund’s performance over the longer term.
| | | | | | | | |
Top Ten Holdings (% Net Assets) | | | | | | | | |
Vishay Intertechnology, Inc. | | | | | | | 0.9 | |
UMB Financial Corp. | | | | | | | 0.9 | |
Portland General Electric Co. | | | | | | | 0.8 | |
II-VI, Inc. | | | | | | | 0.8 | |
First Horizon National Corp. | | | | | | | 0.7 | |
ARRIS International PLC | | | | | | | 0.7 | |
American Axle & Manufacturing Holdings, Inc. | | | | | | | 0.7 | |
Diodes, Inc. | | | | | | | 0.6 | |
Barnes Group, Inc. | | | | | | | 0.6 | |
Mentor Graphics Corp. | | | | | | | 0.6 | |
Total Fund Holdings | | | 627 | | | | | |
5
American Beacon Small Cap Value FundSM
Performance Overview
October 31, 2016 (Unaudited)
| | | | | | | | |
Sector Allocation (% Equities) | | | | | | | | |
Financials | | | | | | | 25.6 | |
Industrials | | | | | | | 20.9 | |
Information Technology | | | | | | | 15.3 | |
Consumer Discretionary | | | | | | | 13.6 | |
Materials | | | | | | | 5.6 | |
Energy | | | | | | | 4.9 | |
Real Estate | | | | | | | 4.1 | |
Health Care | | | | | | | 3.3 | |
Utilities | | | | | | | 3.2 | |
Consumer Staples | | | | | | | 2.4 | |
Telecommunication Services | | | | | | | 1.1 | |
6
American Beacon Small Cap Value FundSM
Expense Examples
October 31, 2016 (Unaudited)
Fund Expense Example
As a shareholder of a Fund, you incur two types of costs: (1) transaction costs, including sales charges (loads) on purchase payments and redemption fees if applicable, and (2) ongoing costs, including management fees, administrative service fees, distribution (12b-1) fees, and other Fund expenses. The Examples are intended to help you understand the ongoing cost (in dollars) of investing in the Fund and to compare these costs with the ongoing costs of investing in other mutual funds. The Examples are based on an investment of $1,000 invested at the beginning of the period in each Class and held for the entire period from May 1, 2016 through October 31, 2016.
Actual Expenses
The “Actual” lines of the table provide information about actual account values and actual expenses. You may use the information on this page, together with the amount you invested, to estimate the expenses that you paid over the period. Simply divide your account value by $1,000 (for example, an $8,600 account value divided by $1,000 = $8.60), then multiply the result by the “Expenses Paid During Period” to estimate the expenses you paid on your account during this period. Shareholders of the Investor and Institutional Classes that invest in the Fund through an IRA or Roth IRA may be subject to a custodial IRA fee of $15 that is typically deducted each December. If your account was subject to a custodial IRA fee during the period, your costs would have been $15 higher.
Hypothetical Example for Comparison Purposes
The “Hypothetical” lines of the table provide information about hypothetical account values and hypothetical expenses based on the Fund’s actual expense ratio and an assumed 5% per year rate of return before expenses (not the Fund’s actual return). You may compare the ongoing costs of investing in the Fund with other funds by contrasting this 5% hypothetical example and the 5% hypothetical examples that appear in the shareholder reports of the other funds. The hypothetical account values and expenses may not be used to estimate the actual ending account balance or expenses you paid for the period. Shareholders of the Investor and Institutional Classes that invest in the Fund through an IRA or Roth IRA may be subject to a custodial IRA fee of $15 that is typically deducted each December. If your account was subject to a custodial IRA fee during the period, your costs would have been $15 higher.
You should also be aware that the expenses shown in the table highlight only your ongoing costs and do not reflect any transaction costs charged by the Fund, such as sales charges (loads) or redemption fees, as applicable. Similarly, the expense examples for other funds do not reflect any transaction costs charged by those funds, such as sales charges (loads), redemption fees or exchange fees. Therefore, the “Hypothetical” lines of the table are useful in comparing ongoing costs only and will not help you determine the relative total costs of owning different funds. If you were subject to any transaction costs during the period, your costs would have been higher.
7
American Beacon Small Cap Value FundSM
Expense Examples
October 31, 2016 (Unaudited)
Small Cap Value Fund
| | | | | | | | | | | | |
| | | Beginning Account
Value 5/1/2016 | | | Ending Account
Value
10/31/2016 | | | Expenses Paid During
Period
5/1/2016-10/31/2016* | |
Institutional Class | | | | | | | | | | | | |
Actual | | $ | 1,000.00 | | | $ | 1,049.56 | | | $ | 4.28 | |
Hypothetical** | | $ | 1,000.00 | | | $ | 1,020.99 | | | $ | 4.22 | |
Y Class | | | | | | | | | | | | |
Actual | | $ | 1,000.00 | | | $ | 1,049.28 | | | $ | 4.64 | |
Hypothetical** | | $ | 1,000.00 | | | $ | 1,020.61 | | | $ | 4.57 | |
Investor Class | | | | | | | | | | | | |
Actual | | $ | 1,000.00 | | | $ | 1,048.12 | | | $ | 5.87 | |
Hypothetical** | | $ | 1,000.00 | | | $ | 1,019.39 | | | $ | 5.79 | |
Advisor Class | | | | | | | | | | | | |
Actual | | $ | 1,000.00 | | | $ | 1,046.89 | | | $ | 6.74 | |
Hypothetical** | | $ | 1,000.00 | | | $ | 1,018.57 | | | $ | 6.65 | |
A Class | | | | | | | | | | | | |
Actual | | $ | 1,000.00 | | | $ | 1,047.52 | | | $ | 6.23 | |
Hypothetical** | | $ | 1,000.00 | | | $ | 1,019.07 | | | $ | 6.14 | |
C Class | | | | | | | | | | | | |
Actual | | $ | 1,000.00 | | | $ | 1,043.36 | | | $ | 10.07 | |
Hypothetical** | | $ | 1,000.00 | | | $ | 1,015.29 | | | $ | 9.93 | |
| * | Expenses are equal to the Fund’s annualized expense ratios for the six-month period of 0.83%, 0.90%, 1.14%, 1.31%, 1.21%, and 1.96% for the Institutional, Y, Investor, Advisor, A, and C Classes respectively, multiplied by the average account value over the period, multiplied by the number derived by dividing the number of days in the most recent fiscal half-year (184) by days in the year (366) to reflect the half-year period. |
| ** | 5% return before expenses. |
8
American Beacon Small Cap Value FundSM
Report of Independent Registered Public Accounting Firm
To the Shareholders and the Board of Trustees of
American Beacon Small Cap Value Fund:
We have audited the accompanying statement of assets and liabilities, including the schedule of investments, of American Beacon Small Cap Value Fund (one of the funds constituting the American Beacon Funds) (the Fund), as of October 31, 2016, and the related statement of operations for the year then ended, the statements of changes in net assets for each of the two years in the period then ended and the financial highlights for each of the five years in the period then ended. These financial statements and financial highlights are the responsibility of the Fund’s management. Our responsibility is to express an opinion on these financial statements and financial highlights based on our audits.
We conducted our audits in accordance with the standards of the Public Company Accounting Oversight Board (United States). Those standards require that we plan and perform the audit to obtain reasonable assurance about whether the financial statements and financial highlights are free of material misstatement. We were not engaged to perform an audit of the Fund’s internal control over financial reporting. Our audits included consideration of internal control over financial reporting as a basis for designing audit procedures that are appropriate in the circumstances, but not for the purpose of expressing an opinion on the effectiveness of the Fund’s internal control over financial reporting. Accordingly, we express no such opinion. An audit also includes examining, on a test basis, evidence supporting the amounts and disclosures in the financial statements and financial highlights, assessing the accounting principles used and significant estimates made by management, and evaluating the overall financial statement presentation. Our procedures included confirmation of securities owned as of October 31, 2016, by correspondence with the custodian and brokers or by other appropriate auditing procedures where replies from brokers were not received. We believe that our audits provide a reasonable basis for our opinion.
In our opinion, the financial statements and financial highlights referred to above present fairly, in all material respects, the financial position of American Beacon Small Cap Value Fund at October 31, 2016, the results of its operations for the year then ended, the changes in its net assets for each of the two years in the period then ended and the financial highlights for each of the five years in the period then ended in conformity with U.S. generally accepted accounting principles.

Dallas, Texas
December 29, 2016
9
American Beacon Small Cap Value FundSM
Schedule of Investments
October 31, 2016
| | | | | | | | |
| | | Shares | | | Fair Value | |
COMMON STOCK - 96.68% | | | | | | | | |
CONSUMER DISCRETIONARY - 13.13% | | | | | | | | |
Auto Components - 1.62% | | | | | | | | |
American Axle & Manufacturing Holdings, Inc.A | | | 2,191,352 | | | $ | 39,269,028 | |
Cooper Tire & Rubber Co. | | | 161,495 | | | | 5,934,941 | |
Cooper-Standard Holding, Inc.A | | | 52,431 | | | | 4,785,377 | |
Dana, Inc. | | | 640,499 | | | | 9,914,925 | |
Gentherm, Inc.A | | | 207,566 | | | | 5,842,983 | |
Superior Industries International, Inc. | | | 173,005 | | | | 4,238,623 | |
Tenneco, Inc.A | | | 436,411 | | | | 24,033,154 | |
| | | | | | | | |
| | | | | | | 94,019,031 | |
| | | | | | | | |
Automobiles - 0.66% | | | | | | | | |
Federal-Mogul Holdings Corp.A | | | 52,665 | | | | 487,678 | |
Hyster-Yale Materials Handling, Inc. | | | 142,872 | | | | 8,316,579 | |
Thor Industries, Inc. | | | 371,444 | | | | 29,459,224 | |
| | | | | | | | |
| | | | | | | 38,263,481 | |
| | | | | | | | |
Commercial Services - 0.06% | | | | | | | | |
Sotheby’s, Class AB | | | 99,765 | | | | 3,579,568 | |
| | | | | | | | |
Distributors - 0.01% | | | | | | | | |
DXP Enterprises, Inc.A | | | 15,611 | | | | 340,164 | |
| | | | | | | | |
Homebuilders - 0.14% | | | | | | | | |
William Lyon Homes, Inc., Class AA B | | | 465,657 | | | | 8,316,634 | |
| | | | | | | | |
Hotels, Restaurants & Leisure - 1.24% | | | | | | | | |
Belmond Ltd., Class AA | | | 937,690 | | | | 12,143,086 | |
Bloomin’ Brands, Inc. | | | 175,976 | | | | 3,044,385 | |
Brinker International, Inc. | | | 422,595 | | | | 20,808,578 | |
Cheesecake Factory, Inc. | | | 341,390 | | | | 18,158,534 | |
Golden Entertainment, Inc. | | | 71,300 | | | | 817,098 | |
ILG, Inc. | | | 378,900 | | | | 6,206,382 | |
International Speedway Corp., Class A | | | 91,520 | | | | 3,011,008 | |
Penn National Gaming, Inc.A | | | 146,389 | | | | 1,892,810 | |
Ruby Tuesday, Inc.A | | | 1,161,832 | | | | 3,450,641 | |
Speedway Motorsports, Inc. | | | 142,036 | | | | 2,671,697 | |
| | | | | | | | |
| | | | | | | 72,204,219 | |
| | | | | | | | |
Household Durables - 2.60% | | | | | | | | |
ACCO Brands Corp.A | | | 740,412 | | | | 8,218,573 | |
Cavco Industries, Inc.A | | | 66,761 | | | | 6,168,716 | |
Ethan Allen Interiors, Inc. | | | 391,947 | | | | 12,032,773 | |
Helen of Troy Ltd.A | | | 108,929 | | | | 8,877,714 | |
HNI Corp. | | | 33,731 | | | | 1,371,502 | |
InvenSense, Inc.A B | | | 394,663 | | | | 3,019,172 | |
KB HomeB | | | 638,962 | | | | 9,290,507 | |
Knoll, Inc. | | | 936,542 | | | | 20,266,769 | |
La-Z-Boy, Inc. | | | 128,302 | | | | 3,002,267 | |
LGI Homes, Inc.A B | | | 62,500 | | | | 1,860,000 | |
Libbey Glass, Inc. | | | 24,051 | | | | 385,057 | |
Lifetime Brands, Inc. | | | 38,287 | | | | 541,761 | |
M/I Homes, Inc.A | | | 314,514 | | | | 6,765,196 | |
Matthews International Corp., Class A | | | 75,265 | | | | 4,508,374 | |
MDC Holdings, Inc | | | 167,988 | | | | 3,982,995 | |
Meritage Homes Corp. | | | 136,297 | | | | 4,218,392 | |
Taylor Morrison Home Corp., Class AA | | | 172,731 | | | | 2,946,791 | |
Toll Brothers, Inc.A | | | 91,280 | | | | 2,504,723 | |
TRI Pointe Homes, Inc.A | | | 1,523,791 | | | | 16,502,657 | |
Tupperware Brands Corp. | | | 167,975 | | | | 9,997,872 | |
See accompanying notes
10
American Beacon Small Cap Value FundSM
Schedule of Investments
October 31, 2016
| | | | | | | | |
| | | Shares | | | Fair Value | |
CONSUMER DISCRETIONARY - 13.13% (continued) | | | | | | | | |
Household Durables - 2.60% (continued) | | | | | | | | |
Universal Electronics, Inc.A | | | 111,816 | | | $ | 7,843,892 | |
Whirlpool Corp. | | | 111,457 | | | | 16,698,488 | |
| | | | | | | | |
| | | | | | | 151,004,191 | |
| | | | | | | | |
Household Products - 0.20% | | | | | | | | |
CalAtlantic Group, Inc. | | | 351,868 | | | | 11,372,374 | |
| | | | | | | | |
Internet & Catalog Retail - 0.18% | | | | | | | | |
Insight Enterprises, Inc.A | | | 372,699 | | | | 10,730,004 | |
| | | | | | | | |
Leisure Equipment & Products - 0.08% | | | | | | | | |
Johnson Outdoors, Inc., Class A | | | 9,836 | | | | 353,899 | |
Smith & Wesson Holding Corp.A B | | | 168,700 | | | | 4,458,741 | |
| | | | | | | | |
| | | | | | | 4,812,640 | |
| | | | | | | | |
Media - 1.00% | | | | | | | | |
Banner Corp. | | | 80,683 | | | | 3,642,031 | |
Entercom Communications Corp., Class A | | | 190,266 | | | | 2,511,511 | |
EW Scripps Co., Class A | | | 759,515 | | | | 10,071,169 | |
John Wiley & Sons, Inc., Class A | | | 70,595 | | | | 3,642,702 | |
Meredith Corp. | | | 228,806 | | | | 10,376,352 | |
MSG Networks, Inc.A | | | 167,150 | | | | 3,192,565 | |
New York Times Co., Class A | | | 853,900 | | | | 9,307,510 | |
Scholastic Corp. | | | 332,370 | | | | 12,713,153 | |
Time, Inc. | | | 199,479 | | | | 2,593,227 | |
| | | | | | | | |
| | | | | | | 58,050,220 | |
| | | | | | | | |
Multiline Retail - 0.34% | | | | | | | | |
Big Lots, Inc. | | | 221,366 | | | | 9,607,284 | |
Dillard’s, Inc., Class A | | | 126,180 | | | | 7,734,834 | |
Fred’s, Inc., Class A | | | 93,174 | | | | 850,679 | |
Stein Mart, Inc. | | | 249,196 | | | | 1,500,160 | |
| | | | | | | | |
| | | | | | | 19,692,957 | |
| | | | | | | | |
Specialty Retail - 4.29% | | | | | | | | |
Aaron’s, Inc. | | | 290,952 | | | | 7,189,424 | |
Abercrombie & Fitch Co., Class A | | | 63,487 | | | | 927,545 | |
American Eagle Outfitters, Inc. | | | 550,400 | | | | 9,378,816 | |
America’s Car-Mart, Inc.A B | | | 37,280 | | | | 1,522,888 | |
Asbury Automotive Group, Inc.A | | | 66,500 | | | | 3,388,175 | |
Ascena Retail Group, Inc.A | | | 299,537 | | | | 1,464,736 | |
Big 5 Sporting Goods Corp. | | | 99,591 | | | | 1,543,661 | |
Buckle, Inc.B | | | 187,506 | | | | 3,909,500 | |
Caleres, Inc. | | | 293,911 | | | | 7,350,714 | |
Chico’s FAS, Inc. | | | 429,484 | | | | 5,012,078 | |
Children’s Place Retail Stores, Inc. | | | 144,077 | | | | 10,942,648 | |
Essendant, Inc. | | | 173,427 | | | | 2,662,104 | |
Express, Inc. | | | 1,089,431 | | | | 13,094,961 | |
Finish Line, Inc., Class A | | | 270,487 | | | | 5,325,889 | |
Genesco, Inc.A | | | 107,001 | | | | 5,756,654 | |
Group 1 Automotive, Inc | | | 175,420 | | | | 10,572,563 | |
Hibbett Sports, Inc.A B | | | 223,565 | | | | 8,685,500 | |
Kirkland’s, Inc. | | | 155,378 | | | | 1,897,165 | |
Lithia Motors, Inc., Class A | | | 70,900 | | | | 6,081,802 | |
Office Depot, Inc. | | | 6,139,317 | | | | 19,338,849 | |
PC Connection, Inc | | | 36,560 | | | | 848,558 | |
Penske Automotive Group, Inc. | | | 300,413 | | | | 13,443,482 | |
Pier 1 Imports, Inc.B | | | 521,055 | | | | 2,245,747 | |
Rent-A-Center, Inc. | | | 129,679 | | | | 1,308,461 | |
See accompanying notes
11
American Beacon Small Cap Value FundSM
Schedule of Investments
October 31, 2016
| | | | | | | | |
| | | Shares | | | Fair Value | |
CONSUMER DISCRETIONARY - 13.13% (continued) | | | | | | | | |
Specialty Retail - 4.29% (continued) | | | | | | | | |
Restoration Hardware Holdings, Inc.A B | | | 952,712 | | | $ | 27,600,067 | |
Rush Enterprises, Inc., Class AA | | | 913,423 | | | | 23,977,354 | |
Select Comfort Corp.A | | | 120,063 | | | | 2,304,009 | |
Shoe Carnival, Inc. | | | 40,177 | | | | 1,019,290 | |
Sonic Automotive, Inc., Class A | | | 1,123,946 | | | | 20,118,633 | |
Tailored Brands, Inc. | | | 146,200 | | | | 2,309,960 | |
The Michaels Cos., Inc.A | | | 623,200 | | | | 14,489,400 | |
Urban Outfitters, Inc.A | | | 302,175 | | | | 10,107,754 | |
West Marine, Inc.A | | | 54,205 | | | | 433,640 | |
Zumiez, Inc.A B | | | 163,208 | | | | 3,631,378 | |
| | | | | | | | |
| | | | | | | 249,883,405 | |
| | | | | | | | |
Textiles & Apparel - 0.71% | | | | | | | | |
Chefs’ Warehouse, Inc.A | | | 73,011 | | | | 832,325 | |
Deckers Outdoor Corp.A | | | 382,645 | | | | 19,970,243 | |
Fossil Group, Inc.A B | | | 82,301 | | | | 2,244,348 | |
Guess?, Inc. | | | 304,122 | | | | 4,105,648 | |
Movado Group, Inc. | | | 79,647 | | | | 1,756,216 | |
Oxford Industries, Inc. | | | 62,184 | | | | 3,900,180 | |
Vera Bradley, Inc.A | | | 627,024 | | | | 8,383,311 | |
| | | | | | | | |
| | | | | | | 41,192,271 | |
| | | | | | | | |
Total Consumer Discretionary | | | | | | | 763,461,159 | |
| | | | | | | | |
CONSUMER STAPLES - 2.30% | | | | | | | | |
Beverages - 0.27% | | | | | | | | |
The Boston Beer Co., Inc., Class AA | | | 99,369 | | | | 15,427,037 | |
| | | | | | | | |
Consumer Products - 0.01% | | | | | | | | |
Tejon Ranch Co.A | | | 25,641 | | | | 572,820 | |
| | | | | | | | |
Food & Drug Retailing - 0.99% | | | | | | | | |
Andersons, Inc. | | | 183,668 | | | | 6,988,567 | |
Ingles Markets, Inc., Class A | | | 27,139 | | | | 1,071,991 | |
SpartanNash Co. | | | 222,203 | | | | 6,221,684 | |
United Natural Foods, Inc.A | | | 633,427 | | | | 26,439,243 | |
Vitamin Shoppe, Inc.A | | | 557,893 | | | | 13,975,220 | |
Weis Markets, Inc. | | | 54,257 | | | | 3,018,317 | |
| | | | | | | | |
| | | | | | | 57,715,022 | |
| | | | | | | | |
Food Products - 0.93% | | | | | | | | |
Darling Ingredients, Inc.A | | | 306,628 | | | | 4,170,141 | |
Fresh Del Monte Produce, Inc. | | | 130,070 | | | | 7,849,725 | |
Hain Celestial Group, Inc.A | | | 181,010 | | | | 6,583,334 | |
Herbalife Ltd.A B | | | 295,888 | | | | 17,954,484 | |
Pilgrim’s Pride Corp.B | | | 456,000 | | | | 9,959,040 | |
Sanderson Farms, Inc.B | | | 85,274 | | | | 7,672,955 | |
| | | | | | | | |
| | | | | | | 54,189,679 | |
| | | | | | | | |
Personal Products - 0.03% | | | | | | | | |
Avon Products, Inc.A | | | 264,639 | | | | 1,733,385 | |
| | | | | | | | |
Tobacco - 0.07% | | | | | | | | |
Universal Corp. | | | 72,481 | | | | 3,928,470 | |
| | | | | | | | |
Total Consumer Staples | | | | | | | 133,566,413 | |
| | | | | | | | |
ENERGY - 4.75% | | | | | | | | |
Energy Equipment & Services - 1.64% | | | | | | | | |
Atwood Oceanics, Inc.B | | | 42,390 | | | | 323,436 | |
Cobalt International Energy, Inc.A | | | 2,342,799 | | | | 2,211,837 | |
See accompanying notes
12
American Beacon Small Cap Value FundSM
Schedule of Investments
October 31, 2016
| | | | | | | | |
| | | Shares | | | Fair Value | |
ENERGY - 4.75% (continued) | | | | | | | | |
Energy Equipment & Services - 1.64% (continued) | | | | | | | | |
Dril-Quip, Inc.A | | | 104,720 | | | $ | 4,974,200 | |
Flotek Industries, Inc.A B | | | 754,342 | | | | 8,886,149 | |
McDermott International, Inc.A | | | 1,575,503 | | | | 8,098,085 | |
Nabors Industries Ltd. | | | 622,400 | | | | 7,406,560 | |
Oil States International, Inc.A | | | 589,455 | | | | 17,241,559 | |
Patterson-UTI Energy, Inc. | | | 451,260 | | | | 10,144,325 | |
PDC Energy, Inc.A | | | 161,658 | | | | 9,914,485 | |
Rowan Cos., PLC, Class AC | | | 376,200 | | | | 4,992,174 | |
RPC, Inc.B | | | 926,089 | | | | 15,993,557 | |
SEACOR Holdings, Inc.B | | | 52,438 | | | | 2,585,718 | |
Unit Corp.A | | | 157,580 | | | | 2,699,345 | |
| | | | | | | | |
| | | | | | | 95,471,430 | |
| | | | | | | | |
Oil & Gas - 3.11% | | | | | | | | |
Aegean Marine Petroleum Network, Inc. | | | 119,489 | | | | 1,027,605 | |
Callon Petroleum Co.A | | | 2,142,381 | | | | 27,829,529 | |
Carrizo Oil & Gas, Inc.A | | | 253,716 | | | | 8,583,212 | |
Consol Energy, Inc.A B | | | 506,390 | | | | 8,583,311 | |
Denbury Resources, Inc.A B | | | 565,260 | | | | 1,350,971 | |
Gran Tierra Energy, Inc.A | | | 919,942 | | | | 2,677,031 | |
Green Plains Renewable Energy, Inc. | | | 117,600 | | | | 3,057,600 | |
Helix Energy Solutions Group, Inc.A | | | 329,220 | | | | 2,870,798 | |
Kosmos Energy Ltd.A | | | 1,694,267 | | | | 8,827,131 | |
Murphy Oil Corp. | | | 527,130 | | | | 13,636,853 | |
Natural Gas Services Group, Inc., Acquired 4/23/14 – 2/19/16, Cost $6,405,534 A D | | | 230,153 | | | | 4,994,320 | |
Oasis Petroleum, Inc.A | | | 548,600 | | | | 5,754,814 | |
Par Pacific Holdings, Inc.A B | | | 65,396 | | | | 833,145 | |
PBF Energy, Inc., Class A | | | 144,700 | | | | 3,154,460 | |
QEP Resources, Inc.A | | | 734,000 | | | | 11,795,380 | |
Range Resources Corp. | | | 518,625 | | | | 17,524,340 | |
RSP Permian, Inc.A | | | 258,533 | | | | 9,333,041 | |
SemGroup Corp., Class A | | | 318,274 | | | | 10,264,338 | |
Synergy Resources Corp.A | | | 2,244,991 | | | | 15,355,738 | |
Whiting Petroleum Corp.A | | | 1,519,700 | | | | 12,522,328 | |
WPX Energy, Inc.A | | | 1,021,400 | | | | 11,092,404 | |
| | | | | | | | |
| | | | | | | 181,068,349 | |
| | | | | | | | |
Total Energy | | | | | | | 276,539,779 | |
| | | | | | | | |
FINANCIALS - 24.71% | | | | | | | | |
Banks - 14.23% | | | | | | | | |
1st Source Corp. | | | 75,165 | | | | 2,597,702 | |
Associated Banc-Corp. | | | 1,426,356 | | | | 28,955,028 | |
BancorpSouth, Inc. | | | 265,507 | | | | 6,239,415 | |
Berkshire Hills Bancorp, Inc. | | | 72,836 | | | | 2,152,304 | |
BOK Financial Corp.B | | | 160,891 | | | | 11,426,479 | |
Boston Private Financial Holdings, Inc. | | | 700,386 | | | | 9,210,076 | |
Brookline Bancorp, Inc., Acquired 7/6/2010 – 3/18/2016, Cost $8,490,626 D | | | 908,954 | | | | 11,634,611 | |
Bryn Mawr Bank Corp., Acquired 7/31/2015 – 2/19/2016, Cost $5,112,963D | | | 177,541 | | | | 5,574,787 | |
Capital Bank Financial Corp., Class A | | | 256,280 | | | | 8,393,170 | |
Cathay General Bancorp | | | 223,903 | | | | 6,705,895 | |
Central Pacific Financial Corp. | | | 426,773 | | | | 10,938,192 | |
Chemical Financial Corp. | | | 136,114 | | | | 5,846,096 | |
City Holding Co. | | | 39,937 | | | | 2,087,507 | |
Clifton Bancorp, Inc. | | | 99,721 | | | | 1,524,734 | |
CoBiz Financial, Inc., Acquired 10/9/2012 – 2/19/2016, Cost $2,846,393 D | | | 350,046 | | | | 4,452,585 | |
Columbia Banking System, Inc. | | | 456,951 | | | | 15,088,522 | |
CVB Financial Corp. | | | 586,456 | | | | 9,840,732 | |
Dime Community Bancshares, Inc. | | | 97,038 | | | | 1,572,016 | |
See accompanying notes
13
American Beacon Small Cap Value FundSM
Schedule of Investments
October 31, 2016
| | | | | | | | |
| | | Shares | | | Fair Value | |
FINANCIALS - 24.71% (continued) | | | | | | | | |
Banks - 14.23% (continued) | | | | | | | | |
East West Bancorp, Inc. | | | 254,500 | | | $ | 10,055,295 | |
FCB Financial Holdings, Inc., Class AA | | | 203,726 | | | | 7,598,980 | |
First Busey Corp. | | | 242,900 | | | | 5,613,419 | |
First Citizens BancShares, Inc., Class A | | | 19,023 | | | | 5,535,693 | |
First Commonwealth Financial Corp. | | | 319,069 | | | | 3,241,741 | |
First Financial Bancorp | | | 142,631 | | | | 3,066,567 | |
First Financial Corp. | | | 112,682 | | | | 4,518,548 | |
First Hawaiian, Inc. | | | 522,400 | | | | 14,251,072 | |
First Horizon National Corp. | | | 2,711,576 | | | | 41,785,386 | |
First Interstate Bancsystem, Inc., Class A | | | 385,977 | | | | 12,312,666 | |
First Merchants Corp. | | | 95,686 | | | | 2,693,561 | |
First Midwest Bancorp, Inc. | | | 511,882 | | | | 9,884,441 | |
Flushing Financial Corp. | | | 34,819 | | | | 745,823 | |
FNB Corp. | | | 844,764 | | | | 11,041,065 | |
Frost Bankers, Inc. | | | 59,665 | | | | 4,533,943 | |
Fulton Financial Corp. | | | 2,043,876 | | | | 30,453,752 | |
Hancock Holding Co | | | 930,446 | | | | 31,216,463 | |
Hanmi Financial Corp. | | | 75,280 | | | | 1,882,000 | |
Hope Bancorp, Inc. | | | 219,485 | | | | 3,542,488 | |
Iberiabank Corp. | | | 377,869 | | | | 24,807,100 | |
International Bancshares Corp. | | | 440,956 | | | | 13,603,493 | |
Investors Bancorp, Inc. | | | 1,195,801 | | | | 14,660,520 | |
MainSource Financial Group, Inc. | | | 161,015 | | | | 4,018,934 | |
MB Financial, Inc. | | | 493,224 | | | | 17,948,421 | |
National Bank Holdings Corp., Class A | | | 80,543 | | | | 1,960,417 | |
NBT Bancorp, Inc. | | | 113,954 | | | | 3,841,389 | |
Northwest Bancshares, Inc | | | 347,260 | | | | 5,465,872 | |
Old National Bancorp | | | 929,124 | | | | 13,658,123 | |
PacWest Bancorp | | | 165,280 | | | | 7,171,499 | |
People’s United Financial, Inc. | | | 821,194 | | | | 13,336,191 | |
Popular, Inc. | | | 833,758 | | | | 30,265,415 | |
Prosperity Bancshares, Inc. | | | 647,813 | | | | 35,934,187 | |
Provident Financial Services, Inc. | | | 199,518 | | | | 4,527,063 | |
Real Industry, Inc.A | | | 722,432 | | | | 3,865,011 | |
Renasant Corp. | | | 82,527 | | | | 2,784,461 | |
S&T Bancorp, Inc. | | | 100,275 | | | | 3,147,632 | |
Sandy Spring Bancorp, Inc. | | | 65,933 | | | | 2,090,076 | |
Seacoast Banking Corp. of Florida, Acquired 12/18/2014 – 10/28/2016, Cost $8,993,674 A D | | | 596,874 | | | | 10,391,576 | |
Simmons First National Corp., Class A | | | 165,736 | | | | 8,179,072 | |
South State Corp. | | | 274,259 | | | | 20,116,898 | |
Sterling Bancorp | | | 753,939 | | | | 13,570,902 | |
TCF Financial Corp. | | | 796,516 | | | | 11,390,179 | |
The Bank of NT Butterfield & Son Ltd. | | | 187,700 | | | | 4,748,810 | |
TowneBank | | | 121,751 | | | | 3,019,425 | |
Trustmark Corp. | | | 380,746 | | | | 10,539,049 | |
UMB Financial Corp. | | | 825,976 | | | | 51,251,811 | |
Umpqua Holdings Corp. | | | 1,579,676 | | | | 24,137,449 | |
Union Bankshares Corp. | | | 111,587 | | | | 3,116,625 | |
United Bankshares, Inc.B | | | 133,874 | | | | 5,047,050 | |
United Community Banks, Inc. | | | 623,417 | | | | 13,447,105 | |
United Financial Bancorp, Inc. | | | 106,546 | | | | 1,567,292 | |
Valley National Bancorp | | | 735,331 | | | | 7,250,364 | |
Washington Federal, Inc. | | | 902,551 | | | | 24,594,515 | |
Washington Trust Bancorp, Inc., Acquired 7/31/2007 – 5/19/2016, Cost $4,079,771D | | | 137,676 | | | | 6,319,328 | |
Webster Financial Corp | | | 859,022 | | | | 34,704,489 | |
WesBanco, Inc | | | 198,683 | | | | 6,538,658 | |
See accompanying notes
14
American Beacon Small Cap Value FundSM
Schedule of Investments
October 31, 2016
| | | | | | | | |
| | | Shares | | | Fair Value | |
FINANCIALS - 24.71% (continued) | | | | | | | | |
Banks - 14.23% (continued) | | | | | | | | |
Wintrust Financial Corp. | | | 304,382 | | | $ | 16,421,409 | |
| | | | | | | | |
| | | | | | | 827,650,564 | |
| | | | | | | | |
Capital Markets - 0.05% | | | | | | | | |
Donnelley Financial Solutions, Inc.A | | | 122,460 | | | | 2,626,767 | |
| | | | | | | | |
Diversified Financials - 3.50% | | | | | | | | |
Ashford, Inc.A | | | 1 | | | | 45 | |
Beneficial Bancorp, Inc. | | | 204,425 | | | | 2,964,162 | |
Calamos Asset Management, Inc., Class A | | | 327,143 | | | | 2,113,343 | |
Capitol Federal Financial, Inc. | | | 463,089 | | | | 6,793,515 | |
Cohen & Steers, Inc. | | | 231,264 | | | | 8,598,395 | |
Credit Acceptance Corp.A B | | | 77,995 | | | | 14,358,880 | |
Customers Bancorp, Inc.A | | | 397,479 | | | | 10,759,757 | |
Essent Group Ltd.A | | | 130,690 | | | | 3,455,444 | |
First BanCorp Puerto RicoA | | | 1,751,010 | | | | 8,982,681 | |
Flagstar Bancorp, Inc.A | | | 139,451 | | | | 3,825,141 | |
Great Western Bancorp, Inc. | | | 349,610 | | | | 11,271,426 | |
Heartland Financial USA, Inc. | | | 52,750 | | | | 1,975,488 | |
Janus Capital Group, Inc. | | | 531,161 | | | | 6,809,484 | |
KCG Holdings, Inc., Class AA | | | 291,601 | | | | 3,720,829 | |
Kearny Financial Corp. | | | 75,300 | | | | 1,050,435 | |
Meridian Bancorp, Inc. | | | 108,707 | | | | 1,733,877 | |
Nelnet, Inc., Class A | | | 174,012 | | | | 6,817,790 | |
Northfield Bancorp, Inc. | | | 192,895 | | | | 3,173,123 | |
Oppenheimer Holdings, Inc., Class A | | | 266,597 | | | | 3,732,358 | |
Oritani Financial Corp. | | | 125,896 | | | | 1,970,272 | |
Pacific Continental Corp. | | | 247,972 | | | | 4,252,720 | |
Piper Jaffray Cos.A | | | 168,181 | | | | 9,510,636 | |
Pzena Investment Management, Inc., Class A | | | 12,712 | | | | 92,543 | |
Retail Opportunity Investments Corp.E | | | 472,952 | | | | 9,511,065 | |
SLM Corp.A | | | 1,201,800 | | | | 8,472,690 | |
Stifel Financial Corp.A | | | 28,343 | | | | 1,109,345 | |
Synovus Financial Corp. | | | 957,202 | | | | 31,654,670 | |
Texas Capital Bancshares, Inc.A | | | 495,936 | | | | 29,409,005 | |
Virtus Investment Partners, Inc. | | | 11,354 | | | | 1,218,284 | |
Waddell & Reed Financial, Inc., Class A | | | 167,916 | | | | 2,639,640 | |
Walker & Dunlop, Inc.A | | | 72,610 | | | | 1,747,723 | |
| | | | | | | | |
| | | | | | | 203,724,766 | |
| | | | | | | | |
Insurance - 6.82% | | | | | | | | |
Allied World Assurance Co., Holdings AG | | | 443,818 | | | | 19,075,298 | |
American Equity Investment Life Holding Co. | | | 253,853 | | | | 4,551,584 | |
AMERISAFE, Inc. | | | 29,190 | | | | 1,622,964 | |
Argo Group International Holdings Ltd. | | | 216,479 | | | | 12,036,232 | |
Aspen Insurance Holdings Ltd. | | | 381,965 | | | | 18,429,811 | |
Assurant, Inc. | | | 183,183 | | | | 14,749,895 | |
Assured Guaranty Ltd. | | | 383,089 | | | | 11,450,530 | |
Axis Capital Holdings Ltd. | | | 239,858 | | | | 13,664,710 | |
CNO Financial Group, Inc. | | | 1,671,481 | | | | 25,205,933 | |
Employers Holdings, Inc. | | | 75,444 | | | | 2,365,169 | |
Endurance Specialty Holdings Ltd. | | | 86,107 | | | | 7,917,539 | |
Enstar Group Ltd.A | | | 176,274 | | | | 29,719,796 | |
FBL Financial Group, Inc., Class A | | | 50,783 | | | | 3,214,564 | |
First American Financial Corp. | | | 429,298 | | | | 16,768,380 | |
Genworth Financial, Inc., Class AA | | | 466,491 | | | | 1,931,273 | |
Global Indemnity PLCA C | | | 399,823 | | | | 12,010,683 | |
Hanover Insurance Group, Inc. | | | 217,789 | | | | 16,593,344 | |
Hilltop Holdings, Inc. | | | 520,494 | | | | 12,856,202 | |
See accompanying notes
15
American Beacon Small Cap Value FundSM
Schedule of Investments
October 31, 2016
| | | | | | | | |
| | | Shares | | | Fair Value | |
FINANCIALS - 24.71% (continued) | | | | | | | | |
Insurance - 6.82% (continued) | | | | | | | | |
Horace Mann Educators Corp. | | | 925,021 | | | $ | 33,254,505 | |
Infinity Property & Casualty Corp. | | | 49,362 | | | | 4,045,216 | |
Kemper Corp. | | | 172,296 | | | | 6,469,715 | |
Maiden Holdings Ltd. | | | 198,238 | | | | 2,705,949 | |
MBIA, Inc.A | | | 269,200 | | | | 2,072,840 | |
National General Holdings Corp. | | | 322,600 | | | | 6,629,430 | |
National Western Life Group, Inc., Class A | | | 5,590 | | | | 1,204,086 | |
Navigators Group, Inc. | | | 44,665 | | | | 4,162,778 | |
Old Republic International Corp. | | | 822,186 | | | | 13,862,056 | |
OneBeacon Insurance Group Ltd., Class A | | | 39,900 | | | | 548,226 | |
Primerica, Inc. | | | 158,796 | | | | 8,686,141 | |
ProAssurance Corp. | | | 148,508 | | | | 7,915,476 | |
Radian Group, Inc. | | | 172,600 | | | | 2,345,634 | |
Renaissancere Holdings Ltd. | | | 124,271 | | | | 15,445,643 | |
Safety Insurance Group, Inc. | | | 128,513 | | | | 8,700,330 | |
Selective Insurance Group, Inc. | | | 366,982 | | | | 13,559,985 | |
State Auto Financial Corp. | | | 69,873 | | | | 1,600,092 | |
Third Point Reinsurance Ltd.A | | | 260,084 | | | | 3,055,987 | |
United Fire Group, Inc. | | | 72,941 | | | | 2,882,628 | |
Universal Insurance Holdings, Inc.B | | | 143,378 | | | | 3,053,951 | |
Validus Holdings Ltd. | | | 280,241 | | | | 14,320,315 | |
White Mountains Insurance Group Ltd. | | | 19,147 | | | | 15,886,649 | |
| | | | | | | | |
| | | | | | | 396,571,539 | |
| | | | | | | | |
Specialty Finance - 0.11% | | | | | | | | |
GATX Corp.B | | | 144,649 | | | | 6,331,287 | |
| | | | | | | | |
Total Financials | | | | | | | 1,436,904,923 | |
| | | | | | | | |
HEALTH CARE - 3.22% | | | | | | | | |
Biotechnology - 0.06% | | | | | | | | |
Charles River Laboratories International, Inc.A | | | 38,360 | | | | 2,910,757 | |
PDL BioPharma, Inc. | | | 270,092 | | | | 869,696 | |
| | | | | | | | |
| | | | | | | 3,780,453 | |
| | | | | | | | |
Health Care Equipment & Supplies - 0.79% | | | | | | | | |
Globus Medical, Inc., Class AA | | | 525,631 | | | | 11,632,214 | |
Hillenbrand, Inc. | | | 362,991 | | | | 11,016,776 | |
Hill-Rom Holdings, Inc. | | | 133,421 | | | | 7,392,858 | |
Integra LifeSciences Holdings Corp.A | | | 16,543 | | | | 1,315,334 | |
Invacare Corp. | | | 705,146 | | | | 6,452,086 | |
Meridian Bioscience, Inc. | | | 175,324 | | | | 2,884,080 | |
Natus Medical, Inc.A | | | 134,958 | | | | 5,310,597 | |
| | | | | | | | |
| | | | | | | 46,003,945 | |
| | | | | | | | |
Health Care Providers & Services - 2.04% | | | | | | | | |
AAC Holdings, Inc.A B | | | 118,022 | | | | 1,934,381 | |
Air Methods Corp.B | | | 178,763 | | | | 4,728,281 | |
Allscripts Healthcare Solutions, Inc. | | | 771,261 | | | | 9,262,845 | |
Almost Family, Inc. | | | 31,702 | | | | 1,244,304 | |
AMN Healthcare Services, Inc.A | | | 297,634 | | | | 9,762,395 | |
Community Health Systems, Inc.B | | | 190,695 | | | | 1,006,870 | |
Hanger Orthopedic Group, Inc.A | | | 697,921 | | | | 5,583,368 | |
HealthSouth Corp. | | | 514,780 | | | | 20,668,415 | |
LifePoint Hospitals, Inc.A | | | 524,889 | | | | 31,414,607 | |
Magellan Health Services, Inc.A | | | 86,150 | | | | 4,432,418 | |
Omnicell, Inc.A | | | 299,255 | | | | 9,763,194 | |
Owens & Minor, Inc. | | | 306,991 | | | | 9,961,858 | |
Select Medical Holdings Corp.A | | | 509,423 | | | | 6,622,499 | |
See accompanying notes
16
American Beacon Small Cap Value FundSM
Schedule of Investments
October 31, 2016
| | | | | | | | |
| | | Shares | | | Fair Value | |
HEALTH CARE - 3.22% (continued) | | | | | | | | |
Health Care Providers & Services - 2.04% (continued) | | | | | | | | |
Triple-S Management Corp., Class BA | | | 89,188 | | | $ | 1,844,408 | |
| | | | | | | | |
| | | | | | | 118,229,843 | |
| | | | | | | | |
Life Sciences - 0.13% | | | | | | | | |
INC Research Holdings, Inc.A | | | 167,000 | | | | 7,631,900 | |
| | | | | | | | |
Pharmaceuticals - 0.20% | | | | | | | | |
Phibro Animal Health Corp. | | | 135,500 | | | | 3,516,225 | |
Spectrum Pharmaceuticals, Inc. | | | 237,143 | | | | 839,486 | |
Supernus Pharmaceuticals, Inc.A | | | 369,665 | | | | 7,319,367 | |
| | | | | | | | |
| | | | | | | 11,675,078 | |
| | | | | | | | |
Total Health Care | | | | | | | 187,321,219 | |
| | | | | | | | |
INDUSTRIALS - 20.25% | | | | | | | | |
Aerospace & Defense - 1.50% | | | | | | | | |
AAR Corp. | | | 531,867 | | | | 17,110,161 | |
Aerovironment, Inc.A | | | 370,597 | | | | 8,890,622 | |
Aircastle Ltd. | | | 695,164 | | | | 14,285,620 | |
Cubic Corp. | | | 138,376 | | | | 5,908,655 | |
Curtiss-Wright Corp. | | | 85,103 | | | | 7,626,931 | |
DigitalGlobe, Inc.A | | | 192,740 | | | | 4,837,774 | |
Kaman Corp. | | | 54,997 | | | | 2,401,169 | |
KLX, Inc.A | | | 159,550 | | | | 5,491,711 | |
Moog, Inc., Class AA | | | 110,825 | | | | 6,435,608 | |
Triumph Group, Inc. | | | 218,436 | | | | 5,176,933 | |
Vectrus, Inc.A | | | 19,931 | | | | 334,243 | |
World Fuel Services Corp. | | | 213,618 | | | | 8,598,125 | |
| | | | | | | | |
| | | | | | | 87,097,552 | |
| | | | | | | | |
Air Freight & Couriers - 0.07% | | | | | | | | |
HUB Group, Inc., Class AA | | | 105,952 | | | | 3,861,950 | |
| | | | | | | | |
Airlines - 0.39% | | | | | | | | |
Hawaiian Holdings, Inc.A | | | 161,700 | | | | 7,280,543 | |
Skywest, Inc. | | | 157,442 | | | | 4,746,876 | |
Spirit Airlines, Inc.A | | | 217,900 | | | | 10,443,947 | |
| | | | | | | | |
| | | | | | | 22,471,366 | |
| | | | | | | | |
Building Products - 2.61% | | | | | | | | |
Apogee Enterprises, Inc. | | | 257,762 | | | | 10,503,802 | |
Crane Co. | | | 333,263 | | | | 22,665,217 | |
Masonite International Corp. | | | 300,806 | | | | 17,115,861 | |
Owens Corning | | | 406,627 | | | | 19,835,265 | |
Ply Gem Holding, Inc.A | | | 579,499 | | | | 7,939,136 | |
Simpson Manufacturing Co., Inc. | | | 792,497 | | | | 33,918,872 | |
Trex Co., Inc.A | | | 455,236 | | | | 24,496,249 | |
Universal Forest Products, Inc. | | | 51,933 | | | | 4,465,719 | |
USG Corp.A | | | 441,930 | | | | 11,127,797 | |
| | | | | | | | |
| | | | | | | 152,067,918 | |
| | | | | | | | |
Commercial Services & Supplies - 4.18% | | | | | | | | |
ABM Industries, Inc. | | | 208,232 | | | | 8,137,707 | |
Aceto Corp. | | | 328,401 | | | | 6,019,590 | |
American Public Education, Inc.A | | | 90,390 | | | | 1,821,359 | |
Apollo Group, Inc., Class AA | | | 143,876 | | | | 1,264,670 | |
Atlas Air Worldwide Holdings, Inc.A | | | 75,980 | | | | 3,179,763 | |
Bridgepoint Education, Inc.A | | | 316,792 | | | | 2,141,514 | |
Brink’s Co. | | | 162,298 | | | | 6,418,886 | |
Capella Education Co. | | | 105,975 | | | | 7,746,773 | |
See accompanying notes
17
American Beacon Small Cap Value FundSM
Schedule of Investments
October 31, 2016
| | | | | | | | |
| | | Shares | | | Fair Value | |
INDUSTRIALS - 20.25% (continued) | | | | | | | | |
Commercial Services & Supplies - 4.18% (continued) | | | | | | | | |
Convergys Corp. | | | 347,402 | | | $ | 10,144,138 | |
CSG Systems International, Inc. | | | 316,749 | | | | 12,045,964 | |
CyrusOne, Inc.E | | | 196,390 | | | | 8,760,958 | |
Deluxe Corp. | | | 256,066 | | | | 15,671,237 | |
DeVry, Inc.B | | | 287,578 | | | | 6,528,021 | |
Graham Holdings Co., Class B | | | 8,400 | | | | 3,990,000 | |
Heidrick & Struggles International, Inc. | | | 159,718 | | | | 2,954,783 | |
Herman Miller, Inc. | | | 359,303 | | | | 9,988,623 | |
Hudson Global, Inc. | | | 623,926 | | | | 898,453 | |
Interface, Inc. | | | 370,636 | | | | 5,874,581 | |
Kelly Services, Inc., Class A | | | 409,190 | | | | 7,664,129 | |
Korn/Ferry International | | | 894,326 | | | | 18,235,307 | |
LSC Communications, Inc. | | | 131,390 | | | | 3,184,894 | |
McGrath Rentcorp, Acquired 3/31/2010 – 5/10/2016, Cost $6,677,584 D | | | 258,324 | | | | 7,775,552 | |
Mobile Mini, Inc. | | | 568,269 | | | | 14,405,619 | |
Morningstar, Inc. | | | 113,203 | | | | 7,995,528 | |
MSA Safety, Inc. | | | 71,574 | | | | 4,172,764 | |
Navigant Consulting, Inc.A | | | 392,899 | | | | 9,193,837 | |
PHH Corp.A | | | 519,820 | | | | 7,547,786 | |
Pitney Bowes, Inc. | | | 658,706 | | | | 11,751,315 | |
Resources Connection, Inc. | | | 324,636 | | | | 4,820,845 | |
RR Donnelley & Sons Co. | | | 376,533 | | | | 6,683,461 | |
Steelcase, Inc., Class A | | | 260,800 | | | | 3,481,680 | |
Strayer Education, Inc.A | | | 118,404 | | | | 6,945,579 | |
Team, Inc. | | | 132,848 | | | | 4,085,076 | |
TrueBlue, Inc.A | | | 393,831 | | | | 6,892,043 | |
Weight Watchers International, Inc.A B | | | 88,256 | | | | 907,272 | |
West Corp. | | | 183,457 | | | | 3,617,772 | |
| | | | | | | | |
| | | | | | | 242,947,479 | |
| | | | | | | | |
Construction & Engineering - 2.24% | | | | | | | | |
AECOM Technology Corp.A | | | 413,745 | | | | 11,522,798 | |
Aegion Corp.A | | | 327,053 | | | | 6,053,751 | |
Comfort Systems USA, Inc. | | | 902,050 | | | | 26,024,143 | |
EMCOR Group, Inc. | | | 349,303 | | | | 21,118,859 | |
Granite Construction, Inc. | | | 268,355 | | | | 13,192,332 | |
Primoris Services Corp. | | | 864,477 | | | | 17,315,474 | |
Quanta Services, Inc.A | | | 318,272 | | | | 9,150,320 | |
Tutor Perini Corp. | | | 1,364,904 | | | | 26,001,421 | |
| | | | | | | | |
| | | | | | | 130,379,098 | |
| | | | | | | | |
Diversified Manufacturing - 0.63% | | | | | | | | |
Barnes Group, Inc. | | | 912,781 | | | | 36,365,195 | |
| | | | | | | | |
Electrical Equipment - 2.02% | | | | | | | | |
Belden, Inc. | | | 13,454 | | | | 871,954 | |
Encore Wire Corp. | | | 346,208 | | | | 11,823,003 | |
EnerSys, Inc. | | | 505,635 | | | | 32,932,008 | |
First Solar, Inc.A B | | | 211,152 | | | | 8,549,544 | |
Geospace Technologies Corp.A | | | 266,571 | | | | 4,912,904 | |
II-VI, Inc. | | | 1,577,850 | | | | 43,864,230 | |
Regal-Beloit Corp. | | | 243,903 | | | | 14,414,667 | |
| | | | | | | | |
| | | | | | | 117,368,310 | |
| | | | | | | | |
Engineering & Construction - 0.46% | | | | | | | | |
KBR, Inc. | | | 1,801,695 | | | | 26,683,103 | |
| | | | | | | | |
Industrial Conglomerates - 0.08% | | | | | | | | |
Park-Ohio Industries, Inc. | | | 42,216 | | | | 1,348,801 | |
See accompanying notes
18
American Beacon Small Cap Value FundSM
Schedule of Investments
October 31, 2016
| | | | | | | | |
| | | Shares | | | Fair Value | |
INDUSTRIALS - 20.25% (continued) | | | | | | | | |
Industrial Conglomerates - 0.08% (continued) | | | | | | | | |
Trimas Corp.A | | | 199,111 | | | $ | 3,574,042 | |
| | | | | | | | |
| | | | | | | 4,922,843 | |
| | | | | | | | |
Machinery - 4.24% | | | | | | | | |
Actuant Corp., Class A | | | 171,196 | | | | 3,817,671 | |
AGCO Corp. | | | 253,382 | | | | 12,942,753 | |
Altra Industrial Motion Corp. | | | 71,337 | | | | 2,104,442 | |
Applied Industrial Technologies, Inc. | | | 107,155 | | | | 5,443,474 | |
Astec Industries, Inc. | | | 140,960 | | | | 7,803,546 | |
Briggs & Stratton Corp. | | | 16,700 | | | | 310,954 | |
Chart Industries, Inc.A | | | 319,480 | | | | 8,862,375 | |
CLARCOR, Inc. | | | 196,244 | | | | 12,208,339 | |
Columbus McKinnon Corp. | | | 96,560 | | | | 1,881,954 | |
EnPro Industries, Inc. | | | 432,107 | | | | 23,385,631 | |
ESCO Technologies, Inc. | | | 61,249 | | | | 2,728,643 | |
Esterline Technologies Corp.A | | | 83,495 | | | | 6,132,708 | |
Greenbrier Cos., Inc.B | | | 85,400 | | | | 2,690,100 | |
iRobot Corp.A | | | 324,378 | | | | 16,445,965 | |
ITT, Inc. | | | 244,658 | | | | 8,616,855 | |
Joy Global, Inc. | | | 81,307 | | | | 2,262,774 | |
Kennametal, Inc. | | | 463,120 | | | | 13,110,927 | |
Lindsay Corp.B | | | 161,956 | | | | 12,681,155 | |
Meritor, Inc.A | | | 1,308,853 | | | | 13,455,009 | |
Miller Industries, Inc. | | | 226,733 | | | | 4,976,789 | |
Navistar International Corp.B | | | 106,166 | | | | 2,367,502 | |
Oshkosh Corp. | | | 402,805 | | | | 21,550,068 | |
Raven Industries, Inc. | | | 300,213 | | | | 6,439,569 | |
Reliance Steel & Aluminum Co. | | | 219,615 | | | | 15,105,120 | |
Sun Hydraulics Corp. | | | 116,079 | | | | 3,416,205 | |
Tennant Co. | | | 55,301 | | | | 3,481,198 | |
Terex Corp. | | | 969,439 | | | | 23,150,202 | |
Trinity Industries, Inc. | | | 330,145 | | | | 7,048,596 | |
Wabash National Corp.A | | | 212,726 | | | | 2,393,168 | |
| | | | | | | | |
| | | | | | | 246,813,692 | |
| | | | | | | | |
Marine - 0.61% | | | | | | | | |
Kirby Corp.A | | | 192,575 | | | | 11,352,296 | |
Matson, Inc. | | | 601,847 | | | | 24,037,769 | |
| | | | | | | | |
| | | | | | | 35,390,065 | |
| | | | | | | | |
Road & Rail - 0.81% | | | | | | | | |
Knight Transportation, Inc. | | | 400,132 | | | | 11,703,861 | |
Marten Transport Ltd., Acquired 10/9/2014 – 2/29/2016, Cost $7,049,756 D | | | 387,988 | | | | 7,953,754 | |
Ryder System, Inc. | | | 201,540 | | | | 13,984,861 | |
Swift Transportation Co.A | | | 416,337 | | | | 9,317,622 | |
Werner Enterprises, Inc. | | | 176,809 | | | | 4,252,256 | |
| | | | | | | | |
| | | | | | | 47,212,354 | |
| | | | | | | | |
Trading Companies & Distributors - 0.34% | | | | | | | | |
Air Lease Corp. | | | 337,057 | | | | 10,199,345 | |
Veritiv Corp.A | | | 28,400 | | | | 1,532,180 | |
WESCO International, Inc.A | | | 146,990 | | | | 7,966,858 | |
| | | | | | | | |
| | | | | | | 19,698,383 | |
| | | | | | | | |
Transportation Infrastructure - 0.07% | | | | | | | | |
Wesco Aircraft Holdings, Inc.A | | | 301,862 | | | | 3,878,927 | |
| | | | | | | | |
Total Industrials | | | | | | | 1,177,158,235 | |
| | | | | | | | |
See accompanying notes
19
American Beacon Small Cap Value FundSM
Schedule of Investments
October 31, 2016
| | | | | | | | |
| | | Shares | | | Fair Value | |
INFORMATION TECHNOLOGY - 14.80% | | | | | | | | |
Communications Equipment - 1.83% | | | | | | | | |
Adtran, Inc. | | | 244,475 | | | $ | 4,437,221 | |
Anixter International, Inc. | | | 187,732 | | | | 12,343,379 | |
Brocade Communications Systems, Inc. | | | 1,878,320 | | | | 19,910,192 | |
CalAmp Corp.A | | | 298,490 | | | | 3,856,491 | |
Comtech Telecommunications Corp. | | | 108,573 | | | | 1,129,159 | |
Digi International, Inc.A | | | 104,860 | | | | 959,469 | |
Extreme NetworksA | | | 2,063,494 | | | | 8,687,310 | |
Finisar Corp.A | | | 216,791 | | | | 5,935,738 | |
IxiaA | | | 601,938 | | | | 7,193,159 | |
NeuStar, Inc., Class AA B | | | 165,100 | | | | 3,706,495 | |
Plantronics, Inc. | | | 406,271 | | | | 21,008,273 | |
Verint Systems, Inc.A | | | 423,080 | | | | 15,230,880 | |
Viavi Solutions, Inc.A | | | 292,344 | | | | 2,081,489 | |
| | | | | | | | |
| | | | | | | 106,479,255 | |
| | | | | | | | |
Computers & Peripherals - 1.36% | | | | | | | | |
Cray, Inc.A | | | 238,745 | | | | 4,965,896 | |
Electronics for Imaging, Inc.A | | | 221,940 | | | | 9,439,108 | |
Lexmark International, Inc., Class A | | | 168,280 | | | | 6,679,033 | |
Mercury Systems, Inc.A | | | 707,347 | | | | 19,650,100 | |
NCR Corp.A | | | 451,285 | | | | 15,817,539 | |
Stratasys Ltd.A | | | 39,097 | | | | 747,535 | |
Synaptics, Inc.A | | | 95,202 | | | | 4,961,928 | |
Teradata Corp.A | | | 615,260 | | | | 16,587,410 | |
| | | | | | | | |
| | | | | | | 78,848,549 | |
| | | | | | | | |
Electronic Equipment & Instruments - 5.28% | | | | | | | | |
Analogic Corp. | | | 40,036 | | | | 3,276,947 | |
Arrow Electronics, Inc. | | | 314,616 | | | | 19,229,330 | |
Avnet, Inc. | | | 447,647 | | | | 18,778,792 | |
AVX Corp. | | | 494,422 | | | | 6,931,796 | |
Benchmark Electronics, Inc.A | | | 201,966 | | | | 5,079,445 | |
Celestica, Inc.A | | | 361,308 | | | | 4,281,500 | |
FLIR Systems, Inc. | | | 285,876 | | | | 9,411,038 | |
Ingram Micro, Inc., Class A | | | 178,080 | | | | 6,624,576 | |
Itron, Inc.A | | | 129,696 | | | | 6,990,614 | |
Jabil Circuit, Inc. | | | 649,822 | | | | 13,867,201 | |
Keysight Technologies, Inc.A | | | 382,138 | | | | 12,534,126 | |
Methode Electronics, Inc. | | | 72,210 | | | | 2,252,952 | |
MTS Systems Corp. | | | 376,705 | | | | 17,912,323 | |
Nanometrics, Inc., Acquired 2/11/2014 – 9/9/2016, Cost $6,051,159 A D | | | 350,866 | | | | 7,329,591 | |
Novanta, Inc.A | | | 28,447 | | | | 496,400 | |
Plexus Corp.A | | | 571,745 | | | | 26,191,638 | |
Rofin-Sinar Technologies, Inc.A | | | 107,382 | | | | 3,495,284 | |
Sanmina Corp.A | | | 849,156 | | | | 23,479,163 | |
Scansource, Inc.A | | | 293,323 | | | | 10,266,305 | |
Taser International, Inc.A | | | 186,510 | | | | 4,174,094 | |
Tech Data Corp.A | | | 390,971 | | | | 30,112,586 | |
Teledyne Technologies, Inc.A | | | 97,636 | | | | 10,513,444 | |
Tronox Ltd., Class A | | | 263,684 | | | | 2,135,840 | |
TTM Technologies, Inc.A | | | 306,600 | | | | 4,031,790 | |
Veeco Instruments, Inc.A | | | 168,941 | | | | 3,666,020 | |
Vishay Intertechnology, Inc. | | | 3,858,227 | | | | 54,401,001 | |
| | | | | | | | |
| | | | | | | 307,463,796 | |
| | | | | | | | |
Internet Software & Services - 0.57% | | | | | | | | |
Grand Canyon Education, Inc.A | | | 143,600 | | | | 6,266,704 | |
LivePerson, Inc.A | | | 291,833 | | | | 2,480,581 | |
Netgear, Inc.A | | | 162,594 | | | | 8,210,997 | |
See accompanying notes
20
American Beacon Small Cap Value FundSM
Schedule of Investments
October 31, 2016
| | | | | | | | |
| | | Shares | | | Fair Value | |
INFORMATION TECHNOLOGY - 14.80% (continued) | | | | | | | | |
Internet Software & Services - 0.57% (continued) | | | | | | | | |
NIC, Inc. | | | 154,014 | | | $ | 3,534,621 | |
WebMD Health Corp.A | | | 249,368 | | | | 12,251,450 | |
Zix Corp. | | | 61,435 | | | | 250,040 | |
| | | | | | | | |
| | | | | | | 32,994,393 | |
| | | | | | | | |
IT Consulting & Services - 0.73% | | | | | | | | |
Acxiom Corp.A | | | 451,849 | | | | 10,645,562 | |
CACI International, Inc., Class AA | | | 33,913 | | | | 3,318,387 | |
EVERTEC, Inc. | | | 56,561 | | | | 856,899 | |
Mantech International Corp., Class A | | | 168,246 | | | | 6,532,992 | |
Science Applications International Corp. | | | 65,199 | | | | 4,492,863 | |
Sykes Enterprises, Inc.A | | | 69,634 | | | | 1,862,013 | |
SYNNEX Corp. | | | 101,728 | | | | 10,431,189 | |
Syntel, Inc. | | | 48,819 | | | | 981,262 | |
Unisys Corp.A B | | | 312,419 | | | | 3,264,779 | |
| | | | | | | | |
| | | | | | | 42,385,946 | |
| | | | | | | | |
Semiconductor Equipment & Products - 3.27% | | | | | | | | |
Advanced Energy Industries, Inc.A | | | 113,175 | | | | 5,398,448 | |
Amkor Technology, Inc.A | | | 416,290 | | | | 3,859,008 | |
Brooks Automation, Inc. | | | 2,344,903 | | | | 30,554,086 | |
Cirrus Logic, Inc.A | | | 337,237 | | | | 18,204,053 | |
Cree, Inc.A | | | 221,700 | | | | 4,943,910 | |
Diodes, Inc.A | | | 1,819,739 | | | | 37,686,795 | |
Entegris, Inc.A | | | 400,702 | | | | 6,371,162 | |
Integrated Device Technology, Inc.A | | | 312,256 | | | | 6,466,822 | |
IXYS Corp. | | | 225,065 | | | | 2,385,689 | |
Kulicke & Soffa Industries, Inc.A | | | 188,388 | | | | 2,494,257 | |
Microsemi Corp. | | | 182,824 | | | | 7,702,375 | |
ON Semiconductor Corp.A | | | 1,158,916 | | | | 13,524,550 | |
Photronics, Inc.A | | | 1,715,862 | | | | 16,643,861 | |
Semtech Corp.A | | | 444,422 | | | | 10,755,012 | |
Teradyne, Inc. | | | 713,120 | | | | 16,608,565 | |
Xcerra Corp.A | | | 1,194,440 | | | | 6,581,364 | |
| | | | | | | | |
| | | | | | | 190,179,957 | |
| | | | | | | | |
Semiconductors & Semiconductor Equipment - 0.03% | | | | | | | | |
ChipMOS TECHNOLOGIES, Inc., ADRA F | | | 85,117 | | | | 1,740,615 | |
| | | | | | | | |
Software - 1.73% | | | | | | | | |
Bottomline Technologies, Inc.A | | | 126,218 | | | | 2,863,886 | |
FARO Technologies, Inc.A | | | 604,188 | | | | 20,270,507 | |
Interactive Intelligence Group, Inc.A | | | 116,049 | | | | 7,015,162 | |
Mentor Graphics Corp. | | | 1,250,183 | | | | 36,130,289 | |
MicroStrategy, Inc., Class AA | | | 61,530 | | | | 11,986,659 | |
Navient Corp. | | | 680,660 | | | | 8,698,835 | |
Netscout Systems, Inc.A | | | 352,226 | | | | 9,668,604 | |
Quality Systems, Inc. | | | 50,252 | | | | 647,748 | |
TiVo Corp.A | | | 165,949 | | | | 3,294,088 | |
| | | | | | | | |
| | | | | | | 100,575,778 | |
| | | | | | | | |
Total Information Technology | | | | | | | 860,668,289 | |
| | | | | | | | |
MATERIALS - 5.41% | | | | | | | | |
Chemicals - 2.51% | | | | | | | | |
A. Schulman, Inc. | | | 217,101 | | | | 6,241,654 | |
American Vanguard Corp. | | | 540,845 | | | | 8,220,844 | |
Cabot Corp. | | | 238,544 | | | | 12,437,684 | |
Calgon Carbon Corp. | | | 525,347 | | | | 8,300,483 | |
See accompanying notes
21
American Beacon Small Cap Value FundSM
Schedule of Investments
October 31, 2016
| | | | | | | | |
| | | Shares | | | Fair Value | |
MATERIALS - 5.41% (continued) | | | | | | | | |
Chemicals - 2.51% (continued) | | | | | | | | |
Cambrex Corp. | | | 280,980 | | | $ | 11,323,494 | |
Ferro Corp.A | | | 249,700 | | | | 3,236,112 | |
HB Fuller Co. | | | 105,684 | | | | 4,446,126 | |
Huntsman Corp. | | | 729,160 | | | | 12,359,262 | |
Innophos Holdings, Inc. | | | 46,269 | | | | 2,120,971 | |
Innospec, Inc. | | | 189,369 | | | | 11,409,482 | |
Kronos Worldwide, Inc.B | | | 307,121 | | | | 2,361,760 | |
LSB Industries, Inc.A B | | | 119,079 | | | | 629,928 | |
Minerals Technologies, Inc. | | | 111,530 | | | | 7,494,816 | |
Olin Corp. | | | 205,368 | | | | 4,503,720 | |
PolyOne Corp. | | | 721,880 | | | | 21,100,552 | |
Scotts Miracle-Gro Co., Class A | | | 246,052 | | | | 21,674,721 | |
Stepan Co. | | | 120,310 | | | | 8,545,619 | |
| | | | | | | | |
| | | | | | | 146,407,228 | |
| | | | | | | | |
Construction Materials - 0.01% | | | | | | | | |
Boise Cascade Co.A | | | 37,249 | | | | 717,043 | |
| | | | | | | | |
Containers & Packaging - 0.30% | | | | | | | | |
Greif, Inc., Class A | | | 98,928 | | | | 4,635,766 | |
Owens-Illinois, Inc.A | | | 666,659 | | | | 12,866,519 | |
| | | | | | | | |
| | | | | | | 17,502,285 | |
| | | | | | | | |
Metals & Mining - 1.84% | | | | | | | | |
Allegheny Technologies, Inc.B | | | 1,197,800 | | | | 16,337,992 | |
Carpenter Technology Corp. | | | 337,759 | | | | 10,676,562 | |
Coeur d’Alene Mines Corp. | | | 383,132 | | | | 4,283,416 | |
Commercial Metals Co. | | | 396,541 | | | | 6,229,659 | |
Ferroglobe PLCC | | | 2,123,070 | | | | 19,638,398 | |
Gibraltar Industries, Inc.A | | | 473,521 | | | | 18,419,967 | |
Global Brass & Copper Holdings, Inc. | | | 165,350 | | | | 4,745,545 | |
Haynes International, Inc. | | | 173,913 | | | | 5,594,781 | |
Materion Corp. | | | 137,288 | | | | 4,159,826 | |
Pan American Silver Corp. | | | 258,929 | | | | 4,150,632 | |
Schnitzer Steel Industries, Inc., Class A | | | 34,714 | | | | 838,343 | |
Stillwater Mining Co.A | | | 888,008 | | | | 11,828,267 | |
| | | | | | | | |
| | | | | | | 106,903,388 | |
| | | | | | | | |
Paper & Forest Products - 0.75% | | | | | | | | |
Clearwater Paper Corp.A | | | 30,000 | | | | 1,593,000 | |
Domtar Corp. | | | 219,036 | | | | 7,874,344 | |
Glatfelter Co. | | | 326,187 | | | | 7,247,875 | |
Louisiana-Pacific Corp.A | | | 807,267 | | | | 14,813,349 | |
Mercer International, Inc. | | | 169,384 | | | | 1,338,134 | |
Potlatch Corp.E | | | 173,733 | | | | 6,671,347 | |
Schweitzer-Mauduit International, Inc. | | | 104,864 | | | | 3,870,530 | |
| | | | | | | | |
| | | | | | | 43,408,579 | |
| | | | | | | | |
Total Materials | | | | | | | 314,938,523 | |
| | | | | | | | |
REAL ESTATE - 3.99% | | | | | | | | |
Equity Real Estate Investment Trusts - 3.96% | | | | | | | | |
Agree Realty Corp.E | | | 112,231 | | | | 5,426,369 | |
American Assets Trust, Inc.E | | | 248,113 | | | | 9,852,567 | |
Apollo Commercial Real Estate Finance, Inc.E | | | 122,005 | | | | 2,064,325 | |
Ashford Hospitality Prime, Inc.E | | | 181,733 | | | | 2,355,260 | |
Ashford Hospitality Trust, Inc.E | | | 586,378 | | | | 3,406,856 | |
Brandywine Realty TrustE | | | 547,728 | | | | 8,489,784 | |
CareTrust REIT, Inc.E | | | 511,373 | | | | 7,200,132 | |
See accompanying notes
22
American Beacon Small Cap Value FundSM
Schedule of Investments
October 31, 2016
| | | | | | | | |
| | | Shares | | | Fair Value | |
REAL ESTATE - 3.99% (continued) | | | | | | | | |
Equity Real Estate Investment Trusts - 3.96% (continued) | | | | | | | | |
CBL & Associates Properties, Inc.E | | | 1,203,943 | | | $ | 12,882,190 | |
Cousins Properties, Inc.E | | | 1,146,444 | | | | 8,907,870 | |
DuPont Fabros Technology, Inc.E | | | 208,100 | | | | 8,492,561 | |
Education Realty Trust, Inc.E | | | 195,263 | | | | 8,316,251 | |
Equity CommonwealthA E | | | 182,677 | | | | 5,518,672 | |
Geo Group, Inc.E | | | 975,414 | | | | 23,370,919 | |
Granite Real Estate Investment TrustE | | | 311,960 | | | | 9,873,534 | |
Healthcare Trust of America, Inc., Class AE | | | 308,408 | | | | 9,437,285 | |
Hospitality Properties TrustE | | | 119,708 | | | | 3,275,211 | |
Invesco Mortgage Capital, Inc.E | | | 428,629 | | | | 6,399,431 | |
LaSalle Hotel PropertiesE | | | 314,479 | | | | 7,468,876 | |
Lexington Realty TrustE | | | 711,600 | | | | 7,215,624 | |
Mack-Cali Realty Corp.E | | | 282,117 | | | | 7,244,765 | |
Medical Properties Trust, Inc.E | | | 592,662 | | | | 8,261,708 | |
New Residential Investment Corp.E | | | 325,554 | | | | 4,544,734 | |
Parkway, Inc.A E | | | 263,625 | | | | 4,750,523 | |
Pebblebrook Hotel TrustE | | | 737,492 | | | | 17,906,306 | |
Pennsylvania Real Estate Investment TrustE | | | 365,555 | | | | 7,131,978 | |
RAIT Financial TrustE | | | 1,102,339 | | | | 3,362,134 | |
Ramco-Gershenson Properties TrustE | | | 402,855 | | | | 6,985,506 | |
RLJ Lodging TrustE | | | 271,272 | | | | 5,349,484 | |
Ryman Hospitality Properties, Inc.E | | | 120,194 | | | | 6,060,181 | |
Select Income REITE | | | 238,500 | | | | 5,900,490 | |
Seritage Growth PropertiesB E | | | 68,300 | | | | 3,111,065 | |
| | | | | | | | |
| | | | | | | 230,562,591 | |
| | | | | | | | |
Real Estate Management & Development - 0.03% | | | | | | | | |
HFF, Inc., Class A | | | 67,300 | | | | 1,792,199 | |
| | | | | | | | |
Total Real Estate | | | | | | | 232,354,790 | |
| | | | | | | | |
TELECOMMUNICATION SERVICES - 1.07% | | | | | | | | |
Diversified Telecommunication - 0.71% | | | | | | | | |
ARRIS International PLCA C | | | 1,487,826 | | | | 41,331,806 | |
| | | | | | | | |
Diversified Telecommunication Services - 0.16% | | | | | | | | |
EchoStar Corp., Class AA | | | 153,168 | | | | 7,159,072 | |
Loral Space & Communications, Inc. | | | 59,083 | | | | 2,292,420 | |
| | | | | | | | |
| | | | | | | 9,451,492 | |
| | | | | | | | |
Wireless Telecommunication Services - 0.20% | | | | | | | | |
Iridium Communications, Inc.A B | | | 325,068 | | | | 2,649,304 | |
Telephone & Data Systems, Inc. | | | 346,403 | | | | 8,951,054 | |
| | | | | | | | |
| | | | | | | 11,600,358 | |
| | | | | | | | |
Total Telecommunication Services | | | | | | | 62,383,656 | |
| | | | | | | | |
UTILITIES - 3.05% | | | | | | | | |
Electric - 2.21% | | | | | | | | |
Allete, Inc. | | | 143,511 | | | | 8,795,789 | |
Black Hills Corp. | | | 165,465 | | | | 10,234,010 | |
Great Plains Energy, Inc. | | | 1,054,501 | | | | 29,990,008 | |
Hawaiian Electric Industries, Inc. | | | 342,506 | | | | 10,103,927 | |
IDACORP, Inc. | | | 92,666 | | | | 7,264,088 | |
NRG Energy, Inc. | | | 590,800 | | | | 6,280,204 | |
NRG Yield, Inc., Class A | | | 105,740 | | | | 1,557,550 | |
NRG Yield, Inc., Class CB | | | 445,660 | | | | 6,863,164 | |
Portland General Electric Co. | | | 1,095,996 | | | | 47,829,265 | |
| | | | | | | | |
| | | | | | | 128,918,005 | |
| | | | | | | | |
See accompanying notes
23
American Beacon Small Cap Value FundSM
Schedule of Investments
October 31, 2016
| | | | | | | | |
| | | Shares | | | Fair Value | |
UTILITIES - 3.05% (continued) | | | | | | | | |
Gas - 0.42% | | | | | | | | |
Chesapeake Utilities Corp. | | | 163,723 | | | $ | 10,486,458 | |
WGL Holdings, Inc. | | | 217,765 | | | | 13,734,439 | |
| | | | | | | | |
| | | | | | | 24,220,897 | |
| | | | | | | | |
Multi-Utilities - 0.30% | | | | | | | | |
Avista Corp. | | | 189,305 | | | | 7,837,227 | |
Vectren Corp. | | | 190,118 | | | | 9,564,837 | |
| | | | | | | | |
| | | | | | | 17,402,064 | |
| | | | | | | | |
Water Utilities - 0.12% | | | | | | | | |
American States Water Co. | | | 176,131 | | | | 7,041,717 | |
| | | | | | | | |
Total Utilities | | | | | | | 177,582,683 | |
| | | | | | | | |
Total Common Stock (Cost $4,993,333,347) | | | | | | | 5,622,879,669 | |
| | | | | | | | |
EXCHANGE TRADED INSTRUMENTS - 0.23% (Cost $13,666,008) | | | | | | | | |
EXCHANGE TRADED FUNDS - 0.23% | | | | | | | | |
Exchange Traded Funds - 0.23% | | | | | | | | |
iShares Russell 2000 Value Index FundB | | | 132,516 | | | | 13,447,724 | |
| | | | | | | | |
SHORT-TERM INVESTMENTS - 3.03% (Cost $176,509,560) | | | | | | | | |
American Beacon U.S. Government Money Market Select Fund, Select ClassG | | | 176,509,560 | | | | 176,509,560 | |
| | | | | | | | |
SECURITIES LENDING COLLATERAL - 4.02% | | | | | | | | |
DWS Government and Agency Securities Portfolio, Institutional Class | | | 51,448,944 | | | | 51,448,944 | |
American Beacon U.S. Government Money Market Select Fund, Select Class G | | | 182,435,583 | | | | 182,435,584 | |
| | | | | | | | |
Total Securities Lending Collateral (Cost $233,884,528) | | | | 233,884,528 | |
| | | | | | | | |
TOTAL INVESTMENTS - 103.96% (Cost $ 5,417,393,443) | | | | | | | 6,046,721,481 | |
LIABILITIES, NET OF OTHER ASSETS - (3.96%) | | | | (230,373,942 | ) |
| | | | | | | | |
TOTAL NET ASSETS - 100.00% | | | | | | $ | 5,816,347,539 | |
| | | | | | | | |
Percentages are stated as a percent of net assets.
| A | Non-income producing security. |
| B | All or a portion of this security is on loan at October 31, 2016. |
| C | PLC - Public Limited Company. |
| D | Illiquid Security. At period end, the amount of illiquid securities was $ 66,426,104 or 1.14% of net assets. |
| E | REIT - Real Estate Investment Trust. |
| F | ADR - American Depositary Receipt. |
| G | The Fund is affiliated by having the same investment advisor. |
Futures Contracts Open on October 31, 2016:
| | | | | | | | | | | | | | | | | | | | |
| | | | | | Number of | | | | | | | | | Unrealized Appreciation | |
Description | | Type | | | Contracts | | | Expiration Date | | | Contract Value | | | (Depreciation) | |
Russell 2000 Mini Index Futures | | | Long | | | | 1,420 | | | | December 2016 | | | $ | 168,880,600 | | | $ | (6,091,853 | ) |
| | | | | | | | | | | | | | | | | | | | |
| | | | | | | | | | | | | | $ | 168,880,600 | | | $ | (6,091,853 | ) |
| | | | | | | | | | | | | | | | | | | | |
See accompanying notes
24
American Beacon Small Cap Value FundSM
Statement of Assets and Liabilities
October 31, 2016
| | | | |
Assets: | | | | |
Investments in unaffiliated securities, at fair value A C | | $ | 5,687,776,337 | |
Investments in affiliated securities, at fair value B | | | 358,945,144 | |
Deposit with brokers for futures contracts | | | 14,980,992 | |
Receivable for investments sold | | | 13,649,669 | |
Receivable for fund shares sold | | | 2,568,374 | |
Dividends and interest receivable | | | 2,290,800 | |
Prepaid expenses | | | 384,912 | |
| �� | | | |
Total assets | | | 6,080,596,228 | |
| | | | |
Liabilities: | | | | |
Payable for investments purchased | | | 11,081,643 | |
Payable for fund shares redeemed | | | 8,425,943 | |
Payable upon return of securities loaned | | | 233,884,528 | |
Management and investment advisory fees payable | | | 4,011,958 | |
Administrative service and service fees payable | | | 247,994 | |
Transfer agent fees payable | | | 54,497 | |
Custody and fund accounting fees payable | | | 156,362 | |
Professional fees payable | | | 70,728 | |
Prospectus and shareholder reports fees payable | | | 133,411 | |
Trustee fees payable | | | 21,884 | |
Payable for variation margin from open futures contracts | | | 6,089,021 | |
Other liabilities | | | 70,720 | |
| | | | |
Total liabilities | | | 264,248,689 | |
| | | | |
Net assets | | $ | 5,816,347,539 | |
| | | | |
Analysis of Net Assets: | | | | |
Paid-in-capital | | | 5,047,754,811 | |
Undistributed net investment income | | | 43,851,960 | |
Accumulated net realized gain | | | 101,504,654 | |
Unrealized appreciation of investments | | | 629,328,038 | |
Unrealized depreciation of foreign currency contracts | | | (71 | ) |
Unrealized depreciation of futures contracts | | | (6,091,853 | ) |
| | | | |
Net assets | | $ | 5,816,347,539 | |
| | | | |
See accompanying notes
25
American Beacon Small Cap Value FundSM
Statement of Assets and Liabilities
October 31, 2016
| | | | |
| Shares outstanding at no par value (unlimited shares authorized): | | | | |
Institutional Class | | | 193,682,972 | |
| | | | |
Y Class | | | 12,307,459 | |
| | | | |
Investor Class | | | 26,260,898 | |
| | | | |
Advisor Class | | | 4,745,469 | |
| | | | |
A Class | | | 2,734,392 | |
| | | | |
C Class | | | 533,312 | |
| | | | |
Net assets: | | | | |
Institutional Class | | $ | 4,717,291,753 | |
| | | | |
Y Class | | $ | 296,082,333 | |
| | | | |
Investor Class | | $ | 617,552,712 | |
| | | | |
Advisor ClassD | | $ | 110,205,158 | |
| | | | |
A Class | | $ | 63,277,387 | |
| | | | |
C Class | | $ | 11,938,196 | |
| | | | |
Net asset value, offering and redemption price per share: | | | | |
Institutional Class | | $ | 24.36 | |
| | | | |
Y Class | | $ | 24.06 | |
| | | | |
Investor Class | | $ | 23.52 | |
| | | | |
Advisor Class D | | $ | 23.22 | |
| | | | |
A Class | | $ | 23.14 | |
| | | | |
A Class (offering price) | | $ | 24.55 | |
| | | | |
C Class | | $ | 22.39 | |
| | | | |
A Cost of investments in unaffiliated securities | | $ | 5,058,448,299 | |
B Cost of investments in affiliated securities | | $ | 358,945,144 | |
C Fair value of securities on loan | | $ | 228,502,651 | |
D Includes Retirement Class Assets (Note 1) | | | | |
See accompanying notes
26
American Beacon Small Cap Value FundSM
Statement of Operations
For the year ended October 31, 2016
| | | | |
Investment income: | | | | |
Dividend income from unaffiliated securities (net of foreign taxes) A | | $ | 99,787,992 | |
Dividend income from affiliated securities | | | 350,172 | |
Miscellaneous income (SEC litigation) | | | 1,179 | |
Income derived from securities lending | | | 3,307,790 | |
| | | | |
Total investment income | | | 103,447,133 | |
| | | | |
Expenses: | | | | |
Management and investment advisory fees (Note 2) | | | 32,935,963 | |
Administrative service fees (Note 2): | | | | |
Institutional Class | | | 7,864,960 | |
Y Class | | | 485,698 | |
Investor Class | | | 1,122,818 | |
Advisor ClassB | | | 195,784 | |
A Class | | | 101,822 | |
C Class | | | 21,155 | |
AMR Class | | | 1,574 | |
Transfer agent fees: | | | | |
Institutional Class | | | 1,340,455 | |
Y Class | | | 13,455 | |
Investor Class | | | 29,233 | |
Advisor ClassB | | | 10,442 | |
A Class | | | 7,529 | |
C Class | | | 1,139 | |
AMR Class | | | 1,108 | |
Custody and fund accounting fees | | | 593,929 | |
Professional fees | | | 175,657 | |
Registration fees and expenses | | | 176,087 | |
Service fees (Note 2): | | | | |
Y Class | | | 280,001 | |
Investor Class | | | 2,158,504 | |
Advisor ClassB | | | 276,594 | |
A Class | | | 89,626 | |
C Class | | | 18,162 | |
Distribution fees (Note 2): | | | | |
Advisor ClassB | | | 283,566 | |
A Class | | | 149,376 | |
C Class | | | 121,083 | |
Prospectus and shareholder report expenses | | | 402,911 | |
Trustee fees | | | 368,956 | |
Other expenses | | | 338,354 | |
| | | | |
Total expenses | | | 49,565,941 | |
| | | | |
Net expenses | | | 49,565,941 | |
| | | | |
Net investment income | | | 53,881,192 | |
| | | | |
See accompanying notes
27
American Beacon Small Cap Value FundSM
Statement of Operations
For the year ended October 31, 2016
| | | | |
Realized and unrealized gain (loss) from investments: | | | | |
Net realized gain (loss) from: | | | | |
Investments | | | 117,359,824 | |
Commission recapture (Note 1) | | | 98,383 | |
Foreign currency transactions | | | (480 | ) |
Futures contracts | | | 15,286,749 | |
Change in net unrealized appreciation (depreciation) of: | | | | |
Investments | | | 103,890,482 | |
Foreign currency transactions | | | (252 | ) |
Futures contracts | | | (8,697,656 | ) |
| | | | |
Net gain from investments | | | 227,937,050 | |
| | | | |
Net increase in net assets resulting from operations | | $ | 281,818,242 | |
| | | | |
A Foreign taxes | | $ | 167,048 | |
B Includes Retirement Class Expenses (Note 1) | | | | |
See accompanying notes
28
American Beacon Small Cap Value FundSM
Statement of Changes in Net Assets
| | | | | | | | |
| | | Year Ended
October 31, 2016 | | | Year Ended
October 31, 2015 | |
Increase (Decrease) in Net Assets: | | | | | | | | |
Operations: | | | | | | | | |
Net investment income | | $ | 53,881,192 | | | $ | 54,550,010 | |
Net realized gain (loss) from investments, commission recapture, foreign currency transactions, and futures contracts | | | 132,744,476 | | | | 393,636,087 | |
Change in net unrealized appreciation (depreciation) from investments, foreign currency transactions, and futures contracts | | | 95,192,574 | | | | (406,284,084 | ) |
| | | | | | | | |
Net increase in net assets resulting from operations | | | 281,818,242 | | | | 41,902,013 | |
| | | | | | | | |
Distributions to Shareholders: | | | | | | | | |
Net investment income: | | | | | | | | |
Institutional Class | | | (35,441,317 | ) | | | (28,087,887 | ) |
Y Class | | | (1,930,427 | ) | | | (1,184,102 | ) |
Investor Class | | | (3,345,737 | ) | | | (2,645,730 | ) |
Advisor Class A | | | (382,344 | ) | | | (198,158 | ) |
Retirement Class | | | — | | | | (2,201 | ) |
A Class | | | (300,302 | ) | | | (69,792 | ) |
AMR Class | | | — | | | | (3,575,553 | ) |
Net realized gain from investments: | | | | | | | | |
Institutional Class | | | (202,232,279 | ) | | | (464,691,033 | ) |
Y Class | | | (11,745,307 | ) | | | (21,977,338 | ) |
Investor Class | | | (34,525,476 | ) | | | (100,257,405 | ) |
Advisor Class A | | | (5,445,704 | ) | | | (12,392,073 | ) |
Retirement Class | | | — | | | | (1,429,633 | ) |
A Class | | | (2,612,559 | ) | | | (3,739,961 | ) |
C Class | | | (617,973 | ) | | | (1,222,539 | ) |
AMR Class | | | — | | | | (43,926,444 | ) |
| | | | | | | | |
Net distributions to shareholders | | | (298,579,425 | ) | | | (685,399,849 | ) |
| | | | | | | | |
Capital Share Transactions: | | | | | | | | |
Proceeds from sales of shares | | | 1,494,089,157 | | | | 1,643,560,940 | |
Reinvestment of dividends and distributions | | | 288,838,431 | | | | 664,480,542 | |
Cost of shares redeemed | | | (1,428,769,445 | ) | | | (1,780,813,137 | ) |
| | | | | | | | |
Net increase in net assets from capital share transactions | | | 354,158,143 | | | | 527,228,345 | |
| | | | | | | | |
Net increase (decrease) in net assets | | | 337,396,960 | | | | (116,269,491 | ) |
| | | | | | | | |
Net Assets: | | | | | | | | |
Beginning of period | | | 5,478,950,579 | | | | 5,595,220,070 | |
| | | | | | | | |
End of Period * | | $ | 5,816,347,539 | | | $ | 5,478,950,579 | |
| | | | | | | | |
*Includes undistributed (overdistribution of) net investment income | | $ | 43,851,960 | | | $ | 34,044,613 | |
| | | | | | | | |
A Includes Retirement Class Distributions (Note 1)
See accompanying notes
29
American Beacon Small Cap Value FundSM
Notes to Financial Statements
October 31, 2016
1. Organization and Significant Accounting Policies
American Beacon Funds (the “Trust”), is organized as a Massachusetts business trust and is registered under the Investment Company Act of 1940, as amended, (the “Act”) as a diversified, open-end management investment company. As of October 31, 2016, he Trust consists of twenty-five active series, one of which is presented in this filing (the “Fund”): American Beacon Small Cap Value Fund. The remaining twenty-four active series are reported in separate filings.
American Beacon Advisors, Inc. (the “Manager”) is a wholly-owned subsidiary of Astro AB Borrower, Inc., which is indirectly owned by investment funds affiliated with Kelso & Company, L.P. and Estancia Capital Management, LLC, and was organized in 1986 to provide business management, advisory, administrative and asset management consulting services to the Trust and other investors.
Class Disclosure
The AMR Class closed on December 11, 2015. The Retirement Class closed on January 15, 2016, and the shares were merged into the Advisor Class.
The Fund has multiple classes of shares designed to meet the needs of different groups of investors. The following table sets forth the differences amongst the classes:
| | | | | | |
Class | | Eligible Investors | | Minimum Initial
Investments | |
Institutional | | Large institutional investors - sold directly or through intermediary channels. | | $ | 250,000 | |
Y Class | | Large institutional retirement plan investors - sold directly or through Retirement plan sponsors. | | $ | 100,000 | |
Investor | | All investors using intermediary organizations such as broker-dealers or retirement plan sponsors - sold directly through intermediary channels. | | $ | 2,500 | |
Advisor Class | | All investors who invest through intermediary organizations, such as broker-dealers or third party administrators. | | $ | 2,500 | |
A Class | | All investors who invest through intermediary organizations, such as broker-dealers or third party administrator. Retail investors who invest directly through a financial intermediary such as a broker, bank, or registered investment advisor, which may include a front-end sales charge and a contingent deferred sales charge (“CDSC”). | | $ | 2,500 | |
C Class | | Retail investors who invest directly through a financial intermediary such as a broker or employee directed benefit plans with applicable sales charges, which may include CDSC. | | $ | 1,000 | |
Each class offered by the Trust has equal rights as to assets and voting privileges. Income and non-class specific expenses are allocated daily to each class on the basis of the relative net assets. Realized and unrealized capital gains and losses of each class are allocated daily based on the relative net assets of each class of the respective Fund. Class specific expenses, where applicable, currently include administrative service fees, service fees, and distribution fees and vary amongst the classes as described more fully in Note 2.
The following is a summary of significant accounting policies, consistently followed by the Fund in preparation of the financial statements. The Fund is considered an investment company and accordingly, follows the investment company accounting and reporting guidance of the Financial Accounting Standards Board Accounting Standard Codification Topic 946, Financial Services—Investment Companies, which is part of U.S. Generally Accepted Accounting Principles (“U.S. GAAP”).
Security Transactions and Investment Income
Security transactions are recorded on the trade date of the security purchase or sale. The Fund may purchase securities with delivery or payment to occur at a later date. At the time the Fund enters into a commitment to
30
American Beacon Small Cap Value FundSM
Notes to Financial Statements
October 31, 2016
purchase a security, the transaction is recorded, and the value of the security is reflected in the Net Asset Value (“NAV”). The value of the security may vary with market fluctuations.
Dividend income, net of foreign taxes, is recorded on the ex-dividend date, except certain dividends from foreign securities which are recorded as soon as the information is available to the Fund. Interest income is earned from settlement date, recorded on the accrual basis, and adjusted, if necessary, for accretion of discounts and amortization of premiums. For financial and tax reporting purposes, realized gains and losses are determined on the basis of specific lot identification.
Dividends to Shareholders
Dividends from net investment income of the Fund normally will be declared and paid at least annually. Distributions, if any, of net realized capital gains are generally paid at least annually and recorded on the ex-dividend date. Dividends to shareholders are determined in accordance with federal income tax regulations, which may differ in amount and character from net investment income and realized gains recognized for purposes of U.S. GAAP. To the extent necessary to fully distribute capital gains, the Fund also designates earnings and profits distributed to shareholders on the redemption of shares.
Commission Recapture
The Fund has established brokerage commission recapture arrangements with certain brokers or dealers. If a Fund’s investment advisor chooses to execute a transaction through a participating broker, the broker rebates a portion of the commission back to the Fund. Any collateral benefit received through participation in the commission recapture program is directed exclusively to the Fund. This amount is reported with the net realized gains in the Fund’s Statement of Operations, if applicable.
Allocation of Income, Expenses, Gains, and Losses
Income, expenses (other than those attributable to a specific class), gains, and losses are allocated daily to each class of shares based upon the relative proportion of net assets represented by such class. Operating expenses directly attributable to a specific class are charged against the operations of that class.
Use of Estimates
The preparation of financial statements in conformity with U.S. GAAP requires management to make estimates and assumptions that affect the amounts reported in the financial statements and accompanying notes. Actual results may differ from those estimated.
Other
Under the Trust’s organizational documents, its officers and trustees are indemnified against certain liability arising out of the performance of their duties to the Trust. In the normal course of business, the Trust enters into contracts that provide indemnification to the other party or parties against potential costs or liabilities. The Trust’s maximum exposure under these arrangements is dependent on claims that may be made in the future and, therefore, cannot be estimated. The Trust has had no prior claims or losses pursuant to any such agreement.
2. Transactions with Affiliates
Management Agreement
From November 1, 2015 to May 29, 2016, the Trust and the Manager were parties to a Management Agreement that obligated the Manager to provide or oversee the provision of all investment advisory, fund management, and securities lending services. As compensation for performing the duties required under the Management Agreement,
31
American Beacon Small Cap Value FundSM
Notes to Financial Statements
October 31, 2016
the Manager received from the Fund an annualized fee equal to 0.05% of the average daily net assets. Effective May 29, 2016, the Fund and the Manager entered a Management Agreement that obligates the Manager to provide investment advisory, fund management, and administrative services to the Fund. As compensation for performing the duties under the Management Agreement, the Manager receives from the Fund an annualized fee at the following annual rates as a percentage of average daily net assets: 0.35% of the first $15 billion, 0.325% of the next $15 billion, and 0.30% of the next $30 billion. The Fund also pays the unaffiliated investment advisors hired to direct investment activities of the Fund an annualized investment advisory fee based on a percentage of the Fund’s average daily assets.
Management fees paid by the Fund during the year ended October 31, 2016 were as follows:
| | | | | | |
Management Fee Rate | | Management Fee | | Amounts paid to Investment Advisors | | Amounts Paid to Manager |
0.75% | | $32,935,963 | | $22,651,802 | | $10,284,161 |
As compensation for services provided by the Manager in connection with securities lending activities, the lending Fund pays to the Manager, with respect to cash collateral posted by borrowers, a fee up to 10% of the net monthly interest income (the gross interest income earned by the investment of cash collateral, less the amount paid to borrowers and related expenses) from such activities and, with respect to loan fees paid by borrowers, a fee up to 10% of such loan fees. This fee is included in “Management and investment advisory fees” on the Statement of Operations. During the year ended October 31, 2016, securities lending fees paid to the Manager were $361,286.
Administration Agreement
From November 1, 2015 to May 29, 2016, the Manager and the Trust were parties to an Administrative Agreement which obligated the Manager to provide or oversee administrative services to each Fund. As compensation for performing the duties required under the Administrative Agreement, the Manager received an annualized fee of 0.30% of the average daily net assets of the Institutional, Y, Investor, A, and C Classes and 0.05% of the average daily net assets of the AMR Class of the Fund.
Distribution Plans
The Fund, except for the Advisor, A, and C Classes of the Fund, has adopted a “defensive” Distribution Plan (the “Plan”) in accordance with Rule 12b-1 under the Act, pursuant to which no separate fees may be charged to the Fund for distribution purposes. However, the Plan authorizes the management and administrative service fees received by the Manager and the investment advisors hired by the Manager to be used for distribution purposes. Under this Plan, the Fund does not intend to compensate the Manager or any other party, either directly or indirectly, for the distribution of Fund shares.
Separate Distribution Plans (the “Distribution Plans”) have been adopted pursuant to Rule 12b-1 under the Act for the Advisor, A and C Classes of the Fund. Under the Distribution Plans, as compensation for distribution assistance, the Manager receives an annual fee of 0.25% of the average daily net assets of the Advisor and A Classes, 0.50% of the average daily net assets of the Retirement Class, and 1.00% of the average daily net assets of the C Class. The fee will be payable without regard to whether the amount of the fee is more or less than the actual expenses incurred in a particular month by the Manager for distribution assistance.
Service Plans
The Manager and the Trust entered into Service Plans that obligate the Manager to oversee additional shareholder servicing of the Y, Investor, Advisor, A, and C Classes. As compensation for performing the duties required under the Service Plans, the Manager receives 0.10% of the average daily net assets of the Y Class, 0.15% of the average daily net assets of the A and C Classes, 0.25% of the average daily net assets of the Advisor and Retirement Classes, and up to 0.375% of the average daily net assets of the Investor Class of the Fund.
32
American Beacon Small Cap Value FundSM
Notes to Financial Statements
October 31, 2016
Sub-Transfer Agent Fees
The Manager has entered into agreements, which include servicing agreements, with financial intermediaries that provide recordkeeping, processing, shareholder communications and other services to customers of the intermediaries that hold positions in the Institutional Class of the Fund and has agreed to compensate the intermediaries for providing these services. Intermediaries transact with the Fund primarily through the use of omnibus accounts on behalf of their customers who hold positions in the Fund(s). Certain services would have been provided by the Fund’s transfer agent and other service providers if the shareholders’ accounts were maintained directly by the Fund’s transfer agent. Accordingly, the Fund, pursuant to the Trust’s Board of Trustees (the “Board”) approval, has agreed to reimburse the Manager for all or a portion of the servicing fees paid to these intermediaries for the Institutional Class. The reimbursement amounts (sub-transfer agent fees) paid to the Manager are subject to a fee limit of up to 0.10% of an intermediaries average net assets in the Institutional Class on an annual basis.
For the year ended October 31, 2016, the sub-transfer agent fees, as reflected in “Transfer agent fees” in the Statement of Operations, were as follows:
| | | | |
Fund | | Sub-Transfer Agent Fees | |
Small Cap Value | | $ | 1,200,273 | |
As of October 31, 2016, the Fund owes the Manager the following reimbursement of sub-transfer agent fees, as reflected in “Transfer agent fees payable” in the Statement of Assets and Liabilities.
| | | | |
Fund | | Reimbursement of
Sub-Transfer Agent Fees | |
Small Cap Value | | $ | 50,028 | |
Brokerage Commissions
Affiliated entities of an investment advisor to the Fund received net commissions on purchases and sales of the Fund’s portfolio securities totaling $3,773 for the year ended October 31, 2016.
Investment in Affiliated Funds
The Fund may invest in the American Beacon U.S. Government Money Market Select Fund (the “USG Select Fund”). The Fund and the USG Select Fund have the same investment advisor and therefore, are considered to be affiliated. The Manager serves as investment advisor to the USG Select Fund and receives management fees totaling 0.10% of its average daily net assets of the USG Select Fund. During the year ended October 31, 2016, the Manager earned fees totaling $127,828 on the Fund’s direct investments in the USG Select Fund and $165,146 from the Fund’s securities lending collateral invested in the USG Select Fund.
Interfund Lending Program
Pursuant to an exemptive order by the Securities and Exchange Commission (“SEC”), the Fund, along with other registered investment companies having management contracts with the Manager, may participate in an interfund lending program. This program provides an alternative credit facility allowing the Fund to borrow from other participating Funds. During the year ended October 31, 2016, the Fund participated as a lender and loaned on average $3,486,585 for 4 days at an average rate of 1.00% with interest charges earned of $376. This amount is included in “Interest income” on the Statement of Operations.
33
American Beacon Small Cap Value FundSM
Notes to Financial Statements
October 31, 2016
Expense Reimbursement Plan
The Fund has adopted an Expense Reimbursement Plan whereby the Manager may seek repayment of fees waived or expenses reimbursed for a period of up to three years. However, reimbursement will occur only if the Class’ average net assets have grown or expenses have declined sufficiently to allow reimbursement without causing its expense ratio to exceed the previously agreed upon contractual expense limit. The carryover of excess expenses potentially reimbursable to the Manager, but not recorded as a liability is $324 expiring in 2017.
Sales Commissions
The Fund’s distributor, Foreside Fund Services, LLC (“Foreside”), may receive a portion of A Class sales charges from broker dealers and it may be used to offset distribution related expenses. For the year ended October 31, 2016, Foreside collected $4,271 from the sale of Class A Shares.
A CDSC of 0.50% will be deducted with respect to Class A Shares on certain purchases of $1,000,000 or more that are redeemed in whole or part within 18 months of purchase, unless waived as discussed in the Prospectus. Any applicable CDSC will be 0.50% of the lesser of the original purchase price or the value of the redemption of the Class A Shares redeemed. During the year ended October 31, 2016, there were no CDSC fees collected for Class A Shares.
A CDSC of 1.00% will be deducted with respect to Class C Shares redeemed within 12 months of purchase, unless waived as discussed in the Prospectus. Any applicable CDSC will be 1.00% of the lesser of the original purchase price or the value of the redemption of the Class C Shares redeemed. During the year ended October 31, 2016, $1,990 in CDSC fees were collected for Class C Shares of the Fund.
Trustee Fees and Expenses
Effective July 1, 2016, as compensation for their service to the Trust and the American Beacon USG Select Fund, each Trustee receives an annual retainer of $120,000, plus $5,000 for each Board of Trustee meeting attended in person or via teleconference, $2,500 for attendance by Committee members at meetings of the Audit Committee and the Investment Committee, and $1,500 for attendance by Committee members at meetings of the Nominating and Governance Committee, plus reimbursement of reasonable expenses incurred in attending Board meetings, Committee meetings, and relevant educational seminars. The Trustees also may be compensated for attendance at special Board and/or Committee meetings from time to time. The Board Chairman receives an additional annual retainer of $50,000 as well as a single $5,000 fee each quarter for his attendance at the committee meetings. The chairpersons of the Audit Committee and the Investment Committee each receive an additional annual retainer of $25,000 and the Chairman of the Nominating and Governance Committee receives an additional annual retainer of $10,000. These expenses are allocated on a prorated basis to each Fund of the Trust according to its respective net assets.
3. Security Valuation and Fair Value Measurements
Investments are valued at the close of the New York Stock Exchange (the “Exchange”), normally 4:00 p.m. Eastern Time, each day that the Exchange is open for business. Equity securities, including exchange-traded funds (“ETFs”), for which market quotations are available are valued at the last sale price or official closing price (closing bid price or last evaluated quote if no sale has occurred) on the primary market or exchange on which they trade.
Investments in open-end mutual funds are valued at the closing NAV per share of the mutual fund on the day of valuation.
Securities for which the market prices are not readily available or are not reflective of the fair value of the security, as determined by the Manager, will be priced at fair value following procedures approved by the Board.
34
American Beacon Small Cap Value FundSM
Notes to Financial Statements
October 31, 2016
Futures contracts are valued based upon their quoted daily settlement prices. Upon entering into a futures contract, the Fund is required to deposit with its futures broker, an amount of cash or U.S. Government and Agency Obligations in accordance with the initial margin requirements of the broker or exchange. Futures contracts are marked to market daily and an appropriate payable or receivable for the change in value (“variation margin”) is recorded by the Fund. Gains or losses are recognized, but not considered realized until the contracts expire or are closed. Futures contracts involve, to varying degrees, risk of loss in excess of the variation margin disclosed on the Statement of Assets and Liabilities.
Other investments for which the above valuation procedures are inappropriate or are deemed not to reflect fair value are stated at fair value as determined in good faith by the Valuation Committee, established by the Fund’s Board.
Valuation Inputs
Various inputs may be used to determine the fair value of the Fund’s investments. These inputs are summarized in three broad levels for financial statement purposes. The inputs or methodologies used to value securities are not necessarily an indication of the risk associated with investing in those securities.
| | |
| Level 1- | | Quoted prices in active markets for identical securities. |
| |
| Level 2 - | | Prices determined using other significant observable inputs. These may include quoted prices for similar securities, interest rates, prepayment speeds, credit risk, and others. Fixed-income securities are considered Level 2 as they are valued using observable inputs. |
| |
| Level 3 - | | Prices determined using other significant unobservable inputs. Unobservable inputs reflect the Fund’s own assumptions about the factors market participants would use in pricing an investment. |
Level 1 and Level 2 trading assets and trading liabilities, at fair value
Common stocks and financial derivative instruments, such as futures contracts that are traded on a national securities exchange, are stated at the last reported sale or settlement price on the day of valuation. To the extent these securities are actively traded and valuation adjustments are not applied, they are categorized as Level 1 of the fair value hierarchy. Preferred securities and other equities traded on inactive markets or valued by reference to similar instruments are generally categorized as Level 2 of the fair value hierarchy.
Investments in registered open-end investment management companies will be valued based upon the NAVs of such investments and are categorized as Level 1 of the fair value hierarchy.
The Fund’s investments are summarized by level based on the inputs used to determine their values. As of October 31, 2016, the investments were classified as described below:
| | | | | | | | | | | | | | | | |
Small Cap Value Fund (1) | | Level 1 | | | Level 2 | | | Level 3 | | | Total | |
Common Stock | | $ | 5,622,879,669 | | | $ | — | | | $ | — | | | $ | 5,622,879,669 | |
Exchange Traded Instruments | | | 13,447,724 | | | | — | | | | — | | | | 13,447,724 | |
Short-Term Investments—Money Market Funds | | | 176,509,560 | | | | — | | | | — | | | | 176,509,560 | |
Securities Lending Collateral invested in Money Market Funds | | | 233,884,528 | | | | — | | | | — | | | | 233,884,528 | |
| | | | | | | | | | | | | | | | |
Total Investments in Securities | | $ | 6,046,721,481 | | | $ | — | | | $ | — | | | $ | 6,046,721,481 | |
| | | | | | | | | | | | | | | | |
Other Financial Instruments—Liabilities | | | | | | | | | | | | | | | | |
Futures Contracts | | $ | (6,091,853 | ) | | $ | — | | | $ | — | | | $ | (6,091,853 | ) |
| | | | | | | | | | | | | | | | |
Total Other Financial Instruments | | $ | (6,091,853 | ) | | $ | — | | | $ | — | | | $ | (6,091,853 | ) |
| | | | | | | | | | | | | | | | |
| (1) | Refer to the Schedule of Investments for industry information. |
35
American Beacon Small Cap Value FundSM
Notes to Financial Statements
October 31, 2016
U.S. GAAP requires all transfers between any levels to be disclosed. The end of period timing recognition has been adopted for the transfers between levels the Fund’s assets and liabilities. During the year ended October 31, 2016, there were no transfers between levels.
4. Securities and Other Investments
American Depositary Receipts (“ADRs”)
ADRs are depositary receipts for foreign issuers in registered form traded in U.S. securities markets. Depositary receipts may not be denominated in the same currency as the securities into which they may be converted. Investing in depositary receipts entails substantially the same risks as direct investment in foreign securities. There is generally less publicly available information about foreign companies and there may be less governmental regulation and supervision of foreign stock exchanges, brokers and listed companies. In addition, such companies may use different accounting and financial standards (and certain currencies may become unavailable for transfer from a foreign currency), resulting in the Fund’s possible inability to convert immediately into U.S. currency proceeds realized upon the sale of portfolio securities of the affected foreign companies. In addition, the Fund may invest in unsponsored depositary receipts, the issuers of which are not obligated to disclose material information about the underlying securities to investors in the United States. Ownership of unsponsored depositary receipts may not entitle the Fund to the same benefits and rights as ownership of a sponsored depositary receipt or the underlying security.
Real Estate Investment Trusts
The Fund may own shares of real estate investment trusts (“REITS”) which report information on the source of their distributions annually. The Fund re-characterizes distributions received from REIT investments based on information provided by the REITs into the following categories: ordinary income, long-term capital gains, and return of capital. If information is not available on a timely basis from the REITs, the re-characterization will be estimated based on available information, which may include the previous year allocation. If new or additional information becomes available from the REITs at a later date, a re-characterization will be made the following year. These re-characterizations are not recorded for financial statement purposes, but as an adjustment to the calculation of taxable income.
Other Investment Company Securities and Other Exchange Traded Products
The Fund may invest in shares of other investment companies, including open-end funds, closed-end funds, business development companies, ETFs, unit investment trusts, and other investment companies of the Trust. The Fund may invest in investment company securities advised by the Manager or a sub-advisor. Investments in the securities of other investment companies may involve duplication of advisory fees and certain other expenses. By investing in another investment company, a Fund becomes a shareholder of that investment company. As a result, Fund shareholders indirectly will bear a Fund’s proportionate share of the fees and expenses paid by shareholders of the other investment company, in addition to the fees and expenses Fund shareholders directly bear in connection with the Fund’s own operations. These other fees and expenses are reflected as Acquired Fund Fees and Expenses and are included in the Fees and Expenses Table for the Fund in its Prospectus, if applicable. Investments in other investment companies may involve the payment of substantial premiums above the value of such issuer’s portfolio securities.
5. Financial Derivative Instruments
The Fund may utilize derivative instruments to gain market exposure on cash balances or reduce market exposure in anticipation of liquidity needs. When considering the Fund’s use of derivatives, it is important to note that the Fund does not use derivatives for the purpose of creating financial leverage.
36
American Beacon Small Cap Value FundSM
Notes to Financial Statements
October 31, 2016
Futures Contracts
Futures contracts are contracts to buy or sell a standard quantity of securities at a specified price on a future date. The Fund may enter into financial futures contracts as a method for keeping assets readily convertible to cash if needed to meet shareholder redemptions or for other needs while maintaining exposure to the stock or bond market, as applicable. The primary risks associated with the use of futures contracts are the possibility of illiquid markets or imperfect correlation between the values of the contracts and the underlying securities, or that the counterparty will fail to perform its obligations.
Upon entering into a futures contract, the Fund is required to set aside or deposit with a broker an amount, termed the initial margin, which typically represents a portion of the face value of the futures contract. The Fund usually reflects this amount on the Schedule of Investments as a U.S. Treasury Bill held as collateral for futures contracts or as Cash deposited with broker on the Statement of Assets and Liabilities. Payments to and from the broker, known as variation margin, are required to be made on a daily basis as the price of the futures contract fluctuates. Changes in initial settlement values are accounted for as unrealized appreciation (depreciation) until the contracts are terminated, at which time realized gains and losses are recognized. Futures contracts are valued at the most recent settlement price established each day by the exchange on which they are traded.
For the year ended October 31, 2016, the Fund entered into futures contracts primarily for exposing cash to markets.
The Fund’s futures contracts outstanding fluctuate throughout the operating year as required to meet strategic requirements. The following table illustrates the average quarterly volume of futures contracts. For purpose of this disclosure, volume is measured by contracts outstanding at each quarter end.
| | | | |
Number of Futures Contracts Outstanding | |
Fund | | Year ended October 31, 2016 | |
Small Cap Value | | | 1,751 | |
The following is a summary of the Fund’s derivative financial instruments categorized by risk exposure (1):
Fair Values of financial derivative instruments not accounted for as hedging instruments as of October 31, 2016:
| | | | | | | | |
Statement of Assets and Liabilities | | Derivative | | | Total | |
Payable for variation margin from open futures contracts(2) | | | Equity Contracts | | | $ | (6,091,853 | ) |
| | |
Statement of Operations | | Derivative | | | Total | |
Net realized gain (loss) from futures contracts | | | Equity Contracts | | | $ | 15,286,749 | |
Change in net unrealized appreciation (depreciation) from futures contracts | | | Equity Contracts | | | | (8,697,656 | ) |
| (1) | See Note 3 in the Notes to Financial Statements for additional information. |
| (2) | Includes cumulative appreciation or (depreciation) of futures contracts as reported in the Schedule of Investments footnotes. Only current day’s variation margin is reported within the Statement of Assets and Liabilities. |
6. Principal Risks
In the normal course of business the Fund trades financial instruments and enters into financial transactions where risk of potential loss exists. Security values fluctuate (market risk) and may decline due to factors affecting securities markets in general, particular industries represented in the securities markets or conditions specifically related to a particular company. Failure of the other party to a transaction to perform (credit and counterparty risk), for example by not making principal and interest payments when due, reduces the value of the issuer’s debt and could reduce the Fund’s income. Similar to credit risk, the Fund may be exposed to counterparty risk, or the risk that an institution or other entity with which the Fund has unsettled or open transactions will fail to make required payments or otherwise comply with the terms of the instrument, transaction or contract. The potential
37
American Beacon Small Cap Value FundSM
Notes to Financial Statements
October 31, 2016
loss could exceed the value of the financial assets recorded in the financial statements. Some of the Fund’s investments may be illiquid and the Fund may not be able to vary the portfolio investments in response to changes in economic and other conditions. If the Fund is required to liquidate all or a portion of its investments quickly, the Fund may realize significantly less than the value at which it previously recorded those investments.
Market Risks
The Fund’s investments in financial derivatives and other financial instruments expose the Fund to various risks such as, but not limited to, interest rate, foreign currency and equity risks.
Interest rate risk is the risk that fixed-income securities will decline in value because of changes in interest rates. As nominal interest rates rise, the value of certain fixed-income securities held by the Fund is likely to decrease. A nominal interest rate can be described as the sum of a real interest rate and an expected inflation rate. Fixed-income securities with longer durations tend to be more sensitive to changes in interest rates, usually making them more volatile than securities with shorter durations. Duration is useful primarily as a measure of the sensitivity of a fixed-income’s market price to interest rate (i.e. yield) movements.
If the Fund invests directly in foreign currencies or in securities that trade in, and receive revenues in, foreign currencies, or in financial derivatives that provide exposure to foreign currencies, they will be subject to the risk that those currencies will decline in value relative to the base currency of the Fund, or, in the case of hedging positions, that the Fund’s base currency will decline in value relative to the currency being hedged. Currency rates in foreign countries may fluctuate significantly over short periods of time for a number of reasons, including changes in interest rates, intervention (or the failure to intervene) by U.S. or foreign governments, central banks or supranational entities such as the International Monetary Fund, or by the imposition of currency controls or other political developments in the United States or abroad. As a result, the Fund’s investments in foreign currency denominated securities may reduce the returns of the Fund.
The fair values of equities, such as common stocks and preferred securities or equity related investments such as futures, may decline due to general market conditions which are not specifically related to a particular company, such as real or perceived adverse economic conditions, changes in the general outlook for corporate earnings, changes in interest or currency rates or adverse investor sentiment generally. They may also decline due to factors which affect a particular industry or industries, such as labor shortages or increased production costs and competitive conditions within an industry. Equity securities and equity related investments generally have greater market price volatility than fixed-income securities.
Credit and Counterparty Risk
A derivative contract may suffer a mark-to-market loss if the value of the contract decreases due to an unfavorable change in the market rates or values of the underlying instrument. Losses can also occur if the counterparty does not perform under the contract.
With exchange-traded futures, there is less counterparty credit risk to the Funds since the exchange or clearinghouse, as counterparty to such instruments, guarantees against a possible default. The clearinghouse stands between the buyer and the seller of the contract; therefore, the credit risk is limited to failure of the offset against a clearing broker or clearinghouse in the event of a default (including the bankruptcy or insolvency) of the clearing broker or clearinghouse. While offset rights may exist under applicable law, a Fund does not have a contractual right of offset against a clearing broker or clearinghouse in the event of a default (including the bankruptcy or insolvency) of the clearing broker or clearinghouse. Additionally, credit risk exists in exchange traded futures with respect to initial and variation margin that is held in a clearing broker’s customer accounts. While clearing brokers are required to segregate customer margin from their own assets, in the event that a clearing broker becomes insolvent or goes into bankruptcy and at that time there is a shortfall in the aggregate
38
American Beacon Small Cap Value FundSM
Notes to Financial Statements
October 31, 2016
amount of margin held by the clearing broker for all its clients, typically the shortfall would be allocated on a pro rata basis across all the clearing broker’s customers, potentially resulting in losses to the Fund.
Cash collateral that has been pledged to cover obligations of the Fund and cash collateral received from the counterparty, if any, is reported separately on the Statement of Assets and Liabilities as “Deposits with brokers for futures contracts” and “Payable to brokers for futures contracts”, respectively. Non-cash collateral pledged by the Funds, if any, is noted in the Schedule of Investments. Generally, the amount of collateral due from or to a party is determined at the close of business of the Fund and additional required collateral is delivered to/pledged by the Fund on the next business day. To the extent amounts due to the Fund from its counterparties are not fully collateralized, contractually or otherwise, the Fund bears the risk of loss from counterparty non-performance. The Fund attempts to mitigate counterparty risk by only entering into agreements with counterparties that it believes have the financial resources to honor their obligations and by monitoring the financial stability of those counterparties.
Offsetting Assets and Liabilities
The Fund is a party to enforceable master netting agreements between brokers and counterparties which provides for the right to offset under certain circumstances. The Fund employs multiple money managers and counterparties and has elected not to offset qualifying financial and derivative instruments on the Statement of Assets and Liabilities, as such all financial and derivative instruments are presented on a gross basis. The impacts of netting arrangements that provide the right to offset are detailed below. The net amount represents the net receivable or payable that would be due from or to the counterparty in the event of default. Exposure from borrowings and other financing agreements can only be netted across transactions governed by the same Master Agreement with the same legal entity. All amounts reported below represent the balance as of the report date, October 31, 2016.
Offsetting of Financial Assets and Derivative Assets as of October 31, 2016:
| | | | | | | | | | | | |
Description | | Gross Amounts of
Recognized Assets | | | Gross Amounts
Offset in the Statement
of Assets and Liabilities | | | Net Amounts of Assets
Presented in the
Statement of Assets and
Liabilities | |
Securities Lending | | $ | 228,502,651 | | | $ | — | | | $ | 228,502,651 | |
Offsetting of Financial Liabilities and Derivative Liabilities as of October 31, 2016:
| | | | | | | | | | | | |
Description | | Gross Amounts of
Recognized
Liabilities | | | Gross Amounts Offset
in the Statements of
Assets and Liabilities | | | Net Amounts of Assets
Presented in the
Statement of Assets and
Liabilities | |
Futures Contracts(1) | | $ | (6,091,853 | ) | | $ | — | | | $ | (6,091,853 | ) |
39
American Beacon Small Cap Value FundSM
Notes to Financial Statements
October 31, 2016
Financial Liabilities, Derivative Liabilities, and Collateral Pledged by Counterparty as of October 31, 2016:
| | | | | | | | | | | | | | | | |
| | | | | | Gross Amounts Not Offset in the
Statement of Assets and Liabilities | | | | |
Counterparty | | Net Amount of Assets
Presented in the Statement
of Assets and Liabilities | | | Financial
Instruments | | | Cash Collateral
Received(2) | | | Net Amount | |
Barclays Capital, Inc. | | $ | 35,479,666 | | | $ | — | | | $ | (35,479,666 | ) | | $ | — | |
BNP Paribas Prime Brokerage | | | 2,309,370 | | | | — | | | | (2,309,370 | ) | | | — | |
Citigroup Global Markets, Inc. | | | 8,297,444 | | | | — | | | | (8,297,444 | ) | | | — | |
Credit Suisse Securities (USA) | | | 24,492,906 | | | | — | | | | (24,492,906 | ) | | | — | |
Goldman Sachs & Co. | | | 11,514,544 | | | | — | | | | (11,514,544 | ) | | | — | |
Goldman Sachs Bank USA (1) | | | (6,091,853 | ) | | | — | | | | — | | | | (6,091,853 | ) |
ING Financial Markets LLC | | | 1,874,692 | | | | — | | | | (1,874,692 | ) | | | — | |
JPMorgan Clearing Corp. | | | 41,279,223 | | | | — | | | | (41,279,223 | ) | | | — | |
Merrill Lynch, Pierce, Fenner & Smith, Inc. | | | 242,880 | | | | — | | | | (242,880 | ) | | | — | |
MS Securities Services Inc. | | | 48,075,638 | | | | — | | | | (48,075,638 | ) | | | — | |
National Financial Services Corp (NFS) | | | 16,875,656 | | | | — | | | | (16,875,656 | ) | | | — | |
Scotia Capital USA Inc. | | | 185,500 | | | | — | | | | (185,500 | ) | | | — | |
SG Americas Securities, LLC | | | 783,039 | | | | — | | | | (783,039 | ) | | | — | |
UBS Securities LLC | | | 37,092,093 | | | | — | | | | (37,092,093 | ) | | | — | |
| | | | | | | | | | | | | | | | |
Total: | | $ | 222,410,798 | | | $ | — | | | $ | (228,502,651 | ) | | $ | (6,091,853 | ) |
| | | | | | | | | | | | | | | | |
| (1) | The securities presented here within are not subject to Master Netting Agreements. As such, this is disclosed for informational purposes only. |
| (2) | Excess of collateral received from the individual counterparty is not shown for financial reporting purposes. Collateral with a value of $233,884,528 has been received in connection with securities lending transactions. |
7. Federal Income and Excise Taxes
It is the policy of the Fund to qualify as a regulated investment company (“RIC”), by complying with all applicable provisions of Subchapter M of the Internal Revenue Code, as amended, and to make distribution of taxable income sufficient to relieve it from substantially all federal income and excise taxes. For federal income tax purposes, the Fund is treated as a single entity for the purpose of determining such qualification.
The Fund does not have any unrecognized tax benefits in the accompanying financial statements. Each of the tax years in the four year period ended October 31, 2016 remain subject to examination by the Internal Revenue Service. If applicable, the Fund recognizes interest accrued related to unrecognized tax benefits in interest expense and penalties in “Other expenses” on the Statement of Operations.
The Fund may be subject to taxes imposed by countries in which it invests. Such taxes are generally based on returns of income earned or gains realized or repatriated. Taxes are accrued and applied to net investment income, net realized capital gains and net unrealized appreciation (depreciation), as applicable, as the income is earned or capital gains are recorded.
Dividends are categorized in accordance with income tax regulations which may treat certain transactions differently than U.S. GAAP. Accordingly, the character of distributions and composition of net assets for tax purposes may differ from those reflected in the accompanying financial statements.
40
American Beacon Small Cap Value FundSM
Notes to Financial Statements
October 31, 2016
The tax character of distributions paid are as follows:
| | | | | | | | |
| | | Year Ended
October 31, 2016 | | | Year Ended
October 31, 2015 | |
Distributions paid from: | | | | | | | | |
Ordinary Income* | | | | | | | | |
Institutional Class A | | $ | 35,450,206 | | | $ | 103,613,515 | |
Y Class | | | 1,930,943 | | | | 4,756,127 | |
Investor Class | | | 3,347,255 | | | | 18,940,157 | |
Advisor Class B | | | 382,583 | | | | 2,212,207 | |
Retirement Class | | | — | | | | 234,560 | |
A Class | | | 300,417 | | | | 677,609 | |
C Class | | | 27 | | | | 198,699 | |
AMR Class | | | — | | | | 10,714,326 | |
Long-term capital gain | | | | | | | | |
Institutional Class A | | | 202,223,390 | | | | 389,165,405 | |
Y Class | | | 11,744,791 | | | | 18,405,313 | |
Investor Class | | | 34,523,958 | | | | 83,962,978 | |
Advisor Class B | | | 5,445,465 | | | | 10,378,024 | |
Retirement Class | | | — | | | | 1,197,274 | |
A Class | | | 2,612,444 | | | | 3,132,144 | |
C Class | | | 617,946 | | | | 1,023,840 | |
AMR Class | | | — | | | | 36,787,671 | |
| | | | | | | | |
Total distributions paid | | $ | 298,579,425 | | | $ | 685,399,849 | |
| | | | | | | | |
| * | For tax purposes, short-term capital gains are considered ordinary income distributions. |
| A | Includes AMR Class Distributions (Note 1). |
| B | Includes Retirement Class Distributions (Note 1). |
As of October 31, 2016, the components of distributable earnings (deficits) on a tax basis were as follows:
| | | | |
Cost basis of investments for federal income tax purposes | | $ | 5,470,650,734 | |
Unrealized appreciation | | | 930,989,255 | |
Unrealized depreciation | | | (354,918,508 | ) |
| | | | |
Net unrealized appreciation (depreciation) | | | 576,070,747 | |
Undistributed ordinary income | | | 45,147,788 | |
Undistributed long-term capital gains | | | 147,374,264 | |
Accumulated capital and other losses | | | 6,091,853 | |
Other temporary differences | | | (6,091,924 | ) |
| | | | |
Distributable earnings (deficits) | | $ | 768,592,728 | |
| | | | |
Financial reporting records are adjusted for permanent book/tax differences to reflect tax character. Financial records are not adjusted for temporary differences. The temporary differences between financial reporting and tax-basis reporting of unrealized appreciation (depreciation) are attributable primarily to the tax deferral of losses from wash sales, the realization for tax purposes of unrealized gains (losses) on certain derivative instruments and reclassifications of income from real estate investment securities and publicly traded partnerships.
Due to inherent differences in the recognition of income, expenses and realized gains (losses) under U.S. GAAP and federal income tax regulations, permanent differences between book and tax reporting have been identified and appropriately reclassified on the Statement of Assets and Liabilities.
41
American Beacon Small Cap Value FundSM
Notes to Financial Statements
October 31, 2016
Accordingly, the following amounts represent current year permanent differences derived from foreign currency reclasses, reclassifications of income from real estate investment securities and publicly traded partnerships and Section 732 basis adjustments as of October 31, 2016:
| | | | |
Paid-in-capital | | $ | 3 | |
Undistributed net investment income (loss) | | | (2,673,718 | ) |
Accumulated net realized gain (loss) | | | 2,673,715 | |
Unrealized appreciation (depreciation) of investments in futures contracts | | | — | |
Under the Regulated Investment Company Modernization Act of 2010 (the “RICMOD”), net capital losses recognized by the Fund in taxable years beginning after December 22, 2010 are carried forward indefinitely and retain their character as short-term and/or long-term losses.
For the year ended October 31, 2016, the Fund did not have capital loss carryforwards.
8. Investment Transactions
The aggregate cost of purchases and proceeds from sales of investments, other than short-term obligations, for the year ended October 31, 2016, were $3,116,035,861 and $2,885,715,935, respectively.
A summary of the Fund’s transactions in the USG Select Fund for the year ended October 31, 2016 are as follows:
| | | | | | | | | | | | | | | | | | | | |
Type of Transaction | | October 31, 2015
Shares/Fair Value | | | Purchases | | | Sales | | | October 31, 2016
Shares/Fair Value | | | Dividend
Income | |
Direct | | $ | 15,000,000 | | | $ | 1,239,496,405 | | | $ | 1,077,986,845 | | | $ | 176,509,560 | | | $ | 350,172 | |
Securities Lending | | | 134,817,316 | | | | 834,228,303 | | | | 786,610,036 | | | | 182,435,583 | | | | N/A | |
9. Securities Lending
The Fund may lend its securities to qualified financial institutions, such as certain broker-dealers, to earn additional income. The borrowers are required to secure their loans continuously with collateral in an amount at least equal to the fair value of the securities loaned, initially in an amount at least equal to 102% of the fair value of domestic securities loaned and 105% of the fair value of international securities loaned. Collateral is monitored and marked-to-market daily. Daily mark-to-market amounts are required to be paid to the borrower or received from the borrower by the end of the following business day. This one day settlement for mark to market amounts may result in the collateral being temporarily less than the value of the securities on loan or temporarily more than the required minimum collateral.
To the extent that a loan is collateralized by cash, such cash collateral shall be invested by the securities lending agent (the “Agent”) in money market mutual funds and other short-term investments, provided the investments meet certain quality and diversification requirements. Securities purchased with cash collateral proceeds are listed in the Fund’s Schedule of Investments and the collateral is shown on the Statements of Assets and Liabilities as a payable.
Securities lending income is generated from the demand premium (if any) paid by the borrower to borrow a specific security and from the return on investment of cash collateral, reduced by negotiated rebate fees paid to the borrower and transaction costs. To the extent that a loan is secured by non-cash collateral, securities lending income is generated as a demand premium reduced by transaction costs. The Fund, the Agent, and the Manager retained 80%, 10% and 10%, respectively, of the income generated from securities lending.
42
American Beacon Small Cap Value FundSM
Notes to Financial Statements
October 31, 2016
While securities are on loan, the Fund continues to receive certain income associated with that security and any gain or loss in the market price that may occur during the term of the loan. In the case of domestic equities, the value of any dividend is received in the form of a substitute payment approximately equal to the dividend. In the case of foreign securities, a negotiated amount is received that is less than the actual dividend, but higher than the dividend amount minus the foreign tax that the Fund would be subject to on the dividend.
Securities lending transactions pose certain risks to the Fund, including that the borrower may not provide additional collateral when required or return the securities when due, that the value of the short-term investments will be less than the amount of cash collateral required to be returned to the borrower, that non-cash collateral may be subject to legal constraints in the event of a borrower bankruptcy, and that the cash collateral investments could become illiquid and unable to be used to return collateral to the borrower. The Fund could also experience delays and costs in gaining access to the collateral. The Fund bears the risk of any deficiency in the amount of the cash collateral available for return to the borrower and any action which impairs its ability to liquidate non-cash collateral to satisfy a borrower default.
As of October 31, 2016, the value of outstanding securities on loan and the value of collateral was as follows:
| | | | | | | | |
Fair Value of Securities on Loan | | Non-Cash Collateral | | | Cash Collateral
Posted by Borrower | |
| $228,502,651 | | $ | — | | | $ | 233,884,528 | |
Cash collateral is listed in the Fund’s Schedule of Investments and is shown on the Statement of Assets and Liabilities. Income earned on these investments is included in income derived from securities lending in the Statement of Operations.
Non-cash collateral received by the Fund may not be sold or re-pledged except to satisfy a borrower default. Therefore, non-cash collateral is not included on the Fund’s Schedule of Investments or Statement of Assets and Liabilities.
10. Capital Share Transactions
The tables below summarize the activity in capital shares for each Class of the Fund:
| | | | | | | | | | | | | | | | |
| | | Institutional Class | |
| | | Year Ended October 31, | |
| | | 2016 | | | 2015 | |
Small Cap Value Fund | | Shares | | | Amount | | | Shares | | | Amount | |
Shares sold | | | 50,066,083 | | | $ | 1,141,562,636 | | | | 47,133,002 | | | $ | 1,203,809,724 | |
Reinvestment of dividends | | | 10,230,460 | | | | 229,980,745 | | | | 19,187,641 | | | | 477,004,747 | |
Shares redeemed | | | (41,325,796 | ) | | | (964,710,175 | ) | | | (35,605,929 | ) | | | (908,703,303 | ) |
| | | | | | | | | | | | | | | | |
Net increase in shares outstanding | | | 18,970,747 | | | $ | 406,833,206 | | | | 30,714,714 | | | $ | 772,111,168 | |
| | | | | | | | | | | | | | | | |
| |
| | | Y Class | |
| | | Year Ended October 31, | |
| | | 2016 | | | 2015 | |
Small Cap Value Fund | | Shares | | | Amount | | | Shares | | | Amount | |
Shares sold | | | 6,190,151 | | | $ | 138,267,948 | | | | 5,301,352 | | | $ | 132,321,317 | |
Reinvestment of dividends | | | 561,615 | | | | 12,479,092 | | | | 840,740 | | | | 20,682,205 | |
Shares redeemed | | | (4,742,116 | ) | | | (108,967,301 | ) | | | (2,763,123 | ) | | | (68,782,281 | ) |
| | | | | | | | | | | | | | | | |
Net increase in shares outstanding | | | 2,009,650 | | | $ | 41,779,739 | | | | 3,378,969 | | | $ | 84,221,241 | |
| | | | | | | | | | | | | | | | |
43
American Beacon Small Cap Value FundSM
Notes to Financial Statements
October 31, 2016
| | | | | | | | | | | | | | | | |
| | | Investor Class | |
| | | Year Ended October 31, | |
| | | 2016 | | | 2015 | |
Small Cap Value Fund | | Shares | | | Amount | | | Shares | | | Amount | |
Shares sold | | | 5,975,063 | | | $ | 132,337,020 | | | | 7,676,345 | | | $ | 189,079,432 | |
Reinvestment of dividends | | | 1,707,590 | | | | 37,152,459 | | | | 4,172,720 | | | | 100,562,556 | |
Shares redeemed | | | (11,718,144 | ) | | | (259,411,145 | ) | | | (13,149,168 | ) | | | (322,523,286 | ) |
| | | | | | | | | | | | | | | | |
Net (decrease) in shares outstanding | | | (4,036,491 | ) | | $ | (89,921,666 | ) | | | (1,300,103 | ) | | $ | (32,881,298 | ) |
| | | | | | | | | | | | | | | | |
| |
| | | Advisor Class | |
| | | Year Ended October 31, | |
| | | 2016A | | | 2015 | |
Small Cap Value Fund | | Shares | | | Amount | | | Shares | | | Amount | |
Shares sold | | | 2,143,395 | | | $ | 45,656,821 | | | | 1,480,253 | | | $ | 36,025,905 | |
Reinvestment of dividends | | | 271,451 | | | | 5,828,048 | | | | 527,671 | | | | 12,590,231 | |
Shares redeemed | | | (2,430,956 | ) | | | (52,219,934 | ) | | | (1,692,044 | ) | | | (40,625,638 | ) |
| | | | | | | | | | | | | | | | |
Net increase (decrease) in shares outstanding | | | (16,110 | ) | | $ | (735,065 | ) | | | 315,880 | | | $ | 7,990,498 | |
| | | | | | | | | | | | | | | | |
| |
| | | Retirement Class | |
| | | Year Ended October 31, | |
| | | 2016 | | | 2015 | |
Small Cap Value Fund | | Shares | | | Amount | | | Shares | | | Amount | |
Shares sold | | | — | | | | — | | | | 280,654 | | | $ | 6,658,646 | |
Reinvestment of dividends | | | — | | | | — | | | | 61,242 | | | | 1,431,833 | |
Shares redeemed | | | — | | | | — | | | | (200,280 | ) | | | (4,788,047 | ) |
| | | | | | | | | | | | | | | | |
Net increase in shares outstanding | | | — | | | $ | — | | | | 141,616 | | | $ | 3,302,432 | |
| | | | | | | | | | | | | | | | |
| |
| | | A Class | |
| | | Year Ended October 31, | |
| | | 2016 | | | 2015 | |
Small Cap Value Fund | | Shares | | | Amount | | | Shares | | | Amount | |
Shares sold | | | 1,532,151 | | | $ | 32,767,569 | | | | 1,730,104 | | | $ | 42,130,039 | |
Reinvestment of dividends | | | 133,614 | | | | 2,863,338 | | | | 154,307 | | | | 3,670,966 | |
Shares redeemed | | | (1,259,802 | ) | | | (27,791,679 | ) | | | (666,513 | ) | | | (16,043,488 | ) |
| | | | | | | | | | | | | | | | |
Net increase in shares outstanding | | | 405,963 | | | $ | 7,839,228 | | | | 1,217,898 | | | $ | 29,757,517 | |
| | | | | | | | | | | | | | | | |
| |
| | | C Class | |
| | | Year Ended October 31, | |
| | | 2016 | | | 2015 | |
Small Cap Value Fund | | Shares | | | Amount | | | Shares | | | Amount | |
Shares sold | | | 160,094 | | | $ | 3,424,578 | | | | 167,293 | | | $ | 3,970,252 | |
Reinvestment of dividends | | | 25,623 | | | | 534,749 | | | | 44,598 | | | | 1,036,007 | |
Shares redeemed | | | (165,427 | ) | | | (3,556,022 | ) | | | (70,346 | ) | | | (1,655,581 | ) |
| | | | | | | | | | | | | | | | |
Net increase in shares outstanding | | | 20,290 | | | $ | 403,305 | | | | 141,545 | | | $ | 3,350,678 | |
| | | | | | | | | | | | | | | | |
| |
| | | AMR Class | |
| | | Year Ended October 31, | |
| | | 2016 | | | 2015 | |
Small Cap Value Fund | | Shares | | | Amount | | | Shares | | | Amount | |
Shares sold | | | 2,918 | | | $ | 72,585 | | | | 1,163,286 | | | $ | 29,565,625 | |
Reinvestment of dividends | | | — | | | | — | | | | 1,919,273 | | | | 47,501,996 | |
Shares redeemed | | | (508,200 | ) | | | (12,113,189 | ) | | | (16,860,953 | ) | | | (417,691,513 | ) |
| | | | | | | | | | | | | | | | |
Net (decrease) in shares outstanding | | | (505,582 | ) | | $ | (12,040,604 | ) | | | (13,778,394 | ) | | $ | (340,623,892 | ) |
| | | | | | | | | | | | | | | | |
| A Includes Retirement Class Transactions (Note 1) | | | | | | | | | | | | | | | | |
11. Subsequent Events
Management has evaluated subsequent events for possible recognition or disclosure in the financial statements through the date the financial statements are issued. Management has determined that there are no material events that would require disclosure in the Fund’s financial statements through this date.
44
American Beacon Small Cap Value FundSM
Financial Highlights
(For a share outstanding throughout the period)
| | | | | | | | | | | | | | | | | | | | |
| | | Institutional Class | |
| | | Year Ended October 31, | |
| | | 2016C | | | 2015 | | | 2014A | | | 2013 | | | 2012 | |
Net asset value, beginning of period | | $ | 24.69 | | | $ | 27.80 | | | $ | 28.04 | | | $ | 21.04 | | | $ | 18.75 | |
| | | | | | | | | | | | | | | | | | | | |
Income from investment operations: | | | | | | | | | | | | | | | | | | | | |
Net investment income | | | 0.23 | | | | 0.24 | | | | 0.17 | | | | 0.25 | | | | 0.17 | |
Net gains (losses) from investments (both realized and unrealized) | | | 0.79 | | | | 0.02 | | | | 2.18 | | | | 7.60 | | | | 2.20 | |
| | | | | | | | | | | | | | | | | | | | |
Total income (loss) from investment operations | | | 1.02 | | | | 0.26 | | | | 2.35 | | | | 7.85 | | | | 2.37 | |
| | | | | | | | | | | | | | | | | | | | |
Less distributions: | | | | | | | | | | | | | | | | | | | | |
Dividends from net investment income | | | (0.20 | ) | | | (0.19 | ) | | | (0.14 | ) | | | (0.27 | ) | | | (0.08 | ) |
Distributions from net realized gains | | | (1.15 | ) | | | (3.18 | ) | | | (2.45 | ) | | | (0.58 | ) | | | — | |
| | | | | | | | | | | | | | | | | | | | |
Total distributions | | | (1.35 | ) | | | (3.37 | ) | | | (2.59 | ) | | | (0.85 | ) | | | (0.08 | ) |
| | | | | | | | | | | | | | | | | | | | |
Net asset value, end of period | | $ | 24.36 | | | $ | 24.69 | | | $ | 27.80 | | | $ | 28.04 | | | $ | 21.04 | |
| | | | | | | | | | | | | | | | | | | | |
Total return B | | | 4.58 | % | | | 0.87 | % | | | 8.78 | % | | | 38.59 | % | | | 12.71 | % |
| | | | | | | | | | | | | | | | | | | | |
Ratios and supplemental data: | | | | | | | | | | | | | | | | | | | | |
Net assets, end of period | | $ | 4,717,291,753 | | | $ | 4,313,522,956 | | | $ | 4,002,884,144 | | | $ | 3,430,107,382 | | | $ | 2,189,761,186 | |
Ratios to average net assets: | | | | | | | | | | | | | | | | | | | | |
Expenses before reimbursements | | | 0.83 | % | | | 0.81 | % | | | 0.80 | % | | | 0.82 | % | | | 0.82 | % |
Expenses, net of reimbursements | | | 0.83 | % | | | 0.81 | % | | | 0.80 | % | | | 0.82 | % | | | 0.82 | % |
Net investment income (loss), before reimbursements | | | 1.01 | % | | | 0.99 | % | | | 0.67 | % | | | 1.01 | % | | | 0.87 | % |
Net investment income (loss), net of reimbursements | | | 1.01 | % | | | 0.99 | % | | | 0.67 | % | | | 1.01 | % | | | 0.87 | % |
Portfolio turnover rate | | | 53 | % | | | 47 | % | | | 73 | % | | | 48 | % | | | 51 | % |
| |
| | | Y Class | |
| | | Year Ended October 31, | |
| | | 2016 C | | | 2015 | | | 2014 A | | | 2013 | | | 2012 | |
Net asset value, beginning of period | | $ | 24.41 | | | $ | 27.52 | | | $ | 27.81 | | | $ | 20.89 | | | $ | 18.66 | |
| | | | | | | | | | | | | | | | | | | | |
Income from investment operations: | | | | | | | | | | | | | | | | | | | | |
Net investment income | | | 0.23 | | | | 0.23 | | | | 0.18 | | | | 0.22 | | | | 0.15 | |
Net gains (losses) from investments (both realized and unrealized) | | | 0.76 | | | | 0.01 | | | | 2.12 | | | | 7.55 | | | | 2.19 | |
| | | | | | | | | | | | | | | | | | | | |
Total income (loss) from investment operations | | | 0.99 | | | | 0.24 | | | | 2.30 | | | | 7.77 | | | | 2.34 | |
| | | | | | | | | | | | | | | | | | | | |
Less distributions: | | | | | | | | | | | | | | | | | | | | |
Dividends from net investment income | | | (0.19 | ) | | | (0.17 | ) | | | (0.14 | ) | | | (0.27 | ) | | | (0.11 | ) |
Distributions from net realized gains | | | (1.15 | ) | | | (3.18 | ) | | | (2.45 | ) | | | (0.58 | ) | | | — | |
| | | | | | | | | | | | | | | | | | | | |
Total distributions | | | (1.34 | ) | | | (3.35 | ) | | | (2.59 | ) | | | (0.85 | ) | | | (0.11 | ) |
| | | | | | | | | | | | | | | | | | | | |
Net asset value, end of period | | $ | 24.06 | | | $ | 24.41 | | | $ | 27.52 | | | $ | 27.81 | | | $ | 20.89 | |
| | | | | | | | | | | | | | | | | | | | |
Total return B | | | 4.49 | % | | | 0.79 | % | | | 8.67 | % | | | 38.45 | % | | | 12.58 | % |
| | | | | | | | | | | | | | | | | | | | |
Ratios and supplemental data: | | | | | | | | | | | | | | | | | | | | |
Net assets, end of period | | $ | 296,082,333 | | | $ | 251,360,287 | | | $ | 190,416,114 | | | $ | 122,849,739 | | | $ | 38,982,081 | |
Ratios to average net assets: | | | | | | | | | | | | | | | | | | | | |
Expenses before reimbursements | | | 0.90 | % | | | 0.90 | % | | | 0.89 | % | | | 0.91 | % | | | 0.91 | % |
Expenses, net of reimbursements | | | 0.90 | % | | | 0.90 | % | | | 0.89 | % | | | 0.91 | % | | | 0.91 | % |
Net investment income (loss), before reimbursements | | | 0.94 | % | | | 0.90 | % | | | 0.58 | % | | | 0.74 | % | | | 0.77 | % |
Net investment income (loss), net of reimbursements | | | 0.94 | % | | | 0.90 | % | | | 0.58 | % | | | 0.74 | % | | | 0.77 | % |
Portfolio turnover rate | | | 53 | % | | | 47 | % | | | 73 | % | | | 48 | % | | | 51 | % |
| A | On August 19, 2014, Opus Capital Group, LLC was terminated and ceased managing assets of the Small Cap Value Fund. On March 17, 2014, Barrow Hanley, Mewhinney & Strauss, LLC began managing additional assets of the Small Cap Value Fund. On September 19, 2014, Hillcrest Asset Management, LLC began managing assets of the Small Cap Value Fund. |
| B | Based on net asset value, which does not reflect the sales charge, redemption fee, or contingent deferred sales charge, if applicable. May include adjustments in accordance with U.S. GAAP and as such, the net asset value for reporting purposes and the returns based upon those net asset values may differ from the net asset value and returns for shareholder transactions. |
| C | On June 20, 2016, Dreman Value Management, LLC was terminated and ceased managing assets of the Small Cap Value Fund, and was replaced by Foundry Asset Management. |
45
American Beacon Small Cap Value FundSM
Financial Highlights
(For a share outstanding throughout the period)
| | | | | | | | | | | | | | | | | | | | |
| | | Investor Class | |
| | | Year Ended October 31, | |
| | | 2016 C | | | 2015 | | | 2014 A | | | 2013 | | | 2012 | |
Net asset value, beginning of period | | $ | 23.86 | | | $ | 26.96 | | | $ | 27.27 | | | $ | 20.47 | | | $ | 18.23 | |
| | | | | | | | | | | | | | | | | | | | |
Income from investment operations: | | | | | | | | | | | | | | | | | | | | |
Net investment income | | | 0.19 | | | | 0.18 | | | | 0.10 | | | | 0.18 | | | | 0.11 | |
Net gains (losses) from investments (both realized and unrealized) | | | 0.73 | | | | (0.02 | ) | | | 2.09 | | | | 7.38 | | | | 2.13 | |
| | | | | | | | | | | | | | | | | | | | |
Total income (loss) from investment operations | | | 0.92 | | | | 0.16 | | | | 2.19 | | | | 7.56 | | | | 2.24 | |
| | | | | | | | | | | | | | | | | | | | |
Less distributions: | | | | | | | | | | | | | | | | | | | | |
Dividends from net investment income | | | (0.11 | ) | | | (0.08 | ) | | | (0.05 | ) | | | (0.18 | ) | | | — | |
Distributions from net realized gains | | | (1.15 | ) | | | (3.18 | ) | | | (2.45 | ) | | | (0.58 | ) | | | — | |
| | | | | | | | | | | | | | | | | | | | |
Total distributions | | | (1.26 | ) | | | (3.26 | ) | | | (2.50 | ) | | | (0.76 | ) | | | — | |
| | | | | | | | | | | | | | | | | | | | |
Net asset value, end of period | | $ | 23.52 | | | $ | 23.86 | | | $ | 26.96 | | | $ | 27.27 | | | $ | 20.47 | |
| | | | | | | | | | | | | | | | | | | | |
Total return B | | | 4.27 | % | | | 0.50 | % | | | 8.40 | % | | | 38.11 | % | | | 12.31 | % |
| | | | | | | | | | | | | | | | | | | | |
Ratios and supplemental data: | | | | | | | | | | | | | | | | | | | | |
Net assets, end of period | | $ | 617,552,712 | | | $ | 723,044,801 | | | $ | 851,731,763 | | | $ | 934,041,370 | | | $ | 748,550,056 | |
Ratios to average net assets: | | | | | | | | | | | | | | | | | | | | |
Expenses before reimbursements | | | 1.14 | % | | | 1.15 | % | | | 1.16 | % | | | 1.18 | % | | | 1.18 | % |
Expenses, net of reimbursements | | | 1.14 | % | | | 1.15 | % | | | 1.16 | % | | | 1.18 | % | | | 1.18 | % |
Net investment income (loss), before reimbursements | | | 0.70 | % | | | 0.67 | % | | | 0.33 | % | | | 0.73 | % | | | 0.51 | % |
Net investment income (loss), net of reimbursements | | | 0.70 | % | | | 0.67 | % | | | 0.33 | % | | | 0.73 | % | | | 0.51 | % |
Portfolio turnover rate | | | 53 | % | | | 47 | % | | | 73 | % | | | 48 | % | | | 51 | % |
| |
| | | Advisor ClassD | |
| | | Year Ended October 31, | |
| | | 2016 C | | | 2015 | | | 2014 A | | | 2013 | | | 2012 | |
Net asset value, beginning of period | | $ | 23.60 | | | $ | 26.69 | | | $ | 27.06 | | | $ | 20.35 | | | $ | 18.15 | |
| | | | | | | | | | | | | | | | | | | | |
Income from investment operations: | | | | | | | | | | | | | | | | | | | | |
Net investment income | | | 0.12 | | | | 0.13 | | | | 0.06 | | | | 0.14 | | | | 0.06 | |
Net gains (losses) from investments (both realized and unrealized) | | | 0.73 | | | | 0.01 | | | | 2.07 | | | | 7.34 | | | | 2.14 | |
| | | | | | | | | | | | | | | | | | | | |
Total income (loss) from investment operations | | | 0.85 | | | | 0.14 | | | | 2.13 | | | | 7.48 | | | | 2.20 | |
| | | | | | | | | | | | | | | | | | | | |
Less distributions: | | | | | | | | | | | | | | | | | | | | |
Dividends from net investment income | | | (0.08 | ) | | | (0.05 | ) | | | (0.05 | ) | | | (0.19 | ) | | | — | |
Distributions from net realized gains | | | (1.15 | ) | | | (3.18 | ) | | | (2.45 | ) | | | (0.58 | ) | | | — | |
| | | | | | | | | | | | | | | | | | | | |
Total distributions | | | (1.23 | ) | | | (3.23 | ) | | | (2.50 | ) | | | (0.77 | ) | | | — | |
| | | | | | | | | | | | | | | | | | | | |
Net asset value, end of period | | $ | 23.22 | | | $ | 23.60 | | | $ | 26.69 | | | $ | 27.06 | | | $ | 20.35 | |
| | | | | | | | | | | | | | | | | | | | |
Total return B | | | 4.01 | % | | | 0.41 | % | | | 8.22 | % | | | 37.93 | % | | | 12.12 | % |
| | | | | | | | | | | | | | | | | | | | |
Ratios and supplemental data: | | | | | | | | | | | | | | | | | | | | |
Net assets, end of period | | $ | 110,205,158 | | | $ | 98,224,328 | | | $ | 102,681,998 | | | $ | 88,032,906 | | | $ | 44,730,536 | |
Ratios to average net assets: | | | | | | | | | | | | | | | | | | | | |
Expenses before reimbursements | | | 1.31 | % | | | 1.31 | % | | | 1.29 | % | | | 1.31 | % | | | 1.32 | % |
Expenses, net of reimbursements | | | 1.31 | % | | | 1.31 | % | | | 1.29 | % | | | 1.31 | % | | | 1.32 | % |
Net investment income (loss), before reimbursements | | | 0.53 | % | | | 0.51 | % | | | 0.18 | % | | | 0.46 | % | | | 0.35 | % |
Net investment income (loss), net of reimbursements | | | 0.53 | % | | | 0.51 | % | | | 0.18 | % | | | 0.46 | % | | | 0.35 | % |
Portfolio turnover rate | | | 53 | % | | | 47 | % | | | 73 | % | | | 48 | % | | | 51 | % |
| A | On August 19, 2014, Opus Capital Group, LLC was terminated and ceased managing assets of the Small Cap Value Fund. On March 17, 2014, Barrow Hanley, Mewhinney & Strauss, LLC began managing additional assets of the Small Cap Value Fund. On September 19, 2014, Hillcrest Asset Management, LLC began managing assets of the Small Cap Value Fund. |
| B | Based on net asset value, which does not reflect the sales charge, redemption fee, or contingent deferred sales charge, if applicable. May include adjustments in accordance with U.S. GAAP and as such, the net asset value for reporting purposes and the returns based upon those net asset values may differ from the net asset value and returns for shareholder transactions. |
| C | On June 20, 2016, Dreman Value Management, LLC was terminated and ceased managing assets of the Small Cap Value Fund, and was replaced by Foundry Asset Management. |
| D | On January 15, 2016, the Retirement Class closed and the assets were merged into the Advisor Class. |
46
American Beacon Small Cap Value FundSM
Financial Highlights
(For a share outstanding throughout the period)
| | | | | | | | | | | | | | | | | | | | |
| | | A Class | |
| | | Year Ended October 31, | |
| | | 2016 C | | | 2015 | | | 2014 A | | | 2013 | | | 2012 | |
Net asset value, beginning of period | | $ | 23.54 | | | $ | 26.63 | | | $ | 27.03 | | | $ | 20.35 | | | $ | 18.19 | |
| | | | | | | | | | | | | | | | | | | | |
Income from investment operations: | | | | | | | | | | | | | | | | | | | | |
Net investment income | | | 0.15 | | | | 0.13 | | | | 0.11 | | | | 0.16 | | | | 0.08 | |
Net gains (losses) from investments (both realized and unrealized) | | | 0.73 | | | | 0.02 | | | | 2.03 | | | | 7.30 | | | | 2.12 | |
| | | | | | | | | | | | | | | | | | | | |
Total income (loss) from investment operations | | | 0.88 | | | | 0.15 | | | | 2.14 | | | | 7.46 | | | | 2.20 | |
| | | | | | | | | | | | | | | | | | | | |
Less distributions: | | | | | | | | | | | | | | | | | | | | |
Dividends from net investment income | | | (0.13 | ) | | | (0.06 | ) | | | (0.09 | ) | | | (0.20 | ) | | | (0.04 | ) |
Distributions from net realized gains | | | (1.15 | ) | | | (3.18 | ) | | | (2.45 | ) | | | (0.58 | ) | | | — | |
| | | | | | | | | | | | | | | | | | | | |
Total distributions | | | (1.28 | ) | | | (3.24 | ) | | | (2.54 | ) | | | (0.78 | ) | | | (0.04 | ) |
| | | | | | | | | | | | | | | | | | | | |
Net asset value, end of period | | $ | 23.14 | | | $ | 23.54 | | | $ | 26.63 | | | $ | 27.03 | | | $ | 20.35 | |
| | | | | | | | | | | | | | | | | | | | |
Total return B | | | 4.17 | % | | | 0.45 | % | | | 8.30 | % | | | 37.83 | % | | | 12.11 | % |
| | | | | | | | | | | | | | | | | | | | |
Ratios and supplemental data: | | | | | | | | | | | | | | | | | | | | |
Net assets, end of period | | $ | 63,277,387 | | | $ | 54,815,183 | | | $ | 29,569,753 | | | $ | 13,417,645 | | | $ | 4,064,204 | |
Ratios to average net assets: | | | | | | | | | | | | | | | | | | | | |
Expenses before reimbursements | | | 1.21 | % | | | 1.21 | % | | | 1.27 | % | | | 1.35 | % | | | 1.44 | % |
Expenses, net of reimbursements | | | 1.21 | % | | | 1.22 | % | | | 1.27 | % | | | 1.32 | % | | | 1.34 | % |
Net investment income (loss), before reimbursements | | | 0.64 | % | | | 0.56 | % | | | 0.19 | % | | | 0.30 | % | | | 0.21 | % |
Net investment income (loss), net of reimbursements | | | 0.64 | % | | | 0.54 | % | | | 0.20 | % | | | 0.34 | % | | | 0.32 | % |
Portfolio turnover rate | | | 53 | % | | | 47 | % | | | 73 | % | | | 48 | % | | | 51 | % |
| |
| | | C Class | |
| | | Year Ended October 31, | |
| | | 2016 C | | | 2015 | | | 2014 A | | | 2013 | | | 2012 | |
Net asset value, beginning of period | | $ | 22.84 | | | $ | 26.05 | | | $ | 26.60 | | | $ | 20.07 | | | $ | 18.04 | |
| | | | | | | | | | | | | | | | | | | | |
Income from investment operations: | | | | | | | | | | | | | | | | | | | | |
Net investment income (loss) | | | (0.02 | ) | | | 0.03 | | | | (0.07 | ) | | | 0.03 | | | | (0.03 | ) |
Net gains (losses) from investments (both realized and unrealized) | | | 0.72 | | | | (0.06 | ) | | | 1.97 | | | | 7.17 | | | | 2.06 | |
| | | | | | | | | | | | | | | | | | | | |
Total income (loss) from investment operations | | | 0.70 | | | | (0.03 | ) | | | 1.90 | | | | 7.20 | | | | 2.03 | |
| | | | | | | | | | | | | | | | | | | | |
Less distributions: | | | | | | | | | | | | | | | | | | | | |
Dividends from net investment income | | | — | | | | — | | | | 0.00 | | | | (0.09 | ) | | | — | |
Distributions from net realized gains | | | (1.15 | ) | | | (3.18 | ) | | | (2.45 | ) | | | (0.58 | ) | | | — | |
| | | | | | | | | | | | | | | | | | | | |
Total distributions | | | (1.15 | ) | | | (3.18 | ) | | | (2.45 | ) | | | (0.67 | ) | | | — | |
| | | | | | | | | | | | | | | | | | | | |
Net asset value, end of period | | $ | 22.39 | | | $ | 22.84 | | | $ | 26.05 | | | $ | 26.60 | | | $ | 20.07 | |
| | | | | | | | | | | | | | | | | | | | |
Total return B | | | 3.42 | % | | | (0.31 | )% | | | 7.46 | % | | | 36.88 | % | | | 11.25 | % |
| | | | | | | | | | | | | | | | | | | | |
Ratios and supplemental data: | | | | | | | | | | | | | | | | | | | | |
Net assets, end of period | | $ | 11,938,196 | | | $ | 11,718,580 | | | $ | 9,676,368 | | | $ | 6,396,419 | | | $ | 2,329,911 | |
Ratios to average net assets: | | | | | | | | | | | | | | | | | | | | |
Expenses before reimbursements | | | 1.96 | % | | | 1.97 | % | | | 2.03 | % | | | 2.09 | % | | | 2.21 | % |
Expenses, net of reimbursements | | | 1.96 | % | | | 1.98 | % | | | 2.03 | % | | | 2.07 | % | | | 2.10 | % |
Net investment income (loss), before reimbursements | | | (0.12 | )% | | | (0.17 | )% | | | (0.56 | )% | | | (0.41 | )% | | | (0.54 | )% |
Net investment income (loss), net of reimbursements | | | (0.12 | )% | | | (0.17 | )% | | | (0.56 | )% | | | (0.39 | )% | | | (0.43 | )% |
Portfolio turnover rate | | | 53 | % | | | 47 | % | | | 73 | % | | | 48 | % | | | 51 | % |
| A | On August 19, 2014, Opus Capital Group, LLC was terminated and ceased managing assets of the Small Cap Value Fund. On March 17, 2014, Barrow Hanley, Mewhinney & Strauss, LLC began managing additional assets of the Small Cap Value Fund. On September 19, 2014, Hillcrest Asset Management, LLC began managing assets of the Small Cap Value Fund. |
| B | Based on net asset value, which does not reflect the sales charge, redemption fee, or contingent deferred sales charge, if applicable. May include adjustments in accordance with U.S. GAAP and as such, the net asset value for reporting purposes and the returns based upon those net asset values may differ from the net asset value and returns for shareholder transactions. |
| C | On June 20, 2016, Dreman Value Management, LLC was terminated and ceased managing assets of the Small Cap Value Fund, and was replaced by Foundry Asset Management. |
47
American Beacon Small Cap Value FundSM
Federal Tax Information
October 31, 2016 (Unaudited)
Certain tax information regarding the Fund is required to be provided to shareholders based upon the Fund’s income and distribution for the taxable year ended October 31, 2016. The information and distributions reported herein may differ from information and distributions taxable to the shareholders for the calendar year ended December 31, 2016.
The Fund designated the following items with regard to distributions paid during the year ended October 31, 2016. All designations are based on financial information available as of this annual report and, accordingly, are subject to change. For each item, it is the intention of the Fund to designate the maximum amount permitted under the Internal Revenue Code of 1986, as amended, and the regulations there under.
| | | | |
Corporate Dividends Received Deduction | | | 73.00 | % |
Qualified Dividend Income | | | 100.00 | % |
The Fund designated $257,167,994 as long-term capital gains distributions for the year ended October 31, 2016.
Shareholders will receive notification in January 2017 of the applicable tax information necessary to prepare their 2016 income tax returns.
48
Disclosure Regarding Approval of the Management and Investment Advisory Agreements (Unaudited)
Renewal and Approval of the Management Agreement and Investment Advisory Agreements of the Fund in June 2016
At in-person meetings held on May 17, 2016 and June 8, 2016 (collectively, the “Meetings”), the Board considered and then, at its June 8th meeting, approved the renewal of: (1) the Management Agreement between American Beacon Advisors, Inc. (“Manager”) and the American Beacon Funds (the “Trust”) on behalf of the American Beacon Small Cap Value Fund (“Fund”); and (2) the investment advisory agreements (the “Investment Advisory Agreements”) among the Manager, the Trust, on behalf of the Fund, and Barrow, Hanley, Mewhinney & Strauss, LLC (“Barrow”), Brandywine Global Investment Management, LLC (“Brandywine”), Dreman Value Management, LLC (“Dreman”), Hillcrest Asset Management LLC (“Hillcrest”), Hotchkis and Wiley Capital Management, LLC (“Hotchkis”), and The Boston Company Asset Management, LLC (“TBC”), (collectively, the “subadvisors”). The Management Agreement and the Investment Advisory Agreements are collectively referred to herein as the “Agreements.” In preparation for the Board to consider the renewal of these Agreements, the Board undertook steps to gather and consider information furnished by the Manager, the subadvisors, Broadridge, Inc. (“Broadridge”) and Morningstar, Inc. (“Morningstar”). The Board, with the assistance of independent legal counsel, requested and received certain relevant information from the Manager and each subadvisor. In connection with the approval of the Agreement with Dreman, the Board noted that it was also considering at the June 8th meeting the approval of an investment advisory agreement with a new subadvisor that would replace Dreman at a later date.
In advance of the Meetings, the Board’s Investment Committee and/or the Manager coordinated the production of information from Broadridge and Morningstar regarding the performance, fees and expenses of the Fund as well as information from the Manager and the subadvisors. At the Meetings, the Board considered the information provided. The Board noted that as a result of the acquisition of Lipper, Inc. (“Lipper”) by Broadridge, Lipper expense and performance information was provided by Broadridge. Further, the Board took into consideration information furnished for the Board’s review and consideration throughout the year at regular meetings of the Board and its committees, as well as information specifically prepared in connection with the renewal process.
In connection with the Board’s consideration of the Agreements, the Trustees received and evaluated such information as they deemed necessary. The information requested on behalf of the Board included, among other information, the following materials. References herein to the “firm” refer to the Manager and/or the subadvisors.
| | • | | comparisons of the performance of an appropriate share class of the Fund to comparable investment companies and appropriate benchmark indices, including peer group averages and performance analyses provided by Broadridge and Morningstar, and to the performance of any similar accounts managed by the firm; |
| | • | | comparisons of the Fund’s management and subadvisory fee rates and expense ratio with the management fee rates paid by comparable mutual funds, including peer group averages and fee and expense analyses provided by Broadridge and Morningstar, and the advisory fee rates charged to other clients for which similar services are provided; |
| | • | | a description of any applicable fee waivers and/or expense reimbursements in place for the Fund during the past year, and any proposed changes to the expense caps; |
| | • | | the Manager’s profitability with respect to the services that it provided to the Fund; |
| | • | | any actual or anticipated economies of scale in relation to the services the firm provides or will provide to the Fund and whether the current fee rates charged or to be charged to the Fund reflect these economies of scale for the benefit of the Fund’s investors; |
| | • | | an evaluation of any other benefits to the firm or Fund as a result of their relationship, if any; |
| | • | | information regarding the securities lending, cash management, administrative and accounting-related services that the Manager provides to the Fund, as applicable, and the fees that the Manager receives for such services; and |
| | • | | information regarding a firm’s financial condition, the personnel of the Manager who are assigned primary responsibility for managing the Fund, staffing levels, portfolio managers’ compensation, disaster recovery |
49
Disclosure Regarding Approval of the Management and Investment Advisory Agreements (Unaudited)
| | plans, insurance coverage, material pending litigation, code of ethics, compliance matters, trading activities, and actual or potential conflicts of interest that the firm experiences, or anticipates that it will experience, in providing services to the Fund. |
The Board noted that the Manager provides management and administrative services to the Fund pursuant to the Management Agreement. The Board considered that prior to May 29, 2016, the Manager provided management and administrative services to the Fund pursuant to separate agreements. The Board noted, in this regard, that many mutual funds have separate contracts governing both types of services, and observed that the actual management fee rates provided by Broadridge for peer group funds reflect the combined advisory and administrative expenses, both gross and net of any waivers and/or reimbursements.
Certain firms may not have been able to, or opted not to, provide information in response to certain information requests, in which case the Board conducted its evaluation of the firm based on information that was provided. In such cases, the Board determined that the omission of any such information was not material to its considerations. The class of shares used for comparative performance purposes was the share class with the lowest expenses available for purchase by the general public, which, was the Institutional Class. The Board also considered that the use of Institutional Class performance generally facilitates a meaningful comparison for expense and performance purposes.
Provided below is an overview of certain factors the Board considered in connection with its renewal and approval of the Management Agreement and Investment Advisory Agreements. The Board did not identify any particular information that was most relevant to its consideration to renew or approve each Agreement, and each Trustee may have afforded different weight to the various factors. Legal counsel to the independent Trustees provided the Board with a memorandum regarding its responsibilities pertaining to the renewal and approval of each Agreement. The memorandum explained the regulatory requirements surrounding the Trustees’ process for evaluating investment advisors and the terms of the contracts. Based on its evaluation, the Board unanimously concluded that the terms of each Agreement were reasonable and fair and that the renewal and approval of each Agreement was in the best interests of the Fund and its shareholders.
Considerations With Respect to the Renewal of the Management Agreement and the Investment Advisory Agreements
In determining whether to renew the Agreements on behalf of the Fund, the Trustees considered the best interests of the Fund. While the Management Agreement and the Investment Advisory Agreements for all series of the Trust and American Beacon Select Funds (together, the “Trusts”) were considered at the Meetings, the Board considered the Fund’s investment management and subadvisory relationships separately.
In each instance, the Board considered, among other things, the following factors: (1) the nature, extent and quality of the services provided; (2) the investment performance of the Fund and the subadvisors for the Fund; (3) the costs incurred by the Manager in rendering services to the Fund and its resulting profits or losses; (4) comparisons of services and fee rates with contracts entered into by the Manager or the subadvisors or their affiliates with other clients (such as pension funds and other institutional clients); (5) the extent to which economies of scale have been taken into account in setting each fee rate schedule; (6) whether fee rate levels reflect these economies of scale for the benefit of Fund investors; and (7) any other benefits derived or anticipated to be derived by the Manager or the subadvisors from their relationship with the Fund. The Trustees posed questions to various management personnel of the Manager regarding certain key aspects of the materials submitted in support of the renewal.
Nature, Extent and Quality of Services. With respect to the renewal of the Management Agreement, the Board considered, among other factors: the Fund’s long-term performance and the length of service of key investment personnel at the Manager; the cost structure of the Fund; the Manager’s culture of compliance and support for compliance operations that reduce risks to the Fund; the Manager’s commitment to enhance the Fund’s product line and increase assets in the Fund; the Manager’s quality of services; the Manager’s active role in
50
Disclosure Regarding Approval of the Management and Investment Advisory Agreements (Unaudited)
monitoring and, as appropriate, recommending additional or replacement subadvisors; the Manager’s commitment to training employees; and the Manager’s efforts to retain key employees and maintain staffing levels.
With respect to the renewal of the Investment Advisory Agreements, the Trustees considered the level of staffing and the size of the subadvisors. The Board also considered the adequacy of the resources committed to the Fund by the subadvisors, and whether those resources were commensurate with the needs of the Fund and are sufficient to sustain appropriate levels of performance and compliance needs. In this regard, the Board considered the financial stability of the subadvisors. The Board also considered the subadvisors’ representations regarding their compliance programs and codes of ethics. Based on the foregoing information, the Board concluded that the nature, extent and quality of the management and advisory services provided by the Manager and the subadvisors were appropriate for the Fund and, thus, determined to renew the Agreements for the Fund.
Investment Performance. The Board evaluated the comparative information provided by Broadridge and the Manager regarding the Fund’s investment performance relative to its Lipper performance universe, Lipper performance group, and benchmark index, as well as the Fund’s Morningstar rating. The Board considered the information provided by Broadridge regarding its independent peer selection methodology to select all Lipper performance groups and universes. The Board also considered that the performance groups and universes selected by Broadridge may not provide appropriate comparisons for certain series of the Trusts. In addition, the Board considered the performance reports and discussions with management at Board and Committee meetings throughout the year. The Board also considered the Manager’s recommendation to continue to retain the subadvisors. A discussion regarding the Board’s considerations with respect to the Fund’s performance appears below under “Additional Considerations and Conclusions with Respect to the Fund.”
Costs of the Services Provided to the Fund and the Profits Realized by the Manager from its Relationship with the Fund. In analyzing the cost of services and profitability of the Manager, the Board considered the revenues earned and the expenses incurred by the Manager, before and after the payment of distribution-related expenses by the Manager. The profits or losses were noted at both an aggregate level for all series of the Trusts and at an individual Fund level, with the Fund being profitable for the Manager. The Board noted that the Manager did not manage other accounts in the same strategy as the Fund.
The Board further considered that, with respect to the Fund, the Management Agreement provides for the Manager to receive a management fee comprised of an annualized fee that is retained by the Manager. In addition, the Board considered that the Manager receives management fees for overseeing the securities lending program on behalf of the Fund. The Board also noted that certain share classes of the Fund maintain higher expense ratios in order to compensate third-party financial intermediaries.
In analyzing the fee rates charged by each subadvisor in connection with its investment advisory services to the Fund, the Board considered that, with respect to Barrow, Brandywine, Dreman, Hillcrest, Hotchkis and TBC, the Manager has negotiated the lowest fee rate a subadvisor charges for any comparable client accounts. The Board did not request profitability data from the subadvisors because the Board did not view this data as imperative to its deliberations given the arm’s-length nature of the relationship between the Manager and the subadvisors with respect to the negotiation of the subadvisory fee rate. In addition, the Board noted that subadvisors may not account for their profits on an account-by-account basis and those that do likely employ different methodologies in connection with these calculations.
Based on the foregoing information, the Board concluded that the profitability levels of the Manager were reasonable in light of the services performed by the Manager. A discussion regarding the Board’s considerations with respect to the Fund’s fee rates is set forth below under “Additional Considerations and Conclusions with Respect to the Fund.”
Economies of Scale. In considering the reasonableness of the management and investment advisory fees rates, the Board considered whether economies of scale will be realized as the Fund grows and whether fee rate
51
Disclosure Regarding Approval of the Management and Investment Advisory Agreements (Unaudited)
levels reflect these economies of scale for the benefit of Fund shareholders. In this regard, the Board considered that the Manager has negotiated breakpoints in the subadvisory fee rates for each subadvisor, except Dreman. The Board also noted that, for purposes of determining the fee rates chargeable to the Fund, Barrow, Brandywine, Hotchkis, and TBC have agreed to take into account assets of American Airlines Group and its pension plans that are managed by the subadvisors. Thus, the Fund is able to receive lower effective fee rates.
In addition, the Board noted the Manager’s representation that the Management Agreement contains fee schedule breakpoints at higher asset levels with respect to the Fund. Based on the foregoing information, the Board concluded that the Manager and subadvisor fee rate schedules for the Fund provide for a reasonable sharing of benefits from any economies of scale with the Fund.
Benefits Derived from the Relationship with the Fund. The Board considered the “fall-out” or ancillary benefits that accrue to the Manager and/or the subadvisor as a result of the advisory relationships with the Fund, including greater exposure in the marketplace with respect to the Manager’s or subadvisors’ investment process and expanding the level of assets under management by the Manager and the subadvisor. In addition, the Board noted that certain subadvisors benefit from soft dollar arrangements for third party and/or proprietary research.
In addition, the Manager noted that the Fund also derives benefits from its association with the Manager. Specifically, the Board noted the Manager’s representation that it provides services to most series of the Trusts at a lower than industry average cost. The Board considered that certain subadvisors reimburse the Manager for certain costs relating to distribution activities for the series of the Trusts, as well as representations by all such subadvisors that they would not reduce their fee rates in lieu of providing such reimbursements. Based on the foregoing information, the Board concluded that the potential benefits accruing to the Manager and the subadvisors by virtue of their relationships with the Fund appear to be fair and reasonable.
Additional Considerations and Conclusions with Respect to the Fund
The performance comparisons below were made versus the Fund’s Lipper performance universe and Lipper performance group, with the 1st Quintile representing the top twenty percent of the universe or group based on performance and the 5th Quintile representing the bottom twenty percent of the universe or group based on performance. References below to the Fund’s Lipper performance group and Lipper performance universe are to the respective group or universe of comparable mutual funds included in the analysis provided by Broadridge. A Lipper performance group consists of the Fund and a representative sample of funds with similar investment classifications and objectives as the Fund, as selected by Broadridge. A Lipper performance universe is an expansion of the performance group, providing a broader view of performance across the Fund’s investment classification/ objective and allowing for a more extensive comparison. In reviewing the performance, the Trustees viewed longer-term performance over a full market cycle, typically five years or longer, if available, as the most important consideration, because relative performance over shorter periods may be significantly impacted by market or economic events that do not reflect manager skill.
The expense comparisons below were made versus the Fund’s Lipper expense universe and Lipper expense group, with the 1st Quintile representing the top twenty percent of the universe or group based on lowest total expense and the 5th Quintile representing the bottom twenty percent of the universe or group based on highest total expense. References below to the Fund’s expense group and expense universe are to the respective group or universe of comparable mutual funds included in the analysis by Broadridge. A Lipper expense group consists of the Fund and a representative sample of funds with similar operating structures and asset sizes, as selected by Broadridge. A Lipper expense universe includes all funds in the investment classification/objective with a similar load type to the share class of the Fund included in the Lipper comparative information and provides a broader view of expenses across the Fund’s investment classification/objective. The Trustees also considered the Fund’s Morningstar fee level category. In addition, information regarding the subadvisors’ use of soft dollars was requested from the Manager and was considered by the Trustees.
52
Disclosure Regarding Approval of the Management and Investment Advisory Agreements (Unaudited)
In considering the renewal of the Management Agreement for the American Beacon Small Cap Value Fund, the Trustees considered the following additional factors:
Lipper Total Expense Analysis and Morningstar Fee Level Ranking
| | |
| Compared to Lipper Expense Universe | | 1st Quintile |
| Compared to Lipper Expense Group | | 2ndQuintile |
| Morningstar Fee Level Ranking - Institutional Class | | Low Expense Ratio |
Lipper Fund Performance Analysis (five-year period ended March 31, 2016)
| | |
| Compared to Lipper Performance Universe | | 2nd Quintile |
| Compared to Lipper Performance Group | | 3rd Quintile |
In considering the renewal of the Investment Advisory Agreements with Barrow, Brandywine, Dreman, Hillcrest, Hotchkis, and TBC, the Trustees considered the following additional factors:
Subadvisor Performance (compared to Lipper Performance Universe for period indicated, ending March 31, 2016)
| | | | |
| Barrow (Fundamental Strategy) | | 5 years | | 1st Quintile |
| Barrow (Diversified Strategy)* | | 1 year | | 2nd Quintile |
| Dreman | | 5 years | | 2nd Quintile |
| Hillcrest* | | 1 year | | 1st Quintile |
| Hotchkis | | 5 years | | 1st Quintile |
| TBC | | 5 years | | 1st Quintile |
| * | The Trustees considered the 1-year performance record for Barrow (Diversified Strategy) and Hillcrest because these subadvisors do not yet have 3-year performance records. |
The Trustees also considered: (1) information provided by each subadvisor regarding fee rates charged for managing accounts in the same strategy as the subadvisor’s allocated portion of the Fund; and (2) the Manager’s recommendation to continue to retain each subadvisor at the present time.
Based on these and other considerations, the Trustees: (1) concluded that the fees paid to the Manager and the subadvisors under the Management and Investment Advisory Agreements are fair and reasonable; (2) determined that the Fund and its shareholders would benefit from the Manager’s and subadvisors’ continued management of the Fund; and (3) approved the renewal of the Management and Investment Advisory Agreements with respect to the Fund.
Approval of Foundry Partners, LLC
At its June 7-8, 2016 meetings, the Board considered the approval of a new investment advisory agreement (“New Agreement”) among the Manager, Foundry Partners, LLC (“Foundry”), and the Trust, on behalf of the Fund. Prior to the meeting, the Board reviewed information provided by Foundry in response to requests from the Board and/or the Manager in connection with the Board’s consideration of the New Agreement, and the Investment Committee of the Board met with representatives of Foundry.
Provided below is an overview of the primary factors the Board considered at its June 7-8, 2016 meetings at which the Board considered the approval of the New Agreement. In determining whether to approve the New Agreement, the Board considered, among other matters, the following factors: (1) the nature and quality of the services to be provided; (2) the prior investment performance of the portfolio management team that is joining Foundry after having managed a portion of the Fund’s assets at another advisory firm; (3) the extent to which
53
Disclosure Regarding Approval of the Management and Investment Advisory Agreements (Unaudited)
the potential materiality of the costs to be incurred by Foundry in rendering its services and the resulting profits or losses are relevant to the Board’s determination of whether to approve the New Agreement; (4) the extent to which economies of scale, if any, have been taken into account in setting the fee schedule; (5) whether fee levels reflect these economies of scale, if any, for the benefit of investors; (6) comparisons of services and fees with contracts entered into by Foundry with other clients; and (7) any other benefits anticipated to be derived by Foundry from its relationship with the Fund.
The Board did not identify any particular information that was most relevant to its consideration of the New Agreement, and each Trustee may have afforded different weight to the various factors. Members of the Board’s Investment Committee posed questions to various management personnel of Foundry regarding certain key aspects of the materials submitted in support of the approval. Legal counsel to the independent Trustees provided the Board with a memorandum regarding its responsibilities pertaining to the approval of the New Agreement. The memorandum explained the regulatory requirements surrounding the Trustees’ process for evaluating investment advisors and the terms of investment advisory contracts. Based on its evaluation, the Board unanimously concluded that the terms of the New Agreement were reasonable and fair and that the approval of the New Agreement was in the best interests of the Fund.
Nature, extent and quality of the services to be provided by Foundry. The Board considered information regarding Foundry’s principal business activities, its reputation, financial condition and overall capabilities to perform the services under the New Agreement. In addition, the Board considered the background and experience of the personnel who will be assigned responsibility for managing Foundry’s allocation of the Fund. The Board considered that the personnel employed by Dreman Value Management, LLC (“Dreman”) that currently are responsible for managing Dreman’s allocation of the Fund would continue to manage the Fund as employees of Foundry. The Board also considered Foundry’s investment resources, infrastructure and the adequacy of its compliance program. In addition, the Board took into consideration the Manager’s recommendation of Foundry. The Board considered Foundry’s representation regarding the strength of its financial condition and that its current staffing levels were adequate to service the Fund. Based on this information, the Board concluded that the nature, extent and quality of the advisory services to be provided by Foundry were appropriate for the Fund in light of its investment objective, and, thus, supported a decision to approve the New Agreement.
Performance of Portfolio Management Team. Since the personnel employed by Dreman that currently are responsible for managing Dreman’s allocation of the Fund would continue to manage the Fund as employees of Foundry, the Board evaluated the information provided by Foundry for periods ended April 30, 2016, regarding the performance of Dreman’s allocation of the Fund, Dreman’s Institutional Small Cap Value Composite (“Composite”) and a registered investment company managed by Dreman in the same strategy as the Fund (“Similar Fund”) relative to performance of an appropriate benchmark index (“Index”). The Board considered information provided by Foundry reflecting that Dreman’s allocation of the Fund, the Composite and the Similar Fund each outperformed the Index for the 1-, 3- and 5-year periods and underperformed the Index for the period beginning on the date that Dreman began managing its allocation of the Fund. Based on the foregoing information, the Board concluded that the historical investment performance record of the personnel employed by Dreman that currently are responsible for managing Dreman’s allocation of the Fund supported approval of the New Agreement.
Comparisons of the amounts to be paid under the New Agreement with those under contracts between Foundry and its other clients. In evaluating the New Agreement, the Board reviewed the proposed advisory fee rate for services to be performed by Foundry on behalf of the Fund. The Board considered that Foundry’s investment advisory fee rate under the New Agreement would be paid to Foundry by the Fund. The Board considered that Foundry’s investment advisory fee rate under the New Agreement would be the same as the investment advisory fee paid by the Fund to Dreman and that Foundry currently has no other subadvisory clients. After evaluating this information, the Board concluded that the advisory fee rate under the New Agreement was reasonable in light of the services to be provided to the Fund.
54
Disclosure Regarding Approval of the Management and Investment Advisory Agreements (Unaudited)
Costs of the services to be provided and profits to be realized by Foundry and its affiliates from its relationship with the Fund. The Board did not consider the costs of the services to be provided and profits to be realized by Foundry from its relationship with the Fund, noting instead the arm’s length nature of the relationship between the Manager and Foundry with respect to the negotiation of the advisory fee rate on behalf of the Fund.
Economies of Scale. The Board considered Foundry’s representation that economies of scale were reflected in the proposed investment advisory fee rate under the New Agreement.
Benefits to be derived by Foundry from the relationship with the Fund. The Board considered the “fallout” or ancillary benefits that might accrue to Foundry as a result of its relationship with the Fund, including that aggregating the Fund’s trades with those of other clients may reduce overall trading costs. The Board also considered Foundry’s representation that it does not currently have any formal soft dollar arrangements in place with any brokers. Based on the foregoing information, the Board concluded that the potential benefits accruing to Foundry by virtue of its relationship with the Fund appear to be fair and reasonable.
Board’s Conclusion. Based on the various considerations described above, the Board, including a majority of Trustees who are not “interested persons” of the Fund, the Manager or Foundry, as that term is defined in the Investment Company Act of 1940, as amended, concluded that the proposed investment advisory fee rate is fair and reasonable and that the approval of the New Agreement is in the best interests of the Fund and approved the New Agreement.
55
Trustees and Officers of the American Beacon FundsSM (Unaudited)
The Trustees and officers of the American Beacon Funds (the “Trust”) are listed below, together with their principal occupations during the past five years. Unless otherwise indicated, the address of each person listed below is 220 Las Colinas Boulevard East, Suite 1200, Irving, Texas 75039. Each Trustee oversees twenty-six seven funds in the fund complex that includes the Trust and the American Beacon Select Funds. The Trust’s Statement of Additional Information contains additional information about the Trustees and is available without charge by calling 1-800-658-5811. A
| | | | |
Name, Age and Address | | Position, Term of Office and Length of Time Served with the Trust | | Principal Occupation(s) During Past 5 Years and Current Directorships |
| INTERESTED TRUSTEES | | |
| | |
| | Lifetime of Trust until removal, resignation or retirement* | | |
| | |
| Alan D. Feld** (79) | | Trustee since 1996 | | Sole Shareholder of a professional corporation which is a Partner in the law firm of Akin, Gump, Strauss, Hauer & Feld, LLP (law firm) (1960-Present); Trustee, American Beacon Mileage Funds (1996-2012); Trustee, American Beacon Select Funds (1999-Present); Trustee, American Beacon Master Trust (1996-2012). |
| | |
| NON-INTERESTED TRUSTEES | | Term | | |
| | |
| | Lifetime of Trust until removal resignation or retirement* | | |
| | |
| Gilbert G. Alvarado (46) | | Trustee since 2015 | | Director, Kura MD, Inc. (local telehealth organization) (2015-present); Vice President & CFO, Sierra Health Foundation (health conversion private foundation) (2006-Present) Vice President & CFO, Sierra Health Foundation: Center for Health Program Management (California public benefit corporation) (2012-Present); Director, Innovative North State (2012-Present); Director, Sacramento Regional Technology Alliance (2011-Present); Director, Women’s Empowerment (2009-2014); Trustee, American Beacon Select Funds (2015-Present). |
| | |
| Josephe B. Armes (54) | | Trustee since 2015 | | Chairman & CEO, CSW Industrials f/k/a Capital Southwest Corporation (investment company) (2013-Present); President & CEO, JBA Investment Partners (family investment vehicle) (2010-Present); Chief Operating Officer, Hicks Holdings, LLC (Hicks Family assets and investments) (2005-2010); Trustee, Baylor University Board of Regents (2001-2010); Director and Chair of Audit Committee, RSP Permian (oil and gas producer) (2013-Present); Trustee, American Beacon Select Funds (2015-Present). |
| | |
| Gerard J. Arpey (58) | | Trustee since 2012 | | Director, The Home Depot, Inc. (2015-Present); Partner, Emerald Creek Group (private equity firm) (2011-Present); Chairman and Chief Executive Officer, AMR Corp. and American Airlines; Inc. (2003- 2011); Director, S. C. Johnson & Son, Inc. (privately held company) (2008-present); Trustee, American Beacon Select Funds (2012-Present). |
| | |
| Brenda A. Cline (55) | | Trustee since 2004 | | Executive Vice President, Chief Financial Officer, Treasurer and Secretary, Kimbell Art Foundation (1993-Present); Director, Range Resources Corporation (oil and natural gas company) (2015-Present); Director, Tyler Technologies, Inc.(public sector software solutions company) (2014-Present); Trustee, American Beacon Mileage Funds (2004-2012); Trustee, American Beacon Select Funds (2004-Present); Trustee, American Beacon Master Trust (2004-2012). |
| | |
| Eugene J. Duffy (62) | | Trustee since 2008 | | Managing Director, Institutional Services, Intercontinental Real Estate Corporation (2014-Present); Principal and Executive Vice President, Paradigm Asset Management (1994-2014); Director, Sunrise Bank of Atlanta (2008-2013); Trustee, American Beacon Mileage Funds (2008- 2012); Trustee, American Beacon Select Funds (2008-Present); Trustee, American Beacon Master Trust (2008-2012). |
56
Trustees and Officers of the American Beacon FundsSM (Unaudited)
| | | | |
Name, Age and Address | | Position, Term of Office and Length of Time Served with the Trust | | Principal Occupation(s) During Past 5 Years and Current Directorships |
| TRUSTEES (CONT.) | | Term | | |
| | |
| M. Dunning (74) | | Trustee since 2008 | | Chairman Emeritus (2008-Present); Lockton Dunning Benefits (consulting firm in employee benefits); Board Director, Oncor Electric Delivery Company LLC (2007-Present); Board Member, BancTec (2010-Present) (software consulting); Trustee, American Beacon Mileage Funds (2008-2012); Trustee, American Beacon Select Funds (2008-Present); Trustee, American Beacon Master Trust (2008-2012). |
| | |
| Richard M. Massman (73) | | Trustee since 2004 Chairman since 2008 | | Consultant and General Counsel Emeritus (2009-Present) and Senior Vice President and General Counsel (1994-2009), Hunt Consolidated, Inc. (holding company engaged in oil and gas exploration and production, refining, real estate, farming, ranching and venture capital activities); Trustee, American Beacon Mileage Funds (2004- 2012); Trustee, American Beacon Select Funds (2004-Present); Trustee, American Beacon Master Trust (2004-2012). |
| | |
| Barbara J. McKenna, CFA (53) | | Trustee since 2012 | | Managing Principal, Longfellow Investment Management Company (2005-Present); Trustee, American Beacon Select Funds (2012-Present). |
| | |
| R. Gerald Turner (70) 225 Perkins Admin. Bldg. Southern Methodist Univ. Dallas, Texas 75275 | | Trustee since 2001 | | President, Southern Methodist University (1995-Present); Director, J.C. Penney Company, Inc. (1996-Present); Director, Kronus Worldwide Inc. (chemical manufacturing) (2003-Present); Trustee, American Beacon Mileage Funds (2001- 2012); Trustee, American Beacon Select Funds (2001-Present); Trustee, American Beacon Master Trust (2001-2012). |
| | |
| OFFICERS | | | | |
| | |
| Gene. L. Needles, Jr. (61) | | President since 2009 Executive Vice President since 2009 | | President, CEO and Director, American Beacon Advisors, Inc. (2009-Present); President, CEO and Director, Astro AB Borrower, Inc. (2015-Present); President, CEO and Director, Astro AB Acquisition, Inc.(2015-Present); President, CEO and Director, Astro AB Topco, Inc. (2015-Present), President, CEO and Director, Astro AB Holdings, LLC. (2015-Present); President, CEO and Director, Lighthouse Holdings, Inc.; (2009-2015); President and CEO, Lighthouse Holdings Parent, Inc. (2009-2015); Manager, President and CEO, American Private Equity Management, L.L.C. (2012-Present); President, American Beacon Cayman Managed Futures Strategy Fund, Ltd. (2014-Present). |
| | |
| Rosemary K. Behan (57) | | VP, Secretary and Chief Legal Officer since 2006 | | Secretary, American Beacon Advisors, Inc. (2006-Present); Secretary, Astro AB Borrower, Inc. (2015-Present); Secretary, Astro AB Acquisition, Inc. (2015- Present); Secretary, Astro AB Topco, Inc. (2015-Present); Secretary, Astro AB Holdings, LLC. (2015-Present); Secretary, Lighthouse Holdings, Inc. (2008- 2015); Secretary, Lighthouse Holdings Parent, Inc. (2008-2015); Secretary, American Private Equity Management, L.L.C. (2008-Present); Secretary, American Beacon Cayman Managed Futures Strategy Fund, Ltd. (2014-Present). |
| | |
| Brian E. Brett (56) | | VP since 2004 | | Vice President, Director of Sales, American Beacon Advisors, Inc. (2004-Present). |
| | |
| Paul B. Cavazos (47) | | VP since 2016 | | Chief Investment Officer and Vice President, Asset Management, American Beacon Advisors, Inc. (2016-Present); Chief Investment Officer and Assistant Treasurer, DTE Energy (2007-2016); |
| | |
| Erica Duncan (46) | | VP since 2011 | | Vice President, Marketing and Client Services, American Beacon Advisors, Inc. (2011-Present); Supervisor, Brand Marketing, Invesco (2010-2011); |
57
Trustees and Officers of the American Beacon FundsSM (Unaudited)
| | | | |
Name, Age and Address | | Position, Term of Office and Length of Time Served with the Trust | | Principal Occupation(s) During Past 5 Years and Current Directorships |
| OFFICERS | | Term | | |
| | |
| Melinda G. Heika (55) | | Treasurer since 2010 | | Treasurer, American Beacon Advisors, Inc. (2010-Present); Treasurer, Astro AB Borrower, Inc. (2015-Present); Treasurer, Astro AB Acquisition, Inc. (2015-Present); Treasurer, Astro AB Topco, Inc. (2015-Present); Treasurer, Astro AB Holdings, LLC. (2015-Present); Treasurer, Lighthouse Holdings, Inc. (2010-2015); Treasurer, Lighthouse Holdings Parent Inc., (2010-2015); Treasurer, American Private Equity Management, L.L.C. (2012-Present); Director and Treasurer, American Beacon Cayman Managed Futures Strategy Fund, Ltd. (2014-Present). |
| | |
| | One Year | | |
| | |
| Terri L. McKinney (52) | | VP since 2010 | | Vice President, Enterprise Services (2009-Present) and Managing Director (2003-2009), American Beacon Advisors, Inc. |
| | |
| Jeffrey K. Ringdahl (41) | | VP since 2010 | | Chief Operating Officer, American Beacon Advisors, Inc. (2010-Present); Manager and Senior Vice President, American Private Equity Management, L.L.C. (2012-Present); Senior Vice President and Director, Astro AB Borrower, Inc. (2015-Present); Senior Vice President and Director, Astro AB Acquisition, Inc. (2015-Present); Senior Vice President and Director, Astro AB Topco, Inc. (2015-Present), Senior Vice President and Director, Astro AB Holdings, LLC.(2015-Present); Senior Vice President, Lighthouse Holdings, Inc. (2013-2015); Senior Vice President, Lighthouse Holdings Parent, Inc. (2013-2015); Director and Vice President, American Beacon Cayman Managed Futures Strategy Fund, Ltd. (2014-Present); Vice President, Product Management, Touchstone Advisors, Inc. (2007-2010). |
| | |
| Samuel J. Silver (53) | | VP since 2011 | | Chief Fixed Income Officer (2016–Present), Vice President, Fixed Income Investments (2011-2016) and Senior Portfolio Manager, Fixed Income Investments (1999-2011), American Beacon Advisors, Inc. |
| | |
| Christina E. Sears (45) | | Chief Compliance Officer since 2004 and Asst. Secretary since 1999 | | Chief Compliance Officer, American Beacon Advisors, Inc. (2004-Present); Chief Compliance Officer, American Private Equity Management, L.L.C. (2012-Present). |
| | |
| Sonia L. Bates (59) | | Asst. Treasurer since 2011 | | Director, Tax and Financial Reporting (2011-Present), Manager, Tax and Financial Reporting (2005-2010), American Beacon Advisors, Inc.; Asst. Treasurer, Astro AB Borrower, Inc. (2015-Present); Asst. Treasurer, Astro AB Acquisition, Inc.(2015-Present); Asst. Treasurer, Astro AB Topco, Inc. (2015-Present); Asst. Treasurer, Astro AB Holdings, LLC.; Asst. Treasurer, Lighthouse Holdings, Inc. (2011-2015); Asst. Treasurer, Lighthouse Holdings Parent Inc. (2011-2015); Asst. Treasurer, American Private Equity Management, L.L.C. (2012-Present). |
| | |
| Shelley D. Abrahams (41) | | Assistant Secretary since 2008 | | Assistant Secretary, American Beacon Advisors, Inc. (2008-Present) |
| | |
| Rebecca L. Harris (49) | | Assistant Secretary since 2011 | | Assistant Secretary, American Beacon Advisors, Inc. (2011-Present) |
| | |
| Diana N. Lai (40) | | Assistant Secretary since 2012 | | Assistant Secretary, American Beacon Advisors, Inc. (2012-Present) |
| | |
| Teresa A. Oxford (58) | | Assistant Secretary since 2015 | | Assistant Secretary, American Beacon Advisors, Inc. (2015-Present) |
| * | As of 11/12/2014, the Board adopted a retirement plan that requires Trustees to retire no later than the last day of the calendar year in which they reach the age of 75. |
| ** | Mr. Feld is deemed to be an “interested person” of the Trusts, as defined by the 1940 Act. Mr. Feld’s law firm of Akin, Gump, Strauss, Hauer & Feld LLP has provided legal services within the past two fiscal years to one or more of the Trust’s sub-advisors. |
58
Trustees and Officers of the American Beacon FundsSM (Unaudited)
| * | The Board has adopted a retirement plan that requires Trustees to retire no later than the last day of the calendar year in which they reach the age of 72, provided, however, that the board may determine to grant one or more annual exemptions to this requirement. |
| ** | Mr. Feld is deemed to be an “interested person” of the Trust, as defined by the 1940 Act. Mr. Feld’s law firm of Akin, Gump, Strauss, Hauer & Feld LLP has provided legal services within the past two years to one or more of the Trust’s sub-advisors. |
59
American Beacon FundsSM
Privacy Policy
October 31, 2016 (Unaudited)
The American Beacon Funds recognize and respect the privacy of our shareholders. We are providing this notice to you so you will understand how shareholder information may be collected and used.
We may collect nonpublic personal information about you from one or more of the following sources:
| | • | | information we receive from you on applications or other forms; |
| | • | | information about your transactions with us or our service providers; and |
| | • | | information we receive from third parties. |
We do not disclose any nonpublic personal information about our customers or former customers to anyone, except as permitted by law.
We restrict access to your nonpublic personal information to those employees or service providers who need to know that information to provide products or services to you. To ensure the confidentiality of your nonpublic personal information, we maintain safeguards that comply with federal standards.
60

Delivery of Documents
eDelivery is NOW AVAILABLE - Stop traditional mail delivery and receive your
shareholder reports and summary prospectus on-line. Sign up at
www.americanbeaconfunds.com
If you invest in the Fund through a financial institution, you may be able to receive the Fund’s regulatory mailings, such as the Prospectus, Annual Report and Semi-Annual Report, by e-mail. If you are interested in this option, please go to www.icsdelivery.com and search for your financial institution’s name or contact your financial institution directly.
To obtain more information about the Fund:
| | |
LOGO | |  |
By E-mail: american_beacon.funds@ambeacon.com | | On the Internet: Visit our website at www.americanbeaconfunds.com |
| | | |
| | |
 | |  |
By Telephone: Institutional, Y, Investor, and Advisor Classes Call (800) 658-5811 | | By Mail: American Beacon Funds P.O. Box 219643 Kansas City, MO 64121-9643 |
| | | |
| | |
| Availability of Quarterly Portfolio Schedules | | Availability of Proxy Voting Policy and Records |
| | |
| In addition to the Schedule of Investments provided in each semi-annual and annual report, the Fund files a complete schedule of its portfolio holdings with the Securities and Exchange Commission (“SEC”) on Form N-Q as of the first and third fiscal quarters. The Fund’s Forms N-Q are available on the SEC’s website at www.sec.gov. The Forms N-Q may also be reviewed and copied at the SEC’s Public Reference Section, 100 F Street, NE, Washington, D.C. 20549-1520. Information regarding the operation of the SEC’s Public Reference Room may be obtained by calling (800)-SEC-0330. A complete schedule of the Fund’s portfolio holdings is also available at www.americanbeaconfunds.com approximately twenty days after the end of each month. | | A description of the policies and procedures the Fund uses to determine how to vote proxies relating to portfolio securities is available in the Fund’s Statement of Additional Information, is available free of charge on the Fund’s website www.americanbeaconfunds.com and by calling 1-800-967-9009 or by accessing the SEC’s website at www.sec.gov. The Fund’s proxy voting record for the most recent year ended June 30 is filed annually with the SEC on Form N-PX. The Fund’s Forms N-PX are available on the SEC’s website at www.sec.gov. The Fund’s proxy voting record may also be obtained by calling 1-800-967-9009 |
Fund Service Providers:
| | | | | | | | | | | | |
CUSTODIAN State Street Bank and Trust Boston, Massachusetts | | | | TRANSFER AGENT Boston Financial Data Services Kansas City, Missouri | | | | INDEPENDENT REGISTERED PUBLIC ACCOUNTING FIRM Ernst & Young LLP Dallas, Texas | | | | DISTRIBUTOR Foreside Fund Services, LLC Portland, Maine |
This report is prepared for shareholders of the American Beacon Funds and may be distributed to others only if preceded or accompanied by a current Prospectus or Summary Prospectus.
|
| American Beacon Funds and American Beacon Small Cap Value Fund are service marks of American Beacon Advisors, Inc. |
AR 10/16
ITEM 2. CODE OF ETHICS.
The Trust has adopted a code of ethics that applies to its principal executive and financial officers (the “Code”). The trust amended its code November 12, 2003 to disclose the removal of terminated Investment Companies. The Trust did not grant any waivers to the provisions of the Code during the period covered by the shareholder report presented in Item 1. The Code is filed herewith as Exhibit 99.CODE.ETH.
ITEM 3. AUDIT COMMITTEE FINANCIAL EXPERT.
The Trust’s Board of Trustees has determined that Ms. Brenda A. Cline, a member of the Trust’s Audit and Compliance Committee, is an “audit committee financial expert” as defined in Form N-CSR. Ms. Brenda Cline is “independent” as defined in Form N-CSR.
ITEM 4. PRINCIPAL ACCOUNTANT FEES AND SERVICES.
| | | | |
| (a) | | | |
Audit Fees | | Fiscal Year Ended | |
$371,653 | | | 10/31/2015 | |
$231,054 | | | 10/31/2016 | |
| |
| (b) | | | |
Audit-Related Fees | | Fiscal Year Ended | |
$0 | | | 10/31/2015 | |
$0 | | | 10/31/2016 | |
| |
| (c) | | | |
Tax Fees | | Fiscal Year Ended | |
$56,375 | | | 10/31/2015 | |
$34,161 | | | 10/31/2016 | |
| |
| (d) | | | |
All Other Fees | | Fiscal Year Ended | |
$0 | | | 10/31/2015 | |
$0 | | | 10/31/2016 | |
(e)(1) Pursuant to its charter, the Trust’s Audit and Compliance Committee shall have the following duties and powers pertaining to pre-approval of audit and non-audit services provided by the Trust’s principal accountant:
| | • | | to approve, prior to appointment, the engagement of auditors to annually audit and provide their opinion on the Trusts’ financial statements, and, in connection therewith, reviewing and evaluating matters potentially affecting the independence and capabilities of the auditors; |
| | • | | to approve, prior to appointment, the engagement of the auditors to provide non-audit services to the Trusts, an investment adviser to any series of the Trusts or any entity controlling, controlled by, or under common control with an investment adviser (“adviser affiliate”) that provides ongoing services to the Trusts, if the engagement relates directly to the operations and financial reporting of the Trusts; |
| | • | | to consider whether the non-audit services provided by a Trust’s auditor to an investment adviser or any adviser affiliate that provides ongoing services to a series of the Trusts, which services were not pre-approved by the Committee, are compatible with maintaining the auditor’s independence; |
| | • | | to review the arrangements for and scope of the annual audit and any special audits; and |
| | • | | to review and approving the fees proposed to be charged to the Trusts by the auditors for each audit and non-audit service. |
The Audit and Compliance Committee may delegate any portion of its authority, including the authority to grant pre-approvals of audit and permitted non-audit services, to a subcommittee of one or more members. Any decisions of the subcommittee to grant pre-approvals shall be presented to the full audit committee at its next regularly scheduled meeting.
(e)(2) None of the fees disclosed in paragraphs (b) through (d) above were approved by the audit committee pursuant to paragraph (c)(7)(i)(C) of Rule 2-01 of Regulation S-X.
(f) Not applicable.
(g) Aggregate Non-Audit Fees for Services Rendered to the:
| | | | | | | | | | |
Registrant | | Adviser | | | Adviser’s Affiliates Providing Ongoing Services to Registrant | | Fiscal Year
Ended | |
| $56,375 | | $ | 46,065 | | | N/A | | | 10/31/2015 | |
| $34,161 | | $ | 215,882 | | | N/A | | | 10/31/2016 | |
(h) Not applicable.
ITEM 5. AUDIT COMMITTEE OF LISTED REGISTRANTS.
Not applicable.
ITEM 6. SCHEDULE OF INVESTMENTS.
The schedules of investments for each series of the Trust are included in the shareholder reports presented in Item 1.
ITEM 7. DISCLOSURE OF PROXY VOTING POLICIES AND PROCEDURES FOR CLOSED-END MANAGEMENT INVESTMENT COMPANIES.
Not applicable.
ITEM 8. PORTFOLIO MANAGERS OF CLOSED-END MANAGEMENT INVESTMENT COMPANIES.
Not applicable.
ITEM 9. PURCHASES OF EQUITY SECURITIES BY CLOSED-END MANAGEMENT INVESTMENT COMPANY AND AFFILIATED PURCHASERS.
Not applicable.
ITEM 10. SUBMISSION OF MATTERS TO A VOTE OF SECURITY HOLDERS.
The Trust has made no material changes to the procedures by which shareholders may recommend nominees to the Trust’s Board of Trustees since the Trust last disclosed such procedures in Schedule 14A.
ITEM 11. CONTROLS AND PROCEDURES.
(a) Based upon an evaluation within 90 days of the filing date of this report, the principal executive and financial officers concluded that the disclosure controls and procedures of the Trust are effective.
(b) There were no changes in the Trust’s internal control over financial reporting during the second fiscal quarter of the period covered by this report that has materially affected, or is reasonably likely to materially affect, the Trust’s internal control over financial reporting.
ITEM 12. EXHIBITS.
(a)(1) Filed herewith as EX-99.CODE ETH.
(a)(2) A separate certification for each principal executive officer and principal financial officer of the Trust as required by Rule 30a-2(a) under the Investment Company Act of 1940 is attached hereto as EX-99.CERT.
(a)(3) Not applicable.
(b) The certifications required by Rule 30a-2(b) under the Investment Company Act of 1940 are attached hereto as EX-99.906CERT.
SIGNATURES
Pursuant to the requirements of the Securities Exchange Act of 1934 and the Investment Company Act of 1940, the registrant has duly caused this report to be signed on its behalf by the undersigned, thereunto duly authorized.
(Registrant): American Beacon Funds
| | |
| | By /s/ Gene L. Needles, Jr. |
| | Gene L. Needles, Jr. |
| | President |
| | American Beacon Funds |
| | Date: January 9, 2017 |
Pursuant to the requirements of the Securities Exchange Act of 1934 and the Investment Company Act of 1940, this report has been signed below by the following persons on behalf of the registrant and in the capacities and on the dates indicated.
| | |
| | By /s/ Gene L. Needles, Jr. |
| | Gene L. Needles, Jr. |
| | President |
| | American Beacon Funds |
| | Date: January 9, 2017 |
| | |
| | By /s/ Melinda G. Heika |
| | Melinda G. Heika |
| | Treasurer |
| | American Beacon Funds |
| | Date: January 9, 2017 |