UNITED STATES
SECURITIES AND EXCHANGE COMMISSION
Washington, D.C. 20549
FORMN-CSR
CERTIFIED SHAREHOLDER REPORT OF REGISTERED
MANAGEMENT INVESTMENT COMPANIES
Investment Company Act file number:811-4984
AMERICAN BEACON FUNDS
(Exact name of registrant as specified in charter)
220 East Las Colinas Boulevard, Suite 1200
Irving, Texas 75039
(Address of principal executive offices)-(Zip code)
GENE L. NEEDLES, JR., PRESIDENT
220 East Las Colinas Boulevard, Suite 1200
Irving, Texas 75039
(Name and address of agent for service)
Registrant’s telephone number, including area code: (817)391-6100
Date of fiscal year end: August 31, 2019
Date of reporting period: August 31, 2019
FormN-CSR is to be used by management investment companies to file reports with the Commission not later than 10 days after the transmission to stockholders of any report that is required to be transmitted to stockholders under Rule30e-1 under the Investment Company Act of 1940 (17 CFR270.30e-1). The Commission may use the information provided on FormN-CSR in its regulatory, disclosure review, inspection, and policymaking roles.
A registrant is required to disclose the information specified by FormN-CSR, and the Commission will make this information public. A registrant is not required to respond to the collection of information contained in FormN-CSR unless the Form displays a currently valid Office of Management and Budget (“OMB”) control number. Please direct comments concerning the accuracy of the information collection burden estimate and any suggestions for reducing the burden to Secretary, Securities and Exchange Commission, 450 Fifth Street, NW, Washington, DC 20549-0609. The OMB has reviewed this collection of information under the clearance requirements of 44 U.S.C. § 3507.
| ITEM 1. | REPORTS TO STOCKHOLDERS. |
About American Beacon Advisors, Inc.
Since 1986, American Beacon Advisors, Inc. has offered a variety of products and investment advisory services to numerous institutional and retail clients, including a variety of mutual funds, corporate cash management, and separate account management.
Our clients include defined benefit plans, defined contribution plans, foundations, endowments, corporations, financial planners, and other institutional investors. With American Beacon Advisors, Inc., you can put the experience of a multi-billion dollar asset management firm to work for your company.
SiM HIGH YIELD OPPORTUNITIES FUND
Investments inhigh-yield securities,includingloans, restricted securitiesandfloating rate securitiesare subject to greater levels of credit, interest rate, market and liquidity risks than investment-grade securities. Investing inforeign and emerging market securitiesmay involve heightened risk due to currency fluctuations and economic and political risks. Investing inderivative instrumentsinvolves liquidity, credit, interest rate and market risks.
SOUND POINT FLOATING RATE INCOME FUND
Investments inhigh-yield securities,includingloans, CLOs, restricted securitiesandfloating rate securitiesare subject to greater levels of credit, interest rate, market, and liquidity risks than investment-grade securities. In addition,loansare subject to the risk that the Fund may not be able to obtain the collateral securing the loan in a timely manner and the value of the collateral may not cover the amount owed on the loan.
Please see the prospectus for a complete discussion of the Funds’ risks. There can be no assurances that the investment objectives of these Funds will be met.
Any opinions herein, including forecasts, reflect our judgment as of the end of the reporting period and are subject to change. Each advisor’s strategies and the Fund’s portfolio composition will change depending on economic and market conditions. This report is not a complete analysis of market conditions and therefore, should not be relied upon as investment advice. Although economic and market information has been compiled from reliable sources, American Beacon Advisors, Inc. makes no representation as to the completeness or accuracy of the statements contained herein.
American Beacon Advisors | August 31, 2019 |
| 1 | ||||
| 2 | ||||
| 9 | ||||
| 11 | ||||
| 12 | ||||
| 17 | ||||
| 28 | ||||
| 31 | ||||
| 57 | ||||
| 62 | ||||
| 68 | ||||
Disclosures Regarding the Approval of the Management and Investment Advisory Agreements | 69 | |||
| 74 | ||||
| 81 | ||||
| Back Cover | ||||
 | Dear Shareholders,
At American Beacon, we take our heritage as a fiduciary very seriously – and we apply that mindset to all aspects of our business as a fund manager. As a result, for more than 30 years, we have endeavored to:
u Identify, engage and oversee the best money managers. As a manager of managers, our goal is to engage the most effective money managers for each asset class, investment style and market strategy we offer. We are committed to partnering with those we judge to be “the best of the best” when it comes to choosing sub-advisors for our mutual funds. Whether our due-diligence process results in the selection of one sub-advisor or multiple sub-advisors, we select those we believe show the greatest potential to help us meet the high standards you’ve come to expect. |
| u | Offer a variety of innovative investment solutions. Our mutual funds – which span the domestic, international, global, frontier and emerging markets – are sub-advised by experienced money managers who employ distinctive, proprietary investment processes to manage assets through a variety of economic and market conditions. From offering some of the first multi-manager funds, one of the first retirement income funds and the first open-ended mutual fund in the U.S. to focus primarily on frontier-market debt, our robust history includes applying a disciplined, solutions-based approach to our product development process in an effort to help you grow your assets while mitigating risk. |
| u | Provide a solutions-based approach to achieving long-term investment goals. We seek to provide investment solutions that might enable you to benefit from taking a more disciplined approach to investing. Our mutual funds provide access to institutional-quality, research-intensive investment managers with diverse processes and styles. Over the long run, having such access and spending time in the market – rather than trying to time the market – may better position you to reach your long-term investment goals during market upswings and potentially insulate against market downswings. |
Our management approach is more than a concept; it’s the cornerstone of American Beacon’s culture. And we strive to employ it at every turn as we seek to provide a well-diversified line of investment solutions to help our shareholders seek long-term rewards.
Thank you for your continued interest in American Beacon. For additional information about our mutual funds or to access your account information, please visit our website atwww.americanbeaconfunds.com.
Best Regards,

Gene L. Needles, Jr.
President
American Beacon Funds
1
August 31, 2019 (Unaudited)
For the 12-month period ended August 31, 2019, the high-yield markets performed well as the ICE BofAML U.S. High Yield Index (“High Yield”) returned 6.58% and the Credit Suisse Leveraged Loan Index (“Bank Loan”) returned 3.38%. High Yield outperformed due to its longer-duration, fixed-rate bonds that appreciated as market yields declined. Bank Loan comprises floating-rate loans that generally have less reaction to changes in interest rates.
The period began with the Federal Reserve (the “Fed”) raising interest rates in response to the low unemployment rate and concerns of potential inflation. Economic growth was expected to be reasonable and allow for a gradual normalization of monetary policy. By July 2019, however, the Fed was forced to cut interest rates due to volatile equity markets, weakening economic growth and global geopolitical uncertainties.
The first indication of trouble appeared in late 2018 when a deep equity market correction sent investors to the sidelines. The S&P 500 Index declined more than 17% as investors sought refuge in the highest-quality government bonds. High Yield and Bank Loan prices declined 4% to 6% during the correction.
While the outlook for domestic growth was still reasonable, concerns about Brexit, Chinese trade wars and European economic growth overwhelmed optimism in the U.S. By period end, the decline in interest rates brought the 10-year Treasury yield below that of the two-year Treasury, causing a yield-curve inversion.
As the Fed and other central banks responded with interest-rate cuts and other forms of stimulus, investors gradually regained confidence and moved back into risk assets. Bank loans, which had been investor favorites for several years while interest rates were rising, quickly fell out of favor as rates began to decline. Investors sought longer-duration, fixed-rate bonds to benefit from the decline in yields.
Within High Yield, the best-performing sectors for the year were: Banking, 13.9%; Media, 11.6%; and Leisure, 10.6%. The worst-performing sectors were: Energy, -6.0%; Automotive, 4.2%; and Transportation, 5.7%. The highest returns were produced by BB-rated bonds and B-rated bonds at 9.7% and 6.1%, respectively. The lowest-quality issues, CCC-rated and below, struggled with a -3.9% return. The relative performance among sectors and credit quality within Bank Loan was generally consistent with that of High Yield.
Although the markets are likely to experience periodic bouts of volatility in the near future, investors ended with a general sense of optimism that central banks and political leaders were aware of their concerns and were eager to maintain market stability. However, several key events in the final months of the year will determine sentiment as we enter 2020.
2
American Beacon SiM High Yield Opportunities FundSM
Performance Overview
August 31, 2019 (Unaudited)
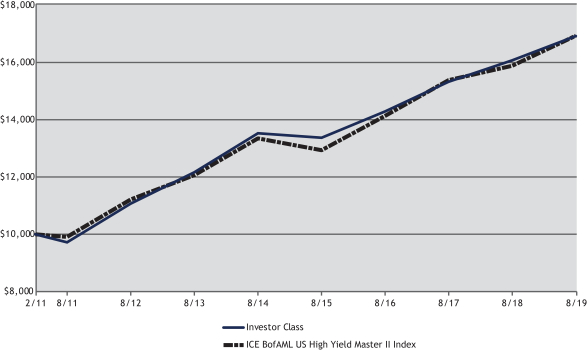
The Investor Class of the American Beacon SiM High Yield Opportunities Fund (the “Fund”) returned 5.32% for the year ending August 31, 2019. The Fund underperformed the ICE BofAML US High Yield Master II Index (the “Index”) which gained 6.58% during the same period.
Comparison of Change in Value of a $10,000 Investment for the Period from 2/14/2011 through 8/31/2019
| Total Returns for the Period ended August 31, 2019 |
| |||||||||||||||||||||||||||||||
Ticker | 1 Year | 3 Years | 5 Years | Since Inception 2/14/2011 | Value of $10,000 2/14/2011- 08/31/2019 | |||||||||||||||||||||||||||
Institutional Class (1,2,4) | SHOIX | 5.65 | % | 6.09 | % | 4.91 | % | 6.71 | % | $ | 17,422 | |||||||||||||||||||||
Y Class (1,2,4) | SHOYX | 5.58 | % | 6.04 | % | 4.85 | % | 6.61 | % | $ | 17,282 | |||||||||||||||||||||
Investor Class (1,2,4) | SHYPX | 5.32 | % | 5.81 | % | 4.58 | % | 6.33 | % | $ | 16,888 | |||||||||||||||||||||
A Class with sales Charge (1,2,4) | SHOAX | (0.17 | )% | 3.97 | % | 3.45 | % | 5.62 | % | $ | 15,957 | |||||||||||||||||||||
A Class without sales charge (1,2,4) | SHOAX | 4.85 | % | 5.65 | % | 4.47 | % | 6.23 | % | $ | 16,755 | |||||||||||||||||||||
C Class with sales charge (1,2,4) | SHOCX | 3.54 | % | 4.98 | % | 3.77 | % | 5.50 | % | $ | 15,804 | |||||||||||||||||||||
C Class without sales charge (1,2,4) | SHOCX | 4.54 | % | 4.98 | % | 3.77 | % | 5.50 | % | $ | 15,804 | |||||||||||||||||||||
ICE BofAML US High Yield Master II Index (3) | 6.58 | % | 6.19 | % | 4.85 | % | 6.33 | % | $ | 16,891 | ||||||||||||||||||||||
| 1. | Performance shown is historical and is not indicative of future returns. Investment returns and principal value will vary, and shares may be worth more or less at redemption than at original purchase. Performance shown is calculated based on the published end of day net asset values as of date indicated, and current performance may be lower or higher than the performance data quoted. To obtain performance as of the most recent month end, please visitwww.americanbeaconfunds.com or call 1-800-967-9009. Fund performance in the table above does not reflect the deduction of taxes a shareholder would pay on distributions or the redemption of shares. Generally accepted accounting principles require adjustments to be made to the net assets of the Fund at period end for financial reporting purposes only, and as such, the total return based on the unadjusted net asset value per share may differ from the total return reported in the financial highlights. A Class shares have a maximum sales charge of 4.75%. The maximum contingent deferred sales charge for the C Class is 1.00% for shares redeemed within one year of the date of purchase. |
| 2. | A portion of fees charged to the Institutional Class of the Fund was waived from Fund inception through 2018 and partially recovered in 2019. Performance prior to waiving fees was lower than actual returns shown for inception through 2018. A portion of fees charged to the Investor Class of the Fund was waived in 2011 and 2012, partially recovered in 2013 and fully recovered in 2016. Performance prior to waiving fees was lower than actual |
3
American Beacon SiM High Yield Opportunities FundSM
Performance Overview
August 31, 2019 (Unaudited)
| returns shown for 2011 and 2012. A portion of fees charged to the Y Class of the Fund was waived from 2011 through 2013 and fully recovered in 2015. Performance prior to waiving fees was lower than actual returns shown for 2011 through 2013. A portion of fees charged to the A and C Classes of the Fund was waived from 2011 through 2014, partially recovered in 2015 and fully recovered in 2016. Performance prior to waiving fees was lower than actual returns shown for 2011 through 2014. |
| 3. | The ICE BofAML US High Yield Master II Index tracks the performance of U.S. dollar denominated, below-investment-grade corporate debt publicly issued in the U.S. domestic market. Qualifying securities must have a below-investment-grade rating and an investment-grade rated country of risk. In addition, qualifying securities must have at least one year remaining term to final maturity, a fixed coupon schedule and a minimum amount outstanding of $100 million. Defaulted securities and securities eligible for the dividends-received deduction are excluded from the Index. One cannot directly invest in an index. |
| 4. | The Total Annual Fund Operating Expense ratios set forth in the most recent Fund prospectus for the Institutional, Y, Investor, A, and C Class shares were 0.87%, 0.88%, 1.14%, 1.07%, and 1.85%, respectively. The expense ratios above may vary from the expense ratios presented in other sections of this report that are based on expenses incurred during the period covered by this report. |
From a sector allocation perspective, the Fund’s overweight to the Energy sector and underweight to the Finance sector detracted from relative performance. On the other hand, a significant overweight to the Consumer sector added to the Fund’s relative returns.
Issue selection within the Fund’s Manufacturing and Service sectors contributed positively to relative returns. Conversely, the Fund’s issue selection within the Finance sector detracted from relative performance.
From a credit quality allocation perspective, the Fund’s underweight to the BB-credit rating category detracted from the Fund’s relative performance. On the other hand, an underweight to the CCC-credit rating category and a null weight to the Below-C credit rating category contributed positively to the Fund’s relative returns.
From a credit quality standpoint, issue selection within the BB-rated and B-rated credit categories contributed positively to relative performance. Security selection within the CCC-rated credit category somewhat offset this performance by negatively impacting the Fund’s returns.
The sub-advisor’s investment process of identifying long-term secular themes and seeking out-of-favor sectors through bottom-up fundamental research remains in place.
| Top Ten Holdings (% Net Assets) | ||||||||
| MEG Energy Corp., 7.000%, Due 3/31/2024 | 2.5 | |||||||
| Athabasca Oil Corp., 9.875%, Due 2/24/2022 | 2.2 | |||||||
| Baytex Energy Corp., 5.625%, Due 6/1/2024 | 2.0 | |||||||
| HCA, Inc., 4.500%, Due 2/15/2027 | 2.0 | |||||||
| Scorpio Tankers, Inc., 3.000%, Due 5/15/2022 | 1.9 | |||||||
| Darling Ingredients, Inc., 5.250%, Due 4/15/2027 | 1.8 | |||||||
| JBS USA LUX S.A. / JBS USA Food Co. / JBS USA Finance, Inc., 5.500%, Due 1/15/2030 | 1.8 | |||||||
| Berry Petroleum Co. LLC, 7.000%, Due 2/15/2026 | 1.7 | |||||||
| California Resources Corp., 8.000%, Due 12/15/2022 | 1.7 | |||||||
| DHT Holdings, Inc., 4.500%, Due 8/15/2021 | 1.7 | |||||||
| Total Fund Holdings | 84 | |||||||
4
American Beacon SiM High Yield Opportunities FundSM
Performance Overview
August 31, 2019 (Unaudited)
| Sector Allocation (% Investments) | ||||||||
| Consumer,Non-Cyclical | 28.9 | |||||||
| Industrial | 19.1 | |||||||
| Energy | 15.5 | |||||||
| Consumer, Cyclical | 13.4 | |||||||
| Communications | 9.3 | |||||||
| Technology | 7.3 | |||||||
| Basic Materials | 3.2 | |||||||
| Financials | 1.3 | |||||||
| Consumer | 1.0 | |||||||
| Foreign Sovereign Obligations | 0.6 | |||||||
| Utilities | 0.4 | |||||||
| Country Allocation (% Fixed Income) | ||||||||
| United States | 67.5 | |||||||
| Canada | 16.6 | |||||||
| Brazil | 3.1 | |||||||
| Monaco | 2.0 | |||||||
| Netherlands | 1.5 | |||||||
| United Kingdom | 1.4 | |||||||
| Supranational | 1.4 | |||||||
| Bermuda | 1.3 | |||||||
| Norway | 1.3 | |||||||
| Chile | 1.0 | |||||||
| Greece | 1.0 | |||||||
| Mexico | 1.0 | |||||||
| Luxembourg | 0.5 | |||||||
| Argentina | 0.4 |
5
American Beacon Sound Point Floating Rate Income FundSM
Performance Overview
August 31, 2019 (Unaudited)
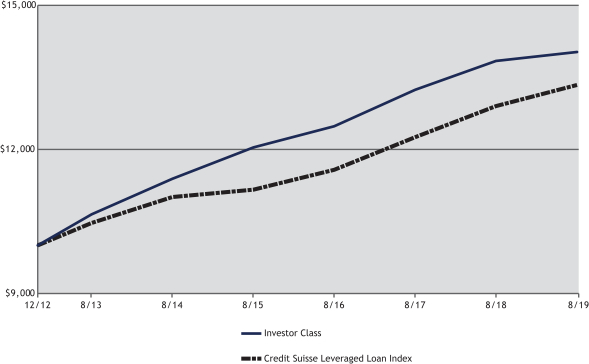
The Investor Class of the American Beacon Sound Point Floating Rate Income Fund (the “Fund”) returned 1.38% for the one-year period ended August 31, 2019. The Fund underperformed the Credit Suisse Leveraged Loan Index (the “Index”) return of 3.38% for the same period.
Comparison of Change in Value of a $10,000 Investment for the Period from 12/3/2012 through 8/31/2019
| Total Returns for the Period ended August 31, 2019 |
| |||||||||||||||||||||||||||||||
Ticker | 1 Year | 3 Years | 5 Years | Since Inception | Value of $10,000 12/3/2012- 08/31/2019 | |||||||||||||||||||||||||||
Institutional Class (1,2,6) | SPFLX | 1.77 | % | 4.27 | % | 4.53 | % | 5.34 | % | $ | 14,205 | |||||||||||||||||||||
Y Class (1,2,3,6) | SPFYX | 1.68 | % | 4.19 | % | 4.44 | % | 5.27 | % | $ | 14,140 | |||||||||||||||||||||
Investor Class (1,2,3,6) | SPFPX | 1.38 | % | 3.98 | % | 4.27 | % | 5.15 | % | $ | 14,027 | |||||||||||||||||||||
A Class with sales Charge (1,2,3,6) | SOUAX | (0.98 | )% | 3.06 | % | 3.70 | % | 4.72 | % | $ | 13,646 | |||||||||||||||||||||
A Class without sales charge (1,2,3,6) | SOUAX | 1.53 | % | 3.93 | % | 4.23 | % | 5.12 | % | $ | 14,001 | |||||||||||||||||||||
C Class with sales charge (1,2,3,6) | SOUCX | (0.33 | )% | 3.16 | % | 3.65 | % | 4.69 | % | $ | 13,618 | |||||||||||||||||||||
C Class without sales charge (1,2,3,6) | SOUCX | 0.67 | % | 3.16 | % | 3.65 | % | 4.69 | % | $ | 13,618 | |||||||||||||||||||||
SP Class (1,2,4,6) | SPFRX | 1.40 | % | 3.99 | % | 4.24 | % | 5.12 | % | $ | 14,004 | |||||||||||||||||||||
Credit Suisse Leveraged Loan Index (5) | 3.38 | % | 4.84 | % | 3.92 | % | 4.36 | % | $ | 13,335 | ||||||||||||||||||||||
| 1. | Performance shown is historical and is not indicative of future returns. Investment returns and principal value will vary, and shares may be worth more or less at redemption than at original purchase. Performance shown is calculated based on the published end of day net asset values as of the date indicated, and current performance may be lower or higher than the performance data quoted. To obtain performance as of the most recent month end, please visitwww.americanbeaconfunds.com or call 1-800-967-9009. Fund performance in the table above does not reflect the deduction of taxes a shareholder would pay on distributions or the redemption of shares. Generally accepted accounting principles require adjustments to be made to the net assets of the Fund at period end for financial reporting purposes only, and as such, the total return based on the unadjusted net asset value per share may differ from the total return reported in the financial highlights. A Class shares have a maximum sales charge of 2.50%. The maximum contingent deferred sales charge for the C Class is 1.00% for shares redeemed within one year of the date of purchase. |
6
American Beacon Sound Point Floating Rate Income FundSM
Performance Overview
August 31, 2019 (Unaudited)
| 2. | A portion of the fees charged to the Institutional Class of the Fund was waived from Fund inception through 2017 and partially recovered in 2018 and 2019. Performance prior to waiving fees was lower than actual returns shown for Fund inception through 2017. A portion of the fees charged to the Investor Class of the Fund was waived from Fund inception through 2016 and fully recovered in 2017. Performance prior to waiving fees was lower than returns shown for inception through 2016. A portion of the fees charged to the Y Class of the Fund was waived from Fund inception through 2016 and fully recovered in 2017. Performance prior to waiving was lower than actual returns shown for inception through 2016. A portion of the fees charged to A and C Classes was waived from Fund inception through 2016, partially recovered in 2017 and 2018. Performance prior to waiving fees was lower than actual returns shown for inception through 2016. A portion of fees charged to the SP Class of the Fund was waived from Fund inception through 2016 and partially recovered from 2017 through 2019. Performance prior to waiving fees was lower than actual returns shown for inception through 2016. |
| 3. | Fund performance represents the returns achieved by the Institutional Class from 12/3/12 up to 12/11/15, the inception date of the Y, Investor, A, and C Classes and the returns of each Class since its inception. Expenses of the Institutional Class are lower than the other Classes. Therefore, total returns shown may be higher than they would have been had the Y, Investor, A, and C Classes been in existence since 12/3/12. |
| 4. | Fund performance represents the returns achieved by the Institutional Class from 12/3/12 up to 5/30/14, the inception date of the SP Class, and the returns of the SP Class since its inception. Expenses of the Institutional Class are lower than the SP Class. Therefore, total returns shown may be higher than they would have been had the SP Class been in existence since 12/3/12. |
| 5. | The Credit Suisse Leveraged Loan Index is an index designed to mirror the investable universe of the U.S. dollar-denominated leveraged loan market. One cannot directly invest in an index. |
| 6. | The Total Annual Fund Operating Expense ratios set forth in the most recent Fund prospectus for the Institutional, Y, Investor, A, C and SP Class shares were 0.84%, 0.90%, 1.06%, 1.15%, 1.90% and 1.06%, respectively. The expense ratios above may vary from the expense ratios presented in other sections of this report that are based on expenses incurred during the period covered by this report. |
While the Fund benefited from its underweight position in traditionally volatile sectors that underperformed during the period, such as Energy, Metals/Mining and Retail, the Fund was hurt by security selection in other sectors. Holdings in Manufacturing, Technology and Health Services experienced unusual idiosyncratic risk and accounted for the majority of the Fund’s underperformance. The Fund was highly diversified and continued to avoid volatile sectors. Thus, the security selection underperformance was not characterized by a particular theme. Rather, each company had unique circumstances that led to its volatility. The Fund’s sub-advisor continues to monitor the issuers closely and believes that market overreaction was a large contributor to the price declines.
The Fund was also adversely affected by the strength of the exchange-traded-fund (“ETF”) market in early 2019. While the Fund performed characteristically well during the rapid market sell off in late 2018, given its high credit quality and prudent sector allocation, the Fund lagged the aggressive recovery in early 2019 as investors flooded back into the large, easy-to-purchase ETF issues. The Fund avoided such loans as they typically do not offer appealing relative value; however, that segment of the market can lead at times.
Since the Fund’s inception, the sub-advisor continues to focus on uncovering opportunities in bank loans with lower volatility and lower credit risk which provide a high level of current income consistent with strong, risk-adjusted returns.
| Top Ten Holdings (% Net Assets) | ||||||||
| Athenahealth, Inc., 6.681%, Due 2/11/2026, 2019 Term Loan B,(3-mo. LIBOR + 4.500%) | 1.5 | |||||||
| CDS U.S. Intermediate Holdings, Inc., 6.080%, Due 7/8/2022, 2017 1st Lien Term Loan,(3-mo. LIBOR + 3.750%) |
| 1.1 | ||||||
| United Natural Foods, Inc., 6.362%, Due 10/22/2025, Term Loan B,(1-mo. LIBOR + 4.250%) | 1.1 | |||||||
| Heartland Dental LLC, 5.862%, Due 4/30/2025, 2018 1st Lien Term Loan,(1-mo. LIBOR + 3.750%) | 1.0 | |||||||
| Intelsat Jackson Holdings S.A., 9.750%, Due 7/15/2025 | 1.0 | |||||||
| ION Trading Technologies S.a.r.l., 6.651%, Due 11/21/2024, USD Incremental Term Loan B,(3-mo. LIBOR + 4.000%) |
| 1.0 | ||||||
| Panther BF Aggregator 2 LP / Panther Finance Co., Inc., 8.500%, Due 5/15/2027 | 1.0 | |||||||
| Panther BF Aggregator LP, 5.612%, Due 4/30/2026, USD Term Loan B,(1-mo. LIBOR + 3.500%) | 1.0 | |||||||
| RegionalCare Hospital Partners Holdings, Inc. / LifePoint Health, Inc., 9.750%, Due 12/1/2026 | 1.0 | |||||||
| Univision Communications, Inc., 6.750%, Due 9/15/2022 | 1.0 | |||||||
| Total Fund Holdings | 312 | |||||||
7
American Beacon Sound Point Floating Rate Income FundSM
Performance Overview
August 31, 2019 (Unaudited)
| Sector Weightings (% Investments) | ||||||||
| Consumer | 19.6 | |||||||
| Service | 17.3 | |||||||
| Technology | 13.3 | |||||||
| Health Care | 9.9 | |||||||
| Manufacturing | 9.3 | |||||||
| Financials | 6.6 | |||||||
| Basic Materials | 4.4 | |||||||
| Communications | 3.9 | |||||||
| Transportation | 3.2 | |||||||
| Telecommunications | 3.0 | |||||||
| Energy | 2.9 | |||||||
| Consumer,Non-Cyclical | 1.9 | |||||||
| Consumer, Cyclical | 1.5 | |||||||
| Media | 1.4 | |||||||
| Utilities | 1.0 | |||||||
| Defense | 0.8 |
8
American Beacon FundsSM
August 31, 2019 (Unaudited)
Fund Expense Example
As a shareholder of a Fund, you incur two types of costs: (1) transaction costs, including sales charges (loads) on purchase payments and redemption fees, if applicable, and (2) ongoing costs, including management fees, distribution (12b-1) fees, sub-transfer agent fees, and other Fund expenses. The Examples are intended to help you understand the ongoing cost (in dollars) of investing in the Funds and to compare these costs with the ongoing costs of investing in other mutual funds. The Examples are based on an investment of $1,000 invested at the beginning of the period in each Class and held for the entire period from March 1, 2019 through August 31, 2019.
Actual Expenses
The “Actual” lines of the tables provide information about actual account values and actual expenses. You may use the information on this page, together with the amount you invested, to estimate the expenses that you paid over the period. Simply divide your account value by $1,000 (for example, an $8,600 account value divided by $1,000 = $8.60), then multiply the result by the “Expenses Paid During Period” to estimate the expenses you paid on your account during this period. Shareholders of the Investor and Institutional Classes that invest in the Funds through an IRA or Roth IRA may be subject to a custodial IRA fee of $15 that is typically deducted each December. If your account was subject to a custodial IRA fee during the period, your costs would have been $15 higher.
Hypothetical Example for Comparison Purposes
The “Hypothetical” lines of the tables provide information about hypothetical account values and hypothetical expenses based on the Funds’ actual expense ratio and an assumed 5% per year rate of return before expenses (not the Funds’ actual return). You may compare the ongoing costs of investing in the Funds with other funds by contrasting this 5% hypothetical example and the 5% hypothetical examples that appear in the shareholder reports of the other funds. The hypothetical account values and expenses may not be used to estimate the actual ending account balance or expenses you paid for the period. Shareholders of the Investor and Institutional Classes that invest in the Funds through an IRA or Roth IRA may be subject to a custodial IRA fee of $15 that is typically deducted each December. If your account was subject to a custodial IRA fee during the period, your costs would have been $15 higher.
You should also be aware that the expenses shown in the table highlight only your ongoing costs and do not reflect any transaction costs charged by the Funds, such as sales charges (loads) or redemption fees, as applicable. Similarly, the expense examples for other funds do not reflect any transaction costs charged by those funds, such as sales charges (loads), redemption fees or exchange fees. Therefore, the “Hypothetical” lines of the tables are useful in comparing ongoing costs only and will not help you determine the relative total costs of owning different funds. If you were subject to any transaction costs during the period, your costs would have been higher.
9
American Beacon FundsSM
Expense Examples
August 31, 2019 (Unaudited)
| American Beacon SiM High Yield Opportunities Fund |
| ||||||||||||||
| Beginning Account Value 3/1/2019 | Ending Account Value 8/31/2019 | Expenses Paid During Period 3/1/2019-8/31/2019* | |||||||||||||
| Institutional Class | |||||||||||||||
| Actual | $1,000.00 | $1,038.00 | $4.31 | ||||||||||||
| Hypothetical** | $1,000.00 | $1,020.97 | $4.28 | ||||||||||||
| Y Class | |||||||||||||||
| Actual | $1,000.00 | $1,037.60 | $4.72 | ||||||||||||
| Hypothetical** | $1,000.00 | $1,020.57 | $4.69 | ||||||||||||
| Investor Class | |||||||||||||||
| Actual | $1,000.00 | $1,036.30 | $5.95 | ||||||||||||
| Hypothetical** | $1,000.00 | $1,019.36 | $5.90 | ||||||||||||
| A Class | |||||||||||||||
| Actual | $1,000.00 | $1,035.40 | $5.80 | ||||||||||||
| Hypothetical** | $1,000.00 | $1,019.51 | $5.75 | ||||||||||||
| C Class | |||||||||||||||
| Actual | $1,000.00 | $1,032.50 | $9.63 | ||||||||||||
| Hypothetical** | $1,000.00 | $1,015.73 | $9.55 | ||||||||||||
| * | Expenses are equal to the Fund’s annualized expense ratios for thesix-month period of 0.84%, 0.92%, 1.16%, 1.13%, and 1.88% for the Institutional, Y, Investor, A, and C Classes, respectively, multiplied by the average account value over the period, multiplied by the number derived by dividing the number of days in the most recent fiscal half-year (184) by days in the year (365) to reflect the half-year period. |
| ** | 5% return before expenses. |
| American Beacon Sound Point Floating Rate Income Fund |
| ||||||||||||||
| Beginning Account Value 3/1/2019 | Ending Account Value 8/31/2019 | Expenses Paid During Period 3/1/2019-8/31/2019* | |||||||||||||
| Institutional Class | |||||||||||||||
| Actual | $1,000.00 | $1,006.20 | $4.25 | ||||||||||||
| Hypothetical** | $1,000.00 | $1,020.97 | $4.28 | ||||||||||||
| Y Class | |||||||||||||||
| Actual | $1,000.00 | $1,005.90 | $4.70 | ||||||||||||
| Hypothetical** | $1,000.00 | $1,020.52 | $4.74 | ||||||||||||
| Investor Class | |||||||||||||||
| Actual | $1,000.00 | $1,005.00 | $6.52 | ||||||||||||
| Hypothetical** | $1,000.00 | $1,018.70 | $6.56 | ||||||||||||
| A Class | |||||||||||||||
| Actual | $1,000.00 | $1,005.80 | $5.76 | ||||||||||||
| Hypothetical** | $1,000.00 | $1,019.46 | $5.80 | ||||||||||||
| C Class | |||||||||||||||
| Actual | $1,000.00 | $1,001.00 | $9.63 | ||||||||||||
| Hypothetical** | $1,000.00 | $1,015.58 | $9.70 | ||||||||||||
| SP Class | |||||||||||||||
| Actual | $1,000.00 | $1,004.60 | $5.81 | ||||||||||||
| Hypothetical** | $1,000.00 | $1,019.41 | $5.85 | ||||||||||||
| * | Expenses are equal to the Fund’s annualized expense ratios for thesix-month period of 0.84%, 0.93%, 1.29%, 1.14%, 1.91%, and 1.15% for the Institutional, Y, Investor, A, C, and SP Classes, respectively, multiplied by the average account value over the period, multiplied by the number derived by dividing the number of days in the most recent fiscal half-year (184) by days in the year (365) to reflect the half-year period. |
| ** | 5% return before expenses. |
10
American Beacon FundsSM
Report of Independent Registered Public Accounting Firm
To the Shareholders of American Beacon SiM High Yield Opportunities Fund and American Beacon Sound Point Floating Rate Income Fund and the Board of Trustees of American Beacon Funds
Opinion on the Financial Statements
We have audited the accompanying statements of assets and liabilities of American Beacon SiM High Yield Opportunities Fund and American Beacon Sound Point Floating Rate Income Fund (collectively referred to as the “Funds), (two of the funds constituting American Beacon Funds (the “Trust”)), including the schedules of investments, as of August 31, 2019, and the related statements of operations, changes in net assets, and the financial highlights for each of the periods indicated in the table below and the related notes (collectively referred to as the “financial statements”). In our opinion, the financial statements present fairly, in all material respects, the financial position of each of the Funds (two of the funds constituting American Beacon Funds) at August 31, 2019, the results of their operations, changes in net assets and financial highlights for each of the periods indicated in the table below, in conformity with U.S. generally accepted accounting principles.
Individual fund constituting the | Statement of operations | Statements of changes | Financial highlights | |||
| American Beacon SiM High Yield Opportunities Fund | For the year ended August 31, 2019 | For each of the two years in the period ended August 31, 2019 | For each of the five years in the period ended August 31, 2019 | |||
| American Beacon Sound Point Floating Rate Income Fund | For the year ended August 31, 2019 | For each of the two years in the period ended August 31, 2019 | For each of the four years in the period ended August 31, 2019 | |||
The financial highlights for the year ended August 31, 2015 of American Beacon Sound Point Floating Rate Income Fund were audited by other auditors whose report dated October 30, 2015, expressed an unqualified opinion on those financial statements and financial highlights.
Basis for Opinion
These financial statements are the responsibility of the Trust’s management. Our responsibility is to express an opinion on each of the Funds’ financial statements based on our audits. We are a public accounting firm registered with the Public Company Accounting Oversight Board (United States) (“PCAOB”) and are required to be independent with respect to the Trust in accordance with the U.S. federal securities laws and the applicable rules and regulations of the Securities and Exchange Commission and the PCAOB.
We conducted our audits in accordance with the standards of the PCAOB. Those standards require that we plan and perform the audit to obtain reasonable assurance about whether the financial statements are free of material misstatement, whether due to error or fraud. The Trust is not required to have, nor were we engaged to perform, an audit of the Trust’s internal control over financial reporting. As part of our audits we are required to obtain an understanding of internal control over financial reporting, but not for the purpose of expressing an opinion on the effectiveness of the Trust’s internal control over financial reporting. Accordingly, we express no such opinion.
Our audits included performing procedures to assess the risks of material misstatement of the financial statements, whether due to error or fraud, and performing procedures that respond to those risks. Such procedures included examining, on a test basis, evidence regarding the amounts and disclosures in the financial statements. Our procedures included confirmation of securities owned as of August 31, 2019, by correspondence with the custodian, brokers and agent banks or by other appropriate auditing procedures where replies from brokers or agent banks were not received. Our audits also included evaluating the accounting principles used and significant estimates made by management, as well as evaluating the overall presentation of the financial statements. We believe that our audits provide a reasonable basis for our opinion.

We have served as the auditor of one or more American Beacon investment companies since 1987.
Dallas, Texas
October 25, 2019
11
American Beacon SiM High Yield Opportunities FundSM
August 31, 2019
| Shares | Fair Value | ||||||||||||||
| COMMON STOCKS - 1.18% | |||||||||||||||
| Energy - 0.70% | |||||||||||||||
| Oil, Gas & Consumable Fuels - 0.70% | |||||||||||||||
| KNOT Offshore Partners LP | 275,914 | $ | 5,123,723 | ||||||||||||
| Whitecap Resources, Inc. | 1,233,000 | 3,398,761 | |||||||||||||
|
| ||||||||||||||
| 8,522,484 | |||||||||||||||
|
| ||||||||||||||
Total Energy | 8,522,484 | ||||||||||||||
|
| ||||||||||||||
| Financials - 0.24% | |||||||||||||||
| Mortgage Real Estate Investment Trusts (REITs) - 0.24% | |||||||||||||||
| Annaly Capital Management, Inc. | 359,000 | 2,979,700 | |||||||||||||
|
| ||||||||||||||
| Materials - 0.24% | |||||||||||||||
| Chemicals - 0.24% | |||||||||||||||
| CVR Partners LP | 816,191 | 2,881,154 | |||||||||||||
|
| ||||||||||||||
Total Common Stocks (Cost $17,337,224) | 14,383,338 | ||||||||||||||
|
| ||||||||||||||
| Principal Amount* | |||||||||||||||
| BANK LOAN OBLIGATIONS - 0.95% (Cost $11,426,910) | |||||||||||||||
| Consumer - 0.95% | |||||||||||||||
| Gol LuxCo S.A., 6.500%, Due 8/31/2020, 1st Lien Term LoanA | $ | 11,450,000 | 11,564,500 | ||||||||||||
|
| ||||||||||||||
| CORPORATE OBLIGATIONS - 60.92% | |||||||||||||||
| Basic Materials - 1.45% | |||||||||||||||
| CVR Partners LP / CVR Nitrogen Finance Corp., 9.250%, Due 6/15/2023B | 16,915,000 | 17,667,718 | |||||||||||||
|
| ||||||||||||||
| Communications - 7.38% | |||||||||||||||
| Diamond Sports Group LLC / Diamond Sports Finance Co., 6.625%, Due 8/15/2027B | 10,610,000 | 11,113,975 | |||||||||||||
| Go Daddy Operating Co. LLC / GD Finance Co., Inc., 5.250%, Due 12/1/2027B | 15,135,000 | 15,967,425 | |||||||||||||
| Iridium Communications, Inc., 10.250%, Due 4/15/2023B | 14,775,000 | 16,030,875 | |||||||||||||
| Salem Media Group, Inc., 6.750%, Due 6/1/2024B | 17,185,000 | 15,015,394 | |||||||||||||
| Univision Communications, Inc., 5.125%, Due 2/15/2025B | 12,750,000 | 12,302,347 | |||||||||||||
| VeriSign, Inc., 4.750%, Due 7/15/2027 | 18,330,000 | 19,383,975 | |||||||||||||
|
| ||||||||||||||
| 89,813,991 | |||||||||||||||
|
| ||||||||||||||
| Consumer, Cyclical - 8.43% | |||||||||||||||
| Aramark Services, Inc., 4.750%, Due 6/1/2026 | 17,232,000 | 17,662,800 | |||||||||||||
| Buena Vista Gaming Authority, 13.000%, Due 4/1/2023B | 9,040,000 | 9,672,800 | |||||||||||||
| Caesars Resort Collection LLC / CRC Finco, Inc., 5.250%, Due 10/15/2025B | 19,270,000 | 19,607,225 | |||||||||||||
| Downstream Development Authority of the Quapaw Tribe of Oklahoma, 10.500%, Due 2/15/2023B | 7,705,000 | 8,186,563 | |||||||||||||
| Goodyear Tire & Rubber Co., 4.875%, Due 3/15/2027 | 15,553,000 | 15,008,645 | |||||||||||||
| Station Casinos LLC, 5.000%, Due 10/1/2025B | 19,305,000 | 19,693,030 | |||||||||||||
| Viking Cruises Ltd., 5.875%, Due 9/15/2027B | 12,300,000 | 12,761,250 | |||||||||||||
|
| ||||||||||||||
| 102,592,313 | |||||||||||||||
|
| ||||||||||||||
| Consumer,Non-Cyclical - 22.08% | |||||||||||||||
| Acadia Healthcare Co., Inc., | |||||||||||||||
5.125%, Due 7/1/2022 | 2,015,000 | 2,030,113 | |||||||||||||
5.625%, Due 2/15/2023 | 6,821,000 | 6,965,878 | |||||||||||||
| AMN Healthcare, Inc., 5.125%, Due 10/1/2024B | 18,872,000 | 19,390,980 | |||||||||||||
| Avanos Medical, Inc., 6.250%, Due 10/15/2022 | 11,075,000 | 11,268,813 | |||||||||||||
| Charles River Laboratories International, Inc., 5.500%, Due 4/1/2026B | 18,386,000 | 19,671,181 | |||||||||||||
| Darling Ingredients, Inc., 5.250%, Due 4/15/2027B | 20,080,000 | 21,385,200 | |||||||||||||
| Dole Food Co., Inc., 7.250%, Due 6/15/2025B | 17,362,000 | 16,754,330 | |||||||||||||
| Gartner, Inc., 5.125%, Due 4/1/2025B | 18,810,000 | 19,726,799 | |||||||||||||
| HCA, Inc., 4.500%, Due 2/15/2027 | 22,796,000 | 24,709,355 | |||||||||||||
| JBS USA LUX S.A. / JBS USA Food Co. / JBS USA Finance, Inc., 5.500%, Due 1/15/2030B | 20,200,000 | 21,412,000 | |||||||||||||
See accompanying notes
12
American Beacon SiM High Yield Opportunities FundSM
Schedule of Investments
August 31, 2019
| Principal Amount* | Fair Value | ||||||||||||||
| CORPORATE OBLIGATIONS - 60.92% (continued) | |||||||||||||||
| Consumer,Non-Cyclical - 22.08% (continued) | |||||||||||||||
| MEDNAX, Inc., 6.250%, Due 1/15/2027B | $ | 19,230,000 | $ | 18,845,400 | |||||||||||
| Post Holdings, Inc., 5.000%, Due 8/15/2026B | 15,728,000 | 16,396,440 | |||||||||||||
| Simmons Foods, Inc., 5.750%, Due 11/1/2024B | 19,645,000 | 18,613,638 | |||||||||||||
| Tenet Healthcare Corp., 4.875%, Due 1/1/2026B | 15,530,000 | 15,958,628 | |||||||||||||
| TreeHouse Foods, Inc., 6.000%, Due 2/15/2024B | 16,999,000 | 17,657,711 | |||||||||||||
| Universal Health Services, Inc., 5.000%, Due 6/1/2026B | 16,976,000 | 17,739,920 | |||||||||||||
|
| ||||||||||||||
| 268,526,386 | |||||||||||||||
|
| ||||||||||||||
| Energy - 4.76% | |||||||||||||||
| Berry Petroleum Co. LLC, 7.000%, Due 2/15/2026B | 22,461,000 | 20,607,967 | |||||||||||||
| California Resources Corp., 8.000%, Due 12/15/2022B | 35,720,000 | 20,539,000 | |||||||||||||
| Denbury Resources, Inc., | |||||||||||||||
5.500%, Due 5/1/2022 | 6,978,000 | 2,930,760 | |||||||||||||
7.750%, Due 2/15/2024B | 8,290,000 | 5,763,208 | |||||||||||||
| Pioneer Energy Services Corp., 6.125%, Due 3/15/2022 | 22,922,000 | 8,108,658 | |||||||||||||
|
| ||||||||||||||
| 57,949,593 | |||||||||||||||
|
| ||||||||||||||
| Financial - 1.03% | |||||||||||||||
| MPT Operating Partnership LP / MPT Finance Corp., 4.625%, Due 8/1/2029 | 11,975,000 | 12,454,000 | |||||||||||||
|
| ||||||||||||||
| Industrial - 8.72% | |||||||||||||||
| AECOM, 5.875%, Due 10/15/2024 | 11,509,000 | 12,429,720 | |||||||||||||
| Borealis Finance LLC, 7.500%, Due 11/16/2022C | 13,710,000 | 12,887,400 | |||||||||||||
| BWX Technologies, Inc., 5.375%, Due 7/15/2026B | 18,370,000 | 19,426,275 | |||||||||||||
| Eagle Bulk Shipco LLC, 8.250%, Due 11/28/2022 | 2,057,143 | 2,062,286 | |||||||||||||
| JPW Industries Holding Corp., 9.000%, Due 10/1/2024C | 13,860,000 | 13,317,000 | |||||||||||||
| Kratos Defense & Security Solutions, Inc., 6.500%, Due 11/30/2025B | 17,365,000 | 18,623,962 | |||||||||||||
| LSB Industries, Inc., 9.625%, Due 5/1/2023B | 9,870,000 | 10,314,150 | |||||||||||||
| Navios Maritime Acquisition Corp. / Navios Acquisition Finance US, Inc., 8.125%, Due 11/15/2021B | 20,985,000 | 17,063,428 | |||||||||||||
|
| ||||||||||||||
| 106,124,221 | |||||||||||||||
|
| ||||||||||||||
| Technology - 7.07% | |||||||||||||||
| Booz Allen Hamilton, Inc., 5.125%, Due 5/1/2025B | 17,807,000 | 18,296,692 | |||||||||||||
| Entegris, Inc., 4.625%, Due 2/10/2026B | 17,015,000 | 17,525,450 | |||||||||||||
| IQVIA, Inc., 5.000%, Due 5/15/2027B | 14,710,000 | 15,537,438 | |||||||||||||
| Leidos, Inc., | |||||||||||||||
7.125%, Due 7/1/2032 | 10,336,000 | 11,886,400 | |||||||||||||
5.500%, Due 7/1/2033 | 6,996,000 | 7,069,937 | |||||||||||||
| Qorvo, Inc., 5.500%, Due 7/15/2026 | 14,662,000 | 15,651,978 | |||||||||||||
|
| ||||||||||||||
| 85,967,895 | |||||||||||||||
|
| ||||||||||||||
Total Corporate Obligations (Cost $757,618,984) | 741,096,117 | ||||||||||||||
|
| ||||||||||||||
| CONVERTIBLE OBLIGATIONS - 5.71% | |||||||||||||||
| Communications - 1.66% | |||||||||||||||
| Gogo, Inc., 6.000%, Due 5/15/2022B | 21,611,000 | 20,217,703 | |||||||||||||
|
| ||||||||||||||
| Energy - 0.49% | |||||||||||||||
| Denbury Resources, Inc., 6.375%, Due 12/31/2024B | 10,487,000 | 5,978,011 | |||||||||||||
|
| ||||||||||||||
| Industrial - 3.56% | |||||||||||||||
| DHT Holdings, Inc., 4.500%, Due 8/15/2021 | 18,376,000 | 20,329,369 | |||||||||||||
| Scorpio Tankers, Inc., 3.000%, Due 5/15/2022 | 23,051,000 | 22,906,835 | |||||||||||||
|
| ||||||||||||||
| 43,236,204 | |||||||||||||||
|
| ||||||||||||||
Total Convertible Obligations (Cost $73,548,169) | 69,431,918 | ||||||||||||||
|
| ||||||||||||||
See accompanying notes
13
American Beacon SiM High Yield Opportunities FundSM
Schedule of Investments
August 31, 2019
| Principal Amount* | Fair Value | ||||||||||||||
| FOREIGN CORPORATE OBLIGATIONS - 27.73% | |||||||||||||||
| Basic Materials - 1.44% | |||||||||||||||
| Kissner Holdings LP / Kissner Milling Co., Ltd. / BSC Holding, Inc. / Kissner USA, 8.375%, Due 12/1/2022B | $ | 16,920,000 | $ | 17,469,900 | |||||||||||
|
| ||||||||||||||
| Consumer, Cyclical - 4.54% | |||||||||||||||
| Codere Finance 2 Luxembourg S.A., 7.625%, Due 11/1/2021B | 5,740,000 | 5,569,751 | |||||||||||||
| Gol Finance, Inc., 7.000%, Due 1/31/2025B | 11,935,000 | 11,711,338 | |||||||||||||
| Ladbrokes Group Finance PLC, 5.125%, Due 9/8/2023C | GBP | 12,800,000 | 16,542,245 | ||||||||||||
| Servicios Corporativos Javer S.A.B. de C.V., 9.875%, Due 4/6/2021B | 3,943,000 | 3,933,182 | |||||||||||||
| Stars Group Holdings B.V. / Stars Group USCo-Borrower LLC, 7.000%, Due 7/15/2026B | 16,505,000 | 17,515,931 | |||||||||||||
|
| ||||||||||||||
| 55,272,447 | |||||||||||||||
|
| ||||||||||||||
| Consumer,Non-Cyclical - 6.00% | |||||||||||||||
| Clearwater Seafoods, Inc., 6.875%, Due 5/1/2025B | 14,335,000 | 14,585,863 | |||||||||||||
| Cooke Omega Investments, Inc. / Alpha VesselCo Holdings, Inc., 8.500%, Due 12/15/2022B | 15,695,000 | 15,224,150 | |||||||||||||
| Minerva Luxembourg S.A., 6.500%, Due 9/20/2026B | 12,425,000 | 12,859,875 | |||||||||||||
| Nova Austral S.A., 8.250%, Due 5/26/2021B C | 17,300,000 | 12,283,000 | |||||||||||||
| Ritchie Bros Auctioneers, Inc., 5.375%, Due 1/15/2025B | 17,370,000 | 18,086,512 | |||||||||||||
|
| ||||||||||||||
| 73,039,400 | |||||||||||||||
|
| ||||||||||||||
| Energy - 9.15% | |||||||||||||||
| Athabasca Oil Corp., 9.875%, Due 2/24/2022B | 28,216,000 | 26,523,040 | |||||||||||||
| Baytex Energy Corp., 5.625%, Due 6/1/2024B | 26,743,000 | 24,870,990 | |||||||||||||
| CES Energy Solutions Corp., 6.375%, Due 10/21/2024B | CAD | 20,167,000 | 14,541,325 | ||||||||||||
| MEG Energy Corp., 7.000%, Due 3/31/2024B | 31,880,000 | 30,325,850 | |||||||||||||
| OKEA ASA, 8.830%, Due 6/28/2023,(3-mo. LIBOR + 6.500%)C D | 14,600,000 | 15,038,000 | |||||||||||||
|
| ||||||||||||||
| 111,299,205 | |||||||||||||||
|
| ||||||||||||||
| Industrial - 6.24% | |||||||||||||||
| ATS Automation Tooling Systems, Inc., 6.500%, Due 6/15/2023B | 14,494,000 | 14,983,173 | |||||||||||||
| Diana Shipping, Inc., 9.500%, Due 9/27/2023 | 12,300,000 | 12,054,000 | |||||||||||||
| Eagle Bulk Shipco LLC, 8.250%, Due 11/28/2022 | 15,678,542 | 15,717,738 | |||||||||||||
| MPC Container Ships Invest B.V., 7.093%, Due 9/22/2022,(3-mo. LIBOR + 4.750%)C D | 17,100,000 | 17,100,272 | |||||||||||||
| Navios Maritime Holdings, Inc. / Navios Maritime Finance II US, Inc., 11.250%, Due 8/15/2022B | 21,595,000 | 16,088,275 | |||||||||||||
|
| ||||||||||||||
| 75,943,458 | |||||||||||||||
|
| ||||||||||||||
| Utilities - 0.36% | |||||||||||||||
| Stoneway Capital Corp., 10.000%, Due 3/1/2027B | 7,862,165 | 4,324,191 | |||||||||||||
|
| ||||||||||||||
Total Foreign Corporate Obligations (Cost $345,837,779) | 337,348,601 | ||||||||||||||
|
| ||||||||||||||
| FOREIGN SOVEREIGN OBLIGATIONS - 0.60% (Cost $8,313,885) | |||||||||||||||
| Mexican Bonos, 6.500%, Due 6/10/2021, Series M | MXN | 147,500,000 | 7,292,387 | ||||||||||||
|
| ||||||||||||||
| Shares | |||||||||||||||
| SHORT-TERM INVESTMENTS - 1.89% (Cost $22,977,485) | |||||||||||||||
| Investment Companies - 1.89% | |||||||||||||||
| American Beacon U.S. Government Money Market Select Fund, Select Class, 2.03%E F | 22,977,485 | 22,977,485 | |||||||||||||
|
| ||||||||||||||
TOTAL INVESTMENTS – 98.98% (Cost $1,237,060,436) | 1,204,094,346 | ||||||||||||||
OTHER ASSETS, NET OF LIABILITIES - 1.02% | 12,403,434 | ||||||||||||||
|
| ||||||||||||||
TOTAL NET ASSETS - 100.00% | $ | 1,216,497,780 | |||||||||||||
|
| ||||||||||||||
Percentages are stated as a percent of net assets. *In U.S. Dollars unless otherwise noted. |
| ||||||||||||||
A Fixed Rate.
B Security exempt from registration under the Securities Act of 1933. These securities may be resold to qualified institutional buyers pursuant to Rule 144A. At the period end, the value of these securities amounted to $858,564,859 or 70.58% of net assets. The Fund has no right to demand registration of these securities.
See accompanying notes
14
American Beacon SiM High Yield Opportunities FundSM
Schedule of Investments
August 31, 2019
C Reg S - Security purchased under the Securities Act of 1933, which exempts from registration securities offered and sold outside of the United States. Such a security cannot be sold in the United States without either an effective registration statement filed pursuant to the Securities Act of 1933, or pursuant to an exemption from registration.
D Variable, floating, or adjustable rate securities with an interest rate that changes periodically. Rates are periodically reset with rates that are based on a predetermined benchmark such as a widely followed interest rate such asT-bills, LIBOR or PRIME plus a fixed spread. The interest rate disclosed reflects the rate in effect on August 31, 2019.
E The Fund is affiliated by having the same investment advisor.
F7-day yield.
LIBOR - London Interbank Offered Rate.
LLC - Limited Liability Company.
LP - Limited Partnership.
PLC - Public Limited Company.
PRIME – A rate, charged by banks, based on the U.S. Federal Funds rate.
| Short Futures Contracts Open on August 31, 2019: |
| |||||||||||||||
| Currency Futures Contracts | ||||||||||||||||
| Description | Number of Contracts | Expiration Date | Notional Amount | Contract Value | Unrealized Appreciation (Depreciation) | |||||||||||
| British Pound Currency Futures | 222 | September 2019 | $ | (17,708,038 | ) | $ | (16,873,388 | ) | $ | 834,650 | ||||||
| Canadian Dollar Currency Futures | 244 | September 2019 | (18,288,212 | ) | (18,320,740 | ) | (32,528 | ) | ||||||||
| Euro Currency Futures | 10 | September 2019 | (1,423,512 | ) | (1,373,687 | ) | 49,825 | |||||||||
|
|
|
|
|
| |||||||||||
| $ | (37,419,762 | ) | $ | (36,567,815 | ) | $ | 851,947 | |||||||||
|
|
|
|
|
| |||||||||||
| Glossary: | ||
| Currency Abbreviations: | ||
| CAD | Canadian Dollar | |
| GBP | Pound Sterling | |
| MXN | Mexican Peso | |
The Fund’s investments are summarized by level based on the inputs used to determine their values. As of August 31, 2019, the investments were classified as described below:
SiM High Yield Opportunities Fund | Level 1 | Level 2 | Level 3 | Total | ||||||||||||||||||||||||
Assets | ||||||||||||||||||||||||||||
Common Stocks | $ | 14,383,338 | $ | - | $ | - | $ | 14,383,338 | ||||||||||||||||||||
Bank Loan Obligations | - | 11,564,500 | - | 11,564,500 | ||||||||||||||||||||||||
Corporate Obligations | - | 741,096,117 | - | 741,096,117 | ||||||||||||||||||||||||
Convertible Obligations | - | 69,431,918 | - | 69,431,918 | ||||||||||||||||||||||||
Foreign Corporate Obligations | - | 337,348,601 | - | 337,348,601 | ||||||||||||||||||||||||
Foreign Sovereign Obligations | - | 7,292,387 | - | 7,292,387 | ||||||||||||||||||||||||
Short-Term Investments | 22,977,485 | - | - | 22,977,485 | ||||||||||||||||||||||||
|
|
|
|
|
|
|
| |||||||||||||||||||||
Total Investments in Securities - Assets | $ | 37,360,823 | $ | 1,166,733,523 | $ | - | $ | 1,204,094,346 | ||||||||||||||||||||
|
|
|
|
|
|
|
| |||||||||||||||||||||
Financial Derivative Instruments - Assets | ||||||||||||||||||||||||||||
Futures Contracts | $ | 884,475 | $ | - | $ | - | $ | 884,475 | ||||||||||||||||||||
|
|
|
|
|
|
|
| |||||||||||||||||||||
Total Financial Derivative Instruments - Assets | $ | 884,475 | $ | - | $ | - | $ | 884,475 | ||||||||||||||||||||
|
|
|
|
|
|
|
| |||||||||||||||||||||
Financial Derivative Instruments - Liabilities | ||||||||||||||||||||||||||||
Futures Contracts | $ | (32,528 | ) | $ | - | $ | - | $ | (32,528 | ) | ||||||||||||||||||
|
|
|
|
|
|
|
| |||||||||||||||||||||
Total Financial Derivative Instruments - Liabilities | $ | (32,528 | ) | $ | - | $ | - | $ | (32,528 | ) | ||||||||||||||||||
|
|
|
|
|
|
|
| |||||||||||||||||||||
U.S. GAAP requires transfers between all levels to/from level 3 be disclosed. During the year ended August 31, 2019, there were no transfers into or out of Level 3.
See accompanying notes
15
American Beacon SiM High Yield Opportunities FundSM
Schedule of Investments
August 31, 2019
The following table is a reconciliation of Level 3 assets within the Fund for which significant unobservable inputs were used to determine fair value. Transfers in or out of Level 3 represent the ending value of any security or instrument where a change in the level has occurred from the beginning to the end of the period:
| Security Type | Balance as of 8/31/2018 | Purchases | Sales | Accrued Discounts (Premiums) | Realized Gain (Loss) | Change in Unrealized Appreciation (Depreciation) | Transfer into Level 3 | Transfer out of Level 3 | Balance as of 8/31/2019 | Unrealized Appreciation (Depreciation) at Period End** | ||||||||||||||||||||||||||||||
| Common Stocks | $ | 454,404 | $ | - | $ | 571,235 | $ | - | $ | 409,910 | $ | (293,079 | ) | $ | - | $ | - | $ | - | $ | - | |||||||||||||||||||
| Foreign Corporate Obligations | 1,593,515 | 10,788 | 865,046 | 92,471 | (877,252 | ) | 45,524 | - | - | - | - | |||||||||||||||||||||||||||||
|
|
|
|
|
|
|
|
|
|
|
|
|
|
|
|
|
|
|
| |||||||||||||||||||||
| $ | 2,047,919 | $ | 10,788 | $ | 1,436,281 | $ | 92,471 | $ | (467,342 | ) | $ | (247,555 | ) | $ | - | $ | - | $ | - | $ | - | |||||||||||||||||||
|
|
|
|
|
|
|
|
|
|
|
|
|
|
|
|
|
|
|
| |||||||||||||||||||||
| ** | Change in unrealized appreciation (depreciation) attributable to Level 3 securities held at period end. This balance is included in the change in unrealized appreciation (depreciation) on the Statements of Operations. |
The common stock and foreign corporate obligations were received from a bankruptcy restructuring.
See accompanying notes
16
American Beacon Sound Point Floating Rate Income FundSM
Schedule of Investments
August 31, 2019
| Shares | Fair Value | ||||||||||||||
| COMMON STOCKS - 0.00% | |||||||||||||||
| Consumer Discretionary - 0.00% | |||||||||||||||
| Diversified Consumer Services - 0.00% | |||||||||||||||
| Tweddle Group, Inc.A B C | 2,722 | $ | 44,777 | ||||||||||||
|
| ||||||||||||||
| Financials - 0.00% | |||||||||||||||
| Diversified Financial Services - 0.00% | |||||||||||||||
| RCS 2L EscrowA B C | 667 | - | |||||||||||||
|
| ||||||||||||||
Total Common Stocks (Cost $148,245) | 44,777 | ||||||||||||||
|
| ||||||||||||||
| WARRANTS - 0.00% (Cost $0) | |||||||||||||||
| Materials - 0.00% | |||||||||||||||
| Building Products - 0.00% | |||||||||||||||
| Euramax Holdings, Inc.A B C | 20 | - | |||||||||||||
|
| ||||||||||||||
| Principal Amount | |||||||||||||||
| BANK LOAN OBLIGATIONSD - 87.07% | |||||||||||||||
| Basic Materials - 4.20% | |||||||||||||||
| 4L Technologies, Inc., 6.612%, Due 5/8/2020, 1st Lien Term Loan,(1-mo. LIBOR + 4.500%) | $ | 9,583,563 | 5,223,042 | ||||||||||||
| Aleris International, Inc., 6.862%, Due 2/27/2023, 2018 Term Loan,(1-mo. LIBOR + 4.750%) | 6,602,310 | 6,599,669 | |||||||||||||
| Archroma Finance S.a.r.l., | |||||||||||||||
6.330%, Due 8/11/2024, USD 2017 Term Loan B2,(3-mo. LIBOR + 4.000%) | 5,010 | 4,968 | |||||||||||||
6.341%, Due 8/11/2024, USD 2017 Term Loan B2,(3-mo. LIBOR + 4.000%) | 1,963,920 | 1,947,561 | |||||||||||||
| Ascend Performance Materials Operations LLC, 7.395%, Due 8/15/2026, 2019 Term Loan B,(3-mo. LIBOR + 5.250%) | 1,501,000 | 1,499,124 | |||||||||||||
| New Arclin U.S. Holding Corp., 10.862%, Due 2/14/2025, 2nd Lien Term Loan,(1-mo. LIBOR + 8.750%) | 2,720,000 | 2,706,400 | |||||||||||||
| OCI Beaumont LLC, 6.330%, Due 3/13/2025, 2018 Term Loan,(3-mo. LIBOR + 4.000%) | 5,453,435 | 5,432,984 | |||||||||||||
| Phoenix Services International LLC, 5.945%, Due 3/1/2025, Term Loan,(1-mo. LIBOR + 3.750%) | 7,892,043 | 7,635,552 | |||||||||||||
| Polymer Additives, Inc., | |||||||||||||||
8.112%, Due 7/31/2025, 2018 1st Lien Term Loan,(1-mo. LIBOR + 6.000%)B | 26,282 | 22,997 | |||||||||||||
8.124%, Due 7/31/2025, 2018 1st Lien Term Loan,(3-mo. LIBOR + 6.000%)B | 10,434,095 | 9,129,833 | |||||||||||||
| Pregis Corp., 6.253%, Due 7/31/2026, 1st Lien Term Loan,(3-mo. LIBOR + 4.000%) | 3,896,000 | 3,874,884 | |||||||||||||
| Starfruit Finco B.V., 5.292%, Due 10/1/2025, 2018 USD Term Loan B,(1-mo. LIBOR + 3.250%) | 2,351,107 | 2,267,831 | |||||||||||||
| Tensar Corp., 7.080%, Due 7/9/2021, Term Loan,(3-mo. LIBOR + 4.750%) | 519,082 | 499,617 | |||||||||||||
| Vantage Specialty Chemicals, Inc., | |||||||||||||||
5.612%, Due 10/28/2024, 2017 1st Lien Term Loan,(1-mo. LIBOR + 3.500%) | 5,926,445 | 5,659,754 | |||||||||||||
5.756%, Due 10/28/2024, 2017 1st Lien Term Loan,(2-mo. LIBOR + 3.500%) | 247,081 | 235,963 | |||||||||||||
10.580%, Due 10/27/2025, 2017 2nd Lien Term Loan,(3-mo. LIBOR + 8.250%) | 5,146,000 | 4,888,700 | |||||||||||||
| Zep, Inc., 6.330%, Due 8/12/2024, 2017 1st Lien Term Loan,(3-mo. LIBOR + 4.000%) | 4,149,743 | 3,260,993 | |||||||||||||
|
| ||||||||||||||
| 60,889,872 | |||||||||||||||
|
| ||||||||||||||
| Consumer - 18.61% | |||||||||||||||
| ABG Intermediate Holdings LLC, 5.612%, Due 9/26/2024, 2017 1st LienAdd-On Term Loan,(1-mo. LIBOR + 3.500%) | 8,740,029 | 8,701,835 | |||||||||||||
| Adient US LLC, | |||||||||||||||
6.459%, Due 5/6/2024, Term Loan B,(3-mo. LIBOR + 4.250%) | 627,750 | 608,918 | |||||||||||||
6.889%, Due 5/6/2024, Term Loan B,(3-mo. LIBOR + 4.250%) | 1,883,250 | 1,826,753 | |||||||||||||
| Allied Universal Holdco LLC | |||||||||||||||
Due 7/10/2026, 2019 Delayed Draw Term LoanE F | 968,468 | 966,289 | |||||||||||||
6.507%, Due 7/10/2026, 2019 Term Loan B,(3-mo. LIBOR + 4.250%) | 9,781,532 | 9,759,523 | |||||||||||||
| AP NMT Acquisition B.V., 8.070%, Due 8/13/2021, USD 1st Lien Term Loan,(3-mo. LIBOR + 5.750%) | 6,541,838 | 6,447,832 | |||||||||||||
| APX Group, Inc., | |||||||||||||||
7.330%, Due 4/1/2024, 2018 Term Loan B,(3-mo. LIBOR + 5.000%) | 5,636,862 | 5,387,882 | |||||||||||||
9.250%, Due 4/1/2024, 2018 Term Loan B,(3-mo. PRIME + 4.000%) | 6,493 | 6,206 | |||||||||||||
See accompanying notes
17
American Beacon Sound Point Floating Rate Income FundSM
Schedule of Investments
August 31, 2019
| Principal Amount | Fair Value | ||||||||||||||
| BANK LOAN OBLIGATIONSD - 87.07% (continued) | |||||||||||||||
| Consumer - 18.61% (continued) | |||||||||||||||
| ASP Unifrax Holdings, Inc., | |||||||||||||||
6.080%, Due 12/12/2025, Term Loan B,(1-mo. LIBOR + 3.750%) | $ | 5,963,035 | $ | 5,739,421 | |||||||||||
10.928%, Due 12/14/2026, 2nd Lien Term Loan,(3-mo. LIBOR + 8.500%) | 2,287,000 | 2,172,650 | |||||||||||||
| BCPE Empire Holdings, Inc., | |||||||||||||||
Due 6/11/2026, 2019 Delayed Draw Term LoanE F | 532,013 | 522,702 | |||||||||||||
6.112%, Due 6/11/2026, 2019 Term Loan B,(1-mo. LIBOR + 4.000%) | 2,700,987 | 2,653,720 | |||||||||||||
| Belfor Holdings, Inc., 6.112%, Due 4/6/2026, Term Loan B,(1-mo. LIBOR + 4.000%) | 697,000 | 702,228 | |||||||||||||
| Bulldog Purchaser, Inc., | |||||||||||||||
Due 9/5/2025, 2018 Delayed Draw Term LoanE F | 238,819 | 235,834 | |||||||||||||
5.862%, Due 9/5/2025, 2018 Term Loan,(1-mo. LIBOR + 3.750%) | 9,954,955 | 9,830,518 | |||||||||||||
Due 9/4/2026, 2018 2nd Lien Delayed Draw Term LoanE F | 40,860 | 40,451 | |||||||||||||
9.862%, Due 9/4/2026, 2018 2nd Lien Term Loan,(1-mo. LIBOR + 7.750%) | 269,674 | 266,977 | |||||||||||||
| Cast and Crew Payroll LLC, 6.120%, Due 2/9/2026, 2019 1st Lien Term Loan,(1-mo. LIBOR + 4.000%) | 3,491,250 | 3,501,060 | |||||||||||||
| Comet Acquisition, Inc., | |||||||||||||||
5.612%, Due 10/24/2025, Term Loan,(1-mo. LIBOR + 3.500%) | 5,000 | 4,931 | |||||||||||||
5.624%, Due 10/24/2025, Term Loan,(3-mo. LIBOR + 3.500%) | 1,985,000 | 1,957,706 | |||||||||||||
| Comet Bidco Ltd., | |||||||||||||||
Due 9/30/2024, 2018 USD Term Loan BF | 2,297,866 | 2,257,653 | |||||||||||||
7.124%, Due 9/30/2024, 2018 USD Term Loan B,(3-mo. LIBOR + 5.000%) | 1,379,105 | 1,354,971 | |||||||||||||
| Corsair Components, Inc., 6.580%, Due 9/6/2024, 2017 1st Lien Term Loan B,(3-mo. LIBOR + 4.250%) | 1,564,174 | 1,540,712 | |||||||||||||
| Del Frisco’s Restaurant Group, Inc., | |||||||||||||||
8.125%, Due 6/27/2025, 2018 Incremental Term Loan,(1-mo. LIBOR + 6.000%) | 4,698,821 | 4,692,948 | |||||||||||||
8.188%, Due 6/27/2025, 2018 Incremental Term Loan,(3-mo. LIBOR + 6.000%) | 3,100,399 | 3,096,523 | |||||||||||||
| Deluxe Entertainment Services Group, Inc., | |||||||||||||||
Due 2/27/2020, 2019 Delayed Draw Term LoanE F | 62,863 | 57,205 | |||||||||||||
9.668%, Due 2/27/2020, 2019 Term Loan,(2-mo. LIBOR + 7.500%) | 189,898 | 172,807 | |||||||||||||
9.756%, Due 2/27/2020, 2019 Term Loan,(2-mo. LIBOR + 7.500%) | 671,847 | 611,381 | |||||||||||||
11.750%, Due 2/27/2020, 2019 Term Loan,(3-mo. PRIME + 6.500%) | 31,431 | 28,603 | |||||||||||||
7.756%, Due 2/28/2020, Term Loan 2014,(3-mo. LIBOR + 5.500%) | 1,030,403 | 154,045 | |||||||||||||
| Dhanani Group, Inc., 5.862%, Due 7/20/2025, 2018 Term Loan B,(1-mo. LIBOR + 3.750%) | 5,870,688 | 5,547,800 | |||||||||||||
| DHX Media Ltd., 5.862%, Due 12/29/2023, Term Loan B,(1-mo. LIBOR + 3.750%) | 6,788,412 | 6,482,934 | |||||||||||||
| Distribution International, Inc., 8.080%, Due 12/15/2023, 2019 Term Loan,(3-mo. LIBOR + 5.750%) | 1,087,799 | 989,897 | |||||||||||||
| Financial & Risk US Holdings, Inc., 5.862%, Due 10/1/2025, 2018 USD Term Loan,(1-mo. LIBOR + 3.750%) | 5,604,530 | 5,629,414 | |||||||||||||
| Fogo de Chao Churrascaria Holdings LLC, 6.362%, Due 4/7/2025, 2018 Add On Term Loan,(1-mo. LIBOR + 4.250%) | 4,029,876 | 4,034,913 | |||||||||||||
| G-III Apparel Group Ltd., 7.438%, Due 12/1/2022, Term Loan B,(1-mo. LIBOR + 5.250%) | 1,304,571 | 1,313,129 | |||||||||||||
| Give & Go Prepared Foods Corp., 6.362%, Due 7/29/2023, 2017 1st LienAdd-On Term Loan,(3-mo. LIBOR + 4.250%) | 11,342,946 | 10,492,225 | |||||||||||||
| Global Eagle Entertainment, Inc., | |||||||||||||||
9.699%, Due 1/6/2023, 1st Lien Term Loan,(3-mo. LIBOR + 7.500%) | 1,238,563 | 1,149,547 | |||||||||||||
9.710%, Due 1/6/2023, 1st Lien Term Loan,(3-mo. LIBOR + 7.500%) | 14,514,409 | 13,471,258 | |||||||||||||
| Hearthside Food Solutions LLC, 5.800%, Due 5/23/2025, 2018 Term Loan B,(1-mo. LIBOR + 3.688%) | 5,662,352 | 5,494,520 | |||||||||||||
| Holley Purchaser, Inc., 7.256%, Due 10/24/2025, Term Loan B,(3-mo. LIBOR + 5.000%) | 1,990,000 | 1,930,300 | |||||||||||||
| International Textile Group, Inc., | |||||||||||||||
7.100%, Due 5/1/2024, 1st Lien Term Loan,(1-mo. LIBOR + 5.000%) | 3,425,175 | 3,014,154 | |||||||||||||
11.100%, Due 5/1/2025, 2nd Lien Term Loan,(1-mo. LIBOR + 9.000%) | 4,347,000 | 3,390,660 | |||||||||||||
| LABL, Inc., 6.600%, Due 7/1/2026, 2019 USD Term Loan,(1-mo. LIBOR + 4.500%) | 8,358,000 | 8,334,514 | |||||||||||||
| Leslie’s Poolmart, Inc., 5.758%, Due 8/16/2023, 2016 Term Loan,(2-mo. LIBOR + 3.500%) | 8,680,491 | 8,116,259 | |||||||||||||
| Mavis Tire Express Services Corp., | |||||||||||||||
Due 3/20/2025, 2018 Delayed Draw Term LoanE F | 316,926 | 310,391 | |||||||||||||
5.362%, Due 3/20/2025, 2018 1st Lien Term Loan,(1-mo. LIBOR + 3.250%) | 3,223,394 | 3,156,928 | |||||||||||||
5.362%, Due 3/20/2025, 2018 Term Loan,(1-mo. LIBOR + 3.250%) | 92,286 | 90,383 | |||||||||||||
See accompanying notes
18
American Beacon Sound Point Floating Rate Income FundSM
Schedule of Investments
August 31, 2019
| Principal Amount | Fair Value | ||||||||||||||
| BANK LOAN OBLIGATIONSD - 87.07% (continued) | |||||||||||||||
| Consumer - 18.61% (continued) | |||||||||||||||
| Mohegan Tribal Gaming Authority, 6.112%, Due 10/13/2023, 2016 Term Loan B,(1-mo. LIBOR + 4.000%) | $ | 7,659,450 | $ | 7,084,991 | |||||||||||
| NorthPole Newco S.a r.l, 9.330%, Due 3/18/2025, Term Loan,(3-mo. LIBOR + 7.000%) | 7,900,000 | 7,119,875 | |||||||||||||
| NPC International, Inc., | |||||||||||||||
5.612%, Due 4/19/2024, 1st Lien Term Loan,(1-mo. LIBOR + 3.500%) | 4,032,708 | 2,887,419 | |||||||||||||
5.819%, Due 4/19/2024, 1st Lien Term Loan,(3-mo. LIBOR + 3.500%) | 2,800,832 | 2,005,396 | |||||||||||||
| Panther BF Aggregator LP, 5.612%, Due 4/30/2026, USD Term Loan B,(1-mo. LIBOR + 3.500%) | 14,787,000 | 14,565,195 | |||||||||||||
| Polyconcept Investments B.V., 5.862%, Due 8/16/2023, USD 2016 Term Loan B,(1-mo. LIBOR + 3.750%) | 2,708,839 | 2,702,067 | |||||||||||||
| PS HoldCo LLC, 6.862%, Due 3/1/2025, Term Loan,(1-mo. LIBOR + 4.750%) | 4,466,250 | 4,332,263 | |||||||||||||
| PSC Industrial Holdings Corp., 10.695%, Due 10/3/2025, 2017 2nd Lien Term Loan,(1-mo. LIBOR + 8.500%) | 3,025,000 | 2,904,000 | |||||||||||||
| PT Intermediate Holdings III LLC, 6.330%, Due 12/7/2024, 1st Lien Term Loan B,(1-mo. LIBOR + 4.000%) | 4,969,325 | 4,824,370 | |||||||||||||
| Q Holding Co., 7.140%, Due 12/17/2021, Term Loan B,(1-mo. LIBOR + 5.000%) | 6,121,062 | 6,090,457 | |||||||||||||
| Recess Holdings, Inc., 10.080%, Due 9/29/2025, 2017 2nd Lien Term Loan,(1-mo. LIBOR + 7.750%) | 2,140,000 | 2,033,000 | |||||||||||||
| SP PF Buyer LLC, 6.830%, Due 12/22/2025, Term Loan,(3-mo. LIBOR + 4.500%) | 4,681,268 | 4,236,547 | |||||||||||||
| Sunshine Luxembourg VII S.a.r.l, Due 7/16/2026, USD 1st Lien Term LoanF | 4,153,000 | 4,149,885 | |||||||||||||
| TGP Holdings III LLC, | |||||||||||||||
6.580%, Due 9/25/2024, 2018 1st Lien Term Loan,(3-mo. LIBOR + 4.250%) | 6,128,929 | 5,745,871 | |||||||||||||
10.830%, Due 9/25/2025, 2nd Lien Term Loan,(3-mo. LIBOR + 8.500%) | 3,473,000 | 3,229,890 | |||||||||||||
| TopGolf International, Inc., 7.701%, Due 2/8/2026, Term Loan B,(1-mo. LIBOR + 5.500%) | 3,990,000 | 4,004,963 | |||||||||||||
| Travelport Finance (Luxembourg) S.a.r.l., 7.541%, Due 5/29/2026, 2019 Term Loan,(3-mo. LIBOR + 5.000%) | 10,837,000 | 9,953,785 | |||||||||||||
| United Natural Foods, Inc., 6.362%, Due 10/22/2025, Term Loan B,(1-mo. LIBOR + 4.250%) | 19,900,000 | 16,450,733 | |||||||||||||
| United PF Holdings LLC, | |||||||||||||||
Due 6/10/2026, 2019 Delayed Draw Term LoanE F | 47,064 | 46,594 | |||||||||||||
6.688%, Due 6/10/2026, 2019 Term Loan,(3-mo. LIBOR + 4.500%) | 343,935 | 340,496 | |||||||||||||
| USS Ultimate Holdings, Inc., | |||||||||||||||
5.950%, Due 8/25/2024, 1st Lien Term Loan,(6-mo. LIBOR + 3.750%) | 4,664,551 | 4,649,997 | |||||||||||||
6.080%, Due 8/25/2024, 1st Lien Term Loan,(3-mo. LIBOR + 3.750%) | 11,899 | 11,862 | |||||||||||||
| World Triathlon Corp., 6.445%, Due 8/12/2026, 2019 Term Loan B,(3-mo. LIBOR + 4.250%) | 2,266,000 | 2,270,260 | |||||||||||||
|
| ||||||||||||||
| 269,889,426 | |||||||||||||||
|
| ||||||||||||||
| Defense - 0.73% | |||||||||||||||
| Maxar Technologies Ltd., 4.870%, Due 10/4/2024, Term Loan B,(1-mo. LIBOR + 2.750%) | 7,172,591 | 6,267,051 | |||||||||||||
| MB Aerospace Holdings, Inc., 5.612%, Due 1/22/2025, 2017 Term Loan,(1-mo. LIBOR + 3.500%) | 4,456,140 | 4,322,456 | |||||||||||||
|
| ||||||||||||||
| 10,589,507 | |||||||||||||||
|
| ||||||||||||||
| Energy - 2.68% | |||||||||||||||
| BCP Renaissance Parent LLC, 5.756%, Due 10/31/2024, 2017 Term Loan B,(3-mo. LIBOR + 3.500%) | 2,653,200 | 2,530,490 | |||||||||||||
| EG America LLC, | |||||||||||||||
6.330%, Due 2/7/2025, 2018 USD Term Loan,(3-mo. LIBOR + 4.000%) | 8,396,722 | 8,265,565 | |||||||||||||
10.330%, Due 4/20/2026, 2018 USD 2nd Lien Term Loan,(3-mo. LIBOR + 8.000%) | 5,313,056 | 5,213,436 | |||||||||||||
| EG Group Ltd., 6.330%, Due 2/7/2025, 2018 USD Term Loan B,(3-mo. LIBOR + 4.000%) | 1,185,000 | 1,166,490 | |||||||||||||
| Huskies Parent, Inc., 6.255%, Due 7/31/2026, 2019 Term Loan,(3-mo. LIBOR + 4.000%) | 2,244,000 | 2,239,804 | |||||||||||||
| KAMC Holdings, Inc., 6.175%, Due 8/8/2026, 2019 Term Loan,(3-mo. LIBOR + 4.000%) | 2,095,000 | 2,089,763 | |||||||||||||
| Matador Bidco S.a.r.l., Due 6/12/2026, Term LoanF | 1,053,000 | 1,054,316 | |||||||||||||
| McDermott Technology Americas, Inc., 7.112%, Due 5/9/2025, 2018 1st Lien Term Loan,(1-mo. LIBOR + 5.000%) | 8,614,903 | 7,888,063 | |||||||||||||
| Navios Maritime Midstream Partners LP, 6.890%, Due 6/18/2020, Term Loan B,(3-mo. LIBOR + 4.500%) | 67,532 | 66,969 | |||||||||||||
| Southcross Energy Partners LP, | |||||||||||||||
10.250%, Due 12/30/2019, 2019 DIP Roll Up Term Loan,(3-mo. PRIME + 5.250%) | 1,507,127 | 1,439,306 | |||||||||||||
10.250%, Due 12/30/2019, 2019 DIP Additional Roll Up Term Loan, (3-mo. PRIME + 5.250%) | 549,834 | 525,091 | |||||||||||||
11.990%, Due 12/30/2019, Term Loan,(1-mo. LIBOR + 10.000%) | 605,444 | 611,498 | |||||||||||||
12.040%, Due 12/30/2019, Term Loan,(1-mo. LIBOR + 10.000%) | 600,368 | 606,372 | |||||||||||||
See accompanying notes
19
American Beacon Sound Point Floating Rate Income FundSM
Schedule of Investments
August 31, 2019
| Principal Amount | Fair Value | ||||||||||||||
| BANK LOAN OBLIGATIONSD - 87.07% (continued) | |||||||||||||||
| Energy - 2.68% (continued) | |||||||||||||||
| Southcross Energy Partners LP, (continued) | |||||||||||||||
14.000%, Due 12/30/2019, DIP LC Term Loan,(3-mo. PRIME + 9.000%) | $ | 1,109,980 | $ | 1,121,080 | |||||||||||
10.250%, Due 8/4/2021, 1st Lien Term Loan,(3-mo. PRIME + 5.250%) | 5,540,631 | 3,989,255 | |||||||||||||
|
| ||||||||||||||
| 38,807,498 | |||||||||||||||
|
| ||||||||||||||
| Financial - 5.99% | |||||||||||||||
| AIS Holdco LLC, 7.256%, Due 8/15/2025, 2018 1st Lien Term Loan,(3-mo. LIBOR + 5.000%) | 2,476,675 | 2,303,308 | |||||||||||||
| AmeriLife Group LLC, | |||||||||||||||
Due 6/5/2026, 2019 Delayed Draw Term LoanE F | 368,053 | 367,593 | |||||||||||||
6.612%, Due 6/5/2026, 2019 1st Lien Term Loan,(1-mo. LIBOR + 4.500%) | 2,628,947 | 2,625,661 | |||||||||||||
| Amynta Agency Borrower, Inc., | |||||||||||||||
6.612%, Due 2/28/2025, 2018 1st Lien Term Loan,(1-mo. LIBOR + 4.500%) | 9,861,200 | 9,392,793 | |||||||||||||
10.612%, Due 3/2/2026, 2018 2nd Lien Term Loan,(1-mo. LIBOR + 8.500%) | 5,535,000 | 5,403,544 | |||||||||||||
| Aretec Group, Inc., 6.362%, Due 10/1/2025, 2018 Term Loan,(1-mo. LIBOR + 4.250%) | 6,836,193 | 6,648,198 | |||||||||||||
| Avison Young (Canada), Inc., | |||||||||||||||
7.124%, Due 1/31/2026, Term Loan,(3-mo. LIBOR + 5.000%) | 671,251 | 656,148 | |||||||||||||
7.256%, Due 1/31/2026, Term Loan,(3-mo. LIBOR + 5.000%) | 645,508 | 630,984 | |||||||||||||
7.330%, Due 1/31/2026, Term Loan,(3-mo. LIBOR + 5.000%) | 671,251 | 656,148 | |||||||||||||
| Citadel Securities LP, 5.612%, Due 2/27/2026, Term Loan B,(1-mo. LIBOR + 3.500%) | 2,680,805 | 2,680,805 | |||||||||||||
| Confie Seguros Holding II Co., | |||||||||||||||
7.080%, Due 4/19/2022, 2016 Term Loan B,(3-mo. LIBOR + 4.750%) | 8,772,165 | 8,552,861 | |||||||||||||
11.020%, Due 10/31/2025, 2018 2nd Lien Term Loan,(3-mo. LIBOR + 8.500%) | 6,375,000 | 6,088,125 | |||||||||||||
| Forest City Enterprises LP, 6.112%, Due 12/7/2025, Term Loan B,(1-mo. LIBOR + 4.000%) | 3,980,000 | 4,004,875 | |||||||||||||
| Higginbotham Insurance Agency, Inc., 6.112%, Due 12/19/2024, 2017 1st Lien Term Loan,(1-mo. LIBOR + 4.000%) | 6,232,095 | 6,107,453 | |||||||||||||
| Hudson River Trading LLC, 5.830%, Due 4/3/2025, 2018 Incremental Term Loan,(3-mo. LIBOR + 3.500%) | 4,770,926 | 4,768,922 | |||||||||||||
| Jane Street Group LLC, 5.112%, Due 8/25/2022, 2018 Term Loan B,(1-mo. LIBOR + 3.000%) | 8,147,401 | 8,093,057 | |||||||||||||
| Kestra Advisor Services Holdings, Inc., 6.370%, Due 6/3/2026, 2019 Term Loan,(1-mo. LIBOR + 4.250%) | 2,439,106 | 2,408,617 | |||||||||||||
| Minotaur Acquisition, Inc., 7.112%, Due 3/27/2026, Term Loan B,(1-mo. LIBOR + 5.000%) | 3,693,743 | 3,562,171 | |||||||||||||
| StepStone Group LP, 6.112%, Due 3/27/2025, Term Loan B,(1-mo. LIBOR + 4.000%) | 2,819,313 | 2,815,788 | |||||||||||||
| VFH Parent LLC, 6.044%, Due 3/1/2026, 2019 Term Loan B,(6-mo. LIBOR + 3.500%) | 9,123,488 | 9,136,534 | |||||||||||||
|
| ||||||||||||||
| 86,903,585 | |||||||||||||||
|
| ||||||||||||||
| Health Care - 9.44% | |||||||||||||||
| 21st Century Oncology Holdings, Inc., 8.455%, Due 1/16/2023, Exit Term Loan,(3-mo. LIBOR + 6.125%) | 4,242,199 | 3,799,441 | |||||||||||||
| ABB Concise Optical Group LLC, | |||||||||||||||
7.034%, Due 6/15/2023, 2016 Term Loan B,(6-mo. LIBOR + 5.000%) | 23,069 | 21,338 | |||||||||||||
7.185%, Due 6/15/2023, 2016 Term Loan B,(6-mo. LIBOR + 5.000%) | 181,012 | 167,436 | |||||||||||||
| Air Methods Corp., 5.830%, Due 4/21/2024, 2017 Term Loan B,(3-mo. LIBOR + 3.500%) | 8,585,237 | 7,064,963 | |||||||||||||
| Amneal Pharmaceuticals LLC, 5.625%, Due 5/4/2025, 2018 Term Loan B,(1-mo. LIBOR + 3.500%) | 4,951,200 | 4,490,738 | |||||||||||||
| Athenahealth, Inc., | |||||||||||||||
6.681%, Due 2/11/2026, 2019 Term Loan B,(3-mo. LIBOR + 4.500%) | 21,353,695 | 21,233,687 | |||||||||||||
6.701%, Due 2/11/2026, 2019 Term Loan B,(1-mo. LIBOR + 4.500%) | 53,652 | 53,351 | |||||||||||||
| BW NHHC Holdco, Inc., 7.145%, Due 5/15/2025, 2018 1st Lien Term Loan,(1-mo. LIBOR + 5.000%) | 1,614,690 | 1,420,927 | |||||||||||||
| Ensemble RCM LLC, 6.003%, Due 8/3/2026, Term Loan,(3-mo. LIBOR + 3.750%) | 490,000 | 489,084 | |||||||||||||
| Envision Healthcare Corp., 5.862%, Due 10/10/2025, 2018 1st Lien Term Loan,(1-mo. LIBOR + 3.750%) | 10,641,263 | 8,213,033 | |||||||||||||
| Gentiva Health Services, Inc., 5.875%, Due 7/2/2025, 2018 1st Lien Term Loan,(1-mo. LIBOR + 3.750%) | 4,921,718 | 4,918,666 | |||||||||||||
| Global Medical Response, Inc., 6.362%, Due 3/14/2025, 2017 Term Loan B2,(1-mo. LIBOR + 4.250%) | 9,043,741 | 8,484,205 | |||||||||||||
| HC Group Holdings II, Inc., 6.612%, Due 5/21/2026, Term Loan B,(1-mo. LIBOR + 4.500%) | 3,006,000 | 2,993,465 | |||||||||||||
| Innoviva, Inc., 6.652%, Due 8/11/2022, 2017 Term Loan B,(3-mo. LIBOR + 4.500%) | 357,500 | 350,350 | |||||||||||||
See accompanying notes
20
American Beacon Sound Point Floating Rate Income FundSM
Schedule of Investments
August 31, 2019
| Principal Amount | Fair Value | ||||||||||||||
| BANK LOAN OBLIGATIONSD - 87.07% (continued) | |||||||||||||||
| Health Care - 9.44% (continued) | |||||||||||||||
| Lifescan Global Corp., | |||||||||||||||
8.660%, Due 10/1/2024, 2018 1st Lien Term Loan,(3-mo. LIBOR + 6.000%) | $ | 6,571,650 | $ | 6,167,494 | |||||||||||
11.820%, Due 9/26/2025, 2018 2nd Lien Term Loan,(3-mo. LIBOR + 9.500%) | 4,506,000 | 3,920,220 | |||||||||||||
| Matrix Medical Network of Arizona LLC, 6.862%, Due 2/7/2025, 2018 Term Loan B,(1-mo. LIBOR + 4.750%) | 6,122,508 | 6,061,283 | |||||||||||||
| MED ParentCo LP, | |||||||||||||||
Due 7/31/2026, 1st Lien Term LoanF | 484,741 | 479,084 | |||||||||||||
6.366%, Due 7/31/2026, 1st Lien Term Loan,(1-mo. LIBOR + 4.250%) | 1,941,259 | 1,918,605 | |||||||||||||
| National Mentor Holdings, Inc., | |||||||||||||||
6.370%, Due 3/9/2026, 2019 Term Loan B,(1-mo. LIBOR + 4.250%) | 2,817,500 | 2,805,188 | |||||||||||||
6.370%, Due 3/9/2026, 2019 Term Loan C,(1-mo. LIBOR + 4.250%) | 175,439 | 174,672 | |||||||||||||
| Onex TSG Intermediate Corp., 6.112%, Due 7/31/2022, 1st Lien Term Loan,(1-mo. LIBOR + 4.000%) | 7,337,617 | 6,799,550 | |||||||||||||
| Phoenix Guarantor, Inc., 6.567%, Due 3/5/2026, Term Loan B,(1-mo. LIBOR + 4.500%) | 12,094,000 | 12,030,507 | |||||||||||||
| Premise Health Holding Corp., | |||||||||||||||
Due 7/10/2025, 2018 1st Lien Delayed Draw Term LoanE F | 391,698 | 385,498 | |||||||||||||
5.830%, Due 7/10/2025, 2018 1st Lien Term Loan,(3-mo. LIBOR + 3.500%) | 4,898,584 | 4,821,040 | |||||||||||||
| Quorum Health Corp., 9.006%, Due 4/29/2022, Term Loan B,(3-mo. LIBOR + 6.750%) | 1,833,686 | 1,803,889 | |||||||||||||
| RegionalCare Hospital Partners Holdings, Inc., 6.650%, Due 11/17/2025, 2018 Term Loan B,(1-mo. LIBOR + 4.500%) | 9,556,975 | 9,521,136 | |||||||||||||
| U.S. Renal Care, Inc., 7.112%, Due 6/26/2026, 2019 Term Loan B,(1-mo. LIBOR + 5.000%) | 10,109,000 | 9,641,459 | |||||||||||||
| Wellpath Holdings, Inc., 7.612%, Due 9/20/2025, 2018 1st Lien Term Loan,(1-mo. LIBOR + 5.500%) | 4,975,000 | 4,894,156 | |||||||||||||
| WP CityMD Bidco LLC, 6.706%, Due 8/7/2026, 2019 Term Loan B,(3-mo. LIBOR + 4.500%) | 1,696,000 | 1,675,512 | |||||||||||||
|
| ||||||||||||||
| 136,799,977 | |||||||||||||||
|
| ||||||||||||||
| Manufacturing - 8.79% | |||||||||||||||
| Advanced Integration Technology LP, 6.862%, Due 4/3/2023, 2017 Term Loan B,(1-mo. LIBOR + 4.750%) | 5,204,645 | 5,126,575 | |||||||||||||
| Airxcel, Inc., | |||||||||||||||
6.612%, Due 4/28/2025, 2018 1st Lien Term Loan,(1-mo. LIBOR + 4.500%) | 5,900,150 | 5,688,748 | |||||||||||||
10.862%, Due 4/27/2026, 2018 2nd Lien Term Loan,(1-mo. LIBOR + 8.750%) | 4,026,000 | 3,643,530 | |||||||||||||
| Anvil International LLC, 7.330%, Due 5/28/2026, 2019 1st Lien Term Loan,(3-mo. LIBOR + 5.000%) | 1,817,000 | 1,762,490 | |||||||||||||
| ASG Technologies Group, Inc., 5.612%, Due 7/31/2024, 2018 Term Loan,(1-mo. LIBOR + 3.500%) | 8,269,501 | 8,207,480 | |||||||||||||
| Associated Asphalt Partners LLC, 7.362%, Due 4/5/2024, 2017 Term Loan B,(1-mo. LIBOR + 5.250%) | 5,099,222 | 4,869,757 | |||||||||||||
| Big Ass Fans LLC, 6.080%, Due 5/21/2024, 2018 Term Loan,(3-mo. LIBOR + 3.750%) | 3,764,748 | 3,755,336 | |||||||||||||
| Bright Bidco B.V., | |||||||||||||||
5.612%, Due 6/30/2024, 2018 Term Loan B,(1-mo. LIBOR + 3.500%) | 2,512,626 | 1,493,454 | |||||||||||||
5.830%, Due 6/30/2024, 2018 Term Loan B,(3-mo. LIBOR + 3.500%) | 5,204,160 | 3,093,248 | |||||||||||||
| Commercial Vehicle Group, Inc., 8.112%, Due 4/12/2023, Term Loan B,(1-mo. LIBOR + 6.000%) | 2,678,031 | 2,678,031 | |||||||||||||
| Constellis Holdings LLC, | |||||||||||||||
7.256%, Due 4/21/2024, 2017 1st Lien Term Loan,(3-mo. LIBOR + 5.000%) | 6,321,504 | 4,324,983 | |||||||||||||
7.258%, Due 4/21/2024, 2017 1st Lien Term Loan,(2-mo. LIBOR + 5.000%) | 16,168 | 11,061 | |||||||||||||
11.256%, Due 4/21/2025, 2017 2nd Lien Term Loan,(3-mo. LIBOR + 9.000%) | 5,861,000 | 1,172,200 | |||||||||||||
| DG Investment Intermediate Holdings, Inc., 5.112%, Due 2/3/2025, 2018 1st Lien Term Loan,(1-mo. LIBOR + 3.000%) | 6,714,820 | 6,572,130 | |||||||||||||
| Euramax International, Inc., 2.000%, Due 2/6/2021, Unsecured Term Loan, Cash (2.000%) orPIK (in-kind rate 14.000%)A B G | 397,801 | 339,483 | |||||||||||||
| Greenway Health LLC, 6.080%, Due 2/14/2024, 2017 1st Lien Term Loan,(3-mo. LIBOR + 3.750%) | 9,224,901 | 8,102,507 | |||||||||||||
| Innovative Xcessories & Services LLC, 6.870%, Due 11/29/2022, Term Loan B,(1-mo. LIBOR + 4.750%) | 6,718,274 | 6,651,091 | |||||||||||||
| Ivanti Software, Inc., | |||||||||||||||
6.300%, Due 1/20/2024, 2017 Term Loan B,(1-mo. LIBOR + 4.250%) | 1,468,094 | 1,462,589 | |||||||||||||
11.050%, Due 1/20/2025, 2017 2nd Lien Term Loan,(1-mo. LIBOR + 9.000%) | 2,828,000 | 2,785,580 | |||||||||||||
See accompanying notes
21
American Beacon Sound Point Floating Rate Income FundSM
Schedule of Investments
August 31, 2019
| Principal Amount | Fair Value | ||||||||||||||
| BANK LOAN OBLIGATIONSD - 87.07% (continued) | |||||||||||||||
| Manufacturing - 8.79% (continued) | |||||||||||||||
| Navios Maritime Partners LP, 7.440%, Due 9/14/2020, 2017 Term Loan B,(3-mo. LIBOR + 5.000%) | $ | 1,245,140 | $ | 1,237,358 | |||||||||||
| NCI Building Systems, Inc., 5.951%, Due 4/12/2025, 2018 Term Loan,(1-mo. LIBOR + 3.750%) | 7,746,500 | 7,511,704 | |||||||||||||
| Netsmart Technologies, Inc., | |||||||||||||||
5.862%, Due 4/19/2023, Term Loan D1,(1-mo. LIBOR + 3.750%) | 7,522,085 | 7,431,219 | |||||||||||||
9.612%, Due 10/19/2023, 2018 2nd Lien Term Loan B,(1-mo. LIBOR + 7.500%) | 354,000 | 350,460 | |||||||||||||
| NN, Inc., | |||||||||||||||
5.362%, Due 4/2/2021, 2017 Term Loan,(1-mo. LIBOR + 3.250%) | 5,701,389 | 5,562,447 | |||||||||||||
5.862%, Due 10/19/2022, 2016 Term Loan B,(1-mo. LIBOR + 3.750%) | 8,119,308 | 7,950,183 | |||||||||||||
| Novetta Solutions LLC, 7.120%, Due 10/16/2022, 2015 Term Loan,(1-mo. LIBOR + 5.000%) | 286,883 | 280,190 | |||||||||||||
| PAE Holding Corp., 7.830%, Due 10/20/2022, 1st Lien Term Loan,(1-mo. LIBOR + 5.500%) | 3,758,134 | 3,748,739 | |||||||||||||
| Transplace Holdings, Inc., 5.895%, Due 10/7/2024, 1st Lien Term Loan,(1-mo. LIBOR + 3.750%) | 5,800,803 | 5,677,535 | |||||||||||||
| TurboCombustor Technology, Inc., 6.612%, Due 12/2/2020, New Term Loan B,(1-mo. LIBOR + 4.500%) | 7,402,809 | 7,162,218 | |||||||||||||
| VIP Cinema Holdings, Inc., 10.120%, Due 3/1/2023, USD Term Loan B,(1-mo. LIBOR + 8.000%) | 4,466,764 | 3,573,411 | |||||||||||||
| Werner FinCo LP, 6.330%, Due 7/24/2024, 2017 Term Loan,(3-mo. LIBOR + 4.000%) | 5,306,690 | 5,160,756 | |||||||||||||
|
| ||||||||||||||
| 127,386,493 | |||||||||||||||
|
| ||||||||||||||
| Media - 1.35% | |||||||||||||||
| Allen Media LLC, | |||||||||||||||
8.602%, Due 9/22/2023, 2018 Term Loan B,(3-mo. LIBOR + 6.500%) | 346,267 | 335,878 | |||||||||||||
8.830%, Due 9/22/2023, 2018 Term Loan B,(3-mo. LIBOR + 6.500%) | 2,185,026 | 2,119,475 | |||||||||||||
| Clear Channel Outdoor Holdings, Inc., 5.667%, Due 8/21/2026, Term Loan B | 5,113,000 | 5,106,609 | |||||||||||||
| SurveyMonkey, Inc., 5.890%, Due 10/10/2025, 2018 Term Loan B, (1 Week LIBOR + 3.750%) | 3,513,274 | 3,486,925 | |||||||||||||
| Univision Communications, Inc., 4.862%, Due 3/15/2024, Term Loan C5,(1-mo. LIBOR + 2.750%) | 8,971,708 | 8,566,366 | |||||||||||||
|
| ||||||||||||||
| 19,615,253 | |||||||||||||||
|
| ||||||||||||||
| Service - 16.45% | |||||||||||||||
| Access CIG LLC, 6.069%, Due 2/27/2025, 2018 1st Lien Term Loan,(3-mo. LIBOR + 3.750%) | 7,458,639 | 7,318,789 | |||||||||||||
| Alvogen Pharma US, Inc., 6.860%, Due 4/2/2022, 2018 Term Loan B,(1-mo. LIBOR + 4.750%) | 2,464,199 | 2,227,635 | |||||||||||||
| Aveanna Healthcare LLC, 6.362%, Due 3/18/2024, 2017 1st Lien Term Loan,(1-mo. LIBOR + 4.250%) | 7,282,173 | 7,154,735 | |||||||||||||
| Blount International, Inc., 5.946%, Due 4/12/2023, 2018 Term Loan B,(1-mo. LIBOR + 3.750%) | 5,925,225 | 5,917,818 | |||||||||||||
| Brand Energy & Infrastructure Services, Inc., | |||||||||||||||
6.509%, Due 6/21/2024, 2017 Term Loan,(3-mo. LIBOR + 4.250%) | 6,386,854 | 6,051,545 | |||||||||||||
6.521%, Due 6/21/2024, 2017 Term Loan,(2-mo. LIBOR + 4.250%) | 5,662,318 | 5,365,046 | |||||||||||||
6.580%, Due 6/21/2024, 2017 Term Loan,(3-mo. LIBOR + 4.250%) | 61,791 | 58,547 | |||||||||||||
| Capstone Logistics LLC, 6.612%, Due 10/7/2021, Term Loan B,(1-mo. LIBOR + 4.500%) | 1,556,470 | 1,547,396 | |||||||||||||
| CDS U.S. Intermediate Holdings, Inc., | |||||||||||||||
6.080%, Due 7/8/2022, 2017 1st Lien Term Loan,(3-mo. LIBOR + 3.750%) | 16,050,165 | 15,327,908 | |||||||||||||
10.580%, Due 7/10/2023, 2nd Lien Term Loan,(3-mo. LIBOR + 8.250%) | 6,095,796 | 5,516,696 | |||||||||||||
| Cengage Learning, Inc., 6.362%, Due 6/7/2023, 2016 Term Loan B,(1-mo. LIBOR + 4.250%) | 13,363,051 | 12,782,961 | |||||||||||||
| Chloe OX Parent LLC, 6.830%, Due 12/29/2024, 1st Lien Term Loan,(3-mo. LIBOR + 4.500%) | 4,937,500 | 4,937,500 | |||||||||||||
| Cvent, Inc., | |||||||||||||||
Due 11/29/2024, 1st Lien Term LoanF | 767,000 | 754,298 | |||||||||||||
5.862%, Due 11/29/2024, 1st Lien Term Loan,(1-mo. LIBOR + 3.750%) | 8,899,350 | 8,751,977 | |||||||||||||
| Deliver Buyer, Inc., 7.330%, Due 5/1/2024, Term Loan B,(3-mo. LIBOR + 5.000%) | 9,988,173 | 9,771,729 | |||||||||||||
| Digital Room Holdings, Inc., 7.112%, Due 5/8/2026, Term Loan,(1-mo. LIBOR + 5.000%) | 2,092,000 | 1,996,563 | |||||||||||||
| DTI Holdco, Inc., | |||||||||||||||
7.006%, Due 9/30/2023, 2018 Term Loan B,(3-mo. LIBOR + 4.750%) | 9,665,877 | 8,844,277 | |||||||||||||
7.008%, Due 9/30/2023, 2018 Term Loan B,(2-mo. LIBOR + 4.750%) | 24,939 | 22,819 | |||||||||||||
| Employbridge LLC, 6.830%, Due 4/18/2025, Term Loan B,(3-mo. LIBOR + 4.500%) | 7,208,596 | 7,181,563 | |||||||||||||
| Heartland Dental LLC, | |||||||||||||||
Due 4/30/2025, 2018 Delayed Draw Term LoanE F | 319,087 | 308,583 | |||||||||||||
5.862%, Due 4/30/2025, 2018 1st Lien Term Loan,(1-mo. LIBOR + 3.750%) | 14,222,248 | 13,754,052 | |||||||||||||
| I-Logic Technologies Bidco Ltd., 5.651%, Due 12/21/2024, 2018 USD Term Loan,(3-mo. LIBOR + 3.000%) | 5,745,065 | 5,558,350 | |||||||||||||
See accompanying notes
22
American Beacon Sound Point Floating Rate Income FundSM
Schedule of Investments
August 31, 2019
| Principal Amount | Fair Value | ||||||||||||||
| BANK LOAN OBLIGATIONSD - 87.07% (continued) | |||||||||||||||
| Service - 16.45% (continued) | |||||||||||||||
| IG Investment Holdings LLC, | |||||||||||||||
6.112%, Due 5/23/2025, 2018 1st Lien Term Loan,(1-mo. LIBOR + 4.000%) | $ | 1,278,524 | $ | 1,266,007 | |||||||||||
6.330%, Due 5/23/2025, 2018 1st Lien Term Loan,(3-mo. LIBOR + 4.000%) | 879,618 | 871,007 | |||||||||||||
| Imagine! Print Solutions, Inc., | |||||||||||||||
6.870%, Due 6/21/2022, 2017 Term Loan,(1-mo. LIBOR + 4.750%) | 8,588,198 | 6,634,383 | |||||||||||||
10.870%, Due 6/21/2023, 2017 2nd Lien Term Loan,(1-mo. LIBOR + 8.750%) | 1,019,000 | 662,350 | |||||||||||||
| Internap Corp., 8.440%, Due 4/6/2022, 2017 Term Loan, PIK(in-kind rate of 0.750%)(1-mo. LIBOR + 6.250%) | 898,628 | 633,533 | |||||||||||||
| Keystone Acquisition Corp., 7.580%, Due 5/1/2024, 1st Lien Term Loan,(3-mo. LIBOR + 5.250%) | 3,355,238 | 3,250,386 | |||||||||||||
| LifeMiles Ltd., 7.612%, Due 8/18/2022, Term Loan B,(1-mo. LIBOR + 5.500%) | 4,323,104 | 3,998,871 | |||||||||||||
| LSC Communications, Inc., 7.643%, Due 9/30/2022, 2017 Term Loan B, (1 Week LIBOR + 5.500%) | 1,129,501 | 950,193 | |||||||||||||
| LSF9 Atlantis Holdings LLC, 8.042%, Due 5/1/2023, 2017 Term Loan,(1-mo. LIBOR + 6.000%) | 2,003,550 | 1,863,302 | |||||||||||||
| McGraw-Hill Global Education Holdings LLC, 6.112%, Due 5/4/2022, 2016 Term Loan B,(1-mo. LIBOR + 4.000%) | 4,271,668 | 4,035,146 | |||||||||||||
| MRO Holdings, Inc., 7.089%, Due 6/4/2026, 2019 Term Loan B,(1-mo. LIBOR + 5.000%) | 2,544,000 | 2,520,163 | |||||||||||||
| Newport Group, Inc., 6.152%, Due 9/13/2025, 2018 1st Lien Term Loan,(3-mo. LIBOR + 3.750%) | 4,885,433 | 4,812,151 | |||||||||||||
| PSC Industrial Holdings Corp., 5.945%, Due 10/3/2024, 2017 1st Lien Term Loan,(1-mo. LIBOR + 3.750%) | 5,832,822 | 5,780,326 | |||||||||||||
| STG-Fairway Acquisitions, Inc., 7.362%, Due 6/30/2022, 2015 1st Lien Term Loan,(1-mo. LIBOR + 5.250%) | 11,252,728 | 11,229,322 | |||||||||||||
| TEN-X LLC, 6.112%, Due 9/27/2024, 1st Lien Term Loan,(1-mo. LIBOR + 4.000%) | 9,865,176 | 9,763,466 | |||||||||||||
| TKC Holdings, Inc., 5.870%, Due 2/1/2023, 2017 1st Lien Term Loan,(1-mo. LIBOR + 3.750%) | 10,152,338 | 9,889,494 | |||||||||||||
| Travelport Finance (Luxembourg) S.a.r.l., 11.541%, Due 5/28/2027, 2019 2nd Lien Term Loan,(3-mo. LIBOR + 9.000%) | 9,325,000 | 8,112,750 | |||||||||||||
| Tweddle Group, Inc., 6.645%, Due 9/17/2023, 2016 Term Loan,(1-mo. LIBOR + 4.500%)A B | 329,037 | 299,193 | |||||||||||||
| Utility One Source LP, 7.830%, Due 4/18/2023, Term Loan B,(3-mo. LIBOR + 5.500%) | 5,923,532 | 5,967,958 | |||||||||||||
| Vestcom Parent Holdings, Inc., | |||||||||||||||
6.112%, Due 12/19/2023, 2016 1st Lien Term Loan,(1-mo. LIBOR + 4.000%) | 7,207,429 | 6,702,909 | |||||||||||||
8.250%, Due 12/19/2023, 2016 1st Lien Term Loan,(3-mo. PRIME + 3.000%) | 1,238 | 1,151 | |||||||||||||
| West Corp., | |||||||||||||||
5.612%, Due 10/10/2024, 2018 Term Loan B1,(1-mo. LIBOR + 3.500%) | 2,668,050 | 2,357,889 | |||||||||||||
6.112%, Due 10/10/2024, 2017 Term Loan,(1-mo. LIBOR + 4.000%) | 12,043,540 | 10,735,973 | |||||||||||||
| William Morris Endeavor Entertainment LLC, 4.870%, Due 5/18/2025, 2018 1st Lien Term Loan,(1-mo. LIBOR + 2.750%) | 2,875,298 | 2,789,039 | |||||||||||||
| Yak Access LLC, 7.112%, Due 7/11/2025, 2018 1st Lien Term Loan B,(1-mo. LIBOR + 5.000%) | 2,395,231 | 2,197,625 | |||||||||||||
|
| ||||||||||||||
| 238,475,374 | |||||||||||||||
|
| ||||||||||||||
| Technology - 12.02% | |||||||||||||||
| 24-7 Intouch, Inc., 6.362%, Due 8/20/2025, 2018 Term Loan,(1-mo. LIBOR + 4.250%) | 3,101,921 | 2,977,844 | |||||||||||||
| Aptean, Inc., 6.580%, Due 4/23/2026, 2019 Term Loan,(3-mo. LIBOR + 4.250%) | 1,738,643 | 1,725,603 | |||||||||||||
| AqGen Ascensus, Inc., 6.200%, Due 12/3/2022, 2017 Repriced Term Loan,(6-mo. LIBOR + 4.000%) | 6,402,455 | 6,408,473 | |||||||||||||
| ConvergeOne Holdings, Inc., 7.112%, Due 1/4/2026, 2019 Term Loan,(1-mo. LIBOR + 5.000%) | 7,108,185 | 6,326,285 | |||||||||||||
| DigiCert Holdings, Inc., Due 8/31/2026, 2019 Term Loan BF | 5,988,000 | 5,963,030 | |||||||||||||
| DigiCert, Inc., 6.112%, Due 10/31/2024, 2017 Term Loan B1,(1-mo. LIBOR + 4.000%) | 9,806,736 | 9,806,736 | |||||||||||||
| Dun & Bradstreet Corp. (The), 7.145%, Due 2/6/2026, Term Loan,(1-mo. LIBOR + 5.000%) | 11,001,000 | 11,023,882 | |||||||||||||
| EIG Investors Corp., | |||||||||||||||
5.882%, Due 2/9/2023, 2018 1st Lien Term Loan,(3-mo. LIBOR + 3.750%) | 4,271,664 | 4,193,877 | |||||||||||||
5.895%, Due 2/9/2023, 2018 1st Lien Term Loan,(3-mo. LIBOR + 3.750%) | 23,324 | 22,900 | |||||||||||||
| Electronics for Imaging, Inc., 7.291%, Due 7/23/2026, Term Loan,(3-mo. LIBOR + 5.000%) | 3,010,000 | 2,806,825 | |||||||||||||
| Genuine Financial Holdings LLC, 5.862%, Due 7/12/2025, 2018 1st Lien Term Loan,(1-mo. LIBOR + 3.750%) | 8,194,080 | 7,955,059 | |||||||||||||
| GI Revelation Acquisition LLC, 7.112%, Due 4/16/2025, 2018 1st Lien Term Loan,(1-mo. LIBOR + 5.000%) | 6,413,220 | 6,240,897 | |||||||||||||
| GrafTech Finance, Inc., 5.612%, Due 2/12/2025, 2018 Term Loan B,(1-mo. LIBOR + 3.500%) | 807,802 | 784,578 | |||||||||||||
| GreenSky Holdings LLC, Due 3/31/2025, 2018 Term Loan BF | 777,000 | 763,402 | |||||||||||||
| Help/Systems Holdings, Inc., 6.080%, Due 3/28/2025, 2018 1st Lien Term Loan,(3-mo. LIBOR + 3.750%) | 1,994,962 | 1,976,269 | |||||||||||||
See accompanying notes
23
American Beacon Sound Point Floating Rate Income FundSM
Schedule of Investments
August 31, 2019
| Principal Amount | Fair Value | ||||||||||||||
| BANK LOAN OBLIGATIONSD - 87.07% (continued) | |||||||||||||||
| Technology - 12.02% (continued) | |||||||||||||||
| ION Trading Technologies S.a.r.l., 6.651%, Due 11/21/2024, USD Incremental Term Loan B,(3-mo. LIBOR + 4.000%) | $ | 15,504,980 | $ | 14,871,912 | |||||||||||
| McAfee LLC, 5.866%, Due 9/30/2024, 2018 USD Term Loan B,(1-mo. LIBOR + 3.750%) | 11,242,997 | 11,245,808 | |||||||||||||
| MLN US HoldCo LLC, | |||||||||||||||
6.612%, Due 11/30/2025, 2018 1st Lien Term Loan,(1-mo. LIBOR + 4.500%) | 578,998 | 552,220 | |||||||||||||
10.862%, Due 11/30/2026, 2018 2nd Lien Term Loan,(1-mo. LIBOR + 8.750%) | 6,060,000 | 5,151,000 | |||||||||||||
| Natel Engineering Co., Inc., 7.116%, Due 4/30/2026, 2019 Term Loan B,(1-mo. LIBOR + 5.000%) | 1,658,842 | 1,658,842 | |||||||||||||
| NeuStar, Inc., 10.112%, Due 8/8/2025, 2nd Lien Term Loan,(1-mo. LIBOR + 8.000%) | 5,991,000 | 5,641,545 | |||||||||||||
| OEConnection LLC, 6.120%, Due 11/22/2024, 1st Lien Term Loan,(1-mo. LIBOR + 4.000%) | 2,308,840 | 2,305,954 | |||||||||||||
| Perforce Software, Inc., 6.612%, Due 7/1/2026, Term Loan B,(1-mo. LIBOR + 4.500%) | 3,682,000 | 3,664,768 | |||||||||||||
| Ping Identity Corp., 5.862%, Due 1/24/2025, 2018 Term Loan B,(1-mo. LIBOR + 3.750%) | 5,217,598 | 5,204,554 | |||||||||||||
| Project Alpha Intermediate Holding, Inc., 6.560%, Due 4/26/2024, 2019 Incremental Term Loan B,(3-mo. LIBOR + 4.250%) | 941,000 | 938,064 | |||||||||||||
| Riverbed Technology, Inc., 5.370%, Due 4/24/2022, 2016 Term Loan,(1-mo. LIBOR + 3.250%) | 10,153,418 | 8,431,601 | |||||||||||||
| Securus Technologies Holdings, Inc., | |||||||||||||||
6.830%, Due 11/1/2024, 2017 1st Lien Term Loan,(3-mo. LIBOR + 4.500%) | 6,919,825 | 6,158,645 | |||||||||||||
10.580%, Due 11/1/2025, 2017 2nd Lien Term Loan,(3-mo. LIBOR + 8.250%) | 7,951,000 | 7,026,696 | |||||||||||||
| Sirius Computer Solutions, Inc., 6.569%, Due 7/1/2026, 2019 Term Loan B,(3-mo. LIBOR + 4.250%) | 1,142,000 | 1,140,927 | |||||||||||||
| SonicWALL, Inc., 5.636%, Due 5/16/2025, 1st Lien Term Loan,(3-mo. LIBOR + 3.500%) | 4,962,500 | 4,615,125 | |||||||||||||
| TriTech Software Systems, 5.862%, Due 8/29/2025, 2018 Term Loan B,(1-mo. LIBOR + 3.750%) | 10,644,673 | 9,934,993 | |||||||||||||
| Ultimate Software Group, Inc., 6.080%, Due 5/4/2026, Term Loan B,(3-mo. LIBOR + 3.750%) | 4,217,000 | 4,224,548 | |||||||||||||
| Verifone Systems, Inc., 6.136%, Due 8/20/2025, 2018 1st Lien Term Loan,(3-mo. LIBOR + 4.000%) | 2,487,205 | 2,380,255 | |||||||||||||
| Vero Parent, Inc., 6.612%, Due 8/16/2024, 2018 Term Loan B,(1-mo. LIBOR + 4.500%) | 4,981,112 | 4,948,186 | |||||||||||||
| Wall Street Systems Delaware, Inc., 7.256%, Due 11/21/2024, 2019 Term Loan,(3-mo. LIBOR + 5.000%) | 5,263,000 | 5,210,370 | |||||||||||||
|
| ||||||||||||||
| 174,281,673 | |||||||||||||||
|
| ||||||||||||||
| Telecommunications - 2.82% | |||||||||||||||
| Global Tel*Link Corp., | |||||||||||||||
6.362%, Due 11/29/2025, 2018 1st Lien Term Loan,(1-mo. LIBOR + 4.250%) | 2,667,667 | 2,543,621 | |||||||||||||
10.362%, Due 11/29/2026, 2018 2nd Lien Term Loan,(1-mo. LIBOR + 8.250%) | 2,555,000 | 2,412,891 | |||||||||||||
| Intelsat Jackson Holdings S.A., | |||||||||||||||
5.895%, Due 11/27/2023, 2017 Term Loan B3,(1-mo. LIBOR + 3.750%) | 7,319,000 | 7,311,169 | |||||||||||||
6.625%, Due 1/2/2024, 2017 Term Loan B5G | 514,000 | 518,713 | |||||||||||||
6.645%, Due 1/2/2024, 2017 Term Loan B4,(1-mo. LIBOR + 4.500%) | 771,000 | 774,377 | |||||||||||||
| NeuStar, Inc., 5.612%, Due 8/8/2024, 2018 Term Loan B4,(1-mo. LIBOR + 3.500%) | 7,809,941 | 7,563,928 | |||||||||||||
| QualTek USA LLC, | |||||||||||||||
8.006%, Due 7/18/2025, 2018 1st Lien Term Loan,(3-mo. LIBOR + 5.750%) | 8,399,726 | 8,179,233 | |||||||||||||
8.008%, Due 7/18/2025, 2018 1st Lien Term Loan,(2-mo. LIBOR + 5.750%) | 61,593 | 59,976 | |||||||||||||
| U.S. Telepacific Corp., 7.330%, Due 5/2/2023, 2017 Term Loan B,(3-mo. LIBOR + 5.000%) | 11,814,912 | 11,495,909 | |||||||||||||
|
| ||||||||||||||
| 40,859,817 | |||||||||||||||
|
| ||||||||||||||
| Transportation - 3.04% | |||||||||||||||
| Accuride Corp., 7.580%, Due 11/17/2023, 2017 Term Loan B,(3-mo. LIBOR + 5.250%) | 1,590,923 | 1,360,239 | |||||||||||||
| Daseke, Inc., 7.112%, Due 2/27/2024, 2017 Term Loan B,(1-mo. LIBOR + 5.000%) | 6,313,786 | 6,124,372 | |||||||||||||
| Entrans International LLC, 8.112%, Due 11/2/2024, 2018 Term Loan,(1-mo. LIBOR + 6.000%) | 6,069,525 | 5,857,092 | |||||||||||||
| Gruden Acquisition, Inc., 7.830%, Due 8/18/2022, 2017 Term Loan,(3-mo. LIBOR + 5.500%) | 5,834,110 | 5,790,354 | |||||||||||||
| Savage Enterprises LLC, 6.210%, Due 8/1/2025, 2018 1st Lien Term Loan B,(1-mo. LIBOR + 4.000%) | 7,631,369 | 7,674,333 | |||||||||||||
| SMB Shipping Logistics LLC, 6.200%, Due 2/2/2024, 1st Lien Term Loan,(6-mo. LIBOR + 4.000%) | 7,973,105 | 7,863,475 | |||||||||||||
| United Road Services, Inc., | |||||||||||||||
Due 9/1/2024, 2017 Term Loan BF | 2,360,000 | 2,321,650 | |||||||||||||
7.362%, Due 9/1/2024, 2017 Term Loan B,(1-mo. LIBOR + 5.250%) | 7,270,167 | 7,152,026 | |||||||||||||
|
| ||||||||||||||
| 44,143,541 | |||||||||||||||
|
| ||||||||||||||
See accompanying notes
24
American Beacon Sound Point Floating Rate Income FundSM
Schedule of Investments
August 31, 2019
| Principal Amount | Fair Value | ||||||||||||||
| BANK LOAN OBLIGATIONSD - 87.07% (continued) | |||||||||||||||
| Utilities - 0.95% | |||||||||||||||
| Frontera Generation Holdings LLC, 6.451%, Due 5/2/2025, 2018 Term Loan B,(1-mo. LIBOR + 4.250%) | $ | 10,585,080 | $ | 10,029,363 | |||||||||||
| Innovative Water Care Global Corp., 7.330%, Due 2/27/2026, 1st Lien Term Loan,(3-mo. LIBOR + 5.000%) | 3,184,020 | 2,977,059 | |||||||||||||
| Star West Generation LLC, 7.080%, Due 3/13/2020, 2015 Term Loan B,(3-mo. LIBOR + 4.750%) | 173,697 | 167,618 | |||||||||||||
| Waterbridge Midstream Operating LLC, 8.136%, Due 6/22/2026, Term Loan B,(3-mo. LIBOR + 5.750%) | 629,000 | 600,695 | |||||||||||||
|
| ||||||||||||||
| 13,774,735 | |||||||||||||||
|
| ||||||||||||||
Total Bank Loan Obligations (Cost $1,327,121,173) | 1,262,416,751 | ||||||||||||||
|
| ||||||||||||||
| CORPORATE OBLIGATIONS - 6.76% | |||||||||||||||
| Communications - 2.70% | |||||||||||||||
| CommScope, Inc., 5.500%, Due 6/15/2024H | 10,000,000 | 9,462,500 | |||||||||||||
| EIG Investors Corp., 10.875%, Due 2/1/2024 | 8,000,000 | 8,410,000 | |||||||||||||
| Univision Communications, Inc., | |||||||||||||||
6.750%, Due 9/15/2022H | 14,560,000 | 14,742,000 | |||||||||||||
5.125%, Due 2/15/2025H | 6,706,000 | 6,470,552 | |||||||||||||
|
| ||||||||||||||
| 39,085,052 | |||||||||||||||
|
| ||||||||||||||
| Consumer, Cyclical - 1.34% | |||||||||||||||
| Constellation Merger Sub, Inc., 8.500%, Due 9/15/2025H | 5,525,000 | 4,696,250 | |||||||||||||
| Panther BF Aggregator 2 LP / Panther Finance Co., Inc., 8.500%, Due 5/15/2027H | 15,159,000 | 14,780,025 | |||||||||||||
|
| ||||||||||||||
| 19,476,275 | |||||||||||||||
|
| ||||||||||||||
| Consumer,Non-Cyclical - 1.78% | |||||||||||||||
| Hadrian Merger Sub, Inc., 8.500%, Due 5/1/2026H | 3,442,000 | 3,295,715 | |||||||||||||
| HLF Financing Sarl LLC / Herbalife International, Inc., 7.250%, Due 8/15/2026H | 8,000,000 | 7,900,000 | |||||||||||||
| RegionalCare Hospital Partners Holdings, Inc. / LifePoint Health, Inc., 9.750%, Due 12/1/2026H | 13,642,000 | 14,579,888 | |||||||||||||
|
| ||||||||||||||
| 25,775,603 | |||||||||||||||
|
| ||||||||||||||
| Energy - 0.05% | |||||||||||||||
| McDermott Technology Americas, Inc. / McDermott Technology US, Inc., 10.625%, Due 5/1/2024H | 1,000,000 | 706,250 | |||||||||||||
|
| ||||||||||||||
| Financial - 0.31% | |||||||||||||||
| Allied Universal Holdco LLC, | |||||||||||||||
6.625%, Due 7/15/2026H | 3,000,000 | 3,187,500 | |||||||||||||
9.750%, Due 7/15/2027H | 1,224,000 | 1,282,140 | |||||||||||||
|
| ||||||||||||||
| 4,469,640 | |||||||||||||||
|
| ||||||||||||||
| Technology - 0.58% | |||||||||||||||
| Granite Merger Sub 2, Inc., 11.000%, Due 7/15/2027H | 5,000,000 | 4,975,000 | |||||||||||||
| Riverbed Technology, Inc., 8.875%, Due 3/1/2023H | 6,010,000 | 3,485,800 | |||||||||||||
|
| ||||||||||||||
| 8,460,800 | |||||||||||||||
|
| ||||||||||||||
Total Corporate Obligations (Cost $100,490,988) | 97,973,620 | ||||||||||||||
|
| ||||||||||||||
| FOREIGN CORPORATE OBLIGATIONS - 1.07% | |||||||||||||||
| Communications - 0.97% | |||||||||||||||
| Intelsat Jackson Holdings S.A., 9.750%, Due 7/15/2025H | 13,644,000 | 14,002,155 | |||||||||||||
|
| ||||||||||||||
| Consumer, Cyclical - 0.10% | |||||||||||||||
| eG Global Finance PLC, 6.750%, Due 2/7/2025H | 1,585,000 | 1,529,525 | |||||||||||||
|
| ||||||||||||||
Total Foreign Corporate Obligations (Cost $15,323,847) | 15,531,680 | ||||||||||||||
|
| ||||||||||||||
See accompanying notes
25
American Beacon Sound Point Floating Rate Income FundSM
Schedule of Investments
August 31, 2019
| Shares | Fair Value | |||||||||||||||
| SHORT-TERM INVESTMENTS - 3.88% (Cost $56,313,566) | ||||||||||||||||
| Investment Companies - 3.88% | ||||||||||||||||
| American Beacon U.S. Government Money Market Select Fund, Select Class, 2.03%I J | 56,313,566 | $ | 56,313,566 | |||||||||||||
|
| |||||||||||||||
TOTAL INVESTMENTS - 98.78% (Cost $1,499,397,819) | 1,432,280,394 | |||||||||||||||
OTHER ASSETS, NET OF LIABILITIES - 1.22% | 17,515,317 | |||||||||||||||
|
| |||||||||||||||
TOTAL NET ASSETS - 100.00% | $ | 1,449,795,711 | ||||||||||||||
|
| |||||||||||||||
| Percentages are stated as a percent of net assets. |
| |||||||||||||||
A Fair valued pursuant to procedures approved by the Board of Trustees. At period end, the value of these securities amounted to $683,453 or 0.05% of net assets.
B Value was determined using significant unobservable inputs.
CNon-income producing security.
D Bank loan obligations, unless otherwise stated, carry a floating rate of interest. The coupon rate shown on floating or adjustable rate securities represents the rate at period end.
E Unfunded Loan Commitment. At period end, the amount of unfunded loan commitments was $3,285,851 or 0.23% of net assets. Of this
amount, $968,468, $368,053, $532,013, $279,679, $62,863, $319,087, $316,926, $391,698 and $47,064 relate to Allied Universal Holdco LLC, AmeriLife Group LLC, BCPE Empire Holdings, Inc., Bulldog Purchaser, Inc., Deluxe Entertainment Services Group, Inc., Heartland
Dental LLC, Mavis Tire Express Services Corp., Premise Health Holding Corp. and United PF Holdings LLC, respectively.
F Coupon rates may not be available for bank loans that are unsettled and/or unfunded as of August 31, 2019.
G Fixed Rate.
H Security exempt from registration under the Securities Act of 1933. These securities may be resold to qualified institutional buyers pursuant to Rule 144A. At the period end, the value of these securities amounted to $105,095,300 or 7.25% of net assets. The Fund has no right to demand registration of these securities.
I The Fund is affiliated by having the same investment advisor.
J7-day yield.
DIP –Debtor-in-possession.
LIBOR – London Interbank Offered Rate.
LLC – Limited Liability Company.
LP – Limited Partnership.
PIK – Payment in Kind.
PLC – Public Limited Company.
PRIME – A rate, charge by banks, based on the U.S. Federal Funds rate.
USD – United States Dollar.
The Fund’s investments are summarized by level based on the inputs used to determine their values. As of August 31, 2019, the investments were classified as described below:
Sound Point Floating Rate Income Fund | Level 1 | Level 2 | Level 3 | Total | ||||||||||||||||||||||||
Assets |
| |||||||||||||||||||||||||||
Common Stocks | $ | - | $ | - | $ | 44,777 | (1) | $ | 44,777 | |||||||||||||||||||
Warrants | - | - | 0 | (1) | - | |||||||||||||||||||||||
Bank Loan Obligations(2) | - | 1,252,625,245 | 9,791,506 | 1,262,416,751 | ||||||||||||||||||||||||
Corporate Obligations | - | 97,973,620 | - | 97,973,620 | ||||||||||||||||||||||||
Foreign Corporate Obligations | - | 15,531,680 | - | 15,531,680 | ||||||||||||||||||||||||
Short-Term Investments | 56,313,566 | - | - | 56,313,566 | ||||||||||||||||||||||||
|
|
|
|
|
|
|
| |||||||||||||||||||||
Total Investments in Securities - Assets | $ | 56,313,566 | $ | 1,366,130,545 | $ | 9,836,283 | $ | 1,432,280,394 | ||||||||||||||||||||
|
|
|
|
|
|
|
| |||||||||||||||||||||
| (1) | Includes investments held in the Fund’s portfolio with $0 fair value. |
| (2) | Unfunded loan commitments represent $3,285,851 at period end. |
U.S. GAAP requires transfers between all levels to/from level 3 be disclosed. During the year ended August 31, 2019, there were transfers from Level 2 to Level 3 with a fair value of $9,452,023 due to a valuation based on a single broker quote.
See accompanying notes
26
American Beacon Sound Point Floating Rate Income FundSM
Schedule of Investments
August 31, 2019
The following table is a reconciliation of Level 3 assets within the Fund for which significant unobservable inputs were used to determine fair value. Transfers in or out of Level 3 represent the ending value of any security or instrument where a change in the level has occurred from the beginning to the end of the period:
| Security Type | Balance as of 8/31/2018 | Purchases | Sales | Accrued Discounts (Premiums) | Realized Gain (Loss) | Change in Unrealized Appreciation (Depreciation) | Transfer into Level 3 | Transfer out of Level 3 | Balance as of 8/31/2019 | Unrealized Appreciation (Depreciation) at Period End** | ||||||||||||||||||||||||||||||
| Common Stocks | $ | 1,541,588 | (1) | $ | 148,245 | $ | 1,492,950 | $ | - | $ | 1,456,569 | $ | (1,608,675 | ) | $ | - | $ | - | $ | 44,777 | (1) | $ | (103,468 | ) | ||||||||||||||||
| Warrants | 0 | (1) | - | - | - | - | - | - | - | 0 | (1) | - | ||||||||||||||||||||||||||||
| Bank Loan Obligations | 12,650,811 | 51,139 | 12,267,378 | 8,404 | (15,159 | ) | (88,334 | ) | 9,452,023 | - | 9,791,506 | (1,097,626 | ) | |||||||||||||||||||||||||||
|
|
|
|
|
|
|
|
|
|
|
|
|
|
|
|
|
|
|
| |||||||||||||||||||||
| $ | 14,192,399 | $ | 199,384 | $ | 13,760,328 | $ | 8,404 | $ | 1,441,410 | $ | (1,697,009 | ) | $ | 9,452,023 | $ | - | $ | 9,836,283 | $ | (1,201,094 | ) | |||||||||||||||||||
|
|
|
|
|
|
|
|
|
|
|
|
|
|
|
|
|
|
|
| |||||||||||||||||||||
| ** | Change in unrealized appreciation (depreciation) attributable to Level 3 securities held at period end. This balance is included in the change in unrealized appreciation (depreciation) on the Statements of Operations. |
| (1) | Investments held in the Fund’s portfolio with $0 fair value. |
For the year ended August 31, 2019, one common stock and a warrant have been fair valued at $0 by the Valuation Committee. The remaining common stocks valued at $44,777 and bank loan obligations valued at $9,791,506 have been classified as Level 3 due to the use of significant unobservable inputs.
See accompanying notes
27
American Beacon FundsSM
Statements of Assets and Liabilities
August 31, 2019
| SiM High Yield Opportunities Fund | Sound Point Floating Rate Income Fund | |||||||||||
Assets: |
| |||||||||||
Investments in unaffiliated securities, at fair value† | $ | 1,181,116,861 | $ | 1,375,966,828 | ||||||||
Investments in affiliated securities, at fair value‡ | 22,977,485 | 56,313,566 | ||||||||||
Cash | 373,145 | 2,702,948 | ||||||||||
Dividends and interest receivable | 19,228,529 | 11,365,265 | ||||||||||
Deposits with broker for futures contracts | 70,249 | - | ||||||||||
Receivable for investments sold | 1,617,031 | 52,106,374 | ||||||||||
Receivable for fund shares sold | 3,540,652 | 3,138,107 | ||||||||||
Receivable for tax reclaims | 39 | 6,456 | ||||||||||
Receivable for expense reimbursement (Note 2) | - | 39,295 | ||||||||||
Receivable for variation margin on open futures contracts (Note 5) | 854,325 | - | ||||||||||
Prepaid expenses | 62,140 | 207,809 | ||||||||||
|
|
|
| |||||||||
Total assets | 1,229,840,456 | 1,501,846,648 | ||||||||||
|
|
|
| |||||||||
Liabilities: |
| |||||||||||
Payable for investments purchased | 9,045,132 | 41,595,448 | ||||||||||
Payable for fund shares redeemed | 2,449,592 | 4,973,449 | ||||||||||
Payable for expense reimbursement (Note 2) | 52,391 | - | ||||||||||
Dividends payable | 688,185 | 527,179 | ||||||||||
Unfunded loan commitments | - | 3,285,851 | ||||||||||
Management andsub-advisory fees payable (Note 2) | 733,590 | 909,004 | ||||||||||
Service fees payable (Note 2) | 72,262 | 139,212 | ||||||||||
Transfer agent fees payable (Note 2) | 86,830 | 80,279 | ||||||||||
Custody and fund accounting fees payable | 69,932 | 191,956 | ||||||||||
Professional fees payable | 72,116 | 96,997 | ||||||||||
Trustee fees payable (Note 2) | - | 12,965 | ||||||||||
Payable for prospectus and shareholder reports | 53,960 | 59,028 | ||||||||||
Other liabilities | 18,686 | 179,569 | ||||||||||
|
|
|
| |||||||||
Total liabilities | 13,342,676 | 52,050,937 | ||||||||||
|
|
|
| |||||||||
Net assets | $ | 1,216,497,780 | $ | 1,449,795,711 | ||||||||
|
|
|
| |||||||||
Analysis of net assets: |
| |||||||||||
Paid-in-capital | $ | 1,253,670,951 | $ | 1,559,577,006 | ||||||||
Total distributable earnings (deficits)A | (37,173,171 | ) | (109,781,295 | ) | ||||||||
|
|
|
| |||||||||
Net assets | $ | 1,216,497,780 | $ | 1,449,795,711 | ||||||||
|
|
|
| |||||||||
Shares outstanding at no par value (unlimited shares authorized): |
| |||||||||||
Institutional Class | 42,039,839 | 35,112,279 | ||||||||||
|
|
|
| |||||||||
Y Class | 70,110,753 | 80,242,718 | ||||||||||
|
|
|
| |||||||||
Investor Class | 8,366,075 | 21,953,829 | ||||||||||
|
|
|
| |||||||||
A Class | 2,517,420 | 4,644,012 | ||||||||||
|
|
|
| |||||||||
C Class | 5,874,957 | 5,954,210 | ||||||||||
|
|
|
| |||||||||
SP Class | N/A | 28,741 | ||||||||||
|
|
|
| |||||||||
Net assets: |
| |||||||||||
Institutional Class | $ | 396,916,950 | $ | 343,916,230 | ||||||||
|
|
|
| |||||||||
Y Class | $ | 661,486,121 | $ | 786,638,267 | ||||||||
|
|
|
| |||||||||
Investor Class | $ | 78,700,798 | $ | 214,702,538 | ||||||||
|
|
|
| |||||||||
A Class | $ | 23,694,436 | $ | 45,602,098 | ||||||||
|
|
|
| |||||||||
C Class | $ | 55,699,475 | $ | 58,653,731 | ||||||||
|
|
|
| |||||||||
SP Class | N/A | $ | 282,847 | |||||||||
|
|
|
| |||||||||
Net asset value, offering and redemption price per share: |
| |||||||||||
Institutional Class | $ | 9.44 | $ | 9.79 | ||||||||
|
|
|
| |||||||||
Y Class | $ | 9.43 | $ | 9.80 | ||||||||
|
|
|
| |||||||||
Investor Class | $ | 9.41 | $ | 9.78 | ||||||||
|
|
|
| |||||||||
A Class | $ | 9.41 | $ | 9.82 | ||||||||
|
|
|
| |||||||||
A Class (offering price) | $ | 9.88 | $ | 10.07 | ||||||||
|
|
|
| |||||||||
C Class | $ | 9.48 | $ | 9.85 | ||||||||
|
|
|
| |||||||||
SP Class | N/A | $ | 9.84 | |||||||||
|
|
|
| |||||||||
† Cost of investments in unaffiliated securities | $ | 1,214,082,951 | $ | 1,443,084,253 | ||||||||
‡ Cost of investments in affiliated securities | $ | 22,977,485 | $ | 56,313,566 | ||||||||
A The Fund’s investments in affiliated securities did not have unrealized appreciation (depreciation) at year end. |
| |||||||||||
See accompanying notes
28
American Beacon FundsSM
Statements of Operations
For the year ended August 31, 2019
| SiM High Yield Opportunities Fund | Sound Point Floating Rate Income Fund | |||||||||||
Investment income: |
| |||||||||||
Dividend income from unaffiliated securities (net of foreign taxes)† | $ | 1,003,735 | $ | - | ||||||||
Dividend income from affiliated securities (Note 8) | 295,437 | 4,021,908 | ||||||||||
Interest income | 81,253,733 | 131,206,825 | ||||||||||
|
|
|
| |||||||||
Total investment income | 82,552,905 | 135,228,733 | ||||||||||
|
|
|
| |||||||||
Expenses: |
| |||||||||||
Management andsub-advisory fees (Note 2) | 8,392,345 | 13,742,038 | ||||||||||
Transfer agent fees: | ||||||||||||
Institutional Class (Note 2) | 123,553 | 112,566 | ||||||||||
Y Class (Note 2) | 674,621 | 1,012,457 | ||||||||||
Investor Class | 4,538 | 14,012 | ||||||||||
A Class | 4,602 | 2,461 | ||||||||||
C Class | 3,658 | 4,397 | ||||||||||
SP Class | - | 47 | ||||||||||
Custody and fund accounting fees | 209,197 | 658,584 | ||||||||||
Professional fees | 126,801 | 230,034 | ||||||||||
Registration fees and expenses | 126,224 | 302,938 | ||||||||||
Service fees (Note 2): | ||||||||||||
Investor Class | 292,672 | 1,609,680 | ||||||||||
A Class | 29,091 | 34,098 | ||||||||||
C Class | 51,906 | 55,181 | ||||||||||
Distribution fees (Note 2): | ||||||||||||
A Class | 66,379 | 134,374 | ||||||||||
C Class | 572,766 | 657,290 | ||||||||||
SP Class | - | 1,442 | ||||||||||
Prospectus and shareholder report expenses | 173,536 | 240,624 | ||||||||||
Trustee fees (Note 2) | 85,217 | 154,205 | ||||||||||
Loan fees (Note 9) | - | 4,547 | ||||||||||
Other expenses | 86,317 | 502,418 | ||||||||||
|
|
|
| |||||||||
Total expenses | 11,023,423 | 19,473,393 | ||||||||||
|
|
|
| |||||||||
Net fees waived and expenses recouped (Note 2) | 50,797 | 11,987 | ||||||||||
|
|
|
| |||||||||
Net expenses | 11,074,220 | 19,485,380 | ||||||||||
|
|
|
| |||||||||
Net investment income | 71,478,685 | 115,743,353 | ||||||||||
|
|
|
| |||||||||
Realized and unrealized gain (loss) from investments: |
| |||||||||||
Net realized gain (loss) from: | ||||||||||||
Investments in unaffiliated securitiesA | 6,129,165 | (30,797,997 | ) | |||||||||
Foreign currency transactions | (23,848 | ) | - | |||||||||
Futures contracts | 3,321,159 | - | ||||||||||
Change in net unrealized (depreciation) of: | ||||||||||||
Investments in unaffiliated securitiesB | (20,001,239 | ) | (59,949,986 | ) | ||||||||
Foreign currency transactions | (23,604 | ) | - | |||||||||
Futures contracts | (253,917 | ) | - | |||||||||
|
|
|
| |||||||||
Net (loss) from investments | (10,852,284 | ) | (90,747,983 | ) | ||||||||
|
|
|
| |||||||||
Net increase in net assets resulting from operations | $ | 60,626,401 | $ | 24,995,370 | ||||||||
|
|
|
| |||||||||
† Foreign taxes | $ | 23,313 | $ | - | ||||||||
A The Fund did not recognize net realized gains (losses) from the sale of investments in affiliated securities. |
| |||||||||||
B The Fund’s investments in affiliated securities did not have a change in unrealized appreciation (depreciation) at year end. |
| |||||||||||
See accompanying notes
29
American Beacon FundsSM
Statements of Changes in Net Assets
| SiM High Yield Opportunities Fund | Sound Point Floating Rate Income Fund | |||||||||||||||||||||||||||
| Year Ended August 31, 2019 | Year Ended August 31, 2018 | Year Ended August 31, 2019 | Year Ended August 31, 2018 | |||||||||||||||||||||||||
Increase (decrease) in net assets: |
| |||||||||||||||||||||||||||
Operations: |
| |||||||||||||||||||||||||||
Net investment income | $ | 71,478,685 | $ | 70,683,646 | $ | 115,743,353 | $ | 75,888,985 | ||||||||||||||||||||
Net realized gain (loss) from investments in unaffiliated securities, foreign currency transactions, and futures contracts | 9,426,476 | 3,252,838 | (30,797,997 | ) | (3,396,848 | ) | ||||||||||||||||||||||
Change in net unrealized (depreciation) of investments in unaffiliated securities, foreign currency transactions, and futures contracts | (20,278,760 | ) | (15,494,279 | ) | (59,949,986 | ) | (7,128,886 | ) | ||||||||||||||||||||
|
|
|
|
|
|
|
| |||||||||||||||||||||
Net increase in net assets resulting from operations | 60,626,401 | 58,442,205 | 24,995,370 | 65,363,251 | ||||||||||||||||||||||||
|
|
|
|
|
|
|
| |||||||||||||||||||||
Distributions to shareholders: |
| |||||||||||||||||||||||||||
Net investment income: | ||||||||||||||||||||||||||||
Institutional Class | - | (21,073,065 | ) | - | (15,197,926 | ) | ||||||||||||||||||||||
Y Class | - | (35,799,953 | ) | - | (41,992,309 | ) | ||||||||||||||||||||||
Investor Class | - | (5,903,365 | ) | - | (14,184,672 | ) | ||||||||||||||||||||||
A Class | - | (2,911,855 | ) | - | (2,073,340 | ) | ||||||||||||||||||||||
C Class | - | (3,125,031 | ) | - | (1,694,366 | ) | ||||||||||||||||||||||
SP Class | - | - | - | (37,275 | ) | |||||||||||||||||||||||
Net realized gain from investments: | ||||||||||||||||||||||||||||
Institutional Class | - | - | - | (653,654 | ) | |||||||||||||||||||||||
Y Class | - | - | - | (1,522,613 | ) | |||||||||||||||||||||||
Investor Class | - | - | - | (381,529 | ) | |||||||||||||||||||||||
A Class | - | - | - | (87,467 | ) | |||||||||||||||||||||||
C Class | - | - | - | (88,440 | ) | |||||||||||||||||||||||
SP Class | - | - | - | (2,075 | ) | |||||||||||||||||||||||
Total retained earnings:* | ||||||||||||||||||||||||||||
Institutional Class | (25,158,278 | ) | - | (25,168,717 | ) | - | ||||||||||||||||||||||
Y Class | (37,145,789 | ) | - | (69,601,964 | ) | - | ||||||||||||||||||||||
Investor Class | (5,006,310 | ) | - | (23,917,366 | ) | - | ||||||||||||||||||||||
A Class | (1,586,624 | ) | - | (3,256,554 | ) | - | ||||||||||||||||||||||
C Class | (3,025,464 | ) | - | (3,309,136 | ) | - | ||||||||||||||||||||||
SP Class | - | - | (34,122 | ) | - | |||||||||||||||||||||||
Tax return of capital: | ||||||||||||||||||||||||||||
Institutional Class | - | (640,329 | ) | - | - | |||||||||||||||||||||||
Y Class | - | (1,009,412 | ) | - | - | |||||||||||||||||||||||
Investor Class | - | (149,749 | ) | - | - | |||||||||||||||||||||||
A Class | - | (64,791 | ) | - | - | |||||||||||||||||||||||
C Class | - | (87,259 | ) | - | - | |||||||||||||||||||||||
|
|
|
|
|
|
|
| |||||||||||||||||||||
Net distributions to shareholders | (71,922,465 | ) | (70,764,809 | ) | (125,287,859 | ) | (77,915,666 | ) | ||||||||||||||||||||
|
|
|
|
|
|
|
| |||||||||||||||||||||
Capital share transactions (Note 10): |
| |||||||||||||||||||||||||||
Proceeds from sales of shares | 615,061,422 | 551,075,868 | 1,129,880,930 | 1,822,617,349 | ||||||||||||||||||||||||
Reinvestment of dividends and distributions | 63,566,129 | 64,533,431 | 118,529,259 | 73,930,335 | ||||||||||||||||||||||||
Cost of shares redeemed | (613,008,694 | ) | (644,287,572 | ) | (2,008,708,410 | ) | (506,619,445 | ) | ||||||||||||||||||||
|
|
|
|
|
|
|
| |||||||||||||||||||||
Net increase (decrease) in net assets from capital share transactions | 65,618,857 | (28,678,273 | ) | (760,298,221 | ) | 1,389,928,239 | ||||||||||||||||||||||
|
|
|
|
|
|
|
| |||||||||||||||||||||
Net increase (decrease) in net assets | 54,322,793 | (41,000,877 | ) | (860,590,710 | ) | 1,377,375,824 | ||||||||||||||||||||||
|
|
|
|
|
|
|
| |||||||||||||||||||||
Net assets: |
| |||||||||||||||||||||||||||
Beginning of period | 1,162,174,987 | 1,203,175,864 | 2,310,386,421 | 933,010,597 | ||||||||||||||||||||||||
|
|
|
|
|
|
|
| |||||||||||||||||||||
End of period | $ | 1,216,497,780 | $ | 1,162,174,987 | $ | 1,449,795,711 | $ | 2,310,386,421 | ||||||||||||||||||||
|
|
|
|
|
|
|
| |||||||||||||||||||||
* Distributions from net investment income and net realized capital gains are combined for the year ended August 31, 2019. See Note 1 in the Notes to Financial Statements for more information regarding new accounting pronouncements. |
| |||||||||||||||||||||||||||
See accompanying notes
30
American Beacon FundsSM
August 31, 2019
1. Organization and Significant Accounting Policies
American Beacon Funds (the “Trust”) is organized as a Massachusetts business trust. The Funds, each a series within the Trust, are registered under the Investment Company Act of 1940, as amended (the “Act”), as diversified,open-end management investment companies. As of August 31, 2019, the Trust consists of thirty-three active series, two of which are presented in this filing: American Beacon SiM High Yield Opportunities Fund and American Beacon Sound Point Floating Rate Income Fund (collectively, the “Funds” and each individually a “Fund”). The remainingthirty-one active series are reported in separate filings.
American Beacon Advisors, Inc. (the “Manager”) is a Delaware corporation and a wholly-owned subsidiary of Resolute Investment Managers, Inc. (“RIM”) organized in 1986 to provide business management, advisory, administrative, and asset management consulting services to the Trust and other investors. The Manager is registered as an investment advisor under the Investment Advisers Act of 1940, as amended (the “Advisers Act”). RIM is, in turn, a wholly-owned subsidiary of Resolute Acquisition, Inc., which is a wholly-owned subsidiary of Resolute Topco, Inc., a wholly-owned subsidiary of Resolute Investment Holdings, LLC (“RIH”). RIH is owned primarily by Kelso Investment Associates VIII, L.P., KEP VI, LLC and Estancia Capital Partners L.P., investment funds affiliated with Kelso & Company, L.P. (“Kelso”) or Estancia Capital Management, LLC (“Estancia”), which are private equity firms.
Recent Accounting Pronouncements
In March 2017, the Financial Accounting Standards Board (“FASB”) issued Accounting Standards Update (“ASU”)2017-08,Premium Amortization of Purchased Callable Debt Securities. The amendments in the ASU shorten the premium amortization period on a purchased callable debt security from the security’s contractual life to the earliest call date. It is anticipated that this change will enhance disclosures by reducing losses recognized when a security is called on an earlier date. This ASU is effective for fiscal years beginning after December 15, 2018. The Manager continues to evaluate the impact this ASU will have on the financial statements and other disclosures.
In August 2018, the FASB issued ASU2018-13,Fair Value Measurement (“Topic 820”). The amendments in the ASU impact disclosure requirements for fair value measurement. It is anticipated that this change will enhance the effectiveness of disclosures in the notes to the financial statements. This ASU is effective for fiscal years beginning after December 15, 2019. Early adoption is permitted and can include the entire standard or certain provisions that exclude or amend disclosures. For the year ended August 31, 2019, the Funds have chosen to adopt the standard. The adoption of this ASU guidance did not have a material impact on the financial statements and other disclosures.
In August 2018, the U.S. Securities and Exchange Commission (“SEC”) adopted amendments to certain disclosure requirements in Securities Act ReleaseNo. 33-10532, Disclosure Update and Simplification, which is intended to facilitate the disclosure of information to investors and simplify compliance without significantly altering the total mix of information provided to investors. Effective with the current reporting period, the Funds adopted the amendments with the impacts being that the Funds are no longer required to present components of distributable earnings on the Statements of Assets and Liabilities or the sources of distributable earnings and the amount of undistributed net investment income on the Statements of Changes in Net Assets.
31
American Beacon FundsSM
Notes to Financial Statements
August 31, 2019
Class Disclosure
Each Fund has multiple classes of shares designed to meet the needs of different groups of investors; however, not all of the Funds offer all classes. The following table sets forth the differences amongst the classes:
Class | Eligible Investors | Minimum Initial Investments | ||||
| Institutional | Large Institutional investors - sold directly or through intermediary channels. | $ | 250,000 | |||
| Y Class | Large institutional retirement plan investors - sold directly or through intermediary channels. | $ | 100,000 | |||
| Investor | All investors using intermediary organizations, such as broker-dealers or retirement plan sponsors - sold directly through intermediary channels. | $ | 2,500 | |||
| A Class | All investors who invest through intermediary organizations, such as broker-dealers or third party administrator. Retail investors who invest directly through a financial intermediary such as a broker, bank, or registered investment advisor which may include afront-end sales charge and a contingent deferred sales charge (“CDSC”). | $ | 2,500 | |||
| C Class | Retail investors who invest directly through a financial intermediary such as a broker or through employee directed benefit plans with applicable sales charges which may include CDSC. | $ | 1,000 | |||
| SP Class | Retail investors who invest directly through a financial intermediary such as a broker, or through employee directed benefit plans and were formerly shareholders of the Investor Class Shares of the Sound Point Floating Rate Income Fund prior to its reorganization. | $ | 1,000 | |||
Each class offered by the Trust has equal rights as to assets and voting privileges. Income andnon-class specific expenses are allocated daily to each class based on the relative net assets. Realized and unrealized capital gains and losses of each class are allocated daily based on the relative net assets of each class of the respective Fund. Class specific expenses, where applicable, currently include service, distribution, transfer agent fees, andsub-transfer agent fees that vary amongst the classes as described more fully in Note 2.
Significant Accounting Policies
The following is a summary of significant accounting policies, consistently followed by the Funds in preparation of the financial statements. The Funds are considered investment companies and accordingly, follow the investment company accounting and reporting guidance of the FASB Accounting Standards Codification Topic 946,Financial Services - Investment Companies,a part of Generally Accepted Accounting Principles (“U.S. GAAP”).
Security Transactions and Investment Income
Security transactions are recorded as of the trade date for financial reporting purposes. Securities purchased or sold on a when-issued or delayed-delivery basis may be settled beyond a standard settlement period for the security after the trade date.
Dividend income, net of foreign taxes, is recorded on theex-dividend date, except certain dividends from foreign securities which are recorded as soon as the information is available to the Funds. Interest income, net of foreign taxes, is earned from settlement date, recorded on the accrual basis, and adjusted, if necessary, for accretion of discounts and amortization of premiums. For convertible securities, premiums attributable to the conversion feature are not amortized. Realized gains (losses) from securities sold are determined on the basis of specific lot identification. Estimated tax liabilities on certain foreign securities are recorded on an accrual basis and are reflected as components of interest income or net change in unrealized appreciation (depreciation) on investments on the Statements of Operations, as appropriate. Tax liabilities realized as a result of such security sales are reflected as a component of net realized gain (loss) on investments on the Statements of Operations.
32
American Beacon FundsSM
Notes to Financial Statements
August 31, 2019
Paydown gains (losses) on mortgage-related and other asset-backed securities, if any, are recorded as components of interest income on the Statements of Operations. Income or short-term capital gain distributions received from registered investment companies, if any, are recorded as dividend income. Long-term gain distributions received from registered investment companies, if any, are recorded as realized gains.
Debt obligations may be placed on anon-accrual status and related interest income may be reduced by ceasing current accruals and writing off interest receivable when the collection of all or a portion of interest has become doubtful based on consistently applied procedures. A debt obligation is removed fornon-accrual when the issuer resumes interest payments or when collectability of interest is probable. Realized gains (losses) from securities sold are determined on the basis of specific lot identification.
Currency Translation
All assets and liabilities initially expressed in foreign currency values are converted into U.S. dollar values at the mean of the bid and ask prices of such currencies against U.S. dollars as last quoted by a recognized dealer. Income, expenses, and purchases and sales of investments are translated into U.S. dollars at the rate of the exchange prevailing on the respective dates of such transactions. The effect of changes in foreign currency exchange rates on investments is separately identified from the fluctuations arising from changes in market values of securities held and is reported with all other foreign currency gains and losses on the Funds’ Statements of Operations.
Distributions to Shareholders
The Funds distribute most or all of its net earnings and realized gains, if any, each taxable year in the form of dividends from net investment income and distributions of realized net capital gains and net gains from foreign currency transactions on an annual basis. The Funds do not have a fixed dividend rate and do not guarantee that it will pay any distributions in any particular period. Dividends to shareholders are determined in accordance with federal income tax regulations, which may differ in amount and character from net investment income and realized gains recognized for purposes of U.S. GAAP. To the extent necessary to fully distribute capital gains, the Funds may designate earnings and profits distributed to shareholders on the redemption of shares.
Allocation of Income, Trust Expenses, Gains, and Losses
Investment income, realized and unrealized gains and losses from investments of the Funds are allocated daily to each class of shares based upon the relative proportion of net assets of each class to the total net assets of the Funds. Expenses directly charged or attributable to the Fund will be paid from the assets of the Fund. Generally, expenses of the Trust will be allocated among and charged to the assets of the Funds on a basis that the Trust’s Board of Trustees (the “Board”) deems fair and equitable, which may be based on the relative net assets of the Funds or nature of the services performed and relative applicability to the Funds.
Use of Estimates
The preparation of financial statements in conformity with U.S. GAAP requires management to make estimates and assumptions that affect the amounts reported in the financial statements and accompanying notes. Actual results may differ from those estimated.
Other
Under the Trust’s organizational documents, its officers and trustees are indemnified against certain liabilities arising out of the performance of their duties to the Trust. In the normal course of business, the Trust enters into contracts that provide indemnification to the other party or parties against potential costs or liabilities. The Trust’s maximum exposure under these arrangements is dependent on claims that may be made in the future and, therefore, cannot be estimated. The Trust has had no prior claims or losses pursuant to any such agreement.
33
American Beacon FundsSM
Notes to Financial Statements
August 31, 2019
2. Transactions with Affiliates
Management and InvestmentSub-Advisory Agreements
The Funds and the Manager are parties to a Management Agreement that obligates the Manager to provide the Funds with investment advisory and administrative services. As compensation for performing the duties under the Management Agreement, the Manager will receive an annualized management fee based on a percentage of the Funds’ average daily net assets that is calculated and accrued daily according to the following schedule:
First $5 billion | 0.35 | % | ||
Next $5 billion | 0.325 | % | ||
Next $10 billion | 0.30 | % | ||
Over $20 billion | 0.275 | % |
The Trust, on behalf of the Funds, and the Manager have entered into an Investment Advisory Agreement with the followingSub-Advisors pursuant to which each Fund has agreed to pay an annualizedsub-advisory fee that is calculated and accrued daily based on the applicable Fund’s average daily net assets according to the following schedules:
Strategic Income Management, LLC
First $250 million | 0.45 | % | ||
Next $250 million | 0.40 | % | ||
Next $500 million | 0.35 | % | ||
Over $1 billion | 0.30 | % |
Sound Point Capital Management, LP
All Assets | 0.35 | % |
The Management andSub-Advisory Fees paid by the Funds for the year ended August 31, 2019 were as follows:
SiM High Yield Opportunities Fund
| Effective Fee Rate | Amount of Fees Paid | |||||||||||
Management Fees | 0.35 | % | $ | 4,048,131 | ||||||||
Sub-Advisor Fees | 0.37 | % | 4,344,214 | |||||||||
|
|
|
| |||||||||
Total | 0.72 | % | $ | 8,392,345 | ||||||||
|
|
|
| |||||||||
Sound Point Floating Rate Income Fund
| Effective Fee Rate | Amount of Fees Paid | |||||||||||
Management Fees | 0.35 | % | $ | 6,871,161 | ||||||||
Sub-Advisor Fees | 0.35 | % | 6,870,877 | |||||||||
|
|
|
| |||||||||
Total | 0.70 | % | $ | 13,742,038 | ||||||||
|
|
|
| |||||||||
Distribution Plans
The Funds, except for the A, C, and SP Classes of the Funds, have adopted a “defensive” Distribution Plan (the “Plan”) in accordance with Rule12b-1 under the Act, pursuant to which no separate fees may be charged to the Funds for distribution purposes. However, the Plan authorizes the management fee received by the Manager
34
American Beacon FundsSM
Notes to Financial Statements
August 31, 2019
and the investment advisors hired by the Manager to be used for distribution purposes. Under this Plan, the Funds do not intend to compensate the Manager or any other party, either directly or indirectly, for the distribution of Fund shares.
Separate Distribution Plans (the “Distribution Plans”) have been adopted pursuant to Rule12b-1 under the Act for the A, C, and SP Classes of the Funds. Under the Distribution Plans, as compensation for distribution and shareholder servicing assistance, the Manager receives an annual fee of 0.25% of the average daily net assets of the A and SP Classes and 1.00% of the average daily net assets of the C Class. The fee will be payable without regard to whether the amount of the fee is more or less than the actual expenses incurred in a particular month by the Manager for distribution assistance.
Service Plans
The Manager and the Trust entered into Service Plans that obligate the Manager to oversee additional shareholder servicing of the Investor, A, and C Classes of the Funds. As compensation for performing the duties required under the Service Plans, the Manager receives an annualized fee up to 0.25% of the average daily net assets of the A and C Classes, and up to 0.375% of the average daily net assets of the Investor Class of the Funds.
Sub-Transfer Agent Fees
The Manager has entered into agreements, which include servicing agreements, with financial intermediaries that provide recordkeeping, processing, shareholder communications and other services to customers of the intermediaries that hold positions in the Institutional and Y Classes of the Funds and has agreed to compensate the intermediaries for providing these services. Intermediaries transact with the Funds primarily through the use of omnibus accounts on behalf of their customers who hold positions in the Funds. Certain services would have been provided by the Funds’ transfer agent and other service providers if the shareholders’ accounts were maintained directly by the Funds’ transfer agent. Accordingly, the Funds, pursuant to Board approval, have agreed to reimburse the Manager for certainnon-distribution shareholder services provided by financial intermediaries for the Institutional and Y Classes. The reimbursement amounts(sub-transfer agent fees) paid to the Manager are subject to a fee limit of up to 0.10% of an intermediary’s average net assets in the Institutional and Y Classes on an annual basis. During the year ended August 31, 2019, thesub-transfer agent fees, as reflected in “Transfer agent fees” on the Statements of Operations, were as follows:
Fund | Sub-Transfer Agent Fees | |||
SiM High Yield Opportunities | $ | 747,908 | ||
Sound Point Floating Rate Income | 1,071,682 | |||
As of August 31, 2019, the Funds owed the Manager the following reimbursement ofsub-transfer agent fees, as reflected in “Transfer agent fees payable” on the Statements of Assets and Liabilities:
Fund | Reimbursement Sub-Transfer Agent Fees | |||
SiM High Yield Opportunities | $ | 75,366 | ||
Sound Point Floating Rate Income | 68,333 | |||
Investments in Affiliated Funds
The Funds may invest in the American Beacon U.S. Government Money Market Select Fund (the “USG Select Fund”). Cash collateral received by the Funds in connection with securities lending may also be invested in the USG Select Fund. The Funds and the USG Select Fund have the same investment advisor and therefore, are considered to be affiliated. The Manager serves as investment advisor to the USG Select Fund and receives
35
American Beacon FundsSM
Notes to Financial Statements
August 31, 2019
management fees and administrative fees totaling 0.10% of the average daily net assets of the USG Select Fund. During the year ended August 31, 2019, the Manager earned fees on the Funds’ direct investments in the USG Select Fund as shown below:
Fund | Direct Investments in USG Select Fund | |||
SiM High Yield Opportunities | $ | 13,561 | ||
Sound Point Floating Rate Income | 187,505 | |||
Interfund Credit Facility
Pursuant to an exemptive order issued by the SEC, the Funds, along with other registered investment companies having management contracts with the Manager, may participate in a credit facility whereby each fund, under certain conditions, is permitted to lend money directly to and borrow directly from other participating funds for temporary purposes. The interfund credit facility is advantageous to the funds because it provides added liquidity and eliminates the need to maintain higher cash balances to meet redemptions. This situation could arise when shareholder redemptions exceed anticipated volumes and certain funds have insufficient cash on hand to satisfy such redemptions or when sales of securities do not settle as expected, resulting in a cash shortfall for a fund. When a fund liquidates portfolio securities to meet redemption requests, they often do not receive payment in settlement for up to two days (or longer for certain foreign transactions). Redemption requests normally are satisfied on the next business day. The credit facility provides a source of immediate, short-term liquidity pending settlement of the sale of portfolio securities. The credit facility is administered by a credit facility team consisting of professionals from the Manager’s asset management, compliance, and accounting areas who report the activities of the credit facility to the Board. During the year ended August 31, 2019, the SiM High Yield Opportunities Fund borrowed on average $27,874,488 for 9 days at an average interest rate of 3.02% with interest charges of $20,763 and the Sound Point Floating Rate Income Fund borrowed on average $17,607,958 for 2 days at an average interest rate of 3.03% with interest charges of $2,919. These amounts are recorded as “Other expenses” in the Statements of Operations.
Expense Reimbursement Plan
The Manager contractually agreed to reduce fees and/or reimburse expenses for the classes of the Funds to the extent that total operating expenses exceed the Funds’ expense cap. During the year ended August 31, 2019, the Manager waived and/or reimbursed/(recouped) expenses as follows:
Fund | Class | Expense Cap | Reimbursed Expenses | (Recouped) Expenses | Expiration of Reimbursed Expenses | |||||||||||||||||
| 9/1/2018 - 12/28/2018 | 12/29/2018 - 8/31/2019 | |||||||||||||||||||||
SiM High Yield Opportunities | Institutional | 0.84 | % | 0.84 | % | $ | 53,922 | $ | (104,719 | ) | 2021-2022 | |||||||||||
Sound Point Floating Rate Income | Institutional | 0.84 | % | N/A | 62,727 | (74,211 | ) | 2021-2022 | ||||||||||||||
Sound Point Floating Rate Income | SP | N/A | N/A | 34 | (537 | ) | 2021-2022 | |||||||||||||||
Of these amounts, $52,391 was disclosed as a payable to the Manager on the Statements of Assets and Liabilities at August 31, 2019 for the SiM High Yield Opportunities Fund and $39,295 was disclosed as a receivable from the Manager on the Statements of Assets and Liabilities for August 31, 2019 for the Sound Point Floating Rate Income Fund.
The Funds have adopted an Expense Reimbursement Plan whereby the Manager may seek repayment of such fee or voluntary reductions and expense reimbursements. Under the policy, the Manager can be reimbursed by the Funds for any contractual or voluntary fee reductions or expense reimbursements if reimbursement to the Manager (a) occurs within thirty-six months from the date of the Manager’s waiver/reimbursement and (b) does not cause the Funds’ annual operating expenses to exceed the lesser of the contractual percentage limit in effect at
36
American Beacon FundsSM
Notes to Financial Statements
August 31, 2019
the time of the waiver/reimbursement or time of recoupment. The reimbursed expenses listed above will expire in 2021 and 2022. The Funds did not record a liability for potential reimbursements due to the current assessment that reimbursements are uncertain. The carryover of excess expenses potentially reimbursable to the Manager, but not recorded as a liability are as follows:
Fund | Recouped Expenses | Excess Expense Carryover | Expired Expense Carryover | Expiration of Reimbursed Expenses | ||||||||||||||||||||||||
SiM High Yield Opportunities | $ | 34,469 | * | $ | 12,941 | $ | - | 2019-2020 | ||||||||||||||||||||
SiM High Yield Opportunities | - | 108,508 | - | 2020-2021 | ||||||||||||||||||||||||
Sound Point Floating Rate Income | 20,872 | * | 18,867 | - | 2019-2020 | |||||||||||||||||||||||
Sound Point Floating Rate Income | - | 25,680 | - | 2020-2021 | ||||||||||||||||||||||||
*Amount is related to Institutional Class.
Sales Commissions
The Funds’ Distributor, Resolute Investment Distributors, Inc. (“RID” or “Distributor”), may receive a portion of Class A sales charges from broker dealers and it may be used to offset distribution related expenses. During the year ended August 31, 2019, RID collected $17,938 and $27,269 for SiM High Yield Opportunities Fund and Sound Point Floating Rate Income Fund, respectively, from the sale of Class A Shares.
A CDSC of 0.50% will be deducted with respect to Class A Shares on certain purchases of $1,000,000 or more that are redeemed in whole or part within 18 months of purchase, unless waived as discussed in the Funds’ Prospectus. Any applicable CDSC will be 0.50% of the lesser of the original purchase price or the value of the redemption of the Class A Shares redeemed. During the year ended August 31, 2019, CDSC fees of $2,443 and $15,978 were collected for the Class A Shares of SiM High Yield Opportunities Fund and Sound Point Floating Rate Income Fund, respectively.
A CDSC of 1.00% will be deducted with respect to Class C Shares redeemed within 12 months of purchase, unless waived as discussed in the Funds’ Prospectus. Any applicable CDSC will be 1.00% of the lesser of the original purchase price or the value of the redemption of the Class C Shares redeemed. During the year ended August 31, 2019, CDSC fees of $4,748 and $34,919 were collected for the Class C Shares of SiM High Yield Opportunities Fund and Sound Point Floating Rate Income Fund, respectively.
Trustee Fees and Expenses
As compensation for their service to the Trusts, each Trustee receives an annual retainer of $120,000, plus $10,000 for each Board meeting attended in person or via teleconference, $2,500 for attendance by Committee members at meetings of the Audit Committee and the Investment Committee, and $1,500 for attendance by Committee members at meetings of the Nominating and Governance Committee, plus reimbursement of reasonable expenses incurred in attending Board meetings, Committee meetings, and relevant educational seminars. The Trustees also may be compensated for attendance at special Board and/or Committee meetings from time to time. The Board Chair receives an additional annual retainer of $50,000 as well as a $2,500 fee each quarter for attendance at the committee meetings. The Chairpersons of the Audit Committee and the Investment Committee each receive an additional annual retainer of $25,000 and the Chairman of the Nominating and Governance Committee receives an additional annual retainer of $10,000. These expenses are allocated on a prorated basis to each fund of the Trusts according to its respective net assets.
37
American Beacon FundsSM
Notes to Financial Statements
August 31, 2019
3. Security Valuation and Fair Value Measurements
The price of the Fund’s shares is based on its net asset value (“NAV”) per share. The Fund’s NAV is computed by adding total assets, subtracting all the Fund’s liabilities, and dividing the result by the total number of shares outstanding.
The NAV of each class of the Fund’s shares is determined based on a pro rata allocation of the Fund’s investment income, expenses and total capital gains and losses. The Fund’s NAV per share is determined each business day as of the regular close of trading on the New York Stock Exchange (“NYSE” or “Exchange”), which is typically 4:00 p.m. Eastern Time (“ET”). However, if trading on the NYSE closes at a time other than 4:00 p.m. ET, the Fund’s NAV per share typically would still be determined as of the regular close of trading on the NYSE. The Fund does not price its shares on days that the NYSE is closed. Foreign exchanges may permit trading in foreign securities on days when the Fund is not open for business, which may result in the value of the Fund’s portfolio investments being affected at a time when you are unable to buy or sell shares.
Equity securities, including shares ofclosed-end funds and exchange-traded funds (“ETFs”), are valued at the last sale price or official closing price taken from the primary exchange in which each security trades. Investments in other mutual funds are valued at the closing NAV per share on the day of valuation. Debt securities are valued at bid quotes from broker/dealers or evaluated bid prices from pricing services, who may consider a number of inputs and factors, such as prices of comparable securities, yield curves, spreads, credit ratings, coupon rates, maturity, default rates, and underlying collateral. Futures are valued based on their daily settlement prices. Exchange-traded andover-the-counter (“OTC”) options are valued at the last sale price. Options with no last sale for the day are priced at mid quote. Swaps are valued at evaluated mid prices from pricing services.
The valuation of securities traded on foreign markets and certain fixed income securities will generally be based on prices determined as of the earlier closing time of the markets on which they primarily trade unless a significant event has occurred. When the Fund holds securities or other assets that are denominated in a foreign currency, the Fund will normally use the currency exchange rates as of 4:00 p.m. ET.
Securities may be valued at fair value, as determined in good faith and pursuant to procedures approved by the Board, under certain limited circumstances. For example, fair value pricing will be used when market quotations are not readily available or reliable, as determined by the Manager, such as when (i) trading for a security is restricted or stopped; (ii) a security’s trading market is closed (other than customary closings); or (iii) a security has beende-listed from a national exchange. A security with limited market liquidity may require fair value pricing if the Manager determines that the available price does not reflect the security’s true market value. In addition, if a significant event that the Manager determines to affect the value of one or more securities held by the Fund occurs after the close of a related exchange but before the determination of the Fund’s NAV, fair value pricing may be used on the affected security or securities. Securities of small-capitalization companies are also more likely to require a fair value determination using these procedures because they are more thinly traded and less liquid than the securities of larger-capitalization companies. The Fund may fair value securities as a result of significant events occurring after the close of the foreign markets in which the Fund invests as described below. In addition, the Fund may invest in illiquid securities requiring these procedures.
The Fund may use fair value pricing for securities primarily traded innon-U.S. markets because most foreign markets close well before the Fund’s pricing time of 4:00 p.m. ET. The earlier close of these foreign markets gives rise to the possibility that significant events, including broad market moves, may have occurred in the interim and may materially affect the value of those securities. If the Manager determines that the last quoted prices ofnon-U.S. securities will, in its judgment, materially affect the value of some or all its portfolio securities, the Manager can adjust the previous closing prices to reflect what it believes to be the fair value of the securities as of the close of the Exchange. In deciding whether it is necessary to adjust closing prices to reflect fair value, the Manager reviews a variety of factors, including developments in foreign markets, the performance of U.S. securities markets, and the performance of instruments trading in U.S. markets that represent foreign securities
38
American Beacon FundsSM
Notes to Financial Statements
August 31, 2019
and baskets of foreign securities. These securities are fair valued using a pricing service, using methods approved by the Board, that considers the correlation of the trading patterns of the foreign security to intraday trading in the U.S. markets, based on indices of domestic securities and other appropriate indicators such as prices of relevant American Depositary Receipts (“ADRs”) and futures contracts. The Valuation Committee, established by the Board, may also fair value securities in other situations, such as when a particular foreign market is closed but the Fund is open. The Fund uses outside pricing services to provide closing prices and information to evaluate and/or adjust those prices. As a means of evaluating its security valuation process, the Valuation Committee routinely compares closing prices, the next day’s opening prices in the same markets and adjusted prices.
Attempts to determine the fair value of securities introduce an element of subjectivity to the pricing of securities. As a result, the price of a security determined through fair valuation techniques may differ from the price quoted or published by other sources and may not accurately reflect the market value of the security when trading resumes. If a reliable market quotation becomes available for a security formerly valued through fair valuation techniques, the Manager compares the new market quotation to the fair value price to evaluate the effectiveness of the Fund’s fair valuation procedures. If any significant discrepancies are found, the Manager may adjust the Fund’s fair valuation procedures.
Valuation Inputs
Various inputs may be used to determine the fair value of the Funds’ investments. These inputs are summarized in three broad levels for financial statement purposes. The inputs or methodologies used to value securities are not necessarily an indication of the risk associated with investing in those securities.
| Level 1 | - | Quoted prices in active markets for identical securities. | ||
| Level 2 | - | Prices determined using other significant observable inputs. These may include quoted prices for similar securities, interest rates, prepayment speeds, credit risk, and others. | ||
| Level 3 | - | Prices determined using other significant unobservable inputs. Unobservable inputs reflect the Fund’s own assumptions about the factors market participants would use in pricing an investment. | ||
Level 1 and Level 2 trading assets and trading liabilities, at fair value
Common stocks, ETFs, preferred securities, and financial derivative instruments, such as futures contracts that are traded on a national securities exchange, are stated at the last reported sale or settlement price on the day of valuation. To the extent these securities are actively traded and valuation adjustments are not applied, they are categorized as Level 1 of the fair value hierarchy. Preferred securities and other equities traded on inactive markets or valued by reference to similar instruments are generally categorized as Level 2 of the fair value hierarchy.
Fixed-income securities including corporate, convertible and municipal bonds and notes, U.S. government agencies, U.S. Treasury obligations, sovereign issues, bank loans, convertible preferred securities, andnon-U.S. bonds are normally valued by pricing service providers that use broker dealer quotations, reported trades or valuation estimates from their internal pricing models. The service providers’ internal models use inputs that are observable such as issuer details, interest rates, yield curves, prepayment speeds, credit risks/spreads, default rates, and quoted prices for similar assets. Securities that use similar valuation techniques and inputs as described above are categorized as Level 2 of the fair value hierarchy. Fixed-income securities purchased on a delayed-delivery basis aremarked-to-market daily until settlement at the forward settlement date and are categorized as Level 2 of the fair value hierarchy.
Investments in registeredopen-end investment management companies will be valued based upon the NAVs of such investments and are categorized as Level 1 of the fair value hierarchy.
39
American Beacon FundsSM
Notes to Financial Statements
August 31, 2019
Level 3 trading assets and trading liabilities, at fair value
The valuation techniques and significant inputs used in determining the fair values of financial instruments classified as Level 3 of the fair value hierarchy are as follows.
Securities and other assets for which market quotes are not readily available are valued at fair value as determined in good faith by the Board or persons acting at their direction and may be categorized as Level 3 of the fair value hierarchy.
Market quotes are considered not readily available in circumstances where there is an absence of current or reliable market-based data (e.g., trade information or broker quotes), including where events occur after the close of the relevant market, but prior to the Exchange close, that materially affect the values of the Fund’s securities or assets. In addition, market quotes are considered not readily available when, due to extraordinary circumstances, the exchanges or markets on which the securities trade, do not open for trading for the entire day and no other market prices are available. The Board has delegated to the Manager the responsibility for monitoring significant events that may materially affect the fair values of a Fund’s securities or assets and for determining whether the value of the applicable securities or assets should bere-evaluated in light of such significant events.
The Board has adopted methods for valuing securities and other assets in circumstances where market quotes are not readily available, and has delegated the responsibility for applying the valuation methods to the Manager. For instances in which daily market quotes are not readily available, investments may be valued pursuant to guidelines established by the Board. In the event that the security or asset cannot be valued, pursuant to one of the valuation methods established by the Board, the fair value of the security or asset will be determined in good faith by the Valuation Committee, generally based upon recommendations provided by the Manager.
When a Fund uses fair valuation methods applied by the Manager that use significant unobservable inputs to determine its NAV, the securities priced using this methodology are categorized as Level 3 of the fair value hierarchy. These methods may require subjective determinations about the value of a security. While the Trust’s policy is intended to result in a calculation of the Fund’s NAV that fairly reflects security values as of the time of pricing, the Trust cannot guarantee that values determined by the Board or persons acting at their direction would accurately reflect the price that a Fund could obtain for a security if it were to dispose of that security as of the time of pricing (for instance, in a forced or distressed sale). The prices used by a Fund may differ from the value that would be realized if the securities were sold.
4. Securities and Other Investments
Bank Loans and Senior Loans
Bank loans are generally fixed and floating rate loans arranged through private negotiations between a company and one or more financial institutions (lenders). The Fund may invest in senior loans, which are floating rate loans, sometimes referred to as adjustable rate loans that hold a senior position in the capital structure of U.S. and foreign corporations, partnerships or other business entities. Under normal circumstances, senior loans have priority of claim ahead of other obligations of a borrower in the event of liquidation. Bank loans and senior loans may be collateralized or uncollateralized. They pay interest at rates that float above, or are adjusted periodically based on, a benchmark that reflects current interest rates. The Fund may also invest in such loans in the form of participations in loans and assignments of all or a portion of loans from third parties.
The purchaser of an assignment typically succeeds to all the rights and obligations of the assigning institution and becomes a lender under the credit agreement with respect to the debt obligation; however, the purchaser’s rights can be more restricted than those of the assigning institution, and, in any event, the Fund may not be able to unilaterally enforce all rights and remedies under the loan and with regard to any associated collateral. A participation typically results in a contractual relationship only with the institution participating out the interest, not with the borrower. In connection with purchasing participations, the Fund generally will have no right to enforce compliance by the borrower with the terms of the loan agreement relating to the loan, nor any
40
American Beacon FundsSM
Notes to Financial Statements
August 31, 2019
rights of set-off against the borrower, and the Fund may not benefit directly from any collateral supporting the loan in which it has purchased the participation. As a result, the Fund will be exposed to the credit risk of both the borrower and the institution selling the participation. If the Fund purchases assignments from lenders, the Fund will acquire direct rights against the borrower on the loan.
Common Stock
Common stock generally takes the form of shares in a corporation which represent an ownership interest. It ranks below preferred stock and debt securities in claims for dividends and for assets of the company in a liquidation or bankruptcy. The value of a company’s common stock may fall as a result of factors directly relating to that company, such as decisions made by its management or decreased demand for the company’s products or services. A stock’s value may also decline because of factors affecting not just the company, but also companies in the same industry or sector. The price of a company’s stock may also be affected by changes in financial markets that are relatively unrelated to the company, such as changes in interest rates, currency exchange rates or industry regulation. Companies that elect to pay dividends on their common stock generally only do so after they invest in their own business and make required payments to bondholders and on other debt and preferred stock. Therefore, the value of a company’s common stock will usually be more volatile than its bonds, other debt and preferred stock. Common stock may be exchange-traded or OTC. OTC stock may be less liquid than exchange-traded stock.
Convertible Securities
Convertible securities are hybrid securities that combine the investment characteristics of bonds and common stocks. Convertible securities include corporate bonds, notes, preferred stock or other securities that may be converted into or exchanged for a prescribed amount of common stock of the same or a different issuer within a particular period of time at a specified price or formula. A convertible security entitles the holder to receive interest paid or accrued on debt or dividends paid on preferred stock until the convertible security matures or is redeemed, converted or exchanged. While no securities investment is without some risk, investments in convertible securities generally entail less risk than the issuer’s common stock, although the extent to which such risk is reduced depends in large measure upon the degree to which the convertible security sells above its value as a fixed income security. The market value of convertible securities tends to decline as interest rates increase and, conversely, to increase as interest rates decline. While convertible securities generally offer lower interest or dividend yields thannon-convertible debt securities of similar quality, they do enable the investor to benefit from increases in the market price of the underlying common stock. Holders of convertible securities have a claim on the assets of the issuer prior to the common stockholders, but may be subordinated to holders of similarnon-convertible securities of the same issuer. Because of the conversion feature, certain convertible securities may be considered equity equivalents.
Corporate Debt and Other Fixed-Income Securities
The Funds may hold debt, including government and corporate debt, and other fixed-income securities. The investment return of corporate debt securities reflects interest earning and changes in the market value of the security. Typically, the values of fixed-income securities change inversely with prevailing interest rates. Therefore, a fundamental risk of fixed-income securities is interest rate risk, which is the risk that their value will generally decline as prevailing interest rates rise, which may cause a Fund’s NAV to likewise decrease, and vice versa. How specific fixed-income securities may react to changes in interest rates will depend on specific characteristics of each security. Fixed-income securities are also subject to credit risk, which is the risk that the credit strength of an issuer of a fixed-income security will weaken and/or that the issuer will be unable to make timely principal and interest payments and that the security may go into default.
Delayed Funding Loans and Revolving Credit Facilities
The Funds may enter into delayed funding loans and revolving credit facilities. Delayed funding loans and revolving credit facilities are borrowing arrangements in which the lender agrees to make loans up to a maximum
41
American Beacon FundsSM
Notes to Financial Statements
August 31, 2019
amount upon demand by the borrower during a specific term. A revolving credit facility differs from a delayed funding loan in that as the borrower repays the loan, an amount equal to the repayment may be borrowed again during the term of the revolving credit facility. Delayed funding loans and revolving credit facilities usually provide for floating or variable rates of interest. These commitments may have the effect of requiring a Fund to increase its investment in a company at a time when it might not otherwise decide to do so (including at a time when the company’s financial condition makes it unlikely that such amounts will be repaid). To the extent that a Fund is committed to advance additional funds, it will at all times segregate or “earmark” assets, determined to be liquid in accordance with procedures established by the Board, in an amount sufficient to meet such commitments.
The Funds may invest in delayed funding loans and revolving credit facilities with credit quality comparable to that of issuers of its securities investments. Delayed funding loans and revolving credit facilities may be subject to restrictions on transfer, and only limited opportunities may exist to resell such instruments. As a result, a Fund may be unable to sell such investments at an opportune time or may have to resell them at less than fair market value.
Floating Rate Loan Interest
The Funds may invest in floating rate loan interests. The floating rate loan interests held by the Funds are typically issued to companies (the “borrower”) by banks, other financial institutions, and privately and publicly offered corporations (the “lender”). Floating rate loan interests are generallynon-investment grade, often involve borrowers whose financial condition is troubled or uncertain and companies that are highly leveraged. The Funds may invest in obligations of borrowers who are in bankruptcy proceedings. Floating rate loan interests may include fully funded term loans or revolving lines of credit. Floating rate loan interests are typically senior in the corporate capital structure of the borrower. Floating rate loan interests generally pay interest at rates that are periodically determined by reference to a base lending rate plus a premium. The base lending rates are generally the lending rate offered by one or more European banks, such as the London Interbank Offered Rate (“LIBOR”), the prime rate offered by one or more U.S. banks or the certificate of deposit rate. Floating rate loan interests may involve foreign borrowers, and investments may be denominated in foreign currencies. The Funds considers these investments to be investments in debt securities for purposes of its investment policies.
When the Funds purchase a floating rate loan interest it may receive a facility fee and when it sells a floating rate loan interest, it may pay a facility fee. On an ongoing basis, the Funds may receive a commitment fee based on the undrawn portion of the underlying line of credit amount of a floating rate loan interest. Facility and commitment fees are typically amortized to income over the term of the loan or term of the commitment, respectively. Consent and amendment fees are recorded to income as earned. Prepayment penalty fees, which may be received by the Funds upon the prepayment of a floating rate loan interest by a borrower, are recorded as realized gains. The Funds may invest in multiple series or tranches of a loan. A different series or tranche may have varying terms and carry different associated risks.
Floating rate loan interests are usually freely callable at the borrower’s option. The Funds may invest in such loans in the form of participations in loans (“Participations”) or assignments (“Assignments”) of all or a portion of loans from third parties. Participations typically will result in the Funds having a contractual relationship only with the lender, not with the borrower. The Funds will have the right to receive payments of principal, interest and any fees to which it is entitled only from the lender selling the Participation and only upon receipt by the lender of the payments from the borrower. In connection with purchasing Participations, the Funds generally will have no right to enforce compliance by the borrower with the terms of the loan agreement, nor any rights of offset against the borrower, and the Funds may not benefit directly from any collateral supporting the loan in which it has purchased the Participation. As a result, the Funds will assume the credit risk of both the borrower and the lender that is selling the Participation. The Funds’ investment in Participations involves the risk of insolvency of the financial intermediaries who are parties to the transactions. In the event of the insolvency of the lender selling the Participation, the Funds may be treated as a general creditor of the lender and may not benefit from any offset between the lender and the borrower. Assignments typically result in the Funds having a direct contractual relationship with the borrower, and the Funds may enforce compliance by the borrower with the terms of the loan agreement.
42
American Beacon FundsSM
Notes to Financial Statements
August 31, 2019
In connection with floating rate loan interests, the Funds may also enter into unfunded floating rate loan interests (“commitments”). In connection with these commitments, the Funds earn a commitment fee, typically set as a percentage of the commitment amount. Such fee income, which is included in “Interest income” on the Statement of Operations, is recognized ratably over the commitment period. Unfunded floating rate loan interests aremarked-to-market daily, and any unrealized appreciation (depreciation) is included on the Statements of Assets and Liabilities and Statements of Operations.
Foreign Debt Securities
The Funds may invest in foreign fixed and floating rate income securities (including emerging market securities) all or a portion of which may benon-U.S. dollar denominated and which include: (a) debt obligations issued or guaranteed by foreign national, provincial, state, municipal or other governments with taxing authority or by their agencies or instrumentalities, including Brady Bonds; (b) debt obligations of supranational entities; (c) debt obligations of the U.S. Government issued innon-dollar securities; (d) debt obligations and other fixed income securities of foreign corporate issuers (both dollar andnon-dollar denominated); and (e) U.S. corporate issuers (both Eurodollar andnon-dollar denominated). There is no minimum rating criteria for the Funds’ investments in such securities. Investing in the securities of foreign issuers involves special considerations that are not typically associated with investing in the securities of U.S. issuers. In addition, emerging markets are markets that have risks that are different and higher than those in more developed markets.
Foreign Securities
The Funds may invest in U.S. dollar-denominated andnon-U.S. dollar denominated equity and debt securities of foreign issuers and foreign branches of U.S. banks, including negotiable certificates of deposit (“CDs”), bankers’ acceptances, and commercial paper. Foreign issuers are issuers organized and doing business principally outside the United States and include corporations, banks,non-U.S. governments, and quasi-governmental organizations. While investments in foreign securities may be intended to reduce risk by providing further diversification, such investments involve sovereign and other risks, in addition to the credit and market risks normally associated with domestic securities. These additional risks include the possibility of adverse political and economic developments (including political or social instability, nationalization, expropriation, or confiscatory taxation); the potentially adverse effects of unavailability of public information regarding issuers, different governmental supervision and regulation of financial markets, reduced liquidity of certain financial markets, and the lack of uniform accounting, auditing, and financial reporting standards or the application of standards that are different or less stringent than those applied in the United States; different laws and customs governing securities tracking; and possibly limited access to the courts to enforce the Funds’ rights as an investor.
High-Yield Securities
Non-investment-grade securities are rated below the four highest credit grades by at least one of the public rating agencies (or are unrated if not publicly rated). Participation in high-yielding securities transactions generally involves greater returns in the form of higher average yields. However, participation in such transactions involves greater risks, including sensitivity to economic changes, solvency, and relative liquidity in the secondary trading market. Lower ratings may reflect a greater possibility that the financial condition of the issuer, or adverse changes in general economic conditions, or both, may impair the ability of the issuer to make payments of interest and principal. The prices and yields of lower-rated securities generally fluctuate more than higher-quality securities, and such prices may decline significantly in periods of general economic difficulty or rising interest rates.
Illiquid and Restricted Securities
Generally, an illiquid asset is an asset that the Funds reasonably expect cannot be sold or disposed of in current market conditions in seven calendar days or less without the sale or disposition significantly changing the market value of the investment. Historically, illiquid securities have included securities that have not been
43
American Beacon FundsSM
Notes to Financial Statements
August 31, 2019
registered under the Securities Act, securities that are otherwise not readily marketable, and repurchase agreements having a remaining maturity of longer than seven calendar days. Securities that have not been registered under the Securities Act are referred to as private placements or restricted securities and are purchased directly from the issuer or in the secondary market. These securities may be sold only in a privately negotiated transaction or pursuant to an exemption from registration. A large institutional market exists for certain securities that are not registered under the Securities Act, including repurchase agreements, commercial paper, foreign securities, municipal securities and corporate bonds and notes. Institutional investors depend on an efficient institutional market in which the unregistered security can be readily resold or on an issuer’s ability to honor a demand for repayment. However, the fact that there are contractual or legal restrictions on resale of such investments to the general public or to certain institutions may not be indicative of their liquidity.
Limitations on resale may have an adverse effect on the marketability of portfolio securities, and the Fund might be unable to dispose of restricted or other illiquid securities promptly or at reasonable prices and might thereby experience difficulty satisfying redemptions within seven calendar days. In addition, the Fund may get only limited information about an issuer, so it may be less able to predict a loss. The Fund also might have to register such restricted securities in order to dispose of them resulting in additional expense and delay. Adverse market conditions could impede such a public offering of securities. In recognition of the increased size and liquidity of the institutional market for unregistered securities and the importance of institutional investors in the formation of capital, the SEC adopted Rule 144A under the Securities Act. Rule 144A is designed to facilitate efficient trading among institutional investors by permitting the sale of certain unregistered securities to qualified institutional buyers. To the extent privately placed securities held by the Fund qualify under Rule 144A and an institutional market develops for those securities, the Fund likely will be able to dispose of the securities without registering them under the Securities Act. To the extent that institutional buyers become, for a time, uninterested in purchasing these securities, investing in Rule 144A securities could increase the level of the Fund’s illiquidity. The Manager or thesub-advisor, as applicable, may determine that certain securities qualified for trading under Rule 144A are liquid. Regulation S under the Securities Act permits the sale abroad of securities that are not registered for sale in the United States and includes a provision for U.S. investors, such as the Fund, to purchase such unregistered securities if certain conditions are met.
Securities sold in private placement offerings made in reliance on the “private placement” exemption from registration afforded by Section 4(a)(2) of the Securities Act and resold to qualified institutional buyers under Rule 144A under the Securities Act (“Section 4(a)(2) securities”) are restricted as to disposition under the federal securities laws, and generally are sold to institutional investors, such as the Fund, that agree they are purchasing the securities for investment and not with an intention to distribute to the public. Any resale by the purchaser must be pursuant to an exempt transaction and may be accomplished in accordance with Rule 144A. Section 4(a)(2) securities normally are resold to other institutional investors through or with the assistance of the issuer or dealers that make a market in the Section 4(a)(2) securities, thus providing liquidity.
Inflation-Indexed Bonds
The Funds may invest in inflation-indexed bonds. Inflation-indexed bonds are fixed-income securities whose principal value is periodically adjusted based on the rate of inflation. The interest rate on these bonds is generally fixed at issuance at a rate lower than typical bonds. Over the life of an inflation-indexed bond, however, interest will be paid based on principal value, which is adjusted for inflation. Any increase or decrease in the principal amount of an inflation-indexed bond will be included as interest income on the Statements of Operations, even though investors do not receive their principal until maturity.
Other Investment Company Securities and Other Exchange-Traded Products
The Funds may invest in shares of other investment companies, includingopen-end funds,closed-end funds, business development companies, ETFs, unit investment trusts, and other investment companies of the Trust. The Funds may invest in securities of an investment company advised by the Manager or asub-advisor. Investments in the securities of other investment companies may involve duplication of advisory fees and certain other expenses.
44
American Beacon FundsSM
Notes to Financial Statements
August 31, 2019
By investing in another investment company, the Funds become a shareholder of that investment company. As a result, the Funds’ shareholders indirectly will bear the Funds’ proportionate share of the fees and expenses paid by shareholders of the other investment company, in addition to the fees and expenses the Funds’ shareholders directly bear in connection with the Funds’ own operations. These other fees and expenses are reflected as Acquired Fund Fees and Expenses and are included in the Fees and Expenses Table for the Funds in their Prospectus, if applicable. Investments in other investment companies may involve the payment of substantial premiums above the value of such issuer’s portfolio securities.
Payment-In-Kind Securities
The Funds may invest inpayment-in-kind securities (“PIKs”). PIKs give the issuer the option at each interest payment date of making interest payments in either cash or additional debt securities. Those additional debt securities usually have the same terms, including maturity dates and interest rates, and associated risks as the original bonds. The daily market quotations of the original bonds may include the accrued interest (referred to as a dirty price) and require apro-rata adjustment from the “Unrealized appreciation (depreciation) of investments” to “Dividend and interest receivable” in the Statements of Assets and Liabilities.
Real Estate Investment Trusts
The Funds may own shares of real estate investment trusts (“REITs”) which report information on the source of their distributions annually. The Fundsre-characterize distributions received from REIT investments based on information provided by the REITs into the following categories: ordinary income, long-term capital gains, and return of capital. If information is not available on a timely basis from the REITs, there-characterization will be estimated based on available information, which may include the previous year allocation. If new or additional information becomes available from the REITs at a later date, are-characterization will be made the following year.
5. Financial Derivative Instruments
The Funds may utilize derivative instruments to gain market exposure on cash balances to hedge foreign currency exposure or reduce market exposure in anticipation of liquidity needs. When considering the Funds’ use of derivatives, it is important to note that the Funds do not use derivatives for the purpose of creating financial leverage.
Futures Contracts
Futures contracts are contracts to buy or sell a standard quantity of securities at a specified price on a future date. The Funds may enter into financial futures contracts as a method for keeping assets readily convertible to cash if needed to meet shareholder redemptions or for other needs while maintaining exposure to the stock or bond market, as applicable. The primary risks associated with the use of futures contracts are the possibility of illiquid markets or imperfect correlation between the values of the contracts and the underlying securities or that the counterparty will fail to perform its obligations.
Upon entering into a futures contract, the Funds are required to set aside or deposit with a broker an amount, termed the initial margin, which typically represents a portion of the face value of the futures contract. The Funds usually reflects this amount on the Schedules of Investments as a U.S. Treasury Bill held as collateral for futures contracts or as cash deposited with broker on the Statements of Assets and Liabilities. Payments to and from the broker, known as variation margin, are required to be made on a daily basis as the price of the futures contract fluctuates. Changes in initial settlement values are accounted for as unrealized appreciation (depreciation) until the contracts are terminated, at which time realized gains and losses are recognized. Futures contracts are valued at the most recent settlement price established each day by the exchange on which they are traded.
45
American Beacon FundsSM
Notes to Financial Statements
August 31, 2019
During the year ended August 31, 2019, the SiM High Yield Opportunities Fund entered into futures contracts primarily for hedging and exposing cash to markets.
The Fund’s average futures contracts outstanding fluctuate throughout the operating year as required to meet strategic requirements. The following table illustrates the average quarterly volume of futures contracts. For the purpose of this disclosure, volume is measured by contracts outstanding at each quarter end.
Average Futures Contracts Outstanding | ||||
Fund | Year Ended August 31, 2019 | |||
SiM High Yield Opportunities | 512 | |||
The following is a summary of the fair valuations of the Funds’ derivative instruments categorized by risk exposure(1):
SiM High Yield Opportunities Fund
| Fair values of financial instruments on the Statements of Assets and Liabilities as of August 31, 2019: |
| ||||||||||||||||||||||||||||||||||||||||||||||||||||||
| Derivatives not accounted for as hedging instruments | |||||||||||||||||||||||||||||||||||||||||||||||||||||||
Assets: | Credit contracts | Foreign exchange contracts | Commodity contracts | Interest rate contracts | Equity��contracts | Total | |||||||||||||||||||||||||||||||||||||||||||||||||
| Receivable for variation margin from open futures contracts(2) | $ | - | $ | 884,475 | $ | - | $ | - | $ | - | $ | 884,475 | |||||||||||||||||||||||||||||||||||||||||||
Liabilities: | Credit contracts | Foreign exchange contracts | Commodity contracts | Interest rate contracts | Equity contracts | Total | |||||||||||||||||||||||||||||||||||||||||||||||||
| Payable for variation margin from open futures contracts(2) | $ | - | $ | (32,528 | ) | $ | - | $ | - | $ | - | $ | (32,528 | ) | |||||||||||||||||||||||||||||||||||||||||
| The effect of financial derivative instruments on the Statements of Operations as of August 31, 2019: |
| ||||||||||||||||||||||||||||||||||||||||||||||||||||||
| Derivatives not accounted for as hedging instruments | |||||||||||||||||||||||||||||||||||||||||||||||||||||||
Realized gain (loss) from derivatives | Credit contracts | Foreign exchange contracts | Commodity contracts | Interest rate contracts | Equity contracts | Total | |||||||||||||||||||||||||||||||||||||||||||||||||
| Futures contracts | $ | - | $ | 3,321,159 | $ | - | $ | - | $ | - | $ | 3,321,159 | |||||||||||||||||||||||||||||||||||||||||||
Net change in unrealized appreciation | Credit contracts | Foreign exchange contracts | Commodity contracts | Interest rate contracts | Equity contracts | Total | |||||||||||||||||||||||||||||||||||||||||||||||||
| Futures contracts | $ | - | $ | (253,917 | ) | $ | - | $ | - | $ | - | $ | (253,917 | ) | |||||||||||||||||||||||||||||||||||||||||
(1) See Note 3 in the Notes to Financial Statements for additional information.
(2) Includes cumulative appreciation (depreciation) of futures contracts as reported in the Fund’s Schedule of Investments footnotes. Only current day’s variation margin is reported within the Statements of Assets and Liabilities.
Offsetting Assets and Liabilities
The Funds are parties to enforceable master netting agreements between brokers and counterparties which provide for the right to offset under certain circumstances. The Funds employ multiple money managers and counterparties and have elected not to offset qualifying financial and derivative instruments on the Statements of Assets and Liabilities, as such all financial and derivative instruments are presented on a gross basis. The impacts of netting arrangements that provide the right to offset are detailed below. The net amount represents the net receivable or payable that would be due from or to the counterparty in the event of default. Exposure from borrowings and other financing agreements such as repurchase agreements can only be netted across transactions governed by the same Master Agreement with the same legal entity. All amounts reported below represent the balance as of the report date, August 31, 2019.
46
American Beacon FundsSM
Notes to Financial Statements
August 31, 2019
SiM High Yield Opportunities Fund
| Offsetting of Financial and Derivative Assets as of August 31, 2019: | ||||||||||||
| Assets | Liabilities | |||||||||||
| Futures contracts | $ | 884,475 | $ | 32,528 | ||||||||
|
|
|
| |||||||||
| Total derivative assets and liabilities in the Statement of Assets and Liabilities | $ | 884,475 | $ | 32,528 | ||||||||
|
|
|
| |||||||||
| Derivatives not subject to a Master Netting Agreement or similar agreement (“MNA”) | $ | (884,475 | ) | $ | (32,528 | ) | ||||||
|
|
|
| |||||||||
6. Principal Risks
Investing in the Funds may involve certain risks including, but not limited to, those described below.
Credit Risk
The Funds are subject to the risk that the issuer or guarantor of a debt security, or the counterparty to a derivatives contract or a loan, will fail to make timely payment of interest or principal or otherwise honor its obligations or default completely. A decline in the credit rating of an individual security held by the Funds may have an adverse impact on its price and make it difficult for the Funds to sell it. Ratings represent a rating agency’s opinion regarding the quality of the security and are not a guarantee of quality. Rating agencies might not always change their credit rating on an issuer or security in a timely manner to reflect events that could affect the issuer’s ability to make timely payments on its obligations. Credit risk is typically greater for securities with ratings that are below investment grade. Since the Funds can invest significantly in high-yield investments considered speculative in nature, this risk may be substantial.
Currency Risk
The Funds may have exposure to foreign currencies by investing in securities denominated innon-U.S. currencies or in securities denominated innon-U.S. currencies, purchasing or selling forward currency exchange contracts innon-U.S. currencies,non-U.S. currency futures contracts, options onnon-U.S. currencies andnon-U.S. currency futures and swaps for cross-currency investments. Foreign currencies may decline in value relative to the U.S. dollar, or, in the case of hedging positions, the U.S. dollar may decline in value relative to the currency being hedged, and thereby affect a Fund’s investments in foreign(non-U.S.) currencies or in securities that trade in, and receive revenues in, or in derivatives that provide exposure to, foreign(non-U.S.) currencies. Currency exchange rates may fluctuate significantly over short periods of time for a number of reasons, including changes in interest rates, intervention (or the failure to intervene) by U.S. or foreign governments, central banks or supranational entities such as the International Monetary Fund, or by the imposition of currency controls or other political developments in the United States or abroad. As a result, the Funds’ investments in foreign currency denominated securities may reduce the returns of the Funds. Currency futures, forwards, options or swaps may not always work as intended, and in specific cases, the Funds may be worse off than if it had not used such instrument(s). There may not always be suitable hedging instruments available. Even where suitable hedging instruments are available, the Funds may choose to not hedge its currency risks.
Equity Investments Risk
Equity securities are subject to market risk. The Funds’ investments in equity securities may include common stocks, preferred stocks, securities convertible into or exchangeable for common stocks, REITs, depositary receipts, and U.S. dollar-denominated foreign stocks traded on U.S. exchanges. Such investments may expose the Funds to additional risk. The value of a company’s common stock may fall as a result of factors affecting the company, companies in the same industry or sector, or the financial markets overall. Common stock generally is subordinate to preferred stock upon the liquidation or bankruptcy of the issuing company. Preferred stocks and convertible securities are sensitive to movements in interest rates. Preferred stocks may be less liquid than common stocks and, unlike common stocks, participation in the growth of an issuer may be limited. Distributions on preferred stocks generally
47
American Beacon FundsSM
Notes to Financial Statements
August 31, 2019
are payable at the discretion of an issuer and after required payments to bond holders. Convertible securities are subject to the risk that the credit standing of the issuer may have an effect on the convertible securities’ investment value. Investments in REITs are subject to the risks associated with investing in the real estate industry such as adverse developments affecting the real estate industry and real property values. Depositary receipts and U.S. dollar-denominated foreign stocks traded on U.S. exchanges are subject to certain of the risks associated with investing directly in foreign securities, including, but not limited to, currency fluctuations and political and financial instability in the home country of a particular depositary receipt or foreign stock.
Futures Contracts Risk
Futures contracts are derivative instruments where one party pays a fixed price for an agreed amount of securities or other underlying assets at an agreed date. The use of such derivative instruments may expose the Funds to additional risks that they would not be subject to if they invested directly in the securities underlying those derivatives. Futures contracts may experience potentially dramatic price changes (losses) and imperfect correlation between the price of the contract and the underlying security or index, which will increase the volatility of the Funds and may involve a small investment of cash (the amount of initial and variation margin) relative to the magnitude of the risk assumed (the potential increase or decrease in the price of the futures contract).
Floating Rate Securities Risk
The coupons on certain fixed income securities in which the Funds may invest are not fixed and may fluctuate based upon changes in market rates. The coupon on a floating rate security is generally based on an interest rate such as a money-market index, LIBOR or a Treasury bill rate. Such securities are subject to interest rate risk and may fluctuate in value in response to interest rate changes if there is a delay between changes in market interest rates and the interest reset date for the obligation, or for other reasons. As short-term interest rates decline, the coupons on floating rate securities typically decrease. Alternatively, during periods of rising interest rates, changes in the coupons of floating rate securities may lag behind changes in market rates or may have limits on the maximum increases in the coupon rates. The value of floating rate securities may decline if their coupons do not rise as much, or as quickly, as interest rates in general. Conversely, floating rate securities will not generally increase in value if interest rates decline. Floating rate obligations are less effective than fixed rate obligations at locking in a particular yield and are subject to credit risk.
High-Yield Securities Risk
Investing in high-yield, below investment-grade securities (commonly referred to as “junk bonds”) generally involves significantly greater risks of loss of your money than an investment in investment grade securities. High-yield debt securities may fluctuate more widely in price and yield and may fall in price when the economy is weak or expected to become weak. High-yield securities are considered to be speculative with respect to an issuer’s ability to pay interest and principal and carry a greater risk that the issuers of lower-rated securities will default on the timely payment of principal and interest. Below investment grade securities may experience greater price volatility and less liquidity than investment grade securities.
Illiquid and Restricted Securities Risk
Securities not registered in the U.S. under the Securities Act, including Rule 144A securities, are restricted as to their resale. Such securities may not be listed on an exchange and may have no active trading market. They may be more difficult to purchase or sell at an advantageous time or price because such securities may not be readily marketable in broad public markets. The Funds may not be able to sell a restricted security when thesub-advisor considers it desirable to do so and/or may have to sell the security at a lower price than the Funds believe is its fair market value. In addition, transaction costs may be higher for restricted securities and the Funds may receive only limited information regarding the issuer of a restricted security. The Funds may have to bear the expense of registering restricted securities for resale and the risk of substantial delays in effecting the registration.
48
American Beacon FundsSM
Notes to Financial Statements
August 31, 2019
Interest Rate Risk
Investments in fixed-income securities or derivatives that are influenced by interest rates are subject to interest rate risk. The value of the Funds’ fixed-income investments typically will fall when interest rates rise. The Funds may be particularly sensitive to changes in interest rates if it invests in debt securities with intermediate and long terms to maturity. Debt securities with longer maturities tend to be more sensitive to changes in interest rates, usually making them more volatile than debt securities with shorter durations. For example, if a bond has a duration of four years, a 1% increase in interest rates could be expected to result in a 4% decrease in the value of the bond. Yields of debt securities will fluctuate over time. Following the financial crisis that started in 2008, the Federal Reserve has attempted to stabilize the economy and support the economic recovery by keeping the federal funds rate (the interest rate at which depository institutions lend reserve balances to each other overnight) at or near zero percent. The Federal Reserve has raised the federal funds rate several times since December 2015 and may increase or decrease rates in the future. Interest rates may rise significantly and/or rapidly, potentially resulting in substantial losses to the Funds. During periods of very low or negative interest rates, the Funds may be unable to maintain positive returns. Certain European countries and Japan have recently experienced negative interest rates on deposits and debt securities have traded at negative yields. Negative interest rates may become more prevalent amongnon-U.S. issuers, and potentially within the United States. Changing interest rates, including rates that fall below zero, may have unpredictable effects on markets, may result in heightened market volatility and may detract from Fund performance to the extent the Funds are exposed to such interest rates.
Liquidity Risk
When there is little or no active trading market for a specific type of security, it can become more difficult to purchase or sell the securities at or near their perceived value. During such periods, certain investments held by the Funds may be difficult to sell or other investments may be difficult to purchase at favorable times or prices. As a result, the Fund may have to lower the price on certain securities that it is trying to sell, sell other securities instead or forgo an investment opportunity, any of which could have a negative effect on Fund management or performance. Additionally, the market for certain investments may become illiquid under adverse market or economic conditions independent of any specific adverse changes in the conditions of a particular issuer.
Loan Interests Risk
Unlike publicly traded common stocks which trade on national exchanges, there is no central place or exchange for loans, including bank loans and senior loans, to trade. Loans trade in anover-the-counter market, and confirmation and settlement, which are effected through standardized procedures and documentation, may take significantly longer than seven days to complete. Extended trade settlement periods may, in unusual market conditions with a high volume of shareholder redemptions, present risk to shareholders regarding a Fund’s ability to pay redemption proceeds within the allowable time periods stated in its prospectus. The secondary market for floating rate loans also may be subject to irregular trading activity and wide bid/ask spreads. The lack of an active trading market for certain loans may impair the ability of a Fund to sell its loan interests at a time when it may otherwise be desirable to do so or may require a Fund to sell them at prices that are less than what a Fund regards as their fair market value and may make it difficult to value such loans. Interest in loans made to finance highly leveraged companies or transactions, such as corporate acquisitions, may be especially vulnerable to adverse changes in economic or market conditions. When a Fund’s loan interest is a participation, the Fund is subject to the risk that the party selling the participation interest will not remit a Fund’s pro rata share of loan payments to the Fund, and the Fund may have less control over the exercise of remedies than the party selling the participation interest.
Market Risk
Conditions in the U.S. and many foreign economies have resulted, and may continue to result, in certain instruments experiencing unusual liquidity issues, increased price volatility and, in some cases, credit downgrades
49
American Beacon FundsSM
Notes to Financial Statements
August 31, 2019
and increased likelihood of default. These events have reduced the willingness and ability of some lenders to extend credit, and have made it more difficult for some borrowers to obtain financing on attractive terms, if at all. In some cases, traditional market participants have been less willing to make a market in some types of debt instruments, which has affected the liquidity of those instruments. During times of market turmoil, investors tend to look to the safety of securities issued or backed by the U.S. Treasury, causing the prices of these securities to rise and the yields to decline. Reduced liquidity in fixed income and credit markets may negatively affect many issuers worldwide. In addition, global economies and financial markets are becoming increasingly interconnected, which increases the possibilities that conditions in one country or region might adversely impact issuers in a different country or region. A rise in protectionist trade policies, and the possibility of changes to some international trade agreements, could affect the economies of many nations, including the United States, in ways that cannot necessarily be foreseen at the present time.
In response to the financial crisis, the U.S. and other governments and the Federal Reserve and certain foreign central banks have taken steps to support financial markets. In some countries where economic conditions are recovering, they are nevertheless perceived as still fragile. Withdrawal of government support, failure of efforts in response to the crisis, or investor perception that such efforts are not succeeding, could adversely impact the value and liquidity of certain securities. The severity or duration of adverse economic conditions may also be affected by policy changes made by governments or quasi-governmental organizations, including changes in tax laws. The impact of new financial regulation legislation on the markets and the practical implications for market participants may not be fully known for some time. Regulatory changes are causing some financial services companies to exit long-standing lines of business, resulting in dislocations for other market participants. In addition, political and governmental events within the U.S. and abroad, such as the United States government’s inability at times to agree on a long-term budget and deficit reduction plan, the threat of a federal government shutdown and threats not to increase the federal government’s debt limit, may affect investor and consumer confidence and may adversely impact financial markets and the broader economy, perhaps suddenly and to a significant degree. The U.S. government has reduced the federal corporate income tax rates, and future legislative, regulatory and policy changes may result in more restrictions on international trade, less stringent prudential regulation of certain players in the financial markets, and significant new investments in infrastructure and national defense. Markets may react strongly to expectations about the changes in these policies, which could increase volatility, especially if the markets’ expectations for changes in government policies are not borne out.
Changes in market conditions will not have the same impact on all types of securities. Interest rates have been unusually low in recent years in the United States and abroad. Because there is little precedent for this situation, it is difficult to predict the impact of a significant rate increase on various markets. For example, because investors may buy securities or other investments with borrowed money, a significant increase in interest rates may cause a decline in the markets for those investments. Because of the sharp decline in the worldwide price of oil, there is a concern that oil producing nations may withdraw significant assets now held in U.S. Treasuries, which could force a substantial increase in interest rates. Regulators have expressed concern that rate increases may cause investors to sell fixed income securities faster than the market can absorb them, contributing to price volatility. In addition, there is a risk that the prices of goods and services in the U.S. and many foreign economies may decline over time, known as deflation (the opposite of inflation). Deflation may have an adverse effect on stock prices and creditworthiness and may make defaults on debt more likely. If a country’s economy slips into a deflationary pattern, it could last for a prolonged period and may be difficult to reverse.
The precise timing and the resulting impact of the United Kingdom’s departure from the European Union (the “EU”), commonly referred to as “Brexit,” are not yet known. The effect on the United Kingdom’s economy will likely depend on the nature of trade relations with the EU and other major economies following its exit, which are matters to be negotiated. The outcomes may cause increased volatility and have a significant adverse impact on world financial markets, other international trade agreements, and the United Kingdom and European economies, as well as the broader global economy for some time, which could significantly adversely affect the value of the Fund’s investments in the United Kingdom and Europe.
50
American Beacon FundsSM
Notes to Financial Statements
August 31, 2019
Other Investment Companies Risk
The Funds may invest in shares of other registered investment companies, including money market funds that are advised by the Manager. To the extent that the Funds invest in shares of other registered investment companies, the Funds will indirectly bear the fees and expenses, including for example advisory and administrative fees charged by those investment companies in addition to the Funds’ direct fees and expenses and will be subject to the risks associated with investments in those companies. For example, the Funds’ investments in money market funds are subject to interest rate risk, credit risk, and market risk.
Prepayment and Extension Risk
Prepayment risk is the risk that the principal amount of a bond may be repaid prior to the bond’s maturity date. Due to a decline in interest rates or excess cash flow, a debt security may be called or otherwise prepaid before maturity. If this occurs, no additional interest will be paid on the investment and the Funds may have to invest at a lower rate, may not benefit from an increase in value that may result from declining interest rates, and may lose any premium it paid to acquire the security. Variable and floating rate securities may be less sensitive to prepayment risk. Extension risk is the risk that a decrease in prepayments may, as a result of higher interest rates or other factors, result in the extension of a security’s effective maturity, heighten interest rate risk and increase the potential for a decline in its price.
Unrated Securities Risk
Because the Funds may purchase securities that are not rated by any rating organization, thesub-advisor, after assessing their credit quality, may internally assign ratings to certain of those securities in categories similar to those of rating organizations. Some unrated securities may not have an active trading market or may be difficult to value, which means a Fund might have difficulty selling them promptly at an acceptable price. Unrated securities may be subject to greater liquidity risk and price volatility.
7. Federal Income and Excise Taxes
It is the policy of each Fund to qualify as a regulated investment company (“RIC”), by complying with all applicable provisions of Subchapter M of the Internal Revenue Code, as amended, and to make distributions of taxable income sufficient to relieve it from substantially all federal income and excise taxes. For federal income tax purposes, each Fund is treated as a single entity for the purpose of determining such qualification.
The Funds do not have any unrecorded tax liabilities in the accompanying financial statements. Each of the tax years in the four year period ended August 31, 2019 remain subject to examination by the Internal Revenue Service. If applicable, the Funds recognize interest accrued related to unrecognized tax benefits in interest expense and penalties in “Other expenses” on the Statements of Operations.
The Funds may be subject to taxes imposed by countries in which it invests. Such taxes are generally based on returns of income earned or gains realized or repatriated. Taxes are accrued and applied to net investment income, net realized capital gains and net unrealized appreciation (depreciation), as applicable, as the income is earned or capital gains are recorded.
Dividends are categorized in accordance with income tax regulations which may treat certain transactions differently than U.S. GAAP. Accordingly, the character of distributions and composition of net assets for tax purposes may differ from those reflected in the accompanying financial statements.
51
American Beacon FundsSM
Notes to Financial Statements
August 31, 2019
The tax character of distributions paid were as follows:
| SiM High Yield Opportunities Fund | Sound Point Floating Rate Income Fund | |||||||||||||||||||||||||||
| Year Ended August 31, 2019 | Year Ended August 31, 2018 | Year Ended August 31, 2019 | Year Ended August 31, 2018 | |||||||||||||||||||||||||
Distributions paid from: | ||||||||||||||||||||||||||||
Ordinary income* | ||||||||||||||||||||||||||||
Institutional Class | $ | 25,158,278 | $ | 19,343,721 | $ | 25,168,717 | $ | 15,833,805 | ||||||||||||||||||||
Y Class | 37,145,789 | 32,868,304 | 69,601,964 | 43,473,516 | ||||||||||||||||||||||||
Investor Class | 5,006,310 | 5,421,270 | 23,917,366 | 14,555,826 | ||||||||||||||||||||||||
A Class | 1,586,624 | 2,674,783 | 3,256,554 | 2,158,429 | ||||||||||||||||||||||||
C Class | 3,025,464 | 2,869,191 | 3,309,136 | 1,780,401 | ||||||||||||||||||||||||
SP Class | - | - | 34,122 | 39,294 | ||||||||||||||||||||||||
Long-term capital gains | ||||||||||||||||||||||||||||
Institutional Class | - | 1,729,344 | - | 17,775 | ||||||||||||||||||||||||
Y Class | - | 2,931,649 | - | 41,406 | ||||||||||||||||||||||||
Investor Class | - | 482,095 | - | 10,375 | ||||||||||||||||||||||||
A Class | - | 237,072 | - | 2,378 | ||||||||||||||||||||||||
C Class | - | 255,840 | - | 2,405 | ||||||||||||||||||||||||
SP Class | - | - | - | 56 | ||||||||||||||||||||||||
Tax Return of Capital | ||||||||||||||||||||||||||||
Institutional Class | - | 640,329 | - | - | ||||||||||||||||||||||||
Y Class | - | 1,009,412 | - | - | ||||||||||||||||||||||||
Investor Class | - | 149,749 | - | - | ||||||||||||||||||||||||
A Class | - | 64,791 | - | - | ||||||||||||||||||||||||
C Class | - | 87,259 | - | - | ||||||||||||||||||||||||
SP Class | - | - | - | - | ||||||||||||||||||||||||
|
|
|
|
|
|
|
| |||||||||||||||||||||
Total distributions paid | $ | 71,922,465 | $ | 70,764,809 | $ | 125,287,859 | $ | 77,915,666 | ||||||||||||||||||||
|
|
|
|
|
|
|
| |||||||||||||||||||||
*For tax purposes, short-term capital gains are considered ordinary income distributions.
As of August 31, 2019 the components of distributable earnings (deficits) on a tax basis were as follows:
Fund | Tax Cost | Unrealized Appreciation | Unrealized (Depreciation) | Net Unrealized Appreciation (Depreciation) | ||||||||||||||||||||||||
| SiM High Yield Opportunities | $ | 1,236,624,978 | $ | 31,023,655 | $ | (63,597,882 | ) | $ | (32,574,227 | ) | ||||||||||||||||||
| Sound Point Floating Rate Income | 1,499,648,547 | 3,945,746 | (71,313,899 | ) | (67,368,153 | ) | ||||||||||||||||||||||
Fund | Net Unrealized Appreciation (Depreciation) | Undistributed Ordinary Income | Undistributed Long-Term Capital Gains | Accumulated Capital and Other (Losses) | Other Temporary Differences | Distributable Earnings/(Deficits) | ||||||||||||||||||||||||||||||||||||||
| SiM High Yield Opportunities | $ | (32,574,227 | ) | $ | 253,399 | $ | - | $ | (4,164,158 | ) | $ | (688,185 | ) | $ | (37,173,171 | ) | ||||||||||||||||||||||||||||
| Sound Point Floating Rate Income | (67,368,153 | ) | 2,026,259 | - | (43,912,222 | ) | (527,179 | ) | (109,781,295 | ) | ||||||||||||||||||||||||||||||||||
Financial reporting records are adjusted for permanent book/tax differences to reflect tax character. Financial records are not adjusted for temporary differences. The temporary differences between financial reporting andtax-basis reporting of unrealized appreciation (depreciation) are attributable primarily to the tax deferral of losses from wash sales, unused capital loss carryforwards, the realization for tax purposes of unrealized gains (losses) on certain derivative instruments, dividends payable at the end of period, and the reclassification of income from real estate investment securities and publicly traded partnerships.
Due to inherent differences in the recognition of income, expenses, and realized gains (losses) under U.S. GAAP and federal income tax regulations, permanent differences between book and tax reporting have been identified and appropriately reclassified on the Statements of Assets and Liabilities.
52
American Beacon FundsSM
Notes to Financial Statements
August 31, 2019
Accordingly, the following amounts represent current year permanent differences derived from reclassifications of income from publicly traded partnerships as of August 31, 2019:
Fund | Paid-In-Capital | Distributable Earnings/(Deficits) | ||||||||||
| SiM High Yield Opportunities | $ | (1,055 | ) | $ | 1,055 | |||||||
| Sound Point Floating Rate Income | - | - | ||||||||||
Under the Regulated Investment Company Modernization Act of 2010 (“RIC MOD”), net capital losses recognized by the Funds in taxable years beginning after December 22, 2010 are carried forward indefinitely and retain their character as short-term and/or long-term losses.
During the year ended August 31, 2019, the Funds had the following post RIC MOD capital loss carryforwards:
Fund | Short-Term Capital Loss Carryforwards | Long-Term Capital Loss Carryforwards | ||||||||||
| SiM High Yield Opportunities | $ | - | $ | 4,164,158 | ||||||||
| Sound Point Floating Rate Income | 27,304,887 | 16,607,335 | ||||||||||
8. Investment Transactions
The aggregate cost of purchases and proceeds from sales and maturities of investments, other than short-term obligations, for the year ended August 31, 2019 were as follows:
Fund | Purchases (non-U.S. Government Securities) | Sales (non-U.S. Government Securities) | ||||||||||
| SiM High Yield Opportunities | $ | 557,415,094 | $ | 490,211,481 | ||||||||
| Sound Point Floating Rate Income | 1,037,471,578 | 1,465,821,730 | ||||||||||
A summary of the Funds’ transactions in the USG Select Fund for the year ended August 31, 2019 were as follows:
SiM High Yield Opportunities Fund
Fund | Type of Transaction | August 31, 2018 Shares/Fair Value | Purchases | Sales | August 31, 2019 Shares/Fair Value | Dividend Income | ||||||||||||||||||||||||||||||||||||
| SiM High Yield Opportunities | Direct | $ | 13,065,359 | $ | 490,201,159 | $ | 480,289,033 | $ | 22,977,485 | $ | 295,437 | |||||||||||||||||||||||||||||||
| Sound Point Floating Rate Income | Direct | 406,580,401 | 940,449,420 | 1,290,716,255 | 56,313,566 | 4,021,908 | ||||||||||||||||||||||||||||||||||||
9. Borrowing Arrangements
Effective November 15, 2018 (the “Effective Date”), the Funds, along with certain other funds managed by the Manager (“Participating Funds”), entered into a committed revolving line of credit (the “Committed Line”) agreement with State Street Bank and Trust Company (the “Bank”) to be used to facilitate portfolio liquidity. The maximum borrowing amount under the Committed Line is $250 million with interest at a rate equal to the higher of(a) one-month LIBOR plus 1.25% per annum or (b) the Federal Funds rate plus 1.25% per annum on amounts borrowed. Each of the Participating Funds paid a closing fee of $100,000 on the Effective Date and a quarterly commitment fee at a rate of 0.25% per annum on the unused portion of the Committed Line amount. The Committed Line expires November 14, 2019, unless extended by the Bank or terminated by the Participating Funds in accordance with the agreement.
On the Effective Date, the Funds, along with certain other Participating Funds managed by the Manager, also entered into an uncommitted discretionary demand revolving line of credit (the “Uncommitted Line”)
53
American Beacon FundsSM
Notes to Financial Statements
August 31, 2019
agreement with the Bank to be used to facilitate portfolio liquidity. The maximum borrowing amount under the Uncommitted Line is $50 million with interest at a rate equal to the higher of(a) one-month LIBOR plus 1.25% per annum or (b) the Federal Funds rate plus 1.25% per annum on each outstanding loan. Each of the Participating Funds paid a closing fee of $35,000 on the Effective Date. The Uncommitted Line expires November 14, 2019 unless extended by the Bank or terminated by the Participating Funds in accordance with the agreement.
The Participating Funds paid administration, legal and arrangement fees, which are recognized as a component of “Other expenses” on the Statements of Operations, along with commitment fees, that have been allocated among the Participating Funds based on average daily net assets.
During the year ended August 31, 2019, the Sound Point Floating Rate Income Fund borrowed $45,000,000 from the Committed Line for 1 day with interest charges of $4,547 in order to facilitate portfolio liquidity. The amount is recorded as “Loan fees” in the Statements of Operations. At August 31, 2019, neither Fund had an outstanding balance with either facility.
10. Capital Share Transactions
The tables below summarize the activity in capital shares for each Class of the Funds:
| Institutional Class | ||||||||||||||||||||||||||||
| Year Ended August 31, | ||||||||||||||||||||||||||||
| 2019 | 2018 | |||||||||||||||||||||||||||
SiM High Yield Opportunities Fund | Shares | Amount | Shares | Amount | ||||||||||||||||||||||||
| Shares sold | 15,437,106 | $ | 145,112,330 | 15,411,903 | $ | 148,250,877 | ||||||||||||||||||||||
| Reinvestment of dividends | 2,289,005 | 21,522,945 | 2,106,104 | 20,276,450 | ||||||||||||||||||||||||
| Shares redeemed | (15,814,162 | ) | (148,162,950 | ) | (14,382,218 | ) | (138,261,396 | ) | ||||||||||||||||||||
|
|
|
|
|
|
|
| |||||||||||||||||||||
| Net increase in shares outstanding | 1,911,949 | $ | 18,472,325 | 3,135,789 | $ | 30,265,931 | ||||||||||||||||||||||
|
|
|
|
|
|
|
| |||||||||||||||||||||
| Y Class | ||||||||||||||||||||||||||||
| Year Ended August 31, | ||||||||||||||||||||||||||||
| 2019 | 2018 | |||||||||||||||||||||||||||
SiM High Yield Opportunities Fund | Shares | Amount | Shares | Amount | ||||||||||||||||||||||||
| Shares sold | 45,133,600 | $ | 424,531,252 | 34,800,437 | $ | 335,555,442 | ||||||||||||||||||||||
| Reinvestment of dividends | 3,538,614 | 33,244,349 | 3,434,577 | 33,017,264 | ||||||||||||||||||||||||
| Shares redeemed | (40,780,186 | ) | (382,696,915 | ) | (36,151,317 | ) | (347,190,605 | ) | ||||||||||||||||||||
|
|
|
|
|
|
|
| |||||||||||||||||||||
| Net increase in shares outstanding | 7,892,028 | $ | 75,078,686 | 2,083,697 | $ | 21,382,101 | ||||||||||||||||||||||
|
|
|
|
|
|
|
| |||||||||||||||||||||
| Investor Class | ||||||||||||||||||||||||||||
| Year Ended August 31, | ||||||||||||||||||||||||||||
| 2019 | 2018 | |||||||||||||||||||||||||||
SiM High Yield Opportunities Fund | Shares | Amount | Shares | Amount | ||||||||||||||||||||||||
| Shares sold | 3,414,989 | $ | 32,164,610 | 4,057,128 | $ | 39,070,118 | ||||||||||||||||||||||
| Reinvestment of dividends | 505,270 | 4,734,555 | 605,205 | 5,805,700 | ||||||||||||||||||||||||
| Shares redeemed | (4,983,054 | ) | (46,728,940 | ) | (7,313,779 | ) | (70,090,118 | ) | ||||||||||||||||||||
|
|
|
|
|
|
|
| |||||||||||||||||||||
| Net (decrease) in shares outstanding | (1,062,795 | ) | $ | (9,829,775 | ) | (2,651,446 | ) | $ | (25,214,300 | ) | ||||||||||||||||||
|
|
|
|
|
|
|
| |||||||||||||||||||||
| A Class | ||||||||||||||||||||||||||||
| Year Ended August 31, | ||||||||||||||||||||||||||||
| 2019 | 2018 | |||||||||||||||||||||||||||
SiM High Yield Opportunities Fund | Shares | Amount | Shares | Amount | ||||||||||||||||||||||||
| Shares sold | 577,283 | $ | 5,426,672 | 2,478,582 | $ | 24,008,251 | ||||||||||||||||||||||
| Reinvestment of dividends | 152,758 | 1,433,137 | 275,461 | 2,654,662 | ||||||||||||||||||||||||
| Shares redeemed | (2,201,657 | ) | (20,442,401 | ) | (7,601,596 | ) | (73,416,572 | ) | ||||||||||||||||||||
|
|
|
|
|
|
|
| |||||||||||||||||||||
| Net (decrease) in shares outstanding | (1,471,616 | ) | $ | (13,582,592 | ) | (4,847,553 | ) | $ | (46,753,659 | ) | ||||||||||||||||||
|
|
|
|
|
|
|
| |||||||||||||||||||||
54
American Beacon FundsSM
Notes to Financial Statements
August 31, 2019
| C Class | ||||||||||||||||||||||||||||
| Year Ended August 31, | ||||||||||||||||||||||||||||
| 2019 | 2018 | |||||||||||||||||||||||||||
SiM High Yield Opportunities Fund | Shares | Amount | Shares | Amount | ||||||||||||||||||||||||
| Shares sold | 828,996 | $ | 7,826,558 | 433,740 | $ | 4,191,180 | ||||||||||||||||||||||
| Reinvestment of dividends | 278,665 | 2,631,143 | 287,554 | 2,779,355 | ||||||||||||||||||||||||
| Shares redeemed | (1,591,180 | ) | (14,977,488 | ) | (1,585,023 | ) | (15,328,881 | ) | ||||||||||||||||||||
|
|
|
|
|
|
|
| |||||||||||||||||||||
| Net (decrease) in shares outstanding | (483,519 | ) | $ | (4,519,787 | ) | (863,729 | ) | $ | (8,358,346 | ) | ||||||||||||||||||
|
|
|
|
|
|
|
| |||||||||||||||||||||
| Institutional Class | ||||||||||||||||||||||||||||
| Year Ended August 31, | ||||||||||||||||||||||||||||
| 2019 | 2018 | |||||||||||||||||||||||||||
Sound Point Floating Rate Income Fund | Shares | Amount | Shares | Amount | ||||||||||||||||||||||||
| Shares sold | 22,285,559 | $ | 225,372,595 | 20,598,612 | $ | 212,735,632 | ||||||||||||||||||||||
| Reinvestment of dividends | 2,152,580 | 21,541,216 | 1,351,680 | 13,952,530 | ||||||||||||||||||||||||
| Shares redeemed | (27,402,192 | ) | (275,051,558 | ) | (6,232,481 | ) | (64,334,923 | ) | ||||||||||||||||||||
|
|
|
|
|
|
|
| |||||||||||||||||||||
| Net increase (decrease) in shares outstanding | (2,964,053 | ) | $ | (28,137,747 | ) | 15,717,811 | $ | 162,353,239 | ||||||||||||||||||||
|
|
|
|
|
|
|
| |||||||||||||||||||||
| Y Class | ||||||||||||||||||||||||||||
| Year Ended August 31, | ||||||||||||||||||||||||||||
| 2019 | 2018 | |||||||||||||||||||||||||||
Sound Point Floating Rate Income Fund | Shares | Amount | Shares | Amount | ||||||||||||||||||||||||
| Shares sold | 65,000,408 | $ | 656,251,877 | 98,071,417 | $ | 1,013,780,487 | ||||||||||||||||||||||
| Reinvestment of dividends | 6,690,163 | 67,046,668 | 4,036,837 | 41,673,333 | ||||||||||||||||||||||||
| Shares redeemed | (113,976,435 | ) | (1,143,163,263 | ) | (28,536,670 | ) | (295,019,930 | ) | ||||||||||||||||||||
|
|
|
|
|
|
|
| |||||||||||||||||||||
| Net increase (decrease) in shares outstanding | (42,285,864 | ) | $ | (419,864,718 | ) | 73,571,584 | $ | 760,433,890 | ||||||||||||||||||||
|
|
|
|
|
|
|
| |||||||||||||||||||||
| Investor Class | ||||||||||||||||||||||||||||
| Year Ended August 31, | ||||||||||||||||||||||||||||
| 2019 | 2018 | |||||||||||||||||||||||||||
Sound Point Floating Rate Income Fund | Shares | Amount | Shares | Amount | ||||||||||||||||||||||||
| Shares sold | 20,578,393 | $ | 208,421,538 | 50,083,235 | $ | 516,124,472 | ||||||||||||||||||||||
| Reinvestment of dividends | 2,368,717 | 23,719,523 | 1,409,179 | 14,498,970 | ||||||||||||||||||||||||
| Shares redeemed | (53,493,144 | ) | (534,924,169 | ) | (11,561,053 | ) | (118,971,050 | ) | ||||||||||||||||||||
|
|
|
|
|
|
|
| |||||||||||||||||||||
| Net increase (decrease) in shares outstanding | (30,546,034 | ) | $ | (302,783,108 | ) | 39,931,361 | $ | 411,652,392 | ||||||||||||||||||||
|
|
|
|
|
|
|
| |||||||||||||||||||||
| A Class | ||||||||||||||||||||||||||||
| Year Ended August 31, | ||||||||||||||||||||||||||||
| 2019 | 2018 | |||||||||||||||||||||||||||
Sound Point Floating Rate Income Fund | Shares | Amount | Shares | Amount | ||||||||||||||||||||||||
| Shares sold | 1,602,405 | $ | 16,254,026 | 4,148,221 | $ | 42,863,294 | ||||||||||||||||||||||
| Reinvestment of dividends | 321,531 | 3,225,741 | 208,376 | 2,150,545 | ||||||||||||||||||||||||
| Shares redeemed | (3,016,027 | ) | (30,303,854 | ) | (1,755,335 | ) | (18,134,112 | ) | ||||||||||||||||||||
|
|
|
|
|
|
|
| |||||||||||||||||||||
| Net increase (decrease) in shares outstanding | (1,092,091 | ) | $ | (10,824,087 | ) | 2,601,262 | $ | 26,879,727 | ||||||||||||||||||||
|
|
|
|
|
|
|
| |||||||||||||||||||||
| C Class | ||||||||||||||||||||||||||||
| Year Ended August 31, | ||||||||||||||||||||||||||||
| 2019 | 2018 | |||||||||||||||||||||||||||
Sound Point Floating Rate Income Fund | Shares | Amount | Shares | Amount | ||||||||||||||||||||||||
| Shares sold | 2,315,641 | $ | 23,536,919 | 3,553,532 | $ | 36,703,691 | ||||||||||||||||||||||
| Reinvestment of dividends | 294,618 | 2,962,557 | 156,573 | 1,616,139 | ||||||||||||||||||||||||
| Shares redeemed | (2,468,948 | ) | (24,791,033 | ) | (932,851 | ) | (9,636,871 | ) | ||||||||||||||||||||
|
|
|
|
|
|
|
| |||||||||||||||||||||
| Net increase in shares outstanding | 141,311 | $ | 1,708,443 | 2,777,254 | $ | 28,682,959 | ||||||||||||||||||||||
|
|
|
|
|
|
|
| |||||||||||||||||||||
| SP Class | ||||||||||||||||||||||||||||
| Year Ended August 31, | ||||||||||||||||||||||||||||
| 2019 | 2018 | |||||||||||||||||||||||||||
Sound Point Floating Rate Income Fund | Shares | Amount | Shares | Amount | ||||||||||||||||||||||||
| Shares sold | 4,327 | $ | 43,975 | 39,534 | $ | 409,773 | ||||||||||||||||||||||
| Reinvestment of dividends | 3,335 | 33,554 | 3,754 | 38,818 | ||||||||||||||||||||||||
| Shares redeemed | (47,492 | ) | (474,533 | ) | (50,521 | ) | (522,559 | ) | ||||||||||||||||||||
|
|
|
|
|
|
|
| |||||||||||||||||||||
| Net (decrease) in shares outstanding | (39,830 | ) | $ | (397,004 | ) | (7,233 | ) | $ | (73,968 | ) | ||||||||||||||||||
|
|
|
|
|
|
|
| |||||||||||||||||||||
55
American Beacon FundsSM
Notes to Financial Statements
August 31, 2019
11. Subsequent Events
Management has evaluated subsequent events for possible recognition or disclosure in the financial statements through the date the financial statements are issued. Management has determined that there are no material events that would require disclosure in the Funds’ financial statements through this date.
56
American Beacon SiM High Yield Opportunities FundSM
(For a share outstanding throughout the period)
| Institutional Class | ||||||||||||||||||||||||||||||||||||
| Year Ended August 31, | ||||||||||||||||||||||||||||||||||||
| 2019 | 2018 | 2017 | 2016 | 2015 | ||||||||||||||||||||||||||||||||
|
| |||||||||||||||||||||||||||||||||||
Net asset value, beginning of period | $ | 9.52 | $ | 9.61 | $ | 9.49 | $ | 9.43 | $ | 10.35 | ||||||||||||||||||||||||||
|
|
|
|
|
|
|
|
|
| |||||||||||||||||||||||||||
Income (loss) from investment operations: | ||||||||||||||||||||||||||||||||||||
Net investment income | 0.59 | 0.59 | 0.57 | 0.59 | 0.57 | |||||||||||||||||||||||||||||||
Net gains (losses) on investments (both realized and unrealized) | (0.07 | ) | (0.11 | ) | 0.13 | 0.05 | (0.65 | ) | ||||||||||||||||||||||||||||
|
|
|
|
|
|
|
|
|
| |||||||||||||||||||||||||||
Total income (loss) from investment operations | 0.52 | 0.48 | 0.70 | 0.64 | (0.08 | ) | ||||||||||||||||||||||||||||||
|
|
|
|
|
|
|
|
|
| |||||||||||||||||||||||||||
Less distributions: | ||||||||||||||||||||||||||||||||||||
Dividends from net investment income | (0.60 | ) | (0.55 | ) | (0.53 | ) | (0.52 | ) | (0.55 | ) | ||||||||||||||||||||||||||
Distributions from net realized gains | - | - | - | - | (0.29 | ) | ||||||||||||||||||||||||||||||
Tax return of capital | - | (0.02 | )A | (0.05 | )A | (0.06 | )A | - | ||||||||||||||||||||||||||||
|
|
|
|
|
|
|
|
|
| |||||||||||||||||||||||||||
Total distributions | (0.60 | ) | (0.57 | ) | (0.58 | ) | (0.58 | ) | (0.84 | ) | ||||||||||||||||||||||||||
|
|
|
|
|
|
|
|
|
| |||||||||||||||||||||||||||
Redemption fees added to beneficial interests | - | - | - | 0.00 | B | 0.00 | B | |||||||||||||||||||||||||||||
|
|
|
|
|
|
|
|
|
| |||||||||||||||||||||||||||
Net asset value, end of period | $ | 9.44 | $ | 9.52 | $ | 9.61 | $ | 9.49 | $ | 9.43 | ||||||||||||||||||||||||||
|
|
|
|
|
|
|
|
|
| |||||||||||||||||||||||||||
Total returnC | 5.65 | % | 5.13 | % | 7.51 | % | 7.28 | % | (0.78 | )% | ||||||||||||||||||||||||||
|
|
|
|
|
|
|
|
|
| |||||||||||||||||||||||||||
Ratios and supplemental data: | ||||||||||||||||||||||||||||||||||||
Net assets, end of period | $ | 396,916,950 | $ | 382,074,042 | $ | 355,492,590 | $ | 419,036,240 | $ | 230,287,454 | ||||||||||||||||||||||||||
Ratios to average net assets: | ||||||||||||||||||||||||||||||||||||
Expenses, before reimbursements or recoupments | 0.83 | % | 0.87 | % | 0.85 | % | 0.91 | % | 0.88 | % | ||||||||||||||||||||||||||
Expenses, net of reimbursements or recoupments | 0.84 | % | 0.84 | % | 0.84 | % | 0.84 | % | 0.84 | % | ||||||||||||||||||||||||||
Net investment income, before expense reimbursements or recoupments | 6.31 | % | 5.91 | % | 6.00 | % | 6.30 | % | 5.38 | % | ||||||||||||||||||||||||||
Net investment income, net of reimbursements or recoupments | 6.30 | % | 5.94 | % | 6.01 | % | 6.37 | % | 5.41 | % | ||||||||||||||||||||||||||
Portfolio turnover rate | 44 | % | 51 | % | 50 | % | 57 | % | 43 | % | ||||||||||||||||||||||||||
| A | Tax return of capital is calculated based on outstanding shares at the time of distribution. |
| B | Amount represents less than $0.01 per share. Effective December 29, 2016, the redemption fee was terminated by the Trust’s Board of Trustees. |
| C | Based on net asset value, which does not reflect the sales charge, redemption fee, or contingent deferred sales charge, if applicable. May include adjustments in accordance with U.S. GAAP and as such, the net asset value for reporting purposes and the returns based upon those net asset values may differ from the net asset value and returns for shareholder transactions. |
See accompanying notes
57
American Beacon SiM High Yield Opportunities FundSM
Financial Highlights
(For a share outstanding throughout the period)
| Y Class | ||||||||||||||||||||||||||||||||||||
| Year Ended August 31, | ||||||||||||||||||||||||||||||||||||
| 2019 | 2018 | 2017 | 2016 | 2015 | ||||||||||||||||||||||||||||||||
|
| |||||||||||||||||||||||||||||||||||
Net asset value, beginning of period | $ | 9.51 | $ | 9.60 | $ | 9.48 | $ | 9.42 | $ | 10.34 | ||||||||||||||||||||||||||
|
|
|
|
|
|
|
|
|
| |||||||||||||||||||||||||||
Income (loss) from investment operations: | ||||||||||||||||||||||||||||||||||||
Net investment income | 0.59 | 0.59 | 0.58 | 0.59 | 0.53 | |||||||||||||||||||||||||||||||
Net gains (losses) on investments (both realized and unrealized) | (0.08 | ) | (0.11 | ) | 0.11 | 0.05 | (0.62 | ) | ||||||||||||||||||||||||||||
|
|
|
|
|
|
|
|
|
| |||||||||||||||||||||||||||
Total income (loss) from investment operations | 0.51 | 0.48 | 0.69 | 0.64 | (0.09 | ) | ||||||||||||||||||||||||||||||
|
|
|
|
|
|
|
|
|
| |||||||||||||||||||||||||||
Less distributions: | ||||||||||||||||||||||||||||||||||||
Dividends from net investment income | (0.59 | ) | (0.55 | ) | (0.52 | ) | (0.52 | ) | (0.54 | ) | ||||||||||||||||||||||||||
Distributions from net realized gains | - | - | - | - | (0.29 | ) | ||||||||||||||||||||||||||||||
Tax return of capital | - | (0.02 | )A | (0.05 | )A | (0.06 | )A | - | ||||||||||||||||||||||||||||
|
|
|
|
|
|
|
|
|
| |||||||||||||||||||||||||||
Total distributions | (0.59 | ) | (0.57 | ) | (0.57 | ) | (0.58 | ) | (0.83 | ) | ||||||||||||||||||||||||||
|
|
|
|
|
|
|
|
|
| |||||||||||||||||||||||||||
Redemption fees added to beneficial interests | - | - | - | 0.00 | B | 0.00 | B | |||||||||||||||||||||||||||||
|
|
|
|
|
|
|
|
|
| |||||||||||||||||||||||||||
Net asset value, end of period | $ | 9.43 | $ | 9.51 | $ | 9.60 | $ | 9.48 | $ | 9.42 | ||||||||||||||||||||||||||
|
|
|
|
|
|
|
|
|
| |||||||||||||||||||||||||||
Total returnC | 5.58 | % | 5.09 | % | 7.46 | % | 7.21 | % | (0.87 | )% | ||||||||||||||||||||||||||
|
|
|
|
|
|
|
|
|
| |||||||||||||||||||||||||||
Ratios and supplemental data: | ||||||||||||||||||||||||||||||||||||
Net assets, end of period | $ | 661,486,121 | $ | 591,845,939 | $ | 577,349,417 | $ | 446,395,255 | $ | 300,014,547 | ||||||||||||||||||||||||||
Ratios to average net assets: | ||||||||||||||||||||||||||||||||||||
Expenses, before reimbursements or recoupments | 0.91 | % | 0.88 | % | 0.89 | % | 0.91 | % | 0.91 | % | ||||||||||||||||||||||||||
Expenses, net of reimbursements or recoupments | 0.91 | % | 0.88 | % | 0.89 | % | 0.91 | % | 0.93 | % | ||||||||||||||||||||||||||
Net investment income, before expense reimbursements or recoupments | 6.23 | % | 5.90 | % | 5.93 | % | 6.28 | % | 5.32 | % | ||||||||||||||||||||||||||
Net investment income, net of reimbursements or recoupments | 6.23 | % | 5.90 | % | 5.93 | % | 6.29 | % | 5.30 | % | ||||||||||||||||||||||||||
Portfolio turnover rate | 44 | % | 51 | % | 50 | % | 57 | % | 43 | % | ||||||||||||||||||||||||||
| A | Tax return of capital is calculated based on outstanding shares at the time of distribution. |
| B | Amount represents less than $0.01 per share. Effective December 29, 2016, the redemption fee was terminated by the Trust’s Board of Trustees. |
| C | Based on net asset value, which does not reflect the sales charge, redemption fee, or contingent deferred sales charge, if applicable. May include adjustments in accordance with U.S. GAAP and as such, the net asset value for reporting purposes and the returns based upon those net asset values may differ from the net asset value and returns for shareholder transactions. |
See accompanying notes
58
American Beacon SiM High Yield Opportunities FundSM
Financial Highlights
(For a share outstanding throughout the period)
| Investor Class | ||||||||||||||||||||||||||||||||||||
| Year Ended August 31, | ||||||||||||||||||||||||||||||||||||
| 2019 | 2018 | 2017 | 2016 | 2015 | ||||||||||||||||||||||||||||||||
|
| |||||||||||||||||||||||||||||||||||
Net asset value, beginning of period | $ | 9.49 | $ | 9.58 | $ | 9.45 | $ | 9.40 | $ | 10.32 | ||||||||||||||||||||||||||
|
|
|
|
|
|
|
|
|
| |||||||||||||||||||||||||||
Income (loss) from investment operations: | ||||||||||||||||||||||||||||||||||||
Net investment income | 0.54 | 0.51 | 0.53 | 0.50 | 0.50 | |||||||||||||||||||||||||||||||
Net gains (losses) on investments (both realized and unrealized) | (0.05 | ) | (0.06 | ) | 0.15 | 0.10 | (0.61 | ) | ||||||||||||||||||||||||||||
|
|
|
|
|
|
|
|
|
| |||||||||||||||||||||||||||
Total income (loss) from investment operations | 0.49 | 0.45 | 0.68 | 0.60 | (0.11 | ) | ||||||||||||||||||||||||||||||
|
|
|
|
|
|
|
|
|
| |||||||||||||||||||||||||||
Less distributions: | ||||||||||||||||||||||||||||||||||||
Dividends from net investment income | (0.57 | ) | (0.52 | ) | (0.51 | ) | (0.49 | ) | (0.52 | ) | ||||||||||||||||||||||||||
Distributions from net realized gains | - | - | - | - | (0.29 | ) | ||||||||||||||||||||||||||||||
Tax return of capital | - | (0.02 | )A | (0.04 | )A | (0.06 | )A | - | ||||||||||||||||||||||||||||
|
|
|
|
|
|
|
|
|
| |||||||||||||||||||||||||||
Total distributions | (0.57 | ) | (0.54 | ) | (0.55 | ) | (0.55 | ) | (0.81 | ) | ||||||||||||||||||||||||||
|
|
|
|
|
|
|
|
|
| |||||||||||||||||||||||||||
Redemption fees added to beneficial interests | - | - | - | 0.00 | B | 0.00 | B | |||||||||||||||||||||||||||||
|
|
|
|
|
|
|
|
|
| |||||||||||||||||||||||||||
Net asset value, end of period | $ | 9.41 | $ | 9.49 | $ | 9.58 | $ | 9.45 | $ | 9.40 | ||||||||||||||||||||||||||
|
|
|
|
|
|
|
|
|
| |||||||||||||||||||||||||||
Total returnC | 5.32 | % | 4.81 | % | 7.31 | % | 6.82 | % | (1.14 | )% | ||||||||||||||||||||||||||
|
|
|
|
|
|
|
|
|
| |||||||||||||||||||||||||||
Ratios and supplemental data: | ||||||||||||||||||||||||||||||||||||
Net assets, end of period | $ | 78,700,798 | $ | 89,459,142 | $ | 115,679,739 | $ | 129,503,495 | $ | 196,928,349 | ||||||||||||||||||||||||||
Ratios to average net assets: | ||||||||||||||||||||||||||||||||||||
Expenses, before reimbursements or recoupments | 1.15 | % | 1.14 | % | 1.13 | % | 1.17 | % | 1.19 | % | ||||||||||||||||||||||||||
Expenses, net of reimbursements or recoupments | 1.15 | % | 1.14 | % | 1.13 | % | 1.18 | % | 1.19 | % | ||||||||||||||||||||||||||
Net investment income, before expense reimbursements or recoupments | 5.98 | % | 5.62 | % | 5.70 | % | 5.97 | % | 5.05 | % | ||||||||||||||||||||||||||
Net investment income, net of reimbursements or recoupments | 5.98 | % | 5.62 | % | 5.70 | % | 5.96 | % | 5.05 | % | ||||||||||||||||||||||||||
Portfolio turnover rate | 44 | % | 51 | % | 50 | % | 57 | % | 43 | % | ||||||||||||||||||||||||||
| A | Tax return of capital is calculated based on outstanding shares at the time of distribution. |
| B | Amount represents less than $0.01 per share. Effective December 29, 2016, the redemption fee was terminated by the Trust’s Board of Trustees. |
| C | Based on net asset value, which does not reflect the sales charge, redemption fee, or contingent deferred sales charge, if applicable. May include adjustments in accordance with U.S. GAAP and as such, the net asset value for reporting purposes and the returns based upon those net asset values may differ from the net asset value and returns for shareholder transactions. |
See accompanying notes
59
American Beacon SiM High Yield Opportunities FundSM
Financial Highlights
(For a share outstanding throughout the period)
| A Class | ||||||||||||||||||||||||||||||||||||
| Year Ended August 31, | ||||||||||||||||||||||||||||||||||||
| 2019 | 2018 | 2017 | 2016 | 2015 | ||||||||||||||||||||||||||||||||
|
| |||||||||||||||||||||||||||||||||||
Net asset value, beginning of period | $ | 9.53 | $ | 9.61 | $ | 9.49 | $ | 9.43 | $ | 10.36 | ||||||||||||||||||||||||||
|
|
|
|
|
|
|
|
|
| |||||||||||||||||||||||||||
Income (loss) from investment operations: | ||||||||||||||||||||||||||||||||||||
Net investment income | 0.47 | 0.48 | 0.55 | 0.54 | 0.49 | |||||||||||||||||||||||||||||||
Net gains (losses) on investments (both realized and unrealized) | (0.02 | ) | (0.01 | ) | 0.11 | 0.07 | (0.62 | ) | ||||||||||||||||||||||||||||
|
|
|
|
|
|
|
|
|
| |||||||||||||||||||||||||||
Total income (loss) from investment operations | 0.45 | 0.47 | 0.66 | 0.61 | (0.13 | ) | ||||||||||||||||||||||||||||||
|
|
|
|
|
|
|
|
|
| |||||||||||||||||||||||||||
Less distributions: | ||||||||||||||||||||||||||||||||||||
Dividends from net investment income | (0.57 | ) | (0.53 | ) | (0.50 | ) | (0.49 | ) | (0.51 | ) | ||||||||||||||||||||||||||
Distributions from net realized gains | - | - | - | - | (0.29 | ) | ||||||||||||||||||||||||||||||
Tax return of capital | - | (0.02 | )A | (0.04 | )A | (0.06 | )A | - | ||||||||||||||||||||||||||||
|
|
|
|
|
|
|
|
|
| |||||||||||||||||||||||||||
Total distributions | (0.57 | ) | (0.55 | ) | (0.54 | ) | (0.55 | ) | (0.80 | ) | ||||||||||||||||||||||||||
|
|
|
|
|
|
|
|
|
| |||||||||||||||||||||||||||
Redemption fees added to beneficial interests | - | - | - | 0.00 | B | 0.00 | B | |||||||||||||||||||||||||||||
|
|
|
|
|
|
|
|
|
| |||||||||||||||||||||||||||
Net asset value, end of period | $ | 9.41 | $ | 9.53 | $ | 9.61 | $ | 9.49 | $ | 9.43 | ||||||||||||||||||||||||||
|
|
|
|
|
|
|
|
|
| |||||||||||||||||||||||||||
Total returnC | 4.85 | % | 5.00 | % | 7.12 | % | 6.87 | % | (1.27 | )% | ||||||||||||||||||||||||||
|
|
|
|
|
|
|
|
|
| |||||||||||||||||||||||||||
Ratios and supplemental data: | ||||||||||||||||||||||||||||||||||||
Net assets, end of period | $ | 23,694,436 | $ | 37,998,012 | $ | 84,955,157 | $ | 79,917,424 | $ | 81,147,262 | ||||||||||||||||||||||||||
Ratios to average net assets: | ||||||||||||||||||||||||||||||||||||
Expenses, before reimbursements or recoupments | 1.17 | % | 1.07 | % | 1.20 | % | 1.23 | % | 1.22 | % | ||||||||||||||||||||||||||
Expenses, net of reimbursements or recoupments | 1.17 | % | 1.07 | % | 1.20 | % | 1.24 | % | 1.24 | % | ||||||||||||||||||||||||||
Net investment income, before expense reimbursements or recoupments | 5.94 | % | 5.65 | % | 5.62 | % | 5.99 | % | 5.01 | % | ||||||||||||||||||||||||||
Net investment income, net of reimbursements or recoupments | 5.94 | % | 5.65 | % | 5.62 | % | 5.98 | % | 4.99 | % | ||||||||||||||||||||||||||
Portfolio turnover rate | 44 | % | 51 | % | 50 | % | 57 | % | 43 | % | ||||||||||||||||||||||||||
| A | Tax return of capital is calculated based on outstanding shares at the time of distribution. |
| B | Amount represents less than $0.01 per share. Effective December 29, 2016, the redemption fee was terminated by the Trust’s Board of Trustees. |
| C | Based on net asset value, which does not reflect the sales charge, redemption fee, or contingent deferred sales charge, if applicable. May include adjustments in accordance with U.S. GAAP and as such, the net asset value for reporting purposes and the returns based upon those net asset values may differ from the net asset value and returns for shareholder transactions. |
See accompanying notes
60
American Beacon SiM High Yield Opportunities FundSM
Financial Highlights
(For a share outstanding throughout the period)
| C Class | ||||||||||||||||||||||||||||||||||||
| Year Ended August 31, | ||||||||||||||||||||||||||||||||||||
| 2019 | 2018 | 2017 | 2016 | 2015 | ||||||||||||||||||||||||||||||||
|
| |||||||||||||||||||||||||||||||||||
Net asset value, beginning of period | $ | 9.56 | $ | 9.65 | $ | 9.53 | $ | 9.47 | $ | 10.40 | ||||||||||||||||||||||||||
|
|
|
|
|
|
|
|
|
| |||||||||||||||||||||||||||
Income (loss) from investment operations: | ||||||||||||||||||||||||||||||||||||
Net investment income | 0.49 | 0.48 | 0.47 | 0.48 | 0.42 | |||||||||||||||||||||||||||||||
Net gains (losses) on investments (both realized and unrealized) | (0.07 | ) | (0.09 | ) | 0.12 | 0.06 | (0.62 | ) | ||||||||||||||||||||||||||||
|
|
|
|
|
|
|
|
|
| |||||||||||||||||||||||||||
Total income (loss) from investment operations | 0.42 | 0.39 | 0.59 | 0.54 | (0.20 | ) | ||||||||||||||||||||||||||||||
|
|
|
|
|
|
|
|
|
| |||||||||||||||||||||||||||
Less distributions: | ||||||||||||||||||||||||||||||||||||
Dividends from net investment income | (0.50 | ) | (0.47 | ) | (0.43 | ) | (0.43 | ) | (0.44 | ) | ||||||||||||||||||||||||||
Distributions from net realized gains | - | - | - | - | (0.29 | ) | ||||||||||||||||||||||||||||||
Tax return of capital | - | (0.01 | )A | (0.04 | )A | (0.05 | )A | - | ||||||||||||||||||||||||||||
|
|
|
|
|
|
|
|
|
| |||||||||||||||||||||||||||
Total distributions | (0.50 | ) | (0.48 | ) | (0.47 | ) | (0.48 | ) | (0.73 | ) | ||||||||||||||||||||||||||
|
|
|
|
|
|
|
|
|
| |||||||||||||||||||||||||||
Redemption fees added to beneficial interests | - | - | - | 0.00 | B | 0.00 | B | |||||||||||||||||||||||||||||
|
|
|
|
|
|
|
|
|
| |||||||||||||||||||||||||||
Net asset value, end of period | $ | 9.48 | $ | 9.56 | $ | 9.65 | $ | 9.53 | $ | 9.47 | ||||||||||||||||||||||||||
|
|
|
|
|
|
|
|
|
| |||||||||||||||||||||||||||
Total returnC | 4.54 | % | 4.08 | % | 6.33 | % | 6.08 | % | (1.98 | )% | ||||||||||||||||||||||||||
|
|
|
|
|
|
|
|
|
| |||||||||||||||||||||||||||
Ratios and supplemental data: | ||||||||||||||||||||||||||||||||||||
Net assets, end of period | $ | 55,699,475 | $ | 60,797,852 | $ | 69,698,961 | $ | 73,668,689 | $ | 73,213,378 | ||||||||||||||||||||||||||
Ratios to average net assets: | ||||||||||||||||||||||||||||||||||||
Expenses, before reimbursements or recoupments | 1.89 | % | 1.85 | % | 1.94 | % | 1.97 | % | 1.97 | % | ||||||||||||||||||||||||||
Expenses, net of reimbursements or recoupments | 1.89 | % | 1.85 | % | 1.94 | % | 1.99 | % | 1.99 | % | ||||||||||||||||||||||||||
Net investment income, before expense reimbursements or recoupments | 5.24 | % | 4.93 | % | 4.90 | % | 5.26 | % | 4.26 | % | ||||||||||||||||||||||||||
Net investment income, net of reimbursements or recoupments | 5.24 | % | 4.93 | % | 4.90 | % | 5.25 | % | 4.24 | % | ||||||||||||||||||||||||||
Portfolio turnover rate | 44 | % | 51 | % | 50 | % | 57 | % | 43 | % | ||||||||||||||||||||||||||
| A | Tax return of capital is calculated based on outstanding shares at the time of distribution. |
| B | Amount represents less than $0.01 per share. Effective December 29, 2016, the redemption fee was terminated by the Trust’s Board of Trustees. |
| C | Based on net asset value, which does not reflect the sales charge, redemption fee, or contingent deferred sales charge, if applicable. May include adjustments in accordance with U.S. GAAP and as such, the net asset value for reporting purposes and the returns based upon those net asset values may differ from the net asset value and returns for shareholder transactions. |
See accompanying notes
61
American Beacon Sound Point Floating Rate Income FundSM
Financial Highlights
(For a share outstanding throughout the period)
| Institutional Class | ||||||||||||||||||||||||||||||||||||
| Year Ended August 31, | ||||||||||||||||||||||||||||||||||||
| 2019 | 2018 | 2017 | 2016 | 2015 | ||||||||||||||||||||||||||||||||
|
| |||||||||||||||||||||||||||||||||||
Net asset value, beginning of period | $ | 10.28 | $ | 10.35 | $ | 10.20 | $ | 10.38 | $ | 10.49 | ||||||||||||||||||||||||||
|
|
|
|
|
|
|
|
|
| |||||||||||||||||||||||||||
Income (loss) from investment operations: | ||||||||||||||||||||||||||||||||||||
Net investment income | 0.56 | 0.53 | 0.46 | 0.51 | 0.52 | A | ||||||||||||||||||||||||||||||
Net gains (losses) on investments (both realized and unrealized) | (0.44 | ) | (0.05 | ) | 0.18 | (0.10 | ) | 0.06 | ||||||||||||||||||||||||||||
|
|
|
|
|
|
|
|
|
| |||||||||||||||||||||||||||
Total income from investment operations | 0.12 | 0.48 | 0.64 | 0.41 | 0.58 | |||||||||||||||||||||||||||||||
|
|
|
|
|
|
|
|
|
| |||||||||||||||||||||||||||
Less distributions: | ||||||||||||||||||||||||||||||||||||
Dividends from net investment income | (0.61 | ) | (0.52 | ) | (0.47 | ) | (0.55 | ) | (0.52 | ) | ||||||||||||||||||||||||||
Distributions from net realized gains | - | (0.03 | ) | (0.02 | ) | (0.04 | ) | (0.17 | ) | |||||||||||||||||||||||||||
|
|
|
|
|
|
|
|
|
| |||||||||||||||||||||||||||
Total distributions | (0.61 | ) | (0.55 | ) | (0.49 | ) | (0.59 | ) | (0.69 | ) | ||||||||||||||||||||||||||
|
|
|
|
|
|
|
|
|
| |||||||||||||||||||||||||||
Net asset value, end of period | $ | 9.79 | $ | 10.28 | $ | 10.35 | $ | 10.20 | $ | 10.38 | ||||||||||||||||||||||||||
|
|
|
|
|
|
|
|
|
| |||||||||||||||||||||||||||
Total returnB | 1.77 | % | 4.71 | % | 6.37 | % | 4.12 | % | 5.75 | % | ||||||||||||||||||||||||||
|
|
|
|
|
|
|
|
|
| |||||||||||||||||||||||||||
Ratios and supplemental data: | ||||||||||||||||||||||||||||||||||||
Net assets, end of period | $ | 343,916,230 | $ | 391,526,212 | $ | 231,445,512 | $ | 63,147,618 | $ | 42,903,291 | ||||||||||||||||||||||||||
Ratios to average net assets: | ||||||||||||||||||||||||||||||||||||
Expenses, before reimbursements or recoupments | 0.84 | % | 0.82 | % | 0.85 | % | 1.26 | % | 1.88 | % | ||||||||||||||||||||||||||
Expenses, net of reimbursements or recoupments | 0.84 | % | 0.84 | % | 0.84 | % | 0.92 | %C | 0.90 | % | ||||||||||||||||||||||||||
Net investment income, before expense reimbursements or recoupments | 6.10 | % | 5.16 | % | 4.51 | % | 4.78 | % | 4.06 | % | ||||||||||||||||||||||||||
Net investment income, net of reimbursements or recoupments | 6.10 | % | 5.14 | % | 4.52 | % | 5.12 | % | 5.04 | % | ||||||||||||||||||||||||||
Portfolio turnover rate | 58 | % | 69 | % | 86 | % | 168 | % | 196 | % | ||||||||||||||||||||||||||
| A | Per share amounts have been calculated using the average shares method. |
| B | Based on net asset value, which does not reflect the sales charge, redemption fee, or contingent deferred sales charge, if applicable. May include adjustments in accordance with U.S. GAAP and as such, the net asset value for reporting purposes and the returns based upon those net asset values may differ from the net asset value and returns for shareholder transactions. |
| C | Expense ratios may exceed stated expense caps in Note 2 due topre-adoption expenses. |
See accompanying notes
62
American Beacon Sound Point Floating Rate Income FundSM
Financial Highlights
(For a share outstanding throughout the period)
| Y Class | ||||||||||||||||||||||||||||
| Year Ended August 31, | December 11, 2015A to August 31, | |||||||||||||||||||||||||||
| 2019 | 2018 | 2017 | 2016 | |||||||||||||||||||||||||
|
| |||||||||||||||||||||||||||
Net asset value, beginning of period | $ | 10.29 | $ | 10.36 | $ | 10.21 | $ | 10.34 | ||||||||||||||||||||
|
|
|
|
|
|
|
| |||||||||||||||||||||
Income (loss) from investment operations: | ||||||||||||||||||||||||||||
Net investment income | 0.54 | 0.52 | 0.46 | 0.53 | ||||||||||||||||||||||||
Net gains (losses) on investments (both realized and unrealized) | (0.42 | ) | (0.04 | ) | 0.17 | (0.09 | ) | |||||||||||||||||||||
|
|
|
|
|
|
|
| |||||||||||||||||||||
Total income from investment operations | 0.12 | 0.48 | 0.63 | 0.44 | ||||||||||||||||||||||||
|
|
|
|
|
|
|
| |||||||||||||||||||||
Less distributions: | ||||||||||||||||||||||||||||
Dividends from net investment income | (0.61 | ) | (0.52 | ) | (0.46 | ) | (0.53 | ) | ||||||||||||||||||||
Distributions from net realized gains | - | (0.03 | ) | (0.02 | ) | (0.04 | ) | |||||||||||||||||||||
|
|
|
|
|
|
|
| |||||||||||||||||||||
Total distributions | (0.61 | ) | (0.55 | ) | (0.48 | ) | (0.57 | ) | ||||||||||||||||||||
|
|
|
|
|
|
|
| |||||||||||||||||||||
Net asset value, end of period | $ | 9.80 | $ | 10.29 | $ | 10.36 | $ | 10.21 | ||||||||||||||||||||
|
|
|
|
|
|
|
| |||||||||||||||||||||
Total returnB | 1.68 | % | 4.68 | % | 6.27 | % | 4.37 | %C | ||||||||||||||||||||
|
|
|
|
|
|
|
| |||||||||||||||||||||
Ratios and supplemental data: | ||||||||||||||||||||||||||||
Net assets, end of period | $ | 786,638,267 | $ | 1,260,705,246 | $ | 507,077,617 | $ | 22,952,034 | ||||||||||||||||||||
Ratios to average net assets: | ||||||||||||||||||||||||||||
Expenses, before reimbursements or recoupments | 0.90 | % | 0.88 | % | 0.92 | % | 1.42 | %D | ||||||||||||||||||||
Expenses, net of reimbursements or recoupments | 0.90 | % | 0.88 | % | 0.93 | % | 0.94 | %D | ||||||||||||||||||||
Net investment income, before expense reimbursements or recoupments | 5.99 | % | 5.13 | % | 4.43 | % | 4.64 | %D | ||||||||||||||||||||
Net investment income, net of reimbursements or recoupments | 5.99 | % | 5.13 | % | 4.42 | % | 5.11 | %D | ||||||||||||||||||||
Portfolio turnover rate | 58 | % | 69 | % | 86 | % | 168 | %E | ||||||||||||||||||||
| A | Commencement of operations. |
| B | Based on net asset value, which does not reflect the sales charge, redemption fee, or contingent deferred sales charge, if applicable. May include adjustments in accordance with U.S. GAAP and as such, the net asset value for reporting purposes and the returns based upon those net asset values may differ from the net asset value and returns for shareholder transactions. |
| C | Not annualized. |
| D | Annualized. |
| E | Portfolio turnover rate is for the period from December 11, 2015 through August 31, 2016 and is not annualized. |
See accompanying notes
63
American Beacon Sound Point Floating Rate Income FundSM
Financial Highlights
(For a share outstanding throughout the period)
| Investor Class | ||||||||||||||||||||||||||||
| Year Ended August 31, | December 11, 2015A to August 31, | |||||||||||||||||||||||||||
| 2019 | 2018 | 2017 | 2016 | |||||||||||||||||||||||||
|
| |||||||||||||||||||||||||||
Net asset value, beginning of period | $ | 10.26 | $ | 10.33 | $ | 10.18 | $ | 10.33 | ||||||||||||||||||||
|
|
|
|
|
|
|
| |||||||||||||||||||||
Income (loss) from investment operations: | ||||||||||||||||||||||||||||
Net investment income | 0.49 | 0.50 | 0.46 | 0.50 | ||||||||||||||||||||||||
Net gains (losses) on investments (both realized and unrealized) | (0.40 | ) | (0.04 | ) | 0.15 | (0.09 | ) | |||||||||||||||||||||
|
|
|
|
|
|
|
| |||||||||||||||||||||
Total income from investment operations | 0.09 | 0.46 | 0.61 | 0.41 | ||||||||||||||||||||||||
|
|
|
|
|
|
|
| |||||||||||||||||||||
Less distributions: | ||||||||||||||||||||||||||||
Dividends from net investment income | (0.57 | ) | (0.50 | ) | (0.44 | ) | (0.52 | ) | ||||||||||||||||||||
Distributions from net realized gains | - | (0.03 | ) | (0.02 | ) | (0.04 | ) | |||||||||||||||||||||
|
|
|
|
|
|
|
| |||||||||||||||||||||
Total distributions | (0.57 | ) | (0.53 | ) | (0.46 | ) | (0.56 | ) | ||||||||||||||||||||
|
|
|
|
|
|
|
| |||||||||||||||||||||
Net asset value, end of period | $ | 9.78 | $ | 10.26 | $ | 10.33 | $ | 10.18 | ||||||||||||||||||||
|
|
|
|
|
|
|
| |||||||||||||||||||||
Total returnB | 1.38 | % | 4.51 | % | 6.12 | % | 4.16 | %C | ||||||||||||||||||||
|
|
|
|
|
|
|
| |||||||||||||||||||||
Ratios and supplemental data: | ||||||||||||||||||||||||||||
Net assets, end of period | $ | 214,702,538 | $ | 538,668,514 | $ | 129,817,379 | $ | 3,641,581 | ||||||||||||||||||||
Ratios to average net assets: | ||||||||||||||||||||||||||||
Expenses, before reimbursements or recoupments | 1.22 | % | 1.04 | % | 1.07 | % | 1.31 | %D | ||||||||||||||||||||
Expenses, net of reimbursements or recoupments | 1.22 | % | 1.04 | % | 1.09 | % | 1.22 | %D | ||||||||||||||||||||
Net investment income, before expense reimbursements or recoupments | 5.60 | % | 5.02 | % | 4.24 | % | 4.26 | %D | ||||||||||||||||||||
Net investment income, net of reimbursements or recoupments | 5.60 | % | 5.02 | % | 4.22 | % | 4.35 | %D | ||||||||||||||||||||
Portfolio turnover rate | 58 | % | 69 | % | 86 | % | 168 | %E | ||||||||||||||||||||
| A | Commencement of operations. |
| B | Based on net asset value, which does not reflect the sales charge, redemption fee, or contingent deferred sales charge, if applicable. May include adjustments in accordance with U.S. GAAP and as such, the net asset value for reporting purposes and the returns based upon those net asset values may differ from the net asset value and returns for shareholder transactions. |
| C | Not annualized. |
| D | Annualized. |
| E | Portfolio turnover rate is for the period from December 11, 2015 through August 31, 2016 and is not annualized. |
See accompanying notes
64
American Beacon Sound Point Floating Rate Income FundSM
Financial Highlights
(For a share outstanding throughout the period)
| A Class | ||||||||||||||||||||||||||||
| Year Ended August 31, | December 11, 2015A to August 31, | |||||||||||||||||||||||||||
| 2019 | 2018 | 2017 | 2016 | |||||||||||||||||||||||||
|
| |||||||||||||||||||||||||||
Net asset value, beginning of period | $ | 10.28 | $ | 10.35 | $ | 10.20 | $ | 10.33 | ||||||||||||||||||||
|
|
|
|
|
|
|
| |||||||||||||||||||||
Income (loss) from investment operations: | ||||||||||||||||||||||||||||
Net investment income | 0.56 | 0.49 | 0.42 | 0.51 | ||||||||||||||||||||||||
Net gains (losses) on investments (both realized and unrealized) | (0.44 | ) | (0.04 | ) | 0.17 | (0.10 | ) | |||||||||||||||||||||
|
|
|
|
|
|
|
| |||||||||||||||||||||
Total income from investment operations | 0.12 | 0.45 | 0.59 | 0.41 | ||||||||||||||||||||||||
|
|
|
|
|
|
|
| |||||||||||||||||||||
Less distributions: | ||||||||||||||||||||||||||||
Dividends from net investment income | (0.58 | ) | (0.49 | ) | (0.42 | ) | (0.50 | ) | ||||||||||||||||||||
Distributions from net realized gains | - | (0.03 | ) | (0.02 | ) | (0.04 | ) | |||||||||||||||||||||
|
|
|
|
|
|
|
| |||||||||||||||||||||
Total distributions | (0.58 | ) | (0.52 | ) | (0.44 | ) | (0.54 | ) | ||||||||||||||||||||
|
|
|
|
|
|
|
| |||||||||||||||||||||
Net asset value, end of period | $ | 9.82 | $ | 10.28 | $ | 10.35 | $ | 10.20 | ||||||||||||||||||||
|
|
|
|
|
|
|
| |||||||||||||||||||||
Total returnB | 1.53 | % | 4.39 | % | 5.92 | % | 4.13 | %C | ||||||||||||||||||||
|
|
|
|
|
|
|
| |||||||||||||||||||||
Ratios and supplemental data: | ||||||||||||||||||||||||||||
Net assets, end of period | $ | 45,602,098 | $ | 58,987,550 | $ | 32,450,342 | $ | 6,849,306 | ||||||||||||||||||||
Ratios to average net assets: | ||||||||||||||||||||||||||||
Expenses, before reimbursements or recoupments | 1.13 | % | 1.13 | % | 1.22 | % | 1.67 | %D | ||||||||||||||||||||
Expenses, net of reimbursements or recoupments | 1.13 | % | 1.14 | % | 1.24 | % | 1.24 | %D | ||||||||||||||||||||
Net investment income, before expense reimbursements or recoupments | 5.80 | % | 4.85 | % | 4.07 | % | 4.51 | %D | ||||||||||||||||||||
Net investment income, net of reimbursements or recoupments | 5.80 | % | 4.84 | % | 4.04 | % | 4.93 | %D | ||||||||||||||||||||
Portfolio turnover rate | 58 | % | 69 | % | 86 | % | 168 | %E | ||||||||||||||||||||
| A | Commencement of operations. |
| B | Based on net asset value, which does not reflect the sales charge, redemption fee, or contingent deferred sales charge, if applicable. May include adjustments in accordance with U.S. GAAP and as such, the net asset value for reporting purposes and the returns based upon those net asset values may differ from the net asset value and returns for shareholder transactions. |
| C | Not annualized. |
| D | Annualized. |
| E | Portfolio turnover rate is for the period from December 11, 2015 through August 31, 2016 and is not annualized. |
See accompanying notes
65
American Beacon Sound Point Floating Rate Income FundSM
Financial Highlights
(For a share outstanding throughout the period)
| C Class | ||||||||||||||||||||||||||||
| Year Ended August 31, | December 11, 2015A to August 31, | |||||||||||||||||||||||||||
| 2019 | 2018 | 2017 | 2016 | |||||||||||||||||||||||||
|
| |||||||||||||||||||||||||||
Net asset value, beginning of period | $ | 10.29 | $ | 10.35 | $ | 10.21 | $ | 10.33 | ||||||||||||||||||||
|
|
|
|
|
|
|
| |||||||||||||||||||||
Income (loss) from investment operations: | ||||||||||||||||||||||||||||
Net investment income | 0.51 | 0.42 | 0.35 | 0.45 | ||||||||||||||||||||||||
Net gains (losses) on investments (both realized and unrealized) | (0.44 | ) | (0.04 | ) | 0.16 | (0.08 | ) | |||||||||||||||||||||
|
|
|
|
|
|
|
| |||||||||||||||||||||
Total income from investment operations | 0.07 | 0.38 | 0.51 | 0.37 | ||||||||||||||||||||||||
|
|
|
|
|
|
|
| |||||||||||||||||||||
Less distributions: | ||||||||||||||||||||||||||||
Dividends from net investment income | (0.51 | ) | (0.41 | ) | (0.35 | ) | (0.45 | ) | ||||||||||||||||||||
Distributions from net realized gains | - | (0.03 | ) | (0.02 | ) | (0.04 | ) | |||||||||||||||||||||
|
|
|
|
|
|
|
| |||||||||||||||||||||
Total distributions | (0.51 | ) | (0.44 | ) | (0.37 | ) | (0.49 | ) | ||||||||||||||||||||
|
|
|
|
|
|
|
| |||||||||||||||||||||
Net asset value, end of period | $ | 9.85 | $ | 10.29 | $ | 10.35 | $ | 10.21 | ||||||||||||||||||||
|
|
|
|
|
|
|
| |||||||||||||||||||||
Total returnB | 0.67 | % | 3.73 | % | 5.03 | % | 3.67 | %C | ||||||||||||||||||||
|
|
|
|
|
|
|
| |||||||||||||||||||||
Ratios and supplemental data: | ||||||||||||||||||||||||||||
Net assets, end of period | $ | 58,653,731 | $ | 59,792,915 | $ | 31,434,098 | $ | 3,040,244 | ||||||||||||||||||||
Ratios to average net assets: | ||||||||||||||||||||||||||||
Expenses, before reimbursements or recoupments | 1.90 | % | 1.88 | % | 1.97 | % | 2.55 | %D | ||||||||||||||||||||
Expenses, net of reimbursements or recoupments | 1.90 | % | 1.88 | % | 1.99 | % | 1.99 | %D | ||||||||||||||||||||
Net investment income, before expense reimbursements or recoupments | 5.07 | % | 4.10 | % | 3.31 | % | 3.50 | %D | ||||||||||||||||||||
Net investment income, net of reimbursements or recoupments | 5.07 | % | 4.10 | % | 3.29 | % | 4.06 | %D | ||||||||||||||||||||
Portfolio turnover rate | 58 | % | 69 | % | 86 | % | 168 | %E | ||||||||||||||||||||
| A | Commencement of operations. |
| B | Based on net asset value, which does not reflect the sales charge, redemption fee, or contingent deferred sales charge, if applicable. May include adjustments in accordance with U.S. GAAP and as such, the net asset value for reporting purposes and the returns based upon those net asset values may differ from the net asset value and returns for shareholder transactions. |
| C | Not annualized. |
| D | Annualized. |
| E | Portfolio turnover rate is for the period from December 11, 2015 through August 31, 2016 and is not annualized. |
See accompanying notes
66
American Beacon Sound Point Floating Rate Income FundSM
Financial Highlights
(For a share outstanding throughout the period)
| SP ClassA | ||||||||||||||||||||||||||||||||||||
| Year Ended August 31, | ||||||||||||||||||||||||||||||||||||
| 2019 | 2018 | 2017 | 2016 | 2015 | ||||||||||||||||||||||||||||||||
|
| |||||||||||||||||||||||||||||||||||
Net asset value, beginning of period | $ | 10.30 | $ | 10.36 | $ | 10.19 | $ | 10.38 | $ | 10.49 | ||||||||||||||||||||||||||
|
|
|
|
|
|
|
|
|
| |||||||||||||||||||||||||||
Income (loss) from investment operations: | ||||||||||||||||||||||||||||||||||||
Net investment income | 0.58 | B | 0.49 | 0.25 | B | 0.30 | 0.43 | B | ||||||||||||||||||||||||||||
Net gains (losses) on investments (both realized and unrealized) | (0.46 | ) | (0.03 | ) | 0.37 | 0.07 | 0.12 | |||||||||||||||||||||||||||||
|
|
|
|
|
|
|
|
|
| |||||||||||||||||||||||||||
Total income from investment operations | 0.12 | 0.46 | 0.62 | 0.37 | 0.55 | |||||||||||||||||||||||||||||||
|
|
|
|
|
|
|
|
|
| |||||||||||||||||||||||||||
Less distributions: | ||||||||||||||||||||||||||||||||||||
Dividends from net investment income | (0.58 | ) | (0.49 | ) | (0.43 | ) | (0.52 | ) | (0.49 | ) | ||||||||||||||||||||||||||
Distributions from net realized gains | - | (0.03 | ) | (0.02 | ) | (0.04 | ) | (0.17 | ) | |||||||||||||||||||||||||||
|
|
|
|
|
|
|
|
|
| |||||||||||||||||||||||||||
Total distributions | (0.58 | ) | (0.52 | ) | (0.45 | ) | (0.56 | ) | (0.66 | ) | ||||||||||||||||||||||||||
|
|
|
|
|
|
|
|
|
| |||||||||||||||||||||||||||
Net asset value, end of period | $ | 9.84 | $ | 10.30 | $ | 10.36 | $ | 10.19 | $ | 10.38 | ||||||||||||||||||||||||||
|
|
|
|
|
|
|
|
|
| |||||||||||||||||||||||||||
Total returnC | 1.40 | % | 4.49 | % | 6.13 | % | 3.70 | % | 5.53 | % | ||||||||||||||||||||||||||
|
|
|
|
|
|
|
|
|
| |||||||||||||||||||||||||||
Ratios and supplemental data: | ||||||||||||||||||||||||||||||||||||
Net assets, end of period | $ | 282,847 | $ | 705,984 | $ | 785,649 | $ | 11,651,032 | $ | 125,577 | ||||||||||||||||||||||||||
Ratios to average net assets: | ||||||||||||||||||||||||||||||||||||
Expenses, before reimbursements or recoupments | 1.06 | % | 1.04 | % | 1.08 | % | 1.49 | % | 1.74 | % | ||||||||||||||||||||||||||
Expenses, net of reimbursements or recoupments | 1.15 | % | 1.15 | % | 1.12 | % | 1.19 | %D | 1.15 | % | ||||||||||||||||||||||||||
Net investment income, before expense reimbursements or recoupments | 5.83 | % | 4.86 | % | 4.25 | % | 4.01 | % | 3.59 | % | ||||||||||||||||||||||||||
Net investment income, net of reimbursements or recoupments | 5.74 | % | 4.75 | % | 4.21 | % | 4.30 | % | 4.18 | % | ||||||||||||||||||||||||||
Portfolio turnover rate | 58 | % | 69 | % | 86 | % | 168 | % | 196 | % | ||||||||||||||||||||||||||
| A | Prior to the reorganization on December 11, 2015, the SP Class was known as the Investor Class. |
| B | Per share amounts have been calculated using the average shares method. |
| C | Based on net asset value, which does not reflect the sales charge, redemption fee, or contingent deferred sales charge, if applicable. May include adjustments in accordance with U.S. GAAP and as such, the net asset value for reporting purposes and the returns based upon those net asset values may differ from the net asset value and returns for shareholder transactions. |
| D | Expense ratios may exceed stated expense caps in Note 2 due topre-adoption expenses. |
See accompanying notes
67
American Beacon FundsSM
August 31, 2019 (Unaudited)
Certain tax information regarding the Funds are required to be provided to shareholders based upon the Fund’s income and distributions for the taxable year ended August 31, 2019. The information and distributions reported herein may differ from information and distributions taxable to the shareholders for the calendar year ended December 31, 2019.
The Funds designated the following items with regard to distributions paid during the fiscal year ended August 31, 2019. All designations are based on financial information available as of this annual report and, accordingly, are subject to change. For each item, it is the intention of the Funds to designate the maximum amount permitted under the Internal Revenue Code of 1986, as amended, and the regulations there under.
Corporate Dividends-Received Deduction:
SiM High Yield Opportunities | 0.36 | % | ||
Sound Point Floating Rate Income | N/A |
Qualified Dividend Income:
SiM High Yield Opportunities | 0.75 | % | ||
Sound Point Floating Rate Income | N/A |
Long-Term Capital Gain Distributions:
SiM High Yield Opportunities | $ | - | ||
Sound Point Floating Rate Income | - |
Short-Term Capital Gain Distributions:
SiM High Yield Opportunities | $ | - | ||
Sound Point Floating Rate Income | - |
Shareholders will receive notification in January 2020 of the applicable tax information necessary to prepare their 2019 income tax returns.
68
Disclosures Regarding the Approval of the Management and Investment Advisory Agreements
August 31, 2019 (Unaudited)
Renewal and Approval of Management Agreement and Investment Advisory Agreements
At in-person meetings held on May 9, 2019 and June 4-5, 2019 (collectively, the “Meetings”), the Board of Trustees (“Board” or “Trustees”) considered and then, at its June 5, 2019 meeting, approved the renewal of:
(1) the Management Agreement between American Beacon Advisors, Inc. (“Manager”) and the American Beacon Funds (“Trust”), on behalf of the American Beacon Sound Point Floating Rate Income Fund (“Sound Point Fund”) and American Beacon SiM High Yield Opportunities Fund (“SiM Fund”) (each, a “Fund” and collectively, the “Funds”);
(2) the Investment Advisory Agreement among the Manager, Sound Point Capital Management, LP (“Sound Point”), and the Trust, on behalf of the Sound Point Fund; and
(3) the Investment Advisory Agreement among the Manager, Strategic Income Management, LLC (“SiM”), and the Trust, on behalf of the SiM Fund.
Sound Point and SiM are hereinafter each referred to as a “subadvisor” and collectively as the “subadvisors.” The Management Agreement and the Investment Advisory Agreements are referred to herein individually as an “Agreement” and collectively as the “Agreements.” In preparation for its consideration of the renewal of the Agreements, the Board undertook steps to gather and consider information furnished by the Manager, the subadvisors, Broadridge, Inc. (“Broadridge”) and Morningstar, Inc. (“Morningstar”). The Board, with the assistance of independent legal counsel, requested and received certain relevant information from the Manager and each subadvisor.
In advance of the Meetings, the Board’s Investment Committee and/or the Manager coordinated the production of information from Broadridge and Morningstar regarding the performance, fees and expenses of the Funds as well as information from the Manager and the subadvisors. At the Meetings, the Board considered the information provided in connection with the renewal process, as well as information furnished to the Board throughout the year at regular meetings of the Board and its committees. In connection with the Board’s consideration of the Agreements, the Board received and evaluated such information as they deemed necessary. This information is described below in the section summarizing the factors the Board considered in connection with its renewal and approval of the Agreements, as well as the section describing additional Board considerations with respect to each Fund.
The Board noted that the Manager provides management and administrative services to the Funds pursuant to the Management Agreement. The Board considered that many mutual funds have separate contracts governing each type of service and observed that, with respect to such mutual funds, the actual management fee rates provided by Broadridge for peer group funds reflect the combined advisory and administrative expenses, reduced by any fee waivers and/or reimbursements.
A firm may not have been able to, or opted not to, provide information in response to certain information requests, in which case the Board conducted its evaluation of the firm based on information that was provided. In such cases, the Board determined that the omission of any such information was not material to its considerations. For each Fund, the class of shares used for comparative performance purposes was the share class with the lowest expenses available for purchase by the general public, which was the Institutional Class. The Board also considered that the use of Institutional Class performance generally facilitates a meaningful comparison for expense and performance purposes.
Provided below is an overview of certain factors the Board considered in connection with its renewal and approval of the Agreements. The Board did not identify any particular information that was most relevant to its consideration to renew or approve each Agreement, and each Trustee may have afforded different weight to the various factors. Legal counsel to the independent Trustees provided the Board with a memorandum regarding its
69
Disclosures Regarding the Approval of the Management and Investment Advisory Agreements
August 31, 2019 (Unaudited)
responsibilities pertaining to the renewal and approval of investment advisory contracts, such as the Agreements. The memorandum explained the regulatory requirements surrounding the Board’s process for evaluating investment advisors and the terms of investment advisory contracts. Based on its evaluation, the Board unanimously concluded that the terms of each Agreement were reasonable and fair and that the renewal and approval of each Agreement was in the best interests of the Funds and their shareholders.
Considerations With Respect to the Renewal of the Management Agreement and the Investment Advisory Agreements
In determining whether to renew the Agreements, the Board considered each Fund’s investment management and subadvisory relationships separately. In each instance, the Board considered, among other things, the following factors: (1) the nature, extent and quality of the services provided; (2) the investment performance of the Funds; (3) the costs incurred by the Manager in rendering services to the Funds and its resulting profits or losses; (4) comparisons of services and fee rates with contracts entered into by the Manager or a subadvisor or their affiliates with other clients (such as pension funds and other institutional clients); (5) the extent to which economies of scale, if any, have been taken into account in setting each fee rate schedule; (6) whether fee rate levels reflect economies of scale, if any, for the benefit of Fund investors; and (7) any other benefits derived or anticipated to be derived by the Manager or a subadvisor from their relationships with the Funds.
Nature, Extent and Quality of Services. With respect to the renewal of the Management Agreement, the Board considered, among other factors: each Fund’s long-term performance; the length of service of key investment personnel at the Manager; the cost structure of the Funds; the Manager’s culture of compliance and support that reduce risks to the Funds; the Manager’s quality of services; the Manager’s active role in monitoring and, as appropriate, recommending additional or replacement subadvisors; and the Manager’s efforts to retain key employees and maintain staffing levels.
With respect to the renewal of each Investment Advisory Agreement, the Board considered the level of staffing and the size of the subadvisor. The Board also considered the adequacy of the resources committed to the Funds by each subadvisor, and whether those resources were commensurate with the needs of the Funds and are sufficient to sustain appropriate levels of performance and compliance needs. In this regard, the Board considered the financial stability of each subadvisor. The Board also considered each subadvisor’s representations regarding its compliance program and code of ethics. Based on the foregoing information, the Board concluded that the nature, extent and quality of the management and advisory services provided by the Manager and each subadvisor were appropriate for each Fund.
Investment Performance.The Board evaluated the comparative information provided by Broadridge and the Manager regarding the performance of each Fund relative to its Broadridge performance universe, Morningstar Category, and benchmark index, as well as the Fund’s Morningstar rating. The Board considered the information provided by Broadridge regarding Broadridge’s independent methodology for selecting each Fund’s Broadridge performance universe. The Board also considered that the performance universes selected by Broadridge may not provide appropriate comparisons for a Fund. In addition, the Board considered the performance reports and discussions with management at Board and Committee meetings throughout the year. The Board also evaluated the comparative information provided by each subadvisor regarding the performance of the relevant Fund relative to the performance of other comparable investment accounts managed by the subadvisor and the Fund’s benchmark index. In addition, the Board considered the Manager’s recommendation to continue to retain each subadvisor. A discussion regarding the Board’s considerations with respect to each Fund’s performance appears below under “Additional Considerations and Conclusions with Respect to Each Fund.”
Costs of the Services Provided to the Funds and the Profits Realized by the Manager from its Relationship with the Funds.In analyzing the cost of services and profitability of the Manager, the Board considered the revenues earned and the expenses incurred by the Manager, before and after the payment of distribution-related expenses by the Manager. The profits or losses were noted at both an aggregate level for all funds within the group
70
Disclosures Regarding the Approval of the Management and Investment Advisory Agreements
August 31, 2019 (Unaudited)
of mutual funds sponsored by the Manager (the “Fund Complex”) and at an individual Fund level, with the Manager earning a profit before and after the payment of distribution-related expenses by the Manager for each Fund. The Board also considered comparative information provided by the Manager regarding the Manager’s overall profitability with respect to the Fund Complex relative to the overall profitability of other firms in the mutual fund industry, as disclosed in publicly available sources. Although the Board noted that, in certain cases, the fee rates paid by other clients of the Manager are lower than the fee rates paid by the Funds, the Manager represented that, among other matters, the difference is attributable to the fact that the Manager does not perform administrative services for non-investment company clients and reflects the greater level of responsibility and regulatory requirements associated with managing the Funds.
The Board also noted that the Manager proposed to continue the expense waivers and reimbursements for the Funds that were in place during the last fiscal year. The Board further considered that, with respect to each Fund, the Management Agreement provides for the Manager to receive a management fee comprised of an annualized fee that is retained by the Manager. The Board also noted that certain share classes of the Funds maintain higher expense ratios in order to compensate third-party financial intermediaries.
In analyzing the fee rates charged by each subadvisor in connection with its investment advisory services to a Fund, the Board considered representations made by each subadvisor that the fee rate negotiated by the Manager is generally favorable relative to the fee rates that the subadvisor charges for any comparable client accounts. The Board did not request profitability data from the subadvisors because the Board did not view this data as imperative to its deliberations given the arm’s-length nature of the relationship between the Manager and the subadvisors with respect to the negotiation of subadvisory fee rates. In addition, the Board noted that subadvisors may not account for their profits on an account-by-account basis and that different firms likely employ different methodologies in connection with these calculations.
Based on the foregoing information, the Board concluded that the profitability levels of the Manager were reasonable in light of the services performed by the Manager. A discussion regarding the Board’s considerations with respect to each Fund’s fee rates is set forth below under “Additional Considerations and Conclusions with Respect to Each Fund.”
Economies of Scale.In considering the reasonableness of the management and investment advisory fees rates, the Board considered whether economies of scale will be realized as each Fund grows and whether fee rate levels reflect these economies of scale for the benefit of Fund shareholders. In this regard, the Board considered that the Manager has negotiated breakpoints in the subadvisory fee schedule for the SiM Fund and, with respect to the Sound Point Fund, Sound Point has represented that the Sound Point Fund’s subadvisory fee rate reflects economies of scale for the benefit of the Sound Point Fund’s shareholders.
In addition, the Board noted the Manager’s representation that the Management Agreement contains fee schedule breakpoints at higher asset levels with respect to each Fund. Based on the foregoing information, the Board concluded that the Manager and subadvisor fee rate schedules for each Fund provide for a reasonable sharing of benefits from any economies of scale with each Fund.
Benefits Derived from the Relationship with the Funds.The Board considered the “fall-out” or ancillary benefits that accrue to the Manager and/or the subadvisors as a result of the advisory relationships with the Funds, including greater exposure in the marketplace with respect to the Manager’s or the subadvisors’ investment process and expanding the level of assets under management by the Manager and the subadvisors. Based on the foregoing information, the Board concluded that the potential benefits accruing to the Manager and the subadvisors by virtue of their relationships with the Funds appear to be fair and reasonable.
71
Disclosures Regarding the Approval of the Management and Investment Advisory Agreements
August 31, 2019 (Unaudited)
Additional Considerations and Conclusions with Respect to Each Fund
The performance comparisons below were made in comparison to each Fund’s Broadridge performance universe and Morningstar Category. With respect to the Broadridge performance universe, the 1st Quintile represents the top 20 percent of the universe based on performance and the 5th Quintile representing the bottom 20 percent of the universe based on performance. References below to each Fund’s Broadridge performance universe are to the universe of mutual funds with a comparable investment classification/objective included in the analysis provided by Broadridge. In reviewing the performance, the Trustees viewed longer-term performance over a full market cycle as the most important consideration, because relative performance over shorter periods may be significantly impacted by market or economic events and not necessarily reflective of manager skill.
The expense comparisons below were made in comparison to each Fund’s Broadridge expense universe and Broadridge expense group, with the 1st Quintile representing the lowest 20 percent of the universe or group based on lowest total expense and the 5th Quintile representing the highest 20 percent of the universe or group based on highest total expense. References below to each Fund’s expense group and expense universe are to the respective group or universe of comparable mutual funds included in the analysis by Broadridge. A Broadridge expense group consists of the Fund and a representative sample of funds with similar operating structures and asset sizes, as selected by Broadridge. A Broadridge expense universe includes all funds in the investment classification/objective with a similar operating structure as the share class of the Fund included in the Broadridge comparative information and provides a broader view of expenses across the Fund’s investment classification/objective. The Board also considered each Fund’s Morningstar fee level category. In reviewing expenses, the Board considered the positive impact of fee waivers where applicable and the Manager’s agreement to continue the fee waivers. In addition, information regarding the subadvisors’ use of soft dollars was requested from the Manager and was considered by the Board.
Additional Considerations and Conclusions with Respect to the American Beacon Sound Point Floating Rate Income Fund
In considering the renewal of the Management Agreement and the Investment Advisory Agreement with Sound Point for the Sound Point Fund, the Board considered the following additional factors:
Broadridge Total Expenses Excluding 12b-1 Fees and Morningstar Fee Level Ranking
Compared to Broadridge Expense Group | 5th Quintile | |
Compared to Broadridge Expense Universe | 5th Quintile | |
Morningstar Fee Level Ranking – Institutional Class | High Expense Ratio |
Broadridge and Morningstar Performance Analysis (five-year period ended December 31, 2018)
Compared to Broadridge Performance Universe | 1st Quintile | |
Compared to Morningstar Category | 1st Quintile |
The Board also considered: (1) the Sound Point Fund’s expenses are in the fifth quintile of its Broadridge expense group and expense universe, but that the Sound Point Fund, on a net-of-fee basis, ranked in the first quintile of its Broadridge performance universe and Morningstar category for the 5-year period ended December 31, 2018; (2) the Sound Point Fund employs a limited-capacity strategy as Sound Point invests primarily in mid-sized issues of small-capitalization issuers; (3) information provided by Sound Point regarding fee rates charged for managing assets in the same or a similar strategy as Sound Point manages the Sound Point Fund; (4) the Sound Point Fund acquired all of the assets of the Sound Point Floating Rate Income Fund, a professionally managed portfolio (“Acquired Fund”), on December 11, 2015, and that the Sound Point Fund’s performance prior to that date is that of the Acquired Fund; (5) Sound Point’s consistent process; and (6) the Manager’s recommendation to continue to retain Sound Point.
72
Disclosures Regarding the Approval of the Management and Investment Advisory Agreements
August 31, 2019 (Unaudited)
Based on these and other considerations, the Board: (1) concluded that the fees paid to the Manager and Sound Point under the Management and Investment Advisory Agreements are fair and reasonable; and (2) determined that the Sound Point Fund and its shareholders would benefit from the Manager’s and Sound Point’s continued management of the Sound Point Fund.
Additional Considerations and Conclusions with Respect to the American Beacon SiM High Yield Opportunities Fund
In considering the renewal of the Management Agreement and the Investment Advisory Agreement with SiM for the SiM Fund, the Board considered the following additional factors:
Broadridge Total Expenses Excluding 12b-1 Fees and Morningstar Fee Level Ranking
Compared to Broadridge Expense Group | 5th Quintile | |
Compared to Broadridge Expense Universe | 5th Quintile | |
Morningstar Fee Level Ranking – Institutional Class | Above Average Expense Ratio |
Broadridge and Morningstar Performance Analysis (five-year period ended December 31, 2018)
Compared to Broadridge Performance Universe | 1st Quintile | |
Compared to Morningstar Category | 1st Quintile |
The Board also considered: (1) that the SiM Fund’s expenses are in the fifth quintile of its Broadridge expense group and expense universe, but that the SiM Fund, on a net-of-fee basis, ranked in the first quintile of its Broadridge performance universe and Morningstar category for the 5-year period ended December 31, 2018; (2) that, as SiM invests significantly in the below investment grade debt securities of small capitalization issuers, the SiM Fund employs a limited-capacity strategy; (3) information provided by SiM regarding fee rates charged for managing assets in the same or a similar strategy as SiM manages the SiM Fund; and (4) the Manager’s recommendation to continue to retain SiM.
Based on these and other considerations, the Board: (1) concluded that the fees paid to the Manager and SiM under the Management and Investment Advisory Agreements are fair and reasonable; and (2) determined that the SiM Fund and its shareholders would benefit from the Manager’s and SiM’s continued management of the SiM Fund.
73
Trustees and Officers of the American Beacon FundsSM(Unaudited)
The Trustees and officers of the American Beacon Funds (the “Trust”) are listed below, together with their principal occupations during the past five years. The address of each person listed below is 220 Las Colinas Boulevard East, Suite 1200, Irving, Texas 75039. Each Trustee oversees thirty-seven funds in the fund complex that includes the Trust, the American Beacon Select Funds, the American Beacon Institutional Funds Trust, the American Beacon Sound Point Enhanced Income Fund, American Beacon Apollo Total Return Fund and the American Beacon Sound Point Alternative Lending Fund. The Trust’s Statement of Additional Information contains additional information about the Trustees and is available without charge by calling 1-800-658-5811.
Name, Age and Address | Position, Term of | Principal Occupation(s) During Past 5 Years | ||
| INTERESTED TRUSTEES | Term | |||
| Lifetime of Trust until removal, resignation or retirement* | ||||
| Alan D. Feld** (82) | Trustee since 1996 | Partner in the law firm of Akin, Gump, Strauss, Hauer & Feld, LLP (law firm) (1960-Present); Trustee, American Beacon Select Funds(1999-Present); Trustee, American Beacon Institutional Funds Trust (2017-Present); Trustee, American Beacon Sound Point Enhanced Income Fund (2018-Present); Trustee, American Beacon Apollo Total Return Fund (2018-Present); Trustee, American Beacon Sound Point Alternative Lending Fund (2019-Present). | ||
| NON-INTERESTED TRUSTEES | Term | |||
| Lifetime of Trust until removal, resignation or retirement* | ||||
| Gilbert G. Alvarado (49) | Trustee since 2015 | Director, Kura MD, Inc. (local telehealth organization) (2015-present); Vice President & CFO, Sierra Health Foundation (health conversion private foundation) (2006-Present); Vice President & CFO, Sierra Health Foundation: Center for Health Program Management (California public benefit corporation) (2012-Present); Director, Innovative North State (2012-2015); Director, Sacramento Regional Technology Alliance (2011-2016); Director, Women’s Empowerment (2009-2014); Director, Valley Healthcare Staffing (2017-present); Trustee, American Beacon Select Funds (2015-Present); Trustee, American Beacon Institutional Funds Trust (2017-Present); Trustee, American Beacon Sound Point Enhanced Income Fund (2018-Present); Trustee, American Beacon Apollo Total Return Fund (2018-Present); Trustee, American Beacon Sound Point Alternative Lending Fund (2019-Present). | ||
| Joseph B. Armes (57) | Trustee since 2015 | Chairman & CEO, CSW Industrials f/k/a Capital Southwest Corporation (investment company) (2015-Present); Chairman of the Board of Capital Southwest Corporation, predecessor to CSW Industrials, Inc. (2014-2017) (investment company); CEO, Capital Southwest Corporation (2013-2015); President & CEO, JBA Investment Partners (family investment vehicle) (2010-Present); Director and Chair of Audit Committee, RSP Permian (oil and gas producer) (2013-Present); Trustee, American Beacon Select Funds (2015-Present); Trustee, American Beacon Institutional Funds Trust (2017-Present); Trustee, American Beacon Sound Point Enhanced Income Fund (2018-Present); Trustee, American Beacon Apollo Total Return Fund (2018-Present); Trustee, American Beacon Sound Point Alternative Lending Fund (2019-Present). | ||
74
Trustees and Officers of the American Beacon FundsSM(Unaudited)
Name, Age and Address | Position, Term of | Principal Occupation(s) During Past 5 Years | ||
| NON-INTERESTED TRUSTEES (CONT.) | Term | |||
| Lifetime of Trust until removal, resignation or retirement* | ||||
| Gerard J. Arpey (60) | Trustee since 2012 | Director, The Home Depot, Inc. (2015-Present); Partner, Emerald Creek Group (private equity firm) (2011-Present); Director, S.C. Johnson & Son, Inc. (privately held company) (2008-present); Trustee, American Beacon Select Funds (2012-Present); Trustee, American Beacon Institutional Funds Trust (2017-Present); Trustee, American Beacon Sound Point Enhanced Income Fund (2018-Present); Trustee, American Beacon Apollo Total Return Fund (2018-Present); Trustee, American Beacon Sound Point Alternative Lending Fund (2019-Present). | ||
| Brenda A. Cline (58) | Trustee since 2004 Chair since 2019 Vice Chair 2018 | Chief Financial Officer, Treasurer and Secretary, Kimbell Art Foundation (1993-Present); Director, Tyler Technologies, Inc. (public sector software solutions company) (2014-Present); Director, Range Resources Corporation (oil and natural gas company) (2015-Present); Trustee, Cushing Closed-End and Open-End Funds and ETFs (2017-Present); Trustee, American Beacon Select Funds (2004-Present); Trustee, American Beacon Institutional Funds Trust (2017-Present); Trustee, American Beacon Sound Point Enhanced Income Fund (2018-Present); Trustee, American Beacon Apollo Total Return Fund (2018-Present); Trustee, American Beacon Sound Point Alternative Lending Fund (2019-Present) | ||
| Eugene J. Duffy (65) | Trustee since 2008 | Managing Director, Global Investment Management Distribution, Mesirow Financial (2016-Present); Managing Director, Institutional Services, Intercontinental Real Estate Corporation (2014-Present); Principal and Executive Vice President, Paradigm Asset Management (1994-2014); Trustee, American Beacon Select Funds (2008-Present); Trustee, American Beacon Institutional Funds Trust (2017-Present); Trustee, American Beacon Sound Point Enhanced Income Fund (2018-Present); Trustee, American Beacon Apollo Total Return Fund (2018-Present); Trustee, American Beacon Sound Point Alternative Lending Fund (2019-Present). | ||
| Claudia A. Holz (61) | Trustee since 2018 | Partner, KPMG LLP (1990-2017); Trustee, American Beacon Select Funds (2018-Present); Trustee, American Beacon Institutional Funds Trust (2018-Present); Trustee, American Beacon Sound Point Enhanced Income Fund (2018-Present); Trustee, American Beacon Apollo Total Return Fund (2018-Present); Trustee, American Beacon Sound Point Alternative Lending Fund (2019-Present). | ||
| Douglas A. Lindgren (57) | Trustee since 2018 | CEO North America, Carne Global Financial Services (2016-2017); Managing Director, IPS Investment Management and Global Head, Content Management, UBS Wealth Management (2010-2016); Trustee, American Beacon Select Funds (2018-Present); Trustee, American Beacon Institutional Funds Trust (2018-Present); Trustee, American Beacon Sound Point Enhanced Income Fund (2018-Present); Trustee, American Beacon Apollo Total Return Fund (2018-Present); Trustee, American Beacon Sound Point Alternative Lending Fund (2019-Present). | ||
| Richard A. Massman (76) | Trustee since 2004 Chair 2008-2018 Chair Emeritus since 2019 | Consultant and General Counsel Emeritus, Hunt Consolidated, Inc. (holding company engaged in oil and gas exploration and production, refining, real estate, farming, ranching and venture capital activities) (2009-Present); Trustee, American Beacon Select Funds (2004-Present); Trustee, American Beacon Institutional Funds Trust (2017-Present); Trustee, American Beacon Sound Point Enhanced Income Fund (2018-Present); Trustee, American Beacon Apollo Total Return Fund (2018-Present); Trustee, American Beacon Sound Point Alternative Lending Fund (2019-Present). | ||
75
Trustees and Officers of the American Beacon FundsSM(Unaudited)
Name, Age and Address | Position, Term of | Principal Occupation(s) During Past 5 Years | ||
| NON-INTERESTED TRUSTEES (CONT.) | Term | |||
| Lifetime of Trust until removal, resignation or retirement* | ||||
| Barbara J. McKenna, CFA (56) | Trustee since 2012 | President/Managing Principal, Longfellow Investment Management Company (2005-Present); Trustee, American Beacon Select Funds (2012-Present); Trustee, American Beacon Institutional Funds Trust (2017-Present); Trustee, American Beacon Sound Point Enhanced Income Fund (2018-Present); Trustee, American Beacon Apollo Total Return Fund (2018-Present); Trustee, American Beacon Sound Point Alternative Lending Fund (2019-Present). | ||
| R. Gerald Turner (73) | Trustee since 2001 | President, Southern Methodist University (1995-Present); Director, J.C. Penney Company, Inc. (1996-Present); Director, Kronus Worldwide Inc. (chemical manufacturing) (2003-Present); Trustee, American Beacon Select Funds (2001-Present); Trustee, American Beacon Institutional Funds Trust (2017-Present); Trustee, American Beacon Sound Point Enhanced Income Fund (2018-Present); Trustee, American Beacon Apollo Total Return Fund (2018-Present); Trustee, American Beacon Sound Point Alternative Lending Fund (2019-Present). | ||
| OFFICERS | Term | |||
| One Year | ||||
| Gene L. Needles, Jr. (64) | President since 2009 | President (2009-2018), CEO and Director (2009-Present), and Chairman (2018-Present), American Beacon Advisors, Inc., President (2015-2018), Director and CEO (2015-Present), and Chairman (2018-Present), Resolute Investment Holdings, LLC; President (2015-2018), Director and CEO (2015-Present), and Chairman (2018-Present), Resolute Topco, Inc.; President (2015-2018); Director, and CEO (2015-Present), and Chairman (2018-Present), Resolute Acquisition, Inc.; President (2015-2018), Director and CEO (2015-Present), Chairman (2018-Present), Resolute Investment Managers, Inc.; Director, Chairman, President and CEO, Resolute Investment Distributors (2017-Present); Director, Chairman, President and CEO; Resolute Investment Services, Inc. (2017-Present); President and CEO, Lighthouse Holdings Parent, Inc. (2009-2015); President, CEO and Director, Lighthouse Holdings, Inc. (2009-2015); Manager, President and CEO, American Private Equity Management, LLC (2012-Present); Director, Chairman, President and CEO, Alpha Quant Advisors, LLC (2016-Present); Director, ARK Investment Management LLC (2016-Present); Director, Shapiro Capital Management LLC (2017-Present); Director, Chairman and CEO, Continuous Capital, LLC (2018-Present); President, American Beacon Cayman Managed Futures Strategy Fund, Ltd. (2014-Present); Director and President, American Beacon Cayman Transformational Innovation Company, LTD., (2017-2018); President, American Beacon Delaware Transformational Innovation Corporation (2017-2018); President American Beacon Cayman TargetRisk Company, Ltd. (2018-Present); Member, Investment Advisory Committee, Employees Retirement System of Texas (2017-Present); Trustee, American Beacon NextShares Trust (2015-Present); President, American Beacon Select Funds (2009-Present); President, American Beacon Institutional Funds Trust (2017-Present); President, American Beacon Sound Point Enhanced Income Fund (2018-Present); President, American Beacon Apollo Total Return Fund (2018-Present); Director, RSW Investments Holdings LLC, (2019-Present); Director, SSI Investment Management, LLC (2019-Present); President, American Beacon Sound Point Alternative Lending Fund (2019-Present). | ||
76
Trustees and Officers of the American Beacon FundsSM(Unaudited)
Name, Age and Address | Position, Term of | Principal Occupation(s) During Past 5 Years | ||
| OFFICERS (CONT.) | Term | |||
| One Year | ||||
| Rosemary K. Behan (60) | VP, Secretary and Chief Legal Officer since 2006 | Vice President, Secretary and General Counsel, American Beacon Advisors, Inc. (2006-Present); Secretary, Resolute Investment Holdings, LLC (2015-Present); Secretary, Resolute Topco, Inc. (2015-Present); Secretary, Resolute Acquisition, Inc. (2015-Present); Vice President, Secretary and General Counsel, Resolute Investment Managers, Inc. (2015-Present); Secretary, Resolute Investment Distributors, Inc. (2017-Present); Vice President, Secretary and General Counsel, Resolute Investment Services, Inc. (2017-Present); Vice President and Secretary, Lighthouse Holdings Parent, Inc. (2008-2015); Vice President and Secretary, Lighthouse Holdings, Inc. (2008-2015); Secretary, American Private Equity Management, LLC (2008-Present); Secretary and General Counsel, Alpha Quant Advisors, LLC (2016-Present); Vice President and Secretary, Continuous Capital, LLC (2018-Present); Secretary, American Beacon Delaware Transformational Innovation Corporation (2017-2018); Secretary, American Beacon Cayman Transformational Innovation Company, Ltd. (2017-2018); Secretary, American Beacon Cayman Managed Futures Strategy Fund, Ltd. (2014-Present); Secretary, American Beacon Cayman TargetRisk Company, Ltd (2018-Present); Chief Legal Officer, Vice President and Secretary, American Beacon Select Funds (2006-Present); Chief Legal Officer, Vice President and Secretary, American Beacon Institutional Funds Trust (2017-Present); Chief Legal Officer, Vice President and Secretary, American Beacon Sound Point Enhanced Income Fund (2018-Present); Chief Legal Officer, Vice President and Secretary American Beacon Apollo Total Return Fund (2018-Present); Chief Legal Officer, Vice President and Secretary, American Beacon Sound Point Alternative Lending Fund (2019-Present). | ||
| Brian E. Brett (59) | VP since 2004 | Senior Vice President, Head of Distribution (2012-Present), Vice President, Director of Sales (2004-2012), American Beacon Advisors, Inc.; Senior Vice President, Resolute Investment Managers, Inc. (2017-Present); Senior Vice President, Resolute Investment Distributors, Inc. (2018-Present), Senior Vice President, Resolute Investment Services, Inc. (2018-Present); Senior Vice President, Lighthouse Holdings Parent, Inc. (2008-2015); Senior Vice President, Lighthouse Holdings, Inc. (2008-2015); Vice President, American Beacon Select Funds (2004-Present); Vice President, American Beacon Institutional Funds Trust (2017-Present); Vice President American Beacon Sound Point Enhanced Income Fund (2018-Present); Vice President American Beacon Apollo Total Return Fund (2018-Present); Vice President, American Beacon Sound Point Alternative Lending Fund (2019-Present). | ||
| Paul B. Cavazos (50) | VP since 2016 | Chief Investment Officer and Senior Vice President, American Beacon Advisors, Inc. (2016-Present); Chief Investment Officer, DTE Energy (2007-2016); Vice President, American Private Equity Management, L.L.C. (2017-Present); Vice President, American Beacon Select Funds (2016-Present); Vice President, American Beacon Institutional Funds Trust (2017-Present); Vice President American Beacon Sound Point Enhanced Income Fund (2018-Present); Vice President American Beacon Apollo Total Return Fund (2018-Present); Vice President, American Beacon Sound Point Alternative Lending Fund (2019-Present). | ||
| Erica Duncan (48) | VP Since 2011 | Vice President, American Beacon Advisors, Inc. (2011-Present); Vice President, Resolute Investment Managers (2018-Present); Vice President, Resolute Investment Services, Inc. (2018-Present); Vice President, American Beacon Select Funds (2011-Present); Vice President, American Beacon Institutional Funds Trust (2017-Present); Vice President American Beacon Sound Point Enhanced Income Fund (2018-Present); Vice President American Beacon Apollo Total Return Fund (2018-Present); Vice President, American Beacon Sound Point Alternative Lending Fund (2019-Present). | ||
77
Trustees and Officers of the American Beacon FundsSM(Unaudited)
Name, Age and Address | Position, Term of | Principal Occupation(s) During Past 5 Years | ||
| OFFICERS (CONT.) | Term | |||
| One Year | ||||
| Melinda G. Heika (58) | Treasurer since 2010 | Treasurer and CFO (2010-Present), American Beacon Advisors, Inc.; Treasurer, Resolute Topco, Inc. (2015-Present); Treasurer, Resolute Investment Holdings, LLC. (2015-Present); Treasurer, Resolute Acquisition, Inc. (2015-Present); Treasurer and CFO, Resolute Investment Managers, Inc. (2017-Present); Treasurer, Resolute Investment Distributors, Inc. (2017-2017); Treasurer and CFO, Resolute Investment Services, Inc. (2015-Present); Treasurer, Lighthouse Holdings Parent Inc., (2010-2015); Treasurer, Lighthouse Holdings, Inc. (2010-2015); Treasurer, American Private Equity Management, LLC (2012-Present); Treasurer and CFO, Alpha Quant Advisors, LLC (2016-Present); Treasurer and CFO, Continuous Capital, LLC (2018-Present); Treasurer, American Beacon Cayman Transformational Innovation, Ltd. (2017-2018); Treasurer, American Beacon Delaware Transformational Innovation Corporation (2017-2018); Director and Treasurer, American Beacon Cayman Managed Futures Strategy Fund, Ltd. (2014-Present); Treasurer, American Beacon Cayman TargetRisk Company, Ltd. (2018-Present); Treasurer, American Beacon Select Funds (2010-Present); Treasurer, American Beacon Institutional Funds Trust (2017-Present); Treasurer, American Beacon Sound Point Enhanced Income Fund (2018-Present); Treasurer, American Beacon Apollo Total Return Fund (2018-Present); Treasurer, American Beacon Sound Point Alternative Lending Fund (2019-Present). | ||
| Terri L. McKinney (55) | VP since 2010 | Vice President (2009-Present), Managing Director (2003-2009), American Beacon Advisors, Inc.; Vice President, Resolute Investment Managers, Inc. (2017-Present); Vice President, Resolute Investment Services, Inc (2018-Present); Vice President, Alpha Quant Advisors, LLC (2016-Present); Vice President, Continuous Capital, LLC (2018-Present); Vice President, American Beacon Select Funds (2010-Present); Vice President, American Beacon Institutional Funds Trust (2017-Present); Vice President, American Beacon Sound Point Enhanced Income Fund (2018-Present); Vice President, American Beacon Apollo Total Return Fund (2018-Present); Vice President, American Beacon Sound Point Alternative Lending Fund (2019-Present). | ||
78
Trustees and Officers of the American Beacon FundsSM(Unaudited)
Name, Age and Address | Position, Term of | Principal Occupation(s) During Past 5 Years | ||
| OFFICERS (CONT.) | Term | |||
| One Year | ||||
| Jeffrey K. Ringdahl (44) | VP since 2010 | Director (2015-Present), President (2018-Present), Chief Operating Officer (2010-Present), Senior Vice President (2013-2018), Vice President (2010-2013), American Beacon Advisors, Inc.; Director (2015-Present), President (2018-Present), Senior Vice Present (2015-2018), Resolute Investment Holdings, LLC; Director (2015-Present), President (2018-Present), Senior Vice President (2015-2018), Resolute Topco, Inc.; Director (2015-Present), President (2018-Present), Senior Vice President (2015-2018), Resolute Acquisition, Inc.; Director (2015-Present), President & COO (2018-Present), Senior Vice President (2015-2018), Resolute Investment Managers, Inc.; Director and Executive Vice President (2017-Present), Resolute Investment Distributors, Inc.; Director (2017-Present), President & COO (2018-Present), Executive Vice President (2017-2018), Resolute Investment Services, Inc.; Senior Vice President (2017-Present), Vice President (2012-2017), Manager (2015-Present), American Private Equity Management, LLC; Senior Vice President, Lighthouse Holdings Parent, Inc. (2013-2015); Senior Vice President, Lighthouse Holdings, Inc. (2013-2015); Trustee, American Beacon NextShares Trust (2015-Present); Director, Executive Vice President & COO, Alpha Quant Advisors, LLC (2016-Present); Director, Shapiro Capital Management, LLC (2017-Present); Director, Executive Vice President & COO, Continuous Capital, LLC (2018-Present); Director and Vice President, American Beacon Cayman Transformational Innovation Company, Ltd., (2017-Present); Vice President, American Beacon Delaware Transformational Innovation Corporation (2017-2018); Director and Vice President, American Beacon Cayman Managed Futures Strategy Fund, Ltd. (2014-Present); Vice President, American Beacon Cayman TargetRisk Company, Ltd (2018-Present); Vice President, American Beacon Select Funds (2010-2018); Vice President, American Beacon Institutional Funds Trust (2017-Present); Vice President, American Beacon Sound Point Enhanced Income Fund (2018-Present); Vice President, American Beacon Apollo Total Return Fund (2018-Present); Director, RSW Investments Holdings LLC, (2019-Present); Director, SSI Investment Management, LLC (2019-Present), Vice President, American Beacon Sound Point Alternative Lending Fund (2019-Present). | ||
| Samuel J. Silver (56) | VP Since 2011 | Vice President (2011-Present), Chief Fixed Income Officer (2016-Present), American Beacon Advisors, Inc. (2011-Present); Vice President, American Beacon Select Funds (2011-Present); Vice President, American Beacon Institutional Funds Trust (2017-Present); Vice President, American Beacon Sound Point Enhanced Income Fund (2018-Present); Vice President, American Beacon Apollo Total Return Fund (2018-Present); Vice President, American Beacon Sound Point Alternative Lending Fund (2019-Present). | ||
| Christina E. Sears (47) | Chief Compliance Officer since 2004 and Asst. Secretary since 1999 | Vice President, American Beacon Advisors, Inc. (2019-Present); Chief Compliance Officer, American Beacon Advisors, Inc. (2004-Present); Vice President, Resolute Investment Managers, Inc. (2017-Present); Vice President, Resolute Investment Distributors (2017-Present); Vice President, Resolute Investment Services, Inc. (2019-Present); Chief Compliance Officer, American Private Equity Management, LLC (2012-Present); Chief Compliance Officer (2016-2019) and Vice President, Alpha Quant Advisors, LLC (2016-Present); Vice President, Continuous Capital, LLC (2018-Present); Chief Compliance Officer (2004-Present) and Assistant Secretary (1999-Present), American Beacon Select Funds; Chief Compliance Officer and Assistant Secretary, American Beacon Institutional Funds Trust (2017-Present); Chief Compliance Officer and Assistant Secretary, American Beacon Sound Point Enhanced Income Fund (2018-Present); Chief Compliance Officer and Assistant Secretary, American Beacon Apollo Total Return Fund (2018-Present); Chief Compliance Officer and Assistant Secretary, American Beacon Sound Point Alternative Lending Fund (2019-Present). | ||
79
Trustees and Officers of the American Beacon FundsSM(Unaudited)
Name, Age and Address | Position, Term of | Principal Occupation(s) During Past 5 Years | ||
| OFFICERS (CONT.) | Term | |||
| One Year | ||||
| Sonia L. Bates (62) | Asst. Treasurer since 2011 | Assistant Treasurer, American Beacon Advisors, Inc. (2011-2018); Assistant Treasurer, Lighthouse Holdings Parent Inc. (2011-2015); Assistant Treasurer, Lighthouse Holdings, Inc. (2011-2015); Assistant Treasurer, American Private Equity Management, LLC (2012-Present); Assistant Treasurer, American Beacon Cayman Transformational Innovation Company, Ltd. (2017-Present); Assistant Treasurer, American Beacon Cayman TargetRisk Company, Ltd. (2018-Present); Assistant Treasurer, American Beacon Select Funds (2011-Present); Assistant Treasurer, American Beacon Institutional Funds Trust (2017-Present); Assistant Treasurer, American Beacon Sound Point Enhanced Income Fund (2018-Present); Assistant Treasurer, American Beacon Apollo Total Return Fund (2018-Present); Assistant Treasurer, American Beacon Sound Point Alternative Lending Fund (2019-Present). | ||
| Shelley D. Abrahams (44) | Assistant Secretary since 2008 | Assistant Secretary, American Beacon Select Funds (2008-Present); Assistant Secretary, American Beacon Institutional Funds Trust (2017-Present); Assistant Secretary, American Beacon Sound Point Enhanced Income Fund (2018-Present); Assistant Secretary, American Beacon Apollo Total Return Fund (2018-Present); Assistant Secretary, American Beacon Sound Point Alternative Lending Fund (2019-Present). | ||
| Rebecca L. Harris (52) | Assistant Secretary since 2010 | Vice President, American Beacon Advisors, Inc. (2011-Present); Vice President, Resolute Investment Managers, Inc. (2017-Present); Vice President, Resolute Investment Services (2015-Present); Vice President, Alpha Quant Advisors, LLC (2016-Present); Vice President, Continuous Capital, LLC (2018-Present); Assistant Secretary, American Beacon Select Funds (2010-Present); Assistant Secretary, American Beacon Institutional Funds Trust (2017-Present); Assistant Secretary, American Beacon Sound Point Enhanced Income Fund (2018-Present); Assistant Secretary, American Beacon Apollo Total Return Fund (2018-Present); Assistant Secretary, American Beacon Sound Point Alternative Lending Fund (2019-Present). | ||
| Teresa A. Oxford (61) | Assistant Secretary since 2015 | Assistant Secretary, American Beacon Advisors, Inc. (2015-Present); Assistant Secretary, Resolute Investment Distributors (2018-Present); Assistant Secretary, Resolute Investment Services (2018-Present); Assistant Secretary, Alpha Quant Advisors, LLC (2016-Present); Assistant Secretary, American Beacon Select Funds (2015-Present); Assistant Secretary, American Beacon Institutional Funds Trust (2017-Present); Assistant Secretary, American Beacon Sound Point Enhanced Income Fund (2018-Present); Assistant Secretary, American Beacon Apollo Total Return Fund (2018-Present); Assistant Secretary, American Beacon Sound Point Alternative Lending Fund (2019-Present). | ||
* As of 11/12/2014, the Board adopted a retirement plan that requires Trustees, other than Messrs. Feld and Massman to retire no later than the last day of the calendar year in which they reach the age of 75. As of 11/7/17, the Board approved a waiver of the mandatory retirement policy with respect to Mr. Massman, who turned 75 in November 2018, to permit him to continue to serve on the Board as Chair Emeritus through 12/31/19.
** Mr. Feld is deemed to be an “interested person” of the Trusts, as defined by the 1940 Act. Mr. Feld’s law firm of Akin, Gump, Strauss, Hauer & Feld LLP has provided legal services within the past two fiscal years to one or more of the Trust’s sub-advisors.
80
American Beacon FundsSM
August 31, 2019 (Unaudited)
The American Beacon Funds recognize and respect the privacy of our shareholders. We are providing this notice to you so you will understand how shareholder information may be collected and used.
We may collect nonpublic personal information about you from one or more of the following sources:
| • | information we receive from you on applications or other forms; |
| • | information about your transactions with us or our service providers; and |
| • | information we receive from third parties. |
We do not disclose any nonpublic personal information about our customers or former customers to anyone, except as permitted by law.
We restrict access to your nonpublic personal information to those employees or service providers who need to know that information to provide products or services to you. To ensure the confidentiality of your nonpublic personal information, we maintain safeguards that comply with federal standards.
81
This page intentionally left blank.
82
This page intentionally left blank.
83
This page intentionally left blank.
84

eDelivery isNOW AVAILABLE - Stop traditional mail delivery and receive your
shareholder reports and summary prospectuson-line. Sign up at
www.americanbeaconfunds.com
If you invest in the Fund through a financial institution, you may be able to receive the Fund’s regulatory mailings, such as the Prospectus, Annual Report and Semi-Annual Report, bye-mail. If you are interested in this option, please go towww.icsdelivery.com and search for your financial institution’s name or contact your financial institution directly.
To obtain more information about the Fund:
 |  | |
| ByE-mail: | On the Internet: | |
| american_beacon.funds@ambeacon.com | Visit our website atwww.americanbeaconfunds.com | |
By Telephone: Call (800)658-5811 |
By Mail: American Beacon Funds P.O. Box 219643 Kansas City, MO 64121-9643 | |
| Availability of Quarterly Portfolio Schedules | Availability of Proxy Voting Policy and Records | |
| In addition to the Schedule of Investments provided in each semi-annual and annual report, the Fund files a complete schedule of its portfolio holdings with the Securities and Exchange Commission (“SEC”) on Form N-PORT as of the first and third fiscal quarters. The Fund’s Forms N-PORT are available on the SEC’s website atwww.sec.gov. The Forms N-PORT may also be reviewed and copied at the SEC’s Public Reference Section, 100 F Street, NE, Washington, D.C. 20549-2736. Information regarding the operation of the SEC’s Public Reference Room may be obtained by calling1-800-SEC-0330. A complete schedule of each Fund’s portfolio holdings is also made available on the Funds’ website atwww.americanbeaconfunds.com, approximately sixty days after the end of each quarter for the Sound Point Floating Rate Income Fund and twenty days after the end of each month for the SiM High Yield Opportunities Fund. | A description of the policies and procedures the Fund uses to determine how to vote proxies relating to portfolio securities is available in the Fund’s Statement of Additional Information, which is available free of charge on the Fund’s website atwww.americanbeaconfunds.com and by calling 1-800-967-9009 or by accessing the SEC’s website atwww.sec.gov. The Fund’s proxy voting record for the most recent year ended June 30 is filed annually with the SEC on Form N-PX. The Fund’s Forms N-PX are available on the SEC’s website atwww.sec.gov. The Fund’s proxy voting record may also be obtained by calling 1-800-967-9009. | |


Fund Service Providers:
CUSTODIAN State Street Bank and Trust Company Boston, Massachusetts | TRANSFER AGENT DST Asset Manager Solutions, Inc. Quincy, Massachusetts | INDEPENDENT REGISTERED PUBLIC ACCOUNTING FIRM Ernst & Young LLP Dallas, Texas | DISTRIBUTOR Resolute Investment Distributors, Inc. Irving, Texas |
This report is prepared for shareholders of the American Beacon Funds and may be distributed to others only if preceded or accompanied by a current Prospectus or Summary Prospectus.
American Beacon Funds, American Beacon SiM High Yield Opportunities Fund and American Beacon Sound Point Floating Rate Income Fund are service marks of American Beacon Advisors, Inc.
AR 8/19

About American Beacon Advisors, Inc.
Since 1986, American Beacon Advisors, Inc. has offered a variety of products and investment advisory services to numerous institutional and retail clients, including a variety of mutual funds, corporate cash management, and separate account management.
Our clients include defined benefit plans, defined contribution plans, foundations, endowments, corporations, financial planners, and other institutional investors. With American Beacon Advisors, Inc., you can put the experience of a multi-billion dollar asset management firm to work for your company.
THE LONDON COMPANY INCOME EQUITY FUND
Investing insmall- and medium-capitalization stocksmay involve greater volatility and lower liquidity than larger company stocks. Investing inforeign securitiesmay involve heightened risk due to currency fluctuations and economic and political risks. Investing individend-paying stocksmay result in less earnings growth or capital appreciation than investing in non-dividend paying stocks. The use offixed-income securitiesentails interest rate and credit risks. Because the Fund may invest infewer issuersthan a more diversified portfolio, the fluctuating value of a single holding may have a greater effect on the value of the Fund. The use offutures contractsfor cash management may subject the Fund to losing more money than invested. The Fund participates in asecurities lendingprogram.
ZEBRA SMALL CAP EQUITY FUND
Investing insmall-capitalization stocksmay involve greater volatility and lower liquidity than larger company stocks. Investing inforeign securitiesmay involve heightened risk due to currency fluctuations and economic and political risks. At times, certain securities may havelimited marketabilityand may be difficult to sell. The use offutures contractsfor cash management may subject the Fund to losing more money than invested. The Fund participates in asecurities lendingprogram.
Please see the prospectus for a complete discussion of the Funds’ risks. There can be no assurances that the investment objectives of these Funds will be met.
Any opinions herein, including forecasts, reflect our judgment as of the end of the reporting period and are subject to change. Each advisor’s strategies and the Fund’s portfolio composition will change depending on economic and market conditions. This report is not a complete analysis of market conditions and therefore, should not be relied upon as investment advice. Although economic and market information has been compiled from reliable sources, American Beacon Advisors, Inc. makes no representation as to the completeness or accuracy of the statements contained herein.
American Beacon Funds | August 31, 2019 |
Contents
| 1 | ||||
| 2 | ||||
| 7 | ||||
| 9 | ||||
Schedules of Investments: | ||||
| 10 | ||||
| 13 | ||||
| 23 | ||||
| 26 | ||||
Financial Highlights: | ||||
| 47 | ||||
| 52 | ||||
| 57 | ||||
Disclosures Regarding the Approval of the Management and Investment Advisory Agreements | 58 | |||
| 63 | ||||
| 70 | ||||
| Back Cover | ||||
 | Dear Shareholders,
At American Beacon, we take our heritage as a fiduciary very seriously – and we apply that mindset to all aspects of our business as a fund manager. As a result, for more than 30 years, we have endeavored to:
u Identify, engage and overseethe best money managers. As a manager of managers, our goal is to engage the most effective money managers for each asset class, investment style and market strategy we offer. We are committed to partnering with those we judge to be “the best of the best” when it comes to choosing sub-advisors for our mutual funds. Whether our due-diligence process results in the selection of one sub-advisor or multiple sub-advisors, we select those we believe show the greatest potential to help us meet the high standards you’ve come to expect. |
| u | Offer a variety of innovative investment solutions. Our mutual funds – which span the domestic, international, global, frontier and emerging markets – are sub-advised by experienced money managers who employ distinctive, proprietary investment processes to manage assets through a variety of economic and market conditions. From offering some of the first multi-manager funds, one of the first retirement income funds and the first open-ended mutual fund in the U.S. to focus primarily on frontier-market debt, our robust history includes applying a disciplined, solutions-based approach to our product development process in an effort to help you grow your assets while mitigating risk. |
| u | Provide a solutions-based approach to achieving long-term investment goals. We seek to provide investment solutions that might enable you to benefit from taking a more disciplined approach to investing. Our mutual funds provide access to institutional-quality, research-intensive investment managers with diverse processes and styles. Over the long run, having such access and spending time in the market – rather than trying to time the market – may better position you to reach your long-term investment goals during market upswings and potentially insulate against market downswings. |
Our management approach is more than a concept; it’s the cornerstone of American Beacon’s culture. And we strive to employ it at every turn as we seek to provide a well-diversified line of investment solutions to help our shareholders seek long-term rewards.
Thank you for your continued interest in American Beacon. For additional information about our mutual funds or to access your account information, please visit our website atwww.americanbeaconfunds.com.
Best Regards,

Gene L. Needles, Jr.
President
American Beacon Funds
1
Domestic Equity Market Overview
August 31, 2019 (Unaudited)
U.S. equities posted benign positive returns over the 12-month period ended August 31, 2019, as evidenced by a 1.31% increase in the broader Russell 3000 Index.
The period began with the Federal Reserve (the “Fed”) raising interest rates in response to the low unemployment rate and concerns of potential inflation. Economic growth was expected to be reasonable and allow for a gradual normalization of monetary policy. By July 2019, however, the Fed was forced to cut interest rates due to volatile equity markets, weakening economic growth and global geopolitical uncertainties. The first indication of trouble appeared in late 2018 when a deep equity market correction sent investors to the sidelines. The S&P 500 Index declined more than 17% as investors sought refuge in the highest-quality government bonds.
While the outlook for domestic growth was still reasonable, concerns about Brexit, Chinese trade wars and European economic growth overwhelmed optimism in the U.S. By period end, the decline in interest rates brought the 10-year Treasury yield below that of the two-year Treasury, causing a yield-curve inversion. As the Fed and other central banks responded with interest-rate cuts and other forms of stimulus, investors gradually regained confidence and moved back into risk assets.
Stocks were mixed across the market-cap spectrum over the 12-month period. Large-cap issues led the way with both the S&P 500 Index and the Russell 1000 Index posting gains of 2.92% and 2.49% respectively. Mid-cap stocks were slightly positive with the Russell Midcap Index up 0.54%. Small-cap issues were weakest with the Russell 2000 Index declining 12.89%. The dispersion between Growth and Value widened, as evidenced by the broader Russell 3000 Growth Index up 3.09% and the Russell 3000 Value Index down 0.56%.
2
American Beacon The London Company Income Equity FundSM
Performance Overview
August 31, 2019 (Unaudited)
The Investor Class of the American Beacon The London Company Income Equity Fund (the “Fund”) returned 4.45% for the twelve-month period ended August 31, 2019, compared to the Russell 1000 Value Index (the “Index”) return of 0.62% for the same period.
Comparison of Change in Value of a $10,000 Investment for the Period from 5/29/2012 through 8/31/2019
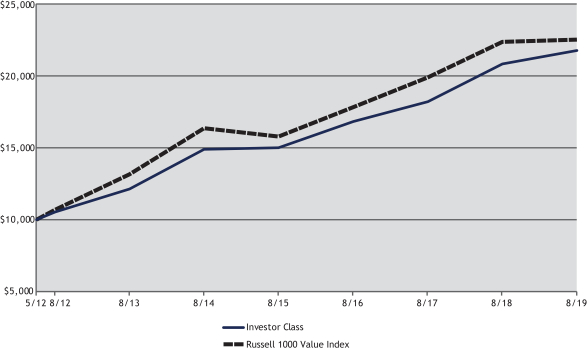
| Total Returns for the Period ended August 31, 2019 |
| |||||||||||||||||||||||||||||||
Ticker | 1 Year | 3 Years | 5 Years | Since Inception | Value of $10,000 5/29/2012- 08/31/2019 | |||||||||||||||||||||||||||
Institutional Class (1,2,4) | ABCIX | 4.78 | % | 9.32 | % | 8.25 | % | 11.66 | % | $ | 22,271 | |||||||||||||||||||||
Y Class (1,2,4) | ABCYX | 4.68 | % | 9.25 | % | 8.17 | % | 11.58 | % | $ | 22,154 | |||||||||||||||||||||
Investor Class (1,2,4) | ABCVX | 4.45 | % | 8.98 | % | 7.88 | % | 11.30 | % | $ | 21,746 | |||||||||||||||||||||
A Class with sales Charge (1,2,4) | ABCAX | (1.59 | )% | 6.82 | % | 6.61 | % | 10.32 | % | $ | 20,395 | |||||||||||||||||||||
A Class without sales charge (1,2,4) | ABCAX | 4.43 | % | 8.95 | % | 7.87 | % | 11.22 | % | $ | 21,639 | |||||||||||||||||||||
C Class with sales charge (1,2,4) | ABECX | 2.64 | % | 8.12 | % | 7.05 | % | 10.39 | % | $ | 20,491 | |||||||||||||||||||||
C Class without sales charge (1,2,4) | ABECX | 3.64 | % | 8.12 | % | 7.05 | % | 10.39 | % | $ | 20,491 | |||||||||||||||||||||
Russell 1000® Value Index (3) | 0.62 | % | 8.08 | % | 6.59 | % | 11.81 | % | $ | 22,496 | ||||||||||||||||||||||
| 1. | Performance shown is historical and is not indicative of future returns. Investment returns and principal value will vary, and shares may be worth more or less at redemption than at original purchase. Performance shown is calculated based on the published end of day net asset values as of date indicated, and current performance may be lower or higher than the performance data quoted. To obtain performance as of the most recent month end, please visitwww.americanbeaconfunds.com or call 1-800- 967-9009. Fund performance in the table above does not reflect the deduction of taxes a shareholder would pay on distributions or the redemption of shares. Generally accepted accounting principles require adjustments to be made to the net assets of the Fund at period end for financial reporting purposes only, and as such, the total return based on the unadjusted net asset value per share may differ from the total return reported in the financial highlights. A Class shares have a maximum sales charge of 5.75%. The maximum contingent deferred sales charge for the C Class is 1.00% for shares redeemed within one year of the date of purchase. |
| 2. | A portion of the fees charged to the Institutional Class of the Fund was waived from 2012 through 2014, partially recovered in 2015 and fully recovered in 2016. Performance prior to waiving fees was lower than actual returns shown for 2012 through 2014. A portion of the fees charged to the Investor Class of the Fund was waived in 2012 and 2013 and fully recovered in 2014 and 2015. Performance prior to waiving fees was lower than actual returns shown in 2012 and 2013. A portion of the fees charged to the Y, A, and C Classes of the Fund was waived from 2012 through 2014 and fully recovered in 2015. Performance prior to waiving fees was lower than actual returns shown for 2012 through 2014. |
3
American Beacon The London Company Income Equity FundSM
Performance Overview
August 31, 2019 (Unaudited)
| 3. | The Russell 1000 Value Index is an unmanaged index of those stocks in the Russell 1000 Index with lower price-to-book ratios and lower forecasted growth values. Russell 1000® Value Index and Russell 1000 Index are registered trademarks of Frank Russell Company. Frank Russell Company (“Russell”) is the source and owner of the trademarks, service marks and copyrights related to the Russell Indexes. Russell® is a trademark of Frank Russell Company. Neither Russell nor its licensors accept any liability for any errors or omissions in the Russell Indexes and/or Russell ratings or underlying data, and no party may rely on any Russell Indexes and/or Russell ratings and/or underlying data contained in this communication. No further distribution of Russell Data is permitted without Russell’s express written consent. Russell does not promote, sponsor or endorse the content of this communication. One cannot directly invest in an index. |
| 4. | The Total Annual Fund Operating Expense ratios set forth in the most recent Fund prospectus for the Institutional, Y, Investor, A, and C Class shares were 0.73%, 0.79%, 1.05%, 1.03%, and 1.81%, respectively. The expense ratios above may vary from the expense ratios presented in other sections of this report that are based on expenses incurred during the period covered by this report. |
The Fund outperformed the Index due to stock selection and sector allocation during the period.
From a security selection standpoint, the Fund’s holdings in the Energy and Industrials sectors were the largest contributors to the Fund’s outperformance relative to the Index. In the Energy sector, a position in Kinder Morgan, Inc. (up 19.8%) contributed to relative returns, while an absence from index-positions Schlumberger Ltd. (down 46.3%) and Exxon Mobil Corp. (down 10.7%) also helped. Companies contributing to performance in the Industrials sector included Fastenal Co. (up 14.1%) and Delta Air Lines, Inc. (up 13.9%). The aforementioned strong performance was somewhat offset by security selection in the Consumer Discretionary sector, where a position in Carnival Corp. (down 25.6%) detracted, and an absence from index-position McDonald’s Corp. (up 37.6%) also hurt relative returns.
From a sector allocation perspective, the Fund’s underweight positions in the Energy sector (down 21.4%) and the Financials sector (down 4.7%) helped relative performance. This performance was somewhat offset by an underweight to the Utilities sector (up 20.5%) and an overweight to the Industrials sector (down 3.4%).
The sub-advisor’s investment process focuses on downside protection, current income and total return appreciation.
| Top Ten Holdings (% Net Assets) |
| |||||||
| Apple, Inc. | 5.2 | |||||||
| Cincinnati Financial Corp. | 4.3 | |||||||
| Merck & Co., Inc. | 3.9 | |||||||
| Cisco Systems, Inc. | 3.6 | |||||||
| Diageo PLC, Sponsored ADR | 3.6 | |||||||
| Texas Instruments, Inc. | 3.6 | |||||||
| Crown Castle International Corp. | 3.5 | |||||||
| Lowe’s Cos, Inc. | 3.5 | |||||||
| Norfolk Southern Corp. | 3.5 | |||||||
| Wells Fargo & Co. | 3.5 | |||||||
| Total Fund Holdings | 32 | |||||||
| Sector Allocation (% Equities) |
| |||||||
| Information Technology | 22.9 | |||||||
| Industrials | 15.7 | |||||||
| Financials | 15.6 | |||||||
| Consumer Staples | 11.3 | |||||||
| Health Care | 10.2 | |||||||
| Consumer Discretionary | 10.0 | |||||||
| Energy | 4.0 | |||||||
| Real Estate | 3.8 | |||||||
| Utilities | 3.7 | |||||||
| Communication Services | 2.8 | |||||||
4
American Beacon Zebra Small Cap Equity FundSM
Performance Overview
August 31, 2019 (Unaudited)
The Investor Class of the American Beacon Zebra Small Cap Equity Fund (the “Fund”) returned -13.26% for the twelve-month period ended August 31, 2019, which was slightly less than the Russell 2000 Index (the “Index”) return of -12.89%. The Fund underperformed the Index due to stock selection despite value added through sector allocation.
Comparison of Change in Value of a $10,000 Investment for the Period from 6/1/2010 through 8/31/2019
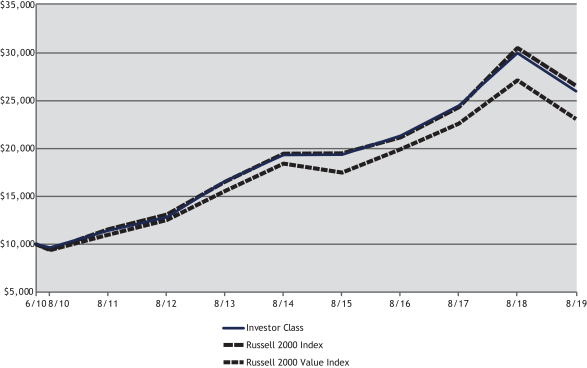
| Total Returns for the Period ended August 31, 2019 |
| |||||||||||||||||||||||||||||||
Ticker | 1 Year | 3 Years | 5 Years | Since Inception | Value of $10,000 6/1/2010- 08/31/2019 | |||||||||||||||||||||||||||
Institutional Class (1,3,5) | AZSIX | (12.94 | )% | 7.26 | % | 6.53 | % | 11.27 | % | $ | 26,844 | |||||||||||||||||||||
Y Class (1,3,5) | AZSYX | (13.02 | )% | 7.12 | % | 6.42 | % | 11.15 | % | $ | 26,595 | |||||||||||||||||||||
Investor Class (1,3,5) | AZSPX | (13.26 | )% | 6.83 | % | 6.12 | % | 10.84 | % | $ | 25,903 | |||||||||||||||||||||
A Class with sales Charge (1,3,5) | AZSAX | (18.26 | )% | 4.72 | % | 4.86 | % | 10.08 | % | $ | 24,300 | |||||||||||||||||||||
A Class without sales charge (1,3,5) | AZSAX | (13.26 | )% | 6.81 | % | 6.11 | % | 10.78 | % | $ | 25,782 | |||||||||||||||||||||
C Class with sales charge (1,2,3,5) | AZSCX | (14.97 | )% | 6.02 | % | 5.30 | % | 9.96 | % | $ | 24,072 | |||||||||||||||||||||
C Class without sales charge (1,2,3,5) | AZSCX | (13.97 | )% | 6.02 | % | 5.30 | % | 9.96 | % | $ | 24,072 | |||||||||||||||||||||
Russell 2000® Index (4) | (12.89 | )% | 7.89 | % | 6.41 | % | 11.09 | % | $ | 26,464 | ||||||||||||||||||||||
Russell 2000® Value Index (4) | (14.89 | )% | 5.05 | % | 4.63 | % | 9.42 | % | $ | 23,003 | ||||||||||||||||||||||
| 1. | Performance shown is historical and is not indicative of future returns. Investment returns and principal value will vary, and shares may be worth more or less at redemption than at original purchase. Performance shown is calculated based on the published end of day net asset values as of date indicated, and current performance may be lower or higher than the performance data quoted. To obtain performance as of the most recent month end, please visitwww.americanbeaconfunds.com or call 1-800-967-9009. Fund performance in the table above does not reflect the deduction of taxes a shareholder would pay on distributions or the redemption of shares. Generally accepted accounting principles require adjustments to be made to the net assets of the Fund at period end for financial reporting purposes only, and as such, the total return based on the unadjusted net asset value per share may differ from the total return reported in the financial highlights. A Class shares have a maximum sales charge of 5.75%. |
| 2. | Fund performance represents the total returns achieved by the Investor Class from 6/1/10 up to 9/1/10, the inception date of the C Class, and the returns of the C Class since its inception. Expenses of the C Class are higher than those of the Investor Class. As a result, total returns shown may be higher than they would have been had the C Class been in existence since 6/1/10. The maximum contingent deferred sales charge is 1.00% for shares redeemed within one year of the date of purchase. |
5
American Beacon Zebra Small Cap Equity FundSM
Performance Overview
August 31, 2019 (Unaudited)
| 3. | A portion of the fees charged to each Class of the Fund has been waived since Fund inception. Performance prior to waiving fees was lower than the actual returns shown since inception. |
| 4. | The Russell 2000 Value Index is an unmanaged index of those stocks in the Russell 2000 Index with lower price-to-book ratios and lower forecasted growth values. Russell 2000® Value Index and Russell 2000 Index are registered trademarks of Frank Russell Company. Frank Russell Company (“Russell”) is the source and owner of the trademarks, service marks and copyrights related to the Russell Indexes. Russell® is a trademark of Frank Russell Company. Neither Russell nor its licensors accept any liability for any errors or omissions in the Russell Indexes and/or Russell ratings or underlying data, and no arty may rely on any Russell Indexes and/or Russell ratings and/or underlying data contained in this communication. No further distribution of Russell Data is permitted without Russell’s express written consent. Russell does not promote, sponsor or endorse the content of this communication. One cannot directly invest in an index. |
| 5. | The Total Annual Fund Operating Expense ratios set forth in the most recent Fund prospectus for the Institutional, Y, Investor, A, and C Class shares were 1.23%, 1.27%, 1.44%, 1.54%, and 2.29%, respectively. The expense ratios above may vary from the expense ratios presented in other sections of this report that are based on expenses incurred during the period covered by this report. |
Stock selection in the Information Technology, Industrials and Financials sectors detracted the most from relative performance. In the Information Technology sector, AVX Corp. (down 33.8%) negatively impacted performance, while Maxar Technologies LTD (down 52.0%) and Mr. Cooper Group, Inc. (down 41.7%) in the Industrials and Financials sectors, respectively, detracted from relative performance.
Stock selection in the Health Care, Consumer Staples and Real Estate sectors contributed positively to the Fund’s relative performance. In the Health Care sector, the Fund benefited from The Ensign Group, Inc. (up 45.8%), while in the Consumer Staples and Real Estate sectors Lancaster Colony Corp. (up 19.8%) and PS Business Parks, Inc. (up 30.3%) contributed, respectively.
Relative contribution from sector allocation was positive for the twelve-month period, primarily due to overweighting Consumer Staples (down 11.05%) and underweighting Energy (down 50.7%). Underweighting Utilities (up 19.11%), the best performing sector in the Index, detracted from the Fund’s relative performance during the period.
The sub-advisor continues to focus on uncovering opportunities by investing in a portfolio of securities that are generally less popular with investors but nevertheless have strong fundamental characteristics. At the same time the portfolio will be underweight stocks that are heavily followed but have weak fundamentals. This contrarian style has tended to result in a portfolio with very good risk-adjusted returns over time.
| Top Ten Holdings (% Net Assets) |
| |||||||
| National General Holdings Corp. | 1.7 | |||||||
| AVX Corp. | 1.6 | |||||||
| International Bancshares Corp. | 1.5 | |||||||
| PS Business Parks, Inc. | 1.5 | |||||||
| Liberty TripAdvisor Holdings, Inc., Class A | 1.3 | |||||||
| Ryman Hospitality Properties, Inc. | 1.3 | |||||||
| Enstar Group Ltd. | 1.2 | |||||||
| SIGA Technologies, Inc. | 1.2 | |||||||
| Insight Enterprises, Inc. | 1.1 | |||||||
| Michaels Cos, Inc. | 1.1 | |||||||
| Total Fund Holdings | 303 | |||||||
| Sector Allocation (% Equities) |
| |||||||
| Financials | 19.6 | |||||||
| Industrials | 17.6 | |||||||
| Health Care | 15.0 | |||||||
| Information Technology | 12.8 | |||||||
| Real Estate | 8.8 | |||||||
| Consumer Discretionary | 8.3 | |||||||
| Materials | 5.5 | |||||||
| Communication Services | 4.2 | |||||||
| Consumer Staples | 3.4 | |||||||
| Utilities | 2.5 | |||||||
| Energy | 2.3 | |||||||
6
American Beacon FundsSM
August 31, 2019 (Unaudited)
Fund Expense Example
As a shareholder of a Fund, you incur two types of costs: (1) transaction costs, including sales charges (loads) on purchase payments and redemption fees, if applicable, and (2) ongoing costs, including management fees, distribution (12b-1) fees, sub-transfer agent fees, and other Fund expenses. The Examples are intended to help you understand the ongoing cost (in dollars) of investing in the Funds and to compare these costs with the ongoing costs of investing in other mutual funds. The Examples are based on an investment of $1,000 invested at the beginning of the period in each Class and held for the entire period from March 1, 2019 through August 31, 2019.
Actual Expenses
The “Actual” lines of the tables provide information about actual account values and actual expenses. You may use the information on this page, together with the amount you invested, to estimate the expenses that you paid over the period. Simply divide your account value by $1,000 (for example, an $8,600 account value divided by $1,000 = $8.60), then multiply the result by the “Expenses Paid During Period” to estimate the expenses you paid on your account during this period. Shareholders of the Investor and Institutional Classes that invest in the Funds through an IRA or Roth IRA may be subject to a custodial IRA fee of $15 that is typically deducted each December. If your account was subject to a custodial IRA fee during the period, your costs would have been $15 higher.
Hypothetical Example for Comparison Purposes
The “Hypothetical” lines of the tables provide information about hypothetical account values and hypothetical expenses based on the Funds’ actual expense ratio and an assumed 5% per year rate of return before expenses (not the Funds’ actual return). You may compare the ongoing costs of investing in the Funds with other funds by contrasting this 5% hypothetical example and the 5% hypothetical examples that appear in the shareholder reports of the other funds. The hypothetical account values and expenses may not be used to estimate the actual ending account balance or expenses you paid for the period. Shareholders of the Investor and Institutional Classes that invest in the Funds through an IRA or Roth IRA may be subject to a custodial IRA fee of $15 that is typically deducted each December. If your account was subject to a custodial IRA fee during the period, your costs would have been $15 higher.
You should also be aware that the expenses shown in the table highlight only your ongoing costs and do not reflect any transaction costs charged by the Funds, such as sales charges (loads) or redemption fees, as applicable. Similarly, the expense examples for other funds do not reflect any transaction costs charged by those funds, such as sales charges (loads), redemption fees or exchange fees. Therefore, the “Hypothetical” lines of the tables are useful in comparing ongoing costs only and will not help you determine the relative total costs of owning different funds. If you were subject to any transaction costs during the period, your costs would have been higher.
7
American Beacon FundsSM
Expense Examples
August 31, 2019 (Unaudited)
| American Beacon The London Company Income Equity Fund |
| ||||||||||||||
| Beginning Account Value 3/1/2019 | Ending Account Value 8/31/2019 | Expenses Paid During Period 3/1/2019-8/31/2019* | |||||||||||||
| Institutional Class | |||||||||||||||
| Actual | $1,000.00 | $1,042.80 | $3.76 | ||||||||||||
| Hypothetical** | $1,000.00 | $1,021.53 | $3.72 | ||||||||||||
| Y Class | |||||||||||||||
| Actual | $1,000.00 | $1,042.10 | $4.12 | ||||||||||||
| Hypothetical** | $1,000.00 | $1,021.17 | $4.08 | ||||||||||||
| Investor Class | |||||||||||||||
| Actual | $1,000.00 | $1,041.20 | $5.51 | ||||||||||||
| Hypothetical** | $1,000.00 | $1,019.81 | $5.45 | ||||||||||||
| A Class | |||||||||||||||
| Actual | $1,000.00 | $1,041.10 | $5.35 | ||||||||||||
| Hypothetical** | $1,000.00 | $1,019.96 | $5.30 | ||||||||||||
| C Class | |||||||||||||||
| Actual | $1,000.00 | $1,037.40 | $9.24 | ||||||||||||
| Hypothetical** | $1,000.00 | $1,016.13 | $9.15 | ||||||||||||
| * | Expenses are equal to the Fund’s annualized expense ratios for thesix-month period of 0.73%, 0.80%, 1.07%, 1.04%, and 1.80% for the Institutional, Y, Investor, A, and C Classes, respectively, multiplied by the average account value over the period, multiplied by the number derived by dividing the number of days in the most recent fiscal half-year (184) by days in the year (365) to reflect the half-year period. |
| ** | 5% return before expenses. |
| American Beacon Zebra Small Cap Equity Fund |
| ||||||||||||||
| Beginning Account Value 3/1/2019 | Ending Account Value 8/31/2019 | Expenses Paid During Period 3/1/2019-8/31/2019* | |||||||||||||
| Institutional Class | |||||||||||||||
| Actual | $1,000.00 | $918.60 | $4.30 | ||||||||||||
| Hypothetical** | $1,000.00 | $1,020.72 | $4.53 | ||||||||||||
| Y Class | |||||||||||||||
| Actual | $1,000.00 | $917.90 | $4.79 | ||||||||||||
| Hypothetical** | $1,000.00 | $1,020.22 | $5.04 | ||||||||||||
| Investor Class | |||||||||||||||
| Actual | $1,000.00 | $916.40 | $6.13 | ||||||||||||
| Hypothetical** | $1,000.00 | $1,018.80 | $6.46 | ||||||||||||
| A Class | |||||||||||||||
| Actual | $1,000.00 | $916.50 | $6.23 | ||||||||||||
| Hypothetical** | $1,000.00 | $1,018.70 | $6.56 | ||||||||||||
| C Class | |||||||||||||||
| Actual | $1,000.00 | $912.40 | $9.83 | ||||||||||||
| Hypothetical** | $1,000.00 | $1,014.92 | $10.36 | ||||||||||||
| * | Expenses are equal to the Fund’s annualized expense ratios for thesix-month period of 0.89%, 0.99%, 1.27%, 1.29%, and 2.04% for the Institutional, Y, Investor, A, and C Classes, respectively, multiplied by the average account value over the period, multiplied by the number derived by dividing the number of days in the most recent fiscal half-year (184) by days in the year (365) to reflect the half-year period. |
| ** | 5% return before expenses. |
8
American Beacon FundsSM
Report of Independent Registered Public Accounting Firm
To the Shareholders of American Beacon The London Company Income Equity Fund and American Beacon Zebra Small Cap Equity Fund and the Board of Trustees of American Beacon Funds
Opinion on the Financial Statements
We have audited the accompanying statements of assets and liabilities of American Beacon The London Company Income Equity Fund and American Beacon Zebra Small Cap Equity Fund (collectively referred to as the “Funds), (two of the funds constituting American Beacon Funds (the “Trust”)), including the schedules of investments, as of August 31, 2019, and the related statements of operations for the year then ended, the statements of changes in net assets for each of the two years in the period then ended, the financial highlights for each of the five years in the period then ended and the related notes (collectively referred to as the “financial statements”). In our opinion, the financial statements present fairly, in all material respects, the financial position of each of the Funds (two of the funds constituting American Beacon Funds) at August 31, 2019, the results of their operations for the year then ended, the changes in their net assets for each of the two years in the period then ended and their financial highlights for each of the five years in the period then ended, in conformity with U.S. generally accepted accounting principles.
Basis for Opinion
These financial statements are the responsibility of the Trust’s management. Our responsibility is to express an opinion on each of the Funds’ financial statements based on our audits. We are a public accounting firm registered with the Public Company Accounting Oversight Board (United States) (“PCAOB”) and are required to be independent with respect to the Trust in accordance with the U.S. federal securities laws and the applicable rules and regulations of the Securities and Exchange Commission and the PCAOB.
We conducted our audits in accordance with the standards of the PCAOB. Those standards require that we plan and perform the audit to obtain reasonable assurance about whether the financial statements are free of material misstatement, whether due to error or fraud. The Trust is not required to have, nor were we engaged to perform, an audit of the Trust’s internal control over financial reporting. As part of our audits we are required to obtain an understanding of internal control over financial reporting, but not for the purpose of expressing an opinion on the effectiveness of the Trust’s internal control over financial reporting. Accordingly, we express no such opinion.
Our audits included performing procedures to assess the risks of material misstatement of the financial statements, whether due to error or fraud, and performing procedures that respond to those risks. Such procedures included examining, on a test basis, evidence regarding the amounts and disclosures in the financial statements. Our procedures included confirmation of securities owned as of August 31, 2019, by correspondence with the custodian. Our audits also included evaluating the accounting principles used and significant estimates made by management, as well as evaluating the overall presentation of the financial statements. We believe that our audits provide a reasonable basis for our opinion.

We have served as the auditor of one or more American Beacon investment companies since 1987.
Dallas, Texas
October 25, 2019
9
American Beacon The London Company Income Equity FundSM
Schedule of Investments
August 31, 2019
| Shares | Fair Value | ||||||||||||||
| COMMON STOCKS - 93.60% | |||||||||||||||
| Communication Services - 2.66% | |||||||||||||||
| Diversified Telecommunication Services - 2.66% | |||||||||||||||
| Verizon Communications, Inc. | 509,549 | $ | 29,635,370 | ||||||||||||
|
| ||||||||||||||
| Consumer Discretionary - 9.35% | |||||||||||||||
| Hotels, Restaurants & Leisure - 3.41% | |||||||||||||||
| Carnival Corp. | 862,110 | 38,001,809 | |||||||||||||
|
| ||||||||||||||
| Multiline Retail - 2.46% | |||||||||||||||
| Target Corp. | 256,700 | 27,477,168 | |||||||||||||
|
| ||||||||||||||
| Specialty Retail - 3.48% | |||||||||||||||
| Lowe’s Cos, Inc. | 345,346 | 38,747,821 | |||||||||||||
|
| ||||||||||||||
Total Consumer Discretionary | 104,226,798 | ||||||||||||||
|
| ||||||||||||||
| Consumer Staples - 10.62% | |||||||||||||||
| Beverages - 5.57% | |||||||||||||||
| Coca-Cola Co. | 394,667 | 21,722,472 | |||||||||||||
| Diageo PLC, Sponsored ADR | 235,850 | 40,396,388 | |||||||||||||
|
| ||||||||||||||
| 62,118,860 | |||||||||||||||
|
| ||||||||||||||
| Food Products - 2.39% | |||||||||||||||
| Nestle S.A., Sponsored ADR | 237,090 | 26,646,545 | |||||||||||||
|
| ||||||||||||||
| Tobacco - 2.66% | |||||||||||||||
| Altria Group, Inc. | 435,711 | 19,057,999 | |||||||||||||
| Philip Morris International, Inc. | 146,330 | 10,548,930 | |||||||||||||
|
| ||||||||||||||
| 29,606,929 | |||||||||||||||
|
| ||||||||||||||
Total Consumer Staples | 118,372,334 | ||||||||||||||
|
| ||||||||||||||
| Energy - 3.74% | |||||||||||||||
| Oil, Gas & Consumable Fuels - 3.74% | |||||||||||||||
| Chevron Corp. | 202,964 | 23,892,922 | |||||||||||||
| Kinder Morgan, Inc. | 881,015 | 17,858,174 | |||||||||||||
|
| ||||||||||||||
| 41,751,096 | |||||||||||||||
|
| ||||||||||||||
Total Energy | 41,751,096 | ||||||||||||||
|
| ||||||||||||||
| Financials - 14.61% | |||||||||||||||
| Banks - 3.52% | |||||||||||||||
| Wells Fargo & Co. | 842,503 | 39,235,365 | |||||||||||||
|
| ||||||||||||||
| Capital Markets - 4.59% | |||||||||||||||
| BlackRock, Inc. | 82,182 | 34,726,826 | |||||||||||||
| Franklin Resources, Inc. | 626,570 | 16,466,260 | |||||||||||||
|
| ||||||||||||||
| 51,193,086 | |||||||||||||||
|
| ||||||||||||||
| Diversified Financial Services - 2.17% | |||||||||||||||
| Berkshire Hathaway, Inc., Class BA | 119,010 | 24,207,824 | |||||||||||||
|
| ||||||||||||||
| Insurance - 4.33% | |||||||||||||||
| Cincinnati Financial Corp. | 429,301 | 48,292,069 | |||||||||||||
|
| ||||||||||||||
Total Financials | 162,928,344 | ||||||||||||||
|
| ||||||||||||||
See accompanying notes
10
American Beacon The London Company Income Equity FundSM
Schedule of Investments
August 31, 2019
| Shares | Fair Value | ||||||||||||||
| COMMON STOCKS - 93.60% (continued) | |||||||||||||||
| Health Care - 9.54% | |||||||||||||||
| Pharmaceuticals - 9.54% | |||||||||||||||
| Johnson & Johnson | 267,452 | $ | 34,330,139 | ||||||||||||
| Merck & Co., Inc. | 506,883 | 43,830,173 | |||||||||||||
| Pfizer, Inc. | 794,373 | 28,239,960 | |||||||||||||
|
| ||||||||||||||
| 106,400,272 | |||||||||||||||
|
| ||||||||||||||
Total Health Care | 106,400,272 | ||||||||||||||
|
| ||||||||||||||
| Industrials - 14.74% | |||||||||||||||
| Air Freight & Logistics - 3.15% | |||||||||||||||
| United Parcel Service, Inc., Class B | 296,071 | 35,131,785 | |||||||||||||
|
| ||||||||||||||
| Airlines - 3.28% | |||||||||||||||
| Delta Air Lines, Inc. | 630,890 | 36,503,295 | |||||||||||||
|
| ||||||||||||||
| Machinery - 1.73% | |||||||||||||||
| PACCAR, Inc. | 294,393 | 19,300,405 | |||||||||||||
|
| ||||||||||||||
| Road & Rail - 3.45% | |||||||||||||||
| Norfolk Southern Corp. | 221,230 | 38,505,081 | |||||||||||||
|
| ||||||||||||||
| Trading Companies & Distributors - 3.13% | |||||||||||||||
| Fastenal Co. | 1,139,780 | 34,900,064 | |||||||||||||
|
| ||||||||||||||
Total Industrials | 164,340,630 | ||||||||||||||
|
| ||||||||||||||
| Information Technology - 21.40% | |||||||||||||||
| Communications Equipment - 3.60% | |||||||||||||||
| Cisco Systems, Inc. | 856,340 | 40,085,275 | |||||||||||||
|
| ||||||||||||||
| IT Services - 2.78% | |||||||||||||||
| Paychex, Inc. | 378,711 | 30,940,689 | |||||||||||||
|
| ||||||||||||||
| Semiconductors & Semiconductor Equipment - 6.69% | |||||||||||||||
| Intel Corp. | 717,511 | 34,017,197 | |||||||||||||
| Texas Instruments, Inc. | 327,830 | 40,568,962 | |||||||||||||
|
| ||||||||||||||
| 74,586,159 | |||||||||||||||
|
| ||||||||||||||
| Software - 3.11% | |||||||||||||||
| Microsoft Corp. | 251,708 | 34,700,465 | |||||||||||||
|
| ||||||||||||||
| Technology Hardware, Storage & Peripherals - 5.22% | |||||||||||||||
| Apple, Inc. | 279,053 | 58,249,523 | |||||||||||||
|
| ||||||||||||||
Total Information Technology | 238,562,111 | ||||||||||||||
|
| ||||||||||||||
| Real Estate - 3.52% | |||||||||||||||
| Equity Real Estate Investment Trusts (REITs) - 3.52% | |||||||||||||||
| Crown Castle International Corp. | 270,190 | 39,223,482 | |||||||||||||
|
| ||||||||||||||
| Utilities - 3.42% | |||||||||||||||
| Multi-Utilities - 3.42% | |||||||||||||||
| Dominion Energy, Inc. | 491,588 | 38,161,976 | |||||||||||||
|
| ||||||||||||||
Total Common Stocks (Cost $806,751,977) | 1,043,602,413 | ||||||||||||||
|
| ||||||||||||||
See accompanying notes
11
American Beacon The London Company Income Equity FundSM
Schedule of Investments
August 31, 2019
| Shares | Fair Value | ||||||||||||||
| SHORT-TERM INVESTMENTS - 5.81% (Cost $64,835,851) | |||||||||||||||
| Investment Companies - 5.81% | |||||||||||||||
| American Beacon U.S. Government Money Market Select Fund, Select Class, 2.03%B C | 64,835,851 | $ | 64,835,851 | ||||||||||||
|
| ||||||||||||||
TOTAL INVESTMENTS - 99.41% (Cost $871,587,828) | 1,108,438,264 | ||||||||||||||
OTHER ASSETS, NET OF LIABILITIES - 0.59% | 6,540,729 | ||||||||||||||
|
| ||||||||||||||
TOTAL NET ASSETS - 100.00% | $ | 1,114,978,993 | |||||||||||||
|
| ||||||||||||||
| Percentages are stated as a percent of net assets. | |||||||||||||||
ANon-income producing security.
B The Fund is affiliated by having the same investment advisor.
C7-day yield.
ADR - American Depositary Receipt.
PLC - Public Limited Company.
| Long Futures Contracts Open on August 31, 2019: |
| |||||||||||||
| Equity Futures Contracts | ||||||||||||||
| Description | Number of Contracts | Expiration Date | Notional Amount | Contract Value | Unrealized Appreciation (Depreciation) | |||||||||
| S&P 500E-Mini Index Futures | 417 | September 2019 | $ 60,562,778 | $ | 60,982,080 | $ | 419,302 | |||||||
|
|
|
|
| ||||||||||
| $ 60,562,778 | $ | 60,982,080 | $ | 419,302 | ||||||||||
|
|
|
|
| ||||||||||
| Index Abbreviations: | ||
| S&P 500 | Standard & Poor’s U.S. EquityLarge-Cap Index. | |
The Fund’s investments are summarized by level based on the inputs used to determine their values. As of August 31, 2019, the investments were classified as described below:
The London Company Income Equity Fund | Level 1 | Level 2 | Level 3 | Total | ||||||||||||||||||||||||
Assets |
| |||||||||||||||||||||||||||
Common Stocks | $ | 1,043,602,413 | $ | - | $ | - | $ | 1,043,602,413 | ||||||||||||||||||||
Short-Term Investments | 64,835,851 | - | - | 64,835,851 | ||||||||||||||||||||||||
|
|
|
|
|
|
|
| |||||||||||||||||||||
Total Investments in Securities - Assets | $ | 1,108,438,264 | $ | - | $ | - | $ | 1,108,438,264 | ||||||||||||||||||||
|
|
|
|
|
|
|
| |||||||||||||||||||||
Financial Derivative Instruments - Assets |
| |||||||||||||||||||||||||||
Futures Contracts | $ | 419,302 | $ | - | $ | - | $ | 419,302 | ||||||||||||||||||||
|
|
|
|
|
|
|
| |||||||||||||||||||||
Total Financial Derivative Instruments - Assets | $ | 419,302 | $ | - | $ | - | $ | 419,302 | ||||||||||||||||||||
|
|
|
|
|
|
|
| |||||||||||||||||||||
U.S. GAAP requires transfers between all levels to/from level 3 be disclosed. During the year ended August 31, 2019, there were no transfers into or out of Level 3.
See accompanying notes
12
American Beacon Zebra Small Cap Equity FundSM
Schedule of Investments
August 31, 2019
| Shares | Fair Value | ||||||||||||||
| COMMON STOCKS - 96.66% | |||||||||||||||
| Communication Services - 4.03% | |||||||||||||||
| Interactive Media & Services - 1.40% | |||||||||||||||
| DHI Group, Inc.A | 20,857 | $ | 75,711 | ||||||||||||
| Liberty TripAdvisor Holdings, Inc., Class AA | 119,562 | 1,044,972 | |||||||||||||
| TravelzooA | 3,303 | 39,206 | |||||||||||||
|
| ||||||||||||||
| 1,159,889 | |||||||||||||||
|
| ||||||||||||||
| Media - 2.63% | |||||||||||||||
| Central European Media Enterprises Ltd., Class AA | 113,841 | 528,222 | |||||||||||||
| Lee Enterprises, Inc.A | 57,221 | 101,854 | |||||||||||||
| MSG Networks, Inc., Class AA | 37,301 | 611,737 | |||||||||||||
| National CineMedia, Inc. | 24,065 | 197,333 | |||||||||||||
| Saga Communications, Inc., Class A | 2,530 | 72,206 | |||||||||||||
| Scholastic Corp. | 8,589 | 301,216 | |||||||||||||
| Tribune Publishing Co. | 15,659 | 119,791 | |||||||||||||
| WideOpenWest, Inc.A | 45,529 | 255,873 | |||||||||||||
|
| ||||||||||||||
| 2,188,232 | |||||||||||||||
|
| ||||||||||||||
Total Communication Services | 3,348,121 | ||||||||||||||
|
| ||||||||||||||
| Consumer Discretionary - 8.01% | |||||||||||||||
| Auto Components - 1.81% | |||||||||||||||
| Dorman Products, Inc.A | 12,273 | 872,365 | |||||||||||||
| Modine Manufacturing Co.A | 30,341 | 309,782 | |||||||||||||
| Standard Motor Products, Inc. | 7,333 | 324,925 | |||||||||||||
|
| ||||||||||||||
| 1,507,072 | |||||||||||||||
|
| ||||||||||||||
| Distributors - 0.15% | |||||||||||||||
| Weyco Group, Inc. | 4,919 | 120,663 | |||||||||||||
|
| ||||||||||||||
| Diversified Consumer Services - 0.82% | |||||||||||||||
| American Public Education, Inc.A | 5,511 | 133,532 | |||||||||||||
| Career Education Corp.A | 24,091 | 494,106 | |||||||||||||
| Collectors Universe, Inc. | 2,172 | 56,298 | |||||||||||||
|
| ||||||||||||||
| 683,936 | |||||||||||||||
|
| ||||||||||||||
| Hotels, Restaurants & Leisure - 0.40% | |||||||||||||||
| BBX Capital Corp. | 37,975 | 157,596 | |||||||||||||
| Nathan’s Famous, Inc. | 1,108 | 73,793 | |||||||||||||
| RCI Hospitality Holdings, Inc. | 5,486 | 97,651 | |||||||||||||
|
| ||||||||||||||
| 329,040 | |||||||||||||||
|
| ||||||||||||||
| Household Durables - 0.94% | |||||||||||||||
| Bassett Furniture Industries, Inc. | 4,483 | 54,603 | |||||||||||||
| Flexsteel Industries, Inc. | 3,778 | 57,199 | |||||||||||||
| Green Brick Partners, Inc.A | 31,226 | 286,967 | |||||||||||||
| Hooker Furniture Corp. | 7,051 | 125,931 | |||||||||||||
| Lifetime Brands, Inc. | 9,168 | 70,777 | |||||||||||||
| Tupperware Brands Corp. | 14,034 | 182,582 | |||||||||||||
|
| ||||||||||||||
| 778,059 | |||||||||||||||
|
| ||||||||||||||
| Leisure Products - 0.87% | |||||||||||||||
| Escalade, Inc. | 5,869 | 60,626 | |||||||||||||
| Johnson Outdoors, Inc., Class A | 4,635 | 259,560 | |||||||||||||
| Marine Products Corp. | 14,253 | 215,648 | |||||||||||||
| MasterCraft Boat Holdings, Inc.A | 12,632 | 191,375 | |||||||||||||
|
| ||||||||||||||
| 727,209 | |||||||||||||||
|
| ||||||||||||||
See accompanying notes
13
American Beacon Zebra Small Cap Equity FundSM
Schedule of Investments
August 31, 2019
| Shares | Fair Value | ||||||||||||||
| COMMON STOCKS - 96.66% (continued) | |||||||||||||||
| Consumer Discretionary - 8.01% (continued) | |||||||||||||||
| Specialty Retail - 1.71% | |||||||||||||||
| Citi Trends, Inc. | 4,696 | $ | 78,940 | ||||||||||||
| Haverty Furniture Cos, Inc. | 6,029 | 115,455 | |||||||||||||
| Michaels Cos, Inc.A | 157,143 | 891,001 | |||||||||||||
| RTW RetailWinds, Inc.A | 23,240 | 23,472 | |||||||||||||
| Sportsman’s Warehouse Holdings, Inc.A | 21,595 | 91,131 | |||||||||||||
| Winmark Corp. | 1,374 | 223,275 | |||||||||||||
|
| ||||||||||||||
| 1,423,274 | |||||||||||||||
|
| ||||||||||||||
| Textiles, Apparel & Luxury Goods - 1.31% | |||||||||||||||
| Culp, Inc. | 4,487 | 62,998 | |||||||||||||
| Rocky Brands, Inc. | 2,366 | 68,945 | |||||||||||||
| Steven Madden Ltd. | 25,462 | 845,848 | |||||||||||||
| Superior Group of Cos., Inc. | 7,952 | 112,759 | |||||||||||||
|
| ||||||||||||||
| 1,090,550 | |||||||||||||||
|
| ||||||||||||||
Total Consumer Discretionary | 6,659,803 | ||||||||||||||
|
| ||||||||||||||
| Consumer Staples - 3.29% | |||||||||||||||
| Food & Staples Retailing - 1.87% | |||||||||||||||
| Ingles Markets, Inc., Class A | 9,523 | 370,254 | |||||||||||||
| Pricesmart, Inc. | 8,043 | 486,038 | |||||||||||||
| SpartanNash Co. | 20,918 | 225,287 | |||||||||||||
| Village Super Market, Inc., Class A | 5,512 | 137,635 | |||||||||||||
| Weis Markets, Inc. | 8,605 | 328,969 | |||||||||||||
|
| ||||||||||||||
| 1,548,183 | |||||||||||||||
|
| ||||||||||||||
| Food Products - 0.08% | |||||||||||||||
| Bridgford Foods Corp.A | 1,993 | 66,746 | |||||||||||||
|
| ||||||||||||||
| Household Products - 0.71% | |||||||||||||||
| Central Garden & Pet Co., Class AA | 22,280 | 536,057 | |||||||||||||
| Oil-Dri Corp. of America | 1,816 | 55,860 | |||||||||||||
|
| ||||||||||||||
| 591,917 | |||||||||||||||
|
| ||||||||||||||
| Personal Products - 0.63% | |||||||||||||||
| Inter Parfums, Inc. | 8,166 | 524,992 | |||||||||||||
|
| ||||||||||||||
Total Consumer Staples | 2,731,838 | ||||||||||||||
|
| ||||||||||||||
| Energy - 2.19% | |||||||||||||||
| Energy Equipment & Services - 0.66% | |||||||||||||||
| DMC Global, Inc. | 5,371 | 233,263 | |||||||||||||
| Mammoth Energy Services, Inc.B | 72,137 | 262,579 | |||||||||||||
| RigNet, Inc.A | 6,668 | 52,277 | |||||||||||||
|
| ||||||||||||||
| 548,119 | |||||||||||||||
|
| ||||||||||||||
| Oil, Gas & Consumable Fuels - 1.53% | |||||||||||||||
| Evolution Petroleum Corp. | 10,516 | 62,255 | |||||||||||||
| Goodrich Petroleum Corp.A | 5,080 | 53,797 | |||||||||||||
| Hallador Energy Co. | 15,978 | 63,433 | |||||||||||||
| NACCO Industries, Inc., Class A | 3,111 | 154,866 | |||||||||||||
| Panhandle Oil and Gas, Inc., Class A | 5,454 | 62,339 | |||||||||||||
| Penn Virginia Corp.A | 11,118 | 316,863 | |||||||||||||
| PrimeEnergy Resources Corp.A | 600 | 67,500 | |||||||||||||
| SilverBow Resources, Inc.A | 28,183 | 244,628 | |||||||||||||
| W&T Offshore, Inc.A | 57,317 | 251,048 | |||||||||||||
|
| ||||||||||||||
| 1,276,729 | |||||||||||||||
|
| ||||||||||||||
Total Energy | 1,824,848 | ||||||||||||||
|
| ||||||||||||||
See accompanying notes
14
American Beacon Zebra Small Cap Equity FundSM
Schedule of Investments
August 31, 2019
| Shares | Fair Value | ||||||||||||||
| COMMON STOCKS - 96.66% (continued) | |||||||||||||||
| Financials - 19.00% | |||||||||||||||
| Banks - 9.49% | |||||||||||||||
| 1st Constitution Bancorp | 4,754 | $ | 82,767 | ||||||||||||
| ACNB Corp. | 3,459 | 116,499 | |||||||||||||
| Bank of Commerce Holdings | 9,428 | 94,280 | |||||||||||||
| Bryn Mawr Bank Corp. | 10,162 | 346,524 | |||||||||||||
| C&F Financial Corp. | 1,880 | 89,112 | |||||||||||||
| Central Valley Community Bancorp | 6,119 | 119,810 | |||||||||||||
| Chemung Financial Corp. | 2,274 | 91,392 | |||||||||||||
| Citizens & Northern Corp. | 5,810 | 137,813 | |||||||||||||
| CNB Financial Corp. | 7,103 | 187,803 | |||||||||||||
| Codorus Valley Bancorp, Inc. | 4,825 | 107,887 | |||||||||||||
| Colony Bankcorp, Inc. | 4,567 | 72,889 | |||||||||||||
| Community Trust Bancorp, Inc. | 8,489 | 330,222 | |||||||||||||
| Enterprise Bancorp, Inc. | 6,211 | 179,684 | |||||||||||||
| Evans Bancorp, Inc. | 2,260 | 77,089 | |||||||||||||
| Farmers National Banc Corp. | 14,122 | 190,647 | |||||||||||||
| First Bancorp, Inc. | 5,752 | 146,101 | |||||||||||||
| First Business Financial Services, Inc. | 4,265 | 96,176 | |||||||||||||
| First Financial Corp. | 6,169 | 250,461 | |||||||||||||
| First Guaranty Bancshares, Inc. | 4,204 | 79,792 | |||||||||||||
| First Mid Bancshares, Inc. | 9,142 | 293,367 | |||||||||||||
| International Bancshares Corp. | 34,759 | 1,237,073 | |||||||||||||
| LCNB Corp. | 6,760 | 113,365 | |||||||||||||
| Macatawa Bank Corp. | 16,042 | 158,655 | |||||||||||||
| Mackinac Financial Corp. | 5,626 | 79,552 | |||||||||||||
| Midland States Bancorp, Inc. | 12,471 | 321,378 | |||||||||||||
| MidWestOne Financial Group, Inc. | 6,715 | 194,533 | |||||||||||||
| MutualFirst Financial, Inc. | 3,760 | 113,439 | |||||||||||||
| Northeast BankA | 4,442 | 93,238 | |||||||||||||
| Northrim BanCorp, Inc. | 3,078 | 111,424 | |||||||||||||
| Old Second Bancorp, Inc. | 16,076 | 189,536 | |||||||||||||
| Parke Bancorp, Inc. | 6,645 | 151,307 | |||||||||||||
| PCB Bancorp | 7,895 | 130,031 | |||||||||||||
| People’s Utah Bancorp | 8,734 | 231,451 | |||||||||||||
| Peoples Bancorp of North Carolina, Inc. | 2,947 | 82,133 | |||||||||||||
| Peoples Bancorp, Inc. | 10,125 | 310,939 | |||||||||||||
| Peoples Financial Services Corp. | 3,254 | 145,681 | |||||||||||||
| Premier Financial Bancorp, Inc. | 7,702 | 119,381 | |||||||||||||
| Republic Bancorp, Inc., Class A | 9,414 | 399,624 | |||||||||||||
| Select Bancorp, Inc.A | 8,571 | 93,424 | |||||||||||||
| Sierra Bancorp | 7,139 | 175,905 | |||||||||||||
| Summit Financial Group, Inc. | 6,179 | 152,189 | |||||||||||||
| United Security Bancshares | 7,586 | 78,743 | |||||||||||||
| Unity Bancorp, Inc. | 6,014 | 118,055 | |||||||||||||
|
| ||||||||||||||
| 7,891,371 | |||||||||||||||
|
| ||||||||||||||
| Capital Markets - 2.61% | |||||||||||||||
| B. Riley Financial, Inc. | 10,813 | 228,803 | |||||||||||||
| Cohen & Steers, Inc. | 14,940 | 805,714 | |||||||||||||
| Diamond Hill Investment Group, Inc. | 2,063 | 278,299 | |||||||||||||
| Donnelley Financial Solutions, Inc.A | 13,755 | 146,216 | |||||||||||||
| GAMCO Investors, Inc., Class A | 26,539 | 468,944 | |||||||||||||
| Pzena Investment Management, Inc., Class A | 9,128 | 74,210 | |||||||||||||
| Silvercrest Asset Management Group, Inc., Class A | 4,713 | 61,599 | |||||||||||||
| Westwood Holdings Group, Inc. | 3,887 | 106,698 | |||||||||||||
|
| ||||||||||||||
| 2,170,483 | |||||||||||||||
|
| ||||||||||||||
See accompanying notes
15
American Beacon Zebra Small Cap Equity FundSM
Schedule of Investments
August 31, 2019
| Shares | Fair Value | ||||||||||||||
| COMMON STOCKS - 96.66% (continued) | |||||||||||||||
| Financials - 19.00% (continued) | |||||||||||||||
| Consumer Finance - 0.52% | |||||||||||||||
| Elevate Credit, Inc.A | 16,373 | $ | 70,568 | ||||||||||||
| Enova International, Inc.A | 15,229 | 363,973 | |||||||||||||
|
| ||||||||||||||
| 434,541 | |||||||||||||||
|
| ||||||||||||||
| Diversified Financial Services - 0.19% | |||||||||||||||
| Marlin Business Services Corp. | 7,204 | 155,822 | |||||||||||||
|
| ||||||||||||||
| Insurance - 4.50% | |||||||||||||||
| Crawford & Co., Class A | 22,161 | 213,854 | |||||||||||||
| Enstar Group Ltd.A | 5,731 | 1,023,671 | |||||||||||||
| Independence Holding Co. | 5,973 | 221,120 | |||||||||||||
| Investors Title Co. | 913 | 134,394 | |||||||||||||
| National General Holdings Corp. | 58,458 | 1,378,440 | |||||||||||||
| National Western Life Group, Inc., Class A | 2,293 | 591,181 | |||||||||||||
| NI Holdings, Inc.A | 10,514 | 176,635 | |||||||||||||
|
| ||||||||||||||
| 3,739,295 | |||||||||||||||
|
| ||||||||||||||
| Mortgage Real Estate Investment Trusts (REITs) - 0.19% | |||||||||||||||
| Great Ajax Corp. | 10,592 | 154,431 | |||||||||||||
|
| ||||||||||||||
| Thrifts & Mortgage Finance - 1.50% | |||||||||||||||
| First Defiance Financial Corp. | 9,280 | 242,672 | |||||||||||||
| FS Bancorp, Inc. | 2,385 | 115,434 | |||||||||||||
| Home Bancorp, Inc. | 4,471 | 166,679 | |||||||||||||
| MMA Capital Holdings, Inc.A | 3,329 | 98,538 | |||||||||||||
| OP Bancorp | 9,376 | 89,072 | |||||||||||||
| Riverview Bancorp, Inc. | 11,309 | 79,729 | |||||||||||||
| Southern Missouri Bancorp, Inc. | 4,523 | 151,068 | |||||||||||||
| Timberland Bancorp, Inc. | 4,519 | 115,551 | |||||||||||||
| Waterstone Financial, Inc. | 11,593 | 192,328 | |||||||||||||
|
| ||||||||||||||
| 1,251,071 | |||||||||||||||
|
| ||||||||||||||
Total Financials | 15,797,014 | ||||||||||||||
|
| ||||||||||||||
| Health Care - 14.49% | |||||||||||||||
| Biotechnology - 3.54% | |||||||||||||||
| Anika Therapeutics, Inc.A | 4,139 | 234,930 | |||||||||||||
| Arena Pharmaceuticals, Inc.A | 3,107 | 164,329 | |||||||||||||
| Athenex, Inc.A | 11,359 | 167,318 | |||||||||||||
| BioSpecifics Technologies Corp.A | 3,065 | 168,820 | |||||||||||||
| Celcuity, Inc.A | 5,496 | 98,873 | |||||||||||||
| Eagle Pharmaceuticals, Inc.A | 3,142 | 177,177 | |||||||||||||
| Emergent BioSolutions, Inc.A | 4,194 | 183,697 | |||||||||||||
| Enanta Pharmaceuticals, Inc.A | 2,608 | 183,994 | |||||||||||||
| Halozyme Therapeutics, Inc.A | 11,315 | 186,924 | |||||||||||||
| Myriad Genetics, Inc.A | 6,041 | 142,145 | |||||||||||||
| Natera, Inc.A | 6,473 | 213,285 | |||||||||||||
| PDL BioPharma, Inc.A | 65,161 | 152,477 | |||||||||||||
| Repligen Corp.A | 2,003 | 185,899 | |||||||||||||
| Retrophin, Inc.A | 10,354 | 130,357 | |||||||||||||
| Vanda Pharmaceuticals, Inc.A | 14,070 | 198,246 | |||||||||||||
| Veracyte, Inc.A | 6,795 | 180,068 | |||||||||||||
| Xencor, Inc.A | 4,743 | 176,819 | |||||||||||||
|
| ||||||||||||||
| 2,945,358 | |||||||||||||||
|
| ||||||||||||||
See accompanying notes
16
American Beacon Zebra Small Cap Equity FundSM
Schedule of Investments
August 31, 2019
| Shares | Fair Value | ||||||||||||||
| COMMON STOCKS - 96.66% (continued) | |||||||||||||||
| Health Care - 14.49% (continued) | |||||||||||||||
| Health Care Equipment & Supplies - 4.26% | |||||||||||||||
| AtriCure, Inc.A | 4,274 | $ | 117,065 | ||||||||||||
| Atrion Corp. | 511 | 397,124 | |||||||||||||
| Cardiovascular Systems, Inc.A | 2,744 | 132,892 | |||||||||||||
| Lantheus Holdings, Inc.A | 10,746 | 233,833 | |||||||||||||
| LeMaitre Vascular, Inc. | 2,840 | 89,914 | |||||||||||||
| Meridian Bioscience, Inc. | 11,851 | 109,385 | |||||||||||||
| Mesa Laboratories, Inc.B | 707 | 156,410 | |||||||||||||
| Misonix, Inc.A | 1,500 | 29,370 | |||||||||||||
| Neogen Corp.A | 9,319 | 657,176 | |||||||||||||
| Orthofix Medical, Inc.A | 3,866 | 196,547 | |||||||||||||
| Quidel Corp.A | 10,341 | 652,000 | |||||||||||||
| RTI Surgical, Inc.A | 15,556 | 49,468 | |||||||||||||
| SeaSpine Holdings Corp.A | 5,316 | 58,423 | |||||||||||||
| STAAR Surgical Co.A | 2,904 | 87,439 | |||||||||||||
| Surmodics, Inc.A | 1,469 | 69,131 | |||||||||||||
| Utah Medical Products, Inc. | 1,294 | 127,226 | |||||||||||||
| Varex Imaging Corp.A | 10,162 | 267,769 | |||||||||||||
| Zynex, Inc.B | 11,987 | 107,164 | |||||||||||||
|
| ||||||||||||||
| 3,538,336 | |||||||||||||||
|
| ||||||||||||||
| Health Care Providers & Services - 2.77% | |||||||||||||||
| Addus HomeCare Corp.A | 2,466 | 216,959 | |||||||||||||
| Amedisys, Inc.A | 4,905 | 631,322 | |||||||||||||
| CorVel Corp.A | 5,104 | 429,910 | |||||||||||||
| Cross Country Healthcare, Inc.A | 5,122 | 52,500 | |||||||||||||
| Joint Corp.A | 2,527 | 42,403 | |||||||||||||
| National HealthCare Corp. | 4,976 | 402,061 | |||||||||||||
| National Research Corp., Class A | 5,719 | 366,188 | |||||||||||||
| RadNet, Inc.A | 11,234 | 156,265 | |||||||||||||
|
| ||||||||||||||
| 2,297,608 | |||||||||||||||
|
| ||||||||||||||
| Health Care Technology - 0.75% | |||||||||||||||
| Computer Programs & Systems, Inc. | 4,630 | 97,924 | |||||||||||||
| HealthStream, Inc.A | 5,337 | 134,866 | |||||||||||||
| NextGen Healthcare, Inc.A | 19,359 | 275,091 | |||||||||||||
| Simulations Plus, Inc. | 3,296 | 119,019 | |||||||||||||
|
| ||||||||||||||
| 626,900 | |||||||||||||||
|
| ||||||||||||||
| Life Sciences Tools & Services - 0.16% | |||||||||||||||
| Luminex Corp. | 6,484 | 132,922 | |||||||||||||
|
| ||||||||||||||
| Pharmaceuticals - 3.01% | |||||||||||||||
| Corcept Therapeutics, Inc.A | 19,209 | 242,226 | |||||||||||||
| Innoviva, Inc.A | 63,424 | 735,084 | |||||||||||||
| Phibro Animal Health Corp., Class A | 10,171 | 210,031 | |||||||||||||
| SIGA Technologies, Inc.A | 200,806 | 1,008,046 | |||||||||||||
| Supernus Pharmaceuticals, Inc.A | 11,377 | 307,520 | |||||||||||||
|
| ||||||||||||||
| 2,502,907 | |||||||||||||||
|
| ||||||||||||||
Total Health Care | 12,044,031 | ||||||||||||||
|
| ||||||||||||||
| Industrials - 17.04% | |||||||||||||||
| Building Products - 2.24% | |||||||||||||||
| Builders FirstSource, Inc.A | 41,612 | 809,353 | |||||||||||||
| CSW Industrials, Inc. | 4,121 | 281,094 | |||||||||||||
| Universal Forest Products, Inc. | 19,668 | 769,019 | |||||||||||||
|
| ||||||||||||||
| 1,859,466 | |||||||||||||||
|
| ||||||||||||||
See accompanying notes
17
American Beacon Zebra Small Cap Equity FundSM
Schedule of Investments
August 31, 2019
| Shares | Fair Value | ||||||||||||||
| COMMON STOCKS - 96.66% (continued) | |||||||||||||||
| Industrials - 17.04% (continued) | |||||||||||||||
| Commercial Services & Supplies - 4.25% | |||||||||||||||
| CompX International, Inc. | 2,531 | $ | 38,345 | ||||||||||||
| Deluxe Corp. | 17,189 | 792,069 | |||||||||||||
| Ennis, Inc. | 8,668 | 174,313 | |||||||||||||
| Herman Miller, Inc. | 18,095 | 765,057 | |||||||||||||
| HNI Corp. | 14,245 | 444,302 | |||||||||||||
| Interface, Inc. | 32,022 | 353,843 | |||||||||||||
| Kimball International, Inc., Class B | 13,297 | 233,362 | |||||||||||||
| Matthews International Corp., Class A | 14,136 | 414,326 | |||||||||||||
| NL Industries, Inc.A | 32,679 | 120,586 | |||||||||||||
| VSE Corp. | 6,013 | 191,454 | |||||||||||||
|
| ||||||||||||||
| 3,527,657 | |||||||||||||||
|
| ||||||||||||||
| Construction & Engineering - 0.86% | |||||||||||||||
| Aegion Corp.A | 9,132 | 180,266 | |||||||||||||
| IES Holdings, Inc.A | 7,930 | 149,639 | |||||||||||||
| Primoris Services Corp. | 19,790 | 386,696 | |||||||||||||
|
| ||||||||||||||
| 716,601 | |||||||||||||||
|
| ||||||||||||||
| Electrical Equipment - 0.64% | |||||||||||||||
| Encore Wire Corp. | 7,541 | 407,138 | |||||||||||||
| Preformed Line Products Co. | 2,463 | 126,229 | |||||||||||||
|
| ||||||||||||||
| 533,367 | |||||||||||||||
|
| ||||||||||||||
| Industrial Conglomerates - 0.34% | |||||||||||||||
| Raven Industries, Inc. | 9,586 | 279,624 | |||||||||||||
|
| ||||||||||||||
| Machinery - 3.60% | |||||||||||||||
| Blue Bird Corp.A | 9,994 | 182,291 | |||||||||||||
| Columbus McKinnon Corp. | 9,556 | 309,328 | |||||||||||||
| Commercial Vehicle Group, Inc.A | 19,165 | 121,698 | |||||||||||||
| Eastern Co. | 2,806 | 61,900 | |||||||||||||
| Franklin Electric Co., Inc. | 14,328 | 656,939 | |||||||||||||
| Gencor Industries, Inc.A | 5,266 | 60,243 | |||||||||||||
| Gorman-Rupp Co. | 7,637 | 228,117 | |||||||||||||
| Hurco Cos, Inc. | 3,474 | 110,855 | |||||||||||||
| Miller Industries, Inc. | 5,446 | 170,405 | |||||||||||||
| Omega Flex, Inc. | 2,637 | 222,035 | |||||||||||||
| Park-Ohio Holdings Corp. | 8,530 | 231,931 | |||||||||||||
| TriMas Corp.A | 19,091 | 560,894 | |||||||||||||
| Twin Disc, Inc.A | 7,508 | 75,906 | |||||||||||||
|
| ||||||||||||||
| 2,992,542 | |||||||||||||||
|
| ||||||||||||||
| Professional Services - 1.33% | |||||||||||||||
| BG Staffing, Inc. | 2,658 | 49,811 | |||||||||||||
| Kelly Services, Inc., Class A | 13,174 | 318,942 | |||||||||||||
| Kforce, Inc. | 8,665 | 281,959 | |||||||||||||
| Resources Connection, Inc. | 9,465 | 156,646 | |||||||||||||
| TrueBlue, Inc.A | 15,388 | 298,681 | |||||||||||||
|
| ||||||||||||||
| 1,106,039 | |||||||||||||||
|
| ||||||||||||||
| Road & Rail - 0.55% | |||||||||||||||
| PAM Transportation Services, Inc.A | 2,430 | 140,187 | |||||||||||||
| Universal Logistics Holdings, Inc. | 15,296 | 320,451 | |||||||||||||
|
| ||||||||||||||
| 460,638 | |||||||||||||||
|
| ||||||||||||||
See accompanying notes
18
American Beacon Zebra Small Cap Equity FundSM
Schedule of Investments
August 31, 2019
| Shares | Fair Value | ||||||||||||||
| COMMON STOCKS - 96.66% (continued) | |||||||||||||||
| Industrials - 17.04% (continued) | |||||||||||||||
| Trading Companies & Distributors - 3.23% | |||||||||||||||
| Applied Industrial Technologies, Inc. | 12,960 | $ | 691,934 | ||||||||||||
| BMC Stock Holdings, Inc.A | 23,078 | 586,874 | |||||||||||||
| DXP Enterprises, Inc.A | 5,316 | 172,504 | |||||||||||||
| Lawson Products, Inc.A | 2,207 | 80,445 | |||||||||||||
| Rush Enterprises, Inc., Class A | 14,120 | 509,873 | |||||||||||||
| Systemax, Inc. | 14,597 | 292,962 | |||||||||||||
| Transcat, Inc.A | 2,350 | 54,591 | |||||||||||||
| Veritiv Corp.A | 6,593 | 109,180 | |||||||||||||
| Willis Lease Finance Corp.A | 3,060 | 189,016 | |||||||||||||
|
| ||||||||||||||
| 2,687,379 | |||||||||||||||
|
| ||||||||||||||
Total Industrials | 14,163,313 | ||||||||||||||
|
| ||||||||||||||
| Information Technology - 12.37% | |||||||||||||||
| Communications Equipment - 0.38% | |||||||||||||||
| Clearfield, Inc.A | 5,697 | 60,901 | |||||||||||||
| DASAN Zhone Solutions, Inc.A | 7,135 | 76,131 | |||||||||||||
| Digi International, Inc.A | 8,022 | 102,521 | |||||||||||||
| TESSCO Technologies, Inc. | 4,909 | 72,555 | |||||||||||||
|
| ||||||||||||||
| 312,108 | |||||||||||||||
|
| ||||||||||||||
| Electronic Equipment, Instruments & Components - 6.44% | |||||||||||||||
| Anixter International, Inc.A | 14,574 | 874,003 | |||||||||||||
| AVX Corp. | 96,582 | 1,308,686 | |||||||||||||
| Bel Fuse, Inc., Class B | 9,332 | 102,652 | |||||||||||||
| Coda Octopus Group, Inc.A | 6,226 | 55,287 | |||||||||||||
| CTS Corp. | 10,655 | 303,987 | |||||||||||||
| Daktronics, Inc. | 14,913 | 107,821 | |||||||||||||
| ePlus, Inc.A | 4,366 | 356,789 | |||||||||||||
| Insight Enterprises, Inc.A | 18,522 | 890,167 | |||||||||||||
| Kimball Electronics, Inc.A | 14,482 | 191,307 | |||||||||||||
| Napco Security Technologies, Inc.A | 4,687 | 161,608 | |||||||||||||
| PC Connection, Inc. | 12,031 | 423,852 | |||||||||||||
| ScanSource, Inc.A | 13,930 | 393,662 | |||||||||||||
| Vishay Precision Group, Inc.A | 5,879 | 183,719 | |||||||||||||
|
| ||||||||||||||
| 5,353,540 | |||||||||||||||
|
| ||||||||||||||
| IT Services - 2.85% | |||||||||||||||
| CSG Systems International, Inc. | 10,878 | 586,107 | |||||||||||||
| Hackett Group, Inc. | 12,769 | 205,964 | |||||||||||||
| Information Services Group, Inc.A | 27,507 | 73,168 | |||||||||||||
| NIC, Inc. | 15,722 | 327,332 | |||||||||||||
| PRGX Global, Inc.A | 9,571 | 51,588 | |||||||||||||
| Sykes Enterprises, Inc.A | 16,645 | 482,705 | |||||||||||||
| TTEC Holdings, Inc. | 13,667 | 641,119 | |||||||||||||
|
| ||||||||||||||
| 2,367,983 | |||||||||||||||
|
| ||||||||||||||
| Semiconductors & Semiconductor Equipment - 2.07% | |||||||||||||||
| Amkor Technology, Inc.A | 68,110 | 595,963 | |||||||||||||
| Diodes, Inc.A | 17,090 | 624,640 | |||||||||||||
| FormFactor, Inc.A | 23,193 | 396,368 | |||||||||||||
| NVE Corp. | 1,551 | 99,574 | |||||||||||||
|
| ||||||||||||||
| 1,716,545 | |||||||||||||||
|
| ||||||||||||||
| Software - 0.57% | |||||||||||||||
| Agilysys, Inc.A | 3,349 | 91,260 | |||||||||||||
| American Software, Inc., Class A | 7,356 | 115,931 | |||||||||||||
See accompanying notes
19
American Beacon Zebra Small Cap Equity FundSM
Schedule of Investments
August 31, 2019
| Shares | Fair Value | ||||||||||||||
| COMMON STOCKS - 96.66% (continued) | |||||||||||||||
| Information Technology - 12.37% (continued) | |||||||||||||||
| Software - 0.57% (continued) | |||||||||||||||
| MajescoA | 13,197 | $ | 110,591 | ||||||||||||
| QAD, Inc., Class A | 3,908 | 158,352 | |||||||||||||
|
| ||||||||||||||
| 476,134 | |||||||||||||||
|
| ||||||||||||||
| Technology Hardware, Storage & Peripherals - 0.06% | |||||||||||||||
| AstroNova, Inc. | 3,233 | 53,118 | |||||||||||||
|
| ||||||||||||||
Total Information Technology | 10,279,428 | ||||||||||||||
|
| ||||||||||||||
| Materials - 5.29% | |||||||||||||||
| Chemicals - 4.56% | |||||||||||||||
| American Vanguard Corp. | 11,755 | 166,568 | |||||||||||||
| Chase Corp. | 3,748 | 375,625 | |||||||||||||
| Hawkins, Inc. | 3,894 | 172,699 | |||||||||||||
| Innophos Holdings, Inc. | 8,117 | 228,006 | |||||||||||||
| Innospec, Inc. | 9,511 | 791,125 | |||||||||||||
| Kronos Worldwide, Inc. | 75,188 | 823,309 | |||||||||||||
| Tredegar Corp. | 21,355 | 369,228 | |||||||||||||
| Valhi, Inc. | 440,840 | 859,638 | |||||||||||||
|
| ||||||||||||||
| 3,786,198 | |||||||||||||||
|
| ||||||||||||||
| Construction Materials - 0.19% | |||||||||||||||
| United States Lime & Minerals, Inc. | 2,087 | 161,054 | |||||||||||||
|
| ||||||||||||||
| Containers & Packaging - 0.15% | |||||||||||||||
| UFP Technologies, Inc.A | 2,913 | 121,705 | |||||||||||||
|
| ||||||||||||||
| Metals & Mining - 0.39% | |||||||||||||||
| Olympic Steel, Inc. | 6,893 | 74,099 | |||||||||||||
| Ryerson Holding Corp.A | 36,486 | 250,659 | |||||||||||||
|
| ||||||||||||||
| 324,758 | |||||||||||||||
|
| ||||||||||||||
Total Materials | 4,393,715 | ||||||||||||||
|
| ||||||||||||||
| Real Estate - 8.57% | |||||||||||||||
| Equity Real Estate Investment Trusts (REITs) - 7.07% | |||||||||||||||
| Alexander’s, Inc. | 1,596 | 602,602 | |||||||||||||
| Getty Realty Corp. | 11,176 | 354,950 | |||||||||||||
| Lexington Realty Trust | 60,748 | 631,172 | |||||||||||||
| LTC Properties, Inc. | 12,161 | 593,457 | |||||||||||||
| One Liberty Properties, Inc. | 5,975 | 160,010 | |||||||||||||
| PotlatchDeltic Corp. | 17,826 | 685,944 | |||||||||||||
| PS Business Parks, Inc. | 7,134 | 1,281,338 | |||||||||||||
| Ryman Hospitality Properties, Inc. | 13,295 | 1,059,080 | |||||||||||||
| Saul Centers, Inc. | 6,454 | 324,184 | |||||||||||||
| Urstadt Biddle Properties, Inc., Class A | 8,711 | 182,844 | |||||||||||||
|
| ||||||||||||||
| 5,875,581 | |||||||||||||||
|
| ||||||||||||||
| Real Estate Management & Development - 1.50% | |||||||||||||||
| American Realty Investors, Inc.A | 2,908 | 33,704 | |||||||||||||
| Consolidated-Tomoka Land Co. | 1,758 | 112,231 | |||||||||||||
| Forestar Group, Inc.A | 16,265 | 310,011 | |||||||||||||
| Marcus & Millichap, Inc.A | 11,477 | 414,090 | |||||||||||||
| RMR Group, Inc., Class A | 7,176 | 334,330 | |||||||||||||
| Stratus Properties, Inc.A | 1,532 | 40,291 | |||||||||||||
|
| ||||||||||||||
| 1,244,657 | |||||||||||||||
|
| ||||||||||||||
Total Real Estate | 7,120,238 | ||||||||||||||
|
| ||||||||||||||
See accompanying notes
20
American Beacon Zebra Small Cap Equity FundSM
Schedule of Investments
August 31, 2019
| Shares | Fair Value | ||||||||||||||
| COMMON STOCKS - 96.66% (continued) | |||||||||||||||
| Utilities - 2.38% | |||||||||||||||
| Electric Utilities - 1.85% | |||||||||||||||
| Genie Energy Ltd., Class B | 17,670 | $ | 126,517 | ||||||||||||
| MGE Energy, Inc. | 9,950 | 754,708 | |||||||||||||
| Otter Tail Corp. | 12,887 | 652,340 | |||||||||||||
|
| ||||||||||||||
| 1,533,565 | |||||||||||||||
|
| ||||||||||||||
| Gas Utilities - 0.08% | |||||||||||||||
| RGC Resources, Inc. | 2,469 | 70,070 | |||||||||||||
|
| ||||||||||||||
| Water Utilities - 0.45% | |||||||||||||||
| Artesian Resources Corp., Class A | 3,036 | 110,510 | |||||||||||||
| Consolidated Water Co., Ltd. | 4,889 | 71,673 | |||||||||||||
| Global Water Resources, Inc. | 4,713 | 56,132 | |||||||||||||
| York Water Co. | 3,716 | 138,755 | |||||||||||||
|
| ||||||||||||||
| 377,070 | |||||||||||||||
|
| ||||||||||||||
Total Utilities | 1,980,705 | ||||||||||||||
|
| ||||||||||||||
Total Common Stocks (Cost $83,183,289) | 80,343,054 | ||||||||||||||
|
| ||||||||||||||
| SHORT-TERM INVESTMENTS - 3.19% (Cost $2,647,579) | |||||||||||||||
| Investment Companies - 3.19% | |||||||||||||||
| American Beacon U.S. Government Money Market Select Fund, Select Class, 2.03%C D | 2,647,579 | 2,647,579 | |||||||||||||
|
| ||||||||||||||
| SECURITIES LENDING COLLATERAL - 0.31% (Cost $255,970) | |||||||||||||||
| Investment Companies - 0.31% | |||||||||||||||
| American Beacon U.S. Government Money Market Select Fund, Select Class, 2.03%C D | 255,970 | 255,970 | |||||||||||||
|
| ||||||||||||||
TOTAL INVESTMENTS - 100.16% (Cost $86,086,838) | 83,246,603 | ||||||||||||||
LIABILITIES, NET OF OTHER ASSETS - (0.16%) | (131,297 | ) | |||||||||||||
|
| ||||||||||||||
TOTAL NET ASSETS - 100.00% | $ | 83,115,306 | |||||||||||||
|
| ||||||||||||||
| Percentages are stated as a percent of net assets. | |||||||||||||||
ANon-income producing security.
B All or a portion of this security is on loan at August 31, 2019.
C The Fund is affiliated by having the same investment advisor.
D7-day yield.
| Long Futures Contracts Open on August 31, 2019: | ||||||||||||||||
| Equity Futures Contracts | ||||||||||||||||
| Description | Number of Contracts | Expiration Date | Notional Amount | Contract Value | Unrealized Appreciation (Depreciation) | |||||||||||
| Russell 2000E-Mini Index Futures | 33 | September 2019 | $ 2,482,969 | $ | 2,465,430 | $ | (17,539 | ) | ||||||||
|
|
|
|
|
| |||||||||||
| $ 2,482,969 | $ | 2,465,430 | $ | (17,539 | ) | |||||||||||
|
|
|
|
|
| |||||||||||
See accompanying notes
21
American Beacon Zebra Small Cap Equity FundSM
Schedule of Investments
August 31, 2019
The Fund’s investments are summarized by level based on the inputs used to determine their values. As of August 31, 2019, the investments were classified as described below:
Zebra Small Cap Equity Fund | Level 1 | Level 2 | Level 3 | Total | ||||||||||||||||||||||||
Assets | ||||||||||||||||||||||||||||
Common Stocks | $ | 80,343,054 | $ | - | $ | - | $ | 80,343,054 | ||||||||||||||||||||
Short-Term Investments | 2,647,579 | - | - | 2,647,579 | ||||||||||||||||||||||||
Securities Lending Collateral | 255,970 | - | - | 255,970 | ||||||||||||||||||||||||
|
|
|
|
|
|
|
| |||||||||||||||||||||
Total Investments in Securities - Assets | $ | 83,246,603 | $ | - | $ | - | $ | 83,246,603 | ||||||||||||||||||||
|
|
|
|
|
|
|
| |||||||||||||||||||||
Financial Derivative Instruments - Liabilities |
| |||||||||||||||||||||||||||
Futures Contracts | $ | (17,539 | ) | $ | - | $ | - | $ | (17,539 | ) | ||||||||||||||||||
|
|
|
|
|
|
|
| |||||||||||||||||||||
Total Financial Derivative Instruments - Liabilities | $ | (17,539 | ) | $ | - | $ | - | $ | (17,539 | ) | ||||||||||||||||||
|
|
|
|
|
|
|
| |||||||||||||||||||||
U.S. GAAP requires transfers between all levels to/from level 3 be disclosed. During the year ended August 31, 2019, there were no transfers into or out of Level 3.
See accompanying notes
22
American Beacon FundsSM
Statements of Assets and Liabilities
August 31, 2019
| The London Company Income Equity Fund | Zebra Small Cap Equity Fund | |||||||||||
Assets: |
| |||||||||||
Investments in unaffiliated securities, at fair value†§ | $ | 1,043,602,413 | $ | 80,343,054 | ||||||||
Investments in affiliated securities, at fair value‡ | 64,835,851 | 2,903,549 | ||||||||||
Dividends and interest receivable | 3,348,248 | 68,053 | ||||||||||
Deposits with broker for futures contracts | 2,168,842 | 119,371 | ||||||||||
Receivable for fund shares sold | 2,549,411 | 106,713 | ||||||||||
Receivable for tax reclaims | 110,114 | - | ||||||||||
Receivable for expense reimbursement (Note 2) | - | 28,501 | ||||||||||
Receivable for variation margin on open futures contracts (Note 5) | 420,275 | - | ||||||||||
Prepaid expenses | 60,842 | 32,445 | ||||||||||
|
|
|
| |||||||||
Total assets | 1,117,095,996 | 83,601,686 | ||||||||||
|
|
|
| |||||||||
Liabilities: |
| |||||||||||
Payable for fund shares redeemed | 1,185,544 | 81,944 | ||||||||||
Management andsub-advisory fees payable (Note 2) | 620,793 | 62,141 | ||||||||||
Service fees payable (Note 2) | 132,956 | 5,565 | ||||||||||
Transfer agent fees payable (Note 2) | 58,504 | 5,047 | ||||||||||
Payable upon return of securities loaned (Note 9)§ | - | 255,970 | ||||||||||
Custody and fund accounting fees payable | 40,868 | 9,874 | ||||||||||
Professional fees payable | 47,662 | 44,593 | ||||||||||
Payable for prospectus and shareholder reports | 23,721 | 3,568 | ||||||||||
Payable for variation margin from open futures contracts (Note 5) | - | 17,432 | ||||||||||
Other liabilities | 6,955 | 246 | ||||||||||
|
|
|
| |||||||||
Total liabilities | 2,117,003 | 486,380 | ||||||||||
|
|
|
| |||||||||
Net assets | $ | 1,114,978,993 | $ | 83,115,306 | ||||||||
|
|
|
| |||||||||
Analysis of net assets: |
| |||||||||||
Paid-in-capital | $ | 816,696,325 | $ | 86,988,314 | ||||||||
Total distributable earnings (deficits)A | 298,282,668 | (3,873,008 | ) | |||||||||
|
|
|
| |||||||||
Net assets | $ | 1,114,978,993 | $ | 83,115,306 | ||||||||
|
|
|
| |||||||||
Shares outstanding at no par value (unlimited shares authorized): |
| |||||||||||
Institutional Class | 12,958,019 | 1,757,646 | ||||||||||
|
|
|
| |||||||||
Y Class | 36,714,252 | 2,833,625 | ||||||||||
|
|
|
| |||||||||
Investor Class | 1,374,138 | 890,075 | ||||||||||
|
|
|
| |||||||||
A Class | 3,326,882 | 191,710 | ||||||||||
|
|
|
| |||||||||
C Class | 7,048,613 | 179,113 | ||||||||||
|
|
|
| |||||||||
Net assets: |
| |||||||||||
Institutional Class | $ | 236,601,692 | $ | 24,989,951 | ||||||||
|
|
|
| |||||||||
Y Class | $ | 666,792,661 | $ | 40,575,598 | ||||||||
|
|
|
| |||||||||
Investor Class | $ | 24,993,208 | $ | 12,486,352 | ||||||||
|
|
|
| |||||||||
A Class | $ | 60,146,845 | $ | 2,693,316 | ||||||||
|
|
|
| |||||||||
C Class | $ | 126,444,587 | $ | 2,370,089 | ||||||||
|
|
|
| |||||||||
Net asset value, offering and redemption price per share: |
| |||||||||||
Institutional Class | $ | 18.26 | $ | 14.22 | ||||||||
|
|
|
| |||||||||
Y Class | $ | 18.16 | $ | 14.32 | ||||||||
|
|
|
| |||||||||
Investor Class | $ | 18.19 | $ | 14.03 | ||||||||
|
|
|
| |||||||||
A Class | $ | 18.08 | $ | 14.05 | ||||||||
|
|
|
| |||||||||
A Class (offering price) | $ | 19.18 | $ | 14.91 | ||||||||
|
|
|
| |||||||||
C Class | $ | 17.94 | $ | 13.23 | ||||||||
|
|
|
| |||||||||
† Cost of investments in unaffiliated securities | $ | 806,751,977 | $ | 83,183,289 | ||||||||
‡ Cost of investments in affiliated securities | $ | 64,835,851 | $ | 2,903,549 | ||||||||
§ Fair value of securities on loan | $ | - | $ | 250,944 | ||||||||
A The Fund’s investments in affiliated securities did not have unrealized appreciation (depreciation) at year end. |
| |||||||||||
See accompanying notes
23
American Beacon FundsSM
Statements of Operations
For the year ended August 31, 2019
| The London Company Income Equity Fund | Zebra Small Cap Equity Fund | |||||||||||
Investment income: |
| |||||||||||
Dividend income from unaffiliated securities (net of foreign taxes)† | $ | 28,149,454 | $ | 1,274,301 | ||||||||
Dividend income from affiliated securities (Note 8) | 978,858 | 33,102 | ||||||||||
Interest income | 23,908 | 1,170 | ||||||||||
Income derived from securities lending (Note 9) | - | 1,556 | ||||||||||
|
|
|
| |||||||||
Total investment income | 29,152,220 | 1,310,129 | ||||||||||
|
|
|
| |||||||||
Expenses: |
| |||||||||||
Management andsub-advisory fees (Note 2) | 6,799,284 | 653,465 | ||||||||||
Transfer agent fees: | ||||||||||||
Institutional Class (Note 2) | 43,740 | 6,009 | ||||||||||
Y Class (Note 2) | 522,386 | 31,485 | ||||||||||
Investor Class | 2,385 | 1,906 | ||||||||||
A Class | 3,322 | 582 | ||||||||||
C Class | 6,302 | 751 | ||||||||||
Custody and fund accounting fees | 120,452 | 34,986 | ||||||||||
Professional fees | 88,373 | 46,803 | ||||||||||
Registration fees and expenses | 88,596 | 84,108 | ||||||||||
Service fees (Note 2): | ||||||||||||
Investor Class | 83,677 | 32,782 | ||||||||||
A Class | 49,672 | 3,692 | ||||||||||
C Class | 127,094 | 2,704 | ||||||||||
Distribution fees (Note 2): | ||||||||||||
A Class | 141,281 | 9,101 | ||||||||||
C Class | 1,261,043 | 27,702 | ||||||||||
Prospectus and shareholder report expenses | 79,199 | 18,664 | ||||||||||
Trustee fees (Note 2) | 76,473 | 5,413 | ||||||||||
Other expenses | 75,106 | 11,168 | ||||||||||
|
|
|
| |||||||||
Total expenses | 9,568,385 | 971,321 | ||||||||||
|
|
|
| |||||||||
Net fees waived and expenses (reimbursed) / recouped (Note 2) | - | (190,897 | ) | |||||||||
|
|
|
| |||||||||
Net expenses | 9,568,385 | 780,424 | ||||||||||
|
|
|
| |||||||||
Net investment income | 19,583,835 | 529,705 | ||||||||||
|
|
|
| |||||||||
Realized and unrealized gain (loss) from investments: |
| |||||||||||
Net realized gain (loss) from: | ||||||||||||
Investments in unaffiliated securitiesA | 62,082,262 | (902,037 | ) | |||||||||
Commission recapture (Note 1) | 9,384 | - | ||||||||||
Foreign currency transactions | - | (81 | ) | |||||||||
Futures contracts | 2,681,503 | (167,575 | ) | |||||||||
Change in net unrealized appreciation of: | ||||||||||||
Investments in unaffiliated securitiesB | (35,196,319 | ) | (10,624,425 | ) | ||||||||
Futures contracts | 141,252 | (26,656 | ) | |||||||||
|
|
|
| |||||||||
Net gain (loss) from investments | 29,718,082 | (11,720,774 | ) | |||||||||
|
|
|
| |||||||||
Net increase (decrease) in net assets resulting from operations | $ | 49,301,917 | $ | (11,191,069 | ) | |||||||
|
|
|
| |||||||||
† Foreign taxes | $ | 82,585 | $ | 2,104 | ||||||||
A The Fund did not recognize net realized gains (losses) from the sale of investments in affiliated securities. |
| |||||||||||
B The Fund’s investments in affiliated securities did not have a change in unrealized appreciation (depreciation) at year end. |
| |||||||||||
See accompanying notes
24
American Beacon FundsSM
Statements of Changes in Net Assets
| The London Company Income Equity Fund | Zebra Small Cap Equity Fund | |||||||||||||||||||||||||||
| Year Ended August 31, 2019 | Year Ended August 31, 2018 | Year Ended August 31, 2019 | Year Ended August 31, 2018 | |||||||||||||||||||||||||
Increase (decrease) in net assets: |
| |||||||||||||||||||||||||||
Operations: |
| |||||||||||||||||||||||||||
Net investment income | $ | 19,583,835 | $ | 20,475,574 | $ | 529,705 | $ | 276,643 | ||||||||||||||||||||
Net realized gain (loss) from investments in unaffiliated securities, commission recapture, foreign currency transactions, and futures contracts | 64,773,149 | 21,722,969 | (1,069,693 | ) | 6,346,625 | |||||||||||||||||||||||
Change in net unrealized appreciation (depreciation) of investments in unaffiliated securities, and futures contracts | (35,055,067 | ) | 105,835,036 | (10,651,081 | ) | 5,661,903 | ||||||||||||||||||||||
|
|
|
|
|
|
|
| |||||||||||||||||||||
Net increase (decrease) in net assets resulting from operations | 49,301,917 | 148,033,579 | (11,191,069 | ) | 12,285,171 | |||||||||||||||||||||||
|
|
|
|
|
|
|
| |||||||||||||||||||||
Distributions to shareholders: |
| |||||||||||||||||||||||||||
Net investment income: | ||||||||||||||||||||||||||||
Institutional Class | - | (4,670,451 | ) | - | (15,431 | ) | ||||||||||||||||||||||
Y Class | - | (12,791,912 | ) | - | (56,016 | ) | ||||||||||||||||||||||
Investor Class | - | (579,365 | ) | - | (11,670 | ) | ||||||||||||||||||||||
A Class | - | (1,295,100 | ) | - | (4,944 | ) | ||||||||||||||||||||||
C Class | - | (1,456,384 | ) | - | - | |||||||||||||||||||||||
Net realized gain from investments: | ||||||||||||||||||||||||||||
Institutional Class | - | - | - | (616,281 | ) | |||||||||||||||||||||||
Y Class | - | - | - | (2,237,225 | ) | |||||||||||||||||||||||
Investor Class | - | - | - | (597,062 | ) | |||||||||||||||||||||||
A Class | - | - | - | (300,058 | ) | |||||||||||||||||||||||
C Class | - | - | - | (180,750 | ) | |||||||||||||||||||||||
Total retained earnings:* | ||||||||||||||||||||||||||||
Institutional Class | (8,464,738 | ) | - | (1,075,441 | ) | - | ||||||||||||||||||||||
Y Class | (21,511,810 | ) | - | (3,866,854 | ) | - | ||||||||||||||||||||||
Investor Class | (857,390 | ) | - | (847,910 | ) | - | ||||||||||||||||||||||
A Class | (1,935,522 | ) | - | (345,372 | ) | - | ||||||||||||||||||||||
C Class | (3,493,331 | ) | - | (277,583 | ) | - | ||||||||||||||||||||||
|
|
|
|
|
|
|
| |||||||||||||||||||||
Net distributions to shareholders | (36,262,791 | ) | (20,793,212 | ) | (6,413,160 | ) | (4,019,437 | ) | ||||||||||||||||||||
|
|
|
|
|
|
|
| |||||||||||||||||||||
Capital share transactions (Note 11): |
| |||||||||||||||||||||||||||
Proceeds from sales of shares | 287,772,196 | 187,282,549 | 53,661,919 | 59,061,135 | ||||||||||||||||||||||||
Reinvestment of dividends and distributions | 21,003,121 | 11,435,964 | 6,373,935 | 3,987,828 | ||||||||||||||||||||||||
Cost of shares redeemed | (240,716,133 | ) | (455,348,646 | ) | (37,619,306 | ) | (35,541,319 | ) | ||||||||||||||||||||
|
|
|
|
|
|
|
| |||||||||||||||||||||
Net increase (decrease) in net assets from capital share transactions | 68,059,184 | (256,630,133 | ) | 22,416,548 | 27,507,644 | |||||||||||||||||||||||
|
|
|
|
|
|
|
| |||||||||||||||||||||
Net increase (decrease) in net assets | 81,098,310 | (129,389,766 | ) | 4,812,319 | 35,773,378 | |||||||||||||||||||||||
|
|
|
|
|
|
|
| |||||||||||||||||||||
Net assets: |
| |||||||||||||||||||||||||||
Beginning of period | 1,033,880,683 | 1,163,270,449 | 78,302,987 | 42,529,609 | ||||||||||||||||||||||||
|
|
|
|
|
|
|
| |||||||||||||||||||||
End of period | $ | 1,114,978,993 | $ | 1,033,880,683 | $ | 83,115,306 | $ | 78,302,987 | ||||||||||||||||||||
|
|
|
|
|
|
|
| |||||||||||||||||||||
* Distributions from net investment income and net realized capital gains are combined for the year ended August 31, 2019. See Note 1 in the Notes to Financial Statements for more information regarding new accounting pronouncements. |
| |||||||||||||||||||||||||||
See accompanying notes
25
American Beacon FundsSM
August 31, 2019
1. Organization and Significant Accounting Policies
American Beacon Funds (the “Trust”) is organized as a Massachusetts business trust. The Funds, each a series within the Trust, are registered under the Investment Company Act of 1940, as amended (the “Act”), as diversified,open-end management investment companies. As of August 31, 2019, the Trust consists of thirty-three active series, two of which are presented in this filing: American Beacon The London Company Income Equity Fund and American Beacon Zebra Small Cap Equity Fund (collectively, the “Funds” and each individually a “Fund”). The remainingthirty-one active series are reported in separate filings.
American Beacon Advisors, Inc. (the “Manager”) is a Delaware corporation and a wholly-owned subsidiary of Resolute Investment Managers, Inc. (“RIM”) organized in 1986 to provide business management, advisory, administrative, and asset management consulting services to the Trust and other investors. The Manager is registered as an investment advisor under the Investment Advisers Act of 1940, as amended (the “Advisers Act”). RIM is, in turn, a wholly-owned subsidiary of Resolute Acquisition, Inc., which is a wholly-owned subsidiary of Resolute Topco, Inc., a wholly-owned subsidiary of Resolute Investment Holdings, LLC (“RIH”). RIH is owned primarily by Kelso Investment Associates VIII, L.P., KEP VI, LLC and Estancia Capital Partners L.P., investment funds affiliated with Kelso & Company, L.P. (“Kelso”) or Estancia Capital Management, LLC (“Estancia”), which are private equity firms.
Recent Accounting Pronouncements
In March 2017, the Financial Accounting Standards Board (“FASB”) issued Accounting Standards Update (“ASU”)2017-08,Premium Amortization of Purchased Callable Debt Securities. The amendments in the ASU shorten the premium amortization period on a purchased callable debt security from the security’s contractual life to the earliest call date. It is anticipated that this change will enhance disclosures by reducing losses recognized when a security is called on an earlier date. This ASU is effective for fiscal years beginning after December 15, 2018. The Manager continues to evaluate the impact this ASU will have on the financial statements and other disclosures.
In August 2018, the FASB issued ASU2018-13,Fair Value Measurement (“Topic 820”). The amendments in the ASU impact disclosure requirements for fair value measurement. It is anticipated that this change will enhance the effectiveness of disclosures in the notes to the financial statements. This ASU is effective for fiscal years beginning after December 15, 2019. Early adoption is permitted and can include the entire standard or certain provisions that exclude or amend disclosures. For the year ended August 31, 2019, the Funds have chosen to adopt the standard. The adoption of this ASU guidance did not have a material impact on the financial statements and other disclosures.
In August 2018, the U.S. Securities and Exchange Commission (“SEC”) adopted amendments to certain disclosure requirements in Securities Act ReleaseNo. 33-10532, Disclosure Update and Simplification, which is intended to facilitate the disclosure of information to investors and simplify compliance without significantly altering the total mix of information provided to investors. Effective with the current reporting period, the Funds adopted the amendments with the impacts being that the Funds are no longer required to present components of distributable earnings on the Statements of Assets and Liabilities or the sources of distributable earnings and the amount of undistributed net investment income on the Statements of Changes in Net Assets.
26
American Beacon FundsSM
Notes to Financial Statements
August 31, 2019
Class Disclosure
Each Fund has multiple classes of shares designed to meet the needs of different groups of investors. The following table sets forth the differences amongst the classes:
Class | Eligible Investors | Minimum Initial Investments | ||||
| Institutional | Large institutional investors - sold directly or through intermediary channels. | $ | 250,000 | |||
| Y Class | Large institutional retirement plan investors - sold directly or through intermediary channels. | $ | 100,000 | |||
| Investor | All investors using intermediary organizations, such as broker-dealers or retirement plan sponsors. | $ | 2,500 | |||
| A Class | All investors who invest through intermediary organizations, such as broker-dealers or third party administrator. Retail investors who invest directly through a financial intermediary such as a broker, bank, or registered investment advisor which may include afront-end sales charge and a contingent deferred sales charge (“CDSC”). | $ | 2,500 | |||
| C Class | Retail investors who invest directly through a financial intermediary such as a broker or through employee directed benefit plans with applicable sales charges which may include CDSC. | $ | 1,000 | |||
Each class offered by the Trust has equal rights as to assets and voting privileges. Income andnon-class specific expenses are allocated daily to each class based on the relative net assets. Realized and unrealized capital gains and losses of each class are allocated daily based on the relative net assets of each class of the respective Fund. Class specific expenses, where applicable, currently include service, distribution, transfer agent fees, andsub-transfer agent fees that vary amongst the classes as described more fully in Note 2.
Significant Accounting Policies
The following is a summary of significant accounting policies, consistently followed by the Funds in preparation of the financial statements. The Funds are considered investment companies and accordingly, follow the investment company accounting and reporting guidance of the FASB Accounting Standards Codification Topic 946,Financial Services – Investment Companies,a part of Generally Accepted Accounting Principles (“U.S. GAAP”).
Security Transactions and Investment Income
Security transactions are recorded as of the trade date for financial reporting purposes. Securities purchased or sold on a when-issued or delayed-delivery basis may be settled beyond a standard settlement period for the security after the trade date.
Dividend income, net of foreign taxes, is recorded on theex-dividend date, except certain dividends from foreign securities which are recorded as soon as the information is available to the Funds. Interest income, net of foreign taxes, is earned from settlement date, recorded on the accrual basis, and adjusted, if necessary, for accretion of discounts and amortization of premiums. Realized gains (losses) from securities sold are determined based on specific lot identification.
Distributions to Shareholders
The London Company Income Equity Fund distributes most or all of its net earning and realized gains, if any, each taxable year in the form of dividends from net investment income on a monthly basis and distributions of realized net capital gains and net gains or losses from foreign currency transactions on an annual basis. The Zebra Small Cap Equity Fund distributes most or all of its net earning and realized gains, if any, each taxable year in the form of dividends from net investment income and distributions of realized net capital gains and net gains or losses
27
American Beacon FundsSM
Notes to Financial Statements
August 31, 2019
from foreign currency transactions on an annual basis. The Funds do not have a fixed dividend rate and does not guarantee that it will pay any distributions in any particular year.
Dividends to shareholders are determined in accordance with federal income tax regulation, which may differ in amount and character from net investment income and realized gains recognized for purposes of U.S. GAAP. To the extent necessary to fully distribute capital gains, the Funds may designate earning and profits distributed to shareholders on the redemption of shares.
Section 19(a) of the Investment Company Act and Rule19a-1 thereunder require the Funds’ to provide a written statement accompanying any distribution from a source other than net income that adequately discloses its source or sources. Thus, if the source of a distribution were the original capital contribution of the Shareholder, and the payment amounted to a return of capital, the Funds’ would be required to provide written disclosure to that effect. Nevertheless, persons who periodically receive the payment of a dividend or other distribution may be under the impression that they are receiving net profits when they are not. Shareholders should read any written disclosure provided pursuant to Section 19(a) and Rule19a-1 carefully and should not assume that the source of any distribution from the Funds’ is net profit.
Commission Recapture
The Funds have established brokerage commission recapture arrangements with certain brokers or dealers. If the Funds’ investment advisor chooses to execute a transaction through a participating broker, the broker rebates a portion of the commission back to the Funds. Any collateral benefit received through participation in the commission recapture program is directed exclusively to the Funds. This amount is reported within the net realized gain (loss) in the Funds’ Statements of Operations, if applicable. For the year ended August 31, 2019, there was recapture in The London Company Income Equity Fund.
Allocation of Income, Trust Expenses, Gains, and Losses
Investment income, realized and unrealized gains and losses from investments of the Funds are allocated daily to each class of shares based upon the relative proportion of net assets of each class to the total net assets of the Funds. Expenses directly charged or attributable to the Funds will be paid from the assets of the Fund. Generally, expenses of the Trust will be allocated among and charged to the assets of the Funds on a basis that the Trust’s Board of Trustees (the “Board”) deems fair and equitable, which may be based on the relative net assets of the Funds or nature of the services performed and relative applicability to the Funds.
Use of Estimates
The preparation of financial statements in conformity with U.S. GAAP requires management to make estimates and assumptions that affect the amounts reported in the financial statements and accompanying notes. Actual results may differ from those estimated.
Other
Under the Trust’s organizational documents, its officers and trustees are indemnified against certain liabilities arising out of the performance of their duties to the Trust. In the normal course of business, the Trust enters into contracts that provide indemnification to the other party or parties against potential costs or liabilities. The Trust’s maximum exposure under these arrangements is dependent on claims that may be made in the future and, therefore, cannot be estimated. The Trust has had no prior claims or losses pursuant to any such agreement.
28
American Beacon FundsSM
Notes to Financial Statements
August 31, 2019
2. Transactions with Affiliates
Management and InvestmentSub-Advisory Agreements
The Funds and the Manager are parties to a Management Agreement that obligates the Manager to provide the Funds with investment advisory and administrative services. As compensation for performing the duties under the Management Agreement, the Manager will receive an annualized management fee based on a percentage of the Funds’ average daily net assets that is calculated and accrued daily according to the following schedule:
First $5 billion | 0.35 | % | ||
Next $5 billion | 0.325 | % | ||
Next $10 billion | 0.30 | % | ||
Over $20 billion | 0.275 | % |
The Trust, on behalf of the Funds, and the Manager have entered into an Investment Advisory Agreement with the followingSub-Advisors pursuant to which each Fund has agreed to pay an annualizedsub-advisory fee that is calculated and accrued daily based on the Funds’ average daily net assets according to the following schedules:
The London Company of Virginia, LLC
First $25 million | 0.40 | % | ||
Next $225 million | 0.35 | % | ||
Over $250 million | 0.30 | % |
Zebra Capital Management, LLC
First $350 million | 0.55 | % | ||
Next $400 million | 0.50 | % | ||
Over $750 million | 0.45 | % |
The Management andSub-Advisory Fees paid by the Funds for the year ended August 31, 2019 were as follows:
The London Company Income Equity Fund
| Effective Fee Rate | Amount of Fees Paid | |||||||||||
Management Fees | 0.35 | % | $ | 3,611,714 | ||||||||
Sub-Advisor Fees | 0.30 | % | 3,187,570 | |||||||||
|
|
|
| |||||||||
Total | 0.65 | % | $ | 6,799,284 | ||||||||
|
|
|
| |||||||||
Zebra Small Cap Equity Fund
| Effective Fee Rate | Amount of Fees Paid | |||||||||||
Management Fees | 0.35 | % | $ | 256,381 | ||||||||
Sub-Advisor Fees | 0.55 | % | 397,084 | |||||||||
|
|
|
| |||||||||
Total | 0.90 | % | $ | 653,465 | ||||||||
|
|
|
| |||||||||
As compensation for services provided by the Manager in connection with securities lending activities conducted by the Funds, the lending Fund pays to the Manager, with respect to cash collateral posted by borrowers, a fee of 10% of the net monthly interest income (the gross interest income earned by the investment of cash collateral, less the amount paid to borrowers and related expenses) from such activities and, with respect to loan fees paid by borrowers, a fee up to 10% of such loan fees. These fees are included in “Income derived from securities lending” and “Management and investment advisory fees” on the Statements of Operations. During the year ended August 31, 2019, the Manager received securities lending fees of $195 for the securities lending activities of the Zebra Small Cap Equity Fund.
29
American Beacon FundsSM
Notes to Financial Statements
August 31, 2019
Distribution Plans
The Funds, except for the A and C Classes of the Funds, have adopted a “defensive” Distribution Plan (the “Plan”) in accordance with Rule12b-1 under the Act, pursuant to which no separate fees may be charged to the Funds for distribution purposes. However, the Plan authorizes the management fee received by the Manager and the investment advisors hired by the Manager to be used for distribution purposes. Under this Plan, the Funds do not intend to compensate the Manager or any other party, either directly or indirectly, for the distribution of Fund shares.
Separate Distribution Plans (the “Distribution Plans”) have been adopted pursuant to Rule12b-1 under the Act for the A and C Classes of the Funds. Under the Distribution Plans, as compensation for distribution and shareholder servicing assistance, the Manager receives an annual fee of 0.25% of the average daily net assets of the A Class and 1.00% of the average daily net assets of the C Class. The fee will be payable without regard to whether the amount of the fee is more or less than the actual expenses incurred in a particular month by the Manager for distribution assistance.
Service Plans
The Manager and the Trust entered into Service Plans that obligate the Manager to oversee additional shareholder servicing of the Investor, A, and C Classes of the Funds. As compensation for performing the duties required under the Service Plans, the Manager receives an annualized fee up to 0.25% of the average daily net assets of the A and C Classes and up to 0.375% of the average daily net assets of the Investor Class of the Funds.
Sub-Transfer Agent Fees
The Manager has entered into agreements, which include servicing agreements, with financial intermediaries that provide recordkeeping, processing, shareholder communications and other services to customers of the intermediaries that hold positions in the Institutional and Y Classes of the Funds and has agreed to compensate the intermediaries for providing these services. Intermediaries transact with the Funds primarily through the use of omnibus accounts on behalf of their customers who hold positions in the Funds. Certain services would have been provided by the Funds’ transfer agent and other service providers if the shareholders’ accounts were maintained directly by the Funds’ transfer agent. Accordingly, the Funds, pursuant to Board approval, have agreed to reimburse the Manager for certainnon-distribution shareholder services provided by financial intermediaries for the Institutional and Y Classes. The reimbursement amounts(sub-transfer agent fees) paid to the Manager are subject to a fee limit of up to 0.10% of an intermediary’s average net assets in the Institutional and Y Classes on an annual basis. During the year ended August 31, 2019, thesub-transfer agent fees, as reflected in “Transfer agent fees” on the Statements of Operations, were as follows:
Fund | Sub-Transfer Agent Fees | |||
The London Company Income Equity | $ | 535,825 | ||
Zebra Small Cap Equity | 33,262 | |||
As of August 31, 2019, the Funds owed the Manager the following reimbursement ofsub-transfer agent fees, as reflected in “Transfer agent fees payable” on the Statements of Assets and Liabilities:
Fund | Reimbursement Sub-Transfer Agent Fees | |||
The London Company Income Equity | $ | 50,818 | ||
Zebra Small Cap Equity | 3,770 | |||
Investments in Affiliated Funds
The Funds may invest in the American Beacon U.S. Government Money Market Select Fund (the “USG Select Fund”). Cash collateral received by the Funds in connection with securities lending may also be invested in the USG
30
American Beacon FundsSM
Notes to Financial Statements
August 31, 2019
Select Fund. The Funds and the USG Select Fund have the same investment advisor and therefore, are considered to be affiliated. The Manager serves as investment advisor to the USG Select Fund and receives management fees and administrative fees totaling 0.10% of the average daily net assets of the USG Select Fund. During the year ended August 31, 2019, the Manager earned fees on the Funds’ direct investments and securities lending collateral investments in the USG Select Fund as shown below:
Fund | Direct Investments in USG Select Fund | Securities Lending Collateral Investments in USG Select Fund | Total | |||||||||
The London Company Income Equity | $ | 43,698 | $ | – | $ | 43,698 | ||||||
Zebra Small Cap Equity | 1,513 | 288 | 1,801 | |||||||||
Interfund Credit Facility
Pursuant to an exemptive order issued by the SEC, the Funds, along with other registered investment companies having management contracts with the Manager, may participate in a credit facility whereby each fund, under certain conditions, is permitted to lend money directly to and borrow directly from other participating funds for temporary purposes. The interfund credit facility is advantageous to the funds because it provides added liquidity and eliminates the need to maintain higher cash balances to meet redemptions. This situation could arise when shareholder redemptions exceed anticipated volumes and certain funds have insufficient cash on hand to satisfy such redemptions or when sales of securities do not settle as expected, resulting in a cash shortfall for a fund. When a fund liquidates portfolio securities to meet redemption requests, they often do not receive payment in settlement for up to two days (or longer for certain foreign transactions). Redemption requests normally are satisfied on the next business day. The credit facility provides a source of immediate, short-term liquidity pending settlement of the sale of portfolio securities. The credit facility is administered by a credit facility team consisting of professionals from the Manager’s asset management, compliance, and accounting areas who report the activities of the credit facility to the Board. During the year ended August 31, 2019, the Zebra Small Cap Equity Fund borrowed on average $920,601 for 11 days at an average interest rate of 2.93% with interest charges of $821. During the year ended August 31, 2019, The London Company Income Equity Fund did not utilize the credit facility.
Expense Reimbursement Plan
The Manager contractually agreed to reduce fees and/or reimburse expenses for the classes of the Funds to the extent that total operating expenses exceed the Funds’ expense cap. During the year ended August 31, 2019, the Manager waived and/or reimbursed expenses as follows:
Fund | Class | Expense Cap | Reimbursed Expenses | (Recouped) Expenses | Expiration of Reimbursed Expenses | |||||||||||||
| 9/1/2018 - 8/31/2019 | ||||||||||||||||||
Zebra Small Cap Equity | Institutional | 0.89 | % | $ | 44,130 | $ | – | 2021-2022 | ||||||||||
Zebra Small Cap Equity | Y | 0.99 | % | 106,961 | – | 2021-2022 | ||||||||||||
Zebra Small Cap Equity | Investor | 1.27 | % | 24,157 | – | 2021-2022 | ||||||||||||
Zebra Small Cap Equity | A | 1.29 | % | 8,754 | – | 2021-2022 | ||||||||||||
Zebra Small Cap Equity | C | 2.04 | % | 6,895 | – | 2021-2022 | ||||||||||||
Of these amounts, $28,501 was disclosed as a receivable from the Manager on the Statements of Assets and Liabilities at August 31, 2019 for the Zebra Small Cap Equity Fund.
The Funds have adopted an Expense Reimbursement Plan whereby the Manager may seek repayment of such fee reductions and expense reimbursements. Under the policy, the Manager can be reimbursed by the Funds for any contractual or voluntary fee reductions or expense reimbursements if reimbursement to the Manager (a) occurs within thirty-six months from the date of the Manager’s waiver/reimbursement and (b) does not cause the Funds’ annual operating expenses to exceed the lesser of the contractual percentage limit in effect at the time of the
31
American Beacon FundsSM
Notes to Financial Statements
August 31, 2019
waiver/reimbursement or time of recoupment. The reimbursed expenses listed above will expire in 2021-2022. The Funds did not record a liability for potential reimbursements due to the current assessment that reimbursements are uncertain. The carryover of excess expenses potentially reimbursable to the Manager, but not recorded as a liability are as follows:
Fund | Recouped Expenses | Excess Expense Carryover | Expired Expense Carryover | Expiration of Reimbursed Expenses | ||||||||||||
Zebra Small Cap Equity | $ | – | $ | 144,028 | $ | – | 2019-2020 | |||||||||
Zebra Small Cap Equity | – | 166,144 | – | 2020-2021 | ||||||||||||
Sales Commissions
The Funds’ Distributor, Resolute Investment Distributors, Inc. (“RID” or “Distributor”), may receive a portion of Class A sales charges from broker dealers and it may be used to offset distribution related expenses. During the year ended August 31, 2019, RID collected $31,601 and $3,909 for The London Company Income Equity Fund and Zebra Small Cap Equity Fund, respectively, from the sale of Class A Shares.
A CDSC of 0.50% will be deducted with respect to Class A Shares on certain purchases of $1,000,000 or more that are redeemed in whole or part within 18 months of purchase, unless waived as discussed in the Funds’ Prospectus. Any applicable CDSC will be 0.50% of the lesser of the original purchase price or the value of the redemption of the Class A Shares redeemed. During the year ended August 31, 2019, CDSC fees of $178 and $8 were collected for the Class A Shares of The London Company Income Equity Fund and Zebra Small Cap Equity Fund, respectively.
A CDSC of 1.00% will be deducted with respect to Class C Shares redeemed within 12 months of purchase, unless waived as discussed in the Funds’ Prospectus. Any applicable CDSC will be 1.00% of the lesser of the original purchase price or the value of the redemption of the Class C Shares redeemed. During the year ended August 31, 2019, CDSC fees of $6,258 and $152 were collected for Class C Shares of the The London Company Income Equity Fund and Zebra Small Cap Equity Fund, respectively.
Trustee Fees and Expenses
As compensation for their service to the Trusts, each Trustee receives an annual retainer of $120,000, plus $10,000 for each Board meeting attended in person or via teleconference, $2,500 for attendance by Committee members at meetings of the Audit Committee and the Investment Committee, and $1,500 for attendance by Committee members at meetings of the Nominating and Governance Committee, plus reimbursement of reasonable expenses incurred in attending Board meetings, Committee meetings, and relevant educational seminars. The Trustees also may be compensated for attendance at special Board and/or Committee meetings from time to time. The Board Chair receives an additional annual retainer of $50,000 as well as a $2,500 fee each quarter for attendance at the committee meetings. The Chairpersons of the Audit Committee and the Investment Committee each receive an additional annual retainer of $25,000 and the Chairman of the Nominating and Governance Committee receives an additional annual retainer of $10,000. These expenses are allocated on a prorated basis to each fund of the Trusts according to its respective net assets.
3. Security Valuation and Fair Value Measurements
The price of the Fund’s shares is based on its net asset value (“NAV”) per share. The Fund’s NAV is computed by adding total assets, subtracting all the Fund’s liabilities, and dividing the result by the total number of shares outstanding.
The NAV of each class of the Fund’s shares is determined based on a pro rata allocation of the Fund’s investment income, expenses and total capital gains and losses. The Fund’s NAV per share is determined each
32
American Beacon FundsSM
Notes to Financial Statements
August 31, 2019
business day as of the regular close of trading on the New York Stock Exchange (“NYSE” or “Exchange”), which is typically 4:00 p.m. Eastern Time (“ET”). However, if trading on the NYSE closes at a time other than 4:00 p.m. ET, the Fund’s NAV per share typically would still be determined as of the regular close of trading on the NYSE. The Fund does not price its shares on days that the NYSE is closed. Foreign exchanges may permit trading in foreign securities on days when the Fund is not open for business, which may result in the value of the Fund’s portfolio investments being affected at a time when you are unable to buy or sell shares.
Equity securities, including shares ofclosed-end funds and exchange-traded funds (“ETFs”), are valued at the last sale price or official closing price taken from the primary exchange in which each security trades. Investments in other mutual funds are valued at the closing NAV per share on the day of valuation. Debt securities are valued at bid quotes from broker/dealers or evaluated bid prices from pricing services, who may consider a number of inputs and factors, such as prices of comparable securities, yield curves, spreads, credit ratings, coupon rates, maturity, default rates, and underlying collateral. Futures are valued based on their daily settlement prices. Exchange-traded andover-the-counter (“OTC”) options are valued at the last sale price. Options with no last sale for the day are priced at mid quote. Swaps are valued at evaluated mid prices from pricing services.
The valuation of securities traded on foreign markets and certain fixed income securities will generally be based on prices determined as of the earlier closing time of the markets on which they primarily trade unless a significant event has occurred. When the Fund holds securities or other assets that are denominated in a foreign currency, the Fund will normally use the currency exchange rates as of 4:00 p.m. ET.
Securities may be valued at fair value, as determined in good faith and pursuant to procedures approved by the Board, under certain limited circumstances. For example, fair value pricing will be used when market quotations are not readily available or reliable, as determined by the Manager, such as when (i) trading for a security is restricted or stopped; (ii) a security’s trading market is closed (other than customary closings); or (iii) a security has beende-listed from a national exchange. A security with limited market liquidity may require fair value pricing if the Manager determines that the available price does not reflect the security’s true market value. In addition, if a significant event that the Manager determines to affect the value of one or more securities held by the Fund occurs after the close of a related exchange but before the determination of the Fund’s NAV, fair value pricing may be used on the affected security or securities. Securities of small-capitalization companies are also more likely to require a fair value determination using these procedures because they are more thinly traded and less liquid than the securities of larger-capitalization companies. The Fund may fair value securities as a result of significant events occurring after the close of the foreign markets in which the Fund invests as described below. In addition, the Fund may invest in illiquid securities requiring these procedures.
The Fund may use fair value pricing for securities primarily traded innon-U.S. markets because most foreign markets close well before the Fund’s pricing time of 4:00 p.m. ET. The earlier close of these foreign markets gives rise to the possibility that significant events, including broad market moves, may have occurred in the interim and may materially affect the value of those securities. If the Manager determines that the last quoted prices ofnon-U.S. securities will, in its judgment, materially affect the value of some or all its portfolio securities, the Manager can adjust the previous closing prices to reflect what it believes to be the fair value of the securities as of the close of the Exchange. In deciding whether it is necessary to adjust closing prices to reflect fair value, the Manager reviews a variety of factors, including developments in foreign markets, the performance of U.S. securities markets, and the performance of instruments trading in U.S. markets that represent foreign securities and baskets of foreign securities. These securities are fair valued using a pricing service, using methods approved by the Board, that considers the correlation of the trading patterns of the foreign security to intraday trading in the U.S. markets, based on indices of domestic securities and other appropriate indicators such as prices of relevant American Depositary Receipts (“ADRs”) and futures contracts. The Valuation Committee, established by the Board, may also fair value securities in other situations, such as when a particular foreign market is closed but the Fund is open. The Fund uses outside pricing services to provide closing prices and information to evaluate and/or adjust those prices. As a means of evaluating its security valuation process, the Valuation Committee routinely compares closing prices, the next day’s opening prices in the same markets and adjusted prices.
33
American Beacon FundsSM
Notes to Financial Statements
August 31, 2019
Attempts to determine the fair value of securities introduce an element of subjectivity to the pricing of securities. As a result, the price of a security determined through fair valuation techniques may differ from the price quoted or published by other sources and may not accurately reflect the market value of the security when trading resumes. If a reliable market quotation becomes available for a security formerly valued through fair valuation techniques, the Manager compares the new market quotation to the fair value price to evaluate the effectiveness of the Fund’s fair valuation procedures. If any significant discrepancies are found, the Manager may adjust the Fund’s fair valuation procedures.
Valuation Inputs
Various inputs may be used to determine the fair value of the Funds’ investments. These inputs are summarized in three broad levels for financial statement purposes. The inputs or methodologies used to value securities are not necessarily an indication of the risk associated with investing in those securities.
| Level 1 | - | Quoted prices in active markets for identical securities. | ||
| Level 2 | - | Prices determined using other significant observable inputs. These may include quoted prices for similar securities, interest rates, prepayment speeds, credit risk, and others. | ||
| Level 3 | - | Prices determined using other significant unobservable inputs. Unobservable inputs reflect the Fund’s own assumptions about the factors market participants would use in pricing an investment. | ||
Level 1 and Level 2 trading assets and trading liabilities, at fair value
Common stocks, ETFs and financial derivative instruments, such as futures contracts that are traded on a national securities exchange, are stated at the last reported sale or settlement price on the day of valuation. To the extent these securities are actively traded and valuation adjustments are not applied, they are categorized as Level 1 of the fair value hierarchy. Preferred securities and other equities traded on inactive markets or valued by reference to similar instruments are generally categorized as Level 2 of the fair value hierarchy.
Investments in registeredopen-end investment management companies will be valued based upon the NAVs of such investments and are categorized as Level 1 of the fair value hierarchy.
4. Securities and Other Investments
American Depositary Receipts
ADRs are depositary receipts for foreign issuers in registered form traded in U.S. securities markets. Depositary receipts may not be denominated in the same currency as the securities into which they may be converted. Investing in depositary receipts entails substantially the same risks as direct investment in foreign securities. There is generally less publicly available information about foreign companies and there may be less governmental regulation and supervision of foreign stock exchanges, brokers, and listed companies. In addition, such companies may use different accounting and financial standards (and certain currencies may become unavailable for transfer from a foreign currency), resulting in the Funds’ possible inability to convert immediately into U.S. currency proceeds realized upon the sale of portfolio securities of the affected foreign companies. In addition, the Funds may invest in unsponsored depositary receipts, the issuers of which are not obligated to disclose material information about the underlying securities to investors in the United States. Ownership of unsponsored depositary receipts may not entitle the Funds to the same benefits and rights as ownership of a sponsored depositary receipt or the underlying security.
Common Stock
Common stock generally takes the form of shares in a corporation which represent an ownership interest. It ranks below preferred stock and debt securities in claims for dividends and for assets of the company in a
34
American Beacon FundsSM
Notes to Financial Statements
August 31, 2019
liquidation or bankruptcy. The value of a company’s common stock may fall as a result of factors directly relating to that company, such as decisions made by its management or decreased demand for the company’s products or services. A stock’s value may also decline because of factors affecting not just the company, but also companies in the same industry or sector. The price of a company’s stock may also be affected by changes in financial markets that are relatively unrelated to the company, such as changes in interest rates, currency exchange rates or industry regulation. Companies that elect to pay dividends on their common stock generally only do so after they invest in their own business and make required payments to bondholders and on other debt and preferred stock. Therefore, the value of a company’s common stock will usually be more volatile than its bonds, other debt and preferred stock. Common stock may be exchange-traded or OTC. OTC stock may be less liquid than exchange-traded stock.
Other Investment Company Securities and Other Exchange-Traded Products
The Funds may invest in shares of other investment companies, includingopen-end funds,closed-end funds, business development companies, ETFs, unit investment trusts, and other investment companies of the Trust. The Funds may invest in investment company securities advised by the Manager or asub-advisor. Investments in the securities of other investment companies may involve duplication of advisory fees and certain other expenses. By investing in another investment company, the Funds become a shareholder of that investment company. As a result, the Funds’ shareholders indirectly will bear the Funds’ proportionate share of the fees and expenses paid by shareholders of the other investment company, in addition to the fees and expenses the Funds’ shareholders directly bear in connection with the Funds’ own operations. These other fees and expenses are reflected as Acquired Fund Fees and Expenses and are included in the Fees and Expenses Table for the Funds in their Prospectus, if applicable. Investments in other investment companies may involve the payment of substantial premiums above the value of such issuer’s portfolio securities.
Real Estate Investment Trusts
The Funds may own shares of real estate investment trusts (“REITs”) which report information on the source of their distributions annually. The Fundsre-characterize distributions received from REIT investments based on information provided by the REITs into the following categories: ordinary income, long-term capital gains, and return of capital. If information is not available on a timely basis from the REITs, there-characterization will be estimated based on available information, which may include the previous year allocation. If new or additional information becomes available from the REITs at a later date, are-characterization will be made the following year.
5. Financial Derivative Instruments
The Funds may utilize derivative instruments to gain market exposure on cash balances or reduce market exposure in anticipation of liquidity needs. When considering the Funds’ use of derivatives, it is important to note that the Funds do not use derivatives for the purpose of creating financial leverage.
Futures Contracts
Futures contracts are contracts to buy or sell a standard quantity of securities at a specified price on a future date. The Funds may enter into financial futures contracts as a method for keeping assets readily convertible to cash if needed to meet shareholder redemptions or for other needs while maintaining exposure to the stock or bond market, as applicable. The primary risks associated with the use of futures contracts are the possibility of illiquid markets or imperfect correlation between the values of the contracts and the underlying securities or that the counterparty will fail to perform its obligations.
Upon entering into a futures contract, the Funds are required to set aside or deposit with a broker an amount, termed the initial margin, which typically represents a portion of the face value of the futures contract. The Funds usually reflects this amount on the Schedules of Investments as a U.S. Treasury Bill held as collateral for
35
American Beacon FundsSM
Notes to Financial Statements
August 31, 2019
futures contracts or as cash deposited with broker on the Statements of Assets and Liabilities. Payments to and from the broker, known as variation margin, are required to be made on a daily basis as the price of the futures contract fluctuates. Changes in initial settlement values are accounted for as unrealized appreciation (depreciation) until the contracts are terminated, at which time realized gains and losses are recognized. Futures contracts are valued at the most recent settlement price established each day by the exchange on which they are traded.
During the year ended August 31, 2019, the Funds entered into futures contracts primarily for exposing cash to markets.
The Funds’ average futures contracts outstanding fluctuate throughout the operating year as required to meet strategic requirements. The following table illustrates the average quarterly volume of futures contracts. For the purpose of this disclosure, volume is measured by contracts outstanding at each quarter end.
Average Futures Contracts Outstanding | ||||
Fund | Year Ended August 31, 2019 | |||
The London Company Income Equity | 336 | |||
Zebra Small Cap Equity | 18 | |||
The following is a summary of the fair valuations of the Funds’ derivative instruments categorized by risk exposure(1):
The London Company Income Equity Fund
| Fair values of financial instruments on the Statements of Assets and Liabilities as of August 31, 2019: |
| ||||||||||||||||||||||||||||||||||||||||||||||||||||||
| Derivatives not accounted for as hedging instruments |
|
| |||||||||||||||||||||||||||||||||||||||||||||||||||||
Assets: | Credit contracts | Foreign exchange contracts | Commodity contracts | Interest rate contracts | Equity contracts | Total | |||||||||||||||||||||||||||||||||||||||||||||||||
| Receivable for variation margin from open futures contracts(2) | $ | – | $ | – | $ | – | $ | – | $ | 419,302 | $ | 419,302 | |||||||||||||||||||||||||||||||||||||||||||
| The effect of financial derivative instruments on the Statements of Operations as of August 31, 2019: |
| ||||||||||||||||||||||||||||||||||||||||||||||||||||||
| Derivatives not accounted for as hedging instruments |
|
| |||||||||||||||||||||||||||||||||||||||||||||||||||||
Realized gain (loss) from derivatives | Credit contracts | Foreign exchange contracts | Commodity contracts | Interest rate contracts | Equity contracts | Total | |||||||||||||||||||||||||||||||||||||||||||||||||
| Futures contracts | $ | – | $ | – | $ | – | $ | – | $ | 2,681,503 | $ | 2,681,503 | |||||||||||||||||||||||||||||||||||||||||||
Net change in unrealized appreciation | Credit contracts | Foreign exchange contracts | Commodity contracts | Interest rate contracts | Equity contracts | Total | |||||||||||||||||||||||||||||||||||||||||||||||||
| Futures contracts | $ | – | $ | – | $ | – | $ | – | $ | 141,252 | $ | 141,252 | |||||||||||||||||||||||||||||||||||||||||||
Zebra Small Cap Equity Fund
| Fair values of financial instruments on the Statements of Assets and Liabilities as of August 31, 2019: |
| ||||||||||||||||||||||||||||||||||||||||||||||||||||||
| Derivatives not accounted for as hedging instruments |
|
| |||||||||||||||||||||||||||||||||||||||||||||||||||||
Liabilities: | Credit contracts | Foreign exchange contracts | Commodity contracts | Interest rate contracts | Equity contracts | Total | |||||||||||||||||||||||||||||||||||||||||||||||||
| Payable for variation margin from open futures contracts(2) | $ | – | $ | – | $ | – | $ | – | $ | (17,539 | ) | $ | (17,539 | ) | |||||||||||||||||||||||||||||||||||||||||
36
American Beacon FundsSM
Notes to Financial Statements
August 31, 2019
| The effect of financial derivative instruments on the Statements of Operations as of August 31, 2019: |
| ||||||||||||||||||||||||||||||||||||||||||||||||||||||
| Derivatives not accounted for as hedging instruments |
|
| |||||||||||||||||||||||||||||||||||||||||||||||||||||
Realized gain (loss) from derivatives | Credit contracts | Foreign exchange contracts | Commodity contracts | Interest rate contracts | Equity contracts | Total | |||||||||||||||||||||||||||||||||||||||||||||||||
| Futures contracts | $ | – | $ | – | $ | – | $ | – | $ | (167,575 | ) | $ | (167,575 | ) | |||||||||||||||||||||||||||||||||||||||||
Net change in unrealized appreciation | Credit contracts | Foreign exchange contracts | Commodity contracts | Interest rate contracts | Equity contracts | Total | |||||||||||||||||||||||||||||||||||||||||||||||||
| Futures contracts | $ | – | $ | – | $ | – | $ | – | $ | (26,656 | ) | $ | (26,656 | ) | |||||||||||||||||||||||||||||||||||||||||
(1)See Note 3 in the Notes to Financial Statements for additional information.
(2)Includes cumulative appreciation (depreciation) of futures contracts as reported in the Fund’s Schedule of Investments footnotes. Only current day’s variation margin is reported within the Statements of Assets and Liabilities.
Offsetting Assets and Liabilities
The Funds are parties to enforceable master netting agreements between brokers and counterparties which provide for the right to offset under certain circumstances. The Funds employ multiple money managers and counterparties and have elected not to offset qualifying financial and derivative instruments on the Statements of Assets and Liabilities, as such all financial and derivative instruments are presented on a gross basis. The impacts of netting arrangements that provide the right to offset are detailed below, if applicable. The net amount represents the net receivable or payable that would be due from or to the counterparty in the event of default. Exposure from borrowings and other financing agreements such as repurchase agreements can only be netted across transactions governed by the same Master Agreement with the same legal entity. All amounts reported below represent the balance as of the report date, August 31, 2019.
The London Company Income Equity Fund
| Offsetting of Financial and Derivative Assets as of August 31, 2019: |
| |||||||||||
| Assets | Liabilities | |||||||||||
| Futures contracts(1) | $ | 419,302 | $ | - | ||||||||
|
|
|
| |||||||||
| Total derivative assets and liabilities in the Statement of Assets and Liabilities | $ | 419,302 | $ | - | ||||||||
|
|
|
| |||||||||
| Derivatives not subject to a Master Netting Agreement or similar agreement (“MNA”) | $ | (419,302 | ) | $ | - | |||||||
|
|
|
| |||||||||
Zebra Small Cap Equity Fund
| Offsetting of Financial and Derivative Assets as of August 31, 2019: |
| |||||||||||
| Assets | Liabilities | |||||||||||
| Futures contracts(1) | $ | - | $ | 17,539 | ||||||||
|
|
|
| |||||||||
| Total derivative assets and liabilities in the Statement of Assets and Liabilities | $ | - | $ | 17,539 | ||||||||
|
|
|
| |||||||||
| Derivatives not subject to a Master Netting Agreement or similar agreement (“MNA”) | $ | - | $ | (17,539 | ) | |||||||
|
|
|
| |||||||||
| Remaining Contractual Maturity of the Agreements As of August 31, 2019 | ||||||||||||||||||||||||||||||||||||
| Overnight and Continuous | <30 days | Between 30 & 90 days | >90 days | Total | ||||||||||||||||||||||||||||||||
Securities Lending Transactions | ||||||||||||||||||||||||||||||||||||
Common Stocks | $ | 255,970 | $ | - | $ | - | $ | - | $ | 255,970 | ||||||||||||||||||||||||||
|
|
|
|
|
|
|
|
|
| |||||||||||||||||||||||||||
Total Borrowings | $ | 255,970 | $ | - | $ | - | $ | - | $ | 255,970 | ||||||||||||||||||||||||||
|
|
|
|
|
|
|
|
|
| |||||||||||||||||||||||||||
(1) Includes cumulative appreciation or (depreciation) of futures contracts as reported in the Schedule of Investments footnotes. Only current day’s variation margin is reported within the Statements of Assets and Liabilities.
37
American Beacon FundsSM
Notes to Financial Statements
August 31, 2019
6. Principal Risks
Investing in the Funds may involve certain risks including, but not limited to, those described below.
Credit Risk
The Funds are subject to the risk that the issuer or guarantor of an obligation, or the counterparty to a transaction, including a derivatives contract or a loan, will fail to make timely payment of interest or principal or otherwise honor its obligations or default completely. The strategies utilized by thesub-advisors require accurate and detailed credit analysis of issuers and there can be no assurance that its analysis will be accurate or complete. The Funds may be subject to substantial losses in the event of credit deterioration or bankruptcy of one or more issuers in its portfolio.
Financial strength and solvency of an issuer are the primary factors influencing credit risk. In addition, inadequacy of collateral or credit enhancement for a debt instrument may affect its credit risk. Credit risk may change over the life of an instrument and debt obligations which are rated by rating agencies may be subject to downgrade. The credit ratings of debt instruments and investments represent the rating agencies’ opinions regarding their credit quality and are not a guarantee of future credit performance of such securities. Rating agencies attempt to evaluate the safety of the timely payment of principal and interest (or dividends) and do not evaluate the risks of fluctuations in market value. The ratings assigned to securities by rating agencies do not purport to fully reflect the true risks of an investment. Further, in recent years many highly-rated structured securities have been subject to substantial losses as the economic assumptions on which their ratings were based proved to be materially inaccurate. A decline in the credit rating of an individual security held by the Fund may have an adverse impact on its price and make it difficult for the Fund to sell it. Ratings represent a rating agency’s opinion regarding the quality of the security and are not a guarantee of quality. Rating agencies might not always change their credit rating on an issuer or security in a timely manner to reflect events that could affect the issuer’s ability to make timely payments on its obligations. Credit risk is typically greater for securities with ratings that are below investment grade (commonly referred to as “junk bonds”). Since the Fund can invest significantly in lower quality debt securities considered speculative in nature, this risk will be substantial. A downgrade or default affecting any of the Fund’s securities could affect the Fund’s performance.
Derivatives Risk
Derivatives may involve significant risk. The use of derivative instruments may expose the Funds to additional risks that they would not be subject to if they invested directly in the securities or other instruments underlying those derivatives, including the high degree of leverage often embedded in such instruments, and potential material and prolonged deviations between the theoretical value and realizable value of a derivative. Some derivatives have the potential for unlimited loss, regardless of the size of the Funds’ initial investment. Derivatives may be illiquid and may be more volatile than other types of investments. The Funds may buy or sell derivatives not traded on an exchange and which may be subject to heightened liquidity and valuation risk. Derivative investments can increase portfolio turnover and transaction costs. Derivatives also are subject to counterparty risk and credit risk. As a result, the Funds may obtain no recovery of their investment or may only obtain a limited recovery, and any recovery may be delayed. Not all derivative transactions require a counterparty to post collateral, which may expose the Funds to greater losses in the event of a default by a counterparty.
Dividend Risk
An issuer of stock held by the Funds may choose not to declare a dividend or the dividend rate might not remain at current levels. Dividend paying stocks might not experience the same level of earnings growth or capital appreciation asnon-dividend paying stocks.
38
American Beacon FundsSM
Notes to Financial Statements
August 31, 2019
Foreign Investing and Emerging Markets Risk
Non-U.S. investments carry potential risks not associated with U.S. investments. Such risks include, but are not limited to: (1) currency exchange rate fluctuations, (2) political and financial instability, (3) less liquidity, (4) lack of uniform accounting, auditing and financial reporting standards, (5) increased price volatility, (6) less government regulation and supervision of foreign stock exchanges, brokers and listed companies, and (7) delays in transaction settlement in some foreign markets. To the extent the Funds invest a significant portion of its assets in securities of a single country or region, it is more likely to be affected by events or conditions of that country or region. In addition, the economies and political environments of emerging market countries tend to be more unstable than those of developed countries, resulting in more volatile rates of return than the developed markets and substantially greater risk to investors. There may be very limited oversight of certain foreign banks or securities depositories that hold foreign securities and currency and the laws of certain countries may limit the ability to recover such assets if a foreign bank or depository or their agents goes bankrupt. When investing in emerging markets, the risks of investing in foreign securities are heightened. Emerging markets have unique risks that are greater than, or in addition to, investing in developed markets because emerging markets are generally smaller, less developed, less liquid and more volatile than the securities markets of the U.S. and other developed markets. There are also risks of: greater political uncertainties; an economy’s dependence on revenues from particular commodities or on international aid or development assistance; currency transfer restrictions; a limited number of potential buyers for such securities, resulting in increased volatility and limited liquidity for emerging market securities; trading suspensions; and delays and disruptions in securities settlement procedures. In addition, there may be less information available to make investment decisions and more volatile rates of return.
Futures Contracts Risk
Futures contracts are derivative instruments where one party pays a fixed price for an agreed amount of securities or other underlying assets at an agreed date. The use of such derivative instruments may expose the Funds to additional risks that they would not be subject to if they invested directly in the securities underlying those derivatives. Futures contracts may experience potentially dramatic price changes (losses) and imperfect correlation between the price of the contract and the underlying security or index, which will increase the volatility of the Funds and may involve a small investment of cash (the amount of initial and variation margin) relative to the magnitude of the risk assumed (the potential increase or decrease in the price of the futures contract).
Liquidity Risk
When there is little or no active trading market for a specific type of security it can become more difficult to purchase or sell the securities at or near their perceived value. During such periods, certain investments held by the Funds may be difficult to sell or other investments may be difficult to purchase at favorable times or prices. As a result, the Funds may have to lower the price on certain securities that it is trying to sell, sell other securities instead or forgo an investment opportunity, any of which could have a negative effect on Fund management or performance. Redemptions by a few large investors in the Funds at such times may have a significant adverse effect on the Funds’ NAV per share and remaining Fund shareholders. In addition, the market-making capacity of dealers in certain types of securities has been reduced in recent years, in part as a result of structural and regulatory changes, such as fewer proprietary trading desks and increased regulatory capital requirements for broker-dealers. Further, many broker-dealers have reduced their inventory of certain debt securities. This could negatively affect the Funds’ ability to buy or sell debt securities and increase the related volatility and trading costs. The Funds may lose money if it is forced to sell certain investments at unfavorable prices to meet redemption requests or other cash needs.
Market Risk
Conditions in the U.S. and many foreign economies have resulted, and may continue to result, in certain instruments experiencing unusual liquidity issues, increased price volatility and, in some cases, credit downgrades
39
American Beacon FundsSM
Notes to Financial Statements
August 31, 2019
and increased likelihood of default. These events have reduced the willingness and ability of some lenders to extend credit, and have made it more difficult for some borrowers to obtain financing on attractive terms, if at all. In some cases, traditional market participants have been less willing to make a market in some types of debt instruments, which has affected the liquidity of those instruments. During times of market turmoil, investors tend to look to the safety of securities issued or backed by the U.S. Treasury, causing the prices of these securities to rise and the yields to decline. Reduced liquidity in fixed income and credit markets may negatively affect many issuers worldwide. In addition, global economies and financial markets are becoming increasingly interconnected, which increases the possibilities that conditions in one country or region might adversely impact issuers in a different country or region. A rise in protectionist trade policies, and the possibility of changes to some international trade agreements, could affect the economies of many nations in ways that cannot necessarily be foreseen at the present time.
In response to the financial crisis, the U.S. and other governments, the Federal Reserve and certain foreign central banks have taken steps to support financial markets. In some countries where economic conditions are recovering, they are nevertheless perceived as still fragile. Withdrawal of government support, failure of efforts in response to the crisis, or investor perception that such efforts are not succeeding, could adversely impact the value and liquidity of certain securities. The severity or duration of adverse economic conditions may also be affected by policy changes made by governments or quasi-governmental organizations, including changes in tax laws. The impact of new financial regulation legislation on the markets and the practical implications for market participants may not be fully known for some time. Regulatory changes are causing some financial services companies to exit long-standing lines of business, resulting in dislocations for other market participants.
In addition, political and governmental events within the U.S. and abroad, such as the U.S. government’s inability at times to agree on a long-term budget and deficit reduction plan, the threat of a federal government shutdown and threats not to increase the federal government’s debt limit, may affect investor and consumer confidence and may adversely impact financial markets and the broader economy, perhaps suddenly and to a significant degree. The U.S. government has recently reduced the federal corporate income tax rates, and future legislative, regulatory and policy changes may result in more restrictions on international trade, less stringent prudential regulation of certain players in the financial markets, and significant new investments in infrastructure and national defense. Markets may react strongly to expectations about the changes in these policies, which could increase volatility, especially if the markets’ expectations for changes in government policies are not borne out.
Changes in market conditions will not have the same impact on all types of securities. Interest rates have been unusually low in recent years in the U.S. and abroad. Because there is little precedent for this situation, it is difficult to predict the impact of a significant rate increase on various markets. For example, because investors may buy securities or other investments with borrowed money, a significant increase in interest rates may cause a decline in the markets for those investments. Regulators have expressed concern that rate increases may cause investors to sell fixed income securities faster than the market can absorb them, contributing to price volatility. In addition, there is a risk that the prices of goods and services in the U.S. and many foreign economies may decline over time, known as deflation (the opposite of inflation). Deflation may have an adverse effect on stock prices and creditworthiness and may make defaults on debt more likely. If a country’s economy slips into a deflationary pattern, it could last for a prolonged period and may be difficult to reverse.
The precise timing and the resulting impact of the United Kingdom’s departure from the European Union (the “EU”), commonly referred to as “Brexit,” are not yet known. The effect on the United Kingdom’s economy will likely depend on the nature of trade relations with the EU and other major economies following its exit, which are matters to be negotiated. The outcomes may cause increased volatility and have a significant adverse impact on world financial markets, other international trade agreements, and the United Kingdom and European economies, as well as the broader global economy for some time, which could significantly adversely affect the value of the Fund’s investments in the United Kingdom and Europe.
40
American Beacon FundsSM
Notes to Financial Statements
August 31, 2019
Other Investment Companies Risk
The Funds may invest in shares of other registered investment companies, including money market funds and ETFs. To the extent that the Funds invest in shares of other registered investment companies, the Funds will indirectly bear the fees and expenses, including for example, advisory and administrative fees, charged by those investment companies in addition to the Funds’ direct fees and expenses and will be subject to the risks associated with investments in those companies. For example, the Funds’ investments in money market funds are subject to interest rate risk, credit risk, and market risk. The Funds must rely on the investment company in which it invests to achieve its investment objective. If the investment company fails to achieve its investment objective, the value of the Funds’ investment may decline, adversely affecting the Funds’ performance. ETFs are subject to the following risks that do not apply to conventional funds: (1) the market price of an ETF’s shares may trade at a discount or premium to its NAV; (2) an active trading market for an ETF’s shares may not develop or be maintained; or (3) trading of an ETF’s shares may be halted if the listing exchange’s officials deem such action appropriate, the shares are delisted from the exchange, or the activation of market-wide “circuit breakers” (which are tied to large decreases in stock prices) halts stock trading generally. An ETF that tracks an index may not precisely replicate the returns of its benchmark index. To the extent the Funds invest in other investment companies that invest in equity securities, fixed-income securities and/or foreign securities, or that track an index, the Funds are subject to the risks associated with the underlying investments held by the investment company or the index fluctuations to which the investment company is subject. ETFs have expenses associated with their operation, typically including advisory fees.
Securities Lending Risk
A Fund may lend its portfolio securities to brokers, dealers and financial institutions to seek income. There is a risk that a borrower may default on its obligations to return loaned securities; however, a Fund’s securities lending agent indemnifies the Fund against that risk. There is a risk that the assets of a Fund’s securities lending agent may be insufficient to satisfy any contractual indemnification requirements to the Fund. Borrowers of a Fund’s securities typically provide collateral in the form of cash that is reinvested in securities. A Fund will be responsible for the risks associated with the investment of cash collateral, including any collateral invested in an affiliated money market fund. A Fund may lose money on its investment of cash collateral or may fail to earn sufficient income on its investment to meet obligations to the borrower. In addition, delays may occur in the recovery of securities from borrowers, which could interfere with a Fund’s ability to vote proxies or to settle transactions and there is the risk of possible loss of rights in the collateral should the borrower fail financially. In any case in which the loaned securities are not returned to the Fund before anex-dividend date, the payment in lieu of the dividend that the Fund receives from the securities’ borrower would not be treated as a dividend for federal income tax purposes and thus would not qualify for treatment as “qualified dividend income”.
7. Federal Income and Excise Taxes
It is the policy of each Fund to qualify as a regulated investment company (“RIC”), by complying with all applicable provisions of Subchapter M of the Internal Revenue Code, as amended, and to make distributions of taxable income sufficient to relieve it from substantially all federal income and excise taxes. For federal income tax purposes, each Fund is treated as a single entity for the purpose of determining such qualification.
The Funds do not have any unrecorded tax liabilities in the accompanying financial statements. Each of the tax years in the four year period ended August 31, 2019 remain subject to examination by the Internal Revenue Service. If applicable, the Funds recognize interest accrued related to unrecognized tax benefits in interest expense and penalties in “Other expenses” on the Statements of Operations.
The Funds may be subject to taxes imposed by countries in which it invests. Such taxes are generally based on returns of income earned or gains realized or repatriated. Taxes are accrued and applied to net investment income, net realized capital gains and net unrealized appreciation (depreciation), as applicable, as the income is earned or capital gains are recorded.
41
American Beacon FundsSM
Notes to Financial Statements
August 31, 2019
Dividends are categorized in accordance with income tax regulations which may treat certain transactions differently than U.S. GAAP. Accordingly, the character of distributions and composition of net assets for tax purposes may differ from those reflected in the accompanying financial statements.
The tax character of distributions paid were as follows:
| The London Company Income Equity Fund | Zebra Small Cap Equity Fund | |||||||||||||||||||||||||||
| Year Ended August 31, 2019 | Year Ended August 31, 2018 | Year Ended August 31, 2019 | Year Ended August 31, 2018 | |||||||||||||||||||||||||
Distributions paid from: |
| |||||||||||||||||||||||||||
Ordinary income* |
| |||||||||||||||||||||||||||
Institutional Class | $ | 5,405,598 | $ | 4,670,451 | $ | 430,179 | $ | 340,321 | ||||||||||||||||||||
Y Class | 13,620,124 | 12,791,912 | 1,546,753 | 1,235,433 | ||||||||||||||||||||||||
Investor Class | 508,198 | 579,365 | 333,333 | 326,429 | ||||||||||||||||||||||||
A Class | 1,169,266 | 1,295,100 | 134,292 | 163,128 | ||||||||||||||||||||||||
C Class | 1,698,853 | 1,456,384 | 101,109 | 95,288 | ||||||||||||||||||||||||
Long-term capital gains |
| |||||||||||||||||||||||||||
Institutional Class | 3,059,140 | – | 645,262 | 291,391 | ||||||||||||||||||||||||
Y Class | 7,891,686 | – | 2,320,101 | 1,057,808 | ||||||||||||||||||||||||
Investor Class | 349,192 | – | 514,577 | 282,303 | ||||||||||||||||||||||||
A Class | 766,256 | – | 211,080 | 141,874 | ||||||||||||||||||||||||
C Class | 1,794,478 | – | 176,474 | 85,462 | ||||||||||||||||||||||||
|
|
|
|
|
|
|
| |||||||||||||||||||||
Total distributions paid | $ | 36,262,791 | $ | 20,793,212 | $ | 6,413,160 | $ | 4,019,437 | ||||||||||||||||||||
|
|
|
|
|
|
|
| |||||||||||||||||||||
*For tax purposes, short-term capital gains are considered ordinary income distributions.
As of August 31, 2019 the components of distributable earnings (deficits) on a tax basis were as follows:
Fund | Tax Cost | Unrealized Appreciation | Unrealized (Depreciation) | Net Unrealized Appreciation (Depreciation) | ||||||||||||||||||||||||
The London Company Income Equity | $ | 872,052,817 | $ | 253,771,334 | $ | (17,385,887 | ) | $ | 236,385,447 | |||||||||||||||||||
Zebra Small Cap Equity | 86,916,219 | 5,729,015 | (9,398,632 | ) | (3,669,617 | ) | ||||||||||||||||||||||
Fund | Net Unrealized Appreciation (Depreciation) | Undistributed Ordinary Income | Undistributed Long-Term Capital Gains | Accumulated Capital and Other (Losses) | Other Temporary Differences | Distributable Earnings/(Deficit) | ||||||||||||||||||||||||||||||||||||||
| The London Company Income Equity | $ | 236,385,447 | $ | 1,861,499 | $ | 60,035,722 | $ | - | $ | - | $ | 298,282,668 | ||||||||||||||||||||||||||||||||
| Zebra Small Cap Equity | (3,669,617 | ) | 287,983 | - | (491,374 | ) | - | (3,873,008 | ) | |||||||||||||||||||||||||||||||||||
Financial reporting records are adjusted for permanent book/tax differences to reflect tax character. Financial records are not adjusted for temporary differences. The temporary differences between financial reporting and tax-basis reporting of unrealized appreciation (depreciation) are attributable primarily to the tax deferral of losses from wash sales, the realization for tax purposes of unrealized gains (losses) on certain derivative instruments and the reclassifications of income from real estate investment securities.
Due to inherent differences in the recognition of income, expenses, and realized gains (losses) under U.S. GAAP and federal income tax regulations, permanent differences between book and tax reporting have been identified and appropriately reclassified on the Statements of Assets and Liabilities. The Funds had no permanent differences as of August 31, 2019.
42
American Beacon FundsSM
Notes to Financial Statements
August 31, 2019
Under the Regulated Investment Company Modernization Act of 2010 (“RIC MOD”), net capital losses recognized by the Funds in taxable years beginning after December 22, 2010 are carried forward indefinitely and retain their character as short-term and/or long-term losses.
As of August 31, 2019, the Funds had the following post RIC MOD capital loss carryforwards:
Fund | Short-Term Capital Loss Carryforwards | |||
The London Company Income Equity | $ | - | ||
Zebra Small Cap Equity | 491,374 | |||
8. Investment Transactions
The aggregate cost of purchases and proceeds from sales of investments, other than short-term obligations, for the year ended August 31, 2019 were as follows:
Fund | Purchases (non-U.S. Government Securities) | Sales(non-U.S. Government Securities) | ||||||
| The London Company Income Equity | $ | 223,700,002 | $ | 225,555,237 | ||||
Zebra Small Cap Equity | 83,118,550 | 67,757,848 | ||||||
A summary of the Funds’ transactions in the USG Select Fund for the year ended August 31, 2019 were as follows:
Fund | Type of Transaction | August 31, 2018 Shares/Fair Value | Purchases | Sales | August 31, 2019 Shares/Fair Value | Dividend Income | ||||||||||||||||||||||||||||||||||||
| The London Company Income Equity | Direct | $ | 12,019,169 | $ | 351,668,049 | $ | 298,851,367 | $ | 64,835,851 | $ | 978,858 | |||||||||||||||||||||||||||||||
| Zebra Small Cap Equity | Direct | 1,991,241 | 59,598,764 | 58,942,426 | 2,647,579 | 33,102 | ||||||||||||||||||||||||||||||||||||
| Zebra Small Cap Equity | Securities Lending | 263,634 | 11,042,649 | 11,050,313 | 255,970 | N/A | ||||||||||||||||||||||||||||||||||||
9. Securities Lending
The Funds may lend their securities to qualified financial institutions, such as certain broker-dealers, to earn additional income. The borrowers are required to secure their loans continuously with collateral in an amount at least equal to the fair value of the securities loaned, initially in an amount at least equal to 102% of the fair value of domestic securities loaned and 105% of the fair value of international securities loaned. Collateral is monitored andmarked-to-market daily. Dailymark-to-market amounts are required to be paid to the borrower or received from the borrower by the end of the following business day. This one day settlement formark-to-market amounts may result in the collateral being temporarily less than the value of the securities on loan or temporarily more than the required minimum collateral.
To the extent that a loan is collateralized by cash, such cash collateral shall be invested by the securities lending agent (the “Agent”) in money market mutual funds and other short-term investments, provided the investments meet certain quality and diversification requirements. Securities purchased with cash collateral proceeds are listed in the Funds’ Schedules of Investments and the collateral is shown on the Statements of Assets and Liabilities as a payable.
Securities lending income is generated from the demand premium (if any) paid by the borrower to borrow a specific security and from the return on investment of cash collateral, reduced by negotiated rebate fees paid to the borrower and transaction costs. To the extent that a loan is secured bynon-cash collateral, securities lending income is generated as a demand premium reduced by transaction costs. The Funds, the Agent, and the Manager retained 80%, 10%, and 10%, respectively, of the income generated from securities lending.
43
American Beacon FundsSM
Notes to Financial Statements
August 31, 2019
While securities are on loan, the Funds continue to receive certain income associated with that security and any gain or loss in the market price that may occur during the term of the loan. In the case of domestic equities, the value of any dividend is received in the form of a substitute payment approximately equal to the dividend. In the case of foreign securities, a negotiated amount is received that is less than the actual dividend, but higher than the dividend amount minus the foreign tax that the Funds would be subject to on the dividend.
Securities lending transactions pose certain risks to the Funds, including that the borrower may not provide additional collateral when required or return the securities when due, that the value of the short-term investments will be less than the amount of cash collateral required to be returned to the borrower, thatnon-cash collateral may be subject to legal constraints in the event of a borrower bankruptcy, and that the cash collateral investments could become illiquid and unable to be used to return collateral to the borrower. The Funds could also experience delays and costs in gaining access to the collateral. The Funds bear the risk of any deficiency in the amount of the cash collateral available for return to the borrower and any action which impairs its ability to liquidatenon-cash collateral to satisfy a borrower default.
As of August 31, 2019, the value of outstanding securities on loan and the value of collateral were as follows:
Fund | Market Value of Securities on Loan | Cash Collateral Received | Non-Cash Collateral Received | Total Collateral Received | ||||||||||||
Zebra Small Cap Equity | $ | 250,944 | $ | 255,970 | $ | – | $ | 255,970 | ||||||||
Cash collateral is listed on the Funds’ Schedules of Investments and is shown on the Statements of Assets and Liabilities. Income earned on these investments is included in “Income derived from securities lending” on the Statements of Operations.
Non-cash collateral received by the Funds may not be sold orre-pledged except to satisfy a borrower default. Therefore,non-cash collateral is not included on the Funds’ Schedules of Investments or Statements of Assets and Liabilities.
10. Borrowing Arrangements
Effective November 15, 2018 (the “Effective Date”), the Funds, along with certain other funds managed by the Manager (“Participating Funds”), entered into a committed revolving line of credit (the “Committed Line”) agreement with State Street Bank and Trust Company (the “Bank”) to be used to facilitate portfolio liquidity. The maximum borrowing amount under the Committed Line is $250 million with interest at a rate equal to the higher of(a) one-month London Inter-Bank Offered Rate (“LIBOR”) plus 1.25% per annum or (b) the Federal Funds rate plus 1.25% per annum on amounts borrowed. Each of the Participating Funds paid a closing fee of $100,000 on the Effective Date and a quarterly commitment fee at a rate of 0.25% per annum on the unused portion of the Committed Line amount. The Committed Line expires November 14, 2019, unless extended by the Bank or terminated by the Participating Funds in accordance with the agreement.
On the Effective Date, the Funds, along with certain other Participating Funds managed by the Manager, also entered into an uncommitted discretionary demand revolving line of credit (the “Uncommitted Line”) agreement with the Bank to be used to facilitate portfolio liquidity. The maximum borrowing amount under the Uncommitted Line is $50 million with interest at a rate equal to the higher of(a) one-month LIBOR plus 1.25% per annum or (b) the Federal Funds rate plus 1.25% per annum on each outstanding loan. Each of the Participating Funds paid a closing fee of $35,000 on the Effective Date. The Uncommitted Line expires November 14, 2019 unless extended by the Bank or terminated by the Participating Funds in accordance with the agreement.
The Participating Funds paid administration, legal and arrangement fees, which are recognized as a component of “Other expenses” on the Statements of Operations, along with commitment fees, that have been allocated among the Participating Funds based on average daily net assets.
During the year ended August 31, 2019, the Funds did not utilize this facility.
44
American Beacon FundsSM
Notes to Financial Statements
August 31, 2019
11. Capital Share Transactions
The tables below summarize the activity in capital shares for each Class of the Funds:
| Institutional Class | ||||||||||||||||||||||||||||
| Year Ended August 31, | ||||||||||||||||||||||||||||
| 2019 | 2018 | |||||||||||||||||||||||||||
The London Company Income Equity Fund | Shares | Amount | Shares | Amount | ||||||||||||||||||||||||
| Shares sold | 2,518,742 | $ | 43,633,426 | 2,952,551 | $ | 49,665,918 | ||||||||||||||||||||||
| Reinvestment of dividends | 425,107 | 7,144,672 | 242,433 | 4,055,264 | ||||||||||||||||||||||||
| Shares redeemed | (3,237,855 | ) | (57,349,793 | ) | (3,752,899 | ) | (63,426,927 | ) | ||||||||||||||||||||
|
|
|
|
|
|
|
| |||||||||||||||||||||
| Net (decrease) in shares outstanding | (294,006 | ) | $ | (6,571,695 | ) | (557,915 | ) | $ | (9,705,745 | ) | ||||||||||||||||||
|
|
|
|
|
|
|
| |||||||||||||||||||||
| Y Class | ||||||||||||||||||||||||||||
| Year Ended August 31, | ||||||||||||||||||||||||||||
| 2019 | 2018 | |||||||||||||||||||||||||||
The London Company Income Equity Fund | Shares | Amount | Shares | Amount | ||||||||||||||||||||||||
| Shares sold | 12,116,030 | $ | 211,185,262 | 6,247,631 | $ | 104,772,964 | ||||||||||||||||||||||
| Reinvestment of dividends | 620,492 | 10,389,027 | 326,075 | 5,420,281 | ||||||||||||||||||||||||
| Shares redeemed | (7,753,635 | ) | (135,683,233 | ) | (16,195,313 | ) | (273,348,174 | ) | ||||||||||||||||||||
|
|
|
|
|
|
|
| |||||||||||||||||||||
| Net increase (decrease) in shares outstanding | 4,982,887 | $ | 85,891,056 | (9,621,607 | ) | $ | (163,154,929 | ) | ||||||||||||||||||||
|
|
|
|
|
|
|
| |||||||||||||||||||||
| Investor Class | ||||||||||||||||||||||||||||
| Year Ended August 31, | ||||||||||||||||||||||||||||
| 2019 | 2018 | |||||||||||||||||||||||||||
The London Company Income Equity Fund | Shares | Amount | Shares | Amount | ||||||||||||||||||||||||
| Shares sold | 272,412 | $ | 4,809,718 | 973,829 | $ | 16,185,272 | ||||||||||||||||||||||
| Reinvestment of dividends | 49,189 | 818,629 | 33,490 | 557,430 | ||||||||||||||||||||||||
| Shares redeemed | (516,690 | ) | (8,965,908 | ) | (1,423,047 | ) | (24,223,226 | ) | ||||||||||||||||||||
|
|
|
|
|
|
|
| |||||||||||||||||||||
| Net (decrease) in shares outstanding | (195,089 | ) | $ | (3,337,561 | ) | (415,728 | ) | $ | (7,480,524 | ) | ||||||||||||||||||
|
|
|
|
|
|
|
| |||||||||||||||||||||
| A Class | ||||||||||||||||||||||||||||
| Year Ended August 31, | ||||||||||||||||||||||||||||
| 2019 | 2018 | |||||||||||||||||||||||||||
The London Company Income Equity Fund | Shares | Amount | Shares | Amount | ||||||||||||||||||||||||
| Shares sold | 809,388 | $ | 14,040,523 | 523,646 | $ | 8,710,107 | ||||||||||||||||||||||
| Reinvestment of dividends | 71,296 | 1,182,853 | 49,937 | 824,306 | ||||||||||||||||||||||||
| Shares redeemed | (921,006 | ) | (16,225,970 | ) | (3,165,632 | ) | (52,521,462 | ) | ||||||||||||||||||||
|
|
|
|
|
|
|
| |||||||||||||||||||||
| Net (decrease) in shares outstanding | (40,322 | ) | $ | (1,002,594 | ) | (2,592,049 | ) | $ | (42,987,049 | ) | ||||||||||||||||||
|
|
|
|
|
|
|
| |||||||||||||||||||||
| C Class | ||||||||||||||||||||||||||||
| Year Ended August 31, | ||||||||||||||||||||||||||||
| 2019 | 2018 | |||||||||||||||||||||||||||
The London Company Income Equity Fund | Shares | Amount | Shares | Amount | ||||||||||||||||||||||||
| Shares sold | 816,853 | $ | 14,103,267 | 477,965 | $ | 7,948,288 | ||||||||||||||||||||||
| Reinvestment of dividends | 90,711 | 1,467,940 | 35,277 | 578,683 | ||||||||||||||||||||||||
| Shares redeemed | (1,292,308 | ) | (22,491,229 | ) | (2,523,282 | ) | (41,828,857 | ) | ||||||||||||||||||||
|
|
|
|
|
|
|
| |||||||||||||||||||||
| Net (decrease) in shares outstanding | (384,744 | ) | $ | (6,920,022 | ) | (2,010,040 | ) | $ | (33,301,886 | ) | ||||||||||||||||||
|
|
|
|
|
|
|
| |||||||||||||||||||||
| Institutional Class | ||||||||||||||||||||||||||||
| Year Ended August 31, | ||||||||||||||||||||||||||||
| 2019 | 2018 | |||||||||||||||||||||||||||
Zebra Small Cap Equity Fund | Shares | Amount | Shares | Amount | ||||||||||||||||||||||||
| Shares sold | 1,321,850 | $ | 19,634,000 | 524,926 | $ | 9,185,662 | ||||||||||||||||||||||
| Reinvestment of dividends | 83,251 | 1,074,766 | 38,165 | 630,864 | ||||||||||||||||||||||||
| Shares redeemed | (287,446 | ) | (4,257,983 | ) | (180,141 | ) | (3,089,552 | ) | ||||||||||||||||||||
|
|
|
|
|
|
|
| |||||||||||||||||||||
| Net increase in shares outstanding | 1,117,655 | $ | 16,450,783 | 382,950 | $ | 6,726,974 | ||||||||||||||||||||||
|
|
|
|
|
|
|
| |||||||||||||||||||||
45
American Beacon FundsSM
Notes to Financial Statements
August 31, 2019
| Y Class | ||||||||||||||||||||||||||||
| Year Ended August 31, | ||||||||||||||||||||||||||||
| 2019 | 2018 | |||||||||||||||||||||||||||
Zebra Small Cap Equity Fund | Shares | Amount | Shares | Amount | ||||||||||||||||||||||||
| Shares sold | 1,628,097 | $ | 24,662,254 | 2,420,192 | $ | 41,602,291 | ||||||||||||||||||||||
| Reinvestment of dividends | 294,871 | 3,836,268 | 136,185 | 2,270,208 | ||||||||||||||||||||||||
| Shares redeemed | (1,681,599 | ) | (25,552,002 | ) | (1,116,700 | ) | (19,525,772 | ) | ||||||||||||||||||||
|
|
|
|
|
|
|
| |||||||||||||||||||||
| Net increase in shares outstanding | 241,369 | $ | 2,946,520 | 1,439,677 | $ | 24,346,727 | ||||||||||||||||||||||
|
|
|
|
|
|
|
| |||||||||||||||||||||
| Investor Class | ||||||||||||||||||||||||||||
| Year Ended August 31, | ||||||||||||||||||||||||||||
| 2019 | 2018 | |||||||||||||||||||||||||||
Zebra Small Cap Equity Fund | Shares | Amount | Shares | Amount | ||||||||||||||||||||||||
| Shares sold | 533,302 | $ | 7,962,838 | 256,249 | $ | 4,482,838 | ||||||||||||||||||||||
| Reinvestment of dividends | 66,208 | 845,481 | 36,917 | 606,174 | ||||||||||||||||||||||||
| Shares redeemed | (282,635 | ) | (4,283,203 | ) | (395,049 | ) | (6,789,420 | ) | ||||||||||||||||||||
|
|
|
|
|
|
|
| |||||||||||||||||||||
| Net increase (decrease) in shares outstanding | 316,875 | $ | 4,525,116 | (101,883 | ) | $ | (1,700,408 | ) | ||||||||||||||||||||
|
|
|
|
|
|
|
| |||||||||||||||||||||
| A Class | ||||||||||||||||||||||||||||
| Year Ended August 31, | ||||||||||||||||||||||||||||
| 2019 | 2018 | |||||||||||||||||||||||||||
Zebra Small Cap Equity Fund | Shares | Amount | Shares | Amount | ||||||||||||||||||||||||
| Shares sold | 54,021 | $ | 852,036 | 151,791 | $ | 2,597,027 | ||||||||||||||||||||||
| Reinvestment of dividends | 26,599 | 340,204 | 18,307 | 300,783 | ||||||||||||||||||||||||
| Shares redeemed | (167,805 | ) | (2,534,363 | ) | (317,426 | ) | (5,514,879 | ) | ||||||||||||||||||||
|
|
|
|
|
|
|
| |||||||||||||||||||||
| Net (decrease) in shares outstanding | (87,185 | ) | $ | (1,342,123 | ) | (147,328 | ) | $ | (2,617,069 | ) | ||||||||||||||||||
|
|
|
|
|
|
|
| |||||||||||||||||||||
| C Class | ||||||||||||||||||||||||||||
| Year Ended August 31, | ||||||||||||||||||||||||||||
| 2019 | 2018 | |||||||||||||||||||||||||||
Zebra Small Cap Equity Fund | Shares | Amount | Shares | Amount | ||||||||||||||||||||||||
| Shares sold | 36,599 | $ | 550,791 | 73,661 | $ | 1,193,317 | ||||||||||||||||||||||
| Reinvestment of dividends | 22,891 | 277,216 | 11,452 | 179,799 | ||||||||||||||||||||||||
| Shares redeemed | (70,825 | ) | (991,755 | ) | (38,764 | ) | (621,696 | ) | ||||||||||||||||||||
|
|
|
|
|
|
|
| |||||||||||||||||||||
| Net increase (decrease) in shares outstanding | (11,335 | ) | $ | (163,748 | ) | 46,349 | $ | 751,420 | ||||||||||||||||||||
|
|
|
|
|
|
|
| |||||||||||||||||||||
12. Subsequent Events
Management has evaluated subsequent events for possible recognition or disclosure in the financial statements through the date the financial statements are issued. Management has determined that there are no material events that would require disclosure in the Funds’ financial statements through this date.
46
American Beacon The London Company Income Equity FundSM
(For a share outstanding throughout the period)
| Institutional Class | ||||||||||||||||||||||||||||||||||||
| Year Ended August 31, | ||||||||||||||||||||||||||||||||||||
| 2019 | 2018 | 2017 | 2016 | 2015 | ||||||||||||||||||||||||||||||||
|
| |||||||||||||||||||||||||||||||||||
Net asset value, beginning of period | $ | 18.13 | $ | 16.13 | $ | 15.25 | $ | 13.85 | $ | 14.12 | ||||||||||||||||||||||||||
|
|
|
|
|
|
|
|
|
| |||||||||||||||||||||||||||
Income (loss) from investment operations: | ||||||||||||||||||||||||||||||||||||
Net investment income | 0.37 | 0.35 | 0.33 | 0.32 | 0.31 | |||||||||||||||||||||||||||||||
Net gains (losses) on investments (both realized and unrealized) | 0.42 | 2.00 | 0.97 | 1.40 | (0.14 | ) | ||||||||||||||||||||||||||||||
|
|
|
|
|
|
|
|
|
| |||||||||||||||||||||||||||
Total income from investment operations | 0.79 | 2.35 | 1.30 | 1.72 | 0.17 | |||||||||||||||||||||||||||||||
|
|
|
|
|
|
|
|
|
| |||||||||||||||||||||||||||
Less distributions: | ||||||||||||||||||||||||||||||||||||
Dividends from net investment income | (0.39 | ) | (0.35 | ) | (0.32 | ) | (0.32 | ) | (0.32 | ) | ||||||||||||||||||||||||||
Distributions from net realized gains | (0.27 | ) | - | (0.10 | ) | - | (0.12 | ) | ||||||||||||||||||||||||||||
|
|
|
|
|
|
|
|
|
| |||||||||||||||||||||||||||
Total distributions | (0.66 | ) | (0.35 | ) | (0.42 | ) | (0.32 | ) | (0.44 | ) | ||||||||||||||||||||||||||
|
|
|
|
|
|
|
|
|
| |||||||||||||||||||||||||||
Net asset value, end of period | $ | 18.26 | $ | 18.13 | $ | 16.13 | $ | 15.25 | $ | 13.85 | ||||||||||||||||||||||||||
|
|
|
|
|
|
|
|
|
| |||||||||||||||||||||||||||
Total returnA | 4.78 | % | 14.75 | % | 8.64 | % | 12.57 | % | 1.08 | % | ||||||||||||||||||||||||||
|
|
|
|
|
|
|
|
|
| |||||||||||||||||||||||||||
Ratios and supplemental data: |
| |||||||||||||||||||||||||||||||||||
Net assets, end of period | $ | 236,601,692 | $ | 240,244,700 | $ | 222,730,033 | $ | 194,708,612 | $ | 137,006,660 | ||||||||||||||||||||||||||
Ratios to average net assets: | ||||||||||||||||||||||||||||||||||||
Expenses, before reimbursements or recoupments | 0.73 | % | 0.73 | % | 0.74 | % | 0.75 | % | 0.75 | % | ||||||||||||||||||||||||||
Expenses, net of reimbursements | 0.73 | % | 0.73 | % | 0.74 | % | 0.77 | % | 0.79 | % | ||||||||||||||||||||||||||
Net investment income, before expense reimbursements | 2.09 | % | 2.08 | % | 2.12 | % | 2.32 | % | 2.35 | % | ||||||||||||||||||||||||||
Net investment income, net of reimbursements or recoupments | 2.09 | % | 2.08 | % | 2.12 | % | 2.30 | % | 2.30 | % | ||||||||||||||||||||||||||
Portfolio turnover rate | 23 | % | 16 | % | 14 | % | 20 | % | 15 | % | ||||||||||||||||||||||||||
| A | Based on net asset value, which does not reflect the sales charge, redemption fee, or contingent deferred sales charge, if applicable. May include adjustments in accordance with U.S. GAAP and as such, the net asset value for reporting purposes and the returns based upon those net asset values may differ from the net asset value and returns for shareholder transactions. |
See accompanying notes
47
American Beacon The London Company Income Equity FundSM
Financial Highlights
(For a share outstanding throughout the period)
| Y Class | ||||||||||||||||||||||||||||||||||||
| Year Ended August 31, | ||||||||||||||||||||||||||||||||||||
| 2019 | 2018 | 2017 | 2016 | 2015 | ||||||||||||||||||||||||||||||||
|
| |||||||||||||||||||||||||||||||||||
Net asset value, beginning of period | $ | 18.04 | $ | 16.05 | $ | 15.17 | $ | 13.79 | $ | 14.06 | ||||||||||||||||||||||||||
|
|
|
|
|
|
|
|
|
| |||||||||||||||||||||||||||
Income (loss) from investment operations: | ||||||||||||||||||||||||||||||||||||
Net investment income | 0.36 | 0.34 | 0.32 | 0.32 | 0.31 | |||||||||||||||||||||||||||||||
Net gains (losses) on investments (both realized and unrealized) | 0.41 | 1.99 | 0.97 | 1.37 | (0.15 | ) | ||||||||||||||||||||||||||||||
|
|
|
|
|
|
|
|
|
| |||||||||||||||||||||||||||
Total income from investment operations | 0.77 | 2.33 | 1.29 | 1.69 | 0.16 | |||||||||||||||||||||||||||||||
|
|
|
|
|
|
|
|
|
| |||||||||||||||||||||||||||
Less distributions: | ||||||||||||||||||||||||||||||||||||
Dividends from net investment income | (0.38 | ) | (0.34 | ) | (0.31 | ) | (0.31 | ) | (0.31 | ) | ||||||||||||||||||||||||||
Distributions from net realized gains | (0.27 | ) | - | (0.10 | ) | - | (0.12 | ) | ||||||||||||||||||||||||||||
|
|
|
|
|
|
|
|
|
| |||||||||||||||||||||||||||
Total distributions | (0.65 | ) | (0.34 | ) | (0.41 | ) | (0.31 | ) | (0.43 | ) | ||||||||||||||||||||||||||
|
|
|
|
|
|
|
|
|
| |||||||||||||||||||||||||||
Net asset value, end of period | $ | 18.16 | $ | 18.04 | $ | 16.05 | $ | 15.17 | $ | 13.79 | ||||||||||||||||||||||||||
|
|
|
|
|
|
|
|
|
| |||||||||||||||||||||||||||
Total returnA | 4.68 | % | 14.69 | % | 8.60 | % | 12.42 | % | 1.03 | % | ||||||||||||||||||||||||||
|
|
|
|
|
|
|
|
|
| |||||||||||||||||||||||||||
Ratios and supplemental data: |
| |||||||||||||||||||||||||||||||||||
Net assets, end of period | $ | 666,792,661 | $ | 572,315,652 | $ | 663,588,078 | $ | 582,952,334 | $ | 364,477,089 | ||||||||||||||||||||||||||
Ratios to average net assets: | ||||||||||||||||||||||||||||||||||||
Expenses, before reimbursements or recoupments | 0.80 | % | 0.79 | % | 0.81 | % | 0.82 | % | 0.83 | % | ||||||||||||||||||||||||||
Expenses, net of reimbursements | 0.80 | % | 0.79 | % | 0.81 | % | 0.82 | % | 0.84 | % | ||||||||||||||||||||||||||
Net investment income, before expense reimbursements | 2.03 | % | 2.00 | % | 2.04 | % | 2.24 | % | 2.27 | % | ||||||||||||||||||||||||||
Net investment income, net of reimbursements or recoupments | 2.03 | % | 2.00 | % | 2.04 | % | 2.24 | % | 2.26 | % | ||||||||||||||||||||||||||
Portfolio turnover rate | 23 | % | 16 | % | 14 | % | 20 | % | 15 | % | ||||||||||||||||||||||||||
| A | Based on net asset value, which does not reflect the sales charge, redemption fee, or contingent deferred sales charge, if applicable. May include adjustments in accordance with U.S. GAAP and as such, the net asset value for reporting purposes and the returns based upon those net asset values may differ from the net asset value and returns for shareholder transactions. |
See accompanying notes
48
American Beacon The London Company Income Equity FundSM
Financial Highlights
(For a share outstanding throughout the period)
| Investor Class | ||||||||||||||||||||||||||||||||||||
| Year Ended August 31, | ||||||||||||||||||||||||||||||||||||
| 2019 | 2018 | 2017 | 2016 | 2015 | ||||||||||||||||||||||||||||||||
|
| |||||||||||||||||||||||||||||||||||
Net asset value, beginning of period | $ | 18.06 | $ | 16.07 | $ | 15.19 | $ | 13.81 | $ | 14.08 | ||||||||||||||||||||||||||
|
|
|
|
|
|
|
|
|
| |||||||||||||||||||||||||||
Income (loss) from investment operations: | ||||||||||||||||||||||||||||||||||||
Net investment income | 0.31 | 0.30 | 0.28 | 0.28 | 0.28 | |||||||||||||||||||||||||||||||
Net gains (losses) on investments (both realized and unrealized) | 0.43 | 1.98 | 0.97 | 1.37 | (0.17 | ) | ||||||||||||||||||||||||||||||
|
|
|
|
|
|
|
|
|
| |||||||||||||||||||||||||||
Total income from investment operations | 0.74 | 2.28 | 1.25 | 1.65 | 0.11 | |||||||||||||||||||||||||||||||
|
|
|
|
|
|
|
|
|
| |||||||||||||||||||||||||||
Less distributions: | ||||||||||||||||||||||||||||||||||||
Dividends from net investment income | (0.34 | ) | (0.29 | ) | (0.27 | ) | (0.27 | ) | (0.26 | ) | ||||||||||||||||||||||||||
Distributions from net realized gains | (0.27 | ) | - | (0.10 | ) | - | (0.12 | ) | ||||||||||||||||||||||||||||
|
|
|
|
|
|
|
|
|
| |||||||||||||||||||||||||||
Total distributions | (0.61 | ) | (0.29 | ) | (0.37 | ) | (0.27 | ) | (0.38 | ) | ||||||||||||||||||||||||||
|
|
|
|
|
|
|
|
|
| |||||||||||||||||||||||||||
Net asset value, end of period | $ | 18.19 | $ | 18.06 | $ | 16.07 | $ | 15.19 | $ | 13.81 | ||||||||||||||||||||||||||
|
|
|
|
|
|
|
|
|
| |||||||||||||||||||||||||||
Total returnA | 4.45 | % | 14.37 | % | 8.33 | % | 12.13 | % | 0.71 | % | ||||||||||||||||||||||||||
|
|
|
|
|
|
|
|
|
| |||||||||||||||||||||||||||
Ratios and supplemental data: |
| |||||||||||||||||||||||||||||||||||
Net assets, end of period | $ | 24,993,208 | $ | 28,343,428 | $ | 31,897,528 | $ | 29,208,149 | $ | 20,564,814 | ||||||||||||||||||||||||||
Ratios to average net assets: | ||||||||||||||||||||||||||||||||||||
Expenses, before reimbursements or recoupments | 1.06 | % | 1.05 | % | 1.05 | % | 1.06 | % | 1.04 | % | ||||||||||||||||||||||||||
Expenses, net of reimbursements | 1.06 | % | 1.05 | % | 1.05 | % | 1.06 | % | 1.16 | % | ||||||||||||||||||||||||||
Net investment income, before expense reimbursements | 1.75 | % | 1.75 | % | 1.79 | % | 2.01 | % | 2.04 | % | ||||||||||||||||||||||||||
Net investment income, net of reimbursements or recoupments | 1.75 | % | 1.75 | % | 1.79 | % | 2.01 | % | 1.93 | % | ||||||||||||||||||||||||||
Portfolio turnover rate | 23 | % | 16 | % | 14 | % | 20 | % | 15 | % | ||||||||||||||||||||||||||
| A | Based on net asset value, which does not reflect the sales charge, redemption fee, or contingent deferred sales charge, if applicable. May include adjustments in accordance with U.S. GAAP and as such, the net asset value for reporting purposes and the returns based upon those net asset values may differ from the net asset value and returns for shareholder transactions. |
See accompanying notes
49
American Beacon The London Company Income Equity FundSM
Financial Highlights
(For a share outstanding throughout the period)
| A Class | ||||||||||||||||||||||||||||||||||||
| Year Ended August 31, | ||||||||||||||||||||||||||||||||||||
| 2019 | 2018 | 2017 | 2016 | 2015 | ||||||||||||||||||||||||||||||||
|
| |||||||||||||||||||||||||||||||||||
Net asset value, beginning of period | $ | 17.96 | $ | 15.98 | $ | 15.11 | $ | 13.73 | $ | 14.00 | ||||||||||||||||||||||||||
|
|
|
|
|
|
|
|
|
| |||||||||||||||||||||||||||
Income (loss) from investment operations: | ||||||||||||||||||||||||||||||||||||
Net investment income | 0.31 | 0.31 | 0.27 | 0.27 | 0.27 | |||||||||||||||||||||||||||||||
Net gains (losses) on investments (both realized and unrealized) | 0.42 | 1.96 | 0.96 | 1.38 | (0.16 | ) | ||||||||||||||||||||||||||||||
|
|
|
|
|
|
|
|
|
| |||||||||||||||||||||||||||
Total income from investment operations | 0.73 | 2.27 | 1.23 | 1.65 | 0.11 | |||||||||||||||||||||||||||||||
|
|
|
|
|
|
|
|
|
| |||||||||||||||||||||||||||
Less distributions: | ||||||||||||||||||||||||||||||||||||
Dividends from net investment income | (0.34 | ) | (0.29 | ) | (0.26 | ) | (0.27 | ) | (0.26 | ) | ||||||||||||||||||||||||||
Distributions from net realized gains | (0.27 | ) | - | (0.10 | ) | - | (0.12 | ) | ||||||||||||||||||||||||||||
|
|
|
|
|
|
|
|
|
| |||||||||||||||||||||||||||
Total distributions | (0.61 | ) | (0.29 | ) | (0.36 | ) | (0.27 | ) | (0.38 | ) | ||||||||||||||||||||||||||
|
|
|
|
|
|
|
|
|
| |||||||||||||||||||||||||||
Net asset value, end of period | $ | 18.08 | $ | 17.96 | $ | 15.98 | $ | 15.11 | $ | 13.73 | ||||||||||||||||||||||||||
|
|
|
|
|
|
|
|
|
| |||||||||||||||||||||||||||
Total returnA | 4.43 | % | 14.41 | % | 8.24 | % | 12.14 | % | 0.71 | % | ||||||||||||||||||||||||||
|
|
|
|
|
|
|
|
|
| |||||||||||||||||||||||||||
Ratios and supplemental data: |
| |||||||||||||||||||||||||||||||||||
Net assets, end of period | $ | 60,146,845 | $ | 60,465,593 | $ | 95,206,378 | $ | 94,705,221 | $ | 72,363,106 | ||||||||||||||||||||||||||
Ratios to average net assets: | ||||||||||||||||||||||||||||||||||||
Expenses, before reimbursements or recoupments | 1.05 | % | 1.03 | % | 1.12 | % | 1.13 | % | 1.13 | % | ||||||||||||||||||||||||||
Expenses, net of reimbursements | 1.05 | % | 1.03 | % | 1.12 | % | 1.13 | % | 1.17 | % | ||||||||||||||||||||||||||
Net investment income, before expense reimbursements | 1.77 | % | 1.75 | % | 1.73 | % | 1.94 | % | 1.96 | % | ||||||||||||||||||||||||||
Net investment income, net of reimbursements or recoupments | 1.77 | % | 1.75 | % | 1.73 | % | 1.94 | % | 1.92 | % | ||||||||||||||||||||||||||
Portfolio turnover rate | 23 | % | 16 | % | 14 | % | 20 | % | 15 | % | ||||||||||||||||||||||||||
| A | Based on net asset value, which does not reflect the sales charge, redemption fee, or contingent deferred sales charge, if applicable. May include adjustments in accordance with U.S. GAAP and as such, the net asset value for reporting purposes and the returns based upon those net asset values may differ from the net asset value and returns for shareholder transactions. |
See accompanying notes
50
American Beacon The London Company Income Equity FundSM
Financial Highlights
(For a share outstanding throughout the period)
| C Class | ||||||||||||||||||||||||||||||||||||
| Year Ended August 31, | ||||||||||||||||||||||||||||||||||||
| 2019 | 2018 | 2017 | 2016 | 2015 | ||||||||||||||||||||||||||||||||
|
| |||||||||||||||||||||||||||||||||||
Net asset value, beginning of period | $ | 17.83 | $ | 15.87 | $ | 15.01 | $ | 13.65 | $ | 13.93 | ||||||||||||||||||||||||||
|
|
|
|
|
|
|
|
|
| |||||||||||||||||||||||||||
Income (loss) from investment operations: | ||||||||||||||||||||||||||||||||||||
Net investment income | 0.17 | 0.16 | 0.15 | 0.17 | 0.18 | |||||||||||||||||||||||||||||||
Net gains (losses) on investments (both realized and unrealized) | 0.42 | 1.97 | 0.96 | 1.36 | (0.17 | ) | ||||||||||||||||||||||||||||||
|
|
|
|
|
|
|
|
|
| |||||||||||||||||||||||||||
Total income from investment operations | 0.59 | 2.13 | 1.11 | 1.53 | 0.01 | |||||||||||||||||||||||||||||||
|
|
|
|
|
|
|
|
|
| |||||||||||||||||||||||||||
Less distributions: | ||||||||||||||||||||||||||||||||||||
Dividends from net investment income | (0.21 | ) | (0.17 | ) | (0.15 | ) | (0.17 | ) | (0.17 | ) | ||||||||||||||||||||||||||
Distributions from net realized gains | (0.27 | ) | - | (0.10 | ) | - | (0.12 | ) | ||||||||||||||||||||||||||||
|
|
|
|
|
|
|
|
|
| |||||||||||||||||||||||||||
Total distributions | (0.48 | ) | (0.17 | ) | (0.25 | ) | (0.17 | ) | (0.29 | ) | ||||||||||||||||||||||||||
|
|
|
|
|
|
|
|
|
| |||||||||||||||||||||||||||
Net asset value, end of period | $ | 17.94 | $ | 17.83 | $ | 15.87 | $ | 15.01 | $ | 13.65 | ||||||||||||||||||||||||||
|
|
|
|
|
|
|
|
|
| |||||||||||||||||||||||||||
Total returnA | 3.64 | % | 13.53 | % | 7.42 | % | 11.28 | % | (0.04 | )% | ||||||||||||||||||||||||||
|
|
|
|
|
|
|
|
|
| |||||||||||||||||||||||||||
Ratios and supplemental data: |
| |||||||||||||||||||||||||||||||||||
Net assets, end of period | $ | 126,444,587 | $ | 132,511,310 | $ | 149,848,432 | $ | 185,308,648 | $ | 122,804,166 | ||||||||||||||||||||||||||
Ratios to average net assets: | ||||||||||||||||||||||||||||||||||||
Expenses, before reimbursements or recoupments | 1.82 | % | 1.81 | % | 1.86 | % | 1.87 | % | 1.88 | % | ||||||||||||||||||||||||||
Expenses, net of reimbursements | 1.82 | % | 1.81 | % | 1.86 | % | 1.87 | % | 1.89 | % | ||||||||||||||||||||||||||
Net investment income, before expense reimbursements | 1.01 | % | 0.98 | % | 0.97 | % | 1.20 | % | 1.22 | % | ||||||||||||||||||||||||||
Net investment income, net of reimbursements or recoupments | 1.01 | % | 0.98 | % | 0.97 | % | 1.20 | % | 1.21 | % | ||||||||||||||||||||||||||
Portfolio turnover rate | 23 | % | 16 | % | 14 | % | 20 | % | 15 | % | ||||||||||||||||||||||||||
| A | Based on net asset value, which does not reflect the sales charge, redemption fee, or contingent deferred sales charge, if applicable. May include adjustments in accordance with U.S. GAAP and as such, the net asset value for reporting purposes and the returns based upon those net asset values may differ from the net asset value and returns for shareholder transactions. |
See accompanying notes
51
American Beacon Zebra Small Cap Equity FundSM
Financial Highlights
(For a share outstanding throughout the period)
| Institutional Class | ||||||||||||||||||||||||||||||||||||
| Year Ended August 31, | ||||||||||||||||||||||||||||||||||||
| 2019 | 2018 | 2017 | 2016 | 2015 | ||||||||||||||||||||||||||||||||
|
| |||||||||||||||||||||||||||||||||||
Net asset value, beginning of period | $ | 18.32 | $ | 16.04 | $ | 14.07 | $ | 14.21 | $ | 14.36 | ||||||||||||||||||||||||||
|
|
|
|
|
|
|
|
|
| |||||||||||||||||||||||||||
Income (loss) from investment operations: | ||||||||||||||||||||||||||||||||||||
Net investment income | 0.09 | 0.11 | 0.24 | 0.18 | 0.13 | |||||||||||||||||||||||||||||||
Net gains (losses) on investments (both realized and unrealized) | (2.62 | ) | 3.44 | 1.90 | 1.15 | (0.03 | ) | |||||||||||||||||||||||||||||
|
|
|
|
|
|
|
|
|
| |||||||||||||||||||||||||||
Total income (loss) from investment operations | (2.53 | ) | 3.55 | 2.14 | 1.33 | 0.10 | ||||||||||||||||||||||||||||||
|
|
|
|
|
|
|
|
|
| |||||||||||||||||||||||||||
Less distributions: | ||||||||||||||||||||||||||||||||||||
Dividends from net investment income | (0.09 | ) | (0.03 | ) | (0.17 | ) | (0.06 | ) | (0.04 | ) | ||||||||||||||||||||||||||
Distributions from net realized gains | (1.48 | ) | (1.24 | ) | - | (1.41 | ) | (0.21 | ) | |||||||||||||||||||||||||||
|
|
|
|
|
|
|
|
|
| |||||||||||||||||||||||||||
Total distributions | (1.57 | ) | (1.27 | ) | (0.17 | ) | (1.47 | ) | (0.25 | ) | ||||||||||||||||||||||||||
|
|
|
|
|
|
|
|
|
| |||||||||||||||||||||||||||
Net asset value, end of period | $ | 14.22 | $ | 18.32 | $ | 16.04 | $ | 14.07 | $ | 14.21 | ||||||||||||||||||||||||||
|
|
|
|
|
|
|
|
|
| |||||||||||||||||||||||||||
Total returnA | (12.94 | )% | 22.98 | % | 15.25 | % | 10.46 | % | 0.68 | % | ||||||||||||||||||||||||||
|
|
|
|
|
|
|
|
|
| |||||||||||||||||||||||||||
Ratios and supplemental data: |
| |||||||||||||||||||||||||||||||||||
Net assets, end of period | $ | 24,989,951 | $ | 11,722,213 | $ | 4,122,461 | $ | 2,305,284 | $ | 1,764,526 | ||||||||||||||||||||||||||
Ratios to average net assets: | ||||||||||||||||||||||||||||||||||||
Expenses, before reimbursements | 1.22 | % | 1.23 | % | 1.36 | % | 1.53 | % | 1.56 | % | ||||||||||||||||||||||||||
Expenses, net of reimbursementsB | 0.89 | % | 0.90 | % | 0.89 | % | 0.89 | % | 1.00 | % | ||||||||||||||||||||||||||
Net investment income, before expense reimbursements | 0.57 | % | 0.30 | % | 0.80 | % | 0.34 | % | 0.17 | % | ||||||||||||||||||||||||||
Net investment income, net of reimbursements | 0.90 | % | 0.64 | % | 1.26 | % | 0.97 | % | 0.73 | % | ||||||||||||||||||||||||||
Portfolio turnover rate | 93 | % | 74 | % | 77 | % | 50 | % | 97 | % | ||||||||||||||||||||||||||
| A | Based on net asset value, which does not reflect the sales charge, redemption fee, or contingent deferred sales charge, if applicable. May include adjustments in accordance with U.S. GAAP and as such, the net asset value for reporting purposes and the returns based upon those net asset values may differ from the net asset value and returns for shareholder transactions. |
| B | Expense ratios may exceed stated expense caps in Note 2 due to security lending expenses, which are not reimbursable under the agreement with the Manager. |
See accompanying notes
52
American Beacon Zebra Small Cap Equity FundSM
Financial Highlights
(For a share outstanding throughout the period)
| Y Class | ||||||||||||||||||||||||||||||||||||
| Year Ended August 31, | ||||||||||||||||||||||||||||||||||||
| 2019 | 2018 | 2017 | 2016 | 2015 | ||||||||||||||||||||||||||||||||
|
| |||||||||||||||||||||||||||||||||||
Net asset value, beginning of period | $ | 18.45 | $ | 16.17 | $ | 14.20 | $ | 14.33 | $ | 14.50 | ||||||||||||||||||||||||||
|
|
|
|
|
|
|
|
|
| |||||||||||||||||||||||||||
Income (loss) from investment operations: | ||||||||||||||||||||||||||||||||||||
Net investment income | 0.13 | 0.08 | 0.15 | 0.12 | 0.10 | |||||||||||||||||||||||||||||||
Net gains (losses) on investments (both realized and unrealized) | (2.69 | ) | 3.47 | 1.99 | 1.22 | (0.02 | ) | |||||||||||||||||||||||||||||
|
|
|
|
|
|
|
|
|
| |||||||||||||||||||||||||||
Total income (loss) from investment operations | (2.56 | ) | 3.55 | 2.14 | 1.34 | 0.08 | ||||||||||||||||||||||||||||||
|
|
|
|
|
|
|
|
|
| |||||||||||||||||||||||||||
Less distributions: | ||||||||||||||||||||||||||||||||||||
Dividends from net investment income | (0.09 | ) | (0.03 | ) | (0.17 | ) | (0.06 | ) | (0.04 | ) | ||||||||||||||||||||||||||
Distributions from net realized gains | (1.48 | ) | (1.24 | ) | - | (1.41 | ) | (0.21 | ) | |||||||||||||||||||||||||||
|
|
|
|
|
|
|
|
|
| |||||||||||||||||||||||||||
Total distributions | (1.57 | ) | (1.27 | ) | (0.17 | ) | (1.47 | ) | (0.25 | ) | ||||||||||||||||||||||||||
|
|
|
|
|
|
|
|
|
| |||||||||||||||||||||||||||
Net asset value, end of period | $ | 14.32 | $ | 18.45 | $ | 16.17 | $ | 14.20 | $ | 14.33 | ||||||||||||||||||||||||||
|
|
|
|
|
|
|
|
|
| |||||||||||||||||||||||||||
Total returnA | (13.02 | )% | 22.79 | % | 15.11 | % | 10.44 | % | 0.54 | % | ||||||||||||||||||||||||||
|
|
|
|
|
|
|
|
|
| |||||||||||||||||||||||||||
Ratios and supplemental data: |
| |||||||||||||||||||||||||||||||||||
Net assets, end of period | $ | 40,575,598 | $ | 47,832,660 | $ | 18,631,514 | $ | 10,988,456 | $ | 9,795,860 | ||||||||||||||||||||||||||
Ratios to average net assets: | ||||||||||||||||||||||||||||||||||||
Expenses, before reimbursements | 1.24 | % | 1.27 | % | 1.41 | % | 1.58 | % | 1.61 | % | ||||||||||||||||||||||||||
Expenses, net of reimbursementsB | 0.99 | % | 1.00 | % | 0.99 | % | 0.99 | % | 1.10 | % | ||||||||||||||||||||||||||
Net investment income, before expense reimbursements | 0.55 | % | 0.26 | % | 0.54 | % | 0.28 | % | 0.12 | % | ||||||||||||||||||||||||||
Net investment income, net of reimbursements | 0.80 | % | 0.54 | % | 0.96 | % | 0.87 | % | 0.64 | % | ||||||||||||||||||||||||||
Portfolio turnover rate | 93 | % | 74 | % | 77 | % | 50 | % | 97 | % | ||||||||||||||||||||||||||
| A | Based on net asset value, which does not reflect the sales charge, redemption fee, or contingent deferred sales charge, if applicable. May include adjustments in accordance with U.S. GAAP and as such, the net asset value for reporting purposes and the returns based upon those net asset values may differ from the net asset value and returns for shareholder transactions. |
| B | Expense ratios may exceed stated expense caps in Note 2 due to security lending expenses, which are not reimbursable under the agreement with the Manager. |
See accompanying notes
53
American Beacon Zebra Small Cap Equity FundSM
Financial Highlights
(For a share outstanding throughout the period)
| Investor Class | ||||||||||||||||||||||||||||||||||||
| Year Ended August 31, | ||||||||||||||||||||||||||||||||||||
| 2019 | 2018 | 2017 | 2016 | 2015 | ||||||||||||||||||||||||||||||||
|
| |||||||||||||||||||||||||||||||||||
Net asset value, beginning of period | $ | 18.14 | $ | 15.95 | $ | 14.05 | $ | 14.22 | $ | 14.39 | ||||||||||||||||||||||||||
|
|
|
|
|
|
|
|
|
| |||||||||||||||||||||||||||
Income (loss) from investment operations: | ||||||||||||||||||||||||||||||||||||
Net investment income | 0.12 | 0.02 | 0.14 | 0.28 | 0.01 | |||||||||||||||||||||||||||||||
Net gains (losses) on investments (both realized and unrealized) | (2.68 | ) | 3.43 | 1.93 | 1.00 | 0.04 | ||||||||||||||||||||||||||||||
|
|
|
|
|
|
|
|
|
| |||||||||||||||||||||||||||
Total income (loss) from investment operations | (2.56 | ) | 3.45 | 2.07 | 1.28 | 0.05 | ||||||||||||||||||||||||||||||
|
|
|
|
|
|
|
|
|
| |||||||||||||||||||||||||||
Less distributions: | ||||||||||||||||||||||||||||||||||||
Dividends from net investment income | (0.07 | ) | (0.02 | ) | (0.17 | ) | (0.04 | ) | (0.01 | ) | ||||||||||||||||||||||||||
Distributions from net realized gains | (1.48 | ) | (1.24 | ) | - | (1.41 | ) | (0.21 | ) | |||||||||||||||||||||||||||
|
|
|
|
|
|
|
|
|
| |||||||||||||||||||||||||||
Total distributions | (1.55 | ) | (1.26 | ) | (0.17 | ) | (1.45 | ) | (0.22 | ) | ||||||||||||||||||||||||||
|
|
|
|
|
|
|
|
|
| |||||||||||||||||||||||||||
Net asset value, end of period | $ | 14.03 | $ | 18.14 | $ | 15.95 | $ | 14.05 | $ | 14.22 | ||||||||||||||||||||||||||
|
|
|
|
|
|
|
|
|
| |||||||||||||||||||||||||||
Total returnA | (13.26 | )% | 22.47 | % | 14.77 | % | 10.07 | % | 0.29 | % | ||||||||||||||||||||||||||
|
|
|
|
|
|
|
|
|
| |||||||||||||||||||||||||||
Ratios and supplemental data: |
| |||||||||||||||||||||||||||||||||||
Net assets, end of period | $ | 12,486,352 | $ | 10,398,506 | $ | 10,766,976 | $ | 7,620,538 | $ | 2,573,002 | ||||||||||||||||||||||||||
Ratios to average net assets: | ||||||||||||||||||||||||||||||||||||
Expenses, before reimbursements | 1.50 | % | 1.44 | % | 1.58 | % | 1.74 | % | 1.82 | % | ||||||||||||||||||||||||||
Expenses, net of reimbursementsB | 1.27 | % | 1.28 | % | 1.27 | % | 1.27 | % | 1.37 | % | ||||||||||||||||||||||||||
Net investment income (loss), before expense reimbursements | 0.27 | % | 0.08 | % | 0.41 | % | 0.09 | % | (0.12 | )% | ||||||||||||||||||||||||||
Net investment income, net of reimbursements | 0.50 | % | 0.24 | % | 0.72 | % | 0.56 | % | 0.33 | % | ||||||||||||||||||||||||||
Portfolio turnover rate | 93 | % | 74 | % | 77 | % | 50 | % | 97 | % | ||||||||||||||||||||||||||
| A | Based on net asset value, which does not reflect the sales charge, redemption fee, or contingent deferred sales charge, if applicable. May include adjustments in accordance with U.S. GAAP and as such, the net asset value for reporting purposes and the returns based upon those net asset values may differ from the net asset value and returns for shareholder transactions. |
| B | Expense ratios may exceed stated expense caps in Note 2 due to security lending expenses, which are not reimbursable under the agreement with the Manager. |
See accompanying notes
54
American Beacon Zebra Small Cap Equity FundSM
Financial Highlights
(For a share outstanding throughout the period)
| A Class | ||||||||||||||||||||||||||||||||||||
| Year Ended August 31, | ||||||||||||||||||||||||||||||||||||
| 2019 | 2018 | 2017 | 2016 | 2015 | ||||||||||||||||||||||||||||||||
|
| |||||||||||||||||||||||||||||||||||
Net asset value, beginning of period | $ | 18.15 | $ | 15.96 | $ | 14.06 | $ | 14.22 | $ | 14.40 | ||||||||||||||||||||||||||
|
|
|
|
|
|
|
|
|
| |||||||||||||||||||||||||||
Income (loss) from investment operations: | ||||||||||||||||||||||||||||||||||||
Net investment income | 0.08 | A | 0.03 | A | 0.16 | 0.10 | 0.05 | |||||||||||||||||||||||||||||
Net gains (losses) on investments (both realized and unrealized) | (2.64 | ) | 3.42 | 1.91 | 1.18 | - | ||||||||||||||||||||||||||||||
|
|
|
|
|
|
|
|
|
| |||||||||||||||||||||||||||
Total income (loss) from investment operations | (2.56 | ) | 3.45 | 2.07 | 1.28 | 0.05 | ||||||||||||||||||||||||||||||
|
|
|
|
|
|
|
|
|
| |||||||||||||||||||||||||||
Less distributions: | ||||||||||||||||||||||||||||||||||||
Dividends from net investment income | (0.06 | ) | (0.02 | ) | (0.17 | ) | (0.03 | ) | (0.02 | ) | ||||||||||||||||||||||||||
Distributions from net realized gains | (1.48 | ) | (1.24 | ) | - | (1.41 | ) | (0.21 | ) | |||||||||||||||||||||||||||
|
|
|
|
|
|
|
|
|
| |||||||||||||||||||||||||||
Total distributions | (1.54 | ) | (1.26 | ) | (0.17 | ) | (1.44 | ) | (0.23 | ) | ||||||||||||||||||||||||||
|
|
|
|
|
|
|
|
|
| |||||||||||||||||||||||||||
Net asset value, end of period | $ | 14.05 | $ | 18.15 | $ | 15.96 | $ | 14.06 | $ | 14.22 | ||||||||||||||||||||||||||
|
|
|
|
|
|
|
|
|
| |||||||||||||||||||||||||||
Total returnB | (13.26 | )% | 22.43 | % | 14.76 | % | 10.04 | % | 0.29 | % | ||||||||||||||||||||||||||
|
|
|
|
|
|
|
|
|
| |||||||||||||||||||||||||||
Ratios and supplemental data: |
| |||||||||||||||||||||||||||||||||||
Net assets, end of period | $ | 2,693,316 | $ | 5,063,046 | $ | 6,801,568 | $ | 5,212,114 | $ | 4,797,155 | ||||||||||||||||||||||||||
Ratios to average net assets: | ||||||||||||||||||||||||||||||||||||
Expenses, before reimbursements | 1.53 | % | 1.54 | % | 1.73 | % | 1.90 | % | 1.94 | % | ||||||||||||||||||||||||||
Expenses, net of reimbursementsC | 1.29 | % | 1.29 | % | 1.29 | % | 1.29 | % | 1.40 | % | ||||||||||||||||||||||||||
Net investment income (loss), before expense reimbursements | 0.27 | % | (0.04 | )% | 0.28 | % | (0.04 | )% | (0.21 | )% | ||||||||||||||||||||||||||
Net investment income, net of reimbursements | 0.51 | % | 0.20 | % | 0.71 | % | 0.57 | % | 0.33 | % | ||||||||||||||||||||||||||
Portfolio turnover rate | 93 | % | 74 | % | 77 | % | 50 | % | 97 | % | ||||||||||||||||||||||||||
| A | Per share amounts have been calculated using the average shares method. |
| B | Based on net asset value, which does not reflect the sales charge, redemption fee, or contingent deferred sales charge, if applicable. May include adjustments in accordance with U.S. GAAP and as such, the net asset value for reporting purposes and the returns based upon those net asset values may differ from the net asset value and returns for shareholder transactions. |
| C | Expense ratios may exceed stated expense caps in Note 2 due to security lending expenses, which are not reimbursable under the agreement with the Manager. |
See accompanying notes
55
American Beacon Zebra Small Cap Equity FundSM
Financial Highlights
(For a share outstanding throughout the period)
| C Class | ||||||||||||||||||||||||||||||||||||
| Year Ended August 31, | ||||||||||||||||||||||||||||||||||||
| 2019 | 2018 | 2017 | 2016 | 2015 | ||||||||||||||||||||||||||||||||
|
| |||||||||||||||||||||||||||||||||||
Net asset value, beginning of period | $ | 17.26 | $ | 15.32 | $ | 13.53 | $ | 13.81 | $ | 14.08 | ||||||||||||||||||||||||||
|
|
|
|
|
|
|
|
|
| |||||||||||||||||||||||||||
Income (loss) from investment operations: | ||||||||||||||||||||||||||||||||||||
Net investment income (loss) | (0.06 | ) | (0.09 | )A | 0.03 | 0.10 | (0.07 | ) | ||||||||||||||||||||||||||||
Net gains (losses) on investments (both realized and unrealized) | (2.49 | ) | 3.27 | 1.86 | 1.03 | 0.01 | ||||||||||||||||||||||||||||||
|
|
|
|
|
|
|
|
|
| |||||||||||||||||||||||||||
Total income (loss) from investment operations | (2.55 | ) | 3.18 | 1.89 | 1.13 | (0.06 | ) | |||||||||||||||||||||||||||||
|
|
|
|
|
|
|
|
|
| |||||||||||||||||||||||||||
Less distributions: | ||||||||||||||||||||||||||||||||||||
Dividends from net investment income | - | - | (0.10 | ) | - | - | ||||||||||||||||||||||||||||||
Distributions from net realized gains | (1.48 | ) | (1.24 | ) | - | (1.41 | ) | (0.21 | ) | |||||||||||||||||||||||||||
|
|
|
|
|
|
|
|
|
| |||||||||||||||||||||||||||
Total distributions | (1.48 | ) | (1.24 | ) | (0.10 | ) | (1.41 | ) | (0.21 | ) | ||||||||||||||||||||||||||
|
|
|
|
|
|
|
|
|
| |||||||||||||||||||||||||||
Net asset value, end of period | $ | 13.23 | $ | 17.26 | $ | 15.32 | $ | 13.53 | $ | 13.81 | ||||||||||||||||||||||||||
|
|
|
|
|
|
|
|
|
| |||||||||||||||||||||||||||
Total returnB | (13.97 | )% | 21.55 | % | 13.97 | % | 9.17 | % | (0.48 | )% | ||||||||||||||||||||||||||
|
|
|
|
|
|
|
|
|
| |||||||||||||||||||||||||||
Ratios and supplemental data: |
| |||||||||||||||||||||||||||||||||||
Net assets, end of period | $ | 2,370,089 | $ | 3,286,562 | $ | 2,207,090 | $ | 1,838,434 | $ | 1,398,217 | ||||||||||||||||||||||||||
Ratios to average net assets: | ||||||||||||||||||||||||||||||||||||
Expenses, before reimbursements | 2.29 | % | 2.29 | % | 2.47 | % | 2.65 | % | 2.69 | % | ||||||||||||||||||||||||||
Expenses, net of reimbursementsC | 2.04 | % | 2.05 | % | 2.04 | % | 2.04 | % | 2.15 | % | ||||||||||||||||||||||||||
Net investment (loss), before expense reimbursements | (0.49 | )% | (0.78 | )% | (0.42 | )% | (0.78 | )% | (0.96 | )% | ||||||||||||||||||||||||||
Net investment income (loss), net of reimbursements | (0.24 | )% | (0.53 | )% | 0.01 | % | (0.18 | )% | (0.41 | )% | ||||||||||||||||||||||||||
Portfolio turnover rate | 93 | % | 74 | % | 77 | % | 50 | % | 97 | % | ||||||||||||||||||||||||||
| A | Per share amounts have been calculated using the average shares method. |
| B | Based on net asset value, which does not reflect the sales charge, redemption fee, or contingent deferred sales charge, if applicable. May include adjustments in accordance with U.S. GAAP and as such, the net asset value for reporting purposes and the returns based upon those net asset values may differ from the net asset value and returns for shareholder transactions. |
| C | Expense ratios may exceed stated expense caps in Note 2 due to security lending expenses, which are not reimbursable under the agreement with the Manager. |
See accompanying notes
56
American Beacon FundsSM
August 31, 2019 (Unaudited)
Certain tax information regarding the Funds are required to be provided to shareholders based upon the Funds’ income and distributions for the taxable year ended August 31, 2019. The information and distributions reported herein may differ from information and distributions taxable to the shareholders for the calendar year ended December 31, 2019.
The Funds designated the following items with regard to distributions paid during the fiscal year ended August 31, 2019. All designations are based on financial information available as of this annual report and, accordingly, are subject to change. For each item, it is the intention of the Funds to designate the maximum amount permitted under the Internal Revenue Code of 1986, as amended, and the regulations there under.
Corporate Dividends-Received Deduction:
The London Company Income Equity | 100.00 | % | ||
Zebra Small Cap Equity | 32.61 | % |
Qualified Dividend Income:
The London Company Income Equity | 100.00 | % | ||
Zebra Small Cap Equity | 33.67 | % |
Long-Term Capital Gain Distributions:
The London Company Income Equity | $ | 13,860,752 | ||
Zebra Small Cap Equity | 3,867,494 |
Short-Term Capital Gain Distributions:
The London Company Income Equity | $ | 1,449,307 | ||
Zebra Small Cap Equity | 2,215,729 |
Shareholders will receive notification in January 2020 of the applicable tax information necessary to prepare their 2019 income tax returns.
57
Disclosures Regarding the Approval of the Management and Investment Advisory Agreements
August 31, 2019 (Unaudited)
Renewal and Approval of Management Agreement and Investment Advisory Agreements
At in-person meetings held on May 9, 2019 and June 4-5, 2019 (collectively, the “Meetings”), the Board of Trustees (“Board” or “Trustees”) considered and then, at its June 5, 2019 meeting, approved the renewal of:
(1) the Management Agreement between American Beacon Advisors, Inc. (“Manager”) and the American Beacon Funds (“Trust”), on behalf of the American Beacon The London Company Income Equity Fund (“TLC Fund”) and the American Beacon Zebra Small Cap Equity Fund (“Zebra Fund”) (each, a “Fund” and collectively, the “Funds”);
(2) the Investment Advisory Agreement among the Manager, The London Company of Virginia, LLC (“TLC”), and the Trust, on behalf of the TLC Fund; and
(3) the Investment Advisory Agreement among the Manager, Zebra Capital Management, LLC (“Zebra”), and the Trust, on behalf of the Zebra Fund.
TLC and Zebra are hereinafter each referred to as a “subadvisor” and collectively as the “subadvisors.” The Management Agreement and the Investment Advisory Agreements are referred to herein individually as an “Agreement” and collectively as the “Agreements.” In preparation for its consideration of the renewal of the Agreements, the Board undertook steps to gather and consider information furnished by the Manager, the subadvisors, Broadridge, Inc. (“Broadridge”) and Morningstar, Inc. (“Morningstar”). The Board, with the assistance of independent legal counsel, requested and received certain relevant information from the Manager and each subadvisor.
In advance of the Meetings, the Board’s Investment Committee and/or the Manager coordinated the production of information from Broadridge and Morningstar regarding the performance, fees and expenses of the Funds as well as information from the Manager and the subadvisors. At the Meetings, the Board considered the information provided in connection with the renewal process, as well as information furnished to the Board throughout the year at regular meetings of the Board and its committees. In connection with the Board’s consideration of the Agreements, the Board received and evaluated such information as they deemed necessary. This information is described below in the section summarizing the factors the Board considered in connection with its renewal and approval of the Agreements, as well as the section describing additional Board considerations with respect to each Fund.
The Board noted that the Manager provides management and administrative services to the Funds pursuant to the Management Agreement. The Board considered that many mutual funds have separate contracts governing each type of service and observed that, with respect to such mutual funds, the actual management fee rates provided by Broadridge for peer group funds reflect the combined advisory and administrative expenses, reduced by any fee waivers and/or reimbursements.
A firm may not have been able to, or opted not to, provide information in response to certain information requests, in which case the Board conducted its evaluation of the firm based on information that was provided. In such cases, the Board determined that the omission of any such information was not material to its considerations. For each Fund, the class of shares used for comparative performance purposes was the share class with the lowest expenses available for purchase by the general public, which was the Institutional Class. The Board also considered that the use of Institutional Class performance generally facilitates a meaningful comparison for expense and performance purposes.
Provided below is an overview of certain factors the Board considered in connection with its renewal and approval of the Agreements. The Board did not identify any particular information that was most relevant to its consideration to renew or approve each Agreement, and each Trustee may have afforded different weight to the various factors. Legal counsel to the independent Trustees provided the Board with a memorandum regarding its
58
Disclosures Regarding the Approval of the Management and Investment Advisory Agreements
August 31, 2019 (Unaudited)
responsibilities pertaining to the renewal and approval of investment advisory contracts, such as the Agreements. The memorandum explained the regulatory requirements surrounding the Board’s process for evaluating investment advisors and the terms of investment advisory contracts. Based on its evaluation, the Board unanimously concluded that the terms of each Agreement were reasonable and fair and that the renewal and approval of each Agreement was in the best interests of the Funds and their shareholders.
Considerations With Respect to the Renewal of the Management Agreement and the Investment Advisory Agreements
In determining whether to renew the Agreements, the Board considered each Fund’s investment management and subadvisory relationships separately. In each instance, the Board considered, among other things, the following factors: (1) the nature, extent and quality of the services provided; (2) the investment performance of the Funds; (3) the costs incurred by the Manager in rendering services to the Funds and its resulting profits or losses; (4) comparisons of services and fee rates with contracts entered into by the Manager or a subadvisor or their affiliates with other clients (such as pension funds and other institutional clients); (5) the extent to which economies of scale, if any, have been taken into account in setting each fee rate schedule; (6) whether fee rate levels reflect economies of scale, if any, for the benefit of Fund investors; and (7) any other benefits derived or anticipated to be derived by the Manager or a subadvisor from their relationships with the Funds.
Nature, Extent and Quality of Services.With respect to the renewal of the Management Agreement, the Board considered, among other factors: each Fund’s long-term performance; the length of service of key investment personnel at the Manager; the cost structure of the Funds; the Manager’s culture of compliance and support that reduce risks to the Funds; the Manager’s quality of services; the Manager’s active role in monitoring and, as appropriate, recommending additional or replacement subadvisors; and the Manager’s efforts to retain key employees and maintain staffing levels.
With respect to the renewal of each Investment Advisory Agreement, the Board considered the level of staffing and the size of the subadvisor. The Board also considered the adequacy of the resources committed to the Funds by each subadvisor, and whether those resources were commensurate with the needs of the Funds and are sufficient to sustain appropriate levels of performance and compliance needs. In this regard, the Board considered the financial stability of each subadvisor. The Board also considered each subadvisor’s representations regarding its compliance program and code of ethics. Based on the foregoing information, the Board concluded that the nature, extent and quality of the management and advisory services provided by the Manager and each subadvisor were appropriate for each Fund.
Investment Performance.The Board evaluated the comparative information provided by Broadridge and the Manager regarding the performance of each Fund relative to its Broadridge performance universe, Morningstar Category, and benchmark index, as well as the Fund’s Morningstar rating. The Board considered the information provided by Broadridge regarding Broadridge’s independent methodology for selecting each Fund’s Broadridge performance universe. The Board also considered that the performance universes selected by Broadridge may not provide appropriate comparisons for a Fund. In addition, the Board considered the performance reports and discussions with management at Board and Committee meetings throughout the year. The Board also evaluated the comparative information provided by each subadvisor regarding the performance of the relevant Fund relative to the performance of the Fund’s benchmark index and, with respect to the TLC Fund, a composite of similar accounts. In addition, the Board considered the Manager’s recommendation to continue to retain each subadvisor. A discussion regarding the Board’s considerations with respect to each Fund’s performance appears below under “Additional Considerations and Conclusions with Respect to Each Fund.”
Costs of the Services Provided to the Funds and the Profits Realized by the Manager from its Relationship with the Funds.In analyzing the cost of services and profitability of the Manager, the Board considered the revenues earned and the expenses incurred by the Manager, before and after the payment of distribution-related expenses by the Manager. The profits or losses were noted at both an aggregate level for all funds within the group
59
Disclosures Regarding the Approval of the Management and Investment Advisory Agreements
August 31, 2019 (Unaudited)
of mutual funds sponsored by the Manager (the “Fund Complex”) and at an individual Fund level, with the Manager earning a profit with respect to the TLC Fund and sustaining a loss with respect to the Zebra Fund before and after the payment of distribution-related expenses by the Manager. The Board also considered comparative information provided by the Manager regarding the Manager’s overall profitability with respect to the Fund Complex relative to the overall profitability of other firms in the mutual fund industry, as disclosed in publicly available sources. Although the Board noted that, in certain cases, the fee rates paid by other clients of the Manager are lower than the fee rates paid by the Funds, the Manager represented that, among other matters, the difference is attributable to the fact that the Manager does not perform administrative services for non-investment company clients and reflects the greater level of responsibility and regulatory requirements associated with managing the Funds.
The Board also noted that the Manager proposed to continue the expense waivers and reimbursements for the Funds that were in place during the last fiscal year. The Board further considered that, with respect to each Fund, the Management Agreement provides for the Manager to receive a management fee comprised of an annualized fee that is retained by the Manager. In addition, the Board considered that the Manager receives fees for overseeing the securities lending program on behalf of each Fund. The Board also noted that certain share classes of the Funds maintain higher expense ratios in order to compensate third-party financial intermediaries.
In analyzing the fee rates charged by each subadvisor in connection with its investment advisory services to a Fund, the Board considered representations made by TLC that the Manager has negotiated the lowest fee rate that TLC charges for any comparable client accounts, and considered representations made by Zebra that, for fee comparison purposes, Zebra does not manage any comparable client accounts and therefore could not provide fee schedules for comparable investment accounts managed by Zebra. The Board did not request profitability data from the subadvisors because the Board did not view this data as imperative to its deliberations given the arm’s-length nature of the relationship between the Manager and the subadvisors with respect to the negotiation of subadvisory fee rates. In addition, the Board noted that subadvisors may not account for their profits on an account-by-account basis and that different firms likely employ different methodologies in connection with these calculations.
Based on the foregoing information, the Board concluded that the profitability levels of the Manager were reasonable in light of the services performed by the Manager. A discussion regarding the Board’s considerations with respect to each Fund’s fee rates is set forth below under “Additional Considerations and Conclusions with Respect to Each Fund.”
Economies of Scale.In considering the reasonableness of the management and investment advisory fees rates, the Board considered whether economies of scale will be realized as each Fund grows and whether fee rate levels reflect these economies of scale for the benefit of Fund shareholders. In this regard, the Board considered that the Manager has negotiated breakpoints with respect to each Fund’s subadvisory fee rate.
In addition, the Board noted the Manager’s representation that the Management Agreement contains fee schedule breakpoints at higher asset levels with respect to each Fund. Based on the foregoing information, the Board concluded that the Manager and subadvisor fee rate schedules for each Fund provide for a reasonable sharing of benefits from any economies of scale with each Fund.
Benefits Derived from the Relationship with the Funds.The Board considered the “fall-out” or ancillary benefits that accrue to the Manager and/or the subadvisors as a result of the advisory relationships with the Funds, including greater exposure in the marketplace with respect to the Manager’s or the subadvisors’ investment process and expanding the level of assets under management by the Manager and the subadvisors. The Board also considered that the Manager may invest the Funds’ cash balances and cash collateral provided by the borrowers of the Funds’ securities in the American Beacon U.S. Government Money Market Select Fund, which the Manager manages directly. In addition, the Board noted that TLC and Zebra benefit from soft dollar arrangements for proprietary and/or third-party research. Based on the foregoing information, the Board concluded that the potential benefits accruing to the Manager and the subadvisors by virtue of their relationships with the Funds appear to be fair and reasonable.
60
Disclosures Regarding the Approval of the Management and Investment Advisory Agreements
August 31, 2019 (Unaudited)
Additional Considerations and Conclusions with Respect to Each Fund
The performance comparisons below were made in comparison to each Fund’s Broadridge performance universe and Morningstar Category. With respect to the Broadridge performance universe, the 1st Quintile represents the top 20 percent of the universe based on performance and the 5th Quintile representing the bottom 20 percent of the universe based on performance. References below to each Fund’s Broadridge performance universe are to the universe of mutual funds with a comparable investment classification/objective included in the analysis provided by Broadridge. In reviewing the performance, the Trustees viewed longer-term performance over a full market cycle as the most important consideration, because relative performance over shorter periods may be significantly impacted by market or economic events and not necessarily reflective of manager skill.
The expense comparisons below were made in comparison to each Fund’s Broadridge expense universe and Broadridge expense group, with the 1st Quintile representing the lowest 20 percent of the universe or group based on lowest total expense and the 5th Quintile representing the highest 20 percent of the universe or group based on highest total expense. References below to each Fund’s expense group and expense universe are to the respective group or universe of comparable mutual funds included in the analysis by Broadridge. A Broadridge expense group consists of the Fund and a representative sample of funds with similar operating structures and asset sizes, as selected by Broadridge. A Broadridge expense universe includes all funds in the investment classification/objective with a similar operating structure as the share class of the Fund included in the Broadridge comparative information and provides a broader view of expenses across the Fund’s investment classification/objective. The Board also considered each Fund’s Morningstar fee level category. In reviewing expenses, the Board considered the positive impact of fee waivers where applicable and the Manager’s agreement to continue the fee waivers. In addition, information regarding the subadvisors’ use of soft dollars was requested from the Manager and was considered by the Board.
Additional Considerations and Conclusions with Respect to the American Beacon The London Company Income Equity Fund
In considering the renewal of the Management Agreement and the Investment Advisory Agreement with TLC for the TLC Fund, the Board considered the following additional factors:
Broadridge Total Expense Analysis Excluding 12b-1 Fees and Morningstar Fee Level Ranking
Compared to Broadridge Expense Group | 1st Quintile | |
Compared to Broadridge Expense Universe | 3rd Quintile | |
Morningstar Fee Level Ranking – Institutional Class | Average Expense Ratio |
Broadridge and Morningstar Performance Analysis (five-year period ended December 31, 2018)
Compared to Broadridge Performance Universe | 1st Quintile | |
Compared to Morningstar Category | 1st Quintile |
The Board also considered: (1) TLC’s representation that no other clients for which TLC provides comparable services receive a lower fee; and (2) the Manager’s recommendation to continue to retain TLC.
Based on these and other considerations, the Board: (1) concluded that the fees paid to the Manager and TLC under the Management and Investment Advisory Agreements are fair and reasonable; and (2) determined that the TLC Fund and its shareholders would benefit from the Manager’s and TLC’s continued management of the TLC Fund.
61
Disclosures Regarding the Approval of the Management and Investment Advisory Agreements
August 31, 2019 (Unaudited)
Additional Considerations and Conclusions with Respect to the American Beacon Zebra Small Cap Equity Fund
In considering the renewal of the Management Agreement and the Investment Advisory Agreement with Zebra for the Zebra Fund, the Board considered the following additional factors:
Broadridge Total Expenses Excluding 12b-1 Fees and Morningstar Fee Level Ranking
Compared to Broadridge Expense Group | 1st Quintile | |
Compared to Broadridge Expense Universe | 3rd Quintile | |
Morningstar Fee Level Ranking – Institutional Class | Below Average Expense Ratio |
Broadridge and Morningstar Performance Analysis (five-year period ended December 31, 2018)
Compared to Broadridge Performance Universe | 2nd Quintile | |
Compared to Morningstar Category | 1st Quintile |
The Board also considered: (1) Zebra’s representation that it does not manage comparable accounts in the same strategy as Zebra manages the Zebra Fund; and (2) the Manager’s recommendation to continue to retain Zebra.
Based on these and other considerations, the Board: (1) concluded that the fees paid to the Manager and Zebra under the Management and Investment Advisory Agreements are fair and reasonable; and (2) determined that the Zebra Fund and its shareholders would benefit from the Manager’s and Zebra’s continued management of the Zebra Fund.
62
Trustees and Officers of the American Beacon FundsSM(Unaudited)
The Trustees and officers of the American Beacon Funds (the “Trust”) are listed below, together with their principal occupations during the past five years. The address of each person listed below is 220 Las Colinas Boulevard East, Suite 1200, Irving, Texas 75039. Each Trustee oversees thirty-seven funds in the fund complex that includes the Trust, the American Beacon Select Funds, the American Beacon Institutional Funds Trust, the American Beacon Sound Point Enhanced Income Fund, American Beacon Apollo Total Return Fund and the American Beacon Sound Point Alternative Lending Fund. The Trust’s Statement of Additional Information contains additional information about the Trustees and is available without charge by calling 1-800-658-5811.
Name, Age and Address | Position, Term of | Principal Occupation(s) During Past 5 Years and Current Directorships | ||
| INTERESTED TRUSTEES | Term | |||
| Lifetime of Trust until removal, resignation or retirement* | ||||
| Alan D. Feld** (82) | Trustee since 1996 | Partner in the law firm of Akin, Gump, Strauss, Hauer & Feld, LLP (law firm) (1960-Present); Trustee, American Beacon Select Funds (1999-Present); Trustee, American Beacon Institutional Funds Trust (2017-Present); Trustee, American Beacon Sound Point Enhanced Income Fund (2018-Present); Trustee, American Beacon Apollo Total Return Fund (2018-Present); Trustee, American Beacon Sound Point Alternative Lending Fund (2019-Present). | ||
| NON-INTERESTED TRUSTEES | Term | |||
| Lifetime of Trust until removal, resignation or retirement* | ||||
| Gilbert G. Alvarado (49) | Trustee since 2015 | Director, Kura MD, Inc. (local telehealth organization) (2015-present); Vice President & CFO, Sierra Health Foundation (health conversion private foundation) (2006-Present); Vice President & CFO, Sierra Health Foundation: Center for Health Program Management (California public benefit corporation) (2012-Present); Director, Innovative North State (2012-2015); Director, Sacramento Regional Technology Alliance (2011-2016); Director, Women’s Empowerment (2009-2014); Director, Valley Healthcare Staffing (2017-present); Trustee, American Beacon Select Funds (2015-Present); Trustee, American Beacon Institutional Funds Trust (2017-Present); Trustee, American Beacon Sound Point Enhanced Income Fund (2018-Present); Trustee, American Beacon Apollo Total Return Fund (2018-Present); Trustee, American Beacon Sound Point Alternative Lending Fund (2019-Present). | ||
| Joseph B. Armes (57) | Trustee since 2015 | Chairman & CEO, CSW Industrials f/k/a Capital Southwest Corporation (investment company) (2015-Present); Chairman of the Board of Capital Southwest Corporation, predecessor to CSW Industrials, Inc. (2014-2017) (investment company); CEO, Capital Southwest Corporation (2013-2015); President & CEO, JBA Investment Partners (family investment vehicle) (2010-Present); Director and Chair of Audit Committee, RSP Permian (oil and gas producer) (2013-Present); Trustee, American Beacon Select Funds (2015-Present); Trustee, American Beacon Institutional Funds Trust (2017-Present); Trustee, American Beacon Sound Point Enhanced Income Fund (2018-Present); Trustee, American Beacon Apollo Total Return Fund (2018-Present); Trustee, American Beacon Sound Point Alternative Lending Fund (2019-Present). | ||
| Gerard J. Arpey (60) | Trustee since 2012 | Director, The Home Depot, Inc. (2015-Present); Partner, Emerald Creek Group (private equity firm) (2011-Present); Director, S.C. Johnson & Son, Inc. (privately held company) (2008-present); Trustee, American Beacon Select Funds (2012-Present); Trustee, American Beacon Institutional Funds Trust (2017-Present); Trustee, American Beacon Sound Point Enhanced Income Fund (2018-Present); Trustee, American Beacon Apollo Total Return Fund (2018-Present); Trustee, American Beacon Sound Point Alternative Lending Fund (2019-Present). | ||
63
Trustees and Officers of the American Beacon FundsSM(Unaudited)
Name, Age and Address | Position, Term of | Principal Occupation(s) During Past 5 Years and Current Directorships | ||
| NON-INTERESTED TRUSTEES (CONT.) | Term | |||
| Lifetime of Trust until removal, resignation or retirement* | ||||
| Brenda A. Cline (58) | Trustee since 2004 Chair since 2019 Vice Chair 2018 | Chief Financial Officer, Treasurer and Secretary, Kimbell Art Foundation (1993-Present); Director, Tyler Technologies, Inc. (public sector software solutions company) (2014-Present); Director, Range Resources Corporation (oil and natural gas company) (2015-Present); Trustee, Cushing Closed-End and Open-End Funds and ETFs (2017-Present); Trustee, American Beacon Select Funds (2004-Present); Trustee, American Beacon Institutional Funds Trust (2017-Present); Trustee, American Beacon Sound Point Enhanced Income Fund (2018-Present); Trustee, American Beacon Apollo Total Return Fund (2018-Present); Trustee, American Beacon Sound Point Alternative Lending Fund (2019-Present). | ||
| Eugene J. Duffy (65) | Trustee since 2008 | Managing Director, Global Investment Management Distribution, Mesirow Financial (2016-Present); Managing Director, Institutional Services, Intercontinental Real Estate Corporation (2014-Present); Principal and Executive Vice President, Paradigm Asset Management (1994-2014); Trustee, American Beacon Select Funds (2008-Present); Trustee, American Beacon Institutional Funds Trust (2017-Present); Trustee, American Beacon Sound Point Enhanced Income Fund (2018-Present); Trustee, American Beacon Apollo Total Return Fund (2018-Present); Trustee, American Beacon Sound Point Alternative Lending Fund (2019-Present). | ||
| Claudia A. Holz (61) | Trustee since 2018 | Partner, KPMG LLP (1990-2017); Trustee, American Beacon Select Funds (2018-Present); Trustee, American Beacon Institutional Funds Trust (2018-Present); Trustee, American Beacon Sound Point Enhanced Income Fund (2018-Present); Trustee, American Beacon Apollo Total Return Fund (2018-Present); Trustee, American Beacon Sound Point Alternative Lending Fund (2019-Present). | ||
| Douglas A. Lindgren (57) | Trustee since 2018 | CEO North America, Carne Global Financial Services (2016-2017); Managing Director, IPS Investment Management and Global Head, Content Management, UBS Wealth Management (2010-2016); Trustee, American Beacon Select Funds (2018-Present); Trustee, American Beacon Institutional Funds Trust (2018-Present); Trustee, American Beacon Sound Point Enhanced Income Fund (2018-Present); Trustee, American Beacon Apollo Total Return Fund (2018-Present); Trustee, American Beacon Sound Point Alternative Lending Fund (2019-Present). | ||
| Richard A. Massman (76) | Trustee since 2004 Chair 2008-2018 Chair Emeritus since 2019 | Consultant and General Counsel Emeritus, Hunt Consolidated, Inc. (holding company engaged in oil and gas exploration and production, refining, real estate, farming, ranching and venture capital activities) (2009-Present); Trustee, American Beacon Select Funds (2004-Present); Trustee, American Beacon Institutional Funds Trust (2017-Present); Trustee, American Beacon Sound Point Enhanced Income Fund (2018-Present); Trustee, American Beacon Apollo Total Return Fund (2018-Present); Trustee, American Beacon Sound Point Alternative Lending Fund (2019-Present). | ||
| Barbara J. McKenna, CFA (56) | Trustee since 2012 | President/Managing Principal, Longfellow Investment Management Company (2005-Present); Trustee, American Beacon Select Funds (2012-Present); Trustee, American Beacon Institutional Funds Trust (2017-Present); Trustee, American Beacon Sound Point Enhanced Income Fund (2018-Present); Trustee, American Beacon Apollo Total Return Fund (2018-Present); Trustee, American Beacon Sound Point Alternative Lending Fund (2019-Present). | ||
| R. Gerald Turner (73) | Trustee since 2001 | President, Southern Methodist University (1995-Present); Director, J.C. Penney Company, Inc. (1996-Present); Director, Kronus Worldwide Inc. (chemical manufacturing) (2003-Present); Trustee, American Beacon Select Funds (2001-Present); Trustee, American Beacon Institutional Funds Trust (2017-Present); Trustee, American Beacon Sound Point Enhanced Income Fund (2018-Present); Trustee, American Beacon Apollo Total Return Fund (2018-Present); Trustee, American Beacon Sound Point Alternative Lending Fund (2019-Present). | ||
64
Trustees and Officers of the American Beacon FundsSM(Unaudited)
Name, Age and Address | Position, Term of | Principal Occupation(s) During Past 5 Years | ||
| OFFICERS | Term | |||
| One Year | ||||
| Gene L. Needles, Jr. (64) | President since 2009 | President (2009-2018), CEO and Director (2009-Present), and Chairman (2018-Present), American Beacon Advisors, Inc., President (2015-2018), Director and CEO (2015-Present), and Chairman (2018-Present), Resolute Investment Holdings, LLC; President (2015-2018), Director and CEO (2015-Present), and Chairman (2018-Present), Resolute Topco, Inc.; President (2015-2018); Director, and CEO (2015-Present), and Chairman (2018-Present), Resolute Acquisition, Inc.; President (2015-2018), Director and CEO (2015-Present), Chairman (2018-Present), Resolute Investment Managers, Inc.; Director, Chairman, President and CEO, Resolute Investment Distributors (2017-Present); Director, Chairman, President and CEO; Resolute Investment Services, Inc. (2017-Present); President and CEO, Lighthouse Holdings Parent, Inc. (2009-2015); President, CEO and Director, Lighthouse Holdings, Inc. (2009-2015); Manager, President and CEO, American Private Equity Management, LLC (2012-Present); Director, Chairman, President and CEO, Alpha Quant Advisors, LLC (2016-Present); Director, ARK Investment Management LLC (2016-Present); Director, Shapiro Capital Management LLC (2017-Present); Director, Chairman and CEO, Continuous Capital, LLC (2018-Present); President, American Beacon Cayman Managed Futures Strategy Fund, Ltd. (2014-Present); Director and President, American Beacon Cayman Transformational Innovation Company, LTD., (2017-2018); President, American Beacon Delaware Transformational Innovation Corporation (2017-2018); President American Beacon Cayman TargetRisk Company, Ltd. (2018-Present); Member, Investment Advisory Committee, Employees Retirement System of Texas (2017-Present); Trustee, American Beacon NextShares Trust (2015-Present); President, American Beacon Select Funds (2009-Present); President, American Beacon Institutional Funds Trust (2017-Present); President, American Beacon Sound Point Enhanced Income Fund (2018-Present); President, American Beacon Apollo Total Return Fund (2018-Present); Director, RSW Investments Holdings LLC, (2019-Present); Director, SSI Investment Management, LLC (2019-Present); President, American Beacon Sound Point Alternative Lending Fund (2019-Present). | ||
| Rosemary K. Behan (60) | VP, Secretary and Chief Legal Officer since 2006 | Vice President, Secretary and General Counsel, American Beacon Advisors, Inc. (2006-Present); Secretary, Resolute Investment Holdings, LLC (2015-Present); Secretary, Resolute Topco, Inc. (2015-Present); Secretary, Resolute Acquisition, Inc. (2015-Present); Vice President, Secretary and General Counsel, Resolute Investment Managers, Inc. (2015-Present); Secretary, Resolute Investment Distributors, Inc. (2017-Present); Vice President, Secretary and General Counsel, Resolute Investment Services, Inc. (2017-Present); Vice President and Secretary, Lighthouse Holdings Parent, Inc. (2008-2015); Vice President and Secretary, Lighthouse Holdings, Inc. (2008-2015); Secretary, American Private Equity Management, LLC (2008-Present); Secretary and General Counsel, Alpha Quant Advisors, LLC (2016-Present); Vice President and Secretary, Continuous Capital, LLC (2018-Present); Secretary, American Beacon Delaware Transformational Innovation Corporation (2017-2018); Secretary, American Beacon Cayman Transformational Innovation Company, Ltd. (2017-2018); Secretary, American Beacon Cayman Managed Futures Strategy Fund, Ltd. (2014-Present); Secretary, American Beacon Cayman TargetRisk Company, Ltd (2018-Present); Chief Legal Officer, Vice President and Secretary, American Beacon Select Funds (2006-Present); Chief Legal Officer, Vice President and Secretary, American Beacon Institutional Funds Trust (2017-Present); Chief Legal Officer, Vice President and Secretary, American Beacon Sound Point Enhanced Income Fund (2018-Present); Chief Legal Officer, Vice President and Secretary American Beacon Apollo Total Return Fund (2018-Present); Chief Legal Officer, Vice President and Secretary, American Beacon Sound Point Alternative Lending Fund (2019-Present). | ||
65
Trustees and Officers of the American Beacon FundsSM(Unaudited)
Name, Age and Address | Position, Term of | Principal Occupation(s) During Past 5 Years | ||
| OFFICERS (CONT.) | Term | |||
| One Year | ||||
| Brian E. Brett (59) | VP since 2004 | Senior Vice President, Head of Distribution (2012-Present), Vice President, Director of Sales (2004-2012), American Beacon Advisors, Inc.; Senior Vice President, Resolute Investment Managers, Inc. (2017-Present); Senior Vice President, Resolute Investment Distributors, Inc. (2018-Present), Senior Vice President, Resolute Investment Services, Inc. (2018-Present); Senior Vice President, Lighthouse Holdings Parent, Inc. (2008-2015); Senior Vice President, Lighthouse Holdings, Inc. (2008-2015); Vice President, American Beacon Select Funds (2004-Present); Vice President, American Beacon Institutional Funds Trust (2017-Present); Vice President American Beacon Sound Point Enhanced Income Fund (2018-Present); Vice President American Beacon Apollo Total Return Fund (2018-Present); Vice President, American Beacon Sound Point Alternative Lending Fund (2019-Present). | ||
| Paul B. Cavazos (50) | VP since 2016 | Chief Investment Officer and Senior Vice President, American Beacon Advisors, Inc. (2016-Present); Chief Investment Officer, DTE Energy (2007-2016); Vice President, American Private Equity Management, L.L.C. (2017-Present); Vice President, American Beacon Select Funds (2016-Present); Vice President, American Beacon Institutional Funds Trust (2017-Present); Vice President American Beacon Sound Point Enhanced Income Fund (2018-Present); Vice President American Beacon Apollo Total Return Fund (2018-Present); Vice President, American Beacon Sound Point Alternative Lending Fund (2019-Present). | ||
| Erica Duncan (48) | VP Since 2011 | Vice President, American Beacon Advisors, Inc. (2011-Present); Vice President, Resolute Investment Managers (2018-Present); Vice President, Resolute Investment Services, Inc. (2018-Present); Vice President, American Beacon Select Funds (2011-Present); Vice President, American Beacon Institutional Funds Trust (2017-Present); Vice President American Beacon Sound Point Enhanced Income Fund (2018-Present); Vice President American Beacon Apollo Total Return Fund (2018-Present); Vice President, American Beacon Sound Point Alternative Lending Fund (2019-Present). | ||
| Melinda G. Heika (58) | Treasurer since 2010 | Treasurer and CFO (2010-Present), American Beacon Advisors, Inc.; Treasurer, Resolute Topco, Inc. (2015-Present); Treasurer, Resolute Investment Holdings, LLC. (2015-Present); Treasurer, Resolute Acquisition, Inc. (2015-Present); Treasurer and CFO, Resolute Investment Managers, Inc. (2017-Present); Treasurer, Resolute Investment Distributors, Inc. (2017-2017); Treasurer and CFO, Resolute Investment Services, Inc. (2015-Present); Treasurer, Lighthouse Holdings Parent Inc., (2010-2015); Treasurer, Lighthouse Holdings, Inc. (2010-2015); Treasurer, American Private Equity Management, LLC (2012-Present); Treasurer and CFO, Alpha Quant Advisors, LLC (2016-Present); Treasurer and CFO, Continuous Capital, LLC (2018-Present); Treasurer, American Beacon Cayman Transformational Innovation, Ltd. (2017-2018); Treasurer, American Beacon Delaware Transformational Innovation Corporation (2017-2018); Director and Treasurer, American Beacon Cayman Managed Futures Strategy Fund, Ltd. (2014-Present); Treasurer, American Beacon Cayman TargetRisk Company, Ltd. (2018-Present); Treasurer, American Beacon Select Funds (2010-Present); Treasurer, American Beacon Institutional Funds Trust (2017-Present); Treasurer, American Beacon Sound Point Enhanced Income Fund (2018-Present); Treasurer, American Beacon Apollo Total Return Fund (2018-Present); Treasurer, American Beacon Sound Point Alternative Lending Fund (2019-Present). | ||
66
Trustees and Officers of the American Beacon FundsSM(Unaudited)
Name, Age and Address | Position, Term of | Principal Occupation(s) During Past 5 Years | ||
| OFFICERS (CONT.) | Term | |||
| One Year | ||||
| Terri L. McKinney (55) | VP since 2010 | Vice President (2009-Present), Managing Director (2003-2009), American Beacon Advisors, Inc.; Vice President, Resolute Investment Managers, Inc. (2017-Present); Vice President, Resolute Investment Services, Inc (2018-Present); Vice President, Alpha Quant Advisors, LLC (2016-Present); Vice President, Continuous Capital, LLC (2018-Present); Vice President, American Beacon Select Funds (2010-Present); Vice President, American Beacon Institutional Funds Trust (2017-Present); Vice President, American Beacon Sound Point Enhanced Income Fund (2018-Present); Vice President, American Beacon Apollo Total Return Fund (2018-Present); Vice President, American Beacon Sound Point Alternative Lending Fund (2019-Present). | ||
| Jeffrey K. Ringdahl (44) | VP since 2010 | Director (2015-Present), President (2018-Present), Chief Operating Officer (2010-Present), Senior Vice President (2013-2018), Vice President (2010-2013), American Beacon Advisors, Inc.; Director (2015-Present), President (2018-Present), Senior Vice Present (2015-2018), Resolute Investment Holdings, LLC; Director (2015-Present), President (2018-Present), Senior Vice President (2015-2018), Resolute Topco, Inc.; Director (2015-Present), President (2018-Present), Senior Vice President (2015-2018), Resolute Acquisition, Inc.; Director (2015-Present), President & COO (2018-Present), Senior Vice President (2015-2018), Resolute Investment Managers, Inc.; Director and Executive Vice President (2017-Present), Resolute Investment Distributors, Inc.; Director (2017-Present), President & COO (2018-Present), Executive Vice President (2017-2018), Resolute Investment Services, Inc.; Senior Vice President (2017-Present), Vice President (2012-2017), Manager (2015-Present), American Private Equity Management, LLC; Senior Vice President, Lighthouse Holdings Parent, Inc. (2013-2015); Senior Vice President, Lighthouse Holdings, Inc. (2013-2015); Trustee, American Beacon NextShares Trust (2015-Present); Director, Executive Vice President & COO, Alpha Quant Advisors, LLC (2016-Present); Director, Shapiro Capital Management, LLC (2017-Present); Director, Executive Vice President & COO, Continuous Capital, LLC (2018-Present); Director and Vice President, American Beacon Cayman Transformational Innovation Company, Ltd., (2017-Present); Vice President, American Beacon Delaware Transformational Innovation Corporation (2017-2018); Director and Vice President, American Beacon Cayman Managed Futures Strategy Fund, Ltd. (2014-Present); Vice President, American Beacon Cayman TargetRisk Company, Ltd (2018-Present); Vice President, American Beacon Select Funds (2010-2018); Vice President, American Beacon Institutional Funds Trust (2017-Present); Vice President, American Beacon Sound Point Enhanced Income Fund (2018-Present); Vice President, American Beacon Apollo Total Return Fund (2018-Present); Director, RSW Investments Holdings LLC, (2019-Present); Director, SSI Investment Management, LLC (2019-Present), Vice President, American Beacon Sound Point Alternative Lending Fund (2019-Present). | ||
| Samuel J. Silver (56) | VP Since 2011 | Vice President (2011-Present), Chief Fixed Income Officer (2016-Present), American Beacon Advisors, Inc. (2011-Present); Vice President, American Beacon Select Funds (2011-Present); Vice President, American Beacon Institutional Funds Trust (2017-Present); Vice President, American Beacon Sound Point Enhanced Income Fund (2018-Present); Vice President, American Beacon Apollo Total Return Fund (2018-Present); Vice President, American Beacon Sound Point Alternative Lending Fund (2019-Present). | ||
67
Trustees and Officers of the American Beacon FundsSM(Unaudited)
Name, Age and Address | Position, Term of | Principal Occupation(s) During Past 5 Years | ||
| OFFICERS (CONT.) | Term | |||
| One Year | ||||
| Christina E. Sears (47) | Chief Compliance Officer since 2004 and Asst. Secretary since 1999 | Vice President, American Beacon Advisors, Inc. (2019-Present); Chief Compliance Officer, American Beacon Advisors, Inc. (2004-Present); Vice President, Resolute Investment Managers, Inc. (2017-Present); Vice President, Resolute Investment Distributors (2017-Present); Vice President, Resolute Investment Services, Inc. (2019-Present); Chief Compliance Officer, American Private Equity Management, LLC (2012-Present); Chief Compliance Officer (2016-2019) and Vice President, Alpha Quant Advisors, LLC (2016-Present); Vice President, Continuous Capital, LLC (2018-Present); Chief Compliance Officer (2004-Present) and Assistant Secretary (1999-Present), American Beacon Select Funds; Chief Compliance Officer and Assistant Secretary, American Beacon Institutional Funds Trust (2017-Present); Chief Compliance Officer and Assistant Secretary, American Beacon Sound Point Enhanced Income Fund (2018-Present); Chief Compliance Officer and Assistant Secretary, American Beacon Apollo Total Return Fund (2018-Present); Chief Compliance Officer and Assistant Secretary, American Beacon Sound Point Alternative Lending Fund (2019-Present). | ||
| Sonia L. Bates (62) | Asst. Treasurer since 2011 | Assistant Treasurer, American Beacon Advisors, Inc. (2011-2018); Assistant Treasurer, Lighthouse Holdings Parent Inc. (2011-2015); Assistant Treasurer, Lighthouse Holdings, Inc. (2011-2015); Assistant Treasurer, American Private Equity Management, LLC (2012-Present); Assistant Treasurer, American Beacon Cayman Transformational Innovation Company, Ltd. (2017-Present); Assistant Treasurer, American Beacon Cayman TargetRisk Company, Ltd. (2018-Present); Assistant Treasurer, American Beacon Select Funds (2011-Present); Assistant Treasurer, American Beacon Institutional Funds Trust (2017-Present); Assistant Treasurer, American Beacon Sound Point Enhanced Income Fund (2018-Present); Assistant Treasurer, American Beacon Apollo Total Return Fund (2018-Present); Assistant Treasurer, American Beacon Sound Point Alternative Lending Fund (2019-Present). | ||
| Shelley D. Abrahams (44) | Assistant Secretary since 2008 | Assistant Secretary, American Beacon Select Funds (2008-Present); Assistant Secretary, American Beacon Institutional Funds Trust (2017-Present); Assistant Secretary, American Beacon Sound Point Enhanced Income Fund (2018-Present); Assistant Secretary, American Beacon Apollo Total Return Fund (2018-Present); Assistant Secretary, American Beacon Sound Point Alternative Lending Fund (2019-Present). | ||
| Rebecca L. Harris (52) | Assistant Secretary since 2010 | Vice President, American Beacon Advisors, Inc. (2011-Present); Vice President, Resolute Investment Managers, Inc. (2017-Present); Vice President, Resolute Investment Services (2015-Present); Vice President, Alpha Quant Advisors, LLC (2016-Present); Vice President, Continuous Capital, LLC (2018-Present); Assistant Secretary, American Beacon Select Funds (2010-Present); Assistant Secretary, American Beacon Institutional Funds Trust (2017-Present); Assistant Secretary, American Beacon Sound Point Enhanced Income Fund (2018-Present); Assistant Secretary, American Beacon Apollo Total Return Fund (2018-Present); Assistant Secretary, American Beacon Sound Point Alternative Lending Fund (2019-Present). | ||
68
Trustees and Officers of the American Beacon FundsSM(Unaudited)
Name, Age and Address | Position, Term of | Principal Occupation(s) During Past 5 Years | ||
| OFFICERS (CONT.) | Term | |||
| One Year | ||||
| Teresa A. Oxford (61) | Assistant Secretary since 2015 | Assistant Secretary, American Beacon Advisors, Inc. (2015-Present); Assistant Secretary, Resolute Investment Distributors (2018-Present); Assistant Secretary, Resolute Investment Services (2018-Present); Assistant Secretary, Alpha Quant Advisors, LLC (2016-Present); Assistant Secretary, American Beacon Select Funds (2015-Present); Assistant Secretary, American Beacon Institutional Funds Trust (2017-Present); Assistant Secretary, American Beacon Sound Point Enhanced Income Fund (2018-Present); Assistant Secretary, American Beacon Apollo Total Return Fund (2018-Present); Assistant Secretary, American Beacon Sound Point Alternative Lending Fund (2019-Present). | ||
* As of 11/12/2014, the Board adopted a retirement plan that requires Trustees, other than Messrs. Feld and Massman to retire no later than the last day of the calendar year in which they reach the age of 75. As of 11/7/17, the Board approved a waiver of the mandatory retirement policy with respect to Mr. Massman, who turned 75 in November 2018, to permit him to continue to serve on the Board as Chair Emeritus through 12/31/19.
** Mr. Feld is deemed to be an “interested person” of the Trusts, as defined by the 1940 Act. Mr. Feld’s law firm of Akin, Gump, Strauss, Hauer & Feld LLP has provided legal services within the past two fiscal years to one or more of the Trust’s sub-advisors.
69
American Beacon FundsSM
August 31, 2019 (Unaudited)
The American Beacon Funds recognize and respect the privacy of our shareholders. We are providing this notice to you so you will understand how shareholder information may be collected and used.
We may collect nonpublic personal information about you from one or more of the following sources:
| • | information we receive from you on applications or other forms; |
| • | information about your transactions with us or our service providers; and |
| • | information we receive from third parties. |
We do not disclose any nonpublic personal information about our customers or former customers to anyone, except as permitted by law.
We restrict access to your nonpublic personal information to those employees or service providers who need to know that information to provide products or services to you. To ensure the confidentiality of your nonpublic personal information, we maintain safeguards that comply with federal standards.
70
This page intentionally left blank.
71
This page intentionally left blank.
72

Delivery of Documents
eDelivery isNOW AVAILABLE - Stop traditional mail delivery and receive your shareholder reports and summary prospectus on-line. Sign up at
www.americanbeaconfunds.com
If you invest in the Fund through a financial institution, you may be able to receive the Fund’s regulatory mailings, such as the Prospectus, Annual Report and Semi-Annual Report, by e-mail. If you are interested in this option, please go towww.icsdelivery.com and search for your financial institution’s name or contact your financial institution directly.
To obtain more information about the Fund:
 |  | |
| ByE-mail: | On the Internet: | |
| american_beacon.funds@ambeacon.com | Visit our website atwww.americanbeaconfunds.com | |
By Telephone: Call (800)658-5811 |
By Mail: American Beacon Funds P.O. Box 219643 Kansas City, MO 64121-9643 | |
| Availability of Quarterly Portfolio Schedules | Availability of Proxy Voting Policy and Records | |
| In addition to the Schedule of Investments provided in each semi-annual and annual report, the Fund files a complete schedule of its portfolio holdings with the Securities and Exchange Commission (“SEC”) on Form N-PORT as of the first and third fiscal quarters. The Fund’s Forms N-PORT are available on the SEC’s website atwww.sec.gov. TheForms N-PORT may also be reviewed and copied at the SEC’s Public Reference Section, 100 F Street NE, Washington, D.C.20549-2736. Information regarding the operation of the SEC’s Public Reference Room may be obtained by calling1-800-SEC-0330. A complete schedule of each Fund’s portfolio holdings is also made available on the Funds’ website atwww.americanbeaconfunds.com approximately 60 days after the end of each quarter for the Zebra Small Cap Equity Fund and 20 days after the end of each month for The London Company Income Equity Fund. | A description of the policies and procedures the Fund uses to determine how to vote proxies relating to portfolio securities is available in the Fund’s Statement of Additional Information, which is available free of charge on the Fund’s website atwww.americanbeaconfunds.com and by calling 1-800-967-9009 or by accessing the SEC’s website atwww.sec.gov. The Fund’s proxy voting record for the most recent year ended June 30 is filed annually with the SEC on Form N-PX. The Fund’s Forms N-PX are available on the SEC’s website atwww.sec.gov. The Fund’s proxy voting record may also be obtained by calling 1-800-967-9009. | |


Fund Service Providers:
CUSTODIAN State Street Bank and Trust Company Boston, Massachusetts | TRANSFER AGENT DST Asset Manager Solutions, Inc. Quincy, Massachusetts | INDEPENDENT REGISTERED PUBLIC ACCOUNTING FIRM Ernst & Young LLP Dallas, Texas | DISTRIBUTOR Resolute Investment Distributors, Inc. Irving, Texas |
This report is prepared for shareholders of the American Beacon Funds and may be distributed to others only if preceded or accompanied by a current Prospectus or Summary Prospectus.
American Beacon Funds, American Beacon The London Company Income Equity Fund and American Beacon Zebra Small Cap Equity Fund are service marks of American Beacon Advisors, Inc.
AR 8/19
| ITEM 2. | CODE OF ETHICS. |
The Trust adopted a code of ethics that applies to its principal executive and financial officers (the “Code”). The Trust amended its code August 19, 2019 to disclose the addition of the American Beacon Sound Point Enhanced Income Fund, American Beacon Apollo Total Return Fund and American Beacon Sound Point Alternative Lending Fund and to disclose a change to limit the value of gifts received by the principal officer or financial officer to $100. The Trust did not grant any waivers to the provisions of the Code during the period covered by the shareholder reports presented in Item 1. The Code is filed herewith as Exhibit 99.CODE ETH.
| ITEM 3. | AUDIT COMMITTEE FINANCIAL EXPERT. |
The Trust’s Board of Trustees has determined that Gilbert G. Alvarado and Claudia Holz, members of the Trust’s Audit and Compliance Committee, are “audit committee financial experts” as defined in FormN-CSR. Mr. Gilbert Alvarado and Ms. Claudia Holz are “independent” as defined in FormN-CSR.
| ITEM 4. | PRINCIPAL ACCOUNTANT FEES AND SERVICES. |
(a)
Audit Fees | Fiscal Year Ended | |||
$272,596 | 8/31/2018 | |||
$166,897 | 8/31/2019 | |||
(b)
Audit-Related Fees | Fiscal Year Ended | |||
$0 | 8/31/2018 | |||
$5,000 | 8/31/2019 | |||
(c)
Tax Fees | Fiscal Year Ended | |||
$69,328 | 8/31/2018 | |||
$40,742 | 8/31/2019 | |||
(d)
All Other Fees | Fiscal Year Ended | |||
$0 | 8/31/2018 | |||
$0 | 8/31/2019 | |||
e)(1) Pursuant to its charter, the Trust’s Audit and Compliance Committee shall have the following duties and powers pertaining topre-approval of audit andnon-audit services provided by the Trust’s principal accountant:
- to approve, prior to appointment, the engagement of auditors to annually audit and provide their opinion on the Trusts’ financial statements, and, in connection therewith, reviewing and evaluating matters potentially affecting the independence and capabilities of the auditors;
- to approve, prior to appointment, the engagement of the auditors to providenon-audit services to the Trusts, an investment adviser to any series of the Trusts or any entity controlling, controlled by, or under common control with an investment adviser (“adviser affiliate”) that provides ongoing services to the Trusts, if the engagement relates directly to the operations and financial reporting of the Trusts;
- to consider whether thenon-audit services provided by a Trust’s auditor to an investment adviser or any adviser affiliate that provides ongoing services to a series of the Trusts, which services were notpre-approved by the Committee, are compatible with maintaining the auditor’s independence;
- to review the arrangements for and scope of the annual audit and any special audits; and
- to review and approving the fees proposed to be charged to the Trusts by the auditors for each audit andnon-audit service.
The Audit and Compliance Committee may delegate any portion of its authority, including the authority to grantpre-approvals of audit and permittednon-audit services, to a subcommittee of one or more members. Any decisions of the subcommittee to grantpre-approvals shall be presented to the full audit committee at its next regularly scheduled meeting.
(e)(2) None of the fees disclosed in paragraphs (b) through (d) above were approved by the audit committee pursuant to paragraph (c)(7)(i)(C) of Rule2-01 of RegulationS-X.
| (f) | Not applicable. |
| (g) | AggregateNon-Audit Fees for Services Rendered to the: |
Registrant | Adviser | Adviser’s Affiliates Providing Ongoing Services to Registrant | Fiscal Year Ended | |||||||
| $69,328 | $ | 131,684 | N/A | 8/31/2018 | ||||||
| $40,742 | $ | 807,829 | N/A | 8/31/2019 | ||||||
| (h) | Not applicable. |
| ITEM 5. | AUDIT COMMITTEE OF LISTED REGISTRANTS. |
Not applicable.
| ITEM 6. | SCHEDULE OF INVESTMENTS. |
The schedules of investments for each series of the Trust are included in the shareholder reports presented in Item 1.
| ITEM 7. | DISCLOSURE OF PROXY VOTING POLICIES AND PROCEDURES FORCLOSED-END MANAGEMENT INVESTMENT COMPANIES. |
Not applicable.
| ITEM 8. | PORTFOLIO MANAGERS OFCLOSED-END MANAGEMENT INVESTMENT COMPANIES. |
Not applicable.
| ITEM 9. | PURCHASES OF EQUITY SECURITIES BYCLOSED-END MANAGEMENT INVESTMENT COMPANY AND AFFILIATED PURCHASERS. |
Not applicable.
| ITEM 10. | SUBMISSION OF MATTERS TO A VOTE OF SECURITY HOLDERS. |
The Trust has made no material changes to the procedures by which shareholders may recommend nominees to the Trust’s Board of Trustees since the Trust last disclosed such procedures in Schedule 14A.
| ITEM 11. | CONTROLS AND PROCEDURES. |
(a) Based upon an evaluation within 90 days of the filing date of this report, the principal executive and financial officers concluded that the disclosure controls and procedures of the Trust are effective.
(b) There were no changes in the Trust’s internal control over financial reporting during the second fiscal quarter of the period covered by this report that has materially affected, or is reasonably likely to materially affect, the Trust’s internal control over financial reporting.
| ITEM 12. | EXHIBITS. |
(a)(1) Filed herewith asEX-99.CODE ETH.
(a)(2) A separate certification for each principal executive officer and principal financial officer of the Trust as required by Rule30a-2(a) under the Investment Company Act of 1940 is attached hereto asEX-99.CERT.
(a)(3) Not applicable.
(b) The certifications required by Rule30a-2(b) under the Investment Company Act of 1940 are attached hereto asEX-99.906CERT.
SIGNATURES
Pursuant to the requirements of the Securities Exchange Act of 1934 and the Investment Company Act of 1940, the registrant has duly caused this report to be signed on its behalf by the undersigned, thereunto duly authorized.
(Registrant): American Beacon Funds
| By | /s/ Gene L. Needles, Jr. | |
Gene L. Needles, Jr. | ||
President | ||
American Beacon Funds | ||
| Date: November 4, 2019 | ||
Pursuant to the requirements of the Securities Exchange Act of 1934 and the Investment Company Act of 1940, this report has been signed below by the following persons on behalf of the registrant and in the capacities and on the dates indicated.
| By | /s/ Gene L. Needles, Jr. | |
Gene L. Needles, Jr. | ||
President | ||
American Beacon Funds | ||
| Date: November 4, 2019 | ||
| By | /s/ Melinda G. Heika | |
Melinda G. Heika | ||
Treasurer | ||
American Beacon Funds | ||
| Date: November 4, 2019 | ||