UNITED STATES
SECURITIES AND EXCHANGE COMMISSION
Washington, D.C. 20549
FORM N-CSR
CERTIFIED SHAREHOLDER REPORT OF REGISTERED MANAGEMENT
INVESTMENT COMPANIES
Investment Company Act file number 811-5018
Smith Barney Investment Series
(Exact name of registrant as specified in charter)
| | |
| 125 Broad Street, New York, NY | | 10004 |
| (Address of principal executive offices) | | (Zip code) |
Robert I. Frenkel, Esq.
Smith Barney Fund Management LLC
300 First Stamford Place
Stamford, CT 06902
(Name and address of agent for service)
Registrant’s telephone number, including area code: (800) 451-2010
Date of fiscal year end: October 31
Date of reporting period: October 31, 2004
| ITEM 1. | REPORT TO STOCKHOLDERS. |
The Annual Report to Stockholders is filed herewith.
SMITH BARNEY
INVESTMENT SERIES
ANNUAL REPORT | OCTOBER 31, 2004
Smith Barney Premier Selections
All Cap Growth Portfolio
Smith Barney Dividend Strategy Portfolio
Smith Barney Growth and Income Portfolio
SB Government Portfolio

NOT FDIC INSURED • NOT BANK GUARANTEED • MAY LOSE VALUE
WHAT’S INSIDE
LETTER FROM THE CHAIRMAN

R. JAY GERKEN
Chairman, President and Chief Executive Officer
Dear Shareholder,
Stock prices collectively advanced over the 12 months ending October 31, 2004, although performance varied sharply among sectors and investment styles. The equity market also shifted gears during the period due to investors’ reaction to mixed signals about the economy.
Last fall, stocks continued to rise as many geopolitical concerns began to ease, and a spate of mortgage refinancings freed up investable cash for investors. Despite positive corporate earnings results, stocks traded in a narrow range during the first quarter of this year due to concerns about anemic job growth. During this time, the economy grew at a moderate pace,i albeit at significantly stronger levels than during the first half of 2003.
In the spring, the economic recovery became broader based as labor market growth improved dramatically in March and April, although signs suggested a rise in inflation during the spring as well. As widely anticipated, the Federal Reserve Board (“Fed”)ii proceeded to push short-term interest rates higher, marking its first hike in four years. The Fed raised its target for the closely watched federal funds rateiii by 0.25% on three occasions during the reporting period, increasing it from a four-decade low of 1.00% in June to 1.75% in September, and then again to 2.00% on November 10th after the fund’s reporting period had ended. Higher rates can help slow a potential acceleration of economic growth and thereby help maintain a balance between that growth and the inflation that can generally accompany it.
As the period came to a close, inflation figures were benign while labor market growth, which had tapered off during the summer, exceeded consensus estimates for October. Crude oil prices, which had risen to record highs in the third quarter, when coupled with investors’ reaction to terrorism concerns, weakened investor sentiment toward the equity markets. However, reports of a pullback in oil prices and strong third-quarter corporate profits gave stock prices a boost in the final month of the period.
Over the 12 months, stocks of small- and mid-capitalization companies continued to outperform large-caps in general. Value-oriented stocks handily outpaced growth-oriented stocks. International stock markets beat out the broad domestic U.S. market by a wide margin.
Following a sharp sell-off in the spring in anticipation that rates were poised to rise, bonds prices rose later in the period. However, the fixed-income markets experienced some downward pricing pressures after the reporting period as interest rate concerns resurfaced. Over the 12 months, investment-grade bonds finished in modestly positive territory on a total return basis.iv
Please read on for a more detailed look at prevailing economic and market conditions during the fund’s fiscal year and to learn how those conditions have affected fund performance.
1 Smith Barney Investment Series | 2004 Annual Report
Information About Your Fund
As you may be aware, several issues in the mutual fund industry have recently come under the scrutiny of federal and state regulators. The fund’s Adviser and some of its affiliates have received requests for information from various government regulators regarding market timing, late trading, fees, and other mutual fund issues in connection with various investigations. The regulators appear to be examining, among other things, the fund’s response to market timing and shareholder exchange activity, including compliance with prospectus disclosure related to these subjects. The fund has been informed that the Adviser and its affiliates are responding to those information requests, but are not in a position to predict the outcome of these requests and investigations.
In November 2003, Citigroup Asset Management (“CAM”) disclosed an investigation by the Securities and Exchange Commission (“SEC”) and the U.S. Attorney relating to CAM’s entry into the transfer agency business during 1997-1999. Citigroup has disclosed that the Staff of the SEC is considering recommending a civil injunctive action and/or an administrative proceeding against certain advisory and transfer agent entities affiliated with Citigroup, the former CEO of CAM, two former employees and a current employee of CAM, relating to the creation, operation and fees of its internal transfer agent unit that serves various CAM-managed funds. Citigroup is cooperating with the SEC and will seek to resolve this matter in discussion with the SEC Staff. Although there can be no assurance, Citigroup does not believe that this matter will have a material adverse effect on the fund.
As always, thank you for your confidence in our stewardship of your assets. We look forward to helping you continue to meet your financial goals.
Sincerely,

R. Jay Gerken, CFA
Chairman, President and Chief Executive Officer
November 18, 2004
The information provided is not intended to be a forecast of future events, a guarantee of future results or investment advice. Views expressed may differ from those of the firm as a whole.
All index performance reflects no deduction for fees, expenses or taxes. Please note an investor cannot invest directly in an index.
| i | | Source: Commerce Department (Bureau of Economic Analysis). Refers to quarterly growth of Gross Domestic Product (“GDP”). Gross domestic product is a market value of goods and services produced by labor and property in a given country. |
| ii | | Source: U.S. Federal Reserve Board. The Fed is responsible for the formulation of a policy designed to promote economic growth, full employment, stable prices, and a sustainable pattern of international trade and payments. |
| iii | | The federal funds rate is the interest rate that banks with excess reserves at a Federal Reserve district bank charge other banks that need overnight loans. |
| iv | | Based on the Lehman Brothers Aggregate Bond Index, which returned 5.53% over the 12 months ended October 31, 2004. This is a broad-based bond index comprised of Government, Corporate, Mortgage and Asset-backed issues, rated investment grade or higher, and having at least one year to maturity. |
2 Smith Barney Investment Series | 2004 Annual Report
FUND PERFORMANCE1
AS OF OCTOBER 31, 2004
(excluding sales charges)
| | | | | | | |
| | | 6 Months | | | 12 Months | |
| | | | | | | | |
Smith Barney Premier Selections All Cap Growth Portfolio | | - | 2.09 | % | | -1.92 | % |
| | | | | | | | |
Russell 1000 Growth Index | | - | 0.73 | % | | 3.38 | % |
| | | | | | | | |
Russell 2000 Growth Index | | | 1.46 | % | | 5.53 | % |
| | | | | | | | |
S&P MidCap 400 Index | | | 3.84 | % | | 11.04 | % |
| | | | | | | | |
Lipper Variable Multi-Cap Growth Funds Category Average | | | 1.90 | % | | 4.78 | % |
| | | | | | | | |
Smith Barney Dividend Strategy Portfolio2 | | | 0.00 | % | | 3.41 | % |
| | | | | | | | |
S&P 500 Index | | | 2.96 | % | | 9.41 | % |
| | | | | | | | |
Lipper Variable Large-Cap Core Funds Category Average | | | 1.68 | % | | 6.69 | % |
| | | | | | | | |
Smith Barney Growth and Income Portfolio | | | 2.27 | % | | 7.18 | % |
| | | | | | | | |
S&P 500 Index | | | 2.96 | % | | 9.41 | % |
| | | | | | | | |
Lipper Variable Large-Cap Core Funds Category Average | | | 1.68 | % | | 6.69 | % |
| | | | | | | | |
SB Government Portfolio | | | 3.80 | % | | 3.90 | % |
| | | | | | | | |
Lehman Brothers Government Bond Index | | | 3.96 | % | | 4.83 | % |
| | | | | | | | |
Lipper Variable General U.S. Government Funds Category Average | | | 4.03 | % | | 4.81 | % |
| | 1 | | The funds are underlying investment options of various variable annuity products. A variable annuity product is a contract issued by an insurance company where the annuity premium (a set amount of dollars) is immediately turned into units of a portfolio of securities. Upon retirement, the policyholder is paid according to accumulated units whose dollar value varies according to the performance of the securities within the sub accounts. Its objective is to preserve, through investment, the purchasing value of the annuity, which otherwise is subject to erosion through inflation. The fund’s performance returns do not reflect the deduction of initial sales charges and expenses imposed in connection with investing in variable annuity contracts such as administrative fees, account charges and surrender charges, which if reflected, would reduce the performance of the fund. Past performance is no guarantee of future results. | |
| | 2 | | Formerly, Smith Barney Large Cap Core Portfolio. | |
Lipper, Inc. is a major independent mutual-fund tracking organization.
Returns are based on the period ended October 31, calculated among the 104 funds for the six-month period and among the 103 funds for the 12-month period in the fund’s Lipper variable multi-cap growth funds category including the reinvestment of dividends and capital gains, if any.
Returns are based on the period ended October 31, calculated among the 212 funds for the six-month period and among the 211 funds for the 12-month period in the fund’s Lipper variable large-cap core funds category including the reinvestment of dividends and capital gains, if any.
Returns are based on the period ended October 31, calculated among the 57 funds for the six-month period and among the 57 funds for the 12-month period in the fund’s Lipper variable general U.S. government funds category including the reinvestment of dividends and capital gains, if any.
3 Smith Barney Investment Series | 2004 Annual Report
Smith Barney Premier Selections All Cap Growth Portfolio
Market Review
At the start of the 12-month period in November of 2003, the stock market was in the middle of a strong rally that saw both stock prices and investors’ expectations rise broadly. Coming off the market bottom set during the preceding three-year recession, improving economic indicators and corporate earnings news along with surprisingly strong gross domestic product (“GDP”)i growth for the third quarter combined to produce gains in the fourth quarter for most market sectors.
However, more mixed economic data and increasing concerns about the job market dampened the rally soon after the start of the New Year and the market slowed during the first quarter. Stocks were generally stuck in a limited trading range through much of the second quarter, as uncertainty over the geopolitical situation, concerns about rising interest rates and questions about the U.S. presidential race kept both businesses and many investors on the sidelines.
After supporting much of the economy through the recession and into the New Year, consumers began to show signs of fatigue as the benefits of the prior year’s tax changes and the mortgage refinancing boom began to diminish. Record-high oil prices hit consumers and businesses at the gas pump, which helped drive most of the market down in the third quarter. However, after the close of the period, following the election and a break in oil prices from their recent highs, the broad market again turned upwards.
Performance Review
For the 12 months ended October 31, 2004, Class A shares of the Smith Barney Premier Selections All Cap Growth Portfolio returned -1.92%. These shares underperformed the fund’s unmanaged benchmarks, the S&P MidCap 400 Index,ii the Russell 1000 Growth Index,iii and the Russell 2000 Growth Index,iv which returned 11.04%, 3.38%, and 5.53%, respectively, for the same period. These shares also underperformed the fund’s Lipper variable multi-cap growth funds category average,1 which was 4.78%.
Fund Overview
Both stock selection and sector allocation had a negative effect on fund performance in comparison to the benchmarks, with the majority of underperformance due to stock selection, especially in the consumer discretionary, information technology and industrials sectors.v Detractors from fund performance came from across the capitalization range rather than from one specific capitalization segment of the portfolio.
Contributors to Performance
On a sector basis, the greatest returns during the period were from the energy and consumer staples sectors. The leading stock contributor was the fund’s holding in Las Vegas-based gaming operator Station Casinos Inc. in consumer discretionary. Other major contributors included shaving supply and consumer product giant Gillette Co. in consumer staples, Alliance Data Systems Corp., a provider of private-label credit card services in information technology, home improvement
chain The Home Depot Inc. in consumer discretionary, and retailer Dick’s Sporting Goods Inc. in consumer discretionary. The fund maintained its positions in all five stocks at the close of the period.
Detractors from Performance
The information technology, consumer discretionary and industrials sectors experienced the greatest total losses during the period. Leading stock detractors included online retailer Amazon.com in consumer discretionary, semiconductor producers Intel Corp. and Cypress Semiconductor, both in information technology, Career Education Corp., a private provider of post-secondary education in industrials, and pharmaceutical
| 1 | | Lipper Inc. is a major independent mutual-fund tracking organization. Returns are based on the period ended October 31, 2004, calculated among funds for the 12-month period in the fund’s Lipper peer group including the reinvestment of dividends and capital gains, if any. |
4 Smith Barney Investment Series | 2004 Annual Report
producer Merck & Co., Inc. in healthcare. The fund had closed its positions in Cypress Semiconductor, Career Education, and Merck by the close of the period, but continued to hold Amazon and Intel.
Portfolio Update
At the close of the period, the fund was overweight in the consumer discretionary, financials and materials sectors, market weight in the industrials sector, and underweight in information technology, healthcare, consumer staples and energy sectors, with no holdings in telecommunications services. In terms of market
capitalization, approximately $36 billion of the portfolio was held in small-cap stocks (companies with market caps of less than $3 billion), $20 billion in mid-cap stocks (companies between $3 billion and $10 billion) and $44 billion in large-caps (companies above $10 billion). The fund’s weighted average market capitalization was $47.9 billion, while its weighted median market cap was $6.1 billion.
Thank you for your investment in the Smith Barney Premier Selections All Cap Growth Portfolio. As ever, we appreciate that you have chosen us to manage your assets and we remain focused on achieving the fund’s investment goals.
Sincerely,
| | |
 | |  |
| Alan J. Blake | | Lawrence B. Weissmann, CFA |
| Portfolio Manager | | Portfolio Manager |
|
 |
| Timothy Woods, CFA | | |
| Portfolio Manager | | |
November 19, 2004
The information provided is not intended to be a forecast of future events, a guarantee of future results or investment advice. Views expressed may differ from those of the firm as a whole.
Portfolio holdings and breakdowns are as of October 31, 2004 and are subject to change and may not be representative of the fund’s current or future investments. The fund’s top ten holdings (as a % of net assets) of this date were: Gillette (2.47%), Microsoft (2.38%), Berkshire Hathaway Inc. (2.36%), Home Depot (2.34%), Texas Instruments (2.29%), Merrill Lynch & Co. Inc. (2.26%), Time Warner Inc. (2.12%), Coca Cola Company (2.07%), Johnson & Johnson 2.06% and Pfizer Inc. 2.02%. Please refer to pages 22 through 26 for a list and percentage breakdown of the fund’s holdings.
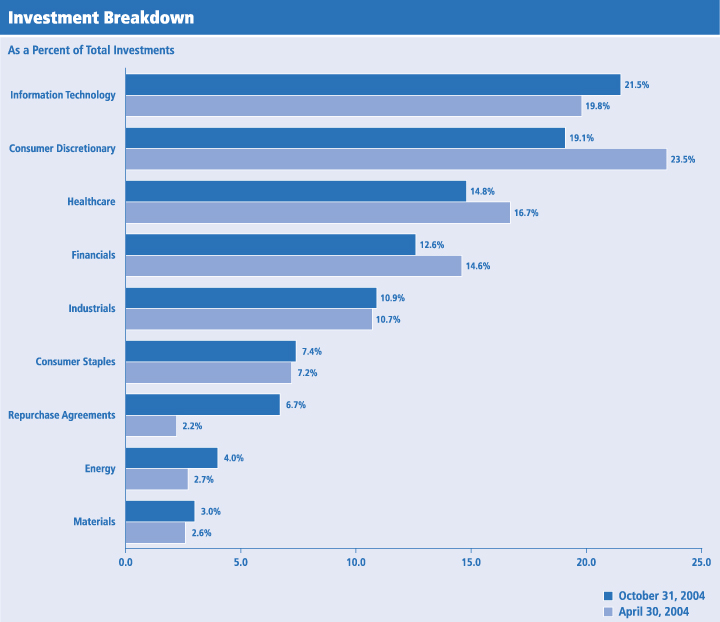
The mention of sector breakdowns is for informational purposes only and should not be construed as a recommendation to purchase or sell any securities. The information provided regarding such sectors is not a sufficient basis upon which to make an investment decision. Investors seeking financial advice regarding the appropriateness of investing in any securities or investment strategies discussed should consult their financial professional. Portfolio holdings are subject to change at any time and may not be representative of the fund’s current or future investments. The fund’s top five sector holdings (as a % of net assets) as of October 31, 2004 were: Information Technology (21.6%); Consumer Discretionary (19.3%); Healthcare (15.0%); Financials (12.7%); Industrials (10.9%). The fund’s portfolio composition is subject to change at any time.
RISKS: The fund may invest in small- and mid-cap companies that may involve a higher degree of risk and volatility than investments in large-cap companies. The fund may use derivatives, such as options and futures, which can be illiquid, may disproportionately increase losses, and have a potentially large impact on fund performance. Investing in foreign securities is subject to certain risks not associated with domestic investing, such as currency fluctuations, and changes in political and economic conditions. These risks are magnified in emerging or developing markets.
All index performance reflects no deduction for fees, expenses or taxes. Please note an investor cannot invest directly in an index.
| i | | Gross domestic product is a market value of goods and services produced by labor and property in a given country. |
| ii | | The S&P MidCap 400 Index is a market-value weighted index which consists of 400 domestic stocks chosen for market size, liquidity, and industry group representation. |
| iii | | The Russell 1000 Growth Index measures the performance of those Russell 1000 companies with higher price-to-book ratios and higher forecasted growth values. |
| iv | | The Russell 2000 Growth Index measures the performance of those Russell 2000 companies with higher price-to-book ratios and higher forecasted growth values. |
| v | | The Russell 3000 Growth Index is used for this comparison. The Russell 3000 Growth Index measures the performance of those Russell 3000 Index companies with higher price-to-book ratios and higher forecasted growth values. |
5 Smith Barney Investment Series | 2004 Annual Report
Smith Barney Premium Selections All Cap Growth Portfolio Fund at a Glance (unaudited)
6 Smith Barney Investment Series | 2004 Annual Report
Smith Barney Premier Selections All Cap Growth Portfolio* Historical Performance (unaudited)
Value of $10,000 Invested in the Smith Barney Premier Selections All Cap Growth Portfolio vs. S&P MidCap 400 Index, Russell 1000 Growth Index and Russell 2000 Growth Index†
September 1999 — October 2004

| † | Hypothetical illustration of $10,000 invested on September 15, 1999 (commencement of operations), assuming the reinvestment of dividends and capital gains, if any, at net asset value through October 31, 2004. Before May 1, 2001, the Portfolio was known as the Select Mid Cap Portfolio and had a different investment style. The S&P MidCap 400 Index is a widely recognized index of 400 medium-capitalization stocks. Figures for the S&P MidCap 400 Index include reinvestment of dividends. The Russell 1000 Growth Index measures the performance of those Russell 1000 companies with higher price-to-book ratios and higher forecasted growth values. (A price-to-book ratio is the price of a stock compared to the difference between a company’s assets and liabilities. The Russell 2000 Growth Index measures the performance of those Russell 2000 companies with higher price-to-book ratios and higher forecasted growth values. (A price-to-book ratio is the price of a stock compared to the difference between a company’s assets and liabilities.) The Indices are unmanaged and are not subject to the same management and trading expenses of a mutual fund. Please note that an investor cannot invest directly in an index. |
| * | Before May 1, 2001, the Portfolio was known as Select Mid Cap Portfolio and had a different investment style. |
All figures represent past performance and are not a guarantee of future results. Investment return and principal value of an investment will fluctuate so that an investor’s shares, when redeemed, may be worth more or less than their original cost. Total returns do not reflect expenses associated with the separate account such as administrative fees, account charges and surrender charges, which, if reflected, would reduce the total returns. Performance figures may reflect fee waivers and/or expense reimbursements. In the absence of fee waivers and/or expense reimbursements, the total return would have been lower.
Average Annual Total Returns‡ (unaudited)
| | | |
Twelve Months Ended 10/31/04 | | (1.92 | )% |
|
|
Five Years Ended 10/31/04 | | 2.29 | |
|
|
9/15/99** through 10/31/04 | | 2.45 | |
|
|
|
Cumulative Total Returns‡ (unaudited) | |
9/15/99** through 10/31/04 | | 13.21 | % |
|
|
| ‡ | | Assumes reinvestment of all dividends and capital gain distributions, if any, at net asset value. All figures represent past performance and are not a guarantee of future results. Investment return and principal value of an investment will fluctuate so that an investor’s shares, when redeemed, may be worth more or less than their original cost. Total returns do not reflect expenses associated with the separate account such as administrative fees, account charges and surrender charges, which, if reflected, would reduce the total returns. Performance figures may reflect fee waivers and/or expense reimbursements. In the absence of fee waivers and/or expense reimbursements, the total return would have been lower. |
| ** | | Commencement of operations. |
7 Smith Barney Investment Series | 2004 Annual Report
Smith Barney Dividend Strategy Portfolio
Special Shareholder Notice
On August 9, 2004, the Board of Directors of Smith Barney Investment Series on behalf of Smith Barney Large Cap Core Portfolio approved several material changes to the Portfolio. All of the following changes are effective as of November 1, 2004.
Name Change
Smith Barney Large Cap Core Portfolio has been renamed Smith Barney Dividend Strategy Portfolio.
Portfolio Manager Change
Scott K. Glasser and Peter J. Hable will now serve as portfolio co-managers for the Portfolio.
Investment Policy Change
The investment policy of the portfolio has changed. Previously, the portfolio sought to invest at least 80% of its net assets in equity securities of U.S. large cap issuers and related investments. Now the investment policy of the portfolio is to invest at least 80% of assets in dividend paying stocks. The fund is also permitted to invest up to 20% of assets in other types of securities, including non-dividend paying companies, preferred stocks and fixed income securities.
Management Fees
Effective September 1, 2004, the management fee payable by the fund was reduced from 0.75% to 0.65% of assets under management. The revised management fee schedule provides for additional fee reductions when assets under management exceed $1 billion.
Market Review
At the start of the 12-month period in November of 2003, the equity marketplace was enjoying a strong rally that showed many of the global equity markets recovering to the levels not seen for months. For most of calendar year 2003 and through October of 2004, the equity marketplace was working off its multi-year low seen on October 9, 2002. Improving economic growth as seen in our gross domestic product (“GDP”)i growth for the third quarter of 2003, as well as better corporate performance, combined to produce strong equity performance in the fourth quarter of 2003 for most market sectors. Aggressive monetary and fiscal policies finally manifested themselves in the third calendar quarter of 2003 with the best real domestic growth of 7.4% that the U.S. has seen in almost two decades.
In March of 2004, signs of inflation began to show as seen by the GDP deflatorii at 2.5% (annualized), which was the highest inflation we have seen since June 2001. This level of inflation was due to higher energy costs working themselves through the system. We believe that the financial marketplace continues to discount a sustainable recovery albeit with higher levels of inflation and, as a result, more restrictive monetary policy.
Stocks were generally stuck in a limited trading range through much of the second quarter of 2004, as uncertainty over the geopolitical situation, concerns about rising interest rates and questions about the U.S. presidential race kept both businesses and many investors uncertain about the overall equity marketplace. In addition, high oil prices were a negative for the consumer.
Performance Review
For the 12 months ended October 31, 2004, the Smith Barney Dividend Strategy Portfolio returned 3.41%. These shares underperformed the portfolio’s unmanaged benchmark, the S&P 500 Index,iii which returned 9.41% for the same period. They also underperformed the Lipper variable large-cap core funds category average,1 which was 6.69%.
Fund Overview
Both stock selection and sector allocation had a negative effect on fund performance in comparison to the benchmarks, with the majority of underperformance due to
| 1 | | Lipper, Inc. is a major independent mutual-fund tracking organization. Returns are based on the 12-month period ended October 31, 2004, calculated among the 211 funds in the fund’s Lipper category, including the reinvestment of dividends and capital gains, if any. |
8 Smith Barney Investment Series | 2004 Annual Report
stock selection, especially in the consumer discretionary and information technology sectors. Contributors to performance came largely from the industrials and consumer staples sectors.
Contributors to Performance
On a sector basis, the greatest returns during the one-year period were from energy, utilities and industrials sectors. The sectors that performed least well for the years were technology, healthcare and consumer staples.
Relative to the portfolio’s benchmark, the fund’s best performing equities during this period were Biogen Idec Inc., a biotechnology company involved in research and development, manufacture, and commercialization of targeted therapies for the treatment of cancer and autoimmune and inflammatory diseases. Canadian National Railway Co., Tyco International Ltd., Exxon Mobil Corp. and St. Jude Medical were the other top four relative performers. The portfolio maintained its positions in all five stocks at the close of the period.
Detractors From Performance
The information technology and consumer discretionary sectors detracted most from the portfolio’s performance for this one-year period, specifically, e-commerce company InterActive Corp. in the consumer discretionary area. In information technology, holdings that weakened our overall performance included Veritas Software Corp., an application server software developer, BEA Systems Inc., an application infrastructure software company, Intel Corp. which manufactures semiconductor chips and supplies advanced technology solutions for the computing and communications industries, and lastly, Siebel Systems Inc., which provides business applications software.
Thank you for your investment in the Smith Barney Dividend Strategy Portfolio. As ever, we appreciate that you have chosen us to manage your assets and we remain focused on achieving the fund’s investment goals.
Sincerely,
Lawrence B. Weissman, CFA
Portfolio Manageriv
November 19, 2004
The information provided is not intended to be a forecast of future events, a guarantee of future results or investment advice. Views expressed may differ from those of the firm as a whole.
Portfolio holdings and breakdowns are as of October 31, 2004 and are subject to change and may not be representative of the fund’s current or future investments. The fund’s top ten holdings (as a % of net assets) as of this date were: Exxon Mobil Corp. (4.17%), Microsoft Corp. (3.80%), General Electric (3.53%), Pfizer Inc. (3.08%), Intel Corporation (2.43%), Wyeth (2.20%), The Proctor & Gamble Co. (1.94%), Teva Pharmaceutical Industries Ltd., Sponsored ADR (1.89%), Amgen Inc. (1.76%), American International Group, Inc. (1.74%). Please refer to pages 27 through 31 for a list and percentage breakdown of the fund’s holdings.
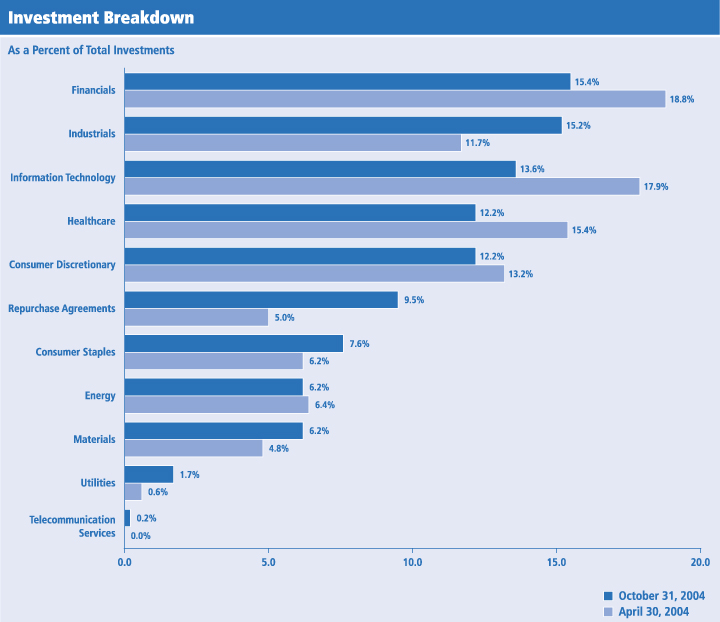
The mention of sector breakdowns is for informational purposes only and should not be construed as a recommendation to purchase or sell any securities. The information provided regarding such sectors is not a sufficient basis upon which to make an investment decision. Investors seeking financial advice regarding the appropriateness of investing in any securities or investment strategies discussed should consult their financial professional. Portfolio holdings are subject to change at any time and may not be representative of the fund’s current or future investments. The fund’s top five sector holdings (as a % of net assets) as of October 31, 2004 were: Financials (15.6%); Industrials (15.2%); Information Technology (13.7%); Consumer Discretionary (12.3%); Healthcare (12.3%). The fund’s portfolio composition is subject to change at any time.
RISKS: Investing in foreign securities is subject to certain risks not associated with domestic investing, such as currency fluctuations, and changes in political and economic conditions. The fund may engage in active and frequent trading, resulting in increased transaction costs, which could detract from the fund’s performance. The fund may use derivatives, such as options and futures, which can be illiquid, may disproportionately increase losses and have a potentially large impact on fund performance.
All index performance reflects no deduction for fees, expenses or taxes. Please note an investor cannot invest directly in an index.
| i | | Gross domestic product is a market value of goods and services produced by labor and property in a given country. |
| ii | | The GDP deflator is a measure of the cost of goods purchased by U.S. households, government, and industry. |
| iii | | The S&P 500 Index is a market capitalization-weighted index of 500 widely held common stock. |
| iv | | Mr. Weissman managed the Portfolio during the reporting period. |
9 Smith Barney Investment Series | 2004 Annual Report
Smith Barney Dividend Strategy Portfolio Fund at a Glance (unaudited)
10 Smith Barney Investment Series | 2004 Annual Report
Smith Barney Dividend Strategy Portfolio* Historical Performance (unaudited)
Value of $10,000 Invested in the Smith Barney Dividend Strategy Portfolio vs. S&P 500 Index†
September 1999 — October 2004
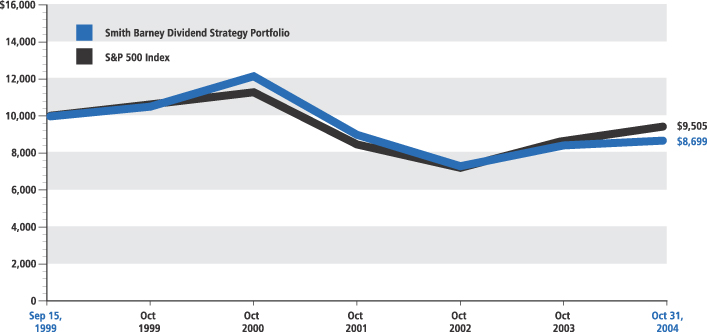
| † | Hypothetical illustration of $10,000 invested on September 15, 1999 (commencement of operations), assuming the reinvestment of dividends and capital gains, if any, at net asset value through October 31, 2004. Before November 1, 2004, the Portfolio was known as Smith Barney Large Cap Core Portfolio and had a different investment style. The S&P 500 Index is an index of widely held common stocks listed on the New York and American Stock Exchanges and the over-the-counter markets. Figures for the S&P 500 Index include reinvestment of dividends. The Index is unmanaged and is not subject to the same management and trading expenses of a mutual fund. Please note that an investor cannot invest directly in an index. |
| * | Before November 1, 2004, the Portfolio was known as Smith Barney Large Cap Core Portfolio and had a different investment style. |
All figures represent past performance and are not a guarantee of future results. Investment return and principal value of an investment will fluctuate so that an investor’s shares, when redeemed, may be worth more or less than their original cost. Total returns do not reflect expenses associated with the separate account such as administrative fees, account charges and surrender charges, which, if reflected, would reduce the total returns. Performance figures may reflect fee waivers and/or expense reimbursements. In the absence of fee waivers and/or expense reimbursements, the total return would have been lower.
Average Annual Total Returns‡ (unaudited)
| | | |
Twelve Months Ended 10/31/04 | | 3.41 | % |
|
|
Five Years Ended 10/31/04 | | (3.71 | ) |
|
|
9/15/99** through 10/31/04 | | (2.68 | ) |
|
|
Cumulative Total Return‡ (unaudited)
| | | |
9/15/99** through 10/31/04 | | (13.01 | )% |
|
|
| ‡ | | Assumes reinvestment of all dividends and capital distributions, if any, at net asset value. All figures represent past performance and are not a guarantee of future results. Investment return and principal value of an investment will fluctuate so that an investor’s shares, when redeemed, may be worth more or less than their original cost. Total returns do not reflect expenses associated with the separate account such as administrative fees, account charges and surrender charges, which, if reflected, would reduce the total returns. Performance figures may reflect fee waivers and/or expense reimbursements. In the absence of fee waivers and/or expense reimbursements, the total return would have been lower. |
| ** | | Commencement of operations. |
11 Smith Barney Investment Series | 2004 Annual Report
Smith Barney Growth and Income Portfolio
Market Overview
US economic growth has settled down to a more sustainable pace of about 3.00%. Job growth and unemployment claims improved steadily during 2004, indicating broad-based strength in the economy. Consumer confidence numbers peaked in July, but the absolute levels remain quite solid. Oil prices spiked to over $55 in late October, before declining to the high $40s in November. High heating oil prices could limit retail sales growth in the Northeast this winter, but all in all the U.S. economy has adjusted well to the significant increase in oil this year.
The strongest areas of the market during the past year were those tied to energy prices, oils and utilities, and those helped by the strong Chinese and solid U.S. economies; the materials and industrials. Defensive stocks such as consumer staples and health care lagged.
The U.S. markets traded in an unusually tight band during 2004. Equity volatility this year was the lowest in 62 years. The positives of strong earnings per share growth and extraordinary free cash flow generation were offset by fears of rising oil prices and interest rates, and uncertainty about the outcome of the U.S. election. The U.S. equity markets are the cheapest that they have ever been on a market value to free cash flow basis. But operating margins are far above normal, and earnings growth is sure to slow in 2005.
Performance Review
For the 12 months ended October 31, 2004, the Smith Barney Growth and Income Portfolio returned 7.18%. These shares underperformed the fund’s unmanaged benchmark, the S&P 500 Index,i which returned 9.41% for the same period. These shares outperformed the Lipper variable large-cap core funds category average1, which was 6.69%.
Explanation of Performance:
The fund’s underperformance relative to the benchmark can be attributed to weak stock selection in the consumer cyclical, technology and energy sectors. Performance was helped by stock selection in the consumer staples, healthcare and industrial sectors. In particular, performance benefited from holdings in the mobile telecommunications service provider AT&T Wireless Services, Inc., manufacturing conglomerate Tyco International Ltd., and aerospace company The Boeing Company. Stocks that detracted from performance included global telecommunications equipment maker Nortel Networks Corporation, provider of financial and business information FT Interactive Corporation, and global communications supplier ADC Telecommunications, Inc.
Thank you for your investment in the Smith Barney Growth and Income Portfolio. As ever, we appreciate that you have chosen us to manage your assets and we remain focused on achieving the fund’s investment goals.
Sincerely,
| | |
 | |  |
| Michael A. Kagan | | Kevin Caliendo |
| Portfolio Manager | | Portfolio Manager |
November 19, 2004
| 1 | | Lipper, Inc. is a major independent mutual-fund tracking organization. Returns are based on the 12-month period ended October 31, 2004, calculated among the 211 funds in the fund’s Lipper category, including the reinvestment of dividends and capital gains, if any. |
12 Smith Barney Investment Series | 2004 Annual Report
The information provided is not intended to be a forecast of future events, a guarantee of future results or investment advice. Views expressed may differ from those of the firm as a whole.
Portfolio holdings and breakdowns are as of October 31, 2004 and are subject to change and may not be representative of the fund’s current or future investments. The fund’s top ten holdings (as a % of net assets) as of this date were: General Electric Co. (4.26%), Microsoft Corporation (3.63%), Bank of America Corp. (2.94%), Pfizer Inc. (2.53%), Exxon Mobil Corporation (2.46%), Wells Fargo & Co (2.39%), Boeing Corporation (2.26%), JP Morgan Chase & Co. (2.05%), Proctor & Gamble Co. (2.02%), American International Group Inc. (2.03%). Please refer to pages 32 through 36 for a list and percentage breakdown of the fund’s holdings.
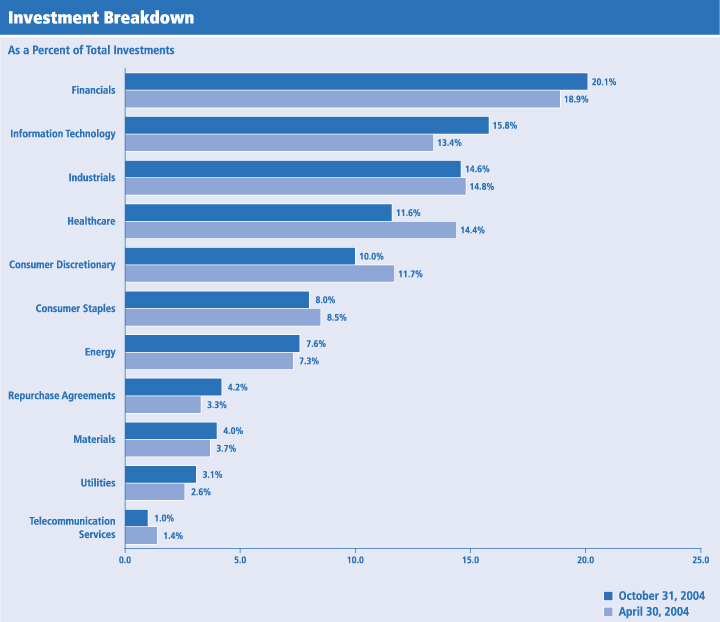
The mention of sector breakdowns is for informational purposes only and should not be construed as a recommendation to purchase or sell any securities. The information provided regarding such sectors is not a sufficient basis upon which to make an investment decision. Investors seeking financial advice regarding the appropriateness of investing in any securities or investment strategies discussed should consult their financial professional. Portfolio holdings are subject to change at any time and may not be representative of the fund’s current or future investments. The fund’s top five sector holdings (as a % of net assets) as of October 31, 2004 were: Financials (20.1%); Information Technology (15.8%); Industrials (14.6%); Healthcare (11.6%); Consumer Discretionary (10.0%). The fund’s portfolio composition is subject to change at any time.
RISKS: Investing in foreign securities is subject to certain risks not associated with domestic investing, such as currency fluctuations, and changes in political and economic conditions. Lower-rated, higher-yielding bonds, known as “junk bonds” are subject to greater credit risk, including the risk of default, than higher-rated obligations. The fund may engage in short sales. Losses from short sales may be unlimited. The fund may use derivatives, such as options and futures, which can be illiquid, may disproportionately increase losses, and have a potentially large impact on the fund performance.
All index performance reflects no deduction for fees, expenses or taxes. Please note an investor cannot invest directly in an index.
| i | | The S&P 500 Index is a market capitalization-weighted index of 500 widely held common stocks. |
13 Smith Barney Investment Series | 2004 Annual Report
Smith Barney Growth and Income Portfolio Fund at a Glance (unaudited)
14 Smith Barney Investment Series | 2004 Annual Report
Smith Barney Growth and Income Portfolio Historical Performance (unaudited)
Value of $10,000 Invested in the Smith Barney Growth and Income Portfolio vs. S&P 500 Index†
September 1999 — October 2004
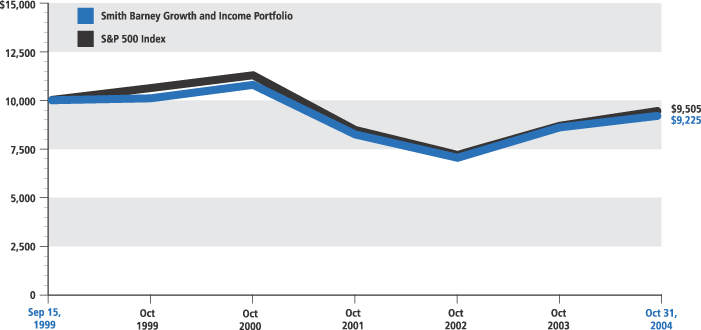
| † | Hypothetical illustration of $10,000 invested on September 15, 1999 (commencement of operations), assuming the reinvestment of dividends and capital gains, if any, at net asset value through October 31, 2004. The S&P 500 Index is an index of widely held common stocks listed on the New York and American Stock Exchanges and the over-the-counter markets. Figures for the S&P 500 Index include reinvestment of dividends. The Index is unmanaged and is not subject to the same management and trading expenses of a mutual fund. Please note that an investor cannot invest directly in an index. |
All figures represent past performance and are not a guarantee of future results. Investment return and principal value of an investment will fluctuate so that an investor’s shares, when redeemed, may be worth more or less than their original cost. Total returns do not reflect expenses associated with the separate account such as administrative fees, account charges and surrender charges, which, if reflected, would reduce the total returns. Performance figures may reflect fee waivers and/or expense reimbursements. In the absence of fee waivers and/or expense reimbursements, the total return would have been lower.
Average Annual Total Returns‡ (unaudited)
| | | |
Twelve Months Ended 10/31/04 | | 7.18 | % |
|
|
Five Years Ended 10/31/04 | | (1.80 | ) |
|
|
9/15/99* through 10/31/04 | | (1.56 | ) |
|
|
Cumulative Total Return‡ (unaudited)
| | | |
9/15/99* through 10/31/04 | | (7.75 | )% |
|
|
| ‡ | | Assumes reinvestment of all dividends and capital gain distributions, if any, at net asset value. All figures represent past performance and are not a guarantee of future results. Investment return and principal value of an investment will fluctuate so that an investor’s shares, when redeemed, may be worth more or less than their original cost. Total returns do not reflect expenses associated with the separate account such as administrative fees, account charges and surrender charges, which, if reflected, would reduce the total returns. Performance figures may reflect fee waivers and/or expense reimbursements. In the absence of fee waivers and/or expense reimbursements, the total return would have been lower. |
| * | | Commencement of operations. |
15 Smith Barney Investment Series | 2004 Annual Report
SB Government Portfolio
Market Overview
U.S. government securities collectively generated positive total returns over the 12 months ended October 31, 2004, despite some market volatility as investors dissected language from the Federal Reserve Board (“Fed”) for clues on its assessment of the U.S. economy and an indication when rates would begin to creep higher. The first five months were relatively stable as the economy showed signs of a turnaround, with the economic outlook for 2004 as encouraging as it has been since 1999. Nevertheless, despite the apparent strength of the economy, the Fed held fast to its 1.00% short-term lending rate, attributing the economic growth more to increases in productivity than to jobs. The Fed did, however, alter its policy language after its January meeting from the open-ended “considerable period” to simply state that it wished to show “patience” in “removing” the accommodation. Following the May policy meeting, the Fed again altered its accommodation language from “patience” in “removing” the accommodation to “a pace that is likely to be measured”. We view this as an attempt by the Fed to signal that it intends to raise rates incrementally and deliberately over the months to come.
Signs of inflation and strong non-farm payroll numbers began to appear in March and April of 2004. Strong job numbers combined with inflation fighting language from the Fed, led to a rise in U.S. Treasury yields, with 10-year yields gaining more than 100 basis points from their early March lows. Yields on most fixed-income instruments, particularly those on shorter-maturity issues, began moving up and continued their ascent as it became more evident that the improving economy and higher inflation would compel the Fed to act in June. The Fed finally raised its federal funds ratei target to 1.25% in June off the stronger employment numbers.
Against this backdrop, fixed income markets finished on a somewhat more stable note in June and July. The Fed raised its federal funds rate target by an additional 0.25% at its August and September meetings, despite significant softening of many economic indicators during the late summer months, bringing the target rate to 1.75% at the end of the reporting cycle for the fund. Following the end of the fund’s reporting period, at its November meeting, the Fed once again raised the target rate by 0.25% to 2.00%.
Over the period, U.S. Treasuries as represented by the Citigroup U.S. Treasury Bond Indexii returned 4.98%, rebounding in the third quarter after the worst quarter in more than two decades. U.S. Agencies as represented by the Citigroup U.S. Agency Indexiii also had positive returns during the period of 4.78%. The sector saw widening in the third quarter of 2004, as the Office of Federal Housing Enterprise Oversight (OFHEO) and the SEC continued to look closely at the accounting practices of FNMA. The market had been expecting no headline risk for the agencies until after the election. The mortgage-backed sector as represented by the Citigroup Mortgage Indexiv returned 5.68%. Early in the third quarter of 2004, the environment looked favorable for mortgage-backed securities with light supply, low volatility and positive technicals. As the 10-year U.S. Treasury note approached 4.10% later in the quarter, convexity started to become a concern and supply from originators increased.
Performance Review
For the 12 months ended October 31, 2004, the SB Government Portfolio returned 3.90%. These shares underperformed the fund’s unmanaged benchmark, the Lehman Brothers Government Bond Index,v which returned 4.83% for the same period. They also underperformed the Lipper variable general U.S. government funds category average,1 which was 4.81%.
| 1 | | Lipper, Inc. is a major independent mutual-fund tracking organization. Returns are based on the 12-month period ended October 31, 2004, calculated among the 57 funds in the fund’s Lipper category, including the reinvestment of dividends and capital gains, if any. |
16 Smith Barney Investment Series | 2004 Annual Report
Factors Influencing Fund Performance
During the period, we benefited from our strategic allocation to mortgage-backed securities, but our defensive duration position dampened overall performance, as U.S. Treasury prices increased on the intermediate to longer dated bonds in the third quarter of 2004. (Duration is a measure of a portfolio’s price sensitivity to interest rate movements. A shorter duration helps cushion price declines in the event of rising rates.) During the period, we continued to invest the fund’s assets primarily in mortgage-backed securities, specifically mortgage pass-throughs, and to a lesser extent,
collateralized mortgage obligations, and U.S. Treasury securities. Most recently, we reallocated some of our exposure to U.S. Treasuries into the mortgage-backed sector, which outperformed U.S. Treasuries by 88 basis pointsvi year-to-date and 152 basis points during the reporting period.
For most of the period, overall duration was kept shorter than that of our benchmark index, the Lehman Brothers Government Bond Index. As of the end of the reporting period, we remained short duration relative to our benchmark.
Thank you for your investment in the SB Government Portfolio. As ever, we appreciate that you have chosen us to manage your assets and we remain focused on achieving the fund’s investment goals.
Sincerely,
| | |

Roger M. Lavan, CFA Portfolio Manager | | 
Francis L. Mustaro Portfolio Manager |
November 19, 2004
The information provided is not intended to be a forecast of future events, a guarantee of future results or investment advice. Views expressed may differ from those of the firm as a whole.
RISKS: Keep in mind, bond and mortgage-related securities are subject to interest rate and market risks. The U.S. government guarantee of principal and interest payment only applies to underlying securities in the fund’s portfolio. Please note that the fund’s shares are not guaranteed by the U.S. government or its agencies. The fund may use derivatives, such as options and futures, which can have a potentially large impact on the fund performance.
All index performance reflects no deduction for fees, expenses or taxes. Please note an investor cannot invest directly in an index.
| i | | The federal funds rate is the interest rate that banks with excess reserves at a Federal Reserve district bank charge other banks that need overnight loans. |
| ii | | The Citigroup U.S. Treasury Bond Index is a broad measure of the performance of short-term U.S. Treasury securities. |
| iii | | The Citigroup U.S. Agency Index is the U.S. Agency component of the Citigroup Broad Investment-Grade Bond Index. |
| iv | | The Citigroup Mortgage Index is the mortgage component of the Citigroup Broad Investment-Grade Bond Index. It includes 30- and 15-year GNMA, Fannie Mae and Freddie Mac pass-throughs, and Fannie Mae and Freddie Mac balloon mortgages. |
| v | | The Lehman Brothers Government Bond Index is a broad-based index of all public debt obligations of the U.S. government and its agencies that have an average maturity of roughly nine years. |
| vi | | A basis point is one-hundredth (1/100 or 0.01) of one percent. |
17 Smith Barney Investment Series | 2004 Annual Report
SB Government Portfolio Fund at a Glance (unaudited)
18 Smith Barney Investment Series | 2004 Annual Report
SB Government Portfolio Historical Performance (unaudited)
Value of $10,000 Invested in the SB Government Portfolio vs. Lehman Brothers Government Bond Index†
September 1999 — October 2004
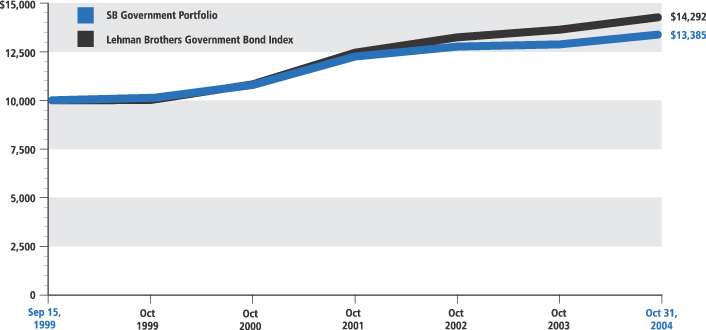
| † | Hypothetical illustration of $10,000 invested on September 15, 1999 (commencement of operations), assuming the reinvestment of dividends and capital gains, if any, at net asset value through October 31, 2004. The Lehman Brothers Government Bond Index includes U.S. Treasury and government agency securities with maturities of one year or more having a minimum outstanding principal of $100 million and are only fixed-coupon securities. The Index is unmanaged and is not subject to the same management and trading expenses as a mutual fund. Please note that an investor cannot invest directly in an index. |
All figures represent past performance and are not a guarantee of future results. Investment return and principal value of an investment will fluctuate so that an investor’s shares, when redeemed, may be worth more or less than their original cost. Total returns do not reflect expenses associated with the separate account such as administrative fees, account charges and surrender charges, which, if reflected, would reduce the total returns. Performance figures may reflect fee waivers and/or expense reimbursements. In the absence of fee waivers and/or expense reimbursements, the total return would have been lower.
Average Annual Total Returns‡ (unaudited)
| | | |
Twelve Months Ended 10/31/04 | | 3.90 | % |
|
|
Five Years Ended 10/31/04 | | 5.73 | |
|
|
9/15/99* through 10/31/04 | | 5.85 | |
|
|
Cumulative Total Return‡ (unaudited)
| | | |
9/15/99* through 10/31/04 | | 33.85 | % |
|
|
| ‡ | | Assumes reinvestment of all dividends and capital gain distributions, if any, at net asset value. All figures represent past performance and are not a guarantee of future results. Investment return and principal value of an investment will fluctuate so that an investor’s shares, when redeemed, may be worth more or less than their original cost. Total returns do not reflect expenses associated with the separate account such as administrative fees, account charges and surrender charges, which, if reflected, would reduce the total returns. Performance figures may reflect fee waivers and/or expense reimbursements. In the absence of fee waivers and/or expense reimbursements, the total return would have been lower. |
| * | | Commencement of operations. |
19 Smith Barney Investment Series | 2004 Annual Report
| | |
| Fund Expenses (unaudited) | | |
Example
As a shareholder of the Funds, you may incur two types of costs: (1) transaction costs, including front-end and back-end sales charges (loads) on purchase payments, reinvested dividends, or other distributions; and (2) ongoing costs, including management fees; distribution and/or service (12b-1) fees; and other Fund expenses. This Example is intended to help you understand your ongoing costs (in dollars) of investing in the Fund and to compare these costs with the ongoing costs of investing in other mutual funds.
This example is based on an investment of $1,000 invested on May 1, 2004 and held for the six months ended October 31, 2004.
Actual Expenses
The table below titled “Based on Actual Total Return” provides information about actual account values and actual expenses. You may use the information provided in this table, together with the amount you invested, to estimate the expenses that you paid over the period. To estimate the expenses you paid on your account, divide your ending account value by $1,000 (for example, an $8,600 ending account value divided by $1,000 = 8.6), then multiply the result by the number under the heading entitled “Expenses Paid During the Period”.
Based on Actual Total Return(1)
| | | | | | | | | | | | | | | |
| | | Actual
Total Return(2) | | | Beginning
Account
Value | | Ending
Account
Value | | Annualized
Expense
Ratios | | | Expenses
Paid During
the Period(3) |
Smith Barney Premier Selections
All Cap Growth Portfolio | | (2.09 | )% | | $ | 1,000.00 | | $ | 979.10 | | 0.95 | % | | $ | 4.73 |
|
Smith Barney Dividend Strategy Portfolio | | 0.00 | | | | 1,000.00 | | | 1,000.00 | | 0.91 | | | | 4.56 |
|
Smith Barney Growth and Income Portfolio | | 2.27 | | | | 1,000.00 | | | 1,022.70 | | 0.92 | | | | 4.68 |
|
SB Government Portfolio | | 3.80 | | | | 1,000.00 | | | 1,038.00 | | 0.70 | | | | 3.59 |
|
| (1) | | For the six months ended October 31, 2004. |
| (2) | | Assumes reinvestment of dividends and capital gains distributions, if any, at net asset value. Total return is not annualized, as it may not be representative of the total return for the year. Total returns do not reflect expenses associated with the separate account such as administrative fees, account charges and surrender charges, which, if reflected, would reduce the total returns. Performance figures may reflect fee waivers and/or expense reimbursements. Past performance is no guarantee of future results. In the absence of fee waivers and/or expense reimbursements, the total return would have been lower. |
| (3) | | Expenses (net of voluntary waiver) are equal to each Fund’s respective annualized expense ratio multiplied by the average account value over the period, multiplied by the number of days in the most recent fiscal half-year, then divided by 366. |
20 Smith Barney Investment Series | 2004 Annual Report
| | |
| Fund Expenses (unaudited) (continued) | | |
Hypothetical Example for Comparison Purposes
The table below titled “Based on Hypothetical Total Return” provides information about hypothetical account values and hypothetical expenses based on the actual expense ratio and an assumed rate of return of 5.00% per year before expenses, which is not the Fund’s actual return. The hypothetical account values and expenses may not be used to estimate the actual ending account balance or expenses you paid for the period. You may use the information provided in this table to compare the ongoing costs of investing in the Funds and other funds. To do so, compare the 5.00% hypothetical example relating to the Fund with the 5.00% hypothetical examples that appear in the shareholder reports of the other funds.
Please note that the expenses shown in the table below are meant to highlight your ongoing costs only and do not reflect any transactional costs, such as front-end or back-end sales charges (loads). Therefore, this table is useful in comparing ongoing costs only, and will not help you determine the relative total costs of owning different funds. In addition, if these transaction costs were included, your costs would have been higher.
Based on Hypothetical Total Return(1)
| | | | | | | | | | | | | | | |
| | | Hypothetical
Annualized
Total Return | | | Beginning
Account
Value | | Ending
Account
Value | | Annualized
Expense
Ratios | | | Expenses
Paid During
the Period(2) |
Smith Barney Premier Selections
All Cap Growth Portfolio | | 5.00 | % | | $ | 1,000.00 | | $ | 1,020.36 | | 0.95 | % | | $ | 4.82 |
|
Smith Barney Dividend Strategy Portfolio | | 5.00 | | | | 1,000.00 | | | 1,020.56 | | 0.91 | | | | 4.62 |
|
Smith Barney Growth and Income Portfolio | | 5.00 | | | | 1,000.00 | | | 1,020.51 | | 0.92 | | | | 4.67 |
|
SB Government Portfolio | | 5.00 | | | | 1,000.00 | | | 1,021.62 | | 0.70 | | | | 3.56 |
|
| (1) | | For the six months ended October 31, 2004. |
| (2) | | Expenses (net of voluntary waiver) are equal to each Fund’s respective annualized expense ratio multiplied by the average account value over the period, multiplied by the number of days in the most recent fiscal half-year, then divided by 366. |
21 Smith Barney Investment Series | 2004 Annual Report
| | |
| Schedules of Investments | | October 31, 2004 |
| | | | | |
| Smith Barney Premier Selections All Cap Growth Portfolio |
| | |
| SHARES | | SECURITY | | VALUE |
| | | | | | |
| COMMON STOCK — 93.9% | | | |
| CONSUMER DISCRETIONARY — 19.3% | | | |
| Hotels, Restaurants & Leisure — 4.5% | | | |
| 10,700 | | Brinker International, Inc.† | | $ | 345,610 |
| 8,200 | | CBRL Group, Inc. | | | 297,332 |
| 13,900 | | Shuffle Master, Inc.† | | | 585,051 |
| 20,300 | | Station Casinos, Inc. | | | 1,034,285 |
| 13,900 | | WMS Industries Inc.† | | | 406,575 |
|
| | | | | | 2,668,853 |
|
| Household Durables — 0.5% | | | |
| 9,100 | | D.R. Horton, Inc. | | | 273,000 |
|
| Internet & Catalog Retail — 2.0% | | | |
| 34,500 | | Amazon.com, Inc.† | | | 1,177,485 |
|
| Leisure Equipment & Products — 0.8% | | | |
| 31,850 | | Marvel Enterprises, Inc.† | | | 490,490 |
|
| Media — 5.9% | | | |
| 7,400 | | The E.W. Scripps Co., Class A Shares | | | 353,128 |
| 16,500 | | Harte-Hanks, Inc. | | | 424,710 |
| 5,200 | | Meredith Corp. | | | 254,800 |
| 1,800 | | Pixar, Inc.† | | | 144,756 |
| 75,300 | | Time Warner Inc.† | | | 1,252,992 |
| 41,500 | | The Walt Disney Co. | | | 1,046,630 |
|
| | | | | | 3,477,016 |
|
| Specialty Retail — 5.6% | | | |
| 15,000 | | Chico’s FAS, Inc.† | | | 600,450 |
| 15,200 | | Dick’s Sporting Goods, Inc.† | | | 547,200 |
| 33,600 | | The Home Depot, Inc. | | | 1,380,288 |
| 9,249 | | PETsMART, Inc. | | | 295,783 |
| 10,000 | | The Sports Authority, Inc.† | | | 241,800 |
| 6,100 | | Williams-Sonoma, Inc.† | | | 232,837 |
|
| | | | | | 3,298,358 |
|
| | | TOTAL CONSUMER DISCRETIONARY | | | 11,385,202 |
|
| CONSUMER STAPLES — 7.4% | | | |
| Beverages — 2.1% | | | |
| 30,100 | | The Coca-Cola Co. | | | 1,223,866 |
|
| Food Products — 2.9% | | | |
| 14,000 | | Hormel Foods Corp. | | | 393,540 |
| 8,300 | | The J.M. Smucker Co. | | | 369,350 |
| 14,400 | | Wm. Wrigley Jr. Co. | | | 941,760 |
|
| | | | | | 1,704,650 |
|
| Personal Products — 2.4% | | | |
| 35,200 | | The Gillette Co. | | | 1,460,096 |
|
| | | TOTAL CONSUMER STAPLES | | | 4,388,612 |
|
See Notes to Financial Statements.
22 Smith Barney Investment Series | 2004 Annual Report
| | |
| Schedules of Investments (continued) | | October 31, 2004 |
| | | | | |
| Smith Barney Premier Selections All Cap Growth Portfolio |
| | |
| SHARES | | SECURITY | | VALUE |
| | | | | | |
| ENERGY — 4.0% | | | |
| Energy Equipment & Services — 2.6% | | | |
| 7,400 | | Cal Dive International, Inc.† | | $ | 262,034 |
| 16,600 | | FMC Technologies, Inc.† | | | 501,818 |
| 9,150 | | Nabors Industries, Ltd.† | | | 449,448 |
| 5,800 | | Smith International, Inc.† | | | 336,864 |
|
| | | | | | 1,550,164 |
|
| Oil & Gas — 1.4% | | | |
| 3,900 | | Murphy Oil Corp. | | | 312,078 |
| 4,200 | | Newfield Exploration Co.† | | | 244,440 |
| 9,000 | | Whiting Petroleum Corp.† | | | 267,120 |
|
| | | | | | 823,638 |
|
| | | TOTAL ENERGY | | | 2,373,802 |
|
| FINANCIALS — 12.7% | | | |
| Banks — 2.5% | | | |
| 5,050 | | Banknorth Group, Inc. | | | 178,114 |
| 3,800 | | East-West Bancorp, Inc. | | | 152,152 |
| 3,600 | | Investors Financial Services Corp. | | | 138,564 |
| 6,500 | | New York Community Bancorp, Inc. | | | 119,340 |
| 100 | | PrivateBancorp, Inc. | | | 3,235 |
| 6,400 | | TCF Financial Corp. | | | 201,728 |
| 7,300 | | Westamerica Bancorporation | | | 417,487 |
| 3,800 | | Zions Bancorporation | | | 251,446 |
|
| | | | | | 1,462,066 |
|
| Diversified Financials — 4.9% | | | |
| 10,950 | | Affiliated Managers Group, Inc.† | | | 611,448 |
| 2,900 | | The Bear Stearns Cos. Inc. | | | 274,775 |
| 6,650 | | Legg Mason, Inc. | | | 423,671 |
| 24,700 | | Merrill Lynch & Co., Inc. | | | 1,332,318 |
| 6,000 | | SLM Corp. | | | 271,560 |
|
| | | | | | 2,913,772 |
|
| Insurance — 5.3% | | | |
| 3,867 | | Ambac Financial Group, Inc. | | | 301,858 |
| 17,000 | | American International Group, Inc. | | | 1,032,070 |
| 497 | | Berkshire Hathaway Inc., Class B Shares† | | | 1,393,588 |
| 10,500 | | Willis Group Holdings Ltd. | | | 377,475 |
|
| | | | | | 3,104,991 |
|
| | | TOTAL FINANCIALS | | | 7,480,829 |
|
| HEALTHCARE — 15.0% | | | |
| Biotechnology — 3.3% | | | |
| 19,600 | | Amgen Inc.† | | | 1,113,280 |
| 10,200 | | Gilead Sciences, Inc.† | | | 353,226 |
| 6,600 | | Martek Biosciences Corp.† | | | 310,570 |
| 7,500 | | Serologicals Corp.† | | | 177,375 |
|
| | | | | | 1,954,451 |
|
See Notes to Financial Statements.
23 Smith Barney Investment Series | 2004 Annual Report
| | |
| Schedules of Investments (continued) | | October 31, 2004 |
| | | | | |
| Smith Barney Premier Selections All Cap Growth Portfolio |
| | |
| SHARES | | SECURITY | | VALUE |
| | | | | | |
| Healthcare Equipment & Supplies — 2.7% | | | |
| 10,900 | | Dade Behring Holdings Inc.† | | $ | 613,561 |
| 8,550 | | DENTSPLY International Inc. | | | 444,685 |
| 12,400 | | Kyphon Inc.† | | | 311,488 |
| 4,800 | | ResMed Inc.† | | | 225,600 |
|
| | | | | | 1,595,334 |
|
| Healthcare Providers & Services — 3.3% | | | |
| 10,000 | | Centene Corp.† | | | 474,300 |
| 3,700 | | Lincare Holdings Inc.† | | | 136,012 |
| 12,500 | | Sierra Health Services, Inc.† | | | 596,500 |
| 4,450 | | Universal Health Services, Inc., Class B Shares | | | 184,942 |
| 24,200 | | VCA Antech, Inc.† | | | 542,564 |
|
| | | | | | 1,934,318 |
|
| Pharmaceuticals — 5.7% | | | |
| 6,500 | | Eyetech Pharmaceuticals Inc.† | | | 275,860 |
| 20,800 | | Johnson & Johnson | | | 1,214,304 |
| 11,300 | | Medicis Pharmaceutical Corp., Class A Shares | | | 459,571 |
| 12,600 | | NPS Pharmaceuticals, Inc.† | | | 215,208 |
| 41,300 | | Pfizer Inc. | | | 1,195,635 |
|
| | | | | | 3,360,578 |
|
| | | TOTAL HEALTHCARE | | | 8,844,681 |
|
| INDUSTRIALS — 10.9% | | | |
| Aerospace & Defense — 0.6% | | | |
| 6,485 | | Alliant Techsystems Inc.† | | | 372,823 |
|
| Airlines — 0.3% | | | |
| 7,100 | | JetBlue Airways Corp.† | | | 156,555 |
|
| Building Products — 0.7% | | | |
| 10,500 | | American Standard Cos. Inc.† | | | 383,985 |
|
| Commercial Services & Supplies — 3.4% | | | |
| 15,100 | | Alliance Data Systems Corp.† | | | 638,428 |
| 7,101 | | ARAMARK Corp., Class B Shares | | | 160,128 |
| 20,400 | | CSG Systems International, Inc.† | | | 342,924 |
| 10,900 | | DiamondCluster International, Inc.† | | | 132,816 |
| 5,000 | | DST Systems, Inc.† | | | 224,250 |
| 15,300 | | Labor Ready, Inc.† | | | 219,555 |
| 6,650 | | Manpower Inc. | | | 300,912 |
|
| | | | | | 2,019,013 |
|
| Industrial Conglomerates — 2.5% | | | |
| 6,400 | | Carlisle Cos. Inc. | | | 372,032 |
| 32,800 | | General Electric Co. | | | 1,119,136 |
|
| | | | | | 1,491,168 |
|
| Machinery — 0.5% | | | |
| 9,100 | | Navistar International Corp.† | | | 314,405 |
|
See Notes to Financial Statements.
24 Smith Barney Investment Series | 2004 Annual Report
| | |
| Schedules of Investments (continued) | | October 31, 2004 |
| | | | | |
| Smith Barney Premier Selections All Cap Growth Portfolio |
| | |
| SHARES | | SECURITY | | VALUE |
| | | | | | |
| Road & Rail — 1.2% | | | |
| 19,900 | | Heartland Express, Inc. | | $ | 407,154 |
| 10,600 | | Old Dominion Freight Line, Inc.† | | | 297,065 |
|
| | | | | | 704,219 |
|
| Trading Companies & Distributors — 1.7% | | | |
| 6,000 | | Fastenal Co. | | | 331,380 |
| 20,500 | | MSC Industrial Direct Co., Inc., Class A Shares | | | 699,870 |
|
| | | | | | 1,031,250 |
|
| | | TOTAL INDUSTRIALS | | | 6,473,418 |
|
| INFORMATION TECHNOLOGY — 21.6% | | | |
| Communications Equipment — 3.9% | | | |
| 44,400 | | Cisco Systems, Inc.† | | | 852,924 |
| 55,300 | | Motorola, Inc. | | | 954,478 |
| 22,700 | | Tekelec† | | | 506,664 |
|
| | | | | | 2,314,066 |
|
| Computers & Peripherals — 2.8% | | | |
| 7,500 | | Avid Technology, Inc.† | | | 397,350 |
| 28,000 | | Dell Inc.† | | | 981,680 |
| 14,200 | | Electronics for Imaging, Inc.† | | | 256,168 |
|
| | | | | | 1,635,198 |
|
| Electronic Equipment & Instruments — 3.0% | | | |
| 14,200 | | Benchmark Electronics, Inc.† | | | 482,374 |
| 12,600 | | Celestica, Inc., Subordinate Voting Shares† | | | 182,448 |
| 4,300 | | Diebold, Inc. | | | 205,755 |
| 3,700 | | Jabil Circuit, Inc.† | | | 89,947 |
| 2,700 | | ScanSource, Inc.† | | | 167,211 |
| 13,000 | | Thermo Electron Corp.† | | | 377,000 |
| 10,000 | | Trimble Navigation Ltd.† | | | 286,900 |
|
| | | | | | 1,791,635 |
|
| Semiconductor Equipment & Products — 5.8% | | | |
| 4,600 | | Cymer, Inc.† | | | 131,192 |
| 20,400 | | Integrated Device Technology, Inc.† | | | 241,128 |
| 40,400 | | Intel Corp. | | | 899,304 |
| 2,300 | | Linear Technology Corp. | | | 87,124 |
| 19,300 | | Microsemi Corp.† | | | 299,922 |
| 40,800 | | MPS Group, Inc.† | | | 429,624 |
| 55,300 | | Texas Instruments Inc. | | | 1,352,085 |
|
| | | | | | 3,440,379 |
|
| Software — 6.1% | | | |
| 13,000 | | Epicor Software Corp.† | | | 199,810 |
| 6,650 | | Mercury Interactive Corp.† | | | 288,810 |
| 50,300 | | Microsoft Corp. | | | 1,407,897 |
| 62,400 | | Quest Software, Inc.† | | | 915,408 |
| 10,200 | | Synopsys, Inc.† | | | 165,648 |
See Notes to Financial Statements.
25 Smith Barney Investment Series | 2004 Annual Report
| | |
| Schedules of Investments (continued) | | October 31, 2004 |
| | | | | | |
| Smith Barney Premier Selections All Cap Growth Portfolio | |
| | |
| SHARES | | SECURITY | | VALUE | |
| Software — 6.1% (continued) | | | | |
| 4,800 | | Verint Systems Inc.† | | $ | 186,624 | |
| 19,900 | | VERITAS Software Corp.† | | | 435,412 | |
|
|
| | | | | | 3,599,609 | |
|
|
| | | TOTAL INFORMATION TECHNOLOGY | | | 12,780,887 | |
|
|
| MATERIALS — 3.0% | | | | |
| Chemicals — 0.7% | | | | |
| 7,400 | | Air Products & Chemicals, Inc. | | | 393,532 | |
|
|
| Containers & Packaging — 1.0% | | | | |
| 12,700 | | Jarden Corp.† | | | 446,024 | |
| 9,800 | | Smurfit-Stone Container Corp.† | | | 170,128 | |
|
|
| | | | | | 616,152 | |
|
|
| Metals & Mining — 1.3% | | | | |
| 17,600 | | AK Steel Holding Corp.† | | | 167,728 | |
| 10,000 | | Compass Minerals International Inc. | | | 214,200 | |
| 19,100 | | Glamis Gold Ltd.† | | | 378,753 | |
|
|
| | | | | | 760,681 | |
|
|
| | | TOTAL MATERIALS | | | 1,770,365 | |
|
|
| | | TOTAL COMMON STOCK
(Cost — $52,385,291) | | | 55,497,796 | |
|
|
FACE
AMOUNT | | | | | |
| REPURCHASE AGREEMENTS — 6.8% | | | | |
| $2,012,000 | | Merrill Lynch & Co., Inc. dated 10/29/04, 1.820% due 11/1/04; Proceeds at maturity — $2,012,305; (Fully collateralized by various U.S. Government Agency Obligations, 0.000% due 11/2/04 to 4/29/05; Market value — $2,052,240) | | | 2,012,000 | |
| 2,000,000 | | UBS Securities LLC dated 10/29/04, 1.840% due 11/1/04; Proceeds at maturity — $2,000,307;
(Fully collateralized by various U.S. Government Agency Obligations, and International Bank for Reconstruction and Development Notes and Bonds, 0.000% to 8.875% due 12/7/04 to 8/6/38;
Market value — $2,040,000) | | | 2,000,000 | |
|
|
| | | TOTAL REPURCHASE AGREEMENTS
(Cost — $4,012,000) | | | 4,012,000 | |
|
|
| | | TOTAL INVESTMENTS — 100.7% (Cost — $56,397,291*) | | | 59,509,796 | |
| | | Liabilities in Excess of Other Assets — (0.7)% | | | (429,463 | ) |
|
|
| | | TOTAL NET ASSETS — 100.0% | | $ | 59,080,333 | |
|
|
| † | | Non-income producing security. |
| * | | Aggregate cost for federal income tax purposes is $56,803,700. |
See Notes to Financial Statements.
26 Smith Barney Investment Series | 2004 Annual Report
| | |
| Schedules of Investments (continued) | | October 31, 2004 |
| | | | | |
| | | Smith Barney Dividend Strategy Portfolio | | |
| | |
| SHARES | | SECURITY | | VALUE |
| | | | | | |
| COMMON STOCK — 91.0% | | | |
| CONSUMER DISCRETIONARY — 12.3% | | | |
| Auto Components — 0.7% | | | |
| 7,400 | | Magna International Inc., Class A Shares | | $ | 539,830 |
|
| Hotels, Restaurants & Leisure — 1.0% | | | |
| 20,100 | | Outback Steakhouse, Inc. | | | 795,759 |
|
| Media — 5.2% | | | |
| 22,682 | | Comcast Corp., Class A Shares* | | | 669,119 |
| 7,800 | | Gannett Co., Inc. | | | 647,010 |
| 13,950 | | News Corp. Inc., Class A Shares | | | 438,588 |
| 2,800 | | Regal Entertainment Group, Class A Shares | | | 55,748 |
| 62,275 | | Time Warner Inc.* | | | 1,036,256 |
| 32,031 | | Viacom Inc., Class B Shares | | | 1,168,811 |
|
| | | | | | 4,015,532 |
|
| Multiline Retail — 3.2% | | | |
| 24,000 | | Target Corp. | | | 1,200,480 |
| 23,675 | | Wal-Mart Stores, Inc. | | | 1,276,556 |
|
| | | | | | 2,477,036 |
|
| Specialty Retail — 2.2% | | | |
| 28,826 | | The Home Depot, Inc. | | | 1,184,172 |
| 21,550 | | The TJX Cos., Inc. | | | 516,769 |
|
| | | | | | 1,700,941 |
|
| | | TOTAL CONSUMER DISCRETIONARY | | | 9,529,098 |
|
| CONSUMER STAPLES — 7.6% | | | |
| Beverages — 1.8% | | | |
| 8,850 | | The Coca-Cola Co. | | | 359,841 |
| 20,455 | | PepsiCo, Inc. | | | 1,014,159 |
|
| | | | | | 1,374,000 |
|
| Food Products — 2.5% | | | |
| 48,200 | | Archer-Daniels-Midland Co. | | | 933,634 |
| 5,200 | | General Mills, Inc. | | | 230,100 |
| 5,200 | | H.J. Heinz Co. | | | 189,020 |
| 13,250 | | Kellogg Co. | | | 569,750 |
|
| | | | | | 1,922,504 |
|
| Household Products — 2.3% | | | |
| 5,200 | | Kimberly-Clark Corp. | | | 310,284 |
| 29,450 | | The Procter & Gamble Co. | | | 1,507,251 |
|
| | | | | | 1,817,535 |
|
| Personal Products — 1.0% | | | |
| 18,875 | | The Estee Lauder Cos. Inc., Class A Shares | | | 810,681 |
|
| | | TOTAL CONSUMER STAPLES | | | 5,924,720 |
|
| ENERGY — 6.2% | | | |
| Energy Equipment & Services — 0.7% | | | |
| 12,600 | | Noble Corp.* | | | 575,568 |
|
See Notes to Financial Statements.
27 Smith Barney Investment Series | 2004 Annual Report
| | |
| Schedules of Investments (continued) | | October 31, 2004 |
| | | | | |
| | | Smith Barney Dividend Strategy Portfolio | | |
| | |
| SHARES | | SECURITY | | VALUE |
| | | | | | |
| Oil & Gas — 5.5% | | | |
| 65,956 | | Exxon Mobil Corp. | | $ | 3,246,354 |
| 10,100 | | Total SA, Sponsored ADR | | | 1,053,228 |
|
| | | | | | 4,299,582 |
|
| | | TOTAL ENERGY | | | 4,875,150 |
|
| FINANCIALS — 15.6% | | | |
| Banks — 5.4% | | | |
| 36,800 | | The Bank of New York Co., Inc. | | | 1,194,528 |
| 15,250 | | Comerica Inc. | | | 938,028 |
| 12,050 | | Fifth Third Bancorp | | | 592,740 |
| 7,700 | | U.S. Bancorp | | | 220,297 |
| 21,000 | | Wells Fargo & Co. | | | 1,254,120 |
|
| | | | | | 4,199,713 |
|
| Diversified Financials — 6.8% | | | |
| 23,225 | | American Express Co. | | | 1,232,551 |
| 32,375 | | J.P. Morgan Chase & Co. | | | 1,249,675 |
| 23,600 | | MBNA Corp. | | | 604,868 |
| 22,150 | | Merrill Lynch & Co., Inc. | | | 1,194,771 |
| 21,700 | | SLM Corp. | | | 982,142 |
|
| | | | | | 5,264,007 |
|
| Insurance — 3.4% | | | |
| 16,175 | | Ambac Financial Group, Inc. | | | 1,262,620 |
| 22,275 | | American International Group, Inc. | | | 1,352,315 |
|
| | | | | | 2,614,935 |
|
| | | TOTAL FINANCIALS | | | 12,078,655 |
|
| HEALTHCARE — 12.3% | | | |
| Biotechnology — 3.0% | | | |
| 24,135 | | Amgen Inc.* | | | 1,370,868 |
| 16,720 | | Biogen Idec Inc.* | | | 972,435 |
|
| | | | | | 2,343,303 |
|
| Healthcare Equipment & Supplies — 1.2% | | | |
| 9,925 | | Medtronic, Inc. | | | 507,267 |
| 5,250 | | St. Jude Medical, Inc.* | | | 401,992 |
|
| | | | | | 909,259 |
|
| Pharmaceuticals — 8.1% | | | |
| 12,175 | | Johnson & Johnson | | | 710,776 |
| 82,840 | | Pfizer Inc. | | | 2,398,218 |
| 56,500 | | Teva Pharmaceutical Industries Ltd., Sponsored ADR | | | 1,469,000 |
| 43,225 | | Wyeth | | | 1,713,871 |
|
| | | | | | 6,291,865 |
|
| | | TOTAL HEALTHCARE | | | 9,544,427 |
|
See Notes to Financial Statements.
28 Smith Barney Investment Series | 2004 Annual Report
| | |
| Schedules of Investments (continued) | | October 31, 2004 |
| | | | | |
| | | Smith Barney Dividend Strategy Portfolio | | |
| | |
| SHARES | | SECURITY | | VALUE |
| | | | | | |
| INDUSTRIALS — 15.2% | | | |
| Aerospace & Defense — 1.9% | | | |
| 6,250 | | General Dynamics Corp. | | $ | 638,250 |
| 8,900 | | United Technologies Corp. | | | 826,098 |
|
| | | | | | 1,464,348 |
|
| Airlines — 1.3% | | | |
| 63,900 | | Southwest Airlines Co. | | | 1,007,703 |
|
| Commercial Services & Supplies — 1.5% | | | |
| 8,900 | | Avery Dennison Corp. | | | 541,476 |
| 13,325 | | Paychex, Inc. | | | 436,980 |
| 6,700 | | Waste Management, Inc. | | | 190,816 |
|
| | | | | | 1,169,272 |
|
| Electrical Equipment — 0.6% | | | |
| 7,800 | | Emerson Electric Co. | | | 499,590 |
|
| Industrial Conglomerates — 6.7% | | | |
| 12,050 | | 3M Co. | | | 934,718 |
| 80,605 | | General Electric Co. | | | 2,750,243 |
| 15,700 | | Honeywell International Inc. | | | 528,776 |
| 31,450 | | Tyco International Ltd. | | | 979,668 |
|
| | | | | | 5,193,405 |
|
| Machinery — 1.9% | | | |
| 5,200 | | Illinois Tool Works, Inc. | | | 479,856 |
| 12,600 | | ITT Industries, Inc. | | | 1,022,364 |
|
| | | | | | 1,502,220 |
|
| Road & Rail — 1.3% | | | |
| 19,300 | | Canadian National Railway Co. | | | 1,043,165 |
|
| | | TOTAL INDUSTRIALS | | | 11,879,703 |
|
| INFORMATION TECHNOLOGY — 13.7% | | | |
| Communications Equipment — 3.4% | | | |
| 34,100 | | Cisco Systems, Inc.* | | | 655,061 |
| 25,000 | | Juniper Networks, Inc.* | | | 665,250 |
| 17,350 | | Motorola, Inc. | | | 299,461 |
| 66,000 | | Nokia Oyj, Sponsored ADR | | | 1,017,720 |
|
| | | | | | 2,637,492 |
|
| Computers & Peripherals — 2.0% | | | |
| 27,975 | | Dell Inc.* | | | 980,804 |
| 48,225 | | EMC Corp.* | | | 620,656 |
|
| | | | | | 1,601,460 |
|
| Electronic Equipment & Instruments — 0.5% | | | |
| 15,100 | | Agilent Technologies, Inc.* | | | 378,406 |
|
| Internet Software & Services — 0.2% | | | |
| 6,425 | | IAC/InterActiveCorp* | | | 138,908 |
|
| IT Consulting & Services — 0.3% | | | |
| 8,700 | | Accenture Ltd., Class A Shares* | | | 210,627 |
|
See Notes to Financial Statements.
29 Smith Barney Investment Series | 2004 Annual Report
| | |
| Schedules of Investments (continued) | | October 31, 2004 |
| | | | | |
| | | Smith Barney Dividend Strategy Portfolio | | |
| | |
| SHARES | | SECURITY | | VALUE |
| | | | | | |
| Semiconductor Equipment & Products — 2.4% | | | |
| 85,143 | | Intel Corp. | | $ | 1,895,283 |
|
| Software — 4.9% | | | |
| 105,785 | | Microsoft Corp. | | | 2,960,922 |
| 19,350 | | SAP AG, Sponsored ADR | | | 825,278 |
|
| | | | | | 3,786,200 |
|
| | | TOTAL INFORMATION TECHNOLOGY | | | 10,648,376 |
|
| MATERIALS — 6.2% | | | |
| Chemicals — 3.3% | | | |
| 14,800 | | Air Products & Chemicals, Inc. | | | 787,064 |
| 13,000 | | The Dow Chemical Co. | | | 584,220 |
| 17,050 | | E.I. du Pont de Nemours & Co. | | | 730,934 |
| 7,800 | | PPG Industries, Inc. | | | 497,250 |
|
| | | | | | 2,599,468 |
|
| Metals & Mining — 2.1% | | | |
| 29,925 | | Alcoa Inc. | | | 972,563 |
| 13,350 | | Newmont Mining Corp. | | | 634,392 |
|
| | | | | | 1,606,955 |
|
| Paper & Forest Products — 0.8% | | | |
| 14,400 | | Bowater Inc. | | | 530,496 |
| 2,600 | | International Paper Co. | | | 100,126 |
|
| | | | | | 630,622 |
|
| | | TOTAL MATERIALS | | | 4,837,045 |
|
| TELECOMMUNICATION SERVICES — 0.2% | | | |
| Diversified Telecommunication Services — 0.2% | | | |
| 3,800 | | Verizon Communications Inc. | | | 148,580 |
|
| UTILITIES — 1.7% | | | |
| Electric Utilities — 1.7% | | | |
| 7,800 | | Ameren Corp. | | | 374,400 |
| 16,450 | | Exelon Corp. | | | 651,749 |
| 4,000 | | FPL Group, Inc. | | | 275,600 |
|
| | | | | | 1,301,749 |
|
| | | TOTAL UTILITIES | | | 1,301,749 |
|
| | | TOTAL COMMON STOCK
(Cost — $63,685,795) | | | 70,767,503 |
|
See Notes to Financial Statements.
30 Smith Barney Investment Series | 2004 Annual Report
| | |
| Schedules of Investments (continued) | | October 31, 2004 |
| | | | | | |
| | | Smith Barney Dividend Strategy Portfolio | | | |
FACE
AMOUNT | | SECURITY | | VALUE | |
| REPURCHASE AGREEMENTS — 9.5% | | | | |
| $1,396,000 | | Deutsche Bank Inc. dated 10/29/04, 1.840% due 11/1/04 Proceeds at maturity — $1,396,214;
(Fully collateralized by U.S. Treasury Notes, 0.000% to 7.100% due 2/3/05 to 6/1/17;
Market value — $1,423,920) | | $ | 1,396,000 | |
| 3,000,000 | | Merrill Lynch & Co. dated 10/29/04, 1.820% due 11/1/04; Proceeds at maturity — $3,000,455;
(Fully collateralized by various U.S. Government Agency Obligations, 0.000% due 11/2/04 to 4/29/05; Market value — $3,060,000) | | | 3,000,000 | |
| 3,000,000 | | UBS Securities LLC dated 10/29/04, 1.840% due 11/1/04; Proceeds at maturity — $3,000,460;
(Fully collateralized by various U.S. Government Agency Obligations, and International Bank for Reconstruction and Development Notes and Bonds, 0.000% to 8.875% due 12/7/04 to 8/6/38;
Market value — $3,060,000) | | | 3,000,000 | |
|
|
| | | TOTAL REPURCHASE AGREEMENTS
(Cost — $7,396,000) | | | 7,396,000 | |
|
|
| | | TOTAL INVESTMENTS — 100.5% (Cost — $71,081,795**) | | | 78,163,503 | |
| | | Liabilities in Excess of Other Assets — (0.5)% | | | (327,544 | ) |
|
|
| | | TOTAL NET ASSETS — 100.0% | | $ | 77,835,959 | |
|
|
| * | | Non-income producing security. |
| ** | | Aggregate cost for federal income tax purposes is $72,256,008. |
Abbreviation used in this schedule:
ADR — American Depositary Receipt.
See Notes to Financial Statements.
31 Smith Barney Investment Series | 2004 Annual Report
| | |
| Schedules of Investments (continued) | | October 31, 2004 |
| | | | | |
| | | Smith Barney Growth and Income Portfolio | | |
| | |
| SHARES | | SECURITY | | VALUE |
| | | | | | |
| COMMON STOCK — 95.6% | | | |
| CONSUMER DISCRETIONARY — 10.0% | | | |
| Hotels, Restaurants & Leisure — 0.8% | | | |
| 20,140 | | McDonald’s Corp. | | $ | 587,081 |
|
| Household Durables — 0.9% | | | |
| 30,820 | | Newell Rubbermaid Inc. | | | 664,479 |
|
| Leisure Equipment & Products — 1.2% | | | |
| 46,540 | | Mattel, Inc. | | | 814,915 |
|
| Media — 4.4% | | | |
| 22,850 | | Comcast Corp., Class A Shares* | | | 674,075 |
| 7,690 | | Comcast Corp., Special Class A Shares* | | | 223,318 |
| 59,734 | | Liberty Media Corp., Class A Shares* | | | 532,827 |
| 3,558 | | Liberty Media International, Inc., Class A Shares* | | | 128,266 |
| 22,310 | | News Corp. Inc., Class A Shares | | | 701,427 |
| 23,620 | | Viacom Inc., Class B Shares | | | 861,894 |
|
| | | | | | 3,121,807 |
|
| Multiline Retail — 0.9% | | | |
| 12,780 | | Costco Wholesale Corp. | | | 612,673 |
|
| Specialty Retail — 1.8% | | | |
| 20,460 | | Best Buy Co., Inc. | | | 1,211,641 |
|
| | | TOTAL CONSUMER DISCRETIONARY | | | 7,012,596 |
|
| CONSUMER STAPLES — 8.0% | | | |
| Beverages — 1.8% | | | |
| 26,110 | | PepsiCo, Inc. | | | 1,294,534 |
|
| Food Products — 2.2% | | | |
| 19,060 | | Kellogg Co. | | | 819,580 |
| 29,600 | | Sara Lee Corp. | | | 689,088 |
|
| | | | | | 1,508,668 |
|
| Household Products — 3.0% | | | |
| 11,070 | | Kimberly-Clark Corp. | | | 660,547 |
| 27,740 | | The Procter & Gamble Co. | | | 1,419,733 |
|
| | | | | | 2,080,280 |
|
| Personal Products — 1.0% | | | |
| 16,550 | | The Estee Lauder Cos. Inc., Class A Shares | | | 710,822 |
|
| | | TOTAL CONSUMER STAPLES | | | 5,594,304 |
|
| ENERGY — 7.6% | | | |
| Energy Equipment & Services — 1.7% | | | |
| 21,640 | | ENSCO International Inc.† | | | 661,102 |
| 19,460 | | GlobalSantaFe Corp. | | | 574,070 |
|
| | | | | | 1,235,172 |
|
See Notes to Financial Statements.
32 Smith Barney Investment Series | 2004 Annual Report
| | |
| Schedules of Investments (continued) | | October 31, 2004 |
| | | | | |
| | | Smith Barney Growth and Income Portfolio | | |
| | |
| SHARES | | SECURITY | | VALUE |
| | | | | | |
| Oil & Gas — 5.9% | | | |
| 12,860 | | ChevronTexaco Corp. | | $ | 682,352 |
| 35,120 | | Exxon Mobil Corp. | | | 1,728,606 |
| 6,800 | | Nexen Inc. | | | 289,408 |
| 13,590 | | Total SA, Sponsored ADR† | | | 1,417,165 |
|
| | | | | | 4,117,531 |
|
| | | TOTAL ENERGY | | | 5,352,703 |
|
| FINANCIALS — 20.1% | | | |
| Banks — 8.8% | | | |
| 46,036 | | Bank of America Corp. | | | 2,061,952 |
| 17,390 | | The Bank of New York Co., Inc. | | | 564,479 |
| 9,310 | | Comerica Inc. | | | 572,658 |
| 19,270 | | U.S. Bancorp | | | 551,315 |
| 15,560 | | Wachovia Corp. | | | 765,708 |
| 28,040 | | Wells Fargo & Co. | | | 1,674,549 |
|
| | | | | | 6,190,661 |
|
| Diversified Financials — 7.5% | | | |
| 17,360 | | American Express Co. | | | 921,295 |
| 10,350 | | Freddie Mac | | | 689,310 |
| 9,010 | | The Goldman Sachs Group, Inc. | | | 886,404 |
| 37,348 | | J.P. Morgan Chase & Co. | | | 1,441,633 |
| 19,730 | | MBNA Corp. | | | 505,680 |
| 14,720 | | Merrill Lynch & Co., Inc. | | | 793,997 |
|
| | | | | | 5,238,319 |
|
| Insurance — 3.8% | | | |
| 23,410 | | American International Group, Inc. | | | 1,421,221 |
| 8 | | Berkshire Hathaway Inc., Class A Shares* | | | 674,000 |
| 7,980 | | The Chubb Corp. | | | 575,597 |
|
| | | | | | 2,670,818 |
|
| | | TOTAL FINANCIALS | | | 14,099,798 |
|
| HEALTHCARE — 11.6% | | | |
| Biotechnology — 2.1% | | | |
| 14,510 | | Amgen Inc.* | | | 824,168 |
| 9,650 | | OSI Pharmaceuticals, Inc.* | | | 627,057 |
|
| | | | | | 1,451,225 |
|
| Healthcare Equipment & Supplies — 2.4% | | | |
| 12,210 | | Fisher Scientific International* | | | 700,366 |
| 14,450 | | Guidant Corp. | | | 962,659 |
|
| | | | | | 1,663,025 |
|
See Notes to Financial Statements.
33 Smith Barney Investment Series | 2004 Annual Report
| | |
| Schedules of Investments (continued) | | October 31, 2004 |
| | | | | |
| | | Smith Barney Growth and Income Portfolio | | |
| | |
| SHARES | | SECURITY | | VALUE |
| | | | | | |
| Pharmaceuticals — 7.1% | | | |
| 23,210 | | GlaxoSmithKline PLC, ADR | | $ | 984,104 |
| 61,200 | | Pfizer Inc. | | | 1,771,740 |
| 10,000 | | Sepracor Inc.* | | | 459,300 |
| 44,080 | | Teva Pharmaceutical Industries Ltd., Sponsored ADR† | | | 1,146,080 |
| 16,480 | | Wyeth | | | 653,432 |
|
| | | | | | 5,014,656 |
|
| | | TOTAL HEALTHCARE | | | 8,128,906 |
|
| INDUSTRIALS — 14.6% | | | |
| Aerospace & Defense — 4.2% | | | |
| 31,820 | | The Boeing Co. | | | 1,587,818 |
| 9,420 | | Lockheed Martin Corp. | | | 518,948 |
| 23,170 | | Raytheon Co. | | | 845,242 |
|
| | | | | | 2,952,008 |
|
| Building Products — 1.1% | | | |
| 20,360 | | American Standard Cos. Inc.* | | | 744,565 |
|
| Commercial Services & Supplies — 2.4% | | | |
| 10,430 | | Avery Dennison Corp. | | | 634,561 |
| 21,300 | | Paychex, Inc. | | | 698,512 |
| 11,510 | | Waste Management, Inc. | | | 327,805 |
|
| | | | | | 1,660,878 |
|
| Industrial Conglomerates — 6.3% | | | |
| 87,700 | | General Electric Co. | | | 2,992,324 |
| 19,460 | | Honeywell International Inc. | | | 655,413 |
| 25,740 | | Tyco International Ltd. | | | 801,801 |
|
| | | | | | 4,449,538 |
|
| Machinery — 0.6% | | | |
| 12,270 | | Navistar International Corp.* | | | 423,928 |
|
| | | TOTAL INDUSTRIALS | | | 10,230,917 |
|
| INFORMATION TECHNOLOGY — 15.8% | | | |
| Communications Equipment — 4.0% | | | |
| 348,750 | | ADC Telecommunications, Inc.*† | | | 770,738 |
| 45,490 | | Cisco Systems, Inc.* | | | 873,863 |
| 282,290 | | Nortel Networks Corp.* | | | 956,963 |
| 10,100 | | Polycom, Inc.* | | | 208,565 |
|
| | | | | | 2,810,129 |
|
| Computers & Peripherals — 3.9% | | | |
| 27,930 | | Dell Inc.* | | | 979,226 |
| 13,430 | | International Business Machines Corp. | | | 1,205,342 |
| 6,900 | | Lexmark International, Inc., Class A Shares* | | | 573,459 |
|
| | | | | | 2,758,027 |
|
See Notes to Financial Statements.
34 Smith Barney Investment Series | 2004 Annual Report
| | |
| Schedules of Investments (continued) | | October 31, 2004 |
| | | | | |
| | | Smith Barney Growth and Income Portfolio | | |
| | |
| SHARES | | SECURITY | | VALUE |
| | | | | | |
| Semiconductor Equipment & Products — 2.0% | | | |
| 11,200 | | Applied Materials, Inc.* | | $ | 180,320 |
| 24,590 | | Intel Corp. | | | 547,373 |
| 20,500 | | Xilinx, Inc. | | | 627,300 |
|
| | | | | | 1,354,993 |
|
| Software — 5.9% | | | |
| 32,130 | | BMC Software, Inc.* | | | 607,900 |
| 91,120 | | Microsoft Corp. | | | 2,550,449 |
| 27,640 | | Oracle Corp.* | | | 349,922 |
| 28,800 | | VERITAS Software Corp.* | | | 630,144 |
|
| | | | | | 4,138,415 |
|
| | | TOTAL INFORMATION TECHNOLOGY | | | 11,061,564 |
|
| MATERIALS — 4.0% | | | |
| Containers & Packaging — 0.5% | | | |
| 19,950 | | Smurfit-Stone Container Corp.* | | | 346,332 |
|
| Metals & Mining — 2.3% | | | |
| 16,350 | | Alcoa Inc. | | | 531,375 |
| 48,590 | | Barrick Gold Corp. | | | 1,093,761 |
|
| | | | | | 1,625,136 |
|
| Paper & Forest Products — 1.2% | | | |
| 21,220 | | International Paper Co. | | | 817,182 |
|
| | | TOTAL MATERIALS | | | 2,788,650 |
|
| TELECOMMUNICATION SERVICES — 0.8% | | | |
| Wireless Telecommunication Services — 0.8% | | | |
| 22,500 | | Nextel Communications, Inc., Class A Shares* | | | 596,025 |
|
| UTILITIES — 3.1% | | | |
| Electric Utilities — 0.6% | | | |
| 10,540 | | FirstEnergy Corp. | | | 435,618 |
|
| Gas Utilities — 1.2% | | | |
| 91,920 | | El Paso Corp. | | | 821,765 |
|
| Multi-Utilities — 1.3% | | | |
| 29,950 | | NiSource Inc. | | | 642,428 |
| 8,000 | | Sempra Energy | | | 268,320 |
|
| | | | | | 910,748 |
|
| | | TOTAL UTILITIES | | | 2,168,131 |
| |
| |
|
|
| | | TOTAL COMMON STOCK (Cost — $59,497,184) | | | 67,033,594 |
|
See Notes to Financial Statements.
35 Smith Barney Investment Series | 2004 Annual Report
| | |
| Schedules of Investments (continued) | | October 31, 2004 |
| | | | | |
| | | Smith Barney Growth and Income Portfolio | | |
FACE
AMOUNT | | SECURITY | | VALUE |
| REPURCHASE AGREEMENTS — 4.2% | | | |
| $1,954,000 | | Merrill Lynch & Co., Inc. dated 10/29/04, 1.820% due 11/1/04; Proceeds at maturity — $1,954,296;
(Fully collateralized by various U.S. Government Agency Obligations, 0.000% due 11/2/04 to 4/29/05;
Market value — $1,993,080) | | $ | 1,954,000 |
| 1,000,000 | | UBS Securities LLC dated 10/29/04, 1.840% due 11/1/04; Proceeds at maturity — $1,000,153;
(Fully collateralized by various U.S. Government Agency Obligations and International Bank for Reconstruction and Development Notes and Bonds, 0.000% to 8.875% due 12/7/04 to 8/6/38; Market value — $1,020,000) | | | 1,000,000 |
|
| | | TOTAL REPURCHASE AGREEMENTS (Cost — $2,954,000) | | | 2,954,000 |
|
| | | TOTAL INVESTMENTS — 99.8% (Cost — $62,451,184**) | | | 69,987,594 |
| | | Other Assets in Excess of Liabilities — 0.2% | | | 176,598 |
|
| | | TOTAL NET ASSETS — 100.0% | | $ | 70,164,192 |
|
| LOANED SECURITIES COLLATERAL | | | |
| 3,490,128 | | State Street Navigator Securities Lending Trust Prime Portfolio (Cost — $3,490,128) | | $ | 3,490,128 |
|
| * | | Non-income producing security. |
| † | | All or a portion of this security is on loan (See Notes 1 and 3). |
| ** | | Aggregate cost for federal income tax purposes is $63,005,679. |
Abbreviation used in this schedule:
ADR — American Depositary Receipt.
See Notes to Financial Statements.
36 Smith Barney Investment Series | 2004 Annual Report
Schedules of Investments (continued) October 31, 2004
| | | | | |
| SB Government Portfolio |
FACE
AMOUNT | | SECURITY | | VALUE |
| U.S. TREASURY OBLIGATIONS — 32.5% | | | |
| | | U.S. Treasury Notes: | | | |
| $ 1,500,000 | | 3.125% due 5/15/07 (a) | | $ | 1,515,704 |
| 7,000,000 | | 3.250% due 8/15/07 (a)(b) | | | 7,092,701 |
| 10,000,000 | | 3.000% due 2/15/08 (a) | | | 10,034,770 |
| 5,000,000 | | 3.125% due 4/15/09 (a) | | | 4,988,090 |
| 3,000,000 | | 3.625% due 7/15/09 (a) | | | 3,048,870 |
| 1,500,000 | | 4.875% due 2/15/12 (a) | | | 1,607,990 |
| 5,000,000 | | 4.000% due 11/15/12 (a) | | | 5,057,035 |
| 5,000,000 | | 4.000% due 2/15/14 (a) | | | 5,001,760 |
| | | U.S. Treasury Bonds: | | | |
| 300,000 | | 7.250% due 5/15/16 (a) | | | 380,672 |
| 200,000 | | 9.000% due 11/15/18 (a)(b) | | | 293,539 |
| 700,000 | | 7.625% due 2/15/25 (a) | | | 956,621 |
| 1,350,000 | | U.S. Treasury Strip, due 5/15/05 (a) | | | 1,336,455 |
|
| | | TOTAL U.S. TREASURY OBLIGATIONS
(Cost — $40,840,624) | | | 41,314,207 |
|
| U.S. GOVERNMENT AGENCIES — 2.8% | | | |
| | | Fannie Mae: | | | |
| 1,700,000 | | 5.250% due 1/15/09 | | | 1,818,811 |
| 1,000,000 | | 4.131% due 2/17/09 | | | 1,019,190 |
| 700,000 | | Federal Home Loan Bank (FHLB), 6.500% due 11/15/05 | | | 729,100 |
|
| | | TOTAL U.S. GOVERNMENT AGENCIES
(Cost — $3,381,940) | | | 3,567,101 |
|
| MORTGAGE-BACKED SECURITIES — 61.6% | | | |
| | | Federal Home Loan Mortgage Corp. (FHLMC), Gold: | | | |
| 427,156 | | 6.500% due 9/1/31 | | | 449,819 |
| 209,178 | | 6.000% due 12/1/31 | | | 216,923 |
| 162,588 | | 4.500% due 4/15/32 | | | 154,070 |
| 398,770 | | 5.000% due 8/1/33 | | | 398,832 |
| 1,378,824 | | 6.000% due 4/15/34 | | | 1,430,695 |
| 2,600,000 | | 5.000% due 11/15/34 (c)(d) | | | 2,592,689 |
| 8,000,000 | | 6.000% due 11/15/34 (c)(d) | | | 8,285,000 |
| | | Federal National Mortgage Association (FNMA): | | | |
| 69,499 | | 6.000% due 8/1/16 | | | 72,991 |
| 1,000,000 | | 5.500% due 11/18/19 (c)(d) | | | 1,035,625 |
| 1,000,000 | | 6.000% due 11/18/19 (c)(d) | | | 1,049,375 |
| 28,664 | | 6.500% due 4/1/29 | | | 30,234 |
| 174,386 | | 7.000% due 11/1/31 | | | 185,378 |
| 11,319 | | 7.500% due 3/1/32 | | | 12,129 |
| 204,713 | | 7.500% due 4/1/32 | | | 219,364 |
| 186,972 | | 6.500% due 5/1/32 | | | 196,985 |
| 91,282 | | 7.500% due 5/1/32 | | | 97,815 |
| 430,882 | | 6.000% due 6/1/32 | | | 447,592 |
| 2,895,298 | | 6.000% due 1/1/33 | | | 3,007,582 |
| 10,000,000 | | 4.500% due 11/15/34 (c)(d) | | | 9,709,380 |
| 5,000,000 | | 5.000% due 11/15/34 (c)(d) | | | 4,982,810 |
| 27,500,000 | | 5.500% due 11/15/34 (c)(d) | | | 28,007,045 |
See Notes to Financial Statements.
37 Smith Barney Investment Series | 2004 Annual Report
| | |
| Schedules of Investments (continued) | | October 31, 2004 |
| | | | | | |
| SB Government Portfolio | |
FACE
AMOUNT | | SECURITY | | VALUE | |
| MORTGAGE-BACKED SECURITIES — 61.6% (continued) | | | | |
| $ 6,000,000 | | 6.500% due 11/15/34 (c)(d) | | $ | 6,309,372 | |
| 1,000,000 | | 7.000% due 11/15/34 (c)(d) | | | 1,061,875 | |
| | | Government National Mortgage Association (GNMA): | | | | |
| 95,116 | | 6.500% due 6/15/31 (a) | | | 100,781 | |
| 122,771 | | 7.000% due 9/15/31 (a) | | | 131,146 | |
| 7,652,480 | | 6.000% due 3/15/33 (a) | | | 7,970,875 | |
|
|
| | | TOTAL MORTGAGE-BACKED SECURITIES (Cost — $76,922,328) | | | 78,156,382 | |
|
|
| PAC IOs — 0.3% | | | | |
| 4,921,396 | | Federal Home Loan Mortgage Corp., yield to maturity 5.500% due 1/15/23 (Cost — $341,422) | | | 391,033 | |
|
|
| | | SUB-TOTAL INVESTMENTS (Cost — $121,486,314) | | | 123,428,723 | |
|
|
| SHORT-TERM INVESTMENTS — 51.7% | | | | |
| U.S. GOVERNMENT AGENCY DISCOUNT NOTES — 27.5% | | | | |
| 10,000,000 | | Federal Farm Credit Discount Notes, zero coupon due 11/1/04 | | | 10,000,000 | |
| 25,000,000 | | Federal Home Loan Bank (FHLB), Discount Notes, zero coupon due 11/12/04 | | | 24,986,708 | |
|
|
| | | TOTAL U.S. GOVERNMENT AGENCY DISCOUNT NOTES (Cost — $34,986,708) | | | 34,986,708 | |
|
|
| U.S. TREASURY BILL — 20.8% | | | | |
| 26,376,000 | | U.S. Treasury Bill, due 11/12/04 (Cost — $26,363,508) | | | 26,363,508 | |
|
|
| REPURCHASE AGREEMENT — 3.4% | | | | |
| 4,329,000 | | UBS Securities LLC dated 10/29/04, 1.780% due 11/1/04; Proceeds at maturity — $4,329,642;
(Fully collateralized by U.S. Treasury Bills due 3/10/05; Market value — $4,415,580)
(Cost — $4,329,000) | | | 4,329,000 | |
|
|
| | | TOTAL SHORT-TERM INVESTMENTS (Cost — $65,679,216) | | | 65,679,216 | |
|
|
| | | TOTAL INVESTMENTS — 148.9% (Cost — $187,165,530**) | | | 189,107,939 | |
| | | Liabilities in Excess of Other Assets — (48.9)% | | | (62,144,611 | ) |
|
|
| | | TOTAL NET ASSETS — 100.0% | | $ | 126,963,328 | |
|
|
| (a) | | All or a portion of this security is segregated for "to-be-announced" securities and open futures contracts. |
| (b) | | All or a portion of this security is held as collateral for open futures contracts. |
| (c) | | Security acquired under mortgage dollar roll agreement (See Notes 1 and 3). |
| (d) | | Security is traded on a "to-be-announced" basis (See Note 1). |
| ** | | Aggregate cost of federal income tax purposes is $187,305,168. |
Abbreviation used in this schedule:
PAC IO — Planned Amortization Class — Interest Only.
See Notes to Financial Statements.
38 Smith Barney Investment Series | 2004 Annual Report
| | |
| Statements of Assets and Liabilities | | October 31, 2004 |
| | | | | | | | | | | | | | | | |
| | | Smith Barney
Premier Selections
All Cap
Growth Portfolio | | | Smith Barney
Dividend
Strategy
Portfolio | | | Smith Barney
Growth and
Income Portfolio | | | SB
Government
Portfolio | |
| ASSETS: | | | | | | | | | | | | | | | | |
Investments, at cost | | $ | 52,385,291 | | | $ | 63,685,795 | | | $ | 59,497,184 | | | $ | 121,486,314 | |
Short-term investments, at cost | | | 4,012,000 | | | | 7,396,000 | | | | 2,954,000 | | | | 65,679,216 | |
Loaned securities collateral, at cost (Notes 1 and 3) | | | — | | | | — | | | | 3,490,128 | | | | — | |
|
|
Investments, at value | | $ | 55,497,796 | | | $ | 70,767,503 | | | $ | 67,033,594 | | | $ | 123,428,723 | |
Short-term investments, at value | | | 4,012,000 | | | | 7,396,000 | | | | 2,954,000 | | | | 65,679,216 | |
Loaned securities collateral, at value (Notes 1 and 3) | | | — | | | | — | | | | 3,490,128 | | | | — | |
Cash | | | 960 | | | | 278 | | | | 796 | | | | 461 | |
Receivable for Fund shares sold | | | 89,118 | | | | 4,501 | | | | 42,046 | | | | 99,036 | |
Dividends and interest receivable | | | 18,465 | | | | 41,250 | | | | 43,714 | | | | 628,319 | |
Receivable for securities sold | | | 4,717 | | | | — | | | | 772,668 | | | | | |
Receivable from broker — variation margin | | | — | | | | 6,075 | | | | — | | | | 20,719 | |
|
|
Total Assets | | | 59,623,056 | | | | 78,215,607 | | | | 74,336,946 | | | | 189,856,474 | |
|
|
| LIABILITIES: | | | | | | | | | | | | | | | | |
Payable for Fund shares reacquired | | | 343,588 | | | | 272,423 | | | | 8,666 | | | | 13,255 | |
Payable for securities purchased | | | 128,385 | | | | 13,972 | | | | 592,343 | | | | 62,705,693 | |
Management fees payable | | | 37,265 | | | | 42,075 | | | | 38,088 | | | | 58,683 | |
Trustees‘ Retirement Plan payable (Note 2) | | | 3,256 | | | | 6,816 | | | | 3,030 | | | | 563 | |
Payable for loaned securities collateral (Notes 1 and 3) | | | — | | | | — | | | | 3,490,128 | | | | — | |
Deferred mortgage dollar roll income | | | — | | | | — | | | | — | | | | 69,689 | |
Accrued expenses | | | 30,229 | | | | 44,362 | | | | 40,499 | | | | 45,263 | |
|
|
Total Liabilities | | | 542,723 | | | | 379,648 | | | | 4,172,754 | | | | 62,893,146 | |
|
|
Total Net Assets | | $ | 59,080,333 | | | $ | 77,835,959 | | | $ | 70,164,192 | | | $ | 126,963,328 | |
|
|
| NET ASSETS: | | | | | | | | | | | | | | | | |
Par value of shares of beneficial interest
($0.00001 par value, unlimited shares authorized) | | $ | 53 | | | $ | 91 | | | $ | 78 | | | $ | 108 | |
Capital paid in excess of par value | | | 67,156,158 | | | | 100,291,756 | | | | 71,567,784 | | | | 124,630,498 | |
Undistributed net investment income | | | — | | | | 237,488 | | | | 334,109 | | | | 3,945,584 | |
Accumulated net realized loss from investment transactions and futures contracts | | | (11,188,383 | ) | | | (29,792,409 | ) | | | (9,274,189 | ) | | | (3,661,143 | ) |
Net unrealized appreciation of investments and
futures contracts | | | 3,112,505 | | | | 7,099,033 | | | | 7,536,410 | | | | 2,048,281 | |
|
|
Total Net Assets | | $ | 59,080,333 | | | $ | 77,835,959 | | | $ | 70,164,192 | | | $ | 126,963,328 | |
|
|
Shares Outstanding | | | 5,261,921 | | | | 9,067,471 | | | | 7,798,438 | | | | 10,809,196 | |
|
|
Net Asset Value | | | $11.23 | | | | $8.58 | | | | $9.00 | | | | $11.75 | |
|
|
See Notes to Financial Statements.
39 Smith Barney Investment Series | 2004 Annual Report
Statements of Operations For the Year Ended October 31, 2004
| | | | | | | | | | | | | | | | |
| | | Smith Barney
Premier Selections
All Cap
Growth Portfolio | | | Smith Barney
Dividend
Strategy Portfolio | | | Smith Barney
Growth and
Income Portfolio | | | SB
Government
Portfolio | |
| INVESTMENT INCOME: | | | | | | | | | | | | | | | | |
Dividends | | $ | 297,090 | | | $ | 936,973 | | | $ | 959,776 | | | | — | |
Interest (Notes 1 and 3) | | | 34,528 | | | | 50,771 | | | | 33,118 | | | $ | 5,136,895 | |
Less: Foreign withholding tax | | | — | | | | (11,257 | ) | | | (8,350 | ) | | | — | |
|
|
Total Investment Income | | | 331,618 | | | | 976,487 | | | | 984,544 | | | | 5,136,895 | |
|
|
| EXPENSES: | | | | | | | | | | | | | | | | |
Management fees (Note 2) | | | 360,077 | | | | 574,649 | | | | 473,463 | | | | 734,796 | |
Audit and legal | | | 44,400 | | | | 57,522 | | | | 56,280 | | | | 56,402 | |
Shareholder communications | | | 17,550 | | | | 22,827 | | | | 19,791 | | | | 30,500 | |
Custody | | | 15,000 | | | | 17,560 | | | | 21,300 | | | | 26,000 | |
Transfer agency services (Note 2) | | | 5,030 | | | | 5,004 | | | | 5,004 | | | | 5,003 | |
Trustees‘ fees | | | 2,831 | | | | 3,238 | | | | 3,344 | | | | 5,303 | |
Other | | | 10,291 | | | | 11,313 | | | | 9,953 | | | | 13,500 | |
|
|
Total Expenses | | | 455,179 | | | | 692,113 | | | | 589,135 | | | | 871,504 | |
Less: Management fee waiver (Notes 2 and 6) | | | (1,689 | ) | | | (1,689 | ) | | | (1,689 | ) | | | (1,689 | ) |
|
|
Net Expenses | | | 453,490 | | | | 690,424 | | | | 587,446 | | | | 869,815 | |
|
|
Net Investment Income (Loss) | | | (121,872 | ) | | | 286,063 | | | | 397,098 | | | | 4,267,080 | |
|
|
| REALIZED AND UNREALIZED GAIN (LOSS) ON INVESTMENTS AND FUTURES CONTRACTS (NOTES 1 AND 3): | | | | | | | | | | | | | | | | |
Realized Gain (Loss) From: | | | | | | | | | | | | | | | | |
Investment transactions | | | 488,527 | | | | 800,773 | | | | 1,849,954 | | | | 593,817 | |
Futures contracts | | | — | | | | — | | | | — | | | | (1,151,925 | ) |
Foreign currency transactions | | | — | | | | 19 | | | | 15 | | | | — | |
|
|
Net Realized Gain (Loss) | | | 488,527 | | | | 800,792 | | | | 1,849,969 | | | | (558,108 | ) |
|
|
Net Change in Unrealized Appreciation From Investments and Futures Contracts | | | (1,328,204 | ) | | | 1,424,267 | | | | 1,768,256 | | | | 1,020,171 | |
|
|
Net Gain (Loss) on Investments and Futures Contracts | | | (839,677 | ) | | | 2,225,059 | | | | 3,618,225 | | | | 462,063 | |
|
|
Increase (Decrease) in Net Assets From Operations | | $ | (961,549 | ) | | $ | 2,511,122 | | | $ | 4,015,323 | | | $ | 4,729,143 | |
|
|
See Notes to Financial Statements.
40 Smith Barney Investment Series | 2004 Annual Report
| | |
| Statements of Changes in Net Assets | | For the Years Ended October 31, |
| | | | | | | | | | | | | | | | |
| | | Smith Barney Premier Selections All Cap Growth Portfolio
| | | Smith Barney Dividend Strategy Portfolio
| |
| | | 2004 | | | 2003 | | | 2004 | | | 2003 | |
| OPERATIONS: | | | | | | | | | | | | | | | | |
Net investment income (loss) | | $ | (121,872 | ) | | $ | (24,214 | ) | | $ | 286,063 | | | $ | 305,604 | |
Net realized gain (loss) | | | 488,527 | | | | (2,703,066 | ) | | | 800,792 | | | | (5,178,360 | ) |
Increase (decrease) in net unrealized appreciation | | | (1,328,204 | ) | | | 10,184,045 | | | | 1,424,267 | | | | 14,387,227 | |
|
|
Increase (Decrease) in Net Assets From Operations | | | (961,549 | ) | | | 7,456,765 | | | | 2,511,122 | | | | 9,514,471 | |
|
|
| DIVIDENDS TO SHAREHOLDERS FROM: | | | | | | | | | | | | | | | | |
Net investment income | | | — | | | | — | | | | (307,815 | ) | | | (214,782 | ) |
|
|
Decrease in Net Assets From
Dividends to Shareholders | | | — | | | | — | | | | (307,815 | ) | | | (214,782 | ) |
|
|
| FUND SHARE TRANSACTIONS (NOTE 4): | | | | | | | | | | | | | | | | |
Net proceeds from sale of shares | | | 31,811,952 | | | | 3,413,153 | | | | 9,042,364 | | | | 8,969,468 | |
Net asset value of shares issued for reinvestment
of dividends | | | — | | | | — | | | | 307,815 | | | | 214,782 | |
Cost of shares reacquired | | | (6,654,085 | ) | | | (4,613,714 | ) | | | (7,434,335 | ) | | | (5,906,321 | ) |
|
|
Increase (Decrease) in Net Assets From
Fund Share Transactions | | | 25,157,867 | | | | (1,200,561 | ) | | | 1,915,844 | | | | 3,277,929 | |
|
|
Increase in Net Assets | | | 24,196,318 | | | | 6,256,204 | | | | 4,119,151 | | | | 12,577,618 | |
| | | | |
| NET ASSETS: | | | | | | | | | | | | | | | | |
Beginning of year | | | 34,884,015 | | | | 28,627,811 | | | | 73,716,808 | | | | 61,139,190 | |
|
|
End of year* | | | $59,080,333 | | | | $34,884,015 | | | | $77,835,959 | | | | $73,716,808 | |
|
|
* Includes undistributed net investment income of: | | | — | | | | — | | | | $237,488 | | | | $259,221 | |
|
|
See Notes to Financial Statements.
41 Smith Barney Investment Series | 2004 Annual Report
Statements of Changes in Net Assets (continued) For the Years Ended October 31,
| | | | | | | | | | | | | | | | |
| | | Smith Barney Growth
and Income Portfolio
| | | SB Government Portfolio
| |
| | | 2004 | | | 2003 | | | 2004 | | | 2003 | |
| OPERATIONS: | | | | | | | | | | | | | | | | |
Net investment income | | $ | 397,098 | | | $ | 292,848 | | | $ | 4,267,080 | | | $ | 3,623,645 | |
Net realized gain (loss) | | | 1,849,969 | | | | (3,819,725 | ) | | | (558,108 | ) | | | (2,603,777 | ) |
Change in net unrealized appreciation (depreciation) | | | 1,768,256 | | | | 12,488,900 | | | | 1,020,171 | | | | (455,785 | ) |
|
|
Increase in Net Assets From Operations | | | 4,015,323 | | | | 8,962,023 | | | | 4,729,143 | | | | 564,083 | |
|
|
| DIVIDENDS TO SHAREHOLDERS FROM: | | | | | | | | | | | | | | | | |
Net investment income | | | (305,096 | ) | | | (198,672 | ) | | | (3,949,420 | ) | | | (1,371,678 | ) |
|
|
Decrease in Net Assets From
Dividends to Shareholders | | | (305,096 | ) | | | (198,672 | ) | | | (3,949,420 | ) | | | (1,371,678 | ) |
|
|
| FUND SHARE TRANSACTIONS (NOTE 4): | | | | | | | | | | | | | | | | |
Net proceeds from sale of shares | | | 15,634,248 | | | | 11,668,435 | | | | 15,381,121 | | | | 66,440,163 | |
Net asset value of shares issued for reinvestment
of dividends | | | 305,096 | | | | 198,672 | | | | 3,949,420 | | | | 1,371,678 | |
Cost of shares reacquired | | | (3,819,398 | ) | | | (3,026,552 | ) | | | (20,525,266 | ) | | | (23,729,838 | ) |
|
|
Increase (Decrease) in Net Assets From
Fund Share Transactions | | | 12,119,946 | | | | 8,840,555 | | | | (1,194,725 | ) | | | 44,082,003 | |
|
|
Increase (Decrease) in Net Assets | | | 15,830,173 | | | | 17,603,906 | | | | (415,002 | ) | | | 43,274,408 | |
| | | | |
| NET ASSETS: | | | | | | | | | | | | | | | | |
Beginning of year | | | 54,334,019 | | | | 36,730,113 | | | | 127,378,330 | | | | 84,103,922 | |
|
|
End of year* | | | $70,164,192 | | | | $54,334,019 | | | | $126,963,328 | | | | $127,378,330 | |
|
|
* Includes undistributed net investment income of: | | | $334,109 | | | | $245,374 | | | | $3,945,584 | | | | $3,422,090 | |
|
|
See Notes to Financial Statements.
42 Smith Barney Investment Series | 2004 Annual Report
For a share of each class of beneficial interest outstanding throughout each year ended October 31:
| | | | | | | | | | | | | | | |
Smith Barney Premier Selections
All Cap Growth Portfolio | | 2004 | | | 2003 | | | 2002 | | | 2001 | | | 2000(1) | |
Net Asset Value, Beginning of Year | | $11.45 | | | $ 8.96 | | | $10.73 | | | $14.48 | | | $10.11 | |
Income (Loss) From Operations: | | | | | | | | | | | | | | | |
Net investment income (loss) | | (0.02 | ) | | (0.01 | ) | | (0.03 | ) | | 0.02 | | | 0.09 | |
Net realized and unrealized gain (loss) | | (0.20 | ) | | 2.50 | | | (1.73 | ) | | (3.69 | ) | | 4.30 | |
Total Income (Loss) From Operations | | (0.22 | ) | | 2.49 | | | (1.76 | ) | | (3.67 | ) | | 4.39 | |
Less Dividends and Distributions From: | | | | | | | | | | | | | | | |
Dividends and investment income | | — | | | — | | | (0.01 | ) | | (0.04 | ) | | (0.02 | ) |
Net realized gains | | — | | | — | | | — | | | (0.04 | ) | | — | |
Total Dividends and Distributions | | — | | | — | | | (0.01 | ) | | (0.08 | ) | | (0.02 | ) |
Net Asset Value, End of Year | | $11.23 | | | $11.45 | | | $ 8.96 | | | $10.73 | | | $14.48 | |
Total Return(2) | | (1.92 | )% | | 27.79 | % | | (16.44 | )% | | (25.45 | )% | | 43.43 | % |
Net Assets, End of Year (000s) | | $59,080 | | | $34,884 | | | $28,628 | | | $34,384 | | | $21,419 | |
Ratios to Average Net Assets: | | | | | | | | | | | | | | | |
Expenses(3) | | 0.94 | %(4) | | 0.90 | % | | 0.95 | %(4) | | 0.95 | %(4) | | 0.95 | %(4) |
Net investment income (loss) | | (0.25 | ) | | (0.08 | ) | | (0.25 | ) | | 0.16 | | | 0.72 | |
Portfolio Turnover Rate | | 46 | % | | 66 | % | | 58 | % | | 116 | % | | 58 | % |
| (1) | | Per share amounts have been calculated using the monthly average shares method. |
| (2) | | Performance figures may reflect fee waivers and/or expense reimbursements. Past performance is no guarantee of future results. In the absence of fee waivers and/or expense reimbursements, the total return would have been lower. Total returns do not reflect expenses associated with the separate account such as administrative fees, account charges and surrender charges which, if reflected, would reduce the total returns for all periods shown. |
| (3) | | As a result of a voluntary expense limitation, the ratio of expenses to average net assets will not exceed 0.95%. |
| (4) | | The manager waived all or a portion of its management fee for the years ended October 31, 2004, 2002, 2001 and 2000. If such fee were not waived, the actual expense ratios would have been 0.95%, 1.11%, 1.08% and 2.14%, respectively. |
See Notes to Financial Statements.
43 Smith Barney Investment Series | 2004 Annual Report
| | |
Financial Highlights (continued) | | |
For a share of each class of beneficial interest outstanding throughout each year ended October 31:
| | | | | | | | | | | | | | | |
| Smith Barney Dividend Strategy Portfolio | | 2004 | | | 2003 | | | 2002 | | | 2001 | | | 2000(1) | |
Net Asset Value, Beginning of Year | | $8.33 | | | $7.24 | | | $8.96 | | | $12.14 | | | $10.51 | |
Income (Loss) From Operations: | | | | | | | | | | | | | | | |
Net investment income | | 0.03 | | | 0.03 | | | 0.02 | | | 0.04 | | | 0.05 | |
Net realized and unrealized gain (loss) | | 0.25 | | | 1.09 | | | (1.72 | ) | | (3.19 | ) | | 1.59 | |
Total Income (Loss) From Operations | | 0.28 | | | 1.12 | | | (1.70 | ) | | (3.15 | ) | | 1.64 | |
Less Dividends From: | | | | | | | | | | | | | | | |
Net investment income | | (0.03 | ) | | (0.03 | ) | | (0.02 | ) | | (0.03 | ) | | (0.01 | ) |
Total Dividends | | (0.03 | ) | | (0.03 | ) | | (0.02 | ) | | (0.03 | ) | | (0.01 | ) |
Net Asset Value, End of Year | | $8.58 | | | $8.33 | | | $7.24 | | | $ 8.96 | | | $12.14 | |
Total Return(2) | | 3.41 | % | | 15.47 | % | | (18.94 | )% | | (26.03 | )% | | 15.61 | % |
Net Assets, End of Year (000s) | | $77,836 | | | $73,717 | | | $61,139 | | | $67,093 | | | $49,630 | |
Ratios to Average Net Assets: | | | | | | | | | | | | | | | |
Expenses(3) | | 0.88 | %(4) | | 0.91 | % | | 0.93 | % | | 0.93 | % | | 0.95 | %(4) |
Net investment income | | 0.37 | | | 0.47 | | | 0.24 | | | 0.42 | | | 0.42 | |
Portfolio Turnover Rate | | 42 | % | | 77 | % | | 45 | % | | 26 | % | | 30 | % |
| (1) | | Per share amounts have been calculated using the monthly average shares method. |
| (2) | | Performance figures may reflect fee waivers and/or expense reimbursements. Past performance is no guarantee of future results. In the absence of fee waivers and/or expense reimbursements, the total return would have been lower. Total returns do not reflect expenses associated with the separate account such as administrative fees, account charges and surrender charges which, if reflected, would reduce the total returns for all periods shown. |
| (3) | | As a result of a voluntary expense limitation, the ratio of expenses to average net assets will not exceed 0.95%. |
| (4) | | The manager waived all or a portion of its management fee for the years ended October 31, 2004 and 2000. If such fee were not waived, the actual expense ratios would have been 0.88% and 1.55%, respectively. |
See Notes to Financial Statements.
44 Smith Barney Investment Series | 2004 Annual Report
| | |
| Financial Highlights (continued) | | |
For a share of each class of beneficial interest outstanding throughout each year ended October 31:
| | | | | | | | | | | | | | | |
| Smith Barney Growth and Income Portfolio | | 2004 | | | 2003 | | | 2002 | | | 2001 | | | 2000(1) | |
Net Asset Value, Beginning of Year | | $8.44 | | | $6.95 | | | $8.15 | | | $10.77 | | | $10.10 | |
Income (Loss) From Operations: | | | | | | | | | | | | | | | |
Net investment income | | 0.05 | | | 0.05 | | | 0.02 | | | 0.05 | | | 0.16 | |
Net realized and unrealized gain (loss) | | 0.55 | | | 1.48 | | | (1.20 | ) | | (2.58 | ) | | 0.53 | |
Total Income (Loss) From Operations | �� | 0.60 | | | 1.53 | | | (1.18 | ) | | (2.53 | ) | | 0.69 | |
Less Dividends and Distributions From: | | | | | | | | | | | | | | | |
Dividends and investment income | | (0.04 | ) | | (0.04 | ) | | (0.02 | ) | | (0.05 | ) | | (0.02 | ) |
Net realized gains | | — | | | — | | | — | | | (0.04 | ) | | — | |
Total Dividends and Distributions | | (0.04 | ) | | (0.04 | ) | | (0.02 | ) | | (0.09 | ) | | (0.02 | ) |
Net Asset Value, End of Year | | $9.00 | | | $8.44 | | | $6.95 | | | $ 8.15 | | | $10.77 | |
Total Return(2) | | 7.18 | % | | 22.09 | % | | (14.47 | )% | | (23.63 | )% | | 6.86 | % |
Net Assets, End of Year (000s) | | $70,164 | | | $54,334 | | | $36,730 | | | $31,576 | | | $18,089 | |
Ratios to Average Net Assets: | | | | | | | | | | | | | | | |
Expenses(3) | | 0.91 | %(4) | | 0.87 | % | | 0.95 | %(4) | | 0.95 | %(4) | | 0.95 | %(4) |
Net investment income | | 0.61 | | | 0.68 | | | 0.40 | | | 0.53 | | | 1.54 | |
Portfolio Turnover Rate | | 43 | % | | 65 | % | | 48 | % | | 68 | % | | 72 | % |
| (1) | | Per share amounts have been calculated using the monthly average shares method. |
| (2) | | Performance figures may reflect fee waivers and/or expense reimbursements. Past performance is no guarantee of future results. In the absence of fee waivers and/or expense reimbursements, the total return would have been lower. Total returns do not reflect expenses associated with the separate account such as administrative fees, account charges and surrender charges which, if reflected, would reduce the total returns for all periods shown. |
| (3) | | As a result of a voluntary expense limitation, the ratio of expenses to average net assets will not exceed 0.95%. |
| (4) | | The manager waived all or a portion of its management fee for the years ended October 31, 2004, 2002, 2001 and 2000. If such fee were not waived, the actual expense ratios would have been 0.91%, 1.09%, 1.18% and 2.05%, respectively. |
See Notes to Financial Statements.
45 Smith Barney Investment Series | 2004 Annual Report
| | |
| Financial Highlights (continued) | | |
For a share of each class of beneficial interest outstanding throughout each year ended October 31:
| | | | | | | | | | | | | | | |
| SB Government Portfolio | | 2004 | | | 2003 | | | 2002(1) | | | 2001 | | | 2000(1) | |
Net Asset Value, Beginning of Year | | $11.68 | | | $11.74 | | | $11.44 | | | $10.62 | | | $10.13 | |
|
|
Income (Loss) From Operations: | | | | | | | | | | | | | | | |
Net investment income | | 0.41 | | | 0.33 | | | 0.35 | (2) | | 0.52 | | | 0.53 | |
Net realized and unrealized gain (loss) | | 0.03 | | | (0.23 | ) | | 0.13 | (2) | | 0.87 | | | 0.12 | |
|
|
Total Income From Operations | | 0.44 | | | 0.10 | | | 0.48 | | | 1.39 | | | 0.65 | |
|
|
Less Dividends and Distributions From: | | | | | | | | | | | | | | | |
Dividends and investment income | | (0.37 | ) | | (0.16 | ) | | (0.11 | ) | | (0.57 | ) | | (0.16 | ) |
Net realized gains | | — | | | — | | | (0.07 | ) | | — | | | — | |
|
|
Total Dividends and Distributions | | (0.37 | ) | | (0.16 | ) | | (0.18 | ) | | (0.57 | ) | | (0.16 | ) |
|
|
Net Asset Value, End of Year | | $11.75 | | | $11.68 | | | $11.74 | | | $11.44 | | | $10.62 | |
|
|
Total Return(3) | | 3.90 | % | | 0.87 | % | | 4.20 | % | | 13.56 | % | | 6.55 | % |
|
|
Net Assets, End of Year (000s) | | $126,963 | | | $127,378 | | | $84,104 | | | $13,410 | | | $4,996 | |
|
|
Ratios to Average Net Assets: | | | | | | | | | | | | | | | |
Expenses(4) | | 0.70 | %(5) | | 0.68 | % | | 0.80 | %(5) | | 0.80 | %(5) | | 0.80 | %(5) |
Net investment income | | 3.44 | | | 2.91 | | | 3.17 | (2) | | 4.47 | | | 5.19 | |
|
|
Portfolio Turnover Rate | | 53 | %* | | 83 | %* | | 145 | % | | 90 | % | | 0 | % |
|
|
| (1) | | Per share amounts have been calculated using the monthly average shares method. |
| (2) | | Effective November 1, 2001, the Fund adopted a change in the accounting method that requires the Fund to amortize premiums and accrete all discounts. Without the adoption of this change, for the year ended October 31, 2002, net investment income, net realized and unrealized gain and the ratio of net investment income to average net assets would have been $0.36, $0.12 and 3.32%, respectively. Per share information, ratios and supplemental data for the periods prior to November 1, 2001 have not been restated to reflect this change in presentation. |
| (3) | | Performance figures may reflect fee waivers and/or expense reimbursements. Past performance is no guarantee of future results. In the absence of fee waivers and/or expense reimbursements, the total return would have been lower. Total returns do not reflect expenses associated with the separate account such as administrative fees, account charges and surrender charges which, if reflected, would reduce the total returns for all periods shown. |
| (4) | | As a result of a voluntary expense limitation, the ratio of expenses to average net assets will not exceed 0.80%. |
| (5) | | The manager waived all or a portion of its management fee for the years ended October 31, 2004, 2002, 2001 and 2000. If such fee were not waived, the actual expense ratios would have been 0.70%, 1.00%, 1.30% and 2.06%, respectively. |
| * | | Excluding mortgage dollar roll transactions. If mortgage dollar roll transactions had been included, the portfolio turnover rate would have been 667% and 429% for the years ended October 31, 2004 and 2003, respectively. |
See Notes to Financial Statements.
46 Smith Barney Investment Series | 2004 Annual Report
Notes to Financial Statements
| 1. | Organization and Significant Accounting Policies |
Smith Barney Premier Selections All Cap Growth Portfolio, Smith Barney Dividend Strategy Portfolio (formerly known as Smith Barney Large Cap Core Portfolio), Smith Barney Growth and Income Portfolio and SB Government Portfolio (“Funds”) are separate diversified investment funds of Smith Barney Investment Series (“Trust”). The Trust, a Massachusetts business trust, is registered under the Investment Company Act of 1940, as amended, (“1940 Act”) as an open-end management investment company.
The following are significant accounting policies consistently followed by the Funds and are in conformity with U.S. generally accepted accounting principles (“GAAP”). Estimates and assumptions are required to be made regarding assets, liabilities and changes in net assets resulting from operations when financial statements are prepared. Changes in the economic environment, financial markets and any other parameters used in determining these estimates could cause actual results to differ.
(a) Investment Valuation. Securities traded on national securities markets are valued at the closing price on such markets. Securities traded in the over-the-counter market and listed securities for which no sales prices were reported are valued at the mean between the bid and asked prices. Securities listed on the NASDAQ National Market System for which market quotations are available are valued at the official closing price or, if there is no official closing price on that day, at the last sale price. Bonds and other fixed income securities (other than short-term obligations) are valued on the basis of valuations furnished by a pricing service, which has been approved by the Board of Trustees. In making such valuations, the pricing service utilizes both dealer-supplied valuations and electronic data processing techniques that take into account appropriate factors such as institutional-size trading in similar groups of securities, yield, quality, coupon rate, maturity, type of issue, trading characteristics and other market data, without exclusive reliance upon quoted prices or exchange or over-the-counter prices, since such valuations are believed to reflect more accurately the market value of such securities. When market quotations or official closing prices are not readily available, or are determined not to reflect accurately fair value, such as when the value of a security has been significantly affected by events after the close of the exchange or market on which the security is principally traded, but before the Funds calculates their net asset values, the Funds may value these investments at fair value as determined in accordance with the procedures approved by the Funds’ Board of Trustees. Fair valuing of securities may be determined with the assistance of a pricing service using calculations based on indices of domestic securities and other appropriate indicators, such as prices of relevant ADRs and futures contracts. Short-term obligations with maturities of 60 days or less are valued at amortized cost method, which approximates value.
(b) Repurchase Agreements. When entering into repurchase agreements, it is the Funds’ policy that a custodian takes possession of the underlying collateral securities, the value of which at least equals the principal amount of the repurchase transaction, including accrued interest. To the extent that any repurchase transaction exceeds one business day, the value of the collateral is marked-to-market to ensure the adequacy of the collateral. If the seller defaults and the value of the collateral declines or if bankruptcy proceedings are commenced with respect to the seller of the security, realization of the collateral by the Fund may be delayed or limited.
(c) Futures Contracts. The Funds may enter into futures contracts to the extent permitted by their investment policies and objectives. Upon entering into a futures contract, the Funds are required to deposit cash or securities as initial margin. Additional securities are also segregated up to the current market value of the futures contracts. Subsequent payments, which are dependent on the daily fluctuations in the value of the underlying instrument, are made or received by the Fund each day (daily variation margin) and are recorded as unrealized gains or losses until the contracts are closed. When the contracts are closed, the Fund records a realized gain or loss equal to the difference between the proceeds from (or cost of) the closing transactions and the Fund’s basis in the contracts. The Funds enter into such contracts typically to hedge a portion of the portfolio. Risks of entering into futures contracts for hedging purposes include the possibility that a change in
47 Smith Barney Investment Series | 2004 Annual Report
Notes to Financial Statements (continued)
the value of the contract may not correlate with the changes in the value of the investments hedged. In addition, the purchase of a futures contract involves the risk that a Fund could lose more than the original margin deposit and subsequent payments required for a futures transaction.
(d) Lending of Portfolio Securities. The Funds have an agreement with their custodian whereby the custodian may lend securities owned by the Funds to brokers, dealers and other financial organizations, and receive a lender’s fee. Fees earned by the Funds on securities lending are recorded as interest income. Loans of securities by the Funds are collateralized by cash, U.S. government securities or high quality money market instruments that are maintained at all times in an amount at least equal to the current market value of the loaned securities, plus a margin which may vary depending on the type of securities loaned. The custodian establishes and maintains the collateral in a segregated account. The Funds maintain exposure for the risk of any losses in the investment of amounts received as collateral. The Funds have the right under the lending agreement to recover the securities from the borrower on demand.
(e) Securities Traded on a To-Be-Announced Basis. The Funds may from time to time purchase securities on a to-be-announced (“TBA”) basis. In a TBA transaction, the Funds commit to purchasing or selling securities for which specific information is not yet known at the time of the trade, particularly the face amount and maturity date in U.S. Government Agency transactions. Securities purchased on a TBA basis are not settled until they are delivered to the Funds, normally 15 to 45 days later. Beginning on the date the Funds enter into a TBA transaction, cash, U.S. government securities or other liquid high grade debt obligations are segregated in an amount equal in value to the purchase price of the TBA security. These transactions are subject to market fluctuations and their current value is determined in the same manner as for the other securities.
(f) Mortgage Dollar Roll Transactions. The SB Government Portfolio may enter into mortgage dollar roll transactions. Mortgage roll transactions involve sales by the Fund of mortgage related securities that it holds with agreements by the Fund to repurchase similar securities at an agreed upon price and date. The securities purchased will bear the same interest rate as those sold, but generally will be collateralized by pools of mortgages with different prepayment histories than those securities sold. Proceeds from the sales will be reinvested and the income from these investments, together with any additional income received on the sales, are included in investment income. Losses may arise due to changes in the value of the securities or if the counterparty does not perform under the terms of the agreement. If the counterparty files for bankruptcy or becomes insolvent, the Fund’s, right to repurchase the securities may be limited.
(g) Investment Transactions and Investment Income. Security transactions are accounted for on trade date. Dividend income is recorded on the ex-dividend date. Foreign dividend income is recorded on the ex-dividend date or as soon as practical after the Funds determine the existence of a dividend declaration after exercising reasonable due diligence. Interest income, adjusted for amortization of premium and accretion of discount, is recorded on an accrual basis. Gains or losses on the sale of securities are calculated by using the specific identification method.
(h) Foreign Currency Translation. The books and records of each Fund are maintained in U.S. dollars. Transactions denominated in foreign currencies are recorded at the current prevailing exchange rates. All assets and liabilities denominated in foreign currencies are translated into U.S. dollar amounts at the current exchange rates at the end of the period. Translation gains or losses resulting from changes in the exchange rates during the reporting period and realized gains and losses on the settlement of foreign currency transactions are reported in the statement of operations for the current period. The Funds do not isolate that portion of realized gains and losses on investments in securities, which are due to changes in the foreign exchange rates from that which is due to changes in market prices of securities.
(i) Dividends and Distributions to Shareholders. Dividends and distributions to shareholders are recorded on the ex-dividend date; the Funds distribute dividends and capital gains, if any, at least annually. The character of income and gains to be distributed is determined in accordance with income tax regulations which may differ from GAAP.
(j) Federal and Other Taxes. It is the Funds’ policy to comply with the federal income and excise tax requirements of the Internal Revenue Code of 1986, as amended, applicable to regulated investment companies. Accordingly, the Funds
48 Smith Barney Investment Series | 2004 Semi-Annual Report
Notes to Financial Statements (continued)
intend to distribute substantially all of their taxable income and net realized gains on investments, if any, to shareholders each year. Therefore, no federal income tax provision is required. Under the applicable foreign tax law, a withholding tax may be imposed on interest, dividends and capital gains at various rates for Smith Barney Dividend Strategy and Smith Barney Growth and Income Portfolios.
(k) Reclassifications. U.S. generally accepted accounting principles require that certain components of net assets be adjusted to reflect permanent differences between financial and tax reporting. Accordingly, during the current year, for the Smith Barney Premier Selections All Cap Growth Portfolio, $121,872 has been reclassified between paid-in capital and accumulated net investment loss as a result of a permanent difference attributable to a tax net operating loss. In addition, the Smith Barney Growth and Income Portfolio has reclassified $3,282 between undistributed net investment income and accumulated net realized loss from investment transactions as a result of permanent differences attributable to basis adjustments from investments in real estate investment trusts. The SB Government Portfolio has reclassified $57,370 between accumulated net realized loss from investment transactions and undistributed net investment income as a result of permanent differences attributable to the sale of premium adjusted bonds. The SB Government Portfolio also reclassified $148,464 between accumulated net realized loss from investment transactions and undistributed net investment income as a result of the classification of paydown income as capital. All of these reclassifications have no effect on the net assets or net asset values per share.
| 2. | Investment Management Agreement and Other Transactions |
Smith Barney Fund Management LLC (“SBFM”), an indirect wholly-owned subsidiary of Citigroup Inc. (“Citigroup”), acts as investment manager to the Funds. Smith Barney Premier Selections All Cap Growth Portfolio pays SBFM a management fee calculated at an annual rate of 0.75% of the average daily net assets of the Fund. Smith Barney Dividend Strategy and Smith Barney Growth and Income Portfolios each paid SBFM a management fee calculated at an annual rate of 0.75%, through August 31, 2004, of the average daily net assets of each Fund, respectively, and SB Government Portfolio paid SBFM a management fee calculated at an annual rate of 0.60% , through August 31, 2004, of the Fund’s average daily net assets. These fees are calculated daily and paid monthly.
Effective September 1, 2004, the management fees, which are calculated daily and payable monthly, are calculated in accordance with the following breakpoint schedules:
| | | |
| SB Government Portfolio | | Fee | |
Average Daily Net Assets | | | |
First $2 billion | | 0.55 | % |
Next $2 billion | | 0.50 | |
Next $2 billion | | 0.45 | |
Next $2 billion | | 0.40 | |
Over $8 billion | | 0.35 | |
|
|
| |
| Smith Barney Growth and Income and Smith Barney Dividend Strategy Portfolios | | Fee | |
Average Daily Net Assets | | | |
First $1 billion | | 0.65 | % |
Next $1 billion | | 0.60 | |
Next $1 billion | | 0.55 | |
Next $1 billion | | 0.50 | |
Over $4 billion | | 0.45 | |
|
|
During the year ended October 31, 2004, Smith Barney Premier Selections All Cap Growth Portfolio, Smith Barney Dividend Strategy Portfolio and Smith Barney Growth and Income Portfolio, had voluntary expense limitations in place of
49 Smith Barney Investment Series | 2004 Annual Report
Notes to Financial Statements (continued)
0.95%, respectively. SB Government had a voluntary expense limitation in place of 0.80%. These expense limitations can be terminated at any time by SBFM.
During the year ended October 31, 2004, SBFM waived $1,689 of each Fund’s management fee.
Citicorp Trust Bank, fsb. (“CTB”), another subsidiary of Citigroup, acts as the Funds’ transfer agent. PFPC Inc. (“PFPC”) acts as the Funds’ sub-transfer agent. CTB receives account fees and asset-based fees that vary according to the size and type of account. PFPC is responsible for shareholder recordkeeping and financial processing for all shareholder accounts and is paid by CTB. For the year ended October 31, 2004, each Fund paid transfer agent fees of $5,000 to CTB.
Citigroup Global Markets Inc. (“CGM”), another indirect wholly-owned subsidiary of Citigroup, acts as the Funds’ distributor.
For the year ended October 31, 2004, CGM and its affiliates received $20,131 in brokerage commissions for the Funds’ agency transactions.
All officers and one Trustee of the Trust are employees of Citigroup or its affiliates and do not receive compensation from the Trust.
The Trustees of the Funds have adopted a Retirement Plan (“Plan”) for all Trustees who are not “interested persons” of the Funds, within the meaning of the 1940 Act. Under the Plan, all Trustees are required to retire from the Board as of the last day of the calendar year in which the applicable Trustee attains age 75 (certain Trustees who had already attained age 75 when the Plan was adopted were required to retire effective December 31, 2003). Trustees may retire under the Plan before attaining the mandatory retirement age. Trustees who have served as Trustee of the Trust or any of the investment companies associated with Citigroup for at least ten years when they retire are eligible to receive the maximum retirement benefit under the Plan. The maximum retirement benefit is an amount equal to five times the amount of retainer and regular meeting fees payable to a Trustee during the calendar year ending on or immediately prior to the applicable Trustee’s retirement. Amounts under the Plan may be paid in installments or in a lump sum (discounted to present value). Benefits under the Plan are unfunded. Two former Trustees are currently receiving payments under the Plan. In addition, two other Trustees elected to receive a lump sum payment from this plan during the period. At October 31, 2004, the Smith Barney Premier Selections All Cap Growth Portfolio, Smith Barney Dividend Strategy Portfolio, Smith Barney Growth and Income Portfolio, and SB Government Portfolio has accrued $3,256, $6,816, $3,030, and $563, respectively, in connection with these plans.
Certain of the Trustees are also covered by a prior retirement plan. Under the prior plan, retirement benefits are payable for a ten-year period following retirement, with the annual payment to be based upon the Trustee’s compensation from the Trust during calendar year 2000. Trustees with more than five but less than ten years of service at retirement will receive a prorated benefit. In order to receive benefits under the current Plan, a Trustee must waive all rights under the prior plan prior to receiving payment under either plan.
50 Smith Barney Investment Series | 2004 Annual Report
Notes to Financial Statements (continued)
During the year ended October 31, 2004, the aggregate cost of purchases and proceeds from sales of investments (excluding short-term investments and mortgage dollar rolls) were as follows:
| | | | | | |
| | | Purchases | | Sales |
Smith Barney Premier Selections All Cap Growth Portfolio | | $ | 42,700,568 | | $ | 20,902,918 |
|
Smith Barney Dividend Strategy Portfolio | | | 31,309,141 | | | 33,860,085 |
|
Smith Barney Growth and Income Portfolio | | | 37,285,503 | | | 27,081,059 |
|
SB Government Portfolio | | | 63,139,182 | | | 69,631,989 |
|
At October 31, 2004, the aggregate gross unrealized appreciation and depreciation of investments for federal income tax purposes were as follows:
| | | | | | | | | | |
| | | Appreciation | | Depreciation | | | Net Unrealized
Appreciation |
Smith Barney Premier Selections All Cap Growth Portfolio | | $ | 6,111,464 | | $ | (3,405,368 | ) | | $ | 2,706,096 |
|
Smith Barney Dividend Strategy Portfolio | | | 9,491,518 | | | (3,584,023 | ) | | | 5,907,495 |
|
Smith Barney Growth and Income Portfolio | | | 8,825,575 | | | (1,843,660 | ) | | | 6,981,915 |
|
SB Government Portfolio | | | 2,230,254 | | | (427,483 | ) | | | 1,802,771 |
|
At October 31, 2004, Smith Barney Dividend Strategy and SB Government Portfolios had the following open futures contracts:
| | | | | | | | | | | | | | |
| Smith Barney Dividend Strategy Portfolio | | Number of Contracts | | Expiration Date | | Basis Value | | Market Value | | Unrealized Gain | |
Contracts to Buy: | | | | | | | | | | | | | | |
S & P 500 Index | | 9 | | 12/04 | | $ | 2,525,850 | | $ | 2,543,175 | | $ | 17,325 | |
|
|
| | | | | |
| SB Government Portfolio | | Number of Contracts | | Expiration Date | | Basis Value | | Market Value | | Unrealized Gain (Loss) | |
Contracts to Buy: | | | | | | | | | | | | | | |
U.S. Treasury Bonds | | 100 | | 12/04 | | $ | 11,008,176 | | $ | 11,384,375 | | $ | 376,199 | |
U.S. 10 Year Treasury Notes | | 65 | | 12/04 | | | 7,289,986 | | | 7,381,562 | | | 91,576 | |
|
|
| | | | | | | | | | | | | | 467,775 | |
|
|
Contracts to Sell: | | | | | | | | | | | | | | |
U.S. 5 Year Treasury Notes | | 331 | | 12/04 | | | 36,503,222 | | | 36,865,125 | | | (361,903 | ) |
|
|
Net Unrealized Gain on Open
Futures Contracts | | | | | | | | | | | | $ | 105,872 | |
|
|
At October 31, 2004, Smith Barney Premier Selections All Cap Growth and Smith Barney Growth and Income Portfolios did not have any open futures contracts.
At October 31, 2004, Smith Barney Growth and Income Portfolio had loaned securities having a market value of $3,431,603. Smith Barney Growth and Income Portfolio received cash collateral amounting to $3,490,128 which was invested in the State Street Navigator Securities Lending Trust Prime Portfolio, a Rule 2a-7 money market fund.
Income earned by Smith Barney Growth and Income Portfolio from securities lending for the year ended October 31, 2004 was $4,291.
51 Smith Barney Investment Series | 2004 Annual Report
Notes to Financial Statements (continued)
At October 31, 2004, Smith Barney Premier Selections All Cap Growth, Smith Barney Dividend Strategy and SB Government Portfolios did not have any securities on loan.
During the year ended October 31, 2004, SB Government Portfolio entered into mortgage dollar roll transactions in the aggregate amount of $729,833,219.
At October 31, 2004, SB Government Portfolio had outstanding mortgage dollar rolls with a total cost of $61,894,484.
| 4. | Shares of Beneficial Interest |
At October 31, 2004, the Trust had an unlimited number of shares authorized with a par value of $0.00001 per share.
Transactions in shares of each Fund were as follows:
| | | | | | |
| | | Year Ended
October 31, 2004 | | | Year Ended
October 31, 2003 | |
|
|
Smith Barney Premier Selections All Cap Growth Portfolio | | | | | | |
Shares sold | | 2,799,961 | | | 344,878 | |
Shares reacquired | | (583,442 | ) | | (495,589 | ) |
|
|
Net Increase (Decrease) | | 2,216,519 | | | (150,711 | ) |
|
|
Smith Barney Dividend Strategy Portfolio | | | | | | |
Shares sold | | 1,048,052 | | | 1,178,419 | |
Shares issued on reinvestment | | 35,544 | | | 30,596 | |
Shares reacquired | | (863,838 | ) | | (801,697 | ) |
|
|
Net Increase | | 219,758 | | | 407,318 | |
|
|
Smith Barney Growth and Income Portfolio | | | | | | |
Shares sold | | 1,757,533 | | | 1,542,017 | |
Shares issued on reinvestment | | 34,319 | | | 29,088 | |
Shares reacquired | | (431,387 | ) | | (420,814 | ) |
|
|
Net Increase | | 1,360,465 | | | 1,150,291 | |
|
|
SB Government Portfolio | | | | | | |
Shares sold | | 1,331,786 | | | 5,651,429 | |
Shares issued on reinvestment | | 345,833 | | | 117,038 | |
Shares reacquired | | (1,774,164 | ) | | (2,029,223 | ) |
|
|
Net Increase (Decrease) | | (96,545 | ) | | 3,739,244 | |
|
|
| 5. | Income Tax Information and Distributions to Shareholders |
The tax character of distributions paid during the fiscal year ended October 31, 2004 were as follows:
| | | | | | | | | | | |
| | | Smith Barney
Premier
Selections All
Cap Growth
Portfolio | | Smith Barney
Dividend Strategy
Portfolio | | Smith Barney
Growth and
Income Portfolio | | SB Government
Portfolio |
Ordinary income | | — | | $ | 307,815 | | $ | 305,096 | | $ | 3,949,420 |
|
The tax character of distributions paid during the fiscal year ended October 31, 2003 were as follows:
| | | | | | | | | | | |
| | | Smith Barney
Premier
Selections All
Cap Growth
Portfolio | | Smith Barney
Dividend Strategy
Portfolio | | Smith Barney
Growth and
Income Portfolio | | SB Government
Portfolio |
Ordinary income | | — | | $ | 214,782 | | $ | 198,672 | | $ | 1,371,678 |
|
52 Smith Barney Investment Series | 2004 Annual Report
Notes to Financial Statements (continued)
As of October 31, 2004, the components of accumulated earnings on a tax basis were as follows:
| | | | | | | | | | | | | | | | |
| | | Smith Barney
Premier
Selections All
Cap Growth
Portfolio | | | Smith Barney
Dividend Strategy
Portfolio | | | Smith Barney
Growth and
Income Portfolio | | | SB Government
Portfolio | |
Undistributed ordinary income — net | | $ | — | | | $ | 237,488 | | | $ | 334,109 | | | $ | 4,085,222 | |
|
|
Total undistributed earnings | | | — | | | | 237,488 | | | | 334,109 | | | | 4,085,222 | |
Capital loss carryforward(1) | | | (10,781,974 | ) | | | (28,600,871 | ) | | | (8,719,694 | ) | | | (3,304,782 | ) |
Other book/tax temporary differences(2) | | | — | | | | (17,325 | ) | | | — | | | | (356,361 | ) |
Unrealized appreciation(3) | | | 2,706,096 | | | | 5,924,820 | | | | 6,981,915 | | | | 1,908,643 | |
|
|
Total accumulated earnings (losses) — net | | $ | (8,075,878 | ) | | $ | (22,455,888 | ) | | $ | (1,403,670 | ) | | $ | 2,332,722 | |
|
|
| (1) | | On October 31, 2004 Smith Barney Premier Selections All Cap Growth Portfolio had a net capital loss carryforward of approximately $10,781,974, of which $1,773,086 expires in 2009, $6,363,962 expires in 2010 and $2,644,926 expires in 2011. Smith Barney Dividend Strategy Portfolio had a net capital loss carryforward of approximately $28,600,871, of which $6,294,961 expires in 2009, $15,846,502 expires in 2010 and $6,459,408 expires in 2011. Smith Barney Growth & Income Portfolio had a net capital loss carryforward of approximately $8,719,694 of which $1,521,927 expires in 2009, $3,442,272 expires in 2010 and $3,755,495 expires in 2011. Smith Barney Government Portfolio had a net capital loss carryforward of approximately $3,304,782 of which $49,007 expires in 2010, $2,378,580 expires in 2011 and $877,195 expires in 2012. These amounts will be available to offset like amount of any future taxable capital gains. |
| (2) | | Other book/tax temporary differences are attributable primarily to the tax deferral of losses on straddles and the realization for tax purposes of unrealized gains (losses) on certain futures contracts. |
| (3) | | The difference between book-basis and tax-basis unrealized appreciation is attributable primarily to the tax deferral of losses on wash sales and the difference between book & tax amortization methods for premium and discounts on fixed income securities. |
In connection with an investigation previously disclosed by Citigroup, the Staff of the Securities and Exchange Commission (“SEC”) has notified Citigroup Asset Management (“CAM”), the Citigroup business unit that includes the funds’ investment manager and other investment advisory companies; Citicorp Trust Bank (“CTB”), an affiliate of CAM; Thomas W. Jones, the former CEO of CAM; and three other individuals, one of whom is an employee and the other two of whom are former employees of CAM, that the SEC Staff is considering recommending a civil injunctive action and/or an administrative proceeding against each of them relating to the creation and operation of an internal transfer agent unit to serve various CAM-managed funds.
In 1999, CTB entered the transfer agent business. CTB hired an unaffiliated subcontractor to perform some of the transfer agent services. The subcontractor, in exchange, had signed a separate agreement with CAM in 1998 that guaranteed investment management revenue to CAM and investment banking revenue to a CAM affiliate. The subcontractor’s business was later taken over by PFPC Inc., and at that time the revenue guarantee was eliminated and a one-time payment was made by the subcontractor to a CAM affiliate.
CAM did not disclose the revenue guarantee when the boards of various CAM-managed funds hired CTB as transfer agent. Nor did CAM disclose to the boards of the various CAM-managed funds the one-time payment received by the CAM affiliate when it was made.
In addition, the SEC Staff has indicated that it is considering recommending action based on the adequacy of the disclosures made to the fund boards that approved the transfer agency arrangement, CAM’s initiation and operation of, and compensation for, the transfer agent business and CAM’s retention of, and agreements with, the subcontractor.
Citigroup is cooperating fully in the investigation and will seek to resolve the matter in discussions with the SEC Staff. Although there can be no assurance, Citigroup does not believe that this matter will have a material adverse effect on the Funds. As previously disclosed, CAM has already agreed to pay the applicable funds, primarily through fee waivers, a total
53 Smith Barney Investment Series | 2004 Annual Report
Notes to Financial Statements (continued)
of approximately $17 million (plus interest) that is the amount of the revenue received by Citigroup relating to the revenue guarantee.
Beginning in June, 2004, class action lawsuits alleging violations of the federal securities laws were filed against Citigroup Global Markets Inc. (the “Distributor”) and a number of its affiliates, including Smith Barney Fund Management LLC and Salomon Brothers Asset Management Inc (the “Advisers”), substantially all of the mutual funds managed by the Advisers, including the Funds (the “Funds”), and directors or trustees of the Funds (collectively, the “Defendants”). The complaints alleged, among other things, that the Distributor created various undisclosed incentives for its brokers to sell Smith Barney and Salomon Brothers funds. In addition, according to the complaints, the Advisers caused the Funds to pay excessive brokerage commissions to the Distributor for steering clients towards proprietary funds. The complaints also alleged that the defendants breached their fiduciary duty to the Funds by improperly charging Rule 12b-1 fees and by drawing on fund assets to make undisclosed payments of soft dollars and excessive brokerage commissions. The complaints also alleged that the Funds failed to adequately disclose certain of the allegedly wrongful conduct. The complaints sought injunctive relief and compensatory and punitive damages, rescission of the Funds’ contracts with the Advisers, recovery of all fees paid to the Advisers pursuant to such contracts and an award of attorneys’ fees and litigation expenses.
On December 15, 2004, a consolidated amended complaint (the “Complaint”) was filed alleging substantially similar causes of action. While the lawsuit is in its earliest stages, to the extent that the Complaint purports to state causes of action against the Funds, Citigroup Asset Management believes the Funds have significant defenses to such allegations, which the Funds intend to vigorously assert in responding to the Complaint.
Additional lawsuits arising out of these circumstances and presenting similar allegations and requests for relief may be filed against the Defendants in the future.
As of the date of this report, Citigroup Asset Management and the Funds believe that the resolution of the pending lawsuit will not have a material effect on the financial position or results of operations of the Funds or the ability of the Advisers and their affiliates to continue to render services to the Funds under their respective contracts.
54 Smith Barney Investment Series | 2004 Annual Report
Report of Independent Registered Public Accounting Firm
The Shareholders and Board of Trustees of
Smith Barney Investment Series:
We have audited the accompanying statements of assets and liabilities, including the schedules of investments, of Smith Barney Premier Selections All Cap Growth Portfolio, Smith Barney Dividend Strategy Portfolio (formerly known as Smith Barney Large Cap Core Portfolio), Smith Barney Growth and Income Portfolio and SB Government Portfolio (“Funds”) of the Smith Barney Investment Series (“Trust”) as of October 31, 2004, and the related statements of operations for the year then ended, the statements of changes in net assets for each of the years in the two-year period then ended and financial highlights for each of the years in the five-year period then ended. These financial statements and financial highlights are the responsibility of the Trust’s management. Our responsibility is to express an opinion on these financial statements and financial highlights based on our audits.
We conducted our audits in accordance with the standards of the Public Company Accounting Oversight Board (United States). Those standards require that we plan and perform the audit to obtain reasonable assurance about whether the financial statements and financial highlights are free of material misstatement. An audit includes examining, on a test basis, evidence supporting the amounts and disclosures in the financial statements and financial highlights. Our procedures included confirmation of securities owned as of October 31, 2004, by correspondence with the custodian and brokers or by other appropriate auditing procedures where replies from brokers were not received. An audit also includes assessing the accounting principles used and significant estimates made by management, as well as evaluating the overall financial statement presentation. We believe that our audits provide a reasonable basis for our opinion.
In our opinion, the financial statements and financial highlights referred to above present fairly, in all material respects, the financial position of the Funds as of October 31, 2004, and the results of their operations for the year then ended, the changes in their net assets for each of the years in the two-year period then ended and the financial highlights for each of the years in the five-year period then ended in conformity with U.S. generally accepted accounting principles.

New York, New York
December 17, 2004
55 Smith Barney Investment Series | 2004 Annual Report
Additional Information (unaudited)
Information about Trustees and Officers
The business and affairs of Smith Barney Investment Series (“Trust”) are managed under the direction of the Trust’s Board of Trustees. Information pertaining to the Trustees and officers of the Trust is set forth below. Each Trustee and Officer holds office for his or her lifetime, unless that individual resigns, retires or is otherwise removed. The Statement of Additional Information includes additional information about the Trustees and is available without charge, upon request by calling the Trust's transfer agent (Citicorp Trust Bank, fsb.) at 1-800-451-2010.
| | | | | | | | | | |
| Name, Address and Age | | Position(s) Held with Fund | | Term of
Office* and
Length of
Time Served | | Principal Occupation(s) During Past Five Years | | Number of
Portfolios in
Fund Complex
Overseen by
Trustee | | Other Board Memberships Held by Trustee
During Past 5 Years |
Non-Interested Trustees: | | | | | | | | | | |
| | | | | |
Elliott J. Berv c/o R. Jay Gerken Citigroup Asset Management (“CAM”) 399 Park Avenue, 4th floor New York, NY 10022 DOB: 4/30/43 | | Trustee | | Since
2001 | | Executive Vice President and Chief Operations Officer, DigiGym Systems (On-line Personal Training Systems) (since 2001); Chief Executive Officer, Rocket City Enterprises (Internet Service Company) (from 2000 to 2001); Motorcity USA (motorsport racing) (since 2004); Consulting, Catalyst (Consulting) (since 1984) | | 36 | | Board Member, American Identity Corp. (doing business as Morpheus Technologies) (Biometric Information Management) (since 2001; Consultant since 1999); Director, Lapoint Industries (Industrial Filter Company) (since 2002); Director, Alzheimer’s Association (New England Chapter) (since 1998) |
| | | | | |
Donald M. Carlton
c/o R. Jay Gerken CAM 399 Park Avenue, 4th floor New York, NY 10022 DOB: 7/20/37 | | Trustee | | Since
2001 | | Consultant, URS Corporation (Engineering) (since 1999); former Chief Executive Officer, Radian International LLC (Engineering) (from 1996 to 1998), Member of Management Committee, Signature Science (Research and Development) (since 2000) | | 31 | | Director, Temple-Inland (forest products) (since 2003); American Electric Power Co. (Electric Utility) (since 1999); Director, Valero Energy (Petroleum Refining) (1999 to 2003); Director, National Instruments Corp. (Technology) (since 1994) |
| | | | | |
A. Benton Cocanougher c/o R. Jay Gerken CAM 399 Park Avenue, 4th floor New York, NY 10022 DOB: 7/6/38 | | Trustee | | Since
2001 | | Interim Chancellor, Texas A&M University System (since 2003); former Special Advisor to the President, Texas A&M University (2002 to 2003); former Dean Emeritus and Wiley Professor, Texas A&M University (since 2001); former Dean and Professor of Marketing, College and Graduate School of Business of Texas A&M University (from 1987 to 2001) | | 31 | | None |
56 Smith Barney Investment Series | 2004 Annual Report
Additional Information (unaudited) (continued)
| | | | | | | | | | |
| Name, Address and Age | | Position(s) Held with Fund | | Term of
Office* and
Length of
Time Served | | Principal Occupation(s) During Past Five Years | | Number of
Portfolios in
Fund Complex
Overseen by
Trustee | | Other Board Memberships Held by Trustee
During Past 5 Years |
Non-Interested Trustees (continued): | | | | | | | | |
| | | | | |
Mark T. Finn c/o R. Jay Gerken CAM 399 Park Avenue, 4th floor New York, NY 10022 DOB: 5/16/43 | | Trustee | | Since
2001 | | Adjunct Professor, College of William & Mary (since 2002); Principal/Member, Balvan Partners (investment management) (since 2002); Chairman, Chief Executive Officer and Owner, Vantage Consulting Group, Inc. (investment advisory and consulting firm) (since 1988); former Vice Chairman and Chief Operating Officer, Linder Asset Management Company (mutual fund company) (1999 to 2001); former President and Director, Delta Financial, Inc. (investment advisory firm) (from 1983 to 1999); former General Partner and Shareholder, Greenwich Ventures, LLC (investment partnership) (1996 to 2001); former President, Secretary and Owner, Phoenix Trading Co. (commodity trading advisory firm) (from 1997 to 2000). | | 36 | | None |
| | | | | |
Stephen Randolph Gross c/o R. Jay Gerken CAM 399 Park Avenue, 4th floor New York, NY 10022 DOB: 10/8/47 | | Trustee | | Since
2001 | | Chief Executive Officer, HLB Gross Collins, P.C. (accounting firm) (since 1979); Partner, Capital Investment Advisory Partners (consulting) (2000 to 2002); former Chief Operating Officer, General Media Communications, Inc. (from March 2003 to August 2003); former Managing Director, Fountainhead Ventures, LLC (consulting) (from 1998 to 2003); former Secretary, Carint N.A. (manufacturing) (1988-2002); former Treasurer, Hank Aaron Enterprises (fast food franchise) (from 1985 to 2001); Treasurer, Coventry Limited, Inc. (since 1985). | | 31 | | Director, United Telesis, Inc.; (Telecommunications) (since 1997); Director, eBank.com, Inc.; (1997 to 2004); Director, Andersen Calhoun, Inc. (Assisted Living) (since 1987); former Director, Charter Bank, Inc. (from 1987 to 1997); former Director, Yu Save, Inc. (Internet Company) (from 1998 to 2000); former Director, Hotpalm.com, Inc. (Wireless Applications) (from 1998 to 2000) |
| | | | | |
Diana R. Harrington c/o R. Jay Gerken CAM 399 Park Avenue, 4th floor New York, NY 10022 DOB: 3/25/40 | | Trustee | | Since
1992 | | Professor, Babson College (since 1993) | | 36 | | None |
57 Smith Barney Investment Series | 2004 Annual Report
Additional Information (unaudited) (continued)
| | | | | | | | | | |
| Name, Address and Age | | Position(s) Held with Fund | | Term of
Office* and
Length of
Time Served | | Principal Occupation(s) During Past Five Years | | Number of
Portfolios in
Fund Complex
Overseen by
Trustee | | Other Board Memberships Held by Trustee
During Past 5 Years |
Non-Interested Trustees (continued): | | | | | | | | |
| | | | | |
Susan B. Kerley c/o R. Jay Gerken CAM 399 Park Avenue, 4th floor New York, NY 10022 DOB: 8/12/51 | | Trustee | | Since
1992 | | Consultant, Strategic Management Advisors, LLC (Investment Consulting) (since 1990)
| | 36 | | Director, Eclipse Funds (currently supervises 12 investment companies in fund complex) (since 1990) |
| | | | | |
Alan G. Merten c/o R. Jay Gerken CAM 399 Park Avenue, 4th floor New York, NY 10022 DOB: 12/27/41 | | Trustee | | Since
2001 | | President, George Mason University (since 1996) | | 31 | | Former Director, Comshare, Inc. (information technology)
(from 1985 to 2003); Director, DigitalNet Holdings, Inc. (since October 2003) |
| | | | | |
R. Richardson Pettit c/o R. Jay Gerken CAM 399 Park Avenue, 4th floor New York, NY 10022 DOB: 7/6/42 | | Trustee | | Since
2001 | | Professor of Finance, University of Houston (from 1977 to 2002); Independent Consultant (since 1984) | | 31 | | None |
| | | | | |
Interested Trustees: | | | | | | | | | | |
| | | | | |
R. Jay Gerken, CFA** CAM
399 Park Avenue, 4th Floor
New York, NY 10022 DOB: 4/5/51 | | Chairman, President and Chief Executive Officer | | Since
2002 | | Managing Director of Citigroup Global Markets Inc. (“CGM”); Chairman, President and Chief Executive Officer of Smith Barney Fund Management LLC (“SBFM”), Travelers Investment Adviser, Inc. (“TIA”) and Citi Fund Management, Inc. (“CFM”); President and Chief Executive Officer of certain mutual funds associated with Citigroup Inc. (“Citigroup”); formerly, Portfolio Manager of Smith Barney Allocation Series Inc. (from 1996 to 2001) and Smith Barney Growth and Income Fund (from 1996 to 2000) | | 221 | | None |
58 Smith Barney Investment Series | 2004 Annual Report
Additional Information (unaudited) (continued)
| | | | | | | | | | |
| Name, Address and Age | | Position(s) Held with Fund | | Term of
Office* and
Length of
Time Served | | Principal Occupation(s) During Past Five Years | | Number of
Portfolios in
Fund Complex
Overseen by
Trustee | | Other Board Memberships Held by Trustee
During Past 5 Years |
Officers: | | | | | | | | | | |
| | | | | |
Andrew B. Shoup CAM
125 Broad Street, 10th Floor
New York, NY 10004
DOB: 8/1/56 | | Senior Vice President and Chief Administrative Officer | | Since
2003 | | Director of CAM; Senior Vice President and Chief Administrative Officer of mutual funds associated with Citigroup; Head of International Funds Administration of CAM from 2001 to 2003; Director of Global Funds Administration of CAM (from 2000 to 2001); Head of U.S. Citibank Funds Administration of CAM (from 1998 to 2000) | | N/A | | N/A |
| | | | | |
Frances M. Guggino
CAM
125 Broad Street, 10th Floor
New York, NY 10004
DOB: 9/8/57 | | Chief Financial Officer and Treasurer | | Since
2004 | | Vice President of CAM; Chief Financial Officer and Treasurer of certain mutual funds associated with Citigroup; Formerly Controller of certain mutual Funds associated with Citigroup | | N/A | | N/A |
| | | | | |
Alan J. Blake
CAM
399 Park Avenue, 4th Floor
New York, NY 10022
DOB: 6/3/49 | | Vice President and Investment Officer | | Since 2001 | | Managing Director of CGM | | N/A | | N/A |
| | | | | |
Kevin Caliendo CAM 399 Park Avenue, 4th Floor New York, NY 10004 DOB: 3/6/70 | | Vice President and Investment Officer | | Since
2003 | | Managing Director of CGM | | N/A | | N/A |
| | | | | |
Michael A. Kagan
CAM
399 Park Avenue, 4th Floor
New York, NY 10022 DOB: 7/3/60 | | Vice President and Investment Officer | | Since 2000 | | Managing Director of CGM | | N/A | | N/A |
| | | | | |
Roger M. Lavan, CFA CAM
399 Park Avenue, 4th Floor
New York, NY 10022
DOB: 5/9/63 | | Vice President and Investment Officer | | Since
2002 | | Managing Director of CGM and Salomon Brothers Asset Management Inc. (“SBAM”) | | N/A | | N/A |
| | | | | |
Francis L. Mustaro
CAM
399 Park Avenue, 4th Floor
New York, NY 10022
DOB: 9/13/50 | | Vice President and Investment Officer | | Since
2002 | | Managing Director of CGM | | N/A | | N/A |
| | | | | |
Lawrence B. Weissman, CFA
CAM
100 First Stamford Place
Stamford, CT 06902
DOB: 3/16/61 | | Vice President and Investment Officer | | Since
1999 | | Managing Director of CGM | | N/A | | N/A |
59 Smith Barney Investment Series | 2004 Annual Report
| | |
| Additional Information (unaudited) (continued) | | |
| | | | | | | | | | |
| Name, Address and Age | | Position(s) Held with Fund | | Term of
Office* and
Length of
Time Served | | Principal Occupation(s) During Past Five Years | | Number of
Portfolios in
Fund Complex
Overseen by
Trustee | | Other Board Memberships Held by Trustee
During Past 5 Years |
Officers (continued): | | | | | | | | | | |
| | | | | |
Timothy Woods, CFA
CAM
100 First Stamford Place
Stamford, CT 06902
DOB: 9/9/60 | | Vice President and Investment Officer | | Since
2001 | | Managing Director of CGM | | N/A | | N/A |
| | | | | |
Andrew Beagley
CAM
399 Park Avenue, 4th Floor
New York, NY 10022
DOB: 10/9/62 | | Chief Anti-Money Laundering Compliance Officer Chief Compliance Officer | | Since
2002 Since
2004 | | Director of CGM (since 2000); Director of Compliance, North America, CAM (since 2000);
Chief Anti-Money Laundering Compliance Officer, Chief Compliance Officer and Vice President of certain mutual funds associated with Citigroup; Director of Compliance, Europe, the Middle East and Africa, CAM (from 1999 to 2000); Compliance Officer, SBFM, CFM, TIA, Salomon Brothers Asset Management Limited, Smith Barney Global Capital Management Inc., Salomon Brothers Asset Management Asia Pacific Limited (from 1997 to 1999) | | N/A | | N/A |
| | | | | |
Wendy S. Setnicka
CAM
125 Broad Street, 10th Floor
New York, NY 10004
DOB: 6/30/64 | | Controller | | Since
2004 | | Vice President of CGM; Controller of certain mutual funds associated with Citigroup; Assistant Controller of CAM (Since 2002) | | N/A | | N/A |
| | | | | |
Robert I. Frenkel CAM
300 First Stamford Place
Stamford, CT 06902
DOB: 12/12/54 | | Secretary and
Chief Legal Officer | | Since
2003 | | Managing Director and General Counsel of Global Mutual Funds for CAM and its predecessor (since 1994); Secretary and Chief Legal Officer of mutual funds associated with Citigroup | | N/A | | N/A |
| * | | Each Trustee and Officer serves until his or her successor has been duly elected and qualified. |
| ** | | Mr. Gerken is an “interested person” of the Funds as defined in the Investment Company Act of 1940, as amended, because Mr. Gerken is an officer of SBFM and certain of its affiliates. |
60 Smith Barney Investment Series | 2004 Annual Report
| | |
| Important Tax Information (unaudited) | | |
The following information is provided with respect to the distributions paid during the taxable year ended October 31, 2004:
| | | | | | | | | |
| | | SB Dividend Strategy Portfolio | | | Smith Barney Growth and Income Portfolio | | | SB Government Portfolio | |
Record Date: | | 12/26/2003 | | | 12/26/2003 | | | 12/26/2003 | |
Payable Date: | | 12/30/2003 | | | 12/30/2003 | | | 12/30/2003 | |
Qualified Dividend Income for Individuals | | 100.00 | % | | 100.00 | % | | — | |
Dividends Qualifying for the Dividends Received Deduction for Corporations | | 100.00 | % | | 100.00 | % | | — | |
Interest from Federal Obligations | | — | | | — | | | 71.09 | % |
The above figures may differ from those cited elsewhere in this report due to differences in the calculations of income and capital gain for Securities and Exchange Commission (book) purposes and Internal Revenue Service (tax) purposes.
61 Smith Barney Investment Series | 2004 Annual Report
SMITH BARNEY
INVESTMENT SERIES
| | |
TRUSTEES Elliott J. Berv Donald M. Carlton A. Benton Cocanougher Mark T. Finn R. Jay Gerken, CFA
Chairman Stephen Randolph Gross Diana R. Harrington Susan B. Kerley Alan G. Merten R. Richardson Pettit OFFICERS R. Jay Gerken, CFA President and Chief Executive Officer Andrew B. Shoup Senior Vice President and Chief Administrative Officer Frances M. Guggino Chief Financial Officer
and Treasurer Alan J. Blake Vice President and Investment Officer Kevin Caliendo Vice President and Investment Officer Michael A. Kagan Vice President and Investment Officer Roger M. Lavan, CFA Vice President and Investment Officer | | OFFICERS (continued) Francis L. Mustaro Vice President and Investment Officer Lawrence B. Weissman, CFA Vice President and Investment Officer Timothy Woods, CFA Vice President and Investment Officer Andrew Beagley Chief Anti-Money Laundering Compliance Officer and Chief Compliance Officer Wendy S. Setnicka Controller Robert I. Frenkel Secretary and
Chief Legal Officer INVESTMENT MANAGER Smith Barney Fund Management LLC CUSTODIAN State Street Bank and
Trust Company TRANSFER AGENT Citicorp Trust Bank, fsb. 125 Broad Street, 11th Floor New York, New York 10004 SUB-TRANSFER AGENT PFPC Inc. P.O. Box 9699 Providence, Rhode Island 02940-9699 |
Smith Barney Investment Series
Smith Barney Premier Selections
All Cap Growth Portfolio
Smith Barney Dividend Strategy Portfolio
Smith Barney Growth and Income Portfolio
SB Government Portfolio
The Funds are separate investment funds of the Smith Barney Investment Series, a Massachusetts business trust.
The Funds file their complete schedule of portfolio holdings with Securities Exchange Commission for the first and third quarters of each fiscal year on Form N-Q. The Funds’ Forms N-Q are available on the Commission’s website at www.sec.gov. The Funds’ Forms N-Q may be reviewed and copied at the Commission’s Public Reference Room in Washington D.C., and information on the operation of the Public Reference Room may be obtained by calling 1-800-SEC-0330. To obtain information on Form N-Q from the Funds, shareholders can call 1-800-451-2010.
Information on how the Funds voted proxies relating to portfolio securities during the 12-month period ended June 30, 2004 and a description of the policies and procedures that the Funds use to determine how to vote proxies relating to portfolio securities is available (1) without charge, upon request, by calling 1-800-451-2010, (2) on the Funds’ website at www.citigroupAM.com and (3) on the SEC’s website at www.sec.gov.
This report is submitted for general information of the shareholders of the Smith Barney Investment Series — Smith Barney Premier Selections All Cap Growth, Smith Barney Dividend Strategy, Smith Barney Growth and Income and SB Government Portfolios.
SMITH BARNEY INVESTMENT SERIES
Smith Barney Mutual Funds
125 Broad Street
10th Floor, MF-2
New York, New York 10004
©2004 Citigroup Global Markets Inc.
Member NASD, SIPC
FD02461 12/04 04-7570
The registrant has adopted a code of ethics that applies to the registrant’s principal executive officer, principal financial officer, principal accounting officer or controller.
| ITEM 3. | AUDIT COMMITTEE FINANCIAL EXPERT. |
The Board of Trustees of the registrant has determined that Stephen Randolph Gross, the Chairman of the Board’s Audit Committee, possesses the technical attributes identified in Instruction 2(b) of Item 3 to Form N-CSR to qualify as an “audit committee financial expert,” and has designated Mr. Gross as the Audit Committee’s financial expert. Mr. Gross is an “independent” Trustee pursuant to paragraph (a)(2) of Item 3 to Form N-CSR.
| ITEM 4. | PRINCIPAL ACCOUNTANT FEES AND SERVICES. |
| | (a) | Audit Fees for the Smith Barney Investment Series were $130,000 and $126,000 for the years ended 10/31/04 and 10/31/03. |
| | (b) | Audit-Related Fees for the Smith Barney Investment Series were $0 and $8,000 for the years ended 10/31/04 and 10/31/03. |
| | (c) | Tax Fees for Smith Barney Investment Series of $17,500 and $16,900 for the years ended 10/31/04 and 10/31/03. These amounts represent aggregate fees paid for tax compliance, tax advice and tax planning services, which include (the filing and amendment of federal, state and local income tax returns, timely RIC qualification review and tax distribution and analysis planning) rendered by the Accountant to Smith Barney Investment Series. |
| | (d) | All Other Fees for Smith Barney Investment Series of $0 and $0 for the years ended 10/31/04 and 10/31/03. |
| | (e) | (1) Audit Committee’s pre–approval policies and procedures described in paragraph (c) (7) of Rule 2-01 of Regulation S-X. |
The Charter for the Audit Committee (the “Committee”) of the Board of each registered investment company (the “Fund”) advised by Smith Barney Fund Management LLC or Salomon Brothers Asset Management Inc. or one of their affiliates (each, an “Adviser”) requires that the Committee shall approve (a) all audit and permissible non-audit services to be provided to the Fund and (b) all permissible non-audit services to be provided by the Fund’s independent auditors to the Adviser and any Covered Service Providers if the engagement relates directly to the operations and financial reporting of the Fund. The Committee may implement policies and procedures by which such services are approved other than by the full Committee.
The Committee shall not approve non-audit services that the Committee believes may impair the independence of the auditors. As of the date of the approval of this Audit Committee Charter, permissible non-audit services include any professional services (including tax services), that are not prohibited services as described below, provided to the Fund by the independent auditors, other than those provided to the Fund in connection with an audit or a review of the financial statements of the Fund. Permissible non-audit services may not include: (i) bookkeeping or other services related to the accounting records or financial statements of the Fund; (ii) financial information systems design and implementation; (iii) appraisal or valuation services, fairness opinions or contribution-in-kind reports; (iv) actuarial services; (v) internal audit outsourcing services; (vi) management functions or human resources; (vii) broker or dealer, investment adviser or investment banking services; (viii) legal services and expert services unrelated to the audit; and (ix) any other service the Public Company Accounting Oversight Board determines, by regulation, is impermissible.
Pre-approval by the Committee of any permissible non-audit services is not required so long as: (i) the aggregate amount of all such permissible non-audit services provided to the Fund, the Adviser and any service providers controlling, controlled by or under common control with the Adviser that provide ongoing services to the Fund (“Covered Service Providers”) constitutes not more than 5% of the total amount of revenues paid to the independent auditors during the fiscal year in which the permissible non-audit services are provided to (a) the Fund, (b) the Adviser and (c) any entity controlling, controlled by or under common control with the Adviser that provides ongoing services to the Fund during the fiscal year in which the services are provided that would have to be approved by the Committee; (ii) the permissible non-audit services were not recognized by the Fund at the time of the engagement to be non-audit services; and (iii) such services are promptly brought to the attention of the Committee and approved by the Committee (or its delegate(s)) prior to the completion of the audit.
(2) For the Smith Barney Investment Series, the percentage of fees that were approved by the audit committee, with respect to: Audit-Related Fees were 100% and 100% for the years ended 10/31/04 and 10/31/03; Tax Fees were 100% and 100% for the years ended 10/31/04 and 10/31/03; and
Other Fees were 100% and 100% for the years ended 10/31/04 and 10/31/03.
| | (g) | Non-audit fees billed by the Accountant for services rendered to Smith Barney Investment Series and CAM and any entity controlling, controlled by, or under common control with CAM that provides ongoing services to Smith Barney Investment Series were $0 and $0 for the years ended 10/31/04 and 10/31/03. |
| | (h) | Yes. The Smith Barney Investment Series’s Audit Committee has considered whether the provision of non-audit services that were rendered to Service Affiliates which were not pre-approved (not requiring pre-approval) is compatible with maintaining the Accountant’s independence. All services provided by the Accountant to the Smith Barney Investment Series or to Service Affiliates which were required to be pre-approved were pre-approved as required. |
| ITEM 5. | AUDIT COMMITTEE OF LISTED REGISTRANTS. |
Not applicable.
| ITEM 7. | DISCLOSURE OF PROXY VOTING POLICIES AND PROCEDURES FOR CLOSED-END MANAGEMENT INVESTMENT COMPANIES. |
Not applicable.
| ITEM 9. | SUBMISSION OF MATTERS TO A VOTE OF SECURITY HOLDERS. |
Not applicable.
| ITEM 10. | CONTROLS AND PROCEDURES. |
| | (a) | The registrant’s principal executive officer and principal financial officer have concluded that the registrant’s disclosure controls and procedures (as defined in Rule 30a- 3(c) under the Investment Company Act of 1940, as amended (the “1940 Act”)) are effective as of a date within 90 days of the filing date of this report that includes the disclosure required by this paragraph, based on their evaluation of the disclosure controls and procedures required by Rule 30a-3(b) under the 1940 Act and 15d-15(b) under the Securities Exchange Act of 1934. |
| | (b) | There were no changes in the registrant’s internal control over financial reporting (as defined in Rule 30a-3(d) under the 1940 Act) that occurred during the registrant’s last fiscal half-year (the registrant’s second fiscal half-year in the case of an annual report) that have materially affected, or are likely to materially affect the registrant’s internal control over financial reporting. |
| | (a) | Code of Ethics attached hereto. |
Exhibit 99.CODE ETH
| | |
| Exhibit 99.CERT | | Certifications pursuant to section 302 of the Sarbanes-Oxley Act of 2002 |
| |
| Exhibit 99.906CERT | | Certifications pursuant to Section 906 of the Sarbanes-Oxley Act of 2002 |
SIGNATURES
Pursuant to the requirements of the Securities Exchange Act of 1934 and the Investment Company Act of 1940, the registrant has duly caused this Report to be signed on its behalf by the undersigned, there unto duly authorized.
| | |
| Smith Barney Investment Series |
| |
| By: | | /s/ R. JAY GERKEN |
| | | R. Jay Gerken |
| | | Chief Executive Officer of |
| | | Smith Barney Investment Series |
Date: January 6, 2005
Pursuant to the requirements of the Securities Exchange Act of 1934 and the Investment Company Act of 1940, this report has been signed below by the following persons on behalf of the registrant and in the capacities and on the dates indicated.
| | |
| |
| By: | | /s/ R. JAY GERKEN |
| | | (R. Jay Gerken) |
| | | Chief Executive Officer of |
| | | Smith Barney Investment Series |
Date: January 6, 2005
| | |
| |
| By: | | /s/ FRANCES M. GUGGINO |
| | | (Frances M. Guggino) |
| | | Chief Financial Officer of |
| | | Smith Barney Investment Series |
Date: January 6, 2005