UNITED STATES
SECURITIES AND EXCHANGE COMMISSION
Washington, D.C. 20549
FORM N-CSR
CERTIFIED SHAREHOLDER REPORT OF REGISTERED
MANAGEMENT INVESTMENT COMPANIES
Investment Company Act file number 811-5018
Smith Barney Investment Series
(Exact name of registrant as specified in charter)
| | |
| 125 Broad Street, New York, NY 10004 |
| (Address of principal executive offices) (Zip code) |
Robert I. Frenkel, Esq.
Legg Mason & Co., LLC
300 First Stamford Place, 4th Floor
Stamford, CT 06902
(Name and address of agent for service)
Registrant’s telephone number, including area code: (800) 451-2010
Date of fiscal year end: October 31
Date of reporting period: October 31, 2005
| ITEM 1. | REPORT TO STOCKHOLDERS. |
The Annual Report to Stockholders is filed herewith.
EXPERIENCE
ANNUAL REPORT
OCTOBER 31, 2005


Smith Barney Investment Series
Smith Barney Premier Selections All Cap Growth Portfolio
Smith Barney Dividend Strategy Portfolio
Smith Barney Growth and Income Portfolio
SB Government Portfolio
INVESTMENT PRODUCTS: NOT FDIC INSURED Ÿ NO BANK GUARANTEE Ÿ MAY LOSE VALUE
Smith Barney Investment Series
Annual Report Ÿ October 31, 2005
What’s
Inside
Under a licensing agreement between Citigroup and Legg Mason, the names of funds, the names of any classes of shares of funds, and the names of investment advisers of funds, as well as all logos, trademarks and service marks related to Citigroup or any of its affiliates (“Citi Marks”) are licensed for use by Legg Mason. Citi Marks include, but are not limited to, “Smith Barney,” “Salomon Brothers,” “Citi,” “Citigroup Asset Management,” and “Davis Skaggs Investment Management”. Legg Mason and its affiliates, as well as the Funds’ investment manager, are not affiliated with Citigroup.
All Citi Marks are owned by Citigroup, and are licensed for use until no later than one year after the date of the licensing agreement.
Letter from the Chairman

R. JAY GERKEN
Chairman, President and
Chief Executive Officer
Dear Shareholder,
The U.S. economy was surprisingly resilient during the fiscal year. While surging oil prices, rising interest rates and the impact of Hurricanes Katrina and Rita threatened to derail economic expansion, growth remained solid throughout the period. After a 3.3% advance in the second quarter of 2005, third quarter gross domestic product (“GDP”)i growth grew to 4.3%, marking the tenth consecutive quarter in which GDP growth grew 3.0% or more.
As expected, the Federal Reserve Board (“Fed”)ii continued to raise interest rates in an attempt to ward off inflation. After raising rates three times from June 2004 through September 2004, the Fed increased its target for the federal funds rateiii in 0.25% increments eight additional times over the reporting period. The Fed again raised rates in early November, after the Funds’ reporting period had ended. All told, the Fed’s twelve rate hikes have brought the target for the federal funds rate from 1.00% to 4.00%. This represents the longest sustained Fed tightening cycle since 1976-1979.
During the 12-month period covered by this report, the U.S. stock market generated solid results, with the S&P 500 Indexiv returning 8.72%. Generally positive economic news, relatively benign core inflation and strong corporate profits supported the market during much of the period. Looking at the fiscal year as a whole, mid-cap stocks generated superior returns, with the Russell Midcapv, Russell 1000vi, and Russell 2000vii Indexes returning 18.09%, 10.47%, and 12.08%, respectively. From a market style perspective, value-oriented stocks significantly outperformed their growth counterparts, with the Russell 3000 Valueviii and Russell 3000 Growthix Indexes returning 11.96% and 8.99%, respectively.
During much of the fiscal year, the fixed income market confounded investors as short-term interest rates rose in concert with the Fed rate tightening, while longer-term rates, surprisingly, declined. However, due to a spike late in the period, the 10-year Treasury yield was 4.56% on October 31, 2005, versus 4.11% when the period began. Nevertheless, this was still lower than its yield of 4.62% when the Fed began its tightening cycle on June 30, 2004. Looking at the one-year period as a whole, the overall bond market, as measured by the Lehman Brothers Aggregate Bond Indexx, returned 1.13%.
Please read on for a more detailed look at prevailing economic and market conditions during the Funds’ fiscal year and to learn how those conditions have affected fund performance.
Smith Barney Investment Series 1
| | | | |
| Performance of the Funds1 as of October 31, 2005 (unaudited) |
| | |
| | | 6 Months | | 12 Months |
Smith Barney Premier Selections All Cap Growth Portfolio | | 10.07% | | 9.97% |
|
Russell 1000 Growth Index | | 7.59% | | 8.81% |
|
Russell 2000 Growth Index | | 13.15% | | 10.91% |
|
S&P MidCap 400 Index | | 11.33% | | 17.65% |
|
Lipper Variable Multi-Cap Growth Funds Category Average | | 12.84% | | 14.64% |
|
| | |
Smith Barney Dividend Strategy Portfolio | | 0.70% | | 2.23% |
|
S&P 500 Index | | 5.27% | | 8.72% |
|
Lipper Variable Large-Cap Core Funds Category Average | | 6.06% | | 9.39% |
|
| | |
Smith Barney Growth and Income Portfolio | | 4.64% | | 6.37% |
|
S&P 500 Index | | 5.27% | | 8.72% |
|
Lipper Variable Large-Cap Core Funds Category Average | | 6.06% | | 9.39% |
|
| | |
SB Government Portfolio | | -0.26% | | 0.41% |
|
Lehman Brothers Government Bond Index | | 0.07% | | 0.94% |
|
Lipper Variable General U.S. Government Funds Category Average | | -0.11% | | 1.49% |
|
| 1 | | The Funds are underlying investment options of various variable annuity and variable life insurance products. A variable annuity product is a contract issued by an insurance company where the annuity premium (a set amount of dollars) is immediately turned into units of a portfolio of securities. Upon retirement, the policyholder is paid according to accumulated units whose dollar value varies according to the performance of the securities within the sub accounts. Its objective is to preserve, through investment, the purchasing value of the annuity, which otherwise is subject to erosion through inflation. The Funds’ performance returns do not reflect the deduction of initial sales charges and expenses imposed in connection with investing in variable annuity contracts, such as administrative fees, account charges, and surrender charges which, if reflected, would reduce the performance of the Funds. Past performance is no guarantee of future results. |
2 Smith Barney Investment Series
|
| The performance shown represents past performance. Past performance is no guarantee of future results and current performance may be higher or lower than the performance shown above. Principal value and investment returns will fluctuate and investors’ shares, when redeemed, may be worth more or less than their original cost. |
| Fund returns assume the reinvestment of all distributions, including returns of capital, if any, at net asset value and the deduction of all fund expenses. |
| Lipper, Inc. is a major independent mutual-fund tracking organization. |
| Returns are based on the period ended October 31, 2005, calculated among the 117 funds for the six-month period and among the 116 funds for the 12-month period in the Lipper Variable Multi-Cap Growth Funds Category, including the reinvestment of all distributions, including returns of capital, if any. |
| Returns are based on the period ended October 31, 2005, calculated among the 228 funds for the six-month period and among the 227 funds for the 12-month period in the Lipper Variable Large-Cap Core Funds Category, including the reinvestment of all distributions, including returns of capital, if any. |
| Returns are based on the period ended October 31, 2005, calculated among the 62 funds for the six-month period and among the 61 funds for the 12-month period in the Lipper Variable General U.S. Government Funds Category, including the reinvestment of all distributions, including returns of capital, if any. |
Special Shareholder Notice
On December 1, 2005, Citigroup Inc. (“Citigroup”) completed the sale of substantially all of its asset management business, Citigroup Asset Management, to Legg Mason, Inc. (“Legg Mason”). As a result, the Funds’ investment advisor, Smith Barney Fund Management LLC (the “Manager”), previously an indirect wholly-owned subsidiary of Citigroup, has become a whole-owned subsidiary of Legg Mason. Completion of the sale caused the existing investment management contracts to terminate. Each Fund’s shareholders previously approved a new investment management contract between the Funds and the Manager, which became effective December 1, 2005.
Information About Your Funds
As you may be aware, several issues in the mutual fund industry have recently come under the scrutiny of federal and state regulators. The Funds’ Manager and some of its affiliates have received requests for information from various government regulators regarding market timing, late trading, fees, and other mutual fund issues in connection with various investigations. The regulators appear to be examining, among other things, the Funds’ response to market timing and shareholder exchange activity, including compliance with prospectus disclosure related to these subjects. The Funds have been informed that the Manager and its affiliates are responding to those information requests, but are not in a position to predict the outcome of these requests and investigations.
Important information concerning the Funds and their Manager with regard to recent regulatory developments is contained in the Notes to Financial Statements included in this report.
Smith Barney Investment Series 3
As always, thank you for your confidence in our stewardship of your assets. We look forward to helping you continue to meet your financial goals.
Sincerely,

R. Jay Gerken, CFA
Chairman, President and Chief Executive Officer
December 1, 2005
All index performance reflects no deduction for fees, expenses or taxes. Please note an investor cannot invest directly in an index.
| i | | Gross domestic product is a market value of goods and services produced by labor and property in a given country. |
| ii | | The Federal Reserve Board is responsible for the formulation of a policy designed to promote economic growth, full employment, stable prices, and a sustainable pattern of international trade and payments. |
| iii | | The federal funds rate is the interest rate that banks with excess reserves at a Federal Reserve district bank charge other banks that need overnight loans. |
| iv | | The S&P 500 Index is an unmanaged index of 500 stocks that is generally representative of the performance of larger companies in the U.S. |
| v | | The Russell Midcap Index measures the performance of the 800 smallest companies in the Russell 1000 Index whose average market capitalization was approximately $4.7 billion as of 6/24/05. |
| vi | | The Russell 1000 Index measures the performance of the 1,000 largest companies in the Russell 3000 Index, which represents approximately 92% of the total market capitalization of the Russell 3000 Index. |
| vii | | The Russell 2000 Index measures the performance of the 2,000 smallest companies in the Russell 3000 Index, which represents approximately 8% of the total market capitalization of the Russell 3000 Index. |
| viii | | The Russell 3000 Value Index measures the performance of those Russell 3000 Index companies with lower price-to-book ratios and lower forecasted growth values. (A price-to-book ratio is the price of a stock compared to the difference between a company’s assets and liabilities.) |
| ix | | The Russell 3000 Growth Index measures the performance of those Russell 3000 Index companies with higher price-to-book ratios and higher forecasted growth values. |
| x | | The Lehman Brothers Aggregate Bond Index is a broad-based bond index comprised of Government, Corporate, Mortgage and Asset-backed issues, rated investment grade or higher, and having at least one year to maturity. |
4 Smith Barney Investment Series
Smith Barney Premier Selections All Cap Growth Portfolio
Manager Overview
Q. What were the overall market conditions during the Fund’s reporting period?
A. Despite some headwinds, the domestic economy continued to expand during the 12-month reporting period as gross domestic product (“GDP”)i grew in excess of 3% during the first three quarters 2005 and the major equity indexes advanced at respectable rates. The major roadblocks to progress were the same for much of the past year: the Federal Reserve Board (“Fed”)ii continued to raise interest rates; oil and energy prices reached new record highs; and weather-related catastrophes took a heavy human and economic toll in the Gulf region. The price of oil skyrocketed throughout the year, from $43 per barrel at the start of 2005 to a high of just under $70 at the end of August, as a result of tension in the Middle East, increased demand from China, labor strikes in Venezuela, and weather-related supply interruptions. During this period, the Fed continued its tightening policy with twelve consecutive federal funds rateiii hikes occurring between June 2004 (before the start of the annual period) and November 2005. The Gulf region hurricanes added insult to injury for the consumer and certain business segments already feeling the strain from higher energy prices and interest rates. Despite this difficult economic environment, equities were able to advance, in part due to attractive valuations and strong corporate profits.
Performance Review
For the 12 months ended October 31, 2005, the Smith Barney Premier Selections All Cap Growth Portfolio returned 9.97%. In comparison, the Fund’s unmanaged benchmarks, the Russell 1000 Growth Index,iv the Russell 2000 Growth Index,v and the S&P MidCap 400 Index,vi , returned 8.81%, 10.91% and 17.65%, respectively, for the same period. The Lipper Variable Multi-Cap Growth Funds Category Average1 increased 14.64% over the same time frame.
Q. What were the most significant factors affecting the Fund’s Performance?
A. During the annual period, the Fund’s strongest returns came from the overweighted energy sector, followed by positive performance in the underweighted consumer staples and the overweighted financials, consumer discretionary and the underweighted industrials sectors. The Fund had losses for the period in the overweighted materials sector and the underweighted utilities sector.
What were the leading contributors to performance?
A. In terms of individual stock holdings, the leading contributors to performance included positions in Chico’s FAS, Inc. in consumer discretionary, Gillette Co. in consumer staples (which was acquired by Procter & Gamble Co. during the period), SanDisk Corp. and Motorola Inc., both in information technology, and Amgen Inc. in health care.
| 1 | | Lipper, Inc. is a major independent mutual-fund tracking organization. Returns are based on the 12-month period ended October 31, 2005, including the reinvestment of all distributions, including returns of capital, if any, calculated among the 116 funds in the Fund’s Lipper category. |
Smith Barney Investment Series 2005 Annual Report 5
What were the leading detractors from performance?
A. In terms of individual stock holdings, the leading detractors from performance included positions in Pfizer Inc., Medicis Pharmaceutical Corp., and Centene Corp., all in health care, DreamWorks Animation SKG, Inc. in consumer discretionary and Alliance Data Systems Corp. in information technology.
Q. Were there any significant changes made to the Fund during the reporting period?
A. In May of 2005, in the middle of the annual period, the Fund’s previous Portfolio Manager for mid-cap equities was replaced with a new team of managers that restructured the mid-cap segment of the Fund, replacing many holdings to better reflect the new team’s investment philosophy and process. The mid-cap segment of the portfolio was brought into better alignment with the new Managers’ emphasis on companies that generate abundant cash flow, have strong or improving balance sheets, and/or whose share prices reflect unappreciated growth expectations. The Fund’s returns for the most recent six-month period largely reflect the current Fund and Portfolio Management, as opposed to the returns for the full 12-month period, which include returns achieved under the previous mid-cap manager, prior to the restructuring.
At the close of the period, the Fund was overweight the consumer discretionary, energy, financials and utilities sectors, underweight the consumer staples, health care, information technology, industrials and materials sectors, with no significant holdings in the telecommunications services sector.
Thank you for your investment in the Smith Barney Premier Selections All Cap Growth Portfolio. As ever, we appreciate that you have chosen us to manage your assets, and we remain focused on achieving the Fund’s investment goals.
Sincerely,
| | | | |
 | |  | | |
| Alan J. Blake | | Timothy Woods, CFA | | |
| Portfolio Manager | | Portfolio Manager | | |
| | |
 | |  | |  |
Brian Angerame Portfolio Manager | | Derek Deutsch, CFA Portfolio Manager | | Peter Stournaras, CFA Portfolio Manager |
December 1, 2005
6 Smith Barney Investment Series 2005 Annual Report
The information provided is not intended to be a forecast of future events, a guarantee of future results or investment advice. Views expressed may differ from those of the firm as a whole.
Portfolio holdings and breakdowns are as of October 31, 2005 and are subject to change and may not be representative of the portfolio manager’s current or future investments. The Fund’s top ten holdings (as a percentage of net assets) as of this date were: Merrill Lynch and Co. Inc. (2.5%), Texas Instruments Inc. (2.5%), Amgen Inc. (2.3%), Bed, Bath & Beyond Inc. (2.2%), Motorola Inc. (2.2%), Home Depot Inc. (2.2%), Amazon.com Inc. (2.2%), Time Warner Inc. (2.1%), Johnson & Johnson (2.0%) and Microsoft Corp. (2.0%). Please refer to pages 29 through 34 for a list and percentage breakdown of the Fund’s holdings.
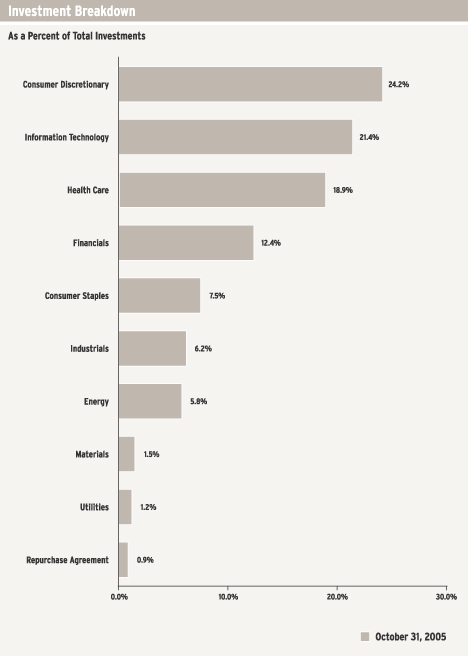
The mention of sector breakdowns is for informational purposes only and should not be construed as a recommendation to purchase or sell any securities. The information provided regarding such sectors is not a sufficient basis upon which to make an investment decision. Investors seeking financial advice regarding the appropriateness of investing in any securities or investment strategies discussed should consult their financial professional. Portfolio holdings are subject to change at any time and may not be representative of the portfolio manager’s current or future investments. The Fund’s top five sector holdings (as a percentage of net assets) as of October 31, 2005 were: Consumer Discretionary (24.0%), Information Technology (21.2%), Health Care (18.8%), Financials (12.3%) and Consumer Staples (7.4%). The Fund’s portfolio composition is subject to change at any time.
RISKS: The Fund may invest in small- and mid-cap companies that may involve a higher degree of risk and volatility than investments in large-cap companies. The Fund may use derivatives, such as options and futures, which can be illiquid, may disproportionately increase losses, and have a potentially large impact on fund performance. The Fund may invest in foreign securities that may be subject to certain risks not associated with domestic investing, such as currency fluctuations, and changes in political and economic conditions. These risks are magnified in emerging or developing markets. Please see the Fund’s prospectus for more information on these and other risks.
All index performance reflects no deduction for fees, expenses or taxes. Please note an investor cannot invest directly in an index.
| i | | Gross domestic product is a market value of goods and services produced by labor and property in a given country. |
| ii | | The Federal Reserve Board is responsible for the formulation of a policy designed to promote economic growth, full employment, stable prices, and a sustainable pattern of international trade and payments. |
| iii | | The federal funds rate is the interest rate that banks with excess reserves at a Federal Reserve district bank charge other banks that need overnight loans. |
| iv | | The Russell 1000 Growth Index measures the performance of those Russell 1000 companies with higher price-to-book ratios and higher forecasted growth values. |
| v | | The Russell 2000 Growth Index measures the performance of those Russell 2000 companies with higher price-to-book ratios and higher forecasted growth values. |
| vi | | The S&P MidCap 400 Index is a market-value weighted index which consists of 400 domestic stocks chosen for market size, liquidity, and industry group representation. |
Smith Barney Investment Series 2005 Annual Report 7
Fund at a Glance (unaudited)
Smith Barney Premier Selections All Cap Growth Portfolio
8 Smith Barney Investment Series 2005 Annual Report
Smith Barney Premier Selections All Cap Growth Portfolio*
Historical Performance (unaudited)
Value of $10,000 Invested in the Smith Barney Premier Selections All Cap Growth Portfolio vs. S&P MidCap 400 Index, Russell 1000 Growth Index and Russell 2000 Growth Index† (September 1999 — October 2005)
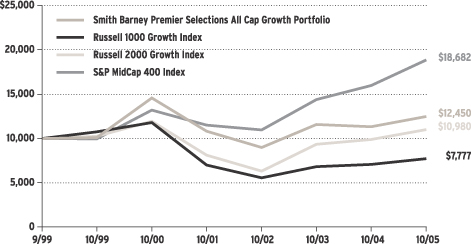
| † | | Hypothetical illustration of $10,000 invested on September 15, 1999 (commencement of operations), assuming the reinvestment of all distributions, including returns of capital, if any, at net asset value through October 31, 2005. Before May 1, 2001, the Portfolio was known as the Select Mid Cap Portfolio and had a different investment style. The S&P MidCap 400 Index is a widely recognized index of 400 medium-capitalization stocks. Figures for the S&P MidCap 400 Index include reinvestment of dividends. The Russell 1000 Growth Index measures the performance of those Russell 1000 companies with higher price-to-book ratios and higher forecasted growth values. (A price-to-book ratio is the price of a stock compared to the difference between a company’s assets and liabilities. The Russell 2000 Growth Index measures the performance of those Russell 2000 companies with higher price-to-book ratios and higher forecasted growth values. (A price-to-book ratio is the price of a stock compared to the difference between a company’s assets and liabilities.) The Indices are unmanaged and are not subject to the same management and trading expenses of a mutual fund. Please note that an investor cannot invest directly in an index. |
| * | | Before May 1, 2001, the Portfolio was known as Select Mid Cap Portfolio and had a different investment style. |
All figures represent past performance and are not a guarantee of future results. Investment return and principal value of an investment will fluctuate so that an investor’s shares, when redeemed, may be worth more or less than their original cost. Total returns do not reflect expenses associated with the separate account such as administrative fees, account charges and surrender charges, which, if reflected, would reduce the total returns. Performance figures may reflect fee waivers and/or expense reimbursements. In the absence of fee waivers and/or expense reimbursements, the total return would have been lower.
Smith Barney Investment Series 2005 Annual Report 9
Fund Performance
| | | |
| Average Annual Total Returns‡ (unaudited) | |
Twelve Months Ended 10/31/05 | | 9.97 | % |
|
|
Five Years Ended 10/31/05 | | (3.00 | ) |
|
|
9/15/99** through 10/31/05 | | 3.64 | |
|
|
| | | |
| Cumulative Total Returns‡ (unaudited) | |
9/15/99** through 10/31/05 | | 24.50 | % |
|
|
| ‡ | | Assumes reinvestment of all distributions, including returns of capital, if any, at net asset value. All figures represent past performance and are not a guarantee of future results. Investment return and principal value of an investment will fluctuate so that an investor’s shares, when redeemed, may be worth more or less than their original cost. Total returns do not reflect expenses associated with the separate account such as administrative fees, account charges and surrender charges, which, if reflected, would reduce the total returns. Performance figures may reflect fee waivers and/or expense reimbursements. In the absence of fee waivers and/or expense reimbursements, the total return would have been lower. |
| ** | | Commencement of operations. |
10 Smith Barney Investment Series 2005 Annual Report
Smith Barney Dividend Strategy Portfolio
Manager Overview
Q. What were the overall market conditions during the Fund’s reporting period?
A. Despite a number of setbacks and obstacles, the domestic economy continued to expand during the 12-month reporting period. The major roadblocks to progress were the same for much of the past year: the Federal Reserve Board (“Fed”)i continued to raise interest rates; oil and energy prices reached new record highs; and the effects of the hurricanes on the Gulf Coast. The price of oil skyrocketed throughout the year, from $43 per barrel at the start of 2005 to a high of just under $70 at the end of August, as a result of tension in the Middle East, increased demand from China, labor strikes in Venezuela and weather-related supply interruptions. Several of these factors, especially higher energy prices, have weighed heavily on the consumer resulting in some reining-in of consumer spending. The housing market continued at a torrid pace throughout the year, showing signs of cooling only in the last few months, despite increasing short-term interest rates throughout the year and recent credit tightening from banks. The war in Iraq continued to put a strain on international relations and domestic spending. The continued dual deficits (both trade and budget deficits) have become a concern to the market with regard to their effect on long-term growth.
While the market experienced some short-term volatility during the period, especially in the first quarter of 2005, the domestic stock market in general registered gains over the past twelve months. However, most of the gains occurred at the end of 2004 following the Presidential election. With the uncertainty from the election removed, the S&P 500 Indexii rallied over 7% from Election Day until the end of year. But in 2005, the equity market has stayed within a narrow range, with the S&P 500 Index ending the third quarter of 2005 virtually flat for the year. In general, market leadership over the period came from the mid- and small-cap stocks, as large-caps had positive returns but lagged their smaller counterparts, while value-oriented stocks continued to outperform growth-oriented stocks.
Performance Review
For the 12 months ended October 31, 2005, the Smith Barney Dividend Strategy Portfolio returned 2.23%. In comparison, the Fund’s unmanaged benchmark, the S&P 500 Index returned 8.72% for the same period. The Lipper Variable Large-Cap Core Funds Category Average1 increased 9.39% over the same time frame.
| 1 | | Lipper, Inc. is a major independent mutual-fund tracking organization. Returns are based on the 12-month period ended October 31, 2005, including the reinvestment of all distributions, including returns of capital, if any, calculated among the 227 funds in the Fund’s Lipper category. |
Smith Barney Investment Series 2005 Annual Report 11
Q. What were the most significant factors affecting the Fund’s Performance?
A. In general economic terms, many of the high-dividend paying stocks that the Fund favors lagged behind other segments of the market during the period. Specifically, the Fund’s overweights and stock selection in industrials, materials and selected health care sector stocks detracted from relative performance. In the slightly underweighted energy sector, the Fund’s investments in large integrated oil companies performed well but lagged the performance of other energy sector stocks that pay little or no dividends.
What were the leading contributors to performance?
A. In terms of individual stock holdings, the leading contributors to performance included positions in GlaxoSmithKline PLC and Wyeth in health care, Chubb Corp. in financials, BP PLC in energy and Albertson’s, Inc. in consumer staples.
What were the leading detractors from performance?
A. In terms of individual stock holdings, the leading detractors from performance included positions in Pfizer Inc. in health care, Pearson PLC in consumer discretionary, Alcoa Inc. in materials, Verizon Communications Inc. in telecommunication services and Gannett Co. Inc. in consumer discretionary.
Q. Were there any significant changes made to the Fund during the reporting period?
A. At the start of the 12-month reporting period, the Smith Barney Large Cap Core Portfolio was renamed Smith Barney Dividend Strategy Portfolio and Portfolio Managers Scott Glasser and Peter Hable became co-managers for the Fund. The investment objective and investment policy of the Fund were also modified: The Fund’s current objective is to seek capital appreciation, principally through investments in dividend-paying stocks and the investment policy of the Fund is to invest, under normal market conditions, at least 80% of assets in dividend-paying stocks. The Fund is permitted to invest up to 20% of assets in other types of securities, including non-dividend paying companies, preferred stocks and fixed income securities.
In-line with these substantial changes, at the start of the annual period a significant portion of the Fund’s existing portfolio positions were closed and a number of new positions were established by the new management team. At the close of the period, the Fund was overweight materials, industrials, health care and consumer staples, market weight telecommunication services, and underweight information technology, consumer discretionary, financials, energy and utilities.
12 Smith Barney Investment Series 2005 Annual Report
Thank you for your investment in the Smith Barney Dividend Strategy Portfolio. As ever, we appreciate that you have chosen us to manage your assets and we remain focused on achieving the Fund’s investment goals.
Sincerely,
| | | | |

Scott K. Glasser,
Portfolio Manager | | 
Peter J. Hable,
Portfolio Manager | | 
Peter C. Stournaras
Portfolio Manager |
December 1, 2005
The information provided is not intended to be a forecast of future events, a guarantee of future results or investment advice. Views expressed may differ from those of the firm as a whole.
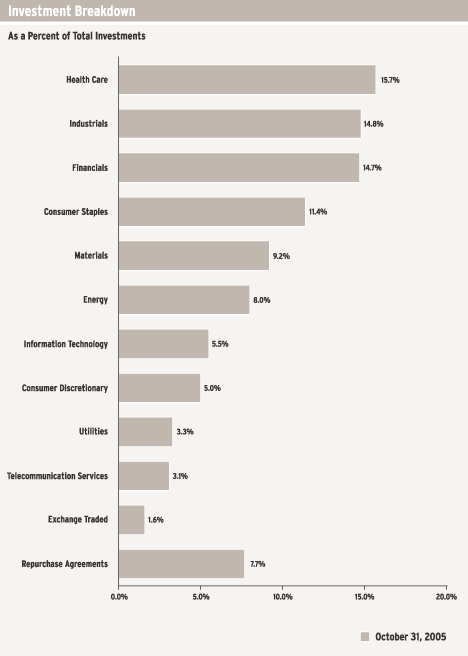
The mention of sector breakdowns is for informational purposes only and should not be construed as a recommendation to purchase or sell any securities. The information provided regarding such sectors is not a sufficient basis upon which to make an investment decision. Investors seeking financial advice regarding the appropriateness of investing in any securities or investment strategies discussed should consult their financial professional. Portfolio holdings are subject to change at any time and may not be representative of the portfolio manager’s current or future investments. The Fund’s top five sector holdings (as a percentage of net assets) as of October 31, 2005 were: Health Care (15.7%), Industrials (14.8%), Financials (14.7%), Consumer Staples (11.3%) and Materials (9.2%). The Fund’s portfolio composition is subject to change at any time.
RISKS: The Fund may invest in foreign securities that may be subject to certain risks not associated with domestic investing, such as currency fluctuations, and changes in political and economic conditions. The Fund may engage in active and frequent trading, resulting in increased transaction costs, which could detract from the Fund’s performance. The Fund may use derivatives, such as options and futures, which can be illiquid, may disproportionately increase losses and have a potentially large impact on fund performance. Please see the Fund’s prospectus for more information on these and other risks.
All index performance reflects no deduction for fees, expenses or taxes. Please note an investor cannot invest directly in an index.
| i | | The Federal Reserve Board is responsible for the formulation of a policy designed to promote economic growth, full employment, stable prices, and a sustainable pattern of international trade and payments. |
| ii | | The S&P 500 Index is an unmanaged index of 500 stocks that is generally representative of the performance of larger companies in the U.S. |
Smith Barney Investment Series 2005 Annual Report 13
Fund at a Glance (unaudited)
Smith Barney Dividend Strategy Portfolio
14 Smith Barney Investment Series 2005 Annual Report
Smith Barney Dividend Strategy Portfolio*
Historical Performance (unaudited)
Value of $10,000 Invested in the Smith Barney Dividend Strategy Portfolio vs. S&P 500 Index† (September 1999 — October 2005)
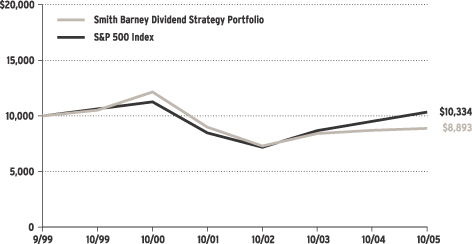
| † | | Hypothetical illustration of $10,000 invested on September 15, 1999 (commencement of operations), assuming the reinvestment of all distributions, including returns of capital, if any, at net asset value through October 31, 2005. Before November 1, 2004, the Portfolio was known as Smith Barney Large Cap Core Portfolio and had a different investment style. The S&P 500 Index is an index of widely held common stocks listed on the New York and American Stock Exchanges and the over-the-counter markets. Figures for the S&P 500 Index include reinvestment of dividends. The Index is unmanaged and is not subject to the same management and trading expenses of a mutual fund. Please note that an investor cannot invest directly in an index. |
| * | | Before November 1, 2004, the Portfolio was known as Smith Barney Large Cap Core Portfolio and had a different investment style. |
All figures represent past performance and are not a guarantee of future results. Investment return and principal value of an investment will fluctuate so that an investor’s shares, when redeemed, may be worth more or less than their original cost. Total returns do not reflect expenses associated with the separate account such as administrative fees, account charges and surrender charges, which, if reflected, would reduce the total returns. Performance figures may reflect fee waivers and/or expense reimbursements. In the absence of fee waivers and/or expense reimbursements, the total return would have been lower.
Fund Performance
| | | |
| Average Annual Total Returns‡ (unaudited) | | | |
Twelve Months Ended 10/31/05 | | 2.23 | % |
|
|
Five Years Ended 10/31/05 | | (6.05 | ) |
|
|
9/15/99** through 10/31/05 | | (1.90 | ) |
|
|
| | | |
| Cumulative Total Return‡ (unaudited) | | | |
9/15/99** through 10/31/05 | | (11.07 | )% |
|
|
| ‡ | | Assumes reinvestment of all distributions, including returns of capital, if any, at net asset value. All figures represent past performance and are not a guarantee of future results. Investment return and principal value of an investment will fluctuate so that an investor’s shares, when redeemed, may be worth more or less than their original cost. Total returns do not reflect expenses associated with the separate account such as administrative fees, account charges and surrender charges, which, if reflected, would reduce the total returns. Performance figures may reflect fee waivers and/or expense reimbursements. In the absence of fee waivers and/or expense reimbursements, the total return would have been lower. |
| ** | | Commencement of operations. |
Smith Barney Investment Series 2005 Annual Report 15
Smith Barney Growth and Income Portfolio
Manager Overview
Q. What were the overall market conditions during the Fund’s reporting period?
A. The market was led by the energy related (energy and utilities) and the defensive (consumer staples, health care and financials) sectors. Oil and natural gas prices rose through the period, hitting all time highs in late August 2005. Supply/demand fundamentals have been tight for energy for the past twenty-four months, but hit a peak in August from the damage done to Gulf of Mexico production facilities by Hurricanes Katrina and Rita. Energy fundamentals appear balanced to us, with strong demand growth in China and India offset by lower gasoline demand in the U.S. due to higher prices. The Federal Reserve Board (“Fed”)i raised interest rates 0.25% at each of the last twelve meetings. We believe that the Fed will continue to increase rates until we hit historical normal levels of real interest rates. That would entail further increases into 2006. Defensive stocks outperformed due to fears that higher oil prices and interest rates would slow economic growth.
The Chinese government partly floated its currency vs. the dollar and the Yen starting in late July. Gold prices began to rise coincident with the first floating of the Yuan.
General Motors faced two crises in 2005, first the downgrading of its credit rating to below investment grade and second the bankruptcy of Delphi Automotive, its largest parts supplier and onetime affiliate. Currently, the debt markets are pricing in a 30% probability of GM’s own bankruptcy within eighteen months. General Motors and Ford are struggling with high costs, declining market shares and a mix shift away from high profit SUV’s. The Portfolio has avoided and will continue to avoid any auto related exposure.
Performance Review
For the 12 months ended October 31, 2005, the Smith Barney Growth and Income Portfolio returned 6.37%. The Fund underperformed its unmanaged benchmark, the S&P 500 Index,ii which returned 8.72% for the same period. The Lipper Variable Large-Cap Core Funds Category Average1 increased 9.39% over the same time frame.
Q. What were the most significant factors affecting the Fund’s Performance?
A. The Fund had strong performance in the health care sector. Returns were helped by over-weights in HMO’s and generic drug stocks, and an underweight in large capitalization pharmaceuticals. We believe that cost pressures and a large number of drugs coming off patent will help HMO and generic drug company earnings and hurt the earnings of the traditional pharmaceutical companies. The consumer discretionary sector returns were
| 1 | | Lipper, Inc. is a major independent mutual-fund tracking organization. Returns are based on the 12-month period ended October 31, 2005, including the reinvestment of all distributions, including returns of capital, if any, calculated among the 227 funds in the Fund’s Lipper category. |
16 Smith Barney Investment Series 2005 Annual Report
helped by positions in Best Buy Co. Inc. and JC Penney Co. Inc., and the absence of any auto related stocks.
The Fund was hurt by poor stock picking in the technology sector. Technology appears to be seeing a changing of the guard, and the Fund owned too many of the old guard and not enough of the new. Positions in International Business Machines Corp., Dell Inc. and Nortel Networks Corp. all detracted from performance.
What were the leading contributors to performance?
A. The biggest contributors to performance were Boeing Co., Teva Pharmaceutical Industries Ltd. and Coventry Health Care Inc. The best performing sectors were health care, consumer discretionary and industrials. Boeing was helped by large orders of the new 787 plane, while Teva benefited from anticipation of a powerful pipeline of new products to come in 2006. Coventry delivered better than expected cost savings, and saw favorable medical cost trends.
What were the leading detractors from performance?
A. The stocks that most hurt performance were OSI Pharmaceuticals, Inc., Sara Lee Corp. and Nortel Networks Corp. The worst performing sectors were technology, consumer staples and materials. OSI had unfavorable tests of its Tarceva drug, and made what was in the eyes of Wall Street a poor acquisition of Eyetech. Sara Lee’s turnaround under new CEO Brenda Barnes took longer than expected. Her performance at PepsiCo Inc. gives us confidence that she will be able to unlock significant hidden value at Sara Lee. Sales growth at Nortel was insufficient to create earnings leverage.
Q. Were there any significant changes made to the Fund during the reporting period?
A. The Portfolio is higher growth and higher quality than it was coming into 2005. U.S. corporate operating margins are now the highest since the late 1960’s. We believe that companies who derive their growth from revenues (typically growth stocks) will show higher earnings per share growth than companies who derive their earnings growth from operating margin expansion (typically value stocks). Many companies with strong franchises, balance sheets and returns, such as Microsoft Corp., Wal-Mart Stores Inc. and Ecolab Inc., which historically have looked expensive to us, now appear to us to trade at attractive levels.
Smith Barney Investment Series 2005 Annual Report 17
Thank you for your investment in the Smith Barney Growth and Income Portfolio. As ever, we appreciate that you have chosen us to manage your assets, and we remain focused on achieving the Fund’s investment goals.
Sincerely,
| | |
 | |  |
| Michael A. Kagan | | Kevin Caliendo |
| Portfolio Manager | | Portfolio Manager |
December 1, 2005
The information provided is not intended to be a forecast of future events, a guarantee of future results or investment advice. Views expressed may differ from those of the firm as a whole.
Portfolio holdings and breakdowns are as of October 31, 2005 and are subject to change and may not be representative of the portfolio manager’s current or future investments. The Fund’s top ten holdings (as a percentage of net assets) as of this date were: General Electric Co. (4.1%), Microsoft Corp. (3.6%), Boeing Co. (2.8%), Wells Fargo & Co. (2.6%), Exxon Mobil Corp. (2.5%), Sprint Nextel Corp. (2.4%), Barrick Gold Corp. (2.4%), Total SA (2.4%), JPMorgan Chase & Co. (2.2%) and PepsiCo Inc. (2.1%). Please refer to pages 40 through 44 for a list and percentage breakdown of the Fund’s holdings.
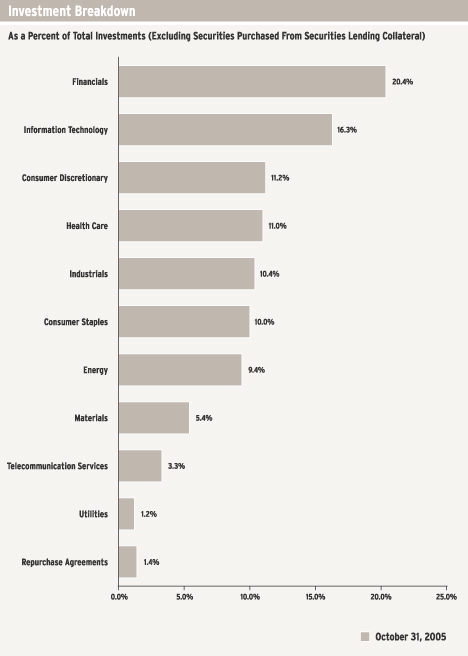
The mention of sector breakdowns is for informational purposes only and should not be construed as a recommendation to purchase or sell any securities. The information provided regarding such sectors is not a sufficient basis upon which to make an investment decision. Investors seeking financial advice regarding the appropriateness of investing in any securities or investment strategies discussed should consult their financial professional. Portfolio holdings are subject to change at any time and may not be representative of the portfolio manager’s current or future investments. The Fund’s top five sector holdings (as a percentage of net assets) as of October 31, 2005 were: Financials (20.4%), Information Technology (16.3%), Consumer Discretionary (11.3%), Health Care (11.0%) and Industrials (10.4%). The Fund’s portfolio composition is subject to change at any time.
RISKS: The Fund may invest in foreign securities, which are subject to certain risks not associated with domestic investing, such as currency fluctuations, and changes in political and economic conditions. The Fund may also invest in lower-rated, higher-yielding bonds, known as “junk bonds,” which are subject to greater credit risk, including the risk of default, than higher-rated obligations. The Fund may engage in short sales. Losses from short sales may be unlimited. The Fund may use derivatives, such as options and futures, which can be illiquid, may disproportionately increase losses, and have a potentially large impact on fund performance. Please see the Fund’s prospectus for more information on these and other risks.
All index performance reflects no deduction for fees, expenses or taxes. Please note an investor cannot invest directly in an index.
| i | | The Federal Reserve Board is responsible for the formulation of a policy designed to promote economic growth, full employment, stable prices, and a sustainable pattern of international trade and payments. |
| ii | | The S&P 500 Index is an unmanaged index of 500 stocks that is generally representative of the performance of larger companies in the U.S. |
18 Smith Barney Investment Series 2005 Annual Report
Fund at a Glance (unaudited)
Smith Barney Growth and Income Portfolio
Smith Barney Investment Series 2005 Annual Report 19
Smith Barney Growth and Income Portfolio
Historical Performance (unaudited)
Value of $10,000 Invested in the Smith Barney Growth and Income Portfolio vs. S&P 500 Index† (September 1999 — October 2005)
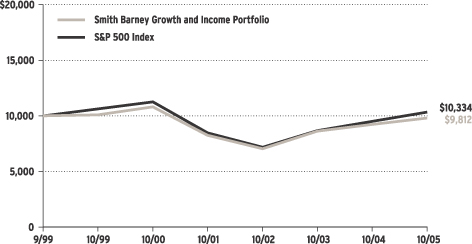
| † | | Hypothetical illustration of $10,000 invested on September 15, 1999 (commencement of operations), assuming the reinvestment of distributions, including returns of capital, if any, at net asset value through October 31, 2005. The S&P 500 Index is an index of widely held common stocks listed on the New York and American Stock Exchanges and the over-the-counter markets. Figures for the S&P 500 Index include reinvestment of dividends. The Index is unmanaged and is not subject to the same management and trading expenses of a mutual fund. Please note that an investor cannot invest directly in an index. |
All figures represent past performance and are not a guarantee of future results. Investment return and principal value of an investment will fluctuate so that an investor’s shares, when redeemed, may be worth more or less than their original cost. Total returns do not reflect expenses associated with the separate account such as administrative fees, account charges and surrender charges, which, if reflected, would reduce the total returns. Performance figures may reflect fee waivers and/or expense reimbursements. In the absence of fee waivers and/or expense reimbursements, the total return would have been lower.
Fund Performance
| | | |
| Average Annual Total Returns‡ (unaudited) | |
Twelve Months Ended 10/31/05 | | 6.37 | % |
|
|
Five Years Ended 10/31/05 | | (1.89 | ) |
|
|
9/15/99* through 10/31/05 | | (0.31 | ) |
|
|
| | | |
| Cumulative Total Return‡ (unaudited) | |
9/15/99* through 10/31/05 | | (1.88 | )% |
|
|
| ‡ | | Assumes reinvestment of all distributions, including returns of capital, if any, at net asset value. All figures represent past performance and are not a guarantee of future results. Investment return and principal value of an investment will fluctuate so that an investor’s shares, when redeemed, may be worth more or less than their original cost. Total returns do not reflect expenses associated with the separate account such as administrative fees, account charges and surrender charges, which, if reflected, would reduce the total returns. Performance figures may reflect fee waivers and/or expense reimbursements. In the absence of fee waivers and/or expense reimbursements, the total return would have been lower. |
| * | | Commencement of operations. |
20 Smith Barney Investment Series 2005 Annual Report
SB Government Portfolio
Manager Overview
Q. What were the overall market conditions during the Fund’s reporting period?
A. During the 12 months ended October 31, 2005, markets were primarily driven by Federal Reserve Board (“Fed”)i activity, employment and inflation data and rising energy costs, exacerbated near period end by the devastating impact of Hurricane Katrina on the U.S. Gulf Coast. The Fed’s eight “measured” 25-basis-pointii hikes during the period brought the federal funds rateiii to 3.75% from 1.75% by period end. The Fed raised rates an additional quarter point to 4.00% on November 1st, after the close of the reporting period. These measured consecutive rate hikes exerted upward pressure on short-term bond yields, driving 2-year yields up about 183 basis points during the 12 months. However, in what Fed Chairman Alan Greenspan termed a “conundrum,” yields on the long bond stayed low during the period, even declining slightly (four basis points) over the 12 months despite relinquishing all gains to end 53 basis points higher by period end. This sharp rise in short yields and relative stagnation in longer yields resulted in the extensive yield curve flattening seen during the period.
As the market fully expected each 25-basis-point hike in the federal funds rate during the period – thanks to the Fed’s well-advertised intentions to raise rates at a measured pace – investors spent much of the period dissecting language from the Fed for clues on its assessment of the U.S. economy and the pace of rate hikes. The Fed reiterated throughout the year that it would increase rates “at a pace that is likely to be measured” and, starting in June 2004, added that, “the Committee will respond to changes in economic prospects as needed to fulfill its obligation to maintain price stability.” In its most recent statement (from the September 20th meeting), the Fed noted that core inflation remained low near the end of the period and long-term inflation expectations remained “contained” (even if the language was downgraded from the “well contained” language used at prior meetings).
Slowing global growth, rising inflation and surging oil prices undoubtedly restrained economic activity during the period, with gross domestic product (“GDP”)iv declining year-over-year to 3.8% growth in first quarter 2005 (from first quarter 2004’s 4.5% pace) and to 3.4% growth in second quarter 2005 (from second quarter 2004’s 3.5%). However, economic growth remained remarkably resilient into the third quarter, particularly after fears of a sharp slowdown in the wake of Hurricanes Katrina and Rita, gaining 3.8% on an annualized basis versus 3.9% last year and consensus expectations of 3.6% growth. Although growth remained strong throughout the period, fears of potential slowing, combined with increasing inflation, drove markets. Oil prices, which breached $70 per barrel before period end, continue to cast a pall on growth and consumer spending expectations.
This was particularly true in the latter half of the period, as investors assessed the potential impact of Hurricanes Katrina and Rita on U.S. economic growth, inflation and the
Smith Barney Investment Series 2005 Annual Report 21
pace of interest rates and growth indicators turned increasingly mixed. For example, the U.S. labor market began to pick up in early 2004 and continued to improve through most of the Fund’s fiscal year, although the pace of improvement remained uneven from month to month. Unemployment fell through the majority of the period, declining from 5.5% in October 2004 to 4.9% in August 2005. However, unemployment skyrocketed, even if not as much as expected, in the wake of Hurricane Katrina, and the unemployment rate rose to 5.0% in October. Industrial production and retail sales also remained positive through most of the period, even considering the volatility in the auto sector as General Motors and Ford were successively downgraded by three major statistical credit rating agencies to below investment grade. Again, however, as with employment, industrial production and retail sales data turned negative near period end as the effects of Hurricane Katrina roiled through the economy, reductions in auto production hit the market and the highly successful automotive dealer incentive packages offered through the summer came to an end.
While inflationary pressures from sustained high commodity prices began to creep into the economy, particularly near the end of the period, continued strong growth and limited wage pressures are keeping long-term inflation expectations “contained”. Core inflation rates, in particular, remained subdued throughout the period despite growing inflationary pressure. Specifically, core Consumer Price Index (CPI)v inflation rose only 0.1% year-over-year to 2.1% in October 2005, and core Producer Price Index (PPI)vi inflation edged up only 0.1% year-over-year to 1.9% in September 2005. However, both consumer and producer headline inflation rose dramatically by period end as continually high and rising energy prices and competitive pricing pressures began to be passed through to the consumer. Headline CPI inflation rose approximately 1.1% to 4.3% in October 2005 versus October 2004, and headline PPI inflation increased 1.5% to 5.9% over the same period. Pricing pressures were also seen in the core PCE deflatorvii, the Fed’s preferred measure of inflation, which rose 0.5% versus September 2004 to 2.0% year-over-year in the latest September reading.
Performance Review
For the 12 months ended October 31, 2005, the SB Government Portfolio returned 0.41%. In comparison, the Fund’s unmanaged benchmark, the Lehman Brothers Government Bond Indexviii, returned 0.94%, and its Lipper Variable General U.S. Government Funds Category Average1 increased 1.49% over the same period.
Q. What were the most significant factors affecting the Fund’s Performance?
What were the leading contributors to performance?
A. The Fund’s underweight allocation to the shorter portion of the yield curve and overweight in the 20+ year portion of the curve positively contributed to performance during the 12 months ending October 31, 2005, as short yields rose dramatically during the
| 1 | | Lipper, Inc. is a major independent mutual-fund tracking organization. Returns are based on the 12-month period ended October 31, 2005, including the reinvestment of distributions, including returns of capital, if any, calculated among the 61 funds in the Fund’s Lipper category. |
22 Smith Barney Investment Series 2005 Annual Report
period as the curve flattened. Our allocation to mortgages also contributed to Fund performance during the period.
What were the leading detractors from performance?
A. The Fund’s shorter duration posture versus the benchmark early in the period detracted from performance, as the longer end (10+ year) of the yield curve held up better than market participants expected. However, the Fund recouped some of its early losses in the second half of the period due to its shorter duration position as rates continued to climb across all parts of the yield curve. In addition, our underweight exposure to U.S. Agencies detracted from performance relative to the benchmark during the 12 months, as Agencies outperformed U.S. Treasuries.
Q. Were there any significant changes made to the Fund during the reporting period?
A. We reduced overall duration in the Fund versus the benchmark in advance of the remarkable yield curve flattening seen during the 12 months ended October 31, 2005. Although remaining somewhat defensive (i.e., slightly short), we brought the Fund’s duration closer to neutral as rates backed up and the 10-year U.S. Treasury bond sold off in the latter half of the period. We also removed our yield curve flattener trade, in which we had underweighted the short end of the yield curve and overweighted the long end in anticipation of further flattening.
We reduced the Fund’s exposure to mortgage-backed securities during the period in anticipation of increased interest rate volatility on the long end of the yield curve and continued monetary policy tightening by the Fed. We opportunistically reallocated assets into U.S. Treasury securities during market troughs as U.S. Treasuries sold off at several points during the period.
Smith Barney Investment Series 2005 Annual Report 23
Thank you for your investment in the SB Government Portfolio. As ever, we appreciate that you have chosen us to manage your assets and we remain focused on achieving the Fund’s investment goals.
Sincerely,
| | |

Roger M. Lavan, CFA Portfolio Manager | | 
Francis L. Mustaro Portfolio Manager |
December 1, 2005
The information provided is not intended to be a forecast of future events, a guarantee of future results or investment advice. Views expressed may differ from those of the firm as a whole.
RISKS: Keep in mind, bond and mortgage-related securities are subject to interest rate and market risks. The U.S. government guarantee of principal and interest payment only applies to underlying securities in the Fund’s portfolio. Please note that the Fund’s shares are not guaranteed by the U.S. government or its agencies. The Fund may use derivatives, such as options and futures, which can have a potentially large impact on fund performance. Please see the Fund’s prospectus for more information on these and other risks.
All index performance reflects no deduction for fees, expenses or taxes. Please note an investor cannot invest directly in an index.
| i | | The Federal Reserve Board is responsible for the formulation of a policy designed to promote economic growth, full employment, stable prices, and a sustainable pattern of international trade and payments. |
| ii | | A basis point is one one-hundredth (1/100 or 0.01) of one percent. |
| iii | | The federal funds rate is the interest rate that banks with excess reserves at a Federal Reserve district bank charge other banks that need overnight loans. |
| iv | | Gross domestic product is a market value of goods and services produced by labor and property in a given country. |
| v | | The Consumer Price Index measures the average change in U.S. consumer prices over time in a fixed market basket of goods and services determined by the U.S. Bureau of Labor Statistics. |
| vi | | The Producer Price Index measures the change in wholesale prices as released monthly by the U.S. Bureau of Labor Statistics. |
| vii | | The PCE deflator is a nation-wide indicator of the average increase in prices for all domestic personal consumption. It’s derived from the largest Gross Domestic Product (“GDP”) component, personal consumption expenditures, and is indexed to a base of 100 in 1992. |
| viii | | The Lehman Brothers Government Bond Index is a broad-based index of all public debt obligations of the U.S. government and its agencies that have an average maturity of roughly nine years. |
24 Smith Barney Investment Series 2005 Annual Report
Fund at a Glance (unaudited)
SB Government Portfolio
Smith Barney Investment Series 2005 Annual Report 25
SB Government Portfolio
Historic Performance (unaudited)
Value of $10,000 Invested in the SB Government Portfolio vs. Lehman Brothers Government Bond Index† (September 1999 — October 2005)
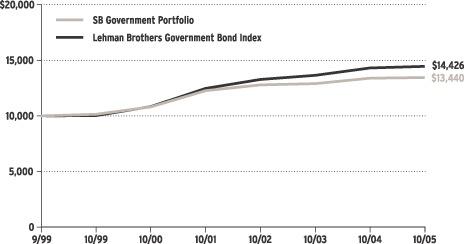
| † | | Hypothetical illustration of $10,000 invested on September 15, 1999 (commencement of operations), assuming the reinvestment of distributions, including returns of capital, if any, at net asset value through October 31, 2005. The Lehman Brothers Government Bond Index includes U.S. Treasury and government agency securities with maturities of one year or more having a minimum outstanding principal of $100 million and are only fixed-coupon securities. The Index is unmanaged and is not subject to the same management and trading expenses as a mutual fund. Please note that an investor cannot invest directly in an index. |
All figures represent past performance and are not a guarantee of future results. Investment return and principal value of an investment will fluctuate so that an investor’s shares, when redeemed, may be worth more or less than their original cost. Total returns do not reflect expenses associated with the separate account such as administrative fees, account charges and surrender charges, which, if reflected, would reduce the total returns. Performance figures may reflect fee waivers and/or expense reimbursements. In the absence of fee waivers and/or expense reimbursements, the total return would have been lower.
Fund Performance
| | | |
| Average Annual Total Returns‡ (unaudited) | |
Twelve Months Ended 10/31/05 | | 0.41 | % |
|
|
Five Years Ended 10/31/05 | | 4.48 | |
|
|
9/15/99* through 10/31/05 | | 4.95 | |
|
|
| | | |
| Cumulative Total Return‡ (unaudited) | |
9/15/99* through 10/31/05 | | 34.40 | % |
|
|
| ‡ | | Assumes reinvestment of all distributions, including returns of capital, if any, at net asset value. All figures represent past performance and are not a guarantee of future results. Investment return and principal value of an investment will fluctuate so that an investor’s shares, when redeemed, may be worth more or less than their original cost. Total returns do not reflect expenses associated with the separate account such as administrative fees, account charges and surrender charges, which, if reflected, would reduce the total returns. Performance figures may reflect fee waivers and/or expense reimbursements. In the absence of fee waivers and/or expense reimbursements, the total return would have been lower. |
| * | | Commencement of operations. |
26 Smith Barney Investment Series 2005 Annual Report
Fund Expenses (unaudited)
Example
As a shareholder of the Fund, you may incur two types of costs: (1) transaction costs and (2) ongoing costs, including management fees; and other Fund expenses. This example is intended to help you understand your ongoing costs (in dollars) of investing in the Fund and to compare these costs with the ongoing costs of investing in other mutual funds.
This example is based on an investment of $1,000 invested on May 1, 2005 and held for the six months ended October 31, 2005.
Actual Expenses
The table below titled “Based on Actual Total Return” provides information about actual account values and actual expenses. You may use the information provided in this table, together with the amount you invested, to estimate the expenses that you paid over the period. To estimate the expenses you paid on your account, divide your ending account value by $1,000 (for example, an $8,600 ending account value divided by $1,000 = 8.6), then multiply the result by the number under the heading entitled “Expenses Paid During the Period”.
| | | | | | | | | | | | | | | |
| Based on Actual Total Return(1) |
| | | | | |
| | | Actual
Total Return(2) | | | Beginning
Account
Value | | Ending
Account
Value | | Annualized
Expense
Ratio | | | Expenses
Paid During
the Period(3) |
Smith Barney Premier Selections
All Cap Growth Portfolio | | 10.07 | % | | $ | 1,000.00 | | $ | 1,100.70 | | 1.02 | % | | $ | 5.40 |
|
Smith Barney Dividend Strategy Portfolio | | 0.70 | | | | 1,000.00 | | | 1,007.00 | | 0.88 | | | | 4.45 |
|
Smith Barney Growth and Income Portfolio | | 4.64 | | | | 1,000.00 | | | 1,046.40 | | 0.81 | | | | 4.18 |
|
SB Government Portfolio | | (0.26 | ) | | | 1,000.00 | | | 997.40 | | 0.67 | | | | 3.37 |
|
| (1) | | For the six months ended October 31, 2005. |
| (2) | | Assumes reinvestment of all distributions, including returns of capital, if any, at net asset value. Total return is not annualized, as it may not be representative of the total return for the year. Total returns do not reflect expenses associated with the separate account such as administrative fees, account charges and surrender charges, which, if reflected, would reduce the total returns. Performance figures may reflect voluntary fee waivers and/or expense reimbursements. Past performance is no guarantee of future results. In the absence of voluntary fee waivers and/or expense reimbursements, the total return would have been lower. |
| (3) | | Expenses are equal to each Fund’s respective annualized expense ratio multiplied by the average account value over the period, multiplied by the number of days in the most recent fiscal half-year, then divided by 365. |
Smith Barney Investment Series 2005 Annual Report 27
Fund Expenses (unaudited) (continued)
Hypothetical Example for Comparison Purposes
The table below titled “Based on Hypothetical Total Return” provides information about hypothetical account values and hypothetical expenses based on the actual expense ratio and an assumed rate of return of 5.00% per year before expenses, which is not the Fund’s actual return. The hypothetical account values and expenses may not be used to estimate the actual ending account balance or expenses you paid for the period. You may use the information provided in this table to compare the ongoing costs of investing in the Fund and other funds. To do so, compare the 5.00% hypothetical example relating to the Fund with the 5.00% hypothetical examples that appear in the shareholder reports of the other funds.
Please note that the expenses shown in the table below are meant to highlight your ongoing costs only and do not reflect any transactional costs, such as front-end or back-end sales charges (loads). Therefore, this table is useful in comparing ongoing costs only, and will not help you determine the relative total costs of owning different funds. In addition, if these transaction costs were included, your costs would have been higher.
| | | | | | | | | | | | | | | |
| Based on Hypothetical Total Return(1) |
| | | | | |
| | | Hypothetical
Annualized
Total Return | | | Beginning
Account
Value | | Ending
Account
Value | | Annualized
Expense
Ratio | | | Expenses
Paid During
the Period(2) |
Smith Barney Premier Selections All Cap Growth Portfolio | | 5.00 | % | | $ | 1,000.00 | | $ | 1,020.06 | | 1.02 | % | | $ | 5.19 |
|
Smith Barney Dividend Strategy Portfolio | | 5.00 | | | | 1,000.00 | | | 1,020.77 | | 0.88 | | | | 4.48 |
|
Smith Barney Growth and Income Portfolio | | 5.00 | | | | 1,000.00 | | | 1,021.12 | | 0.81 | | | | 4.13 |
|
SB Government Portfolio | | 5.00 | | | | 1,000.00 | | | 1,021.83 | | 0.67 | | | | 3.41 |
|
| (1) | | For the six months ended October 31, 2005. |
| (2) | | Expenses are equal to each Fund’s respective annualized expense ratio multiplied by the average account value over the period, multiplied by the number of days in the most recent fiscal half-year, then divided by 365. |
28 Smith Barney Investment Series 2005 Annual Report
Schedule of Investments (October 31, 2005)
SMITH BARNEY PREMIER SELECTIONS ALL CAP GROWTH PORTFOLIO
| | | | | | |
| | |
| Shares | | Security | | Value | |
| | | | | | | |
| COMMON STOCKS — 98.3% | | | | |
| CONSUMER DISCRETIONARY — 24.0% | | | | |
| Diversified Consumer Services — 1.6% | | | | |
| 8,400 | | Laureate Education Inc.* | | $ | 414,960 | |
| 33,300 | | ServiceMaster Co. | | | 418,914 | |
|
|
| | | Total Diversified Consumer Services | | | 833,874 | |
|
|
| Hotels, Restaurants & Leisure — 4.8% | | | | |
| 10,700 | | Brinker International Inc.* | | | 407,884 | |
| 2,600 | | CBRL Group Inc. | | | 90,220 | |
| 8,950 | | GTECH Holdings Corp. | | | 284,968 | |
| 23,000 | | La Quinta Corp., Paired* | | | 192,050 | |
| 20,850 | | Shuffle Master Inc.* | | | 528,756 | |
| 8,700 | | Station Casinos Inc. | | | 557,670 | |
| 10,200 | | Texas Roadhouse Inc.* | | | 160,548 | |
| 13,900 | | WMS Industries Inc.* | | | 349,307 | |
|
|
| | | Total Hotels, Restaurants & Leisure | | | 2,571,403 | |
|
|
| Household Durables — 2.3% | | | | |
| 12,300 | | Ethan Allen Interiors Inc. | | | 415,986 | |
| 19,050 | | Jarden Corp.* | | | 643,699 | |
| 2,270 | | Mohawk Industries Inc.* | | | 177,174 | |
|
|
| | | Total Household Durables | | | 1,236,859 | |
|
|
| Internet & Catalog Retail — 4.6% | | | | |
| 28,800 | | Amazon.com Inc.* | | | 1,148,544 | |
| 26,300 | | eBay Inc.* | | | 1,041,480 | |
| 14,300 | | GSI Commerce Inc.* | | | 228,514 | |
|
|
| | | Total Internet & Catalog Retail | | | 2,418,538 | |
|
|
| Media — 2.8% | | | | |
| 14,100 | | Harte-Hanks Inc. | | | 360,960 | |
| 63,000 | | Time Warner Inc. | | | 1,123,290 | |
|
|
| | | Total Media | | | 1,484,250 | |
|
|
| Multiline Retail — 0.5% | | | | |
| 12,600 | | Family Dollar Stores Inc. | | | 278,964 | |
|
|
| Specialty Retail — 7.4% | | | | |
| 5,300 | | Aeropostale Inc.* | | | 103,562 | |
| 29,030 | | Bed Bath & Beyond Inc.* | | | 1,176,296 | |
| 15,800 | | Chico’s FAS Inc.* | | | 624,732 | |
| 11,200 | | Dick’s Sporting Goods Inc.* | | | 335,216 | |
| 3,100 | | Guitar Center Inc.* | | | 161,541 | |
| 28,100 | | Home Depot Inc. | | | 1,153,224 | |
| 9,500 | | Sherwin-Williams Co. | | | 404,225 | |
|
|
| | | Total Specialty Retail | | | 3,958,796 | |
|
|
| | | TOTAL CONSUMER DISCRETIONARY | | | 12,782,684 | |
|
|
See Notes to Financial Statements.
Smith Barney Investment Series 2005 Annual Report 29
Schedule of Investments (October 31, 2005) (continued)
| | | | | | |
| | |
| Shares | | Security | | Value | |
| | | | | | | |
| CONSUMER STAPLES — 7.4% | | | | |
| Beverages — 2.3% | | | | |
| 25,100 | | Coca-Cola Co. | | $ | 1,073,778 | |
| 2,700 | | Molson Coors Brewing Co., Class B Shares | | | 166,590 | |
|
|
| | | Total Beverages | | | 1,240,368 | |
|
|
| Food & Staples Retailing — 0.7% | | | | |
| 14,750 | | Albertson’s Inc. | | | 370,372 | |
|
|
| Food Products — 2.5% | | | | |
| 14,600 | | Hormel Foods Corp. | | | 464,280 | |
| 12,900 | | Wm. Wrigley Jr. Co. | | | 896,550 | |
|
|
| | | Total Food Products | | | 1,360,830 | |
|
|
| Household Products — 1.9% | | | | |
| 17,822 | | Procter & Gamble Co. | | | 997,854 | |
|
|
| | | TOTAL CONSUMER STAPLES | | | 3,969,424 | |
|
|
| ENERGY — 5.8% | | | | |
| Energy Equipment & Services — 2.9% | | | | |
| 7,400 | | Cal Dive International Inc.* | | | 455,396 | |
| 16,600 | | FMC Technologies Inc.* | | | 605,236 | |
| 3,800 | | Nabors Industries Ltd.* | | | 260,794 | |
| 7,300 | | Smith International Inc. | | | 236,520 | |
|
|
| | | Total Energy Equipment & Services | | | 1,557,946 | |
|
|
| Oil, Gas & Consumable Fuels — 2.9% | | | | |
| 5,200 | | Arch Coal Inc. | | | 400,764 | |
| 6,050 | | Murphy Oil Corp. | | | 283,443 | |
| 10,450 | | Newfield Exploration Co.* | | | 473,698 | |
| 9,000 | | Whiting Petroleum Corp.* | | | 364,950 | |
|
|
| | | Total Oil, Gas & Consumable Fuels | | | 1,522,855 | |
|
|
| | | TOTAL ENERGY | | | 3,080,801 | |
|
|
| FINANCIALS — 12.3% | | | | |
| Capital Markets — 4.6% | | | | |
| 6,950 | | Affiliated Managers Group Inc.* | | | 533,413 | |
| 2,200 | | Bear Stearns Cos. Inc. | | | 232,760 | |
| 1,510 | | Legg Mason Inc. | | | 162,038 | |
| 20,600 | | Merrill Lynch & Co. Inc. | | | 1,333,644 | |
| 4,800 | | National Financial Partners Corp. | | | 217,104 | |
|
|
| | | Total Capital Markets | | | 2,478,959 | |
|
|
| Commercial Banks — 2.2% | | | | |
| 6,900 | | East-West Bancorp Inc. | | | 264,201 | |
| 11,450 | | North Fork Bancorporation Inc. | | | 290,143 | |
| 5,800 | | Westamerica Bancorporation | | | 309,198 | |
| 3,950 | | Zions Bancorporation | | | 290,206 | |
|
|
| | | Total Commercial Banks | | | 1,153,748 | |
|
|
See Notes to Financial Statements.
30 Smith Barney Investment Series 2005 Annual Report
Schedule of Investments (October 31, 2005) (continued)
| | | | | | |
| | |
| Shares | | Security | | Value | |
| | | | | | | |
| Consumer Finance — 0.5% | | | | |
| 7,100 | | Nelnet Inc., Class A Shares* | | $ | 263,410 | |
|
|
| Insurance — 3.9% | | | | |
| 14,200 | | American International Group Inc. | | | 920,160 | |
| 327 | | Berkshire Hathaway Inc., Class B Shares* | | | 920,505 | |
| 10,100 | | Old Republic International Corp. | | | 261,691 | |
|
|
| | | Total Insurance | | | 2,102,356 | |
|
|
| Real Estate — 0.4% | | | | |
| 2,600 | | Alexandria Real Estate Equities Inc. | | | 210,210 | |
|
|
| Thrifts & Mortgage Finance — 0.7% | | | | |
| 19,600 | | New York Community Bancorp Inc. | | | 316,932 | |
| 1,240 | | PMI Group Inc. | | | 49,451 | |
|
|
| | | Total Thrifts & Mortgage Finance | | | 366,383 | |
|
|
| | | TOTAL FINANCIALS | | | 6,575,066 | |
|
|
| HEALTH CARE — 18.8% | | | | |
| Biotechnology — 3.4% | | | | |
| 16,400 | | Amgen Inc.* | | | 1,242,464 | |
| 10,100 | | ImClone Systems Inc.* | | | 350,470 | |
| 10,400 | | Vertex Pharmaceuticals Inc.* | | | 236,600 | |
|
|
| | | Total Biotechnology | | | 1,829,534 | |
|
|
| Health Care Equipment & Supplies — 5.2% | | | | |
| 21,800 | | Dade Behring Holdings Inc. | | | 785,018 | |
| 2,800 | | DENTSPLY International Inc. | | | 154,392 | |
| 6,700 | | Fisher Scientific International Inc.* | | | 378,550 | |
| 2,800 | | Gen-Probe Inc.* | | | 114,352 | |
| 12,400 | | Kyphon Inc.* | | | 497,116 | |
| 9,600 | | ResMed Inc.* | | | 366,048 | |
| 14,900 | | Thermo Electron Corp.* | | | 449,831 | |
|
|
| | | Total Health Care Equipment & Supplies | | | 2,745,307 | |
|
|
| Health Care Providers & Services — 5.5% | | | | |
| 8,000 | | Amedisys Inc.* | | | 305,680 | |
| 8,325 | | Coventry Health Care Inc.* | | | 449,467 | |
| 9,400 | | DaVita Inc.* | | | 462,292 | |
| 9,000 | | Eclipsys Corp.* | | | 144,000 | |
| 12,500 | | Sierra Health Services Inc.* | | | 937,500 | |
| 24,200 | | VCA Antech Inc.* | | | 624,360 | |
|
|
| | | Total Health Care Providers & Services | | | 2,923,299 | |
|
|
| Pharmaceuticals — 4.7% | | | | |
| 17,400 | | Johnson & Johnson | | | 1,089,588 | |
| 12,400 | | Medicis Pharmaceutical Corp., Class A Shares | | | 365,800 | |
| 11,700 | | MGI Pharma Inc.* | | | 219,492 | |
| 34,600 | | Pfizer Inc. | | | 752,204 | |
See Notes to Financial Statements.
Smith Barney Investment Series 2005 Annual Report 31
Schedule of Investments (October 31, 2005) (continued)
| | | | | | |
| | |
| Shares | | Security | | Value | |
| | | | | | | |
| Pharmaceuticals — 4.7% (continued) | | | | |
| 4,400 | | Valeant Pharmaceuticals International | | $ | 75,504 | |
|
|
| | | Total Pharmaceuticals | | | 2,502,588 | |
|
|
| | | TOTAL HEALTH CARE | | | 10,000,728 | |
|
|
| INDUSTRIALS — 6.1% | | | | |
| Aerospace & Defense — 0.8% | | | | |
| 3,385 | | Alliant Techsystems Inc.* | | | 237,695 | |
| 4,000 | | Armor Holdings Inc.* | | | 178,840 | |
|
|
| | | Total Aerospace & Defense | | | 416,535 | |
|
|
| Commercial Services & Supplies — 0.7% | | | | |
| 15,300 | | Labor Ready Inc.* | | | 357,255 | |
|
|
| Electrical Equipment — 0.8% | | | | |
| 12,100 | | Roper Industries Inc. | | | 456,170 | |
|
|
| Industrial Conglomerates — 1.7% | | | | |
| 27,400 | | General Electric Co. | | | 929,134 | |
|
|
| Machinery — 0.4% | | | | |
| 4,600 | | AGCO Corp.* | | | 73,554 | |
| 2,800 | | Eaton Corp. | | | 164,724 | |
|
|
| | | Total Machinery | | | 238,278 | |
|
|
| Road & Rail — 0.8% | | | | |
| 20,750 | | Heartland Express Inc. | | | 409,812 | |
|
|
| Trading Companies & Distributors — 0.9% | | | | |
| 12,000 | | MSC Industrial Direct Co. Inc., Class A Shares | | | 458,160 | |
|
|
| | | TOTAL INDUSTRIALS | | | 3,265,344 | |
|
|
| INFORMATION TECHNOLOGY — 21.2% | | | | |
| Communications Equipment — 3.4% | | | | |
| 37,100 | | Cisco Systems Inc.* | | | 647,395 | |
| 52,600 | | Motorola Inc. | | | 1,165,616 | |
|
|
| | | Total Communications Equipment | | | 1,813,011 | |
|
|
| Computers & Peripherals — 2.4% | | | | |
| 2,000 | | Avid Technology Inc.* | | | 98,460 | |
| 23,400 | | Dell Inc.* | | | 745,992 | |
| 7,250 | | SanDisk Corp.* | | | 426,953 | |
|
|
| | | Total Computers & Peripherals | | | 1,271,405 | |
|
|
| Electronic Equipment & Instruments — 1.3% | | | | |
| 7,200 | | Benchmark Electronics Inc.* | | | 202,248 | |
| 3,850 | | CDW Corp. | | | 216,948 | |
| 10,000 | | Trimble Navigation Ltd.* | | | 288,700 | |
|
|
| | | Total Electronic Equipment & Instruments | | | 707,896 | |
|
|
See Notes to Financial Statements.
32 Smith Barney Investment Series 2005 Annual Report
Schedule of Investments (October 31, 2005) (continued)
| | | | | | |
| | |
| Shares | | Security | | Value | |
| | | | | | | |
| IT Services — 2.5% | | | | |
| 17,800 | | Acxiom Corp. | | $ | 379,852 | |
| 3,200 | | Affiliated Computer Services Inc., Class A Shares* | | | 173,152 | |
| 40,800 | | MPS Group Inc.* | | | 507,960 | |
| 13,400 | | Sabre Holdings Corp., Class A Shares | | | 261,702 | |
|
|
| | | Total IT Services | | | 1,322,666 | |
|
|
| Semiconductors & Semiconductor Equipment — 7.4% | | | | |
| 10,500 | | Cypress Semiconductor Corp.* | | | 142,800 | |
| 4,400 | | Diodes, Inc.* | | | 159,544 | |
| 14,200 | | Entegris Inc.* | | | 138,592 | |
| 7,700 | | FormFactor Inc.* | | | 189,574 | |
| 33,700 | | Intel Corp. | | | 791,950 | |
| 20,000 | | MEMC Electronic Materials Inc.* | | | 358,800 | |
| 8,400 | | Microchip Technology Inc. | | | 253,428 | |
| 19,300 | | Microsemi Corp.* | | | 447,181 | |
| 6,200 | | Tessera Technologies Inc.* | | | 172,980 | |
| 46,100 | | Texas Instruments Inc. | | | 1,316,155 | |
|
|
| | | Total Semiconductors & Semiconductor Equipment | | | 3,971,004 | |
|
|
| Software — 4.2% | | | | |
| 11,050 | | Amdocs Ltd.* | | | 292,493 | |
| 42,000 | | Microsoft Corp. | | | 1,079,400 | |
| 52,200 | | Quest Software Inc.* | | | 726,102 | |
| 7,800 | | Synopsys Inc.* | | | 147,810 | |
|
|
| | | Total Software | | | 2,245,805 | |
|
|
| | | TOTAL INFORMATION TECHNOLOGY | | | 11,331,787 | |
|
|
| MATERIALS — 1.5% | | | | |
| Chemicals — 1.1% | | | | |
| 6,250 | | Air Products & Chemicals Inc. | | | 357,750 | |
| 4,750 | | Cytec Industries Inc. | | | 196,175 | |
|
|
| | | Total Chemicals | | | 553,925 | |
|
|
| Metals & Mining — 0.4% | | | | |
| 10,000 | | Compass Minerals International Inc. | | | 223,900 | |
|
|
| | | TOTAL MATERIALS | | | 777,825 | |
|
|
| UTILITIES — 1.2% | | | | |
| Multi-Utilities — 1.2% | | | | |
| 8,750 | | KeySpan Corp. | | | 302,488 | |
| 8,250 | | SCANA Corp. | | | 327,277 | |
|
|
| | | TOTAL UTILITIES | | | 629,765 | |
|
|
| | | TOTAL INVESTMENTS BEFORE SHORT-TERM INVESTMENT
(Cost — $44,625,570) | | | 52,413,424 | |
|
|
See Notes to Financial Statements.
Smith Barney Investment Series 2005 Annual Report 33
Schedule of Investments (October 31, 2005) (continued)
| | | | | | | |
| | |
Face
Amount | | Security | | Value | |
| | | | | | | | |
| | SHORT-TERM INVESTMENT — 0.9% | | | | |
| | Repurchase Agreement — 0.9% | | | | |
| $ | 490,000 | | Interest in $447,167,000 joint tri-party repurchase agreement dated 10/31/05 with Goldman, Sachs & Co., 4.010% due 11/1/05, Proceeds at maturity — $490,055; (Fully collateralized by various U.S. Treasury obligations, 1.875% to 3.875% due 1/15/07 to 4/15/32; Market value — $499,926) (Cost — $490,000) | | $ | 490,000 | |
|
|
|
| | | | TOTAL INVESTMENTS — 99.2% (Cost — $45,115,570#) | | | 52,903,424 | |
| | | | Other Assets in Excess of Liabilities — 0.8% | | | 404,159 | |
|
|
|
| | | | TOTAL NET ASSETS — 100.0% | | $ | 53,307,583 | |
|
|
|
| * | | Non-income producing security. |
| # | | Aggregate cost for federal income tax purposes is $45,443,330. |
See Notes to Financial Statements.
34 Smith Barney Investment Series 2005 Annual Report
Schedule of Investments (October 31, 2005) (continued)
SMITH BARNEY DIVIDEND STRATEGY PORTFOLIO
| | | | | | |
| | |
| Shares | | Security | | Value | |
| | | | | | | |
| COMMON STOCKS — 90.5% | | | | |
| CONSUMER DISCRETIONARY — 5.0% | | | | |
| Hotels, Restaurants & Leisure — 1.0% | | | | |
| 9,100 | | International Game Technology | | $ | 241,059 | |
| 15,721 | | McDonald’s Corp. | | | 496,784 | |
|
|
| | | Total Hotels, Restaurants & Leisure | | | 737,843 | |
|
|
| Leisure Equipment & Products — 0.3% | | | | |
| 13,900 | | Hasbro Inc. | | | 261,876 | |
|
|
| Media — 2.4% | | | | |
| 8,536 | | Gannett Co. Inc. | | | 534,866 | |
| 48,500 | | Pearson PLC | | | 538,889 | |
| 19,270 | | Regal Entertainment Group, Class A Shares | | | 355,146 | |
| 20,000 | | Time Warner Inc. | | | 356,600 | |
|
|
| | | Total Media | | | 1,785,501 | |
|
|
| Multiline Retail — 0.6% | | | | |
| 8,464 | | Target Corp. | | | 471,360 | |
|
|
| Specialty Retail — 0.7% | | | | |
| 12,799 | | Home Depot Inc. | | | 525,271 | |
|
|
| | | TOTAL CONSUMER DISCRETIONARY | | | 3,781,851 | |
|
|
| CONSUMER STAPLES — 11.3% | | | | |
| Beverages — 1.5% | | | | |
| 9,800 | | Coca-Cola Co. | | | 419,244 | |
| 12,897 | | PepsiCo Inc. | | | 761,955 | |
|
|
| | | Total Beverages | | | 1,181,199 | |
|
|
| Food & Staples Retailing — 3.3% | | | | |
| 47,022 | | Albertson’s Inc. | | | 1,180,722 | |
| 27,300 | | Wal-Mart Stores Inc. | | | 1,291,563 | |
|
|
| | | Total Food & Staples Retailing | | | 2,472,285 | |
|
|
| Food Products — 4.0% | | | | |
| 11,250 | | Campbell Soup Co. | | | 327,375 | |
| 10,000 | | General Mills Inc. | | | 482,600 | |
| 12,800 | | H.J. Heinz Co. | | | 454,400 | |
| 33,004 | | Kraft Foods Inc., Class A Shares | | | 934,013 | |
| 20,823 | | Unilever PLC, Sponsored ADR | | | 845,414 | |
|
|
| | | Total Food Products | | | 3,043,802 | |
|
|
| Household Products — 2.5% | | | | |
| 21,006 | | Kimberly-Clark Corp. | | | 1,193,981 | |
| 12,800 | | Procter & Gamble Co. | | | 716,672 | |
|
|
| | | Total Household Products | | | 1,910,653 | |
|
|
| | | TOTAL CONSUMER STAPLES | | | 8,607,939 | |
|
|
See Notes to Financial Statements.
Smith Barney Investment Series 2005 Annual Report 35
Schedule of Investments (October 31, 2005) (continued)
| | | | | | |
| | |
| Shares | | Security | | Value | |
| | | | | | | |
| ENERGY — 8.0% | | | | |
| Oil, Gas & Consumable Fuels — 8.0% | | | | |
| 30,801 | | BP PLC, Sponsored ADR | | $ | 2,045,186 | |
| 27,946 | | Chevron Corp. | | | 1,594,878 | |
| 43,042 | | Exxon Mobil Corp. | | | 2,416,378 | |
|
|
| | | TOTAL ENERGY | | | 6,056,442 | |
|
|
| EXCHANGE TRADED — 1.6% | | | | |
| 11,400 | | Health Care Select Sector SPDR Fund | | | 346,902 | |
| 7,000 | | SPDR Trust Series 1 | | | 840,910 | |
|
|
| | | TOTAL EXCHANGE TRADED | | | 1,187,812 | |
|
|
| FINANCIALS — 14.0% | | | | |
| Capital Markets — 2.4% | | | | |
| 2,850 | | Goldman Sachs Group Inc. | | | 360,155 | |
| 11,400 | | Merrill Lynch & Co. Inc. | | | 738,036 | |
| 8,563 | | UBS AG, Registered Shares | | | 733,592 | |
|
|
| | | Total Capital Markets | | | 1,831,783 | |
|
|
| Commercial Banks — 3.1% | | | | |
| 11,400 | | Bank of America Corp. | | | 498,636 | |
| 11,400 | | U.S. Bancorp | | | 337,212 | |
| 24,573 | | Wells Fargo & Co. | | | 1,479,295 | |
|
|
| | | Total Commercial Banks | | | 2,315,143 | |
|
|
| Consumer Finance — 1.1% | | | | |
| 32,100 | | MBNA Corp. | | | 820,797 | |
|
|
| Diversified Financial Services — 2.2% | | | | |
| 46,141 | | JPMorgan Chase & Co. | | | 1,689,683 | |
|
|
| Insurance — 2.4% | | | | |
| 10,000 | | Assurant Inc. | | | 382,000 | |
| 15,721 | | Chubb Corp. | | | 1,461,581 | |
|
|
| | | Total Insurance | | | 1,843,581 | |
|
|
| Real Estate — 2.8% | | | | |
| 6,000 | | Mills Corp. | | | 321,000 | |
| 27,200 | | Plum Creek Timber Co. Inc. | | | 1,058,080 | |
| 8,304 | | ProLogis | | | 357,072 | |
| 5,219 | | Simon Property Group Inc. | | | 373,785 | |
|
|
| | | Total Real Estate | | | 2,109,937 | |
|
|
| | | TOTAL FINANCIALS | | | 10,610,924 | |
|
|
| HEALTH CARE — 14.7% | | | | |
| Health Care Equipment & Supplies — 0.5% | | | | |
| 7,150 | | Medtronic Inc. | | | 405,119 | |
|
|
| Pharmaceuticals — 14.2% | | | | |
| 45,256 | | Abbott Laboratories | | | 1,948,271 | |
| 15,700 | | Eli Lilly & Co. | | | 781,703 | |
See Notes to Financial Statements.
36 Smith Barney Investment Series 2005 Annual Report
Schedule of Investments (October 31, 2005) (continued)
| | | | | | |
| | |
| Shares | | Security | | Value | |
| | | | | | | |
| Pharmaceuticals — 14.2% (continued) | | | | |
| 29,794 | | GlaxoSmithKline PLC, Sponsored ADR | | $ | 1,548,990 | |
| 39,950 | | Johnson & Johnson | | | 2,501,669 | |
| 8,700 | | Novartis AG, Sponsored ADR | | | 468,234 | |
| 60,657 | | Pfizer Inc. | | | 1,318,683 | |
| 48,705 | | Wyeth | | | 2,170,295 | |
|
|
| | | Total Pharmaceuticals | | | 10,737,845 | |
|
|
| | | TOTAL HEALTH CARE | | | 11,142,964 | |
|
|
| INDUSTRIALS — 14.8% | | | | |
| Aerospace & Defense — 3.9% | | | | |
| 42,082 | | Honeywell International Inc. | | | 1,439,204 | |
| 12,800 | | Raytheon Co. | | | 472,960 | |
| 20,000 | | United Technologies Corp. | | | 1,025,600 | |
|
|
| | | Total Aerospace & Defense | | | 2,937,764 | |
|
|
| Air Freight & Logistics — 0.5% | | | | |
| 5,600 | | United Parcel Service Inc., Class B Shares | | | 408,464 | |
|
|
| Building Products — 0.3% | | | | |
| 6,900 | | Masco Corp. | | | 196,650 | |
|
|
| Commercial Services & Supplies — 1.8% | | | | |
| 8,500 | | Pitney Bowes Inc. | | | 357,680 | |
| 9,250 | | R.R. Donnelley & Sons Co. | | | 323,935 | |
| 22,800 | | Waste Management Inc. | | | 672,828 | |
|
|
| | | Total Commercial Services & Supplies | | | 1,354,443 | |
|
|
| Electrical Equipment — 3.1% | | | | |
| 10,700 | | Cooper Industries Ltd., Class A Shares | | | 758,523 | |
| 23,510 | | Emerson Electric Co. | | | 1,635,121 | |
|
|
| | | Total Electrical Equipment | | | 2,393,644 | |
|
|
| Industrial Conglomerates — 5.2% | | | | |
| 12,800 | | 3M Co. | | | 972,544 | |
| 74,725 | | General Electric Co. | | | 2,533,925 | |
| 15,700 | | Tyco International Ltd. | | | 414,323 | |
|
|
| | | Total Industrial Conglomerates | | | 3,920,792 | |
|
|
| | | TOTAL INDUSTRIALS | | | 11,211,757 | |
|
|
| INFORMATION TECHNOLOGY — 5.5% | | | | |
| Computers & Peripherals — 1.2% | | | | |
| 6,950 | | Hewlett-Packard Co. | | | 194,878 | |
| 8,530 | | International Business Machines Corp. | | | 698,436 | |
|
|
| | | Total Computers & Peripherals | | | 893,314 | |
|
|
| IT Services — 1.1% | | | | |
| 18,500 | | Automatic Data Processing Inc. | | | 863,210 | |
|
|
| Semiconductors & Semiconductor Equipment — 0.6% | | | | |
| 18,500 | | Intel Corp. | | | 434,750 | |
|
|
See Notes to Financial Statements.
Smith Barney Investment Series 2005 Annual Report 37
Schedule of Investments (October 31, 2005) (continued)
| | | | | | |
| | |
| Shares | | Security | | Value | |
| | | | | | | |
| Software — 2.6% | | | | |
| 77,721 | | Microsoft Corp. | | $ | 1,997,430 | |
|
|
| | | TOTAL INFORMATION TECHNOLOGY | | | 4,188,704 | |
|
|
| MATERIALS — 9.2% | | | | |
| Chemicals — 6.4% | | | | |
| 37,767 | | Dow Chemical Co. | | | 1,731,995 | |
| 42,000 | | E.I. du Pont de Nemours & Co. | | | 1,750,980 | |
| 42,600 | | Olin Corp. | | | 761,688 | |
| 9,980 | | PPG Industries Inc. | | | 598,500 | |
|
|
| | | Total Chemicals | | | 4,843,163 | |
|
|
| Metals & Mining — 1.2% | | | | |
| 38,144 | | Alcoa Inc. | | | 926,518 | |
|
|
| Paper & Forest Products — 1.6% | | | | |
| 19,188 | | Weyerhaeuser Co. | | | 1,215,368 | |
|
|
| | | TOTAL MATERIALS | | | 6,985,049 | |
|
|
| TELECOMMUNICATION SERVICES — 3.1% | | | | |
| Diversified Telecommunication Services — 3.1% | | | | |
| 45,311 | | BellSouth Corp. | | | 1,178,992 | |
| 37,919 | | Verizon Communications Inc. | | | 1,194,828 | |
|
|
| | | TOTAL TELECOMMUNICATION SERVICES | | | 2,373,820 | |
|
|
| UTILITIES — 3.3% | | | | |
| Electric Utilities — 1.0% | | | | |
| 8,600 | | Cinergy Corp. | | | 343,140 | |
| 8,600 | | FPL Group Inc. | | | 370,316 | |
|
|
| | | Total Electric Utilities | | | 713,456 | |
|
|
| Gas Utilities — 1.0% | | | | |
| 19,750 | | Equitable Resources Inc. | | | 763,337 | |
|
|
| Multi-Utilities — 1.3% | | | | |
| 4,300 | | Ameren Corp. | | | 226,180 | |
| 15,000 | | KeySpan Corp. | | | 518,550 | |
| 11,400 | | NiSource Inc. | | | 269,610 | |
|
|
| | | Total Multi-Utilities | | | 1,014,340 | |
|
|
| | | TOTAL UTILITIES | | | 2,491,133 | |
|
|
| | | TOTAL COMMON STOCKS
(Cost — $65,259,701) | | | 68,638,395 | |
|
|
| CONVERTIBLE PREFERRED STOCKS — 1.7% | | | | |
| FINANCIALS — 0.7% | | | | |
| Diversified Financial Services — 0.7% | | | | |
| 2,245 | | State Street Corp., 6.750% due 2/15/06 (a) | | | 544,289 | |
|
|
See Notes to Financial Statements.
38 Smith Barney Investment Series 2005 Annual Report
Schedule of Investments (October 31, 2005) (continued)
| | | | | | | |
| | |
| Shares | | Security | | Value | |
| | | | | | | | |
| | HEALTH CARE — 1.0% | | | | |
| | Health Care Equipment & Supplies — 1.0% | | | | |
| | 13,698 | | Baxter International Inc., Equity Units, 7.000% due 2/16/06 (b) | | $ | 742,021 | |
|
|
|
| | | | TOTAL CONVERTIBLE PREFERRED STOCKS (Cost — $1,192,217) | | | 1,286,310 | |
|
|
|
| | | | TOTAL INVESTMENTS BEFORE SHORT-TERM INVESTMENTS
(Cost — $66,451,918) | | | 69,924,705 | |
|
|
|
| | |
Face
Amount | | | | | |
| | SHORT-TERM INVESTMENTS — 7.7% | | | | |
| | Repurchase Agreements — 7.7% | | | | |
| $ | 220,000 | | Interest in $442,372,000 joint tri-party repurchase agreement dated 10/31/05 with Morgan Stanley, 3.990% due 11/1/05; Proceeds at maturity — $220,024; (Fully collateralized by various U.S. government agency obligations, 0.000% to 6.000% due 11/28/06 to 7/21/25; Market value — $225,418) | | | 220,000 | |
| | 2,652,000 | | Interest in $542,622,000 joint tri-party repurchase agreement dated 10/31/05 with Greenwich Capital Markets Inc., 4.020% due 11/1/05; Proceeds at maturity — $2,652,296; (Fully collateralized by various U.S. Treasury obligations, 1.500% to 6.250% due 3/31/06 to 5/15/30; Market value — $2,705,061) | | | 2,652,000 | |
| | 1,500,000 | | Interest in $572,678,000 joint tri-party repurchase agreement dated 10/31/05 with Deutsche Bank Securities Inc., 4.000% due 11/1/05; Proceeds at maturity — $1,500,167; (Fully collateralized by various U.S. government agency obligations, 0.000% to 7.125% due 11/28/05 to 1/15/30; Market value — $1,530,009) | | | 1,500,000 | |
| | 1,500,000 | | Interest in $689,187,000 joint tri-party repurchase agreement dated 10/31/05 with Merrill Lynch, Pierce, Fenner & Smith Inc., 4.000% due 11/1/05; Proceeds at maturity — $1,500,167; (Fully collateralized by U.S. Treasury obligations, 0.000% to 3.750% due 11/3/05 to 5/15/08; Market value — $1,530,003) | | | 1,500,000 | |
|
|
|
| | | | TOTAL SHORT-TERM INVESTMENTS
(Cost — $5,872,000) | | | 5,872,000 | |
|
|
|
| | | | TOTAL INVESTMENTS — 99.9% (Cost — $72,323,918#) | | | 75,796,705 | |
| | | | Other Assets in Excess of Liabilities — 0.1% | | | 69,646 | |
|
|
|
| | | | TOTAL NET ASSETS — 100.0% | | $ | 75,866,351 | |
|
|
|
| (a) | | SPACES Forward purchase contract unit—Each unit represents 1 space (fixed share purchase contract and U.S. Treasury Strip) and 1 cover (variable share repurchase contract). SPACES is a service mark of Goldman, Sachs & Co. |
| (b) | | Each unit represents a separate contract to purchase common stock and senior notes. |
| # | | Aggregate cost for federal income tax purposes is $72,772,261. |
| | |
Abbreviations used in this schedule:
|
| ADR | | — American Depositary Receipt |
| SPDR | | — Standard & Poor’s Depositary Receipts |
See Notes to Financial Statements.
Smith Barney Investment Series 2005 Annual Report 39
Schedule of Investments (October 31, 2005) (continued)
SMITH BARNEY GROWTH AND INCOME PORTFOLIO
| | | | | | |
| | |
| Shares | | Security | | Value | |
| | | | | | | |
| COMMON STOCKS — 98.7% | | | | |
| CONSUMER DISCRETIONARY — 11.3% | | | | |
| Hotels, Restaurants & Leisure — 2.4% | | | | |
| 2,570 | | Ctrip.com International Ltd., ADR (a) | | $ | 147,852 | |
| 27,040 | | McDonald’s Corp. | | | 854,464 | |
| 11,600 | | Station Casinos Inc. | | | 743,560 | |
|
|
| | | Total Hotels, Restaurants & Leisure | | | 1,745,876 | |
|
|
| Household Durables — 1.0% | | | | |
| 31,420 | | Newell Rubbermaid Inc. (a) | | | 722,346 | |
|
|
| Media — 4.8% | | | | |
| 13,010 | | Comcast Corp., Class A Shares* | | | 362,069 | |
| 25,100 | | EchoStar Communications Corp., Class A Shares* | | | 674,437 | |
| 61,034 | | Liberty Media Corp., Class A Shares* | | | 486,441 | |
| 65,520 | | News Corp., Class B Shares | | | 986,731 | |
| 59,300 | | Time Warner Inc. | | | 1,057,319 | |
|
|
| | | Total Media | | | 3,566,997 | |
|
|
| Specialty Retail — 3.1% | | | | |
| 35,090 | | Best Buy Co. Inc. | | | 1,553,083 | |
| 33,600 | | Staples Inc. | | | 763,728 | |
|
|
| | | Total Specialty Retail | | | 2,316,811 | |
|
|
| | | TOTAL CONSUMER DISCRETIONARY | | | 8,352,030 | |
|
|
| CONSUMER STAPLES — 10.0% | | | | |
| Beverages — 2.1% | | | | |
| 26,710 | | PepsiCo Inc. | | | 1,578,027 | |
|
|
| Food & Staples Retailing — 1.9% | | | | |
| 28,900 | | Wal-Mart Stores Inc. | | | 1,367,259 | |
|
|
| Food Products — 3.4% | | | | |
| 26,560 | | Kellogg Co. | | | 1,173,155 | |
| 18,150 | | McCormick & Co. Inc., Non Voting Shares | | | 549,763 | |
| 45,900 | | Sara Lee Corp. | | | 819,315 | |
|
|
| | | Total Food Products | | | 2,542,233 | |
|
|
| Household Products — 2.6% | | | | |
| 14,130 | | Kimberly-Clark Corp. | | | 803,149 | |
| 20,540 | | Procter & Gamble Co. | | | 1,150,035 | |
|
|
| | | Total Household Products | | | 1,953,184 | |
|
|
| | | TOTAL CONSUMER STAPLES | | | 7,440,703 | |
|
|
| ENERGY — 9.4% | | | | |
| Energy Equipment & Services — 1.7% | | | | |
| 13,010 | | ENSCO International Inc. | | | 593,126 | |
| 15,520 | | GlobalSantaFe Corp. | | | 691,416 | |
|
|
| | | Total Energy Equipment & Services | | | 1,284,542 | |
|
|
See Notes to Financial Statements.
40 Smith Barney Investment Series 2005 Annual Report
Schedule of Investments (October 31, 2005) (continued)
| | | | | | |
| | |
| Shares | | Security | | Value | |
| | | | | | | |
| Oil, Gas & Consumable Fuels — 7.7% | | | | |
| 10,370 | | Burlington Resources Inc. | | $ | 748,921 | |
| 32,720 | | Exxon Mobil Corp. | | | 1,836,901 | |
| 20,900 | | Nexen Inc. | | | 864,006 | |
| 9,580 | | Suncor Energy Inc. | | | 513,775 | |
| 13,850 | | Total SA, Sponsored ADR (a) | | | 1,745,377 | |
|
|
| | | Total Oil, Gas & Consumable Fuels | | | 5,708,980 | |
|
|
| | | TOTAL ENERGY | | | 6,993,522 | |
|
|
| FINANCIALS — 20.4% | | | | |
| Capital Markets — 3.3% | | | | |
| 9,190 | | Goldman Sachs Group Inc. | | | 1,161,340 | |
| 20,120 | | Merrill Lynch & Co. Inc. | | | 1,302,569 | |
|
|
| | | Total Capital Markets | | | 2,463,909 | |
|
|
| Commercial Banks — 6.7% | | | | |
| 34,136 | | Bank of America Corp. | | | 1,493,109 | |
| 12,580 | | Comerica Inc. | | | 726,872 | |
| 15,920 | | Wachovia Corp. | | | 804,278 | |
| 31,740 | | Wells Fargo & Co. | | | 1,910,748 | |
|
|
| | | Total Commercial Banks | | | 4,935,007 | |
|
|
| Consumer Finance — 2.9% | | | | |
| 21,410 | | American Express Co. | | | 1,065,576 | |
| 14,170 | | Capital One Financial Corp. | | | 1,081,879 | |
|
|
| | | Total Consumer Finance | | | 2,147,455 | |
|
|
| Diversified Financial Services — 2.1% | | | | |
| 43,548 | | JPMorgan Chase & Co. | | | 1,594,728 | |
|
|
| Insurance — 4.3% | | | | |
| 12,470 | | AFLAC Inc. | | | 595,817 | |
| 17,760 | | American International Group Inc. | | | 1,150,848 | |
| 8 | | Berkshire Hathaway Inc., Class A Shares (a)* | | | 687,200 | |
| 8,160 | | Chubb Corp. | | | 758,635 | |
|
|
| | | Total Insurance | | | 3,192,500 | |
|
|
| Thrifts & Mortgage Finance — 1.1% | | | | |
| 13,660 | | Golden West Financial Corp. | | | 802,252 | |
|
|
| | | TOTAL FINANCIALS | | | 15,135,851 | |
|
|
| HEALTH CARE — 11.0% | | | | |
| Biotechnology — 1.5% | | | | |
| 14,870 | | Amgen Inc.* | | | 1,126,551 | |
|
|
| Health Care Providers & Services — 4.4% | | | | |
| 14,955 | | Coventry Health Care Inc.* | | | 807,421 | |
| 23,200 | | UnitedHealth Group Inc. | | | 1,343,048 | |
| 15,060 | | WellPoint Inc.* | | | 1,124,681 | |
|
|
| | | Total Health Care Providers & Services | | | 3,275,150 | |
|
|
See Notes to Financial Statements.
Smith Barney Investment Series 2005 Annual Report 41
Schedule of Investments (October 31, 2005) (continued)
| | | | | | |
| | |
| Shares | | Security | | Value | |
| | | | | | | |
| Pharmaceuticals — 5.1% | | | | |
| 21,000 | | Pfizer Inc. | | $ | 456,540 | |
| 30,200 | | Sanofi-Aventis, ADR | | | 1,211,624 | |
| 12,770 | | Sepracor Inc. (a)* | | | 718,312 | |
| 35,280 | | Teva Pharmaceutical Industries Ltd., Sponsored ADR (a) | | | 1,344,874 | |
|
|
| | | Total Pharmaceuticals | | | 3,731,350 | |
|
|
| | | TOTAL HEALTH CARE | | | 8,133,051 | |
|
|
| INDUSTRIALS — 10.4% | | | | |
| Aerospace & Defense — 4.3% | | | | |
| 32,420 | | Boeing Co. | | | 2,095,629 | |
| 28,770 | | Raytheon Co. | | | 1,063,051 | |
|
|
| | | Total Aerospace & Defense | | | 3,158,680 | |
|
|
| Building Products — 1.1% | | | | |
| 20,760 | | American Standard Cos. Inc. | | | 789,711 | |
|
|
| Industrial Conglomerates — 5.0% | | | | |
| 89,600 | | General Electric Co. | | | 3,038,336 | |
| 9,680 | | Textron Inc. | | | 697,347 | |
|
|
| | | Total Industrial Conglomerates | | | 3,735,683 | |
|
|
| | | TOTAL INDUSTRIALS | | | 7,684,074 | |
|
|
| INFORMATION TECHNOLOGY — 16.3% | | | | |
| Communications Equipment — 0.9% | | | | |
| 36,188 | | ADC Telecommunications Inc. (a)* | | | 631,481 | |
|
|
| Computers & Peripherals — 2.2% | | | | |
| 28,530 | | Dell Inc.* | | | 909,536 | |
| 9,210 | | International Business Machines Corp. | | | 754,115 | |
|
|
| | | Total Computers & Peripherals | | | 1,663,651 | |
|
|
| Electronic Equipment & Instruments — 0.3% | | | | |
| 11,370 | | Dolby Laboratories Inc., Class A Shares* | | | 183,057 | |
|
|
| Internet Software & Services — 1.4% | | | | |
| 2,000 | | Netease.com Depositary Receipts* | | | 152,540 | |
| 6,380 | | SINA Corp. (a)* | | | 161,733 | |
| 20,100 | | Yahoo! Inc.* | | | 743,097 | |
|
|
| | | Total Internet Software & Services | | | 1,057,370 | |
|
|
| IT Services — 1.1% | | | | |
| 21,700 | | Paychex Inc. | | | 841,092 | |
|
|
| Semiconductors & Semiconductor Equipment — 3.7% | | | | |
| 44,200 | | Applied Materials Inc. | | | 723,996 | |
| 32,700 | | ASML Holding NV, NY Registered Shares* | | | 555,246 | |
| 29,290 | | Intel Corp. | | | 688,315 | |
| 23,200 | | Maxim Integrated Products Inc. | | | 804,576 | |
|
|
| | | Total Semiconductors & Semiconductor Equipment | | | 2,772,133 | |
|
|
See Notes to Financial Statements.
42 Smith Barney Investment Series 2005 Annual Report
Schedule of Investments (October 31, 2005) (continued)
| | | | | | | |
| | |
| Shares | | Security | | Value | |
| | | | | | | | |
| | Software — 6.7% | | | | |
| | 22,200 | | Adobe Systems Inc. | | $ | 715,950 | |
| | 19,800 | | Cognos Inc.* | | | 743,094 | |
| | 13,860 | | Electronic Arts Inc.* | | | 788,357 | |
| | 104,720 | | Microsoft Corp. | | | 2,691,304 | |
|
|
|
| | | | Total Software | | | 4,938,705 | |
|
|
|
| | | | TOTAL INFORMATION TECHNOLOGY | | | 12,087,489 | |
|
|
|
| | MATERIALS — 5.4% | | | | |
| | Chemicals — 2.3% | | | | |
| | 22,400 | | E.I. du Pont de Nemours & Co. | | | 933,856 | |
| | 22,600 | | Ecolab Inc. | | | 747,608 | |
|
|
|
| | | | Total Chemicals | | | 1,681,464 | |
|
|
|
| | Metals & Mining — 3.1% | | | | |
| | 71,390 | | Barrick Gold Corp. | | | 1,802,597 | |
| | 25,900 | | Placer Dome Inc. | | | 516,705 | |
|
|
|
| | | | Total Metals & Mining | | | 2,319,302 | |
|
|
|
| | | | TOTAL MATERIALS | | | 4,000,766 | |
|
|
|
| | TELECOMMUNICATION SERVICES — 3.3% | | | | |
| | Wireless Telecommunication Services — 3.3% | | | | |
| | 10,780 | | ALLTEL Corp. | | | 666,851 | |
| | 77,309 | | Sprint Nextel Corp. | | | 1,802,073 | |
|
|
|
| | | | TOTAL TELECOMMUNICATION SERVICES | | | 2,468,924 | |
|
|
|
| | UTILITIES — 1.2% | | | | |
| | Multi-Utilities — 1.2% | | | | |
| | 20,700 | | Sempra Energy | | | 917,010 | |
|
|
|
| | | | TOTAL INVESTMENTS BEFORE SHORT-TERM INVESTMENTS
(Cost — $63,972,401) | | | 73,213,420 | |
|
|
|
| | |
Face
Amount | | | | | |
| | SHORT-TERM INVESTMENTS — 9.3% | | | | |
| | Repurchase Agreement — 1.4% | | | | |
| $ | 1,032,000 | | Interest in $164,777,000 joint tri-party repurchase agreement dated 10/31/05 with Barclays Capital Inc., 3.930% due 11/1/05, Proceeds at maturity — $1,032,113; (Fully collateralized by various U.S. Treasury Strips, 0.000% due 2/15/11 to 2/15/19; Market value — $1,062,963) (Cost — $1,032,000) | | | 1,032,000 | |
|
|
|
See Notes to Financial Statements.
Smith Barney Investment Series 2005 Annual Report 43
Schedule of Investments (October 31, 2005) (continued)
| | | | | | |
| | |
| Shares | | Security | | Value | |
| | | | | | | |
| Securities Purchased from Securities Lending Collateral — 7.9% | | | | |
| 5,831,978 | | State Street Navigator Securities Lending Trust Prime Portfolio
(Cost — $5,831,978) | | $ | 5,831,978 | |
|
|
| | | TOTAL SHORT-TERM INVESTMENTS
(Cost — $6,863,978) | | | 6,863,978 | |
|
|
| | | TOTAL INVESTMENTS — 108.0% (Cost — $70,836,379#) | | | 80,077,398 | |
| | | Liabilities in Excess of Other Assets — (8.0)% | | | (5,934,858 | ) |
|
|
| | | TOTAL NET ASSETS — 100.0% | | $ | 74,142,540 | |
|
|
| * | | Non-income producing security. |
| (a) | | All or a portion of this security is on loan (See Notes 1 and 3). |
| # | | Aggregate cost for federal income tax purposes is $71,350,139. |
| | |
Abbreviation used in this schedule:
|
| ADR | | — American Depositary Receipt |
See Notes to Financial Statements.
44 Smith Barney Investment Series 2005 Annual Report
Schedule of Investments (October 31, 2005) (continued)
SB GOVERNMENT PORTFOLIO
| | | | | | |
| | |
Face
Amount | | Security | | Value |
| | | | | | | |
| | MORTGAGE-BACKED SECURITIES — 49.4% | | | |
| | FHLMC — 3.7% | | | |
| | | | Federal Home Loan Mortgage Corp. (FHLMC), Gold: | | | |
| $ | 305,954 | | 6.500% due 9/1/31(a) | | $ | 314,365 |
| | 141,949 | | 6.000% due 12/1/31 (a) | | | 143,605 |
| | 337,291 | | 5.000% due 8/1/33 (a) | | | 325,823 |
| | 2,600,000 | | 5.000% due 11/1/35 (b)(c) | | | 2,501,689 |
| | 1,600,000 | | 6.000% due 11/1/35 (b)(c) | | | 1,616,000 |
|
|
| | | | TOTAL FHLMC | | | 4,901,482 |
|
|
| | FNMA — 40.8% | | | |
| | | | Federal National Mortgage Association (FNMA): | | | |
| | 1,952,756 | | 6.000% due 8/1/16-1/1/33 (a) | | | 1,972,633 |
| | 26,500,000 | | 5.500% due 11/1/20-11/1/35 (b)(c) | | | 26,164,206 |
| | 1,000,000 | | 6.000% due 11/1/20 (b)(c) | | | 1,022,812 |
| | 143,275 | | 6.500% due 4/1/29-5/1/32 (a) | | | 147,375 |
| | 129,390 | | 7.000% due 11/1/31 (a) | | | 135,399 |
| | 169,171 | | 7.500% due 3/1/32-5/1/32 (a) | | | 178,619 |
| | 2,400,000 | | 4.500% due 11/1/35 (b)(c) | | | 2,242,500 |
| | 15,000,000 | | 5.000% due 11/1/35 (b)(c) | | | 14,437,500 |
| | 7,000,000 | | 6.500% due 11/1/35 (b)(c) | | | 7,185,934 |
|
|
| | | | TOTAL FNMA | | | 53,486,978 |
|
|
| | GNMA — 4.9% | | | |
| | | | Government National Mortgage Association (GNMA): | | | |
| | 51,695 | | 6.500% due 6/15/31 (a) | | | 53,670 |
| | 74,706 | | 7.000% due 9/15/31 (a) | | | 78,579 |
| | 6,110,726 | | 6.000% due 3/15/33 (a) | | | 6,220,893 |
|
|
| | | | TOTAL GNMA | | | 6,353,142 |
|
|
| | | | TOTAL MORTGAGE-BACKED SECURITIES
(Cost — $66,046,280) | | | 64,741,602 |
|
|
| | COLLATERALIZED MORTGAGE OBLIGATIONS — 1.0% |
| | | | Federal Home Loan Mortgage Corp. (FHLMC): | | | |
| | 121,832 | | Series 2525, Class AM, 4.500% due 4/15/32 (a) | | | 106,571 |
| | 3,608,746 | | Series 2686, Class QI, PAC IO, 5.500% due 1/15/23 (a) | | | 151,542 |
| | 1,091,762 | | Series 2780, Class SL PAC, 6.000% due 4/15/34 (a)(d) | | | 1,075,811 |
|
|
| | | | TOTAL COLLATERALIZED MORTGAGE OBLIGATIONS
(Cost — $1,327,549) | | | 1,333,924 |
|
|
| | U.S. GOVERNMENT & AGENCY OBLIGATIONS — 47.3% |
| | U.S. Government Agencies — 2.6% |
| | 700,000 | | Federal Home Loan Bank (FHLB), Series K805, 6.500% due 11/15/05 (a) | | | 700,567 |
| | | | Federal National Mortgage Association (FNMA): | | | |
| | 1,700,000 | | 5.250% due 1/15/09 (a) | | | 1,730,350 |
| | 1,000,000 | | Notes, 4.308% due 2/17/09 (a)(d) | | | 1,001,540 |
|
|
| | | | Total U.S. Government Agencies | | | 3,432,457 |
|
|
See Notes to Financial Statements.
Smith Barney Investment Series 2005 Annual Report 45
Schedule of Investments (October 31, 2005) (continued)
| | | | | | | |
| | |
Face
Amount | | Security | | Value | |
| | | | | | | | |
| | U.S. Government Obligations — 44.7% | |
| | | | U.S. Treasury Bonds: | | | | |
| $ | 300,000 | | 7.250% due 5/15/16 (a) | | $ | 364,172 | |
| | 200,000 | | 9.000% due 11/15/18 (a)(e) | | | 282,094 | |
| | 700,000 | | 7.625% due 2/15/25 (a) | | | 943,168 | |
| | 8,000,000 | | 5.375% due 2/15/31 (a) | | | 8,727,504 | |
| | | | U.S. Treasury Notes: | | | | |
| | 1,500,000 | | 3.625% due 4/30/07 (a) | | | 1,483,770 | |
| | 7,700,000 | | 3.500% due 5/31/07 (a) | | | 7,599,245 | |
| | 8,500,000 | | 3.250% due 8/15/08 (a) | | | 8,243,674 | |
| | 7,500,000 | | 3.375% due 10/15/09 (a) | | | 7,211,723 | |
| | 5,000,000 | | 4.000% due 4/15/10 (a) | | | 4,905,860 | |
| | 5,000,000 | | 4.125% due 8/15/10 | | | 4,925,785 | |
| | 6,300,000 | | 4.250% due 8/15/13 (a) | | | 6,180,155 | |
| | 8,000,000 | | 4.000% due 2/15/15 (a) | | | 7,652,192 | |
|
|
|
| | | | Total U.S. Government Obligations | | | 58,519,342 | |
|
|
|
| | | | TOTAL U.S. GOVERNMENT & AGENCY OBLIGATIONS
(Cost — $63,044,156) | | | 61,951,799 | |
|
|
|
| | | | TOTAL INVESTMENTS BEFORE SHORT-TERM INVESTMENTS
(Cost — $130,417,985) | | | 128,027,325 | |
|
|
|
| | SHORT-TERM INVESTMENTS — 44.4% | | | | |
| | U.S. Government Agencies — 38.1% | | | | |
| | 25,000,000 | | Federal Farm Credit Discount Note, 3.650% due 11/3/05 | | | 24,994,944 | |
| | 25,000,000 | | Federal Home Loan Bank Discount Notes, 3.720% due 11/9/05 | | | 24,979,389 | |
|
|
|
| | | | Total U.S. Government Agencies
(Cost — $49,974,333) | | | 49,974,333 | |
|
|
|
| | Repurchase Agreement — 6.3% | | | | |
| | 8,218,000 | | Interest in $164,777,000 joint tri-party repurchase agreement dated 10/31/05 with Barclays Capital Inc., 3.930% due 11/1/05, Proceeds at maturity — $8,218,897; (Fully collateralized by various U.S. Treasury Strips, 0.000% due 2/15/11 to 2/15/19; Market value - $8,464,563) (a)
(Cost — $8,218,000) | | | 8,218,000 | |
|
|
|
| | | | TOTAL SHORT-TERM INVESTMENTS
(Cost — $58,192,333) | | | 58,192,333 | |
|
|
|
| | | | TOTAL INVESTMENTS — 142.1% (Cost — $188,610,318#) | | | 186,219,658 | |
| | | | Liabilities in Excess of Other Assets — (42.1)% | | | (55,206,263 | ) |
|
|
|
| | | | TOTAL NET ASSETS — 100.0% | | $ | 131,013,395 | |
|
|
|
| (a) | | All or a portion of this security is segregated for “to be announced” securities, open futures contracts and/or mortgage dollar rolls. |
| (b) | | This security is traded on a “to-be-announced” basis. |
| (c) | | Security acquired under mortgage dollar roll agreement. |
| (d) | | Variable rate securities. Coupon rate disclosed is that which is in effect at October 31, 2005. |
| (e) | | All or a portion of this security is held at the broker as collateral for open futures contracts. |
| # | | Aggregate cost for federal income tax purposes is $188,684,303. |
| | |
Abbreviations used in this schedule:
|
| IO | | — Interest Only |
| PAC | | — Planned Amortization Cost |
See Notes to Financial Statements.
46 Smith Barney Investment Series 2005 Annual Report
Statement of Assets and Liabilities (October 31, 2005)
| | | | | | | | | | | | | | | | |
| | | | |
| | | Smith Barney
Premier Selections
All Cap Growth
Portfolio | | | Smith Barney
Dividend
Strategy
Portfolio | | | Smith Barney
Growth and
Income
Portfolio | | | SB
Government
Portfolio | |
| ASSETS: | | | | | | | | | | | | | | | | |
Investments, at cost | | $ | 44,625,570 | | | $ | 66,451,918 | | | $ | 63,972,401 | | | $ | 130,417,985 | |
Short-term investments, at cost | | | 490,000 | | | | 5,872,000 | | | | 6,863,978 | | | | 58,192,333 | |
|
|
Investments, at value | | $ | 52,413,424 | | | $ | 69,924,705 | | | $ | 73,213,420 | | | $ | 128,027,325 | |
Short-term investments, at value | | | 490,000 | | | | 5,872,000 | | | | 6,863,978 | | | | 58,192,333 | |
Cash | | | 74 | | | | 1,177 | | | | 345 | | | | 875 | |
Receivable for securities sold | | | 650,854 | | | | 313,688 | | | | 720,771 | | | | — | |
Dividends and interest receivable | | | 29,059 | | | | 113,873 | | | | 16,089 | | | | 711,177 | |
Receivable for Fund shares sold | | | 2,055 | | | | — | | | | 20,253 | | | | 88,914 | |
Receivable from broker — variation margin on open futures contracts | | | — | | | | — | | | | — | | | | 5,094 | |
Prepaid expenses | | | 967 | | | | 273 | | | | 993 | | | | 1,967 | |
|
|
Total Assets | | | 53,586,433 | | | | 76,225,716 | | | | 80,835,849 | | | | 187,027,685 | |
|
|
| LIABILITIES: | | | | | | | | | | | | | | | | |
Payable for securities purchased | | | 102,163 | | | | — | | | | 730,876 | | | | 55,844,176 | |
Payable for loaned securities collateral (Notes 1 and 3) | | | — | | | | — | | | | 5,831,978 | | | | — | |
Payable for Fund shares repurchased | | | 105,049 | | | | 261,160 | | | | 48,951 | | | | 24,929 | |
Management fee payable | | | 34,071 | | | | 41,983 | | | | 40,861 | | | | 61,688 | |
Deferred dollar roll income | | | — | | | | — | | | | — | | | | 24,644 | |
Trustees’ Retirement Plan payable (Note 2) | | | 5,144 | | | | 9,422 | | | | 5,070 | | | | 5,417 | |
Trustees’ fees payable | | | 449 | | | | — | | | | — | | | | 1,584 | |
Transfer agent fees payable | | | 1,251 | | | | 1,013 | | | | 1,478 | | | | 1,643 | |
Accrued expenses | | | 30,723 | | | | 45,787 | | | | 34,095 | | | | 50,209 | |
|
|
Total Liabilities | | | 278,850 | | | | 359,365 | | | | 6,693,309 | | | | 56,014,290 | |
|
|
Total Net Assets | | $ | 53,307,583 | | | $ | 75,866,351 | | | $ | 74,142,540 | | | $ | 131,013,395 | |
|
|
| NET ASSETS: | | | | | | | | | | | | | | | | |
Par value (Note 4) | | $ | 43 | | | $ | 87 | | | $ | 78 | | | $ | 115 | |
Paid-in capital in excess of par value | | | 55,788,391 | | | | 97,383,210 | | | | 71,861,358 | | | | 132,928,946 | |
Undistributed net investment income | | | 65,509 | | | | 1,104,524 | | | | 368,174 | | | | 4,243,941 | |
Accumulated net realized loss on investments, futures contracts and foreign currency transactions | | | (10,334,214 | ) | | | (26,094,257 | ) | | | (7,328,089 | ) | | | (3,849,164 | ) |
Net unrealized appreciation (depreciation) on investments and futures contracts | | | 7,787,854 | | | | 3,472,787 | | | | 9,241,019 | | | | (2,310,443 | ) |
|
|
Total Net Assets | | $ | 53,307,583 | | | $ | 75,866,351 | | | $ | 74,142,540 | | | $ | 131,013,395 | |
|
|
Shares Outstanding | | | 4,317,033 | | | | 8,731,998 | | | | 7,832,395 | | | | 11,540,394 | |
|
|
Net Asset Value | | | $12.35 | | | | $8.69 | | | | $9.47 | | | | $11.35 | |
|
|
See Notes to Financial Statements.
Smith Barney Investment Series 2005 Annual Report 47
Statements of Operations (For the year ended October 31, 2005)
| | | | | | | | | | | | | | | |
| | | | |
| | | Smith Barney
Premier Selections
All Cap Growth
Portfolio | | Smith Barney
Dividend
Strategy
Portfolio | | | Smith Barney
Growth and
Income
Portfolio | | | SB
Government
Portfolio | |
| INVESTMENT INCOME: | | | | | | | | | | | | | | | |
Interest | | $ | 12,536 | | $ | 235,199 | | | $ | 64,706 | | | $ | 5,663,939 | |
Dividends | | | 594,548 | | | 2,077,667 | | | | 1,391,580 | | | | — | |
Income from securities lending | | | — | | | — | | | | 6,225 | | | | — | |
Less: Foreign taxes withheld | | | — | | | (5,721 | ) | | | (15,096 | ) | | | — | |
|
|
Total Investment Income | | | 607,084 | | | 2,307,145 | | | | 1,447,415 | | | | 5,663,939 | |
|
|
| EXPENSES: | | | | | | | | | | | | | | | |
Management fee (Note 2) | | | 430,664 | | | 512,506 | | | | 488,246 | | | | 719,276 | |
Legal fees | | | 29,405 | | | 53,637 | | | | 27,095 | | | | 48,099 | |
Custody fees | | | 19,618 | | | 50,103 | | | | 18,162 | | | | 25,057 | |
Shareholder reports | | | 22,801 | | | 26,309 | | | | 17,214 | | | | 16,847 | |
Audit and tax | | | 18,600 | | | 19,089 | | | | 17,201 | | | | 13,051 | |
Trustees’ fees | | | 10,434 | | | 4,366 | | | | 5,282 | | | | 11,533 | |
Transfer agent fees (Note 2) | | | 4,979 | | | 4,770 | | | | 5,232 | | | | 5,484 | |
Insurance | | | 355 | | | 1,063 | | | | 731 | | | | 3,600 | |
Registration fees | | | 43 | | | — | | | | — | | | | 39 | |
Miscellaneous expenses | | | 4,676 | | | 4,751 | | | | 8,930 | | | | 9,124 | |
|
|
Total Expenses | | | 541,575 | | | 676,594 | | | | 588,093 | | | | 852,110 | |
|
|
Net Investment Income | | | 65,509 | | | 1,630,551 | | | | 859,322 | | | | 4,811,829 | |
|
|
| REALIZED AND UNREALIZED GAIN (LOSS) ON INVESTMENTS, FUTURES CONTRACTS AND FOREIGN CURRENCY TRANSACTIONS (NOTES 1 AND 3): | | | | | | | | | | | | | | | |
Net Realized Gain (Loss) From: | | | | | | | | | | | | | | | |
Investments | | | 854,169 | | | 3,549,110 | | | | 1,946,100 | | | | (73,054 | ) |
Futures contracts | | | — | | | 134,370 | | | | — | | | | 224,887 | |
Foreign currency transactions | | | — | | | 1,552 | | | | — | | | | — | |
|
|
Net Realized Gain | | | 854,169 | | | 3,685,032 | | | | 1,946,100 | | | | 151,833 | |
|
|
Change in Net Unrealized Appreciation/Depreciation From: | | | | | | | | | | | | | | | |
Investments | | | 4,675,349 | | | (3,608,921 | ) | | | 1,704,609 | | | | (4,333,069 | ) |
Futures contracts | | | — | | | (17,325 | ) | | | — | | | | (25,655 | ) |
|
|
Change in Net Unrealized Appreciation/Depreciation | | | 4,675,349 | | | (3,626,246 | ) | | | 1,704,609 | | | | (4,358,724 | ) |
|
|
Net Gain (Loss) on Investments, Futures Contracts and Foreign Currency Transactions | | | 5,529,518 | | | 58,786 | | | | 3,650,709 | | | | (4,206,891 | ) |
|
|
Increase in Net Assets From Operations | | $ | 5,595,027 | | $ | 1,689,337 | | | $ | 4,510,031 | | | $ | 604,938 | |
|
|
See Notes to Financial Statements.
48 Smith Barney Investment Series 2005 Annual Report
Statements of Changes in net Assets (For the years ended October 31,)
| | | | | | | | | | | | | | | | |
| | |
| | | Smith Barney Premier Selections All Cap Growth Portfolio
| | | Smith Barney Dividend Strategy Portfolio
| |
| | | | |
| | | 2005 | | | 2004 | | | 2005 | | | 2004 | |
| OPERATIONS: | | | | | | | | | | | | | | | | |
Net investment income (loss) | | $ | 65,509 | | | $ | (121,872 | ) | | $ | 1,630,551 | | | $ | 286,063 | |
Net realized gain | | | 854,169 | | | | 488,527 | | | | 3,685,032 | | | | 800,792 | |
Change in net unrealized appreciation/depreciation | | | 4,675,349 | | | | (1,328,204 | ) | | | (3,626,246 | ) | | | 1,424,267 | |
|
|
Increase (Decrease) in Net Assets From Operations | | | 5,595,027 | | | | (961,549 | ) | | | 1,689,337 | | | | 2,511,122 | |
|
|
DISTRIBUTIONS TO SHAREHOLDERS
FROM (NOTE 1): | | | | | | | | | | | | | |
Net investment income | | | — | | | | — | | | | (750,395 | ) | | | (307,815 | ) |
|
|
Decrease in Net Assets From Distributions to Shareholders | | | — | | | | — | | | | (750,395 | ) | | | (307,815 | ) |
|
|
| FUND SHARE TRANSACTIONS (NOTE 4): | | | | | | | | | | | | | | | | |
Net proceeds from sale of shares | | | 2,175,320 | | | | 31,811,952 | | | | 7,025,850 | | | | 9,042,364 | |
Net asset value of shares issued for reinvestment of distributions | | | — | | | | — | | | | 750,395 | | | | 307,815 | |
Cost of shares repurchased | | | (13,543,097 | ) | | | (6,654,085 | ) | | | (10,684,795 | ) | | | (7,434,335 | ) |
|
|
Increase (Decrease) in Net Assets From Fund Share Transactions | | | (11,367,777 | ) | | | 25,157,867 | | | | (2,908,550 | ) | | | 1,915,844 | |
|
|
Increase (Decrease) in Net Assets | | | (5,772,750 | ) | | | 24,196,318 | | | | (1,969,608 | ) | | | 4,119,151 | |
NET ASSETS: | | | | | | | | | | | | | | | | |
Beginning of year | | | 59,080,333 | | | | 34,884,015 | | | | 77,835,959 | | | | 73,716,808 | |
|
|
End of year* | | $ | 53,307,583 | | | $ | 59,080,333 | | | $ | 75,866,351 | | | $ | 77,835,959 | |
|
|
* Includes undistributed net investment income of: | | | $65,509 | | | | — | | | | $1,104,524 | | | | $237,488 | |
|
|
See Notes to Financial Statements.
Smith Barney Investment Series 2005 Annual Report 49
Statements of Changes in Net Assets (continued) (For the years ended October 31,)
| | | | | | | | | | | | | | | | |
| | |
| | | Smith Barney Growth
and Income Portfolio
| | | SB Government Portfolio
| |
| | | | |
| | | 2005 | | | 2004 | | | 2005 | | | 2004 | |
| OPERATIONS: | | | | | | | | | | | | | | | | |
Net investment income | | $ | 859,322 | | | $ | 397,098 | | | $ | 4,811,829 | | | $ | 4,267,080 | |
Net realized gain (loss) | | | 1,946,100 | | | | 1,849,969 | | | | 151,833 | | | | (558,108 | ) |
Change in net unrealized appreciation/depreciation | | | 1,704,609 | | | | 1,768,256 | | | | (4,358,724 | ) | | | 1,020,171 | |
|
|
Increase in Net Assets From Operations | | | 4,510,031 | | | | 4,015,323 | | | | 604,938 | | | | 4,729,143 | |
|
|
DISTRIBUTIONS TO SHAREHOLDERS
FROM (NOTE 1): | | | | | | | | | | | | | |
Net investment income | | | (825,257 | ) | | | (305,096 | ) | | | (4,853,346 | ) | | | (3,949,420 | ) |
|
|
Decrease in Net Assets From Distributions to Shareholders | | | (825,257 | ) | | | (305,096 | ) | | | (4,853,346 | ) | | | (3,949,420 | ) |
|
|
| FUND SHARE TRANSACTIONS (NOTE 4): | | | | | | | | | | | | | | | | |
Net proceeds from sale of shares | | | 7,667,798 | | | | 15,634,248 | | | | 16,268,536 | | | | 15,381,121 | |
Net asset value of shares issued for reinvestment of distributions | | | 825,257 | | | | 305,096 | | | | 4,853,346 | | | | 3,949,420 | |
Cost of shares repurchased | | | (8,199,481 | ) | | | (3,819,398 | ) | | | (12,823,407 | ) | | | (20,525,266 | ) |
|
|
Increase (Decrease) in Net Assets From Fund Share Transactions | | | 293,574 | | | | 12,119,946 | | | | 8,298,475 | | | | (1,194,725 | ) |
|
|
Increase (Decrease) in Net Assets | | | 3,978,348 | | | | 15,830,173 | | | | 4,050,067 | | | | (415,002 | ) |
NET ASSETS: | | | | | | | | | | | | | | | | |
Beginning of year | | | 70,164,192 | | | | 54,334,019 | | | | 126,963,328 | | | | 127,378,330 | |
|
|
End of year* | | $ | 74,142,540 | | | $ | 70,164,192 | | | $ | 131,013,395 | | | $ | 126,963,328 | |
|
|
* Includes undistributed net investment income of: | | | $368,174 | | | | $334,109 | | | | $4,243,941 | | | | $3,945,584 | |
|
|
See Notes to Financial Statements.
50 Smith Barney Investment Series 2005 Annual Report
Financial Highlights
For a share of each class of beneficial interest outstanding throughout each year ended October 31:
| | | | | | | | | | | | | | | |
| | | | | |
Smith Barney
Premier Selections All Cap Growth Portfolio | | 2005 | | | 2004 | | | 2003 | | | 2002 | | | 2001 | |
Net Asset Value, Beginning of Year | | $11.23 | | | $11.45 | | | $8.96 | | | $10.73 | | | $14.48 | |
|
|
Income (Loss) From Operations: | | | | | | | | | | | | | | | |
Net investment income (loss) | | 0.02 | | | (0.02 | ) | | (0.01 | ) | | (0.03 | ) | | 0.02 | |
Net realized and unrealized gain (loss) | | 1.10 | | | (0.20 | ) | | 2.50 | | | (1.73 | ) | | (3.69 | ) |
|
|
Total Income (Loss) From Operations | | 1.12 | | | (0.22 | ) | | 2.49 | | | (1.76 | ) | | (3.67 | ) |
|
|
Less Distributions From: | | | | | | | | | | | | | | | |
Net investment income | | — | | | — | | | — | | | (0.01 | ) | | (0.04 | ) |
Net realized gains | | — | | | — | | | — | | | — | | | (0.04 | ) |
|
|
Total Distributions | | — | | | — | | | — | | | (0.01 | ) | | (0.08 | ) |
|
|
Net Asset Value, End of Year | | $12.35 | | | $11.23 | | | $11.45 | | | $ 8.96 | | | $10.73 | |
|
|
Total Return(1) | | 9.97 | % | | (1.92 | )% | | 27.79 | % | | (16.44 | )% | | (25.45 | )% |
|
|
Net Assets, End of Year (000s) | | $53,308 | | | $59,080 | | | $34,884 | | | $28,628 | | | $34,384 | |
|
|
Ratios to Average Net Assets: | | | | | | | | | | | | | | | |
Gross expenses | | 0.94 | % | | 0.95 | % | | 0.90 | % | | 1.11 | % | | 1.08 | % |
Net expenses(2) | | 0.94 | | | 0.94 | (3) | | 0.90 | | | 0.95 | (3) | | 0.95 | (3) |
Net investment income (loss) | | 0.11 | | | (0.25 | ) | | (0.08 | ) | | (0.25 | ) | | 0.16 | |
|
|
Portfolio Turnover Rate | | 43 | % | | 46 | % | | 66 | % | | 58 | % | | 116 | % |
|
|
| (1) | | Performance figures may reflect voluntary fee waivers and/or expense reimbursements. Past performance is no guarantee of future results. In the absence of voluntary fee waivers and/or expense reimbursements, the total return would be lower. Total returns do not reflect expenses associated with the separate account such as administrative fees, account charges and surrender charges which, if reflected, would reduce the total return for all periods shown. | |
| (2) | | As a result of a voluntary expense limitation, the ratio of expenses to average net assets of the Fund will not exceed 0.95%. |
| (3) | | The investment manager voluntarily waived a portion of its fees. |
See Notes to Financial Statements.
Smith Barney Investment Series 2005 Annual Report 51
Financial Highlights (continued)
For a share of each class of beneficial interest outstanding throughout each year ended October 31:
| | | | | | | | | | | | | | | | | | | | |
| | | | | |
Smith Barney Dividend Strategy Portfolio | | 2005 | | | 2004 | | | 2003 | | | 2002 | | | 2001 | |
Net Asset Value, Beginning of Year | | $ | 8.58 | | | $ | 8.33 | | | $ | 7.24 | | | $ | 8.96 | | | $ | 12.14 | |
|
|
Income (Loss) From Operations: | | | | | | | | | | | | | | | | | | | | |
Net investment income | | | 0.18 | | | | 0.03 | | | | 0.03 | | | | 0.02 | | | | 0.04 | |
Net realized and unrealized gain (loss) | | | 0.01 | | | | 0.25 | | | | 1.09 | | | | (1.72 | ) | | | (3.19 | ) |
|
|
Total Income (Loss) From Operations | | | 0.19 | | | | 0.28 | | | | 1.12 | | | | (1.70 | ) | | | (3.15 | ) |
|
|
Less Distributions From: | | | | | | | | | | | | | | | | | | | | |
Net investment income | | | (0.08 | ) | | | (0.03 | ) | | | (0.03 | ) | | | (0.02 | ) | | | (0.03 | ) |
|
|
Total Distributions | | | (0.08 | ) | | | (0.03 | ) | | | (0.03 | ) | | | (0.02 | ) | | | (0.03 | ) |
|
|
Net Asset Value, End of Year | | $ | 8.69 | | | $ | 8.58 | | | $ | 8.33 | | | $ | 7.24 | | | $ | 8.96 | |
|
|
Total Return(1) | | | 2.23 | % | | | 3.41 | % | | | 15.47 | % | | | (18.94 | )% | | | (26.03 | )% |
|
|
Net Assets, End of Year (000s) | | | $75,866 | | | | $77,836 | | | | $73,717 | | | | $61,139 | | | | $67,093 | |
|
|
Ratios to Average Net Assets: | | | | | | | | | | | | | | | | | | | | |
Gross expenses | | | 0.86 | % | | | 0.88 | % | | | 0.91 | % | | | 0.93 | % | | | 0.93 | % |
Net expenses(2) | | | 0.86 | | | | 0.88 | (3) | | | 0.91 | | | | 0.93 | | | | 0.93 | |
Net investment income | | | 2.07 | | | | 0.37 | | | | 0.47 | | | | 0.24 | | | | 0.42 | |
|
|
Portfolio Turnover Rate | | | 99 | % | | | 42 | % | | | 77 | % | | | 45 | % | | | 26 | % |
|
|
| (1) | | Performance figures may reflect voluntary fee waivers and/or expense reimbursements. Past performance is no guarantee of future results. In the absence of voluntary fee waivers and/or expense reimbursements, the total return would be lower. Total returns do not reflect expenses associated with the separate account such as administrative fees, account charges and surrender charges which, if reflected, would reduce the total return for all periods shown. |
| (2) | | As a result of a voluntary expense limitation, the ratio of expenses to average net assets of the Fund will not exceed 0.95%. |
| (3) | | The investment manager voluntarily waived a portion of its fees. |
See Notes to Financial Statements.
52 Smith Barney Investment Series 2005 Annual Report
Financial Highlights (continued)
For a share of each class of beneficial interest outstanding throughout each year ended October 31:
| | | | | | | | | | | | | | | | | | | | |
| | | | | |
Smith Barney
Growth and Income Portfolio | | 2005 | | | 2004 | | | 2003 | | | 2002 | | | 2001 | |
Net Asset Value, Beginning of Year | | $ | 9.00 | | | $ | 8.44 | | | $ | 6.95 | | | $ | 8.15 | | | $ | 10.77 | |
|
|
Income (Loss) From Operations: | | | | | | | | | | | | | | | | | | | | |
Net investment income | | | 0.11 | | | | 0.05 | | | | 0.05 | | | | 0.02 | | | | 0.05 | |
Net realized and unrealized gain (loss) | | | 0.46 | | | | 0.55 | | | | 1.48 | | | | (1.20 | ) | | | (2.58 | ) |
|
|
Total Income (Loss) From Operations | | | 0.57 | | | | 0.60 | | | | 1.53 | | | | (1.18 | ) | | | (2.53 | ) |
|
|
Less Distributions From: | | | | | | | | | | | | | | | | | | | | |
Net investment income | | | (0.10 | ) | | | (0.04 | ) | | | (0.04 | ) | | | (0.02 | ) | | | (0.05 | ) |
Net realized gains | | | — | | | | — | | | | — | | | | — | | | | (0.04 | ) |
|
|
Total Distributions | | | (0.10 | ) | | | (0.04 | ) | | | (0.04 | ) | | | (0.02 | ) | | | (0.09 | ) |
|
|
Net Asset Value, End of Year | | $ | 9.47 | | | $ | 9.00 | | | $ | 8.44 | | | $ | 6.95 | | | $ | 8.15 | |
|
|
Total Return(1) | | | 6.37 | % | | | 7.18 | % | | | 22.09 | % | | | (14.47 | )% | | | (23.63 | )% |
|
|
Net Assets, End of Year (000s) | | | $74,143 | | | | $70,164 | | | | $54,334 | | | | $36,730 | | | | $31,576 | |
|
|
Ratios to Average Net Assets: | | | | | | | | | | | | | | | | | | | | |
Gross expenses | | | 0.78 | % | | | 0.91 | % | | | 0.87 | % | | | 1.09 | % | | | 1.18 | % |
Net expenses(2) | | | 0.78 | | | | 0.91 | (3) | | | 0.87 | | | | 0.95 | (3) | | | 0.95 | (3) |
Net investment income | | | 1.14 | | | | 0.61 | | | | 0.68 | | | | 0.40 | | | | 0.53 | |
|
|
Portfolio Turnover Rate | | | 57 | % | | | 43 | % | | | 65 | % | | | 48 | % | | | 68 | % |
|
|
| (1) | | Performance figures may reflect voluntary fee waivers and/or expense reimbursements. Past performance is no guarantee of future results. In the absence of voluntary fee waivers and/or expense reimbursements, the total return would be lower. Total returns do not reflect expenses associated with the separate account such as administrative fees, account charges and surrender charges which, if reflected, would reduce the total return for all periods shown. |
| (2) | | As a result of a voluntary expense limitation, the ratio of expenses to average net assets of the Fund will not exceed 0.95%. |
| (3) | | The investment manager voluntarily waived a portion of its fees. |
See Notes to Financial Statements.
Smith Barney Investment Series 2005 Annual Report 53
Financial Highlights (continued)
For a share of each class of beneficial interest outstanding throughout each year ended October 31:
| | | | | | | | | | | | | | | | | | | | |
| | | | | |
| SB Government Portfolio | | 2005 | | | 2004 | | | 2003 | | | 2002(1) | | | 2001 | |
Net Asset Value, Beginning of Year | | | $11.75 | | | | $11.68 | | | | $11.74 | | | | $11.44 | | | | $10.62 | |
|
|
Income (Loss) From Operations: | | | | | | | | | | | | | | | | | | | | |
Net investment income | | | 0.45 | | | | 0.41 | | | | 0.33 | | | | 0.35 | (2) | | | 0.52 | |
Net realized and unrealized gain (loss) | | | (0.40 | ) | | | 0.03 | | | | (0.23 | ) | | | 0.13 | (2) | | | 0.87 | |
|
|
Total Income From Operations | | | 0.05 | | | | 0.44 | | | | 0.10 | | | | 0.48 | | | | 1.39 | |
|
|
Less Distributions From: | | | | | | | | | | | | | | | | | | | | |
Net investment income | | | (0.45 | ) | | | (0.37 | ) | | | (0.16 | ) | | | (0.11 | ) | | | (0.57 | ) |
Net realized gains | | | — | | | | — | | | | — | | | | (0.07 | ) | | | — | |
|
|
Total Distributions | | | (0.45 | ) | | | (0.37 | ) | | | (0.16 | ) | | | (0.18 | ) | | | (0.57 | ) |
|
|
Net Asset Value, End of Year | | | $11.35 | | | | $11.75 | | | | $11.68 | | | | $11.74 | | | | $11.44 | |
|
|
Total Return(3) | | | 0.41 | % | | | 3.90 | % | | | 0.87 | % | | | 4.20 | % | | | 13.56 | % |
|
|
Net Assets, End of Year (000s) | | $ | 131,013 | | | $ | 126,963 | | | $ | 127,378 | | | $ | 84,104 | | | $ | 13,410 | |
|
|
Ratios to Average Net Assets: | | | | | | | | | | | | | | | | | | | | |
Gross expenses | | | 0.65 | % | | | 0.70 | % | | | 0.68 | % | | | 1.00 | % | | | 1.30 | % |
Net expenses(4) | | | 0.65 | | | | 0.70 | (5) | | | 0.68 | | | | 0.80 | (5) | | | 0.80 | (5) |
Net investment income | | | 3.68 | | | | 3.44 | | | | 2.91 | | | | 3.17 | (2) | | | 4.47 | |
|
|
Portfolio Turnover Rate | | | 96 | %(6) | | | 53 | %(6) | | | 83 | %(6) | | | 145 | % | | | 90 | % |
|
|
| (1) | | Per share amounts have been calculated using the average shares method. |
| (2) | | Effective November 1, 2001, the Fund adopted a change in the accounting method that requires the Fund to amortize premiums and accrete all discounts. Without the adoption of this change, for the year ended October 31, 2002, net investment income, net realized and unrealized gain and the ratio of net investment income to average net assets would have been $0.36, $0.12 and 3.32%, respectively. Per share information, ratios and supplemental data for the periods prior to November 1, 2001 have not been restated to reflect this change in presentation. |
| (3) | | Performance figures may reflect voluntary fee waivers and/or expense reimbursements. Past performance is no guarantee of future results. In the absence of voluntary fee waivers and/or expense reimbursements, the total return would be lower. Total returns do not reflect expenses associated with the separate account such as administrative fees, account charges and surrender charges which, if reflected, would reduce the total return for all periods shown. Total returns for periods of less than one year are not annualized. |
| (4) | | As a result of a voluntary expense limitation, the ratio of expenses to average net assets of the Fund will not exceed 0.80%. |
| (5) | | The investment manager voluntarily waived a portion of its fees. |
| (6) | | Excluding mortgage dollar roll transactions, If mortgage dollar roll transactions had been included, the portfolio turnover rate would have been 614%, 667% and 429% for the years ended October 31, 2005, 2004 and 2003, respectively. |
See Notes to Financial Statements.
54 Smith Barney Investment Series 2005 Annual Report
Notes to Financial Statements
| 1. | Organization and Significant Accounting Policies |
The Smith Barney Premier Selections All Cap Growth Portfolio, Smith Barney Dividend Strategy Portfolio, Smith Barney Growth and Income Portfolio and SB Government Portfolio (“Funds”) are separate diversified investment funds of Smith Barney Investment Series (“Trust”), a Massachusetts business trust. The Trust is registered under the Investment Company Act of 1940, as amended (“1940 Act”), as an open-end management investment company.
The following are significant accounting policies consistently followed by the Funds and are in conformity with U.S. generally accepted accounting principles (“GAAP”). Estimates and assumptions are required to be made regarding assets, liabilities and changes in net assets resulting from operations when financial statements are prepared. Changes in the economic environment, financial markets and any other parameters used in determining these estimates could cause actual results to differ.
(a) Investment Valuation. Equity securities for which market quotations are available are valued at the last sale price or official closing price on the primary market or exchange on which they trade. Debt securities are valued at the mean between the bid and asked prices provided by an independent pricing service that are based on transactions in debt obligations, quotations from bond dealers, market transactions in comparable securities and various relationships between securities. When prices are not readily available, or are determined not to reflect fair value, such as when the value of a security has been significantly affected by events after the close of the exchange or market on which the security is principally traded, but before the Funds calculates their net asset value, such Funds may value these investments at fair value as determined in accordance with the procedures approved by the Funds’ Board of Trustees. Short-term obligations with maturities of 60 days or less are valued at amortized cost, which approximates market value.
(b) Repurchase Agreements. When entering into repurchase agreements, it is the Funds’ policy that their custodian or a third party custodian takes possession of the underlying collateral securities, the market value of which at least equals the principal amount of the repurchase transaction, including accrued interest. To the extent that any repurchase transaction exceeds one business day, the value of the collateral is marked-to-market to ensure the adequacy of the collateral. If the seller defaults and the market value of the collateral declines or if bankruptcy proceedings are commenced with respect to the seller of the security, realization of the collateral by the Funds may be delayed or limited.
(c) Financial Futures Contracts. The Funds may enter into financial futures contracts to hedge a portion of the portfolio. Upon entering into a financial futures contract, the Funds are required to deposit cash or securities as initial margin. Additional securities are also segregated up to the current market value of the financial futures contracts. Subsequent payments, known as variation margin, are made or received by the Funds each day, depending on the daily fluctuation in the value of the underlying financial instruments. The Funds recognize an unrealized gain or loss equal to the daily variation margin. When the financial futures contracts are closed, a realized gain or loss is recognized equal to the difference between the proceeds from (or cost of) the closing transactions and the Funds’ basis in the contracts.
Smith Barney Investment Series 2005 Annual Report 55
Notes to Financial Statements (continued)
The risks associated with entering into financial futures contracts include the possibility that a change in the value of the contract may not correlate with the changes in the value of the underlying instruments. In addition, investing in financial futures contracts involves the risk that the Funds could lose more than the original margin deposit and subsequent payments required for a futures transaction. Risks may also arise upon entering into these contracts from the potential inability of the counterparties to meet the terms of their contracts.
(d) Lending of Portfolio Securities. The Funds have an agreement with their custodian whereby the custodian may lend securities owned by the Funds to brokers, dealers and other financial organizations. In exchange for lending securities under the terms of the agreement with their custodian, the Funds receive a lender’s fee. Fees earned by the Funds on securities lending are recorded as securities lending income. Loans of securities by the Funds are collateralized by cash, U.S. government securities or high quality money market instruments that are maintained at all times in an amount at least equal to the current market value of the loaned securities, plus a margin which varies depending on the type of securities loaned. The custodian establishes and maintains the collateral in a segregated account. The Funds have the right under the lending agreement to recover the securities from the borrower on demand.
The Funds maintain the risk of any loss on the securities on loan as well as the potential loss on investments purchased with cash collateral received from securities lending.
(e) Securities Traded on a To-Be-Announced Basis. SB Government Portfolio may trade securities on a to-be-announced (“TBA”) basis. In a TBA transaction, the Fund commits to purchasing or selling securities, which have not yet been issued by the issuer and for which specific information is not known, such as the face amount and maturity date and the underlying pool of investments in U.S. government agency mortgage pass-through transactions. Securities purchased on a TBA basis are not settled until they are delivered to the Fund, normally 15 to 45 days later. Beginning on the date the Fund enters into a TBA transaction, cash, U.S. government securities or other liquid high-grade debt obligations are segregated in an amount equal in value to the purchase price of the TBA security. These transactions are subject to market fluctuations and their current value is determined in the same manner as for other securities.
(f) Mortgage Dollar Rolls. SB Government Portfolio may enter into dollar rolls in which the Fund sells mortgage-backed securities for delivery in the current month and simultaneously contracts to repurchase substantially similar (same type, coupon and maturity) securities to settle on a specified future date. During the roll period, the Fund forgoes principal and interest paid on the securities. The Fund is compensated by a fee paid by the counterparty, often in the form of a drop in the repurchase price of the securities. Dollar rolls are accounted for as financing arrangements; the fee is accrued into interest income ratably over the term of the dollar roll and any gain or loss on the roll is deferred and realized upon disposition of the rolled security.
The risk of entering into a mortgage dollar roll is that the market value of the securities the Fund is obligated to repurchase under the agreement may decline below the repurchase price. In the event the buyer of securities under a mortgage dollar roll files for bankruptcy or becomes insolvent, the Fund’s use of proceeds of the dollar roll may be restricted
56 Smith Barney Investment Series 2005 Annual Report
Notes to Financial Statements (continued)
pending a determination by the other party, or its trustee or receiver, whether to enforce the Fund’s obligation to repurchase the securities.
(g) Stripped Securities. Certain Funds invest in “Stripped Securities,” a term used collectively for stripped fixed income securities. Stripped Securities can be principal only securities (“PO”), which are debt obligations that have been stripped of unmatured interest coupons or interest only securities (“IO”), which are unmatured interest coupons that have been stripped from debt obligations. Stripped Securities do not make periodic payments of interest prior to maturity. As is the case with all securities, the market value of Stripped Securities will fluctuate in response to changes in economic conditions, interest rates and the market’s perception of the securities. However, fluctuations in response to interest rates may be greater in Stripped Securities than for debt obligations of comparable maturities that pay interest currently. The amount of fluctuation increases with a longer period of maturity.
The yield to maturity on IO’s is sensitive to the rate of principal repayments (including prepayments) on the related underlying debt obligation and principal payments may have a material effect on yield to maturity. If the underlying debt obligation experiences greater than anticipated prepayments of principal, the Funds may not fully recoup its initial investment in IO’s.
(h) Security Transactions and Investment Income. Security transactions are accounted for on a trade date basis. Interest income, adjusted for amortization of premium and accretion of discount, is recorded on the accrual basis. Dividend income is recorded on the ex-dividend date. Foreign dividend income is recorded on the ex-dividend date or as soon as practical after the Funds determine the existence of a dividend declaration after exercising reasonable due diligence. The cost of investments sold is determined by use of the specific identification method.
(i) Foreign Currency Translation. Investment securities and other assets and liabilities denominated in foreign currencies are translated into U.S. dollar amounts based upon prevailing exchange rates on the date of valuation. Purchases and sales of investment securities and income and expense items denominated in foreign currencies are translated into U.S. dollar amounts based upon prevailing exchange rates on the respective dates of such transactions.
The Funds do not isolate that portion of the results of operations resulting from changes in foreign exchange rates on investments from the fluctuations arising from changes in market prices of securities held. Such fluctuations are included with the net realized and unrealized gain or loss on investments.
Net realized foreign exchange gains or losses arise from sales of foreign currencies, including gains and losses on forward foreign currency contracts, currency gains or losses realized between the trade and settlement dates on securities transactions and the difference between the amounts of dividends, interest and foreign withholding taxes recorded on the Funds’ books and the U.S. dollar equivalent of the amounts actually received or paid. Net unrealized foreign exchange gains and losses arise from changes in the fair values of assets and liabilities, other than investments in securities, at the date of valuation, resulting from changes in exchange rates.
Smith Barney Investment Series 2005 Annual Report 57
Notes to Financial Statements (continued)
Foreign security and currency transactions may involve certain considerations and risks not typically associated with those of U.S. dollar denominated transactions as a result of, among other factors, the possibility of lower levels of governmental supervision and regulation of foreign securities markets and the possibility of political or economic instability.
(j) Distributions to Shareholders. Distributions from net investment income and distributions of net realized gains, if any, are declared at least annually. Distributions to shareholders of the Funds are recorded on the ex-dividend date and are determined in accordance with income tax regulations, which may differ from GAAP.
(k) Federal and Other Taxes. It is the Funds’ policy to comply with the federal income and excise tax requirements of the Internal Revenue Code of 1986, as amended, applicable to regulated investment companies. Accordingly, the Funds intend to distribute substantially all of its taxable income and net realized gains on investments, if any, to shareholders each year. Therefore, no federal income tax provision is required in the Funds’ financial statements. Under the applicable foreign tax laws, a withholding tax may be imposed on interest, dividends and capital gains at various rates.
(l) Reclassification. GAAP requires that certain components of net assets be adjusted to reflect permanent differences between financial and tax reporting. These reclassifications have no effect on net assets or net asset values per share. There were no reclassifications during the current year for Smith Barney Premier Selections All Cap Growth Portfolio and Smith Barney Growth and Income Portfolio. Additionally, during the current year, the following reclassifications have been made:
| | | | | | | | | | | | |
| | | |
| Fund | | Undistributed Net
Investment Income | | | Realized Gains /
Accumulated Net
Realized Losses | | | Paid-in
Capital | |
Smith Barney Dividend Strategy Portfolio(a) | | $ | (13,120 | ) | | $ | 13,120 | | | | — | |
SB Government Portfolio(b) | | | — | | | | 20 | | | $ | (20 | ) |
SB Government Portfolio (c) | | | 339,874 | | | | (339,874 | ) | | | — | |
|
|
| (a) | | Reclassifications are primarily due to foreign currency transactions treated as ordinary income for tax purposes and book/tax differences in the treatment of distributions from real estate investment trusts. |
| (b) | | Reclassifications are primarily due to rounding. |
| (c) | | Reclassifications are primarily due to differences between book and tax amortization of premium on fixed income securities and income from mortgage backed securities treated as capital gains for tax purposes. |
| 2. | Management Agreement and Other Transactions with Affiliates |
Smith Barney Fund Management LLC (“SBFM”), an indirect wholly-owned subsidiary of Citigroup Inc. (“Citigroup”), acts as investment manager to the Funds. Smith Barney Premier Selections All Cap Growth Portfolio, Smith Barney Dividend Strategy Portfolio, Smith Barney Growth and Income Portfolios and SB Government Portfolio each paid SBFM a management fee which are calculated daily and payable monthly, are calculated in accordance with the following breakpoint schedules:
| | | |
| |
| Smith Barney Dividend Strategy and Smith Barney Growth and Income Portfolios | | Fee | |
Average Daily Net Assets | | | |
First $1 billion | | 0.65 | % |
Next $1 billion | | 0.60 | |
Next $1 billion | | 0.55 | |
Next $1 billion | | 0.50 | |
Over $4 billion | | 0.45 | |
|
|
58 Smith Barney Investment Series 2005 Annual Report
Notes to Financial Statements (continued)
| | | |
| |
| SB Government Portfolio | | Fee | |
Average Daily Net Assets | | | |
First $2 billion | | 0.55 | % |
Next $2 billion | | 0.50 | |
Next $2 billion | | 0.45 | |
Next $2 billion | | 0.40 | |
Over $8 billion | | 0.35 | |
|
|
Prior to October 1, 2005, the management fee for Smith Barney Premier Selections All Cap Growth Portfolio was calculated at an annual rate of .75% of average daily net assets of the Fund.
Effective October 1, 2005, the Smith Barney Premier Selections All Cap Growth Portfolio applied the following breakpoints to the management fee:
| | | |
| |
| Smith Barney Premier Selections All Cap Growth Portfolios | | Fee | |
Average Daily Net Assets | | | |
First $1 billion | | 0.750 | % |
Next $1 billion | | 0.725 | |
Next $3 billion | | 0.700 | |
Next $5 billion | | 0.675 | |
Over $10 billion | | 0.650 | |
|
|
During the year ended October 31, 2005, Smith Barney Premier Selections All Cap Growth Portfolio, Smith Barney Dividend Strategy Portfolio and Smith Barney Growth and Income Portfolio, had voluntary expense limitations in place of 0.95%, respectively. SB Government Portfolio had a voluntary expense limitation in place of 0.80%. These expense limitations can be terminated at any time by SBFM.
Citicorp Trust Bank, fsb. (“CTB”), another subsidiary of Citigroup, acts as the Funds’ transfer agent. PFPC Inc. (“PFPC”) acts as the Funds’ sub-transfer agent. CTB receives account fees and asset-based fees that vary according to the size and type of account. PFPC is responsible for shareholder recordkeeping and financial processing for all shareholder accounts and is paid by CTB. For the year ended October 31, 2005, each Fund paid transfer agent fees of $4,167 to CTB.
Citigroup Global Markets Inc. (“CGM”), another indirect wholly-owned subsidiary of Citigroup, acts as the Funds’ distributor.
For the year ended October 31, 2005, CGM and its affiliates received in brokerage commissions of $8,796, $325 and $60,593 for the Smith Barney Premier Selections All Cap Growth Portfolio, Smith Barney Growth and Income Portfolio and Smith Barney Dividend Strategy Portfolio, respectively for the Funds’ agency transactions.
Certain officers and one Trustee of the Trust are employees of Citigroup or its affiliates and do not receive compensation from the Trust.
The Trustees of the Funds have adopted a Retirement Plan (“Plan”) for all Trustees who are not “interested persons” of the Funds, within the meaning of the 1940 Act. Under the Plan, all Trustees are required to retire from the Board as of the last day of the calendar year in which the applicable Trustee attains age 75. Trustees may retire under the Plan before attaining the mandatory retirement age. Trustees who have served as Trustee of the
Smith Barney Investment Series 2005 Annual Report 59
Notes to Financial Statements (continued)
Trust or any of the investment companies associated with the manager for at least ten years when they retire are eligible to receive the maximum retirement benefit under the Plan. The maximum retirement benefit is an amount equal to five times the amount of retainer and regular meeting fees payable to a Trustee during the entirety of the calendar year of the Trustee’s retirement (assuming no change in relevant facts for the balance of the year following the Trustee’s retirement). Amounts under the Plan may be paid in installments or in a lump sum (discounted to present value). Benefits under the Plan are unfunded. Three former Trustees are currently receiving payments under the Plan. In addition, two other former Trustees elected to receive a lump sum payment under the Plan.
Certain of the Trustees are also covered by a prior retirement plan. Under the prior plan, retirement benefits are payable for a ten-year period following retirement, with the annual payment to be based upon the Trustee’s compensation from the Trust during calendar year 2000. Trustees with more than five but less than ten years of service at retirement will receive a prorated benefit. In order to receive benefits under the current Plan, a Trustee must waive all rights under the prior plan prior to receiving payment under either plan.
At October 31, 2005, the Smith Barney Premier Selections All Cap Growth Portfolio, Smith Barney Dividend Strategy Portfolio, Smith Barney Growth and Income Portfolio, and SB Government Portfolio have accrued $5,144, $9,422, $5,070, and $5,417, respectively, in connection with these plans.
During the year ended October 31, 2005, the aggregate cost of purchases and proceeds from sales of investments (excluding short-term investments) were as follows:
| | | | | | |
| | |
| | | Purchases | | Sales |
Smith Barney Premier Selections All Cap Growth Portfolio | | $ | 24,170,794 | | $ | 32,781,882 |
Smith Barney Dividend Strategy Portfolio | | | 69,956,845 | | | 70,736,177 |
Smith Barney Growth and Income Portfolio | | | 43,797,002 | | | 41,251,248 |
SB Government Portfolio | | | 130,781,446 | | | 118,723,777 |
|
At October 31, 2005, the aggregate gross unrealized appreciation and depreciation of investments for federal income tax purposes were as follows:
| | | | | | | | | | | |
| | | |
| Fund | | Gross
unrealized
appreciation | | Gross
unrealized
depreciation | | | Net
unrealized
appreciation/ depreciation | |
Smith Barney Premier Selections All Cap Growth Portfolio | | $ | 9,690,055 | | $ | (2,229,961 | ) | | $ | 7,460,094 | |
Smith Barney Dividend Strategy Portfolio | | | 5,333,747 | | | (2,309,303 | ) | | | 3,024,444 | |
Smith Barney Growth and Income Portfolio | | | 10,482,509 | | | (1,755,250 | ) | | | 8,727,259 | |
SB Government Portfolio | | | 257,645 | | | (2,722,290 | ) | | | (2,464,645 | ) |
|
|
At October 31, 2005, SB Government Portfolio had the following open futures contracts:
| | | | | | | | | | | | | | |
| | | | | |
| Contracts to Buy: | | Number of
Contracts | | Expiration
Date | | Basis
Value | | Market
Value | | Unrealized
Gain (Loss) | |
U.S. Treasury 10 Years Notes | | 76 | | 12/05 | | $ | 8,447,182 | | $ | 8,242,438 | | $ | (204,744 | ) |
U.S. Treasury Bonds | | 20 | | 12/05 | | | 2,296,322 | | | 2,239,375 | | | (56,947 | ) |
|
|
| | | | | | | | | | | | | | (261,691 | ) |
|
|
60 Smith Barney Investment Series 2005 Annual Report
Notes to Financial Statements (continued)
| | | | | | | | | | | |
| | | | | |
| Contracts to Sell: | | Number of
Contracts | | Expiration
Date | | Basis
Value | | Market
Value | | Unrealized
Gain (Loss) |
U.S. Treasury 5 Years Notes | | 109 | | 12/05 | | 11,726,068 | | 11,542,078 | | $ | 183,990 |
U.S. Treasury 2 Years Notes | | 83 | | 12/05 | | 17,189,778 | | 17,031,860 | | | 157,918 |
|
| | | | | | | | | | | | 341,908 |
|
Net Unrealized Gain on Open Futures Contracts | | | | | | $ | 80,217 |
|
At October 31, 2005, Smith Barney Growth and Income Portfolio loaned securities having a market value of $5,700,669. The Fund received cash collateral amounting to $5,831,978 which was invested into the State Street Navigator Securities Lending Trust Prime Portfolio, a Rule 2a-7 money market fund, registered under the 1940 Act.
At October 31, 2005, SB Government Portfolio had outstanding mortgage dollar rolls with a total cost of $56,267,352.
During the year ended October 31, 2005, SB Government Portfolio entered into mortgage dollar roll transactions in the aggregate amount of $643,335,328.
For the year ended October 31, 2005, SB Government Portfolio recorded interest income of $1,231,940 related to such mortgage dollar rolls.
| 4. | Shares of Beneficial Interest |
At October 31, 2005, the Trust had an unlimited number of shares of beneficial interest authorized with a par value of $0.00001 per share.
Transactions in shares of the Fund were as follows:
| | | | | | |
| | |
| Smith Barney Premier Selections All Cap Growth Portfolio | | Year Ended
October 31, 2005 | | | Year Ended
October 31, 2004 | |
Shares sold | | 182,244 | | | 2,799,961 | |
Shares repurchased | | (1,127,132 | ) | | (583,442 | ) |
|
|
Net Increase (Decrease) | | (944,888 | ) | | 2,216,519 | |
|
|
| | |
| Smith Barney Dividend Strategy Portfolio | | | | | | |
Shares sold | | 801,488 | | | 1,048,052 | |
Shares issued on reinvestment | | 84,314 | | | 35,544 | |
Shares repurchased | | (1,221,275 | ) | | (863,838 | ) |
|
|
Net Increase (Decrease) | | (335,473 | ) | | 219,758 | |
|
|
| | |
| Smith Barney Growth and Income Portfolio | | | | | | |
Shares sold | | 817,377 | | | 1,757,533 | |
Shares issued on reinvestment | | 86,414 | | | 34,319 | |
Shares repurchased | | (869,834 | ) | | (431,387 | ) |
|
|
Net Increase | | 33,957 | | | 1,360,465 | |
|
|
| | |
| SB Government Portfolio | | | | | | |
Shares sold | | 1,421,226 | | | 1,331,786 | |
Shares issued on reinvestment | | 429,880 | | | 345,833 | |
Shares repurchased | | (1,119,908 | ) | | (1,774,164 | ) |
|
|
Net Increase (Decrease) | | 731,198 | | | (96,545 | ) |
|
|
Smith Barney Investment Series 2005 Annual Report 61
Notes to Financial Statements (continued)
| 5. | Income Tax Information and Distributions to Shareholders |
During the fiscal years ended October 31, 2005 and October 31, 2004, Smith Barney Premier Selections All Cap Growth Portfolio did not make any distribution.
The tax character of distributions paid during the fiscal years ended October 31, 2005, was as follows:
| | | | | | | | | |
| | | |
| | | Smith Barney
Dividend
Strategy Portfolio | | Smith Barney
Growth and
Income Portfolio | | SB Government
Portfolio |
Distributions paid from: | | | | | | | | | |
Ordinary Income | | $ | 750,395 | | $ | 825,257 | | $ | 4,853,346 |
|
Total Distributions Paid | | $ | 750,395 | | $ | 825,257 | | $ | 4,853,346 |
|
The tax character of distributions paid during the fiscal year ended October 31, 2004 were as follows:
| | | | | | | | | |
| | | |
| | | Smith Barney
Dividend
Strategy Portfolio | | Smith Barney
Growth and
Income Portfolio | | SB Government
Portfolio |
Distributions paid from: | | | | | | | | | |
Ordinary Income | | $ | 307,815 | | $ | 305,096 | | $ | 3,949,420 |
|
Total Distributions Paid | | $ | 307,815 | | $ | 305,096 | | $ | 3,949,420 |
|
As of October 31, 2005, the components of accumulated earnings on a tax basis were as follows:
| | | | | | | | | | | | | | | | |
| | | | |
| | | Smith
Barney
Premier
Selections
All Cap
Growth
Portfolio | | | Smith
Barney
Dividend
Strategy
Portfolio | | | Smith
Barney
Growth and
Income
Portfolio | | | SB Government
Portfolio | |
Undistributed ordinary income — net | | $ | 65,509 | | | $ | 1,104,524 | | | $ | 368,174 | | | $ | 4,243,941 | |
|
|
Total undistributed earnings | | $ | 65,509 | | | $ | 1,104,524 | | | $ | 368,174 | | | $ | 4,243,941 | |
|
|
Capital loss carryforward (*) | | | (10,006,454 | ) | | | (25,645,914 | ) | | | (6,814,329 | ) | | | (3,571,137 | ) |
Other book/tax temporary differences | | | — | | | | — | | | | — | | | | (204,042 | )(c) |
Unrealized appreciation/(depreciation) | | | 7,460,094 | (a) | | | 3,024,444 | (b) | | | 8,727,259 | (a) | | | (2,384,428 | )(d) |
|
|
Total accumulated earnings / (losses) — net | | $ | (2,480,851 | ) | | $ | (21,516,946 | ) | | $ | 2,281,104 | | | $ | (1,915,666 | ) |
|
|
| (*) | | During the taxable year ended October 31, 2005, Smith Barney Premier Selections All Cap Growth Portfolio utilized $775,520, Smith Barney Dividend Strategy Portfolio utilized $2,954,957 and Smith Barney Growth and Income Portfolio utilized $1,905,365 of each of their respective capital loss carryovers available from prior years. As of October 31, 2005, the Funds had the following net capital loss carryforwards remaining: |
62 Smith Barney Investment Series 2005 Annual Report
Notes to Financial Statements (continued)
| | | | | | | | | | | | | | | | |
| | | | |
| Year of Expiration | | Smith Barney
Premier
Selections All Cap
Growth Portfolio | | | Smith Barney
Dividend
Strategy
Portfolio | | | Smith Barney
Growth and
Income
Portfolio | | | SB Government
Portfolio | |
10/31/2009 | | $ | (997,566 | ) | | $ | (3,340,004 | ) | | | — | | | | — | |
10/31/2010 | | | (6,363,962 | ) | | | (15,846,502 | ) | | $ | (3,058,834 | ) | | $ | (49,007 | ) |
10/31/2011 | | | (2,644,926 | ) | | | (6,459,408 | ) | | | (3,755,495 | ) | | | (2,378,580 | ) |
10/31/2012 | | | — | | | | — | | | | — | | | | (877,195 | ) |
10/31/2013 | | | — | | | | — | | | | — | | | | (266,355 | ) |
|
|
| | | $ | (10,006,454 | ) | | $ | (25,645,914 | ) | | $ | (6,814,329 | ) | | $ | (3,571,137 | ) |
|
|
These amounts will be available to offset any future taxable capital gains.
| (a) | | The difference between book-basis and tax-basis unrealized appreciation / (depreciation) is attributable primarily to the tax deferral of losses on wash sales. |
| (b) | | The difference between book-basis and tax-basis unrealized appreciation / (depreciation) is attributable primarily to the tax deferral of losses on wash sales and the difference between the book and tax cost basis of investments in real estate investment trusts. |
| (c) | | Other book/tax temporary differences are attributable primarily to the tax deferral of losses on straddles and the realization for tax purposes of unrealized gains on certain futures contracts. |
| (d) | | The difference between book-basis and tax-basis unrealized appreciation / (depreciation) is attributable primarily to the difference between book & tax amortization methods for premiums on fixed income securities. |
On May 31, 2005, the U.S. Securities and Exchange Commission (“SEC”) issued an order in connection with the settlement of an administrative proceeding against SBFM and CGM relating to the appointment of an affiliated transfer agent for the Smith Barney family of mutual funds (the “Funds”).
The SEC order finds that SBFM and CGM willfully violated Section 206(1) of the Investment Advisers Act of 1940 (“Advisers Act”). Specifically, the order finds that SBFM and CGM knowingly or recklessly failed to disclose to the boards of the Funds in 1999 when proposing a new transfer agent arrangement with an affiliated transfer agent that: First Data Investors Services Group (“First Data”), the Funds’ then-existing transfer agent, had offered to continue as transfer agent and do the same work for substantially less money than before; and that Citigroup Asset Management (“CAM”), the Citigroup business unit that, at the time, included the funds’ investment manager and other investment advisory companies, had entered into a side letter with First Data under which CAM agreed to recommend the appointment of First Data as sub-transfer agent to the affiliated transfer agent in exchange for, among other things, a guarantee by First Data of specified amounts of asset management and investment banking fees to CAM and CGM. The order also finds that SBFM and CGM willfully violated Section 206(2) of the Advisers Act by virtue of the omissions discussed above and other misrepresentations and omissions in the materials provided to the Funds’ boards, including the failure to make clear that the affiliated transfer agent would earn a high profit for performing limited functions while First Data continued to perform almost all of the transfer agent functions, and the suggestion that the proposed arrangement was in the Funds’ best interests and that no viable alternatives existed. SBFM and CGM do not admit or deny any wrongdoing or liability. The settlement does not establish wrongdoing or liability for purposes of any other proceeding.
The SEC censured SBFM and CGM and ordered them to cease and desist from violations of Sections 206(1) and 206(2) of the Advisers Act. The order requires Citigroup to
Smith Barney Investment Series 2005 Annual Report 63
Notes to Financial Statements (continued)
pay $208.1 million, including $109 million in disgorgement of profits, $19.1 million in interest, and a civil money penalty of $80 million. Approximately $24.4 million has already been paid to the Funds, primarily through fee waivers. The remaining $183.7 million, including the penalty, has been paid to the U.S. Treasury and will be distributed pursuant to a plan prepared and submitted for approval by the SEC. The order also requires that transfer agency fees received from the Funds since December 1, 2004 less certain expenses be placed in escrow and provides that a portion of such fees may be subsequently distributed in accordance with the terms of the order.
The order required SBFM to recommend a new transfer agent contract to the Fund boards within 180 days of the entry of the order; if a Citigroup affiliate submitted a proposal to serve as transfer agent or sub-transfer agent, SBFM and CGM would have been required, at their expense, to engage an independent monitor to oversee a competitive bidding process. On November 21, 2005, and within the specified timeframe, the Funds’ Board selected a new transfer agent for the Funds. No Citigroup affiliate submitted a proposal to serve as transfer agent. Under the order, SBFM also must comply with an amended version of a vendor policy that Citigroup instituted in August 2004.
At this time, there is no certainty as to how the proceeds of the settlement will be distributed, to whom such distributions will be made, the methodology by which such distributions will be allocated, and when such distributions will be made. Although there can be no assurance, SBFM does not believe that this matter will have a material adverse effect on the Funds.
On December 1, 2005, Citigroup completed the sale of substantially all of its global asset management business, including SBFM, to Legg Mason Inc.
Beginning in August 2005, five class action lawsuits alleging violations of federal securities laws and state law were filed against CGM and SBFM (collectively, the “Defendants”) based on the May 31, 2005 settlement order issued against the Defendants by the SEC. The complaints seek injunctive relief and compensatory and punitive damages, removal of SBFM as the advisor for the Smith Barney family of funds, rescission of the Funds’ management and other contracts with SBFM, recovery of all fees paid to SBFM pursuant to such contracts, and an award of attorneys’ fees and litigation expenses.
On October 5, 2005, a motion to consolidate the five actions and any subsequently-filed, related action was filed. That motion contemplates that a consolidated amended complaint alleging substantially similar causes of action will be filed in the future.
As of the date of this report, the Funds’ investment manager believes that resolution of the pending lawsuit will not have a material effect on the financial position or results of operations of the Funds or the ability of the Funds’ investment manager and its affiliates to continue to render services to the Funds under their respective contracts.
* * *
64 Smith Barney Investment Series 2005 Annual Report
Notes to Financial Statements (continued)
Beginning in June 2004, class action lawsuits alleging violations of the federal securities laws were filed against Citigroup Global Markets Inc. (the “Distributor’) and a number of its affiliates, including Smith Barney Fund Management LLC and Salomon Brothers Asset Management Inc (the “Advisers”), substantially all of the mutual funds managed by the Advisers, including the Fund (the “Funds”), and directors or trustees of the Funds (collectively, the “Defendants”). The complaints alleged, among other things, that the Distributor created various undisclosed incentives for its brokers to sell Smith Barney and Salomon Brothers funds. In addition, according to the complaints, the Advisers caused the Funds to pay excessive brokerage commissions to the Distributor for steering clients towards proprietary funds. The complaints also alleged that the defendants breached their fiduciary duty to the Funds by improperly charging Rule l2b-1 fees and by drawing on fund assets to make undisclosed payments of soft dollars and excessive brokerage commissions. The complaints also alleged that the Funds failed to adequately disclose certain of the allegedly wrongful conduct. The complaints sought injunctive relief and compensatory and punitive damages, rescission of the Funds’ contracts with the Advisers, recovery of all fees paid to the Advisers pursuant to such contracts and an award of attorneys’ fees and litigation expenses.
On December 15, 2004, a consolidated amended complaint (the “Complaint”) was filed alleging substantially similar causes of action. While the lawsuit is in its earliest stages, to the extent that the Complaint purports to state causes of action against the Funds, the Funds’ investment manager believes the Funds have significant defenses to such allegations, which the Funds intend to vigorously assert in responding to the Complaint.
Additional lawsuits arising out of theses circumstances and presenting similar allegations and requests for relief may be filed against the Defendants in the future.
As of the date of this report, the Funds’ investment manager and the Funds believe that the resolution of the pending lawsuit will not have a material effect on the financial position or results of operations of the Funds or the ability of the Advisers and their affiliates to continue to render services to the Funds under their respective contracts.
The Defendants have moved to dismiss the Complaint. Those motions are pending before the court.
The Funds have received information concerning SBFM as follows:
On September 16, 2005, the staff of the Securities and Exchange Commission (the “Commission”) informed SBFM that the staff is considering recommending that the Commission institute administrative proceedings against SBFM for alleged violations of Sections 19(a) and 34(b) of the Investment Company Act (and related Rule 19a-1). The notification is a result of an industry wide inspection undertaken by the Commission and is based upon alleged deficiencies in disclosures regarding dividends and distributions paid to shareholders of certain funds. In connection with the contemplated proceedings, the staff may seek a cease and desist order and/or monetary damages from SBFM.
Although there can be no assurance, SBFM believes that this matter is not likely to have a material adverse effect on the Funds or SBFM’s ability to perform investment advisory services relating to the Funds.
Smith Barney Investment Series 2005 Annual Report 65
Notes to Financial Statements (continued)
On December 1, 2005, Citigroup Inc. (“Citigroup”) completed the sale of substantially all of its asset management business, Citigroup Asset Management (“CAM”), to Legg Mason, Inc. (“Legg Mason”). As a result, the Funds’ investment manager (the “Manager”), previously an indirect wholly-owned subsidiary of Citigroup, has become a wholly-owned subsidiary of Legg Mason. Completion of the sale caused each Fund’s existing investment management contract to terminate. Each Fund’s shareholders previously approved a new investment management contract between each Fund, as applicable, and the Manager which became effective on December 1, 2005.
Legg Mason, whose principal executive offices are at 100 Light Street, Baltimore, Maryland 21202, is a financial services holding company. As of December 2, 2005, Legg Mason’s asset management operation had aggregate assets under management of approximately $830 billion.
Each Fund’s Board has appointed such Fund’s current distributor, Citigroup Global Markets Inc. (“CGM”), and Legg Mason Investor Services, LLC (“LMIS”), a wholly-owned broker-dealer subsidiary of Legg Mason, as co-distributors of such Fund. Each Fund’s Board has also approved amended and restated Rule 12b-1 Plans. CGM and other broker-dealers, financial intermediaries and financial institutions (each called a “Service Agent”) that currently offer Fund shares will continue to make Fund shares available to their clients. Additional Service Agents may offer Fund shares in the future.
Effective December 1, 2005, with respect to those Fund classes subject to a Rule 12b-1 Plan, each Fund pays service and distribution fees to each of LMIS and CGM for the services they provide and expenses they bear under the Distribution Agreements. The expenses intended to be covered by the distribution fees include those of each co-distributor. The co-distributors will provide the Funds’ Board with periodic reports of amounts expended under each Fund’s Rule 12b-1 Plans and the purposes for which such expenditures were made.
Effective December 1, 2005, CGM will no longer be an affiliated person of the Funds under the Investment Company Act of 1940, as amended. As a result, each Fund will be permitted to execute transactions with CGM or an affiliate of CGM as agent (but not as principal) without the restrictions applicable to transactions with affiliated persons. Similarly, each Fund generally will be permitted to purchase securities in underwritings in which CGM or an affiliate of CGM is a member without the restrictions imposed by certain rules of the Securities and Exchange Commission. The Manager’s use of CGM or affiliates of CGM as agent in portfolio transactions with a fund will be governed by such Fund’s policy of seeking the best overall terms available.
Certain officers and one Trustee of the Funds are employees of Legg Mason or its affiliates and do not receive compensation from the Funds.
Each Fund’s Board has approved PFPC Inc. (“PFPC”) to serve as transfer agent for such Fund. The principal business office of PFPC is located at P.O. Box 9699, Providence, RI 02940-9699.
66 Smith Barney Investment Series 2005 Annual Report
Report of Independent Registered Public Accounting Firm
The Shareholders and Board of Trustees
Smith Barney Investment Series:
We have audited the accompanying statements of assets and liabilities, including the schedules of investments, of Smith Barney Premier Selections All Cap Growth Portfolio, Smith Barney Dividend Strategy Portfolio (formerly known as Smith Barney Large Cap Core Portfolio), Smith Barney Growth and Income Portfolio and SB Government Portfolio, each a series of the Smith Barney Investment Series, as of October 31, 2005, and the related statements of operations for the year then ended, the statements of changes in net assets for each of the years in the two-year period then ended and the financial highlights for each of the years in the five-year period then ended. These financial statements and financial highlights are the responsibility of the Trust’s management. Our responsibility is to express an opinion on these financial statements and financial highlights based on our audits.
We conducted our audits in accordance with the standards of the Public Company Accounting Oversight Board (United States). Those standards require that we plan and perform the audit to obtain reasonable assurance about whether the financial statements and financial highlights are free of material misstatement. An audit includes examining, on a test basis, evidence supporting the amounts and disclosures in the financial statements. Our procedures included confirmation of securities owned as of October 31, 2005, by correspondence with the custodian and brokers or by other appropriate auditing procedures. An audit also includes assessing the accounting principles used and significant estimates made by management, as well as evaluating the overall financial statement presentation. We believe that our audits provide a reasonable basis for our opinion.
In our opinion, the financial statements and financial highlights referred to above present fairly, in all material respects, the financial position of Smith Barney Premier Selections All Cap Growth Portfolio, Smith Barney Dividend Strategy Portfolio, Smith Barney Growth and Income Portfolio and SB Government Portfolio as of October 31, 2005, and the results of their operations for the year then ended, the changes in their net assets for each of the years in the two-year period then ended and the financial highlights for each of the years in the five-year period then ended in conformity with U.S. generally accepted accounting principles.

New York, New York
December 16, 2005
Smith Barney Investment Series 2005 Annual Report 67
Board Approval of Management Agreement (unaudited)
Smith Barney Premier Selections All Cap Growth Portfolio
Background
The members of the Board of Smith Barney Premier Selections All Cap Growth Portfolio (the “Fund”), a series of Smith Barney Investment Series, including the Fund’s Board members that are not considered to be “interested persons” under the Investment Company Act of 1940, as amended (the “Independent Board Members”), received information from the Fund’s manager (the “Manager”) to assist them in their consideration of the Fund’s management agreement (the “Management Agreement”). The Board received and considered a variety of information about the Manager and the Fund’s distributors, as well as the advisory and distribution arrangements for the Fund and other funds overseen by the Board, certain portions of which are discussed below. The presentation made to the Board encompassed the Fund and all the funds for which the Board has responsibility. The discussion below covers both advisory and administrative functions being rendered by the Manager, each function encompassed by the Management Agreement.
Board Approval of Management Agreement
In approving the Management Agreement, the Fund’s Board, including the Independent Board Members, considered the factors below. In all of the Board’s considerations with respect to the approval of the Management Agreement, the Board was mindful of the proposed acquisition of the Manager by Legg Mason, Inc.
Nature, Extent and Quality of the Services under the Management Agreement
The Board received and considered information regarding the nature, extent and quality of services provided to the Fund by the Manager under the Management Agreement during the past year. The Board noted information received at regular meetings throughout the year related to the services rendered by the Manager in its management of the Fund’s affairs and the Manager’s role in coordinating the activities of the Fund’s other service providers. The Board’s evaluation of the services provided by the Manager took into account the Board’s knowledge and familiarity gained as Board members of funds in the Citigroup Asset Management (“CAM”) fund complex, including the scope and quality of the Manager’s investment management and other capabilities and the quality of its administrative and other services. The Board observed that the scope of services provided by the Manager had expanded over time as a result of regulatory and other developments, including maintaining and monitoring its own and the Fund’s expanded compliance programs. The Board also considered the Manager’s response to recent regulatory compliance issues affecting it and the CAM fund complex. The Board reviewed information received from the Manager regarding the Fund’s compliance policies and procedures established pursuant to Rule 38a-1 under the Investment Company Act of 1940, as amended.
The Board reviewed the qualifications, backgrounds and responsibilities of the Fund’s senior personnel and the portfolio management team primarily responsible for the day-to-day portfolio management of the Fund. The Board also considered the degree to which the Manager implemented organizational changes to improve investment results and the
68 Smith Barney Investment Series 2005 Annual Report
Board Approval of Management Agreement (unaudited) (continued)
services provided to the CAM fund complex. The Board also considered, based on its knowledge of the Manager and its affiliates, the financial resources available to CAM and its parent organization, Citigroup Inc.
The Board also considered the Manager’s brokerage policies and practices, the standards applied in seeking best execution, the Manager’s policies and practices regarding soft dollars, the use of a broker affiliated with the Manager and the existence of quality controls applicable to brokerage allocation procedures. In addition, management also reported to the Board on, among other things, its business plans, recent organizational changes and portfolio manager compensation plan.
The Board concluded that, overall, the nature, extent and quality of services provided (and expected to be provided) under the Management Agreement were acceptable.
Fund Performance
The Board received and considered performance information for the Fund as well as for a group of funds (the “Performance Universe”) selected by Lipper, Inc. (“Lipper”), an independent provider of investment company data. The Board was provided with a description of the methodology Lipper used to determine the similarity of the Fund with the funds included in the Performance Universe. The Board also noted that it had received and discussed with management information throughout the year at periodic intervals comparing the Fund’s performance against its benchmark(s).
The information comparing the Fund’s performance to that of its Performance Universe, consisting of all underlying variable insurance products (VIPs) classified as “multi-cap growth funds” by Lipper, showed, among other data, that the Fund’s performance for the 1- and 3- year periods ended March 31, 2005 was below the median while the performance for the 5- year period ended March 31, 2005 was better than the median. The Board noted management’s discussion of the Fund’s performance. Management noted that there has been a change in the portfolio management team, effective May 2005, which was implemented in an attempt to improve the Fund’s results over time. Any potential impact of such changes were, therefore, not reflected in the Lipper materials.
Based on their review, which included careful consideration of all of the factors noted above, the Board, mindful of the proposed transaction with Legg Mason, concluded that it will continue to evaluate the Fund’s performance and the actions taken by the Manager to improve performance.
Management Fees and Expense Ratios
The Board reviewed and considered the contractual management fee (the “Contractual Management Fee”) payable by the Fund to the Manager in light of the nature, extent and quality of the management services provided by the Manager. The Board also reviewed and considered that fee waiver and/or expense reimbursement arrangements are currently in place for the Fund and considered the actual fee rate (after taking waivers and reimbursements into account) (the “Actual Management Fee”) and that the Manager had agreed to continue its fee waivers and reimbursements until further notice.
Additionally, the Board received and considered information comparing the Fund’s Contractual Management Fees and Actual Management Fee and the Fund’s overall
Smith Barney Investment Series 2005 Annual Report 69
Board Approval of Management Agreement (unaudited) (continued)
expenses with those of funds in both the relevant expense group and a broader group of funds, each selected and provided by Lipper. The Board also reviewed information regarding fees charged by the Manager to other U.S. clients investing primarily in an asset class similar to that of the Fund including, where applicable, separate accounts. The Manager reviewed with the Board the significant differences in scope of services provided to the Fund and to these other clients, noting that the Fund is provided with administrative services, office facilities, Fund officers (including the Fund’s chief executive, chief financial and chief compliance officers), and that the Manager coordinates and oversees the provision of services to the Fund by other Fund providers. The Board considered the fee comparisons in light of the differences required to manage these different types of accounts. The Board received an analysis of complex-wide management fees provided by the Manager, which, among other things, set out a proposed framework of fees based on asset classes.
Management also discussed with the Board the Fund’s distribution arrangements. The Board was provided with information concerning revenues received by and certain expenses incurred by the Fund’s affiliated distributors and how the amounts received by the distributors are paid.
The information comparing the Fund’s Contractual and Actual Management Fees as well as its actual total expense ratio to its Expense Group, consisting of a group of underlying VIPs (including the Fund) classified as “multi-cap growth funds” and chosen by Lipper to be comparable to the Fund, showed that the Fund’s Contractual Management Fee and Actual Management Fee (which reflects a fee waiver) were below the median. The Board noted that the Fund’s actual total expense ratio was also below the median. The Board also took into account that the Manager had agreed to institute fee breakpoints effective October 1, 2005. The Board also noted that the Manager was continuing its voluntary waiver until further notice, resulting in the same net effective fee as currently in place, which is lower than the current contractual fee.
Taking all of the above into consideration, the Board determined that the Management Fee was reasonable in light of the nature, extent and quality of the services provided to the Fund under the Management Agreement.
Manager Profitability
The Board received and considered a profitability analysis of the Manager and its affiliates in providing services to the Fund. The Board also received profitability information with respect to the CAM fund complex as a whole. In addition, the Board received information with respect to the Manager’s allocation methodologies used in preparing this profitability data as well as a report from an outside consultant that had reviewed the Manager’s methodology. The Manager’s profitability was considered not excessive in light of the nature, extent and quality of the services provided to the Fund.
Economies of Scale
The Board received and discussed information concerning whether the Manager realizes economies of scale as the Fund’s assets grow. The Board noted that the Manager had agreed to institute breakpoints in the Fund’s Contractual Management Fee, reflecting the
70 Smith Barney Investment Series 2005 Annual Report
Board Approval of Management Agreement (unaudited) (continued)
potential for reducing the Contractual Management Fee as the Fund grows. The Board considered whether the breakpoint fee structure was a reasonable means of sharing any economies of scale or other efficiencies that might accrue from increases in the Fund’s assets levels. The Board noted that the Fund had not yet reached the specified asset level at which a breakpoint to its Contractual Management Fee would be triggered. The Board also noted that as the Fund’s assets increase over time, certain expenses, such as fees for Board members, auditors and legal fees, become a smaller percentage of overall assets. The Board determined that the management fee structure, including the proposed breakpoints, was reasonable.
Other Benefits to the Manager
The Board considered other benefits received by the Manager and its affiliates as a result of their relationship with the Fund, including the opportunity to offer additional products and services to Fund shareholders.
In light of the costs of providing investment management and other services to the Fund and the Manager’s ongoing commitment to the Fund, the profits and other ancillary benefits that the Manager and its affiliates received were considered reasonable.
In light of all of the foregoing, the Board approved the Management Agreement to continue for another year.
No single factor reviewed by the Board was identified by the Board as the principal factor in determining whether to approve the Management Agreement, and each Board Member attributed different weight to the various factors. The Independent Board Members were advised by separate independent legal counsel throughout the process. The Board also discussed the proposed continuance of the Management Agreement in private sessions with their independent legal counsel at which no representatives of the Manager were present.
Additional Information
Smith Barney Premier Selections All Cap Growth Portfolio
On June 23, 2005, Citigroup Inc. entered into a definitive agreement (the “Transaction Agreement”) with Legg Mason, Inc. under which Citigroup agreed to sell substantially all of its asset management business, Citigroup Asset Management (“CAM”), which includes the Adviser, to Legg Mason in exchange for the broker-dealer and investment banking businesses of Legg Mason and certain other considerations (the “Transaction”). The Transaction closed on December 1, 2005.
The consummation of the Transaction resulted in the automatic termination of the Fund’s current management agreement in accordance with the Investment Company Act of 1940, as amended (the “1940 Act”). Prior to the closing of the Transaction, the Fund’s Board approved a new management agreement between the Fund and the Adviser (the “New Management Agreement”) and authorized the Fund’s officers to submit the New Management Agreement to shareholders for their approval.
On July 11, 2005, members of the Board discussed with CAM management and certain Legg Mason representatives the Transaction and Legg Mason’s general plans and
Smith Barney Investment Series 2005 Annual Report 71
Board Approval of Management Agreement (unaudited) (continued)
intentions regarding the Fund, including the preservation, strengthening and growth of CAM’s business and its combination with Legg Mason’s business. The Board Members also inquired about the plans for and anticipated roles and responsibilities of certain CAM employees and officers after the Transaction.
At a meeting held on August 7, 2005, the Fund’s Board, including a majority of the Board Members who are not “interested persons” of the Fund or the Adviser as defined in the 1940 Act (the “Independent Board Members”), approved the New Management Agreement. To assist the Board in its consideration of the New Management Agreement, Legg Mason previously provided materials and information about Legg Mason, including its financial condition and asset management capabilities and organization, and CAM provided materials and information about the Transaction between Legg Mason and Citigroup. Representatives of CAM and Legg Mason also made presentations to and responded to questions from the Board, including at meetings held prior to the August 2005 meeting. The Independent Board Members, through their independent legal counsel, also requested and received additional information from CAM and Legg Mason in connection with their consideration of the New Management Agreement. The additional information was provided in advance of and at the August meeting. After the presentations and after reviewing the written materials provided, the Independent Board Members met in executive session with their counsel to consider the New Management Agreement. The Independent Board Members also conferred separately and with their counsel about the Transaction on a number of occasions, including in connection with the July and August meetings.
In their deliberations concerning the New Management Agreement, among other things, the Board Members considered:
(i) the automatic termination of the current management agreement upon completion of the Transaction and the need for continuity of services provided under the current management agreement;
(ii) the reputation, financial strength and resources of Legg Mason and its investment advisory subsidiaries;
(iii) that, following the Transaction, CAM will be part of an organization focused on the asset management business;
(iv) that Legg Mason is an experienced and respected asset management firm, and that Legg Mason has advised the Board Members that (a) it may wish to combine certain CAM operations with those of certain Legg Mason subsidiaries; (b) it is expected that these combination processes will result in changes to portfolio managers or portfolio management teams for a number of the CAM funds, subject to Board consent and appropriate notice to shareholders, and that, in other cases, the current portfolio managers or portfolio management teams will remain in place; and (c) in the future, it may recommend that Legg Mason subsidiaries be appointed as the adviser or subadviser to some or all of the CAM funds, subject to applicable regulatory requirements;
(v) that CAM management had advised the Board that a number of portfolio managers and other key CAM personnel would be retained after the closing of the Transaction;
72 Smith Barney Investment Series 2005 Annual Report
Board Approval of Management Agreement (unaudited) (continued)
(vi) that CAM management and Legg Mason have advised the Board that following the Transaction, there is not expected to be any diminution in the nature, quality and extent of services provided to the Fund and their shareholders by the Adviser, including compliance services;
(vii) that Legg Mason has advised the Board that it has no present intention to alter the expense waivers and reimbursements currently in effect and, while it reserves the right to do so in the future, it would consult with the Board before making any changes;
(viii) that under the Transaction Agreement, Citigroup and Legg Mason have agreed not to take any action that is not contemplated by the Transaction or fail to take any action that to their respective knowledge would cause any of the requirements of Section 15(f) of the 1940 Act not to be met;
(ix) the assurances from Citigroup and Legg Mason that, for a three year period following the closing of the Transaction, Citigroup-affiliated broker-dealers will continue to offer the Fund as an investment product, and the potential benefits to Fund shareholders from this and other third-party distribution access;
(x) the potential benefits to Fund shareholders from being part of a combined fund family with Legg Mason sponsored funds including possible economies of scale and access to investment opportunities;
(xi) that Citigroup and Legg Mason would derive benefits from the Transaction and that, as a result, they have a financial interest in the matters that were being considered;
(xii) the potential effects of regulatory restrictions on the Fund if Citigroup-affiliated broker-dealers remain principal underwriters of the Fund after the closing of the Transaction;
(xiii) the fact that the Fund’s total advisory and administrative fees will not increase by virtue of the New Management Agreement, but will remain the same;
(xiv) the terms and conditions of the New Management Agreement, including the differences from the current management agreement, and the benefits of a single, uniform form of agreement covering these services;
(xv) that the Fund would not bear the costs of obtaining shareholder approval of the New Management Agreement;
(xvi) that Citigroup and Legg Mason were negotiating a license arrangement that would permit the Fund to maintain its current name for some agreed upon time period after the closing of the Transaction; and
(xvii) that, as discussed in detail above, within the past year the Board had performed a full annual review of the current management agreement as required by the 1940 Act. In that regard, the Board’s deliberations concerning the New Management Agreement reflected its prior evaluation of relevant factors, including the nature, quality and extent of services provided, costs of services provided, profitability, fall-out benefits, fees and economies of scale and investment performance considered in connection with the renewal of the current management agreement and its determination that information provided by CAM and Legg Mason management prior to and at the August meeting supported the continued appropriateness of such conclusions with respect to the New Management Agreement.
Smith Barney Investment Series 2005 Annual Report 73
Board Approval of Management Agreement (unaudited) (continued)
No single factor reviewed by the Board was identified by the Board as the principal factor in determining whether to approve the New Management Agreement, and each Board Member attributed different weight to the various factors. The Independent Board Members were advised by separate independent legal counsel throughout the process. The Board also discussed the New Management Agreement in private sessions with their independent legal counsel at which no representatives of the Adviser were present. In light of all of the foregoing, the Board approved the New Management Agreement and authorized the Fund’s officers to submit the New Management Agreement to shareholders for their approval.
74 Smith Barney Investment Series 2005 Annual Report
Board Approval of Management Agreement (unaudited) (continued)
Smith Barney Dividend Strategy Portfolio
Background
The members of the Board of Smith Barney Dividend Strategy Portfolio (the “Fund”), a series of Smith Barney Investment Series, including the Fund’s Board members that are not considered to be “interested persons” under the Investment Company Act of 1940, as amended (the “Independent Board Members”), received information from the Fund’s manager (the “Manager”) to assist them in their consideration of the Fund’s management agreement (the “Management Agreement”). The Board received and considered a variety of information about the Manager and the Fund’s distributors, as well as the advisory and distribution arrangements for the Fund and other funds overseen by the Board, certain portions of which are discussed below. The presentation made to the Board encompassed the Fund and all the funds for which the Board has responsibility. The discussion below covers both advisory and administrative functions being rendered by the Manager, each function encompassed by the Management Agreement.
Board Approval of Management Agreement
In approving the Management Agreement, the Fund’s Board, including the Independent Board Members, considered the factors below. In all of the Board’s considerations with respect to the approval of the Management Agreement, the Board was mindful of the proposed acquisition of the Manager by Legg Mason, Inc.
Nature, Extent and Quality of the Services under the Management Agreement
The Board received and considered information regarding the nature, extent and quality of services provided to the Fund by the Manager under the Management Agreement during the past year. The Board noted information received at regular meetings throughout the year related to the services rendered by the Manager in its management of the Fund’s affairs and the Manager’s role in coordinating the activities of the Fund’s other service providers. The Board’s evaluation of the services provided by the Manager took into account the Board’s knowledge and familiarity gained as Board members of funds in the Citigroup Asset Management (“CAM”) fund complex, including the scope and quality of the Manager’s investment management and other capabilities and the quality of its administrative and other services. The Board observed that the scope of services provided by the Manager had expanded over time as a result of regulatory and other developments, including maintaining and monitoring its own and the Fund’s expanded compliance programs. The Board also considered the Manager’s response to recent regulatory compliance issues affecting it and the CAM fund complex. The Board reviewed information received from the Manager regarding the Fund’s compliance policies and procedures established pursuant to Rule 38a-1 under the Investment Company Act of 1940, as amended.
The Board reviewed the qualifications, backgrounds and responsibilities of the Fund’s senior personnel and the portfolio management team primarily responsible for the day-to-day portfolio management of the Fund. The Board also considered the degree to which the Manager implemented organizational changes to improve investment results and the
Smith Barney Investment Series 2005 Annual Report 75
Board Approval of Management Agreement (unaudited) (continued)
services provided to the CAM fund complex. The Board also considered, based on its knowledge of the Manager and its affiliates, the financial resources available to CAM and its parent organization, Citigroup Inc.
The Board also considered the Manager’s brokerage policies and practices, the standards applied in seeking best execution, the Manager’s policies and practices regarding soft dollars, the use of a broker affiliated with the Manager and the existence of quality controls applicable to brokerage allocation procedures. In addition, management also reported to the Board on, among other things, its business plans, recent organizational changes and portfolio manager compensation plan.
The Board concluded that, overall, the nature, extent and quality of services provided (and expected to be provided) under the Management Agreement were acceptable.
Fund Performance
The Board received and considered performance information for the Fund as well as for a group of funds (the “Performance Universe”) selected by Lipper, Inc. (“Lipper”), an independent provider of investment company data. The Board was provided with a description of the methodology Lipper used to determine the similarity of the Fund with the funds included in the Performance Universe. The Board also noted that it had received and discussed with management information throughout the year at periodic intervals comparing the Fund’s performance against its benchmark(s).
The information comparing the Fund’s performance to that of its Performance Universe, consisting of all underlying variable insurance products (VIPs) classified as “large-cap core funds” by Lipper, showed, among other data, that the Fund’s performance for the 1-, 3-, and 5-year periods ended March 31, 2005 was lower than the median. Management noted that there had been a change in the Fund’s investment strategy, as well as its portfolio management team, effective November 2004, which was implemented in an attempt to improve the Fund’s results over time. Any potential impact of such changes were, therefore, not fully reflected in the Lipper report.
Based on their review, which included careful consideration of all of the factors noted above, the Board, mindful of the proposed transaction with Legg Mason, concluded that it will continue to evaluate the Fund’s performance and the actions taken by management to improve performance.
Management Fees and Expense Ratios
The Board reviewed and considered the contractual management fee (the “Contractual Management Fee”) payable by the Fund to the Manager in light of the nature, extent and quality of the management services provided by the Manager. The Board also reviewed and considered that fee waiver and/or expense reimbursement arrangements are currently in place for the Fund and considered the actual fee rate (after taking waivers and reimbursements into account) (the “Actual Management Fee”) and that the Manager had agreed to continue its fee waivers and reimbursements until further notice.
Additionally, the Board received and considered information comparing the Fund’s Contractual Management Fees and Actual Management Fee and the Fund’s overall expenses with those of funds in both the relevant expense group and a broader group of
76 Smith Barney Investment Series 2005 Annual Report
Board Approval of Management Agreement (unaudited) (continued)
funds, each selected and provided by Lipper. The Board also reviewed information regarding fees charged by the Manager to other U.S. clients investing primarily in an asset class similar to that of the Fund including, where applicable, separate accounts. The Manager reviewed with the Board the significant differences in scope of services provided to the Fund and to these other clients, noting that the Fund is provided with administrative services, office facilities, Fund officers (including the Fund’s chief executive, chief financial and chief compliance officers), and that the Manager coordinates and oversees the provision of services to the Fund by other Fund providers. The Board considered the fee comparisons in light of the differences required to manage these different types of accounts. The Board received an analysis of complex-wide management fees provided by the Manager, which, among other things, set out a proposed framework of fees based on asset classes.
Management also discussed with the Board the Fund’s distribution arrangements. The Board was provided with information concerning revenues received by and certain expenses incurred by the Fund’s affiliated distributors and how the amounts received by the distributors are paid.
The information comparing the Fund’s Contractual and Actual Management Fees as well as its actual total expense ratio to its Expense Group, consisting of a group of underlying VIPs (including the Fund) classified as “large-cap core funds” and chosen by Lipper to be comparable to the Fund, showed that the Fund’s Contractual Management Fee was below the median and the Actual Management Fee (which reflects a fee waiver) was above the median. The Board noted that the Fund’s actual total expense ratio was higher than the median. The Board noted that commencing September 1, 2004, the Manager reduced its Contractual Management Fee and implemented breakpoints and that the full benefit of this adjustment was therefore not reflected in the Lipper Report. The Board also noted that the Manager was continuing its voluntary waiver until further notice.
Taking all of the above into consideration, the Board determined that the Management Fee was reasonable in light of the nature, extent and quality of the services provided to the Fund under the Management Agreement.
Manager Profitability
The Board received and considered a profitability analysis of the Manager and its affiliates in providing services to the Fund. The Board also received profitability information with respect to the CAM fund complex as a whole. In addition, the Board received information with respect to the Manager’s allocation methodologies used in preparing this profitability data as well as a report from an outside consultant that had reviewed the Manager’s methodology. The Manager’s profitability was considered not excessive in light of the nature, extent and quality of the services provided to the Fund.
Economies of Scale
The Board received and discussed information concerning whether the Manager realizes economies of scale as the Fund’s assets grow. The Board noted that commencing September 1, 2004, the Manager reduced its Contractual Management Fee and implemented breakpoints, reflecting the potential for reducing the Contractual Management Fee as the Fund grows. The Board considered whether the breakpoint fee structure
Smith Barney Investment Series 2005 Annual Report 77
Board Approval of Management Agreement (unaudited) (continued)
was a reasonable means of sharing any economies of scale or other efficiencies that might accrue from increases in the Fund’s assets levels. The Board noted that the Fund had not yet reached the specified asset level at which a breakpoint to its Contractual Management Fee would be triggered. The Board also noted that as the Fund’s assets have increased over time, certain expenses, such as fees for Board members, auditors and legal fees, become a smaller percentage of overall assets. The Board determined that the management fee structure was reasonable.
Other Benefits to the Manager
The Board considered other benefits received by the Manager and its affiliates as a result of their relationship with the Fund, including the opportunity to offer additional products and services to Fund shareholders.
In light of the costs of providing investment management and other services to the Fund and the Manager’s ongoing commitment to the Fund, the profits and other ancillary benefits that the Manager and its affiliates received were considered reasonable.
In light of all of the foregoing, the Board approved the Management Agreement to continue for another year.
No single factor reviewed by the Board was identified by the Board as the principal factor in determining whether to approve the Management Agreement, and each Board Member attributed different weight to the various factors. The Independent Board Members were advised by separate independent legal counsel throughout the process. The Board also discussed the proposed continuance of the Management Agreement in private sessions with their independent legal counsel at which no representatives of the Manager were present.
Additional Information
Smith Barney Dividend Strategy Portfolio
On June 23, 2005, Citigroup Inc. entered into a definitive agreement (the “Transaction Agreement”) with Legg Mason, Inc. under which Citigroup agreed to sell substantially all of its asset management business, Citigroup Asset Management (“CAM”), which includes the Adviser, to Legg Mason in exchange for the broker-dealer and investment banking businesses of Legg Mason and certain other considerations (the “Transaction”). The Transaction closed on December 1, 2005.
The consummation of the Transaction resulted in the automatic termination of the Fund’s current management agreement in accordance with the Investment Company Act of 1940, as amended (the “1940 Act”). Prior to the closing of the Transaction, the Fund’s Board approved a new management agreement between the Fund and the Adviser (the “New Management Agreement”) and authorized the Fund’s officers to submit the New Management Agreement to shareholders for their approval.
On July 11, 2005, members of the Board discussed with CAM management and certain Legg Mason representatives the Transaction and Legg Mason’s general plans and intentions regarding the Fund, including the preservation, strengthening and growth of CAM’s business and its combination with Legg Mason’s business. The Board Members
78 Smith Barney Investment Series 2005 Annual Report
Board Approval of Management Agreement (unaudited) (continued)
also inquired about the plans for and anticipated roles and responsibilities of certain CAM employees and officers after the Transaction.
At a meeting held on August 7, 2005, the Fund’s Board, including a majority of the Board Members who are not “interested persons” of the Fund or the Adviser as defined in the 1940 Act (the “Independent Board Members”), approved the New Management Agreement. To assist the Board in its consideration of the New Management Agreement, Legg Mason previously provided materials and information about Legg Mason, including its financial condition and asset management capabilities and organization, and CAM provided materials and information about the Transaction between Legg Mason and Citigroup. Representatives of CAM and Legg Mason also made presentations to and responded to questions from the Board, including at meetings held prior to the August 2005 meeting. The Independent Board Members, through their independent legal counsel, also requested and received additional information from CAM and Legg Mason in connection with their consideration of the New Management Agreement. The additional information was provided in advance of and at the August meeting. After the presentations and after reviewing the written materials provided, the Independent Board Members met in executive session with their counsel to consider the New Management Agreement. The Independent Board Members also conferred separately and with their counsel about the Transaction on a number of occasions, including in connection with the July and August meetings.
In their deliberations concerning the New Management Agreement, among other things, the Board Members considered:
(i) the automatic termination of the current management agreement upon completion of the Transaction and the need for continuity of services provided under the current management agreement;
(ii) the reputation, financial strength and resources of Legg Mason and its investment advisory subsidiaries;
(iii) that, following the Transaction, CAM will be part of an organization focused on the asset management business;
(iv) that Legg Mason is an experienced and respected asset management firm, and that Legg Mason has advised the Board Members that (a) it may wish to combine certain CAM operations with those of certain Legg Mason subsidiaries; (b) it is expected that these combination processes will result in changes to portfolio managers or portfolio management teams for a number of the CAM funds, subject to Board consent and appropriate notice to shareholders, and that, in other cases, the current portfolio managers or portfolio management teams will remain in place; and (c) in the future, it may recommend that Legg Mason subsidiaries be appointed as the adviser or subadviser to some or all of the CAM funds, subject to applicable regulatory requirements;
(v) that CAM management had advised the Board that a number of portfolio managers and other key CAM personnel would be retained after the closing of the Transaction;
(vi) that CAM management and Legg Mason have advised the Board that following the Transaction, there is not expected to be any diminution in the nature,
Smith Barney Investment Series 2005 Annual Report 79
Board Approval of Management Agreement (unaudited) (continued)
quality and extent of services provided to the Fund and their shareholders by the Adviser, including compliance services;
(vii) that Legg Mason has advised the Board that it has no present intention to alter the expense waivers and reimbursements currently in effect and, while it reserves the right to do so in the future, it would consult with the Board before making any changes;
(viii) that under the Transaction Agreement, Citigroup and Legg Mason have agreed not to take any action that is not contemplated by the Transaction or fail to take any action that to their respective knowledge would cause any of the requirements of Section 15(f) of the 1940 Act not to be met;
(ix) the assurances from Citigroup and Legg Mason that, for a three year period following the closing of the Transaction, Citigroup-affiliated broker-dealers will continue to offer the Fund as an investment product, and the potential benefits to Fund shareholders from this and other third-party distribution access;
(x) the potential benefits to Fund shareholders from being part of a combined fund family with Legg Mason sponsored funds including possible economies of scale and access to investment opportunities;
(xi) that Citigroup and Legg Mason would derive benefits from the Transaction and that, as a result, they have a financial interest in the matters that were being considered;
(xii) the potential effects of regulatory restrictions on the Fund if Citigroup-affiliated broker-dealers remain principal underwriters of the Fund after the closing of the Transaction;
(xiii) the fact that the Fund’s total advisory and administrative fees will not increase by virtue of the New Management Agreement, but will remain the same;
(xiv) the terms and conditions of the New Management Agreement, including the differences from the current management agreement, and the benefits of a single, uniform form of agreement covering these services;
(xv) that the Fund would not bear the costs of obtaining shareholder approval of the New Management Agreement;
(xvi) that Citigroup and Legg Mason were negotiating a license arrangement that would permit the Fund to maintain its current name for some agreed upon time period after the closing of the Transaction; and
(xvii) that, as discussed in detail above, within the past year the Board had performed a full annual review of the current management agreement as required by the 1940 Act. In that regard, the Board’s deliberations concerning the New Management Agreement reflected its prior evaluation of relevant factors, including the nature, quality and extent of services provided, costs of services provided, profitability, fall-out benefits, fees and economies of scale and investment performance considered in connection with the renewal of the current management agreement and its determination that information provided by CAM and Legg Mason management prior to and at the August meeting supported the continued appropriateness of such conclusions with respect to the New Management Agreement.
80 Smith Barney Investment Series 2005 Annual Report
Board Approval of Management Agreement (unaudited) (continued)
No single factor reviewed by the Board was identified by the Board as the principal factor in determining whether to approve the New Management Agreement, and each Board Member attributed different weight to the various factors. The Independent Board Members were advised by separate independent legal counsel throughout the process. The Board also discussed the New Management Agreement in private sessions with their independent legal counsel at which no representatives of the Adviser were present. In light of all of the foregoing, the Board approved the New Management Agreement and authorized the Fund’s officers to submit the New Management Agreement to shareholders for their approval.
Smith Barney Investment Series 2005 Annual Report 81
Board Approval of Management Agreement (unaudited) (continued)
Smith Barney Growth and Income Portfolio
Background
The members of the Board of Smith Barney Growth and Income Portfolio (the “Fund”), a series of Smith Barney Investment Series, including the Fund’s Board members that are not considered to be “interested persons” under the Investment Company Act of 1940, as amended (the “Independent Board Members”), received information from the Fund’s manager (the “Manager”) to assist them in their consideration of the Fund’s management agreement (the “Management Agreement”). The Board received and considered a variety of information about the Manager and the Fund’s distributors, as well as the advisory and distribution arrangements for the Fund and other funds overseen by the Board, certain portions of which are discussed below. The presentation made to the Board encompassed the Fund and all the funds for which the Board has responsibility. The discussion below covers both advisory and administrative functions being rendered by the Manager, each function encompassed by the Management Agreement.
Board Approval of Management Agreement
In approving the Management Agreement, the Fund’s Board, including the Independent Board Members, considered the factors below. In all of the Board’s considerations with respect to the approval of the Management Agreement, the Board was mindful of the proposed acquisition of the Manager by Legg Mason, Inc.
Nature, Extent and Quality of the Services under the Management Agreement
The Board received and considered information regarding the nature, extent and quality of services provided to the Fund by the Manager under the Management Agreement during the past year. The Board noted information received at regular meetings throughout the year related to the services rendered by the Manager in its management of the Fund’s affairs and the Manager’s role in coordinating the activities of the Fund’s other service providers. The Board’s evaluation of the services provided by the Manager took into account the Board’s knowledge and familiarity gained as Board members of funds in the Citigroup Asset Management (“CAM”) fund complex, including the scope and quality of the Manager’s investment management and other capabilities and the quality of its administrative and other services. The Board observed that the scope of services provided by the Manager had expanded over time as a result of regulatory and other developments, including maintaining and monitoring its own and the Fund’s expanded compliance programs. The Board also considered the Manager’s response to recent regulatory compliance issues affecting it and the CAM fund complex. The Board reviewed information received from the Manager regarding the Fund’s compliance policies and procedures established pursuant to Rule 38a-1 under the Investment Company Act of 1940, as amended.
The Board reviewed the qualifications, backgrounds and responsibilities of the Fund’s senior personnel and the portfolio management team primarily responsible for the day-to-day portfolio management of the Fund. The Board also considered the degree to which the Manager implemented organizational changes to improve investment results and the
82 Smith Barney Investment Series 2005 Annual Report
Board Approval of Management Agreement (unaudited) (continued)
services provided to the CAM fund complex. The Board also considered, based on its knowledge of the Manager and its affiliates, the financial resources available to CAM and its parent organization, Citigroup Inc.
The Board also considered the Manager’s brokerage policies and practices, the standards applied in seeking best execution, the Manager’s policies and practices regarding soft dollars, the use of a broker affiliated with the Manager and the existence of quality controls applicable to brokerage allocation procedures. In addition, management also reported to the Board on, among other things, its business plans, recent organizational changes and portfolio manager compensation plan.
The Board concluded that, overall, the nature, extent and quality of services provided (and expected to be provided) under the Management Agreement were acceptable.
Fund Performance
The Board received and considered performance information for the Fund as well as for a group of funds (the “Performance Universe”) selected by Lipper, Inc. (“Lipper”), an independent provider of investment company data. The Board was provided with a description of the methodology Lipper used to determine the similarity of the Fund with the funds included in the Performance Universe. The Board also noted that it had received and discussed with management information throughout the year at periodic intervals comparing the Fund’s performance against its benchmark(s).
The information comparing the Fund’s performance to that of its Performance Universe, consisting of underlying variable insurance products (VIPs) classified as “large-cap core funds” by Lipper, showed, among other data, that the Fund’s performance for the 1-year period ended March 31, 2005 was lower than the median while the performance for the 3- and 5- year periods ended March 31, 2005 was better than the median.
Based on their review, which included careful consideration of all of the factors noted above, the Board concluded that the Fund’s performance was satisfactory.
Management Fees and Expense Ratios
The Board reviewed and considered the contractual management fee (the “Contractual Management Fee”) payable by the Fund to the Manager in light of the nature, extent and quality of the management services provided by the Manager. The Board also reviewed and considered that fee waiver and/or expense reimbursement arrangements are currently in place for the Fund and considered the actual fee rate (after taking waivers and reimbursements into account) (the “Actual Management Fee”) and that the Manager had agreed to continue its fee waivers and reimbursements until further notice.
Additionally, the Board received and considered information comparing the Fund’s Contractual Management Fees and Actual Management Fee and the Fund’s overall expenses with those of funds in both the relevant expense group and a broader group of funds, each selected and provided by Lipper. The Board also reviewed information regarding fees charged by the Manager to other U.S. clients investing primarily in an asset class similar to that of the Fund including, where applicable, separate accounts. The Manager reviewed with the Board the significant differences in scope of services provided to the Fund and to these other clients, noting that the Fund is provided with administrative
Smith Barney Investment Series 2005 Annual Report 83
Board Approval of Management Agreement (unaudited) (continued)
services, office facilities, Fund officers (including the Fund’s chief executive, chief financial and chief compliance officers), and that the Manager coordinates and oversees the provision of services to the Fund by other Fund providers. The Board considered the fee comparisons in light of the differences required to manage these different types of accounts. The Board received an analysis of complex-wide management fees provided by the Manager, which, among other things, set out a proposed framework of fees based on asset classes.
Management also discussed with the Board the Fund’s distribution arrangements. The Board was provided with information concerning revenues received by and certain expenses incurred by the Fund’s affiliated distributors and how the amounts received by the distributors are paid.
The information comparing the Fund’s Contractual and Actual Management Fees as well as its actual total expense ratio to its Expense Group, consisting of a group of underlying VIPs (including the Fund) classified as “large-cap core funds” and chosen by Lipper to be comparable to the Fund, showed that the Fund’s Contractual Management Fee was below the median and the Actual Management Fee (which reflects a fee waiver) was above the median. The Board noted that the Fund’s actual total expense ratio was higher than the median. The Board also noted that commencing September 1, 2004, the Manager reduced its Contractual Management Fee and implemented breakpoints and that the full benefit of this adjustment was therefore not reflected in the Lipper Report. The Board noted that the Manager was continuing its voluntary waiver until further notice.
Taking all of the above into consideration, the Board determined that the Management Fee was reasonable in light of the nature, extent and quality of the services provided to the Fund under the Management Agreement.
Manager Profitability
The Board received and considered a profitability analysis of the Manager and its affiliates in providing services to the Fund. The Board also received profitability information with respect to the CAM fund complex as a whole. In addition, the Board received information with respect to the Manager’s allocation methodologies used in preparing this profitability data as well as a report from an outside consultant that had reviewed the Manager’s methodology. The Manager’s profitability was considered not excessive in light of the nature, extent and quality of the services provided to the Fund.
Economies of Scale
The Board received and discussed information concerning whether the Manager realizes economies of scale as the Fund’s assets grow. The Board noted that commencing September 1, 2004, the Manager reduced its Contractual Management Fee and implemented breakpoints, reflecting the potential for reducing the Contractual Management Fee as the Fund grows. The Board considered whether the breakpoint fee structure was a reasonable means of sharing any economies of scale or other efficiencies that might accrue from increases in the Fund’s assets levels. The Board noted that the Fund had not yet reached the specified asset level at which a breakpoint to its Contractual Management Fee would be triggered. The Board also noted that as the Fund’s assets have increased over time, certain expenses, such as
84 Smith Barney Investment Series 2005 Annual Report
Board Approval of Management Agreement (unaudited) (continued)
fees for Board members, auditors and legal fees, become a smaller percentage of overall assets. The Board determined that the management fee structure was reasonable.
Other Benefits to the Manager
The Board considered other benefits received by the Manager and its affiliates as a result of their relationship with the Fund, including the opportunity to offer additional products and services to Fund shareholders.
In light of the costs of providing investment management and other services to the Fund and the Manager’s ongoing commitment to the Fund, the profits and other ancillary benefits that the Manager and its affiliates received were considered reasonable.
In light of all of the foregoing, the Board approved the Management Agreement to continue for another year.
No single factor reviewed by the Board was identified by the Board as the principal factor in determining whether to approve the Management Agreement, and each Board Member attributed different weight to the various factors. The Independent Board Members were advised by separate independent legal counsel throughout the process. The Board also discussed the proposed continuance of the Management Agreement in private sessions with their independent legal counsel at which no representatives of the Manager were present.
Additional Information
Smith Barney Growth and Income Portfolio
On June 23, 2005, Citigroup Inc. entered into a definitive agreement (the “Transaction Agreement”) with Legg Mason, Inc. under which Citigroup agreed to sell substantially all of its asset management business, Citigroup Asset Management (“CAM”), which includes the Adviser, to Legg Mason in exchange for the broker-dealer and investment banking businesses of Legg Mason and certain other considerations (the “Transaction”). The Transaction closed on December 1, 2005.
The consummation of the Transaction resulted in the automatic termination of the Fund’s current management agreement in accordance with the Investment Company Act of 1940, as amended (the “1940 Act”). Prior to the closing of the Transaction, the Fund’s Board approved a new management agreement between the Fund and the Adviser (the “New Management Agreement”) and authorized the Fund’s officers to submit the New Management Agreement to shareholders for their approval.
On July 11, 2005, members of the Board discussed with CAM management and certain Legg Mason representatives the Transaction and Legg Mason’s general plans and intentions regarding the Fund, including the preservation, strengthening and growth of CAM’s business and its combination with Legg Mason’s business. The Board Members also inquired about the plans for and anticipated roles and responsibilities of certain CAM employees and officers after the Transaction.
At a meeting held on August 7, 2005, the Fund’s Board, including a majority of the Board Members who are not “interested persons” of the Fund or the Adviser as defined in the 1940 Act (the “Independent Board Members”), approved the New Management Agreement. To
Smith Barney Investment Series 2005 Annual Report 85
Board Approval of Management Agreement (unaudited) (continued)
assist the Board in its consideration of the New Management Agreement, Legg Mason previously provided materials and information about Legg Mason, including its financial condition and asset management capabilities and organization, and CAM provided materials and information about the Transaction between Legg Mason and Citigroup. Representatives of CAM and Legg Mason also made presentations to and responded to questions from the Board, including at meetings held prior to the August 2005 meeting. The Independent Board Members, through their independent legal counsel, also requested and received additional information from CAM and Legg Mason in connection with their consideration of the New Management Agreement. The additional information was provided in advance of and at the August meeting. After the presentations and after reviewing the written materials provided, the Independent Board Members met in executive session with their counsel to consider the New Management Agreement. The Independent Board Members also conferred separately and with their counsel about the Transaction on a number of occasions, including in connection with the July and August meetings.
In their deliberations concerning the New Management Agreement, among other things, the Board Members considered:
(i) the automatic termination of the current management agreement upon completion of the Transaction and the need for continuity of services provided under the current management agreement;
(ii) the reputation, financial strength and resources of Legg Mason and its investment advisory subsidiaries;
(iii) that, following the Transaction, CAM will be part of an organization focused on the asset management business;
(iv) that Legg Mason is an experienced and respected asset management firm, and that Legg Mason has advised the Board Members that (a) it may wish to combine certain CAM operations with those of certain Legg Mason subsidiaries; (b) it is expected that these combination processes will result in changes to portfolio managers or portfolio management teams for a number of the CAM funds, subject to Board consent and appropriate notice to shareholders, and that, in other cases, the current portfolio managers or portfolio management teams will remain in place; and (c) in the future, it may recommend that Legg Mason subsidiaries be appointed as the adviser or subadviser to some or all of the CAM funds, subject to applicable regulatory requirements;
(v) that CAM management had advised the Board that a number of portfolio managers and other key CAM personnel would be retained after the closing of the Transaction;
(vi) that CAM management and Legg Mason have advised the Board that following the Transaction, there is not expected to be any diminution in the nature, quality and extent of services provided to the Fund and their shareholders by the Adviser, including compliance services;
(vii) that Legg Mason has advised the Board that it has no present intention to alter the expense waivers and reimbursements currently in effect and, while it reserves the right to do so in the future, it would consult with the Board before making any changes;
86 Smith Barney Investment Series 2005 Annual Report
Board Approval of Management Agreement (unaudited) (continued)
(viii) that under the Transaction Agreement, Citigroup and Legg Mason have agreed not to take any action that is not contemplated by the Transaction or fail to take any action that to their respective knowledge would cause any of the requirements of Section 15(f) of the 1940 Act not to be met;
(ix) the assurances from Citigroup and Legg Mason that, for a three year period following the closing of the Transaction, Citigroup-affiliated broker-dealers will continue to offer the Fund as an investment product, and the potential benefits to Fund shareholders from this and other third-party distribution access;
(x) the potential benefits to Fund shareholders from being part of a combined fund family with Legg Mason sponsored funds including possible economies of scale and access to investment opportunities;
(xi) that Citigroup and Legg Mason would derive benefits from the Transaction and that, as a result, they have a financial interest in the matters that were being considered;
(xii) the potential effects of regulatory restrictions on the Fund if Citigroup-affiliated broker-dealers remain principal underwriters of the Fund after the closing of the Transaction;
(xiii) the fact that the Fund’s total advisory and administrative fees will not increase by virtue of the New Management Agreement, but will remain the same;
(xiv) the terms and conditions of the New Management Agreement, including the differences from the current management agreement, and the benefits of a single, uniform form of agreement covering these services;
(xv) that the Fund would not bear the costs of obtaining shareholder approval of the New Management Agreement;
(xvi) that Citigroup and Legg Mason were negotiating a license arrangement that would permit the Fund to maintain its current name for some agreed upon time period after the closing of the Transaction; and
(xvii) that, as discussed in detail above, within the past year the Board had performed a full annual review of the current management agreement as required by the 1940 Act. In that regard, the Board’s deliberations concerning the New Management Agreement reflected its prior evaluation of relevant factors, including the nature, quality and extent of services provided, costs of services provided, profitability, fall-out benefits, fees and economies of scale and investment performance considered in connection with the renewal of the current management agreement and its determination that information provided by CAM and Legg Mason management prior to and at the August meeting supported the continued appropriateness of such conclusions with respect to the New Management Agreement.
No single factor reviewed by the Board was identified by the Board as the principal factor in determining whether to approve the New Management Agreement, and each Board Member attributed different weight to the various factors. The Independent Board Members were advised by separate independent legal counsel throughout the process. The Board also discussed the New Management Agreement in private sessions with their independent legal counsel at which no representatives of the Adviser were present. In light of all of the foregoing, the Board approved the New Management Agreement and authorized the Fund’s officers to submit the New Management Agreement to shareholders for their approval.
Smith Barney Investment Series 2005 Annual Report 87
Board Approval of Management Agreement (unaudited) (continued)
SB Government Portfolio
Background
The members of the Board of SB Government Portfolio (the “Fund”), a series of Smith Barney Investment Series, including the Fund’s Board members that are not considered to be “interested persons” under the Investment Company Act of 1940, as amended (the “Independent Board Members”), received information from the Fund’s manager (the “Manager”) to assist them in their consideration of the Fund’s management agreement (the “Management Agreement”). The Board received and considered a variety of information about the Manager and the Fund’s distributors, as well as the advisory and distribution arrangements for the Fund and other funds overseen by the Board, certain portions of which are discussed below. The presentation made to the Board encompassed the Fund and all the funds for which the Board has responsibility. The discussion below covers both advisory and administrative functions being rendered by the Manager, each function encompassed by the Management Agreement.
Board Approval of Management Agreement
In approving the Management Agreement, the Fund’s Board, including the Independent Board Members, considered the factors below. In all of the Board’s considerations with respect to the approval of the Management Agreement, the Board was mindful of the proposed acquisition of the Manager by Legg Mason, Inc.
Nature, Extent and Quality of the Services under the Management Agreement
The Board received and considered information regarding the nature, extent and quality of services provided to the Fund by the Manager under the Management Agreement during the past year. The Board noted information received at regular meetings throughout the year related to the services rendered by the Manager in its management of the Fund’s affairs and the Manager’s role in coordinating the activities of the Fund’s other service providers. The Board’s evaluation of the services provided by the Manager took into account the Board’s knowledge and familiarity gained as Board members of funds in the Citigroup Asset Management (“CAM”) fund complex, including the scope and quality of the Manager’s investment management and other capabilities and the quality of its administrative and other services. The Board observed that the scope of services provided by the Manager had expanded over time as a result of regulatory and other developments, including maintaining and monitoring its own and the Fund’s expanded compliance programs. The Board also considered the Manager’s response to recent regulatory compliance issues affecting it and the CAM fund complex. The Board reviewed information received from the Manager regarding the Fund’s compliance policies and procedures established pursuant to Rule 38a-1 under the Investment Company Act of 1940, as amended.
The Board reviewed the qualifications, backgrounds and responsibilities of the Fund’s senior personnel and the portfolio management team primarily responsible for the day-to-day portfolio management of the Fund. The Board also considered the degree to which the Manager implemented organizational changes to improve investment results and the services provided to the CAM fund complex. The Board also considered, based on its
88 Smith Barney Investment Series 2005 Annual Report
Board Approval of Management Agreement (unaudited) (continued)
knowledge of the Manager and its affiliates, the financial resources available to CAM and its parent organization, Citigroup Inc.
The Board also considered the Manager’s brokerage policies and practices, the standards applied in seeking best execution, the use of a broker affiliated with the Manager and the existence of quality controls applicable to brokerage allocation procedures. In addition, management also reported to the Board on, among other things, its business plans, recent organizational changes and portfolio manager compensation plan.
The Board concluded that, overall, the nature, extent and quality of services provided (and expected to be provided) under the Management Agreement were acceptable.
Fund Performance
The Board received and considered performance information for the Fund as well as for a group of funds (the “Performance Universe”) selected by Lipper, Inc. (“Lipper”), an independent provider of investment company data. The Board was provided with a description of the methodology Lipper used to determine the similarity of the Fund with the funds included in the Performance Universe. The Board also noted that it had received and discussed with management information throughout the year at periodic intervals comparing the Fund’s performance against its benchmark(s).
The information comparing the Fund’s performance to that of its Performance Universe, consisting of all underlying variable insurance products (VIPs) classified as “U.S. government funds” by Lipper, showed, among other data, that the Fund’s performance for the 1-, 3-, and 5-year periods ended March 31, 2005 was lower than the median. The Board noted the explanations from the Manager concerning the underperformance versus the peer group, including the presence in the peer group of a number of funds with longer maturity portfolios.
Based on their review, which included careful consideration of all of the factors noted above, the Board, mindful of the proposed transaction with Legg Mason, will continue to evaluate the Fund’s performance and investment strategies and any actions taken by the Manager to improve performance.
Management Fees and Expense Ratios
The Board reviewed and considered the contractual management fee (the “Contractual Management Fee”) payable by the Fund to the Manager in light of the nature, extent and quality of the management services provided by the Manager. The Board also reviewed and considered that fee waiver and/or expense reimbursement arrangements are currently in place for the Fund and considered the actual fee rate (after taking waivers and reimbursements into account) (the “Actual Management Fee”) and that the Manager had agreed to continue its fee waivers and reimbursements until further notice.
Additionally, the Board received and considered information comparing the Fund’s Contractual Management Fees and Actual Management Fee and the Fund’s overall expenses with those of funds in both the relevant expense group and a broader group of funds, each selected and provided by Lipper. The Board also reviewed information regarding fees charged by the Manager to other U.S. clients investing primarily in an asset class similar to that of the Fund including, where applicable, separate accounts. The Manager reviewed with the Board the significant differences in scope of services provided to the Fund and to these other clients, noting that the Fund is provided with administrative services, office facilities, Fund officers
Smith Barney Investment Series 2005 Annual Report 89
Board Approval of Management Agreement (unaudited) (continued)
(including the Fund’s chief executive, chief financial and chief compliance officers), and that the Manager coordinates and oversees the provision of services to the Fund by other Fund providers. The Board considered the fee comparisons in light of the differences required to manage these different types of accounts. The Board received an analysis of complex-wide management fees provided by the Manager, which, among other things, set out a proposed framework of fees based on asset classes.
Management also discussed with the Board the Fund’s distribution arrangements. The Board was provided with information concerning revenues received by and certain expenses incurred by the Fund’s affiliated distributors and how the amounts received by the distributors are paid.
The information comparing the Fund’s Contractual and Actual Management Fees as well as its actual total expense ratio to its Expense Group, consisting of a group of underlying VIPs (including the Fund) classified as “U.S. government funds” and chosen by Lipper to be comparable to the Fund, showed that the Fund’s Contractual Management Fee and the Actual Management Fee were higher than the median. The Board noted that commencing September 1, 2004, the Manager reduced its Contractual Management Fee and implemented breakpoints and that the full benefit of this adjustment was therefore not reflected in the Lipper Report. The Board noted that the Fund’s actual total expense ratio was lower than the median. The Board also noted that the Manager was continuing its voluntary waiver until further notice.
Taking all of the above into consideration, the Board determined that the Management Fee was reasonable in light of the nature, extent and quality of the services provided to the Fund under the Management Agreement.
Manager Profitability
The Board received and considered a profitability analysis of the Manager and its affiliates in providing services to the Fund. The Board also received profitability information with respect to the CAM fund complex as a whole. In addition, the Board received information with respect to the Manager’s allocation methodologies used in preparing this profitability data as well as a report from an outside consultant that had reviewed the Manager’s methodology. The Manager’s profitability was considered not excessive in light of the nature, extent and quality of the services provided to the Fund.
Economies of Scale
The Board received and discussed information concerning whether the Manager realizes economies of scale as the Fund’s assets grow. The Board noted that commencing September 1, 2004, the Manager reduced its Contractual Management Fee and implemented breakpoints, reflecting the potential for reducing the Contractual Management Fee as the Fund grows. The Board considered whether the breakpoint fee structure was a reasonable means of sharing any economies of scale or other efficiencies that might accrue from increases in the Fund’s assets levels. The Board noted that the Fund had not yet reached the specified asset level at which a breakpoint to its Contractual Management Fee would be triggered. The Board also noted that as the Fund’s assets have increased over time, certain expenses, such as fees for Board members, auditors and legal fees, become a smaller percentage of overall assets. The Board determined that the management fee structure was reasonable.
90 Smith Barney Investment Series 2005 Annual Report
Board Approval of Management Agreement (unaudited) (continued)
Other Benefits to the Manager
The Board considered other benefits received by the Manager and its affiliates as a result of their relationship with the Fund, including the opportunity to offer additional products and services to Fund shareholders.
In light of the costs of providing investment management and other services to the Fund and the Manager’s ongoing commitment to the Fund, the profits and other ancillary benefits that the Manager and its affiliates received were considered reasonable.
In light of all of the foregoing, the Board approved the Management Agreement to continue for another year.
No single factor reviewed by the Board was identified by the Board as the principal factor in determining whether to approve the Management Agreement, and each Board Member attributed different weight to the various factors. The Independent Board Members were advised by separate independent legal counsel throughout the process. The Board also discussed the proposed continuance of the Management Agreement in private sessions with their independent legal counsel at which no representatives of the Manager were present.
Additional Information
SB Government Portfolio
On June 23, 2005, Citigroup Inc. entered into a definitive agreement (the “Transaction Agreement”) with Legg Mason, Inc. under which Citigroup agreed to sell substantially all of its asset management business, Citigroup Asset Management (“CAM”), which includes the Adviser, to Legg Mason in exchange for the broker-dealer and investment banking businesses of Legg Mason and certain other considerations (the “Transaction”). The Transaction closed on December 1, 2005.
The consummation of the Transaction resulted in the automatic termination of the Fund’s current management agreement in accordance with the Investment Company Act of 1940, as amended (the “1940 Act”). Prior to the closing of the Transaction, the Fund’s Board approved a new management agreement between the Fund and the Adviser (the “New Management Agreement”) and authorized the Fund’s officers to submit the New Management Agreement to shareholders for their approval.
On July 11, 2005, members of the Board discussed with CAM management and certain Legg Mason representatives the Transaction and Legg Mason’s general plans and intentions regarding the Fund, including the preservation, strengthening and growth of CAM’s business and its combination with Legg Mason’s business. The Board Members also inquired about the plans for and anticipated roles and responsibilities of certain CAM employees and officers after the Transaction.
At a meeting held on August 7, 2005, the Fund’s Board, including a majority of the Board Members who are not “interested persons” of the Fund or the Adviser as defined in the 1940 Act (the “Independent Board Members”), approved the New Management Agreement. To assist the Board in its consideration of the New Management Agreement, Legg Mason previously provided materials and information about Legg Mason, including its financial condition and asset management capabilities and organization, and CAM provided materials and information about the Transaction between Legg Mason and Citigroup. Representatives of CAM and Legg Mason also made presentations to and responded to questions from the Board, including at meetings held prior to the August 2005 meeting. The Independent
Smith Barney Investment Series 2005 Annual Report 91
Board Approval of Management Agreement (unaudited) (continued)
Board Members, through their independent legal counsel, also requested and received additional information from CAM and Legg Mason in connection with their consideration of the New Management Agreement. The additional information was provided in advance of and at the August meeting. After the presentations and after reviewing the written materials provided, the Independent Board Members met in executive session with their counsel to consider the New Management Agreement. The Independent Board Members also conferred separately and with their counsel about the Transaction on a number of occasions, including in connection with the July and August meetings.
In their deliberations concerning the New Management Agreement, among other things, the Board Members considered:
(i) the automatic termination of the current management agreement upon completion of the Transaction and the need for continuity of services provided under the current management agreement;
(ii) the reputation, financial strength and resources of Legg Mason and its investment advisory subsidiaries;
(iii) that, following the Transaction, CAM will be part of an organization focused on the asset management business;
(iv) that Legg Mason and its wholly-owned subsidiary, Western Asset, are experienced and respected asset management firms, and that Legg Mason has advised the Board Members that (a) it intends to combine the fixed income investment operations (including money market fund operations) of CAM with those of Western Asset and may also wish to combine other CAM operations with those of other Legg Mason subsidiaries; (b) after the closing of the Transaction, it will take steps to combine the investment management operations of Western Asset with the fixed income operations of the Adviser, which, among other things, may involve Western Asset and the Adviser sharing common systems and procedures, employees (including portfolio managers), investment and trading platforms, and other resources; (c) it is expected that these combination processes will result in changes to portfolio managers or portfolio management teams for a number of the CAM funds, subject to Board consent and appropriate notice to shareholders, and that, in other cases, the current portfolio managers or portfolio management teams will remain in place; and (d) in the future, it may recommend that Western Asset or other Legg Mason subsidiaries be appointed as the adviser or subadviser to some or all of the CAM funds, subject to applicable regulatory requirements;
(v) that CAM management had advised the Board that a number of portfolio managers and other key CAM personnel would be retained after the closing of the Transaction;
(vi) that CAM management and Legg Mason have advised the Board that following the Transaction, there is not expected to be any diminution in the nature, quality and extent of services provided to the Fund and their shareholders by the Adviser, including compliance services;
(vii) that Legg Mason has advised the Board that it has no present intention to alter the expense waivers and reimbursements currently in effect and, while it reserves the right to do so in the future, it would consult with the Board before making any changes;
92 Smith Barney Investment Series 2005 Annual Report
Board Approval of Management Agreement (unaudited) (continued)
(viii) that under the Transaction Agreement, Citigroup and Legg Mason have agreed not to take any action that is not contemplated by the Transaction or fail to take any action that to their respective knowledge would cause any of the requirements of Section 15(f) of the 1940 Act not to be met;
(ix) the assurances from Citigroup and Legg Mason that, for a three year period following the closing of the Transaction, Citigroup-affiliated broker-dealers will continue to offer the Fund as an investment product, and the potential benefits to Fund shareholders from this and other third-party distribution access;
(x) the potential benefits to Fund shareholders from being part of a combined fund family with Legg Mason sponsored funds including possible economies of scale and access to investment opportunities;
(xi) that Citigroup and Legg Mason would derive benefits from the Transaction and that, as a result, they have a financial interest in the matters that were being considered;
(xii) the potential effects of regulatory restrictions on the Fund if Citigroup-affiliated broker-dealers remain principal underwriters of the Fund after the closing of the Transaction;
(xiii) the fact that the Fund’s total advisory and administrative fees will not increase by virtue of the New Management Agreement, but will remain the same;
(xiv) the terms and conditions of the New Management Agreement, including the differences from the current management agreement, and the benefits of a single, uniform form of agreement covering these services;
(xv) that the Fund would not bear the costs of obtaining shareholder approval of the New Management Agreement;
(xvi) that Citigroup and Legg Mason were negotiating a license arrangement that would permit the Fund to maintain its current name for some agreed upon time period after the closing of the Transaction; and
(xvii) that, as discussed in detail above, within the past year the Board had performed a full annual review of the current management agreement as required by the 1940 Act. In that regard, the Board’s deliberations concerning the New Management Agreement reflected its prior evaluation of relevant factors, including the nature, quality and extent of services provided, costs of services provided, profitability, fall-out benefits, fees and economies of scale and investment performance considered in connection with the renewal of the current management agreement and its determination that information provided by CAM and Legg Mason management prior to and at the August meeting supported the continued appropriateness of such conclusions with respect to the New Management Agreement.
No single factor reviewed by the Board was identified by the Board as the principal factor in determining whether to approve the New Management Agreement, and each Board Member attributed different weight to the various factors. The Independent Board Members were advised by separate independent legal counsel throughout the process. The Board also discussed the New Management Agreement in private sessions with their independent legal counsel at which no representatives of the Adviser were present. In light of all of the foregoing, the Board approved the New Management Agreement and authorized the Fund’s officers to submit the New Management Agreement to shareholders for their approval.
Smith Barney Investment Series 2005 Annual Report 93
Additional Information (unaudited)
Information about Trustees and Officers
The business and affairs of Smith Barney Investment Series (“Trust”) are managed under the direction of the Trust’s Board of Trustees. Information pertaining to the Trustees and officers of the Trust is set forth below. Each Trustee and Officer holds office for his or her lifetime, unless that individual resigns, retires or is otherwise removed. The Statement of Additional Information includes additional information about the Trustees and is available without charge, upon request by calling 1-800-451-2010.
| | | | | | | | | | |
| | | | | |
Name, Address and
Birth Year | | Position(s)
Held with
Fund | | Term of
Office* and
Length
of Time
Served | | Principal
Occupation(s) During Past
Five Years | | Number of
Portfolios
in Fund
Complex
Overseen by
Trustee | | Other Board
Memberships Held by
Trustee
During Past
5 Years |
| Non-Interested Trustees: | | | | | | |
Elliott J. Berv c/o R. Jay Gerken, CFA Citigroup Asset Management (“CAM”) 399 Park Avenue New York, NY 10022 Birth Year: 1943 | | Trustee | | Since 2001 | | Executive Vice President and Chief Operations Officer, DigiGym Systems (on-line personal training systems) (since 2001); Consultant Catalyst (Consulting) (since 1984); Chief Executive Officer, Motorcity USA (motorsport racing) (Since 2004) | | 37 | | Board Member, American Identity Corp. (doing business as Morpheus Technologies) (Biometric information management) (since 2001); Director, Lapoint Industries (Industrial Filter Company) (since 2002); Director. Alzheimer’s Association (New England Chapter) (since 1998) |
| | | | | |
Donald M. Carlton c/o R. Jay Gerken, CFA CAM 399 Park Avenue New York, NY 10022 Birth Year: 1937 | | Trustee | | Since 1997 | | Consultant, URS Corporation (Engineering) (since 1999); former Chief Executive Officer, Radian International L.L.C. (Engineering) (from 1996 to 1998), Member of Management Committee, Signature Science (Research and Development) (since 2000) | | 37 | | Director, Temple-Inland (forest products) (since 2003); Director, American Electric Power Co. (Electric Utility) (since 1999); Former Director, National Instruments Corp. (Technology) (since 1994); Director, Valero Energy (Petroleum Refining) (since 1999) |
94 Smith Barney Investment Series 2005 Annual Report
Additional Information (unaudited) (continued)
| | | | | | | | | | |
| | | | | |
Name, Address and
Birth Year | | Position(s)
Held with
Fund | | Term of
Office* and
Length
of Time
Served | | Principal
Occupation(s) During Past
Five Years | | Number of
Portfolios
in Fund
Complex
Overseen by
Trustee | | Other Board
Memberships Held by
Trustee
During Past
5 Years |
| Non-Interested Trustees: | | | | | | | | |
A. Benton Cocanougher c/o R. Jay Gerken, CFA CAM 399 Park Avenue New York, NY 10022 Birth Year: 1938 | | Trustee | | Since 1991 | | Dean Emeritus and Professor, Texas A&M University (since 2004); former Interim Chancellor, Texas A&M University System (from 2003 to 2004); former Special Advisor to the President, Texas A&M University (from 2002-2003); former Dean Emeritus and Wiley Professor, Texas A&M University (from 2001 to 2002); former Dean and Professor of Marketing, College and Graduate School of Business of Texas A&M University (from 1987 to 2001) | | 32 | | None |
| | | | | |
Mark T. Finn
c/o R. Jay Gerken, CFA CAM 399 Park Avenue New York, NY 10022 Birth Year: 1943 | | Trustee | | Since 2001 | | Adjunct Professor, William & Mary College (since September 2002); Principal/Member, Belvan Partners/Balfour Vantage–Manager and General Partner to the Vantage Hedge Fund, LP (since March 2002); Chairman and Owner, Vantage Consulting Group, Inc. (Investment Advisory and Consulting Firm) (since 1988); former Vice Chairman and Chief Operating Officer, Lindner Asset Management Company (Mutual Fund Company) (from March 1999 to 2001); former General Partner and Shareholder, Greenwich Ventures, LLC (Investment Partnership) (from 1996 to 2001); former President, Secretary, and Owner, Phoenix Trading Co. (Commodity Trading Advisory Firm) (from 1997 to 2000) | | 37 | | Former President and Director, Delta Financial, Inc. (Investment Advisory Firm) (from 1983 to 1999) |
Smith Barney Investment Series 2005 Annual Report 95
Additional Information (unaudited) (continued)
| | | | | | | | | | |
| | | | | |
Name, Address and
Birth Year | | Position(s)
Held with
Fund | | Term of
Office* and
Length
of Time
Served | | Principal
Occupation(s) During Past
Five Years | | Number of
Portfolios
in Fund
Complex
Overseen by
Trustee | | Other Board
Memberships Held by
Trustee
During Past
5 Years |
| Non-Interested Trustees: | | | | | | | | |
Stephen Randolph Gross
c/o R. Jay Gerken, CFA CAM 399 Park Avenue New York, NY 10022 Birth Year: 1947 | | Trustee | | Since 1986 | | Chairman, HLB Gross Collins, PC (accounting and consulting firm (since 1979); Treasurer, Coventry Limited, Inc. (Senior Living Facilities) (since 1985); former Managing Director, Fountainhead Ventures, LLC (technology accelerator) (from 1998 to 2003); former Treasurer, Hank Aaron Enterprises (fast food franchise) (from 1985 to 2001); former Partner, Capital Investment Advisory Partners (leverage buyout consulting) (from 2000 to 2002); former Secretary, Carint N.A. (manufacturing) (from 1998 to 2002) | | 37 | | Director, Andersen Calhoun (assisted living) (since 1987); former Director, Yu Save, Inc. (internet company) (from 1998 to 2000); former Director, Hotpalm.com, Inc. (wireless applications) from 1998 to 2000); former Director, United Telesis, Inc. (telecommunications) (from 1997 to 2002); former Director ebank.com, Inc. (from 1997 to 2004) |
| | | | | |
Diana R. Harrington c/o R. Jay Gerken, CFA CAM 399 Park Avenue New York, NY 10022 Birth Year: 1940 | | Trustee | | Since 2001 | | Professor, Babson College (since 1993) | | 37 | | Former Trustee, The Highland Family of Funds (Investment Company) (from 1997 to 1998) |
| | | | | |
Susan B. Kerley c/o R. Jay Gerken, CFA CAM 399 Park Avenue New York, NY 10022 Birth Year: 1951 | | Trustee | | Since 2001 | | Consultant, Strategic Management Advisors, LLC (Investment Consulting) (since 1990) | | 37 | | Chairperson and Independent Board Member of Eclipse Fund, Inc. and Eclipse Funds (which trade as Mainstay Funds) (currently supervises 16 investment companies in the fund complex) |
96 Smith Barney Investment Series 2005 Annual Report
Additional Information (unaudited) (continued)
| | | | | | | | | | |
| | | | | |
Name, Address and
Birth Year | | Position(s)
Held with
Fund | | Term of
Office* and
Length
of Time
Served | | Principal
Occupation(s) During Past
Five Years | | Number of
Portfolios
in Fund
Complex
Overseen by
Trustee | | Other Board
Memberships Held by
Trustee
During Past
5 Years |
| Non-Interested Trustees: | | | | | | | | |
Alan G. Merten c/o R. Jay Gerken, CFA CAM 399 Park Avenue New York, NY 10022 Birth Year: 1941 | | Trustee | | Since 1990 | | President, George Mason University (since 1996) | | 37 | | Director, Xybernaut Corporation (information technology) (since 2004); Director, Digital Net Holdings, Inc. (since 2003); Director, Comshare, Inc. (information technology) (from 1985 to 2003) |
| | | | | |
R. Richardson Pettit c/o R. Jay Gerken, CFA CAM 399 Park Avenue New York, NY 10022 Birth Year: 1942 | | Trustee | | Since 1990 | | Professor of Finance, University of Houston (from 1977 to 2002); Independent Consultant (since 1984) | | 37 | | None |
| | | | |
| Interested Trustee: | | | | | | | | |
R. Jay Gerken, CFA ** CAM 399 Park Avenue, Mezzanine New York, NY 10022
Birth Year: 1951 | | Chairman, President and Chief Executive Officer | | Since 2002 | | Managing Director of CAM; Chairman, President, Chief Executive Officer and Director SBFM, and CFM; President and Chief Executive Officer of certain mutual funds associated with Legg Mason, Inc. (“Legg Mason”); formerly Portfolio Manager of Smith Barney Allocation Series, Inc. (from 1996 to 2001) and Smith Barney Growth and Income Fund (from 1996 to 2000); formerly Chairman, President and Chief Executive Officer of Travelers Investment Adviser, Inc. (“TIA”) (from 2002 to 2005) | | 171 | | N/A |
Smith Barney Investment Series 2005 Annual Report 97
Additional Information (unaudited) (continued)
| | | | | | | | | | |
| | | | | |
Name, Address and
Birth Year | | Position(s)
Held with
Fund | | Term of
Office* and
Length
of Time
Served | | Principal
Occupation(s) During Past
Five Years | | Number of
Portfolios
in Fund
Complex
Overseen by
Trustee | | Other Board
Memberships Held by
Trustee
During Past
5 Years |
| Officers: | | | | | | | | | | |
Andrew B. Shoup
CAM
125 Broad Street,
11th Floor
New York, NY 10004
Birth Year: 1956 | | Senior Vice President and Chief Administrative Officer | | Since
2003 | | Director of CAM; Senior Vice President and Chief Administrative Officer of mutual funds associated with CAM; Head of International Funds Administration of CAM from 2001 to 2003; Director of Global Funds Administration of CAM (from 2000 to 2001); Head of U.S. Citibank Funds Administration of CAM (from 1998 to 2000) | | N/A | | N/A |
| | | | | |
Frances M. Guggino
CAM
125 Broad Street,
10th Floor
New York, NY 10004
Birth Year: 1957 | | Chief Financial Officer and Treasurer | | Since
2004 | | Director of CAM; Chief Financial Officer and Treasurer of certain mutual funds associated with CAM; Controller of certain mutual funds associated with CAM | | N/A | | N/A |
| | | | | |
Alan J. Blake
CAM
399 Park Avenue,
4th Floor
New York, NY 10022
Birth Year: 1949 | | Vice President and Investment Officer | | Since 2001 | | Managing Director of CAM | | N/A | | N/A |
| | | | | |
Kevin Caliendo CAM 399 Park Avenue,
4th Floor New York, NY 10004 Birth Year: 1970 | | Vice President and Investment Officer | | Since
2003 | | Managing Director of CAM | | N/A | | N/A |
| | | | | |
Scott K. Glasser
CAM
399 Park Avenue
4th Floor
New York, NY 10022
Birth Year: 1966 | | Vice President and Investment Officer | | Since
1996 | | Managing Director of CAM; Investment Officer of SBFM | | N/A | | N/A |
| | | | | |
Peter J. Hable
CAM
One Sansome Street
San Francisco, CA 94104
Birth Year: 1958 | | Vice President and Investment Officer | | Since
1999 | | Managing Director of CAM and Investment Officer of SBFM | | N/A | | N/A |
98 Smith Barney Investment Series 2005 Annual Report
Additional Information (unaudited) (continued)
| | | | | | | | | | |
| | | | | |
Name, Address and
Birth Year | | Position(s)
Held with
Fund | | Term of
Office* and
Length
of Time
Served | | Principal
Occupation(s) During Past
Five Years | | Number of
Portfolios
in Fund
Complex
Overseen by
Trustee | | Other Board
Memberships Held by
Trustee
During Past
5 Years |
| | | | | |
Michael A. Kagan
CAM
399 Park Avenue,
4th Floor
New York, NY 10022 Birth Year: 1960 | | Vice President and Investment Officer | | Since 2000 | | Managing Director of CAM | | N/A | | N/A |
| Officers: | | | | | | | | | | |
Roger M. Lavan, CFA CAM
399 Park Avenue,
4th Floor
New York, NY 10022
Birth Year: 1963 | | Vice President and Investment Officer | | Since
2002 | | Managing Director of CAM and Salomon Brothers Asset Management Inc. (“SBAM”) | | N/A | | N/A |
| | | | | |
Francis L. Mustaro
CAM
399 Park Avenue,
4th Floor
New York, NY 10022
Birth Year: 1950 | | Vice President and Investment Officer | | Since
2002 | | Managing Director of CAM | | N/A | | N/A |
| | | | | |
Timothy Woods, CFA
CAM
100 First Stamford Place
Stamford, CT 06902
Birth Year: 1960 | | Vice President and Investment Officer | | Since
2001 | | Managing Director of CAM | | N/A | | N/A |
| | | | | |
Andrew Beagley
CAM
399 Park Avenue,
4th Floor
New York, NY 10022
Birth Year: 1962 | | Chief Anti-Money Laundering Compliance Officer Chief Compliance Officer | | Since
2002 Since
2004 | | Chief Anti-Money Laundering Compliance Officer and Chief Compliance Officer of certain mutual funds associated with CAM; Managing Director of CAM (since 2005); Director of CAM (2000-2005); Director of Compliance, North America, CAM (2000-2005); Director of Compliance, Europe, the Middle East and Africa, CAM (from 1999 to 2000); Compliance Officer, SBFM, CFM, TIA, Salomon Brothers Asset Management Limited, Smith Barney Global Capital Management Inc., Salomon Brothers Asset Management Asia Pacific Limited (from 1997 to 1999) | | N/A | | N/A |
Smith Barney Investment Series 2005 Annual Report 99
Additional Information (unaudited) (continued)
| | | | | | | | | | |
| | | | | |
Name, Address and
Birth Year | | Position(s)
Held with
Fund | | Term of
Office* and
Length
of Time
Served | | Principal
Occupation(s) During Past
Five Years | | Number of
Portfolios
in Fund
Complex
Overseen by
Trustee | | Other Board
Memberships Held by
Trustee
During Past
5 Years |
| Officers: | | | | | | | | |
Wendy S. Setnicka
CAM
125 Broad Street,
10th Floor
New York, NY 10004
Birth Year: 1964 | | Controller | | Since
2004 | | Vice President of CAM; Controller of certain mutual funds associated with
CAM; Assistant Controller of CAM (Since 2002) | | N/A | | N/A |
| | | | | |
Robert I. Frenkel CAM
300 First Stamford Place
Stamford, CT 06902
Birth Year: 1954 | | Secretary and
Chief Legal Officer | | Since
2003 | | Managing Director and General Counsel of Global Mutual Funds for CAM and its predecessor (since 1994); Secretary and Chief Legal Officer of mutual funds associated with
CAM | | N/A | | N/A |
| * | | Each Trustee and Officer serves until his or her successor has been duly elected and qualified. |
| ** | | Mr. Gerken is an “interested person” of the Funds as defined in the Investment Company Act of 1940, as amended, because Mr. Gerken is an officer of SBFM and certain of its affiliates. |
100 Smith Barney Investment Series 2005 Annual Report
Additional Shareholder Information (unaudited)
Smith Barney Premier Selections All Cap Growth Portfolio
Results of a Special Meeting of Shareholders
On October 21, 2005, a Special Meeting of Shareholders was held to elect Trustees. The following table provides the number of votes cast for, against or withheld, as well as the number of abstentions and broker non-votes as to each matter voted on at the Special Meeting of Shareholders.
| | | | | | | | |
| Item Voted On | | Votes For | | Votes Against | | Abstentions | | Broker
Non-Votes |
Election of Trustees1 | | | | | | | | |
Nominees: | | | | | | | | |
Elliot J. Berv | | 1,373,101,980.622 | | 72,611,605.603 | | 78,283.260 | | 0 |
Donald M. Carlton | | 1,372,667,931.470 | | 73,045,654.755 | | 78,283.260 | | 0 |
A. Benton Cocanougher | | 1,372,238,417.747 | | 73,475,168.477 | | 78,283.260 | | 0 |
Mark T. Finn | | 1,372,966,510.879 | | 72,747,075.345 | | 78,283.260 | | 0 |
Stephen Randolph Gross | | 1,372,665,788.992 | | 73,047,797.233 | | 78,283.260 | | 0 |
Diana R. Harrington | | 1,372,790,017.323 | | 72,923,568.902 | | 78,283.260 | | 0 |
Susan B. Kerley | | 1,372,864,058.699 | | 72,849,527.525 | | 78,283.260 | | 0 |
Alan G. Merten | | 1,373,132,217.647 | | 72,581,368.578 | | 78,283.260 | | 0 |
R. Richardson Pettit | | 1,372,801,010.747 | | 72,912,575.478 | | 78,283.260 | | 0 |
R. Jay Gerken | | 1,371,873,090.739 | | 73,840,495.485 | | 78,283.260 | | 0 |
|
| 1 | | Trustees are elected by the shareholders of all of the series of the Trust of which the Fund is a series. |
Smith Barney Dividend Strategy Portfolio
Results of a Special Meeting of Shareholders
On October 21, 2005, a Special Meeting of Shareholders was held to elect Trustees. The following table provides the number of votes cast for, against or withheld, as well as the number of abstentions and broker non-votes as to each matter voted on at the Special Meeting of Shareholders.
| | | | | | | | |
| Item Voted On | | Votes For | | Votes Against | | Abstentions | | Broker
Non-Votes |
Election of Trustees1 | | | | | | | | |
Nominees: | | | | | | | | |
Elliot J. Berv | | 1,373,101,980.622 | | 72,611,605.603 | | 78,283.260 | | 0 |
Donald M. Carlton | | 1,372,667,931.470 | | 73,045,654.755 | | 78,283.260 | | 0 |
A. Benton Cocanougher | | 1,372,238,417.747 | | 73,475,168.477 | | 78,283.260 | | 0 |
Mark T. Finn | | 1,372,966,510.879 | | 72,747,075.345 | | 78,283.260 | | 0 |
Stephen Randolph Gross | | 1,372,665,788.992 | | 73,047,797.233 | | 78,283.260 | | 0 |
Diana R. Harrington | | 1,372,790,017.323 | | 72,923,568.902 | | 78,283.260 | | 0 |
Susan B. Kerley | | 1,372,864,058.699 | | 72,849,527.525 | | 78,283.260 | | 0 |
Alan G. Merten | | 1,373,132,217.647 | | 72,581,368.578 | | 78,283.260 | | 0 |
R. Richardson Pettit | | 1,372,801,010.747 | | 72,912,575.478 | | 78,283.260 | | 0 |
R. Jay Gerken | | 1,371,873,090.739 | | 73,840,495.485 | | 78,283.260 | | 0 |
|
| 1 | | Trustees are elected by the shareholders of all of the series of the Trust of which the Fund is a series. |
Smith Barney Investment Series 2005 Annual Report 101
Additional Shareholder Information (unaudited) (continued)
Smith Barney Growth and Income Portfolio
Results of a Special Meeting of Shareholders
On October 21, 2005, a Special Meeting of Shareholders was held to elect Trustees. The following table provides the number of votes cast for, against or withheld, as well as the number of abstentions and broker non-votes as to each matter voted on at the Special Meeting of Shareholders.
| | | | | | | | |
| Item Voted On | | Votes For | | Votes Against | | Abstentions | | Broker
Non-Votes |
Election of Trustees1 | | | | | | | | |
Nominees: | | | | | | | | |
Elliot J. Berv | | 1,373,101,980.622 | | 72,611,605.603 | | 78,283.260 | | 0 |
Donald M. Carlton | | 1,372,667,931.470 | | 73,045,654.755 | | 78,283.260 | | 0 |
A. Benton Cocanougher | | 1,372,238,417.747 | | 73,475,168.477 | | 78,283.260 | | 0 |
Mark T. Finn | | 1,372,966,510.879 | | 72,747,075.345 | | 78,283.260 | | 0 |
Stephen Randolph Gross | | 1,372,665,788.992 | | 73,047,797.233 | | 78,283.260 | | 0 |
Diana R. Harrington | | 1,372,790,017.323 | | 72,923,568.902 | | 78,283.260 | | 0 |
Susan B. Kerley | | 1,372,864,058.699 | | 72,849,527.525 | | 78,283.260 | | 0 |
Alan G. Merten | | 1,373,132,217.647 | | 72,581,368.578 | | 78,283.260 | | 0 |
R. Richardson Pettit | | 1,372,801,010.747 | | 72,912,575.478 | | 78,283.260 | | 0 |
R. Jay Gerken | | 1,371,873,090.739 | | 73,840,495.485 | | 78,283.260 | | 0 |
|
| 1 | | Trustees are elected by the shareholders of all of the series of the Trust of which the Fund is a series. |
SB Government Portfolio
Results of a Special Meeting of Shareholders
On October 21, 2005, a Special Meeting of Shareholders was held to elect Trustees. The following table provides the number of votes cast for, against or withheld, as well as the number of abstentions and broker non-votes as to each matter voted on at the Special Meeting of Shareholders.
| | | | | | | | |
| Item Voted On | | Votes For | | Votes Against | | Abstentions | | Broker
Non-Votes |
Election of Trustees1 | | | | | | | | |
Nominees: | | | | | | | | |
Elliot J. Berv | | 1,373,101,980.622 | | 72,611,605.603 | | 78,283.260 | | 0 |
Donald M. Carlton | | 1,372,667,931.470 | | 73,045,654.755 | | 78,283.260 | | 0 |
A. Benton Cocanougher | | 1,372,238,417.747 | | 73,475,168.477 | | 78,283.260 | | 0 |
Mark T. Finn | | 1,372,966,510.879 | | 72,747,075.345 | | 78,283.260 | | 0 |
Stephen Randolph Gross | | 1,372,665,788.992 | | 73,047,797.233 | | 78,283.260 | | 0 |
Diana R. Harrington | | 1,372,790,017.323 | | 72,923,568.902 | | 78,283.260 | | 0 |
Susan B. Kerley | | 1,372,864,058.699 | | 72,849,527.525 | | 78,283.260 | | 0 |
Alan G. Merten | | 1,373,132,217.647 | | 72,581,368.578 | | 78,283.260 | | 0 |
R. Richardson Pettit | | 1,372,801,010.747 | | 72,912,575.478 | | 78,283.260 | | 0 |
R. Jay Gerken | | 1,371,873,090.739 | | 73,840,495.485 | | 78,283.260 | | 0 |
|
| 1 | | Trustees are elected by the shareholders of all of the series of the Trust of which the Fund is a series. |
102 Smith Barney Investment Series 2005 Annual Report
Important Tax Information (unaudited)
The following information is provided with respect to the distributions paid during the taxable year ended October 31, 2005:
| | | | | | |
| | |
| | | Smith Barney
Dividend Strategy
Portfolio | | | Smith Barney
Growth and
Income Portfolio | |
Record Date: | | 12/27/2004 | | | 12/27/2004 | |
Payable Date: | | 12/28/2004 | | | 12/28/2004 | |
|
|
Dividends Qualifying for the Dividends Received Deduction for Corporations | | 94.65 | % | | 100.00 | % |
|
|
Please retain this information for your records.
Smith Barney Investment Series 2005 Annual Report 103
Smith Barney Investment Series
| | |
TRUSTEES Elliott J. Berv Donald M. Carlton A. Benton Cocanougher Mark T. Finn R. Jay Gerken, CFA
Chairman Stephen Randolph Gross Diana R. Harrington Susan B. Kerley Alan G. Merten R. Richardson Pettit OFFICERS R. Jay Gerken, CFA President and Chief Executive Officer Andrew B. Shoup Senior Vice President and Chief Administrative Officer Frances M. Guggino Chief Financial Officer
and Treasurer Alan J. Blake Vice President and Investment Officer Kevin Caliendo Vice President and Investment Officer Scott K. Glasser Vice President
and Investment Officer Peter J. Hable Vice President
and Investment Officer Michael A. Kagan Vice President and Investment Officer Roger M. Lavan, CFA Vice President and
Investment Officer | | OFFICERS (continued) Francis L. Mustaro Vice President and Investment Officer Timothy Woods, CFA Vice President and Investment Officer Andrew Beagley Chief Anti-Money Laundering Compliance Officer and Chief Compliance Officer Wendy S. Setnicka Controller Robert I. Frenkel Secretary and
Chief Legal Officer INVESTMENT MANAGER Smith Barney Fund
Management LLC DISTRIBUTORS Citigroup Global Markets Inc. Legg Mason Investors
Services, LLC CUSTODIAN State Street Bank and
Trust Company TRANSFER AGENT PFPC Inc. P.O. Box 9699 Providence, Rhode Island 02940-9699 INDEPENDENT REGISTERED PUBLIC ACCOUNTING FIRM KPMG LLP 345 Park Avenue New York, New York 10154 |
This report is submitted for general information of the shareholders of the Smith Barney Investment Series — Smith Barney Premier Selections All Cap Growth, Smith Barney Dividend Strategy, Smith Barney Growth and Income and SB Government Portfolios.
This report must be preceded or accompanied by a free prospectus. Investors should consider the Funds’ investment objectives, risks, charges and expenses carefully before investing. The prospectus contains this and other important information about the Funds. Please read the prospectus carefully before investing.
www.citigroupam.com
©2005 Legg Mason Investor Services, LLC
Member NASD, SIPC
Smith Barney Investment Series
Smith Barney Premier Selections All Cap Growth Portfolio
Smith Barney Dividend Strategy Portfolio
Smith Barney Growth and Income Portfolio
SB Government Portfolio
The Funds are separate investment funds of the Smith Barney Investment Series, a Massachusetts business trust.
SMITH BARNEY INVESTMENT SERIES
Smith Barney Mutual Funds
125 Broad Street
10th Floor, MF-2
New York, New York 10004
The Funds files their complete schedule of portfolio holdings with the Securities and Exchange Commission for the first and third quarters of each fiscal year on Form N-Q. The Funds’ Forms N-Q are available on the Commission’s website at http://www.sec.gov. The Funds’ Forms N-Q may be reviewed and copied at the Commission’s Public Reference Room in Washington D.C., and how information on the operation of the Public Reference Room may be obtained by calling 800-SEC-0330. To obtain information on Form N-Q from the Funds, shareholders can call 800-451-2010.
Information on how the Funds voted proxies relating to portfolio securities during the most recent 12 month period ended June 30, and a description of the policies and procedures that the Funds use to determine how to vote proxies relating to portfolio securities is available (1) without charge, upon request, by calling 1-800-451-2010, (2) on the Funds’ website at www.citigroupam.com and (3) on the SEC’s website at www.sec.gov.
The registrant has adopted a code of ethics that applies to the registrant’s principal executive officer, principal financial officer, principal accounting officer or controller.
| ITEM 3. | AUDIT COMMITTEE FINANCIAL EXPERT. |
The Board of Trustees of the registrant has determined that Stephen Randolph Gross, the Chairman of the Board’s Audit Committee, possesses the technical attributes identified in Instruction 2(b) of Item 3 to Form N-CSR to qualify as an “audit committee financial expert,” and has designated Mr. Gross as the Audit Committee’s financial expert. Mr. Gross is an “independent” Trustee pursuant to paragraph (a)(2) of Item 3 to Form N-CSR.
| ITEM 4. | PRINCIPAL ACCOUNTANT FEES AND SERVICES. |
(a) Audit Fees. The aggregate fees billed in the last two fiscal years ending October 31, 2004 and October 31, 2005 (the “Reporting Periods”) for professional services rendered by the Registrant’s principal accountant (the “Auditor”) for the audit of the Registrant’s annual financial statements, or services that are normally provided by the Auditor in connection with the statutory and regulatory filings or engagements for the Reporting Periods, were $130,000 in 2004 and $130,000 in 2005.
(b) Audit-Related Fees. The aggregate fees billed in the Reporting Periods for assurance and related services by the Auditor that are reasonably related to the performance of the audit of the Registrant’s financial statements and are not reported under paragraph (a) of this Item 4 were $0 in 2004 and $8,000 in 2005. These services consisted of procedures performed in connection with the review and preparation with the issuance of the 17-F2 Security Count Independent Accountants Reports and the annual registration statement filed on Form N-1A of the Smith Barney Investment Series.
In addition, there were no Audit-Related Fees billed in the Reporting Period for assurance and related services by the Auditor to the Registrant’s investment adviser (not including any sub-adviser whose role is primarily portfolio management and is subcontracted with or overseen by another investment adviser), and any entity controlling, controlled by or under common control with the investment adviser that provides ongoing services to the Smith Barney Investment Series (“service affiliates”), that were reasonably related to the performance of the annual audit of the service affiliates. Accordingly, there were no such fees that required pre-approval by the Audit Committee for the Reporting Periods (prior to May 6, 2003 services provided by the Auditor were not required to be pre-approved).
(c) Tax Fees. The aggregate fees billed in the Reporting Periods for professional services rendered by the Auditor for tax compliance, tax advice and tax planning (“Tax Services”) were $17,500 in 2004 and $29,600 in 2005. These services consisted of (i) review or preparation of U.S. federal, state, local and excise tax returns; (ii) U.S. federal, state and local tax planning, advice and assistance regarding statutory, regulatory or administrative developments, and (iii) tax advice regarding tax qualification matters and/or treatment of various financial instruments held or proposed to be acquired or held.
There were no fees billed for tax services by the Auditors to service affiliates during the Reporting Periods that required pre-approval by the Audit Committee.
(d) All Other Fees. There were no other fees billed in the Reporting Periods for products and services provided by the Auditor, other than the services reported in paragraphs (a) through (c) of this Item for the Smith Barney Investment Series
All Other Fees. There were no other non-audit services rendered by the Auditor to Smith Barney Fund Management LLC (“SBFM”), and any entity controlling, controlled by or under common control with SBFM that provided ongoing services to Smith Barney Investment Series requiring pre-approval by the Audit Committee in the Reporting Period.
(e) Audit Committee’s pre–approval policies and procedures described in paragraph (c) (7) of Rule 2-01 of Regulation S-X.
(1) The Charter for the Audit Committee (the “Committee”) of the Board of each registered investment company (the “Fund”) advised by Smith Barney Fund Management LLC or Salomon Brothers Asset Management Inc. or one of their affiliates (each, an “Adviser”) requires that the Committee shall approve (a) all audit and permissible non-audit services to be provided to the Fund and (b) all permissible non-audit services to be provided by the Fund’s independent auditors to the Adviser and any Covered Service Providers if the engagement relates directly to the operations and financial reporting of the Fund. The Committee may implement policies and procedures by which such services are approved other than by the full Committee.
The Committee shall not approve non-audit services that the Committee believes may impair the independence of the auditors. As of the date of the approval of this Audit Committee Charter, permissible non-audit services include any professional services (including tax services), that are not prohibited services as described below, provided to the Fund by the independent auditors, other than those provided to the Fund in connection with an audit or a review of the financial statements of the Fund. Permissible non-audit services may not include: (i) bookkeeping or other services related to the accounting records or financial statements of the Fund; (ii) financial information systems design and implementation; (iii) appraisal or valuation services, fairness opinions or contribution-in-kind reports; (iv) actuarial services; (v) internal audit outsourcing services; (vi) management functions or human resources; (vii) broker or dealer, investment adviser or investment banking services; (viii) legal services and expert services unrelated to the audit; and (ix) any other service the Public Company Accounting Oversight Board determines, by regulation, is impermissible.
Pre-approval by the Committee of any permissible non-audit services is not required so long as: (i) the aggregate amount of all such permissible non-audit services provided to the Fund, the Adviser and any service providers controlling, controlled by or under common control with the Adviser that provide ongoing services to the Fund (“Covered Service Providers”) constitutes not more than 5% of the total amount of revenues paid to the independent auditors during the fiscal year in which the permissible non-audit services are provided to (a) the Fund, (b) the Adviser and (c) any entity controlling, controlled by or under common control with the Adviser that provides ongoing services to the Fund during the fiscal year in which the services are provided that would have to be approved by the Committee; (ii) the permissible non-audit services were not recognized by the Fund at the time of the engagement to be non-audit services; and (iii) such services are promptly brought to the attention of the Committee and approved by the Committee (or its delegate(s)) prior to the completion of the audit.
(2) For the Smith Barney Investment Series, the percentage of fees that were approved by the audit committee, with respect to: Audit-Related Fees were 100% and 100% for 2004 and 2005; Tax Fees were 100% and 100% for 2004 and 2005; and Other Fees were 100% and 100% for 2004 and 2005.
(f) N/A
(g) Non-audit fees billed by the Auditor for services rendered to Smith Barney Investment Series and CAM and any entity controlling, controlled by, or under common control with CAM that provides ongoing services to Smith Barney Investment Series during the reporting period were $0 in 2005 for fees related to the transfer agent matter as fully described in the notes the financial statements titled “additional information” and $75,000 for 2004.
(h) Yes. The Smith Barney Investment Series’ Audit Committee has considered whether the provision of non-audit services that were rendered to Service Affiliates which were not pre-approved (not requiring pre-approval) is compatible with maintaining the Accountant’s independence. All services provided by the Auditor to the Smith Barney Investment Series or to Service Affiliates, which were required to be pre-approved, were pre-approved as required.
| ITEM 5. | AUDIT COMMITTEE OF LISTED REGISTRANTS. |
Not applicable.
| ITEM 6. | SCHEDULE OF INVESTMENTS. |
Not applicable.
| ITEM 7. | DISCLOSURE OF PROXY VOTING POLICIES AND PROCEDURES FOR CLOSED-END MANAGEMENT INVESTMENT COMPANIES. |
Not applicable.
| ITEM 9. | PURCHASES OF EQUITY SECURITIES BY CLOSED-END MANAGEMENT INVESTMENT COMPANY AND AFFILIATED PURCHASERS. |
Not applicable.
| ITEM 10. | SUBMISSION OF MATTERS TO A VOTE OF SECURITY HOLDERS. |
Not applicable.
| ITEM 11. | CONTROLS AND PROCEDURES. |
| | (a) | The registrant’s principal executive officer and principal financial officer have concluded that the registrant’s disclosure controls and procedures (as defined in Rule 30a- 3(c) under the Investment Company Act of 1940, as amended (the “1940 Act”)) are effective as of a date within 90 days of the filing date of this report that includes the disclosure required by this paragraph, based on their evaluation of the disclosure controls and procedures required by Rule 30a-3(b) under the 1940 Act and 15d-15(b) under the Securities Exchange Act of 1934. |
| | (b) | There were no changes in the registrant’s internal control over financial reporting (as defined in Rule 30a-3(d) under the 1940 Act) that occurred during the registrant’s last fiscal half-year (the registrant’s second fiscal half-year in the case of an annual report) that have materially affected, or are likely to materially affect the registrant’s internal control over financial reporting. |
| | (a) | Code of Ethics attached hereto. |
Exhibit 99.CODE ETH
| | |
| Exhibit 99.CERT | | Certifications pursuant to section 302 of the Sarbanes-Oxley Act of 2002 |
| |
| Exhibit 99.906CERT | | Certifications pursuant to Section 906 of the Sarbanes-Oxley Act of 2002 |
SIGNATURES
Pursuant to the requirements of the Securities Exchange Act of 1934 and the Investment Company Act of 1940, the registrant has duly caused this Report to be signed on its behalf by the undersigned, there unto duly authorized.
| | |
| Smith Barney Investment Series |
| |
| By: | | /S/ R. JAY GERKEN |
| | | (R. Jay Gerken) |
| | | Chief Executive Officer of
Smith Barney Investment Series |
Date: January 9, 2006
Pursuant to the requirements of the Securities Exchange Act of 1934 and the Investment Company Act of 1940, this report has been signed below by the following persons on behalf of the registrant and in the capacities and on the dates indicated.
| | |
| |
| By: | | /S/ R. JAY GERKEN |
| | | (R. Jay Gerken) |
| | | Chief Executive Officer of
Smith Barney Investment Series |
Date: January 9, 2006
| | |
| |
| By: | | /S/ FRANCES M. GUGGINO |
| | | (Frances M. Guggino) |
| | | Chief Financial Officer of
Smith Barney Investment Series |
Date: January 9, 2006