UNITED STATES
SECURITIES AND EXCHANGE COMMISSION
Washington, D.C. 20549
FORM N-CSR
CERTIFIED SHAREHOLDER REPORT OF REGISTERED
MANAGEMENT INVESTMENT COMPANIES
Investment Company Act file number 811-5018
Legg Mason Partners Investment Series
(Exact name of registrant as specified in charter)
| | |
| 125 Broad Street, New York, NY | | 10004 |
| |
| (Address of principal executive offices) | | (Zip code) |
Robert I. Frenkel, Esq.
Legg Mason & Co., LLC
300 First Stamford Place, 4th Fl.
Stamford, CT 06902
(Name and address of agent for service)
Registrant’s telephone number, including area code: (800) 451-2010
Date of fiscal year end: October 31
Date of reporting period: October 31, 2006
| ITEM 1. | REPORT TO STOCKHOLDERS. |
The Annual Report to Stockholders is filed herewith.
ANNUAL REPORT
OCTOBER 31, 2006

Legg Mason Partners
International Fund
INVESTMENT PRODUCTS: NOT FDIC INSURED Ÿ NO BANK GUARANTEE Ÿ MAY LOSE VALUE
Legg Mason Partners International Fund
Annual Report • October 31, 2006
What’s
Inside
Fund Objective
The Fund seeks long-term capital growth. Dividend income, if any, is incidental to this goal.
Letter from the Chairman

R. JAY GERKEN, CFA
Chairman, President and Chief Executive Officer
Dear Shareholder,
While the U.S. economy continued to expand, it weakened considerably as the reporting period progressed. After expanding 4.1% in the third quarter of 2005, gross domestic product (“GDP”)i rose 1.7% during the last three months of the year. The economy then rebounded sharply in the first quarter of 2006. Over this period, GDP rose 5.6%, its highest reading since the third quarter of 2003. The economy then took a step backwards in the second quarter 2006, as GDP growth was 2.6% according to the U.S. Commerce Department. The preliminary estimate for third quarter GDP growth was 2.2%.
After increasing the federal funds rateii to 5.25% in June—its 17th consecutive rate hike—the Federal Reserve Board (“Fed”)iii paused from raising rates at its next four meetings. In its statement accompanying the December meeting, the Fed stated, “Economic growth has slowed over the course of the year, partly reflecting a substantial cooling of the housing market. Although recent indicators have been mixed, the economy seems likely to expand at a moderate pace on balance over coming quarters.” The Fed’s next meeting is at the end of January, and we believe any further rate movements will likely be data dependent.
For the 12-month period ended October 31, 2006, the U.S. stock market generated solid results, with the S&P 500 Indexiv returning 16.33%. For much of the period, stock prices moved in fits and starts due to continued interest rate hikes, high oil prices and inflationary pressures. However, toward the end of the period, several of these overhangs were removed, as the Fed paused from tightening rates and, after peaking at $78 a barrel in mid-July, subsequently oil prices fell 15% in the latter part of the third quarter.v
International equities also generated positive results during the reporting period and significantly outperformed their
Legg Mason Partners International Fund I
U.S. counterparts. During the 12 months ended October 31, 2006, the MSCI EAFE Indexvi returned 27.52%. As was the case in the U.S., international equities experienced periods of volatility, but rallied toward the end of period. One notable exception was Japan, as its equity market lagged the MSCI EAFE Index during the reporting period. Mixed economic data and concerns over the likelihood of higher interest rates dragged its market down.
Please read on for a more detailed look at prevailing economic and market conditions during the Fund’s fiscal year and to learn how those conditions have affected Fund performance.
Special Shareholder Notices
Shareholders approved a reorganization pursuant to which the Fund’s assets have been acquired, and its liabilities assumed by Legg Mason Partners Global Equity Fund, formerly known as Legg Mason Partners International Large Cap Fund, (the “Acquiring Fund”), in exchange for shares of the Acquiring Fund, effective as of the close of business on December 1, 2006. The Fund has been liquidated and shares of the Acquiring Fund have been distributed to Fund shareholders.
Effective August 1, 2006, Legg Mason Partners Fund Advisor, LLC (“LMPFA”) became the Fund’s investment manager and Batterymarch Financial Management, Inc. (“Batterymarch”) became the Fund’s subadviser. The portfolio managers who are responsible for the day-to-day management of the Fund remained the same immediately prior to and immediately after the date of these changes. LMPFA and Batterymarch are wholly-owned subsidiaries of Legg Mason.
The Fund was formerly known as Smith Barney International Fund.
Information About Your Fund
As you may be aware, several issues in the mutual fund industry have come under the scrutiny of federal and state regulators. Affiliates of the Fund’s manager have, in recent years, received requests for information from various government regulators regarding market timing, late trading,
II Legg Mason Partners International Fund
fees, and other mutual fund issues in connection with various investigations. The regulators appear to be examining, among other things, the Fund’s response to market timing and shareholder exchange activity, including compliance with prospectus disclosure related to these subjects. The Fund is not in a position to predict the outcome of these requests and investigations.
Important information with regard to recent regulatory developments that may affect the Fund is contained in the Notes to Financial Statements included in this report.
As always, thank you for your confidence in our stewardship of your assets. We look forward to helping you meet your financial goals.
Sincerely,

R. Jay Gerken, CFA
Chairman, President and Chief Executive Officer
December 13, 2006
All index performance reflects no deduction for fees, expenses or taxes. Please note that an investor cannot invest directly in an index.
| i | | Gross domestic product is a market value of goods and services produced by labor and property in a given country. |
| ii | | The federal funds rate is the interest rate that banks with excess reserves at a Federal Reserve district bank charge other banks that need overnight loans. |
| iii | | The Federal Reserve Board is responsible for the formulation of a policy designed to promote economic growth, full employment, stable prices, and a sustainable pattern of international trade and payments. |
| iv | | The S&P 500 Index is an unmanaged index of 500 stocks that is generally representative of the performance of larger companies in the U.S. |
| v | | Source: The Wall Street Journal, 9/29/06. |
| vi | | The MSCI EAFE Index is an unmanaged index of common stocks of companies located in Europe, Australasia and the Far East. Please note an investor cannot invest directly in an index. |
Legg Mason Partners International Fund III
Fund Overview
Q. What were the overall market conditions during the Fund’s reporting period?
A. During the period, returns from the international stock markets were strong. The end of 2005 saw Japan as the best performing region. The re-election of Prime Minister Koizumi in July of 2005 was interpreted as a mandate for reform and was credited with sparking a revival in the financial sector and galvanizing the corporate sector. This was coupled with more vibrant domestic activity and an ongoing demand for Japanese products from China. In the second half of the period, though, sentiment deteriorated even though fundamentals remained strong. Sector performance reflected the outlook for lower Japanese interest rates and hence a weakened yen. As a result, Japan ended the period as the second worst performing region.
For 2006 to date, positive performance in the international stock markets is led by Continental Europe as a result of buoyant consumer and business confidence. Early in the year, the European Central Bank (“ECB”) was sufficiently confident to raise rates for only the second time in 6 years. Mergers and acquisitions proved to be a major driver of the markets, as companies awash with cash were gearing up, either through acquisitions or internal growth. Growth within the Eurozone continued to accelerate due to strong export performance and reduced unemployment. Some ground was lost in a correction in May and June as inflation fears began to increase, but lost ground was recovered in this last quarter.
Legg Mason Partners International Fund 2006 Annual Report 1
Performance Review
For the 12 months ended October 31, 2006, Class A shares of the Legg Mason Partners International Fund, excluding sales charges, returned 24.67%. These shares underperformed the Lipper International Multi-Cap Growth Funds Category Average1 which returned 26.17% over the same time frame. The Fund’s unmanaged benchmark, the MSCI EAFE Indexi, returned 27.52% for the same period.
| | | | |
| Performance Snapshot as of October 31, 2006 (excluding sales charges) (unaudited) |
| | |
| | | 6 months | | 12 months |
International Fund — Class A Shares | | 3.04% | | 24.67% |
| |
MSCI EAFE Index | | 3.77% | | 27.52% |
| |
Lipper International Multi-Cap Growth Funds Category Average | | 1.18% | | 26.17% |
| |
| The performance shown represents past performance. Past performance is no guarantee of future results and current performance may be higher or lower than the performance shown above. Principal value and investment returns will fluctuate and investors’ shares, when redeemed, may be worth more or less than their original cost. To obtain performance data current to the most recent month-end, please visit our website at www.leggmason.com/InvestorServices. |
| Excluding sales charges, Class B shares returned 2.62% and Class C shares returned 2.90% over the six months ended October 31, 2006. Excluding sales charges, Class B shares returned 23.71% and Class C shares returned 24.34% over the twelve months ended October 31, 2006. All share class returns assume the reinvestment of all distributions, including returns of capital, if any, at net asset value and the deduction of all Fund expenses. Returns have not been adjusted to include sales charges that may apply when shares are purchased or the deduction of taxes that a shareholder would pay on Fund distributions. |
| Performance figures reflect reimbursements and/or fee waivers, without which the performance would have been lower. |
| Lipper, Inc. is a major independent mutual-fund tracking organization. Returns are based on the period ended October 31, 2006, including the reinvestment of all distributions, including returns of capital, if any, calculated among the 197 funds for the six-month period and among the 177 funds for the 12-month period in the Fund’s Lipper category and excluding sales charges. |
Q. What were the most significant factors affecting Fund performance?
What were the leading contributors to performance?
A. Overall, since February 2006 stock selection has contributed to relative performance in all major regions except Japan. In that period, the strongest stock selection was Continental Europe, specifically in the health care and materials sectors. Within those sectors, Schering AG (health care) and Arcelor S.A. (materials), both of which were subject to acquisition bids during the period, are two examples of stocks that benefited performance.
| 1 | | Lipper, Inc. is a major independent mutual-fund tracking organization. Returns are based on the 12-month period ended October 31, 2006, including the reinvestment of all distributions, including returns of capital, if any, calculated among the 177 funds in the Fund’s Lipper category, and excluding sales charges. |
2 Legg Mason Partners International Fund 2006 Annual Report
What were the leading detractors from performance?
A. Since February 2006, stock selection in Japan detracted from performance, as did an overweight in that region. The most difficult sector was financials, where stocks like OMC Card, Inc. and UFJ NICOS Co., Ltd. hurt performance.
Q. Were there any significant changes to the Fund during the reporting period?
A. There were no significant changes to the Fund made during the period.
As ever, we appreciate that you have chosen us to manage your assets.
Sincerely,
Batterymarch Financial Management, Inc.
December 4, 2006
The information provided is not intended to be a forecast of future events, a guarantee of future results or investment advice. Views expressed may differ from those of the firm as a whole.
Portfolio holdings and breakdowns are as of October 31, 2006 and are subject to change and may not be representative of the portfolio manager’s current or future investments. The Fund’s top ten holdings (as a percentage of net assets) as of this date were: BP PLC (2.1%), Toyota Motor Corp. (1.7%), Royal Bank of Scotland Group PLC (1.4%), HSBC Holdings PLC (1.4%), Fondiaria Sai SpA (1.3%), BNP Paribas SA (1.3%), Endesa SA (1.2%), Mittal Steel Co., NV (1.1%), Telefonica (1.1%), and Siemens (1.1%). Please refer to pages 9 through 15 for a list and percentage breakdown of the fund’s holdings.
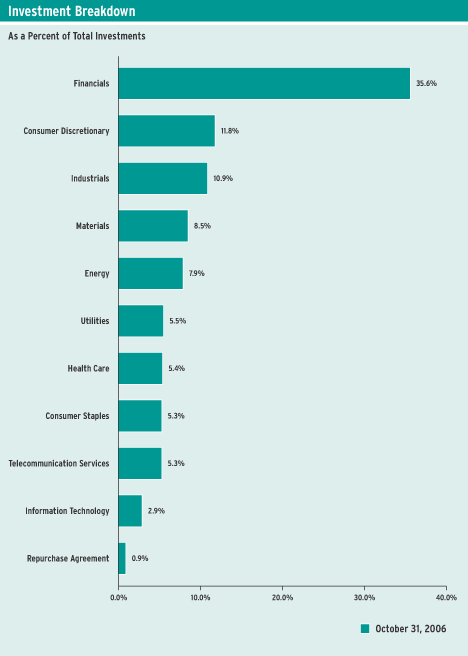
The mention of sector breakdowns is for informational purposes only and should not be construed as a recommendation to purchase or sell any securities. The information provided regarding such sectors is not a sufficient basis upon which to make an investment decision. Investors seeking financial advice regarding the appropriateness of investing in any securities or investment strategies discussed should consult their financial professional. Portfolio holdings are subject to change at any time and may not be representative of the portfolio manager’s current or future investments. The Fund’s top five sector holdings (as a percentage of net assets) as of October 31, 2006 were: Financials (35.8%), Consumer Discretionary (11.8%), Industrials (11.0%), Materials (8.6%), and Energy (7.9%). The Fund’s portfolio composition is subject to change at any time.
RISKS: Keep in mind that the Fund is subject to risks associated with overseas investing, which could result in significant market fluctuations. These risks include currency fluctuations, changes in political and economic conditions, differing securities regulations and periods of illiquidity, and are heightened for investments in the securities of issuers located in emerging markets. The Fund may engage in active and frequent trading, resulting in increased transaction costs, which could detract from the Fund’s performance. The Fund may use derivatives, such as options and futures, which can be illiquid, may disproportionately increase losses, and have a potentially large impact on Fund performance. Please see the Fund’s prospectus for more information on these and other risks.
All index performance reflects no deduction for fees, expenses or taxes. Please note an investor cannot invest directly in an index.
| i | | The MSCI EAFE Index is an unmanaged index of common stocks of companies located in Europe, Australasia and the Far East. |
Legg Mason Partners International Fund 2006 Annual Report 3
Fund at a Glance (unaudited)
4 Legg Mason Partners International Fund 2006 Annual Report
Fund Expenses (unaudited)
Example
As a shareholder of the Fund, you may incur two types of costs: (1) transaction costs, including front-end and back-end sales charges (loads) on purchase payments; and (2) ongoing costs, including management fees; distribution and/or service (12b-1) fees; and other Fund expenses. This example is intended to help you understand your ongoing costs (in dollars) of investing in the Fund and to compare these costs with the ongoing costs of investing in other mutual funds.
This example is based on an investment of $1,000 invested on May 1, 2006 and held for the six months ended October 31, 2006.
Actual Expenses
The table below titled “Based on Actual Total Return” provides information about actual account values and actual expenses. You may use the information provided in this table, together with the amount you invested, to estimate the expenses that you paid over the period. To estimate the expenses you paid on your account, divide your ending account value by $1,000 (for example, an $8,600 ending account value divided by $1,000 = 8.6), then multiply the result by the number under the heading entitled “Expenses Paid During the Period”.
| | | | | | | | | | | | | | | |
| Based on Actual Total Return(1) |
| | | | | |
| | | Actual Total Return Without Sales Charges(2) | | | Beginning
Account
Value | | Ending
Account
Value | | Annualized
Expense
Ratio | | | Expenses Paid During the Period(3) |
Class 1 | | 3.30 | % | | $ | 1,000.00 | | $ | 1,033.00 | | 1.56 | % | | $ | 7.99 |
| |
Class A | | 3.04 | | | | 1,000.00 | | | 1,030.40 | | 2.04 | | | | 10.44 |
| |
Class B | | 2.62 | | | | 1,000.00 | | | 1,026.20 | | 2.84 | | | | 14.50 |
| |
Class C | | 2.90 | | | | 1,000.00 | | | 1,029.00 | | 2.30 | | | | 11.76 |
| |
| (1) | | For the six months ended October 31, 2006. |
| (2) | | Assumes reinvestment of all distributions, including returns of capital, if any, at net asset value and does not reflect the deduction of the applicable sales charges with respect to Class 1 and A shares or the applicable contingent deferred sales charges (“CDSC”) with respect to Class B and C shares. Total return is not annualized, as it may not be representative of the total return for the year. Performance figures may reflect fee waivers and/or expense reimbursements. Past performance is no guarantee of future results. In the absence of fee waivers and/or expense reimbursements, the total return would have been lower. |
| (3) | | Expenses (net of fee waivers and/or expense reimbursements) are equal to each class’ respective annualized expense ratio, multiplied by the average account value over the period, multiplied by the number of days in the most recent fiscal half-year, then divided by 365. |
Legg Mason Partners International Fund 2006 Annual Report 5
Fund Expenses (unaudited) (continued)
Hypothetical Example for Comparison Purposes
The table below titled “Based on Hypothetical Total Return” provides information about hypothetical account values and hypothetical expenses based on the actual expense ratio and an assumed rate of return of 5.00% per year before expenses, which is not the Fund’s actual return. The hypothetical account values and expenses may not be used to estimate the actual ending account balance or expenses you paid for the period. You may use the information provided in this table to compare the ongoing costs of investing in the Fund and other funds. To do so, compare the 5.00% hypothetical example relating to the Fund with the 5.00% hypothetical examples that appear in the shareholder reports of the other funds.
Please note that the expenses shown in the table below are meant to highlight your ongoing costs only and do not reflect any transactional costs, such as front-end or back-end sales charges (loads). Therefore, the table is useful in comparing ongoing costs only, and will not help you determine the relative total costs of owning different funds. In addition, if these transaction costs were included, your costs would have been higher.
| | | | | | | | | | | | | | | |
| Based on Hypothetical Total Return(1) |
| | | | | |
| | | Hypothetical
Annualized
Total Return | | | Beginning
Account
Value | | Ending
Account
Value | | Annualized
Expense
Ratio | | | Expenses
Paid During the Period(2) |
Class 1 | | 5.00 | % | | $ | 1,000.00 | | $ | 1,017.34 | | 1.56 | % | | $ | 7.93 |
| |
Class A | | 5.00 | | | | 1,000.00 | | | 1,014.92 | | 2.04 | | | | 10.36 |
| |
Class B | | 5.00 | | | | 1,000.00 | | | 1,010.89 | | 2.84 | | | | 14.39 |
| |
Class C | | 5.00 | | | | 1,000.00 | | | 1,013.61 | | 2.30 | | | | 11.67 |
| |
| (1) | | For the six months ended October 31, 2006. |
| (2) | | Expenses (net of fee waivers and/or expense reimbursements) are equal to each class’ respective annualized expense ratio, multiplied by the average account value over the period, multiplied by the number of days in the most recent fiscal half-year, then divided by 365. |
6 Legg Mason Partners International Fund 2006 Annual Report
Fund Performance
| | | | | | | | | | | | |
| Average Annual Total Returns(1) (unaudited) | | | | | | | |
| |
| | | Without Sales Charges(2) | |
| | | Class 1 | | | Class A | | | Class B | | | Class C | |
Twelve Months Ended 10/31/06 | | 25.18 | % | | 24.67 | % | | 23.71 | % | | 24.34 | % |
| | |
Five Years Ended 10/31/06 | | 7.72 | | | 7.13 | | | 6.22 | | | 7.26 | |
| | |
Ten Years Ended 10/31/06 | | 6.27 | | | 5.74 | | | 4.89 | | | N/A | |
| | |
Inception* through 10/31/06 | | 6.45 | | | 7.91 | | | 7.07 | | | (7.51 | ) |
| | |
| |
| | | With Sales Charges(3) | |
| | | Class 1 | | | Class A | | | Class B | | | Class C | |
Twelve Months Ended 10/31/06 | | 14.56 | % | | 18.44 | % | | 18.71 | % | | 23.34 | % |
| | |
Five Years Ended 10/31/06 | | 5.82 | | | 6.04 | | | 6.06 | | | 7.26 | |
| | |
Ten Years Ended 10/31/06 | | 5.33 | | | 5.20 | | | 4.89 | | | N/A | |
| | |
Inception* through 10/31/06 | | 5.52 | | | 7.44 | | | 7.07 | | | (7.51 | ) |
| | |
| | | | | | | | | |
| Cumulative Total Returns(1) (unaudited) | | | | | | | |
| |
| | | Without Sales Charges(2) |
Class 1 (10/31/96 through 10/31/06) | | | | | | 83.63 | % | | |
| |
Class A (10/31/96 through 10/31/06) | | | | | | 74.79 | | | |
| |
Class B (10/31/96 through 10/31/06) | | | | | | 61.23 | | | |
| |
Class C (Inception* through 10/31/06) | | | | | | (38.06 | ) | | |
| |
| (1) | | All figures represent past performance and are not a guarantee of future results. Investment return and principal value of an investment will fluctuate so that an investor’s shares, when redeemed, may be worth more or less than their original cost. The returns shown do not reflect the deduction of taxes that a shareholder would pay on Fund distributions or the redemption of Fund shares. Performance figures may reflect fee waivers and/or expense reimbursements. In the absence of fee waivers and/or expense reimbursements, the total return would have been lower. |
| (2) | | Assumes reinvestment of all distributions, including returns of capital, if any, at net asset value and does not reflect the deduction of the applicable sales charges with respect to Class 1 and A shares or the applicable CDSC with respect to Class B and C shares. |
| (3) | | Assumes reinvestment of all distributions, including returns of capital, if any, at net asset value. In addition, Class 1 and A shares reflect the deduction of the maximum initial sales charges of 8.50% and 5.00%, respectively. Class B shares reflect the deduction of a 5.00% CDSC, which applies if shares are redeemed within one year from purchase payment. Thereafter, the CDSC declines by 1.00% per year until no CDSC is incurred. Class C shares reflect the deduction of a 1.00% CDSC, which applies if shares are redeemed within one year from purchase payment. |
| * | | Inception date for Class 1 shares is August 8, 1996. Inception date for Class A and B shares is March 17, 1995. Inception date for Class C shares is September 13, 2000. |
Legg Mason Partners International Fund 2006 Annual Report 7
Historical Performance (unaudited)
Value of $10,000 Invested in Class A and B Shares of the Legg Mason Partners International Fund vs. MSCI EAFE Index† (October 1996 — October 2006)
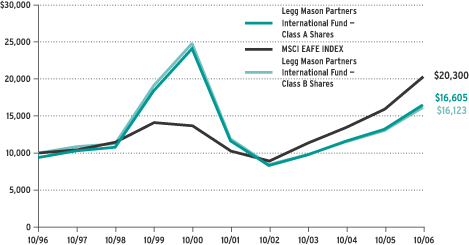
| † | | Hypothetical illustration of $10,000 invested in Class A and B shares on October 31, 1996, assuming deduction of the maximum initial sales charge of 5.00% at the time of investment for Class A shares. It also assumes reinvestment of all distributions, including returns of capital, if any, at net asset value through October 31, 2006. The Morgan Stanley Capital International Europe, Australasia and the Far East Index (“MSCI EAFE”) is a composite portfolio consisting of equity total returns for the countries of Europe, Australasia and the Far East. The Index is unmanaged and is not subject to the same management and trading expenses of a mutual fund. The performance of the Fund’s other classes may be greater or less than the performance of Class A and B shares as indicated on this chart, depending on whether greater or lesser sales charges and fees were incurred by shareholders investing in the other classes. Please note that an Investor may not invest directly in an index. |
All figures represent past performance and are not a guarantee of future results. The investment return and principal value of an investment will fluctuate so that an investor’s shares, when redeemed, may be worth more or less than their original cost. The returns shown do not reflect the deduction of taxes that a shareholder would pay on Fund distributions or the redemption of Fund shares. Performance figures may reflect fee waivers and/or expense reimbursements. In the absence of fee waivers and/or expense reimbursements, the total return would have been lower.
8 Legg Mason Partners International Fund 2006 Annual Report
Schedule of Investments (October 31, 2006)
LEGG MASON PARTNERS INTERNATIONAL FUND
| | | | | |
| | |
| Shares | | Security | | Value |
| | | | | |
| COMMON STOCKS — 99.3% | | | |
| Australia — 3.1% | | | |
| 56,450 | | BHP Billiton Ltd. | | $ | 1,192,312 |
| 20,350 | | Caltex Australia Ltd. | | | 348,995 |
| 12,550 | | Commonwealth Bank of Australia | | | 463,493 |
| 30,600 | | Leighton Holdings Ltd. | | | 503,930 |
| 52,550 | | QBE Insurance Group Ltd. | | | 1,004,965 |
| 14,000 | | Rio Tinto Ltd. | | | 849,817 |
| |
| | Total Australia | | | 4,363,512 |
| |
| Austria — 0.7% | | | |
| 9,600 | | Boehler-Uddeholm AG | | | 595,645 |
| 6,300 | | OMV AG | | | 342,694 |
| |
| | Total Austria | | | 938,339 |
| |
| Belgium — 2.0% | | | |
| 5,400 | | Delhaize Group | | | 436,917 |
| 25,800 | | Dexia | | | 697,259 |
| 21,500 | | Fortis | | | 903,152 |
| 5,500 | | InBev NV | | | 310,066 |
| 5,000 | | Mobistar SA | | | 414,771 |
| |
| | Total Belgium | | | 2,762,165 |
| |
| Bermuda — 0.3% | | | |
| 45,000 | | Esprit Holdings Ltd. | | | 435,624 |
| |
| Canada — 3.2% | | | |
| 6,500 | | Canadian Imperial Bank of Commerce | | | 507,215 |
| 9,800 | | Canadian Pacific Railway Ltd. | | | 553,465 |
| 11,400 | | Industrial Alliance Insurance and Financial Services Inc. | | | 335,115 |
| 15,300 | | Royal Bank of Canada | | | 678,728 |
| 15,900 | | Shaw Communications Inc. | | | 521,643 |
| 11,300 | | Sun Life Financial Inc. | | | 475,313 |
| 9,000 | | TELUS Corp. | | | 520,551 |
| 7,300 | | Toronto-Dominion Bank | | | 423,330 |
| 21,500 | | TransAlta Corp. | | | 451,412 |
| |
| | Total Canada | | | 4,466,772 |
| |
| Cayman Islands — 0.3% | | | |
| 238,000 | | Hutchison Telecommunications International Ltd.* | | | 458,345 |
| |
| Denmark — 1.3% | | | |
| 8,950 | | Carlsberg A/S | | | 769,873 |
| 10,400 | | Danske Bank A/S | | | 436,608 |
| 4,550 | | Topdanmark A/S* | | | 646,335 |
| |
| | Total Denmark | | | 1,852,816 |
| |
| Finland — 1.2% | | | |
| 8,300 | | Metso Corp. | | | 360,956 |
| 22,361 | | Nokia Oyj | | | 444,099 |
See Notes to Financial Statements.
Legg Mason Partners International Fund 2006 Annual Report 9
Schedule of Investments (October 31, 2006) (continued)
| | | | | |
| | |
| Shares | | Security | | Value |
| | | | | |
| Finland — 1.2% (continued) | | | |
| 18,500 | | Sampo Oyj, A Shares | | $ | 401,207 |
| 18,350 | | SanomaWSOY Oyj | | | 473,654 |
| |
| | Total Finland | | | 1,679,916 |
| |
| France — 8.3% | | | |
| 16,400 | | Air France-KLM | | | 584,605 |
| 5,100 | | Assurances Generales de France | | | 716,509 |
| 16,212 | | BNP Paribas SA | | | 1,783,818 |
| 9,800 | | Bouygues SA | | | 571,756 |
| 8,400 | | Capgemini SA | | | 477,417 |
| 3,500 | | Ciments Francais SA | | | 595,877 |
| 9,000 | | Compagnie de Saint-Gobain | | | 663,825 |
| 2,300 | | Natexis Banques Populaires | | | 636,275 |
| 4,900 | | Pinault Printemps Redoute SA | | | 731,593 |
| 2,800 | | Sanofi-Aventis | | | 238,172 |
| 8,380 | | Societe Generale | | | 1,393,522 |
| 21,600 | | Suez SA | | | 967,218 |
| 20,752 | | Total SA | | | 1,406,061 |
| 1,800 | | Vallourec SA | | | 448,297 |
| 3,400 | | Vinci SA | | | 383,224 |
| |
| | Total France | | | 11,598,169 |
| |
| Germany — 4.8% | | | |
| 21,850 | | Altana AG | | | 1,220,365 |
| 12,950 | | Bayerische Motoren Werke AG | | | 744,288 |
| 2,900 | | Deutsche Bank AG | | | 360,128 |
| 24,650 | | Deutsche Lufthansa AG | | | 568,897 |
| 6,700 | | Deutsche Postbank AG | | | 498,716 |
| 2,338 | | E.ON AG | | | 280,693 |
| 4,851 | | Fresenius Medical Care AG & Co. | | | 647,698 |
| 8,750 | | Heidelberger Druckmaschinen AG | | | 398,518 |
| 4,700 | | Salzgitter AG | | | 503,098 |
| 16,601 | | Siemens AG | | | 1,494,796 |
| |
| | Total Germany | | | 6,717,197 |
| |
| Greece — 0.4% | | | |
| 17,360 | | Alpha Bank AE | | | 505,526 |
| |
| Hong Kong — 1.1% | | | |
| 219,985 | | Hang Lung Properties Ltd. | | | 480,780 |
| 209,000 | | Li & Fung Ltd. | | | 544,096 |
| 286,000 | | Sino Land Co., Ltd. | | | 497,839 |
| |
| | Total Hong Kong | | | 1,522,715 |
| |
| Italy — 5.8% | | | |
| 67,700 | | Banca Intesa SpA | | | 463,028 |
| 18,000 | | Banca Popolare di Verona e Novara Scrl | | | 484,850 |
| 22,000 | | Banche Popolari Unite Scpa | | | 604,115 |
| 92,600 | | Capitalia SpA | | | 819,011 |
See Notes to Financial Statements.
10 Legg Mason Partners International Fund 2006 Annual Report
Schedule of Investments (October 31, 2006) (continued)
| | | | | |
| | |
| Shares | | Security | | Value |
| | | | | |
| Italy — 5.8% (continued) | | | |
| 37,726 | | Eni SpA | | $ | 1,138,579 |
| 32,400 | | Fiat SpA* | | | 572,303 |
| 41,026 | | Fondiaria Sai SpA | | | 1,827,656 |
| 25,700 | | Saipem SpA | | | 606,588 |
| 756,400 | | Seat Pagine Gialle SpA | | | 421,691 |
| 133,250 | | UniCredito Italiano SpA | | | 1,105,364 |
| |
| | Total Italy | | | 8,043,185 |
| |
| Japan — 21.0% | | | |
| 102,500 | | Bank of Yokohama Ltd. | | | 793,186 |
| 15,900 | | Bridgestone Corp. | | | 332,101 |
| 5,850 | | Canon Inc. | | | 313,983 |
| 115,000 | | Dainippon Ink and Chemicals Inc. | | | 435,114 |
| 35,000 | | Dowa Mining Co., Ltd. | | | 294,813 |
| 13,300 | | Elpida Memory Inc.* | | | 621,623 |
| 120,000 | | Fuji Electric Holdings Co., Ltd. | | | 653,313 |
| 92,000 | | Gunma Bank Ltd. | | | 643,417 |
| 15,500 | | Hisamitsu Pharmaceutical Co. Inc. | | | 447,141 |
| 3,900 | | Hitachi Construction Machinery Co., Ltd. | | | 92,809 |
| 29,600 | | Hokkaido Electric Power Co. Inc. | | | 706,934 |
| 30,420 | | Honda Motor Co., Ltd. | | | 1,078,059 |
| 14,100 | | Hoya Corp. | | | 545,557 |
| 174,000 | | Ishikawajima-Harima Heavy Industries Co., Ltd. | | | 586,852 |
| 89,000 | | Itochu Corp. | | | 710,050 |
| 58,000 | | JTEKT Corp. | | | 1,208,954 |
| 172 | | Jupiter Telecommunications Co.* | | | 139,726 |
| 19,000 | | Kansai Electric Power Co. Inc. | | | 448,896 |
| 49 | | KDDI Corp. | | | 305,778 |
| 136,000 | | Kobe Steel Ltd. | | | 416,778 |
| 19,800 | | Komatsu Ltd. | | | 357,627 |
| 29,500 | | Konica Minolta Holdings Inc.* | | | 393,434 |
| 18,800 | | Leopalace21 Corp. | | | 708,098 |
| 144,000 | | Marubeni Corp. | | | 738,367 |
| 53,000 | | Matsushita Electric Industrial Co., Ltd. | | | 1,109,271 |
| 64,000 | | Mazda Motor Corp. | | | 433,350 |
| 29,300 | | Mitsubishi Corp. | | | 566,838 |
| 101,500 | | Mitsubishi Electric Corp. | | | 886,235 |
| 101 | | Mitsubishi UFJ Financial Group Inc. | | | 1,270,930 |
| 30,000 | | Mitsui & Co., Ltd. | | | 410,118 |
| 97 | | Mizuho Financial Group Inc. | | | 756,437 |
| 43,000 | | NTN Corp. | | | 354,468 |
| 3,320 | | ORIX Corp. | | | 936,432 |
| 35,200 | | Ricoh Co., Ltd. | | | 696,045 |
| 56,000 | | Sekisui Chemical Co., Ltd. | | | 495,669 |
| 21,700 | | Seven & I Holdings Co., Ltd. | | | 696,585 |
| 24,000 | | Sharp Corp. | | | 428,351 |
| 97,000 | | Showa Denko KK | | | 423,472 |
See Notes to Financial Statements.
Legg Mason Partners International Fund 2006 Annual Report 11
Schedule of Investments (October 31, 2006) (continued)
| | | | | |
| | |
| Shares | | Security | | Value |
| | | | | |
| Japan — 21.0% (continued) | | | |
| 58,000 | | Sompo Japan Insurance Inc. | | $ | 772,539 |
| 20,000 | | Stanley Electric Co., Ltd. | | | 397,192 |
| 64 | | Sumitomo Mitsui Financial Group Inc. | | | 701,250 |
| 15,300 | | Suzuki Motor Corp. | | | 434,823 |
| 4,000 | | T&D Holdings Inc. | | | 292,758 |
| 5,050 | | Takeda Pharmaceutical Co., Ltd. | | | 324,649 |
| 11,130 | | Tokyo Electric Power Co. Inc. | | | 323,934 |
| 39,950 | | Toyota Motor Corp. | | | 2,369,915 |
| 18,000 | | Yamaha Motor Co., Ltd. | | | 493,066 |
| 61,000 | | Yaskawa Electric Corp. | | | 651,669 |
| |
| | Total Japan | | | 29,198,606 |
| |
| Netherlands — 6.1% | | | |
| 32,390 | | ABN Amro Holding NV | | | 945,270 |
| 68,100 | | Hagemeyer NV* | | | 349,649 |
| 6,050 | | Heineken NV | | | 274,388 |
| 21,500 | | ING Groep NV, CVA | | | 953,129 |
| 76,900 | | Koninklijke Ahold NV* | | | 810,287 |
| 93,073 | | Koninklijke KPN NV | | | 1,244,598 |
| 35,898 | | Mittal Steel Co., NV | | | 1,542,816 |
| 38,700 | | Royal Dutch Shell PLC, Class A Shares | | | 1,341,960 |
| 22,200 | | Vedior NV, CVA | | | 406,311 |
| 22,800 | | Wolters Kluwer NV | | | 627,248 |
| |
| | Total Netherlands | | | 8,495,656 |
| |
| Norway — 1.5% | | | |
| 39,300 | | DNB NOR ASA | | | 514,818 |
| 7,600 | | Petroleum Geo-Services ASA* | | | 442,543 |
| 68,600 | | Telenor ASA | | | 1,083,932 |
| |
| | Total Norway | | | 2,041,293 |
| |
| Portugal — 0.9% | | | |
| 31,406 | | Banco Espirito Santo SA | | | 498,188 |
| 165,700 | | Energias de Portugal SA | | | 744,944 |
| |
| | Total Portugal | | | 1,243,132 |
| |
| Singapore — 1.0% | | | |
| 176,000 | | CapitaLand Ltd. | | | 615,879 |
| 75,000 | | Keppel Corp. Ltd. | | | 760,859 |
| |
| | Total Singapore | | | 1,376,738 |
| |
| Spain — 4.3% | | | |
| 10,300 | | Banco Bilbao Vizcaya Argentaria SA | | | 248,896 |
| 63,550 | | Banco Santander Central Hispano SA | | | 1,100,611 |
| 96,000 | | Corporacion Mapfre SA | | | 425,461 |
| 36,084 | | Endesa SA | | | 1,601,044 |
| 5,400 | | Fomento de Construcciones y Contratas SA | | | 471,057 |
| 16,700 | | Red Electrica de Espana | | | 648,622 |
| 79,725 | | Telefonica SA | | | 1,537,553 |
| |
| | Total Spain | | | 6,033,244 |
| |
See Notes to Financial Statements.
12 Legg Mason Partners International Fund 2006 Annual Report
Schedule of Investments (October 31, 2006) (continued)
| | | | | |
| | |
| Shares | | Security | | Value |
| | | | | |
| Sweden — 2.1% | | | |
| 12,600 | | Alfa Laval AB | | $ | 466,990 |
| 33,700 | | Boliden AB | | | 744,738 |
| 9,900 | | Nobia AB | | | 351,147 |
| 20,900 | | Skandinaviska Enskilda Banken AB | | | 584,939 |
| 21,100 | | Swedbank AB | | | 691,396 |
| |
| | Total Sweden | | | 2,839,210 |
| |
| Switzerland — 5.7% | | | |
| 4,700 | | Baloise Holding AG | | | 450,123 |
| 9,054 | | Holcim Ltd. | | | 780,398 |
| 2,500 | | Julius Baer Holding Ltd. | | | 264,376 |
| 3,678 | | Nestle SA | | | 1,258,018 |
| 22,200 | | Novartis AG | | | 1,348,919 |
| 6,950 | | Roche Holding AG | | | 1,217,669 |
| 5,956 | | Swiss Life Holding | | | 1,406,854 |
| 13,200 | | UBS AG | | | 789,312 |
| 1,800 | | Zurich Financial Services AG | | | 445,455 |
| |
| | Total Switzerland | | | 7,961,124 |
| |
| United Kingdom — 24.2% | | | |
| 24,200 | | Anglo American PLC | | | 1,091,744 |
| 13,930 | | AstraZeneca PLC | | | 823,551 |
| 33,700 | | Aviva PLC | | | 498,413 |
| 100,283 | | Barclays PLC | | | 1,353,978 |
| 21,900 | | Barratt Developments PLC | | | 452,617 |
| 14,500 | | Bellway PLC | | | 372,729 |
| 16,100 | | Berkeley Group Holdings PLC* | | | 442,432 |
| 86,650 | | BG Group PLC | | | 1,150,068 |
| 263,463 | | BP PLC | | | 2,931,205 |
| 119,133 | | Brit Insurance Holdings PLC | | | 736,606 |
| 88,300 | | British Airways PLC* | | | 774,291 |
| 42,600 | | British American Tobacco PLC | | | 1,161,715 |
| 52,000 | | British Energy Group PLC* | | | 417,280 |
| 15,000 | | British Land Co. PLC | | | 427,947 |
| 202,800 | | Cable & Wireless PLC | | | 566,974 |
| 20,400 | | Charter PLC* | | | 358,938 |
| 26,800 | | Collins Stewart Tullett PLC | | | 438,814 |
| 38,697 | | Drax Group PLC | | | 601,854 |
| 108,300 | | DSG International PLC | | | 449,516 |
| 76,300 | | GKN PLC | | | 444,830 |
| 46,599 | | GlaxoSmithKline PLC | | | 1,244,981 |
| 52,882 | | HBOS PLC | | | 1,096,971 |
| 105,600 | | HSBC Holdings PLC | | | 2,003,126 |
| 75,300 | | Imperial Chemical Industries PLC | | | 584,495 |
| 224,400 | | Legal & General Group PLC | | | 618,798 |
| 129,850 | | Lloyds TSB Group PLC | | | 1,386,436 |
| 9,200 | | Lonmin PLC | | | 509,499 |
| 117,600 | | Man Group PLC | | | 1,095,179 |
See Notes to Financial Statements.
Legg Mason Partners International Fund 2006 Annual Report 13
Schedule of Investments (October 31, 2006) (continued)
| | | | | | | |
| | |
| Shares | | Security | | Value | |
| | United Kingdom — 24.2% (continued) | | | | |
| | 34,700 | | Northern Rock PLC | | $ | 792,650 | |
| | 16,700 | | Persimmon PLC | | | 425,457 | |
| | 115,100 | | Premier Foods PLC | | | 596,902 | |
| | 58,900 | | Prudential PLC | | | 722,181 | |
| | 16,600 | | Rio Tinto PLC | | | 916,145 | |
| | 56,215 | | Royal Bank of Scotland Group PLC | | | 2,003,951 | |
| | 23,300 | | Royal Dutch Shell PLC, Class B Shares | | | 835,044 | |
| | 58,940 | | Scottish & Newcastle PLC | | | 634,377 | |
| | 18,100 | | Severn Trent PLC | | | 482,194 | |
| | 66,200 | | Tesco PLC | | | 499,310 | |
| | 64,800 | | Tullow Oil PLC | | | 481,660 | |
| | 17,600 | | Vedanta Resources PLC | | | 491,041 | |
| | 283,800 | | Vodafone Group PLC | | | 731,146 | |
| | | |
| | | Total United Kingdom | | | 33,647,045 | |
| | | |
| | | TOTAL COMMON STOCKS
(Cost — $121,903,072) | | | 138,180,329 | |
| | | |
| | PREFERRED STOCKS — 0.5% | | | | |
| | Germany — 0.5% | | | | |
| | 26,900 | | ProSiebenSat.1 Media AG, 0.000% (Cost — $679,105) | | | 769,589 | |
| | | |
| | RIGHT — 0.0% | | | | |
| | Japan — 0.0% | | | | |
| | 35,000 | | Dowa Mining (a)(b)* (Cost — $0) | | | 14,568 | |
| | | |
| | | TOTAL INVESTMENTS BEFORE SHORT-TERM INVESTMENT
(Cost — $122,582,177) | | | 138,964,486 | |
| | | |
| | |
Face
Amount | | | | | |
| | SHORT-TERM INVESTMENT — 1.0% | | | | |
| | Repurchase Agreement — 1.0% | | | | |
| $ | 1,323,000 | | Interest in $382,313,000 joint tri-party repurchase agreement dated 10/31/06 with Banc of America Securities LLC, 5.290% due 11/1/06; Proceeds at maturity — $1,323,194; (Fully collateralized by various U.S. government agency obligations, 0.000% to 5.375% due 9/18/07 to 5/15/19; Market value — $1,349,470) (Cost — $1,323,000) | | | 1,323,000 | |
| | | |
| | | TOTAL INVESTMENTS — 100.8% (Cost — $123,905,177#) | | | 140,287,486 | |
| | | Liabilities in Excess of Other Assets — (0.8)% | | | (1,084,106 | ) |
| | | |
| | | TOTAL NET ASSETS — 100.0% | | $ | 139,203,380 | |
| | | |
| * | | Non-income producing security. |
| (b) | | Security is valued in good faith at fair value by or under the direction of the Board of Trustees. (See Note 1). |
| # | | Aggregate cost for federal income tax purposes is $124,032,943. |
|
| Abbreviation used in this schedule: |
| CVA — Certificaaten van aandelen (Share Certificates) |
See Notes to Financial Statements.
14 Legg Mason Partners International Fund 2006 Annual Report
Schedule of Investments (October 31, 2006) (continued)
Summary of Investments by Sector†
| | | |
Financials | | 35.6 | % |
Consumer Discretionary | | 11.8 | |
Industrials | | 10.9 | |
Materials | | 8.5 | |
Energy | | 7.9 | |
Utilities | | 5.5 | |
Health Care | | 5.4 | |
Consumer Staples | | 5.3 | |
Telecommunication Services | | 5.3 | |
Information Technology | | 2.9 | |
Repurchase Agreement | | 0.9 | |
| | |
| | 100.0 | % |
| | |
| † | | As a percentage of total investments. Please note that Fund holdings are as of October 31, 2006 and are subject to change. |
See Notes to Financial Statements.
Legg Mason Partners International Fund 2006 Annual Report 15
Statement of Assets and Liabilities (October 31, 2006)
| | | | |
| ASSETS: | | | | |
Investments, at value (Cost — $123,905,177) | | $ | 140,287,486 | |
Foreign currency, at value (Cost — $46,587) | | | 47,092 | |
Cash | | | 836 | |
Receivable for securities sold | | | 1,515,049 | |
Dividends and interest receivable | | | 242,240 | |
Receivable for Fund shares sold | | | 135,669 | |
Prepaid expenses | | | 22,931 | |
| | |
Total Assets | | | 142,251,303 | |
| | |
| LIABILITIES: | | | | |
Payable for securities purchased | | | 2,445,284 | |
Payable for Fund shares repurchased | | | 184,669 | |
Investment management fee payable | | | 134,579 | |
Distribution fees payable | | | 25,170 | |
Trustees’ retirement plan | | | 3,933 | |
Trustees’ fees payable | | | 1,913 | |
Accrued expenses | | | 252,375 | |
| | |
Total Liabilities | | | 3,047,923 | |
| | |
Total Net Assets | | $ | 139,203,380 | |
| | |
| NET ASSETS: | | | | |
Par value (Note 6) | | $ | 51 | |
Paid-in capital in excess of par value | | | 181,156,690 | |
Undistributed net investment income | | | 498,125 | |
Accumulated net realized loss on investments and foreign currency transactions | | | (58,844,209 | ) |
Net unrealized appreciation on investments and foreign currencies | | | 16,392,723 | |
| | |
Total Net Assets | | $ | 139,203,380 | |
| | |
Shares Outstanding: | | | | |
Class 1 | | | 131,268 | |
| |
Class A | | | 2,760,946 | |
| |
Class B | | | 2,165,191 | |
| |
Class C | | | 62,524 | |
| |
Net Asset Value: | | | | |
Class 1 (and redemption price) | | | $29.45 | |
| |
Class A (and redemption price) | | | $28.13 | |
| |
Class B * | | | $25.82 | |
| |
Class C * | | | $28.37 | |
| |
Maximum Public Offering Price Per Share: | | | | |
Class 1 (based on maximum initial sales charge of 8.50%) | | | $32.19 | |
| |
Class A (based on maximum initial sales charge of 5.00%) | | | $29.61 | |
| | |
| * | | Redemption price is NAV of Class B and C shares reduced by a 5.00% and 1.00% CDSC, respectively, if shares are redeemed within one year from purchase payment (See Note 2). |
See Notes to Financial Statements.
16 Legg Mason Partners International Fund 2006 Annual Report
Statement of Operations (For the year ended October 31, 2006)
| | | | |
| INVESTMENT INCOME: | | | | |
Dividends | | $ | 3,596,906 | |
Interest | | | 62,763 | |
Income from securities lending | | | 10,946 | |
Less: Foreign taxes withheld | | | (259,056 | ) |
| | |
Total Investment Income | | | 3,411,559 | |
| | |
| EXPENSES: | | | | |
Investment management fee (Note 2) | | | 1,096,660 | |
Transfer agent fees (Note 2 and 4) | | | 854,385 | |
Distribution fees (Note 2 and 4) | | | 729,683 | |
Shareholder reports (Note 4) | | | 73,739 | |
Custody fees | | | 70,353 | |
Merger and proxy fees | | | 61,032 | |
Legal fees | | | 59,502 | |
Registration fees | | | 52,923 | |
Audit and tax | | | 28,033 | |
Trustees’ fees | | | 21,821 | |
Insurance | | | 2,458 | |
Miscellaneous expenses | | | 5,241 | |
| | |
Total Expenses | | | 3,055,830 | |
Less: Fee waivers and/or expense reimbursements (Notes 2 and 8) | | | (107,759 | ) |
| | |
Net Expenses | | | 2,948,071 | |
| | |
Net Investment Income | | | 463,488 | |
| | |
REALIZED AND UNREALIZED GAIN (LOSS) ON INVESTMENTS
AND FOREIGN CURRENCY TRANSACTIONS (NOTES 1 AND 3): | | | | |
Net Realized Gain (Loss) From: | | | | |
Investment transactions | | | 31,489,020 | |
Foreign currency transactions | | | (34,079 | ) |
| | |
Net Realized Gain | | | 31,454,941 | |
| | |
Change in Net Unrealized Appreciation/Depreciation From: | | | | |
Investments | | | (4,279,253 | ) |
Foreign currencies | | | 8,118 | |
| | |
Change in Net Unrealized Appreciation/Depreciation | | | (4,271,135 | ) |
| | |
Increase From Payment by Affiliate (Note 2) | | | 2,544 | |
| | |
Net Gain on Investments and Foreign Currency Transactions | | | 27,186,350 | |
| | |
Increase in Net Assets From Operations | | $ | 27,649,838 | |
| | |
See Notes to Financial Statements.
Legg Mason Partners International Fund 2006 Annual Report 17
Statements of Changes in Net Assets (For the years ended October 31,)
| | | | | | | | |
| | |
| | | 2006 | | | 2005 | |
| OPERATIONS: | | | | | | | | |
Net investment income | | $ | 463,488 | | | $ | 1,067,235 | |
Net realized gain | | | 31,454,941 | | | | 9,077,225 | |
Change in net unrealized appreciation/depreciation | | | (4,271,135 | ) | | | 4,527,819 | |
Increase from payment by affiliate | | | 2,544 | | | | — | |
| | |
Increase in Net Assets From Operations | | | 27,649,838 | | | | 14,672,279 | |
| | |
| DISTRIBUTIONS TO SHAREHOLDERS FROM (NOTES 1 AND 5): | | | | | | | | |
Net investment income | | | (984,447 | ) | | | — | |
| | |
Decrease in Net Assets From Distributions to Shareholders | | | (984,447 | ) | | | — | |
| | |
| FUND SHARE TRANSACTIONS (NOTE 6): | | | | | | | | |
Net proceeds from sale of shares | | | 21,405,982 | | | | 14,961,550 | |
Reinvestment of distributions | | | 919,680 | | | | — | |
Cost of shares repurchased | | | (27,862,798 | ) | | | (22,888,590 | ) |
| | |
Decrease in Net Assets From Fund Share Transactions | | | (5,537,136 | ) | | | (7,927,040 | ) |
| | |
Increase in Net Assets | | | 21,128,255 | | | | 6,745,239 | |
| NET ASSETS: | | | | | | | | |
Beginning of year | | | 118,075,125 | | | | 111,329,886 | |
| | |
End of year* | | $ | 139,203,380 | | | $ | 118,075,125 | |
| | |
* Includes undistributed net investment income of: | | | $498,125 | | | | $984,448 | |
| | |
See Notes to Financial Statements.
18 Legg Mason Partners International Fund 2006 Annual Report
Financial Highlights
For a share of each class of beneficial interest outstanding throughout each year ended October 31:
| | | | | | | | | | | | | | | | | | | | |
| | | | | |
| Class 1 Shares(1) | | 2006 | | | 2005 | | | 2004 | | | 2003 | | | 2002 | |
Net Asset Value, Beginning of Year | | $ | 23.84 | | | $ | 20.88 | | | $ | 17.50 | | | $ | 14.83 | | | | $20.58 | |
| | |
Income (Loss) From Operations: | | | | | | | | | | | | | | | | | | | | |
Net investment income (loss) | | | 0.28 | | | | 0.35 | | | | 0.09 | | | | 0.00 | (2) | | | (0.19 | ) |
Net realized and unrealized gain (loss) | | | 5.67 | | | | 2.61 | | | | 3.29 | | | | 2.67 | | | | (5.56 | ) |
| | |
Total Income (Loss) From Operations | | | 5.95 | | | | 2.96 | | | | 3.38 | | | | 2.67 | | | | (5.75 | ) |
| | |
Less Distributions From: | | | | | | | | | | | | | | | | | | | | |
Net investment income | | | (0.34 | ) | | | — | | | | — | | | | — | | | | — | |
| | |
Total Distributions | | | (0.34 | ) | | | — | | | | — | | | | — | | | | — | |
| | |
Net Asset Value, End of Year | | $ | 29.45 | | | $ | 23.84 | | | $ | 20.88 | | | $ | 17.50 | | | $ | 14.83 | |
| | |
Total Return(3) | | | 25.18 | %(4) | | | 14.18 | % | | | 19.31 | % | | | 18.00 | % | | | (27.94 | )% |
| | |
Net Assets, End of Year (millions) | | | $4 | | | | $3 | | | | $3 | | | | $3 | | | | $3 | |
| | |
Ratios to Average Net Assets: | | | | | | | | | | | | | | | | | | | | |
Gross expenses | | | 1.63 | % | | | 1.71 | % | | | 1.99 | % | | | 2.45 | % | | | 2.02 | % |
Net expenses | | | 1.58 | (5)(6) | | | 1.71 | (5) | | | 1.89 | (6) | | | 2.45 | | | | 2.02 | |
Net investment income (loss) | | | 1.06 | | | | 1.53 | | | | 0.47 | | | | (0.03 | ) | | | (1.00 | ) |
| | |
Portfolio Turnover Rate | | | 150 | % | | | 30 | % | | | 56 | % | | | 153 | % | | | 24 | % |
| | |
| (1) | | Per share amounts have been calculated using the average shares method. |
| (2) | | Amount represents less than $0.01 per share. |
| (3) | | Performance figures may reflect fee waivers and/or expense reimbursements. Past performance is no guarantee of future results. In the absence of fee waivers and/or expense reimbursements, the total return would have been lower. |
| (4) | | The investment manager fully reimbursed the Fund for losses incurred resulting from an investment transaction error. Without this reimbursement, total return would not have changed. |
| (5) | | As a result of a voluntary expense limitation, the ratio of expenses to average net assets, other than interest, brokerage, taxes and extraordinary expenses, of Class 1 shares will not exceed 1.75%. |
| (6) | | Reflects fee waivers and/or expense reimbursements. |
See Notes to Financial Statements.
Legg Mason Partners International Fund 2006 Annual Report 19
Financial Highlights (continued)
For a share of each class of beneficial interest outstanding throughout each year ended October 31:
| | | | | | | | | | | | | | | | | | | | |
| | | | | |
| Class A Shares(1) | | 2006 | | | 2005 | | | 2004 | | | 2003 | | | 2002 | |
Net Asset Value, Beginning of Year | | $ | 22.81 | | | $ | 20.03 | | | $ | 16.89 | | | $ | 14.42 | | | $ | 20.15 | |
| | |
Income (Loss) From Operations: | | | | | | | | | | | | | | | | | | | | |
Net investment income (loss) | | | 0.17 | | | | 0.27 | | | | (0.02 | ) | | | (0.12 | ) | | | (0.30 | ) |
Net realized and unrealized gain (loss) | | | 5.41 | | | | 2.51 | | | | 3.16 | | | | 2.59 | | | | (5.43 | ) |
| | |
Total Income (Loss) From Operations | | | 5.58 | | | | 2.78 | | | | 3.14 | | | | 2.47 | | | | (5.73 | ) |
| | |
Less Distributions From: | | | | | | | | | | | | | | | | | | | | |
Net investment income | | | (0.26 | ) | | | — | | | | — | | | | — | | | | — | |
| | |
Total Distributions | | | (0.26 | ) | | | — | | | | — | | | | — | | | | — | |
| | |
Net Asset Value, End of Year | | $ | 28.13 | | | $ | 22.81 | | | $ | 20.03 | | | $ | 16.89 | | | $ | 14.42 | |
| | |
Total Return(2) | | | 24.67 | %(3) | | | 13.88 | % | | | 18.59 | % | | | 17.13 | % | | | (28.44 | )% |
| | |
Net Assets, End of Year (millions) | | | $77 | | | | $62 | | | | $56 | | | | $49 | | | | $40 | |
| | |
Ratios to Average Net Assets: | | | | | | | | | | | | | | | | | | | | |
Gross expenses | | | 2.05 | % | | | 2.33 | % | | | 2.59 | % | | | 3.21 | % | | | 2.72 | % |
Net expenses | | | 1.99 | (4)(5) | | | 2.00 | (4)(5) | | | 2.49 | (5) | | | 3.21 | | | | 2.72 | |
Net investment income (loss) | | | 0.66 | | | | 1.23 | | | | (0.13 | ) | | | (0.77 | ) | | | (1.67 | ) |
| | |
Portfolio Turnover Rate | | | 150 | % | | | 30 | % | | | 56 | % | | | 153 | % | | | 24 | % |
| | |
| (1) | | Per share amounts have been calculated using the average shares method. |
| (2) | | Performance figures may reflect fee waivers and/or expense reimbursements. Past performance is no guarantee of future results. In the absence of fee waivers and/or expense reimbursements, the total return would have been lower. |
| (3) | | The investment manager fully reimbursed the Fund for losses incurred resulting from an investment transaction error. Without this reimbursement, total return would not have changed. |
| (4) | | As a result of a voluntary expense limitation, the ratio of expenses to average net assets, other than interest, brokerage, taxes and extraordinary expenses, of Class A shares will not exceed 2.00%. |
| (5) | | Reflects fee waivers and/or expense reimbursements. |
See Notes to Financial Statements.
20 Legg Mason Partners International Fund 2006 Annual Report
Financial Highlights (continued)
For a share of each class of beneficial interest outstanding throughout each year ended October 31:
| | | | | | | | | | | | | | | | | | | | |
| | | | | |
| Class B Shares(1) | | 2006 | | | 2005 | | | 2004 | | | 2003 | | | 2002 | |
Net Asset Value, Beginning of Year | | $ | 20.96 | | | $ | 18.54 | | | $ | 15.78 | | | $ | 13.60 | | | $ | 19.18 | |
| | |
Income (Loss) From Operations: | | | | | | | | | | | | | | | | | | | | |
Net investment income (loss) | | | (0.02 | ) | | | 0.10 | | | | (0.19 | ) | | | (0.24 | ) | | | (0.44 | ) |
Net realized and unrealized gain (loss) | | | 4.97 | | | | 2.32 | | | | 2.95 | | | | 2.42 | | | | (5.14 | ) |
| | |
Total Income (Loss) From Operations | | | 4.95 | | | | 2.42 | | | | 2.76 | | | | 2.18 | | | | (5.58 | ) |
| | |
Less Distributions From: | | | | | | | | | | | | | | | | | | | | |
Net investment income | | | (0.09 | ) | | | — | | | | — | | | | — | | | | — | |
| | |
Total Distributions | | | (0.09 | ) | | | — | | | | — | | | | — | | | | — | |
| | |
Net Asset Value, End of Year | | $ | 25.82 | | | $ | 20.96 | | | $ | 18.54 | | | $ | 15.78 | | | $ | 13.60 | |
| | |
Total Return(2) | | | 23.71 | %(3) | | | 13.05 | % | | | 17.49 | % | | | 16.03 | % | | | (29.09 | )% |
| | |
Net Assets, End of Year (millions) | | | $56 | | | | $51 | | | | $50 | | | | $46 | | | | $43 | |
| | |
Ratios to Average Net Assets: | | | | | | | | | | | | | | | | | | | | |
Gross expenses | | | 2.84 | % | | | 3.13 | % | | | 3.53 | % | | | 4.15 | % | | | 3.60 | % |
Net expenses | | | 2.72 | (4)(5) | | | 2.75 | (4)(5) | | | 3.43 | (5) | | | 4.15 | | | | 3.60 | |
Net investment income (loss) | | | (0.08 | ) | | | 0.49 | | | | (1.07 | ) | | | (1.73 | ) | | | (2.57 | ) |
| | |
Portfolio Turnover Rate | | | 150 | % | | | 30 | % | | | 56 | % | | | 153 | % | | | 24 | % |
| | |
| (1) | | Per share amounts have been calculated using the average shares method. |
| (2) | | Performance figures may reflect fee waivers and/or expense reimbursements. Past performance is no guarantee of future results. In the absence of fee waivers and/or expense reimbursements, the total return would have been lower. |
| (3) | | The investment manager fully reimbursed the Fund for losses incurred resulting from an investment transaction error. Without this reimbursement, total return would not have changed. |
| (4) | | As a result of a voluntary expense limitation, the ratio of expenses to average net assets, other than interest, brokerage, taxes and extraordinary expenses, of Class B shares will not exceed 2.75%. |
| (5) | | Reflects fee waivers and/or expense reimbursements. |
See Notes to Financial Statements.
Legg Mason Partners International Fund 2006 Annual Report 21
Financial Highlights (continued)
For a share of each class of beneficial interest outstanding throughout each year ended October 31:
| | | | | | | | | | | | | | | | | | | | |
| | | | | |
| Class C Shares(1) | | 2006 | | | 2005 | | | 2004 | | | 2003 | | | 2002 | |
Net Asset Value, Beginning of Year | | $ | 22.98 | | | $ | 20.26 | | | $ | 17.03 | | | $ | 14.42 | | | $ | 20.13 | |
| | |
Income (Loss) From Operations: | | | | | | | | | | | | | | | | | | | | |
Net investment income (loss) | | | 0.10 | | | | 0.19 | | | | 0.02 | | | | (0.01 | ) | | | (0.30 | ) |
Net realized and unrealized gain (loss) | | | 5.46 | | | | 2.53 | | | | 3.21 | | | | 2.62 | | | | (5.41 | ) |
| | |
Total Income (Loss) From Operations | | | 5.56 | | | | 2.72 | | | | 3.23 | | | | 2.61 | | | | (5.71 | ) |
| | |
Less Distributions From: | | | | | | | | | | | | | | | | | | | | |
Net investment income | | | (0.17 | ) | | | — | | | | — | | | | — | | | | — | |
| | |
Total Distributions | | | (0.17 | ) | | | — | | | | — | | | | — | | | | — | |
| | |
Net Asset Value, End of Year | | $ | 28.37 | | | $ | 22.98 | | | $ | 20.26 | | | $ | 17.03 | | | $ | 14.42 | |
| | |
Total Return(2) | | | 24.34 | %(3) | | | 13.43 | % | | | 18.97 | % | | | 18.10 | % | | | (28.37 | )% |
| | |
Net Assets, End of Year (millions) | | | $2 | | | | $2 | | | | $2 | | | | $2 | | | | $2 | |
| | |
Ratios to Average Net Assets: | | | | | | | | | | | | | | | | | | | | |
Gross expenses | | | 2.27 | % | | | 2.36 | % | | | 2.34 | % | | | 2.41 | % | | | 2.63 | % |
Net expenses | | | 2.24 | (4)(5) | | | 2.36 | (4)(5) | | | 2.24 | (5) | | | 2.41 | | | | 2.63 | |
Net investment income (loss) | | | 0.38 | | | | 0.84 | | | | 0.11 | | | | (0.06 | ) | | | (1.65 | ) |
| | |
Portfolio Turnover Rate | | | 150 | % | | | 30 | % | | | 56 | % | | | 153 | % | | | 24 | % |
| | |
| (1) | | Per share amounts have been calculated using the average shares method. |
| (2) | | Performance figures may reflect fee waivers and/or expense reimbursements. Past performance is no guarantee of future results. In the absence of fee waivers and/or expense reimbursements, the total return would have been lower. |
| (3) | | The investment manager fully reimbursed the Fund for losses incurred resulting from an investment transaction error. Without this reimbursement, total return would not have changed. |
| (4) | | As a result of a voluntary expense limitation, the ratio of expenses to average net assets, other than interest, brokerage, taxes and extraordinary expenses, of Class C shares will not exceed 2.75%. |
| (5) | | Reflects fee waivers and/or expense reimbursements. |
See Notes to Financial Statements.
22 Legg Mason Partners International Fund 2006 Annual Report
Notes to Financial Statements
| 1. | Organization and Significant Accounting Policies |
Legg Mason Partners International Fund (formerly known as Smith Barney International Fund) (the “Fund”), is a separate diversified investment fund of Legg Mason Partners Investment Series (formerly known as Smith Barney Investment Series) (the “Trust”). The Trust, a Massachusetts business trust, is registered under the Investment Company Act of 1940, as amended (the “1940 Act”), as an open-end management investment company.
The following are significant accounting policies consistently followed by the Fund and are in conformity with U.S. generally accepted accounting principles (“GAAP”). Estimates and assumptions are required to be made regarding assets, liabilities and changes in net assets resulting from operations when financial statements are prepared. Changes in the economic environment, financial markets and any other parameters used in determining these estimates could cause actual results to differ.
(a) Investment Valuation. Equity securities for which market quotations are available are valued at the last sale price or official closing price on the primary market or exchange on which they trade. Debt securities are valued at the mean between the bid and asked prices provided by an independent pricing service that are based on transactions in debt obligations, quotations from bond dealers, market transactions in comparable securities and various other relationships between securities. When prices are not readily available, or are determined not to reflect fair value, such as when the value of a security has been significantly affected by events after the close of the exchange or market on which the security is principally traded, but before the Fund calculates its net asset value, the Fund may value these investments at fair value as determined in accordance with the procedures approved by the Fund’s Board of Trustees. Fair valuing of securities may be determined with the assistance of a pricing service using calculations based on indices of domestic securities and other appropriate indicators, such as prices of relevant ADRs and futures contracts. Short-term obligations maturing within 60 days are valued at amortized cost, which approximates market value.
(b) Repurchase Agreements. When entering into repurchase agreements, it is the Fund’s policy that its custodian or a third party custodian take possession of the underlying collateral securities, the market value of which at least equals the principal amount of the repurchase transaction, including accrued interest. To the extent that any repurchase transaction exceeds one business day, the value of the collateral is marked-to-market to ensure the adequacy of the collateral. If the seller defaults, and the market value of the collateral declines or if bankruptcy proceedings are commenced with respect to the seller of the security, realization of the collateral by the Fund may be delayed or limited.
(c) Lending of Portfolio Securities. The Fund has an agreement with its custodian whereby the custodian may lend securities owned by the Fund to brokers, dealers and other financial organizations. In exchange for lending securities under the terms of the agreement with its custodian, the Fund receives a lender’s fee. Fees earned by the Fund on securities lending are recorded as securities lending income. Loans of securities by the Fund are collateralized by cash, U.S. government securities or high quality money market instruments that are maintained at all times in an amount at least equal to the current market value of the loaned securities, plus a margin which varies depending on the type of
Legg Mason Partners International Fund 2006 Annual Report 23
Notes to Financial Statements (continued)
securities loaned. The custodian establishes and maintains the collateral in a segregated account. The Fund has the right under the lending agreement to recover the securities from the borrower on demand.
The Fund maintains the risk of any loss on the securities on loan as well as the potential loss on investments purchased with cash collateral received from securities lending.
(d) Foreign Currency Translation. Investment securities and other assets and liabilities denominated in foreign currencies are translated into U.S. dollar amounts based upon prevailing exchange rates on the date of valuation. Purchases and sales of investment securities and income and expense items denominated in foreign currencies are translated into U.S. dollar amounts based upon prevailing exchange rates on the respective dates of such transactions.
The Fund does not isolate that portion of the results of operations resulting from changes in foreign exchange rates on investments from the fluctuations arising from changes in market prices of securities held. Such fluctuations are included with the net realized and unrealized gain or loss on investments.
Net realized foreign exchange gains or losses arise from sales of foreign currencies, including gains and losses on forward foreign currency contracts, currency gains or losses realized between the trade and settlement dates on securities transactions and the difference between the amounts of dividends, interest and foreign withholding taxes recorded on the Fund’s books and the U.S. dollar equivalent of the amounts actually received or paid. Net unrealized foreign exchange gains and losses arise from changes in the fair values of assets and liabilities, other than investments in securities, at the date of valuation, resulting from changes in exchange rates.
Foreign security and currency transactions may involve certain considerations and risks not typically associated with those of U.S. dollar denominated transactions as a result of, among other factors, the possibility of lower levels of governmental supervision and regulation of foreign securities markets and the possibility of political or economic instability.
(e) Foreign Risk. The Fund’s investments in foreign securities may involve risks not present in domestic investments. Since securities may be denominated in foreign currencies and may require settlement in foreign currencies and pay interest or dividends in foreign currencies, changes in the relationship of these foreign currencies to the U.S. dollar can significantly affect the value of the investments and earnings of the Fund. Foreign investments may also subject the Fund to foreign government exchange restrictions, expropriation, taxation or other political, social or economic developments, all of which affect the market and/or credit risk of the investments.
(f) Security Transactions and Investment Income. Security transactions are accounted for on a trade date basis. Interest income, adjusted for amortization of premium and accretion of discount, is recorded on the accrual basis. Dividend income is recorded on the ex-dividend date. Foreign dividend income is recorded on the ex-dividend date or as soon as practical after the Fund determines the existence of a dividend declaration after exercising reasonable due diligence. The cost of investments sold is determined by use of the specific identification method. To the extent any issuer defaults on an expected interest payment, the Fund’s policy is to generally halt any additional interest income accruals and consider the realizability of interest accrued up to the date of default.
24 Legg Mason Partners International Fund 2006 Annual Report
Notes to Financial Statements (continued)
(g) Distributions to Shareholders. Distributions from net investment income and distributions of net realized gains, if any, are declared at least annually. Distributions to shareholders of the Fund are recorded on the ex-dividend date and are determined in accordance with income tax regulations, which may differ from GAAP.
(h) Class Accounting. Investment income, common expenses and realized/unrealized gain (loss) on investments are allocated to the various classes of the Fund on the basis of daily net assets of each class. Fees relating to a specific class are charged directly to that class.
(i) Federal and Other Taxes. It is the Fund’s policy to comply with the federal income and excise tax requirements of the Internal Revenue Code of 1986, as amended, applicable to regulated investment companies. Accordingly, the Fund intends to distribute substantially all of its income and net realized gains on investments, if any, to shareholders each year. Therefore, no federal income tax provision is required in the Fund’s financial statements. Under the applicable foreign tax laws, a withholding tax may be imposed on interest, dividends and capital gains at various rates.
(j) Reclassification. GAAP requires that certain components of net assets be adjusted to reflect permanent differences between financial and tax reporting. These reclassifications have no effect on net assets or net asset values per share. During the current year, the following reclassifications have been made:
| | | | | | | | | | | |
| | | |
| | | Undistributed Net
Investment Income | | | Accumulated Net
Realized Loss | | Paid-in Capital | |
| (a) | | $ | 61,031 | | | | — | | $ | (61,031 | ) |
| (b) | | | (26,395 | ) | | $ | 26,395 | | | — | |
| | |
| (a) | Reclassifications are primarily due to book/tax differences in the treatment of various items. |
| (b) | Reclassifications are primarily due to foreign currency transactions treated as ordinary income for tax purposes and book/tax differences in the treatment of passive foreign investment companies. |
| 2. | Investment Management Agreement and Other Transactions with Affiliates |
On December 1, 2005, Citigroup Inc. (“Citigroup”) completed the sale of substantially all of its asset management business to Legg Mason, Inc. (“Legg Mason”). As a result, the Fund’s then investment manager, Smith Barney Fund Management LLC (“SBFM”) and the Fund’s then subadviser, Legg Mason International Equities Ltd. (“LMIE”) (formerly Citigroup Asset Management Ltd), previously indirect wholly-owned subsidiaries of Citigroup, became wholly-owned subsidiaries of Legg Mason. Completion of the sale caused the Fund’s then existing investment management agreement and subadvisory agreement to terminate. The Fund’s shareholders approved a new investment management agreement between the Fund and SBFM and a new subadvisory agreement between SBFM and LMIE, each of which became effective on December 19, 2005. An interim management agreement and sub-advisory agreement took effect upon the closing of the sale and continued in effect until December 19, 2005.
Legg Mason Partners International Fund 2006 Annual Report 25
Notes to Financial Statements (continued)
Prior to the Legg Mason transaction, and continuing under a new investment management agreement effective December 19, 2006, the Fund paid SBFM an investment management fee calculated daily and paid monthly in accordance with the following breakpoint schedule:
| | | |
| |
| Average Daily Net Assets | | Annual Rate | |
First $1 billion | | 0.850 | % |
Next $1 billion | | 0.825 | |
Next $3 billion | | 0.800 | |
Next $5 billion | | 0.775 | |
Over $10 billion | | 0.750 | |
| | |
Effective February 1, 2006, the subadvisory agreement with LMIE with respect to the Fund was terminated.
Effective August 1, 2006, Legg Mason Partners Fund Advisor, LLC (“LMPFA”) became the Fund’s investment manager and Batterymarch Financial Management, Inc. (“Batterymarch”) became the Fund’s subadviser. The portfolio managers who are responsible for the day-to-day management of the Fund remained the same immediately prior to and immediately after the date of these changes. LMPFA and Batterymarch are wholly-owned subsidiaries of Legg Mason.
LMPFA provides administrative and certain oversight services to the Fund. LMPFA has delegated to the subadviser the day-to-day portfolio management of the Fund, except for the management of cash and short-term investments. The Fund’s investment management fee remains unchanged. For its services, LMPFA pays Batterymarch 70% of the net management fee that it receives from the Fund.
During the year ended October 31, 2006, the Fund was reimbursed for expenses in the amount of $2,544 for losses incurred resulting from an investment transaction error.
During the year ended October 31, 2006, the Fund’s Class 1, A, B and C shares had voluntary expense limitations in place of 1.75, 2.00%, 2.75% and 2.75%, respectively.
During the year ended October 31, 2006, SBFM and LMPFA waived a portion of their investment management fee in the amount of $45,656. In addition during the year ended October 31, 2006, the Fund was reimbursed for expenses in the amount of $62,103.
The Fund’s Board has approved PFPC Inc. (“PFPC”) to serve as transfer agent for the Fund, effective January 1, 2006. The principal business office of PFPC is located at 4400 Computer Drive, Westborough, MA 01581. Prior to January 1, 2006, Citicorp Trust Bank, fsb. (“CTB”), a subsidiary of Citigroup, acted as the Fund’s transfer agent. Also, prior to January 1, 2006, PFPC and Primerica Shareholder Services (‘PSS”), another subsidiary of Citigroup, acted as the Fund’s sub-transfer agents. CTB received account fees and asset-based fees that varied according to the size and type of account. PFPC and PSS were responsible for shareholder recordkeeping and financial processing for all shareholder accounts and were paid by CTB. For the period ended October 31, 2006, the Fund paid transfer agent fees of $374,718 to CTB. In addition, for the period ended October 31, 2006, the Fund also paid $36 to other Citigroup affiliates for shareholder recordkeeping services.
26 Legg Mason Partners International Fund 2006 Annual Report
Notes to Financial Statements (continued)
The Fund’s Board has appointed the Fund’s current distributors, Citigroup Global Markets Inc. (“CGM”), and PFS Investments Inc. (“PFS”), both of which are subsidiaries of Citigroup, and Legg Mason Investor Services, LLC (“LMIS”), a wholly-owned broker-dealer subsidiary of Legg Mason, as co-distributors of the Fund. The Fund’s Board has also
approved an amended and restated Rule 12b-1 Plan. CGM and other broker-dealers, financial intermediaries and financial institutions (each called a “Service Agent”) that currently offer Fund shares will continue to make the Fund’s shares available to their clients. Additional Service Agents may offer Fund shares in the future.
There is a maximum initial sales charge of 8.50% and 5.00% for Class 1 and A shares, respectively. There is a contingent deferred sales charge (“CDSC”) of 5.00% on Class B shares, which applies if redemption occurs within one year from purchase payment. This CDSC declines thereafter by 1.00% per year until no CDSC is incurred. Class C shares have a 1.00% CDSC, which applies if redemption occurs within one year from purchase payment. In certain cases, Class A shares have a 1.00% CDSC, which applies if redemption occurs within one year from purchase payment. This CDSC only applies to those purchases of Class A shares, which, when combined with current holdings of Class A shares, equal or exceed $1,000,000 in the aggregate. These purchases do not incur an initial sales charge.
For the year ended October 31, 2006, LMIS and PFS, CGM and their affiliates received sales charges of approximately $400 and $16,900 on sales of the Fund’s Class 1 and A shares, respectively. In addition, for the year ended October 31, 2006, CDSCs paid to LMIS and PFS, CGM and their affiliates were approximately $8,000 for Class B shares.
Effective November 20, 2006, the maximum initial sales charge on Class A shares of the Fund will increase from 5.00% to 5.75% for shares purchased on or after that date.
During a special meeting in June 2006, the Fund’s Board approved a number of initiatives to streamline and restructure the fund complex. In that connection, the Board voted to establish a mandatory retirement age of 75 for current Trustees and 72 for all future Trustees, and to allow current Trustees to elect to retire as of the date on which Trustees elected, in accordance with the Joint Proxy Statement.
On July 10, 2006, the Board also voted to amend its retirement plans to provide for the payment of certain benefits (in lieu of any other retirement payments under the plans) to Trustees who have not elected to retire as of the Effective Date. Under the amended plan, Trustees electing to receive benefits under the amendments must waive all rights under the plan prior to amendment. Each fund overseen by the Board (including the Fund) will pay a pro rata share (based upon asset size) of such benefits. As of October 31, 2006, the Fund’s allocable share of benefits under this amendment are $3,933.
Under the previous Retirement Plan (the “Plan”), all Trustees who were not “Interested Persons” of the Fund, within the meaning of the 1940 Act, were required to retire from the Board as of the last day of the calendar year in which the applicable Trustee attained age 75. Trustees were able to retire under the Plan before attaining the mandatory retirement age. Trustees who had served as Trustee of the Trust or any of the investment companies associated with CFM and LMPFA for at least ten years when they retired, continue to be eligible to receive the maximum retirement benefit under the previous Plan,
Legg Mason Partners International Fund 2006 Annual Report 27
Notes to Financial Statements (continued)
subject to the terms of the amended Plans. The maximum retirement benefit was an amount equal to five times the amount of retainer and regular meeting fees payable to a Trustee during the entirety of the calendar year of the Trustee’s retirement (assuming no change in relevant facts for the balance of the year following the Trustee’s retirement). Amounts owed under the Plan may be paid in installments or in a lump sum (discounted to present value). Benefits under the Plan are unfunded. Two former Trustees are currently receiving payments under the Plan. In addition, three other Trustees received full payments under the Plan.
Certain officers and one Trustee of the Trust are employees of Legg Mason or its affiliates and do not receive compensation from the Trust.
During the year ended October 31, 2006, the aggregate cost of purchases and proceeds from sales of investments (excluding short-term investments) were as follows:
| | | |
Purchases | | $ | 193,579,662 |
| |
Sales | | | 200,299,054 |
| |
At October 31, 2006, the aggregate gross unrealized appreciation and depreciation of investments for federal income tax purposes were as follows:
| | | | |
Gross unrealized appreciation | | $ | 17,753,572 | |
Gross unrealized depreciation | | | (1,499,029 | ) |
| | |
Net unrealized appreciation | | $ | 16,254,543 | |
| | |
| 4. | Class Specific Expenses |
The Fund has adopted a Rule 12b-1 distribution plan and under that plan the Fund pays a distribution/service fee with respect to its Class A, B and C shares calculated at an annual rate of 0.25% of the average daily net assets with respect to Class A and at the annual rate of 1.00% of the respective average daily net assets of Class B and C shares. Distribution fees are accrued daily and paid monthly.
For the year ended October 31, 2006, class specific expenses were as follows:
| | | | | | | | | |
| | | |
| | | Distribution
Fees | | Transfer Agent
Fees | | Shareholder
Reports Expenses |
Class 1 | | | — | | $ | 18,346 | | $ | 1,487 |
Class A | | $ | 174,807 | | | 458,464 | | | 38,540 |
Class B | | | 536,881 | | | 375,282 | | | 32,477 |
Class C | | | 17,995 | | | 2,293 | | | 1,235 |
| |
Total | | $ | 729,683 | | $ | 854,385 | | $ | 73,739 |
| |
28 Legg Mason Partners International Fund 2006 Annual Report
Notes to Financial Statements (continued)
| 5. | Distributions to Shareholders by Class |
| | | | | |
| | |
| | | Year Ended October 31, 2006 | | Year Ended October 31, 2005 |
Net Investment Income: | | | | | |
Class 1 | | $ | 45,816 | | — |
Class A | | | 701,136 | | — |
Class B | | | 224,353 | | — |
Class C | | | 13,142 | | — |
| |
Total | | $ | 984,447 | | — |
| |
| 6. | Shares of Beneficial Interest |
At October 31, 2006, the Trust had an unlimited number of shares of beneficial interest authorized with a par value of $0.00001 per share. The Fund has the ability to issue multiple classes of shares. Each share of a class represents an identical interest and has the same rights, except that each class bears certain direct expenses, including those specifically related to the distribution of its shares.
Transactions in shares of each class were as follows:
| | | | | | | | | | | | | | |
| | |
| | | Year Ended October 31, 2006 | | | Year Ended October 31, 2005 | |
| | | Shares | | | Amount | | | Shares | | | Amount | |
Class 1 | | | | | | | | | | | | | | |
Shares sold | | 16,299 | | | $ | 433,167 | | | 12,231 | | | $ | 281,074 | |
Shares issued on reinvestment | | 1,827 | | | | 45,816 | | | — | | | | — | |
Shares repurchased | | (25,516 | ) | | | (683,893 | ) | | (35,497 | ) | | | (808,567 | ) |
| | |
Net Decrease | | (7,390 | ) | | $ | (204,910 | ) | | (23,266 | ) | | $ | (527,493 | ) |
| | |
Class A | | | | | | | | | | | | | | |
Shares sold | | 565,499 | | | $ | 14,638,628 | | | 454,284 | | | $ | 9,935,355 | |
Shares issued on reinvestment | | 28,615 | | | | 687,610 | | | — | | | | — | |
Shares repurchased | | (566,800 | ) | | | (14,463,457 | ) | | (528,425 | ) | | | (11,539,470 | ) |
| | |
Net Increase (Decrease) | | 27,314 | | | $ | 862,781 | | | (74,141 | ) | | $ | (1,604,115 | ) |
| | |
Class B | | | | | | | | | | | | | | |
Shares sold | | 261,546 | | | $ | 6,271,220 | | | 233,692 | | | $ | 4,702,432 | |
Shares issued on reinvestment | | 7,894 | | | | 175,165 | | | — | | | | — | |
Shares repurchased | | (519,477 | ) | | | (12,229,636 | ) | | (491,729 | ) | | | (9,913,605 | ) |
| | |
Net Decrease | | (250,037 | ) | | $ | (5,783,251 | ) | | (258,037 | ) | | $ | (5,211,173 | ) |
| | |
Class C | | | | | | | | | | | | | | |
Shares sold | | 2,392 | | | $ | 62,967 | | | 1,915 | | | $ | 42,689 | |
Shares issued on reinvestment | | 457 | | | | 11,089 | | | — | | | | — | |
Shares repurchased | | (18,710 | ) | | | (485,812 | ) | | (28,577 | ) | | | (626,948 | ) |
| | |
Net Decrease | | (15,861 | ) | | $ | (411,756 | ) | | (26,662 | ) | | $ | (584,259 | ) |
| | |
Legg Mason Partners International Fund 2006 Annual Report 29
Notes to Financial Statements (continued)
| 7. | Income Tax Information and Distributions to Shareholders |
The tax character of distributions paid during the fiscal years ended October 31, were as follows:
| | | | | |
| | |
| | | 2006 | | 2005 |
Distributions paid from: | | | | | |
Ordinary Income | | $ | 984,447 | | — |
| |
As of October 31, 2006, the components of accumulated earnings on a tax basis were as follows:
| | | | |
Undistributed ordinary income — net | | $ | 515,271 | |
| | |
Capital loss carryforward* | | | (58,733,107 | ) |
Other book/tax temporary differences(a) | | | (482 | ) |
Unrealized appreciation/(depreciation)(b) | | | 16,264,957 | |
| | |
Total Accumulated Earnings/(Losses) — Net | | $ | (41,953,361 | ) |
| | |
| * | | During the taxable year ended October 31, 2006, the Fund utilized $31,537,828 of its capital loss carryover available from prior years. As of October 31, 2006, the Fund had the following net capital loss carryforwards remaining: |
| | | | |
Year of Expiration | | Amount | |
10/31/2010 | | $ | (28,335,638 | ) |
10/31/2011 | | | (30,397,469 | ) |
| | | | |
| | $ | (58,733,107 | ) |
| | | | |
This amount will be available to offset any future taxable capital gains.
| (a) | | Other book/tax temporary differences are attributable primarily to the realization for tax purposes of unrealized gains on certain foreign currency contracts. |
| (b) | | The difference between book-basis and tax-basis unrealized appreciation/(depreciation) is attributable primarily to the tax deferral of losses on wash sales and the realization for tax purposes of unrealized gains on investments in passive foreign investment companies. |
Due to the proposed reorganization described in Note 11, the expiration dates of these loss carryforwards will move up by one year. Additionally, as a result of the reorganization, the loss carryforwards will be subject to various tax limitations, which may result in future taxable capital gain distributions to shareholders due to the fact that some portion of the Fund’s loss carryforwards may be unable to be utilized.
On May 31, 2005, the U.S. Securities and Exchange Commission (“SEC”) issued an order in connection with the settlement of an administrative proceeding against SBFM the Fund’s prior investment manager and CGM relating to the appointment of an affiliated transfer agent for the Smith Barney family of mutual funds (the “Funds”).
The SEC order finds that SBFM and CGM willfully violated Section 206(1) of the Investment Advisers Act of 1940 (“Advisers Act”). Specifically, the order finds that SBFM and CGM knowingly or recklessly failed to disclose to the boards of the Funds in 1999 when proposing a new transfer agent arrangement with an affiliated transfer agent that: First Data Investors Services Group (“First Data”), the Funds’ then-existing transfer agent, had offered to continue as transfer agent and do the same work for substantially less money
30 Legg Mason Partners International Fund 2006 Annual Report
Notes to Financial Statements (continued)
than before; and that Citigroup Asset Management (“CAM”), the Citigroup business unit that, at the time, included the Fund’s investment manager and other investment advisory companies, had entered into a side letter with First Data under which CAM agreed to recommend the appointment of First Data as sub-transfer agent to the affiliated transfer agent in exchange for, among other things, a guarantee by First Data of specified amounts of asset management and investment banking fees to CAM and CGM. The order also finds that SBFM and CGM willfully violated Section 206(2) of the Advisers Act by virtue of the omissions discussed above and other misrepresentations and omissions in the materials provided to the Funds’ boards, including the failure to make clear that the affiliated transfer agent would earn a high profit for performing limited functions while First Data continued to perform almost all of the transfer agent functions, and the suggestion that the proposed arrangement was in the Funds’ best interests and that no viable alternatives existed. SBFM and CGM do not admit or deny any wrongdoing or liability. The settlement does not establish wrongdoing or liability for purposes of any other proceeding.
The SEC censured SBFM and CGM and ordered them to cease and desist from violations of Sections 206(1) and 206(2) of the Advisers Act. The order requires Citigroup to pay $208.1 million, including $109 million in disgorgement of profits, $19.1 million in interest, and a civil money penalty of $80 million. Approximately $24.4 million has already been paid to the Funds, primarily through fee waivers. The remaining $183.7 million, including the penalty, has been paid to the U.S. Treasury and will be distributed pursuant to a plan submitted for the approval of the SEC. At this time, there is no certainty as to how the above-described proceeds of the settlement will be distributed, to whom such distributions will be made, the methodology by which such distributions will be allocated, and when such distributions will be made. The order also required that transfer agency fees received from the Funds since December 1, 2004, less certain expenses, be placed in escrow and provided that a portion of such fees might be subsequently distributed in accordance with the terms of the order. On April 3, 2006, an aggregate amount of approximately $9 million was distributed to the affected Funds.
The order required SBFM to recommend a new transfer agent contract to the Funds’ boards within 180 days of the entry of the order; if a Citigroup affiliate submitted a proposal to serve as transfer agent or sub-transfer agent, SBFM and CGM would have been required, at their expense, to engage an independent monitor to oversee a competitive bidding process. On November 21, 2005, and within the specified timeframe, the Fund’s Board selected a new transfer agent for the Fund. No Citigroup affiliate submitted a proposal to serve as transfer agent. Under the order, SBFM also must comply with an amended version of a vendor policy that Citigroup instituted in August 2004.
Although there can be no assurance, the Fund’s manager does not believe that this matter will have a material adverse effect on the Funds.
On December 1, 2005, Citigroup completed the sale of substantially all of its global asset management business, including SBFM, to Legg Mason.
Legg Mason Partners International Fund 2006 Annual Report 31
Notes to Financial Statements (continued)
Beginning in August 2005, five class action lawsuits alleging violations of federal securities laws and state law were filed against CGM and SBFM, (collectively, the “Defendants”) based on the May 31, 2005 settlement order issued against the Defendants by the SEC as described in Note 8. The complaints seek injunctive relief and compensatory and punitive damages, removal of SBFM as the investment manager for the Smith Barney family of funds, rescission of the Funds’ management and other contracts with SBFM, recovery of all fees paid to SBFM pursuant to such contracts, and an award of attorneys’ fees and litigation expenses.
On October 5, 2005, a motion to consolidate the five actions and any subsequently-filed, related action was filed. That motion contemplates that a consolidated amended complaint alleging substantially similar causes of action will be filed in the future.
As of the date of this report, the Fund’s manager believes that resolution of the pending lawsuit will not have a material effect on the financial position or results of operations of the Fund or the ability of the Fund’s investment manager and its affiliates to continue to render services to the Funds under their respective contracts.
* * *
Beginning in June 2004, class action lawsuits alleging violations of the federal securities laws were filed against CGM and a number of its then affiliates, including SBFM and Salomon Brothers Asset Management Inc. (“SBAM”), which were then investment adviser or manager to certain of the Funds (the “Managers”), substantially all of the mutual funds then managed by the Managers (the “Defendant Funds”), and Board Members of the Defendant Funds (collectively, the “Defendants”). The complaints alleged, among other things, that CGM created various undisclosed incentives for its brokers to sell Smith Barney and Salomon Brothers funds. In addition, according to the complaints, the Managers caused the Defendant Funds to pay excessive brokerage commissions to CGM for steering clients towards proprietary funds. The complaints also alleged that the defendants breached their fiduciary duty to the Defendant Funds by improperly charging Rule 12b-1 fees and by drawing on fund assets to make undisclosed payments of soft dollars and excessive brokerage commissions. The complaints also alleged that the Defendant Funds failed to adequately disclose certain of the allegedly wrongful conduct. The complaints sought injunctive relief and compensatory and punitive damages, rescission of the Defendant Funds’ contracts with the Managers, recovery of all fees paid to the Managers pursuant to such contracts and an award of attorneys’ fees and litigation expenses.
On December 15, 2004, a consolidated amended complaint (the “Complaint”) was filed alleging substantially similar causes of action. On May 27, 2005, all of the Defendants filed motions to dismiss the Complaint. On July 26, 2006, the court issued a decision and order (1) finding that plaintiffs lacked standing to sue on behalf of the shareholders of the Defendant Funds in which none of the plaintiffs had invested and dismissing those Defendant Funds from the case (although stating that they could be brought back into the
32 Legg Mason Partners International Fund 2006 Annual Report
Notes to Financial Statements (continued)
case if standing as to them could be established), and (2) other than one stayed claim, dismissing all of the causes of action against the remaining Defendants, with prejudice, except for the cause of action under Section 36(b) of the 1940 Act, which the court granted plaintiffs leave to replead as a derivative claim.
On October 16, 2006, plaintiffs filed their Second Consolidated Amended Complaint (“Second Amended Complaint”) which alleges derivative claims on behalf of nine funds identified in the Second Amended Complaint, Section 36(b) of the 1940 Act, against CAM, SBAM, SBFM and CGM as investment advisers to the identified funds, as well as CGM as a distributor for the identified funds (collectively, the “Second Amended Complaint Defendants”). The Fund was not identified in the Second Amended Complaint. The Second Amended Complaint alleges no claims against any of the Funds or any of their Board Members. Under Section 36(b), the Second Amended Complaint alleges similar facts and seeks similar relief against the Second Amended Complaint Defendants as the Complaint.
Additional lawsuits arising out of these circumstances and presenting similar allegations and requests for relief may be filed in the future.
On September 16, 2005, the staff of the SEC informed SBFM and SBAM that the staff is considering recommending that the SEC institute administrative proceedings against SBFM and SBAM for alleged violations of Section 19(a) and 34(b) of the 1940 Act (and related Rule 19a-1). The notification is a result of an industry wide inspection by the SEC and is based upon alleged deficiencies in disclosures regarding dividends and distributions paid to shareholders of certain funds. Section 19(a) and related Rule 19a-1 of the 1940 Act generally require funds that are making dividend and distribution payments to provide shareholders with a written statement disclosing the source of the dividends and distributions, and, in particular, the portion of the payments made from each of net investment income, undistributed net profits and/or paid-in capital. In connection with the contemplated proceedings, the staff may seek a cease and desist order and/or monetary damages from SBFM or SBAM.
Although there can be no assurance, the Fund’s manager believes that this matter is not likely to have a material adverse effect on the Fund.
| 11. | Additional Shareholder Information |
Shareholders approved a reorganization pursuant to which the Fund’s assets have been acquired, and its liabilities assumed by the Legg Mason Partners Global Equity Fund, formerly known as the Legg Mason Partners International Large Cap Fund, (the “Acquiring Fund”), in exchange for shares of the Acquiring Fund, effective as of the close of business December 1, 2006. The Fund has been liquidated and shares of the Acquiring Fund have been distributed to Fund shareholders.
Legg Mason Partners International Fund 2006 Annual Report 33
Report of Independent Registered Public Accounting Firm
The Board of Trustees and Shareholders
Legg Mason Partners Investment Series:
We have audited the accompanying statement of assets and liabilities, including the schedule of investments, of Legg Mason Partners International Fund (formerly Smith Barney International Fund), a series of Legg Mason Partners Investment Series (formerly Smith Barney Investment Series), as of October 31, 2006, and the related statement of operations for the year then ended, the statements of changes in net assets for each of the years in the two-year period then ended, and the financial highlights for each of the years in the five-year period then ended. These financial statements and financial highlights are the responsibility of the Fund’s management. Our responsibility is to express an opinion on these financial statements and financial highlights based on our audits.
We conducted our audits in accordance with the standards of the Public Company Accounting Oversight Board (United States). Those standards require that we plan and perform the audit to obtain reasonable assurance about whether the financial statements and financial highlights are free of material misstatement. An audit includes examining, on a test basis, evidence supporting the amounts and disclosures in the financial statements. Our procedures included confirmation of securities owned as of October 31, 2006, by correspondence with the custodian and brokers or by other appropriate auditing procedures. An audit also includes assessing the accounting principles used and significant estimates made by management, as well as evaluating the overall financial statement presentation. We believe that our audits provide a reasonable basis for our opinion.
In our opinion, the financial statements and financial highlights referred to above present fairly, in all material respects, the financial position of Legg Mason Partners International Fund, as of October 31, 2006, and the results of its operations for the year then ended, the changes in its net assets for each of the years in the two-year period then ended, and the financial highlights for each of the years in the five-year period then ended, in conformity with U.S. generally accepted accounting principles.

New York, New York
December 27, 2006
34 Legg Mason Partners International Fund
Board Approval of Management and Subadvisory Agreements (unaudited)
At a meeting held in person on June 19, 2006, the Fund’s Board, including a majority of the Board Members who are not “interested persons” of the Fund or Legg Mason Partners Fund Advisor, LLC (the “Manager”) or any sub-investment adviser or proposed subinvestment adviser as defined in the Investment Company Act of 1940, as amended (the “1940 Act”) (the “Independent Board Members”), approved a new management agreement (the “New Management Agreement”) between the Fund and the Manager. The Fund’s Board, including a majority of the Independent Board Members, also approved one or more new subadvisory agreements between the Manager and Batterymarch Financial Management, Inc. (the “Subadviser”) (the “New Subadvisory Agreement”). The New Management Agreement and the New Subadvisory Agreement replaced the Fund’s prior management agreement with Smith Barney Fund Management, LLC and were entered into in connection with an internal reorganization of the Manager’s and the prior manager’s parent organization, Legg Mason. In approving the New Management Agreement and New Subadvisory Agreement, the Board, including the Independent Board Members, considered the factors discussed below, among other things.
The Board noted that the Manager will provide administrative and certain oversight services to the Fund, and that the Manager will delegate to the Subadviser the day-to-day portfolio management of the Fund. The Board Members reviewed the qualifications, backgrounds and responsibilities of the senior personnel that will provide oversight and general management services and the portfolio management team that would be primarily responsible for the day-to-day management of the Fund. The Board Members noted that the portfolio management team was expected to be the same as then managing the Fund.
The Board Members received and considered information regarding the nature, extent and quality of services expected to be provided to the Fund by the Manager under the New Management Agreement and by the Subadviser under the New Subadvisory Agreement. The Board Members’ evaluation of the services expected to be provided by the Manager and the Subadviser took into account the Board Members’ knowledge and familiarity gained as Fund Board Members, including as to the scope and quality of Legg Mason’s investment management and other capabilities and the quality of its administrative and other services. The Board Members considered, among other things, information and assurances provided by Legg Mason as to the operations, facilities and organization of the Manager and the Subadviser and the qualifications, backgrounds and responsibilities of their senior personnel. The Board Members further considered the financial resources available to the Manager, the Subadviser and Legg Mason. The Board Members concluded that, overall, the nature, extent and quality of services expected to be provided under the New Management Agreement and the New Subadvisory Agreement were acceptable.
The Board Members also received and considered performance information for the Fund as well as comparative information with respect to a peer group of funds (the “Performance Universe”) selected by Lipper, Inc. (“Lipper”), an independent provider of investment company data. The Board Members were provided with a description of the methodology Lipper used to determine the similarity of the Fund to the funds included in
Legg Mason Partners International Fund 35
Board Approval of Management and Subadvisory Agreements (unaudited) (continued)
the Performance Universe. The Board Members noted that they had received and discussed with management, at periodic intervals, information comparing the Fund’s performance against, among other things, its benchmark.
The Board Members reviewed and considered the management fee that would be payable by the Fund to the Manager in light of the nature, extent and quality of the management services expected to be provided by the Manager, including the fee waiver and/or expense reimbursement arrangements currently in place. Additionally, the Board Members received and considered information comparing the Fund’s management fee and overall expenses with those of comparable funds in both the relevant expense group and a broader group of funds, each selected and provided by Lipper. The Board Members also reviewed and considered the subadvisory fee that would be payable by the Manager to the Subadviser in light of the nature, extent and quality of the management services expected to be provided by the Subadviser. The Board Members noted that the Manager, and not the Fund, will pay the subadvisory fee to the Subadviser. The Board Members determined that the Fund’s management fee and the Fund’s subadvisory fee were reasonable in light of the nature, extent and quality of the services expected to be provided to the Fund under the New Management Agreement and the New Subadvisory Agreement.
The Board Members received and considered a pro-forma profitability analysis of Legg Mason and its affiliates in providing services to the Fund, including information with respect to the allocation methodologies used in preparing the profitability data. The Board Members recognized that Legg Mason may realize economies of scale based on its internal reorganization and synergies of operations. The Board Members noted that it was not possible to predict with a high degree of confidence how Legg Mason’s and its affiliates’ profitability would be affected by its internal reorganization and by other factors including potential economies of scale, but that based on their review of the pro forma profitability analysis, their most recent prior review of the profitability of the predecessor manager and its affiliates from their relationship with the Fund and other factors considered, they determined that the management fee was reasonable. The Board Members noted that they expect to receive and evaluate profitability information on an annual basis.
In their deliberations, the Board Members also considered, the information that had been received, the factors that had been identified and the conclusions that had been reached by the Board in connection with the Board’s most recent approval of the Fund’s prior management agreement, in addition to information provided in connection with the Board’s evaluation of the terms and conditions of the New Management Agreement and the New Subadvisory Agreement.
The Board Members considered Legg Mason’s advice and the advice of its counsel that the New Management Agreement and the New Subadvisory Agreement were being entered into in connection with an internal reorganization within Legg Mason that did not involve an actual change of control or management. The Board Members further noted that the terms and conditions of the New Management Agreement are substantially identical to those of the Fund’s previous management agreement except for the identity of the Manager, and that the initial term of the New Management Agreement (after which it
36 Legg Mason Partners International Fund
Board Approval of Management and Subadvisory Agreements (unaudited) (continued)
will continue in effect only if such continuance is specifically approved at least annually by the Board, including a majority of the Independent Board Members) was the same as that under the prior management agreement.
In light of all of the foregoing, the Board, including the Independent Board Members, approved the New Management Agreement and the New Subadvisory Agreement. No single factor reviewed by the Board Members was identified as the principal factor in determining whether to approve the New Management Agreement and the New Subadvisory Agreement. The Independent Board Members were advised by separate independent legal counsel throughout the process. The Independent Board Members also discussed the proposed approval of the New Management Agreement and the New Subadvisory Agreement in private sessions with their independent legal counsel at which no representatives of the Manager or Subadviser were present.
Legg Mason Partners International Fund 37
Additional Information (unaudited)
Information about Trustees and Officers
The business and affairs of the Legg Mason Partners International Fund (formerly known as Smith Barney International Fund) (the “Fund”) are managed under the direction of the Board of Trustee of the Legg Mason Partners Investment Series (formerly known as Smith Barney Investment Series) (the “Trust”). Information pertaining to the Trustees and Officers of the Trust is set forth below. Each Trustee and Officer holds office for his or her lifetime, unless that individual resigns, retires or is otherwise removed. The Statement of Additional Information includes additional information about the Fund’s Trustees and is available, without charge, upon request by calling Legg Mason Partners Shareholder Services at 1-800-451-2010.
| | | | | | | | | | |
| | | | | |
Name, Address and Birth Year | | Position(s)
Held with
Fund | | Term of
Office* and
Length
of Time
Served | | Principal
Occupation(s)
During Past
Five Years | | Number of
Portfolios
in Fund
Complex
Overseen by
Trustee | | Other
Trusteeships
Held by
Trustee |
| Non-Interested Trustees: | | | | | | | | |
Elliott J. Berv c/o R. Jay Gerken Legg Mason & Co., LLC (“Legg Mason”) 399 Park Avenue, 4th Floor New York, NY 10022 Birth Year: 1943 | | Trustee | | Since 2001 | | President and Chief Executive Officer, Catalyst (consulting) (since 1984); Chief Executive Officer, Rocket City Enterprises (media) (2000 to 2005); Chief Executive Officer, Landmark City (real estate development) (2001 to 2004); Executive Vice President, DigiGym Systems (personal fitness systems) (2001 to 2004); Chief Executive Officer, Motocity USA (Motorsport Racing) (2004 to 2005) | | 37 | | Board Member, American Identity Corp. (doing business as Morpheus Technologies) (biometric information management) (since 2001); Director, Lapoint Industries (industrial filter company) (since 2002); Director, Alzheimer’s Association (New England Chapter) (since 1998) |
| | | | | |
Donald M. Carlton c/o R. Jay Gerken
Legg Mason 399 Park Avenue, 4th Floor New York, NY 10022 Birth Year: 1937 | | Trustee | | Since 2001 | | Consultant, URS Corporation (engineering) (since 1999); Member of the Management Committee, Signature Science (research and development) (since 2000) | | 37 | | Director, Temple Inland (forest products) (since 2003); Director, American Electric Power Co. (electric utility) (since 1999); Director, National Instruments Corp. (technology) (since 1994); Formerly, Director, Valero Energy (petroleum refining) (from 1999 to 2003) |
38 Legg Mason Partners International Fund
Additional Information (unaudited) (continued)
| | | | | | | | | | |
| | | | | |
Name, Address and Birth Year | | Position(s)
Held with
Fund | | Term of
Office* and
Length
of Time
Served | | Principal
Occupation(s)
During Past
Five Years | | Number of
Portfolios
in Fund
Complex
Overseen by
Trustee | | Other
Trusteeships
Held by
Trustee |
A. Benton Cocanougher c/o R. Jay Gerken
Legg Mason 399 Park Avenue, 4th Floor New York, NY 10022 Birth Year: 1938 | | Trustee | | Since 2001 | | Dean Emeritus and Professor, Texas A&M University (since 2001); Formerly, Interim Chancellor, Texas A&M University System (from 2003 to 2004); Formerly, Special Advisor to the President, Texas A&M University (from 2002 to 2003); Formerly, Dean and Professor of Marketing, College and Graduate School of Business of Texas A&M University (from 1987 to 2001) | | 37 | | None |
| | | | | |
Mark T. Finn
c/o R. Jay Gerken
Legg Mason 399 Park Avenue, 4th Floor New York, NY 10022 Birth Year: 1943 | | Trustee | | Since 2001 | | Adjunct Professor, College of William & Mary (since 2002); Principal/Member, Balvan Partners (investment management) (since 2002); Chairman, Chief Executive Officer and Owner, Vantage Consulting Group, Inc. (investment management) (since 1988); Formerly, Vice Chairman and Chief Operating Officer, Lindner Asset Management Company (mutual fund company) (from 1999 to 2001); Formerly, General Partner and Shareholder, Greenwich Ventures, LLC (investment partnership) (from 1996 to 2001) | | 37 | | None |
Legg Mason Partners International Fund 39
Additional Information (unaudited) (continued)
| | | | | | | | | | |
| | | | | |
Name, Address and Birth Year | | Position(s)
Held with
Fund | | Term of
Office* and
Length
of Time
Served | | Principal
Occupation(s)
During Past
Five Years | | Number of
Portfolios
in Fund
Complex
Overseen by
Trustee | | Other
Trusteeships
Held by
Trustee |
Stephen R. Gross
c/o R. Jay Gerken Legg Mason 399 Park Avenue, 4th Floor New York, NY 10022 Birth Year: 1947 | | Trustee | | Since 2001 | | Chairman, HLB Gross Collins, P.C. (accounting and consulting firm) (since 1979); Treasurer, Coventry Limited, Inc. (Senior Living Facilities) (since 1985); Formerly, Managing Director, Fountainhead Ventures, L.L.C. (technology accelerator) (from 1998 to 2003); Formerly, Treasurer, Hank Aaron Enterprises (fast food franchise) (from 1985 to 2001); Formerly, Partner, Capital Investment Advisory Partners (leverage buyout consulting) (from 2000 to 2002); Formerly, Secretary, Carint N.A. (manufacturing) (from 1998 to 2002) | | 37 | | Director, Andersen Calhoun (assisted living) (since 1987); Formerly, Director United Telesis, Inc. (telecommunications) (from 1997 to 2002); Formerly, Director, ebank Financial Services, Inc. (from 1997 to 2004) |
| | | | | |
Diana R. Harrington c/o R. Jay Gerken Legg Mason 399 Park Avenue, 4th Floor New York, NY 10022 Birth Year: 1940 | | Trustee | | Since 1992 | | Professor, Babson College
(since 1992) | | 37 | | None |
| | | | | |
Susan B. Kerley c/o R. Jay Gerken
Legg Mason 399 Park Avenue, 4th Floor New York, NY 10022 Birth Year: 1951 | | Trustee | | Since 1992 | | Investment Consulting Partner, Strategic Management Advisors, LLC (investment consulting) (since 1990) | | 37 | | Chairperson and Independent Board Member of Eclipse Funds, Inc. and Eclipse Funds (which trade as MainStay Funds) (currently supervises 16 investment companies in fund complex) (since 1991) |
40 Legg Mason Partners International Fund
Additional Information (unaudited) (continued)
| | | | | | | | | | |
| | | | | |
Name, Address and Birth Year | | Position(s)
Held with
Fund | | Term of
Office* and
Length
of Time
Served | | Principal
Occupation(s)
During Past
Five Years | | Number of
Portfolios
in Fund
Complex
Overseen by
Trustee | | Other
Trusteeships
Held by
Trustee |
Alan G. Merten c/o R. Jay Gerken Legg Mason 399 Park Avenue, 4th Floor New York, NY 10022 Birth Year: 1941 | | Trustee | | Since 2001 | | President, George Mason University (since 1996) | | 37 | | Trustee, First Potomac Realty Trust (since 2005); Director, Xybernaut Corporation (information technology) (from 2004 to 2006); Director, Digital Net Holdings, Inc. (from 2003 to 2004); Director, Comshare, Inc. (information technology) (from 1985 to 2003); Director, BTG, Inc. (information systems) (from 1997 to 2001) |
| | | | | |
R. Richardson Pettit c/o R. Jay Gerken Legg Mason 399 Park Avenue, 4th Floor New York, NY 10022 Birth Year: 1942 | | Trustee | | Since 2001 | | Formerly, Duncan Professor of Finance, University of Houston (from 1977 to 2006) | | 37 | | None |
| | | | |
| Interested Trustee: | | | | | | | | |
R. Jay Gerken, CFA** Legg Mason 399 Park Avenue, 4th Floor New York, NY 10022 Birth Year: 1951 | | Chairman, President and Chief Executive Officer | | Since 2002 | | Managing Director of Legg Mason; President and Chief Executive Officer of Legg Mason Partners Fund Advisors, LLC (‘‘LMPFA’’) (Since 2006); President and Chief Executive Officer of Smith Barney Fund Management LLC (‘‘SBFM’’) and Citi Fund Management Inc, (‘‘CFM’’); President and Chief Executive Officer of certain mutual funds associated with Legg Mason; formerly, Chairman of SBFM and CFM (from 2002 to 2006); formerly, Chairman, President and Chief Executive Officer of Travelers Investment Advisers, Inc. (from 2002 to 2005) | | 162 | | Trustee, Consulting Group Capital Markets Funds |
Legg Mason Partners International Fund 41
Additional Information (unaudited) (continued)
| | | | | | | | | | |
| | | | | |
Name, Address and Birth Year | | Position(s)
Held with
Fund | | Term of
Office* and
Length
of Time
Served | | Principal
Occupation(s)
During Past
Five Years | | Number of
Portfolios
in Fund
Complex
Overseen by
Trustee | | Other
Trusteeships
Held by
Trustee |
| Officers: | | | | | | | | | | |
Frances M. Guggino Legg Mason 125 Broad Street, 10th Floor New York, NY 10004 Birth Year: 1957 | | Chief Financial Officer and Treasurer | | Since
2004 | | Director of Legg Mason; Chief Financial Officer and Treasurer of certain mutual funds associated with Legg Mason; Formerly, Controller of certain mutual funds associated with Legg Mason (from 1999 to 2004) | | N/A | | N/A |
| | | | | |
Ted P. Becker Legg Mason 399 Park Avenue, 4th Floor New York, NY 10022 Birth Year: 1951 | | Chief Compliance Officer | | Since 2006 | | Director of Global Compliance at Legg Mason (since 2006); Chief Compliance Officer of LMPFA (since 2006); Managing Director of Compliance at Legg Mason (since 2005); Chief Compliance Officer with certain mutual funds associated with Legg Mason (since 2006); Managing Director of Compliance at Legg Mason or its predecessor (from 2002 to 2005); Prior to 2002, Managing Director— Internal Audit & Risk Review at Citigroup, Inc. | | N/A | | N/A |
| | | | | |
John Chiota Legg Mason 100 First Stamford Place, 5th Floor Stamford, CT 06902 Birth Year: 1968 | | Chief Anti- Money Laundering Compliance Officer | | Since 2006 | | Vice President of Legg Mason or its predecessor (since 2004); Chief Anti- Money Laundering Compliance Officer with certain mutual funds associated with Legg Mason (since 2006); Prior to August 2004, Chief AML Compliance Officer with TD Waterhouse | | N/A | | N/A |
42 Legg Mason Partners International Fund
Additional Information (unaudited) (continued)
| | | | | | | | | | |
| | | | | |
Name, Address and Birth Year | | Position(s)
Held with
Fund | | Term of
Office* and
Length
of Time
Served | | Principal
Occupation(s)
During Past
Five Years | | Number of
Portfolios
in Fund
Complex
Overseen by
Trustee | | Other
Trusteeships
Held by
Trustee |
Robert I. Frenkel Legg Mason 300 First Stamford Place, 4th Floor Stamford, CT 06902 Birth Year: 1954 | | Secretary and Chief Legal Officer
| | Since
2003
| | Managing Director and General Counsel of Global Mutual Funds for Legg Mason and its predecessor (since 1994); Secretary and Chief Legal Officer of mutual funds associated with Legg Mason (since 2003); Formerly, Secretary of CFM (from 2001 to 2004) | | N/A | | N/A |
| * | | Each Trustee and Officer serves until his or her successor has been duly elected and qualified. |
| ** | | Mr. Gerken is an “interested person” of the Fund as defined in the Investment Company Act of 1940, as amended, because Mr. Gerken is an officer of LMPFA and certain of its affiliates. |
Legg Mason Partners International Fund 43
Additional Shareholder Information (unaudited)
Results of a Special Meeting of Shareholders
On October 19, 2006, a Special Meeting of Shareholder was held to approve an Agreement and Plan of Reorganization, providing for (i) the acquisition of all of the assets and the assumption of all of the liabilities of the Legg Mason Partners International Fund (the “Acquired Fund”), in exchange for shares of the corresponding Legg Mason Partners International Large Cap Fund (the “Acquiring Fund”) to be distributed to the shareholders of the Acquired Fund and (ii) the subsequent termination of the Acquired Fund. The following table provides the number of votes cast for, against or withheld, as well as the number of abstentions and broker non-votes for the matter voted on at the Special Meeting of Shareholder.
Approval of Agreement and Plan of Reorganization
| | | | | | |
| | | |
| Votes For | | Votes Against | | Abstentions | | Broker Non-Votes |
| 2,390,205.627 | | 55,457.421 | | 146,011.492 | | 0.000 |
| |
On December 11, 2006, a Special Meeting of Shareholders was held to elect Board Members. The following table provides the number of votes cast for or against, as well as the number of abstentions and broker non-votes as to the matter voted on at the Special Meeting of Shareholders.
Election of Board Members†
| | | | | | | | |
| | | | |
| Item Voted On | | Votes For | | Votes
Against | | Abstentions | | Broker Non-Votes |
Nominees: | | | | | | | | |
Paul R. Ades | | 123,276,317.131 | | 3,082,135.672 | | 0.000 | | 0.000 |
Andrew L. Breech | | 123,263,371.782 | | 3,095,081.021 | | 0.000 | | 0.000 |
Dwight B. Crane | | 123,262,454.821 | | 3,095,997.982 | | 0.000 | | 0.000 |
Robert M. Frayn, Jr. | | 123,177,621.132 | | 3,180,831.671 | | 0.000 | | 0.000 |
Frank G. Hubbard | | 123,240,887.733 | | 3,117,565.070 | | 0.000 | | 0.000 |
Howard J. Johnson | | 123,237,577.056 | | 3,120,875.747 | | 0.000 | | 0.000 |
David E. Maryatt | | 123,181,879.401 | | 3,176,573.402 | | 0.000 | | 0.000 |
Jerome H. Miller | | 123,151,423.644 | | 3,207,029.159 | | 0.000 | | 0.000 |
Ken Miller | | 123,225,633.504 | | 3,132,819.299 | | 0.000 | | 0.000 |
John J. Murphy | | 123,258,467.753 | | 3,099,985.050 | | 0.000 | | 0.000 |
Thomas F. Schlafly | | 123,271,369.107 | | 3,087,083.696 | | 0.000 | | 0.000 |
Jerry A. Viscione | | 123,159,026.695 | | 3,199,426.108 | | 0.000 | | 0.000 |
R. Jay Gerken, CFA | | 123,180,648.353 | | 3,177,804.450 | | 0.000 | | 0.000 |
| |
| † | | Board Members are elected by the shareholders of all of the series of the Trust of which the Fund is a series. |
44 Legg Mason Partners International Fund
Important Tax Information (unaudited)
The following information is provided with respect to the distributions paid during the taxable year ended October 31, 2006.
| | | |
Record Date: | | 12/28/2005 | |
Payable Date: | | 12/29/2005 | |
| | |
Ordinary Income: | | | |
Qualified Dividend Income for Individuals | | 100.00 | % |
| | |
Please retain this information for your records.
Legg Mason Partners International Fund 45
Legg Mason Partners International Fund
| | |
TRUSTEES Elliott J. Berv Donald M. Carlton A. Benton Cocanougher Mark T. Finn R. Jay Gerken, CFA Chairman Stephen R. Gross Diana R. Harrington Susan B. Kerley Alan G. Merten R. Richardson Pettit | | INVESTMENT MANAGER Legg Mason Partners Fund Advisor, LLC SUBADVISER Batterymarch Financial Management, Inc. DISTRIBUTORS Citigroup Global Markets Inc. Legg Mason Investor Services, LLC PFS Investments Inc. CUSTODIAN State Street Bank and Trust Company TRANSFER AGENT PFPC Inc. 4400 Computer Drive Westborough, Massachussetts 01581 INDEPENDENT REGISTERED PUBLIC ACCOUNTING FIRM KPMG LLP 345 Park Avenue New York, New York 10154 |
This report is submitted for the general information of shareholders of Legg Mason Partners International Fund, but it may also be used as sales literature when preceded or accompanied by the current prospectus.
This report must be preceded or accompanied by a free prospectus. Investors should consider the Fund’s investment objectives, risks, charges and expenses carefully before investing. The prospectus contains this and other important information about the Fund. Please read the prospectus carefully before investing.
www.leggmason.com/InvestorServices
©2006 Legg Mason Investor Services, LLC Member NASD, SIPC
Legg Mason Partners International Fund
The Fund is a separate investment fund of Legg Mason Partners Investment Series, a Massachusetts business trust.
LEGG MASON PARTNERS INTERNATIONAL FUND
Legg Mason Partners Funds
125 Broad Street
10th Floor, MF-2
New York, New York 10004
The Fund files its complete schedule of portfolio holdings with the Securities and Exchange Commission for the first and third quarters of each fiscal year on Form N-Q. The Fund’s Forms N-Q are available on the Commission’s website at www.sec.gov. The Fund’s Forms N-Q may be reviewed and copied at the Commission’s Public Reference Room in Washington, D.C., and information on the operation of the Public Reference Room may be obtained by calling 1-800-SEC-0330. To obtain information on Form N-Q from the Fund, shareholders can call Legg Mason Partners Shareholder Services at 1-800-451-2010.
Information on how the Fund voted proxies relating to portfolio securities during the prior 12-month period ended June 30th of each year, and a description of the policies and procedures that the Fund uses to determine how to vote proxies relating to portfolio transactions is available (1) without charge, upon request, by calling 1-800-451-2010, (2) on the Fund’s website at www.leggmason.com/InvestorServices and (3) on the SEC’s website at www.sec.gov.
The registrant has adopted a code of ethics that applies to the registrant’s principal executive officer, principal financial officer, principal accounting officer or controller.
| ITEM 3. | AUDIT COMMITTEE FINANCIAL EXPERT. |
The Board of Trustees of the registrant has determined that Stephen Randolph Gross, the Chairman of the Board’s Audit Committee, possesses the technical attributes identified in Instruction 2(b) of Item 3 to Form N-CSR to qualify as an “audit committee financial expert,” and has designated Mr. Gross as the Audit Committee’s financial expert. Mr. Gross is an “independent” Trustee pursuant to paragraph (a)(2) of Item 3 to Form N-CSR.
| ITEM 4. | PRINCIPAL ACCOUNTANT FEES AND SERVICES. |
a) Audit Fees. The aggregate fees billed in the last two fiscal years ending October 31, 2005 and October 31, 2006 (the “Reporting Periods”) for professional services rendered by the Registrant’s principal accountant (the “Auditor”) for the audit of the Registrant’s annual financial statements, or services that are normally provided by the Auditor in connection with the statutory and regulatory filings or engagements for the Reporting Periods, were $130,000 in 2005 and $136,000 in 2006.
b) Audit-Related Fees. The aggregate fees billed in the Reporting Periods for assurance and related services by the Auditor that are reasonably related to the performance of the audit of the Registrant’s financial statements and are not reported under paragraph (a) of this Item 4 were $8,000 in 2005 and $0 in 2006. These services consisted of procedures performed in connection with the Review of the Annual Registration Statement filed on Form N-1A of the Legg Mason Partners Investment Series and the Review and Preparation with the Issuance of the 17-F2 Security Count Independent Accountants Reports.
In addition, there were no Audit-Related Fees billed in the Reporting Period for assurance and related services by the Auditor to the Registrant’s investment adviser (not including any sub-adviser whose role is primarily portfolio management and is subcontracted with or overseen by another investment adviser), and any entity controlling, controlled by or under common control with the investment adviser that provides ongoing services to the Legg Mason Partners Investment Series (“service affiliates”), that were reasonably related to the performance of the annual audit of the service affiliates. Accordingly, there were no such fees that required pre-approval by the Audit Committee for the Reporting Periods (prior to May 6, 2003 services provided by the Auditor were not required to be pre-approved).
(c) Tax Fees. The aggregate fees billed in the Reporting Periods for professional services rendered by the Auditor for tax compliance, tax advice and tax planning (“Tax Services”) were $29,600 in 2005 and $0 in 2006. These services consisted of (i) review or preparation of U.S. federal, state, local and excise tax returns; (ii) U.S. federal, state and local tax planning, advice and assistance regarding statutory, regulatory or administrative developments, and (iii) tax advice regarding tax qualification matters and/or treatment of various financial instruments held or proposed to be acquired or held.
There were no fees billed for tax services by the Auditors to service affiliates during the Reporting Periods that required pre-approval by the Audit Committee.
d) All Other Fees. There were no other fees billed in the Reporting Periods for products and services provided by the Auditor, other than the services reported in paragraphs (a) through (c) of this Item 4 on behalf of the Legg Mason Partners Investment Series.
All Other Fees. There were no other non-audit services rendered by the Auditor to Smith Barney Fund Management LLC (“SBFM”), and any entity controlling, controlled by or under common control with SBFM that provided ongoing services to Legg Mason Partners Investment Series requiring pre-approval by the Audit Committee in the Reporting Period.
(e) Audit Committee’s pre–approval policies and procedures described in paragraph (c) (7) of Rule 2-01 of Regulation S-X.
(1) The Charter for the Audit Committee (the “Committee”) of the Board of each registered investment company (the “Fund”) advised by Smith Barney Fund Management LLC or Salomon Brothers Asset Management Inc. or one of their affiliates (each, an “Adviser”) requires that the Committee shall approve (a) all audit and permissible non-audit services to be provided to the Fund and (b) all permissible non-audit services to be provided by the Fund’s independent auditors to the Adviser and any Covered Service Providers if the engagement relates directly to the operations and financial reporting of the Fund. The Committee may implement policies and procedures by which such services are approved other than by the full Committee.
The Committee shall not approve non-audit services that the Committee believes may impair the independence of the auditors. As of the date of the approval of this Audit Committee Charter, permissible non-audit services include any professional services (including tax services), that are not prohibited services as described below, provided to the Fund by the independent auditors, other than those provided to the Fund in connection with an audit or a review of the financial statements of the Fund. Permissible non-audit services may not include: (i) bookkeeping or other services related to the accounting records or financial statements of the Fund; (ii) financial information systems design and implementation; (iii) appraisal or valuation services, fairness opinions or contribution-in-kind reports; (iv) actuarial services; (v) internal audit outsourcing services; (vi) management functions or human resources; (vii) broker or dealer, investment adviser or investment banking services; (viii) legal services and expert services unrelated to the audit; and (ix) any other service the Public Company Accounting Oversight Board determines, by regulation, is impermissible.
Pre-approval by the Committee of any permissible non-audit services is not required so long as: (i) the aggregate amount of all such permissible non-audit services provided to the Fund, the Adviser and any service providers controlling, controlled by or under common control with the Adviser that provide ongoing services to the Fund (“Covered Service Providers”) constitutes not more than 5% of the total amount of revenues paid to the independent auditors during the fiscal year in which the permissible non-audit services are provided to (a) the Fund, (b) the Adviser and (c) any entity controlling, controlled by or under common control with the Adviser that provides ongoing services to the Fund during the fiscal year in which the services are provided that would have to be approved by the Committee; (ii) the permissible non-audit services were not recognized by the Fund at the time of the engagement to be non-audit services; and (iii) such services are promptly brought to the attention of the Committee and approved by the Committee (or its delegate(s)) prior to the completion of the audit.
(2) For the Legg Mason Partners Investment Series, the percentage of fees that were approved by the audit committee, with respect to: Audit-Related Fees were 100% and 0% for 2005 and 2006; Tax Fees were 100% and 0% for 2005 and 2006; and Other Fees were 100% and 0% for 2005 and 2006.
(f) N/A
(g) Non-audit fees billed by the Auditor for services rendered to Legg Mason Partners Investment Series and CAM and any entity controlling, controlled by, or under common control with CAM that provides ongoing services to Legg Mason Partners Investment Series during the reporting period were $0 in 2006 for fees related to the transfer agent matter as fully described in the notes the financial statements titled “additional information” and $75,000 for 2005.
(h) Yes. Legg Mason Partners Investment Series’s Audit Committee has considered whether the provision of non-audit services that were rendered to Service Affiliates which were not pre-approved (not requiring pre-approval) is compatible with maintaining the Accountant’s independence. All services provided by the Auditor to the Legg Mason Partners Investment Series or to Service Affiliates, which were required to be pre-approved, were pre-approved as required.
| ITEM 5. | AUDIT COMMITTEE OF LISTED REGISTRANTS. |
Not applicable.
| ITEM 6. | SCHEDULE OF INVESTMENTS. |
Included herein under Item 1.
| ITEM 7. | DISCLOSURE OF PROXY VOTING POLICIES AND PROCEDURES FOR CLOSED-END MANAGEMENT INVESTMENT COMPANIES. |
Not applicable.
| ITEM 8. | PORTFOLIO MANAGERS OF CLOSED-END MANAGEMENT INVESTMENT COMPANIES. |
Not applicable.
| ITEM 9. | PURCHASES OF EQUITY SECURITIES BY CLOSED-END MANAGEMENT INVESTMENT COMPANY AND AFFILIATED PURCHASERS. |
Not applicable.
| ITEM 10. | SUBMISSION OF MATTERS TO A VOTE OF SECURITY HOLDERS. |
Not applicable.
| ITEM 11. | CONTROLS AND PROCEDURES. |
| | (a) | The registrant’s principal executive officer and principal financial officer have concluded that the registrant’s disclosure controls and procedures (as defined in Rule 30a- 3(c) under the Investment Company Act of 1940, as amended (the “1940 Act”)) are effective as of a date within 90 days of the filing date of this report that includes the disclosure required by this paragraph, based on their evaluation of the disclosure controls and procedures required by Rule 30a-3(b) under the 1940 Act and 15d-15(b) under the Securities Exchange Act of 1934. |
| | (b) | There were no changes in the registrant’s internal control over financial reporting (as defined in Rule 30a-3(d) under the 1940 Act) that occurred during the registrant’s last fiscal half-year (the registrant’s second fiscal half-year in the case of an annual report) that have materially affected, or are likely to materially affect the registrant’s internal control over financial reporting. |
| | (a)(1) | Code of Ethics attached hereto. |
Exhibit 99.CODE ETH
| | (a)(2) | Certifications pursuant to section 302 of the Sarbanes-Oxley Act of 2002 attached hereto. |
Exhibit 99.CERT
| | (b) | Certifications pursuant to Section 906 of the Sarbanes-Oxley Act of 2002 attached hereto. |
Exhibit 99.906CERT
SIGNATURES
Pursuant to the requirements of the Securities Exchange Act of 1934 and the Investment Company Act of 1940, the registrant has duly caused this Report to be signed on its behalf by the undersigned, there unto duly authorized.
Legg Mason Partners Investment Series
| | |
| By: | | /s/ R. Jay Gerken |
| | R. Jay Gerken |
| | Chief Executive Officer of |
| | Legg Mason Partners Investment Series |
|
| Date: January 8, 2007 |
Pursuant to the requirements of the Securities Exchange Act of 1934 and the Investment Company Act of 1940, this report has been signed below by the following persons on behalf of the registrant and in the capacities and on the dates indicated.
| | |
| By: | | /s/ R. Jay Gerken |
| | R. Jay Gerken |
| | Chief Executive Officer of |
| | Legg Mason Partners Investment Series |
|
| Date: January 8, 2007 |
| |
| By: | | /s/ Frances M. Guggino |
| | Frances M. Guggino |
| | Chief Financial Officer of |
| | Legg Mason Partners Investment Series |
|
| Date: January 8, 2007 |